| | |
| UNITED STATES
SECURITIES AND EXCHANGE COMMISSION |
| | |
| CERTIFIED SHAREHOLDER REPORT OF REGISTERED
MANAGEMENT INVESTMENT COMPANIES
|
| | |
| Investment Company Act file number: | (811-04528) |
| | |
| Exact name of registrant as specified in charter: | Putnam Ohio Tax Exempt Income Fund |
| | |
| Address of principal executive offices: | One Post Office Square, Boston, Massachusetts 02109 |
| | |
| Name and address of agent for service: | Robert T. Burns, Vice President
One Post Office Square
Boston, Massachusetts 02109 |
| | |
| Copy to: | John W. Gerstmayr, Esq.
Ropes & Gray LLP
800 Boylston Street
Boston, Massachusetts 02199-3600 |
| | |
| Registrant’s telephone number, including area code: | (617) 292-1000 |
| | |
| Date of fiscal year end: | May 31, 2012 |
| | |
| Date of reporting period: | June 1, 2011 — May 31, 2012 |
| | |
|
Item 1. Report to Stockholders: | |
| | |
| The following is a copy of the report transmitted to stockholders pursuant to Rule 30e-1 under the Investment Company Act of 1940: | |
Putnam Ohio
Tax Exempt
Income Fund
Annual report
5 | 31 | 12
| | |
| Message from the Trustees | 1 | |
| |
| About the fund | 2 | |
| |
| Performance snapshot | 4 | |
| |
| Interview with your fund’s portfolio manager | 5 | |
| |
| Your fund’s performance | 10 | |
| |
| Your fund’s expenses | 13 | |
| |
| Terms and definitions | 15 | |
| |
| Other information for shareholders | 16 | |
| |
| Financial statements | 17 | |
| |
| Federal tax information | 38 | |
| |
| About the Trustees | 39 | |
| |
| Officers | 41 | |
| |
Consider these risks before investing: Investments in a single state carry risks of vulnerability to common economic forces and other factors affecting the state’s tax-exempt investments, which may result in greater losses and volatility. Capital gains, if any, are taxable for federal and, in most cases, state purposes. For some investors, investment income may be subject to the federal alternative minimum tax. Funds that invest in bonds are subject to certain risks including interest-rate risk, credit risk, and inflation risk. As interest rates rise, the prices of bonds fall. Long-term bonds are more exposed to interest-rate risk than short-term bonds. Unlike bonds, funds that invest in bonds have ongoing fees and expenses. Since the fund invests in tax-exempt bonds, which, to be treated as tax exempt under the Internal Revenue Code, may be issued only by limited types of issuers for limited types of projects, the fund’s investments may be focused in certain market segments. Consequently, the fund may be more vulnerable to fluctuations in the values of the securities it holds than a fund that invests more broadly. The prices of bonds may fall or fail to rise over extended periods of time for a variety of reasons, including both general financial market conditions and factors related to a specific issuer or industry.
Message from the Trustees
Dear Fellow Shareholder:
Markets worldwide continue to be buffeted by headwinds out of Europe and evidence of a slowing global economy. The coming election in the United States has added to uncertainty around important economic issues at the federal and state levels. It is prudent to expect this volatility to stay with us as policymakers around the world work out solutions to debt issues and pave the way to sustained economic growth.
Long-term investors should also understand that Putnam’s experienced investment team is trained to uncover opportunities in precisely this type of environment, while actively seeking to guard against downside risk. As always, it is wise to rely on the expertise and insights of your financial advisor, someone who can help you maintain a long-term focus and a balanced investment approach.
In other news, please join us in welcoming the return of Elizabeth T. Kennan to the Board of Trustees. Dr. Kennan, who served as a Trustee from 1992 until 2010, has rejoined the Board, effective January 1, 2012. Dr. Kennan is a Partner of Cambus-Kenneth Farm (thoroughbred horse breeding and general farming), and is also President Emeritus of Mount Holyoke College.
We would also like to take this opportunity to welcome new shareholders to the fund and to thank all of our investors for your continued confidence in Putnam.

About the fund
Seeking a high level of tax-free income for Ohio investors

Municipal bonds can help investors keep more of their investment income while also financing important public projects such as schools, roads, and hospitals. Municipal bonds are typically issued by states and local municipalities to raise funds for building and maintaining public facilities, and they offer income that is generally exempt from federal, state, and local income tax.
Putnam Ohio Tax Exempt Income Fund seeks to capitalize on investment opportunities in Ohio by investing in bonds across a range of sectors. The fund also combines bonds of differing credit quality to increase income potential. In addition to investing in high-quality bonds, the fund’s managers allocate a smaller portion of the portfolio to lower-rated bonds, which may offer higher income in return for more risk.
When deciding whether to invest in a bond, the fund’s managers consider the risks involved — including credit risk, interest-rate risk, and the risk that the bond will be prepaid.
The managers are backed by the resources of Putnam’s fixed-income organization, in which municipal bond analysts are grouped into sector teams and conduct ongoing, rigorous research. Once a bond has been purchased, the managers continue to monitor developments that may affect the bond market, the sector, and the issuer of the bond.
The goal of this in-depth research and active management is to stay a step ahead of the market and pinpoint opportunities for investors.
Understanding tax-equivalent yield
To understand the value of tax-free income, it is helpful to compare a municipal bond’s yield with the “tax-equivalent yield” — the before-tax yield that must be offered by a taxable bond in order to equal the municipal bond’s yield after taxes.
How to calculate tax-equivalent yield:
The tax-equivalent yield equals the municipal bond’s yield divided by “one minus the tax rate.” For example, if a municipal bond’s yield is 5%, then its tax-equivalent yield is 7.7%, assuming the maximum 35% federal tax rate for 2012.
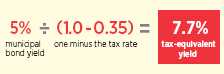
Results for investors subject to lower tax rates would not be as advantageous.

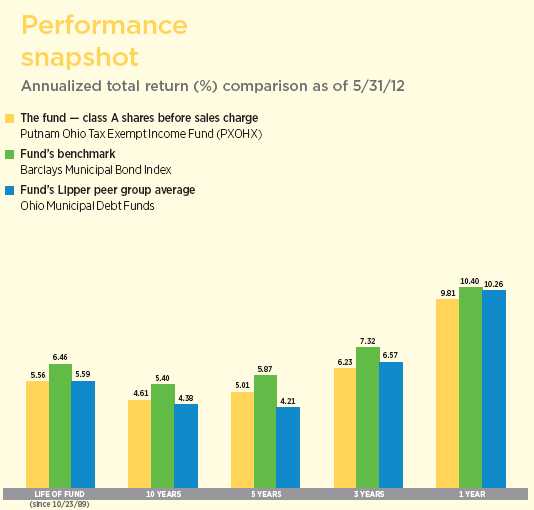
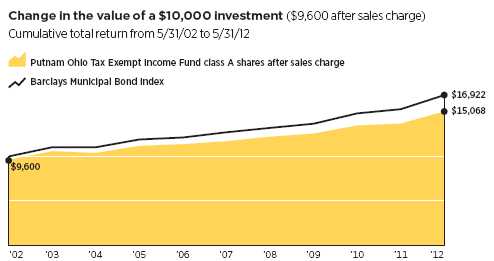
Current performance may be lower or higher than the quoted past performance, which cannot guarantee future results. Share price, principal value, and return will fluctuate, and you may have a gain or a loss when you sell your shares. Performance of class A shares assumes reinvestment of distributions and does not account for taxes. Fund returns in the bar chart do not reflect a sales charge of 4.00%; had they, returns would have been lower. See pages 5 and 10–12 for additional performance information. For a portion of the periods, the fund had expense limitations, without which returns would have been lower. To obtain the most recent month-end performance, visit putnam.com.
4
Interview with your fund’s portfolio manager

Municipal bonds were frequently in the news during the past 12 months. How would you describe the investment environment?
The past 12 months marked a particularly strong period for municipal bonds and for the fund. In the months before the fund’s fiscal year began, investors had become increasingly concerned about a potential wave of defaults in the municipal bond market and the perceived threat of unusually high supply in 2011, and as a result the market sold off dramatically. Neither of these concerns materialized, however. While defaults in calendar 2011 were somewhat higher than in 2010, they were still quite low overall, and were nowhere near the record-setting levels forecast by some in the media. Through the end of May, defaults year-to-date totaled about $1.4 billion, which is in line with historical averages. With regard to supply, new issuance remained relatively light by historical standards throughout the fund’s fiscal year, and that generally offered some price stability to the market. Many of the new issues that have taken place have been municipalities refunding or refinancing existing debt, which also has helped limit supply in the market.
Against this backdrop, tax-exempt bonds posted solid returns and outpaced the broad taxable bond market, as measured by the Barclays U.S. Aggregate Bond Index. While I’m pleased to report the fund posted a solid absolute gain, it did trail its benchmark and the average return of its Lipper peer group.
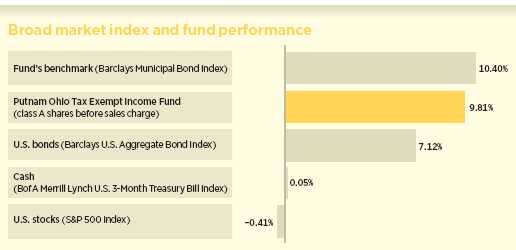
This comparison shows your fund’s performance in the context of broad market indexes for the 12 months ended 5/31/12. See pages 4 and 10–12 for additional fund performance information. Index descriptions can be found on page 15.
5
Last August, Standard & Poor’s [S&P] downgraded its credit rating for U.S. Treasuries and a number of municipal bonds. What impact did that have on the market?
On the heels of its August downgrade of U.S. sovereign debt, S&P lowered its ratings from AAA to AA+ for more than 11,000 municipal securities, including taxable and tax-exempt securities. While this number does seem large, it covers less than 1% of the nearly $4 trillion municipal bond market. These securities all had links to the federal government, and, according to S&P, the affected issues fell into four broad categories: municipal housing bonds backed by the federal government or invested in U.S. government securities; bonds of certain government-related entities in the housing and public power sectors; bonds backed by federal leases; and defeased bonds secured by U.S. Treasury and government agency securities held in escrow.
The downgrade was not surprising given the interdependence of state and federal finances, and S&P had been suggesting such a move was imminent for some time. Nonetheless, we believe S&P’s downgrades underscore the importance of performing intensive fundamental research when investing in the municipal bond market. At Putnam, we independently research every bond we hold and assess the credit risk it represents before we add it to the portfolio.
You mentioned an increase in defaults in 2011. What contributed to that change?
Prior to the fourth quarter of 2011, defaults in the municipal bond market had been trending lower since 2009, with the majority of defaults that did occur stemming from lower-rated or unrated securities, often in more speculative real-estate-backed sectors of the market. Late in 2011, however, we saw an increase in the default rate, driven in part by two high-profile
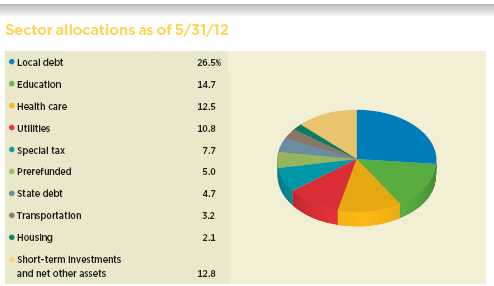
Allocations are represented as a percentage of the fund’s net assets. Summary information may differ from the portfolio schedule included in the financial statements due to the inclusion of derivative securities, any interest accruals, the exclusion of as-of trades, if any, and the use of different classifications of securities for presentation purposes. Holdings and allocations may vary over time.
6
events. The first was the bankruptcy filing of American Airlines. With about $3 billion of par-value bonds in the municipal market, that event had a significant effect on default levels. The second was a default by Jefferson County, Alabama, a county whose fiscal struggles had captured headlines for a number of years. The county’s bonds had been trading at distressed levels for some time, and their eventual default in 2011 was well anticipated by the market.

Overall, the default rate remained relatively low for all of last year, finishing well below 1%. Looking ahead, we believe defaults will continue to be in line with historical averages. That said, we believe it’s likely that certain cities or counties will continue to capture headlines in 2012, as a number of municipalities work to find their fiscal footing.
What effect have potential policy changes had on the tax-exempt bond market?
As the 2012 presidential election race has heated up, there has been a lot of discussion about tax reform. For example, in President Obama’s fiscal 2013 budget proposal, individuals and married couples earning more than $200,000 and $250,000, respectively, would only be able to exclude from federal taxes 28 cents of every dollar of municipal bond income earned. Meanwhile, Republicans in general and presumptive presidential nominee Mitt Romney in particular have been calling for a flatter rate on a broader tax base.
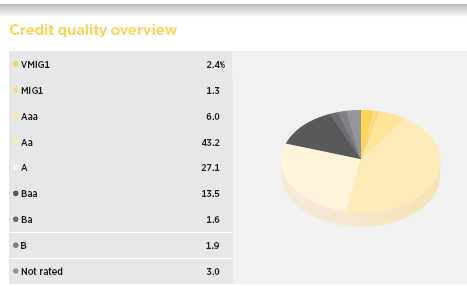
Credit qualities are shown as a percentage of portfolio market value as of 5/31/12. A bond rated Baa or higher (MIG3/VMIG3 or higher, for short-term debt) is considered investment grade. The chart reflects Moody’s ratings; percentages may include bonds or derivatives not rated by Moody’s but rated by Standard & Poor’s (S&P) or, if unrated by S&P, by Fitch, and then included in the closest equivalent Moody’s rating. Ratings will vary over time. Credit qualities are included for portfolio securities and are not included for derivative instruments and cash. The fund itself has not been rated by an independent rating agency.
7
Income tax rates are only one factor among many that affect the municipal bond market, including the prevailing interest-rate environment, the strength of the equity markets, and the tax picture more broadly.
We believe there is likely to be a much broader discussion on tax reform in 2013. However, in our view a number of issues likely will need to be addressed even before then, and it remains to be seen whether Congress will act on the debt ceiling, the alternative minimum tax, and the Bush-era tax cuts, which are slated to expire at the end of the year. Of course, we’re monitoring the situation closely.
How did you position the portfolio during the fund’s fiscal year?
We sought to benefit from improving fundamentals in the municipal bond market. While we believed that the budget challenges faced by many states were significant, we were confident that conditions would improve as long as the broad economy did not stall. Against this backdrop, we believed that essential service revenue bonds continued to be attractive, while we remained highly selective regarding the fund’s positioning in local general obligation bonds [G.O.s], which are securities issued at the city or county level. We believe that as the federal government looks to reduce transfer payments to the states — and as states, including Ohio, seek in turn to close their deficits by reducing spending — these types of bonds are at risk for downgrades or other headline-driven price volatility. And unlike state general obligation bonds, local G.O.s rely more on property tax revenue than on income or sales taxes. With real-estate prices still under pressure in many markets, property taxes have been slower to recover than other tax sources.
From a credit perspective, we held an overweight position in A-rated and Baa-rated securities versus the fund’s benchmark. In
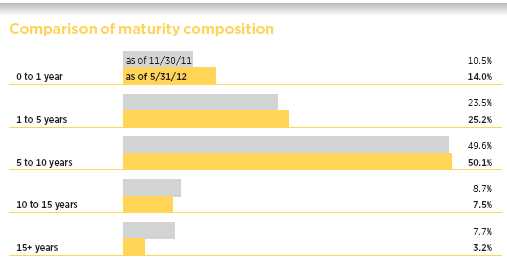
This chart illustrates the fund’s composition by maturity, showing the percentage of holdings in different maturity ranges and how the composition has changed over the past six months. Holdings and maturity ranges will vary over time. The effective maturity dates of bonds with call features may change as a result of market conditions.
8
terms of sectors, relative to the benchmark index, we favored higher education, utility, and health-care bonds, particularly those of larger, higher-quality hospitals and continuing-care retirement communities. Overall, this positioning generally helped the fund’s relative performance during its fiscal year.
What is your outlook for the months ahead?
Technical factors in the market have been positive — specifically, higher refunding activity and strong investor demand. However, we believe that some uncertainty remains. We believe that Ohio and other states will continue to face financial challenges as the economy struggles to find its footing. For the most part, however, we believe that the fiscal conditions across the country are showing signs of gradual improvement: Tax receipts are beginning to improve, albeit slowly, and we believe defaults will remain relatively low in 2012. Our main focus, however, remains on the economy and Congress’s plans to reduce the deficit. Higher federal income tax rates, a change in the tax status of municipal bonds, and significant cuts in state funding all would have consequences for the municipal bond market in our view. But for investors with longer time horizons, we believe that our actively managed approach remains a prudent way to diversify holdings and generate tax-exempt income in the municipal bond market.
Thank you, Thalia, for updating us on the fund.
The views expressed in this report are exclusively those of Putnam Management and are subject to change. They are not meant as investment advice.
Please note that the holdings discussed in this report may not have been held by the fund for the entire period. Portfolio composition is subject to review in accordance with the fund’s investment strategy and may vary in the future. Current and future portfolio holdings are subject to risk.
Portfolio Manager Thalia Meehan holds a B.A. from Williams College. A CFA charterholder, Thalia joined Putnam in 1989 and has been in the investment industry since 1983.
In addition to Thalia, your fund’s portfolio managers are Paul M. Drury, CFA, and Susan A. McCormack, CFA.
IN THE NEWS
Risk-averse investors around the world are stampeding into government bonds, driving yields to record lows. In the United States, the rate on a 10-year U.S. Treasury note recently dipped to levels not seen since 1945. Several factors have driven the prices of U.S. Treasuries higher and their yields lower, including concerns about a U.S. economic slowdown, Europe’s dire economic situation, and the decelerating economies of China and India. In early June, the 10-year Treasury note yield fell to 1.54%, below the prior low of 1.55%, which was reached just after World War II. Meanwhile, municipal bond yields have also declined, but not as significantly as Treasuries. As a result, municipal bonds potentially offer a greater income opportunity than Treasuries in today’s record-low interest-rate environment.
9
Your fund’s performance
This section shows your fund’s performance, price, and distribution information for periods ended May 31, 2012, the end of its most recent fiscal year. In accordance with regulatory requirements for mutual funds, we also include performance as of the most recent calendar quarter-end and expense information taken from the fund’s current prospectus. Performance should always be considered in light of a fund’s investment strategy. Data represent past performance. Past performance does not guarantee future results. More recent returns may be less or more than those shown. Investment return and principal value will fluctuate, and you may have a gain or a loss when you sell your shares. Performance information does not reflect any deduction for taxes a shareholder may owe on fund distributions or on the redemption of fund shares. For the most recent month-end performance, please visit the Individual Investors section at putnam.com or call Putnam at 1-800-225-1581. Class Y shares are not available to all investors. See the Terms and Definitions section in this report for definitions of the share classes offered by your fund.
Fund performance Total return for periods ended 5/31/12
| | | | | | | | | |
| | Class A | Class B | Class C | Class M | Class Y |
| (inception dates) | (10/23/89) | (7/15/93) | (10/3/06) | (4/3/95) | (1/2/08) |
|
| | Before | After | | | | | Before | After | Net |
| sales | sales | Before | After | Before | After | sales | sales | asset |
| charge | charge | CDSC | CDSC | CDSC | CDSC | charge | charge | value |
|
| Annual average | | | | | | | | | |
| (life of fund) | 5.56% | 5.38% | 4.84% | 4.84% | 4.76% | 4.76% | 5.22% | 5.07% | 5.61% |
|
| 10 years | 56.96 | 50.68 | 47.06 | 47.06 | 45.49 | 45.49 | 52.40 | 47.38 | 58.45 |
| Annual average | 4.61 | 4.19 | 3.93 | 3.93 | 3.82 | 3.82 | 4.30 | 3.95 | 4.71 |
|
| 5 years | 27.71 | 22.65 | 23.61 | 21.61 | 22.94 | 22.94 | 25.97 | 21.90 | 28.95 |
| Annual average | 5.01 | 4.17 | 4.33 | 3.99 | 4.22 | 4.22 | 4.73 | 4.04 | 5.22 |
|
| 3 years | 19.87 | 15.06 | 17.54 | 14.54 | 17.10 | 17.10 | 18.74 | 14.89 | 20.67 |
| Annual average | 6.23 | 4.79 | 5.53 | 4.63 | 5.40 | 5.40 | 5.89 | 4.74 | 6.46 |
|
| 1 year | 9.81 | 5.43 | 9.01 | 4.01 | 9.00 | 8.00 | 9.50 | 5.92 | 10.07 |
|
Current performance may be lower or higher than the quoted past performance, which cannot guarantee future results. After-sales-charge returns for class A and M shares reflect the deduction of the maximum 4.00% and 3.25% sales charge, respectively, levied at the time of purchase. Class B share returns after contingent deferred sales charge (CDSC) reflect the applicable CDSC, which is 5% in the first year, declining over time to 1% in the sixth year, and is eliminated thereafter. Class C share returns after CDSC reflect a 1% CDSC for the first year that is eliminated thereafter. Class Y shares have no initial sales charge or CDSC. Performance for class B, C, M, and Y shares before their inception is derived from the historical performance of class A shares, adjusted for the applicable sales charge (or CDSC) and the higher operating expenses for such shares, except for class Y shares, for which 12b-1 fees are not applicable.
For a portion of the periods, the fund had expense limitations, without which returns would have been lower.
Class B performance does not reflect conversion to class A shares.
10
Comparative index returns For periods ended 5/31/12
| | |
| | Barclays Municipal | Lipper Ohio Municipal Debt Funds |
| | Bond Index | category average* |
|
| Annual average (life of fund) | 6.46% | 5.59% |
|
| 10 years | 69.22 | 53.75 |
| Annual average | 5.40 | 4.38 |
|
| 5 years | 32.99 | 23.05 |
| Annual average | 5.87 | 4.21 |
|
| 3 years | 23.62 | 21.16 |
| Annual average | 7.32 | 6.57 |
|
| 1 year | 10.40 | 10.26 |
|
Index and Lipper results should be compared with fund performance before sales charge, before CDSC, or at net
asset value.
* Over the 1-year, 3-year, 5-year, 10-year, and life-of-fund periods ended 5/31/12, there were 33, 32, 29, 24, and 7 funds,
respectively, in this Lipper category.
Past performance does not indicate future results. At the end of the same time period, a $10,000 investment in the fund’s class B and class C shares would have been valued at $14,706 and $14,549, respectively, and no contingent deferred sales charges would apply. A $10,000 investment in the fund’s class M shares ($9,675 after sales charge) would have been valued at $14,738. A $10,000 investment in the fund’s class Y shares would have been valued at $15,845.
11
Fund price and distribution information For the 12-month period ended 5/31/12
| | | | | | | |
| Distributions | Class A | Class B | Class C | Class M | Class Y |
|
| Number | 12 | 12 | 12 | 12 | 12 |
|
| Income 1 | $0.342954 | $0.285601 | $0.272101 | $0.317588 | $0.363410 |
|
| Capital gains 2 | — | — | — | — | — |
|
| Total | $0.342954 | $0.285601 | $0.272101 | $0.317588 | $0.363410 |
|
| | Before | After | Net | Net | Before | After | Net |
| | sales | sales | asset | asset | sales | sales | asset |
| Share value | charge | charge | value | value | charge | charge | value |
|
| 5/31/11 | $8.84 | $9.21 | $8.83 | $8.84 | $8.84 | $9.14 | $8.84 |
|
| 5/31/12 | 9.35 | 9.74 | 9.33 | 9.35 | 9.35 | 9.66 | 9.35 |
|
| | Before | After | Net | Net | Before | After | Net |
| | sales | sales | asset | asset | sales | sales | asset |
| Current yield (end of period) | charge | charge | value | value | charge | charge | value |
|
| Current dividend rate 3 | 3.51% | 3.37% | 2.89% | 2.74% | 3.24% | 3.13% | 3.74% |
|
| Taxable equivalent 4 | 5.74 | 5.51 | 4.73 | 4.48 | 5.30 | 5.12 | 6.12 |
|
| Current 30-day SEC yield 5 | N/A | 2.23 | 1.71 | 1.55 | N/A | 1.98 | 2.55 |
|
| Taxable equivalent 4 | N/A | 3.65 | 2.80 | 2.53 | N/A | 3.24 | 4.17 |
|
The classification of distributions, if any, is an estimate. Before-sales-charge share value and current dividend rate for class A and M shares, if applicable, do not take into account any sales charge levied at the time of purchase. After-sales-charge share value, current dividend rate, and current 30-day SEC yield, if applicable, are calculated assuming that the maximum sales charge (4.00% for class A shares and 3.25% for class M shares) was levied at the time of purchase. Final distribution information will appear on your year-end tax forms.
1 For some investors, investment income may be subject to the federal alternative minimum tax.
2 Capital gains, if any, are taxable for federal and, in most cases, state purposes.
3 Most recent distribution, excluding capital gains, annualized and divided by share price before or after sales charge at period-end.
4 Assumes maximum 38.85% federal and state combined tax rate for 2012. Results for investors subject to lower tax rates would not be as advantageous.
5 Based only on investment income and calculated using the maximum offering price for each share class, in accordance with SEC guidelines.
Fund performance as of most recent calendar quarter
Total return for periods ended 6/30/12
| | | | | | | | | |
| | Class A | Class B | Class C | Class M | Class Y |
| (inception dates) | (10/23/89) | (7/15/93) | (10/3/06) | (4/3/95) | (1/2/08) |
|
| | Before | After | | | | | Before | After | Net |
| sales | sales | Before | After | Before | After | sales | sales | asset |
| charge | charge | CDSC | CDSC | CDSC | CDSC | charge | charge | value |
|
| Annual average | | | | | | | | | |
| (life of fund) | 5.54% | 5.36% | 4.82% | 4.82% | 4.74% | 4.74% | 5.20% | 5.05% | 5.59% |
|
| 10 years | 55.14 | 48.97 | 45.48 | 45.48 | 43.65 | 43.65 | 50.64 | 45.67 | 56.88 |
| Annual average | 4.49 | 4.07 | 3.82 | 3.82 | 3.69 | 3.69 | 4.18 | 3.83 | 4.61 |
|
| 5 years | 28.25 | 23.14 | 24.31 | 22.31 | 23.46 | 23.46 | 26.36 | 22.27 | 29.64 |
| Annual average | 5.10 | 4.25 | 4.45 | 4.11 | 4.31 | 4.31 | 4.79 | 4.10 | 5.33 |
|
| 3 years | 21.34 | 16.52 | 19.07 | 16.07 | 18.56 | 18.56 | 20.23 | 16.33 | 22.14 |
| Annual average | 6.66 | 5.23 | 5.99 | 5.09 | 5.84 | 5.84 | 6.33 | 5.17 | 6.89 |
|
| 1 year | 9.55 | 5.16 | 8.87 | 3.87 | 8.73 | 7.73 | 9.24 | 5.66 | 9.79 |
|
12
Your fund’s expenses
As a mutual fund investor, you pay ongoing expenses, such as management fees, distribution fees (12b-1 fees), and other expenses. Using the following information, you can estimate how these expenses affect your investment and compare them with the expenses of other funds. You may also pay one-time transaction expenses, including sales charges (loads) and redemption fees, which are not shown in this section and would have resulted in higher total expenses. For more information, see your fund’s prospectus or talk to your financial representative.
Expense ratios
| | | | | |
| | Class A | Class B | Class C | Class M | Class Y |
|
| Total annual operating expenses for the fiscal year | | | | | |
| ended 5/31/11 | 0.80% | 1.42% | 1.57% | 1.07% | 0.57% |
|
| Annualized expense ratio for the six-month period | | | | | |
| ended 5/31/12* | 0.80% | 1.42% | 1.57% | 1.07% | 0.57% |
|
Fiscal-year expense information in this table is taken from the most recent prospectus, is subject to change, and may differ from that shown for the annualized expense ratio and in the financial highlights of this report. Expenses are shown as a percentage of average net assets.
* For the fund’s most recent fiscal half year; may differ from expense ratios based on one-year data in the financial highlights.
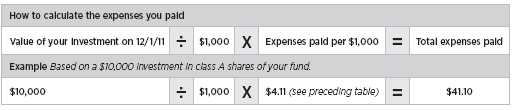
Expenses per $1,000
The following table shows the expenses you would have paid on a $1,000 investment in the fund from December 1, 2011, to May 31, 2012. It also shows how much a $1,000 investment would be worth at the close of the period, assuming actual returns and expenses.
| | | | | |
| | Class A | Class B | Class C | Class M | Class Y |
|
| Expenses paid per $1,000*† | $4.11 | $7.28 | $8.05 | $5.49 | $2.93 |
|
| Ending value (after expenses) | $1,054.40 | $1,050.00 | $1,050.10 | $1,051.70 | $1,054.30 |
|
* Expenses for each share class are calculated using the fund’s annualized expense ratio for each class, which represents the ongoing expenses as a percentage of average net assets for the six months ended 5/31/12. The expense ratio may differ for each share class.
† Expenses are calculated by multiplying the expense ratio by the average account value for the period; then multiplying the result by the number of days in the period; and then dividing that result by the number of days in the year.
13
Estimate the expenses you paid
To estimate the ongoing expenses you paid for the six months ended May 31, 2012, use the following calculation method. To find the value of your investment on December 1, 2011, call Putnam at 1-800-225-1581.
Compare expenses using the SEC’s method
The Securities and Exchange Commission (SEC) has established guidelines to help investors assess fund expenses. Per these guidelines, the following table shows your fund’s expenses based on a $1,000 investment, assuming a hypothetical 5% annualized return. You can use this information to compare the ongoing expenses (but not transaction expenses or total costs) of investing in the fund with those of other funds. All mutual fund shareholder reports will provide this information to help you make this comparison. Please note that you cannot use this information to estimate your actual ending account balance and expenses paid during the period.
| | | | | |
| | Class A | Class B | Class C | Class M | Class Y |
|
| Expenses paid per $1,000*† | $4.04 | $7.16 | $7.92 | $5.40 | $2.88 |
|
| Ending value (after expenses) | $1,021.00 | $1,017.90 | $1,017.15 | $1,019.65 | $1,022.15 |
|
* Expenses for each share class are calculated using the fund’s annualized expense ratio for each class, which represents the ongoing expenses as a percentage of average net assets for the six months ended 5/31/12. The expense ratio may differ for each share class.
† Expenses are calculated by multiplying the expense ratio by the average account value for the period; then
multiplying the result by the number of days in the period; and then dividing that result by the number of days in
the year.
14
Terms and definitions
Important terms
Total return shows how the value of the fund’s shares changed over time, assuming you held the shares through the entire period and reinvested all distributions in the fund.
Before sales charge, or net asset value, is the price, or value, of one share of a mutual fund, without a sales charge. Before-sales-charge figures fluctuate with market conditions, and are calculated by dividing the net assets of each class of shares by the number of outstanding shares in the class.
After sales charge is the price of a mutual fund share plus the maximum sales charge levied at the time of purchase. After-sales-charge performance figures shown here assume the 4.00% maximum sales charge for class A shares and 3.25% for class M shares.
Contingent deferred sales charge (CDSC) is generally a charge applied at the time of the redemption of class B or C shares and assumes redemption at the end of the period. Your fund’s class B CDSC declines over time from a 5% maximum during the first year to 1% during the sixth year. After the sixth year, the CDSC no longer applies. The CDSC for class C shares is 1% for one year after purchase.
Share classes
Class A shares are generally subject to an initial sales charge and no CDSC (except on certain redemptions of shares bought without an initial sales charge).
Class B shares are not subject to an initial sales charge. They may be subject to a CDSC.
Class C shares are not subject to an initial sales charge and are subject to a CDSC only if the shares are redeemed during the first year.
Class M shares have a lower initial sales charge and a higher 12b-1 fee than class A shares and no CDSC (except on certain redemptions of shares bought without an initial sales charge).
Class Y shares are not subject to an initial sales charge or CDSC, and carry no 12b-1 fee. They are generally only available to corporate and institutional clients and clients in other approved programs.
Fixed-income terms
Current yield is the annual rate of return earned from dividends or interest of an investment. Current yield is expressed as a percentage of the price of a security, fund share, or principal investment.
Yield curve is a graph that plots the yields of bonds with equal credit quality against their differing maturity dates, ranging from shortest to longest. It is used as a benchmark for other debt, such as mortgage or bank lending rates.
Comparative indexes
Barclays Municipal Bond Index is an unmanaged index of long-term fixed-rate investment-grade tax-exempt bonds.
Barclays U.S. Aggregate Bond Index is an unmanaged index of U.S. investment-grade fixed-income securities.
BofA (Bank of America) Merrill Lynch U.S. 3-Month Treasury Bill Index is an unmanaged index that seeks to measure the performance of U.S. Treasury bills available in the marketplace.
S&P 500 Index is an unmanaged index of common stock performance.
Indexes assume reinvestment of all distributions and do not account for fees. Securities and performance of a fund and an index will differ. You cannot invest directly in an index.
Lipper is a third-party industry-ranking entity that ranks mutual funds. Its rankings do not reflect sales charges. Lipper rankings are based on total return at net asset value relative to other funds that have similar current investment styles or objectives as determined by Lipper. Lipper may change a fund’s category assignment at its discretion. Lipper category averages reflect performance trends for funds within a category.
15
Other information for shareholders
Important notice regarding Putnam’s privacy policy
In order to conduct business with our shareholders, we must obtain certain personal information such as account holders’ names, addresses, Social Security numbers, and dates of birth. Using this information, we are able to maintain accurate records of accounts and transactions.
It is our policy to protect the confidentiality of our shareholder information, whether or not a shareholder currently owns shares of our funds. In particular, it is our policy not to sell information about you or your accounts to outside marketing firms. We have safeguards in place designed to prevent unauthorized access to our computer systems and procedures to protect personal information from unauthorized use.
Under certain circumstances, we must share account information with outside vendors who provide services to us, such as mailings and proxy solicitations. In these cases, the service providers enter into confidentiality agreements with us, and we provide only the information necessary to process transactions and perform other services related to your account. Finally, it is our policy to share account information with your financial representative, if you’ve listed one on your Putnam account.
Proxy voting
Putnam is committed to managing our mutual funds in the best interests of our shareholders. The Putnam funds’ proxy voting guidelines and procedures, as well as information regarding how your fund voted proxies relating to portfolio securities during the 12-month period ended June 30, 2011, are available in the Individual Investors section at putnam.com, and on the Securities and Exchange Commission (SEC) website, www.sec.gov. If you have questions about finding forms on the SEC’s website, you may call the SEC at 1-800-SEC-0330. You may also obtain the Putnam funds’ proxy voting guidelines and procedures at no charge by calling Putnam’s Shareholder Services at 1-800-225-1581.
Fund portfolio holdings
The fund will file a complete schedule of its portfolio holdings with the SEC for the first and third quarters of each fiscal year on Form N-Q. Shareholders may obtain the fund’s Forms N-Q on the SEC’s website at www.sec.gov. In addition, the fund’s Forms N-Q may be reviewed and copied at the SEC’s Public Reference Room in Washington, D.C. You may call the SEC at 1-800-SEC-0330 for information about the SEC’s website or the operation of the Public Reference Room.
Trustee and employee fund ownership
Putnam employees and members of the Board of Trustees place their faith, confidence, and, most importantly, investment dollars in Putnam mutual funds. As of May 31, 2012, Putnam employees had approximately $326,000,000 and the Trustees had approximately $77,000,000 invested in Putnam mutual funds. These amounts include investments by the Trustees’ and employees’ immediate family members as well as investments through retirement and deferred compensation plans.
16
Financial statements
These sections of the report, as well as the accompanying Notes, preceded by the Report of Independent Registered Public Accounting Firm, constitute the fund’s financial statements.
The fund’s portfolio lists all the fund’s investments and their values as of the last day of the reporting period. Holdings are organized by asset type and industry sector, country, or state to show areas of concentration and diversification.
Statement of assets and liabilities shows how the fund’s net assets and share price are determined. All investment and non-investment assets are added together. Any unpaid expenses and other liabilities are subtracted from this total. The result is divided by the number of shares to determine the net asset value per share, which is calculated separately for each class of shares. (For funds with preferred shares, the amount subtracted from total assets includes the liquidation preference of preferred shares.)
Statement of operations shows the fund’s net investment gain or loss. This is done by first adding up all the fund’s earnings — from dividends and interest income — and subtracting its operating expenses to determine net investment income (or loss). Then, any net gain or loss the fund realized on the sales of its holdings — as well as any unrealized gains or losses over the period — is added to or subtracted from the net investment result to determine the fund’s net gain or loss for the fiscal year.
Statement of changes in net assets shows how the fund’s net assets were affected by the fund’s net investment gain or loss, by distributions to shareholders, and by changes in the number of the fund’s shares. It lists distributions and their sources (net investment income or realized capital gains) over the current reporting period and the most recent fiscal year-end. The distributions listed here may not match the sources listed in the Statement of operations because the distributions are determined on a tax basis and may be paid in a different period from the one in which they were earned.
Financial highlights provide an overview of the fund’s investment results, per-share distributions, expense ratios, net investment income ratios, and portfolio turnover in one summary table, reflecting the five most recent reporting periods. In a semiannual report, the highlights table also includes the current reporting period.
17
Report of Independent Registered Public Accounting Firm
To the Trustees and Shareholders of
Putnam Ohio Tax Exempt Income Fund:
In our opinion, the accompanying statement of assets and liabilities, including the portfolio, and the related statements of operations and of changes in net assets and the financial highlights present fairly, in all material respects, the financial position of Putnam Ohio Tax Exempt Income Fund (the “fund”) at May 31, 2012, and the results of its operations, the changes in its net assets and the financial highlights for each of the periods indicated, in conformity with accounting principles generally accepted in the United States of America. These financial statements and financial highlights (hereafter referred to as “financial statements”) are the responsibility of the fund’s management. Our responsibility is to express an opinion on these financial statements based on our audits. We conducted our audits of these financial statements in accordance with the standards of the Public Company Accounting Oversight Board (United States). Those standards require that we plan and perform the audit to obtain reasonable assurance about whether the financial statements are free of material misstatement. An audit includes examining, on a test basis, evidence supporting the amounts and disclosures in the financial statements, assessing the accounting principles used and significant estimates made by management, and evaluating the overall financial statement presentation. We believe that our audits, which included confirmation of investments owned at May 31, 2012 by correspondence with the custodian, provide a reasonable basis for our opinion.
PricewaterhouseCoopers LLP
Boston, Massachusetts
July 12, 2012
18
The fund’s portfolio 5/31/12
| |
| Key to holding’s abbreviations | |
| AGM Assured Guaranty Municipal Corporation | FRB Floating Rate Bonds: the rate shown is the current |
| | interest rate at the close of the reporting period |
| AGO Assured Guaranty, Ltd. | |
| | G.O. Bonds General Obligation Bonds |
| AMBAC AMBAC Indemnity Corporation | |
| | GNMA Coll. Government National Mortgage |
| Cmnwlth. of PR Gtd. Commonwealth of | Association Collateralized |
| Puerto Rico Guaranteed | |
| | NATL National Public Finance Guarantee Corp. |
| COP Certificates of Participation | |
| | SGI Syncora Guarantee, Inc. |
| FGIC Financial Guaranty Insurance Company | |
| | U.S. Govt. Coll. U.S. Government Collateralized |
| FHA Insd. Federal Housing Administration Insured | |
| | VRDN Variable Rate Demand Notes, which are |
| FHLMC Coll. Federal Home Loan Mortgage | floating-rate securities with long-term maturities, that |
| Corporation Collateralized | carry coupons that reset every one or seven days. The |
| | rate shown is the current interest rate at the close of |
| FNMA Coll. Federal National Mortgage | the reporting period. |
| Association Collateralized | |
| | | |
| MUNICIPAL BONDS AND NOTES (98.2%)* | Rating** | Principal amount | Value |
|
| California (1.1%) | | | |
| CA State G.O. Bonds | | | |
| 5 1/4s, 2/1/29 | A1 | $750,000 | $866,025 |
| 5s, 11/1/32 | A1 | 750,000 | 812,243 |
|
| | | | 1,678,268 |
| Guam (0.7%) | | | |
| Territory of GU, Govt. Ltd. Oblig. Rev. Bonds | | | |
| (Section 30), Ser. A, 5 3/4s, 12/1/34 | BBB– | 500,000 | 533,470 |
|
| Territory of GU, Govt. Wtr. Wks. Auth. Wtr. & | | | |
| Waste Wtr. Syst. Rev. Bonds, 5 5/8s, 7/1/40 | Ba2 | 350,000 | 356,227 |
|
| Territory of GU, Pwr. Auth. Rev. Bonds, Ser. A, | | | |
| 5 1/2s, 10/1/40 | BBB | 250,000 | 257,890 |
|
| | | | 1,147,587 |
| Ohio (89.6%) | | | |
| Akron, G.O. Bonds, AGM, 5s, 12/1/25 | Aa3 | 1,005,000 | 1,115,691 |
|
| Akron, Wtr. Wks. Rev. Bonds, NATL, U.S. Govt. | | | |
| Coll., 6s, 12/1/12 (Escrowed to maturity) | Baa2 | 310,000 | 318,751 |
|
| Allen Cnty., Hosp. Fac. Rev. Bonds (Catholic | | | |
| Hlth. Care), Ser. A, 5 1/4s, 6/1/38 | AA– | 1,000,000 | 1,092,620 |
|
| Allen Cnty., Hosp. Fac. VRDN (Catholic Hlth. | | | |
| Care), Ser. B, 0.20s, 10/1/31 | VMIG1 | 285,000 | 285,000 |
|
| American Muni. Pwr. — Ohio, Inc. Rev. Bonds | | | |
| (Prairie State Energy Campus), Ser. A | | | |
| AGO, 5 3/4s, 2/15/39 | Aa3 | 1,500,000 | 1,706,490 |
| 5s, 2/15/38 | A1 | 1,500,000 | 1,601,595 |
|
| Barberton, City School Dist. G.O. Bonds (School | | | |
| Impt.), 5 1/4s, 12/1/28 | AA | 1,390,000 | 1,574,106 |
|
| Brookfield, Local School Dist. G.O. Bonds (School | | | |
| Fac. Impt.), AGM, 5s, 1/15/26 | Aa2 | 1,000,000 | 1,114,020 |
|
| Buckeye, Tobacco Settlement Fin. Auth. Rev. | | | |
| Bonds, Ser. A-2 | | | |
| 5 3/4s, 6/1/34 | B3 | 2,250,000 | 1,720,463 |
| 5 3/8s, 6/1/24 | B3 | 690,000 | 563,985 |
|
19
| | | |
| MUNICIPAL BONDS AND NOTES (98.2%)* cont. | Rating** | Principal amount | Value |
|
| Ohio cont. | | | |
| Cincinnati, City School Dist. COP (School Impt.), | | | |
| AGM, 5s, 12/15/28 | Aa2 | $2,500,000 | $2,777,275 |
|
| Cleveland, G.O. Bonds, Ser. A | | | |
| AGO, 5s, 12/1/29 | AA | 2,000,000 | 2,171,500 |
| FGIC, NATL, 4 3/4s, 11/15/26 | AA | 1,790,000 | 1,911,702 |
|
| Cleveland, Arpt. Syst. Ser. C, AGM, 5s, 1/1/23 | Aa3 | 1,500,000 | 1,623,255 |
|
| Cleveland, Income Tax Rev. Bonds (Bridges & | | | |
| Roadways), Ser. B, AGO, 5s, 10/1/29 | AA | 1,000,000 | 1,093,210 |
|
| Cleveland, Muni. School Dist. G.O. Bonds, AGM, | | | |
| 5s, 12/1/27 | Aa2 | 1,375,000 | 1,446,225 |
|
| Cleveland, Pkg. Fac. Rev. Bonds | | | |
| AGM, 5 1/4s, 9/15/22 | Aa3 | 1,630,000 | 1,926,905 |
| AGM, 5 1/4s, 9/15/22 (Escrowed to maturity) | Aa3 | 770,000 | 1,018,225 |
|
| Cleveland, Pub. Pwr. Syst. Rev. Bonds, Ser. B-1, | | | |
| NATL, zero %, 11/15/25 | A2 | 3,000,000 | 1,662,300 |
|
| Cleveland, Urban Renewal Increment Rev. Bonds | | | |
| (Rock & Roll Hall of Fame), 6 3/4s, 3/15/18 | B/P | 1,015,000 | 1,019,050 |
|
| Columbus G.O. Bonds, Ser. A, 5s, 7/1/14 | Aaa | 1,375,000 | 1,503,288 |
|
| Columbus, Swr. VRDN, Ser. B, 0.17s, 6/1/32 | VMIG1 | 2,100,000 | 2,100,000 |
|
| Cuyahoga Cmnty., College Dist. Rev. Bonds | | | |
| Ser. C, 5 1/4s, 2/1/29 | Aa2 | 995,000 | 1,141,942 |
| Ser. D, 5s, 8/1/32 | Aa2 | 750,000 | 850,913 |
| Ser. C, 5s, 8/1/25 | Aa2 | 1,500,000 | 1,724,805 |
|
| Cuyahoga Cnty. G.O. Bonds (Ltd. Tax), Ser. A, | | | |
| 4s, 12/1/17 | Aa1 | 750,000 | 861,660 |
|
| Dublin, G.O. Bonds, Ser. B, 6.4s, 12/1/14 | Aaa | 825,000 | 889,474 |
|
| Elyria, OH City School Dist. G.O. Bonds | | | |
| (Classroom Fac. & School Impt.), SGI, 5s, | | | |
| 12/1/35 | A1 | 500,000 | 531,000 |
|
| Erie Cnty., OH Hosp. Fac. Rev. Bonds | | | |
| (Firelands Regl. Med. Ctr.) | | | |
| 5 5/8s, 8/15/32 | A– | 1,500,000 | 1,518,915 |
| Ser. A, 5 1/4s, 8/15/46 | A– | 590,000 | 600,608 |
|
| Field, Local School Dist. G.O. Bonds (School Fac. | | | |
| Construction & Impt.), AMBAC, 5s, 12/1/22 | A–/P | 1,170,000 | 1,211,324 |
|
| Franklin Cnty., Rev. Bonds (OCLC Online Computer | | | |
| Library Ctr.), 5s, 4/15/13 | A | 2,610,000 | 2,688,274 |
|
| Franklin Cnty., Hlth. Care Fac. Rev. Bonds | | | |
| (Presbyterian Svcs.), Ser. A, 5 5/8s, 7/1/26 | BBB | 1,100,000 | 1,205,556 |
|
| Greene Cnty., Hosp. Facs. Rev. Bonds (Kettering | | | |
| Hlth. Network), 5 1/2s, 4/1/39 | A | 1,000,000 | 1,090,600 |
|
| Hamilton Cnty., Econ. Dev. Rev. Bonds (King | | | |
| Highland Cmnty. Urban), Ser. A, NATL, 5s, 6/1/22 | A1 | 1,745,000 | 1,878,004 |
|
| Hamilton Cnty., Hlth. Care Rev. Bonds (Life | | | |
| Enriching Cmntys.), 6 5/8s, 1/1/46 | BBB | 590,000 | 645,820 |
|
| Hamilton Cnty., Sales Tax Rev. Bonds, Ser. B, | | | |
| AMBAC | | | |
| zero %, 12/1/24 | A2 | 3,000,000 | 1,776,450 |
| zero %, 12/1/22 | A2 | 500,000 | 331,055 |
|
20
| | | |
| MUNICIPAL BONDS AND NOTES (98.2%)* cont. | Rating** | Principal amount | Value |
|
| Ohio cont. | | | |
| Hamilton Cnty., Swr. Syst. Rev. Rev. Bonds | | | |
| (Metro. Swr. Dist.), Ser. A, NATL, 5s, 12/1/28 | AA+ | $1,500,000 | $1,661,655 |
|
| Hamilton, City School Dist. G.O. Bonds (School | | | |
| Impt.), AGM, 5s, 12/1/26 | Aa3 | 2,000,000 | 2,164,780 |
|
| Huron Cnty., Human Svcs. Rev. Bonds, NATL, | | | |
| 6.55s, 12/1/20 | Aa3 | 1,800,000 | 2,215,530 |
|
| Lake Cnty., Hosp. Fac. Rev. Bonds (Lake Hosp. | | | |
| Syst.), Ser. C, 6s, 8/15/43 | Baa1 | 1,115,000 | 1,191,411 |
|
| Lakewood, City School Dist. G.O. Bonds | | | |
| FGIC, NATL, zero %, 12/1/17 | Aa2 | 1,190,000 | 1,051,329 |
| AGM, zero %, 12/1/16 | Aa2 | 1,250,000 | 1,164,225 |
|
| Lorain Cnty., Hosp. Rev. Bonds (Catholic), | | | |
| Ser. H, AGO, 5s, 2/1/29 | Aa3 | 2,000,000 | 2,145,160 |
|
| Lorain Cnty., Port Auth. Recovery Zone Fac. Rev. | | | |
| Bonds (U.S. Steel Corp.), 6 3/4s, 12/1/40 | BB | 500,000 | 563,980 |
|
| Lucas Cnty., Hlth. Care Rev. Bonds | | | |
| (Lutheran Homes), Ser. A, 7s, 11/1/45 | BB+ | 700,000 | 755,692 |
|
| Lucas Cnty., Hlth. Care Fac. Rev. Bonds (Sunset | | | |
| Retirement Cmntys.), 5 1/2s, 8/15/30 | A–/F | 650,000 | 698,861 |
|
| Miami Cnty., Hosp. Fac. Rev. Bonds (Upper Valley | | | |
| Med. Ctr.), 5 1/4s, 5/15/17 | A2 | 1,250,000 | 1,390,775 |
|
| Midview, School Dist. COP (School Bldg. Fac.), | | | |
| 5 1/4s, 11/1/17 | A1 | 2,535,000 | 2,606,208 |
|
| Montgomery Cnty., Rev. Bonds (Catholic Hlth. | | | |
| Initiatives), Ser. D, 6 1/4s, 10/1/33 | Aa2 | 1,000,000 | 1,205,010 |
|
| Mount Healthy, City School Dist. G.O. Bonds | | | |
| (School Impt.), AGM, 5 1/4s, 12/1/22 | Aa3 | 1,105,000 | 1,275,700 |
|
| OH Hsg. Fin. Agcy. Rev. Bonds | | | |
| Ser. B, GNMA Coll., 5s, 3/1/34 | Aaa | 75,000 | 75,465 |
| (Single Fam. Mtge.), Ser. 1, 5s, 11/1/28 | Aaa | 1,075,000 | 1,163,870 |
| (Res. Mtge.), Ser. C, GNMA Coll., FNMA Coll., | | | |
| 4.1s, 3/1/15 | Aaa | 335,000 | 339,754 |
|
| OH Hsg. Fin. Agcy. Single Fam. Mtge. Rev. Bonds, | | | |
| Ser. 85-A, FGIC, FHA Insd., zero %, 1/15/15 | | | |
| (Escrowed to maturity) | AAA/P | 10,000 | 8,641 |
|
| OH State G.O. Bonds | | | |
| (Infrastructure Impt.), Ser. A, 5s, 2/1/21 | Aa1 | 1,000,000 | 1,244,510 |
| (Common Schools), Ser. A, 4s, 9/15/16 | Aa1 | 1,000,000 | 1,132,040 |
|
| OH State Rev. Bonds | | | |
| Ser. A, 5s, 10/1/22 | Aa3 | 3,090,000 | 3,513,206 |
| (Revitalization), Ser. A, AMBAC, 5s, 4/1/19 | Aa3 | 1,750,000 | 1,976,660 |
|
| OH State Air Quality Dev. Auth. FRB (Columbus | | | |
| Southern Pwr. Co.), Ser. B, 5.8s, 12/1/38 | Baa1 | 1,000,000 | 1,133,470 |
|
| OH State Air Quality Dev. Auth. Rev. Bonds | | | |
| (Buckeye Pwr. Recvy. Zone Fac.), 6s, 12/1/40 | A2 | 1,000,000 | 1,101,900 |
| (Valley Elec. Corp.), Ser. E, 5 5/8s, 10/1/19 | Baa3 | 500,000 | 575,745 |
|
21
| | | |
| MUNICIPAL BONDS AND NOTES (98.2%)* cont. | Rating** | Principal amount | Value |
|
| Ohio cont. | | | |
| OH State Higher Edl. Fac. Rev. Bonds | | | |
| (Case Western Reserve U.), 6 1/4s, 10/1/18 | AA– | $1,000,000 | $1,267,500 |
| (Case Western Reserve U.), 6s, 10/1/14 | A1 | 1,000,000 | 1,113,490 |
| (U. of Dayton), Ser. A, 5 5/8s, 12/1/41 | A2 | 1,200,000 | 1,343,772 |
| (U. of Dayton), 5 1/2s, 12/1/36 | A2 | 1,000,000 | 1,094,540 |
| (Oberlin College), 5 1/8s, 10/1/24 | Aa2 | 1,500,000 | 1,573,320 |
|
| OH State Higher Edl. Fac. VRDN (Case Western | | | |
| Reserve), Ser. B-2, 0.17s, 12/1/44 | VMIG1 | 1,300,000 | 1,300,000 |
|
| OH State Higher Edl. Fac. Comm. Rev. Bonds | | | |
| (Summa Hlth. Syst. — 2010), 5 3/4s, 11/15/40 | Baa1 | 1,000,000 | 1,090,360 |
| (Kenyon College), 5s, 7/1/44 | A1 | 2,000,000 | 2,121,180 |
| (Xavier U.), 5s, 5/1/40 | A3 | 750,000 | 803,528 |
| (Cleveland Clinic Hlth.), 5s, 1/1/31 | Aa2 | 1,500,000 | 1,701,210 |
|
| OH State Higher Edl. Fac. Comm. VRDN (Cleveland | | | |
| Clinic Foundation), Ser. B-4, 0.18s, 1/1/43 | A–1+ | 2,090,000 | 2,090,000 |
|
| OH State Higher Edl. Fac. Commn. Rev. Bonds | | | |
| (U. Hosp. Hlth. Syst.), Ser. 09-A, 6 3/4s, | | | |
| 1/15/39 (Prerefunded 1/15/15) | A2 | 2,000,000 | 2,189,560 |
| (Oberlin College), 5s, 10/1/33 | Aa2 | 1,000,000 | 1,036,390 |
|
| OH State Hsg. Fin. Agcy. Rev. Bonds (Res. Mtge.) | | | |
| Ser. F, GNMA Coll., FNMA Coll., FHLMC Coll., | | | |
| 5.45s, 9/1/33 | Aaa | 900,000 | 926,406 |
| Ser. L, GNMA Coll., FNMA Coll., 4 3/4s, 3/1/37 | Aaa | 690,000 | 699,598 |
|
| OH State Poll. Control Rev. Bonds (Standard | | | |
| Oil Co.), 6 3/4s, 12/1/15 | A2 | 1,700,000 | 1,906,074 |
|
| OH State U. Rev. Bonds, Ser. A, 5 1/8s, 12/1/31 | | | |
| (Prerefunded 12/1/12) | Aa1 | 1,000,000 | 1,024,200 |
|
| OH State Wtr. Dev. Auth. Poll. Control Rev. Bonds | | | |
| (Loan Fund Wtr. Quality), Ser. B-1, 5s, 12/1/17 | Aaa | 1,500,000 | 1,822,365 |
|
| OH State Wtr. Dev. Auth. Poll. Control Fac. | | | |
| Mandatory Put Bonds (11/1/12) (First Energy | | | |
| Generation), Ser. C, 7 1/4s, 11/1/12 | Baa3 | 500,000 | 510,555 |
|
| OH U. Gen. Recipients Athens Rev. Bonds | | | |
| 5s, 12/1/42 | Aa3 | 500,000 | 546,875 |
| NATL, 5s, 12/1/25 | Aa3 | 2,265,000 | 2,402,780 |
|
| Penta Career Ctr. COP, 5s, 4/1/20 | Aa3 | 1,500,000 | 1,725,780 |
|
| Powell, G.O. Bonds, FGIC, NATL, U.S. Govt. Coll., | | | |
| 5 1/2s, 12/1/25 (Prerefunded 12/1/12) | Aa1 | 1,500,000 | 1,539,060 |
|
| Rickenbacker, Port Auth. Rev. Bonds (OASBO | | | |
| Expanded Asset Pooled), Ser. A, 5 3/8s, 1/1/32 | A1 | 2,165,000 | 2,589,340 |
|
| River Valley, Local School Dist. G.O. Bonds | | | |
| (School Fac. Construction & Impt.), AGM, | | | |
| 5 1/4s, 11/1/23 | Aa2 | 300,000 | 373,656 |
|
| Scioto Cnty., Hosp. Rev. Bonds (Southern Med. | | | |
| Ctr.), 5 1/2s, 2/15/28 | A2 | 2,250,000 | 2,457,315 |
|
| South Western City, School Dist. G.O. Bonds | | | |
| (Franklin & Pickway Cnty.), AGM, 4 3/4s, 12/1/23 | Aa2 | 2,000,000 | 2,183,740 |
|
| Steubenville Hosp. Rev. Bonds (Trinity Hlth. | | | |
| Syst.), 5s, 10/1/30 | A3 | 500,000 | 514,380 |
|
22
| | | |
| MUNICIPAL BONDS AND NOTES (98.2%)* cont. | Rating** | Principal amount | Value |
|
| Ohio cont. | | | |
| Sylvania, City School Dist. G.O. Bonds (School | | | |
| Impt.), AGO, 5s, 12/1/27 | Aa2 | $1,500,000 | $1,647,525 |
|
| Tallmadge, City School Dist. G.O. Bonds (School | | | |
| Fac.), AGM, 5s, 12/1/26 | AA– | 1,410,000 | 1,532,134 |
|
| Toledo, G.O. Bonds (Macys), Ser. A, NATL, 6.35s, | | | |
| 12/1/25 | A2 | 1,500,000 | 1,503,000 |
|
| Toledo, Swr. Syst. Mtge. Rev. Bonds, AMBAC, 6.2s, | | | |
| 11/15/12 | A/P | 660,000 | 675,536 |
|
| Toledo, Wtr. Wks. Mtge. Rev. Bonds, AMBAC, 6.2s, | | | |
| 11/15/12 | A/P | 265,000 | 268,260 |
|
| Toledo-Lucas Cnty., Port Auth. Rev. Bonds (CSX | | | |
| Transn, Inc.), 6.45s, 12/15/21 | Baa3 | 1,900,000 | 2,364,740 |
|
| U. of Cincinnati Rev. Bonds | | | |
| Ser. F, 5s, 6/1/34 | Aa3 | 1,500,000 | 1,679,205 |
| Ser. A, 5s, 6/1/31 | Aa3 | 500,000 | 577,815 |
| Ser. A, 5s, 6/1/30 | Aa3 | 1,000,000 | 1,162,140 |
|
| Westerville, G.O. Bonds, AMBAC, 5s, 12/1/26 | Aaa | 1,320,000 | 1,485,383 |
|
| Woodridge, School Dist. Rev. Bonds, AMBAC, | | | |
| 6.8s, 12/1/14 | Aa2 | 1,440,000 | 1,550,347 |
|
| Youngstown State U. Rev. Bonds | | | |
| AGO, 5 1/4s, 12/15/29 | Aa3 | 500,000 | 561,375 |
| 5s, 12/15/25 | A1 | 500,000 | 560,910 |
|
| Zanesville, Hsg. Dev. Corp. Mtge. Rev. Bonds, | | | |
| U.S. Govt. Coll. | | | |
| 7 3/8s, 10/1/21 (Escrowed to maturity) | AAA/P | 220,000 | 276,426 |
| 7 3/8s, 10/1/20 (Escrowed to maturity) | AAA/P | 205,000 | 257,578 |
| 7 3/8s, 10/1/19 (Escrowed to maturity) | AAA/P | 185,000 | 232,449 |
| 7 3/8s, 10/1/18 (Escrowed to maturity) | AAA/P | 180,000 | 226,166 |
| 7 3/8s, 10/1/17 (Escrowed to maturity) | AAA/P | 160,000 | 201,037 |
| 7 3/8s, 10/1/16 (Escrowed to maturity) | AAA/P | 155,000 | 194,754 |
|
| | | | 139,551,387 |
| Puerto Rico (6.1%) | | | |
| Children’s Trust Fund Tobacco Settlement | | | |
| Rev. Bonds, 5 3/8s, 5/15/33 | BBB | 475,000 | 475,100 |
|
| Cmnwlth. of PR, G.O. Bonds, Ser. A | | | |
| 6s, 7/1/40 | Baa1 | 1,350,000 | 1,473,147 |
| 5 1/4s, 7/1/22 | Baa1 | 1,000,000 | 1,080,040 |
|
| Cmnwlth. of PR, Aqueduct & Swr. Auth. | | | |
| Rev. Bonds, Ser. A, 6s, 7/1/38 | Baa2 | 1,000,000 | 1,069,030 |
|
| Cmnwlth. of PR, Elec. Pwr. Auth. Rev. Bonds, | | | |
| Ser. ZZ, 5 1/4s, 7/1/26 | Baa1 | 1,000,000 | 1,083,330 |
|
| Cmnwlth. of PR, Hwy. & Trans. Auth. Rev. Bonds | | | |
| Ser. N, 5 1/2s, 7/1/25 | Baa1 | 750,000 | 841,658 |
| Ser. G, 5s, 7/1/33 | Baa1 | 100,000 | 100,837 |
| Ser. G, 5s, 7/1/33 (Prerefunded 7/1/13) | Aaa | 195,000 | 204,998 |
|
| Cmnwlth. of PR, Indl. Tourist Edl. Med. & Env. | | | |
| Control Facs. Rev. Bonds (Cogen. Fac.-AES), | | | |
| 6 5/8s, 6/1/26 | Ba1 | 1,000,000 | 1,000,350 |
|
| Cmnwlth. of PR, Infrastructure Fin. Auth. | | | |
| Special Tax Bonds, Ser. C, FGIC, 5 1/2s, 7/1/19 | Baa1 | 1,000,000 | 1,132,340 |
|
23
| | | |
| MUNICIPAL BONDS AND NOTES (98.2%)* cont. | Rating** | Principal amount | Value |
|
| Puerto Rico cont. | | | |
| Cmnwlth. of PR, Pub. Bldg. Auth. Rev. Bonds | | | |
| (Govt. Fac.), Ser. M-3, NATL, Cmnwlth. of PR Gtd., | | | |
| 6s, 7/1/28 | Baa1 | $500,000 | $562,595 |
|
| Cmnwlth. of PR, Sales Tax Fin. Corp. Rev. Bonds, | | | |
| Ser. A, NATL, zero %, 8/1/43 | Aa2 | 3,000,000 | 527,130 |
|
| | | | 9,550,555 |
| Virgin Islands (0.7%) | | | |
| VI Pub. Fin. Auth. Rev. Bonds | | | |
| Ser. A, 6s, 10/1/39 | Baa3 | 300,000 | 332,916 |
| Ser. A-1, 5s, 10/1/39 | Baa2 | 375,000 | 384,446 |
| Ser. A, 5s, 10/1/25 | Baa2 | 350,000 | 376,599 |
|
| | | | 1,093,961 |
| |
| TOTAL INVESTMENTS | | | |
|
| Total investments (cost $141,354,534) | | | $153,021,758 |
Notes to the fund’s portfolio
Unless noted otherwise, the notes to the fund’s portfolio are for the close of the fund’s reporting period, which ran from June 1, 2011 through May 31, 2012 (the reporting period). Within the following notes to the portfolio, references to “ASC 820” represent Accounting Standards Codification ASC 820 Fair Value Measurements and Disclosures.
* Percentages indicated are based on net assets of $155,837,868.
** The Moody’s, Standard & Poor’s or Fitch ratings indicated are believed to be the most recent ratings available at the close of the reporting period for the securities listed. Ratings are generally ascribed to securities at the time of issuance. While the agencies may from time to time revise such ratings, they undertake no obligation to do so, and the ratings do not necessarily represent what the agencies would ascribe to these securities at the close of the reporting period. Securities rated by Putnam are indicated by “/P.” Securities rated by Fitch are indicated by “/F.” The rating of an insured security represents what is believed to be the most recent rating of the insurer’s claims-paying ability available at the close of the reporting period, if higher than the rating of the direct issuer of the bond, and does not reflect any subsequent changes. Ratings are not covered by the Report of Independent Registered Public Accounting Firm. Security ratings are defined in the Statement of Additional Information.
The rates shown on Mandatory Put Bonds are the current interest rates at the close of the reporting period.
The dates shown parenthetically on Mandatory Put Bonds represent the next mandatory put dates.
The dates shown parenthetically on prerefunded bonds represent the next prerefunding dates.
The dates shown on debt obligations are the original maturity dates.
The fund had the following sector concentrations greater than 10% at the close of the reporting period (as a percentage of net assets):
| | | | |
| Local government | 25.9% | | | |
| Education | 15.3 | | | |
| Health care | 13.9 | | | |
| Utilities | 11.9 | | | |
The fund had the following insurance concentrations greater than 10% at the close of the reporting period (as a percentage of net assets):
24
ASC 820 establishes a three-level hierarchy for disclosure of fair value measurements. The valuation hierarchy is based upon the transparency of inputs to the valuation of the fund’s investments. The three levels are defined as follows:
Level 1: Valuations based on quoted prices for identical securities in active markets.
Level 2: Valuations based on quoted prices in markets that are not active or for which all significant inputs are observable, either directly or indirectly.
Level 3: Valuations based on inputs that are unobservable and significant to the fair value measurement.
The following is a summary of the inputs used to value the fund’s net assets as of the close of the reporting period:
| | | |
| | | Valuation inputs | |
|
| Investments in securities: | Level 1 | Level 2 | Level 3 |
|
| Municipal bonds and notes | $— | $153,021,758 | $— |
|
| Totals by level | $— | $153,021,758 | $— |
The accompanying notes are an integral part of these financial statements.
25
Statement of assets and liabilities 5/31/12
| |
| ASSETS | |
|
| Investment in securities, at value (Note 1): | |
| Unaffiliated issuers (identified cost $141,354,534) | $153,021,758 |
|
| Cash | 369,922 |
|
| Interest and other receivables | 2,402,488 |
|
| Receivable for shares of the fund sold | 579,842 |
|
| Total assets | 156,374,010 |
| |
| LIABILITIES | |
|
| Distributions payable to shareholders | 86,160 |
|
| Payable for shares of the fund repurchased | 185,441 |
|
| Payable for compensation of Manager (Note 2) | 58,524 |
|
| Payable for investor servicing fees (Note 2) | 12,341 |
|
| Payable for custodian fees | 2,780 |
|
| Payable for Trustee compensation and expenses (Note 2) | 62,685 |
|
| Payable for administrative services (Note 2) | 658 |
|
| Payable for distribution fees (Note 2) | 61,831 |
|
| Payable for audit expense | 55,126 |
|
| Other accrued expenses | 10,596 |
|
| Total liabilities | 536,142 |
| | |
| Net assets | $155,837,868 |
|
| |
| REPRESENTED BY | |
|
| Paid-in capital (Unlimited shares authorized) (Notes 1, 4 and 6) | $145,741,542 |
|
| Distributions in excess of net investment income (Note 1) | (62,484) |
|
| Accumulated net realized loss on investments (Note 1) | (1,508,414) |
|
| Net unrealized appreciation of investments | 11,667,224 |
|
| Total — Representing net assets applicable to capital shares outstanding | $155,837,868 |
| |
| COMPUTATION OF NET ASSET VALUE AND OFFERING PRICE | |
|
| Net asset value and redemption price per class A share | |
| ($135,447,528 divided by 14,493,596 shares) | $9.35 |
|
| Offering price per class A share (100/96.00 of $9.35)* | $9.74 |
|
| Net asset value and offering price per class B share ($1,676,416 divided by 179,593 shares)** | $9.33 |
|
| Net asset value and offering price per class C share ($11,574,337 divided by 1,238,523 shares)** | $9.35 |
|
| Net asset value and redemption price per class M share ($489,800 divided by 52,395 shares) | $9.35 |
|
| Offering price per class M share (100/96.75 of $9.35)† | $9.66 |
|
| Net asset value, offering price and redemption price per class Y share | |
| ($6,649,787 divided by 710,991 shares) | $9.35 |
|
* On single retail sales of less than $100,000. On sales of $100,000 or more the offering price is reduced.
** Redemption price per share is equal to net asset value less any applicable contingent deferred sales charge.
† On single retail sales of less than $50,000. On sales of $50,000 or more the offering price is reduced.
The accompanying notes are an integral part of these financial statements.
26
Statement of operations Year ended 5/31/12
| |
| INTEREST INCOME | $6,776,417 |
|
| |
| EXPENSES | |
|
| Compensation of Manager (Note 2) | 657,191 |
|
| Investor servicing fees (Note 2) | 74,799 |
|
| Custodian fees (Note 2) | 7,242 |
|
| Trustee compensation and expenses (Note 2) | 11,906 |
|
| Administrative services (Note 2) | 4,598 |
|
| Distribution fees — Class A (Note 2) | 296,363 |
|
| Distribution fees — Class B (Note 2) | 13,124 |
|
| Distribution fees — Class C (Note 2) | 93,617 |
|
| Distribution fees — Class M (Note 2) | 1,938 |
|
| Other | 99,115 |
|
| Total expenses | 1,259,893 |
| | |
| Expense reduction (Note 2) | (683) |
|
| Net expenses | 1,259,210 |
| | |
| Net investment income | 5,517,207 |
|
| |
| Net realized gain on investments (Notes 1 and 3) | 420,639 |
|
| Net unrealized appreciation of investments during the year | 7,707,745 |
|
| Net gain on investments | 8,128,384 |
| | |
| Net increase in net assets resulting from operations | $13,645,591 |
|
The accompanying notes are an integral part of these financial statements.
27
Statement of changes in net assets
| | |
| INCREASE (DECREASE) IN NET ASSETS | Year ended 5/31/12 | Year ended 5/31/11 |
|
| Operations: | | |
| Net investment income | $5,517,207 | $6,503,822 |
|
| Net realized gain (loss) on investments | 420,639 | (1,089,903) |
|
| Net unrealized appreciation (depreciation) of investments | 7,707,745 | (3,562,990) |
|
| Net increase in net assets resulting from operations | 13,645,591 | 1,850,929 |
|
| Distributions to shareholders (Note 1): | | |
| From ordinary income | | |
| Taxable net investment income | | |
|
| Class A | (45,460) | (8,300) |
|
| Class B | (637) | (126) |
|
| Class C | (2,917) | (509) |
|
| Class M | (290) | (49) |
|
| Class Y | (1,282) | (212) |
|
| From tax-exempt net investment income | | |
| Class A | (4,915,764) | (5,846,925) |
|
| Class B | (48,270) | (81,368) |
|
| Class C | (275,855) | (294,724) |
|
| Class M | (13,546) | (35,202) |
|
| Class Y | (185,451) | (143,522) |
|
| Increase in capital from settlement payments (Note 6) | 13,848 | 225 |
|
| Redemption fees (Note 1) | — | 4 |
|
| Increase (decrease) from capital share transactions (Note 4) | 209,376 | (10,525,141) |
|
| Total increase (decrease) in net assets | 8,379,343 | (15,084,920) |
| |
| NET ASSETS | | |
|
| Beginning of year | 147,458,525 | 162,543,445 |
|
| End of year (including distributions in excess of net | | |
| investment income of $62,484 and $130,363, respectively) | $155,837,868 | $147,458,525 |
|
The accompanying notes are an integral part of these financial statements.
28
|
| This page left blank intentionally. |
29
Financial highlights (For a common share outstanding throughout the period)
| | | | | | | | | | | | | | |
| INVESTMENT OPERATIONS: | | | | LESS DISTRIBUTIONS: | | | | | RATIOS AND SUPPLEMENTAL DATA: | |
|
| | | | | | | | | | | | | Ratio | Ratio | |
| | | | Net realized | | | | | | | | | of expenses | of net investment | |
| | Net asset value, | | and unrealized | Total from | From | | | | | Total return | Net assets, | to average | income (loss) | Portfolio |
| | beginning | Net investment | gain (loss) | investment | net investment | Total | Redemption | Non-recurring, | Net asset value | at net asset | end of period | net assets | to average | turnover |
| Period ended | of period | income (loss) | on investments | operations | income | distributions | fees | reimbursements | end of period | value (%) a | (in thousands) | (%) b | net assets (%) | (%) |
|
| Class A | | | | | | | | | | | | | | |
| May 31, 2012 | $8.84 | .34 | .51 | .85 | (.34) | (.34) | — | — c,d | $9.35 | 9.81 | $135,448 | .80 | 3.79 | 12 |
| May 31, 2011 | 9.05 | .36 | (.21) | .15 | (.36) | (.36) | — c | — c,e | 8.84 | 1.74 | 132,617 | .79 | 4.14 | 11 |
| May 31, 2010 | 8.79 | .37 | .26 | .63 | (.37) | (.37) | — | — | 9.05 | 7.29 | 147,041 | .82 f | 4.15 f | 9 |
| May 31, 2009 | 8.93 | .36 | (.13) | .23 | (.37) | (.37) | — c | — | 8.79 | 2.84 | 142,288 | .84 f | 4.32 f | 20 |
| May 31, 2008 | 8.98 | .36 | (.04) | .32 | (.37) | (.37) | — c | — | 8.93 | 3.62 | 142,524 | .88 f | 4.06 f | 36 |
|
| Class B | | | | | | | | | | | | | | |
| May 31, 2012 | $8.83 | .29 | .50 | .79 | (.29) | (.29) | — | — c,d | $9.33 | 9.01 | $1,676 | 1.43 | 3.16 | 12 |
| May 31, 2011 | 9.04 | .31 | (.21) | .10 | (.31) | (.31) | — c | — c,e | 8.83 | 1.10 | 1,852 | 1.42 | 3.49 | 11 |
| May 31, 2010 | 8.78 | .31 | .26 | .57 | (.31) | (.31) | — | — | 9.04 | 6.61 | 3,454 | 1.45 f | 3.51 f | 9 |
| May 31, 2009 | 8.93 | .31 | (.14) | .17 | (.32) | (.32) | — c | — | 8.78 | 2.06 | 6,387 | 1.48 f | 3.67 f | 20 |
| May 31, 2008 | 8.97 | .31 | (.04) | .27 | (.31) | (.31) | — c | — | 8.93 | 3.07 | 9,189 | 1.52 f | 3.41 f | 36 |
|
| Class C | | | | | | | | | | | | | | |
| May 31, 2012 | $8.84 | .27 | .51 | .78 | (.27) | (.27) | — | — c,d | $9.35 | 9.00 | $11,574 | 1.58 | 3.00 | 12 |
| May 31, 2011 | 9.05 | .30 | (.22) | .08 | (.29) | (.29) | — c | — c,e | 8.84 | .97 | 8,487 | 1.57 | 3.36 | 11 |
| May 31, 2010 | 8.79 | .30 | .26 | .56 | (.30) | (.30) | — | — | 9.05 | 6.44 | 8,716 | 1.60 f | 3.37 f | 9 |
| May 31, 2009 | 8.93 | .30 | (.13) | .17 | (.31) | (.31) | — c | — | 8.79 | 2.01 | 4,985 | 1.63 f | 3.55 f | 20 |
| May 31, 2008 | 8.97 | .29 | (.04) | .25 | (.29) | (.29) | — c | — | 8.93 | 2.89 | 3,088 | 1.67 f | 3.27 f | 36 |
|
| Class M | | | | | | | | | | | | | | |
| May 31, 2012 | $8.84 | .32 | .51 | .83 | (.32) | (.32) | — | — c,d | $9.35 | 9.50 | $490 | 1.08 | 3.47 | 12 |
| May 31, 2011 | 9.06 | .34 | (.22) | .12 | (.34) | (.34) | — c | — c,e | 8.84 | 1.35 | 852 | 1.07 | 3.85 | 11 |
| May 31, 2010 | 8.80 | .34 | .27 | .61 | (.35) | (.35) | — | — | 9.06 | 6.99 | 999 | 1.10 f | 3.87 f | 9 |
| May 31, 2009 | 8.94 | .34 | (.13) | .21 | (.35) | (.35) | — c | — | 8.80 | 2.56 | 1,085 | 1.13 f | 4.03 f | 20 |
| May 31, 2008 | 8.98 | .34 | (.04) | .30 | (.34) | (.34) | — c | — | 8.94 | 3.45 | 986 | 1.17 f | 3.77 f | 36 |
|
| Class Y | | | | | | | | | | | | | | |
| May 31, 2012 | $8.84 | .36 | .51 | .87 | (.36) | (.36) | — | — c,d | $9.35 | 10.07 | $6,650 | .58 | 3.98 | 12 |
| May 31, 2011 | 9.06 | .38 | (.22) | .16 | (.38) | (.38) | — c | — c,e | 8.84 | 1.87 | 3,650 | .57 | 4.38 | 11 |
| May 31, 2010 | 8.79 | .39 | .27 | .66 | (.39) | (.39) | — | — | 9.06 | 7.65 | 2,334 | .60 f | 4.39 f | 9 |
| May 31, 2009 | 8.93 | .38 | (.13) | .25 | (.39) | (.39) | — c | — | 8.79 | 3.04 | 234 | .63 f | 4.63 f | 20 |
| May 31, 2008† | 9.00 | .16 | (.07) | .09 | (.16) | (.16) | — | — | 8.93 | 1.03* | 10 | .28*f | 1.78*f | 36 |
|
* Not annualized.
† For the period January 2, 2008 (commencement of operations) to May 31, 2008.
a Total return assumes dividend reinvestment and does not reflect the effect of sales charges.
b Includes amounts paid through expense offset arrangements (Note 2).
c Amount represents less than $0.01 per share.
d Reflects a non-recurring reimbursement related to restitution amounts in connection with a distribution plan approved by the Securities and Exchange Commission (the SEC) which amounted to less than $0.01 per share outstanding on July 21, 2011 (Note 6).
e Reflects a non-recurring reimbursement related to short-term trading related lawsuits, which amounted to less than $0.01 per share outstanding on May 11, 2011 (Note 6).
f Reflects an involuntary contractual expense limitation in effect during the period. As a result of such limitation, the expenses of each class reflect a reduction of the following amounts:
| |
| | Percentage of |
| | average net assets |
|
| May 31, 2010 | 0.03% |
|
| May 31, 2009 | 0.06 |
|
| May 31, 2008 | 0.01 |
|
The accompanying notes are an integral part of these financial statements.
Notes to financial statements 5/31/12
Within the following Notes to financial statements, references to “State Street” represent State Street Bank and Trust Company, references to “the SEC” represent the Securities and Exchange Commission and references to “Putnam Management” represent Putnam Investment Management, LLC, the fund’s manager, an indirect wholly-owned subsidiary of Putnam Investments, LLC. Unless otherwise noted, the “reporting period” represents the period from June 1, 2011 through May 31, 2012.
Putnam Ohio Tax Exempt Income Fund (the fund) is a Massachusetts business trust, which is registered under the Investment Company Act of 1940, as amended, as a diversified open-end management investment company. The investment objective of the fund is to seek as high a level of current income exempt from federal income tax and Ohio personal income tax as Putnam Management believes is consistent with preservation of capital. The fund invests mainly in bonds that pay interest that is exempt from federal income tax and Ohio personal income tax (but that may be subject to federal alternative minimum tax (AMT)), are investment-grade in quality, and have intermediate to long-term maturities (three years or longer).
The fund offers class A, class B, class C, class M and class Y shares. Class A and class M shares are sold with a maximum front-end sales charge of 4.00% and 3.25%, respectively, and generally do not pay a contingent deferred sales charge. Class B shares, which convert to class A shares after approximately eight years, do not pay a front-end sales charge and are subject to a contingent deferred sales charge if those shares are redeemed within six years of purchase. Class C shares have a one-year 1.00% contingent deferred sales charge and do not convert to class A shares. The expenses for class A, class B, class C, and class M shares may differ based on the distribution fee of each class, which is identified in Note 2. Class Y shares, which are sold at net asset value, are generally subject to the same expenses as class A, class B, class C, and class M shares, but do not bear a distribution fee. Class Y shares are not available to all investors.
In the normal course of business, the fund enters into contracts that may include agreements to indemnify another party under given circumstances. The fund’s maximum exposure under these arrangements is unknown as this would involve future claims that may be, but have not yet been, made against the fund. However, the fund’s management team expects the risk of material loss to be remote.
Note 1: Significant accounting policies
The following is a summary of significant accounting policies consistently followed by the fund in the preparation of its financial statements. The preparation of financial statements is in conformity with accounting principles generally accepted in the United States of America and requires management to make estimates and assumptions that affect the reported amounts of assets and liabilities in the financial statements and the reported amounts of increases and decreases in net assets from operations. Actual results could differ from those estimates. Subsequent events after the Statement of assets and liabilities date through the date that the financial statements were issued have been evaluated in the preparation of the financial statements.
Prior to August 2, 2010, a 1.00% redemption fee applied to certain shares that were redeemed (either by selling or exchanging into another fund) within 7 days of purchase. The redemption fee was accounted for as an addition to paid-in-capital. Effective August 2, 2010, this redemption fee no longer applies to shares redeemed.
Investment income, realized and unrealized gains and losses and expenses of the fund are borne pro-rata based on the relative net assets of each class to the total net assets of the fund, except that each class bears expenses unique to that class (including the distribution fees applicable to such classes). Each class votes as a class only with respect to its own distribution plan or other matters on which a class vote is required by law or determined by the Trustees. If the fund were liquidated, shares of each class would receive their pro-rata share of the net assets of the fund. In addition, the Trustees declare separate dividends on each class of shares.
Security valuation Tax-exempt bonds and notes are generally valued on the basis of valuations provided by an independent pricing service approved by the Trustees. Such services use information with respect to transactions in bonds, quotations from bond dealers, market transactions in comparable securities and various relationships between securities in determining value. These securities will generally be categorized as Level 2.
Certain investments, including certain restricted and illiquid securities and derivatives, are also valued at fair value following procedures approved by the Trustees. Such valuations and procedures are reviewed periodically by the Trustees. These valuations consider such factors as significant market or specific security events such as interest rate or credit quality changes, various relationships with other securities, discount rates, U.S. Treasury, U.S. swap and credit yields, index levels, convexity exposures and recovery rates. These securities are classified as Level 2 or
32
as Level 3 depending on the priority of the significant inputs. The fair value of securities is generally determined as the amount that the fund could reasonably expect to realize from an orderly disposition of such securities over a reasonable period of time. By its nature, a fair value price is a good faith estimate of the value of a security in a current sale and does not reflect an actual market price, which may be different by a material amount.
Security transactions and related investment income Security transactions are recorded on the trade date (the date the order to buy or sell is executed). Gains or losses on securities sold are determined on the identified cost basis.
Interest income is recorded on the accrual basis. All premiums/discounts are amortized/accreted on a yield-to-maturity basis. The premium in excess of the call price, if any, is amortized to the call date; thereafter, any remaining premium is amortized to maturity.
Interfund lending The fund, along with other Putnam funds, may participate in an interfund lending program pursuant to an exemptive order issued by the SEC. This program allows the fund to borrow from other Putnam funds that permit such transactions. Interfund lending transactions are subject to each fund’s investment policies and borrowing and lending limits. Interest earned or paid on the interfund lending transaction will be based on the average of certain current market rates. During the reporting period, the fund did not utilize the program.
Line of credit The fund participates, along with other Putnam funds, in a $315 million ($325 million prior to June 29, 2012) unsecured committed line of credit and a $185 million unsecured uncommitted line of credit, both provided by State Street. Borrowings may be made for temporary or emergency purposes, including the funding of shareholder redemption requests and trade settlements. Interest is charged to the fund based on the fund’s borrowing at a rate equal to the Federal Funds rate plus 1.25% for the committed line of credit and the Federal Funds rate plus 1.30% for the uncommitted line of credit. A closing fee equal to 0.02% of the committed line of credit and $50,000 for the uncommitted line of credit has been paid by the participating funds. In addition, a commitment fee of 0.11% (0.13% prior to June 29, 2012) per annum on any unutilized portion of the committed line of credit is allocated to the participating funds based on their relative net assets and paid quarterly. During the reporting period, the fund had no borrowings against these arrangements.
Federal taxes It is the policy of the fund to distribute all of its income within the prescribed time period and otherwise comply with the provisions of the Internal Revenue Code of 1986, as amended (the Code), applicable to regulated investment companies. It is also the intention of the fund to distribute an amount sufficient to avoid imposition of any excise tax under Section 4982 of the Code.
The fund is subject to the provisions of Accounting Standards Codification ASC 740 Income Taxes (ASC 740). ASC 740 sets forth a minimum threshold for financial statement recognition of the benefit of a tax position taken or expected to be taken in a tax return. The fund did not have a liability to record for any unrecognized tax benefits in the accompanying financial statements. No provision has been made for federal taxes on income, capital gains or unrealized appreciation on securities held nor for excise tax on income and capital gains. Each of the fund’s federal tax returns for the prior three fiscal years remains subject to examination by the Internal Revenue Service.
At May 31, 2012, the fund had a capital loss carryover of $1,430,206 available to the extent allowed by the Code to offset future net capital gain, if any. The amounts of the carryovers and the expiration dates are:
| | | |
| Loss carryover |
| Short-term | Long-term | Total | Expiration |
|
| $369,024 | $336,590 | $705,614 | —* |
|
| 413,222 | — | 413,222 | May 31, 2017 |
|
| 97,718 | — | 97,718 | May 31, 2018 |
|
| 213,652 | — | 213,652 | May 31, 2019 |
|
* Under the Regulated Investment Company Modernization Act of 2010, the fund will be permitted to carry forward capital losses incurred in taxable years beginning after December 22, 2010 for an unlimited period. However, any losses incurred during those future years will be required to be utilized prior to the losses incurred in pre-enactment tax years. As a result of this ordering rule, pre-enactment capital loss carryforwards may be more likely to expire unused. Additionally, post-enactment capital losses that are carried forward will retain their character as either short-term or long-term capital losses rather than being considered all short-term as under previous law.
Distributions to shareholders Income dividends are recorded daily by the fund and are paid monthly. Distributions from capital gains, if any, are recorded on the ex-dividend date and paid at least annually. The amount and character of income and gains to be distributed are determined in accordance with income tax regulations which
33
may differ from generally accepted accounting principles. These differences include temporary and/or permanent differences of dividends payable, market discount and straddle loss deferrals. Reclassifications are made to the fund’s capital accounts to reflect income and gains available for distribution (or available capital loss carryovers) under income tax regulations. For the reporting period ended, the fund reclassified $40,144 to decrease distributions in excess of net investment income, $13,848 to decrease paid-in-capital and $26,296 to increase accumulated net realized losses.
The tax basis components of distributable earnings and the federal tax cost as of the close of the reporting period were as follows:
| |
| Unrealized appreciation | $12,038,317 |
| Unrealized depreciation | (319,742) |
|
| Net unrealized appreciation | 11,718,575 |
| Undistributed ordinary income | 23,676 |
| Capital loss carryforward | (1,430,206) |
| Cost for federal income tax purposes | $141,303,183 |
Note 2: Management fee, administrative services and other transactions
The fund pays Putnam Management a management fee (based on the fund’s average net assets and computed and paid monthly) at annual rates that may vary based on the average of the aggregate net assets of most open-end funds, as defined in the fund’s management contract, sponsored by Putnam Management. Such annual rates may vary as follows:
| |
| 0.590% | of the first $5 billion, |
| 0.540% | of the next $5 billion, |
| 0.490% | of the next $10 billion, |
| 0.440% | of the next $10 billion, |
| 0.390% | of the next $50 billion, |
| 0.370% | of the next $50 billion, |
| 0.360% | of the next $100 billion and |
| 0.355% | of any excess thereafter. |
Putnam Management has contractually agreed, through June 30, 2013 to waive fees or reimburse the fund’s expenses to the extent necessary to limit the cumulative expenses of the fund, exclusive of brokerage, interest, taxes, investment-related expenses, extraordinary expenses and payments under the fund’s investor servicing contract, investment management contract and distribution plans, on a fiscal year-to-date basis to an annual rate of 0.20% of the fund’s average net assets over such fiscal year-to-date period. During the reporting period, the fund’s expenses were not reduced as a result of this limit.
Putnam Investments Limited (PIL), an affiliate of Putnam Management, is authorized by the Trustees to manage a separate portion of the assets of the fund as determined by Putnam Management from time to time. Putnam Management pays a quarterly sub-management fee to PIL for its services at an annual rate of 0.40% of the average net assets of the portion of the fund managed by PIL.
The fund reimburses Putnam Management an allocated amount for the compensation and related expenses of certain officers of the fund and their staff who provide administrative services to the fund. The aggregate amount of all such reimbursements is determined annually by the Trustees.
Custodial functions for the fund’s assets are provided by State Street. Custody fees are based on the fund’s asset level, the number of its security holdings and transaction volumes.
Putnam Investor Services, Inc., an affiliate of Putnam Management, provides investor servicing agent functions to the fund. Putnam Investor Services, Inc. received fees for investor servicing based on the fund’s retail asset level, the number of shareholder accounts in the fund and the level of defined contribution plan assets in the fund. Investor servicing fees will not exceed an annual rate of 0.32% of the fund’s average net assets. Prior to March 1, 2012, investor servicing fees could not exceed an annual rate of 0.375% of the fund’s average net assets. The amounts incurred for investor servicing agent functions during the reporting period are included in Investor servicing fees in the Statement of operations.
34
The fund has entered into expense offset arrangements with Putnam Investor Services, Inc. and State Street whereby Putnam Investor Services, Inc.’s and State Street’s fees are reduced by credits allowed on cash balances. For the reporting period, the fund’s expenses were reduced by $683 under the expense offset arrangements.
Each independent Trustee of the fund receives an annual Trustee fee, of which $118, as a quarterly retainer, has been allocated to the fund, and an additional fee for each Trustees meeting attended. Trustees also are reimbursed for expenses they incur relating to their services as Trustees.
The fund has adopted a Trustee Fee Deferral Plan (the Deferral Plan) which allows the Trustees to defer the receipt of all or a portion of Trustees fees payable on or after July 1, 1995. The deferred fees remain invested in certain Putnam funds until distribution in accordance with the Deferral Plan.
The fund has adopted an unfunded noncontributory defined benefit pension plan (the Pension Plan) covering all Trustees of the fund who have served as a Trustee for at least five years and were first elected prior to 2004. Benefits under the Pension Plan are equal to 50% of the Trustee’s average annual attendance and retainer fees for the three years ended December 31, 2005. The retirement benefit is payable during a Trustee’s lifetime, beginning the year following retirement, for the number of years of service through December 31, 2006. Pension expense for the fund is included in Trustee compensation and expenses in the Statement of operations. Accrued pension liability is included in Payable for Trustee compensation and expenses in the Statement of assets and liabilities. The Trustees have terminated the Pension Plan with respect to any Trustee first elected after 2003.
The fund has adopted distribution plans (the Plans) with respect to its class A, class B, class C and class M shares pursuant to Rule 12b–1 under the Investment Company Act of 1940. The purpose of the Plans is to compensate Putnam Retail Management Limited Partnership, an indirect wholly-owned subsidiary of Putnam Investments, LLC, for services provided and expenses incurred in distributing shares of the fund. The Plans provide for payments by the fund to Putnam Retail Management Limited Partnership at an annual rate of up to 0.35%, 1.00%, 1.00% and 1.00% of the average net assets attributable to class A, class B, class C and class M shares, respectively. The Trustees have approved payment by the fund at the annual rate of 0.85%, 1.00% and 0.50% of the average net assets for class B, class C and class M shares, respectively. For class A shares, the annual payment rate will equal the weighted average of (i) 0.20% on the net assets of the fund attributable to class A shares purchased and paid for prior to April 1, 2005 and (ii) 0.25% on all other net assets of the fund attributable to class A shares.
For the reporting period, Putnam Retail Management Limited Partnership, acting as underwriter, received net commissions of $22,122 and $451 from the sale of class A and class M shares, respectively, and received $1,796 and $534 in contingent deferred sales charges from redemptions of class B and class C shares, respectively.
A deferred sales charge of up to 1.00% is assessed on certain redemptions of class A shares. For the reporting period, Putnam Retail Management Limited Partnership, acting as underwriter, received no monies on class A redemptions.
Note 3: Purchases and sales of securities
During the reporting period, cost of purchases and proceeds from sales of investment securities other than short-term investments aggregated $16,480,035 and $16,125,181, respectively. There were no purchases or proceeds from sales of long-term U.S. government securities.
Note 4: Capital shares
At the close of the reporting period, there was an unlimited number of shares of beneficial interest authorized.
Transactions in capital shares were as follows:
| | | | |
| | Year ended 5/31/12 | Year ended 5/31/11 |
|
| Class A | Shares | Amount | Shares | Amount |
|
| Shares sold | 1,362,920 | $12,513,913 | 1,982,357 | $17,832,508 |
|
| Shares issued in connection with | | | | |
| reinvestment of distributions | 438,670 | 4,001,815 | 510,569 | 4,530,670 |
|
| | 1,801,590 | 16,515,728 | 2,492,926 | 22,363,178 |
|
| Shares repurchased | (2,316,347) | (21,001,906) | (3,725,907) | (32,680,716) |
|
| Net decrease | (514,757) | $(4,486,178) | (1,232,981) | $(10,317,538) |
|
35
| | | | |
| | Year ended 5/31/12 | Year ended 5/31/11 |
|
| Class B | Shares | Amount | Shares | Amount |
|
| Shares sold | 64,705 | $592,503 | 8,613 | $77,736 |
|
| Shares issued in connection with | | | | |
| reinvestment of distributions | 4,610 | 41,948 | 7,977 | 70,895 |
|
| | 69,315 | 634,451 | 16,590 | 148,631 |
|
| Shares repurchased | (99,550) | (896,015) | (188,662) | (1,684,989) |
|
| Net decrease | (30,235) | $(261,564) | (172,072) | $(1,536,358) |
|
| |
| | Year ended 5/31/12 | Year ended 5/31/11 |
|
| Class C | Shares | Amount | Shares | Amount |
|
| Shares sold | 397,977 | $3,657,698 | 292,331 | $2,622,646 |
|
| Shares issued in connection with | | | | |
| reinvestment of distributions | 25,692 | 234,643 | 26,414 | 234,266 |
|
| | 423,669 | 3,892,341 | 318,745 | 2,856,912 |
|
| Shares repurchased | (145,546) | (1,313,546) | (321,030) | (2,821,249) |
|
| Net increase (decrease) | 278,123 | $2,578,795 | (2,285) | $35,663 |
|
| |
| | Year ended 5/31/12 | Year ended 5/31/11 |
|
| Class M | Shares | Amount | Shares | Amount |
|
| Shares sold | 19,452 | $179,437 | 132 | $1,161 |
|
| Shares issued in connection with | | | | |
| reinvestment of distributions | 824 | 7,552 | 3,414 | 30,373 |
|
| | 20,276 | 186,989 | 3,546 | 31,534 |
|
| Shares repurchased | (64,180) | (569,373) | (17,434) | (153,404) |
|
| Net decrease | (43,904) | $(382,384) | (13,888) | $(121,870) |
|
| |
| | Year ended 5/31/12 | Year ended 5/31/11 |
|
| Class Y | Shares | Amount | Shares | Amount |
|
| Shares sold | 391,786 | $3,617,378 | 401,740 | $3,573,080 |
|
| Shares issued in connection with | | | | |
| reinvestment of distributions | 10,322 | 94,669 | 5,235 | 46,398 |
|
| | 402,108 | 3,712,047 | 406,975 | 3,619,478 |
|
| Shares repurchased | (103,849) | (951,340) | (251,820) | (2,204,516) |
|
| Net increase | 298,259 | $2,760,707 | 155,155 | $1,414,962 |
|
Note 5: Market, credit and other risks
In the normal course of business, the fund trades financial instruments and enters into financial transactions where risk of potential loss exists due to changes in the market (market risk) or failure of the contracting party to the transaction to perform (credit risk). The fund may be exposed to additional credit risk that an institution or other entity with which the fund has unsettled or open transactions will default. The fund may be affected by economic and political developments in the state of Ohio.
Note 6: Regulatory matters and litigation
In late 2003 and 2004, Putnam Management settled charges brought by the SEC and the Massachusetts Securities Division in connection with excessive short-term trading in Putnam funds. In July 2011, the fund recorded a receivable of $13,848 related to restitution amounts in connection with a distribution plan approved by the SEC. This amount, which was received by the fund in December 2011, is reported as part of Increase in capital from settlement
36
payments on the Statement of changes in net assets. These allegations and related matters have served as the general basis for certain lawsuits, including purported class action lawsuits against Putnam Management and, in a limited number of cases, some Putnam funds. In May 2011, the fund received a payment of $225 related to settlement of those lawsuits. This amount is reported as a part of Increase in capital from settlement payments on the Statement of changes in net assets. Putnam Management has agreed to bear any costs incurred by the Putnam funds as a result of these matters.
Note 7: New accounting pronouncements
In May 2011, the Financial Accounting Standards Board (FASB) issued Accounting Standards Update (ASU) 2011–04 “Fair Value Measurements and Disclosures (Topic 820) — Amendments to Achieve Common Fair Value Measurement and Disclosure Requirements in U.S. GAAP and IFRS”. ASU 2011–04 amends FASB Topic 820 “Fair Value Measurement” and seeks to develop common requirements for measuring fair value and for disclosing information about fair value measurements in accordance with GAAP. ASU 2011–04 is effective for fiscal years and interim periods beginning after December 15, 2011. The application of ASU 2011–04 will not have a material impact on the fund’s financial statements.
In December 2011, the FASB issued ASU No. 2011–11 “Disclosures about Offsetting Assets and Liabilities”. The update creates new disclosure requirements requiring entities to disclose both gross and net information for derivatives and other financial instruments that are either offset in the Statement of assets and liabilities or subject to an enforceable master netting arrangement or similar agreement. The disclosure requirements are effective for annual reporting periods beginning on or after January 1, 2013 and interim periods within those annual periods. Putnam Management is currently evaluating the application of ASU 2011–11 and its impact, if any, on the fund’s financial statements.
37
Federal tax information (Unaudited)
The fund has designated 99.09% of dividends paid from net investment income during the reporting period as tax exempt for Federal income tax purposes.
The Form 1099 that will be mailed to you in January 2013 will show the tax status of all distributions paid to your account in calendar 2012.
38
About the Trustees
Independent Trustees

Ravi Akhoury Born 1947, Trustee since 2009
Principal occupations during past five years: Advisor to New York Life Insurance Company. Trustee of American India Foundation and of the Rubin Museum. From 1992 to 2007, was Chairman and CEO of MacKay Shields, a multi-product investment management firm with over $40 billion in assets under management.
Other directorships: RAGE Frameworks, Inc., a private software company; English Helper, Inc., a private software company

Barbara M. Baumann Born 1955, Trustee since 2010
Principal occupations during past five years: President and Owner of Cross Creek Energy Corporation, a strategic consultant to domestic energy firms and direct investor in energy projects. Trustee of Mount Holyoke College and member of the Investment Committee for the college’s endowment. Former Chair and current board member of Girls Incorporated of Metro Denver. Member of the Finance Committee, The Children’s Hospital of Colorado.
Other directorships: SM Energy Company, a domestic exploration and production company; UniSource Energy Corporation, an Arizona utility

Jameson A. Baxter
Born 1943, Trustee since 1994, Vice Chair from 2005 to 2011, and Chair since 2011
Principal occupations during past five years: President of Baxter Associates, Inc., a private investment firm. Chair of Mutual Fund Directors Forum. Chair Emeritus of the Board of Trustees of Mount Holyoke College. Director of the Adirondack Land Trust and Trustee of the Nature Conservancy’s Adirondack Chapter.

Charles B. Curtis Born 1940, Trustee since 2001
Principal occupations during past five years: Senior Advisor to the Center for Strategic and International Studies. Former President and Chief Operating Officer of the Nuclear Threat Initiative, a private foundation dealing with national security issues. Member of the Council on Foreign Relations and U.S. State Department International Security Advisory Board. Chairman of World Institute of Nuclear Security, a non-profit international non-governmental organization.
Other directorships: Southern California Edison, a regulated electric utility, and its parent company, Edison International

Robert J. Darretta Born 1946, Trustee since 2007
Principal occupations during past five years: Health Care Industry Advisor to Permira, a global private equity firm. Until April 2007, was Vice Chairman of the Board of Directors of Johnson & Johnson. Served as Johnson & Johnson’s Chief Financial Officer for a decade.
Other directorships: UnitedHealth Group, a diversified health-care company

John A. Hill Born 1942, Trustee since 1985 and Chairman from 2000 to 2011
Principal occupations during past five years: Founder and Vice-Chairman of First Reserve Corporation, the leading private equity buyout firm focused on the worldwide energy industry. Trustee and Chairman of the Board of Trustees of Sarah Lawrence College. Member of the Advisory Board of the Millstein Center for Corporate Governance and Performance at the Yale School of Management.
Other directorships: Devon Energy Corporation, a leading independent natural gas and oil exploration and production company

Paul L. Joskow Born 1947, Trustee since 1997
Principal occupations during past five years: Economist and President of the Alfred P. Sloan Foundation, a philanthropic institution focused primarily on research and education on issues related to science, technology, and economic performance. Elizabeth and James Killian Professor of Economics, Emeritus at the Massachusetts Institute of Technology (MIT). Prior to 2007, served as the Director of the Center for Energy and Environmental Policy Research at MIT.
Other directorships: Yale University; TransCanada Corporation, an energy company focused on natural gas transmission, oil pipeline, and power services; Exelon Corporation, an energy company focused on power services; Boston Symphony Orchestra
39

Elizabeth T. Kennan Born 1938, Trustee from 1992 to 2010 and since 2012
Principal occupations during the past five years: Partner of Cambus-Kenneth Farm (thoroughbred horse breeding and general farming). President Emeritus of Mount Holyoke College. Trustee of the National Trust for Historic Preservation and of Centre College. Chairman of the Board of Shaker Village of Pleasant Hill.
Other directorships: Former Chairman and now Lead Director of Northeast Utilities, which operates New England’s largest energy delivery system

Kenneth R. Leibler Born 1949, Trustee since 2006
Principal occupations during past five years: Founder and former Chairman of Boston
Options Exchange, an electronic marketplace for the trading of derivative securities. Vice Chairman of the Board of Trustees of Beth Israel Deaconess Hospital in Boston, Massachusetts. Until November 2010, director of Ruder Finn Group, a global communications and advertising firm.
Other directorships: Northeast Utilities, which operates New England’s largest energy delivery system

Robert E. Patterson Born 1945, Trustee since 1984
Principal occupations during past five years: Senior Partner of Cabot Properties, LP and Co-Chairman of Cabot Properties, Inc., a private equity firm investing in commercial real estate. Past Chairman and Trustee of the Joslin Diabetes Center.

George Putnam, III Born 1951, Trustee since 1984
Principal occupations during past five years: Chairman of New Generation Research, Inc., a publisher of financial advisory and other research services. Founder and President of New Generation Advisors, LLC, a registered investment advisor to private funds. Director of The Boston Family Office, LLC, a registered investment advisor.

W. Thomas Stephens Born 1942, Trustee from 1997 to 2008 and since 2009
Principal occupations during past five years: Retired as Chairman and Chief Executive Officer of Boise Cascade, LLC, a paper, forest products, and timberland assets company, in December 2008. Prior to 2010, Director of Boise Inc., a manufacturer of paper and packaging products.
Other directorships: TransCanada Pipelines Ltd., an energy infrastructure company
Interested Trustee

Robert L. Reynolds*
Born 1952, Trustee since 2008 and President of the Putnam Funds since 2009
Principal occupations during past five years: President and Chief Executive Officer of Putnam Investments since 2008. Prior to joining Putnam Investments, served as Vice Chairman and Chief Operating Officer of Fidelity Investments from 2000 to 2007.
The address of each Trustee is One Post Office Square, Boston, MA 02109.
As of May 31, 2012, there were 109 Putnam funds. All Trustees serve as Trustees of all Putnam funds.
Each Trustee serves for an indefinite term, until his or her resignation, retirement at age 75, removal, or death.
* Mr. Reynolds is an “interested person” (as defined in the Investment Company Act of 1940) of the fund, Putnam Management, and/or Putnam Retail Management. He is President and Chief Executive Officer of Putnam Investments, as well as the President of your fund and each of the other Putnam funds.
40
Officers
In addition to Robert L. Reynolds, the other officers of the fund are shown below:
| |
| Jonathan S. Horwitz (Born 1955) | Robert T. Burns (Born 1961) |
| Executive Vice President, Principal Executive | Vice President and Chief Legal Officer |
| Officer, and Compliance Liaison | Since 2011 |
| Since 2004 | General Counsel, Putnam Investments and |
| | Putnam Management |
| Steven D. Krichmar (Born 1958) | |
| Vice President and Principal Financial Officer | James P. Pappas (Born 1953) |
| Since 2002 | Vice President |
| Chief of Operations, Putnam Investments and | Since 2004 |
| Putnam Management | Director of Trustee Relations, |
| | Putnam Investments and Putnam Management |
| Janet C. Smith (Born 1965) | |
| Vice President, Assistant Treasurer, and | Judith Cohen (Born 1945) |
| Principal Accounting Officer | Vice President, Clerk, and Assistant Treasurer |
| Since 2007 | Since 1993 |
| Director of Fund Administration Services, | |
| Putnam Investments and Putnam Management | Michael Higgins (Born 1976) |
| | Vice President and Treasurer |
| Robert R. Leveille (Born 1969) | Since 2010 |
| Vice President and Chief Compliance Officer | Manager of Finance, Dunkin’ Brands (2008– |
| Since 2007 | 2010); Senior Financial Analyst, Old Mutual Asset |
| Chief Compliance Officer, Putnam Investments, | Management (2007–2008); Senior Financial |
| Putnam Management, and Putnam Retail | Analyst, Putnam Investments (1999–2007) |
| Management | |
| | Nancy E. Florek (Born 1957) |
| Mark C. Trenchard (Born 1962) | Vice President, Assistant Clerk, Assistant |
| Vice President and BSA Compliance Officer | Treasurer, and Proxy Manager |
| Since 2002 | Since 2000 |
| Director of Operational Compliance, | |
| Putnam Investments and Putnam | Susan G. Malloy (Born 1957) |
| Retail Management | Vice President and Assistant Treasurer |
| Since 2007 |
| | Director of Accounting & Control Services, |
| | Putnam Management |
The principal occupations of the officers for the past five years have been with the employers as shown above although in some cases, they have held different positions with such employers. The address of each Officer is One Post Office Square, Boston, MA 02109.
41
The Putnam family of funds
The following is a list of Putnam’s open-end mutual funds offered to the public. Investors should carefully consider the investment objective, risks, charges, and expenses of a fund before investing. For a prospectus, or a summary prospectus if available, containing this and other information for any Putnam fund or product, call your financial advisor at 1-800-225-1581 and ask for a prospectus. Please read the prospectus carefully before investing.
| |
| Growth | Income |
| Growth Opportunities Fund | American Government Income Fund |
| International Growth Fund | Diversified Income Trust |
| Multi-Cap Growth Fund | Floating Rate Income Fund |
| Small Cap Growth Fund | Global Income Trust |
| Voyager Fund | High Yield Advantage Fund |
| | High Yield Trust |
| Blend | Income Fund |
| Asia Pacific Equity Fund | Money Market Fund* |
| Capital Opportunities Fund | Short Duration Income Fund |
| Capital Spectrum Fund | U.S. Government Income Trust |
| Emerging Markets Equity Fund | |
| Equity Spectrum Fund | Tax-free income |
| Europe Equity Fund | AMT-Free Municipal Fund |
| Global Equity Fund | Tax Exempt Income Fund |
| International Capital Opportunities Fund | Tax Exempt Money Market Fund* |
| International Equity Fund | Tax-Free High Yield Fund |
| Investors Fund | State tax-free income funds: |
| Multi-Cap Core Fund | Arizona, California, Massachusetts, Michigan, |
| Research Fund | Minnesota, New Jersey, New York, Ohio, |
| | and Pennsylvania. |
| Value | |
| Convertible Securities Fund | Absolute Return |
| Equity Income Fund | Absolute Return 100 Fund |
| George Putnam Balanced Fund | Absolute Return 300 Fund |
| The Putnam Fund for Growth and Income | Absolute Return 500 Fund |
| International Value Fund | Absolute Return 700 Fund |
| Multi-Cap Value Fund | |
| Small Cap Value Fund | |
* An investment in a money market fund is not insured or guaranteed by the Federal Deposit Insurance Corporation or any other government agency. Although the fund seeks to preserve the value of your investment at $1.00 per share, it is possible to lose money by investing in the fund.
42
| |
| Global Sector | Putnam RetirementReady Funds — portfolios |
| Global Consumer Fund | with automatically adjusting allocations to |
| Global Energy Fund | stocks, bonds, and money market instruments, |
| Global Financials Fund | becoming more conservative over time. |
| Global Health Care Fund | RetirementReady 2055 Fund |
| Global Industrials Fund | RetirementReady 2050 Fund |
| Global Natural Resources Fund | RetirementReady 2045 Fund |
| Global Sector Fund | RetirementReady 2040 Fund |
| Global Technology Fund | RetirementReady 2035 Fund |
| Global Telecommunications Fund | RetirementReady 2030 Fund |
| Global Utilities Fund | RetirementReady 2025 Fund |
| | RetirementReady 2020 Fund |
| Asset Allocation | RetirementReady 2015 Fund |
| Putnam Global Asset Allocation Funds — | |
| portfolios with allocations to stocks, bonds, | Putnam Retirement Income Lifestyle |
| and money market instruments that are | Funds — portfolios with managed |
| adjusted dynamically within specified ranges | allocations to stocks, bonds, and money |
| as market conditions change. | market investments to generate |
| retirement income. |
| Dynamic Asset Allocation Balanced Fund | |
| Prior to November 30, 2011, this fund was known as | Retirement Income Fund Lifestyle 1 |
| Putnam Asset Allocation: Balanced Portfolio. | Retirement Income Fund Lifestyle 2 |
| Dynamic Asset Allocation | Retirement Income Fund Lifestyle 3 |
| Conservative Fund | |
| Prior to November 30, 2011, this fund was known as | |
| Putnam Asset Allocation: Conservative Portfolio. | |
| Dynamic Asset Allocation Growth Fund | |
| Prior to November 30, 2011, this fund was known as | |
| Putnam Asset Allocation: Growth Portfolio. | |
| Dynamic Risk Allocation Fund | |
A short-term trading fee of 1% may apply to redemptions or exchanges from certain funds within the time period specified in the fund's prospectus.
Check your account balances and the most recent month-end performance in the Individual Investors section at putnam.com.
43
Services for shareholders
Investor services
Systematic investment plan Tell us how much you wish to invest regularly — weekly, semimonthly, or monthly — and the amount you choose will be transferred automatically from your checking or savings account. There’s no additional fee for this service, and you can suspend it at any time. This plan may be a great way to save for college expenses or to plan for your retirement.
Please note that regular investing does not guarantee a profit or protect against loss in a declining market. Before arranging a systematic investment plan, consider your financial ability to continue making purchases in periods when prices are low.
Systematic exchange You can make regular transfers from one Putnam fund to another Putnam fund. There are no additional fees for this service, and you can cancel or change your options at any time.
Dividends PLUS You can choose to have the dividend distributions from one of your Putnam funds automatically reinvested in another Putnam fund at no additional charge.
Free exchange privilege You can exchange money between Putnam funds free of charge, as long as they are the same class of shares. A signature guarantee is required if you are exchanging more than $500,000. The fund reserves the right to revise or terminate the exchange privilege.
Reinstatement privilege If you’ve sold Putnam shares or received a check for a dividend or capital gain, you may reinvest the proceeds with Putnam within 90 days of the transaction and they will be reinvested at the fund’s current net asset value — with no sales charge. However, reinstatement of class B shares may have special tax consequences. Ask your financial or tax representative for details.
Check-writing service You have ready access to many Putnam accounts. It’s as simple as writing a check, and there are no special fees or service charges. For more information about the check-writing service, call Putnam or visit our website.
Dollar cost averaging When you’re investing for long-term goals, it’s time, not timing, that counts. Investing on a systematic basis is a better strategy than trying to figure out when the markets will go up or down. This means investing the same amount of money regularly over a long period. This method of investing is called dollar cost averaging. When a fund’s share price declines, your investment dollars buy more shares at lower prices. When it increases, they buy fewer shares. Over time, you will pay a lower average price per share.
For more information
Visit the Individual Investors section at putnam.com A secure section of our website contains complete information on your account, including balances and transactions, updated daily. You may also conduct transactions, such as exchanges, additional investments, and address changes. Log on today to get your password.
Call us toll free at 1-800-225-1581 Ask a helpful Putnam representative or your financial advisor for details about any of these or other services, or see your prospectus.
44
Fund information
Founded 75 years ago, Putnam Investments was built around the concept that a balance between risk and reward is the hallmark of a well-rounded financial program. We manage over 100 funds across income, value, blend, growth, asset allocation, absolute return, and global sector categories.
| | |
| Investment Manager | Charles B. Curtis | Robert R. Leveille |
| Putnam Investment | Robert J. Darretta | Vice President and |
| Management, LLC | John A. Hill | Chief Compliance Officer |
| One Post Office Square | Paul L. Joskow | |
| Boston, MA 02109 | Elizabeth T. Kennan | Mark C. Trenchard |
| | Kenneth R. Leibler | Vice President and |
| Investment Sub-Manager | Robert E. Patterson | BSA Compliance Officer |
| Putnam Investments Limited | George Putnam, III | |
| 57–59 St James’s Street | Robert L. Reynolds | Robert T. Burns |
| London, England SW1A 1LD | W. Thomas Stephens | Vice President and |
| | | Chief Legal Officer |
| Marketing Services | Officers | |
| Putnam Retail Management | Robert L. Reynolds | James P. Pappas |
| One Post Office Square | President | Vice President |
| Boston, MA 02109 | | |
| | Jonathan S. Horwitz | Judith Cohen |
| Custodian | Executive Vice President, | Vice President, Clerk, and |
| State Street Bank | Principal Executive Officer, | Assistant Treasurer |
| and Trust Company | and Compliance Liaison | |
| | | Michael Higgins |
| Legal Counsel | Steven D. Krichmar | Vice President and Treasurer |
| Ropes & Gray LLP | Vice President and | |
| | Principal Financial Officer | Nancy E. Florek |
| Independent Registered | | Vice President, Assistant Clerk, |
| Public Accounting Firm | Janet C. Smith | Assistant Treasurer, and |
| PricewaterhouseCoopers LLP | Vice President, Assistant | Proxy Manager |
| | Treasurer, and Principal | |
| Trustees | Accounting Officer | Susan G. Malloy |
| Jameson A. Baxter, Chair | | Vice President and |
| Ravi Akhoury | | Assistant Treasurer |
| Barbara M. Baumann | | |
| | |
This report is for the information of shareholders of Putnam Ohio Tax Exempt Income Fund. It may also be used as sales literature when preceded or accompanied by the current prospectus, the most recent copy of Putnam’s Quarterly Performance Summary, and Putnam’s Quarterly Ranking Summary. For more recent performance, please visit putnam.com. Investors should carefully consider the investment objectives, risks, charges, and expenses of a fund, which are described in its prospectus. For this and other information or to request a prospectus or summary prospectus, call 1-800-225-1581 toll free. Please read the prospectus carefully before investing. The fund’s Statement of Additional Information contains additional information about the fund’s Trustees and is available without charge upon request by calling 1-800-225-1581.
| |
| (a) The fund’s principal executive, financial and accounting officers are employees of Putnam Investment Management, LLC, the Fund’s investment manager. As such they are subject to a comprehensive Code of Ethics adopted and administered by Putnam Investments which is designed to protect the interests of the firm and its clients. The Fund has adopted a Code of Ethics which incorporates the Code of Ethics of Putnam Investments with respect to all of its officers and Trustees who are employees of Putnam Investment Management, LLC. For this reason, the Fund has not adopted a separate code of ethics governing its principal executive, financial and accounting officers. |
| |
| (c) In May 2008, the Code of Ethics of Putnam Investment Management, LLC was updated in its entirety to include the amendments adopted in August 2007 as well as a several additional technical, administrative and non-substantive changes. In May of 2009, the Code of Ethics of Putnam Investment Management, LLC was amended to reflect that all employees will now be subject to a 90-day blackout restriction on holding Putnam open-end funds, except for portfolio managers and their supervisors (and each of their immediate family members), who will be subject to a one-year blackout restriction on the funds that they manage or supervise. In June 2010, the Code of Ethics of Putnam Investments was updated in its entirety to include the amendments adopted in May of 2009 and to change certain rules and limits contained in the Code of Ethics. In addition, the updated Code of Ethics included numerous technical, administrative and non-substantive changes, which were intended primarily to make the document easier to navigate and understand. In July 2011, the Code of Ethics of Putnam Investments was updated to reflect several technical, administrative and non-substantive changes resulting from changes in employee titles. |
| |
| Item 3. Audit Committee Financial Expert: |
| |
| The Funds’ Audit and Compliance Committee is comprised solely of Trustees who are “independent” (as such term has been defined by the Securities and Exchange Commission (“SEC”) in regulations implementing Section 407 of the Sarbanes-Oxley Act (the “Regulations”)). The Trustees believe that each of the members of the Audit and Compliance Committee also possess a combination of knowledge and experience with respect to financial accounting matters, as well as other attributes, that qualify them for service on the Committee. In addition, the Trustees have determined that each of Mr. Leibler, Mr. Hill, Mr. Darretta and Ms. Baumann qualifies as an “audit committee financial expert” (as such term has been defined by the Regulations) based on their review of his or her pertinent experience and education. The SEC has stated that the designation or identification of a person as an audit committee financial expert pursuant to this Item 3 of Form N-CSR does not impose on such person any duties, obligations or liability that are greater than the duties, obligations and liability imposed on such person as a member of the Audit and Compliance Committee and the Board of Trustees in the absence of such designation or identification. |
| |
| Item 4. Principal Accountant Fees and Services: |
| |
| The following table presents fees billed in each of the last two fiscal years for services rendered to the fund by the fund’s independent auditor: |
| | | | | |
| Fiscal year ended | Audit Fees | Audit-Related Fees | Tax Fees | All Other Fees |
|
|
| | | | | |
| May 31, 2012 | $47,678 | $-- | $11,198 | $299 |
| May 31, 2011 | $48,584 | $-- | $7,141 | $ — |
| |
| For the fiscal years ended May 31, 2012 and May 31, 2011, the fund’s independent auditor billed aggregate non-audit fees in the amounts of $104,248 and $ 235,362 respectively, to the fund, Putnam Management and any entity controlling, controlled by or under common control with Putnam Management that provides ongoing services to the fund. |
| |
| Audit Fees represent fees billed for the fund’s last two fiscal years relating to the audit and review of the financial statements included in annual reports and registration statements, and other services that are normally provided in connection with statutory and regulatory filings or engagements. |
| |
| Audit-Related Fees represent fees billed in the fund’s last two fiscal years for services traditionally performed by the fund’s auditor, including accounting consultation for proposed transactions or concerning financial accounting and reporting standards and other audit or attest services not required by statute or regulation. |
| |
| Tax Fees represent fees billed in the fund’s last two fiscal years for tax compliance, tax planning and tax advice services. Tax planning and tax advice services include assistance with tax audits, employee benefit plans and requests for rulings or technical advice from taxing authorities. |
| |
| All Other Fees represent fees billed for services relating to an analysis of fund profitability |
| |
| Pre-Approval Policies of the Audit and Compliance Committee. The Audit and Compliance Committee of the Putnam funds has determined that, as a matter of policy, all work performed for the funds by the funds’ independent auditors will be pre-approved by the Committee itself and thus will generally not be subject to pre-approval procedures. |
| |
| The Audit and Compliance Committee also has adopted a policy to pre-approve the engagement by Putnam Management and certain of its affiliates of the funds’ independent auditors, even in circumstances where pre-approval is not required by applicable law. Any such requests by Putnam Management or certain of its affiliates are typically submitted in writing to the Committee and explain, among other things, the nature of the proposed engagement, the estimated fees, and why this work should be performed by that particular audit firm as opposed to another one. In reviewing such requests, the Committee considers, among other things, whether the provision of such services by the audit firm are compatible with the independence of the audit firm. |
| |
| The following table presents fees billed by the fund’s independent auditor for services required to be approved pursuant to paragraph (c)(7)(ii) of Rule 2-01 of Regulation S-X. |
| | | | | |
| Fiscal year ended | Audit-Related Fees | Tax Fees | All Other Fees | Total Non-Audit Fees |
|
|
| | | | | |
| May 31, 2012 | $ — | $76,005 | $ — | $ — |
| | | | | |
| May 31, 2011 | $ — | $191,000 | $ — | $ — |
| |
| Item 5. Audit Committee of Listed Registrants |
| |
| Item 6. Schedule of Investments: |
| |
| The registrant’s schedule of investments in unaffiliated issuers is included in the report to shareholders in Item 1 above. |
| |
| Item 7. Disclosure of Proxy Voting Policies and Procedures For Closed-End Management Investment Companies: |
| |
| Item 8. Portfolio Managers of Closed-End Investment Companies |
| |
| Item 9. Purchases of Equity Securities by Closed-End Management Investment Companies and Affiliated Purchasers: |
| |
| Item 10. Submission of Matters to a Vote of Security Holders: |
| |
| Item 11. Controls and Procedures: |
| |
| (a) The registrant’s principal executive officer and principal financial officer have concluded, based on their evaluation of the effectiveness of the design and operation of the registrant’s disclosure controls and procedures as of a date within 90 days of the filing date of this report, that the design and operation of such procedures are generally effective to provide reasonable assurance that information required to be disclosed by the registrant in this report is recorded, processed, summarized and reported within the time periods specified in the Commission’s rules and forms. |
| |
| (b) Changes in internal control over financial reporting: Not applicable |
| |
| (a)(1) The Code of Ethics of The Putnam Funds, which incorporates the Code of Ethics of Putnam Investments, is filed herewith. |
| |
| (a)(2) Separate certifications for the principal executive officer and principal financial officer of the registrant as required by Rule 30a-2(a) under the Investment Company Act of 1940, as amended, are filed herewith. |
| |
| (b) The certifications required by Rule 30a-2(b) under the Investment Company Act of 1940, as amended, are filed herewith. |
| |
| Pursuant to the requirements of the Securities Exchange Act of 1934 and the Investment Company Act of 1940, the registrant has duly caused this report to be signed on its behalf by the undersigned, thereunto duly authorized. |
| |
| Putnam Ohio Tax Exempt Income Fund |
| |
| By (Signature and Title): |
| |
| /s/Janet C. Smith
Janet C. Smith
Principal Accounting Officer
|
| |
| Pursuant to the requirements of the Securities Exchange Act of 1934 and the Investment Company Act of 1940, this report has been signed below by the following persons on behalf of the registrant and in the capacities and on the dates indicated. |
| |
| By (Signature and Title): |
| |
| /s/Jonathan S. Horwitz
Jonathan S. Horwitz
Principal Executive Officer
|
| |
| By (Signature and Title): |
| |
| /s/Steven D. Krichmar
Steven D. Krichmar
Principal Financial Officer
|