| | |
| UNITED STATES
SECURITIES AND EXCHANGE COMMISSION |
| | |
| CERTIFIED SHAREHOLDER REPORT OF REGISTERED
MANAGEMENT INVESTMENT COMPANIES
|
| | |
| Investment Company Act file number: | (811-04528) |
| | |
| Exact name of registrant as specified in charter: | Putnam Ohio Tax Exempt Income Fund |
| | |
| Address of principal executive offices: | One Post Office Square, Boston, Massachusetts 02109 |
| | |
| Name and address of agent for service: | Robert T. Burns, Vice President
One Post Office Square
Boston, Massachusetts 02109 |
| | |
| Copy to: | John W. Gerstmayr, Esq.
Ropes & Gray LLP
800 Boylston Street
Boston, Massachusetts 02199-3600 |
| | |
| Registrant’s telephone number, including area code: | (617) 292-1000 |
| | |
| Date of fiscal year end: | May 31, 2013 |
| | |
| Date of reporting period : | June 1, 2012 — May 31, 2013 |
| | |
|
Item 1. Report to Stockholders: | |
| | |
| The following is a copy of the report transmitted to stockholders pursuant to Rule 30e-1 under the Investment Company Act of 1940: | |
Putnam Ohio
Tax Exempt
Income Fund
Annual report
5 | 31 | 13
| | |
| Message from the Trustees | 1 | |
| |
| About the fund | 2 | |
| |
| Performance snapshot | 4 | |
| |
| Interview with your fund’s portfolio manager | 5 | |
| |
| Your fund’s performance | 11 | |
| |
| Your fund’s expenses | 14 | |
| |
| Terms and definitions | 16 | |
| |
| Other information for shareholders | 17 | |
| |
| Important notice regarding Putnam’s privacy policy | 18 | |
| |
| Financial statements | 19 | |
| |
| Federal tax information | 40 | |
| |
| About the Trustees | 41 | |
| |
| Officers | 43 | |
| |
Consider these risks before investing: Single-state investments are at risk of common economic forces and other factors affecting a state’s tax-exempt investments. This may result in greater losses and volatility. Capital gains, if any, are taxed at the federal and, in most cases, state levels. For some investors, investment income may be subject to the federal alternative minimum tax. Bond investments are subject to interest-rate risk (the risk of bond prices falling if interest rates rise) and credit risk (the risk of an issuer defaulting on interest or principal payments). Interest-rate risk is greater for longer-term bonds, and credit risk is greater for below-investment-grade bonds. Unlike bonds, funds that invest in bonds have fees and expenses. Tax-exempt bonds may be issued under the Internal Revenue Code only by limited types of issuers for limited types of projects. As a result, the fund’s investments may be focused in certain market segments and be more vulnerable to fluctuations in the values of the securities it holds than a more broadly invested fund. Interest the fund receives might be taxable. Bond prices may fall or fail to rise over time for several reasons, including general financial market conditions and factors related to a specific issuer or industry. You can lose money by investing in the fund.
Message from the Trustees
Dear Fellow Shareholder:
Some steadiness has returned to the investing environment, as many economies around the world are either improving or stabilizing. The U.S. equity market achieved record highs in the second quarter, as the nation’s economy slowly healed. Unemployment, housing, and consumer confidence data in the United States have all improved since the beginning of the year. State finances are faring better as well, although the ultimate consequences of federal budget sequestration on state economies remain to be measured.
Against this backdrop of perceived economic progress, the Federal Reserve indicated that it may taper its monetary-easing and asset-purchasing policies. This posed challenges for markets that had become accustomed to the extraordinary programs put in place by the central bank.
Putnam’s investment teams bring astute analysis of key market and policy-related risks to the task of finding the most attractive opportunities for investors. Integrating new thinking into time-tested strategies may prove particularly beneficial as the economy moves into the next stage of the current recovery. Our fixed-income managers, in particular, are cognizant of the risks of Fed policy changes and actively manage the funds to deal with the impact of the changes. When combined with the guidance of a financial advisor, who can help ensure that your portfolio matches your individual goals and tolerance for risk, we believe Putnam’s emphasis on innovative thinking, active investing, and risk management can serve shareholders well.
We would like to extend a welcome to new shareholders of the fund and to thank you for investing with Putnam.

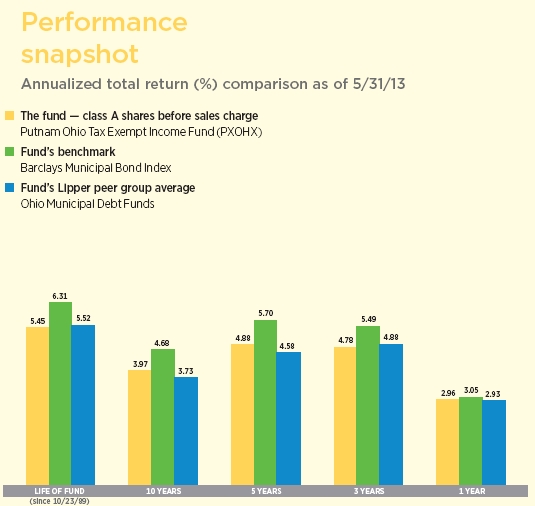
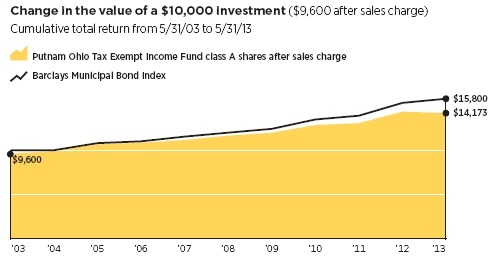
Current performance may be lower or higher than the quoted past performance, which cannot guarantee future results. Share price, principal value, and return will fluctuate, and you may have a gain or a loss when you sell your shares. Performance of class A shares assumes reinvestment of distributions and does not account for taxes. Fund returns in the bar chart do not reflect a sales charge of 4.00%; had they, returns would have been lower. See pages 5 and 11–14 for additional performance information. For a portion of the periods, the fund had expense limitations, without which returns would have been lower. To obtain the most recent month-end performance, visit putnam.com.
| |
| 4 | Ohio Tax Exempt Income Fund |
Interview with your fund’s portfolio manager

Putnam Ohio Tax Exempt Income Fund posted solid gains during its fiscal year. How would you describe the investment environment?
For most of the past 12 months, the investment environment was positive for municipal bonds. Demand remained high, supply was relatively tight, and fundamentals in the municipal market continued to improve, albeit gradually. There were some bumps along the way, however. As 2012 came to a close, investor uncertainty surrounding the fiscal cliff led to a sell-off in December. By way of background, as part of the 2011 debt-ceiling negotiations, Congress had scheduled $1.2 trillion in tax increases and spending cuts to begin taking effect on January 1, 2013. Ultimately, existing tax rates were preserved for the vast majority of taxpayers, but the political gridlock leading up to the final legislation sent some investors to the sidelines to wait for greater clarity.
Regarding more recent performance, the beginning of the calendar year tends to be one of tempered demand, particularly as individual investors are making adjustments to their portfolios in advance of tax season. At the same time, bond issuance tends to be lighter before beginning to pick back up toward the end of March. This seasonal trend, along with increased volatility in Treasury rates, partially explains the municipal bond market’s lackluster performance in March. During April, the municipal market followed the Treasury
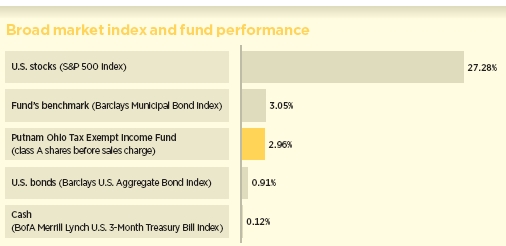
This comparison shows your fund’s performance in the context of broad market indexes for the 12 months ended 5/31/13. See pages 4 and 11–14 for additional fund performance information. Index descriptions can be found on page 16.
| |
| Ohio Tax Exempt Income Fund | 5 |
market to some extent and benefited as rates moved lower and prices moved higher. Gains in April were reversed during May as rising rates sent investors scrambling, with the 10-year Treasury yield soaring close to 50 basis points, or half a percentage point, as concerns over the Federal Reserve’s eventual tapering of its latest quantitative easing came into the fore. Municipal bonds followed U.S. Treasuries, but not to the same magnitude.
Despite the muted performance in the first quarter of the calendar year, we saw some encouraging trends as we closed out the period. Refinancing activity has been high, as many issuers are retiring higher-coupon bonds whenever possible and replacing them with lower-yielding debt. While this trend makes it difficult to add higher-yielding securities to the portfolio, refinancing activity has simultaneously helped buoy prices and demand — seasonal weakness notwithstanding — and this has been true particularly for more seasoned, or mature, bonds with coupons above today’s prevailing rates. In addition, increased clarity on tax rates, at least for the near future, has had a positive influence on the market.
Against this backdrop, tax-exempt bonds posted gains and outpaced the broad taxable bond market, as measured by the Barclays U.S. Aggregate Bond Index. The fund turned in mixed results for the period, outperforming the average return of its Lipper peer group but trailing its benchmark, the Barclays Municipal Bond Index.
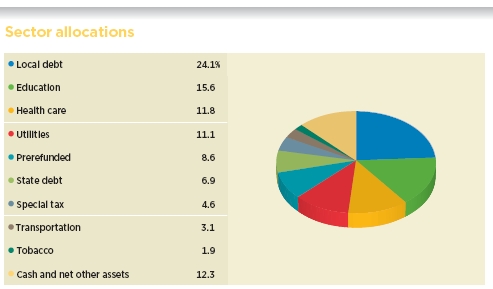
Allocations are represented as a percentage of the fund’s net assets as of 5/31/13. Cash and net other assets, if any, represent the market value weights of cash, derivatives, short-term securities, and other unclassified assets in the portfolio. Summary information may differ from the information in the portfolio schedule notes included in the financial statements due to the inclusion of derivative securities, any interest accruals, and the use of different classifications of securities for presentation purposes. Holdings and allocations may vary over time.
| |
| 6 | Ohio Tax Exempt Income Fund |

You mentioned the fiscal cliff and related legislation. How did policy developments impact the municipal bond market?
For months now, the focal point of many discussions about municipal bonds has been federal policy and the potential risks it entails. On January 1, 2013, Congress enacted a last-minute tax deal to raise rates on top earners while preserving existing brackets for most other taxpayers. Although the new, higher rates for top earners have likely bolstered demand for municipal bonds by making their taxable equivalent yields that much more attractive, the correlation between tax rates and demand is rarely one-to-one. Taxes are one factor among many that investors consider when weighing options for their fixed-income portfolios and, to that end, the question of whether the income from municipal bonds will remain fully tax free is still unsettled. While we are skeptical of the prospects for any further significant tax reform in the near term under a divided Congress, we do believe it remains a possibility. We believe it is highly likely, however, that changes to the tax treatment of municipal bonds will continue to be part of any tax-reform negotiations, so some short-term headline risk may exist. We are monitoring the situation closely.
Beyond the issue of taxes, since January much of the talk among federal lawmakers has revolved around sequestration, the other half of the fiscal cliff that mandated
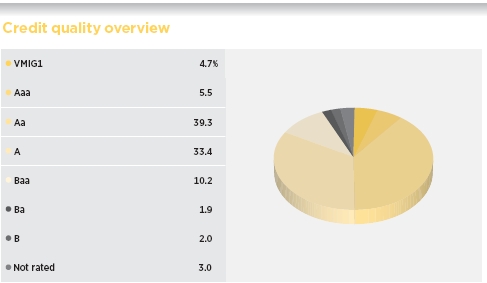
Credit qualities are shown as a percentage of the fund’s net assets as of 5/31/13. A bond rated Baa or higher (MIG3/VMIG3 or higher, for short-term debt) is considered investment grade. The chart reflects Moody’s ratings; percentages may include bonds or derivatives not rated by Moody’s but rated by Standard & Poor’s (S&P) or, if unrated by S&P, by Fitch ratings, and then included in the closest equivalent Moody’s rating. Ratings may vary over time.
Derivative instruments are only included to the extent of any unrealized gain or loss on such instruments and are shown in the not-rated category. Cash is also shown in the not-rated category. The fund itself has not been rated by an independent rating agency.
| |
| Ohio Tax Exempt Income Fund | 7 |
across-the-board spending cuts. While the political rhetoric associated with those cuts often has painted them as catastrophic, we believe any fallout for most states will be fairly benign. In our view, the cuts won’t be beneficial for states and local communities, but their impact will be staggered over time. Thus, while we believe widespread negative effects are unlikely, isolated budget or insolvency issues may create some headline risk. Sectors and localities that benefit most from federal support and areas that are heavily reliant on defense spending are the most vulnerable, in our opinion. But at this point, it is difficult to quantify exactly how sequestration will affect states’ finances. The ultimate impact will depend on how well these states have prepared and budgeted for the sequestration cuts.
Outside of the sequestration issue, how are states’ finances faring?
Across the nation, states have made slow, steady progress as they began to emerge from the Great Recession. While a handful of states still face some budget pressure for the remainder of their 2013 fiscal year, 45 states reported that they are likely to meet or exceed their revenue projections for fiscal year 2013, according to the National Conference of State Legislatures. While we believe this is an encouraging trend, challenges remain at the local level given federal deficit reduction and the ensuing cutbacks to the states. Many states have lowered expenses by reducing their financial support to cities and counties. Should the economy begin to slow, this reduced spending would almost certainly negatively affect municipal finances, in our opinion. However, on balance, we think the
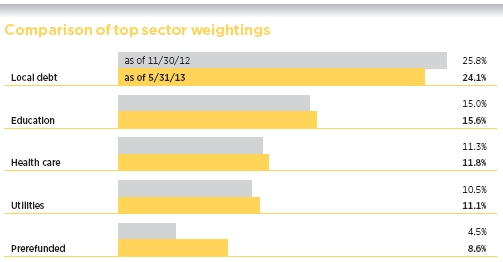
This chart shows how the fund’s top weightings have changed over the past six months. Allocations are represented as a percentage of the fund’s net assets. Cash and net other assets, if any, represent the market value weights of cash, derivatives, short-term securities, and other unclassified assets in the portfolio. Current period summary information may differ from the portfolio schedule included in the financial statements due to the inclusion of derivative securities, any interest accruals, and the use of different classifications of securities for presentation purposes. Holdings and allocations may vary over time.
| |
| 8 | Ohio Tax Exempt Income Fund |
outlook is becoming increasingly stable given the general improvement in employment, economic growth, and consumer confidence, all of which have contributed to rising tax collections.
It is important to keep in mind that general obligation bonds, which are backed by the general credit and taxing power of state and local municipalities, compose approximately one third of the overall municipal market, while two thirds are revenue bonds. Generally speaking, we feel that revenue credits, which are typically issued by state and local governments to finance a specific revenue-generating project, have fared well. Among revenue bonds, we have seen opportunities in higher education, utility, and health-care bonds.
How would you describe the general health of the municipal bond market?
For calendar year 2012, bankruptcy filings represented approximately 0.12% of the $3.7 trillion municipal bond market. This is in line with historical averages, and we do not believe defaults will increase meaningfully in the near future. We do expect to see occasional isolated incidents of insolvency, however, which can create headline risk. For example, a fiscal emergency was recently declared in Detroit, Michigan, which has been in financial distress for some time now. In other news, credit rating agencies Moody’s and Standard & Poor’s recently downgraded Puerto Rico’s debt. The government of Puerto Rico has since put in proposals for pension reform in an attempt to repair its credit profile. Perhaps the most significant development, however, is the bankruptcy proceedings in Stockton, California. The city filed for bankruptcy protection in the summer of 2012, and we believe the eventual outcome of the legal proceedings, with bondholders on one side and pension funds on the other, may set a precedent in the market, and could impact how other distressed cities negotiate with creditors.
How did you position the portfolio during the period?
As has been our strategy for some time, we continued to favor essential service revenue bonds over local general obligation bonds. From a credit-quality perspective, the single A-rated and Baa-rated segments of the curve, as well as other rating categories of the high-yield municipal bond market, offered attractive relative value opportunities, in our analysis. In terms of maturities, we find 10 to 20 years to be the optimal part of the yield curve in today’s environment. We continue to have a favorable outlook and have overweighted investments relative to the fund’s benchmark in several sectors of the municipal bond market, including continuing-care retirement communities, utilities, and higher education. Generally speaking, the supply/demand picture becomes more favorable in the summer months when reinvestment demand is typically the highest of the year — thereby providing support for municipal bond prices. That said, we believe other factors such as interest rates and the direction of the economy could influence market activity.
What is your outlook for the second half of 2013?
We continue to have a constructive outlook for municipal bonds, though we believe that returns in 2013 will be less about price appreciation and more about coupon income in the tax-exempt market. While the spreads are much narrower than they were at their peak, they remain attractive within certain credit-quality areas, in our opinion. Although they softened somewhat at the end of the period, technical factors in the market — specifically, continued refunding activity and stable investor demand — generally have remained supportive in recent months. While investors now have more near-term certainty on tax rates for 2013, many issues remain unresolved, including federal budget sequestration, the debt ceiling, and the potential for broader tax reform later this year, all of which
| |
| Ohio Tax Exempt Income Fund | 9 |
could affect the value of municipal bonds. As always, we are monitoring the situation closely and positioning the fund accordingly, based on our analysis.
Thank you, Thalia, for bringing us up to date.
The views expressed in this report are exclusively those of Putnam Management and are subject to change. They are not meant as investment advice.
Please note that the holdings discussed in this report may not have been held by the fund for the entire period. Portfolio composition is subject to review in accordance with the fund’s investment strategy and may vary in the future. Current and future portfolio holdings are subject to risk.
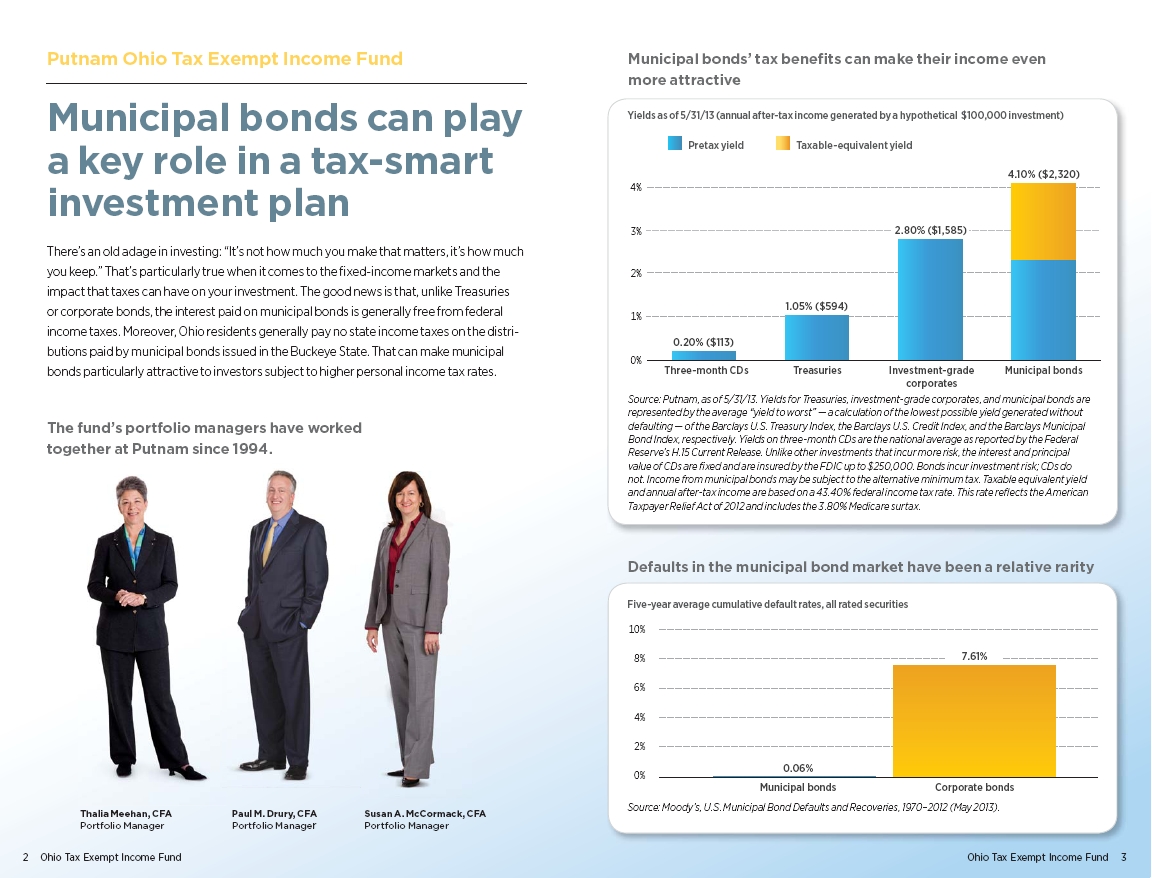
Portfolio Manager Thalia Meehan holds a B.A. from Williams College. A CFA charterholder, Thalia joined Putnam in 1989 and has been in the investment industry since 1983.
In addition to Thalia, your fund’s portfolio managers are Paul M. Drury, CFA, and Susan A. McCormack, CFA.
IN THE NEWS
As individual states continue to work their way through the nation’s multi-year economic recovery in the wake of the Great Recession, the overall fiscal outlook from state officials around the country is one of stability, with some feelings of uncertainty, according to a recent report by the National Conference of State Legislatures (NCSL). A small but growing number of states reported “moderate to strong” fiscal conditions resulting in budget surplus projections, according to the report “State Budget Update: Spring 2013,” while a handful of states continue to grapple with ongoing budget difficulties. Some of the concerns can be tied to the federal budget sequestration that went into effect on March 1, 2013, as part of January’s American Taxpayer Relief Act. The sequestration includes $85 billion in federal spending cuts for fiscal year 2013, split evenly between defense and non-defense spending and resulting in estimated 5.9% across-the-board cuts of federal nondiscretionary accounts, according to the NCSL.
| |
| 10 | Ohio Tax Exempt Income Fund |
Your fund’s performance
This section shows your fund’s performance, price, and distribution information for periods ended May 31, 2013, the end of its most recent fiscal year. In accordance with regulatory requirements for mutual funds, we also include performance information as of the most recent calendar quarter-end and expense information taken from the fund’s current prospectus. Performance should always be considered in light of a fund’s investment strategy. Data represent past performance. Past performance does not guarantee future results. More recent returns may be less or more than those shown. Investment return and principal value will fluctuate, and you may have a gain or a loss when you sell your shares. Performance information does not reflect any deduction for taxes a shareholder may owe on fund distributions or on the redemption of fund shares. For the most recent month-end performance, please visit the Individual Investors section at putnam.com or call Putnam at 1-800-225-1581. Class Y shares are not available to all investors. See the Terms and Definitions section in this report for definitions of the share classes offered by your fund.
Fund performance Total return for periods ended 5/31/13
| | | | | | | | | |
| | Class A | Class B | Class C | Class M | Class Y |
| (inception dates) | (10/23/89) | (7/15/93) | (10/3/06) | (4/3/95) | (1/2/08) |
|
| | Before | After | | | | | Before | After | Net |
| | sales | sales | Before | After | Before | After | sales | sales | asset |
| charge | charge | CDSC | CDSC | CDSC | CDSC | charge | charge | value |
|
| Annual average | | | | | | | | | |
| (life of fund) | 5.45% | 5.27% | 4.73% | 4.73% | 4.65% | 4.65% | 5.11% | 4.96% | 5.51% |
|
| 10 years | 47.63 | 41.73 | 38.50 | 38.50 | 36.81 | 36.81 | 43.49 | 38.83 | 49.56 |
| Annual average | 3.97 | 3.55 | 3.31 | 3.31 | 3.18 | 3.18 | 3.68 | 3.34 | 4.11 |
|
| 5 years | 26.91 | 21.83 | 22.85 | 20.85 | 22.06 | 22.06 | 25.06 | 21.00 | 28.46 |
| Annual average | 4.88 | 4.03 | 4.20 | 3.86 | 4.07 | 4.07 | 4.57 | 3.89 | 5.14 |
|
| 3 years | 15.05 | 10.45 | 12.92 | 9.92 | 12.41 | 12.41 | 13.98 | 10.27 | 15.82 |
| Annual average | 4.78 | 3.37 | 4.13 | 3.20 | 3.98 | 3.98 | 4.46 | 3.31 | 5.02 |
|
| 1 year | 2.96 | –1.16 | 2.43 | –2.55 | 2.17 | 1.17 | 2.68 | –0.66 | 3.30 |
|
Current performance may be lower or higher than the quoted past performance, which cannot guarantee future results. After-sales-charge returns for class A and M shares reflect the deduction of the maximum 4.00% and 3.25% sales charge, respectively, levied at the time of purchase. Class B share returns after contingent deferred sales charge (CDSC) reflect the applicable CDSC, which is 5% in the first year, declining over time to 1% in the sixth year, and is eliminated thereafter. Class C share returns after CDSC reflect a 1% CDSC for the first year that is eliminated thereafter. Class Y shares have no initial sales charge or CDSC. Performance for class B, C, M, and Y shares before their inception is derived from the historical performance of class A shares, adjusted for the applicable sales charge (or CDSC) and the higher operating expenses for such shares, except for class Y shares, for which 12b-1 fees are not applicable.
For a portion of the periods, the fund had expense limitations, without which returns would have been lower.
Class B share performance does not reflect conversion to class A shares.
| |
| Ohio Tax Exempt Income Fund | 11 |
Comparative index returns For periods ended 5/31/13
| | |
| | Barclays Municipal | Lipper Ohio Municipal Debt |
| | Bond Index | Funds category average* |
|
| Annual average (life of fund) | 6.31% | 5.52% |
|
| 10 years | 58.00 | 44.48 |
| Annual average | 4.68 | 3.73 |
|
| 5 years | 31.93 | 25.11 |
| Annual average | 5.70 | 4.58 |
|
| 3 years | 17.38 | 15.40 |
| Annual average | 5.49 | 4.88 |
|
| 1 year | 3.05 | 2.93 |
|
Index and Lipper results should be compared with fund performance before sales charge, before CDSC, or at net asset value.
* Over the 1-year, 3-year, 5-year, 10-year, and life-of-fund periods ended 5/31/13, there were 33, 31, 29, 23, and 7 funds, respectively, in this Lipper category.
Past performance does not indicate future results. At the end of the same time period, a $10,000 investment in the fund’s class B and class C shares would have been valued at $13,850 and $13,681, respectively, and no contingent deferred sales charges would apply. A $10,000 investment in the fund’s class M shares ($9,675 after sales charge) would have been valued at $13,883. A $10,000 investment in the fund’s class Y shares would have been valued at $14,956.
| |
| 12 | Ohio Tax Exempt Income Fund |
Fund price and distribution information For the 12-month period ended 5/31/13
| | | | | | | |
| Distributions | Class A | Class B | Class C | Class M | Class Y |
|
| Number | 12 | 12 | 12 | 12 | 12 |
|
| Income 1 | $0.314960 | $0.256314 | $0.242108 | $0.289251 | $0.336313 |
|
| Capital gains 2 | — | — | — | — | — |
|
| Total | $0.314960 | $0.256314 | $0.242108 | $0.289251 | $0.336313 |
|
| | Before | After | Net | Net | Before | After | Net |
| | sales | sales | asset | asset | sales | sales | asset |
| Share value | charge | charge | value | value | charge | charge | value |
|
| 5/31/12 | $9.35 | $9.74 | $9.33 | $9.35 | $9.35 | $9.66 | $9.35 |
|
| 5/31/13 | 9.31 | 9.70 | 9.30 | 9.31 | 9.31 | 9.62 | 9.32 |
|
| | Before | After | Net | Net | Before | After | Net |
| | sales | sales | asset | asset | sales | sales | asset |
| Current rate (end of period) | charge | charge | value | value | charge | charge | value |
|
| Current dividend rate 3 | 3.12% | 3.00% | 2.50% | 2.34% | 2.85% | 2.75% | 3.35% |
|
| Taxable equivalent 4 | 5.86 | 5.63 | 4.69 | 4.39 | 5.35 | 5.16 | 6.29 |
|
| Current 30-day SEC yield 5 | N/A | 1.75 | 1.20 | 1.05 | N/A | 1.50 | 2.05 |
|
| Taxable equivalent 4 | N/A | 3.29 | 2.25 | 1.97 | N/A | 2.82 | 3.85 |
|
The classification of distributions, if any, is an estimate. Before-sales-charge share value and current dividend rate for class A and M shares, if applicable, do not take into account any sales charge levied at the time of purchase. After-sales-charge share value, current dividend rate, and current 30-day SEC yield, if applicable, are calculated assuming that the maximum sales charge (4.00% for class A shares and 3.25% for class M shares) was levied at the time of purchase. Final distribution information will appear on your year-end tax forms.
1 For some investors, investment income may be subject to the federal alternative minimum tax.
2 Capital gains, if any, are taxable for federal and, in most cases, state purposes.
3 Most recent distribution, including any return of capital and excluding capital gains, annualized and divided by share price before or after sales charge at period-end.
4 Assumes maximum 46.75% federal and state combined tax rate for 2013. Results for investors subject to lower tax rates would not be as advantageous.
5 Based only on investment income and calculated using the maximum offering price for each share class, in accordance with SEC guidelines.
| |
| Ohio Tax Exempt Income Fund | 13 |
Fund performance as of most recent calendar quarter
Total return for periods ended 6/30/13
| | | | | | | | | |
| | Class A | Class B | Class C | Class M | Class Y |
| (inception dates) | (10/23/89) | (7/15/93) | (10/3/06) | (4/3/95) | (1/2/08) |
|
| | Before | After | | | | | Before | After | Net |
| | sales | sales | Before | After | Before | After | sales | sales | asset |
| charge | charge | CDSC | CDSC | CDSC | CDSC | charge | charge | value |
|
| Annual average | | | | | | | | | |
| (life of fund) | 5.31% | 5.13% | 4.59% | 4.59% | 4.51% | 4.51% | 4.97% | 4.83% | 5.37% |
|
| 10 years | 44.20 | 38.43 | 35.29 | 35.29 | 33.64 | 33.64 | 40.17 | 35.61 | 46.11 |
| Annual average | 3.73 | 3.31 | 3.07 | 3.07 | 2.94 | 2.94 | 3.43 | 3.09 | 3.87 |
|
| 5 years | 24.67 | 19.68 | 20.82 | 18.82 | 20.05 | 20.05 | 22.99 | 18.99 | 26.19 |
| Annual average | 4.51 | 3.66 | 3.86 | 3.51 | 3.72 | 3.72 | 4.23 | 3.54 | 4.76 |
|
| 3 years | 12.39 | 7.89 | 10.31 | 7.31 | 9.81 | 9.81 | 11.46 | 7.84 | 13.14 |
| Annual average | 3.97 | 2.56 | 3.32 | 2.38 | 3.17 | 3.17 | 3.68 | 2.55 | 4.20 |
|
| 1 year | 0.16 | –3.85 | –0.46 | –5.30 | –0.61 | –1.58 | 0.00 | –3.25 | 0.39 |
|
See the discussion following the Fund performance table on page 11 for information about the calculation of fund performance.
Your fund’s expenses
As a mutual fund investor, you pay ongoing expenses, such as management fees, distribution fees (12b-1 fees), and other expenses. Using the following information, you can estimate how these expenses affect your investment and compare them with the expenses of other funds. You may also pay one-time transaction expenses, including sales charges (loads) and redemption fees, which are not shown in this section and would have resulted in higher total expenses. For more information, see your fund’s prospectus or talk to your financial representative.
Expense ratios
| | | | | |
| | Class A | Class B | Class C | Class M | Class Y |
|
| Total annual operating expenses for the fiscal | | | | | |
| year ended 5/31/12 | 0.81% | 1.43% | 1.58% | 1.08% | 0.58% |
|
| Annualized expense ratio for the six-month | | | | | |
| period ended 5/31/13* | 0.80% | 1.42% | 1.57% | 1.07% | 0.57% |
|
Fiscal-year expense information in this table is taken from the most recent prospectus, is subject to change, and may differ from that shown for the annualized expense ratio and in the financial highlights of this report. Expenses are shown as a percentage of average net assets.
* For the fund’s most recent fiscal half year; may differ from expense ratios based on one-year data in the financial highlights.
| |
| 14 | Ohio Tax Exempt Income Fund |
Expenses per $1,000
The following table shows the expenses you would have paid on a $1,000 investment in the fund from December 1, 2012, to May 31, 2013. It also shows how much a $1,000 investment would be worth at the close of the period, assuming actual returns and expenses.
| | | | | |
| | Class A | Class B | Class C | Class M | Class Y |
|
| Expenses paid per $1,000*† | $3.97 | $7.03 | $7.77 | $5.30 | $2.83 |
|
| Ending value (after expenses) | $989.80 | $986.70 | $986.00 | $988.50 | $991.00 |
|
* Expenses for each share class are calculated using the fund’s annualized expense ratio for each class, which represents the ongoing expenses as a percentage of average net assets for the six months ended 5/31/13. The expense ratio may differ for each share class.
† Expenses are calculated by multiplying the expense ratio by the average account value for the period; then multiplying the result by the number of days in the period; and then dividing that result by the number of days in the year.
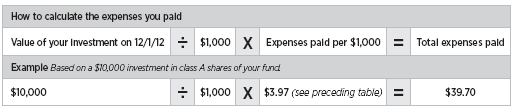
Estimate the expenses you paid
To estimate the ongoing expenses you paid for the six months ended May 31, 2013, use the following calculation method. To find the value of your investment on December 1, 2012, call Putnam at 1-800-225-1581.
Compare expenses using the SEC’s method
The Securities and Exchange Commission (SEC) has established guidelines to help investors assess fund expenses. Per these guidelines, the following table shows your fund’s expenses based on a $1,000 investment, assuming a hypothetical 5% annualized return. You can use this information to compare the ongoing expenses (but not transaction expenses or total costs) of investing in the fund with those of other funds. All mutual fund shareholder reports will provide this information to help you make this comparison. Please note that you cannot use this information to estimate your actual ending account balance and expenses paid during the period.
| | | | | |
| | Class A | Class B | Class C | Class M | Class Y |
|
| Expenses paid per $1,000*† | $4.03 | $7.14 | $7.90 | $5.39 | $2.87 |
|
| Ending value (after expenses) | $1,020.94 | $1,017.85 | $1,017.10 | $1,019.60 | $1,022.09 |
|
* Expenses for each share class are calculated using the fund’s annualized expense ratio for each class, which represents the ongoing expenses as a percentage of average net assets for the six months ended 5/31/13. The expense ratio may differ for each share class.
† Expenses are calculated by multiplying the expense ratio by the average account value for the period; then multiplying the result by the number of days in the period; and then dividing that result by the number of days in the year.
| |
| Ohio Tax Exempt Income Fund | 15 |
Terms and definitions
Important terms
Total return shows how the value of the fund’s shares changed over time, assuming you held the shares through the entire period and reinvested all distributions in the fund.
Before sales charge, or net asset value, is the price, or value, of one share of a mutual fund, without a sales charge. Before-sales-charge figures fluctuate with market conditions, and are calculated by dividing the net assets of each class of shares by the number of outstanding shares in the class.
After sales charge is the price of a mutual fund share plus the maximum sales charge levied at the time of purchase. After-sales-charge performance figures shown here assume the 4.00% maximum sales charge for class A shares and 3.25% for class M shares.
Contingent deferred sales charge (CDSC) is generally a charge applied at the time of the redemption of class B or C shares and assumes redemption at the end of the period. Your fund’s class B CDSC declines over time from a 5% maximum during the first year to 1% during the sixth year. After the sixth year, the CDSC no longer applies. The CDSC for class C shares is 1% for one year after purchase.
Share classes
Class A shares are generally subject to an initial sales charge and no CDSC (except on certain redemptions of shares bought without an initial sales charge).
Class B shares are not subject to an initial sales charge. They may be subject to a CDSC.
Class C shares are not subject to an initial sales charge and are subject to a CDSC only if the shares are redeemed during the first year.
Class M shares have a lower initial sales charge and a higher 12b-1 fee than class A shares and no CDSC (except on certain redemptions of shares bought without an initial sales charge).
Class Y shares are not subject to an initial sales charge or CDSC, and carry no 12b-1 fee. They are generally only available to corporate and institutional clients and clients in other approved programs.
Fixed-income terms
Current rate is the annual rate of return earned from dividends or interest of an investment. Current rate is expressed as a percentage of the price of a security, fund share, or principal investment.
Yield curve is a graph that plots the yields of bonds with equal credit quality against their differing maturity dates, ranging from shortest to longest. It is used as a benchmark for other debt, such as mortgage or bank lending rates.
Comparative indexes
Barclays Municipal Bond Index is an unmanaged index of long-term fixed-rate investment-grade tax-exempt bonds.
Barclays U.S. Aggregate Bond Index is an unmanaged index of U.S. investment-grade fixed-income securities.
BofA Merrill Lynch U.S. 3-Month Treasury Bill Index is an unmanaged index that seeks to measure the performance of U.S. Treasury bills available in the marketplace.
S&P 500 Index is an unmanaged index of common stock performance.
Indexes assume reinvestment of all distributions and do not account for fees. Securities and performance of a fund and an index will differ. You cannot invest directly in an index.
Lipper is a third-party industry-ranking entity that ranks mutual funds. Its rankings do not reflect sales charges. Lipper rankings are based on total return at net asset value relative to other funds that have similar current investment styles or objectives as determined by Lipper. Lipper may change a fund’s category assignment at its discretion. Lipper category averages reflect performance trends for funds within a category.
| |
| 16 | Ohio Tax Exempt Income Fund |
Other information for shareholders
Proxy voting
Putnam is committed to managing our mutual funds in the best interests of our shareholders. The Putnam funds’ proxy voting guidelines and procedures, as well as information regarding how your fund voted proxies relating to portfolio securities during the 12-month period ended June 30, 2012, are available in the Individual Investors section of putnam.com, and on the Securities and Exchange Commission (SEC) website, www.sec.gov. If you have questions about finding forms on the SEC’s website, you may call the SEC at 1-800-SEC-0330. You may also obtain the Putnam funds’ proxy voting guidelines and procedures at no charge by calling Putnam’s Shareholder Services at 1-800-225-1581.
Fund portfolio holdings
The fund will file a complete schedule of its portfolio holdings with the SEC for the first and third quarters of each fiscal year on Form N-Q. Shareholders may obtain the fund’s Forms N-Q on the SEC’s website at www.sec.gov. In addition, the fund’s Forms N-Q may be reviewed and copied at the SEC’s Public Reference Room in Washington, D.C. You may call the SEC at 1-800-SEC-0330 for information about the SEC’s website or the operation of the Public Reference Room.
Trustee and employee fund ownership
Putnam employees and members of the Board of Trustees place their faith, confidence, and, most importantly, investment dollars in Putnam mutual funds. As of May 31, 2013, Putnam employees had approximately $385,000,000 and the Trustees had approximately $92,000,000 invested in Putnam mutual funds. These amounts include investments by the Trustees’ and employees’ immediate family members as well as investments through retirement and deferred compensation plans.
| |
| Ohio Tax Exempt Income Fund | 17 |
Important notice regarding Putnam’s privacy policy
In order to conduct business with our shareholders, we must obtain certain personal information such as account holders’ names, addresses, Social Security numbers, and dates of birth. Using this information, we are able to maintain accurate records of accounts and transactions.
It is our policy to protect the confidentiality of our shareholder information, whether or not a shareholder currently owns shares of our funds. In particular, it is our policy not to sell information about you or your accounts to outside marketing firms. We have safeguards in place designed to prevent unauthorized access to our computer systems and procedures to protect personal information from unauthorized use.
Under certain circumstances, we must share account information with outside vendors who provide services to us, such as mailings and proxy solicitations. In these cases, the service providers enter into confidentiality agreements with us, and we provide only the information necessary to process transactions and perform other services related to your account. Finally, it is our policy to share account information with your financial representative, if you’ve listed one on your Putnam account.
| |
| 18 | Ohio Tax Exempt Income Fund |
Financial statements
These sections of the report, as well as the accompanying Notes, preceded by the Report of Independent Registered Public Accounting Firm, constitute the fund’s financial statements.
The fund’s portfolio lists all the fund’s investments and their values as of the last day of the reporting period. Holdings are organized by asset type and industry sector, country, or state to show areas of concentration and diversification.
Statement of assets and liabilities shows how the fund’s net assets and share price are determined. All investment and non-investment assets are added together. Any unpaid expenses and other liabilities are subtracted from this total. The result is divided by the number of shares to determine the net asset value per share, which is calculated separately for each class of shares. (For funds with preferred shares, the amount subtracted from total assets includes the liquidation preference of preferred shares.)
Statement of operations shows the fund’s net investment gain or loss. This is done by first adding up all the fund’s earnings — from dividends and interest income — and subtracting its operating expenses to determine net investment income (or loss). Then, any net gain or loss the fund realized on the sales of its holdings — as well as any unrealized gains or losses over the period — is added to or subtracted from the net investment result to determine the fund’s net gain or loss for the fiscal year.
Statement of changes in net assets shows how the fund’s net assets were affected by the fund’s net investment gain or loss, by distributions to shareholders, and by changes in the number of the fund’s shares. It lists distributions and their sources (net investment income or realized capital gains) over the current reporting period and the most recent fiscal year-end. The distributions listed here may not match the sources listed in the Statement of operations because the distributions are determined on a tax basis and may be paid in a different period from the one in which they were earned.
Financial highlights provide an overview of the fund’s investment results, per-share distributions, expense ratios, net investment income ratios, and portfolio turnover in one summary table, reflecting the five most recent reporting periods. In a semiannual report, the highlights table also includes the current reporting period.
| |
| Ohio Tax Exempt Income Fund | 19 |
Report of Independent Registered Public Accounting Firm
To the Trustees and Shareholders of
Putnam Ohio Tax Exempt Income Fund:
In our opinion, the accompanying statement of assets and liabilities, including the portfolio, and the related statements of operations and of changes in net assets and the financial highlights present fairly, in all material respects, the financial position of Putnam Ohio Tax Exempt Income Fund (the “fund”) at May 31, 2013, and the results of its operations, the changes in its net assets and the financial highlights for each of the periods indicated, in conformity with accounting principles generally accepted in the United States of America. These financial statements and financial highlights (hereafter referred to as “financial statements”) are the responsibility of the fund’s management. Our responsibility is to express an opinion on these financial statements based on our audits. We conducted our audits of these financial statements in accordance with the standards of the Public Company Accounting Oversight Board (United States). Those standards require that we plan and perform the audit to obtain reasonable assurance about whether the financial statements are free of material misstatement. An audit includes examining, on a test basis, evidence supporting the amounts and disclosures in the financial statements, assessing the accounting principles used and significant estimates made by management, and evaluating the overall financial statement presentation. We believe that our audits, which included confirmation of investments owned at May 31, 2013 by correspondence with the custodian, provide a reasonable basis for our opinion.
PricewaterhouseCoopers LLP
Boston, Massachusetts
July 8, 2013
|
| 20 Ohio Tax Exempt Income Fund |
The fund’s portfolio 5/31/13
Key to holding’s abbreviations
| |
| AGM Assured Guaranty Municipal Corporation | FRB Floating Rate Bonds: the rate shown is |
| | the current interest rate at the close of the |
| AGO Assured Guaranty, Ltd. | reporting period |
| | |
| AMBAC AMBAC Indemnity Corporation | G.O. Bonds General Obligation Bonds |
| | |
| Cmnwlth. of PR Gtd. Commonwealth of | GNMA Coll. Government National Mortgage |
| Puerto Rico Guaranteed | Association Collateralized |
| | |
| COP Certificates of Participation | NATL National Public Finance Guarantee Corp. |
| | |
| FGIC Financial Guaranty Insurance Company | SGI Syncora Guarantee, Inc. |
| | |
| FHA Insd. Federal Housing Administration Insured | U.S. Govt. Coll. U.S. Government Collateralized |
| | |
| FHLMC Coll. Federal Home Loan Mortgage | VRDN Variable Rate Demand Notes, which are |
| Corporation Collateralized | floating-rate securities with long-term maturities, |
| | that carry coupons that reset every one or seven |
| FNMA Coll. Federal National Mortgage | days. The rate shown is the current interest rate at the |
| Association Collateralized | close of the reporting period. |
| | |
| | | |
| MUNICIPAL BONDS AND NOTES (98.2%)* | Rating** | Principal amount | Value |
|
| California (0.5%) | | | |
| CA State G.O. Bonds, 5s, 11/1/32 | A1 | $750,000 | $822,818 |
|
| | | | 822,818 |
| Guam (0.7%) | | | |
| Territory of GU, Govt. Ltd. Oblig. Rev. Bonds | | | |
| (Section 30), Ser. A, 5 3/4s, 12/1/34 | BBB+ | 500,000 | 546,585 |
|
| Territory of GU, Govt. Wtr. Wks. Auth. Wtr. & | | | |
| Waste Wtr. Syst. Rev. Bonds, 5 5/8s, 7/1/40 | Ba2 | 350,000 | 367,343 |
|
| Territory of GU, Pwr. Auth. Rev. Bonds, Ser. A, | | | |
| 5 1/2s, 10/1/40 | BBB | 250,000 | 272,095 |
|
| | | | 1,186,023 |
| Ohio (90.8%) | | | |
| Akron, G.O. Bonds, AGM, 5s, 12/1/25 | Aa3 | 1,005,000 | 1,123,741 |
|
| Allen Cnty., Hosp. Fac. Rev. Bonds (Catholic Hlth. | | | |
| Care), Ser. A, 5 1/4s, 6/1/38 | AA– | 1,000,000 | 1,099,210 |
|
| American Muni. Pwr. — Ohio, Inc. Rev. Bonds | | | |
| (Prairie State Energy Campus), Ser. A | | | |
| AGO, 5 3/4s, 2/15/39 | AA– | 1,500,000 | 1,708,485 |
| 5s, 2/15/38 | A1 | 1,500,000 | 1,611,330 |
|
| Barberton, City School Dist. G.O. Bonds (School | | | |
| Impt.), 5 1/4s, 12/1/28 | AA | 1,390,000 | 1,552,338 |
|
| Brookfield, Local School Dist. G.O. Bonds (School | | | |
| Fac. Impt.), AGM, 5s, 1/15/26 | Aa2 | 1,000,000 | 1,111,900 |
|
| Buckeye, Tobacco Settlement Fin. Auth. Rev. | | | |
| Bonds, Ser. A-2 | | | |
| 5 3/4s, 6/1/34 | B3 | 2,250,000 | 2,029,658 |
| 5 3/8s, 6/1/24 | B3 | 690,000 | 657,791 |
|
| Cincinnati, G.O. Bonds, Ser. D, 4s, 12/1/32 | Aa1 | 1,000,000 | 1,041,710 |
|
| Cincinnati, City School Dist. COP (School Impt.), | | | |
| AGM, 5s, 12/15/28 | Aa2 | 2,500,000 | 2,756,025 |
|
| Cleveland, G.O. Bonds, Ser. A | | | |
| AGO, 5s, 12/1/29 | AA | 2,000,000 | 2,179,960 |
| FGIC, NATL, 4 3/4s, 11/15/26 | AA | 1,790,000 | 1,938,266 |
|
| |
| Ohio Tax Exempt Income Fund | 21 |
| | | |
| MUNICIPAL BONDS AND NOTES (98.2%)* cont. | Rating** | Principal amount | Value |
|
| Ohio cont. | | | |
| Cleveland, Arpt. Syst. Rev. Bonds, Ser. C, | | | |
| AGM, 5s, 1/1/23 | AA– | $1,500,000 | $1,668,630 |
|
| Cleveland, Income Tax Rev. Bonds (Bridges & | | | |
| Roadways), Ser. B, AGO, 5s, 10/1/29 | AA | 1,000,000 | 1,100,450 |
|
| Cleveland, Muni. School Dist. G.O. Bonds, | | | |
| AGM, U.S. Govt. Coll., 5s, 12/1/27 | | | |
| (Prerefunded 6/1/14) | Aa2 | 1,375,000 | 1,439,323 |
|
| Cleveland, Pkg. Fac. Rev. Bonds, AGM | | | |
| 5 1/4s, 9/15/22 | AA– | 1,630,000 | 1,904,883 |
| 5 1/4s, 9/15/22 (Escrowed to maturity) | AA– | 770,000 | 980,179 |
|
| Cleveland, Pub. Pwr. Syst. Rev. Bonds, Ser. B-1, | | | |
| NATL, zero %, 11/15/25 | A2 | 3,000,000 | 1,803,780 |
|
| Cleveland, State U. Rev. Bonds, 5s, 6/1/37 | A1 | 1,500,000 | 1,625,025 |
|
| Cleveland, Urban Renewal Increment Rev. Bonds | | | |
| (Rock & Roll Hall of Fame), 6 3/4s, 3/15/18 | B/P | 870,000 | 873,663 |
|
| Cleveland, Wtr. Rev. Bonds (2nd Lien) | | | |
| Ser. X, 5s, 1/1/42 | Aa1 | 1,000,000 | 1,107,110 |
| Ser. A, 5s, 1/1/26 | Aa2 | 500,000 | 584,550 |
|
| Columbus G.O. Bonds, Ser. A | | | |
| 5s, 2/15/25 | Aaa | 1,500,000 | 1,820,010 |
| 5s, 7/1/14 | Aaa | 1,375,000 | 1,445,496 |
|
| Columbus, Swr. Rev. Bonds, Ser. A, | | | |
| 4 1/2s, 6/1/29 | Aa1 | 1,110,000 | 1,211,110 |
|
| Columbus, Swr. VRDN, Ser. B, 0.1s, 6/1/32 | VMIG1 | 2,930,000 | 2,930,000 |
|
| Cuyahoga Cmnty., College Dist. Rev. Bonds | | | |
| Ser. C, 5 1/4s, 2/1/29 | Aa2 | 995,000 | 1,135,564 |
| Ser. D, 5s, 8/1/32 | Aa2 | 750,000 | 844,958 |
| Ser. C, 5s, 8/1/25 | Aa2 | 1,500,000 | 1,708,830 |
|
| Cuyahoga Cnty. G.O. Bonds | | | |
| (Cap. Impt.), Ser. A, 4s, 12/1/27 | Aa1 | 1,000,000 | 1,059,050 |
| (Ltd. Tax), Ser. A, 4s, 12/1/17 | Aa1 | 750,000 | 848,528 |
|
| Dublin, G.O. Bonds, Ser. B, 6.4s, 12/1/14 | Aaa | 565,000 | 580,368 |
|
| Elyria, OH City School Dist. G.O. Bonds | | | |
| (Classroom Fac. & School Impt.), SGI, 5s, 12/1/35 | A1 | 500,000 | 532,485 |
|
| Erie Cnty., OH Hosp. Fac. Rev. Bonds (Firelands | | | |
| Regl. Med. Ctr.), Ser. A, 5 1/4s, 8/15/46 | A– | 590,000 | 619,099 |
|
| Field, Local School Dist. G.O. Bonds (School Facs. | | | |
| Construction & Impt.) | | | |
| AMBAC, 5s, 12/1/22 | A–/P | 650,000 | 681,077 |
| AMBAC, 5s, 12/1/22 (Prerefunded 6/1/15) | AAA/P | 520,000 | 568,428 |
|
| Franklin Cnty., Hlth. Care Fac. Rev. Bonds | | | |
| (Presbyterian Svcs.), Ser. A, 5 5/8s, 7/1/26 | BBB | 1,100,000 | 1,224,168 |
|
| Greene Cnty., Hosp. Facs. Rev. Bonds (Kettering | | | |
| Hlth. Network), 5 1/2s, 4/1/39 | A | 1,000,000 | 1,072,330 |
|
| Hamilton Cnty., Econ. Dev. Rev. Bonds (King | | | |
| Highland Cmnty. Urban), Ser. A, NATL, 5s, 6/1/22 | A1 | 1,745,000 | 1,896,675 |
|
| Hamilton Cnty., Hlth. Care Rev. Bonds (Life | | | |
| Enriching Cmntys.) | | | |
| 6 5/8s, 1/1/46 | BBB | 590,000 | 668,865 |
| 5s, 1/1/32 | BBB | 370,000 | 392,522 |
|
|
| 22 Ohio Tax Exempt Income Fund |
| | | |
| MUNICIPAL BONDS AND NOTES (98.2%)* cont. | Rating** | Principal amount | Value |
|
| Ohio cont. | | | |
| Hamilton Cnty., Sales Tax Rev. Bonds, | | | |
| Ser. B, AMBAC | | | |
| zero %, 12/1/24 | A2 | $3,000,000 | $1,931,400 |
| zero %, 12/1/22 | A2 | 500,000 | 350,795 |
|
| Hamilton Cnty., Swr. Syst. Rev. Rev. Bonds (Metro. | | | |
| Swr. Dist.), Ser. A, NATL, 5s, 12/1/28 | AA+ | 1,500,000 | 1,660,530 |
|
| Hamilton, City School Dist. G.O. Bonds (School | | | |
| Impt.), AGM, 5s, 12/1/26 | AA– | 2,000,000 | 2,202,280 |
|
| Huran Cnty., Human Svcs. G.O. Bonds, NATL, | | | |
| 6.55s, 12/1/20 | Aa3 | 1,800,000 | 2,154,042 |
|
| JobsOhio Beverage Syst. Rev. Bonds (Statewide | | | |
| Sr. Lien Liquor Profits), Ser. A, 5s, 1/1/38 | AA | 700,000 | 768,040 |
|
| Lake Cnty., Hosp. Fac. Rev. Bonds (Lake Hosp. | | | |
| Syst.), Ser. C, 6s, 8/15/43 | A3 | 1,115,000 | 1,210,422 |
|
| Lakewood, City School Dist. G.O. Bonds | | | |
| FGIC, NATL, zero %, 12/1/17 | Aa2 | 1,190,000 | 1,097,537 |
| AGM, zero %, 12/1/16 | Aa2 | 1,250,000 | 1,188,138 |
|
| Lancaster, City Fac. Construction & Impt. School | | | |
| Dist. G.O. Bonds, 5s, 10/1/37 | AA | 1,000,000 | 1,112,500 |
|
| Lorain Cnty., Hosp. Rev. Bonds (Catholic), Ser. H, | | | |
| AGO, 5s, 2/1/29 | AA– | 2,000,000 | 2,171,780 |
|
| Lorain Cnty., Port Auth. Econ. Dev. Facs. Rev. | | | |
| Bonds (Kendal at Oberlin), 5s, 11/15/30 | A– | 750,000 | 833,130 |
|
| Lorain Cnty., Port Auth. Recovery Zone Fac. Rev. | | | |
| Bonds (U.S. Steel Corp.), 6 3/4s, 12/1/40 | BB | 500,000 | 567,790 |
|
| Lucas Cnty., Hlth. Care Rev. Bonds (Lutheran | | | |
| Homes), Ser. A, 7s, 11/1/45 | BB+ | 700,000 | 775,222 |
|
| Lucas Cnty., Hlth. Care Fac. Rev. Bonds (Sunset | | | |
| Retirement Cmntys.), 5 1/2s, 8/15/30 | A–/F | 650,000 | 714,084 |
|
| Miami Cnty., Hosp. Fac. Rev. Bonds (Upper Valley | | | |
| Med. Ctr.), 5 1/4s, 5/15/17 | A2 | 1,250,000 | 1,370,850 |
|
| Montgomery Cnty., Rev. Bonds (Catholic Hlth. | | | |
| Initiatives), Ser. D, 6 1/4s, 10/1/33 | Aa3 | 1,000,000 | 1,187,940 |
|
| Montgomery Cnty., VRDN (Miami Valley Hosp.), | | | |
| Ser. C, 0.06s, 11/15/39 | NR/F | 1,600,000 | 1,600,000 |
|
| Mount Healthy, City School Dist. G.O. Bonds | | | |
| (School Impt.), AGM, 5 1/4s, 12/1/22 | A1 | 1,105,000 | 1,261,170 |
|
| Napoleon, City Facs. Construction & Impt. School | | | |
| Dist. G.O. Bonds, 5s, 12/1/36 | Aa3 | 500,000 | 547,315 |
|
| New Albany, Plain Local School Dist. G.O. Bonds | | | |
| (School Impt.), 4s, 12/1/29 | Aa1 | 1,410,000 | 1,492,203 |
|
| OH Hsg. Fin. Agcy. Rev. Bonds | | | |
| (Single Fam. Mtge.), Ser. 1, 5s, 11/1/28 | Aaa | 915,000 | 984,686 |
| (Res. Mtge.), Ser. C, GNMA Coll., FNMA Coll., | | | |
| 4.1s, 3/1/15 | Aaa | 120,000 | 123,970 |
|
| OH Hsg. Fin. Agcy. Single Fam. Mtge. Rev. Bonds, | | | |
| Ser. 85-A, FGIC, FHA Insd., U.S. Govt. Coll., zero %, | | | |
| 1/15/15 (Escrowed to maturity) | AAA/P | 5,000 | 4,579 |
|
| |
| Ohio Tax Exempt Income Fund | 23 |
| | | |
| MUNICIPAL BONDS AND NOTES (98.2%)* cont. | Rating** | Principal amount | Value |
|
| Ohio cont. | | | |
| OH State G.O. Bonds | | | |
| (Hwy. Cap. Impts.), Ser. Q, 5s, 5/1/27 | AAA | $1,500,000 | $1,764,945 |
| (Infrastructure Impt.), Ser. B, 5s, 8/1/23 | Aa1 | 1,250,000 | 1,543,875 |
| (Infrastructure Impt.), Ser. A, 5s, 2/1/21 | Aa1 | 1,000,000 | 1,217,490 |
| Ser. B, 5s, 8/1/20 | Aa1 | 1,415,000 | 1,727,262 |
| (Common Schools), Ser. A, 4s, 9/15/16 | Aa1 | 1,000,000 | 1,109,150 |
|
| OH State Rev. Bonds | | | |
| Ser. A, U.S. Govt. Coll., 5s, 10/1/22 | | | |
| (Prerefunded 4/1/18) | AA– | 3,090,000 | 3,678,460 |
| (Revitalization), Ser. A, AMBAC, U.S. Govt. Coll., | | | |
| 5s, 4/1/19 (Prerefunded 4/1/16) | AA– | 1,750,000 | 1,969,345 |
|
| OH State Air Quality Dev. Auth. FRB (Columbus | | | |
| Southern Pwr. Co.), Ser. B, 5.8s, 12/1/38 | Baa1 | 1,000,000 | 1,155,060 |
|
| OH State Air Quality Dev. Auth. Rev. Bonds | | | |
| (Buckeye Pwr. Recvy. Zone Fac.), 6s, 12/1/40 | A2 | 1,000,000 | 1,091,810 |
| (Valley Elec. Corp.), Ser. E, 5 5/8s, 10/1/19 | Baa3 | 500,000 | 581,300 |
|
| OH State Higher Edl. Fac. Rev. Bonds | | | |
| (Case Western Reserve U.), 6 1/4s, 10/1/18 | AA– | 1,000,000 | 1,238,030 |
| (Case Western Reserve U.), 6s, 10/1/14 | AA– | 1,000,000 | 1,073,490 |
| (U. of Dayton), Ser. A, 5 5/8s, 12/1/41 | A2 | 1,200,000 | 1,349,052 |
| (U. of Dayton), 5 1/2s, 12/1/36 | A2 | 1,000,000 | 1,114,940 |
| (Oberlin College), 5 1/8s, 10/1/24 | Aa2 | 1,500,000 | 1,517,175 |
|
| OH State Higher Edl. Fac. VRDN (Case Western | | | |
| Reserve), Ser. B-2, 0.08s, 12/1/44 | VMIG1 | 2,400,000 | 2,400,000 |
|
| OH State Higher Edl. Fac. Comm. Rev. Bonds | | | |
| (U. Hosp. Hlth. Syst.), Ser. 09-A, 6 3/4s, | | | |
| 1/15/39 (Prerefunded 1/15/15) | A2 | 2,000,000 | 2,206,140 |
| (Summa Hlth. Syst. — 2010), 5 3/4s, 11/15/40 | Baa1 | 1,000,000 | 1,114,790 |
| (Kenyon College), 5s, 7/1/44 | A1 | 2,000,000 | 2,108,220 |
| (Xavier U.), 5s, 5/1/40 | A3 | 750,000 | 792,983 |
| (Oberlin College), 5s, 10/1/33 | Aa2 | 1,000,000 | 1,008,640 |
| (Cleveland Clinic Hlth.), 5s, 1/1/31 | Aa2 | 1,500,000 | 1,687,815 |
|
| OH State Higher Edl. Fac. Comm. VRDN | | | |
| (Cleveland Clinic Foundation), Ser. B-4, | | | |
| 0.05s, 1/1/43 | VMIG1 | 2,410,000 | 2,410,000 |
|
| OH State Hsg. Fin. Agcy. Rev. Bonds (Res. Mtge.), | | | |
| Ser. F, GNMA Coll., FNMA Coll., FHLMC Coll., | | | |
| 5.45s, 9/1/33 | Aaa | 450,000 | 460,575 |
|
| OH State Poll. Control Rev. Bonds (Standard Oil | | | |
| Co.), 6 3/4s, 12/1/15 | A2 | 1,700,000 | 1,855,635 |
|
| OH State U. Rev. Bonds (Gen. Receipts Special | | | |
| Purpose), Ser. A, 5s, 6/1/38 | Aa2 | 1,000,000 | 1,115,700 |
|
| OH State Wtr. Dev. Auth. Poll. Control Rev. Bonds | | | |
| (Loan Fund Wtr. Quality), Ser. B-1, 5s, 12/1/17 | Aaa | 1,500,000 | 1,770,690 |
|
| OH U. Gen. Recipients Athens Rev. Bonds | | | |
| 5s, 12/1/42 | Aa3 | 500,000 | 542,155 |
| NATL, 5s, 12/1/25 | Aa3 | 2,265,000 | 2,336,393 |
|
| Penta Career Ctr. COP, 5s, 4/1/20 | Aa3 | 1,500,000 | 1,739,940 |
|
|
| 24 Ohio Tax Exempt Income Fund |
| | | |
| MUNICIPAL BONDS AND NOTES (98.2%)* cont. | Rating** | Principal amount | Value |
|
| Ohio cont. | | | |
| Rickenbacker, Port Auth. Rev. Bonds (OASBO | | | |
| Expanded Asset Pooled), Ser. A, 5 3/8s, 1/1/32 | A1 | $2,165,000 | $2,333,437 |
|
| River Valley, Local School Dist. G.O. Bonds (School | | | |
| Fac. Construction & Impt.), AGM, 5 1/4s, 11/1/23 | Aa2 | 300,000 | 368,988 |
|
| Scioto Cnty., Hosp. Rev. Bonds (Southern Med. | | | |
| Ctr.), 5 1/2s, 2/15/28 | A2 | 2,250,000 | 2,407,905 |
|
| South Western City, School Dist. G.O. Bonds | | | |
| (Franklin & Pickway Cnty.), AGM, 4 3/4s, 12/1/23 | Aa2 | 2,000,000 | 2,205,780 |
|
| Steubenville Hosp. Rev. Bonds (Trinity Hlth. Syst.), | | | |
| 5s, 10/1/30 | A3 | 500,000 | 508,455 |
|
| Sylvania, City School Dist. G.O. Bonds (School | | | |
| Impt.), AGO, 5s, 12/1/27 | Aa2 | 1,500,000 | 1,672,920 |
|
| Tallmadge, City School Dist. G.O. Bonds (School | | | |
| Fac.), AGM, 5s, 12/1/26 (Prerefunded 6/1/15) | AA– | 1,410,000 | 1,541,313 |
|
| Toledo-Lucas Cnty., Port Auth. Rev. Bonds (CSX | | | |
| Transn, Inc.), 6.45s, 12/15/21 | Baa2 | 1,900,000 | 2,422,842 |
|
| U. of Cincinnati Rev. Bonds | | | |
| Ser. F, 5s, 6/1/34 | Aa3 | 1,500,000 | 1,673,235 |
| Ser. A, 5s, 6/1/31 | Aa3 | 500,000 | 566,480 |
| Ser. A, 5s, 6/1/30 | Aa3 | 1,000,000 | 1,137,970 |
|
| Westerville, G.O. Bonds, AMBAC, 5s, 12/1/26 | Aaa | 1,320,000 | 1,481,964 |
|
| Woodridge, School Dist. G.O. Bonds, AMBAC, | | | |
| 6.8s, 12/1/14 | Aa2 | 980,000 | 1,005,921 |
|
| Youngstown State U. Rev. Bonds | | | |
| AGO, 5 1/4s, 12/15/29 | AA– | 500,000 | 554,050 |
| 5s, 12/15/25 | A1 | 500,000 | 562,515 |
|
| Zanesville, Hsg. Dev. Corp. Mtge. Rev. Bonds, U.S. | | | |
| Govt. Coll. | | | |
| 7 3/8s, 10/1/21 (Escrowed to maturity) | AAA/P | 220,000 | 261,851 |
| 7 3/8s, 10/1/20 (Escrowed to maturity) | AAA/P | 205,000 | 243,997 |
| 7 3/8s, 10/1/19 (Escrowed to maturity) | AAA/P | 185,000 | 220,193 |
| 7 3/8s, 10/1/18 (Escrowed to maturity) | AAA/P | 180,000 | 214,241 |
| 7 3/8s, 10/1/17 (Escrowed to maturity) | AAA/P | 160,000 | 190,437 |
| 7 3/8s, 10/1/16 (Escrowed to maturity) | AAA/P | 155,000 | 184,486 |
|
| | | | 147,888,013 |
| Puerto Rico (5.5%) | | | |
| Children’s Trust Fund Tobacco Settlement (The) | | | |
| Rev. Bonds, 5 3/8s, 5/15/33 | BBB | 415,000 | 419,445 |
|
| Cmnwlth. of PR, G.O. Bonds, Ser. A | | | |
| 6s, 7/1/40 | Baa3 | 1,350,000 | 1,403,258 |
| 5 1/4s, 7/1/22 | Baa3 | 1,000,000 | 1,011,250 |
|
| Cmnwlth. of PR, Aqueduct & Swr. Auth. Rev. | | | |
| Bonds, Ser. A, 6s, 7/1/38 | Ba1 | 840,000 | 860,941 |
|
| Cmnwlth. of PR, Elec. Pwr. Auth. Rev. Bonds, | | | |
| Ser. ZZ, 5 1/4s, 7/1/26 | BBB+ | 1,000,000 | 1,018,280 |
|
| Cmnwlth. of PR, Hwy. & Trans. Auth. Rev. Bonds | | | |
| Ser. N, 5 1/2s, 7/1/25 | BBB | 750,000 | 769,275 |
| Ser. G, 5s, 7/1/33 | BBB | 100,000 | 95,130 |
| Ser. G, 5s, 7/1/33 (Prerefunded 7/1/13) | Aaa | 195,000 | 195,684 |
|
| |
| Ohio Tax Exempt Income Fund | 25 |
| | | |
| MUNICIPAL BONDS AND NOTES (98.2%)* cont. | Rating** | Principal amount | Value |
|
| Puerto Rico cont. | | | |
| Cmnwlth. of PR, Indl. Tourist Edl. Med. & Env. | | | |
| Control Facs. Rev. Bonds (Cogen. Fac.-AES), | | | |
| 6 5/8s, 6/1/26 | Ba1 | $1,000,000 | $1,000,020 |
|
| Cmnwlth. of PR, Infrastructure Fin. Auth. Rev. | | | |
| Bonds, Ser. C, FGIC, 5 1/2s, 7/1/19 | BBB+ | 1,000,000 | 1,070,110 |
|
| Cmnwlth. of PR, Pub. Bldg. Auth. Rev. Bonds | | | |
| (Govt. Fac.), Ser. M-3, NATL, Cmnwlth. | | | |
| of PR Gtd., 6s, 7/1/28 | A | 500,000 | 516,485 |
|
| Cmnwlth. of PR, Sales Tax Fin. Corp. Rev. Bonds, | | | |
| Ser. A, NATL, zero %, 8/1/43 | Aa3 | 3,000,000 | 577,350 |
|
| | | | 8,937,228 |
| Virgin Islands (0.7%) | | | |
| VI Pub. Fin. Auth. Rev. Bonds | | | |
| Ser. A, 6s, 10/1/39 | Baa3 | 300,000 | 335,506 |
| Ser. A-1, 5s, 10/1/39 | Baa2 | 375,000 | 400,714 |
| Ser. A, 5s, 10/1/25 | Baa2 | 350,000 | 388,889 |
|
| | | | 1,125,109 |
|
| TOTAL INVESTMENTS | | | |
|
| Total investments (cost $149,292,575) | | | $159,959,191 |
Notes to the fund’s portfolio
Unless noted otherwise, the notes to the fund’s portfolio are for the close of the fund’s reporting period, which ran from June 1, 2012 through May 31, 2013 (the reporting period). Within the following notes to the portfolio, references to “ASC 820” represent Accounting Standards Codification ASC 820 Fair Value Measurements and Disclosures and references to “OTC”, if any, represent over-the-counter.
* Percentages indicated are based on net assets of $162,973,095.
** The Moody’s, Standard & Poor’s or Fitch ratings indicated are believed to be the most recent ratings available at the close of the reporting period for the securities listed. Ratings are generally ascribed to securities at the time of issuance. While the agencies may from time to time revise such ratings, they undertake no obligation to do so, and the ratings do not necessarily represent what the agencies would ascribe to these securities at the close of the reporting period. Securities rated by Putnam are indicated by “/P.” Securities rated by Fitch are indicated by “/F.” The rating of an insured security represents what is believed to be the most recent rating of the insurer’s claims-paying ability available at the close of the reporting period, if higher than the rating of the direct issuer of the bond, and does not reflect any subsequent changes. Ratings are not covered by the Report of Independent Registered Public Accounting Firm. Security ratings are defined in the Statement of Additional Information.
The dates shown parenthetically on prerefunded bonds represent the next prerefunding dates. The dates shown on debt obligations are the original maturity dates.
The fund had the following sector concentrations greater than 10% at the close of the reporting period (as a percentage of net assets):
| |
| Local government | 24.0% |
| Education | 16.8 |
| Health care | 14.2 |
| Utilities | 12.7 |
The fund had the following insurance concentration greater than 10% at the close of the reporting period (as a percentage of net assets):
|
| 26 Ohio Tax Exempt Income Fund |
ASC 820 establishes a three-level hierarchy for disclosure of fair value measurements. The valuation hierarchy is based upon the transparency of inputs to the valuation of the fund’s investments. The three levels are defined as follows:
Level 1: Valuations based on quoted prices for identical securities in active markets.
Level 2: Valuations based on quoted prices in markets that are not active or for which all significant inputs are observable, either directly or indirectly.
Level 3: Valuations based on inputs that are unobservable and significant to the fair value measurement.
The following is a summary of the inputs used to value the fund’s net assets as of the close of the reporting period:
| | | |
| | | Valuation inputs | |
|
| Investments in securities: | Level 1 | Level 2 | Level 3 |
|
| Municipal bonds and notes | $— | $159,959,191 | $— |
|
| Totals by level | $— | $159,959,191 | $— |
The accompanying notes are an integral part of these financial statements.
| |
| Ohio Tax Exempt Income Fund | 27 |
Statement of assets and liabilities 5/31/13
| |
| ASSETS | |
|
| Investment in securities, at value (Note 1): | |
| Unaffiliated issuers (identified cost $149,292,575) | $159,959,191 |
|
| Cash | 83,239 |
|
| Interest and other receivables | 2,560,814 |
|
| Receivable for shares of the fund sold | 772,515 |
|
| Receivable for investments sold | 298,704 |
|
| Total assets | 163,674,463 |
| |
| LIABILITIES | |
|
| Payable for shares of the fund repurchased | 353,194 |
|
| Payable for compensation of Manager (Note 2) | 61,191 |
|
| Payable for custodian fees (Note 2) | 2,182 |
|
| Payable for investor servicing fees (Note 2) | 12,334 |
|
| Payable for Trustee compensation and expenses (Note 2) | 69,582 |
|
| Payable for administrative services (Note 2) | 300 |
|
| Payable for distribution fees (Note 2) | 66,981 |
|
| Payable for auditing and tax fees | 59,524 |
|
| Distributions payable to shareholders | 64,538 |
|
| Other accrued expenses | 11,542 |
|
| Total liabilities | 701,368 |
| | |
| Net assets | $162,973,095 |
|
| |
| REPRESENTED BY | |
|
| Paid-in capital (Unlimited shares authorized) (Notes 1 and 4) | $153,570,071 |
|
| Distributions in excess of net investment income (Note 1) | (41,475) |
|
| Accumulated net realized loss on investments (Note 1) | (1,222,117) |
|
| Net unrealized appreciation of investments | 10,666,616 |
|
| Total — Representing net assets applicable to capital shares outstanding | $162,973,095 |
| |
| COMPUTATION OF NET ASSET VALUE AND OFFERING PRICE | |
|
| Net asset value and redemption price per class A share | |
| ($138,048,501 divided by 14,829,578 shares) | $9.31 |
|
| Offering price per class A share (100/96.00 of $9.31)* | $9.70 |
|
| Net asset value and offering price per class B share ($2,179,372 divided by 234,382 shares)** | $9.30 |
|
| Net asset value and offering price per class C share ($14,421,052 divided by 1,549,118 shares)** | $9.31 |
|
| Net asset value and redemption price per class M share ($586,176 divided by 62,947 shares) | $9.31 |
|
| Offering price per class M share (100/96.75 of $9.31)† | $9.62 |
|
| Net asset value, offering price and redemption price per class Y share | |
| ($7,737,994 divided by 830,582 shares) | $9.32 |
|
* On single retail sales of less than $100,000. On sales of $100,000 or more the offering price is reduced.
** Redemption price per share is equal to net asset value less any applicable contingent deferred sales charge.
† On single retail sales of less than $50,000. On sales of $50,000 or more the offering price is reduced.
The accompanying notes are an integral part of these financial statements.
|
| 28 Ohio Tax Exempt Income Fund |
Statement of operations Year ended 5/31/13
| |
| INTEREST INCOME | $6,754,708 |
|
| |
| EXPENSES | |
|
| Compensation of Manager (Note 2) | 720,433 |
|
| Investor servicing fees (Note 2) | 71,085 |
|
| Custodian fees (Note 2) | 7,536 |
|
| Trustee compensation and expenses (Note 2) | 15,951 |
|
| Distribution fees (Note 2) | 471,618 |
|
| Administrative services (Note 2) | 4,714 |
|
| Other | 105,711 |
|
| Total expenses | 1,397,048 |
| | |
| Expense reduction (Note 2) | (1,248) |
|
| Net expenses | 1,395,800 |
| | |
| Net investment income | 5,358,908 |
|
| |
| Net realized gain on investments (Notes 1 and 3) | 271,401 |
|
| Net unrealized depreciation of investments during the year | (1,000,608) |
|
| Net loss on investments | (729,207) |
| | |
| Net increase in net assets resulting from operations | $4,629,701 |
|
The accompanying notes are an integral part of these financial statements.
|
| Ohio Tax Exempt Income Fund 29 |
Statement of changes in net assets
| | |
| INCREASE IN NET ASSETS | Year ended 5/31/13 | Year ended 5/31/12 |
|
| Operations: | | |
| Net investment income | $5,358,908 | $5,517,207 |
|
| Net realized gain on investments | 271,401 | 420,639 |
|
| Net unrealized appreciation (depreciation) of investments | (1,000,608) | 7,707,745 |
|
| Net increase in net assets resulting from operations | 4,629,701 | 13,645,591 |
|
| Distributions to shareholders (Note 1): | | |
| From ordinary income | | |
| Taxable net investment income | | |
|
| Class A | (20,566) | (45,460) |
|
| Class B | (257) | (637) |
|
| Class C | (1,781) | (2,917) |
|
| Class M | (74) | (290) |
|
| Class Y | (1,006) | (1,282) |
|
| From tax-exempt net investment income | | |
| Class A | (4,628,296) | (4,915,764) |
|
| Class B | (54,870) | (48,270) |
|
| Class C | (350,900) | (275,855) |
|
| Class M | (14,739) | (13,546) |
|
| Class Y | (250,514) | (185,451) |
|
| Increase in capital from settlement payments (Note 6) | — | 13,848 |
|
| Increase from capital share transactions (Note 4) | 7,828,529 | 209,376 |
|
| Total increase in net assets | 7,135,227 | 8,379,343 |
| |
| NET ASSETS | | |
|
| Beginning of year | 155,837,868 | 147,458,525 |
|
| End of year (including distributions in excess of net | | |
| investment income of $41,475 and $62,484, respectively) | $162,973,095 | $155,837,868 |
|
The accompanying notes are an integral part of these financial statements.
|
| 30 Ohio Tax Exempt Income Fund |
|
| This page left blank intentionally. |
| |
| Ohio Tax Exempt Income Fund | 31 |
Financial highlights (For a common share outstanding throughout the period)
| | | | | | | | | | | | | | |
| INVESTMENT OPERATIONS: | | | | LESS DISTRIBUTIONS: | | | | | RATIOS AND SUPPLEMENTAL DATA: | |
|
| | | | | | | | | | | | | Ratio | Ratio | |
| | | | Net realized | | | | | | | | | of expenses | of net investment | |
| | Net asset value, | | and unrealized | Total from | From | | | | | Total return | Net assets, | to average | income (loss) | Portfolio |
| | beginning | Net investment | gain (loss) | investment | net investment | Total | Redemption | Non-recurring | Net asset value, | at net asset | end of period | net assets | to average | turnover |
| Period ended | of period | income (loss) | on investments | operations | income | distributions | fees | reimbursements | end of period | value (%) a | (in thousands) | (%) b | net assets (%) | (%) |
|
| Class A | | | | | | | | | | | | | | |
| May 31, 2013 | $9.35 | .32 | (.05) | .27 | (.31) | (.31) | — | — | $9.31 | 2.96 | $138,049 | .80 | 3.36 | 10 |
| May 31, 2012 | 8.84 | .34 | .51 | .85 | (.34) | (.34) | — c | — c,d | 9.35 | 9.81 | 135,448 | .80 | 3.79 | 12 |
| May 31, 2011 | 9.05 | .36 | (.21) | .15 | (.36) | (.36) | — | — c,e | 8.84 | 1.74 | 132,617 | .79 | 4.14 | 11 |
| May 31, 2010 | 8.79 | .37 | .26 | .63 | (.37) | (.37) | — c | — | 9.05 | 7.29 | 147,041 | .82 f | 4.15 f | 9 |
| May 31, 2009 | 8.93 | .36 | (.13) | .23 | (.37) | (.37) | — c | — | 8.79 | 2.84 | 142,288 | .84 f | 4.32 f | 20 |
|
| Class B | | | | | | | | | | | | | | |
| May 31, 2013 | $9.33 | .26 | (.03) | .23 | (.26) | (.26) | — | — | $9.30 | 2.43 | $2,179 | 1.42 | 2.73 | 10 |
| May 31, 2012 | 8.83 | .29 | .50 | .79 | (.29) | (.29) | — c | — c,d | 9.33 | 9.01 | 1,676 | 1.43 | 3.16 | 12 |
| May 31, 2011 | 9.04 | .31 | (.21) | .10 | (.31) | (.31) | — | — c,e | 8.83 | 1.10 | 1,852 | 1.42 | 3.49 | 11 |
| May 31, 2010 | 8.78 | .31 | .26 | .57 | (.31) | (.31) | — c | — | 9.04 | 6.61 | 3,454 | 1.45 f | 3.51 f | 9 |
| May 31, 2009 | 8.93 | .31 | (.14) | .17 | (.32) | (.32) | — c | — | 8.78 | 2.06 | 6,387 | 1.48 f | 3.67 f | 20 |
|
| Class C | | | | | | | | | | | | | | |
| May 31, 2013 | $9.35 | .24 | (.04) | .20 | (.24) | (.24) | — | — | $9.31 | 2.17 | $14,421 | 1.57 | 2.59 | 10 |
| May 31, 2012 | 8.84 | .27 | .51 | .78 | (.27) | (.27) | — c | — c,d | 9.35 | 9.00 | 11,574 | 1.58 | 3.00 | 12 |
| May 31, 2011 | 9.05 | .30 | (.22) | .08 | (.29) | (.29) | — | — c,e | 8.84 | .97 | 8,487 | 1.57 | 3.36 | 11 |
| May 31, 2010 | 8.79 | .30 | .26 | .56 | (.30) | (.30) | — c | — | 9.05 | 6.44 | 8,716 | 1.60 f | 3.37 f | 9 |
| May 31, 2009 | 8.93 | .30 | (.13) | .17 | (.31) | (.31) | — c | — | 8.79 | 2.01 | 4,985 | 1.63 f | 3.55 f | 20 |
|
| Class M | | | | | | | | | | | | | | |
| May 31, 2013 | $9.35 | .29 | (.04) | .25 | (.29) | (.29) | — | — | $9.31 | 2.68 | $586 | 1.07 | 3.08 | 10 |
| May 31, 2012 | 8.84 | .32 | .51 | .83 | (.32) | (.32) | — c | — c,d | 9.35 | 9.50 | 490 | 1.08 | 3.47 | 12 |
| May 31, 2011 | 9.06 | .34 | (.22) | .12 | (.34) | (.34) | — | — c,e | 8.84 | 1.35 | 852 | 1.07 | 3.85 | 11 |
| May 31, 2010 | 8.80 | .34 | .27 | .61 | (.35) | (.35) | — c | — | 9.06 | 6.99 | 999 | 1.10 f | 3.87 f | 9 |
| May 31, 2009 | 8.94 | .34 | (.13) | .21 | (.35) | (.35) | — c | — | 8.80 | 2.56 | 1,085 | 1.13 f | 4.03 f | 20 |
|
| Class Y | | | | | | | | | | | | | | |
| May 31, 2013 | $9.35 | .34 | (.03) | .31 | (.34) | (.34) | — | — | $9.32 | 3.30 | $7,738 | .57 | 3.59 | 10 |
| May 31, 2012 | 8.84 | .36 | .51 | .87 | (.36) | (.36) | — c | — c,d | 9.35 | 10.07 | 6,650 | .58 | 3.98 | 12 |
| May 31, 2011 | 9.06 | .38 | (.22) | .16 | (.38) | (.38) | — | — c,e | 8.84 | 1.87 | 3,650 | .57 | 4.38 | 11 |
| May 31, 2010 | 8.79 | .39 | .27 | .66 | (.39) | (.39) | — c | — | 9.06 | 7.65 | 2,334 | .60 f | 4.39 f | 9 |
| May 31, 2009 | 8.93 | .38 | (.13) | .25 | (.39) | (.39) | — c | — | 8.79 | 3.04 | 234 | .63 f | 4.63 f | 20 |
|
a Total return assumes dividend reinvestment and does not reflect the effect of sales charges.
b Includes amounts paid through expense offset arrangements (Note 2).
c Amount represents less than $0.01 per share.
d Reflects a non-recurring reimbursement related to restitution amounts in connection with a distribution plan approved by the Securities and Exchange Commission (the SEC) which amounted to less than $0.01 per share outstanding on July 21, 2011 (Note 6).
e Reflects a non-recurring reimbursement related to short-term trading related lawsuits, which amounted to less than $0.01 per share outstanding on May 11, 2011.
f Reflects an involuntary contractual expense limitation in effect during the period. As a result of such limitation, the expenses of each class reflect a reduction of the following amounts:
| |
| | Percentage of |
| | average net assets |
|
| May 31, 2010 | 0.03% |
|
| May 31, 2009 | 0.06 |
|
The accompanying notes are an integral part of these financial statements.
| | |
| 32 Ohio Tax Exempt Income Fund | Ohio Tax Exempt Income Fund | 33 |
Notes to financial statements 5/31/13
Within the following Notes to financial statements, references to “State Street” represent State Street Bank and Trust Company, references to “the SEC” represent the Securities and Exchange Commission, references to “Putnam Management” represent Putnam Investment Management, LLC, the fund’s manager, an indirect wholly-owned subsidiary of Putnam Investments, LLC and references to “OTC”, if any, represent over-the-counter. Unless otherwise noted, the “reporting period” represents the period from June 1, 2012 through May 31, 2013.
Putnam Ohio Tax Exempt Income Fund (the fund) is a Massachusetts business trust, which is registered under the Investment Company Act of 1940, as amended, as a diversified open-end management investment company. The investment objective of the fund is to seek as high a level of current income exempt from federal income tax and Ohio personal income tax as Putnam Management believes is consistent with preservation of capital. The fund invests mainly in bonds that pay interest that is exempt from federal income tax and Ohio personal income tax (but that may be subject to federal alternative minimum tax (AMT)), are investment-grade in quality, and have intermediate- to long-term maturities (three years or longer).
The fund offers class A, class B, class C, class M and class Y shares. Class A and class M shares are sold with a maximum front-end sales charge of 4.00% and 3.25%, respectively, and generally do not pay a contingent deferred sales charge. Class B shares, which convert to class A shares after approximately eight years, do not pay a front-end sales charge and are subject to a contingent deferred sales charge if those shares are redeemed within six years of purchase. Class C shares have a one-year 1.00% contingent deferred sales charge and do not convert to class A shares. The expenses for class A, class B, class C, and class M shares may differ based on the distribution fee of each class, which is identified in Note 2. Class Y shares, which are sold at net asset value, are generally subject to the same expenses as class A, class B, class C, and class M shares, but do not bear a distribution fee. Class Y shares are not available to all investors.
In the normal course of business, the fund enters into contracts that may include agreements to indemnify another party under given circumstances. The fund’s maximum exposure under these arrangements is unknown as this would involve future claims that may be, but have not yet been, made against the fund. However, the fund’s management team expects the risk of material loss to be remote.
Note 1: Significant accounting policies
The following is a summary of significant accounting policies consistently followed by the fund in the preparation of its financial statements. The preparation of financial statements is in conformity with accounting principles generally accepted in the United States of America and requires management to make estimates and assumptions that affect the reported amounts of assets and liabilities in the financial statements and the reported amounts of increases and decreases in net assets from operations. Actual results could differ from those estimates. Subsequent events after the Statement of assets and liabilities date through the date that the financial statements were issued have been evaluated in the preparation of the financial statements.
Investment income, realized and unrealized gains and losses and expenses of the fund are borne pro-rata based on the relative net assets of each class to the total net assets of the fund, except that each class bears expenses unique to that class (including the distribution fees applicable to such classes). Each class votes as a class only with respect to its own distribution plan or other matters on which a class vote is required by law or determined by the Trustees. If the fund were liquidated, shares of each class would receive their pro-rata share of the net assets of the fund. In addition, the Trustees declare separate dividends on each class of shares.
Security valuation Tax-exempt bonds and notes are generally valued on the basis of valuations provided by an independent pricing service approved by the Trustees. Such services use information with respect to transactions in bonds, quotations from bond dealers, market transactions in comparable securities and various relationships between securities in determining value. These securities will generally be categorized as Level 2.
Certain investments, including certain restricted and illiquid securities and derivatives, are also valued at fair value following procedures approved by the Trustees. Such valuations and procedures are reviewed periodically by the Trustees. These valuations consider such factors as significant market or specific security events such as interest rate or credit quality changes, various relationships with other securities, discount rates, U.S. Treasury, U.S. swap and credit yields, index levels, convexity exposures and recovery rates. These securities are classified as Level 2 or as Level 3 depending on the priority of the significant inputs. The fair value of securities is generally determined as the amount that the fund could reasonably expect to realize from an orderly disposition of such securities over
|
| 34 Ohio Tax Exempt Income Fund |
a reasonable period of time. By its nature, a fair value price is a good faith estimate of the value of a security in a current sale and does not reflect an actual market price, which may be different by a material amount.
Security transactions and related investment income Security transactions are recorded on the trade date (the date the order to buy or sell is executed). Gains or losses on securities sold are determined on the identified cost basis. Interest income is recorded on the accrual basis. All premiums/discounts are amortized/accreted on a yield-to-maturity basis. The premium in excess of the call price, if any, is amortized to the call date; thereafter, any remaining premium is amortized to maturity.
Interfund lending The fund, along with other Putnam funds, may participate in an interfund lending program pursuant to an exemptive order issued by the SEC. This program allows the fund to borrow from other Putnam funds that permit such transactions. Interfund lending transactions are subject to each fund’s investment policies and borrowing and lending limits. Interest earned or paid on the interfund lending transaction will be based on the average of certain current market rates. During the reporting period, the fund did not utilize the program.
Line of credit The fund participates, along with other Putnam funds, in a $315 million unsecured committed line of credit and a $185 million unsecured uncommitted line of credit, both provided by State Street. Borrowings may be made for temporary or emergency purposes, including the funding of shareholder redemption requests and trade settlements. Interest is charged to the fund based on the fund’s borrowing at a rate equal to the Federal Funds rate plus 1.25% for the committed line of credit and the Federal Funds rate plus 1.30% for the uncommitted line of credit. A closing fee equal to 0.02% of the committed line of credit and $50,000 for the uncommitted line of credit has been paid by the participating funds. In addition, a commitment fee of 0.11% per annum on any unutilized portion of the committed line of credit is allocated to the participating funds based on their relative net assets and paid quarterly. During the reporting period, the fund had no borrowings against these arrangements.
Federal taxes It is the policy of the fund to distribute all of its income within the prescribed time period and otherwise comply with the provisions of the Internal Revenue Code of 1986, as amended (the Code), applicable to regulated investment companies. It is also the intention of the fund to distribute an amount sufficient to avoid imposition of any excise tax under Section 4982 of the Code.
The fund is subject to the provisions of Accounting Standards Codification ASC 740 Income Taxes (ASC 740). ASC 740 sets forth a minimum threshold for financial statement recognition of the benefit of a tax position taken or expected to be taken in a tax return. The fund did not have a liability to record for any unrecognized tax benefits in the accompanying financial statements. No provision has been made for federal taxes on income, capital gains or unrealized appreciation on securities held nor for excise tax on income and capital gains. Each of the fund’s federal tax returns for the prior three fiscal years remains subject to examination by the Internal Revenue Service.
At May 31, 2013, the fund had a capital loss carryover of $1,158,348 available to the extent allowed by the Code to offset future net capital gain, if any. The amounts of the carryovers and the expiration dates are:
| | | |
| Loss carryover |
|
| Short-term | Long-term | Total | Expiration |
|
| $259,820 | $173,936 | $433,756 | * |
|
| 413,222 | N/A | 413,222 | May 31, 2017 |
|
| 97,718 | N/A | 97,718 | May 31, 2018 |
|
| 213,652 | N/A | 213,652 | May 31, 2019 |
|
* Under the Regulated Investment Company Modernization Act of 2010, the fund will be permitted to carry forward capital losses incurred in taxable years beginning after December 22, 2010 for an unlimited period. However, any losses incurred will be required to be utilized prior to the losses incurred in pre-enactment tax years. As a result of this ordering rule, pre-enactment capital loss carryforwards may be more likely to expire unused. Additionally, post-enactment capital losses that are carried forward will retain their character as either short-term or long-term capital losses rather than being considered all short-term as under previous law.
Distributions to shareholders Income dividends are recorded daily by the fund and are paid monthly. Distributions from capital gains, if any, are recorded on the ex-dividend date and paid at least annually. The amount and character of income and gains to be distributed are determined in accordance with income tax regulations which may differ from generally accepted accounting principles. These differences include temporary and/or permanent differences from straddle loss deferrals. Reclassifications are made to the fund’s capital accounts to reflect income and gains available for distribution (or available capital loss carryovers) under income tax regulations. For the
| |
| Ohio Tax Exempt Income Fund | 35 |
reporting period ended, the fund reclassified $14,896 to increase distributions in excess of investment income and $14,896 to decrease accumulated net realized loss.
The tax basis components of distributable earnings and the federal tax cost as of the close of the reporting period were as follows:
| |
| Unrealized appreciation | $11,233,322 |
| Unrealized depreciation | (529,330) |
|
| Net unrealized appreciation | 10,703,992 |
| Undistributed tax-exempt income | 4,260 |
| Undistributed ordinary income | 18,803 |
| Capital loss carryforward | (1,158,348) |
| Cost for federal income tax purposes | $149,255,199 |
Note 2: Management fee, administrative services and other transactions
The fund pays Putnam Management a management fee (based on the fund’s average net assets and computed and paid monthly) at annual rates that may vary based on the average of the aggregate net assets of most open-end funds, as defined in the fund’s management contract, sponsored by Putnam Management. Such annual rates may vary as follows:
| | | | |
| 0.590% | of the first $5 billion, | | 0.390% | of the next $50 billion, |
| |
|
| 0.540% | of the next $5 billion, | | 0.370% | of the next $50 billion, |
| |
|
| 0.490% | of the next $10 billion, | | 0.360% | of the next $100 billion and |
| |
|
| 0.440% | of the next $10 billion, | | 0.355% | of any excess thereafter. |
| |
|
Putnam Management has contractually agreed, through June 30, 2014, to waive fees or reimburse the fund’s expenses to the extent necessary to limit the cumulative expenses of the fund, exclusive of brokerage, interest, taxes, investment-related expenses, extraordinary expenses, acquired fund fees and expenses and payments under the fund’s investor servicing contract, investment management contract and distribution plans, on a fiscal year-to-date basis to an annual rate of 0.20% of the fund’s average net assets over such fiscal year-to-date period. During the reporting period, the fund’s expenses were not reduced as a result of this limit.
Putnam Investments Limited (PIL), an affiliate of Putnam Management, is authorized by the Trustees to manage a separate portion of the assets of the fund as determined by Putnam Management from time to time. Putnam Management pays a quarterly sub-management fee to PIL for its services at an annual rate of 0.40% of the average net assets of the portion of the fund managed by PIL.
The fund reimburses Putnam Management an allocated amount for the compensation and related expenses of certain officers of the fund and their staff who provide administrative services to the fund. The aggregate amount of all such reimbursements is determined annually by the Trustees.
Custodial functions for the fund’s assets are provided by State Street. Custody fees are based on the fund’s asset level, the number of its security holdings and transaction volumes.
Putnam Investor Services, Inc., an affiliate of Putnam Management, provides investor servicing agent functions to the fund. Putnam Investor Services, Inc. received fees for investor servicing based on the fund’s retail asset level, the number of shareholder accounts in the fund and the level of defined contribution plan assets in the fund. Investor servicing fees will not exceed an annual rate of 0.32% of the fund’s average net assets. During the reporting period, the expenses for each class of shares related to investor servicing fees were as follows:
| | | | |
| Class A | $60,859 | | Class M | 211 |
| |
|
| Class B | 888 | | Class Y | 3,097 |
| |
|
| Class C | 6,030 | | Total | $71,085 |
| |
|
The fund has entered into expense offset arrangements with Putnam Investor Services, Inc. and State Street whereby Putnam Investor Services, Inc.’s and State Street’s fees are reduced by credits allowed on cash balances. For the reporting period, the fund’s expenses were reduced by $1,248 under the expense offset arrangements.
|
| 36 Ohio Tax Exempt Income Fund |
Each independent Trustee of the fund receives an annual Trustee fee, of which $118, as a quarterly retainer, has been allocated to the fund, and an additional fee for each Trustees meeting attended. Trustees also are reimbursed for expenses they incur relating to their services as Trustees.
The fund has adopted a Trustee Fee Deferral Plan (the Deferral Plan) which allows the Trustees to defer the receipt of all or a portion of Trustees fees payable on or after July 1, 1995. The deferred fees remain invested in certain Putnam funds until distribution in accordance with the Deferral Plan.
The fund has adopted an unfunded noncontributory defined benefit pension plan (the Pension Plan) covering all Trustees of the fund who have served as a Trustee for at least five years and were first elected prior to 2004. Benefits under the Pension Plan are equal to 50% of the Trustee’s average annual attendance and retainer fees for the three years ended December 31, 2005. The retirement benefit is payable during a Trustee’s lifetime, beginning the year following retirement, for the number of years of service through December 31, 2006. Pension expense for the fund is included in Trustee compensation and expenses in the Statement of operations. Accrued pension liability is included in Payable for Trustee compensation and expenses in the Statement of assets and liabilities. The Trustees have terminated the Pension Plan with respect to any Trustee first elected after 2003.
The fund has adopted distribution plans (the Plans) with respect to its class A, class B, class C and class M shares pursuant to Rule 12b–1 under the Investment Company Act of 1940. The purpose of the Plans is to compensate Putnam Retail Management Limited Partnership, an indirect wholly-owned subsidiary of Putnam Investments, LLC, for services provided and expenses incurred in distributing shares of the fund. The Plans provide for payments by the fund to Putnam Retail Management Limited Partnership at an annual rate of up to 0.35%, 1.00%, 1.00% and 1.00% of the average net assets attributable to class A, class B, class C and class M shares, respectively. The Trustees have approved payment by the fund at the annual rate of 0.85%, 1.00% and 0.50% of the average net assets for class B, class C and class M shares, respectively. For class A shares, the annual payment rate will equal the weighted average of (i) 0.20% on the net assets of the fund attributable to class A shares purchased and paid for prior to April 1, 2005 and (ii) 0.25% on all other net assets of the fund attributable to class A shares. During the reporting period, the class specific expenses related to distribution fees were as follows:
| | | | |
| Class A | $314,525 | | Class M | 2,416 |
| |
|
| Class B | 17,229 | | Total | $471,618 |
| |
|
| Class C | 137,448 | | | |
| | |
For the reporting period, Putnam Retail Management Limited Partnership, acting as underwriter, received net commissions of $29,244 and $607 from the sale of class A and class M shares, respectively, and received $878 and $260 in contingent deferred sales charges from redemptions of class B and class C shares, respectively.
A deferred sales charge of up to 1.00% is assessed on certain redemptions of class A shares. For the reporting period, Putnam Retail Management Limited Partnership, acting as underwriter, received no monies on class A redemptions.
Note 3: Purchases and sales of securities
During the reporting period, cost of purchases and proceeds from sales of investment securities other than short-term investments aggregated $20,361,099 and $15,492,437, respectively. There were no purchases or proceeds from sales of long-term U.S. government securities.
Note 4: Capital shares
At the close of the reporting period, there was an unlimited number of shares of beneficial interest authorized. Transactions in capital shares were as follows:
| | | | |
| | Year ended 5/31/13 | Year ended 5/31/12 |
|
| Class A | Shares | Amount | Shares | Amount |
|
| Shares sold | 2,635,755 | $24,838,558 | 1,362,920 | $12,513,913 |
|
| Shares issued in connection with | | | | |
| reinvestment of distributions | 419,441 | 3,949,187 | 438,670 | 4,001,815 |
|
| | 3,055,196 | 28,787,745 | 1,801,590 | 16,515,728 |
|
| Shares repurchased | (2,719,214) | (25,630,570) | (2,316,347) | (21,001,906) |
|
| Net increase (decrease) | 335,982 | $3,157,175 | (514,757) | $(4,486,178) |
|
| |
| |
Ohio Tax Exempt Income Fund 37 |
| | | | |
| | Year ended 5/31/13 | Year ended 5/31/12 |
|
| Class B | Shares | Amount | Shares | Amount |
|
| Shares sold | 81,000 | $762,230 | 64,705 | $592,503 |
|
| Shares issued in connection with | | | | |
| reinvestment of distributions | 5,356 | 50,374 | 4,610 | 41,948 |
|
| | 86,356 | 812,604 | 69,315 | 634,451 |
|
| Shares repurchased | (31,567) | (297,345) | (99,550) | (896,015) |
|
| Net increase (decrease) | 54,789 | $515,259 | (30,235) | $(261,564) |
|
| |
| | Year ended 5/31/13 | Year ended 5/31/12 |
|
| Class C | Shares | Amount | Shares | Amount |
|
| Shares sold | 505,212 | $4,760,408 | 397,977 | $3,657,698 |
|
| Shares issued in connection with | | | | |
| reinvestment of distributions | 33,413 | 314,608 | 25,692 | 234,643 |
|
| | 538,625 | 5,075,016 | 423,669 | 3,892,341 |
|
| Shares repurchased | (228,030) | (2,148,884) | (145,546) | (1,313,546) |
|
| Net increase | 310,595 | $2,926,132 | 278,123 | $2,578,795 |
|
| |
| | Year ended 5/31/13 | Year ended 5/31/12 |
|
| Class M | Shares | Amount | Shares | Amount |
|
| Shares sold | 25,137 | $236,532 | 19,452 | $179,437 |
|
| Shares issued in connection with | | | | |
| reinvestment of distributions | 1,138 | 10,709 | 824 | 7,552 |
|
| | 26,275 | 247,241 | 20,276 | 186,989 |
|
| Shares repurchased | (15,723) | (148,336) | (64,180) | (569,373) |
|
| Net increase (decrease) | 10,552 | $98,905 | (43,904) | $(382,384) |
|
| |
| | Year ended 5/31/13 | Year ended 5/31/12 |
|
| Class Y | Shares | Amount | Shares | Amount |
|
| Shares sold | 336,157 | $3,167,625 | 391,786 | $3,617,378 |
|
| Shares issued in connection with | | | | |
| reinvestment of distributions | 13,586 | 128,036 | 10,322 | 94,669 |
|
| | 349,743 | 3,295,661 | 402,108 | 3,712,047 |
|
| Shares repurchased | (230,152) | (2,164,603) | (103,849) | (951,340) |
|
| Net increase | 119,591 | $1,131,058 | 298,259 | $2,760,707 |
|
Note 5: Market, credit and other risks
In the normal course of business, the fund trades financial instruments and enters into financial transactions where risk of potential loss exists due to changes in the market (market risk) or failure of the contracting party to the transaction to perform (credit risk). The fund may be exposed to additional credit risk that an institution or other entity with which the fund has unsettled or open transactions will default. The fund may be affected by economic and political developments in the state of Ohio.
|
| 38 Ohio Tax Exempt Income Fund |
Note 6: Regulatory matters and litigation
In late 2003 and 2004, Putnam Management settled charges brought by the SEC and the Massachusetts Securities Division in connection with excessive short-term trading in Putnam funds. In July 2011, the fund recorded a receivable of $13,848 related to restitution amounts in connection with a distribution plan approved by the SEC. This amount, which was received by the fund in December 2011, is reported as part of Increase in capital from settlement payments on the Statement of changes in net assets. Putnam Management has agreed to bear any costs incurred by the Putnam funds as a result of this matter.
Note 7: New accounting pronouncement
In January 2013, ASU 2013–01, “Clarifying the Scope of Disclosures about Offsetting Assets and Liabilities,” amended ASU No. 2011–11, “Disclosures about Offsetting Assets and Liabilities.” The ASUs create new disclosure requirements requiring entities to disclose both gross and net information for derivatives and other financial instruments that are either offset in the Statement of assets and liabilities or subject to an enforceable master netting arrangement or similar agreement. The disclosure requirements are effective for annual reporting periods beginning on or after January 1, 2013 and interim periods within those annual periods. Putnam Management is currently evaluating the application of ASUs 2013–01 and 2011–11 and their impact, if any, on the fund’s financial statements.
|
| Ohio Tax Exempt Income Fund 39 |
Federal tax information (Unaudited)
The fund has designated 99.56% of dividends paid from net investment income during the reporting period as tax exempt for Federal income tax purposes.
The Form 1099 that will be mailed to you in January 2014 will show the tax status of all distributions paid to your account in calendar 2013.
|
| 40 Ohio Tax Exempt Income Fund |
About the Trustees
Independent Trustees

| |
| Ohio Tax Exempt Income Fund | 41 |

* Mr. Reynolds is an “interested person” (as defined in the Investment Company Act of 1940) of the fund, Putnam Management, and Putnam Retail Management. He is President and Chief Executive Officer of Putnam Investments, as well as the President of your fund and each of the other Putnam funds.
The address of each Trustee is One Post Office Square, Boston, MA 02109.
As of May 31, 2013, there were 116 Putnam funds. All Trustees serve as Trustees of all Putnam funds.
Each Trustee serves for an indefinite term, until his or her resignation, retirement at age 75, removal, or death.
|
| 42 Ohio Tax Exempt Income Fund |
Officers
In addition to Robert L. Reynolds, the other officers of the fund are shown below:
| |
| Jonathan S. Horwitz (Born 1955) | Janet C. Smith (Born 1965) |
| Executive Vice President, Principal Executive | Vice President, Principal Accounting Officer, |
| Officer, and Compliance Liaison | and Assistant Treasurer |
| Since 2004 | Since 2007 |
| | Director of Fund Administration Services, |
| Steven D. Krichmar (Born 1958) | Putnam Investments and Putnam Management |
| Vice President and Principal Financial Officer | |
| Since 2002 | Susan G. Malloy (Born 1957) |
| Chief of Operations, Putnam Investments and | Vice President and Assistant Treasurer |
| Putnam Management | Since 2007 |
| | Director of Accounting & Control Services, |
| Robert T. Burns (Born 1961) | Putnam Investments and Putnam Management |
| Vice President and Chief Legal Officer | |
| Since 2011 | James P. Pappas (Born 1953) |
| General Counsel, Putnam Investments, Putnam | Vice President |
| Management, and Putnam Retail Management | Since 2004 |
| | Director of Trustee Relations, |
| Robert R. Leveille (Born 1969) | Putnam Investments and Putnam Management |
| Vice President and Chief Compliance Officer | |
| Since 2007 | Mark C. Trenchard (Born 1962) |
| Chief Compliance Officer, Putnam Investments, | Vice President and BSA Compliance Officer |
| Putnam Management, and Putnam Retail | Since 2002 |
| Management | Director of Operational Compliance, |
| | Putnam Investments and Putnam |
| Michael J. Higgins (Born 1976) | Retail Management |
| Vice President, Treasurer, and Clerk | |
| Since 2010 | Nancy E. Florek (Born 1957) |
| Manager of Finance, Dunkin’ Brands (2008– | Vice President, Director of Proxy Voting and |
| 2010); Senior Financial Analyst, Old Mutual Asset | Corporate Governance, Assistant Clerk, and |
| Management (2007–2008); Senior Financial | Associate Treasurer |
| Analyst, Putnam Investments (1999–2007) | Since 2000 |
The principal occupations of the officers for the past five years have been with the employers as shown above although in some cases, they have held different positions with such employers. The address of each Officer is One Post Office Square, Boston, MA 02109.
|
| Ohio Tax Exempt Income Fund 43 |
Services for shareholders
Investor services
Systematic investment plan Tell us how much you wish to invest regularly — weekly, semimonthly, or monthly — and the amount you choose will be transferred automatically from your checking or savings account. There’s no additional fee for this service, and you can suspend it at any time. This plan may be a great way to save for college expenses or to plan for your retirement.
Please note that regular investing does not guarantee a profit or protect against loss in a declining market. Before arranging a systematic investment plan, consider your financial ability to continue making purchases in periods when prices are low.
Systematic exchange You can make regular transfers from one Putnam fund to another Putnam fund. There are no additional fees for this service, and you can cancel or change your options at any time.
Dividends PLUS You can choose to have the dividend distributions from one of your Putnam funds automatically reinvested in another Putnam fund at no additional charge.
Free exchange privilege You can exchange money between Putnam funds free of charge, as long as they are the same class of shares. A signature guarantee is required if you are exchanging more than $500,000. The fund reserves the right to revise or terminate the exchange privilege.
Reinstatement privilege If you’ve sold Putnam shares or received a check for a dividend or capital gain, you may reinvest the proceeds with Putnam within 90 days of the transaction and they will be reinvested at the fund’s current net asset value — with no sales charge. However, reinstatement of class B shares may have special tax consequences. Ask your financial or tax representative for details.
Check-writing service You have ready access to many Putnam accounts. It’s as simple as writing a check, and there are no special fees or service charges. For more information about the check-writing service, call Putnam or visit our website.
Dollar cost averaging When you’re investing for long-term goals, it���s time, not timing, that counts. Investing on a systematic basis is a better strategy than trying to figure out when the markets will go up or down. This means investing the same amount of money regularly over a long period. This method of investing is called dollar cost averaging. When a fund’s share price declines, your investment dollars buy more shares at lower prices. When it increases, they buy fewer shares. Over time, you will pay a lower average price per share.
For more information
Visit the Individual Investors section at putnam.com A secure section of our website contains complete information on your account, including balances and transactions, updated daily. You may also conduct transactions, such as exchanges, additional investments, and address changes. Log on today to get your password.
Call us toll free at 1-800-225-1581 Ask a helpful Putnam representative or your financial advisor for details about any of these or other services, or see your prospectus.
|
| 44 Ohio Tax Exempt Income Fund |
Fund information
Founded over 75 years ago, Putnam Investments was built around the concept that a balance between risk and reward is the hallmark of a well-rounded financial program. We manage over 100 funds across income, value, blend, growth, asset allocation, absolute return, and global sector categories.
| | |
| Investment Manager | Trustees | Robert T. Burns |
| Putnam Investment | Jameson A. Baxter, Chair | Vice President and |
| Management, LLC | Liaquat Ahamed | Chief Legal Officer |
| One Post Office Square | Ravi Akhoury | |
| Boston, MA 02109 | Barbara M. Baumann | Robert R. Leveille |
| | Charles B. Curtis | Vice President and |
| Investment Sub-Manager | Robert J. Darretta | Chief Compliance Officer |
| Putnam Investments Limited | Katinka Domotorffy | |
| 57–59 St James’s Street | John A. Hill | Michael J. Higgins |
| London, England SW1A 1LD | Paul L. Joskow | Vice President, Treasurer, |
| | Elizabeth T. Kennan | and Clerk |
| Marketing Services | Kenneth R. Leibler | |
| Putnam Retail Management | Robert E. Patterson | Janet C. Smith |
| One Post Office Square | George Putnam, III | Vice President, |
| Boston, MA 02109 | Robert L. Reynolds | Principal Accounting Officer, |
| | W. Thomas Stephens | and Assistant Treasurer |
| Custodian | | |
| State Street Bank | Officers | Susan G. Malloy |
| and Trust Company | Robert L. Reynolds | Vice President and |
| | President | Assistant Treasurer |
| Legal Counsel | | |
| Ropes & Gray LLP | Jonathan S. Horwitz | James P. Pappas |
| | Executive Vice President, | Vice President |
| Independent Registered | Principal Executive Officer, and | |
| Public Accounting Firm | Compliance Liaison | Mark C. Trenchard |
| PricewaterhouseCoopers LLP | | Vice President and |
| | Steven D. Krichmar | BSA Compliance Officer |
| | Vice President and | |
| | Principal Financial Officer | Nancy E. Florek |
| | | Vice President, Director of |
| | | Proxy Voting and Corporate |
| | | Governance, Assistant Clerk, |
| | | and Associate Treasurer |
This report is for the information of shareholders of Putnam Ohio Tax Exempt Income Fund. It may also be used as sales literature when preceded or accompanied by the current prospectus, the most recent copy of Putnam’s Quarterly Performance Summary, and Putnam’s Quarterly Ranking Summary. For more recent performance, please visit putnam.com. Investors should carefully consider the investment objectives, risks, charges, and expenses of a fund, which are described in its prospectus. For this and other information or to request a prospectus or summary prospectus, call 1-800-225-1581 toll free. Please read the prospectus carefully before investing. The fund’s Statement of Additional Information contains additional information about the fund’s Trustees and is available without charge upon request by calling 1-800-225-1581.

| |
| (a) The fund’s principal executive, financial and accounting officers are employees of Putnam Investment Management, LLC, the Fund’s investment manager. As such they are subject to a comprehensive Code of Ethics adopted and administered by Putnam Investments which is designed to protect the interests of the firm and its clients. The Fund has adopted a Code of Ethics which incorporates the Code of Ethics of Putnam Investments with respect to all of its officers and Trustees who are employees of Putnam Investment Management, LLC. For this reason, the Fund has not adopted a separate code of ethics governing its principal executive, financial and accounting officers. |
| |
| (c) In May 2008, the Code of Ethics of Putnam Investment Management, LLC was updated in its entirety to include the amendments adopted in August 2007 as well as a several additional technical, administrative and non-substantive changes. In May of 2009, the Code of Ethics of Putnam Investment Management, LLC was amended to reflect that all employees will now be subject to a 90-day blackout restriction on holding Putnam open-end funds, except for portfolio managers and their supervisors (and each of their immediate family members), who will be subject to a one-year blackout restriction on the funds that they manage or supervise. In June 2010, the Code of Ethics of Putnam Investments was updated in its entirety to include the amendments adopted in May of 2009 and to change certain rules and limits contained in the Code of Ethics. In addition, the updated Code of Ethics included numerous technical, administrative and non-substantive changes, which were intended primarily to make the document easier to navigate and understand. In July 2011, the Code of Ethics of Putnam Investments was updated to reflect several technical, administrative and non-substantive changes resulting from changes in employee titles. |
| |
| Item 3. Audit Committee Financial Expert: |
| |
| The Funds’ Audit and Compliance Committee is comprised solely of Trustees who are “independent” (as such term has been defined by the Securities and Exchange Commission (“SEC”) in regulations implementing Section 407 of the Sarbanes-Oxley Act (the “Regulations”)). The Trustees believe that each of the members of the Audit and Compliance Committee also possess a combination of knowledge and experience with respect to financial accounting matters, as well as other attributes, that qualify them for service on the Committee. In addition, the Trustees have determined that each of Mr. Leibler, Mr. Hill, Mr. Darretta and Ms. Baumann qualifies as an “audit committee financial expert” (as such term has been defined by the Regulations) based on their review of his or her pertinent experience and education. The SEC has stated that the designation or identification of a person as an audit committee financial expert pursuant to this Item 3 of Form N-CSR does not impose on such person any duties, obligations or liability that are greater than the duties, obligations and liability imposed on such person as a member of the Audit and Compliance Committee and the Board of Trustees in the absence of such designation or identification. |
| |
| Item 4. Principal Accountant Fees and Services: |
| |
| The following table presents fees billed in each of the last two fiscal years for services rendered to the fund by the fund’s independent auditor: |
| | | | | |
| Fiscal year ended | Audit Fees | Audit-Related Fees | Tax Fees | All Other Fees |
|
|
| | | | | |
| May 31, 2013 | $48,608 | $-- | $11,521 | $ — |
| May 31, 2012 | $47,678 | $-- | $11,198 | $299 |
| |
| For the fiscal years ended May 31, 2013 and May 31, 2012, the fund’s independent auditor billed aggregate non-audit fees in the amounts of $159,021 and $104,248 respectively, to the fund, Putnam Management and any entity controlling, controlled by or under common control with Putnam Management that provides ongoing services to the fund. |
| |
| Audit Fees represent fees billed for the fund’s last two fiscal years relating to the audit and review of the financial statements included in annual reports and registration statements, and other services that are normally provided in connection with statutory and regulatory filings or engagements. |
| |
| Audit-Related Fees represent fees billed in the fund’s last two fiscal years for services traditionally performed by the fund’s auditor, including accounting consultation for proposed transactions or concerning financial accounting and reporting standards and other audit or attest services not required by statute or regulation. |
| |
| Tax Fees represent fees billed in the fund’s last two fiscal years for tax compliance, tax planning and tax advice services. Tax planning and tax advice services include assistance with tax audits, employee benefit plans and requests for rulings or technical advice from taxing authorities. |
| |
| All Other Fees represent fees billed for services relating to an analysis of fund profitability |
| |
| Pre-Approval Policies of the Audit and Compliance Committee. The Audit and Compliance Committee of the Putnam funds has determined that, as a matter of policy, all work performed for the funds by the funds’ independent auditors will be pre-approved by the Committee itself and thus will generally not be subject to pre-approval procedures. |
| |
| The Audit and Compliance Committee also has adopted a policy to pre-approve the engagement by Putnam Management and certain of its affiliates of the funds’ independent auditors, even in circumstances where pre-approval is not required by applicable law. Any such requests by Putnam Management or certain of its affiliates are typically submitted in writing to the Committee and explain, among other things, the nature of the proposed engagement, the estimated fees, and why this work should be performed by that particular audit firm as opposed to another one. In reviewing such requests, the Committee considers, among other things, whether the provision of such services by the audit firm are compatible with the independence of the audit firm. |
| |
| The following table presents fees billed by the fund’s independent auditor for services required to be approved pursuant to paragraph (c)(7)(ii) of Rule 2-01 of Regulation S-X. |
| | | | | |
| Fiscal year ended | Audit-Related Fees | Tax Fees | All Other Fees | Total Non-Audit Fees |
|
|
| | | | | |
| May 31, 2013 | $ — | $147,500 | $ — | $ — |
| | | | | |
| May 31, 2012 | $ — | $76,005 | $ — | $ — |
| |
| Item 5. Audit Committee of Listed Registrants |
| |
| Item 6. Schedule of Investments: |
| |
| The registrant’s schedule of investments in unaffiliated issuers is included in the report to shareholders in Item 1 above. |
| |
| Item 7. Disclosure of Proxy Voting Policies and Procedures For Closed-End Management Investment Companies: |
| |
| Item 8. Portfolio Managers of Closed-End Investment Companies |
| |
| Item 9. Purchases of Equity Securities by Closed-End Management Investment Companies and Affiliated Purchasers: |
| |
| Item 10. Submission of Matters to a Vote of Security Holders: |
| |
| Item 11. Controls and Procedures: |
| |
| (a) The registrant’s principal executive officer and principal financial officer have concluded, based on their evaluation of the effectiveness of the design and operation of the registrant’s disclosure controls and procedures as of a date within 90 days of the filing date of this report, that the design and operation of such procedures are generally effective to provide reasonable assurance that information required to be disclosed by the registrant in this report is recorded, processed, summarized and reported within the time periods specified in the Commission’s rules and forms. |
| |
| (b) Changes in internal control over financial reporting: Not applicable |
| |
| (a)(1) The Code of Ethics of The Putnam Funds, which incorporates the Code of Ethics of Putnam Investments, is filed herewith. |
| |
| (a)(2) Separate certifications for the principal executive officer and principal financial officer of the registrant as required by Rule 30a-2(a) under the Investment Company Act of 1940, as amended, are filed herewith. |
| |
| (b) The certifications required by Rule 30a-2(b) under the Investment Company Act of 1940, as amended, are filed herewith. |
| |
| Pursuant to the requirements of the Securities Exchange Act of 1934 and the Investment Company Act of 1940, the registrant has duly caused this report to be signed on its behalf by the undersigned, thereunto duly authorized. |
| |
| Putnam Ohio Tax Exempt Income Fund |
| |
| By (Signature and Title): |
| |
| /s/Janet C. Smith
Janet C. Smith
Principal Accounting Officer
|
| |
| Pursuant to the requirements of the Securities Exchange Act of 1934 and the Investment Company Act of 1940, this report has been signed below by the following persons on behalf of the registrant and in the capacities and on the dates indicated. |
| |
| By (Signature and Title): |
| |
| /s/Jonathan S. Horwitz
Jonathan S. Horwitz
Principal Executive Officer
|
| |
| By (Signature and Title): |
| |
| /s/Steven D. Krichmar
Steven D. Krichmar
Principal Financial Officer
|