| | |
| UNITED STATES
SECURITIES AND EXCHANGE COMMISSION |
| | |
| CERTIFIED SHAREHOLDER REPORT OF REGISTERED
MANAGEMENT INVESTMENT COMPANIES
|
| | |
| Investment Company Act file number: | (811–04528) |
| | |
| Exact name of registrant as specified in charter: | Putnam OhioTax Exempt Income Fund |
| | |
| Address of principal executive offices: | 100 Federal Street, Boston, Massachusetts 02110 |
| | |
| Name and address of agent for service: | Robert T. Burns, Vice President
100 Federal Street
Boston, Massachusetts 02110 |
| | |
| Copy to: | Bryan Chegwidden, Esq.
Ropes & Gray LLP
1211 Avenue of the Americas
New York, New York 10036 |
| | |
| Registrant's telephone number, including area code: | (617) 292–1000 |
| | |
| Date of fiscal year end: | May 31, 2020 |
| | |
| Date of reporting period: | June 1, 2019 — May 31, 2020 |
| | |
|
Item 1. Report to Stockholders: | |
| | |
| The following is a copy of the report transmitted to stockholders pursuant to Rule 30e-1 under the Investment Company Act of 1940: | |
Putnam Ohio
Tax Exempt
Income Fund
Annual report
5 | 31 | 20
IMPORTANT NOTICE: Delivery of paper fund reports
In accordance with regulations adopted by the Securities and Exchange Commission, beginning on January 1, 2021, reports like this one will no longer be sent by mail unless you specifically request it. Instead, they will be on Putnam’s website, and you will be notified by mail whenever a new one is available, and provided with a website link to access the report.
If you wish to stop receiving paper reports sooner, or if you wish to continue to receive paper reports free of charge after January 1, 2021, please see the back cover or insert for instructions. If you invest through a bank or broker, your choice will apply to all funds held in your account. If you invest directly with Putnam, your choice will apply to all Putnam funds in your account.
If you already receive these reports electronically, no action is required.
Message from the Trustees
July 7, 2020
Dear Fellow Shareholder:
Financial markets worldwide continue to be challenged by volatility and economic uncertainty due to the COVID-19 pandemic. In addition, our nation is struggling with confusion, anger, and grief over the excessive force that caused the death of George Floyd and with the overall issue of systemic racial injustice. Your Board of Trustees and Putnam Investments stand united against oppression and racism. We will work to support thoughtful and resourceful actions to elevate both our workplace and society.
Also, we would like to take this opportunity to thank Robert E. Patterson, who retired as a Trustee on June 30, 2020, for his 36 years of service. We will miss Bob’s experienced judgment and insights, and we wish him well. We are also pleased to welcome Mona K. Sutphen to the Board. Ms. Sutphen brings extensive professional and directorship experience to her role as a Trustee.
As always, thank you for investing with Putnam.


Municipal bonds finance important public projects, such as schools, roads, and hospitals. The bonds are backed by either the issuing city, town, or other government entity or by revenues collected from usage fees.
However, unlike U.S. Treasuries or corporate bonds, the interest paid on municipal bonds is generally free from federal income taxes. Moreover, Ohio residents generally pay no state income taxes on distributions paid from municipal bonds issued in the Buckeye State. That can make municipal bonds particularly attractive to investors subject to higher personal income tax rates.

| |
| 2 Ohio Tax Exempt Income Fund |
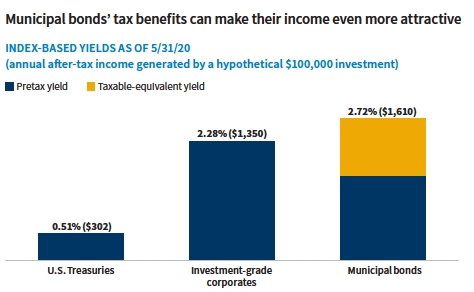
Source: Putnam, as of 5/31/20. Past performance is no guarantee of future results. Yields for U.S. Treasuries, investment-grade corporates, and municipal bonds are represented by the average “yield to worst” — a calculation of the lowest possible yield generated without defaulting — of the Bloomberg Barclays U.S. Treasury Index, an unmanaged index of U.S. dollar-denominated, fixed-rate, nominal debt issued by the U.S. Treasury; the Bloomberg Barclays U.S. Credit Index, an unmanaged index of U.S. dollar-denominated, investment-grade, fixed-rate, taxable corporate and government related bonds; and the Bloomberg Barclays Municipal Bond Index, an unmanaged index of long-term fixed-rate, investment-grade tax-exempt bonds, respectively. You cannot invest directly in an index. Bond investments are subject to interest-rate risk (the risk of bond prices falling if interest rates rise) and credit risk (the risk of an issuer defaulting on interest or principal payments). Interest-rate risk is greater for longer-term bonds, and credit risk is greater for below-investment-grade bonds. Income from municipal bonds may be subject to the alternative minimum tax. Taxable equivalent yield and annual after-tax income are based on a 40.80% federal income tax rate. This rate reflects the Tax Cuts and Jobs Act of 2017 and includes the 3.80% Medicare surtax.
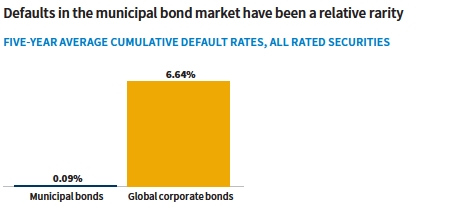
Source: Moody’s Investor Services, U.S. Municipal Bond Defaults and Recoveries, Five-Year Average Cumulative Default Rates, 1970–2018 (August 2019). Most recent data available.
|
| Ohio Tax Exempt Income Fund 3 |
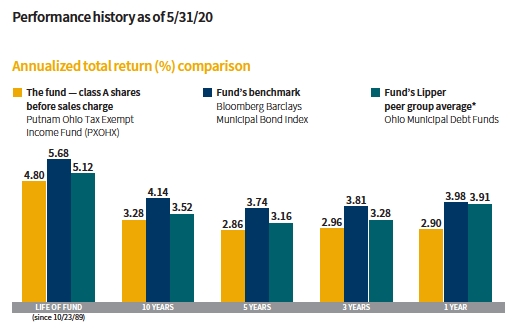
Current performance may be lower or higher than the quoted past performance, which cannot guarantee future results. Share price, principal value, and return will fluctuate, and you may have a gain or a loss when you sell your shares. Performance of class A shares assumes reinvestment of distributions and does not account for taxes. Fund returns in the bar chart do not reflect a sales charge of 4.00%; had they, returns would have been lower. See below and pages 10–13 for additional performance information. For a portion of the periods, the fund had expense limitations, without which returns would have been lower. To obtain the most recent month-end performance, visit putnam.com.
* Source: Lipper, a Refinitiv company.
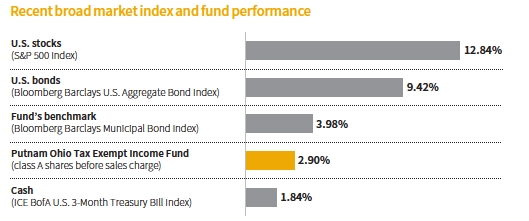
This comparison shows your fund’s performance in the context of broad market indexes for the 12 months ended 5/31/20. See above and pages 10–13 for additional fund performance information. Index descriptions can be found on pages 16–17.
| |
| 4 Ohio Tax Exempt Income Fund |


Paul, how did municipal bond funds perform during the reporting period?
Municipal bonds enjoyed solid performance for much of the period, supported by stable U.S. economic fundamentals, falling interest rates, and positive supply/demand technicals. However, in late February 2020, fears about the spread of the coronavirus and its potential impact on global economic growth sparked a steep sell-off in equities and other high-risk assets. After experiencing their largest inflow year in 2019, municipal bond funds saw large outflows in March and April, particularly in the lowest tiers of the market, as investors sought cash. [Fund flows are a measure of investor demand for mutual funds.] Municipal bonds rebounded in May due to rising optimism about policy initiatives to address the economic impact of the pandemic and positive inflows. The Bloomberg Barclays Municipal Bond Index [the fund’s benchmark] closed the period with a return of 3.98%.
With the health risks posed by the pandemic rising and economic and financial market conditions deteriorating, monetary and fiscal policy makers moved into action. The Federal Reserve lowered interest rates to near zero and
|
| Ohio Tax Exempt Income Fund 5 |
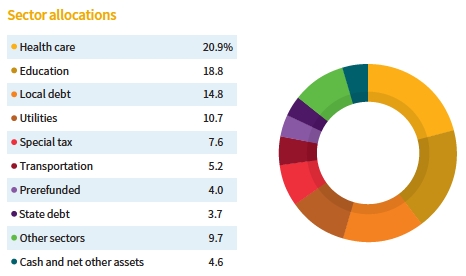
Allocations are shown as a percentage of the fund’s net assets as of 5/31/20. Cash and net other assets, if any, represent the market value weights of cash, derivatives, short-term securities, and other unclassified assets in the portfolio. Summary information may differ from the information in the portfolio schedule notes included in the financial statements due to the inclusion of derivative securities, any interest accruals, the timing of matured security transactions, the use of different classifications of securities for presentation purposes, and rounding. Holdings and allocations may vary over time.
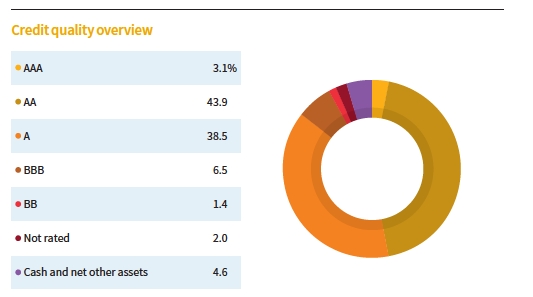
Credit qualities are shown as a percentage of the fund’s net assets as of 5/31/20. A bond rated BBB or higher (SP-3 or higher, for short-term debt) is considered investment grade. This chart reflects the highest security rating provided by one or more of Standard & Poor’s, Moody’s, and Fitch. Ratings may vary over time.
Cash and net other assets, if any, represent the market value weights of cash, derivatives, and short-term securities in the portfolio. The fund itself has not been rated by an independent rating agency.
| |
| 6 Ohio Tax Exempt Income Fund |
increased its asset purchases to help ease tight credit markets. In an especially noteworthy move, the Fed announced on March 23 that it would start buying corporate and municipal debt. This allowed cash-strapped states and cities to get loans to tide them over until the U.S. economy bounces back. On April 9, the Fed authorized the Municipal Liquidity Facility [MLF] to provide aid to state and local governments. On April 27, Fed officials increased the scope and duration of the MLF’s programs to include a broader group of counties and cities. With regard to fiscal initiatives, Congress finalized a $2.2 trillion relief package on March 27 to help hard-hit industries and to provide relief for families, small businesses, and hospitals and health-care systems. In April, Congress passed a new pandemic relief-package totaling $484 billion to aid small businesses and hospitals.
Credit spreads widened significantly in March and April, particularly among lower-quality, high-yield municipals led by airline/airport and tobacco bonds. As investors rushed to safety, even general obligation bonds of highly rated issuers, such as the State of California, sold off. The outflows depressed prices, and yields rose, resulting in a steepening of the municipal yield curve. In turn, the municipal bond market saw a dislocation in the municipal and U.S. Treasury yield relationship, referred to as the Municipal/ Treasury [M/T] ratio. The M/T ratio measures the yield on AAA-rated municipal bonds relative to the yield on U.S. Treasury bonds of similar maturities. The higher, or cheaper, the ratio, the more attractive municipal bonds are relative to U.S. Treasuries. Given the sell-off, municipal bonds were yielding significantly more than 100% of Treasury yields. Historically, a ratio in excess of 100% is interpreted as a buy signal and suggests an attractive entry point for long-term investors.
How did the fund perform during the reporting period?
For the 12 months ended May 31, 2020, the fund underperformed its benchmark and underperformed the average return of its Lipper peer group, Ohio Municipal Debt Funds. Our overweight to lower-rated, investment-grade-securities and underweight to securities rated AA and AAA were headwinds for the fund’s performance. Additionally, sector overweights in tobacco and long-term care depressed returns.

Did your investment approach shift in response to the pandemic and economic uncertainty?
We became more cautious in our fundamental outlook. At this point, while we don’t expect widespread defaults in the municipal market, we believe some sectors could be hit harder than others. Small colleges, dorm financing, and weaker issuers in health care and transportation come to mind. As such, we have become select sellers of lower-rated bonds in sectors that we believe could encounter more challenging credit conditions and possibly see an uptick in defaults over the next 12 to 24 months. This includes certain project finance, retirement communities, and land development sectors. In addition, we trimmed bonds that we believe may be more susceptible to the economic challenges brought on by the pandemic. Finally, we carried a higher-than-normal average cash balance to give us greater flexibility to act swiftly in the event that timely investment opportunities presented themselves.
In our view, safe-harbor sectors include state and local general obligation bonds and utilities. We believe states and local governments are in a unique and flexible position with broad capabilities to raise revenue and reduce expenses. And, as I mentioned earlier, the Fed is providing
|
| Ohio Tax Exempt Income Fund 7 |
states, and by extension localities, with emergency aid and helping to maintain liquidity across the municipal bond market. We believe that water, sewer, and electric utilities should also remain resilient during the crisis as they provide essential services, and most of these borrowers can benefit from the ability to raise rates if needed. While we may see a moderate increase in payment delinquencies, we do not expect any of these sectors to encounter a significant spike in defaults.
At period-end, the fund held an overweight exposure to higher-quality bonds rated A and BBB and a neutral exposure to lower-rated, high-yield bonds relative to its Lipper peer group. Duration positioning, a measure of the portfolio’s interest-rate sensitivity, was slightly longer than that of its Lipper peer group at period-end. The fund’s yield-curve positioning was focused on longer intermediate-term securities with maturities of 15 to 20 years. As part of this strategy, the fund held underweight exposures to long maturity holdings compared with the benchmark.
What is your current assessment of the health of the municipal bond market?
We believe that the majority of state and local governments have ample reserves in preparation for potential revenue declines. Those without strong reserve levels will have some flexibility to balance their budgets using one-time measures; reducing expenses; borrowing on a short-term basis from either the market or the MLF; and, in some cases, raising revenues by increasing taxes or fees. In our view, most state and local governments would only see prolonged fiscal stress should economic activity fail to stabilize over the next 12 to 18 months. Our exposure to state and local governments is limited to credits with diverse tax bases and, in our view, the ability to enact broad revenue enhancements or expense cuts.
What is your outlook for the coming months?
With regard to the effects of the pandemic on the U.S. economy, we believe it is too early to know the magnitude of the shock or how deep or long any recession will be. We’ll continue to work closely with our macroeconomic
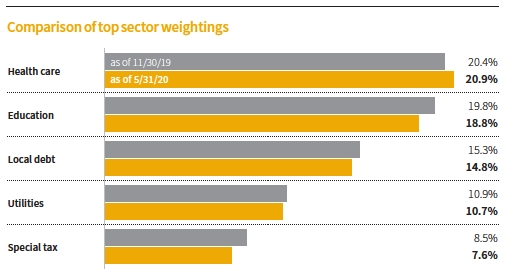
This chart shows how the fund’s top weightings have changed over the past six months. Allocations are shown as a percentage of the fund’s net assets. Current period summary information may differ from the information in the portfolio schedule notes included in the financial statements due to the inclusion of derivative securities, any interest accruals, the timing of matured security transactions, the use of different classifications of securities for presentation purposes, and rounding. Holdings and allocations may vary over time.
| |
| 8 Ohio Tax Exempt Income Fund |
team and municipal credit research analysts to monitor the direction of U.S. economic activity and its potential impact on municipal credit fundamentals.
From a valuation perspective, municipals started to look very attractive to us in early to mid-April. We selectively added to the fund’s position in investment-grade municipal bonds. Against this backdrop, we believe our research-driven approach can continue to add both income and return opportunities for our shareholders.
Thank you, Paul, for your time and insights today.
The views expressed in this report are exclusively those of Putnam Management and are subject to change. They are not meant as investment advice.
Please note that the holdings discussed in this report may not have been held by the fund for the entire period. Portfolio composition is subject to review in accordance with the fund’s investment strategy and may vary in the future. Current and future portfolio holdings are subject to risk. Statements in the Q&A concerning the fund’s performance or portfolio composition relative to those of the fund’s Lipper peer group may reference information produced by Lipper Inc. or through a third party.
|
| Ohio Tax Exempt Income Fund 9 |
Your fund’s performance
This section shows your fund’s performance, price, and distribution information for periods ended May 31, 2020, the end of its most recent fiscal year. In accordance with regulatory requirements for mutual funds, we also include performance information as of the most recent calendar quarter-end and expense information taken from the fund’s current prospectus. Performance should always be considered in light of a fund’s investment strategy. Data represent past performance. Past performance does not guarantee future results. More recent returns may be less or more than those shown. Investment return and principal value will fluctuate, and you may have a gain or a loss when you sell your shares. Performance information does not reflect any deduction for taxes a shareholder may owe on fund distributions or on the redemption of fund shares. For the most recent month-end performance, please visit the Individual Investors section at putnam.com or call Putnam at 1-800-225-1581. Class R6 and Y shares are not available to all investors. See the Terms and definitions section in this report for definitions of the share classes offered by your fund.
| | | | | | | | |
| Fund performance Total return for periods ended 5/31/20 | | | | |
| | Annual | | | | | | | |
| | average | | Annual | | Annual | | Annual | |
| | (life of fund) | 10 years | average | 5 years | average | 3 years | average | 1 year |
| Class A (10/23/89) | | | | | | | | |
| Before sales charge | 4.80% | 38.04% | 3.28% | 15.16% | 2.86% | 9.16% | 2.96% | 2.90% |
| After sales charge | 4.66 | 32.52 | 2.86 | 10.56 | 2.03 | 4.79 | 1.57 | –1.21 |
| Class B (7/15/93) | | | | | | | | |
| Before CDSC | 4.59 | 31.33 | 2.76 | 11.63 | 2.22 | 7.13 | 2.32 | 2.27 |
| After CDSC | 4.59 | 31.33 | 2.76 | 9.63 | 1.86 | 4.13 | 1.36 | –2.73 |
| Class C (10/3/06) | | | | | | | | |
| Before CDSC | 4.54 | 27.74 | 2.48 | 10.77 | 2.07 | 6.64 | 2.17 | 2.11 |
| After CDSC | 4.54 | 27.74 | 2.48 | 10.77 | 2.07 | 6.64 | 2.17 | 1.11 |
| Class R6 (5/22/18) | | | | | | | | |
| Net asset value | 4.90 | 41.31 | 3.52 | 16.60 | 3.12 | 10.02 | 3.23 | 3.27 |
| Class Y (1/2/08) | | | | | | | | |
| Net asset value | 4.90 | 41.14 | 3.51 | 16.45 | 3.09 | 9.88 | 3.19 | 3.13 |
Current performance may be lower or higher than the quoted past performance, which cannot guarantee future results. After-sales-charge returns for class A shares reflect the deduction of the maximum 4.00% sales charge levied at the time of purchase. Class B share returns after contingent deferred sales charge (CDSC) reflect the applicable CDSC, which is 5% in the first year, declining over time to 1% in the sixth year, and is eliminated thereafter. Class C share returns after CDSC reflect a 1% CDSC for the first year that is eliminated thereafter. Class R6 and Y shares have no initial sales charge or CDSC. Performance for class B, C, and Y shares before their inception is derived from the historical performance of class A shares, adjusted for the applicable sales charge (or CDSC) and the higher operating expenses for such shares, except for class Y shares, for which 12b-1 fees are not applicable. Performance for class R6 shares prior to their inception is derived from the historical performance of class Y shares and has not been adjusted for the lower investor servicing fees applicable to class R6 shares; had it, returns would have been higher.
For a portion of the periods, the fund had expense limitations, without which returns would have been lower.
Class B share performance reflects conversion to class A shares after eight years.
Class C share performance reflects conversion to class A shares after 10 years.
| |
| 10 Ohio Tax Exempt Income Fund |
| | | | | | | | |
| Comparative index returns For periods ended 5/31/20 | | | | |
| |
| | Annual | | | | | | | |
| | average | | Annual | | Annual | | Annual | |
| | (life of fund) | 10 years | average | 5 years | average | 3 years | average | 1 year |
| Bloomberg Barclays | | | | | | | | |
| Municipal Bond Index | 5.68% | 49.98% | 4.14% | 20.17% | 3.74% | 11.87% | 3.81% | 3.98% |
| Lipper Ohio Municipal Debt | | | | | | | | |
| Funds category average* | 5.12 | 41.59 | 3.52 | 16.89 | 3.16 | 10.18 | 3.28 | 3.91 |
Index and Lipper results should be compared with fund performance before sales charge, before CDSC, or at net asset value.
* Over the 1-year, 3-year, 5-year, 10-year, and life-of-fund periods ended 5/31/20, there were 27, 24, 22, 20, and 5 funds, respectively, in this Lipper category.
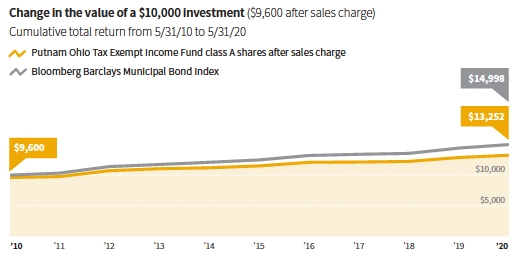
Past performance does not indicate future results. At the end of the same time period, a $10,000 investment in the fund’s class B and C shares would have been valued at $13,133 and $12,774, respectively, and no contingent deferred sales charges would apply. A $10,000 investment in the fund’s class R6 and Y shares would have been valued at $14,131 and $14,114, respectively.
|
| Ohio Tax Exempt Income Fund 11 |
| | | | | | |
| Fund price and distribution information For the 12-month period ended 5/31/20 | |
| Distributions | Class A | Class B | Class C | Class R6 | Class Y |
| Number | 12 | 12 | 12 | 12 | 12 |
| Income1 | $0.221360 | $0.164338 | $0.150980 | $0.244480 | $0.242007 |
| Capital gains2 | — | — | — | — | — |
| Total | $0.221360 | $0.164338 | $0.150980 | $0.244480 | $0.242007 |
| | Before | After | Net | Net | Net | Net |
| | sales | sales | asset | asset | asset | asset |
| Share value | charge | charge | value | value | value | value |
| 5/31/19 | $9.06 | $9.44 | $9.05 | $9.06 | $9.07 | $9.07 |
| 5/31/20 | 9.10 | 9.48 | 9.09 | 9.10 | 9.12 | 9.11 |
| | Before | After | Net | Net | Net | Net |
| Current rate | sales | sales | asset | asset | asset | asset |
| (end of period) | charge | charge | value | value | value | value |
| Current dividend rate3 | 2.23% | 2.14% | 1.61% | 1.46% | 2.52% | 2.45% |
| Taxable equivalent4 | 4.10 | 3.93 | 2.96 | 2.68 | 4.63 | 4.50 |
| Current 30-day | | | | | | |
| SEC yield5 | N/A | 1.25 | 0.70 | 0.55 | 1.55 | 1.52 |
| Taxable equivalent4 | N/A | 2.30 | 1.29 | 1.01 | 2.85 | 2.79 |
The classification of distributions, if any, is an estimate. Before-sales-charge share value and current dividend rate for class A shares, if applicable, do not take into account any sales charge levied at the time of purchase. After-sales-charge share value, current dividend rate, and current 30-day SEC yield, if applicable, are calculated assuming that the maximum sales charge (4.00% for class A shares) was levied at the time of purchase. Final distribution information will appear on your year-end tax forms.
1 For some investors, investment income may be subject to the federal alternative minimum tax.
2 Capital gains, if any, are taxable for federal and, in most cases, state purposes.
3 Most recent distribution, including any return of capital and excluding capital gains, annualized and divided by share price before or after sales charge at period-end.
4 Assumes maximum 45.60% federal and state combined tax rate for 2020. Results for investors subject to lower tax rates would not be as advantageous.
5 Based only on investment income and calculated using the maximum offering price for each share class, in accordance with SEC guidelines.
| |
| 12 Ohio Tax Exempt Income Fund |
| | | | | | | | |
| Fund performance as of most recent calendar quarter Total return for periods ended 6/30/20 |
| | Annual | | | | | | | |
| | average | | Annual | | Annual | | Annual | |
| | (life of fund) | 10 years | average | 5 years | average | 3 years | average | 1 year |
| Class A (10/23/89) | | | | | | | | |
| Before sales charge | 4.81% | 39.68% | 3.40% | 16.19% | 3.05% | 10.30% | 3.32% | 3.23% |
| After sales charge | 4.67 | 34.10 | 2.98 | 11.55 | 2.21 | 5.89 | 1.93 | –0.90 |
| Class B (7/15/93) | | | | | | | | |
| Before CDSC | 4.60 | 32.89 | 2.88 | 12.75 | 2.43 | 8.26 | 2.68 | 2.58 |
| After CDSC | 4.60 | 32.89 | 2.88 | 10.75 | 2.06 | 5.26 | 1.72 | –2.42 |
| Class C (10/3/06) | | | | | | | | |
| Before CDSC | 4.55 | 29.26 | 2.60 | 11.77 | 2.25 | 7.77 | 2.52 | 2.43 |
| After CDSC | 4.55 | 29.26 | 2.60 | 11.77 | 2.25 | 7.77 | 2.52 | 1.43 |
| Class R6 (5/22/18) | | | | | | | | |
| Net asset value | 4.92 | 43.00 | 3.64 | 17.77 | 3.32 | 11.18 | 3.60 | 3.48 |
| Class Y (1/2/08) | | | | | | | | |
| Net asset value | 4.91 | 42.82 | 3.63 | 17.62 | 3.30 | 11.04 | 3.55 | 3.46 |
See the discussion following the fund performance table on page 10 for information about the calculation of fund performance.
Your fund’s expenses
As a mutual fund investor, you pay ongoing expenses, such as management fees, distribution fees (12b-1 fees), and other expenses. Using the following information, you can estimate how these expenses affect your investment and compare them with the expenses of other funds. You may also pay one-time transaction expenses, including sales charges (loads) and redemption fees, which are not shown in this section and would have resulted in higher total expenses. For more information, see your fund’s prospectus or talk to your financial representative.
| | | | | |
| Expense ratios | | | | | |
| | Class A | Class B | Class C | Class R6 | Class Y |
| Total annual operating expenses for the fiscal | | | | | |
| year ended 5/31/19 | 0.84%* | 1.47% | 1.62% | 0.59% | 0.62% |
| Annualized expense ratio for the six-month | | | | | |
| period ended 5/31/20 † | 0.83% | 1.46% | 1.61% | 0.59% | 0.61% |
Fiscal year expense information in this table is taken from the most recent prospectus, is subject to change, and may differ from that shown for the annualized expense ratio and in the financial highlights of this report.
Expenses are shown as a percentage of average net assets.
* Reflects a blended distribution and service (12b-1) fee rate of 0.22%. Effective July 1, 2020, the distribution and service (12b-1) fee rate for class A shares is 0.25%.
† Expense ratios for each class are for the fund’s most recent fiscal half year. As a result of this, ratios may differ from expense ratios based on one-year data in the financial highlights.
|
| Ohio Tax Exempt Income Fund 13 |
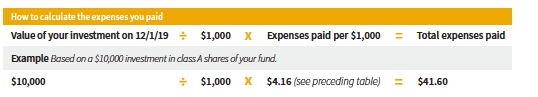
Expenses per $1,000
The following table shows the expenses you would have paid on a $1,000 investment in each class of the fund from 12/1/19 to 5/31/20. It also shows how much a $1,000 investment would be worth at the close of the period, assuming actual returns and expenses.
| | | | | |
| | Class A | Class B | Class C | Class R6 | Class Y |
| Expenses paid per $1,000 *† | $4.16 | $7.31 | $8.06 | $2.96 | $3.06 |
| Ending value (after expenses) | $1,006.10 | $1,004.10 | $1,002.20 | $1,007.40 | $1,007.20 |
* Expenses for each share class are calculated using the fund’s annualized expense ratio for each class, which represents the ongoing expenses as a percentage of average net assets for the six months ended 5/31/20. The expense ratio may differ for each share class.
† Expenses are calculated by multiplying the expense ratio by the average account value for the period; then multiplying the result by the number of days in the period; and then dividing that result by the number of days in the year.
Estimate the expenses you paid
To estimate the ongoing expenses you paid for the six months ended 5/31/20, use the following calculation method. To find the value of your investment on 12/1/19, call Putnam at 1-800-225-1581.
Compare expenses using the SEC’s method
The Securities and Exchange Commission (SEC) has established guidelines to help investors assess fund expenses. Per these guidelines, the following table shows your fund’s expenses based on a $1,000 investment, assuming a hypothetical 5% annualized return. You can use this information to compare the ongoing expenses (but not transaction expenses or total costs) of investing in the fund with those of other funds. All mutual fund shareholder reports will provide this information to help you make this comparison. Please note that you cannot use this information to estimate your actual ending account balance and expenses paid during the period.
| | | | | |
| | Class A | Class B | Class C | Class R6 | Class Y |
| Expenses paid per $1,000 *† | $4.19 | $7.36 | $8.12 | $2.98 | $3.08 |
| Ending value (after expenses) | $1,020.85 | $1,017.70 | $1,016.95 | $1,022.05 | $1,021.95 |
* Expenses for each share class are calculated using the fund’s annualized expense ratio for each class, which represents the ongoing expenses as a percentage of average net assets for the six months ended 5/31/20. The expense ratio may differ for each share class.
† Expenses are calculated by multiplying the expense ratio by the average account value for the six-month period; then multiplying the result by the number of days in the six-month period; and then dividing that result by the number of days in the year.
|
| 14 Ohio Tax Exempt Income Fund |
Consider these risks before investing
The value of investments in the fund’s portfolio may fall or fail to rise over extended periods of time for a variety of reasons, including general economic, political, or financial market conditions; investor sentiment and market perceptions; government actions; geopolitical events or changes; and factors related to a specific issuer, geography, industry, or sector. These and other factors may lead to increased volatility and reduced liquidity in the fund’s portfolio holdings. The fund’s performance will be closely tied to the economic and political conditions in Ohio, and can be more volatile than the performance of a more geographically diversified fund. Capital gains, if any, are taxed at the federal and, in most cases, state levels. For some investors, investment income may be subject to the federal alternative minimum tax. Bond investments are subject to interest-rate risk (the risk of bond prices falling if interest rates rise) and credit risk (the risk of an issuer defaulting on interest or principal payments). Interest-rate risk is generally greater for longer-term bonds, and credit risk is generally greater for below-investment-grade bonds. Unlike bonds, funds that invest in bonds have fees and expenses. Tax-exempt bonds may be issued under the Internal Revenue Code only by limited types of issuers for limited types of projects. As a result, the fund’s investments may be focused in certain market segments and be more vulnerable to fluctuations in the values of the securities it holds than a more broadly invested fund. Interest the fund receives might be taxable. You can lose money by investing in the fund.
|
| Ohio Tax Exempt Income Fund 15 |
Terms and definitions
Important terms
Total return shows how the value of the fund’s shares changed over time, assuming you held the shares through the entire period and reinvested all distributions in the fund.
Before sales charge, or net asset value, is the price, or value, of one share of a mutual fund, without a sales charge. Before-sales-charge figures fluctuate with market conditions, and are calculated by dividing the net assets of each class of shares by the number of outstanding shares in the class.
After sales charge is the price of a mutual fund share plus the maximum sales charge levied at the time of purchase. After-sales-charge performance figures shown here assume the 4.00% maximum sales charge for class A shares.
Contingent deferred sales charge (CDSC) is generally a charge applied at the time of the redemption of class B or C shares and assumes redemption at the end of the period. Your fund’s class B CDSC declines over time from a 5% maximum during the first year to 1% during the sixth year. After the sixth year, the CDSC no longer applies. The CDSC for class C shares is 1% for one year after purchase.
Share classes
Class A shares are generally subject to an initial sales charge and no CDSC (except on certain redemptions of shares bought without an initial sales charge).
Class B shares are closed to new investments and are only available by exchange from another Putnam fund or through dividend and/ or capital gains reinvestment. They are not subject to an initial sales charge and may be subject to a CDSC.
Class C shares are not subject to an initial sales charge and are subject to a CDSC only if the shares are redeemed during the first year.
Class R6 shares are not subject to an initial sales charge or CDSC and carry no 12b-1 fee. They are generally only available to employer-sponsored retirement plans, corporate and institutional clients, and clients in other approved programs.
Class Y shares are not subject to an initial sales charge or CDSC and carry no 12b-1 fee. They are generally only available to corporate and institutional clients and clients in other approved programs.
Fixed-income terms
Current rate is the annual rate of return earned from dividends or interest of an investment. Current rate is expressed as a percentage of the price of a security, fund share, or principal investment.
Yield curve is a graph that plots the yields of bonds with equal credit quality against their differing maturity dates, ranging from shortest to longest. It is used as a benchmark for other debt, such as mortgage or bank lending rates.
Comparative indexes
Bloomberg Barclays Municipal Bond Index is an unmanaged index of long-term fixed-rate investment-grade tax-exempt bonds.
Bloomberg Barclays U.S. Aggregate Bond Index is an unmanaged index of U.S. investment-grade fixed-income securities.
ICE BofA (Intercontinental Exchange Bank of America) U.S. 3-Month Treasury Bill Index is an unmanaged index that seeks to measure the performance of U.S. Treasury bills available in the marketplace.
S&P 500 Index is an unmanaged index of common stock performance.
Indexes assume reinvestment of all distributions and do not account for fees. Securities and performance of a fund and an index will differ. You cannot invest directly in an index.
|
| 16 Ohio Tax Exempt Income Fund |
ICE Data Indices, LLC (“ICE BofA”), used with permission. ICE BofA permits use of the ICE BofA indices and related data on an “as is” basis; makes no warranties regarding same; does not guarantee the suitability, quality, accuracy, timeliness, and/or completeness of the ICE BofA indices or any data included in, related to, or derived therefrom; assumes no liability in connection with the use of the foregoing; and does not sponsor, endorse, or recommend Putnam Investments, or any of its products or services.
Lipper, a Refinitiv company, is a third-party industry-ranking entity that ranks mutual funds. Its rankings do not reflect sales charges. Lipper rankings are based on total return at net asset value relative to other funds that have similar current investment styles or objectives as determined by Lipper. Lipper may change a fund’s category assignment at its discretion. Lipper category averages reflect performance trends for funds within a category.
Other information for shareholders
Proxy voting
Putnam is committed to managing our mutual funds in the best interests of our shareholders. The Putnam funds’ proxy voting guidelines and procedures, as well as information regarding how your fund voted proxies relating to portfolio securities during the 12-month period ended June 30, 2019, are available in the Individual Investors section of putnam.com and on the Securities and Exchange Commission (SEC) website, www.sec.gov. If you have questions about finding forms on the SEC’s website, you may call the SEC at 1-800-SEC-0330. You may also obtain the Putnam funds’ proxy voting guidelines and procedures at no charge by calling Putnam’s Shareholder Services at 1-800-225-1581.
Fund portfolio holdings
The fund will file a complete schedule of its portfolio holdings with the SEC for the first and third quarters of each fiscal year on Form N-PORT within 60 days of the end of such fiscal quarter. Shareholders may obtain the fund’s Form N-PORT on the SEC’s website at www.sec.gov.
Prior to its use of Form N-PORT, the fund filed its complete schedule of its portfolio holdings with the SEC on Form N-Q, which is available online at www.sec.gov.
Trustee and employee fund ownership
Putnam employees and members of the Board of Trustees place their faith, confidence, and, most importantly, investment dollars in Putnam mutual funds. As of May 31, 2020, Putnam employees had approximately $453,000,000 and the Trustees had approximately $73,000,000 invested in Putnam mutual funds. These amounts include investments by the Trustees’ and employees’ immediate family members as well as investments through retirement and deferred compensation plans.
|
| Ohio Tax Exempt Income Fund 17 |
Liquidity risk management program
Putnam, as the administrator of the fund’s liquidity risk management program (appointed by the Board of Trustees), presented the first annual report on the program to the Trustees in April 2020. The report covered the structure of the program, including the program documents and related policies and procedures adopted to comply with Rule 22e-4 under the Investment Company Act of 1940, and reviewed the operation of the program from December 2018 through March 2020. The report included a description of the annual liquidity assessment of the fund that Putnam performed in November 2019. The report noted that there were no material compliance exceptions identified under Rule 22e-4 during the period. The report included a review of the governance of the program and the methodology for classification of the fund’s investments. The report also included a discussion of liquidity monitoring during the period, including during the market liquidity challenges caused by the COVID 19 pandemic, and the impact those challenges had on the liquidity of the fund’s investments. Putnam concluded that the program has been operating effectively and adequately to ensure compliance with Rule 22e-4.
Important notice regarding Putnam’s privacy policy
In order to conduct business with our shareholders, we must obtain certain personal information such as account holders’ names, addresses, Social Security numbers, and dates of birth. Using this information, we are able to maintain accurate records of accounts and transactions.
It is our policy to protect the confidentiality of our shareholder information, whether or not a shareholder currently owns shares of our funds. In particular, it is our policy not to sell information about you or your accounts to outside marketing firms. We have safeguards in place designed to prevent unauthorized access to our computer systems and procedures to protect personal information from unauthorized use.
Under certain circumstances, we must share account information with outside vendors who provide services to us, such as mailings and proxy solicitations. In these cases, the service providers enter into confidentiality agreements with us, and we provide only the information necessary to process transactions and perform other services related to your account. Finally, it is our policy to share account information with your financial representative, if you’ve listed one on your Putnam account.
| |
| 18 Ohio Tax Exempt Income Fund |
Audited financial statements
These sections of the report, as well as the accompanying Notes, preceded by the Report of Independent Registered Public Accounting Firm, constitute the fund’s audited financial statements.
The fund’s portfolio lists all the fund’s investments and their values as of the last day of the reporting period. Holdings are organized by asset type and industry sector, country, or state to show areas of concentration and diversification.
Statement of assets and liabilities shows how the fund’s net assets and share price are determined. All investment and non-investment assets are added together. Any unpaid expenses and other liabilities are subtracted from this total. The result is divided by the number of shares to determine the net asset value per share, which is calculated separately for each class of shares. (For funds with preferred shares, the amount subtracted from total assets includes the liquidation preference of preferred shares.)
Statement of operations shows the fund’s net investment gain or loss. This is done by first adding up all the fund’s earnings — from dividends and interest income — and subtracting its operating expenses to determine net investment income (or loss). Then, any net gain or loss the fund realized on the sales of its holdings — as well as any unrealized gains or losses over the period — is added to or subtracted from the net investment result to determine the fund’s net gain or loss for the fiscal year.
Statement of changes in net assets shows how the fund’s net assets were affected by the fund’s net investment gain or loss, by distributions to shareholders, and by changes in the number of the fund’s shares. It lists distributions and their sources (net investment income or realized capital gains) over the current reporting period and the most recent fiscal year-end. The distributions listed here may not match the sources listed in the Statement of operations because the distributions are determined on a tax basis and may be paid in a different period from the one in which they were earned.
Financial highlights provide an overview of the fund’s investment results, per-share distributions, expense ratios, net investment income ratios, and portfolio turnover in one summary table, reflecting the five most recent reporting periods. In a semian-nual report, the highlights table also includes the current reporting period.
|
| Ohio Tax Exempt Income Fund 19 |
Report of Independent Registered Public Accounting Firm
To the Trustees and Shareholders of
Putnam Ohio Tax Exempt Income Fund:
Opinion on the Financial Statements
We have audited the accompanying statement of assets and liabilities, including the fund’s portfolio, of Putnam Ohio Tax Exempt Income Fund (the “Fund”) as of May 31, 2020, the related statement of operations for the year ended May 31, 2020, the statement of changes in net assets for each of the two years in the period ended May 31, 2020, including the related notes, and the financial highlights for each of the periods indicated therein (collectively referred to as the “financial statements”). In our opinion, the financial statements present fairly, in all material respects, the financial position of the Fund as of May 31, 2020, the results of its operations for the year then ended, the changes in its net assets for each of the two years in the period ended May 31, 2020 and the financial highlights for each of the periods indicated therein in conformity with accounting principles generally accepted in the United States of America.
Basis for Opinion
These financial statements are the responsibility of the Fund’s management. Our responsibility is to express an opinion on the Fund’s financial statements based on our audits. We are a public accounting firm registered with the Public Company Accounting Oversight Board (United States) (“PCAOB”) and are required to be independent with respect to the Fund in accordance with the U.S. federal securities laws and the applicable rules and regulations of the Securities and Exchange Commission and the PCAOB.
We conducted our audits of these financial statements in accordance with the standards of the PCAOB. Those standards require that we plan and perform the audit to obtain reasonable assurance about whether the financial statements are free of material misstatement, whether due to error or fraud.
Our audits included performing procedures to assess the risks of material misstatement of the financial statements, whether due to error or fraud, and performing procedures that respond to those risks. Such procedures included examining, on a test basis, evidence regarding the amounts and disclosures in the financial statements. Our audits also included evaluating the accounting principles used and significant estimates made by management, as well as evaluating the overall presentation of the financial statements. Our procedures included confirmation of securities owned as of May 31, 2020 by correspondence with the custodian, transfer agent and brokers; when replies were not received from brokers, we performed other auditing procedures. We believe that our audits provide a reasonable basis for our opinion.
PricewaterhouseCoopers LLP
Boston, Massachusetts
July 7, 2020
We have served as the auditor of one or more investment companies in the Putnam Investments family of mutual funds since at least 1957. We have not been able to determine the specific year we began serving as auditor.
| |
| 20 Ohio Tax Exempt Income Fund |
| |
| The fund’s portfolio 5/31/20 | |
| |
| Key to holding’s abbreviations | |
| |
| AGM Assured Guaranty Municipal Corporation | PSFG Permanent School Fund Guaranteed |
| AMBAC AMBAC Indemnity Corporation | VRDN Variable Rate Demand Notes, which are floating- |
| COP Certificates of Participation | rate securities with long-term maturities that carry |
| FRB Floating Rate Bonds: the rate shown is the current | coupons that reset and are payable upon demand |
| interest rate at the close of the reporting period. Rates | either daily, weekly or monthly. The rate shown is the |
| may be subject to a cap or floor. For certain securities, | current interest rate at the close of the reporting |
| the rate may represent a fixed rate currently in place | period. Rates are set by remarketing agents and may |
| at the close of the reporting period. | take into consideration market supply and demand, |
| G.O. Bonds General Obligation Bonds | credit quality and the current SIFMA Municipal Swap |
| NATL National Public Finance Guarantee Corporation | Index rate, which was 0.14% as of the close of the |
| reporting period. |
| | | |
| MUNICIPAL BONDS AND NOTES (97.0%)* | Rating** | Principal amount | Value |
| Alaska (1.3%) | | | |
| AK State Indl. Dev. & Export Auth. Rev. Bonds, | | | |
| (Tanana Chiefs Conference), Ser. A | | | |
| 5.00%, 10/1/31 | A+/F | $500,000 | $630,845 |
| 5.00%, 10/1/30 | A+/F | 650,000 | 829,296 |
| | | | 1,460,141 |
| Guam (1.3%) | | | |
| Territory of GU, Govt. G.O. Bonds, 5.00%, 11/15/31 | Ba1 | 585,000 | 590,651 |
| Territory of GU, Port Auth. Rev. Bonds, Ser. B | | | |
| 5.00%, 7/1/37 | A | 200,000 | 216,314 |
| 5.00%, 7/1/36 | A | 400,000 | 434,264 |
| 5.00%, 7/1/33 | A | 200,000 | 219,568 |
| | | | 1,460,797 |
| Illinois (1.0%) | | | |
| IL State G.O. Bonds, Ser. B, 5.00%, 10/1/32 | Baa3 | 1,050,000 | 1,064,207 |
| | | | 1,064,207 |
| Indiana (1.5%) | | | |
| Whiting, Env. Fac. Mandatory Put Bonds (6/5/26), | | | |
| (BP Products North America, Inc.), Ser. A, | | | |
| 5.00%, 12/1/44 | A1 | 1,500,000 | 1,718,805 |
| | | | 1,718,805 |
| Minnesota (1.6%) | | | |
| Minneapolis & St. Paul, Hsg. & Redev. Auth. Hlth. | | | |
| Care VRDN, (Allina Hlth. Syst.) | | | |
| Ser. B-1, 0.05%, 11/15/35 | VMIG 1 | 1,300,000 | 1,300,000 |
| Ser. B-2, 0.05%, 11/15/35 | VMIG 1 | 500,000 | 500,000 |
| | | | 1,800,000 |
| New York (0.1%) | | | |
| NY City, Muni. Wtr. & Swr. Syst. Fin. Auth. VRDN, | | | |
| Ser. DD-1, 0.06%, 6/15/43 | VMIG 1 | 100,000 | 100,000 |
| | | | 100,000 |
| Ohio (85.7%) | | | |
| Allen Cnty., Hosp. Fac. Rev. Bonds | | | |
| 5.00%, 8/1/21 | A1 | 400,000 | 418,320 |
| Ser. A, 4.00%, 8/1/38 | A1 | 1,370,000 | 1,495,259 |
|
| Ohio Tax Exempt Income Fund 21 |
| | | |
| MUNICIPAL BONDS AND NOTES (97.0%)* cont. | Rating** | Principal amount | Value |
| Ohio cont. | | | |
| American Muni. Pwr., Inc. Rev. Bonds | | | |
| (Greenup Hydroelectric Pwr. Plant), Ser. A, | | | |
| 5.00%, 2/15/41 | A1 | $1,000,000 | $1,171,950 |
| (Hydroelectric Pwr. Plant), Ser. A, 5.00%, 2/15/41 | A2 | 830,000 | 969,772 |
| Bluffton, Hosp. Fac. Rev. Bonds, (Blanchard Valley | | | |
| Hlth. Syst.), 5.00%, 12/1/31 | A2 | 650,000 | 775,652 |
| Bowling Green State U. Rev. Bonds, Ser. A, | | | |
| 5.00%, 6/1/42 | A1 | 1,000,000 | 1,114,520 |
| Buckeye, Tobacco Settlement Fin. Auth. Rev. Bonds | | | |
| Ser. B-2, Class 2, 5.00%, 6/1/55 | BB/P | 1,000,000 | 1,010,670 |
| Ser. A-2, Class 1, 4.00%, 6/1/48 | BBB+ | 1,500,000 | 1,587,480 |
| Carlisle, Local School Dist. G.O. Bonds, | | | |
| (School Impt.) | | | |
| 5.00%, 12/1/47 | AA | 500,000 | 589,190 |
| 5.00%, 12/1/42 | AA | 350,000 | 414,295 |
| 5.00%, 12/1/37 | AA | 100,000 | 119,496 |
| Centerville, Hlth. Care Rev. Bonds, (Graceworks | | | |
| Lutheran Svcs.), 5.25%, 11/1/50 | BB+/P | 500,000 | 464,925 |
| Cincinnati, G.O. Bonds, Ser. D, 4.00%, 12/1/32 | | | |
| (Prerefunded 12/1/22) | Aa2 | 500,000 | 547,040 |
| Cincinnati, Econ. Dev. Rev. Bonds, (Keystone Parke | | | |
| Phase III), Ser. B, 5.00%, 11/1/40 | AA | 500,000 | 599,665 |
| Cleveland, Income Tax Rev. Bonds | | | |
| (Impt. Pk. & Recreational), 5.00%, 10/1/33 | AA | 615,000 | 760,792 |
| (Pub. Fac. Impt.), Ser. B-1, 5.00%, 10/1/33 | AA | 300,000 | 373,179 |
| (Bridges & Roadways Impt.), Ser. B-2, | | | |
| 5.00%, 10/1/32 | AA | 1,000,000 | 1,249,970 |
| (Pub. Fac. Impt.), Ser. B-1, 5.00%, 10/1/32 | AA | 500,000 | 624,985 |
| (Impt. Bridges), 4.00%, 10/1/29 | AA | 300,000 | 356,238 |
| (Impt. Bridges), 4.00%, 10/1/28 | AA | 400,000 | 478,968 |
| Cleveland, Pkg. Fac. Rev. Bonds, AGM, | | | |
| 5.25%, 9/15/22 | AA | 1,630,000 | 1,810,474 |
| Cleveland, Pub. Pwr. Syst. Rev. Bonds | | | |
| Ser. A, AGM, 4.00%, 11/15/38 | AA | 600,000 | 690,408 |
| Ser. A, AGM, 4.00%, 11/15/36 | AA | 750,000 | 872,430 |
| Ser. B-1, NATL, zero %, 11/15/25 | A3 | 3,000,000 | 2,812,050 |
| Cleveland, State U. Rev. Bonds, 5.00%, 6/1/37 | A1 | 1,500,000 | 1,581,195 |
| Cleveland, Wtr. Poll. Control Rev. Bonds, | | | |
| (Green Bonds) | | | |
| 5.00%, 11/15/41 | Aa3 | 500,000 | 595,625 |
| 5.00%, 11/15/36 | Aa3 | 435,000 | 523,014 |
| Cleveland-Cuyahoga Cnty., Rev. Bonds, (Euclid Ave. | | | |
| Dev., Corp.), 5.00%, 8/1/39 | A2 | 1,000,000 | 1,057,460 |
| Cleveland-Cuyahoga Cnty., Port Auth. Cultural | | | |
| Fac. Rev. Bonds, (Playhouse Square Foundation), | | | |
| 5.50%, 12/1/53 | BB+ | 700,000 | 696,493 |
| Columbus, Metro. Library Special Oblig. Rev. Bonds, | | | |
| 4.00%, 12/1/38 | Aa2 | 1,000,000 | 1,188,840 |
| Columbus, Swr. VRDN, Ser. B, 0.07%, 6/1/32 | VMIG 1 | 1,430,000 | 1,430,000 |
| Confluence Cmnty. Auth. Rev. Bonds, (Stadium & | | | |
| Sports), 4.00%, 5/1/36 | AA+ | 1,000,000 | 1,165,950 |
| |
| 22 Ohio Tax Exempt Income Fund |
| | | |
| MUNICIPAL BONDS AND NOTES (97.0%)* cont. | Rating** | Principal amount | Value |
| Ohio cont. | | | |
| Cuyahoga Cmnty., College Dist. Rev. Bonds, Ser. D, | | | |
| 5.00%, 8/1/32 | Aa2 | $750,000 | $822,150 |
| Cuyahoga Cnty., COP, (Convention Hotel), | | | |
| 5.00%, 12/1/27 | AA– | 1,250,000 | 1,378,288 |
| Cuyahoga Cnty., Econ. Dev. Rev. Bonds | | | |
| 5.00%, 1/1/41 | A | 1,435,000 | 1,731,973 |
| 5.00%, 1/1/37 | A | 400,000 | 488,272 |
| 5.00%, 1/1/34 | A | 300,000 | 370,887 |
| Fairview Park City School Dist. G.O. Bonds, | | | |
| 5.00%, 12/1/42 | Aa2 | 1,000,000 | 1,117,350 |
| Franklin Cnty., Rev. Bonds, (Trinity Hlth. Corp. Oblig. | | | |
| Group), Ser. 17OH, 5.00%, 12/1/46 | Aa3 | 2,445,000 | 2,806,004 |
| Franklin Cnty., Convention Fac. Auth. Rev. | | | |
| Bonds, (Greater Columbus Convention Ctr. Hotel | | | |
| Expansion), 5.00%, 12/1/44 | BBB– | 1,000,000 | 912,420 |
| Franklin Cnty., Hlth. Care Fac. Rev. Bonds | | | |
| (OH Presbyterian Retirement Svcs. (OPRS) | | | |
| Cmntys. Oblig. Group), Ser. A, 5.625%, 7/1/26 | BBB/F | 1,100,000 | 1,103,487 |
| 5.00%, 11/15/44 | BBB+/F | 1,000,000 | 1,010,490 |
| Franklin Cnty., Hosp. Fac. Rev. Bonds, (Nationwide | | | |
| Children’s Hosp.), Ser. A | | | |
| 4.00%, 11/1/39 | Aa2 | 500,000 | 565,445 |
| 4.00%, 11/1/38 | Aa2 | 300,000 | 339,996 |
| Gallia Cnty., Local School Impt. Dist. G.O. Bonds, | | | |
| 5.00%, 11/1/27 | Aa2 | 815,000 | 964,438 |
| Hamilton Cnty., Hlth. Care Rev. Bonds, (Life | | | |
| Enriching Cmnty.), 5.00%, 1/1/46 | BBB–/F | 1,000,000 | 927,860 |
| Hamilton Cnty., Hosp. Fac. Rev. Bonds, (TriHealth, | | | |
| Inc. Oblig. Group), Ser. A, 5.00%, 8/15/42 | A+ | 970,000 | 1,106,440 |
| Hamilton Cnty., Sales Tax Rev. Bonds, Ser. B, AMBAC | | | |
| zero %, 12/1/24 | A1 | 3,000,000 | 2,832,120 |
| zero %, 12/1/22 | A1 | 500,000 | 487,410 |
| Huber Heights City School Dist. G.O. Bonds, (School | | | |
| Impt.), 5.00%, 12/1/31 | Aa2 | 1,000,000 | 1,216,700 |
| Huran Cnty., Human Svcs. G.O. Bonds, NATL, | | | |
| 6.55%, 12/1/20 | Aa3 | 255,000 | 262,900 |
| Kent State U. Rev. Bonds, (Gen. Receipts), | | | |
| 5.00%, 5/1/30 | Aa3 | 1,000,000 | 1,211,770 |
| Lake Cnty., Cmnty. College Dist. COP, 4.00%, 10/1/35 | A2 | 1,840,000 | 2,116,221 |
| Lake Cnty., Hosp. Fac. Rev. Bonds, (Lake Hosp. Syst., | | | |
| Inc.), Ser. C, 6.00%, 8/15/43 | Baa1 | 180,000 | 180,421 |
| Lakewood, City School Dist. G.O. Bonds, (School | | | |
| Fac. Impt.), Ser. B | | | |
| 4.00%, 11/1/35 | Aa2 | 500,000 | 580,495 |
| 4.00%, 11/1/34 | Aa2 | 430,000 | 501,251 |
| 4.00%, 11/1/33 | Aa2 | 375,000 | 438,600 |
| 4.00%, 11/1/32 | Aa2 | 225,000 | 265,208 |
| Lorain Cnty., Port Auth. Econ. Dev. Facs. Rev. Bonds, | | | |
| (Kendal at Oberlin), 5.00%, 11/15/30 | A | 750,000 | 818,940 |
|
| Ohio Tax Exempt Income Fund 23 |
| | | |
| MUNICIPAL BONDS AND NOTES (97.0%)* cont. | Rating** | Principal amount | Value |
| Ohio cont. | | | |
| Lucas Cnty., Hlth. Care Fac. Rev. Bonds | | | |
| (Lutheran Homes), Ser. A, 7.00%, 11/1/45 | | | |
| (Prerefunded 11/1/20) | BB+/P | $700,000 | $719,565 |
| (Sunset Retirement Cmntys.), 5.50%, 8/15/30 | A–/F | 650,000 | 666,933 |
| Miami Cnty., Hosp. Fac. Rev. Bonds, (Kettering Hlth. | | | |
| Network Oblig. Group), 5.00%, 8/1/39 | A+ | 1,000,000 | 1,156,460 |
| Miami U. Rev. Bonds, 5.00%, 9/1/41 | Aa3 | 500,000 | 600,050 |
| Middleburg Heights, Hosp. Rev. Bonds, (Southwest | | | |
| Gen. Hlth. Ctr.), 5.00%, 8/1/47 | A2 | 1,200,000 | 1,252,980 |
| New Albany, Plain Local School Dist. G.O. Bonds, | | | |
| (School Impt.), 4.00%, 12/1/29 | Aa1 | 1,410,000 | 1,518,626 |
| North Royalton, City School Dist. G.O. Bonds, | | | |
| (School Impt.), 5.00%, 12/1/47 | Aa2 | 2,000,000 | 2,334,600 |
| Northeastern Local School Dist. Clark Cnty., G.O. | | | |
| Bonds, AGM, 4.00%, 12/1/34 | AA | 790,000 | 934,965 |
| OH State G.O. Bonds, (Infrastructure Impt.), Ser. A, | | | |
| 4.00%, 2/1/33 | Aa1 | 2,315,000 | 2,449,386 |
| OH State Higher Edl. Fac. Comm. Rev. Bonds | | | |
| (Summa Hlth. Syst.), 5.75%, 11/15/40 | Baa2 | 370,000 | 371,188 |
| 5.25%, 12/1/48 | BB | 250,000 | 233,908 |
| (Kenyon College), 5.00%, 7/1/44 | | | |
| (Prerefunded 7/2/20) | A | 1,305,000 | 1,309,959 |
| (Case Western Reserve U.), 5.00%, 12/1/40 | AA– | 1,000,000 | 1,152,890 |
| (Xavier U.), 5.00%, 5/1/40 | A3 | 750,000 | 751,268 |
| (U. of Findlay (The)), 5.00%, 3/1/39 | BBB– | 500,000 | 529,935 |
| (Oberlin Coll.), 5.00%, 10/1/31 | AA | 650,000 | 722,748 |
| (U. of Dayton), Ser. A, 5.00%, 12/1/24 | A+ | 285,000 | 323,506 |
| (Kenyon College 2020), 4.00%, 7/1/44 | A2 | 1,400,000 | 1,461,936 |
| (Kenyon College 2020), 4.00%, 7/1/40 | A2 | 730,000 | 770,712 |
| OH State Hosp. Rev. Bonds, (U. Hosp. Hlth. Syst.), | | | |
| Ser. A, 5.00%, 1/15/41 | A2 | 1,000,000 | 1,113,280 |
| OH State Hosp. Fac. Rev. Bonds, (Cleveland Clinic | | | |
| Hlth. Syst.), Ser. A, 4.00%, 1/1/34 | Aa2 | 1,250,000 | 1,434,038 |
| OH State Private Activity Rev. Bonds, (Portsmouth | | | |
| Bypass Gateway Group, LLC), AGM, 5.00%, 12/31/39 | AA | 750,000 | 854,145 |
| OH State Tpk. Comm. Rev. Bonds, (Infrastructure), | | | |
| Ser. A-1, 5.25%, 2/15/32 | Aa3 | 350,000 | 387,909 |
| OH State U. Rev. Bonds, Ser. A, 5.00%, 12/1/39 | Aa1 | 1,000,000 | 1,175,250 |
| OH State Wtr. Dev. Auth. Rev. Bonds, Ser. A, | | | |
| 5.00%, 12/1/34 | Aaa | 750,000 | 918,878 |
| OH U. Gen. Recipients Athens Rev. Bonds, 5.00%, | | | |
| 12/1/42 (Prerefunded 6/1/22) | Aa3 | 500,000 | 547,605 |
| Revere, Local School Dist. G.O. Bonds, (School Fac. | | | |
| Impt.), Ser. C | | | |
| 4.00%, 12/1/33 | Aa1 | 270,000 | 320,404 |
| 4.00%, 12/1/31 | Aa1 | 1,000,000 | 1,203,360 |
| Rickenbacker, Port Auth. Rev. Bonds, (OASBO | | | |
| Expanded Asset Pooled), Ser. A, 5.375%, 1/1/32 | A2 | 935,000 | 1,231,545 |
| Scioto Cnty., Hosp. Rev. Bonds, (Southern | | | |
| OH Med. Ctr.) | | | |
| 5.00%, 2/15/34 | A3 | 1,025,000 | 1,125,460 |
| 5.00%, 2/15/32 | A3 | 865,000 | 956,837 |
| |
| 24 Ohio Tax Exempt Income Fund |
| | | |
| MUNICIPAL BONDS AND NOTES (97.0%)* cont. | Rating** | Principal amount | Value |
| Ohio cont. | | | |
| Summit Cnty., G.O. Bonds, 4.00%, 12/1/31 | Aa1 | $750,000 | $842,018 |
| Toledo, Wtr. Wks. Syst. Rev. Bonds, 5.00%, 11/15/36 | Aa3 | 500,000 | 612,905 |
| Toledo-Lucas Cnty., Port Auth. FRB, (CSX Transn, | | | |
| Inc.), 6.45%, 12/15/21 | A3 | 1,900,000 | 2,059,277 |
| U. of Akron Rev. Bonds, Ser. A | | | |
| 5.00%, 1/1/31 | A1 | 500,000 | 567,200 |
| 5.00%, 1/1/28 | A1 | 1,000,000 | 1,116,650 |
| Warren Cnty., Hlth. Care Fac. Rev. Bonds, (Otterbein | | | |
| Homes Oblig. Group) | | | |
| Ser. A, 5.75%, 7/1/33 | A | 500,000 | 536,955 |
| 5.00%, 7/1/39 | A | 1,000,000 | 1,051,110 |
| Willoughby-Eastlake, City School Dist. | | | |
| G.O. Bonds, (School Impt.), 5.00%, 12/1/46 | | | |
| (Prerefunded 12/1/25) | A2 | 1,000,000 | 1,245,550 |
| Youngstown State U. Rev. Bonds, 5.00%, 12/15/25 | A+ | 500,000 | 515,455 |
| | | | 95,181,287 |
| Texas (2.2%) | | | |
| Clifton, Higher Ed. Fin. Corp. Rev. Bonds, (IDEA Pub. | | | |
| Schools), PSFG, 4.00%, 8/15/32 | AAA | 2,000,000 | 2,441,600 |
| | | | 2,441,600 |
| Washington (2.3%) | | | |
| Grant Cnty., Pub. Util. Dist. No. 2 Mandatory Put | | | |
| Bonds (12/2/20), (Elec. Syst.), 2.00%, 1/1/44 | AA+ | 2,600,000 | 2,608,756 |
| | | | 2,608,756 |
| Total municipal bonds and notes (cost $102,984,426) | | $107,835,593 |
| | | |
| | Principal amount/ | |
| SHORT-TERM INVESTMENTS (1.9%)* | | shares | Value |
| Putnam Short Term Investment Fund 0.71% L | Shares | 1,773,781 | $1,773,781 |
| U.S. Treasury Bills 0.015%, 9/3/20 | | $113,000 | 112,955 |
| U.S. Treasury Bills zero %, 8/13/20 | | 107,000 | 106,971 |
| U.S. Treasury Bills 0.005%, 9/10/20 | | 69,000 | 68,969 |
| U.S. Treasury Bills 1.548%, 7/16/20 | | 48,000 | 47,992 |
| U.S. Treasury Bills 0.005%, 6/11/20 | | 32,000 | 31,999 |
| Total short-term investments (cost $2,142,685) | | | $2,142,667 |
| |
| TOTAL INVESTMENTS | | | |
| Total investments (cost $105,127,111) | | | $109,978,260 |
Notes to the fund’s portfolio
Unless noted otherwise, the notes to the fund’s portfolio are for the close of the fund’s reporting period, which ran from June 1, 2019 through May 31, 2020 (the reporting period). Within the following notes to the portfolio, references to “Putnam Management” represent Putnam Investment Management, LLC, the fund’s manager, an indirect wholly-owned subsidiary of Putnam Investments, LLC and references to “ASC 820” represent Accounting Standards Codification 820 Fair Value Measurements and Disclosures.
* Percentages indicated are based on net assets of $111,148,559.
|
| Ohio Tax Exempt Income Fund 25 |
** The Moody’s, Standard & Poor’s or Fitch ratings indicated are believed to be the most recent ratings available at the close of the reporting period for the securities listed. Ratings are generally ascribed to securities at the time of issuance. While the agencies may from time to time revise such ratings, they undertake no obligation to do so, and the ratings do not necessarily represent what the agencies would ascribe to these securities at the close of the reporting period. Securities rated by Fitch are indicated by “/F.” Securities rated by Putnam are indicated by “/P.” The Putnam rating categories are comparable to the Standard & Poor’s classifications. If a security is insured, it will usually be rated by the ratings organizations based on the financial strength of the insurer. Ratings are not covered by the Report of Independent Registered Public Accounting Firm. For further details regarding security ratings, please see the Statement of Additional Information.
L Affiliated company (Note 5). The rate quoted in the security description is the annualized 7-day yield of the fund at the close of the reporting period.
Unless otherwise noted, the rates quoted in Short-term investments security descriptions represent the weighted average yield to maturity.
On Mandatory Put Bonds, the rates shown are the current interest rates at the close of the reporting period and the dates shown represent the next mandatory put dates. Rates are set by remarketing agents and may take into consideration market supply and demand, credit quality and the current SIFMA Municipal Swap Index, 1 Month US LIBOR or 3 Month US LIBOR rates, which were 0.14%, 0.18% and 0.34%, respectively, as of the close of the reporting period.
The dates shown parenthetically on prerefunded bonds represent the next prerefunding dates.
The dates shown on debt obligations are the original maturity dates.
The fund had the following sector concentrations greater than 10% at the close of the reporting period (as a percentage of net assets):
| | | | |
| Healthcare | 22.1% | | | |
| Education | 18.6 | | | |
| Local debt | 14.5 | | | |
| Utilities | 12.0 | | | |
| | | | | | |
| OTC TOTAL RETURN SWAP CONTRACTS OUTSTANDING at 5/31/20 | | |
| | | Upfront | | | | |
| | | premium | Termina- | Payments | Total return | Unrealized |
| Swap counterparty/ | | received | tion | received (paid) | received by | appreciation/ |
| Notional amount | Value | (paid) | date | by fund | or paid by fund | (depreciation) |
| Citibank, N.A. | | | | | | |
| $665,000 | $3,764 | $— | 8/20/20 | — | 1.81% minus | $3,764 |
| | | | | | Municipal Market | |
| | | | | | Data Index AAA | |
| | | | | | municipal yields | |
| | | | | | 30 Year rate — At | |
| | | | | | maturity | |
| 360,000 | 13,023 | — | 6/4/20 | — | 1.86% minus | 13,023 |
| | | | | | Municipal Market | |
| | | | | | Data Index AAA | |
| | | | | | municipal yields | |
| | | | | | 30 Year rate — At | |
| | | | | | maturity | |
| 89,000 | 1,514 | — | 8/25/20 | — | 1.87% minus | 1,514 |
| | | | | | Municipal Market | |
| | | | | | Data Index AAA | |
| | | | | | municipal yields | |
| | | | | | 30 Year rate — At | |
| | | | | | maturity | |
| |
| 26 Ohio Tax Exempt Income Fund |
| | | | | | |
| OTC TOTAL RETURN SWAP CONTRACTS OUTSTANDING at 5/31/20 cont. | | |
| | | Upfront | | | | |
| | | premium | Termina- | Payments | Total return | Unrealized |
| Swap counterparty/ | | received | tion | received (paid) | received by | appreciation/ |
| Notional amount | Value | (paid) | date | by fund | or paid by fund | (depreciation) |
| Citibank, N.A. cont. | | | | | | |
| $269,000 | $6,763 | $— | 8/24/20 | — | 1.91% minus | $6,763 |
| | | | | | Municipal Market | |
| | | | | | Data Index AAA | |
| | | | | | municipal yields | |
| | | | | | 30 Year rate — At | |
| | | | | | maturity | |
| 230,000 | 10,192 | — | 7/15/20 | — | 1.98% minus | 10,192 |
| | | | | | Municipal Market | |
| | | | | | Data Index AAA | |
| | | | | | municipal yields | |
| | | | | | 30 Year rate — At | |
| | | | | | maturity | |
| Upfront premium received | | — | | Unrealized appreciation | 35,256 |
| Upfront premium (paid) | | — | | Unrealized (depreciation) | — |
| Total | | $— | | Total | | $35,256 |
ASC 820 establishes a three-level hierarchy for disclosure of fair value measurements. The valuation hierarchy is based upon the transparency of inputs to the valuation of the fund’s investments. The three levels are defined as follows:
Level 1: Valuations based on quoted prices for identical securities in active markets.
Level 2: Valuations based on quoted prices in markets that are not active or for which all significant inputs are observable, either directly or indirectly.
Level 3: Valuations based on inputs that are unobservable and significant to the fair value measurement.
The following is a summary of the inputs used to value the fund’s net assets as of the close of the reporting period:
| | | |
| | | Valuation inputs |
| Investments in securities: | Level 1 | Level 2 | Level 3 |
| Municipal bonds and notes | $— | $107,835,593 | $— |
| Short-term investments | 1,773,781 | 368,886 | — |
| Totals by level | $1,773,781 | $108,204,479 | $— |
| | | | |
| | | Valuation inputs |
| Other financial instruments: | Level 1 | Level 2 | Level 3 |
| Total return swap contracts | $— | $35,256 | $— |
| Totals by level | $— | $35,256 | $— |
The accompanying notes are an integral part of these financial statements.
|
| Ohio Tax Exempt Income Fund 27 |
| |
| Statement of assets and liabilities 5/31/20 | |
| ASSETS | |
| Investment in securities, at value (Notes 1 and 8): | |
| Unaffiliated issuers (identified cost $103,353,330) | $108,204,479 |
| Affiliated issuers (identified cost $1,773,781) (Notes 1 and 5) | 1,773,781 |
| Interest and other receivables | 1,422,377 |
| Receivable for shares of the fund sold | 11,060 |
| Receivable for investments sold | 2,160 |
| Unrealized appreciation on OTC swap contracts (Note 1) | 35,256 |
| Prepaid assets | 4,516 |
| Total assets | 111,453,629 |
| |
| LIABILITIES | |
| Payable for shares of the fund repurchased | 59,517 |
| Payable for compensation of Manager (Note 2) | 40,361 |
| Payable for custodian fees (Note 2) | 5,002 |
| Payable for investor servicing fees (Note 2) | 13,275 |
| Payable for Trustee compensation and expenses (Note 2) | 57,918 |
| Payable for administrative services (Note 2) | 433 |
| Payable for distribution fees (Note 2) | 38,305 |
| Payable for auditing and tax fees | 59,494 |
| Distributions payable to shareholders | 13,981 |
| Other accrued expenses | 16,784 |
| Total liabilities | 305,070 |
| | |
| Net assets | $111,148,559 |
| |
| REPRESENTED BY | |
| Paid-in capital (Unlimited shares authorized) (Notes 1 and 4) | $106,293,937 |
| Total distributable earnings (Note 1) | 4,854,622 |
| Total — Representing net assets applicable to capital shares outstanding | $111,148,559 |
| |
| COMPUTATION OF NET ASSET VALUE AND OFFERING PRICE | |
| Net asset value and redemption price per class A share ($90,396,997 divided by 9,931,575 shares) | $9.10 |
| Offering price per class A share (100/96.00 of $9.10)* | $9.48 |
| Net asset value and offering price per class B share ($711,435 divided by 78,300 shares)** | $9.09 |
| Net asset value and offering price per class C share ($5,360,995 divided by 589,064 shares)** | $9.10 |
| Net asset value, offering price and redemption price per class R6 share | |
| ($737,068 divided by 80,809 shares) | $9.12 |
| Net asset value, offering price and redemption price per class Y share | |
| ($13,942,064 divided by 1,529,613 shares) | $9.11 |
* On single retail sales of less than $100,000. On sales of $100,000 or more the offering price is reduced.
** Redemption price per share is equal to net asset value less any applicable contingent deferred sales charge.
The accompanying notes are an integral part of these financial statements.
|
| 28 Ohio Tax Exempt Income Fund |
| |
| Statement of operations Year ended 5/31/20 | |
| INVESTMENT INCOME | |
| Interest (including interest income of $28,578 from investments in affiliated issuers) (Note 5) | $3,654,759 |
| Total investment income | 3,654,759 |
| |
| EXPENSES | |
| Compensation of Manager (Note 2) | 479,495 |
| Investor servicing fees (Note 2) | 81,145 |
| Custodian fees (Note 2) | 8,551 |
| Trustee compensation and expenses (Note 2) | 3,183 |
| Distribution fees (Note 2) | 268,327 |
| Administrative services (Note 2) | 3,085 |
| Auditing and tax fees | 59,470 |
| Other | 50,362 |
| Total expenses | 953,618 |
| | |
| Expense reduction (Note 2) | (22,764) |
| Net expenses | 930,854 |
| | |
| Net investment income | 2,723,905 |
| |
| REALIZED AND UNREALIZED GAIN (LOSS) | |
| Net realized gain (loss) on: | |
| Securities from unaffiliated issuers (Notes 1 and 3) | 718,329 |
| Futures contracts (Note 1) | (91,830) |
| Swap contracts (Note 1) | 27,988 |
| Total net realized gain | 654,487 |
| Change in net unrealized appreciation (depreciation) on: | |
| Securities from unaffiliated issuers | (336,424) |
| Swap contracts | 35,256 |
| Total change in net unrealized depreciation | (301,168) |
| | |
| Net gain on investments | 353,319 |
| |
| Net increase in net assets resulting from operations | $3,077,224 |
The accompanying notes are an integral part of these financial statements.
|
| Ohio Tax Exempt Income Fund 29 |
| | |
| Statement of changes in net assets | | |
| INCREASE (DECREASE) IN NET ASSETS | Year ended 5/31/20 | Year ended 5/31/19 |
| Operations | | |
| Net investment income | $2,723,905 | $3,044,673 |
| Net realized gain on investments | 654,487 | 581,630 |
| Change in net unrealized appreciation (depreciation) | | |
| of investments | (301,168) | 1,901,342 |
| Net increase in net assets resulting from operations | 3,077,224 | 5,527,645 |
| Distributions to shareholders (Note 1): | | |
| From ordinary income | | |
| Taxable net investment income | | |
| Class A | (19,406) | (13,334) |
| Class B | (231) | (183) |
| Class C | (1,467) | (1,091) |
| Class M | (118) | (76) |
| Class R6 | (144) | (74) |
| Class Y | (3,407) | (2,165) |
| From tax-exempt net investment income | | |
| Class A | (2,143,104) | (2,438,258) |
| Class B | (15,716) | (24,179) |
| Class C | (100,182) | (141,308) |
| Class M | (5,695) | (12,285) |
| Class R6 | (18,743) | (10,217) |
| Class Y | (397,176) | (408,486) |
| Increase (decrease) from capital share transactions (Note 4) | 1,327,374 | (16,326,105) |
| Total increase (decrease) in net assets | 1,699,209 | (13,850,116) |
| |
| NET ASSETS | | |
| Beginning of year | 109,449,350 | 123,299,466 |
| End of year | $111,148,559 | $109,449,350 |
The accompanying notes are an integral part of these financial statements.
| |
| 30 Ohio Tax Exempt Income Fund |
|
| This page left blank intentionally. |
|
| Ohio Tax Exempt Income Fund 31 |
| | | | | | | | | | | | |
| Financial highlights (For a common share outstanding throughout the period) | | | | | | | | |
| |
| | INVESTMENT OPERATIONS | | | LESS DISTRIBUTIONS | | | | RATIOS AND SUPPLEMENTAL DATA | | |
| | | | | | | | | | | | Ratio | |
| | | | Net realized | | | | | | | | of net investment | |
| | Net asset value, | | and unrealized | Total from | From | | | Total return | Net assets, | Ratio of expenses | income (loss) | |
| | beginning | Net investment | gain (loss) | investment | net investment | Total | Net asset value, | at net asset value | end of period | to average | to average | Portfolio |
| Period ended | of period | income (loss) | on investments | operations | income | distributions | end of period | (%) a | (in thousands) | net assets (%) b | net assets (%) | turnover (%) |
| Class A | | | | | | | | | | | | |
| May 31, 2020 | $9.06 | .22 | .04 | .26 | (.22) | (.22) | $9.10 | 2.90 | $90,397 | .83 | 2.46 | 19 |
| May 31, 2019 | 8.85 | .24 | .21 | .45 | (.24) | (.24) | 9.06 | 5.19 | 85,815 | .84 | 2.70 | 19 |
| May 31, 2018 | 9.02 | .25 | (.17) | .08 | (.25) | (.25) | 8.85 | .85 | 100,922 | .83 | 2.74 | 33 |
| May 31, 2017 | 9.24 | .25 | (.22) | .03 | (.25) | (.25) | 9.02 | .39 | 108,906 | .83 | 2.81 | 15 |
| May 31, 2016 | 9.07 | .29 | .16 | .45 | (.28) | (.28) | 9.24 | 5.10 | 120,182 | .82c | 3.11c | 11 |
| Class B | | | | | | | | | | | | |
| May 31, 2020 | $9.05 | .17 | .03 | .20 | (.16) | (.16) | $9.09 | 2.27 | $711 | 1.46 | 1.84 | 19 |
| May 31, 2019 | 8.84 | .18 | .21 | .39 | (.18) | (.18) | 9.05 | 4.53 | 1,053 | 1.47 | 2.08 | 19 |
| May 31, 2018 | 9.01 | .19 | (.17) | .02 | (.19) | (.19) | 8.84 | .21 | 1,249 | 1.46 | 2.11 | 33 |
| May 31, 2017 | 9.22 | .20 | (.21) | (.01) | (.20) | (.20) | 9.01 | (.13) | 1,484 | 1.46 | 2.18 | 15 |
| May 31, 2016 | 9.06 | .23 | .16 | .39 | (.23) | (.23) | 9.22 | 4.33 | 1,530 | 1.44c | 2.49c | 11 |
| Class C | | | | | | | | | | | | |
| May 31, 2020 | $9.06 | .15 | .04 | .19 | (.15) | (.15) | $9.10 | 2.11 | $5,361 | 1.61 | 1.68 | 19 |
| May 31, 2019 | 8.85 | .17 | .21 | .38 | (.17) | (.17) | 9.06 | 4.36 | 6,576 | 1.62 | 1.92 | 19 |
| May 31, 2018 | 9.02 | .18 | (.17) | .01 | (.18) | (.18) | 8.85 | .07 | 8,588 | 1.61 | 1.97 | 33 |
| May 31, 2017 | 9.24 | .18 | (.22) | (.04) | (.18) | (.18) | 9.02 | (.39) | 11,007 | 1.61 | 2.03 | 15 |
| May 31, 2016 | 9.07 | .21 | .17 | .38 | (.21) | (.21) | 9.24 | 4.28 | 11,138 | 1.59c | 2.34c | 11 |
| Class R6 | | | | | | | | | | | | |
| May 31, 2020 | $9.07 | .25 | .04 | .29 | (.24) | (.24) | $9.12 | 3.27 | $737 | .59 | 2.69 | 19 |
| May 31, 2019 | 8.86 | .26 | .21 | .47 | (.26) | (.26) | 9.07 | 5.44 | 637 | .59 | 2.97 | 19 |
| May 31, 2018 † | 8.81 | .01 | .05 | .06 | (.01) | (.01) | 8.86 | .65* | 10 | .02* | .08* | 33 |
| Class Y | | | | | | | | | | | | |
| May 31, 2020 | $9.07 | .24 | .04 | .28 | (.24) | (.24) | $9.11 | 3.13 | $13,942 | .61 | 2.68 | 19 |
| May 31, 2019 | 8.86 | .26 | .21 | .47 | (.26) | (.26) | 9.07 | 5.42 | 14,847 | .62 | 2.92 | 19 |
| May 31, 2018 | 9.03 | .27 | (.17) | .10 | (.27) | (.27) | 8.86 | 1.07 | 12,015 | .61 | 2.96 | 33 |
| May 31, 2017 | 9.24 | .27 | (.21) | .06 | (.27) | (.27) | 9.03 | .72 | 13,328 | .61 | 3.03 | 15 |
| May 31, 2016 | 9.08 | .31 | .15 | .46 | (.30) | (.30) | 9.24 | 5.22 | 12,568 | .59c | 3.34c | 11 |
* Not annualized.
† For the period May 21, 2018 (commencement of operations) to May 31, 2018.
a Total return assumes dividend reinvestment and does not reflect the effect of sales charges.
b Includes amounts paid through expense offset arrangements, if any (Note 2). Also excludes acquired fund fees and expenses, if any.
c Reflects a voluntary waiver of certain fund expenses in effect during the period. As a result of such waivers, the expenses of each class reflect a reduction of less than 0.01% as a percentage of average net assets.
The accompanying notes are an integral part of these financial statements.
| |
| 32 Ohio Tax Exempt Income Fund | Ohio Tax Exempt Income Fund 33 |
Notes to financial statements 5/31/20
Within the following Notes to financial statements, references to “State Street” represent State Street Bank and Trust Company, references to “the SEC” represent the Securities and Exchange Commission, references to “Putnam Management” represent Putnam Investment Management, LLC, the fund’s manager, an indirect wholly-owned subsidiary of Putnam Investments, LLC and references to “OTC”, if any, represent over-the-counter. Unless otherwise noted, the “reporting period” represents the period from June 1, 2019 through May 31, 2020.
Putnam Ohio Tax Exempt Income Fund (the fund) is a Massachusetts business trust, which is registered under the Investment Company Act of 1940, as amended, as a diversified open-end management investment company. The goal of the fund is to seek as high a level of current income exempt from federal income tax and Ohio personal income tax as Putnam Management believes is consistent with preservation of capital. The fund invests mainly in bonds that pay interest that is exempt from federal income tax and Ohio personal income tax (but that may be subject to federal alternative minimum tax (AMT)), are investment-grade in quality, and have intermediate- to long-term maturities (i.e., three years or longer). Under normal circumstances, Putnam Management invests at least 80% of the fund’s net assets in tax-exempt investments. Tax-exempt investments are issued by or for states, territories or possessions of the United States or by their political subdivisions, agencies, authorities or other government entities, and the income from these investments is exempt from both federal and Ohio personal income tax. This investment policy cannot be changed without the approval of the fund’s shareholders. Interest income from private activity bonds may be subject to federal AMT for individuals. These investments are not included for the purpose of complying with the 80% investment policy. Putnam Management may consider, among other factors, credit, interest rate and prepayment risks, as well as general market conditions, when deciding whether to buy or sell investments.
The fund offers class A, class B, class C, class R6 and class Y shares. Effective November 25, 2019, all class M shares were converted to class A shares and are no longer available for purchase. Purchases of class B shares are closed to new and existing investors except by exchange from class B shares of another Putnam fund or through dividend and/or capital gains reinvestment. Class A shares are sold with a maximum front-end sales charge of 4.00%. Class A shares generally are not subject to a contingent deferred sales charge and class R6 and class Y shares are not subject to a contingent deferred sales charge. Prior to November 25, 2019, class M shares were sold with a maximum front-end-sales charge of 3.25% and were not subject to a contingent differed sales charge. Class B shares, which convert to class A shares after approximately eight years, are not subject to a front-end sales charge and are subject to a contingent deferred sales charge if those shares are redeemed within six years of purchase. Class C shares are subject to a one-year 1.00% contingent deferred sales charge and generally convert to class A shares after approximately ten years. The expenses for class A, class B and class C shares may differ based on the distribution fee of each class, which is identified in Note 2. Class R6 and class Y shares, which are sold at net asset value, are generally subject to the same expenses as class A, class B and class C shares, but do not bear a distribution fee, and in the case of class R6 shares, bear a lower investor servicing fee, which is identified in Note 2. Class R6 and class Y shares are not available to all investors.
In the normal course of business, the fund enters into contracts that may include agreements to indemnify another party under given circumstances. The fund’s maximum exposure under these arrangements is unknown as this would involve future claims that may be, but have not yet been, made against the fund. However, the fund’s management team expects the risk of material loss to be remote.
The fund has entered into contractual arrangements with an investment adviser, administrator, distributor, shareholder servicing agent and custodian, who each provide services to the fund. Unless expressly stated otherwise, shareholders are not parties to, or intended beneficiaries of these contractual arrangements, and these contractual arrangements are not intended to create any shareholder right to enforce them against the service providers or to seek any remedy under them against the service providers, either directly or on behalf of the fund.
Under the fund’s Amended and Restated Agreement and Declaration of Trust, any claims asserted against or on behalf of the Putnam Funds, including claims against Trustees and Officers, must be brought in state and federal courts located within the Commonwealth of Massachusetts.
Note 1: Significant accounting policies
The following is a summary of significant accounting policies consistently followed by the fund in the preparation of its financial statements. The preparation of financial statements is in conformity with accounting principles generally accepted in the United States of America and requires management to make estimates and assumptions that affect the reported amounts of assets and liabilities in the financial statements and the reported amounts of increases and decreases in net assets from operations. Actual results could differ from those
| |
| 34 Ohio Tax Exempt Income Fund |
estimates. Subsequent events after the Statement of assets and liabilities date through the date that the financial statements were issued have been evaluated in the preparation of the financial statements.
Investment income, realized and unrealized gains and losses and expenses of the fund are borne pro-rata based on the relative net assets of each class to the total net assets of the fund, except that each class bears expenses unique to that class (including the distribution fees applicable to such classes). Each class votes as a class only with respect to its own distribution plan or other matters on which a class vote is required by law or determined by the Trustees. If the fund were liquidated, shares of each class would receive their pro-rata share of the net assets of the fund. In addition, the Trustees declare separate dividends on each class of shares.
Security valuation Portfolio securities and other investments are valued using policies and procedures adopted by the Board of Trustees. The Trustees have formed a Pricing Committee to oversee the implementation of these procedures and have delegated responsibility for valuing the fund’s assets in accordance with these procedures to Putnam Management. Putnam Management has established an internal Valuation Committee that is responsible for making fair value determinations, evaluating the effectiveness of the pricing policies of the fund and reporting to the Pricing Committee.
Tax-exempt bonds and notes are generally valued on the basis of valuations provided by an independent pricing service approved by the Trustees. Such services use information with respect to transactions in bonds, quotations from bond dealers, market transactions in comparable securities and various relationships between securities in determining value. These securities will generally be categorized as Level 2.
Market quotations are not considered to be readily available for certain debt obligations (including short-term investments with remaining maturities of 60 days or less) and other investments; such investments are valued on the basis of valuations furnished by an independent pricing service approved by the Trustees or dealers selected by Putnam Management. Such services or dealers determine valuations for normal institutional-size trading units of such securities using methods based on market transactions for comparable securities and various relationships, generally recognized by institutional traders, between securities (which consider such factors as security prices, yields, maturities and ratings). These securities will generally be categorized as Level 2. Securities quoted in foreign currencies, if any, are translated into U.S. dollars at the current exchange rate.
Investments in open-end investment companies (excluding exchange-traded funds), if any, which can be classified as Level 1 or Level 2 securities, are valued based on their net asset value. The net asset value of such investment companies equals the total value of their assets less their liabilities and divided by the number of their outstanding shares.
To the extent a pricing service or dealer is unable to value a security or provides a valuation that Putnam Management does not believe accurately reflects the security’s fair value, the security will be valued at fair value by Putnam Management in accordance with policies and procedures approved by the Trustees. Certain investments, including certain restricted and illiquid securities and derivatives, are also valued at fair value following procedures approved by the Trustees. These valuations consider such factors as significant market or specific security events such as interest rate or credit quality changes, various relationships with other securities, discount rates, U.S. Treasury, U.S. swap and credit yields, index levels, convexity exposures, recovery rates, sales and other multiples and resale restrictions. These securities are classified as Level 2 or as Level 3 depending on the priority of the significant inputs.
To assess the continuing appropriateness of fair valuations, the Valuation Committee reviews and affirms the reasonableness of such valuations on a regular basis after considering all relevant information that is reasonably available. Such valuations and procedures are reviewed periodically by the Trustees. The fair value of securities is generally determined as the amount that the fund could reasonably expect to realize from an orderly disposition of such securities over a reasonable period of time. By its nature, a fair value price is a good faith estimate of the value of a security in a current sale and does not reflect an actual market price, which may be different by a material amount.
Security transactions and related investment income Security transactions are recorded on the trade date (the date the order to buy or sell is executed). Gains or losses on securities sold are determined on the identified cost basis.
Interest income, including amortization and accretion of premiums and discounts on debt securities, is recorded on the accrual basis.
Futures contracts The fund uses futures contracts for hedging treasury term structure risk and for yield curve positioning.
|
| Ohio Tax Exempt Income Fund 35 |
The potential risk to the fund is that the change in value of futures contracts may not correspond to the change in value of the hedged instruments. In addition, losses may arise from changes in the value of the underlying instruments, if there is an illiquid secondary market for the contracts, if interest or exchange rates move unexpectedly or if the counterparty to the contract is unable to perform. With futures, there is minimal counterparty credit risk to the fund since futures are exchange traded and the exchange’s clearinghouse, as counterparty to all exchange traded futures, guarantees the futures against default. Risks may exceed amounts recognized on the Statement of assets and liabilities. When the contract is closed, the fund records a realized gain or loss equal to the difference between the value of the contract at the time it was opened and the value at the time it was closed.
Futures contracts are valued at the quoted daily settlement prices established by the exchange on which they trade. The fund and the broker agree to exchange an amount of cash equal to the daily fluctuation in the value of the futures contract. Such receipts or payments are known as “variation margin.” Futures contracts outstanding at period end, if any, are listed after the fund’s portfolio.
Interest rate swap contracts The fund entered into OTC and/or centrally cleared interest rate swap contracts, which are arrangements between two parties to exchange cash flows based on a notional principal amount, for hedging term structure risk and for yield curve positioning.
An OTC and centrally cleared interest rate swap can be purchased or sold with an upfront premium. For OTC interest rate swap contracts, an upfront payment received by the fund is recorded as a liability on the fund’s books. An upfront payment made by the fund is recorded as an asset on the fund’s books. OTC and centrally cleared interest rate swap contracts are marked to market daily based upon quotations from an independent pricing service or market makers. Any change is recorded as an unrealized gain or loss on OTC interest rate swaps. Daily fluctuations in the value of centrally cleared interest rate swaps are settled through a central clearing agent and are recorded in variation margin on the Statement of assets and liabilities and recorded as unrealized gain or loss. Payments, including upfront premiums, received or made are recorded as realized gains or losses at the reset date or the closing of the contract. Certain OTC and centrally cleared interest rate swap contracts may include extended effective dates. Payments related to these swap contracts are accrued based on the terms of the contract.
The fund could be exposed to credit or market risk due to unfavorable changes in the fluctuation of interest rates or if the counterparty defaults, in the case of OTC interest rate contracts, or the central clearing agency or a clearing member defaults, in the case of centrally cleared interest rate swap contracts, on its respective obligation to perform under the contract. The fund’s maximum risk of loss from counterparty risk or central clearing risk is the fair value of the contract. This risk may be mitigated for OTC interest rate swap contracts by having a master netting arrangement between the fund and the counterparty and for centrally cleared interest rate swap contracts through the daily exchange of variation margin. There is minimal counterparty risk with respect to centrally cleared interest rate swap contracts due to the clearinghouse guarantee fund and other resources that are available in the event of a clearing member default. Risk of loss may exceed amounts recognized on the Statement of assets and liabilities.
OTC and centrally cleared interest rate swap contracts outstanding, including their respective notional amounts at period end, if any, are listed after the fund’s portfolio.
Total return swap contracts The fund entered into OTC and/or centrally cleared total return swap contracts, which are arrangements to exchange a market-linked return for a periodic payment, both based on a notional principal amount, to hedge sector exposure and for gaining exposure to specific sectors.
To the extent that the total return of the security, index or other financial measure underlying the transaction exceeds or falls short of the offsetting interest rate obligation, the fund will receive a payment from or make a payment to the counterparty. OTC and/or centrally cleared total return swap contracts are marked to market daily based upon quotations from an independent pricing service or market maker. Any change is recorded as an unrealized gain or loss on OTC total return swaps. Daily fluctuations in the value of centrally cleared total return swaps are settled through a central clearing agent and are recorded in variation margin on the Statement of assets and liabilities and recorded as unrealized gain or loss. Payments received or made are recorded as realized gains or losses. Certain OTC and/or centrally cleared total return swap contracts may include extended effective dates. Payments related to these swap contracts are accrued based on the terms of the contract. The fund could be exposed to credit or market risk due to unfavorable changes in the fluctuation of interest rates or in the price of the underlying security or index, the possibility that there is no liquid market for these agreements or that the counterparty may default on its obligation to perform. The fund’s maximum risk of loss from counterparty risk or central clearing risk is the fair value of the contract. This risk may be mitigated for OTC total return swap
| |
| 36 Ohio Tax Exempt Income Fund |
contracts by having a master netting arrangement between the fund and the counterparty and for centrally cleared total return swap contracts through the daily exchange of variation margin. There is minimal counterparty risk with respect to centrally cleared total return swap contracts due to the clearinghouse guarantee fund and other resources that are available in the event of a clearing member default. Risk of loss may exceed amounts recognized on the Statement of assets and liabilities.
OTC and/or centrally cleared total return swap contracts outstanding, including their respective notional amounts at period end, if any, are listed after the fund’s portfolio.
Master agreements The fund is a party to ISDA (International Swaps and Derivatives Association, Inc.) Master Agreements (Master Agreements) with certain counterparties that govern OTC derivative and foreign exchange contracts entered into from time to time. The Master Agreements may contain provisions regarding, among other things, the parties’ general obligations, representations, agreements, collateral requirements, events of default and early termination. With respect to certain counterparties, in accordance with the terms of the Master Agreements, collateral posted to the fund is held in a segregated account by the fund’s custodian and, with respect to those amounts which can be sold or repledged, is presented in the fund’s portfolio.
Collateral pledged by the fund is segregated by the fund’s custodian and identified in the fund’s portfolio. Collateral can be in the form of cash or debt securities issued by the U.S. Government or related agencies or other securities as agreed to by the fund and the applicable counterparty. Collateral requirements are determined based on the fund’s net position with each counterparty.
Termination events applicable to the fund may occur upon a decline in the fund’s net assets below a specified threshold over a certain period of time. Termination events applicable to counterparties may occur upon a decline in the counterparty’s long-term and short-term credit ratings below a specified level. In each case, upon occurrence, the other party may elect to terminate early and cause settlement of all derivative and foreign exchange contracts outstanding, including the payment of any losses and costs resulting from such early termination, as reasonably determined by the terminating party. Any decision by one or more of the fund’s counterparties to elect early termination could impact the fund’s future derivative activity.
At the close of the reporting period, the fund did not have a net liability position on open derivative contracts subject to the Master Agreements.
Interfund lending The fund, along with other Putnam funds, may participate in an interfund lending program pursuant to an exemptive order issued by the SEC. This program allows the fund to borrow from other Putnam funds that permit such transactions. Interfund lending transactions are subject to each fund’s investment policies and borrowing and lending limits. Interest earned or paid on the interfund lending transaction will be based on the average of certain current market rates. During the reporting period, the fund did not utilize the program.
Lines of credit The fund participates, along with other Putnam funds, in a $317.5 million unsecured committed line of credit and a $235.5 million unsecured uncommitted line of credit, both provided by State Street. Borrowings may be made for temporary or emergency purposes, including the funding of shareholder redemption requests and trade settlements. Interest is charged to the fund based on the fund’s borrowing at a rate equal to 1.25% plus the higher of (1) the Federal Funds rate and (2) the overnight LIBOR for the committed line of credit and the Federal Funds rate plus 1.30% for the uncommitted line of credit. A closing fee equal to 0.04% of the committed line of credit and 0.04% of the uncommitted line of credit has been paid by the participating funds. In addition, a commitment fee of 0.21% per annum on any unutilized portion of the committed line of credit is allocated to the participating funds based on their relative net assets and paid quarterly. During the reporting period, the fund had no borrowings against these arrangements.
Federal taxes It is the policy of the fund to distribute all of its income within the prescribed time period and otherwise comply with the provisions of the Internal Revenue Code of 1986, as amended (the Code), applicable to regulated investment companies. It is also the intention of the fund to distribute an amount sufficient to avoid imposition of any excise tax under Section 4982 of the Code.
The fund is subject to the provisions of Accounting Standards Codification 740 Income Taxes (ASC 740). ASC 740 sets forth a minimum threshold for financial statement recognition of the benefit of a tax position taken or expected to be taken in a tax return. The fund did not have a liability to record for any unrecognized tax benefits in the accompanying financial statements. No provision has been made for federal taxes on income, capital gains or unrealized appreciation on securities held nor for excise tax on income and capital gains. Each of the fund’s federal tax returns for the prior three fiscal years remains subject to examination by the Internal Revenue Service.
|
| Ohio Tax Exempt Income Fund 37 |
Under the Regulated Investment Company Modernization Act of 2010, the fund will be permitted to carry forward capital losses incurred for an unlimited period and the carry forwards will retain their character as either short-term or long-term capital losses. At May 31, 2020, the fund had the following capital loss carryovers available, to the extent allowed by the Code, to offset future net capital gain, if any:
| | |
| | Loss carryover | |
| Short-term | Long-term | Total |
| $72,339 | $— | $72,339 |
Distributions to shareholders Income dividends are recorded daily by the fund and are paid monthly. Distributions from capital gains, if any, are recorded on the ex-dividend date and paid at least annually. The amount and character of income and gains to be distributed are determined in accordance with income tax regulations which may differ from generally accepted accounting principles. These differences include temporary and/or permanent differences from market discount. Reclassifications are made to the fund’s capital accounts to reflect income and gains available for distribution (or available capital loss carryovers) under income tax regulations. At the close of the reporting period, the fund reclassified $49,540 to increase undistributed net investment income and $49,540 to increase accumulated net realized loss.
Tax cost of investments includes adjustments to net unrealized appreciation (depreciation) which may not necessarily be final tax cost basis adjustments, but closely approximate the tax basis unrealized gains and losses that may be realized and distributed to shareholders. The tax basis components of distributable earnings and the federal tax cost as of the close of the reporting period were as follows:
| |
| Unrealized appreciation | $5,845,148 |
| Unrealized depreciation | (1,003,215) |
| Net unrealized appreciation | 4,841,933 |
| Undistributed ordinary income | 83,228 |
| Undistributed tax-exempt income | 15,780 |
| Capital loss carryforward | (72,339) |
| Cost for federal income tax purposes | $105,171,583 |
Note 2: Management fee, administrative services and other transactions
The fund pays Putnam Management a management fee (based on the fund’s average net assets and computed and paid monthly) at annual rates that may vary based on the average of the aggregate net assets of all open-end mutual funds sponsored by Putnam Management (excluding net assets of funds that are invested in, or that are invested in by, other Putnam funds to the extent necessary to avoid “double counting” of those assets). Such annual rates may vary as follows:
| | | | |
| 0.590% | of the first $5 billion, | | 0.390% | of the next $50 billion, |
| 0.540% | of the next $5 billion, | | 0.370% | of the next $50 billion, |
| 0.490% | of the next $10 billion, | | 0.360% | of the next $100 billion and |
| 0.440% | of the next $10 billion, | | 0.355% | of any excess thereafter. |
For the reporting period, the management fee represented an effective rate (excluding the impact from any expense waivers in effect) of 0.429% of the fund’s average net assets.
Putnam Management has contractually agreed, through September 30, 2021, to waive fees and/or reimburse the fund’s expenses to the extent necessary to limit the cumulative expenses of the fund, exclusive of brokerage, interest, taxes, investment-related expenses, extraordinary expenses, acquired fund fees and expenses and payments under the fund’s investor servicing contract, investment management contract and distribution plans, on a fiscal year-to-date basis to an annual rate of 0.20% of the fund’s average net assets over such fiscal year-to-date period. During the reporting period, the fund’s expenses were not reduced as a result of this limit.
Putnam Investments Limited (PIL), an affiliate of Putnam Management, is authorized by the Trustees to manage a separate portion of the assets of the fund as determined by Putnam Management from time to time. PIL did not manage any portion of the assets of the fund during the reporting period. If Putnam Management were to engage
| |
| 38 Ohio Tax Exempt Income Fund |
the services of PIL, Putnam Management would pay a quarterly sub-management fee to PIL for its services at an annual rate of 0.40% of the average net assets of the portion of the fund managed by PIL.
The fund reimburses Putnam Management an allocated amount for the compensation and related expenses of certain officers of the fund and their staff who provide administrative services to the fund. The aggregate amount of all such reimbursements is determined annually by the Trustees.
Custodial functions for the fund’s assets are provided by State Street. Custody fees are based on the fund’s asset level, the number of its security holdings and transaction volumes.
Putnam Investor Services, Inc., an affiliate of Putnam Management, provides investor servicing agent functions to the fund. Putnam Investor Services, Inc. received fees for investor servicing for class A, class B, class C, class M, and class Y shares that included (1) a per account fee for each direct and underlying non-defined contribution account (retail account) of the fund; (2) a specified rate of the fund’s assets attributable to defined contribution plan accounts; and (3) a specified rate based on the average net assets in retail accounts. Putnam Investor Services, Inc. has agreed that the aggregate investor servicing fees for each fund’s retail and defined contribution accounts for these share classes will not exceed an annual rate of 0.25% of the fund’s average assets attributable to such accounts. Effective November 25, 2019, the fund converted all of its class M shares to class A shares and class M shares were no longer able to be purchased.
Class R6 shares paid a monthly fee based on the average net assets of class R6 shares at an annual rate of 0.05%.
During the reporting period, the expenses for each class of shares related to investor servicing fees were as follows:
| | | | |
| Class A | $64,584 | | Class R6 | 353 |
| Class B | 637 | | Class Y | 10,946 |
| Class C | 4,436 | | Total | $81,145 |
| Class M | 189 | | | |
The fund has entered into expense offset arrangements with Putnam Investor Services, Inc. and State Street whereby Putnam Investor Services, Inc.’s and State Street’s fees are reduced by credits allowed on cash balances. For the reporting period, the fund’s expenses were reduced by $22,764 under the expense offset arrangements.
Each Independent Trustee of the fund receives an annual Trustee fee, of which $91, as a quarterly retainer, has been allocated to the fund, and an additional fee for each Trustees meeting attended. Trustees also are reimbursed for expenses they incur relating to their services as Trustees.
The fund has adopted a Trustee Fee Deferral Plan (the Deferral Plan) which allows the Trustees to defer the receipt of all or a portion of Trustees fees payable on or after July 1, 1995. The deferred fees remain invested in certain Putnam funds until distribution in accordance with the Deferral Plan.
The fund has adopted an unfunded noncontributory defined benefit pension plan (the Pension Plan) covering all Trustees of the fund who have served as a Trustee for at least five years and were first elected prior to 2004. Benefits under the Pension Plan are equal to 50% of the Trustee’s average annual attendance and retainer fees for the three years ended December 31, 2005. The retirement benefit is payable during a Trustee’s lifetime, beginning the year following retirement, for the number of years of service through December 31, 2006. Pension expense for the fund is included in Trustee compensation and expenses in the Statement of operations. Accrued pension liability is included in Payable for Trustee compensation and expenses in the Statement of assets and liabilities. The Trustees have terminated the Pension Plan with respect to any Trustee first elected after 2003.
The fund has adopted distribution plans (the Plans) with respect to the following share classes pursuant to Rule 12b–1 under the Investment Company Act of 1940. The purpose of the Plans is to compensate Putnam Retail Management Limited Partnership, an indirect wholly-owned subsidiary of Putnam Investments, LLC, for services provided and expenses incurred in distributing shares of the fund. The Plans provide payments by the fund to Putnam Retail Management Limited Partnership at an annual rate of up to the following amounts (Maximum %) of the average net assets attributable to each class. The Trustees have approved payment by the fund at the following annual rate (Approved %) of the average net assets attributable to each class. During the reporting period, the class-specific expenses related to distribution fees were as follows:
|
| Ohio Tax Exempt Income Fund 39 |
| | | |
| | Maximum % | Approved % | Amount |
| Class A | 0.35% | * | $198,531 |
| Class B | 1.00% | 0.85% | 7,442 |
| Class C | 1.00% | 1.00% | 61,067 |
| Class M** | 1.00% | 0.50% | 1,287 |
| Total | | | $268,327 |
* Equals the weighted average of (i) 0.20% of the net assets of the fund attributable to class A shares purchased and paid for prior to April 1, 2005 and (ii) 0.25% of all other net assets of the fund attributable to class A shares. Effective July 1, 2020, the Trustees have approved payment by the fund at a rate of 0.25% of all assets attributable to class A shares.
** Effective November 25, 2019, the fund converted all of its class M shares to class A shares and class M shares were no longer able to be purchased.
For the reporting period, Putnam Retail Management Limited Partnership, acting as underwriter, received net commissions of $3,716 and no monies from the sale of class A and class M shares, respectively, and received no monies and $28 in contingent deferred sales charges from redemptions of class B and class C shares, respectively.
A deferred sales charge of up to 1.00% is assessed on certain redemptions of class A shares. For the reporting period, Putnam Retail Management Limited Partnership, acting as underwriter, received no monies on class A redemptions.
Note 3: Purchases and sales of securities
During the reporting period, the cost of purchases and the proceeds from sales, excluding short-term investments, were as follows:
| | |
| | Cost of purchases | Proceeds from sales |
| Investments in securities (Long-term) | $21,018,067 | $20,727,361 |
| U.S. government securities (Long-term) | — | — |
| Total | $21,018,067 | $20,727,361 |
The fund may purchase or sell investments from or to other Putnam funds in the ordinary course of business, which can reduce the fund’s transaction costs, at prices determined in accordance with SEC requirements and policies approved by the Trustees. During the reporting period, purchases or sales of long-term securities from or to other Putnam funds, if any, did not represent more than 5% of the fund’s total cost of purchases and/or total proceeds from sales.
Note 4: Capital shares
At the close of the reporting period, there were an unlimited number of shares of beneficial interest authorized. Transactions, including, if applicable, direct exchanges pursuant to share conversions, in capital shares were as follows:
| | | | |
| | YEAR ENDED 5/31/20 | YEAR ENDED 5/31/19 |
| Class A | Shares | Amount | Shares | Amount |
| Shares sold | 1,160,159 | $10,639,476 | 252,027 | $2,237,179 |
| Shares issued in connection with | | | | |
| reinvestment of distributions | 215,869 | 1,974,002 | 251,518 | 2,224,330 |
| | 1,376,028 | 12,613,478 | 503,545 | 4,461,509 |
| Shares repurchased | (913,628) | (8,330,479) | (2,437,546) | (21,488,246) |
| Net increase (decrease) | 462,400 | $4,282,999 | (1,934,001) | $(17,026,737) |
| |
| 40 Ohio Tax Exempt Income Fund |
| | | | |
| | YEAR ENDED 5/31/20 | YEAR ENDED 5/31/19 |
| Class B | Shares | Amount | Shares | Amount |
| Shares sold | 1 | $6 | 5,005 | $43,955 |
| Shares issued in connection with | | | | |
| reinvestment of distributions | 1,736 | 15,855 | 2,710 | 23,932 |
| | 1,737 | 15,861 | 7,715 | 67,887 |
| Shares repurchased | (39,831) | (362,496) | (32,679) | (289,230) |
| Net decrease | (38,094) | $(346,635) | (24,964) | $(221,343) |
| |
| | YEAR ENDED 5/31/20 | YEAR ENDED 5/31/19 |
| Class C | Shares | Amount | Shares | Amount |
| Shares sold | 33,612 | $307,829 | 45,362 | $403,628 |
| Shares issued in connection with | | | | |
| reinvestment of distributions | 10,150 | 92,845 | 14,928 | 131,980 |
| | 43,762 | 400,674 | 60,290 | 535,608 |
| Shares repurchased | (180,171) | (1,645,833) | (305,088) | (2,698,010) |
| Net decrease | (136,409) | $(1,245,159) | (244,798) | $(2,162,402) |
| |
| | YEAR ENDED 5/31/20 * | YEAR ENDED 5/31/19 |
| Class M | Shares | Amount | Shares | Amount |
| Shares sold | — | $— | — | $— |
| Shares issued in connection with | | | | |
| reinvestment of distributions | 520 | 4,766 | 1,346 | 11,913 |
| | 520 | 4,766 | 1,346 | 11,913 |
| Shares repurchased | (58,003) | (530,149) | (2,000) | (17,395) |
| Net decrease | (57,483) | $(525,383) | (654) | $(5,482) |
| |
| | YEAR ENDED 5/31/20 | YEAR ENDED 5/31/19 |
| Class R6 | Shares | Amount | Shares | Amount |
| Shares sold | 26,353 | $240,717 | 77,287 | $675,532 |
| Shares issued in connection with | | | | |
| reinvestment of distributions | 2,052 | 18,800 | 1,168 | 10,385 |
| | 28,405 | 259,517 | 78,455 | 685,917 |
| Shares repurchased | (17,832) | (162,124) | (9,355) | (81,962) |
| Net increase | 10,573 | $97,393 | 69,100 | $603,955 |
| |
| | YEAR ENDED 5/31/20 | YEAR ENDED 5/31/19 |
| Class Y | Shares | Amount | Shares | Amount |
| Shares sold | 235,184 | $2,145,771 | 893,859 | $7,880,339 |
| Shares issued in connection with | | | | |
| reinvestment of distributions | 40,089 | 367,174 | 41,432 | 367,083 |
| | 275,273 | 2,512,945 | 935,291 | 8,247,422 |
| Shares repurchased | (382,112) | (3,448,786) | (654,961) | (5,761,518) |
| Net increase (decrease) | (106,839) | $(935,841) | 280,330 | $2,485,904 |
* Effective November 25, 2019, the fund converted all of its class M shares to class A shares and class M shares were no longer able to be purchased.
|
| Ohio Tax Exempt Income Fund 41 |
Note 5: Affiliated transactions
Transactions during the reporting period with any company which is under common ownership or control were as follows:
| | | | | |
| | | | | | Shares |
| | | | | | outstanding |
| | | | | | and fair |
| | Fair value as | Purchase | Sale | Investment | value as |
| Name of affiliate | of 5/31/19 | cost | proceeds | income | of 5/31/20 |
| Short-term investments | | | | | |
| Putnam Short Term | | | | | |
| Investment Fund* | $— | $20,362,240 | $18,588,459 | $28,578 | $1,773,781 |
| Total Short-term | | | | | |
| investments | $— | $20,362,240 | $18,588,459 | $28,578 | $1,773,781 |
* Management fees charged to Putnam Short Term Investment Fund have been waived by Putnam Management. There were no realized or unrealized gains or losses during the period.
Note 6: Market, credit and other risks
In the normal course of business, the fund trades financial instruments and enters into financial transactions where risk of potential loss exists due to changes in the market (market risk) or failure of the contracting party to the transaction to perform (credit risk). The fund may be exposed to additional credit risk that an institution or other entity with which the fund has unsettled or open transactions will default. The fund focuses a majority of its investments in the state of Ohio and may be affected by economic and political developments in that state.
On July 27, 2017, the United Kingdom’s Financial Conduct Authority (“FCA”), which regulates LIBOR, announced a desire to phase out the use of LIBOR by the end of 2021. LIBOR has historically been a common benchmark interest rate index used to make adjustments to variable-rate loans. It is used throughout global banking and financial industries to determine interest rates for a variety of financial instruments and borrowing arrangements. The transition process might lead to increased volatility and illiquidity in markets that currently rely on LIBOR to determine interest rates. It could also lead to a reduction in the value of some LIBOR-based investments and reduce the effectiveness of new hedges placed against existing LIBOR-based investments. While some LIBOR-based instruments may contemplate a scenario where LIBOR is no longer available by providing for an alternative rate-setting methodology, not all may have such provisions and there may be significant uncertainty regarding the effectiveness of any such alternative methodologies. Since the usefulness of LIBOR as a benchmark could deteriorate during the transition period, these effects could occur prior to the end of 2021.
Beginning in January 2020, global financial markets have experienced, and may continue, to experience significant volatility resulting from the spread of a virus known as COVID–19. The outbreak of COVID–19 has resulted in travel and border restrictions, quarantines, supply chain disruptions, lower consumer demand, and general market uncertainty. The effects of COVID–19 have adversely affected, and may continue to adversely affect, the global economy, the economies of certain nations, and individual issuers, all of which may negatively impact the fund’s performance.
Note 7: Summary of derivative activity
The volume of activity for the reporting period for any derivative type that was held during the period is listed below and was based on an average of the holdings at the end of each fiscal quarter:
| |
| Futures contracts (number of contracts) | 3 |
| OTC interest rate swap contracts (notional) | $5,900,000 |
| OTC total return swap contracts (notional) | $1,300,000 |
| |
| 42 Ohio Tax Exempt Income Fund |
The following is a summary of the fair value of derivative instruments as of the close of the reporting period:
| | | | |
| Fair value of derivative instruments as of the close of the reporting period | |
| | ASSET DERIVATIVES | LIABILITY DERIVATIVES |
| Derivatives not | | | | |
| accounted for as | Statement of | | Statement of | |
| hedging instruments | assets and | | assets and | |
| under ASC 815 | liabilities location | Fair value | liabilities location | Fair value |
| Interest rate contracts | Receivables | $35,256 | Payables | $— |
| Total | | $35,256 | | $— |
The following is a summary of realized and change in unrealized gains or losses of derivative instruments in the Statement of operations for the reporting period (Note 1):
| | | |
| Amount of realized gain or (loss) on derivatives recognized in net gain or (loss) on investments | |
| Derivatives not accounted for as hedging | | | |
| instruments under ASC 815 | Futures | Swaps | Total |
| Interest rate contracts | $(91,830) | $27,988 | $(63,842) |
| Total | $(91,830) | $27,988 | $(63,842) |
| |
| Change in unrealized appreciation or (depreciation) on derivatives recognized in net gain or (loss) |
| on investments | | | |
| Derivatives not accounted for as | | | |
| hedging instruments under ASC 815 | Swaps | | Total |
| Interest rate contracts | $35,256 | | $35,256 |
| Total | $35,256 | | $35,256 |
|
| Ohio Tax Exempt Income Fund 43 |
Note 8: Offsetting of financial and derivative assets and liabilities
The following table summarizes any derivatives, repurchase agreements and reverse repurchase agreements, at the end of the reporting period, that are subject to an enforceable master netting agreement or similar agreement. For securities lending transactions or borrowing transactions associated with securities sold short, if any, see Note 1. For financial reporting purposes, the fund does not offset financial assets and financial liabilities that are subject to the master netting agreements in the Statement of assets and liabilities.
| | |
| | Citibank, N.A. | Total |
| Assets: | | |
| OTC Total return swap contracts*# | $35,256 | $35,256 |
| Total Assets | $35,256 | $35,256 |
| Liabilities: | | |
| OTC Total return swap contracts*# | — | — |
| Total Liabilities | $— | $— |
| Total Financial and Derivative Net Assets | $35,256 | $35,256 |
| Total collateral received (pledged)†## | $— | |
| Net amount | $35,256 | |
| Controlled collateral received (including TBA | | |
| commitments)** | $— | $— |
| Uncontrolled collateral received | $— | $— |
| Collateral (pledged) (including TBA commitments)** | $— | $— |
* Excludes premiums, if any. Included in unrealized appreciation and depreciation on OTC swap contracts on the Statement of assets and liabilities.
** Included with Investments in securities on the Statement of assets and liabilities.
† Additional collateral may be required from certain brokers based on individual agreements.
# Covered by master netting agreement (Note 1).
## Any over-collateralization of total financial and derivative net assets is not shown. Collateral may include amounts related to unsettled agreements.
|
| 44 Ohio Tax Exempt Income Fund |
Federal tax information (Unaudited)
The fund has designated 99.08% of dividends paid from net investment income during the reporting period as tax exempt for Federal income tax purposes.
The Form 1099 that will be mailed to you in January 2021 will show the tax status of all distributions paid to your account in calendar 2020.
|
| Ohio Tax Exempt Income Fund 45 |

| |
| 46 Ohio Tax Exempt Income Fund |

* Mr. Reynolds is an “interested person” (as defined in the Investment Company Act of 1940) of the fund and Putnam Investments. He is President and Chief Executive Officer of Putnam Investments, as well as the President of your fund and each of the other Putnam funds.
The address of each Trustee is 100 Federal Street, Boston, MA 02110.
As of May 31, 2020, there were 100 Putnam funds. All Trustees serve as Trustees of all Putnam funds.
Each Trustee serves for an indefinite term, until his or her resignation, retirement at age 75, removal, or death.
|
| Ohio Tax Exempt Income Fund 47 |
Officers
In addition to Robert L. Reynolds, the other officers of the fund are shown below:
| |
| Robert T. Burns (Born 1961) | Richard T. Kircher (Born 1962) |
| Vice President and Chief Legal Officer | Vice President and BSA Compliance Officer |
| Since 2011 | Since 2019 |
| General Counsel, Putnam Investments, | Assistant Director, Operational Compliance, Putnam |
| Putnam Management, and Putnam Retail Management | Investments and Putnam Retail Management |
| |
| James F. Clark (Born 1974) | Susan G. Malloy (Born 1957) |
| Vice President and Chief Compliance Officer | Vice President and Assistant Treasurer |
| Since 2016 | Since 2007 |
| Chief Compliance Officer and Chief Risk Officer, | Head of Accounting and Middle Office Services, |
| Putnam Investments and Chief Compliance Officer, | Putnam Investments and Putnam Management |
| Putnam Management | |
| | Denere P. Poulack (Born 1968) |
| Nancy E. Florek (Born 1957) | Assistant Vice President, Assistant Clerk, |
| Vice President, Director of Proxy Voting and Corporate | and Assistant Treasurer |
| Governance, Assistant Clerk, and Assistant Treasurer | Since 2004 |
| Since 2000 | |
| | Janet C. Smith (Born 1965) |
| Michael J. Higgins (Born 1976) | Vice President, Principal Financial Officer, Principal |
| Vice President, Treasurer, and Clerk | Accounting Officer, and Assistant Treasurer |
| Since 2010 | Since 2007 |
| | Head of Fund Administration Services, |
| Jonathan S. Horwitz (Born 1955) | Putnam Investments and Putnam Management |
| Executive Vice President, Principal Executive Officer, | |
| and Compliance Liaison | Mark C. Trenchard (Born 1962) |
| Since 2004 | Vice President |
| | Since 2002 |
| | Director of Operational Compliance, Putnam |
| | Investments and Putnam Retail Management |
The principal occupations of the officers for the past five years have been with the employers as shown above, although in some cases they have held different positions with such employers. The address of each officer is 100 Federal Street, Boston, MA 02110.
| |
| 48 Ohio Tax Exempt Income Fund |
Fund information
Founded over 80 years ago, Putnam Investments was built around the concept that a balance between risk and reward is the hallmark of a well-rounded financial program. We manage funds across income, value, blend, growth, sustainable, asset allocation, absolute return, and global sector categories.
| | |
| Investment Manager | Trustees | Michael J. Higgins |
| Putnam Investment | Kenneth R. Leibler, Chair | Vice President, Treasurer, |
| Management, LLC | Liaquat Ahamed | and Clerk |
| 100 Federal Street | Ravi Akhoury | |
| Boston, MA 02110 | Barbara M. Baumann | Jonathan S. Horwitz |
| | Katinka Domotorffy | Executive Vice President, |
| Investment Sub-Advisor | Catharine Bond Hill | Principal Executive Officer, |
| Putnam Investments Limited | Paul L. Joskow | and Compliance Liaison |
| 16 St James’s Street | George Putnam, III | |
| London, England SW1A 1ER | Robert L. Reynolds | Richard T. Kircher |
| | Manoj P. Singh | Vice President and BSA |
| Marketing Services | Mona K. Sutphen | Compliance Officer |
| Putnam Retail Management | | |
| 100 Federal Street | Officers | Susan G. Malloy |
| Boston, MA 02110 | Robert L. Reynolds | Vice President and |
| President | Assistant Treasurer |
| Custodian | | |
| State Street Bank | Robert T. Burns | Denere P. Poulack |
| and Trust Company | Vice President and | Assistant Vice President, Assistant |
| Chief Legal Officer | Clerk, and Assistant Treasurer |
| Legal Counsel | | |
| Ropes & Gray LLP | James F. Clark | Janet C. Smith |
| Vice President, Chief Compliance | Vice President, |
| Independent Registered Public | Officer, and Chief Risk Officer | Principal Financial Officer, |
| Accounting Firm | | Principal Accounting Officer, |
| PricewaterhouseCoopers LLP | Nancy E. Florek | and Assistant Treasurer |
| Vice President, Director of | |
| | Proxy Voting and Corporate | Mark C. Trenchard |
| | Governance, Assistant Clerk, | Vice President |
| | and Assistant Treasurer | |
This report is for the information of shareholders of Putnam Ohio Tax Exempt Income Fund. It may also be used as sales literature when preceded or accompanied by the current prospectus, the most recent copy of Putnam’s Quarterly Performance Summary, and Putnam’s Quarterly Ranking Summary. For more recent performance, please visit putnam.com. Investors should carefully consider the investment objectives, risks, charges, and expenses of a fund, which are described in its prospectus. For this and other information or to request a prospectus or summary prospectus, call 1- 800-225-1581 toll free. Please read the prospectus carefully before investing. The fund’s Statement of Additional Information contains additional information about the fund’s Trustees and is available without charge upon request by calling 1-800-225-1581.

| |
| (a) The fund's principal executive, financial and accounting officers are employees of Putnam Investment Management, LLC, the Fund's investment manager. As such they are subject to a comprehensive Code of Ethics adopted and administered by Putnam Investments which is designed to protect the interests of the firm and its clients. The Fund has adopted a Code of Ethics which incorporates the Code of Ethics of Putnam Investments with respect to all of its officers and Trustees who are employees of Putnam Investment Management, LLC. For this reason, the Fund has not adopted a separate code of ethics governing its principal executive, financial and accounting officers. |
| |
| (c) In October 2019, the Code of Ethics of Putnam Investments was amended. The key changes to the Code of Ethics are as follows: (i) Employee notification to the Code of Ethics Officer before acting as a public official for any government entity (ii) Clarifying changes to the Insider Trading provisions and to the rules for trading in securities issued by Great-West Lifeco. |
| |
| Item 3. Audit Committee Financial Expert: |
| |
| The Funds' Audit, Compliance and Distributions Committee is comprised solely of Trustees who are “independent” (as such term has been defined by the Securities and Exchange Commission (“SEC”) in regulations implementing Section 407 of the Sarbanes-Oxley Act (the “Regulations”)). The Trustees believe that each member of the Audit, Compliance and Distributions Committee also possesses a combination of knowledge and experience with respect to financial accounting matters, as well as other attributes, that qualifies him or her for service on the Committee. In addition, the Trustees have determined that each of Ms. Baumann, Dr. Joskow, and Mr. Singh qualifies as an “audit committee financial expert” (as such term has been defined by the Regulations) based on their review of his or her pertinent experience and education; in the case of Dr. Joskow, including his experience serving on the audit committees of several public companies and institutions and his education and experience as an economist who studies companies and industries, routinely using public company financial statements in his research. The SEC has stated, and the funds' amended and restated agreement and Declaration of Trust provides, that the designation or identification of a person as an audit committee financial expert pursuant to this Item 3 of Form N-CSR does not impose on such person any duties, obligations or liability that are greater than the duties, obligations and liability imposed on such person as a member of the Audit, Compliance and Distributions Committee and the Board of Trustees in the absence of such designation or identification |
| |
| Item 4. Principal Accountant Fees and Services: |
| |
| The following table presents fees billed in each of the last two fiscal years for services rendered to the fund by the fund's independent auditor: |
| | | | | |
| Fiscal year ended | Audit Fees | Audit-Related Fees | Tax Fees | All Other Fees |
|
|
| | | | | |
| May 31, 2020 | $47,037 | $ — | $12,430 | $ — |
| May 31, 2019 | $47,187 | $ — | $12,430 | $ — |
| |
| For the fiscal years ended May 31, 2020 and May 31, 2019, the fund's independent auditor billed aggregate non-audit fees in the amounts of $296,146 and $559,414 respectively, to the fund, Putnam Management and any entity controlling, controlled by or under common control with Putnam Management that provides ongoing services to the fund. |
| |
| Audit Fees represent fees billed for the fund's last two fiscal years relating to the audit and review of the financial statements included in annual reports and registration statements, and other services that are normally provided in connection with statutory and regulatory filings or engagements. |
| |
| Audit-Related Fees represent fees billed in the fund's last two fiscal years for services traditionally performed by the fund's auditor, including accounting consultation for proposed transactions or concerning financial accounting and reporting standards and other audit or attest services not required by statute or regulation. |
| |
| Tax Fees represent fees billed in the fund's last two fiscal years for tax compliance, tax planning and tax advice services. Tax planning and tax advice services include assistance with tax audits, employee benefit plans and requests for rulings or technical advice from taxing authorities. |
| |
| Pre-Approval Policies of the Audit, Compliance and Distributions Committee. The Audit, Compliance and Distributions Committee of the Putnam funds has determined that, as a matter of policy, all work performed for the funds by the funds' independent auditors will be pre-approved by the Committee itself and thus will generally not be subject to pre-approval procedures. |
| |
| The Audit, Compliance and Distributions Committee also has adopted a policy to pre-approve the engagement by Putnam Management and certain of its affiliates of the funds' independent auditors, even in circumstances where pre-approval is not required by applicable law. Any such requests by Putnam Management or certain of its affiliates are typically submitted in writing to the Committee and explain, among other things, the nature of the proposed engagement, the estimated fees, and why this work should be performed by that particular audit firm as opposed to another one. In reviewing such requests, the Committee considers, among other things, whether the provision of such services by the audit firm are compatible with the independence of the audit firm. |
| |
| The following table presents fees billed by the fund's independent auditor for services required to be approved pursuant to paragraph (c)(7)(ii) of Rule 2–01 of Regulation S-X. |
| | | | | |
| Fiscal year ended | Audit-Related Fees | Tax Fees | All Other Fees | Total Non-Audit Fees |
|
|
| May 31, 2020 | $ — | $283,716 | $ — | $ — |
| May 31, 2019 | $ — | $546,984 | $ — | $ — |
| |
| Item 5. Audit Committee of Listed Registrants |
| |
| Item 6. Schedule of Investments: |
| |
| The registrant's schedule of investments in unaffiliated issuers is included in the report to shareholders in Item 1 above. |
| |
| Item 7. Disclosure of Proxy Voting Policies and Procedures For Closed-End Management Investment Companies: |
| |
| Item 8. Portfolio Managers of Closed-End Investment Companies |
| |
| Item 9. Purchases of Equity Securities by Closed-End Management Investment Companies and Affiliated Purchasers: |
| |
| Item 10. Submission of Matters to a Vote of Security Holders: |
| |
| Item 11. Controls and Procedures: |
| |
| (a) The registrant's principal executive officer and principal financial officer have concluded, based on their evaluation of the effectiveness of the design and operation of the registrant's disclosure controls and procedures as of a date within 180 days of the filing date of this report, that the design and operation of such procedures are generally effective to provide reasonable assurance that information required to be disclosed by the registrant in this report is recorded, processed, summarized and reported within the time periods specified in the Commission's rules and forms. |
| |
| (b) Changes in internal control over financial reporting: Not applicable |
| |
| Item 12. Disclosures of Securities Lending Activities for Closed-End Management Investment Companies: |
| |
| (a)(1) The Code of Ethics of The Putnam Funds, which incorporates the Code of Ethics of Putnam Investments, is filed herewith. |
| |
| Pursuant to the requirements of the Securities Exchange Act of 1934 and the Investment Company Act of 1940, the registrant has duly caused this report to be signed on its behalf by the undersigned, thereunto duly authorized. |
| |
| Putnam Ohio Tax Exempt Income Fund |
| |
| By (Signature and Title): |
| |
| /s/ Janet C. Smith
Janet C. Smith
Principal Accounting Officer
|
| |
| Pursuant to the requirements of the Securities Exchange Act of 1934 and the Investment Company Act of 1940, this report has been signed below by the following persons on behalf of the registrant and in the capacities and on the dates indicated. |
| |
| By (Signature and Title): |
| |
| /s/ Jonathan S. Horwitz
Jonathan S. Horwitz
Principal Executive Officer
|
| |
| By (Signature and Title): |
| |
| /s/ Janet C. Smith
Janet C. Smith
Principal Financial Officer
|