| | |
| UNITED STATES
SECURITIES AND EXCHANGE COMMISSION |
| | |
| CERTIFIED SHAREHOLDER REPORT OF REGISTERED
MANAGEMENT INVESTMENT COMPANIES
|
| | |
| Investment Company Act file number: | (811-04528) |
| | |
| Exact name of registrant as specified in charter: | Putnam Ohio Tax Exempt Income Fund |
| | |
| Address of principal executive offices: | One Post Office Square, Boston, Massachusetts 02109 |
| | |
| Name and address of agent for service: | Robert T. Burns, Vice President
One Post Office Square
Boston, Massachusetts 02109 |
| | |
| Copy to: | Bryan Chegwidden, Esq.
Ropes & Gray LLP
1211 Avenue of the Americas
New York, New York 10036 |
| | |
| Registrant's telephone number, including area code: | (617) 292-1000 |
| | |
| Date of fiscal year end: | May 31, 2018 |
| | |
| Date of reporting period : | June 1, 2017 — May 31, 2018 |
| | |
|
Item 1. Report to Stockholders: | |
| | |
| The following is a copy of the report transmitted to stockholders pursuant to Rule 30e-1 under the Investment Company Act of 1940: | |
Putnam Ohio
Tax Exempt
Income Fund
Annual report
5 | 31 | 18
Consider these risks before investing: Bond prices may fall or fail to rise over time for several reasons, including general financial market conditions, changing market perceptions (including perceptions about the risk of default and expectations about monetary policy or interest rates) changes in government intervention in the financial markets, and factors related to a specific issuer or industry. These and other factors may lead to increased volatility and reduced liquidity in the fund’s portfolio holdings. The fund’s performance will be closely tied to the economic and political conditions in Ohio and can be more volatile than the performance of a more geographically diversified fund. Capital gains, if any, are taxed at the federal and, in most cases, state levels. For some investors, investment income may be subject to the federal alternative minimum tax. Bond investments are subject to interest-rate risk (the risk of bond prices falling if interest rates rise) and credit risk (the risk of an issuer defaulting on interest or principal payments). Interest-rate risk is greater for longer-term bonds, and credit risk is greater for below-investment-grade bonds. Unlike bonds, funds that invest in bonds have fees and expenses. Tax-exempt bonds may be issued under the Internal Revenue Code only by limited types of issuers for limited types of projects. As a result, the fund’s investments may be focused in certain market segments and be more vulnerable to fluctuations in the values of the securities it holds than a more broadly invested fund. Interest the fund receives might be taxable. You can lose money by investing in the fund.
Message from the Trustees
July 13, 2018
Dear Fellow Shareholder:
During the first half of 2018, conditions became more challenging for global financial markets. After an extended period of record advances and low volatility, a sharp downturn early in the year pushed the U.S. market into a brief correction. The market has since rallied, but both stocks and bonds have been more volatile, due in part to uncertainty surrounding trade policy and U.S. interest rates. Navigating a change in market trends is nothing new to Putnam’s experienced investment professionals, who continue to monitor risks and seek opportunities.
We would like to take this opportunity to extend our thanks to Jameson A. Baxter, who retired from her position as Chair of your Board of Trustees on June 30, 2018. It is hard to express in a few words the extent of Jamie’s commitment to protecting the interests of Putnam shareholders like you. In addition to her professional and directorship experience, Jamie brought intelligence, insight, and compassion to a board she served for decades. Jamie began as a Trustee in 1994, served as Vice Chair for six years, and became Chair in 2011. We are also pleased to announce the appointment of Kenneth R. Leibler as your new Board of Trustees Chair. Ken became a Trustee in 2006, has served as Vice Chair since 2016, and now leads the Board in overseeing your fund and protecting your interests.
Thank you for investing with Putnam.


Municipal bonds finance important public projects, such as schools, roads, and hospitals. The bonds are backed by either the issuing city, town, or other government entity or by revenues collected from usage fees.
However, unlike U.S. Treasuries or corporate bonds, the interest paid on municipal bonds is generally free from federal income taxes. Moreover, Ohio residents generally pay no state income taxes on distributions paid from municipal bonds issued in the Buckeye State. That can make municipal bonds particularly attractive to investors subject to higher personal income tax rates.
|
| 2 Ohio Tax Exempt Income Fund |
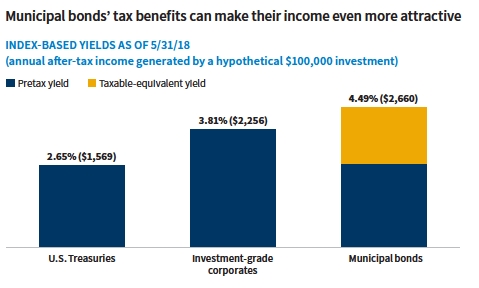
Source: Putnam, as of 5/31/18. Past performance is no guarantee of future results. Yields for U.S. Treasuries, investment-grade corporates, and municipal bonds are represented by the average “yield to worst” — a calculation of the lowest possible yield generated without defaulting — of the Bloomberg Barclays U.S. Treasury Index, an unmanaged index of U.S. dollar-denominated, fixed-rate, nominal debt issued by the U.S. Treasury; the Bloomberg Barclays U.S. Credit Index, an unmanaged index of U.S. dollar-denominated, investment-grade, fixed-rate, taxable corporate and government related bonds; and the Bloomberg Barclays Municipal Bond Index, an unmanaged index of long-term fixed-rate investment-grade tax-exempt bonds, respectively. You cannot invest directly in an index. Bond investments are subject to interest-rate risk (the risk of bond prices falling if interest rates rise) and credit risk (the risk of an issuer defaulting on interest or principal payments). Interest-rate risk is greater for longer-term bonds, and credit risk is greater for below-investment-grade bonds. Income from municipal bonds may be subject to the alternative minimum tax. Taxable equivalent yield and annual after-tax income are based on a 40.80% federal income tax rate. This rate reflects the Tax Cuts and Jobs Act of 2017 and includes the 3.80% Medicare surtax.
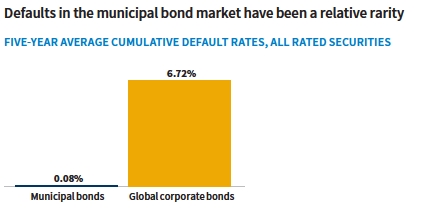
Source: Moody’s Investor Services, Annual U.S. Municipal Bond Defaults and Recoveries, 1970–2016 (June 2017). Most recent data available.
|
| Ohio Tax Exempt Income Fund 3 |
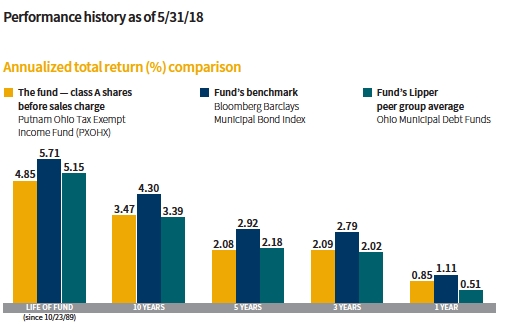
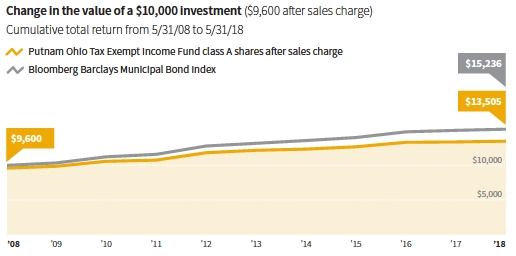
Current performance may be lower or higher than the quoted past performance, which cannot guarantee future results. Share price, principal value, and return will fluctuate, and you may have a gain or a loss when you sell your shares. Performance of class A shares assumes reinvestment of distributions and does not account for taxes. Fund returns in the bar chart do not reflect a sales charge of 4.00%; had they, returns would have been lower. See below and pages 9–12 for additional performance information. For a portion of the periods, the fund had expense limitations, without which returns would have been lower. To obtain the most recent month-end performance, visit putnam.com.
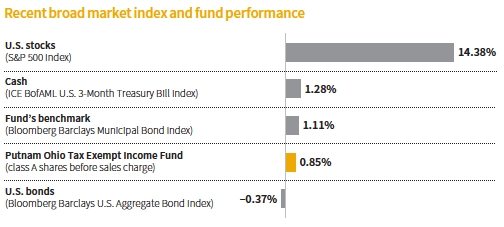
This comparison shows your fund’s performance in the context of broad market indexes for the 12 months ended 5/31/18. See above and pages 9–12 for additional fund performance information. Index descriptions can be found on pages 14–15.
|
| 4 Ohio Tax Exempt Income Fund |


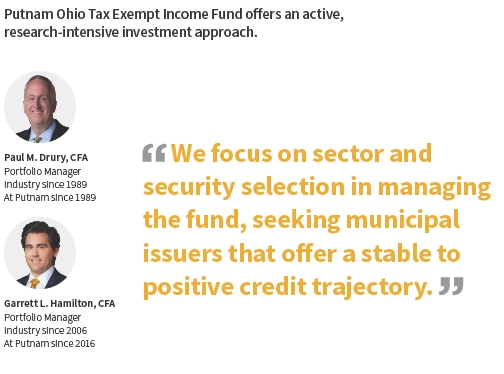
Paul has a B.A. from Suffolk University. He has been in the investment industry since he joined Putnam in 1989.
In addition to Paul, Garrett L. Hamilton, CFA, is a Portfolio Manager of the fund.
Paul, how was the market for municipal bonds during the reporting period?
Volatility in the municipal bond market picked up in the fall of 2017, as investors absorbed the changing details of the proposed tax legislation. With the passage of the Tax Cuts and Jobs Act in December 2017, which eliminated advanced refundings, bond issuers rushed to issue new deals before the legislation took effect in 2018, resulting in heavier near-term municipal bond supply. Total municipal bond new-issue volume for December 2017 was $62.5 billion — surpassing the previous record of $52.7 billion in December 1985, which was just before the last comprehensive tax overhaul took effect. However, the flood of new issuance was well received by investors, and the municipal bond market rallied as strong demand helped buoy prices.
The Federal Reserve announced three interest-rate hikes during the period, raising the federal funds rate in June and December 2017 and in March 2018. At the end of the period, the federal funds rate stood at a target range of 1.50% to 1.75%. Rising U.S. Treasury rates weighed on municipal bond prices, but the asset class still delivered positive
|
| Ohio Tax Exempt Income Fund 5 |
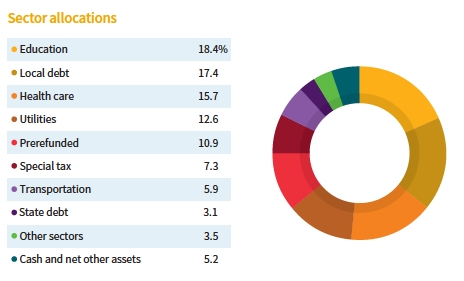
Allocations are shown as a percentage of the fund’s net assets as of 5/31/18. Cash and net other assets, if any, represent the market value weights of cash, derivatives, short-term securities, and other unclassified assets in the portfolio. Summary information may differ from the information in the portfolio schedule notes included in the financial statements due to the inclusion of derivative securities, any interest accruals, the use of different classifications of securities for presentation purposes, and rounding. Holdings and allocations may vary over time.
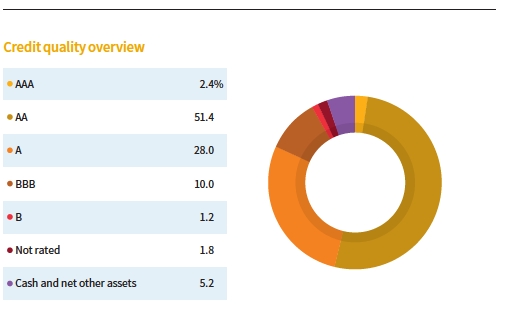
Credit qualities are shown as a percentage of the fund’s net assets as of 5/31/18. A bond rated BBB or higher (SP-3 or higher, for short-term debt) is considered investment grade. This chart reflects the highest security rating provided by one or more of Standard & Poor’s, Moody’s, and Fitch. Ratings may vary over time.
Cash and net other assets, if any, represent the market value weights of cash, derivatives, and short-term securities in the portfolio. The fund itself has not been rated by an independent rating agency.
|
| 6 Ohio Tax Exempt Income Fund |
performance — outperforming the broader fixed-income markets, as measured by the Bloomberg Barclays U.S. Aggregate Bond Index, which posted a negative result for the period. [Bond prices generally fall as rates rise.] We attribute the municipal bond market’s better relative performance to the positive technical tailwind provided by the new tax legislation. The new tax law reduced or eliminated a number of deductions, which has made the tax-exempt status of municipal bonds more attractive to retail buyers, especially in high-tax states. At the same time, the legislation disallowed advanced refundings, which has significantly reduced new-issue supply.
How did the fund perform during the reporting period?
For the 12 months ended May 31, 2018, the fund underperformed its benchmark, the Bloomberg Barclays Municipal Bond Index, but outperformed the average return of its Lipper peer group, Ohio Municipal Debt Funds.
What was your investment strategy in this environment?
Given our outlook for interest rates to trend higher, the fund began the period with more of a barbell approach to structuring the portfolio — overweighting short-term bonds, underweighting intermediate-term bonds with maturities of 5 to 10 years, and overweighting bonds with maturities of 11 to 16 years. However, with the flattening of the yield curve that materialized as the period progressed, we began steering the portfolio away from the short and long ends of the curve and focusing more on bonds with maturities of 15 to 20 years where we saw better value.
Duration positioning, which affects the portfolio’s sensitivity to interest rates, was generally neutral relative to the benchmark index. From a credit-quality standpoint, the fund held an overweight exposure to higher-quality bonds rated A and BBB. From a sector-positioning perspective, we placed greater focus on higher education, continuing-care retirement facility, and state- and local-backed bonds relative to the fund’s Lipper group. This strategy was positive for performance results.

We maintained an underweight position in Puerto Rico-based issuers relative to the fund’s Lipper peers. Puerto Rico’s current economic and financial situation remains extremely difficult and could further challenge the debt-restructuring process, in our view. However, this underweight exposure aided performance, as Puerto Rico debt generally underperformed during the period.
We continue to have a constructive outlook on credit fundamentals. Historically, municipal bonds have lower default rates and higher recoveries than do similar-rated corporate bonds. Technicals remain positive for the front end of the yield curve, and valuations are reasonable, in our view. That said, with the Fed actively hiking short-term interest rates, our duration positioning has been somewhat cautious.
What is your outlook for interest rates in the coming months?
Jerome Powell was sworn in as the new Federal Reserve chair on February 5, 2018. Investors generally believe that Chairman Powell will implement the plan laid out by his predecessor, Janet Yellen, for gradual rate increases. At the Fed’s first meeting under Chairman Powell in March 2018, the central bank reiterated its plan for three interest-rate hikes this year but hinted that it would be open to the possibility of a fourth hike if necessary to keep the U.S. economy from overheating. The Fed also revised its outlook to three rate hikes in 2019 instead of two.
|
| Ohio Tax Exempt Income Fund 7 |
Just after the close of the period on June 13, 2018, the Fed raised its benchmark rate by a quarter percentage point to a target range of 1.75% to 2.00%. In its statement, the Fed upgraded its outlook for U.S. economic growth from “moderate” to “rising at a solid rate.” Noting that unemployment and inflation remain low, the central bank abandoned its pledge to keep rates low “for some time” and signaled that two more rate increases were likely this year to foster the expansion.
We believe the U.S. economy will maintain its upward trajectory, supported by stronger consumer and construction spending, and the labor market will continue tightening. This path should allow the Fed to continue normalizing interest rates. In our view, this scenario will likely lead to short-term rates rising more than long-term rates. We expect the Fed to deliver two more rate hikes during the balance of 2018, and we anticipate that the Fed will continue reducing its balance sheet as planned.
Broadly speaking, the municipal bond market continues to adjust to fluctuating supply and demand conditions created by the new tax legislation. We believe municipal bonds offer a high-quality, low-default investment option for investors seeking attractive tax-free income and diversification opportunities.
Thank you, Paul, for your time and insights today.
The views expressed in this report are exclusively those of Putnam Management and are subject to change. They are not meant as investment advice.
Please note that the holdings discussed in this report may not have been held by the fund for the entire period. Portfolio composition is subject to review in accordance with the fund’s investment strategy and may vary in the future. Current and future portfolio holdings are subject to risk. Statements in the Q&A concerning the fund’s performance or portfolio composition relative to those of the fund’s Lipper peer group may reference information produced by Lipper Inc. or through a third party.
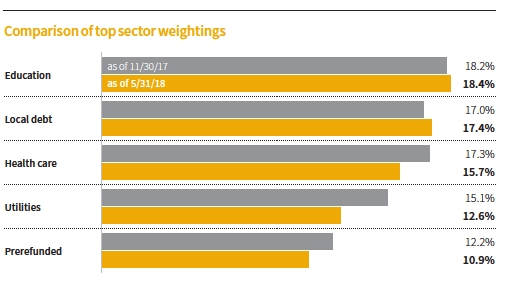
This chart shows how the fund’s top weightings have changed over the past six months. Allocations are shown as a percentage of the fund’s net assets. Current period summary information may differ from the information in the portfolio schedule notes included in the financial statements due to the inclusion of derivative securities, any interest accruals, the use of different classifications of securities for presentation purposes, and rounding. Holdings and allocations may vary over time.
|
| 8 Ohio Tax Exempt Income Fund |
Your fund’s performance
This section shows your fund’s performance, price, and distribution information for periods ended May 31, 2018, the end of its most recent fiscal year. In accordance with regulatory requirements for mutual funds, we also include performance information as of the most recent calendar quarter-end and expense information taken from the fund’s current prospectus. Performance should always be considered in light of a fund’s investment strategy. Data represent past performance. Past performance does not guarantee future results. More recent returns may be less or more than those shown. Investment return and principal value will fluctuate, and you may have a gain or a loss when you sell your shares. Performance information does not reflect any deduction for taxes a shareholder may owe on fund distributions or on the redemption of fund shares. For the most recent month-end performance, please visit the Individual Investors section at putnam.com or call Putnam at 1-800-225-1581. Class R6 and Y shares are not available to all investors. See the Terms and definitions section in this report for definitions of the share classes offered by your fund.
Fund performance Total return for periods ended 5/31/18
| | | | | | | | |
| | Annual | | | | | | | |
| | average | | Annual | | Annual | | Annual | |
| | (life of fund) | 10 years | average | 5 years | average | 3 years | average | 1 year |
| Class A (10/23/89) | | | | | | | | |
| Before sales charge | 4.85% | 40.68% | 3.47% | 10.85% | 2.08% | 6.40% | 2.09% | 0.85% |
| After sales charge | 4.71 | 35.05 | 3.05 | 6.41 | 1.25 | 2.14 | 0.71 | –3.19 |
| Class B (7/15/93) | | | | | | | | |
| Before CDSC | 4.63 | 33.52 | 2.93 | 7.45 | 1.45 | 4.42 | 1.45 | 0.21 |
| After CDSC | 4.63 | 33.52 | 2.93 | 5.55 | 1.09 | 1.49 | 0.50 | –4.69 |
| Class C (10/3/06) | | | | | | | | |
| Before CDSC | 4.58 | 30.16 | 2.67 | 6.63 | 1.29 | 3.95 | 1.30 | 0.07 |
| After CDSC | 4.58 | 30.16 | 2.67 | 6.63 | 1.29 | 3.95 | 1.30 | –0.92 |
| Class M (4/3/95) | | | | | | | | |
| Before sales charge | 4.53 | 36.73 | 3.18 | 9.33 | 1.80 | 5.40 | 1.77 | 0.57 |
| After sales charge | 4.40 | 32.28 | 2.84 | 5.78 | 1.13 | 1.98 | 0.65 | –2.70 |
| Class R6 (5/22/18) | | | | | | | | |
| Net asset value | 4.94 | 43.95 | 3.71 | 12.06 | 2.30 | 7.08 | 2.31 | 1.04 |
| Class Y (1/2/08) | | | | | | | | |
| Net asset value | 4.94 | 43.99 | 3.71 | 12.09 | 2.31 | 7.11 | 2.32 | 1.07 |
Current performance may be lower or higher than the quoted past performance, which cannot guarantee future results. After-sales-charge returns for class A and M shares reflect the deduction of the maximum 4.00% and 3.25% sales charge, respectively, levied at the time of purchase. Class B share returns after contingent deferred sales charge (CDSC) reflect the applicable CDSC, which is 5% in the first year, declining over time to 1% in the sixth year, and is eliminated thereafter. Class C share returns after CDSC reflect a 1% CDSC for the first year that is eliminated thereafter. Class R6 and Y shares have no initial sales charge or CDSC. Performance for class B, C, M, and Y shares before their inception is derived from the historical performance of class A shares, adjusted for the applicable sales charge (or CDSC) and the higher operating expenses for such shares, except for class Y shares, for which 12b-1 fees are not applicable. Performance for class R6 shares prior to their inception is derived from the historical performance of class Y shares and has not been adjusted for the lower investor servicing fees applicable to class R6 shares; had it, returns would have been higher.
For a portion of the periods, the fund had expense limitations, without which returns would have been lower.
Class B share performance reflects conversion to class A shares after eight years.
Class C share performance reflects conversion to class A shares after 10 years.
|
| Ohio Tax Exempt Income Fund 9 |
Comparative index returns For periods ended 5/31/18
| | | | | | | | |
| | Annual | | | | | | | |
| | average | | Annual | | Annual | | Annual | |
| | (life of fund) | 10 years | average | 5 years | average | 3 years | average | 1 year |
| Bloomberg Barclays | | | | | | | | |
| Municipal Bond Index | 5.71% | 52.36% | 4.30% | 15.49% | 2.92% | 8.61% | 2.79% | 1.11% |
| Lipper Ohio Municipal Debt | | | | | | | | |
| Funds category average* | 5.15 | 39.77 | 3.39 | 11.42 | 2.18 | 6.20 | 2.02 | 0.51 |
Index and Lipper results should be compared with fund performance before sales charge, before CDSC, or at net asset value.
* Over the 1-year, 3-year, 5-year, 10-year, and life-of-fund periods ended 5/31/18, there were 31, 29, 28, 23, and 6 funds, respectively, in this Lipper category.
Past performance does not indicate future results. At the end of the same time period, a $10,000 investment in the fund’s class B and C shares would have been valued at $13,352 and $13,016, respectively, and no contingent deferred sales charges would apply. A $10,000 investment in the fund’s class M shares ($9,675 after sales charge) would have been valued at $13,228. A $10,000 investment in the fund’s class R6 and Y shares would have been valued at $14,395 and $14,399, respectively.
|
| 10 Ohio Tax Exempt Income Fund |
Fund price and distribution information For the 12-month period ended 5/31/18
| | | | | | | | |
| Distributions | Class A | Class B | Class C | Class M | ClassR6 | Class Y |
| Number | 12 | 12 | 12 | 12 | 1 | 12 |
| Income1 | $0.245120 | $0.188800 | $0.175714 | $0.220408 | $0.006960 | $0.265127 |
| Capital gains2 | — | — | — | — | — | — |
| Total | $0.245120 | $0.188800 | $0.175714 | $0.220408 | $0.006960 | $0.265127 |
| | Before | After | Net | Net | Before | After | Net | Net |
| | sales | sales | asset | asset | sales | sales | asset | asset |
| Share value | charge | charge | value | value | charge | charge | value | value |
| 5/31/17 | $9.02 | $9.40 | $9.01 | $9.02 | $9.02 | $9.32 | — | $9.03 |
| 5/22/18* | — | — | — | — | — | — | $8.81 | — |
| 5/31/18 | 8.85 | 9.22 | 8.84 | 8.85 | 8.85 | 9.15 | 8.86 | 8.86 |
| | Before | After | Net | Net | Before | After | Net | Net |
| Current rate | sales | sales | asset | asset | sales | sales | asset | asset |
| (end of period) | charge | charge | value | value | charge | charge | value | value |
| Current dividend rate3 | 2.58% | 2.48% | 1.96% | 1.81% | 2.31% | 2.23% | N/A | 2.80% |
| Taxable equivalent4 | 4.76 | 4.58 | 3.62 | 3.34 | 4.26 | 4.11 | N/A | 5.17 |
| Current 30-day | | | | | | | | |
| SEC yield5 | N/A | 1.84 | 1.30 | 1.16 | N/A | 1.59 | N/A | 2.14 |
| Taxable equivalent4 | N/A | 3.39 | 2.40 | 2.14 | N/A | 2.93 | N/A | 3.95 |
The classification of distributions, if any, is an estimate. Before-sales-charge share value and current dividend rate for class A and M shares, if applicable, do not take into account any sales charge levied at the time of purchase. After-sales-charge share value, current dividend rate, and current 30-day SEC yield, if applicable, are calculated assuming that the maximum sales charge (4.00% for class A shares and 3.25% for class M shares) was levied at the time of purchase. Final distribution information will appear on your year-end tax forms.
* Inception date of class R6 shares.
1 For some investors, investment income may be subject to the federal alternative minimum tax.
2 Capital gains, if any, are taxable for federal and, in most cases, state purposes.
3 Most recent distribution, including any return of capital and excluding capital gains, annualized and divided by share price before or after sales charge at period-end.
4 Assumes maximum 45.80% federal and state combined tax rate for 2018. Results for investors subject to lower tax rates would not be as advantageous.
5 Based only on investment income and calculated using the maximum offering price for each share class, in accordance with SEC guidelines.
|
| Ohio Tax Exempt Income Fund 11 |
Fund performance as of most recent calendar quarter Total return for periods ended 6/30/18
| | | | | | | | |
| | Annual | | | | | | | |
| | average | | Annual | | Annual | | Annual | |
| | (life of fund) | 10 years | average | 5 years | average | 3 years | average | 1 year |
| Class A (10/23/89) | | | | | | | | |
| Before sales charge | 4.85% | 42.28% | 3.59% | 14.12% | 2.68% | 6.69% | 2.18% | 1.28% |
| After sales charge | 4.70 | 36.58 | 3.17 | 9.56 | 1.84 | 2.42 | 0.80 | –2.77 |
| Class B (7/15/93) | | | | | | | | |
| Before CDSC | 4.62 | 35.34 | 3.07 | 10.62 | 2.04 | 4.82 | 1.58 | 0.65 |
| After CDSC | 4.62 | 35.34 | 3.07 | 8.66 | 1.67 | 1.88 | 0.62 | –4.28 |
| Class C (10/3/06) | | | | | | | | |
| Before CDSC | 4.57 | 31.79 | 2.80 | 9.77 | 1.88 | 4.23 | 1.39 | 0.50 |
| After CDSC | 4.57 | 31.79 | 2.80 | 9.77 | 1.88 | 4.23 | 1.39 | –0.49 |
| Class M (4/3/95) | | | | | | | | |
| Before sales charge | 4.52 | 38.28 | 3.29 | 12.43 | 2.37 | 5.81 | 1.90 | 0.89 |
| After sales charge | 4.40 | 33.78 | 2.95 | 8.78 | 1.70 | 2.37 | 0.78 | –2.39 |
| Class R6 (5/22/18) | | | | | | | | |
| Net asset value | 4.93 | 45.59 | 3.83 | 15.37 | 2.90 | 7.50 | 2.44 | 1.48 |
| Class Y (1/2/08) | | | | | | | | |
| Net asset value | 4.93 | 45.62 | 3.83 | 15.40 | 2.91 | 7.52 | 2.45 | 1.51 |
See the discussion following the fund performance table on page 9 for information about the calculation of fund performance.
Your fund’s expenses
As a mutual fund investor, you pay ongoing expenses, such as management fees, distribution fees (12b-1 fees), and other expenses. Using the following information, you can estimate how these expenses affect your investment and compare them with the expenses of other funds. You may also pay one-time transaction expenses, including sales charges (loads) and redemption fees, which are not shown in this section and would have resulted in higher total expenses. For more information, see your fund’s prospectus or talk to your financial representative.
Expense ratios
| | | | | | |
| | Class A | Class B | Class C | Class M | Class R6 | Class Y |
| Total annual operating expenses for the | | | | | | |
| fiscal year ended 5/31/17 | 0.83% | 1.46% | 1.61% | 1.11% | 0.59%* | 0.61% |
| Annualized expense ratio for the | | | | | | |
| six-month period ended 5/31/18† | 0.83% | 1.46% | 1.61% | 1.11% | 0.59% | 0.61% |
Fiscal-year expense information in this table is taken from the most recent prospectus, is subject to change, and may differ from that shown for the annualized expense ratio and in the financial highlights of this report.
Expenses are shown as a percentage of average net assets.
* Other expenses are based on expenses of class A shares for the fund’s last fiscal year, restated to reflect the lower investor servicing fees applicable to class R6 shares.
† Expense ratios for each class, except for those that started up during the six-month period, are for the fund’s most recent fiscal half year. For a new class, the ratio is for the period from the inception date of the class to 5/31/18. Class inception dates can be found in the Fund performance table on the first page of the Your fund’s performance section. As a result of this, ratios may differ from expense ratios based on one-year date in the financial highlights.
|
| 12 Ohio Tax Exempt Income Fund |
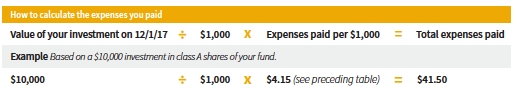
Expenses per $1,000
The following table shows the expenses you would have paid on a $1,000 investment in each class from 12/1/17 to 5/31/18. For a new class, the expenses shown are for the period from the inception date of the class to 5/31/18. Class inception dates can be found in the Fund performance table on the first page of the Your fund’s performance section. The table also shows how much a $1,000 investment would be worth at the close of the period, assuming actual returns and expenses.
| | | | | | |
| | Class A | Class B | Class C | Class M | Class R6 | Class Y |
| Expenses paid per $1,000*† | $4.15 | $7.28 | $8.03 | $5.54 | $0.16‡ | $3.05 |
| Ending value (after expenses) | $1,003.30 | $1,001.30 | $999.40 | $1,001.90 | $1,006.50 | $1,004.40 |
* Expenses for each share class are calculated using the fund’s annualized expense ratio for each class, which represents the ongoing expenses as a percentage of average net assets for the six months ended 5/31/18, or in the case of a new class, the average net assets of the class from the inception date for the class to 5/31/18. Class inception dates can be found in the Fund performance table on the first page of the Your fund’s performance section. The expense ratio may differ for each share class.
† Expenses are calculated by multiplying the expense ratio by the average account value for the period; then multiplying the result by the number of days in the period; and then dividing that result by the number of days in the year.
‡ Had expenses for shares of any new class been shown for the entire period from 12/1/17 to 5/31/18, they would have been higher.
Estimate the expenses you paid
To estimate the ongoing expenses you paid for the six months ended 5/31/18, use the following calculation method. To find the value of your investment on 12/1/17, call Putnam at 1-800-225-1581.
Compare expenses using the SEC’s method
The Securities and Exchange Commission (SEC) has established guidelines to help investors assess fund expenses. Per these guidelines, the following table shows your fund’s expenses based on a $1,000 investment, assuming a hypothetical 5% annualized return. You can use this information to compare the ongoing expenses (but not transaction expenses or total costs) of investing in the fund with those of other funds. All mutual fund shareholder reports will provide this information to help you make this comparison. Please note that you cannot use this information to estimate your actual ending account balance and expenses paid during the period.
| | | | | | |
| | Class A | Class B | Class C | Class M | Class R6 | Class Y |
| Expenses paid per $1,000*† | $4.18 | $7.34 | $8.10 | $5.59 | $2.97 | $3.07 |
| Ending value (after expenses) | $1,020.79 | $1,017.65 | $1,016.90 | $1,019.40 | $1,021.99 | $1,021.89 |
* Expenses for each share class are calculated using the fund’s annualized expense ratio for each class, which represents the ongoing expenses as a percentage of average net assets for the six months ended 5/31/18, or in the case of a new class, the average net assets of the class from the inception date for the class to 5/31/18. Class inception dates can be found in the Fund performance table on the first page of the Your fund’s performance section. The expense ratio may differ for each share class.
† Expenses are calculated by multiplying the expense ratio by the average account value for the six-month period; then multiplying the result by the number of days in the six-month period; and then dividing that result by the number of days in the year.
|
| Ohio Tax Exempt Income Fund 13 |
Terms and definitions
Important terms
Total return shows how the value of the fund’s shares changed over time, assuming you held the shares through the entire period and reinvested all distributions in the fund.
Before sales charge, or net asset value, is the price, or value, of one share of a mutual fund, without a sales charge. Before-sales-charge figures fluctuate with market conditions, and are calculated by dividing the net assets of each class of shares by the number of outstanding shares in the class.
After sales charge is the price of a mutual fund share plus the maximum sales charge levied at the time of purchase. After-sales-charge performance figures shown here assume the 4.00% maximum sales charge for class A shares and 3.25% for class M shares.
Contingent deferred sales charge (CDSC) is generally a charge applied at the time of the redemption of class B or class C shares and assumes redemption at the end of the period. Your fund’s class B CDSC declines over time from a 5% maximum during the first year to 1% during the sixth year. After the sixth year, the CDSC no longer applies. The CDSC for class C shares is 1% for one year after purchase.
Share classes
Class A shares are generally subject to an initial sales charge and no CDSC (except on certain redemptions of shares bought without an initial sales charge).
Class B shares are closed to new investments and are only available by exchange from another Putnam fund or through dividend and/or capital gains reinvestment. They are not subject to an initial sales charge and may be subject to a CDSC.
Class C shares are not subject to an initial sales charge and are subject to a CDSC only if the shares are redeemed during the first year.
Class M shares have a lower initial sales charge and a higher 12b-1 fee than class A shares and no CDSC.
Class R6 shares are not subject to an initial sales charge or CDSC and carry no 12b-1 fee. They are generally only available to employer-sponsored retirement plans, corporate and institutional clients, and clients in other approved programs.
Class Y shares are not subject to an initial sales charge or CDSC and carry no 12b-1 fee. They are generally only available to corporate and institutional clients and clients in other approved programs.
Fixed-income terms
Current rate is the annual rate of return earned from dividends or interest of an investment. Current rate is expressed as a percentage of the price of a security, fund share, or principal investment.
Yield curve is a graph that plots the yields of bonds with equal credit quality against their differing maturity dates, ranging from shortest to longest. It is used as a benchmark for other debt, such as mortgage or bank lending rates.
Comparative indexes
Bloomberg Barclays Municipal Bond Index is an unmanaged index of long-term fixed-rate investment-grade tax-exempt bonds.
Bloomberg Barclays U.S. Aggregate Bond Index is an unmanaged index of U.S. investment-grade fixed-income securities.
ICE BofAML (Intercontinental Exchange Bank of America Merrill Lynch) U.S. 3-Month Treasury Bill Index is an unmanaged index that seeks to measure the performance of U.S. Treasury bills available in the marketplace.
S&P 500 Index is an unmanaged index of common stock performance.
|
| 14 Ohio Tax Exempt Income Fund |
ICE Data Indices, LLC (“ICE BofAML”), used with permission. ICE BofAML permits use of the ICE BofAML indices and related data on an “as is” basis; makes no warranties regarding same; does not guarantee the suitability, quality, accuracy, timeliness, and/or completeness of the ICE BofAML indices or any data included in, related to, or derived therefrom; assumes no liability in connection with the use of the foregoing; and does not sponsor, endorse, or recommend Putnam Investments, or any of its products or services.
Indexes assume reinvestment of all distributions and do not account for fees. Securities and performance of a fund and an index will differ. You cannot invest directly in an index.
Lipper is a third-party industry-ranking entity that ranks mutual funds. Its rankings do not reflect sales charges. Lipper rankings are based on total return at net asset value relative to other funds that have similar current investment styles or objectives as determined by Lipper. Lipper may change a fund’s category assignment at its discretion. Lipper category averages reflect performance trends for funds within a category.
Other information for shareholders
Proxy voting
Putnam is committed to managing our mutual funds in the best interests of our shareholders. The Putnam funds’ proxy voting guidelines and procedures, as well as information regarding how your fund voted proxies relating to portfolio securities during the 12-month period ended June 30, 2017, are available in the Individual Investors section of putnam.com and on the Securities and Exchange Commission (SEC) website, www.sec.gov. If you have questions about finding forms on the SEC’s website, you may call the SEC at 1-800-SEC-0330. You may also obtain the Putnam funds’ proxy voting guidelines and procedures at no charge by calling Putnam’s Shareholder Services at 1-800-225-1581.
Fund portfolio holdings
The fund will file a complete schedule of its portfolio holdings with the SEC for the first and third quarters of each fiscal year on Form N-Q. Shareholders may obtain the fund’s Form N-Q on the SEC’s website at www.sec.gov. In addition, the fund’s Form N-Q may be reviewed and copied at the SEC’s Public Reference Room in Washington, D.C. You may call the SEC at 1-800-SEC-0330 for information about the SEC’s website or the operation of the Public Reference Room.
Trustee and employee fund ownership
Putnam employees and members of the Board of Trustees place their faith, confidence, and, most importantly, investment dollars in Putnam mutual funds. As of May 31, 2018, Putnam employees had approximately $514,000,000 and the Trustees had approximately $80,000,000 invested in Putnam mutual funds. These amounts include investments by the Trustees’ and employees’ immediate family members as well as investments through retirement and deferred compensation plans.
|
| Ohio Tax Exempt Income Fund 15 |
Important notice regarding Putnam’s privacy policy
In order to conduct business with our shareholders, we must obtain certain personal information such as account holders’ names, addresses, Social Security numbers, and dates of birth. Using this information, we are able to maintain accurate records of accounts and transactions.
It is our policy to protect the confidentiality of our shareholder information, whether or not a shareholder currently owns shares of our funds. In particular, it is our policy not to sell information about you or your accounts to outside marketing firms. We have safeguards in place designed to prevent unauthorized access to our computer systems and procedures to protect personal information from unauthorized use.
Under certain circumstances, we must share account information with outside vendors who provide services to us, such as mailings and proxy solicitations. In these cases, the service providers enter into confidentiality agreements with us, and we provide only the information necessary to process transactions and perform other services related to your account. Finally, it is our policy to share account information with your financial representative, if you’ve listed one on your Putnam account.
|
| 16 Ohio Tax Exempt Income Fund |
Financial statements
These sections of the report, as well as the accompanying Notes, preceded by the Report of Independent Registered Public Accounting Firm, constitute the fund’s financial statements.
The fund’s portfolio lists all the fund’s investments and their values as of the last day of the reporting period. Holdings are organized by asset type and industry sector, country, or state to show areas of concentration and diversification.
Statement of assets and liabilities shows how the fund’s net assets and share price are determined. All investment and non-investment assets are added together. Any unpaid expenses and other liabilities are subtracted from this total. The result is divided by the number of shares to determine the net asset value per share, which is calculated separately for each class of shares. (For funds with preferred shares, the amount subtracted from total assets includes the liquidation preference of preferred shares.)
Statement of operations shows the fund’s net investment gain or loss. This is done by first adding up all the fund’s earnings — from dividends and interest income — and subtracting its operating expenses to determine net investment income (or loss). Then, any net gain or loss the fund realized on the sales of its holdings — as well as any unrealized gains or losses over the period — is added to or subtracted from the net investment result to determine the fund’s net gain or loss for the fiscal year.
Statement of changes in net assets shows how the fund’s net assets were affected by the fund’s net investment gain or loss, by distributions to shareholders, and by changes in the number of the fund’s shares. It lists distributions and their sources (net investment income or realized capital gains) over the current reporting period and the most recent fiscal year-end. The distributions listed here may not match the sources listed in the Statement of operations because the distributions are determined on a tax basis and may be paid in a different period from the one in which they were earned.
Financial highlights provide an overview of the fund’s investment results, per-share distributions, expense ratios, net investment income ratios, and portfolio turnover in one summary table, reflecting the five most recent reporting periods. In a semiannual report, the highlights table also includes the current reporting period.
|
| Ohio Tax Exempt Income Fund 17 |
Report of Independent Registered Public Accounting Firm
To the Trustees and Shareholders of
Putnam Ohio Tax Exempt Income Fund
Opinion on the Financial Statements
We have audited the accompanying statement of assets and liabilities, including the fund’s portfolio, of Putnam Ohio Tax Exempt Income Fund (the “Fund”) as of May 31, 2018, the related statement of operations for the year ended May 31, 2018, the statement of changes in net assets for each of the two years in the period ended May 31, 2018, including the related notes, and the financial highlights for each of the periods indicated therein (collectively referred to as the “financial statements”). In our opinion, the financial statements present fairly, in all material respects, the financial position of the Fund as of May 31, 2018, the results of its operations for the year then ended, the changes in its net assets for each of the two years in the period ended May 31, 2018 and the financial highlights for each of the periods indicated therein in conformity with accounting principles generally accepted in the United States of America.
Basis for Opinion
These financial statements are the responsibility of the Fund’s management. Our responsibility is to express an opinion on the Fund’s financial statements based on our audits. We are a public accounting firm registered with the Public Company Accounting Oversight Board (United States) (“PCAOB”) and are required to be independent with respect to the Fund in accordance with the U.S. federal securities laws and the applicable rules and regulations of the Securities and Exchange Commission and the PCAOB.
We conducted our audits of these financial statements in accordance with the standards of the PCAOB. Those standards require that we plan and perform the audit to obtain reasonable assurance about whether the financial statements are free of material misstatement, whether due to error or fraud.
Our audits included performing procedures to assess the risks of material misstatement of the financial statements, whether due to error or fraud, and performing procedures that respond to those risks. Such procedures included examining, on a test basis, evidence regarding the amounts and disclosures in the financial statements. Our audits also included evaluating the accounting principles used and significant estimates made by management, as well as evaluating the overall presentation of the financial statements. Our procedures included confirmation of securities owned as of May 31, 2018 by correspondence with the custodian. We believe that our audits provide a reasonable basis for our opinion.
PricewaterhouseCoopers LLP
Boston, Massachusetts
July 13, 2018
We have served as the auditor of one or more investment companies in the Putnam Investments family of mutual funds since at least 1957. We have not determined the specific year we began serving as auditor.
|
| 18 Ohio Tax Exempt Income Fund |
The fund’s portfolio 5/31/18
Key to holding’s abbreviations
| |
| AGC Assured Guaranty Corp. | GNMA Coll. Government National Mortgage |
| AGM Assured Guaranty Municipal Corporation | Association Collateralized |
| AMBAC AMBAC Indemnity Corporation | NATL National Public Finance Guarantee Corp. |
| COP Certificates of Participation | U.S. Govt. Coll. U.S. Government Collateralized |
| FHLMC Coll. Federal Home Loan Mortgage | VRDN Variable Rate Demand Notes, which are floating- |
| Corporation Collateralized | rate securities with long-term maturities that carry |
| FNMA Coll. Federal National Mortgage | coupons that reset and are payable upon demand |
| Association Collateralized | either daily, weekly or monthly. The rate shown is the |
| FRB Floating Rate Bonds: the rate shown is the current | current interest rate at the close of the reporting |
| interest rate at the close of the reporting period. Rates | period. Rates are set by remarketing agents and may |
| may be subject to a cap or floor. For certain securities, | take into consideration market supply and demand, |
| the rate may represent a fixed rate currently in place | credit quality and the current SIFMA Municipal Swap |
| at the close of the reporting period. | Index rate, which was 1.06% as of the close of the |
| G.O. Bonds General Obligation Bonds | reporting period. |
| |
| | | |
| MUNICIPAL BONDS AND NOTES (95.0%)* | Rating** | Principal amount | Value |
| California (0.8%) | | | |
| CA State Poll. Control Fin. Auth. Solid Waste Disp. | | | |
| 144A Mandatory Put Bonds (11/1/17), (Republic | | | |
| Svcs., Inc.), Ser. A, 2.05%, 8/1/23 | A–2 | $1,000,000 | $1,000,180 |
| | | | 1,000,180 |
| Guam (0.5%) | | | |
| Territory of GU, Govt. Ltd. Oblig. Rev. | | | |
| Bonds, (Section 30), Ser. A, 5.75%, 12/1/34 | | | |
| (Prerefunded 12/1/19) | BBB+ | 250,000 | 264,393 |
| Territory of GU, Govt. Wtr. Wks. Auth. Wtr. & | | | |
| Waste Wtr. Syst. Rev. Bonds, 5.625%, 7/1/40 | | | |
| (Prerefunded 7/1/20) | A– | 350,000 | 376,621 |
| | | | 641,014 |
| Minnesota (0.6%) | | | |
| Minneapolis & St. Paul, Hsg. & Redev. Auth. | | | |
| Hlth. Care VRDN, (Allina Hlth. Syst.), Ser. B-1, | | | |
| 0.90%, 11/15/35 | VMIG1 | 750,000 | 750,000 |
| | | | 750,000 |
| Ohio (87.1%) | | | |
| Allen Cnty., Hosp. Fac. Rev. Bonds | | | |
| (Catholic Hlth. Care), Ser. A, U.S. Govt. Coll., 5.25%, | | | |
| 6/1/38 (Prerefunded 6/1/20) | A+ | 1,000,000 | 1,065,370 |
| 5.00%, 8/1/21 | A+ | 400,000 | 432,452 |
| Ser. A, 4.00%, 8/1/38 | A+ | 1,370,000 | 1,409,812 |
| American Muni. Pwr., Inc. Rev. Bonds | | | |
| (Prairie State Energy Campus), Ser. A, AGC, U.S. | | | |
| Govt. Coll., 5.75%, 2/15/39 (Prerefunded 2/15/19) | AA | 1,500,000 | 1,543,050 |
| Ser. A, 5.25%, 2/15/33 | A1 | 250,000 | 274,590 |
| (Greenup Hydroelectric Pwr. Plant), Ser. A, | | | |
| 5.00%, 2/15/41 | A1 | 1,000,000 | 1,123,350 |
| (Hydroelectric Pwr. Plant), Ser. A, 5.00%, 2/15/41 | A2 | 830,000 | 929,376 |
|
| Ohio Tax Exempt Income Fund 19 |
| | | |
| MUNICIPAL BONDS AND NOTES (95.0%)* cont. | Rating** | Principal amount | Value |
| Ohio cont. | | | |
| American Muni. Pwr., Inc. Rev. Bonds | | | |
| (Meldahl Hydroelectric (Green Bond)), Ser. A, | | | |
| 5.00%, 2/15/30 | A | $150,000 | $170,919 |
| (Meldahl Hydroelectric Fac. (Green Bond)), Ser. A, | | | |
| 5.00%, 2/15/27 | A | 250,000 | 287,278 |
| Bluffton, Hosp. Fac. Rev. Bonds, (Blanchard Valley | | | |
| Hlth. Syst.), 5.00%, 12/1/31 | A2 | 650,000 | 742,833 |
| Bowling Green State U. Rev. Bonds, Ser. A, | | | |
| 5.00%, 6/1/42 | A1 | 1,000,000 | 1,129,000 |
| Buckeye, Tobacco Settlement Fin. Auth. Rev. Bonds, | | | |
| Ser. A-2, 5.75%, 6/1/34 | B– | 1,500,000 | 1,492,170 |
| Butler Cnty., Hosp. Fac. Rev. Bonds, (Cincinnati | | | |
| Children’s Hosp. Med. Ctr.), Ser. X, 5.00%, 5/15/29 | Aa2 | 1,000,000 | 1,195,750 |
| Carlisle, Local School Dist. G.O. Bonds, | | | |
| (School Impt.) | | | |
| 5.00%, 12/1/47 | AA | 500,000 | 564,330 |
| 5.00%, 12/1/42 | AA | 350,000 | 396,449 |
| 5.00%, 12/1/37 | AA | 100,000 | 114,223 |
| Centerville, Hlth. Care Rev. Bonds, (Graceworks | | | |
| Lutheran Svcs.), 5.25%, 11/1/50 | BB+/P | 500,000 | 528,095 |
| Cincinnati, G.O. Bonds, Ser. D, 4.00%, 12/1/32 | Aa2 | 500,000 | 527,320 |
| Cincinnati, Econ. Dev. Rev. Bonds, (Keystone Parke | | | |
| Phase III), Ser. B, 5.00%, 11/1/40 | AA | 500,000 | 562,430 |
| Cleveland, Income Tax Rev. Bonds | | | |
| (Impt. Pk. & Recreational), 5.00%, 10/1/33 | AA+ | 615,000 | 711,131 |
| (Pub. Fac. Impt.), Ser. B-1, 5.00%, 10/1/33 | AA+ | 300,000 | 346,572 |
| (Bridges & Roadways Impt.), Ser. B-2, | | | |
| 5.00%, 10/1/32 | AA+ | 1,000,000 | 1,159,820 |
| (Pub. Fac. Impt.), Ser. B-1, 5.00%, 10/1/32 | AA+ | 500,000 | 579,910 |
| (Impt. Bridges), 4.00%, 10/1/29 | AA+ | 300,000 | 322,464 |
| (Impt. Bridges), 4.00%, 10/1/28 | AA+ | 400,000 | 431,976 |
| Cleveland, Pkg. Fac. Rev. Bonds, AGM | | | |
| 5.25%, 9/15/22 | AA | 1,630,000 | 1,808,730 |
| 5.25%, 9/15/22 (Escrowed to maturity) | AA | 770,000 | 869,114 |
| Cleveland, Pub. Pwr. Syst. Rev. Bonds, Ser. B-1, | | | |
| NATL, zero %, 11/15/25 | A3 | 3,000,000 | 2,382,270 |
| Cleveland, State U. Rev. Bonds, 5.00%, 6/1/37 | A1 | 1,500,000 | 1,618,380 |
| Cleveland, Wtr. Poll. Control Rev. Bonds, | | | |
| (Green Bonds) | | | |
| 5.00%, 11/15/41 | Aa3 | 500,000 | 563,800 |
| 5.00%, 11/15/36 | Aa3 | 435,000 | 492,359 |
| Cleveland-Cuyahoga Cnty., Rev. Bonds, (Euclid Ave. | | | |
| Dev., Corp.), 5.00%, 8/1/39 | A2 | 1,000,000 | 1,087,600 |
| Columbus, Swr. Rev. Bonds, 5.00%, 6/1/32 | Aa1 | 1,000,000 | 1,169,030 |
| Columbus, Swr. VRDN, Ser. B, 0.99%, 6/1/32 | VMIG1 | 1,430,000 | 1,430,000 |
| Cuyahoga Cmnty., College Dist. Rev. Bonds, Ser. D, | | | |
| 5.00%, 8/1/32 | Aa2 | 750,000 | 822,038 |
| Cuyahoga Cnty., COP, (Convention Hotel), | | | |
| 5.00%, 12/1/27 | AA– | 1,250,000 | 1,395,613 |
| Cuyahoga, Rev. Bonds, (Sports Fac. Impt.) | | | |
| 5.00%, 12/1/27 | AA– | 250,000 | 281,475 |
| 5.00%, 12/1/25 | AA– | 100,000 | 112,918 |
|
| 20 Ohio Tax Exempt Income Fund |
| | | |
| MUNICIPAL BONDS AND NOTES (95.0%)* cont. | Rating** | Principal amount | Value |
| Ohio cont. | | | |
| Dayton, City School Dist. G.O. Bonds, | | | |
| 5.00%, 11/1/23 | Aa2 | $750,000 | $851,595 |
| Fairview Park City School Dist. G.O. Bonds, | | | |
| 5.00%, 12/1/42 | Aa2 | 1,905,000 | 2,108,321 |
| Franklin Cnty., Hlth. Care Fac. Rev. Bonds | | | |
| (OH Presbyterian Retirement Svcs. (OPRS) | | | |
| Cmntys. Oblig. Group), Ser. A, 5.625%, 7/1/26 | BBB/F | 1,100,000 | 1,157,189 |
| 5.00%, 11/15/44 | BBB+/F | 1,000,000 | 1,062,150 |
| Franklin Cnty., Hosp. Fac. Rev. Bonds, (Nationwide | | | |
| Children’s Hosp.), Ser. A | | | |
| 4.00%, 11/1/39 | Aa2 | 500,000 | 517,445 |
| 4.00%, 11/1/38 | Aa2 | 300,000 | 310,953 |
| Gallia Cnty., Local School Impt. Dist. G.O. Bonds, | | | |
| 5.00%, 11/1/27 | Aa2 | 815,000 | 929,239 |
| Greene Cnty., Hosp. Facs. Rev. Bonds, (Kettering | | | |
| Hlth. Network), 5.50%, 4/1/39 | A+ | 1,000,000 | 1,030,470 |
| Hamilton Cnty., Hlth. Care Rev. Bonds, (Life | | | |
| Enriching Cmnty.), 5.00%, 1/1/46 | BBB–/F | 500,000 | 535,420 |
| Hamilton Cnty., Hosp. Fac. Rev. Bonds, (TriHealth, | | | |
| Inc.), Ser. A, 5.00%, 8/15/36 | A+ | 750,000 | 844,058 |
| Hamilton Cnty., Sales Tax Rev. Bonds | | | |
| Ser. A, 5.00%, 12/1/27 | AA– | 100,000 | 119,979 |
| Ser. B, AMBAC, zero %, 12/1/24 | A1 | 3,000,000 | 2,515,800 |
| Ser. B, AMBAC, zero %, 12/1/22 | A1 | 500,000 | 447,800 |
| Huber Heights City School Dist. G.O. Bonds, (School | | | |
| Impt.), 5.00%, 12/1/31 | Aa2 | 1,000,000 | 1,152,130 |
| Huran Cnty., Human Svcs. G.O. Bonds, NATL, | | | |
| 6.55%, 12/1/20 | Aa3 | 820,000 | 866,888 |
| JobsOhio Beverage Syst. Rev. Bonds, (Statewide Sr. | | | |
| Lien Liquor Profits), Ser. A, 5.00%, 1/1/38 | AA | 700,000 | 769,475 |
| Kent State U. Rev. Bonds, (Gen. Receipts), | | | |
| 5.00%, 5/1/30 | Aa3 | 1,000,000 | 1,161,230 |
| Lake Cnty., Hosp. Fac. Rev. Bonds, (Lake Hosp. Syst., | | | |
| Inc.), Ser. C | | | |
| 6.00%, 8/15/43 | Baa1 | 180,000 | 181,474 |
| U.S. Govt. Coll., 6.00%, 8/15/43 | | | |
| (Prerefunded 8/15/18) | AAA/P | 935,000 | 943,125 |
| Lakewood, City School Dist. G.O. Bonds, (School | | | |
| Fac. Impt.), Ser. B | | | |
| 4.00%, 11/1/35 | Aa2 | 500,000 | 528,515 |
| 4.00%, 11/1/34 | Aa2 | 430,000 | 456,312 |
| 4.00%, 11/1/33 | Aa2 | 375,000 | 399,825 |
| 4.00%, 11/1/32 | Aa2 | 225,000 | 241,031 |
| Lancaster, City Fac. Construction & Impt. School | | | |
| Dist. G.O. Bonds, U.S. Govt. Coll., 5.00%, 10/1/37 | | | |
| (Prerefunded 10/1/22) | AA | 1,000,000 | 1,124,120 |
| Lorain Cnty., Port Auth. Econ. Dev. Facs. Rev. Bonds, | | | |
| (Kendal at Oberlin), 5.00%, 11/15/30 | A– | 750,000 | 821,693 |
| Lucas Cnty., Hlth. Care Fac. Rev. Bonds | | | |
| (Lutheran Homes), Ser. A, 7.00%, 11/1/45 | | | |
| (Prerefunded 11/1/20) | BB+/P | 700,000 | 779,247 |
| (Sunset Retirement Cmntys.), 5.50%, 8/15/30 | A–/F | 650,000 | 694,649 |
|
| Ohio Tax Exempt Income Fund 21 |
| | | |
| MUNICIPAL BONDS AND NOTES (95.0%)* cont. | Rating** | Principal amount | Value |
| Ohio cont. | | | |
| Miami U. Rev. Bonds, 5.00%, 9/1/41 | Aa3 | $500,000 | $571,340 |
| Middleburg Heights, Hosp. Rev. Bonds, (Southwest | | | |
| Gen. Hlth. Ctr.), 5.00%, 8/1/47 | A2 | 1,200,000 | 1,304,376 |
| Milford, Exempt Village School Dist. G.O. Bonds, | | | |
| 5.00%, 12/1/19 | Aa2 | 200,000 | 209,560 |
| Montgomery Cnty., Rev. Bonds, (Catholic Hlth. | | | |
| Initiatives), Ser. D, 6.25%, 10/1/33 | Baa1 | 1,000,000 | 1,016,040 |
| Mount Healthy City School Dist. G.O. Bonds, | | | |
| 5.00%, 12/1/21 | Aa2 | 500,000 | 547,865 |
| Napoleon, City Fac. Construction & Impt. School | | | |
| Dist. G.O. Bonds, 5.00%, 12/1/36 | Aa3 | 500,000 | 542,055 |
| New Albany, Plain Local School Dist. G.O. Bonds, | | | |
| (School Impt.), 4.00%, 12/1/29 | Aa1 | 1,410,000 | 1,497,476 |
| North Royalton, City School Dist. G.O. Bonds, | | | |
| (School Impt.), 5.00%, 12/1/47 | Aa2 | 2,000,000 | 2,258,660 |
| OH Hsg. Fin. Agcy. Rev. Bonds (Single Fam. Mtge.), | | | |
| Ser. 1, GNMA Coll., FNMA Coll., FHLMC Coll., | | | |
| 5.00%, 11/1/28 | Aaa | 160,000 | 163,989 |
| OH State G.O. Bonds | | | |
| (Hwy.), Ser. S, 5.00%, 5/1/31 | AAA | 150,000 | 175,815 |
| (Infrastructure Impt.), Ser. A, 4.00%, 2/1/33 | Aa1 | 2,315,000 | 2,433,482 |
| OH State Rev. Bonds, (Northeast OH Regl. Swr. Dist.), | | | |
| 5.00%, 11/15/44 | Aa1 | 1,250,000 | 1,408,025 |
| OH State Air Quality Dev. Auth. FRB, (Columbus | | | |
| Southern Pwr. Co.), Ser. B, 5.80%, 12/1/38 | A2 | 1,000,000 | 1,050,280 |
| OH State Higher Edl. Fac. Rev. Bonds | | | |
| (Case Western Reserve U.), 6.25%, 10/1/18 | AA– | 1,000,000 | 1,015,040 |
| (U. of Dayton), Ser. A, 5.625%, 12/1/41 | A+ | 1,200,000 | 1,299,420 |
| (U. of Dayton), 5.50%, 12/1/36 | | | |
| (Prerefunded 12/1/18) | A+ | 1,000,000 | 1,018,920 |
| OH State Higher Edl. Fac. Comm. Rev. Bonds | | | |
| (Summa Hlth. Syst.), 5.75%, 11/15/40 | Baa2 | 370,000 | 391,985 |
| (Summa Hlth. Syst.), U.S. Govt. Coll., 5.75%, | | | |
| 11/15/40 (Prerefunded 5/15/20) | Baa2 | 630,000 | 675,644 |
| (Kenyon College), 5.00%, 7/1/44 | A | 1,305,000 | 1,365,422 |
| (Case Western Reserve U.), 5.00%, 12/1/40 | AA– | 1,000,000 | 1,143,300 |
| (Xavier U.), 5.00%, 5/1/40 | A3 | 750,000 | 781,148 |
| (Oberlin Coll.), 5.00%, 10/1/31 | AA | 650,000 | 728,462 |
| (U. of Dayton), Ser. A, 5.00%, 12/1/24 | A+ | 285,000 | 330,412 |
| OH State Hosp. Rev. Bonds, (U. Hosp. Hlth. Syst.), | | | |
| Ser. A, 5.00%, 1/15/41 | A2 | 1,000,000 | 1,098,060 |
| OH State Hosp. Fac. Rev. Bonds, (Cleveland Clinic | | | |
| Hlth. Syst.), Ser. A, 4.00%, 1/1/34 | Aa2 | 1,250,000 | 1,331,888 |
| OH State Private Activity Rev. Bonds, (Portsmouth | | | |
| Bypass Gateway Group, LLC), AGM, 5.00%, 12/31/39 | AA | 750,000 | 825,840 |
| OH State Special Oblig. Cap. Fac. Lease | | | |
| Appropriation Rev. Bonds, Ser. C, 5.00%, 12/1/28 | Aa2 | 500,000 | 587,990 |
| OH State Tpk. Comm. Rev. Bonds | | | |
| (Infrastructure), Ser. A-1, 5.25%, 2/15/32 | Aa3 | 350,000 | 390,586 |
| 5.00%, 2/15/48 | Aa3 | 1,250,000 | 1,362,150 |
|
| 22 Ohio Tax Exempt Income Fund |
| | | |
| MUNICIPAL BONDS AND NOTES (95.0%)* cont. | Rating** | Principal amount | Value |
| Ohio cont. | | | |
| OH State U. Rev. Bonds | | | |
| Ser. A, 5.00%, 12/1/39 | Aa1 | $1,000,000 | $1,128,490 |
| (Gen. Receipts Special Purpose), Ser. A, | | | |
| 5.00%, 6/1/38 | Aa2 | 1,000,000 | 1,110,680 |
| OH State Wtr. Dev. Auth. Rev. Bonds, Ser. A | | | |
| 5.00%, 12/1/35 | Aaa | 1,000,000 | 1,158,880 |
| 5.00%, 12/1/34 | Aaa | 750,000 | 872,078 |
| OH U. Gen. Recipients Athens Rev. Bonds | | | |
| 5.00%, 12/1/43 | Aa3 | 1,035,000 | 1,126,825 |
| 5.00%, 12/1/42 | Aa3 | 500,000 | 541,665 |
| Penta Career Ctr. COP, 5.00%, 4/1/20 | Aa3 | 1,500,000 | 1,584,375 |
| Princeton, City School Dist. G.O. Bonds, | | | |
| 5.00%, 12/1/36 | AA | 500,000 | 564,245 |
| Revere, Local School Dist. G.O. Bonds, (School Fac. | | | |
| Impt.), Ser. C | | | |
| 4.00%, 12/1/33 | Aa1 | 270,000 | 290,077 |
| 4.00%, 12/1/31 | Aa1 | 1,000,000 | 1,083,790 |
| Rickenbacker, Port Auth. Rev. Bonds, (OASBO | | | |
| Expanded Asset Pooled), Ser. A, 5.375%, 1/1/32 | A2 | 1,355,000 | 1,522,898 |
| Scioto Cnty., Hosp. Rev. Bonds, (Southern | | | |
| OH Med. Ctr.) | | | |
| 5.00%, 2/15/34 | A2 | 1,025,000 | 1,138,867 |
| 5.00%, 2/15/32 | A2 | 865,000 | 971,075 |
| Summit Cnty., G.O. Bonds, 4.00%, 12/1/31 | Aa1 | 750,000 | 800,783 |
| Toledo, Wtr. Wks. Syst. Rev. Bonds | | | |
| 5.00%, 11/15/36 | Aa3 | 500,000 | 573,720 |
| 5.00%, 11/15/28 | Aa3 | 250,000 | 294,200 |
| Toledo-Lucas Cnty., Port Auth. Rev. Bonds, (CSX | | | |
| Transn, Inc.), 6.45%, 12/15/21 | Baa1 | 1,900,000 | 2,170,750 |
| U. of Akron Rev. Bonds, Ser. A | | | |
| 5.00%, 1/1/31 | A1 | 500,000 | 567,555 |
| 5.00%, 1/1/28 | A1 | 1,000,000 | 1,124,340 |
| U. of Cincinnati Rev. Bonds | | | |
| Ser. F, 5.00%, 6/1/34 | Aa3 | 1,000,000 | 1,065,020 |
| Ser. A, 5.00%, 6/1/31 | Aa3 | 500,000 | 550,405 |
| Ser. A, 5.00%, 6/1/30 | Aa3 | 1,000,000 | 1,102,010 |
| Warren Cnty., Hlth. Care Fac. Rev. Bonds, (Otterbein | | | |
| Homes Oblig. Group) | | | |
| Ser. A, 5.75%, 7/1/33 | A | 500,000 | 572,115 |
| 5.00%, 7/1/39 | A | 1,000,000 | 1,085,980 |
| Willoughby-Eastlake, City School Dist. G.O. Bonds, | | | |
| (School Impt.), 5.00%, 12/1/46 | Aa3 | 1,000,000 | 1,130,430 |
| Youngstown State U. Rev. Bonds | | | |
| AGC, U.S. Govt. Coll., 5.25%, 12/15/29 | | | |
| (Prerefunded 6/15/19) | AA | 500,000 | 518,000 |
| 5.00%, 12/15/25 | A+ | 500,000 | 540,365 |
| | | | 107,338,978 |
|
| Ohio Tax Exempt Income Fund 23 |
| | | |
| MUNICIPAL BONDS AND NOTES (95.0%)* cont. | Rating** | Principal amount | Value |
| Puerto Rico (3.4%) | | | |
| Cmnwlth. of PR, Hwy. & Trans. Auth. Rev. Bonds, | | | |
| Ser. AA, NATL, U.S. Govt. Coll., 5.50%, 7/1/19 | | | |
| (Escrowed to maturity) | Baa2 | $3,800,000 | $3,951,050 |
| Cmnwlth. of PR, Sales Tax Fin. Corp. Rev. Bonds, | | | |
| Ser. A, NATL, zero %, 8/1/43 | Baa2 | 1,000,000 | 237,480 |
| | | | 4,188,530 |
| Texas (0.5%) | | | |
| TX State G.O. Bonds, (Mobility Fund (The)-Trans. | | | |
| Comm.), Ser. B, 5.00%, 10/1/34 | Aaa | 500,000 | 590,160 |
| | | | 590,160 |
| Washington (2.1%) | | | |
| Grant Cnty., Pub. Util. Dist. No. 2 Mandatory Put | | | |
| Bonds (12/2/20), (Elec. Syst.), 2.00%, 1/1/44 | AA | 2,600,000 | 2,592,452 |
| | | | 2,592,452 |
| |
| TOTAL INVESTMENTS | | | |
| Total investments (cost $113,815,083) | | | $117,101,314 |
Notes to the fund’s portfolio
Unless noted otherwise, the notes to the fund’s portfolio are for the close of the fund’s reporting period, which ran from June 1, 2017 through May 31, 2018 (the reporting period). Within the following notes to the portfolio, references to “Putnam Management” represent Putnam Investment Management, LLC, the fund’s manager, an indirect wholly-owned subsidiary of Putnam Investments, LLC and references to “ASC 820” represent Accounting Standards Codification 820 Fair Value Measurements and Disclosures.
* Percentages indicated are based on net assets of $123,299,466.
** The Moody’s, Standard & Poor’s or Fitch ratings indicated are believed to be the most recent ratings available at the close of the reporting period for the securities listed. Ratings are generally ascribed to securities at the time of issuance. While the agencies may from time to time revise such ratings, they undertake no obligation to do so, and the ratings do not necessarily represent what the agencies would ascribe to these securities at the close of the reporting period. Securities rated by Fitch are indicated by “/F.” Securities rated by Putnam are indicated by “/P.” The Putnam rating categories are comparable to the Standard & Poor’s classifications. If a security is insured, it will usually be rated by the ratings organizations based on the financial strength of the insurer. Ratings are not covered by the Report of Independent Registered Public Accounting Firm. For further details regarding security ratings, please see the Statement of Additional Information.
144A after the name of an issuer represents securities exempt from registration under Rule 144A of the Securities Act of 1933, as amended. These securities may be resold in transactions exempt from registration, normally to qualified institutional buyers.
On Mandatory Put Bonds, the rates shown are the current interest rates at the close of the reporting period and the dates shown represent the next mandatory put dates.
The dates shown parenthetically on prerefunded bonds represent the next prerefunding dates.
The dates shown on debt obligations are the original maturity dates.
The fund had the following sector concentrations greater than 10% at the close of the reporting period (as a percentage of net assets):
| | |
| Education | 17.2% | |
| Local debt | 17.1 | |
| Health care | 16.1 | |
| Utilities | 13.6 | |
| Prerefunded | 10.6 | |
|
| 24 Ohio Tax Exempt Income Fund |
ASC 820 establishes a three-level hierarchy for disclosure of fair value measurements. The valuation hierarchy is based upon the transparency of inputs to the valuation of the fund’s investments. The three levels are defined as follows:
Level 1: Valuations based on quoted prices for identical securities in active markets.
Level 2: Valuations based on quoted prices in markets that are not active or for which all significant inputs are observable, either directly or indirectly.
Level 3: Valuations based on inputs that are unobservable and significant to the fair value measurement.
The following is a summary of the inputs used to value the fund’s net assets as of the close of the reporting period:
| | | |
| | | | Valuation inputs | |
| Investments in securities: | Level 1 | Level 2 | Level 3 |
| Municipal bonds and notes | $— | $117,101,314 | $— |
| Totals by level | $— | $117,101,314 | $— |
During the reporting period, transfers within the fair value hierarchy, if any, did not represent, in the aggregate, more than 1% of the fund’s net assets measured as of the end of the period. Transfers are accounted for using the end of period pricing valuation method.
The accompanying notes are an integral part of these financial statements.
|
| Ohio Tax Exempt Income Fund 25 |
Statement of assets and liabilities 5/31/18
| |
| ASSETS | |
| Investment in securities, at value, (Note 1): | |
| Unaffiliated issuers (identified cost $113,815,083) | $117,101,314 |
| Cash | 4,798,039 |
| Interest and other receivables | 1,784,256 |
| Receivable for shares of the fund sold | 46,253 |
| Prepaid assets | 6,806 |
| Total assets | 123,736,668 |
| |
| LIABILITIES | |
| Payable for shares of the fund repurchased | 150,415 |
| Payable for compensation of Manager (Note 2) | 45,316 |
| Payable for custodian fees (Note 2) | 3,208 |
| Payable for investor servicing fees (Note 2) | 15,410 |
| Payable for Trustee compensation and expenses (Note 2) | 69,520 |
| Payable for administrative services (Note 2) | 468 |
| Payable for distribution fees (Note 2) | 46,349 |
| Payable for auditing and tax fees | 59,813 |
| Distributions payable to shareholders | 31,685 |
| Other accrued expenses | 15,018 |
| Total liabilities | 437,202 |
| Net assets | $123,299,466 |
| |
| REPRESENTED BY | |
| Paid-in capital (Unlimited shares authorized) (Notes 1 and 4) | $121,506,320 |
| Undistributed net investment income (Note 1) | 35,476 |
| Accumulated net realized loss on investments (Note 1) | (1,528,561) |
| Net unrealized appreciation of investments and assets | 3,286,231 |
| Total — Representing net assets applicable to capital shares outstanding | $123,299,466 |
| |
| COMPUTATION OF NET ASSET VALUE AND OFFERING PRICE | |
| Net asset value and redemption price per class A share | |
| ($100,922,080 divided by 11,403,176 shares) | $8.85 |
| Offering price per class A share (100/96.00 of $8.85)* | $9.22 |
| Net asset value and offering price per class B share ($1,249,382 divided by 141,358 shares)** | $8.84 |
| Net asset value and offering price per class C share ($8,587,886 divided by 970,271 shares)** | $8.85 |
| Net asset value and redemption price per class M share ($514,725 divided by 58,137 shares) | $8.85 |
| Offering price per class M share (100/96.75 of $8.85)† | $9.15 |
| Net asset value and redemption price per class R6 share ($10,065 divided by 1,136 shares) | $8.86 |
| Net asset value, offering price and redemption price per class Y share | |
| ($12,015,328 divided by 1,356,122 shares) | $8.86 |
* On single retail sales of less than $100,000. On sales of $100,000 or more the offering price is reduced.
** Redemption price per share is equal to net asset value less any applicable contingent deferred sales charge.
† On single retail sales of less than $50,000. On sales of $50,000 or more the offering price is reduced.
The accompanying notes are an integral part of these financial statements.
|
| 26 Ohio Tax Exempt Income Fund |
Statement of operations Year ended 5/31/18
| |
| INVESTMENT INCOME | |
| Interest income | $4,630,388 |
| Total investment income | 4,630,388 |
| |
| EXPENSES | |
| Compensation of Manager (Note 2) | 563,842 |
| Investor servicing fees (Note 2) | 95,250 |
| Custodian fees (Note 2) | 7,586 |
| Trustee compensation and expenses (Note 2) | 3,911 |
| Distribution fees (Note 2) | 349,825 |
| Administrative services (Note 2) | 3,910 |
| Auditing and tax fees | 60,215 |
| Other | 58,303 |
| Total expenses | 1,142,842 |
| Expense reduction (Note 2) | (20,516) |
| Net expenses | 1,122,326 |
| | |
| Net investment income | 3,508,062 |
| |
| REALIZED AND UNREALIZED GAIN (LOSS) | |
| Net realized gain (loss) on: | |
| Securities from unaffiliated issuers (Notes 1 and 3) | 847,478 |
| Total net realized gain | 847,478 |
| Change in net unrealized appreciation (depreciation) on: | |
| Securities from unaffiliated issuers | (3,333,479) |
| Total change in net unrealized depreciation | (3,333,479) |
| | |
| Net loss on investments | (2,486,001) |
| |
| Net increase in net assets resulting from operations | $1,022,061 |
The accompanying notes are an integral part of these financial statements.
|
| Ohio Tax Exempt Income Fund 27 |
Statement of changes in net assets
| | |
| DECREASE IN NET ASSETS | Year ended 5/31/18 | Year ended 5/31/17 |
| Operations | | |
| Net investment income | $3,508,062 | $3,874,045 |
| Net realized gain on investments | 847,478 | 493,940 |
| Net unrealized depreciation of investments | (3,333,479) | (4,052,394) |
| Net increase in net assets resulting from operations | 1,022,061 | 315,591 |
| Distributions to shareholders (Note 1): | | |
| From ordinary income | | |
| Taxable net investment income | | |
| Class A | (12,905) | (49,443) |
| Class B | (159) | (630) |
| Class C | (1,249) | (4,597) |
| Class M | (72) | (214) |
| Class R6 | — | — |
| Class Y | (1,612) | (5,163) |
| From tax-exempt net investment income | | |
| Class A | (2,867,397) | (3,160,812) |
| Class B | (27,830) | (32,970) |
| Class C | (197,059) | (221,517) |
| Class M | (13,461) | (13,252) |
| Class R6 | (8) | — |
| Class Y | (389,663) | (372,851) |
| Decrease from capital share transactions (Note 4) | (9,503,565) | (7,099,154) |
| Total decrease in net assets | (11,992,919) | (10,645,012) |
| |
| NET ASSETS | | |
| Beginning of year | 135,292,385 | 145,937,397 |
| End of year (including undistributed net investment | | |
| income of $35,476 and $50,288, respectively) | $123,299,466 | $135,292,385 |
The accompanying notes are an integral part of these financial statements.
|
| 28 Ohio Tax Exempt Income Fund |
|
| This page left blank intentionally. |
|
| Ohio Tax Exempt Income Fund 29 |
Financial highlights (For a common share outstanding throughout the period)
| | | | | | | | | | | | |
| | INVESTMENT OPERATIONS | LESS DISTRIBUTIONS | RATIOS AND SUPPLEMENTAL DATA |
| | | | | | | | | | | | Ratio | |
| | | | Net realized | | | | | | | | of net investment | |
| | Net asset value, | | and unrealized | Total from | From | | | Total return | Net assets, | Ratio of expenses | income (loss) | |
| | beginning | Net investment | gain (loss) | investment | net investment | Total | Net asset value, | at net asset value | end of period | to average | to average | Portfolio |
| Period ended | of period | income (loss) | on investments | operations | income | distributions | end of period | (%)a | (in thousands) | net assets (%)b | net assets (%) | turnover (%) |
| Class A | | | | | | | | | | | | |
| May 31, 2018 | $9.02 | .25 | (.17) | .08 | (.25) | (.25) | $8.85 | .85 | $100,922 | .83 | 2.74 | 33 |
| May 31, 2017 | 9.24 | .25 | (.22) | .03 | (.25) | (.25) | 9.02 | .39 | 108,906 | .83 | 2.81 | 15 |
| May 31, 2016 | 9.07 | .29 | .16 | .45 | (.28) | (.28) | 9.24 | 5.10 | 120,182 | .82c | 3.11c | 11 |
| May 31, 2015 | 9.12 | .30 | (.05) | .25 | (.30) | (.30) | 9.07 | 2.74 | 117,935 | .80 | 3.28 | 16 |
| May 31, 2014 | 9.31 | .31 | (.19) | .12 | (.31) | (.31) | 9.12 | 1.40 | 123,335 | .81 | 3.48 | 9 |
| Class B | | | | | | | | | | | | |
| May 31, 2018 | $9.01 | .19 | (.17) | .02 | (.19) | (.19) | $8.84 | .21 | $1,249 | 1.46 | 2.11 | 33 |
| May 31, 2017 | 9.22 | .20 | (.21) | (.01) | (.20) | (.20) | 9.01 | (.13) | 1,484 | 1.46 | 2.18 | 15 |
| May 31, 2016 | 9.06 | .23 | .16 | .39 | (.23) | (.23) | 9.22 | 4.33 | 1,530 | 1.44c | 2.49c | 11 |
| May 31, 2015 | 9.11 | .24 | (.05) | .19 | (.24) | (.24) | 9.06 | 2.11 | 1,791 | 1.42 | 2.66 | 16 |
| May 31, 2014 | 9.30 | .25 | (.19) | .06 | (.25) | (.25) | 9.11 | .78 | 1,807 | 1.43 | 2.86 | 9 |
| Class C | | | | | | | | | | | | |
| May 31, 2018 | $9.02 | .18 | (.17) | .01 | (.18) | (.18) | $8.85 | .07 | $8,588 | 1.61 | 1.97 | 33 |
| May 31, 2017 | 9.24 | .18 | (.22) | (.04) | (.18) | (.18) | 9.02 | (.39) | 11,007 | 1.61 | 2.03 | 15 |
| May 31, 2016 | 9.07 | .21 | .17 | .38 | (.21) | (.21) | 9.24 | 4.28 | 11,138 | 1.59c | 2.34c | 11 |
| May 31, 2015 | 9.12 | .23 | (.05) | .18 | (.23) | (.23) | 9.07 | 1.95 | 10,798 | 1.57 | 2.51 | 16 |
| May 31, 2014 | 9.31 | .24 | (.19) | .05 | (.24) | (.24) | 9.12 | .62 | 10,681 | 1.58 | 2.71 | 9 |
| Class M | | | | | | | | | | | | |
| May 31, 2018 | $9.02 | .22 | (.17) | .05 | (.22) | (.22) | $8.85 | .57 | $515 | 1.11 | 2.46 | 33 |
| May 31, 2017 | 9.24 | .23 | (.22) | .01 | (.23) | (.23) | 9.02 | .11 | 567 | 1.11 | 2.53 | 15 |
| May 31, 2016 | 9.08 | .26 | .16 | .42 | (.26) | (.26) | 9.24 | 4.69 | 520 | 1.09c | 2.84c | 11 |
| May 31, 2015 | 9.12 | .27 | (.04) | .23 | (.27) | (.27) | 9.08 | 2.57 | 546 | 1.07 | 3.01 | 16 |
| May 31, 2014 | 9.31 | .29 | (.20) | .09 | (.28) | (.28) | 9.12 | 1.13 | 498 | 1.08 | 3.21 | 9 |
| Class R6 | | | | | | | | | | | | |
| May 31, 2018† | $8.81 | .01 | .05 | .06 | (.01) | (.01) | $8.86 | .65* | $10 | .02* | .08* | 33 |
| Class Y | | | | | | | | | | | | |
| May 31, 2018 | $9.03 | .27 | (.17) | .10 | (.27) | (.27) | $8.86 | 1.07 | $12,015 | .61 | 2.96 | 33 |
| May 31, 2017 | 9.24 | .27 | (.21) | .06 | (.27) | (.27) | 9.03 | .72 | 13,328 | .61 | 3.03 | 15 |
| May 31, 2016 | 9.08 | .31 | .15 | .46 | (.30) | (.30) | 9.24 | 5.22 | 12,568 | .59c | 3.34c | 11 |
| May 31, 2015 | 9.12 | .32 | (.04) | .28 | (.32) | (.32) | 9.08 | 3.08 | 12,031 | .57 | 3.52 | 16 |
| May 31, 2014 | 9.32 | .33 | (.20) | .13 | (.33) | (.33) | 9.12 | 1.52 | 5,519 | .58 | 3.71 | 9 |
* Not annualized.
† For the period May 22, 2018 (commencement of operations) to May 31, 2018.
a Total return assumes dividend reinvestment and does not reflect the effect of sales charges.
b Includes amounts paid through expense offset arrangements, if any (Note 2). Also excludes acquired fund fees and expenses, if any.
c Reflects a voluntary waiver of certain fund expenses in effect during the period. As a result of such waivers, the expenses of each class reflect a reduction of less than 0.01% as a percentage of average net assets.
The accompanying notes are an integral part of these financial statements.
| |
| 30 Ohio Tax Exempt Income Fund | Ohio Tax Exempt Income Fund 31 |
Notes to financial statements 5/31/18
Within the following Notes to financial statements, references to “State Street” represent State Street Bank and Trust Company, references to “the SEC” represent the Securities and Exchange Commission, references to “Putnam Management” represent Putnam Investment Management, LLC, the fund’s manager, an indirect wholly-owned subsidiary of Putnam Investments, LLC and references to “OTC”, if any, represent over-the-counter. Unless otherwise noted, the “reporting period” represents the period from June 1, 2017 through May 31, 2018.
Putnam Ohio Tax Exempt Income Fund (the fund) is a Massachusetts business trust, which is registered under the Investment Company Act of 1940, as amended, as a diversified open-end management investment company. The goal of the fund is to seek as high a level of current income exempt from federal income tax and Ohio personal income tax as Putnam Management believes is consistent with preservation of capital. The fund invests mainly in bonds that pay interest that is exempt from federal income tax and Ohio personal income tax (but that may be subject to federal alternative minimum tax (AMT)), are investment-grade in quality, and have intermediate- to long-term maturities (i.e., three years or longer). Under normal circumstances, Putnam Management invests at least 80% of the fund’s net assets in tax-exempt investments. Tax-exempt investments are issued by or for states, territories or possessions of the United States or by their political subdivisions, agencies, authorities or other government entities, and the income from these investments is exempt from both federal and Ohio personal income tax. This investment policy cannot be changed without the approval of the fund’s shareholders. Putnam Management may consider, among other factors, credit, interest rate and prepayment risks, as well as general market conditions, when deciding whether to buy or sell investments.
The fund offers class A, class B, class C, class M, class R6 and class Y shares. The fund began offering class R6 shares on May 22, 2018. The fund registered class T shares in February 2017, however, as of the date of this report, class T shares had not commenced operations and are not available for purchase. Purchases of class B shares are closed to new and existing investors except by exchange from class B shares of another Putnam fund or through dividend and/or capital gains reinvestment. Class A and class M shares are sold with a maximum front-end sales charge of 4.00% and 3.25%, respectively. Class A shares generally are not subject to a contingent deferred sales charge, and class M, class R6 and class Y shares are not subject to a contingent deferred sales charge. Class B shares, which convert to class A shares after approximately eight years, are not subject to a front-end sales charge and are subject to a contingent deferred sales charge if those shares are redeemed within six years of purchase. Class C shares are subject to a one-year 1.00% contingent deferred sales charge and generally convert to class A shares after approximately ten years. Prior to April 1, 2018, class C shares did not convert to class A shares. The expenses for class A, class B, class C and class M shares may differ based on the distribution fee of each class, which is identified in Note 2. Class R6 and class Y shares, which are sold at net asset value, are generally subject to the same expenses as class A, class B, class C and class M shares, but do not bear a distribution fee and in the case of class R6 shares, bear a lower investor servicing fee, which is identified in Note 2. Class R6 and class Y shares are not available to all investors.
In the normal course of business, the fund enters into contracts that may include agreements to indemnify another party under given circumstances. The fund’s maximum exposure under these arrangements is unknown as this would involve future claims that may be, but have not yet been, made against the fund. However, the fund’s management team expects the risk of material loss to be remote.
The fund has entered into contractual arrangements with an investment adviser, administrator, distributor, shareholder servicing agent and custodian, who each provide services to the fund. Unless expressly stated otherwise, shareholders are not parties to, or intended beneficiaries of these contractual arrangements, and these contractual arrangements are not intended to create any shareholder right to enforce them against the service providers or to seek any remedy under them against the service providers, either directly or on behalf of the fund.
Under the fund’s Agreement and Declaration of Trust, any claims asserted against or on behalf of the Putnam Funds, including claims against Trustees and Officers, must be brought in state and federal courts located within the Commonwealth of Massachusetts.
Note 1: Significant accounting policies
The following is a summary of significant accounting policies consistently followed by the fund in the preparation of its financial statements. The preparation of financial statements is in conformity with accounting principles generally accepted in the United States of America and requires management to make estimates and assumptions that affect the reported amounts of assets and liabilities in the financial statements and the reported amounts of increases and decreases in net assets from operations. Actual results could differ from those
|
| 32 Ohio Tax Exempt Income Fund |
estimates. Subsequent events after the Statement of assets and liabilities date through the date that the financial statements were issued have been evaluated in the preparation of the financial statements.
Investment income, realized and unrealized gains and losses and expenses of the fund are borne pro-rata based on the relative net assets of each class to the total net assets of the fund, except that each class bears expenses unique to that class (including the distribution fees applicable to such classes). Each class votes as a class only with respect to its own distribution plan or other matters on which a class vote is required by law or determined by the Trustees. If the fund were liquidated, shares of each class would receive their pro-rata share of the net assets of the fund. In addition, the Trustees declare separate dividends on each class of shares.
Security valuation Portfolio securities and other investments are valued using policies and procedures adopted by the Board of Trustees. The Trustees have formed a Pricing Committee to oversee the implementation of these procedures and have delegated responsibility for valuing the fund’s assets in accordance with these procedures to Putnam Management. Putnam Management has established an internal Valuation Committee that is responsible for making fair value determinations, evaluating the effectiveness of the pricing policies of the fund and reporting to the Pricing Committee.
Tax-exempt bonds and notes are generally valued on the basis of valuations provided by an independent pricing service approved by the Trustees. Such services use information with respect to transactions in bonds, quotations from bond dealers, market transactions in comparable securities and various relationships between securities in determining value. These securities will generally be categorized as Level 2.
Certain investments, including certain restricted and illiquid securities and derivatives, are also valued at fair value following procedures approved by the Trustees. To assess the continuing appropriateness of fair valuations, the Valuation Committee reviews and affirms the reasonableness of such valuations on a regular basis after considering all relevant information that is reasonably available. Such valuations and procedures are reviewed periodically by the Trustees. These valuations consider such factors as significant market or specific security events such as interest rate or credit quality changes, various relationships with other securities, discount rates, U.S. Treasury, U.S. swap and credit yields, index levels, convexity exposures, recovery rates, sales and other multiples and resale restrictions. These securities are classified as Level 2 or as Level 3 depending on the priority of the significant inputs. The fair value of securities is generally determined as the amount that the fund could reasonably expect to realize from an orderly disposition of such securities over a reasonable period of time. By its nature, a fair value price is a good faith estimate of the value of a security in a current sale and does not reflect an actual market price, which may be different by a material amount.
Security transactions and related investment income Security transactions are recorded on the trade date (the date the order to buy or sell is executed). Gains or losses on securities sold are determined on the identified cost basis.
Interest income is recorded on the accrual basis. All premiums/discounts are amortized/accreted on a yield-to-maturity basis. The premium in excess of the call price, if any, is amortized to the call date; thereafter, any remaining premium is amortized to maturity.
Interfund lending The fund, along with other Putnam funds, may participate in an interfund lending program pursuant to an exemptive order issued by the SEC. This program allows the fund to borrow from other Putnam funds that permit such transactions. Interfund lending transactions are subject to each fund’s investment policies and borrowing and lending limits. Interest earned or paid on the interfund lending transaction will be based on the average of certain current market rates. During the reporting period, the fund did not utilize the program.
Lines of credit The fund participates, along with other Putnam funds, in a $317.5 million unsecured committed line of credit and a $235.5 million unsecured uncommitted line of credit, both provided by State Street. Borrowings may be made for temporary or emergency purposes, including the funding of shareholder redemption requests and trade settlements. Interest is charged to the fund based on the fund’s borrowing at a rate equal to 1.25% plus the higher of (1) the Federal Funds rate and (2) the overnight LIBOR for the committed line of credit and the Federal Funds rate plus 1.30% for the uncommitted line of credit. A closing fee equal to 0.04% of the committed line of credit plus a $25,000 flat fee and 0.04% of the uncommitted line of credit has been paid by the participating funds. In addition, a commitment fee of 0.21% per annum on any unutilized portion of the committed line of credit is allocated to the participating funds based on their relative net assets and paid quarterly. During the reporting period, the fund had no borrowings against these arrangements.
Federal taxes It is the policy of the fund to distribute all of its income within the prescribed time period and otherwise comply with the provisions of the Internal Revenue Code of 1986, as amended (the Code), applicable
|
| Ohio Tax Exempt Income Fund 33 |
to regulated investment companies. It is also the intention of the fund to distribute an amount sufficient to avoid imposition of any excise tax under Section 4982 of the Code.
The fund is subject to the provisions of Accounting Standards Codification 740 Income Taxes (ASC 740). ASC 740 sets forth a minimum threshold for financial statement recognition of the benefit of a tax position taken or expected to be taken in a tax return. The fund did not have a liability to record for any unrecognized tax benefits in the accompanying financial statements. No provision has been made for federal taxes on income, capital gains or unrealized appreciation on securities held nor for excise tax on income and capital gains. Each of the fund’s federal tax returns for the prior three fiscal years remains subject to examination by the Internal Revenue Service.
At May 31, 2018, the fund had a capital loss carryover of $1,539,003 available to the extent allowed by the Code to offset future net capital gain, if any. For any carryover, the amount of the carryover and that carryover’s expiration date is:
| | | |
| | Loss carryover | |
| Short-term | Long-term | Total | Expiration |
| $737,920 | $587,431 | $1,325,351 | * |
| 213,652 | N/A | 213,652 | May 31, 2019 |
* Under the Regulated Investment Company Modernization Act of 2010, the fund will be permitted to carry forward capital losses incurred in taxable years beginning after December 22, 2010 for an unlimited period. However, any losses incurred will be required to be utilized prior to the losses incurred in pre-enactment tax years. As a result of this ordering rule, pre-enactment capital loss carryforwards may be more likely to expire unused. Additionally, post-enactment capital losses that are carried forward will retain their character as either short-term or long-term capital losses rather than being considered all short-term as under previous law.
Distributions to shareholders Income dividends are recorded daily by the fund and are paid monthly. Distributions from capital gains, if any, are recorded on the ex-dividend date and paid at least annually. The amount and character of income and gains to be distributed are determined in accordance with income tax regulations which may differ from generally accepted accounting principles. These differences include temporary and/or permanent differences from the expiration of a capital loss carryover. Reclassifications are made to the fund’s capital accounts to reflect income and gains available for distribution (or available capital loss carryovers) under income tax regulations. At the close of the reporting period, the fund reclassified $11,459 to decrease undistributed net investment income, $97,717 to decrease paid-in capital and $109,176 to decrease accumulated net realized loss.
Tax cost of investments includes adjustments to net unrealized appreciation (depreciation) which may not necessarily be final tax cost basis adjustments, but closely approximate the tax basis unrealized gains and losses that may be realized and distributed to shareholders. The tax basis components of distributable earnings and the federal tax cost as of the close of the reporting period were as follows:
| |
| Unrealized appreciation | $3,821,422 |
| Unrealized depreciation | (524,749) |
| Net unrealized appreciation | 3,296,673 |
| Undistributed ordinary income | 15,152 |
| Undistributed tax-exempt income | 52,009 |
| Capital loss carryforward | (1,539,003) |
| Cost for federal income tax purposes | $113,804,641 |
Note 2: Management fee, administrative services and other transactions
The fund pays Putnam Management a management fee (based on the fund’s average net assets and computed and paid monthly) at annual rates that may vary based on the average of the aggregate net assets of all open-end mutual funds sponsored by Putnam Management (excluding net assets of funds that are invested in, or that are invested in by, other Putnam funds to the extent necessary to avoid “double counting” of those assets). Such annual rates may vary as follows:
|
| 34 Ohio Tax Exempt Income Fund |
| | | | |
| 0.590% | of the first $5 billion, | | 0.390% | of the next $50 billion, |
| 0.540% | of the next $5 billion, | | 0.370% | of the next $50 billion, |
| 0.490% | of the next $10 billion, | | 0.360% | of the next $100 billion and |
| 0.440% | of the next $10 billion, | | 0.355% | of any excess thereafter. |
For the reporting period, the management fee represented an effective rate (excluding the impact from any expense waivers in effect) of 0.433% of the fund’s average net assets.
Putnam Management has contractually agreed, through September 30, 2019, to waive fees or reimburse the fund’s expenses to the extent necessary to limit the cumulative expenses of the fund, exclusive of brokerage, interest, taxes, investment-related expenses, extraordinary expenses, acquired fund fees and expenses and payments under the fund’s investor servicing contract, investment management contract and distribution plans, on a fiscal year-to-date basis to an annual rate of 0.20% of the fund’s average net assets over such fiscal year-to-date period. During the reporting period, the fund’s expenses were not reduced as a result of this limit.
Putnam Investments Limited (PIL), an affiliate of Putnam Management, is authorized by the Trustees to manage a separate portion of the assets of the fund as determined by Putnam Management from time to time. PIL did not manage any portion of the assets of the fund during the reporting period. If Putnam Management were to engage the services of PIL, Putnam Management would pay a quarterly sub-management fee to PIL for its services at an annual rate of 0.40% of the average net assets of the portion of the fund managed by PIL.
The fund reimburses Putnam Management an allocated amount for the compensation and related expenses of certain officers of the fund and their staff who provide administrative services to the fund. The aggregate amount of all such reimbursements is determined annually by the Trustees.
Custodial functions for the fund’s assets are provided by State Street. Custody fees are based on the fund’s asset level, the number of its security holdings and transaction volumes.
Putnam Investor Services, Inc., an affiliate of Putnam Management, provides investor servicing agent functions to the fund. Putnam Investor Services, Inc. received fees for investor servicing for class A, class B, class C, class M and class Y shares that included (1) a per account fee for each direct and underlying non-defined contribution account (retail account) of the fund; (2) a specified rate of the fund’s assets attributable to defined contribution plan accounts; and (3) a specified rate based on the average net assets in retail accounts. Putnam Investor Services, Inc. has agreed that the aggregate investor servicing fees for each fund’s retail and defined contribution accounts for these share classes will not exceed an annual rate of 0.25% of the fund’s average assets attributable to such accounts.
Class R6 shares paid a monthly fee based on the average net assets of class R6 shares at an annual rate of 0.05%.
During the reporting period, the expenses for each class of shares related to investor servicing fees were as follows:
| | | | |
| Class A | $76,854 | | Class R6 | —* |
| Class B | 968 | | Class Y | 9,660 |
| Class C | 7,366 | | Total | $95,250 |
| Class M | 402 | | | |
* Amount represents less than $1.00.
The fund has entered into expense offset arrangements with Putnam Investor Services, Inc. and State Street whereby Putnam Investor Services, Inc.’s and State Street’s fees are reduced by credits allowed on cash balances. For the reporting period, the fund’s expenses were reduced by $20,516 under the expense offset arrangements.
Each Independent Trustee of the fund receives an annual Trustee fee, of which $96, as a quarterly retainer, has been allocated to the fund, and an additional fee for each Trustees meeting attended. Trustees also are reimbursed for expenses they incur relating to their services as Trustees.
The fund has adopted a Trustee Fee Deferral Plan (the Deferral Plan) which allows the Trustees to defer the receipt of all or a portion of Trustees fees payable on or after July 1, 1995. The deferred fees remain invested in certain Putnam funds until distribution in accordance with the Deferral Plan.
|
| Ohio Tax Exempt Income Fund 35 |
The fund has adopted an unfunded noncontributory defined benefit pension plan (the Pension Plan) covering all Trustees of the fund who have served as a Trustee for at least five years and were first elected prior to 2004. Benefits under the Pension Plan are equal to 50% of the Trustee’s average annual attendance and retainer fees for the three years ended December 31, 2005. The retirement benefit is payable during a Trustee’s lifetime, beginning the year following retirement, for the number of years of service through December 31, 2006. Pension expense for the fund is included in Trustee compensation and expenses in the Statement of operations. Accrued pension liability is included in Payable for Trustee compensation and expenses in the Statement of assets and liabilities. The Trustees have terminated the Pension Plan with respect to any Trustee first elected after 2003.
The fund has adopted distribution plans (the Plans) with respect to the following share classes pursuant to Rule 12b–1 under the Investment Company Act of 1940. The purpose of the Plans is to compensate Putnam Retail Management Limited Partnership, an indirect wholly-owned subsidiary of Putnam Investments, LLC, for services provided and expenses incurred in distributing shares of the fund. The Plans provide payments by the fund to Putnam Retail Management Limited Partnership at an annual rate of up to the following amounts (Maximum %) of the average net assets attributable to each class. The Trustees have approved payment by the fund at the following annual rate (Approved %) of the average net assets attributable to each class. During the reporting period, the class-specific expenses related to distribution fees were as follows:
| | | |
| | Maximum % | Approved % | Amount |
| Class A | 0.35% | * | $235,113 |
| Class B | 1.00% | 0.85% | 11,247 |
| Class C | 1.00% | 1.00% | 100,719 |
| Class M | 1.00% | 0.50% | 2,746 |
| Total | | | $349,825 |
* Equals the weighted average of (i) 0.20% of the net assets of the fund attributable to class A shares purchased and paid for prior to April 1, 2005 and (ii) 0.25% of all other net assets of the fund attributable to class A shares.
For the reporting period, Putnam Retail Management Limited Partnership, acting as underwriter, received net commissions of $6,542 and $113 from the sale of class A and class M shares, respectively, and received $724 and $55 in contingent deferred sales charges from redemptions of class B and class C shares, respectively.
A deferred sales charge of up to 1.00% is assessed on certain redemptions of class A shares. For the reporting period, Putnam Retail Management Limited Partnership, acting as underwriter, received no monies on class A redemptions.
Note 3: Purchases and sales of securities
During the reporting period, the cost of purchases and the proceeds from sales, excluding short-term investments, were as follows:
| | |
| | Cost of purchases | Proceeds from sales |
| Investments in securities (Long-term) | $40,838,800 | $48,364,349 |
| U.S. government securities (Long-term) | — | — |
| Total | $40,838,800 | $48,364,349 |
The fund may purchase or sell investments from or to other Putnam funds in the ordinary course of business, which can reduce the fund’s transaction costs, at prices determined in accordance with SEC requirements and policies approved by the Trustees. During the reporting period, purchases or sales of long-term securities from or to other Putnam funds, if any, did not represent more than 5% of the fund’s total cost of purchases and/or total proceeds from sales.
|
| 36 Ohio Tax Exempt Income Fund |
Note 4: Capital shares
At the close of the reporting period, there were an unlimited number of shares of beneficial interest authorized. Transactions, including, if applicable, direct exchanges pursuant to share conversions, in capital shares were as follows:
| | | | |
| | YEAR ENDED 5/31/18 | YEAR ENDED 5/31/17 |
| Class A | Shares | Amount | Shares | Amount |
| Shares sold | 560,932 | $5,021,459 | 974,724 | $8,887,287 |
| Shares issued in connection with | | | | |
| reinvestment of distributions | 288,224 | 2,573,008 | 316,499 | 2,867,735 |
| | 849,156 | 7,594,467 | 1,291,223 | 11,755,022 |
| Shares repurchased | (1,518,298) | (13,570,815) | (2,232,100) | (20,093,116) |
| Net decrease | (669,142) | $(5,976,348) | (940,877) | $(8,338,094) |
| |
| | YEAR ENDED 5/31/18 | YEAR ENDED 5/31/17 |
| Class B | Shares | Amount | Shares | Amount |
| Shares sold | 39 | $346 | 27,496 | $249,340 |
| Shares issued in connection with | | | | |
| reinvestment of distributions | 3,100 | 27,636 | 3,540 | 32,020 |
| | 3,139 | 27,982 | 31,036 | 281,360 |
| Shares repurchased | (26,534) | (237,934) | (32,128) | (288,195) |
| Net decrease | (23,395) | $(209,952) | (1,092) | $(6,835) |
| |
| | YEAR ENDED 5/31/18 | YEAR ENDED 5/31/17 |
| Class C | Shares | Amount | Shares | Amount |
| Shares sold | 76,105 | $683,133 | 185,411 | $1,693,651 |
| Shares issued in connection with | | | | |
| reinvestment of distributions | 20,484 | 182,967 | 22,539 | 204,103 |
| | 96,589 | 866,100 | 207,950 | 1,897,754 |
| Shares repurchased | (346,371) | (3,092,227) | (193,819) | (1,745,988) |
| Net increase (decrease) | (249,782) | $(2,226,127) | 14,131 | $151,766 |
| |
| | YEAR ENDED 5/31/18 | YEAR ENDED 5/31/17 |
| Class M | Shares | Amount | Shares | Amount |
| Shares sold | 5,908 | $53,073 | 7,365 | $66,184 |
| Shares issued in connection with | | | | |
| reinvestment of distributions | 1,320 | 11,784 | 1,256 | 11,372 |
| | 7,228 | 64,857 | 8,621 | 77,556 |
| Shares repurchased | (11,918) | (106,053) | (2,111) | (19,317) |
| Net increase (decrease) | (4,690) | $(41,196) | 6,510 | $58,239 |
|
| Ohio Tax Exempt Income Fund 37 |
| | | | |
| | | | FOR THE PERIOD OF 5/22/18 |
| | | | (COMMENCEMENT OF OPERATIONS) TO 5/31/18 |
| Class R6 | | | Shares | Amount |
| Shares sold | | | 1,135 | $10,000 |
| Shares issued in connection with reinvestment of distributions | | 1 | 8 |
| | | | 1,136 | 10,008 |
| Shares repurchased | | | — | — |
| Net increase | | | 1,136 | $10,008 |
| |
| | YEAR ENDED 5/31/18 | YEAR ENDED 5/31/17 |
| Class Y | Shares | Amount | Shares | Amount |
| Shares sold | 265,487 | $2,379,026 | 398,863 | $3,583,642 |
| Shares issued in connection with | | | | |
| reinvestment of distributions | 38,788 | 346,603 | 29,307 | 265,533 |
| | 304,275 | 2,725,629 | 428,170 | 3,849,175 |
| Shares repurchased | (424,034) | (3,785,579) | (311,840) | (2,813,405) |
| Net increase (decrease) | (119,759) | $(1,059,950) | 116,330 | $1,035,770 |
At the close of the reporting period, Putnam Investments, LLC owned the following shares of the fund:
| | | |
| | Shares owned | Percentage of ownership | Value |
| Class R6 | 1,136 | 100.00% | $10,065 |
Note 5: Market, credit and other risks
In the normal course of business, the fund trades financial instruments and enters into financial transactions where risk of potential loss exists due to changes in the market (market risk) or failure of the contracting party to the transaction to perform (credit risk). The fund may be exposed to additional credit risk that an institution or other entity with which the fund has unsettled or open transactions will default. The fund focuses a majority of its investments in the state of Ohio and may be affected by economic and political developments in that state.
|
| 38 Ohio Tax Exempt Income Fund |
Federal tax information (Unaudited)
The fund has designated 99.54% of dividends paid from net investment income during the reporting period as tax exempt for Federal income tax purposes.
The Form 1099 that will be mailed to you in January 2019 will show the tax status of all distributions paid to your account in calendar 2018.
|
| Ohio Tax Exempt Income Fund 39 |

|
| 40 Ohio Tax Exempt Income Fund |

* Mr. Reynolds is an “interested person” (as defined in the Investment Company Act of 1940) of the fund and Putnam Investments. He is President and Chief Executive Officer of Putnam Investments, as well as the President of your fund and each of the other Putnam funds.
The address of each Trustee is One Post Office Square, Boston, MA 02109.
As of May 31, 2018, there were 103 Putnam funds. All Trustees serve as Trustees of all Putnam funds.
Each Trustee serves for an indefinite term, until his or her resignation, retirement at age 75, removal, or death.
|
| Ohio Tax Exempt Income Fund 41 |
Officers
In addition to Robert L. Reynolds, the other officers of the fund are shown below:
| |
| Jonathan S. Horwitz (Born 1955) | Susan G. Malloy (Born 1957) |
| Executive Vice President, Principal Executive Officer, | Vice President and Assistant Treasurer |
| and Compliance Liaison | Since 2007 |
| Since 2004 | Head of Accounting, Middle Office, & Control Services, |
| | Putnam Investments and Putnam Management |
| Robert T. Burns (Born 1961) | |
| Vice President and Chief Legal Officer | Mark C. Trenchard (Born 1962) |
| Since 2011 | Vice President and BSA Compliance Officer |
| General Counsel, Putnam Investments, | Since 2002 |
| Putnam Management, and Putnam Retail Management | Director of Operational Compliance, Putnam |
| | Investments and Putnam Retail Management |
| James F. Clark (Born 1974) | |
| Vice President and Chief Compliance Officer | Nancy E. Florek (Born 1957) |
| Since 2016 | Vice President, Director of Proxy Voting and Corporate |
| Chief Compliance Officer, Putnam Investments | Governance, Assistant Clerk, and Assistant Treasurer |
| and Putnam Management | Since 2000 |
| | |
| Michael J. Higgins (Born 1976) | Denere P. Poulack (Born 1968) |
| Vice President, Treasurer, and Clerk | Assistant Vice President, Assistant Clerk, |
| Since 2010 | and Assistant Treasurer |
| | Since 2004 |
| Janet C. Smith (Born 1965) | |
| Vice President, Principal Financial Officer, Principal | |
| Accounting Officer, and Assistant Treasurer | |
| Since 2007 | |
| Head of Fund Administration Services, | |
| Putnam Investments and Putnam Management | |
The principal occupations of the officers for the past five years have been with the employers as shown above, although in some cases they have held different positions with such employers. The address of each officer is One Post Office Square, Boston, MA 02109.
|
| 42 Ohio Tax Exempt Income Fund |
Putnam family of funds
The following is a list of Putnam’s open-end mutual funds offered to the public. Investors should carefully consider the investment objective, risks, charges, and expenses of a fund before investing. For a prospectus, or a summary prospectus if available, containing this and other information for any Putnam fund or product, contact your financial advisor or call Putnam Investor Services at 1-800-225-1581. Please read the prospectus carefully before investing.
| |
| Blend | Value |
| Capital Opportunities Fund | Convertible Securities Fund |
| Capital Spectrum Fund | Equity Income Fund |
| Emerging Markets Equity Fund | International Value Fund |
| Equity Spectrum Fund | Small Cap Value Fund |
| Europe Equity Fund | |
| Global Equity Fund | Income |
| International Capital Opportunities Fund | Diversified Income Trust |
| International Equity Fund | Emerging Markets Income Fund |
| Investors Fund | Floating Rate Income Fund |
| Low Volatility Equity Fund | Global Income Trust |
| Multi-Cap Core Fund | Government Money Market Fund* |
| Research Fund | High Yield Fund |
| Income Fund |
| Global Sector | Money Market Fund† |
| Global Consumer Fund | Mortgage Securities Fund |
| Global Financials Fund | Short Duration Income Fund |
| Global Health Care Fund | |
| Global Industrials Fund | Tax-free Income |
| Global Natural Resources Fund | AMT-Free Municipal Fund |
| Global Sector Fund | Intermediate-Term Municipal Income Fund |
| Global Technology Fund | Short-Term Municipal Income Fund |
| Global Telecommunications Fund | Tax Exempt Income Fund |
| Global Utilities Fund | Tax-Free High Yield Fund |
| |
| Growth | State tax-free income funds‡: |
| Growth Opportunities Fund | California, Massachusetts, Minnesota, |
| International Growth Fund | New Jersey, New York, Ohio, and Pennsylvania. |
| Small Cap Growth Fund | |
| Sustainable Future Fund | |
| Sustainable Leaders Fund | |
|
| Ohio Tax Exempt Income Fund 43 |
| |
| Absolute Return | Asset Allocation |
| Absolute Return 100 Fund® | Dynamic Risk Allocation Fund |
| Fixed Income Absolute Return Fund | George Putnam Balanced Fund |
| Multi-Asset Absolute Return Fund | |
| Dynamic Asset Allocation Balanced Fund |
| Putnam PanAgora** | Dynamic Asset Allocation Conservative Fund |
| Putnam PanAgora Managed Futures Strategy | Dynamic Asset Allocation Growth Fund |
| Putnam PanAgora Market Neutral Fund | |
| Putnam PanAgora Risk Parity Fund | Retirement Income Fund Lifestyle 1 |
| |
| | RetirementReady® 2060 Fund |
| | RetirementReady® 2055 Fund |
| | RetirementReady® 2050 Fund |
| | RetirementReady® 2045 Fund |
| | RetirementReady® 2040 Fund |
| | RetirementReady® 2035 Fund |
| | RetirementReady® 2030 Fund |
| | RetirementReady® 2025 Fund |
| | RetirementReady® 2020 Fund |
* You could lose money by investing in the fund. Although the fund seeks to preserve the value of your investment at $1.00 per share, it cannot guarantee it will do so. An investment in the fund is not insured or guaranteed by the Federal Deposit Insurance Corporation or any other government agency. The fund’s sponsor has no legal obligation to provide financial support to the fund, and you should not expect that the sponsor will provide financial support to the fund at any time.
† You could lose money by investing in the fund. Although the fund seeks to preserve the value of your investment at $1.00 per share, it cannot guarantee it will do so. The fund may impose a fee upon sale of your shares or may temporarily suspend your ability to sell shares if the fund’s liquidity falls below required minimums because of market conditions or other factors. An investment in the fund is not insured or guaranteed by the Federal Deposit Insurance Corporation or any other government agency. The fund’s sponsor has no legal obligation to provide financial support to the fund, and you should not expect that the sponsor will provide financial support to the fund at any time.
‡ Not available in all states.
** Sub-advised by PanAgora Asset Management.
Check your account balances and the most recent month-end performance in the Individual Investors section at putnam.com.
|
| 44 Ohio Tax Exempt Income Fund |
Fund information
Founded over 80 years ago, Putnam Investments was built around the concept that a balance between risk and reward is the hallmark of a well-rounded financial program. We manage over 100 funds across income, value, blend, growth, asset allocation, absolute return, and global sector categories.
| | |
| Investment Manager | Trustees | Michael J. Higgins |
| Putnam Investment | Kenneth R. Leibler, Chair | Vice President, Treasurer, |
| Management, LLC | Liaquat Ahamed | and Clerk |
| One Post Office Square | Ravi Akhoury | |
| Boston, MA 02109 | Barbara M. Baumann | Janet C. Smith |
| | Katinka Domotorffy | Vice President, |
| Investment Sub-Advisor | Catharine Bond Hill | Principal Financial Officer, |
| Putnam Investments Limited | Paul L. Joskow | Principal Accounting Officer, |
| 16 St James’s Street | Robert E. Patterson | and Assistant Treasurer |
| London, England SW1A 1ER | George Putnam, III | |
| Robert L. Reynolds | Susan G. Malloy |
| Marketing Services | Manoj P. Singh | Vice President and |
| Putnam Retail Management | | Assistant Treasurer |
| One Post Office Square | Officers | |
| Boston, MA 02109 | Robert L. Reynolds | Mark C. Trenchard |
| President | Vice President and |
| Custodian | | BSA Compliance Officer |
| State Street Bank | Jonathan S. Horwitz | |
| and Trust Company | Executive Vice President, | Nancy E. Florek |
| Principal Executive Officer, | Vice President, Director of |
| Legal Counsel | and Compliance Liaison | Proxy Voting and Corporate |
| Ropes & Gray LLP | | Governance, Assistant Clerk, |
| | Robert T. Burns | and Assistant Treasurer |
| Independent Registered Public | Vice President and | |
| Accounting Firm | Chief Legal Officer | Denere P. Poulack |
| PricewaterhouseCoopers LLP | | Assistant Vice President, Assistant |
| | James F. Clark | Clerk, and Assistant Treasurer |
| | Vice President and | |
| | Chief Compliance Officer | |
This report is for the information of shareholders of Putnam Ohio Tax Exempt Income Fund. It may also be used as sales literature when preceded or accompanied by the current prospectus, the most recent copy of Putnam’s Quarterly Performance Summary, and Putnam’s Quarterly Ranking Summary. For more recent performance, please visit putnam.com. Investors should carefully consider the investment objectives, risks, charges, and expenses of a fund, which are described in its prospectus. For this and other information or to request a prospectus or summary prospectus, call 1-800-225-1581 toll free. Please read the prospectus carefully before investing. The fund’s Statement of Additional Information contains additional information about the fund’s Trustees and is available without charge upon request by calling 1-800-225-1581.

| |
| (a) The fund's principal executive, financial and accounting officers are employees of Putnam Investment Management, LLC, the Fund's investment manager. As such they are subject to a comprehensive Code of Ethics adopted and administered by Putnam Investments which is designed to protect the interests of the firm and its clients. The Fund has adopted a Code of Ethics which incorporates the Code of Ethics of Putnam Investments with respect to all of its officers and Trustees who are employees of Putnam Investment Management, LLC. For this reason, the Fund has not adopted a separate code of ethics governing its principal executive, financial and accounting officers. |
| |
| Item 3. Audit Committee Financial Expert: |
| |
| The Funds' Audit, Compliance and Distributions Committee is comprised solely of Trustees who are “independent” (as such term has been defined by the Securities and Exchange Commission (“SEC”) in regulations implementing Section 407 of the Sarbanes-Oxley Act (the “Regulations”)). The Trustees believe that each of the members of the Audit, Compliance and Distributions Committee also possess a combination of knowledge and experience with respect to financial accounting matters, as well as other attributes, that qualify them for service on the Committee. In addition, the Trustees have determined that each of Mr. Patterson, Ms. Baumann and Mr. Singh qualifies as an “audit committee financial expert” (as such term has been defined by the Regulations) based on their review of his or her pertinent experience and education. The SEC has stated, and the funds' amended and restated agreement and Declaration of Trust provides, that the designation or identification of a person as an audit committee financial expert pursuant to this Item 3 of Form N-CSR does not impose on such person any duties, obligations or liability that are greater than the duties, obligations and liability imposed on such person as a member of the Audit, Compliance and Distribution Committee and the Board of Trustees in the absence of such designation or identification. |
| |
| Item 4. Principal Accountant Fees and Services: |
| |
| The following table presents fees billed in each of the last two fiscal years for services rendered to the fund by the fund's independent auditor: |
| | | | | |
| Fiscal year ended | Audit Fees | Audit-Related Fees | Tax Fees | All Other Fees |
|
|
| | | | | |
| May 31, 2018 | $47,493 | $ — | $12,597 | $177 |
| May 31, 2017 | $53,035 | $ — | $12,187 | $ — |
| |
| For the fiscal years ended May 31, 2018 and May 31, 2017, the fund's independent auditor billed aggregate non-audit fees in the amounts of $612,126 and $364,080 respectively, to the fund, Putnam Management and any entity controlling, controlled by or under common control with Putnam Management that provides ongoing services to the fund. |
| |
| Audit Fees represent fees billed for the fund's last two fiscal years relating to the audit and review of the financial statements included in annual reports and registration statements, and other services that are normally provided in connection with statutory and regulatory filings or engagements. |
| |
| Audit-Related Fees represent fees billed in the fund's last two fiscal years for services traditionally performed by the fund's auditor, including accounting consultation for proposed transactions or concerning financial accounting and reporting standards and other audit or attest services not required by statute or regulation. |
| |
| Tax Fees represent fees billed in the fund's last two fiscal years for tax compliance, tax planning and tax advice services. Tax planning and tax advice services include assistance with tax audits, employee benefit plans and requests for rulings or technical advice from taxing authorities. |
| |
| All Other Fees represent fees billed for services relating to an analysis of fund profitability |
| |
| Pre-Approval Policies of the Audit, Compliance and Distributions Committee. The Audit, Compliance and Distributions Committee of the Putnam funds has determined that, as a matter of policy, all work performed for the funds by the funds' independent auditors will be pre-approved by the Committee itself and thus will generally not be subject to pre-approval procedures. |
| |
| The Audit, Compliance and Distributions Committee also has adopted a policy to pre-approve the engagement by Putnam Management and certain of its affiliates of the funds' independent auditors, even in circumstances where pre-approval is not required by applicable law. Any such requests by Putnam Management or certain of its affiliates are typically submitted in writing to the Committee and explain, among other things, the nature of the proposed engagement, the estimated fees, and why this work should be performed by that particular audit firm as opposed to another one. In reviewing such requests, the Committee considers, among other things, whether the provision of such services by the audit firm are compatible with the independence of the audit firm. |
| |
| The following table presents fees billed by the fund's independent auditor for services required to be approved pursuant to paragraph (c)(7)(ii) of Rule 2-01 of Regulation S-X. |
| | | | | |
| Fiscal year ended | Audit-Related Fees | Tax Fees | All Other Fees | Total Non-Audit Fees |
|
|
| | | | | |
| May 31, 2018 | $ — | $600,294 | $ — | $ — |
| | | | | |
| May 31, 2017 | $ — | $351,893 | $ — | $ — |
| |
|
Item 5. Audit Committee of Listed Registrants |
| |
|
Item 6. Schedule of Investments: |
| |
| The registrant's schedule of investments in unaffiliated issuers is included in the report to shareholders in Item 1 above. |
| |
|
Item 7. Disclosure of Proxy Voting Policies and Procedures For Closed-End Management Investment Companies: |
| |
|
Item 8. Portfolio Managers of Closed-End Investment Companies |
| |
|
Item 9. Purchases of Equity Securities by Closed-End Management Investment Companies and Affiliated Purchasers: |
| |
|
Item 10. Submission of Matters to a Vote of Security Holders: |
| |
|
Item 11. Controls and Procedures: |
| |
| (a) The registrant's principal executive officer and principal financial officer have concluded, based on their evaluation of the effectiveness of the design and operation of the registrant's disclosure controls and procedures as of a date within 90 days of the filing date of this report, that the design and operation of such procedures are generally effective to provide reasonable assurance that information required to be disclosed by the registrant in this report is recorded, processed, summarized and reported within the time periods specified in the Commission's rules and forms. |
| |
| (b) Changes in internal control over financial reporting: Not applicable |
| |
| (a)(1) The Code of Ethics of The Putnam Funds, which incorporates the Code of Ethics of Putnam Investments, is filed herewith. |
| |
| (a)(2) Separate certifications for the principal executive officer and principal financial officer of the registrant as required by Rule 30a-2(a) under the Investment Company Act of 1940, as amended, are filed herewith. |
| |
| (b) The certifications required by Rule 30a-2(b) under the Investment Company Act of 1940, as amended, are filed herewith. |
| |
| Pursuant to the requirements of the Securities Exchange Act of 1934 and the Investment Company Act of 1940, the registrant has duly caused this report to be signed on its behalf by the undersigned, thereunto duly authorized. |
| |
| Putnam Ohio Tax Exempt Income Fund |
| |
| By (Signature and Title): |
| |
| /s/ Janet C. Smith
Janet C. Smith
Principal Accounting Officer
|
| |
| Pursuant to the requirements of the Securities Exchange Act of 1934 and the Investment Company Act of 1940, this report has been signed below by the following persons on behalf of the registrant and in the capacities and on the dates indicated. |
| |
| By (Signature and Title): |
| |
| /s/ Jonathan S. Horwitz
Jonathan S. Horwitz
Principal Executive Officer
|
| |
| By (Signature and Title): |
| |
| /s/ Janet C. Smith
Janet C. Smith
Principal Financial Officer
|