UNITED STATES
SECURITIES AND EXCHANGE COMMISSION
Washington, D.C. 20549
FORM N-CSR
CERTIFIED SHAREHOLDER REPORT OF REGISTERED MANAGEMENT
INVESTMENT COMPANIES
Investment Company Act File Number 811-04704
The Primary Trend Fund, Inc.
3960 Hillside Drive, Suite 204
Delafield, WI 53018_______
(Address of principal executive offices)
Arnold Investment Counsel Incorporated
3960 Hillside Drive, Suite 204
________Delafield, WI 53018_____
(Name and address of agent for service)
Registrant's telephone number, including area code: (262) 303-4850
Date of fiscal year end: June 30
Date of reporting period: June 30, 2012
Item 1. Reports to Stockholders
The following is a copy of the report transmitted to shareholders pursuant to Rule 30e-1 under the Investment Company Act of 1940 (17 CFR 270.30e-1)

ANNUAL REPORT
The Primary
Trend Fund
DELAFIELD, WISCONSIN
JUNE 30, 2012
MESSAGE TO SHAREHOLDERS…
| “…there are three story lines that we feel will monopolize this year’s [2012] headlines and create a cloud of uncertainty over the markets: 1) anything emanating from the PIIGS, the European Union or the International Monetary Fund; 2) the surreal obsession with the jobs numbers and the unemployment rate…; and 3) the “Quadrennial Circus” and the tug-o-war during the next nine months over who will lead the U.S. out of this economic and fiscal quagmire.” | |||
| The Primary Trend Fund | |||
| December 31, 2011 – Semiannual Report | |||
We aren’t fond of being right when it comes to expectations of a less-than rosy stock market environment, but the overriding themes that we laid out in The Primary Trend Fund’s Semiannual Report are alive and well – still – as we slog through the summer of 2012. Granted, we didn’t quite go out on a limb with those headline grabbers. What plagued the markets in the latter half of 2011 continued to do so in the first half of 2012.
Austerity has become the buzzword over the past 12 months. It is a double-edged sword. Like peace, austerity is best administered from a position of strength. Wisconsin is a prime example of parlaying austerity into fiscal fitness. However, Stockton (CA), Scranton (PA), Greece, Spain and the entire Eurozone are examples of austerity backed into a corner.
This uncertainty, domestically as well as abroad, has put investors on the defensive over the past year. Punctuated by robust rallies as well as climactic sell-offs, the stock market limped to the finish line. For the full year ended June 30, 2012, the blue chip averages of the Dow Jones Industrial Average and S&P 500 Index posted total returns of +6.63% and +5.45%, respectively. Small cap stocks, as measured by the Russell 2000 Index, had a less auspicious showing of –2.08% for the same 12 months.
While following a less volatile path, our Fund did lag the S&P 500 Index. For the same 12-month period ended 6/30/12, The Primary Trend Fund posted a total return of +3.08%.
Our #1 Mistake
Any way you slice it, not owning Apple, Inc. (AAPL - $584) in the portfolio during the past year was a mistake. Apple is by far the largest component in the S&P 500 Index with a market capitalization of $550 billion (as of 6/30/12)…surpassing the second-largest component, Exxon Mobil, by nearly 40%. By comprising 4.6% of the S&P 500 Index, and gaining an amazing 74% over the past 12 months, Apple’s stock alone accounted for nearly two-thirds of the S&P 500’s performance. While we are being somewhat tongue-in-cheek in this ‘mea culpa,’ the mere impact that Apple stock had on the largest U.S. stock market benchmark is a great tribute to the late Steve Jobs – indeed, he left his mark on Corporate America. There is no doubt that Apple is a great company, but going forward, will it be a great stock? Hindsight is always 20/20.
Dividends Did Matter…And Still Do
The best sector performance over the past year, with a total return of +14.88%, was posted by the S&P Utilities sector. Its ultra-conservative reputation, coupled with above-average dividend yields in an environment starved for yield, captured the attention of investors. Unfortunately, The Primary Trend Fund had only 3.6% of its portfolio invested in utilities. While our sole representation remains in Aqua America (WTR - $24.96), a water utility, it did provide a total return of +17.0%. We still find the long-term prospects for Aqua America very attractive, but its spectacular move over the last two months puts it in our holding tank. We full-heartedly embrace dividends as an integral part of our value-oriented philosophy because dividends do matter, but we believe that the above-average yields offered by blue chip common stocks currently is a better alternative to the somewhat exploited utility sector. In fact, the Fund’s “Top Ten” equity holdings yield is 3.2%, on average, while the Dow Jones 15 Utility Average is only slightly higher at 3.8%.
MESSAGE TO SHAREHOLDERS…(continued)
Energizing the Portfolio
Last summer, crude oil traded at $95-$100 per barrel and natural gas exchanged hands at $4.25 per mcf (one thousand cubic feet). During the past 12 months, oil fell to as low as $75 per barrel (-25%) and natural gas dropped to under $2.00 per mcf (-55%). This was not lost on the energy sector. The S&P Energy sector was the worst performing sector from 7/1/11 to 6/30/12, with a total return loss of 10.34%. The good news: the Fund entered its fiscal year 2012 with a mere 3.1% in energy relative to the S&P 500 weighting of 12.6%. The bad news: we started to increase our energy exposure before the commodities’ collapse was over. As of 6/30/12, the Fund has 13.4% of its portfolio invested in energy stocks (Encana, Nabors Industries, Petrobras, Royal Dutch Shell and Swift Energy) vs. the S&P 500’s 10.80%. Healthy dividend yields, cheap valuations and a potential rebound in the underlying commodities are all captivating rationale for the Fund’s overweighted commitment to this sector. The natural gas industry is especially alluring in the near and long term, so additional investment in this area is likely.
Playing Defense
In a secular bull market, positioning a portfolio defensively can really water down performance. However, in the secular range-bound stock market that we’ve experienced for nearly 13 years, occasionally playing defense may very well be the prudent course of action. The Fund’s 12.9% investment in consumer staple stocks (Campbell Soup, Kraft Foods, Molson Coors and WalMart Stores) and its 16.6% investment in healthcare stocks (Abbott Labs, Eli Lilly, Johnson & Johnson and Pfizer) has proven to be the right portfolio emphasis thus far in 2012. The fact that the majority of these are multi-year holdings is proof that “buy-and-hold” is not dead, contrary to what the mainstream media keeps pitching.
This 29.5% defensive posture in these two sectors, coupled with the Fund’s 17.6% cash position, has been a solid anchor in the debt storm that is pouring down on both the U.S. and Europe. We believe this 47.1% of the portfolio gives us the flexibility to become more aggressively invested in economically-sensitive equities when the situation is warranted: either when geopolitical risks subside or a major correction in the stock market creates an overall bona fide buying opportunity. Neither has occurred yet.
Chinese Curse
Of all the factors afflicting the global financial markets these days, the simplest explanation may have its roots in ancient China: “May you live in interesting times.” Often referred to as the Chinese Curse as it was cast upon enemies in order to bring bad luck.
We most certainly do live in interesting times, with investors and the general public alike hoping to survive. The dysfunctionality in governments worldwide, to include our very own Capital Hill, has translated into extreme volatility in equity markets.
In the past year alone, the S&P 500 Index has experienced nine rallies of +5% or more (on an intraday basis) interspersed by nine corrections of –5% or more. The best rally occurred last fall when the S&P 500 jumped +20.2% in just three weeks. The worst decline occurred last summer when the S&P 500 dropped 18.9% in just five weeks. Currently, we are in the midst of a +11.0% up move from the early-June lows through August 7, 2012.
This volatility continues to disenchant the average investor and confound the professional investor. The “Flash Crash” in May 2010, the JPMorgan “Whale Trader” fiasco earlier this year and last week’s Knight Capital Group trading glitch have all contributed to the whipsaw trading environment and growing disdain for Wall Street.
Politics as Usual
Merkel, Monti, Draghi and Lagarde have no easy task. The European economy is in a funk – aided and abetted by a fiscal house of cards in Western Europe, discord within the euro monetary mechanism and an unrealistic socialist entitlement mentality.
2
MESSAGE TO SHAREHOLDERS…(continued)
The fiscal cliff we face here in the U.S. is analogous to where Greece was just two to three years ago. As we write, the numbers are downright ugly: 1) the unemployment rate is at 8.3% (and understated in our opinion); 2) second quarter GDP came in at 1.5%…anemic at best and contributing to the worst economic recovery since the Depression Era 1930s; and 3) Federal debt now tallies $16 trillion and counting. Both presidential candidate Romney and President Obama are correct on one point: the decision by voters this November is crucial and will take the U.S. on two decidedly different paths.
And even with this political and fiscal cloud of uncertainty enveloping our stock market, the S&P 500 is within spitting distance of its previous recovery high of 1,419 (a mere 1.2% away as we write). The technical underpinnings of this market are surprisingly strong as equities climb the “wall of worry.” All of the major averages are trading above their respective up-trending 50-day and 200-day moving averages – a sign of a bullish trend. Healthy breadth, historically a leading indicator, continues to point to higher stock prices.
We believe that the American business environment is being smothered by the bureaucratic policies emanating from Washington, D.C. The lack of tax reform and fiscal restraint is not just a European phenomenon. The “Quadrennial Circus” is in town for a few more months…and what happens in November will dictate the investment climate for 2013.
We are confident in the current allocation of your Primary Trend Fund portfolio and believe that our value-oriented philosophy stands the test of time. Your continued trust in that philosophy is never taken for granted.
Our best regards,
 |  | |
| Lilli Gust | Barry S. Arnold | |
| President | Vice President | |
| Chief Investment Officer |
| Summary of Investments by Sector (Unaudited) | |||||
| Percent of | |||||
| Sector | Investment Securities | ||||
| Short-term Investments | 17.6 | % | |||
| Health Care | 16.6 | % | |||
| Energy | 13.4 | % | |||
| Consumer Staples | 12.9 | % | |||
| Information Technology | 9.7 | % | |||
| Consumer Discretionary | 8.9 | % | |||
| Financials | 7.6 | % | |||
| Industrials | 5.7 | % | |||
| Utilities | 3.6 | % | |||
| Telecommunication Services | 2.4 | % | |||
| Materials | 1.6 | % | |||
| Total Investments | 100.0 | % | |||
| Top Ten Equity Holdings (Unaudited) | |||||
| Percent of | |||||
| Security | Investment Securities | ||||
| Encana Corp. | 5.5 | % | |||
| DreamWorks Animation | |||||
| SKG, Inc., Class A | 5.1 | % | |||
| Eli Lilly & Co. | 4.8 | % | |||
| General Electric Co. | 4.8 | % | |||
| Intel Corp. | 4.4 | % | |||
| Molson Coors | |||||
| Brewing Co., Class B | 4.4 | % | |||
| Johnson & Johnson | 4.0 | % | |||
| Royal Dutch Shell PLC ADR | 4.0 | % | |||
| Abbott Laboratories | 3.9 | % | |||
| Pfizer, Inc. | 3.8 | % | |||
| Total | 44.7 | % | |||
3
EXPENSE EXAMPLE (Unaudited)
For the Six Months Ended June 30, 2012
As a shareholder of the Primary Trend Fund, you incur ongoing costs, including management fees and other Fund expenses. If you invest through a financial intermediary, you may also incur additional costs such as a transaction fee charged on the purchase or sale of the Fund or an asset-based management fee. This Example is intended to help you understand your ongoing costs (in dollars) of investing in the Fund and to compare these costs with the ongoing costs of investing in other mutual funds.
The Example is based on an investment of $1,000 invested at the beginning of the period and held for the entire period from January 1, 2012 to June 30, 2012.
Actual Expenses
The first line of the table below provides information about actual account values and actual expenses. You may use the information in this line, together with the amount you invested, to estimate the expenses you paid over the period. Simply divide your account value by $1,000 (for example, an $8,600 account value divided by $1,000 = 8.6), then multiply the result by the number in the first line under the heading entitled “Expenses Paid During Period” to estimate the expenses you paid on your account during the period.
Hypothetical Example for Comparison Purposes
The second line of the table below provides information about hypothetical account values and hypothetical expenses based on the Fund’s actual expense ratios and an assumed rate of return of 5% per year before expenses, which is not the Fund’s actual return. The hypothetical account values and expenses may not be used to estimate the actual ending account balance or expenses you paid for the period. You may use this information to compare the ongoing costs of investing in the Fund and other funds. To do so, compare this 5% hypothetical example with the 5% hypothetical examples that appear in the shareholder reports of the other funds.
Please note that the expenses shown in the table are meant to highlight your ongoing costs only and do not reflect any costs that may be associated with investing in the Fund through a financial intermediary. Therefore, the second line of the table is useful in comparing the ongoing costs only, and will not help you determine the relative total costs of owning different funds. In addition, if any costs associated with investing through a financial intermediary were included, your costs would have been higher.
| Beginning | Ending | Expenses paid | |
| account value | account value | during period | |
| 1/1/12 | 6/30/12 | 1/1/12-6/30/121 | |
| Actual | $1,000.00 | $1,042.70 | $10.16 |
| Hypothetical (5% return before expenses) | 1,000.00 | 1,015.10 | 10.02 |
| 1 | Expenses are equal to the Fund’s annualized expense ratio of 2.00% for the period from January 1, 2012 through June 30, 2012, multiplied by the average account value over the period, multiplied by 182/366 (to reflect the one-half year period). The Fund is contractually obligated to limit annual expenses to 2.00% of its average daily net assets for the fiscal year. |
4
PORTFOLIO OF INVESTMENTS
As of June 30, 2012
The Primary Trend Fund
| Shares | Value | ||||||
| COMMON STOCKS (82.0%) | |||||||
| CONSUMER DISCRETIONARY (8.8%) | |||||||
| Media (5.0%) | |||||||
| 40,000 | DreamWorks Animation SKG, Inc., Class A* | $ | 762,400 | ||||
| Multiline Retail (3.0%) | |||||||
| 10,000 | Kohl’s Corp. | 454,900 | |||||
| Specialty Retail (0.8%) | |||||||
| 65,000 | Pacific Sunwear of California, Inc.* | 118,950 | |||||
| Total Consumer Discretionary | 1,336,250 | ||||||
| CONSUMER STAPLES (12.8%) | |||||||
| Beverages (4.4%) | |||||||
| 16,000 | Molson Coors Brewing Co., Class B | 665,760 | |||||
| Food & Staples Retailing (3.7%) | |||||||
| 8,000 | Wal-Mart Stores, Inc. | 557,760 | |||||
| Food Products (4.7%) | |||||||
| 10,000 | Campbell Soup Co. | 333,800 | |||||
| 10,000 | Kraft Foods, Inc., Class A | 386,200 | |||||
| 720,000 | |||||||
| Total Consumer Staples | 1,943,520 | ||||||
| ENERGY (13.4%) | |||||||
| Energy Equipment & Services (1.0%) | |||||||
| 10,000 | Nabors Industries Ltd.* | 144,000 | |||||
| Oil, Gas & Consumable Fuels (12.4%) | |||||||
| 15,000 | Arch Coal, Inc. | 103,350 | |||||
| 40,000 | Encana Corp. | 833,200 | |||||
| 8,000 | Petroleo Brasileiro S.A. ADR | 150,160 | |||||
| 9,000 | Royal Dutch Shell PLC ADR | 606,870 | |||||
| 10,000 | Swift Energy Co.* | 186,100 | |||||
| 1,879,680 | |||||||
| Total Energy | 2,023,680 | ||||||
| FINANCIALS (7.5%) | |||||||
| Capital Markets (2.4%) | |||||||
| 25,000 | Morgan Stanley | 364,750 | |||||
See notes to financial statements.
5
PORTFOLIO OF INVESTMENTS (continued)
As of June 30, 2012
The Primary Trend Fund (continued)
| Shares | Value | ||||||
| COMMON STOCKS (82.0%) (continued) | |||||||
| FINANCIALS (7.5%) (continued) | |||||||
| Commercial Banks (2.8%) | |||||||
| 13,000 | U.S. Bancorp | $ | 418,080 | ||||
| Diversified Financial Services (2.3%) | |||||||
| 10,000 | JPMorgan Chase & Co. | 357,300 | |||||
| Total Financials | 1,140,130 | ||||||
| HEALTH CARE (16.5%) | |||||||
| Pharmaceuticals (16.5%) | |||||||
| 9,000 | Abbott Laboratories | 580,230 | |||||
| 17,000 | Eli Lilly & Co. | 729,470 | |||||
| 9,000 | Johnson & Johnson | 608,040 | |||||
| 25,000 | Pfizer, Inc. | 575,000 | |||||
| Total Health Care | 2,492,740 | ||||||
| INDUSTRIALS (5.7%) | |||||||
| Industrial Conglomerates (4.8%) | |||||||
| 35,000 | General Electric Co. | 729,400 | |||||
| Road & Rail (0.9%) | |||||||
| 10,000 | Hertz Global Holdings, Inc.* | 128,000 | |||||
| Total Industrials | 857,400 | ||||||
| INFORMATION TECHNOLOGY (9.7%) | |||||||
| Communications Equipment (2.3%) | |||||||
| 20,000 | Cisco Systems, Inc. | 343,400 | |||||
| Semiconductors & Semiconductor Equipment (4.4%) | |||||||
| 25,000 | Intel Corp. | 666,250 | |||||
| Software (3.0%) | |||||||
| 15,000 | Microsoft Corp. | 458,850 | |||||
| Total Information Technology | 1,468,500 | ||||||
| MATERIALS (1.6%) | |||||||
| Chemicals (1.6%) | |||||||
| 6,000 | LyondellBasell Industries NV, Class A | 241,620 | |||||
See notes to financial statements.
6
PORTFOLIO OF INVESTMENTS (continued)
As of June 30, 2012
The Primary Trend Fund (continued)
| Shares | Value | ||||||
| COMMON STOCKS (82.0%) (continued) | |||||||
| TELECOMMUNICATION SERVICES (2.4%) | |||||||
| Diversified Telecommunication Services (2.4%) | |||||||
| 8,000 | Verizon Communications, Inc. | $ | 355,520 | ||||
| UTILITIES (3.6%) | |||||||
| Water Utilities (3.6%) | |||||||
| 22,000 | Aqua America, Inc. | 549,120 | |||||
| Total Common Stocks | |||||||
| (Cost $11,907,334) | 12,408,480 | ||||||
| Principal | |||||||
| Amount | |||||||
| SHORT-TERM INVESTMENTS (17.5%) | |||||||
| Commercial Paper (3.4%) | |||||||
| $ 359,000 | Abbey National North America LLC, 0.27%, 7/19/2012(a) | 358,952 | |||||
| 160,000 | Abbey National North America LLC, 0.29%, 7/25/2012(a) | 159,969 | |||||
| 518,921 | |||||||
| Variable Rate Demand Notes (14.1%) | |||||||
| 2,135,383 | American Family Financial Services Demand Note, 0.10%(b) | 2,135,383 | |||||
| Total Short-Term Investments | |||||||
| (Cost $2,654,304) | 2,654,304 | ||||||
| TOTAL INVESTMENTS (99.5%) | |||||||
| (Cost $14,561,638) | 15,062,784 | ||||||
| Other Assets less Liabilities (0.5%) | 76,200 | ||||||
| NET ASSETS (100.0%) | $ | 15,138,984 | |||||
| * | Non-income producing. | |
| (a) | Each issue shows the rate of the discount at the time of purchase. | |
| (b) | Variable rate security; the coupon rate shown represents the rate at June 30, 2012. |
ADR – American Depository Receipt
LLC – Limited Liability Corporation
PLC – Public Limited Company
See notes to financial statements.
7
STATEMENT OF ASSETS AND LIABILITIES
June 30, 2012
| The Primary | ||||
| Trend Fund | ||||
| Assets: | ||||
| Investments, at Value (Note 2a): | ||||
| Common Stocks | $ | 12,408,480 | ||
| Short-Term Investments | 2,654,304 | |||
| Total Investments (Cost $14,561,638) | 15,062,784 | |||
| Cash | 6,800 | |||
| Receivable for Investments Sold | 101,621 | |||
| Dividends Receivable | 11,385 | |||
| Interest Receivable | 169 | |||
| Prepaid Expenses and Other Assets | 11,565 | |||
| Total Assets | 15,194,324 | |||
| Liabilities: | ||||
| Payable for capital stock redeemed | 9,170 | |||
| Accrued Investment Advisory Fees (Note 3) | 7,181 | |||
| Professional Fees | 18,595 | |||
| Transfer Agent Fees | 8,315 | |||
| Administration and Accounting Fees | 4,907 | |||
| Other | 7,172 | |||
| Total Liabilities | 55,340 | |||
| Net Assets | $ | 15,138,984 | ||
| Shares Outstanding | 1,348,381 | |||
| Net Asset Value, Offering and Redemption Price Per Share | $ | 11.23 | ||
| Net Assets Consist of: | ||||
| Capital Stock ($0.01 par value, 30,000,000 shares authorized) | $ | 14,764,393 | ||
| Accumulated Undistributed Net Investment Income | 54,099 | |||
| Accumulated Net Realized Loss on Investments | (180,654 | ) | ||
| Net Unrealized Appreciation on Investments | 501,146 | |||
| Net Assets | $ | 15,138,984 | ||
See notes to financial statements.
8
STATEMENT OF OPERATIONS
For the Year Ended June 30, 2012
| The Primary | ||||
| Trend Fund | ||||
| Investment Income: | ||||
| Dividends* | $ | 365,283 | ||
| Interest | 2,618 | |||
| Total Investment Income | 367,901 | |||
| Expenses: | ||||
| Investment Advisory Fees (Note 3) | 108,670 | |||
| Administration and Accounting Fees | 58,227 | |||
| Shareholder Servicing Costs | 49,537 | |||
| Professional Fees | 29,107 | |||
| Registration Fees | 23,633 | |||
| Printing & Postage | 13,367 | |||
| Directors | 8,000 | |||
| Custodial Fees | 4,261 | |||
| Pricing | 3,290 | |||
| Insurance | 2,302 | |||
| Other | 1,465 | |||
| Total Expenses Before Reimbursement | 301,859 | |||
| Less Expenses Reimbursed By Advisor | (8,156 | ) | ||
| Total Expenses | 293,703 | |||
| Net Investment Income | 74,198 | |||
| Net Realized Loss on Investments | (97,918 | ) | ||
| Change in Net Unrealized Appreciation on Investments | 470,118 | |||
| Net Realized and Unrealized Gain on Investments | 372,200 | |||
| Net Increase in Net Assets From Operations | $ | 446,398 | ||
* Net of foreign tax withholding of $7,554.
See notes to financial statements.
9
STATEMENTS OF CHANGES IN NET ASSETS
| The Primary | ||||||||
| Trend Fund | ||||||||
| Year Ended | Year Ended | |||||||
| June 30, 2012 | June 30, 2011 | |||||||
| Operations: | ||||||||
| Net Investment Income | $ | 74,198 | $ | 40,158 | ||||
| Net Realized Gain (Loss) on Investments | (97,918 | ) | 1,333,641 | |||||
| Change in Net Unrealized Appreciation on Investments | 470,118 | 1,382,998 | ||||||
| Net Increase in Net Assets from Operations | 446,398 | 2,756,797 | ||||||
| Distributions to Shareholders: | ||||||||
| From Net Investment Income | (60,175 | ) | (29,960 | ) | ||||
| Decrease in Net Assets from Distributions | (60,175 | ) | (29,960 | ) | ||||
| Fund Share Transactions: | ||||||||
| Proceeds from Shares Sold | 229,202 | 541,445 | ||||||
| Reinvested Distributions | 56,364 | 26,946 | ||||||
| Cost of Shares Redeemed | (660,992 | ) | (2,330,721 | ) | ||||
| Net Decrease in Net Assets from Fund Share Transactions | (375,426 | ) | (1,762,330 | ) | ||||
| Total Increase in Net Assets | 10,797 | 964,507 | ||||||
| Net Assets: | ||||||||
| Beginning of Year | 15,128,187 | 14,163,680 | ||||||
| End of Year | $ | 15,138,984 | $ | 15,128,187 | ||||
| Accumulated Undistributed Net Investment Income at End of Year | $ | 54,099 | $ | 40,076 | ||||
| Transactions in Shares: | ||||||||
| Sales | 20,881 | 52,348 | ||||||
| Reinvested Distributions | 5,372 | 2,870 | ||||||
| Redemptions | (61,163 | ) | (220,148 | ) | ||||
| Net Decrease | (34,910 | ) | (164,930 | ) | ||||
See notes to financial statements.
10
FINANCIAL HIGHLIGHTS
The following table shows per share operation performance data, total investment return, ratios and supplemental data for each of the years ended June 30:
| 2012 | 2011 | 2010 | 2009 | 2008 | ||||||||||||||||
| The Primary Trend Fund | ||||||||||||||||||||
| Per Share Operating Performance | ||||||||||||||||||||
| Net Asset Value, Beginning of Year | $ | 10.94 | $ | 9.15 | $ | 8.11 | $ | 10.59 | $ | 14.43 | ||||||||||
| Net Investment Income | 0.05 | 0.03 | 0.02 | 0.11 | 0.15 | |||||||||||||||
| Net Realized and Unrealized Gain (Loss) on Investments | 0.28 | 1.78 | 1.06 | (1.74 | ) | (2.60 | ) | |||||||||||||
| Total from Investment Operations | 0.33 | 1.81 | 1.08 | (1.63 | ) | (2.45 | ) | |||||||||||||
| Less Distributions: | ||||||||||||||||||||
| From Net Investment Income | (0.04 | ) | (0.02 | ) | (0.04 | ) | (0.14 | ) | (0.16 | ) | ||||||||||
| From Net Realized Gains | — | — | — | (0.71 | ) | (1.23 | ) | |||||||||||||
| Total Distributions | (0.04 | ) | (0.02 | ) | (0.04 | ) | (0.85 | ) | (1.39 | ) | ||||||||||
| Net Increase (Decrease) | 0.29 | 1.79 | 1.04 | (2.48 | ) | (3.84 | ) | |||||||||||||
| Net Asset Value, End of Year | $ | 11.23 | $ | 10.94 | $ | 9.15 | $ | 8.11 | $ | 10.59 | ||||||||||
| Total Investment Return | 3.08 | % | 19.81 | % | 13.39 | % | (16.96 | )% | (18.39 | )% | ||||||||||
| Ratios and Supplemental Data | ||||||||||||||||||||
| Net Assets, End of Year (in thousands) | $ | 15,139 | $ | 15,128 | $ | 14,164 | $ | 12,889 | $ | 16,959 | ||||||||||
| Ratio of Expenses to Average Net Assets: | ||||||||||||||||||||
| Net of Waivers, Reimbursements and Recoupments | 2.00 | % | 2.00 | % | 2.00 | % | 2.00 | % | 1.71 | % | ||||||||||
| Before Waivers, Reimbursements and Recoupments | 2.06 | % | 2.03 | % | 1.97 | % | 2.08 | % | 1.71 | % | ||||||||||
| Ratio of Net Investment Income to Average Net Assets: | ||||||||||||||||||||
| Net of Waivers, Reimbursements and Recoupments | 0.51 | % | 0.26 | % | 0.20 | % | 1.33 | % | 1.20 | % | ||||||||||
| Before Waivers, Reimbursements and Recoupments | 0.45 | % | 0.23 | % | 0.23 | % | 1.25 | % | 1.20 | % | ||||||||||
| Portfolio Turnover | 57.1 | % | 92.4 | % | 52.2 | % | 54.5 | % | 75.8 | % | ||||||||||
See notes to financial statements.
11
| NOTES TO FINANCIAL STATEMENTS |
June 30, 2012
| 1. Organization |
The Primary Trend Fund, Inc. (The “Fund”), a Wisconsin Corporation, began operations on September 15, 1986. The Fund is registered under the Investment Company Act of 1940, as amended, as an open-end diversified investment management company. The Fund seeks capital growth and income.
| 2. Significant Accounting Policies |
The following is a summary of significant accounting policies followed by the Fund.
| a. | Securities listed on a national securities exchange are valued at the last sale price. Securities that are traded on the NASDAQ National Market or the NASDAQ SmallCap Market are valued at the NASDAQ Official Closing Price. If no sale is reported, the average of the last bid and asked prices is used. Other securities for which market quotations are readily available are valued at the average of the latest bid and asked prices. Debt securities (other than short-term instruments) are valued at prices furnished by a national pricing service, subject to review by the Adviser and determination of the appropriate price whenever a furnished price is significantly different from the previous day’s furnished price. Other assets and securities for which no quotations are readily available are valued at fair value as determined in good faith by the Board of Directors. Securities with maturities of 60 days or less are valued at amortized cost. |
| Generally accepted accounting principles (“GAAP”) defines fair value, establishes a framework for measuring fair value and expands disclosure about fair value measurements. It also provides guidance on determining when there has been a significant decrease in the volume and level of activity for an asset or liability, when a transaction is not orderly and how that information must be incorporated into a fair value measurement. |
| Under GAAP, various inputs are used in determining the value of the Fund’s investments. These inputs are summarized into three broad levels and described below: |
| Level 1 – | quoted prices for active markets for identical securities. An active market for the security is a market in which transactions occur with sufficient frequency and volume to provide pricing information on an ongoing basis. | |
| Level 2 – | other significant observable inputs (including quoted prices for similar securities, interest rates, prepayment speeds, credit risk, etc.) | |
| Level 3 – | significant unobservable inputs, including the Fund’s own assumptions in determining the fair value of investments. |
Common Stocks. Securities traded on a national exchange (or reported on the NASDAQ national market) are stated at the last reported sales price on the day of valuation. To the extent these securities are actively traded and valuation adjustments are not applied, they are categorized in Level 1 of the fair value hierarchy. |
Short-Term Investments. Short-term investments are valued using amortized cost, which approximates fair value. To the extent the inputs are observable and timely, the values would be categorized in Level 2 of the fair value hierarchy. |
12
NOTES TO FINANCIAL STATEMENTS (continued) |
June 30, 2012
| The inputs or methodology used for valuing securities are not necessarily an indication of the risk associated with investing in those securities. The following is a summary of the inputs used to value the Fund’s investments as of June 30, 2012: |
| Level 1 | Level 2 | Level 3 | Total | ||||||||||||||
| Common Stocks* | $ | 12,408,480 | $ | — | $ | — | $ | 12,408,480 | |||||||||
| Short-Term Investments | — | 2,654,304 | — | 2,654,304 | |||||||||||||
| Total | $ | 12,408,480 | $ | 2,654,304 | $ | — | $ | 15,062,784 | |||||||||
* All sub-categories within common stocks as detailed in the Portfolio of Investments represent Level 1 evaluation status.
| The Fund adopted the Financial Accounting Standards Board (“FASB”) amendments to authoritative guidance which require the Fund to disclose details of transfers in and out of Level 1 and Level 2 measurements and Level 2 and Level 3 measurements and the reasons for the transfers. For the year ended June 30, 2012, there were no transfers in and out of Level 1, Level 2 and Level 3. The Fund did not hold any Level 3 securities during the year ended June 30, 2012. It is the Fund’s policy to recognize transfers into and out of all Levels at the end of the reporting period. |
| In May 2011, the FASB issued Accounting Standards Update (“ASU”) No. 2011-04, “Fair Value Measurements (Topic 820) – Amendments to Achieve Common Fair Value Measurement and Disclosure Requirements in U.S. GAAP and International Financial Reporting Standards (“IFRSs”)” (“ASU No. 2011-04”). ASU No. 2011-04 requires additional disclosures regarding fair value measurements in financial statements of interim and annual periods beginning after December 15, 2011. The above disclosures reflect the requirements of ASU No. 2011-04. |
| b. | Security transactions are recorded on the trade date. Dividend income is recorded on the ex-dividend date. Interest income is recorded as earned, and includes amortization of premiums and discounts. Securities gains and losses are determined on the basis of identified cost, which is the same basis used for federal income tax purposes. Withholding taxes on foreign dividends have been provided for in accordance with the Fund’s understanding of the applicable country’s tax codes and regulations. |
| c. | The Fund intends to comply with the requirements of Subchapter M of the Internal Revenue Code (the “Code”) applicable to regulated investment companies and to distribute substantially all of its net investment income and any net realized gains to its shareholders. Therefore, no provision is made for federal income or excise taxes. |
| Accounting for Uncertainty in Income Taxes (the “Income Tax Statement”) requires an evaluation of tax positions taken (or expected to be taken) in the course of preparing a Fund’s tax returns to determine whether these positions meet a “more-likely-than-not” standard that, based on the technical merits, have a more than fifty percent likelihood of being sustained by a taxing authority upon examination. A tax position that meets the “more-likely-than-not” recognition threshold is measured to determine the amount of benefit to recognize in the financial statements. The Fund recognizes interest and penalties, if any, related to unrecognized tax benefits as income tax expense in the Statements of Operations. |
13
NOTES TO FINANCIAL STATEMENTS (continued) |
June 30, 2012
| The Income Tax Statement requires management of the Fund to analyze all open tax years 2008-2011, as defined by IRS statute of limitations for all major jurisdictions, including federal tax authorities and certain state tax authorities. As of and during the year ended June 30, 2012, the Fund does not have a liability for any unrecognized tax benefits. The Fund has no examination in progress and is not aware of any tax positions for which it is reasonably possible that the total amounts of unrecognized tax benefits will significantly change in the next twelve months. |
| d. | Distributions to shareholders, which are determined in accordance with income tax regulations, are recorded on the ex-dividend date. The character of distributions made during the year from net investment income or net realized gain may differ from the characterization for federal income tax purposes due to differences in the recognition of income, expense and gain/(loss) items for financial statement and tax purposes. Where appropriate, reclassifications between net asset accounts are made for such differences that are permanent in nature. |
| The tax character of distributions paid during the fiscal years ended June 30, 2012 and 2011 were as follows: |
| 2012 | 2011 | ||||||||
| Distributions paid from: | |||||||||
| Ordinary income | $ | 60,175 | $ | 29,960 | |||||
| Net long term capital gains | — | — | |||||||
| Total taxable distributions | 60,175 | 29,960 | |||||||
| Total distributions paid | $ | 60,175 | $ | 29,960 | |||||
| e. | The preparation of financial statements in conformity with GAAP requires management to make estimates and assumptions that affect the reported amounts of assets and liabilities and disclosure of contingent assets and liabilities at the date of the financial statements and the reported amounts of increases and decreases in net assets from operations during the reporting period. Actual results could differ from those estimates. |
| 3. Investment Advisory Fees and Management Agreements |
The Fund has an agreement with Arnold Investment Counsel, Inc. (the “Adviser”), with whom certain officers and directors of the Fund are affiliated, to serve as investment adviser. Under the terms of the agreement, the Adviser receives from the Fund a monthly fee at an annual rate of 0.74% of its average daily net assets. The agreement further stipulates that the Adviser will reimburse the Fund for annual expenses exceeding 2.0% of the Fund’s average daily net asset value. For the year ended June 30, 2012, the Adviser reimbursed the Fund $8,156.
As part of the Expense Reimbursement Recoupment Agreement, the Fund has agreed to repay the Adviser for amounts previously waived or reimbursed by the Adviser pursuant to the Investment Advisory Agreement provided that such repayment does not cause the Fund’s expenses, exclusive of taxes, interest, fees incurred in acquiring or disposing of portfolio securities, and extraordinary expenses, to
14
NOTES TO FINANCIAL STATEMENTS (continued) |
June 30, 2012
exceed 2.0% and the repayment is made within three years after the year in which the Adviser incurred the expense. As of June 30, 2012, there was $4,670 and $8,156 of fees available to be recovered no later than June 30, 2014 and June 30, 2015, respectively.
| 4. Purchases and Sales of Securities |
Total purchases and sales of securities, other than short-term investments, for the Fund for the year ended June 30, 2012 were as follows:
| Purchases | $7,017,851 | |
| Sales | 7,698,647 |
| 5. Tax Information |
At June 30, 2012, gross unrealized appreciation and depreciation of investments, based on cost for federal income tax purposes was as follows:
| Cost of investments | $ | 14,561,638 | |||
| Gross unrealized appreciation | 1,567,633 | ||||
| Gross unrealized depreciation | (1,066,487 | ) | |||
| Net unrealized appreciation on investments | $ | 501,146 |
As of June 30, 2012, the components of accumulated earnings/(deficit) on a tax basis were as follows:
| Undistributed ordinary income | $ | 54,099 | |||
| Undistributed long-term capital gains | — | ||||
| Accumulated earnings | 54,099 | ||||
| Accumulated capital and other losses | (180,654 | ) | |||
| Net unrealized appreciation | 501,146 | ||||
| Total accumulated earnings/(deficit) | $ | 374,591 |
At June 30, 2012, the Fund had capital loss carryforwards, which reduce the Fund’s taxable income arising from future net realized gains on investments, if any, to the extent permitted by the Code, and thus will reduce the amount of distributions to shareholders which would otherwise be necessary to relieve the Fund of any liability for federal tax. Pursuant to the Code, such capital loss carryforwards will expire as follows:
| Short-Term | Long-Term | ||||||||
| Losses Expiring: | |||||||||
| 2018 | $ | 82,736 | $ | — | |||||
| Losses Not Subject to Expiration | 97,918 | — | |||||||
| $ | 180,654 | $ | — | ||||||
Under the recently enacted Regulated Investment Company Modernization Act of 2010 (the “Act”), the Fund will be permitted to carryforward capital losses incurred in taxable years beginning after December 22, 2010, the date of enactment of the Act, for an unlimited period. However, any losses incurred during those future taxable years will be required to be utilized prior to the losses incurred in pre-enactment taxable years. As a result of this ordering rule, pre-enactment capital loss carryforwards may be more likely to expire unused. Additionally, post-enactment capital losses that are carried forward will retain their character as either short-term or long-term capital losses rather than being considered all short-term as under previous law.
15
REPORT OF INDEPENDENT REGISTERED PUBLIC ACCOUNTING FIRM
| To the Shareholders and Board of Directors of |
| The Primary Trend Fund, Inc. |
We have audited the accompanying statement of assets and liabilities of The Primary Trend Fund, Inc. (the “Fund”), including the portfolio of investments as of June 30, 2012, and the related statement of operations for the year then ended, the statements of changes in net assets for each of the two years in the period then ended and the financial highlights for each of the five years in the period then ended. These financial statements and financial highlights are the responsibility of Fund management. Our responsibility is to express an opinion on these financial statements and financial highlights based on our audits.
We conducted our audits in accordance with the standards of the Public Company Accounting Oversight Board (United States). Those standards require that we plan and perform the audit to obtain reasonable assurance about whether the financial statements and financial highlights are free of material misstatement. An audit includes examining, on a test basis, evidence supporting the amounts and disclosures in the financial statements. Our procedures included confirmation of securities owned as of June 30, 2012, by correspondence with the Fund’s custodian and broker or by other appropriate auditing procedures where a reply from the broker was not received. An audit also includes assessing the accounting principles used and significant estimates made by management, as well as evaluating the overall financial statement presentation. We believe that our audits provide a reasonable basis for our opinion.
In our opinion, the financial statements and financial highlights referred to above present fairly, in all material respects, the financial position of The Primary Trend Fund, Inc. as of June 30, 2012, the results of its operations for the year then ended, the changes in its net assets for each of the two years in the period then ended and the financial highlights for each of the five years in the period then ended, in conformity with accounting principles generally accepted in the United States of America.

COHEN FUND AUDIT SERVICES, LTD.
Westlake, Ohio
August 28, 2012
16
| Proxy Voting Policies and Procedures (Unaudited) |
For a description of the policies and procedures that the Fund uses to determine how to vote proxies relating to portfolio securities, please call 1-800-443-6544 and request a Statement of Additional Information. One will be mailed to you free of charge. The Statement of Additional Information is also available on the website of the Securities and Exchange Commission at http://www.sec.gov. Information on how the Fund voted proxies relating to portfolio securities during the twelve-month period ended June 30, 2012, will be available without charge, upon request, by calling 1-800-443-6544 or by accessing the website of the Securities and Exchange Commission.
| Disclosure of Portfolio Holdings (Unaudited) |
The Fund will file its complete schedule of portfolio holdings with the Securities and Exchange Commission for the first and third quarters of each fiscal year on Form N-Q. The Form N-Q will be available on the website of the Securities and Exchange Commission at http://www.sec.gov.
| Tax Designation (Unaudited) |
For the year ended June 30, 2012, 100.00% of the dividends paid from net investment income, including short-term capital gains (if any), for the Fund, is designated as qualified dividend income.
For the year ended June 30, 2012, 100.00% of the dividends paid from net investment income, including short-term capital gains (if any), for the Fund, qualifies for the dividends received deduction available to corporate shareholders.
17
DIRECTORS AND OFFICERS (Unaudited)
| Number of | |||||
| Term of | Principal | Funds | Other | ||
| Position(s) | Office and | Occupation(s) | in Complex | Directorships | |
| Name, Address | Held with | Length of | During Past | Overseen | Held |
| and Age | the Fund | Time Served | 5 Years | by Director | by Director |
| Independent Directors: | |||||
| Clark Hillery | Director | Indefinite, until | Director of Team Services | 1 | None |
| 3960 Hillside Drive | successor elected | for the Milwaukee Bucks | |||
| Suite 204 | |||||
| Delafield, WI 53018 | 14 years | ||||
| Age: 62 | |||||
| William J. Rack | Director | Indefinite, until | Commercial Real Estate | 1 | None |
| 3960 Hillside Drive | successor elected | Development and Leasing | |||
| Suite 204 | |||||
| Delafield, WI 53018 | 10 years | ||||
| Age: 66 | |||||
| Interested Directors: | |||||
| Barry S. Arnold | Director, | Indefinite, until | Portfolio Manager | 1 | Arnold Investment |
| 3960 Hillside Drive | Vice | successor elected | Counsel, Inc. | ||
| Suite 204 | President | ||||
| Delafield, WI 53018 | and | 15 years | |||
| Age: 47 | Secretary | ||||
| Officer: | |||||
| Lilli Gust | President, | N/A | Investment Adviser | 1 | Arnold Investment |
| 3960 Hillside Drive | Treasurer | Counsel, Inc. | |||
| Suite 204 | and Chief | ||||
| Delafield, WI 53018 | Compliance | ||||
| Age: 66 | Officer |
Certain officer and directors of the Fund are affiliated with the Adviser. None of these individuals receives a fee from the Fund for serving as an officer or director. The independent directors’ remuneration for the Fund totaled $8,000 for the year ended June 30, 2012.
Additional information about the Fund’s Directors is available in the Statement of Additional Information and is available, without charge, upon request, by calling 1-800-443-6544.
18
FUND PERFORMANCE COMPARISON (Unaudited)
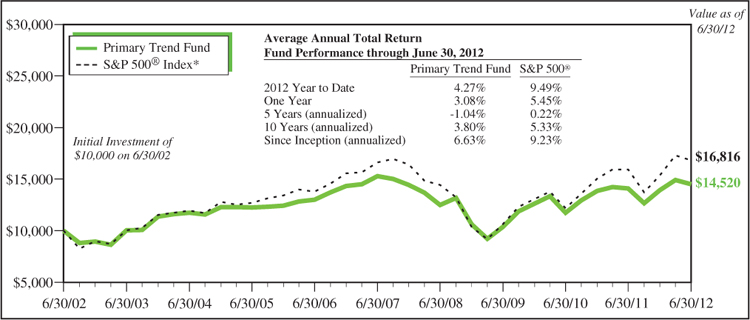
The performance data quoted is past performance and past performance is no guarantee of future results. Investment returns and principal value of an investment will fluctuate so that an investor’s shares, when redeemed, may be worth more or less than their original cost. Current performance may be higher or lower than the performance quoted. To obtain performance current to the most recent month-end, please call 1-800-443-6544.
The performance included in the table and graph does not reflect the deduction of taxes on Fund distributions or the redemption of Fund shares. Total returns are based on net change in NAV assuming reinvestment of distributions. As of October 31, 2011, the effective date of the most recent prospectus, the gross and net expense ratios for the Fund were 2.03% and 2.00%, respectively.
| * | The S&P 500® Index is an unmanaged but commonly used measure of common stock total return performance. The Fund’s total returns include operating expenses such as transaction costs and advisory fees which reduce total returns while the total returns of the Index do not include such costs. |
19

www.primarytrendfunds.com
INVESTMENT ADVISER
Arnold Investment Counsel Incorporated
3960 Hillside Drive, Suite 204
Delafield, Wisconsin 53018
1-800-443-6544
OFFICERS
Lilli Gust, President and Treasurer
Barry S. Arnold, Vice President and Secretary
DIRECTORS
Barry S. Arnold
Clark J. Hillery
William J. Rack
ADMINISTRATOR
UMB Fund Services, Inc.
803 West Michigan Street
Milwaukee, Wisconsin 53233
CUSTODIAN
U.S. Bank, N.A.
1555 North RiverCenter Drive
Milwaukee, Wisconsin 53212
TRANSFER AGENT AND
DIVIDEND DISBURSING AGENT
U.S. Bancorp Fund Services, LLC
615 East Michigan Street
Milwaukee, Wisconsin 53202
1-800-968-2122
INDEPENDENT REGISTERED
PUBLIC ACCOUNTING FIRM
Cohen Fund Audit Services, Ltd.
800 Westpoint Pkwy, Suite 1100
Westlake, Ohio 44145
LEGAL COUNSEL
Foley & Lardner LLP
777 East Wisconsin Avenue
Milwaukee, Wisconsin 53202
Founding member of
100%
NO-LOADTM
MUTUAL FUND
COUNCIL
Item 2. Code of Ethics
The Registrant has a code of ethics (the “Code”) that applies to the Registrant’s principal executive officer and principal financial officer. During the period covered by this report, there were no amendments to the provisions of the Code, nor were there any implicit or explicit waivers to the provisions of the Code. The Code is incorporated by reference to the Registrant’s Form N-CSR filed September 4, 2008. (SEC Accession No. 0000898531-08-000244)
Item 3. Audit Committee Financial Expert
While The Primary Trend Fund, Inc. believes that each of the members of its audit committee has sufficient knowledge of accounting principles and financial statements to serve on the audit committee, none has the requisite experience to qualify as an “audit committee financial expert” as such term is defined by the Securities and Exchange Commission.
Item 4. Principal Accountant Fees and Services
The aggregate fees billed for professional services by the Registrant’s principal accountant for each of the last two fiscal years were as follows:
(a) Audit Fees for Registrant.
The aggregate fees billed for professional services rendered by the principal accountant to the Registrant for the audit of the Registrant’s annual financial statements or services that are normally provided by the accountant in connection with statutory and regulatory filings or engagements.
Fiscal year ended June 30, 2012 $14,000
Fiscal year ended June 30, 2011 $13,500
(b) Audit-Related Fees for Registrant.
The aggregate fees billed for assurance and related services by the principal accountant to the Registrant that are reasonably related to the performance of the audit of the Registrant’s financial statements and are not required under “Audit Fees” above.
Fiscal year ended June 30, 2012 $0
Fiscal year ended June 30, 2011 $0
(c) Tax Fees for Registrant.
The aggregate fees billed for professional services rendered by the principal accountant to the Registrant for review of Federal and excise tax returns, tax compliance, tax advice and tax planning. The fees paid were comprised of a review of the tax returns, tax notes and other documentation for the filing and returns, along with their underlying schedules, that were prepared by the Registrant’s administrator.
Fiscal year ended June 30, 2012 $1,000
Fiscal year ended June 30, 2011 $1,000
(d) All Other Fees.
The aggregate fees billed for products and services provided by the principal accountant to the Registrant, other than services reported under “Audit Fees,” “Audit-Related Fees,” and “Tax Fees” above.
Fiscal year ended June 30, 2012 $0
Fiscal year ended June 30, 2011 $0
(e) Audit Committee’s pre-approval policies and procedures.
(1) Pursuant to the registrant’s Audit Committee Charter (“Charter”), the Audit Committee shall pre-approve all auditing services and permissible non-audit services to be provided. In addition, the Charter provides that the Audit Committee may delegate to one or more of its members the authority to grant such pre-approvals.
(2) During the fiscal year ended June 30, 2012, all of the non-audit services provided by the Registrant’s principal accountant were pre-approved by the audit committee.
(f) Less than 50% of hours expended on the principal accountant’s engagement to audit the registrant’s financial statements for the most recent fiscal year were attributed to work performed by persons other than the principal accountant’s full-time, permanent employees.
(g) During the last two fiscal years there were no other non-audit services rendered by the Registrant’s principal accountant to the Registrant, its investment adviser or any entity controlling, controlled by or under the common control with the investment adviser that provides ongoing services to the Registrant.
(h) Not applicable.
Item 5. Audit Committee of Listed Registrants
Not applicable.
Item 6. Schedule of Investments
Included as part of the report to shareholders filed under Item I of this Form N-CSR.
Item 7. Disclosure of Proxy Voting Policies and Procedures for Closed-End Management Investment Companies
Not applicable.
Item 8. Portfolio Managers of Closed-End Management Investment Companies
Not applicable.
Item 9. Purchase of Equity Securities of Closed-End Management Investment Company and Affiliated Purchasers
Not applicable.
Item 10. Submission of Matters to a Vote of Security Holders
Not applicable.
Item 11. Controls and Procedures
| (a) | The Principal Executive and Financial Officers concluded that the Registrant’s Disclosure Controls and Procedures are effective based on their evaluation of the Disclosure Controls and Procedures as of a date within 90 days of the filing date of this report. |
| (b) | There were no changes in Registrant’s internal control over financial reporting that occurred during the Registrant’s second fiscal quarter of the period covered by this report that materially affected or were reasonably likely to materially affect Registrant’s internal control over financial reporting. |
Item 12. Exhibits
| (a) | (1) Code of Ethics. Incorporated by reference to the Registrant’s Form N-CSR filed |
September 4, 2008. (SEC Accession No. 0000898531-08-000244)
| (2) | Certifications required pursuant to Sections 302 of the Sarbanes-Oxley Act of 2002. Filed herewith. |
(3) Any written solicitation to purchase securities under Rule 23c-1 under the Act sent or
given during the period covered by the report by or on behalf of the registrant to 10 or
more persons. Not applicable to open-end management investment companies.
| (b) | Certification pursuant to Section 906 of the Sarbanes-Oxley Act of 2002. Filed herewith. |
SIGNATURES
Pursuant to the requirements of the Securities Exchange Act of 1934 and the Investment Company Act of 1940, the registrant has duly caused this report to be signed on its behalf by the undersigned, thereunto duly authorized.
The Primary Trend Fund, Inc.
| /s/ Lilli Gust |
Lilli Gust
Principal Executive Officer
August 31, 2012
Pursuant to the requirements of the Securities Exchange Act of 1934 and the Investment Company Act of 1940, this report has been signed below by the following persons on behalf of the registrant and in the capacities and on the dates indicated.
| /s/ Lilli Gust |
Lilli Gust
Principal Executive Officer
August 31, 2012
| /s/ Lilli Gust |
Lilli Gust
Principal Financial Officer
August 31, 2012