UNITED STATES
SECURITIES AND EXCHANGE COMMISSION
Washington, D.C. 20549
SECURITIES AND EXCHANGE COMMISSION
Washington, D.C. 20549
FORM N-CSR
CERTIFIED SHAREHOLDER REPORT OF REGISTERED
MANAGEMENT INVESTMENT COMPANIES
Investment Company Act File Number 811-04704
Sims Total Return Fund, Inc.
225 East Mason Street, Suite 802
Milwaukee, WI 53202
(Address of principal executive offices)
David C. Sims, President
Sims Capital Management LLC
225 East Mason Street, Suite 802
Milwaukee, WI 53202
(Name and address of agent for service)
Registrant's telephone number, including area code: (414) 765-1107
Date of fiscal year end: June 30
Date of reporting period: June 30, 2017
Item 1. Reports to Stockholders
The following is a copy of the report transmitted to shareholders pursuant to Rule 30e-1 under the Investment Company Act of 1940 (17 CFR 270.30e-1)
ANNUAL REPORT Sims Total Return Fund June 30, 2017 |
| SIMS TOTAL RETURN FUND |
| Table of Contents |
| Message to Shareholders | 2 |
| Fund Performance Comparison | 3 |
| Graphical Illustration | 4 |
| Portfolio of Investments | 5 |
| Statement of Assets and Liabilities | 6 |
| Statement of Operations | 7 |
| Statements of Changes in Net Assets | 8 |
| Financial Highlights | 9 |
| Notes to Financial Statements | 10 |
| Report of Independent Registered Public Accounting Firm | 13 |
| Directors and Officers | 14 |
| Expense Example | 15 |
| Additional Information | 16 |
SIMS TOTAL RETURN FUND MESSAGE TO SHAREHOLDERS June 30, 2017 (Unaudited) |
Fellow Shareholders,
The S&P 500 Index (total return) rose 9.34% during the first six months of 2017, while our Fund rose 1.23%. As noted in the last letter, our concern about expensive prices for shares has led us to a considerable cash position. In a rising market, the cash position will likely temper positive results, as was the case so far in 2017.
Our Fund’s goal is, and has been, superior long-term investment performance with due respect for the value of capital and the need to protect it. Although we are equity investors, we are risk averse. We have too much regard for the importance of preserving our capital to take any undue risk. We would rather give up a little potential upside than run the risk of a permanent loss of capital.
The current elevated prices for our portfolio investments are both blessings as well as curses. We are pleased to be able to increase the stated value of the portfolio, but the market prices give us reason to contemplate selling or reducing some of our portfolio positions. We’re not in a rush to do anything currently. We believe the Fund owns high-quality companies, with attractive returns on capital. We believe time is a friend to those companies, even while the share price may rise and fall in the interim.
Our investment philosophy and strategy is simple. We seek to identify and acquire what we feel are high quality growing companies which sell at significant discounts from intrinsic values. When the stock market recognizes to a large extent what we see in a portfolio company, then we’re faced with a more difficult decision. Do we continue to hold a quality company even when it sells at an elevated price that is much closer to intrinsic value?
It is a difficult question and one we wrestle with in the current environment. Our first responsibility is to respect and protect capital, with the goal of achieving a reasonable return. It’s a “defense-first” philosophy which has served us well.
From an administrative point of view, the Fund appears to be making progress on its distribution. The Fund was added to Fidelity’s mutual fund platform in the first half of the year, and we are working on gaining admission to another platform. While distribution is not a particularly interesting topic for investors, having greater access to potential investors and potential accounts is an intangible that we believe to be beneficial. It’s a good step forward.
As always, we love hearing from our shareholders. However, we won’t comment on any undisclosed purchases or sales that the Fund has made or is contemplating. With that caveat in mind, all other issues are on the table.
 |  |
| Luke E. Sims | David C. Sims |
| Email: luke@simscapital.com | Email: dave@simscapital.com |
| 414/530-5680 | 414/765-1107 |
July 31, 2017
Opinions expressed are subject to change at any time, are not guaranteed and should not be considered investment advice.
Mutual fund investing involves risk. Principal loss is possible. Investments in mid-cap companies involve additional risks such as limited liquidity and greater volatility.
Fund holdings and allocations are subject to change at any time and should not be a recommendation to buy or sell any security. Please refer to the Portfolio of Investments for a complete list of Fund holdings.
Must be preceded or accompanied by a prospectus.
The Sims Total Return Fund is distributed by Quasar Distributors, LLC.
2
SIMS TOTAL RETURN FUND FUND PERFORMANCE COMPARISON June 30, 2017 (Unaudited) |
Initial Investment of $10,000
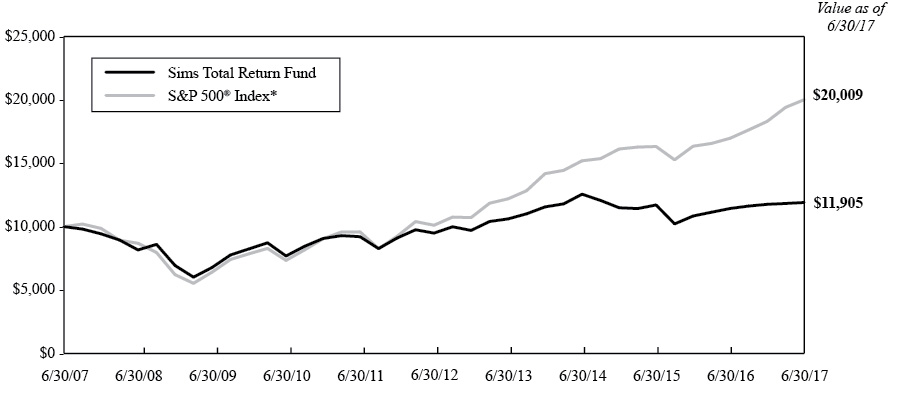
| Average Annual Total Return Fund Performance through June 30, 2017 | ||
| Sims Total Return Fund | S&P 500® | |
| 2017 Year to Date | 1.23% | 9.34% |
| One Year | 4.13% | 17.90% |
| 5 Years | 4.64% | 14.63% |
| 10 Years | 1.76% | 7.18% |
| Since Inception | 6.31% | 10.09% |
The performance data quoted is past performance and past performance is no guarantee of future results. Investment returns and principal value of an investment will fluctuate so that an investor’s shares, when redeemed, may be worth more or less than their original cost. Current performance may be higher or lower than the performance quoted. To obtain performance current to the most recent month-end, please call 1-414-765-1107.
The performance included in the table and graph does not reflect the deduction of taxes on Fund distributions or the redemption of Fund shares. Total returns are based on net change in NAV assuming reinvestment of distributions. As of October 28, 2016, the effective date of the most recent prospectus, the gross and net expense ratios for the Fund were both 2.89%.
| * | The S&P® Index is an unmanaged but commonly used measure of common stock total return performance. The Fund’s total returns include operating expenses such as transaction costs and advisory fees which reduce total returns while the total returns of the Index do not include such costs. |
3
SIMS TOTAL RETURN FUND GRAPHICAL ILLUSTRATION June 30, 2017 (Unaudited) |
The following chart provides a visual breakdown of the Fund by the industry sectors that the underlying securities represent as a percentage of the total investments.
Summary of Investments by Sector
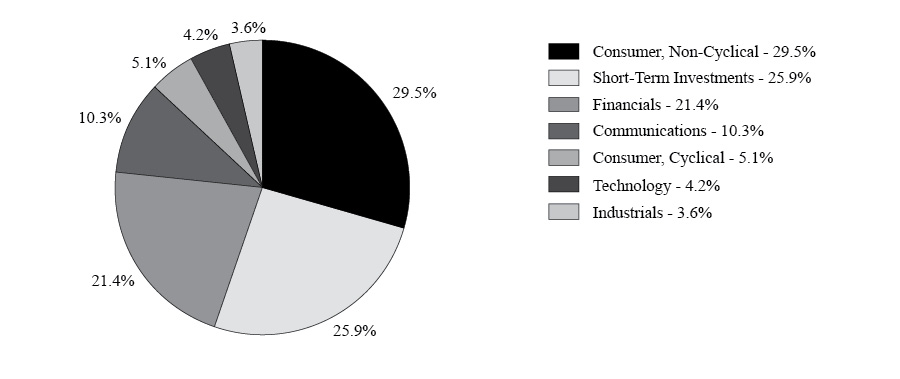
Top Ten Equity Holdings
| Security | Percent of Investment Securities |
| Colgate-Palmolive Co. | 17.5% |
| T. Rowe Price Group, Inc. | 8.6% |
| eBay, Inc. | 5.1% |
| Cabela's, Inc. | 5.1% |
| Automatic Data Processing, Inc. | 5.0% |
| Franklin Resources, Inc. | 4.9% |
| White Mountains Insurance Group Ltd. | 4.8% |
| Paychex, Inc. | 4.2% |
| Abbott Laboratories | 4.1% |
| General Electric Co. | 3.6% |
| Total | 62.9% |
4
SIMS TOTAL RETURN FUND PORTFOLIO OF INVESTMENTS As of June 30, 2017 |
Shares | Fair Value | ||||||
| COMMON STOCKS (74.6%) | |||||||
| COMMUNICATIONS (10.4%) | |||||||
| Internet (5.2%) | |||||||
| 12,000 | eBay, Inc.* | $ | 419,040 | ||||
| Telecommunications (5.2%) | |||||||
| 5,000 | Cisco Systems, Inc. | 156,500 | |||||
| 6,000 | Verizon Communications, Inc. | 267,960 | |||||
| 424,460 | |||||||
| Total Communications | 843,500 | ||||||
| CONSUMER, CYCLICAL (5.1%) | |||||||
| Retail (5.1%) | |||||||
| 7,000 | Cabela's, Inc.* | 415,940 | |||||
| CONSUMER, NON-CYCLICAL (29.7%) | |||||||
| Commercial Services (5.0%) | |||||||
| 4,000 | Automatic Data Processing, Inc. | 409,840 | |||||
| Cosmetics/Personal Care (17.6%) | |||||||
| 19,400 | Colgate-Palmolive Co. | 1,438,122 | |||||
| Healthcare-Products (4.2%) | |||||||
| 7,000 | Abbott Laboratories | 340,270 | |||||
| Pharmaceuticals (2.9%) | |||||||
| 7,000 | Pfizer, Inc. | 235,130 | |||||
| Total Consumer, Non-Cyclical | 2,423,362 | ||||||
| FINANCIALS (21.6%) | |||||||
| Banks (3.2%) | |||||||
| 5,000 | U.S. Bancorp | 259,600 | |||||
| Diversified Financial Services (13.6%) | |||||||
| 9,000 | Franklin Resources, Inc. | 403,110 | |||||
| 9,500 | T. Rowe Price Group, Inc. | 704,995 | |||||
| 1,108,105 | |||||||
| Insurance (4.8%) | |||||||
| 450 | White Mountains Insurance Group Ltd. | 390,884 | |||||
| Total Financials | 1,758,589 | ||||||
| INDUSTRIALS (3.6%) | |||||||
| Miscellaneous Manufacturing (3.6%) | |||||||
| 11,000 | General Electric Co. | 297,110 | |||||
| TECHNOLOGY (4.2%) | |||||||
| Software (4.2%) | |||||||
| 6,000 | Paychex, Inc. | 341,640 | |||||
Total Common Stocks (Cost $5,332,978) | 6,080,141 | ||||||
| SHORT-TERM INVESTMENTS (26.1%) | |||||||
| Money Market Funds (26.1%) | |||||||
| 2,127,195 | First American Treasury Obligations Fund - Institutional Class, 0.840% (a) | 2,127,195 | |||||
Total Short-Term Investments (Cost $2,127,195) | 2,127,195 | ||||||
TOTAL INVESTMENTS (100.7%) (Cost $7,460,173) | 8,207,336 | ||||||
| Liabilities in excess of Other Assets (-0.7%) | (54,057 | ) | |||||
| NET ASSETS (100.0%) | $ | 8,153,279 | |||||
| * | Non-income producing. |
(a) | Holding is greater than 25% of portfolio value. Additional information regarding the underlying Fund’s holdings and financial statements may be found at https://www.sec.gov. |
See accompanying Notes to Financial Statements.
5
SIMS TOTAL RETURN FUND STATEMENT OF ASSETS AND LIABILITIES June 30, 2017 |
| Assets: | ||||
| Investments, at Fair Value (Note 2a): | ||||
| Common Stocks | $ | 6,080,141 | ||
| Short-Term Investments | 2,127,195 | |||
| Total Investments (Cost $7,460,173) | 8,207,336 | |||
| Dividends Receivable | 8,120 | |||
| Interest Receivable | 1,311 | |||
| Prepaid Expenses and Other Assets | 8,333 | |||
| Total Assets | 8,225,100 | |||
| Liabilities: | ||||
| Payable for Capital Stock Redeemed | 32,751 | |||
| Accrued Investment Advisory Fees (Note 3) | 5,047 | |||
| Professional Fees | 14,757 | |||
| Transfer Agent Fees | 6,861 | |||
| Administration and Accounting Fees | 5,994 | |||
| Other Fees | 6,411 | |||
| Total Liabilities | 71,821 | |||
| Net Assets | $ | 8,153,279 | ||
| Shares Outstanding | 763,005 | |||
| Net Asset Value, Offering and Redemption Price Per Share | $ | 10.69 | ||
| Net Assets Consist of: | ||||
| Capital Stock ($0.01 par value, 30,000,000 shares authorized) | $ | 7,248,449 | ||
| Accumulated Undistributed Net Realized Gain on Investments | 157,667 | |||
| Net Unrealized Appreciation on Investments | 747,163 | |||
| Net Assets | $ | 8,153,279 | ||
See accompanying Notes to Financial Statements.
6
SIMS TOTAL RETURN FUND STATEMENT OF OPERATIONS For the Year Ended June 30, 2017 |
| Investment Income: | ||||
| Dividends | $ | 80,400 | ||
| Interest | 17,703 | |||
| Total Investment Income | 98,103 | |||
| Expenses: | ||||
| Administration and Accounting Fees | 70,781 | |||
| Investment Advisory Fees (Note 3) | 65,180 | |||
| Shareholder Servicing Costs | 41,389 | |||
| Professional Fees | 25,979 | |||
| Registration Fees | 16,210 | |||
| Directors | 11,000 | |||
| Printing & Postage | 7,671 | |||
| Pricing | 3,389 | |||
| Insurance | 2,414 | |||
| Custodial Fees | 2,185 | |||
| Other | 780 | |||
| Total Expenses | 246,978 | |||
| Net Investment Loss | (148,875 | ) | ||
| Net Realized Gain on Investments | 619,963 | |||
| Change in Net Unrealized Appreciation on Investments | (104,754 | ) | ||
| Net Realized and Unrealized Gain on Investments | 515,209 | |||
| Net Increase in Net Assets From Operations | $ | 366,334 | ||
See accompanying Notes to Financial Statements.
7
SIMS TOTAL RETURN FUND STATEMENTS OF CHANGES IN NET ASSETS |
| For Year Ended June 30, 2017 | For Year Ended June 30, 2016 | |||||||
| Operations: | ||||||||
| Net Investment Loss | $ | (148,875 | ) | $ | (14,745 | ) | ||
| Net Realized Gain on Investments | 619,963 | 719,254 | ||||||
| Change in Net Unrealized Appreciation on Investments | (104,754 | ) | (1,021,710 | ) | ||||
| Net Increase (Decrease) in Net Assets from Operations | 366,334 | (317,201 | ) | |||||
| Distributions to Shareholders: | ||||||||
| From Net Investment Income | — | (19,126 | ) | |||||
| From Net Realized Gains | (861,044 | ) | (476,370 | ) | ||||
| Decrease in Net Assets from Distributions | (861,044 | ) | (495,496 | ) | ||||
| Fund Share Transactions: | ||||||||
| Proceeds from Shares Sold | 11,763 | 69,135 | ||||||
| Reinvested Distributions | 784,502 | 451,466 | ||||||
| Cost of Shares Redeemed | (1,503,366 | ) | (1,534,557 | ) | ||||
| Net Decrease in Net Assets from Fund Share Transactions | (707,101 | ) | (1,013,956 | ) | ||||
| Total Decrease in Net Assets | (1,201,811 | ) | (1,826,653 | ) | ||||
| Net Assets: | ||||||||
| Beginning of Year | 9,355,090 | 11,181,743 | ||||||
| End of Year | $ | 8,153,279 | $ | 9,355,090 | ||||
| Accumulated Undistributed Net Investment Income at End of Year | $ | — | $ | — | ||||
| Transactions in Shares: | ||||||||
| Sales | 1,060 | 6,131 | ||||||
| Reinvested Distributions | 74,290 | 41,687 | ||||||
| Redemptions | (135,476 | ) | (133,905 | ) | ||||
| Net Decrease | (60,126 | ) | (86,087 | ) | ||||
See accompanying Notes to Financial Statements.
8
SIMS TOTAL RETURN FUND FINANCIAL HIGHLIGHTS |
The following table shows per share operation performance data, total investment return, ratios and supplemental data for each of the years ended June 30:
| 2017 | 2016 | 2015 | 2014 | 2013 | ||||||||||||||||
| Sims Total Return Fund | ||||||||||||||||||||
| Per Share Operating Performance | ||||||||||||||||||||
| Net Asset Value, Beginning of Year | $ | 11.37 | $ | 12.30 | $ | 14.32 | $ | 12.50 | $ | 11.23 | ||||||||||
| Net Investment Income (Loss) | (0.20 | ) | (0.02 | ) | 0.01 | 0.01 | 0.04 | |||||||||||||
| Net Realized and Unrealized Gain (Loss) on Investments | 0.66 | (0.30 | ) | (0.99 | ) | 2.24 | 1.28 | |||||||||||||
| Total from Investment Operations | 0.46 | (0.32 | ) | (0.98 | ) | 2.25 | 1.32 | |||||||||||||
| Less Distributions: | ||||||||||||||||||||
| From Net Investment Income | — | (0.02 | ) | — | (0.06 | ) | (0.05 | ) | ||||||||||||
| From Net Realized Gains | (1.14 | ) | (0.59 | ) | (1.04 | ) | (0.37 | ) | — | |||||||||||
| Total Distributions | (1.14 | ) | (0.61 | ) | (1.04 | ) | (0.43 | ) | (0.05 | ) | ||||||||||
| Net Increase (Decrease) | (0.68 | ) | (0.93 | ) | (2.02 | ) | 1.82 | 1.27 | ||||||||||||
| Net Asset Value, End of Year | $ | 10.69 | $ | 11.37 | $ | 12.30 | $ | 14.32 | $ | 12.50 | ||||||||||
| Total Investment Return | 4.13 | % | (2.36 | )% | (6.76 | )% | 18.36 | % | 11.80 | % | ||||||||||
| Ratios and Supplemental Data | ||||||||||||||||||||
| Net Assets, End of Year (in thousands) | $ | 8,153 | $ | 9,355 | $ | 11,182 | $ | 17,909 | $ | 15,955 | ||||||||||
| Ratio of Expenses to Average Net Assets: | ||||||||||||||||||||
| Net of Waivers, Reimbursements and Recoupments* | 2.80 | % | 2.14 | % | 2.00 | % | 1.98 | % | 2.00 | % | ||||||||||
| Before Waivers, Reimbursements and Recoupments | 2.80 | % | 2.89 | % | 2.18 | % | 1.92 | % | 1.99 | % | ||||||||||
| Ratio of Net Investment Income (Loss) to Average Net Assets: | ||||||||||||||||||||
| Net of Waivers, Reimbursements and Recoupments* | (1.69 | )% | (0.15 | )% | 0.07 | % | 0.11 | % | 0.31 | % | ||||||||||
| Before Waivers, Reimbursements and Recoupments | (1.69 | )% | (0.90 | )% | (0.11 | )% | 0.17 | % | 0.32 | % | ||||||||||
| Portfolio Turnover | 165.1 | % | 85.9 | % | 17.2 | % | 14.0 | % | 38.0 | % | ||||||||||
| * | Effective April 23, 2016, the expense cap of 2.00% was discontinued. |
See accompanying Notes to Financial Statements.
9
SIMS TOTAL RETURN FUND NOTES TO FINANCIAL STATEMENTS June 30, 2017 |
| 1. | Organization |
Sims Total Return Fund, Inc. (the “Company”) is an open-end, diversified management investment company registered under the Investment Company Act of 1940, as amended. The Company is a Wisconsin corporation. The Company began operations on September 15, 1986. Sims Total Return Fund, the only series of the Company, is hereinafter referred to as the “Fund”. The investment objective of the Fund is to seek total return.
| 2. | Significant Accounting Policies |
The Fund is an investment company and follows the accounting and reporting guidance under Financial Accounting Standards Board (“FASB”) Accounting Standards Codification (“ASC”) Topic 946, Financial Services – Investment Companies. The following is a summary of significant accounting policies followed by the Fund.
| a. | Securities listed on a national securities exchange are valued at the last sale price. Securities that are traded on the NASDAQ National Market or the NASDAQ Small-Cap Market are valued at the NASDAQ Official Closing Price. If no sale is reported, the average of the last bid and asked prices is used. Other securities for which market quotations are readily available are valued at the average of the latest bid and asked prices. Debt securities (other than short-term instruments) are valued at prices furnished by a national pricing service, subject to review by the Adviser and determination of the appropriate price whenever a furnished price is significantly different from the previous day’s furnished price. Other assets and securities for which no quotations are readily available are valued at fair value as determined in good faith by the Board of Directors. Money market mutual funds are normally priced at net asset value based on the liquidity and transparency of the market. |
Accounting principles generally accepted in the United States of America (“GAAP”) defines fair value, establishes a framework for measuring fair value and expands disclosure about fair value measurements. It also provides guidance on determining when there has been a significant decrease in the volume and level of activity for an asset or liability, when a transaction is not orderly and how that information must be incorporated into a fair value measurement.
Under GAAP, various inputs are used in determining the value of the Fund’s investments. These inputs are summarized into three broad levels and described below:
| Level 1– | quoted prices for active markets for identical securities. An active market for the security is a market in which transactions occur with sufficient frequency and volume to provide pricing information on an ongoing basis. |
| Level 2– | other significant observable inputs (including quoted prices for similar securities, interest rates, prepayment speeds, credit risk, etc.). |
| Level 3– | significant unobservable inputs, including the Fund’s own assumptions in determining the fair value of investments. |
The inputs or methodology used for valuing securities are not necessarily an indication of the risk associated with investing in those securities. The following is a summary of the inputs used to value the Fund’s investments as of June 30, 2017:
| Level 1 | Level 2 | Level 3 | Total | |||||||||||||
| Common Stocks* | $ | 6,080,141 | $ | — | $ | — | $ | 6,080,141 | ||||||||
| Short-Term Investments | 2,127,195 | — | — | 2,127,195 | ||||||||||||
| Total | $ | 8,207,336 | $ | — | $ | — | $ | 8,207,336 | ||||||||
| * | All sub-categories within common stocks as detailed in the Portfolio of Investments represent Level 1 evaluation status. |
The Fund is required to disclose details of transfers in and out of Level 1 and Level 2 measurements and Level 2 and Level 3 measurements and the reasons for the transfers. For the year ended June 30, 2017, there were no transfers in and out of Level 1, Level 2 and Level 3. The Fund did not hold any Level 3 securities during the year ended June 30, 2017. It is the Fund’s policy to recognize transfers into and out of all Levels at the end of the reporting period.
10
SIMS TOTAL RETURN FUND NOTES TO FINANCIAL STATEMENTS (Continued) June 30, 2017 |
| b. | Security transactions are recorded on the trade date. Dividend income is recorded on the ex-dividend date. Interest income is recorded as earned, and includes amortization of premiums and discounts. Securities gains and losses are determined on the basis of identified cost, which is the same basis used for federal income tax purposes. Withholding taxes on foreign dividends have been provided for in accordance with the Fund’s understanding of the country’s tax codes and regulations. |
| c. | The Fund intends to comply with the requirements of Subchapter M of the Internal Revenue Code (the “Code”) applicable to regulated investment companies and to distribute substantially all of its net investment income and any net realized gains to its shareholders. Therefore, no provision is made for federal income or excise taxes. |
GAAP requires an evaluation of tax positions taken (or expected to be taken) in the course of preparing a Fund’s tax returns to determine whether these positions meet a “more-likely-than-not” standard that, based on the technical merits, have a more than fifty percent likelihood of being sustained by a taxing authority upon examination. A tax position that meets the “more likely-than-not” recognition threshold is measured to determine the amount of benefit to recognize in the financial statements. The Fund recognizes interest and penalties, if any, related to unrecognized tax benefits as income tax expense in the Statement of Operations.
GAAP requires management of the Fund to analyze all open tax years 2013-2016, as defined by IRS statute of limitations for all major jurisdictions, including federal tax authorities and certain state tax authorities. As of and during the year ended June 30, 2017, the Fund does not have a liability for any unrecognized tax benefits. The Fund has no examination in progress and is not aware of any tax positions for which it is reasonably possible that the total amounts of unrecognized tax benefits will significantly change in the next twelve months.
| d. | Distributions to shareholders, which are determined in accordance with income tax regulations, are recorded on the ex-dividend date. The character of distributions made during the year from net investment income or net realized gain may differ from the characterization for federal income tax purposes due to differences in the recognition of income, expense and gain/(loss) items for financial statement and tax purposes. Where appropriate, reclassifications between net asset accounts are made for such differences that are permanent in nature. The following reclassifications made by the Fund during the fiscal year ended June 30, 2017 are primarily the result of permanent book/tax differences in the tax treatment of certain items of net investment income. |
| Accumulated undistributed net investment income | $ | 148,875 | ||
| Accumulated undistributed net realized gain on investments | (148,875 | ) |
The tax character of distributions paid during the fiscal years ended June 30, 2017 and 2016 were as follows:
| 2017 | 2016 | |||||||
| Distributions paid from: | ||||||||
| Ordinary income | $ | 300,505 | $ | 52,902 | ||||
| Net long term capital gains | 560,539 | 442,594 | ||||||
| Total distributions paid | $ | 861,044 | $ | 495,496 | ||||
| e. | The preparation of financial statements in conformity with GAAP requires management to make estimates and assumptions that affect the reported amounts of assets and liabilities and disclosure of contingent assets and liabilities at the date of the financial statements and the reported amounts of increases and decreases in net assets from operations during the reporting period. Actual results could differ from those estimates. |
| 3. | Investment Advisory Fees and Management Agreements |
The Fund has an agreement with Sims Capital Management LLC (the “Adviser”) to serve as investment adviser. Under the terms of the agreement, the Fund pays the Adviser an investment advisory fee, payable monthly, based on the average net asset value of the Fund determined as of the close of each business day of the month at the annual rate of 0.74% of the average daily net asset value of the Fund. As noted in the Fund’s June 30, 2016, annual report, the Board of Directors, including all of the Independent Directors,
11
SIMS TOTAL RETURN FUND NOTES TO FINANCIAL STATEMENTS (Continued) June 30, 2017 |
reviewed the agreement and found it to be reasonable, fair and in the best interests of the Fund and the Fund’s shareholders. The agreement went into effect on April 23, 2016 and shall continue in effect for two years from that date. The agreement will then come up for renewal on an annual basis.
Certain officers of the Fund are affiliated with Sims Capital Management, LLC. The Independent Directors’ remuneration for the Fund totaled $11,000 for the year ended June 30, 2017.
| 4. | Purchases and Sales of Securities |
Total purchases and sales of securities, other than short-term investments, for the Fund for the year ended June 30, 2017, were as follows:
| Purchases | $ | 6,763,338 | ||
| Sales | 7,070,994 |
| 5. | Tax Information |
At June 30, 2017, gross unrealized appreciation and depreciation of investments, based on cost for federal income tax purposes was as follows:
| Cost of investments | $ | 7,460,173 | ||
| Gross unrealized appreciation | 778,494 | |||
| Gross unrealized depreciation | (31,331 | ) | ||
| Net unrealized appreciation on investments | $ | 747,163 |
As of June 30, 2017, the components of accumulated earnings/(deficit) on a tax basis were as follows:
| Undistributed ordinary income | $ | 35,322 | ||
| Undistributed long-term capital gains | 122,345 | |||
| Accumulated earnings | 157,667 | |||
| Net unrealized appreciation | 747,163 | |||
| Total accumulated earnings | $ | 904,830 |
12
SIMS TOTAL RETURN FUND REPORT OF INDEPENDENT REGISTERED PUBLIC ACCOUNTING FIRM |
To the Shareholders and Board of Directors of
Sims Total Return Fund, Inc.
Sims Total Return Fund, Inc.
We have audited the accompanying statement of assets and liabilities, including the portfolio of investments, of Sims Total Return Fund, Inc. (the “Fund”) as of June 30, 2017, and the related statement of operations for the year then ended, the statements of changes in net assets for each of the two years in the period then ended, and the financial highlights for each of the five years in the period then ended. These financial statements and financial highlights are the responsibility of the Fund’s management. Our responsibility is to express an opinion on these financial statements and financial highlights based on our audits.
We conducted our audits in accordance with the standards of the Public Company Accounting Oversight Board (United States). Those standards require that we plan and perform the audit to obtain reasonable assurance about whether the financial statements and financial highlights are free of material misstatement. An audit includes examining, on a test basis, evidence supporting the amounts and disclosures in the financial statements. Our procedures included confirmation of securities owned as of June 30, 2017, by correspondence with the custodian. An audit also includes assessing the accounting principles used and significant estimates made by management, as well as evaluating the overall financial statement presentation. We believe that our audits provide a reasonable basis for our opinion.
In our opinion, the financial statements and financial highlights referred to above present fairly, in all material respects, the financial position of Sims Total Return Fund, Inc. as of June 30, 2017, the results of its operations for the year then ended, the changes in its net assets for each of the two years in the period then ended, and the financial highlights for each of the five years in the period then ended, in conformity with accounting principles generally accepted in the United States of America.

COHEN & COMPANY, LTD.
Cleveland, Ohio
August 21, 2017
Cleveland, Ohio
August 21, 2017
13
SIMS TOTAL RETURN FUND DIRECTORS AND OFFICERS June 30, 2017 (Unaudited) |
| Name, Address and Age | Position(s) Held with the Fund | Term of Office and Length of Time Served | Principal Occupation(s) During Past 5 Years | Number of Funds in Complex Overseen by Director | Other Directorships Held by Director |
| Independent Directors: | |||||
| Clark Hillery 225 East Mason Street Suite 802 Milwaukee, WI 53202 Age: 67 | Director | Indefinite, (until successor elected) 19 years | Director of Team Services for the Milwaukee Bucks since December, 2000. Director of Facilities since July 2015. | 1 | None |
| William J. Rack 225 East Mason Street Suite 802 Milwaukee, WI 53202 Age: 71 | Director | Indefinite, (until successor elected) 15 years | Managing member of Lakeland Business Properties LLC since May 1997, which engages in commercial real estate development and leasing. | 1 | None |
| Richard L. Teigen 225 East Mason Street Suite 802 Milwaukee, WI 53202 Age: 64 | Director | Indefinite (until successor elected) Elected October 2016 | Retired Partner of Foley & Lardner LLP since February 2013; Partner & Associate Attorney of Foley & Lardner LLP from 1978 to 2013. | 1 | None |
| Interested Director: | |||||
| Barry S. Arnold 225 East Mason Street Suite 802 Milwaukee, WI 53202 Age: 52 | Director | As Director, indefinite, (until successor elected) As Director, served 20 years As Vice President and Secretary, served 13 years | Former Portfolio Manager, Chief Investment Officer and Secretary of the Arnold Investment Counsel Incorporated from January 1997 to 2016. Portfolio Manager for Global View Capital Management, Ltd. since 2017. | 1 | None |
| Officers of the Fund: | |||||
| Luke E. Sims 225 East Mason Street Suite 802 Milwaukee, WI 53202 Age: 67 | President and Chief Executive Officer | Indefinite (until successor elected) Since April 2016 | Chairman of Sims Capital Management LLC (the Adviser to the Fund); and Retired Partner of Foley & Lardner LLP (national law firm) where he was affiliated from 1976 through 2010. | N/A | N/A |
| David C. Sims 225 East Mason Street Suite 802 Milwaukee, WI 53202 Age: 36 | Vice President, Chief Financial Officer, Chief Compliance Officer, Treasurer and Secretary | Indefinite (until successor elected) Since April 2016 | President of Sims Capital Management LLC (the Adviser to the Fund); Manager of Peregrine Investment Fund LLC (private investment fund); and roles with the Fund as previously identified. | N/A | N/A |
Additional information about the Fund’s Directors is available in the Statement of Additional Information and is available, without charge, upon request, by calling 1-414-765-1107.
14
SIMS TOTAL RETURN FUND EXPENSE EXAMPLE For the Six Months Ended June 30, 2017 (Unaudited) |
As a shareholder of the Sims Total Return Fund, you incur ongoing costs, including management fees and other Fund expenses. If you invest through a financial intermediary, you may also incur additional costs such as a transaction fee charged on the purchase or sale of the Fund or an asset-based management fee. This Example is intended to help you understand your ongoing costs (in dollars) of investing in the Fund and to compare these costs with the ongoing costs of investing in other mutual funds.
The Example is based on an investment of $1,000 invested at the beginning of the period and held for the entire period from January 1, 2017 to June 30, 2017.
Actual Expenses
The first line of the table below provides information about actual account values and actual expenses. You may use the information in this line, together with the amount you invested, to estimate the expenses you paid over the period. Simply divide your account value by $1,000 (for example, an $8,600 account value divided by $1,000 = 8.6), then multiply the result by the number in the first line under the heading entitled “Expenses Paid During Period” to estimate the expenses you paid on your account during the period.
Hypothetical Example for Comparison Purposes
The second line of the table below provides information about hypothetical account values and hypothetical expenses based on the Fund’s actual expense ratios and an assumed rate of return of 5% per year before expenses, which is not the Fund‘s actual return. The hypothetical account values and expenses may not be used to estimate the actual ending account balance or expenses you paid for the period. You may use this information to compare the ongoing costs of investing in the Fund and other funds. To do so, compare this 5% hypothetical example with the 5% hypothetical examples that appear in the shareholder reports of the other funds.
Please note that the expenses shown in the table are meant to highlight your ongoing costs only and do not reflect any costs that may be associated with investing in the Fund through a financial intermediary. Therefore, the second line of the table is useful in comparing the ongoing costs only, and will not help you determine the relative total costs of owning different funds. In addition, if any costs associated with investing through a financial intermediary were included, your costs would have been higher.
| Beginning account value 1/1/17 | Ending account value 6/30/17 | Expenses paid during period 1/1/17-6/30/171 | ||||||||||
| Actual | $ | 1,000.00 | $ | 1,012.30 | $ | 14.52 | ||||||
| Hypothetical (5% return before expenses) | 1,000.00 | 1,010.60 | 14.51 | |||||||||
1 | Expenses are equal to the Fund’s annualized expense ratio of 2.91% for the period from January 1, 2017 through June 30, 2017, multiplied by the average account value over the period, multiplied by 181/365 (to reflect the one-half year period). |
15
SIMS TOTAL RETURN FUND ADDITIONAL INFORMATION June 30, 2017 (Unaudited) |
Proxy Voting Policies and Procedures
For a description of the policies and procedures that the Fund uses to determine how to vote proxies relating to portfolio securities, please call 1-414-765-1107 and request a Statement of Additional Information. One will be mailed to you free of charge. The Statement of Additional Information is also available on the website of the Securities and Exchange Commission at http://www.sec.gov. Information on how the Fund voted proxies relating to portfolio securities during the twelve-month period ended June 30, 2017, will be available without charge, upon request, by calling 1-414-765-1107 or by accessing the website of the Securities and Exchange Commission.
Disclosure of Portfolio Holdings
The Fund will file its complete schedule of portfolio holdings with the Securities and Exchange Commission for the first and third quarters of each fiscal year on Form N-Q. The Form N-Q will be available on the website of the Securities and Exchange Commission at http://www.sec.gov.
Tax Designation
For the year ended June 30, 2017, 64.07% of the dividends paid from net investment income, including short-term capital gains (if any), for the Fund, is designated as qualified dividend income.
For the year ended June 30, 2017, 64.32% of the dividends paid from net investment income, including short-term capital gains (if any), for the Fund, qualifies for the dividends received deduction available to corporate shareholders.
For the year ended June 30, 2017, the Fund designates $560,539 as a 20% rate gain distribution for purposes of the dividends paid deduction.
16
THIS PAGE INTENTIONALLY LEFT BLANK
| SIMS TOTAL RETURN FUND |
INVESTMENT ADVISER
Sims Capital Management LLC
225 East Mason Street, Suite 802
Milwaukee, WI 53202-3657
1-414-765-1107
OFFICERS
Luke E. Sims, President and CEO
David C. Sims, Vice President, CFO, CCO, Treasurer and Secretary
DIRECTORS
Barry S. Arnold
Clark J. Hillery
William J. Rack
Richard L. Teigen
ADMINISTRATOR
UMB Fund Services, Inc.
235 West Galena Street
Milwaukee, Wisconsin 53212
CUSTODIAN
U.S. Bank, N.A.
1555 North RiverCenter Drive
Milwaukee, Wisconsin 53212
TRANSFER AGENT AND DIVIDEND DISBURSING AGENT
U.S. Bancorp Fund Services, LLC
615 East Michigan Street
Milwaukee, Wisconsin 53202
1-800-968-2122
INDEPENDENT REGISTERED PUBLIC ACCOUNTING FIRM
Cohen & Company, Ltd.
1350 Euclid Avenue, Suite 800
Cleveland, Ohio 44115
LEGAL COUNSEL
Foley & Lardner LLP
777 East Wisconsin Avenue
Milwaukee, Wisconsin 53202
Item 2. Code of Ethics
The Registrant has a code of ethics (the “Code”) that applies to the Registrant’s principal executive officer and principal financial officer. A copy of the Code is filed as an exhibit to this Form N-CSR. During the period covered by this report, there were no amendments to the provisions of the Code, nor were there any implicit or explicit waivers to the provisions of the Code. The Code is incorporated by reference to the Registrant’s Form N-CSR filed August 28, 2014. (SEC Accession No. 0000898531-14-000336)
Item 3. Audit Committee Financial Expert
While Sims Total Return Fund, Inc. believes that each of the members of its audit committee has sufficient knowledge of accounting principles and financial statements to serve on the audit committee, none has the requisite experience to qualify as an “audit committee financial expert” as such term is defined by the Securities and Exchange Commission.
Item 4. Principal Accountant Fees and Services
The aggregate fees billed for professional services by the Registrant’s principal accountant for each of the last two fiscal years were as follows:
(a) Audit Fees for Registrant.
The aggregate fees billed for professional services rendered by the principal accountant to the Registrant for the audit of the Registrant’s annual financial statements or services that are normally provided by the accountant in connection with statutory and regulatory filings or engagements.
Fiscal year ended June 30, 2017 $14,500
Fiscal year ended June 30, 2016 $14,500
(b) Audit-Related Fees for Registrant.
The aggregate fees billed for assurance and related services by the principal accountant to the Registrant that are reasonably related to the performance of the audit of the Registrant’s financial statements and are not required under “Audit Fees” above.
Fiscal year ended June 30, 2017 $0
Fiscal year ended June 30, 2016 $0
(c) Tax Fees for Registrant.
The aggregate fees billed for professional services rendered by the principal accountant to the Registrant for review of Federal and excise tax returns, tax compliance, tax advice and tax planning. The fees paid were comprised of a review of the tax returns, tax notes and other documentation for the filing and returns, along with their underlying schedules, that were prepared by the Registrant’s administrator.
Fiscal year ended June 30, 2017 $1,000
Fiscal year ended June 30, 2016 $1,000
(d) All Other Fees.
The aggregate fees billed for products and services provided by the principal accountant to the Registrant, other than services reported under “Audit Fees,” “Audit-Related Fees,” and “Tax Fees” above.
Fiscal year ended June 30, 2017 $0
Fiscal year ended June 30, 2016 $0
(e) Audit Committee’s pre-approval policies and procedures.
(1) Pursuant to the registrant’s Audit Committee Charter (“Charter”), the Audit Committee shall pre-approve all auditing services and permissible non-audit services to be provided. In addition, the Charter provides that the Audit Committee may delegate to one or more of its members the authority to grant such pre-approvals.
(2) During the fiscal year ended June 30, 2017, all of the non-audit services provided by the Registrant’s principal accountant were pre-approved by the audit committee.
(f) Less than 50% of hours expended on the principal accountant’s engagement to audit the registrant’s financial statements for the most recent fiscal year were attributed to work performed by persons other than the principal accountant’s full-time, permanent employees.
(g) During the last two fiscal years there were no other non-audit services rendered by the Registrant’s principal accountant to the Registrant, its investment adviser or any entity controlling, controlled by or under the common control with the investment adviser that provides ongoing services to the Registrant.
(h) Not applicable.
Item 5. Audit Committee of Listed Registrants
Not applicable.
Item 6. Schedule of Investments
Included as part of the report to shareholders filed under Item I of this Form N-CSR.
Item 7. Disclosure of Proxy Voting Policies and Procedures for Closed-End Management Investment Companies
Not applicable.
Item 8. Portfolio Managers of Closed-End Management Investment Companies
Not applicable.
Item 9. Purchase of Equity Securities of Closed-End Management Investment Company and Affiliated Purchasers
Not applicable.
Item 10. Submission of Matters to a Vote of Security Holders
Included as part of the report to shareholders filed under Item I of this Form N-CSR.
Item 11. Controls and Procedures
| (a) | The Principal Executive and Financial Officers concluded that the Registrant’s Disclosure Controls and Procedures are effective based on their evaluation of the Disclosure Controls and Procedures as of a date within 90 days of the filing date of this report. |
| (b) | There were no changes in Registrant’s internal control over financial reporting that occurred during the Registrant’s second fiscal quarter of the period covered by this report that materially affected or were reasonably likely to materially affect Registrant’s internal control over financial reporting. |
Item 12. Exhibits
| (a) | (1) Code of Ethics. Incorporated by reference to the Registrant’s Form N-CSR filed August 28, 2014. (SEC Accession No. 0000898531-14-000336) |
| (2) | Certifications required pursuant to Sections 302 of the Sarbanes-Oxley Act of 2002. Filed herewith. |
| (3) | Any written solicitation to purchase securities under Rule 23c-1 under the Act sent or given during the period covered by the report by or on behalf of the registrant to 10 or more persons. Not applicable to open-end management investment companies. |
| (b) | Certification pursuant to Section 906 of the Sarbanes-Oxley Act of 2002. Filed herewith. |
SIGNATURES
Pursuant to the requirements of the Securities Exchange Act of 1934 and the Investment Company Act of 1940, the registrant has duly caused this report to be signed on its behalf by the undersigned, thereunto duly authorized.
| Sims Total Return Fund, Inc. | |
| /s/ Luke E. Sims | |
| Luke E. Sims | |
| Principal Executive Officer | |
| August 28, 2017 |
Pursuant to the requirements of the Securities Exchange Act of 1934 and the Investment Company Act of 1940, this report has been signed below by the following persons on behalf of the registrant and in the capacities and on the dates indicated.
| /s/ Luke E. Sims | |
| Luke E. Sims | |
| Principal Executive Officer | |
| August 28, 2017 |
| /s/ David C. Sims | |
| David C. Sims | |
| Principal Financial Officer | |
| August 28, 2017 |