UNITED STATES
SECURITIES AND EXCHANGE COMMISSION
Washington, D.C. 20549
FORM N-CSRS
CERTIFIED SHAREHOLDER REPORT OF REGISTERED
MANAGEMENT INVESTMENT COMPANIES
Investment Company Act file number | 811-05084 |
|
Mutual of America Investment Corporation |
(Exact name of registrant as specified in charter) |
|
320 Park Avenue, New York, N.Y. | | 10022 |
(Address of principal executive offices) | | (Zip code) |
|
John R. Greed Senior Executive Vice President and Chief Financial Officer Mutual of America Life Insurance Company 320 Park Avenue New York, NY 10022 |
(Name and address of agent for service) |
|
Registrant’s telephone number, including area code: | (212) 224-1600 | |
|
Date of fiscal year end: | December 31 | |
|
Date of reporting period: | June 30, 2012 | |
| | | | | | | | |
ITEM 1. REPORTS TO STOCKHOLDERS.
The Semi-Annual Report to Shareholders follows:
JUNE 30, 2012
Semi-Annual Reports of Investment Options Offered by
Mutual of America Life Insurance Company
This report is not to be construed as an offering for sale of any Variable Policy. No offering is made except in conjunction with a prospectus which must precede or accompany this report.


320 PARK AVENUE
NEW YORK NY 10022-6839
August 2012
Dear Contract Owner,
As a valued variable accumulation annuity contract owner, we are pleased to provide you with the semi-annual fund reports for the investment options offered by your contract. Included in this booklet are the semi-annual reports of the Mutual of America Investment Corporation Funds. If you have also selected other investment options, you will receive annual reports for those funds in a separate booklet or booklets. The reports provide an update on each portfolio's performance as of June 30, 2012. Please note that portfolio performance does not take into account the fees charged by the contract. If these fees had been included, the fund's performance would have been lower. As always, past performance cannot predict or guarantee future returns.
Mutual of America has specialized in providing retirement products and related services to organizations and their employees, as well as individuals, for over 65 years. As a mutual company, we do not have stockholders and are not publicly traded. We operate solely for the benefit of our customers, managing the Company for their long-term interest, rather than for the short-term demands of stockholders. Today, as in the past, Mutual of America remains financially strong and is rated among the strongest companies in the life insurance industry by the major independent rating agencies.*
Since 1945, Mutual of America has remained committed to its Mission to offer plan sponsors, plan participants and individuals carefully selected, quality products and services at a competitive price and the personal attention they need to help build and preserve assets for a financially secure future. Integrity, prudence, and reliability are the values that have guided us since our inception and that continue to serve us well.
We hope you find the enclosed information helpful. We appreciate and value your business and look forward to serving you in the future. If you have any questions, please call your local Mutual of America Regional Office or 1-800-468-3785.
Sincerely,
Mutual of America Life Insurance Company
* While these ratings do not apply to the safety or investment performance of the Separate Account investment funds available under Mutual of America's products, they do reflect the Company's ability to fulfill its General Account obligations, which include its obligations under the Interest Accumulation Account, annuity purchase rate guarantees and annuity benefit payouts, as well as life insurance and disability income payments. Third party ratings are subject to change.
JUNE 30, 2012
Semi-Annual Reports of Mutual of America
Investment Corporation
This report is not to be construed as an offering for sale of any Variable Policy. No offering is made except in conjunction with a prospectus which must precede or accompany this report.


(This page has been left blank intentionally.)
CONTENTS
| | | Page | |
| Semi-Annual Report of Mutual of America Investment Corporation | |
|
| President's Message | | 1 | |
|
| Portfolio Management Discussions | | 5 | |
|
| Asset Allocations | | 11 | |
|
| Expense Example | | 15 | |
|
| Summary Portfolios of Investments in Securities: | | | |
|
| Equity Index Fund | | 22 | |
|
| All America Fund | | 24 | |
|
| Small Cap Value Fund | | 26 | |
|
| Small Cap Growth Fund | | 27 | |
|
| Mid Cap Value Fund | | 28 | |
|
| Mid-Cap Equity Index Fund | | 29 | |
|
| International Fund | | 30 | |
|
| Composite Fund | | 31 | |
|
| Retirement Income Fund | | 33 | |
|
| 2010 Retirement Fund | | 33 | |
|
| 2015 Retirement Fund | | 33 | |
|
| 2020 Retirement Fund | | 34 | |
|
| 2025 Retirement Fund | | 34 | |
|
| 2030 Retirement Fund | | 34 | |
|
| 2035 Retirement Fund | | 35 | |
|
| 2040 Retirement Fund | | 35 | |
|
| 2045 Retirement Fund | | 35 | |
|
| Conservative Allocation Fund | | 36 | |
|
| Moderate Allocation Fund | | 36 | |
|
| Aggressive Allocation Fund | | 36 | |
|
| Money Market Fund | | 37 | |
|
| Mid-Term Bond Fund | | 38 | |
|
| Bond Fund | | 41 | |
|
| Footnotes to Summary Portfolios of Investments in Securities | | 43 | |
|
| Statements of Assets and Liabilities | | 44 | |
|
| Statements of Operations | | 48 | |
|
| Statements of Changes in Net Assets | | 52 | |
|
| Financial Highlights | | 60 | |
|
| Notes to Financial Statements | | 76 | |
|
| Additional Information | | 89 | |
|
(This page has been left blank intentionally.)
MUTUAL OF AMERICA INVESTMENT CORPORATION
We are pleased to present the Mutual of America Investment Corporation (the "Investment Company") Semi-Annual Report. This Report includes important information regarding the performance and financial position of the Investment Company's funds for the six months ended June 30, 2012.
Six Month Retrospective
The most remarkable thing so far about the 2012 equity market, represented by the S&P 500®, is how similar it is to the previous two years. In both of those cases prices advanced strongly in the beginning of the year, only to drop during the late spring, summer and early fall, before advancing again through the end of the year. The same pattern has revealed itself so far this year, raising the question about what will happen during the second half.
The reasons for the mid-year declines are essentially the same: in general, an increase in investor fear that global growth is slowing and might lead to worldwide recession. The particular factors leading to this fear include the sovereign debt crisis in Europe, a slowdown in China engineered to reduce rising inflationary pressure, weakening economic data in the United States and the failure by the U.S. to get its own debt problems under control. The reason for the end-of-year and beginning-of-year rallies was a series of liquidity injections by the major central banks around the world. It has long been a staple of Wall Street wisdom that an investor should "never fight the Federal Reserve," or in this case, the Feds around the world, whenever they loosen monetary policy.
The major difference between now and the last two years is that we've seen this happen before. The effectiveness of successive quantitative easing appears to have diminished, and any new ones would likely prove less impressive to investors. As such, current confidence in monetary policy initiatives is lower compared to past years. The aggressive injection of liquidity by monetary authorities was designed to protect the recovery from petering out while giving policy makers the time to develop programs for fiscal stimulus to promote growth. Simultaneously, the expectation was that policy makers would implement strategies for getting control of rising deficits and, over the long term, reducing national debts. But so far, no such policies have been successfully deployed.
For example, the efforts by the U.S. Congress to come up with a deficit reduction plan in 2011 concluded in failure. Instead, it resulted in an agreement to implement "automatic sequestration of funds" equally apportioned from the defense and discretionary portions of the budget beginning in January 2013. Similarly, Europe staggered from one crisis to another, agreeing to bailouts for Ireland; Portugal; Greece; and most recently, Spanish banks. The condition for each bailout was the implementation of severe "austerity measures" in each of the recipient countries, raising the bar on economic growth necessary to pay off existing debt, as well as the additional debt added by the bailouts.
Debt Crisis in Europe Continues to Affect Markets
The most recent European Summit, the 20th in the past two years, took a small step in the direction of addressing the European Union's fatal flaw, namely, the lack of a centralized fiscal authority to police taxing and spending activities by individual constituent nations, as well as to provide continent-wide oversight and regulation of the banks. The breakthrough at this summit was a general agreement to establish a centralized bank regulatory authority over all banks, or at least the largest European banks.
In addition, the summit agreed to allow the European Stabilization Mechanism (ESM) to provide funds for bank recapitalization directly to the banks needing it rather than through the government of the country in which the bank is domiciled. This decision is important in two regards: first, lending directly to banks avoids adding to the debt burdens of the sovereign, and second, the funds provided directly to the banks from the ESM will not take priority over previous private lenders in the case of a default by the bank, as happened in the Greek bailout. In the latter case, all private funding dried up, and would probably have done so in Spain's case if this second provision had not been agreed upon.
The attempt to work out the details of these new agreements will inevitably involve politics and therefore setbacks, which means the European situation will continue to roil markets for some time, and well beyond the current year.
U.S. Economic Data Remains Weak
In the meantime, the economic data from the U.S. and China, the two largest drivers of global growth, have been steadily softening and generally below expectations. U.S. Gross Domestic Product (GDP) for the first quarter of 2012 came in at 1.9%, versus an expectation of 2.5%. While GDP for the second quarter of this year has not yet
1
been reported at the time of this writing in late July 2012, the economic components that make up the measure have nearly all weakened, including consumption, net exports, business spending and government spending. The one bright spot has been residential construction, not so much because it has been robust, but that it has stopped declining and has even been up a bit on a month-to-month basis for several months. However, that will not move the needle on overall growth for the economy.
In the meantime, nearly all regional surveys of manufacturing activity, the engine behind the domestic recovery so far, showed weakening, with the recently released ISM Manufacturing survey for June dropping to 49.7 versus May's 53.5 and an expectation of 52.0. A reading below 50 is generally interpreted as contraction rather than expansion. At the least, the reading suggests a pull back by businesses. This conclusion is buttressed by the employment data recorded over the past few months. Weekly unemployment claims declined from a peak of 667,000 in March 2009 to a low of 362,000 in March 2012, but have since steadily risen back toward the 400,000 level. During this backup in weekly claims, job growth has slowed from an average of over 200,000 per month to less than 100,000 per month, a rate insufficient to cover new entrants to the job market, reduce unemployment or sustain recovery. Without jobs growth, consumer spending will remain muted; without sustainable spending, production will stall or decline. In addition, a slowdown in spending among our trading partners augurs sluggish domestic growth at best, and the threat of falling back into recession.
China Data Also Fails to Meet Expectations
China has witnessed a similar weakening in its data, with production data failing to meet expectations in most months of this year, while exports, although still positive, have increased at a successively slower rate. Furthermore, the strategy of shifting from more of a production-led economy to a consumer-led economy is not materializing quickly enough to take up the slack. Despite interest rate reductions and giving banks more flexibility to compete, allowing the currency to trade in a wider range and opening the markets to greater inflow and outflow of capital — all necessary moves to make China a true global player — the larger forces of global macroeconomics are overpowering even the tight fisted economic controls employed by the Chinese authorities.
Ultimately, China's growth depends on the health of other parts of the global economy, especially Europe and the U.S., and vice-versa. The complex global interdependence that has developed over the past 10 to 20 years means that both prosperity and suffering are shared, albeit perhaps to different degrees in different regions or countries. Nonetheless, for better or worse, we have become a more united world than at any time in history. And the driver of this increasing interdependence has been finance and economics, fostered by instantaneous communications. Our problems are significant but addressable, if the political will exists to solve them.
End of Bush Era Tax Cuts Looms Large
The U.S. is, in fact, currently facing a supreme test of political will with the so-called "fiscal cliff" arriving at the end of this year. On January 1, 2013, the Bush era tax cuts are scheduled to end, along with the payroll tax cut instituted two years ago to provide modest stimulus to consumer spending. Similarly, an investment tax credit for business capital investment will also end.
Further, the Patient Protection and Affordable Care Act, President Obama's signature achievement of his first term and just upheld by the United States Supreme Court, includes an additional 0.9% tax on high levels of income. Also, another incremental tax on high-income individuals of 3.8% on net investment income, over and above the current 15% capital gains rate, will be levied. Finally, if Congress does not specifically act on deficit reduction before the end of the year, the automatic spending cuts agreed to as a penalty for failure to implement a specific deficit reduction package in 2010 will take effect. Together, these tax increases and spending cuts are estimated to reduce GDP by over 3%. Obviously, if all these measures take effect, economic growth will be negative if current growth of less than 2.0% persists into next year.
The fly in the ointment is that between now and then, there are presidential and congressional elections that by all current prognostications will be close races, although the House is widely expected to remain under Republican control. Most commentators agree that a deficit pact before the election, or even in the post-election "lame duck" period, is highly unlikely. There is some chance that Congress may vote to postpone the implementation of these tax increases and spending cuts, or at least some of them, but that remains to be seen given the extreme partisanship that has marked the current congressional term.
Businesses, Consumers and Investors Exercising Caution
All of these uncertainties are making businessmen, consumers and investors around the world reluctant to spend or invest. That seems to be what the deteriorating economic data suggest.
2
Stock markets tend to move in the direction of corporate earnings. As we are about to enter the 2012 second quarter reporting season, the expectation is that year-over-year growth will come in at +5.0%, the slowest growth in 12 consecutive quarters. The percentage of positive earnings surprises has also been decelerating in successive quarters, while we have recently witnessed a number of high-profile company pre-announcements warning that second quarter earnings are likely to come in below expectations.
Weakness in Europe and difficult foreign exchange comparisons seem to be the common theme. And negative earnings revisions by analysts have increased compared to positive revisions. Should earnings disappoint, or worse, go negative, stocks would probably decline in response to another strong indication that the economy could be entering a recession. Of course, stocks remain relatively cheap, especially as compared to bonds, and there is the abiding hope that the Federal Reserve can find another creative way to prop up the economy.
Markets Face Headwinds Moving Forward
That seems to be one explanation why markets have held up as well as they have so far. After all, through June, the S&P 500 was up over 9% year-to-date. But if earnings begin to fall, stocks will no longer appear so inexpensive, and with slowdowns in Europe and China, as well as currency headwinds against the Euro, the odds are increasing that earnings could prove fragile.
Forecasting the trajectory of the economy and corporate profits becomes exceedingly difficult when the factors driving them are a function of politics. Europe, the U.S. and China are each facing serious economic and financial issues that can only be resolved by bold and courageous policy decisions. Most of these decisions are dependent on political considerations among polarized nations (Europe), opposing political ideologies (U.S.) and conflicting options for sustained growth (China). At some point, stock markets will lose patience with half-baked steps, deferral of real solutions to problems and political gridlock, and will raise the price of risky assets. The recent increase in stock volatility suggests that we might be approaching just such a market response.
The bond markets of the healthiest developed economies (United States, Germany and Japan) have actually already signaled concern with the increasing risk to global economic growth through appreciation of their sovereign bonds and consequent historically low yields. They have become the few "safe havens" for risk-averse investors. If markets become convinced that credible actions are being taken by policy makers to address problems, stocks will advance and bond prices will decline and yields will rise. Probabilities at present do not favor this latter outcome. We should probably expect more volatility in stocks and perhaps even lower interest rates for sovereign bonds of the strongest countries over the next six to twelve months.
The total return performance (net of investment management and other operating expenses) for each of the Investment Company Funds is reflected below:
Total Returns — Six Months Ended June 30, 2012
| Equity Index Fund | | +9.44% | |
| All America Fund | | +9.00% | |
| Small Cap Value Fund | | +8.99% | |
| Small Cap Growth Fund | | +6.74% | |
| Mid Cap Value Fund | | +3.72% | |
| Mid-Cap Equity Index Fund | | +7.94% | |
| International Fund | | +3.30% | |
| Composite Fund | | +6.60% | |
| Retirement Income Fund | | +3.91% | |
| 2010 Retirement Fund | | +4.96% | |
| 2015 Retirement Fund | | +5.39% | |
| 2020 Retirement Fund | | +6.04% | |
| 2025 Retirement Fund | | +6.71% | |
| 2030 Retirement Fund | | +7.09% | |
| 2035 Retirement Fund | | +7.36% | |
| 2040 Retirement Fund | | +7.32% | |
| 2045 Retirement Fund | | +7.32% | |
3
Total Returns — Six Months Ended June 30, 2012 (Continued)
| Conservative Allocation Fund | | +4.18% | |
| Moderate Allocation Fund | | +5.85% | |
| Aggressive Allocation Fund | | +7.43% | |
| Money Market Fund | | -0.09% | |
| Mid-Term Bond Fund | | +1.85% | |
| Bond Fund | | +2.95% | |
The above performance figures do not reflect the deduction of respective Separate Account fees and expenses imposed by Mutual of America Life Insurance Company. All Fund performances presented throughout this report are historical, reflect the full reinvestment of dividends paid, and should not be considered indicative of future results.
The pages which immediately follow include brief discussions of each Fund's performance for the six months ended June 30, 2012, compared with its relevant index.
Following the discussions are graphical representations of the asset allocations of each Fund and an illustration of each Fund's operating expenses. The summarized portfolios of each Fund and financial statements are presented in the pages which then follow.
Thank you for your continued investment in our Funds.
Sincerely,

John R. Greed
Chairman of the Board, President
and Chief Executive Officer
Mutual of America Investment Corporation
The views expressed in this Semi-Annual Report are subject to change at any time based on market and other conditions and should not be construed as a recommendation. This Report contains forward-looking statements, which speak only as of the date they were made and involve a number of risks and uncertainties that could cause actual results to differ materially from those expressed herein. Readers are cautioned not to place undue reliance on our forward-looking statements, as we assume no obligation to update these forward-looking statements. Readers assume any and all responsibility for any investment decision made as a result of the views expressed herein.
4
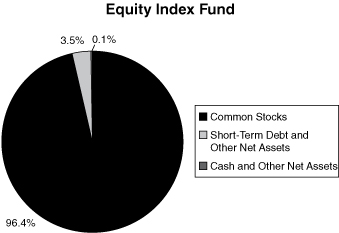
EQUITY INDEX FUND
The Equity Index Fund's objective is to replicate the performance of the S&P 500® Index (the "S&P 500"), which consists of 500 stocks chosen by Standard & Poor's for market size, liquidity and industry group representation. The S&P 500 is a market-weighted index of 500 stocks traded on the New York Stock Exchange, American Stock Exchange and NASDAQ, with each stock's weight in the index proportionate to its market value. The weightings make each company's influence on the S&P 500's performance directly proportional to that company's market value.
The S&P 500 had an overall strong first half of 2012, returning 9.49% including dividends. The S&P 500 reached its high of 1422 on April 2, 2012, which was followed by a market correction of over 10.5% to the intra-quarter low of 1,278 on June 4, 2012. Concerns over sovereign defaults in Europe, the potential of a breakup of the European Union and a potential slow-down in corporate earnings weighed on the market. Despite no resolution to fiscal concerns in Europe and minimal improvement to domestic economic conditions, the market recovered from its low on June 4, 2012, and rallied 7% into the end of June. Telecom, Financials, Consumer Discretionary and IT were the best performing sectors for the first half of the year, returning 15.6%, 11.3%, 11.3% and 11.0%, respectively. Energy and Materials were the worst performing, with returns of -0.12% and 2.9% respectively.
The Equity Index Fund's performance for the six months ended June 30, 2012, was 9.44%, in line with the benchmark return of 9.49%. Note that the Equity Index Fund's performance includes expenses, such as transaction costs and management fees, which are not applicable to the benchmark.
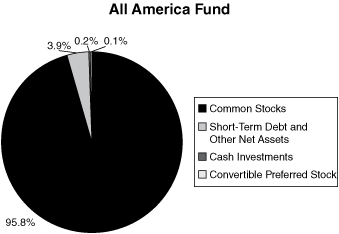
ALL AMERICA FUND
The investment objective of the All America Fund is to outperform the S&P 500® Index (the "S&P 500"). The All America Fund is approximately 60% invested in the 500 stocks that comprise the S&P 500, with the remaining 40% actively managed, using three different investment approaches. The actively managed portion of the All America Fund is close to being equally distributed between large cap stocks and small cap stocks, with the small cap stocks in turn equally distributed between small cap value and small cap growth stocks.
For the six months ended June 30, 2012, the S&P 500 of large capitalization stocks increased by 9.49% on a total return basis, while the Russell 2000® Growth Index was up 8.81% and the Russell 2000® Value Index was up 8.23%.
The All America Fund's return for the six months ended June 30, 2012, was 9.00% versus the benchmark return of 9.49%. The underperformance of the Fund was largely the result of the underperformance of the Small Cap Growth component of the Fund. The Equity Index, Large Cap and Small Cap Value components each performed in line with the benchmark. It should be noted that the S&P 500, the fund's benchmark, outperformed all domestic indexes except the Russell 1000® Growth Index for the six months ended June 30, 2012.
SMALL CAP VALUE FUND
The investment objective of the Small Cap Value Fund is to outperform the Russell 2000® Value Index. The Small Cap Value Fund generally invests in companies that are below $3 billion in market capitalization and have lower price-to-book characteristics than the overall market.
For the six months ended June 30, 2012, the Small Cap Value Fund returned 8.99% versus an 8.23% return for the Russell 2000 Value Index. Stock selection was the primary driver of positive performance versus the benchmark. Sectors contributing to Fund performance included Technology, Healthcare and Utilities, while sectors detracting from Fund performance included Energy and Consumer Cyclical.
SMALL CAP GROWTH FUND
The investment objective of the Small Cap Growth Fund is capital appreciation. The Small Cap Growth Fund invests in growth stocks within the small capitalization marketplace. The Fund returned 6.74% during the six months ended June 30, 2012. The Fund's benchmark, the Russell 2000® Growth Index, returned 8.81% for the period. The Small Cap Growth Fund showed competitive results for 2012, especially when one considers that the Fund's performance includes expenses, such as transaction costs and management fees, which are not applicable to the benchmark.
For the six-month period, eight of the ten economic sectors in the small cap growth universe had positive returns, with Healthcare showing the most impressive results, up 22.63%. The next best performing sector was Consumer Discretionary, which had a return of 12.29%. The Healthcare sector contributed more than half the return for the benchmark during the first six months of the year.
Our best performance was in the Industrial and Energy sectors. We underperformed in both Healthcare and Technology. With our bottom-up stock selection approach, we remain focused on companies that have sustainable top line growth as opposed to those that have benefited from policy stimulus or margin expansion (reduced operating expenses).
5
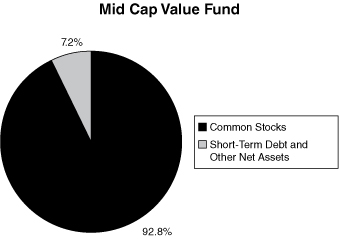
MID CAP VALUE FUND
The investment objective of the Mid Cap Value Fund is to outperform the Russell Midcap® Value Index. The Mid Cap Value Fund generally invests in companies that are between $1 billion and $20 billion in market capitalization and have lower price-to-book characteristics.
For the six months ended June 30, 2012, the Mid Cap Value Fund returned 3.72% versus a 7.78% return for the Russell Midcap Value Index. Adverse stock selection was the primary driver of performance versus the benchmark. Sectors contributing to Mid Cap Value Fund performance included Basic Materials and Technology while sectors detracting from Fund performance included Industrials and Finance.
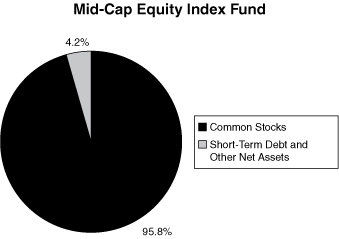
MID-CAP EQUITY INDEX FUND
The Mid-Cap Equity Index Fund invests in the 400 stocks that comprise the S&P MidCap 400® Index (the "S&P MidCap 400"). The S&P MidCap 400 is a market-weighted index of 400 stocks traded on the New York Stock Exchange, American Stock Exchange and NASDAQ. The weightings make each company's influence on the S&P MidCap 400's performance directly proportional to that company's market value. The companies included in the S&P MidCap 400 tend to be typical of this asset class, the medium-capitalized sector of the U.S. securities market.
The S&P MidCap 400 underperformed the S&P 500® in the first half of 2012, a continuation of their respective performance during 2011 and was driven by investor demand for yield and liquidity. Within the S&P MidCap 400, the Healthcare sector was extremely strong, up 15%. Similar to their large-cap counterparts, Telecom, Consumer Discretionary and Financials outperformed and were up 13.7%, 11.5% and 9.2% respectively. Energy and Consumer Staples were the worst performing sectors with returns of -10.7% and -3.3% respectively.
The Mid-Cap Equity Index Fund's performance for the six months ended June 30, 2012, was 7.94%, in line with the 7.90% return of the S&P MidCap 400. Note that the performance of the Mid-Cap Equity Index Fund includes expenses, such as transaction costs and management fees, which are not applicable to the benchmark.
INTERNATIONAL FUND
The International Fund seeks capital appreciation by investing, directly or indirectly, in stocks of companies located outside of the United States that are reflected or contained in the Morgan Stanley Capital International, Inc. Europe, Australasia and Far East® Index (the "MSCI EAFE® Index"). Currently the International Fund is invested exclusively in exchange traded funds that reflect or closely match the holdings in the MSCI EAFE Index.
For the six months ended June 30, 2012, the International Fund returned 3.30%, outperforming the 2.96% return of the benchmark. The fund's benchmark closes earlier in the day than the actual market for the fund's investments. This time lag can result in both positive and negative performance differences. On the last business day of the period, the time lag resulted in the fund underperforming the benchmark.
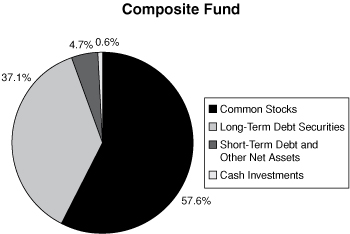
COMPOSITE FUND
The Composite Fund invests in a diversified portfolio of common stocks and fixed-income securities, seeking appreciation and current income. The equity portion of the Composite Fund invests in stocks within the S&P 500® Index (the "S&P 500").
For the six months ended June 30, 2012, the equity portion of the Fund had a total return of 9.70% (before expenses), outperforming the S&P 500 Index by 21 basis points. The primary reason for the outperformance of this portion of the Fund was good stock selection in the Materials, Financials and Technology sectors.
The equity portion of the Composite Fund maintains sector weights within plus or minus 100 basis points of the S&P 500 Index and does not take positions in individual stocks with overweights of more than 200 basis points. This structural discipline produces a relatively low-risk portfolio that emphasizes stock selection based on strong fundamental analysis.
For the six months ended June 30, 2012, the fixed income portion of the Fund had a total return of 3.20% (before expenses), outperforming the Barclays Aggregate Index by 83 basis points. The fixed income portion of the Fund focused on income and capital preservation.
The Federal Reserve maintained its interest rate policies and promised to retain them for some time into the future. These are designed to drive short-term rates to negligible levels and flatten the yield curve so that even long-term Treasury rates remain under three percent. As a result, income needs of market participants were focused on intermediate corporate bonds. This compressed the spread between the Treasury and corporate bonds. We expect this to continue throughout the year.
The Fund's primary strategy is to maintain a diversified portfolio of higher yielding corporate bonds while keeping the duration slightly short in order to guard against incipient inflation. The corporate bond holdings have relatively short maturities and each represents only a small percentage of the entire portfolio. The focus on income,
6
rather than market volatility, will enable the Fund to provide favorable compounded rates of return over meaningful time periods.
For the six months ended June 30, 2012, the Composite Fund returned 6.91% before expenses and 6.60% after expenses compared to the weighted benchmark return of 6.78%, 40% of which is based on the Barclays Capital Aggregate Bond Index and 60% of which is based on the S&P 500. About two-thirds of the Fund's pre-tax outperformance was attributable to the outperformance of the fixed income component, with the other third coming from the equity portion.
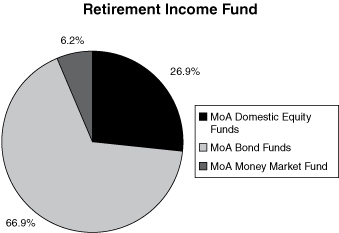
RETIREMENT INCOME FUND
The objective of the Retirement Income Fund is current income consistent with the preservation of capital and, to a lesser extent, capital appreciation. The Retirement Income Fund invests primarily in the fixed-income funds of the Investment Company and also invests in two equity funds of the Investment Company. The Fund's target allocation is approximately 75% of net assets in fixed-income funds (approximately 30% in the Bond, 38% in the Mid-Term Bond Funds and 7% in the Money Market Fund) and approximately 25% of net assets in equity funds (20% in the Equity Index Fund and 5% in the Mid-Cap Equity Index Fund).
Performance for the Retirement Income Fund is compared to the Barclays Capital Aggregate Bond Index (68% weighting), the Citigroup 3-Month Treasury Bill Index (7% weighting) and the S&P 500® Index (25% weighting). For the six months ended June 30, 2012, the Fund returned 3.91% versus a 4.09% return in the weighted benchmark. The small underperformance of the Fund is mainly attributable to the underperformance of the Mid-Term Bond Fund relative to the Barclays Capital Aggregate Bond Index.
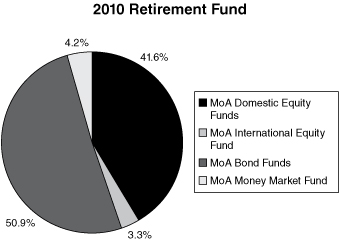
2010 RETIREMENT FUND
The objective of the 2010 Retirement Fund is current income and capital appreciation appropriate for the asset allocation associated with a target retirement in 2010. The 2010 Retirement Fund invests in funds of the Investment Company. The Fund's target allocation is approximately 59% of net assets in fixed-income funds (approximately 25% in the Bond Fund, 29% in the Mid-Term Bond Fund and 5% in the Money Market Fund) and approximately 41% of net assets in equity funds (25% in the Equity Index Fund, 12% in the Mid-Cap Equity Index Fund and 4% in the International Fund).
Performance for the 2010 Retirement Fund is compared to the Barclays Capital Aggregate Bond Index (54% weighting), the Citigroup 3-Month Treasury Bill Index (5% weighting) and the S&P 500® Index (41% weighting). For the six months ended June 30, 2012, the Fund returned 4.96% versus a 5.31% return in the weighted benchmark. The underperformance of the Fund is mainly attributable to the underperformance of the International and Mid-Cap Equity Index Funds relative to the S&P 500 Index, and the Mid-Term Bond Fund underperforming the Barclays Capital Aggregate Bond Index.
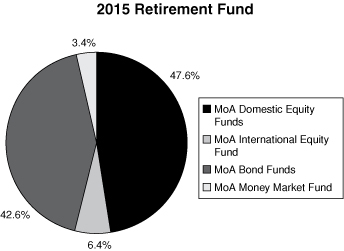
2015 RETIREMENT FUND
The objective of the 2015 Retirement Fund is current income and capital appreciation appropriate for the asset allocation associated with a target retirement in 2015. The 2015 Retirement Fund invests in funds of the Investment Company. The Fund's target allocation is approximately 51% of net assets in equity funds (approximately 29% in the Equity Index Fund, 11% in the Mid-Cap Equity Index Fund, 7% in the International Fund and 2% each in the Small Cap Growth and Small Cap Value Funds) and approximately 49% of net assets in fixed-income funds (26% in the Bond Fund, 19% in the Mid-Term Bond Fund and 4% in the Money Market Fund).
Performance for the 2015 Retirement Fund is compared to the S&P 500® Index (51% weighting), the Barclays Capital Aggregate Bond Index (45% weighting) and the Citigroup 3-Month Treasury Bill Index (4% weighting). For the six months ended June 30, 2012, the Fund returned 5.39% versus a 6.05% return in the weighted benchmark. The underperformance of the Fund is mainly attributable to the underperformance of the International and Mid-Cap Equity Index Funds relative to the S&P 500 Index, and the Mid-Term Bond Fund underperforming the Barclays Capital Aggregate Bond Index.
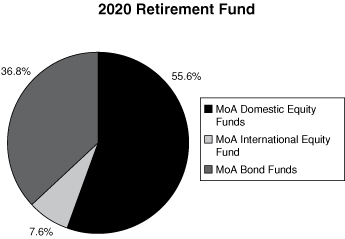
2020 RETIREMENT FUND
The objective of the 2020 Retirement Fund is current income and capital appreciation appropriate for the asset allocation associated with a target retirement in 2020. The 2020 Retirement Fund invests in funds of the Investment Company. The Fund's target allocation is approximately 61% of net assets in equity funds (approximately 33% in the Equity Index Fund, 11% in the Mid-Cap Equity Index Fund, 9% in the International Fund and 4% each in the Small Cap Growth and Small Cap Value Funds) and approximately 39% of net assets in fixed-income funds (25% in the Bond Fund and 14% in the Mid-Term Bond Fund).
7
Performance for the 2020 Retirement Fund is compared to the S&P 500® Index (61% weighting) and the Barclays Capital Aggregate Bond Index (39% weighting). For the six months ended June 30, 2012, the Fund returned 6.04% versus a 6.85% return in the weighted benchmark. The underperformance of the Fund is mainly attributable to the underperformance of the International Fund relative to the S&P 500 Index, and to a lesser extent, the Mid-Cap Equity Index and Small Cap Growth Funds underperforming the S&P 500 Index.
2025 RETIREMENT FUND
The objective of the 2025 Retirement Fund is current income and capital appreciation appropriate for the asset allocation associated with a target retirement in 2025. The 2025 Retirement Fund invests in funds of the Investment Company. The Fund's target allocation is approximately 71% of net assets in equity funds (approximately 37% in the Equity Index Fund, 15% in the Mid-Cap Equity Index Fund, 9% in the International Fund and 5% each in the Small Cap Growth and Small Cap Value Funds) and approximately 29% of net assets in fixed-income funds (22% in the Bond Fund and 7% in the Mid-Term Bond Fund).
Performance for the 2025 Retirement Fund is compared to the S&P 500® Index (71% weighting) and the Barclays Capital Aggregate Bond Index (29% weighting). For the six months ended June 30, 2012, the Fund returned 6.71% versus a 7.55% return in the weighted benchmark. The underperformance of the Fund is mainly attributable to the underperformance of the International Fund relative to the S&P 500 Index, and to a lesser extent, the Mid-Cap Equity Index and Small Cap Growth Funds underperforming the S&P 500 Index.
2030 RETIREMENT FUND
The objective of the 2030 Retirement Fund is current income and capital appreciation appropriate for the asset allocation associated with a target retirement in 2030. The 2030 Retirement Fund invests in funds of the Investment Company. The Fund's target allocation is approximately 79% of net assets in equity funds (approximately 40% in the Equity Index Fund, 17% in the Mid-Cap Equity Index Fund, 10% in the International Fund and 6% each in the Small Cap Growth and Small Cap Value Funds) and approximately 21% of net assets in the Bond Fund.
Performance for the 2030 Retirement Fund is compared to the S&P 500® Index (79% weighting) and the Barclays Capital Aggregate Bond Index (21% weighting). For the six months ended June 30, 2012, the Fund returned 7.09% versus a 8.09% return in the weighted benchmark. The underperformance of the Fund is mainly attributable to the underperformance of the International Fund relative to the S&P 500 Index, and to a lesser extent, the Mid-Cap Equity Index and Small Cap Growth Funds underperforming the S&P 500 Index.
2035 RETIREMENT FUND
The objective of the 2035 Retirement Fund is current income and capital appreciation appropriate for the asset allocation associated with a target retirement in 2035. The 2035 Retirement Fund invests in funds of the Investment Company. The Fund's target allocation is approximately 86% of net assets in equity funds (approximately 40% in the Equity Index Fund, 20% in the Mid-Cap Equity Index Fund, 12% in the International Fund and 7% each in the Small Cap Growth and Small Cap Value Funds) and approximately 14% of net assets in the Bond Fund.
Performance for the 2035 Retirement Fund is compared to the S&P 500® Index (86% weighting) and the Barclays Capital Aggregate Bond Index (14% weighting). For the six months ended June 30, 2012, the Fund returned 7.36% versus a 8.56% return in the weighted benchmark. The underperformance of the Fund is mainly attributable to the underperformance of the International Fund relative to the S&P 500 Index, and to a lesser extent, the Mid-Cap Equity Index and Small Cap Growth Funds underperforming the S&P 500 Index.
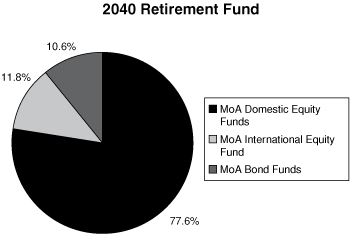
2040 RETIREMENT FUND
The objective of the 2040 Retirement Fund is current income and capital appreciation appropriate for the asset allocation associated with a target retirement in 2040. The 2040 Retirement Fund invests in funds of the Investment Company. The Fund's target allocation is approximately 89% of net assets in equity funds (approximately 35% in the Equity Index Fund, 24% in the Mid-Cap Equity Index Fund, 14% in the International Fund and 8% each in the Small Cap Growth and Small Cap Value Funds) and approximately 11% of net assets in the Bond Fund.
Performance for the 2040 Retirement Fund is compared to the S&P 500® Index (89% weighting) and the Barclays Capital Aggregate Bond Index (11% weighting). For the six months ended June 30, 2012, the Fund returned 7.32% versus a 8.76% return in the weighted benchmark. The underperformance of the Fund is mainly attributable to the underperformance of the International Fund relative to the S&P 500 Index, and to a lesser extent, the Mid-Cap Equity Index and Small Cap Growth Funds underperforming the S&P 500 Index.
2045 RETIREMENT FUND
The objective of the 2045 Retirement Fund is current income and capital appreciation appropriate for the asset allocation associated with a target retirement in 2045. The 2045 Retirement Fund invests in funds of the Investment
8
Company. The Fund's target allocation is approximately 90% of net assets in equity funds (approximately 35% in the Equity Index Fund, 20% in the Mid-Cap Equity Index Fund, 15% in the International Fund and 10% each in the Small Cap Growth and Small Cap Value Funds) and approximately 10% of net assets in the Bond Fund.
Performance for the 2045 Retirement Fund is compared to the S&P 500® Index (90% weighting) and the Barclays Capital Aggregate Bond Index (10% weighting). For the six months ended June 30, 2012, the Fund returned 7.32% versus a 8.83% return in the weighted benchmark. The underperformance of the Fund is mainly attributable to the underperformance of the International Fund relative to the S&P 500 Index, and to a lesser extent, the Mid-Cap Equity Index and Small Cap Growth Funds underperforming the S&P 500 Index.
CONSERVATIVE ALLOCATION FUND
The objective of the Conservative Allocation Fund is current income and, to a lesser extent, capital appreciation. The Conservative Allocation Fund invests primarily in the fixed-income funds of the Investment Company and also invests in an equity fund of the Investment Company. The Conservative Allocation Fund's target allocation is approximately 75% of net assets in fixed-income funds (approximately 30% in the Bond Fund and approximately 45% in the Mid-Term Bond Fund) and approximately 25% of net assets in equity funds (the Equity Index Fund).
Performance for the Conservative Allocation Fund is compared to the Barclays Capital Aggregate Bond Index (75% weighting) and the S&P 500® Index (25% weighting). For the six months ended June 30, 2012, the Conservative Allocation Fund returned 4.18% versus a 4.26% return in the weighted benchmark. The small underperformance of the Fund is mainly attributable to the Mid-Term Bond Fund underperforming the Barclays Capital Aggregate Bond Index.
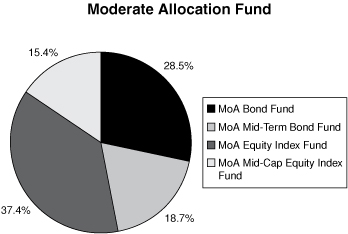
MODERATE ALLOCATION FUND
The objective of the Moderate Allocation Fund is capital appreciation and current income. The Moderate Allocation Fund invests in the equity and fixed-income funds of the Investment Company. The Moderate Allocation Fund's target allocation is approximately 50% of net assets in equity funds (approximately 35% of its net assets in the Equity Index Fund and approximately 15% of its net assets in the Mid-Cap Equity Index Fund) and approximately 50% of net assets in fixed-income funds (approximately 30% of its net assets in the Bond Fund and approximately 20% of its net assets in the Mid-Term Bond Fund).
Performance for the Moderate Allocation Fund is compared to the S&P 500® Index (50% weighting) and the Barclays Capital Aggregate Bond Index (50% weighting). For the six months ended June 30, 2012, the Moderate Allocation Fund returned 5.85% versus a 6.08% return for the weighted benchmark. The underperformance of the Fund is mainly attributable to the Mid-Cap Equity Index Fund underperforming the S&P 500 Index, and the Mid-Term Bond Fund underperforming the Barclays Capital Aggregate Bond Index.
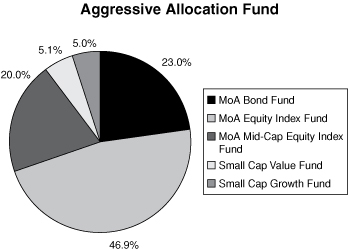
AGGRESSIVE ALLOCATION FUND
The objective of the Aggressive Allocation Fund is capital appreciation and, to a lesser extent, current income. The Aggressive Allocation Fund invests in the equity and fixed-income funds of the Investment Company. The Aggressive Allocation Fund's target allocation is approximately 75% of net assets in equity funds (approximately 45% of its net assets in the Equity Index Fund, approximately 20% of its net assets in the Mid-Cap Equity Index Fund, approximately 5% of its net assets in the Small Cap Value Fund and approximately 5% of its net assets in the Small Cap Growth Fund) and approximately 25% of net assets in the Bond Fund.
Performance for the Aggressive Allocation Fund is compared to the S&P 500® Index (75% weighting) and the Barclays Capital Aggregate Bond Index (25% weighting). For the six months ended June 30, 2012, the Aggressive Allocation Fund returned 7.43% versus a 7.82% return for the weighted benchmark. The underperformance of the Fund is mainly attributable to the Mid-Cap Equity Index and Small Cap Growth Funds underperforming the S&P 500 Index.
MONEY MARKET FUND
The Money Market Fund's investment objective is to realize current income while maintaining liquidity, investment quality and stability of capital through investing in high-quality commercial paper issued by U.S. corporations and securities issued by the U.S. government and its agencies. The Money Market Fund returned 0.07% before expenses and -0.09% after expenses for the six months ended June 30, 2012, compared to a 0.03% return for the Citigroup 3-Month Treasury Bill Index. Note that the benchmark performance does not reflect any expenses.
During the first half of 2012, the Federal Reserve remained committed to a near-zero interest rate policy by keeping the Fed Funds target rate at a range of 0% to 0.25%. As a result, money market returns were affected by extremely low yields and a decrease in supply of eligible investments. The Fund's strategy continued to focus on quality, liquidity, and maintaining a relatively short weighted average maturity.
9
The seven-day effective yield as of August 14, 2012, was -0.17%. As with all performance reporting, this yield is not necessarily indicative of future annual yields. Neither the Federal Deposit Insurance Corporation nor any other U.S. government agency insures or guarantees the Separate Account's investments in shares of the Money Market Fund.
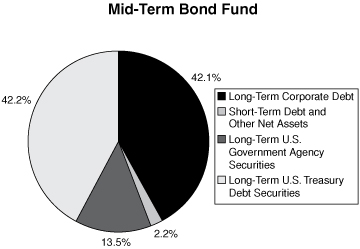
MID-TERM BOND FUND
The Mid-Term Bond Fund seeks a high level of return consistent with the preservation of capital through investment in publicly traded debt securities. The Mid-Term Bond Fund primarily invests in corporate and U.S. government agency securities, which normally yield more than U.S. Treasury issues.
The Mid-Term Bond Fund continued to overweight corporate issues during the first half of 2012 in order to capture additional income. The Fund will continue to focus on income, rather than market volatility, to achieve superior returns over market cycles. In addition, the Fund's corporate securities will remain highly diversified in order to shield the portfolio from any credit risk that might arise should the domestic economy weaken.
Portfolio duration remains targeted at 90% of the Barclays Capital Intermediate Government/Credit Bond Index. While this may impede performance during a market rally, it will enable the fund to maintain value if the government's monetary and fiscal policies begin to promote inflation. Even though official inflation numbers are relatively benign, anecdotal evidence suggests the opposite conclusion. At the very least, it is prudent to guard against the potential effects of the enormous debt burden that is being imposed by the federal government.
For the six months ended June 30, 2012, the Mid-Term Bond Fund returned 1.85% versus a 2.10% return for the Barclays Capital Intermediate Government/Credit Bond Index. The Fund's emphasis on higher yielding corporate issues was a major contributor to its outperformance.
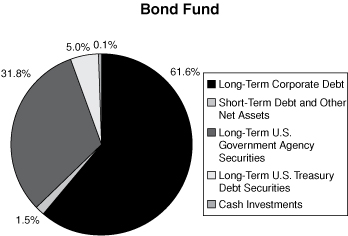
BOND FUND
The Bond Fund's primary investment objective is to provide as high a level of current income over time as is believed to be consistent with prudent investment risk by investing primarily in investment grade, publicly traded debt securities. A secondary objective is preservation of capital. The Bond Fund primarily invests in corporate, U.S. government agency and mortgage-backed securities, all of which normally yield more than U.S. Treasury issues.
The Federal Reserve has maintained its commitment to low short-term rates in order to stimulate the economy, re-liquefy the banking system, and support the mortgage market. This has had the effect of reducing long-term rates, especially through massive government purchases of longer-dated issues. This is evidenced by the difference between two- and ten-year Treasury bond yields. At the end of 2011 this spread was 163 basis points, but declined to 132 basis points at the end of June 2012.
The corporate bond market performed well due to the decline in absolute yields as well as a continuing tightening of the spreads between government and corporate bonds. This was created by a supply/demand imbalance that left investors desperate for quality investments with reasonable income.
The Bond Fund's strategy was to maintain a slightly shorter duration than its benchmark, emphasize relatively short corporate bonds with high yields, establish extreme credit diversification and take a market weight in mortgage-related securities.
The Bond Fund's return for the six months ended June 30, 2012, was 2.95%. This compares favorably to the Barclays Capital U.S. Aggregate Bond Index, which returned 2.37% for the period. The Fund's emphasis on higher yielding corporate issues was a major contributor to its performance.
10
MUTUAL OF AMERICA INVESTMENT CORPORATION
ASSET ALLOCATIONS AS OF JUNE 30, 2012 (Unaudited)


11
MUTUAL OF AMERICA INVESTMENT CORPORATION
ASSET ALLOCATIONS AS OF JUNE 30, 2012 (Unaudited) (Continued)

12
MUTUAL OF AMERICA INVESTMENT CORPORATION
ASSET ALLOCATIONS AS OF JUNE 30, 2012 (Unaudited) (Continued)


13
MUTUAL OF AMERICA INVESTMENT CORPORATION
ASSET ALLOCATIONS AS OF JUNE 30, 2012 (Unaudited) (Continued)

14
MUTUAL OF AMERICA INVESTMENT CORPORATION
EXPENSE EXAMPLE (Unaudited)
EXAMPLE
As a shareholder of one of the Mutual of America Investment Corporation Funds, you incur ongoing costs, including management fees and other Fund expenses. You do not incur transactional costs, such as sales charges (loads), redemption fees or exchange fees.
This Example is intended to help you understand your ongoing costs (in dollars) of investing in a Fund and to compare these costs with the ongoing costs of investing in other mutual funds. The Example is based on an investment of $1,000 invested at January 1, 2012 and held for the entire period ending June 30, 2012.
ACTUAL EXPENSES
The first line of the tables below provides information about actual account values and actual expenses. You may use the information in this line, together with the amount you invested, to estimate the expenses that you paid over the period. Simply divide your account value by $1,000 (for example, an $8,600 account value divided by $1,000=8.6), then multiply the result by the number in the first line under the heading entitled "Expenses Paid During Period" to estimate the expenses you paid on your account during this period.
HYPOTHETICAL EXAMPLE FOR COMPARISON PURPOSES
The second line of the tables below provides information about hypothetical account values and hypothetical expenses based on each Fund's actual expense ratio and an assumed rate of return of 5% per year before expenses, which is not the Fund's actual return. The hypothetical account values and expenses may not be used to estimate the actual ending account balance or expenses you paid for the period. You may use this information to compare the ongoing costs of investing in the Fund with other funds. To do so, compare this 5% hypothetical example with the 5% hypothetical examples that appear in the shareholder reports of the other funds.
Please note that the second line of the table is useful in comparing ongoing costs only, and will not help you determine the relative total costs of owning other funds, which may also charge transactional costs, such as sales charges (loads), redemption fees or exchange fees.
Equity Index Fund
| | | Beginning
Account Value
January 1, 2012 | | Ending
Account Value
June 30, 2012 | | Expenses Paid
During Period*
January 1 to
June 30, 2012 | |
| Actual | | $ | 1,000.00 | | | $ | 1,094.40 | | | $ | 1.20 | | |
Hypothetical
(5% return before expenses) | | $ | 1,000.00 | | | $ | 1,023.39 | | | $ | 1.16 | | |
* Expenses are equal to the Fund's annual expense ratio of 0.23%, multiplied by the average account value over the period, multiplied by 182/366 (to reflect the one-half year period).
All America Fund
| | | Beginning
Account Value
January 1, 2012 | | Ending
Account Value
June 30, 2012 | | Expenses Paid
During Period*
January 1 to
June 30, 2012 | |
| Actual | | $ | 1,000.00 | | | $ | 1,089.99 | | | $ | 2.86 | | |
Hypothetical
(5% return before expenses) | | $ | 1,000.00 | | | $ | 1,021.76 | | | $ | 2.76 | | |
* Expenses are equal to the Fund's annual expense ratio of 0.55%, multiplied by the average account value over the period, multiplied by 182/366 (to reflect the one-half year period).
15
MUTUAL OF AMERICA INVESTMENT CORPORATION
EXPENSE EXAMPLE (Unaudited) (Continued)
Small Cap Value Fund
| | | Beginning
Account Value
January 1, 2012 | | Ending
Account Value
June 30, 2012 | | Expenses Paid
During Period*
January 1 to
June 30, 2012 | |
| Actual | | $ | 1,000.00 | | | $ | 1,089.89 | | | $ | 4.67 | | |
Hypothetical
(5% return before expenses) | | $ | 1,000.00 | | | $ | 1,019.98 | | | $ | 4.52 | | |
* Expenses are equal to the Fund's annual expense ratio of 0.90%, multiplied by the average account value over the period, multiplied by 182/366 (to reflect the one-half year period).
Small Cap Growth Fund
| | | Beginning
Account Value
January 1, 2012 | | Ending
Account Value
June 30, 2012 | | Expenses Paid
During Period*
January 1 to
June 30, 2012 | |
| Actual | | $ | 1,000.00 | | | $ | 1,067.42 | | | $ | 4.68 | | |
Hypothetical
(5% return before expenses) | | $ | 1,000.00 | | | $ | 1,019.93 | | | $ | 4.57 | | |
* Expenses are equal to the Fund's annual expense ratio of 0.91%, multiplied by the average account value over the period, multiplied by 182/366 (to reflect the one-half year period).
Mid Cap Value Fund
| | | Beginning
Account Value
January 1, 2012 | | Ending
Account Value
June 30, 2012 | | Expenses Paid
During Period*
January 1 to
June 30, 2012 | |
| Actual | | $ | 1,000.00 | | | $ | 1,037.19 | | | $ | 3.55 | | |
Hypothetical
(5% return before expenses) | | $ | 1,000.00 | | | $ | 1,021.00 | | | $ | 3.52 | | |
* Expenses are equal to the Fund's annual expense ratio of 0.70%, multiplied by the average account value over the period, multiplied by 182/366 (to reflect the one-half year period).
Mid-Cap Equity Index Fund
| | | Beginning
Account Value
January 1, 2012 | | Ending
Account Value
June 30, 2012 | | Expenses Paid
During Period*
January 1 to
June 30, 2012 | |
| Actual | | $ | 1,000.00 | | | $ | 1,079.41 | | | $ | 1.19 | | |
Hypothetical
(5% return before expenses) | | $ | 1,000.00 | | | $ | 1,023.39 | | | $ | 1.16 | | |
* Expenses are equal to the Fund's annual expense ratio of 0.23%, multiplied by the average account value over the period, multiplied by 182/366 (to reflect the one-half year period).
16
MUTUAL OF AMERICA INVESTMENT CORPORATION
EXPENSE EXAMPLE (Unaudited) (Continued)
International Fund
| | | Beginning
Account Value
January 1, 2012 | | Ending
Account Value
June 30, 2012 | | Expenses Paid
During Period*
January 1 to
June 30, 2012 | |
| Actual | | $ | 1,000.00 | | | $ | 1,033.01 | | | $ | 2.12 | | |
Hypothetical
(5% return before expenses) | | $ | 1,000.00 | | | $ | 1,022.42 | | | $ | 2.11 | | |
* Expenses are equal to the Fund's annual expense ratio of 0.42% (reflecting direct expenses and the proportional expense ratios of the underlying funds in which the Fund invests), multiplied by the average account value over the period, multiplied by 182/366 (to reflect the one-half year period).
Composite Fund
| | | Beginning
Account Value
January 1, 2012 | | Ending
Account Value
June 30, 2012 | | Expenses Paid
During Period*
January 1 to
June 30, 2012 | |
| Actual | | $ | 1,000.00 | | | $ | 1,066.02 | | | $ | 2.82 | | |
Hypothetical
(5% return before expenses) | | $ | 1,000.00 | | | $ | 1,021.76 | | | $ | 2.76 | | |
* Expenses are equal to the Fund's annual expense ratio of 0.55%, multiplied by the average account value over the period, multiplied by 182/366 (to reflect the one-half year period).
Retirement Income Fund
| | | Beginning
Account Value
January 1, 2012 | | Ending
Account Value
June 30, 2012 | | Expenses Paid
During Period*
January 1 to
June 30, 2012 | |
| Actual | | $ | 1,000.00 | | | $ | 1,039.11 | | | $ | 2.59 | | |
Hypothetical
(5% return before expenses) | | $ | 1,000.00 | | | $ | 1,021.96 | | | $ | 2.56 | | |
* Expenses are equal to the Fund's annual expense ratio of 0.51% (reflecting direct investment management fees and the proportional expense ratios of the underlying funds in which the Fund invests), multiplied by the average account value over the period, multiplied by 182/366 (to reflect the one-half year period).
2010 Retirement Fund
| | | Beginning
Account Value
January 1, 2012 | | Ending
Account Value
June 30, 2012 | | Expenses Paid
During Period*
January 1 to
June 30, 2012 | |
| Actual | | $ | 1,000.00 | | | $ | 1,049.58 | | | $ | 2.34 | | |
Hypothetical
(5% return before expenses) | | $ | 1,000.00 | | | $ | 1,022.22 | | | $ | 2.31 | | |
* Expenses are equal to the Fund's annual expense ratio of 0.46% (reflecting direct investment management fees and the proportional expense ratios of the underlying funds in which the Fund invests), multiplied by the average account value over the period, multiplied by 182/366 (to reflect the one-half year period).
17
MUTUAL OF AMERICA INVESTMENT CORPORATION
EXPENSE EXAMPLE (Unaudited) (Continued)
2015 Retirement Fund
| | | Beginning
Account Value
January 1, 2012 | | Ending
Account Value
June 30, 2012 | | Expenses Paid
During Period*
January 1 to
June 30, 2012 | |
| Actual | | $ | 1,000.00 | | | $ | 1,053.88 | | | $ | 2.35 | | |
Hypothetical
(5% return before expenses) | | $ | 1,000.00 | | | $ | 1,022.22 | | | $ | 2.31 | | |
* Expenses are equal to the Fund's annual expense ratio of 0.46% (reflecting direct investment management fees and the proportional expense ratios of the underlying funds in which the Fund invests), multiplied by the average account value over the period, multiplied by 182/366 (to reflect the one-half year period).
2020 Retirement Fund
| | | Beginning
Account Value
January 1, 2012 | | Ending
Account Value
June 30, 2012 | | Expenses Paid
During Period*
January 1 to
June 30, 2012 | |
| Actual | | $ | 1,000.00 | | | $ | 1,060.41 | | | $ | 2.36 | | |
Hypothetical
(5% return before expenses) | | $ | 1,000.00 | | | $ | 1,022.22 | | | $ | 2.31 | | |
* Expenses are equal to the Fund's annual expense ratio of 0.46% (reflecting direct investment management fees and the proportional expense ratios of the underlying funds in which the Fund invests), multiplied by the average account value over the period, multiplied by 182/366 (to reflect the one-half year period).
2025 Retirement Fund
| | | Beginning
Account Value
January 1, 2012 | | Ending
Account Value
June 30, 2012 | | Expenses Paid
During Period*
January 1 to
June 30, 2012 | |
| Actual | | $ | 1,000.00 | | | $ | 1,067.09 | | | $ | 2.26 | | |
Hypothetical
(5% return before expenses) | | $ | 1,000.00 | | | $ | 1,022.32 | | | $ | 2.21 | | |
* Expenses are equal to the Fund's annual expense ratio of 0.44% (reflecting direct investment management fees and the proportional expense ratios of the underlying funds in which the Fund invests), multiplied by the average account value over the period, multiplied by 182/366 (to reflect the one-half year period).
2030 Retirement Fund
| | | Beginning
Account Value
January 1, 2012 | | Ending
Account Value
June 30, 2012 | | Expenses Paid
During Period*
January 1 to
June 30, 2012 | |
| Actual | | $ | 1,000.00 | | | $ | 1,070.90 | | | $ | 2.21 | | |
Hypothetical
(5% return before expenses) | | $ | 1,000.00 | | | $ | 1,022.37 | | | $ | 2.16 | | |
* Expenses are equal to the Fund's annual expense ratio of 0.43% (reflecting direct investment management fees and the proportional expense ratios of the underlying funds in which the Fund invests), multiplied by the average account value over the period, multiplied by 182/366 (to reflect the one-half year period).
18
MUTUAL OF AMERICA INVESTMENT CORPORATION
EXPENSE EXAMPLE (Unaudited) (Continued)
2035 Retirement Fund
| | | Beginning
Account Value
January 1, 2012 | | Ending
Account Value
June 30, 2012 | | Expenses Paid
During Period*
January 1 to
June 30, 2012 | |
| Actual | | $ | 1,000.00 | | | $ | 1,073.59 | | | $ | 2.16 | | |
Hypothetical
(5% return before expenses) | | $ | 1,000.00 | | | $ | 1,022.42 | | | $ | 2.11 | | |
* Expenses are equal to the Fund's annual expense ratio of 0.42% (reflecting direct investment management fees and the proportional expense ratios of the underlying funds in which the Fund invests), multiplied by the average account value over the period, multiplied by 182/366 (to reflect the one-half year period).
2040 Retirement Fund
| | | Beginning
Account Value
January 1, 2012 | | Ending
Account Value
June 30, 2012 | | Expenses Paid
During Period*
January 1 to
June 30, 2012 | |
| Actual | | $ | 1,000.00 | | | $ | 1,073.22 | | | $ | 2.22 | | |
Hypothetical
(5% return before expenses) | | $ | 1,000.00 | | | $ | 1,022.37 | | | $ | 2.16 | | |
* Expenses are equal to the Fund's annual expense ratio of 0.43% (reflecting direct investment management fees and the proportional expense ratios of the underlying funds in which the Fund invests), multiplied by the average account value over the period, multiplied by 182/366 (to reflect the one-half year period).
2045 Retirement Fund
| | | Beginning
Account Value
January 1, 2012 | | Ending
Account Value
June 30, 2012 | | Expenses Paid
During Period*
January 1 to
June 30, 2012 | |
| Actual | | $ | 1,000.00 | | | $ | 1,073.22 | | | $ | 2.32 | | |
Hypothetical
(5% return before expenses) | | $ | 1,000.00 | | | $ | 1,022.27 | | | $ | 2.26 | | |
* Expenses are equal to the Fund's annual expense ratio of 0.45% (reflecting direct investment management fees and the proportional expense ratios of the underlying funds in which the Fund invests), multiplied by the average account value over the period, multiplied by 182/366 (to reflect the one-half year period).
Conservative Allocation Fund
| | | Beginning
Account Value
January 1, 2012 | | Ending
Account Value
June 30, 2012 | | Expenses Paid
During Period*
January 1 to
June 30, 2012 | |
| Actual | | $ | 1,000.00 | | | $ | 1,041.78 | | | $ | 2.44 | | |
Hypothetical
(5% return before expenses) | | $ | 1,000.00 | | | $ | 1,022.12 | | | $ | 2.41 | | |
* Expenses are equal to the Fund's annual expense ratio of 0.48% (reflecting the proportional expense ratios of the underlying funds in which the Fund invests), multiplied by the average account value over the period, multiplied by 182/366 (to reflect the one-half year period).
19
MUTUAL OF AMERICA INVESTMENT CORPORATION
EXPENSE EXAMPLE (Unaudited) (Continued)
Moderate Allocation Fund
| | | Beginning
Account Value
January 1, 2012 | | Ending
Account Value
June 30, 2012 | | Expenses Paid
During Period*
January 1 to
June 30, 2012 | |
| Actual | | $ | 1,000.00 | | | $ | 1,058.49 | | | $ | 2.00 | | |
Hypothetical
(5% return before expenses) | | $ | 1,000.00 | | | $ | 1,022.57 | | | $ | 1.96 | | |
* Expenses are equal to the Fund's annual expense ratio of 0.39% (reflecting the proportional expense ratios of the underlying funds in which the Fund invests), multiplied by the average account value over the period, multiplied by 182/366 (to reflect the one-half year period).
Aggressive Allocation Fund
| | | Beginning
Account Value
January 1, 2012 | | Ending
Account Value
June 30, 2012 | | Expenses Paid
During Period*
January 1 to
June 30, 2012 | |
| Actual | | $ | 1,000.00 | | | $ | 1,074.29 | | | $ | 1.96 | | |
Hypothetical
(5% return before expenses) | | $ | 1,000.00 | | | $ | 1,022.62 | | | $ | 1.91 | | |
* Expenses are equal to the Fund's annual expense ratio of 0.38% (reflecting the proportional expense ratios of the underlying funds in which the Fund invests), multiplied by the average account value over the period, multiplied by 182/366 (to reflect the one-half year period).
Money Market Fund
| | | Beginning
Account Value
January 1, 2012 | | Ending
Account Value
June 30, 2012 | | Expenses Paid
During Period*
January 1 to
June 30, 2012 | |
| Actual | | $ | 1,000.00 | | | $ | 999.10 | | | $ | 1.54 | | |
Hypothetical
(5% return before expenses) | | $ | 1,000.00 | | | $ | 1,022.98 | | | $ | 1.56 | | |
* Expenses are equal to the Fund's annual expense ratio of 0.31%, multiplied by the average account value over the period, multiplied by 182/366 (to reflect the one-half year period).
Mid-Term Bond Fund
| | | Beginning
Account Value
January 1, 2012 | | Ending
Account Value
June 30, 2012 | | Expenses Paid
During Period*
January 1 to
June 30, 2012 | |
| Actual | | $ | 1,000.00 | | | $ | 1,018.52 | | | $ | 2.86 | | |
Hypothetical
(5% return before expenses) | | $ | 1,000.00 | | | $ | 1,021.66 | | | $ | 2.87 | | |
* Expenses are equal to the Fund's annual expense ratio of 0.57%, multiplied by the average account value over the period, multiplied by 182/366 (to reflect the one-half year period).
20
MUTUAL OF AMERICA INVESTMENT CORPORATION
EXPENSE EXAMPLE (Unaudited) (Continued)
Bond Fund
| | | Beginning
Account Value
January 1, 2012 | | Ending
Account Value
June 30, 2012 | | Expenses Paid
During Period*
January 1 to
June 30, 2012 | |
| Actual | | $ | 1,000.00 | | | $ | 1,029.50 | | | $ | 2.88 | | |
Hypothetical
(5% return before expenses) | | $ | 1,000.00 | | | $ | 1,021.66 | | | $ | 2.87 | | |
* Expenses are equal to the Fund's annual expense ratio of 0.57%, multiplied by the average account value over the period, multiplied by 182/366 (to reflect the one-half year period).
21
MUTUAL OF AMERICA INVESTMENT CORPORATION (EQUITY INDEX FUND)
SUMMARY PORTFOLIO OF INVESTMENTS IN SECURITIES
June 30, 2012 (Unaudited)
| | | Shares | | Value | |
| INDEXED ASSETS: | |
| COMMON STOCKS | |
| CONSUMER DISCRETIONARY (10.6%) | |
| Amazon.com, Inc.* | | | 29,554 | | | $ | 6,748,656 | | |
| Comcast Corp. Cl A | | | 214,146 | | | | 6,846,248 | | |
| Disney (Walt) Co. | | | 142,656 | | | | 6,918,816 | | |
| Home Depot, Inc. | | | 124,679 | | | | 6,606,740 | | |
| McDonald's Corp. | | | 80,490 | | | | 7,125,780 | | |
| Other Securities | | | 2,077,549 | | | | 75,395,093 | | |
| | | | 109,641,333 | | |
| CONSUMER STAPLES (10.8%) | |
| Altria Group, Inc. | | | 160,205 | | | | 5,535,083 | | |
| Coca-Cola Co. | | | 181,992 | | | | 14,229,954 | | |
| CVS Caremark Corp. | | | 101,490 | | | | 4,742,628 | | |
| Kraft Foods, Inc. Cl A | | | 141,397 | | | | 5,460,752 | | |
| PepsiCo, Inc. | | | 125,321 | | | | 8,855,182 | | |
| Philip Morris Int'l., Inc. | | | 132,533 | | | | 11,564,830 | | |
| Proctor & Gamble Co. | | | 221,716 | | | | 13,580,105 | | |
| Wal-Mart Stores, Inc. | | | 141,000 | | | | 9,830,520 | | |
| Other Securities | | | 795,331 | | | | 37,387,530 | | |
| | | | 111,186,584 | | |
| ENERGY (10.4%) | |
| Chevron Corp. | | | 156,871 | | | | 16,549,891 | | |
| ConocoPhillips | | | 101,251 | | | | 5,657,906 | | |
| Exxon Mobil Corp. | | | 373,134 | | | | 31,929,076 | | |
| Occidental Petroleum Corp. | | | 66,492 | | | | 5,703,019 | | |
| Schlumberger Ltd. | | | 105,480 | | | | 6,846,707 | | |
| Other Securities | | | 1,049,653 | | | | 40,055,667 | | |
| | | | 106,742,266 | | |
| FINANCIALS (13.9%) | |
| American Express Co. | | | 82,230 | | | | 4,786,608 | | |
| Bank of America Corp. | | | 872,845 | | | | 7,139,872 | | |
| Berkshire Hathaway, Inc. Cl B* | | | 141,331 | | | | 11,777,112 | | |
| Citigroup, Inc. | | | 242,801 | | | | 6,655,175 | | |
| JPMorgan Chase & Co. | | | 300,960 | | | | 10,753,301 | | |
| U.S. Bancorp | | | 148,595 | | | | 4,778,815 | | |
| Wells Fargo & Co. | | | 425,868 | | | | 14,241,026 | | |
| Other Securities | | | 2,466,464 | | | | 83,250,083 | | |
| | | | 143,381,992 | | |
| HEALTH CARE (11.4%) | |
| Abbott Laboratories | | | 126,227 | | | | 8,137,855 | | |
| Amgen, Inc. | | | 61,135 | | | | 4,465,300 | | |
| Bristol-Myers Squibb Co. | | | 136,554 | | | | 4,909,116 | | |
| | | Shares | | Value | |
| INDEXED ASSETS (CONTINUED): | |
| COMMON STOCKS (CONTINUED) | |
| HEALTH CARE (CONTINUED) | |
| Johnson & Johnson | | | 213,913 | | | $ | 14,451,962 | | |
| Merck & Co., Inc. | | | 243,651 | | | | 10,172,429 | | |
| Pfizer, Inc. | | | 593,356 | | | | 13,647,188 | | |
| UnitedHealth Group, Inc. | | | 82,096 | | | | 4,802,616 | | |
| Other Securities | | | 1,154,306 | | | | 57,266,605 | | |
| | | | 117,853,071 | | |
| INDUSTRIALS (10.1%) | |
| 3M Co. | | | 55,348 | | | | 4,959,181 | | |
| Caterpillar, Inc. | | | 54,070 | | | | 4,591,084 | | |
| General Electric Co. | | | 834,185 | | | | 17,384,415 | | |
| Union Pacific Corp. | | | 37,255 | | | | 4,444,894 | | |
| United Parcel Service, Inc. Cl B | | | 76,868 | | | | 6,054,124 | | |
| United Technologies Corp. | | | 75,774 | | | | 5,723,210 | | |
| Other Securities | | | 1,204,408 | | | | 60,779,550 | | |
| | | | 103,936,458 | | |
| INFORMATION TECHNOLOGY (19.3%) | |
| Apple, Inc.* | | | 77,232 | | | | 45,103,487 | | |
| Cisco Systems, Inc. | | | 428,172 | | | | 7,351,713 | | |
| EMC Corp.* | | | 172,417 | | | | 4,419,048 | | |
| Google, Inc. Cl A* | | | 21,472 | | | | 12,455,263 | | |
| Int'l. Business Machines Corp. | | | 92,915 | | | | 18,172,316 | | |
| Intel Corp. | | | 396,922 | | | | 10,577,971 | | |
| Microsoft Corp. | | | 603,497 | | | | 18,460,973 | | |
| Oracle Corp. | | | 312,215 | | | | 9,272,786 | | |
| QUALCOMM, Inc. | | | 146,818 | | | | 8,174,826 | | |
| Visa, Inc. Cl A | | | 40,034 | | | | 4,949,403 | | |
| Other Securities | | | 2,210,028 | | | | 60,218,482 | | |
| | | | 199,156,268 | | |
| MATERIALS (3.3%) | |
| Other Securities | | | 753,708 | | | | 34,160,035 | | |
| TELECOMMUNICATION SERVICES (3.0%) | |
| AT&T, Inc. | | | 459,847 | | | | 16,398,144 | | |
| Verizon Communications, Inc. | | | 223,794 | | | | 9,945,405 | | |
| Other Securities | | | 451,944 | | | | 4,816,477 | | |
| | | | 31,160,026 | | |
| UTILITIES (3.6%) | |
| Other Securities | | | 979,712 | | | | 36,900,759 | | |
TOTAL INDEXED ASSETS-COMMON STOCKS
(Cost: $791,197,555) 96.4% | | $ | 994,118,792 | | |
The accompanying notes are an integral part of these portfolio schedules.
22
MUTUAL OF AMERICA INVESTMENT CORPORATION (EQUITY INDEX FUND)
SUMMARY PORTFOLIO OF INVESTMENTS IN SECURITIES (Continued)
June 30, 2012 (Unaudited)
| | | Rating** | | Rate | | Maturity | | Face
Amount | | Value | |
| SHORT-TERM DEBT SECURITIES: | |
| U.S. GOVERNMENT (0.3%) | |
| U.S. Treasury Bill (1) | | A-1+ | | | 0.09 | % | | 08/09/12 | | $ | 3,000,000 | | | $ | 2,999,700 | | |
| COMMERCIAL PAPER (3.2%) | |
| Abbott Laboratories† | | A-1+ | | | 0.15 | | | 08/07/12 | | | 550,000 | | | | 549,913 | | |
| ConocoPhillips† | | A-1 | | | 0.12 | | | 07/13/12 | | | 10,000,000 | | | | 9,999,567 | | |
| Nestle Capital Corp.† | | A-1+ | | | 0.01 | | | 07/02/12 | | | 4,500,000 | | | | 4,499,998 | | |
| New Jersey Natural Gas | | A-1 | | | 0.11 | | | 07/05/12 | | | 6,000,000 | | | | 5,999,908 | | |
| Praxair, Inc. | | A-1 | | | 0.11 | | | 07/16/12 | | | 1,000,000 | | | | 999,951 | | |
| Toyota Motor Credit Corp. | | A-1+ | | | 0.12 | | | 07/23/12 | | | 10,000,000 | | | | 9,999,233 | | |
| Wal-Mart Stores, Inc.† | | A-1+ | | | 0.13 | | | 08/06/12 | | | 850,000 | | | | 849,886 | | |
| | | | 32,898,456 | | |
TOTAL SHORT-TERM DEBT SECURITIES
(Cost: $35,898,156) 3.5% | | | 35,898,156 | | |
TEMPORARY CASH INVESTMENTS (2)
(Cost: $750,000) 0.1% | | | 750,000 | | |
TOTAL INVESTMENTS
(Cost: $827,845,711) 100.0% | | | 1,030,766,948 | | |
| OTHER NET ASSETS 0.0% (3) | | | 456,498 | | |
| NET ASSETS 100.0% | | $ | 1,031,223,446 | | |
The accompanying notes are an integral part of these portfolio schedules.
23
MUTUAL OF AMERICA INVESTMENT CORPORATION (ALL AMERICA FUND)
SUMMARY PORTFOLIO OF INVESTMENTS IN SECURITIES
June 30, 2012 (Unaudited)
| | | Shares | | Value | |
| INDEXED ASSETS: | |
| COMMON STOCKS | |
| CONSUMER DISCRETIONARY (5.9%) | |
| Amazon.com, Inc.* | | | 4,093 | | | $ | 934,637 | | |
| Comcast Corp. Cl A | | | 29,476 | | | | 942,348 | | |
| Disney (Walt) Co. | | | 19,691 | | | | 955,014 | | |
| McDonald's Corp. | | | 11,123 | | | | 984,719 | | |
| Starbucks Corp. | | | 8,705 | | | | 464,151 | | |
| Other Securities | | | 294,965 | | | | 10,851,281 | | |
| | | | 15,132,150 | | |
| CONSUMER STAPLES (6.0%) | |
| Altria Group, Inc. | | | 22,102 | | | | 763,624 | | |
| Coca-Cola Co. | | | 25,072 | | | | 1,960,383 | | |
| Kraft Foods, Inc. Cl A | | | 19,513 | | | | 753,592 | | |
| PepsiCo, Inc. | | | 17,265 | | | | 1,219,945 | | |
| Philip Morris Int'l., Inc. | | | 18,292 | | | | 1,596,160 | | |
| Proctor & Gamble Co. | | | 30,539 | | | | 1,870,514 | | |
| Wal-Mart Stores, Inc. | | | 19,458 | | | | 1,356,612 | | |
| Other Securities | | | 123,709 | | | | 5,814,643 | | |
| | | | 15,335,473 | | |
| ENERGY (5.7%) | |
| Chevron Corp. | | | 21,650 | | | | 2,284,080 | | |
| Exxon Mobil Corp. | | | 51,487 | | | | 4,405,748 | | |
| Occidental Petroleum Corp. | | | 9,130 | | | | 783,080 | | |
| Schlumberger Ltd. | | | 14,486 | | | | 940,286 | | |
| Other Securities | | | 158,091 | | | | 6,281,259 | | |
| | | | 14,694,453 | | |
| FINANCIALS (7.7%) | |
| American Tower Corp. | | | 4,358 | | | | 304,668 | | |
| Bank of America Corp. | | | 119,822 | | | | 980,144 | | |
| Berkshire Hathaway, Inc. Cl B* | | | 19,487 | | | | 1,623,852 | | |
| Capital One Financial Corp. | | | 6,424 | | | | 351,136 | | |
| Citigroup, Inc. | | | 33,275 | | | | 912,068 | | |
| Goldman Sachs Group, Inc. | | | 5,586 | | | | 535,474 | | |
| JPMorgan Chase & Co. | | | 41,485 | | | | 1,482,259 | | |
| Simon Property Group, Inc. | | | 3,460 | | | | 538,584 | | |
| Wells Fargo & Co. | | | 58,641 | | | | 1,960,960 | | |
| Other Securities | | | 351,572 | | | | 11,056,568 | | |
| | | | 19,745,713 | | |
| HEALTH CARE (6.4%) | |
| Abbott Laboratories | | | 17,433 | | | | 1,123,906 | | |
| Gilead Sciences, Inc.* | | | 8,422 | | | | 431,880 | | |
| Johnson & Johnson | | | 29,570 | | | | 1,997,754 | | |
| | | Shares | | Value | |
| INDEXED ASSETS (CONTINUED): | |
| COMMON STOCKS (CONTINUED) | |
| HEALTH CARE (CONTINUED) | |
| Merck & Co., Inc. | | | 33,641 | | | $ | 1,404,512 | | |
| Pfizer, Inc. | | | 81,704 | | | | 1,879,192 | | |
| UnitedHealth Group, Inc. | | | 11,373 | | | | 665,321 | | |
| Other Securities | | | 178,152 | | | | 8,770,267 | | |
| | | | 16,272,832 | | |
| INDUSTRIALS (5.6%) | |
| 3M Co. | | | 7,649 | | | | 685,350 | | |
| Boeing Co. | | | 8,174 | | | | 607,328 | | |
| Caterpillar, Inc. | | | 7,412 | | | | 629,353 | | |
| General Electric Co. | | | 115,002 | | | | 2,396,647 | | |
| Precision Castparts Corp. | | | 1,594 | | | | 262,197 | | |
| Union Pacific Corp. | | | 5,134 | | | | 612,538 | | |
| Other Securities | | | 177,219 | | | | 9,128,750 | | |
| | | | 14,322,163 | | |
| INFORMATION TECHNOLOGY (10.7%) | |
| Apple, Inc.* | | | 10,647 | | | | 6,217,853 | | |
| Cisco Systems, Inc. | | | 58,915 | | | | 1,011,571 | | |
| EMC Corp.* | | | 23,794 | | | | 609,840 | | |
| Google, Inc. Cl A* | | | 2,957 | | | | 1,715,267 | | |
| Int'l. Business Machines Corp. | | | 12,816 | | | | 2,506,558 | | |
| Intel Corp. | | | 54,876 | | | | 1,462,445 | | |
| Microsoft Corp. | | | 83,172 | | | | 2,544,236 | | |
| Oracle Corp. | | | 43,086 | | | | 1,279,654 | | |
| QUALCOMM, Inc. | | | 20,085 | | | | 1,118,333 | | |
| Other Securities | | | 309,872 | | | | 8,985,993 | | |
| | | | 27,451,750 | | |
| MATERIALS (1.8%) | |
Freeport-McMoRan Copper &
Gold, Inc. | | | 10,616 | | | | 361,687 | | |
| Other Securities | | | 93,084 | | | | 4,342,055 | | |
| | | | 4,703,742 | | |
| TELECOMMUNICATION SERVICES (1.7%) | |
| AT&T, Inc. | | | 63,476 | | | | 2,263,559 | | |
| Verizon Communications, Inc. | | | 30,877 | | | | 1,372,174 | | |
| Other Securities | | | 62,317 | | | | 664,925 | | |
| | | | 4,300,658 | | |
| UTILITIES (2.0%) | |
| Other Securities | | | 135,224 | | | | 5,094,450 | | |
TOTAL INDEXED ASSETS-COMMON STOCKS
(Cost: $121,631,838) 53.5% | | $ | 137,053,384 | | |
| | | Rating** | | Rate | | Maturity | | Face
Amount | | Value | |
| INDEXED ASSETS: | |
| SHORT-TERM DEBT SECURITIES: | |
| U.S. GOVERNMENT (0.2%) | |
| U.S. Treasury Bill (1) | | A-1+ | | | 0.09 | % | | 08/09/12 | | $ | 400,000 | | | $ | 399,960 | | |
| COMMERCIAL PAPER (1.5%) | |
| General Electric Capital Corp. | | A-1+ | | | 0.13 | | | 07/20/12 | | | 2,000,000 | | | | 1,999,856 | | |
| San Diego Gas & Electric Co.† | | A-1 | | | 0.14 | | | 07/02/12 | | | 1,800,000 | | | | 1,799,986 | | |
| | | | 3,799,842 | | |
TOTAL INDEXED ASSETS-SHORT-TERM DEBT SECURITIES
(Cost: $4,199,802) 1.7% | | | 4,199,802 | | |
TOTAL INDEXED ASSETS
(Cost: $125,831,640) 55.2% | | $ | 141,253,186 | | |
The accompanying notes are an integral part of these portfolio schedules.
24
MUTUAL OF AMERICA INVESTMENT CORPORATION (ALL AMERICA FUND)
SUMMARY PORTFOLIO OF INVESTMENTS IN SECURITIES (Continued)
June 30, 2012 (Unaudited)
| | | Shares | | Value | |
| ACTIVE ASSETS: | |
| COMMON STOCKS | |
| CONSUMER DISCRETIONARY (4.2%) | |
| Amazon.com, Inc.* | | | 3,603 | | | $ | 822,745 | | |
| Disney (Walt) Co. | | | 14,336 | | | | 695,296 | | |
| Starbucks Corp. | | | 21,172 | | | | 1,128,891 | | |
| Other Securities | | | 430,579 | | | | 8,096,811 | | |
| | | | 10,743,743 | | |
| CONSUMER STAPLES (3.0%) | |
| Kraft Foods, Inc. Cl A | | | 13,240 | | | | 511,329 | | |
| PepsiCo, Inc. | | | 9,829 | | | | 694,517 | | |
| Philip Morris Int'l., Inc. | | | 13,570 | | | | 1,184,118 | | |
| Proctor & Gamble Co. | | | 15,945 | | | | 976,631 | | |
| Wal-Mart Stores, Inc. | | | 17,613 | | | | 1,227,978 | | |
| Other Securities | | | 112,984 | | | | 3,189,984 | | |
| | | | 7,784,557 | | |
| ENERGY (4.0%) | |
| Chevron Corp. | | | 6,326 | | | | 667,393 | | |
| Exxon Mobil Corp. | | | 25,539 | | | | 2,185,372 | | |
| McMoRan Exploration Co.* | | | 121,927 | | | | 1,544,815 | | |
| Occidental Petroleum Corp. | | | 7,449 | | | | 638,901 | | |
| Other Securities | | | 506,000 | | | | 5,160,100 | | |
| | | | 10,196,581 | | |
| FINANCIALS (7.9%) | |
| American Tower Corp. | | | 10,902 | | | | 762,159 | | |
| Bank of America Corp. | | | 52,718 | | | | 431,233 | | |
| Berkshire Hathaway, Inc. Cl B* | | | 8,795 | | | | 732,887 | | |
| Capital One Financial Corp. | | | 14,184 | | | | 775,297 | | |
| Citigroup, Inc. | | | 13,874 | | | | 380,286 | | |
| Goldman Sachs Group, Inc. | | | 4,870 | | | | 466,838 | | |
| JPMorgan Chase & Co. | | | 31,400 | | | | 1,121,922 | | |
| Simon Property Group, Inc. | | | 5,117 | | | | 796,512 | | |
| Wells Fargo & Co. | | | 38,762 | | | | 1,296,201 | | |
| Other Securities | | | 657,445 | | | | 13,658,142 | | |
| | | | 20,421,477 | | |
| HEALTH CARE (5.7%) | |
| Abbott Laboratories | | | 4,072 | | | | 262,522 | | |
| Gilead Sciences, Inc.* | | | 9,727 | | | | 498,801 | | |
| Merck & Co., Inc. | | | 21,999 | | | | 918,458 | | |
| Pfizer, Inc. | | | 51,541 | | | | 1,185,443 | | |
| UnitedHealth Group, Inc. | | | 9,910 | | | | 579,735 | | |
| Other Securities | | | 489,999 | | | | 11,026,585 | | |
| | | | 14,471,544 | | |
| | | Shares | | Value | |
| ACTIVE ASSETS (CONTINUED): | |
| COMMON STOCKS (CONTINUED) | |
| INDUSTRIALS (5.1%) | |
| Boeing Co. | | | 10,566 | | | $ | 785,054 | | |
| Caterpillar, Inc. | | | 7,729 | | | | 656,269 | | |
| General Electric Co. | | | 62,144 | | | | 1,295,081 | | |
| Precision Castparts Corp. | | | 4,211 | | | | 692,667 | | |
| Union Pacific Corp. | | | 3,758 | | | | 448,367 | | |
| Other Securities | | | 247,534 | | | | 9,269,409 | | |
| | | | 13,146,847 | | |
| INFORMATION TECHNOLOGY (7.5%) | |
| Apple, Inc.* | | | 5,154 | | | | 3,009,931 | | |
| Cisco Systems, Inc. | | | 14,262 | | | | 244,879 | | |
| EMC Corp.* | | | 15,865 | | | | 406,620 | | |
| Google, Inc. Cl A* | | | 1,426 | | | | 827,180 | | |
| Int'l. Business Machines Corp. | | | 6,324 | | | | 1,236,848 | | |
| Intel Corp. | | | 19,277 | | | | 513,732 | | |
| Microsoft Corp. | | | 32,624 | | | | 997,968 | | |
| Oracle Corp. | | | 24,380 | | | | 724,086 | | |
| QUALCOMM, Inc. | | | 11,609 | | | | 646,389 | | |
| Other Securities | | | 431,793 | | | | 10,505,989 | | |
| | | | 19,113,622 | | |
| MATERIALS (2.5%) | |
Freeport-McMoRan Copper &
Gold, Inc. | | | 11,668 | | | | 397,529 | | |
| Other Securities | | | 278,991 | | | | 5,977,869 | | |
| | | | 6,375,398 | | |
| TELECOMMUNICATION SERVICES (0.9%) | |
| AT&T, Inc. | | | 32,277 | | | | 1,150,998 | | |
| Other Securities | | | 125,493 | | | | 1,157,646 | | |
| | | | 2,308,644 | | |
| UTILITIES (1.4%) | |
| Other Securities | | | 98,349 | | | | 3,689,463 | | |
TOTAL ACTIVE ASSETS-COMMON STOCKS
(Cost: $91,209,276) 42.2% | | | | $ | 108,251,876 | | |
| ACTIVE ASSETS: | |
| CONVERTIBLE PREFERRED STOCKS | |
| ENERGY (0.1%) | |
Energy XXI (Bermuda)
Ltd., 7.25% | | | 556 | | | | 207,905 | | |
TOTAL ACTIVE ASSETS-CONVERTIBLE
PREFERRED STOCKS
(Cost: $55,600) 0.1% | | $ | 207,905 | | |
| | | Rating** | | Rate | | Maturity | | Face
Amount | | Value | |
| ACTIVE ASSETS: | |
| SHORT-TERM DEBT SECURITIES: | |
| COMMERCIAL PAPER (2.0%) | |
| Nestle Capital Corp.† | | A-1+ | | | 0.01 | % | | 07/02/12 | | $ | 3,700,000 | | | $ | 3,699,997 | | |
| Novartis Finance Corp.† | | A-1+ | | | 0.13 | | | 07/09/12 | | | 500,000 | | | | 499,984 | | |
| San Diego Gas & Electric Co.† | | A-1 | | | 0.14 | | | 07/02/12 | | | 1,000,000 | | | | 999,992 | | |
| | | | 5,199,973 | | |
TOTAL ACTIVE ASSETS-SHORT-TERM DEBT SECURITIES
(Cost: $5,199,973) 2.0% | | | 5,199,973 | | |
TOTAL ACTIVE ASSETS
(Cost: $96,464,849) 44.3% | | | 113,659,754 | | |
TEMPORARY CASH INVESTMENTS (2)
(Cost: $592,600) 0.2% | | | 592,600 | | |
TOTAL INVESTMENTS
(Cost: $222,889,089) 99.7% | | | 255,505,540 | | |
| OTHER NET ASSETS 0.3% | | | 667,213 | | |
| NET ASSETS 100.0% | | $ | 256,172,753 | | |
The accompanying notes are an integral part of these portfolio schedules.
25
MUTUAL OF AMERICA INVESTMENT CORPORATION (SMALL CAP VALUE FUND)
SUMMARY PORTFOLIO OF INVESTMENTS IN SECURITIES
June 30, 2012 (Unaudited)
| | | Shares | | Value | |
| COMMON STOCKS: | |
| CONSUMER DISCRETIONARY (5.0%) | |
| Bassett Furniture Industries, Inc. | | | 250,937 | | | $ | 2,587,160 | | |
| Pep Boys - Manny, Moe & Jack | | | 274,091 | | | | 2,713,501 | | |
| Rent-A-Center, Inc. | | | 73,658 | | | | 2,485,221 | | |
| Wolverine World Wide, Inc. | | | 84,192 | | | | 3,264,966 | | |
| Other Securities | | | 231,312 | | | | 2,939,381 | | |
| | | | 13,990,229 | | |
| CONSUMER STAPLES (2.2%) | |
| Prestige Brands Hldgs., Inc.* | | | 170,630 | | | | 2,697,660 | | |
| The Pantry, Inc.* | | | 172,820 | | | | 2,540,454 | | |
| Other Securities | | | 61,635 | | | | 1,049,028 | | |
| | | | 6,287,142 | | |
| ENERGY (5.4%) | |
| Energy XXI (Bermuda) Ltd. | | | 144,958 | | | | 4,535,736 | | |
| McMoRan Exploration Co.* | | | 681,706 | | | | 8,637,212 | | |
| Other Securities | | | 2,484,528 | | | | 1,996,323 | | |
| | | | 15,169,271 | | |
| FINANCIALS (34.6%) | |
| Brookline Bancorp, Inc. | | | 266,743 | | | | 2,360,676 | | |
| Cash America Int'l., Inc. | | | 53,763 | | | | 2,367,723 | | |
| Colonial Properties Trust | | | 140,135 | | | | 3,102,589 | | |
| EastGroup Properties, Inc. | | | 51,570 | | | | 2,748,681 | | |
| Ellington Financial LLC | | | 201,248 | | | | 4,258,408 | | |
| Equity Lifestyle Properties, Inc. | | | 55,306 | | | | 3,814,455 | | |
| Forest City Enterprises, Inc. Cl A* | | | 193,991 | | | | 2,832,269 | | |
| Glacier Bancorp, Inc. | | | 143,562 | | | | 2,223,775 | | |
| Highwoods Properties, Inc. | | | 86,575 | | | | 2,913,249 | | |
Meadowbrook Insurance
Group, Inc. | | | 270,752 | | | | 2,379,910 | | |
| ProAssurance Corp. | | | 49,226 | | | | 4,385,544 | | |
| SeaBright Hldgs., Inc. | | | 421,334 | | | | 3,745,659 | | |
| Signature Bank* | | | 51,071 | | | | 3,113,799 | | |
| SVB Financial Group* | | | 47,850 | | | | 2,809,752 | | |
| Symetra Financial Corp. | | | 257,477 | | | | 3,249,360 | | |
| UMB Financial Corp. | | | 44,108 | | | | 2,259,653 | | |
| Other Securities | | | 2,980,980 | | | | 48,513,971 | | |
| | | | 97,079,473 | | |
| HEALTH CARE (6.1%) | |
Computer Programs &
Systems, Inc. | | | 39,041 | | | | 2,233,926 | | |
| Conceptus, Inc.* | | | 198,804 | | | | 3,940,295 | | |
| Medicines Co.* | | | 98,025 | | | | 2,248,694 | | |
| QLT, Inc.* | | | 462,866 | | | | 3,527,039 | | |
| Other Securities | | | 746,710 | | | | 5,232,237 | | |
| | | | 17,182,191 | | |
| | | Shares | | Value | |
| COMMON STOCKS (CONTINUED): | |
| INDUSTRIALS (12.0%) | |
| Actuant Corp. Cl A | | | 116,737 | | | $ | 3,170,577 | | |
| Alaska Air Group, Inc.* | | | 80,066 | | | | 2,874,369 | | |
| AZZ, Inc. | | | 52,383 | | | | 3,208,983 | | |
| Encore Wire Corp. | | | 139,323 | | | | 3,731,070 | | |
| Genesee & Wyoming, Inc. Cl A* | | | 79,177 | | | | 4,183,713 | | |
| Miller Industries, Inc. | | | 181,808 | | | | 2,896,201 | | |
| Mueller Industries, Inc. | | | 127,675 | | | | 5,437,678 | | |
| Old Dominion Freight Line, Inc.* | | | 125,117 | | | | 5,416,315 | | |
| Other Securities | | | 105,211 | | | | 2,587,267 | | |
| | | | 33,506,173 | | |
| INFORMATION TECHNOLOGY (9.4%) | |
| Cirrus Logic, Inc.* | | | 78,784 | | | | 2,354,066 | | |
| LogMeIn, Inc.* | | | 77,260 | | | | 2,357,975 | | |
| Richardson Electronics Ltd. | | | 354,018 | | | | 4,365,042 | | |
| TIBCO Software, Inc.* | | | 136,327 | | | | 4,078,904 | | |
| Other Securities | | | 654,768 | | | | 13,153,625 | | |
| | | | 26,309,612 | | |
| MATERIALS (10.4%) | |
| Boise, Inc. | | | 616,526 | | | | 4,056,741 | | |
| Crown Hldgs., Inc.* | | | 133,733 | | | | 4,612,451 | | |
| Innophos Hldgs., Inc. | | | 86,374 | | | | 4,876,676 | | |
| Kaiser Aluminum Corp. | | | 79,388 | | | | 4,115,474 | | |
| Silgan Hldgs., Inc. | | | 156,858 | | | | 6,696,268 | | |
| Other Securities | | | 632,264 | | | | 4,897,558 | | |
| | | | 29,255,168 | | |
| TELECOMMUNICATION SERVICES (0.6%) | |
| Other Securities | | | 107,770 | | | | 1,594,996 | | |
| UTILITIES (6.0%) | |
| Avista Corp. | | | 133,367 | | | | 3,560,899 | | |
| Idacorp, Inc. | | | 70,860 | | | | 2,981,789 | | |
| Northwest Natural Gas Co. | | | 47,677 | | | | 2,269,425 | | |
| PNM Resources, Inc. | | | 146,738 | | | | 2,867,261 | | |
| UNS Energy Corp. | | | 85,423 | | | | 3,281,097 | | |
| Other Securities | | | 61,209 | | | | 1,969,094 | | |
| | | | 16,929,565 | | |
TOTAL COMMON STOCKS
(Cost: $209,500,617) 91.7% | | $ | 257,303,820 | | |
| CONVERTIBLE PREFERRED STOCKS: | |
| ENERGY (0.6%) | |
Energy XXI (Bermuda)
Ltd., 7.25% | | | 4,255 | | | | 1,591,072 | | |
TOTAL CONVERTIBLE PREFERRED STOCKS
(Cost: $425,500) 0.6% | | $ | 1,591,072 | | |
| | | Rating** | | Rate | | Maturity | | Face
Amount | | Value | |
| SHORT-TERM DEBT SECURITIES: | |
| U.S. GOVERNMENT (1.8%) | |
| U.S. Treasury Bill | | A-1+ | | | 0.03 | % | | 08/23/12 | | $ | 5,000,000 | | | $ | 4,999,764 | | |
| COMMERCIAL PAPER (6.1%) | |
| ConocoPhillips† | | A-1 | | | 0.12 | | | 07/13/12 | | | 2,000,000 | | | | 1,999,913 | | |
| Nestle Capital Corp.† | | A-1+ | | | 0.01 | | | 07/02/12 | | | 3,500,000 | | | | 3,499,998 | | |
| Praxair, Inc. | | A-1 | | | 0.11 | | | 07/16/12 | | | 1,496,000 | | | | 1,495,927 | | |
| San Diego Gas & Electric Co.† | | A-1 | | | 0.15 | | | 07/05/12 | | | 5,000,000 | | | | 4,999,896 | | |
| Toyota Motor Credit Corp. | | A-1+ | | | 0.10 | | | 07/30/12 | | | 5,000,000 | | | | 4,999,583 | | |
| | | | 16,995,317 | | |
TOTAL SHORT-TERM DEBT SECURITIES
(Cost: $21,995,081) 7.9% | | | 21,995,081 | | |
TOTAL INVESTMENTS
(Cost: $231,921,198) 100.2% | | | 280,889,973 | | |
| OTHER NET ASSETS -0.2% | | | (646,903 | ) | |
| NET ASSETS 100.0% | | $ | 280,243,070 | | |
The accompanying notes are an integral part of these portfolio schedules.
26
MUTUAL OF AMERICA INVESTMENT CORPORATION (SMALL CAP GROWTH FUND)
SUMMARY PORTFOLIO OF INVESTMENTS IN SECURITIES
June 30, 2012 (Unaudited)
| | | Shares | | Value | |
| COMMON STOCKS: | |
| CONSUMER DISCRETIONARY (13.2%) | |
| AFC Enterprises, Inc.* | | | 184,542 | | | $ | 4,270,302 | | |
American Axle & Mfg.
Hldgs., Inc.* | | | 274,487 | | | | 2,879,369 | | |
| Denny's Corp.* | | | 668,422 | | | | 2,967,794 | | |
| Express, Inc.* | | | 131,871 | | | | 2,396,096 | | |
| HSN, Inc. | | | 73,421 | | | | 2,962,537 | | |
| Maidenform Brands, Inc.* | | | 146,525 | | | | 2,918,778 | | |
| Shutterfly, Inc.* | | | 76,098 | | | | 2,335,448 | | |
| Other Securities | | | 1,038,221 | | | | 17,202,782 | | |
| | | | 37,933,106 | | |
| CONSUMER STAPLES (3.2%) | |
| Hain Celestial Group, Inc.* | | | 42,670 | | | | 2,348,557 | | |
| Other Securities | | | 274,242 | | | | 6,795,203 | | |
| | | | 9,143,760 | | |
| ENERGY (7.6%) | |
| Energy XXI (Bermuda) Ltd. | | | 154,821 | | | | 4,844,349 | | |
| MarkWest Energy Partners LP | | | 47,336 | | | | 2,334,138 | | |
| McMoRan Exploration Co.* | | | 544,832 | | | | 6,903,626 | | |
| Other Securities | | | 920,302 | | | | 7,785,036 | | |
| | | | 21,867,149 | | |
| FINANCIALS (7.5%) | |
| Colonial Properties Trust | | | 110,218 | | | | 2,440,227 | | |
iShares Russell 2000 Growth
Index Fund | | | 39,550 | | | | 3,617,639 | | |
| Signature Bank* | | | 46,401 | | | | 2,829,069 | | |
| Other Securities | | | 567,510 | | | | 12,822,159 | | |
| | | | 21,709,094 | | |
| HEALTH CARE (21.7%) | |
| Cubist Pharmaceuticals, Inc.* | | | 67,684 | | | | 2,565,900 | | |
| Cyberonics, Inc.* | | | 78,294 | | | | 3,518,532 | | |
| DexCom, Inc.* | | | 160,120 | | | | 2,075,155 | | |
| HMS Hldgs. Corp.* | | | 94,895 | | | | 3,160,952 | | |
| Neogen Corp.* | | | 58,172 | | | | 2,687,546 | | |
| NxStage Medical, Inc.* | | | 138,507 | | | | 2,321,377 | | |
| PAREXEL International Corp.* | | | 81,053 | | | | 2,288,126 | | |
| Questcor Pharmaceuticals, Inc.* | | | 62,292 | | | | 3,316,426 | | |
| Salix Pharmaceuticals Ltd.* | | | 96,343 | | | | 5,244,913 | | |
| SXC Health Solutions Corp.* | | | 38,138 | | | | 3,783,671 | | |
| Other Securities | | | 1,798,099 | | | | 31,363,608 | | |
| | | | 62,326,206 | | |
| | | Shares | | Value | |
| COMMON STOCKS (CONTINUED): | |
| INDUSTRIALS (14.2%) | |
| Acco Brands Corp.* | | | 202,361 | | | $ | 2,092,413 | | |
| Astronics Corp.* | | | 109,138 | | | | 3,082,057 | | |
| AZZ, Inc. | | | 53,050 | | | | 3,249,843 | | |
| Genesee & Wyoming, Inc. Cl A* | | | 50,113 | | | | 2,647,971 | | |
| Healthcare Svcs. Group, Inc. | | | 120,061 | | | | 2,326,782 | | |
| Old Dominion Freight Line, Inc.* | | | 74,997 | | | | 3,246,620 | | |
| Raven Industries, Inc. | | | 73,550 | | | | 5,118,345 | | |
| Robbins & Myers, Inc. | | | 54,577 | | | | 2,282,410 | | |
| Smith (A.O.) Corp. | | | 51,765 | | | | 2,530,791 | | |
| Sun Hydraulics Corp. | | | 91,537 | | | | 2,223,434 | | |
| Teledyne Technologies, Inc.* | | | 51,801 | | | | 3,193,532 | | |
| Other Securities | | | 312,530 | | | | 8,949,926 | | |
| | | | 40,944,124 | | |
| INFORMATION TECHNOLOGY (20.5%) | |
| Adtran, Inc. | | | 92,789 | | | | 2,801,300 | | |
| Cirrus Logic, Inc.* | | | 114,525 | | | | 3,422,007 | | |
| CommVault Systems, Inc.* | | | 86,674 | | | | 4,296,430 | | |
| Informatica Corp.* | | | 60,505 | | | | 2,562,992 | | |
| LogMeIn, Inc.* | | | 112,498 | | | | 3,433,439 | | |
| Microsemi Corp.* | | | 115,911 | | | | 2,143,194 | | |
| Nanometrics, Inc.* | | | 159,743 | | | | 2,453,652 | | |
| Parametric Technology Corp.* | | | 124,550 | | | | 2,610,568 | | |
| RealD, Inc.* | | | 141,049 | | | | 2,110,093 | | |
| Responsys, Inc.* | | | 219,866 | | | | 2,664,776 | | |
| Sourcefire, Inc.* | | | 78,557 | | | | 4,037,830 | | |
| TIBCO Software, Inc.* | | | 88,939 | | | | 2,661,055 | | |
| Other Securities | | | 1,208,547 | | | | 23,924,122 | | |
| | | | 59,121,458 | | |
| MATERIALS (4.2%) | |
| Innophos Hldgs., Inc. | | | 62,775 | | | | 3,544,277 | | |
| Other Securities | | | 606,204 | | | | 8,675,451 | | |
| | | | 12,219,728 | | |
| TELECOMMUNICATION SERVICES (1.5%) | |
| AboveNet, Inc.* | | | 34,179 | | | | 2,871,036 | | |
| Other Securities | | | 92,782 | | | | 1,373,174 | | |
| | | | 4,244,210 | | |
| UTILITIES (0.8%) | |
| Northwest Natural Gas Co. | | | 49,320 | | | | 2,347,632 | | |
TOTAL COMMON STOCKS
(Cost: $226,841,494) 94.4% | | $ | 271,856,467 | | |
| | | Rating** | | Rate | | Maturity | | Face
Amount | | Value | |
| SHORT-TERM DEBT SECURITIES: | |
| COMMERCIAL PAPER (5.9%) | |
| ConocoPhillips† | | A-1 | | | 0.12 | % | | 07/13/12 | | $ | 4,000,000 | | | $ | 3,999,826 | | |
| Nestle Capital Corp.† | | A-1+ | | | 0.01 - 0.10 | | | 07/02/12 - 07/09/12 | | | 5,400,000 | | | | 5,399,951 | | |
| New Jersey Natural Gas | | A-1 | | | 0.11 | | | 07/05/12 | | | 3,500,000 | | | | 3,499,947 | | |
| Toyota Motor Credit Corp. | | A-1+ | | | 0.10 | | | 07/30/12 | | | 4,000,000 | | | | 3,999,667 | | |
| | | | 16,899,391 | | |
TOTAL SHORT-TERM DEBT SECURITIES
(Cost: $16,899,391) 5.9% | | | 16,899,391 | | |
TOTAL INVESTMENTS
(Cost: $243,740,885) 100.3% | | | 288,755,858 | | |
| OTHER NET ASSETS -0.3% | | | (808,570 | ) | |
| NET ASSETS 100.0% | | $ | 287,947,288 | | |
The accompanying notes are an integral part of these portfolio schedules.
27
MUTUAL OF AMERICA INVESTMENT CORPORATION (MID CAP VALUE FUND)
SUMMARY PORTFOLIO OF INVESTMENTS IN SECURITIES
June 30, 2012 (Unaudited)
| | | Shares | | Value | |
| COMMON STOCKS: | |
| CONSUMER DISCRETIONARY (7.5%) | |
| CBS Corp. Cl B | | | 19,076 | | | $ | 625,311 | | |
| Newell Rubbermaid, Inc. | | | 25,777 | | | | 467,595 | | |
| V.F. Corp. | | | 6,253 | | | | 834,463 | | |
| Other Securities | | | 52,500 | | | | 1,853,642 | | |
| | | | 3,781,011 | | |
| CONSUMER STAPLES (5.5%) | |
| ConAgra Foods, Inc. | | | 31,403 | | | | 814,280 | | |
| Dr. Pepper Snapple Group, Inc. | | | 17,601 | | | | 770,044 | | |
| J.M. Smucker Co. | | | 6,775 | | | | 511,648 | | |
| Other Securities | | | 22,501 | | | | 686,309 | | |
| | | | 2,782,281 | | |
| ENERGY (8.2%) | |
| Energy XXI (Bermuda) Ltd. | | | 23,437 | | | | 733,344 | | |
| McMoRan Exploration Co.* | | | 102,193 | | | | 1,294,785 | | |
| Noble Energy, Inc. | | | 8,397 | | | | 712,234 | | |
| Range Resources Corp. | | | 10,221 | | | | 632,373 | | |
| Spectra Energy Corp. | | | 17,501 | | | | 508,579 | | |
| Other Securities | | | 6,236 | | | | 235,970 | | |
| | | | 4,117,285 | | |
| FINANCIALS (27.3%) | |
| American Financial Group, Inc. | | | 22,519 | | | | 883,420 | | |
| Ameriprise Financial, Inc. | | | 15,536 | | | | 811,911 | | |
| Aon PLC* | | | 13,110 | | | | 613,286 | | |
| Associated Banc-Corp. | | | 35,032 | | | | 462,072 | | |
| BOK Financial Corp. | | | 11,843 | | | | 689,263 | | |
| Boston Properties, Inc. | | | 5,830 | | | | 631,797 | | |
| Equity Residential | | | 16,958 | | | | 1,057,501 | | |
| Everest Re Group Ltd. | | | 5,685 | | | | 588,341 | | |
| Host Hotels & Resorts, Inc. | | | 34,412 | | | | 544,398 | | |
| National Retail Pptys., Inc. | | | 16,449 | | | | 465,342 | | |
| People's United Financial, Inc. | | | 40,439 | | | | 469,497 | | |
| Public Storage | | | 5,103 | | | | 736,924 | | |
| Reinsurance Grp. of America, Inc. | | | 8,642 | | | | 459,841 | | |
| StanCorp Financial Group, Inc. | | | 12,885 | | | | 478,807 | | |
| Vornado Realty Trust | | | 9,825 | | | | 825,103 | | |
| Other Securities | | | 221,440 | | | | 4,072,294 | | |
| | | | 13,789,797 | | |
| HEALTH CARE (7.6%) | |
| AmerisourceBergen Corp. | | | 17,615 | | | | 693,150 | | |
| CIGNA Corp. | | | 11,462 | | | | 504,328 | | |
| | | Shares | | Value | |
| COMMON STOCKS (CONTINUED): | |
| HEALTH CARE (CONTINUED) | |
| Forest Laboratories, Inc.* | | | 14,473 | | | $ | 506,410 | | |
| Humana, Inc. | | | 8,584 | | | | 664,745 | | |
| Mettler-Toledo Int'l., Inc.* | | | 3,196 | | | | 498,097 | | |
| Other Securities | | | 24,524 | | | | 949,043 | | |
| | | | 3,815,773 | | |
| INDUSTRIALS (9.1%) | |
| Kirby Corp.* | | | 15,712 | | | | 739,721 | | |
| Lincoln Electric Hldgs., Inc. | | | 11,981 | | | | 524,648 | | |
| Old Dominion Freight Line, Inc.* | | | 14,320 | | | | 619,913 | | |
| Precision Castparts Corp. | | | 5,121 | | | | 842,353 | | |
| Other Securities | | | 46,494 | | | | 1,877,076 | | |
| | | | 4,603,711 | | |
| INFORMATION TECHNOLOGY (7.8%) | |
| Informatica Corp.* | | | 11,317 | | | | 479,388 | | |
| NCR Corp.* | | | 23,781 | | | | 540,542 | | |
| Teradata Corp.* | | | 7,675 | | | | 552,677 | | |
| TIBCO Software, Inc.* | | | 18,996 | | | | 568,360 | | |
| Other Securities | | | 48,274 | | | | 1,774,368 | | |
| | | | 3,915,335 | | |
| MATERIALS (6.3%) | |
| Crown Hldgs., Inc.* | | | 42,242 | | | | 1,456,926 | | |
| Cytec Industries, Inc. | | | 10,131 | | | | 594,082 | | |
| Eastman Chemical Co. | | | 10,522 | | | | 529,993 | | |
| Other Securities | | | 14,328 | | | | 605,596 | | |
| | | | 3,186,597 | | |
| TELECOMMUNICATION SERVICES (0.7%) | |
| Other Securities | | | 35,415 | | | | 342,109 | | |
| UTILITIES (12.7%) | |
| Ameren Corp. | | | 21,916 | | | | 735,063 | | |
| Atmos Energy Corp. | | | 18,147 | | | | 636,415 | | |
| Edison International | | | 18,465 | | | | 853,083 | | |
| FirstEnergy Corp. | | | 19,552 | | | | 961,763 | | |
| Great Plains Energy, Inc. | | | 27,493 | | | | 588,625 | | |
| Integrys Energy Group, Inc. | | | 10,700 | | | | 608,509 | | |
| ITC Hldgs. Corp. | | | 9,659 | | | | 665,602 | | |
| NV Energy, Inc. | | | 40,396 | | | | 710,162 | | |
| Other Securities | | | 136,100 | | | | 647,878 | | |
| | | | 6,407,100 | | |
TOTAL COMMON STOCKS
(Cost: $42,655,872) 92.7% | | $ | 46,740,999 | | |
| | | Rating** | | Rate | | Maturity | | Face
Amount | | Value | |
| SHORT-TERM DEBT SECURITIES: | |
| COMMERCIAL PAPER (7.0%) | |
| Nestle Capital Corp.† | | A-1+ | | | 0.01 | % | | 07/02/12 | | $ | 1,800,000 | | | $ | 1,799,999 | | |
| New Jersey Natural Gas | | A-1 | | | 0.12 | | | 07/11/12 | | | 700,000 | | | | 699,974 | | |
| Toyota Motor Credit Corp. | | A-1+ | | | 0.12 | | | 07/06/12 | | | 1,000,000 | | | | 999,980 | | |
| | | | 3,499,953 | | |
TOTAL SHORT-TERM DEBT SECURITIES
(Cost: $3,499,953) 7.0% | | | 3,499,953 | | |
TOTAL INVESTMENTS
(Cost: $46,155,825) 99.7% | | | 50,240,952 | | |
| OTHER NET ASSETS 0.3% | | | 147,586 | | |
| NET ASSETS 100.0% | | $ | 50,388,538 | | |
The accompanying notes are an integral part of these portfolio schedules.
28
MUTUAL OF AMERICA INVESTMENT CORPORATION (MID-CAP EQUITY INDEX FUND)
SUMMARY PORTFOLIO OF INVESTMENTS IN SECURITIES
June 30, 2012 (Unaudited)
| | | Shares | | Value | |
| INDEXED ASSETS: | |
| COMMON STOCKS | |
| CONSUMER DISCRETIONARY (13.0%) | |
| Advance Auto Parts, Inc. | | | 36,777 | | | $ | 2,508,927 | | |
| Dick's Sporting Goods, Inc. | | | 47,279 | | | | 2,269,392 | | |
| Foot Locker, Inc. | | | 75,284 | | | | 2,302,185 | | |
| LKQ Corp.* | | | 72,284 | | | | 2,414,286 | | |
| PetSmart, Inc. | | | 51,506 | | | | 3,511,679 | | |
| Polaris Industries, Inc. | | | 35,796 | | | | 2,558,698 | | |
| PVH Corp. | | | 34,354 | | | | 2,672,398 | | |
| Tractor Supply Co. | | | 34,427 | | | | 2,859,507 | | |
| Other Securities | | | 2,064,474 | | | | 51,575,152 | | |
| | | | 72,672,224 | | |
| CONSUMER STAPLES (3.4%) | |
| Church & Dwight Co., Inc. | | | 66,521 | | | | 3,689,920 | | |
| Energizer Hldgs., Inc.* | | | 30,396 | | | | 2,287,299 | | |
| Other Securities | | | 491,860 | | | | 13,152,700 | | |
| | | | 19,129,919 | | |
| ENERGY (5.1%) | |
| Cimarex Energy Co. | | | 41,325 | | | | 2,277,834 | | |
| HollyFrontier Corp. | | | 95,880 | | | | 3,397,028 | | |
| Oceaneering Int'l., Inc. | | | 52,859 | | | | 2,529,832 | | |
| Other Securities | | | 813,791 | | | | 20,623,957 | | |
| | | | 28,828,651 | | |
| FINANCIALS (21.4%) | |
| Affiliated Managers Group, Inc.* | | | 24,602 | | | | 2,692,689 | | |
| Alleghany Corp.* | | | 6,860 | | | | 2,330,685 | | |
| Camden Property Trust | | | 38,416 | | | | 2,599,611 | | |
| Essex Property Trust, Inc. | | | 16,930 | | | | 2,605,866 | | |
| Everest Re Group Ltd. | | | 24,950 | | | | 2,582,076 | | |
| Federal Realty Investment Trust | | | 30,742 | | | | 3,199,935 | | |
New York Community
Bancorp, Inc. | | | 208,489 | | | | 2,612,367 | | |
| Rayonier, Inc. | | | 57,979 | | | | 2,603,257 | | |
| Realty Income Corp. | | | 63,153 | | | | 2,637,901 | | |
| SL Green Realty Corp | | | 43,624 | | | | 3,500,390 | | |
| The Macerich Co. | | | 64,603 | | | | 3,814,807 | | |
| UDR, Inc. | | | 119,511 | | | | 3,088,164 | | |
| Other Securities | | | 3,753,455 | | | | 85,706,139 | | |
| | | | 119,973,887 | | |
| HEALTH CARE (10.5%) | |
| Hologic, Inc.* | | | 124,399 | | | | 2,244,158 | | |
| IDEXX Laboratories, Inc.* | | | 25,267 | | | | 2,428,917 | | |
| Mettler-Toledo Int'l., Inc.* | | | 15,105 | | | | 2,354,114 | | |
| | | Shares | | Value | |
| INDEXED ASSETS (CONTINUED): | |
| COMMON STOCKS (CONTINUED) | |
| HEALTH CARE (CONTINUED) | |
| Regeneron Pharmaceuticals, Inc.* | | | 42,209 | | | $ | 4,821,108 | | |
| Schein (Henry), Inc.* | | | 41,403 | | | | 3,249,721 | | |
| Vertex Pharmaceuticals, Inc.* | | | 101,214 | | | | 5,659,882 | | |
| Other Securities | | | 1,092,394 | | | | 38,067,965 | | |
| | | | 58,825,865 | | |
| INDUSTRIALS (15.4%) | |
| AMETEK, Inc. | | | 77,819 | | | | 3,883,946 | | |
| Donaldson Co., Inc. | | | 71,157 | | | | 2,374,509 | | |
| Hubbell, Inc. Cl B | | | 28,848 | | | | 2,248,413 | | |
| Hunt (J.B.) Transport Svcs., Inc. | | | 40,673 | | | | 2,424,111 | | |
| Kansas City Southern | | | 51,884 | | | | 3,609,051 | | |
| Other Securities | | | 2,174,757 | | | | 71,963,357 | | |
| | | | 86,503,387 | | |
| INFORMATION TECHNOLOGY (15.0%) | |
| Alliance Data Systems Corp.* | | | 23,237 | | | | 3,136,995 | | |
| ANSYS, Inc.* | | | 44,971 | | | | 2,838,120 | | |
| Equinix, Inc.* | | | 22,374 | | | | 3,929,993 | | |
| FactSet Research Systems, Inc. | | | 24,317 | | | | 2,260,022 | | |
| Rackspace Hosting, Inc.* | | | 55,665 | | | | 2,445,920 | | |
| Skyworks Solutions, Inc.* | | | 91,062 | | | | 2,492,367 | | |
| TIBCO Software, Inc.* | | | 82,145 | | | | 2,457,778 | | |
| Trimble Navigation Ltd.* | | | 61,334 | | | | 2,821,977 | | |
| Other Securities | | | 3,179,625 | | | | 61,856,856 | | |
| | | | 84,240,028 | | |
| MATERIALS (6.6%) | |
| Albemarle Corp. | | | 43,716 | | | | 2,607,222 | | |
| Ashland, Inc. | | | 37,228 | | | | 2,580,273 | | |
| Royal Gold, Inc. | | | 28,803 | | | | 2,258,155 | | |
| Valspar Corp. | | | 45,178 | | | | 2,371,393 | | |
| Other Securities | | | 807,117 | | | | 27,424,461 | | |
| | | | 37,241,504 | | |
| TELECOMMUNICATION SERVICES (0.5%) | |
| Other Securities | | | 114,167 | | | | 2,736,498 | | |
| UTILITIES (4.9%) | |
| Alliant Energy Corp. | | | 52,215 | | | | 2,379,438 | | |
| OGE Energy Corp. | | | 46,743 | | | | 2,420,820 | | |
| Other Securities | | | 844,909 | | | | 22,732,185 | | |
| | | | 27,532,443 | | |
TOTAL INDEXED ASSETS-COMMON STOCKS
(Cost: $473,315,147) 95.8% | | $ | 537,684,406 | | |
| | | Rating** | | Rate | | Maturity | | Face
Amount | | Value | |
| SHORT-TERM DEBT SECURITIES: | |
| U.S. GOVERNMENT (0.5%) | |
| U.S. Treasury Bill (1) | | A-1+ | | | 0.09 | % | | 08/09/12 | | $ | 3,000,000 | | | $ | 2,999,700 | | |
| COMMERCIAL PAPER (2.9%) | |
| ConocoPhillips† | | A-1 | | | 0.12 | | | 07/13/12 | | | 5,000,000 | | | | 4,999,784 | | |
| Nestle Capital Corp.† | | A-1+ | | | 0.01 | | | 07/02/12 | | | 3,000,000 | | | | 2,999,998 | | |
| New Jersey Natural Gas | | A-1 | | | 0.11 | | | 07/05/12 | | | 3,000,000 | | | | 2,999,954 | | |
| Toyota Motor Credit Corp. | | A-1+ | | | 0.08 | | | 07/17/12 | | | 5,000,000 | | | | 4,999,811 | | |
| | | | 15,999,547 | | |
TOTAL SHORT-TERM DEBT SECURITIES
(Cost: $18,999,247) 3.4% | | | 18,999,247 | | |
TEMPORARY CASH INVESTMENTS (2)
(Cost: $170,700) 0.0% (3) | | | 170,700 | | |
TOTAL INVESTMENTS
(Cost: $492,485,094) 99.2% | | | 556,854,353 | | |
| OTHER NET ASSETS 0.8% | | | 4,411,398 | | |
| NET ASSETS 100.0% | | $ | 561,265,751 | | |
The accompanying notes are an integral part of these portfolio schedules.
29
MUTUAL OF AMERICA INVESTMENT CORPORATION (INTERNATIONAL FUND)
PORTFOLIO OF INVESTMENTS IN SECURITIES
June 30, 2012 (Unaudited)
| | | Shares | | Value | |
| COMMON STOCKS: | |
| FINANCIALS (97.5%) | |
| iShares MSCI EAFE Growth Index Fund | | | 120,600 | | | $ | 6,459,336 | | |
| iShares MSCI EAFE Index Fund | | | 169,900 | | | | 8,488,204 | | |
| iShares MSCI EAFE Value Index Fund | | | 152,700 | | | | 6,483,642 | | |
| Vanguard MSCI EAFE ETF | | | 1,225,000 | | | | 38,673,250 | | |
| Vanguard MSCI Europe ETF | | | 276,100 | | | | 11,825,363 | | |
| Vanguard MSCI Pacific ETF | | | 130,900 | | | | 6,560,708 | | |
| | | | 78,490,503 | | |
TOTAL COMMON STOCKS
(Cost: $82,857,255) 97.5% | | $ | 78,490,503 | | |
| | | Rating** | | Rate | | Maturity | | Face
Amount | | Value | |
| SHORT-TERM DEBT SECURITIES: | |
| COMMERCIAL PAPER (2.5%) | |
| New Jersey Natural Gas | | A-1 | | | 0.11 | % | | 07/19/12 | | $ | 1,000,000 | | | $ | 999,942 | | |
| San Diego Gas & Electric Co.† | | A-1 | | | 0.14 | | | 07/02/12 | | | 980,000 | | | | 979,992 | | |
| | | | 1,979,934 | | |
TOTAL SHORT-TERM DEBT SECURITIES
(Cost: $1,979,934) 2.5% | | | 1,979,934 | | |
TOTAL INVESTMENTS
(Cost: $84,837,189) 100.0% | | | 80,470,437 | | |
| OTHER NET ASSETS 0.0% (3) | | | 9,294 | | |
| NET ASSETS 100.0% | | $ | 80,479,731 | | |
The accompanying notes are an integral part of these portfolio schedules.
30
MUTUAL OF AMERICA INVESTMENT CORPORATION (COMPOSITE FUND)
SUMMARY PORTFOLIO OF INVESTMENTS IN SECURITIES
June 30, 2012 (Unaudited)
| | | Shares | | Value | |
| COMMON STOCKS: | |
| CONSUMER DISCRETIONARY (5.8%) | |
| Amazon.com, Inc.* | | | 6,189 | | | $ | 1,413,258 | | |
| Disney (Walt) Co. | | | 24,630 | | | | 1,194,555 | | |
| Starbucks Corp. | | | 36,380 | | | | 1,939,782 | | |
| Other Securities | | | 152,881 | | | | 5,199,497 | | |
| | | | 9,747,092 | | |
| CONSUMER STAPLES (6.5%) | |
| PepsiCo, Inc. | | | 16,911 | | | | 1,194,931 | | |
| Philip Morris Int'l., Inc. | | | 23,225 | | | | 2,026,614 | | |
| Proctor & Gamble Co. | | | 27,413 | | | | 1,679,046 | | |
| Wal-Mart Stores, Inc. | | | 30,261 | | | | 2,109,797 | | |
| Other Securities | | | 104,666 | | | | 3,912,605 | | |
| | | | 10,922,993 | | |
| ENERGY (6.7%) | |
| Chevron Corp. | | | 10,841 | | | | 1,143,726 | | |
| Exxon Mobil Corp. | | | 43,875 | | | | 3,754,382 | | |
| National Oilwell Varco, Inc. | | | 12,158 | | | | 783,462 | | |
| Noble Energy, Inc. | | | 10,408 | | | | 882,807 | | |
| Occidental Petroleum Corp. | | | 12,800 | | | | 1,097,856 | | |
| Other Securities | | | 67,546 | | | | 3,556,643 | | |
| | | | 11,218,876 | | |
| FINANCIALS (8.7%) | |
| American Tower Corp. | | | 18,624 | | | | 1,302,004 | | |
| Bank of America Corp. | | | 90,566 | | | | 740,830 | | |
| Berkshire Hathaway, Inc. Cl B* | | | 15,110 | | | | 1,259,116 | | |
| Capital One Financial Corp. | | | 24,568 | | | | 1,342,887 | | |
| JPMorgan Chase & Co. | | | 54,300 | | | | 1,940,139 | | |
| Simon Property Group, Inc. | | | 8,796 | | | | 1,369,185 | | |
| Wells Fargo & Co. | | | 67,072 | | | | 2,242,888 | | |
| Other Securities | | | 104,079 | | | | 4,390,596 | | |
| | | | 14,587,645 | | |
| HEALTH CARE (6.9%) | |
| Abbott Laboratories | | | 6,912 | | | | 445,617 | | |
| Forest Laboratories, Inc.* | | | 27,502 | | | | 962,295 | | |
| McKesson Corp. | | | 9,394 | | | | 880,688 | | |
| Merck & Co., Inc. | | | 37,783 | | | | 1,577,440 | | |
| Pfizer, Inc. | | | 85,541 | | | | 1,967,443 | | |
| UnitedHealth Group, Inc. | | | 17,013 | | | | 995,261 | | |
| | | Shares | | Value | |
| COMMON STOCKS (CONTINUED): | |
| HEALTH CARE (CONTINUED) | |
| Other Securities | | | 109,050 | | | $ | 4,653,921 | | |
| | | | 11,482,665 | | |
| INDUSTRIALS (6.0%) | |
| Boeing Co. | | | 18,152 | | | | 1,348,694 | | |
| Caterpillar, Inc. | | | 13,216 | | | | 1,122,171 | | |
| Cummins, Inc. | | | 9,218 | | | | 893,316 | | |
| General Electric Co. | | | 106,760 | | | | 2,224,878 | | |
| Precision Castparts Corp. | | | 7,238 | | | | 1,190,579 | | |
| Roper Industries, Inc. | | | 9,545 | | | | 940,946 | | |
| Other Securities | | | 32,625 | | | | 2,272,532 | | |
| | | | 9,993,116 | | |
| INFORMATION TECHNOLOGY (11.0%) | |
| Apple, Inc.* | | | 8,865 | | | | 5,177,155 | | |
| Google, Inc. Cl A* | | | 2,462 | | | | 1,428,133 | | |
| Int'l. Business Machines Corp. | | | 10,860 | | | | 2,123,999 | | |
| Microsoft Corp. | | | 56,064 | | | | 1,714,998 | | |
| Oracle Corp. | | | 41,455 | | | | 1,231,214 | | |
| QUALCOMM, Inc. | | | 19,962 | | | | 1,111,484 | | |
| Salesforce.com, inc.* | | | 7,752 | | | | 1,071,792 | | |
| Other Securities | | | 170,225 | | | | 4,690,906 | | |
| | | | 18,549,681 | | |
| MATERIALS (2.4%) | |
| Eastman Chemical Co. | | | 21,182 | | | | 1,066,937 | | |
| Other Securities | | | 65,463 | | | | 2,870,470 | | |
| | | | 3,937,407 | | |
| TELECOMMUNICATION SERVICES (1.8%) | |
| AT&T, Inc. | | | 54,830 | | | | 1,955,238 | | |
| CenturyLink, Inc. | | | 12,144 | | | | 479,567 | | |
| Other Securities | | | 161,937 | | | | 527,915 | | |
| | | | 2,962,720 | | |
| UTILITIES (1.8%) | |
| Dominion Resources, Inc. | | | 16,796 | | | | 906,984 | | |
| Other Securities | | | 50,881 | | | | 2,150,544 | | |
| | | | 3,057,528 | | |
TOTAL COMMON STOCKS
(Cost: $81,414,337) 57.6% | | | | $ | 96,459,723 | | |
The accompanying notes are an integral part of these portfolio schedules.
31
MUTUAL OF AMERICA INVESTMENT CORPORATION (COMPOSITE FUND)
SUMMARY PORTFOLIO OF INVESTMENTS IN SECURITIES (Continued)
June 30, 2012 (Unaudited)
| | | Rating** | | Rate | | Maturity | | Face
Amount | | Value | |
| LONG-TERM DEBT SECURITIES: | |
| U.S. GOVERNMENT (5.8%) | |
| U.S. Treasury Strip | | AA+ | | | 0.00 | % | | 08/15/21 - 08/15/29 | | $ | 12,850,000 | | | $ | 9,784,458 | | |
| U.S. GOVERNMENT AGENCIES (13.4%) | |
| MORTGAGE-BACKED OBLIGATIONS (13.4%) | |
| FHARM | | AA+ | | | 4.64 - 5.77 | | | 02/01/36 - 09/01/39 | | | 628,127 | | | | 675,620 | | |
| FHLMC | | AA+ | | | 4.00 - 6.00 | | | 02/01/25 - 07/01/41 | | | 2,562,812 | | | | 2,757,618 | | |
| FNMA | | AA+ | | | 3.50 - 8.00 | | | 09/01/16 - 12/25/49 | | | 12,901,091 | | | | 14,098,302 | | |
| GNMA (4) | | AA+ | | | 3.50 - 7.00 | | | 10/15/24 - 03/20/42 | | | 4,125,111 | | | | 4,501,359 | | |
| Other Securities | | | | | | | | | 348,571 | | | | 406,510 | | |
| | | | 22,439,409 | | |
| CORPORATE DEBT (17.9%) | |
| CONSUMER DISCRETIONARY (2.5%) | |
| Other Securities | | | | | | | | | 4,000,000 | | | | 4,237,779 | | |
| CONSUMER STAPLES (0.9%) | |
| Other Securities | | | | | | | | | 1,450,000 | | | | 1,557,832 | | |
| ENERGY (2.6%) | |
| National Oilwell Varco, Inc. | | A- | | | 6.13 | | | 08/15/15 | | | 250,000 | | | | 253,863 | | |
| Noble Drilling Corp. | | BBB+ | | | 7.50 | | | 03/15/19 | | | 800,000 | | | | 1,003,570 | | |
| Other Securities | | | | | | | | | 2,850,000 | | | | 3,058,084 | | |
| | | | 4,315,517 | | |
| FINANCIALS (6.5%) | |
| Ally Financial, Inc. | | B+ | | | 0.00 | | | 12/01/12 | | | 2,500,000 | | | | 2,459,371 | | |
| Bank of America Corp. | | A- | | | 3.70 | | | 09/01/15 | | | 250,000 | | | | 252,562 | | |
| First Horizon National Corp. | | BB+ | | | 4.50 | | | 05/15/13 | | | 1,500,000 | | | | 1,522,541 | | |
| Other Securities | | | | | | | | | 6,247,000 | | | | 6,633,460 | | |
| | | | 10,867,934 | | |
| HEALTH CARE (1.3%) | |
| Other Securities | | | | | | | | | 2,050,000 | | | | 2,245,932 | | |
| INDUSTRIALS (1.3%) | |
| Other Securities | | | | | | | | | 2,100,000 | | | | 2,183,316 | | |
| INFORMATION TECHNOLOGY (0.1%) | |
| Other Securities | | | | | | | | | 100,000 | | | | 107,205 | | |
| MATERIALS (1.2%) | |
| Geon Co. | | BB- | | | 7.50 | | | 12/15/15 | | | 1,000,000 | | | | 1,030,000 | | |
| Other Securities | | | | | | | | | 900,000 | | | | 937,801 | | |
| | | | 1,967,801 | | |
| TELECOMMUNICATION SERVICES (0.3%) | |
| CenturyLink, Inc. | | BB | | | 5.00 | | | 02/15/15 | | | 500,000 | | | | 523,585 | | |
| UTILITIES (1.2%) | |
| Other Securities | | | | | | | | | 1,890,000 | | | | 1,974,153 | | |
TOTAL LONG-TERM DEBT SECURITIES
(Cost: $57,694,029) 37.1% | | | 62,204,921 | | |
| SHORT-TERM DEBT SECURITIES: | |
| COMMERCIAL PAPER (4.5%) | |
| Abbott Laboratories† | | A-1+ | | | 0.14 | | | 08/07/12 | | | 1,000,000 | | | | 999,852 | | |
| General Electric Capital Corp. | | A-1+ | | | 0.15 | | | 07/11/12 | | | 2,500,000 | | | | 2,499,885 | | |
| San Diego Gas & Electric Co.† | | A-1 | | | 0.14 | | | 07/02/12 | | | 4,020,000 | | | | 4,019,969 | | |
| | | | 7,519,706 | | |
TOTAL SHORT-TERM DEBT SECURITIES
(Cost: $7,519,706) 4.5% | | | 7,519,706 | | |
TEMPORARY CASH INVESTMENTS (2)
(Cost: $1,017,200) 0.6% | | | 1,017,200 | | |
TOTAL INVESTMENTS
(Cost: $147,645,272) 99.8% | | | 167,201,550 | | |
| OTHER NET ASSETS 0.2% | | | 269,033 | | |
| NET ASSETS 100.0% | | $ | 167,470,583 | | |
The accompanying notes are an integral part of these portfolio schedules.
32
MUTUAL OF AMERICA INVESTMENT CORPORATION (RETIREMENT INCOME FUND)
PORTFOLIO OF INVESTMENTS IN SECURITIES
June 30, 2012 (Unaudited)
| | | Shares | | Value | |
| COMMON STOCKS: | |
| DIVERSIFIED MUTUAL FUNDS (100.0%) | |
| Mutual of America Investment Corporation | |
| Bond Fund (29.9%) | | | 5,350,714 | | | $ | 7,650,333 | | |
| Equity Index Fund (21.5%) | | | 2,435,769 | | | | 5,511,181 | | |
| Mid-Cap Equity Index Fund (5.4%) | | | 899,339 | | | | 1,392,832 | | |
| Mid-Term Bond Fund (37.0%) | | | 8,795,076 | | | | 9,492,974 | | |
| Money Market Fund (6.2%) | | | 1,321,573 | | | | 1,587,751 | | |
TOTAL INVESTMENTS
(Cost: $24,511,659) 100.0% | | $ | 25,635,071 | | |
| OTHER NET ASSETS | | | | | — | | |
| NET ASSETS 100.0% | | | | $ | 25,635,071 | | |
MUTUAL OF AMERICA INVESTMENT CORPORATION (2010 RETIREMENT FUND)
PORTFOLIO OF INVESTMENTS IN SECURITIES
June 30, 2012 (Unaudited)
| | | Shares | | Value | |
| COMMON STOCKS: | |
| DIVERSIFIED MUTUAL FUNDS (100.0%) | |
| Mutual of America Investment Corporation | |
| Bond Fund (24.7%) | | | 3,677,377 | | | $ | 5,257,833 | | |
| Equity Index Fund (26.4%) | | | 2,493,687 | | | | 5,642,226 | | |
| International Fund (3.3%) | | | 1,132,867 | | | | 701,068 | | |
| Mid-Cap Equity Index Fund (15.2%) | | | 2,085,918 | | | | 3,230,521 | | |
| Mid-Term Bond Fund (26.2%) | | | 5,189,468 | | | | 5,601,258 | | |
| Money Market Fund (4.2%) | | | 745,480 | | | | 895,627 | | |
TOTAL INVESTMENTS
(Cost: $19,721,499) 100.0% | | $ | 21,328,533 | | |
| OTHER NET ASSETS | | | | | — | | |
| NET ASSETS 100.0% | | | | $ | 21,328,533 | | |
MUTUAL OF AMERICA INVESTMENT CORPORATION (2015 RETIREMENT FUND)
PORTFOLIO OF INVESTMENTS IN SECURITIES
June 30, 2012 (Unaudited)
| | | Shares | | Value | |
| COMMON STOCKS: | |
| DIVERSIFIED MUTUAL FUNDS (100.0%) | |
| Mutual of America Investment Corporation | |
| Bond Fund (24.9%) | | | 17,693,425 | | | $ | 25,297,671 | | |
| Equity Index Fund (31.3%) | | | 14,070,491 | | | | 31,835,950 | | |
| International Fund (6.5%) | | | 10,586,722 | | | | 6,551,529 | | |
| Mid-Cap Equity Index Fund (11.8%) | | | 7,757,657 | | | | 12,014,508 | | |
| Mid-Term Bond Fund (17.7%) | | | 16,600,186 | | | | 17,917,427 | | |
| Money Market Fund (3.4%) | | | 2,912,741 | | | | 3,499,396 | | |
| Small Cap Growth Fund (2.2%) | | | 1,818,400 | | | | 2,258,335 | | |
| Small Cap Value Fund (2.2%) | | | 1,738,199 | | | | 2,212,439 | | |
TOTAL INVESTMENTS
(Cost: $90,333,151) 100.0% | | $ | 101,587,255 | | |
| OTHER NET ASSETS | | | | | — | | |
| NET ASSETS 100.0% | | | | $ | 101,587,255 | | |
The accompanying notes are an integral part of these portfolio schedules.
33
MUTUAL OF AMERICA INVESTMENT CORPORATION (2020 RETIREMENT FUND)
PORTFOLIO OF INVESTMENTS IN SECURITIES
June 30, 2012 (Unaudited)
| | | Shares | | Value | |
| COMMON STOCKS: | |
| DIVERSIFIED MUTUAL FUNDS (100.0%) | |
| Mutual of America Investment Corporation | |
| Bond Fund (23.8%) | | | 23,430,126 | | | $ | 33,499,878 | | |
| Equity Index Fund (35.5%) | | | 22,033,413 | | | | 49,852,889 | | |
| International Fund (7.6%) | | | 17,257,541 | | | | 10,679,726 | | |
| Mid-Cap Equity Index Fund (11.6%) | | | 10,461,360 | | | | 16,201,812 | | |
| Mid-Term Bond Fund (12.9%) | | | 16,738,778 | | | | 18,067,017 | | |
| Small Cap Growth Fund (4.3%) | | | 4,878,150 | | | | 6,058,345 | | |
| Small Cap Value Fund (4.3%) | | | 4,692,315 | | | | 5,972,538 | | |
TOTAL INVESTMENTS
(Cost: $125,185,143) 100.0% | | $ | 140,332,205 | | |
| OTHER NET ASSETS | | | | | — | | |
| NET ASSETS 100.0% | | | | $ | 140,332,205 | | |
MUTUAL OF AMERICA INVESTMENT CORPORATION (2025 RETIREMENT FUND)
PORTFOLIO OF INVESTMENTS IN SECURITIES
June 30, 2012 (Unaudited)
| | | Shares | | Value | |
| COMMON STOCKS: | |
| DIVERSIFIED MUTUAL FUNDS (100.0%) | |
| Mutual of America Investment Corporation | |
| Bond Fund (19.4%) | | | 18,379,916 | | | $ | 26,279,200 | | |
| Equity Index Fund (40.1%) | | | 22,829,466 | | | | 51,654,041 | | |
| International Fund (7.9%) | | | 15,887,894 | | | | 9,832,128 | | |
| Mid-Cap Equity Index Fund (16.1%) | | | 13,037,367 | | | | 20,191,348 | | |
| Mid-Term Bond Fund (5.9%) | | | 7,384,545 | | | | 7,970,516 | | |
| Small Cap Growth Fund (5.4%) | | | 5,565,302 | | | | 6,911,744 | | |
| Small Cap Value Fund (5.2%) | | | 5,359,131 | | | | 6,821,284 | | |
TOTAL INVESTMENTS
(Cost: $114,171,660) 100.0% | | $ | 129,660,261 | | |
| OTHER NET ASSETS | | | | | — | | |
| NET ASSETS 100.0% | | | | $ | 129,660,261 | | |
MUTUAL OF AMERICA INVESTMENT CORPORATION (2030 RETIREMENT FUND)
PORTFOLIO OF INVESTMENTS IN SECURITIES
June 30, 2012 (Unaudited)
| | | Shares | | Value | |
| COMMON STOCKS: | |
| DIVERSIFIED MUTUAL FUNDS (100.0%) | |
| Mutual of America Investment Corporation | |
| Bond Fund (19.7%) | | | 14,675,860 | | | $ | 20,983,222 | | |
| Equity Index Fund (41.1%) | | | 19,351,221 | | | | 43,784,151 | | |
| International Fund (8.4%) | | | 14,436,237 | | | | 8,933,779 | | |
| Mid-Cap Equity Index Fund (18.1%) | | | 12,482,522 | | | | 19,332,044 | | |
| Small Cap Growth Fund (6.4%) | | | 5,460,813 | | | | 6,781,974 | | |
| Small Cap Value Fund (6.3%) | | | 5,259,304 | | | | 6,694,220 | | |
TOTAL INVESTMENTS
(Cost: $93,022,440) 100.0% | | $ | 106,509,390 | | |
| OTHER NET ASSETS | | | | | — | | |
| NET ASSETS 100.0% | | | | $ | 106,509,390 | | |
The accompanying notes are an integral part of these portfolio schedules.
34
MUTUAL OF AMERICA INVESTMENT CORPORATION (2035 RETIREMENT FUND)
PORTFOLIO OF INVESTMENTS IN SECURITIES
June 30, 2012 (Unaudited)
| | | Shares | | Value | |
| COMMON STOCKS: | |
| DIVERSIFIED MUTUAL FUNDS (100.0%) | |
| Mutual of America Investment Corporation | |
| Bond Fund (12.9%) | | | 7,543,062 | | | $ | 10,784,904 | | |
| Equity Index Fund (41.1%) | | | 15,135,317 | | | | 34,245,229 | | |
| International Fund (10.1%) | | | 13,599,912 | | | | 8,416,224 | | |
| Mid-Cap Equity Index Fund (21.2%) | | | 11,429,289 | | | | 17,700,872 | | |
| Small Cap Growth Fund (7.4%) | | | 4,985,763 | | | | 6,191,993 | | |
| Small Cap Value Fund (7.3%) | | | 4,798,896 | | | | 6,108,198 | | |
TOTAL INVESTMENTS
(Cost: $72,590,456) 100.0% | | $ | 83,447,420 | | |
| OTHER NET ASSETS | | | | | — | | |
| NET ASSETS 100.0% | | | | $ | 83,447,420 | | |
MUTUAL OF AMERICA INVESTMENT CORPORATION (2040 RETIREMENT FUND)
PORTFOLIO OF INVESTMENTS IN SECURITIES
June 30, 2012 (Unaudited)
| | | Shares | | Value | |
| COMMON STOCKS: | |
| DIVERSIFIED MUTUAL FUNDS (100.0%) | |
| Mutual of America Investment Corporation | |
| Bond Fund (10.6%) | | | 5,611,847 | | | $ | 8,023,695 | | |
| Equity Index Fund (35.9%) | | | 12,050,815 | | | | 27,266,223 | | |
| International Fund (11.8%) | | | 14,488,375 | | | | 8,966,044 | | |
| Mid-Cap Equity Index Fund (24.8%) | | | 12,117,554 | | | | 18,766,807 | | |
| Small Cap Growth Fund (8.5%) | | | 5,167,463 | | | | 6,417,653 | | |
| Small Cap Value Fund (8.4%) | | | 4,977,548 | | | | 6,335,593 | | |
TOTAL INVESTMENTS
(Cost: $66,289,732) 100.0% | | $ | 75,776,015 | | |
| OTHER NET ASSETS | | | | | — | | |
| NET ASSETS 100.0% | | | | $ | 75,776,015 | | |
MUTUAL OF AMERICA INVESTMENT CORPORATION (2045 RETIREMENT FUND)
PORTFOLIO OF INVESTMENTS IN SECURITIES
June 30, 2012 (Unaudited)
| | | Shares | | Value | |
| COMMON STOCKS: | |
| DIVERSIFIED MUTUAL FUNDS (100.0%) | |
| Mutual of America Investment Corporation | |
| Bond Fund (9.7%) | | | 6,373,437 | | | $ | 9,112,600 | | |
| Equity Index Fund (36.0%) | | | 15,016,584 | | | | 33,976,584 | | |
| International Fund (12.8%) | | | 19,474,919 | | | | 12,051,937 | | |
| Mid-Cap Equity Index Fund (20.6%) | | | 12,530,375 | | | | 19,406,155 | | |
| Small Cap Growth Fund (10.5%) | | | 8,000,345 | | | | 9,935,909 | | |
| Small Cap Value Fund (10.4%) | | | 7,724,825 | | | | 9,832,420 | | |
TOTAL INVESTMENTS
(Cost: $82,828,982) 100.0% | | $ | 94,315,605 | | |
| OTHER NET ASSETS | | | | | — | | |
| NET ASSETS 100.0% | | | | $ | 94,315,605 | | |
The accompanying notes are an integral part of these portfolio schedules.
35
MUTUAL OF AMERICA INVESTMENT CORPORATION (CONSERVATIVE ALLOCATION FUND)
PORTFOLIO OF INVESTMENTS IN SECURITIES
June 30, 2012 (Unaudited)
| | | Shares | | Value | |
| COMMON STOCKS: | |
| DIVERSIFIED MUTUAL FUNDS (100.0%) | |
| Mutual of America Investment Corporation | |
| Bond Fund (29.3%) | | | 15,374,589 | | | $ | 21,982,250 | | |
| Equity Index Fund (27.3%) | | | 9,040,380 | | | | 20,454,799 | | |
| Mid-Term Bond Fund (43.4%) | | | 30,152,115 | | | | 32,544,715 | | |
TOTAL INVESTMENTS
(Cost: $69,027,142) 100.0% | | $ | 74,981,764 | | |
| OTHER NET ASSETS | | | | | — | | |
| NET ASSETS 100.0% | | | | $ | 74,981,764 | | |
MUTUAL OF AMERICA INVESTMENT CORPORATION (MODERATE ALLOCATION FUND)
PORTFOLIO OF INVESTMENTS IN SECURITIES
June 30, 2012 (Unaudited)
| | | Shares | | Value | |
| COMMON STOCKS: | |
| DIVERSIFIED MUTUAL FUNDS (100.0%) | |
| Mutual of America Investment Corporation | |
| Bond Fund (28.5%) | | | 40,313,881 | | | $ | 57,639,900 | | |
| Equity Index Fund (37.4%) | | | 33,449,885 | | | | 75,683,843 | | |
| Mid-Cap Equity Index Fund (15.4%) | | | 20,142,057 | | | | 31,194,588 | | |
| Mid-Term Bond Fund (18.7%) | | | 35,128,404 | | | | 37,915,878 | | |
TOTAL INVESTMENTS
(Cost: $177,788,144) 100.0% | | $ | 202,434,209 | | |
| OTHER NET ASSETS | | | | | — | | |
| NET ASSETS 100.0% | | | | $ | 202,434,209 | | |
MUTUAL OF AMERICA INVESTMENT CORPORATION (AGGRESSIVE ALLOCATION FUND)
PORTFOLIO OF INVESTMENTS IN SECURITIES
June 30, 2012 (Unaudited)
| | | Shares | | Value | |
| COMMON STOCKS: | |
| DIVERSIFIED MUTUAL FUNDS (100.0%) | |
| Mutual of America Investment Corporation | |
| Bond Fund (23.0%) | | | 28,228,412 | | | $ | 40,360,364 | | |
| Equity Index Fund (46.9%) | | | 36,271,735 | | | | 82,068,572 | | |
| Mid-Cap Equity Index Fund (20.0%) | | | 22,627,992 | | | | 35,044,628 | | |
| Small Cap Growth Fund (5.0%) | | | 7,080,217 | | | | 8,793,169 | | |
| Small Cap Value Fund (5.1%) | | | 6,982,374 | | | | 8,887,403 | | |
TOTAL INVESTMENTS
(Cost: $153,883,095) 100.0% | | $ | 175,154,136 | | |
| OTHER NET ASSETS | | | | | — | | |
| NET ASSETS 100.0% | | | | $ | 175,154,136 | | |
The accompanying notes are an integral part of these portfolio schedules.
36
MUTUAL OF AMERICA INVESTMENT CORPORATION (MONEY MARKET FUND)
PORTFOLIO OF INVESTMENTS IN SECURITIES
June 30, 2012 (Unaudited)
| | | Rating** | | Rate | | Maturity | | Face
Amount | | Value | |
| SHORT-TERM DEBT SECURITIES: | |
| U.S. GOVERNMENT (17.0%) | |
| U.S. Treasury Bill | | A-1+ | | | 0.09 | % | | 08/16/12 | | $ | 10,000,000 | | | $ | 9,997,856 | | |
| U.S. Treasury Bill | | A-1+ | | | 0.09 | | | 09/27/12 | | | 5,000,000 | | | | 4,999,000 | | |
| U.S. Treasury Bill | | A-1+ | | | 0.09 | | | 09/27/12 | | | 1,500,000 | | | | 1,499,700 | | |
| | | | 16,496,556 | | |
| U.S. GOVERNMENT AGENCIES (8.1%) | |
| FHLMC | | A-1+ | | | 0.11 | | | 07/05/12 | | | 2,842,000 | | | | 2,841,957 | | |
| FHLMC | | A-1+ | | | 0.11 | | | 07/10/12 | | | 3,000,000 | | | | 2,999,908 | | |
| FHLMC | | A-1+ | | | 0.11 | | | 09/24/12 | | | 2,000,000 | | | | 1,999,381 | | |
| | | | 7,841,246 | | |
| COMMERCIAL PAPER (74.8%) | |
| Abbott Laboratories† | | A-1+ | | | 0.15 | | | 08/07/12 | | | 700,000 | | | | 699,888 | | |
| Abbott Laboratories† | | A-1+ | | | 0.15 | | | 08/13/12 | | | 300,000 | | | | 299,945 | | |
| Baker Hughes, Inc.† | | A-1 | | | 0.17 | | | 08/17/12 | | | 3,800,000 | | | | 3,799,139 | | |
| Becton, Dickinson & Co. | | A-1+ | | | 0.14 | | | 08/24/12 | | | 3,700,000 | | | | 3,699,209 | | |
| Coca-Cola Co.† | | A-1 | | | 0.14 | | | 08/13/12 | | | 900,000 | | | | 899,846 | | |
| Coca-Cola Co.† | | A-1 | | | 0.15 | | | 07/02/12 | | | 250,000 | | | | 249,994 | | |
| Coca-Cola Co.† | | A-1 | | | 0.15 | | | 07/27/12 | | | 1,700,000 | | | | 1,699,615 | | |
| Coca-Cola Co.† | | A-1 | | | 0.15 | | | 08/08/12 | | | 950,000 | | | | 949,846 | | |
| ConocoPhillips† | | A-1 | | | 0.12 | | | 07/13/12 | | | 3,800,000 | | | | 3,799,835 | | |
| Danaher Corp.† | | A-1 | | | 0.17 | | | 07/10/12 | | | 900,000 | | | | 899,958 | | |
| Dell, Inc.† | | A-1 | | | 0.14 | | | 07/23/12 | | | 2,700,000 | | | | 2,699,759 | | |
| Dell, Inc.† | | A-1 | | | 0.17 | | | 07/09/12 | | | 1,100,000 | | | | 1,099,953 | | |
| Disney (Walt) Co.† | | A-1 | | | 0.12 | | | 07/10/12 | | | 1,000,000 | | | | 999,967 | | |
| Disney (Walt) Co.† | | A-1 | | | 0.15 | | | 07/10/12 | | | 871,000 | | | | 870,964 | | |
| Du Pont (EI) de Nemours & Co.† | | A-1 | | | 0.16 | | | 08/06/12 | | | 3,150,000 | | | | 3,149,482 | | |
| Du Pont (EI) de Nemours & Co.† | | A-1 | | | 0.21 | | | 09/12/12 | | | 650,000 | | | | 649,458 | | |
| Emerson Electric Co.† | | A-1 | | | 0.14 | | | 07/17/12 | | | 3,850,000 | | | | 3,849,277 | | |
| General Electric Capital Corp.† | | A-1+ | | | 0.15 | | | 08/01/12 | | | 3,650,000 | | | | 3,649,513 | | |
| Google, Inc.† | | A-1+ | | | 0.13 | | | 08/14/12 | | | 1,100,000 | | | | 1,099,733 | | |
| Illinois Tool Works, Inc.† | | A-1 | | | 0.13 | | | 07/19/12 | | | 3,800,000 | | | | 3,799,739 | | |
| McDonald's Corp.† | | A-1 | | | 0.13 | | | 07/25/12 | | | 2,000,000 | | | | 1,999,566 | | |
| McDonald's Corp.† | | A-1 | | | 0.15 | | | 07/09/12 | | | 300,000 | | | | 299,989 | | |
| Medtronic, Inc.† | | A-1+ | | | 0.14 | | | 09/20/12 | | | 2,000,000 | | | | 1,998,893 | | |
| Nestle Capital Corp.† | | A-1+ | | | 0.14 | | | 07/30/12 | | | 3,900,000 | | | | 3,899,491 | | |
| New Jersey Natural Gas | | A-1 | | | 0.11 | | | 07/19/12 | | | 2,000,000 | | | | 1,999,884 | | |
| New Jersey Natural Gas | | A-1 | | | 0.12 | | | 07/06/12 | | | 400,000 | | | | 399,992 | | |
| New Jersey Natural Gas | | A-1 | | | 0.12 | | | 07/11/12 | | | 1,400,000 | | | | 1,399,949 | | |
| Private Export Funding Corp.† | | A-1 | | | 0.16 | | | 09/07/12 | | | 3,800,000 | | | | 3,797,192 | | |
| Procter & Gamble Co.† | | A-1+ | | | 0.12 | | | 07/06/12 | | | 700,000 | | | | 699,986 | | |
| Rockwell Collins, Inc.† | | A-1 | | | 0.12 | | | 07/13/12 | | | 1,600,000 | | | | 1,599,931 | | |
| San Diego Gas & Electric Co.† | | A-1 | | | 0.15 | | | 07/06/12 | | | 3,800,000 | | | | 3,799,905 | | |
| Toyota Motor Credit Corp. | | A-1+ | | | 0.15 | | | 07/09/12 | | | 3,900,000 | | | | 3,899,854 | | |
| Unilever Capital Corp.† | | A-1 | | | 0.13 | | | 07/31/12 | | | 2,850,000 | | | | 2,849,681 | | |
| Unilever Capital Corp.† | | A-1 | | | 0.18 | | | 08/02/12 | | | 1,000,000 | | | | 999,776 | | |
| Wal-Mart Stores† | | A-1+ | | | 0.13 | | | 07/16/12 | | | 1,100,000 | | | | 1,099,928 | | |
| Wal-Mart Stores† | | A-1+ | | | 0.13 | | | 08/06/12 | | | 1,099,000 | | | | 1,098,853 | | |
| Wal-Mart Stores† | | A-1+ | | | 0.14 | | | 08/06/12 | | | 1,651,000 | | | | 1,650,762 | | |
| | | | 72,358,752 | | |
TOTAL SHORT-TERM DEBT SECURITIES
(Cost: $96,700,907) 99.9% | | | 96,696,554 | | |
TEMPORARY CASH INVESTMENTS (2)
(Cost: $94,900) 0.1% | | $ | 94,900 | | |
TOTAL INVESTMENTS
(Cost: $96,795,807) 100.0% | | | 96,791,454 | | |
| OTHER NET ASSETS 0.0% (3) | | | 64 | | |
| NET ASSETS 100.0% | | $ | 96,791,518 | | |
The accompanying notes are an integral part of these portfolio schedules.
37
MUTUAL OF AMERICA INVESTMENT CORPORATION (MID-TERM BOND FUND)
SUMMARY PORTFOLIO OF INVESTMENTS IN SECURITIES
June 30, 2012 (Unaudited)
| | | Rating** | | Rate | | Maturity | | Face
Amount | | Value | |
| LONG-TERM DEBT SECURITIES: | |
| U.S. GOVERNMENT (42.2%) | |
| U.S. Treasury Note | | AA+ | | | 1.00 - 3.25 | % | | 03/31/15 - 05/15/19 | | $ | 69,000,000 | | | $ | 74,302,022 | | |
| U.S. Treasury Strip | | AA+ | | | 0.00 | | | 08/15/17 - 08/15/18 | | | 75,000,000 | | | | 70,834,963 | | |
| | | | 145,136,985 | | |
| U.S. GOVERNMENT AGENCIES (13.5%) | |
| MORTGAGE-BACKED OBLIGATIONS (0.0%) (3) | |
| FNMA | | AA+ | | | 6.00 - 8.00 | | | 09/01/12 - 06/01/17 | | | 2,602 | | | | 2,708 | | |
| Other Securities | | | | | | | | | 39,144 | | | | 41,767 | | |
| | | | 44,475 | | |
| NON-MORTGAGE-BACKED OBLIGATIONS (13.5%) | |
| FFCB | | AA+ | | | 4.95 - 5.10 | | | 08/05/13 - 10/10/14 | | | 17,500,000 | | | | 19,037,390 | | |
| FHLB | | AA+ | | | 1.38 | | | 05/28/14 | | | 17,000,000 | | | | 17,343,922 | | |
| FNMA | | AA+ | | | 1.25 | | | 02/27/14 | | | 10,000,000 | | | | 10,167,080 | | |
| | | | 46,548,392 | | |
| CORPORATE DEBT (42.1%) | |
| CONSUMER DISCRETIONARY (3.7%) | |
| AutoZone, Inc. | | BBB | | | 4.00 - 6.50 | | | 01/15/14 - 11/15/20 | | | 1,700,000 | | | | 1,828,731 | | |
| Hyatt Hotels Corp. | | BBB | | | 3.88 - 5.75 | | | 08/15/15 - 08/15/16 | | | 1,725,000 | | | | 1,834,927 | | |
| Marriott International, Inc. | | BBB | | | 3.00 - 5.63 | | | 02/15/13 - 03/01/19 | | | 1,950,000 | | | | 1,983,807 | | |
| Whirlpool Corp. | | BBB- | | | 5.50 - 6.50 | | | 03/01/13 - 06/15/16 | | | 1,350,000 | | | | 1,428,785 | | |
| Other Securities | | | | | | | | | 5,500,000 | | | | 5,744,984 | | |
| | | | 12,821,234 | | |
| CONSUMER STAPLES (2.7%) | |
| Avon Products, Inc. | | BBB- | | | 4.20 | | | 07/15/18 | | | 1,800,000 | | | | 1,812,281 | | |
| Other Securities | | | | | | | | | 7,125,000 | | | | 7,440,198 | | |
| | | | 9,252,479 | | |
| ENERGY (3.2%) | |
| Marathon Petroleum Corp. | | BBB | | | 3.50 | | | 03/01/16 | | | 1,500,000 | | | | 1,572,360 | | |
| Sunoco, Inc. | | BB+ | | | 4.88 - 9.63 | | | 10/15/14 - 01/15/17 | | | 1,290,000 | | | | 1,414,441 | | |
| Transocean, Inc. | | BBB- | | | 1.50 | | | 12/15/37 | | | 1,200,000 | | | | 1,194,000 | | |
| Other Securities | | | | | | | | | 6,565,000 | | | | 6,879,912 | | |
| | | | 11,060,713 | | |
| FINANCIALS (15.7%) | |
| Aflac, Inc. | | A- | | | 2.65 | | | 02/15/17 | | | 1,500,000 | | | | 1,534,662 | | |
| Block Financial LLC | | BBB | | | 5.13 - 7.88 | | | 01/15/13 - 10/30/14 | | | 1,500,000 | | | | 1,542,316 | | |
| Citigroup, Inc. | | BBB+ | | | 5.63 | | | 08/27/12 | | | 1,500,000 | | | | 1,508,987 | | |
| CNA Financial Corp. | | BBB- | | | 5.85 - 6.50 | | | 12/15/14 - 08/15/16 | | | 1,200,000 | | | | 1,339,850 | | |
| Hartford Financial Svcs. | | BBB | | | 4.00 - 5.50 | | | 10/15/16 - 10/15/17 | | | 1,850,000 | | | | 1,936,380 | | |
| HCP, Inc. | | BBB | | | 5.65 - 6.00 | | | 12/15/13 - 01/30/17 | | | 1,750,000 | | | | 1,928,510 | | |
| Health Care REIT, Inc. | | BBB- | | | 3.63 | | | 03/15/16 | | | 1,750,000 | | | | 1,798,984 | | |
| Kemper Corp. | | BBB- | | | 6.00 | | | 11/30/15 | | | 1,500,000 | | | | 1,572,399 | | |
| Morgan Stanley | | A- | | | 2.88 - 4.00 | | | 01/24/14 - 07/24/15 | | | 1,500,000 | | | | 1,488,567 | | |
| ProLogis LP | | BBB- | | | 6.63 | | | 05/15/18 | | | 1,500,000 | | | | 1,730,138 | | |
| Raymond James Financial, Inc. | | BBB | | | 4.25 | | | 04/15/16 | | | 1,600,000 | | | | 1,663,795 | | |
| Reckson Operating Partnership | | BBB- | | | 6.00 | | | 03/31/16 | | | 1,700,000 | | | | 1,806,597 | | |
| Reinsurance Grp. of America, Inc. | | A- | | | 5.63 | | | 03/15/17 | | | 1,500,000 | | | | 1,635,380 | | |
| Senior Housing Pptys. Trust | | BBB- | | | 4.30 | | | 01/15/16 | | | 1,650,000 | | | | 1,651,531 | | |
| Simon Property Group LP | | A- | | | 2.80 | | | 01/30/17 | | | 1,500,000 | | | | 1,544,108 | | |
The accompanying notes are an integral part of these portfolio schedules.
38
MUTUAL OF AMERICA INVESTMENT CORPORATION (MID-TERM BOND FUND)
SUMMARY PORTFOLIO OF INVESTMENTS IN SECURITIES (Continued)
June 30, 2012 (Unaudited)
| | | Rating** | | Rate | | Maturity | | Face
Amount | | Value | |
| LONG-TERM DEBT SECURITIES (CONTINUED): | |
| FINANCIALS (CONTINUED) | |
| SLM Corp. | | BBB- | | | 5.00 | % | | 10/01/13 | | $ | 1,500,000 | | | $ | 1,545,000 | | |
| Ventas Realty LP/Capital Corp. | | BBB | | | 4.00 | | | 04/30/19 | | | 1,700,000 | | | | 1,743,340 | | |
| Vornado Realty LP | | BBB | | | 4.25 | | | 04/01/15 | | | 1,500,000 | | | | 1,581,914 | | |
| Zions Bancorporation | | BBB- to BB+ | | | 4.50 - 5.65 | | | 05/15/14 - 03/27/17 | | | 1,400,000 | | | | 1,435,124 | | |
| Other Securities | | | | | | | | | 22,055,000 | | | | 23,069,739 | | |
| | | | 54,057,321 | | |
| HEALTH CARE (3.7%) | |
| Biogen Idec, Inc. | | BBB+ | | | 6.88 | | | 03/01/18 | | | 1,250,000 | | | | 1,525,556 | | |
| CIGNA Corp. | | BBB | | | 2.75 | | | 11/15/16 | | | 1,750,000 | | | | 1,802,976 | | |
| Humana, Inc. | | BBB | | | 6.45 | | | 06/01/16 | | | 1,415,000 | | | | 1,609,209 | | |
| Laboratory Corp. of America | | BBB+ | | | 3.13 - 5.63 | | | 02/01/13 - 11/15/20 | | | 1,685,000 | | | | 1,817,917 | | |
| Medtronic, Inc. | | A+ | | | 1.63 | | | 04/15/13 | | | 1,500,000 | | | | 1,503,750 | | |
| Other Securities | | | | | | | | | 4,000,000 | | | | 4,293,935 | | |
| | | | 12,553,343 | | |
| INDUSTRIALS (4.5%) | |
| Pitney Bowes, Inc. | | BBB+ | | | 5.25 | | | 01/15/37 | | | 1,500,000 | | | | 1,495,737 | | |
| Ryder System, Inc. | | BBB+ | | | 6.00 - 7.20 | | | 03/01/13 - 09/01/15 | | | 1,500,000 | | | | 1,659,512 | | |
| Southwest Airlines Co. | | BBB- | | | 5.25 - 5.75 | | | 10/01/14 - 12/15/16 | | | 1,235,000 | | | | 1,390,406 | | |
| URS Corp.† | | BBB- | | | 3.85 | | | 04/01/17 | | | 1,700,000 | | | | 1,678,799 | | |
| Other Securities | | | | | | | | | 8,825,000 | | | | 9,404,844 | | |
| | | | 15,629,298 | | |
| INFORMATION TECHNOLOGY (2.0%) | |
| Arrow Electronics, Inc. | | BBB- | | | 6.88 | | | 07/01/13 - 06/01/18 | | | 1,450,000 | | | | 1,605,293 | | |
| Avnet, Inc. | | BBB- | | | 5.88 - 6.00 | | | 03/15/14 - 09/01/15 | | | 1,730,000 | | | | 1,869,545 | | |
| Ingram Micro, Inc. | | BBB- | | | 5.25 | | | 09/01/17 | | | 1,500,000 | | | | 1,608,072 | | |
| Lexmark International, Inc. | | BBB- | | | 6.65 | | | 06/01/18 | | | 1,500,000 | | | | 1,684,457 | | |
| | | | 6,767,367 | | |
| MATERIALS (3.1%) | |
| Airgas, Inc. | | BBB | | | 3.25 | | | 10/01/15 | | | 1,500,000 | | | | 1,563,098 | | |
| Freeport-McMoRan Copper & Gold | | BBB | | | 2.15 | | | 03/01/17 | | | 1,750,000 | | | | 1,725,407 | | |
| Kinross Gold Corp. | | NR | | | 3.63 - 5.13 | | | 09/01/16 - 09/01/21 | | | 2,750,000 | | | | 2,774,424 | | |
| Other Securities | | | | | | | | | 4,250,000 | | | | 4,480,771 | | |
| | | | 10,543,700 | | |
| TELECOMMUNICATION SERVICES (0.4%) | |
| CenturyLink, Inc. | | BB | | | 5.00 | | | 02/15/15 | | | 1,250,000 | | | | 1,308,961 | | |
| UTILITIES (3.1%) | |
| Black Hills Corp. | | BBB- | | | 9.00 | | | 05/15/14 | | | 2,000,000 | | | | 2,207,220 | | |
| Constellation Energy | | BBB- | | | 5.15 | | | 12/01/20 | | | 1,500,000 | | | | 1,660,412 | | |
| Other Securities | | | | | | | | | 6,450,000 | | | | 6,872,939 | | |
| | | | 10,740,571 | | |
TOTAL LONG-TERM DEBT SECURITIES
(Cost: $314,070,742) 97.8% | | | 336,464,839 | | |
The accompanying notes are an integral part of these portfolio schedules.
39
MUTUAL OF AMERICA INVESTMENT CORPORATION (MID-TERM BOND FUND)
SUMMARY PORTFOLIO OF INVESTMENTS IN SECURITIES (Continued)
June 30, 2012 (Unaudited)
| | | Rating** | | Rate | | Maturity | | Face
Amount | | Value | |
| SHORT-TERM DEBT SECURITIES: | |
| COMMERCIAL PAPER (1.4%) | |
| ConocoPhillips† | | A-1 | | | 0.12 | % | | 07/13/12 | | $ | 2,000,000 | | | $ | 1,999,913 | | |
| New Jersey Natural Gas | | A-1 | | | 0.11 | | | 07/05/12 | | | 1,500,000 | | | | 1,499,977 | | |
| San Diego Gas & Electric Co.† | | A-1 | | | 0.14 | | | 07/02/12 | | | 1,400,000 | | | | 1,399,989 | | |
| | | | 4,899,879 | | |
TOTAL SHORT-TERM DEBT SECURITIES
(Cost: $4,899,879) 1.4% | | | 4,899,879 | | |
TEMPORARY CASH INVESTMENTS (2)
(Cost: $30,000) 0.0% (3) | | | 30,000 | | |
TOTAL INVESTMENTS
(Cost: $319,000,621) 99.2% | | | 341,394,718 | | |
| OTHER NET ASSETS 0.8% | | | 2,600,429 | | |
| NET ASSETS 100.0% | | $ | 343,995,147 | | |
The accompanying notes are an integral part of these portfolio schedules.
40
MUTUAL OF AMERICA INVESTMENT CORPORATION (BOND FUND)
SUMMARY PORTFOLIO OF INVESTMENTS IN SECURITIES
June 30, 2012 (Unaudited)
| | | Rating** | | Rate | | Maturity | | Face
Amount | | Value | |
| LONG-TERM DEBT SECURITIES: | |
| U.S. GOVERNMENT (5.0%) | |
| U.S. Treasury Note | | AA+ | | | 2.13 | % | | 08/15/21 | | $ | 5,000,000 | | | $ | 5,255,470 | | |
| U.S. Treasury Strip | | AA+ | | | 0.00 | | | 08/15/18 - 08/15/29 | | | 41,000,000 | | | | 27,422,137 | | |
| | | | 32,677,607 | | |
| U.S. GOVERNMENT AGENCIES (31.8%) | |
| MORTGAGE-BACKED OBLIGATIONS (29.3%) | |
| FHARM | | AA+ | | | 3.38 - 5.77 | | | 02/01/36 - 04/01/42 | | | 5,150,042 | | | | 5,472,067 | | |
| FHLMC | | AA+ | | | 4.00 - 6.00 | | | 12/15/20 - 12/01/41 | | | 22,636,059 | | | | 24,380,174 | | |
| FNMA | | AA+ | | | 3.00 - 8.00 | | | 09/01/16 - 12/25/49 | | | 110,754,542 | | | | 120,655,343 | | |
| GNMA (4) | | AA+ | | | 3.50 - 7.00 | | | 02/20/20 - 03/20/42 | | | 36,212,758 | | | | 39,666,285 | | |
| Other Securities | | | | | | | | | 1,917,138 | | | | 2,235,805 | | |
| | | | 192,409,674 | | |
| NON-MORTGAGE-BACKED OBLIGATIONS (2.5%) | |
| FNMA | | AA+ | | | 0.00 | | | 10/09/19 | | | 20,000,000 | | | | 16,211,416 | | |
| CORPORATE DEBT (61.0%) | |
| CONSUMER DISCRETIONARY (7.4%) | |
| Advance Auto Parts, Inc. | | BBB- | | | 5.75 | | | 05/01/20 | | | 3,000,000 | | | | 3,390,312 | | |
| AutoZone, Inc. | | BBB | | | 4.00 | | | 11/15/20 | | | 3,000,000 | | | | 3,206,562 | | |
| Hyatt Hotels Corp. | | BBB | | | 3.88 - 5.38 | | | 08/15/16 - 08/15/21 | | | 3,000,000 | | | | 3,186,104 | | |
| Newell Rubbermaid, Inc. | | BBB- | | | 4.70 | | | 08/15/20 | | | 3,000,000 | | | | 3,245,595 | | |
| Omnicom Group, Inc. | | BBB+ | | | 4.45 | | | 08/15/20 | | | 3,000,000 | | | | 3,234,807 | | |
| Whirlpool Corp. | | BBB- | | | 4.85 - 6.50 | | | 06/15/16 - 06/15/21 | | | 3,000,000 | | | | 3,261,321 | | |
| Other Securities | | | | | | | | | 27,620,000 | | | | 28,833,578 | | |
| | | | 48,358,279 | | |
| CONSUMER STAPLES (3.8%) | |
| Energizer Hldgs., Inc. | | BBB- | | | 4.70 | | | 05/19/21 | | | 3,000,000 | | | | 3,162,297 | | |
| Ingredion, Inc. | | BBB | | | 4.63 | | | 11/01/20 | | | 3,225,000 | | | | 3,494,533 | | |
| Other Securities | | | | | | | | | 17,244,000 | | | | 17,952,261 | | |
| | | | 24,609,091 | | |
| ENERGY (6.2%) | |
| Cameron International Corp. | | BBB+ | | | 4.50 | | | 06/01/21 | | | 3,000,000 | | | | 3,208,788 | | |
| Marathon Petroleum Corp. | | BBB | | | 5.13 | | | 03/01/21 | | | 3,000,000 | | | | 3,358,818 | | |
| Seariver Maritime, Inc. | | AAA | | | 0.00 | | | 09/01/12 | | | 10,000,000 | | | | 9,942,260 | | |
| Other Securities | | | | | | | | | 22,775,000 | | | | 24,271,893 | | |
| | | | 40,781,759 | | |
| FINANCIALS (22.0%) | |
| Alleghany Corp. | | BBB | | | 5.63 | | | 09/15/20 | | | 3,000,000 | | | | 3,209,856 | | |
| Ally Financial, Inc. | | B+ | | | 0.00 | | | 12/01/12 | | | 10,000,000 | | | | 9,837,500 | | |
| Barrick N.A. Finance LLC | | A- | | | 4.40 | | | 05/30/21 | | | 3,000,000 | | | | 3,233,484 | | |
| Capital One Financial Corp. | | BBB | | | 4.75 | | | 07/15/21 | | | 3,200,000 | | | | 3,491,776 | | |
| Fairfax Financial Hldgs. | | BBB- | | | 5.80 - 8.25 | | | 10/01/15 - 05/15/21 | | | 3,000,000 | | | | 3,305,439 | | |
| First Horizon National Corp. | | BB+ | | | 4.50 | | | 05/15/13 | | | 5,000,000 | | | | 5,075,135 | | |
| Hartford Financial Svcs. | | BBB | | | 5.50 | | | 10/15/16 - 03/30/20 | | | 3,000,000 | | | | 3,209,763 | | |
| HCP, Inc. | | BBB | | | 5.65 - 6.00 | | | 12/15/13 - 01/30/17 | | | 3,250,000 | | | | 3,512,769 | | |
| Health Care REIT, Inc. | | BBB- | | | 3.63 - 6.13 | | | 03/15/16 - 04/15/20 | | | 3,250,000 | | | | 3,553,988 | | |
| Marsh & McLennan Cos., Inc. | | BBB- | | | 4.80 | | | 07/15/21 | | | 3,000,000 | | | | 3,266,616 | | |
| Pacific LifeCorp.† | | BBB+ | | | 6.00 | | | 02/10/20 | | | 3,000,000 | | | | 3,274,614 | | |
| ProLogis LP | | BBB- | | | 6.63 | | | 05/15/18 | | | 3,000,000 | | | | 3,460,275 | | |
| Prudential Financial, Inc. | | | A | | | | 4.50 - 4.75 | | | 09/17/15 - 11/16/21 | | | 3,000,000 | | | | 3,191,120 | | |
The accompanying notes are an integral part of these portfolio schedules.
41
MUTUAL OF AMERICA INVESTMENT CORPORATION (BOND FUND)
SUMMARY PORTFOLIO OF INVESTMENTS IN SECURITIES (Continued)
June 30, 2012 (Unaudited)
| | | Rating** | | Rate | | Maturity | | Face
Amount | | Value | |
| LONG-TERM DEBT SECURITIES (CONTINUED): | |
| FINANCIALS (CONTINUED) | |
| Raymond James Financial, Inc. | | BBB | | | 4.25 | % | | 04/15/16 | | $ | 3,150,000 | | | $ | 3,275,597 | | |
| Reckson Operating Partnership | | BBB- | | | 6.00 | | | 03/31/16 | | | 3,200,000 | | | | 3,400,653 | | |
| Retail Properties, Inc.† | | A- | | | 7.88 | | | 03/15/16 | | | 5,000,000 | | | | 5,909,310 | | |
| SLM Corp. | | BBB- | | | 5.00 | | | 10/01/13 | | | 3,150,000 | | | | 3,244,500 | | |
| Vornado Realty LP | | BBB | | | 4.25 | | | 04/01/15 | | | 3,000,000 | | | | 3,163,827 | | |
| Other Securities | | | | | | | | | 71,346,000 | | | | 74,206,754 | | |
| | | | 144,822,976 | | |
| HEALTH CARE (5.9%) | |
| CIGNA Corp. | | BBB | | | 2.75 - 5.38 | | | 11/15/16 - 03/15/17 | | | 3,000,000 | | | | 3,277,642 | | |
| Laboratory Corp. of America | | BBB+ | | | 4.63 - 5.63 | | | 02/01/13 - 11/15/20 | | | 3,000,000 | | | | 3,252,688 | | |
| Medco Health Solutions, Inc. | | BBB+ | | | 4.13 | | | 09/15/20 | | | 3,000,000 | | | | 3,180,744 | | |
| PerkinElmer, Inc. | | BBB | | | 5.00 | | | 11/15/21 | | | 3,000,000 | | | | 3,220,056 | | |
| Quest Diagnostics, Inc. | | BBB+ | | | 4.75 | | | 01/30/20 | | | 2,850,000 | | | | 3,156,939 | | |
| Other Securities | | | | | | | | | 20,750,000 | | | | 22,832,967 | | |
| | | | 38,921,036 | | |
| INDUSTRIALS (4.3%) | |
| L-3 Communications Corp. | | BBB- | | | 4.75 | | | 07/15/20 | | | 3,000,000 | | | | 3,199,845 | | |
| Pentair, Inc. | | BBB- | | | 5.00 | | | 05/15/21 | | | 3,000,000 | | | | 3,325,707 | | |
| Other Securities | | | | | | | | | 20,900,000 | | | | 21,735,435 | | |
| | | | 28,260,987 | | |
| INFORMATION TECHNOLOGY (2.5%) | |
| Arrow Electronics, Inc. | | BBB- | | | 6.88 | | | 06/01/18 | | | 2,900,000 | | | | 3,367,460 | | |
| Avnet, Inc. | | BBB- | | | 5.88 - 6.00 | | | 03/15/14 - 06/15/20 | | | 3,000,000 | | | | 3,279,659 | | |
| Ingram Micro, Inc. | | BBB- | | | 5.25 | | | 09/01/17 | | | 3,000,000 | | | | 3,216,144 | | |
| Lexmark International, Inc. | | BBB- | | | 6.65 | | | 06/01/18 | | | 3,000,000 | | | | 3,368,913 | | |
| Other Securities | | | | | | | | | 2,770,000 | | | | 2,968,689 | | |
| | | | 16,200,865 | | |
| MATERIALS (4.6%) | |
| Geon Co. | | BB- | | | 7.50 | | | 12/15/15 | | | 3,750,000 | | | | 3,862,500 | | |
| Teck Resources Ltd. | | BBB | | | 4.75 | | | 01/15/22 | | | 3,000,000 | | | | 3,223,521 | | |
| Other Securities | | | | | | | | | 22,100,000 | | | | 22,937,547 | | |
| | | | 30,023,568 | | |
| TELECOMMUNICATION SERVICES (0.7%) | |
| Other Securities | | | | | | | | | 4,000,000 | | | | 4,486,500 | | |
| UTILITIES (3.6%) | |
| Constellation Energy | | BBB- | | | 5.15 | | | 12/01/20 | | | 3,000,000 | | | | 3,320,823 | | |
| National Fuel Gas Co. | | BBB | | | 4.90 | | | 12/01/21 | | | 3,000,000 | | | | 3,236,334 | | |
| PPL Energy Supply LLC | | BBB | | | 4.60 - 5.40 | | | 08/15/14 - 12/15/21 | | | 3,000,000 | | | | 3,171,791 | | |
| Other Securities | | BBB- | | | 4.63 | | | 10/01/20 | | | 13,900,000 | | | | 14,009,159 | | |
| | | | 23,738,107 | | |
| SOVEREIGN DEBT (0.7%) | |
| Sri Lanka AID | | NR | | | 6.59 | | | 09/15/28 | | | 3,616,360 | | | | 4,539,906 | | |
TOTAL LONG-TERM DEBT SECURITIES
(Cost: $609,340,654) 98.5% | | | 646,041,771 | | |
| SHORT-TERM DEBT SECURITIES: | |
| COMMERCIAL PAPER (1.2%) | |
| General Electric Capital Corp. | | A-1+ | | | 0.07 | | | 07/12/12 | | | 4,000,000 | | | | 3,999,907 | | |
| New Jersey Natural Gas | | A-1 | | | 0.12 | | | 07/03/12 | | | 1,600,000 | | | | 1,599,984 | | |
| San Diego Gas & Electric Co.† | | A-1 | | | 0.14 | | | 07/02/12 | | | 2,500,000 | | | | 2,499,981 | | |
| | | | 8,099,872 | | |
TOTAL SHORT-TERM DEBT SECURITIES
(Cost: $8,099,872) 1.2% | | | 8,099,872 | | |
TEMPORARY CASH INVESTMENTS (2)
(Cost: $850,200) 0.1% | | | 850,200 | | |
TOTAL INVESTMENTS
(Cost: $618,290,726) 99.8% | | | 654,991,843 | | |
| OTHER NET ASSETS 0.2% | | | 1,615,158 | | |
| NET ASSETS 100.0% | | $ | 656,607,001 | | |
The accompanying notes are an integral part of these portfolio schedules.
42
MUTUAL OF AMERICA INVESTMENT CORPORATION
FOOTNOTES TO SUMMARY PORTFOLIOS OF INVESTMENTS IN SECURITIES
June 30, 2012 (Unaudited)
Abbreviations: FFCB = Federal Farm Credit Bank
FHARM = Federal Home Adjustable Rate Mortgage
FHLB = Federal Home Loan Bank
FHLMC = Federal Home Loan Mortgage Corporation
FNMA = Federal National Mortgage Association
GNMA = Government National Mortgage Association
NR = Not Rated
"Other Securities" represent securities in the respective category that individually, or in the aggregate by issuer, do not exceed 1% of net assets.
* Non-income producing security.
** Ratings as per Standard & Poor's Corporation.
† Security is exempt from registration under Rule 144A of the Securities Act of 1933. These securities may be resold in transactions exempt from registration, normally to qualified institutional buyers. At June 30, 2012, the aggregate values of these securities and their percentages of the respective Funds' net assets were as follows:
| Fund | | Aggregate
Market
Value | | Percentage
of
Net Assets | |
| EQUITY INDEX FUND | | $ | 15,899,364 | | | | 1.5 | % | |
| ALL AMERICA FUND | | $ | 7,308,147 | | | | 2.9 | % | |
| SMALL CAP VALUE FUND | | $ | 12,296,666 | | | | 4.4 | % | |
| SMALL CAP GROWTH FUND | | $ | 9,399,777 | | | | 3.3 | % | |
| MID CAP VALUE FUND | | $ | 1,799,999 | | | | 3.6 | % | |
| MID-CAP EQUITY INDEX FUND | | $ | 7,999,782 | | | | 1.4 | % | |
| INTERNATIONAL FUND | | $ | 979,992 | | | | 1.2 | % | |
| COMPOSITE FUND | | $ | 5,227,752 | | | | 3.1 | % | |
| MONEY MARKET FUND | | $ | 60,959,864 | | | | 63.0 | % | |
| MID-TERM BOND FUND | | $ | 11,289,870 | | | | 3.3 | % | |
| BOND FUND | | $ | 18,999,764 | | | | 2.9 | % | |
(1) This security, or a portion thereof, has been segregated to cover initial margin requirements on open futures contracts. Information on futures contracts outstanding in the Funds as of June 30, 2012, were as follows:
| Fund | | Number of
Contracts | | Contract Type | | Purchased (P)
or Sold (S) | | Expiration
Date | | Underlying
Face Amount
at Value(a) | | Unrealized
Gain(Loss) | | Face Value
of Futures
as a %
of Total
Investments | |
| EQUITY INDEX FUND | | | 529 | | | E-mini S&P 500
Stock Index | | | P | | | September 2012 | | $ | 35,876,780 | | | $ | 908,243 | | | | 3.5 | % | |
| ALL AMERICA FUND | | | 63 | | | E-mini S&P 500
Stock Index | | | P | | | September 2012 | | $ | 4,272,660 | | | $ | 85,085 | | | | 1.7 | % | |
MID-CAP EQUITY
INDEX FUND | | | 245 | | | E-mini S&P MidCap
400 Stock Index | | | P | | | September 2012 | | $ | 23,017,750 | | | $ | 537,114 | | | | 4.1 | % | |
(a) Includes the cumulative appreciation(depreciation) of futures contracts, which is included in Net Unrealized Appreciation (Depreciation) of Investments and Futures Contracts in the Components of Net Assets section of the Statements of Assets and Liabilities. The Receivable or Payable for Daily Variation on Futures Contracts in the Statements of Assets and Liabilities only includes the current day's variation margin payable or receivable.
(2) The fund has an arrangement with its custodian bank, JP Morgan Chase Bank, whereby uninvested cash, subject to parameters set by the fund, is automatically invested in the fund's name by the bank in overnight commercial paper issued by J.P. Morgan Chase & Co. On the next business day, these funds (and earned interest) are automatically returned to the fund. The annual rate of interest earned on this temporary cash investment at June 30, 2012 was 0.15%.
(3) Percentage is less than 0.05%.
(4) U.S. Government guaranteed security.
43
MUTUAL OF AMERICA INVESTMENT CORPORATION
STATEMENTS OF ASSETS AND LIABILITIES
June 30, 2012 (Unaudited)
| | | Equity Index
Fund | | All America
Fund | | Small Cap
Value Fund | | Small Cap
Growth Fund | | Mid Cap
Value Fund | | Mid-Cap
Equity Index
Fund | | International
Fund | |
| ASSETS: | |
Investments at fair value
(Cost: Equity Index Fund — $827,845,711
All America Fund — $222,889,089
Small Cap Value Fund — $231,921,198
Small Cap Growth Fund — $243,740,885
Mid Cap Value Fund — $46,155,825
Mid-Cap Equity Index Fund — $492,485,094
International Fund — $84,837,189
Composite Fund — $147,645,272
Retirement Income Fund — $24,511,659
Retirement 2010 Fund — $19,721,499
Retirement 2015 Fund — $90,333,151
Retirement 2020 Fund — $125,185,143
Retirement 2025 Fund — $114,171,660)
(Notes 1 and 3) | | $ | 1,030,766,948 | | | $ | 255,505,540 | | | $ | 280,889,973 | | | $ | 288,755,858 | | | $ | 50,240,952 | | | $ | 556,854,353 | | | $ | 80,470,437 | | |
| Cash | | | 138,857 | | | | 629,559 | | | | 377,448 | | | | 699,982 | | | | 86,453 | | | | 96 | | | | 9,294 | | |
| Interest and dividends receivable | | | 1,297,444 | | | | 279,892 | | | | 209,057 | | | | 82,258 | | | | 61,133 | | | | 530,086 | | | | — | | |
| Receivable for securities sold | | | — | | | | 164,016 | | | | 315,928 | | | | — | | | | — | | | | 5,127,119 | | | | — | | |
| Receivable for daily variation margin on future contracts | | | 869,129 | | | | 107,100 | | | | — | | | | — | | | | — | | | | 651,480 | | | | — | | |
| TOTAL ASSETS | | | 1,033,072,378 | | | | 256,686,107 | | | | 281,792,406 | | | | 289,538,098 | | | | 50,388,538 | | | | 563,163,134 | | | | 80,479,731 | | |
| LIABILITIES: | |
| Payable for securities purchased | | | 1,694,750 | | | | 492,087 | | | | 1,549,336 | | | | 1,590,810 | | | | — | | | | 1,897,383 | | | | — | | |
| Other Liabilities | | | 154,182 | | | | 21,267 | | | | — | | | | — | | | | — | | | | — | | | | — | | |
| TOTAL LIABILITIES | | | 1,848,932 | | | | 513,354 | | | | 1,549,336 | | | | 1,590,810 | | | | — | | | | 1,897,383 | | | | — | | |
| NET ASSETS | | $ | 1,031,223,446 | | | $ | 256,172,753 | | | $ | 280,243,070 | | | $ | 287,947,288 | | | $ | 50,388,538 | | | $ | 561,265,751 | | | $ | 80,479,731 | | |
| NUMBER OF SHARES OUTSTANDING (Note 4) | | | 455,796,090 | | | | 146,010,880 | | | | 220,182,071 | | | | 231,854,568 | | | | 43,710,385 | | | | 362,409,355 | | | | 130,009,352 | | |
| NET ASSET VALUES, offering and redemption price per share | | $ | 2.26 | | | $ | 1.75 | | | $ | 1.27 | | | $ | 1.24 | | | $ | 1.15 | | | $ | 1.55 | | | $ | 0.62 | | |
| COMPONENTS OF NET ASSETS: | |
| Paid-in capital | | $ | 827,105,957 | | | $ | 231,987,270 | | | $ | 240,611,183 | | | $ | 226,160,573 | | | $ | 46,497,625 | | | $ | 462,882,268 | | | $ | 86,026,075 | | |
| Accumulated undistributed net investment income (loss) | | | 8,634,390 | | | | 1,656,247 | | | | 2,214,597 | | | | — | | | | 305,635 | | | | 3,341,967 | | | | 440,968 | | |
Accumulated undistributed net realized gain (loss)
on investments and futures contracts | | | (8,346,381 | ) | | | (10,172,300 | ) | | | (11,551,485 | ) | | | 16,771,742 | | | | (499,849 | ) | | | 30,135,143 | | | | (1,620,560 | ) | |
Net unrealized appreciation (depreciation)
of investments and futures contracts | | | 203,829,480 | | | | 32,701,536 | | | | 48,968,775 | | | | 45,014,973 | | | | 4,085,127 | | | | 64,906,373 | | | | (4,366,752 | ) | |
| NET ASSETS | | $ | 1,031,223,446 | | | $ | 256,172,753 | | | $ | 280,243,070 | | | $ | 287,947,288 | | | $ | 50,388,538 | | | $ | 561,265,751 | | | $ | 80,479,731 | | |
The accompanying notes are an integral part of these financial statements.
44
| | | Composite
Fund | | Retirement
Income
Fund | | 2010
Retirement
Fund | | 2015
Retirement
Fund | | 2020
Retirement
Fund | | 2025
Retirement
Fund | |
| ASSETS: | |
Investments at fair value
(Cost: Equity Index Fund — $827,845,711
All America Fund — $222,889,089
Small Cap Value Fund — $231,921,198
Small Cap Growth Fund — $243,740,885
Mid Cap Value Fund — $46,155,825
Mid-Cap Equity Index Fund — $492,485,094
International Fund — $84,837,189
Composite Fund — $147,645,272
Retirement Income Fund — $24,511,659
Retirement 2010 Fund — $19,721,499
Retirement 2015 Fund — $90,333,151
Retirement 2020 Fund — $125,185,143
Retirement 2025 Fund — $114,171,660)
(Notes 1 and 3) | | $ | 167,201,550 | | | $ | 25,635,071 | | | $ | 21,328,533 | | | $ | 101,587,255 | | | $ | 140,332,205 | | | $ | 129,660,261 | | |
| Cash | | | 70 | | | | | | | | | | | | | | | | | | | | | | |
| Interest and dividends receivable | | | 537,067 | | | | — | | | | — | | | | — | | | | — | | | | — | | |
| Receivable for securities sold | | | 256,387 | | | | — | | | | — | | | | — | | | | — | | | | — | | |
| Receivable for daily variation margin on future contracts | | | — | | | | — | | | | — | | | | — | | | | — | | | | — | | |
| TOTAL ASSETS | | | 167,995,074 | | | | 25,635,071 | | | | 21,328,533 | | | | 101,587,255 | | | | 140,332,205 | | | | 129,660,261 | | |
| LIABILITIES: | |
| Payable for securities purchased | | | 524,491 | | | | — | | | | — | | | | — | | | | — | | | | — | | |
| Other Liabilities | | | — | | | | — | | | | — | | | | — | | | | — | | | | — | | |
| TOTAL LIABILITIES | | | 524,491 | | | | — | | | | — | | | | — | | | | — | | | | — | | |
| NET ASSETS | | $ | 167,470,583 | | | $ | 25,635,071 | | | $ | 21,328,533 | | | $ | 101,587,255 | | | $ | 140,332,205 | | | $ | 129,660,261 | | |
| NUMBER OF SHARES OUTSTANDING (Note 4) | | | 106,826,907 | | | | 23,579,195 | | | | 21,020,352 | | | | 103,608,130 | | | | 146,934,892 | | | | 136,691,260 | | |
| NET ASSET VALUES, offering and redemption price per share | | $ | 1.57 | | | $ | 1.09 | | | $ | 1.01 | | | $ | 0.98 | | | $ | 0.96 | | | $ | 0.95 | | |
| COMPONENTS OF NET ASSETS: | |
| Paid-in capital | | $ | 160,816,930 | | | $ | 23,245,853 | | | $ | 18,551,406 | | | $ | 89,108,191 | | | $ | 124,116,152 | | | $ | 112,572,457 | | |
| Accumulated undistributed net investment income (loss) | | | 1,820,352 | | | | 598,298 | | | | 501,103 | | | | 2,132,728 | | | | 2,712,014 | | | | 2,312,037 | | |
Accumulated undistributed net realized gain (loss)
on investments and futures contracts | | | (14,722,977 | ) | | | 667,508 | | | | 668,990 | | | | (907,768 | ) | | | (1,643,023 | ) | | | (712,834 | ) | |
Net unrealized appreciation (depreciation)
of investments and futures contracts | | | 19,556,278 | | | | 1,123,412 | | | | 1,607,034 | | | | 11,254,104 | | | | 15,147,062 | | | | 15,488,601 | | |
| NET ASSETS | | $ | 167,470,583 | | | $ | 25,635,071 | | | $ | 21,328,533 | | | $ | 101,587,255 | | | $ | 140,332,205 | | | $ | 129,660,261 | | |
The accompanying notes are an integral part of these financial statements.
45
MUTUAL OF AMERICA INVESTMENT CORPORATION
STATEMENTS OF ASSETS AND LIABILITIES (Continued)
June 30, 2012 (Unaudited)
| | | 2030
Retirement
Fund | | 2035
Retirement
Fund | | 2040
Retirement
Fund | | 2045
Retirement
Fund | | Conservative
Allocation
Fund | |
| ASSETS: | |
Investments at fair value
(Cost: Retirement 2030 Fund — $93,022,440
Retirement 2035 Fund — $72,590,456
Retirement 2040 Fund — $66,289,732
Retirement 2045 Fund — $82,828,982
Conservative Allocation Fund — $69,027,142
Moderate Allocation Fund — $177,788,144
Aggressive Allocation Fund — $153,883,095
Money Market Fund — $96,795,807
Mid-Term Bond Fund — $319,000,621
Bond Fund — $618,290,726)
(Notes 1 and 3) | | $ | 106,509,390 | | | $ | 83,447,420 | | | $ | 75,776,015 | | | $ | 94,315,605 | | | $ | 74,981,764 | | |
| Cash | | | — | | | | — | | | | — | | | | — | | | | — | | |
| Interest and dividends receivable | | | — | | | | — | | | | — | | | | — | | | | — | | |
| Receivable for securities sold | | | — | | | | — | | | | — | | | | — | | | | — | | |
| Receivable for daily variation margin on future contracts | | | — | | | | — | | | | — | | | | — | | | | — | | |
| TOTAL ASSETS | | | 106,509,390 | | | | 83,447,420 | | | | 75,776,015 | | | | 94,315,605 | | | | 74,981,764 | | |
| LIABILITIES: | |
| Payable for securities purchased | | | — | | | | — | | | | — | | | | — | | | | — | | |
| Other Liabilities | | | — | | | | — | | | | — | | | | — | | | | — | | |
| TOTAL LIABILITIES | | | — | | | | — | | | | — | | | | — | | | | — | | |
| NET ASSETS | | $ | 106,509,390 | | | $ | 83,447,420 | | | $ | 75,776,015 | | | $ | 94,315,605 | | | $ | 74,981,764 | | |
| NUMBER OF SHARES OUTSTANDING (Note 4) | | | 112,746,033 | | | | 90,257,394 | | | | 82,832,141 | | | | 103,574,977 | | | | 64,920,961 | | |
| NET ASSET VALUES, offering and redemption price per share | | $ | 0.94 | | | $ | 0.92 | | | $ | 0.91 | | | $ | 0.91 | | | $ | 1.15 | | |
| COMPONENTS OF NET ASSETS: | |
| Paid-in capital | | $ | 91,907,103 | | | $ | 71,663,536 | | | $ | 65,285,269 | | | $ | 81,691,897 | | | $ | 67,666,853 | | |
| Accumulated undistributed net investment income (loss) | | | 1,804,778 | | | | 1,281,243 | | | | 1,115,985 | | | | 1,327,885 | | | | 1,854,505 | | |
Accumulated undistributed net realized gain (loss)
on investments and futures contracts | | | (689,441 | ) | | | (354,323 | ) | | | (111,522 | ) | | | (190,800 | ) | | | (494,216 | ) | |
Net unrealized appreciation (depreciation)
of investments and futures contracts | | | 13,486,950 | | | | 10,856,964 | | | | 9,486,283 | | | | 11,486,623 | | | | 5,954,622 | | |
| NET ASSETS | | $ | 106,509,390 | | | $ | 83,447,420 | | | $ | 75,776,015 | | | $ | 94,315,605 | | | $ | 74,981,764 | | |
The accompanying notes are an integral part of these financial statements.
46
| | | Moderate
Allocation
Fund | | Aggressive
Allocation
Fund | | Money
Market
Fund | | Mid-Term
Bond Fund | | Bond Fund | |
| ASSETS: | |
Investments at fair value
(Cost: Retirement 2030 Fund — $93,022,440
Retirement 2035 Fund — $72,590,456
Retirement 2040 Fund — $66,289,732
Retirement 2045 Fund — $82,828,982
Conservative Allocation Fund — $69,027,142
Moderate Allocation Fund — $177,788,144
Aggressive Allocation Fund — $153,883,095
Money Market Fund — $96,795,807
Mid-Term Bond Fund — $319,000,621
Bond Fund — $618,290,726)
(Notes 1 and 3) | | $ | 202,434,209 | | | $ | 175,154,136 | | | $ | 96,791,454 | | | $ | 341,394,718 | | | $ | 654,991,843 | | |
| Cash | | | — | | | | — | | | | 64 | | | | 47 | | | | 23 | | |
| Interest and dividends receivable | | | — | | | | — | | | | — | | | | 2,557,579 | | | | 5,371,994 | | |
| Receivable for securities sold | | | — | | | | — | | | | — | | | | 42,803 | | | | 195,169 | | |
| Receivable for daily variation margin on future contracts | | | — | | | | — | | | | — | | | | — | | | | — | | |
| TOTAL ASSETS | | | 202,434,209 | | | | 175,154,136 | | | | 96,791,518 | | | | 343,995,147 | | | | 660,559,029 | | |
| LIABILITIES: | |
| Payable for securities purchased | | | — | | | | — | | | | — | | | | — | | | | 3,952,028 | | |
| Other Liabilities | | | — | | | | — | | | | — | | | | — | | | | — | | |
| TOTAL LIABILITIES | | | — | | | | — | | | | — | | | | — | | | | 3,952,028 | | |
| NET ASSETS | | $ | 202,434,209 | | | $ | 175,154,136 | | | $ | 96,791,518 | | | $ | 343,995,147 | | | $ | 656,607,001 | | |
| NUMBER OF SHARES OUTSTANDING (Note 4) | | | 162,143,831 | | | | 131,448,649 | | | | 80,566,158 | | | | 318,706,907 | | | | 459,232,308 | | |
| NET ASSET VALUES, offering and redemption price per share | | $ | 1.25 | | | $ | 1.33 | | | $ | 1.20 | | | $ | 1.08 | | | $ | 1.43 | | |
| COMPONENTS OF NET ASSETS: | |
| Paid-in capital | | $ | 178,820,072 | | | $ | 154,773,627 | | | $ | 96,796,752 | | | $ | 314,990,143 | | | $ | 609,514,636 | | |
| Accumulated undistributed net investment income (loss) | | | 4,454,203 | | | | 3,143,042 | | | | — | | | | 5,157,581 | | | | 12,000,646 | | |
Accumulated undistributed net realized gain (loss)
on investments and futures contracts | | | (5,486,131 | ) | | | (4,033,574 | ) | | | (881 | ) | | | 1,453,326 | | | | (1,609,398 | ) | |
Net unrealized appreciation (depreciation)
of investments and futures contracts | | | 24,646,065 | | | | 21,271,041 | | | | (4,353 | ) | | | 22,394,097 | | | | 36,701,117 | | |
| NET ASSETS | | $ | 202,434,209 | | | $ | 175,154,136 | | | $ | 96,791,518 | | | $ | 343,995,147 | | | $ | 656,607,001 | | |
The accompanying notes are an integral part of these financial statements.
47
MUTUAL OF AMERICA INVESTMENT CORPORATION
STATEMENTS OF OPERATIONS
For the Six Months Ended June 30, 2012 (Unaudited)
| | | Equity Index
Fund | | All America
Fund | | Small Cap
Value Fund | | Small Cap
Growth Fund | | Mid Cap
Value Fund | | Mid-Cap
Equity Index
Fund | | International
Fund | |
| INVESTMENT INCOME AND EXPENSES: | |
| INCOME: | |
| Dividends | | $ | 10,438,878 | | | $ | 2,487,115 | | | $ | 3,448,500 | | | $ | 1,069,402 | | | $ | 487,872 | | | $ | 3,965,653 | | | $ | 507,478 | | |
| Interest | | | 15,339 | | | | 3,780 | | | | 6,964 | | | | 5,251 | | | | 760 | | | | 8,713 | | | | 170 | | |
| Total income | | | 10,454,217 | | | | 2,490,895 | | | | 3,455,464 | | | | 1,074,653 | | | | 488,632 | | | | 3,974,366 | | | | 507,648 | | |
| EXPENSES: | |
| Investment advisory fees (Note 2) | | | 374,783 | | | | 517,177 | | | | 1,032,321 | | | | 1,077,295 | | | | 143,038 | | | | 208,303 | | | | 28,743 | | |
| Accounting and recordkeeping expenses | | | 208,320 | | | | 41,320 | | | | 52,136 | | | | 55,692 | | | | 9,319 | | | | 113,464 | | | | 15,308 | | |
| Shareholders reports | | | 87,884 | | | | 17,432 | | | | 21,995 | | | | 23,495 | | | | 3,931 | | | | 47,867 | | | | 6,458 | | |
| Custodian expenses | | | 21,857 | | | | 34,821 | | | | 10,029 | | | | 11,220 | | | | 5,696 | | | | 15,784 | | | | 3,221 | | |
| Independent directors' fees and expenses | | | 23,762 | | | | 18,232 | | | | 21,596 | | | | 22,109 | | | | 2,641 | | | | 23,278 | | | | 4,339 | | |
| Audit | | | 51,783 | | | | 10,271 | | | | 12,960 | | | | 13,844 | | | | 2,316 | | | | 28,204 | | | | 3,805 | | |
| Legal and Compliance | | | 92,870 | | | | 18,420 | | | | 23,242 | | | | 24,828 | | | | 4,154 | | | | 50,583 | | | | 6,825 | | |
| Administrative | | | 219,164 | | | | 43,471 | | | | 54,850 | | | | 58,591 | | | | 9,804 | | | | 119,370 | | | | 16,105 | | |
| Licenses | | | 24,539 | | | | 4,867 | | | | 6,141 | | | | 6,560 | | | | 1,098 | | | | 13,366 | | | | 1,803 | | |
| Other | | | 22,362 | | | | 4,435 | | | | 5,597 | | | | 5,978 | | | | 1,000 | | | | 12,180 | | | | 1,643 | | |
| Total expenses | | | 1,127,324 | | | | 710,446 | | | | 1,240,867 | | | | 1,299,612 | | | | 182,997 | | | | 632,399 | | | | 88,250 | | |
| Net Investment Income (Loss) | | | 9,326,893 | | | | 1,780,449 | | | | 2,214,597 | | | | (224,959 | ) | | | 305,635 | | | | 3,341,967 | | | | 419,398 | | |
NET REALIZED AND UNREALIZED GAIN (LOSS) ON INVESTMENTS AND
FUTURES CONTRACTS (Note 1): | |
| Net realized gain (loss) on: | |
| Investment securities | | | (993,042 | ) | | | 6,411,252 | | | | 5,339,235 | | | | 16,018,653 | | | | 143,468 | | | | 10,559,360 | | | | (1,991 | ) | |
| Futures contracts | | | 1,922,137 | | | | 165,863 | | | | — | | | | — | | | | — | | | | (285,566 | ) | | | — | | |
| | | | 929,095 | | | | 6,577,115 | | | | 5,339,235 | | | | 16,018,653 | | | | 143,468 | | | | 10,273,794 | | | | (1,991 | ) | |
| Change in net unrealized appreciation (depreciation) of: | |
| Investment securities | | | 77,272,402 | | | | 14,081,722 | | | | 15,838,758 | | | | 2,572,881 | | | | 1,574,399 | | | | 25,847,918 | | | | 1,692,735 | | |
| Futures contracts | | | 925,947 | | | | 87,046 | | | | — | | | | — | | | | — | | | | 540,653 | | | | — | | |
| | | | 78,198,349 | | | | 14,168,768 | | | | 15,838,758 | | | | 2,572,881 | | | | 1,574,399 | | | | 26,388,571 | | | | 1,692,735 | | |
NET REALIZED AND UNREALIZED GAIN (LOSS) ON INVESTMENTS AND
FUTURES CONTRACTS | | | 79,127,444 | | | | 20,745,883 | | | | 21,177,993 | | | | 18,591,534 | | | | 1,717,867 | | | | 36,662,365 | | | | 1,690,744 | | |
| NET INCREASE (DECREASE) IN NET ASSETS RESULTING FROM OPERATIONS | | $ | 88,454,337 | | | $ | 22,526,332 | | | $ | 23,392,590 | | | $ | 18,366,575 | | | $ | 2,023,502 | | | $ | 40,004,332 | | | $ | 2,110,142 | | |
(a) The Retirement Funds incur no operating expenses other than those included in each of the underlying funds in which they invest. The Allocation Funds incur no advisory or operating expenses other than those included in each of the underlying funds in which they invest.
The accompanying notes are an integral part of these financial statements.
48
| | | Composite
Fund | | Retirement
Income
Fund | | 2010
Retirement
Fund | | 2015
Retirement
Fund | | 2020
Retirement
Fund | | 2025
Retirement
Fund | |
| INVESTMENT INCOME AND EXPENSES: | |
| INCOME: | |
| Dividends | | $ | 894,110 | | | $ | — | | | $ | — | | | $ | — | | | $ | — | | | $ | — | | |
| Interest | | | 1,361,723 | | | | — | | | | — | | | | — | | | | — | | | | — | | |
| Total income | | | 2,255,833 | | | | — | | | | — | | | | — | | | | — | | | | — | | |
| EXPENSES: | |
| Investment advisory fees (Note 2) | | | 333,804 | | | | 6,103 | (a) | | | 5,241 | (a) | | | 24,576 | (a) | | | 32,991 | (a) | | | 30,307 | (a) | |
| Accounting and recordkeeping expenses | | | 27,813 | | | | — | | | | — | | | | — | | | | — | | | | — | | |
| Shareholders reports | | | 11,734 | | | | — | | | | — | | | | — | | | | — | | | | — | | |
| Custodian expenses | | | 14,085 | | | | — | | | | — | | | | — | | | | — | | | | — | | |
| Independent directors' fees and expenses | | | 19,010 | | | | — | | | | — | | | | — | | | | — | | | | — | | |
| Audit | | | 6,914 | | | | — | | | | — | | | | — | | | | — | | | | — | | |
| Legal and Compliance | | | 12,399 | | | | — | | | | — | | | | — | | | | — | | | | — | | |
| Administrative | | | 29,261 | | | | — | | | | — | | | | — | | | | — | | | | — | | |
| Licenses | | | 3,276 | | | | — | | | | — | | | | — | | | | — | | | | — | | |
| Other | | | 2,986 | | | | — | | | | — | | | | — | | | | — | | | | — | | |
| Total expenses | | | 461,282 | | | | 6,103 | | | | 5,241 | | | | 24,576 | | | | 32,991 | | | | 30,307 | | |
| Net Investment Income (Loss) | | | 1,794,551 | | | | (6,103 | ) | | | (5,241 | ) | | | (24,576 | ) | | | (32,991 | ) | | | (30,307 | ) | |
NET REALIZED AND UNREALIZED GAIN (LOSS) ON INVESTMENTS AND
FUTURES CONTRACTS (Note 1): | |
| Net realized gain (loss) on: | |
| Investment securities | | | 2,548,647 | | | | 124,550 | | | | 561,657 | | | | 677,000 | | | | 55,360 | | | | 8,079 | | |
| Futures contracts | | | — | | | | — | | | | — | | | | — | | | | — | | | | — | | |
| | | | 2,548,647 | | | | 124,550 | | | | 561,657 | | | | 677,000 | | | | 55,360 | | | | 8,079 | | |
| Change in net unrealized appreciation (depreciation) of: | |
| Investment securities | | | 6,176,229 | | | | 793,449 | | | | 445,494 | | | | 4,317,504 | | | | 7,232,179 | | | | 7,477,125 | | |
| Futures contracts | | | — | | | | — | | | | — | | | | — | | | | — | | | | — | | |
| | | | 6,176,229 | | | | 793,449 | | | | 445,494 | | | | 4,317,504 | | | | 7,232,179 | | | | 7,477,125 | | |
NET REALIZED AND UNREALIZED GAIN (LOSS) ON INVESTMENTS AND
FUTURES CONTRACTS | | | 8,724,876 | | | | 917,999 | | | | 1,007,151 | | | | 4,994,504 | | | | 7,287,539 | | | | 7,485,204 | | |
| NET INCREASE (DECREASE) IN NET ASSETS RESULTING FROM OPERATIONS | | $ | 10,519,427 | | | $ | 911,896 | | | $ | 1,001,910 | | | $ | 4,969,928 | | | $ | 7,254,548 | | | $ | 7,454,897 | | |
The accompanying notes are an integral part of these financial statements.
49
MUTUAL OF AMERICA INVESTMENT CORPORATION
STATEMENTS OF OPERATIONS (Continued)
For the Six Months Ended June 30, 2012 (Unaudited)
| | | 2030
Retirement
Fund | | 2035
Retirement
Fund | | 2040
Retirement
Fund | | 2045
Retirement
Fund | | Conservative
Allocation
Fund | |
| INVESTMENT INCOME AND EXPENSES: | |
| INCOME: | |
| Dividends | | $ | — | | | $ | — | | | $ | — | | | $ | — | | | $ | — | | |
| Interest | | | — | | | | — | | | | — | | | | — | | | | — | | |
| Total income | | | | | — | | | | — | | | | — | | | | — | | |
| EXPENSES: | |
| Investment advisory fees (Note 2) | | | 25,060 | (a) | | | 19,568 | (a) | | | 17,607 | (a) | | | 21,657 | (a) | | | — | (a) | |
| Accounting and recordkeeping expenses | | | — | | | | — | | | | — | | | | — | | | | — | | |
| Shareholders reports | | | — | | | | — | | | | — | | | | — | | | | — | | |
| Custodian expenses | | | — | | | | — | | | | — | | | | — | | | | — | | |
| Independent directors' fees and expenses | | | — | | | | — | | | | — | | | | — | | | | — | | |
| Audit | | | — | | | | — | | | | — | | | | — | | | | — | | |
| Legal and Compliance | | | — | | | | — | | | | — | | | | — | | | | — | | |
| Administrative | | | — | | | | — | | | | — | | | | — | | | | — | | |
| Licenses | | | — | | | | — | | | | — | | | | — | | | | — | | |
| Other | | | — | | | | — | | | | — | | | | — | | | | — | | |
| Total expenses | | | 25,060 | | | | 19,568 | | | | 17,607 | | | | 21,657 | | | | — | | |
| Net Investment Income (Loss) | | | (25,060 | ) | | | (19,568 | ) | | | (17,607 | ) | | | (21,657 | ) | | | — | | |
| NET REALIZED AND UNREALIZED GAIN (LOSS) ON INVESTMENTS AND FUTURES CONTRACTS (Note 1): | |
| Net realized gain(loss) on: | |
| Investment securities | | | (5,795 | ) | | | 3,452 | | | | 2,526 | | | | (6,781 | ) | | | 221,546 | | |
| Futures contracts | | | — | | | | — | | | | — | | | | — | | | | — | | |
| | | | (5,795 | ) | | | 3,452 | | | | 2,526 | | | | (6,781 | ) | | | 221,546 | | |
| Change in net unrealized appreciation (depreciation) of: | |
| Investment securities | | | 6,492,089 | | | | 5,183,540 | | | | 4,599,318 | | | | 5,633,765 | | | | 2,612,823 | | |
| Futures contracts | | | — | | | | — | | | | — | | | | — | | | | — | | |
| | | | 6,492,089 | | | | 5,183,540 | | | | 4,599,318 | | | | 5,633,765 | | | | 2,612,823 | | |
| NET REALIZED AND UNREALIZED GAIN (LOSS) ON INVESTMENTS AND FUTURES CONTRACTS | | | 6,486,294 | | | | 5,186,992 | | | | 4,601,844 | | | | 5,626,984 | | | | 2,834,369 | | |
| NET INCREASE (DECREASE) IN NET ASSETS RESULTING FROM OPERATIONS | | $ | 6,461,234 | | | $ | 5,167,424 | | | $ | 4,584,237 | | | $ | 5,605,327 | | | $ | 2,834,369 | | |
(a) The Retirement Funds incur no operating expenses other than those included in each of the underlying funds in which they invest. The Allocation Funds incur no advisory or operating expenses other than those included in each of the underlying funds in which they invest.
The accompanying notes are an integral part of these financial statements.
50
| | | Moderate
Allocation
Fund | | Aggressive
Allocation
Fund | | Money
Market
Fund | | Mid-Term
Bond Fund | | Bond Fund | |
| INVESTMENT INCOME AND EXPENSES: | |
| INCOME: | |
| Dividends | | $ | — | | | $ | — | | | $ | — | | | $ | — | | | $ | — | | |
| Interest | | | — | | | | — | | | | 52,082 | | | | 5,984,557 | | | | 13,629,834 | | |
| Total income | | | | | | | 52,082 | | | | 5,984,557 | | | | 13,629,834 | | |
| EXPENSES: | |
| Investment advisory fees (Note 2) | | | — | (a) | | | — | (a) | | | 73,439 | | | | 677,958 | | | | 1,282,405 | | |
| Accounting and recordkeeping expenses | | | — | | | | — | | | | 15,199 | | | | 75,522 | | | | 144,145 | | |
| Shareholders reports | | | — | | | | — | | | | 6,412 | | | | 31,861 | | | | 60,811 | | |
| Custodian expenses | | | — | | | | — | | | | 7,125 | | | | 7,578 | | | | 19,160 | | |
| Independent directors' fees and expenses | | | — | | | | — | | | | 17,726 | | | | 25,426 | | | | 25,653 | | |
| Audit | | | — | | | | — | | | | 3,778 | | | | 18,773 | | | | 35,831 | | |
| Legal and Compliance | | | — | | | | — | | | | 6,776 | | | | 33,668 | | | | 64,260 | | |
| Administrative | | | — | | | | — | | | | 15,990 | | | | 79,454 | | | | 151,648 | | |
| Licenses | | | — | | | | — | | | | 1,790 | | | | 8,896 | | | | 16,980 | | |
| Other | | | — | | | | — | | | | 1,632 | | | | 8,107 | | | | 15,473 | | |
| Total expenses | | | — | | | | — | | | | 149,867 | | | | 967,243 | | | | 1,816,366 | | |
| Net Investment Income (Loss) | | | — | | | | — | | | | (97,785 | ) | | | 5,017,314 | | | | 11,813,468 | | |
| NET REALIZED AND UNREALIZED GAIN (LOSS) ON INVESTMENTS AND FUTURES CONTRACTS (Note 1): | |
| Net realized gain(loss) on: | |
| Investment securities | | | 64,208 | | | | 3,144 | | | | (323 | ) | | | 608,544 | | | | 5,609,012 | | |
| Futures contracts | | | — | | | | — | | | | — | | | | — | | | | — | | |
| | | | 64,208 | | | | 3,144 | | | | (323 | ) | | | 608,544 | | | | 5,609,012 | | |
| Change in net unrealized appreciation (depreciation) of: | |
| Investment securities | | | 10,660,653 | | | | 11,766,458 | | | | 5,428 | | | | 608,050 | | | | 1,153,745 | | |
| Futures contracts | | | — | | | | — | | | | — | | | | — | | | | — | | |
| | | | 10,660,653 | | | | 11,766,458 | | | | 5,428 | | | | 608,050 | | | | 1,153,745 | | |
| NET REALIZED AND UNREALIZED GAIN (LOSS) ON INVESTMENTS AND FUTURES CONTRACTS | | | 10,724,861 | | | | 11,769,602 | | | | 5,105 | | | | 1,216,594 | | | | 6,762,757 | | |
| NET INCREASE (DECREASE) IN NET ASSETS RESULTING FROM OPERATIONS | | $ | 10,724,861 | | | $ | 11,769,602 | | | $ | (92,680 | ) | | $ | 6,233,908 | | | $ | 18,576,225 | | |
The accompanying notes are an integral part of these financial statements.
51
MUTUAL OF AMERICA INVESTMENT CORPORATION
STATEMENTS OF CHANGES IN NET ASSETS
| | | Equity Index Fund | | All America Fund | | Small Cap Value Fund | |
| | | For the Six
Months Ended
June 30,
2012
(Unaudited) | | For the
Year Ended
December 31,
2011 | | For the Six
Months Ended
June 30,
2012
(Unaudited) | | For the
Year Ended
December 31,
2011 | | For the Six
Months Ended
June 30,
2012
(Unaudited) | | For the
Year Ended
December 31,
2011 | |
| INCREASE (DECREASE) IN NET ASSETS: | |
| FROM OPERATIONS: | |
| Net investment income (loss) | | $ | 9,326,893 | | | $ | 16,802,930 | | | $ | 1,780,449 | | | $ | 3,252,974 | | | $ | 2,214,597 | | | $ | 2,565,895 | | |
| Net realized gain (loss) on investments and futures contracts | | | 929,095 | | | | 1,199,991 | | | | 6,577,115 | | | | 10,836,801 | | | | 5,339,235 | | | | 14,130,799 | | |
Change in net unrealized appreciation (depreciation) of investments and
futures contracts | | | 78,198,349 | | | | (377,096 | ) | | | 14,168,768 | | | | (13,294,248 | ) | | | 15,838,758 | | | | (23,731,915 | ) | |
| NET INCREASE (DECREASE) IN NET ASSETS RESULTING FROM OPERATIONS | | | 88,454,337 | | | | 17,625,825 | | | | 22,526,332 | | | | 795,527 | | | | 23,392,590 | | | | (7,035,221 | ) | |
| DIVIDEND DISTRIBUTIONS (Note 5) | |
| From net investment income | | | — | | | | (18,904,206 | ) | | | — | | | | (6,317,474 | ) | | | — | | | | (2,548,887 | ) | |
| From capital gains | | | — | | | | — | | | | — | | | | — | | | | — | | | | — | | |
| Total distributions | | | — | | | | (18,904,206 | ) | | | — | | | | (6,317,474 | ) | | | — | | | | (2,548,887 | ) | |
| CAPITAL SHARE TRANSACTIONS (Note 4): | |
| Net proceeds from sale of shares | | | 52,705,296 | | | | 115,501,542 | | | | 2,871,727 | | | | 7,840,554 | | | | 8,512,001 | | | | 20,202,900 | | |
| Dividends reinvested | | | — | | | | 18,904,206 | | | | — | | | | 6,317,474 | | | | — | | | | 2,548,887 | | |
| Cost of shares redeemed | | | (38,594,570 | ) | | | (109,845,972 | ) | | | (19,476,118 | ) | | | (28,895,564 | ) | | | (11,176,659 | ) | | | (30,842,376 | ) | |
| NET INCREASE (DECREASE) IN NET ASSETS FROM CAPITAL SHARE TRANSACTIONS | | | 14,110,726 | | | | 24,559,776 | | | | (16,604,391 | ) | | | (14,737,536 | ) | | | (2,664,658 | ) | | | (8,090,589 | ) | |
| INCREASE (DECREASE) IN NET ASSETS | | | 102,565,063 | | | | 23,281,395 | | | | 5,921,941 | | | | (20,259,483 | ) | | | 20,727,932 | | | | (17,674,697 | ) | |
| NET ASSETS, BEGINNING OF PERIOD | | | 928,658,383 | | | | 905,376,988 | | | | 250,250,812 | | | | 270,510,295 | | | | 259,515,138 | | | | 277,189,835 | | |
| NET ASSETS, END OF PERIOD | | $ | 1,031,223,446 | | | $ | 928,658,383 | | | $ | 256,172,753 | | | $ | 250,250,812 | | | $ | 280,243,070 | | | $ | 259,515,138 | | |
| ACCUMULATED UNDISTRIBUTED NET INVESTMENT INCOME (LOSS) | | $ | 8,634,390 | | | $ | (692,503 | ) | | $ | 1,656,247 | | | $ | (124,202 | ) | | $ | 2,214,597 | | | $ | — | | |
| OTHER INFORMATION: | |
| Shares outstanding at the beginning of period | | | 449,187,528 | | | | 436,979,517 | | | | 155,472,750 | | | | 164,065,152 | | | | 222,210,260 | | | | 229,217,197 | | |
| Shares sold | | | 23,652,573 | | | | 54,523,607 | | | | 1,660,577 | | | | 4,571,499 | | | | 6,808,502 | | | | 16,565,987 | | |
| Shares issued as reinvestment of dividends | | | — | | | | 9,209,608 | | | | — | | | | 4,099,118 | | | | — | | | | 2,173,743 | | |
| Shares redeemed | | | (17,044,011 | ) | | | (51,525,204 | ) | | | (11,122,447 | ) | | | (17,263,019 | ) | | | (8,836,691 | ) | | | (25,746,667 | ) | |
| Net increase (decrease) | | | 6,608,562 | | | | 12,208,011 | | | | (9,461,870 | ) | | | (8,592,402 | ) | | | (2,028,189 | ) | | | (7,006,937 | ) | |
| Shares outstanding at the end of period | | | 455,796,090 | | | | 449,187,528 | | | | 146,010,880 | | | | 155,472,750 | | | | 220,182,071 | | | | 222,210,260 | | |
The accompanying notes are an integral part of these financial statements.
52
| | | Small Cap Growth Fund | | Mid-Cap Value Fund | | Mid-Cap Equity Index Fund | |
| | | For the Six
Months Ended
June 30,
2012
(Unaudited) | | For the
Year Ended
December 31,
2011 | | For the Six
Months Ended
June 30,
2012
(Unaudited) | | For the
Year Ended
December 31,
2011 | | For the Six
Months Ended
June 30,
2012
(Unaudited) | | For the
Year Ended
December 31,
2011 | |
| INCREASE (DECREASE) IN NET ASSETS: | |
| FROM OPERATIONS: | |
| Net investment income (loss) | | $ | (224,959 | ) | | $ | (888,732 | ) | | $ | 305,635 | | | $ | 634,548 | | | $ | 3,341,967 | | | $ | 5,941,732 | | |
| Net realized gain (loss) on investments and futures contracts | | | 16,018,653 | | | | 31,496,456 | | | | 143,468 | | | | 994,607 | | | | 10,273,794 | | | | 21,902,626 | | |
Change in net unrealized appreciation (depreciation) of investments and
futures contracts | | | 2,572,881 | | | | (38,320,121 | ) | | | 1,574,399 | | | | (2,666,651 | ) | | | 26,388,571 | | | | (40,405,479 | ) | |
| NET INCREASE (DECREASE) IN NET ASSETS RESULTING FROM OPERATIONS | | | 18,366,575 | | | | (7,712,397 | ) | | | 2,023,502 | | | | (1,037,496 | ) | | | 40,004,332 | | | | (12,561,121 | ) | |
| DIVIDEND DISTRIBUTIONS (Note 5) | |
| From net investment income | | | — | | | | — | | | | — | | | | (628,396 | ) | | | — | | | | (6,190,609 | ) | |
| From capital gains | | | — | | | | — | | | | — | | | | — | | | | — | | | | (8,969,464 | ) | |
| Total distributions | | | — | | | | — | | | | — | | | | (628,396 | ) | | | — | | | | (15,160,073 | ) | |
| CAPITAL SHARE TRANSACTIONS (Note 4): | |
| Net proceeds from sale of shares | | | 10,187,026 | | | | 32,797,199 | | | | 2,210,945 | | | | 5,346,389 | | | | 33,221,426 | | | | 84,977,973 | | |
| Dividends reinvested | | | — | | | | — | | | | — | | | | 628,396 | | | | — | | | | 15,160,073 | | |
| Cost of shares redeemed | | | (12,035,052 | ) | | | (34,423,945 | ) | | | (4,814,453 | ) | | | (8,030,202 | ) | | | (17,283,431 | ) | | | (60,933,929 | ) | |
| NET INCREASE (DECREASE) IN NET ASSETS FROM CAPITAL SHARE TRANSACTIONS | | | (1,848,026 | ) | | | (1,626,746 | ) | | | (2,603,508 | ) | | | (2,055,417 | ) | | | 15,937,995 | | | | 39,204,117 | | |
| INCREASE (DECREASE) IN NET ASSETS | | | 16,518,549 | | | | (9,339,143 | ) | | | (580,006 | ) | | | (3,721,309 | ) | | | 55,942,327 | | | | 11,482,923 | | |
| NET ASSETS, BEGINNING OF PERIOD | | | 271,428,739 | | | | 280,767,882 | | | | 50,968,544 | | | | 54,689,853 | | | | 505,323,424 | | | | 493,840,501 | | |
| NET ASSETS, END OF PERIOD | | $ | 287,947,288 | | | $ | 271,428,739 | | | $ | 50,388,538 | | | $ | 50,968,544 | | | $ | 561,265,751 | | | $ | 505,323,424 | | |
| ACCUMULATED UNDISTRIBUTED NET INVESTMENT INCOME (LOSS) | | $ | — | | | $ | — | | | $ | 305,635 | | | $ | — | | | $ | 3,341,967 | | | $ | — | | |
| OTHER INFORMATION: | |
| Shares outstanding at the beginning of period | | | 233,295,435 | | | | 235,799,898 | | | | 45,857,125 | | | | 47,569,341 | | | | 352,190,597 | | | | 326,716,727 | | |
| Shares sold | | | 8,233,998 | | | | 26,887,842 | | | | 1,895,818 | | | | 4,561,657 | | | | 21,321,780 | | | | 54,650,356 | | |
| Shares issued as reinvestment of dividends | | | — | | | | — | | | | — | | | | 561,926 | | | | — | | | | 11,117,003 | | |
| Shares redeemed | | | (9,674,865 | ) | | | (29,392,305 | ) | | | (4,042,558 | ) | | | (6,835,799 | ) | | | (11,103,022 | ) | | | (40,293,489 | ) | |
| Net increase (decrease) | | | (1,440,867 | ) | | | (2,504,463 | ) | | | (2,146,740 | ) | | | (1,712,216 | ) | | | 10,218,758 | | | | 25,473,870 | | |
| Shares outstanding at the end of period | | | 231,854,568 | | | | 233,295,435 | | | | 43,710,385 | | | | 45,857,125 | | | | 362,409,355 | | | | 352,190,597 | | |
The accompanying notes are an integral part of these financial statements.
53
MUTUAL OF AMERICA INVESTMENT CORPORATION
STATEMENTS OF CHANGES IN NET ASSETS (Continued)
| | | International Fund | | Composite Fund | | Retirement Income Fund | |
| | | For the Six
Months Ended
June 30,
2012
(Unaudited) | | For the
Year Ended
December 31,
2011 | | For the Six
Months Ended
June 30,
2012
(Unaudited) | | For the
Year Ended
December 31,
2011 | | For the Six
Months Ended
June 30,
2012
(Unaudited) | | For the
Year Ended
December 31,
2011 | |
| INCREASE (DECREASE) IN NET ASSETS: | |
| FROM OPERATIONS: | |
| Net investment income (loss) | | $ | 419,398 | | | $ | 2,157,164 | | | $ | 1,794,551 | | | $ | 3,683,548 | | | $ | (6,103 | ) | | $ | 605,283 | | |
| Net realized gain (loss) on investments and futures contracts | | | (1,991 | ) | | | (41,804 | ) | | | 2,548,647 | | | | 2,281,819 | | | | 124,550 | | | | 708,815 | | |
Change in net unrealized appreciation (depreciation) of investments and
futures contracts | | | 1,692,735 | | | | (11,076,546 | ) | | | 6,176,229 | | | | (1,670,945 | ) | | | 793,449 | | | | (390,018 | ) | |
| NET INCREASE (DECREASE) IN NET ASSETS RESULTING FROM OPERATIONS | | | 2,110,142 | | | | (8,961,186 | ) | | | 10,519,427 | | | | 4,294,422 | | | | 911,896 | | | | 924,080 | | |
| DIVIDEND DISTRIBUTIONS (Note 5) | |
| From net investment income | | | — | | | | (2,142,256 | ) | | | — | | | | (7,396,780 | ) | | | — | | | | (478,508 | ) | |
| From capital gains | | | — | | | | (211,930 | ) | | | — | | | | — | | | | — | | | | (47,419 | ) | |
| Total distributions | | | — | | | | (2,354,186 | ) | | | — | | | | (7,396,780 | ) | | | — | | | | (525,927 | ) | |
| CAPITAL SHARE TRANSACTIONS (Note 4): | |
| Net proceeds from sale of shares | | | 10,863,856 | | | | 21,481,303 | | | | 2,930,091 | | | | 8,108,962 | | | | 3,554,250 | | | | 9,779,827 | | |
| Dividends reinvested | | | — | | | | 2,354,186 | | | | — | | | | 7,396,780 | | | | — | | | | 525,927 | | |
| Cost of shares redeemed | | | (1,255,544 | ) | | | (4,866,870 | ) | | | (7,031,456 | ) | | | (18,027,578 | ) | | | (2,100,164 | ) | | | (5,580,493 | ) | |
| NET INCREASE (DECREASE) IN NET ASSETS FROM CAPITAL SHARE TRANSACTIONS | | | 9,608,312 | | | | 18,968,619 | | | | (4,101,365 | ) | | | (2,521,836 | ) | | | 1,454,086 | | | | 4,725,261 | | |
| INCREASE (DECREASE) IN NET ASSETS | | | 11,718,454 | | | | 7,653,247 | | | | 6,418,062 | | | | (5,624,194 | ) | | | 2,365,982 | | | | 5,123,414 | | |
| NET ASSETS, BEGINNING OF PERIOD | | | 68,761,277 | | | | 61,108,030 | | | | 161,052,521 | | | | 166,676,715 | | | | 23,269,089 | | | | 18,145,675 | | |
| NET ASSETS, END OF PERIOD | | $ | 80,479,731 | | | $ | 68,761,277 | | | $ | 167,470,583 | | | $ | 161,052,521 | | | $ | 25,635,071 | | | $ | 23,269,089 | | |
| ACCUMULATED UNDISTRIBUTED NET INVESTMENT INCOME (LOSS) | | $ | 440,968 | | | $ | 21,570 | | | $ | 1,820,352 | | | $ | 25,801 | | | $ | 598,298 | | | $ | 598,298 | | |
| OTHER INFORMATION: | |
| Shares outstanding at the beginning of period | | | 114,779,271 | | | | 86,063,890 | | | | 109,476,608 | | | | 111,151,229 | | | | 22,240,340 | | | | 17,677,383 | | |
| Shares sold | | | 17,296,053 | | | | 31,688,865 | | | | 1,874,846 | | | | 5,170,990 | | | | 3,298,211 | | | | 9,320,778 | | |
| Shares issued as reinvestment of dividends | | | — | | | | 3,924,540 | | | | — | | | | 5,121,567 | | | | — | | | | 519,182 | | |
| Shares redeemed | | | (2,065,972 | ) | | | (6,898,024 | ) | | | (4,524,547 | ) | | | (11,967,178 | ) | | | (1,959,356 | ) | | | (5,277,003 | ) | |
| Net increase (decrease) | | | 15,230,081 | | | | 28,715,381 | | | | (2,649,701 | ) | | | (1,674,621 | ) | | | 1,338,855 | | | | 4,562,957 | | |
| Shares outstanding at the end of period | | | 130,009,352 | | | | 114,779,271 | | | | 106,826,907 | | | | 109,476,608 | | | | 23,579,195 | | | | 22,240,340 | | |
The accompanying notes are an integral part of these financial statements.
54
| | | 2010 Retirement Fund | | 2015 Retirement Fund | | 2020 Retirement Fund | |
| | | For the Six
Months Ended
June 30,
2012
(Unaudited) | | For the
Year Ended
December 31,
2011 | | For the Six
Months Ended
June 30,
2012
(Unaudited) | | For the
Year Ended
December 31,
2011 | | For the Six
Months Ended
June 30,
2012
(Unaudited) | | For the
Year Ended
December 31,
2011 | |
| INCREASE (DECREASE) IN NET ASSETS: | |
| FROM OPERATIONS: | |
| Net investment income (loss) | | $ | (5,241 | ) | | $ | 507,104 | | | $ | (24,576 | ) | | $ | 2,165,457 | | | $ | (32,991 | ) | | $ | 2,761,452 | | |
| Net realized gain (loss) on investments and futures contracts | | | 561,657 | | | | 953,249 | | | | 677,000 | | | | 890,433 | | | | 55,360 | | | | 197,700 | | |
Change in net unrealized appreciation (depreciation) of investments and
futures contracts | | | 445,494 | | | | (897,953 | ) | | | 4,317,504 | | | | (1,432,237 | ) | | | 7,232,179 | | | | (1,547,109 | ) | |
| NET INCREASE (DECREASE) IN NET ASSETS RESULTING FROM OPERATIONS | | | 1,001,910 | | | | 562,400 | | | | 4,969,928 | | | | 1,623,653 | | | | 7,254,548 | | | | 1,412,043 | | |
| DIVIDEND DISTRIBUTIONS (Note 5) | |
| From net investment income | | | — | | | | (441,941 | ) | | | — | | | | (1,729,238 | ) | | | — | | | | (1,955,796 | ) | |
| From capital gains | | | — | | | | (25,781 | ) | | | — | | | | (120,136 | ) | | | — | | | | (139,097 | ) | |
| Total distributions | | | — | | | | (467,722 | ) | | | — | | | | (1,849,374 | ) | | | — | | | | (2,094,893 | ) | |
| CAPITAL SHARE TRANSACTIONS (Note 4): | |
| Net proceeds from sale of shares | | | 2,621,506 | | | | 6,037,036 | | | | 10,465,572 | | | | 20,326,509 | | | | 17,659,400 | | | | 33,106,062 | | |
| Dividends reinvested | | | — | | | | 467,722 | | | | — | | | | 1,849,374 | | | | — | | | | 2,094,893 | | |
| Cost of shares redeemed | | | (2,876,876 | ) | | | (5,194,258 | ) | | | (4,785,972 | ) | | | (9,140,521 | ) | | | (2,566,534 | ) | | | (6,988,453 | ) | |
| NET INCREASE (DECREASE) IN NET ASSETS FROM CAPITAL SHARE TRANSACTIONS | | | (255,370 | ) | | | 1,310,500 | | | | 5,679,600 | | | | 13,035,362 | | | | 15,092,866 | | | | 28,212,502 | | |
| INCREASE (DECREASE) IN NET ASSETS | | | 746,540 | | | | 1,405,178 | | | | 10,649,528 | | | | 12,809,641 | | | | 22,347,414 | | | | 27,529,652 | | |
| NET ASSETS, BEGINNING OF PERIOD | | | 20,581,993 | | | | 19,176,815 | | | | 90,937,727 | | | | 78,128,086 | | | | 117,984,791 | | | | 90,455,139 | | |
| NET ASSETS, END OF PERIOD | | $ | 21,328,533 | | | $ | 20,581,993 | | | $ | 101,587,255 | | | $ | 90,937,727 | | | $ | 140,332,205 | | | $ | 117,984,791 | | |
| ACCUMULATED UNDISTRIBUTED NET INVESTMENT INCOME (LOSS) | | $ | 501,103 | | | $ | 501,103 | | | $ | 2,132,728 | | | $ | 2,132,728 | | | $ | 2,712,014 | | | $ | 2,712,014 | | |
| OTHER INFORMATION: | |
| Shares outstanding at the beginning of period | | | 21,291,136 | | | | 19,977,014 | | | | 97,748,763 | | | | 83,797,669 | | | | 131,001,202 | | | | 99,880,789 | | |
| Shares sold | | | 2,595,645 | | | | 6,160,261 | | | | 10,783,153 | | | | 21,464,309 | | | | 18,669,677 | | | | 36,290,152 | | |
| Shares issued as reinvestment of dividends | | | — | | | | 507,013 | | | | — | | | | 2,097,793 | | | | — | | | | 2,477,827 | | |
| Shares redeemed | | | (2,866,429 | ) | | | (5,353,152 | ) | | | (4,923,786 | ) | | | (9,611,008 | ) | | | (2,735,987 | ) | | | (7,647,566 | ) | |
| Net increase (decrease) | | | (270,784 | ) | | | 1,314,122 | | | | 5,859,367 | | | | 13,951,094 | | | | 15,933,690 | | | | 31,120,413 | | |
| Shares outstanding at the end of period | | | 21,020,352 | | | | 21,291,136 | | | | 103,608,130 | | | | 97,748,763 | | | | 146,934,892 | | | | 131,001,202 | | |
The accompanying notes are an integral part of these financial statements.
55
MUTUAL OF AMERICA INVESTMENT CORPORATION
STATEMENTS OF CHANGES IN NET ASSETS (Continued)
| | | 2025 Retirement Fund | | 2030 Retirement Fund | | 2035 Retirement Fund | |
| | | For the Six
Months Ended
June 30,
2012
(Unaudited) | | For the
Year Ended
December 31,
2011 | | For the Six
Months Ended
June 30,
2012
(Unaudited) | | For the
Year Ended
December 31,
2011 | | For the Six
Months Ended
June 30,
2012
(Unaudited) | | For the
Year Ended
December 31,
2011 | |
| INCREASE (DECREASE) IN NET ASSETS: | |
| FROM OPERATIONS: | |
| Net investment income (loss) | | $ | (30,307 | ) | | $ | 2,357,359 | | | $ | (25,060 | ) | | $ | 1,837,878 | | | $ | (19,568 | ) | | $ | 1,302,656 | | |
| Net realized gain (loss) on investments and futures contracts | | | 8,079 | | | | 268,218 | | | | (5,795 | ) | | | 248,287 | | | | 3,452 | | | | 242,917 | | |
Change in net unrealized appreciation (depreciation) of investments and
futures contracts | | | 7,477,125 | | | | (2,097,902 | ) | | | 6,492,089 | | | | (2,104,574 | ) | | | 5,183,540 | | | | (1,957,978 | ) | |
| NET INCREASE (DECREASE) IN NET ASSETS RESULTING FROM OPERATIONS | | | 7,454,897 | | | | 527,675 | | | | 6,461,234 | | | | (18,409 | ) | | | 5,167,424 | | | | (412,405 | ) | |
| DIVIDEND DISTRIBUTIONS (Note 5) | |
| From net investment income | | | — | | | | (1,518,829 | ) | | | — | | | | (1,162,444 | ) | | | — | | | | (836,651 | ) | |
| From capital gains | | | — | | | | (201,103 | ) | | | — | | | | (195,986 | ) | | | — | | | | (173,801 | ) | |
| Total distributions | | | — | | | | (1,719,932 | ) | | | — | | | | (1,358,430 | ) | | | — | | | | (1,010,452 | ) | |
| CAPITAL SHARE TRANSACTIONS (Note 4): | |
| Net proceeds from sale of shares | | | 14,908,844 | | | | 32,624,713 | | | | 11,831,771 | | | | 27,048,601 | | | | 10,040,174 | | | | 19,402,632 | | |
| Dividends reinvested | | | — | | | | 1,719,932 | | | | — | | | | 1,358,430 | | | | — | | | | 1,010,452 | | |
| Cost of shares redeemed | | | (2,192,470 | ) | | | (4,182,066 | ) | | | (2,018,372 | ) | | | (4,198,317 | ) | | | (812,154 | ) | | | (2,779,132 | ) | |
| NET INCREASE (DECREASE) IN NET ASSETS FROM CAPITAL SHARE TRANSACTIONS | | | 12,716,374 | | | | 30,162,579 | | | | 9,813,399 | | | | 24,208,714 | | | | 9,228,020 | | | | 17,633,952 | | |
| INCREASE (DECREASE) IN NET ASSETS | | | 20,171,271 | | | | 28,970,322 | | | | 16,274,633 | | | | 22,831,875 | | | | 14,395,444 | | | | 16,211,095 | | |
| NET ASSETS, BEGINNING OF PERIOD | | | 109,488,990 | | | | 80,518,668 | | | | 90,234,757 | | | | 67,402,882 | | | | 69,051,976 | | | | 52,840,881 | | |
| NET ASSETS, END OF PERIOD | | $ | 129,660,261 | | | $ | 109,488,990 | | | $ | 106,509,390 | | | $ | 90,234,757 | | | $ | 83,447,420 | | | $ | 69,051,976 | | |
| ACCUMULATED UNDISTRIBUTED NET INVESTMENT INCOME (LOSS) | | $ | 2,312,037 | | | $ | 2,312,037 | | | $ | 1,804,778 | | | $ | 1,804,778 | | | $ | 1,281,243 | | | $ | 1,281,243 | | |
| OTHER INFORMATION: | |
| Shares outstanding at the beginning of period | | | 123,168,724 | | | | 89,584,434 | | | | 102,295,614 | | | | 75,141,561 | | | | 80,186,050 | | | | 59,862,854 | | |
| Shares sold | | | 15,864,155 | | | | 36,123,268 | | | | 12,633,113 | | | | 30,143,771 | | | | 10,953,593 | | | | 22,163,711 | | |
| Shares issued as reinvestment of dividends | | | — | | | | 2,084,433 | | | | — | | | | 1,669,841 | | | | — | | | | 1,279,489 | | |
| Shares redeemed | | | (2,341,619 | ) | | | (4,623,411 | ) | | | (2,182,694 | ) | | | (4,659,559 | ) | | | (882,249 | ) | | | (3,120,004 | ) | |
| Net increase (decrease) | | | 13,522,536 | | | | 33,584,290 | | | | 10,450,419 | | | | 27,154,053 | | | | 10,071,344 | | | | 20,323,196 | | |
| Shares outstanding at the end of period | | | 136,691,260 | | | | 123,168,724 | | | | 112,746,033 | | | | 102,295,614 | | | | 90,257,394 | | | | 80,186,050 | | |
The accompanying notes are an integral part of these financial statements.
56
| | | 2040 Retirement Fund | | 2045 Retirement Fund | | Conservative Allocation Fund | |
| | | For the Six
Months Ended
June 30,
2012
(Unaudited) | | For the
Year Ended
December 31,
2011 | | For the Six
Months Ended
June 30,
2012
(Unaudited) | | For the
Year Ended
December 31,
2011 | | For the Six
Months Ended
June 30,
2012
(Unaudited) | | For the
Year Ended
December 31,
2011 | |
| INCREASE (DECREASE) IN NET ASSETS: | |
| FROM OPERATIONS: | |
| Net investment income (loss) | | $ | (17,607 | ) | | $ | 1,126,355 | | | $ | (21,657 | ) | | $ | 1,343,257 | | | $ | — | | | $ | 1,915,996 | | |
| Net realized gain (loss) on investments and futures contracts | | | 2,526 | | | | 280,637 | | | | (6,781 | ) | | | 244,723 | | | | 221,546 | | | | 876,682 | | |
Change in net unrealized appreciation (depreciation) of investments and
futures contracts | | | 4,599,318 | | | | (2,194,412 | ) | | | 5,633,765 | | | | (2,672,642 | ) | | | 2,612,823 | | | | 362,228 | | |
| NET INCREASE (DECREASE) IN NET ASSETS RESULTING FROM OPERATIONS | | | 4,584,237 | | | | (787,420 | ) | | | 5,605,327 | | | | (1,084,662 | ) | | | 2,834,369 | | | | 3,154,906 | | |
| DIVIDEND DISTRIBUTIONS (Note 5) | |
| From net investment income | | | — | | | | (707,075 | ) | | | — | | | | (801,800 | ) | | | — | | | | (1,565,125 | ) | |
| From capital gains | | | — | | | | (182,882 | ) | | | — | | | | (173,340 | ) | | | — | | | | (19,438 | ) | |
| Total distributions | | | — | | | | (889,957 | ) | | | — | | | | (975,140 | ) | | | — | | | | (1,584,563 | ) | |
| CAPITAL SHARE TRANSACTIONS (Note 4): | |
| Net proceeds from sale of shares | | | 10,039,462 | | | | 18,677,607 | | | | 14,004,701 | | | | 24,785,755 | | | | 8,485,161 | | | | 17,507,346 | | |
| Dividends reinvested | | | — | | | | 889,957 | | | | — | | | | 975,140 | | | | — | | | | 1,584,563 | | |
| Cost of shares redeemed | | | (919,781 | ) | | | (2,449,742 | ) | | | (816,202 | ) | | | (1,987,479 | ) | | | (2,412,392 | ) | | | (6,320,201 | ) | |
| NET INCREASE (DECREASE) IN NET ASSETS FROM CAPITAL SHARE TRANSACTIONS | | | 9,119,681 | | | | 17,117,822 | | | | 13,188,499 | | | | 23,773,416 | | | | 6,072,769 | | | | 12,771,708 | | |
| INCREASE (DECREASE) IN NET ASSETS | | | 13,703,918 | | | | 15,440,445 | | | | 18,793,826 | | | | 21,713,614 | | | | 8,907,138 | | | | 14,342,051 | | |
| NET ASSETS, BEGINNING OF PERIOD | | | 62,072,097 | | | | 46,631,652 | | | | 75,521,779 | | | | 53,808,165 | | | | 66,074,626 | | | | 51,732,575 | | |
| NET ASSETS, END OF PERIOD | | $ | 75,776,015 | | | $ | 62,072,097 | | | $ | 94,315,605 | | | $ | 75,521,779 | | | $ | 74,981,764 | | | $ | 66,074,626 | | |
| ACCUMULATED UNDISTRIBUTED NET INVESTMENT INCOME (LOSS) | | $ | 1,115,985 | | | $ | 1,115,985 | | | $ | 1,327,885 | | | $ | 1,327,885 | | | $ | 1,854,505 | | | $ | 1,854,505 | | |
| OTHER INFORMATION: | |
| Shares outstanding at the beginning of period | | | 72,819,703 | | | | 53,059,793 | | | | 89,009,683 | | | | 61,484,646 | | | | 59,597,939 | | | | 47,977,563 | | |
| Shares sold | | | 11,017,942 | | | | 21,357,545 | | | | 15,476,164 | | | | 28,528,576 | | | | 7,437,707 | | | | 15,902,834 | | |
| Shares issued as reinvestment of dividends | | | — | | | | 1,139,502 | | | | — | | | | 1,254,688 | | | | — | | | | 1,476,269 | | |
| Shares redeemed | | | (1,005,504 | ) | | | (2,737,137 | ) | | | (910,870 | ) | | | (2,258,227 | ) | | | (2,114,685 | ) | | | (5,758,727 | ) | |
| Net increase (decrease) | | | 10,012,438 | | | | 19,759,910 | | | | 14,565,294 | | | | 27,525,037 | | | | 5,323,022 | | | | 11,620,376 | | |
| Shares outstanding at the end of period | | | 82,832,141 | | | | 72,819,703 | | | | 103,574,977 | | | | 89,009,683 | | | | 64,920,961 | | | | 59,597,939 | | |
The accompanying notes are an integral part of these financial statements.
57
MUTUAL OF AMERICA INVESTMENT CORPORATION
STATEMENTS OF CHANGES IN NET ASSETS (Continued)
| | | Moderate Allocation Fund | | Aggressive Allocation Fund | | Money Market Fund | |
| | | For the Six
Months Ended
June 30,
2012
(Unaudited) | | For the
Year Ended
December 31,
2011 | | For the Six
Months Ended
June 30,
2012
(Unaudited) | | For the
Year Ended
December 31,
2011 | | For the Six
Months Ended
June 30,
2012
(Unaudited) | | For the
Year Ended
December 31,
2011 | |
| INCREASE (DECREASE) IN NET ASSETS: | |
| FROM OPERATIONS: | |
| Net investment income (loss) | | $ | — | | | $ | 4,627,842 | | | $ | — | | | $ | 3,305,812 | | | $ | (97,785 | ) | | $ | (177,791 | ) | |
| Net realized gain (loss) on investments and futures contracts | | | 64,208 | | | | 1,092,571 | | | | 3,144 | | | | 784,096 | | | | (323 | ) | | | 479 | | |
Change in net unrealized appreciation (depreciation) of investments and
futures contracts | | | 10,660,653 | | | | 1,173,084 | | | | 11,766,458 | | | | (732,789 | ) | | | 5,428 | | | | (11,870 | ) | |
| NET INCREASE (DECREASE) IN NET ASSETS RESULTING FROM OPERATIONS | | | 10,724,861 | | | | 6,893,497 | | | | 11,769,602 | | | | 3,357,119 | | | | (92,680 | ) | | | (189,182 | ) | |
| DIVIDEND DISTRIBUTIONS (Note 5) | |
| From net investment income | | | — | | | | (4,054,555 | ) | | | — | | | | (3,017,256 | ) | | | — | | | | — | | |
| From capital gains | | | — | | | | (304,510 | ) | | | — | | | | — | | | | — | | | | — | | |
| Total distributions | | | — | | | | (4,359,065 | ) | | | — | | | | (3,017,256 | ) | | | — | | | | — | | |
| CAPITAL SHARE TRANSACTIONS (Note 4): | |
| Net proceeds from sale of shares | | | 13,094,223 | | | | 25,085,892 | | | | 9,664,731 | | | | 15,471,781 | | | | 4,391,328 | | | | 10,887,817 | | |
| Dividends reinvested | | | — | | | | 4,359,065 | | | | — | | | | 3,017,256 | | | | — | | | | — | | |
| Cost of shares redeemed | | | (3,408,890 | ) | | | (12,642,498 | ) | | | (4,568,751 | ) | | | (7,944,371 | ) | | | (8,098,353 | ) | | | (18,925,022 | ) | |
| NET INCREASE (DECREASE) IN NET ASSETS FROM CAPITAL SHARE TRANSACTIONS | | | 9,685,333 | | | | 16,802,459 | | | | 5,095,980 | | | | 10,544,666 | | | | (3,707,025 | ) | | | (8,037,205 | ) | |
| INCREASE (DECREASE) IN NET ASSETS | | | 20,410,194 | | | | 19,336,891 | | | | 16,865,582 | | | | 10,884,529 | | | | (3,799,705 | ) | | | (8,226,387 | ) | |
| NET ASSETS, BEGINNING OF PERIOD | | | 182,024,015 | | | | 162,687,124 | | | | 158,288,554 | | | | 147,404,025 | | | | 100,591,223 | | | | 108,817,610 | | |
| NET ASSETS, END OF PERIOD | | $ | 202,434,209 | | | $ | 182,024,015 | | | $ | 175,154,136 | | | $ | 158,288,554 | | | $ | 96,791,518 | | | $ | 100,591,223 | | |
| ACCUMULATED UNDISTRIBUTED NET INVESTMENT INCOME (LOSS) | | $ | 4,454,203 | | | $ | 4,454,203 | | | $ | 3,143,042 | | | $ | 3,143,042 | | | $ | — | | | $ | — | | |
| OTHER INFORMATION: | |
| Shares outstanding at the beginning of period | | | 154,321,854 | | | | 139,889,356 | | | | 127,613,673 | | | | 119,017,515 | | | | 83,650,118 | | | | 90,330,033 | | |
| Shares sold | | | 10,582,348 | | | | 21,227,945 | | | | 7,303,149 | | | | 12,279,281 | | | | 3,653,662 | | | | 9,059,065 | | |
| Shares issued as reinvestment of dividends | | | — | | | | 3,917,722 | | | | — | | | | 2,645,970 | | | | — | | | | — | | |
| Shares redeemed | | | (2,760,371 | ) | | | (10,713,169 | ) | | | (3,468,173 | ) | | | (6,329,093 | ) | | | (6,737,622 | ) | | | (15,738,980 | ) | |
| Net increase (decrease) | | | 7,821,977 | | | | 14,432,498 | | | | 3,834,976 | | | | 8,596,158 | | | | (3,083,960 | ) | | | (6,679,915 | ) | |
| Shares outstanding at the end of period | | | 162,143,831 | | | | 154,321,854 | | | | 131,448,649 | | | | 127,613,673 | | | | 80,566,158 | | | | 83,650,118 | | |
The accompanying notes are an integral part of these financial statements.
58
| | | Mid-Term Bond Fund | | Bond Fund | |
| | | For the Six
Months Ended
June 30,
2012
(Unaudited) | | For the
Year Ended
December 31,
2011 | | For the Six
Months Ended
June 30,
2012
(Unaudited) | | For the
Year Ended
December 31,
2011 | |
| INCREASE (DECREASE) IN NET ASSETS: | |
| FROM OPERATIONS: | |
| Net investment income (loss) | | $ | 5,017,314 | | | $ | 10,029,013 | | | $ | 11,813,468 | | | $ | 22,608,804 | | |
| Net realized gain (loss) on investments and futures contracts | | | 608,544 | | | | 844,782 | | | | 5,609,012 | | | | 5,779,208 | | |
Change in net unrealized appreciation (depreciation) of investments and
futures contracts | | | 608,050 | | | | 9,872,731 | | | | 1,153,745 | | | | 15,778,546 | | |
| NET INCREASE (DECREASE) IN NET ASSETS RESULTING FROM OPERATIONS | | | 6,233,908 | | | | 20,746,526 | | | | 18,576,225 | | | | 44,166,558 | | |
| DIVIDEND DISTRIBUTIONS (Note 5) | |
| From net investment income | | | — | | | | (10,100,703 | ) | | | — | | | | (22,722,570 | ) | |
| From capital gains | | | — | | | | — | | | | — | | | | — | | |
| Total distributions | | | — | | | | (10,100,703 | ) | | | — | | | | (22,722,570 | ) | |
| CAPITAL SHARE TRANSACTIONS (Note 4): | |
| Net proceeds from sale of shares | | | 22,200,317 | | | | 86,254,417 | | | | 36,648,758 | | | | 110,796,918 | | |
| Dividends reinvested | | | — | | | | 10,100,703 | | | | — | | | | 22,722,570 | | |
| Cost of shares redeemed | | | (22,771,687 | ) | | | (66,520,582 | ) | | | (33,717,273 | ) | | | (117,046,903 | ) | |
| NET INCREASE (DECREASE) IN NET ASSETS FROM CAPITAL SHARE TRANSACTIONS | | | (571,370 | ) | | | 29,834,538 | | | | 2,931,485 | | | | 16,472,585 | | |
| INCREASE (DECREASE) IN NET ASSETS | | | 5,662,538 | | | | 40,480,361 | | | | 21,507,710 | | | | 37,916,573 | | |
| NET ASSETS, BEGINNING OF PERIOD | | | 338,332,609 | | | | 297,852,248 | | | | 635,099,291 | | | | 597,182,718 | | |
| NET ASSETS, END OF PERIOD | | $ | 343,995,147 | | | $ | 338,332,609 | | | $ | 656,607,001 | | | $ | 635,099,291 | | |
| ACCUMULATED UNDISTRIBUTED NET INVESTMENT INCOME (LOSS) | | $ | 5,157,581 | | | $ | 140,267 | | | $ | 12,000,646 | | | $ | 187,178 | | |
| OTHER INFORMATION: | |
| Shares outstanding at the beginning of period | | | 319,283,521 | | | | 289,925,398 | | | | 457,267,817 | | | | 444,790,076 | | |
| Shares sold | | | 20,776,222 | | | | 82,259,549 | | | | 25,969,809 | | | | 79,248,176 | | |
| Shares issued as reinvestment of dividends | | | — | | | | 9,537,207 | | | | — | | | | 16,371,590 | | |
| Shares redeemed | | | (21,352,836 | ) | | | (62,438,633 | ) | | | (24,005,318 | ) | | | (83,142,025 | ) | |
| Net increase (decrease) | | | (576,614 | ) | | | 29,358,123 | | | | 1,964,491 | | | | 12,477,741 | | |
| Shares outstanding at the end of period | | | 318,706,907 | | | | 319,283,521 | | | | 459,232,308 | | | | 457,267,817 | | |
The accompanying notes are an integral part of these financial statements.
59
MUTUAL OF AMERICA INVESTMENT CORPORATION
FINANCIAL HIGHLIGHTS
Income from investment operations and distributions per share for a Fund share outstanding throughout the six months ended June 30, 2012 and the five years ended December 31, 2011 (or since the Fund's inception date if in existence less than five years) and other supplementary data with respect to each Fund are presented below and in the pages following:
| | | Equity Index Fund | | All America Fund | |
| | | Six
Months Ended
June 30,
2012 | | Years Ended December 31, | | Six
Months Ended
June 30,
2012 | | Years Ended December 31, | |
| | | (Unaudited) | | 2011 | | 2010 | | 2009 | | 2008 | | 2007 | | (Unaudited) | | 2011 | | 2010 | | 2009 | | 2008 | | 2007 | |
| Net Asset Value, Beginning of Period | | $ | 2.07 | | | $ | 2.07 | | | $ | 1.84 | | | $ | 1.48 | | | $ | 2.41 | | | $ | 2.38 | | | $ | 1.61 | | | $ | 1.65 | | | $ | 1.42 | | | $ | 1.15 | | | $ | 1.86 | | | $ | 2.00 | | |
| INCOME (LOSS) FROM INVESTMENT OPERATIONS: | |
| Net Investment Income | | | 0.02 | | | | 0.04 | | | | 0.03 | | | | 0.03 | | | | 0.04 | | | | 0.05 | | | | 0.01 | | | | 0.02 | | | | 0.02 | | | | 0.02 | | | | 0.03 | | | | 0.03 | | |
| Net Realized and Unrealized Gains (Losses) on Investments and Futures Contracts | | | 0.17 | | | | — | | | | 0.23 | | | | 0.36 | | | | (0.93 | ) | | | 0.07 | | | | 0.13 | | | | (0.02 | ) | | | 0.23 | | | | 0.28 | | | | (0.68 | ) | | | 0.06 | | |
| Total From Investment Operations | | | 0.19 | | | | 0.04 | | | | 0.26 | | | | 0.39 | | | | (0.89 | ) | | | 0.12 | | | | 0.14 | | | | — | | | | 0.25 | | | | 0.30 | | | | (0.65 | ) | | | 0.09 | | |
Less: Dividend Distributions:
From Net Investment Income | | | — | | | | (0.04 | ) | | | (0.03 | ) | | | (0.03 | ) | | | (0.03 | ) | | | (0.05 | ) | | | — | | | | (0.04 | ) | | | (0.02 | ) | | | (0.03 | ) | | | (0.02 | ) | | | (0.03 | ) | |
| From Capital Gains | | | — | | | | — | | | | — | | | | — | | | | (0.01 | ) | | | (0.04 | ) | | | — | | | | — | | | | — | | | | — | | | | (0.04 | ) | | | (0.20 | ) | |
| From Return of Capital | | | — | | | | — | | | | — | | | | — | | | | — | | | | — | | | | — | | | | — | | | | — | | | | — | | | | — | | | | — | | |
| Total Distributions | | | — | | | | (0.04 | ) | | | (0.03 | ) | | | (0.03 | ) | | | (0.04 | ) | | | (0.09 | ) | | | — | | | | (0.04 | ) | | | (0.02 | ) | | | (0.03 | ) | | | (0.06 | ) | | | (0.23 | ) | |
| Net Asset Value, End of Period | | $ | 2.26 | | | $ | 2.07 | | | $ | 2.07 | | | $ | 1.84 | | | $ | 1.48 | | | $ | 2.41 | | | $ | 1.75 | | | $ | 1.61 | | | $ | 1.65 | | | $ | 1.42 | | | $ | 1.15 | | | $ | 1.86 | | |
| Total Return (%) | | | 9.44 | (c) | | | 1.88 | | | | 14.68 | | | | 26.13 | | | | (37.08 | ) | | | 5.22 | | | | 9.00 | (c) | | | 0.24 | | | | 17.78 | | | | 25.31 | | | | (35.49 | ) | | | 4.27 | | |
| Net Assets, End of Period ($ millions) | | | 1,031 | | | | 929 | | | | 905 | | | | 768 | | | | 545 | | | | 816 | | | | 256 | | | | 250 | | | | 271 | | | | 256 | | | | 222 | | | | 389 | | |
| Ratio of Net Investment Income (Loss) to Average Net Assets (%) | | | 1.87 | (d) | | | 1.81 | | | | 1.76 | | | | 1.98 | | | | 2.07 | | | | 1.82 | | | | 1.38 | (d) | | | 1.24 | | | | 1.21 | | | | 1.46 | | | | 1.64 | | | | 1.30 | | |
| Ratio of Expenses to Average Net Assets Before Expense Reimbursement (%) | | | 0.23 | (d) | | | 0.23 | | | | 0.25 | | | | 0.26 | | | | 0.25 | | | | 0.20 | | | | 0.55 | (d) | | | 0.56 | | | | 0.57 | | | | 0.58 | | | | 0.56 | | | | 0.55 | | |
| Ratio of Expenses to Average Net Assets After Expense Reimbursement (%) | | | 0.23 | (d) | | | 0.23 | | | | 0.25 | | | | 0.26 | | | | 0.25 | | | | 0.20 | | | | 0.55 | (d) | | | 0.56 | | | | 0.57 | | | | 0.58 | | | | 0.56 | | | | 0.55 | | |
| Portfolio Turnover Rate (%)(a) | | | 3.94 | (c) | | | 5.26 | | | | 4.50 | | | | 4.29 | | | | 4.70 | | | | 4.66 | | | | 8.31 | (c) | | | 24.67 | | | | 22.71 | | | | 35.15 | | | | 31.03 | | | | 29.24 | | |
(a) Portfolio turnover rate excludes all short-term securities.
(c) Not annualized.
(d) Annualized.
(e) Allocation and Retirement Funds exclude expenses of the underlying funds.
(f) For the period November 5, 2007 (commencement of operations) through December 31, 2007.
(g) Includes less than $0.005 of tax-basis return of capital distributions.
(h) Includes less than $0.005 of dividend distributions.
NA = Not Applicable
The accompanying notes are an integral part of these financial statements.
60
| | | Small Cap Value Fund | |
| | | Six
Months Ended
June 30,
2012 | | Years Ended December 31, | |
| | | (Unaudited) | | 2011 | | 2010 | | 2009 | | 2008 | | 2007 | |
| Net Asset Value, Beginning of Period | | $ | 1.17 | | | $ | 1.21 | | | $ | 0.96 | | | $ | 0.75 | | | $ | 1.06 | | | $ | 1.24 | | |
| INCOME (LOSS) FROM INVESTMENT OPERATIONS: | |
| Net Investment Income | | | 0.01 | | | | 0.01 | | | | 0.01 | | | | 0.01 | | | | 0.01 | | | | 0.01 | | |
| Net Realized and Unrealized Gains (Losses) on Investments and Futures Contracts | | | 0.09 | | | | (0.04 | ) | | | 0.25 | | | | 0.21 | | | | (0.30 | ) | | | (0.06 | ) | |
| Total From Investment Operations | | | 0.10 | | | | (0.03 | ) | | | 0.26 | | | | 0.22 | | | | (0.29 | ) | | | (0.05 | ) | |
Less: Dividend Distributions:
From Net Investment Income | | | — | | | | (0.01 | ) | | | (0.01 | ) | | | (0.01 | )(g) | | | (0.01 | ) | | | (0.01 | ) | |
| From Capital Gains | | | — | | | | — | | | | — | | | | — | | | | — | | | | (0.12 | ) | |
| From Return of Capital | | | — | | | | — | | | | — | | | | — | | | | (0.01 | ) | | | — | | |
| Total Distributions | | | — | | | | (0.01 | ) | | | (0.01 | ) | | | (0.01 | ) | | | (0.02 | ) | | | (0.13 | ) | |
| Net Asset Value, End of Period | | $ | 1.27 | | | $ | 1.17 | | | $ | 1.21 | | | $ | 0.96 | | | $ | 0.75 | | | $ | 1.06 | | |
| Total Return (%) | | | 8.99 | (c) | | | (2.46 | ) | | | 27.72 | | | | 29.28 | | | | (27.76 | ) | | | (3.99 | ) | |
| Net Assets, End of Period ($ millions) | | | 280 | | | | 260 | | | | 277 | | | | 205 | | | | 155 | | | | 215 | | |
| Ratio of Net Investment Income (Loss) to Average Net Assets (%) | | | 1.61 | (d) | | | 0.92 | | | | 0.99 | | | | 1.30 | | | | 1.23 | | | | 0.96 | | |
| Ratio of Expenses to Average Net Assets Before Expense Reimbursement (%) | | | 0.90 | (d) | | | 0.90 | | | | 0.92 | | | | 0.93 | | | | 0.92 | | | | 0.89 | | |
| Ratio of Expenses to Average Net Assets After Expense Reimbursement (%) | | | 0.90 | (d) | | | 0.90 | | | | 0.92 | | | | 0.93 | | | | 0.92 | | | | 0.89 | | |
| Portfolio Turnover Rate (%)(a) | | | 13.89 | (c) | | | 23.34 | | | | 35.34 | | | | 39.03 | | | | 59.64 | | | | 55.77 | | |
The accompanying notes are an integral part of these financial statements.
61
MUTUAL OF AMERICA INVESTMENT CORPORATION
FINANCIAL HIGHLIGHTS (Continued)
| | | Small Cap Growth Fund | | Mid Cap Value Fund | |
| | | Six
Months Ended
June 30,
2012 | | Years Ended December 31, | | Six
Months Ended
June 30,
2012 | | Years Ended December 31, | |
| | | (Unaudited) | | 2011 | | 2010 | | 2009 | | 2008 | | 2007 | | (Unaudited) | | 2011 | | 2010 | | 2009 | | 2008 | | 2007 | |
| Net Asset Value, Beginning of Period | | $ | 1.16 | | | $ | 1.19 | | | $ | 0.89 | | | $ | 0.70 | | | $ | 1.08 | | | $ | 1.19 | | | $ | 1.11 | | | $ | 1.15 | | | $ | 0.98 | | | $ | 0.79 | | | $ | 1.20 | | | $ | 1.21 | | |
| INCOME (LOSS) FROM INVESTMENT OPERATIONS: | |
| Net Investment Income | | | — | | | | — | | | | — | | | | — | | | | — | | | | — | | | | 0.01 | | | | 0.01 | | | | 0.01 | | | | 0.01 | | | | 0.02 | | | | 0.02 | | |
| Net Realized and Unrealized Gains (Losses) on Investments and Futures Contracts | | | 0.08 | | | | (0.03 | ) | | | 0.30 | | | | 0.19 | | | | (0.36 | ) | | | 0.05 | | | | 0.03 | | | | (0.04 | ) | | | 0.17 | | | | 0.19 | | | | (0.41 | ) | | | (0.01 | ) | |
| Total From Investment Operations | | | 0.08 | | | | (0.03 | ) | | | 0.30 | | | | 0.19 | | | | (0.36 | ) | | | 0.05 | | | | 0.04 | | | | (0.03 | ) | | | 0.18 | | | | 0.20 | | | | (0.39 | ) | | | 0.01 | | |
Less: Dividend Distributions:
From Net Investment Income | | | — | | | | — | | | | — | | | | — | | | | — | | | | — | | | | — | | | | (0.01 | ) | | | (0.01 | ) | | | (0.01 | )(g) | | | (0.02 | )(g) | | | (0.02 | ) | |
| From Capital Gains | | | — | | | | — | | | | — | | | | — | | | | (0.02 | ) | | | (0.16 | ) | | | — | | | | — | | | | — | | | | — | | | | — | | | | — | | |
| From Return of Capital | | | — | | | | — | | | | — | | | | — | | | | — | | | | — | | | | — | | | | — | | | | — | | | | — | | | | — | | | | — | | |
| Total Distributions | | | — | | | | — | | | | — | | | | — | | | | (0.02 | ) | | | (0.16 | ) | | | — | | | | (0.01 | ) | | | (0.01 | ) | | | (0.01 | ) | | | (0.02 | ) | | | (0.02 | ) | |
| Net Asset Value, End of Period | | $ | 1.24 | | | $ | 1.16 | | | $ | 1.19 | | | $ | 0.89 | | | $ | 0.70 | | | $ | 1.08 | | | $ | 1.15 | | | $ | 1.11 | | | $ | 1.15 | | | $ | 0.98 | | | $ | 0.79 | | | $ | 1.20 | | |
| Total Return (%) | | | 6.74 | (c) | | | (2.28 | ) | | | 33.27 | | | | 27.69 | | | | (34.37 | ) | | | 4.68 | | | | 3.72 | (c) | | | (2.12 | ) | | | 18.94 | | | | 25.22 | | | | (32.64 | ) | | | 0.88 | | |
| Net Assets, End of Period ($ millions) | | | 288 | | | | 271 | | | | 281 | | | | 194 | | | | 147 | | | | 223 | | | | 50 | | | | 51 | | | | 55 | | | | 42 | | | | 30 | | | | 40 | | |
| Ratio of Net Investment Income (Loss) to Average Net Assets (%) | | | (0.16 | )(d) | | | (0.31 | ) | | | (0.26 | ) | | | (0.26 | ) | | | (0.16 | ) | | | (0.26 | ) | | | 1.18 | (d) | | | 1.19 | | | | 1.25 | | | | 1.57 | | | | 1.62 | | | | 1.54 | | |
| Ratio of Expenses to Average Net Assets Before Expense Reimbursement (%) | | | 0.91 | (d) | | | 0.90 | | | | 0.92 | | | | 0.93 | | | | 0.92 | | | | 0.89 | | | | 0.70 | (d) | | | 0.70 | | | | 0.72 | | | | 0.73 | | | | 0.74 | | | | 0.75 | | |
| Ratio of Expenses to Average Net Assets After Expense Reimbursement (%) | | | 0.91 | (d) | | | 0.90 | | | | 0.92 | | | | 0.93 | | | | 0.92 | | | | 0.89 | | | | 0.70 | (d) | | | 0.70 | | | | 0.72 | | | | 0.73 | | | | 0.74 | | | | 0.75 | | |
| Portfolio Turnover Rate (%)(a) | | | 31.07 | (c) | | | 59.53 | | | | 50.73 | | | | 94.14 | | | | 93.16 | | | | 94.06 | | | | 8.74 | (c) | | | 12.99 | | | | 29.88 | | | | 20.16 | | | | 33.80 | | | | 27.24 | | |
(a) Portfolio turnover rate excludes all short-term securities.
(c) Not annualized.
(d) Annualized.
(e) Allocation and Retirement Funds exclude expenses of the underlying funds.
(f) For the period November 5, 2007 (commencement of operations) through December 31, 2007.
(g) Includes less than $0.005 of tax-basis return of capital distributions.
(h) Includes less than $0.005 of dividend distributions.
NA = Not Applicable
The accompanying notes are an integral part of these financial statements.
62
| | | Mid-Cap Equity Index Fund | |
| | | Six
Months Ended
June 30,
2012 | | Years Ended December 31, | |
| | | (Unaudited) | | 2011 | | 2010 | | 2009 | | 2008 | | 2007 | |
| Net Asset Value, Beginning of Period | | $ | 1.43 | | | $ | 1.51 | | | $ | 1.24 | | | $ | 0.93 | | | $ | 1.51 | | | $ | 1.56 | | |
| INCOME (LOSS) FROM INVESTMENT OPERATIONS: | |
| Net Investment Income | | | 0.01 | | | | 0.02 | | | | 0.01 | | | | 0.01 | | | | 0.02 | | | | 0.03 | | |
| Net Realized and Unrealized Gains (Losses) on Investments and Futures Contracts | | | 0.11 | | | | (0.05 | ) | | | 0.31 | | | | 0.32 | | | | (0.56 | ) | | | 0.09 | | |
| Total From Investment Operations | | | 0.12 | | | | (0.03 | ) | | | 0.32 | | | | 0.33 | | | | (0.54 | ) | | | 0.12 | | |
Less: Dividend Distributions:
From Net Investment Income | | | — | | | | (0.02 | ) | | | (0.01 | ) | | | (0.01 | ) | | | (0.02 | ) | | | (0.03 | ) | |
| From Capital Gains | | | — | | | | (0.03 | ) | | | (0.04 | ) | | | (0.01 | ) | | | (0.02 | ) | | | (0.14 | ) | |
| From Return of Capital | | | — | | | | — | | | | — | | | | — | | | | — | | | | — | | |
| Total Distributions | | | — | | | | (0.05 | ) | | | (0.05 | ) | | | (0.02 | ) | | | (0.04 | ) | | | (0.17 | ) | |
| Net Asset Value, End of Period | | $ | 1.55 | | | $ | 1.43 | | | $ | 1.51 | | | $ | 1.24 | | | $ | 0.93 | | | $ | 1.51 | | |
| Total Return (%) | | | 7.94 | (c) | | | (1.99 | ) | | | 26.28 | | | | 36.69 | | | | (36.31 | ) | | | 7.74 | | |
| Net Assets, End of Period ($ millions) | | | 561 | | | | 505 | | | | 494 | | | | 377 | | | | 248 | | | | 379 | | |
| Ratio of Net Investment Income (Loss) to Average Net Assets (%) | | | 1.20 | (d) | | | 1.14 | | | | 1.16 | | | | 1.41 | | | | 1.47 | �� | | | 1.52 | | |
| Ratio of Expenses to Average Net Assets Before Expense Reimbursement (%) | | | 0.23 | (d) | | | 0.23 | | | | 0.25 | | | | 0.26 | | | | 0.25 | | | | 0.22 | | |
| Ratio of Expenses to Average Net Assets After Expense Reimbursement (%) | | | 0.23 | (d) | | | 0.23 | | | | 0.25 | | | | 0.26 | | | | 0.25 | | | | 0.22 | | |
| Portfolio Turnover Rate (%)(a) | | | 7.33 | (c) | | | 15.98 | | | | 13.29 | | | | 15.41 | | | | 22.66 | | | | 20.53 | | |
The accompanying notes are an integral part of these financial statements.
63
MUTUAL OF AMERICA INVESTMENT CORPORATION
FINANCIAL HIGHLIGHTS (Continued)
| | | International Fund | | Composite Fund | |
| | | Six
Months Ended
June 30,
2012 | | Years Ended December 31, | | Period Ended
December 31, | | Six
Months Ended
June 30,
2012 | | Years Ended December 31, | |
| | | (Unaudited) | | 2011 | | 2010 | | 2009 | | 2008 | | 2007(f) | | (Unaudited) | | 2011 | | 2010 | | 2009 | | 2008 | | 2007 | |
| Net Asset Value, Beginning of Period | | $ | 0.60 | | | $ | 0.71 | | | $ | 0.67 | | | $ | 0.55 | | | $ | 0.95 | | | $ | 1.00 | | | $ | 1.47 | | | $ | 1.50 | | | $ | 1.39 | | | $ | 1.20 | | | $ | 1.60 | | | $ | 1.55 | | |
| INCOME (LOSS) FROM INVESTMENT OPERATIONS: | |
| Net Investment Income | | | — | | | | 0.02 | | | | 0.02 | | | | 0.01 | | | | 0.02 | | | | 0.02 | | | | 0.02 | | | | 0.04 | | | | 0.04 | | | | 0.04 | | | | 0.04 | | | | 0.05 | | |
| Net Realized and Unrealized Gains (Losses) on Investments and Futures Contracts | | | 0.02 | | | | (0.11 | ) | | | 0.04 | | | | 0.13 | | | | (0.40 | ) | | | (0.05 | ) | | | 0.08 | | | | — | | | | 0.11 | | | | 0.19 | | | | (0.40 | ) | | | 0.05 | | |
| Total From Investment Operations | | | 0.02 | | | | (0.09 | ) | | | 0.06 | | | | 0.14 | | | | (0.38 | ) | | | (0.03 | ) | | | 0.10 | | | | 0.04 | | | | 0.15 | | | | 0.23 | | | | (0.36 | ) | | | 0.10 | | |
| Less: Dividend Distributions: | |
| From Net Investment Income | | | — | | | | (0.02 | ) | | | (0.02 | ) | | | (0.01 | ) | | | (0.02 | ) | | | (0.02 | ) | | | — | | | | (0.07 | ) | | | (0.04 | ) | | | (0.04 | ) | | | (0.04 | ) | | | (0.05 | ) | |
| From Capital Gains | | | — | | | | — | (h) | | | — | | | | — | | | | — | | | | — | | | | — | | | | — | | | | — | | | | — | | | | — | | | | — | | |
| From Return of Capital | | | — | | | | — | | | | — | | | | (0.01 | ) | | | — | | | | — | | | | — | | | | — | | | | — | | | | — | | | | — | | | | — | | |
| Total Distributions | | | — | | | | (0.02 | ) | | | (0.02 | ) | | | (0.02 | ) | | | (0.02 | ) | | | (0.02 | ) | | | — | | | | (0.07 | ) | | | (0.04 | ) | | | (0.04 | ) | | | (0.04 | ) | | | (0.05 | ) | |
| Net Asset Value, End of Period | | $ | 0.62 | | | $ | 0.60 | | | $ | 0.71 | | | $ | 0.67 | | | $ | 0.55 | | | $ | 0.95 | | | $ | 1.57 | | | $ | 1.47 | | | $ | 1.50 | | | $ | 1.39 | | | $ | 1.20 | | | $ | 1.60 | | |
| Total Return (%) | | | 3.30 | (c) | | | (12.60 | ) | | | 8.32 | | | | 25.22 | | | | (40.06 | ) | | | (2.93 | )(c) | | | 6.60 | (c) | | | 2.84 | | | | 11.02 | | | | 18.45 | | | | (22.51 | ) | | | 6.69 | | |
| Net Assets, End of Period ($ millions) | | | 80 | | | | 69 | | | | 61 | | | | 33 | | | | 12 | | | | 3 | | | | 167 | | | | 161 | | | | 167 | | | | 166 | | | | 150 | | | | 220 | | |
| Ratio of Net Investment Income (Loss) to Average Net Assets (%) | | | 1.10 | (d) | | | 3.24 | | | | 3.48 | | | | 3.45 | | | | 5.17 | | | | 3.38 | (c) | | | 2.15 | (d) | | | 2.22 | | | | 2.26 | | | | 2.74 | | | | 3.01 | | | | 2.72 | | |
| Ratio of Expenses to Average Net Assets Before Expense Reimbursement (%)(e) | | | 0.23 | (d) | | | 0.23 | | | | 0.24 | | | | 0.25 | | | | 0.20 | | | | 0.22 | (d) | | | 0.55 | (d) | | | 0.56 | | | | 0.57 | | | | 0.58 | | | | 0.57 | | | | 0.55 | | |
| Ratio of Expenses to Average Net Assets After Expense Reimbursement (%)(e) | | | 0.23 | (d) | | | 0.23 | | | | 0.24 | | | | 0.25 | | | | 0.20 | | | | 0.22 | (d) | | | 0.55 | (d) | | | 0.56 | | | | 0.57 | | | | 0.58 | | | | 0.57 | | | | 0.55 | | |
| Portfolio Turnover Rate (%)(a) | | | 0.04 | (c) | | | 1.44 | | | | 9.17 | | | | 4.95 | | | | — | | | | — | | | | 11.89 | (c) | | | 22.69 | | | | 36.00 | | | | 31.73 | | | | 37.98 | | | | 24.95 | | |
(a) Portfolio turnover rate excludes all short-term securities.
(c) Not annualized.
(d) Annualized.
(e) Allocation and Retirement Funds exclude expenses of the underlying funds.
(f) For the period November 5, 2007 (commencement of operations) through December 31, 2007.
(g) Includes less than $0.005 of tax-basis return of capital distributions.
(h) Includes less than $0.005 of dividend distributions.
NA = Not Applicable
The accompanying notes are an integral part of these financial statements.
64
| | | Retirement Income Fund | |
| | | Six
Months Ended
June 30,
2012 | | Years Ended December 31, | | Period Ended
December 31, | |
| | | (Unaudited) | | 2011 | | 2010 | | 2009 | | 2008 | | 2007(f) | |
| Net Asset Value, Beginning of Period | | $ | 1.05 | | | $ | 1.03 | | | $ | 0.97 | | | $ | 0.83 | | | $ | 0.96 | | | $ | 1.00 | | |
| INCOME (LOSS) FROM INVESTMENT OPERATIONS: | |
| Net Investment Income | | | — | | | | 0.03 | | | | 0.02 | | | | 0.03 | | | | 0.03 | | | | 0.04 | | |
| Net Realized and Unrealized Gains (Losses) on Investments and Futures Contracts | | | 0.04 | | | | 0.02 | | | | 0.07 | | | | 0.11 | | | | (0.13 | ) | | | (0.04 | ) | |
| Total From Investment Operations | | | 0.04 | | | | 0.05 | | | | 0.09 | | | | 0.14 | | | | (0.10 | ) | | | — | | |
| Less: Dividend Distributions: | |
| From Net Investment Income | | | — | | | | (0.03 | ) | | | (0.02 | ) | | | — | | | | (0.03 | ) | | | (0.03 | ) | |
| From Capital Gains | | | — | | | | — | (h) | | | (0.01 | ) | | | — | | | | — | | | | (0.01 | ) | |
| From Return of Capital | | | — | | | | — | | | | — | | | | — | | | | — | | | | — | | |
| Total Distributions | | | — | | | | (0.03 | ) | | | (0.03 | ) | | | — | | | | (0.03 | ) | | | (0.04 | ) | |
| Net Asset Value, End of Period | | $ | 1.09 | | | $ | 1.05 | | | $ | 1.03 | | | $ | 0.97 | | | $ | 0.83 | | | $ | 0.96 | | |
| Total Return (%) | | | 3.91 | (c) | | | 4.72 | | | | 9.04 | | | | 16.25 | | | | (9.61 | ) | | | 0.07 | (c) | |
| Net Assets, End of Period ($ millions) | | | 26 | | | | 23 | | | | 18 | | | | 9 | | | | 4 | | | | 1 | | |
| Ratio of Net Investment Income (Loss) to Average Net Assets (%) | | | (0.05 | )(d) | | | 3.03 | | | | 3.65 | | | | 4.39 | | | | 5.42 | | | | 6.12 | (c) | |
| Ratio of Expenses to Average Net Assets Before Expense Reimbursement (%)(e) | | | 0.05 | (d) | | | 0.05 | | | | 0.05 | | | | 0.05 | | | | 0.05 | | | | 0.05 | (d) | |
| Ratio of Expenses to Average Net Assets After Expense Reimbursement (%)(e) | | | 0.05 | (d) | | | 0.05 | | | | 0.05 | | | | 0.05 | | | | 0.05 | | | | 0.05 | (d) | |
| Portfolio Turnover Rate (%)(a) | | | 7.15 | (c) | | | 23.77 | | | | 17.62 | | | | 35.31 | | | | 82.92 | | | | 14.38 | (c) | |
The accompanying notes are an integral part of these financial statements.
65
MUTUAL OF AMERICA INVESTMENT CORPORATION
FINANCIAL HIGHLIGHTS (Continued)
| | | 2010 Retirement Fund | | 2015 Retirement Fund | |
| | | Six
Months Ended
June 30,
2012 | | Years Ended December 31, | | Period Ended
December 31, | | Six
Months Ended
June 30,
2012 | | Years Ended December 31, | | Period Ended
December 31, | |
| | | (Unaudited) | | 2011 | | 2010 | | 2009 | | 2008 | | 2007(f) | | (Unaudited) | | 2011 | | 2010 | | 2009 | | 2008 | | 2007(f) | |
| Net Asset Value, Beginning of Period | | $ | 0.97 | | | $ | 0.96 | | | $ | 0.87 | | | $ | 0.74 | | | $ | 0.94 | | | $ | 0.99 | | | $ | 0.93 | | | $ | 0.93 | | | $ | 0.83 | | | $ | 0.70 | | | $ | 0.92 | | | $ | 0.98 | | |
| INCOME (LOSS) FROM INVESTMENT OPERATIONS: | |
| Net Investment Income | | | — | | | | 0.02 | | | | 0.02 | | | | 0.02 | | | | 0.03 | | | | 0.03 | | | | — | | | | 0.02 | | | | 0.02 | | | | 0.02 | | | | 0.03 | | | | 0.03 | | |
| Net Realized and Unrealized Gains (Losses) on Investments and Futures Contracts | | | 0.04 | | | | 0.01 | | | | 0.07 | | | | 0.13 | | | | (0.20 | ) | | | (0.03 | ) | | | 0.05 | | | | — | | | | 0.08 | | | | 0.13 | | | | (0.22 | ) | | | (0.04 | ) | |
| Total From Investment Operations | | | 0.04 | | | | 0.03 | | | | 0.09 | | | | 0.15 | | | | (0.17 | ) | | | — | | | | 0.05 | | | | 0.02 | | | | 0.10 | | | | 0.15 | | | | (0.19 | ) | | | (0.01 | ) | |
| Less: Dividend Distributions: | |
| From Net Investment Income | | | — | | | | (0.02 | ) | | | — | (h) | | | (0.02 | )(g) | | | (0.03 | ) | | | (0.03 | ) | | | — | | | | (0.02 | ) | | | — | (h) | | | (0.02 | )(g) | | | (0.03 | )(g) | | | (0.03 | ) | |
| From Capital Gains | | | — | | | | — | (h) | | | — | (h) | | | — | | | | — | | | | (0.02 | ) | | | — | | | | — | (h) | | | — | (h) | | | — | | | | — | | | | (0.02 | ) | |
| Total Distributions | | | — | | | | (0.02 | ) | | | — | | | | (0.02 | ) | | | (0.03 | ) | | | (0.05 | ) | | | — | | | | (0.02 | ) | | | — | | | | (0.02 | ) | | | (0.03 | ) | | | (0.05 | ) | |
| Net Asset Value, End of Period | | $ | 1.01 | | | $ | 0.97 | | | $ | 0.96 | | | $ | 0.87 | | | $ | 0.74 | | | $ | 0.94 | | | $ | 0.98 | | | $ | 0.93 | | | $ | 0.93 | | | $ | 0.83 | | | $ | 0.70 | | | $ | 0.92 | | |
| Total Return (%) | | | 4.96 | (c) | | | 3.08 | | | | 11.36 | | | | 19.79 | | | | (17.45 | ) | | | (0.68 | )(c) | | | 5.39 | (c) | | | 2.09 | | | | 12.27 | | | | 21.27 | | | | (21.01 | ) | | | (1.18 | )(c) | |
| Net Assets, End of Period ($ millions) | | | 21 | | | | 21 | | | | 19 | | | | 15 | | | | 8 | | | | 2 | | | | 102 | | | | 91 | | | | 78 | | | | 44 | | | | 20 | | | | 5 | | |
| Ratio of Net Investment Income (Loss) to Average Net Assets (%) | | | (0.05 | )(d) | | | 2.41 | | | | 2.67 | | | | 3.51 | | | | 5.36 | | | | 5.28 | (c) | | | (0.05 | )(d) | | | 2.53 | | | | 2.79 | | | | 3.45 | | | | 4.65 | | | | 5.39 | (c) | |
| Ratio of Expenses to Average Net Assets Before Expense Reimbursement (%)(e) | | | 0.05 | (d) | | | 0.05 | | | | 0.05 | | | | 0.05 | | | | 0.05 | | | | 0.04 | (d) | | | 0.05 | (d) | | | 0.05 | | | | 0.05 | | | | 0.05 | | | | 0.05 | | | | 0.04 | (d) | |
| Ratio of Expenses to Average Net Assets After Expense Reimbursement (%)(e) | | | 0.05 | (d) | | | 0.05 | | | | 0.05 | | | | 0.05 | | | | 0.05 | | | | 0.04 | (d) | | | 0.05 | (d) | | | 0.05 | | | | 0.05 | | | | 0.05 | | | | 0.05 | | | | 0.04 | (d) | |
| Portfolio Turnover Rate (%)(a) | | | 11.35 | (c) | | | 21.22 | | | | 18.31 | | | | 38.17 | | | | 32.37 | | | | 32.49 | (c) | | | 3.19 | (c) | | | 8.10 | | | | 5.64 | | | | 26.96 | | | | 21.47 | | | | 2.79 | (c) | |
(a) Portfolio turnover rate excludes all short-term securities.
(c) Not annualized.
(d) Annualized.
(e) Allocation and Retirement Funds exclude expenses of the underlying funds.
(f) For the period November 5, 2007 (commencement of operations) through December 31, 2007.
(g) Includes less than $0.005 of tax-basis return of capital distributions.
(h) Includes less than $0.005 of dividend distributions.
NA = Not Applicable
The accompanying notes are an integral part of these financial statements.
66
| | | 2020 Retirement Fund | |
| | | Six
Months Ended
June 30,
2012 | | Years Ended December 31, | | Period Ended
December 31, | |
| | | (Unaudited) | | 2011 | | 2010 | | 2009 | | 2008 | | 2007(f) | |
| Net Asset Value, Beginning of Period | | $ | 0.90 | | | $ | 0.91 | | | $ | 0.80 | | | $ | 0.66 | | | $ | 0.91 | | | $ | 0.97 | | |
| INCOME (LOSS) FROM INVESTMENT OPERATIONS: | |
| Net Investment Income | | | — | | | | 0.02 | | | | 0.02 | | | | 0.02 | | | | 0.02 | | | | 0.02 | | |
| Net Realized and Unrealized Gains (Losses) on Investments and Futures Contracts | | | 0.06 | | | | (0.01 | ) | | | 0.09 | | | | 0.14 | | | | (0.25 | ) | | | (0.04 | ) | |
| Total From Investment Operations | | | 0.06 | | | | 0.01 | | | | 0.11 | | | | 0.16 | | | | (0.23 | ) | | | (0.02 | ) | |
| Less: Dividend Distributions: | |
| From Net Investment Income | | | — | | | | (0.02 | ) | | | — | (h) | | | (0.02 | )(g) | | | (0.02 | )(g) | | | (0.02 | ) | |
| From Capital Gains | | | — | | | | — | (h) | | | — | (h) | | | — | | | | — | | | | (0.02 | ) | |
| Total Distributions | | | — | | | | (0.02 | ) | | | — | | | | (0.02 | ) | | | (0.02 | ) | | | (0.04 | ) | |
| Net Asset Value, End of Period | | $ | 0.96 | | | $ | 0.90 | | | $ | 0.91 | | | $ | 0.80 | | | $ | 0.66 | | | $ | 0.91 | | |
| Total Return (%) | | | 6.04 | (c) | | | 1.55 | | | | 13.90 | | | | 23.18 | | | | (24.81 | ) | | | (1.54 | )(c) | |
| Net Assets, End of Period ($ millions) | | | 140 | | | | 118 | | | | 90 | | | | 50 | | | | 21 | | | | 5 | | |
| Ratio of Net Investment Income (Loss) to Average Net Assets (%) | | | (0.05 | )(d) | | | 2.63 | | | | 2.76 | | | | 3.61 | | | | 4.73 | | | | 5.29 | (c) | |
| Ratio of Expenses to Average Net Assets Before Expense Reimbursement (%)(e) | | | 0.05 | (d) | | | 0.05 | | | | 0.05 | | | | 0.05 | | | | 0.05 | | | | 0.04 | (d) | |
| Ratio of Expenses to Average Net Assets After Expense Reimbursement (%)(e) | | | 0.05 | (d) | | | 0.05 | | | | 0.05 | | | | 0.05 | | | | 0.05 | | | | 0.04 | (d) | |
| Portfolio Turnover Rate (%)(a) | | | 1.16 | (c) | | | 4.73 | | | | 2.62 | | | | 13.70 | | | | 14.74 | | | | 2.51 | (c) | |
The accompanying notes are an integral part of these financial statements.
67
MUTUAL OF AMERICA INVESTMENT CORPORATION
FINANCIAL HIGHLIGHTS (Continued)
| | | 2025 Retirement Fund | | 2030 Retirement Fund | |
| | | Six
Months Ended
June 30,
2012 | | Years Ended December 31, | | Period Ended
December 31, | | Six
Months Ended
June 30,
2012 | | Years Ended December 31, | | Period Ended
December 31, | |
| | | (Unaudited) | | 2011 | | 2010 | | 2009 | | 2008 | | 2007(f) | | (Unaudited) | | 2011 | | 2010 | | 2009 | | 2008 | | 2007(f) | |
| Net Asset Value, Beginning of Period | | $ | 0.89 | | | $ | 0.90 | | | $ | 0.78 | | | $ | 0.64 | | | $ | 0.92 | | | $ | 0.99 | | | $ | 0.88 | | | $ | 0.90 | | | $ | 0.77 | | | $ | 0.62 | | | $ | 0.92 | | | $ | 0.99 | | |
| INCOME (LOSS) FROM INVESTMENT OPERATIONS: | |
| Net Investment Income | | | — | | | | 0.02 | | | | 0.02 | | | | 0.02 | | | | 0.02 | | | | 0.02 | | | | — | | | | 0.02 | | | | 0.02 | | | | 0.01 | | | | 0.02 | | | | 0.02 | | |
| Net Realized and Unrealized Gains (Losses) on Investments and Futures Contracts | | | 0.06 | | | | (0.02 | ) | | | 0.10 | | | | 0.14 | | | | (0.28 | ) | | | (0.04 | ) | | | 0.06 | | | | (0.02 | ) | | | 0.11 | | | | 0.15 | | | | (0.30 | ) | | | (0.04 | ) | |
| Total From Investment Operations | | | 0.06 | | | | — | | | | 0.12 | | | | 0.16 | | | | (0.26 | ) | | | (0.02 | ) | | | 0.06 | | | | — | | | | 0.13 | | | | 0.16 | | | | (0.28 | ) | | | (0.02 | ) | |
| Less: Dividend Distributions: | |
| From Net Investment Income | | | — | | | | (0.01 | ) | | | — | (h) | | | (0.02 | )(g) | | | (0.02 | )(g) | | | (0.02 | ) | | | — | | | | (0.02 | ) | | | — | (h) | | | (0.01 | )(g) | | | (0.02 | )(g) | | | (0.02 | ) | |
| From Capital Gains | | | — | | | | — | (h) | | | — | (h) | | | — | | | | — | | | | (0.03 | ) | | | — | | | | — | (h) | | | — | (h) | | | — | | | | — | | | | (0.03 | ) | |
| Total Distributions | | | — | | | | (0.01 | ) | | | — | | | | (0.02 | ) | | | (0.02 | ) | | | (0.05 | ) | | | — | | | | (0.02 | ) | | | — | | | | (0.01 | ) | | | (0.02 | ) | | | (0.05 | ) | |
| Net Asset Value, End of Period | | $ | 0.95 | | | $ | 0.89 | | | $ | 0.90 | | | $ | 0.78 | | | $ | 0.64 | | | $ | 0.92 | | | $ | 0.94 | | | $ | 0.88 | | | $ | 0.90 | | | $ | 0.77 | | | $ | 0.62 | | | $ | 0.92 | | |
| Total Return (%) | | | 6.71 | (c) | | | 0.83 | | | | 15.49 | | | | 25.10 | | | | (28.32 | ) | | | (1.95 | )(c) | | | 7.09 | (c) | | | 0.21 | | | | 16.59 | | | | 26.47 | | | | (29.95 | ) | | | (2.22 | )(c) | |
| Net Assets, End of Period ($ millions) | | | 130 | | | | 109 | | | | 81 | | | | 42 | | | | 15 | | | | 2 | | | | 107 | | | | 90 | | | | 67 | | | | 35 | | | | 12 | | | | 2 | | |
| Ratio of Net Investment Income (Loss) to Average Net Assets (%) | | | (0.05 | )(d) | | | 2.49 | | | | 2.50 | | | | 3.25 | | | | 5.06 | | | | 4.48 | (c) | | | (0.05 | )(d) | | | 2.37 | | | | 2.37 | | | | 3.07 | | | | 4.61 | | | | 4.82 | (c) | |
| Ratio of Expenses to Average Net Assets Before Expense Reimbursement (%)(e) | | | 0.05 | (d) | | | 0.05 | | | | 0.05 | | | | 0.05 | | | | 0.05 | | | | 0.04 | (d) | | | 0.05 | (d) | | | 0.05 | | | | 0.05 | | | | 0.05 | | | | 0.05 | | | | 0.05 | (d) | |
| Ratio of Expenses to Average Net Assets After Expense Reimbursement (%)(e) | | | 0.05 | (d) | | | 0.05 | | | | 0.05 | | | | 0.05 | | | | 0.05 | | | | 0.04 | (d) | | | 0.05 | (d) | | | 0.05 | | | | 0.05 | | | | 0.05 | | | | 0.05 | | | | 0.05 | (d) | |
| Portfolio Turnover Rate (%)(a) | | | 1.05 | (c) | | | 2.52 | | | | 3.16 | | | | 9.21 | | | | 10.06 | | | | 0.28 | (c) | | | 1.39 | (c) | | | 2.66 | | | | 1.74 | | | | 8.96 | | | | 12.34 | | | | 4.11 | (c) | |
(a) Portfolio turnover rate excludes all short-term securities.
(c) Not annualized.
(d) Annualized.
(e) Allocation and Retirement Funds exclude expenses of the underlying funds.
(f) For the period November 5, 2007 (commencement of operations) through December 31, 2007.
(g) Includes less than $0.005 of tax-basis return of capital distributions.
(h) Includes less than $0.005 of dividend distributions.
NA = Not Applicable
The accompanying notes are an integral part of these financial statements.
68
| | | 2035 Retirement Fund | |
| | | Six
Months Ended
June 30,
2012 | | Years Ended December 31, | | Period Ended
December 31, | |
| | | (Unaudited) | | 2011 | | 2010 | | 2009 | | 2008 | | 2007(f) | |
| Net Asset Value, Beginning of Period | | $ | 0.86 | | | $ | 0.88 | | | $ | 0.75 | | | $ | 0.60 | | | $ | 0.92 | | | $ | 1.00 | | |
| INCOME (LOSS) FROM INVESTMENT OPERATIONS: | |
| Net Investment Income | | | — | | | | 0.01 | | | | 0.01 | | | | 0.01 | | | | 0.02 | | | | 0.02 | | |
| Net Realized and Unrealized Gains (Losses) on Investments and Futures Contracts | | | 0.06 | | | | (0.02 | ) | | | 0.12 | | | | 0.15 | | | | (0.32 | ) | | | (0.05 | ) | |
| Total From Investment Operations | | | 0.06 | | | | (0.01 | ) | | | 0.13 | | | | 0.16 | | | | (0.30 | ) | | | (0.03 | ) | |
| Less: Dividend Distributions: | |
| From Net Investment Income | | | — | | | | (0.01 | ) | | | — | (h) | | | (0.01 | )(g) | | | (0.02 | )(g) | | | (0.02 | ) | |
| From Capital Gains | | | — | | | | — | (h) | | | — | (h) | | | — | | | | — | | | | (0.03 | ) | |
| Total Distributions | | | — | | | | (0.01 | ) | | | — | | | | (0.01 | ) | | | (0.02 | ) | | | (0.05 | ) | |
| Net Asset Value, End of Period | | $ | 0.92 | | | $ | 0.86 | | | $ | 0.88 | | | $ | 0.75 | | | $ | 0.60 | | | $ | 0.92 | | |
| Total Return (%) | | | 7.36 | (c) | | | (0.63 | ) | | | 17.66 | | | | 27.05 | | | | (32.53 | ) | | | (2.54 | )(c) | |
| Net Assets, End of Period ($ millions) | | | 83 | | | | 69 | | | | 53 | | | | 27 | | | | 9 | | | | 2 | | |
| Ratio of Net Investment Income (Loss) to Average Net Assets (%) | | | (0.05 | )(d) | | | 2.17 | | | | 2.20 | | | | 2.74 | | | | 4.21 | | | | 3.76 | (c) | |
| Ratio of Expenses to Average Net Assets Before Expense Reimbursement (%)(e) | | | 0.05 | (d) | | | 0.05 | | | | 0.05 | | | | 0.05 | | | | 0.05 | | | | 0.05 | (d) | |
| Ratio of Expenses to Average Net Assets After Expense Reimbursement (%)(e) | | | 0.05 | (d) | | | 0.05 | | | | 0.05 | | | | 0.05 | | | | 0.05 | | | | 0.05 | (d) | |
| Portfolio Turnover Rate (%)(a) | | | 0.36 | (c) | | | 2.78 | | | | 1.47 | | | | 6.27 | | | | 7.62 | | | | 0.71 | (c) | |
The accompanying notes are an integral part of these financial statements.
69
MUTUAL OF AMERICA INVESTMENT CORPORATION
FINANCIAL HIGHLIGHTS (Continued)
| | | 2040 Retirement Fund | | 2045 Retirement Fund | |
| | | Six
Months Ended
June 30,
2012 | | Years Ended December 31, | | Period Ended
December 31, | | Six
Months Ended
June 30,
2012 | | Years Ended December 31, | |
| | | (Unaudited) | | 2011 | | 2010 | | 2009 | | 2008 | | 2007(f) | | (Unaudited) | | 2011 | | 2010 | | 2009 | | 2008 | | 2007(f) | |
| Net Asset Value, Beginning of Period | | $ | 0.85 | | | $ | 0.88 | | | $ | 0.74 | | | $ | 0.59 | | | $ | 0.91 | | | $ | 0.99 | | | $ | 0.85 | | | $ | 0.88 | | | $ | 0.74 | | | $ | 0.59 | | | $ | 0.91 | | | $ | 0.99 | | |
| INCOME (LOSS) FROM INVESTMENT OPERATIONS: | |
| Net Investment Income | | | — | | | | 0.01 | | | | 0.01 | | | | 0.01 | | | | 0.02 | | | | 0.02 | | | | — | | | | 0.01 | | | | 0.01 | | | | 0.01 | | | | 0.02 | | | | 0.02 | | |
| Net Realized and Unrealized Gains (Losses) on Investments and Futures Contracts | | | 0.06 | | | | (0.03 | ) | | | 0.13 | | | | 0.15 | | | | (0.32 | ) | | | (0.05 | ) | | | 0.06 | | | | (0.03 | ) | | | 0.13 | | | | 0.15 | | | | (0.32 | ) | | | (0.05 | ) | |
| Total From Investment Operations | | | 0.06 | | | | (0.02 | ) | | | 0.14 | | | | 0.16 | | | | (0.30 | ) | | | (0.03 | ) | | | 0.06 | | | | (0.02 | ) | | | 0.14 | | | | 0.16 | | | | (0.30 | ) | | | (0.03 | ) | |
Less: Dividend Distributions:
From Net Investment Income | | | — | | | | (0.01 | ) | | | — | (h) | | | (0.01 | )(g) | | | (0.02 | )(g) | | | (0.02 | ) | | | — | | | | (0.01 | ) | | | — | (h) | | | (0.01 | )(g) | | | (0.02 | )(g) | | | (0.02 | ) | |
| From Capital Gains | | | — | | | | — | (h) | | | — | (h) | | | — | | | | — | | | | (0.03 | ) | | | — | | | | — | (h) | | | — | (h) | | | — | | | | — | | | | (0.03 | ) | |
| Total Distributions | | | — | | | | (0.01 | ) | | | — | | | | (0.01 | ) | | | (0.02 | ) | | | (0.05 | ) | | | — | | | | (0.01 | ) | | | — | | | | (0.01 | ) | | | (0.02 | ) | | | (0.05 | ) | |
| Net Asset Value, End of Period | | $ | 0.91 | | | $ | 0.85 | | | $ | 0.88 | | | $ | 0.74 | | | $ | 0.59 | | | $ | 0.91 | | | $ | 0.91 | | | $ | 0.85 | | | $ | 0.88 | | | $ | 0.74 | | | $ | 0.59 | | | $ | 0.91 | | |
| Total Return (%) | | | 7.32 | (c) | | | (1.24 | ) | | | 18.38 | | | | 27.84 | | | | (32.75 | ) | | | (2.68 | )(c) | | | 7.32 | (c) | | | (1.45 | ) | | | 18.57 | | | | 27.55 | | | | (32.90 | ) | | | (2.79 | )(c) | |
| Net Assets, End of Period ($ millions) | | | 76 | | | | 62 | | | | 47 | | | | 23 | | | | 6 | | | | 1 | | | | 94 | | | | 76 | | | | 54 | | | | 25 | | | | 7 | | | | 1 | | |
| Ratio of Net Investment Income (Loss) to Average Net Assets (%) | | | (0.05 | )(d) | | | 2.09 | | | | 2.13 | | | | 2.75 | | | | 4.20 | | | | 3.93 | (c) | | | (0.05 | )(d) | | | 2.09 | | | | 2.14 | | | | 2.61 | | | | 4.49 | | | | 4.17 | (c) | |
| Ratio of Expenses to Average Net Assets Before Expense Reimbursement (%)(e) | | | 0.05 | (d) | | | 0.05 | | | | 0.05 | | | | 0.05 | | | | 0.05 | | | | 0.05 | (d) | | | 0.05 | (d) | | | 0.05 | | | | 0.05 | | | | 0.05 | | | | 0.05 | | | | 0.03 | (d) | |
| Ratio of Expenses to Average Net Assets After Expense Reimbursement (%)(e) | | | 0.05 | (d) | | | 0.05 | | | | 0.05 | | | | 0.05 | | | | 0.05 | | | | 0.05 | (d) | | | 0.05 | (d) | | | 0.05 | | | | 0.05 | | | | 0.05 | | | | 0.05 | | | | 0.03 | (d) | |
| Portfolio Turnover Rate (%)(a) | | | 0.72 | (c) | | | 2.28 | | | | 1.37 | | | | 5.79 | | | | 7.79 | | | | 1.18 | (c) | | | 0.37 | (c) | | | 1.97 | | | | 1.04 | | | | 7.87 | | | | 6.77 | | | | 6.34 | (c) | |
(a) Portfolio turnover rate excludes all short-term securities.
(c) Not annualized.
(d) Annualized.
(e) Allocation and Retirement Funds exclude expenses of the underlying funds.
(f) For the period November 5, 2007 (commencement of operations) through December 31, 2007.
(g) Includes less than $0.005 of tax-basis return of capital distributions.
(h) Includes less than $0.005 of dividend distributions.
NA = Not Applicable
The accompanying notes are an integral part of these financial statements.
70
| | | Conservative Allocation Fund | |
| | | Period Ended
December 31, | | Six
Months Ended
June 30,
2012 | | Years Ended December 31, | |
| | | (Unaudited) | | 2011 | | 2010 | | 2009 | | 2008 | | 2007 | |
| Net Asset Value, Beginning of Period | | $ | 1.11 | | | $ | 1.08 | | | $ | 0.99 | | | $ | 0.89 | | | $ | 1.03 | | | $ | 1.02 | | |
| INCOME (LOSS) FROM INVESTMENT OPERATIONS: | |
| Net Investment Income | | | — | | | | 0.03 | | | | 0.03 | | | | 0.03 | | | | 0.04 | | | | 0.04 | | |
| Net Realized and Unrealized Gains (Losses) on Investments and Futures Contracts | | | 0.04 | | | | 0.03 | | | | 0.06 | | | | 0.11 | | | | (0.14 | ) | | | 0.02 | | |
| Total From Investment Operations | | | 0.04 | | | | 0.06 | | | | 0.09 | | | | 0.14 | | | | (0.10 | ) | | | 0.06 | | |
Less: Dividend Distributions:
From Net Investment Income | | | — | | | | (0.03 | ) | | | — | (h) | | | (0.03 | ) | | | (0.04 | ) | | | (0.04 | ) | |
| From Capital Gains | | | — | | | | — | (h) | | | — | (h) | | | (0.01 | ) | | | — | | | | (0.01 | ) | |
| Total Distributions | | | — | | | | (0.03 | ) | | | — | | | | (0.04 | ) | | | (0.04 | ) | | | (0.05 | ) | |
| Net Asset Value, End of Period | | $ | 1.15 | | | $ | 1.11 | | | $ | 1.08 | | | $ | 0.99 | | | $ | 0.89 | | | $ | 1.03 | | |
| Total Return (%) | | | 4.18 | (c) | | | 5.79 | | | | 9.34 | | | | 15.94 | | | | (10.19 | ) | | | 6.43 | | |
| Net Assets, End of Period ($ millions) | | | 75 | | | | 66 | | | | 52 | | | | 38 | | | | 24 | | | | 20 | | |
| Ratio of Net Investment Income (Loss) to Average Net Assets (%) | | | — | (d) | | | 3.40 | | | | 3.47 | | | | 4.24 | | | | 4.04 | | | | 4.48 | | |
| Ratio of Expenses to Average Net Assets Before Expense Reimbursement (%)(e) | | | — | (d) | | | — | | | | — | | | | — | | | | — | | | | — | | |
| Ratio of Expenses to Average Net Assets After Expense Reimbursement (%)(e) | | | — | (d) | | | — | | | | — | | | | — | | | | — | | | | — | | |
| Portfolio Turnover Rate (%)(a) | | | 2.09 | (c) | | | 12.14 | | | | 20.11 | | | | 14.24 | | | | 38.30 | | | | 13.72 | | |
The accompanying notes are an integral part of these financial statements.
71
MUTUAL OF AMERICA INVESTMENT CORPORATION
FINANCIAL HIGHLIGHTS (Continued)
| | | Moderate Allocation Fund | | Aggressive Allocation Fund | |
| | | Six
Months Ended
June 30,
2012 | | Years Ended December 31, | | Six
Months Ended
June 30,
2012 | | Years Ended December 31, | |
| | | (Unaudited) | | 2011 | | 2010 | | 2009 | | 2008 | | 2007 | | (Unaudited) | | 2011 | | 2010 | | 2009 | | 2008 | | 2007 | |
| Net Asset Value, Beginning of Period | | $ | 1.18 | | | $ | 1.16 | | | $ | 1.03 | | | $ | 0.88 | | | $ | 1.14 | | | $ | 1.14 | | | $ | 1.24 | | | $ | 1.24 | | | $ | 1.06 | | | $ | 0.86 | | | $ | 1.24 | | | $ | 1.27 | | |
| INCOME (LOSS) FROM INVESTMENT OPERATIONS: | |
| Net Investment Income | | | — | | | | 0.03 | | | | 0.03 | | | | 0.03 | | | | 0.03 | | | | 0.04 | | | | — | | | | 0.02 | | | | 0.02 | | | | 0.02 | | | | 0.02 | | | | 0.03 | | |
| Net Realized and Unrealized Gains (Losses) on Investments and Futures Contracts | | | 0.07 | | | | 0.02 | | | | 0.11 | | | | 0.15 | | | | (0.25 | ) | | | 0.03 | | | | 0.09 | | | | — | | | | 0.16 | | | | 0.20 | | | | (0.37 | ) | | | 0.04 | | |
| Total From Investment Operations | | | 0.07 | | | | 0.05 | | | | 0.14 | | | | 0.18 | | | | (0.22 | ) | | | 0.07 | | | | 0.09 | | | | 0.02 | | | | 0.18 | | | | 0.22 | | | | (0.35 | ) | | | 0.07 | | |
Less: Dividend Distributions:
From Net Investment Income | | | — | | | | (0.03 | ) | | | — | (h) | | | (0.03 | )(g) | | | (0.03 | ) | | | (0.04 | ) | | | — | | | | (0.02 | ) | | | — | (h) | | | (0.02 | ) | | | (0.02 | )(g) | | | (0.04 | )(g) | |
| From Capital Gains | | | — | | | | — | (h) | | | (0.01 | ) | | | — | | | | (0.01 | ) | | | (0.03 | ) | | | — | | | | — | | | | — | | | | — | | | | (0.01 | ) | | | (0.06 | ) | |
| Total Distributions | | | — | | | | (0.03 | ) | | | (0.01 | ) | | | (0.03 | ) | | | (0.04 | ) | | | (0.07 | ) | | | — | | | | (0.02 | ) | | | — | | | | (0.02 | ) | | | (0.03 | ) | | | (0.10 | ) | |
| Net Asset Value, End of Period | | $ | 1.25 | | | $ | 1.18 | | | $ | 1.16 | | | $ | 1.03 | | | $ | 0.88 | | | $ | 1.14 | | | $ | 1.33 | | | $ | 1.24 | | | $ | 1.24 | | | $ | 1.06 | | | $ | 0.86 | | | $ | 1.24 | | |
| Total Return (%) | | | 5.85 | (c) | | | 4.19 | | | | 13.11 | | | | 21.27 | | | | (19.85 | ) | | | 6.36 | | | | 7.43 | (c) | | | 2.31 | | | | 17.02 | | | | 25.64 | | | | (28.20 | ) | | | 5.52 | | |
| Net Assets, End of Period ($ millions) | | | 202 | | | | 182 | | | | 163 | | | | 125 | | | | 90 | | | | 102 | | | | 175 | | | | 158 | | | | 147 | | | | 117 | | | | 81 | | | | 101 | | |
| Ratio of Net Investment Income (Loss) to Average Net Assets (%) | | | — | (d) | | | 2.68 | | | | 2.73 | | | | 3.22 | | | | 3.14 | | | | 3.54 | | | | — | (d) | | | 2.13 | | | | 2.07 | | | | 2.44 | | | | 2.41 | | | | 2.75 | | |
| Ratio of Expenses to Average Net Assets Before Expense Reimbursement (%)(e) | | | — | (d) | | | — | | | | — | | | | — | | | | — | | | | — | | | | — | (d) | | | — | | | | — | | | | — | | | | — | | | | — | | |
| Ratio of Expenses to Average Net Assets After Expense Reimbursement (%)(e) | | | — | (d) | | | — | | | | — | | | | — | | | | — | | | | — | | | | — | (d) | | | — | | | | — | | | | — | | | | — | | | | — | | |
| Portfolio Turnover Rate (%)(a) | | | 1.41 | (c) | | | 11.21 | | | | 15.68 | | | | 15.29 | | | | 25.21 | | | | 12.35 | | | | 1.99 | (c) | | | 7.73 | | | | 12.91 | | | | 11.70 | | | | 20.56 | | | | 9.14 | | |
(a) Portfolio turnover rate excludes all short-term securities.
(c) Not annualized.
(d) Annualized.
(e) Allocation and Retirement Funds exclude expenses of the underlying funds.
(f) For the period November 5, 2007 (commencement of operations) through December 31, 2007.
(g) Includes less than $0.005 of tax-basis return of capital distributions.
(h) Includes less than $0.005 of dividend distributions.
NA = Not Applicable
The accompanying notes are an integral part of these financial statements.
72
| | | Money Market Fund | |
| | | Six
Months Ended
June 30,
2012 | | Years Ended December 31, | |
| | | (Unaudited) | | 2011 | | 2010 | | 2009 | | 2008 | | 2007 | |
| Net Asset Value, Beginning of Period | | $ | 1.20 | | | $ | 1.20 | | | $ | 1.21 | | | $ | 1.21 | | | $ | 1.21 | | | $ | 1.21 | | |
| INCOME (LOSS) FROM INVESTMENT OPERATIONS: | |
| Net Investment Income | | | (0.00 | ) | | | — | | | | — | | | | — | | | | 0.03 | | | | 0.05 | | |
| Net Realized and Unrealized Gains (Losses) on Investments and Futures Contracts | | | 0.00 | | | | — | | | | (0.01 | ) | | | — | | | | — | | | | — | | |
| Total From Investment Operations | | | 0.00 | | | | — | | | | (0.01 | ) | | | — | | | | 0.03 | | | | 0.05 | | |
Less: Dividend Distributions:
From Net Investment Income | | | — | | | | — | | | | — | | | | — | | | | (0.03 | ) | | | (0.05 | ) | |
| From Capital Gains | | | — | | | | — | | | | — | | | | — | | | | — | | | | — | | |
| Total Distributions | | | — | | | | — | | | | — | | | | — | | | | (0.03 | ) | | | (0.05 | ) | |
| Net Asset Value, End of Period | | $ | 1.20 | | | $ | 1.20 | | | $ | 1.20 | | | $ | 1.21 | | | $ | 1.21 | | | $ | 1.21 | | |
| Total Return (%) | | | (0.09 | )(c) | | | (0.17 | ) | | | (0.14 | ) | | | (0.08 | ) | | | 2.34 | | | | 5.03 | | |
| Net Assets, End of Period ($ millions) | | | 97 | | | | 101 | | | | 109 | | | | 119 | | | | 201 | | | | 312 | | |
| Ratio of Net Investment Income (Loss) to Average Net Assets (%) | | | (0.20 | )(d) | | | (0.17 | ) | | | (0.15 | ) | | | (0.04 | ) | | | 2.38 | | | | 4.89 | | |
| Ratio of Expenses to Average Net Assets Before Expense Reimbursement (%)(e) | | | 0.31 | (d) | | | 0.31 | | | | 0.32 | | | | 0.33 | | | | 0.32 | | | | 0.28 | | |
| Ratio of Expenses to Average Net Assets After Expense Reimbursement (%)(e) | | | 0.31 | (d) | | | 0.31 | | | | 0.32 | | | | 0.33 | | | | 0.32 | | | | 0.28 | | |
| Portfolio Turnover Rate (%)(a) | | | N/A | | | | N/A | | | | NA | | | | NA | | | | NA | | | | NA | | |
The accompanying notes are an integral part of these financial statements.
73
MUTUAL OF AMERICA INVESTMENT CORPORATION
FINANCIAL HIGHLIGHTS (Continued)
| | | Mid-Term Bond Fund | |
| | | Six
Months Ended
June 30,
2012 | | Years Ended December 31, | |
| | | (Unaudited) | | 2011 | | 2010 | | 2009 | | 2008 | | 2007 | |
| Net Asset Value, Beginning of Period | | $ | 1.06 | | | $ | 1.03 | | | $ | 1.00 | | | $ | 0.94 | | | $ | 0.96 | | | $ | 0.93 | | |
| INCOME (LOSS) FROM INVESTMENT OPERATIONS: | |
| Net Investment Income | | | 0.02 | | | | 0.03 | | | | 0.04 | | | | 0.04 | | | | 0.04 | | | | 0.04 | | |
| Net Realized and Unrealized Gains (Losses) on Investments and Futures Contracts | | | 0.00 | | | | 0.03 | | | | 0.02 | | | | 0.07 | | | | (0.02 | ) | | | 0.03 | | |
| Total From Investment Operations | | | 0.02 | | | | 0.06 | | | | 0.06 | | | | 0.11 | | | | 0.02 | | | | 0.07 | | |
Less: Dividend Distributions:
From Net Investment Income | | | — | | | | (0.03 | ) | | | (0.03 | ) | | | (0.04 | ) | | | (0.04 | ) | | | (0.04 | ) | |
| From Capital Gains | | | — | | | | — | | | | — | (h) | | | (0.01 | ) | | | — | | | | — | | |
| Total Distributions | | | — | | | | (0.03 | ) | | | (0.03 | ) | | | (0.05 | ) | | | (0.04 | ) | | | (0.04 | ) | |
| Net Asset Value, End of Period | | $ | 1.08 | | | $ | 1.06 | | | $ | 1.03 | | | $ | 1.00 | | | $ | 0.94 | | | $ | 0.96 | | |
| Total Return (%) | | | 1.85 | (c) | | | 6.34 | | | | 6.93 | �� | | | 11.22 | | | | 1.84 | | | | 7.22 | | |
| Net Assets, End of Period ($ millions) | | | 344 | | | | 338 | | | | 298 | | | | 234 | | | | 183 | | | | 122 | | |
| Ratio of Net Investment Income to Average Net Assets (%) | | | 2.96 | (d) | | | 3.02 | | | | 3.66 | | | | 4.16 | | | | 4.27 | | | | 4.28 | | |
| Ratio of Expenses to Average Net Assets Before Expense Reimbursement (%) | | | 0.57 | (d) | | | 0.55 | | | | 0.57 | | | | 0.58 | | | | 0.55 | | | | 0.56 | | |
| Ratio of Expenses to Average Net Assets After Expense Reimbursement (%) | | | 0.57 | (d) | | | 0.55 | | | | 0.57 | | | | 0.58 | | | | 0.55 | | | | 0.56 | | |
| Portfolio Turnover Rate (%)(a) | | | 6.06 | (c) | | | 23.69 | | | | 16.70 | | | | 30.76 | | | | 34.95 | | | | 26.78 | | |
(a) Portfolio turnover rate excludes all short-term securities.
(c) Not annualized.
(d) Annualized.
(e) Allocation and Retirement Funds exclude expenses of the underlying funds.
(f) For the period November 5, 2007 (commencement of operations) through December 31, 2007.
(g) Includes less than $0.005 of tax-basis return of capital distributions.
(h) Includes less than $0.005 of dividend distributions.
NA = Not Applicable
The accompanying notes are an integral part of these financial statements.
74
| | | Bond Fund | |
| | | Six
Months Ended
June 30,
2012 | | Years Ended December 31, | |
| | | (Unaudited) | | 2011 | | 2010 | | 2009 | | 2008 | | 2007 | |
| Net Asset Value, Beginning of Period | | $ | 1.39 | | | $ | 1.34 | | | $ | 1.30 | | | $ | 1.18 | | | $ | 1.27 | | | $ | 1.26 | | |
| INCOME (LOSS) FROM INVESTMENT OPERATIONS: | |
| Net Investment Income | | | 0.03 | | | | 0.05 | | | | 0.05 | | | | 0.05 | | | | 0.07 | | | | 0.06 | | |
| Net Realized and Unrealized Gains (Losses) on Investments and Futures Contracts | | | 0.01 | | | | 0.05 | | | | 0.04 | | | | 0.12 | | | | (0.09 | ) | | | 0.01 | | |
| Total From Investment Operations | | | 0.04 | | | | 0.10 | | | | 0.09 | | | | 0.17 | | | | (0.02 | ) | | | 0.07 | | |
Less: Dividend Distributions:
From Net Investment Income | | | — | | | | (0.05 | ) | | | (0.05 | ) | | | (0.05 | ) | | | (0.07 | ) | | | (0.06 | ) | |
| From Capital Gains | | | — | | | | — | | | | — | | | | — | | | | — | | | | — | | |
| Total Distributions | | | — | | | | (0.05 | ) | | | (0.05 | ) | | | (0.05 | ) | | | (0.07 | ) | | | (0.06 | ) | |
| Net Asset Value, End of Period | | $ | 1.43 | | | $ | 1.39 | | | $ | 1.34 | | | $ | 1.30 | | | $ | 1.18 | | | $ | 1.27 | | |
| Total Return (%) | | | 2.95 | (c) | | | 7.30 | | | | 7.29 | | | | 14.61 | | | | (1.75 | ) | | | 5.90 | | |
| Net Assets, End of Period ($ millions) | | | 657 | | | | 635 | | | | 597 | | | | 488 | | | | 372 | | | | 384 | | |
| Ratio of Net Investment Income to Average Net Assets (%) | | | 3.69 | (d) | | | 3.61 | | | | 3.81 | | | | 4.62 | | | | 5.05 | | | | 4.95 | | |
| Ratio of Expenses to Average Net Assets Before Expense Reimbursement (%) | | | 0.57 | (d) | | | 0.55 | | | | 0.57 | | | | 0.58 | | | | 0.56 | | | | 0.53 | | |
| Ratio of Expenses to Average Net Assets After Expense Reimbursement (%) | | | 0.57 | (d) | | | 0.55 | | | | 0.57 | | | | 0.58 | | | | 0.56 | | | | 0.53 | | |
| Portfolio Turnover Rate (%)(a) | | | 16.97 | (c) | | | 30.24 | | | | 40.33 | | | | 46.27 | | | | 23.76 | | | | 17.56 | | |
The accompanying notes are an integral part of these financial statements.
75
MUTUAL OF AMERICA INVESTMENT CORPORATION
NOTES TO FINANCIAL STATEMENTS (Unaudited)
1. SIGNIFICANT ACCOUNTING POLICIES AND ORGANIZATION
Mutual of America Investment Corporation (the "Investment Company") is a diversified, open-end management investment company — a type of company commonly known as a "mutual fund". It is registered as such under the Investment Company Act of 1940 (the "Investment Company Act"). The Investment Company was formed on February 21, 1986 as a Maryland corporation and principally offers its shares exclusively to separate accounts of Mutual of America Life Insurance Company ("Mutual of America Life") and its affiliates. As a "series" type mutual fund, the Investment Company issues separate classes (or series) of capital stock, each of which represents a separate Fund of investments. At June 30, 2012, there were 23 active Funds (collectively, "the Funds"): Equity Index Fund, All America Fund, Small Cap Value Fund, Small Cap Growth Fund, Mid Cap Value Fund, Mid-Cap Equity Index Fund, International Fund, Composite Fund, Money Market Fund, Mid-Term Bond Fund, Bond Fund; Retirement Income Fund, 2010 Retirement Fund, 2015 Retirement Fund, 2020 Retirement Fund, 2025 Retirement Fund, 2030 Retirement Fund, 2035 Retirement Fund, 2040 Retirement Fund and 2045 Retirement Fund (collectively, "Retirement Funds"); a Conservative Allocation Fund, a Moderate Allocation Fund and an Aggressive Allocation Fund (collectively, "Allocation Funds"). The International Fund and the Retirement Funds commenced operations on November 5, 2007.
Investment Company shares are issued to Mutual of America Life, and on a limited basis, to Wilton Reassurance Life Company of New York (formerly The American Life Insurance Company of New York), for allocation to their Separate Accounts as a funding medium for variable accumulation annuity contracts and variable life insurance policies. In addition, shares of selected equity and fixed income funds of the Investment Company are directly issued to one or more of the Investment Company's Allocation Funds.
The preparation of financial statements in accordance with U.S. generally accepted accounting principles requires management to make estimates and assumptions that affect the reported amounts of assets, liabilities, income, expenses and related disclosures. Actual results, however, may differ from those estimates.
The following is a summary of the significant accounting policies consistently followed by the Investment Company, which are in conformity with U.S. generally accepted accounting principles ("GAAP"):
Fair Value — The Investment Company values its investments at fair value. Fair value is an estimate of the price the Fund would receive upon selling a security in an orderly arms-length transaction. Investments are categorized based on a three-level valuation hierarchy for measurement and disclosure of fair value. The valuation hierarchy is based upon the transparency of inputs used to measure fair value. The three levels are as follows:
• Level 1 — quoted prices in active markets for identical securities.
• Level 2 — other significant observable inputs (including yield, quality, coupon rate, maturity, issue type, quoted prices for similar securities, prepayment speeds, trading characteristics, etc.).
• Level 3 — significant unobservable inputs (including the Fund's own assumptions in determining the fair value of investments).
As of June 30, 2012, management determined that the fair value inputs for all equity securities, including shares of registered investment companies, were considered Level 1, with the exception of non-registered securities under Rule 144A of the Securities Act of 1933 which were considered Level 2. In addition, certain Rule 144A securities not actively traded are considered Level 3; however, there were no such securities as of June 30, 2012. Fair value inputs for all debt securities were considered Level 2. The inputs used for valuing securities are not necessarily an indication of the risk associated with investing in those securities. Transfers between levels are reflected based on the fair value at the beginning of a reporting period.
76
MUTUAL OF AMERICA INVESTMENT CORPORATION
NOTES TO FINANCIAL STATEMENTS (Unaudited) (Continued)
1. SIGNIFICANT ACCOUNTING POLICIES AND ORGANIZATION (CONTINUED)
The following is a summary of the inputs used to value the Funds' investments and other financial instruments as of December June 30, 2012, by fair value input hierarchy:
| Fund | | Level 1 — Quoted
Prices | | Level 2 — Significant
Observable Inputs | | Level 3 — Significant
Unobservable Inputs | | Total | |
Investments at Market Value:
(See Portfolios of Investments for More Details) | |
| Equity Index Fund | |
| Common Stock | | $ | 994,118,792 | | | | — | | | | — | | | $ | 994,118,792 | | |
| Short-Term Debt Securities | | | — | | | $ | 35,898,156 | | | | — | | | $ | 35,898,156 | | |
| Temporary Cash Investments | | | — | | | $ | 750,000 | | | | — | | | $ | 750,000 | | |
| | | $ | 994,118,792 | | | $ | 36,648,156 | | | | — | | | $ | 1,030,766,948 | | |
| All America Fund | |
| Common Stock-Indexed | | $ | 137,053,384 | | | | — | | | | — | | | $ | 137,053,384 | | |
| Common Stock-Active | | $ | 107,943,688 | | | $ | 308,188 | | | | — | | | $ | 108,251,876 | | |
| Convertible Preferred Stock | | $ | 207,905 | | | | — | | | | — | | | $ | 207,905 | | |
| Short-Term Debt Securities | | | — | | | $ | 9,399,775 | | | | — | | | $ | 9,399,775 | | |
| Temporary Cash Investments | | | — | | | $ | 592,600 | | | | — | | | $ | 592,600 | | |
| | | $ | 245,204,977 | | | $ | 10,300,563 | | | | — | | | $ | 255,505,540 | | |
| Small Cap Value Fund | |
| Common Stock | | $ | 255,506,961 | | | $ | 1,796,859 | | | | — | | | $ | 257,303,820 | | |
| Convertible Preferred Stock | | $ | 1,591,072 | | | | — | | | | — | | | $ | 1,591,072 | | |
| Short-Term Debt Securities | | | — | | | $ | 21,995,081 | | | | — | | | $ | 21,995,081 | | |
| | | $ | 257,098,033 | | | $ | 23,791,940 | | | | — | | | $ | 280,889,973 | | |
| Small Cap Growth Fund | |
| Common Stock | | $ | 271,856,467 | | | | — | | | | — | | | $ | 271,856,467 | | |
| Short-Term Debt Securities | | | — | | | $ | 16,899,391 | | | | — | | | $ | 16,899,391 | | |
| | | $ | 271,856,467 | | | $ | 16,899,391 | | | | — | | | $ | 288,755,858 | | |
| Mid Cap Value Fund | |
| Common Stock | | $ | 46,740,999 | | | | — | | | | — | | | $ | 46,740,999 | | |
| Short-Term Debt Securities | | | — | | | $ | 3,499,953 | | | | — | | | $ | 3,499,953 | | |
| | | $ | 46,740,999 | | | $ | 3,499,953 | | | | — | | | $ | 50,240,952 | | |
| Mid-Cap Equity Index Fund | |
| Common Stock | | $ | 537,684,406 | | | | — | | | | — | | | $ | 537,684,406 | | |
| Short-Term Debt Securities | | | — | | | $ | 18,999,247 | | | | — | | | $ | 18,999,247 | | |
| Temporary Cash Investments | | | — | | | $ | 170,700 | | | | — | | | $ | 170,700 | | |
| | | $ | 537,684,406 | | | $ | 19,169,947 | | | | — | | | $ | 556,854,353 | | |
| International Fund | |
| Common Stock | | $ | 78,490,503 | | | | — | | | | — | | | $ | 78,490,503 | | |
| Short-Term Debt Securities | | | — | | | $ | 1,979,934 | | | | — | | | $ | 1,979,934 | | |
| | | $ | 78,490,503 | | | $ | 1,979,934 | | | | — | | | $ | 80,470,437 | | |
| Composite Fund | |
| Common Stock | | $ | 96,459,723 | | | | — | | | | — | | | $ | 96,459,723 | | |
| U.S. Government Debt | | | — | | | $ | 9,784,458 | | | | — | | | $ | 9,784,458 | | |
U.S. Government Agency Residential
Mortgage-Backed Obligations | | | — | | | $ | 22,439,409 | | | | — | | | $ | 22,439,409 | | |
| Corporate Long-Term Debt | | | — | | | $ | 29,981,054 | | | | — | | | $ | 29,981,054 | | |
| Short-Term Debt | | | — | | | $ | 7,519,706 | | | | — | | | $ | 7,519,706 | | |
| Temporary Cash Investments | | | — | | | $ | 1,017,200 | | | | — | | | $ | 1,017,200 | | |
| | | $ | 96,459,723 | | | $ | 70,741,827 | | | | — | | | $ | 167,201,550 | | |
| Retirement Income Fund | |
| Common Stock | | $ | 25,635,071 | | | | — | | | | — | | | $ | 25,635,071 | | |
| 2010 Retirement Fund | |
| Common Stock | | $ | 21,328,533 | | | | — | | | | — | | | $ | 21,328,533 | | |
77
MUTUAL OF AMERICA INVESTMENT CORPORATION
NOTES TO FINANCIAL STATEMENTS (Unaudited) (Continued)
1. SIGNIFICANT ACCOUNTING POLICIES AND ORGANIZATION (CONTINUED)
| Fund | | Level 1 — Quoted
Prices | | Level 2 — Significant
Observable Inputs | | Level 3 — Significant
Unobservable Inputs | | Total | |
| 2015 Retirement Fund | | | | | | | | | |
| Common Stock | | $ | 101,587,255 | | | | — | | | | — | | | $ | 101,587,255 | | |
| 2020 Retirement Fund | | | | | | | | | |
| Common Stock | | $ | 140,332,205 | | | | — | | | | — | | | $ | 140,332,205 | | |
| 2025 Retirement Fund | | | | | | | | | |
| Common Stock | | $ | 129,660,261 | | | | — | | | | — | | | $ | 129,660,261 | | |
| 2030 Retirement Fund | | | | | | | | | |
| Common Stock | | $ | 106,509,390 | | | | — | | | | — | | | $ | 106,509,390 | | |
| 2035 Retirement Fund | | | | | | | | | |
| Common Stock | | $ | 83,447,420 | | | | — | | | | — | | | $ | 83,447,420 | | |
| 2040 Retirement Fund | | | | | | | | | |
| Common Stock | | $ | 75,776,015 | | | | — | | | | — | | | $ | 75,776,015 | | |
| 2045 Retirement Fund | | | | | | | | | |
| Common Stock | | $ | 94,315,605 | | | | — | | | | — | | | $ | 94,315,605 | | |
| Conservative Allocation Fund | | | | | | | | | |
| Common Stock | | $ | 74,981,764 | | | | — | | | | — | | | $ | 74,981,764 | | |
| Moderate Allocation Fund | | | | | | | | | |
| Common Stock | | $ | 202,434,209 | | | | — | | | | — | | | $ | 202,434,209 | | |
| Aggressive Allocation Fund | | | | | | | | | |
| Common Stock | | $ | 175,154,136 | | | | — | | | | — | | | $ | 175,154,136 | | |
| Money Market Fund | | | | | | | | | |
| U.S. Government Debt | | | — | | | $ | 16,496,556 | | | | — | | | $ | 16,496,556 | | |
| U.S. Government Agency Short-Term Debt | | | — | | | $ | 7,841,246 | | | | — | | | $ | 7,841,246 | | |
| Commercial Paper | | | — | | | $ | 72,358,752 | | | | — | | | $ | 72,358,752 | | |
| Temporary Cash Investments | | | — | | | $ | 94,900 | | | | — | | | $ | 94,900 | | |
| | | | — | | | $ | 96,791,454 | | | | — | | | $ | 96,791,454 | | |
| Mid-Term Bond Fund | |
| U.S. Government Debt | | | — | | | $ | 145,136,985 | | | | — | | | $ | 145,136,985 | | |
U.S. Government Agency Residential
Mortgage-Backed Obligations | | | — | | | $ | 44,475 | | | | — | | | $ | 44,475 | | |
U.S. Government Agency
Non-Mortgage-Backed Obligations | | | — | | | $ | 46,548,392 | | | | — | | | $ | 46,548,392 | | |
| Corporate Debt | | | — | | | $ | 144,734,987 | | | | — | | | $ | 144,734,987 | | |
| Short-Term Debt | | | — | | | $ | 4,899,879 | | | | — | | | $ | 4,899,879 | | |
| Temporary Cash Investments | | | — | | | $ | 30,000 | | | | — | | | $ | 30,000 | | |
| | | | — | | | $ | 341,394,718 | | | | — | | | $ | 341,394,718 | | |
| Bond Fund | |
| U.S. Government Debt | | | — | | | $ | 32,677,607 | | | | — | | | $ | 32,677,607 | | |
U.S. Government Agency Residential
Mortgage-Backed Obligations | | | — | | | $ | 192,409,674 | | | | — | | | $ | 192,409,674 | | |
U.S. Government Agency
Non-Mortgage-Backed Obligations | | | — | | | $ | 16,211,416 | | | | — | | | $ | 16,211,416 | | |
| Long-Term Corporate Debt | | | — | | | $ | 400,203,168 | | | | — | | | $ | 400,203,168 | | |
| Sovereign Debt | | | — | | | $ | 4,539,906 | | | | — | | | $ | 4,539,906 | | |
| Short-Term Debt | | | — | | | $ | 8,099,872 | | | | — | | | $ | 8,099,872 | | |
| Temporary Cash Investments | | | — | | | $ | 850,200 | | | | — | | | $ | 850,200 | | |
| | | | | | — | | | $ | 654,991,843 | | | | — | | | $ | 654,991,843 | | |
| Other Financial Instruments:* | | | |
| Equity Index Fund | | $ | 908,243 | | | | — | | | | — | | | $ | 908,243 | | |
| All America Fund | | $ | 85,085 | | | | — | | | | — | | | $ | 85,085 | | |
| Mid-Cap Equity Index Fund | | $ | 537,114 | | | | — | | | | — | | | $ | 537,114 | | |
* Other financial instruments are derivative instruments not reflected in the Portfolio of Investments, such as futures, which are valued at the unrealized appreciation/depreciation on the instrument.
78
MUTUAL OF AMERICA INVESTMENT CORPORATION
NOTES TO FINANCIAL STATEMENTS (Unaudited) (Continued)
1. SIGNIFICANT ACCOUNTING POLICIES AND ORGANIZATION (CONTINUED)
| | | Fair Value Measurement Using Significant Unobservable
Inputs (Level 3) for the Year Ended June 30, 2012 | |
| | | Balance
December 31,
2011 | | Change in
Unrealized
Gains
(Losses) | | Transfers
Into
Level 3(a) | | Transfers
Out of
Level 3(b) | | Balance
June 30,
2012 | | Net Change in
Unrealized Gains/(Losses)
of Level 3 Assets Held as of
June 30, 2012 Included
in Statement of Operations | |
All America Fund —
Active Common Stock | | | — | | | | — | | | $ | 540,384 | | | $ | (540,384 | ) | | | — | | | | — | | |
Small Cap Value Fund —
Common Stock | | | — | | | | — | | | $ | 3,150,656 | | | $ | (3,150,656 | ) | | | — | | | | — | | |
(a) Reflects transfers into Level 3 from Level 2 as a result of a security being carried at a calculated fair value due to the absence of recent trading activity in the security, as described in Security Valuation below.
(b) Reflects transfers into Level 2 as a result of a security no longer being carried at a calculated fair value due to a recent trade, as further described under Security Valuation below.
During the six months ended June 30, 2012, there were no transfers of securities between Level 1 and Level 2.
In May 2011, the FASB issued ASU No. 2011-04, "Fair Value Measurements (Topic 820) — Amendments to Achieve Common Fair Value Measurement and Disclosure Requirements in U.S. GAAP and IFRSs" ("ASU No. 2011-04"). ASU No. 2011-04 requires additional disclosures regarding fair value measurements in financial statements of interim and annual periods beginning after December 15, 2011. The discussion under Security Valuation, below, reflects these additional disclosures.
Security Valuation — Investment securities are carried at fair value as follows:
Exchange-traded equity securities are valued at the last sales price on the principal exchange on which the security is traded. If there is no trading volume for a particular valuation day, the last bid price is used. For equity securities traded in the over-the-counter market, the security is valued at the last sale price, or if no sale, at the latest bid price available.
Short-term debt securities with a maturity of 60 days or less are valued at amortized cost, which approximates fair value for such securities.
Debt securities, including short-term debt securities maturing in excess of 60 days, are valued on the basis of prices obtained from an independent pricing source. The pricing source may utilize various pricing methodologies that incorporate both models (which consider factors such as yield, quality, coupon rate, maturity, issue type, quoted prices for similar securities, prepayment speeds and trading characteristics) and dealer-supplied valuations to derive a valuation.
In the rare instance when a price is not available from an independent pricing source or when prices may not reflect fair value, such as when the price provided by the pricing source is not based on a recent trade, a calculated fair value is used, as determined in good faith by the Adviser and reviewed by a Valuation Committee, in accordance with procedures adopted by the Board of Directors of the Investment Company.
The Advisor uses a market approach to calculate fair value for equity securities which are categorized as Level 3. The Adviser's valuation is primarily based on information regarding the specific equity issuer, such as the last trade price, financial statements, the relationship of per-share book value to the last trade price, operating information and any corporate actions, such as dividends or returns of capital, that may have occurred since the last trade. The Adviser also considers industry-specific conditions and overall market conditions, to determine whether the last trade price reflects fair value or needs to be adjusted. Generally, absent any significant contrary indications, the last trade price will be used as the calculated fair value.
The Retirement Funds and the Allocation Funds value their investments in the underlying Funds of the Investment Company at their respective net asset values.
79
MUTUAL OF AMERICA INVESTMENT CORPORATION
NOTES TO FINANCIAL STATEMENTS (Unaudited) (Continued)
1. SIGNIFICANT ACCOUNTING POLICIES AND ORGANIZATION (CONTINUED)
Investment Transactions — Investment transactions are accounted for as of the trade date. Realized gains and losses on the sale of short and long-term debt securities are computed on the basis of amortized cost at the time of sale. Realized gains and losses on the sale of equity securities are based on the identified cost basis of the security, determined on the first-in, first-out ("FIFO") basis.
Futures Contracts — The Equity Index Fund, Mid-Cap Equity Index Fund and a portion of the All America Fund each maintain indexed asset portfolios which are subject to equity price risk. In order to remain more fully invested in the equity markets while minimizing transaction costs, the funds purchase stock index futures contracts. An initial cash margin deposit (represented by cash or Treasury bills) is made upon entering into a futures contract and serves as collateral for the contract. This initial margin, maintained in a segregated account, is equal to approximately 5%-6% of the contract amount, and does not involve the borrowing of funds to finance the transaction. During the period the futures contract is outstanding, changes in the value of the contract are recognized as unrealized gains or losses by "marking-to-market" on a daily basis to reflect the market value of the contract at the end of each trading day. The accumulated unrealized gain or loss on the contract is included in Net Unrealized Appreciation (Depreciation) of Investments in the Components of Net Assets section of the Statement of Assets and Liabilities. Futures contracts are valued at the settlement price established each day by the exchange on which traded. Depending upon whether unrealized gains or losses are incurred, variation margin payments are received or made daily. The net change in unrealized appreciation or depreciation of futures contracts is recorded in the Statement of Operations. When the contract is closed, a realized gain or loss from futures transactions is recorded in the Statement of Operations, equal to the net variation margin received or paid over the period the contract was outstanding.
The "Underlying Face Amount at Value" (appearing in the "Notes to the Summary Portfolio of Investments in Securities") representing the aggregate of outstanding contractual amounts under futures contracts reflects the extent of a Fund's exposure to off-balance sheet risk. The use of futures transactions involves the risk of imperfect correlation in the price movements of the contract and the underlying securities. With futures contracts, there is minimal counterparty credit risk to the Fund since futures are exchange traded and the exchange's clearinghouse, as counterparty to all exchange traded futures, guarantees the futures against default.
During the six months ended June 30, 2012, the Equity Index Fund, Mid-Cap Equity Index Fund and the All America Fund purchased futures contracts with total principal amounts of $135,545,706, $76,793,531 and $15,710,400, respectively.
Retirement Funds — Each of the Retirement Funds invests in equity (stock) funds and fixed income (bond) funds and targets different percentages to these asset classes. The targets reflect varying emphases on achieving capital appreciation and gains versus preserving capital and producing income, depending on the specific Fund's time horizon.
The Retirement Funds target their investments in the following underlying funds of the Investment Company in accordance with the percentage allocations noted:
| | | Equity
Index
Fund | | Mid-Cap
Equity
Index
Fund | | Small Cap
Growth
Fund | | Small Cap
Value
Fund | | International
Fund | | Bond
Fund | | Mid-Term
Bond
Fund | | Money
Market
Fund | |
| Retirement Income Fund | | | 20 | % | | | 5 | % | | | — | | | | — | | | | — | | | | 30 | % | | | 38 | % | | | 7 | % | |
| 2010 Retirement Fund | | | 25 | % | | | 12 | % | | | — | | | | — | | | | 4 | % | | | 25 | % | | | 29 | % | | | 5 | % | |
| 2015 Retirement Fund | | | 29 | % | | | 11 | % | | | 2 | % | | | 2 | % | | | 7 | % | | | 26 | % | | | 16 | % | | | 4 | % | |
| 2020 Retirement Fund | | | 33 | % | | | 11 | % | | | 4 | % | | | 4 | % | | | 9 | % | | | 25 | % | | | 14 | % | | | — | | |
| 2025 Retirement Fund | | | 37 | % | | | 15 | % | | | 5 | % | | | 5 | % | | | 9 | % | | | 22 | % | | | 7 | % | | | — | | |
| 2030 Retirement Fund | | | 40 | % | | | 17 | % | | | 6 | % | | | 6 | % | | | 10 | % | | | 21 | % | | | — | | | | — | | |
| 2035 Retirement Fund | | | 40 | % | | | 20 | % | | | 7 | % | | | 7 | % | | | 12 | % | | | 14 | % | | | — | | | | — | | |
| 2040 Retirement Fund | | | 35 | % | | | 24 | % | | | 8 | % | | | 8 | % | | | 14 | % | | | 11 | % | | | — | | | | — | | |
| 2045 Retirement Fund | | | 35 | % | | | 20 | % | | | 10 | % | | | 10 | % | | | 15 | % | | | 10 | % | | | — | | | | — | | |
Generally, rebalancing of the Retirement Funds' holdings is performed on a quarterly or other periodic basis and the mix of underlying Funds is reviewed annually.
80
MUTUAL OF AMERICA INVESTMENT CORPORATION
NOTES TO FINANCIAL STATEMENTS (Unaudited) (Continued)
1. SIGNIFICANT ACCOUNTING POLICIES AND ORGANIZATION (CONTINUED)
Allocation Funds — The Allocation Funds target their investments in the following underlying Funds of the Investment Company in accordance with the percentage allocations noted:
| Conservative Allocation: | | Equity Index (25%), Bond (30%), | |
|
| | Mid-Term Bond (45%). | |
|
| Moderate Allocation: | | Equity Index (35%), Bond (30%), | |
|
| | Mid-Term Bond (20%), Mid-Cap Equity Index (15%). | |
|
| Aggressive Allocation: | | Equity Index (45%), Bond (25%), | |
|
| | Mid-Cap Equity Index (20%), Small Cap Value (5%), Small Cap Growth (5%). | |
|
Generally, rebalancing of the Allocation Funds' holdings is performed on a monthly basis.
Investment Income — Interest income, accretion of discount and amortization of premium are recorded daily on an accrual basis using the effective interest method. A debt obligation may cease accrual of income and result in a reduction to interest income when the collection of all or a portion of current and past due interest is in doubt. Dividend income is recorded on the ex-dividend date. Foreign source tax withheld from dividends is recorded as a reduction from dividend income. Should reclamation efforts succeed, such amounts are recorded as income upon collection.
Distributions to Shareholders ("Dividends") — Distributions to shareholders are recorded on the ex-dividend date. It is the Investment Company's policy to make distributions of its net investment income twice a year and, on an annual basis, to distribute net realized gains, if any, in accordance with Federal income tax regulations, which may differ from U.S. generally accepted accounting principles. Accordingly, periodic reclassifications (which do not impact the funds' net asset values) are made within the funds' capital accounts to reflect income and gains available for distribution under Federal income tax regulations.
Federal Income Taxes — Each Fund in the Investment Company intends to comply with the requirements of the Internal Revenue Code applicable to regulated investment companies and to distribute substantially all of its taxable income to shareholders. Therefore, no Federal income or excise tax provision is required.
GAAP requires the evaluation of tax positions taken in the course of preparing a fund's tax return to determine whether it is "more-likely-than-not" that tax positions taken in the fund's tax return will be ultimately sustained, and, if not, a tax liability and expense is recorded.
As of June 30, 2012, management has evaluated the tax positions taken on the Funds' tax returns for all open tax years and has concluded that no tax provision is required in any of the Funds' financial statements. Each Fund's federal and state income, franchise and federal excise tax returns for tax years for which the applicable statutes of limitations have not expired are subject to examination by the Internal Revenue Service and state departments of revenue.
At June 30, 2012, the Funds had the following capital loss carry forwards to offset net capital gains, to the extent provided by Federal income tax regulations, which if unused expire on the dates noted.
| Expiring on December 31, | | Equity
Index Fund | | All America
Fund | | Small Cap
Value Fund | | Small Cap
Growth Fund | | Mid Cap
Value Fund | |
| 2012 | | $ | 0 | | | $ | 0 | | | $ | 0 | | | $ | 0 | | | $ | 0 | | |
| 2013 | | | 0 | | | | 0 | | | | 0 | | | | 0 | | | | 0 | | |
| 2014 | | | 0 | | | | 0 | | | | 0 | | | | 0 | | | | 0 | | |
| 2015 | | | 0 | | | | 0 | | | | 0 | | | | 0 | | | | 0 | | |
| 2016 | | | 726,632 | | | | 0 | | | | 0 | | | | 0 | | | | 0 | | |
| 2017 | | | 0 | | | | 1,107,941 | | | | 9,203,586 | | | | 0 | | | | 520,477 | | |
| 2018 | | | 0 | | | | 0 | | | | 0 | | | | 0 | | | | 0 | | |
| No Expiration | | | 0 | | | | 0 | | | | 0 | | | | 0 | | | | 0 | | |
| Total | | $ | 726,632 | | | $ | 1,107,941 | | | $ | 9,203,586 | | | $ | 0 | | | $ | 520,477 | | |
81
MUTUAL OF AMERICA INVESTMENT CORPORATION
NOTES TO FINANCIAL STATEMENTS (Unaudited) (Continued)
1. SIGNIFICANT ACCOUNTING POLICIES AND ORGANIZATION (CONTINUED)
| Expiring on December 31, | | Mid-Cap
Equity Index
Fund | | International
Fund | | Composite
Fund | | Retirement
Income
Fund | | 2010
Retirement
Fund | |
| 2012 | | $ | 0 | | | $ | 0 | | | $ | 0 | | | $ | 0 | | | $ | 0 | | |
| 2013 | | | 0 | | | | 0 | | | | 0 | | | | 0 | | | | 0 | | |
| 2014 | | | 0 | | | | 0 | | | | 0 | | | | 0 | | | | 0 | | |
| 2015 | | | 0 | | | | 0 | | | | 0 | | | | 0 | | | | 0 | | |
| 2016 | | | 0 | | | | 0 | | | | 2,112,905 | | | | 0 | | | | 0 | | |
| 2017 | | | 0 | | | | 0 | | | | 11,795,277 | | | | 0 | | | | 0 | | |
| 2018 | | | 0 | | | | 0 | | | | 0 | | | | 0 | | | | 0 | | |
| No Expiration | | | 0 | | | | 5,384 | | | | 0 | | | | 0 | | | | 0 | | |
| Total | | $ | 0 | | | $ | 5,384 | | | $ | 13,908,182 | | | $ | 0 | | | $ | 0 | | |
| Expiring on December 31, | | 2015
Retirement
Fund | | 2020
Retirement
Fund | | 2025
Retirement
Fund | | 2030
Retirement
Fund | | 2035
Retirement
Fund | |
| 2012 | | $ | 0 | | | $ | 0 | | | $ | 0 | | | $ | 0 | | | $ | 0 | | |
| 2013 | | | 0 | | | | 0 | | | | 0 | | | | 0 | | | | 0 | | |
| 2014 | | | 0 | | | | 0 | | | | 0 | | | | 0 | | | | 0 | | |
| 2015 | | | 0 | | | | 0 | | | | 0 | | | | 0 | | | | 0 | | |
| 2016 | | | 0 | | | | 0 | | | | 0 | | | | 0 | | | | 0 | | |
| 2017 | | | 0 | | | | 0 | | | | 0 | | | | 0 | | | | 0 | | |
| 2018 | | | 0 | | | | 0 | | | | 0 | | | | 0 | | | | 0 | | |
| No Expiration | | | 0 | | | | 0 | | | | 0 | | | | 0 | | | | 0 | | |
| Total | | $ | 0 | | | $ | 0 | | | $ | 0 | | | $ | 0 | | | $ | 0 | | |
| Expiring on December 31, | | 2040
Retirement
Fund | | 2045
Retirement
Fund | | Conservative
Allocation
Fund | | Moderate
Allocation
Fund | | Aggressive
Allocation
Fund | |
| 2012 | | $ | 0 | | | $ | 0 | | | $ | 0 | | | $ | 0 | | | $ | 0 | | |
| 2013 | | | 0 | | | | 0 | | | | 0 | | | | 0 | | | | 0 | | |
| 2014 | | | 0 | | | | 0 | | | | 0 | | | | 0 | | | | 0 | | |
| 2015 | | | 0 | | | | 0 | | | | 0 | | | | 0 | | | | 0 | | |
| 2016 | | | 0 | | | | 0 | | | | 0 | | | | 0 | | | | 0 | | |
| 2017 | | | 0 | | | | 0 | | | | 0 | | | | 0 | | | | 0 | | |
| 2018 | | | 0 | | | | 0 | | | | 0 | | | | 0 | | | | 0 | | |
| No Expiration | | | 0 | | | | 0 | | | | 0 | | | | 0 | | | | 0 | | |
| Total | | $ | 0 | | | $ | 0 | | | $ | 0 | | | $ | 0 | | | $ | 0 | | |
| Expiring on December 31, | | Money
Market Fund | | Mid-Term
Bond Fund | | Bond Fund | |
| 2012 | | $ | 0 | | | $ | 0 | | | $ | 0 | | |
| 2013 | | | 0 | | | | 0 | | | | 0 | | |
| 2014 | | | 0 | | | | 0 | | | | 0 | | |
| 2015 | | | 0 | | | | 0 | | | | 0 | | |
| 2016 | | | 0 | | | | 0 | | | | 0 | | |
| 2017 | | | 0 | | | | 0 | | | | 1,609,399 | | |
| 2018 | | | 0 | | | | 0 | | | | 0 | | |
| No Expiration | | | 881 | | | | 0 | | | | 0 | | |
| Total | | $ | 881 | | | $ | 0 | | | $ | 1,609,399 | | |
82
MUTUAL OF AMERICA INVESTMENT CORPORATION
NOTES TO FINANCIAL STATEMENTS (Unaudited) (Continued)
1. SIGNIFICANT ACCOUNTING POLICIES AND ORGANIZATION (CONTINUED)
The Regulated Investment Company Modernization Act of 2010 (the "Act") was enacted on December 22, 2010. The Act makes changes to several tax rules impacting the Funds. In general, the provisions of the Act were effective for the Funds' fiscal year ending December 31, 2011.
Under the Act, the Fund is permitted to carry forward capital losses incurred in taxable years beginning after December 22, 2010 for an unlimited period. However, any losses incurred during those future taxable years will be required to be utilized prior to the losses incurred in pre-enactment taxable years. As a result of this ordering rule, pre-enactment capital loss carryforwards (those expiring between December 31, 2012 and December 31, 2018) may be more likely to expire unused. Additionally, post-enactment capital losses (those relating to taxable years after 2010 and have no expiration date) that are carried forward will retain their character as either short-term or long-term capital losses rather than being considered all short-term as under previous law.
2. EXPENSES
The Investment Company has an Investment Advisory Agreement with Mutual of America Capital Management Corporation ("the Adviser"), an indirect wholly-owned subsidiary of Mutual of America Life. For providing investment management services to each of the Funds of the Investment Company, the Adviser receives a fee, calculated as a daily charge of the value of the net assets of each fund, at the following annual rates:
| Fund | | Annual Investment
Management Fee | |
| Retirement Funds | | | .05 | % | |
| Equity Index, Mid Cap Equity Index, International Funds | | | .075 | % | |
| Money Market Fund | | | .15 | % | |
| All America, Composite, Mid-Term Bond, Bond Funds | | | .40 | % | |
| Mid Cap Value Fund | | | .55 | % | |
| Small Cap Value, Small Cap Growth Funds | | | .75 | % | |
The Adviser does not assess a fee for investment management to the Allocation Funds. However, shareholders in the Allocation Funds (and the Retirement and International Funds) will indirectly bear their pro-rata share of the investment management fees incurred by the underlying Funds in which they invest.
3. INVESTMENTS
The cost of investment purchases and proceeds from sales of investments, excluding short-term securities and futures contracts, for the six months ended June 30, 2012, were as follows:
| | | Equity Index
Fund | | All America
Fund | | Small Cap
Value Fund | | Small Cap
Growth Fund | | Mid Cap
Value Fund | |
| Cost of investment purchases | | $ | 57,134,875 | | | $ | 20,843,559 | | | $ | 36,075,960 | | | $ | 85,833,096 | | | $ | 4,344,111 | | |
| Proceeds from sales of investments | | $ | 38,036,647 | | | $ | 37,183,524 | | | $ | 44,440,803 | | | $ | 93,264,109 | | | $ | 7,416,485 | | |
| | | Mid-Cap
Equity Index
Fund | | International
Fund | | Composite
Fund | | Retirement
Income
Fund | | 2010
Retirement
Fund | |
| Cost of investment purchases | | $ | 44,510,429 | | | $ | 8,720,351 | | | $ | 19,191,841 | | | $ | 3,205,012 | | | $ | 2,392,196 | | |
| Proceeds from sales of investments | | $ | 39,365,575 | | | $ | 31,811 | | | $ | 23,653,708 | | | $ | 1,757,030 | | | $ | 2,652,807 | | |
| | | 2015
Retirement
Fund | | 2020
Retirement
Fund | | 2025
Retirement
Fund | | 2030
Retirement
Fund | | 2035
Retirement
Fund | |
| Cost of investment purchases | | $ | 8,797,285 | | | $ | 16,591,955 | | | $ | 13,965,656 | | | $ | 11,184,616 | | | $ | 9,493,066 | | |
| Proceeds from sales of investments | | $ | 3,142,260 | | | $ | 1,532,081 | | | $ | 1,279,589 | | | $ | 1,396,278 | | | $ | 284,613 | | |
83
MUTUAL OF AMERICA INVESTMENT CORPORATION
NOTES TO FINANCIAL STATEMENTS (Unaudited) (Continued)
3. INVESTMENTS (CONTINUED)
| | | 2040
Retirement
Fund | | 2045
Retirement
Fund | | Conservative
Allocation
Fund | | Moderate
Allocation
Fund | | Aggressive
Allocation
Fund | |
| Cost of investment purchases | | $ | 9,609,607 | | | $ | 13,489,759 | | | $ | 7,568,211 | | | $ | 12,446,727 | | | $ | 8,490,204 | | |
| Proceeds from sales of investments | | $ | 507,534 | | | $ | 322,918 | | | $ | 1,495,442 | | | $ | 2,761,394 | | | $ | 3,394,224 | | |
| | | Money
Market Fund | | Mid-Term
Bond Fund | | Bond
Fund | |
| Cost of investment purchases | | | — | | | $ | 22,562,358 | | | $ | 124,952,981 | | |
| Proceeds from sales of investments | | | — | | | $ | 20,394,910 | | | $ | 107,999,078 | | |
The cost of short-term security purchases for the Money Market Fund for the six months ended June 30, 2012, was $551,799,009; net proceeds from sales for the year were $555,655,431.
The components of net unrealized appreciation (depreciation) of investments for Federal income tax purposes and the cost of investments for Federal income tax purposes at June 30, 2012 for each of the funds were as follows. Differences with amounts reflected in the Statements of Assets and Liabilities arise principally from wash sales and the treatment of distributions from Real Estate Investment Trusts (REITs).
| | | Equity Index
Fund | | All America
Fund | | Small Cap
Value Fund | | Small Cap
Growth Fund | | Mid Cap
Value Fund | |
| Unrealized Appreciation | | $ | 280,307,306 | | | $ | 49,320,657 | | | $ | 57,396,725 | | | $ | 53,761,047 | | | $ | 8,485,311 | | |
| Unrealized Depreciation | | | (85,693,873 | ) | | | (25,873,812 | ) | | | (10,803,581 | ) | | | (9,024,419 | ) | | | (4,346,671 | ) | |
| Net | | $ | 194,613,433 | | | $ | 23,446,845 | | | $ | 46,593,144 | | | $ | 44,736,628 | | | $ | 4,138,640 | | |
| Tax Cost of Investments | | $ | 836,153,515 | | | $ | 232,058,695 | | | $ | 234,296,829 | | | $ | 244,019,230 | | | $ | 46,102,312 | | |
| | | Mid-Cap
Equity Index
Fund | | International
Fund | | Composite
Fund | | Retirement
Income
Fund | | 2010
Retirement
Fund | |
| Unrealized Appreciation | | $ | 107,579,730 | | | $ | 0 | | | $ | 25,256,880 | | | $ | 1,126,962 | | | $ | 1,651,753 | | |
| Unrealized Depreciation | | | (44,948,502 | ) | | | (6,055,198 | ) | | | (6,515,397 | ) | | ( 8,659) | | | (483,139 | ) | |
| Net | | $ | 62,631,228 | | | $ | (6,055,198 | ) | | $ | 18,741,483 | | | $ | 1,118,303 | | | $ | 1,168,614 | | |
| Tax Cost of Investments | | $ | 494,223,125 | | | $ | 86,525,635 | | | $ | 148,460,067 | | | $ | 24,516,768 | | | $ | 20,159,919 | | |
| | | 2015
Retirement
Fund | | 2020
Retirement
Fund | | 2025
Retirement
Fund | | 2030
Retirement
Fund | | 2035
Retirement
Fund | |
| Unrealized Appreciation | | $ | 11,350,381 | | | $ | 15,527,254 | | | $ | 15,855,364 | | | $ | 13,789,708 | | | $ | 11,161,159 | | |
| Unrealized Depreciation | | | (2,321,354 | ) | | | (2,561,986 | ) | | | (1,535,397 | ) | | | (1,399,263 | ) | | | (987,190 | ) | |
| Net | | $ | 9,029,027 | | | $ | 12,965,268 | | | $ | 14,319,967 | | | $ | 12,390,445 | | | $ | 10,173,969 | | |
| Tax Cost of Investments | | $ | 92,558,228 | | | $ | 127,366,937 | | | $ | 115,340,294 | | | $ | 94,118,945 | | | $ | 73,273,451 | | |
| | | 2040
Retirement
Fund | | 2045
Retirement
Fund | | Conservative
Allocation
Fund | | Moderate
Allocation
Fund | | Aggressive
Allocation
Fund | |
| Unrealized Appreciation | | $ | 9,819,908 | | | $ | 11,919,446 | | | $ | 5,954,622 | | | $ | 24,646,065 | | | $ | 21,271,041 | | |
| Unrealized Depreciation | | | (794,971 | ) | | | (957,082 | ) | | | (1,444,495 | ) | | | (7,464,535 | ) | | | (4,634,430 | ) | |
| Net | | $ | 9,024,937 | | | $ | 10,962,364 | | | $ | 4,510,127 | | | $ | 17,181,530 | | | $ | 16,636,611 | | |
| Tax Cost of Investments | | $ | 66,751,078 | | | $ | 83,353,241 | | | $ | 70,471,637 | | | $ | 185,252,679 | | | $ | 158,517,525 | | |
84
MUTUAL OF AMERICA INVESTMENT CORPORATION
NOTES TO FINANCIAL STATEMENTS (Unaudited) (Continued)
3. INVESTMENTS (CONTINUED)
| | | Money
Market Fund | | Mid-Term
Bond Fund | | Bond
Fund | |
| Unrealized Appreciation | | $ | 177 | | | $ | 22,531,689 | | | $ | 37,852,991 | | |
| Unrealized Depreciation | | | (4,530 | ) | | | (137,592 | ) | | | (1,151,873 | ) | |
| Net | | $ | (4,353 | ) | | $ | 22,394,097 | | | $ | 36,701,118 | | |
| Tax Cost of Investments | | $ | 96,795,807 | | | $ | 319,000,621 | | | $ | 618,920,725 | | |
4. CAPITAL SHARE ACTIVITY
The Investment Company has registered an indefinite number of its capital shares pursuant to Rule 24f-2 under the Investment Company Act of 1940. As of June 30, 2012, shares authorized were allocated into the 23 series of Funds as follows:
| | | Authorized No. of Shares | |
| Equity Index Fund | | | 500,000,000 | | |
| All America Fund | | | 225,000,000 | | |
| Small Cap Value Fund | | | 350,000,000 | | |
| Small Cap Growth Fund | | | 350,000,000 | | |
| Mid Cap Value Fund | | | 100,000,000 | | |
| Mid-Cap Equity Index Fund | | | 400,000,000 | | |
| International Fund | | | 200,000,000 | | |
| Composite Fund | | | 200,000,000 | | |
| Retirement Income Fund | | | 50,000,000 | | |
| 2010 Retirement Fund | | | 50,000,000 | | |
| 2015 Retirement Fund | | | 150,000,000 | | |
| 2020 Retirement Fund | | | 175,000,000 | | |
| 2025 Retirement Fund | | | 175,000,000 | | |
| 2030 Retirement Fund | | | 150,000,000 | | |
| 2035 Retirement Fund | | | 150,000,000 | | |
| 2040 Retirement Fund | | | 100,000,000 | | |
| 2045 Retirement Fund | | | 150,000,000 | | |
| 2050 Retirement Fund* | | | 100,000,000 | | |
| Conservative Allocation Fund | | | 100,000,000 | | |
| Moderate Allocation Fund | | | 200,000,000 | | |
| Aggressive Allocation Fund | | | 200,000,000 | | |
| Money Market Fund | | | 175,000,000 | | |
| Mid-Term Bond Fund | | | 350,000,000 | | |
| Bond Fund | | | 500,000,000 | | |
| Sub-Total | | | 5,100,000,000 | | |
| Shares to be allocated at the discretion of the Board of Directors | | | 900,000,000 | | |
| Total | | | 6,000,000,000 | | |
* The 2050 Retirement Fund is expected to commence operations on or after October 1, 2012.
5. DIVIDENDS
No 2012 dividends were declared or paid as of June 30, 2012. It is the Investment Company's practice to declare and distribute such dividends at the end of the year in conformity with Internal Revenue Code regulations.
On August 18, 2011 and August 19, 2011, required distributions of net investment income and, as applicable, net realized gains relating to 2010 were declared and paid for the funds in accordance with Internal Revenue Section 855(a). On December 29, 2011, dividend distributions were declared and paid for each of the funds (other than the Small Cap Growth and Money Market Funds) from net investment income relating to 2011.
85
MUTUAL OF AMERICA INVESTMENT CORPORATION
NOTES TO FINANCIAL STATEMENTS (Unaudited) (Continued)
5. DIVIDENDS (CONTINUED)
Pursuant to shareholders' instructions, substantially all dividend distributions throughout 2011 were immediately reinvested into their respective funds. The tax character of the distributions paid during 2011 was as follows:
| | | Equity Index
Fund | | All America
Fund | | Small Cap
Value Fund | | Small Cap
Growth | | Mid Cap
Value Fund | |
| Ordinary Income (a) | | $ | 18,904,206 | | | $ | 6,317,474 | | | $ | 2,548,887 | | | $ | 0 | | | $ | 628,396 | | |
| Long-Term Capital Gains (b) | | $ | 0 | | | $ | 0 | | | $ | 0 | | | $ | 0 | | | $ | 0 | | |
| | | Mid-Cap
Equity
Index Fund | | International
Fund | | Composite
Fund | | Retirement
Fund | | 2010
Retirement
Fund | |
| Ordinary Income (a) | | $ | 6,927,757 | | | $ | 2,142,256 | | | $ | 7,396,780 | | | $ | 478,508 | | | $ | 441,941 | | |
| Long-Term Capital Gains (b) | | $ | 8,232,316 | | | $ | 211,930 | | | $ | 0 | | | $ | 47,419 | | | $ | 25,781 | | |
| | | 2015
Retirement
Fund | | 2020
Retirement
Fund | | 2025
Retirement
Fund | | 2030
Retirement
Fund | | 2035
Retirement
Fund | |
| Ordinary Income (a) | | $ | 1,729,238 | | | $ | 1,955,796 | | | $ | 1,518,829 | | | $ | 1,162,444 | | | $ | 836,651 | | |
| Long-Term Capital Gains (b) | | $ | 120,136 | | | $ | 139,097 | | | $ | 201,103 | | | $ | 195,986 | | | $ | 173,801 | | |
| | | 2040
Retirement
Fund | | 2045
Retirement
Equity Fund | | Conservative
Allocation
Fund | | Moderate
Allocation
Fund | | Aggressive
Allocation
Fund | |
| Ordinary Income (a) | | $ | 707,075 | | | $ | 801,800 | | | $ | 1,565,125 | | | $ | 4,054,555 | | | $ | 3,017,256 | | |
| Long-Term Capital Gains (b) | | $ | 182,882 | | | $ | 173,340 | | | $ | 19,438 | | | $ | 304,510 | | | $ | 0 | | |
| | | Money
Market Fund | | Mid-Term
Bond Fund | | Bond
Fund | | | | | |
| Ordinary Income (a) | | $ | 0 | | | $ | 100,100,703 | | | $ | 22,722,570 | | | | | | | | | | |
| Long-Term Capital Gains (b) | | $ | 0 | | | $ | 0 | | | $ | 0 | | | | | | | | | | |
Notes:
(a) Includes distributions from Fund-level net short-term capital gains.
(b) To the extent reported, each Fund designates these amounts as capital gain dividends for Federal income tax purposes.
Undistributed net income and gains (losses) — As of June 30, 2012, undistributed net income and undistributed accumulated gain (loss) on a tax basis were as follows:
| | | Equity Index
Fund | | All America
Fund | | Small Cap
Value Fund | | Small Cap
Growth Fund | | Mid Cap
Value Fund | |
Accumulated undistributed net
investment income | | $ | 9,326,893 | | | $ | 1,780,449 | | | $ | 2,503,264 | | | $ | 677,928 | | | $ | 305,635 | | |
Accumulated undistributed net realized
gain/(loss) on investments
and futures contracts | | $ | (731,080 | ) | | $ | (1,126,897 | ) | | $ | (9,464,522 | ) | | $ | 16,372,159 | | | $ | (553,362 | ) | |
Net unrealized appreciation (depreciation)
of investments and futures contracts | | $ | 195,521,676 | | | $ | 23,531,930 | | | $ | 46,593,144 | | | $ | 44,736,628 | | | $ | 4,138,640 | | |
| | | Mid-Cap
Equity Index
Fund | | International
Fund | | Composite
Fund | | Retirement
Income
Fund | | 2010
Retirement
Fund | |
Accumulated undistributed net
investment income | | $ | 3,618,137 | | | $ | 441,002 | | | $ | 1,820,352 | | | $ | 598,298 | | | $ | 501,103 | | |
Accumulated undistributed net realized
gain/(loss) on investments
and futures contracts | | $ | 31,597,006 | | | $ | 67,852 | | | $ | (13,908,182 | ) | | $ | 672,618 | | | $ | 1,107,409 | | |
Net unrealized appreciation (depreciation)
of investments and futures contracts | | $ | 63,168,342 | | | $ | (6,055,198 | ) | | $ | 18,741,483 | | | $ | 1,118,303 | | | $ | 1,168,614 | | |
86
MUTUAL OF AMERICA INVESTMENT CORPORATION
NOTES TO FINANCIAL STATEMENTS (Unaudited) (Continued)
5. DIVIDENDS (CONTINUED)
| | | 2015
Retirement
Fund | | 2020
Retirement
Fund | | 2025
Retirement
Fund | | 2030
Retirement
Fund | | 2035
Retirement
Fund | |
Accumulated undistributed net
investment income | | $ | 2,132,730 | | | $ | 2,712,014 | | | $ | 2,312,037 | | | $ | 1,804,778 | | | $ | 1,281,243 | | |
Accumulated undistributed net realized
gain/(loss) on investments
and futures contracts | | $ | 1,317,307 | | | $ | 538,771 | | | $ | 455,802 | | | $ | 407,063 | | | $ | 328,670 | | |
Net unrealized appreciation (depreciation)
of investments and futures contracts | | $ | 9,029,027 | | | $ | 12,965,268 | | | $ | 14,319,967 | | | $ | 12,390,445 | | | $ | 10,173,969 | | |
| | | 2040
Retirement
Fund | | 2045
Retirement
Fund | | Conservative
Allocation
Fund | | Moderate
Allocation
Fund | | Aggressive
Allocation
Fund | |
Accumulated undistributed net
investment income | | $ | 1,115,985 | | | $ | 1,327,885 | | | $ | 1,854,530 | | | $ | 4,454,203 | | | $ | 3,143,042 | | |
Accumulated undistributed net realized
gain/(loss) on investments
and futures contracts | | $ | 349,824 | | | $ | 333,459 | | | $ | 950,282 | | | $ | 1,978,404 | | | $ | 600,855 | | |
Net unrealized appreciation (depreciation)
of investments and futures contracts | | $ | 9,024,937 | | | $ | 10,962,364 | | | $ | 4,510,127 | | | $ | 17,181,530 | | | $ | 16,636,612 | | |
| | | Money
Market Fund | | Mid-Term
Bond Fund | | Bond
Fund | | | | | |
Accumulated undistributed net
investment income | | $ | 0 | | | $ | 5,286,661 | | | $ | 12,000,646 | | | | | | | | | | |
Accumulated undistributed net realized
gain/(loss) on investments
and futures contracts | | $ | (881 | ) | | $ | 1,324,247 | | | $ | (1,609,399 | ) | | | | | | | | | |
Net unrealized appreciation (depreciation)
of investments and futures contracts | | $ | (4,353 | ) | | $ | 22,394,097 | | | $ | 36,701,118 | | | | | | | | | | |
The difference between the components of distributable earnings on a tax basis and the amounts reflected in the statements of assets and liabilities are primarily due to wash sales, post-October losses and the Federal income tax treatment of futures contracts.
Reclassifications — Periodically, the Funds may reclassify book to tax differences as a result of the differences arising from the accounting for REIT securities, non-deductible net operating loss, return of capital distributions and Fund distributions for Federal income tax purposes versus financial reporting purposes. Each Fund's net assets are not affected by these reclassifications.
During the six months ended June 30, 2012, each Fund reclassified the following book to tax differences [increases (decreases)]:
| | | Equity Index
Fund | | All America
Fund | | Small Cap
Value Fund | | Small Cap
Growth Fund | | Mid Cap
Value Fund | |
| Accumulated undistributed net investment income | | $ | 0 | | | $ | 0 | | | $ | 0 | | | $ | 224,959 | | | $ | 0 | | |
Accumulated undistributed net realized gains
(loss) on investments and futures contracts | | $ | 0 | | | $ | 0 | | | $ | 0 | | | $ | (224,959 | ) | | $ | 0 | | |
| Paid in capital | | $ | 0 | | | $ | 0 | | | $ | 0 | | | $ | 0 | | | $ | 0 | | |
87
MUTUAL OF AMERICA INVESTMENT CORPORATION
NOTES TO FINANCIAL STATEMENTS (Unaudited) (Continued)
5. DIVIDENDS (CONTINUED)
| | | Mid-Cap
Equity Index
Fund | | International
Fund | | Composite
Fund | | Retirement
Income
Fund | | 2010
Retirement
Fund | |
| Accumulated undistributed net investment income | | $ | 0 | | | $ | 0 | | | $ | 0 | | | $ | 6,103 | | | $ | 5,241 | | |
Accumulated undistributed net realized gains
(loss) on investments and futures contracts | | $ | 0 | | | $ | 0 | | | $ | 0 | | | $ | 0 | | | $ | 0 | | |
| Paid in capital | | $ | 0 | | | $ | 0 | | | $ | 0 | | | $ | (6,103 | ) | | $ | (5,241 | ) | |
| | | 2015
Retirement
Fund | | 2020
Retirement
Fund | | 2025
Retirement
Fund | | 2030
Retirement
Fund | | 2035
Retirement
Fund | |
| Accumulated undistributed net investment income | | $ | 24,576 | | | $ | 32,991 | | | $ | 30,307 | | | $ | 25,060 | | | $ | 19,568 | | |
Accumulated undistributed net realized gains
(loss) on investments and futures contracts | | $ | 0 | | | $ | 0 | | | $ | 0 | | | $ | 0 | | | $ | 0 | | |
| Paid in capital | | $ | (24,576 | ) | | $ | (32,991 | ) | | $ | (30,307 | ) | | $ | (25,060 | ) | | $ | (19,568 | ) | |
| | | 2040
Retirement
Fund | | 2045
Retirement
Fund | | Conservative
Allocation
Fund | | Moderate
Allocation
Fund | | Aggressive
Allocation
Fund | |
| Accumulated undistributed net investment income | | $ | 17,607 | | | $ | 21,657 | | | $ | 0 | | | $ | 0 | | | $ | 0 | | |
Accumulated undistributed net realized gains
(loss) on investments and futures contracts | | $ | 0 | | | $ | 0 | | | $ | 0 | | | $ | 0 | | | $ | 0 | | |
| Paid in capital | | $ | (17,607 | ) | | $ | (21,657 | ) | | $ | 0 | | | $ | 0 | | | $ | 0 | | |
| | | Money
Market Fund | | Mid-Term
Bond Fund | | Bond
Fund | |
| Accumulated undistributed net investment income | | $ | 97,785 | | | $ | 0 | | | $ | 0 | | |
Accumulated undistributed net realized gains
(loss) on investments and futures contracts | | $ | 0 | | | $ | 0 | | | $ | 0 | | |
| Paid in capital | | $ | (97,785 | ) | | $ | 0 | | | $ | 0 | | |
These reclassifications were made as a result of the differences arising from the disallowance of net operating losses, expiration of capital loss carryforwards, distributions from REITs, distribution reclassifications and other cumulative adjustments for Federal income tax purposes versus financial reporting purposes.
6. SUBSEQUENT EVENTS
Management, on behalf of the Investment Company, has evaluated the need for disclosures and/or adjustments to the financial statements resulting from subsequent events. As a result of this evaluation no additional subsequent events require disclosure and/or adjustment to the financial statements.
88
MUTUAL OF AMERICA INVESTMENT CORPORATION
ADDITIONAL INFORMATION
Quarterly Portfolio Schedules
Included in this Semi-Annual Report are summary schedules of Mutual of America Investment Corporation's ("Investment Company") Fund portfolio holdings as of June 30, 2012. The Investment Company files complete schedules of Fund portfolio holdings with the Securities and Exchange Commission ("SEC") for the first and third quarters of each fiscal year on Form N-Q and for the second and fourth quarters of each fiscal year on Form N-CSR. The Forms N-Q and N-CSR are available on the SEC's website at http://www.sec.gov. Additionally, the Forms N-Q and N-CSR may be reviewed and copied at the SEC's Public Reference Room in Washington, DC. Information on the operation of the Public Reference Room may be obtained by calling 1-800-SEC-0330.
Proxy Voting Policies and Procedures
A copy of the Investment Company's proxy voting policies and procedures can be obtained free of charge by calling 1-800-468-3785. It is also available on the SEC's website at http://www.sec.gov.
Information regarding how the Investment Company voted proxies relating to portfolio securities during the 12-month period ended June 30, 2012 is available without charge by calling 1-800-468-3785. It is also available on the SEC website.
Code of Ethics
The Investment Company has adopted a Code of Ethics that complies with Rule 17j-1 of the Investment Company Act of 1940 and with the requirements of the Sarbanes-Oxley Act of 2002. A copy of the Code of Ethics is available free of charge, upon request. To obtain a free copy of the Code of Ethics, please call (212) 224-1568 or write to:
Ms. Kathryn Lu
Chief Compliance Officer
Mutual of America Investment Corporation
320 Park Avenue
New York, NY 10022-6839
Renewal of Investment Advisory Agreements
At its meeting held on February 23, 2012, the Board of Directors of the Investment Company renewed for a one-year period the investment advisory agreement with Mutual of America Capital Management Corporation (the "Adviser"). The Board determined that renewing the agreement with the Adviser was in the best interest of the Investment Company based on the following considerations which are further enumerated below. The Board concluded that Mutual of America Capital Management Corporation has performed extensive services for the Investment Company and has demonstrated satisfactory performance, that its fee is reasonable in comparison to fees charged for similar services to similar funds by other advisers, that the method of calculating the fee is reasonable, that the Adviser has not made excessive profits from the contract and the fee levels reflect that the Funds are appropriately benefiting from economies of scale.
Nature, Extent and Quality of Services
The Board considered the depth of experience and organizational structure of the Adviser. At December 31, 2011, the Adviser had approximately $11.0 billion of assets under management. The individual portfolio managers that oversee the investment performance of each of the Investment Company's Funds have extensive experience and knowledge of the specific markets in which they participate. The Adviser adheres to a strict best execution policy which requires it to select broker/dealers based on their ability to execute trades at a favorable and reasonable price. All else being equal, the Advisor will also consider any research that the broker/dealers may provide. The Adviser maintains a highly qualified staff of research analysts and quantitative analysts who assist in the implementation of the disciplined investment policies employed by the portfolio managers to enhance stock selection and manage risk in the portfolios. The Adviser's quantitative analysts have developed proprietary models that result in daily risk and attribution reports as well as information on stock movements, to enable the portfolio managers to make fully informed decisions on stock selection and to constantly evaluate the structure of each portfolio. When
89
purchasing research and other services, the Adviser uses its own funds to purchase such services from recognized firms that are utilized by the research staff. The Adviser also receives research services from broker/dealers which are utilized to benefit the Funds. The Board was aware of the receipt of these research services when it considered renewing the advisory agreement with the Adviser. The Adviser, at no cost, provides services beyond those set forth in the advisory agreement, such as assistance in the preparation of marketing materials and attendance at client and prospect meetings.
Investment Performance
The Board considered the short- and long-term performance of the Funds. During 2011, the vast majority of the Funds demonstrated gross performance that was above their benchmarks, when considering minimal tracking error. Performance has continued to improve over the past number of years due to changes made in the Adviser's investment process and personnel, including the creation of the quantitative research group mentioned above.
Cost and Profit
The Board compared the advisory fees charged to each Fund by the Adviser with fees of numerous similar funds. In the case of each Fund, the Adviser's fee compared favorably with fees charged by other advisers. Finally, the Adviser has not shown excessively high profits from the fees it is paid by the Investment Company.
Economies of Scale
The Board concluded that the reasonableness of the Adviser's fees, particularly when compared to fees of similar funds that, in most cases, are many times the asset size of the Funds of the Investment Company demonstrates the fact that the Funds are benefiting from economies of scale. The Adviser utilizes the resources at its disposal efficiently. Its fees reflect cost savings and expense discounts, if any, that it realizes from volume increases.
90
(This page has been left blank intentionally.)
(This page has been left blank intentionally.)
MUTUAL OF AMERICA
LIFE INSURANCE COMPANY
320 PARK AVENUE
NEW YORK, NY 10022-6839
www.mutualofamerica.com

320 PARK AVENUE
NEW YORK, NY 10022-6839
ADDRESS SERVICE REQUESTED

You can receive these and other important documents electronically. Sign up for eDocuments and we'll waive the monthly participant charge.
Find out more at mutualofamerica.com
or call 1-800-468-3785.
ITEM 2. CODE OF ETHICS.
Item not applicable to semi-annual report.
ITEM 3. AUDIT COMMITTEE FINANCIAL EXPERT.
Item not applicable to semi-annual report.
ITEM 4. PRINCIPAL ACCOUNTANT FEES AND SERVICES.
Item not applicable to semi-annual report.
ITEM 5. AUDIT COMMITTEE OF LISTED REGISTRANTS.
Not applicable.
ITEM 6. INVESTMENTS.
(a) Schedule I – Portfolios of Investments in Securities follows:
(b) Not applicable.
MUTUAL OF AMERICA INVESTMENT CORPORATION - EQUITY INDEX FUND
PORTFOLIO OF INVESTMENTS IN SECURITIES
June 30, 2012 (Unaudited)
| | Shares | | Value | |
INDEXED ASSETS: | | | | | |
COMMON STOCKS: | | | | | |
CONSUMER DISCRETIONARY (10.6%) | | | | | |
Abercrombie & Fitch Co. Cl A | | 6,914 | | 236,044 | |
Amazon.com, Inc.* | | 29,554 | | 6,748,656 | |
Apollo Group, Inc.* | | 9,203 | | 333,057 | |
AutoNation, Inc.* | | 3,420 | | 120,658 | |
AutoZone, Inc.* | | 2,169 | | 796,392 | |
Bed Bath & Beyond, Inc.* | | 18,138 | | 1,120,928 | |
Best Buy Co., Inc. | | 22,686 | | 475,499 | |
Big Lots, Inc.* | | 5,262 | | 214,637 | |
BorgWarner, Inc.* | | 10,010 | | 656,556 | |
Cablevision Systems Corp. Cl A | | 16,341 | | 217,172 | |
CarMax, Inc.* | | 18,968 | | 492,030 | |
Carnival Corp. | | 35,045 | | 1,200,992 | |
CBS Corp. Cl B | | 53,788 | | 1,763,171 | |
Chipotle Mexican Grill, Inc.* | | 2,642 | | 1,003,828 | |
Coach, Inc. | | 24,889 | | 1,455,509 | |
Comcast Corp. Cl A | | 214,146 | | 6,846,248 | |
D.R. Horton, Inc. | | 23,206 | | 426,526 | |
Darden Restaurants, Inc. | | 10,084 | | 510,553 | |
DeVry, Inc. | | 5,178 | | 160,363 | |
DIRECTV Cl A* | | 52,758 | | 2,575,646 | |
Discovery Communications, Inc. Cl A* | | 21,032 | | 1,135,728 | |
Disney (Walt) Co. | | 142,656 | | 6,918,816 | |
Dollar Tree, Inc.* | | 18,564 | | 998,743 | |
Expedia, Inc. | | 7,287 | | 350,286 | |
Family Dollar Stores, Inc. | | 9,173 | | 609,821 | |
Ford Motor Co. | | 321,484 | | 3,083,032 | |
Fossil, Inc.* | | 4,351 | | 333,026 | |
GameStop Corp. Cl A | | 11,663 | | 214,133 | |
Gannett Co., Inc. | | 18,781 | | 276,644 | |
Gap, Inc. | | 26,585 | | 727,366 | |
Genuine Parts Co. | | 12,732 | | 767,103 | |
Goodyear Tire & Rubber Co.* | | 19,455 | | 229,764 | |
H&R Block, Inc. | | 23,780 | | 380,004 | |
Harley-Davidson, Inc. | | 18,817 | | 860,501 | |
Harman Int’l. Industries, Inc. | | 6,351 | | 251,500 | |
Hasbro, Inc. | | 9,603 | | 325,254 | |
Home Depot, Inc. | | 124,679 | | 6,606,740 | |
International Game Technology | | 22,708 | | 357,651 | |
Interpublic Group of Cos., Inc. | | 37,661 | | 408,622 | |
Johnson Controls, Inc. | | 58,112 | | 1,610,284 | |
Kohl’s Corp. | | 19,769 | | 899,292 | |
Leggett & Platt, Inc. | | 11,635 | | 245,848 | |
Lennar Corp. Cl A | | 13,653 | | 422,014 | |
Limited Brands, Inc. | | 19,872 | | 845,156 | |
Lowe’s Cos., Inc. | | 95,790 | | 2,724,268 | |
Macy’s, Inc. | | 34,744 | | 1,193,456 | |
Marriott International, Inc. Cl A | | 21,617 | | 847,386 | |
Mattel, Inc. | | 26,873 | | 871,760 | |
McDonald’s Corp. | | 80,490 | | 7,125,780 | |
McGraw-Hill Cos., Inc. | | 23,290 | | 1,048,050 | |
Netflix, Inc.* | | 4,589 | | 314,209 | |
Newell Rubbermaid, Inc. | | 22,859 | | 414,662 | |
News Corp. Cl A | | 166,352 | | 3,707,986 | |
NIKE, Inc. Cl B | | 32,010 | | 2,809,838 | |
Nordstrom, Inc. | | 13,036 | | 647,759 | |
O’Reilly Automotive, Inc.* | | 10,153 | | 850,517 | |
Omnicom Group, Inc. | | 22,491 | | 1,093,063 | |
Penney (J.C.) Co., Inc. | | 12,326 | | 287,319 | |
Priceline.com, Inc.* | | 4,023 | | 2,673,364 | |
Pulte Homes, Inc.* | | 27,984 | | 299,429 | |
Ralph Lauren Corp. | | 5,316 | | 744,559 | |
Ross Stores, Inc. | | 17,807 | | 1,112,403 | |
Scripps Networks Interactive, Inc. Cl A | | 7,565 | | 430,146 | |
Sears Hldgs. Corp.* | | 3,291 | | 196,473 | |
Staples, Inc. | | 57,291 | | 747,648 | |
Starbucks Corp. | | 63,139 | | 3,366,571 | |
Starwood Hotels & Resorts | | 16,335 | | 866,408 | |
Target Corp. | | 54,141 | | 3,150,465 | |
Tiffany & Co. | | 10,607 | | 561,641 | |
Time Warner Cable, Inc. | | 24,753 | | 2,032,221 | |
Time Warner, Inc. | | 76,898 | | 2,960,573 | |
TJX Cos., Inc. | | 58,596 | | 2,515,526 | |
TripAdvisor, Inc.* | | 7,613 | | 340,225 | |
Urban Outfitters, Inc.* | | 9,194 | | 253,662 | |
V.F. Corp. | | 7,021 | | 936,952 | |
Viacom, Inc. Cl B | | 43,256 | | 2,033,897 | |
Washington Post Co. Cl B | | 382 | | 142,799 | |
Whirlpool Corp. | | 6,517 | | 398,580 | |
Wyndham Worldwide Corp. | | 11,724 | | 618,324 | |
Wynn Resorts Ltd. | | 6,729 | | 697,932 | |
Yum! Brands, Inc. | | 37,468 | | 2,413,689 | |
| | | | 109,641,333 | |
CONSUMER STAPLES (10.8%) | | | | | |
Altria Group, Inc. | | 160,205 | | 5,535,083 | |
Archer-Daniels-Midland Co. | | 54,769 | | 1,616,781 | |
Avon Products, Inc. | | 35,491 | | 575,309 | |
Beam, Inc. | | 12,554 | | 784,499 | |
Brown-Forman Corp. Cl B | | 7,763 | | 751,847 | |
Campbell Soup Co. | | 14,377 | | 479,904 | |
Clorox Co. | | 10,395 | | 753,222 | |
Coca-Cola Co. | | 181,992 | | 14,229,954 | |
Coca-Cola Enterprises, Inc. | | 24,699 | | 692,560 | |
Colgate-Palmolive Co. | | 38,223 | | 3,979,014 | |
ConAgra Foods, Inc. | | 34,185 | | 886,417 | |
Constellation Brands, Inc. Cl A* | | 12,880 | | 348,533 | |
Costco Wholesale Corp. | | 34,253 | | 3,254,035 | |
CVS Caremark Corp. | | 101,490 | | 4,742,628 | |
Dean Foods Co.* | | 14,898 | | 253,713 | |
Dr. Pepper Snapple Group, Inc. | | 17,068 | | 746,725 | |
Estee Lauder Cos., Inc. Cl A | | 18,431 | | 997,486 | |
General Mills, Inc. | | 52,268 | | 2,014,409 | |
Heinz (H.J.) Co. | | 25,592 | | 1,391,693 | |
Hershey Co. | | 12,072 | | 869,546 | |
Hormel Foods Corp. | | 11,200 | | 340,704 | |
J.M. Smucker Co. | | 9,247 | | 698,333 | |
Kellogg Co. | | 19,860 | | 979,694 | |
Kimberly-Clark Corp. | | 31,269 | | 2,619,404 | |
Kraft Foods, Inc. Cl A | | 141,397 | | 5,460,752 | |
Kroger Co. | | 43,229 | | 1,002,481 | |
Lorillard, Inc. | | 10,314 | | 1,360,932 | |
McCormick & Co., Inc. | | 10,566 | | 640,828 | |
Mead Johnson Nutrition Co. | | 15,805 | | 1,272,461 | |
Molson Coors Brewing Co. Cl B | | 12,610 | | 524,702 | |
Monster Beverage Corp.* | | 12,829 | | 913,425 | |
PepsiCo, Inc. | | 125,321 | | 8,855,182 | |
Philip Morris Int’l., Inc. | | 132,533 | | 11,564,830 | |
Proctor & Gamble Co. | | 221,716 | | 13,580,105 | |
Reynolds American, Inc. | | 25,890 | | 1,161,684 | |
Safeway, Inc. | | 19,452 | | 353,054 | |
Sysco Corp. | | 47,550 | | 1,417,466 | |
Tyson Foods, Inc. Cl A | | 23,971 | | 451,374 | |
Wal-Mart Stores, Inc. | | 141,000 | | 9,830,520 | |
Walgreen Co. | | 68,829 | | 2,035,962 | |
Whole Foods Market, Inc. | | 12,792 | | 1,219,333 | |
| | | | 111,186,584 | |
ENERGY (10.4%) | | | | | |
Alpha Natural Resources, Inc.* | | 19,485 | | 169,714 | |
Anadarko Petroleum Corp. | | 40,495 | | 2,680,769 | |
Apache Corp. | | 30,340 | | 2,666,583 | |
Baker Hughes, Inc. | | 35,110 | | 1,443,021 | |
Cabot Oil & Gas Corp. | | 15,856 | | 624,726 | |
Cameron International Corp.* | | 20,669 | | 882,773 | |
Chesapeake Energy Corp. | | 56,474 | | 1,050,416 | |
Chevron Corp. | | 156,871 | | 16,549,891 | |
ConocoPhillips | | 101,251 | | 5,657,906 | |
Consol Energy, Inc. | | 18,774 | | 567,726 | |
Denbury Resources, Inc.* | | 32,795 | | 495,532 | |
Devon Energy Corp. | | 34,110 | | 1,978,039 | |
Diamond Offshore Drilling, Inc. | | 5,654 | | 334,321 | |
EOG Resources, Inc. | | 21,836 | | 1,967,642 | |
EQT Corp. | | 11,787 | | 632,137 | |
Exxon Mobil Corp. | | 373,134 | | 31,929,076 | |
FMC Technologies, Inc.* | | 18,989 | | 744,938 | |
Halliburton Co. | | 73,070 | | 2,074,457 | |
Helmerich & Payne, Inc. | | 9,175 | | 398,929 | |
Hess Corp. | | 24,901 | | 1,081,948 | |
Kinder Morgan, Inc. | | 40,765 | | 1,313,434 | |
Marathon Oil Corp. | | 57,863 | | 1,479,557 | |
Marathon Petroleum Corp. | | 26,133 | | 1,173,894 | |
Murphy Oil Corp. | | 16,117 | | 810,524 | |
Nabors Industries Ltd.* | | 24,914 | | 358,762 | |
National Oilwell Varco, Inc. | | 34,517 | | 2,224,275 | |
Newfield Exploration Co.* | | 11,982 | | 351,192 | |
Noble Drilling Corp.* | | 20,851 | | 678,283 | |
Noble Energy, Inc. | | 14,829 | | 1,257,796 | |
Occidental Petroleum Corp. | | 66,492 | | 5,703,019 | |
Peabody Energy Corp. | | 23,081 | | 565,946 | |
Phillips 66* | | 48,404 | | 1,608,949 | |
Pioneer Natural Resources Co. | | 10,667 | | 940,936 | |
QEP Resources, Inc. | | 14,414 | | 431,988 | |
Range Resources Corp. | | 13,065 | | 808,332 | |
Rowan Companies PLC Cl A* | | 10,094 | | 326,339 | |
Schlumberger Ltd. | | 105,480 | | 6,846,707 | |
Southwestern Energy Co.* | | 28,476 | | 909,239 | |
Spectra Energy Corp. | | 53,059 | | 1,541,895 | |
Sunoco, Inc. | | 8,588 | | 407,930 | |
Tesoro Corp.* | | 11,615 | | 289,910 | |
Valero Energy Corp. | | 44,046 | | 1,063,711 | |
Williams Cos., Inc. | | 50,685 | | 1,460,742 | |
WPX Energy, Inc.* | | 15,968 | | 258,362 | |
| | | | 106,742,266 | |
FINANCIALS (13.9%) | | | | | |
ACE Ltd. | | 27,613 | | 2,046,952 | |
Aflac, Inc. | | 37,005 | | 1,576,043 | |
Allstate Corp. | | 40,001 | | 1,403,635 | |
American Express Co. | | 82,230 | | 4,786,608 | |
American Int’l. Group, Inc.* | | 50,689 | | 1,626,610 | |
American Tower Corp. | | 31,675 | | 2,214,399 | |
Ameriprise Financial, Inc. | | 17,742 | | 927,197 | |
Aon PLC* | | 26,601 | | 1,244,395 | |
Apartment Investment & Management Co. Cl A | | 10,695 | | 289,086 | |
Assurant, Inc. | | 7,021 | | 244,612 | |
AvalonBay Communities, Inc. | | 7,844 | | 1,109,769 | |
Bank of America Corp. | | 872,845 | | 7,139,872 | |
Bank of New York Mellon Corp. | | 95,041 | | 2,086,150 | |
BB&T Corp. | | 56,151 | | 1,732,258 | |
Berkshire Hathaway, Inc. Cl B* | | 141,331 | | 11,777,112 | |
BlackRock, Inc. | | 10,413 | | 1,768,336 | |
Boston Properties, Inc. | | 12,421 | | 1,346,064 | |
Capital One Financial Corp. | | 46,649 | | 2,549,834 | |
CBRE Group, Inc.* | | 26,652 | | 436,027 | |
Charles Schwab Corp. | | 86,927 | | 1,123,966 | |
Chubb Corp. | | 21,957 | | 1,598,909 | |
Cincinnati Financial Corp. | | 13,269 | | 505,151 | |
Citigroup, Inc. | | 242,801 | | 6,655,175 | |
CME Group, Inc. | | 5,315 | | 1,425,005 | |
Comerica, Inc. | | 15,966 | | 490,316 | |
Discover Financial Svcs. | | 43,296 | | 1,497,176 | |
E*Trade Financial Corp.* | | 21,379 | | 171,887 | |
Equity Residential | | 24,561 | | 1,531,624 | |
Federated Investors, Inc. Cl B | | 7,090 | | 154,917 | |
Fifth Third Bancorp | | 74,469 | | 997,885 | |
First Horizon National Corp. | | 20,628 | | 178,432 | |
Franklin Resources, Inc. | | 11,540 | | 1,280,825 | |
Genworth Financial, Inc. Cl A* | | 41,423 | | 234,454 | |
Goldman Sachs Group, Inc. | | 40,681 | | 3,899,681 | |
Hartford Financial Svcs. Group, Inc. | | 36,597 | | 645,205 | |
HCP, Inc. | | 33,244 | | 1,467,723 | |
Health Care REIT, Inc. | | 17,185 | | 1,001,886 | |
Host Hotels & Resorts, Inc. | | 58,300 | | 922,306 | |
Hudson City Bancorp, Inc. | | 43,088 | | 274,471 | |
Huntington Bancshares, Inc. | | 70,089 | | 448,570 | |
IntercontinentalExchange, Inc.* | | 5,613 | | 763,256 | |
Invesco Ltd. | | 37,857 | | 855,568 | |
JPMorgan Chase & Co. | | 300,960 | | 10,753,301 | |
KeyCorp | | 77,720 | | 601,553 | |
Kimco Realty Corp. | | 32,911 | | 626,296 | |
Legg Mason, Inc. | | 10,436 | | 275,197 | |
Leucadia National Corp. | | 16,041 | | 341,192 | |
Lincoln National Corp. | | 22,990 | | 502,791 | |
Loews Corp. | | 24,834 | | 1,015,959 | |
M&T Bank Corp. | | 10,267 | | 847,746 | |
Marsh & McLennan Cos., Inc. | | 44,492 | | 1,433,977 | |
MetLife, Inc. | | 87,445 | | 2,697,678 | |
Moody’s Corp. | | 16,477 | | 602,234 | |
Morgan Stanley | | 123,387 | | 1,800,216 | |
Nasdaq OMX Group, Inc. | | 10,370 | | 235,088 | |
Northern Trust Corp. | | 19,402 | | 892,880 | |
NYSE Euronext | | 21,117 | | 540,173 | |
People’s United Financial, Inc. | | 29,269 | | 339,813 | |
Plum Creek Timber Co., Inc. | | 13,112 | | 520,546 | |
PNC Financial Svcs. Grp., Inc. | | 43,923 | | 2,684,135 | |
Principal Financial Grp., Inc. | | 23,953 | | 628,287 | |
Progressive Corp. | | 52,149 | | 1,086,264 | |
ProLogis, Inc. | | 37,746 | | 1,254,300 | |
Prudential Financial, Inc. | | 37,869 | | 1,833,996 | |
Public Storage | | 11,681 | | 1,686,853 | |
Regions Financial Corp. | | 111,934 | | 755,555 | |
Simon Property Group, Inc. | | 25,113 | | 3,909,090 | |
SLM Corp. | | 39,179 | | 615,502 | |
State Street Corp. | | 38,374 | | 1,713,015 | |
SunTrust Banks, Inc. | | 43,822 | | 1,061,807 | |
T. Rowe Price Group, Inc. | | 20,414 | | 1,285,265 | |
Torchmark Corp. | | 7,918 | | 400,255 | |
Travelers Cos., Inc. | | 31,232 | | 1,993,851 | |
U.S. Bancorp | | 148,595 | | 4,778,815 | |
Unum Group | | 23,894 | | 457,092 | |
Ventas, Inc. | | 23,091 | | 1,457,504 | |
Vornado Realty Trust | | 15,297 | | 1,284,642 | |
Wells Fargo & Co. | | 425,868 | | 14,241,026 | |
Weyerhaeuser Co. | | 43,427 | | 971,028 | |
XL Group PLC | | 25,548 | | 537,530 | |
Zions Bancorporation | | 14,943 | | 290,193 | |
| | | | 143,381,992 | |
HEALTH CARE (11.4%) | | | | | |
Abbott Laboratories | | 126,227 | | 8,137,855 | |
Aetna, Inc. | | 29,264 | | 1,134,565 | |
Agilent Technologies, Inc. | | 28,321 | | 1,111,316 | |
Alexion Pharmaceuticals, Inc.* | | 15,381 | | 1,527,333 | |
Allergan, Inc. | | 24,651 | | 2,281,943 | |
AmerisourceBergen Corp. | | 20,393 | | 802,465 | |
Amgen, Inc. | | 61,135 | | 4,465,300 | |
Bard (C.R.), Inc. | | 6,758 | | 726,080 | |
Baxter International, Inc. | | 46,110 | | 2,450,747 | |
Becton, Dickinson & Co. | | 16,423 | | 1,227,619 | |
Biogen Idec, Inc.* | | 18,616 | | 2,687,778 | |
Boston Scientific Corp.* | | 113,835 | | 645,444 | |
Bristol-Myers Squibb Co. | | 136,554 | | 4,909,116 | |
Cardinal Health, Inc. | | 27,895 | | 1,171,590 | |
CareFusion Corp.* | | 18,188 | | 467,068 | |
Celgene Corp.* | | 35,406 | | 2,271,649 | |
Cerner Corp.* | | 11,538 | | 953,731 | |
CIGNA Corp. | | 23,367 | | 1,028,148 | |
Coventry Health Care, Inc. | | 11,353 | | 360,912 | |
Covidien PLC | | 38,956 | | 2,084,146 | |
DaVita, Inc.* | | 7,384 | | 725,183 | |
Dentsply International, Inc. | | 11,462 | | 433,378 | |
Edwards Lifesciences Corp.* | | 8,493 | | 877,327 | |
Express Scripts Hldg. Co.* | | 64,384 | | 3,594,559 | |
Forest Laboratories, Inc.* | | 22,375 | | 782,901 | |
Gilead Sciences, Inc.* | | 60,847 | | 3,120,234 | |
Hospira, Inc.* | | 13,469 | | 471,146 | |
Humana, Inc. | | 13,296 | | 1,029,642 | |
Intuitive Surgical, Inc.* | | 3,286 | | 1,819,754 | |
Johnson & Johnson | | 213,913 | | 14,451,962 | |
Laboratory Corp. of America Hldgs.* | | 7,720 | | 714,949 | |
Life Technologies Corp.* | | 14,360 | | 646,056 | |
Lilly (Eli) & Co. | | 82,106 | | 3,523,168 | |
McKesson Corp. | | 18,672 | | 1,750,500 | |
Medtronic, Inc. | | 82,927 | | 3,211,763 | |
Merck & Co., Inc. | | 243,651 | | 10,172,429 | |
Mylan, Inc.* | | 35,429 | | 757,118 | |
Patterson Cos., Inc. | | 7,185 | | 247,667 | |
PerkinElmer, Inc. | | 9,454 | | 243,913 | |
Perrigo Co. | | 7,246 | | 854,521 | |
Pfizer, Inc. | | 593,356 | | 13,647,188 | |
Quest Diagnostics, Inc. | | 12,692 | | 760,251 | |
St. Jude Medical, Inc. | | 28,363 | | 1,131,967 | |
Stryker Corp. | | 25,466 | | 1,403,177 | |
Tenet Healthcare Corp.* | | 33,859 | | 177,421 | |
Thermo Fisher Scientific, Inc. | | 29,861 | | 1,550,085 | |
UnitedHealth Group, Inc. | | 82,096 | | 4,802,616 | |
Varian Medical Systems, Inc.* | | 9,013 | | 547,720 | |
Waters Corp.* | | 7,068 | | 561,694 | |
Watson Pharmaceuticals, Inc.* | | 10,672 | | 789,621 | |
WellPoint, Inc. | | 26,468 | | 1,688,394 | |
Zimmer Hldgs., Inc. | | 14,294 | | 919,962 | |
| | | | 117,853,071 | |
INDUSTRIALS (10.1%) | | | | | |
3M Co. | | 55,348 | | 4,959,181 | |
Avery Dennison Corp. | | 8,678 | | 237,257 | |
Boeing Co. | | 59,182 | | 4,397,223 | |
Caterpillar, Inc. | | 54,070 | | 4,591,084 | |
Cintas Corp. | | 8,785 | | 339,189 | |
Cooper Industries PLC | | 13,195 | | 899,635 | |
CSX Corp. | | 79,876 | | 1,786,027 | |
Cummins, Inc. | | 16,125 | | 1,562,674 | |
Danaher Corp. | | 46,774 | | 2,435,990 | |
Deere & Co. | | 31,904 | | 2,580,076 | |
Donnelley (R.R.) & Sons Co. | | 14,936 | | 175,797 | |
Dover Corp. | | 15,340 | | 822,377 | |
Dun & Bradstreet Corp. | | 3,835 | | 272,937 | |
Eaton Corp. | | 28,668 | | 1,136,113 | |
Emerson Electric Co. | | 59,538 | | 2,773,280 | |
Equifax, Inc. | | 9,643 | | 449,364 | |
Expeditors Int’l. of Wash. | | 17,387 | | 673,746 | |
Fastenal Co. | | 24,526 | | 988,643 | |
FedEx Corp. | | 25,881 | | 2,370,958 | |
Flowserve Corp. | | 4,345 | | 498,589 | |
Fluor Corp. | | 14,121 | | 696,730 | |
General Dynamics Corp. | | 29,010 | | 1,913,500 | |
General Electric Co. | | 834,185 | | 17,384,415 | |
Goodrich Corp. | | 10,202 | | 1,294,634 | |
Grainger (W.W.), Inc. | | 5,285 | | 1,010,703 | |
Honeywell International, Inc. | | 63,575 | | 3,550,028 | |
Illinois Tool Works, Inc. | | 40,180 | | 2,125,120 | |
Ingersoll-Rand PLC | | 25,471 | | 1,074,367 | |
Iron Mountain, Inc. | | 13,908 | | 458,408 | |
Jacobs Engineering Group, Inc.* | | 10,768 | | 407,676 | |
Joy Global, Inc. | | 9,038 | | 512,726 | |
L-3 Communications Hldgs., Inc. | | 7,723 | | 571,579 | |
Lockheed Martin Corp. | | 21,585 | | 1,879,622 | |
Masco Corp. | | 29,145 | | 404,241 | |
Norfolk Southern Corp. | | 25,554 | | 1,834,011 | |
Northrop Grumman Corp. | | 20,134 | | 1,284,348 | |
PACCAR, Inc. | | 28,429 | | 1,114,133 | |
Pall Corp. | | 9,277 | | 508,472 | |
Parker Hannifin Corp. | | 12,755 | | 980,604 | |
Pitney Bowes, Inc. | | 15,668 | | 234,550 | |
Precision Castparts Corp. | | 11,579 | | 1,904,630 | |
Quanta Services, Inc.* | | 16,961 | | 408,251 | |
Raytheon Co. | | 26,295 | | 1,488,034 | |
Republic Services, Inc. | | 26,105 | | 690,738 | |
Robert Half Int’l., Inc. | | 11,457 | | 327,326 | |
Robinson (C.H.) Worldwide, Inc. | | 13,160 | | 770,255 | |
Rockwell Automation, Inc. | | 11,815 | | 780,499 | |
Rockwell Collins, Inc. | | 11,910 | | 587,759 | |
Roper Industries, Inc. | | 7,905 | | 779,275 | |
Ryder System, Inc. | | 4,308 | | 155,131 | |
Snap-on, Inc. | | 4,713 | | 293,384 | |
Southwest Airlines Co. | | 62,985 | | 580,722 | |
Stanley Black & Decker, Inc. | | 14,418 | | 927,942 | |
Stericycle, Inc.* | | 6,882 | | 630,873 | |
Textron, Inc. | | 22,659 | | 563,529 | |
Tyco International Ltd. | | 37,582 | | 1,986,209 | |
Union Pacific Corp. | | 37,255 | | 4,444,894 | |
United Parcel Service, Inc. Cl B | | 76,868 | | 6,054,124 | |
United Technologies Corp. | | 75,774 | | 5,723,210 | |
Waste Management, Inc. | | 37,657 | | 1,257,744 | |
Xylem, Inc. | | 15,571 | | 391,922 | |
| | | | 103,936,458 | |
INFORMATION TECHNOLOGY (19.3%) | | | | | |
Accenture Ltd. Cl A | | 52,448 | | 3,151,600 | |
Adobe Systems, Inc.* | | 39,865 | | 1,290,430 | |
Advanced Micro Devices, Inc.* | | 49,072 | | 281,183 | |
Akamai Technologies, Inc.* | | 14,628 | | 464,439 | |
Altera Corp. | | 26,707 | | 903,765 | |
Amphenol Corp. Cl A | | 13,070 | | 717,804 | |
Analog Devices, Inc. | | 24,458 | | 921,333 | |
Apple, Inc.* | | 77,232 | | 45,103,487 | |
Applied Materials, Inc. | | 103,077 | | 1,181,262 | |
Autodesk, Inc.* | | 18,772 | | 656,832 | |
Automatic Data Processing, Inc. | | 38,901 | | 2,165,230 | |
BMC Software, Inc.* | | 13,174 | | 562,266 | |
Broadcom Corp. Cl A* | | 40,780 | | 1,378,364 | |
CA, Inc. | | 28,058 | | 760,091 | |
Cisco Systems, Inc. | | 428,172 | | 7,351,713 | |
Citrix Systems, Inc.* | | 14,977 | | 1,257,169 | |
Cognizant Technology Solutions* | | 24,233 | | 1,453,980 | |
Computer Sciences Corp. | | 13,452 | | 333,879 | |
Corning, Inc. | | 123,310 | | 1,594,398 | |
Dell, Inc.* | | 119,510 | | 1,496,265 | |
eBay, Inc.* | | 94,483 | | 3,969,231 | |
Electronic Arts, Inc.* | | 28,216 | | 348,468 | |
EMC Corp.* | | 172,417 | | 4,419,048 | |
F5 Networks, Inc.* | | 6,554 | | 652,516 | |
Fidelity Nat’l. Information Svcs., Inc. | | 19,268 | | 656,653 | |
First Solar, Inc.* | | 4,548 | | 68,493 | |
Fiserv, Inc.* | | 10,901 | | 787,270 | |
FLIR Systems, Inc. | | 13,255 | | 258,473 | |
Google, Inc. Cl A* | | 21,472 | | 12,455,263 | |
Harris Corp. | | 9,233 | | 386,401 | |
Hewlett-Packard Co. | | 165,157 | | 3,321,307 | |
Int’l. Business Machines Corp. | | 92,915 | | 18,172,316 | |
Intel Corp. | | 396,922 | | 10,577,971 | |
Intuit, Inc. | | 23,395 | | 1,388,493 | |
Jabil Circuit, Inc. | | 14,906 | | 303,039 | |
JDS Uniphase Corp.* | | 20,168 | | 221,848 | |
Juniper Networks, Inc.* | | 44,616 | | 727,687 | |
KLA-Tencor Corp. | | 13,439 | | 661,871 | |
Lam Research Corp.* | | 16,588 | | 626,022 | |
Lexmark International, Inc. Cl A | | 5,936 | | 157,779 | |
Linear Technology Corp. | | 18,789 | | 588,659 | |
LSI Corp.* | | 48,777 | | 310,709 | |
MasterCard, Inc. Cl A | | 8,509 | | 3,659,806 | |
Microchip Technology, Inc. | | 15,687 | | 518,926 | |
Micron Technology, Inc.* | | 82,728 | | 522,014 | |
Microsoft Corp. | | 603,497 | | 18,460,973 | |
Molex, Inc. | | 11,061 | | 264,800 | |
Motorola Solutions, Inc. | | 24,071 | | 1,158,056 | |
NetApp, Inc.* | | 29,567 | | 940,822 | |
Nvidia Corp.* | | 50,481 | | 697,647 | |
Oracle Corp. | | 312,215 | | 9,272,786 | |
Paychex, Inc. | | 25,441 | | 799,102 | |
QUALCOMM, Inc. | | 146,818 | | 8,174,826 | |
Red Hat, Inc.* | | 15,937 | | 900,122 | |
SAIC, Inc. | | 21,581 | | 261,562 | |
Salesforce.com, inc.* | | 11,753 | | 1,624,970 | |
SanDisk Corp.* | | 19,425 | | 708,624 | |
Seagate Technology PLC* | | 32,913 | | 813,938 | |
Symantec Corp.* | | 58,407 | | 853,326 | |
TE Connectivity Ltd. | | 34,929 | | 1,114,584 | |
Teradata Corp.* | | 13,273 | | 955,789 | |
Teradyne, Inc.* | | 15,319 | | 215,385 | |
Texas Instruments, Inc. | | 95,497 | | 2,739,809 | |
Total System Services, Inc. | | 12,917 | | 309,104 | |
VeriSign, Inc.* | | 12,057 | | 525,323 | |
Visa, Inc. Cl A | | 40,034 | | 4,949,403 | |
Western Digital Corp.* | | 19,680 | | 599,846 | |
Western Union Co. | | 49,998 | | 841,966 | |
Xerox Corp. | | 109,592 | | 862,489 | |
Xilinx, Inc. | | 21,778 | | 731,087 | |
Yahoo!, Inc.* | | 100,706 | | 1,594,176 | |
| | | | 199,156,268 | |
MATERIALS (3.3%) | | | | | |
Air Products & Chemicals, Inc. | | 17,317 | | 1,398,001 | |
Airgas, Inc. | | 5,735 | | 481,797 | |
Alcoa, Inc. | | 84,945 | | 743,269 | |
Allegheny Technologies, Inc. | | 9,184 | | 292,878 | |
Ball Corp. | | 12,369 | | 507,747 | |
Bemis Co., Inc. | | 8,267 | | 259,088 | |
CF Industries Hldgs., Inc. | | 5,530 | | 1,071,382 | |
Cliffs Natural Resources, Inc. | | 11,898 | | 586,452 | |
Dow Chemical Co. | | 96,037 | | 3,025,166 | |
Du Pont (E.I.) de Nemours & Co. | | 75,569 | | 3,821,524 | |
Eastman Chemical Co. | | 11,454 | | 576,938 | |
Ecolab, Inc. | | 23,498 | | 1,610,318 | |
FMC Corp. | | 11,498 | | 614,913 | |
Freeport-McMoRan Copper & Gold, Inc. | | 76,950 | | 2,621,687 | |
Int’l. Flavors & Fragrances, Inc. | | 6,602 | | 361,790 | |
International Paper Co. | | 36,158 | | 1,045,328 | |
MeadWestvaco Corp. | | 14,026 | | 403,248 | |
Monsanto Co. | | 43,508 | | 3,601,592 | |
Newmont Mining Corp. | | 40,048 | | 1,942,728 | |
Nucor Corp. | | 25,906 | | 981,837 | |
Owens-Illinois, Inc.* | | 13,649 | | 261,651 | |
PPG Industries, Inc. | | 12,450 | | 1,321,194 | |
Praxair, Inc. | | 24,383 | | 2,651,164 | |
Sealed Air Corp. | | 15,939 | | 246,098 | |
Sherwin-Williams Co. | | 7,066 | | 935,185 | |
Sigma-Aldrich Corp. | | 9,725 | | 718,969 | |
The Mosaic Co. | | 24,174 | | 1,323,768 | |
Titanium Metals Corp. | | 6,950 | | 78,605 | |
United States Steel Corp. | | 12,170 | | 250,702 | |
Vulcan Materials Co. | | 10,703 | | 425,016 | |
| | | | 34,160,035 | |
TELECOMMUNICATION SERVICES (3.0%) | | | | | |
AT&T, Inc. | | 459,847 | | 16,398,144 | |
CenturyLink, Inc. | | 49,771 | | 1,965,457 | |
Crown Castle International Corp.* | | 20,277 | | 1,189,449 | |
Frontier Communications Corp. | | 75,710 | | 289,969 | |
MetroPCS Communications, Inc.* | | 25,149 | | 152,151 | |
Sprint Nextel Corp.* | | 233,651 | | 761,702 | |
Verizon Communications, Inc. | | 223,794 | | 9,945,405 | |
Windstream Corp. | | 47,386 | | 457,749 | |
| | | | 31,160,026 | |
UTILITIES (3.6%) | | | | | |
AES Corp.* | | 52,215 | | 669,918 | |
AGL Resources, Inc. | | 9,434 | | 365,568 | |
Ameren Corp. | | 19,619 | | 658,021 | |
American Electric Power Co., Inc. | | 39,157 | | 1,562,364 | |
CenterPoint Energy, Inc. | | 34,696 | | 717,166 | |
CMS Energy Corp. | | 20,981 | | 493,054 | |
Consolidated Edison, Inc. | | 23,475 | | 1,459,910 | |
Dominion Resources, Inc. | | 45,827 | | 2,474,658 | |
DTE Energy Co. | | 13,362 | | 792,767 | |
Duke Energy Corp. | | 108,386 | | 2,499,381 | |
Edison International | | 26,493 | | 1,223,977 | |
Entergy Corp. | | 14,345 | | 973,882 | |
Exelon Corp. | | 69,018 | | 2,596,457 | |
FirstEnergy Corp. | | 33,670 | | 1,656,227 | |
Integrys Energy Group, Inc. | | 6,213 | | 353,333 | |
NextEra Energy, Inc. | | 33,479 | | 2,303,690 | |
NiSource, Inc. | | 23,084 | | 571,329 | |
Northeast Utilities | | 24,900 | | 966,369 | |
NRG Energy, Inc.* | | 19,747 | | 342,808 | |
ONEOK, Inc. | | 16,421 | | 694,773 | |
Pepco Hldgs., Inc. | | 18,485 | | 361,751 | |
PG&E Corp. | | 34,092 | | 1,543,345 | |
Pinnacle West Capital Corp. | | 8,788 | | 454,691 | |
PPL Corp. | | 47,300 | | 1,315,413 | |
Progress Energy, Inc. | | 23,144 | | 1,392,574 | |
Public Svc. Enterprise Group, Inc. | | 40,741 | | 1,324,083 | |
SCANA Corp. | | 9,247 | | 442,376 | |
Sempra Energy | | 19,206 | | 1,322,909 | |
Southern Co. | | 69,537 | | 3,219,563 | |
TECO Energy, Inc. | | 17,246 | | 311,463 | |
Wisconsin Energy Corp. | | 18,467 | | 730,739 | |
Xcel Energy, Inc. | | 38,937 | | 1,106,200 | |
| | | | 36,900,759 | |
TOTAL INDEXED ASSETS - COMMON STOCKS
(Cost: $791,197,555) 96.4% | | | | 994,118,792 | |
| | Rating** | | Rate(%) | | Maturity | | Face Amount | | Value | |
SHORT-TERM DEBT SECURITIES: | | | | | | | | | | | |
U.S. GOVERNMENT (0.3%) | | | | | | | | | | | |
U.S. Treasury Bill (1) | | A-1+ | | 0.09 | | 08/09/12 | | 3,000,000 | | 2,999,700 | |
COMMERCIAL PAPER (3.2%) | | | | | | | | | | | |
Abbott Laboratories† | | A-1+ | | 0.15 | | 08/07/12 | | 550,000 | | 549,913 | |
ConocoPhillips† | | A-1 | | 0.12 | | 07/13/12 | | 10,000,000 | | 9,999,567 | |
Nestle Capital Corp.† | | A-1+ | | 0.01 | | 07/02/12 | | 4,500,000 | | 4,499,998 | |
New Jersey Natural Gas | | A-1 | | 0.11 | | 07/05/12 | | 6,000,000 | | 5,999,908 | |
Praxair, Inc. | | A-1 | | 0.11 | | 07/16/12 | | 1,000,000 | | 999,951 | |
Toyota Motor Credit Corp. | | A-1+ | | 0.12 | | 07/23/12 | | 10,000,000 | | 9,999,233 | |
Wal-Mart Stores, Inc.† | | A-1+ | | 0.13 | | 08/06/12 | | 850,000 | | 849,886 | |
| | | | | | | | | | 32,898,456 | |
TOTAL SHORT-TERM DEBT SECURITIES
(Cost: $35,898,156) 3.5% | | | | | | | | 35,898,156 | |
| | | | | | | | | | | |
TEMPORARY CASH INVESTMENTS (2)
(Cost: $750,000) 0.1% | | | | | | | | | | 750,000 | |
| | | | | | | | | | | |
TOTAL INVESTMENTS
(Cost: $827,845,711) 100.0% | | | | | | | | | | 1,030,766,948 | |
| | | | | | | | | | | |
OTHER NET ASSETS 0.0% (3) | | | | | | | | | | 456,498 | |
| | | | | | | | | | | |
NET ASSETS 100.0% | | | | | | | | | | $ | 1,031,223,446 | |
| | | | | | | | | | | | |
The accompanying notes are an integral part of these portfolio schedules.
MUTUAL OF AMERICA INVESTMENT CORPORATION - ALL AMERICA FUND
PORTFOLIO OF INVESTMENTS IN SECURITIES
June 30, 2012 (Unaudited)
| | Shares | | Value | |
INDEXED ASSETS: | | | | | |
COMMON STOCKS: | | | | | |
CONSUMER DISCRETIONARY (5.9%) | | | | | |
Abercrombie & Fitch Co. Cl A | | 956 | | 32,638 | |
Amazon.com, Inc.* | | 4,093 | | 934,637 | |
Apollo Group, Inc.* | | 1,269 | | 45,925 | |
AutoNation, Inc.* | | 472 | | 16,652 | |
AutoZone, Inc.* | | 299 | | 109,784 | |
Bed Bath & Beyond, Inc.* | | 2,516 | | 155,489 | |
Best Buy Co., Inc. | | 3,118 | | 65,353 | |
Big Lots, Inc.* | | 727 | | 29,654 | |
BorgWarner, Inc.* | | 1,374 | | 90,121 | |
Cablevision Systems Corp. Cl A | | 2,224 | | 29,557 | |
CarMax, Inc.* | | 2,608 | | 67,652 | |
Carnival Corp. | | 4,835 | | 165,695 | |
CBS Corp. Cl B | | 7,402 | | 242,638 | |
Chipotle Mexican Grill, Inc.* | | 365 | | 138,682 | |
Coach, Inc. | | 3,440 | | 201,171 | |
Comcast Corp. Cl A | | 29,476 | | 942,348 | |
D.R. Horton, Inc. | | 3,186 | | 58,559 | |
Darden Restaurants, Inc. | | 1,399 | | 70,831 | |
DeVry, Inc. | | 710 | | 21,989 | |
DIRECTV Cl A* | | 7,284 | | 355,605 | |
Discovery Communications, Inc. Cl A* | | 2,906 | | 156,924 | |
Disney (Walt) Co. | | 19,691 | | 955,014 | |
Dollar Tree, Inc.* | | 2,564 | | 137,943 | |
Expedia, Inc. | | 1,006 | | 48,358 | |
Family Dollar Stores, Inc. | | 1,262 | | 83,898 | |
Ford Motor Co. | | 44,365 | | 425,460 | |
Fossil, Inc.* | | 599 | | 45,847 | |
GameStop Corp. Cl A | | 1,613 | | 29,615 | |
Gannett Co., Inc. | | 2,578 | | 37,974 | |
Gap, Inc. | | 3,677 | | 100,603 | |
Genuine Parts Co. | | 1,753 | | 105,618 | |
Goodyear Tire & Rubber Co.* | | 2,675 | | 31,592 | |
H&R Block, Inc. | | 3,273 | | 52,303 | |
Harley-Davidson, Inc. | | 2,574 | | 117,709 | |
Harman Int’l. Industries, Inc. | | 875 | | 34,650 | |
Hasbro, Inc. | | 1,322 | | 44,776 | |
Home Depot, Inc. | | 17,199 | | 911,375 | |
International Game Technology | | 3,117 | | 49,093 | |
Interpublic Group of Cos., Inc. | | 5,197 | | 56,387 | |
Johnson Controls, Inc. | | 7,999 | | 221,652 | |
Kohl’s Corp. | | 2,728 | | 124,097 | |
Leggett & Platt, Inc. | | 1,606 | | 33,935 | |
Lennar Corp. Cl A | | 1,881 | | 58,142 | |
Limited Brands, Inc. | | 2,738 | | 116,447 | |
Lowe’s Cos., Inc. | | 13,219 | | 375,948 | |
Macy’s, Inc. | | 4,796 | | 164,743 | |
Marriott International, Inc. Cl A | | 2,980 | | 116,816 | |
Mattel, Inc. | | 3,721 | | 120,709 | |
McDonald’s Corp. | | 11,123 | | 984,719 | |
McGraw-Hill Cos., Inc. | | 3,214 | | 144,630 | |
Netflix, Inc.* | | 638 | | 43,684 | |
Newell Rubbermaid, Inc. | | 3,148 | | 57,105 | |
News Corp. Cl A | | 22,934 | | 511,199 | |
NIKE, Inc. Cl B | | 4,461 | | 391,587 | |
Nordstrom, Inc. | | 1,798 | | 89,343 | |
O’Reilly Automotive, Inc.* | | 1,402 | | 117,446 | |
Omnicom Group, Inc. | | 3,089 | | 150,125 | |
Penney (J.C.) Co., Inc. | | 1,693 | | 39,464 | |
Priceline.com, Inc.* | | 555 | | 368,809 | |
Pulte Homes, Inc.* | | 3,814 | | 40,810 | |
Ralph Lauren Corp. | | 737 | | 103,224 | |
Ross Stores, Inc. | | 2,466 | | 154,051 | |
Scripps Networks Interactive, Inc. Cl A | | 1,044 | | 59,362 | |
Sears Hldgs. Corp.* | | 453 | | 27,044 | |
Staples, Inc. | | 7,856 | | 102,521 | |
Starbucks Corp. | | 8,705 | | 464,151 | |
Starwood Hotels & Resorts | | 2,248 | | 119,234 | |
Target Corp. | | 7,470 | | 434,679 | |
Tiffany & Co. | | 1,463 | | 77,466 | |
Time Warner Cable, Inc. | | 3,411 | | 280,043 | |
Time Warner, Inc. | | 10,630 | | 409,255 | |
TJX Cos., Inc. | | 8,105 | | 347,948 | |
TripAdvisor, Inc.* | | 1,044 | | 46,656 | |
Urban Outfitters, Inc.* | | 1,268 | | 34,984 | |
V.F. Corp. | | 972 | | 129,713 | |
Viacom, Inc. Cl B | | 5,986 | | 281,462 | |
Washington Post Co. Cl B | | 53 | | 19,812 | |
Whirlpool Corp. | | 893 | | 54,616 | |
Wyndham Worldwide Corp. | | 1,615 | | 85,175 | |
Wynn Resorts Ltd. | | 926 | | 96,045 | |
Yum! Brands, Inc. | | 5,172 | | 333,180 | |
| | | | 15,132,150 | |
CONSUMER STAPLES (6.0%) | | | | | |
Altria Group, Inc. | | 22,102 | | 763,624 | |
Archer-Daniels-Midland Co. | | 7,573 | | 223,555 | |
Avon Products, Inc. | | 4,848 | | 78,586 | |
Beam, Inc. | | 1,733 | | 108,295 | |
Brown-Forman Corp. Cl B | | 1,078 | | 104,404 | |
Campbell Soup Co. | | 1,984 | | 66,226 | |
Clorox Co. | | 1,433 | | 103,835 | |
Coca-Cola Co. | | 25,072 | | 1,960,383 | |
Coca-Cola Enterprises, Inc. | | 3,415 | | 95,757 | |
Colgate-Palmolive Co. | | 5,275 | | 549,128 | |
ConAgra Foods, Inc. | | 4,712 | | 122,182 | |
Constellation Brands, Inc. Cl A* | | 1,776 | | 48,059 | |
Costco Wholesale Corp. | | 4,702 | | 446,690 | |
CVS Caremark Corp. | | 14,082 | | 658,052 | |
Dean Foods Co.* | | 2,047 | | 34,860 | |
Dr. Pepper Snapple Group, Inc. | | 2,354 | | 102,988 | |
Estee Lauder Cos., Inc. Cl A | | 2,548 | | 137,898 | |
General Mills, Inc. | | 7,221 | | 278,297 | |
Heinz (H.J.) Co. | | 3,529 | | 191,907 | |
Hershey Co. | | 1,667 | | 120,074 | |
Hormel Foods Corp. | | 1,546 | | 47,029 | |
J.M. Smucker Co. | | 1,273 | | 96,137 | |
Kellogg Co. | | 2,736 | | 134,967 | |
Kimberly-Clark Corp. | | 4,318 | | 361,719 | |
Kraft Foods, Inc. Cl A | | 19,513 | | 753,592 | |
Kroger Co. | | 5,953 | | 138,050 | |
Lorillard, Inc. | | 1,425 | | 188,029 | |
McCormick & Co., Inc. | | 1,457 | | 88,367 | |
Mead Johnson Nutrition Co. | | 2,182 | | 175,673 | |
Molson Coors Brewing Co. Cl B | | 1,736 | | 72,235 | |
Monster Beverage Corp.* | | 1,769 | | 125,953 | |
PepsiCo, Inc. | | 17,265 | | 1,219,945 | |
Philip Morris Int’l., Inc. | | 18,292 | | 1,596,160 | |
Proctor & Gamble Co. | | 30,539 | | 1,870,514 | |
Reynolds American, Inc. | | 3,577 | | 160,500 | |
Safeway, Inc. | | 2,676 | | 48,569 | |
Sysco Corp. | | 6,535 | | 194,808 | |
Tyson Foods, Inc. Cl A | | 3,296 | | 62,064 | |
Wal-Mart Stores, Inc. | | 19,458 | | 1,356,612 | |
Walgreen Co. | | 9,475 | | 280,271 | |
Whole Foods Market, Inc. | | 1,778 | | 169,479 | |
| | | | 15,335,473 | |
ENERGY (5.7%) | | | | | |
Alpha Natural Resources, Inc.* | | 2,649 | | 23,073 | |
Anadarko Petroleum Corp. | | 5,563 | | 368,271 | |
Apache Corp. | | 4,170 | | 366,501 | |
Baker Hughes, Inc. | | 4,829 | | 198,472 | |
Cabot Oil & Gas Corp. | | 2,171 | | 85,537 | |
Cameron International Corp.* | | 2,831 | | 120,912 | |
Chesapeake Energy Corp. | | 7,776 | | 144,634 | |
Chevron Corp. | | 21,650 | | 2,284,080 | |
ConocoPhillips | | 13,957 | | 779,917 | |
Consol Energy, Inc. | | 2,574 | | 77,838 | |
Denbury Resources, Inc.* | | 4,467 | | 67,496 | |
Devon Energy Corp. | | 4,678 | | 271,277 | |
Diamond Offshore Drilling, Inc. | | 778 | | 46,003 | |
EOG Resources, Inc. | | 2,995 | | 269,879 | |
EQT Corp. | | 1,613 | | 86,505 | |
Exxon Mobil Corp. | | 51,487 | | 4,405,748 | |
FMC Technologies, Inc.* | | 2,606 | | 102,233 | |
Halliburton Co. | | 10,028 | | 284,695 | |
Helmerich & Payne, Inc. | | 1,258 | | 54,698 | |
Hess Corp. | | 3,422 | | 148,686 | |
Kinder Morgan, Inc. | | 5,638 | | 181,656 | |
Marathon Oil Corp. | | 7,966 | | 203,691 | |
Marathon Petroleum Corp. | | 3,612 | | 162,251 | |
Murphy Oil Corp. | | 2,214 | | 111,342 | |
Nabors Industries Ltd.* | | 3,403 | | 49,003 | |
National Oilwell Varco, Inc. | | 4,720 | | 304,157 | |
Newfield Exploration Co.* | | 1,639 | | 48,039 | |
Noble Drilling Corp.* | | 2,867 | | 93,264 | |
Noble Energy, Inc. | | 2,039 | | 172,948 | |
Occidental Petroleum Corp. | | 9,130 | | 783,080 | |
Peabody Energy Corp. | | 3,154 | | 77,336 | |
Phillips 66* | | 6,682 | | 222,110 | |
Pioneer Natural Resources Co. | | 1,466 | | 129,316 | |
QEP Resources, Inc. | | 1,973 | | 59,131 | |
Range Resources Corp. | | 1,788 | | 110,624 | |
Rowan Companies PLC Cl A* | | 1,385 | | 44,777 | |
Schlumberger Ltd. | | 14,486 | | 940,286 | |
Southwestern Energy Co.* | | 3,904 | | 124,655 | |
Spectra Energy Corp. | | 7,314 | | 212,545 | |
Sunoco, Inc. | | 1,184 | | 56,240 | |
Tesoro Corp.* | | 1,590 | | 39,686 | |
Valero Energy Corp. | | 6,009 | | 145,117 | |
Williams Cos., Inc. | | 6,980 | | 201,164 | |
WPX Energy, Inc.* | | 2,199 | | 35,580 | |
| | | | 14,694,453 | |
FINANCIALS (7.7%) | | | | | |
ACE Ltd. | | 3,807 | | 282,213 | |
Aflac, Inc. | | 5,090 | | 216,783 | |
Allstate Corp. | | 5,496 | | 192,855 | |
American Express Co. | | 11,352 | | 660,800 | |
American Int’l. Group, Inc.* | | 6,980 | | 223,988 | |
American Tower Corp. | | 4,358 | | 304,668 | |
Ameriprise Financial, Inc. | | 2,443 | | 127,671 | |
Aon PLC* | | 3,676 | | 171,963 | |
Apartment Investment & Management Co. Cl A | | 1,472 | | 39,788 | |
Assurant, Inc. | | 965 | | 33,621 | |
AvalonBay Communities, Inc. | | 1,082 | | 153,081 | |
Bank of America Corp. | | 119,822 | | 980,144 | |
Bank of New York Mellon Corp. | | 13,128 | | 288,160 | |
BB&T Corp. | | 7,723 | | 238,255 | |
Berkshire Hathaway, Inc. Cl B* | | 19,487 | | 1,623,852 | |
BlackRock, Inc. | | 1,431 | | 243,012 | |
Boston Properties, Inc. | | 1,713 | | 185,638 | |
Capital One Financial Corp. | | 6,424 | | 351,136 | |
CBRE Group, Inc.* | | 3,660 | | 59,878 | |
Charles Schwab Corp. | | 11,919 | | 154,113 | |
Chubb Corp. | | 3,028 | | 220,499 | |
Cincinnati Financial Corp. | | 1,830 | | 69,668 | |
Citigroup, Inc. | | 33,275 | | 912,068 | |
CME Group, Inc. | | 734 | | 196,793 | |
Comerica, Inc. | | 2,192 | | 67,316 | |
Discover Financial Svcs. | | 5,984 | | 206,927 | |
E*Trade Financial Corp.* | | 2,932 | | 23,573 | |
Equity Residential | | 3,384 | | 211,026 | |
Federated Investors, Inc. Cl B | | 974 | | 21,282 | |
Fifth Third Bancorp | | 10,237 | | 137,176 | |
First Horizon National Corp. | | 2,829 | | 24,471 | |
Franklin Resources, Inc. | | 1,590 | | 176,474 | |
Genworth Financial, Inc. Cl A* | | 5,662 | | 32,047 | |
Goldman Sachs Group, Inc. | | 5,586 | | 535,474 | |
Hartford Financial Svcs. Group, Inc. | | 5,029 | | 88,661 | |
HCP, Inc. | | 4,587 | | 202,516 | |
Health Care REIT, Inc. | | 2,378 | | 138,637 | |
Host Hotels & Resorts, Inc. | | 8,025 | | 126,955 | |
Hudson City Bancorp, Inc. | | 5,926 | | 37,749 | |
Huntington Bancshares, Inc. | | 9,626 | | 61,606 | |
IntercontinentalExchange, Inc.* | | 776 | | 105,520 | |
Invesco Ltd. | | 5,229 | | 118,175 | |
JPMorgan Chase & Co. | | 41,485 | | 1,482,259 | |
KeyCorp | | 10,711 | | 82,903 | |
Kimco Realty Corp. | | 4,539 | | 86,377 | |
Legg Mason, Inc. | | 1,437 | | 37,894 | |
Leucadia National Corp. | | 2,211 | | 47,028 | |
Lincoln National Corp. | | 3,156 | | 69,022 | |
Loews Corp. | | 3,415 | | 139,708 | |
M&T Bank Corp. | | 1,413 | | 116,671 | |
Marsh & McLennan Cos., Inc. | | 6,150 | | 198,215 | |
MetLife, Inc. | | 12,076 | | 372,545 | |
Moody’s Corp. | | 2,274 | | 83,115 | |
Morgan Stanley | | 16,978 | | 247,709 | |
Nasdaq OMX Group, Inc. | | 1,427 | | 32,350 | |
Northern Trust Corp. | | 2,666 | | 122,689 | |
NYSE Euronext | | 2,896 | | 74,080 | |
People’s United Financial, Inc. | | 4,036 | | 46,858 | |
Plum Creek Timber Co., Inc. | | 1,808 | | 71,778 | |
PNC Financial Svcs. Grp., Inc. | | 6,041 | | 369,166 | |
Principal Financial Grp., Inc. | | 3,290 | | 86,297 | |
Progressive Corp. | | 7,190 | | 149,768 | |
ProLogis, Inc. | | 5,211 | | 173,162 | |
Prudential Financial, Inc. | | 5,225 | | 253,047 | |
Public Storage | | 1,611 | | 232,645 | |
Regions Financial Corp. | | 15,398 | | 103,937 | |
Simon Property Group, Inc. | | 3,460 | | 538,584 | |
SLM Corp. | | 5,407 | | 84,944 | |
State Street Corp. | | 5,288 | | 236,056 | |
SunTrust Banks, Inc. | | 6,009 | | 145,598 | |
T. Rowe Price Group, Inc. | | 2,808 | | 176,792 | |
Torchmark Corp. | | 1,091 | | 55,150 | |
Travelers Cos., Inc. | | 4,303 | | 274,704 | |
U.S. Bancorp | | 20,473 | | 658,412 | |
Unum Group | | 3,279 | | 62,727 | |
Ventas, Inc. | | 3,188 | | 201,227 | |
Vornado Realty Trust | | 2,109 | | 177,114 | |
Wells Fargo & Co. | | 58,641 | | 1,960,960 | |
Weyerhaeuser Co. | | 5,993 | | 134,003 | |
XL Group PLC | | 3,519 | | 74,040 | |
Zions Bancorporation | | 2,057 | | 39,947 | |
| | | | 19,745,713 | |
HEALTH CARE (6.4%) | | | | | |
Abbott Laboratories | | 17,433 | | 1,123,906 | |
Aetna, Inc. | | 4,037 | | 156,514 | |
Agilent Technologies, Inc. | | 3,900 | | 153,036 | |
Alexion Pharmaceuticals, Inc.* | | 2,133 | | 211,807 | |
Allergan, Inc. | | 3,407 | | 315,386 | |
AmerisourceBergen Corp. | | 2,814 | | 110,731 | |
Amgen, Inc. | | 8,445 | | 616,823 | |
Bard (C.R.), Inc. | | 936 | | 100,564 | |
Baxter International, Inc. | | 6,365 | | 338,300 | |
Becton, Dickinson & Co. | | 2,267 | | 169,458 | |
Biogen Idec, Inc.* | | 2,577 | | 372,067 | |
Boston Scientific Corp.* | | 15,682 | | 88,917 | |
Bristol-Myers Squibb Co. | | 18,812 | | 676,291 | |
Cardinal Health, Inc. | | 3,850 | | 161,700 | |
CareFusion Corp.* | | 2,506 | | 64,354 | |
Celgene Corp.* | | 4,907 | | 314,833 | |
Cerner Corp.* | | 1,594 | | 131,760 | |
CIGNA Corp. | | 3,227 | | 141,988 | |
Coventry Health Care, Inc. | | 1,568 | | 49,847 | |
Covidien PLC | | 5,378 | | 287,723 | |
DaVita, Inc.* | | 1,020 | | 100,174 | |
Dentsply International, Inc. | | 1,578 | | 59,664 | |
Edwards Lifesciences Corp.* | | 1,169 | | 120,758 | |
Express Scripts Hldg. Co.* | | 8,883 | | 495,938 | |
Forest Laboratories, Inc.* | | 3,074 | | 107,559 | |
Gilead Sciences, Inc.* | | 8,422 | | 431,880 | |
Hospira, Inc.* | | 1,860 | | 65,063 | |
Humana, Inc. | | 1,840 | | 142,490 | |
Intuitive Surgical, Inc.* | | 454 | | 251,421 | |
Johnson & Johnson | | 29,570 | | 1,997,754 | |
Laboratory Corp. of America Hldgs.* | | 1,063 | | 98,444 | |
Life Technologies Corp.* | | 1,982 | | 89,170 | |
Lilly (Eli) & Co. | | 11,323 | | 485,870 | |
McKesson Corp. | | 2,577 | | 241,594 | |
Medtronic, Inc. | | 11,459 | | 443,807 | |
Merck & Co., Inc. | | 33,641 | | 1,404,512 | |
Mylan, Inc.* | | 4,885 | | 104,392 | |
Patterson Cos., Inc. | | 994 | | 34,263 | |
PerkinElmer, Inc. | | 1,304 | | 33,643 | |
Perrigo Co. | | 1,004 | | 118,402 | |
Pfizer, Inc. | | 81,704 | | 1,879,192 | |
Quest Diagnostics, Inc. | | 1,752 | | 104,945 | |
St. Jude Medical, Inc. | | 3,911 | | 156,088 | |
Stryker Corp. | | 3,526 | | 194,283 | |
Tenet Healthcare Corp.* | | 4,653 | | 24,382 | |
Thermo Fisher Scientific, Inc. | | 4,116 | | 213,662 | |
UnitedHealth Group, Inc. | | 11,373 | | 665,321 | |
Varian Medical Systems, Inc.* | | 1,243 | | 75,537 | |
Waters Corp.* | | 973 | | 77,324 | |
Watson Pharmaceuticals, Inc.* | | 1,471 | | 108,839 | |
WellPoint, Inc. | | 3,656 | | 233,216 | |
Zimmer Hldgs., Inc. | | 1,977 | | 127,240 | |
| | | | 16,272,832 | |
INDUSTRIALS (5.6%) | | | | | |
3M Co. | | 7,649 | | 685,350 | |
Avery Dennison Corp. | | 1,195 | | 32,671 | |
Boeing Co. | | 8,174 | | 607,328 | |
Caterpillar, Inc. | | 7,412 | | 629,353 | |
Cintas Corp. | | 1,215 | | 46,911 | |
Cooper Industries PLC | | 1,819 | | 124,019 | |
CSX Corp. | | 11,023 | | 246,474 | |
Cummins, Inc. | | 2,222 | | 215,334 | |
Danaher Corp. | | 6,456 | | 336,228 | |
Deere & Co. | | 4,385 | | 354,615 | |
Donnelley (R.R.) & Sons Co. | | 2,046 | | 24,081 | |
Dover Corp. | | 2,109 | | 113,063 | |
Dun & Bradstreet Corp. | | 529 | | 37,649 | |
Eaton Corp. | | 3,947 | | 156,420 | |
Emerson Electric Co. | | 8,208 | | 382,329 | |
Equifax, Inc. | | 1,328 | | 61,885 | |
Expeditors Int’l. of Wash. | | 2,388 | | 92,535 | |
Fastenal Co. | | 3,379 | | 136,207 | |
FedEx Corp. | | 3,563 | | 326,406 | |
Flowserve Corp. | | 599 | | 68,735 | |
Fluor Corp. | | 1,938 | | 95,621 | |
General Dynamics Corp. | | 4,007 | | 264,302 | |
General Electric Co. | | 115,002 | | 2,396,647 | |
Goodrich Corp. | | 1,408 | | 178,675 | |
Grainger (W.W.), Inc. | | 728 | | 139,223 | |
Honeywell International, Inc. | | 8,756 | | 488,935 | |
Illinois Tool Works, Inc. | | 5,518 | | 291,847 | |
Ingersoll-Rand PLC | | 3,483 | | 146,913 | |
Iron Mountain, Inc. | | 1,911 | | 62,987 | |
Jacobs Engineering Group, Inc.* | | 1,484 | | 56,184 | |
Joy Global, Inc. | | 1,240 | | 70,345 | |
L-3 Communications Hldgs., Inc. | | 1,063 | | 78,673 | |
Lockheed Martin Corp. | | 2,972 | | 258,802 | |
Masco Corp. | | 4,013 | | 55,660 | |
Norfolk Southern Corp. | | 3,524 | | 252,917 | |
Northrop Grumman Corp. | | 2,773 | | 176,890 | |
PACCAR, Inc. | | 3,916 | | 153,468 | |
Pall Corp. | | 1,279 | | 70,102 | |
Parker Hannifin Corp. | | 1,752 | | 134,694 | |
Pitney Bowes, Inc. | | 2,149 | | 32,171 | |
Precision Castparts Corp. | | 1,594 | | 262,197 | |
Quanta Services, Inc.* | | 2,348 | | 56,516 | |
Raytheon Co. | | 3,625 | | 205,139 | |
Republic Services, Inc. | | 3,594 | | 95,097 | |
Robert Half Int’l., Inc. | | 1,576 | | 45,026 | |
Robinson (C.H.) Worldwide, Inc. | | 1,814 | | 106,173 | |
Rockwell Automation, Inc. | | 1,630 | | 107,678 | |
Rockwell Collins, Inc. | | 1,639 | | 80,885 | |
Roper Industries, Inc. | | 1,091 | | 107,551 | |
Ryder System, Inc. | | 591 | | 21,282 | |
Snap-on, Inc. | | 650 | | 40,463 | |
Southwest Airlines Co. | | 8,692 | | 80,140 | |
Stanley Black & Decker, Inc. | | 1,986 | | 127,819 | |
Stericycle, Inc.* | | 949 | | 86,995 | |
Textron, Inc. | | 3,131 | | 77,868 | |
Tyco International Ltd. | | 5,190 | | 274,292 | |
Union Pacific Corp. | | 5,134 | | 612,538 | |
United Parcel Service, Inc. Cl B | | 10,615 | | 836,037 | |
United Technologies Corp. | | 10,440 | | 788,533 | |
Waste Management, Inc. | | 5,190 | �� | 173,346 | |
Xylem, Inc. | | 2,143 | | 53,939 | |
| | | | 14,322,163 | |
INFORMATION TECHNOLOGY (10.7%) | | | | | |
Accenture Ltd. Cl A | | 7,237 | | 434,871 | |
Adobe Systems, Inc.* | | 5,505 | | 178,197 | |
Advanced Micro Devices, Inc.* | | 6,737 | | 38,603 | |
Akamai Technologies, Inc.* | | 2,016 | | 64,008 | |
Altera Corp. | | 3,663 | | 123,956 | |
Amphenol Corp. Cl A | | 1,797 | | 98,691 | |
Analog Devices, Inc. | | 3,367 | | 126,835 | |
Apple, Inc.* | | 10,647 | | 6,217,853 | |
Applied Materials, Inc. | | 14,225 | | 163,019 | |
Autodesk, Inc.* | | 2,587 | | 90,519 | |
Automatic Data Processing, Inc. | | 5,365 | | 298,616 | |
BMC Software, Inc.* | | 1,816 | | 77,507 | |
Broadcom Corp. Cl A* | | 5,596 | | 189,145 | |
CA, Inc. | | 3,877 | | 105,028 | |
Cisco Systems, Inc. | | 58,915 | | 1,011,571 | |
Citrix Systems, Inc.* | | 2,064 | | 173,252 | |
Cognizant Technology Solutions* | | 3,353 | | 201,180 | |
Computer Sciences Corp. | | 1,862 | | 46,215 | |
Corning, Inc. | | 16,978 | | 219,526 | |
Dell, Inc.* | | 16,412 | | 205,478 | |
eBay, Inc.* | | 13,042 | | 547,894 | |
Electronic Arts, Inc.* | | 3,891 | | 48,054 | |
EMC Corp.* | | 23,794 | | 609,840 | |
F5 Networks, Inc.* | | 901 | | 89,704 | |
Fidelity Nat’l. Information Svcs., Inc. | | 2,662 | | 90,721 | |
First Solar, Inc.* | | 629 | | 9,473 | |
Fiserv, Inc.* | | 1,508 | | 108,908 | |
FLIR Systems, Inc. | | 1,826 | | 35,607 | |
Google, Inc. Cl A* | | 2,957 | | 1,715,267 | |
Harris Corp. | | 1,272 | | 53,233 | |
Hewlett-Packard Co. | | 22,677 | | 456,034 | |
Int’l. Business Machines Corp. | | 12,816 | | 2,506,558 | |
Intel Corp. | | 54,876 | | 1,462,445 | |
Intuit, Inc. | | 3,233 | | 191,879 | |
Jabil Circuit, Inc. | | 2,055 | | 41,778 | |
JDS Uniphase Corp.* | | 2,761 | | 30,371 | |
Juniper Networks, Inc.* | | 6,172 | | 100,665 | |
KLA-Tencor Corp. | | 1,858 | | 91,507 | |
Lam Research Corp.* | | 2,284 | | 86,198 | |
Lexmark International, Inc. Cl A | | 818 | | 21,742 | |
Linear Technology Corp. | | 2,586 | | 81,019 | |
LSI Corp.* | | 6,678 | | 42,539 | |
MasterCard, Inc. Cl A | | 1,180 | | 507,530 | |
Microchip Technology, Inc. | | 2,161 | | 71,486 | |
Micron Technology, Inc.* | | 11,298 | | 71,290 | |
Microsoft Corp. | | 83,172 | | 2,544,236 | |
Molex, Inc. | | 1,524 | | 36,485 | |
Motorola Solutions, Inc. | | 3,318 | | 159,629 | |
NetApp, Inc.* | | 4,072 | | 129,571 | |
Nvidia Corp.* | | 6,926 | | 95,717 | |
Oracle Corp. | | 43,086 | | 1,279,654 | |
Paychex, Inc. | | 3,513 | | 110,343 | |
QUALCOMM, Inc. | | 20,085 | | 1,118,333 | |
Red Hat, Inc.* | | 2,202 | | 124,369 | |
SAIC, Inc. | | 2,963 | | 35,912 | |
Salesforce.com, inc.* | | 1,620 | | 223,981 | |
SanDisk Corp.* | | 2,671 | | 97,438 | |
Seagate Technology PLC* | | 4,531 | | 112,052 | |
Symantec Corp.* | | 8,049 | | 117,596 | |
TE Connectivity Ltd. | | 4,819 | | 153,774 | |
Teradata Corp.* | | 1,838 | | 132,354 | |
Teradyne, Inc.* | | 2,116 | | 29,751 | |
Texas Instruments, Inc. | | 13,169 | | 377,819 | |
Total System Services, Inc. | | 1,784 | | 42,691 | |
VeriSign, Inc.* | | 1,657 | | 72,195 | |
Visa, Inc. Cl A | | 5,533 | | 684,045 | |
Western Digital Corp.* | | 2,704 | | 82,418 | |
Western Union Co. | | 6,887 | | 115,977 | |
Xerox Corp. | | 15,143 | | 119,175 | |
Xilinx, Inc. | | 2,996 | | 100,576 | |
Yahoo!, Inc.* | | 13,888 | | 219,847 | |
| | | | 27,451,750 | |
MATERIALS (1.8%) | | | | | |
Air Products & Chemicals, Inc. | | 2,388 | | 192,783 | |
Airgas, Inc. | | 789 | | 66,284 | |
Alcoa, Inc. | | 11,642 | | 101,868 | |
Allegheny Technologies, Inc. | | 1,256 | | 40,054 | |
Ball Corp. | | 1,706 | | 70,031 | |
Bemis Co., Inc. | | 1,140 | | 35,728 | |
CF Industries Hldgs., Inc. | | 762 | | 147,630 | |
Cliffs Natural Resources, Inc. | | 1,632 | | 80,441 | |
Dow Chemical Co. | | 13,213 | | 416,210 | |
Du Pont (E.I.) de Nemours & Co. | | 10,418 | | 526,838 | |
Eastman Chemical Co. | | 1,572 | | 79,182 | |
Ecolab, Inc. | | 3,246 | | 222,448 | |
FMC Corp. | | 1,586 | | 84,819 | |
Freeport-McMoRan Copper & Gold, Inc. | | 10,616 | | 361,687 | |
Int’l. Flavors & Fragrances, Inc. | | 910 | | 49,868 | |
International Paper Co. | | 4,955 | | 143,249 | |
MeadWestvaco Corp. | | 1,926 | | 55,373 | |
Monsanto Co. | | 5,990 | | 495,852 | |
Newmont Mining Corp. | | 5,508 | | 267,193 | |
Nucor Corp. | | 3,567 | | 135,189 | |
Owens-Illinois, Inc.* | | 1,877 | | 35,982 | |
PPG Industries, Inc. | | 1,716 | | 182,102 | |
Praxair, Inc. | | 3,362 | | 365,550 | |
Sealed Air Corp. | | 2,194 | | 33,875 | |
Sherwin-Williams Co. | | 972 | | 128,644 | |
Sigma-Aldrich Corp. | | 1,340 | | 99,066 | |
The Mosaic Co. | | 3,329 | | 182,296 | |
Titanium Metals Corp. | | 954 | | 10,790 | |
United States Steel Corp. | | 1,661 | | 34,217 | |
Vulcan Materials Co. | | 1,473 | | 58,493 | |
| | | | 4,703,742 | |
TELECOMMUNICATION SERVICES (1.7%) | | | | | |
AT&T, Inc. | | 63,476 | | 2,263,559 | |
CenturyLink, Inc. | | 6,890 | | 272,086 | |
Crown Castle International Corp.* | | 2,794 | | 163,896 | |
Frontier Communications Corp. | | 10,420 | | 39,909 | |
MetroPCS Communications, Inc.* | | 3,430 | | 20,752 | |
Sprint Nextel Corp.* | | 32,244 | | 105,115 | |
Verizon Communications, Inc. | | 30,877 | | 1,372,174 | |
Windstream Corp. | | 6,539 | | 63,167 | |
| | | | 4,300,658 | |
UTILITIES (2.0%) | | | | | |
AES Corp.* | | 7,177 | | 92,081 | |
AGL Resources, Inc. | | 1,301 | | 50,414 | |
Ameren Corp. | | 2,709 | | 90,860 | |
American Electric Power Co., Inc. | | 5,402 | | 215,540 | |
CenterPoint Energy, Inc. | | 4,776 | | 98,720 | |
CMS Energy Corp. | | 2,895 | | 68,033 | |
Consolidated Edison, Inc. | | 3,242 | | 201,620 | |
Dominion Resources, Inc. | | 6,325 | | 341,550 | |
DTE Energy Co. | | 1,846 | | 109,523 | |
Duke Energy Corp. | | 14,990 | | 345,669 | |
Edison International | | 3,650 | | 168,630 | |
Entergy Corp. | | 1,979 | | 134,354 | |
Exelon Corp. | | 9,540 | | 358,895 | |
FirstEnergy Corp. | | 4,645 | | 228,488 | |
Integrys Energy Group, Inc. | | 858 | | 48,794 | |
NextEra Energy, Inc. | | 4,626 | | 318,315 | |
NiSource, Inc. | | 3,188 | | 78,903 | |
Northeast Utilities | | 3,433 | | 133,235 | |
NRG Energy, Inc.* | | 2,718 | | 47,184 | |
ONEOK, Inc. | | 2,260 | | 95,621 | |
Pepco Hldgs., Inc. | | 2,550 | | 49,904 | |
PG&E Corp. | | 4,704 | | 212,950 | |
Pinnacle West Capital Corp. | | 1,213 | | 62,761 | |
PPL Corp. | | 6,525 | | 181,460 | |
Progress Energy, Inc. | | 3,202 | | 192,664 | |
Public Svc. Enterprise Group, Inc. | | 5,621 | | 182,683 | |
SCANA Corp. | | 1,277 | | 61,092 | |
Sempra Energy | | 2,649 | | 182,463 | |
Southern Co. | | 9,626 | | 445,684 | |
TECO Energy, Inc. | | 2,375 | | 42,893 | |
Wisconsin Energy Corp. | | 2,545 | | 100,706 | |
Xcel Energy, Inc. | | 5,377 | | 152,761 | |
| | | | 5,094,450 | |
TOTAL INDEXED ASSETS - COMMON STOCKS | | | | | |
(Cost: $121,631,838) 53.5% | | | | 137,053,384 | |
| | Rating** | | Rate(%) | | Maturity | | Face Amount | | Value | |
INDEXED ASSETS: | | | | | | | | | | | |
SHORT-TERM DEBT SECURITIES: | | | | | | | | | | | |
U.S. GOVERNMENT (0.2%) | | | | | | | | | | | |
U.S. Treasury Bill (1) | | A-1+ | | 0.09 | | 08/09/12 | | 400,000 | | 399,960 | |
COMMERCIAL PAPER (1.5%) | | | | | | | | | | | |
General Electric Capital Corp. | | A-1+ | | 0.13 | | 07/20/12 | | 2,000,000 | | 1,999,856 | |
San Diego Gas & Electric Co.† | | A-1 | | 0.14 | | 07/02/12 | | 1,800,000 | | 1,799,986 | |
| | | | | | | | | | 3,799,842 | |
TOTAL INDEXED ASSETS - SHORT-TERM DEBT SECURITIES | | | | | | | |
(Cost: $4,199,802) 1.7% | | | | | | | | | | 4,199,802 | |
| | | | | | | | | | | |
TOTAL INDEXED ASSETS | | | | | | | | | | | |
(Cost: $125,831,640) 55.2% | | | | | | | | | | 141,253,186 | |
| | Shares | | Value | |
ACTIVE ASSETS: | | | | | |
COMMON STOCKS: | | | | | |
CONSUMER DISCRETIONARY (4.2%) | | | | | |
Abercrombie & Fitch Co. Cl A | | 3,487 | | 119,046 | |
AFC Enterprises, Inc.* | | 17,691 | | 409,370 | |
Amazon.com, Inc.* | | 3,603 | | 822,745 | |
American Axle & Mfg. Hldgs., Inc.* | | 26,440 | | 277,356 | |
ANN, Inc.* | | 7,356 | | 187,504 | |
Bally Technologies, Inc.* | | 3,778 | | 176,281 | |
Bassett Furniture Industries, Inc. | | 27,116 | | 279,566 | |
bebe stores, inc. | | 17,190 | | 100,905 | |
BorgWarner, Inc.* | | 2,075 | | 136,099 | |
Brunswick Corp. | | 8,363 | | 185,826 | |
Darden Restaurants, Inc. | | 5,336 | | 270,162 | |
Denny’s Corp.* | | 62,530 | | 277,633 | |
Discovery Communications, Inc. Cl A* | | 4,827 | | 260,658 | |
Disney (Walt) Co. | | 14,336 | | 695,296 | |
Express, Inc.* | | 12,720 | | 231,122 | |
Ford Motor Co. | | 26,524 | | 254,365 | |
HSN, Inc. | | 6,973 | | 281,361 | |
Johnson Controls, Inc. | | 5,238 | | 145,145 | |
Macy’s, Inc. | | 10,028 | | 344,462 | |
Maidenform Brands, Inc.* | | 13,952 | | 277,924 | |
Monro Muffler Brake, Inc. | | 2,932 | | 97,460 | |
P.F. Chang’s China Bistro, Inc. | | 3,470 | | 178,601 | |
Pep Boys - Manny, Moe & Jack | | 45,960 | | 455,004 | |
Quiksilver, Inc.* | | 36,673 | | 85,448 | |
Red Robin Gourmet Burgers, Inc.* | | 4,977 | | 151,848 | |
Rent-A-Center, Inc. | | 7,315 | | 246,808 | |
Shutterfly, Inc.* | | 13,994 | | 429,476 | |
Starbucks Corp. | | 21,172 | | 1,128,891 | |
Steiner Leisure Ltd.* | | 2,879 | | 133,614 | |
Steve Madden Ltd.* | | 4,994 | | 158,560 | |
Target Corp. | | 3,975 | | 231,305 | |
Time Warner Cable, Inc. | | 5,357 | | 439,810 | |
Time Warner, Inc. | | 9,015 | | 347,078 | |
Urban Outfitters, Inc.* | | 6,460 | | 178,231 | |
Viacom, Inc. Cl B | | 6,401 | | 300,975 | |
WMS Industries, Inc.* | | 6,190 | | 123,491 | |
Wolverine World Wide, Inc. | | 8,363 | | 324,317 | |
| | | | 10,743,743 | |
CONSUMER STAPLES (3.0%) | | | | | |
Clorox Co. | | 5,747 | | 416,428 | |
Constellation Brands, Inc. Cl A* | | 6,717 | | 181,762 | |
Darling International, Inc.* | | 10,244 | | 168,924 | |
Estee Lauder Cos., Inc. Cl A | | 5,271 | | 285,267 | |
Hain Celestial Group, Inc.* | | 4,120 | | 226,765 | |
J.M. Smucker Co. | | 5,816 | | 439,224 | |
Kraft Foods, Inc. Cl A | | 13,240 | | 511,329 | |
Nu Skin Enterprises, Inc. Cl A | | 3,441 | | 161,383 | |
PepsiCo, Inc. | | 9,829 | | 694,517 | |
Philip Morris Int’l., Inc. | | 13,570 | | 1,184,118 | |
Prestige Brands Hldgs., Inc.* | | 17,149 | | 271,126 | |
Proctor & Gamble Co. | | 15,945 | | 976,631 | |
The Pantry, Inc.* | | 17,262 | | 253,751 | |
TreeHouse Foods, Inc.* | | 2,373 | | 147,814 | |
Tyson Foods, Inc. Cl A | | 24,583 | | 462,898 | |
Vector Group Ltd. | | 10,261 | | 174,642 | |
Wal-Mart Stores, Inc. | | 17,613 | | 1,227,978 | |
| | | | 7,784,557 | |
ENERGY (4.0%) | | | | | |
Abraxas Petroleum Corp.* | | 35,475 | | 113,165 | |
Anadarko Petroleum Corp. | | 6,989 | | 462,672 | |
Apache Corp. | | 4,731 | | 415,808 | |
Berry Petroleum Co. Cl A | | 4,950 | | 196,317 | |
Chevron Corp. | | 6,326 | | 667,393 | |
Endeavour International Corp.* | | 25,229 | | 211,924 | |
Energy XXI (Bermuda) Ltd. | | 29,624 | | 926,935 | |
EOG Resources, Inc. | | 3,423 | | 308,447 | |
Exxon Mobil Corp. | | 25,539 | | 2,185,372 | |
Gasco Energy, Inc.* | | 305,816 | | 53,518 | |
Halliburton Co. | | 15,737 | | 446,773 | |
Hess Corp. | | 4,574 | | 198,740 | |
Lufkin Industries, Inc. | | 2,288 | | 124,284 | |
MarkWest Energy Partners LP | | 4,411 | | 217,506 | |
McMoRan Exploration Co.* | | 121,927 | | 1,544,815 | |
National Oilwell Varco, Inc. | | 7,079 | | 456,171 | |
Noble Energy, Inc. | | 6,057 | | 513,755 | |
Occidental Petroleum Corp. | | 7,449 | | 638,901 | |
Range Resources Corp. | | 3,971 | | 245,686 | |
Saratoga Resources, Inc.* | | 45,646 | | 268,399 | |
| | | | 10,196,581 | |
FINANCIALS (7.9%) | | | | | |
American Tower Corp. | | 10,902 | | 762,159 | |
Aon PLC* | | 4,615 | | 215,890 | |
Ashford Hospitality Trust, Inc. | | 15,502 | | 130,682 | |
Aspen Insurance Hldgs. Ltd. | | 5,669 | | 163,834 | |
Associated Estates Realty Corp. | | 20,358 | | 304,352 | |
BancFirst Corp. | | 3,741 | | 156,785 | |
Bank of America Corp. | | 52,718 | | 431,233 | |
Bank of Marin Bancorp | | 2,448 | | 90,600 | |
Banner Corp. | | 4,269 | | 93,534 | |
BB&T Corp. | | 14,565 | | 449,330 | |
Berkshire Hathaway, Inc. Cl B* | | 8,795 | | 732,887 | |
Brookline Bancorp, Inc. | | 25,922 | | 229,410 | |
Bryn Mawr Bank Corp. | | 7,387 | | 155,644 | |
Capital One Financial Corp. | | 14,184 | | 775,297 | |
Cash America Int’l., Inc. | | 5,631 | | 247,989 | |
Chesapeake Lodging Trust | | 19,130 | | 329,418 | |
Citigroup, Inc. | | 13,874 | | 380,286 | |
Colonial Properties Trust | | 24,374 | | 539,640 | |
Dime Community Bancshares | | 12,281 | | 163,214 | |
EastGroup Properties, Inc. | | 5,045 | | 268,899 | |
Ellington Financial LLC | | 20,630 | | 436,531 | |
Equity Lifestyle Properties, Inc. | | 5,783 | | 398,854 | |
FelCor Lodging Trust, Inc.* | | 46,512 | | 218,606 | |
First Interstate BancSytem, Inc. | | 11,319 | | 161,183 | |
First Niagara Financial Group, Inc. | | 5,185 | | 39,665 | |
Flushing Financial Corp. | | 3,420 | | 46,615 | |
Forest City Enterprises, Inc. Cl A* | | 19,052 | | 278,159 | |
Franklin Resources, Inc. | | 1,841 | | 204,333 | |
Glacier Bancorp, Inc. | | 13,777 | | 213,406 | |
Goldman Sachs Group, Inc. | | 4,870 | | 466,838 | |
Highwoods Properties, Inc. | | 8,543 | | 287,472 | |
IBERIABANK Corp. | | 3,130 | | 157,909 | |
Investors Bancorp, Inc.* | | 12,881 | | 194,374 | |
iShares Russell 2000 Growth Index Fund | | 3,800 | | 347,586 | |
Janus Capital Group, Inc. | | 23,081 | | 180,493 | |
JPMorgan Chase & Co. | | 31,400 | | 1,121,922 | |
Marlin Business Svcs. Corp. | | 14,497 | | 237,606 | |
MB Financial, Inc. | | 9,110 | | 196,229 | |
Meadowbrook Insurance Group, Inc. | | 28,411 | | 249,733 | |
MetLife, Inc. | | 14,386 | | 443,808 | |
Mid-America Apt. Communities, Inc. | | 1,674 | | 114,234 | |
National Retail Pptys., Inc. | | 7,624 | | 215,683 | |
NBH Hldgs. Co.† | | 16,887 | | 308,188 | |
Northwest Bancshares, Inc. | | 30,633 | | 358,713 | |
Pennsylvania REIT | | 11,247 | | 168,480 | |
PHH Corp.* | | 10,401 | | 181,809 | |
PNC Financial Svcs. Grp., Inc. | | 6,213 | | 379,676 | |
ProAssurance Corp. | | 6,713 | | 598,061 | |
Prosperity Bancshares, Inc. | | 4,824 | | 202,753 | |
PS Business Parks, Inc. | | 2,362 | | 159,955 | |
S.Y. Bancorp, Inc. | | 13,706 | | 328,259 | |
SeaBright Hldgs., Inc. | | 42,287 | | 375,931 | |
Select Income REIT* | | 7,460 | | 177,250 | |
Signature Bank* | | 9,610 | | 585,921 | |
Simon Property Group, Inc. | | 5,117 | | 796,512 | |
Starwood Property Trust, Inc. | | 7,675 | | 163,554 | |
Steel Excel, Inc.* | | 2,924 | | 79,387 | |
Stifel Financial Corp.* | | 5,984 | | 184,906 | |
SVB Financial Group* | | 4,813 | | 282,619 | |
Symetra Financial Corp. | | 26,998 | | 340,715 | |
Terreno Realty Corp. | | 6,610 | | 99,877 | |
UMB Financial Corp. | | 4,318 | | 221,211 | |
Urstadt Biddle Pptys., Inc. Cl A | | 6,621 | | 130,897 | |
Wells Fargo & Co. | | 38,762 | | 1,296,201 | |
Westamerica Bancorporation | | 3,566 | | 168,280 | |
| | | | 20,421,477 | |
HEALTH CARE (5.7%) | | | | | |
Abbott Laboratories | | 4,072 | | 262,522 | |
Abiomed, Inc.* | | 6,097 | | 139,134 | |
Acorda Therapeutics, Inc.* | | 1,787 | | 42,102 | |
Alnylam Pharmaceuticals, Inc.* | | 9,168 | | 106,991 | |
Alphatec Hldgs., Inc.* | | 11,145 | | 20,507 | |
BioScrip, Inc.* | | 19,057 | | 141,594 | |
BioSpecifics Technologies Corp.* | | 3,489 | | 65,523 | |
Bruker Corp.* | | 8,000 | | 106,480 | |
Cantel Medical Corp. | | 5,184 | | 141,264 | |
Capital Senior Living Corp.* | | 13,952 | | 147,891 | |
Celgene Corp.* | | 6,636 | | 425,766 | |
Cepheid, Inc.* | | 2,383 | | 106,639 | |
Computer Programs & Systems, Inc. | | 3,834 | | 219,381 | |
Conceptus, Inc.* | | 24,922 | | 493,954 | |
Covidien PLC | | 5,466 | | 292,431 | |
Cubist Pharmaceuticals, Inc.* | | 6,652 | | 252,177 | |
Cyberonics, Inc.* | | 7,582 | | 340,735 | |
DexCom, Inc.* | | 15,252 | | 197,666 | |
Emergent Biosolutions, Inc.* | | 7,810 | | 118,322 | |
Express Scripts Hldg. Co.* | | 4,064 | | 226,893 | |
Forest Laboratories, Inc.* | | 16,214 | | 567,328 | |
Gilead Sciences, Inc.* | | 9,727 | | 498,801 | |
Halozyme Therapeutics, Inc.* | | 4,839 | | 42,874 | |
Harvard Bioscience, Inc.* | | 26,040 | | 98,171 | |
HeartWare International, Inc.* | | 1,541 | | 136,841 | |
HMS Hldgs. Corp.* | | 9,147 | | 304,687 | |
Impax Laboratories, Inc.* | | 8,700 | | 176,349 | |
Insulet Corp.* | | 6,996 | | 149,505 | |
IPC The Hospitalist Co.* | | 3,248 | | 147,199 | |
Ironwood Pharmaceuticals, Inc.* | | 5,557 | | 76,575 | |
MAP Pharmaceuticals, Inc.* | | 3,902 | | 58,452 | |
McKesson Corp. | | 5,538 | | 519,188 | |
Medicines Co.* | | 18,272 | | 419,160 | |
Merck & Co., Inc. | | 21,999 | | 918,458 | |
Mylan, Inc.* | | 21,436 | | 458,087 | |
Neogen Corp.* | | 5,637 | | 260,429 | |
NPS Pharmaceuticals Inc* | | 22,100 | | 190,281 | |
NxStage Medical, Inc.* | | 13,333 | | 223,461 | |
Omeros Corp.* | | 5,200 | | 52,000 | |
OraSure Technologies, Inc.* | | 4,697 | | 52,794 | |
OSI Pharmaceuticals, Inc. - rights* | | 1,570 | | 0 | |
PAREXEL International Corp.* | | 10,400 | | 293,592 | |
Pfizer, Inc. | | 51,541 | | 1,185,443 | |
Pharmacyclics, Inc.* | | 2,705 | | 147,720 | |
Progenics Pharmaceuticals, Inc* | | 7,105 | | 69,487 | |
QLT, Inc.* | | 64,658 | | 492,694 | |
Questcor Pharmaceuticals, Inc.* | | 6,030 | | 321,037 | |
Sagent Pharmaceuticals, Inc.* | | 5,935 | | 107,305 | |
Salix Pharmaceuticals Ltd.* | | 9,219 | | 501,882 | |
Seattle Genetics, Inc.* | | 7,111 | | 180,548 | |
St. Jude Medical, Inc. | | 5,322 | | 212,401 | |
Stryker Corp. | | 7,002 | | 385,810 | |
SXC Health Solutions Corp.* | | 3,671 | | 364,200 | |
UnitedHealth Group, Inc. | | 9,910 | | 579,735 | |
Vascular Solutions, Inc.* | | 9,064 | | 113,844 | |
WellCare Health Plans, Inc.* | | 2,110 | | 111,830 | |
WellPoint, Inc. | | 3,220 | | 205,404 | |
| | | | 14,471,544 | |
INDUSTRIALS (5.1%) | | | | | |
Acacia Research Corp.* | | 4,343 | | 161,733 | |
Acco Brands Corp.* | | 19,592 | | 202,581 | |
Actuant Corp. Cl A | | 11,394 | | 309,461 | |
Alaska Air Group, Inc.* | | 7,856 | | 282,030 | |
Astronics Corp.* | | 10,547 | | 297,847 | |
AZZ, Inc. | | 10,683 | | 654,440 | |
Boeing Co. | | 10,566 | | 785,054 | |
Caterpillar, Inc. | | 7,729 | | 656,269 | |
Cummins, Inc. | | 5,365 | | 519,922 | |
Encore Wire Corp. | | 13,981 | | 374,411 | |
EnPro Industries, Inc.* | | 5,007 | | 187,112 | |
Expeditors Int’l. of Wash. | | 9,856 | | 381,920 | |
FedEx Corp. | | 5,376 | | 492,495 | |
General Electric Co. | | 62,144 | | 1,295,081 | |
Genesee & Wyoming, Inc. Cl A* | | 12,783 | | 675,453 | |
Healthcare Svcs. Group, Inc. | | 11,424 | | 221,397 | |
Hub Group, Inc. Cl A* | | 3,729 | | 134,990 | |
Insperity, Inc. | | 6,220 | | 168,251 | |
Kaydon Corp. | | 4,690 | | 100,319 | |
Miller Industries, Inc. | | 18,090 | | 288,174 | |
Mueller Industries, Inc. | | 13,393 | | 570,408 | |
Old Dominion Freight Line, Inc.* | | 19,752 | | 855,064 | |
On Assignment, Inc.* | | 11,894 | | 189,828 | |
Precision Castparts Corp. | | 4,211 | | 692,667 | |
Raven Industries, Inc. | | 7,000 | | 487,130 | |
RBC Bearings, Inc.* | | 3,203 | | 151,502 | |
Rexnord Corp.* | | 1,886 | | 37,795 | |
Robbins & Myers, Inc. | | 5,262 | | 220,057 | |
Roper Industries, Inc. | | 5,584 | | 550,471 | |
Smith (A.O.) Corp. | | 4,998 | | 244,352 | |
Sun Hydraulics Corp. | | 8,827 | | 214,408 | |
Teledyne Technologies, Inc.* | | 4,799 | | 295,858 | |
Union Pacific Corp. | | 3,758 | | 448,367 | |
| | | | 13,146,847 | |
INFORMATION TECHNOLOGY (7.5%) | | | | | |
Adtran, Inc. | | 9,182 | | 277,205 | |
Altera Corp. | | 4,087 | | 138,304 | |
Apple, Inc.* | | 5,154 | | 3,009,931 | |
Automatic Data Processing, Inc. | | 6,413 | | 356,948 | |
Brightcove, Inc.* | | 6,761 | | 103,105 | |
Cavium, Inc.* | | 5,559 | | 155,652 | |
Cirrus Logic, Inc.* | | 18,670 | | 557,860 | |
Cisco Systems, Inc. | | 14,262 | | 244,879 | |
Coherent, Inc.* | | 1,387 | | 60,057 | |
CommVault Systems, Inc.* | | 12,702 | | 629,638 | |
comScore, Inc.* | | 10,828 | | 178,229 | |
EMC Corp.* | | 15,865 | | 406,620 | |
Emulex Corp.* | | 10,320 | | 74,304 | |
Finisar Corp.* | | 12,333 | | 184,502 | |
Google, Inc. Cl A* | | 1,426 | | 827,180 | |
Harris Corp. | | 2,288 | | 95,753 | |
iGATE Corp.* | | 11,241 | | 191,322 | |
Imperva, Inc.* | | 5,473 | | 157,732 | |
Informatica Corp.* | | 5,835 | | 247,171 | |
Int’l. Business Machines Corp. | | 6,324 | | 1,236,848 | |
Intel Corp. | | 19,277 | | 513,732 | |
KLA-Tencor Corp. | | 7,349 | | 361,938 | |
Littelfuse, Inc. | | 2,210 | | 125,727 | |
LogMeIn, Inc.* | | 18,741 | | 571,975 | |
Mercury Computer Systems, Inc.* | | 10,942 | | 141,480 | |
Microsemi Corp.* | | 19,210 | | 355,193 | |
Microsoft Corp. | | 32,624 | | 997,968 | |
MKS Instruments, Inc. | | 6,659 | | 192,645 | |
Nanometrics, Inc.* | | 15,349 | | 235,761 | |
NetApp, Inc.* | | 1,895 | | 60,299 | |
Oracle Corp. | | 24,380 | | 724,086 | |
Parametric Technology Corp.* | | 21,136 | | 443,011 | |
Plantronics, Inc. | | 4,393 | | 146,726 | |
Plexus Corp.* | | 9,462 | | 266,828 | |
QUALCOMM, Inc. | | 11,609 | | 646,389 | |
RealD, Inc.* | | 13,802 | | 206,478 | |
Responsys, Inc.* | | 20,858 | | 252,799 | |
Richardson Electronics Ltd. | | 36,554 | | 450,711 | |
Salesforce.com, inc.* | | 4,512 | | 623,829 | |
Sapient Corp. | | 9,719 | | 97,870 | |
Semtech Corp.* | | 7,126 | | 173,304 | |
Sourcefire, Inc.* | | 7,493 | | 385,140 | |
Stratasys, Inc.* | | 2,432 | | 120,506 | |
Super Micro Computer, Inc.* | | 8,422 | | 133,573 | |
Take-Two Interactive Software, Inc.* | | 7,321 | | 69,257 | |
Teradyne, Inc.* | | 6,477 | | 91,067 | |
Texas Instruments, Inc. | | 13,338 | | 382,667 | |
TIBCO Software, Inc.* | | 22,263 | | 666,109 | |
TTM Technologies, Inc.* | | 13,812 | | 129,971 | |
Volterra Semiconductor Corp.* | | 3,623 | | 84,959 | |
Wright Express Corp.* | | 2,459 | | 151,769 | |
Yahoo!, Inc.* | | 11,157 | | 176,615 | |
| | | | 19,113,622 | |
MATERIALS (2.5%) | | | | | |
Allied Nevada Gold Corp.* | | 5,735 | | 162,759 | |
Ball Corp. | | 8,507 | | 349,212 | |
Boise, Inc. | | 61,890 | | 407,236 | |
Buckeye Technologies, Inc. | | 6,395 | | 182,194 | |
CF Industries Hldgs., Inc. | | 1,561 | | 302,428 | |
Commercial Metals Co. | | 13,109 | | 165,698 | |
Copper Mountain Mining Corp.* | | 26,862 | | 92,808 | |
Crown Hldgs., Inc.* | | 13,106 | | 452,026 | |
CVR Partners LP | | 7,829 | | 189,618 | |
Dow Chemical Co. | | 11,438 | | 360,297 | |
Eastman Chemical Co. | | 12,320 | | 620,558 | |
FMC Corp. | | 4,888 | | 261,410 | |
Freeport-McMoRan Copper & Gold, Inc. | | 11,668 | | 397,529 | |
Innophos Hldgs., Inc. | | 14,590 | | 823,751 | |
Kaiser Aluminum Corp. | | 7,910 | | 410,054 | |
McEwen Mining, Inc.* | | 58,248 | | 175,327 | |
Silgan Hldgs., Inc. | | 19,758 | | 843,470 | |
TPC Group, Inc.* | | 4,845 | | 179,023 | |
| | | | 6,375,398 | |
TELECOMMUNICATION SERVICES (0.9%) | | | | | |
AboveNet, Inc.* | | 3,294 | | 276,696 | |
AT&T, Inc. | | 32,277 | | 1,150,998 | |
CenturyLink, Inc. | | 7,061 | | 278,839 | |
Consolidated Comms. Hldgs., Inc. | | 19,650 | | 290,820 | |
Sprint Nextel Corp.* | | 95,488 | | 311,291 | |
| | | | 2,308,644 | |
UTILITIES (1.4%) | | | | | |
Avista Corp. | | 13,157 | | 351,292 | |
Black Hills Corp. | | 6,288 | | 202,285 | |
Dominion Resources, Inc. | | 9,776 | | 527,904 | |
Edison International | | 5,654 | | 261,215 | |
Entergy Corp. | | 1,528 | | 103,736 | |
Idacorp, Inc. | | 6,994 | | 294,308 | |
Northwest Natural Gas Co. | | 9,578 | | 455,912 | |
PNM Resources, Inc. | | 14,581 | | 284,913 | |
PPL Corp. | | 6,269 | | 174,341 | |
Public Svc. Enterprise Group, Inc. | | 11,013 | | 357,923 | |
Sempra Energy | | 5,142 | | 354,181 | |
UNS Energy Corp. | | 8,369 | | 321,453 | |
| | | | 3,689,463 | |
TOTAL ACTIVE ASSETS - COMMON STOCKS | | | | | |
(Cost: $91,209,276) 42.2% | | | | 108,251,876 | |
| | | | | |
ACTIVE ASSETS: | | | | | |
CONVERTIBLE PREFERRED STOCKS: | | | | | |
ENERGY (0.1%) | | | | | |
Energy XXI (Bermuda) Ltd., 7.25% | | 556 | | 207,905 | |
TOTAL ACTIVE ASSETS - CONVERTIBLE PREFERRED STOCKS | | | | | |
(Cost: $55,600) 0.1% | | | | 207,905 | |
| | Rating** | | Rate(%) | | Maturity | | Face Amount | | Value | |
ACTIVE ASSETS: | | | | | | | | | | | |
SHORT-TERM DEBT SECURITIES: | | | | | | | | | | | |
COMMERCIAL PAPER (2.0%) | | | | | | | | | | | |
Nestle Capital Corp.† | | A-1+ | | 0.01 | | 07/02/12 | | 3,700,000 | | 3,699,997 | |
Novartis Finance Corp.† | | A-1+ | | 0.13 | | 07/09/12 | | 500,000 | | 499,984 | |
San Diego Gas & Electric Co.† | | A-1 | | 0.14 | | 07/02/12 | | 1,000,000 | | 999,992 | |
| | | | | | | | | | 5,199,973 | |
TOTAL ACTIVE ASSETS - SHORT-TERM DEBT SECURITIES | | | | | | | |
(Cost: $5,199,973) 2.0% | | | | | | | | | | 5,199,973 | |
| | | | | | | | | | | |
TOTAL ACTIVE ASSETS | | | | | | | | | | | |
(Cost: $96,464,849) 44.3% | | | | | | | | | | 113,659,754 | |
| | | | | | | | | | | |
TEMPORARY CASH INVESTMENTS (2) | | | | | | | | | | | |
(Cost: $592,600) 0.2% | | | | | | | | | | 592,600 | |
| | | | | | | | | | | |
TOTAL INVESTMENTS | | | | | | | | | | | |
(Cost: $222,889,089) 99.7% | | | | | | | | | | 255,505,540 | |
| | | | | | | | | | | |
OTHER NET ASSETS 0.3% | | | | | | | | | | 667,213 | |
| | | | | | | | | | | |
NET ASSETS 100.0% | | | | | | | | | | $ | 256,172,753 | |
| | | | | | | | | | | | |
The accompanying notes are an integral part of these portfolio schedules.
MUTUAL OF AMERICA INVESTMENT CORPORATION - SMALL CAP VALUE FUND
PORTFOLIO OF INVESTMENTS IN SECURITIES
June 30, 2012 (Unaudited)
| | Shares | | Value | |
COMMON STOCKS: | | | | | |
CONSUMER DISCRETIONARY (5.0%) | | | | | |
Bassett Furniture Industries, Inc. | | 250,937 | | 2,587,160 | |
bebe stores, inc. | | 167,590 | | 983,753 | |
Pep Boys - Manny, Moe & Jack | | 274,091 | | 2,713,501 | |
Rent-A-Center, Inc. | | 73,658 | | 2,485,221 | |
Shutterfly, Inc.* | | 63,722 | | 1,955,628 | |
Wolverine World Wide, Inc. | | 84,192 | | 3,264,966 | |
| | | | 13,990,229 | |
CONSUMER STAPLES (2.2%) | | | | | |
Prestige Brands Hldgs., Inc.* | | 170,630 | | 2,697,660 | |
The Pantry, Inc.* | | 172,820 | | 2,540,454 | |
Vector Group Ltd. | | 61,635 | | 1,049,028 | |
| | | | 6,287,142 | |
ENERGY (5.4%) | | | | | |
Endeavour International Corp.* | | 58,432 | | 490,829 | |
Energy XXI (Bermuda) Ltd. | | 144,958 | | 4,535,736 | |
Gasco Energy, Inc.* | | 2,236,626 | | 391,410 | |
McMoRan Exploration Co.* | | 681,706 | | 8,637,212 | |
Saratoga Resources, Inc.* | | 189,470 | | 1,114,084 | |
| | | | 15,169,271 | |
FINANCIALS (34.6%) | | | | | |
Ashford Hospitality Trust, Inc. | | 148,330 | | 1,250,422 | |
Aspen Insurance Hldgs. Ltd. | | 56,483 | | 1,632,359 | |
Associated Estates Realty Corp. | | 102,796 | | 1,536,800 | |
BancFirst Corp. | | 38,241 | | 1,602,680 | |
Bank of Marin Bancorp | | 25,013 | | 925,731 | |
Banner Corp. | | 42,279 | | 926,333 | |
Brookline Bancorp, Inc. | | 266,743 | | 2,360,676 | |
Bryn Mawr Bank Corp. | | 75,431 | | 1,589,331 | |
Cash America Int’l., Inc. | | 53,763 | | 2,367,723 | |
Chesapeake Lodging Trust | | 120,188 | | 2,069,637 | |
Colonial Properties Trust | | 140,135 | | 3,102,589 | |
Dime Community Bancshares | | 125,352 | | 1,665,928 | |
EastGroup Properties, Inc. | | 51,570 | | 2,748,681 | |
Ellington Financial LLC | | 201,248 | | 4,258,408 | |
Equity Lifestyle Properties, Inc. | | 55,306 | | 3,814,455 | |
FelCor Lodging Trust, Inc.* | | 462,527 | | 2,173,877 | |
First Interstate BancSytem, Inc. | | 115,823 | | 1,649,320 | |
First Niagara Financial Group, Inc. | | 51,526 | | 394,174 | |
Flushing Financial Corp. | | 34,959 | | 476,491 | |
Forest City Enterprises, Inc. Cl A* | | 193,991 | | 2,832,269 | |
Glacier Bancorp, Inc. | | 143,562 | | 2,223,775 | |
Highwoods Properties, Inc. | | 86,575 | | 2,913,249 | |
IBERIABANK Corp. | | 31,925 | | 1,610,616 | |
Investors Bancorp, Inc.* | | 131,530 | | 1,984,788 | |
Janus Capital Group, Inc. | | 221,130 | | 1,729,237 | |
Marlin Business Svcs. Corp. | | 129,133 | | 2,116,490 | |
MB Financial, Inc. | | 93,200 | | 2,007,528 | |
Meadowbrook Insurance Group, Inc. | | 270,752 | | 2,379,910 | |
Mid-America Apt. Communities, Inc. | | 16,381 | | 1,117,839 | |
National Retail Pptys., Inc. | | 76,962 | | 2,177,255 | |
NBH Hldgs. Co.† | | 98,458 | | 1,796,859 | |
Northwest Bancshares, Inc. | | 157,061 | | 1,839,184 | |
Pennsylvania REIT | | 111,798 | | 1,674,734 | |
PHH Corp.* | | 104,995 | | 1,835,313 | |
ProAssurance Corp. | | 49,226 | | 4,385,544 | |
Prosperity Bancshares, Inc. | | 49,252 | | 2,070,062 | |
S.Y. Bancorp, Inc. | | 88,905 | | 2,129,275 | |
SeaBright Hldgs., Inc. | | 421,334 | | 3,745,659 | |
Select Income REIT* | | 74,249 | | 1,764,156 | |
Signature Bank* | | 51,071 | | 3,113,799 | |
Steel Excel, Inc.* | | 27,916 | | 757,919 | |
SVB Financial Group* | | 47,850 | | 2,809,752 | |
Symetra Financial Corp. | | 257,477 | | 3,249,360 | |
Terreno Realty Corp. | | 65,800 | | 994,238 | |
UMB Financial Corp. | | 44,108 | | 2,259,653 | |
Urstadt Biddle Pptys., Inc. Cl A | | 67,873 | | 1,341,849 | |
Westamerica Bancorporation | | 35,464 | | 1,673,546 | |
| | | | 97,079,473 | |
HEALTH CARE (6.1%) | | | | | |
Alphatec Hldgs., Inc.* | | 110,804 | | 203,879 | |
Capital Senior Living Corp.* | | 136,096 | | 1,442,618 | |
Computer Programs & Systems, Inc. | | 39,041 | | 2,233,926 | |
Conceptus, Inc.* | | 198,804 | | 3,940,295 | |
Harvard Bioscience, Inc.* | | 253,950 | | 957,392 | |
Medicines Co.* | | 98,025 | | 2,248,694 | |
NPS Pharmaceuticals Inc* | | 219,790 | | 1,892,392 | |
PAREXEL International Corp.* | | 26,070 | | 735,956 | |
QLT, Inc.* | | 462,866 | | 3,527,039 | |
| | | | 17,182,191 | |
INDUSTRIALS (12.0%) | | | | | |
Actuant Corp. Cl A | | 116,737 | | 3,170,577 | |
Alaska Air Group, Inc.* | | 80,066 | | 2,874,369 | |
AZZ, Inc. | | 52,383 | | 3,208,983 | |
Encore Wire Corp. | | 139,323 | | 3,731,070 | |
Genesee & Wyoming, Inc. Cl A* | | 79,177 | | 4,183,713 | |
Insperity, Inc. | | 59,506 | | 1,609,637 | |
Kaydon Corp. | | 45,705 | | 977,630 | |
Miller Industries, Inc. | | 181,808 | | 2,896,201 | |
Mueller Industries, Inc. | | 127,675 | | 5,437,678 | |
Old Dominion Freight Line, Inc.* | | 125,117 | | 5,416,315 | |
| | | | 33,506,173 | |
INFORMATION TECHNOLOGY (9.4%) | | | | | |
Cirrus Logic, Inc.* | | 78,784 | | 2,354,066 | |
Coherent, Inc.* | | 13,532 | | 585,936 | |
CommVault Systems, Inc.* | | 43,379 | | 2,150,297 | |
Emulex Corp.* | | 98,467 | | 708,962 | |
LogMeIn, Inc.* | | 77,260 | | 2,357,975 | |
Microsemi Corp.* | | 82,321 | | 1,522,115 | |
MKS Instruments, Inc. | | 68,276 | | 1,975,225 | |
Parametric Technology Corp.* | | 93,819 | | 1,966,446 | |
Plexus Corp.* | | 40,227 | | 1,134,401 | |
Richardson Electronics Ltd. | | 354,018 | | 4,365,042 | |
Semtech Corp.* | | 73,070 | | 1,777,062 | |
TIBCO Software, Inc.* | | 136,327 | | 4,078,904 | |
TTM Technologies, Inc.* | | 141,677 | | 1,333,181 | |
| | | | 26,309,612 | |
MATERIALS (10.4%) | | | | | |
Boise, Inc. | | 616,526 | | 4,056,741 | |
Buckeye Technologies, Inc. | | 63,546 | | 1,810,426 | |
Commercial Metals Co. | | 133,622 | | 1,688,982 | |
Copper Mountain Mining Corp.* | | 198,900 | | 687,200 | |
Crown Hldgs., Inc.* | | 133,733 | | 4,612,451 | |
Innophos Hldgs., Inc. | | 86,374 | | 4,876,676 | |
Kaiser Aluminum Corp. | | 79,388 | | 4,115,474 | |
McEwen Mining, Inc.* | | 236,196 | | 710,950 | |
Silgan Hldgs., Inc. | | 156,858 | | 6,696,268 | |
| | | | 29,255,168 | |
TELECOMMUNICATION SERVICES (0.6%) | | | | | |
Consolidated Comms. Hldgs., Inc. | | 107,770 | | 1,594,996 | |
| | | | | |
UTILITIES (6.0%) | | | | | |
Avista Corp. | | 133,367 | | 3,560,899 | |
Black Hills Corp. | | 61,209 | | 1,969,094 | |
Idacorp, Inc. | | 70,860 | | 2,981,789 | |
Northwest Natural Gas Co. | | 47,677 | | 2,269,425 | |
PNM Resources, Inc. | | 146,738 | | 2,867,261 | |
UNS Energy Corp. | | 85,423 | | 3,281,097 | |
| | | | 16,929,565 | |
TOTAL COMMON STOCKS | | | | | |
(Cost: $209,500,617) 91.7% | | | | 257,303,820 | |
| | | | | |
| | Shares | | Value | |
CONVERTIBLE PREFERRED STOCKS: | | | | | |
ENERGY (0.6%) | | | | | |
Energy XXI (Bermuda) Ltd., 7.25% | | 4,255 | | 1,591,072 | |
TOTAL CONVERTIBLE PREFERRED STOCKS | | | | | |
(Cost: $425,500) 0.6% | | | | 1,591,072 | |
| | Rating** | | Rate(%) | | Maturity | | Face Amount | | Value | |
SHORT-TERM DEBT SECURITIES: | | | | | | | | | | | |
U.S. GOVERNMENT (1.8%) | | | | | | | | | | | |
U.S. Treasury Bill | | A-1+ | | 0.03 | | 08/23/12 | | 5,000,000 | | 4,999,764 | |
COMMERCIAL PAPER (6.1%) | | | | | | | | | | | |
ConocoPhillips† | | A-1 | | 0.12 | | 07/13/12 | | 2,000,000 | | 1,999,913 | |
Nestle Capital Corp.† | | A-1+ | | 0.01 | | 07/02/12 | | 3,500,000 | | 3,499,998 | |
Praxair, Inc. | | A-1 | | 0.11 | | 07/16/12 | | 1,496,000 | | 1,495,927 | |
San Diego Gas & Electric Co.† | | A-1 | | 0.15 | | 07/05/12 | | 5,000,000 | | 4,999,896 | |
Toyota Motor Credit Corp. | | A-1+ | | 0.10 | | 07/30/12 | | 5,000,000 | | 4,999,583 | |
| | | | | | | | | | 16,995,317 | |
TOTAL SHORT-TERM DEBT SECURITIES | | | | | | | | | | | |
(Cost: $21,995,081) 7.9% | | | | | | | | | | 21,995,081 | |
| | | | | | | | | | | |
TOTAL INVESTMENTS | | | | | | | | | | | |
(Cost: $231,921,198) 100.2% | | | | | | | | | | 280,889,973 | |
| | | | | | | | | | | |
OTHER NET ASSETS -0.2% | | | | | | | | | | (646,903 | ) |
| | | | | | | | | | | |
NET ASSETS 100.0% | | | | | | | | | | $ | 280,243,070 | |
| | | | | | | | | | | | |
The accompanying notes are an integral part of these portfolio schedules.
MUTUAL OF AMERICA INVESTMENT CORPORATION - SMALL CAP GROWTH FUND
PORTFOLIO OF INVESTMENTS IN SECURITIES
June 30, 2012 (Unaudited)
| | Shares | | Value | |
COMMON STOCKS: | | | | | |
CONSUMER DISCRETIONARY (13.2%) | | | | | |
AFC Enterprises, Inc.* | | 184,542 | | 4,270,302 | |
American Axle & Mfg. Hldgs., Inc.* | | 274,487 | | 2,879,369 | |
ANN, Inc.* | | 76,648 | | 1,953,758 | |
Bally Technologies, Inc.* | | 38,913 | | 1,815,681 | |
Brunswick Corp. | | 88,347 | | 1,963,070 | |
Denny’s Corp.* | | 668,422 | | 2,967,794 | |
Express, Inc.* | | 131,871 | | 2,396,096 | |
HSN, Inc. | | 73,421 | | 2,962,537 | |
Maidenform Brands, Inc.* | | 146,525 | | 2,918,778 | |
Monro Muffler Brake, Inc. | | 29,927 | | 994,773 | |
P.F. Chang’s China Bistro, Inc. | | 36,014 | | 1,853,641 | |
Pep Boys - Manny, Moe & Jack | | 192,862 | | 1,909,334 | |
Quiksilver, Inc.* | | 380,200 | | 885,866 | |
Red Robin Gourmet Burgers, Inc.* | | 50,512 | | 1,541,121 | |
Shutterfly, Inc.* | | 76,098 | | 2,335,448 | |
Steiner Leisure Ltd.* | | 29,976 | | 1,391,186 | |
Steve Madden Ltd.* | | 51,157 | | 1,624,235 | |
WMS Industries, Inc.* | | 63,665 | | 1,270,117 | |
| | | | 37,933,106 | |
CONSUMER STAPLES (3.2%) | | | | | |
Darling International, Inc.* | | 107,150 | | 1,766,904 | |
Hain Celestial Group, Inc.* | | 42,670 | | 2,348,557 | |
Nu Skin Enterprises, Inc. Cl A | | 35,832 | | 1,680,521 | |
TreeHouse Foods, Inc.* | | 24,602 | | 1,532,459 | |
Vector Group Ltd. | | 106,658 | | 1,815,319 | |
| | | | 9,143,760 | |
ENERGY (7.6%) | | | | | |
Abraxas Petroleum Corp.* | | 370,518 | | 1,181,952 | |
Berry Petroleum Co. Cl A | | 51,150 | | 2,028,609 | |
Endeavour International Corp.* | | 199,374 | | 1,674,742 | |
Energy XXI (Bermuda) Ltd. | | 154,821 | | 4,844,349 | |
Lufkin Industries, Inc. | | 23,536 | | 1,278,476 | |
MarkWest Energy Partners LP | | 47,336 | | 2,334,138 | |
McMoRan Exploration Co.* | | 544,832 | | 6,903,626 | |
Saratoga Resources, Inc.* | | 275,724 | | 1,621,257 | |
| | | | 21,867,149 | |
FINANCIALS (7.5%) | | | | | |
Associated Estates Realty Corp. | | 95,752 | | 1,431,492 | |
Chesapeake Lodging Trust | | 76,629 | | 1,319,551 | |
Colonial Properties Trust | | 110,218 | | 2,440,227 | |
iShares Russell 2000 Growth Index Fund | | 39,550 | | 3,617,639 | |
Northwest Bancshares, Inc. | | 158,094 | | 1,851,281 | |
ProAssurance Corp. | | 19,225 | | 1,712,755 | |
PS Business Parks, Inc. | | 24,265 | | 1,643,226 | |
S.Y. Bancorp, Inc. | | 51,663 | | 1,237,329 | |
Signature Bank* | | 46,401 | | 2,829,069 | |
Starwood Property Trust, Inc. | | 79,002 | | 1,683,533 | |
Stifel Financial Corp.* | | 62,880 | | 1,942,992 | |
| | | | 21,709,094 | |
HEALTH CARE (21.7%) | | | | | |
Abiomed, Inc.* | | 63,022 | | 1,438,162 | |
Acorda Therapeutics, Inc.* | | 18,775 | | 442,339 | |
Alnylam Pharmaceuticals, Inc.* | | 94,702 | | 1,105,172 | |
BioScrip, Inc.* | | 197,196 | | 1,465,166 | |
BioSpecifics Technologies Corp.* | | 35,376 | | 664,361 | |
Bruker Corp.* | | 88,718 | | 1,180,837 | |
Cantel Medical Corp. | | 53,902 | | 1,468,830 | |
Cepheid, Inc.* | | 25,704 | | 1,150,254 | |
Conceptus, Inc.* | | 51,390 | | 1,018,550 | |
Cubist Pharmaceuticals, Inc.* | | 67,684 | | 2,565,900 | |
Cyberonics, Inc.* | | 78,294 | | 3,518,532 | |
DexCom, Inc.* | | 160,120 | | 2,075,155 | |
Emergent Biosolutions, Inc.* | | 80,593 | | 1,220,984 | |
Halozyme Therapeutics, Inc.* | | 50,157 | | 444,391 | |
HeartWare International, Inc.* | | 15,847 | | 1,407,214 | |
HMS Hldgs. Corp.* | | 94,895 | | 3,160,952 | |
Impax Laboratories, Inc.* | | 88,889 | | 1,801,780 | |
Insulet Corp.* | | 72,579 | | 1,551,013 | |
IPC The Hospitalist Co.* | | 34,229 | | 1,551,258 | |
Ironwood Pharmaceuticals, Inc.* | | 58,535 | | 806,612 | |
MAP Pharmaceuticals, Inc.* | | 39,400 | | 590,212 | |
Medicines Co.* | | 85,422 | | 1,959,581 | |
Neogen Corp.* | | 58,172 | | 2,687,546 | |
NxStage Medical, Inc.* | | 138,507 | | 2,321,377 | |
Omeros Corp.* | | 53,200 | | 532,000 | |
OraSure Technologies, Inc.* | | 48,830 | | 548,849 | |
PAREXEL International Corp.* | | 81,053 | | 2,288,126 | |
Pharmacyclics, Inc.* | | 28,101 | | 1,534,596 | |
Progenics Pharmaceuticals, Inc* | | 73,356 | | 717,422 | |
QLT, Inc.* | | 190,576 | | 1,452,189 | |
Questcor Pharmaceuticals, Inc.* | | 62,292 | | 3,316,426 | |
Sagent Pharmaceuticals, Inc.* | | 61,638 | | 1,114,415 | |
Salix Pharmaceuticals Ltd.* | | 96,343 | | 5,244,913 | |
Seattle Genetics, Inc.* | | 73,939 | | 1,877,311 | |
SXC Health Solutions Corp.* | | 38,138 | | 3,783,671 | |
Vascular Solutions, Inc.* | | 92,065 | | 1,156,336 | |
WellCare Health Plans, Inc.* | | 21,958 | | 1,163,774 | |
| | | | 62,326,206 | |
INDUSTRIALS (14.2%) | | | | | |
Acacia Research Corp.* | | 44,974 | | 1,674,832 | |
Acco Brands Corp.* | | 202,361 | | 2,092,413 | |
Astronics Corp.* | | 109,138 | | 3,082,057 | |
AZZ, Inc. | | 53,050 | | 3,249,843 | |
EnPro Industries, Inc.* | | 52,563 | | 1,964,279 | |
Genesee & Wyoming, Inc. Cl A* | | 50,113 | | 2,647,971 | |
Healthcare Svcs. Group, Inc. | | 120,061 | | 2,326,782 | |
Hub Group, Inc. Cl A* | | 37,671 | | 1,363,690 | |
Old Dominion Freight Line, Inc.* | | 74,997 | | 3,246,620 | |
On Assignment, Inc.* | | 124,511 | | 1,987,196 | |
Raven Industries, Inc. | | 73,550 | | 5,118,345 | |
RBC Bearings, Inc.* | | 33,074 | | 1,564,400 | |
Rexnord Corp.* | | 19,737 | | 395,529 | |
Robbins & Myers, Inc. | | 54,577 | | 2,282,410 | |
Smith (A.O.) Corp. | | 51,765 | | 2,530,791 | |
Sun Hydraulics Corp. | | 91,537 | | 2,223,434 | |
Teledyne Technologies, Inc.* | | 51,801 | | 3,193,532 | |
| | | | 40,944,124 | |
INFORMATION TECHNOLOGY (20.5%) | | | | | |
Adtran, Inc. | | 92,789 | | 2,801,300 | |
Brightcove, Inc.* | | 70,209 | | 1,070,687 | |
Cavium, Inc.* | | 57,287 | | 1,604,036 | |
Cirrus Logic, Inc.* | | 114,525 | | 3,422,007 | |
CommVault Systems, Inc.* | | 86,674 | | 4,296,430 | |
comScore, Inc.* | | 112,207 | | 1,846,927 | |
Finisar Corp.* | | 128,413 | | 1,921,058 | |
iGATE Corp.* | | 116,818 | | 1,988,242 | |
Imperva, Inc.* | | 56,649 | | 1,632,624 | |
Informatica Corp.* | | 60,505 | | 2,562,992 | |
Littelfuse, Inc. | | 24,235 | | 1,378,729 | |
LogMeIn, Inc.* | | 112,498 | | 3,433,439 | |
Mercury Computer Systems, Inc.* | | 113,674 | | 1,469,805 | |
Microsemi Corp.* | | 115,911 | | 2,143,194 | |
Nanometrics, Inc.* | | 159,743 | | 2,453,652 | |
Parametric Technology Corp.* | | 124,550 | | 2,610,568 | |
Plantronics, Inc. | | 45,910 | | 1,533,394 | |
Plexus Corp.* | | 58,394 | | 1,646,711 | |
RealD, Inc.* | | 141,049 | | 2,110,093 | |
Responsys, Inc.* | | 219,866 | | 2,664,776 | |
Sapient Corp. | | 104,268 | | 1,049,979 | |
Sourcefire, Inc.* | | 78,557 | | 4,037,830 | |
Stratasys, Inc.* | | 25,190 | | 1,248,165 | |
Super Micro Computer, Inc.* | | 88,495 | | 1,403,531 | |
Take-Two Interactive Software, Inc.* | | 76,268 | | 721,495 | |
Teradyne, Inc.* | | 66,908 | | 940,726 | |
TIBCO Software, Inc.* | | 88,939 | | 2,661,055 | |
Volterra Semiconductor Corp.* | | 38,117 | | 893,844 | |
Wright Express Corp.* | | 25,505 | | 1,574,169 | |
| | | | 59,121,458 | |
MATERIALS (4.2%) | | | | | |
Allied Nevada Gold Corp.* | | 60,196 | | 1,708,362 | |
CVR Partners LP | | 82,184 | | 1,990,496 | |
Innophos Hldgs., Inc. | | 62,775 | | 3,544,277 | |
McEwen Mining, Inc.* | | 366,215 | | 1,102,307 | |
Silgan Hldgs., Inc. | | 46,626 | | 1,990,464 | |
TPC Group, Inc.* | | 50,983 | | 1,883,822 | |
| | | | 12,219,728 | |
TELECOMMUNICATION SERVICES (1.5%) | | | | | |
AboveNet, Inc.* | | 34,179 | | 2,871,036 | |
Consolidated Comms. Hldgs., Inc. | | 92,782 | | 1,373,174 | |
| | | | 4,244,210 | |
UTILITIES (0.8%) | | | | | |
Northwest Natural Gas Co. | | 49,320 | | 2,347,632 | |
| | | | | |
TOTAL COMMON STOCKS | | | | | |
(Cost: $226,841,494) 94.4% | | | | 271,856,467 | |
| | Rating** | | Rate(%) | | Maturity | | Face Amount | | Value | |
SHORT-TERM DEBT SECURITIES: | | | | | | | | | | | |
COMMERCIAL PAPER (5.9%) | | | | | | | | | | | |
ConocoPhillips† | | A-1 | | 0.12 | | 07/13/12 | | 4,000,000 | | 3,999,826 | |
Nestle Capital Corp.† | | A-1+ | | 0.01 | | 07/02/12 | | 3,500,000 | | 3,499,998 | |
Nestle Capital Corp.† | | A-1+ | | 0.10 | | 07/09/12 | | 1,900,000 | | 1,899,953 | |
New Jersey Natural Gas | | A-1 | | 0.11 | | 07/05/12 | | 3,500,000 | | 3,499,947 | |
Toyota Motor Credit Corp. | | A-1+ | | 0.10 | | 07/30/12 | | 4,000,000 | | 3,999,667 | |
| | | | | | | | | | 16,899,391 | |
TOTAL SHORT-TERM DEBT SECURITIES | | | | | | | | | | | |
(Cost: $16,899,391) 5.9% | | | | | | | | | | 16,899,391 | |
| | | | | | | | | | | |
TOTAL INVESTMENTS | | | | | | | | | | | |
(Cost: $243,740,885) 100.3% | | | | | | | | | | 288,755,858 | |
| | | | | | | | | | | |
OTHER NET ASSETS -0.3% | | | | | | | | | | (808,570 | ) |
| | | | | | | | | | | |
NET ASSETS 100.0% | | | | | | | | | | $ | 287,947,288 | |
| | | | | | | | | | | | |
The accompanying notes are an integral part of these portfolio schedules.
MUTUAL OF AMERICA INVESTMENT CORPORATION - MID CAP VALUE FUND
PORTFOLIO OF INVESTMENTS IN SECURITIES
June 30, 2012 (Unaudited)
| | Shares | | Value | |
COMMON STOCKS: | | | | | |
CONSUMER DISCRETIONARY (7.5%) | | | | | |
CBS Corp. Cl B | | 19,076 | | 625,311 | |
Discovery Communications, Inc. Cl A* | | 5,799 | | 313,146 | |
Lamar Advertising Co. Cl A* | | 9,387 | | 268,468 | |
Newell Rubbermaid, Inc. | | 25,777 | | 467,595 | |
Penney (J.C.) Co., Inc. | | 11,158 | | 260,093 | |
Rent-A-Center, Inc. | | 10,250 | | 345,835 | |
Shutterfly, Inc.* | | 10,066 | | 308,926 | |
V.F. Corp. | | 6,253 | | 834,463 | |
Whirlpool Corp. | | 5,840 | | 357,174 | |
| | | | 3,781,011 | |
CONSUMER STAPLES (5.5%) | | | | | |
ConAgra Foods, Inc. | | 31,403 | | 814,280 | |
Dr. Pepper Snapple Group, Inc. | | 17,601 | | 770,044 | |
J.M. Smucker Co. | | 6,775 | | 511,648 | |
Ralcorp Hldgs., Inc.* | | 6,101 | | 407,181 | |
Vector Group Ltd. | | 16,400 | | 279,128 | |
| | | | 2,782,281 | |
ENERGY (8.2%) | | | | | |
Atwood Oceanics, Inc.* | | 6,236 | | 235,970 | |
Energy XXI (Bermuda) Ltd. | | 23,437 | | 733,344 | |
McMoRan Exploration Co.* | | 102,193 | | 1,294,785 | |
Noble Energy, Inc. | | 8,397 | | 712,234 | |
Range Resources Corp. | | 10,221 | | 632,373 | |
Spectra Energy Corp. | | 17,501 | | 508,579 | |
| | | | 4,117,285 | |
FINANCIALS (27.3%) | | | | | |
American Financial Group, Inc. | | 22,519 | | 883,420 | |
Ameriprise Financial, Inc. | | 15,536 | | 811,911 | |
Annaly Capital Mgmt., Inc. | | 17,226 | | 289,052 | |
Aon PLC* | | 13,110 | | 613,286 | |
Associated Banc-Corp. | | 35,032 | | 462,072 | |
Assurant, Inc. | | 3,541 | | 123,368 | |
BOK Financial Corp. | | 11,843 | | 689,263 | |
Boston Properties, Inc. | | 5,830 | | 631,797 | |
City National Corp. | | 4,506 | | 218,901 | |
Comerica, Inc. | | 8,210 | | 252,129 | |
DDR Corp. | | 12,272 | | 179,662 | |
Discover Financial Svcs. | | 12,829 | | 443,627 | |
Equity Residential | | 16,958 | | 1,057,501 | |
Everest Re Group Ltd. | | 5,685 | | 588,341 | |
Fifth Third Bancorp | | 18,140 | | 243,076 | |
Fulton Financial Corp. | | 39,809 | | 397,692 | |
Genworth Financial, Inc. Cl A* | | 17,211 | | 97,414 | |
HCC Insurance Hldgs., Inc. | | 5,072 | | 159,261 | |
Host Hotels & Resorts, Inc. | | 34,412 | | 544,398 | |
Janus Capital Group, Inc. | | 31,612 | | 247,206 | |
Lincoln National Corp. | | 11,260 | | 246,256 | |
M&T Bank Corp. | | 2,741 | | 226,324 | |
Marsh & McLennan Cos., Inc. | | 12,380 | | 399,007 | |
National Retail Pptys., Inc. | | 16,449 | | 465,342 | |
People’s United Financial, Inc. | | 40,439 | | 469,497 | |
Principal Financial Grp., Inc. | | 6,714 | | 176,108 | |
Progressive Corp. | | 17,917 | | 373,211 | |
Public Storage | | 5,103 | | 736,924 | |
Reinsurance Grp. of America, Inc. | | 8,642 | | 459,841 | |
StanCorp Financial Group, Inc. | | 12,885 | | 478,807 | |
Vornado Realty Trust | | 9,825 | | 825,103 | |
| | | | 13,789,797 | |
HEALTH CARE (7.6%) | | | | | |
AmerisourceBergen Corp. | | 17,615 | | 693,150 | |
CIGNA Corp. | | 11,462 | | 504,328 | |
Forest Laboratories, Inc.* | | 14,473 | | 506,410 | |
Hospira, Inc.* | | 9,310 | | 325,664 | |
Humana, Inc. | | 8,584 | | 664,745 | |
MEDNAX, Inc.* | | 6,323 | | 433,378 | |
Mettler-Toledo Int’l., Inc.* | | 3,196 | | 498,097 | |
Mylan, Inc.* | | 8,891 | | 190,001 | |
| | | | 3,815,773 | |
INDUSTRIALS (9.1%) | | | | | |
Flowserve Corp. | | 2,910 | | 333,923 | |
General Cable Corp.* | | 11,751 | | 304,821 | |
Joy Global, Inc. | | 6,270 | | 355,697 | |
Kirby Corp.* | | 15,712 | | 739,721 | |
L-3 Communications Hldgs., Inc. | | 3,344 | | 247,489 | |
Lincoln Electric Hldgs., Inc. | | 11,981 | | 524,648 | |
Old Dominion Freight Line, Inc.* | | 14,320 | | 619,913 | |
Oshkosh Corp.* | | 15,389 | | 322,400 | |
Precision Castparts Corp. | | 5,121 | | 842,353 | |
Timken Co. | | 6,830 | | 312,746 | |
| | | | 4,603,711 | |
INFORMATION TECHNOLOGY (7.8%) | | | | | |
Altera Corp. | | 6,227 | | 210,722 | |
Coherent, Inc.* | | 9,787 | | 423,777 | |
Harris Corp. | | 6,810 | | 284,999 | |
Informatica Corp.* | | 11,317 | | 479,388 | |
KLA-Tencor Corp. | | 5,004 | | 246,447 | |
Microsemi Corp.* | | 12,684 | | 234,527 | |
NCR Corp.* | | 23,781 | | 540,542 | |
Tech Data Corp.* | | 7,762 | | 373,896 | |
Teradata Corp.* | | 7,675 | | 552,677 | |
TIBCO Software, Inc.* | | 18,996 | | 568,360 | |
| | | | 3,915,335 | |
MATERIALS (6.3%) | | | | | |
Agnico-Eagle Mines Ltd. | | 7,332 | | 296,653 | |
Crown Hldgs., Inc.* | | 42,242 | | 1,456,926 | |
Cytec Industries, Inc. | | 10,131 | | 594,082 | |
Eastman Chemical Co. | | 10,522 | | 529,993 | |
Walter Energy, Inc. | | 6,996 | | 308,943 | |
| | | | 3,186,597 | |
TELECOMMUNICATION SERVICES (0.7%) | | | | | |
Windstream Corp. | | 35,415 | | 342,109 | |
| | | | | |
UTILITIES (12.7%) | | | | | |
Ameren Corp. | | 21,916 | | 735,063 | |
Atmos Energy Corp. | | 18,147 | | 636,415 | |
Edison International | | 18,465 | | 853,083 | |
Entergy Corp. | | 6,273 | | 425,874 | |
FirstEnergy Corp. | | 19,552 | | 961,763 | |
GenOn Energy, Inc.* | | 129,827 | | 222,004 | |
Great Plains Energy, Inc. | | 27,493 | | 588,625 | |
Integrys Energy Group, Inc. | | 10,700 | | 608,509 | |
ITC Hldgs. Corp. | | 9,659 | | 665,602 | |
NV Energy, Inc. | | 40,396 | | 710,162 | |
| | | | 6,407,100 | |
TOTAL COMMON STOCKS
(Cost: $42,655,872) 92.7% | | | | 46,740,999 | |
| | Rating** | | Rate(%) | | Maturity | | Face Amount | | Value | |
SHORT-TERM DEBT SECURITIES: | | | | | | | | | | | |
COMMERCIAL PAPER (7.0%) | | | | | | | | | | | |
Nestle Capital Corp.† | | A-1+ | | 0.01 | | 07/02/12 | | 1,800,000 | | 1,799,999 | |
New Jersey Natural Gas | | A-1 | | 0.12 | | 07/11/12 | | 700,000 | | 699,974 | |
Toyota Motor Credit Corp. | | A-1+ | | 0.12 | | 07/06/12 | | 1,000,000 | | 999,980 | |
| | | | | | | | | | 3,499,953 | |
TOTAL SHORT-TERM DEBT SECURITIES
(Cost: $3,499,953) 7.0% | | | | | | | | | | 3,499,953 | |
| | | | | | | | | | | |
TOTAL INVESTMENTS
(Cost: $46,155,825) 99.7% | | | | | | | | | | 50,240,952 | |
| | | | | | | | | | | |
OTHER NET ASSETS 0.3% | | | | | | | | | | 147,586 | |
| | | | | | | | | | | |
NET ASSETS 100.0% | | | | | | | | | | $ | 50,388,538 | |
| | | | | | | | | | | | |
The accompanying notes are an integral part of these portfolio schedules.
MUTUAL OF AMERICA INVESTMENT CORPORATION - MID-CAP EQUITY INDEX FUND
PORTFOLIO OF INVESTMENTS IN SECURITIES
June 30, 2012 (Unaudited)
| | Shares | | Value | |
INDEXED ASSETS: | | | | | |
COMMON STOCKS: | | | | | |
CONSUMER DISCRETIONARY (13.0%) | | | | | |
Aaron’s, Inc. | | 36,424 | | 1,031,163 | |
Advance Auto Parts, Inc. | | 36,777 | | 2,508,927 | |
Aeropostale, Inc.* | | 41,097 | | 732,760 | |
AMC Networks, Inc. Cl A* | | 27,277 | | 969,697 | |
American Eagle Outfitters, Inc. | | 95,468 | | 1,883,584 | |
ANN, Inc.* | | 24,676 | | 628,991 | |
Ascena Retail Group, Inc.* | | 63,682 | | 1,185,759 | |
Bally Technologies, Inc.* | | 20,323 | | 948,271 | |
Barnes & Noble, Inc.* | | 19,705 | | 324,344 | |
Bob Evans Farms, Inc. | | 13,706 | | 550,981 | |
Brinker International, Inc. | | 34,524 | | 1,100,280 | |
Carter’s, Inc.* | | 24,683 | | 1,298,326 | |
Cheesecake Factory, Inc.* | | 25,566 | | 817,089 | |
Chico’s FAS, Inc. | | 84,047 | | 1,247,257 | |
Cinemark Hldgs., Inc. | | 50,844 | | 1,161,785 | |
Collective Brands, Inc.* | | 29,164 | | 624,693 | |
Deckers Outdoor Corp.* | | 20,697 | | 910,875 | |
Dick’s Sporting Goods, Inc. | | 47,279 | | 2,269,392 | |
DreamWorks Animation SKG Cl A* | | 34,348 | | 654,673 | |
Foot Locker, Inc. | | 75,284 | | 2,302,185 | |
Gentex Corp. | | 73,547 | | 1,534,926 | |
Guess?, Inc. | | 30,091 | | 913,864 | |
Hanesbrands, Inc.* | | 46,358 | | 1,285,507 | |
HSN, Inc. | | 18,026 | | 727,349 | |
International Speedway Corp. Cl A | | 13,124 | | 343,586 | |
ITT Educational Svcs., Inc.* | | 8,711 | | 529,193 | |
KB Home | | 33,701 | | 330,270 | |
Lamar Advertising Co. Cl A* | | 27,516 | | 786,958 | |
Life Time Fitness, Inc.* | | 19,788 | | 920,340 | |
LKQ Corp.* | | 72,284 | | 2,414,286 | |
Matthews International Corp. Cl A | | 13,571 | | 440,922 | |
MDC Hldgs., Inc. | | 17,828 | | 582,441 | |
Meredith Corp. | | 18,094 | | 577,922 | |
Mohawk Industries, Inc.* | | 27,916 | | 1,949,374 | |
New York Times Co. Cl A* | | 59,633 | | 465,137 | |
NVR, Inc.* | | 2,441 | | 2,074,850 | |
Office Depot, Inc.* | | 136,842 | | 295,579 | |
Panera Bread Co. Cl A* | | 14,205 | | 1,980,745 | |
PetSmart, Inc. | | 51,506 | | 3,511,679 | |
Polaris Industries, Inc. | | 35,796 | | 2,558,698 | |
PVH Corp. | | 34,354 | | 2,672,398 | |
RadioShack Corp. | | 49,170 | | 188,813 | |
Regis Corp. | | 28,833 | | 517,841 | |
Rent-A-Center, Inc. | | 27,748 | | 936,218 | |
Saks, Inc.* | | 74,997 | | 798,718 | |
Scholastic Corp. | | 11,807 | | 332,485 | |
Scientific Games Corp. Cl A* | | 28,056 | | 239,879 | |
Service Corp. International | | 102,528 | | 1,268,271 | |
Signet Jewelers Ltd. | | 40,811 | | 1,796,092 | |
Sotheby’s | | 32,667 | | 1,089,771 | |
Strayer Education, Inc. | | 5,737 | | 625,448 | |
Tempur-Pedic Int’l., Inc.* | | 32,929 | | 770,209 | |
The Warnaco Group, Inc.* | | 20,594 | | 876,893 | |
The Wendy’s Co. | | 143,806 | | 678,764 | |
Thor Industries, Inc. | | 21,014 | | 575,994 | |
Toll Brothers, Inc.* | | 71,122 | | 2,114,457 | |
Tractor Supply Co. | | 34,427 | | 2,859,507 | |
Tupperware Brands Corp. | | 26,583 | | 1,455,685 | |
Under Armour, Inc. Cl A* | | 17,516 | | 1,654,912 | |
Valassis Communications, Inc.* | | 21,581 | | 469,387 | |
Wiley (John) & Sons, Inc. Cl A | | 22,499 | | 1,102,226 | |
Williams-Sonoma, Inc. | | 49,293 | | 1,723,776 | |
WMS Industries, Inc.* | | 27,560 | | 549,822 | |
| | | | 72,672,224 | |
CONSUMER STAPLES (3.4%) | | | | | |
Church & Dwight Co., Inc. | | 66,521 | | 3,689,920 | |
Energizer Hldgs., Inc.* | | 30,396 | | 2,287,299 | |
Flowers Foods, Inc. | | 54,158 | | 1,258,090 | |
Green Mountain Coffee Roasters, Inc.* | | 73,325 | | 1,597,019 | |
Harris Teeter Supermarkets, Inc. | | 23,589 | | 966,913 | |
Hillshire Brands Co.* | | 58,694 | | 1,701,539 | |
Ingredion, Inc. | | 36,747 | | 1,819,711 | |
Lancaster Colony Corp. | | 9,405 | | 669,730 | |
Post Hldgs., Inc.* | | 12,700 | | 390,525 | |
Ralcorp Hldgs., Inc.* | | 26,420 | | 1,763,271 | |
Smithfield Foods, Inc.* | | 78,523 | | 1,698,452 | |
SUPERVALU, Inc. | | 95,319 | | 493,752 | |
Tootsie Roll Industries, Inc. | | 12,059 | | 287,728 | |
Universal Corp. | | 10,921 | | 505,970 | |
| | | | 19,129,919 | |
ENERGY (5.1%) | | | | | |
Arch Coal, Inc. | | 104,275 | | 718,455 | |
Atwood Oceanics, Inc.* | | 27,697 | | 1,048,054 | |
Bill Barrett Corp.* | | 24,582 | | 526,546 | |
CARBO Ceramics, Inc. | | 9,083 | | 696,939 | |
Cimarex Energy Co. | | 41,325 | | 2,277,834 | |
Dresser-Rand Group, Inc.* | | 36,528 | | 1,626,957 | |
Dril-Quip, Inc.* | | 16,162 | | 1,060,066 | |
Energen Corp. | | 34,087 | | 1,538,346 | |
Forest Oil Corp.* | | 61,857 | | 453,412 | |
Helix Energy Solutions Group* | | 51,399 | | 843,458 | |
HollyFrontier Corp. | | 95,880 | | 3,397,028 | |
Northern Oil and Gas, Inc.* | | 30,622 | | 488,115 | |
Oceaneering Int’l., Inc. | | 52,859 | | 2,529,832 | |
Oil States International, Inc.* | | 24,043 | | 1,591,647 | |
Patterson-UTI Energy, Inc. | | 79,920 | | 1,163,635 | |
Plains Exploration & Production Co.* | | 60,350 | | 2,123,113 | |
Quicksilver Resources, Inc.* | | 63,073 | | 341,856 | |
SM Energy Co. | | 32,807 | | 1,611,152 | |
Superior Energy Services, Inc.* | | 77,276 | | 1,563,293 | |
Tidewater, Inc. | | 25,089 | | 1,163,126 | |
Unit Corp.* | | 20,719 | | 764,324 | |
World Fuel Services Corp. | | 34,222 | | 1,301,463 | |
| | | | 28,828,651 | |
FINANCIALS (21.4%) | | | | | |
Affiliated Managers Group, Inc.* | | 24,602 | | 2,692,689 | |
Alexander & Baldwin, Inc. | | 21,578 | | 1,149,029 | |
Alexandria Real Estate Equities, Inc. | | 29,782 | | 2,165,747 | |
Alleghany Corp.* | | 6,860 | | 2,330,685 | |
American Campus Communities, Inc. | | 35,673 | | 1,604,572 | |
American Financial Group, Inc. | | 35,644 | | 1,398,314 | |
Apollo Investment Corp. | | 98,353 | | 755,351 | |
Aspen Insurance Hldgs. Ltd. | | 34,414 | | 994,565 | |
Associated Banc-Corp. | | 81,723 | | 1,077,926 | |
Astoria Financial Corp. | | 39,031 | | 382,504 | |
BancorpSouth, Inc. | | 38,085 | | 552,994 | |
Bank of Hawaii Corp. | | 21,935 | | 1,007,913 | |
Berkley (W.R.) Corp. | | 53,661 | | 2,088,486 | |
BioMed Realty Trust, Inc. | | 73,651 | | 1,375,801 | |
BRE Properties, Inc. | | 37,192 | | 1,860,344 | |
Brown & Brown, Inc. | | 53,985 | | 1,472,171 | |
Camden Property Trust | | 38,416 | | 2,599,611 | |
Cathay General Bancorp | | 36,409 | | 601,113 | |
CBOE Holdings, Inc. | | 40,388 | | 1,117,940 | |
City National Corp. | | 22,177 | | 1,077,359 | |
Commerce Bancshares, Inc. | | 37,169 | | 1,408,705 | |
Corporate Office Pptys. Trust | | 35,056 | | 824,167 | |
Cullen/Frost Bankers, Inc. | | 29,496 | | 1,695,725 | |
Duke Realty Corp. | | 124,808 | | 1,827,189 | |
East West Bancorp, Inc. | | 68,256 | | 1,601,286 | |
Eaton Vance Corp. | | 55,154 | | 1,486,400 | |
Equity One, Inc. | | 28,454 | | 603,225 | |
Essex Property Trust, Inc. | | 16,930 | | 2,605,866 | |
Everest Re Group Ltd. | | 24,950 | | 2,582,076 | |
Federal Realty Investment Trust | | 30,742 | | 3,199,935 | |
Fidelity Nat’l. Financial, Inc. Cl A | | 105,815 | | 2,037,997 | |
First American Financial Corp. | | 49,637 | | 841,844 | |
First Niagara Financial Group, Inc. | | 168,204 | | 1,286,761 | |
FirstMerit Corp. | | 53,204 | | 878,930 | |
Fulton Financial Corp. | | 96,907 | | 968,101 | |
Gallagher (Arthur J.) & Co. | | 56,573 | | 1,984,015 | |
Greenhill & Co., Inc. | | 13,564 | | 483,557 | |
Hancock Hldg. Co. | | 40,756 | | 1,240,613 | |
Hanover Insurance Group, Inc. | | 22,259 | | 870,995 | |
HCC Insurance Hldgs., Inc. | | 48,210 | | 1,513,794 | |
Highwoods Properties, Inc. | | 35,212 | | 1,184,884 | |
Home Properties, Inc. | | 23,241 | | 1,426,068 | |
Hospitality Properties Trust | | 59,525 | | 1,474,434 | |
International Bancshares Corp. | | 24,911 | | 486,263 | |
Janus Capital Group, Inc. | | 90,662 | | 708,977 | |
Jefferies Group, Inc. | | 74,714 | | 970,535 | |
Jones Lang LaSalle, Inc. | | 21,128 | | 1,486,777 | |
Kemper Corp. | | 23,322 | | 717,152 | |
Liberty Property Trust | | 56,199 | | 2,070,371 | |
Mack-Cali Realty Corp. | | 42,456 | | 1,234,196 | |
Mercury General Corp. | | 17,791 | | 741,351 | |
MSCI, Inc. Cl A* | | 60,013 | | 2,041,642 | |
National Retail Pptys., Inc. | | 50,367 | | 1,424,882 | |
New York Community Bancorp, Inc. | | 208,489 | | 2,612,367 | |
Old Republic Int’l. Corp. | | 121,493 | | 1,007,177 | |
OMEGA Healthcare Investors, Inc. | | 49,579 | | 1,115,528 | |
Potlatch Corp. | | 19,376 | | 618,869 | |
Prosperity Bancshares, Inc. | | 22,935 | | 963,958 | |
Protective Life Corp. | | 38,181 | | 1,122,903 | |
Raymond James Financial, Inc. | | 52,733 | | 1,805,578 | |
Rayonier, Inc. | | 57,979 | | 2,603,257 | |
Realty Income Corp. | | 63,153 | | 2,637,901 | |
Regency Centers Corp. | | 42,420 | | 2,017,919 | |
Reinsurance Grp. of America, Inc. | | 34,752 | | 1,849,154 | |
SEI Investments Co. | | 68,319 | | 1,358,865 | |
Senior Housing Pptys. Trust | | 75,525 | | 1,685,718 | |
Signature Bank* | | 22,336 | | 1,361,826 | |
SL Green Realty Corp | | 43,624 | | 3,500,390 | |
StanCorp Financial Group, Inc. | | 20,932 | | 777,833 | |
SVB Financial Group* | | 20,998 | | 1,233,003 | |
Synovus Financial Corp. | | 365,402 | | 723,496 | |
Taubman Centers, Inc. | | 28,410 | | 2,192,116 | |
TCF Financial Corp. | | 76,924 | | 883,088 | |
The Macerich Co. | | 64,603 | | 3,814,807 | |
Trustmark Corp. | | 30,970 | | 758,146 | |
UDR, Inc. | | 119,511 | | 3,088,164 | |
Valley National Bancorp | | 97,939 | | 1,038,153 | |
Waddell & Reed Financial, Inc. Cl A | | 40,467 | | 1,225,341 | |
Washington Federal, Inc. | | 51,107 | | 863,197 | |
Webster Financial Corp. | | 34,610 | | 749,653 | |
Weingarten Realty Investors | | 58,184 | | 1,532,567 | |
Westamerica Bancorporation | | 13,119 | | 619,086 | |
| | | | 119,973,887 | |
HEALTH CARE (10.5%) | | | | | |
Allscripts Healthcare Solutions, Inc.* | | 93,155 | | 1,018,184 | |
AMERIGROUP Corp.* | | 23,345 | | 1,538,669 | |
Bio-Rad Laboratories, Inc. Cl A* | | 9,212 | | 921,292 | |
Catalyst Health Solutions, Inc.* | | 24,012 | | 2,243,681 | |
Charles River Laboratories Int’l., Inc.* | | 23,613 | | 773,562 | |
Community Health Systems, Inc.* | | 40,532 | | 1,136,112 | |
Cooper Companies, Inc. | | 22,443 | | 1,790,054 | |
Covance, Inc.* | | 25,791 | | 1,234,099 | |
Endo Health Solutions, Inc.* | | 55,224 | | 1,710,840 | |
Gen-Probe, Inc.* | | 21,500 | | 1,767,300 | |
Health Management Associates, Inc. Cl A* | | 122,927 | | 964,977 | |
Health Net, Inc.* | | 39,783 | | 965,533 | |
Hill-Rom Hldgs., Inc. | | 28,975 | | 893,879 | |
HMS Hldgs. Corp.* | | 41,305 | | 1,375,870 | |
Hologic, Inc.* | | 124,399 | | 2,244,158 | |
IDEXX Laboratories, Inc.* | | 25,267 | | 2,428,917 | |
LifePoint Hospitals, Inc.* | | 22,426 | | 919,017 | |
Lincare Hldgs., Inc. | | 35,821 | | 1,218,630 | |
Masimo Corp.* | | 26,310 | | 588,818 | |
Medicis Pharmaceutical Corp. Cl A | | 29,139 | | 995,097 | |
MEDNAX, Inc.* | | 23,152 | | 1,586,838 | |
Mettler-Toledo Int’l., Inc.* | | 15,105 | | 2,354,114 | |
Omnicare, Inc. | | 58,316 | | 1,821,209 | |
Owens & Minor, Inc. | | 29,703 | | 909,803 | |
Regeneron Pharmaceuticals, Inc.* | | 42,209 | | 4,821,108 | |
ResMed, Inc.* | | 68,561 | | 2,139,103 | |
Schein (Henry), Inc.* | | 41,403 | | 3,249,721 | |
STERIS Corp. | | 27,371 | | 858,628 | |
Techne Corp. | | 17,231 | | 1,278,540 | |
Teleflex, Inc. | | 19,560 | | 1,191,400 | |
Thoratec Corp.* | | 28,303 | | 950,415 | |
United Therapeutics Corp.* | | 23,495 | | 1,160,183 | |
Universal Health Svcs., Inc. Cl B | | 45,949 | | 1,983,159 | |
VCA Antech, Inc.* | | 42,703 | | 938,612 | |
Vertex Pharmaceuticals, Inc.* | | 101,214 | | 5,659,882 | |
WellCare Health Plans, Inc.* | | 22,537 | | 1,194,461 | |
| | | | 58,825,865 | |
INDUSTRIALS (15.4%) | | | | | |
Acuity Brands, Inc. | | 20,343 | | 1,035,662 | |
AECOM Technology Corp.* | | 54,870 | | 902,612 | |
AGCO Corp.* | | 45,676 | | 2,088,763 | |
Alaska Air Group, Inc.* | | 33,659 | | 1,208,358 | |
Alliant TechSystems, Inc. | | 16,351 | | 826,870 | |
AMETEK, Inc. | | 77,819 | | 3,883,946 | |
BE Aerospace, Inc.* | | 48,312 | | 2,109,302 | |
Carlisle Cos., Inc. | | 29,319 | | 1,554,493 | |
Clarcor, Inc. | | 24,387 | | 1,174,478 | |
Clean Harbors, Inc.* | | 23,245 | | 1,311,483 | |
Con-way, Inc. | | 26,061 | | 941,063 | |
Copart, Inc.* | | 52,208 | | 1,236,808 | |
Corporate Executive Board Co. | | 16,091 | | 657,800 | |
Corrections Corp. of America | | 46,652 | | 1,373,901 | |
Crane Co. | | 24,599 | | 894,912 | |
Deluxe Corp. | | 24,426 | | 609,184 | |
Donaldson Co., Inc. | | 71,157 | | 2,374,509 | |
Esterline Technologies Corp.* | | 15,061 | | 939,053 | |
Exelis, Inc. | | 89,818 | | 885,605 | |
Fortune Brands Home & Security, Inc.* | | 78,960 | | 1,758,439 | |
FTI Consulting, Inc.* | | 21,430 | | 616,113 | |
Gardner Denver, Inc. | | 25,212 | | 1,333,967 | |
GATX Corp. | | 23,059 | | 887,772 | |
General Cable Corp.* | | 24,931 | | 646,710 | |
Graco, Inc. | | 29,899 | | 1,377,746 | |
Granite Construction, Inc. | | 16,557 | | 432,303 | |
Harsco Corp. | | 38,540 | | 785,445 | |
HNI Corp. | | 21,609 | | 556,432 | |
Hubbell, Inc. Cl B | | 28,848 | | 2,248,413 | |
Hunt (J.B.) Transport Svcs., Inc. | | 40,673 | | 2,424,111 | |
Huntington Ingalls Industries, Inc.* | | 22,342 | | 899,042 | |
IDEX Corp. | | 40,947 | | 1,596,114 | |
ITT Corp. | | 46,192 | | 812,979 | |
JetBlue Airways Corp* | | 113,244 | | 600,193 | |
Kansas City Southern | | 51,884 | | 3,609,051 | |
KBR, Inc. | | 72,634 | | 1,794,786 | |
Kennametal, Inc. | | 41,557 | | 1,377,615 | |
Kirby Corp.* | | 26,597 | | 1,252,187 | |
Korn/Ferry International* | | 24,735 | | 354,947 | |
Landstar System, Inc. | | 22,750 | | 1,176,630 | |
Lennox International, Inc. | | 24,742 | | 1,153,719 | |
Lincoln Electric Hldgs., Inc. | | 41,383 | | 1,812,162 | |
Manpower, Inc. | | 38,396 | | 1,407,213 | |
Miller (Herman), Inc. | | 30,241 | | 560,063 | |
Mine Safety Appliances Co. | | 15,196 | | 611,487 | |
MSC Industrial Direct Co., Inc. Cl A | | 23,203 | | 1,520,957 | |
Nordson Corp. | | 26,934 | | 1,381,445 | |
Oshkosh Corp.* | | 44,839 | | 939,377 | |
Pentair, Inc. | | 47,969 | | 1,836,253 | |
Regal-Beloit Corp. | | 19,696 | | 1,226,273 | |
Rollins, Inc. | | 30,128 | | 673,963 | |
Shaw Group, Inc.* | | 32,800 | | 895,768 | |
SPX Corp. | | 25,848 | | 1,688,391 | |
Terex Corp.* | | 51,359 | | 915,731 | |
The Brink’s Co. | | 23,179 | | 537,289 | |
Timken Co. | | 42,176 | | 1,931,239 | |
Towers Watson & Co. Cl A | | 23,839 | | 1,427,956 | |
Trinity Industries, Inc. | | 41,109 | | 1,026,903 | |
Triumph Group, Inc. | | 25,430 | | 1,430,946 | |
United Rentals, Inc.* | | 38,788 | | 1,320,344 | |
URS Corp. | | 37,966 | | 1,324,254 | |
UTI Worldwide, Inc. | | 49,470 | | 722,757 | |
Valmont Industries, Inc. | | 11,105 | | 1,343,372 | |
Wabtec Corp. | | 23,039 | | 1,797,272 | |
Waste Connections, Inc. | | 60,039 | | 1,796,367 | |
Watsco, Inc. | | 14,168 | | 1,045,598 | |
Werner Enterprises, Inc. | | 20,804 | | 497,008 | |
Woodward, Inc. | | 28,638 | | 1,129,483 | |
| | | | 86,503,387 | |
INFORMATION TECHNOLOGY (15.0%) | | | | | |
ACI Worldwide, Inc.* | | 18,412 | | 813,995 | |
Acxiom Corp.* | | 37,355 | | 564,434 | |
Adtran, Inc. | | 31,254 | | 943,558 | |
Advent Software, Inc.* | | 15,023 | | 407,274 | |
Alliance Data Systems Corp.* | | 23,237 | | 3,136,995 | |
ANSYS, Inc.* | | 44,971 | | 2,838,120 | |
AOL, Inc.* | | 47,530 | | 1,334,642 | |
Arrow Electronics, Inc.* | | 54,424 | | 1,785,651 | |
Atmel Corp.* | | 220,837 | | 1,479,608 | |
Avnet, Inc.* | | 68,657 | | 2,118,755 | |
Broadridge Financial Solutions, Inc. | | 60,471 | | 1,286,218 | |
Cadence Design Systems, Inc.* | | 130,378 | | 1,432,854 | |
Ciena Corp.* | | 45,897 | | 751,334 | |
Compuware Corp.* | | 102,696 | | 954,046 | |
Concur Technologies, Inc.* | | 22,047 | | 1,501,401 | |
Convergys Corp. | | 55,869 | | 825,185 | |
CoreLogic, Inc.* | | 51,616 | | 945,089 | |
Cree, Inc.* | | 56,120 | | 1,440,600 | |
Cypress Semiconductor Corp.* | | 72,438 | | 957,630 | |
Diebold, Inc. | | 31,001 | | 1,144,247 | |
DST Systems, Inc. | | 16,197 | | 879,659 | |
Equinix, Inc.* | | 22,374 | | 3,929,993 | |
FactSet Research Systems, Inc. | | 24,317 | | 2,260,022 | |
Fair Isaac Corp. | | 16,227 | | 686,078 | |
Fairchild Semiconductor Int’l., Inc.* | | 61,429 | | 866,149 | |
Gartner, Inc.* | | 43,981 | | 1,893,382 | |
Global Payments, Inc. | | 38,648 | | 1,670,753 | |
Henry (Jack) & Associates, Inc. | | 41,720 | | 1,440,174 | |
Informatica Corp.* | | 52,266 | | 2,213,988 | |
Ingram Micro, Inc. Cl A* | | 75,096 | | 1,311,927 | |
Integrated Device Technology, Inc.* | | 67,601 | | 379,918 | |
International Rectifier Corp.* | | 32,525 | | 650,175 | |
Intersil Corp. Cl A | | 61,554 | | 655,550 | |
Itron, Inc.* | | 18,516 | | 763,600 | |
Lender Processing Svcs., Inc. | | 39,319 | | 993,984 | |
ManTech International Corp. Cl A | | 11,457 | | 268,896 | |
MEMC Electronic Materials, Inc.* | | 92,126 | | 199,913 | |
Mentor Graphics Corp.* | | 43,294 | | 649,410 | |
MICROS Systems, Inc.* | | 38,520 | | 1,972,224 | |
Monster Worldwide, Inc.* | | 57,338 | | 487,373 | |
National Instruments Corp. | | 44,458 | | 1,194,142 | |
NCR Corp.* | | 75,990 | | 1,727,253 | |
NeuStar, Inc. Cl A* | | 32,330 | | 1,079,822 | |
Parametric Technology Corp.* | | 60,184 | | 1,261,457 | |
Plantronics, Inc. | | 20,115 | | 671,841 | |
Polycom, Inc.* | | 90,729 | | 954,469 | |
QLogic Corp.* | | 46,951 | | 642,759 | |
Quest Software, Inc.* | | 24,950 | | 694,858 | |
Rackspace Hosting, Inc.* | | 55,665 | | 2,445,920 | |
RF Micro Devices, Inc.* | | 138,250 | | 587,563 | |
Riverbed Technology, Inc.* | | 81,325 | | 1,313,399 | |
Rovi Corp.* | | 58,755 | | 1,152,773 | |
Semtech Corp.* | | 31,705 | | 771,066 | |
Silicon Laboratories, Inc.* | | 20,182 | | 764,898 | |
Skyworks Solutions, Inc.* | | 91,062 | | 2,492,367 | |
Solera Hldgs., Inc. | | 33,883 | | 1,415,971 | |
Synopsys, Inc.* | | 71,396 | | 2,101,184 | |
Tech Data Corp.* | | 19,278 | | 928,621 | |
Tellabs, Inc. | | 185,583 | | 617,991 | |
TIBCO Software, Inc.* | | 82,145 | | 2,457,778 | |
Trimble Navigation Ltd.* | | 61,334 | | 2,821,977 | |
ValueClick, Inc.* | | 41,273 | | 676,464 | |
VeriFone Systems, Inc.* | | 58,904 | | 1,949,133 | |
Vishay Intertechnology, Inc.* | | 69,542 | | 655,781 | |
Wright Express Corp.* | | 18,779 | | 1,159,040 | |
Zebra Technologies Corp. Cl A* | | 25,224 | | 866,697 | |
| | | | 84,240,028 | |
MATERIALS (6.6%) | | | | | |
Albemarle Corp. | | 43,716 | | 2,607,222 | |
AptarGroup, Inc. | | 31,585 | | 1,612,414 | |
Ashland, Inc. | | 37,228 | | 2,580,273 | |
Cabot Corp. | | 30,574 | | 1,244,362 | |
Carpenter Technology Corp. | | 21,382 | | 1,022,915 | |
Commercial Metals Co. | | 55,525 | | 701,836 | |
Compass Minerals Int’l., Inc. | | 16,279 | | 1,241,762 | |
Cytec Industries, Inc. | | 22,124 | | 1,297,351 | |
Domtar Corp. | | 17,660 | | 1,354,699 | |
Greif, Inc. Cl A | | 15,583 | | 638,903 | |
Intrepid Potash, Inc.* | | 24,968 | | 568,272 | |
Louisiana-Pacific Corp.* | | 64,008 | | 696,407 | |
Martin Marietta Materials, Inc. | | 21,895 | | 1,725,764 | |
Minerals Technologies, Inc. | | 8,603 | | 548,699 | |
NewMarket Corp. | | 5,362 | | 1,161,409 | |
Olin Corp. | | 38,721 | | 808,882 | |
Packaging Corp. of America | | 46,707 | | 1,319,006 | |
Reliance Steel & Aluminum Co. | | 36,940 | | 1,865,470 | |
Rock-Tenn Co. Cl A | | 33,358 | | 1,819,679 | |
Royal Gold, Inc. | | 28,803 | | 2,258,155 | |
RPM International, Inc. | | 64,206 | | 1,746,403 | |
Scotts Miracle-Gro Co. Cl A | | 22,190 | | 912,453 | |
Sensient Technologies Corp. | | 24,305 | | 892,723 | |
Silgan Hldgs., Inc. | | 22,938 | | 979,223 | |
Sonoco Products Co. | | 48,750 | | 1,469,813 | |
Steel Dynamics, Inc. | | 107,315 | | 1,260,951 | |
Valspar Corp. | | 45,178 | | 2,371,393 | |
Worthington Industries, Inc. | | 26,139 | | 535,065 | |
| | | | 37,241,504 | |
TELECOMMUNICATION SERVICES (0.5%) | | | | | |
Telephone & Data Systems, Inc. | | 44,171 | | 940,401 | |
tw telecom inc* | | 69,996 | | 1,796,097 | |
| | | | 2,736,498 | |
UTILITIES (4.9%) | | | | | |
Alliant Energy Corp. | | 52,215 | | 2,379,438 | |
Aqua America, Inc. | | 65,794 | | 1,642,218 | |
Atmos Energy Corp. | | 42,208 | | 1,480,235 | |
Black Hills Corp. | | 20,981 | | 674,959 | |
Cleco Corp. | | 29,060 | | 1,215,580 | |
Great Plains Energy, Inc. | | 74,821 | | 1,601,918 | |
Hawaiian Electric Industries, Inc. | | 45,290 | | 1,291,671 | |
Idacorp, Inc. | | 23,549 | | 990,942 | |
MDU Resources Group | | 91,651 | | 1,980,578 | |
National Fuel Gas Co. | | 40,222 | | 1,889,630 | |
NV Energy, Inc. | | 111,625 | | 1,962,368 | |
OGE Energy Corp. | | 46,743 | | 2,420,820 | |
PNM Resources, Inc. | | 38,012 | | 742,754 | |
Questar Corp. | | 84,842 | | 1,769,804 | |
UGI Corp. | | 54,161 | | 1,593,958 | |
Vectren Corp. | | 38,987 | | 1,150,896 | |
Westar Energy, Inc. | | 59,453 | | 1,780,617 | |
WGL Hldgs., Inc. | | 24,253 | | 964,057 | |
| | | | 27,532,443 | |
TOTAL INDEXED ASSETS - COMMON STOCKS
(Cost: $473,315,147) 95.8% | | | | 537,684,406 | |
| | Rating** | | Rate(%) | | Maturity | | Face Amount | | Value | |
SHORT-TERM DEBT SECURITIES: | | | | | | | | | | | |
U.S. GOVERNMENT (0.5%) | | | | | | | | | | | |
U.S. Treasury Bill (1) | | A-1+ | | 0.09 | | 08/09/12 | | 3,000,000 | | 2,999,700 | |
COMMERCIAL PAPER (2.9%) | | | | | | | | | | | |
ConocoPhillips† | | A-1 | | 0.12 | | 07/13/12 | | 5,000,000 | | 4,999,784 | |
Nestle Capital Corp.† | | A-1+ | | 0.01 | | 07/02/12 | | 3,000,000 | | 2,999,998 | |
New Jersey Natural Gas | | A-1 | | 0.11 | | 07/05/12 | | 3,000,000 | | 2,999,954 | |
Toyota Motor Credit Corp. | | A-1+ | | 0.08 | | 07/17/12 | | 5,000,000 | | 4,999,811 | |
| | | | | | | | | | 15,999,547 | |
TOTAL SHORT-TERM DEBT SECURITIES
(Cost: $18,999,247) 3.4% | | | | | | | | | | 18,999,247 | |
| | | | | | | | | | | |
TEMPORARY CASH INVESTMENTS (2)
(Cost: $170,700) 0.0% (3) | | | | | | | | | | 170,700 | |
| | | | | | | | | | | |
TOTAL INVESTMENTS
(Cost: $492,485,094) 99.2% | | | | | | | | | | 556,854,353 | |
| | | | | | | | | | | |
OTHER NET ASSETS 0.8% | | | | | | | | | | 4,411,398 | |
| | | | | | | | | | | |
NET ASSETS 100.0% | | | | | | | | | | $ | 561,265,751 | |
| | | | | | | | | | | | |
The accompanying notes are an integral part of these portfolio schedules.
MUTUAL OF AMERICA INVESTMENT CORPORATION - INTERNATIONAL FUND
PORTFOLIO OF INVESTMENTS IN SECURITIES
June 30, 2012 (Unaudited)
| | Shares | | Value | |
COMMON STOCKS: | | | | | |
FINANCIALS (97.5%) | | | | | |
iShares MSCI EAFE Growth Index Fund | | 120,600 | | 6,459,336 | |
iShares MSCI EAFE Index Fund | | 169,900 | | 8,488,204 | |
iShares MSCI EAFE Value Index Fund | | 152,700 | | 6,483,642 | |
Vanguard MSCI EAFE ETF | | 1,225,000 | | 38,673,250 | |
Vanguard MSCI Europe ETF | | 276,100 | | 11,825,363 | |
Vanguard MSCI Pacific ETF | | 130,900 | | 6,560,708 | |
| | | | 78,490,503 | |
TOTAL COMMON STOCKS
(Cost: $82,857,255) 97.5% | | | | 78,490,503 | |
| | Rating** | | Rate(%) | | Maturity | | Face Amount | | Value | |
SHORT-TERM DEBT SECURITIES: | | | | | | | | | | | |
COMMERCIAL PAPER (2.5%) | | | | | | | | | | | |
New Jersey Natural Gas | | A-1 | | 0.11 | | 07/19/12 | | 1,000,000 | | 999,942 | |
San Diego Gas & Electric Co.† | | A-1 | | 0.14 | | 07/02/12 | | 980,000 | | 979,992 | |
| | | | | | | | | | 1,979,934 | |
TOTAL SHORT-TERM DEBT SECURITIES
(Cost: $1,979,934) 2.5% | | | | | | | | | | 1,979,934 | |
| | | | | | | | | | | |
TOTAL INVESTMENTS
(Cost: $84,837,189) 100.0% | | | | | | | | | | 80,470,437 | |
| | | | | | | | | | | |
OTHER NET ASSETS 0.0% (3) | | | | | | | | | | 9,294 | |
| | | | | | | | | | | |
NET ASSETS 100.0% | | | | | | | | | | $ | 80,479,731 | |
| | | | | | | | | | | | |
The accompanying notes are an integral part of these portfolio schedules.
MUTUAL OF AMERICA INVESTMENT CORPORATION - COMPOSITE FUND
PORTFOLIO OF INVESTMENTS IN SECURITIES
June 30, 2012 (Unaudited)
| | Shares | | Value | |
COMMON STOCKS: | | | | | |
CONSUMER DISCRETIONARY (5.8%) | | | | | |
Abercrombie & Fitch Co. Cl A | | 5,914 | | 201,904 | |
Amazon.com, Inc.* | | 6,189 | | 1,413,258 | |
BorgWarner, Inc.* | | 3,524 | | 231,139 | |
Darden Restaurants, Inc. | | 9,169 | | 464,226 | |
Discovery Communications, Inc. Cl A* | | 8,295 | | 447,930 | |
Disney (Walt) Co. | | 24,630 | | 1,194,555 | |
Ford Motor Co. | | 46,272 | | 443,748 | |
Johnson Controls, Inc. | | 8,983 | | 248,919 | |
Macy’s, Inc. | | 17,003 | | 584,053 | |
Starbucks Corp. | | 36,380 | | 1,939,782 | |
Target Corp. | | 6,829 | | 397,380 | |
Time Warner Cable, Inc. | | 9,212 | | 756,305 | |
Time Warner, Inc. | | 15,508 | | 597,058 | |
Urban Outfitters, Inc.* | | 11,101 | | 306,277 | |
Viacom, Inc. Cl B | | 11,071 | | 520,558 | |
| | | | 9,747,092 | |
CONSUMER STAPLES (6.5%) | | | | | |
Clorox Co. | | 9,770 | | 707,934 | |
Constellation Brands, Inc. Cl A* | | 11,421 | | 309,052 | |
Estee Lauder Cos., Inc. Cl A | | 8,887 | | 480,964 | |
J.M. Smucker Co. | | 9,968 | | 752,783 | |
Kraft Foods, Inc. Cl A | | 22,490 | | 868,564 | |
PepsiCo, Inc. | | 16,911 | | 1,194,931 | |
Philip Morris Int’l., Inc. | | 23,225 | | 2,026,614 | |
Proctor & Gamble Co. | | 27,413 | | 1,679,046 | |
Tyson Foods, Inc. Cl A | | 42,130 | | 793,308 | |
Wal-Mart Stores, Inc. | | 30,261 | | 2,109,797 | |
| | | | 10,922,993 | |
ENERGY (6.7%) | | | | | |
Anadarko Petroleum Corp. | | 11,880 | | 786,456 | |
Apache Corp. | | 8,128 | | 714,370 | |
Chevron Corp. | | 10,841 | | 1,143,726 | |
EOG Resources, Inc. | | 5,820 | | 524,440 | |
Exxon Mobil Corp. | | 43,875 | | 3,754,382 | |
Halliburton Co. | | 27,028 | | 767,325 | |
Hess Corp. | | 7,862 | | 341,604 | |
National Oilwell Varco, Inc. | | 12,158 | | 783,462 | |
Noble Energy, Inc. | | 10,408 | | 882,807 | |
Occidental Petroleum Corp. | | 12,800 | | 1,097,856 | |
Range Resources Corp. | | 6,828 | | 422,448 | |
| | | | 11,218,876 | |
FINANCIALS (8.7%) | | | | | |
American Tower Corp. | | 18,624 | | 1,302,004 | |
Aon PLC* | | 7,916 | | 370,310 | |
Bank of America Corp. | | 90,566 | | 740,830 | |
BB&T Corp. | | 25,023 | | 771,960 | |
Berkshire Hathaway, Inc. Cl B* | | 15,110 | | 1,259,116 | |
Capital One Financial Corp. | | 24,568 | | 1,342,887 | |
Citigroup, Inc. | | 23,848 | | 653,674 | |
Franklin Resources, Inc. | | 3,157 | | 350,395 | |
Goldman Sachs Group, Inc. | | 8,453 | | 810,305 | |
JPMorgan Chase & Co. | | 54,300 | | 1,940,139 | |
MetLife, Inc. | | 24,672 | | 761,131 | |
PNC Financial Svcs. Grp., Inc. | | 11,010 | | 672,821 | |
Simon Property Group, Inc. | | 8,796 | | 1,369,185 | |
Wells Fargo & Co. | | 67,072 | | 2,242,888 | |
| | | | 14,587,645 | |
HEALTH CARE (6.9%) | | | | | |
Abbott Laboratories | | 6,912 | | 445,617 | |
Celgene Corp.* | | 6,964 | | 446,810 | |
Covidien PLC | | 15,040 | | 804,640 | |
Express Scripts Hldg. Co.* | | 6,966 | | 388,912 | |
Forest Laboratories, Inc.* | | 27,502 | | 962,295 | |
Gilead Sciences, Inc.* | | 16,537 | | 848,017 | |
McKesson Corp. | | 9,394 | | 880,688 | |
Merck & Co., Inc. | | 37,783 | | 1,577,440 | |
Mylan, Inc.* | | 36,840 | | 787,271 | |
Pfizer, Inc. | | 85,541 | | 1,967,443 | |
St. Jude Medical, Inc. | | 9,284 | | 370,524 | |
Stryker Corp. | | 11,900 | | 655,690 | |
UnitedHealth Group, Inc. | | 17,013 | | 995,261 | |
WellPoint, Inc. | | 5,519 | | 352,057 | |
| | | | 11,482,665 | |
INDUSTRIALS (6.0%) | | | | | |
Boeing Co. | | 18,152 | | 1,348,694 | |
Caterpillar, Inc. | | 13,216 | | 1,122,171 | |
Cummins, Inc. | | 9,218 | | 893,316 | |
Expeditors Int’l. of Wash. | | 16,934 | | 656,193 | |
FedEx Corp. | | 9,233 | | 845,835 | |
General Electric Co. | | 106,760 | | 2,224,878 | |
Precision Castparts Corp. | | 7,238 | | 1,190,579 | |
Roper Industries, Inc. | | 9,545 | | 940,946 | |
Union Pacific Corp. | | 6,458 | | 770,504 | |
| | | | 9,993,116 | |
INFORMATION TECHNOLOGY (11.0%) | | | | | |
Altera Corp. | | 6,933 | | 234,613 | |
Apple, Inc.* | | 8,865 | | 5,177,155 | |
Automatic Data Processing, Inc. | | 11,018 | | 613,262 | |
Cisco Systems, Inc. | | 24,603 | | 422,434 | |
EMC Corp.* | | 27,241 | | 698,187 | |
Google, Inc. Cl A* | | 2,462 | | 1,428,133 | |
Harris Corp. | | 3,923 | | 164,178 | |
Int’l. Business Machines Corp. | | 10,860 | | 2,123,999 | |
Intel Corp. | | 32,695 | | 871,322 | |
KLA-Tencor Corp. | | 12,632 | | 622,126 | |
Microsoft Corp. | | 56,064 | | 1,714,998 | |
NetApp, Inc.* | | 3,257 | | 103,638 | |
Nortel Networks Corp.* | | 5,827 | | 67 | |
Oracle Corp. | | 41,455 | | 1,231,214 | |
QUALCOMM, Inc. | | 19,962 | | 1,111,484 | |
Salesforce.com, inc.* | | 7,752 | | 1,071,792 | |
Texas Instruments, Inc. | | 22,916 | | 657,460 | |
Yahoo!, Inc.* | | 19,180 | | 303,619 | |
| | | | 18,549,681 | |
MATERIALS (2.4%) | | | | | |
Ball Corp. | | 14,609 | | 599,699 | |
CF Industries Hldgs., Inc. | | 2,655 | | 514,380 | |
Dow Chemical Co. | | 19,658 | | 619,227 | |
Eastman Chemical Co. | | 21,182 | | 1,066,937 | |
FMC Corp. | | 8,489 | | 453,992 | |
Freeport-McMoRan Copper & Gold, Inc. | | 20,052 | | 683,172 | |
| | | | 3,937,407 | |
TELECOMMUNICATION SERVICES (1.8%) | | | | | |
AT&T, Inc. | | 54,830 | | 1,955,238 | |
CenturyLink, Inc. | | 12,144 | | 479,567 | |
Sprint Nextel Corp.* | | 161,937 | | 527,915 | |
| | | | 2,962,720 | |
UTILITIES (1.8%) | | | | | |
Dominion Resources, Inc. | | 16,796 | | 906,984 | |
Edison International | | 9,713 | | 448,741 | |
Entergy Corp. | | 2,627 | | 178,347 | |
PPL Corp. | | 10,777 | | 299,708 | |
Public Svc. Enterprise Group, Inc. | | 18,929 | | 615,193 | |
Sempra Energy | | 8,835 | | 608,555 | |
| | | | 3,057,528 | |
TOTAL COMMON STOCKS
(Cost: $81,414,337) 57.6% | | | | 96,459,723 | |
| | Rating** | | Rate(%) | | Maturity | | Face Amount | | Value | |
LONG-TERM DEBT SECURITIES: | | | | | | | | | | | |
U.S. GOVERNMENT (5.8%) | | | | | | | | | | | |
U.S. Treasury Strip | | AA+ | | 0.00 | | 08/15/21 | | 300,000 | | 257,877 | |
U.S. Treasury Strip | | AA+ | | 0.00 | | 11/15/21 | | 7,050,000 | | 6,009,281 | |
U.S. Treasury Strip | | AA+ | | 0.00 | | 08/15/29 | | 5,500,000 | | 3,517,300 | |
| | | | | | | | | | 9,784,458 | |
U.S. GOVERNMENT AGENCIES (13.4%) | | | | | | | | | | | |
MORTGAGE-BACKED OBLIGATIONS (13.4%) | | | | | | | | | | |
FHARM | | AA+ | | 4.64 | | 09/01/39 | | 147,153 | | 157,416 | |
FHARM | | AA+ | | 5.22 | | 04/01/37 | | 158,048 | | 169,257 | |
FHARM | | AA+ | | 5.24 | | 02/01/36 | | 92,685 | | 99,690 | |
FHARM | | AA+ | | 5.43 | | 05/01/37 | | 159,900 | | 173,029 | |
FHARM | | AA+ | | 5.77 | | 03/01/37 | | 70,341 | | 76,228 | |
FHLMC | | AA+ | | 4.00 | | 02/01/25 | | 195,589 | | 206,818 | |
FHLMC | | AA+ | | 4.00 | | 03/01/41 | | 496,932 | | 528,326 | |
FHLMC | | AA+ | | 4.00 | | 07/01/41 | | 385,543 | | 409,658 | |
FHLMC | | AA+ | | 4.50 | | 08/01/34 | | 181,325 | | 194,132 | |
FHLMC | | AA+ | | 4.50 | | 08/15/35 | | 220,239 | | 241,267 | |
FHLMC | | AA+ | | 5.00 | | 02/01/26 | | 90,161 | | 97,459 | |
FHLMC | | AA+ | | 5.50 | | 01/15/32 | | 165,469 | | 172,186 | |
FHLMC | | AA+ | | 5.50 | | 07/01/32 | | 192,310 | | 210,100 | |
FHLMC | | AA+ | | 5.50 | | 05/01/33 | | 253,283 | | 277,901 | |
FHLMC | | AA+ | | 5.50 | | 06/01/37 | | 233,549 | | 254,569 | |
FHLMC | | AA+ | | 6.00 | | 03/15/32 | | 148,412 | | 165,202 | |
FNMA | | AA+ | | 3.50 | | 01/01/32 | | 483,133 | | 511,692 | |
FNMA | | AA+ | | 3.50 | | 04/01/42 | | 497,675 | | 533,148 | |
FNMA | | AA+ | | 4.00 | | 05/01/19 | | 111,858 | | 119,975 | |
FNMA | | AA+ | | 4.00 | | 06/01/39 | | 283,775 | | 302,412 | |
FNMA | | AA+ | | 4.00 | | 11/01/40 | | 408,193 | | 435,128 | |
FNMA | | AA+ | | 4.00 | | 05/01/41 | | 349,539 | | 382,115 | |
FNMA | | AA+ | | 4.50 | | 05/01/18 | | 131,545 | | 141,645 | |
FNMA | | AA+ | | 4.50 | | 05/01/30 | | 280,941 | | 303,775 | |
FNMA | | AA+ | | 4.50 | | 04/01/31 | | 290,015 | | 313,776 | |
FNMA | | AA+ | | 4.50 | | 08/01/33 | | 171,346 | | 184,412 | |
FNMA | | AA+ | | 4.50 | | 09/01/33 | | 326,744 | | 351,660 | |
FNMA | | AA+ | | 4.50 | | 06/01/34 | | 211,241 | | 227,217 | |
FNMA | | AA+ | | 4.50 | | 08/01/35 | | 284,309 | | 305,456 | |
FNMA | | AA+ | | 4.50 | | 12/01/35 | | 228,295 | | 245,276 | |
FNMA | | AA+ | | 4.50 | | 05/01/39 | | 325,907 | | 349,741 | |
FNMA | | AA+ | | 4.50 | | 05/01/39 | | 241,853 | | 259,540 | |
FNMA | | AA+ | | 4.50 | | 05/01/40 | | 342,493 | | 374,525 | |
FNMA | | AA+ | | 5.00 | | 04/01/18 | | 270,919 | | 293,334 | |
FNMA | | AA+ | | 5.00 | | 06/01/33 | | 320,944 | | 349,241 | |
FNMA | | AA+ | | 5.00 | | 10/01/33 | | 260,156 | | 283,094 | |
FNMA | | AA+ | | 5.00 | | 11/01/33 | | 652,799 | | 710,355 | |
FNMA | | AA+ | | 5.00 | | 11/01/33 | | 207,391 | | 225,677 | |
FNMA | | AA+ | | 5.00 | | 03/01/34 | | 100,033 | | 108,853 | |
FNMA | | AA+ | | 5.00 | | 04/01/34 | | 122,430 | | 133,147 | |
FNMA | | AA+ | | 5.00 | | 09/01/35 | | 161,736 | | 175,491 | |
FNMA | | AA+ | | 5.00 | | 11/25/35 | | 300,000 | | 334,954 | |
FNMA | | AA+ | | 5.00 | | 05/01/39 | | 328,215 | | 361,202 | |
FNMA | | AA+ | | 5.00 | | 06/01/40 | | 150,704 | | 163,897 | |
FNMA | | AA+ | | 5.50 | | 04/01/17 | | 16,624 | | 18,117 | |
FNMA | | AA+ | | 5.50 | | 05/01/17 | | 9,470 | | 10,320 | |
FNMA | | AA+ | | 5.50 | | 06/01/17 | | 4,740 | | 5,166 | |
FNMA | | AA+ | | 5.50 | | 03/01/34 | | 80,887 | | 88,926 | |
FNMA | | AA+ | | 5.50 | | 05/01/34 | | 667,063 | | 732,939 | |
FNMA | | AA+ | | 5.50 | | 07/01/34 | | 148,472 | | 163,134 | |
FNMA | | AA+ | | 5.50 | | 09/01/34 | | 280,219 | | 308,243 | |
FNMA | | AA+ | | 5.50 | | 09/01/34 | | 156,705 | | 172,181 | |
FNMA | | AA+ | | 5.50 | | 10/01/34 | | 112,931 | | 124,084 | |
FNMA | | AA+ | | 5.50 | | 02/01/35 | | 196,202 | | 215,577 | |
FNMA | | AA+ | | 5.50 | | 02/01/35 | | 145,237 | | 159,308 | |
FNMA | | AA+ | | 5.50 | | 08/01/35 | | 92,148 | | 101,075 | |
FNMA | | AA+ | | 5.50 | | 08/01/37 | | 82,130 | | 89,625 | |
FNMA | | AA+ | | 5.50 | | 11/01/38 | | 120,953 | | 130,403 | |
FNMA | | AA+ | | 5.50 | | 06/01/48 | | 136,858 | | 148,321 | |
FNMA | | AA+ | | 6.00 | | 03/01/17 | | 8,008 | | 8,810 | |
FNMA | | AA+ | | 6.00 | | 05/01/23 | | 64,953 | | 73,350 | |
FNMA | | AA+ | | 6.00 | | 03/01/32 | | 10,335 | | 11,638 | |
FNMA | | AA+ | | 6.00 | | 04/01/32 | | 46,056 | | 51,861 | |
FNMA | | AA+ | | 6.00 | | 04/01/32 | | 25,847 | | 29,105 | |
FNMA | | AA+ | | 6.00 | | 05/01/32 | | 45,511 | | 51,248 | |
FNMA | | AA+ | | 6.00 | | 04/01/33 | | 195,802 | | 220,486 | |
FNMA | | AA+ | | 6.00 | | 05/01/33 | | 143,566 | | 161,664 | |
FNMA | | AA+ | | 6.00 | | 06/01/34 | | 106,434 | | 118,786 | |
FNMA | | AA+ | | 6.00 | | 09/01/34 | | 59,489 | | 66,393 | |
FNMA | | AA+ | | 6.00 | | 10/01/34 | | 100,488 | | 112,151 | |
FNMA | | AA+ | | 6.00 | | 11/01/34 | | 124,319 | | 138,748 | |
FNMA | | AA+ | | 6.00 | | 12/01/36 | | 180,455 | | 198,861 | |
FNMA | | AA+ | | 6.00 | | 01/01/37 | | 165,201 | | 182,052 | |
FNMA | | AA+ | | 6.00 | | 04/01/37 | | 97,845 | | 107,030 | |
FNMA | | AA+ | | 6.00 | | 05/01/37 | | 76,123 | | 83,269 | |
FNMA | | AA+ | | 6.00 | | 06/01/37 | | 160,466 | | 175,529 | |
FNMA | | AA+ | | 6.00 | | 10/25/44 | | 174,165 | | 194,004 | |
FNMA | | AA+ | | 6.00 | | 02/25/47 | | 157,346 | | 178,385 | |
FNMA | | AA+ | | 6.00 | | 12/25/49 | | 146,985 | | 168,644 | |
FNMA | | AA+ | | 6.50 | | 09/01/16 | | 10,012 | | 10,748 | |
FNMA | | AA+ | | 6.50 | | 03/01/17 | | 21,040 | | 22,864 | |
FNMA | | AA+ | | 6.50 | | 05/01/17 | | 4,025 | | 4,374 | |
FNMA | | AA+ | | 6.50 | | 06/01/17 | | 24,284 | | 26,389 | |
FNMA | | AA+ | | 6.50 | | 04/01/32 | | 14,826 | | 16,970 | |
FNMA | | AA+ | | 6.50 | | 05/01/32 | | 61,077 | | 69,912 | |
FNMA | | AA+ | | 6.50 | | 05/01/32 | | 46,125 | | 52,798 | |
FNMA | | AA+ | | 6.50 | | 07/01/32 | | 20,300 | | 23,236 | |
FNMA | | AA+ | | 6.50 | | 07/01/34 | | 113,637 | | 129,471 | |
FNMA | | AA+ | | 6.50 | | 05/01/37 | | 147,683 | | 166,739 | |
FNMA | | AA+ | | 6.50 | | 09/01/37 | | 116,670 | | 131,724 | |
FNMA | | AA+ | | 7.00 | | 09/01/31 | | 19,720 | | 23,430 | |
FNMA | | AA+ | | 7.00 | | 11/01/31 | | 12,016 | | 14,276 | |
FNMA | | AA+ | | 7.00 | | 04/01/32 | | 21,155 | | 25,009 | |
FNMA | | AA+ | | 7.50 | | 06/01/31 | | 14,289 | | 16,878 | |
FNMA | | AA+ | | 7.50 | | 02/01/32 | | 10,800 | | 12,791 | |
FNMA | | AA+ | | 7.50 | | 04/01/32 | | 19,843 | | 23,531 | |
FNMA | | AA+ | | 7.50 | | 06/01/32 | | 14,022 | | 16,628 | |
FNMA | | AA+ | | 8.00 | | 03/01/31 | | 8,528 | | 10,194 | |
FNMA | | AA+ | | 8.00 | | 04/01/32 | | 14,240 | | 17,086 | |
FNMA | | AA+ | | 8.00 | | 04/01/32 | | 2,577 | | 3,083 | |
GNMA (4) | | AA+ | | 3.50 | | 09/20/33 | | 400,004 | | 418,616 | |
GNMA (4) | | AA+ | | 3.50 | | 01/20/37 | | 403,907 | | 418,867 | |
GNMA (4) | | AA+ | | 4.00 | | 08/15/41 | | 408,170 | | 446,526 | |
GNMA (4) | | AA+ | | 4.00 | | 01/15/42 | | 496,337 | | 542,979 | |
GNMA (4) | | AA+ | | 4.00 | | 03/20/42 | | 323,523 | | 353,394 | |
GNMA (4) | | AA+ | | 4.50 | | 04/20/31 | | 454,463 | | 504,114 | |
GNMA (4) | | AA+ | | 4.50 | | 10/15/40 | | 371,123 | | 407,074 | |
GNMA (4) | | AA+ | | 5.00 | | 10/15/24 | | 388,316 | | 424,218 | |
GNMA (4) | | AA+ | | 5.00 | | 04/15/39 | | 319,207 | | 351,763 | |
GNMA (4) | | AA+ | | 5.00 | | 06/20/39 | | 232,294 | | 268,522 | |
GNMA (4) | | AA+ | | 5.00 | | 11/15/39 | | 273,106 | | 300,959 | |
GNMA (4) | | AA+ | | 6.50 | | 04/15/31 | | 6,755 | | 7,849 | |
GNMA (4) | | AA+ | | 6.50 | | 10/15/31 | | 9,202 | | 10,692 | |
GNMA (4) | | AA+ | | 6.50 | | 12/15/31 | | 7,454 | | 8,661 | |
GNMA (4) | | AA+ | | 6.50 | | 05/15/32 | | 11,895 | | 13,776 | |
GNMA (4) | | AA+ | | 7.00 | | 05/15/31 | | 6,952 | | 8,402 | |
GNMA (4) | | AA+ | | 7.00 | | 09/15/31 | | 6,496 | | 7,852 | |
GNMA (4) | | AA+ | | 7.00 | | 09/15/31 | | 2,395 | | 2,895 | |
GNMA (4) | | AA+ | | 7.00 | | 05/15/32 | | 3,512 | | 4,200 | |
Vendee Mortgage Trust (4) | | AA+ | | 5.25 | | 01/15/32 | | 348,571 | | 406,510 | |
| | | | | | | | | | 22,439,409 | |
CORPORATE DEBT (17.9%) | | | | | | | | | | | |
CONSUMER DISCRETIONARY (2.5%) | | | | | | | | | | | |
Advance Auto Parts, Inc. | | BBB- | | 5.75 | | 05/01/20 | | 250,000 | | 282,526 | |
AutoZone, Inc. | | BBB | | 4.00 | | 11/15/20 | | 250,000 | | 267,214 | |
Ethan Allen Interiors, Inc. | | BB- | | 5.38 | | 10/01/15 | | 500,000 | | 506,187 | |
Expedia, Inc. | | BBB- | | 5.95 | | 08/15/20 | | 250,000 | | 261,927 | |
Home Depot, Inc. | | A- | | 5.40 | | 03/01/16 | | 500,000 | | 576,412 | |
Hyatt Hotels Corp. | | BBB | | 3.88 | | 08/15/16 | | 100,000 | | 105,942 | |
Kohl’s Corp. | | BBB+ | | 4.00 | | 11/01/21 | | 100,000 | | 103,936 | |
Lowe’s Cos., Inc. | | A- | | 3.12 | | 04/15/22 | | 300,000 | | 306,969 | |
Marriott International, Inc. | | BBB | | 5.63 | | 02/15/13 | | 500,000 | | 513,686 | |
Omnicom Group, Inc. | | BBB+ | | 4.45 | | 08/15/20 | | 250,000 | | 269,567 | |
Scholastic Corp. | | BB- | | 5.00 | | 04/15/13 | | 500,000 | | 506,250 | |
Tupperware Brands Corp. | | BBB- | | 4.75 | | 06/01/21 | | 250,000 | | 258,991 | |
Whirlpool Corp. | | BBB- | | 6.50 | | 06/15/16 | | 250,000 | | 278,172 | |
| | | | | | | | | | 4,237,779 | |
CONSUMER STAPLES (0.9%) | | | | | | | | | | | |
Avon Products, Inc. | | BBB- | | 4.20 | | 07/15/18 | | 150,000 | | 151,023 | |
CVS Caremark Corp. | | BBB+ | | 6.13 | | 08/15/16 | | 250,000 | | 292,429 | |
Ingredion, Inc. | | BBB | | 4.63 | | 11/01/20 | | 250,000 | | 270,894 | |
Kroger Co. | | BBB | | 4.95 | | 01/15/15 | | 500,000 | | 544,531 | |
Sysco Corp. | | A+ | | 2.60 | | 06/12/22 | | 300,000 | | 298,955 | |
| | | | | | | | | | 1,557,832 | |
ENERGY (2.6%) | | | | | | | | | | | |
Cameron International Corp. | | BBB+ | | 4.50 | | 06/01/21 | | 300,000 | | 320,879 | |
Diamond Offshore Drilling, Inc. | | A- | | 4.88 | | 07/01/15 | | 500,000 | | 546,317 | |
Enbridge, Inc. | | A- | | 5.80 | | 06/15/14 | | 100,000 | | 108,580 | |
EQT Corp. | | BBB | | 4.88 | | 11/15/21 | | 200,000 | | 204,287 | |
Kinder Morgan, Inc. | | BB | | 5.15 | | 03/01/15 | | 500,000 | | 523,750 | |
National Oilwell Varco, Inc. | | A- | | 6.13 | | 08/15/15 | | 250,000 | | 253,863 | |
Noble Drilling Corp. | | BBB+ | | 7.50 | | 03/15/19 | | 800,000 | | 1,003,570 | |
Seacor Hldgs., Inc. | | BB+ | | 7.38 | | 10/01/19 | | 250,000 | | 271,133 | |
Sunoco, Inc. | | BB+ | | 4.88 | | 10/15/14 | | 500,000 | | 528,213 | |
Weatherford Int’l. Ltd. | | BBB | | 5.50 | | 02/15/16 | | 500,000 | | 554,925 | |
| | | | | | | | | | 4,315,517 | |
FINANCIALS (6.5%) | | | | | | | | | | | |
Aflac, Inc. | | A- | | 4.00 | | 02/15/22 | | 300,000 | | 311,895 | |
Alleghany Corp. | | BBB | | 5.63 | | 09/15/20 | | 300,000 | | 320,986 | |
Ally Financial, Inc. | | B+ | | 0.00 | | 12/01/12 | | 2,500,000 | | 2,459,371 | |
Bank of America Corp. | | A- | | 3.70 | | 09/01/15 | | 250,000 | | 252,562 | |
Barrick N.A. Finance LLC | | A- | | 4.40 | | 05/30/21 | | 250,000 | | | 269,457 | |
| | | | | | | | | | | | |
Berkley (W.R.) Corp. | | BBB+ | | 7.38 | | 09/15/19 | | 250,000 | | 296,436 | |
Block Financial LLC | | BBB | | 5.13 | | 10/30/14 | | 250,000 | | 257,829 | |
Bunge Ltd. Finance Corp. | | BBB- | | 5.35 | | 04/15/14 | | 500,000 | | 527,600 | |
CNA Financial Corp. | | BBB- | | 6.50 | | 08/15/16 | | 250,000 | | 281,318 | |
Duke Realty LP | | BBB- | | 4.63 | | 05/15/13 | | 250,000 | | 255,463 | |
Fairfax Financial Hldgs. | | BBB- | | 8.25 | | 10/01/15 | | 500,000 | | 563,194 | |
First Horizon National Corp. | | BB+ | | 4.50 | | 05/15/13 | | 1,500,000 | | 1,522,541 | |
Hartford Financial Svcs. | | BBB | | 5.50 | | 10/15/16 | | 250,000 | | 270,714 | |
HCP, Inc. | | BBB | | 5.65 | | 12/15/13 | | 250,000 | | 264,043 | |
Health Care REIT, Inc. | | BBB- | | 6.13 | | 04/15/20 | | 250,000 | | 278,300 | |
Markel Corp. | | BBB | | 6.80 | | 02/15/13 | | 250,000 | | 257,678 | |
Morgan Stanley | | A- | | 4.00 | | 07/24/15 | | 250,000 | | 248,548 | |
Old Republic Int’l. Corp. | | BBB+ | | 3.75 | | 03/15/18 | | 100,000 | | 90,000 | |
Pacific LifeCorp.† | | BBB+ | | 6.00 | | 02/10/20 | | 100,000 | | 109,154 | |
ProLogis LP | | BBB- | | 6.63 | | 05/15/18 | | 150,000 | | 173,014 | |
Prudential Financial, Inc. | | A | | 4.50 | | 11/16/21 | | 250,000 | | 259,474 | |
Raymond James Financial, Inc. | | BBB | | 4.25 | | 04/15/16 | | 250,000 | | 259,968 | |
Reckson Operating Partnership | | BBB- | | 6.00 | | 03/31/16 | | 100,000 | | 106,270 | |
Regency Centers LP | | BBB | | 4.95 | | 04/15/14 | | 250,000 | | 261,485 | |
Senior Housing Pptys. Trust | | BBB- | | 4.30 | | 01/15/16 | | 250,000 | | 250,232 | |
Ventas Realty LP/Capital Corp. | | BBB | | 4.00 | | 04/30/19 | | 100,000 | | 102,549 | |
Ventas Realty LP/Capital Corp. | | BBB | | 4.75 | | 06/01/21 | | 200,000 | | 207,768 | |
Zions Bancorporation | | BB+ | | 5.65 | | 05/15/14 | | 397,000 | | 410,085 | |
| | | | | | | | | | 10,867,934 | |
HEALTH CARE (1.3%) | | | | | | | | | | | |
Allergan, Inc. | | A+ | | 5.75 | | 04/01/16 | | 250,000 | | 289,761 | |
Bio-Rad Laboratories, Inc. | | BBB | | 4.88 | | 12/15/20 | | 200,000 | | 209,800 | |
CIGNA Corp. | | BBB | | 2.75 | | 11/15/16 | | 250,000 | | 257,568 | |
Laboratory Corp. of America | | BBB+ | | 5.63 | | 12/15/15 | | 500,000 | | 564,593 | |
Medco Health Solutions, Inc. | | BBB+ | | 4.13 | | 09/15/20 | | 250,000 | | 265,062 | |
PerkinElmer, Inc. | | BBB | | 5.00 | | 11/15/21 | | 100,000 | | 107,335 | |
Quest Diagnostics, Inc. | | BBB+ | | 4.75 | | 01/30/20 | | 250,000 | | 276,925 | |
WellPoint, Inc. | | A- | | 4.35 | | 08/15/20 | | 250,000 | | 274,888 | |
| | | | | | | | | | 2,245,932 | |
INDUSTRIALS (1.3%) | | | | | | | | | | | |
CSX Corp. | | BBB | | 6.25 | | 04/01/15 | | 250,000 | | 284,828 | |
Donnelley (R.R.) & Sons Co. | | BB+ | | 4.95 | | 04/01/14 | | 500,000 | | 506,250 | |
L-3 Communications Corp. | | BBB- | | 4.75 | | 07/15/20 | | 250,000 | | 266,654 | |
Masco Corp. | | BBB- | | 5.88 | | 07/15/12 | | 500,000 | | 500,375 | |
Pentair, Inc. | | BBB- | | 5.00 | | 05/15/21 | | 250,000 | | 277,142 | |
Pitney Bowes, Inc. | | BBB+ | | 5.25 | | 01/15/37 | | 250,000 | | 249,290 | |
URS Corp.† | | BBB- | | 5.00 | �� | 04/01/22 | | 100,000 | | 98,777 | |
| | | | | | | | | | 2,183,316 | |
INFORMATION TECHNOLOGY (0.1%) | | | | | | | | | | | |
Ingram Micro, Inc. | | BBB- | | 5.25 | | 09/01/17 | | 100,000 | | 107,205 | |
| | | | | | | | | | | |
MATERIALS (1.2%) | | | | | | | | | | | |
Freeport-McMoRan Copper & Gold | | BBB | | 3.55 | | 03/01/22 | | 100,000 | | 98,388 | |
Geon Co. | | BB- | | 7.50 | | 12/15/15 | | 1,000,000 | | 1,030,000 | |
Packaging Corp. of America | | BBB | | 3.90 | | 06/15/22 | | 250,000 | | 250,811 | |
Teck Resources Ltd. | | BBB | | 4.75 | | 01/15/22 | | 300,000 | | 322,352 | |
Vulcan Materials Co. | | BB | | 7.00 | | 06/15/18 | | 250,000 | | 266,250 | |
| | | | | | | | | | 1,967,801 | |
TELECOMMUNICATION SERVICES (0.3%) | | | | | | | | | | | |
CenturyLink, Inc. | | BB | | 5.00 | | 02/15/15 | | 500,000 | | 523,585 | |
| | | | | | | | | | | |
UTILITIES (1.2%) | | | | | | | | | | | |
AmerenEnergy Generating Co. | | BB- | | 6.30 | | 04/01/20 | | 250,000 | | 196,875 | |
Constellation Energy | | BBB- | | 5.15 | | 12/01/20 | | 340,000 | | 376,360 | |
Entergy Corp. | | BBB- | | 5.13 | | 09/15/20 | | 250,000 | | 259,551 | |
National Fuel Gas Co. | | BBB | | 4.90 | | 12/01/21 | | 250,000 | | | 269,695 | |
| | | | | | | | | | | | |
Progress Energy, Inc. | | A | | 5.25 | | 12/15/15 | | 500,000 | | 568,960 | |
SCANA Corp. | | BBB | | 4.13 | | 02/01/22 | | 300,000 | | 302,712 | |
| | | | | | | | | | 1,974,153 | |
TOTAL LONG-TERM DEBT SECURITIES
(Cost: $57,694,029) 37.1% | | | | | | | | | | 62,204,921 | |
| | | | | | | | | | | |
| | Rating** | | Rate(%) | | Maturity | | Face Amount | | Value | |
SHORT-TERM DEBT SECURITIES: | | | | | | | | | | | |
COMMERCIAL PAPER (4.5%) | | | | | | | | | | | |
Abbott Laboratories† | | A-1+ | | 0.14 | | 08/07/12 | | 1,000,000 | | 999,852 | |
General Electric Capital Corp. | | A-1+ | | 0.15 | | 07/11/12 | | 2,500,000 | | 2,499,885 | |
San Diego Gas & Electric Co.† | | A-1 | | 0.14 | | 07/02/12 | | 4,020,000 | | 4,019,969 | |
| | | | | | | | | | 7,519,706 | |
TOTAL SHORT-TERM DEBT SECURITIES
(Cost: $7,519,706) 4.5% | | | | | | | | | | 7,519,706 | |
| | | | | | | | | | | |
TEMPORARY CASH INVESTMENTS (2)
(Cost: $1,017,200) 0.6% | | | | | | | | | | 1,017,200 | |
| | | | | | | | | | | |
TOTAL INVESTMENTS
(Cost: $147,645,272) 99.8% | | | | | | | | | | 167,201,550 | |
| | | | | | | | | | | |
OTHER NET ASSETS 0.2% | | | | | | | | | | 269,033 | |
| | | | | | | | | | | |
NET ASSETS 100.0% | | | | | | | | | | $ | 167,470,583 | |
| | | | | | | | | | | | |
The accompanying notes are an integral part of these portfolio schedules.
MUTUAL OF AMERICA INVESTMENT CORPORATION - RETIREMENT INCOME FUND
PORTFOLIO OF INVESTMENTS IN SECURITIES
June 30, 2012 (Unaudited)
| | Shares | | Value | |
COMMON STOCKS: | | | | | |
DIVERSIFIED MUTUAL FUNDS (100.0%) | | | | | |
Mutual of America Investment Corporation | | | | | |
Bond Fund (29.9%) | | 5,350,714 | | 7,650,333 | |
Equity Index Fund (21.5%) | | 2,435,769 | | 5,511,181 | |
Mid-Cap Equity Index Fund (5.4%) | | 899,339 | | 1,392,832 | |
Mid-Term Bond Fund (37.0%) | | 8,795,076 | | 9,492,974 | |
Money Market Fund (6.2%) | | 1,321,573 | | 1,587,751 | |
TOTAL INVESTMENTS
(Cost: $24,511,659) 100.0% | | | | 25,635,071 | |
OTHER NET ASSETS | | | | — | |
| | | | | | |
NET ASSETS 100.0% | | | | $ | 25,635,071 | |
The accompanying notes are an integral part of these portfolio schedules.
MUTUAL OF AMERICA INVESTMENT CORPORATION - 2010 RETIREMENT FUND
PORTFOLIO OF INVESTMENTS IN SECURITIES
June 30, 2012 (Unaudited)
| | Shares | | Value | |
COMMON STOCKS: | | | | | |
DIVERSIFIED MUTUAL FUNDS (100.0%) | | | | | |
Mutual of America Investment Corporation | | | | | |
Bond Fund (24.7%) | | 3,677,377 | | 5,257,833 | |
Equity Index Fund (26.4%) | | 2,493,687 | | 5,642,226 | |
International Fund (3.3%) | | 1,132,867 | | 701,068 | |
Mid-Cap Equity Index Fund (15.2%) | | 2,085,918 | | 3,230,521 | |
Mid-Term Bond Fund (26.2%) | | 5,189,468 | | 5,601,258 | |
Money Market Fund (4.2%) | | 745,480 | | 895,627 | |
TOTAL INVESTMENTS
(Cost: $19,721,499) 100.0% | | | | 21,328,533 | |
OTHER NET ASSETS | | | | — | |
| | | | | | |
NET ASSETS 100.0% | | | | $ | 21,328,533 | |
The accompanying notes are an integral part of these portfolio schedules.
MUTUAL OF AMERICA INVESTMENT CORPORATION - 2015 RETIREMENT FUND
PORTFOLIO OF INVESTMENTS IN SECURITIES
June 30, 2012 (Unaudited)
| | Shares | | Value | |
COMMON STOCKS: | | | | | |
DIVERSIFIED MUTUAL FUNDS (100.0%) | | | | | |
Mutual of America Investment Corporation | | | | | |
Bond Fund (24.9%) | | 17,693,425 | | 25,297,671 | |
Equity Index Fund (31.3%) | | 14,070,491 | | 31,835,950 | |
International Fund (6.5%) | | 10,586,722 | | 6,551,529 | |
Mid-Cap Equity Index Fund (11.8%) | | 7,757,657 | | 12,014,508 | |
Mid-Term Bond Fund (17.7%) | | 16,600,186 | | 17,917,427 | |
Money Market Fund (3.4%) | | 2,912,741 | | 3,499,396 | |
Small Cap Growth Fund (2.2%) | | 1,818,400 | | 2,258,335 | |
Small Cap Value Fund (2.2%) | | 1,738,199 | | 2,212,439 | |
TOTAL INVESTMENTS
(Cost: $90,333,151) 100.0% | | | | 101,587,255 | |
OTHER NET ASSETS | | | | — | |
�� | | | | | | |
NET ASSETS 100.0% | | | | $ | 101,587,255 | |
The accompanying notes are an integral part of these portfolio schedules.
MUTUAL OF AMERICA INVESTMENT CORPORATION - 2020 RETIREMENT FUND
PORTFOLIO OF INVESTMENTS IN SECURITIES
June 30, 2012 (Unaudited)
| | Shares | | Value | |
COMMON STOCKS: | | | | | |
DIVERSIFIED MUTUAL FUNDS (100.0%) | | | | | |
Mutual of America Investment Corporation | | | | | |
Bond Fund (23.8%) | | 23,430,126 | | 33,499,878 | |
Equity Index Fund (35.5%) | | 22,033,413 | | 49,852,889 | |
International Fund (7.6%) | | 17,257,541 | | 10,679,726 | |
Mid-Cap Equity Index Fund (11.6%) | | 10,461,360 | | 16,201,812 | |
Mid-Term Bond Fund (12.9%) | | 16,738,778 | | 18,067,017 | |
Small Cap Growth Fund (4.3%) | | 4,878,150 | | 6,058,345 | |
Small Cap Value Fund (4.3%) | | 4,692,315 | | 5,972,538 | |
TOTAL INVESTMENTS
(Cost: $125,185,143) 100.0% | | | | 140,332,205 | |
OTHER NET ASSETS | | | | — | |
| | | | | | |
NET ASSETS 100.0% | | | | $ | 140,332,205 | |
The accompanying notes are an integral part of these portfolio schedules.
MUTUAL OF AMERICA INVESTMENT CORPORATION - 2025 RETIREMENT FUND
PORTFOLIO OF INVESTMENTS IN SECURITIES
June 30, 2012 (Unaudited)
| | Shares | | Value | |
COMMON STOCKS: | | | | | |
DIVERSIFIED MUTUAL FUNDS (100.0%) | | | | | |
Mutual of America Investment Corporation | | | | | |
Bond Fund (19.4%) | | 18,379,916 | | 26,279,200 | |
Equity Index Fund (40.1%) | | 22,829,466 | | 51,654,041 | |
International Fund (7.9%) | | 15,887,894 | | 9,832,128 | |
Mid-Cap Equity Index Fund (16.1%) | | 13,037,367 | | 20,191,348 | |
Mid-Term Bond Fund (5.9%) | | 7,384,545 | | 7,970,516 | |
Small Cap Growth Fund (5.4%) | | 5,565,302 | | 6,911,744 | |
Small Cap Value Fund (5.2%) | | 5,359,131 | | 6,821,284 | |
TOTAL INVESTMENTS
(Cost: $114,171,660) 100.0% | | | | 129,660,261 | |
OTHER NET ASSETS | | | | — | |
| | | | | | |
NET ASSETS 100.0% | | | | $ | 129,660,261 | |
The accompanying notes are an integral part of these portfolio schedules.
MUTUAL OF AMERICA INVESTMENT CORPORATION - 2030 RETIREMENT FUND
PORTFOLIO OF INVESTMENTS IN SECURITIES
June 30, 2012 (Unaudited)
| | Shares | | Value | |
COMMON STOCKS: | | | | | |
DIVERSIFIED MUTUAL FUNDS (100.0%) | | | | | |
Mutual of America Investment Corporation | | | | | |
Bond Fund (19.7%) | | 14,675,860 | | 20,983,222 | |
Equity Index Fund (41.1%) | | 19,351,221 | | 43,784,151 | |
International Fund (8.4%) | | 14,436,237 | | 8,933,779 | |
Mid-Cap Equity Index Fund (18.1%) | | 12,482,522 | | 19,332,044 | |
Small Cap Growth Fund (6.4%) | | 5,460,813 | | 6,781,974 | |
Small Cap Value Fund (6.3%) | | 5,259,304 | | 6,694,220 | |
TOTAL INVESTMENTS
(Cost: $93,022,440) 100.0% | | | | 106,509,390 | |
OTHER NET ASSETS | | | | — | |
| | | | | | |
NET ASSETS 100.0% | | | | $ | 106,509,390 | |
The accompanying notes are an integral part of these portfolio schedules.
MUTUAL OF AMERICA INVESTMENT CORPORATION - 2035 RETIREMENT FUND
PORTFOLIO OF INVESTMENTS IN SECURITIES
June 30, 2012 (Unaudited)
| | Shares | | Value | |
COMMON STOCKS: | | | | | |
DIVERSIFIED MUTUAL FUNDS (100.0%) | | | | | |
Mutual of America Investment Corporation | | | | | |
Bond Fund (12.9%) | | 7,543,062 | | 10,784,904 | |
Equity Index Fund (41.1%) | | 15,135,317 | | 34,245,229 | |
International Fund (10.1%) | | 13,599,912 | | 8,416,224 | |
Mid-Cap Equity Index Fund (21.2%) | | 11,429,289 | | 17,700,872 | |
Small Cap Growth Fund (7.4%) | | 4,985,763 | | 6,191,993 | |
Small Cap Value Fund (7.3%) | | 4,798,896 | | 6,108,198 | |
TOTAL INVESTMENTS
(Cost: $72,590,456) 100.0% | | | | 83,447,420 | |
OTHER NET ASSETS | | | | — | |
| | | | | | |
NET ASSETS 100.0% | | | | $ | 83,447,420 | |
The accompanying notes are an integral part of these portfolio schedules.
MUTUAL OF AMERICA INVESTMENT CORPORATION - 2040 RETIREMENT FUND
PORTFOLIO OF INVESTMENTS IN SECURITIES
June 30, 2012 (Unaudited)
| | Shares | | Value | |
COMMON STOCKS: | | | | | |
DIVERSIFIED MUTUAL FUNDS (100.0%) | | | | | |
Mutual of America Investment Corporation | | | | | |
Bond Fund (10.6%) | | 5,611,847 | | 8,023,695 | |
Equity Index Fund (35.9%) | | 12,050,815 | | 27,266,223 | |
International Fund (11.8%) | | 14,488,375 | | 8,966,044 | |
Mid-Cap Equity Index Fund (24.8%) | | 12,117,554 | | 18,766,807 | |
Small Cap Growth Fund (8.5%) | | 5,167,463 | | 6,417,653 | |
Small Cap Value Fund (8.4%) | | 4,977,548 | | 6,335,593 | |
TOTAL INVESTMENTS
(Cost: $66,289,732) 100.0% | | | | 75,776,015 | |
OTHER NET ASSETS | | | | — | |
| | | | | | |
NET ASSETS 100.0% | | | | $ | 75,776,015 | |
The accompanying notes are an integral part of these portfolio schedules.
MUTUAL OF AMERICA INVESTMENT CORPORATION - 2045 RETIREMENT FUND
PORTFOLIO OF INVESTMENTS IN SECURITIES
June 30, 2012 (Unaudited)
| | Shares | | Value | |
COMMON STOCKS: | | | | | |
DIVERSIFIED MUTUAL FUNDS (100.0%) | | | | | |
Mutual of America Investment Corporation | | | | | |
Bond Fund (9.7%) | | 6,373,437 | | 9,112,600 | |
Equity Index Fund (36.0%) | | 15,016,584 | | 33,976,584 | |
International Fund (12.8%) | | 19,474,919 | | 12,051,937 | |
Mid-Cap Equity Index Fund (20.6%) | | 12,530,375 | | 19,406,155 | |
Small Cap Growth Fund (10.5%) | | 8,000,345 | | 9,935,909 | |
Small Cap Value Fund (10.4%) | | 7,724,825 | | 9,832,420 | |
TOTAL INVESTMENTS
(Cost: $82,828,982) 100.0% | | | | 94,315,605 | |
OTHER NET ASSETS | | | | — | |
| | | | | | |
NET ASSETS 100.0% | | | | $ | 94,315,605 | |
The accompanying notes are an integral part of these portfolio schedules.
MUTUAL OF AMERICA INVESTMENT CORPORATION - CONSERVATIVE ALLOCATION FUND
PORTFOLIO OF INVESTMENTS IN SECURITIES
June 30, 2012 (Unaudited)
| | Shares | | Value | |
COMMON STOCKS: | | | | | |
DIVERSIFIED MUTUAL FUNDS (100.0%) | | | | | |
Mutual of America Investment Corporation | | | | | |
Bond Fund (29.3%) | | 15,374,589 | | 21,982,250 | |
Equity Index Fund (27.3%) | | 9,040,380 | | 20,454,799 | |
Mid-Term Bond Fund (43.4%) | | 30,152,115 | | 32,544,715 | |
TOTAL INVESTMENTS
(Cost: $69,027,142) 100.0% | | | | 74,981,764 | |
OTHER NET ASSETS | | | | — | |
| | | | | | |
NET ASSETS 100.0% | | | | $ | 74,981,764 | |
The accompanying notes are an integral part of these portfolio schedules.
MUTUAL OF AMERICA INVESTMENT CORPORATION - MODERATE ALLOCATION FUND
PORTFOLIO OF INVESTMENTS IN SECURITIES
June 30, 2012 (Unaudited)
| | Shares | | Value | |
COMMON STOCKS: | | | | | |
DIVERSIFIED MUTUAL FUNDS (100.0%) | | | | | |
Mutual of America Investment Corporation | | | | | |
Bond Fund (28.5%) | | 40,313,881 | | 57,639,900 | |
Equity Index Fund (37.4%) | | 33,449,885 | | 75,683,843 | |
Mid-Cap Equity Index Fund (15.4%) | | 20,142,057 | | 31,194,588 | |
Mid-Term Bond Fund (18.7%) | | 35,128,404 | | 37,915,878 | |
TOTAL INVESTMENTS
(Cost: $177,788,144) 100.0% | | | | 202,434,209 | |
OTHER NET ASSETS | | | | — | |
| | | | | | |
NET ASSETS 100.0% | | | | $ | 202,434,209 | |
The accompanying notes are an integral part of these portfolio schedules.
MUTUAL OF AMERICA INVESTMENT CORPORATION - AGGRESSIVE ALLOCATION FUND
PORTFOLIO OF INVESTMENTS IN SECURITIES
June 30, 2012 (Unaudited)
| | Shares | | Value | |
COMMON STOCKS: | | | | | |
DIVERSIFIED MUTUAL FUNDS (100.0%) | | | | | |
Mutual of America Investment Corporation | | | | | |
Bond Fund (23.0%) | | 28,228,412 | | 40,360,364 | |
Equity Index Fund (46.9%) | | 36,271,735 | | 82,068,572 | |
Mid-Cap Equity Index Fund (20.0%) | | 22,627,992 | | 35,044,628 | |
Small Cap Growth Fund (5.0%) | | 7,080,217 | | 8,793,169 | |
Small Cap Value Fund (5.1%) | | 6,982,374 | | 8,887,403 | |
TOTAL INVESTMENTS
(Cost: $153,883,095) 100.0% | | | | 175,154,136 | |
OTHER NET ASSETS | | | | — | |
| | | | | | |
NET ASSETS 100.0% | | | | $ | 175,154,136 | |
The accompanying notes are an integral part of these portfolio schedules.
MUTUAL OF AMERICA INVESTMENT CORPORATION - MONEY MARKET FUND
PORTFOLIO OF INVESTMENTS IN SECURITIES
June 30, 2012 (Unaudited)
| | Rating** | | Rate(%) | | Maturity | | Face Amount | | Value | |
SHORT-TERM DEBT SECURITIES: | | | | | | | | | | | |
U.S. GOVERNMENT (17.0%) | | | | | | | | | | | |
U.S. Treasury Bill | | A-1+ | | 0.09 | | 08/16/12 | | 10,000,000 | | 9,997,856 | |
U.S. Treasury Bill | | A-1+ | | 0.09 | | 09/27/12 | | 5,000,000 | | 4,999,000 | |
U.S. Treasury Bill | | A-1+ | | 0.09 | | 09/27/12 | | 1,500,000 | | 1,499,700 | |
| | | | | | | | | | 16,496,556 | |
U.S. GOVERNMENT AGENCIES (8.1%) | | | | | | | | | | | |
FHLMC | | A-1+ | | 0.11 | | 07/05/12 | | 2,842,000 | | 2,841,957 | |
FHLMC | | A-1+ | | 0.11 | | 07/10/12 | | 3,000,000 | | 2,999,908 | |
FHLMC | | A-1+ | | 0.11 | | 09/24/12 | | 2,000,000 | | 1,999,381 | |
| | | | | | | | | | 7,841,246 | |
COMMERCIAL PAPER (74.8%) | | | | | | | | | | | |
Abbott Laboratories† | | A-1+ | | 0.15 | | 08/07/12 | | 700,000 | | 699,888 | |
Abbott Laboratories† | | A-1+ | | 0.15 | | 08/13/12 | | 300,000 | | 299,945 | |
Baker Hughes, Inc.† | | A-1 | | 0.17 | | 08/17/12 | | 3,800,000 | | 3,799,139 | |
Becton, Dickinson & Co. | | A-1+ | | 0.14 | | 08/24/12 | | 3,700,000 | | 3,699,209 | |
Coca-Cola Co.† | | A-1 | | 0.14 | | 08/13/12 | | 900,000 | | 899,846 | |
Coca-Cola Co.† | | A-1 | | 0.15 | | 07/02/12 | | 250,000 | | 249,994 | |
Coca-Cola Co.† | | A-1 | | 0.15 | | 07/27/12 | | 1,700,000 | | 1,699,615 | |
Coca-Cola Co.† | | A-1 | | 0.15 | | 08/08/12 | | 950,000 | | 949,846 | |
ConocoPhillips† | | A-1 | | 0.12 | | 07/13/12 | | 3,800,000 | | 3,799,835 | |
Danaher Corp.† | | A-1 | | 0.17 | | 07/10/12 | | 900,000 | | 899,958 | |
Dell, Inc.† | | A-1 | | 0.14 | | 07/23/12 | | 2,700,000 | | 2,699,759 | |
Dell, Inc.† | | A-1 | | 0.17 | | 07/09/12 | | 1,100,000 | | 1,099,953 | |
Disney (Walt) Co.† | | A-1 | | 0.12 | | 07/10/12 | | 1,000,000 | | 999,967 | |
Disney (Walt) Co.† | | A-1 | | 0.15 | | 07/10/12 | | 871,000 | | 870,964 | |
Du Pont (EI) de Nemours & Co.† | | A-1 | | 0.16 | | 08/06/12 | | 3,150,000 | | 3,149,482 | |
Du Pont (EI) de Nemours & Co.† | | A-1 | | 0.21 | | 09/12/12 | | 650,000 | | 649,458 | |
Emerson Electric Co.† | | A-1 | | 0.14 | | 07/17/12 | | 3,850,000 | | 3,849,277 | |
General Electric Capital Corp.† | | A-1+ | | 0.15 | | 08/01/12 | | 3,650,000 | | 3,649,513 | |
Google, Inc.† | | A-1+ | | 0.13 | | 08/14/12 | | 1,100,000 | | 1,099,733 | |
Illinois Tool Works, Inc.† | | A-1 | | 0.13 | | 07/19/12 | | 3,800,000 | | 3,799,739 | |
McDonald’s Corp.† | | A-1 | | 0.13 | | 07/25/12 | | 2,000,000 | | 1,999,566 | |
McDonald’s Corp.† | | A-1 | | 0.15 | | 07/09/12 | | 300,000 | | 299,989 | |
Medtronic, Inc.† | | A-1+ | | 0.14 | | 09/20/12 | | 2,000,000 | | 1,998,893 | |
Nestle Capital Corp.† | | A-1+ | | 0.14 | | 07/30/12 | | 3,900,000 | | 3,899,491 | |
New Jersey Natural Gas | | A-1 | | 0.11 | | 07/19/12 | | 2,000,000 | | 1,999,884 | |
New Jersey Natural Gas | | A-1 | | 0.12 | | 07/06/12 | | 400,000 | | 399,992 | |
New Jersey Natural Gas | | A-1 | | 0.12 | | 07/11/12 | | 1,400,000 | | 1,399,949 | |
Private Export Funding Corp.† | | A-1 | | 0.16 | | 09/07/12 | | 3,800,000 | | 3,797,192 | |
Procter & Gamble Co.† | | A-1+ | | 0.12 | | 07/06/12 | | 700,000 | | 699,986 | |
Rockwell Collins, Inc.† | | A-1 | | 0.12 | | 07/13/12 | | 1,600,000 | | 1,599,931 | |
San Diego Gas & Electric Co.† | | A-1 | | 0.15 | | 07/06/12 | | 3,800,000 | | 3,799,905 | |
Toyota Motor Credit Corp. | | A-1+ | | 0.15 | | 07/09/12 | | 3,900,000 | | 3,899,854 | |
Unilever Capital Corp.† | | A-1 | | 0.13 | | 07/31/12 | | 2,850,000 | | 2,849,681 | |
Unilever Capital Corp.† | | A-1 | | 0.18 | | 08/02/12 | | 1,000,000 | | 999,776 | |
Wal-Mart Stores† | | A-1+ | | 0.13 | | 07/16/12 | | 1,100,000 | | 1,099,928 | |
Wal-Mart Stores† | | A-1+ | | 0.13 | | 08/06/12 | | 1,099,000 | | 1,098,853 | |
Wal-Mart Stores† | | A-1+ | | 0.14 | | 08/06/12 | | 1,651,000 | | 1,650,762 | |
| | | | | | | | | | 72,358,752 | |
TOTAL SHORT-TERM DEBT SECURITIES | | | | | | | | | | | |
(Cost: $96,700,907) 99.9% | | | | | | | | | | 96,696,554 | |
| | | | | | | | | | | |
TEMPORARY CASH INVESTMENTS (2) | | | | | | | | | | | |
(Cost: $94,900) 0.1% | | | | | | | | | | 94,900 | |
| | | | | | | | | | | |
TOTAL INVESTMENTS | | | | | | | | | | | |
(Cost: $96,795,807) 100.0% | | | | | | | | | | 96,791,454 | |
| | | | | | | | | | | |
OTHER NET ASSETS 0.0% (3) | | | | | | | | | | 64 | |
| | | | | | | | | | | |
NET ASSETS 100.0% | | | | | | | | | | $ | 96,791,518 | |
| | | | | | | | | | | | |
The accompanying notes are an integral part of these portfolio schedules.
MUTUAL OF AMERICA INVESTMENT CORPORATION - MID-TERM BOND FUND
PORTFOLIO OF INVESTMENTS IN SECURITIES
June 30, 2012 (Unaudited)
| | Rating** | | Rate(%) | | Maturity | | Face Amount | | Value | |
LONG-TERM DEBT SECURITIES: | | | | | | | | | | | |
U.S. GOVERNMENT (42.2%) | | | | | | | | | | | |
U.S. Treasury Note | | AA+ | | 1.00 | | 10/31/16 | | 5,000,000 | | 5,076,170 | |
U.S. Treasury Note | | AA+ | | 1.25 | | 08/31/15 | | 9,000,000 | | 9,224,298 | |
U.S. Treasury Note | | AA+ | | 1.88 | | 06/30/15 | | 5,000,000 | | 5,213,280 | |
U.S. Treasury Note | | AA+ | | 1.88 | | 10/31/17 | | 5,000,000 | | 5,275,000 | |
U.S. Treasury Note | | AA+ | | 2.25 | | 11/30/17 | | 3,500,000 | | 3,762,500 | |
U.S. Treasury Note | | AA+ | | 2.38 | | 03/31/16 | | 3,500,000 | | 3,736,523 | |
U.S. Treasury Note | | AA+ | | 2.50 | | 03/31/15 | | 1,500,000 | | 1,586,250 | |
U.S. Treasury Note | | AA+ | | 3.00 | | 02/28/17 | | 16,500,000 | | 18,236,356 | |
U.S. Treasury Note | | AA+ | | 3.13 | | 05/15/19 | | 3,000,000 | | 3,409,686 | |
U.S. Treasury Note | | AA+ | | 3.25 | | 05/31/16 | | 10,000,000 | | 11,034,380 | |
U.S. Treasury Note | | AA+ | | 3.25 | | 07/31/16 | | 7,000,000 | | 7,747,579 | |
U.S. Treasury Strip | | AA+ | | 0.00 | | 08/15/17 | | 15,000,000 | | 14,361,493 | |
U.S. Treasury Strip | | AA+ | | 0.00 | | 11/15/17 | | 5,000,000 | | 4,769,735 | |
U.S. Treasury Strip | | AA+ | | 0.00 | | 08/15/18 | | 55,000,000 | | 51,703,735 | |
| | | | | | | | | | 145,136,985 | |
U.S. GOVERNMENT AGENCIES (13.5%) | | | | | | | | | | | |
MORTGAGE-BACKED OBLIGATIONS (0.0%) (3) | | | | | | | | | | | |
FHLMC | | AA+ | | 6.00 | | 02/01/19 | | 5,703 | | 6,355 | |
FHLMC | | AA+ | | 6.50 | | 04/01/14 | | 15,937 | | 16,448 | |
FHLMC | | AA+ | | 7.00 | | 02/01/14 | | 5,406 | | 5,613 | |
FHLMC | | AA+ | | 7.50 | | 03/15/21 | | 8,409 | | 9,605 | |
FHLMC | | AA+ | | 8.00 | | 09/01/18 | | 1,461 | | 1,482 | |
FHLMC | | AA+ | | 8.50 | | 09/01/17 | | 2,228 | | 2,264 | |
FNMA | | AA+ | | 6.00 | | 09/01/12 | | 16 | | 16 | |
FNMA | | AA+ | | 6.50 | | 08/01/13 | | 2,299 | | 2,404 | |
FNMA | | AA+ | | 8.00 | | 06/01/17 | | 287 | | 288 | |
| | | | | | | | | | 44,475 | |
NON-MORTGAGE-BACKED OBLIGATIONS (13.5%) | | | | | | | | | | | |
FFCB | | AA+ | | 4.95 | | 10/10/14 | | 12,500,000 | | 13,777,275 | |
FFCB | | AA+ | | 5.10 | | 08/05/13 | | 5,000,000 | | 5,260,115 | |
FHLB | | AA+ | | 1.38 | | 05/28/14 | | 17,000,000 | | 17,343,922 | |
FNMA | | AA+ | | 1.25 | | 02/27/14 | | 10,000,000 | | 10,167,080 | |
| | | | | | | | | | 46,548,392 | |
CORPORATE DEBT (42.1%) | | | | | | | | | | | |
CONSUMER DISCRETIONARY (3.7%) | | | | | | | | | | | |
AutoZone, Inc. | | BBB | | 4.00 | | 11/15/20 | | 700,000 | | 748,198 | |
AutoZone, Inc. | | BBB | | 6.50 | | 01/15/14 | | 1,000,000 | | 1,080,533 | |
Best Buy Co., Inc. | | BBB- | | 6.75 | | 07/15/13 | | 1,000,000 | | 1,042,301 | |
Brinker International, Inc. | | BBB- | | 5.75 | | 06/01/14 | | 1,000,000 | | 1,068,468 | |
Ethan Allen Interiors, Inc. | | BB- | | 5.38 | | 10/01/15 | | 500,000 | | 506,187 | |
Home Depot, Inc. | | A- | | 5.40 | | 03/01/16 | | 250,000 | | 288,206 | |
Hyatt Hotels Corp. | | BBB | | 3.88 | | 08/15/16 | | 1,525,000 | | 1,615,619 | |
Hyatt Hotels Corp.† | | BBB | | 5.75 | | 08/15/15 | | 200,000 | | 219,308 | |
Johnson Controls, Inc. | | BBB+ | | 4.88 | | 09/15/13 | | 250,000 | | 261,268 | |
Kohl’s Corp. | | BBB+ | | 4.00 | | 11/01/21 | | 1,000,000 | | 1,039,360 | |
Leggett & Platt, Inc. | | BBB+ | | 4.70 | | 04/01/13 | | 750,000 | | 769,150 | |
Marriott International, Inc. | | BBB | | 3.00 | | 03/01/19 | | 1,200,000 | | 1,213,278 | |
Marriott International, Inc. | | BBB | | 5.63 | | 02/15/13 | | 750,000 | | 770,529 | |
Newell Rubbermaid, Inc. | | BBB- | | 5.50 | | 04/15/13 | | 500,000 | | 516,919 | |
Scholastic Corp. | | BB- | | 5.00 | | 04/15/13 | | 250,000 | | 253,125 | |
Whirlpool Corp. | | BBB- | | 5.50 | | 03/01/13 | | 850,000 | | 872,441 | |
Whirlpool Corp. | | BBB- | | 6.50 | | 06/15/16 | | 500,000 | | 556,344 | |
| | | | | | | | | | 12,821,234 | |
CONSUMER STAPLES (2.7%) | | | | | | | | | | | |
Anheuser-Busch Cos., Inc. | | A | | 4.38 | | 01/15/13 | | 1,000,000 | | 1,017,152 | |
Avon Products, Inc. | | BBB- | | 4.20 | | 07/15/18 | | 1,800,000 | | 1,812,281 | |
Cargill, Inc.† | | A | | 5.20 | | 01/22/13 | | 1,000,000 | | 1,023,884 | |
Clorox Co. | | BBB+ | | 5.00 | | 03/01/13 | | 500,000 | | 514,067 | |
Clorox Co. | | BBB+ | | 5.00 | | 01/15/15 | | 300,000 | | 327,482 | |
CVS Caremark Corp. | | BBB+ | | 6.13 | | 08/15/16 | | 500,000 | | 584,857 | |
Dr. Pepper Snapple Group, Inc. | | BBB | | 2.60 | | 01/15/19 | | 150,000 | | 152,347 | |
Hershey Co. | | A | | 4.85 | | 08/15/15 | | 500,000 | | 559,569 | |
Hershey Co. | | A | | 5.00 | | 04/01/13 | | 500,000 | | 516,396 | |
Ingredion, Inc. | | BBB | | 4.63 | | 11/01/20 | | 275,000 | | 297,983 | |
Kraft Foods, Inc. | | BBB- | | 5.25 | | 10/01/13 | | 500,000 | | 526,308 | |
Kroger Co. | | BBB | | 4.95 | | 01/15/15 | | 500,000 | | 544,531 | |
Molson Coors Brewing Co. | | BBB- | | 3.50 | | 05/01/22 | | 400,000 | | 410,714 | |
Safeway, Inc. | | BBB | | 3.95 | | 08/15/20 | | 1,000,000 | | 964,908 | |
| | | | | | | | | | 9,252,479 | |
ENERGY (3.2%) | | | | | | | | | | | |
Diamond Offshore Drilling, Inc. | | A- | | 4.88 | | 07/01/15 | | 500,000 | | 546,317 | |
Enbridge, Inc. | | A- | | 5.80 | | 06/15/14 | | 1,065,000 | | 1,156,372 | |
Kinder Morgan, Inc. | | BB | | 5.15 | | 03/01/15 | | 250,000 | | 261,875 | |
Marathon Petroleum Corp. | | BBB | | 3.50 | | 03/01/16 | | 1,500,000 | | 1,572,360 | |
Nabors Industries Ltd. | | BBB | | 5.38 | | 08/15/12 | | 750,000 | | 753,019 | |
National Oilwell Varco, Inc. | | A- | | 6.13 | | 08/15/15 | | 1,000,000 | | 1,015,453 | |
Noble Corp. | | A- | | 5.88 | | 06/01/13 | | 1,000,000 | | 1,044,394 | |
Sunoco, Inc. | | BB+ | | 4.88 | | 10/15/14 | | 500,000 | | 528,213 | |
Sunoco, Inc. | | BB+ | | 5.75 | | 01/15/17 | | 290,000 | | 308,097 | |
Sunoco, Inc. | | BB+ | | 9.63 | | 04/15/15 | | 500,000 | | 578,131 | |
Transocean, Inc. | | BBB- | | 1.50 | | 12/15/37 | | 1,200,000 | | 1,194,000 | |
Valero Energy Corp. | | BBB | | 4.75 | | 06/15/13 | | 1,000,000 | | 1,034,040 | |
Weatherford Int’l. Ltd. | | BBB | | 5.15 | | 03/15/13 | | 500,000 | | 513,517 | |
Weatherford Int’l. Ltd. | | BBB | | 5.50 | | 02/15/16 | | 500,000 | | 554,925 | |
| | | | | | | | | | 11,060,713 | |
FINANCIALS (15.7%) | | | | | | | | | | | |
Aflac, Inc. | | A- | | 2.65 | | 02/15/17 | | 1,500,000 | | 1,534,662 | |
American Express Credit Corp. | | A- | | 5.88 | | 05/02/13 | | 1,000,000 | | 1,041,690 | |
Bank of America Corp. | | A- | | 3.70 | | 09/01/15 | | 250,000 | | 252,562 | |
Bank of America Corp. | | BBB+ | | 5.75 | | 08/15/16 | | 500,000 | | 519,941 | |
Block Financial LLC | | BBB | | 5.13 | | 10/30/14 | | 750,000 | | 773,487 | |
Block Financial LLC | | BBB | | 7.88 | | 01/15/13 | | 750,000 | | 768,829 | |
Boston Properties LP | | A- | | 3.70 | | 11/15/18 | | 470,000 | | 491,102 | |
Bunge Ltd. Finance Corp. | | BBB- | | 5.10 | | 07/15/15 | | 1,000,000 | | 1,068,597 | |
Caterpillar Financial Services | | A | | 6.13 | | 02/17/14 | | 1,000,000 | | 1,085,929 | |
Citigroup, Inc. | | BBB+ | | 5.63 | | 08/27/12 | | 1,500,000 | | 1,508,987 | |
CNA Financial Corp. | | BBB- | | 5.85 | | 12/15/14 | | 200,000 | | 214,577 | |
CNA Financial Corp. | | BBB- | | 6.50 | | 08/15/16 | | 1,000,000 | | 1,125,273 | |
Duke Realty LP | | BBB- | | 4.63 | | 05/15/13 | | 500,000 | | 510,927 | |
Erac USA Finance Co.† | | BBB+ | | 2.75 | | 03/15/17 | | 1,000,000 | | 1,014,052 | |
ERP Operating LP | | BBB+ | | 5.38 | | 08/01/16 | | 500,000 | | 560,033 | |
Fairfax Financial Hldgs. | | BBB- | | 8.25 | | 10/01/15 | | 742,000 | | 835,779 | |
First Horizon National Corp. | | BB+ | | 4.50 | | 05/15/13 | | 125,000 | | 126,878 | |
Fosters Finance Corp.† | | BBB+ | | 4.88 | | 10/01/14 | | 500,000 | | 535,231 | |
General Electric Capital Corp. | | AA+ | | 5.00 | | 01/08/16 | | 500,000 | | 550,916 | |
Goldman Sachs Group, Inc. | | A- | | 3.70 | | 08/01/15 | | 900,000 | | 907,953 | |
Harley-Davidson Financial Svcs.† | | BBB+ | | 3.88 | | 03/15/16 | | 500,000 | | 528,072 | |
Harley-Davidson Funding† | | BBB+ | | 5.25 | | 12/15/12 | | 1,000,000 | | 1,016,465 | |
Hartford Financial Svcs. | | BBB | | 4.00 | | 10/15/17 | | 850,000 | | 853,526 | |
Hartford Financial Svcs. | | BBB | | 5.50 | | 10/15/16 | | 1,000,000 | | 1,082,854 | |
HCP, Inc. | | BBB | | 5.65 | | 12/15/13 | | 500,000 | | 528,087 | |
HCP, Inc. | | BBB | | 6.00 | | 01/30/17 | | 1,250,000 | | 1,400,423 | |
Health Care REIT, Inc. | | BBB- | | 3.63 | | 03/15/16 | | 1,750,000 | | 1,798,984 | |
HSBC Finance Corp. | | A | | 3.87 | | 11/10/13 | | 40,000 | | 40,280 | |
HSBC Finance Corp. | | A | | 3.90 | | 11/10/13 | | 43,000 | | 43,390 | |
HSBC Finance Corp. | | A | | 4.68 | | 11/10/13 | | 70,000 | | 70,800 | |
Jefferson-Pilot Corp. | | A- | | 4.75 | | 01/30/14 | | 500,000 | | 519,587 | |
Kemper Corp. | | BBB- | | 6.00 | | 11/30/15 | | 1,500,000 | | 1,572,399 | |
KeyCorp | | BBB+ | | 6.50 | | 05/14/13 | | 1,050,000 | | 1,099,812 | |
Kimco Realty Corp. | | BBB+ | | 6.00 | | 11/30/12 | | 1,000,000 | | 1,016,156 | |
Lincoln National Corp. | | A- | | 5.65 | | 08/27/12 | | 400,000 | | 402,748 | |
Mack-Cali Realty LP | | BBB | | 5.80 | | 01/15/16 | | 1,000,000 | | 1,079,107 | |
Markel Corp. | | BBB | | 6.80 | | 02/15/13 | | 1,000,000 | | 1,030,710 | |
MetLife, Inc. | | A- | | 5.00 | | 11/24/13 | | 250,000 | | 264,923 | |
Morgan Stanley | | A- | | 2.88 | | 01/24/14 | | 500,000 | | 494,374 | |
Morgan Stanley | | A- | | 4.00 | | 07/24/15 | | 1,000,000 | | 994,193 | |
Nissan Motor Acceptance Corp.† | | BBB+ | | 4.50 | | 01/30/15 | | 790,000 | | 841,657 | |
Odyssey Re Hldgs. Corp. | | BBB- | | 6.88 | | 05/01/15 | | 250,000 | | 269,510 | |
Old Republic Int’l. Corp. | | BBB+ | | 3.75 | | 03/15/18 | | 750,000 | | 675,000 | |
ProLogis LP | | BBB- | | 6.63 | | 05/15/18 | | 1,500,000 | | 1,730,138 | |
Protective Life Corp. | | A- | | 4.88 | | 11/01/14 | | 1,000,000 | | 1,061,937 | |
Prudential Financial, Inc. | | A | | 4.75 | | 09/17/15 | | 1,000,000 | | 1,076,612 | |
Raymond James Financial, Inc. | | BBB | | 4.25 | | 04/15/16 | | 1,600,000 | | 1,663,795 | |
Reckson Operating Partnership | | BBB- | | 6.00 | | 03/31/16 | | 1,700,000 | | 1,806,597 | |
Regency Centers LP | | BBB | | 4.95 | | 04/15/14 | | 500,000 | | 522,970 | |
Reinsurance Grp. of America, Inc. | | A- | | 5.63 | | 03/15/17 | | 1,500,000 | | 1,635,380 | |
Senior Housing Pptys. Trust | | BBB- | | 4.30 | | 01/15/16 | | 1,650,000 | | 1,651,531 | |
Simon Property Group LP | | A- | | 2.80 | | 01/30/17 | | 1,500,000 | | 1,544,108 | |
SLM Corp. | | BBB- | | 5.00 | | 10/01/13 | | 1,500,000 | | 1,545,000 | |
Southtrust Bank, N.A. | | A+ | | 4.75 | | 03/01/13 | | 250,000 | | 255,952 | |
Textron Financial Corp. | | BBB- | | 5.40 | | 04/28/13 | | 1,000,000 | | 1,027,198 | |
Tyco Int’l. Finance | | A- | | 6.00 | | 11/15/13 | | 675,000 | | 725,263 | |
Ventas Realty LP/Capital Corp. | | BBB | | 4.00 | | 04/30/19 | | 1,700,000 | | 1,743,340 | |
Vornado Realty LP | | BBB | | 4.25 | | 04/01/15 | | 1,500,000 | | 1,581,914 | |
Zions Bancorporation | | BBB- | | 4.50 | | 03/27/17 | | 400,000 | | 402,164 | |
Zions Bancorporation | | BB+ | | 5.65 | | 05/15/14 | | 1,000,000 | | 1,032,960 | |
| | | | | | | | | | 54,057,321 | |
HEALTH CARE (3.7%) | | | | | | | | | | | |
Allergan, Inc. | | A+ | | 5.75 | | 04/01/16 | | 500,000 | | 579,523 | |
Baxter International, Inc. | | A+ | | 4.63 | | 03/15/15 | | 250,000 | | 275,056 | |
Bio-Rad Laboratories, Inc. | | BBB | | 4.88 | | 12/15/20 | | 1,000,000 | | 1,048,999 | |
Biogen Idec, Inc. | | BBB+ | | 6.88 | | 03/01/18 | | 1,250,000 | | 1,525,556 | |
Cardinal Health, Inc. | | A- | | 5.50 | | 06/15/13 | | 1,000,000 | | 1,040,969 | |
CIGNA Corp. | | BBB | | 2.75 | | 11/15/16 | | 1,750,000 | | 1,802,976 | |
Humana, Inc. | | BBB | | 6.45 | | 06/01/16 | | 1,415,000 | | 1,609,209 | |
Laboratory Corp. of America | | BBB+ | | 3.13 | | 05/15/16 | | 500,000 | | 521,723 | |
Laboratory Corp. of America | | BBB+ | | 4.63 | | 11/15/20 | | 400,000 | | 439,663 | |
Laboratory Corp. of America | | BBB+ | | 5.50 | | 02/01/13 | | 285,000 | | 291,938 | |
Laboratory Corp. of America | | BBB+ | | 5.63 | | 12/15/15 | | 500,000 | | 564,593 | |
Lilly (Eli) & Co. | | AA- | | 5.20 | | 03/15/17 | | 500,000 | | 586,000 | |
Medtronic, Inc. | | A+ | | 1.63 | | 04/15/13 | | 1,500,000 | | 1,503,750 | |
UnitedHealth Group, Inc. | | A- | | 5.50 | | 11/15/12 | | 750,000 | | 763,388 | |
| | | | | | | | | | 12,553,343 | |
INDUSTRIALS (4.5%) | | | | | | | | | | | |
Avery Dennison Corp. | | BBB | | 4.88 | | 01/15/13 | | 500,000 | | 510,845 | |
Black & Decker Corp. | | A | | 4.75 | | 11/01/14 | | 500,000 | | 539,134 | |
Black & Decker Corp. | | A | | 5.75 | | 11/15/16 | | 500,000 | | 580,849 | |
Burlington Northern Santa Fe | | BBB+ | | 4.30 | | 07/01/13 | | 500,000 | | 515,648 | |
CSX Corp. | | BBB | | 6.25 | | 04/01/15 | | 1,000,000 | | 1,139,311 | |
Dun & Bradstreet Corp. | | A- | | 6.00 | | 04/01/13 | | 1,000,000 | | 1,036,956 | |
Masco Corp. | | BBB- | | 4.80 | | 06/15/15 | | 500,000 | | 513,738 | |
Masco Corp. | | BBB- | | 5.88 | | 07/15/12 | | 300,000 | | 300,225 | |
Pitney Bowes, Inc. | | BBB+ | | 5.25 | | 01/15/37 | | 1,500,000 | | 1,495,737 | |
Precision Castparts Corp. | | A- | | 5.60 | | 12/15/13 | | 750,000 | | 798,833 | |
Roper Industries, Inc. | | BBB | | 6.63 | | 08/15/13 | | 1,000,000 | | 1,051,953 | |
Ryder System, Inc. | | BBB+ | | 6.00 | | 03/01/13 | | 500,000 | | 514,652 | |
Ryder System, Inc. | | BBB+ | | 7.20 | | 09/01/15 | | 1,000,000 | | 1,144,860 | |
Southwest Airlines Co. | | BBB- | | 5.25 | | 10/01/14 | | 500,000 | | 541,165 | |
Southwest Airlines Co. | | BBB- | | 5.75 | | 12/15/16 | | 735,000 | | 849,241 | |
Stanley Black & Decker, Inc. | | A | | 4.90 | | 11/01/12 | | 525,000 | | 531,114 | |
Textron, Inc. | | BBB- | | 4.63 | | 09/21/16 | | 750,000 | | 809,529 | |
Union Pacific Corp. | | A- | | 4.88 | | 01/15/15 | | 500,000 | | 544,646 | |
URS Corp.† | | BBB- | | 3.85 | | 04/01/17 | | 1,700,000 | | 1,678,799 | |
Waste Management, Inc. | | BBB | | 5.00 | | 03/15/14 | | 500,000 | | 532,063 | |
| | | | | | | | | | 15,629,298 | |
INFORMATION TECHNOLOGY (2.0%) | | | | | | | | | | | |
Arrow Electronics, Inc. | | BBB- | | 6.88 | | 06/01/18 | | 700,000 | | 812,835 | |
Arrow Electronics, Inc. | | BBB- | | 6.88 | | 07/01/13 | | 750,000 | | 792,458 | |
Avnet, Inc. | | BBB- | | 5.88 | | 03/15/14 | | 750,000 | | 794,073 | |
Avnet, Inc. | | BBB- | | 6.00 | | 09/01/15 | | 980,000 | | 1,075,472 | |
Ingram Micro, Inc. | | BBB- | | 5.25 | | 09/01/17 | | 1,500,000 | | 1,608,072 | |
Lexmark International, Inc. | | BBB- | | 6.65 | | 06/01/18 | | 1,500,000 | | 1,684,457 | |
| | | | | | | | | | 6,767,367 | |
MATERIALS (3.1%) | | | | | | | | | | | |
Airgas, Inc. | | BBB | | 3.25 | | 10/01/15 | | 1,500,000 | | 1,563,098 | |
Cytec Industries, Inc. | | BBB | | 6.00 | | 10/01/15 | | 1,000,000 | | 1,098,245 | |
Freeport-McMoRan Copper & Gold | | BBB | | 2.15 | | 03/01/17 | | 1,750,000 | | 1,725,407 | |
Kinross Gold Corp. | | NR | | 3.63 | | 09/01/16 | | 2,000,000 | | 2,015,614 | |
Kinross Gold Corp. | | NR | | 5.13 | | 09/01/21 | | 750,000 | | 758,810 | |
Lubrizol Corp. | | AA+ | | 5.50 | | 10/01/14 | | 500,000 | | 552,791 | |
Rohm & Haas Co. | | BBB | | 5.60 | | 03/15/13 | | 750,000 | | 773,985 | |
Sealed Air Corp.† | | BB | | 5.63 | | 07/15/13 | | 1,000,000 | | 1,032,500 | |
Vulcan Materials Co. | | BB | | 6.30 | | 06/15/13 | | 1,000,000 | | 1,023,250 | |
| | | | | | | | | | 10,543,700 | |
TELECOMMUNICATION SERVICES (0.4%) | | | | | | | | | | | |
CenturyLink, Inc. | | BB | | 5.00 | | 02/15/15 | | 1,250,000 | | 1,308,961 | |
| | | | | | | | | | | |
UTILITIES (3.1%) | | | | | | | | | | | |
AGL Capital Corp. | | BBB+ | | 6.38 | | 07/15/16 | | 500,000 | | 577,094 | |
Atmos Energy Corp. | | BBB+ | | 4.95 | | 10/15/14 | | 1,000,000 | | 1,080,089 | |
Black Hills Corp. | | BBB- | | 9.00 | | 05/15/14 | | 2,000,000 | | 2,207,220 | |
CenterPoint Energy Resources | | BBB+ | | 7.88 | | 04/01/13 | | 750,000 | | 788,198 | |
Constellation Energy | | BBB- | | 5.15 | | 12/01/20 | | 1,500,000 | | 1,660,412 | |
Entergy Corp. | | BBB- | | 4.70 | | 01/15/17 | | 600,000 | | 629,362 | |
Entergy New Orleans, Inc. | | BBB+ | | 5.25 | | 08/01/13 | | 1,000,000 | | 1,037,917 | |
Exelon Generation Co. LLC | | BBB | | 5.35 | | 01/15/14 | | 1,000,000 | | 1,059,245 | |
PPL Energy Supply LLC | | BBB | | 5.70 | | 10/15/15 | | 600,000 | | 651,083 | |
TransAlta Corp. | | BBB | | 5.75 | | 12/15/13 | | 1,000,000 | | 1,049,951 | |
| | | | | | | | | | 10,740,571 | |
TOTAL LONG-TERM DEBT SECURITIES | | | | | | | | | | | |
(Cost: $314,070,742) 97.8% | | | | | | | | | | 336,464,839 | |
| | Rating** | | Rate(%) | | Maturity | | Face Amount | | Value | |
SHORT-TERM DEBT SECURITIES: | | | | | | | | | | | |
COMMERCIAL PAPER (1.4%) | | | | | | | | | | | |
ConocoPhillips† | | A-1 | | 0.12 | | 07/13/12 | | 2,000,000 | | 1,999,913 | |
New Jersey Natural Gas | | A-1 | | 0.11 | | 07/05/12 | | 1,500,000 | | 1,499,977 | |
San Diego Gas & Electric Co.† | | A-1 | | 0.14 | | 07/02/12 | | 1,400,000 | | 1,399,989 | |
| | | | | | | | | | 4,899,879 | |
TOTAL SHORT-TERM DEBT SECURITIES | | | | | | | | | | | |
(Cost: $4,899,879) 1.4% | | | | | | | | | | 4,899,879 | |
| | | | | | | | | | | |
TEMPORARY CASH INVESTMENTS (2) | | | | | | | | | | | |
(Cost: $30,000) 0.0% (3) | | | | | | | | | | 30,000 | |
| | | | | | | | | | | |
TOTAL INVESTMENTS | | | | | | | | | | | |
(Cost: $319,000,621) 99.2% | | | | | | | | | | 341,394,718 | |
| | | | | | | | | | | |
OTHER NET ASSETS 0.8% | | | | | | | | | | 2,600,429 | |
| | | | | | | | | | | |
NET ASSETS 100.0% | | | | | | | | | | $ | 343,995,147 | |
| | | | | | | | | | | | |
The accompanying notes are an integral part of these portfolio schedules.
MUTUAL OF AMERICA INVESTMENT CORPORATION - BOND FUND
PORTFOLIO OF INVESTMENTS IN SECURITIES
June 30, 2012 (Unaudited)
| | Rating** | | Rate(%) | | Maturity | | Face Amount | | Value | |
LONG-TERM DEBT SECURITIES: | | | | | | | | | | | |
U.S. GOVERNMENT (5.0%) | | | | | | | | | | | |
U.S. Treasury Note | | AA+ | | 2.13 | | 08/15/21 | | 5,000,000 | | 5,255,470 | |
U.S. Treasury Strip | | AA+ | | 0.00 | | 08/15/18 | | 4,000,000 | | 3,760,272 | |
U.S. Treasury Strip | | AA+ | | 0.00 | | 08/15/29 | | 37,000,000 | | 23,661,865 | |
| | | | | | | | | | 32,677,607 | |
U.S. GOVERNMENT AGENCIES (31.8%) | | | | | | | | | | | |
MORTGAGE-BACKED OBLIGATIONS (29.3%) | | | | | | | | | |
FHARM | | AA+ | | 3.38 | | 04/01/42 | | 1,192,109 | | 1,222,946 | |
FHARM | | AA+ | | 4.64 | | 09/01/39 | | 1,186,721 | | 1,269,488 | |
FHARM | | AA+ | | 5.22 | | 04/01/37 | | 651,948 | | 698,185 | |
FHARM | | AA+ | | 5.24 | | 02/01/36 | | 409,953 | | 440,936 | |
FHARM | | AA+ | | 5.39 | | 04/01/37 | | 806,475 | | 863,047 | |
FHARM | | AA+ | | 5.43 | | 05/01/37 | | 586,302 | | 634,439 | |
FHARM | | AA+ | | 5.77 | | 03/01/37 | | 316,534 | | 343,026 | |
FHLMC | | AA+ | | 4.00 | | 05/01/24 | | 613,296 | | 648,504 | |
FHLMC | | AA+ | | 4.00 | | 02/01/25 | | 1,446,825 | | 1,529,885 | |
FHLMC | | AA+ | | 4.00 | | 05/01/26 | | 1,378,524 | | 1,457,662 | |
FHLMC | | AA+ | | 4.00 | | 12/01/34 | | 1,155,735 | | 1,233,081 | |
FHLMC | | AA+ | | 4.00 | | 12/15/38 | | 500,000 | | 545,714 | |
FHLMC | | AA+ | | 4.00 | | 07/01/41 | | 2,409,642 | | 2,560,362 | |
FHLMC | | AA+ | | 4.00 | | 12/01/41 | | 1,239,179 | | 1,317,463 | |
FHLMC | | AA+ | | 4.50 | | 03/01/34 | | 1,569,478 | | 1,680,330 | |
FHLMC | | AA+ | | 4.50 | | 08/01/34 | | 1,359,934 | | 1,455,986 | |
FHLMC | | AA+ | | 4.50 | | 08/15/35 | | 567,282 | | 621,446 | |
FHLMC | | AA+ | | 5.00 | | 02/01/26 | | 338,104 | | 365,470 | |
FHLMC | | AA+ | | 5.00 | | 08/01/35 | | 1,655,383 | | 1,789,304 | |
FHLMC | | AA+ | | 5.50 | | 12/15/20 | | 531,482 | | 535,824 | |
FHLMC | | AA+ | | 5.50 | | 03/01/21 | | 417,280 | | 456,769 | |
FHLMC | | AA+ | | 5.50 | | 07/01/32 | | 961,552 | | 1,050,500 | |
FHLMC | | AA+ | | 5.50 | | 01/15/33 | | 800,055 | | 891,549 | |
FHLMC | | AA+ | | 5.50 | | 05/01/33 | | 1,497,045 | | 1,642,547 | |
FHLMC | | AA+ | | 5.50 | | 01/15/35 | | 617,000 | | 673,731 | |
FHLMC | | AA+ | | 5.50 | | 06/01/37 | | 2,335,488 | | 2,545,694 | |
FHLMC | | AA+ | | 6.00 | | 07/15/29 | | 589,760 | | 651,466 | |
FHLMC | | AA+ | | 6.00 | | 03/15/32 | | 653,015 | | 726,887 | |
FNMA | | AA+ | | 3.00 | | 05/01/32 | | 1,290,898 | | 1,334,022 | |
FNMA | | AA+ | | 3.50 | | 01/01/32 | | 2,415,667 | | 2,558,462 | |
FNMA | | AA+ | | 3.50 | | 03/01/32 | | 1,967,317 | | 2,083,450 | |
FNMA | | AA+ | | 3.50 | | 04/01/42 | | 2,189,769 | | 2,345,849 | |
FNMA | | AA+ | | 4.00 | | 05/01/19 | | 917,233 | | 983,792 | |
FNMA | | AA+ | | 4.00 | | 01/01/31 | | 3,662,131 | | 3,941,570 | |
FNMA | | AA+ | | 4.00 | | 11/01/33 | | 2,499,622 | | 2,673,156 | |
FNMA | | AA+ | | 4.00 | | 03/01/35 | | 1,250,152 | | 1,336,943 | |
FNMA | | AA+ | | 4.00 | | 06/01/39 | | 1,589,142 | | 1,693,507 | |
FNMA | | AA+ | | 4.00 | | 11/01/40 | | 2,257,068 | | 2,406,002 | |
FNMA | | AA+ | | 4.00 | | 12/01/40 | | 1,871,191 | | 1,994,663 | |
FNMA | | AA+ | | 4.00 | | 05/01/41 | | 2,220,044 | | 2,426,948 | |
FNMA | | AA+ | | 4.50 | | 05/01/18 | | 624,838 | | 672,814 | |
FNMA | | AA+ | | 4.50 | | 05/01/19 | | 139,530 | | 150,156 | |
FNMA | | AA+ | | 4.50 | | 06/01/19 | | 296,479 | | 319,058 | |
FNMA | | AA+ | | 4.50 | | 05/01/30 | | 1,560,781 | | 1,687,637 | |
FNMA | | AA+ | | 4.50 | | 04/01/31 | | 1,947,241 | | 2,106,780 | |
FNMA | | AA+ | | 4.50 | | 08/01/33 | | 649,932 | | 699,492 | |
FNMA | | AA+ | | 4.50 | | 08/01/33 | | 421,333 | | 453,462 | |
FNMA | | AA+ | | 4.50 | | 09/01/33 | | 1,663,424 | | 1,790,269 | |
FNMA | | AA+ | | 4.50 | | 10/01/33 | | 1,512,373 | | 1,627,699 | |
FNMA | | AA+ | | 4.50 | | 10/01/33 | | 882,175 | | 949,445 | |
FNMA | | AA+ | | 4.50 | | 05/01/34 | | 432,024 | | 464,697 | |
FNMA | | AA+ | | 4.50 | | 06/01/34 | | 860,053 | | 925,099 | |
FNMA | | AA+ | | 4.50 | | 07/01/34 | | 1,010,765 | | 1,087,210 | |
FNMA | | AA+ | | 4.50 | | 01/01/35 | | 1,679,731 | | 1,807,818 | |
FNMA | | AA+ | | 4.50 | | 08/01/35 | | 1,421,544 | | 1,527,278 | |
FNMA | | AA+ | | 4.50 | | 09/01/35 | | 774,515 | | 822,442 | |
FNMA | | AA+ | | 4.50 | | 12/01/35 | | 1,289,679 | | 1,385,605 | |
FNMA | | AA+ | | 4.50 | | 05/01/39 | | 2,559,874 | | 2,747,077 | |
FNMA | | AA+ | | 4.50 | | 05/01/39 | | 2,444,303 | | 2,623,055 | |
FNMA | | AA+ | | 4.50 | | 05/01/40 | | 1,712,467 | | 1,872,624 | |
FNMA | | AA+ | | 4.50 | | 11/01/40 | | 2,282,240 | | 2,456,272 | |
FNMA | | AA+ | | 4.50 | | 06/01/41 | | 1,958,205 | | 2,107,527 | |
FNMA | | AA+ | | 4.50 | | 01/01/42 | | 340,009 | | 366,574 | |
FNMA | | AA+ | | 5.00 | | 04/01/18 | | 145,135 | | 157,143 | |
FNMA | | AA+ | | 5.00 | | 09/01/18 | | 646,465 | | 699,952 | |
FNMA | | AA+ | | 5.00 | | 09/01/20 | | 532,190 | | 576,305 | |
FNMA | | AA+ | | 5.00 | | 10/01/20 | | 853,476 | | 924,223 | |
FNMA | | AA+ | | 5.00 | | 10/01/25 | | 575,964 | | 626,358 | |
FNMA | | AA+ | | 5.00 | | 09/01/33 | | 3,091,522 | | 3,364,095 | |
FNMA | | AA+ | | 5.00 | | 10/01/33 | | 1,683,365 | | 1,831,784 | |
FNMA | | AA+ | | 5.00 | | 11/01/33 | | 1,657,105 | | 1,803,208 | |
FNMA | | AA+ | | 5.00 | | 03/01/34 | | 444,593 | | 483,792 | |
FNMA | | AA+ | | 5.00 | | 04/01/34 | | 722,918 | | 786,204 | |
FNMA | | AA+ | | 5.00 | | 04/01/34 | | 254,298 | | 276,560 | |
FNMA | | AA+ | | 5.00 | | 04/01/35 | | 914,326 | | 992,083 | |
FNMA | | AA+ | | 5.00 | | 06/01/35 | | 592,072 | | 642,423 | |
FNMA | | AA+ | | 5.00 | | 09/01/35 | | 1,940,835 | | 2,105,889 | |
FNMA | | AA+ | | 5.00 | | 11/25/35 | | 2,500,000 | | 2,791,283 | |
FNMA | | AA+ | | 5.00 | | 05/01/39 | | 2,234,655 | | 2,459,244 | |
FNMA | | AA+ | | 5.00 | | 09/25/40 | | 1,678,430 | | 1,906,512 | |
FNMA | | AA+ | | 5.50 | | 04/01/17 | | 60,956 | | 66,431 | |
FNMA | | AA+ | | 5.50 | | 05/01/17 | | 126,898 | | 138,294 | |
FNMA | | AA+ | | 5.50 | | 01/01/24 | | 525,788 | | 578,432 | |
FNMA | | AA+ | | 5.50 | | 03/01/24 | | 1,202,299 | | 1,322,068 | |
FNMA | | AA+ | | 5.50 | | 09/01/25 | | 515,375 | | 566,376 | |
FNMA | | AA+ | | 5.50 | | 11/01/26 | | 457,324 | | 501,631 | |
FNMA | | AA+ | | 5.50 | | 01/01/27 | | 268,924 | | 294,978 | |
FNMA | | AA+ | | 5.50 | | 03/01/33 | | 563,417 | | 619,762 | |
FNMA | | AA+ | | 5.50 | | 09/01/33 | | 828,230 | | 910,540 | |
FNMA | | AA+ | | 5.50 | | 10/01/33 | | 1,280,046 | | 1,407,257 | |
FNMA | | AA+ | | 5.50 | | 03/01/34 | | 742,696 | | 816,505 | |
FNMA | | AA+ | | 5.50 | | 03/01/34 | | 346,660 | | 381,111 | |
FNMA | | AA+ | | 5.50 | | 07/01/34 | | 593,887 | | 652,536 | |
FNMA | | AA+ | | 5.50 | | 09/01/34 | | 705,738 | | 776,315 | |
FNMA | | AA+ | | 5.50 | | 09/01/34 | | 611,150 | | 671,504 | |
FNMA | | AA+ | | 5.50 | | 09/01/34 | | 270,760 | | 297,499 | |
FNMA | | AA+ | | 5.50 | | 10/01/34 | | 1,485,939 | | 1,632,683 | |
FNMA | | AA+ | | 5.50 | | 02/01/35 | | 706,325 | | 776,079 | |
FNMA | | AA+ | | 5.50 | | 02/01/35 | | 522,855 | | 573,509 | |
FNMA | | AA+ | | 5.50 | | 04/01/35 | | 786,664 | | 862,876 | |
FNMA | | AA+ | | 5.50 | | 08/01/35 | | 1,706,574 | | 1,871,907 | |
FNMA | | AA+ | | 5.50 | | 02/25/37 | | 762,061 | | 839,077 | |
FNMA | | AA+ | | 5.50 | | 05/01/38 | | 1,491,453 | | 1,627,555 | |
FNMA | | AA+ | | 5.50 | | 06/01/48 | | 775,529 | | 840,484 | |
FNMA | | AA+ | | 5.50 | | 11/01/38 | | 669,893 | | 722,232 | |
FNMA | | AA+ | | 6.00 | | 03/01/17 | | 101,941 | | 112,144 | |
FNMA | | AA+ | | 6.00 | | 05/01/23 | | 639,214 | | 721,845 | |
FNMA | | AA+ | | 6.00 | | 01/01/25 | | 412,096 | | 460,925 | |
FNMA | | AA+ | | 6.00 | | 03/01/28 | | 667,930 | | 736,352 | |
FNMA | | AA+ | | 6.00 | | 04/01/32 | | 180,538 | | 203,297 | |
FNMA | | AA+ | | 6.00 | | 04/01/32 | | 94,053 | | 105,910 | |
FNMA | | AA+ | | 6.00 | | 05/01/32 | | 609,842 | | 686,719 | |
FNMA | | AA+ | | 6.00 | | 04/01/33 | | 1,118,340 | | 1,259,319 | |
FNMA | | AA+ | | 6.00 | | 11/01/34 | | 614,455 | | 685,770 | |
FNMA | | AA+ | | 6.00 | | 03/01/36 | | 234,532 | | 256,255 | |
FNMA | | AA+ | | 6.00 | | 12/01/36 | | 697,557 | | 768,708 | |
FNMA | | AA+ | | 6.00 | | 01/01/37 | | 802,162 | | 883,982 | |
FNMA | | AA+ | | 6.00 | | 03/01/37 | | 898,894 | | 983,277 | |
FNMA | | AA+ | | 6.00 | | 04/01/37 | | 489,226 | | 535,152 | |
FNMA | | AA+ | | 6.00 | | 05/01/37 | | 342,128 | | 374,245 | |
FNMA | | AA+ | | 6.00 | | 06/01/37 | | 673,956 | | 737,223 | |
FNMA | | AA+ | | 6.00 | | 07/01/37 | | 476,114 | | 524,678 | |
FNMA | | AA+ | | 6.00 | | 08/01/37 | | 973,765 | | 1,073,088 | |
FNMA | | AA+ | | 6.00 | | 12/01/37 | | 443,063 | | 488,255 | |
FNMA | | AA+ | | 6.00 | | 10/25/44 | | 884,223 | | 984,941 | |
FNMA | | AA+ | | 6.00 | | 02/25/47 | | 1,904,518 | | 2,159,171 | |
FNMA | | AA+ | | 6.00 | | 12/25/49 | | 1,469,849 | | 1,686,441 | |
FNMA | | AA+ | | 6.50 | | 09/01/16 | | 35,497 | | 38,108 | |
FNMA | | AA+ | | 6.50 | | 03/01/17 | | 280,534 | | 304,847 | |
FNMA | | AA+ | | 6.50 | | 05/01/17 | | 16,675 | | 18,120 | |
FNMA | | AA+ | | 6.50 | | 04/01/32 | | 53,912 | | 61,711 | |
FNMA | | AA+ | | 6.50 | | 05/01/32 | | 627,305 | | 718,048 | |
FNMA | | AA+ | | 6.50 | | 05/01/32 | | 239,485 | | 274,128 | |
FNMA | | AA+ | | 6.50 | | 09/01/36 | | 454,037 | | 508,648 | |
FNMA | | AA+ | | 6.50 | | 05/01/37 | | 664,575 | | 750,326 | |
FNMA | | AA+ | | 6.50 | | 07/01/37 | | 186,352 | | 210,397 | |
FNMA | | AA+ | | 6.50 | | 09/01/37 | | 445,074 | | 502,501 | |
FNMA | | AA+ | | 6.50 | | 05/01/38 | | 719,388 | | 810,637 | |
FNMA | | AA+ | | 7.00 | | 09/01/31 | | 71,133 | | 84,514 | |
FNMA | | AA+ | | 7.00 | | 11/01/31 | | 48,064 | | 57,106 | |
FNMA | | AA+ | | 7.00 | | 01/25/44 | | 737,973 | | 836,488 | |
FNMA | | AA+ | | 7.50 | | 04/01/32 | | 79,380 | | 94,133 | |
FNMA | | AA+ | | 7.50 | | 06/01/32 | | 199,108 | | 236,112 | |
FNMA | | AA+ | | 8.00 | | 03/01/31 | | 32,405 | | 38,738 | |
FNMA | | AA+ | | 8.00 | | 04/01/32 | | 33,496 | | 40,077 | |
FNMA | | AA+ | | 8.00 | | 04/01/32 | | 33,214 | | 39,854 | |
GNMA (4) | | AA+ | | 3.50 | | 09/20/33 | | 2,400,024 | | 2,511,695 | |
GNMA (4) | | AA+ | | 3.50 | | 01/20/37 | | 1,615,629 | | 1,675,467 | |
GNMA (4) | | AA+ | | 4.00 | | 08/15/41 | | 2,641,101 | | 2,889,288 | |
GNMA (4) | | AA+ | | 4.00 | | 11/15/41 | | 1,482,585 | | 1,621,905 | |
GNMA (4) | | AA+ | | 4.00 | | 12/15/41 | | 2,176,029 | | 2,380,513 | |
GNMA (4) | | AA+ | | 4.00 | | 01/15/42 | | 992,078 | | 1,085,304 | |
GNMA (4) | | AA+ | | 4.00 | | 03/20/42 | | 1,493,181 | | 1,631,051 | |
GNMA (4) | | AA+ | | 4.00 | | 04/15/24 | | 710,272 | | 766,030 | |
GNMA (4) | | AA+ | | 4.25 | | 06/20/36 | | 1,417,560 | | 1,549,334 | |
GNMA (4) | | AA+ | | 4.25 | | 04/20/41 | | 1,419,535 | | 1,554,596 | |
GNMA (4) | | AA+ | | 4.29 | | 04/15/41 | | 1,140,096 | | 1,247,232 | |
GNMA (4) | | AA+ | | 4.50 | | 02/20/20 | | 1,605,587 | | 1,751,206 | |
GNMA (4) | | AA+ | | 4.50 | | 06/20/30 | | 370,350 | | 411,621 | |
GNMA (4) | | AA+ | | 4.50 | | 09/15/30 | | 1,287,282 | | 1,422,842 | |
GNMA (4) | | AA+ | | 4.50 | | 06/20/34 | | 1,359,610 | | 1,502,626 | |
GNMA (4) | | AA+ | | 4.50 | | 10/15/40 | | 3,015,374 | | 3,307,473 | |
GNMA (4) | | AA+ | | 4.50 | | 10/15/40 | | 1,724,139 | | 1,891,156 | |
GNMA (4) | | AA+ | | 5.00 | | 04/15/39 | | 2,253,229 | | 2,483,031 | |
GNMA (4) | | AA+ | | 5.00 | | 06/20/39 | | 2,032,576 | | 2,349,567 | |
GNMA (4) | | AA+ | | 5.00 | | 11/15/39 | | 1,560,605 | | 1,719,768 | |
GNMA (4) | | AA+ | | 5.00 | | 06/20/40 | | 1,441,987 | | 1,598,569 | |
GNMA (4) | | AA+ | | 5.00 | | 06/20/40 | | 1,370,709 | | 1,519,552 | |
GNMA (4) | | AA+ | | 5.50 | | 01/15/36 | | 456,375 | | 506,717 | |
GNMA (4) | | AA+ | | 6.50 | | 04/15/31 | | 25,220 | | 29,303 | |
GNMA (4) | | AA+ | | 6.50 | | 12/15/31 | | 106,223 | | 123,421 | |
GNMA (4) | | AA+ | | 6.50 | | 05/15/32 | | 45,417 | | 52,600 | |
GNMA (4) | | AA+ | | 7.00 | | 09/15/31 | | 32,842 | | 39,696 | |
GNMA (4) | | AA+ | | 7.00 | | 09/15/31 | | 23,486 | | 28,388 | |
GNMA (4) | | AA+ | | 7.00 | | 05/15/32 | | 13,657 | | 16,334 | |
Vendee Mortgage Trust (4) | | AA+ | | 5.25 | | 01/15/32 | | 1,917,138 | | 2,235,805 | |
| | | | | | | | | | 192,409,674 | |
NON-MORTGAGE-BACKED OBLIGATIONS (2.5%) | | | | | | | | | |
FNMA | | AA+ | | 0.00 | | 10/09/19 | | 20,000,000 | | 16,211,416 | |
| | | | | | | | | | | |
CORPORATE DEBT (61.0%) | | | | | | | | | | | |
CONSUMER DISCRETIONARY (7.4%) | | | | | | | | | | | |
Advance Auto Parts, Inc. | | BBB- | | 5.75 | | 05/01/20 | | 3,000,000 | | 3,390,312 | |
AutoZone, Inc. | | BBB | | 4.00 | | 11/15/20 | | 3,000,000 | | 3,206,562 | |
Best Buy Co., Inc. | | BBB- | | 6.75 | | 07/15/13 | | 500,000 | | 521,151 | |
Brinker International, Inc. | | BBB- | | 5.75 | | 06/01/14 | | 2,000,000 | | 2,136,936 | |
Ethan Allen Interiors, Inc. | | BB- | | 5.38 | | 10/01/15 | | 2,000,000 | | 2,024,748 | |
Expedia, Inc. | | BBB- | | 5.95 | | 08/15/20 | | 3,000,000 | | 3,143,124 | |
Home Depot, Inc. | | A- | | 5.40 | | 03/01/16 | | 2,000,000 | | 2,305,648 | |
Hyatt Hotels Corp. | | BBB | | 3.88 | | 08/15/16 | | 2,800,000 | | 2,966,382 | |
Hyatt Hotels Corp. | | BBB | | 5.38 | | 08/15/21 | | 200,000 | | 219,722 | |
Johnson Controls, Inc. | | BBB+ | | 4.88 | | 09/15/13 | | 2,500,000 | | 2,612,683 | |
Kohl’s Corp. | | BBB+ | | 4.00 | | 11/01/21 | | 2,620,000 | | 2,723,123 | |
Leggett & Platt, Inc. | | BBB+ | | 4.70 | | 04/01/13 | | 2,000,000 | | 2,051,066 | |
Lowe’s Cos., Inc. | | A- | | 3.12 | | 04/15/22 | | 2,000,000 | | 2,046,458 | |
Marriott International, Inc. | | BBB | | 3.00 | | 03/01/19 | | 1,000,000 | | 1,011,065 | |
Marriott International, Inc. | | BBB | | 5.63 | | 02/15/13 | | 2,000,000 | | 2,054,744 | |
Mattel, Inc. | | BBB+ | | 4.35 | | 10/01/20 | | 1,000,000 | | 1,069,946 | |
Newell Rubbermaid, Inc. | | BBB- | | 4.70 | | 08/15/20 | | 3,000,000 | | 3,245,595 | |
Omnicom Group, Inc. | | BBB+ | | 4.45 | | 08/15/20 | | 3,000,000 | | 3,234,807 | |
Scholastic Corp. | | BB- | | 5.00 | | 04/15/13 | | 2,000,000 | | 2,025,000 | |
Tupperware Brands Corp. | | BBB- | | 4.75 | | 06/01/21 | | 3,000,000 | | 3,107,886 | |
Whirlpool Corp. | | BBB- | | 6.50 | | 06/15/16 | | 2,000,000 | | 2,225,374 | |
Whirlpool Corp. | | BBB- | | 4.85 | | 06/15/21 | | 1,000,000 | | 1,035,947 | |
| | | | | | | | | | 48,358,279 | |
CONSUMER STAPLES (3.8%) | | | | | | | | | | | |
Avon Products, Inc. | | BBB- | | 4.20 | | 07/15/18 | | 3,000,000 | | 3,020,469 | |
Beam, Inc. | | BBB- | | 5.38 | | 01/15/16 | | 344,000 | | 382,596 | |
Cargill, Inc.† | | A | | 5.00 | | 11/15/13 | | 500,000 | | 526,503 | |
Clorox Co. | | BBB+ | | 5.00 | | 03/01/13 | | 2,000,000 | | 2,056,266 | |
CVS Caremark Corp. | | BBB+ | | 6.13 | | 08/15/16 | | 2,000,000 | | 2,339,428 | |
Energizer Hldgs., Inc. | | BBB- | | 4.70 | | 05/19/21 | | 3,000,000 | | 3,162,297 | |
Ingredion, Inc. | | BBB | | 4.63 | | 11/01/20 | | 3,225,000 | | 3,494,533 | |
Kroger Co. | | BBB | | 4.95 | | 01/15/15 | | 2,000,000 | | 2,178,122 | |
Molson Coors Brewing Co. | | BBB- | | 3.50 | | 05/01/22 | | 3,000,000 | | 3,080,355 | |
Ralcorp Hldgs., Inc. | | BBB- | | 4.95 | | 08/15/20 | | 1,500,000 | | 1,570,289 | |
Safeway, Inc. | | BBB | | 3.95 | | 08/15/20 | | 2,900,000 | | 2,798,233 | |
| | | | | | | | | | 24,609,091 | |
ENERGY (6.2%) | | | | | | | | | | | |
Cameron International Corp. | | BBB+ | | 4.50 | | 06/01/21 | | 3,000,000 | | 3,208,788 | |
Diamond Offshore Drilling, Inc. | | A- | | 4.88 | | 07/01/15 | | 2,000,000 | | 2,185,266 | |
Enbridge, Inc. | | A- | | 5.80 | | 06/15/14 | | 1,000,000 | | 1,085,795 | |
EQT Corp. | | BBB | | 4.88 | | 11/15/21 | | 3,000,000 | | 3,064,305 | |
Kinder Morgan, Inc. | | BB | | 5.15 | | 03/01/15 | | 2,000,000 | | 2,095,000 | |
Marathon Petroleum Corp. | | BBB | | 5.13 | | 03/01/21 | | 3,000,000 | | 3,358,818 | |
Nabors Industries Ltd. | | BBB | | 5.38 | | 08/15/12 | | 1,000,000 | | 1,004,025 | |
National Oilwell Varco, Inc. | | A- | | 6.13 | | 08/15/15 | | 2,000,000 | | 2,030,906 | |
Noble Drilling Corp. | | BBB+ | | 7.50 | | 03/15/19 | | 2,000,000 | | 2,508,924 | |
Seacor Hldgs., Inc. | | BB+ | | 7.38 | | 10/01/19 | | 2,775,000 | | 3,009,571 | |
Seariver Maritime, Inc. | | AAA | | 0.00 | | 09/01/12 | | 10,000,000 | | 9,942,260 | |
Sunoco, Inc. | | BB+ | | 5.75 | | 01/15/17 | | 2,000,000 | | 2,124,810 | |
Transocean, Inc. | | BBB- | | 1.50 | | 12/15/37 | | 3,000,000 | | 2,985,000 | |
Weatherford Int’l. Ltd. | | BBB | | 5.15 | | 03/15/13 | | 500,000 | | 513,517 | |
Weatherford Int’l. Ltd. | | BBB | | 5.50 | | 02/15/16 | | 1,500,000 | | 1,664,774 | |
| | | | | | | | | | 40,781,759 | |
FINANCIALS (22.0%) | | | | | | | | | | | |
Aflac, Inc. | | A- | | 4.00 | | 02/15/22 | | 3,000,000 | | 3,118,947 | |
Alleghany Corp. | | BBB | | 5.63 | | 09/15/20 | | 3,000,000 | | 3,209,856 | |
Allstate Corp. | | A- | | 7.45 | | 05/16/19 | | 2,000,000 | | 2,561,156 | |
Ally Financial, Inc. | | B+ | | 0.00 | | 12/01/12 | | 10,000,000 | | 9,837,500 | |
American Express Credit Corp. | | A- | | 5.88 | | 05/02/13 | | 500,000 | | 520,845 | |
Bank of America Corp. | | A- | | 3.70 | | 09/01/15 | | 2,000,000 | | 2,020,492 | |
Barrick N.A. Finance LLC | | A- | | 4.40 | | 05/30/21 | | 3,000,000 | | 3,233,484 | |
Berkley (W.R.) Corp. | | BBB+ | | 7.38 | | 09/15/19 | | 2,000,000 | | 2,371,488 | |
Block Financial LLC | | BBB | | 5.13 | | 10/30/14 | | 1,750,000 | | 1,804,803 | |
Block Financial LLC | | BBB | | 7.88 | | 01/15/13 | | 1,250,000 | | 1,281,381 | |
Boston Properties LP | | A- | | 3.85 | | 02/01/23 | | 3,000,000 | | 3,028,182 | |
Bunge Ltd. Finance Corp. | | BBB- | | 5.35 | | 04/15/14 | | 2,000,000 | | 2,110,400 | |
Capital One Financial Corp. | | BBB | | 4.75 | | 07/15/21 | | 3,200,000 | | 3,491,776 | |
Citigroup, Inc. | | BBB+ | | 5.63 | | 08/27/12 | | 3,000,000 | | 3,017,973 | |
CNA Financial Corp. | | BBB- | | 6.50 | | 08/15/16 | | 2,000,000 | | 2,250,546 | |
Duke Realty LP | | BBB- | | 4.63 | | 05/15/13 | | 2,000,000 | | 2,043,706 | |
Fairfax Financial Hldgs.† | | BBB- | | 5.80 | | 05/15/21 | | 500,000 | | 489,471 | |
Fairfax Financial Hldgs. | | BBB- | | 8.25 | | 10/01/15 | | 2,500,000 | | 2,815,968 | |
First Horizon National Corp. | | BB+ | | 4.50 | | 05/15/13 | | 5,000,000 | | 5,075,135 | |
Genworth Financial, Inc. | | BBB | | 7.20 | | 02/15/21 | | 1,750,000 | | 1,666,875 | |
Genworth Financial, Inc. | | BBB | | 7.63 | | 09/24/21 | | 1,300,000 | | 1,228,284 | |
Goldman Sachs Group, Inc. | | A- | | 3.70 | | 08/01/15 | | 3,000,000 | | 3,026,511 | |
Harley-Davidson Financial Svcs.† | | BBB+ | | 3.88 | | 03/15/16 | | 2,678,000 | | 2,828,354 | |
Harley-Davidson Funding† | | BBB+ | | 5.25 | | 12/15/12 | | 500,000 | | 508,233 | |
Hartford Financial Svcs. | | BBB | | 5.50 | | 10/15/16 | | 2,000,000 | | 2,165,708 | |
Hartford Financial Svcs. | | BBB | | 5.50 | | 03/30/20 | | 1,000,000 | | 1,044,055 | |
HCP, Inc. | | BBB | | 5.65 | | 12/15/13 | | 2,000,000 | | 2,112,346 | |
HCP, Inc. | | BBB | | 6.00 | | 01/30/17 | | 1,250,000 | | 1,400,423 | |
Health Care REIT, Inc. | | BBB- | | 3.63 | | 03/15/16 | | 750,000 | | 770,993 | |
Health Care REIT, Inc. | | BBB- | | 6.13 | | 04/15/20 | | 2,500,000 | | 2,782,995 | |
HSBC Finance Corp. | | A | | 3.87 | | 11/10/13 | | 100,000 | | 100,699 | |
HSBC Finance Corp. | | A | | 4.04 | | 10/10/13 | | 70,000 | | 70,185 | |
JP Morgan Chase Bank NA | | A | | 6.00 | | 10/01/17 | | 2,000,000 | | 2,239,244 | |
Kemper Corp. | | BBB- | | 6.00 | | 11/30/15 | | 2,500,000 | | 2,620,665 | |
KeyCorp | | BBB+ | | 6.50 | | 05/14/13 | | 2,000,000 | | 2,094,880 | |
Kimco Realty Corp. | | BBB+ | | 6.00 | | 11/30/12 | | 1,000,000 | | 1,016,156 | |
Lincoln National Corp. | | A- | | 4.85 | | 06/24/21 | | 1,000,000 | | 1,047,387 | |
Lincoln National Corp. | | A- | | 5.65 | | 08/27/12 | | 2,000,000 | | 2,013,742 | |
Markel Corp. | | BBB | | 5.35 | | 06/01/21 | | 1,000,000 | | 1,053,505 | |
Markel Corp. | | BBB | | 6.80 | | 02/15/13 | | 2,000,000 | | 2,061,420 | |
Marsh & McLennan Cos., Inc. | | BBB- | | 4.80 | | 07/15/21 | | 3,000,000 | | 3,266,616 | |
Morgan Stanley | | A- | | 2.88 | | 01/24/14 | | 1,000,000 | | 988,747 | |
Morgan Stanley | | A- | | 4.00 | | 07/24/15 | | 2,000,000 | | 1,988,386 | |
Old Republic Int’l. Corp. | | BBB+ | | 3.75 | | 03/15/18 | | 2,000,000 | | 1,800,000 | |
Pacific LifeCorp.† | | BBB+ | | 6.00 | | 02/10/20 | | 3,000,000 | | 3,274,614 | |
ProLogis LP | | BBB- | | 6.63 | | 05/15/18 | | 3,000,000 | | 3,460,275 | |
Protective Life Corp. | | A- | | 4.88 | | 11/01/14 | | 1,000,000 | | 1,061,937 | |
Protective Life Secured Trust | | AA- | | 3.40 | | 12/10/14 | | 124,000 | | 124,440 | |
Protective Life Secured Trust | | AA- | | 3.55 | | 10/10/14 | | 53,000 | | 53,345 | |
Protective Life Secured Trust | | AA- | | 3.65 | | 08/10/14 | | 21,000 | | 21,148 | |
Prudential Financial, Inc. | | A | | 4.50 | | 11/16/21 | | 1,000,000 | | 1,037,896 | |
Prudential Financial, Inc. | | A | | 4.75 | | 09/17/15 | | 2,000,000 | | 2,153,224 | |
Raymond James Financial, Inc. | | BBB | | 4.25 | | 04/15/16 | | 3,150,000 | | 3,275,597 | |
Reckson Operating Partnership | | BBB- | | 6.00 | | 03/31/16 | | 3,200,000 | | 3,400,653 | |
Regency Centers LP | | BBB | | 4.95 | | 04/15/14 | | 2,000,000 | | 2,091,878 | |
Reinsurance Grp. of America, Inc. | | A- | | 5.00 | | 06/01/21 | | 3,000,000 | | 3,129,075 | |
Retail Properties, Inc.† | | A- | | 7.88 | | 03/15/16 | | 5,000,000 | | 5,909,310 | |
Senior Housing Pptys. Trust | | BBB- | | 4.30 | | 01/15/16 | | 3,000,000 | | 3,002,784 | |
SLM Corp. | | BBB- | | 5.00 | | 10/01/13 | | 3,150,000 | | 3,244,500 | |
Southtrust Bank, N.A. | | A+ | | 4.75 | | 03/01/13 | | 1,250,000 | | 1,279,761 | |
Travelers Cos., Inc. | | A | | 3.90 | | 11/01/20 | | 2,500,000 | | 2,771,350 | |
Ventas Realty LP/Capital Corp. | | BBB | | 4.75 | | 06/01/21 | | 3,000,000 | | 3,116,514 | |
Vornado Realty LP | | BBB | | 4.25 | | 04/01/15 | | 3,000,000 | | 3,163,827 | |
Zions Bancorporation | | BBB- | | 4.50 | | 03/27/17 | | 1,000,000 | | 1,005,410 | |
Zions Bancorporation | | BB+ | | 5.65 | | 05/15/14 | | 2,000,000 | | 2,065,920 | |
| | | | | | | | | | 144,822,976 | |
HEALTH CARE (5.9%) | | | | | | | | | | | |
Allergan, Inc. | | A+ | | 5.75 | | 04/01/16 | | 2,000,000 | | 2,318,090 | |
AmerisourceBergen Corp. | | A- | | 4.88 | | 11/15/19 | | 2,500,000 | | 2,858,923 | |
Bio-Rad Laboratories, Inc. | | BBB | | 4.88 | | 12/15/20 | | 3,000,000 | | 3,146,997 | |
Biogen Idec, Inc. | | BBB+ | | 6.88 | | 03/01/18 | | 2,500,000 | | 3,051,113 | |
CIGNA Corp. | | BBB | | 2.75 | | 11/15/16 | | 1,000,000 | | 1,030,272 | |
CIGNA Corp. | | BBB | | 5.38 | | 03/15/17 | | 2,000,000 | | 2,247,370 | |
Humana, Inc. | | BBB | | 7.20 | | 06/15/18 | | 2,000,000 | | 2,403,380 | |
Laboratory Corp. of America | | BBB+ | | 4.63 | | 11/15/20 | | 1,000,000 | | 1,099,158 | |
Laboratory Corp. of America | | BBB+ | | 5.50 | | 02/01/13 | | 1,000,000 | | 1,024,345 | |
Laboratory Corp. of America | | BBB+ | | 5.63 | | 12/15/15 | | 1,000,000 | | 1,129,185 | |
Medco Health Solutions, Inc. | | BBB+ | | 4.13 | | 09/15/20 | | 3,000,000 | | 3,180,744 | |
Medtronic, Inc. | | A+ | | 1.63 | | 04/15/13 | | 3,000,000 | | 3,007,500 | |
PerkinElmer, Inc. | | BBB | | 5.00 | | 11/15/21 | | 3,000,000 | | 3,220,056 | |
Quest Diagnostics, Inc. | | BBB+ | | 4.75 | | 01/30/20 | | 2,850,000 | | 3,156,939 | |
UnitedHealth Group, Inc. | | A- | | 5.50 | | 11/15/12 | | 2,000,000 | | 2,035,700 | |
WellPoint, Inc. | | A- | | 4.35 | | 08/15/20 | | 2,000,000 | | 2,199,106 | |
Wyeth | | AA | | 5.50 | | 03/15/13 | | 1,750,000 | | 1,812,158 | |
| | | | | | | | | | 38,921,036 | |
INDUSTRIALS (4.3%) | | | | | | | | | | | |
Black & Decker Corp. | | A | | 4.75 | | 11/01/14 | | 2,000,000 | | 2,156,536 | |
CSX Corp. | | BBB | | 6.25 | | 04/01/15 | | 2,000,000 | | 2,278,622 | |
Donnelley (R.R.) & Sons Co. | | BB+ | | 4.95 | | 04/01/14 | | 2,000,000 | | 2,025,000 | |
L-3 Communications Corp. | | BBB- | | 4.75 | | 07/15/20 | | 3,000,000 | | 3,199,845 | |
Masco Corp. | | BBB- | | 5.88 | | 07/15/12 | | 2,000,000 | | 2,001,500 | |
Pentair, Inc. | | BBB- | | 5.00 | | 05/15/21 | | 3,000,000 | | 3,325,707 | |
Pitney Bowes, Inc. | | BBB+ | | 5.25 | | 01/15/37 | | 3,000,000 | | 2,991,474 | |
Precision Castparts Corp. | | A- | | 5.60 | | 12/15/13 | | 2,000,000 | | 2,130,220 | |
Ryder System, Inc. | | BBB+ | | 6.00 | | 03/01/13 | | 2,000,000 | | 2,058,606 | |
Textron, Inc. | | BBB- | | 4.63 | | 09/21/16 | | 2,900,000 | | 3,130,179 | |
URS Corp.† | | BBB- | | 5.00 | | 04/01/22 | | 3,000,000 | | 2,963,298 | |
| | | | | | | | | | 28,260,987 | |
INFORMATION TECHNOLOGY (2.5%) | | | | | | | | | | | |
Arrow Electronics, Inc. | | BBB- | | 6.88 | | 06/01/18 | | 2,900,000 | | 3,367,460 | |
Avnet, Inc. | | BBB- | | 5.88 | | 03/15/14 | | 400,000 | | 423,506 | |
Avnet, Inc. | | BBB- | | 5.88 | | 06/15/20 | | 600,000 | | 661,313 | |
Avnet, Inc. | | BBB- | | 6.00 | | 09/01/15 | | 2,000,000 | | 2,194,840 | |
Fiserv, Inc. | | BBB- | | 4.63 | | 10/01/20 | | 2,770,000 | | 2,968,689 | |
Ingram Micro, Inc. | | BBB- | | 5.25 | | 09/01/17 | | 3,000,000 | | 3,216,144 | |
Lexmark International, Inc. | | BBB- | | 6.65 | | 06/01/18 | | 3,000,000 | | 3,368,913 | |
| | | | | | | | | | 16,200,865 | |
MATERIALS (4.6%) | | | | | | | | | | | |
Airgas, Inc. | | BBB | | 3.25 | | 10/01/15 | | 2,000,000 | | 2,084,130 | |
Cytec Industries, Inc. | | BBB | | 6.00 | | 10/01/15 | | 2,000,000 | | 2,196,490 | |
Eastman Chemical Co. | | BBB | | 4.50 | | 01/15/21 | | 2,500,000 | | 2,738,905 | |
Freeport-McMoRan Copper & Gold | | BBB | | 3.55 | | 03/01/22 | | 3,000,000 | | 2,951,634 | |
Geon Co. | | BB- | | 7.50 | | 12/15/15 | | 3,750,000 | | 3,862,500 | |
Kinross Gold Corp. | | NR | | 5.13 | | 09/01/21 | | 3,000,000 | | 3,035,238 | |
Lubrizol Corp. | | AA+ | | 5.50 | | 10/01/14 | | 2,000,000 | | 2,211,164 | |
Methanex Corp. | | BBB- | | 5.25 | | 03/01/22 | | 600,000 | | 622,506 | |
Newmont Mining Corp. | | BBB+ | | 3.50 | | 03/15/22 | | 3,000,000 | | 2,960,994 | |
Packaging Corp. of America | | BBB | | 3.90 | | 06/15/22 | | 2,000,000 | | 2,006,486 | |
Teck Resources Ltd. | | BBB | | 4.75 | | 01/15/22 | | 3,000,000 | | 3,223,521 | |
Vulcan Materials Co. | | BB | | 7.00 | | 06/15/18 | | 2,000,000 | | 2,130,000 | |
| | | | | | | | | | 30,023,568 | |
TELECOMMUNICATION SERVICES (0.7%) | | | | | | | | | | | |
Alltel Corp. | | A- | | 7.00 | | 03/15/16 | | 2,000,000 | | 2,392,162 | |
CenturyLink, Inc. | | BB | | 5.00 | | 02/15/15 | | 2,000,000 | | 2,094,338 | |
| | | | | | | | | | 4,486,500 | |
UTILITIES (3.6%) | | | | | | | | | | | |
AGL Capital Corp. | | BBB+ | | 6.38 | | 07/15/16 | | 500,000 | | 577,094 | |
AmerenEnergy Generating Co. | | BB- | | 6.30 | | 04/01/20 | | 2,500,000 | | 1,968,750 | |
Constellation Energy | | BBB- | | 5.15 | | 12/01/20 | | 3,000,000 | | 3,320,823 | |
Entergy Corp. | | BBB- | | 4.70 | | 01/15/17 | | 1,500,000 | | 1,573,406 | |
Entergy Corp. | | BBB- | | 5.13 | | 09/15/20 | | 500,000 | | 519,103 | |
Entergy New Orleans, Inc. | | BBB+ | | 5.25 | | 08/01/13 | | 1,075,000 | | 1,115,761 | |
National Fuel Gas Co. | | BBB | | 4.90 | | 12/01/21 | | 3,000,000 | | 3,236,334 | |
PPL Energy Supply LLC | | BBB | | 4.60 | | 12/15/21 | | 1,000,000 | | 1,026,187 | |
PPL Energy Supply LLC | | BBB | | 5.40 | | 08/15/14 | | 2,000,000 | | 2,145,604 | |
Progress Energy, Inc. | | A | | 5.25 | | 12/15/15 | | 2,000,000 | | 2,275,840 | |
SCANA Corp. | | BBB | | 4.13 | | 02/01/22 | | 3,100,000 | | 3,128,024 | |
UIL Hldgs. Corp. | | BBB- | | 4.63 | | 10/01/20 | | 2,725,000 | | 2,851,181 | |
| | | | | | | | | | 23,738,107 | |
SOVEREIGN DEBT (0.7%) | | | | | | | | | | | |
Sri Lanka AID | | NR | | 6.59 | | 09/15/28 | | 3,616,360 | | 4,539,906 | |
| | | | | | | | | | | |
TOTAL LONG-TERM DEBT SECURITIES | | | | | | | | | | | |
(Cost: $609,340,654) 98.5% | | | | | | | | | | 646,041,771 | |
| | Rating** | | Rate(%) | | Maturity | | Face Amount | | Value | |
SHORT-TERM DEBT SECURITIES: | | | | | | | | | | | |
COMMERCIAL PAPER (1.2%) | | | | | | | | | | | |
General Electric Capital Corp. | | A-1+ | | 0.07 | | 07/12/12 | | 4,000,000 | | 3,999,907 | |
New Jersey Natural Gas | | A-1 | | 0.12 | | 07/03/12 | | 1,600,000 | | 1,599,984 | |
San Diego Gas & Electric Co.† | | A-1 | | 0.14 | | 07/02/12 | | 2,500,000 | | 2,499,981 | |
| | | | | | | | | | 8,099,872 | |
TOTAL SHORT-TERM DEBT SECURITIES | | | | | | | | | | | |
(Cost: $8,099,872) 1.2% | | | | | | | | | | 8,099,872 | |
| | | | | | | | | | | |
TEMPORARY CASH INVESTMENTS (2) | | | | | | | | | | | |
(Cost: $850,200) 0.1% | | | | | | | | | | 850,200 | |
| | | | | | | | | | | |
TOTAL INVESTMENTS | | | | | | | | | | | |
(Cost: $618,290,726) 99.8% | | | | | | | | | | 654,991,843 | |
| | | | | | | | | | | |
OTHER NET ASSETS 0.2% | | | | | | | | | | 1,615,158 | |
| | | | | | | | | | | |
NET ASSETS 100.0% | | | | | | | | | | $ | 656,607,001 | |
| | | | | | | | | | | | |
The accompanying notes are an integral part of these portfolio schedules.
MUTUAL OF AMERICA INVESTMENT CORPORATION
FOOTNOTES TO PORTFOLIOS OF INVESTMENTS IN SECURITIES
June 30, 2012 (Unaudited)
Abbreviations: FFCB = Federal Farm Credit Bank
FHARM = Federal Home Adjustable Rate Mortgage
FHLB = Federal Home Loan Bank
FHLMC = Federal Home Loan Mortgage Corporation
FNMA = Federal National Mortgage Association
GNMA = Government National Mortgage Association
NR = Not Rated
* Non-income producing security.
** Ratings as per Standard & Poor’s Corporation.
† Security is exempt from registration under Rule 144A of the Securities Act of 1933. These securities may be resold in transactions exempt from registration, normally to qualified institutional buyers. At June 30, 2012, the aggregate values of these securities and their percentages of the respective Funds’ net assets were as follows:
| | Aggregate | | Percentage | |
| | Market | | of | |
Fund | | Value | | Net Assets | |
| | | | | |
EQUITY INDEX FUND | | $ | 15,899,364 | | 1.5 | % |
ALL AMERICA FUND | | $ | 7,308,147 | | 2.9 | % |
SMALL CAP VALUE FUND | | $ | 12,296,666 | | 4.4 | % |
SMALL CAP GROWTH FUND | | $ | 9,399,777 | | 3.3 | % |
MID CAP VALUE FUND | | $ | 1,799,999 | | 3.6 | % |
MID-CAP EQUITY INDEX FUND | | $ | 7,999,782 | | 1.4 | % |
INTERNATIONAL FUND | | $ | 979,992 | | 1.2 | % |
COMPOSITE FUND | | $ | 5,227,752 | | 3.1 | % |
MONEY MARKET FUND | | $ | 60,959,864 | | 63.0 | % |
MID-TERM BOND FUND | | $ | 11,289,870 | | 3.3 | % |
BOND FUND | | $ | 18,999,764 | | 2.9 | % |
(1) This security, or a portion thereof, has been segregated to cover initial margin requirements on open futures contracts. Information on futures contracts outstanding in the Funds as of June 30, 2012, were as follows:
| | | | | | | | | | | | | | Face Value | |
| | | | | | | | | | | | | | of Futures | |
| | | | | | | | | | Underlying | | | | as a % of | |
| | Number of | | | | Purchased (P) | | Expiration | | Face Amount | | Unrealized | | Total | |
Fund | | Contracts | | Contract Type | | or Sold (S) | | Date | | at Value(a) | | Gain(Loss) | | Investments | |
| | | | | | | | | | | | | | | |
EQUITY INDEX FUND | | 529 | | E-mini S&P 500 Stock Index | | P | | September 2012 | | $ | 35,876,780 | | $ | 908,243 | | 3.5 | % |
ALL AMERICA FUND | | 63 | | E-mini S&P 500 Stock Index | | P | | September 2012 | | $ | 4,272,660 | | $ | 85,085 | | 1.7 | % |
MID-CAP EQUITY INDEX FUND | | 245 | | E-mini S&P MidCap 400 Stock Index | | P | | September 2012 | | $ | 23,017,750 | | $ | 537,114 | | 4.1 | % |
(a) Includes the cumulative appreciation(depreciation) of futures contracts, which is included in Net Unrealized Appreciation (Depreciation) of Investments and Futures Contracts in the Components of Net Assets section of the Statements of Assets and Liabilities. The Receivable or Payable for Daily Variation on Futures Contracts in the Statements of Assets and Liabilities only includes the current day’s variation margin payable or receivable.
(2) The fund has an arrangement with its custodian bank, JP Morgan Chase Bank, whereby uninvested cash, subject to parameters set by the fund, is automatically invested in the fund’s name by the bank in overnight commercial paper issued by J.P. Morgan Chase & Co. On the next business day, these funds (and earned interest) are automatically returned to the fund. The annual rate of interest earned on this temporary cash investment at June 30, 2012 was 0.15%.
(3) Percentage is less than 0.05%.
(4) U.S. Government guaranteed security.
Fair Value—The Investment Company values its investments at fair value. Fair value is an estimate of the price the Fund would receive upon selling a security in an orderly arms-length transaction. Investments are categorized based on a three-level valuation hierarchy for measurement and disclosure of fair value. The valuation hierarchy is based upon the transparency of inputs used to measure fair value. The three levels are as follows:
· Level 1 – quoted prices in active markets for identical securities.
· Level 2 – other significant observable inputs (including yield, quality, coupon rate, maturity, issue type, quoted prices for similar securities, prepayment speeds, trading characteristics, etc.).
· Level 3 – significant unobservable inputs (including the Fund’s own assumptions in determining the fair value of investments).
As of June 30, 2012, management determined that the fair value inputs for all equity securities, including shares of registered investment companies, were considered Level 1, with the exception of non-registered securities under Rule 144A of the Securities Act of 1933 which were considered Level 2. In addition, certain Rule 144A securities not actively traded were considered Level 3; however, there were no such securities as of June 30, 2012. Fair value inputs for all debt securities were considered Level 2. The inputs used for valuing securities are not necessarily an indication of the risk associated with investing in those securities. Transfers between levels are reflected based on the fair value at the beginning of a reporting period.
The following is a summary of the inputs used to value the Funds’ investments and other financial instruments as of June 30, 2012, by fair value input hierarchy:
Fund | | Level 1 – Quoted
Prices | | Level 2 – Significant
Observable Inputs | | Level 3 – Significant
Unobservable Inputs | | Total | |
Investments at Market Value: | | | | | | | | | |
(See Portfolios of Investments for More Details) | | | | | | | | | |
Equity Index Fund | | | | | | | | | |
Common Stock | | $ | 994,118,792 | | — | | — | | $ | 994,118,792 | |
Short-Term Debt Securities | | — | | $ | 35,898,156 | | — | | $ | 35,898,156 | |
Temporary Cash Investments | | — | | $ | 750,000 | | — | | $ | 750,000 | |
| | $ | 994,118,792 | | $ | 36,648,156 | | — | | $ | 1,030,766,948 | |
| | | | | | | | | |
All America Fund | | | | | | | | | |
Common Stock - Indexed | | $ | 137,053,384 | | — | | — | | $ | 137,053,384 | |
Common Stock - Active | | $ | 107,943,688 | | $ | 308,188 | | — | | $ | 108,251,876 | |
Convertible Preferred Stock | | $ | 207,905 | | — | | — | | $ | 207,905 | |
Short-Term Debt Securities | | — | | $ | 9,399,775 | | — | | $ | 9,399,775 | |
Temporary Cash Investments | | — | | $ | 592,600 | | — | | $ | 592,600 | |
| | $ | 245,204,977 | | $ | 10,300,563 | | — | | $ | 255,505,540 | |
| | | | | | | | | |
Small Cap Value Fund | | | | | | | | | |
Common Stock | | $ | 255,506,961 | | $ | 1,796,859 | | — | | $ | 257,303,820 | |
Convertible Preferred Stock | | $ | 1,591,072 | | — | | — | | $ | 1,591,072 | |
Short-Term Debt Securities | | — | | $ | 21,995,081 | | — | | $ | 21,995,081 | |
| | $ | 257,098,033 | | $ | 23,791,940 | | — | | $ | 280,889,973 | |
| | | | | | | | | |
Small Cap Growth Fund | | | | | | | | | |
Common Stock | | $ | 271,856,467 | | — | | — | | $ | 271,856,467 | |
Short-Term Debt Securities | | — | | $ | 16,899,391 | | — | | $ | 16,899,391 | |
| | $ | 271,856,467 | | $ | 16,899,391 | | — | | $ | 288,755,858 | |
| | | | | | | | | |
Mid Cap Value Fund | | | | | | | | | |
Common Stock | | $ | 46,740,999 | | — | | — | | $ | 46,740,999 | |
Short-Term Debt Securities | | — | | $ | 3,499,953 | | — | | $ | 3,499,953 | |
| | $ | 46,740,999 | | $ | 3,499,953 | | — | | $ | 50,240,952 | |
| | | | | | | | | |
Mid-Cap Equity Index Fund | | | | | | | | | |
Common Stock | | $ | 537,684,406 | | — | | — | | $ | 537,684,406 | |
Short-Term Debt Securities | | — | | $ | 18,999,247 | | — | | $ | 18,999,247 | |
Temporary Cash Investments | | — | | $ | 170,700 | | — | | $ | 170,700 | |
| | $ | 537,684,406 | | $ | 19,169,947 | | — | | $ | 556,854,353 | |
| | | | | | | | | |
International Fund | | | | | | | | | |
Common Stock | | $ | 78,490,503 | | — | | — | | $ | 78,490,503 | |
Short-Term Debt Securities | | — | | $ | 1,979,934 | | — | | $ | 1,979,934 | |
| | $ | 78,490,503 | | $ | 1,979,934 | | — | | $ | 80,470,437 | |
| | | | | | | | | |
Composite Fund | | | | | | | | | |
Common Stock | | $ | 96,459,723 | | — | | — | | $ | 96,459,723 | |
U.S. Government Debt | | — | | $ | 9,784,458 | | — | | $ | 9,784,458 | |
U.S. Government Agency Residential Mortgage-Backed Obligations | | — | | $ | 22,439,409 | | — | | $ | 22,439,409 | |
Corporate Long-Term Debt | | — | | $ | 29,981,054 | | — | | $ | 29,981,054 | |
Short-Term Debt | | — | | $ | 7,519,706 | | — | | $ | 7,519,706 | |
Temporary Cash Investments | | — | | $ | 1,017,200 | | — | | $ | 1,017,200 | |
| | $ | 96,459,723 | | $ | 70,741,827 | | — | | $ | 167,201,550 | |
| | | | | | | | | |
Retirement Income Fund | | | | | | | | | |
Common Stock | | $ | 25,635,071 | | — | | — | | $ | 25,635,071 | |
| | | | | | | | | |
2010 Retirement Fund | | | | | | | | | |
Common Stock | | $ | 21,328,533 | | — | | — | | $ | 21,328,533 | |
| | | | | | | | | |
2015 Retirement Fund | | | | | | | | | |
Common Stock | | $ | 101,587,255 | | — | | — | | $ | 101,587,255 | |
| | | | | | | | | |
2020 Retirement Fund | | | | | | | | | |
Common Stock | | $ | 140,332,205 | | — | | — | | $ | 140,332,205 | |
| | | | | | | | | |
2025 Retirement Fund | | | | | | | | | |
Common Stock | | $ | 129,660,261 | | — | | — | | $ | 129,660,261 | |
| | | | | | | | | |
2030 Retirement Fund | | | | | | | | | |
Common Stock | | $ | 106,509,390 | | — | | — | | $ | 106,509,390 | |
| | | | | | | | | |
2035 Retirement Fund | | | | | | | | | |
Common Stock | | $ | 83,447,420 | | — | | — | | $ | 83,447,420 | |
| | | | | | | | | |
2040 Retirement Fund | | | | | | | | | |
Common Stock | | $ | 75,776,015 | | — | | — | | $ | 75,776,015 | |
| | | | | | | | | |
2045 Retirement Fund | | | | | | | | | |
Common Stock | | $ | 94,315,605 | | — | | — | | $ | 94,315,605 | |
Conservative Allocation Fund | | | | | | | | | |
Common Stock | | $ | 74,981,764 | | — | | — | | $ | 74,981,764 | |
| | | | | | | | | |
Moderate Allocation Fund | | | | | | | | | |
Common Stock | | $ | 202,434,209 | | — | | — | | $ | 202,434,209 | |
| | | | | | | | | |
Aggressive Allocation Fund | | | | | | | | | |
Common Stock | | $ | 175,154,136 | | — | | — | | $ | 175,154,136 | |
| | | | | | | | | |
Money Market Fund | | | | | | | | | |
U.S. Government Debt | | — | | $ | 16,496,556 | | — | | $ | 16,496,556 | |
U.S. Government Agency Short-Term Debt | | — | | $ | 7,841,246 | | — | | $ | 7,841,246 | |
Commercial Paper | | — | | $ | 72,358,752 | | — | | $ | 72,358,752 | |
Temporary Cash Investments | | — | | $ | 94,900 | | — | | $ | 94,900 | |
| | — | | $ | 96,791,454 | | — | | $ | 96,791,454 | |
| | | | | | | | | |
Mid-Term Bond Fund | | | | | | | | | |
U.S. Government Debt | | — | | $ | 145,136,985 | | — | | $ | 145,136,985 | |
U.S. Government Agency Residential Mortgage-Backed Obligations | | — | | $ | 44,475 | | — | | $ | 44,475 | |
U.S. Government Agency Non-Mortgage-Backed Obligations | | — | | $ | 46,548,392 | | — | | $ | 46,548,392 | |
Corporate Debt | | — | | $ | 144,734,987 | | — | | $ | 144,734,987 | |
Short-Term Debt | | — | | $ | 4,899,879 | | — | | $ | 4,899,879 | |
Temporary Cash Investments | | — | | $ | 30,000 | | — | | $ | 30,000 | |
| | — | | $ | 341,394,718 | | — | | $ | 341,394,718 | |
| | | | | | | | | |
Bond Fund | | | | | | | | | |
U.S. Government Debt | | — | | $ | 32,677,607 | | — | | $ | 32,677,607 | |
U.S. Government Agency Residential Mortgage-Backed Obligations | | — | | $ | 192,409,674 | | — | | $ | 192,409,674 | |
U.S. Government Agency Non-Mortgage-Backed Obligations | | — | | $ | 16,211,416 | | — | | $ | 16,211,416 | |
Long-Term Corporate Debt | | — | | $ | 400,203,168 | | — | | $ | 400,203,168 | |
Sovereign Debt | | — | | $ | 4,539,906 | | — | | $ | 4,539,906 | |
Short-Term Debt | | — | | 8,099,872 | | — | | 8,099,872 | |
Temporary Cash Investments | | — | | 850,200 | | — | | 850,200 | |
| | — | | $ | 654,991,843 | | — | | $ | 654,991,843 | |
| | | | | | | | | |
Other Financial Instruments:* | | | | | | | | | |
Equity Index Fund | | $ | 908,243 | | — | | — | | $ | 908,243 | |
All America Fund | | $ | 85,085 | | — | | — | | $ | 85,085 | |
Mid-Cap Equity Index Fund | | $ | 537,114 | | — | | — | | $ | 537,114 | |
* Other financial instruments are derivative instruments not reflected in the Portfolio of Investments, such as futures, which are valued at the unrealized appreciation/depreciation on the instrument.
Fair Value Measurement Using Signficant Unobservable Inputs (Level 3)
for the Six Months Ended June 30, 2012
| | | | | | | | | | | | Net Change in | |
| | | | Change in | | | | | | | | Unrealized Gains/(Losses) | |
| | Balance | | Unrealized | | Transfers | | Transfers | | Balance | | of Level 3 Assets Held as of | |
| | December 31, | | Gains | | Into | | Out of | | June 30, | | June 30, 2012 Included | |
| | 2011 | | (Losses) | | Level 3 (a) | | Level 3 (b) | | 2012 | | in Statement of Operations | |
All America Fund - Active Common Stock | | — | | — | | $ | 540,384 | | $ | (540,384 | ) | — | | — | |
Small Cap Value Fund - Common Stock | | — | | — | | $ | 3,150,656 | | $ | (3,150,656 | ) | — | | — | |
(a) Reflects transfers into Level 3 from Level 2 as a result of a security being carried at a calculated fair value due to the absence of recent trading activity in the security, as described in Security Valuation below.
(b) Reflects transfers into Level 2 as a result of a security no longer being carried at a calculated fair value due to a recent trade, as further described in Security Valuation below
During the six months ended June 30, 2012, there were no transfers of securities between Level 1 and Level 2.
In May 2011, the FASB issued ASU No. 2011-04, “Fair Value Measurements (Topic 820) — Amendments to Achieve Common Fair Value Measurement and Disclosure Requirements in U.S. GAAP and IFRSs” (“ASU No. 2011-04”). ASU No. 2011-04 requires additional disclosures regarding fair value measurements in financial statements of interim and annual periods beginning after December 15, 2011. The discussion under Security Valuation, below, reflects these additional disclosures.
Security Valuation — Investment securities are carried at fair value as follows:
Exchange-traded equity securities are valued at the last sales price on the principal exchange on which the security is traded. If there is no trading volume for a particular valuation day, the last bid price is used. For equity securities traded in the over-the-counter market, the security is valued at the last sale price, or if no sale, at the latest bid price available.
Short-term debt securities with a maturity of 60 days or less are valued at amortized cost, which approximates fair value for such securities.
Debt securities, including short-term debt securities maturing in excess of 60 days, are valued on the basis of prices obtained from an independent pricing source. The pricing source may utilize various pricing methodologies that incorporate both models (which consider factors such as yield, quality, coupon rate, maturity, issue type, quoted prices for similar securities, prepayment speeds and trading characteristics) and dealer supplied valuations to derive a valuation.
In the rare instance when a price is not available from an independent pricing source or when prices may not reflect fair value, such as when the price porvided by the pricing source is not based on a recent trade, a calculated fair value is used, as determined in good faith by the Adviser and reviewed by a Valuation Committee, in accordance with procedures adopted by the Board of Directors of the Investment Company.
The Advisor uses a market approach to calculate fair value for equity securities which are categorized as Level 3. The Adviser’s valuation is primarily based on information regarding the specific equity issuer, such as the last trade price, financial statements, the relationship of per-share book value to the last trade price, operating information and any corporate actions, such as dividends or returns of capital, that may have occurred since the last trade. The Adviser also considers industry-specific conditions and overall market conditions, to determine whether the last trade price reflects fair value or needs to be adjusted. Generally, absent any significant contrary indications, the last trade price will be used to calculate fair value.
Retirement Funds and the Allocation Funds value their investments in the underlying Funds of the Investment Company at their respective net asset values.
Investment Transactions — Investment transactions are accounted for as of the trade date. Realized gain and loss on the sale of short and long-term debt securities are computed on the basis of amortized cost at the time of sale. Realized gains and losses on the sale of equity securities are based on the identified cost basis of the security, determined on the first-in, first-out (“FIFO”) basis.
Futures Contracts - The Equity Index Fund, Mid-Cap Equity Index Fund and a portion of the All America Fund each maintain indexed asset portfolios which are subject to equity price risk. In order to remain more fully invested in the equity markets while minimizing transaction costs, the funds purchase stock index futures contracts. An initial cash margin deposit (represented by cash or Treasury bills) is made upon entering into a futures contract and serves as collateral for the contract. This initial margin, maintained in a segregated account, is equal to approximately 5%-6% of the contract amount, and does not involve the borrowing of funds to finance the transaction. During the period the futures contract is outstanding, changes in the value of the contract are recognized as unrealized gains or losses by “marking-to-market” on a daily basis to reflect the market value of the contract at the end of each trading day. The accumulated unrealized gain or loss on the contract is included in Net Unrealized Appreciation (Depreciation) of Investments in the Components of Net Assets section of the Statement of Assets and Liabilities.
Futures contracts are valued at the settlement price established each day by the exchange on which traded. Depending upon whether unrealized gains or losses are incurred, variation margin payments are received or made daily. The net change in unrealized appreciation or depreciation of futures contracts is recorded in the Statement of Operations. When the contract is closed, a realized gain or loss from futures transactions is recorded in the Statement of Operations, equal to the net variation margin received or paid over the period the contract was outstanding. The “Underlying Face Amount at Value” (appearing in the “Notes to the Summary Portfolios of Investments in Securities”), representing the aggregate of outstanding contractual amounts under futures contracts, reflects the extent of a Fund’s exposure to off-balance sheet risk. The use of futures transactions involves the risk of imperfect correlation in the price movements of the contract and the underlying securities. With futures contracts, there is minimal counterparty credit risk to the Fund since futures are exchange traded and the exchange’s clearinghouse, as counterparty to all exchange traded futures, guarantees the futures against default.
Tax Information - The components of net unrealized appreciation (depreciation) of investments for Federal income tax purposes and the cost of investments for Federal income tax purposes at June 30, 2012 for each of the funds were as follows.
| | Equity Index | | All America | | Small Cap | | Small Cap | | Mid Cap | |
| | Fund | | Fund | | Value Fund | | Growth | | Value Fund | |
Unrealized Appreciation | | $ | 280,307,306 | | $ | 49,320,657 | | $ | 57,396,725 | | $ | 53,761,047 | | $ | 8,485,311 | |
Unrealized Depreciation | | (85,693,873 | ) | (25,873,812 | ) | (10,803,581 | ) | (9,024,419 | ) | (4,346,671 | ) |
Net | | $ | 194,613,433 | | $ | 23,446,845 | | $ | 46,593,144 | | $ | 44,736,628 | | $ | 4,138,640 | |
Cost of Investments | | $ | 836,153,515 | | $ | 232,058,695 | | $ | 234,296,829 | | $ | 244,019,230 | | $ | 46,102,312 | |
| | Mid-Cap | | | | | | Retirement | | 2010 | |
| | Equity Index | | International | | Composite | | Income | | Retirement | |
| | Fund | | Fund | | Fund | | Fund | | Fund | |
Unrealized Appreciation | | $ | 107,579,730 | | $ | — | | $ | 25,256,880 | | $ | 1,126,962 | | $ | 1,651,753 | |
Unrealized Depreciation | | (44,948,502 | ) | (6,055,198 | ) | (6,515,397 | ) | (8,659 | ) | (483,139 | ) |
Net | | $ | 62,631,228 | | $ | (6,055,198 | ) | $ | 18,741,483 | | $ | 1,118,303 | | $ | 1,168,614 | |
Cost of Investments | | $ | 494,223,125 | | $ | 86,525,635 | | $ | 148,460,067 | | $ | 24,516,768 | | $ | 20,159,919 | |
| | 2015 | | 2020 | | 2025 | | 2030 | | 2035 | |
| | Retirement | | Retirement | | Retirement | | Retirement | | Retirement | |
| | Fund | | Fund | | Fund | | Fund | | Fund | |
Unrealized Appreciation | | $ | 11,350,381 | | $ | 15,527,254 | | $ | 15,855,364 | | $ | 13,789,708 | | $ | 11,161,159 | |
Unrealized Depreciation | | (2,321,354 | ) | (2,561,986 | ) | (1,535,397 | ) | (1,399,263 | ) | (987,190 | ) |
Net | | $ | 9,029,027 | | $ | 12,965,268 | | $ | 14,319,967 | | $ | 12,390,445 | | $ | 10,173,969 | |
Cost of Investments | | $ | 92,558,228 | | $ | 127,366,937 | | $ | 115,340,294 | | $ | 94,118,945 | | $ | 73,273,451 | |
| | 2040 | | 2045 | | Conservative | | Moderate | | Aggressive | |
| | Retirement | | Retirement | | Allocation | | Allocation | | Allocation | |
| | Fund | | Fund | | Fund | | Fund | | Fund | |
Unrealized Appreciation | | $ | 9,819,908 | | $ | 11,919,446 | | $ | 5,954,622 | | $ | 24,646,065 | | $ | 21,271,041 | |
Unrealized Depreciation | | (794,971 | ) | (957,082 | ) | (1,444,495 | ) | (7,464,535 | ) | (4,634,430 | ) |
Net | | $ | 9,024,937 | | $ | 10,962,364 | | $ | 4,510,127 | | $ | 17,181,530 | | $ | 16,636,611 | |
Cost of Investments | | $ | 66,751,078 | | $ | 83,353,241 | | $ | 70,471,637 | | $ | 185,252,679 | | $ | 158,517,525 | |
| | Money | | | | | |
| | Market | | Mid-Term | | Bond | |
| | Fund | | Bond Fund | | Fund | |
Unrealized Appreciation | | $ | 177 | | $ | 22,531,689 | | $ | 37,852,991 | |
Unrealized Depreciation | | (4,530 | ) | (137,592 | ) | (1,151,873 | ) |
Net | | $ | (4,353 | ) | $ | 22,394,097 | | $ | 36,701,118 | |
Cost of Investments | | $ | 96,795,807 | | $ | 319,000,621 | | $ | 618,920,725 | |
ITEM 7. DISCLOSURE OF PROXY VOTING POLICIES AND PROCEDURES FOR CLOSED-END MANAGEMENT INVESTMENT COMPANIES.
Not applicable.
ITEM 8. PORTFOLIO MANAGERS OF CLOSED-END MANAGEMENT INVESTMENT COMPANIES
Not applicable.
ITEM 9. PURCHASES OF EQUITY SECURITES BY CLOSED-END MANAGEMENT INVESTMENT COMPANY AND AFFILIATED PURCHASERS.
Not applicable.
ITEM 10. SUBMISSION OF MATTERS TO A VOTE OF SECURITY HOLDERS.
Not applicable.
ITEM 11. CONTROLS AND PROCEDURES.
(a) The registrant’s principal executive officer and principal financial officer have evaluated the registrant’s disclosure controls and procedures within 90 days of this filing and have concluded that the registrant’s disclosure controls and procedures were effective, as of that date, in ensuring that information required to be disclosed by the registrant in this Form N-CSR was recorded, processed, summarized, and reported in a timely and accurate manner.
(b) The registrant’s principal executive officer and principal financial officer are aware of no changes in the registrant’s internal control over financial reporting that occurred during the second fiscal quarter of the period covered by this report that has materially affected, or is likely to materially affect, the registrant’s internal control over financial reporting.
ITEM 12. EXHIBITS.
Attached hereto:
(a) (1) Not applicable to semi-annual report. |
| |
(2) Exhibit 99.CERT | Certifications by the registrant’s principal executive officer and principal financial officer, pursuant to Section 302 of the Sarbanes-Oxley Act of 2002 and required by Rule 30a-2(a) under the Investment Company Act of 1940. |
| |
(3) Not applicable. | |
| |
(b) Exhibit 99.906CERT | Certifications pursuant to Section 906 of the Sarbanes-Oxley Act of 2002 and required by Rule 30a-2(b) under the Investment Company Act of 1940. |
SIGNATURES
Pursuant to the requirements of the Securities Exchange Act of 1934 and the Investment Company Act of 1940, the registrant has duly caused this report to be signed on its behalf by the undersigned, thereunto duly authorized.
| Mutual of America Investment Corporation | |
| | |
By: | /s/ JOHN R. GREED | |
| John R. Greed | |
| Chairman of the Board, | |
| President and Chief Executive Officer of | |
| Mutual of America Investment Corporation | |
Date: September 6, 2012
Pursuant to the requirements of the Securities Exchange Act of 1934 and the Investment Company Act of 1940, this report has been signed below by the following persons on behalf of the registrant and in the capacities and on the dates indicated.
By: | /s/ JOHN R. GREED | |
| John R. Greed | |
| Chairman of the Board, | |
| President and Chief Executive Officer of | |
| Mutual of America Investment Corporation | |
Date: September 6, 2012
By: | /s/ GEORGE L. MEDLIN | |
| George L. Medlin | |
| Executive Vice President | |
| Chief Financial Officer and Treasurer of | |
| Mutual of America Investment Corporation | |
Date: September 6, 2012