UNITED STATES
SECURITIES AND EXCHANGE COMMISSION
Washington, D.C. 20549
FORM N-CSR
CERTIFIED SHAREHOLDER REPORT OF REGISTERED
MANAGEMENT INVESTMENT COMPANIES
Investment Company Act file number 811-05084
Mutual of America Investment Corporation
(Exact name of registrant as specified in charter)
320 Park Avenue, New York, N.Y. 10022
(Address of principal executive offices) (Zip code)
John R. Greed
President
Mutual of America Life Insurance Company
320 Park Avenue
New York, NY 10022
(Name and address of agent for service)
Registrant's telephone number, including area code:
(212) 224-1600
Date of fiscal year end: December 31
Date of reporting period: June 30, 2015
| ITEM 1. | REPORTS TO STOCKHOLDERS. |
The Semi-Annual Report to Shareholders follows:
JUNE 30, 2015
Semi-Annual Reports of Investment Options Offered by Mutual of America Life Insurance Company
This report is not to be construed as an offering for sale of any Variable Policy. No offering is made except in conjunction with a prospectus which must precede or accompany this report.


320 PARK AVENUE
NEW YORK NY 10022-6839
August 2015
Dear Contract Owner,
As a valued variable annuity owner, we are pleased to provide you with the semi-annual fund reports for the investment options you have selected. Included in this booklet are the semi-annual reports of the Mutual of America Investment Corporation Funds. If you have also selected other investments options, you will receive semi-annual reports for those funds in a separate booklet or booklets. The reports provide an update on each portfolio’s performance as of June 30, 2015. Please note that portfolio performance does not take into account the fees charged by the contract. If these fees had been included, the fund’s performance would have been lower. As always, past performance cannot predict or guarantee future returns.
Mutual of America has specialized in providing retirement products and related services to organizations and their employees, as well as individuals, for 70 years. As a mutual company, we do not have stockholders and are not publicly traded. We operate solely for the benefit of our customers, managing the Company for their long-term interest, rather than for the short-term demands of stockholders. Today, as in the past, Mutual of America remains financially strong and is rated among the strongest companies in the life insurance industry by the major independent rating agencies.*
Since 1945, Mutual of America has remained committed to offering plan sponsors, plan participants and individuals carefully selected, quality products and services at a competitive price and personal attention they need to help build and preserve assets for a financially secure future. Integrity, prudence, and reliability are the values that have guided us since our inception and that continue to serve us well.
We hope you will find the enclosed information helpful. We appreciate and value your business and look forward to serving you in the future. If you have any questions, please call your local Mutual of America Regional Office or
1-800-468-3785.
Sincerely,
Mutual of America Life Insurance Company
| * | While these ratings do not apply to the safety or investment performance of the Separate Account investment funds available under Mutual of America’s products, they do reflect the Company’s ability to fulfill its General Account obligations, which include its obligations under the Interest Accumulation Account, annuity purchase rate guarantees and annuity benefit payouts, as well as life insurance and disability income payments. Third party ratings are subject to change. |
JUNE 30, 2015
Semi-Annual Reports of Mutual of America Investment Corporation
This report is not to be construed as an offering for sale of any Variable Policy. No offering is made except in conjunction with a prospectus which must precede or accompany this report.

(This page has been left blank intentionally.)
CONTENTS
MUTUALOF AMERICA INVESTMENT CORPORATION
We are pleased to present the Mutual of America Investment Corporation (the “Investment Company”) Semi-Annual Report. This Report includes important information regarding the performance and financial position of the Investment Company’s funds for the six months ended June 30, 2015.
The second quarter of 2015 ended with a flurry of unsettling events. The Greek government declared a bank holiday, instituted capital controls to preclude cash from leaving the country, and announced a nationwide referendum for the following week to either accept or reject European creditors’ austerity demands in exchange for a new bailout. That same weekend, China announced a number of stimulus measures aimed at arresting a rapid decline of more than 20% in its A-shares market, following a greater than 100% increase over the prior year. Finally, although of less global consequence, the governor of Puerto Rico announced that the U.S. territory would be unable to pay its debts.
All of these issues developed over a long period of time, generating a sense of rising uncertainty in global markets, and probably contributed to the sideways movement of stock markets and bond markets so far this year. Of course, the most important issue hanging over the markets is the question of when the Federal Reserve (Fed) will begin to raise policy rates. While the stated policy of the Fed is focused exclusively on the twin goals of contained inflation and sustainable growth in the domestic economy, events affecting the global economy have become more important considerations as the world has increasingly globalized over the past 25 years.
These issues remain unresolved and it is unlikely they will be resolved over the near term. As such, they represent ongoing uncertainty and will continue to trigger volatility in markets globally. The key issue is to what degree they will impact fundamentals — growth, currency fluctuations, trade, inflation/deflation, and corporate earnings on a global and domestic basis.
In the U.S., second quarter economic data showed improvement over the first quarter, which was negatively impacted by non-recurring items that yielded a decline in Gross Domestic Product (GDP) growth of -0.2%. Current consensus for second quarter GDP growth is 2.7%. In the early part of the second quarter, the improvement was modest and mixed. As the quarter improved, most data points showed sequential improvement. Autos, housing, labor, personal income and spending, and even the manufacturing data were solid. Trade, however, suffered as the strong U.S. dollar continued to impair exports while encouraging imports. In summary, the U.S. economy seems to be back on a modest growth track, one probably strong enough to encourage the Fed to begin to normalize interest rate policy at a modest pace sometime this year. Our guess is December rather than September given the Fed’s continuing concern about the lack of acceleration in average hourly earnings despite other compensation data suggesting accelerating income gains. Inflation also remains below the preferred target of 2.0%. And other factors that are not part of the Fed’s mandate, such as the strong dollar, which acts to restrain growth, and macroeconomic and geopolitical concerns, are important factors in any decision to raise U.S. policy rates.
On the global front, the two immediate major concerns are how the Greek crisis will be resolved (and what that implication is for the Euro, Eurozone, and European economic growth) and the impact on Chinese growth in light of its recent stock market meltdown. Then, of course, there is the just-completed agreement between the West and Iran over limiting the latter’s program to develop nuclear capability. This agreement represents one of the most significant diplomatic achievements in recent history, with potentially both positive and negative implications.
After months of acrimonious negotiations between a leftist Greek government, the European Union and the International Monetary Authority over a new debt bailout package, Greece capitulated rather than be forced out of the Eurozone and the Euro. Ironically, this is happening only one week after a Greek referendum emphatically refused to succumb to further austerity measures. However, the outcome is still highly uncertain despite the fact that the Greek Parliament approved the compromise agreement, which mandates even more austerity than Prime Minister Alexis Tsipras was elected to alleviate. The specific terms of the bailout still must be ironed out, and any agreement must be accepted by all 28 governments comprising the European Union. The ultimate implications of a final decision will remain unknown for years.
It has been clear for some time that China’s growth is slowing and is most likely to do so for the foreseeable future. This trend has seriously hurt the economies of commodity producers whose prosperity over the past approximately 20 years was almost entirely fueled by China’s outsized 10% average annualized growth. Going forward, the slowdown likely will reduce global growth because China’s past expansion produced a meaningful share of incremental growth, either directly or indirectly. The costs to China of this extraordinary growth have been the creation of tremendous excess capacity in industrial infrastructure, residential real estate and bank debt. The government is attempting a transition to a more consumer-oriented versus an export-oriented economy, a difficult task for a nation where the cultural norms support extremely high savings rates. Such a shift also requires a liberalization of the financial system to give foreigners the confidence to invest in Chinese companies through equity and debt purchases. This liberalization
1
would also increase the probabilities that the Chinese currency, the Yuan, would eventually achieve reserve currency status — as similarly enjoyed by the U.S. dollar and the Euro — and thereby support direct Chinese consumer purchases of foreign goods.
Unfortunately, recent Chinese efforts to steer their economy and financial system toward these goals have gone awry. As growth has continued to slow, authorities have responded with stimulatory measures that have resulted in more speculation in housing and further investment in areas of the economy already swamped to capacity. At the same time, these measures are adding to an onerous debt load held by the state-controlled banks and, more frighteningly, non-bank lenders. And China’s most recent foray into promoting a bull market in stocks to create a “wealth effect,” as seen in the U.S., Europe, Japan and U.K., seems to have backfired. Most commentators have quickly concluded that the leadership’s bungling of this stock market crisis has undermined confidence in President Xi Jinping’s government by its citizens and other global leaders. That is probably too hasty a judgment, at least domestically where it matters, as Xi moved swiftly and adeptly over the first three years of his tenure to consolidate power and initiate global outreach programs that fostered rising nationalism.
While all of these geopolitical and macroeconomic issues will continue to create periods of volatility in markets, history strongly suggests that the key drivers of stock and bond prices are economic and corporate profit growth. At present, economic prospects continue to improve in the U.S., Europe and Japan, perhaps not with as much acceleration as one would hope or the past would seem to indicate, but improvement nonetheless. We have often made the point that the direction of change is the most important variable in market behavior. In specific terms, at least in the U.S., bear markets have never occurred in the post-World War II period in the absence of recession, and recessions have never occurred until after short-term interest rates exceed long-term interest rates (i.e., the inverted yield curve). Even if the Fed begins to raise short-term policy rates within the next three-to-nine months, we are a long way away from either an inverted yield curve or a recession.
With about 95% of companies having already reported, second quarter earnings for S&P 500 companies are estimated to come in 4% ahead of expectations, despite the fact that estimates had not been cut as drastically in advance as has generally been the case in prior quarters over the past year or so. Excluding the energy sector, earnings for the second quarter should advance year-over-year about 5% while sales are tracking a 2% year-over-year gain. Including the energy sector, earnings and sales will be reported down about 2% and 3%, respectively. While a bit slower than we’ve seen over the past two years, these results are quite respectable given headwinds of a strong dollar and weak economic growth abroad.
Many naysayers complain that the growth rate during this expansion has been anemic compared to those in the past. That is true, but the economy has grown and so have corporate profits. In response, stocks have risen significantly in all major developed economies over the past seven years. Slow growth over a long period of time is, in our opinion, preferable to rapid growth for a short span of time, which generally leads to excesses and then collapse. Our thesis has been, and continues to be, that the economies of the developed nations are likely to continue to grow at a slow but relatively steady pace for much longer, and markets will follow.
The total return performance (net of investment management and other operating expenses) for each of the Investment Company Funds is reflected below:
| | | | |
| Total Returns — Six Months Ended June 30, 2015 | |
| |
Equity Index Fund | | | +1.18% | |
All America Fund | | | +2.34% | |
Small Cap Value Fund | | | +2.04% | |
Small Cap Growth Fund | | | +8.60% | |
Mid Cap Value Fund | | | +0.47% | |
Mid-Cap Equity Index Fund | | | +4.13% | |
International Fund | | | +6.26% | |
Composite Fund | | | +1.84% | |
Retirement Income Fund | | | +1.22% | |
2010 Retirement Fund | | | +1.51% | |
2015 Retirement Fund | | | +1.84% | |
2020 Retirement Fund | | | +2.04% | |
2025 Retirement Fund | | | +2.30% | |
2030 Retirement Fund | | | +2.45% | |
2035 Retirement Fund | | | +2.74% | |
2040 Retirement Fund | | | +3.11% | |
2
| | | | |
| Total Returns — Six Months Ended June 30, 2015 | |
| |
2045 Retirement Fund | | | +3.23% | |
2050 Retirement Fund | | | +3.36% | |
Conservative Allocation Fund | | | +1.47% | |
Moderate Allocation Fund | | | +2.01% | |
Aggressive Allocation Fund | | | +2.82% | |
Money Market Fund | | | -0.06% | |
Mid-Term Bond Fund | | | +1.24% | |
Bond Fund | | | +0.83% | |
The above performance figures do not reflect the deduction of respective Separate Account fees and expenses imposed by Mutual of America Life Insurance Company. All Fund performances presented throughout this report are historical, reflect the full reinvestment of dividends paid, and should not be considered indicative of future results.
The pages that immediately follow include brief discussions of each Fund’s performance for the six months ended June 30, 2015, compared with its relevant index.
Following the discussions are the graphical representations of the asset allocations of each Fund and an illustration of each Fund’s operating expenses. The summarized portfolios of each Fund and financial statements are presented in the pages that follow.
Thank you for your continued investment in our Funds.
Sincerely,

John R. Greed
Chairman of the Board, President
and Chief Executive Officer
Mutual of America Investment Corporation
The views expressed in this Semi-Annual Report are subject to change at any time based on market and other conditions and should not be construed as a recommendation. This Report contains forward looking statements which speak only as of the date they were made and involve a number of risks and uncertainties that could cause actual results to differ materially from those expressed herein. Readers are cautioned not to place undue reliance on our forward-looking statements, as we assume no obligation to update these forward-looking statements. Readers assume any and all responsibility for any investment decision made as a result of the views expressed herein.
3
EQUITY INDEX FUND
The Equity Index Fund’s objective is to replicate the performance of the S&P 500® Index (S&P 500), which consists of 500 stocks chosen by Standard & Poor’s for market size, liquidity and industry group representation. The S&P 500 is a market-weighted index of 500 stocks traded on the New York Stock Exchange, American Stock Exchange and NASDAQ, with each stock’s weight in the index proportionate to its market value. The weightings make each company’s influence on the S&P 500’s performance directly proportional to that company’s market value.
The Equity Index Fund’s performance for the six months ended June 30, 2015, was 1.25% before expenses and 1.18% after expenses, in line with the benchmark return of 1.23%. Note that the Equity Index Fund’s performance includes expenses, such as transaction costs and management fees, which are not applicable to the benchmark.
ALL AMERICA FUND
The investment objective of the All America Fund is to outperform the S&P 500® Index (S&P 500). The All America Fund is approximately 60% invested in the 500 stocks that comprise the S&P 500, with the remaining 40% actively managed, using three different investment approaches. The actively managed portion of the All America Fund is close to being equally distributed between large cap stocks and small cap stocks, with the small cap stocks in turn equally distributed between small cap value and small cap growth stocks.
For the six months ended June 30, 2015, the S&P 500 of large capitalization stocks increased by 1.23% on a total return basis, while the Russell 2000® Growth Index was up 8.74% and the Russell 2000® Value Index was up 0.76%.
The All America Fund’s return for the six months ended June 30, 2015, before expenses was 2.60% and 2.34% after expenses versus the benchmark return of 1.23%. The out-performance of the Fund was largely the result of out-performance by the Small Cap Value and Active Large Cap components of the Funds, although the Equity Index and Small Cap Growth components of the Fund each out-performed modestly.
SMALL CAP VALUE FUND
The investment objective of the Small Cap Value Fund is to outperform the Russell 2000® Value Index. The Small Cap Value Fund generally invests in companies that are below $3 billion in market capitalization and have lower price-to-book characteristics than the overall market.
For the six months ended June 30, 2015, the Small Cap Value Fund returned 2.46% before expenses and 2.04% after expenses versus a 0.76% return for the Russell 2000® Value Index. Within the benchmark, the best performing sectors were Health Care and Financials while the worst performing sectors were Energy and Utilities.
Stock selection was the primary driver of positive performance versus the benchmark. Sectors contributing to Fund performance included Consumer Cyclicals and Retail, while sectors detracting from Fund performance included Utilities and Consumer Staples.
SMALL CAP GROWTH FUND
The investment objective of the Small Cap Growth Fund is capital appreciation. The Small Cap Growth Fund invests in growth stocks within the small capitalization marketplace. The Fund returned 9.04% before expenses and 8.60% after expenses during the six months ended June 30, 2015. The Fund’s benchmark, the Russell 2000® Growth Index, returned 8.74% for the period.
The small capitalization growth marketplace produced one of the highest returns of any index domestically. This level of return was driven by the Health Care and Information Technology sectors. More specifically, Health Care drove most of the performance in the small capitalization growth style given the high representation of biotechnology and pharmaceuticals in the sector. Year-to-date ending June, the Health Care sector provided 55% of the benchmark’s 8.74% return of which biotechnology and pharmaceuticals were almost 80% responsible for the performance in the Health Care sector.
Information Technology was the second most meaningful area of return providing 29% of the Russell 2000® Growth Index performance. The semi-conductor and semi-conductor equipment industry as well as software industry accounted for 73% of the technology sector’s return.
Together, Health Care and Information Technology represented 84% of the Russell 2000® Growth Index’s return (7.3 percentage points of the 8.74% performance). In both of these sectors, our Fund produced outsized performance given strong stock selection. Energy and Financials were detractors from our overall performance.
4
As investors continue their search for growth, in a slowing global economic environment, the domestic small cap growth area of investing is attractive to some individuals who believe young innovative companies, with relative high levels of volatility, can provide attractive relative returns overtime.
MID CAP VALUE FUND
The investment objective of the Mid Cap Value Fund is to outperform the Russell Midcap® Value Index. The Mid Cap Value Fund generally invests in companies that are between $1 billion and $20 billion in market capitalization and have lower price-to-book characteristics.
For the six months ended June 30, 2015, the Mid Cap Value Fund returned 0.78% before expenses and 0.47% after expenses versus a 0.41% return for the Russell Midcap® Value Index. Within the benchmark, the best performing sectors were Health Care and Insurance while the worst performing sectors were Utilities and Energy.
Stock selection was neutral to performance versus the benchmark while sector allocation added to or detracted from performance. Sectors contributing to Mid Cap Value Fund performance included Health Care and, while Energy was one of the worst performing sectors within the benchmark, our Fund’s individual Energy selections greatly outperformed the benchmark, while sectors detracting from Fund performance included Retail and Industrial.
MID-CAP EQUITY INDEX FUND
The Mid-Cap Equity Index Fund invests in the 400 stocks that comprise the S&P MidCap 400® Index (S&P MidCap 400). The S&P MidCap 400 is a market-weighted index of 400 stocks traded on the New York Stock Exchange, American Stock Exchange and NASDAQ. The weightings make each company’s influence on the S&P MidCap 400’s performance directly proportional to that company’s market value. The companies included in the S&P MidCap 400 tend to be typical of this asset class, the medium-capitalized sector of the U.S. securities market.
The S&P MidCap 400 had a strong six month period ending June 30, 2015 up 4.20%. Most of the outperformance in the first half of the year came from the first quarter as the index was up 5.3%. Within the S&P MidCap 400, Health Care was up substantially followed by Information Technology and Consumer Discretionary sectors, 16.6%, 7.2%, and 5.2%, respectively. The worst performing sector was Utilities as it detracted 11.6% from the index.
The Mid-Cap Equity Index Fund’s performance for the six months ended June 30, 2015, was 4.20% before expenses and 4.13% after expenses, in line with the 4.20% return of the S&P MidCap 400. Note that the performance of the Mid-Cap Equity Index Fund includes expenses, such as transaction costs and management fees, which are not applicable to the benchmark.
INTERNATIONAL FUND
The International Fund seeks capital appreciation by investing, directly or indirectly, in stocks of companies located outside of the United States that are reflected or contained in the Morgan Stanley Capital International, Inc. Europe, Australasia and Far East® Index (MSCI EAFE® Index). Currently the International Fund is invested mainly in exchange traded funds that reflect the MSCI EAFE® Index. The Fund also has invested a small percentage of assets in exchange traded funds that provide exposure to emerging markets and to companies with small market capitalizations in developed market countries.
For the six months ended June 30, 2015, the International Fund returned 6.33% before expenses and 6.26% after expenses, outperforming the 5.52% return of the benchmark. The fund’s benchmark closes earlier in the day than the actual market for the fund’s investments. This time lag can result in both positive and negative performance differences.
COMPOSITE FUND
For the six months ended June 30, 2015, the fixed income portion of the Fund had a total return of 1.06% before expenses, compared to the Barclays Capital Aggregate Bond Index, which returned -0.10% for the period. The fixed income portion of the Fund focused on income and capital preservation.
The fixed income markets experienced negative returns during the first half of 2015. Treasury rates moved higher across the yield curve. The rise in rates was driven primarily by improved economic data and expectations that the Federal Reserve will raise short term rates.
The yield curve steepened as yields on short-dated Treasuries decreased from the end of 2014, while longer-dated bond yields increased through the first half of 2015. Two-year Treasury Notes yielded 0.65% at the end of the 2nd quarter, down slightly from 0.67% at the end of 2014. Yields on ten-year Notes jumped from 2.17% at 2014 year-end to 2.35% on June 30, an 8.4% increase. In the same period, thirty-year Treasury Bonds increased 37 basis points to a yield of 3.12%.
5
In the corporate bond market, high-grade spreads widened from 144 at the end of 2014 to 148 on June 30. In the AAA-rated segment, spreads widened from 65 to 79 basis points, while BBB-rated bonds tightened from 198 to 193 basis points. With a return of -1.77%, the AAA-rated sector was the worst investment-grade performer, while BBB and A-rated bonds both returned -0.45%.
The fixed income portion of the Fund’s strategy is to overweight corporates, underweight Treasuries, and market weight mortgage-backed securities. The portfolio’s objective is to maintain a similar maturity profile to the Barclays Capital Aggregate Bond Index with an overweighting of BBB issuers. To achieve the duration target, intermediate maturities are emphasized. The Fund also stresses diversification in order to protect the Fund from unexpected credit events, so few holdings exceed one-half of one percent of the Fund’s value. This extreme diversification will be maintained going forward as part of our risk control.
For the six months ended June 30, 2015, the equity portion of the Fund had a total return of 2.87% (before expenses), out-performing the S&P 500 Index by 164 basis points. The primary reason for the out-performance of this portion of the Fund was good stock selection in a market that traded sideways within a narrow 5% band in which only about 50% of active large cap managers were able to outperform the S&P 500.
This flat S&P 500 performance for the first half of 2015 was the result of a number of macroeconomic and geopolitical uncertainties that arose after two back-to-back performance years for the market. These concerns included a slowing Chinese economy, another debt crisis in Greece, questions about the impact of a major decline in the price of oil and a strengthening in the U. S. dollar, a spreading Middle Eastern war spearheaded by the avowed terrorist group ISIS, and an impending rate increase by the Federal Reserve.
The equity portion of the Composite Fund maintains sector weights within plus or minus 100 basis points of the S&P 500 Index and does not take positions in individual stocks with over-weights of more than 200 basis points. This structural discipline produces a relatively low-risk portfolio that emphasizes stock selection based on strong fundamental analysis.
The six months ended June 30, 2015 was characterized by a wide dispersion in sector performance such that outperformance required over-weights in sectors outperforming the benchmark and underweights in underperforming sectors. Our investment style precludes such an investment posture.
For the six months ended June 30, 2015, the Composite Fund returned 2.09% before expenses and 1.84% after expenses compared to the weighted benchmark return of 0.70%, 40% of which is based on the Barclays Capital Aggregate Bond Index and 60% of which is based on the S&P 500. The out-performance of the Composite Fund was the result of solid out-performance of both the equity and fixed income portions of the Fund.
RETIREMENT INCOME FUND
The objective of the Retirement Income Fund is current income consistent with the preservation of capital and, to a lesser extent, capital appreciation. The Retirement Income Fund invests primarily in the fixed-income funds of the Investment Company and also invests in two equity funds of the Investment Company. The Fund’s current target allocation is approximately 75% of net assets in fixed-income funds (approximately 30% in the Bond, 40% in the Mid-Term Bond Funds and 5% in the Money Market Fund) and approximately 25% of net assets in equity funds (20% in the Equity Index Fund and 5% in the Mid-Cap Equity Index Fund).
Performance for the Retirement Income Fund is compared to the Barclays Capital Aggregate Bond Index (70% weighting), the Citigroup 3-Month Treasury Bill Index (5% weighting) and the S&P 500® Index (25% weighting). For the six months ended June 30, 2015, the Fund returned 1.24% before expenses and 1.22% after expenses, versus a 0.24% return in the weighted benchmark. The outperformance of the Fund is attributable largely to the outperformance of both the Mid-Term Bond and Bond Fund.
2010 RETIREMENT FUND
The objective of the 2010 Retirement Fund is current income and capital appreciation appropriate for the asset allocation associated with a target retirement in 2010. The 2010 Retirement Fund invests in funds of the Investment Company. The Fund’s current target allocation is approximately 65% of net assets in fixed-income funds (approximately 25% in the Bond Fund, 35% in the Mid-Term Bond Fund and 5% in the Money Market Fund) and approximately 35% of net assets in equity funds (24% in the Equity Index Fund, 8% in the Mid-Cap Equity Index Fund and 3% in the International Fund) (See Note 1 in the Notes to Financial Statements for additional information on changes to Fund target allocations during 2015).
Performance for the 2010 Retirement Fund is compared to the Barclays Capital Aggregate Bond Index (60% weighting), the Citigroup 3-Month Treasury Bill Index (5% weighting) and the S&P 500® Index (35% weighting). For the
6
six months ended June 30, 2015, the Fund returned 1.53% before expenses and 1.51% after expenses, versus a 0.37% return in the weighted benchmark. The outperformance of the Fund is attributable largely to the outperformance of both the Mid-Term Bond and Bond Fund.
2015 RETIREMENT FUND
The objective of the 2015 Retirement Fund is current income and capital appreciation appropriate for the asset allocation associated with a target retirement in 2015. The 2015 Retirement Fund invests in funds of the Investment Company. The Fund’s current target allocation is approximately 45% of net assets in equity funds (approximately 27% in the Equity Index Fund, 10% in the Mid-Cap Equity Index Fund, 6% in the International Fund and 1% each in the Small Cap Growth and Small Cap Value Funds) and approximately 55% of net assets in fixed-income funds (25% in the Bond Fund and 30% in the Mid-Term Bond Fund) (See Note 1 in the Notes to Financial Statements for additional information on changes to Fund target allocations during 2015).
Performance for the 2015 Retirement Fund is compared to the S&P 500® Index (45% weighting) and the Barclays Capital Aggregate Bond Index (55% weighting). For the six months ended June 30, 2015, the Fund returned 1.87% before expenses and 1.84% after expenses, versus a 0.50% return in the weighted benchmark. The outperformance of the Fund is attributable largely to the outperformance of both the Mid-Term Bond and Bond Fund.
2020 RETIREMENT FUND
The objective of the 2020 Retirement Fund is current income and capital appreciation appropriate for the asset allocation associated with a target retirement in 2020. The 2020 Retirement Fund invests in funds of the Investment Company. The Fund’s current target allocation is approximately 55% of net assets in equity funds (approximately 31% in the Equity Index Fund, 12% in the Mid-Cap Equity Index Fund, 8% in the International Fund and 2% each in the Small Cap Growth and Small Cap Value Funds) and approximately 45% of net assets in fixed-income funds (25% in the Bond Fund and 20% in the Mid-Term Bond Fund) (See Note 1 in the Notes to Financial Statements for additional information on changes to Fund target allocations during 2015).
Performance for the 2020 Retirement Fund is compared to the S&P 500® Index (55% weighting) and the Barclays Capital Aggregate Bond Index (45% weighting). For the six months ended June 30, 2015, the Fund returned 2.07% before expenses and 2.04% after expenses, versus a 0.63% return in the weighted benchmark. The outperformance of the Fund is attributable largely to the outperformance of both the Mid-Term Bond and Bond Fund.
2025 RETIREMENT FUND
The objective of the 2025 Retirement Fund is current income and capital appreciation appropriate for the asset allocation associated with a target retirement in 2025. The 2025 Retirement Fund invests in funds of the Investment Company. The Fund’s current target allocation is approximately 68% of net assets in equity funds (approximately 37% in the Equity Index Fund, 15% in the Mid-Cap Equity Index Fund, 10% in the International Fund and 3% each in the Small Cap Growth and Small Cap Value Funds) and approximately 32% of net assets in fixed-income funds (22% in the Bond Fund and 10% in the Mid-Term Bond Fund) (See Note 1 in the Notes to Financial Statements for additional information on changes to Fund target allocations during 2015).
Performance for the 2025 Retirement Fund is compared to the S&P 500® Index (68% weighting) and the Barclays Capital Aggregate Bond Index (32% weighting). For the six months ended June 30, 2015, the Fund returned 2.33% before expenses and 2.30% after expenses, versus a 0.81% return in the weighted benchmark. The outperformance of the Fund is due to the outperformance of the Mid-Cap Equity Index, the Small Cap Value, the Small Cap Growth, and the International Fund as well as the outperformance of both the Mid-Term Bond and Bond Fund.
2030 RETIREMENT FUND
The objective of the 2030 Retirement Fund is current income and capital appreciation appropriate for the asset allocation associated with a target retirement in 2030. The 2030 Retirement Fund invests in funds of the Investment Company. The Fund’s current target allocation is approximately 78% of net assets in equity funds (approximately 39% in the Equity Index Fund, 18% in the Mid-Cap Equity Index Fund, 11% in the International Fund and 5% each in the Small Cap Growth and Small Cap Value Funds) and approximately 22% of net assets in the Bond Fund (See Note 1 in the Notes to Financial Statements for additional information on changes to Fund target allocations during 2015).
Performance for the 2030 Retirement Fund is compared to the S&P 500® Index (78% weighting) and the Barclays Capital Aggregate Bond Index (22% weighting). For the six months ended June 30, 2015, the Fund returned 2.48%
7
before expenses and 2.45% after expenses, versus a 0.94% return in the weighted benchmark. The outperformance of the Fund is due to the outperformance of the Mid-Cap Equity Index, the Small Cap Value, the Small Cap Growth, and the International Fund as well as the outperformance of the Bond Fund.
2035 RETIREMENT FUND
The objective of the 2035 Retirement Fund is current income and capital appreciation appropriate for the asset allocation associated with a target retirement in 2035. The 2035 Retirement Fund invests in funds of the Investment Company. The Fund’s current target allocation is approximately 85% of net assets in equity funds (approximately 40% in the Equity Index Fund, 20% in the Mid-Cap Equity Index Fund, 13% in the International Fund and 6% each in the Small Cap Growth and Small Cap Value Funds) and approximately 15% of net assets in the Bond Fund (See Note 1 in the Notes to Financial Statements for additional information on changes to Fund target allocations during 2015).
Performance for the 2035 Retirement Fund is compared to the S&P 500® Index (85% weighting) and the Barclays Capital Aggregate Bond Index (15% weighting). For the six months ended June 30, 2015, the Fund returned 2.77% before expenses and 2.74% after expenses, versus a 1.03% return in the weighted benchmark. The outperformance of the Fund is due to the outperformance of the Mid-Cap Equity Index, the Small Cap Value, the Small Cap Growth, and the International Fund as well as the outperformance of the Bond Fund.
2040 RETIREMENT FUND
The objective of the 2040 Retirement Fund is current income and capital appreciation appropriate for the asset allocation associated with a target retirement in 2040. The 2040 Retirement Fund invests in funds of the Investment Company. The Fund’s current target allocation is approximately 87% of net assets in equity funds (approximately 37% in the Equity Index Fund, 20% in the Mid-Cap Equity Index Fund, 14% in the International Fund and 8% each in the Small Cap Growth and Small Cap Value Funds) and approximately 13% of net assets in the Bond Fund (See Note 1 in the Notes to Financial Statements for additional information on changes to Fund target allocations during 2015).
Performance for the 2040 Retirement Fund is compared to the S&P 500® Index (87% weighting) and the Barclays Capital Aggregate Bond Index (13% weighting). For the six months ended June 30, 2015, the Fund returned 3.14% before expenses and 3.11% after expenses, versus a 1.06% return in the weighted benchmark. The outperformance of the Fund is due to the outperformance of the Mid-Cap Equity Index, the Small Cap Value, the Small Cap Growth, and the International Fund as well as the outperformance of the Bond Fund.
2045 RETIREMENT FUND
The objective of the 2045 Retirement Fund is current income and capital appreciation appropriate for the asset allocation associated with a target retirement in 2045. The 2045 Retirement Fund invests in funds of the Investment Company. The Fund’s current target allocation is approximately 89% of net assets in equity funds (approximately 34% in the Equity Index Fund, 22% in the Mid-Cap Equity Index Fund, 15% in the International Fund and 9% each in the Small Cap Growth and Small Cap Value Funds) and approximately 11% of net assets in the Bond Fund (See Note 1 in the Notes to Financial Statements for additional information on changes to Fund target allocations during 2015).
Performance for the 2045 Retirement Fund is compared to the S&P 500® Index (89% weighting) and the Barclays Capital Aggregate Bond Index (11% weighting). For the six months ended June 30, 2015, the Fund returned 3.26% before expenses and 3.23% after expenses, versus a 1.09% return in the weighted benchmark. The outperformance of the Fund is due to the outperformance of the Mid-Cap Equity Index, the Small Cap Value, the Small Cap Growth, and the International Fund as well as the outperformance of the Bond Fund.
2050 RETIREMENT FUND
The objective of the 2050 Retirement Fund is current income and capital appreciation appropriate for the asset allocation associated with a target retirement in 2050. The 2050 Retirement Fund invests in funds of the Investment Company. The Fund’s current target allocation is approximately 91% of net assets in equity funds (approximately 34% in the Equity Index Fund, 22% in the Mid-Cap Equity Index Fund, 15% in the International Fund and 10% each in the Small Cap Growth and Small Cap Value Funds) and approximately 9% of net assets in the Bond Fund (See Note 1 in the Notes to Financial Statements for additional information on changes to Fund target allocations during 2015).
Performance for the 2050 Retirement Fund is compared to the S&P 500® Index (91% weighting) and the Barclays Capital Aggregate Bond Index (9% weighting). For the six months ended June 30, 2015, the Fund returned 3.38% before expenses and 3.36% after expenses, versus a 1.11% return in the weighted benchmark. The outperformance of
8
the Fund is due to the outperformance of the Mid-Cap Equity Index, the Small Cap Value, the Small Cap Growth, and the International Fund as well as the outperformance of the Bond Fund.
CONSERVATIVE ALLOCATION FUND
The objective of the Conservative Allocation Fund is current income and, to a lesser extent, capital appreciation. The Conservative Allocation Fund invests primarily in the fixed-income funds of the Investment Company and also invests in the equity funds of the Investment Company. The Conservative Allocation Fund’s target allocation is approximately 65% of net assets in fixed-income funds (approximately 30% in the Bond Fund and 35% in the Mid-Term Bond Fund) and approximately 35% of net assets in equity funds (approximately 25% in the Equity Index Fund, 5% in the Mid-Cap Equity Index Fund and 5% in the International Fund).
Performance for the Conservative Allocation Fund is compared to the Barclays Capital Aggregate Bond Index (65% weighting) and the S&P 500® Index (35% weighting). For the six months ended June 30, 2015, the Conservative Allocation Fund returned 1.48% before expenses and 1.47% after expenses, versus a 0.37% return in the weighted benchmark. The outperformance of the Fund is attributable largely to the outperformance of both the Mid-Term Bond and Bond Fund.
MODERATE ALLOCATION FUND
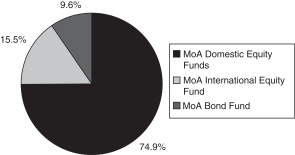
The objective of the Moderate Allocation Fund is capital appreciation and current income. The Moderate Allocation Fund invests in the equity and fixed-income funds of the Investment Company. The Moderate Allocation Fund’s target allocation is approximately 60% of net assets in equity funds (approximately 35% of its net assets in the Equity Index Fund, 15% in the Mid-Cap Equity Index Fund and 10% in the International Fund) and approximately 40% of net assets in fixed-income funds (approximately 25% of its net assets in the Bond Fund and approximately 15% of its net assets in the Mid-Term Bond Fund).
Performance for the Moderate Allocation Fund is compared to the S&P 500® Index (60% weighting) and the Barclays Capital Aggregate Bond Index (40% weighting). For the six months ended June 30, 2015, the Moderate Allocation Fund returned 2.02% before expenses and 2.01% after expenses, versus a 0.70% return for the weighted benchmark. The outperformance of the Fund is attributable largely to the outperformance of both the Mid-Term Bond and Bond Fund.
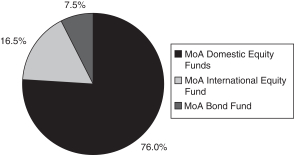
AGGRESSIVE ALLOCATION FUND
The objective of the Aggressive Allocation Fund is capital appreciation and, to a lesser extent, current income. The Aggressive Allocation Fund invests in the equity and fixed-income funds of the Investment Company. The Aggressive Allocation Fund’s target allocation is approximately 80% of net assets in equity funds (approximately 35% of its net assets in the Equity Index Fund, 20% in the Mid-Cap Equity Index Fund, 5% in the Small Cap Value Fund, 5% in the Small Cap Growth Fund and 15% in the International Fund) and approximately 20% of net assets in the Bond Fund.
Performance for the Aggressive Allocation Fund is compared to the S&P 500® Index (80% weighting) and the Barclays Capital Aggregate Bond Index (20% weighting). For the six months ended June 30, 2015, the Aggressive Allocation Fund returned 2.83% before expenses and 2.82% after expenses, versus a 0.97% return for the weighted benchmark. The outperformance of the Fund is due to the outperformance of the Mid-Cap Equity Index Fund, the International Fund as well as the outperformance of the Bond Fund.
MONEY MARKET FUND
The Money Market Fund’s investment objective is to realize current income while maintaining liquidity, investment quality and stability of capital through investing in high-quality commercial paper issued by U.S. corporations and securities issued by the U.S. government and its agencies. For the six months ended June 30, 2015, the Money Market Fund returned 0.07% before expenses and -0.06% after expenses, compared to a 0.01% return for the Citigroup 3-Month Treasury Bill Index. Note that the benchmark performance does not reflect any expenses.
Despite expectations of rising rates later on this year, the Federal Reserve stayed committed to a near-zero interest rate policy throughout the first half of 2015. The Fed Funds target rate remained anchored at a range of 0% to 0.25%. As a result, money market returns were affected by extremely low yields and a limited supply of eligible investments. The Fund’s strategy continued to focus on quality, liquidity, and maintaining a relatively short weighted average maturity.
9
The seven-day effective yield as of August 11, 2015, was -0.15%. As with all performance reporting, this yield is not necessarily indicative of future annual yields. Neither the Federal Deposit Insurance Corporation nor any other U.S. government agency insures or guarantees the Separate Account’s investments in shares of the Money Market Fund.
MID-TERM BOND FUND
The Mid-Term Bond Fund seeks a high level of return consistent with the preservation of capital through investment in publicly traded debt securities. The Mid-Term Bond Fund primarily invests in corporate and U.S. government agency securities, which normally yield more than U.S. Treasury issues.
The Mid-Term Bond Fund emphasized corporate issues, particularly BBB-rated bonds, during the first half of 2015 in order to capture incremental income. The Fund will continue to focus on income, rather than market volatility, to achieve superior returns over market cycles. In addition, the Fund’s corporate positions will remain highly diversified in order to shield the portfolio from any credit risks. The objective of the Fund was to maintain a similar maturity profile similar to the Barclays Capital Intermediate Government/Credit Bond Index.
For the six months ended June 30, 2015, the Mid-Term Bond Fund returned 1.47% before expenses. The Fund’s return is 65 basis points higher than the 0.82% return of the Barclays Capital Intermediate Government/Credit Bond Index during the same period. The Fund’s continuing emphasis on higher-yielding corporate issues was a major contributor to its outperformance.
BOND FUND
The Bond Fund’s primary investment objective is to provide as high a level of current income over time as is believed to be consistent with prudent investment risk. It does this by investing primarily in investment grade publicly traded debt securities. A secondary objective is preservation of capital. The securities held by the Bond Fund include corporate, U.S. agency and mortgage-backed bonds, all of which normally yield more than U.S. Treasury issues.
The fixed income markets experienced negative returns during the first half of 2015. Treasury rates moved higher across the yield curve. The rise in rates was driven primarily by improved economic data and expectations that the Federal Reserve will raise short term rates.
The yield curve steepened as yields on short-dated Treasuries decreased from the end of 2014, while longer-dated bond yields increased through the first half of 2015. Two-year Treasury Notes yielded 0.65% at the end of the 2nd quarter, down slightly from 0.67% at the end of 2014. Yields on ten-year Notes jumped from 2.17% at 2014 year-end to 2.35% on June 30, an 8.4% increase. In the same period, thirty-year Treasury Bonds increased 37 basis points to a yield of 3.12%.
In the corporate bond market, high-grade spreads widened from 144 at the end of 2014 to 148 on June 30. In the AAA-rated segment, spreads widened from 65 to 79 basis points, while BBB-rated bonds tightened from 198 to 193 basis points. With a return of -1.77%, the AAA-rated sector was the worst investment-grade performer, while BBB and A-rated bonds both returned -0.45%.
Through the first two quarters of 2015, the Bond Fund returned 1.08% before expenses, beating the Barclay’s Capital Aggregate Bond Index’s return of -0.10% by 116 basis points. Compared to this index, the Fund’s relative outperformance was due to an overweight position in corporate bonds and an underweight position in Treasuries. Despite the fact that spreads widened, the security selection of investment grade corporates was one the main contributors to performance. In particular, the Triple-B rated industrial bonds added the most value of all corporate bonds, accounting for 58% of total excess return.
The Bond Fund’s strategy is to overweight corporates, underweight Treasuries, and market weight mortgage-backed securities. The portfolio’s objective is to maintain a similar maturity profile to the Barclays Capital Aggregate Bond Index with an overweighting of BBB issuers. To achieve the duration target, intermediate maturities are emphasized. The Bond Fund also stresses diversification in order to protect the Fund from unexpected credit events, so few holdings exceed one-half of one percent of the Fund’s value. This extreme diversification will be maintained going forward as part of our risk control.
For the six months ended June 30, 2015, the Bond Fund returned 1.06% before expenses and 0.83% after expenses. This compares favorably to the Barclays Capital U.S. Aggregate Bond Index, which returned -0.10% for the period. As in past years, the Fund’s emphasis on higher-yielding corporate issues was a major contributor to its outperformance.
10
MUTUAL OF AMERICA INVESTMENT CORPORATION
ASSET ALLOCATIONS AS OF JUNE 30, 2015 (Unaudited)
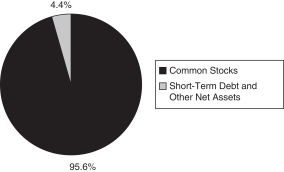
Equity Index Fund
All America Fund

Small Cap Value Fund
Small Cap Growth Fund

Mid Cap Value Fund

Mid-Cap Equity Index Fund

11
MUTUAL OF AMERICA INVESTMENT CORPORATION
ASSET ALLOCATIONS AS OF JUNE 30, 2015 (Unaudited) (Continued)
International Fund

Composite Fund

Retirement Income Fund

2010 Retirement Fund

2015 Retirement Fund

2020 Retirement Fund

12
MUTUAL OF AMERICA INVESTMENT CORPORATION
ASSET ALLOCATIONS AS OF JUNE 30, 2015 (Unaudited) (Continued)
2025 Retirement Fund

2030 Retirement Fund

2035 Retirement Fund

2040 Retirement Fund

2045 Retirement Fund
2050 Retirement Fund
13
MUTUAL OF AMERICA INVESTMENT CORPORATION
ASSET ALLOCATIONS AS OF JUNE 30, 2015 (Unaudited) (Continued)
Conservative Allocation Fund
Moderate Allocation Fund

Aggressive Allocation Fund
Money Market Fund

Mid-Term Bond Fund
Bond Fund

14
MUTUAL OF AMERICA INVESTMENT CORPORATION
EXPENSE EXAMPLE (Unaudited)
EXAMPLE
As a shareholder of one of the Mutual of America Investment Corporation Funds, you incur ongoing costs, including management fees and other Fund expenses. You do not incur transactional costs, such as sales charges (loads), redemption fees or exchange fees.
This Example is intended to help you understand your ongoing costs (in dollars) of investing in a Fund and to compare these costs with the ongoing costs of investing in other mutual funds. The Example is based on an investment of $1,000 invested at January 1, 2015 and held for the entire period ending June 30, 2015.
ACTUAL EXPENSES
The first line of the tables below provides information about actual account values and actual expenses. You may use the information in this line, together with the amount you invested, to estimate the expenses that you paid over the period. Simply divide your account value by $1,000 (for example, an $8,600 account value divided by $1,000=8.6), then multiply the result by the number in the first line under the heading entitled “Expenses Paid During Period” to estimate the expenses you paid on your account during this period.
HYPOTHETICAL EXAMPLE FOR COMPARISON PURPOSES
The second line of the tables below provides information about hypothetical account values and hypothetical expenses based on each Fund’s actual expense ratio and an assumed rate of return of 5% per year before expenses, which is not the Fund’s actual return. The hypothetical account values and expenses may not be used to estimate the actual ending account balance or expenses you paid for the period. You may use this information to compare the ongoing costs of investing in the Fund with other funds. To do so, compare this 5% hypothetical example with the 5% hypothetical examples that appear in the shareholder reports of the other funds.
Please note that the second line of the table is useful in comparing ongoing costs only, and will not help you determine the relative total costs of owning other funds, which may also charge transactional costs, such as sales charges (loads), redemption fees or exchange fees.
| | | | | | | | | | | | | | | | |
| | | Equity Index Fund | | | |
| | | | | Beginning
Account Value
January 1, 2015 | | | Ending
Account Value
June 30, 2015 | | | Expenses Paid
During Period*
January 1 to
June 30, 2015 | | | |
| | | Actual | | | $1,000.00 | | | | $1,011.85 | | | | $0.70 | | | |
| | | Hypothetical
(5% return before expenses) | | | $1,000.00 | | | | $1,023.91 | | | | $0.70 | | | |
| | * | Expenses are equal to the Fund’s annual expense ratio of 0.14%, multiplied by the average account value over the period, multiplied by 181/365 (to reflect the one-half year period). |
| | | | | | | | | | | | | | | | |
| | | All America Fund | | | |
| | | | | Beginning
Account Value
January 1, 2015 | | | Ending
Account Value
June 30, 2015 | | | Expenses Paid
During Period*
January 1 to
June 30, 2015 | | | |
| | | Actual | | | $1,000.00 | | | | $1,023.51 | | | | $2.51 | | | |
| | | Hypothetical
(5% return before expenses) | | | $1,000.00 | | | | $1,022.08 | | | | $2.51 | | | |
| | * | Expenses are equal to the Fund’s annual expense ratio of 0.50%, multiplied by the average account value over the period, multiplied by 181/365 (to reflect the one-half year period). |
15
MUTUAL OF AMERICA INVESTMENT CORPORATION
EXPENSE EXAMPLE (Unaudited) (Continued)
| | | | | | | | | | | | | | | | |
| | | Small Cap Value Fund | | | |
| | | | | Beginning
Account Value
January 1, 2015 | | | Ending
Account Value
June 30, 2015 | | | Expenses Paid
During Period*
January 1 to
June 30, 2015 | | | |
| | | Actual | | | $1,000.00 | | | | $1,020.53 | | | | $4.16 | | | |
| | | Hypothetical
(5% return before expenses) | | | $1,000.00 | | | | $1,020.39 | | | | $4.16 | | | |
| | * | Expenses are equal to the Fund’s annual expense ratio of 0.83%, multiplied by the average account value over the period, multiplied by 181/365 (to reflect the one-half year period). |
| | | | | | | | | | | | | | | | |
| | | Small Cap Growth Fund | | | |
| | | | | Beginning
Account Value
January 1, 2015 | | | Ending
Account Value
June 30, 2015 | | | Expenses Paid
During Period*
January 1 to
June 30, 2015 | | | |
| | | Actual | | | $1,000.00 | | | | $1,086.49 | | | | $4.19 | | | |
| | | Hypothetical
(5% return before expenses) | | | $1,000.00 | | | | $1,020.50 | | | | $4.06 | | | |
| | * | Expenses are equal to the Fund’s annual expense ratio of 0.81%, multiplied by the average account value over the period, multiplied by 181/365 (to reflect the one-half year period). |
| | | | | | | | | | | | | | | | |
| | | Mid Cap Value Fund | | | |
| | | | | Beginning
Account Value
January 1, 2015 | | | Ending
Account Value
June 30, 2015 | | | Expenses Paid
During Period*
January 1 to
June 30, 2015 | | | |
| | | Actual | | | $1,000.00 | | | | $1,004.73 | | | | $3.13 | | | |
| | | Hypothetical
(5% return before expenses) | | | $1,000.00 | | | | $1,021.41 | | | | $3.16 | | | |
| | * | Expenses are equal to the Fund’s annual expense ratio of 0.63%, multiplied by the average account value over the period, multiplied by 181/365 (to reflect the one-half year period). |
| | | | | | | | | | | | | | | | |
| | | Mid-Cap Equity Index Fund | | | |
| | | | | Beginning
Account Value
January 1, 2015 | | | Ending
Account Value
June 30, 2015 | | | Expenses Paid
During Period*
January 1 to
June 30, 2015 | | | |
| | | Actual | | | $1,000.00 | | | | $1,041.52 | | | | $0.71 | | | |
| | | Hypothetical
(5% return before expenses) | | | $1,000.00 | | | | $1,023.91 | | | | $0.70 | | | |
| | * | Expenses are equal to the Fund’s annual expense ratio of 0.14%, multiplied by the average account value over the period, multiplied by 181/365 (to reflect the one-half year period). |
16
MUTUAL OF AMERICA INVESTMENT CORPORATION
EXPENSE EXAMPLE (Unaudited) (Continued)
| | | | | | | | | | | | | | | | |
| | | International Fund | | | |
| | | | | Beginning
Account Value
January 1, 2015 | | | Ending
Account Value
June 30, 2015 | | | Expenses Paid
During Period*
January 1 to
June 30, 2015 | | | |
| | | Actual | | | $1,000.00 | | | | $1,062.98 | | | | $1.84 | | | |
| | | Hypothetical
(5% return before expenses) | | | $1,000.00 | | | | $1,022.79 | | | | $1.81 | | | |
| | * | Expenses are equal to the Fund’s annual expense ratio of 0.36% (reflecting direct expenses and the proportional expense ratios of the underlying funds in which the Fund invests), multiplied by the average account value over the period, multiplied by 181/365 (to reflect the one-half year period). |
| | | | | | | | | | | | | | | | |
| | | Composite Fund | | | |
| | | | | Beginning
Account Value
January 1, 2015 | | | Ending Account Value
June 30, 2015 | | | Expenses Paid
During Period*
January 1 to
June 30, 2015 | | | |
| | | Actual | | | $1,000.00 | | | | $1,018.53 | | | | $2.50 | | | |
| | | Hypothetical
(5% return before expenses) | | | $1,000.00 | | | | $1,022.08 | | | | $2.51 | | | |
| | * | Expenses are equal to the Fund’s annual expense ratio of 0.50%, multiplied by the average account value over the period, multiplied by 181/365 (to reflect the one-half year period). |
| | | | | | | | | | | | | | | | |
| | | Retirement Income Fund | | | |
| | | | | Beginning
Account Value
January 1, 2015 | | | Ending
Account Value
June 30, 2015 | | | Expenses Paid
During Period*
January 1 to
June 30, 2015 | | | |
| | | Actual | | | $1,000.00 | | | | $1,012.29 | | | | $2.10 | | | |
| | | Hypothetical
(5% return before expenses) | | | $1,000.00 | | | | $1,022.48 | | | | $2.11 | | | |
| | * | Expenses are equal to the Fund’s annual expense ratio of 0.42% (reflecting direct investment management fees and the proportional expense ratios of the underlying funds in which the Fund invests), multiplied by the average account value over the period, multiplied by 181/365 (to reflect the one-half year period). |
| | | | | | | | | | | | | | | | |
| | | 2010 Retirement Fund | | | |
| | | | | Beginning
Account Value
January 1, 2015 | | | Ending
Account Value
June 30, 2015 | | | Expenses Paid
During Period*
January 1 to
June 30, 2015 | | | |
| | | Actual | | | $1,000.00 | | | | $1,015.19 | | | | $1.90 | | | |
| | | Hypothetical
(5% return before expenses) | | | $1,000.00 | | | | $1,022.69 | | | | $1.91 | | | |
| | * | Expenses are equal to the Fund’s annual expense ratio of 0.38% (reflecting direct investment management fees and the proportional expense ratios of the underlying funds in which the Fund invests), multiplied by the average account value over the period, multiplied by 181/365 (to reflect the one-half year period). |
17
MUTUAL OF AMERICA INVESTMENT CORPORATION
EXPENSE EXAMPLE (Unaudited) (Continued)
| | | | | | | | | | | | | | | | |
| | | 2015 Retirement Fund | | | |
| | | | | Beginning
Account Value
January 1, 2015 | | | Ending
Account Value
June 30, 2015 | | | Expenses Paid
During Period*
January 1 to
June 30, 2015 | | | |
| | | Actual | | | $1,000.00 | | | | $1,018.53 | | | | $1.95 | | | |
| | | Hypothetical
(5% return before expenses) | | | $1,000.00 | | | | $1,022.64 | | | | $1.96 | | | |
| | * | Expenses are equal to the Fund’s annual expense ratio of 0.39% (reflecting direct expenses and the proportional expense ratios of the underlying funds in which the Fund invests), multiplied by the average account value over the period, multiplied by 181/365 (to reflect the one-half year period). |
| | | | | | | | | | | | | | | | |
| | | 2020 Retirement Fund | | | |
| | | | | Beginning
Account Value
January 1, 2015 | | | Ending
Account Value
June 30, 2015 | | | Expenses Paid
During Period*
January 1 to
June 30, 2015 | | | |
| | | Actual | | | $1,000.00 | | | | $1,020.53 | | | | $1.85 | | | |
| | | Hypothetical
(5% return before expenses) | | | $1,000.00 | | | | $1,022.74 | | | | $1.86 | | | |
| | * | Expenses are equal to the Fund’s annual expense ratio of 0.37% (reflecting direct expenses and the proportional expense ratios of the underlying funds in which the Fund invests), multiplied by the average account value over the period, multiplied by 181/365 (to reflect the one-half year period). |
| | | | | | | | | | | | | | | | |
| | | 2025 Retirement Fund | | | |
| | | | | Beginning
Account Value
January 1, 2015 | | | Ending
Account Value
June 30, 2015 | | | Expenses Paid
During Period*
January 1 to
June 30, 2015 | | | |
| | | Actual | | | $1,000.00 | | | | $1,023.12 | | | | $1.71 | | | |
| | | Hypothetical
(5% return before expenses) | | | $1,000.00 | | | | $1,022.89 | | | | $1.71 | | | |
| | * | Expenses are equal to the Fund’s annual expense ratio of 0.34% (reflecting direct expenses and the proportional expense ratios of the underlying funds in which the Fund invests), multiplied by the average account value over the period, multiplied by 181/365 (to reflect the one-half year period). |
| | | | | | | | | | | | | | | | |
| | | 2030 Retirement Fund | | | |
| | | | | Beginning
Account Value
January 1, 2015 | | | Ending
Account Value
June 30, 2015 | | | Expenses Paid
During Period*
January 1 to
June 30, 2015 | | | |
| | | Actual | | | $1,000.00 | | | | $1,024.63 | | | | $1.71 | | | |
| | | Hypothetical
(5% return before expenses) | | | $1,000.00 | | | | $1,022.89 | | | | $1.71 | | | |
| | * | Expenses are equal to the Fund’s annual expense ratio of 0.34% (reflecting direct expenses and the proportional expense ratios of the underlying funds in which the Fund invests), multiplied by the average account value over the period, multiplied by 181/365 (to reflect the one-half year period). |
18
MUTUAL OF AMERICA INVESTMENT CORPORATION
EXPENSE EXAMPLE (Unaudited) (Continued)
| | | | | | | | | | | | | | | | |
| | | 2035 Retirement Fund | | | |
| | | | | Beginning
Account Value
January 1, 2015 | | | Ending
Account Value
June 30, 2015 | | | Expenses Paid
During Period*
January 1 to
June 30, 2015 | | | |
| | | Actual | | | $1,000.00 | | | | $1,027.54 | | | | $1.66 | | | |
| | | Hypothetical
(5% return before expenses) | | | $1,000.00 | | | | $1,022.94 | | | | $1.66 | | | |
| | * | Expenses are equal to the Fund’s annual expense ratio of 0.33% (reflecting direct expenses and the proportional expense ratios of the underlying funds in which the Fund invests), multiplied by the average account value over the period, multiplied by 181/365 (to reflect the one-half year period). |
| | | | | | | | | | | | | | | | |
| | | 2040 Retirement Fund | | | |
| | | | | Beginning
Account Value
January 1, 2015 | | | Ending
Account Value
June 30, 2015 | | | Expenses Paid
During Period*
January 1 to
June 30, 2015 | | | |
| | | Actual | | | $1,000.00 | | | | $1,031.27 | | | | $1.76 | | | |
| | | Hypothetical
(5% return before expenses) | | | $1,000.00 | | | | $1,022.84 | | | | $1.76 | | | |
| | * | Expenses are equal to the Fund’s annual expense ratio of 0.35% (reflecting direct expenses and the proportional expense ratios of the underlying funds in which the Fund invests), multiplied by the average account value over the period, multiplied by 181/365 (to reflect the one-half year period). |
| | | | | | | | | | | | | | | | |
| | | 2045 Retirement Fund | | | |
| | | | | Beginning
Account Value
January 1, 2015 | | | Ending
Account Value
June 30, 2015 | | | Expenses Paid
During Period*
January 1 to
June 30, 2015 | | | |
| | | Actual | | | $1,000.00 | | | | $1,032.48 | | | | $1.76 | | | |
| | | Hypothetical
(5% return before expenses) | | | $1,000.00 | | | | $1,022.84 | | | | $1.76 | | | |
| | * | Expenses are equal to the Fund’s annual expense ratio of 0.35% (reflecting direct expenses and the proportional expense ratios of the underlying funds in which the Fund invests), multiplied by the average account value over the period, multiplied by 181/365 (to reflect the one-half year period). |
| | | | | | | | | | | | | | | | |
| | | 2050 Retirement Fund | | | |
| | | | | Beginning
Account Value
January 1, 2015 | | | Ending
Account Value
June 30, 2015 | | | Expenses Paid
During Period*
January 1 to
June 30, 2015 | | | |
| | | Actual | | | $1,000.00 | | | | $1,033.78 | | | | $1.76 | | | |
| | | Hypothetical
(5% return before expenses) | | | $1,000.00 | | | | $1,022.84 | | | | $1.76 | | | |
| | * | Expenses are equal to the Fund’s annual expense ratio of 0.35% (reflecting direct investment management fees and the proportional expense ratios of the underlying funds in which the Fund invests), multiplied by the average account value over the period, multiplied by 181/365 (to reflect the one-half year period). |
19
MUTUAL OF AMERICA INVESTMENT CORPORATION
EXPENSE EXAMPLE (Unaudited) (Continued)
| | | | | | | | | | | | | | | | |
| | | Conservative Allocation Fund | | | |
| | | | | Beginning
Account Value
January 1, 2015 | | | Ending
Account Value
June 30, 2015 | | | Expenses Paid
During Period*
January 1 to
June 30, 2015 | | | |
| | | Actual | | | $1,000.00 | | | | $1,014.80 | | | | $1.80 | | | |
| | | Hypothetical
(5% return before expenses) | | | $1,000.00 | | | | $1,022.79 | | | | $1.81 | | | |
| | * | Expenses are equal to the Fund’s annual expense ratio of 0.36% (reflecting direct operating expenses and the proportional expense ratios of the underlying funds in which the Fund invests), multiplied by the average account value over the period, multiplied by 181/365 (to reflect the one-half year period). |
| | | | | | | | | | | | | | | | |
| | | Moderate Allocation Fund | | | |
| | | | | Beginning
Account Value
January 1, 2015 | | | Ending
Account Value
June 30, 2015 | | | Expenses Paid
During Period*
January 1 to
June 30, 2015 | | | |
| | | Actual | | | $1,000.00 | | | | $1,020.19 | | | | $1.40 | | | |
| | | Hypothetical
(5% return before expenses) | | | $1,000.00 | | | | $1,023.20 | | | | $1.40 | | | |
| | * | Expenses are equal to the Fund’s annual expense ratio of 0.28% (reflecting direct operating expenses and the proportional expense ratios of the underlying funds in which the Fund invests), multiplied by the average account value over the period, multiplied by 181/365 (to reflect the one-half year period). |
| | | | | | | | | | | | | | | | |
| | | Aggressive Allocation Fund | | | |
| | | | | Beginning
Account Value
January 1, 2015 | | | Ending
Account Value
June 30, 2015 | | | Expenses Paid
During Period*
January 1 to
June 30, 2015 | | | |
| | | Actual | | | $1,000.00 | | | | $1,028.37 | | | | $1.41 | | | |
| | | Hypothetical
(5% return before expenses) | | | $1,000.00 | | | | $1,023.20 | | | | $1.40 | | | |
| | * | Expenses are equal to the Fund’s annual expense ratio of 0.28% (reflecting direct operating expenses and the proportional expense ratios of the underlying funds in which the Fund invests), multiplied by the average account value over the period, multiplied by 181/365 (to reflect the one-half year period). |
| | | | | | | | | | | | | | | | |
| | | Money Market Fund | | | |
| | | | | Beginning
Account Value
January 1, 2015 | | | Ending
Account Value
June 30, 2015 | | | Expenses Paid
During Period*
January 1 to
June 30, 2015 | | | |
| | | Actual | | | $1,000.00 | | | | $999.40 | | | | $1.29 | | | |
| | | Hypothetical
(5% return before expenses) | | | $1,000.00 | | | | $1,023.30 | | | | $1.30 | | | |
| | * | Expenses are equal to the Fund’s annual expense ratio of 0.26%, multiplied by the average account value over the period, multiplied by 181/365 (to reflect the one-half year period). |
20
MUTUAL OF AMERICA INVESTMENT CORPORATION
EXPENSE EXAMPLE (Unaudited) (Continued)
| | | | | | | | | | | | | | | | |
| | | Mid-Term Bond Fund | | | |
| | | | | Beginning
Account Value
January 1, 2015 | | | Ending
Account Value
June 30, 2015 | | | Expenses Paid
During Period*
January 1 to
June 30, 2015 | | | |
| | | Actual | | | $1,000.00 | | | | $1,012.49 | | | | $2.35 | | | |
| | | Hypothetical
(5% return before expenses) | | | $1,000.00 | | | | $1,022.23 | | | | $2.36 | | | |
| | * | Expenses are equal to the Fund’s annual expense ratio of 0.47%, multiplied by the average account value over the period, multiplied by 181/365 (to reflect the one-half year period). |
| | | | | | | | | | | | | | | | |
| | | Bond Fund | | | |
| | | | | Beginning
Account Value
January 1, 2015 | | | Ending
Account Value
June 30, 2015 | | | Expenses Paid
During Period*
January 1 to
June 30, 2015 | | | |
| | | Actual | | | $1,000.00 | | | | $1,008.34 | | | | $2.29 | | | |
| | | Hypothetical
(5% return before expenses) | | | $1,000.00 | | | | $1,022.28 | | | | $2.31 | | | |
| | * | Expenses are equal to the Fund’s annual expense ratio of 0.46%, multiplied by the average account value over the period, multiplied by 181/365 (to reflect the one-half year period). |
21
MUTUAL OF AMERICA INVESTMENT CORPORATION — EQUITY INDEX FUND
SUMMARY PORTFOLIO OF INVESTMENTS IN SECURITIES
June 30, 2015 (Unaudited)
| | | | | | | | |
| | | Shares | | | Value | |
| | | | | | | | |
| INDEXED ASSETS: | | | | | | | | |
COMMON STOCKS: | | | | | | | | |
CONSUMER DISCRETIONARY (12.4%) | | | | | | | | |
Amazon.com, Inc.* | | | 37,068 | | | $ | 16,090,848 | |
Comcast Corp. Cl A | | | 244,057 | | | | 14,677,588 | |
Disney (Walt) Co. | | | 151,403 | | | | 17,281,138 | |
Home Depot, Inc. | | | 126,117 | | | | 14,015,382 | |
McDonald’s Corp. | | | 92,997 | | | | 8,841,225 | |
Other Securities | | | 2,721,381 | | | | 154,978,263 | |
| | | | | | | | |
| | | | | | | 225,884,444 | |
| | | | | | | | |
CONSUMER STAPLES (9.2%) | | | | | | | | |
Altria Group, Inc. | | | 190,748 | | | | 9,329,485 | |
Coca-Cola Co. | | | 380,553 | | | | 14,929,094 | |
CVS Health Corp. | | | 109,524 | | | | 11,486,877 | |
PepsiCo, Inc. | | | 143,163 | | | | 13,362,834 | |
Philip Morris Int’l., Inc. | | | 150,263 | | | | 12,046,585 | |
Proctor & Gamble Co. | | | 263,155 | | | | 20,589,247 | |
Wal-Mart Stores, Inc. | | | 153,185 | | | | 10,865,412 | |
Other Securities | | | 1,085,872 | | | | 73,416,138 | |
| | | | | | | | |
| | | | | | | 166,025,672 | |
| | | | | | | | |
ENERGY (7.7%) | | | | | | | | |
Chevron Corp. | | | 182,414 | | | | 17,597,479 | |
Exxon Mobil Corp. | | | 405,751 | | | | 33,758,483 | |
Schlumberger Ltd. | | | 123,265 | | | | 10,624,210 | |
Other Securities | | | 1,521,678 | | | | 76,838,940 | |
| | | | | | | | |
| | | | | | | 138,819,112 | |
| | | | | | | | |
FINANCIALS (16.1%) | | | | | | | | |
Bank of America Corp. | | | 1,018,721 | | | | 17,338,631 | |
Berkshire Hathaway, Inc. Cl B* | | | 176,977 | | | | 24,088,339 | |
Citigroup, Inc. | | | 294,319 | | | | 16,258,182 | |
JPMorgan Chase & Co. | | | 360,229 | | | | 24,409,117 | |
Wells Fargo & Co. | | | 454,607 | | | | 25,567,098 | |
Other Securities | | | 3,390,866 | | | | 185,782,322 | |
| | | | | | | | |
| | | | | | | 293,443,689 | |
| | | | | | | | |
HEALTH CARE (15.0%) | | | | | | | | |
AbbVie, Inc. | | | 166,811 | | | | 11,208,031 | |
Allergan PLC* | | | 38,102 | | | | 11,562,433 | |
Amgen, Inc. | | | 73,793 | | | | 11,328,701 | |
BIOGEN, Inc.* | | | 22,815 | | | | 9,215,891 | |
Bristol-Myers Squibb Co. | | | 161,806 | | | | 10,766,571 | |
Celgene Corp.* | | | 76,960 | | | | 8,906,966 | |
Gilead Sciences, Inc. | | | 142,623 | | | | 16,698,301 | |
Johnson & Johnson | | | 269,157 | | | | 26,232,041 | |
| | | | | | | | |
| | | Shares | | | Value | |
| | | | | | | | |
| INDEXED ASSETS (CONTINUED): | |
COMMON STOCKS (CONTINUED): | |
HEALTH CARE (CONTINUED) | |
Medtronic PLC | | | 138,373 | | | $ | 10,253,439 | |
Merck & Co., Inc. | | | 274,268 | | | | 15,614,077 | |
Pfizer, Inc. | | | 597,648 | | | | 20,039,137 | |
UnitedHealth Group, Inc. | | | 92,327 | | | | 11,263,894 | |
Other Securities | | | 1,230,973 | | | | 109,974,890 | |
| | | | | | | | |
| | | | | | | 273,064,372 | |
| | | | | | | | |
INDUSTRIALS (9.9%) | | | | | | | | |
3M Co. | | | 61,611 | | | | 9,506,577 | |
Boeing Co. | | | 62,394 | | | | 8,655,296 | |
General Electric Co. | | | 977,641 | | | | 25,975,921 | |
United Technologies Corp. | | | 80,303 | | | | 8,908,012 | |
Other Securities | | | 1,705,088 | | | | 126,025,146 | |
| | | | | | | | |
| | | | | | | 179,070,952 | |
| | | | | | | | |
INFORMATION TECHNOLOGY (19.1%) | |
Apple, Inc. | | | 559,072 | | | | 70,121,602 | |
Cisco Systems, Inc. | | | 493,501 | | | | 13,551,537 | |
EMC Corp. | | | 188,415 | | | | 4,972,272 | |
Facebook, Inc. Cl A* | | | 204,353 | | | | 17,526,335 | |
Google, Inc. Cl A* | | | 27,781 | | | | 15,002,851 | |
Google, Inc. Cl C* | | | 27,840 | | | | 14,490,873 | |
Int’l. Business Machines Corp. | | | 88,918 | | | | 14,463,402 | |
Intel Corp. | | | 460,344 | | | | 14,001,363 | |
MasterCard, Inc. Cl A | | | 94,061 | | | | 8,792,822 | |
Microsoft Corp. | | | 784,783 | | | | 34,648,169 | |
Oracle Corp. | | | 309,205 | | | | 12,460,962 | |
QUALCOMM, Inc. | | | 158,140 | | | | 9,904,308 | |
Visa, Inc. Cl A | | | 187,535 | | | | 12,592,975 | |
Other Securities | | | 2,188,178 | | | | 104,219,905 | |
| | | | | | | | |
| | | | | | | 346,749,376 | |
| | | | | | | | |
MATERIALS (3.1%) | | | | | | | | |
Other Securities | | | 955,569 | | | | 56,244,940 | |
| | | | | | | | |
TELECOMMUNICATION SERVICES (2.2%) | |
AT&T, Inc. | | | 504,021 | | | | 17,902,826 | |
Verizon Communications, Inc. | | | 395,754 | | | | 18,446,094 | |
Other Securities | | | 195,812 | | | | 3,666,159 | |
| | | | | | | | |
| | | | | | | 40,015,079 | |
| | | | | | | | |
UTILITIES (2.8%) | | | | | | | | |
Other Securities | | | 1,122,533 | | | | 50,120,415 | |
| | | | | | | | |
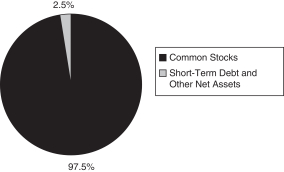
TOTAL INDEXED ASSETS-COMMON STOCKS | |
(Cost: $1,098,600,754) 97.5% | | | | | | | 1,769,438,051 | |
| | | | | | | | |
The accompanying notes are an integral part of these portfolio schedules.
22
MUTUAL OF AMERICA INVESTMENT CORPORATION — EQUITY INDEX FUND
SUMMARY PORTFOLIO OF INVESTMENTS IN SECURITIES (Continued)
June 30, 2015 (Unaudited)
| | | | | | | | | | | | | | |
| | | Rating** | | Rate(%) | | Maturity | | Face Amount | | | Value | |
| SHORT-TERM DEBT SECURITIES: | | | | | | | | | | | | | | |
U.S. GOVERNMENT (0.5%) | | | | | | | | | | | | | | |
U.S. Treasury Bill (1) | | A-1+ | | 0.07 - 0.12 | | 11/19/15 - 01/07/16 | | $ | 8,900,000 | | | $ | 8,897,170 | |
| | | | | | | | | | | | | | |
COMMERCIAL PAPER (1.9%) | | | | | | | | | | | | | | |
Air Products & Chemicals† | | A-1 | | 0.10 | | 07/22/15 | | | 4,000,000 | | | | 3,999,767 | |
EMC Corp.† | | A-1 | | 0.11 | | 07/17/15 | | | 4,000,000 | | | | 3,999,804 | |
Nestle Finance | | A-1+ | | 0.03 | | 08/12/15 | | | 12,200,000 | | | | 12,199,573 | |
Private Export Funding Corp.† | | A-1 | | 0.13 | | 08/11/15 | | | 400,000 | | | | 399,941 | |
Toyota Motor Credit Corp. | | A-1+ | | 0.13 - 0.14 | | 07/24/15 - 08/04/15 | | | 13,500,000 | | | | 13,498,387 | |
| | | | | | | | | | | | | | |
| | | | | | | | | | | | | 34,097,472 | |
| | | | | | | | | | | | | | |
TOTAL SHORT-TERM DEBT SECURITIES
(Cost: $42,994,642) 2.4% | | | | 42,994,642 | |
| | | | | | | | | | | | | | |
TOTAL INVESTMENTS
(Cost: $1,141,595,396) 99.9% | | | | 1,812,432,693 | |
| | | | | | | | | | | | | | |
OTHER NET ASSETS 0.1% | | | | 2,375,388 | |
| | | | | | | | | | | | | | |
NET ASSETS 100.0% | | | $ | 1,814,808,081 | |
| | | | | | | | | | | | | | |
The accompanying notes are an integral part of these portfolio schedules.
23
MUTUAL OF AMERICA INVESTMENT CORPORATION — ALL AMERICA FUND
SUMMARY PORTFOLIO OF INVESTMENTS IN SECURITIES
June 30, 2015 (Unaudited)
| | | | | | | | |
| | | Shares | | | Value | |
| | | | | | | | |
| INDEXED ASSETS: | | | | | | | | |
COMMON STOCKS: | | | | | | | | |
CONSUMER DISCRETIONARY (6.7%) | | | | | | | | |
Amazon.com, Inc.* | | | 3,471 | | | $ | 1,506,726 | |
Comcast Corp. Cl A | | | 22,855 | | | | 1,374,500 | |
Disney (Walt) Co. | | | 14,178 | | | | 1,618,277 | |
Home Depot, Inc. | | | 11,811 | | | | 1,312,556 | |
McDonald’s Corp. | | | 8,708 | | | | 827,870 | |
Starbucks Corp. | | | 13,622 | | | | 730,344 | |
Time Warner, Inc. | | | 7,499 | | | | 655,488 | |
Other Securities | | | 233,721 | | | | 13,126,068 | |
| | | | | | | | |
| | | | | | | 21,151,829 | |
| | | | | | | | |
CONSUMER STAPLES (4.9%) | | | | | | | | |
Coca-Cola Co. | | | 35,637 | | | | 1,398,040 | |
PepsiCo, Inc. | | | 13,407 | | | | 1,251,409 | |
Philip Morris Int’l., Inc. | | | 14,071 | | | | 1,128,072 | |
Proctor & Gamble Co. | | | 24,643 | | | | 1,928,068 | |
Wal-Mart Stores, Inc. | | | 14,345 | | | | 1,017,491 | |
Other Securities | | | 129,805 | | | | 8,824,255 | |
| | | | | | | | |
| | | | | | | 15,547,335 | |
| | | | | | | | |
ENERGY (4.1%) | | | | | | | | |
Chevron Corp. | | | 17,082 | | | | 1,647,901 | |
Exxon Mobil Corp. | | | 37,998 | | | | 3,161,434 | |
Other Securities | | | 154,032 | | | | 8,190,022 | |
| | | | | | | | |
| | | | | | | 12,999,357 | |
| | | | | | | | |
FINANCIALS (8.7%) | | | | | | | | |
American Int’l. Group, Inc. | | | 12,107 | | | | 748,455 | |
Bank of America Corp. | | | 95,399 | | | | 1,623,691 | |
Berkshire Hathaway, Inc. Cl B* | | | 16,573 | | | | 2,255,751 | |
Capital One Financial Corp. | | | 4,962 | | | | 436,507 | |
Citigroup, Inc. | | | 27,561 | | | | 1,522,470 | |
Goldman Sachs Group, Inc. | | | 3,649 | | | | 761,875 | |
JPMorgan Chase & Co. | | | 33,735 | | | | 2,285,884 | |
Wells Fargo & Co. | | | 42,572 | | | | 2,394,249 | |
Other Securities | | | 296,809 | | | | 15,449,670 | |
| | | | | | | | |
| | | | | | | 27,478,552 | |
| | | | | | | | |
HEALTH CARE (8.1%) | | | | | | | | |
Allergan PLC* | | | 3,568 | | | | 1,082,745 | |
BIOGEN, Inc.* | | | 2,136 | | | | 862,816 | |
Celgene Corp.* | | | 7,207 | | | | 834,102 | |
Gilead Sciences, Inc. | | | 13,357 | | | | 1,563,838 | |
Johnson & Johnson | | | 25,205 | | | | 2,456,479 | |
Medtronic PLC | | | 12,958 | | | | 960,188 | |
| | | | | | | | |
| | | Shares | | | Value | |
| | | | | | | | |
| INDEXED ASSETS (CONTINUED): | |
COMMON STOCKS (CONTINUED): | |
HEALTH CARE (CONTINUED) | |
Merck & Co., Inc. | | | 25,685 | | | $ | 1,462,247 | |
Mylan N.V.* | | | 3,730 | | | | 253,118 | |
Pfizer, Inc. | | | 55,967 | | | | 1,876,574 | |
UnitedHealth Group, Inc. | | | 8,645 | | | | 1,054,690 | |
Other Securities | | | 149,223 | | | | 13,163,475 | |
| | | | | | | | |
| | | | | | | 25,570,272 | |
| | | | | | | | |
INDUSTRIALS (5.3%) | | | | | | | | |
Boeing Co. | | | 5,843 | | | | 810,541 | |
General Electric Co. | | | 91,552 | | | | 2,432,537 | |
Roper Technologies, Inc. | | | 913 | | | | 157,456 | |
Union Pacific Corp. | | | 7,954 | | | | 758,573 | |
Other Securities | | | 164,111 | | | | 12,611,410 | |
| | | | | | | | |
| | | | | | | 16,770,517 | |
| | | | | | | | |
INFORMATION TECHNOLOGY (10.2%) | |
Apple, Inc. | | | 52,355 | | | | 6,566,621 | |
Cisco Systems, Inc. | | | 46,215 | | | | 1,269,064 | |
Facebook, Inc. Cl A* | | | 19,136 | | | | 1,641,199 | |
Google, Inc. Cl A* | | | 2,601 | | | | 1,404,644 | |
Google, Inc. Cl C* | | | 2,607 | | | | 1,356,975 | |
Int’l. Business Machines Corp. | | | 8,327 | | | | 1,354,470 | |
Intel Corp. | | | 43,109 | | | | 1,311,160 | |
MasterCard, Inc. Cl A | | | 8,809 | | | | 823,465 | |
Microsoft Corp. | | | 73,492 | | | | 3,244,672 | |
Oracle Corp. | | | 28,956 | | | | 1,166,927 | |
QUALCOMM, Inc. | | | 14,810 | | | | 927,550 | |
Salesforce.com, inc.* | | | 5,531 | | | | 385,124 | |
Other Securities | | | 234,589 | | | | 11,019,747 | |
| | | | | | | | |
| | | | | | | 32,471,618 | |
| | | | | | | | |
MATERIALS (1.7%) | |
Other Securities | | | 89,478 | | | | 5,266,577 | |
| | | | | | | | |
TELECOMMUNICATION SERVICES (1.2%) | |
AT&T, Inc. | | | 47,199 | | | | 1,676,508 | |
Verizon Communications, Inc. | | | 37,061 | | | | 1,727,413 | |
Other Securities | | | 18,337 | | | | 343,324 | |
| | | | | | | | |
| | | | | | | 3,747,245 | |
| | | | | | | | |
UTILITIES (1.5%) | |
Other Securities | | | 105,114 | | | | 4,693,339 | |
| | | | | | | | |
TOTAL INDEXED ASSETS-COMMON STOCKS | |
(Cost: $113,447,402) 52.4% | | | | | | | 165,696,641 | |
| | | | | | | | |
| | | | | | | | | | | | | | | | |
| | | Rating** | | | Rate(%) | | Maturity | | Face Amount | | | Value | |
| INDEXED ASSETS: | | | | | | | | | | | | | | | | |
SHORT-TERM DEBT SECURITIES: | | | | | | | | | | | | | | | | |
U.S. GOVERNMENT (0.2%) | | | | | | | | | | | | | | | | |
U.S. Treasury Bill (1) | | | A-1+ | | | 0.07 - 0.12 | | 11/19/15 - 01/07/16 | | $ | 500,000 | | | $ | 499,826 | |
| | | | | | | | | | | | | | | | |
COMMERCIAL PAPER (1.3%) | | | | | | | | | | | | | | | | |
Toyota Motor Credit Corp. | | | A-1+ | | | 0.10 | | 07/16/15 | | | 4,000,000 | | | | 3,999,833 | |
| | | | | | | | | | | | | | | | |
TOTAL INDEXED ASSETS-SHORT-TERM DEBT SECURITIES
(Cost: $4,499,659) 1.5% | | | | 4,499,659 | |
| | | | | | | | | | | | | | | | |
TOTAL INDEXED ASSETS
(Cost: $117,947,061) 53.9% | | | $ | 170,196,300 | |
| | | | | | | | | | | | | | | | |
The accompanying notes are an integral part of these portfolio schedules.
24
MUTUAL OF AMERICA INVESTMENT CORPORATION — ALL AMERICA FUND
SUMMARY PORTFOLIO OF INVESTMENTS IN SECURITIES (Continued)
June 30, 2015 (Unaudited)
| | | | | | | | |
| | | Shares | | | Value | |
| | | | | | | | |
| | | | | | | | |
| ACTIVE ASSETS: | | | | | | | | |
COMMON STOCKS: | |
CONSUMER DISCRETIONARY (6.4%) | |
Amazon.com, Inc.* | | | 2,525 | | | $ | 1,096,077 | |
Diamond Resorts Int’l., Inc.* | | | 47,199 | | | | 1,489,128 | |
Disney (Walt) Co. | | | 11,631 | | | | 1,327,562 | |
Home Depot, Inc. | | | 7,891 | | | | 876,927 | |
McDonald’s Corp. | | | 6,647 | | | | 631,930 | |
Starbucks Corp. | | | 17,079 | | | | 915,691 | |
Time Warner, Inc. | | | 7,314 | | | | 639,317 | |
Other Securities | | | 376,620 | | | | 13,179,132 | |
| | | | | | | | |
| | | | | | | 20,155,764 | |
| | | | | | | | |
CONSUMER STAPLES (2.5%) | |
Coca-Cola Co. | | | 11,096 | | | | 435,296 | |
PepsiCo, Inc. | | | 7,201 | | | | 672,141 | |
Philip Morris Int’l., Inc. | | | 4,812 | | | | 385,778 | |
Proctor & Gamble Co. | | | 12,566 | | | | 983,164 | |
Wal-Mart Stores, Inc. | | | 10,119 | | | | 717,741 | |
Other Securities | | | 122,665 | | | | 4,689,687 | |
| | | | | | | | |
| | | | | | | 7,883,807 | |
| | | | | | | | |
ENERGY (2.4%) | |
Chevron Corp. | | | 5,132 | | | | 495,084 | |
Exxon Mobil Corp. | | | 20,720 | | | | 1,723,904 | |
Other Securities | | | 220,258 | | | | 5,451,740 | |
| | | | | | | | |
| | | | | | | 7,670,728 | |
| | | | | | | | |
FINANCIALS (8.4%) | |
American Int’l. Group, Inc. | | | 11,806 | | | | 729,847 | |
Bank of America Corp. | | | 42,771 | | | | 727,962 | |
Berkshire Hathaway, Inc. Cl B* | | | 4,800 | | | | 653,328 | |
Capital One Financial Corp. | | | 11,507 | | | | 1,012,271 | |
Citigroup, Inc. | | | 11,256 | | | | 621,781 | |
Goldman Sachs Group, Inc. | | | 3,950 | | | | 824,721 | |
JPMorgan Chase & Co. | | | 25,475 | | | | 1,726,186 | |
Wells Fargo & Co. | | | 24,760 | | | | 1,392,502 | |
Other Securities | | | 711,615 | | | | 18,939,711 | |
| | | | | | | | |
| | | | | | | 26,628,309 | |
| | | | | | | | |
HEALTH CARE (7.5%) | |
Allergan PLC* | | | 2,433 | | | | 738,318 | |
BIOGEN, Inc.* | | | 1,737 | | | | 701,644 | |
Celgene Corp.* | | | 10,769 | | | | 1,246,350 | |
Gilead Sciences, Inc. | | | 9,745 | | | | 1,140,945 | |
Medtronic PLC | | | 9,085 | | | | 673,199 | |
| | | | | | | | |
| | | Shares | | | Value | |
| | | | | | | | |
| ACTIVE ASSETS (CONTINUED): | |
COMMON STOCKS (CONTINUED): | |
HEALTH CARE (CONTINUED) | |
Merck & Co., Inc. | | | 17,848 | | | $ | 1,016,087 | |
Mylan N.V.* | | | 17,391 | | | | 1,180,153 | |
Pfizer, Inc. | | | 41,817 | | | | 1,402,124 | |
UnitedHealth Group, Inc. | | | 4,983 | | | | 607,926 | |
Other Securities | | | 481,714 | | | | 14,865,351 | |
| | | | | | | | |
| | | | | | | 23,572,097 | |
| | | | | | | | |
INDUSTRIALS (5.4%) | |
Boeing Co. | | | 6,062 | | | | 840,921 | |
General Electric Co. | | | 64,724 | | | | 1,719,717 | |
Roper Technologies, Inc. | | | 8,718 | | | | 1,503,506 | |
Union Pacific Corp. | | | 6,097 | | | | 581,471 | |
Other Securities | | | 292,284 | | | | 12,446,058 | |
| | | | | | | | |
| | | | | | | 17,091,673 | |
| | | | | | | | |
INFORMATION TECHNOLOGY (7.9%) | |
Apple, Inc. | | | 23,706 | | | | 2,973,325 | |
Cisco Systems, Inc. | | | 23,117 | | | | 634,793 | |
Facebook, Inc. Cl A* | | | 8,302 | | | | 712,021 | |
Google, Inc. Cl A* | | | 1,157 | | | | 624,826 | |
Google, Inc. Cl C* | | | 1,160 | | | | 603,786 | |
Intel Corp. | | | 11,918 | | | | 362,486 | |
MasterCard, Inc. Cl A | | | 6,601 | | | | 617,061 | |
Microsoft Corp. | | | 26,468 | | | | 1,168,562 | |
Oracle Corp. | | | 16,658 | | | | 671,317 | |
QUALCOMM, Inc. | | | 9,418 | | | | 589,849 | |
Salesforce.com, inc.* | | | 14,642 | | | | 1,019,522 | |
Other Securities | | | 537,902 | | | | 15,154,072 | |
| | | | | | | | |
| | | | | | | 25,131,620 | |
| | | | | | | | |
MATERIALS (1.7%) | |
Other Securities | | | 160,093 | | | | 5,422,873 | |
| | | | | | | | |
TELECOMMUNICATION SERVICES (0.7%) | |
AT&T, Inc. | | | 22,436 | | | | 796,927 | |
Verizon Communications, Inc. | | | 9,524 | | | | 443,914 | |
Other Securities | | | 78,211 | | | | 932,745 | |
| | | | | | | | |
| | | | | | | 2,173,586 | |
| | | | | | | | |
UTILITIES (1.1%) | |
Other Securities | | | 81,032 | | | | 3,598,397 | |
| | | | | | | | |
TOTAL ACTIVE ASSETS-COMMON STOCKS
(Cost: $97,536,812) 44.0% | | | | | | | 139,328,854 | |
| | | | | | | | |
The accompanying notes are an integral part of these portfolio schedules.
25
MUTUAL OF AMERICA INVESTMENT CORPORATION — ALL AMERICA FUND
SUMMARY PORTFOLIO OF INVESTMENTS IN SECURITIES (Continued)
June 30, 2015 (Unaudited)
| | | | | | | | | | | | | | | | | | |
| | | Rating** | | Rate(%) | | | Maturity | | | Face Amount | | | Value | |
| | | | | |
| ACTIVE ASSETS: | | | | | | | | | | | | | | | | | | |
SHORT-TERM DEBT SECURITIES: | | | | | | | | | | | | | | | | | | |
COMMERCIAL PAPER (1.0%) | | | | | | | | | | | | | | | | | | |
Toyota Motor Credit Corp. | | A-1+ | | | 0.12 - 0.14 | | | | 07/20/15 - 08/10/15 | | | $ | 3,000,000 | | | $ | 2,999,672 | |
| | | | | | | | | | | | | | | | | | |
TOTAL ACTIVE ASSETS-SHORT-TERM DEBT SECURITIES
(Cost: $2,999,672) 1.0% | | | | 2,999,672 | |
| | | | | | | | | | | | | | | | | | |
TOTAL ACTIVE ASSETS
(Cost: $100,536,484) 45.0% | | | | 142,328,526 | |
| | | | | | | | | | | | | | | | | | |
TOTAL INVESTMENTS
(Cost: $218,483,545) 98.9% | | | | 312,524,826 | |
| | | | | | | | | | | | | | | | | | |
OTHER NET ASSETS 1.1% | | | | 3,451,957 | |
| | | | | | | | | | | | | | | | | | |
NET ASSETS 100.0% | | | $ | 315,976,783 | |
| | | | | | | | | | | | | | | | | | |
The accompanying notes are an integral part of these portfolio schedules.
26
MUTUAL OF AMERICA INVESTMENT CORPORATION — SMALL CAP VALUE FUND
SUMMARY PORTFOLIO OF INVESTMENTS IN SECURITIES
June 30, 2015 (Unaudited)
| | | | | | | | |
| | | Shares | | | Value | |
| | | | | | | | |
| COMMON STOCKS: | | | | | | | | |
CONSUMER DISCRETIONARY (12.5%) | |
Bassett Furniture Industries, Inc. | | | 299,180 | | | $ | 8,499,704 | |
CST Brands, Inc. | | | 75,404 | | | | 2,945,280 | |
Diamond Resorts Int’l., Inc.* | | | 367,002 | | | | 11,578,913 | |
Houghton Mifflin Harcourt Co.* | | | 291,540 | | | | 7,346,808 | |
Select Comfort Corp.* | | | 126,249 | | | | 3,796,307 | |
The Men’s Wearhouse, Inc. | | | 70,659 | | | | 4,527,122 | |
Other Securities | | | 804,407 | | | | 11,039,099 | |
| | | | | | | | |
| | | | | | | 49,733,233 | |
| | | | | | | | |
CONSUMER STAPLES (2.6%) | |
Crimson Wine Group Ltd.* | | | 430,428 | | | | 4,024,502 | |
Farmer Brothers Co.* | | | 141,875 | | | | 3,334,063 | |
Vector Group Ltd. | | | 132,036 | | | | 3,097,565 | |
| | | | | | | | |
| | | | | | | 10,456,130 | |
| | | | | | | | |
ENERGY (3.5%) | |
PBF Energy, Inc. | | | 214,011 | | | | 6,082,193 | |
Other Securities | | | 1,164,542 | | | | 7,868,836 | |
| | | | | | | | |
| | | | | | | 13,951,029 | |
| | | | | | | | |
FINANCIALS (36.2%) | |
Aspen Insurance Hldgs. Ltd. | | | 73,138 | | | | 3,503,310 | |
BancFirst Corp. | | | 53,871 | | | | 3,525,857 | |
Banner Corp. | | | 88,029 | | | | 4,219,230 | |
Brookline Bancorp, Inc. | | | 345,137 | | | | 3,896,597 | |
Chatham Lodging Trust | | | 131,481 | | | | 3,480,302 | |
Chesapeake Lodging Trust | | | 128,246 | | | | 3,908,938 | |
Customers Bancorp, Inc.* | | | 123,291 | | | | 3,315,295 | |
Ellington Financial LLC | | | 286,752 | | | | 5,307,780 | |
FelCor Lodging Trust, Inc. | | | 530,785 | | | | 5,244,156 | |
Forest City Enterprises, Inc. Cl A* | | | 229,701 | | | | 5,076,392 | |
Glacier Bancorp, Inc. | | | 122,831 | | | | 3,613,688 | |
Highwoods Properties, Inc. | | | 100,759 | | | | 4,025,322 | |
Investors Bancorp, Inc. | | | 314,900 | | | | 3,873,270 | |
Meadowbrook Insurance Group, Inc.* | | | 472,531 | | | | 4,063,767 | |
Northfield Bancorp, Inc. | | | 236,553 | | | | 3,560,123 | |
Pennsylvania REIT | | | 144,768 | | | | 3,089,349 | |
PrivateBancorp, Inc. | | | 104,666 | | | | 4,167,800 | |
Stock Yards Bancorp, Inc. | | | 126,272 | | | | 4,771,819 | |
SVB Financial Group* | | | 54,211 | | | | 7,805,300 | |
Symetra Financial Corp. | | | 261,025 | | | | 6,308,974 | |
Other Securities | | | 2,284,252 | | | | 57,270,626 | |
| | | | | | | | |
| | | | | | | 144,027,895 | |
| | | | | | | | |
| | | | | | | | |
| | | Shares | | | Value | |
| | | | | | | | |
| COMMON STOCKS (CONTINUED): | |
HEALTH CARE (5.6%) | |
Supernus Pharmaceuticals, Inc.* | | | 252,052 | | | $ | 4,279,843 | |
Other Securities | | | 1,868,070 | | | | 18,172,449 | |
| | | | | | | | |
| | | | | | | 22,452,292 | |
| | | | | | | | |
INDUSTRIALS (14.7%) | |
Alaska Air Group, Inc. | | | 82,279 | | | | 5,301,236 | |
AZZ, Inc. | | | 100,873 | | | | 5,225,221 | |
Blount International, Inc.* | | | 312,097 | | | | 3,408,099 | |
Deluxe Corp. | | | 59,599 | | | | 3,695,138 | |
Encore Wire Corp. | | | 100,144 | | | | 4,435,378 | |
EnPro Industries, Inc. | | | 61,154 | | | | 3,499,232 | |
Miller Industries, Inc. | | | 249,665 | | | | 4,980,817 | |
Mueller Industries, Inc. | | | 305,921 | | | | 10,621,577 | |
Old Dominion Freight Line, Inc.* | | | 71,803 | | | | 4,926,045 | |
Orbital ATK, Inc. | | | 83,265 | | | | 6,108,320 | |
Uti Worldwide, Inc.* | | | 324,562 | | | | 3,242,374 | |
Other Securities | | | 154,898 | | | | 2,929,121 | |
| | | | | | | | |
| | | | | | | 58,372,558 | |
| | | | | | | | |
INFORMATION TECHNOLOGY (9.8%) | |
Proofpoint, Inc.* | | | 66,084 | | | | 4,207,568 | |
Richardson Electronics Ltd. | | | 518,914 | | | | 4,192,825 | |
SYNNEX Corp. | | | 49,931 | | | | 3,654,450 | |
Other Securities | | | 1,451,885 | | | | 26,979,674 | |
| | | | | | | | |
| | | | | | | 39,034,517 | |
| | | | | | | | |
MATERIALS (5.3%) | |
Kaiser Aluminum Corp. | | | 97,149 | | | | 8,071,139 | |
Kraton Performance Polymers, Inc.* | | | 133,485 | | | | 3,187,622 | |
Silgan Hldgs., Inc. | | | 70,653 | | | | 3,727,652 | |
Other Securities | | | 303,776 | | | | 6,060,925 | |
| | | | | | | | |
| | | | | | | 21,047,338 | |
| | | | | | | | |
TELECOMMUNICATION SERVICES (1.0%) | |
Other Securities | | | 346,798 | | | | 4,053,232 | |
| | | | | | | | |
UTILITIES (4.4%) | |
Avista Corp. | | | 99,799 | | | | 3,058,839 | |
Idacorp, Inc. | | | 63,669 | | | | 3,574,378 | |
Other Securities | | | 312,729 | | | | 10,895,337 | |
| | | | | | | | |
| | | | | | | 17,528,554 | |
| | | | | | | | |
TOTAL COMMON STOCKS | | | | | | | | |
(Cost: $293,749,526) 95.6% | | | | | �� | | 380,656,778 | |
| | | | | | | | |
The accompanying notes are an integral part of these portfolio schedules.
27
MUTUAL OF AMERICA INVESTMENT CORPORATION — SMALL CAP VALUE FUND
SUMMARY PORTFOLIO OF INVESTMENTS IN SECURITIES (Continued)
June 30, 2015 (Unaudited)
| | | | | | | | | | | | | | |
| | | Rating** | | Rate(%) | | Maturity | | Face Amount | | | Value | |
| SHORT-TERM DEBT SECURITIES: | | | | | | | | | | | | | | |
COMMERCIAL PAPER (4.0%) | | | | | | | | | | | | | | |
Nestle Finance | | A-1+ | | 0.03 | | 08/12/15 | | $ | 11,000,000 | | | $ | 10,999,615 | |
Toyota Motor Credit Corp. | | A-1+ | | 0.13 | | 07/24/15 | | | 5,000,000 | | | | 4,999,585 | |
| | | | | | | | | | | | | | |
| | | | | | | | | | | | | 15,999,200 | |
| | | | | | | | | | | | | | |
TOTAL SHORT-TERM DEBT SECURITIES
(Cost: $15,999,200) 4.0% | | | | 15,999,200 | |
| | | | | | | | | | | | | | |
TOTAL INVESTMENTS
(Cost: $309,748,726) 99.6% | | | | 396,655,978 | |
| | | | | | | | | | | | | | |
OTHER NET ASSETS 0.4% | | | | 1,526,234 | |
| | | | | | | | | | | | | | |
NET ASSETS 100.0% | | | $ | 398,182,212 | |
| | | | | | | | | | | | | | |
The accompanying notes are an integral part of these portfolio schedules.
28
MUTUAL OF AMERICA INVESTMENT CORPORATION — SMALL CAP GROWTH FUND
SUMMARY PORTFOLIO OF INVESTMENTS IN SECURITIES
June 30, 2015 (Unaudited)
| | | | | | | | |
| | | Shares | | | Value | |
| | | | | | | | |
| COMMON STOCKS: | | | | | | | | |
CONSUMER DISCRETIONARY (15.9%) | |
Carmike Cinemas, Inc.* | | | 171,924 | | | $ | 4,562,850 | |
CST Brands, Inc. | | | 194,642 | | | | 7,602,721 | |
Diamond Resorts Int’l., Inc.* | | | 173,433 | | | | 5,471,799 | |
Eros International PLC* | | | 142,392 | | | | 3,576,877 | |
Five Below, Inc.* | | | 102,370 | | | | 4,046,694 | |
Haverty Furniture Cos., Inc. | | | 155,808 | | | | 3,368,569 | |
Houghton Mifflin Harcourt Co.* | | | 147,006 | | | | 3,704,546 | |
Popeyes Louisiana Kitchen, Inc.* | | | 55,981 | | | | 3,358,270 | |
Red Robin Gourmet Burgers, Inc.* | | | 58,236 | | | | 4,997,788 | |
Select Comfort Corp.* | | | 148,170 | | | | 4,455,457 | |
Steve Madden Ltd.* | | | 103,327 | | | | 4,420,346 | |
Other Securities | | | 658,623 | | | | 21,357,676 | |
| | | | | | | | |
| | | | | | | 70,923,593 | |
| | | | | | | | |
CONSUMER STAPLES (2.2%) | |
WD-40 Co. | | | 46,748 | | | | 4,074,556 | |
Other Securities | | | 115,308 | | | | 5,918,712 | |
| | | | | | | | |
| | | | | | | 9,993,268 | |
| | | | | | | | |
ENERGY (2.5%) | |
Other Securities | | | 468,569 | | | | 11,224,377 | |
| | | | | | | | |
FINANCIALS (7.9%) | |
Heritage Financial Corp. | | | 204,812 | | | | 3,659,990 | |
Investors Bancorp, Inc. | | | 351,045 | | | | 4,317,855 | |
iShares Micro-Cap ETF | | | 29,644 | | | | 2,416,900 | |
iShares Russell 2000 Growth ETF | | | 20,000 | | | | 3,091,600 | |
Stifel Financial Corp.* | | | 59,798 | | | | 3,452,760 | |
Other Securities | | | 640,418 | | | | 18,231,161 | |
| | | | | | | | |
| | | | | | | 35,170,266 | |
| | | | | | | | |
HEALTH CARE (25.9%) | |
Abiomed, Inc.* | | | 63,428 | | | | 4,169,122 | |
DexCom, Inc.* | | | 78,117 | | | | 6,247,798 | |
Emergent Biosolutions, Inc.* | | | 145,063 | | | | 4,779,826 | |
Exact Sciences Corp.* | | | 139,160 | | | | 4,138,612 | |
Omnicell, Inc.* | | | 94,251 | | | | 3,554,220 | |
PAREXEL International Corp.* | | | 54,356 | | | | 3,495,615 | |
Receptos, Inc.* | | | 20,234 | | | | 3,845,472 | |
Supernus Pharmaceuticals, Inc.* | | | 286,856 | | | | 4,870,811 | |
WellCare Health Plans, Inc.* | | | 45,273 | | | | 3,840,492 | |
Other Securities | | | 2,068,138 | | | | 76,807,902 | |
| | | | | | | | |
| | | | | | | 115,749,870 | |
| | | | | | | | |
| | | | | | | | |
| | | Shares | | | Value | |
| | | | | | | | |
| COMMON STOCKS (CONTINUED): | |
INDUSTRIALS (11.7%) | |
Allegiant Travel Co. | | | 21,098 | | | $ | 3,752,912 | |
Astronics Corp.* | | | 87,377 | | | | 6,194,156 | |
AZZ, Inc. | | | 85,491 | | | | 4,428,444 | |
CEB, Inc. | | | 53,159 | | | | 4,628,057 | |
EnPro Industries, Inc. | | | 60,733 | | | | 3,475,137 | |
Healthcare Svcs. Group, Inc. | | | 111,215 | | | | 3,675,649 | |
Sun Hydraulics Corp. | | | 103,311 | | | | 3,937,163 | |
Teledyne Technologies, Inc.* | | | 37,873 | | | | 3,996,012 | |
The Advisory Board Co.* | | | 61,627 | | | | 3,369,148 | |
Trex Co., Inc.* | | | 104,260 | | | | 5,153,567 | |
Other Securities | | | 296,354 | | | | 9,792,031 | |
| | | | | | | | |
| | | | | | | 52,402,276 | |
| | | | | | | | |
INFORMATION TECHNOLOGY (23.1%) | |
CalAmp Corp.* | | | 205,408 | | | | 3,750,750 | |
Cavium, Inc.* | | | 65,027 | | | | 4,474,522 | |
comScore, Inc.* | | | 110,160 | | | | 5,867,095 | |
FARO Technologies, Inc.* | | | 91,750 | | | | 4,284,725 | |
Imperva, Inc.* | | | 104,743 | | | | 7,091,128 | |
LogMeIn, Inc.* | | | 64,973 | | | | 4,190,122 | |
Manhattan Associates, Inc.* | | | 74,937 | | | | 4,469,974 | |
MaxLinear, Inc. Cl A* | | | 319,559 | | | | 3,866,659 | |
Monolithic Power Systems, Inc. | | | 89,919 | | | | 4,559,792 | |
Proofpoint, Inc.* | | | 97,063 | | | | 6,179,976 | |
Qlik Technologies, Inc.* | | | 130,513 | | | | 4,562,741 | |
Rogers Corp.* | | | 58,875 | | | | 3,893,986 | |
Ruckus Wireless, Inc.* | | | 357,856 | | | | 3,700,231 | |
Other Securities | | | 1,763,289 | | | | 42,765,052 | |
| | | | | | | | |
| | | | | | | 103,656,753 | |
| | | | | | | | |
MATERIALS (3.6%) | |
A. Schulman, Inc. | | | 89,267 | | | | 3,902,731 | |
Mueller Water Products, Inc. Cl A | | | 379,021 | | | | 3,449,090 | |
Other Securities | | | 322,109 | | | | 8,748,895 | |
| | | | | | | | |
| | | | | | | 16,100,716 | |
| | | | | | | | |
TELECOMMUNICATION SERVICES (1.6%) | |
Other Securities | | | 573,815 | | | | 6,988,146 | |
| | | | | | | | |
UTILITIES (0.6%) | |
Other Securities | | | 52,806 | | | | 2,574,278 | |
| | | | | | | | |
TOTAL COMMON STOCKS | |
(Cost: $328,326,050) 95.0% | | | | | | | 424,783,543 | |
| | | | | | | | |
The accompanying notes are an integral part of these portfolio schedules.
29
MUTUAL OF AMERICA INVESTMENT CORPORATION — SMALL CAP GROWTH FUND
SUMMARY PORTFOLIO OF INVESTMENTS IN SECURITIES (Continued)
June 30, 2015 (Unaudited)
| | | | | | | | | | | | | | | | | | |
| | | Rating** | | Rate(%) | | | Maturity | | | Face Amount | | | Value | |
| SHORT-TERM DEBT SECURITIES: | | | | | | | | | | | | | | | | | | |
U.S. GOVERNMENT (0.2%) | | | | | | | | | | | | | | | | | | |
U.S. Treasury Bill | | A-1+ | | | 0.07 | | | | 11/19/15 | | | $ | 700,000 | | | $ | 699,805 | |
| | | | | | | | | | | | | | | | | | |
U.S. GOVERNMENT AGENCIES (2.4%) | | | | | | | | | | | | | | | | | | |
FHLB | | A-1+ | | | 0.02 | | | | 07/27/15 | | | | 10,500,000 | | | | 10,499,849 | |
| | | | | | | | | | | | | | | | | | |
COMMERCIAL PAPER (1.3%) | | | | | | | | | | | | | | | | | | |
General Electric Capital Corp. | | A-1+ | | | 0.12 | | | | 08/03/15 | | | | 2,500,000 | | | | 2,499,724 | |
Novartis Finance Corp.† | | A-1+ | | | 0.13 | | | | 07/09/15 | | | | 1,840,000 | | | | 1,839,947 | |
San Diego Gas & Electric Co.† | | A-1 | | | 0.14 | | | | 07/01/15 | | | | 1,625,000 | | | | 1,625,000 | |
| | | | | | | | | | | | | | | | | | |
| | | | | | | | | | | | | | | | | 5,964,671 | |
| | | | | | | | | | | | | | | | | | |
TOTAL SHORT-TERM DEBT SECURITIES
(Cost: $17,164,325) 3.9% | | | | 17,164,325 | |
| | | | | | | | | | | | | | | | | | |
TOTAL INVESTMENTS
(Cost: $345,490,375) 98.9% | | | | 441,947,868 | |
| | | | | | | | | | | | | | | | | | |
OTHER NET ASSETS 1.1% | | | | 4,962,116 | |
| | | | | | | | | | | | | | | | | | |
NET ASSETS 100.0% | | | $ | 446,909,984 | |
| | | | | | | | | | | | | | | | | | |
The accompanying notes are an integral part of these portfolio schedules.
30
MUTUAL OF AMERICA INVESTMENT CORPORATION — MID CAP VALUE FUND
SUMMARY PORTFOLIO OF INVESTMENTS IN SECURITIES
June 30, 2015 (Unaudited)
| | | | | | | | |
| | | Shares | | | Value | |
| | | | | | | | |
| COMMON STOCKS: | | | | | | | | |
CONSUMER DISCRETIONARY (6.4%) | |
Diamond Resorts Int’l., Inc.* | | | 53,305 | | | $ | 1,681,773 | |
Dillard’s, Inc. Cl A | | | 7,895 | | | | 830,475 | |
Other Securities | | | 78,681 | | | | 3,221,064 | |
| | | | | | | | |
| | | | | | | 5,733,312 | |
| | | | | | | | |
CONSUMER STAPLES (3.7%) | |
Constellation Brands, Inc. Cl A | | | 7,519 | | | | 872,354 | |
Energizer Hldgs., Inc.* | | | 7,185 | | | | 945,187 | |
Ingredion, Inc. | | | 11,357 | | | | 906,402 | |
Other Securities | | | 24,735 | | | | 580,283 | |
| | | | | | | | |
| | | | | | | 3,304,226 | |
| | | | | | | | |
ENERGY (5.1%) | |
Noble Energy, Inc. | | | 20,888 | | | | 891,500 | |
PBF Energy, Inc. | | | 31,939 | | | | 907,706 | |
Other Securities | | | 55,755 | | | | 2,734,469 | |
| | | | | | | | |
| | | | | | | 4,533,675 | |
| | | | | | | | |
FINANCIALS (33.1%) | |
American Financial Group, Inc. | | | 27,163 | | | | 1,766,682 | |
Ameriprise Financial, Inc. | | | 15,623 | | | | 1,951,783 | |
Aon PLC | | | 10,584 | | | | 1,055,013 | |
Associated Banc-Corp. | | | 45,648 | | | | 925,285 | |
Discover Financial Svcs. | | | 16,715 | | | | 963,118 | |
Duke Realty Corp. | | | 46,529 | | | | 864,044 | |
Everest Re Group Ltd. | | | 5,652 | | | | 1,028,721 | |
Fifth Third Bancorp | | | 42,465 | | | | 884,121 | |
Hartford Financial Svcs. Group, Inc. | | | 26,111 | | | | 1,085,434 | |
Home Properties, Inc. | | | 13,120 | | | | 958,416 | |
Host Hotels & Resorts, Inc. | | | 44,839 | | | | 889,157 | |
KeyCorp | | | 71,319 | | | | 1,071,211 | |
Lincoln National Corp. | | | 19,166 | | | | 1,135,011 | |
Reinsurance Grp. of America, Inc. | | | 11,258 | | | | 1,068,046 | |
Vornado Realty Trust | | | 11,850 | | | | 1,124,921 | |
Voya Financial, Inc. | | | 24,956 | | | | 1,159,705 | |
Other Securities | | | 397,206 | | | | 11,805,471 | |
| | | | | | | | |
| | | | | | | 29,736,139 | |
| | | | | | | | |
HEALTH CARE (11.0%) | |
Boston Scientific Corp.* | | | 67,726 | | | | 1,198,750 | |
Cardinal Health, Inc. | | | 11,152 | | | | 932,865 | |
CIGNA Corp. | | | 8,265 | | | | 1,338,930 | |
HCA Hldgs., Inc.* | | | 14,838 | | | | 1,346,103 | |
Hospira, Inc.* | | | 11,230 | | | | 996,213 | |
| | | | | | | | |
| | | Shares | | | Value | |
| | | | | | | | |
| COMMON STOCKS (CONTINUED): | |
HEALTH CARE (CONTINUED) | |
Humana, Inc. | | | 6,040 | | | $ | 1,155,331 | |
MEDNAX, Inc.* | | | 11,429 | | | | 847,003 | |
Mylan N.V.* | | | 11,583 | | | | 786,022 | |
Other Securities | | | 21,479 | | | | 1,311,906 | |
| | | | | | | | |
| | | | | | | 9,913,123 | |
| | | | | | | | |
INDUSTRIALS (8.7%) | |
Alaska Air Group, Inc. | | | 16,943 | | | | 1,091,637 | |
L-3 Communications Hldgs., Inc. | | | 9,725 | | | | 1,102,621 | |
Old Dominion Freight Line, Inc.* | | | 17,932 | | | | 1,230,225 | |
Oshkosh Corp. | | | 22,655 | | | | 960,119 | |
Triumph Group, Inc. | | | 18,065 | | | | 1,192,109 | |
Other Securities | | | 26,085 | | | | 2,229,142 | |
| | | | | | | | |
| | | | | | | 7,805,853 | |
| | | | | | | | |
INFORMATION TECHNOLOGY (11.1%) | |
Avago Technologies Ltd. | | | 10,064 | | | | 1,337,808 | |
Broadcom Corp. Cl A | | | 16,105 | | | | 829,246 | |
CA, Inc. | | | 35,125 | | | | 1,028,811 | |
Western Digital Corp. | | | 11,385 | | | | 892,812 | |
Other Securities | | | 153,539 | | | | 5,948,463 | |
| | | | | | | | |
| | | | | | | 10,037,140 | |
| | | | | | | | |
MATERIALS (7.7%) | |
CF Industries Hldgs., Inc. | | | 13,310 | | | | 855,567 | |
Crown Hldgs., Inc.* | | | 30,019 | | | | 1,588,305 | |
Eastman Chemical Co. | | | 13,709 | | | | 1,121,670 | |
International Paper Co. | | | 19,330 | | | | 919,915 | |
Packaging Corp. of America | | | 22,331 | | | | 1,395,464 | |
Other Securities | | | 15,212 | | | | 1,009,668 | |
| | | | | | | | |
| | | | | | | 6,890,589 | |
| | | | | | | | |
UTILITIES (9.2%) | |
Atmos Energy Corp. | | | 16,659 | | | | 854,274 | |
Edison International | | | 18,428 | | | | 1,024,228 | |
Great Plains Energy, Inc. | | | 33,163 | | | | 801,218 | |
PPL Corp. | | | 26,935 | | | | 793,774 | |
Public Svc. Enterprise Group, Inc. | | | 24,476 | | | | 961,417 | |
Other Securities | | | 81,754 | | | | 3,780,544 | |
| | | | | | | | |
| | | | | | | 8,215,455 | |
| | | | | | | | |
TOTAL COMMON STOCKS | |
(Cost: $68,674,906) 96.0% | | | | | | | 86,169,512 | |
| | | | | | | | |
| | | | | | | | | | | | | | | | | | |
| | | Rating** | | Rate(%) | | | Maturity | | | Face Amount | | | Value | |
| SHORT-TERM DEBT SECURITIES: | | | | | | | | | | | | | | | | | | |
COMMERCIAL PAPER (0.6%) | | | | | | | | | | | | | | | | | | |
Toyota Motor Credit Corp. | | A-1+ | | | 0.14 | | | | 08/10/15 | | | $ | 500,000 | | | $ | 499,922 | |
| | | | | | | | | | | | | | | | | | |
TOTAL SHORT-TERM DEBT SECURITIES
(Cost: $499,922) 0.6% | | | | 499,922 | |
| | | | | | | | | | | | | | | | | | |
TOTAL INVESTMENTS
(Cost: $69,174,828) 96.6% | | | | 86,669,434 | |
| | | | | | | | | | | | | | | | | | |
OTHER NET ASSETS 3.4% | | | | 3,048,437 | |
| | | | | | | | | | | | | | | | | | |
NET ASSETS 100.0% | | | $ | 89,717,871 | |
| | | | | | | | | | | | | | | | | | |
The accompanying notes are an integral part of these portfolio schedules.
31
MUTUAL OF AMERICA INVESTMENT CORPORATION — MID-CAP EQUITY INDEX FUND
SUMMARY PORTFOLIO OF INVESTMENTS IN SECURITIES
June 30, 2015 (Unaudited)
| | | | | | | | |
| | | Shares | | | Value | |
| | | | | | | | |
| INDEXED ASSETS: | |
COMMON STOCKS: | |
CONSUMER DISCRETIONARY (13.6%) | |
Advance Auto Parts, Inc. | | | 44,495 | | | $ | 7,087,606 | |
Foot Locker, Inc. | | | 85,035 | | | | 5,698,195 | |
Jarden Corp.* | | | 108,889 | | | | 5,635,006 | |
LKQ Corp.* | | | 184,957 | | | | 5,594,025 | |
Polaris Industries, Inc. | | | 37,177 | | | | 5,506,285 | |
Signet Jewelers Ltd. | | | 48,720 | | | | 6,247,853 | |
Williams-Sonoma, Inc. | | | 51,821 | | | | 4,263,314 | |
Other Securities | | | 3,012,826 | | | | 100,648,265 | |
| | | | | | | | |
| | | | | | | 140,680,549 | |
| | | | | | | | |
CONSUMER STAPLES (4.0%) | |
Church & Dwight Co., Inc. | | | 79,575 | | | | 6,455,920 | |
Energizer Hldgs., Inc.* | | | 37,812 | | | | 4,974,169 | |
Hain Celestial Group, Inc.* | | | 62,383 | | | | 4,108,544 | |
WhiteWave Foods Co. Cl A* | | | 106,476 | | | | 5,204,547 | |
Other Securities | | | 749,435 | | | | 20,573,200 | |
| | | | | | | | |
| | | | | | | 41,316,380 | |
| | | | | | | | |
ENERGY (4.3%) | |
Dresser-Rand Group, Inc.* | | | 46,775 | | | | 3,984,295 | |
HollyFrontier Corp. | | | 119,171 | | | | 5,087,410 | |
Other Securities | | | 1,629,395 | | | | 35,603,446 | |
| | | | | | | | |
| | | | | | | 44,675,151 | |
| | | | | | | | |
FINANCIALS (22.8%) | |
Alleghany Corp.* | | | 9,765 | | | | 4,577,441 | |
Everest Re Group Ltd. | | | 27,016 | | | | 4,917,182 | |
Extra Space Storage, Inc. | | | 67,546 | | | | 4,405,350 | |
Federal Realty Investment Trust | | | 41,760 | | | | 5,349,038 | |
Gallagher (Arthur J.) & Co. | | | 102,119 | | | | 4,830,229 | |
HCC Insurance Hldgs., Inc. | | | 58,189 | | | | 4,471,243 | |
Jones Lang LaSalle, Inc. | | | 27,276 | | | | 4,664,196 | |
MSCI, Inc. Cl A | | | 68,357 | | | | 4,207,373 | |
New York Community Bancorp, Inc. | | | 270,135 | | | | 4,965,081 | |
Raymond James Financial, Inc. | | | 77,841 | | | | 4,637,767 | |
Signature Bank* | | | 30,908 | | | | 4,524,622 | |
SVB Financial Group* | | | 31,156 | | | | 4,485,841 | |
UDR, Inc. | | | 157,472 | | | | 5,043,828 | |
Other Securities | | | 5,546,845 | | | | 175,637,671 | |
| | | | | | | | |
| | | | | | | 236,716,862 | |
| | | | | | | | |
HEALTH CARE (8.8%) | |
Centene Corp.* | | | 72,305 | | | | 5,813,322 | |
Community Health Systems, Inc.* | | | 71,769 | | | | 4,519,294 | |
| | | | | | | | |
| | | Shares | | | Value | |
| | | | | | | | |
| INDEXED ASSETS (CONTINUED): | |
COMMON STOCKS (CONTINUED): | |
HEALTH CARE (CONTINUED) | |
Cooper Companies, Inc. | | | 29,544 | | | $ | 5,257,946 | |
Hologic, Inc.* | | | 148,629 | | | | 5,656,820 | |
MEDNAX, Inc.* | | | 56,868 | | | | 4,214,487 | |
Mettler-Toledo Int’l., Inc.* | | | 17,006 | | | | 5,806,869 | |
Omnicare, Inc. | | | 58,909 | | | | 5,552,173 | |
ResMed, Inc. | | | 85,685 | | | | 4,830,063 | |
United Therapeutics Corp.* | | | 28,104 | | | | 4,888,691 | |
Other Securities | | | 777,765 | | | | 44,214,519 | |
| | | | | | | | |
| | | | | | | 90,754,184 | |
| | | | | | | | |
INDUSTRIALS (14.2%) | |
Acuity Brands, Inc. | | | 26,408 | | | | 4,752,912 | |
Alaska Air Group, Inc. | | | 78,822 | | | | 5,078,501 | |
Carlisle Cos., Inc. | | | 39,723 | | | | 3,977,067 | |
Fortune Brands Home & Security, Inc. | | | 96,932 | | | | 4,441,424 | |
Manpowergroup, Inc. | | | 47,563 | | | | 4,251,181 | |
Towers Watson & Co. Cl A | | | 42,149 | | | | 5,302,344 | |
Wabtec Corp. | | | 58,744 | | | | 5,536,035 | |
Other Securities | | | 2,355,682 | | | | 113,426,185 | |
| | | | | | | | |
| | | | | | | 146,765,649 | |
| | | | | | | | |
INFORMATION TECHNOLOGY (15.5%) | |
ANSYS, Inc.* | | | 54,584 | | | | 4,980,244 | |
CDK Global, Inc. | | | 97,477 | | | | 5,261,808 | |
Gartner, Inc.* | | | 50,482 | | | | 4,330,346 | |
Global Payments, Inc. | | | 40,408 | | | | 4,180,208 | |
SunEdison, Inc.* | | | 177,251 | | | | 5,301,577 | |
Synopsys, Inc.* | | | 94,297 | | | | 4,776,143 | |
Other Securities | | | 4,402,841 | | | | 132,449,350 | |
| | | | | | | | |
| | | | | | | 161,279,676 | |
| | | | | | | | |
MATERIALS (6.6%) | |
Ashland, Inc. | | | 37,802 | | | | 4,608,064 | |
RPM International, Inc. | | | 81,004 | | | | 3,966,766 | |
Other Securities | | | 1,427,461 | | | | 59,438,671 | |
| | | | | | | | |
| | | | | | | 68,013,501 | |
| | | | | | | | |
TELECOMMUNICATION SERVICES (0.2%) | |
Other Securities | | | 59,781 | | | | 1,757,561 | |
| | | | | | | | |
UTILITIES (4.2%) | |
Other Securities | | | 1,286,504 | | | | 43,250,232 | |
| | | | | | | | |
TOTAL INDEXED ASSETS-COMMON STOCKS | | | | | | | | |
(Cost: $709,311,534) 94.2% | | | | | | | 975,209,745 | |
| | | | | | | | |
The accompanying notes are an integral part of these portfolio schedules.
32
MUTUAL OF AMERICA INVESTMENT CORPORATION — MID-CAP EQUITY INDEX FUND
SUMMARY PORTFOLIO OF INVESTMENTS IN SECURITIES (Continued)
June 30, 2015 (Unaudited)
| | | | | | | | | | | | | | |
| | | Rating** | | Rate(%) | | Maturity | | Face Amount | | | Value | |
| SHORT-TERM DEBT SECURITIES: | | | | | | | | | | | | | | |
U.S. GOVERNMENT (0.3%) | | | | | | | | | | | | | | |
U.S. Treasury Bill (1) | | A-1+ | | 0.07 - 0.09 | | 09/10/15 - 12/17/15 | | $ | 3,100,000 | | | $ | 3,099,132 | |
| | | | | | | | | | | | | | |
COMMERCIAL PAPER (5.1%) | | | | | | | | | | | | | | |
Coca-Cola Co.† | | A-1+ | | 0.13 | | 07/29/15 | | | 680,000 | | | | 679,931 | |
General Electric Capital Corp. | | A-1+ | | 0.12 | | 08/03/15 | | | 2,500,000 | | | | 2,499,725 | |
Intercontinental Exchange, Inc.† | | A-1 | | 0.19 | | 08/03/15 - 08/13/15 | | | 1,450,000 | | | | 1,449,710 | |
National Rural Utilities | | A-1 | | 0.10 | | 07/21/15 | | | 1,150,000 | | | | 1,149,936 | |
Nestle Finance | | A-1+ | | 0.03 | | 08/12/15 | | | 21,000,000 | | | | 20,999,265 | |
Private Export Funding Corp.† | | A-1 | | 0.13 | | 08/11/15 | | | 300,000 | | | | 299,956 | |
Toyota Motor Credit Corp. | | A-1+ | | 0.10 - 0.14 | | 07/13/15 - 08/10/15 | | | 21,500,000 | | | | 21,498,539 | |
Travelers Cos., Inc.† | | A-1 | | 0.07 | | 07/01/15 | | | 4,000,000 | | | | 4,000,000 | |
| | | | | | | | | | | | | | |
| | | | | | | | | | | | | 52,577,062 | |
| | | | | | | | | | | | | | |
TOTAL SHORT-TERM DEBT SECURITIES
(Cost: $55,676,194) 5.4% | | | | 55,676,194 | |
| | | | | | | | | | | | | | |
TOTAL INVESTMENTS
(Cost: $764,987,728) 99.6% | | | | 1,030,885,939 | |
| | | | | | | | | | | | | | |
OTHER NET ASSETS 0.4% | | | | 4,506,992 | |
| | | | | | | | | | | | | | |
NET ASSETS 100.0% | | | $ | 1,035,392,931 | |
| | | | | | | | | | | | | | |
The accompanying notes are an integral part of these portfolio schedules.
33
MUTUAL OF AMERICA INVESTMENT CORPORATION — INTERNATIONAL FUND
PORTFOLIO OF INVESTMENTS IN SECURITIES
June 30, 2015 (Unaudited)
| | | | | | | | |
| | | Shares | | | Value | |
| COMMON STOCKS: | | | | | | | | |
FINANCIALS (96.1%) | | | | | | | | |
iShares Core MSCI Europe ETF | | | 372,200 | | | $ | 16,868,104 | |
iShares Core MSCI Pacific ETF | | | 167,406 | | | | 8,586,254 | |
iShares MSCI EAFE ETF | | | 1,287,745 | | | | 81,758,930 | |
iShares MSCI EAFE Growth ETF | | | 358,024 | | | | 25,018,717 | |
iShares MSCI EAFE Small-Cap ETF | | | 177,935 | | | | 9,078,244 | |
iShares MSCI EAFE Value ETF | | | 456,586 | | | | 23,893,145 | |
iShares MSCI Emerging Markets Minimum Volatility ETF | | | 179,014 | | | | 10,325,528 | |
Vanguard FTSE Developed Markets ETF | | | 2,416,800 | | | | 95,826,121 | |
Vanguard FTSE Europe ETF | | | 424,630 | | | | 22,921,527 | |
Vanguard FTSE Pacific ETF | | | 220,480 | | | | 13,455,894 | |
| | | | | | | | |
| | | | | | | 307,732,464 | |
| | | | | | | | |
| TOTAL COMMON STOCKS | | | | | | | | |
(Cost: $293,205,528) 96.1% | | | | | | | 307,732,464 | |
| | | | | | | | |
| | | | | | | | | | | | | | |
| | | Rating** | | Rate(%) | | Maturity | | Face Amount | | | Value | |
| SHORT-TERM DEBT SECURITIES: | | | | | | | | | | | | | | |
U.S. GOVERNMENT (0.1%) | | | | | | | | | | | | | | |
U.S. Treasury Bill | | A-1+ | | 0.07 | | 11/19/15 | | $ | 400,000 | | | $ | 399,889 | |
| | | | | | | | | | | | | | |
U.S. GOVERNMENT AGENCIES (0.8%) | | | | | | | | | | | | | | |
FHLB | | A-1+ | | 0.02 | | 07/27/15 | | | 2,371,000 | | | | 2,370,966 | |
| | | | | | | | | | | | | | |
COMMERCIAL PAPER (1.4%) | | | | | | | | | | | | | | |
Abbott Laboratories† | | A-1+ | | 0.12 | | 08/27/15 | | | 600,000 | | | | 599,886 | |
Google, Inc.† | | A-1+ | | 0.12 | | 07/08/15 | | | 450,000 | | | | 449,990 | |
Toyota Motor Credit Corp. | | A-1+ | | 0.12 - 0.14 | | 07/28/15 - 08/04/15 | | | 3,500,000 | | | | 3,499,597 | |
| | | | | | | | | | | | | | |
| | | | | | | | | | | | | 4,549,473 | |
| | | | | | | | | | | | | | |
TOTAL SHORT-TERM DEBT SECURITIES
(Cost: $7,320,328) 2.3% | | | | 7,320,328 | |
| | | | | | | | | | | | | | |
TOTAL INVESTMENTS
(Cost: $300,525,856) 98.4% | | | | 315,052,792 | |
| | | | | | | | | | | | | | |
OTHER NET ASSETS 1.6% | | | | 5,097,093 | |
| | | | | | | | | | | | | | |
NET ASSETS 100.0% | | | $ | 320,149,885 | |
| | | | | |
The accompanying notes are an integral part of these portfolio schedules.
34
MUTUAL OF AMERICA INVESTMENT CORPORATION — COMPOSITE FUND
SUMMARY PORTFOLIO OF INVESTMENTS IN SECURITIES
June 30, 2015 (Unaudited)
| | | | | | | | |
| | | Shares | | | Value | |
| | | | | | | | |
| COMMON STOCKS: | | | | | | | | |
CONSUMER DISCRETIONARY (8.2%) | | | | | | | | |
Amazon.com, Inc.* | | | 4,037 | | | $ | 1,752,421 | |
Disney (Walt) Co. | | | 18,641 | | | | 2,127,684 | |
Home Depot, Inc. | | | 12,605 | | | | 1,400,794 | |
McDonald’s Corp. | | | 10,612 | | | | 1,008,883 | |
Starbucks Corp. | | | 27,488 | | | | 1,473,769 | |
Target Corp. | | | 12,793 | | | | 1,044,293 | |
Time Warner Cable, Inc. | | | 6,974 | | | | 1,242,558 | |
Time Warner, Inc. | | | 11,739 | | | | 1,026,106 | |
Other Securities | | | 87,708 | | | | 4,570,711 | |
| | | | | | | | |
| | | | | | | 15,647,219 | |
| | | | | | | | |
CONSUMER STAPLES (5.1%) | | | | | | | | |
Constellation Brands, Inc. Cl A | | | 10,552 | | | | 1,224,243 | |
PepsiCo, Inc. | | | 11,566 | | | | 1,079,570 | |
Proctor & Gamble Co. | | | 19,924 | | | | 1,558,854 | |
Wal-Mart Stores, Inc. | | | 16,246 | | | | 1,152,329 | |
Other Securities | | | 89,412 | | | | 4,753,664 | |
| | | | | | | | |
| | | | | | | 9,768,660 | |
| | | | | | | | |
ENERGY (4.6%) | | | | | | | | |
Exxon Mobil Corp. | | | 33,205 | | | | 2,762,656 | |
Other Securities | | | 98,389 | | | | 6,024,312 | |
| | | | | | | | |
| | | | | | | 8,786,968 | |
| | | | | | | | |
FINANCIALS (9.5%) | | | | | | | | |
American Int’l. Group, Inc. | | | 18,744 | | | | 1,158,754 | |
Bank of America Corp. | | | 68,534 | | | | 1,166,449 | |
Berkshire Hathaway, Inc. Cl B* | | | 7,737 | | | | 1,053,083 | |
Capital One Financial Corp. | | | 18,594 | | | | 1,635,714 | |
Citigroup, Inc. | | | 18,048 | | | | 996,972 | |
Goldman Sachs Group, Inc. | | | 6,399 | | | | 1,336,047 | |
JPMorgan Chase & Co. | | | 41,092 | | | | 2,784,394 | |
MetLife, Inc. | | | 18,672 | | | | 1,045,445 | |
Simon Property Group, Inc. | | | 6,659 | | | | 1,152,140 | |
Wells Fargo & Co. | | | 40,069 | | | | 2,253,481 | |
Other Securities | | | 78,027 | | | | 3,488,069 | |
| | | | | | | | |
| | | | | | | 18,070,548 | |
| | | | | | | | |
HEALTH CARE (9.5%) | | | | | | | | |
Abbott Laboratories | | | 19,167 | | | | 940,716 | |
Allergan PLC* | | | 3,825 | | | | 1,160,735 | |
BIOGEN, Inc.* | | | 2,773 | | | | 1,120,126 | |
| | | | | | | | |
| | | Shares | | | Value | |
| | | | | | | | |
| COMMON STOCKS (CONTINUED): | |
HEALTH CARE (CONTINUED) | |
Celgene Corp.* | | | 10,545 | | | $ | 1,220,426 | |
Gilead Sciences, Inc. | | | 15,496 | | | | 1,814,272 | |
Medtronic PLC | | | 18,620 | | | | 1,379,742 | |
Merck & Co., Inc. | | | 28,593 | | | | 1,627,799 | |
Mylan N.V.* | | | 27,880 | | | | 1,891,937 | |
Pfizer, Inc. | | | 64,734 | | | | 2,170,531 | |
Other Securities | | | 43,067 | | | | 4,826,315 | |
| | | | | | | | |
| | | | | | | 18,152,599 | |
| | | | | | | | |
INDUSTRIALS (6.2%) | | | | | | | | |
Boeing Co. | | | 9,741 | | | | 1,351,272 | |
FedEx Corp. | | | 6,990 | | | | 1,191,096 | |
General Electric Co. | | | 103,514 | | | | 2,750,367 | |
Roper Technologies, Inc. | | | 13,916 | | | | 2,399,953 | |
Other Securities | | | 60,431 | | | | 4,118,263 | |
| | | | | | | | |
| | | | | | | 11,810,951 | |
| | | | | | | | |
INFORMATION TECHNOLOGY (10.8%) | |
Apple, Inc. | | | 38,706 | | | | 4,854,696 | |
Cisco Systems, Inc. | | | 36,976 | | | | 1,015,361 | |
Facebook, Inc. Cl A* | | | 13,236 | | | | 1,135,186 | |
Google, Inc. Cl A* | | | 1,866 | | | | 1,007,715 | |
Google, Inc. Cl C* | | | 1,870 | | | | 973,354 | |
Microsoft Corp. | | | 42,426 | | | | 1,873,108 | |
Oracle Corp. | | | 26,425 | | | | 1,064,928 | |
Salesforce.com, inc.* | | | 23,464 | | | | 1,633,798 | |
Other Securities | | | 133,697 | | | | 7,191,704 | |
| | | | | | | | |
| | | | | | | 20,749,850 | |
| | | | | | | | |
MATERIALS (1.9%) | |
Other Securities | | | 66,337 | | | | 3,606,162 | |
| | | | | | | | |
TELECOMMUNICATION SERVICES (1.0%) | |
AT&T, Inc. | | | 35,507 | | | | 1,261,209 | |
Verizon Communications, Inc. | | | 15,217 | | | | 709,264 | |
| | | | | | | | |
| | | | | | | 1,970,473 | |
| | | | | | | | |
UTILITIES (1.5%) | |
Other Securities | | | 53,529 | | | | 2,885,352 | |
| | | | | | | | |
TOTAL COMMON STOCKS | |
(Cost: $71,507,620) 58.3% | | | | | | | 111,448,782 | |
| | | | | | | | |
| | | | | | | | | | | | | | |
| | | Rating** | | Rate(%) | | Maturity | | Face Amount | | | Value | |
| LONG-TERM DEBT SECURITIES: | | | | | | | | | | | | | | |
U.S. GOVERNMENT (8.9%) | | | | | | | | | | | | | | |
U.S. Treasury Note | | AA+ | | 0.50 - 2.13 | | 03/31/17 - 05/15/25 | | $ | 2,800,000 | | | $ | 2,769,757 | |
U.S. Treasury Strip | | AA+ | | 0.00 | | 08/15/21 - 08/15/29 | | | 18,850,000 | | | | 14,293,817 | |
| | | | | | | | | | | | | | |
| | | | | | | | | | | | | 17,063,574 | |
| | | | | | | | | | | | | | |
U.S. GOVERNMENT AGENCIES (12.0%) | | | | | | | | | | | | | | |
MORTGAGE-BACKED OBLIGATIONS (11.8%) | | | | | | | | | | | | | | |
FHARM | | AA+ | | 2.36 - 5.79 | | 02/01/36 - 09/01/39 | | | 201,949 | | | | 214,558 | |
FHLMC | | AA+ | | 2.50 - 6.00 | | 02/01/25 - 06/01/45 | | | 5,334,478 | | | | 5,620,047 | |
FHLMC Strip | | AA+ | | 3.00 | | 01/15/43 | | | 430,137 | | | | 437,963 | |
FNMA | | AA+ | | 2.42 - 8.00 | | 09/01/16 - 12/25/49 | | | 11,828,730 | | | | 12,564,718 | |
FNMA Strip | | AA+ | | 3.00 | | 08/25/42 | | | 368,459 | | | | 368,682 | |
GNMA (2) | | AA+ | | 3.50 - 7.00 | | 10/15/24 - 10/20/43 | | | 2,904,385 | | | | 3,161,771 | |
Other Securities | | | | | | | | | 226,686 | | | | 251,537 | |
| | | | | | | | | | | | | | |
| | | | | | | | | | | | | 22,619,276 | |
| | | | | | | | | | | | | | |
The accompanying notes are an integral part of these portfolio schedules.
35
MUTUAL OF AMERICA INVESTMENT CORPORATION — COMPOSITE FUND
SUMMARY PORTFOLIO OF INVESTMENTS IN SECURITIES (Continued)
June 30, 2015 (Unaudited)
| | | | | | | | | | | | | | |
| | | Rating** | | Rate(%) | | Maturity | | Face Amount | | | Value | |
| LONG-TERM DEBT SECURITIES (CONTINUED): | | | | | | | | | | | | | | |
U.S. GOVERNMENT AGENCIES (CONTINUED) | | | | | | | | | | | | | | |
NON-MORTGAGE-BACKED OBLIGATIONS (0.2%) | | | | | | | | | | | | | | |
FHLMC | | AA+ | | 0.00 | | 11/29/19 | | $ | 500,000 | | | $ | 456,083 | |
| | | | | | | | | | | | | | |
CORPORATE DEBT (16.7%) | | | | | | | | | | | | | | |
CONSUMER DISCRETIONARY (2.8%) | | | | | | | | | | | | | | |
Home Depot, Inc. | | A | | 5.40 | | 03/01/16 | | | 500,000 | | | | 515,788 | |
Other Securities | | | | | | | | | 4,770,000 | | | | 4,906,614 | |
| | | | | | | | | | | | | | |
| | | | | | | | | | | | | 5,422,402 | |
| | | | | | | | | | | | | | |
CONSUMER STAPLES (0.9%) | | | | | | | | | | | | | | |
Other Securities | | | | | | | | | 1,625,000 | | | | 1,645,585 | |
| | | | | | | | | | | | | | |
ENERGY (2.1%) | | | | | | | | | | | | | | |
Other Securities | | | | | | | | | 3,810,000 | | | | 3,920,935 | |
| | | | | | | | | | | | | | |
FINANCIALS (3.7%) | | | | | | | | | | | | | | |
Bank of America Corp. | | A- | | 3.70 | | 09/01/15 | | | 250,000 | | | | 251,036 | |
Capital One Financial Corp. | | BBB | | 4.75 | | 07/15/21 | | | 300,000 | | | | 327,683 | |
Other Securities | | | | | | | | | 6,250,000 | | | | 6,532,150 | |
| | | | | | | | | | | | | | |
| | | | | | | | | | | | | 7,110,869 | |
| | | | | | | | | | | | | | |
HEALTH CARE (2.1%) | | | | | | | | | | | | | | |
Allergan, Inc. | | BBB- | | 5.75 | | 04/01/16 | | | 250,000 | | | | 259,036 | |
Other Securities | | | | | | | | | 3,515,000 | | | | 3,703,235 | |
| | | | | | | | | | | | | | |
| | | | | | | | | | | | | 3,962,271 | |
| | | | | | | | | | | | | | |
INDUSTRIALS (1.1%) | | | | | | | | | | | | | | |
Other Securities | | | | | | | | | 2,050,000 | | | | 2,114,608 | |
| | | | | | | | | | | | | | |
INFORMATION TECHNOLOGY (1.1%) | | | | | | | | | | | | | | |
Other Securities | | | | | | | | | 2,035,000 | | | | 2,119,710 | |
| | | | | | | | | | | | | | |
MATERIALS (1.5%) | | | | | | | | | | | | | | |
Geon Co. | | BBB- | | 7.50 | | 12/15/15 | | | 1,000,000 | | | | 1,024,799 | |
Other Securities | | | | | | | | | 1,850,000 | | | | 1,871,910 | |
| | | | | | | | | | | | | | |
| | | | | | | | | | | | | 2,896,709 | |
| | | | | | | | | | | | | | |
TELECOMMUNICATION SERVICES (0.4%) | | | | | | | | | | | | | | |
AT&T, Inc. | | BBB+ | | 3.00 | | 06/30/22 | | | 350,000 | | | | 337,947 | |
Verizon Communications, Inc. | | BBB+ | | 4.50 | | 09/15/20 | | | 325,000 | | | | 350,589 | |
| | | | | | | | | | | | | | |
| | | | | | | | | | | | | 688,536 | |
| | | | | | | | | | | | | | |
UTILITIES (1.0%) | | | | | | | | | | | | | | |
Other Securities | | | | | | | | | 1,740,000 | | | | 1,820,498 | |
| | | | | | | | | | | | | | |
TOTAL LONG-TERM DEBT SECURITIES
(Cost: $69,775,478) 37.6% | | | | | | | | | | | | | 71,841,056 | |
| | | | | | | | | | | | | | |
| | | | | |
| SHORT-TERM DEBT SECURITIES: | | | | | | | | | | | | | | |
COMMERCIAL PAPER (2.8%) | | | | | | | | | | | | | | |
Abbott Laboratories† | | A-1+ | | 0.12 | | 07/27/15 - 08/27/15 | | | 930,000 | | | | 929,857 | |
Toyota Motor Credit Corp. | | A-1+ | | 0.10 - 0.16 | | 07/16/15 - 08/17/15 | | | 4,500,000 | | | | 4,499,395 | |
| | | | | | | | | | | | | | |
| | | | | | | | | | | | | 5,429,252 | |
| | | | | | | | | | | | | | |
TOTAL SHORT-TERM DEBT SECURITIES
(Cost: $5,429,252) 2.8% | | | | 5,429,252 | |
| | | | | | | | | | | | | | |
TOTAL INVESTMENTS
(Cost: $146,712,350) 98.7% | | | | 188,719,090 | |
| | | | | | | | | | | | | | |
OTHER NET ASSETS 1.3% | | | | 2,479,515 | |
| | | | | | | | | | | | | | |
NET ASSETS 100.0% | | | $ | 191,198,605 | |
| | | | | | | | | | | | | | |
The accompanying notes are an integral part of these portfolio schedules.
36
MUTUAL OF AMERICA INVESTMENT CORPORATION — RETIREMENT INCOME FUND
PORTFOLIO OF INVESTMENTS IN SECURITIES
June 30, 2015 (Unaudited)
| | | | | | | | |
| | | Shares | | | Value | |
| COMMON STOCKS: | | | | | | | | |
DIVERSIFIED MUTUAL FUNDS (100.0%) | | | | | | | | |
Mutual of America Investment Corporation | | | | | | | | |
Bond Fund (30.9%) | | | 11,861,154 | | | $ | 17,371,134 | |
Equity Index Fund (19.9%) | | | 3,233,251 | | | | 11,148,670 | |
Mid-Cap Equity Index Fund (4.9%) | | | 1,232,280 | | | | 2,774,211 | |
Mid-Term Bond Fund (40.3%) | | | 21,141,624 | | | | 22,596,506 | |
Money Market Fund (4.0%) | | | 1,881,444 | | | | 2,250,689 | |
| | | | | | | | |
TOTAL INVESTMENTS
(Cost: $53,932,783) 100.0% | | | | | | | 56,141,210 | |
| | | | | | | | |
OTHER NET ASSETS -0.0% (3) | | | | | | | (77 | ) |
| | | | | | | | |
NET ASSETS 100.0% | | | | | | $ | 56,141,133 | |
| | | | | | | | |
MUTUAL OF AMERICA INVESTMENT CORPORATION — 2010 RETIREMENT FUND
PORTFOLIO OF INVESTMENTS IN SECURITIES
June 30, 2015 (Unaudited)
| | | | | | | | |
| | | Shares | | | Value | |
| COMMON STOCKS: | | | | | | | | |
DIVERSIFIED MUTUAL FUNDS (100.0%) | | | | | | | | |
Mutual of America Investment Corporation | | | | | | | | |
Bond Fund (26.0%) | | | 4,746,512 | | | $ | 6,951,457 | |
Equity Index Fund (24.9%) | | | 1,928,885 | | | | 6,651,046 | |
International Fund (3.0%) | | | 970,322 | | | | 796,893 | |
Mid-Cap Equity Index Fund (8.9%) | | | 1,058,792 | | | | 2,383,640 | |
Mid-Term Bond Fund (33.2%) | | | 8,326,129 | | | | 8,899,100 | |
Money Market Fund (4.0%) | | | 901,596 | | | | 1,078,539 | |
| | | | | | | | |
TOTAL INVESTMENTS
(Cost: $24,455,276) 100.0% | | | | | | | 26,760,675 | |
| | | | | | | | |
OTHER NET ASSETS -0.0% (3) | | | | | | | (36 | ) |
| | | | | | | | |
NET ASSETS 100.0% | | | | | | $ | 26,760,639 | |
| | | | | | | | |
MUTUAL OF AMERICA INVESTMENT CORPORATION — 2015 RETIREMENT FUND
PORTFOLIO OF INVESTMENTS IN SECURITIES
June 30, 2015 (Unaudited)
| | | | | | | | |
| | | Shares | | | Value | |
| COMMON STOCKS: | | | | | | | | |
DIVERSIFIED MUTUAL FUNDS (100.0%) | | | | | | | | |
Mutual of America Investment Corporation | | | | | | | | |
Bond Fund (25.0%) | | | 26,700,082 | | | $ | 39,103,338 | |
Equity Index Fund (27.9%) | | | 12,656,468 | | | | 43,641,147 | |
International Fund (6.0%) | | | 11,370,244 | | | | 9,337,994 | |
Mid-Cap Equity Index Fund (10.9%) | | | 7,585,323 | | | | 17,076,701 | |
Mid-Term Bond Fund (28.2%) | | | 41,296,666 | | | | 44,138,539 | |
Small Cap Growth Fund (1.0%) | | | 961,279 | | | | 1,605,155 | |
Small Cap Value Fund (1.0%) | | | 944,333 | | | | 1,549,148 | |
| | | | | | | | |
TOTAL INVESTMENTS
(Cost: $138,190,159) 100.0% | | | | | | | 156,452,022 | |
| | | | | | | | |
OTHER NET ASSETS -0.0% (3) | | | | | | | (367 | ) |
| | | | | | | | |
NET ASSETS 100.0% | | | | | | $ | 156,451,655 | |
| | | | | | | | |
The accompanying notes are an integral part of these portfolio schedules.
37
MUTUAL OF AMERICA INVESTMENT CORPORATION — 2020 RETIREMENT FUND
PORTFOLIO OF INVESTMENTS IN SECURITIES
June 30, 2015 (Unaudited)
| | | | | | | | |
| | | Shares | | | Value | |
| COMMON STOCKS: | | | | | | | | |
DIVERSIFIED MUTUAL FUNDS (100.0%) | | | | | | | | |
Mutual of America Investment Corporation | | | | | | | | |
Bond Fund (24.5%) | | | 58,374,910 | | | $ | 85,492,390 | |
Equity Index Fund (33.4%) | | | 33,675,795 | | | | 116,118,518 | |
International Fund (8.7%) | | | 36,887,697 | | | | 30,294,611 | |
Mid-Cap Equity Index Fund (11.4%) | | | 17,662,667 | | | | 39,763,644 | |
Mid-Term Bond Fund (17.5%) | | | 56,975,170 | | | | 60,895,974 | |
Small Cap Growth Fund (2.3%) | | | 4,803,236 | | | | 8,020,505 | |
Small Cap Value Fund (2.2%) | | | 4,721,737 | | | | 7,745,858 | |
| | | | | | | | |
TOTAL INVESTMENTS
(Cost: $302,835,674) 100.0% | | | | | | | 348,331,500 | |
| | | | | | | | |
OTHER NET ASSETS -0.0% (3) | | | | | | | (736 | ) |
| | | | | | | | |
NET ASSETS 100.0% | | | | | | $ | 348,330,764 | |
| | | | | | | | |
MUTUAL OF AMERICA INVESTMENT CORPORATION — 2025 RETIREMENT FUND
PORTFOLIO OF INVESTMENTS IN SECURITIES
June 30, 2015 (Unaudited)
| | | | | | | | |
| | | Shares | | | Value | |
| COMMON STOCKS: | | | | | | | | |
DIVERSIFIED MUTUAL FUNDS (100.0%) | | | | | | | | |
Mutual of America Investment Corporation | | | | | | | | |
Bond Fund (22.3%) | | | 56,265,587 | | | $ | 82,403,203 | |
Equity Index Fund (37.5%) | | | 40,326,605 | | | | 139,051,376 | |
International Fund (9.5%) | | | 42,663,845 | | | | 35,038,365 | |
Mid-Cap Equity Index Fund (16.4%) | | | 26,827,593 | | | | 60,396,477 | |
Mid-Term Bond Fund (7.2%) | | | 24,763,745 | | | | 26,467,887 | |
Small Cap Growth Fund (3.6%) | | | 7,916,941 | | | | 13,219,811 | |
Small Cap Value Fund (3.5%) | | | 7,783,075 | | | | 12,767,886 | |
| | | | | | | | |
TOTAL INVESTMENTS
(Cost: $309,950,282) 100.0% | | | | | | | 369,345,005 | |
| | | | | | | | |
OTHER NET ASSETS -0.0% (3) | | | | | | | (772 | ) |
| | | | | | | | |
NET ASSETS 100.0% | | | | | | $ | 369,344,233 | |
| | | | | | | | |
MUTUAL OF AMERICA INVESTMENT CORPORATION — 2030 RETIREMENT FUND
PORTFOLIO OF INVESTMENTS IN SECURITIES
June 30, 2015 (Unaudited)
| | | | | | | | |
| | | Shares | | | Value | |
| COMMON STOCKS: | | | | | | | | |
DIVERSIFIED MUTUAL FUNDS (100.0%) | | | | | | | | |
Mutual of America Investment Corporation | | | | | | | | |
Bond Fund (22.3%) | | | 46,884,787 | | | $ | 68,664,647 | |
Equity Index Fund (40.7%) | | | 36,259,378 | | | | 125,027,048 | |
International Fund (9.5%) | | | 35,619,675 | | | | 29,253,228 | |
Mid-Cap Equity Index Fund (17.4%) | | | 23,772,332 | | | | 53,518,222 | |
Small Cap Growth Fund (5.1%) | | | 9,474,199 | | | | 15,820,140 | |
Small Cap Value Fund (5.0%) | | | 9,314,875 | | | | 15,280,755 | |
| | | | | | | | |
TOTAL INVESTMENTS
(Cost: $252,355,411) 100.0% | | | | | | | 307,564,040 | |
| | | | | | | | |
OTHER NET ASSETS -0.0% (3) | | | | | | | (650 | ) |
| | | | | | | | |
NET ASSETS 100.0% | | | | | | $ | 307,563,390 | |
| | | | | | | | |
The accompanying notes are an integral part of these portfolio schedules.
38
MUTUAL OF AMERICA INVESTMENT CORPORATION — 2035 RETIREMENT FUND
PORTFOLIO OF INVESTMENTS IN SECURITIES
June 30, 2015 (Unaudited)
| | | | | | | | |
| | | Shares | | | Value | |
| COMMON STOCKS: | | | | | | | | |
DIVERSIFIED MUTUAL FUNDS (100.0%) | | | | | | | | |
Mutual of America Investment Corporation | | | | | | | | |
Bond Fund (15.6%) | | | 27,046,047 | | | $ | 39,610,018 | |
Equity Index Fund (40.6%) | | | 30,057,166 | | | | 103,641,013 | |
International Fund (11.5%) | | | 35,699,096 | | | | 29,318,454 | |
Mid-Cap Equity Index Fund (20.1%) | | | 22,780,596 | | | | 51,285,546 | |
Small Cap Growth Fund (6.2%) | | | 9,421,579 | | | | 15,732,276 | |
Small Cap Value Fund (6.0%) | | | 9,262,342 | | | | 15,194,576 | |
| | | | | | | | |
TOTAL INVESTMENTS
(Cost: $206,687,860) 100.0% | | | | | | | 254,781,883 | |
| | | | | | | | |
OTHER NET ASSETS -0.0% (3) | | | | | | | (544 | ) |
| | | | | | | | |
NET ASSETS 100.0% | | | | | | $ | 254,781,339 | |
| | | | | | | | |
MUTUAL OF AMERICA INVESTMENT CORPORATION — 2040 RETIREMENT FUND
PORTFOLIO OF INVESTMENTS IN SECURITIES
June 30, 2015 (Unaudited)
| | | | | | | | |
| | | Shares | | | Value | |
| COMMON STOCKS: | | | | | | | | |
DIVERSIFIED MUTUAL FUNDS (100.0%) | | | | | | | | |
Mutual of America Investment Corporation | | | | | | | | |
Bond Fund (11.6%) | | | 16,638,043 | | | $ | 24,367,079 | |
Equity Index Fund (35.7%) | | | 21,789,820 | | | | 75,134,131 | |
International Fund (13.5%) | | | 34,517,902 | | | | 28,348,379 | |
Mid-Cap Equity Index Fund (23.0%) | | | 21,501,392 | | | | 48,405,698 | |
Small Cap Growth Fund (8.2%) | | | 10,366,216 | | | | 17,309,642 | |
Small Cap Value Fund (8.0%) | | | 10,192,194 | | | | 16,719,968 | |
| | | | | | | | |
TOTAL INVESTMENTS
(Cost: $167,795,232) 100.0% | | | | | | | 210,284,897 | |
| | | | | | | | |
OTHER NET ASSETS -0.0% (3) | | | | | | | (458 | ) |
| | | | | | | | |
NET ASSETS 100.0% | | | | | | $ | 210,284,439 | |
| | | | | | | | |
MUTUAL OF AMERICA INVESTMENT CORPORATION — 2045 RETIREMENT FUND
PORTFOLIO OF INVESTMENTS IN SECURITIES
June 30, 2015 (Unaudited)
| | | | | | | | |
| | | Shares | | | Value | |
| COMMON STOCKS: | | | | | | | | |
DIVERSIFIED MUTUAL FUNDS (100.0%) | |
Mutual of America Investment Corporation | | | | | | | | |
Bond Fund (9.6%) | | | 16,850,082 | | | $ | 24,677,619 | |
Equity Index Fund (35.6%) | | | 26,631,683 | | | | 91,829,505 | |
International Fund (15.5%) | | | 48,463,245 | | | | 39,801,215 | |
Mid-Cap Equity Index Fund (21.1%) | | | 24,200,028 | | | | 54,481,088 | |
Small Cap Growth Fund (9.3%) | | | 14,287,459 | | | | 23,857,384 | |
Small Cap Value Fund (8.9%) | | | 14,047,507 | | | | 23,044,486 | |
| | | | | | | | |
TOTAL INVESTMENTS
(Cost: $203,146,662) 100.0% | | | | | | | 257,691,297 | |
| | | | | | | | |
OTHER NET ASSETS -0.0% (3) | | | | | | | (556 | ) |
| | | | | | | | |
NET ASSETS 100.0% | | | | | | $ | 257,690,741 | |
| | | | | | | | |
The accompanying notes are an integral part of these portfolio schedules.
39
MUTUAL OF AMERICA INVESTMENT CORPORATION — 2050 RETIREMENT FUND
PORTFOLIO OF INVESTMENTS IN SECURITIES
June 30, 2015 (Unaudited)
| | | | | | | | |
| | | Shares | | | Value | |
| COMMON STOCKS: | | | | | | | | |
DIVERSIFIED MUTUAL FUNDS (100.0%) | |
Mutual of America Investment Corporation | | | | | | | | |
Bond Fund (7.5%) | | | 3,693,732 | | | $ | 5,409,618 | |
Equity Index Fund (35.4%) | | | 7,429,280 | | | | 25,617,124 | |
International Fund (16.5%) | | | 14,527,066 | | | | 11,930,586 | |
Mid-Cap Equity Index Fund (20.3%) | | | 6,509,860 | | | | 14,655,530 | |
Small Cap Growth Fund (10.3%) | | | 4,448,565 | | | | 7,428,271 | |
Small Cap Value Fund (10.0%) | | | 4,379,055 | | | | 7,183,700 | |
| | | | | | | | |
TOTAL INVESTMENTS
(Cost: $67,715,128) 100.0% | | | | | | | 72,224,829 | |
| | | | | | | | |
OTHER NET ASSETS -0.0% (3) | | | | | | | (98 | ) |
| | | | | | | | |
NET ASSETS 100.0% | | | | | | $ | 72,224,731 | |
| | | | | | | | |
MUTUAL OF AMERICA INVESTMENT CORPORATION — CONSERVATIVE ALLOCATION FUND
PORTFOLIO OF INVESTMENTS IN SECURITIES
June 30, 2015 (Unaudited)
| | | | | | | | |
| | | Shares | | | Value | |
| COMMON STOCKS: | | | | | | | | |
DIVERSIFIED MUTUAL FUNDS (100.0%) | |
Mutual of America Investment Corporation | | | | | | | | |
Bond Fund (29.8%) | | | 26,332,435 | | | $ | 38,564,905 | |
Equity Index Fund (25.1%) | | | 9,433,745 | | | | 32,528,780 | |
International Fund (5.1%) | | | 8,058,550 | | | | 6,618,213 | |
Mid-Cap Equity Index Fund (5.0%) | | | 2,893,536 | | | | 6,514,166 | |
Mid-Term Bond Fund (35.0%) | | | 42,346,108 | | | | 45,260,197 | |
| | | | | | | | |
TOTAL INVESTMENTS
(Cost: $119,820,194) 100.0% | | | | | | | 129,486,261 | |
| | | | | | | | |
OTHER NET ASSETS -0.0% (3) | | | | | | | (127 | ) |
| | | | | | | | |
NET ASSETS 100.0% | | | | | | $ | 129,486,134 | |
| | | | | | | | |
MUTUAL OF AMERICA INVESTMENT CORPORATION — MODERATE ALLOCATION FUND
PORTFOLIO OF INVESTMENTS IN SECURITIES
June 30, 2015 (Unaudited)
| | | | | | | | |
| | | Shares | | | Value | |
| COMMON STOCKS: | | | | | | | | |
DIVERSIFIED MUTUAL FUNDS (100.0%) | |
Mutual of America Investment Corporation | | | | | | | | |
Bond Fund (24.7%) | | | 54,969,109 | | | $ | 80,504,459 | |
Equity Index Fund (35.1%) | | | 33,094,457 | | | | 114,113,989 | |
International Fund (10.2%) | | | 40,397,727 | | | | 33,177,279 | |
Mid-Cap Equity Index Fund (15.1%) | | | 21,751,286 | | | | 48,968,280 | |
Mid-Term Bond Fund (14.9%) | | | 45,462,675 | | | | 48,591,235 | |
| | | | | | | | |
TOTAL INVESTMENTS
(Cost: $267,224,922) 100.0% | | | | | | | 325,355,242 | |
| | | | | | | | |
OTHER NET ASSETS -0.0% (3) | | | | | | | (276 | ) |
| | | | | | | | |
NET ASSETS 100.0% | | | | | | $ | 325,354,966 | |
| | | | | | | | |
The accompanying notes are an integral part of these portfolio schedules.
40
MUTUAL OF AMERICA INVESTMENT CORPORATION — AGGRESSIVE ALLOCATION FUND
PORTFOLIO OF INVESTMENTS IN SECURITIES
June 30, 2015 (Unaudited)
| | | | | | | | |
| | | Shares | | | Value | |
| COMMON STOCKS: | | | | | | | | |
DIVERSIFIED MUTUAL FUNDS (100.0%) | |
Mutual of America Investment Corporation | | | | | | | | |
Bond Fund (19.7%) | | | 35,161,563 | | | $ | 51,495,515 | |
Equity Index Fund (34.9%) | | | 26,468,884 | | | | 91,268,154 | |
International Fund (15.2%) | | | 48,479,844 | | | | 39,814,848 | |
Mid-Cap Equity Index Fund (20.0%) | | | 23,195,097 | | | | 52,218,704 | |
Small Cap Growth Fund (5.2%) | | | 8,053,739 | | | | 13,448,238 | |
Small Cap Value Fund (5.0%) | | | 7,923,955 | | | | 12,998,994 | |
| | | | | | | | |
TOTAL INVESTMENTS
(Cost: $195,573,604) 100.0% | | | | | | | 261,244,453 | |
| | | | | | | | |
OTHER NET ASSETS -0.0% (3) | | | | | | | (237 | ) |
| | | | | | | | |
NET ASSETS 100.0% | | | | | | $ | 261,244,216 | |
| | | | | | | | |
The accompanying notes are an integral part of these portfolio schedules.
41
MUTUAL OF AMERICA INVESTMENT CORPORATION — MONEY MARKET FUND
PORTFOLIO OF INVESTMENTS IN SECURITIES
June 30, 2015 (Unaudited)
| | | | | | | | | | | | | | | | | | |
| | | Rating** | | Rate(%) | | | Maturity | | | Face Amount | | | Value | |
| SHORT-TERM DEBT SECURITIES: | | | | | | | | | | | | | | | | | | |
U.S. GOVERNMENT (5.7%) | | | | | | | | | | | | | | | | | | |
U.S. Treasury Bill | | A-1+ | | | 0.06 | | | | 12/24/15 | | | $ | 4,000,000 | | | $ | 3,999,126 | |
| | | | | | | | | | | | | | | | | | |
U.S. GOVERNMENT AGENCIES (22.6%) | | | | | | | | | | | | | | | | | | |
FHLB | | A-1+ | | | 0.01 | | | | 07/24/15 | | | | 5,000,000 | | | | 4,999,968 | |
FHLB | | A-1+ | | | 0.03 | | | | 08/05/15 | | | | 10,800,000 | | | | 10,799,736 | |
| | | | | | | | | | | | | | | | | | |
| | | | | | | | | | | | | | | | | 15,799,704 | |
| | | | | | | | | | | | | | | | | | |
COMMERCIAL PAPER (70.2%) | | | | | | | | | | | | | | | | | | |
Abbott Laboratories† | | A-1+ | | | 0.12 | | | | 07/27/15 | | | | 1,250,000 | | | | 1,249,892 | |
Abbott Laboratories† | | A-1+ | | | 0.12 | | | | 07/28/15 | | | | 1,700,000 | | | | 1,699,847 | |
Coca-Cola Co.† | | A-1+ | | | 0.23 | | | | 10/21/15 | | | | 2,800,000 | | | | 2,798,393 | |
Danaher Corp.† | | A-1 | | | 0.17 | | | | 07/10/15 | | | | 2,875,000 | | | | 2,874,878 | |
EMC Corp.† | | A-1 | | | 0.12 | | | | 07/21/15 | | | | 3,000,000 | | | | 2,999,800 | |
Emerson Electric Co.† | | A-1 | | | 0.12 | | | | 08/10/15 | | | | 1,100,000 | | | | 1,099,853 | |
Emerson Electric Co.† | | A-1 | | | 0.13 | | | | 08/19/15 | | | | 1,900,000 | | | | 1,899,664 | |
General Electric Capital Corp. | | A-1+ | | | 0.14 | | | | 08/10/15 | | | | 500,000 | | | | 499,922 | |
General Electric Capital Corp. | | A-1+ | | | 0.15 | | | | 08/31/15 | | | | 2,500,000 | | | | 2,499,786 | |
Google, Inc.† | | A-1+ | | | 0.13 | | | | 07/08/15 | | | | 450,000 | | | | 449,989 | |
Honeywell International† | | A-1 | | | 0.12 | | | | 07/17/15 | | | | 600,000 | | | | 599,968 | |
Honeywell International† | | A-1 | | | 0.13 | | | | 09/01/15 | | | | 800,000 | | | | 799,837 | |
Intercontinental Exchange, Inc.† | | A-1 | | | 0.19 | | | | 07/24/15 | | | | 1,800,000 | | | | 1,799,781 | |
Intercontinental Exchange, Inc.† | | A-1 | | | 0.19 | | | | 07/31/15 | | | | 1,000,000 | | | | 999,842 | |
J.P. Morgan Securities LLC | | A-1 | | | 0.18 | | | | 07/24/15 | | | | 350,000 | | | | 349,960 | |
J.P. Morgan Securities LLC | | A-1 | | | 0.20 | | | | 07/06/15 | | | | 300,000 | | | | 299,992 | |
J.P. Morgan Securities LLC | | A-1 | | | 0.20 | | | | 07/23/15 | | | | 500,000 | | | | 499,939 | |
J.P. Morgan Securities LLC† | | A-1 | | | 0.20 | | | | 07/28/15 | | | | 1,850,000 | | | | 1,849,722 | |
National Oilwell Varco, Inc.† | | A-1 | | | 0.15 | | | | 07/22/15 | | | | 3,000,000 | | | | 2,999,737 | |
National Rural Utilities | | A-1 | | | 0.10 | | | | 07/21/15 | | | | 2,400,000 | | | | 2,399,867 | |
Novartis Finance Corp.† | | A-1+ | | | 0.13 | | | | 07/09/15 | | | | 1,185,000 | | | | 1,184,966 | |
Pfizer, Inc.† | | A-1+ | | | 0.13 | | | | 07/16/15 | | | | 250,000 | | | | 249,986 | |
Private Export Funding Corp. | | A-1 | | | 0.13 | | | | 08/11/15 | | | | 2,000,000 | | | | 1,999,704 | |
QUALCOMM, Inc.† | | A-1+ | | | 0.12 | | | | 09/08/15 | | | | 2,900,000 | | | | 2,900,090 | |
San Diego Gas & Electric Co.† | | A-1 | | | 0.08 | | | | 07/01/15 | | | | 1,400,000 | | | | 1,400,000 | |
San Diego Gas & Electric Co.† | | A-1 | | | 0.14 | | | | 07/01/15 | | | | 1,575,000 | | | | 1,575,000 | |
Simon Property Group LP† | | A-1 | | | 0.17 | | | | 08/17/15 | | | | 2,900,000 | | | | 2,899,356 | |
Toyota Motor Credit Corp. | | A-1+ | | | 0.14 | | | | 08/10/15 | | | | 3,000,000 | | | | 2,999,533 | |
Unilever Capital† | | A-1 | | | 0.12 | | | | 07/06/15 | | | | 500,000 | | | | 499,992 | |
United Technologies Corp.† | | A-1 | | | 0.12 | | | | 07/27/15 | | | | 500,000 | | | | 499,957 | |
Wisconsin Gas Co. | | A-1 | | | 0.12 | | | | 07/10/15 | | | | 2,200,000 | | | | 2,199,934 | |
| | | | | | | | | | | | | | | | | | |
| | | | | | | | | | | | | | | | | 49,079,187 | |
| | | | | | | | | | | | | | | | | | |
TOTAL SHORT-TERM DEBT SECURITIES
(Cost: $68,876,136) 98.5% | | | | 68,878,017 | |
| | | | | | | | | | | | | | | | | | |
TOTAL INVESTMENTS
(Cost: $68,876,136) 98.5% | | | | 68,878,017 | |
| | | | | | | | | | | | | | | | | | |
OTHER NET ASSETS 1.5% | | | | 1,055,336 | |
| | | | | | | | | | | | | | | | | | |
NET ASSETS 100.0% | | | $ | 69,933,353 | |
| | | | | | | | | | | | | | | | | | |
The accompanying notes are an integral part of these financial statements.
42
MUTUAL OF AMERICA INVESTMENT CORPORATION — MID-TERM BOND FUND
SUMMARY PORTFOLIO OF INVESTMENTS IN SECURITIES
June 30, 2015 (Unaudited)
| | | | | | | | | | | | | | |
| | | Rating** | | Rate(%) | | Maturity | | Face Amount | | | Value | |
| LONG-TERM DEBT SECURITIES: | | | | | | | | | | | | | | |
U.S. GOVERNMENT (26.3%) | | | | | | | | | | | | | | |
U.S. Treasury Note | | AA+ | | 1.25 - 2.00 | | 11/30/18 - 05/31/22 | | $ | 62,250,000 | | | $ | 62,024,934 | |
U.S. Treasury Strip | | AA+ | | 0.00 | | 11/15/17 - 08/15/18 | | | 60,000,000 | | | | 58,116,020 | |
| | | | | | | | | | | | | | |
| | | | | | | | | | | | | 120,140,954 | |
| | | | | | | | | | | | | | |
U.S. GOVERNMENT AGENCIES (7.5%) | | | | | | | | | | | | | | |
MORTGAGE-BACKED OBLIGATIONS (0.0%) (3) | | | | | | | | | | | | | | |
FHLMC | | AA+ | | 7.50 - 8.50 | | 09/01/17 - 03/15/21 | | | 4,061 | | | | 4,481 | |
| | | | | | | | | | | | | | |
NON-MORTGAGE-BACKED OBLIGATIONS (7.5%) | | | | | | | | | | | | | | |
FHLMC | | AA+ | | 0.00 | | 11/29/19 | | | 13,500,000 | | | | 12,314,228 | |
FNMA | | AA+ | | 0.00 | | 10/09/19 | | | 23,000,000 | | | | 21,006,540 | |
Other Securities | | | | | | | | | 900,000 | | | | 808,160 | |
| | | | | | | | | | | | | | |
| | | | | | | | | | | | | 34,128,928 | |
| | | | | | | | | | | | | | |
CORPORATE DEBT (62.9%) | | | | | | | | | | | | | | |
CONSUMER DISCRETIONARY (9.7%) | | | | | | | | | | | | | | |
Advance Auto Parts, Inc. | | BBB- | | 4.50 - 5.75 | | 05/01/20 - 01/15/22 | | | 2,000,000 | | | | 2,197,402 | |
Expedia, Inc. | | BBB- | | 5.95 | | 08/15/20 | | | 2,000,000 | | | | 2,229,232 | |
Family Dollar Stores, Inc. | | BBB- | | 5.00 | | 02/01/21 | | | 2,000,000 | | | | 2,069,962 | |
Kohl’s Corp. | | BBB | | 3.25 - 4.00 | | 11/01/21 - 02/01/23 | | | 2,025,000 | | | | 2,076,513 | |
Marriott International, Inc. | | BBB | | 3.00 - 3.38 | | 03/01/19 - 10/15/20 | | | 2,000,000 | | | | 2,053,333 | |
Tupperware Brands Corp. | | BBB- | | 4.75 | | 06/01/21 | | | 2,000,000 | | | | 2,109,782 | |
Wyndham Worldwide Corp. | | BBB- | | 2.95 | | 03/01/17 | | | 2,160,000 | | | | 2,192,607 | |
Other Securities | | | | | | | | | 29,585,000 | | | | 29,633,432 | |
| | | | | | | | | | | | | | |
| | | | | | | | | | | | | 44,562,263 | |
| | | | | | | | | | | | | | |
CONSUMER STAPLES (3.9%) | | | | | | | | | | | | | | |
Mead Johnson Nutrition Co. | | BBB | | 4.90 | | 11/01/19 | | | 3,075,000 | | | | 3,338,933 | |
Other Securities | | | | | | | | | 14,500,000 | | | | 14,432,256 | |
| | | | | | | | | | | | | | |
| | | | | | | | | | | | | 17,771,189 | |
| | | | | | | | | | | | | | |
ENERGY (4.4%) | | | | | | | | | | | | | | |
Pioneer Natural Resources Co. | | BBB- | | 6.65 | | 03/15/17 | | | 2,000,000 | | | | 2,162,854 | |
SESI LLC | | BBB- | | 7.13 | | 12/15/21 | | | 2,150,000 | | | | 2,279,000 | |
Other Securities | | | | | | | | | 15,640,000 | | | | 15,626,673 | |
| | | | | | | | | | | | | | |
| | | | | | | | | | | | | 20,068,527 | |
| | | | | | | | | | | | | | |
FINANCIALS (17.4%) | | | | | | | | | | | | | | |
Alleghany Corp. | | BBB+ | | 4.95 | | 06/27/22 | | | 2,000,000 | | | | 2,157,228 | |
American Tower Corp. | | BBB- | | 4.50 | | 01/15/18 | | | 2,000,000 | | | | 2,116,372 | |
Berkley (W.R.) Corp. | | BBB+ | | 4.63 | | 03/15/22 | | | 2,000,000 | | | | 2,126,464 | |
Boston Properties LP | | A- | | 3.70 | | 11/15/18 | | | 1,970,000 | | | | 2,075,572 | |
Capital One Financial Corp. | | BBB | | 4.75 | | 07/15/21 | | | 2,000,000 | | | | 2,184,556 | |
Fairfax Financial Hldgs. | | BBB- | | 8.25 | | 10/01/15 | | | 742,000 | | | | 753,872 | |
Fairfax Financial Hldgs.† | | BBB- | | 5.80 | | 05/15/21 | | | 1,274,000 | | | | 1,357,627 | |
First Tennessee Bank | | BBB- | | 2.95 | | 12/01/19 | | | 2,200,000 | | | | 2,198,907 | |
Government Pptys. Income Trust | | BBB- | | 3.75 | | 08/15/19 | | | 2,000,000 | | | | 2,057,272 | |
Healthcare Realty Trust | | BBB- | | 5.75 | | 01/15/21 | | | 2,000,000 | | | | 2,214,654 | |
Moody’s Corp. | | BBB+ | | 5.50 | | 09/01/20 | | | 2,000,000 | | | | 2,245,056 | |
Morgan Stanley | | A- | | 4.00 - 4.75 | | 07/24/15 - 03/22/17 | | | 2,000,000 | | | | 2,056,619 | |
Nasdaq OMX Group, Inc. | | BBB- | | 5.55 | | 01/15/20 | | | 2,150,000 | | | | 2,379,837 | |
Vornado Realty LP | | BBB | | 2.50 - 5.00 | | 06/30/19 - 01/15/22 | | | 2,000,000 | | | | 2,122,878 | |
Other Securities | | | | | | | | | 50,379,000 | | | | 51,503,331 | |
| | | | | | | | | | | | | | |
| | | | | | | | | | | | | 79,550,245 | |
| | | | | | | | | | | | | | |
HEALTH CARE (7.3%) | | | | | | | | | | | | | | |
Agilent Technologies, Inc. | | BBB+ | | 5.00 | | 07/15/20 | | | 2,000,000 | | | | 2,190,096 | |
Bio-Rad Laboratories, Inc. | | BBB | | 4.88 | | 12/15/20 | | | 2,000,000 | | | | 2,168,036 | |
Hospira, Inc. | | BBB- | | 6.05 | | 03/30/17 | | | 2,000,000 | | | | 2,151,916 | |
Laboratory Corp. of America | | BBB | | 3.13 - 5.63 | | 12/15/15 - 08/23/22 | | | 2,000,000 | | | | 2,057,942 | |
The accompanying notes are an integral part of these portfolio schedules.
43
MUTUAL OF AMERICA INVESTMENT CORPORATION — MID-TERM BOND FUND
SUMMARY PORTFOLIO OF INVESTMENTS IN SECURITIES (Continued)
June 30, 2015 (Unaudited)
| | | | | | | | | | | | | | | | | | |
| | | Rating** | | Rate(%) | | | Maturity | | | Face Amount | | | Value | |
| LONG-TERM DEBT SECURITIES (CONTINUED): | | | | | | | | | | | | | | | | | | |
CORPORATE DEBT (CONTINUED) | | | | | | | | | | | | | | | | | | |
HEALTH CARE (CONTINUED) | | | | | | | | | | | | | | | | | | |
Owens & Minor, Inc. | | BBB | | | 3.88 | | | | 09/15/21 | | | $ | 2,000,000 | | | $ | 2,057,060 | |
PerkinElmer, Inc. | | BBB | | | 5.00 | | | | 11/15/21 | | | | 2,000,000 | | | | 2,176,198 | |
Quest Diagnostics, Inc. | | BBB+ | | | 4.75 | | | | 01/30/20 | | | | 2,000,000 | | | | 2,177,646 | |
Thermo Fisher Scientific, Inc. | | BBB | | | 3.60 - 4.50 | | | | 03/01/21 - 08/15/21 | | | | 2,000,000 | | | | 2,112,469 | |
Other Securities | | | | | | | | | | | | | 16,250,000 | | | | 16,402,734 | |
| | | | | | | | | | | | | | | | | | |
| | | | | | | | | | | | | | | | | 33,494,097 | |
| | | | | | | | | | | | | | | | | | |
INDUSTRIALS (5.1%) | | | | | | | | | | | | | | | | | | |
GATX Corp. | | BBB | | | 6.00 | | | | 02/15/18 | | | | 2,050,000 | | | | 2,240,306 | |
Harsco Corp. | | BB | | | 5.75 | | | | 05/15/18 | | | | 2,250,000 | | | | 2,317,500 | |
L-3 Communications Corp. | | BBB- | | | 5.20 | | | | 10/15/19 | | | | 2,000,000 | | | | 2,167,232 | |
Valmont Industries, Inc. | | BBB+ | | | 6.63 | | | | 04/20/20 | | | | 2,000,000 | | | | 2,307,968 | |
Other Securities | | | | | | | | | | | | | 13,985,000 | | | | 14,156,501 | |
| | | | | | | | | | | | | | | | | | |
| | | | | | | | | | | | | | | | | 23,189,507 | |
| | | | | | | | | | | | | | | | | | |
INFORMATION TECHNOLOGY (7.4%) | | | | | | | | | | | | | | | | | | |
Adobe Systems, Inc. | | A- | | | 4.75 | | | | 02/01/20 | | | | 2,000,000 | | | | 2,202,186 | |
Arrow Electronics, Inc. | | BBB- | | | 3.00 - 6.88 | | | | 03/01/18 - 03/01/23 | | | | 2,000,000 | | | | 2,098,154 | |
eBay, Inc. | | A | | | 2.88 | | | | 08/01/21 | | | | 2,100,000 | | | | 2,072,681 | |
Fiserv, Inc. | | BBB | | | 4.75 | | | | 06/15/21 | | | | 1,900,000 | | | | 2,077,274 | |
Lexmark International, Inc. | | BBB- | | | 6.65 | | | | 06/01/18 | | | | 2,000,000 | | | | 2,199,900 | |
Symantec Corp. | | BBB | | | 4.20 | | | | 09/15/20 | | | | 2,000,000 | | | | 2,077,284 | |
Tech Data Corp. | | BBB- | | | 3.75 | | | | 09/21/17 | | | | 2,000,000 | | | | 2,072,218 | |
Western Union Co. | | BBB | | | 5.93 | | | | 10/01/16 | | | | 2,000,000 | | | | 2,099,838 | |
Other Securities | | | | | | | | | | | | | 16,717,000 | | | | 17,048,064 | |
| | | | | | | | | | | | | | | | | | |
| | | | | | | | | | | | | | | | | 33,947,599 | |
| | | | | | | | | | | | | | | | | | |
MATERIALS (4.9%) | | | | | | | | | | | | | | | | | | |
Alcoa, Inc. | | BBB- | | | 6.75 | | | | 07/15/18 | | | | 2,000,000 | | | | 2,212,828 | |
Kinross Gold Corp. | | BBB- | | | 3.63 - 5.13 | | | | 09/01/16 - 09/01/21 | | | | 2,750,000 | | | | 2,753,904 | |
Other Securities | | | | | | | | | | | | | 17,187,000 | | | | 17,168,222 | |
| | | | | | | | | | | | | | | | | | |
| | | | | | | | | | | | | | | | | 22,134,954 | |
| | | | | | | | | | | | | | | | | | |
TELECOMMUNICATION SERVICES (0.9%) | | | | | | | | | | | | | | | | | | |
Verizon Communications, Inc. | | BBB+ | | | 4.50 | | | | 09/15/20 | | | | 2,000,000 | | | | 2,157,470 | |
Other Securities | | | | | | | | | | | | | 2,000,000 | | | | 1,952,214 | |
| | | | | | | | | | | | | | | | | | |
| | | | | | | | | | | | | | | | | 4,109,684 | |
| | | | | | | | | | | | | | | | | | |
UTILITIES (1.9%) | | | | | | | | | | | | | | | | | | |
Entergy Corp. | | BBB- | | | 4.70 - 5.13 | | | | 01/15/17 - 09/15/20 | | | | 2,000,000 | | | | 2,147,979 | |
Other Securities | | | | | | | | | | | | | 6,165,000 | | | | 6,320,570 | |
| | | | | | | | | | | | | | | | | | |
| | | | | | | | | | | | | | | | | 8,468,549 | |
| | | | | | | | | | | | | | | | | | |
TOTAL LONG-TERM DEBT SECURITIES
(Cost: $434,210,421) 96.7% | | | | | | | | | | | | | | | | | 441,570,977 | |
| | | | | | | | | | | | | | | | | | |
| | | | | |
| SHORT-TERM DEBT SECURITIES: | | | | | | | | | | | | | | | | | | |
U.S. GOVERNMENT AGENCIES (2.7%) | | | | | | | | | | | | | | | | | | |
FHLB | | A-1+ | | | 0.01 - 0.02 | | | | 07/27/15 - 07/31/15 | | | | 12,500,000 | | | | 12,499,836 | |
| | | | | | | | | | | | | | | | | | |
TOTAL SHORT-TERM DEBT SECURITIES
(Cost: $12,499,836) 2.7% | | | | 12,499,836 | |
| | | | | | | | | | | | | | | | | | |
TOTAL INVESTMENTS
(Cost: $446,710,257) 99.4% | | | | 454,070,813 | |
| | | | | | | | | | | | | | | | | | |
OTHER NET ASSETS 0.6% | | | | 2,728,577 | |
| | | | | | | | | | | | | | | | | | |
NET ASSETS 100.0% | | | $ | 456,799,390 | |
| | | | | | | | | | | | | | | | | | |
The accompanying notes are an integral part of these portfolio schedules.
44
MUTUAL OF AMERICA INVESTMENT CORPORATION — BOND FUND
SUMMARY PORTFOLIO OF INVESTMENTS IN SECURITIES
June 30, 2015 (Unaudited)
| | | | | | | | | | | | | | |
| | | Rating** | | Rate(%) | | Maturity | | Face Amount | | | Value | |
| LONG-TERM DEBT SECURITIES: | | | | | | | | | | | | | | |
U.S. GOVERNMENT (7.8%) | | | | | | | | | | | | | | |
U.S. Treasury Note | | AA+ | | 2.13 | | 05/15/25 | | $ | 12,500,000 | | | $ | 12,273,438 | |
U.S. Treasury Strip | | AA+ | | 0.00 | | 08/15/24 - 08/15/29 | | | 90,000,000 | | | | 65,733,168 | |
| | | | | | | | | | | | | | |
| | | | | | | | | | | | | 78,006,606 | |
| | | | | | | | | | | | | | |
U.S. GOVERNMENT AGENCIES (29.5%) | | | | | | | | | | | | | | |
MORTGAGE-BACKED OBLIGATIONS (26.1%) | | | | | | | | | | | | | | |
FHARM | | AA+ | | 2.29 - 5.79 | | 02/01/36 - 04/01/42 | | | 2,044,764 | | | | 2,156,987 | |
FHLMC | | AA+ | | 2.50 - 6.00 | | 03/01/21 - 04/01/45 | | | 76,593,402 | | | | 79,823,661 | |
FHLMC Strip | | AA+ | | 3.00 | | 01/15/43 | | | 2,580,823 | | | | 2,627,775 | |
FNMA | | AA+ | | 2.25 - 8.00 | | 09/01/16 - 12/25/49 | | | 124,617,804 | | | | 132,026,360 | |
FNMA Strip | | AA+ | | 3.00 | | 08/25/42 | | | 2,046,993 | | | | 2,048,233 | |
GNMA (2) | | AA+ | | 2.68 - 7.00 | | 02/20/20 - 10/16/47 | | | 40,576,846 | | | | 43,210,305 | |
Other Securities | | | | | | | | | 1,246,773 | | | | 1,383,455 | |
| | | | | | | | | | | | | | |
| | | | | | | | | | | | | 263,276,776 | |
| | | | | | | | | | | | | | |
NON-MORTGAGE-BACKED OBLIGATIONS (3.4%) | | | | | | | | | | | | | | |
FHLMC | | AA+ | | 0.00 | | 11/29/19 | | | 11,000,000 | | | | 10,033,815 | |
FNMA | | AA+ | | 0.00 | | 10/09/19 | | | 26,000,000 | | | | 23,746,523 | |
| | | | | | | | | | | | | | |
| | | | | | | | | | | | | 33,780,338 | |
| | | | | | | | | | | | | | |
CORPORATE DEBT (60.6%) | | | | | | | | | | | | | | |
CONSUMER DISCRETIONARY (9.4%) | | | | | | | | | | | | |
Advance Auto Parts, Inc. | | BBB- | | 4.50 - 5.75 | | 05/01/20 - 01/15/22 | | | 4,000,000 | | | | 4,394,804 | |
AutoZone, Inc. | | BBB | | 3.25 - 4.00 | | 11/15/20 - 04/15/25 | | | 5,700,000 | | | | 5,835,901 | |
Expedia, Inc. | | BBB- | | 5.95 | | 08/15/20 | | | 4,000,000 | | | | 4,458,464 | |
Harman Int’l. Industries, Inc. | | BBB- | | 4.15 | | 05/15/25 | | | 5,000,000 | | | | 4,927,565 | |
Scripps Networks Interactive, Inc. | | BBB | | 3.50 | | 06/15/22 | | | 5,000,000 | | | | 4,918,955 | |
Whirlpool Corp. | | BBB | | 3.70 - 6.50 | | 06/15/16 - 05/01/25 | | | 5,000,000 | | | | 5,190,430 | |
Other Securities | | | | | | | | | 64,450,000 | | | | 65,262,578 | |
| | | | | | | | | | | | | | |
| | | | | | | | | | | | | 94,988,697 | |
| | | | | | | | | | | | | | |
CONSUMER STAPLES (2.6%) | | | | | | | | | | | | | | |
Kroger Co. | | BBB | | 2.95 | | 11/01/21 | | | 4,800,000 | | | | 4,769,299 | |
Other Securities | | | | | | | | | 20,569,000 | | | | 21,019,226 | |
| | | | | | | | | | | | | | |
| | | | | | | | | | | | | 25,788,525 | |
| | | | | | | | | | | | | | |
ENERGY (5.5%) | | | | | | | | | | | | | | |
Diamond Offshore Drilling, Inc. | | BBB+ | | 3.45 - 4.88 | | 07/01/15 - 11/01/23 | | | 5,000,000 | | | | 4,836,902 | |
FMC Technologies, Inc. | | BBB | | 2.00 | | 10/01/17 | | | 4,500,000 | | | | 4,493,880 | |
Kinder Morgan Energy Partners | | BBB- | | 4.30 | | 05/01/24 | | | 5,000,000 | | | | 4,934,220 | |
Murphy Oil Corp. | | BBB | | 2.50 - 3.70 | | 12/01/17 - 12/01/22 | | | 4,725,000 | | | | 4,427,404 | |
SESI LLC | | BBB- | | 7.13 | | 12/15/21 | | | 4,500,000 | | | | 4,770,000 | |
Other Securities | | | | | | | | | 30,575,000 | | | | 31,420,927 | |
| | | | | | | | | | | | | | |
| | | | | | | | | | | | | 54,883,333 | |
| | | | | | | | | | | | | | |
FINANCIALS (16.2%) | | | | | | | | | | | | | | |
Alleghany Corp. | | BBB+ | | 4.95 - 5.63 | | 09/15/20 - 06/27/22 | | | 5,000,000 | | | | 5,516,526 | |
American Express Co. | | BBB | | 3.63 | | 12/05/24 | | | 5,000,000 | | | | 4,864,910 | |
American Tower Corp. | | BBB- | | 4.50 | | 01/15/18 | | | 5,000,000 | | | | 5,290,930 | |
Bank of America Corp. | | BBB+ | | 3.95 | | 04/21/25 | | | 5,000,000 | | | | 4,815,950 | |
Berkley (W.R.) Corp. | | BBB+ | | 4.63 - 7.38 | | 09/15/19 - 03/15/22 | | | 4,000,000 | | | | 4,495,514 | |
Capital One Financial Corp. | | BBB | | 4.75 | | 07/15/21 | | | 4,000,000 | | | | 4,369,112 | |
Citigroup, Inc. | | BBB+ | | 3.88 | | 03/26/25 | | | 5,000,000 | | | | 4,789,525 | |
Fairfax Financial Hldgs. | | BBB- | | 8.25 | | 10/01/15 | | | 2,500,000 | | | | 2,540,000 | |
Fairfax Financial Hldgs.† | | BBB- | | 5.80 | | 05/15/21 | | | 1,500,000 | | | | 1,598,462 | |
Fairfax U.S., Inc.† | | BBB- | | 4.88 | | 08/13/24 | | | 1,000,000 | | | | 970,871 | |
First Tennessee Bank | | BBB- | | 2.95 | | 12/01/19 | | | 5,000,000 | | | | 4,997,515 | |
HCP, Inc. | | BBB+ | | 3.40 - 6.00 | | 01/30/17 - 02/01/25 | | | 5,000,000 | | �� | | 4,854,177 | |
Health Care REIT, Inc. | | BBB | | 3.63 - 6.13 | | 03/15/16 - 03/15/23 | | | 4,000,000 | | | | 4,359,864 | |
The accompanying notes are an integral part of these portfolio schedules.
45
MUTUAL OF AMERICA INVESTMENT CORPORATION — BOND FUND
SUMMARY PORTFOLIO OF INVESTMENTS IN SECURITIES (Continued)
June 30, 2015 (Unaudited)
| | | | | | | | | | | | | | |
| | | Rating** | | Rate(%) | | Maturity | | Face Amount | | | Value | |
| LONG-TERM DEBT SECURITIES (CONTINUED): | | | | | | | | | | | | | | |
CORPORATE DEBT (CONTINUED) | | | | | | | | | | | | | | |
FINANCIALS (CONTINUED) | | | | | | | | | | | | | | |
Hospitality Properties Trust | | BBB- | | 5.00 | | 08/15/22 | | $ | 4,550,000 | | | $ | 4,736,250 | |
JPMorgan Chase & Co. | | A- | | 3.88 | | 09/10/24 | | | 5,000,000 | | | | 4,919,530 | |
JPMorgan Chase Bank NA | | A | | 6.00 | | 10/01/17 | | | 2,000,000 | | | | 2,180,706 | |
Mack-Cali Realty LP | | BBB- | | 4.50 | | 04/18/22 | | | 5,000,000 | | | | 4,942,395 | |
Other Securities | | | | | | | | | 89,369,000 | | | | 93,170,949 | |
| | | | | | | | | | | | | | |
| | | | | | | | | | | | | 163,413,186 | |
| | | | | | | | | | | | | | |
HEALTH CARE (6.7%) | | | | | | | | | | | | | | |
Agilent Technologies, Inc. | | BBB+ | | 5.00 | | 07/15/20 | | | 4,000,000 | | | | 4,380,192 | |
Edwards Lifesciences Corp. | | BBB- | | 2.88 | | 10/15/18 | | | 4,500,000 | | | | 4,604,576 | |
Humana, Inc. | | BBB+ | | 3.85 - 7.20 | | 06/15/18 - 10/01/24 | | | 5,000,000 | | | | 5,289,229 | |
Owens & Minor, Inc. | | BBB | | 3.88 - 4.38 | | 09/15/21 - 12/15/24 | | | 5,000,000 | | | | 5,123,123 | |
PerkinElmer, Inc. | | BBB | | 5.00 | | 11/15/21 | | | 4,000,000 | | | | 4,352,396 | |
Quest Diagnostics, Inc. | | BBB+ | | 3.50 - 4.75 | | 01/30/20 - 03/30/25 | | | 4,700,000 | | | | 5,019,577 | |
Zimmer Biomet Hldgs., Inc. | | BBB | | 3.15 | | 04/01/22 | | | 5,000,000 | | | | 4,918,280 | |
Other Securities | | | | | | | | | 32,000,000 | | | | 34,081,908 | |
| | | | | | | | | | | | | | |
| | | | | | | | | | | | | 67,769,281 | |
| | | | | | | | | | | | | | |
INDUSTRIALS (4.3%) | | | | | | | | | | | | | | |
Verisk Analytics, Inc. | | BBB- | | 4.00 | | 06/15/25 | | | 5,000,000 | | | | 4,896,520 | |
Other Securities | | | | | | | | | 37,650,000 | | | | 38,681,555 | |
| | | | | | | | | | | | | | |
| | | | | | | | | | | | | 43,578,075 | |
| | | | | | | | | | | | | | |
INFORMATION TECHNOLOGY (7.0%) | | | | | | | | | | | | | | |
Adobe Systems, Inc. | | A- | | 4.75 | | 02/01/20 | | | 4,000,000 | | | | 4,404,372 | |
Arrow Electronics, Inc. | | BBB- | | 4.00 - 6.88 | | 06/01/18 - 04/01/25 | | | 5,000,000 | | | | 5,322,140 | |
eBay, Inc. | | A | | 2.88 | | 08/01/21 | | | 5,000,000 | | | | 4,934,955 | |
Fidelity Nat’l. Information | | BBB | | 3.88 | | 06/05/24 | | | 5,000,000 | | | | 4,934,400 | |
Ingram Micro, Inc. | | BBB- | | 4.95 - 5.25 | | 09/01/17 - 12/15/24 | | | 4,750,000 | | | | 5,024,681 | |
Keysight Technologies, Inc.† | | BBB- | | 4.55 | | 10/30/24 | | | 5,000,000 | | | | 4,825,970 | |
Lam Research Corp. | | BBB | | 2.75 | | 03/15/20 | | | 5,000,000 | | | | 4,965,760 | |
Lexmark International, Inc. | | BBB- | | 6.65 | | 06/01/18 | | | 4,000,000 | | | | 4,399,800 | |
Other Securities | | | | | | | | | 30,118,000 | | | | 31,104,044 | |
| | | | | | | | | | | | | | |
| | | | | | | | | | | | | 69,916,122 | |
| | | | | | | | | | | | | | |
MATERIALS (5.7%) | | | | | | | | | | | | | | |
Alcoa, Inc. | | BBB- | | 6.75 | | 07/15/18 | | | 4,000,000 | | | | 4,425,656 | |
Domtar Corp. | | BBB- | | 4.40 | | 04/01/22 | | | 5,000,000 | | | | 5,081,345 | |
Other Securities | | | | | | | | | 47,850,000 | | | | 47,723,391 | |
| | | | | | | | | | | | | | |
| | | | | | | | | | | | | 57,230,392 | |
| | | | | | | | | | | | | | |
TELECOMMUNICATION SERVICES (0.7%) | | | | | | | | | | | | | | |
AT&T, Inc. | | BBB+ | | 3.00 | | 02/15/22 - 06/30/22 | | | 5,000,000 | | | | 4,869,992 | |
Other Securities | | | | | | | | | 2,000,000 | | | | 2,157,470 | |
| | | | | | | | | | | | | | |
| | | | | | | | | | | | | 7,027,462 | |
| | | | | | | | | | | | | | |
UTILITIES (2.5%) | | | | | | | | | | | | | | |
National Fuel Gas Co. | | BBB | | 4.90 - 5.20 | | 12/01/21 - 07/15/25 | | | 5,000,000 | | | | 5,131,471 | |
Other Securities | | | | | | | | | 19,225,000 | | | | 19,957,705 | |
| | | | | | | | | | | | | | |
| | | | | | | | | | | | | 25,089,176 | |
| | | | | | | | | | | | | | |
SOVEREIGN DEBT (0.4%) | | | | | | | | | | | | | | |
Sri Lanka AID | | NR | | 6.59 | | 09/15/28 | | | 3,210,686 | | | | 3,902,909 | |
| | | | | | | | | | | | | | |
TOTAL LONG-TERM DEBT SECURITIES
(Cost: $968,666,629) 98.3% | | | | | | | | | | | | | 988,650,878 | |
| | | | | | | | | | | | | | |
The accompanying notes are an integral part of these portfolio schedules.
46
MUTUAL OF AMERICA INVESTMENT CORPORATION — BOND FUND
SUMMARY PORTFOLIO OF INVESTMENTS IN SECURITIES (Continued)
June 30, 2015 (Unaudited)
| | | | | | | | | | | | | | |
| | | Rating** | | Rate(%) | | Maturity | | Face Amount | | | Value | |
| SHORT-TERM DEBT SECURITIES: | | | | | | | | | | | | | | |
U.S. GOVERNMENT AGENCIES (1.4%) | | | | | | | | | | | | | | |
FHLB | | A-1+ | | 0.01 - 0.02 | | 07/27/15 - 07/31/15 | | $ | 14,000,000 | | | $ | 13,999,814 | |
| | | | | | | | | | | | | | |
TOTAL SHORT-TERM DEBT SECURITIES
(Cost: $13,999,814) 1.4% | | | | 13,999,814 | |
| | | | | | | | | | | | | | |
TOTAL INVESTMENTS
(Cost: $982,666,443) 99.7% | | | | 1,002,650,692 | |
| | | | | | | | | | | | | | |
OTHER NET ASSETS 0.3% | | | | 2,695,813 | |
| | | | | | | | | | | | | | |
NET ASSETS 100.0% | | | $ | 1,005,346,505 | |
| | | | | | | | | | | | | | |
The accompanying notes are an integral part of these portfolio schedules.
47
MUTUAL OF AMERICA INVESTMENT CORPORATION
FOOTNOTES TO SUMMARY PORTFOLIOS OF INVESTMENTS IN SECURITIES
June 30, 2015 (Unaudited)
| | |
| Abbreviations: | | FHARM = Federal Home Adjustable Rate Mortgage |
| | FHLB = Federal Home Loan Bank |
| | FHLMC = Federal Home Loan Mortgage Corporation |
| | FNMA = Federal National Mortgage Association |
| | GNMA = Government National Mortgage Association |
| | NR = Not Rated |
| | “Other Securities” represent securities in the respective category that individually, or in the aggregate by issuer, do not exceed 1% of net assets. |
| * | Non-income producing security. |
| ** | Ratings as per Standard & Poor’s Corporation (unaudited). |
| † | Security is exempt from registration under Rule 144A of the Securities Act of 1933. These securities may be resold in transactions exempt from registration, normally to qualified institutional buyers. At June 30, 2015, the aggregate values of these securities and their percentages of the respective Funds’ net assets were as follows: |
| | | | | | | | |
Fund | | Aggregate
Market
Value | | | Percentage
of
Net Assets | |
EQUITY INDEX FUND | | $ | 8,399,512 | | | | 0.5 | % |
SMALL CAP GROWTH FUND | | $ | 3,464,947 | | | | 0.8 | % |
MID-CAP EQUITY INDEX FUND | | $ | 6,429,597 | | | | 0.6 | % |
INTERNATIONAL FUND | | $ | 1,049,876 | | | | 0.3 | % |
COMPOSITE FUND | | $ | 1,352,026 | | | | 0.7 | % |
MONEY MARKET FUND | | $ | 35,330,550 | | | | 50.5 | % |
MID-TERM BOND FUND | | $ | 5,732,433 | | | | 1.3 | % |
BOND FUND | | $ | 16,609,147 | | | | 1.7 | % |
| (1) | This security, or a portion thereof, has been segregated to cover initial margin requirements on open futures contracts. Information on futures contracts outstanding in the Funds as of June 30, 2015, was as follows: |
| | | | | | | | | | | | | | | | | | | | | | | | | | |
Fund | | Number of
Contracts | | | Contract Type | | Purchased (P)
or Sold (S) | | | Expiration
Date | | | Underlying
Face Amount
at Value(a) | | | Unrealized
Gain(Loss) | | | Face Value
of Futures
as a %
of Total
Investments | |
EQUITY INDEX FUND | | | 442 | | | E-mini S&P 500
Stock Index | | | P | | | | September 2015 | | | $ | 45,402,240 | | | $ | (671,840 | ) | | | 2.5 | % |
ALL AMERICA FUND | | | 50 | | | E-mini S&P 500
Stock Index | | | P | | | | September 2015 | | | $ | 5,136,000 | | | $ | (77,666 | ) | | | 1.6 | % |
MID-CAP EQUITY INDEX FUND | | | 403 | | | E-mini S&P MidCap
400 Stock Index | | | P | | | | September 2015 | | | $ | 60,373,430 | | | $ | (1,104,872 | ) | | | 5.9 | % |
| | (a) | Includes the cumulative appreciation (depreciation) of futures contracts, which is included in Net Unrealized Appreciation (Depreciation) of Investments and Futures Contracts in the Components of Net Assets section of the Statements of Assets and Liabilities. The Receivable or Payable for Daily Variation on Futures Contracts in the Statements of Assets and Liabilities only includes the current day’s variation margin payable or receivable. |
| (2) | U.S. Government guaranteed security. |
| (3) | Percentage is less than 0.05%. |
48
(This page has been left blank intentionally.)
MUTUAL OF AMERICA INVESTMENT CORPORATION
STATEMENTS OF ASSETS AND LIABILITIES
June 30, 2015 (Unaudited)
| | | | | | | | | | | | | | | | | | | | | | | | |
| | | Equity Index
Fund | | | All America
Fund | | | Small Cap
Value Fund | | | Small Cap
Growth Fund | | | Mid Cap
Value Fund | | | Mid-Cap
Equity Index
Fund | |
ASSETS: | | | | | | | | | | | | | | | | | | | | | | | | |
Investments at fair value | | | | | | | | | | | | | | | | | | | | | | | | |
(Cost: Equity Index Fund — $1,141,595,396 All America Fund — $218,483,545 Small Cap Value Fund — $309,748,726 Small Cap Growth Fund — $345,490,375 Mid Cap Value Fund — $69,174,828 Mid-Cap Equity Index Fund — $764,987,728 International Fund — $300,525,856 Composite Fund — $146,712,350 Retirement Income Fund — $53,932,783 2010 Retirement Fund — $24,455,276 2015 Retirement Fund — $138,190,159 2020 Retirement Fund — $302,835,674 2025 Retirement Fund — $309,950,282) | |
(Notes 1 and 3) | | $ | 1,812,432,693 | | | $ | 312,524,826 | | | $ | 396,655,978 | | | $ | 441,947,868 | | | $ | 86,669,434 | | | $ | 1,030,885,939 | |
Cash | | | 932,649 | | | | 2,891,023 | | | | 739,976 | | | | 1,429,090 | | | | 1,114,346 | | | | 506,775 | |
Interest and dividends receivable | | | 2,039,720 | | | | 310,857 | | | | 240,872 | | | | 178,715 | | | | 143,429 | | | | 924,858 | |
Receivable for securities sold | | | 844,400 | | | | 548,012 | | | | 1,258,928 | | | | 4,479,748 | | | | 1,792,251 | | | | 12,531,129 | |
Receivable for daily variation on future contracts | | | 93,697 | | | | 11,508 | | | | — | | | | — | | | | — | | | | 67,412 | |
| | | | | | | | | | | | | | | | | | | | | | | | |
TOTAL ASSETS | | | 1,816,343,159 | | | | 316,286,226 | | | | 398,895,754 | | | | 448,035,421 | | | | 89,719,460 | | | | 1,044,916,113 | |
| | | | | | | | | | | | | | | | | | | | | | | | |
| | | | | | |
LIABILITIES: | | | | | | | | | | | | | | | | | | | | | | | | |
Payable for securities purchased | | | 1,527,632 | | | | 304,455 | | | | 704,485 | | | | 1,115,389 | | | | — | | | | 9,518,531 | |
Accrued expenses | | | 7,446 | | | | 4,988 | | | | 9,057 | | | | 10,048 | | | | 1,589 | | | | 4,651 | |
| | | | | | | | | | | | | | | | | | | | | | | | |
TOTAL LIABILITIES: | | | 1,535,078 | | | | 309,443 | | | | 713,542 | | | | 1,125,437 | | | | 1,589 | | | | 9,523,182 | |
| | | | | | | | | | | | | | | | | | | | | | | | |
NET ASSETS | | $ | 1,814,808,081 | | | $ | 315,976,783 | | | $ | 398,182,212 | | | $ | 446,909,984 | | | $ | 89,717,871 | | | $ | 1,035,392,931 | |
| | | | | | | | | | | | | | | | | | | | | | | | |
NUMBEROF SHARES OUTSTANDING (Note 4) | | | 526,316,575 | | | | 127,834,681 | | | | 242,724,823 | | | | 267,640,708 | | | | 54,894,676 | | | | 459,912,680 | |
| | | | | | | | | | | | | | | | | | | | | | | | |
NET ASSET VALUES, offering and redemption price per share | | | $3.45 | | | | $2.47 | | | | $1.64 | | | | $1.67 | | | | $1.63 | | | | $2.25 | |
| | | | | | | | | | | | | | | | | | | | | | | | |
| | | | | | |
COMPONENTSOF NET ASSETS: | | | | | | | | | | | | | | | | | | | | | | | | |
Paid-in capital | | $ | 1,029,437,156 | | | $ | 192,504,836 | | | $ | 274,711,505 | | | $ | 272,505,379 | | | $ | 63,451,359 | | | $ | 643,362,982 | |
Accumulated undistributed net investment income (loss) | | | 45,919,514 | | | | 6,229,895 | | | | 5,429,951 | | | | — | | | | 1,520,934 | | | | 18,249,659 | |
Accumulated undistributed net realized gain (loss) on investments and futures contracts | | | 69,285,954 | | | | 23,278,437 | | | | 31,133,504 | | | | 77,947,112 | | | | 7,250,972 | | | | 108,986,951 | |
Net unrealized appreciation (depreciation) of investments and futures contracts | | | 670,165,457 | | | | 93,963,615 | | | | 86,907,252 | | | | 96,457,493 | | | | 17,494,606 | | | | 264,793,339 | |
| | | | | | | | | | | | | | | | | | | | | | | | |
NET ASSETS | | $ | 1,814,808,081 | | | $ | 315,976,783 | | | $ | 398,182,212 | | | $ | 446,909,984 | | | $ | 89,717,871 | | | $ | 1,035,392,931 | |
| | | | | | | | | | | | | | | | | | | | | | | | |
The accompanying notes are an integral part of these financial statements.
50
| | | | | | | | | | | | | | | | | | | | | | | | | | | | |
International
Fund | | | Composite
Fund | | | Retirement
Income
Fund | | | 2010
Retirement
Fund | | | 2015
Retirement
Fund | | | 2020
Retirement
Fund | | | 2025
Retirement
Fund | | | |
| | | | | | | | | | | | | | | | | | | | | | | | | | | | |
| | | | | | | | | | | | | | | | | | | | | | | | | | | | |
| |
| |
| |
| |
| |
| |
| |
| |
| |
| |
| |
| |
| |
| $ | 315,052,792 | | | $ | 188,719,090 | | | $ | 56,141,210 | | | $ | 26,760,675 | | | $ | 156,452,022 | | | $ | 348,331,500 | | | $ | 369,345,005 | | | |
| | 436,636 | | | | 1,980,924 | | | | — | | | | — | | | | — | | | | — | | | | — | | | |
| | 4,661,441 | | | | 570,397 | | | | — | | | | — | | | | — | | | | — | | | | — | | | |
| | — | | | | 355,263 | | | | — | | | | — | | | | — | | | | — | | | | — | | | |
| | — | | | | — | | | | — | | | | — | | | | — | | | | — | | | | — | | | |
| | | | | | | | | | | | | | | | | | | | | | | | | | | | |
| | 320,150,869 | | | | 191,625,674 | | | | 56,141,210 | | | | 26,760,675 | | | | 156,452,022 | | | | 348,331,500 | | | | 369,345,005 | | | |
| | | | | | | | | | | | | | | | | | | | | | | | | | | | |
| | | | | | | |
| | | | | | | | | | | | | | | | | | | | | | | | | | | | |
| | — | | | | 424,245 | | | | — | | | | — | | | | — | | | | — | | | | — | | | |
| | 984 | | | | 2,824 | | | | 77 | | | | 36 | | | | 367 | | | | 736 | | | | 772 | | | |
| | | | | | | | | | | | | | | | | | | | | | | | | | | | |
| | 984 | | | | 427,069 | | | | 77 | | | | 36 | | | | 367 | | | | 736 | | | | 772 | | | |
| | | | | | | | | | | | | | | | | | | | | | | | | | | | |
| $ | 320,149,885 | | | $ | 191,198,605 | | | $ | 56,141,133 | | | $ | 26,760,639 | | | $ | 156,451,655 | | | $ | 348,330,764 | | | $ | 369,344,233 | | | |
| | | | | | | | | | | | | | | | | | | | | | | | | | | | |
| | 389,825,032 | | | | 93,772,572 | | | | 47,705,659 | | | | 24,277,132 | | | | 136,042,380 | | | | 288,190,069 | | | | 293,281,834 | | | |
| | | | | | | | | | | | | | | | | | | | | | | | | | | | |
| | $0.82 | | | | $2.04 | | | | $1.18 | | | | $1.10 | | | | $1.15 | | | | $1.21 | | | | $1.26 | | | |
| | | | | | | | | | | | | | | | | | | | | | | | | | | | |
| | | | | | | |
| | | | | | | | | | | | | | | | | | | | | | | | | | | | |
| $ | 294,081,176 | | | $ | 136,876,638 | | | $ | 50,305,606 | | | $ | 21,878,898 | | | $ | 122,960,244 | | | $ | 278,951,883 | | | $ | 288,175,286 | | | |
| | 13,178,786 | | | | 5,783,615 | | | | 1,043,642 | | | | 553,391 | | | | 3,145,217 | | | | 5,971,939 | | | | 5,804,497 | | | |
| | | | | | | |
| | (1,637,013 | ) | | | 6,531,612 | | | | 2,583,458 | | | | 2,022,951 | | | | 12,084,331 | | | | 17,911,116 | | | | 15,969,727 | | | |
| | | | | | | |
| | 14,526,936 | | | | 42,006,740 | | | | 2,208,427 | | | | 2,305,399 | | | | 18,261,863 | | | | 45,495,826 | | | | 59,394,723 | | | |
| | | | | | | | | | | | | | | | | | | | | | | | | | | | |
| $ | 320,149,885 | | | $ | 191,198,605 | | | $ | 56,141,133 | | | $ | 26,760,639 | | | $ | 156,451,655 | | | $ | 348,330,764 | | | $ | 369,344,233 | | | |
| | | | | | | | | | | | | | | | | | | | | | | | | | | | |
The accompanying notes are an integral part of these financial statements.
51
MUTUAL OF AMERICA INVESTMENT CORPORATION
STATEMENTS OF ASSETS AND LIABILITIES (Continued)
June 30, 2015 (Unaudited)
| | | | | | | | | | | | | | | | | | | | |
| | | 2030
Retirement
Fund | | | 2035
Retirement
Fund | | | 2040
Retirement
Fund | | | 2045
Retirement
Fund | | | 2050
Retirement
Fund | |
ASSETS: | | | | | | | | | | | | | | | | | | | | |
Investments at fair value | | | | | | | | | | | | | | | | | | | | |
(Cost: 2030 Retirement Fund — $252,355,411 2035 Retirement Fund — $206,687,860 2040 Retirement Fund — $167,795,232 2045 Retirement Fund — $203,146,662 2050 Retirement Fund — $67,715,128 Conservative Allocation Fund — $119,820,194 Moderate Allocation Fund — $267,224,922 Aggressive Allocation Fund — $195,573,604 Money Market Fund — $68,876,136 Mid-Term Bond Fund — $446,710,257 Bond Fund — $982,666,443) | |
(Notes 1 and 3) | | $ | 307,564,040 | | | $ | 254,781,883 | | | $ | 210,284,897 | | | $ | 257,691,297 | | | $ | 72,224,829 | |
Cash | | | — | | | | — | | | | — | | | | — | | | | — | |
Interest and dividends receivable | | | — | | | | — | | | | — | | | | — | | | | — | |
Receivable for securities sold | | | — | | | | — | | | | — | | | | — | | | | — | |
Receivable for daily variation on future contracts | | | — | | | | — | | | | — | | | | — | | | | — | |
| | | | | | | | | | | | | | | | | | | | |
TOTAL ASSETS | | | 307,564,040 | | | | 254,781,883 | | | | 210,284,897 | | | | 257,691,297 | | | | 72,224,829 | |
| | | | | | | | | | | | | | | | | | | | |
| | | | | |
LIABILITIES: | | | | | | | | | | | | | | | | | | | | |
Payable for securities purchased | | | — | | | | — | | | | — | | | | — | | | | — | |
Accrued expenses | | | 650 | | | | 544 | | | | 458 | | | | 556 | | | | 98 | |
| | | | | | | | | | | | | | | | | | | | |
TOTAL LIABILITIES | | | 650 | | | | 544 | | | | 458 | | | | 556 | | | | 98 | |
| | | | | | | | | | | | | | | | | | | | |
NET ASSETS | | $ | 307,563,390 | | | $ | 254,781,339 | | | $ | 210,284,439 | | | $ | 257,690,741 | | | $ | 72,224,731 | |
| | | | | | | | | | | | | | | | | | | | |
NUMBEROF SHARES OUTSTANDING (Note 4) | | | 237,058,187 | | | | 195,709,756 | | | | 161,394,969 | | | | 197,735,368 | | | | 50,161,582 | |
| | | | | | | | | | | | | | | | | | | | |
NET ASSET VALUES, offering and redemption price per share | | | $1.30 | | | | $1.30 | | | | $1.30 | | | | $1.30 | | | | $1.44 | |
| | | | | | | | | | | | | | | | | | | | |
| | | | | |
COMPONENTSOF NET ASSETS: | | | | | | | | | | | | | | | | | | | | |
Paid-in capital | | $ | 234,020,832 | | | $ | 191,528,562 | | | $ | 154,503,597 | | | $ | 187,311,529 | | | $ | 65,794,532 | |
Accumulated undistributed net investment income (loss) | | | 4,662,610 | | | | 3,637,561 | | | | 2,857,782 | | | | 3,540,101 | | | | 592,908 | |
Accumulated undistributed net realized gain (loss) on investments and futures contracts | | | 13,671,319 | | | | 11,521,193 | | | | 10,433,395 | | | | 12,294,476 | | | | 1,327,590 | |
Net unrealized appreciation (depreciation) of investments and futures contracts | | | 55,208,629 | | | | 48,094,023 | | | | 42,489,665 | | | | 54,544,635 | | | | 4,509,701 | |
| | | | | | | | | | | | | | | | | | | | |
NET ASSETS | | $ | 307,563,390 | | | $ | 254,781,339 | | | $ | 210,284,439 | | | $ | 257,690,741 | | | $ | 72,224,731 | |
| | | | | | | | | | | | | | | | | | | | |
The accompanying notes are an integral part of these financial statements.
52
| | | | | | | | | | | | | | | | | | | | | | | | |
Conservative Allocation Fund | | | Moderate
Allocation
Fund | | | Aggressive
Allocation
Fund | | | Money
Market
Fund | | | Mid-Term
Bond Fund | | | Bond Fund | | | |
| | | | | | | | | | | | | | | | | | | | | | | | |
| | | | | | | | | | | | | | | | | | | | | | | | |
| | | | | | | | | | | | | | | | | | | | | | | | |
| | | | | | | | | | | | | | | | | | | | | | | | |
| | | | | | | | | | | | | | | | | | | | | | | | |
| | | | | | | | | | | | | | | | | | | | | | | | |
| | | | | | | | | | | | | | | | | | | | | | | | |
| | | | | | | | | | | | | | | | | | | | | | | | |
| | | | | | | | | | | | | | | | | | | | | | | | |
| | | | | | | | | | | | | | | | | | | | | | | | |
| | | | | | | | | | | | | | | | | | | | | | | | |
| | | | | | | | | | | | | | | | | | | | | | | | |
| | | | | | | | | | | | | | | | | | | | | | | | |
| $ | 129,486,261 | | | $ | 325,355,242 | | | $ | 261,244,453 | | | $ | 68,878,017 | | | $ | 454,070,813 | | | $ | 1,002,650,692 | | | |
| | — | | | | — | | | | — | | | | 1,055,914 | | | | 1,906,524 | | | | 1,958,510 | | | |
| | — | | | | — | | | | — | | | | — | | | | 3,035,826 | | | | 7,309,681 | | | |
| | — | | | | — | | | | — | | | | — | | | | — | | | | 32,598 | | | |
| | — | | | | — | | | | — | | | | — | | | | — | | | | — | | | |
| | | | | | | | | | | | | | | | | | | | | | | | |
| | 129,486,261 | | | | 325,355,242 | | | | 261,244,453 | | | | 69,933,931 | | | | 459,013,163 | | | | 1,011,951,481 | | | |
| | | | | | | | | | | | | | | | | | | | | | | | |
| | | | | | |
| | | | | | | | | | | | | | | | | | | | | | | | |
| | — | | | | — | | | | — | | | | — | | | | 2,208,083 | | | | 6,593,086 | | | |
| | 127 | | | | 276 | | | | 237 | | | | 578 | | | | 5,690 | | | | 11,890 | | | |
| | | | | | | | | | | | | | | | | | | | | | | | |
| | 127 | | | | 276 | | | | 237 | | | | 578 | | | | 2,213,773 | | | | 6,604,976 | | | |
| | | | | | | | | | | | | | | | | | | | | | | | |
| $ | 129,486,134 | | | $ | 325,354,966 | | | $ | 261,244,216 | | | $ | 69,933,353 | | | $ | 456,799,390 | | | $ | 1,005,346,505 | | | |
| | | | | | | | | | | | | | | | | | | | | | | | |
| | 101,727,497 | | | | 210,525,167 | | | | 143,951,605 | | | | 58,460,166 | | | | 427,388,125 | | | | 686,458,727 | | | |
| | | | | | | | | | | | | | | | | | | | | | | | |
| | $1.27 | | | | $1.55 | | | | $1.81 | | | | $1.20 | | | | $1.07 | | | | $1.46 | | | |
| | | | | | | | | | | | | | | | | | | | | | | | |
| | | | | | |
| | | | | | | | | | | | | | | | | | | | | | | | |
| $ | 112,375,929 | | | $ | 245,138,609 | | | $ | 173,734,105 | | | $ | 69,931,472 | | | $ | 431,619,489 | | | $ | 939,007,894 | | | |
| | 2,608,920 | | | | 6,514,098 | | | | 4,669,780 | | | | — | | | | 15,620,383 | | | | 44,918,121 | | | |
| | | | | | |
| | 4,835,218 | | | | 15,571,939 | | | | 17,169,482 | | | | — | | | | 2,198,962 | | | | 1,436,241 | | | |
| | | | | | |
| | 9,666,067 | | | | 58,130,320 | | | | 65,670,849 | | | | 1,881 | | | | 7,360,556 | | | | 19,984,249 | | | |
| | | | | | | | | | | | | | | | | | | | | | | | |
| $ | 129,486,134 | | | $ | 325,354,966 | | | $ | 261,244,216 | | | $ | 69,933,353 | | | $ | 456,799,390 | | | $ | 1,005,346,505 | | | |
| | | | | | | | | | | | | | | | | | | | | | | | |
The accompanying notes are an integral part of these financial statements.
53
MUTUAL OF AMERICA INVESTMENT CORPORATION
STATEMENTS OF OPERATIONS
For the Six Months Ended June 30, 2015 (Unaudited)
| | | | | | | | | | | | | | | | | | | | |
| |
| Equity Index
Fund |
| |
| All America
Fund |
| |
| Small Cap
Value Fund |
| |
|
Small Cap
Growth Fund |
| |
| Mid Cap
Value Fund |
|
INVESTMENT INCOMEAND EXPENSES: | | | | | | | | | | | | | | | | | | | | |
INCOME: | | | | | | | | | | | | | | | | | | | | |
Dividends | | $ | 18,532,726 | | | $ | 2,900,285 | | | $ | 3,559,099 | | | $ | 1,660,522 | | | $ | 882,885 | |
Interest | | | 29,490 | | | | 5,011 | | | | 10,511 | | | | 8,968 | | | | 1,761 | |
| | | | | | | | | | | | | | | | | | | | |
Total income | | | 18,562,216 | | | | 2,905,296 | | | | 3,569,610 | | | | 1,669,490 | | | | 884,646 | |
| | | | | | | | | | | | | | | | | | | | |
| | | | | |
EXPENSES: | | | | | | | | | | | | | | | | | | | | |
Investment advisory fees (Note 2) | | | 678,515 | | | | 631,027 | | | | 1,480,879 | | | | 1,589,409 | | | | 256,313 | |
Accounting and recordkeeping expenses | | | 164,081 | | | | 45,055 | | | | 41,156 | | | | 34,403 | | | | 10,184 | |
Shareholders reports | | | 62,879 | | | | 17,266 | | | | 15,772 | | | | 13,184 | | | | 3,903 | |
Custodian expenses | | | 43,030 | | | | 11,816 | | | | 10,793 | | | | 9,022 | | | | 2,671 | |
Independent directors’ fees and expenses | | | 46,430 | | | | 12,749 | | | | 11,646 | | | | 9,735 | | | | 2,882 | |
Audit | | | 49,464 | | | | 13,582 | | | | 12,407 | | | | 10,371 | | | | 3,070 | |
Legal and Compliance | | | 79,685 | | | | 21,881 | | | | 19,986 | | | | 16,708 | | | | 4,946 | |
Administrative | | | 124,787 | | | | 34,265 | | | | 31,300 | | | | 26,163 | | | | 7,745 | |
Licenses | | | 38,810 | | | | 10,657 | | | | 9,735 | | | | 8,137 | | | | 2,409 | |
Other | | | 14,420 | | | | 3,959 | | | | 3,617 | | | | 3,024 | | | | 894 | |
| | | | | | | | | | | | | | | | | | | | |
Total expenses | | | 1,302,101 | | | | 802,257 | | | | 1,637,291 | | | | 1,720,156 | | | | 295,017 | |
| | | | | | | | | | | | | | | | | | | | |
Net Investment Income (Loss) | | | 17,260,115 | | | | 2,103,039 | | | | 1,932,319 | | | | (50,666 | ) | | | 589,629 | |
| | | | | | | | | | | | | | | | | | | | |
NET REALIZEDAND UNREALIZED GAIN (LOSS)ON INVESTMENTSAND
FUTURES CONTRACTS (Note 1): | | | | | | | | | | | | | | | | | | | | |
Net realized gain (loss) on: | | | | | | | | | | | | | | | | | | | | |
Investment securities | | | 14,439,338 | | | | 10,393,556 | | | | 8,449,340 | | | | 27,559,510 | | | | 2,150,404 | |
Futures contracts | | | 2,087,025 | | | | (57,054 | ) | | | — | | | | — | | | | — | |
| | | | | | | | | | | | | | | | | | | | |
| | | 16,526,363 | | | | 10,336,502 | | | | 8,449,340 | | | | 27,559,510 | | | | 2,150,404 | |
| | | | | | | | | | | | | | | | | | | | |
Change in net unrealized appreciation (depreciation) of: | | | | | | | | | | | | | | | | | | | | |
Investment securities | | | (11,046,284 | ) | | | (4,859,162 | ) | | | (2,238,744 | ) | | | 7,682,018 | | | | (2,155,389 | ) |
Futures contracts | | | (1,328,198 | ) | | | (45,101 | ) | | | — | | | | — | | | | — | |
| | | | | | | | | | | | | | | | | | | | |
| | | (12,374,482 | ) | | | (4,904,263 | ) | | | (2,238,744 | ) | | | 7,682,018 | | | | (2,155,389 | ) |
| | | | | | | | | | | | | | | | | | | | |
NET REALIZEDAND UNREALIZED GAIN (LOSS)ON INVESTMENTSAND
FUTURES CONTRACTS | | | 4,151,881 | | | | 5,432,239 | | | | 6,210,596 | | | | 35,241,528 | | | | (4,985 | ) |
| | | | | | | | | | | | | | | | | | | | |
NET INCREASE (DECREASE)IN NET ASSETS RESULTINGFROM OPERATIONS | | $ | 21,411,996 | | | $ | 7,535,278 | | | $ | 8,142,915 | | | $ | 35,190,862 | | | $ | 584,644 | |
| | | | | | | | | | | | | | | | | | | | |
| (a) | The Retirement and Allocation Funds incur direct investment management expenses of .05% and .00%, respectively. Through December 31, 2014 the Funds also bore their pro-rata share of the investment management fees charged to each of the underlying funds in which they invest. They also did not incur operating expenses other than those included in each of the underlying funds in which they invest. Commencing January 1, 2015, the expense allocation methodology was modified such that certain operating expenses that can be attributed only to the Retirement and Allocation Funds are now charged directly to those Funds to the extent that the net assets of the funds exceed $100 million. The Retirement and Allocation Funds will also continue to bear their pro-rata share of the operating expenses borne by each of the underlying Funds in which they invest. This change in expense allocation methodology is not expected to result in a material change in the expense ratios of the Funds. |
The accompanying notes are an integral part of these financial statements.
54
| | | | | | | | | | | | | | | | | | | | | | | | | | | | | | | | |
Mid-Cap
Equity Index
Fund | | | International
Fund | | | Composite
Fund | | | Retirement
Income
Fund | | | 2010
Retirement
Fund | | | 2015
Retirement
Fund | | | 2020
Retirement
Fund | | | 2025
Retirement
Fund | | | |
| | | | | | | | | | | | | | | | | | | | | | | | | | | | | | | | |
| | | | | | | | | | | | | | | | | | | | | | | | | | | | | | | | |
| $ | 7,623,584 | | | $ | 5,256,316 | | | $ | 1,039,863 | | | $ | — | | | $ | — | | | $ | — | | | $ | — | | | $ | — | | | |
| | 22,899 | | | | 3,428 | | | | 1,282,880 | | | | — | | | | — | | | | — | | | | — | | | | — | | | |
| | | | | | | | | | | | | | | | | | | | | | | | | | | | | | | | |
| | 7,646,483 | | | | 5,259,744 | | | | 2,322,743 | | | | — | | | | — | | | | — | | | | — | | | | — | | | |
| | | | | | | | | | | | | | | | | | | | | | | | | | | | | | | | |
| | | | | | | | |
| | | | | | | | | | | | | | | | | | | | | | | | | | | | | | | | |
| | 381,714 | | | | 111,969 | | | | 385,188 | | | | 13,931 | (a) | | | 6,668 | (a) | | | 39,247 | (a) | | | 83,880 | (a) | | | 88,225 | (a) | | |
| | 93,617 | | | | 26,587 | | | | 24,102 | | | | — | (a) | | | — | (a) | | | 2,456 | (a) | | | 4,157 | (a) | | | 4,285 | (a) | | |
| | 35,876 | | | | 10,189 | | | | 9,236 | | | | — | (a) | | | — | (a) | | | 941 | (a) | | | 1,593 | (a) | | | 1,642 | (a) | | |
| | 24,551 | | | | 6,972 | | | | 6,321 | | | | — | (a) | | | — | (a) | | | 644 | (a) | | | 1,090 | (a) | | | 1,124 | (a) | | |
| | 26,491 | | | | 7,523 | | | | 6,820 | | | | — | (a) | | | — | (a) | | | 695 | (a) | | | 1,176 | (a) | | | 1,213 | (a) | | |
| | 28,222 | | | | 8,015 | | | | 7,265 | | | | — | (a) | | | — | (a) | | | 740 | (a) | | | 1,253 | (a) | | | 1,292 | (a) | | |
| | 45,465 | | | | 12,912 | | | | 11,705 | | | | — | (a) | | | — | (a) | | | 1,193 | (a) | | | 2,019 | (a) | | | 2,081 | (a) | | |
| | 71,198 | | | | 20,220 | | | | 18,330 | | | | — | (a) | | | — | (a) | | | 1,868 | (a) | | | 3,162 | (a) | | | 3,259 | (a) | | |
| | 22,143 | | | | 6,289 | | | | 5,701 | | | | — | (a) | | | — | (a) | | | 581 | (a) | | | 983 | (a) | | | 1,014 | (a) | | |
| | 8,228 | | | | 2,337 | | | | 2,118 | | | | — | (a) | | | — | (a) | | | 215 | (a) | | | 366 | (a) | | | 377 | (a) | | |
| | | | | | | | | | | | | | | | | | | | | | | | | | | | | | | | |
| | 737,505 | | | | 213,013 | | | | 476,786 | | | | 13,931 | | | | 6,668 | | | | 48,580 | | | | 99,679 | | | | 104,512 | | | |
| | | | | | | | | | | | | | | | | | | | | | | | | | | | | | | | |
| | 6,908,978 | | | | 5,046,731 | | | | 1,845,957 | | | | (13,931 | ) | | | (6,668 | ) | | | (48,580 | ) | | | (99,679 | ) | | | (104,512 | ) | | |
| | | | | | | | | | | | | | | | | | | | | | | | | | | | | | | | |
| | | | | | | | |
| | | | | | | | | | | | | | | | | | | | | | | | | | | | | | | | |
| | | | | | | | | | | | | | | | | | | | | | | | | | | | | | | | |
| | 48,383,305 | | | | 106 | | | | 5,766,161 | | | | 1,175,601 | | | | 695,285 | | | | 4,062,726 | | | | 4,573,480 | | | | 4,215,371 | | | |
| | 2,846,653 | | | | — | | | | — | | | | — | | | | — | | | | — | | | | — | | | | — | | | |
| | | | | | | | | | | | | | | | | | | | | | | | | | | | | | | | |
| | 51,229,958 | | | | 106 | | | | 5,766,161 | | | | 1,175,601 | | | | 695,285 | | | | 4,062,726 | | | | 4,573,480 | | | | 4,215,371 | | | |
| | | | | | | | | | | | | | | | | | | | | | | | | | | | | | | | |
| | | | | | | | | | | | | | | | | | | | | | | | | | | | | | | | |
| | (15,145,059 | ) | | | 11,566,597 | | | | (4,032,480 | ) | | | (512,321 | ) | | | (297,954 | ) | | | (1,147,728 | ) | | | 2,004,359 | | | | 3,533,211 | | | |
| | (1,762,074 | ) | | | — | | | | — | | | | — | | | | — | | | | — | | | | — | | | | — | | | |
| | | | | | | | | | | | | | | | | | | | | | | | | | | | | | | | |
| | (16,907,133 | ) | | | 11,566,597 | | | | (4,032,480 | ) | | | (512,321 | ) | | | (297,954 | ) | | | (1,147,728 | ) | | | 2,004,359 | | | | 3,533,211 | | | |
| | | | | | | | | | | | | | | | | | | | | | | | | | | | | | | | |
| | | | | | | | |
| | 34,322,825 | | | | 11,566,703 | | | | 1,733,681 | | | | 663,280 | | | | 397,331 | | | | 2,914,998 | | | | 6,577,839 | | | | 7,748,582 | | | |
| | | | | | | | | | | | | | | | | | | | | | | | | | | | | | | | |
| $ | 41,231,803 | | | $ | 16,613,434 | | | $ | 3,579,638 | | | $ | 649,349 | | | $ | 390,663 | | | $ | 2,866,418 | | | $ | 6,478,160 | | | $ | 7,644,070 | | | |
| | | | | | | | | | | | | | | | | | | | | | | | | | | | | | | | |
The accompanying notes are an integral part of these financial statements.
55
MUTUAL OF AMERICA INVESTMENT CORPORATION
STATEMENTS OF OPERATIONS (Continued)
For the Six Months Ended June 30, 2015 (Unaudited)
| | | | | | | | | | | | | | | | |
| | | 2030
Retirement
Fund | | | 2035
Retirement
Fund | | | 2040
Retirement
Fund | | | 2045
Retirement
Fund | |
INVESTMENT INCOMEAND EXPENSES: | | | | | | | | | | | | | | | | |
INCOME: | | | | | | | | | | | | | | | | |
Dividends | | $ | — | | | $ | — | | | $ | — | | | $ | — | |
Interest | | | — | | | | — | | | | — | | | | — | |
| | | | | | | | | | | | | | | | |
Total income | | | — | | | | — | | | | — | | | | — | |
| | | | | | | | | | | | | | | | |
| | | | |
EXPENSES: | | | | | | | | | | | | | | | | |
Investment advisory fees (Note 2) | | | 73,724 | (a) | | | 61,129 | (a) | | | 50,019 | (a) | | | 61,385 | (a) |
Accounting and recordkeeping expenses | | | 3,692 | (a) | | | 3,146 | (a) | | | 2,745 | (a) | | | 3,274 | (a) |
Shareholders reports | | | 1,415 | (a) | | | 1,206 | (a) | | | 1,052 | (a) | | | 1,255 | (a) |
Custodian expenses | | | 968 | (a) | | | 825 | (a) | | | 720 | (a) | | | 859 | (a) |
Independent directors’ fees and expenses | | | 1,045 | (a) | | | 890 | (a) | | | 777 | (a) | | | 927 | (a) |
Audit | | | 1,113 | (a) | | | 948 | (a) | | | 827 | (a) | | | 987 | (a) |
Legal and Compliance | | | 1,793 | (a) | | | 1,528 | (a) | | | 1,333 | (a) | | | 1,590 | (a) |
Administrative | | | 2,807 | (a) | | | 2,393 | (a) | | | 2,087 | (a) | | | 2,490 | (a) |
Licenses | | | 873 | (a) | | | 744 | (a) | | | 649 | (a) | | | 774 | (a) |
Other | | | 324 | (a) | | | 276 | (a) | | | 241 | (a) | | | 288 | (a) |
| | | | | | | | | | | | | | | | |
Total expenses | | | 87,754 | | | | 73,085 | (a) | | | 60,450 | | | | 73,829 | |
| | | | | | | | | | | | | | | | |
Net Investment Income (Loss) | | | (87,754 | ) | | | (73,085 | ) | | | (60,450 | ) | | | (73,829 | ) |
| | | | | | | | | | | | | | | | |
NET REALIZEDAND UNREALIZED GAIN (LOSS)ON INVESTMENTSAND FUTURES CONTRACTS (Note 1): | | | | | | | | | | | | | | | | |
Net realized gain (loss) on: | | | | | | | | | | | | | | | | |
Investment securities | | | 3,250,582 | | | | 3,422,908 | | | | 2,901,629 | | | | 3,336,558 | |
Futures contracts | | | — | | | | — | | | | — | | | | — | |
| | | | | | | | | | | | | | | | |
| | | 3,250,582 | | | | 3,422,908 | | | | 2,901,629 | | | | 3,336,558 | |
| | | | | | | | | | | | | | | | |
Change in net unrealized appreciation (depreciation) of: | | | | | | | | | | | | | | | | |
Investment securities | | | 3,700,354 | | | | 3,029,709 | | | | 3,019,149 | | | | 4,237,056 | |
Futures contracts | | | — | | | | — | | | | — | | | | — | |
| | | | | | | | | | | | | | | | |
| | | 3,700,354 | | | | 3,029,709 | | | | 3,019,149 | | | | 4,237,056 | |
| | | | | | | | | | | | | | | | |
NET REALIZEDAND UNREALIZED GAIN (LOSS)ON INVESTMENTSAND FUTURES CONTRACTS | | | 6,950,936 | | | | 6,452,617 | | | | 5,920,778 | | | | 7,573,614 | |
| | | | | | | | | | | | | | | | |
NET INCREASE (DECREASE)IN NET ASSETS RESULTINGFROM OPERATIONS | | $ | 6,863,182 | | | $ | 6,379,532 | | | $ | 5,860,328 | | | $ | 7,499,785 | |
| | | | | | | | | | | | | | | | |
| (a) | The Retirement and Allocation Funds incur direct investment management expenses of .05% and .00%, respectively. Through December 31, 2014 the Funds also bore their pro-rata share of the investment management fees charged to each of the underlying funds in which they invest. They also did not incur operating expenses other than those included in each of the underlying funds in which they invest. Commencing January 1, 2015, the expense allocation methodology was modified such that certain operating expenses that can be attributed only to the Retirement and Allocation Funds are now charged directly to those Funds to the extent that the net assets of the funds exceed $100 million. The Retirement and Allocation Funds will also continue to bear their pro-rata share of the operating expenses borne by each of the underlying Funds in which they invest. This change in expense allocation methodology is not expected to result in a material change in the expense ratios of the Funds. |
The accompanying notes are an integral part of these financial statements.
56
| | | | | | | | | | | | | | | | | | | | | | | | | | | | |
2050
Retirement
Fund | | | Conservative
Allocation
Fund | | | Moderate
Allocation
Fund | | | Aggressive
Allocation
Fund | | | Money
Market
Fund | | | Mid-Term
Bond Fund | | | Bond Fund | | | |
| | | | | | | | | | | | | | | | | | | | | | | | | | | | |
| | | | | | | | | | | | | | | | | | | | | | | | | | | | |
| $ | — | | | $ | — | | | $ | — | | | $ | — | | | $ | — | | | $ | — | | | $ | — | | | |
| | — | | | | — | | | | — | | | | — | | | | 47,216 | | | | 6,070,962 | | | | 15,666,735 | | | |
| | | | | | | | | | | | | | | | | | | | | | | | | | | | |
| | — | | | | — | | | | — | | | | — | | | | 47,216 | | | | 6,070,962 | | | | 15,666,735 | | | |
| | | | | | | | | | | | | | | | | | | | | | | | | | | | |
| | | | | | | |
| | | | | | | | | | | | | | | | | | | | | | | | | | | | |
| | 15,293 | (a) | | | — | (a) | | | — | (a) | | | — | (a) | | | 54,645 | | | | 888,361 | | | | 1,919,455 | | | |
| | — | (a) | | | 2,038 | (a) | | | 4,430 | (a) | | | 3,804 | (a) | | | 10,374 | | | | 41,090 | | | | 88,270 | | | |
| | — | (a) | | | 781 | (a) | | | 1,698 | (a) | | | 1,458 | (a) | | | 3,975 | | | | 15,746 | | | | 33,827 | | | |
| | — | (a) | | | 535 | (a) | | | 1,162 | (a) | | | 998 | (a) | | | 2,721 | | | | 10,776 | | | | 23,149 | | | |
| | — | (a) | | | 577 | (a) | | | 1,254 | (a) | | | 1,076 | (a) | | | 2,935 | | | | 11,627 | | | | 24,978 | | | |
| | — | (a) | | | 615 | (a) | | | 1,335 | (a) | | | 1,147 | (a) | | | 3,127 | | | | 12,387 | | | | 26,610 | | | |
| | — | (a) | | | 990 | (a) | | | 2,151 | (a) | | | 1,847 | (a) | | | 5,038 | | | | 19,955 | | | | 42,868 | | | |
| | — | (a) | | | 1,550 | (a) | | | 3,369 | (a) | | | 2,893 | (a) | | | 7,889 | | | | 31,249 | | | | 67,131 | | | |
| | — | (a) | | | 482 | (a) | | | 1,048 | (a) | | | 900 | (a) | | | 2,454 | | | | 9,719 | | | | 20,877 | | | |
| | — | (a) | | | 179 | (a) | | | 389 | (a) | | | 334 | (a) | | | 912 | | | | 3,611 | | | | 7,758 | | | |
| | | | | | | | | | | | | | | | | | | | | | | | | | | | |
| | 15,293 | | | | 7,747 | | | | 16,836 | | | | 14,457 | | | | 94,070 | | | | 1,044,521 | | | | 2,254,923 | | | |
| | | | | | | | | | | | | | | | | | | | | | | | | | | | |
| | (15,293 | ) | | | (7,747 | ) | | | (16,836 | ) | | | (14,457 | ) | | | (46,854 | ) | | | 5,026,441 | | | | 13,411,812 | | | |
| | | | | | | | | | | | | | | | | | | | | | | | | | | | |
| | | | | | | | | | | | | | | | | | | | | | | | | | | | |
| | | | | | | | | | | | | | | | | | | | | | | | | | | | |
| | 178,400 | | | | 1,097,313 | | | | 5,942,305 | | | | 4,670,302 | | | | 1 | | | | 634,551 | | | | (165,084 | ) | | |
| | — | | | | — | | | | — | | | | — | | | | — | | | | — | | | | — | | | |
| | | | | | | | | | | | | | | | | | | | | | | | | | | | |
| | 178,400 | | | | 1,097,313 | | | | 5,942,305 | | | | 4,670,302 | | | | 1 | | | | 634,551 | | | | (165,084 | ) | | |
| | | | | | | | | | | | | | | | | | | | | | | | | | | | |
| | | | | | | | | | | | | | | | | | | | | | | | | | | | |
| | 1,554,512 | | | | 715,695 | | | | 383,193 | | | | 2,557,186 | | | | (2,491 | ) | | | (269,356 | ) | | | (5,615,995 | ) | | |
| | — | | | | — | | | | — | | | | — | | | | — | | | | — | | | | — | | | |
| | | | | | | | | | | | | | | | | | | | | | | | | | | | |
| | 1,554,512 | | | | 715,695 | | | | 383,193 | | | | 2,557,186 | | | | (2,491 | ) | | | (269,356 | ) | | | (5,615,995 | ) | | |
| | | | | | | | | | | | | | | | | | | | | | | | | | | | |
| | 1,732,912 | | | | 1,813,008 | | | | 6,325,498 | | | | 7,227,488 | | | | (2,490 | ) | | | 365,195 | | | | (5,781,079 | ) | | |
| | | | | | | | | | | | | | | | | | | | | | | | | | | | |
| $ | 1,717,619 | | | $ | 1,805,261 | | | $ | 6,308,662 | | | $ | 7,213,031 | | | $ | (49,344 | ) | | $ | 5,391,636 | | | $ | 7,630,733 | | | |
| | | | | | | | | | | | | | | | | | | | | | | | | | | | |
The accompanying notes are an integral part of these financial statements.
57
MUTUAL OF AMERICA INVESTMENT CORPORATION
STATEMENTS OF CHANGES IN NET ASSETS
| | | | | | | | | | | | | | | | |
| | | Equity Index Fund | | | All America Fund | |
| | | For the
Six Months
Ended
June 30,
2015
(Unaudited) | | | For the
Year Ended
December 31,
2014 | | | For the
Six Months
Ended
June 30,
2015
(Unaudited) | | | For the
Year Ended
December 31,
2014 | |
INCREASE (DECREASE)IN NET ASSETS: | | | | | | | | | | | | | | | | |
FROM OPERATIONS: | | | | | | | | | | | | | | | | |
Net investment income (loss) | | $ | 17,260,115 | | | $ | 29,425,579 | | | $ | 2,103,039 | | | $ | 4,258,182 | |
Net realized gain (loss) on investments and futures contracts | | | 16,526,363 | | | | 64,273,594 | | | | 10,336,502 | | | | 21,165,181 | |
Change in net unrealized appreciation (depreciation) of investments and futures contracts | | | (12,374,482 | ) | | | 113,758,639 | | | | (4,904,263 | ) | | | 8,030,602 | |
| | | | | | | | | | | | | | | | |
NET INCREASE (DECREASE)IN NET ASSETS RESULTINGFROM OPERATIONS | | | 21,411,996 | | | | 207,457,812 | | | | 7,535,278 | | | | 33,453,965 | |
| | | | | | | | | | | | | | | | |
| | | | |
DISTRIBUTIONS (Notes 1 and Note 5) | | | | | | | | | | | | | | | | |
From net investment income | | | — | | | | (24,529,282 | ) | | | — | | | | (3,966,513 | ) |
From net realized gains | | | — | | | | (20,276,973 | ) | | | — | | | | (23,520,331 | ) |
| | | | | | | | | | | | | | | | |
Total distributions | | | — | | | | (44,806,255 | ) | | | — | | | | (27,486,844 | ) |
| | | | | | | | | | | | | | | | |
| | | | |
CAPITAL SHARE TRANSACTIONS (Note 4): | | | | | | | | | | | | | | | | |
Net proceeds from sale of shares | | | 98,143,107 | | | | 200,883,507 | | | | 2,580,698 | | | | 5,473,836 | |
Dividends reinvested | | | — | | | | 44,806,255 | | | | — | | | | 27,486,844 | |
Cost of shares redeemed | | | (93,857,386 | ) | | | (175,606,931 | ) | | | (18,322,316 | ) | | | (33,028,231 | ) |
| | | | | | | | | | | | | | | | |
NET INCREASE (DECREASE)IN NET ASSETSFROM CAPITAL SHARE TRANSACTIONS | | | 4,285,721 | | | | 70,082,831 | | | | (15,741,618 | ) | | | (67,551 | ) |
| | | | | | | | | | | | | | | | |
INCREASE (DECREASE)IN NET ASSETS | | | 25,697,717 | | | | 232,734,388 | | | | (8,206,340 | ) | | | 5,899,570 | |
NET ASSETS, BEGINNINGOF PERIOD | | | 1,789,110,364 | | | | 1,556,375,976 | | | | 324,183,123 | | | | 318,283,553 | �� |
| | | | | | | | | | | | | | | | |
NET ASSETS, ENDOF PERIOD | | $ | 1,814,808,081 | | | $ | 1,789,110,364 | | | $ | 315,976,783 | | | $ | 324,183,123 | |
| | | | | | | | | | | | | | | | |
ACCUMULATED UNDISTRIBUTED NET INVESTMENT INCOME (LOSS) | | $ | 45,919,514 | | | $ | 28,715,350 | | | $ | 6,229,895 | | | $ | 3,971,841 | |
| | | | | | | | | | | | | | | | |
| | | | |
OTHER INFORMATION: | | | | | | | | | | | | | | | | |
Shares outstanding at the beginning of period | | | 524,974,834 | | | | 504,328,472 | | | | 134,209,249 | | | | 133,925,766 | |
| | | | | | | | | | | | | | | | |
Shares sold | | | 28,410,603 | | | | 61,976,101 | | | | 1,045,537 | | | | 2,274,534 | |
Shares issued as reinvestment of dividends | | | — | | | | 13,626,112 | | | | — | | | | 11,766,990 | |
Shares redeemed | | | (27,068,862 | ) | | | (54,955,851 | ) | | | (7,420,105 | ) | | | (13,758,041 | ) |
| | | | | | | | | | | | | | | | |
Net increase (decrease) | | | 1,341,741 | | | | 20,646,362 | | | | (6,374,568 | ) | | | 283,483 | |
| | | | | | | | | | | | | | | | |
Shares outstanding at the end of period | | | 526,316,575 | | | | 524,974,834 | | | | 127,834,681 | | | | 134,209,249 | |
| | | | | | | | | | | | | | | | |
The accompanying notes are an integral part of these financial statements.
58
| | | | | | | | | | | | | | | | | | | | | | | | | | | | | | | | |
| Small Cap Value Fund | | | Small Cap Growth Fund | | | Mid Cap Value Fund | | | Mid-Cap Equity Index Fund | | | |
For the
Six Months
Ended
June 30,
2015
(Unaudited) | | | For the
Year Ended
December 31,
2014 | | | For the
Six Months
Ended
June 30,
2015
(Unaudited) | | | For the
Year Ended
December 31,
2014 | | | For the
Six Months
Ended
June 30,
2015
(Unaudited) | | | For the
Year Ended
December 31,
2014 | | | For the
Six Months
Ended
June 30,
2015
(Unaudited) | | | For the
Year Ended
December 31,
2014 | | | |
| | | | | | | | | | | | | | | | | | | | | | | | | | | | | | | | |
| | | | | | | | | | | | | | | | | | | | | | | | | | | | | | | | |
| $ | 1,932,319 | | | $ | 3,839,561 | | | $ | (50,666 | ) | | $ | (356,262 | ) | | $ | 589,629 | | | $ | 1,028,762 | | | $ | 6,908,978 | | | $ | 12,261,754 | | | |
| | 8,449,340 | | | | 24,556,592 | | | | 27,559,510 | | | | 50,567,338 | | | | 2,150,404 | | | | 5,078,377 | | | | 51,229,958 | | | | 58,668,447 | | | |
| | | | | | | | |
| | (2,238,744 | ) | | | (9,069,882 | ) | | | 7,682,018 | | | | (28,964,625 | ) | | | (2,155,389 | ) | | | 4,464,671 | | | | (16,907,133 | ) | | | 16,493,410 | | | |
| | | | | | | | | | | | | | | | | | | | | | | | | | | | | | | | |
| | 8,142,915 | | | | 19,326,271 | | | | 35,190,862 | | | | 21,246,451 | | | | 584,644 | | | | 10,571,810 | | | | 41,231,803 | | | | 87,423,611 | | | |
| | | | | | | | | | | | | | | | | | | | | | | | | | | | | | | | |
| | | | | | | | |
| | | | | | | | | | | | | | | | | | | | | | | | | | | | | | | | |
| | — | | | | (4,756,094 | ) | | | — | | | | (211,378 | ) | | | — | | | | (645,431 | ) | | | — | | | | (9,181,477 | ) | | |
| | — | | | | (36,455,404 | ) | | | — | | | | (31,305,992 | ) | | | — | | | | (5,410,001 | ) | | | — | | | | (41,218,855 | ) | | |
| | | | | | | | | | | | | | | | | | | | | | | | | | | | | | | | |
| | — | | | | (41,211,498 | ) | | | — | | | | (31,517,370 | ) | | | — | | | | (6,055,432 | ) | | | — | | | | (50,400,332 | ) | | |
| | | | | | | | | | | | | | | | | | | | | | | | | | | | | | | | |
| | | | | | | | |
| | | | | | | | | | | | | | | | | | | | | | | | | | | | | | | | |
| | 12,738,370 | | | | 29,123,428 | | | | 21,700,357 | | | | 29,941,719 | | | | 5,260,810 | | | | 17,268,133 | | | | 47,491,300 | | | | 93,894,132 | | | |
| | — | | | | 41,211,498 | | | | — | | | | 31,517,370 | | | | — | | | | 6,055,432 | | | | — | | | | 50,400,332 | | | |
| | (16,155,615 | ) | | | (36,715,125 | ) | | | (22,330,277 | ) | | | (62,340,748 | ) | | | (8,455,540 | ) | | | (7,843,296 | ) | | | (53,958,762 | ) | | | (82,369,583 | ) | | |
| | | | | | | | | | | | | | | | | | | | | | | | | | | | | | | | |
| | (3,417,245 | ) | | | 33,619,801 | | | | (629,920 | ) | | | (881,659 | ) | | | (3,194,730 | ) | | | 15,480,269 | | | | (6,467,462 | ) | | | 61,924,881 | | | |
| | | | | | | | | | | | | | | | | | | | | | | | | | | | | | | | |
| | 4,725,670 | | | | 11,734,574 | | | | 34,560,942 | | | | (11,152,578 | ) | | | (2,610,086 | ) | | | 19,996,647 | | | | 34,764,341 | | | | 98,948,160 | | | |
| | 393,456,542 | | | | 381,721,968 | | | | 412,349,042 | | | | 423,501,620 | | | | 92,327,957 | | | | 72,331,310 | | | | 1,000,628,590 | | | | 901,680,430 | | | |
| | | | | | | | | | | | | | | | | | | | | | | | | | | | | | | | |
| $ | 398,182,212 | | | $ | 393,456,542 | | | $ | 446,909,984 | | | $ | 412,349,042 | | | $ | 89,717,871 | | | $ | 92,327,957 | | | $ | 1,035,392,931 | | | $ | 1,000,628,590 | | | |
| | | | | | | | | | | | | | | | | | | | | | | | | | | | | | | | |
| $ | 5,429,951 | | | $ | 2,553,337 | | | $ | — | | | $ | — | | | $ | 1,520,934 | | | $ | 969,246 | | | $ | 18,249,659 | | | $ | 11,509,632 | | | |
| | | | | | | | | | | | | | | | | | | | | | | | | | | | | | | | |
| | | | | | | | |
| | | | | | | | | | | | | | | | | | | | | | | | | | | | | | | | |
| | 244,764,120 | | | | 222,484,724 | | | | 268,125,197 | | | | 267,803,649 | | | | 56,753,645 | | | | 47,238,273 | | | | 462,801,870 | | | | 433,467,620 | | | |
| | | | | | | | | | | | | | | | | | | | | | | | | | | | | | | | |
| | 7,807,468 | | | | 17,919,560 | | | | 13,413,560 | | | | 19,668,152 | | | | 3,213,722 | | | | 10,715,300 | | | | 21,186,597 | | | | 44,498,982 | | | |
| | — | | | | 26,338,022 | | | | — | | | | 21,594,428 | | | | — | | | | 3,871,430 | | | | — | | | | 23,681,584 | | | |
| | (9,846,765 | ) | | | (21,978,186 | ) | | | (13,898,049 | ) | | | (40,941,032 | ) | | | (5,072,691 | ) | | | (5,071,358 | ) | | | (24,075,787 | ) | | | (38,846,316 | ) | | |
| | | | | | | | | | | | | | | | | | | | | | | | | | | | | | | | |
| | (2,039,297 | ) | | | 22,279,396 | | | | (484,489 | ) | | | 321,548 | | | | (1,858,969 | ) | | | 9,515,372 | | | | (2,889,190 | ) | | | 29,334,250 | | | |
| | | | | | | | | | | | | | | | | | | | | | | | | | | | | | | | |
| | 242,724,823 | | | | 244,764,120 | | | | 267,640,708 | | | | 268,125,197 | | | | 54,894,676 | | | | 56,753,645 | | | | 459,912,680 | | | | 462,801,870 | | | |
| | | | | | | | | | | | | | | | | | | | | | | | | | | | | | | | |
The accompanying notes are an integral part of these financial statements.
59
MUTUAL OF AMERICA INVESTMENT CORPORATION
STATEMENTS OF CHANGES IN NET ASSETS (Continued)
| | | | | | | | | | | | | | | | |
| | | International Fund | | | Composite Fund | |
| | | For the
Six Months
Ended
June 30,
2015
(Unaudited) | | | For the
Year Ended
December 31,
2014 | | | For the
Six Months
Ended
June 30,
2015
(Unaudited) | | | For the
Year Ended
December 31,
2014 | |
INCREASE (DECREASE)IN NET ASSETS: | | | | | | | | | | | | | | | | |
FROM OPERATIONS: | | | | | | | | | | | | | | | | |
Net investment income (loss) | | $ | 5,046,731 | | | $ | 8,132,055 | | | $ | 1,845,957 | | | $ | 3,941,990 | |
Net realized gain (loss) on investments and futures contracts | | | 106 | | | | 37,335 | | | | 5,766,161 | | | | 5,241,485 | |
Change in net unrealized appreciation (depreciation) of investments and
futures contracts | | | 11,566,597 | | | | (25,660,305 | ) | | | (4,032,480 | ) | | | 7,249,605 | |
| | | | | | | | | | | | | | | | |
NET INCREASE (DECREASE)IN NET ASSETS RESULTINGFROM OPERATIONS | | | 16,613,434 | | | | (17,490,915 | ) | | | 3,579,638 | | | | 16,433,080 | |
| | | | | | | | | | | | | | | | |
| | | | |
DISTRIBUTIONS (Notes 1 and Note 5) | | | | | | | | | | | | | | | | |
From net investment income | | | — | | | | (3,863,157 | ) | | | — | | | | (3,641,558 | ) |
From net realized gains | | | — | | | | (863,378 | ) | | | — | | | | — | |
| | | | | | | | | | | | | | | | |
Total distributions | | | — | | | | (4,726,535 | ) | | | — | | | | (3,641,558 | ) |
| | | | | | | | | | | | | | | | |
| | | | |
CAPITAL SHARE TRANSACTIONS (Note 4): | | | | | | | | | | | | | | | | |
Net proceeds from sale of shares | | | 45,034,432 | | | | 119,004,856 | | | | 2,782,871 | | | | 5,774,213 | |
Dividends reinvested | | | — | | | | 4,726,535 | | | | — | | | | 3,641,558 | |
Cost of shares redeemed | | | (5,331,556 | ) | | | (11,845,104 | ) | | | (8,989,187 | ) | | | (14,873,202 | ) |
| | | | | | | | | | | | | | | | |
NET INCREASE (DECREASE)IN NET ASSETSFROM CAPITAL SHARE TRANSACTIONS | | | 39,702,876 | | | | 111,886,287 | | | | (6,206,316 | ) | | | (5,457,431 | ) |
| | | | | | | | | | | | | | | | |
INCREASE (DECREASE)IN NET ASSETS | | | 56,316,310 | | | | 89,668,837 | | | | (2,626,678 | ) | | | 7,334,091 | |
NET ASSETS, BEGINNINGOF PERIOD | | | 263,833,575 | | | | 174,164,738 | | | | 193,825,283 | | | | 186,491,192 | |
| | | | | | | | | | | | | | | | |
NET ASSETS, ENDOF PERIOD | | $ | 320,149,885 | | | $ | 263,833,575 | | | $ | 191,198,605 | | | $ | 193,825,283 | |
| | | | | | | | | | | | | | | | |
ACCUMULATED UNDISTRIBUTED NET INVESTMENT INCOME (LOSS) | | $ | 13,178,786 | | | $ | 8,132,055 | | | $ | 5,783,615 | | | $ | 3,940,898 | |
| | | | | | | | | | | | | | | | |
| | | | |
OTHER INFORMATION: | | | | | | | | | | | | | | | | |
Shares outstanding at the beginning of period | | | 341,369,894 | | | | 207,998,511 | | | | 96,812,141 | | | | 99,694,061 | |
| | | | | | | | | | | | | | | | |
Shares sold | | | 54,987,887 | | | | 141,996,939 | | | | 1,362,963 | | | | 2,950,873 | |
Shares issued as reinvestment of dividends | | | — | | | | 5,692,817 | | | | — | | | | 1,857,200 | |
Shares redeemed | | | (6,532,749 | ) | | | (14,318,373 | ) | | | (4,402,532 | ) | | | (7,689,993 | ) |
| | | | | | | | | | | | | | | | |
Net increase (decrease) | | | 48,455,138 | | | | 133,371,383 | | | | (3,039,569 | ) | | | (2,881,920 | ) |
| | | | | | | | | | | | | | | | |
Shares outstanding at the end of period | | | 389,825,032 | | | | 341,369,894 | | | | 93,772,572 | | | | 96,812,141 | |
| | | | | | | | | | | | | | | | |
The accompanying notes are an integral part of these financial statements.
60
| | | | | | | | | | | | | | | | | | | | | | | | | | | | | | | | |
| Retirement Income Fund | | | 2010 Retirement Fund | | | 2015 Retirement Fund | | | 2020 Retirement Fund | | | |
For the
Six Months
Ended
June 30,
2015
(Unaudited) | | | For the
Year Ended
December 31,
2014 | | | For the
Six Months
Ended
June 30,
2015
(Unaudited) | | | For the
Year Ended
December 31,
2014 | | | For the
Six Months
Ended
June 30,
2015
(Unaudited) | | | For the
Year Ended
December 31,
2014 | | | For the
Six Months
Ended
June 30,
2015
(Unaudited) | | | For the
Year Ended
December 31,
2014 | | | |
| | | | | | | | | | | | | | | | | | | | | | | | | | | | | | | | |
| | | | | | | | | | | | | | | | | | | | | | | | | | | | | | | | |
| $ | (13,931 | ) | | $ | 989,080 | | | $ | (6,668 | ) | | $ | 511,896 | | | $ | (48,580 | ) | | $ | 2,865,287 | | | $ | (99,679 | ) | | $ | 5,350,590 | | | |
| | 1,175,601 | | | | 1,548,214 | | | | 695,285 | | | | 1,392,302 | | | | 4,062,726 | | | | 8,985,307 | | | | 4,573,480 | | | | 15,490,205 | | | |
| | | | | | | | |
| | (512,321 | ) | | | 297,295 | | | | (297,954 | ) | | | (245,571 | ) | | | (1,147,728 | ) | | | (1,950,195 | ) | | | 2,004,359 | | | | (701,197 | ) | | |
| | | | | | | | | | | | | | | | | | | | | | | | | | | | | | | | |
| | 649,349 | | | | 2,834,589 | | | | 390,663 | | | | 1,658,627 | | | | 2,866,418 | | | | 9,900,399 | | | | 6,478,160 | | | | 20,139,598 | | | |
| | | | | | | | | | | | | | | | | | | | | | | | | | | | | | | | |
| | | | | | | | |
| | | | | | | | | | | | | | | | | | | | | | | | | | | | | | | | |
| | — | | | | (746,239 | ) | | | — | | | | (478,710 | ) | | | — | | | | (2,616,090 | ) | | | — | | | | (3,853,531 | ) | | |
| | — | | | | (853,955 | ) | | | — | | | | (653,628 | ) | | | — | | | | (3,478,425 | ) | | | — | | | | (3,571,569 | ) | | |
| | | | | | | | | | | | | | | | | | | | | | | | | | | | | | | | |
| | — | | | | (1,600,194 | ) | | | — | | | | (1,132,338 | ) | | | — | | | | (6,094,515 | ) | | | — | | | | (7,425,100 | ) | | |
| | | | | | | | | | | | | | | | | | | | | | | | | | | | | | | | |
| | | | | | | | |
| | | | | | | | | | | | | | | | | | | | | | | | | | | | | | | | |
| | 8,653,185 | | | | 19,027,717 | | | | 2,329,838 | | | | 4,531,697 | | | | 9,988,009 | | | | 23,686,143 | | | | 31,831,673 | | | | 63,885,795 | | | |
| | — | | | | 1,600,194 | | | | — | | | | 1,132,338 | | | | — | | | | 6,094,515 | | | | — | | | | 7,425,100 | | | |
| | (6,696,540 | ) | | | (7,899,016 | ) | | | (2,517,868 | ) | | | (3,674,978 | ) | | | (10,564,304 | ) | | | (17,349,841 | ) | | | (10,020,022 | ) | | | (15,276,500 | ) | | |
| | | | | | | | | | | | | | | | | | | | | | | | | | | | | | | | |
| | 1,956,645 | | | | 12,728,895 | | | | (188,030 | ) | | | 1,989,057 | | | | (576,295 | ) | | | 12,430,817 | | | | 21,811,651 | | | | 56,034,395 | | | |
| | | | | | | | | | | | | | | | | | | | | | | | | | | | | | | | |
| | 2,605,994 | | | | 13,963,290 | | | | 202,633 | | | | 2,515,346 | | | | 2,290,123 | | | | 16,236,701 | | | | 28,289,811 | | | | 68,748,893 | | | |
| | 53,535,139 | | | | 39,571,849 | | | | 26,558,006 | | | | 24,042,660 | | | | 154,161,532 | | | | 137,924,831 | | | | 320,040,953 | | | | 251,292,060 | | | |
| | | | | | | | | | | | | | | | | | | | | | | | | | | | | | | | |
| $ | 56,141,133 | | | $ | 53,535,139 | | | $ | 26,760,639 | | | $ | 26,558,006 | | | $ | 156,451,655 | | | $ | 154,161,532 | | | $ | 348,330,764 | | | $ | 320,040,953 | | | |
| | | | | | | | | | | | | | | | | | | | | | | | | | | | | | | | |
| $ | 1,043,642 | | | $ | 1,043,642 | | | $ | 553,391 | | | $ | 553,391 | | | $ | 3,145,217 | | | $ | 3,145,217 | | | $ | 5,971,939 | | | $ | 5,971,939 | | | |
| | | | | | | | | | | | | | | | | | | | | | | | | | | | | | | | |
| | | | | | | | |
| | | | | | | | | | | | | | | | | | | | | | | | | | | | | | | | |
| | 46,045,385 | | | | 34,961,828 | | | | 24,456,165 | | | | 22,616,328 | | | | 136,513,695 | | | | 125,288,707 | | | | 270,183,637 | | | | 221,831,608 | | | |
| | | | | | | | | | | | | | | | | | | | | | | | | | | | | | | | |
| | 7,331,549 | | | | 16,491,999 | | | | 2,101,293 | | | | 4,176,979 | | | | 8,677,077 | | | | 21,121,082 | | | | 26,307,635 | | | | 54,995,344 | | | |
| | — | | | | 1,404,057 | | | | — | | | | 1,062,168 | | | | — | | | | 5,552,659 | | | | — | | | | 6,459,934 | | | |
| | (5,671,275 | ) | | | (6,812,499 | ) | | | (2,280,326 | ) | | | (3,399,310 | ) | | | (9,148,392 | ) | | | (15,448,753 | ) | | | (8,301,203 | ) | | | (13,103,249 | ) | | |
| | | | | | | | | | | | | | | | | | | | | | | | | | | | | | | | |
| | 1,660,274 | | | | 11,083,557 | | | | (179,033 | ) | | | 1,839,837 | | | | (471,315 | ) | | | 11,224,988 | | | | 18,006,432 | | | | 48,352,029 | | | |
| | | | | | | | | | | | | | | | | | | | | | | | | | | | | | | | |
| | 47,705,659 | | | | 46,045,385 | | | | 24,277,132 | | | | 24,456,165 | | | | 136,042,380 | | | | 136,513,695 | | | | 288,190,069 | | | | 270,183,637 | | | |
| | | | | | | | | | | | | | | | | | | | | | | | | | | | | | | | |
The accompanying notes are an integral part of these financial statements.
61
MUTUAL OF AMERICA INVESTMENT CORPORATION
STATEMENTS OF CHANGES IN NET ASSETS (Continued)
| | | | | | | | | | | | | | | | |
| | | 2025 Retirement Fund | | | 2030 Retirement Fund | |
| | | For the
Six Months
Ended
June 30,
2015
(Unaudited) | | | For the
Year Ended
December 31,
2014 | | | For the
Six Months
Ended
June 30,
2015
(Unaudited) | | | For the
Year Ended
December 31,
2014 | |
INCREASE (DECREASE)IN NET ASSETS: | | | | | | | | | | | | | | | | |
FROM OPERATIONS: | | | | | | | | | | | | | | | | |
Net investment income (loss) | | $ | (104,512 | ) | | $ | 5,003,277 | | | $ | (87,754 | ) | | $ | 3,928,982 | |
Net realized gain (loss) on investments and futures contracts | | | 4,215,371 | | | | 13,645,476 | | | | 3,250,582 | | | | 12,059,724 | |
Change in net unrealized appreciation (depreciation) of investments and futures contracts | | | 3,533,211 | | | | 3,839,197 | | | | 3,700,354 | | | | 3,675,712 | |
| | | | | | | | | | | | | | | | |
NET INCREASE (DECREASE)IN NET ASSETS RESULTINGFROM OPERATIONS | | | 7,644,070 | | | | 22,487,950 | | | | 6,863,182 | | | | 19,664,418 | |
| | | | | | | | | | | | | | | | |
| | | | |
DISTRIBUTIONS (Notes 1 and Note 5) | | | | | | | | | | | | | | | | |
From net investment income | | | — | | | | (3,459,110 | ) | | | — | | | | (2,762,712 | ) |
From net realized gains | | | — | | | | (2,819,455 | ) | | | — | | | | (2,549,750 | ) |
| | | | | | | | | | | | | | | | |
Total distributions | | | — | | | | (6,278,565 | ) | | | — | | | | (5,312,462 | ) |
| | | | | | | | | | | | | | | | |
| | | | |
CAPITAL SHARE TRANSACTIONS (Note 4): | | | | | | | | | | | | | | | | |
Net proceeds from sale of shares | | | 35,819,922 | | | | 63,610,725 | | | | 28,565,304 | | | | 55,246,165 | |
Dividends reinvested | | | — | | | | 6,278,565 | | | | — | | | | 5,312,462 | |
Cost of shares redeemed | | | (5,209,685 | ) | | | (11,753,478 | ) | | | (4,924,358 | ) | | | (9,611,179 | ) |
| | | | | | | | | | | | | | | | |
NET INCREASE (DECREASE)IN NET ASSETSFROM CAPITAL SHARE TRANSACTIONS | | | 30,610,237 | | | | 58,135,812 | | | | 23,640,946 | | | | 50,947,448 | |
| | | | | | | | | | | | | | | | |
INCREASE (DECREASE)IN NET ASSETS | | | 38,254,307 | | | | 74,345,197 | | | | 30,504,128 | | | | 65,299,404 | |
NET ASSETS, BEGINNINGOF PERIOD | | | 331,089,926 | | | | 256,744,729 | | | | 277,059,262 | | | | 211,759,858 | |
| | | | | | | | | | | | | | | | |
NET ASSETS, ENDOF PERIOD | | $ | 369,344,233 | | | $ | 331,089,926 | | | $ | 307,563,390 | | | $ | 277,059,262 | |
| | | | | | | | | | | | | | | | |
ACCUMULATED UNDISTRIBUTED NET INVESTMENT INCOME (LOSS) | | $ | 5,804,497 | | | $ | 5,804,497 | | | $ | 4,662,610 | | | $ | 4,662,610 | |
| | | | | | | | | | | | | | | | |
| | | | |
OTHER INFORMATION: | | | | | | | | | | | | | | | | |
Shares outstanding at the beginning of period | | | 268,929,635 | | | | 220,409,889 | | | | 218,780,055 | | | | 177,408,455 | |
| | | | | | | | | | | | | | | | |
Shares sold | | | 28,496,500 | | | | 53,077,272 | | | | 22,052,321 | | | | 44,925,560 | |
Shares issued as reinvestment of dividends | | | — | | | | 5,284,854 | | | | — | | | | 4,370,328 | |
Shares redeemed | | | (4,144,301 | ) | | | (9,842,380 | ) | | | (3,774,189 | ) | | | (7,924,288 | ) |
| | | | | | | | | | | | | | | | |
Net increase (decrease) | | | 24,352,199 | | | | 48,519,746 | | | | 18,278,132 | | | | 41,371,600 | |
| | | | | | | | | | | | | | | | |
Shares outstanding at the end of period | | | 293,281,834 | | | | 268,929,635 | | | | 237,058,187 | | | | 218,780,055 | |
| | | | | | | | | | | | | | | | |
The accompanying notes are an integral part of these financial statements.
62
| | | | | | | | | | | | | | | | | | | | | | | | | | | | | | | | |
| 2035 Retirement Fund | | | 2040 Retirement Fund | | | 2045 Retirement Fund | | | 2050 Retirement Fund | | | |
For the
Six Months
Ended
June 30,
2015
(Unaudited) | | | For the
Year Ended
December 31,
2014 | | | For the
Six Months
Ended
June 30,
2015
(Unaudited) | | | For the
Year Ended
December 31,
2014 | | | For the
Six Months
Ended
June 30,
2015
(Unaudited) | | | For the
Year Ended
December 31,
2014 | | | For the
Six Months
Ended
June 30,
2015
(Unaudited) | | | For the
Year Ended
December 31,
2014 | | | |
| | | | | | | | | | | | | | | | | | | | | | | | | | | | | | | | |
| | | | | | | | | | | | | | | | | | | | | | | | | | | | | | | | |
| $ | (73,085 | ) | | $ | 2,974,656 | | | $ | (60,450 | ) | | $ | 2,279,235 | | | $ | (73,829 | ) | | $ | 2,817,679 | | | $ | (15,293 | ) | | $ | 470,594 | | | |
| | 3,422,908 | | | | 9,433,453 | | | | 2,901,629 | | | | 8,540,747 | | | | 3,336,558 | | | | 10,187,546 | | | | 178,400 | | | | 1,271,844 | | | |
| | | | | | | | |
| | 3,029,709 | | | | 3,646,401 | | | | 3,019,149 | | | | 1,662,706 | | | | 4,237,056 | | | | 2,026,948 | | | | 1,554,512 | | | | 722,036 | | | |
| | | | | | | | | | | | | | | | | | | | | | | | | | | | | | | | |
| | 6,379,532 | | | | 16,054,510 | | | | 5,860,328 | | | | 12,482,688 | | | | 7,499,785 | | | | 15,032,173 | | | | 1,717,619 | | | | 2,464,474 | | | |
| | | | | | | | | | | | | | | | | | | | | | | | | | | | | | | | |
| | | | | | | | |
| | | | | | | | | | | | | | | | | | | | | | | | | | | | | | | | |
| | — | | | | (2,061,376 | ) | | | — | | | | (1,709,321 | ) | | | — | | | | (2,118,365 | ) | | | — | | | | (48,352 | ) | | |
| | — | | | | (2,255,109 | ) | | | — | | | | (2,115,297 | ) | | | — | | | | (2,510,179 | ) | | | — | | | | (67,482 | ) | | |
| | | | | | | | | | | | | | | | | | | | | | | | | | | | | | | | |
| | — | | | | (4,316,485 | ) | | | — | | | | (3,824,618 | ) | | | — | | | | (4,628,544 | ) | | | — | | | | (115,834 | ) | | |
| | | | | | | | | | | | | | | | | | | | | | | | | | | | | | | | |
| | | | | | | | |
| | | | | | | | | | | | | | | | | | | | | | | | | | | | | | | | |
| | 22,616,758 | | | | 48,788,674 | | | | 19,272,938 | | | | 34,207,916 | | | | 20,181,036 | | | | 37,208,271 | | | | 20,789,333 | | | | 28,066,598 | | | |
| | — | | | | 4,316,485 | | | | — | | | | 3,824,618 | | | | — | | | | 4,628,544 | | | | — | | | | 115,834 | | | |
| | (4,067,838 | ) | | | (7,555,845 | ) | | | (3,458,856 | ) | | | (6,126,354 | ) | | | (2,095,958 | ) | | | (6,273,383 | ) | | | (493,137 | ) | | | (610,481 | ) | | |
| | | | | | | | | | | | | | | | | | | | | | | | | | | | | | | | |
| | 18,548,920 | | | | 45,549,314 | | | | 15,814,082 | | | | 31,906,180 | | | | 18,085,078 | | | | 35,563,432 | | | | 20,296,196 | | | | 27,571,951 | | | |
| | | | | | | | | | | | | | | | | | | | | | | | | | | | | | | | |
| | 24,928,452 | | | | 57,287,339 | | | | 21,674,410 | | | | 40,564,250 | | | | 25,584,863 | | | | 45,967,061 | | | | 22,013,815 | | | | 29,920,591 | | | |
| | 229,852,887 | | | | 172,565,548 | | | | 188,610,029 | | | | 148,045,779 | | | | 232,105,878 | | | | 186,138,817 | | | | 50,210,916 | | | | 20,290,325 | | | |
| | | | | | | | | | | | | | | | | | | | | | | | | | | | | | | | |
| $ | 254,781,339 | | | $ | 229,852,887 | | | $ | 210,284,439 | | | $ | 188,610,029 | | | $ | 257,690,741 | | | $ | 232,105,878 | | | $ | 72,224,731 | | | $ | 50,210,916 | | | |
| | | | | | | | | | | | | | | | | | | | | | | | | | | | | | | | |
| $ | 3,637,561 | | | $ | 3,637,561 | | | $ | 2,857,782 | | | $ | 2,857,782 | | | $ | 3,540,101 | | | $ | 3,540,101 | | | $ | 592,908 | | | $ | 592,908 | | | |
| | | | | | | | | | | | | | | | | | | | | | | | | | | | | | | | |
| | | | | | | | |
| | | | | | | | | | | | | | | | | | | | | | | | | | | | | | | | |
| | 181,398,047 | | | | 144,301,756 | | | | 149,253,147 | | | | 123,313,696 | | | | 183,851,790 | | | | 154,880,979 | | | | 36,041,942 | | | | 15,556,794 | | | |
| | | | | | | | | | | | | | | | | | | | | | | | | | | | | | | | |
| | 17,454,714 | | | | 39,748,793 | | | | 14,806,537 | | | | 27,836,625 | | | | 15,499,803 | | | | 30,334,894 | | | | 14,465,289 | | | | 20,860,316 | | | |
| | — | | | | 3,542,685 | | | | — | | | | 3,144,107 | | | | — | | | | 3,802,172 | | | | — | | | | 86,165 | | | |
| | (3,143,005 | ) | | | (6,195,187 | ) | | | (2,664,715 | ) | | | (5,041,281 | ) | | | (1,616,225 | ) | | | (5,166,255 | ) | | | (345,649 | ) | | | (461,333 | ) | | |
| | | | | | | | | | | | | | | | | | | | | | | | | | | | | | | | |
| | 14,311,709 | | | | 37,096,291 | | | | 12,141,822 | | | | 25,939,451 | | | | 13,883,578 | | | | 28,970,811 | | | | 14,119,640 | | | | 20,485,148 | | | |
| | | | | | | | | | | | | | | | | | | | | | | | | | | | | | | | |
| | 195,709,756 | | | | 181,398,047 | | | | 161,394,969 | | | | 149,253,147 | | | | 197,735,368 | | | | 183,851,790 | | | | 50,161,582 | | | | 36,041,942 | | | |
| | | | | | | | | | | | | | | | | | | | | | | | | | | | | | | | |
The accompanying notes are an integral part of these financial statements.
63
MUTUAL OF AMERICA INVESTMENT CORPORATION
STATEMENTS OF CHANGES IN NET ASSETS (Continued)
| | | | | | | | | | | | | | | | |
| | | Conservative Allocation Fund | | | Moderate Allocation Fund | |
| | | For the
Six Months
Ended
June 30,
2015
(Unaudited) | | | For the
Year Ended
December 31,
2014 | | | For the
Six Months
Ended
June 30,
2015
(Unaudited) | | | For the
Year Ended
December 31,
2014 | |
INCREASE (DECREASE)IN NET ASSETS: | | | | | | | | | | | | | | | | |
FROM OPERATIONS: | | | | | | | | | | | | | | | | |
Net investment income (loss) | | $ | (7,747 | ) | | $ | 2,464,461 | | | $ | (16,836 | ) | | $ | 5,816,011 | |
Net realized gain (loss) on investments and futures contracts | | | 1,097,313 | | | | 4,283,970 | | | | 5,942,305 | | | | 17,802,197 | |
Change in net unrealized appreciation (depreciation) of investments and futures contracts | | | 715,695 | | | | 23,341 | | | | 383,193 | | | | (1,516,814 | ) |
| | | | | | | | | | | | | | | | |
NET INCREASE (DECREASE)IN NET ASSETS RESULTINGFROM OPERATIONS | | | 1,805,261 | | | | 6,771,772 | | | | 6,308,662 | | | | 22,101,394 | |
| | | | | | | | | | | | | | | | |
| | | | |
DISTRIBUTIONS (Notes 1 and Note 5) | | | | | | | | | | | | | | | | |
From net investment income | | | — | | | | (2,273,586 | ) | | | — | | | | (5,452,659 | ) |
From net realized gains | | | — | | | | (1,664,925 | ) | | | — | | | | (3,993,394 | ) |
| | | | | | | | | | | | | | | | |
Total distributions | | | — | | | | (3,938,511 | ) | | | — | | | | (9,446,053 | ) |
| | | | | | | | | | | | | | | | |
| | | | |
CAPITAL SHARE TRANSACTIONS (Note 4): | | | | | | | | | | | | | | | | |
Net proceeds from sale of shares | | | 9,960,216 | | | | 27,512,215 | | | | 11,797,160 | | | | 28,072,903 | |
Dividends reinvested | | | — | | | | 3,938,511 | | | | — | | | | 9,446,053 | |
Cost of shares redeemed | | | (4,802,468 | ) | | | (9,352,979 | ) | | | (7,959,036 | ) | | | (16,363,290 | ) |
| | | | | | | | | | | | | | | | |
NET INCREASE (DECREASE)IN NET ASSETSFROM CAPITAL SHARE TRANSACTIONS | | | 5,157,748 | | | | 22,097,747 | | | | 3,838,124 | | | | 21,155,666 | |
| | | | | | | | | | | | | | | | |
INCREASE (DECREASE)IN NET ASSETS | | | 6,963,009 | | | | 24,931,008 | | | | 10,146,786 | | | | 33,811,007 | |
NET ASSETS, BEGINNINGOF PERIOD | | | 122,523,125 | | | | 97,592,117 | | | | 315,208,180 | | | | 281,397,173 | |
| | | | | | | | | | | | | | | | |
NET ASSETS, ENDOF PERIOD | | $ | 129,486,134 | | | $ | 122,523,125 | | | $ | 325,354,966 | | | $ | 315,208,180 | |
| | | | | | | | | | | | | | | | |
ACCUMULATED UNDISTRIBUTED NET INVESTMENT INCOME (LOSS) | | $ | 2,608,920 | | | $ | 2,608,920 | | | $ | 6,514,098 | | | $ | 6,514,098 | |
| | | | | | | | | | | | | | | | |
| | | | |
OTHER INFORMATION: | | | | | | | | | | | | | | | | |
Shares outstanding at the beginning of period | | | 97,670,821 | | | | 79,934,785 | | | | 208,049,805 | | | | 193,762,078 | |
| | | | | | | | | | | | | | | | |
Shares sold | | | 7,820,566 | | | | 22,009,867 | | | | 7,623,522 | | | | 18,843,986 | |
Shares issued as reinvestment of dividends | | | — | | | | 3,216,965 | | | | — | | | | 6,402,498 | |
Shares redeemed | | | (3,763,890 | ) | | | (7,490,796 | ) | | | (5,148,160 | ) | | | (10,958,757 | ) |
| | | | | | | | | | | | | | | | |
Net increase (decrease) | | | 4,056,676 | | | | 17,736,036 | | | | 2,475,362 | | | | 14,287,727 | |
| | | | | | | | | | | | | | | | |
Shares outstanding at the end of period | | | 101,727,497 | | | | 97,670,821 | | | | 210,525,167 | | | | 208,049,805 | |
| | | | | | | | | | | | | | | | |
The accompanying notes are an integral part of these financial statements.
64
| | | | | | | | | | | | | | | | | | | | | | | | | | | | | | | | |
| Aggressive Allocation Fund | | | Money Market Fund | | | Mid-Term Bond Fund | | | Bond Fund | | | |
For the
Six Months
Ended
June 30,
2015
(Unaudited) | | | For the
Year Ended
December 31,
2014 | | | For the
Six Months
Ended
June 30,
2015
(Unaudited) | | | For the
Year Ended
December 31,
2014 | | | For the
Six Months
Ended
June 30,
2015
(Unaudited) | | | For the
Year Ended
December 31,
2014 | | | For the
Six Months
Ended
June 30,
2015
(Unaudited) | | | For the
Year Ended
December 31,
2014 | | | |
| | | | | | | | | | | | | | | | | | | | | | | | | | | | | | | | |
| | | | | | | | | | | | | | | | | | | | | | | | | | | | | | | | |
| $ | (14,457 | ) | | $ | 3,931,404 | | | $ | (46,854 | ) | | $ | (112,131 | ) | | $ | 5,026,441 | | | $ | 10,593,944 | | | $ | 13,411,812 | | | $ | 31,506,309 | | | |
| | 4,670,302 | | | | 17,884,871 | | | | 1 | | | | 113 | | | | 634,551 | | | | 1,564,411 | | | | (165,084 | ) | | | 1,687,269 | | | |
| | | | | | | | |
| | 2,557,186 | | | | (3,648,961 | ) | | | (2,491 | ) | | | 4,165 | | | | (269,356 | ) | | | 591,865 | | | | (5,615,995 | ) | | | 19,079,980 | | | |
| | | | | | | | | | | | | | | | | | | | | | | | | | | | | | | | |
| | 7,213,031 | | | | 18,167,314 | | | | (49,344 | ) | | | (107,853 | ) | | | 5,391,636 | | | | 12,750,220 | | | | 7,630,733 | | | | 52,273,558 | | | |
| | | | | | | | | | | | | | | | | | | | | | | | | | | | | | | | |
| | | | | | | | |
| | | | | | | | | | | | | | | | | | | | | | | | | | | | | | | | |
| | — | | | | (3,819,966 | ) | | | — | | | | — | | | | — | | | | (10,740,646 | ) | | | — | | | | (26,340,172 | ) | | |
| | — | | | | (3,901,158 | ) | | | — | | | | — | | | | — | | | | (2,091,825 | ) | | | — | | | | — | | | |
| | | | | | | | | | | | | | | | | | | | | | | | | | | | | | | | |
| | — | | | | (7,721,124 | ) | | | — | | | | — | | | | — | | | | (12,832,471 | ) | | | — | | | | (26,340,172 | ) | | |
| | | | | | | | | | | | | | | | | | | | | | | | | | | | | | | | |
| | | | | | | | |
| | | | | | | | | | | | | | | | | | | | | | | | | | | | | | | | |
| | 5,308,262 | | | | 14,917,233 | | | | 3,993,310 | | | | 7,274,917 | | | | 35,049,890 | | | | 75,795,501 | | | | 71,198,011 | | | | 149,352,882 | | | |
| | — | | | | 7,721,124 | | | | — | | | | — | | | | — | | | | 12,832,471 | | | | — | | | | 26,340,172 | | | |
| | (6,077,279 | ) | | | (14,708,504 | ) | | | (11,489,379 | ) | | | (13,675,231 | ) | | | (18,875,634 | ) | | | (45,450,673 | ) | | | (29,364,038 | ) | | | (49,629,189 | ) | | |
| | | | | | | | | | | | | | | | | | | | | | | | | | | | | | | | |
| | (769,017 | ) | | | 7,929,853 | | | | (7,496,069 | ) | | | (6,400,314 | ) | | | 16,174,256 | | | | 43,177,299 | | | | 41,833,973 | | | | 126,063,865 | | | |
| | | | | | | | | | | | | | | | | | | | | | | | | | | | | | | | |
| | 6,444,014 | | | | 18,376,043 | | | | (7,545,413 | ) | | | (6,508,167 | ) | | | 21,565,892 | | | | 43,095,048 | | | | 49,464,706 | | | | 151,997,251 | | | |
| | 254,800,202 | | | | 236,424,159 | | | | 77,478,766 | | | | 83,986,933 | | | | 435,233,498 | | | | 392,138,450 | | | | 955,881,799 | | | | 803,884,548 | | | |
| | | | | | | | | | | | | | | | | | | | | | | | | | | | | | | | |
| $ | 261,244,216 | | | $ | 254,800,202 | | | $ | 69,933,353 | | | $ | 77,478,766 | | | $ | 456,799,390 | | | $ | 435,233,498 | | | $ | 1,005,346,505 | | | $ | 955,881,799 | | | |
| | | | | | | | | | | | | | | | | | | | | | | | | | | | | | | | |
| $ | 4,669,780 | | | $ | 4,669,780 | | | $ | — | | | $ | — | | | $ | 15,620,383 | | | $ | 10,593,942 | | | $ | 44,918,121 | | | $ | 31,506,309 | | | |
| | | | | | | | | | | | | | | | | | | | | | | | | | | | | | | | |
| | | | | | | | |
| | | | | | | | | | | | | | | | | | | | | | | | | | | | | | | | |
| | 144,356,850 | | | | 139,705,582 | | | | 64,724,065 | | | | 70,066,197 | | | | 412,252,911 | | | | 371,707,177 | | | | 658,106,501 | | | | 571,329,146 | | | |
| | | | | | | | | | | | | | | | | | | | | | | | | | | | | | | | |
| | 2,933,491 | | | | 8,631,107 | | | | 3,337,060 | | | | 6,073,454 | | | | 32,807,123 | | | | 70,789,793 | | | | 48,313,705 | | | | 102,660,413 | | | |
| | — | | | | 4,516,418 | | | | — | | | | — | | | | — | | | | 12,210,237 | | | | — | | | | 18,362,750 | | | |
| | (3,338,736 | ) | | | (8,496,257 | ) | | | (9,600,959 | ) | | | (11,415,586 | ) | | | (17,671,909 | ) | | | (42,454,296 | ) | | | (19,961,479 | ) | | | (34,245,808 | ) | | |
| | | | | | | | | | | | | | | | | | | | | | | | | | | | | | | | |
| | (405,245 | ) | | | 4,651,268 | | | | (6,263,899 | ) | | | (5,342,132 | ) | | | 15,135,214 | | | | 40,545,734 | | | | 28,352,226 | | | | 86,777,355 | | | |
| | | | | | | | | | | | | | | | | | | | | | | | | | | | | | | | |
| | 143,951,605 | | | | 144,356,850 | | | | 58,460,166 | | | | 64,724,065 | | | | 427,388,125 | | | | 412,252,911 | | | | 686,458,727 | | | | 658,106,501 | | | |
| | | | | | | | | | | | | | | | | | | | | | | | | | | | | | | | |
The accompanying notes are an integral part of these financial statements.
65
MUTUAL OF AMERICA INVESTMENT CORPORATION
FINANCIAL HIGHLIGHTS
Income from investment operations and distributions per share for a Fund share outstanding throughout the six months ended June 30, 2015 and the five years ended December 31, 2014 (or since the Fund’s inception date if in existence less than five years) and other supplementary data with respect to each Fund are presented below and in the pages following:
| | | | | | | | | | | | | | | | | | | | | | | | |
| | | Equity Index Fund | |
| | | Six Months
Ended
June 30,
2015
(Unaudited) | | | Years Ended December 31, | |
| | | | 2014 | | | 2013 | | | 2012 | | | 2011 | | | 2010 | |
Net Asset Value, Beginning of Period | | $ | 3.41 | | | $ | 3.09 | | | $ | 2.40 | | | $ | 2.07 | | | $ | 2.07 | | | $ | 1.84 | |
| | | | | | | | | | | | | | | | | | | | | | | | |
| | | | | | |
INCOME (LOSS)FROM INVESTMENT OPERATIONS: | | | | | | | | | | | | | | | | | | | | | | | | |
Net Investment Income (Loss) | | | 0.03 | | | | 0.06 | | | | 0.05 | | | | 0.05 | | | | 0.04 | | | | 0.03 | |
Net Realized and Unrealized Gains (Losses) on Investments and Futures Contracts | | | 0.01 | | | | 0.35 | | | | 0.70 | | | | 0.28 | | | | — | (f) | | | 0.23 | |
| | | | | | | | | | | | | | | | | | | | | | | | |
Total From Investment Operations | | | 0.04 | | | | 0.41 | | | | 0.75 | | | | 0.33 | | | | 0.04 | | | | 0.26 | |
| | | | | | | | | | | | | | | | | | | | | | | | |
| | | | | | |
Less: Distributions | | | | | | | | | | | | | | | | | | | | | | | | |
From Net Investment Income | | | — | | | | (0.05 | ) | | | (0.04 | ) | | | — | (f) | | | (0.04 | ) | | | (0.03 | ) |
From Net Realized Gains | | | — | | | | (0.04 | ) | | | (0.02 | ) | | | — | | | | — | | | | — | |
| | | | | | | | | | | | | | | | | | | | | | | | |
Total Distributions | | | — | | | | (0.09 | ) | | | (0.06 | ) | | | — | | | | (0.04 | ) | | | (0.03 | ) |
| | | | | | | | | | | | | | | | | | | | | | | | |
Net Asset Value, End of Period | | $ | 3.45 | | | $ | 3.41 | | | $ | 3.09 | | | $ | 2.40 | | | $ | 2.07 | | | $ | 2.07 | |
| | | | | | | | | | | | | | | | | | | | | | | | |
Total Return (%) | | | 1.18 | (b) | | | 13.49 | | | | 32.02 | | | | 15.94 | | | | 1.88 | | | | 14.68 | |
Net Assets, End of Period ($ millions) | | | 1,815 | | | | 1,789 | | | | 1,556 | | | | 1,109 | | | | 929 | | | | 905 | |
Ratio of Net Investment Income (Loss) to Average Net Assets (%) | | | 1.91 | (c) | | | 1.82 | | | | 1.87 | | | | 2.03 | | | | 1.81 | | | | 1.76 | |
Ratio of Expenses to Average Net Assets Before Expense Reimbursement (%) | | | 0.14 | (c) | | | 0.17 | | | | 0.19 | | | | 0.22 | | | | 0.23 | | | | 0.25 | |
Ratio of Expenses to Average Net Assets After Expense Reimbursement (%) | | | 0.14 | (c) | | | 0.17 | | | | 0.19 | | | | 0.22 | | | | 0.23 | | | | 0.25 | |
Portfolio Turnover Rate (%)(a) | | | 1.49 | (b) | | | 8.07 | | | | 3.90 | | | | 6.45 | | | | 5.26 | | | | 4.50 | |
| (a) | Portfolio turnover rate excludes all short-term securities. |
| (d) | Allocation and Retirement Funds exclude expenses of the underlying funds. |
| (e) | For the period October 1, 2012 (commencement of operations) through December 31, 2012. |
| (f) | Amount is less than $0.005 per share. |
NA = Not Applicable
The accompanying notes are an integral part of these financial statements.
66
| | | | | | | | | | | | | | | | | | | | | | | | | | | | | | | | | | | | | | | | | | | | | | | | |
| All America Fund | | | Small Cap Value Fund | | | |
Six Months
Ended
June 30,
2015
(Unaudited) | | | Years Ended December 31, | | | Six Months
Ended
June 30,
2015
(Unaudited) | | | Years Ended December 31, | | | |
| | 2014 | | | 2013 | | | 2012 | | | 2011 | | | 2010 | | | | 2014 | | | 2013 | | | 2012 | | | 2011 | | | 2010 | | | |
| $ | 2.42 | | | $ | 2.38 | | | $ | 1.85 | | | $ | 1.61 | | | $ | 1.65 | | | $ | 1.42 | | | $ | 1.61 | | | $ | 1.72 | | | $ | 1.35 | | | $ | 1.17 | | | $ | 1.21 | | | $ | 0.96 | | | |
| | | | | | | | | | | | | | | | | | | | | | | | | | | | | | | | | | | | | | | | | | | | | | | | |
| | | | | | | | | | | | |
| | | | | | | | | | | | | | | | | | | | | | | | | | | | | | | | | | | | | | | | | | | | | | | | |
| | 0.02 | | | | 0.03 | | | | 0.03 | | | | 0.03 | | | | 0.02 | | | | 0.02 | | | | 0.01 | | | | 0.02 | | | | 0.03 | | | | 0.02 | | | | 0.01 | | | | 0.01 | | | |
| | | | | | | | | | | | |
| | 0.03 | | | | 0.23 | | | | 0.55 | | | | 0.21 | | | | (0.02 | ) | | | 0.23 | | | | 0.02 | | | | 0.06 | | | | 0.36 | | | | 0.16 | | | | (0.04 | ) | | | 0.25 | | | |
| | | | | | | | | | | | | | | | | | | | | | | | | | | | | | | | | | | | | | | | | | | | | | | | |
| | 0.05 | | | | 0.26 | | | | 0.58 | | | | 0.24 | | | | — | | | | 0.25 | | | | 0.03 | | | | 0.08 | | | | 0.39 | | | | 0.18 | | | | (0.03 | ) | | | 0.26 | | | |
| | | | | | | | | | | | | | | | | | | | | | | | | | | | | | | | | | | | | | | | | | | | | | | | |
| | | | | | | | | | | | |
| | | | | | | | | | | | | | | | | | | | | | | | | | | | | | | | | | | | | | | | | | | | | | | | |
| | — | | | | (0.03 | ) | | | (0.03 | ) | | | — | | | | (0.04 | ) | | | (0.02 | ) | | | — | | | | (0.02 | ) | | | (0.02 | ) | | | — | | | | (0.01 | ) | | | (0.01 | ) | | |
| | — | | | | (0.19 | ) | | | (0.02 | ) | | | — | | | | — | | | | — | | | | — | | | | (0.17 | ) | | | — | | | | — | | | | — | | | | — | | | |
| | | | | | | | | | | | | | | | | | | | | | | | | | | | | | | | | | | | | | | | | | | | | | | | |
| | — | | | | (0.22 | ) | | | (0.05 | ) | | | — | | | | (0.04 | ) | | | (0.02 | ) | | | — | | | | (0.19 | ) | | | (0.02 | ) | | | — | | | | (0.01 | ) | | | (0.01 | ) | | |
| | | | | | | | | | | | | | | | | | | | | | | | | | | | | | | | | | | | | | | | | | | | | | | | |
| $ | 2.47 | | | $ | 2.42 | | | $ | 2.38 | | | $ | 1.85 | | | $ | 1.61 | | | $ | 1.65 | | | $ | 1.64 | | | $ | 1.61 | | | $ | 1.72 | | | $ | 1.35 | | | $ | 1.17 | | | $ | 1.21 | | | |
| | | | | | | | | | | | | | | | | | | | | | | | | | | | | | | | | | | | | | | | | | | | | | | | |
| | 2.34 | (b) | | | 11.16 | | | | 32.13 | | | | 14.73 | | | | 0.24 | | | | 17.78 | | | | 2.04 | (b) | | | 5.17 | | | | 29.35 | | | | 15.46 | | | | (2.46 | ) | | | 27.72 | | | |
| | 316 | | | | 324 | | | | 318 | | | | 256 | | | | 250 | | | | 271 | | | | 398 | | | | 393 | | | | 382 | | | | 290 | | | | 260 | | | | 277 | | | |
| | 1.31 | (c) | | | 1.35 | | | | 1.44 | | | | 1.52 | | | | 1.24 | | | | 1.21 | | | | 0.98 | (c) | | | 1.02 | | | | 1.70 | | | | 1.67 | | | | 0.92 | | | | 0.99 | | | |
| | 0.50 | (c) | | | 0.49 | | | | 0.51 | | | | 0.55 | | | | 0.56 | | | | 0.57 | | | | 0.83 | (c) | | | 0.84 | | | | 0.87 | | | | 0.90 | | | | 0.90 | | | | 0.92 | | | |
| | 0.50 | (c) | | | 0.49 | | | | 0.51 | | | | 0.55 | | | | 0.56 | | | | 0.57 | | | | 0.83 | (c) | | | 0.84 | | | | 0.87 | | | | 0.90 | | | | 0.90 | | | | 0.92 | | | |
| | 7.57 | (b) | | | 15.38 | | | | 28.48 | | | | 17.37 | | | | 24.67 | | | | 22.71 | | | | 8.76 | (b) | | | 38.09 | | | | 41.36 | | | | 24.71 | | | | 23.34 | | | | 35.34 | | | |
The accompanying notes are an integral part of these financial statements.
67
MUTUAL OF AMERICA INVESTMENT CORPORATION
FINANCIAL HIGHLIGHTS (Continued)
| | | | | | | | | | | | | | | | | | | | | | | | |
| | | Small Cap Growth Fund | |
| | | Six Months
Ended
June 30,
2015
(Unaudited) | | | Years Ended December 31, | |
| | | | 2014 | | | 2013 | | | 2012 | | | 2011 | | | 2010 | |
Net Asset Value, Beginning of Period | | $ | 1.54 | | | $ | 1.58 | | | $ | 1.22 | | | $ | 1.16 | | | $ | 1.19 | | | $ | 0.89 | |
| | | | | | | | | | | | | | | | | | | | | | | | |
| | | | | | |
INCOME (LOSS)FROM INVESTMENT OPERATIONS: | | | | | | | | | | | | | | | | | | | | | | | | |
Net Investment Income (Loss) | | | — | (f) | | | — | (f) | | | — | (f) | | | — | (f) | | | — | (f) | | | — | (f) |
Net Realized and Unrealized Gains (Losses) on Investments and Futures Contracts | | | 0.13 | | | | 0.09 | | | | 0.47 | | | | 0.07 | | | | (0.03 | ) | | | 0.30 | |
| | | | | | | | | | | | | | | | | | | | | | | | |
Total From Investment Operations | | | 0.13 | | | | 0.09 | | | | 0.47 | | | | 0.07 | | | | (0.03 | ) | | | 0.30 | |
| | | | | | | | | | | | | | | | | | | | | | | | |
| | | | | | |
Less: Distributions | | | | | | | | | | | | | | | | | | | | | | | | |
From Net Investment Income | | | — | | | | — | (f) | | | — | | | | — | | | | — | | | | — | |
From Net Realized Gains | | | — | | | | (0.13 | ) | | | (0.11 | ) | | | (0.01 | ) | | | — | | | | — | |
| | | | | | | | | | | | | | | | | | | | | | | | |
Total Distributions | | | — | | | | (0.13 | ) | | | (0.11 | ) | | | (0.01 | ) | | | — | | | | — | |
| | | �� | | | | | | | | | | | | | | | | | | | | | |
Net Asset Value, End of Period | | $ | 1.67 | | | $ | 1.54 | | | $ | 1.58 | | | $ | 1.22 | | | $ | 1.16 | | | $ | 1.19 | |
| | | | | | | | | | | | | | | | | | | | | | | | |
Total Return (%) | | | 8.60 | (b) | | | 5.70 | | | | 41.19 | | | | 5.62 | | | | (2.28 | ) | | | 33.27 | |
Net Assets, End of Period ($ millions) | | | 447 | | | | 412 | | | | 424 | | | | 272 | | | | 271 | | | | 281 | |
Ratio of Net Investment Income (Loss) to Average Net Assets (%) | | | (0.02 | )(c) | | | (0.09 | ) | | | 0.19 | | | | (0.08 | ) | | | (0.31 | ) | | | (0.26 | ) |
Ratio of Expenses to Average Net Assets Before Expense Reimbursement (%) | | | 0.81 | (c) | | | 0.84 | | | | 0.86 | | | | 0.90 | | | | 0.90 | | | | 0.92 | |
Ratio of Expenses to Average Net Assets After Expense Reimbursement (%) | | | 0.81 | (c) | | | 0.84 | | | | 0.86 | | | | 0.90 | | | | 0.90 | | | | 0.92 | |
Portfolio Turnover Rate (%)(a) | | | 34.65 | (b) | | | 67.58 | | | | 53.36 | | | | 66.69 | | | | 59.53 | | | | 50.73 | |
| (a) | Portfolio turnover rate excludes all short-term securities. |
| (d) | Allocation and Retirement Funds exclude expenses of the underlying funds. |
| (e) | For the period October 1, 2012 (commencement of operations) through December 31, 2012. |
| (f) | Amount is less than $0.005 per share. |
NA = Not Applicable
The accompanying notes are an integral part of these financial statements.
68
| | | | | | | | | | | | | | | | | | | | | | | | | | | | | | | | | | | | | | | | | | | | | | | | |
| Mid Cap Value Fund | | | Mid-Cap Equity Index Fund | | | |
Six Months
Ended
June 30,
2015
(Unaudited) | | | Years Ended December 31, | | | Six Months
Ended
June 30,
2015
(Unaudited) | | | Years Ended December 31, | | | |
| | 2014 | | | 2013 | | | 2012 | | | 2011 | | | 2010 | | | | 2014 | | | 2013 | | | 2012 | | | 2011 | | | 2010 | | | |
| $ | 1.63 | | | $ | 1.53 | | | $ | 1.23 | | | $ | 1.11 | | | $ | 1.15 | | | $ | 0.98 | | | $ | 2.16 | | | $ | 2.08 | | | $ | 1.63 | | | $ | 1.43 | | | $ | 1.51 | | | $ | 1.24 | | | |
| | | | | | | | | | | | | | | | | | | | | | | | | | | | | | | | | | | | | | | | | | | | | | | | |
| | | | | | | | | | | | |
| | | | | | | | | | | | | | | | | | | | | | | | | | | | | | | | | | | | | | | | | | | | | | | | |
| | 0.01 | | | | 0.02 | | | | 0.01 | | | | 0.02 | | | | 0.01 | | | | 0.01 | | | | 0.02 | | | | 0.03 | | | | 0.02 | | | | 0.02 | | | | 0.02 | | | | 0.01 | | | |
| | | | | | | | | | | | |
| | (0.01 | ) | | | 0.19 | | | | 0.33 | | | | 0.10 | | | | (0.04 | ) | | | 0.17 | | | | 0.07 | | | | 0.17 | | | | 0.51 | | | | 0.24 | | | | (0.05 | ) | | | 0.31 | | | |
| | | | | | | | | | | | | | | | | | | | | | | | | | | | | | | | | | | | | | | | | | | | | | | | |
| | 0.00 | | | | 0.21 | | | | 0.34 | | | | 0.12 | | | | (0.03 | ) | | | 0.18 | | | | 0.09 | | | | 0.20 | | | | 0.53 | | | | 0.26 | | | | (0.03 | ) | | | 0.32 | | | |
| | | | | | | | | | | | | | | | | | | | | | | | | | | | | | | | | | | | | | | | | | | | | | | | |
| | | | | | | | | | | | |
| | | | | | | | | | | | | | | | | | | | | | | | | | | | | | | | | | | | | | | | | | | | | | | | |
| | — | | | | (0.01 | ) | | | (0.01 | ) | | | — | | | | (0.01 | ) | | | (0.01 | ) | | | — | | | | (0.02 | ) | | | (0.02 | ) | | | — | | | | (0.02 | ) | | | (0.01 | ) | | |
| | — | | | | (0.10 | ) | | | (0.03 | ) | | | — | | | | — | | | | — | | | | — | | | | (0.10 | ) | | | (0.06 | ) | | | (0.06 | ) | | | (0.03 | ) | | | (0.04 | ) | | |
| | | | | | | | | | | | | | | | | | | | | | | | | | | | | | | | | | | | | | | | | | | | | | | | |
| | — | | | | (0.11 | ) | | | (0.04 | ) | | | — | | | | (0.01 | ) | | | (0.01 | ) | | | — | | | | (0.12 | ) | | | (0.08 | ) | | | (0.06 | ) | | | (0.05 | ) | | | (0.05 | ) | | |
| | | | | | | | | | | | | | | | | | | | | | | | | | | | | | | | | | | | | | | | | | | | | | | | |
| $ | 1.63 | | | $ | 1.63 | | | $ | 1.53 | | | $ | 1.23 | | | $ | 1.11 | | | $ | 1.15 | | | $ | 2.25 | | | $ | 2.16 | | | $ | 2.08 | | | $ | 1.63 | | | $ | 1.43 | | | $ | 1.51 | | | |
| | | | | | | | | | | | | | | | | | | | | | | | | | | | | | | | | | | | | | | | | | | | | | | | |
| | 0.47 | (b) | | | 13.82 | | | | 27.78 | | | | 11.01 | | | | (2.12 | ) | | | 18.94 | | | | 4.13 | (b) | | | 9.63 | | | | 33.21 | | | | 17.80 | | | | (1.99 | ) | | | 26.28 | | | |
| | 90 | | �� | | 92 | | | | 72 | | | | 53 | | | | 51 | | | | 55 | | | | 1,035 | | | | 1,001 | | | | 902 | | | | 610 | | | | 505 | | | | 494 | | | |
| | 1.26 | (c) | | | 1.25 | | | | 1.08 | | | | 1.36 | | | | 1.19 | | | | 1.25 | | | | 1.35 | (c) | | | 1.31 | | | | 1.25 | | | | 1.50 | | | | 1.14 | | | | 1.16 | | | |
| | 0.63 | (c) | | | 0.64 | | | | 0.66 | | | | 0.70 | | | | 0.70 | | | | 0.72 | | | | 0.14 | (c) | | | 0.17 | | | | 0.19 | | | | 0.22 | | | | 0.23 | | | | 0.25 | | | |
| | 0.63 | (c) | | | 0.64 | | | | 0.66 | | | | 0.70 | | | | 0.70 | | | | 0.72 | | | | 0.14 | (c) | | | 0.17 | | | | 0.19 | | | | 0.22 | | | | 0.23 | | | | 0.25 | | | |
| | 9.53 | (b) | | | 40.91 | | | | 36.42 | | | | 29.05 | | | | 12.99 | | | | 29.88 | | | | 9.75 | (b) | | | 16.29 | | | | 13.30 | | | | 12.98 | | | | 15.98 | | | | 13.29 | | | |
The accompanying notes are an integral part of these financial statements.
69
MUTUAL OF AMERICA INVESTMENT CORPORATION
FINANCIAL HIGHLIGHTS (Continued)
| | | | | | | | | | | | | | | | | | | | | | | | |
| | | International Fund | |
| | | Six Months
Ended
June 30,
2015
(Unaudited) | | | Years Ended December 31, | |
| | | | 2014 | | | 2013 | | | 2012 | | | 2011 | | | 2010 | |
Net Asset Value, Beginning of Period | | $ | 0.77 | | | $ | 0.84 | | | $ | 0.71 | | | $ | 0.60 | | | $ | 0.71 | | | $ | 0.67 | |
| | | | | | | | | | | | | | | | | | | | | | | | |
| | | | | | |
INCOME (LOSS)FROM INVESTMENT OPERATIONS: | | | | | | | | | | | | | | | | | | | | | | | | |
Net Investment Income (Loss) | | | 0.01 | | | | 0.02 | | | | 0.02 | | | | 0.02 | | | | 0.02 | | | | 0.02 | |
Net Realized and Unrealized Gains (Losses) on Investments and Futures Contracts | | | 0.04 | | | | (0.08 | ) | | | 0.13 | | | | 0.09 | | | | (0.11 | ) | | | 0.04 | |
| | | | | | | | | | | | | | | | | | | | | | | | |
Total From Investment Operations | | | 0.05 | | | | (0.06 | ) | | | 0.15 | | | | 0.11 | | | | (0.09 | ) | | | 0.06 | |
| | | | | | | | | | | | | | | | | | | | | | | | |
| | | | | | |
Less: Distributions | | | | | | | | | | | | | | | | | | | | | | | | |
From Net Investment Income | | | — | | | | (0.01 | ) | | | (0.02 | ) | | | — | (f) | | | (0.02 | ) | | | (0.02 | ) |
From Net Realized Gains | | | — | | | | — | (f) | | | — | | | | — | (f) | | | — | (f) | | | — | |
| | | | | | | | | | | | | | | | | | | | | | | | |
Total Distributions | | | — | | | | (0.01 | ) | | | (0.02 | ) | | | — | | | | (0.02 | ) | | | (0.02 | ) |
| | | | | | | | | | | | | | | | | | | | | | | | |
Net Asset Value, End of Period | | $ | 0.82 | | | $ | 0.77 | | | $ | 0.84 | | | $ | 0.71 | | | $ | 0.60 | | | $ | 0.71 | |
| | | | | | | | | | | | | | | | | | | | | | | | |
Total Return (%) | | | 6.26 | (b) | | | (6.03 | ) | | | 21.00 | | | | 18.24 | | | | (12.60 | ) | | | 8.32 | |
Net Assets, End of Period ($ millions) | | | 320 | | | | 264 | | | | 174 | | | | 115 | | | | 69 | | | | 61 | |
Ratio of Net Investment Income (Loss) to Average Net Assets (%) | | | 3.36 | (c) | | | 3.48 | | | | 2.76 | | | | 3.20 | | | | 3.24 | | | | 3.48 | |
Ratio of Expenses to Average Net Assets Before Expense Reimbursement (%)(d) | | | 0.14 | (c) | | | 0.17 | | | | 0.18 | | | | 0.21 | | | | 0.23 | | | | 0.24 | |
Ratio of Expenses to Average Net Assets After Expense Reimbursement (%)(d) | | | 0.14 | (c) | | | 0.17 | | | | 0.18 | | | | 0.21 | | | | 0.23 | | | | 0.24 | |
Portfolio Turnover Rate (%)(a) | | | — | (b) | | | 0.61 | | | | 10.22 | | | | 0.28 | | | | 1.44 | | | | 9.17 | |
| (a) | Portfolio turnover rate excludes all short-term securities. |
| (d) | Allocation and Retirement Funds exclude expenses of the underlying funds. |
| (e) | For the period October 1, 2012 (commencement of operations) through December 31, 2012. |
| (f) | Amount is less than $0.005 per share. |
NA = Not Applicable
The accompanying notes are an integral part of these financial statements.
70
| | | | | | | | | | | | | | | | | | | | | | | | | | | | | | | | | | | | | | | | | | | | | | | | |
| Composite Fund | | | Retirement Income Fund | | | |
Six Months
Ended
June 30,
2015
(Unaudited) | | | Years Ended December 31, | | | Six Months
Ended
June 30,
2015
(Unaudited) | | | Years Ended December 31, | | | |
| | 2014 | | | 2013 | | | 2012 | | | 2011 | | | 2010 | | | | 2014 | | | 2013 | | | 2012 | | | 2011 | | | 2010 | | | |
| $ | 2.00 | | | $ | 1.87 | | | $ | 1.64 | | | $ | 1.47 | | | $ | 1.50 | | | $ | 1.39 | | | $ | 1.16 | | | $ | 1.13 | | | $ | 1.07 | | | $ | 1.05 | | | $ | 1.03 | | | $ | 0.97 | | | |
| | | | | | | | | | | | | | | | | | | | | | | | | | | | | | | | | | | | | | | | | | | | | | | | |
| | | | | | | | | | | | |
| | | | | | | | | | | | | | | | | | | | | | | | | | | | | | | | | | | | | | | | | | | | | | | | |
| | 0.02 | | | | 0.04 | | | | 0.04 | | | | 0.04 | | | | 0.04 | | | | 0.04 | | | | — | (f) | | | 0.02 | | | | 0.02 | | | | — | (f) | | | 0.03 | | | | 0.02 | | | |
| | | | | | | | | | | | |
| | 0.02 | | | | 0.13 | | | | 0.23 | | | | 0.13 | | | | — | | | | 0.11 | | | | 0.02 | | | | 0.05 | | | | 0.06 | | | | 0.07 | | | | 0.02 | | | | 0.07 | | | |
| | | | | | | | | | | | | | | | | | | | | | | | | | | | | | | | | | | | | | | | | | | | | | | | |
| | 0.04 | | | | 0.17 | | | | 0.27 | | | | 0.17 | | | | 0.04 | | | | 0.15 | | | | 0.02 | | | | 0.07 | | | | 0.08 | | | | 0.07 | | | | 0.05 | | | | 0.09 | | | |
| | | | | | | | | | | | | | | | | | | | | | | | | | | | | | | | | | | | | | | | | | | | | | | | |
| | | | | | | | | | | | |
| | | | | | | | | | | | | | | | | | | | | | | | | | | | | | | | | | | | | | | | | | | | | | | | |
| | — | | | | (0.04 | ) | | | (0.04 | ) | | | — | (f) | | | (0.07 | ) | | | (0.04 | ) | | | — | | | | (0.02 | ) | | | — | (f) | | | (0.03 | ) | | | (0.03 | ) | | | (0.02 | ) | | |
| | — | | | | — | | | | — | | | | — | | | | — | | | | — | | | | — | | | | (0.02 | ) | | | (0.02 | ) | | | (0.02 | ) | | | — | (f) | | | (0.01 | ) | | |
| | | | | | | | | | | | | | | | | | | | | | | | | | | | | | | | | | | | | | | | | | | �� | | | | | |
| | — | | | | (0.04 | ) | | | (0.04 | ) | | | — | | | | (0.07 | ) | | | (0.04 | ) | | | — | | | | (0.04 | ) | | | (0.02 | ) | | | (0.05 | ) | | | (0.03 | ) | | | (0.03 | ) | | |
| | | | | | | | | | | | | | | | | | | | | | | | | | | | | | | | | | | | | | | | | | | | | | | | |
| $ | 2.04 | | | $ | 2.00 | | | $ | 1.87 | | | $ | 1.64 | | | $ | 1.47 | | | $ | 1.50 | | | $ | 1.18 | | | $ | 1.16 | | | $ | 1.13 | | | $ | 1.07 | | | $ | 1.05 | | | $ | 1.03 | | | |
| | | | | | | | | | | | | | | | | | | | | | | | | | | | | | | | | | | | | | | | | | | | | | | | |
| | 1.84 | (b) | | | 9.10 | | | | 16.37 | | | | 11.65 | | | | 2.84 | | | | 11.02 | | | | 1.22 | (b) | | | 6.50 | | | | 7.40 | | | | 7.15 | | | | 4.72 | | | | 9.04 | | | |
| | 191 | | | | 194 | | | | 186 | | | | 170 | | | | 161 | | | | 167 | | | | 56 | | | | 54 | | | | 40 | | | | 31 | | | | 23 | | | | 18 | | | |
| | 1.92 | (c) | | | 2.09 | | | | 2.04 | | | | 2.17 | | | | 2.22 | | | | 2.26 | | | | (0.05 | )(c) | | | 2.21 | | | | 2.18 | | | | (0.03 | ) | | | 3.03 | | | | 3.65 | | | |
| | 0.50 | (c) | | | 0.49 | | | | 0.51 | | | | 0.55 | | | | 0.56 | | | | 0.57 | | | | 0.05 | (c) | | | 0.05 | | | | 0.05 | | | | 0.05 | | | | 0.05 | | | | 0.05 | | | |
| | 0.50 | (c) | | | 0.49 | | | | 0.51 | | | | 0.55 | | | | 0.56 | | | | 0.57 | | | | 0.05 | (c) | | | 0.05 | | | | 0.05 | | | | 0.05 | | | | 0.05 | | | | 0.05 | | | |
| | 6.99 | (b) | | | 12.31 | | | | 20.98 | | | | 25.42 | | | | 22.69 | | | | 36.00 | | | | 13.19 | (b) | | | 17.63 | | | | 24.01 | | | | 18.07 | | | | 23.77 | | | | 17.62 | | | |
The accompanying notes are an integral part of these financial statements.
71
MUTUAL OF AMERICA INVESTMENT CORPORATION
FINANCIAL HIGHLIGHTS (Continued)
| | | | | | | | | | | | | | | | | | | | | | | | |
| | | 2010 Retirement Fund | |
| | | Six Months
Ended
June 30,
2015
(Unaudited) | | | Years Ended December 31, | |
| | | | 2014 | | | 2013 | | | 2012 | | | 2011 | | | 2010 | |
Net Asset Value, Beginning of Period | | $ | 1.09 | | | $ | 1.06 | | | $ | 1.00 | | | $ | 0.97 | | | $ | 0.96 | | | $ | 0.87 | |
| | | | | | | | | | | | | | | | | | | | | | | | |
| | | | | | |
INCOME (LOSS)FROM INVESTMENT OPERATIONS: | | | | | | | | | | | | | | | | | | | | | | | | |
Net Investment Income (Loss) | | | — | (f) | | | 0.02 | | | | 0.02 | | | | — | (f) | | | 0.02 | | | | 0.02 | |
Net Realized and Unrealized Gains (Losses) on Investments and Futures Contracts | | | 0.01 | | | | 0.06 | | | | 0.09 | | | | 0.09 | | | | 0.01 | | | | 0.07 | |
| | | | | | | | | | | | | | | | | | | | | | | | |
Total From Investment Operations | | | 0.01 | | | | 0.08 | | | | 0.11 | | | | 0.09 | | | | 0.03 | | | | 0.09 | |
| | | | | | | | | | | | | | | | | | | | | | | | |
| | | | | | |
Less: Distributions | | | | | | | | | | | | | | | | | | | | | | | | |
From Net Investment Income | | | — | | | | (0.02 | ) | | | — | (f) | | | (0.02 | ) | | | (0.02 | ) | | | — | (f) |
From Net Realized Gains | | | — | | | | (0.03 | ) | | | (0.05 | ) | | | (0.04 | ) | | | — | (f) | | | — | (f) |
| | | | | | | | | | | | | | | | | | | | | | | | |
Total Distributions | | | — | | | | (0.05 | ) | | | (0.05 | ) | | | (0.06 | ) | | | (0.02 | ) | | | — | |
| | | | | | | | | | | | | | | | | | | | | | | | |
Net Asset Value, End of Period | | $ | 1.10 | | | $ | 1.09 | | | $ | 1.06 | | | $ | 1.00 | | | $ | 0.97 | | | $ | 0.96 | |
| | | | | | | | | | | | | | | | | | | | | | | | |
Total Return (%) | | | 1.51 | (b) | | | 6.93 | | | | 11.78 | | | | 9.69 | | | | 3.08 | | | | 11.36 | |
Net Assets, End of Period ($ millions) | | | 27 | | | | 27 | | | | 24 | | | | 21 | | | | 21 | | | | 19 | |
Ratio of Net Investment Income (Loss) to Average Net Assets (%) | | | (0.05 | )(c) | | | 2.06 | | | | 2.09 | | | | (0.03 | ) | | | 2.41 | | | | 2.67 | |
Ratio of Expenses to Average Net Assets Before Expense Reimbursement (%)(d) | | | 0.05 | (c) | | | 0.05 | | | | 0.05 | | | | 0.05 | | | | 0.05 | | | | 0.05 | |
Ratio of Expenses to Average Net Assets After Expense Reimbursement (%)(d) | | | 0.05 | (c) | | | 0.05 | | | | 0.05 | | | | 0.05 | | | | 0.05 | | | | 0.05 | |
Portfolio Turnover Rate (%)(a) | | | 11.04 | (b) | | | 20.45 | | | | 19.60 | | | | 26.61 | | | | 21.22 | | | | 18.31 | |
| (a) | Portfolio turnover rate excludes all short-term securities. |
| (d) | Allocation and Retirement Funds exclude expenses of the underlying funds. |
| (e) | For the period October 1, 2012 (commencement of operations) through December 31, 2012. |
| (f) | Amount is less than $0.005 per share. |
NA = Not Applicable
The accompanying notes are an integral part of these financial statements.
72
| | | | | | | | | | | | | | | | | | | | | | | | | | | | | | | | | | | | | | | | | | | | | | | | |
| 2015 Retirement Fund | | | 2020 Retirement Fund | | | |
Six Months
Ended
June 30,
2015
(Unaudited) | | | Years Ended December 31, | | | Six Months
Ended
June 30,
2015
(Unaudited) | | | Years Ended December 31, | | | |
| | 2014 | | | 2013 | | | 2012 | | | 2011 | | | 2010 | | | | 2014 | | | 2013 | | | 2012 | | | 2011 | | | 2010 | | | |
| $ | 1.13 | | | $ | 1.10 | | | $ | 1.00 | | | $ | 0.93 | | | $ | 0.93 | | | $ | 0.83 | | | $ | 1.18 | | | $ | 1.13 | | | $ | 0.99 | | | $ | 0.90 | | | $ | 0.91 | | | $ | 0.80 | | | |
| | | | | | | | | | | | | | | | | | | | | | | | | | | | | | | | | | | | | | | | | | | | | | | | |
| | | | | | | | | | | | |
| | | | | | | | | | | | | | | | | | | | | | | | | | | | | | | | | | | | | | | | | | | | | | | | |
| | — | (f) | | | 0.02 | | | | 0.02 | | | | — | (f) | | | 0.02 | | | | 0.02 | | | | — | (f) | | | 0.02 | | | | 0.02 | | | | — | (f) | | | 0.02 | | | | 0.02 | | | |
| | | | | | | | | | | | |
| | 0.02 | | | | 0.06 | | | | 0.12 | | | | 0.10 | | | | — | (f) | | | 0.08 | | | | 0.03 | | | | 0.06 | | | | 0.14 | | | | 0.11 | | | | (0.01 | ) | | | 0.09 | | | |
| | | | | | | | | | | | | | | | | | | | | | | | | | | | | | | | | | | | | | | | | | | | | | | | |
| | 0.02 | | | | 0.08 | | | | 0.14 | | | | 0.10 | | | | 0.02 | | | | 0.10 | | | | 0.03 | | | | 0.08 | | | | 0.16 | | | | 0.11 | | | | 0.01 | | | | 0.11 | | | |
| | | | | | | | | | | | | | | | | | | | | | | | | | | | | | | | | | | | | | | | | | | | | | | | |
| | | | | | | | | | | | |
| | | | | | | | | | | | | | | | | | | | | | | | | | | | | | | | | | | | | | | | | | | | | | | | |
| | — | | | | (0.02 | ) | | | — | (f) | | | (0.02 | ) | | | (0.02 | ) | | | — | (f) | | | — | | | | (0.02 | ) | | | — | (f) | | | (0.02 | ) | | | (0.02 | ) | | | — | (f) | | |
| | — | | | | (0.03 | ) | | | (0.04 | ) | | | (0.01 | ) | | | — | (f) | | | — | (f) | | | — | | | | (0.01 | ) | | | (0.02 | ) | | | — | (f) | | | — | (f) | | | — | (f) | | |
| | | | | | | | | | | | | | | | | | | | | | | | | | | | | | | | | | | | | | | | | | | | | | | | |
| | — | | | | (0.05 | ) | | | (0.04 | ) | | | (0.03 | ) | | | (0.02 | ) | | | — | | | | — | | | | (0.03 | ) | | | (0.02 | ) | | | (0.02 | ) | | | (0.02 | ) | | | — | | | |
| | | | | | | | | | | | | | | | | | | | | | | | | | | | | | | | | | | | | | | | | | | | | | | | |
| $ | 1.15 | | | $ | 1.13 | | | $ | 1.10 | | | $ | 1.00 | | | $ | 0.93 | | | $ | 0.93 | | | $ | 1.21 | | | $ | 1.18 | | | $ | 1.13 | | | $ | 0.99 | | | $ | 0.90 | | | $ | 0.91 | | | |
| | | | | | | | | | | | | | | | | | | | | | | | | | | | | | | | | | | | | | | | | | | | | | | | |
| | 1.84 | (b) | | | 7.16 | | | | 14.80 | | | | 10.59 | | | | 2.09 | | | | 12.27 | | | | 2.04 | (b) | | | 7.36 | | | | 17.72 | | | | 11.69 | | | | 1.55 | | | | 13.90 | | | |
| | 156 | | | | 154 | | | | 138 | | | | 112 | | | | 91 | | | | 78 | | | | 348 | | | | 320 | | | | 251 | | | | 169 | | | | 118 | | | | 90 | | | |
| | (0.06 | )(c) | | | 2.00 | | | | 2.07 | | | | (0.03 | ) | | | 2.53 | | | | 2.79 | | | | (0.06 | )(c) | | | 1.92 | | | | 1.85 | | | | (0.03 | ) | | | 2.63 | | | | 2.76 | | | |
| | 0.06 | (c) | | | 0.05 | | | | 0.05 | | | | 0.05 | | | | 0.05 | | | | 0.05 | | | | 0.06 | (c) | | | 0.05 | | | | 0.05 | | | | 0.05 | | | | 0.05 | | | | 0.05 | | | |
| | 0.06 | (c) | | | 0.05 | | | | 0.05 | | | | 0.05 | | | | 0.05 | | | | 0.05 | | | | 0.06 | (c) | | | 0.05 | | | | 0.05 | | | | 0.05 | | | | 0.05 | | | | 0.05 | | | |
| | 8.62 | (b) | | | 16.41 | | | | 11.83 | | | | 19.59 | | | | 8.10 | | | | 5.64 | | | | 4.03 | (b) | | | 9.54 | | | | 3.56 | | | | 9.89 | | | | 4.73 | | | | 2.62 | | | |
The accompanying notes are an integral part of these financial statements.
73
MUTUAL OF AMERICA INVESTMENT CORPORATION
FINANCIAL HIGHLIGHTS (Continued)
| | | | | | | | | | | | | | | | | | | | | | | | |
| | | 2025 Retirement Fund | |
| | | Six Months
Ended
June 30,
2015
(Unaudited) | | | Years Ended December 31, | |
| | | | 2014 | | | 2013 | | | 2012 | | | 2011 | | | 2010 | |
Net Asset Value, Beginning of Period | | $ | 1.23 | | | $ | 1.16 | | | $ | 0.98 | | | $ | 0.89 | | | $ | 0.90 | | | $ | 0.78 | |
| | | | | | | | | | | | | | | | | | | | | | | | |
| | | | | | |
INCOME (LOSS)FROM INVESTMENT OPERATIONS: | | | | | | | | | | | | | | | | | | | | | | | | |
Net Investment Income (Loss) | | | — | (f) | | | 0.02 | | | | 0.02 | | | | — | (f) | | | 0.02 | | | | 0.02 | |
Net Realized and Unrealized Gains (Losses) on Investments and Futures Contracts | | | 0.03 | | | | 0.08 | | | | 0.18 | | | | 0.11 | | | | (0.02 | ) | | | 0.10 | |
| | | | | | | | | | | | | | | | | | | | | | | | |
Total From Investment Operations | | | 0.03 | | | | 0.10 | | | | 0.20 | | | | 0.11 | | | | — | | | | 0.12 | |
| | | | | | | | | | | | | | | | | | | | | | | | |
| | | | | | |
Less: Distributions | | | | | | | | | | | | | | | | | | | | | | | | |
From Net Investment Income | | | — | | | | (0.02 | ) | | | — | (f) | | | (0.02 | ) | | | (0.01 | ) | | | — | (f) |
From Net Realized Gains | | | — | | | | (0.01 | ) | | | (0.02 | ) | | | — | (f) | | | — | (f) | | | — | (f) |
| | | | | | | | | | | | | | | | | | | | | | | | |
Total Distributions | | | — | | | | (0.03 | ) | | | (0.02 | ) | | | (0.02 | ) | | | (0.01 | ) | | | — | |
| | | | | | | | | | | | | | | | | | | | | | | | |
Net Asset Value, End of Period | | $ | 1.26 | | | $ | 1.23 | | | $ | 1.16 | | | $ | 0.98 | | | $ | 0.89 | | | $ | 0.90 | |
| | | | | | | | | | | | | | | | | | | | | | | | |
Total Return (%) | | | 2.30 | (b) | | | 8.00 | | | | 21.11 | | | | 12.90 | | | | 0.83 | | | | 15.49 | |
Net Assets, End of Period ($ millions) | | | 369 | | | | 331 | | | | 257 | | | | 162 | | | | 109 | | | | 81 | |
Ratio of Net Investment Income (Loss) to Average Net Assets (%) | | | (0.06 | )(c) | | | 1.75 | | | | 1.67 | | | | (0.04 | ) | | | 2.49 | | | | 2.50 | |
Ratio of Expenses to Average Net Assets Before Expense Reimbursement (%)(d) | | | 0.06 | (c) | | | 0.05 | | | | 0.05 | | | | 0.05 | | | | 0.05 | | | | 0.05 | |
Ratio of Expenses to Average Net Assets After Expense Reimbursement (%)(d) | | | 0.06 | (c) | | | 0.05 | | | | 0.05 | | | | 0.05 | | | | 0.05 | | | | 0.05 | |
Portfolio Turnover Rate (%)(a) | | | 2.49 | (b) | | | 6.00 | | | | 1.49 | | | | 8.59 | | | | 2.52 | | | | 3.16 | |
| (a) | Portfolio turnover rate excludes all short-term securities. |
| (d) | Allocation and Retirement Funds exclude expenses of the underlying funds. |
| (e) | For the period October 1, 2012 (commencement of operations) through December 31, 2012. |
| (f) | Amount is less than $0.005 per share. |
NA = Not Applicable
The accompanying notes are an integral part of these financial statements.
74
| | | | | | | | | | | | | | | | | | | | | | | | | | | | | | | | | | | | | | | | | | | | | | | | |
| 2030 Retirement Fund | | | 2035 Retirement Fund | | | |
Six Months
Ended
June 30,
2015
(Unaudited) | | | Years Ended December 31, | | | Six Months
Ended
June 30,
2015
(Unaudited) | | | Years Ended December 31, | | | |
| | 2014 | | | 2013 | | | 2012 | | | 2011 | | | 2010 | | | | 2014 | | | 2013 | | | 2012 | | | 2011 | | | 2010 | | | |
| $ | 1.27 | | | $ | 1.19 | | | $ | 0.98 | | | $ | 0.88 | | | $ | 0.90 | | | $ | 0.77 | | | $ | 1.27 | | | $ | 1.20 | | | $ | 0.97 | | | $ | 0.86 | | | $ | 0.88 | | | $ | 0.75 | | | |
| | | | | | | | | | | | | | | | | | | | | | | | | | | | | | | | | | | | | | | | | | | | | | | | |
| | | | | | | | | | | | |
| | | | | | | | | | | | | | | | | | | | | | | | | | | | | | | | | | | | | | | | | | | | | | | | |
| | — | (f) | | | 0.02 | | | | 0.02 | | | | — | (f) | | | 0.02 | | | | 0.02 | | | | — | (f) | | | 0.01 | | | | 0.01 | | | | — | (f) | | | 0.01 | | | | 0.01 | | | |
| | | | | | | | | | | | |
| | 0.03 | | | | 0.09 | | | | 0.21 | | | | 0.12 | | | | (0.02 | ) | | | 0.11 | | | | 0.03 | | | | 0.08 | | | | 0.24 | | | | 0.13 | | | | (0.02 | ) | | | 0.12 | | | |
| | | | | | | | | | | | | | | | | | | | | | | | | | | | | | | | | | | | | | | | | | | | | | | | |
| | 0.03 | | | | 0.11 | | | | 0.23 | | | | 0.12 | | | | — | | | | 0.13 | | | | 0.03 | | | | 0.09 | | | | 0.25 | | | | 0.13 | | | | (0.01 | ) | | | 0.13 | | | |
| | | | | | | | | | | | | | | | | | | | | | | | | | | | | | | | | | | | | | | | | | | | | | | | |
| | | | | | | | | | | | |
| | | | | | | | | | | | | | | | | | | | | | | | | | | | | | | | | | | | | | | | | | | | | | | | |
| | — | | | | (0.02 | ) | | | — | (f) | | | (0.02 | ) | | | (0.02 | ) | | | — | (f) | | | — | | | | (0.01 | ) | | | — | (f) | | | (0.02 | ) | | | (0.01 | ) | | | — | (f) | | |
| | — | | | | (0.01 | ) | | | (0.02 | ) | | | — | (f) | | | — | (f) | | | — | (f) | | | — | | | | (0.01 | ) | | | (0.02 | ) | | | — | (f) | | | — | (f) | | | — | (f) | | |
| | | | | | | | | | | | | | | | | | | | | | | | | | | | | | | | | | | | | | | | | | | | | | | | |
| | — | | | | (0.03 | ) | | | (0.02 | ) | | | (0.02 | ) | | | (0.02 | ) | | | — | | | | — | | | | (0.02 | ) | | | (0.02 | ) | | | (0.02 | ) | | | (0.01 | ) | | | — | | | |
| | | | | | | | | | | | | | | | | | | | | | | | | | | | | | | | | | | | | | | | | | | | | | | | |
| $ | 1.30 | | | $ | 1.27 | | | $ | 1.19 | | | $ | 0.98 | | | $ | 0.88 | | | $ | 0.90 | | | $ | 1.30 | | | $ | 1.27 | | | $ | 1.20 | | | $ | 0.97 | | | $ | 0.86 | | | $ | 0.88 | | | |
| | | | | | | | | | | | | | | | | | | | | | | | | | | | | | | | | | | | | | | | | | | | | | | | |
| | 2.45 | (b) | | | 8.44 | | | | 23.72 | | | | 13.69 | | | | 0.21 | | | | 16.59 | | | | 2.74 | (b) | | | 8.26 | | | | 25.92 | | | | 14.39 | | | | (0.63 | ) | | | 17.66 | | | |
| | 308 | | | | 277 | | | | 212 | | | | 133 | | | | 90 | | | | 67 | | | | 255 | | | | 230 | | | | 173 | | | | 107 | | | | 69 | | | | 53 | | | |
| | (0.06 | )(c) | | | 1.66 | | | | 1.60 | | | | (0.04 | ) | | | 2.37 | | | | 2.37 | | | | (0.06 | )(c) | | | 1.52 | | | | 1.47 | | | | (0.04 | ) | | | 2.17 | | | | 2.20 | | | |
| | 0.06 | (c) | | | 0.05 | | | | 0.05 | | | | 0.05 | | | | 0.05 | | | | 0.05 | | | | 0.06 | (c) | | | 0.05 | | | | 0.05 | | | | 0.05 | | | | 0.05 | | | | 0.05 | | | |
| | 0.06 | (c) | | | 0.05 | | | | 0.05 | | | | 0.05 | | | | 0.05 | | | | 0.05 | | | | 0.06 | (c) | | | 0.05 | | | | 0.05 | | | | 0.05 | | | | 0.05 | | | | 0.05 | | | |
| | 2.23 | (b) | | | 5.52 | | | | 1.58 | | | | 7.61 | | | | 2.66 | | | | 1.74 | | | | 2.69 | (b) | | | 4.29 | | | | 1.76 | | | | 6.51 | | | | 2.78 | | | | 1.47 | | | |
The accompanying notes are an integral part of these financial statements.
75
MUTUAL OF AMERICA INVESTMENT CORPORATION
FINANCIAL HIGHLIGHTS (Continued)
| | | | | | | | | | | | | | | | | | | | | | | | |
| | | 2040 Retirement Fund | |
| | | Six Months
Ended
June 30,
2015
(Unaudited) | | | Years Ended December 31, | |
| | | | 2014 | | | 2013 | | | 2012 | | | 2011 | | | 2010 | |
Net Asset Value, Beginning of Period | | $ | 1.26 | | | $ | 1.20 | | | $ | 0.96 | | | $ | 0.85 | | | $ | 0.88 | | | $ | 0.74 | |
| | | | | | | | | | | | | | | | | | | | | | | | |
| | | | | | |
INCOME (LOSS)FROM INVESTMENT OPERATIONS: | | | | | | | | | | | | | | | | | | | | | | | | |
Net Investment Income (Loss) | | | — | (f) | | | 0.01 | | | | 0.01 | | | | — | (f) | | | 0.01 | | | | 0.01 | |
Net Realized and Unrealized Gains (Losses) on Investments and Futures Contracts | | | 0.04 | | | | 0.08 | | | | 0.25 | | | | 0.13 | | | | (0.03 | ) | | | 0.13 | |
| | | | | | | | | | | | | | | | | | | | | | | | |
Total From Investment Operations | | | 0.04 | | | | 0.09 | | | | 0.26 | | | | 0.13 | | | | (0.02 | ) | | | 0.14 | |
| | | | | | | | | | | | | | | | | | | | | | | | |
| | | | | | |
Less: Distributions | | | | | | | | | | | | | | | | | | | | | | | | |
From Net Investment Income | | | — | | | | (0.01 | ) | | | — | (f) | | | (0.02 | ) | | | (0.01 | ) | | | — | (f) |
From Net Realized Gains | | | — | | | | (0.02 | ) | | | (0.02 | ) | | | — | (f) | | | — | (f) | | | — | (f) |
| | | | | | | | | | | | | | | | | | | | | | | | |
Total Distributions | | | — | | | | (0.03 | ) | | | (0.02 | ) | | | (0.02 | ) | | | (0.01 | ) | | | — | |
| | | | | | | | | | | | | | | | | | | | | | | | |
Net Asset Value, End of Period | | $ | 1.30 | | | $ | 1.26 | | | $ | 1.20 | | | $ | 0.96 | | | $ | 0.85 | | | $ | 0.88 | |
| | | | | | | | | | | | | | | | | | | | | | | | |
Total Return (%) | | | 3.11 | (b) | | | 7.71 | | | | 27.20 | | | | 14.63 | | | | (1.24 | ) | | | 18.38 | |
Net Assets, End of Period ($ millions) | | | 210 | | | | 189 | | | | 148 | | | | 94 | | | | 62 | | | | 47 | |
Ratio of Net Investment Income (Loss) to Average Net Assets (%) | | | (0.06 | )(c) | | | 1.40 | | | | 1.39 | | | | (0.04 | ) | | | 2.09 | | | | 2.13 | |
Ratio of Expenses to Average Net Assets Before Expense Reimbursement (%)(d) | | | 0.06 | (c) | | | 0.05 | | | | 0.05 | | | | 0.05 | | | | 0.05 | | | | 0.05 | |
Ratio of Expenses to Average Net Assets After Expense Reimbursement (%)(d) | | | 0.06 | (c) | | | 0.05 | | | | 0.05 | | | | 0.05 | | | | 0.05 | | | | 0.05 | |
Portfolio Turnover Rate (%)(a) | | | 2.73 | (b) | | | 4.31 | | | | 1.37 | | | | 4.99 | | | | 2.28 | | | | 1.37 | |
| (a) | Portfolio turnover rate excludes all short-term securities. |
| (d) | Allocation and Retirement Funds exclude expenses of the underlying funds. |
| (e) | For the period October 1, 2012 (commencement of operations) through December 31, 2012. |
| (f) | Amount is less than $0.005 per share. |
NA = Not Applicable
The accompanying notes are an integral part of these financial statements.
76
| | | | | | | | | | | | | | | | | | | | | | | | | | | | | | | | | | | | | | | | |
| 2045 Retirement Fund | | | 2050 Retirement Fund | | | |
Six Months
Ended
June 30,
2015
(Unaudited) | | | Years Ended December 31, | | | Six Months
Ended
June 30,
2015
(Unaudited) | | | Years Ended December 31, | | | Period Ended
December 31,
2012(e) | | | |
| | 2014 | | | 2013 | | | 2012 | | | 2011 | | | 2010 | | | | 2014 | | | 2013 | | | | |
| $ | 1.26 | | | $ | 1.20 | | | $ | 0.96 | | | $ | 0.85 | | | $ | 0.88 | | | $ | 0.74 | | | $ | 1.39 | | | $ | 1.30 | | | $ | 1.02 | | | $ | 1.00 | | | |
| | | | | | | | | | | | | | | | | | | | | | | | | | | | | | | | | | | | | | | | |
| | | | | | | | | | |
| | | | | | | | | | | | | | | | | | | | | | | | | | | | | | | | | | | | | | | | |
| | — | (f) | | | 0.01 | | | | 0.01 | | | | — | (f) | | | 0.01 | | | | 0.01 | | | | — | (f) | | | 0.01 | | | | — | (f) | | | — | (f) | | |
| | | | | | | | | | |
| | 0.04 | | | | 0.07 | | | | 0.25 | | | | 0.13 | | | | (0.03 | ) | | | 0.13 | | | | 0.05 | | | | 0.08 | | | | 0.28 | | | | 0.02 | | | |
| | | | | | | | | | | | | | | | | | | | | | | | | | | | | | | | | | | | | | | | |
| | 0.04 | | | | 0.08 | | | | 0.26 | | | | 0.13 | | | | (0.02 | ) | | | 0.14 | | | | 0.05 | | | | 0.09 | | | | 0.28 | | | | 0.02 | | | |
| | | | | | | | | | | | | | | | | | | | | | | | | | | | | | | | | | | | | | | | |
| | | | | | | | | | |
| | | | | | | | | | | | | | | | | | | | | | | | | | | | | | | | | | | | | | | | |
| | — | | | | (0.01 | ) | | | — | (f) | | | (0.02 | ) | | | (0.01 | ) | | | — | (f) | | | — | | | | — | (f) | | | — | (f) | | | — | | | |
| | — | | | | (0.01 | ) | | | (0.02 | ) | | | — | (f) | | | — | (f) | | | — | (f) | | | — | | | | — | (f) | | | — | (f) | | | — | | | |
| | | | | | | | | | | | | | | | | | | | | | | | | | | | | | | | | | | | | | | | |
| | — | | | | (0.02 | ) | | | (0.02 | ) | | | (0.02 | ) | | | (0.01 | ) | | | — | | | | — | | | | — | | | | — | | | | — | | | |
| | | | | | | | | | | | | | | | | | | | | | | | | | | | | | | | | | | | | | | | |
| $ | 1.30 | | | $ | 1.26 | | | $ | 1.20 | | | $ | 0.96 | | | $ | 0.85 | | | $ | 0.88 | | | $ | 1.44 | | | $ | 1.39 | | | $ | 1.30 | | | $ | 1.02 | | | |
| | | | | | | | | | | | | | | | | | | | | | | | | | | | | | | | | | | | | | | | |
| | 3.23 | (b) | | | 7.36 | | | | 27.68 | | | | 14.45 | | | | (1.45 | ) | | | 18.57 | | | | 3.36 | (b) | | | 7.15 | | | | 28.17 | | | | 1.83 | (b) | | |
| | 258 | | | | 232 | | | | 186 | | | | 118 | | | | 76 | | | | 54 | | | | 72 | | | | 50 | | | | 20 | | | | 2 | | | |
| | (0.06 | )(c) | | | 1.37 | | | | 1.37 | | | | (0.04 | ) | | | 2.09 | | | | 2.14 | | | | (0.05 | )(c) | | | 1.47 | | | | 0.54 | | | | (0.01 | )(b) | | |
| | 0.06 | (c) | | | 0.05 | | | | 0.05 | | | | 0.05 | | | | 0.05 | | | | 0.05 | | | | 0.05 | (c) | | | 0.05 | | | | 0.05 | | | | 0.05 | (c) | | |
| | 0.06 | (c) | | | 0.05 | | | | 0.05 | | | | 0.05 | | | | 0.05 | | | | 0.05 | | | | 0.05 | (c) | | | 0.05 | | | | 0.05 | | | | 0.05 | (c) | | |
| | 2.37 | (b) | | | 3.48 | | | | 0.93 | | | | 4.03 | | | | 1.97 | | | | 1.04 | | | | 1.21 | (b) | | | 1.53 | | | | 1.22 | | | | 0.76 | (b) | | |
The accompanying notes are an integral part of these financial statements.
77
MUTUAL OF AMERICA INVESTMENT CORPORATION
FINANCIAL HIGHLIGHTS (Continued)
| | | | | | | | | | | | | | | | | | | | | | | | |
| | | Conservative Allocation Fund | |
| | | Six Months
Ended
June 30,
2015
(Unaudited) | | | Years Ended December 31, | |
| | | | 2014 | | | 2013 | | | 2012 | | | 2011 | | | 2010 | |
Net Asset Value, Beginning of Period | | $ | 1.25 | | | $ | 1.22 | | | $ | 1.15 | | | $ | 1.11 | | | $ | 1.08 | | | $ | 0.99 | |
| | | | | | | | | | | | | | | | | | | | | | | | |
| | | | | | |
INCOME (LOSS)FROM INVESTMENT OPERATIONS: | | | | | | | | | | | | | | | | | | | | | | | | |
Net Investment Income (Loss) | | | — | | | | 0.03 | | | | 0.03 | | | | — | (f) | | | 0.03 | | | | 0.03 | |
Net Realized and Unrealized Gains (Losses) on Investments and Futures Contracts | | | 0.02 | | | | 0.05 | | | | 0.05 | | | | 0.08 | | | | 0.03 | | | | 0.06 | |
| | | | | | | | | | | | | | | | | | | | | | | | |
Total From Investment Operations | | | 0.02 | | | | 0.08 | | | | 0.08 | | | | 0.08 | | | | 0.06 | | | | 0.09 | |
| | | | | | | | | | | | | | | | | | | | | | | | |
| | | | | | |
Less: Distributions | | | | | | | | | | | | | | | | | | | | | | | | |
From Net Investment Income | | | — | | | | (0.03 | ) | | | — | (f) | | | (0.03 | ) | | | (0.03 | ) | | | — | (f) |
From Net Realized Gains | | | — | | | | (0.02 | ) | | | (0.01 | ) | | | (0.01 | ) | | | — | (f) | | | — | (f) |
| | | | | | | | | | | | | | | | | | | | | | | | |
Total Distributions | | | — | | | | (0.05 | ) | | | (0.01 | ) | | | (0.04 | ) | | | (0.03 | ) | | | — | |
| | | | | | | | | | | | | | | | | | | | | | | | |
Net Asset Value, End of Period | | $ | 1.27 | | | $ | 1.25 | | | $ | 1.22 | | | $ | 1.15 | | | $ | 1.11 | | | $ | 1.08 | |
| | | | | | | | | | | | | | | | | | | | | | | | |
Total Return (%) | | | 1.47 | (b) | | | 6.62 | | | | 7.34 | | | | 7.44 | | | | 5.79 | | | | 9.34 | |
Net Assets, End of Period ($ millions) | | | 129 | | | | 123 | | | | 98 | | | | 86 | | | | 66 | | | | 52 | |
Ratio of Net Investment Income (Loss) to Average Net Assets (%) | | | (0.01 | ) | | | 2.31 | | | | 2.45 | | | | 0.03 | | | | 3.40 | | | | 3.47 | |
Ratio of Expenses to Average Net Assets Before Expense Reimbursement (%)(d) | | | 0.01 | | | | — | | | | — | | | | — | | | | — | | | | — | |
Ratio of Expenses to Average Net Assets After Expense Reimbursement (%)(d) | | | 0.01 | | | | — | | | | — | | | | — | | | | — | | | | — | |
Portfolio Turnover Rate (%)(a) | | | 3.99 | (b) | | | 17.24 | | | | 10.16 | | | | 10.14 | | | | 12.14 | | | | 20.11 | |
| (a) | Portfolio turnover rate excludes all short-term securities. |
| (d) | Allocation and Retirement Funds exclude expenses of the underlying funds. |
| (e) | For the period October 1, 2012 (commencement of operations) through December 31, 2012. |
| (f) | Amount is less than $0.005 per share. |
NA = Not Applicable
The accompanying notes are an integral part of these financial statements.
78
| | | | | | | | | | | | | | | | | | | | | | | | | | | | | | | | | | | | | | | | | | | | | | | | |
| Moderate Allocation Fund | | | Aggressive Allocation Fund | | | |
Six Months
Ended
June 30,
2015
(Unaudited) | | | Years Ended December 31, | | | Six Months
Ended
June 30,
2015
(Unaudited) | | | Years Ended December 31, | | | |
| | 2014 | | | 2013 | | | 2012 | | | 2011 | | | 2010 | | | | 2014 | | | 2013 | | | 2012 | | | 2011 | | | 2010 | | | |
| $ | 1.52 | | | $ | 1.45 | | | $ | 1.27 | | | $ | 1.18 | | | $ | 1.16 | | | $ | 1.03 | | | $ | 1.77 | | | $ | 1.69 | | | $ | 1.38 | | | $ | 1.24 | | | $ | 1.24 | | | $ | 1.06 | | | |
| | | | | | | | | | | | | | | | | | | | | | | | | | | | | | | | | | | | | | | | | | | | | | | | |
| | | | | | | | | | | | |
| | | | | | | | | | | | | | | | | | | | | | | | | | | | | | | | | | | | | | | | | | | | | | | | |
| | — | | | | 0.03 | | | | 0.03 | | | | — | (f) | | | 0.03 | | | | 0.03 | | | | — | | | | 0.03 | | | | 0.03 | | | | — | (f) | | | 0.02 | | | | 0.02 | | | |
| | | | | | | | | | | | |
| | 0.03 | | | | 0.09 | | | | 0.16 | | | | 0.13 | | | | 0.02 | | | | 0.11 | | | | 0.04 | | | | 0.11 | | | | 0.30 | | | | 0.17 | | | | — | (f) | | | 0.16 | | | |
| | | | | | | | | | | | | | | | | | | | | | | | | | | | | | | | | | | | | | | | | | | | | | | | |
| | 0.03 | | | | 0.12 | | | | 0.19 | | | | 0.13 | | | | 0.05 | | | | 0.14 | | | | 0.04 | | | | 0.14 | | | | 0.33 | | | | 0.17 | | | | 0.02 | | | | 0.18 | | | |
| | | | | | | | | | | | | | | | | | | | | | | | | | | | | | | | | | | | | | | | | | | | | | | | |
| | | | | | | | | | | | |
| | | | | | | | | | | | | | | | | | | | | | | | | | | | | | | | | | | | | | | | | | | | | | | | |
| | — | | | | (0.03 | ) | | | — | (f) | | | (0.03 | ) | | | (0.03 | ) | | | — | (f) | | | — | | | | (0.03 | ) | | | — | (f) | | | (0.03 | ) | | | (0.02 | ) | | | — | (f) | | |
| | — | | | | (0.02 | ) | | | (0.01 | ) | | | (0.01 | ) | | | — | (f) | | | (0.01 | ) | | | — | | | | (0.03 | ) | | | (0.02 | ) | | | — | (f) | | | — | | | | — | | | |
| | | | | | | | | | | | | | | | | | | | | | | | | | | | | | | | | | | | | | | | | | | | | | | | |
| | — | | | | (0.05 | ) | | | (0.01 | ) | | | (0.04 | ) | | | (0.03 | ) | | | (0.01 | ) | | | — | | | | (0.06 | ) | | | (0.02 | ) | | | (0.03 | ) | | | (0.02 | ) | | | — | | | |
| | | | | | | | | | | | | | | | | | | | | | | | | | | | | | | | | | | | | | | | | | | | | | | | |
| $ | 1.55 | | | $ | 1.52 | | | $ | 1.45 | | | $ | 1.27 | | | $ | 1.18 | | | $ | 1.16 | | | $ | 1.81 | | | $ | 1.77 | | | $ | 1.69 | | | $ | 1.38 | | | $ | 1.24 | | | $ | 1.24 | | | |
| | | | | | | | | | | | | | | | | | | | | | | | | | | | | | | | | | | | | | | | | | | | | | | | |
| | 2.01 | (b) | | | 7.71 | | | | 15.66 | | | | 10.90 | | | | 4.19 | | | | 13.11 | | | | 2.82 | (b) | | | 7.66 | | | | 24.19 | | | | 13.41 | | | | 2.31 | | | | 17.02 | | | |
| | 325 | | | | 315 | | | | 281 | | | | 225 | | | | 182 | | | | 163 | | | | 261 | | | | 255 | | | | 236 | | | | 187 | | | | 158 | | | | 147 | | | |
| | (0.01 | ) | | | 1.95 | | | | 2.09 | | | | 0.02 | | | | 2.68 | | | | 2.73 | | | | (0.01 | ) | | | 1.60 | | | | 1.75 | | | | 0.01 | | | | 2.13 | | | | 2.07 | | | |
| | | | | | | | | | | | |
| | 0.01 | | | | — | | | | — | | | | — | | | | — | | | | — | | | | 0.01 | | | | — | | | | — | | | | — | | | | — | | | | — | | | |
| | | | | | | | | | | | |
| | 0.01 | | | | — | | | | — | | | | — | | | | — | | | | — | | | | 0.01 | | | | — | | | | — | | | | — | | | | — | | | | — | | | |
| | 3.91 | (b) | | | 13.87 | | | | 4.71 | | | | 8.11 | | | | 11.21 | | | | 15.68 | | | | 3.89 | (b) | | | 19.61 | | | | 4.93 | | | | 7.82 | | | | 7.73 | | | | 12.91 | | | |
The accompanying notes are an integral part of these financial statements.
79
MUTUAL OF AMERICA INVESTMENT CORPORATION
FINANCIAL HIGHLIGHTS (Continued)
| | | | | | | | | | | | | | | | | | | | | | | | |
| | | Money Market Fund | |
| | | Six Months
Ended
June 30,
2015
(Unaudited) | | | Years Ended December 31, | |
| | | | 2014 | | | 2013 | | | 2012 | | | 2011 | | | 2010 | |
Net Asset Value, Beginning of Period | | $ | 1.20 | | | $ | 1.20 | | | $ | 1.20 | | | $ | 1.20 | | | $ | 1.20 | | | $ | 1.21 | |
| | | | | | | | | | | | | | | | | | | | | | | | |
| | | | | | |
INCOME (LOSS)FROM INVESTMENT OPERATIONS: | | | | | | | | | | | | | | | | | | | | | | | | |
Net Investment Income (Loss) | | | — | (f) | | | — | (f) | | | — | (f) | | | — | (f) | | | — | (f) | | | — | (f) |
Net Realized and Unrealized Gains (Losses) on Investments and Futures Contracts | | | — | (f) | | | — | (f) | | | — | (f) | | | — | (f) | | | — | (f) | | | (0.01 | ) |
| | | | | | | | | | | | | | | | | | | | | | | | |
Total From Investment Operations | | | — | | | | — | | | | — | | | | — | | | | — | | | | (0.01 | ) |
| | | | | | | | | | | | | | | | | | | | | | | | |
| | | | | | |
Less: Distributions | | | | | | | | | | | | | | | | | | | | | | | | |
From Net Investment Income | | | — | | | | — | | | | — | | | | — | | | | — | | | | — | |
From Net Realized Gains | | | — | | | | — | | | | — | | | | — | | | | — | | | | — | |
| | | | | | | | | | | | | | | | | | | | | | | | |
Total Distributions | | | — | | | | — | | | | — | | | | — | | | | — | | | | — | |
| | | | | | | | | | | | | | | | | | | | | | | | |
Net Asset Value, End of Period | | $ | 1.20 | | | $ | 1.20 | | | $ | 1.20 | | | $ | 1.20 | | | $ | 1.20 | | | $ | 1.20 | |
| | | | | | | | | | | | | | | | | | | | | | | | |
Total Return (%) | | | (0.06 | )(b) | | | (0.14 | ) | | | (0.16 | ) | | | (0.17 | ) | | | (0.17 | ) | | | (0.14 | ) |
Net Assets, End of Period ($ millions) | | | 70 | | | | 77 | | | | 84 | | | | 90 | | | | 101 | | | | 109 | |
Ratio of Net Investment Income (Loss) to Average Net Assets (%) | | | (0.13 | )(c) | | | (0.14 | ) | | | (0.16 | ) | | | (0.18 | ) | | | (0.17 | ) | | | (0.15 | ) |
Ratio of Expenses to Average Net Assets Before Expense Reimbursement (%) | | | 0.26 | (c) | | | 0.24 | | | | 0.27 | | | | 0.30 | | | | 0.31 | | | | 0.32 | |
Ratio of Expenses to Average Net Assets After Expense Reimbursement (%) | | | 0.26 | (c) | | | 0.24 | | | | 0.27 | | | | 0.30 | | | | 0.31 | | | | 0.32 | |
Portfolio Turnover Rate (%)(a) | | | NA | | | | NA | | | | NA | | | | NA | | | | NA | | | | NA | |
| (a) | Portfolio turnover rate excludes all short-term securities. |
| (d) | Allocation and Retirement Funds exclude expenses of the underlying funds. |
| (e) | For the period October 1, 2012 (commencement of operations) through December 31, 2012. |
| (f) | Amount is less than $0.005 per share. |
NA = Not Applicable
The accompanying notes are an integral part of these financial statements.
80
| | | | | | | | | | | | | | | | | | | | | | | | | | | | | | | | | | | | | | | | | | | | | | | | |
| Mid-Term Bond Fund | | | Bond Fund | | | |
Six Months
Ended
June 30,
2015
(Unaudited) | | | Years Ended December 31, | | | Six Months
Ended
June 30,
2015
(Unaudited) | | | Years Ended December 31, | | | |
| | 2014 | | | 2013 | | | 2012 | | | 2011 | | | 2010 | | | | 2014 | | | 2013 | | | 2012 | | | 2011 | | | 2010 | | | |
| $ | 1.06 | | | $ | 1.05 | | | $ | 1.09 | | | $ | 1.06 | | | $ | 1.03 | | | $ | 1.00 | | | $ | 1.45 | | | $ | 1.41 | | | $ | 1.47 | | | $ | 1.39 | | | $ | 1.34 | | | $ | 1.30 | | | |
| | | | | | | | | | | | | | | | | | | | | | | | | | | | | | | | | | | | | | | | | | | | | | | | |
| | | | | | | | | | | | |
| | | | | | | | | | | | | | | | | | | | | | | | | | | | | | | | | | | | | | | | | | | �� | | | | | |
| | 0.01 | | | | 0.03 | | | | 0.03 | | | | 0.03 | | | | 0.03 | | | | 0.04 | | | | 0.02 | | | | 0.04 | | | | 0.05 | | | | 0.05 | | | | 0.05 | | | | 0.05 | | | |
| | | | | | | | | | | | |
| | 0.00 | | | | 0.02 | | | | (0.04 | ) | | | — | (f) | | | 0.03 | | | | 0.02 | | | | (0.01 | ) | | | 0.04 | | | | (0.06 | ) | | | 0.03 | | | | 0.05 | | | | 0.04 | | | |
| | | | | | | | | | | | | | | | | | | | | | | | | | | | | | | | | | | | | | | | | | | | | | | | |
| | 0.01 | | | | 0.05 | | | | (0.01 | ) | | | 0.03 | | | | 0.06 | | | | 0.06 | | | | 0.01 | | | | 0.08 | | | | (0.01 | ) | | | 0.08 | | | | 0.10 | | | | 0.09 | | | |
| | | | | | | | | | | | | | | | | | | | | | | | | | | | | | | | | | | | | | | | | | | | | | | | |
| | | | | | | | | | | | |
| | | | | | | | | | | | | | | | | | | | | | | | | | | | | | | | | | | | | | | | | | | | | | | | |
| | — | | | | (0.03 | ) | | | (0.03 | ) | | | — | (f) | | | (0.03 | ) | | | (0.03 | ) | | | — | | | | (0.04 | ) | | | (0.05 | ) | | | — | (f) | | | (0.05 | ) | | | (0.05 | ) | | |
| | — | | | | (0.01 | ) | | | — | (f) | | | — | (f) | | | — | | | | — | (f) | | | — | | | | — | | | | — | (f) | | | — | | | | — | | | | — | | | |
| | | | | | | | | | | | | | | | | | | | | | | | | | | | | | | | | | | | | | | | | | | | | | | | |
| | — | | | | (0.04 | ) | | | (0.03 | ) | | | — | | | | (0.03 | ) | | | (0.03 | ) | | | — | | | | (0.04 | ) | | | (0.05 | ) | | | — | | | | (0.05 | ) | | | (0.05 | ) | | |
| | | | | | | | | | | | | | | | | | | | | | | | | | | | | | | | | | | | | | | | | | | | | | | | |
| $ | 1.07 | | | $ | 1.06 | | | $ | 1.05 | | | $ | 1.09 | | | $ | 1.06 | | | $ | 1.03 | | | $ | 1.46 | | | $ | 1.45 | | | $ | 1.41 | | | $ | 1.47 | | | $ | 1.39 | | | $ | 1.34 | | | |
| | | | | | | | | | | | | | | | | | | | | | | | | | | | | | | | | | | | | | | | | | | | | | | | |
| | 1.24 | (b) | | | 3.22 | | | | (0.55 | ) | | | 3.33 | | | | 6.34 | | | | 6.93 | | | | 0.83 | (b) | | | 6.31 | | | | (0.91 | ) | | | 5.79 | | | | 7.30 | | | | 7.29 | | | |
| | 457 | | | | 435 | | | | 392 | | | | 387 | | | | 338 | | | | 298 | | | | 1,005 | | | | 956 | | | | 804 | | | | 753 | | | | 635 | | | | 597 | | | |
| | 2.25 | (c) | | | 2.57 | | | | 2.77 | | | | 2.94 | | | | 3.02 | | | | 3.66 | | | | 2.72 | (c) | | | 3.59 | | | | 3.35 | | | | 3.55 | | | | 3.61 | | | | 3.81 | | | |
| | 0.47 | (c) | | | 0.49 | | | | 0.51 | | | | 0.55 | | | | 0.55 | | | | 0.57 | | | | 0.46 | (c) | | | 0.48 | | | | 0.51 | | | | 0.55 | | | | 0.55 | | | | 0.57 | | | |
| | 0.47 | (c) | | | 0.49 | | | | 0.51 | | | | 0.55 | | | | 0.55 | | | | 0.57 | | | | 0.46 | (c) | | | 0.48 | | | | 0.51 | | | | 0.55 | | | | 0.55 | | | | 0.57 | | | |
| | 14.33 | (b) | | | 36.56 | | | | 23.94 | | | | 14.30 | | | | 23.69 | | | | 16.70 | | | | 18.23 | (b) | | | 15.00 | | | | 27.41 | | | | 28.89 | | | | 30.24 | | | | 40.33 | | | |
The accompanying notes are an integral part of these financial statements.
81
MUTUAL OF AMERICA INVESTMENT CORPORATION
NOTES TO FINANCIAL STATEMENTS (Unaudited)
June 30, 2015
| 1. | SIGNIFICANT ACCOUNTING POLICIESAND ORGANIZATION |
Mutual of America Investment Corporation (the “Investment Company”) is a diversified, open-end management investment company — a type of company commonly known as a “mutual fund”. It is registered as such under the Investment Company Act of 1940 (the “Investment Company Act”). The Investment Company was formed on February 21, 1986 as a Maryland corporation and principally offers its shares exclusively to separate accounts of Mutual of America Life Insurance Company (“Mutual of America Life”) and its affiliates. As a “series” type mutual fund, the Investment Company issues separate classes (or series) of capital stock, each of which represents a separate Fund of investments. At June 30, 2015, there were 24 active Funds (collectively, “the Funds”): Equity Index Fund, All America Fund, Small Cap Value Fund, Small Cap Growth Fund, Mid Cap Value Fund, Mid-Cap Equity Index Fund, International Fund, Composite Fund, Money Market Fund, Mid-Term Bond Fund, Bond Fund; Retirement Income Fund, 2010 Retirement Fund, 2015 Retirement Fund, 2020 Retirement Fund, 2025 Retirement Fund, 2030 Retirement Fund, 2035 Retirement Fund, 2040 Retirement Fund, 2045 Retirement Fund and 2050 Retirement Fund (collectively, “Retirement Funds”); a Conservative Allocation Fund, a Moderate Allocation Fund and an Aggressive Allocation Fund (collectively, “Allocation Funds”). The International Fund and the Retirement Funds (other than the 2050 Retirement Fund) commenced operations on November 5, 2007. The 2050 Retirement Fund commenced operations on October 1, 2012.
Investment Company shares are issued to Mutual of America Life and, on a limited basis, to Wilton Reassurance Life Company of New York (formerly The American Life Insurance Company of New York), for allocation to their Separate Accounts as a funding medium for variable accumulation annuity contracts and variable life insurance policies. In addition, shares of selected equity and fixed income funds of the Investment Company are directly issued to one or more of the Investment Company’s Retirement Funds and Allocation Funds.
The preparation of financial statements in accordance with U.S. generally accepted accounting principles (“GAAP”) requires management to make estimates and assumptions that affect the reported amounts of assets, liabilities, income, expenses and related disclosures. Changes in the economic environment, financial markets and any other parameters used in determining these estimates could cause actual results to differ.
The following is a summary of the significant accounting policies consistently followed by the Investment Company, which are in conformity with GAAP:
Fair Value — The Investment Company values its investments at fair value. Fair value is an estimate of the price the Fund would receive upon selling a security in an orderly arms-length transaction. Investments are categorized based on a three-level valuation hierarchy for measurement and disclosure of fair value. The valuation hierarchy is based upon the transparency of inputs used to measure fair value. These inputs are summarized in the three broad levels listed below:
| | • | | Level 1 — quoted prices in active markets for identical securities. |
| | • | | Level 2 — other significant observable inputs (including yield, quality, coupon rate, maturity, issue type, quoted prices for similar securities, prepayment speeds, trading characteristics, etc.). |
| | • | | Level 3 — significant unobservable inputs (including the Fund’s own assumptions in determining the fair value of investments). |
As of June 30, 2015 management determined that the fair value inputs for all equity securities, including shares of registered investment companies, were considered Level 1, with the exception of non-registered securities under Rule 144A of the Securities Act of 1933 which were considered Level 2. In addition, certain Rule 144A securities not actively traded are considered Level 3; however, there were no such securities as of June 30, 2015. Fair value inputs for all debt securities were considered Level 2. The inputs or methodologies used for valuing securities are not necessarily an indication of the risk associated with investing in those securities. Transfers between levels are reflected based on the fair value at the beginning of a reporting period.
82
MUTUAL OF AMERICA INVESTMENT CORPORATION
NOTES TO FINANCIAL STATEMENTS (Unaudited) (Continued)
June 30, 2015
| 1. | SIGNIFICANT ACCOUNTING POLICIESAND ORGANIZATION (CONTINUED) |
The following is a summary of the inputs used to value the Funds’ investments and other financial instruments as of June 30, 2015:
| | | | | | | | | | | | | | | | |
Fund | | Level 1 — Quoted
Prices | | | Level 2 — Significant
Observable Inputs | | | Level 3 — Significant
Unobservable Inputs | | | Total | |
Investments at Fair Value: | | | | | | | | | | | | | | | | |
(See Summary Portfolios or Portfolios of Investments for More Details) | | | | | | | | | |
Equity Index Fund | | | | | | | | | | | | | | | | |
Common Stock | | $ | 1,769,438,051 | | | | — | | | | — | | | $ | 1,769,438,051 | |
Short-Term Debt Securities | | | — | | | $ | 42,994,642 | | | | — | | | $ | 42,994,642 | |
| | | | | | | | | | | | | | | | |
| | $ | 1,769,438,051 | | | $ | 42,994,642 | | | | — | | | $ | 1,812,432,693 | |
All America Fund | | | | | | | | | | | | | | | | |
Common Stock-Indexed | | $ | 165,696,641 | | | | — | | | | — | | | $ | 165,696,641 | |
Common Stock-Active | | $ | 139,328,854 | | | | — | | | | — | | | $ | 139,328,854 | |
Short-Term Debt Securities-Indexed | | | — | | | $ | 4,499,659 | | | | — | | | $ | 4,499,659 | |
Short-Term Debt Securities-Active | | | — | | | $ | 2,999,672 | | | | — | | | $ | 2,999,672 | |
| | | | | | | | | | | | | | | | |
| | $ | 305,025,495 | | | $ | 7,499,331 | | | | — | | | $ | 312,524,826 | |
Small Cap Value Fund | | | | | | | | | | | | | | | | |
Common Stock | | $ | 380,656,778 | | | | — | | | | — | | | $ | 380,656,778 | |
Short-Term Debt Securities | | | — | | | $ | 15,999,200 | | | | — | | | $ | 15,999,200 | |
| | | | | | | | | | | | | | | | |
| | $ | 380,656,778 | | | $ | 15,999,200 | | | | — | | | $ | 396,655,978 | |
Small Cap Growth Fund | | | | | | | | | | | | | | | | |
Common Stock | | $ | 424,783,543 | | | | — | | | | — | | | $ | 424,783,543 | |
Short-Term Debt Securities | | | — | | | $ | 17,164,325 | | | | — | | | $ | 17,164,325 | |
| | | | | | | | | | | | | | | | |
| | $ | 424,783,543 | | | $ | 17,164,325 | | | | — | | | $ | 441,947,868 | |
Mid Cap Value Fund | | | | | | | | | | | | | | | | |
Common Stock | | $ | 86,169,512 | | | | — | | | | — | | | $ | 86,169,512 | |
Short-Term Debt Securities | | | — | | | $ | 499,922 | | | | — | | | $ | 499,922 | |
| | | | | | | | | | | | | | | | |
| | $ | 86,169,512 | | | $ | 499,922 | | | | — | | | $ | 86,669,434 | |
Mid-Cap Equity Index Fund | | | | | | | | | | | | | | | | |
Common Stock | | $ | 975,209,745 | | | | — | | | | — | | | $ | 975,209,745 | |
Short-Term Debt Securities | | | — | | | $ | 55,676,194 | | | | — | | | $ | 55,676,194 | |
| | | | | | | | | | | | | | | | |
| | $ | 975,209,745 | | | $ | 55,676,194 | | | | — | | | $ | 1,030,885,939 | |
International Fund | | | | | | | | | | | | | | | | |
Common Stock | | $ | 307,732,464 | | | | — | | | | — | | | $ | 307,732,464 | |
Short-Term Debt Securities | | | — | | | $ | 7,320,328 | | | | — | | | $ | 7,320,328 | |
| | | | | | | | | | | | | | | | |
| | $ | 307,732,464 | | | $ | 7,320,328 | | | | — | | | $ | 315,052,792 | |
Composite Fund | | | | | | | | | | | | | | | | |
Common Stock | | $ | 111,448,782 | | | | — | | | | — | | | $ | 111,448,782 | |
U.S. Government Debt | | | — | | | $ | 17,063,574 | | | | — | | | $ | 17,063,574 | |
U.S. Government Agency Residential
Mortgage-Backed Obligations | | | — | | | $ | 22,619,276 | | | | — | | | $ | 22,619,276 | |
U.S. Government Agency
Non-Mortgage-Backed Obligations | | | — | | | $ | 456,083 | | | | — | | | $ | 456,083 | |
Long-Term Corporate Debt | | | — | | | $ | 31,702,123 | | | | — | | | $ | 31,702,123 | |
Short-Term Debt Securities | | | — | | | $ | 5,429,252 | | | | — | | | $ | 5,429,252 | |
| | | | | | | | | | | | | | | | |
| | $ | 111,448,782 | | | $ | 77,270,308 | | | | — | | | $ | 188,719,090 | |
Retirement Income Fund | | | | | | | | | | | | | | | | |
Common Stock | | $ | 56,141,210 | | | | — | | | | — | | | $ | 56,141,210 | |
2010 Retirement Fund | | | | | | | | | | | | | | | | |
Common Stock | | $ | 26,760,675 | | | | — | | | | — | | | $ | 26,760,675 | |
2015 Retirement Fund | | | | | | | | | | | | | | | | |
Common Stock | | $ | 156,452,022 | | | | — | | | | — | | | $ | 156,452,022 | |
83
MUTUAL OF AMERICA INVESTMENT CORPORATION
NOTES TO FINANCIAL STATEMENTS (Unaudited) (Continued)
June 30, 2015
| 1. | SIGNIFICANT ACCOUNTING POLICIESAND ORGANIZATION (CONTINUED) |
| | | | | | | | | | | | | | | | |
Fund | | Level 1 — Quoted
Prices | | | Level 2 — Significant
Observable Inputs | | | Level 3 — Significant
Unobservable Inputs | | | Total | |
2020 Retirement Fund | | | | | | | | | | | | | | | | |
Common Stock | | $ | 348,331,500 | | | | — | | | | — | | | $ | 348,331,500 | |
2025 Retirement Fund | | | | | | | | | | | | | | | | |
Common Stock | | $ | 369,345,005 | | | | — | | | | — | | | $ | 369,345,005 | |
2030 Retirement Fund | | | | | | | | | | | | | | | | |
Common Stock | | $ | 307,564,040 | | | | — | | | | — | | | $ | 307,564,040 | |
2035 Retirement Fund | | | | | | | | | | | | | | | | |
Common Stock | | $ | 254,781,883 | | | | — | | | | — | | | $ | 254,781,883 | |
2040 Retirement Fund | | | | | | | | | | | | | | | | |
Common Stock | | $ | 210,284,897 | | | | — | | | | — | | | $ | 210,284,897 | |
2045 Retirement Fund | | | | | | | | | | | | | | | | |
Common Stock | | $ | 257,691,297 | | | | — | | | | — | | | $ | 257,691,297 | |
2050 Retirement Fund | | | | | | | | | | | | | | | | |
Common Stock | | $ | 72,224,829 | | | | — | | | | — | | | $ | 72,224,829 | |
Conservative Allocation Fund | | | | | | | | | | | | | | | | |
Common Stock | | $ | 129,486,261 | | | | — | | | | — | | | $ | 129,486,261 | |
Moderate Allocation Fund | | | | | | | | | | | | | | | | |
Common Stock | | $ | 325,355,242 | | | | — | | | | — | | | $ | 325,355,242 | |
Aggressive Allocation Fund | | | | | | | | | | | | | | | | |
Common Stock | | $ | 261,244,453 | | | | — | | | | — | | | $ | 261,244,453 | |
Money Market Fund | | | | | | | | | | | | | | | | |
U.S. Government Debt | | | — | | | $ | 3,999,126 | | | | — | | | $ | 3,999,126 | |
U.S. Government Agency Short-Term Debt | | | — | | | $ | 15,799,704 | | | | — | | | $ | 15,799,704 | |
Commercial Paper | | | — | | | $ | 49,079,187 | | | | — | | | $ | 49,079,187 | |
| | | | | | | | | | | | | | | | |
| | | — | | | $ | 68,878,017 | | | | — | | | $ | 68,878,017 | |
Mid-Term Bond Fund | | | | | | | | | | | | | | | | |
U.S. Government Debt | | | — | | | $ | 120,140,954 | | | | — | | | $ | 120,140,954 | |
U.S. Government Agency Residential
Mortgage-Backed Obligations | | | — | | | $ | 4,481 | | | | — | | | $ | 4,481 | |
U.S. Government Agency
Non-Mortgage-Backed Obligations | | | — | | | $ | 34,128,928 | | | | — | | | $ | 34,128,928 | |
Long-Term Corporate Debt | | | — | | | $ | 287,296,614 | | | | — | | | $ | 287,296,614 | |
Short-Term Debt Securities | | | — | | | $ | 12,499,836 | | | | — | | | $ | 12,499,836 | |
| | | | | | | | | | | | | | | | |
| | | — | | | $ | 454,070,813 | | | | — | | | $ | 454,070,813 | |
Bond Fund | | | | | | | | | | | | | | | | |
U.S. Government Debt | | | — | | | $ | 78,006,606 | | | | — | | | $ | 78,006,606 | |
U.S. Government Agency Residential
Mortgage-Backed Obligations | | | — | | | $ | 263,276,776 | | | | — | | | $ | 263,276,776 | |
U.S. Government Agency
Non-Mortgage-Backed Obligations | | | — | | | $ | 33,780,338 | | | | — | | | $ | 33,780,338 | |
Long-Term Corporate Debt | | | — | | | $ | 609,684,249 | | | | — | | | $ | 609,684,249 | |
Sovereign Debt | | | — | | | $ | 3,902,909 | | | | — | | | $ | 3,902,909 | |
Short-Term Debt Securities | | | — | | | $ | 13,999,814 | | | | — | | | $ | 13,999,814 | |
| | | | | | | | | | | | | | | | |
| | | — | | | $ | 1,002,650,692 | | | | — | | | $ | 1,002,650,692 | |
Other Financial Instruments:* | | | | | | | | | | | | | | | | |
| | | | |
Equity Index Fund | | $ | (671,840 | ) | | | — | | | | — | | | $ | (671,840 | ) |
All America Fund | | $ | (77,666 | ) | | | — | | | | — | | | $ | (77,666 | ) |
Mid-Cap Equity Index Fund | | $ | (1,104,872 | ) | | | — | | | | — | | | $ | (1,104,872 | ) |
| * | Other financial instruments are derivative instruments not reflected in the Portfolio of Investments, such as futures, which are valued at the unrealized appreciation/depreciation on the instrument. |
84
MUTUAL OF AMERICA INVESTMENT CORPORATION
NOTES TO FINANCIAL STATEMENTS (Unaudited) (Continued)
June 30, 2015
| 1. | SIGNIFICANT ACCOUNTING POLICIESAND ORGANIZATION (CONTINUED) |
During the six months ended June 30, 2015, there were no transfers of securities between Level 1, Level 2, or Level 3.
Security Valuation — Investment securities are carried at fair value as follows:
Exchange-traded equity securities are valued at the last reported sales price on the principal exchange on which the security is traded. If there is no trading volume for a particular valuation day, the last bid price is used. For equity securities traded in the over-the-counter market, the security is valued at the last sale price, or if no sale, at the latest bid price available.
Short-term debt securities with a maturity of 60 days or less are valued at amortized cost, which approximates fair value for such securities.
Debt securities, including short-term debt securities maturing in excess of 60 days, are valued on the basis of prices obtained from an independent pricing source. The pricing source may utilize various pricing methodologies that incorporate both models (which consider factors such as yield, quality, coupon rate, maturity, issue type, quoted prices for similar securities, prepayment speeds and trading characteristics) and dealer-supplied valuations to derive a valuation.
In the rare instance when a price is not available from an independent pricing source or when prices may not reflect fair value, such as when the price provided by the pricing source is not based on a recent trade, a calculated fair value is used, as determined in good faith by the Adviser and reviewed by a Valuation Committee, in accordance with procedures adopted by the Board of Directors of the Investment Company.
The Advisor uses a market approach to calculate fair value for equity securities which are categorized as Level 3. The Adviser’s valuation is primarily based on information regarding the specific equity issuer, such as the last trade price, financial statements, the relationship of per-share book value to the last trade price, operating information and any corporate actions, such as dividends or returns of capital, that may have occurred since the last trade. The Adviser also considers industry-specific conditions and overall market conditions, to determine whether the last trade price reflects fair value or needs to be adjusted. Generally, absent any significant contrary indications, the last trade price will be used as the calculated fair value.
The Retirement Funds and the Allocation Funds value their investments in the underlying Funds of the Investment Company at their respective net asset values.
Investment Transactions — Investment transactions are accounted for as of the trade date. Realized gains and losses on the sale of short and long-term debt securities are computed on the basis of amortized cost at the time of sale. Realized gains and losses on the sale of equity securities are based on the identified cost basis of the security, determined on the first-in, first-out (“FIFO”) basis.
Futures Contracts — The Equity Index Fund, Mid-Cap Equity Index Fund and a portion of the All America Fund each maintain indexed asset portfolios which are subject to equity price risk. In order to remain more fully invested in the equity markets while minimizing transaction costs, the funds purchase stock index futures contracts. An initial cash margin deposit (represented by cash or Treasury bills) is made upon entering into a futures contract and serves as collateral for the contract. This initial margin, maintained in a segregated account, is equal to approximately 5%-6% of the contract amount, and does not involve the borrowing of funds to finance the transaction. During the period the futures contract is outstanding, changes in the value of the contract are recognized as unrealized appreciation or depreciation by “marking-to-market” on a daily basis to reflect the market value of the contract at the end of each trading day. The accumulated unrealized appreciation or depreciation on the contract is included in Net Unrealized Appreciation (Depreciation) of Investments and Futures Contracts in the Components of Net Assets section of the Statements of Assets and Liabilities. Futures contracts are valued at the settlement price established each day by the exchange on which traded. Depending upon whether unrealized appreciation or depreciation are incurred, variation margin payments are received or made daily. The net change in unrealized appreciation or depreciation of futures
85
MUTUAL OF AMERICA INVESTMENT CORPORATION
NOTES TO FINANCIAL STATEMENTS (Unaudited) (Continued)
June 30, 2015
| 1. | SIGNIFICANT ACCOUNTING POLICIESAND ORGANIZATION (CONTINUED) |
contracts is recorded in the Statements of Operations. When the contract is closed, a realized gain or loss from futures transactions is recorded in the Statements of Operations, equal to the net variation margin received or paid over the period the contract was outstanding.
The “Underlying Face Amount at Value” (appearing in the “Footnotes to Summary Portfolios of Investments in Securities”) representing the aggregate of outstanding contractual amounts under futures contracts reflects the extent of a Fund’s exposure to off-balance sheet risk. The use of futures transactions involves the risk of imperfect correlation in the price movements of the contract and the underlying securities. With futures contracts, there is minimal counterparty credit risk to the Fund since futures are exchange traded and the exchange’s clearinghouse, as counterparty to all exchange traded futures, guarantees the futures against default.
During the six months ended June 30, 2015, the Equity Index Fund, Mid-Cap Equity Index Fund and the All America Fund purchased futures contracts with total principal amounts of $174,953,317, $191,965,536 and $28,074,589, respectively.
Retirement Funds — Each of the Retirement Funds invests in equity (stock) funds and fixed income (bond) funds and targets different percentages to these asset classes. The targets reflect varying emphases on achieving capital appreciation and gains versus preserving capital and producing income, depending on the specific Fund’s time horizon.
The Retirement Funds target their investments in the following underlying funds of the Investment Company in accordance with the percentage allocations noted:
| | | | | | | | | | | | | | | | | | | | | | | | | | | | | | | | |
| | | Equity
Index
Fund | | | Mid-Cap
Equity
Index
Fund | | | Small Cap
Growth
Fund | | | Small Cap
Value
Fund | | | International
Fund | | | Bond
Fund | | | Mid-Term
Bond
Fund | | | Money
Market
Fund | |
Retirement Income Fund | | | 20% | | | | 5% | | | | — | | | | — | | | | — | | | | 30% | | | | 40% | | | | 5% | |
2010 Retirement Fund | | | 24% | | | | 8% | | | | — | | | | — | | | | 3% | | | | 25% | | | | 35% | | | | 5% | |
2015 Retirement Fund | | | 27% | | | | 10% | | | | 1% | | | | 1% | | | | 6% | | | | 25% | | | | 30% | | | | — | |
2020 Retirement Fund | | | 31% | | | | 12% | | | | 2% | | | | 2% | | | | 8% | | | | 25% | | | | 20% | | | | — | |
2025 Retirement Fund | | | 37% | | | | 15% | | | | 3% | | | | 3% | | | | 10% | | | | 22% | | | | 10% | | | | — | |
2030 Retirement Fund | | | 39% | | | | 18% | | | | 5% | | | | 5% | | | | 11% | | | | 22% | | | | — | | | | — | |
2035 Retirement Fund | | | 40% | | | | 20% | | | | 6% | | | | 6% | | | | 13% | | | | 15% | | | | — | | | | — | |
2040 Retirement Fund | | | 37% | | | | 20% | | | | 8% | | | | 8% | | | | 14% | | | | 13% | | | | — | | | | — | |
2045 Retirement Fund | | | 34% | | | | 22% | | | | 9% | | | | 9% | | | | 15% | | | | 11% | | | | — | | | | — | |
2050 Retirement Fund | | | 34% | | | | 22% | | | | 10% | | | | 10% | | | | 15% | | | | 9% | | | | — | | | | — | |
Generally, rebalancing of the Retirement Funds’ holdings is performed on a quarterly or other periodic basis and the mix of underlying Funds is reviewed annually.
Allocation Funds — The Allocation Funds target their investments in the following underlying Funds of the Investment Company in accordance with the percentage allocations noted:
| | | | | | | | | | | | | | | | | | | | | | | | | | | | |
| | | Equity
Index
Fund | | | Mid-Cap
Equity
Index
Fund | | | Small Cap
Growth
Fund | | | Small Cap
Value
Fund | | | International
Fund | | | Bond
Fund | | | Mid-Term
Bond
Fund | |
Conservative Allocation | | | 25% | | | | 5% | | | | — | | | | — | | | | 5% | | | | 30% | | | | 35% | |
Moderate Allocation | | | 35% | | | | 15% | | | | — | | | | — | | | | 10% | | | | 25% | | | | 15% | |
Aggressive Allocation | | | 35% | | | | 20% | | | | 5% | | | | 5% | | | | 15% | | | | 20% | | | | — | |
Generally, rebalancing of the Allocation Funds’ holdings is performed on a periodic basis.
86
MUTUAL OF AMERICA INVESTMENT CORPORATION
NOTES TO FINANCIAL STATEMENTS (Unaudited) (Continued)
June 30, 2015
| 1. | SIGNIFICANT ACCOUNTING POLICIESAND ORGANIZATION (CONTINUED) |
Change in Target Investments — During the year, the Retirement Funds listed below had changes to their target investments. Overall increases (decreases) to the target percentages were as follows:
| | | | | | | | | | | | | | | | | | | | | | | | | | | | | | | | |
| | | Equity
Index
Fund | | | Mid-Cap
Equity
Index
Fund | | | Small Cap
Growth
Fund | | | Small Cap
Value
Fund | | | International
Fund | | | Bond
Fund | | | Mid-Term
Bond
Fund | | | Money
Market
Fund | |
2010 Retirement Fund | | | (1% | ) | | | (1% | ) | | | — | | | | — | | | | — | | | | — | | | | 2% | | | | — | |
2015 Retirement Fund | | | (1% | ) | | | (1% | ) | | | — | | | | — | | | | — | | | | — | | | | 2% | | | | — | |
2020 Retirement Fund | | | (2% | ) | | | 1% | | | | — | | | | — | | | | (1% | ) | | | — | | | | 2% | | | | — | |
2025 Retirement Fund | | | — | | | | (1% | ) | | | — | | | | — | | | | — | | | | (1% | ) | | | 2% | | | | — | |
2030 Retirement Fund | | | (1% | ) | | | 1% | | | | — | | | | — | | | | 1% | | | | (1% | ) | | | — | | | | — | |
2035 Retirement Fund | | | — | | | | — | | | | — | | | | — | | | | 1% | | | | (1% | ) | | | — | | | | — | |
2040 Retirement Fund | | | 2% | | | | (3% | ) | | | — | | | | — | | | | — | | | | 1% | | | | — | | | | — | |
2045 Retirement Fund | | | (1% | ) | | | 1% | | | | — | | | | — | | | | (1% | ) | | | 1% | | | | — | | | | — | |
2050 Retirement Fund | | | (1% | ) | | | 2% | | | | — | | | | — | | | | (2% | ) | | | 1% | | | | — | | | | — | |
Investment Income — Interest income, accretion of discount and amortization of premium are recorded daily on an accrual basis using the effective interest method. A debt obligation may cease accrual of income and result in a reduction to interest income when the collection of all or a portion of current and past due interest is in doubt. Dividend income is recorded on the ex-dividend date. Foreign source tax withheld from dividends is recorded as a reduction from dividend income. Should reclamation efforts succeed, such amounts are recorded as income upon collection.
Distributions to Shareholders (“Dividends”) — Distributions to shareholders are recorded on the ex-dividend date and are made at least annually. It is the Investment Company’s policy to make distributions of its net investment income and net realized gains, if any, in accordance with Federal income tax regulations, which may differ from U.S. generally accepted accounting principles. Accordingly, periodic reclassifications (which do not impact the funds’ net asset values) are made within the funds’ capital accounts to reflect income and gains available for distribution under Federal income tax regulations.
Federal Income Taxes — Each Fund in the Investment Company intends to comply with the requirements of the Internal Revenue Code applicable to regulated investment companies and to distribute substantially all of its taxable income to shareholders. Therefore, no Federal income or excise tax provision is required.
GAAP requires the evaluation of tax positions taken in the course of preparing a fund’s tax return to determine whether it is “more-likely-than-not” that tax positions taken in the fund’s tax return will be ultimately sustained, and, if not, a tax liability and expense is recorded.
As of June 30, 2015, management has evaluated the tax positions taken on the Funds’ tax returns for all open tax years and has concluded that no tax provision is required in any of the Funds’ financial statements. Each Fund’s federal and state income, franchise and federal excise tax returns for tax years for which the applicable statutes of limitations have not expired are subject to examination by the Internal Revenue Service and state departments of revenue.
As of June 30, 2015, Bond Fund had a capital loss carry forward of $165,084 to offset any future net realized capital gains generated after December 31, 2014.
87
MUTUAL OF AMERICA INVESTMENT CORPORATION
NOTES TO FINANCIAL STATEMENTS (Unaudited) (Continued)
June 30, 2015
The Investment Company has an Investment Advisory Agreement with Mutual of America Capital Management LLC (“the Adviser”), an indirect wholly-owned subsidiary of Mutual of America Life. For providing investment management services to each of the Funds of the Investment Company, the Adviser receives a fee, calculated as a daily charge of the value of the net assets of each fund, at the following annual rates:
| | | | |
Fund | | Annual Investment
Management Fee | |
Retirement Funds | | | .05 | % |
Equity Index, Mid-Cap Equity Index, International Funds | | | .075 | % |
Money Market Fund | | | .15 | % |
Bond Fund | | | .39 | % |
All America, Composite, Mid-Term Bond Funds | | | .40 | % |
Mid Cap Value Fund | | | .55 | % |
Small Cap Value, Small Cap Growth Funds | | | .75 | % |
The Adviser does not assess a fee for investment management to the Allocation Funds. However, shareholders in the Allocation Funds (and the Retirement and International Funds) will indirectly bear their pro-rata share of the investment management fees incurred by the underlying Funds in which they invest.
The cost of investment purchases and proceeds from sales of investments, excluding short-term securities and futures contracts, for the six months ended June 30, 2015, were as follows:
| | | | | | | | | | | | | | | | | | | | |
| | | Equity Index
Fund | | | All America
Fund | | | Small Cap
Value Fund | | | Small Cap
Growth Fund | | | Mid Cap
Value Fund | |
Cost of investment purchases | | $ | 72,763,956 | | | $ | 23,462,343 | | | $ | 33,153,227 | | | $ | 140,930,651 | | | $ | 8,561,055 | |
| | | | | | | | | | | | | | | | | | | | |
Proceeds from sales of investments | | $ | 26,127,376 | | | $ | 35,151,867 | | | $ | 36,011,630 | | | $ | 148,481,098 | | | $ | 10,568,242 | |
| | | | | | | | | | | | | | | | | | | | |
| | | | | |
| | | Mid-Cap Equity
Index Fund | | | International
Fund | | | Composite
Fund | | | Retirement
Income Fund | | | 2010
Retirement
Fund | |
Cost of investment purchases | | $ | 95,807,184 | | | $ | 43,839,160 | | | $ | 12,986,873 | | | $ | 9,346,722 | | | $ | 2,967,777 | |
| | | | | | | | | | | | | | | | | | | | |
Proceeds from sales of investments | | $ | 125,603,346 | | | | — | | | $ | 19,084,225 | | | $ | 7,404,107 | | | $ | 3,162,538 | |
| | | | | | | | | | | | | | | | | | | | |
| | | | | |
| | | 2015
Retirement
Fund | | | 2020
Retirement
Fund | | | 2025
Retirement
Fund | | | 2030
Retirement
Fund | | | 2035
Retirement
Fund | |
Cost of investment purchases | | $ | 13,588,846 | | | $ | 35,290,427 | | | $ | 39,319,591 | | | $ | 30,137,601 | | | $ | 25,069,034 | |
| | | | | | | | | | | | | | | | | | | | |
Proceeds from sales of investments | | $ | 14,214,698 | | | $ | 13,578,785 | | | $ | 8,814,215 | | | $ | 6,584,667 | | | $ | 6,593,398 | |
| | | | | | | | | | | | | | | | | | | | |
| | | | | |
| | | 2040
Retirement
Fund | | | 2045
Retirement
Fund | | | 2050
Retirement
Fund | | | Conservative
Allocation
Fund | | | Moderate
Allocation
Fund | |
Cost of investment purchases | | $ | 21,227,543 | | | $ | 23,832,915 | | | $ | 21,022,701 | | | $ | 10,227,860 | | | $ | 16,444,521 | |
| | | | | | | | | | | | | | | | | | | | |
Proceeds from sales of investments | | $ | 5,474,080 | | | $ | 5,821,854 | | | $ | 741,798 | | | $ | 5,077,732 | | | $ | 12,622,957 | |
| | | | | | | | | | | | | | | | | | | | |
| | | | | |
| | | Aggressive
Allocation
Fund | | | Money Market
Fund | | | Mid-Term
Bond Fund | | | Bond Fund | | | | |
Cost of investment purchases | | $ | 10,130,933 | | | | — | | | $ | 75,025,140 | | | $ | 231,137,221 | | | | | |
| | | | | | | | | | | | | | | | | | | | |
Proceeds from sales of investments | | $ | 10,914,170 | | | | — | | | $ | 63,521,935 | | | $ | 178,692,146 | | | | | |
| | | | | | | | | | | | | | | | | | | | |
The cost of short-term security purchases for the Money Market Fund for the six months ended June 30, 2015, was $787,302,876; net proceeds from sales for the year were $795,948,319.
88
MUTUAL OF AMERICA INVESTMENT CORPORATION
NOTES TO FINANCIAL STATEMENTS (Unaudited) (Continued)
June 30, 2015
| 3. | INVESTMENTS (CONTINUED) |
The components of net unrealized appreciation (depreciation) of investments for Federal income tax purposes and the cost of investments for Federal income tax purposes at June 30, 2015 for each of the funds were as follows:
| | | | | | | | | | | | | | | | | | | | |
| | | Equity Index
Fund | | | All America
Fund | | | Small Cap
Value Fund | | | Small Cap
Growth Fund | | | Mid Cap
Value Fund | |
Unrealized Appreciation | | $ | 687,596,921 | | | $ | 98,620,327 | | | $ | 99,991,728 | | | $ | 105,992,749 | | | $ | 19,214,153 | |
Unrealized Depreciation | | | (29,400,807 | ) | | | (11,039,911 | ) | | | (14,257,717 | ) | | | (9,497,511 | ) | | | (1,742,008 | ) |
| | | | | | | | | | | | | | | | | | | | |
Net | | $ | 658,196,114 | | | $ | 87,580,416 | | | $ | 85,734,011 | | | $ | 96,495,238 | | | $ | 17,472,145 | |
| | | | | | | | | | | | | | | | | | | | |
Tax Cost of Investments | | $ | 1,154,236,580 | | | $ | 224,944,410 | | | $ | 310,921,967 | | | $ | 345,452,630 | | | $ | 69,197,289 | |
| | | | | | | | | | | | | | | | | | | | |
| | | | | |
| | | Mid-Cap Equity
Index Fund | | | International
Fund | | | Composite
Fund | | | Retirement
Income Fund | | | 2010
Retirement
Fund | |
Unrealized Appreciation | | $ | 297,433,895 | | | $ | 16,636,606 | | | $ | 44,495,757 | | | $ | 2,212,935 | | | $ | 2,332,508 | |
Unrealized Depreciation | | | (35,996,348 | ) | | | (3,847,846 | ) | | | (3,140,033 | ) | | | (125,281 | ) | | | (41,209 | ) |
| | | | | | | | | | | | | | | | | | | | |
Net | | $ | 261,437,547 | | | $ | 12,788,760 | | | $ | 41,355,724 | | | $ | 2,087,654 | | | $ | 2,291,299 | |
| | | | | | | | | | | | | | | | | | | | |
Tax Cost of Investments | | $ | 769,448,392 | | | $ | 302,264,032 | | | $ | 147,363,366 | | | $ | 54,053,556 | | | $ | 24,469,376 | |
| | | | | | | | | | | | | | | | | | | | |
| | | | | |
| | | 2015
Retirement
Fund | | | 2020
Retirement
Fund | | | 2025
Retirement
Fund | | | 2030
Retirement
Fund | | | 2035
Retirement
Fund | |
Unrealized Appreciation | | $ | 18,412,551 | | | $ | 45,495,826 | | | $ | 59,394,723 | | | $ | 55,208,629 | | | $ | 48,094,023 | |
Unrealized Depreciation | | | (186,023 | ) | | | (564,049 | ) | | | (694,517 | ) | | | (576,969 | ) | | | (447,433 | ) |
| | | | | | | | | | | | | | | | | | | | |
Net | | $ | 18,226,528 | | | $ | 44,931,777 | | | $ | 58,700,206 | | | $ | 54,631,660 | | | $ | 47,646,590 | |
| | | | | | | | | | | | | | | | | | | | |
Tax Cost of Investments | | $ | 138,225,494 | | | $ | 303,399,723 | | | $ | 310,644,799 | | | $ | 252,932,380 | | | $ | 207,135,293 | |
| | | | | | | | | | | | | | | | | | | | |
| | | | | |
| | | 2040
Retirement
Fund | | | 2045
Retirement
Fund | | | 2050
Retirement
Fund | | | Conservative
Allocation
Fund | | | Moderate
Allocation Fund | |
Unrealized Appreciation | | $ | 42,489,665 | | | $ | 54,544,635 | | | $ | 4,509,701 | | | $ | 9,797,270 | | | $ | 58,971,680 | |
Unrealized Depreciation | | | (304,157 | ) | | | (375,515 | ) | | | (994 | ) | | | (131,204 | ) | | | (5,842,502 | ) |
| | | | | | | | | | | | | | | | | | | | |
Net | | $ | 42,185,508 | | | $ | 54,169,120 | | | $ | 4,508,707 | | | $ | 9,666,066 | | | $ | 53,129,178 | |
| | | | | | | | | | | | | | | | | | | | |
Tax Cost of Investments | | $ | 168,099,389 | | | $ | 203,522,177 | | | $ | 67,716,122 | | | $ | 119,820,195 | | | $ | 272,226,064 | |
| | | | | | | | | | | | | | | | | | | | |
| | | | | |
| | | Aggressive
Allocation
Fund | | | Money Market
Fund | | | Mid-Term
Bond Fund | | | Bond Fund | | | | |
Unrealized Appreciation | | $ | 66,723,992 | | | $ | 1,881 | | | $ | 9,404,452 | | | $ | 26,928,521 | | | | | |
Unrealized Depreciation | | | (5,176,690 | ) | | | 0 | | | | (2,043,898 | ) | | | (6,944,272 | ) | | | | |
| | | | | | | | | | | | | | | | | | | | |
Net | | $ | 61,547,302 | | | $ | 1,881 | | | $ | 7,360,554 | | | $ | 19,984,249 | | | | | |
| | | | | | | | | | | | | | | | | | | | |
Tax Cost of Investments | | $ | 199,697,151 | | | $ | 68,876,136 | | | $ | 446,710,259 | | | $ | 982,666,443 | | | | | |
| | | | | | | | | | | | | | | | | | | | |
Differences between amounts reflected in the Statements of Assets and Liabilities and those computed for Federal income tax purposes arise primarily from federal income tax treatment of wash sales, REITs, partnerships, corporate actions and futures contracts.
89
MUTUAL OF AMERICA INVESTMENT CORPORATION
NOTES TO FINANCIAL STATEMENTS (Unaudited) (Continued)
June 30, 2015
| 3. | INVESTMENTS (CONTINUED) |
Investments in affiliated investment companies during the six months ended June 30, 2015 were as follows:
| | | | | | | | | | | | | | | | | | | | | | | | |
Affiliated Investment Company | | Value as of
December 31,
2014 | | | Purchases | | | Realized
Gain
(Loss) on
Investment
Securities | | | Change in
Unrealized
Appreciation
(Depreciation)
of Investment
Securities | | | Sales | | | Value as of
June 30,
2015 | |
Retirement Income Fund | | | | | | | | | | | | | | | | | | | | | | | | |
Bond Fund | | $ | 15,966,282 | | | $ | 2,998,920 | | | $ | 65,895 | | | $ | 57,505 | | | $ | (1,717,468 | ) | | $ | 17,371,134 | |
Equity Index Fund | | | 11,634,388 | | | | 1,533,502 | | | | 839,961 | | | | (693,093 | ) | | | (2,166,088 | ) | | | 11,148,670 | |
Mid-Cap Equity Index Fund | | | 3,072,080 | | | | 383,375 | | | | 285,290 | | | | (147,449 | ) | | | (819,085 | ) | | | 2,774,211 | |
Mid-Term Bond Fund | | | 20,582,191 | | | | 4,047,550 | | | | (13,800 | ) | | | 270,523 | | | | (2,289,958 | ) | | | 22,596,506 | |
Money Market Fund | | | 2,280,374 | | | | 383,375 | | | | (1,745 | ) | | | 193 | | | | (411,508 | ) | | | 2,250,689 | |
| | | | | | | | | | | | | | | | | | | | | | | | |
Total | | $ | 53,535,315 | | | $ | 9,346,722 | | | $ | 1,175,601 | | | $ | (512,321 | ) | | $ | (7,404,107 | ) | | $ | 56,141,210 | |
| | | | | | | | | | | | | | | | | | | | | | | | |
2010 Retirement Fund | | | | | | | | | | | | | | | | | | | | | | | | |
Bond Fund | | $ | 6,484,388 | | | $ | 983,006 | | | $ | 27,374 | | | $ | 20,285 | | | $ | (563,596 | ) | | $ | 6,951,457 | |
Equity Index Fund | | | 7,170,134 | | | | 503,544 | | | | 448,275 | | | | (359,432 | ) | | | (1,111,475 | ) | | | 6,651,046 | |
International Fund | | | 761,989 | | | | 61,788 | | | | 9,033 | | | | 37,732 | | | | (73,649 | ) | | | 796,893 | |
Mid-Cap Equity Index Fund | | | 2,613,709 | | | | 174,005 | | | | 184,959 | | | | (72,135 | ) | | | (516,898 | ) | | | 2,383,640 | |
Mid-Term Bond Fund | | | 8,420,984 | | | | 1,142,453 | | | | 26,498 | | | | 75,480 | | | | (766,315 | ) | | | 8,899,100 | |
Money Market Fund | | | 1,106,901 | | | | 102,981 | | | | (854 | ) | | | 116 | | | | (130,605 | ) | | | 1,078,539 | |
| | | | | | | | | | | | | | | | | | | | | | | | |
Total | | $ | 26,558,105 | | | $ | 2,967,777 | | | $ | 695,285 | | | $ | (297,954 | ) | | $ | (3,162,538 | ) | | $ | 26,760,675 | |
| | | | | | | | | | | | | | | | | | | | | | | | |
2015 Retirement Fund | | | | | | | | | | | | | | | | | | | | | | | | |
Bond Fund | | $ | 36,868,235 | | | $ | 4,073,235 | | | $ | 215,389 | | | $ | 68,862 | | | $ | (2,122,383 | ) | | $ | 39,103,338 | |
Equity Index Fund | | | 45,636,514 | | | | 2,188,475 | | | | 2,204,986 | | | | (1,616,533 | ) | | | (4,772,295 | ) | | | 43,641,147 | |
International Fund | | | 8,195,471 | | | | 1,143,293 | | | | 108,316 | | | | 400,286 | | | | (509,372 | ) | | | 9,337,994 | |
Mid-Cap Equity Index Fund | | | 17,909,677 | | | | 851,650 | | | | 1,023,359 | | | | (246,228 | ) | | | (2,461,757 | ) | | | 17,076,701 | |
Mid-Term Bond Fund | | | 40,907,794 | | | | 5,174,919 | | | | (10,964 | ) | | | 514,328 | | | | (2,447,538 | ) | | | 44,138,539 | |
Small Cap Growth Fund | | | 2,370,037 | | | | 78,637 | | | | 278,270 | | | | (87,855 | ) | | | (1,033,934 | ) | | | 1,605,155 | |
Small Cap Value Fund | | | 2,275,148 | | | | 78,637 | | | | 243,370 | | | | (180,588 | ) | | | (867,419 | ) | | | 1,549,148 | |
| | | | | | | | | | | | | | | | | | | | | | | | |
Total | | $ | 154,162,876 | | | $ | 13,588,846 | | | $ | 4,062,726 | | | $ | (1,147,728 | ) | | $ | (14,214,698 | ) | | $ | 156,452,022 | |
| | | | | | | | | | | | | | | | | | | | | | | | |
2020 Retirement Fund | | | | | | | | | | | | | | | | | | | | | | | | |
Bond Fund | | $ | 76,595,533 | | | $ | 10,057,772 | | | $ | 202,003 | | | $ | 374,949 | | | $ | (1,737,867 | ) | | $ | 85,492,390 | |
Equity Index Fund | | | 111,088,452 | | | | 9,291,074 | | | | 2,627,981 | | | | (1,312,622 | ) | | | (5,576,367 | ) | | | 116,118,518 | |
International Fund | | | 25,608,239 | | | | 3,712,743 | | | | 148,656 | | | | 1,437,375 | | | | (612,402 | ) | | | 30,294,611 | |
Mid-Cap Equity Index Fund | | | 37,076,791 | | | | 3,236,818 | | | | 972,262 | | | | 587,630 | | | | (2,109,857 | ) | | | 39,763,644 | |
Mid-Term Bond Fund | | | 53,667,054 | | | | 7,845,496 | | | | 28,370 | | | | 632,778 | | | | (1,277,724 | ) | | | 60,895,974 | |
Small Cap Growth Fund | | | 8,163,343 | | | | 573,262 | | | | 384,304 | | | | 316,703 | | | | (1,417,107 | ) | | | 8,020,505 | |
Small Cap Value Fund | | | 7,842,607 | | | | 573,262 | | | | 209,904 | | | | (32,454 | ) | | | (847,461 | ) | | | 7,745,858 | |
| | | | | | | | | | | | | | | | | | | | | | | | |
Total | | $ | 320,042,019 | | | $ | 35,290,427 | | | $ | 4,573,480 | | | $ | 2,004,359 | | | $ | (13,578,785 | ) | | $ | 348,331,500 | |
| | | | | | | | | | | | | | | | | | | | | | | | |
2025 Retirement Fund | | | | | | | | | | | | | | | | | | | | | | | | |
Bond Fund | | $ | 72,366,762 | | | $ | 10,228,395 | | | $ | 120,834 | | | $ | 417,828 | | | $ | (730,616 | ) | | $ | 82,403,203 | |
Equity Index Fund | | | 129,589,532 | | | | 12,478,589 | | | | 2,395,089 | | | | (843,979 | ) | | | (4,567,855 | ) | | | 139,051,376 | |
International Fund | | | 28,014,884 | | | | 5,602,111 | | | | 109,642 | | | | 1,633,783 | | | | (322,055 | ) | | | 35,038,365 | |
Mid-Cap Equity Index Fund | | | 54,869,811 | | | | 5,294,754 | | | | 1,248,794 | | | | 1,086,458 | | | | (2,103,340 | ) | | | 60,396,477 | |
Mid-Term Bond Fund | | | 22,979,721 | | | | 3,481,060 | | | | 21,270 | | | | 263,695 | | | | (277,859 | ) | | | 26,467,887 | |
Small Cap Growth Fund | | | 11,866,950 | | | | 1,011,778 | | | | 282,605 | | | | 774,352 | | | | (715,874 | ) | | | 13,219,811 | |
Small Cap Value Fund | | | 11,403,387 | | | | 1,222,904 | | | | 37,137 | | | | 201,074 | | | | (96,616 | ) | | | 12,767,886 | |
| | | | | | | | | | | | | | | | | | | | | | | | |
Total | | $ | 331,091,047 | | | $ | 39,319,591 | | | $ | 4,215,371 | | | $ | 3,533,211 | | | $ | (8,814,215 | ) | | $ | 369,345,005 | |
| | | | | | | | | | | | | | | | | | | | | | | | |
2030 Retirement Fund | | | | | | | | | | | | | | | | | | | | | | | | |
Bond Fund | | $ | 60,405,219 | | | $ | 8,416,095 | | | $ | 95,230 | | | $ | 354,492 | | | $ | (606,389 | ) | | $ | 68,664,647 | |
Equity Index Fund | | | 116,004,414 | | | | 10,425,846 | | | | 1,585,362 | | | | (208,735 | ) | | | (2,779,839 | ) | | | 125,027,048 | |
International Fund | | | 23,911,458 | | | | 4,129,378 | | | | 137,525 | | | | 1,360,789 | | | | (285,922 | ) | | | 29,253,228 | |
Mid-Cap Equity Index Fund | | | 48,543,406 | | | | 4,540,592 | | | | 835,414 | | | | 1,219,359 | | | | (1,620,549 | ) | | | 53,518,222 | |
Small Cap Growth Fund | | | 14,375,702 | | | | 1,312,845 | | | | 530,447 | | | | 747,485 | | | | (1,146,339 | ) | | | 15,820,140 | |
Small Cap Value Fund | | | 13,819,971 | | | | 1,312,845 | | | | 66,604 | | | | 226,964 | | | | (145,629 | ) | | | 15,280,755 | |
| | | | | | | | | | | | | | | | | | | | | | | | |
Total | | $ | 277,060,170 | | | $ | 30,137,601 | | | $ | 3,250,582 | | | $ | 3,700,354 | | | $ | (6,584,667 | ) | | $ | 307,564,040 | |
| | | | | | | | | | | | | | | | | | | | | | | | |
90
MUTUAL OF AMERICA INVESTMENT CORPORATION
NOTES TO FINANCIAL STATEMENTS (Unaudited) (Continued)
June 30, 2015
| 3. | INVESTMENTS (CONTINUED) |
| | | | | | | | | | | | | | | | | | | | | | | | |
Affiliated Investment Company | | Value as of
December 31,
2014 | | | Purchases | | | Realized
Gain
(Loss) on
Investment
Securities | | | Change in
Unrealized
Appreciation
(Depreciation)
of Investment
Securities | | | Sales | | | Value as of
June 30,
2015 | |
2035 Retirement Fund | | | | | | | | | | | | | | | | | | | | | | | | |
Bond Fund | | $ | 34,287,171 | | | $ | 5,507,509 | | | $ | 66,852 | | | $ | 181,668 | | | $ | (433,182 | ) | | $ | 39,610,018 | |
Equity Index Fund | | | 96,314,085 | | | | 8,492,688 | | | | 1,432,680 | | | | (298,024 | ) | | | (2,300,416 | ) | | | 103,641,013 | |
International Fund | | | 23,917,152 | | | | 4,250,839 | | | | 118,002 | | | | 1,370,982 | | | | (338,521 | ) | | | 29,318,454 | |
Mid-Cap Equity Index Fund | | | 47,238,976 | | | | 4,246,344 | | | | 1,176,614 | | | | 836,454 | | | | (2,212,842 | ) | | | 51,285,546 | |
Small Cap Growth Fund | | | 14,327,165 | | | | 1,273,903 | | | | 553,448 | | | | 720,832 | | | | (1,143,072 | ) | | | 15,732,276 | |
Small Cap Value Fund | | | 13,769,081 | | | | 1,297,751 | | | | 75,312 | | | | 217,797 | | | | (165,365 | ) | | | 15,194,576 | |
| | | | | | | | | | | | | | | | | | | | | | | | |
Total | | $ | 229,853,630 | | | $ | 25,069,034 | | | $ | 3,422,908 | | | $ | 3,029,709 | | | $ | (6,593,398 | ) | | $ | 254,781,883 | |
| | | | | | | | | | | | | | | | | | | | | | | | |
2040 Retirement Fund | | | | | | | | | | | | | | | | | | | | | | | | |
Bond Fund | | $ | 20,723,371 | | | $ | 3,758,093 | | | $ | 41,026 | | | $ | 105,478 | | | $ | (260,889 | ) | | $ | 24,367,079 | |
Equity Index Fund | | | 69,509,433 | | | | 6,398,381 | | | | 959,679 | | | | (169,906 | ) | | | (1,563,456 | ) | | | 75,134,131 | |
International Fund | | | 23,002,281 | | | | 4,238,879 | | | | 133,267 | | | | 1,275,207 | | | | (301,255 | ) | | | 28,348,379 | |
Mid-Cap Equity Index Fund | | | 44,567,064 | | | | 3,920,915 | | | | 967,058 | | | | 908,627 | | | | (1,957,966 | ) | | | 48,405,698 | |
Small Cap Growth Fund | | | 15,709,453 | | | | 1,432,422 | | | | 702,411 | | | | 683,725 | | | | (1,218,369 | ) | | | 17,309,642 | |
Small Cap Value Fund | | | 15,099,054 | | | | 1,478,853 | | | | 98,188 | | | | 216,018 | | | | (172,145 | ) | | | 16,719,968 | |
| | | | | | | | | | | | | | | | | | | | | | | | |
Total | | $ | 188,610,656 | | | $ | 21,227,543 | | | $ | 2,901,629 | | | $ | 3,019,149 | | | $ | (5,474,080 | ) | | $ | 210,284,897 | |
| | | | | | | | | | | | | | | | | | | | | | | | |
2045 Retirement Fund | | | | | | | | | | | | | | | | | | | | | | | | |
Bond Fund | | $ | 20,903,102 | | | $ | 3,768,728 | | | $ | 25,922 | | | $ | 120,623 | | | $ | (140,756 | ) | | $ | 24,677,619 | |
Equity Index Fund | | | 85,817,347 | | | | 6,712,200 | | | | 1,056,208 | | | | (71,692 | ) | | | (1,684,558 | ) | | | 91,829,505 | |
International Fund | | | 32,381,312 | | | | 5,656,709 | | | | 82,778 | | | | 1,899,028 | | | | (218,612 | ) | | | 39,801,215 | |
Mid-Cap Equity Index Fund | | | 50,284,552 | | | | 4,148,017 | | | | 1,285,433 | | | | 825,255 | | | | (2,062,169 | ) | | | 54,481,088 | |
Small Cap Growth Fund | | | 21,788,163 | | | | 1,745,391 | | | | 819,964 | | | | 1,095,228 | | | | (1,591,362 | ) | | | 23,857,384 | |
Small Cap Value Fund | | | 20,932,146 | | | | 1,801,870 | | | | 66,253 | | | | 368,614 | | | | (124,397 | ) | | | 23,044,486 | |
| | | | | | | | | | | | | | | | | | | | | | | | |
Total | | $ | 232,106,622 | | | $ | 23,832,915 | | | $ | 3,336,558 | | | $ | 4,237,056 | | | $ | (5,821,854 | ) | | $ | 257,691,297 | |
| | | | | | | | | | | | | | | | | | | | | | | | |
2050 Retirement Fund | | | | | | | | | | | | | | | | | | | | | | | | |
Bond Fund | | $ | 3,745,522 | | | $ | 1,709,749 | | | $ | 289 | | | $ | 22,667 | | | $ | (68,609 | ) | | $ | 5,409,618 | |
Equity Index Fund | | | 18,326,092 | | | | 7,186,695 | | | | 22,085 | | | | 150,777 | | | | (68,525 | ) | | | 25,617,124 | |
International Fund | | | 7,696,675 | | | | 3,792,240 | | | | 5,673 | | | | 469,031 | | | | (33,033 | ) | | | 11,930,586 | |
Mid-Cap Equity Index Fund | | | 10,148,171 | | | | 4,238,584 | | | | 45,847 | | | | 378,172 | | | | (155,244 | ) | | | 14,655,530 | |
Small Cap Growth Fund | | | 5,237,733 | | | | 2,047,716 | | | | 97,567 | | | | 429,386 | | | | (384,131 | ) | | | 7,428,271 | |
Small Cap Value Fund | | | 5,056,821 | | | | 2,047,717 | | | | 6,939 | | | | 104,479 | | | | (32,256 | ) | | | 7,183,700 | |
| | | | | | | | | | | | | | | | | | | | | | | | |
Total | | $ | 50,211,014 | | | $ | 21,022,701 | | | $ | 178,400 | | | $ | 1,554,512 | | | $ | (741,798 | ) | | $ | 72,224,829 | |
| | | | | | | | | | | | | | | | | | | | | | | | |
Conservative Allocation Fund | | | | | | | | | | | | | | | | | | | | | | | | |
Bond Fund | | $ | 36,389,697 | | | $ | 2,823,673 | | | $ | 88,342 | | | $ | 207,931 | | | $ | (944,738 | ) | | $ | 38,564,905 | |
Equity Index Fund | | | 32,446,155 | | | | 2,074,813 | | | | 994,173 | | | | (628,169 | ) | | | (2,358,192 | ) | | | 32,528,780 | |
International Fund | | | 5,500,281 | | | | 912,126 | | | | (6,896 | ) | | | 370,158 | | | | (157,456 | ) | | | 6,618,213 | |
Mid-Cap Equity Index Fund | | | 6,353,030 | | | | 414,963 | | | | 27,429 | | | | 233,896 | | | | (515,152 | ) | | | 6,514,166 | |
Mid-Term Bond Fund | | | 41,833,962 | | | | 4,002,285 | | | | (5,735 | ) | | | 531,879 | | | | (1,102,194 | ) | | | 45,260,197 | |
| | | | | | | | | | | | | | | | | | | | | | | | |
Total | | $ | 122,523,125 | | | $ | 10,227,860 | | | $ | 1,097,313 | | | $ | 715,695 | | | $ | (5,077,732 | ) | | $ | 129,486,261 | |
| | | | | | | | | | | | | | | | | | | | | | | | |
Moderate Allocation Fund | | | | | | | | | | | | | | | | | | | | | | | | |
Bond Fund | | $ | 77,121,305 | | | $ | 4,191,521 | | | $ | 266,250 | | | $ | 365,694 | | | $ | (1,440,311 | ) | | $ | 80,504,459 | |
Equity Index Fund | | | 116,126,635 | | | | 3,353,983 | | | | 3,964,327 | | | | (2,653,608 | ) | | | (6,677,348 | ) | | | 114,113,989 | |
International Fund | | | 27,800,033 | | | | 4,123,145 | | | | (26,488 | ) | | | 1,856,714 | | | | (576,125 | ) | | | 33,177,279 | |
Mid-Cap Equity Index Fund | | | 48,614,754 | | | | 1,437,421 | | | | 1,684,550 | | | | 296,541 | | | | (3,064,986 | ) | | | 48,968,280 | |
Mid-Term Bond Fund | | | 45,545,453 | | | | 3,338,451 | | | | 53,666 | | | | 517,852 | | | | (864,187 | ) | | | 48,591,235 | |
| | | | | | | | | | | | | | | | | | | | | | | | |
Total | | $ | 315,208,180 | | | $ | 16,444,521 | | | $ | 5,942,305 | | | $ | 383,193 | | | $ | (12,622,957 | ) | | $ | 325,355,242 | |
| | | | | | | | | | | | | | | | | | | | | | | | |
91
MUTUAL OF AMERICA INVESTMENT CORPORATION
NOTES TO FINANCIAL STATEMENTS (Unaudited) (Continued)
June 30, 2015
| 3. | INVESTMENTS (CONTINUED) |
| | | | | | | | | | | | | | | | | | | | | | | | |
Affiliated Investment Company | | Value as of
December 31,
2014 | | | Purchases | | | Realized
Gain
(Loss) on
Investment
Securities | | | Change in
Unrealized
Appreciation
(Depreciation)
of Investment
Securities | | | Sales | | | Value as of
June 30,
2015 | |
Aggressive Allocation Fund | | | | | | | | | | | | | | | | | | | | | | | | |
Bond Fund | | $ | 49,577,494 | | | $ | 2,508,968 | | | $ | 183,185 | | | $ | 225,018 | | | $ | (999,150 | ) | | $ | 51,495,515 | |
Equity Index Fund | | | 93,420,201 | | | | 1,474,380 | | | | 2,567,931 | | | | (1,485,076 | ) | | | (4,709,282 | ) | | | 91,268,154 | |
International Fund | | | 33,457,170 | | | | 4,883,831 | | | | (24,017 | ) | | | 2,247,227 | | | | (749,363 | ) | | | 39,814,848 | |
Mid-Cap Equity Index Fund | | | 52,115,303 | | | | 842,503 | | | | 1,331,611 | | | | 804,236 | | | | (2,874,949 | ) | | | 52,218,704 | |
Small Cap Growth Fund | | | 13,448,275 | | | | 210,626 | | | | 520,583 | | | | 592,447 | | | | (1,323,693 | ) | | | 13,448,238 | |
Small Cap Value Fund | | | 12,781,759 | | | | 210,625 | | | | 91,009 | | | | 173,334 | | | | (257,733 | ) | | | 12,998,994 | |
| | | | | | | | | | | | | | | | | | | | | | | | |
Total | | $ | 254,800,202 | | | $ | 10,130,933 | | | $ | 4,670,302 | | | $ | 2,557,186 | | | $ | (10,914,170 | ) | | $ | 261,244,453 | |
| | | | | | | | | | | | | | | | | | | | | | | | |
The Investment Company has registered an indefinite number of its capital shares pursuant to Rule 24f-2 under the Investment Company Act of 1940. On February 26, 2015, the Board of Directors of the Investment Company increased the number of authorized shares from seven and a half billion to eight and a quarter billion. Also on that date, the Board of Directors changed the number of authorized shares as indicated by the following table. As a result of these actions, there remained 610,000,000 unallocated shares as of June 30, 2015.
| | | | | | | | | | | | |
| | | Authorized No. of Shares | |
| | | Previous
Allocation | | | Allocation
Increase/
(Decrease) | | | Total Shares
Allocated | |
Equity Index Fund | | | 700,000,000 | | | | — | | | | 700,000,000 | |
All America Fund | | | 200,000,000 | | | | — | | | | 200,000,000 | |
Small Cap Value Fund | | | 325,000,000 | | | | — | | | | 325,000,000 | |
Small Cap Growth Fund | | | 395,000,000 | | | | — | | | | 395,000,000 | |
Mid Cap Value Fund | | | 100,000,000 | | | | — | | | | 100,000,000 | |
Mid-Cap Equity Index Fund | | | 600,000,000 | | | | — | | | | 600,000,000 | |
International Fund | | | 425,000,000 | | | | 100,000,000 | | | | 525,000,000 | |
Composite Fund | | | 150,000,000 | | | | — | | | | 150,000,000 | |
Retirement Income Fund | | | 70,000,000 | | | | 10,000,000 | | | | 80,000,000 | |
2010 Retirement Fund | | | 50,000,000 | | | | — | | | | 50,000,000 | |
2015 Retirement Fund | | | 200,000,000 | | | | — | | | | 200,000,000 | |
2020 Retirement Fund | | | 350,000,000 | | | | 75,000,000 | | | | 425,000,000 | |
2025 Retirement Fund | | | 375,000,000 | | | | 50,000,000 | | | | 425,000,000 | |
2030 Retirement Fund | | | 290,000,000 | | | | 75,000,000 | | | | 365,000,000 | |
2035 Retirement Fund | | | 245,000,000 | | | | 50,000,000 | | | | 295,000,000 | |
2040 Retirement Fund | | | 200,000,000 | | | | 25,000,000 | | | | 225,000,000 | |
2045 Retirement Fund | | | 250,000,000 | | | | 25,000,000 | | | | 275,000,000 | |
2050 Retirement Fund | | | 100,000,000 | | | | 10,000,000 | | | | 110,000,000 | |
Conservative Allocation Fund | | | 125,000,000 | | | | 25,000,000 | | | | 150,000,000 | |
Moderate Allocation Fund | | | 250,000,000 | | | | 5,000,000 | | | | 255,000,000 | |
Aggressive Allocation Fund | | | 200,000,000 | | | | — | | | | 200,000,000 | |
Money Market Fund | | | 125,000,000 | | | | — | | | | 125,000,000 | |
Mid-Term Bond Fund | | | 500,000,000 | | | | 40,000,000 | | | | 540,000,000 | |
Bond Fund | | | 750,000,000 | | | | 175,000,000 | | | | 925,000,000 | |
| | | | | | | | | | | | |
Sub-Total | | | 6,975,000,000 | | | | 665,000,000 | | | | 7,640,000,000 | |
Shares to be allocated at the discretion of the Board of Directors | | | 525,000,000 | | | | 85,000,000 | | | | 610,000,000 | |
| | | | | | | | | | | | |
Total | | | 7,500,000,000 | | | | 750,000,000 | | | | 8,250,000,000 | |
| | | | | | | | | | | | |
92
MUTUAL OF AMERICA INVESTMENT CORPORATION
NOTES TO FINANCIAL STATEMENTS (Unaudited) (Continued)
June 30, 2015
| 5. | DISTRIBUTIONSTO SHAREHOLDERSAND INCOME TAX INFORMATION |
Distributions — On September 11, 2014, required distributions of net investment income and, as applicable, net realized gains relating to 2013 were declared and paid for all applicable funds in accordance with Internal Revenue Section 855(a).
The Funds of Mutual of America Investment Corporation intend to declare and pay their respective tax year 2014 investment company taxable income and capital gains in 2015 in accordance with Internal Revenue Section 855(a).
Pursuant to shareholders’ instructions, substantially all dividend distributions throughout 2015 and 2014 were immediately reinvested into their respective funds. The tax character of the distributions paid during 2015 and 2014 was as follows:
| | | | | | | | | | | | | | | | | | | | |
| | | Equity Index
Fund | | | All America
Fund | | | Small Cap
Value Fund | | | Small Cap
Growth | | | Mid Cap
Value Fund | |
Ordinary Income (a) | | | | | | | | | | | | | | | | | | | | |
2015 | | $ | 0 | | | $ | 0 | | | $ | 0 | | | $ | 0 | | | $ | 0 | |
2014 | | $ | 30,196,225 | | | $ | 6,490,290 | | | $ | 4,756,094 | | | $ | 2,993,761 | | | $ | 1,405,694 | |
Long-Term Capital Gains | | | | | | | | | | | | | | | | | | | | |
2015 | | $ | 0 | | | $ | 0 | | | $ | 0 | | | $ | 0 | | | $ | 0 | |
2014 | | $ | 14,610,030 | | | $ | 20,996,554 | | | $ | 36,455,404 | | | $ | 28,523,609 | | | $ | 4,649,738 | |
| | | | | |
| | | Mid-Cap
Equity Index
Fund | | | International
Fund | | | Composite
Fund | | | Retirement
Fund | | | 2010
Retirement
Fund | |
Ordinary Income (a) | | | | | | | | | | | | | | | | | | | | |
2015 | | $ | 0 | | | $ | 0 | | | $ | 0 | | | $ | 0 | | | $ | 0 | |
2014 | | $ | 15,510,466 | | | $ | 3,900,803 | | | $ | 3,641,558 | | | $ | 746,239 | | | $ | 478,710 | |
Long-Term Capital Gains | | | | | | | | | | | | | | | | | | | | |
2015 | | $ | 0 | | | $ | 0 | | | $ | 0 | | | $ | 0 | | | $ | 0 | |
2014 | | $ | 34,889,866 | | | $ | 825,732 | | | $ | 0 | | | $ | 853,955 | | | $ | 653,628 | |
| | | | | |
| | | 2015
Retirement
Fund | | | 2020
Retirement
Fund | | | 2025
Retirement
Fund | | | 2030
Retirement
Fund | | | 2035
Retirement
Fund | |
Ordinary Income (a) | | | | | | | | | | | | | | | | | | | | |
2015 | | $ | 0 | | | $ | 0 | | | $ | 0 | | | $ | 0 | | | $ | 0 | |
2014 | | $ | 2,616,090 | | | $ | 3,853,531 | | | $ | 3,459,110 | | | $ | 2,762,712 | | | $ | 2,061,376 | |
Long-Term Capital Gains | | | | | | | | | | | | | | | | | | | | |
2015 | | $ | 0 | | | $ | 0 | | | $ | 0 | | | $ | 0 | | | $ | 0 | |
2014 | | $ | 3,478,425 | | | $ | 3,571,569 | | | $ | 2,819,455 | | | $ | 2,549,750 | | | $ | 2,255,109 | |
| | | | | |
| | | 2040
Retirement
Fund | | | 2045
Retirement
Fund | | | 2050
Retirement
Fund | | | Conservative
Allocation
Fund | | | Moderate
Allocation
Fund | |
Ordinary Income (a) | | | | | | | | | | | | | | | | | | | | |
2015 | | $ | 0 | | | $ | 0 | | | $ | 0 | | | $ | 0 | | | $ | 0 | |
2014 | | $ | 1,709,321 | | | $ | 2,118,365 | | | $ | 55,752 | | | $ | 2,273,586 | | | $ | 5,452,659 | |
Long-Term Capital Gains | | | | | | | | | | | | | | | | | | | | |
2015 | | $ | 0 | | | $ | 0 | | | $ | 0 | | | $ | 0 | | | $ | 0 | |
2014 | | $ | 2,115,297 | | | $ | 2,510,179 | | | $ | 60,082 | | | $ | 1,664,925 | | | $ | 3,993,394 | |
93
MUTUAL OF AMERICA INVESTMENT CORPORATION
NOTES TO FINANCIAL STATEMENTS (Unaudited) (Continued)
June 30, 2015
| 5. | DISTRIBUTIONSTO SHAREHOLDERSAND INCOME TAX INFORMATION (CONTINUED) |
| | | | | | | | | | | | | | | | | | |
| | | Aggressive
Allocation
Fund | | | Money Market
Fund | | | Mid-Term
Bond Fund | | | Bond Fund | | | |
Ordinary Income (a) | | | | | | | | | | | | | | | | | | |
2015 | | $ | 0 | | | $ | 0 | | | $ | 0 | | | $ | 0 | | | |
2014 | | $ | 3,819,966 | | | $ | 0 | | | $ | 10,843,710 | | | $ | 26,340,172 | | | |
Long-Term Capital Gains | | | | | | | | | | | | | | | | | | |
2015 | | $ | 0 | | | $ | 0 | | | $ | 0 | | | $ | 0 | | | |
2014 | | $ | 3,901,158 | | | $ | 0 | | | $ | 1,988,761 | | | $ | 0 | | | |
Notes:
| (a) | Includes distributions from Fund-level net short-term capital gains. |
Undistributed net income and gains (losses) — As of June 30, 2015, undistributed net income and undistributed accumulated gain (loss) for Federal income tax purposes were as follows:
| | | | | | | | | | | | | | | | | | | | |
| | | Equity Index
Fund | | | All America
Fund | | | Small Cap
Value Fund | | | Small Cap
Growth Fund | | | Mid Cap
Value Fund | |
Accumulated undistributed net investment income | | $ | 48,645,597 | | | $ | 6,292,642 | | | $ | 6,153,845 | | | $ | 0 | | | $ | 1,678,462 | |
Accumulated undistributed net realized gain/(loss) on investments and futures contracts | | $ | 78,529,214 | | | $ | 29,598,889 | | | $ | 31,582,851 | | | $ | 77,909,367 | | | $ | 7,115,905 | |
Net unrealized appreciation (depreciation) of investments and futures contracts | | $ | 658,196,114 | | | $ | 87,580,416 | | | $ | 85,734,011 | | | $ | 96,495,238 | | | $ | 17,472,145 | |
| | | | | |
| | | Mid-Cap
Equity Index
Fund | | | International
Fund | | | Composite
Fund | | | Retirement
Income
Fund | | | 2010
Retirement
Fund | |
Accumulated undistributed net investment income | | $ | 23,276,521 | | | $ | 13,194,165 | | | $ | 5,918,616 | | | $ | 1,043,642 | | | $ | 553,391 | |
Accumulated undistributed net realized gain/(loss) on investments and futures contracts | | $ | 107,315,881 | | | $ | 85,784 | | | $ | 7,047,627 | | | $ | 2,704,231 | | | $ | 2,037,051 | |
Net unrealized appreciation (depreciation) of investments and futures contracts | | $ | 261,437,547 | | | $ | 12,788,760 | | | $ | 41,355,724 | | | $ | 2,087,654 | | | $ | 2,291,299 | |
| | | | | |
| | | 2015
Retirement
Fund | | | 2020
Retirement
Fund | | | 2025
Retirement
Fund | | | 2030
Retirement
Fund | | | 2035
Retirement
Fund | |
Accumulated undistributed net investment income | | $ | 3,145,220 | | | $ | 5,971,939 | | | $ | 5,804,497 | | | $ | 4,662,610 | | | $ | 3,637,561 | |
Accumulated undistributed net realized gain/(loss) on investments and futures contracts | | $ | 12,119,663 | | | $ | 18,475,165 | | | $ | 16,664,244 | | | $ | 14,248,288 | | | $ | 11,968,626 | |
Net unrealized appreciation (depreciation) of investments and futures contracts | | $ | 18,226,528 | | | $ | 44,931,777 | | | $ | 58,700,206 | | | $ | 54,631,660 | | | $ | 47,646,590 | |
| | | | | |
| | | 2040
Retirement
Fund | | | 2045
Retirement
Fund | | | 2050
Retirement
Fund | | | Conservative
Allocation
Fund | | | Moderate
Allocation
Fund | |
Accumulated undistributed net investment income | | $ | 2,857,782 | | | $ | 3,540,101 | | | $ | 592,908 | | | $ | 2,621,100 | | | $ | 6,538,841 | |
Accumulated undistributed net realized gain/(loss) on investments and futures contracts | | $ | 10,737,552 | | | $ | 12,669,991 | | | $ | 1,328,584 | | | $ | 4,823,039 | | | $ | 20,548,338 | |
Net unrealized appreciation (depreciation) of investments and futures contracts | | $ | 42,185,508 | | | $ | 54,169,120 | | | $ | 4,508,707 | | | $ | 9,666,066 | | | $ | 53,129,178 | |
94
MUTUAL OF AMERICA INVESTMENT CORPORATION
NOTES TO FINANCIAL STATEMENTS (Unaudited) (Continued)
June 30, 2015
| 5. | DISTRIBUTIONSTO SHAREHOLDERSAND INCOME TAX INFORMATION (CONTINUED) |
| | | | | | | | | | | | | | | | | | |
| | | Aggressive
Allocation
Fund | | | Money Market
Fund | | | Mid-Term
Bond Fund | | | Bond Fund | | | |
Accumulated undistributed net investment income | | $ | 4,687,286 | | | $ | 0 | | | $ | 15,675,071 | | | $ | 45,384,162 | | | |
Accumulated undistributed net realized gain/(loss) on investments and futures contracts | | $ | 21,275,523 | | | $ | 0 | | | $ | 2,144,276 | | | $ | 970,200 | | | |
Net unrealized appreciation (depreciation) of investments and futures contracts | | $ | 61,547,302 | | | $ | 1,881 | | | $ | 7,360,554 | | | $ | 19,984,249 | | | |
The difference between the components of distributable earnings for income tax purposes and the amounts reflected in the statements of assets and liabilities arise primarily from federal income tax treatment of wash sales, REITs, partnerships, corporate actions and futures contracts.
Reclassifications — The Funds make adjustments to the components of net assets for book to tax differences that are considered permanent in nature. For the six months ended June 30, 2015, the Funds reclassified amounts primarily relating to differences in the book to tax treatment of partnership investments, REITs, net operating losses and the character of distributions. Each Fund’s net assets are not affected by these reclassifications.
During the six months ended June 30, 2015, each Fund reclassified the following book to tax differences [increases (decreases)]:
| | | | | | | | | | | | | | | | | | | | |
| | | Equity Index
Fund | | | All America
Fund | | | Small Cap
Value Fund | | | Small Cap
Growth Fund | | | Mid Cap
Value Fund | |
Accumulated undistributed net investment income | | $ | (55,951 | ) | | $ | 155,015 | | | $ | 944,295 | | | $ | 50,666 | | | $ | (37,941 | ) |
Accumulated undistributed net realized gains (loss) on investments and futures contracts | | $ | 55,951 | | | $ | (155,015 | ) | | $ | (944,295 | ) | | $ | (560,250 | ) | | $ | 37,941 | |
| | | | | | | | | | | | | | | | | | | | |
Paid in capital | | $ | 0 | | | $ | 0 | | | $ | 0 | | | $ | 509,584 | | | $ | 0 | |
| | | | | | | | | | | | | | | | | | | | |
| | | | | |
| | | Mid-Cap
Equity Index
Fund | | | International
Fund | | | Composite
Fund | | | Retirement
Income
Fund | | | 2010
Retirement
Fund | |
Accumulated undistributed net investment income | | $ | (168,951 | ) | | $ | 0 | | | $ | (3,240 | ) | | $ | 13,931 | | | $ | 6,668 | |
Accumulated undistributed net realized gains (loss) on investments and futures contracts | | $ | 168,951 | | | $ | 0 | | | $ | 3,240 | | | $ | 0 | | | $ | 0 | |
| | | | | | | | | | | | | | | | | | | | |
Paid in capital | | $ | 0 | | | $ | 0 | | | $ | 0 | | | $ | (13,931 | ) | | $ | (6,668 | ) |
| | | | | | | | | | | | | | | | | | | | |
| | | | | |
| | | 2015
Retirement
Fund | | | 2020
Retirement
Fund | | | 2025
Retirement
Fund | | | 2030
Retirement
Fund | | | 2035
Retirement
Fund | |
Accumulated undistributed net investment income | | $ | 48,580 | | | $ | 99,679 | | | $ | 104,512 | | | $ | 87,754 | | | $ | 73,085 | |
Accumulated undistributed net realized gains (loss) on investments and futures contracts | | $ | 0 | | | $ | 0 | | | $ | 0 | | | $ | 0 | | | $ | 0 | |
| | | | | | | | | | | | | | | | | | | | |
Paid in capital | | $ | (48,580 | ) | | $ | (99,679 | ) | | $ | (104,512 | ) | | $ | (87,754 | ) | | $ | (73,085 | ) |
| | | | | | | | | | | | | | | | | | | | |
| | | | | |
| | | 2040
Retirement
Fund | | | 2045
Retirement
Fund | | | 2050
Retirement
Fund | | | Conservative
Allocation
Fund | | | Moderate
Allocation
Fund | |
Accumulated undistributed net investment income | | $ | 60,450 | | | $ | 73,829 | | | $ | 15,293 | | | $ | 7,747 | | | $ | 16,836 | |
Accumulated undistributed net realized gains (loss) on investments and futures contracts | | $ | 0 | | | $ | 0 | | | $ | 0 | | | $ | (7,747 | ) | | $ | (298 | ) |
| | | | | | | | | | | | | | | | | | | | |
Paid in capital | | $ | (60,450 | ) | | $ | (73,829 | ) | | $ | (15,293 | ) | | $ | 0 | | | $ | (16,538 | ) |
| | | | | | | | | | | | | | | | | | | | �� |
95
MUTUAL OF AMERICA INVESTMENT CORPORATION
NOTES TO FINANCIAL STATEMENTS (Unaudited) (Continued)
June 30, 2015
| 5. | DISTRIBUTIONSTO SHAREHOLDERSAND INCOME TAX INFORMATION (CONTINUED) |
| | | | | | | | | | | | | | | | | | |
| | | Aggressive
Allocation
Fund | | | Money Market
Fund | | | Mid-Term
Bond Fund | | | Bond Fund | | | |
Accumulated undistributed net investment income | | $ | 14,457 | | | $ | 46,854 | | | $ | 0 | | | $ | 0 | | | |
Accumulated undistributed net realized gains (loss) on investments and futures contracts | | $ | (397 | ) | | $ | (1 | ) | | $ | 0 | | | $ | 0 | | | |
| | | | | | | | | | | | | | | | | | |
Paid in capital | | $ | (14,060 | ) | | $ | (46,853 | ) | | $ | 0 | | | $ | 0 | | | |
| | | | | | | | | | | | | | | | | | |
96
MUTUAL OF AMERICA INVESTMENT CORPORATION
ADDITIONAL INFORMATION
Quarterly Portfolio Schedules
Included in this Semi-Annual Report are summary schedules of Mutual of America Investment Corporation’s (“Investment Company”) Fund portfolio holdings as of June 30, 2015. The Investment Company files complete schedules of Fund portfolio holdings with the Securities and Exchange Commission (“SEC”) for the first and third quarters of each fiscal year on Form N-Q and for the second and fourth quarters of each fiscal year on Form N-CSR. The Forms N-Q and N-CSR are available on the SEC’s website at http://www.sec.gov. Additionally, the Forms N-Q and N-CSR may be reviewed and copied at the SEC’s Public Reference Room in Washington, DC. Information on the operation of the Public Reference Room may be obtained by calling 1-800-SEC-0330.
Proxy Voting Policies and Procedures
A copy of the Investment Company’s proxy voting policies and procedures can be obtained free of charge by calling 1-800-468-3785. It is also available on the SEC’s website at http://www.sec.gov.
Information regarding how the Investment Company voted proxies relating to portfolio securities during the 12-month period ended June 30, 2015 is available without charge by calling 1-800-468-3785. It is also available on the SEC website.
Code of Ethics
The Investment Company has adopted a Code of Ethics that complies with Rule 17j-1 of the Investment Company Act of 1940 and with the requirements of the Sarbanes-Oxley Act of 2002. A copy of the Code of Ethics is available free of charge, upon request. To obtain a free copy of the Code of Ethics, please call (212) 224-1568 or write to:
Ms. Kathryn Lu
Chief Compliance Officer
Mutual of America Investment Corporation
320 Park Avenue
New York, NY 10022-6839
Renewal of Investment Advisory Agreements
At its meeting held on February 26, 2015, the Board of Directors of the Investment Company renewed for a one-year period the investment advisory agreement with Mutual of America Capital Management Corporation (the “Adviser”). The Board determined that renewing the agreement with the Adviser was in the best interest of the Investment Company based on the following considerations which are further enumerated below. The Board concluded that Mutual of America Capital Management Corporation has performed extensive services for the Investment Company and has demonstrated satisfactory performance, that its fee is reasonable in comparison to fees charged for similar services to similar funds by other advisers, that the method of calculating the fee is reasonable, that the Adviser has not made excessive profits from the contract and the fee levels reflect that the Funds are appropriately benefiting from economies of scale.
Nature, Extent and Quality of Services
The Board considered the depth of experience and organizational structure of the Adviser. At December 31, 2014, the Adviser had approximately $14 billion of assets under management. The individual portfolio managers that oversee the investment performance of each of the Investment Company’s Funds have extensive experience and knowledge of the specific markets in which they participate. The Adviser adheres to a strict best execution policy which requires it to select broker/dealers based on their ability to execute trades at a favorable and reasonable price. All else being equal, the Advisor will also consider any research that the broker/dealers may provide. The Adviser maintains a highly qualified staff of research analysts and quantitative analysts who assist in the implementation of the disciplined investment policies employed by the portfolio managers to enhance stock selection and manage risk in the portfolios. The Adviser’s quantitative analysts have developed proprietary models that result in daily risk and attribution reports as well as information on stock movements, to enable the portfolio managers to make fully informed decisions on stock selection and to constantly evaluate the structure of each portfolio. When purchasing research and other services, the
97
Adviser uses its own funds to purchase such services from recognized firms that are utilized by the research staff. The Adviser also receives research services from broker/dealers which are utilized to benefit the Funds. The Board was aware of the receipt of these research services when it considered renewing the advisory agreement with the Adviser. The Adviser, at no cost, provides services beyond those set forth in the advisory agreement, such as assistance in the preparation of marketing materials and attendance at client and prospect meetings.
Investment Performance
The Board considered the short- and long-term performance of the Funds. During 2014, the vast majority of the Funds demonstrated gross performance that was above their benchmarks, when considering minimal tracking error. Performance has continued to improve over the past number of years due to changes made in the Adviser’s investment process and personnel, including the creation of the quantitative research group mentioned above.
Cost and Profit
The Board compared the advisory fees charged to each Fund by the Adviser with fees of numerous similar funds. In the case of each Fund, the Adviser’s fee compared favorably with fees charged by other advisers. Finally, the Adviser has not shown excessively high profits from the fees it is paid by the Investment Company.
Economies of Scale
The Board concluded that the reasonableness of the Adviser’s fees, particularly when compared to fees of similar funds that, in most cases, are many times the asset size of the Funds of the Investment Company demonstrates the fact that the Funds are benefiting from economies of scale. The Adviser utilizes the resources at its disposal efficiently. Its fees reflect cost savings and expense discounts, if any, that it realizes from volume increases.
98
MUTUALOF AMERICA
LIFE INSURANCE COMPANY
320 PARK AVENUE
NEW YORK, NY 10022-6839
www.mutualofamerica.com
320 PARK AVENUE
NEW YORK NY 10022-6839
ADDRESS SERVICE REQUESTED
| | |
 | | You can receive these and other important documents electronically. Sign up for eDocuments and we’ll waive the monthly participant charge. Find out more at mutualofamerica.com or call 1-800-468-3785. |
Item not applicable to semi-annual report.
| ITEM 3. | AUDIT COMMITTEE FINANCIAL EXPERT. |
Item not applicable to semi-annual report.
| ITEM 4. | PRINCIPAL ACCOUNTANT FEES AND SERVICES. |
Item not applicable to semi-annual report.
| ITEM 5. | AUDIT COMMITTEE OF LISTED REGISTRANTS. |
Not applicable.
(a) Schedule I – Portfolios of Investments in Securities follows:
MUTUAL OF AMERICA INVESTMENT CORPORATION - EQUITY INDEX FUND
PORTFOLIO OF INVESTMENTS IN SECURITIES
June 30, 2015 (Unaudited)
| | | | | | | | |
| | | Shares | | | Value | |
INDEXED ASSETS: | | | | | | | | |
COMMON STOCKS: | | | | | | | | |
CONSUMER DISCRETIONARY (12.4%) | | | | | | | | |
Amazon.com, Inc.* | | | 37,068 | | | | 16,090,848 | |
AutoNation, Inc.* | | | 7,446 | | | | 468,949 | |
AutoZone, Inc.* | | | 3,082 | | | | 2,055,386 | |
Bed Bath & Beyond, Inc.* | | | 16,619 | | | | 1,146,379 | |
Best Buy Co., Inc. | | | 28,558 | | | | 931,276 | |
BorgWarner, Inc. | | | 22,084 | | | | 1,255,255 | |
Cablevision Systems Corp. Cl A | | | 21,569 | | | | 516,362 | |
CarMax, Inc.* | | | 20,210 | | | | 1,338,104 | |
Carnival Corp. | | | 43,743 | | | | 2,160,467 | |
CBS Corp. Cl B | | | 43,807 | | | | 2,431,289 | |
Chipotle Mexican Grill, Inc.* | | | 3,028 | | | | 1,831,910 | |
Coach, Inc. | | | 26,911 | | | | 931,390 | |
Comcast Corp. Cl A | | | 244,057 | | | | 14,677,588 | |
D.R. Horton, Inc. | | | 32,533 | | | | 890,103 | |
Darden Restaurants, Inc. | | | 12,090 | | | | 859,357 | |
Delphi Automotive PLC | | | 27,967 | | | | 2,379,712 | |
DIRECTV* | | | 48,786 | | | | 4,526,853 | |
Discovery Communications, Inc. Cl A* | | | 14,479 | | | | 481,572 | |
Discovery Communications, Inc. Cl C* | | | 25,160 | | | | 781,973 | |
Disney (Walt) Co. | | | 151,403 | | | | 17,281,138 | |
Dollar General Corp. | | | 28,781 | | | | 2,237,435 | |
Dollar Tree, Inc.* | | | 19,919 | | | | 1,573,402 | |
Expedia, Inc. | | | 9,613 | | | | 1,051,182 | |
Family Dollar Stores, Inc.* | | | 9,397 | | | | 740,578 | |
Ford Motor Co. | | | 385,412 | | | | 5,785,039 | |
Fossil Group, Inc.* | | | 4,075 | | | | 282,642 | |
GameStop Corp. Cl A | | | 10,523 | | | | 452,068 | |
Gap, Inc. | | | 25,648 | | | | 978,984 | |
Garmin Ltd. | | | 11,713 | | | | 514,552 | |
General Motors Co. | | | 131,063 | | | | 4,368,330 | |
Genuine Parts Co. | | | 14,719 | | | | 1,317,792 | |
Goodyear Tire & Rubber Co. | | | 26,378 | | | | 795,297 | |
H&R Block, Inc. | | | 26,934 | | | | 798,593 | |
Hanesbrands, Inc. | | | 39,010 | | | | 1,299,813 | |
Harley-Davidson, Inc. | | | 20,332 | | | | 1,145,708 | |
Harman Int’l. Industries, Inc. | | | 6,953 | | | | 826,990 | |
Hasbro, Inc. | | | 10,837 | | | | 810,499 | |
Home Depot, Inc. | | | 126,117 | | | | 14,015,382 | |
Interpublic Group of Cos., Inc. | | | 40,435 | | | | 779,182 | |
Johnson Controls, Inc. | | | 63,671 | | | | 3,153,625 | |
Kohl’s Corp. | | | 19,271 | | | | 1,206,557 | |
L Brands, Inc. | | | 23,863 | | | | 2,045,775 | |
Leggett & Platt, Inc. | | | 13,361 | | | | 650,413 | |
Lennar Corp. Cl A | | | 17,290 | | | | 882,482 | |
Lowe’s Cos., Inc. | | | 90,437 | | | | 6,056,571 | |
Macy’s, Inc. | | | 32,682 | | | | 2,205,055 | |
Marriott International, Inc. Cl A | | | 20,004 | | | | 1,488,098 | |
Mattel, Inc. | | | 32,984 | | | | 847,359 | |
McDonald’s Corp. | | | 92,997 | | | | 8,841,225 | |
Michael Kors Hldgs. Ltd.* | | | 19,293 | | | | 812,042 | |
Mohawk Industries, Inc.* | | | 6,070 | | | | 1,158,763 | |
Netflix, Inc.* | | | 5,893 | | | | 3,871,347 | |
Newell Rubbermaid, Inc. | | | 26,206 | | | | 1,077,329 | |
News Corp. Cl A* | | | 48,758 | | | | 711,379 | |
NIKE, Inc. Cl B | | | 67,567 | | | | 7,298,592 | |
Nordstrom, Inc. | | | 13,714 | | | | 1,021,693 | |
| | | | | | | | |
O’Reilly Automotive, Inc.* | | | 9,828 | | | | 2,220,931 | |
Omnicom Group, Inc. | | | 23,738 | | | | 1,649,554 | |
Priceline Group Inc.* | | | 5,032 | | | | 5,793,694 | |
Pulte Homes, Inc. | | | 31,597 | | | | 636,680 | |
PVH Corp. | | | 8,029 | | | | 924,941 | |
Ralph Lauren Corp. | | | 5,863 | | | | 776,027 | |
Ross Stores, Inc. | | | 40,231 | | | | 1,955,629 | |
Royal Caribbean Cruises Ltd. | | | 15,981 | | | | 1,257,545 | |
Scripps Networks Interactive, Inc. Cl A | | | 9,132 | | | | 596,959 | |
Staples, Inc. | | | 61,977 | | | | 948,868 | |
Starbucks Corp. | | | 145,465 | | | | 7,799,111 | |
Starwood Hotels & Resorts | | | 16,688 | | | | 1,353,230 | |
Target Corp. | | | 62,057 | | | | 5,065,713 | |
TEGNA, Inc. | | | 21,931 | | | | 703,327 | |
Tiffany & Co. | | | 10,929 | | | | 1,003,282 | |
Time Warner Cable, Inc. | | | 27,399 | | | | 4,881,680 | |
Time Warner, Inc. | | | 80,073 | | | | 6,999,181 | |
TJX Cos., Inc. | | | 66,042 | | | | 4,369,999 | |
Tractor Supply Co. | | | 13,298 | | | | 1,196,022 | |
TripAdvisor, Inc.* | | | 10,826 | | | | 943,378 | |
Twenty-First Century Fox, Inc. Cl A | | | 171,761 | | | | 5,589,962 | |
Under Armour, Inc. Cl A* | | | 16,288 | | | | 1,359,071 | |
Urban Outfitters, Inc.* | | | 9,296 | | | | 325,360 | |
V.F. Corp. | | | 33,107 | | | | 2,308,882 | |
Viacom, Inc. Cl B | | | 34,772 | | | | 2,247,662 | |
Whirlpool Corp. | | | 7,669 | | | | 1,327,120 | |
Wyndham Worldwide Corp. | | | 11,576 | | | | 948,190 | |
Wynn Resorts Ltd. | | | 7,944 | | | | 783,834 | |
Yum! Brands, Inc. | | | 41,973 | | | | 3,780,928 | |
| | | | | | | | |
| | | | | | | 225,884,444 | |
| | | | | | | | |
CONSUMER STAPLES (9.2%) | | | | | | | | |
Altria Group, Inc. | | | 190,748 | | | | 9,329,485 | |
Archer-Daniels-Midland Co. | | | 60,157 | | | | 2,900,771 | |
Brown-Forman Corp. Cl B | | | 15,207 | | | | 1,523,437 | |
Campbell Soup Co. | | | 17,334 | | | | 825,965 | |
Clorox Co. | | | 12,759 | | | | 1,327,191 | |
Coca-Cola Co. | | | 380,553 | | | | 14,929,094 | |
Coca-Cola Enterprises, Inc. | | | 20,996 | | | | 912,066 | |
Colgate-Palmolive Co. | | | 82,541 | | | | 5,399,007 | |
ConAgra Foods, Inc. | | | 41,355 | | | | 1,808,041 | |
Constellation Brands, Inc. Cl A | | | 16,474 | | | | 1,911,313 | |
Costco Wholesale Corp. | | | 42,695 | | | | 5,766,387 | |
CVS Health Corp. | | | 109,524 | | | | 11,486,877 | |
Dr. Pepper Snapple Group, Inc. | | | 18,720 | | | | 1,364,688 | |
Estee Lauder Cos., Inc. Cl A | | | 21,607 | | | | 1,872,463 | |
General Mills, Inc. | | | 57,935 | | | | 3,228,138 | |
Hershey Co. | | | 14,186 | | | | 1,260,142 | |
Hormel Foods Corp. | | | 13,012 | | | | 733,486 | |
J.M. Smucker Co. | | | 9,464 | | | | 1,025,992 | |
Kellogg Co. | | | 24,199 | | | | 1,517,277 | |
Keurig Green Mountain, Inc. | | | 11,311 | | | | 866,762 | |
Kimberly-Clark Corp. | | | 35,290 | | | | 3,739,681 | |
Kraft Foods Group, Inc.* | | | 57,571 | | | | 4,901,595 | |
Kroger Co. | | | 47,460 | | | | 3,441,325 | |
McCormick & Co., Inc. | | | 12,408 | | | | 1,004,428 | |
Mead Johnson Nutrition Co. | | | 19,590 | | | | 1,767,410 | |
Molson Coors Brewing Co. Cl B | | | 15,534 | | | | 1,084,429 | |
Mondelez International, Inc. Cl A | | | 157,973 | | | | 6,499,009 | |
Monster Beverage Corp.* | | | 14,258 | | | | 1,910,857 | |
PepsiCo, Inc. | | | 143,163 | | | | 13,362,834 | |
Philip Morris Int’l., Inc. | | | 150,263 | | | | 12,046,585 | |
Proctor & Gamble Co. | | | 263,155 | | | | 20,589,247 | |
Reynolds American, Inc. | | | 40,338 | | | | 3,011,654 | |
Sysco Corp. | | | 57,839 | | | | 2,087,988 | |
Tyson Foods, Inc. Cl A | | | 28,356 | | | | 1,208,816 | |
| | | | | | | | |
Wal-Mart Stores, Inc. | | | 153,185 | | | | 10,865,412 | |
Walgreens Boots Alliance, Inc. | | | 84,678 | | | | 7,150,210 | |
Whole Foods Market, Inc. | | | 34,625 | | | | 1,365,610 | |
| | | | | | | | |
| | | | | | | 166,025,672 | |
| | | | | | | | |
ENERGY (7.7%) | | | | | | | | |
Anadarko Petroleum Corp. | | | 49,343 | | | | 3,851,715 | |
Apache Corp. | | | 36,527 | | | | 2,105,051 | |
Baker Hughes, Inc. | | | 42,301 | | | | 2,609,972 | |
Cabot Oil & Gas Corp. | | | 40,058 | | | | 1,263,429 | |
Cameron International Corp.* | | | 18,652 | | | | 976,805 | |
Chesapeake Energy Corp. | | | 50,494 | | | | 564,018 | |
Chevron Corp. | | | 182,414 | | | | 17,597,479 | |
Cimarex Energy Co. | | | 9,155 | | | | 1,009,888 | |
ConocoPhillips | | | 119,588 | | | | 7,343,899 | |
CONSOL Energy, Inc. | | | 22,562 | | | | 490,498 | |
Devon Energy Corp. | | | 37,574 | | | | 2,235,277 | |
Diamond Offshore Drilling, Inc. | | | 6,624 | | | | 170,965 | |
Ensco PLC Cl A | | | 22,885 | | | | 509,649 | |
EOG Resources, Inc. | | | 53,217 | | | | 4,659,148 | |
EQT Corp. | | | 14,753 | | | | 1,200,009 | |
Exxon Mobil Corp. | | | 405,751 | | | | 33,758,483 | |
FMC Technologies, Inc.* | | | 22,431 | | | | 930,662 | |
Halliburton Co. | | | 82,775 | | | | 3,565,119 | |
Helmerich & Payne, Inc. | | | 10,488 | | | | 738,565 | |
Hess Corp. | | | 23,604 | | | | 1,578,636 | |
Kinder Morgan, Inc. | | | 168,264 | | | | 6,459,655 | |
Marathon Oil Corp. | | | 65,777 | | | | 1,745,722 | |
Marathon Petroleum Corp. | | | 52,847 | | | | 2,764,427 | |
Murphy Oil Corp. | | | 16,139 | | | | 670,898 | |
National Oilwell Varco, Inc. | | | 37,771 | | | | 1,823,584 | |
Newfield Exploration Co.* | | | 16,047 | | | | 579,618 | |
Noble Corp. PLC | | | 23,172 | | | | 356,617 | |
Noble Energy, Inc. | | | 37,615 | | | | 1,605,408 | |
Occidental Petroleum Corp. | | | 74,458 | | | | 5,790,599 | |
ONEOK, Inc. | | | 20,367 | | | | 804,089 | |
Phillips 66 | | | 52,696 | | | | 4,245,190 | |
Pioneer Natural Resources Co. | | | 14,447 | | | | 2,003,654 | |
Range Resources Corp. | | | 16,331 | | | | 806,425 | |
Schlumberger Ltd. | | | 123,265 | | | | 10,624,210 | |
Southwestern Energy Co.* | | | 37,561 | | | | 853,762 | |
Spectra Energy Corp. | | | 65,000 | | | | 2,119,000 | |
Tesoro Corp. | | | 12,154 | | | | 1,025,919 | |
Transocean Ltd. | | | 33,206 | | | | 535,281 | |
Valero Energy Corp. | | | 49,463 | | | | 3,096,384 | |
Williams Cos., Inc. | | | 65,332 | | | | 3,749,403 | |
| | | | | | | | |
| | | | | | | 138,819,112 | |
| | | | | | | | |
FINANCIALS (16.1%) | | | | | | | | |
ACE Ltd. | | | 31,744 | | | | 3,227,730 | |
Affiliated Managers Group, Inc.* | | | 5,331 | | | | 1,165,357 | |
Aflac, Inc. | | | 42,067 | | | | 2,616,567 | |
Allstate Corp. | | | 39,628 | | | | 2,570,668 | |
American Express Co. | | | 84,847 | | | | 6,594,309 | |
American Int’l. Group, Inc. | | | 129,281 | | | | 7,992,151 | |
American Tower Corp. | | | 41,012 | | | | 3,826,009 | |
Ameriprise Financial, Inc. | | | 17,549 | | | | 2,192,397 | |
Aon PLC | | | 27,305 | | | | 2,721,762 | |
Apartment Investment & Management Co. Cl A | | | 15,121 | | | | 558,419 | |
Assurant, Inc. | | | 6,624 | | | | 443,808 | |
AvalonBay Communities, Inc. | | | 12,853 | | | | 2,054,809 | |
Bank of America Corp. | | | 1,018,721 | | | | 17,338,631 | |
Bank of New York Mellon Corp. | | | 108,807 | | | | 4,566,630 | |
BB&T Corp. | | | 70,897 | | | | 2,857,858 | |
Berkshire Hathaway, Inc. Cl B* | | | 176,977 | | | | 24,088,339 | |
BlackRock, Inc. | | | 12,340 | | | | 4,269,393 | |
Boston Properties, Inc. | | | 14,901 | | | | 1,803,617 | |
| | | | | | | | |
Capital One Financial Corp. | | | 52,982 | | | | 4,660,827 | |
CBRE Group, Inc.* | | | 26,987 | | | | 998,519 | |
Charles Schwab Corp. | | | 112,135 | | | | 3,661,208 | |
Chubb Corp. | | | 22,316 | | | | 2,123,144 | |
Cincinnati Financial Corp. | | | 14,429 | | | | 724,047 | |
Citigroup, Inc. | | | 294,319 | | | | 16,258,182 | |
CME Group, Inc. | | | 30,861 | | | | 2,871,925 | |
Comerica, Inc. | | | 17,302 | | | | 887,939 | |
Crown Castle Int’l. Corp. | | | 32,655 | | | | 2,622,197 | |
Discover Financial Svcs. | | | 43,002 | | | | 2,477,775 | |
E*Trade Financial Corp.* | | | 28,100 | | | | 841,595 | |
Equinix, Inc. | | | 5,495 | | | | 1,395,730 | |
Equity Residential | | | 35,252 | | | | 2,473,633 | |
Essex Property Trust, Inc. | | | 6,309 | | | | 1,340,663 | |
Fifth Third Bancorp | | | 78,287 | | | | 1,629,935 | |
Franklin Resources, Inc. | | | 37,879 | | | | 1,857,207 | |
General Growth Pptys., Inc. | | | 61,229 | | | | 1,571,136 | |
Genworth Financial, Inc.* | | | 48,139 | | | | 364,412 | |
Goldman Sachs Group, Inc. | | | 38,964 | | | | 8,135,294 | |
Hartford Financial Svcs. Group, Inc. | | | 40,749 | | | | 1,693,936 | |
HCP, Inc. | | | 44,936 | | | | 1,638,816 | |
Health Care REIT, Inc. | | | 34,044 | | | | 2,234,308 | |
Host Hotels & Resorts, Inc. | | | 73,527 | | | | 1,458,040 | |
Hudson City Bancorp, Inc. | | | 47,121 | | | | 465,555 | |
Huntington Bancshares, Inc. | | | 78,966 | | | | 893,105 | |
Intercontinental Exchange, Inc. | | | 10,810 | | | | 2,417,224 | |
Invesco Ltd. | | | 41,878 | | | | 1,570,006 | |
Iron Mountain, Inc. | | | 18,339 | | | | 568,509 | |
JPMorgan Chase & Co. | | | 360,229 | | | | 24,409,117 | |
KeyCorp | | | 82,788 | | | | 1,243,476 | |
Kimco Realty Corp. | | | 40,109 | | | | 904,057 | |
Legg Mason, Inc. | | | 9,426 | | | | 485,722 | |
Leucadia National Corp. | | | 30,784 | | | | 747,436 | |
Lincoln National Corp. | | | 24,626 | | | | 1,458,352 | |
Loews Corp. | | | 28,884 | | | | 1,112,323 | |
M&T Bank Corp. | | | 12,925 | | | | 1,614,720 | |
Marsh & McLennan Cos., Inc. | | | 52,250 | | | | 2,962,575 | |
McGraw-Hill Financial, Inc. | | | 26,559 | | | | 2,667,852 | |
MetLife, Inc. | | | 108,286 | | | | 6,062,933 | |
Moody’s Corp. | | | 17,351 | | | | 1,873,214 | |
Morgan Stanley | | | 148,932 | | | | 5,777,072 | |
Nasdaq OMX Group, Inc. | | | 11,344 | | | | 553,701 | |
Navient Corp. | | | 37,343 | | | | 680,016 | |
Northern Trust Corp. | | | 21,289 | | | | 1,627,757 | |
People’s United Financial, Inc. | | | 30,428 | | | | 493,238 | |
Plum Creek Timber Co., Inc. | | | 16,949 | | | | 687,621 | |
PNC Financial Svcs. Grp., Inc. | | | 50,324 | | | | 4,813,491 | |
Principal Financial Grp., Inc. | | | 26,469 | | | | 1,357,595 | |
Progressive Corp. | | | 51,901 | | | | 1,444,405 | |
ProLogis, Inc. | | | 50,761 | | | | 1,883,233 | |
Prudential Financial, Inc. | | | 43,946 | | | | 3,846,154 | |
Public Storage | | | 14,074 | | | | 2,594,823 | |
Realty Income Corp. | | | 22,605 | | | | 1,003,436 | |
Regions Financial Corp. | | | 129,842 | | | | 1,345,163 | |
Simon Property Group, Inc. | | | 30,181 | | | | 5,221,917 | |
SL Green Realty Corp | | | 9,671 | | | | 1,062,746 | |
State Street Corp. | | | 40,036 | | | | 3,082,772 | |
SunTrust Banks, Inc. | | | 50,138 | | | | 2,156,937 | |
T. Rowe Price Group, Inc. | | | 25,562 | | | | 1,986,934 | |
The Macerich Co. | | | 13,670 | | | | 1,019,782 | |
Torchmark Corp. | | | 12,337 | | | | 718,260 | |
Travelers Cos., Inc. | | | 30,993 | | | | 2,995,783 | |
U.S. Bancorp | | | 172,118 | | | | 7,469,921 | |
Unum Group | | | 24,238 | | | | 866,509 | |
Ventas, Inc. | | | 32,102 | | | | 1,993,213 | |
| | | | | | | | |
Vornado Realty Trust | | | 17,049 | | | | 1,618,462 | |
Wells Fargo & Co. | | | 454,607 | | | | 25,567,098 | |
Weyerhaeuser Co. | | | 50,016 | | | | 1,575,504 | |
XL Group PLC | | | 29,691 | | | | 1,104,505 | |
Zions Bancorporation | | | 19,869 | | | | 630,543 | |
| | | | | | | | |
| | | | | | | 293,443,689 | |
| | | | | | | | |
HEALTH CARE (15.0%) | | | | | | | | |
Abbott Laboratories | | | 144,507 | | | | 7,092,404 | |
AbbVie, Inc. | | | 166,811 | | | | 11,208,031 | |
Aetna, Inc. | | | 33,874 | | | | 4,317,580 | |
Agilent Technologies, Inc. | | | 32,347 | | | | 1,247,947 | |
Alexion Pharmaceuticals, Inc.* | | | 21,733 | | | | 3,928,674 | |
Allergan PLC* | | | 38,102 | | | | 11,562,433 | |
AmerisourceBergen Corp. | | | 20,302 | | | | 2,158,915 | |
Amgen, Inc. | | | 73,793 | | | | 11,328,701 | |
Anthem, Inc. | | | 25,633 | | | | 4,207,401 | |
Bard (C.R.), Inc. | | | 7,168 | | | | 1,223,578 | |
Baxter International, Inc. | | | 52,763 | | | | 3,689,717 | |
Becton, Dickinson & Co. | | | 20,268 | | | | 2,870,962 | |
BIOGEN, Inc.* | | | 22,815 | | | | 9,215,891 | |
Boston Scientific Corp.* | | | 130,131 | | | | 2,303,319 | |
Bristol-Myers Squibb Co. | | | 161,806 | | | | 10,766,571 | |
Cardinal Health, Inc. | | | 32,168 | | | | 2,690,853 | |
Celgene Corp.* | | | 76,960 | | | | 8,906,966 | |
Cerner Corp.* | | | 29,603 | | | | 2,044,383 | |
CIGNA Corp. | | | 24,988 | | | | 4,048,056 | |
DaVita HealthCare Partners, Inc.* | | | 16,739 | | | | 1,330,248 | |
DENTSPLY International, Inc. | | | 13,674 | | | | 704,895 | |
Edwards Lifesciences Corp.* | | | 10,399 | | | | 1,481,130 | |
Endo International PLC* | | | 19,630 | | | | 1,563,530 | |
Express Scripts Hldg. Co.* | | | 70,812 | | | | 6,298,019 | |
Gilead Sciences, Inc. | | | 142,623 | | | | 16,698,301 | |
HCA Hldgs., Inc.* | | | 28,050 | | | | 2,544,696 | |
Hospira, Inc.* | | | 16,803 | | | | 1,490,594 | |
Humana, Inc. | | | 14,503 | | | | 2,774,134 | |
Intuitive Surgical, Inc.* | | | 3,591 | | | | 1,739,840 | |
Johnson & Johnson | | | 269,157 | | | | 26,232,041 | |
Laboratory Corp. of America Hldgs.* | | | 9,676 | | | | 1,172,925 | |
Lilly (Eli) & Co. | | | 94,786 | | | | 7,913,683 | |
Mallinckrodt PLC* | | | 11,404 | | | | 1,342,479 | |
McKesson Corp. | | | 22,488 | | | | 5,055,527 | |
Medtronic PLC | | | 138,373 | | | | 10,253,439 | |
Merck & Co., Inc. | | | 274,268 | | | | 15,614,077 | |
Mylan N.V.* | | | 39,837 | | | | 2,703,339 | |
Patterson Cos., Inc. | | | 8,469 | | | | 412,017 | |
PerkinElmer, Inc. | | | 11,134 | | | | 586,094 | |
Perrigo Co. PLC | | | 14,192 | | | | 2,623,107 | |
Pfizer, Inc. | | | 597,648 | | | | 20,039,137 | |
Quest Diagnostics, Inc. | | | 13,972 | | | | 1,013,249 | |
Regeneron Pharmaceuticals, Inc.* | | | 7,333 | | | | 3,740,783 | |
Schein (Henry), Inc.* | | | 8,145 | | | | 1,157,567 | |
St. Jude Medical, Inc. | | | 27,085 | | | | 1,979,101 | |
Stryker Corp. | | | 29,003 | | | | 2,771,817 | |
Tenet Healthcare Corp.* | | | 9,774 | | | | 565,719 | |
Thermo Fisher Scientific, Inc. | | | 38,688 | | | | 5,020,155 | |
UnitedHealth Group, Inc. | | | 92,327 | | | | 11,263,894 | |
Universal Health Svcs., Inc. Cl B | | | 8,806 | | | | 1,251,333 | |
Varian Medical Systems, Inc.* | | | 9,741 | | | | 821,459 | |
Vertex Pharmaceuticals, Inc.* | | | 23,643 | | | | 2,919,438 | |
Waters Corp.* | | | 7,991 | | | | 1,025,885 | |
Zimmer Biomet Hldgs., Inc. | | | 16,526 | | | | 1,805,135 | |
Zoetis, Inc. | | | 48,594 | | | | 2,343,203 | |
| | | | | | | | |
| | | | | | | 273,064,372 | |
| | | | | | | | |
| | | | | | | | |
INDUSTRIALS (9.9%) | | | | | | | | |
3M Co. | | | 61,611 | | | | 9,506,577 | |
Allegion PLC | | | 9,177 | | | | 551,905 | |
American Airlines Group, Inc. | | | 67,301 | | | | 2,687,665 | |
AMETEK, Inc. | | | 23,423 | | | | 1,283,112 | |
Boeing Co. | | | 62,394 | | | | 8,655,296 | |
Caterpillar, Inc. | | | 58,626 | | | | 4,972,657 | |
Cintas Corp. | | | 9,250 | | | | 782,458 | |
CSX Corp. | | | 95,646 | | | | 3,122,842 | |
Cummins, Inc. | | | 16,252 | | | | 2,132,100 | |
Danaher Corp. | | | 59,853 | | | | 5,122,818 | |
Deere & Co. | | | 32,391 | | | | 3,143,547 | |
Delta Air Lines, Inc. | | | 79,570 | | | | 3,268,736 | |
Dover Corp. | | | 15,596 | | | | 1,094,527 | |
Dun & Bradstreet Corp. | | | 3,537 | | | | 431,514 | |
Eaton Corp. PLC | | | 45,286 | | | | 3,056,352 | |
Emerson Electric Co. | | | 64,977 | | | | 3,601,675 | |
Equifax, Inc. | | | 11,533 | | | | 1,119,739 | |
Expeditors Int’l. of Wash. | | | 18,396 | | | | 848,148 | |
Fastenal Co. | | | 26,382 | | | | 1,112,793 | |
FedEx Corp. | | | 25,577 | | | | 4,358,321 | |
Flowserve Corp. | | | 13,206 | | | | 695,428 | |
Fluor Corp. | | | 14,349 | | | | 760,640 | |
General Dynamics Corp. | | | 30,258 | | | | 4,287,256 | |
General Electric Co. | | | 977,641 | | | | 25,975,921 | |
Grainger (W.W.), Inc. | | | 5,752 | | | | 1,361,211 | |
Honeywell International, Inc. | | | 75,791 | | | | 7,728,408 | |
Hunt (J.B.) Transport Svcs., Inc. | | | 9,323 | | | | 765,325 | |
Illinois Tool Works, Inc. | | | 32,846 | | | | 3,014,934 | |
Ingersoll-Rand PLC | | | 25,658 | | | | 1,729,862 | |
Jacobs Engineering Group, Inc.* | | | 12,206 | | | | 495,808 | |
Joy Global, Inc. | | | 9,359 | | | | 338,796 | |
Kansas City Southern | | | 10,772 | | | | 982,406 | |
L-3 Communications Hldgs., Inc. | | | 8,035 | | | | 911,008 | |
Lockheed Martin Corp. | | | 25,935 | | | | 4,821,317 | |
Masco Corp. | | | 34,087 | | | | 909,100 | |
Nielsen Holdings | | | 35,862 | | | | 1,605,542 | |
Norfolk Southern Corp. | | | 29,528 | | | | 2,579,566 | |
Northrop Grumman Corp. | | | 18,821 | | | | 2,985,575 | |
PACCAR, Inc. | | | 34,480 | | | | 2,200,169 | |
Pall Corp. | | | 10,383 | | | | 1,292,164 | |
Parker Hannifin Corp. | | | 13,461 | | | | 1,565,918 | |
Pentair PLC | | | 17,375 | | | | 1,194,531 | |
Pitney Bowes, Inc. | | | 19,884 | | | | 413,786 | |
Precision Castparts Corp. | | | 13,413 | | | | 2,680,856 | |
Quanta Services, Inc.* | | | 20,740 | | | | 597,727 | |
Raytheon Co. | | | 29,626 | | | | 2,834,616 | |
Republic Services, Inc. | | | 24,184 | | | | 947,287 | |
Robert Half Int’l., Inc. | | | 12,989 | | | | 720,890 | |
Robinson (C.H.) Worldwide, Inc. | | | 14,027 | | | | 875,145 | |
Rockwell Automation, Inc. | | | 13,027 | | | | 1,623,685 | |
Rockwell Collins, Inc. | | | 12,895 | | | | 1,190,853 | |
Roper Technologies, Inc. | | | 9,756 | | | | 1,682,520 | |
Ryder System, Inc. | | | 5,250 | | | | 458,693 | |
Snap-on, Inc. | | | 5,684 | | | | 905,177 | |
Southwest Airlines Co. | | | 64,960 | | | | 2,149,526 | |
Stanley Black & Decker, Inc. | | | 14,842 | | | | 1,561,972 | |
Stericycle, Inc.* | | | 8,199 | | | | 1,097,928 | |
Textron, Inc. | | | 26,991 | | | | 1,204,608 | |
The ADT Corp. | | | 16,574 | | | | 556,389 | |
Tyco International PLC | | | 40,894 | | | | 1,573,601 | |
Union Pacific Corp. | | | 84,929 | | | | 8,099,679 | |
United Parcel Service, Inc. Cl B | | | 67,406 | | | | 6,532,315 | |
United Rentals, Inc.* | | | 9,424 | | | | 825,731 | |
United Technologies Corp. | | | 80,303 | | | | 8,908,012 | |
Waste Management, Inc. | | | 41,400 | | | | 1,918,890 | |
Xylem, Inc. | | | 17,734 | | | | 657,399 | |
| | | | | | | | |
| | | | | | | 179,070,952 | |
| | | | | | | | |
| | | | | | | | |
INFORMATION TECHNOLOGY (19.1%) | | | | | | | | |
Accenture Ltd. Cl A | | | 60,711 | | | | 5,875,611 | |
Adobe Systems, Inc.* | | | 46,024 | | | | 3,728,404 | |
Akamai Technologies, Inc.* | | | 17,366 | | | | 1,212,494 | |
Alliance Data Systems Corp.* | | | 6,034 | | | | 1,761,566 | |
Altera Corp. | | | 29,320 | | | | 1,501,184 | |
Amphenol Corp. Cl A | | | 29,985 | | | | 1,738,230 | |
Analog Devices, Inc. | | | 30,341 | | | | 1,947,437 | |
Apple, Inc. | | | 559,072 | | | | 70,121,602 | |
Applied Materials, Inc. | | | 119,109 | | | | 2,289,275 | |
Autodesk, Inc.* | | | 22,150 | | | | 1,109,161 | |
Automatic Data Processing, Inc. | | | 45,564 | | | | 3,655,600 | |
Avago Technologies Ltd. | | | 24,915 | | | | 3,311,951 | |
Broadcom Corp. Cl A | | | 52,841 | | | | 2,720,783 | |
CA, Inc. | | | 31,002 | | | | 908,049 | |
Cisco Systems, Inc. | | | 493,501 | | | | 13,551,537 | |
Citrix Systems, Inc.* | | | 15,675 | | | | 1,099,758 | |
Cognizant Technology Solutions* | | | 59,205 | | | | 3,616,833 | |
Computer Sciences Corp. | | | 13,420 | | | | 880,889 | |
Corning, Inc. | | | 122,501 | | | | 2,416,945 | |
eBay, Inc.* | | | 107,228 | | | | 6,459,415 | |
Electronic Arts, Inc.* | | | 30,078 | | | | 2,000,187 | |
EMC Corp. | | | 188,415 | | | | 4,972,272 | |
F5 Networks, Inc.* | | | 7,017 | | | | 844,496 | |
Facebook, Inc. Cl A* | | | 204,353 | | | | 17,526,335 | |
Fidelity Nat’l. Information Svcs., Inc. | | | 27,525 | | | | 1,701,045 | |
First Solar, Inc.* | | | 7,344 | | | | 345,021 | |
Fiserv, Inc.* | | | 23,083 | | | | 1,911,965 | |
FLIR Systems, Inc. | | | 13,871 | | | | 427,504 | |
Google, Inc. Cl A* | | | 27,781 | | | | 15,002,851 | |
Google, Inc. Cl C* | | | 27,840 | | | | 14,490,873 | |
Harris Corp. | | | 11,960 | | | | 919,844 | |
Hewlett-Packard Co. | | | 175,093 | | | | 5,254,541 | |
Int’l. Business Machines Corp. | | | 88,918 | | | | 14,463,402 | |
Intel Corp. | | | 460,344 | | | | 14,001,363 | |
Intuit, Inc. | | | 26,816 | | | | 2,702,248 | |
Juniper Networks, Inc. | | | 33,893 | | | | 880,201 | |
KLA-Tencor Corp. | | | 15,616 | | | | 877,775 | |
Lam Research Corp. | | | 15,389 | | | | 1,251,895 | |
Linear Technology Corp. | | | 23,192 | | | | 1,025,782 | |
MasterCard, Inc. Cl A | | | 94,061 | | | | 8,792,822 | |
Microchip Technology, Inc. | | | 19,657 | | | | 932,233 | |
Micron Technology, Inc.* | | | 104,765 | | | | 1,973,773 | |
Microsoft Corp. | | | 784,783 | | | | 34,648,169 | |
Motorola Solutions, Inc. | | | 18,057 | | | | 1,035,388 | |
NetApp, Inc. | | | 30,149 | | | | 951,502 | |
NVIDIA Corp. | | | 49,712 | | | | 999,708 | |
Oracle Corp. | | | 309,205 | | | | 12,460,962 | |
Paychex, Inc. | | | 31,654 | | | | 1,483,940 | |
Qorvo, Inc.* | | | 14,603 | | | | 1,172,183 | |
QUALCOMM, Inc. | | | 158,140 | | | | 9,904,308 | |
Red Hat, Inc.* | | | 17,832 | | | | 1,353,984 | |
Salesforce.com, inc.* | | | 59,065 | | | | 4,112,696 | |
SanDisk Corp. | | | 20,071 | | | | 1,168,534 | |
Seagate Technology PLC | | | 30,890 | | | | 1,467,275 | |
Skyworks Solutions, Inc. | | | 18,511 | | | | 1,926,995 | |
Symantec Corp. | | | 66,142 | | | | 1,537,802 | |
TE Connectivity Ltd. | | | 39,398 | | | | 2,533,291 | |
Teradata Corp.* | | | 13,976 | | | | 517,112 | |
Texas Instruments, Inc. | | | 100,914 | | | | 5,198,080 | |
Total System Services, Inc. | | | 15,848 | | | | 661,971 | |
VeriSign, Inc.* | | | 10,126 | | | | 624,977 | |
Visa, Inc. Cl A | | | 187,535 | | | | 12,592,975 | |
Western Digital Corp. | | | 21,045 | | | | 1,650,349 | |
| | | | | | | | |
Western Union Co. | | | 50,400 | | | | 1,024,632 | |
Xerox Corp. | | | 101,171 | | | | 1,076,459 | |
Xilinx, Inc. | | | 25,055 | | | | 1,106,429 | |
Yahoo!, Inc.* | | | 84,869 | | | | 3,334,503 | |
| | | | | | | | |
| | | | | | | 346,749,376 | |
| | | | | | | | |
MATERIALS (3.1%) | | | | | | | | |
Air Products & Chemicals, Inc. | | | 18,804 | | | | 2,572,951 | |
Airgas, Inc. | | | 6,647 | | | | 703,120 | |
Alcoa, Inc. | | | 118,951 | | | | 1,326,304 | |
Allegheny Technologies, Inc. | | | 10,793 | | | | 325,949 | |
Avery Dennison Corp. | | | 8,709 | | | | 530,726 | |
Ball Corp. | | | 13,364 | | | | 937,485 | |
CF Industries Hldgs., Inc. | | | 22,918 | | | | 1,473,169 | |
Dow Chemical Co. | | | 105,154 | | | | 5,380,730 | |
Du Pont (E.I.) de Nemours & Co. | | | 87,846 | | | | 5,617,755 | |
Eastman Chemical Co. | | | 14,475 | | | | 1,184,345 | |
Ecolab, Inc. | | | 26,053 | | | | 2,945,813 | |
FMC Corp. | | | 13,029 | | | | 684,674 | |
Freeport-McMoRan Copper & Gold, Inc. | | | 101,139 | | | | 1,883,208 | |
Int’l. Flavors & Fragrances, Inc. | | | 7,858 | | | | 858,801 | |
International Paper Co. | | | 40,957 | | | | 1,949,144 | |
LyondellBasell Inds. N.V. Cl A | | | 38,152 | | | | 3,949,495 | |
Martin Marietta Materials, Inc. | | | 6,044 | | | | 855,286 | |
MeadWestvaco Corp.* | | | 32,515 | | | | 1,534,383 | |
Monsanto Co. | | | 46,220 | | | | 4,926,590 | |
Newmont Mining Corp. | | | 51,626 | | | | 1,205,983 | |
Nucor Corp. | | | 31,157 | | | | 1,373,089 | |
Owens-Illinois, Inc.* | | | 15,847 | | | | 363,530 | |
PPG Industries, Inc. | | | 26,385 | | | | 3,026,887 | |
Praxair, Inc. | | | 28,048 | | | | 3,353,138 | |
Sealed Air Corp. | | | 20,417 | | | | 1,049,025 | |
Sherwin-Williams Co. | | | 7,695 | | | | 2,116,279 | |
Sigma-Aldrich Corp. | | | 11,606 | | | | 1,617,296 | |
The Mosaic Co. | | | 30,276 | | | | 1,418,431 | |
Vulcan Materials Co. | | | 12,884 | | | | 1,081,354 | |
| | | | | | | | |
| | | | | | | 56,244,940 | |
| | | | | | | | |
TELECOMMUNICATION SERVICES (2.2%) | | | | | | | | |
AT&T, Inc. | | | 504,021 | | | | 17,902,826 | |
CenturyLink, Inc. | | | 54,490 | | | | 1,600,916 | |
Frontier Communications Corp. | | | 112,703 | | | | 557,880 | |
Level 3 Communications, Inc.* | | | 28,619 | | | | 1,507,363 | |
Verizon Communications, Inc. | | | 395,754 | | | | 18,446,094 | |
| | | | | | | | |
| | | | | | | 40,015,079 | |
| | | | | | | | |
UTILITIES (2.8%) | | | | | | | | |
AES Corp. | | | 66,937 | | | | 887,585 | |
AGL Resources, Inc. | | | 11,592 | | | | 539,724 | |
Ameren Corp. | | | 23,583 | | | | 888,607 | |
American Electric Power Co., Inc. | | | 47,410 | | | | 2,511,308 | |
CenterPoint Energy, Inc. | | | 41,586 | | | | 791,382 | |
CMS Energy Corp. | | | 26,602 | | | | 847,008 | |
Consolidated Edison, Inc. | | | 28,556 | | | | 1,652,821 | |
Dominion Resources, Inc. | | | 57,557 | | | | 3,848,837 | |
DTE Energy Co. | | | 17,448 | | | | 1,302,319 | |
Duke Energy Corp. | | | 67,065 | | | | 4,736,130 | |
Edison International | | | 31,502 | | | | 1,750,881 | |
Entergy Corp. | | | 17,411 | | | | 1,227,476 | |
Eversource Energy | | | 30,752 | | | | 1,396,448 | |
Exelon Corp. | | | 83,834 | | | | 2,634,064 | |
FirstEnergy Corp. | | | 41,119 | | | | 1,338,423 | |
NextEra Energy, Inc. | | | 43,019 | | | | 4,217,153 | |
NiSource, Inc. | | | 30,968 | | | | 1,411,831 | |
NRG Energy, Inc. | | | 32,760 | | | | 749,549 | |
Pepco Hldgs., Inc. | | | 24,301 | | | | 654,669 | |
PG&E Corp. | | | 46,772 | | | | 2,296,505 | |
Pinnacle West Capital Corp. | | | 10,646 | | | | 605,651 | |
| | | | | | | | |
PPL Corp. | | | 64,879 | | | | 1,911,984 | |
Public Svc. Enterprise Group, Inc. | | | 48,999 | | | | 1,924,681 | |
SCANA Corp. | | | 14,058 | | | | 712,038 | |
Sempra Energy | | | 22,575 | | | | 2,233,571 | |
Southern Co. | | | 88,121 | | | | 3,692,270 | |
TECO Energy, Inc. | | | 22,884 | | | | 404,131 | |
WEC Energy Group, Inc. | | | 8,599 | | | | 386,685 | |
Wisconsin Energy Corp.* | | | 22,046 | | | | 991,409 | |
Xcel Energy, Inc. | | | 48,952 | | | | 1,575,275 | |
| | | | | | | | |
| | | | | | | 50,120,415 | |
| | | | | | | | |
TOTAL INDEXED ASSETS - COMMON STOCKS
(Cost: $1,098,600,754) 97.5% | | | | | | | 1,769,438,051 | |
| | | | | | | | |
| | | | | | | | | | | | | | | | | | |
| | | Rating** | | Rate(%) | | | Maturity | | | Face Amount | | | Value | |
SHORT-TERM DEBT SECURITIES: | | | | | | | | | | | | | | | | | | |
U.S. GOVERNMENT (0.5%) | | | | | | | | | | | | | | | | | | |
U.S. Treasury Bill (1) | | A-1+ | | | 0.07 | | | | 11/19/15 | | | | 7,900,000 | | | | 7,897,803 | |
U.S. Treasury Bill (1) | | A-1+ | | | 0.12 | | | | 01/07/16 | | | | 1,000,000 | | | | 999,367 | |
| | | | | | | | | | | | | | | | | | |
| | | | | | | | | | | | | | | | | 8,897,170 | |
| | | | | | | | | | | | | | | | | | |
COMMERCIAL PAPER (1.9%) | | | | | | | | | | | | | | | | | | |
Air Products & Chemicals† | | A-1 | | | 0.10 | | | | 07/22/15 | | | | 4,000,000 | | | | 3,999,767 | |
EMC Corp.† | | A-1 | | | 0.11 | | | | 07/17/15 | | | | 4,000,000 | | | | 3,999,804 | |
Nestle Finance | | A-1+ | | | 0.03 | | | | 08/12/15 | | | | 12,200,000 | | | | 12,199,573 | |
Private Export Funding Corp.† | | A-1 | | | 0.13 | | | | 08/11/15 | | | | 400,000 | | | | 399,941 | |
Toyota Motor Credit Corp. | | A-1+ | | | 0.13 | | | | 07/24/15 | | | | 3,500,000 | | | | 3,499,709 | |
Toyota Motor Credit Corp. | | A-1+ | | | 0.14 | | | | 08/04/15 | | | | 10,000,000 | | | | 9,998,678 | |
| | | | | | | | | | | | | | | | | | |
| | | | | | | | | | | | | | | | | 34,097,472 | |
| | | | | | | | | | | | | | | | | | |
TOTAL SHORT-TERM DEBT SECURITIES
(Cost: $42,994,642) 2.4% | | | | | | | | | | | | | | | | | 42,994,642 | |
| | | | | | | | | | | | | | | | | | |
TOTAL INVESTMENTS
(Cost: $1,141,595,396) 99.9% | | | | | | | | | | | | | | | | | 1,812,432,693 | |
| | | | | | | | | | | | | | | | | | |
OTHER NET ASSETS 0.1% | | | | | | | | | | | | | | | | | 2,375,388 | |
| | | | | | | | | | | | | | | | | | |
NET ASSETS 100.0% | | | | | | | | | | | | | | | | $ | 1,814,808,081 | |
| | | | | | | | | | | | | | | | | | |
The accompanying notes are an integral part of these portfolio schedules.
MUTUAL OF AMERICA INVESTMENT CORPORATION - ALL AMERICA FUND
PORTFOLIO OF INVESTMENTS IN SECURITIES
June 30, 2015 (Unaudited)
| | | | | | | | |
| | | Shares | | | Value | |
INDEXED ASSETS: | | | | | |
COMMON STOCKS: | | | | | |
CONSUMER DISCRETIONARY (6.7%) | | | | | | | | |
Amazon.com, Inc.* | | | 3,471 | | | | 1,506,726 | |
AutoNation, Inc.* | | | 697 | | | | 43,897 | |
AutoZone, Inc.* | | | 289 | | | | 192,734 | |
Bed Bath & Beyond, Inc.* | | | 1,557 | | | | 107,402 | |
Best Buy Co., Inc. | | | 2,674 | | | | 87,199 | |
BorgWarner, Inc. | | | 2,068 | | | | 117,545 | |
Cablevision Systems Corp. Cl A | | | 2,019 | | | | 48,335 | |
CarMax, Inc.* | | | 1,893 | | | | 125,336 | |
Carnival Corp. | | | 4,096 | | | | 202,301 | |
CBS Corp. Cl B | | | 4,103 | | | | 227,717 | |
Chipotle Mexican Grill, Inc.* | | | 283 | | | | 171,212 | |
Coach, Inc. | | | 2,520 | | | | 87,217 | |
Comcast Corp. Cl A | | | 22,855 | | | | 1,374,500 | |
D.R. Horton, Inc. | | | 3,046 | | | | 83,339 | |
Darden Restaurants, Inc. | | | 1,132 | | | | 80,463 | |
Delphi Automotive PLC | | | 2,619 | | | | 222,851 | |
DIRECTV* | | | 4,568 | | | | 423,865 | |
Discovery Communications, Inc. Cl A* | | | 1,355 | | | | 45,067 | |
Discovery Communications, Inc. Cl C* | | | 2,357 | | | | 73,256 | |
Disney (Walt) Co. | | | 14,178 | | | | 1,618,277 | |
Dollar General Corp. | | | 2,696 | | | | 209,587 | |
Dollar Tree, Inc.* | | | 1,865 | | | | 147,316 | |
Expedia, Inc. | | | 900 | | | | 98,415 | |
Family Dollar Stores, Inc.* | | | 880 | | | | 69,353 | |
Ford Motor Co. | | | 36,092 | | | | 541,746 | |
Fossil Group, Inc.* | | | 382 | | | | 26,496 | |
GameStop Corp. Cl A | | | 985 | | | | 42,316 | |
Gap, Inc. | | | 2,402 | | | | 91,684 | |
Garmin Ltd. | | | 1,096 | | | | 48,147 | |
General Motors Co. | | | 12,273 | | | | 409,059 | |
Genuine Parts Co. | | | 1,379 | | | | 123,462 | |
Goodyear Tire & Rubber Co. | | | 2,470 | | | | 74,471 | |
H&R Block, Inc. | | | 2,522 | | | | 74,777 | |
Hanesbrands, Inc. | | | 3,653 | | | | 121,718 | |
Harley-Davidson, Inc. | | | 1,904 | | | | 107,290 | |
Harman Int’l. Industries, Inc. | | | 651 | | | | 77,430 | |
Hasbro, Inc. | | | 1,014 | | | | 75,837 | |
Home Depot, Inc. | | | 11,811 | | | | 1,312,556 | |
Interpublic Group of Cos., Inc. | | | 3,786 | | | | 72,956 | |
Johnson Controls, Inc. | | | 5,962 | | | | 295,298 | |
Kohl’s Corp. | | | 1,805 | | | | 113,011 | |
L Brands, Inc. | | | 2,234 | | | | 191,521 | |
Leggett & Platt, Inc. | | | 1,252 | | | | 60,947 | |
Lennar Corp. Cl A | | | 1,619 | | | | 82,634 | |
Lowe’s Cos., Inc. | | | 8,470 | | | | 567,241 | |
Macy’s, Inc. | | | 3,061 | | | | 206,526 | |
Marriott International, Inc. Cl A | | | 1,874 | | | | 139,407 | |
Mattel, Inc. | | | 3,088 | | | | 79,331 | |
McDonald’s Corp. | | | 8,708 | | | | 827,870 | |
Michael Kors Hldgs. Ltd.* | | | 1,807 | | | | 76,057 | |
Mohawk Industries, Inc.* | | | 568 | | | | 108,431 | |
Netflix, Inc.* | | | 551 | | | | 361,974 | |
Newell Rubbermaid, Inc. | | | 2,455 | | | | 100,925 | |
News Corp. Cl A* | | | 4,566 | | | | 66,618 | |
NIKE, Inc. Cl B | | | 6,328 | | | | 683,551 | |
Nordstrom, Inc. | | | 1,284 | | | | 95,658 | |
MUTUAL OF AMERICA INVESTMENT CORPORATION - ALL AMERICA FUND
PORTFOLIO OF INVESTMENTS IN SECURITIES
June 30, 2015 (Unaudited)
| | | | | | | | |
O’Reilly Automotive, Inc.* | | | 921 | | | | 208,128 | |
Omnicom Group, Inc. | | | 2,223 | | | | 154,476 | |
Priceline Group Inc.* | | | 471 | | | | 542,300 | |
Pulte Homes, Inc. | | | 2,960 | | | | 59,644 | |
PVH Corp. | | | 751 | | | | 86,515 | |
Ralph Lauren Corp. | | | 549 | | | | 72,666 | |
Ross Stores, Inc. | | | 3,767 | | | | 183,114 | |
Royal Caribbean Cruises Ltd. | | | 1,496 | | | | 117,720 | |
Scripps Networks Interactive, Inc. Cl A | | | 856 | | | | 55,957 | |
Staples, Inc. | | | 5,803 | | | | 88,844 | |
Starbucks Corp. | | | 13,622 | | | | 730,344 | |
Starwood Hotels & Resorts | | | 1,562 | | | | 126,663 | |
Target Corp. | | | 5,811 | | | | 474,352 | |
TEGNA, Inc. | | | 2,054 | | | | 65,872 | |
Tiffany & Co. | | | 1,023 | | | | 93,911 | |
Time Warner Cable, Inc. | | | 2,565 | | | | 457,006 | |
Time Warner, Inc. | | | 7,499 | | | | 655,488 | |
TJX Cos., Inc. | | | 6,185 | | | | 409,261 | |
Tractor Supply Co. | | | 1,245 | | | | 111,975 | |
TripAdvisor, Inc.* | | | 1,013 | | | | 88,273 | |
Twenty-First Century Fox, Inc. Cl A | | | 16,085 | | | | 523,490 | |
Under Armour, Inc. Cl A* | | | 1,525 | | | | 127,246 | |
Urban Outfitters, Inc.* | | | 871 | | | | 30,485 | |
V.F. Corp. | | | 3,101 | | | | 216,264 | |
Viacom, Inc. Cl B | | | 3,257 | | | | 210,532 | |
Whirlpool Corp. | | | 718 | | | | 124,250 | |
Wyndham Worldwide Corp. | | | 1,085 | | | | 88,872 | |
Wynn Resorts Ltd. | | | 743 | | | | 73,312 | |
Yum! Brands, Inc. | | | 3,930 | | | | 354,014 | |
| | | | | | | | |
| | | | | | | 21,151,829 | |
| | | | | | | | |
CONSUMER STAPLES (4.9%) | | | | | | | | |
Altria Group, Inc. | | | 17,862 | | | | 873,630 | |
Archer-Daniels-Midland Co. | | | 5,634 | | | | 271,671 | |
Brown-Forman Corp. Cl B | | | 1,424 | | | | 142,656 | |
Campbell Soup Co. | | | 1,623 | | | | 77,336 | |
Clorox Co. | | | 1,194 | | | | 124,200 | |
Coca-Cola Co. | | | 35,637 | | | | 1,398,040 | |
Coca-Cola Enterprises, Inc. | | | 1,966 | | | | 85,403 | |
Colgate-Palmolive Co. | | | 7,729 | | | | 505,554 | |
ConAgra Foods, Inc. | | | 3,872 | | | | 169,284 | |
Constellation Brands, Inc. Cl A | | | 1,542 | | | | 178,903 | |
Costco Wholesale Corp. | | | 3,998 | | | | 539,970 | |
CVS Health Corp. | | | 10,256 | | | | 1,075,649 | |
Dr. Pepper Snapple Group, Inc. | | | 1,753 | | | | 127,794 | |
Estee Lauder Cos., Inc. Cl A | | | 2,023 | | | | 175,313 | |
General Mills, Inc. | | | 5,426 | | | | 302,337 | |
Hershey Co. | | | 1,329 | | | | 118,055 | |
Hormel Foods Corp. | | | 1,219 | | | | 68,715 | |
J.M. Smucker Co. | | | 886 | | | | 96,051 | |
Kellogg Co. | | | 2,267 | | | | 142,141 | |
Keurig Green Mountain, Inc. | | | 1,060 | | | | 81,228 | |
Kimberly-Clark Corp. | | | 3,305 | | | | 350,231 | |
Kraft Foods Group, Inc.* | | | 5,391 | | | | 458,990 | |
Kroger Co. | | | 4,445 | | | | 322,307 | |
McCormick & Co., Inc. | | | 1,162 | | | | 94,064 | |
Mead Johnson Nutrition Co. | | | 1,834 | | | | 165,463 | |
Molson Coors Brewing Co. Cl B | | | 1,454 | | | | 101,504 | |
Mondelez International, Inc. Cl A | | | 14,794 | | | | 608,625 | |
Monster Beverage Corp.* | | | 1,335 | | | | 178,917 | |
PepsiCo, Inc. | | | 13,407 | | | | 1,251,409 | |
Philip Morris Int’l., Inc. | | | 14,071 | | | | 1,128,072 | |
MUTUAL OF AMERICA INVESTMENT CORPORATION - ALL AMERICA FUND
PORTFOLIO OF INVESTMENTS IN SECURITIES
June 30, 2015 (Unaudited)
| | | | | | | | |
Proctor & Gamble Co. | | | 24,643 | | | | 1,928,068 | |
Reynolds American, Inc. | | | 3,779 | | | | 282,134 | |
Sysco Corp. | | | 5,416 | | | | 195,518 | |
Tyson Foods, Inc. Cl A | | | 2,655 | | | | 113,183 | |
Wal-Mart Stores, Inc. | | | 14,345 | | | | 1,017,491 | |
Walgreens Boots Alliance, Inc. | | | 7,929 | | | | 669,525 | |
Whole Foods Market, Inc. | | | 3,243 | | | | 127,904 | |
| | | | | | | | |
| | | | | | | 15,547,335 | |
| | | | | | | | |
ENERGY (4.1%) | | | | | | | | |
Anadarko Petroleum Corp. | | | 4,620 | | | | 360,637 | |
Apache Corp. | | | 3,420 | | | | 197,095 | |
Baker Hughes, Inc. | | | 3,961 | | | | 244,394 | |
Cabot Oil & Gas Corp. | | | 3,751 | | | | 118,307 | |
Cameron International Corp.* | | | 1,747 | | | | 91,490 | |
Chesapeake Energy Corp. | | | 4,728 | | | | 52,812 | |
Chevron Corp. | | | 17,082 | | | | 1,647,901 | |
Cimarex Energy Co. | | | 857 | | | | 94,536 | |
ConocoPhillips | | | 11,199 | | | | 687,731 | |
CONSOL Energy, Inc. | | | 2,112 | | | | 45,915 | |
Devon Energy Corp. | | | 3,518 | | | | 209,286 | |
Diamond Offshore Drilling, Inc. | | | 620 | | | | 16,002 | |
Ensco PLC Cl A | | | 2,143 | | | | 47,725 | |
EOG Resources, Inc. | | | 4,983 | | | | 436,262 | |
EQT Corp. | | | 1,381 | | | | 112,331 | |
Exxon Mobil Corp. | | | 37,998 | | | | 3,161,434 | |
FMC Technologies, Inc.* | | | 2,100 | | | | 87,129 | |
Halliburton Co. | | | 7,751 | | | | 333,836 | |
Helmerich & Payne, Inc. | | | 982 | | | | 69,152 | |
Hess Corp. | | | 2,210 | | | | 147,805 | |
Kinder Morgan, Inc. | | | 15,757 | | | | 604,911 | |
Marathon Oil Corp. | | | 6,159 | | | | 163,460 | |
Marathon Petroleum Corp. | | | 4,948 | | | | 258,830 | |
Murphy Oil Corp. | | | 1,512 | | | | 62,854 | |
National Oilwell Varco, Inc. | | | 3,538 | | | | 170,815 | |
Newfield Exploration Co.* | | | 1,502 | | | | 54,252 | |
Noble Corp. PLC | | | 2,170 | | | | 33,396 | |
Noble Energy, Inc. | | | 3,522 | | | | 150,319 | |
Occidental Petroleum Corp. | | | 6,973 | | | | 542,290 | |
ONEOK, Inc. | | | 1,907 | | | | 75,288 | |
Phillips 66 | | | 4,934 | | | | 397,483 | |
Pioneer Natural Resources Co. | | | 1,352 | | | | 187,509 | |
Range Resources Corp. | | | 1,529 | | | | 75,502 | |
Schlumberger Ltd. | | | 11,544 | | | | 994,977 | |
Southwestern Energy Co.* | | | 3,517 | | | | 79,941 | |
Spectra Energy Corp. | | | 6,087 | | | | 198,436 | |
Tesoro Corp. | | | 1,138 | | | | 96,059 | |
Transocean Ltd. | | | 3,109 | | | | 50,117 | |
Valero Energy Corp. | | | 4,633 | | | | 290,026 | |
Williams Cos., Inc. | | | 6,118 | | | | 351,112 | |
| | | | | | | | |
| | | | | | | 12,999,357 | |
| | | | | | | | |
FINANCIALS (8.7%) | | | | | | | | |
ACE Ltd. | | | 2,972 | | | | 302,193 | |
Affiliated Managers Group, Inc.* | | | 499 | | | | 109,081 | |
Aflac, Inc. | | | 3,940 | | | | 245,068 | |
Allstate Corp. | | | 3,711 | | | | 240,733 | |
American Express Co. | | | 7,945 | | | | 617,485 | |
American Int’l. Group, Inc. | | | 12,107 | | | | 748,455 | |
American Tower Corp. | | | 3,840 | | | | 358,234 | |
Ameriprise Financial, Inc. | | | 1,644 | | | | 205,385 | |
Aon PLC | | | 2,557 | | | | 254,882 | |
Apartment Investment & Management Co. Cl A | | | 1,416 | | | | 52,293 | |
MUTUAL OF AMERICA INVESTMENT CORPORATION - ALL AMERICA FUND
PORTFOLIO OF INVESTMENTS IN SECURITIES
June 30, 2015 (Unaudited)
| | | | | | | | |
Assurant, Inc. | | | 621 | | | | 41,607 | |
AvalonBay Communities, Inc. | | | 1,203 | | | | 192,324 | |
Bank of America Corp. | | | 95,399 | | | | 1,623,691 | |
Bank of New York Mellon Corp. | | | 10,189 | | | | 427,632 | |
BB&T Corp. | | | 6,639 | | | | 267,618 | |
Berkshire Hathaway, Inc. Cl B* | | | 16,573 | | | | 2,255,751 | |
BlackRock, Inc. | | | 1,155 | | | | 399,607 | |
Boston Properties, Inc. | | | 1,395 | | | | 168,851 | |
Capital One Financial Corp. | | | 4,962 | | | | 436,507 | |
CBRE Group, Inc.* | | | 2,528 | | | | 93,536 | |
Charles Schwab Corp. | | | 10,501 | | | | 342,858 | |
Chubb Corp. | | | 2,090 | | | | 198,843 | |
Cincinnati Financial Corp. | | | 1,351 | | | | 67,793 | |
Citigroup, Inc. | | | 27,561 | | | | 1,522,470 | |
CME Group, Inc. | | | 2,890 | | | | 268,943 | |
Comerica, Inc. | | | 1,620 | | | | 83,138 | |
Crown Castle Int’l. Corp. | | | 3,058 | | | | 245,557 | |
Discover Financial Svcs. | | | 4,027 | | | | 232,036 | |
E*Trade Financial Corp.* | | | 2,631 | | | | 78,798 | |
Equinix, Inc. | | | 514 | | | | 130,556 | |
Equity Residential | | | 3,301 | | | | 231,631 | |
Essex Property Trust, Inc. | | | 590 | | | | 125,375 | |
Fifth Third Bancorp | | | 7,332 | | | | 152,652 | |
Franklin Resources, Inc. | | | 3,548 | | | | 173,958 | |
General Growth Pptys., Inc. | | | 5,733 | | | | 147,109 | |
Genworth Financial, Inc.* | | | 4,507 | | | | 34,118 | |
Goldman Sachs Group, Inc. | | | 3,649 | | | | 761,875 | |
Hartford Financial Svcs. Group, Inc. | | | 3,815 | | | | 158,590 | |
HCP, Inc. | | | 4,208 | | | | 153,466 | |
Health Care REIT, Inc. | | | 3,188 | | | | 209,228 | |
Host Hotels & Resorts, Inc. | | | 6,885 | | | | 136,530 | |
Hudson City Bancorp, Inc. | | | 4,412 | | | | 43,591 | |
Huntington Bancshares, Inc. | | | 7,394 | | | | 83,626 | |
Intercontinental Exchange, Inc. | | | 1,013 | | | | 226,517 | |
Invesco Ltd. | | | 3,921 | | | | 146,998 | |
Iron Mountain, Inc. | | | 1,717 | | | | 53,227 | |
JPMorgan Chase & Co. | | | 33,735 | | | | 2,285,884 | |
KeyCorp | | | 7,752 | | | | 116,435 | |
Kimco Realty Corp. | | | 3,756 | | | | 84,660 | |
Legg Mason, Inc. | | | 883 | | | | 45,501 | |
Leucadia National Corp. | | | 2,882 | | | | 69,975 | |
Lincoln National Corp. | | | 2,307 | | | | 136,621 | |
Loews Corp. | | | 2,705 | | | | 104,170 | |
M&T Bank Corp. | | | 1,210 | | | | 151,165 | |
Marsh & McLennan Cos., Inc. | | | 4,892 | | | | 277,376 | |
McGraw-Hill Financial, Inc. | | | 2,487 | | | | 249,819 | |
MetLife, Inc. | | | 10,140 | | | | 567,739 | |
Moody’s Corp. | | | 1,624 | | | | 175,327 | |
Morgan Stanley | | | 13,947 | | | | 541,004 | |
Nasdaq OMX Group, Inc. | | | 1,063 | | | | 51,885 | |
Navient Corp. | | | 3,497 | | | | 63,680 | |
Northern Trust Corp. | | | 1,993 | | | | 152,385 | |
People’s United Financial, Inc. | | | 2,849 | | | | 46,182 | |
Plum Creek Timber Co., Inc. | | | 1,588 | | | | 64,425 | |
PNC Financial Svcs. Grp., Inc. | | | 4,713 | | | | 450,798 | |
Principal Financial Grp., Inc. | | | 2,478 | | | | 127,097 | |
Progressive Corp. | | | 4,860 | | | | 135,254 | |
ProLogis, Inc. | | | 4,753 | | | | 176,336 | |
Prudential Financial, Inc. | | | 4,115 | | | | 360,145 | |
Public Storage | | | 1,317 | | | | 242,815 | |
Realty Income Corp. | | | 2,116 | | | | 93,929 | |
MUTUAL OF AMERICA INVESTMENT CORPORATION - ALL AMERICA FUND
PORTFOLIO OF INVESTMENTS IN SECURITIES
June 30, 2015 (Unaudited)
| | | | | | | | |
Regions Financial Corp. | | | 12,160 | | | | 125,978 | |
Simon Property Group, Inc. | | | 2,826 | | | | 488,955 | |
SL Green Realty Corp | | | 905 | | | | 99,450 | |
State Street Corp. | | | 3,749 | | | | 288,673 | |
SunTrust Banks, Inc. | | | 4,696 | | | | 202,022 | |
T. Rowe Price Group, Inc. | | | 2,393 | | | | 186,008 | |
The Macerich Co. | | | 1,280 | | | | 95,488 | |
Torchmark Corp. | | | 1,155 | | | | 67,244 | |
Travelers Cos., Inc. | | | 2,903 | | | | 280,604 | |
U.S. Bancorp | | | 16,119 | | | | 699,565 | |
Unum Group | | | 2,270 | | | | 81,153 | |
Ventas, Inc. | | | 3,006 | | | | 186,643 | |
Vornado Realty Trust | | | 1,596 | | | | 151,508 | |
Wells Fargo & Co. | | | 42,572 | | | | 2,394,249 | |
Weyerhaeuser Co. | | | 4,684 | | | | 147,546 | |
XL Group PLC | | | 2,780 | | | | 103,416 | |
Zions Bancorporation | | | 1,860 | | | | 59,027 | |
| | | | | | | | |
| | | | | | | 27,478,552 | |
| | | | | | | | |
HEALTH CARE (8.1%) | | | | | | | | |
Abbott Laboratories | | | 13,533 | | | | 664,200 | |
AbbVie, Inc. | | | 15,621 | | | | 1,049,575 | |
Aetna, Inc. | | | 3,173 | | | | 404,431 | |
Agilent Technologies, Inc. | | | 3,030 | | | | 116,897 | |
Alexion Pharmaceuticals, Inc.* | | | 2,035 | | | | 367,867 | |
Allergan PLC* | | | 3,568 | | | | 1,082,745 | |
AmerisourceBergen Corp. | | | 1,901 | | | | 202,152 | |
Amgen, Inc. | | | 6,910 | | | | 1,060,823 | |
Anthem, Inc. | | | 2,401 | | | | 394,100 | |
Bard (C.R.), Inc. | | | 672 | | | | 114,710 | |
Baxter International, Inc. | | | 4,940 | | | | 345,454 | |
Becton, Dickinson & Co. | | | 1,898 | | | | 268,856 | |
BIOGEN, Inc.* | | | 2,136 | | | | 862,816 | |
Boston Scientific Corp.* | | | 12,186 | | | | 215,692 | |
Bristol-Myers Squibb Co. | | | 15,152 | | | | 1,008,214 | |
Cardinal Health, Inc. | | | 3,012 | | | | 251,954 | |
Celgene Corp.* | | | 7,207 | | | | 834,102 | |
Cerner Corp.* | | | 2,772 | | | | 191,434 | |
CIGNA Corp. | | | 2,340 | | | | 379,080 | |
DaVita HealthCare Partners, Inc.* | | | 1,567 | | | | 124,529 | |
DENTSPLY International, Inc. | | | 1,280 | | | | 65,984 | |
Edwards Lifesciences Corp.* | | | 974 | | | | 138,727 | |
Endo International PLC* | | | 1,838 | | | | 146,397 | |
Express Scripts Hldg. Co.* | | | 6,631 | | | | 589,761 | |
Gilead Sciences, Inc. | | | 13,357 | | | | 1,563,838 | |
HCA Hldgs., Inc.* | | | 2,627 | | | | 238,321 | |
Hospira, Inc.* | | | 1,573 | | | | 139,541 | |
Humana, Inc. | | | 1,358 | | | | 259,758 | |
Intuitive Surgical, Inc.* | | | 336 | | | | 162,792 | |
Johnson & Johnson | | | 25,205 | | | | 2,456,479 | |
Laboratory Corp. of America Hldgs.* | | | 907 | | | | 109,947 | |
Lilly (Eli) & Co. | | | 8,876 | | | | 741,057 | |
Mallinckrodt PLC* | | | 1,067 | | | | 125,607 | |
McKesson Corp. | | | 2,106 | | | | 473,450 | |
Medtronic PLC | | | 12,958 | | | | 960,188 | |
Merck & Co., Inc. | | | 25,685 | | | | 1,462,247 | |
Mylan N.V.* | | | 3,730 | | | | 253,118 | |
Patterson Cos., Inc. | | | 793 | | | | 38,579 | |
PerkinElmer, Inc. | | | 1,042 | | | | 54,851 | |
Perrigo Co. PLC | | | 1,329 | | | | 245,639 | |
Pfizer, Inc. | | | 55,967 | | | | 1,876,574 | |
Quest Diagnostics, Inc. | | | 1,308 | | | | 94,856 | |
MUTUAL OF AMERICA INVESTMENT CORPORATION - ALL AMERICA FUND
PORTFOLIO OF INVESTMENTS IN SECURITIES
June 30, 2015 (Unaudited)
| | | | | | | | |
Regeneron Pharmaceuticals, Inc.* | | | 686 | | | | 349,949 | |
Schein (Henry), Inc.* | | | 762 | | | | 108,295 | |
St. Jude Medical, Inc. | | | 2,537 | | | | 185,379 | |
Stryker Corp. | | | 2,715 | | | | 259,473 | |
Tenet Healthcare Corp.* | | | 915 | | | | 52,960 | |
Thermo Fisher Scientific, Inc. | | | 3,623 | | | | 470,120 | |
UnitedHealth Group, Inc. | | | 8,645 | | | | 1,054,690 | |
Universal Health Svcs., Inc. Cl B | | | 825 | | | | 117,233 | |
Varian Medical Systems, Inc.* | | | 912 | | | | 76,909 | |
Vertex Pharmaceuticals, Inc.* | | | 2,214 | | | | 273,385 | |
Waters Corp.* | | | 749 | | | | 96,157 | |
Zimmer Biomet Hldgs., Inc. | | | 1,547 | | | | 168,979 | |
Zoetis, Inc. | | | 4,550 | | | | 219,401 | |
| | | | | | | | |
| | | | | | | 25,570,272 | |
| | | | | | | | |
INDUSTRIALS (5.3%) | | | | | | | | |
3M Co. | | | 5,769 | | | | 890,157 | |
Allegion PLC | | | 860 | | | | 51,720 | |
American Airlines Group, Inc. | | | 6,303 | | | | 251,710 | |
AMETEK, Inc. | | | 2,193 | | | | 120,133 | |
Boeing Co. | | | 5,843 | | | | 810,541 | |
Caterpillar, Inc. | | | 5,491 | | | | 465,747 | |
Cintas Corp. | | | 867 | | | | 73,340 | |
CSX Corp. | | | 8,957 | | | | 292,446 | |
Cummins, Inc. | | | 1,522 | | | | 199,671 | |
Danaher Corp. | | | 5,605 | | | | 479,732 | |
Deere & Co. | | | 3,034 | | | | 294,450 | |
Delta Air Lines, Inc. | | | 7,452 | | | | 306,128 | |
Dover Corp. | | | 1,461 | | | | 102,533 | |
Dun & Bradstreet Corp. | | | 331 | | | | 40,382 | |
Eaton Corp. PLC | | | 4,241 | | | | 286,225 | |
Emerson Electric Co. | | | 6,085 | | | | 337,292 | |
Equifax, Inc. | | | 1,081 | | | | 104,954 | |
Expeditors Int’l. of Wash. | | | 1,723 | | | | 79,439 | |
Fastenal Co. | | | 2,470 | | | | 104,185 | |
FedEx Corp. | | | 2,395 | | | | 408,108 | |
Flowserve Corp. | | | 1,236 | | | | 65,088 | |
Fluor Corp. | | | 1,343 | | | | 71,192 | |
General Dynamics Corp. | | | 2,834 | | | | 401,549 | |
General Electric Co. | | | 91,552 | | | | 2,432,537 | |
Grainger (W.W.), Inc. | | | 539 | | | | 127,554 | |
Honeywell International, Inc. | | | 7,097 | | | | 723,681 | |
Hunt (J.B.) Transport Svcs., Inc. | | | 883 | | | | 72,485 | |
Illinois Tool Works, Inc. | | | 3,076 | | | | 282,346 | |
Ingersoll-Rand PLC | | | 2,402 | | | | 161,943 | |
Jacobs Engineering Group, Inc.* | | | 1,144 | | | | 46,469 | |
Joy Global, Inc. | | | 877 | | | | 31,747 | |
Kansas City Southern | | | 1,008 | | | | 91,930 | |
L-3 Communications Hldgs., Inc. | | | 752 | | | | 85,262 | |
Lockheed Martin Corp. | | | 2,429 | | | | 451,551 | |
Masco Corp. | | | 3,192 | | | | 85,131 | |
Nielsen Holdings | | | 3,359 | | | | 150,382 | |
Norfolk Southern Corp. | | | 2,766 | | | | 241,638 | |
Northrop Grumman Corp. | | | 1,763 | | | | 279,665 | |
PACCAR, Inc. | | | 3,228 | | | | 205,979 | |
Pall Corp. | | | 972 | | | | 120,965 | |
Parker Hannifin Corp. | | | 1,261 | | | | 146,692 | |
Pentair PLC | | | 1,628 | | | | 111,925 | |
Pitney Bowes, Inc. | | | 1,862 | | | | 38,748 | |
Precision Castparts Corp. | | | 1,257 | | | | 251,237 | |
Quanta Services, Inc.* | | | 1,942 | | | | 55,968 | |
Raytheon Co. | | | 2,775 | | | | 265,512 | |
MUTUAL OF AMERICA INVESTMENT CORPORATION - ALL AMERICA FUND
PORTFOLIO OF INVESTMENTS IN SECURITIES
June 30, 2015 (Unaudited)
| | | | | | | | |
Republic Services, Inc. | | | 2,265 | | | | 88,720 | |
Robert Half Int’l., Inc. | | | 1,217 | | | | 67,544 | |
Robinson (C.H.) Worldwide, Inc. | | | 1,314 | | | | 81,980 | |
Rockwell Automation, Inc. | | | 1,220 | | | | 152,061 | |
Rockwell Collins, Inc. | | | 1,207 | | | | 111,466 | |
Roper Technologies, Inc. | | | 913 | | | | 157,456 | |
Ryder System, Inc. | | | 491 | | | | 42,899 | |
Snap-on, Inc. | | | 532 | | | | 84,721 | |
Southwest Airlines Co. | | | 6,084 | | | | 201,320 | |
Stanley Black & Decker, Inc. | | | 1,390 | | | | 146,284 | |
Stericycle, Inc.* | | | 768 | | | | 102,843 | |
Textron, Inc. | | | 2,527 | | | | 112,780 | |
The ADT Corp. | | | 1,552 | | | | 52,101 | |
Tyco International PLC | | | 3,829 | | | | 147,340 | |
Union Pacific Corp. | | | 7,954 | | | | 758,573 | |
United Parcel Service, Inc. Cl B | | | 6,312 | | | | 611,696 | |
United Rentals, Inc.* | | | 882 | | | | 77,281 | |
United Technologies Corp. | | | 7,520 | | | | 834,194 | |
Waste Management, Inc. | | | 3,876 | | | | 179,653 | |
Xylem, Inc. | | | 1,660 | | | | 61,536 | |
| | | | | | | | |
| | | | | | | 16,770,517 | |
| | | | | | | | |
INFORMATION TECHNOLOGY (10.2%) | | | | | | | | |
Accenture Ltd. Cl A | | | 5,686 | | | | 550,291 | |
Adobe Systems, Inc.* | | | 4,310 | | | | 349,153 | |
Akamai Technologies, Inc.* | | | 1,626 | | | | 113,527 | |
Alliance Data Systems Corp.* | | | 566 | | | | 165,238 | |
Altera Corp. | | | 2,745 | | | | 140,544 | |
Amphenol Corp. Cl A | | | 2,808 | | | | 162,780 | |
Analog Devices, Inc. | | | 2,841 | | | | 182,350 | |
Apple, Inc. | | | 52,355 | | | | 6,566,621 | |
Applied Materials, Inc. | | | 11,154 | | | | 214,380 | |
Autodesk, Inc.* | | | 2,074 | | | | 103,856 | |
Automatic Data Processing, Inc. | | | 4,267 | | | | 342,341 | |
Avago Technologies Ltd. | | | 2,333 | | | | 310,126 | |
Broadcom Corp. Cl A | | | 4,948 | | | | 254,773 | |
CA, Inc. | | | 2,903 | | | | 85,029 | |
Cisco Systems, Inc. | | | 46,215 | | | | 1,269,064 | |
Citrix Systems, Inc.* | | | 1,467 | | | | 102,925 | |
Cognizant Technology Solutions* | | | 5,544 | | | | 338,683 | |
Computer Sciences Corp. | | | 1,257 | | | | 82,509 | |
Corning, Inc. | | | 11,472 | | | | 226,343 | |
eBay, Inc.* | | | 10,041 | | | | 604,870 | |
Electronic Arts, Inc.* | | | 2,817 | | | | 187,331 | |
EMC Corp. | | | 17,645 | | | | 465,652 | |
F5 Networks, Inc.* | | | 657 | | | | 79,070 | |
Facebook, Inc. Cl A* | | | 19,136 | | | | 1,641,199 | |
Fidelity Nat’l. Information Svcs., Inc. | | | 2,578 | | | | 159,320 | |
First Solar, Inc.* | | | 687 | | | | 32,275 | |
Fiserv, Inc.* | | | 2,162 | | | | 179,078 | |
FLIR Systems, Inc. | | | 1,299 | | | | 40,035 | |
Google, Inc. Cl A* | | | 2,601 | | | | 1,404,644 | |
Google, Inc. Cl C* | | | 2,607 | | | | 1,356,975 | |
Harris Corp. | | | 1,120 | | | | 86,139 | |
Hewlett-Packard Co. | | | 16,397 | | | | 492,074 | |
Int’l. Business Machines Corp. | | | 8,327 | | | | 1,354,470 | |
Intel Corp. | | | 43,109 | | | | 1,311,160 | |
Intuit, Inc. | | | 2,511 | | | | 253,033 | |
Juniper Networks, Inc. | | | 3,174 | | | | 82,429 | |
KLA-Tencor Corp. | | | 1,463 | | | | 82,235 | |
Lam Research Corp. | | | 1,442 | | | | 117,307 | |
Linear Technology Corp. | | | 2,171 | | | | 96,023 | |
MUTUAL OF AMERICA INVESTMENT CORPORATION - ALL AMERICA FUND
PORTFOLIO OF INVESTMENTS IN SECURITIES
June 30, 2015 (Unaudited)
| | | | | | | | |
MasterCard, Inc. Cl A | | | 8,809 | | | | 823,465 | |
Microchip Technology, Inc. | | | 1,840 | | | | 87,262 | |
Micron Technology, Inc.* | | | 9,810 | | | | 184,820 | |
Microsoft Corp. | | | 73,492 | | | | 3,244,672 | |
Motorola Solutions, Inc. | | | 1,691 | | | | 96,962 | |
NetApp, Inc. | | | 2,824 | | | | 89,125 | |
NVIDIA Corp. | | | 4,656 | | | | 93,632 | |
Oracle Corp. | | | 28,956 | | | | 1,166,927 | |
Paychex, Inc. | | | 2,964 | | | | 138,952 | |
Qorvo, Inc.* | | | 1,368 | | | | 109,809 | |
QUALCOMM, Inc. | | | 14,810 | | | | 927,550 | |
Red Hat, Inc.* | | | 1,669 | | | | 126,727 | |
Salesforce.com, inc.* | | | 5,531 | | | | 385,124 | |
SanDisk Corp. | | | 1,880 | | | | 109,454 | |
Seagate Technology PLC | | | 2,893 | | | | 137,418 | |
Skyworks Solutions, Inc. | | | 1,733 | | | | 180,405 | |
Symantec Corp. | | | 6,193 | | | | 143,987 | |
TE Connectivity Ltd. | | | 3,689 | | | | 237,203 | |
Teradata Corp.* | | | 1,309 | | | | 48,433 | |
Texas Instruments, Inc. | | | 9,451 | | | | 486,821 | |
Total System Services, Inc. | | | 1,485 | | | | 62,028 | |
VeriSign, Inc.* | | | 949 | | | | 58,572 | |
Visa, Inc. Cl A | | | 17,562 | | | | 1,179,288 | |
Western Digital Corp. | | | 1,970 | | | | 154,487 | |
Western Union Co. | | | 4,720 | | | | 95,958 | |
Xerox Corp. | | | 9,474 | | | | 100,803 | |
Xilinx, Inc. | | | 2,347 | | | | 103,644 | |
Yahoo!, Inc.* | | | 7,947 | | | | 312,238 | |
| | | | | | | | |
| | | | | | | 32,471,618 | |
| | | | | | | | |
MATERIALS (1.7%) | | | | | | | | |
Air Products & Chemicals, Inc. | | | 1,760 | | | | 240,821 | |
Airgas, Inc. | | | 622 | | | | 65,795 | |
Alcoa, Inc. | | | 11,139 | | | | 124,200 | |
Allegheny Technologies, Inc. | | | 1,010 | | | | 30,502 | |
Avery Dennison Corp. | | | 816 | | | | 49,727 | |
Ball Corp. | | | 1,251 | | | | 87,758 | |
CF Industries Hldgs., Inc. | | | 2,147 | | | | 138,009 | |
Dow Chemical Co. | | | 9,848 | | | | 503,922 | |
Du Pont (E.I.) de Nemours & Co. | | | 8,226 | | | | 526,056 | |
Eastman Chemical Co. | | | 1,355 | | | | 110,866 | |
Ecolab, Inc. | | | 2,440 | | | | 275,891 | |
FMC Corp. | | | 1,220 | | | | 64,111 | |
Freeport-McMoRan Copper & Gold, Inc. | | | 9,471 | | | | 176,350 | |
Int’l. Flavors & Fragrances, Inc. | | | 735 | | | | 80,328 | |
International Paper Co. | | | 3,835 | | | | 182,508 | |
LyondellBasell Inds. N.V. Cl A | | | 3,573 | | | | 369,877 | |
Martin Marietta Materials, Inc. | | | 566 | | | | 80,095 | |
MeadWestvaco Corp.* | | | 3,044 | | | | 143,646 | |
Monsanto Co. | | | 4,329 | | | | 461,428 | |
Newmont Mining Corp. | | | 4,835 | | | | 112,946 | |
Nucor Corp. | | | 2,917 | | | | 128,552 | |
Owens-Illinois, Inc.* | | | 1,484 | | | | 34,043 | |
PPG Industries, Inc. | | | 2,470 | | | | 283,358 | |
Praxair, Inc. | | | 2,626 | | | | 313,938 | |
Sealed Air Corp. | | | 1,911 | | | | 98,187 | |
Sherwin-Williams Co. | | | 721 | | | | 198,289 | |
Sigma-Aldrich Corp. | | | 1,086 | | | | 151,334 | |
The Mosaic Co. | | | 2,835 | | | | 132,820 | |
Vulcan Materials Co. | | | 1,206 | | | | 101,220 | |
| | | | | | | | |
| | | | | | | 5,266,577 | |
| | | | | | | | |
MUTUAL OF AMERICA INVESTMENT CORPORATION - ALL AMERICA FUND
PORTFOLIO OF INVESTMENTS IN SECURITIES
June 30, 2015 (Unaudited)
| | | | | | | | |
TELECOMMUNICATION SERVICES (1.2%) | | | | | | | | |
AT&T, Inc. | | | 47,199 | | | | 1,676,508 | |
CenturyLink, Inc. | | | 5,103 | | | | 149,926 | |
Frontier Communications Corp. | | | 10,554 | | | | 52,242 | |
Level 3 Communications, Inc.* | | | 2,680 | | | | 141,156 | |
Verizon Communications, Inc. | | | 37,061 | | | | 1,727,413 | |
| | | | | �� | | | |
| | | | | | | 3,747,245 | |
| | | | | | | | |
UTILITIES (1.5%) | | | | | | | | |
AES Corp. | | | 6,268 | | | | 83,114 | |
AGL Resources, Inc. | | | 1,085 | | | | 50,518 | |
Ameren Corp. | | | 2,208 | | | | 83,197 | |
American Electric Power Co., Inc. | | | 4,439 | | | | 235,134 | |
CenterPoint Energy, Inc. | | | 3,894 | | | | 74,103 | |
CMS Energy Corp. | | | 2,492 | | | | 79,345 | |
Consolidated Edison, Inc. | | | 2,674 | | | | 154,771 | |
Dominion Resources, Inc. | | | 5,390 | | | | 360,429 | |
DTE Energy Co. | | | 1,634 | | | | 121,962 | |
Duke Energy Corp. | | | 6,281 | | | | 443,564 | |
Edison International | | | 2,950 | | | | 163,961 | |
Entergy Corp. | | | 1,631 | | | | 114,986 | |
Eversource Energy | | | 2,879 | | | | 130,735 | |
Exelon Corp. | | | 7,850 | | | | 246,647 | |
FirstEnergy Corp. | | | 3,850 | | | | 125,318 | |
NextEra Energy, Inc. | | | 4,028 | | | | 394,865 | |
NiSource, Inc. | | | 2,900 | | | | 132,211 | |
NRG Energy, Inc. | | | 3,067 | | | | 70,173 | |
Pepco Hldgs., Inc. | | | 2,276 | | | | 61,315 | |
PG&E Corp. | | | 4,380 | | | | 215,058 | |
Pinnacle West Capital Corp. | | | 997 | | | | 56,719 | |
PPL Corp. | | | 6,075 | | | | 179,030 | |
Public Svc. Enterprise Group, Inc. | | | 4,588 | | | | 180,217 | |
SCANA Corp. | | | 1,316 | | | | 66,655 | |
Sempra Energy | | | 2,114 | | | | 209,159 | |
Southern Co. | | | 8,252 | | | | 345,759 | |
TECO Energy, Inc. | | | 2,143 | | | | 37,845 | |
WEC Energy Group, Inc. | | | 805 | | | | 36,218 | |
Wisconsin Energy Corp.* | | | 2,064 | | | | 92,818 | |
Xcel Energy, Inc. | | | 4,584 | | | | 147,513 | |
| | | | | | | | |
| | | | | | | 4,693,339 | |
| | | | | | | | |
TOTAL INDEXED ASSETS - COMMON STOCKS
(Cost: $113,447,402) 52.4% | | | | | | | 165,696,641 | |
| | | | | | | | |
| | | | | | | | | | | | | | | | |
| | | Rating** | | Rate(%) | | | Maturity | | Face Amount | | | Value | |
INDEXED ASSETS: | | | | | | | | | | | | | | | | |
SHORT-TERM DEBT SECURITIES: | | | | | | | | | | | | | | | | |
U.S. GOVERNMENT (0.2%) | | | | | | | | | | | | | | | | |
U.S. Treasury Bill (1) | | A-1+ | | | 0.07 | | | 11/19/15 | | | 400,000 | | | | 399,889 | |
U.S. Treasury Bill (1) | | A-1+ | | | 0.12 | | | 01/07/16 | | | 100,000 | | | | 99,937 | |
| | | | | | | | | | | | | | | | |
| | | | | | | | | | | | | | | 499,826 | |
| | | | | | | | | | | | | | | | |
COMMERCIAL PAPER (1.3%) | | | | | | | | | | | | | | | | |
Toyota Motor Credit Corp. | | A-1+ | | | 0.10 | | | 07/16/15 | | | 4,000,000 | �� | | | 3,999,833 | |
| | | | | | | | | | | | | | | | |
TOTAL INDEXED ASSETS - SHORT-TERM DEBT SECURITIES
(Cost: $4,499,659) 1.5% | | | | | | | | | | | | | | | 4,499,659 | |
| | | | | | | | | | | | | | | | |
TOTAL INDEXED ASSETS
(Cost: $117,947,061) 53.9% | | | | | | | | | | | | | | | 170,196,300 | |
| | | | | | | | | | | | | | | | |
MUTUAL OF AMERICA INVESTMENT CORPORATION - ALL AMERICA FUND
PORTFOLIO OF INVESTMENTS IN SECURITIES
June 30, 2015 (Unaudited)
| | | | | | | | |
| | | Shares | | | Value | |
ACTIVE ASSETS: | | | | | |
COMMON STOCKS: | | | | | |
CONSUMER DISCRETIONARY (6.4%) | | | | | | | | |
Amazon.com, Inc.* | | | 2,525 | | | | 1,096,077 | |
American Axle & Mfg. Hldgs., Inc.* | | | 7,752 | | | | 162,094 | |
AutoZone, Inc.* | | | 672 | | | | 448,157 | |
Bassett Furniture Industries, Inc. | | | 26,345 | | | | 748,461 | |
Carmike Cinemas, Inc.* | | | 20,460 | | | | 543,008 | |
CST Brands, Inc. | | | 22,924 | | | | 895,412 | |
Diamond Resorts Int’l., Inc.* | | | 47,199 | | | | 1,489,128 | |
Discovery Communications, Inc. Cl A* | | | 3,916 | | | | 130,246 | |
Discovery Communications, Inc. Cl C* | | | 3,916 | | | | 121,709 | |
Disney (Walt) Co. | | | 11,631 | | | | 1,327,562 | |
Dollar Tree, Inc.* | | | 2,856 | | | | 225,595 | |
Drew Industries, Inc. | | | 4,082 | | | | 236,838 | |
Eros International PLC* | | | 15,328 | | | | 385,040 | |
Five Below, Inc.* | | | 8,578 | | | | 339,088 | |
Ford Motor Co. | | | 17,022 | | | | 255,500 | |
FTD Companies, Inc.* | | | 4,703 | | | | 132,578 | |
General Motors Co. | | | 8,284 | | | | 276,106 | |
Haverty Furniture Cos., Inc. | | | 13,472 | | | | 291,265 | |
Home Depot, Inc. | | | 7,891 | | | | 876,927 | |
Houghton Mifflin Harcourt Co.* | | | 38,402 | | | | 967,730 | |
HSN, Inc. | | | 3,189 | | | | 223,836 | |
Intrawest Resorts Hldgs., Inc.* | | | 31,622 | | | | 367,448 | |
Johnson Controls, Inc. | | | 4,249 | | | | 210,453 | |
Macy’s, Inc. | | | 8,136 | | | | 548,936 | |
McDonald’s Corp. | | | 6,647 | | | | 631,930 | |
Panera Bread Co. Cl A* | | | 1,236 | | | | 216,016 | |
Performance Sports Group Ltd.* | | | 11,360 | | | | 204,480 | |
Popeyes Louisiana Kitchen, Inc.* | | | 4,842 | | | | 290,472 | |
Priceline Group Inc.* | | | 261 | | | | 300,508 | |
Red Robin Gourmet Burgers, Inc.* | | | 4,893 | | | | 419,917 | |
Ruby Tuesday, Inc.* | | | 33,036 | | | | 207,136 | |
Select Comfort Corp.* | | | 23,459 | | | | 705,412 | |
Sotheby’s | | | 3,256 | | | | 147,301 | |
Stage Stores, Inc. | | | 5,650 | | | | 99,045 | |
Starbucks Corp. | | | 17,079 | | | | 915,691 | |
Steve Madden Ltd.* | | | 8,639 | | | | 369,576 | |
Target Corp. | | | 7,994 | | | | 652,550 | |
The Men’s Wearhouse, Inc. | | | 10,656 | | | | 682,730 | |
Time Warner Cable, Inc. | | | 4,346 | | | | 774,327 | |
Time Warner, Inc. | | | 7,314 | | | | 639,317 | |
Viacom, Inc. Cl B | | | 5,192 | | | | 335,611 | |
Vista Outdoor, Inc.* | | | 5,892 | | | | 264,551 | |
| | | | | | | | |
| | | | | | | 20,155,764 | |
| | | | | | | | |
CONSUMER STAPLES (2.5%) | | | | | | | | |
Boston Beer Co., Inc. Cl A* | | | 585 | | | | 135,714 | |
Coca-Cola Co. | | | 11,096 | | | | 435,296 | |
Colgate-Palmolive Co. | | | 6,181 | | | | 404,299 | |
Constellation Brands, Inc. Cl A | | | 6,619 | | | | 767,936 | |
Crimson Wine Group Ltd.* | | | 38,623 | | | | 361,125 | |
Estee Lauder Cos., Inc. Cl A | | | 5,961 | | | | 516,580 | |
Farmer Brothers Co.* | | | 12,471 | | | | 293,069 | |
Mead Johnson Nutrition Co. | | | 2,488 | | | | 224,467 | |
Mondelez International, Inc. Cl A | | | 9,124 | | | | 375,361 | |
PepsiCo, Inc. | | | 7,201 | | | | 672,141 | |
Philip Morris Int’l., Inc. | | | 4,812 | | | | 385,778 | |
Proctor & Gamble Co. | | | 12,566 | | | | 983,164 | |
Sysco Corp. | | | 8,886 | | | | 320,785 | |
Tyson Foods, Inc. Cl A | | | 7,508 | | | | 320,066 | |
United Natural Foods, Inc.* | | | 2,415 | | | | 153,787 | |
Vector Group Ltd. | | | 11,168 | | | | 262,001 | |
Village Super Market, Inc. Cl A | | | 6,716 | | | | 212,830 | |
Wal-Mart Stores, Inc. | | | 10,119 | | | | 717,741 | |
WD-40 Co. | | | 3,920 | | | | 341,667 | |
| | | | | | | | |
| | | | | | | 7,883,807 | |
| | | | | | | | |
MUTUAL OF AMERICA INVESTMENT CORPORATION - ALL AMERICA FUND
PORTFOLIO OF INVESTMENTS IN SECURITIES
June 30, 2015 (Unaudited)
| | | | | | | | |
ENERGY (2.4%) | | | | | |
Anadarko Petroleum Corp. | | | 5,670 | | | | 442,600 | |
Apache Corp. | | | 3,838 | | | | 221,184 | |
Bonanza Creek Energy, Inc.* | | | 8,039 | | | | 146,712 | |
C&J Energy Services Ltd.* | | | 8,050 | | | | 106,260 | |
Carrizo Oil and Gas, Inc.* | | | 7,669 | | | | 377,621 | |
Chevron Corp. | | | 5,132 | | | | 495,084 | |
Denbury Resources, Inc. | | | 12,742 | | | | 81,039 | |
EOG Resources, Inc. | | | 5,554 | | | | 486,253 | |
Exxon Mobil Corp. | | | 20,720 | | | | 1,723,904 | |
Gulf Coast Ultra Deep Royalty Trust* | | | 70,148 | | | | 49,104 | |
Halliburton Co. | | | 12,768 | | | | 549,918 | |
Helix Energy Solutions Group* | | | 4,360 | | | | 55,067 | |
Hess Corp. | | | 3,711 | | | | 248,192 | |
Matador Resources Co.* | | | 7,635 | | | | 190,875 | |
Matrix Service Co.* | | | 3,630 | | | | 66,356 | |
National Oilwell Varco, Inc. | | | 5,743 | | | | 277,272 | |
Noble Energy, Inc. | | | 9,828 | | | | 419,459 | |
Occidental Petroleum Corp. | | | 6,043 | | | | 469,964 | |
PBF Energy, Inc. | | | 18,938 | | | | 538,218 | |
PDC Energy, Inc.* | | | 3,520 | | | | 188,813 | |
Range Resources Corp. | | | 3,222 | | | | 159,102 | |
Synergy Resources Corp.* | | | 17,108 | | | | 195,544 | |
Targa Resources Corp.* | | | 2,042 | | | | 182,187 | |
| | | | | | | | |
| | | | | | | 7,670,728 | |
| | | | | | | | |
FINANCIALS (8.4%) | | | | | | | | |
Agree Realty Corp. | | | 2,408 | | | | 70,241 | |
Alexander’s, Inc. | | | 313 | | | | 128,330 | |
American Int’l. Group, Inc. | | | 11,806 | | | | 729,847 | |
Aon PLC | | | 3,744 | | | | 373,202 | |
Ashford Hospitality Trust, Inc. | | | 11,468 | | | | 97,019 | |
Aspen Insurance Hldgs. Ltd. | | | 6,225 | | | | 298,178 | |
BancFirst Corp. | | | 4,591 | | | | 300,481 | |
Bank of America Corp. | | | 42,771 | | | | 727,962 | |
Bank of Marin Bancorp | | | 3,772 | | | | 191,882 | |
Banner Corp. | | | 7,537 | | | | 361,248 | |
Berkshire Hathaway, Inc. Cl B* | | | 4,800 | | | | 653,328 | |
Brookline Bancorp, Inc. | | | 28,465 | | | | 321,370 | |
Bryn Mawr Bank Corp. | | | 8,112 | | | | 244,658 | |
Capital One Financial Corp. | | | 11,507 | | | | 1,012,271 | |
Charter Financial Corp. | | | 13,887 | | | | 172,338 | |
Chatham Lodging Trust | | | 12,107 | | | | 320,472 | |
Chesapeake Lodging Trust | | | 17,786 | | | | 542,118 | |
Citigroup, Inc. | | | 11,256 | | | | 621,781 | |
Columbia Banking System, Inc. | | | 2,957 | | | | 96,221 | |
Comerica, Inc. | | | 8,127 | | | | 417,078 | |
Customers Bancorp, Inc.* | | | 10,414 | | | | 280,032 | |
Dime Community Bancshares | | | 13,342 | | | | 226,013 | |
Eagle Bancorp, Inc.* | | | 4,763 | | | | 209,381 | |
Easterly Government Pptys. | | | 12,070 | | | | 192,154 | |
EastGroup Properties, Inc. | | | 1,887 | | | | 106,106 | |
Ellington Financial LLC | | | 24,970 | | | | 462,195 | |
Enterprise Financial Svcs. Corp. | | | 8,738 | | | | 198,964 | |
Equity Lifestyle Properties, Inc. | | | 4,891 | | | | 257,169 | |
FBR & Co.* | | | 3,996 | | | | 92,467 | |
FelCor Lodging Trust, Inc. | | | 44,851 | | | | 443,128 | |
First Connecticut Bancorp, Inc. | | | 4,683 | | | | 74,319 | |
First Interstate BancSytem, Inc. | | | 9,196 | | | | 255,097 | |
MUTUAL OF AMERICA INVESTMENT CORPORATION - ALL AMERICA FUND
PORTFOLIO OF INVESTMENTS IN SECURITIES
June 30, 2015 (Unaudited)
| | | | | | | | |
Flushing Financial Corp. | | | 8,390 | | | | 176,274 | |
Forest City Enterprises, Inc. Cl A* | | | 20,922 | | | | 462,376 | |
Franklin Resources, Inc. | | | 4,479 | | | | 219,605 | |
Glacier Bancorp, Inc. | | | 10,795 | | | | 317,589 | |
Goldman Sachs Group, Inc. | | | 3,950 | | | | 824,721 | |
Hanmi Financial Corp. | | | 6,068 | | | | 150,729 | |
Heritage Financial Corp. | | | 17,365 | | | | 310,313 | |
Highwoods Properties, Inc. | | | 8,778 | | | | 350,681 | |
Host Hotels & Resorts, Inc. | | | 16,139 | | | | 320,036 | |
Investors Bancorp, Inc. | | | 57,381 | | | | 705,787 | |
iShares Micro-Cap ETF | | | 2,556 | | | | 208,391 | |
iShares Russell 2000 Value ETF | | | 1,720 | | | | 175,371 | |
Janus Capital Group, Inc. | | | 12,163 | | | | 208,231 | |
JPMorgan Chase & Co. | | | 25,475 | | | | 1,726,186 | |
Marlin Business Svcs. Corp. | | | 13,515 | | | | 228,133 | |
MB Financial, Inc. | | | 5,814 | | | | 200,234 | |
Meadowbrook Insurance Group, Inc.* | | | 37,666 | | | | 323,928 | |
MetLife, Inc. | | | 11,672 | | | | 653,515 | |
Northfield Bancorp, Inc. | | | 20,934 | | | | 315,057 | |
Parkway Properties, Inc. | | | 10,410 | | | | 181,550 | |
Pennsylvania REIT | | | 12,349 | | | | 263,528 | |
PNC Financial Svcs. Grp., Inc. | | | 5,040 | | | | 482,076 | |
Primerica, Inc. | | | 4,796 | | | | 219,129 | |
PrivateBancorp, Inc. | | | 9,198 | | | | 366,264 | |
Prosperity Bancshares, Inc. | | | 4,246 | | | | 245,164 | |
QTS Realty Trust, Inc. | | | 7,375 | | | | 268,819 | |
Sabra Health Care REIT, Inc. | | | 10,680 | | | | 274,903 | |
Safety Insurance Group, Inc. | | | 3,979 | | | | 229,628 | |
Selective Insurance Group, Inc. | | | 7,189 | | | | 201,651 | |
Silvercrest Asset Mgmt. Group, Inc. Cl A | | | 13,030 | | | | 183,202 | |
Simon Property Group, Inc. | | | 4,151 | | | | 718,206 | |
Sovran Self Storage, Inc. | | | 1,691 | | | | 146,965 | |
Starwood Property Trust, Inc. | | | 7,818 | | | | 168,634 | |
Stifel Financial Corp.* | | | 4,963 | | | | 286,564 | |
Stock Yards Bancorp, Inc. | | | 10,722 | | | | 405,184 | |
SVB Financial Group* | | | 4,736 | | | | 681,889 | |
Symetra Financial Corp. | | | 22,094 | | | | 534,012 | |
Terreno Realty Corp. | | | 8,441 | | | | 166,288 | |
The GEO Group, Inc. | | | 6,207 | | | | 212,031 | |
UMB Financial Corp. | | | 2,901 | | | | 165,415 | |
Urstadt Biddle Pptys., Inc. Cl A | | | 6,809 | | | | 127,192 | |
Wells Fargo & Co. | | | 24,760 | | | | 1,392,502 | |
Zions Bancorporation | | | 11,133 | | | | 353,306 | |
| | | | | | | | |
| | | | | | | 26,628,309 | |
| | | | | | | | |
HEALTH CARE (7.5%) | | | | | | | | |
Abbott Laboratories | | | 12,034 | | | | 590,629 | |
Abiomed, Inc.* | | | 5,376 | | | | 353,364 | |
Acadia Healthcare Co., Inc.* | | | 2,150 | | | | 168,410 | |
ACADIA Pharmaceuticals, Inc.* | | | 6,047 | | | | 253,248 | |
Acceleron Pharma, Inc.* | | | 3,395 | | | | 107,418 | |
Acorda Therapeutics, Inc.* | | | 5,120 | | | | 170,650 | |
Adeptus Health, Inc. Cl A* | | | 2,200 | | | | 208,978 | |
Agios Pharmaceuticals, Inc.* | | | 1,310 | | | | 145,593 | |
Albany Molecular Research, Inc* | | | 16,415 | | | | 331,911 | |
Alexion Pharmaceuticals, Inc.* | | | 707 | | | | 127,768 | |
Allergan PLC* | | | 2,433 | | | | 738,318 | |
Alnylam Pharmaceuticals, Inc.* | | | 1,642 | | | | 196,827 | |
Anacor Pharmaceuticals, Inc.* | | | 1,500 | | | | 116,145 | |
Ani Pharmaceuticals, Inc.* | | | 1,565 | | | | 97,108 | |
Anika Therapeutics, Inc.* | | | 5,587 | | | | 184,539 | |
BIOGEN, Inc.* | | | 1,737 | | | | 701,644 | |
MUTUAL OF AMERICA INVESTMENT CORPORATION - ALL AMERICA FUND
PORTFOLIO OF INVESTMENTS IN SECURITIES
June 30, 2015 (Unaudited)
| | | | | | | | |
BioSpecifics Technologies Corp.* | | | 4,410 | | | | 227,556 | |
bluebird bio, Inc.* | | | 690 | | | | 116,175 | |
Cambrex Corp.* | | | 4,558 | | | | 200,279 | |
Cardiovascular Systems, Inc.* | | | 3,270 | | | | 86,492 | |
Catalent, Inc.* | | | 2,671 | | | | 78,340 | |
Celgene Corp.* | | | 10,769 | | | | 1,246,350 | |
Cempra, Inc.* | | | 2,045 | | | | 70,266 | |
Cepheid, Inc.* | | | 4,289 | | | | 262,272 | |
Cerner Corp.* | | | 3,218 | | | | 222,235 | |
Computer Programs & Systems, Inc. | | | 4,627 | | | | 247,174 | |
DexCom, Inc.* | | | 6,567 | | | | 525,229 | |
Emergent Biosolutions, Inc.* | | | 14,939 | | | | 492,240 | |
Ensign Group, Inc. | | | 7,110 | | | | 363,037 | �� |
Entellus Medical, Inc.* | | | 2,000 | | | | 51,740 | |
Esperion Therapeutics, Inc.* | | | 1,580 | | | | 129,181 | |
Exact Sciences Corp.* | | | 11,788 | | | | 350,575 | |
Express Scripts Hldg. Co.* | | | 5,005 | | | | 445,145 | |
Gilead Sciences, Inc. | | | 9,745 | | | | 1,140,945 | |
GW Pharmaceuticals PLC ADR* | | | 1,614 | | | | 198,264 | |
Harvard Bioscience, Inc.* | | | 40,748 | | | | 232,264 | |
Humana, Inc. | | | 1,765 | | | | 337,609 | |
Insulet Corp.* | | | 6,113 | | | | 189,411 | |
Intersect ENT, Inc.* | | | 3,960 | | | | 113,375 | |
Isis Pharmaceuticals, Inc.* | | | 1,675 | | | | 96,396 | |
Karyopharm Therapeutics, Inc.* | | | 3,011 | | | | 81,929 | |
Kindred Healthcare, Inc. | | | 5,827 | | | | 118,230 | |
Kite Pharma, Inc.* | | | 955 | | | | 58,226 | |
Lannett Co., Inc.* | | | 4,442 | | | | 264,032 | |
McKesson Corp. | | | 2,165 | | | | 486,714 | |
Medicines Co.* | | | 5,629 | | | | 161,046 | |
Medidata Solutions, Inc.* | | | 4,573 | | | | 248,405 | |
Medtronic PLC | | | 9,085 | | | | 673,199 | |
Merck & Co., Inc. | | | 17,848 | | | | 1,016,087 | |
Mylan N.V.* | | | 17,391 | | | | 1,180,153 | |
Neogen Corp.* | | | 3,586 | | | | 170,120 | |
Neurocrine Biosciences, Inc.* | | | 3,880 | | | | 185,309 | |
NuVasive, Inc.* | | | 1,670 | | | | 79,125 | |
Omeros Corp.* | | | 11,265 | | | | 202,657 | |
Omnicell, Inc.* | | | 7,911 | | | | 298,324 | |
OSI Pharmaceuticals, Inc. - rights* | | | 1,570 | | | | 16 | |
Pacific Biosciences of CA, Inc.* | | | 31,732 | | | | 182,777 | |
Pacira Pharmaceuticals, Inc.* | | | 1,893 | | | | 133,873 | |
PAREXEL International Corp.* | | | 4,696 | | | | 302,000 | |
Pfizer, Inc. | | | 41,817 | | | | 1,402,124 | |
PTC Therapeutics, Inc.* | | | 1,386 | | | | 66,708 | |
QLT, Inc.* | | | 50,717 | | | | 209,461 | |
Receptos, Inc.* | | | 1,746 | | | | 331,827 | |
Rigel Pharmaceuticals, Inc.* | | | 17,294 | | | | 55,514 | |
Sarepta Therapeutics, Inc.* | | | 4,677 | | | | 142,321 | |
Sorrento Therapeutics, Inc.* | | | 10,467 | | | | 184,429 | |
St. Jude Medical, Inc. | | | 3,206 | | | | 234,262 | |
STAAR Surgical Co.* | | | 16,975 | | | | 163,979 | |
Stryker Corp. | | | 4,423 | | | | 422,706 | |
Supernus Pharmaceuticals, Inc.* | | | 46,374 | | | | 787,431 | |
Team Health Hldgs., Inc.* | | | 3,663 | | | | 239,304 | |
Ultragenyx Pharmaceutical, Inc.* | | | 780 | | | | 79,864 | |
UnitedHealth Group, Inc. | | | 4,983 | | | | 607,926 | |
Universal American Corp.* | | | 13,229 | | | | 133,877 | |
Vertex Pharmaceuticals, Inc.* | | | 2,148 | | | | 265,235 | |
WellCare Health Plans, Inc.* | | | 3,785 | | | | 321,082 | |
Wright Medical Group, Inc.* | | | 6,349 | | | | 166,725 | |
| | | | | | | | |
| | | | | | | 23,572,097 | |
| | | | | | | | |
MUTUAL OF AMERICA INVESTMENT CORPORATION - ALL AMERICA FUND
PORTFOLIO OF INVESTMENTS IN SECURITIES
June 30, 2015 (Unaudited)
| | | | | | | | |
INDUSTRIALS (5.4%) | | | | | |
Alaska Air Group, Inc. | | | 7,226 | | | | 465,571 | |
Allegiant Travel Co. | | | 1,987 | | | | 353,448 | |
Astronics Corp.* | | | 9,047 | | | | 641,342 | |
AZZ, Inc. | | | 16,073 | | | | 832,581 | |
Blount International, Inc.* | | | 27,629 | | | | 301,709 | |
Boeing Co. | | | 6,062 | | | | 840,921 | |
CEB, Inc. | | | 4,439 | | | | 386,459 | |
Covenant Transport, Inc. Cl A* | | | 10,590 | | | | 265,385 | |
Cummins, Inc. | | | 4,352 | | | | 570,939 | |
Delta Air Lines, Inc. | | | 9,877 | | | | 405,747 | |
Deluxe Corp. | | | 5,277 | | | | 327,174 | |
Encore Wire Corp. | | | 8,793 | | | | 389,442 | |
EnPro Industries, Inc. | | | 10,433 | | | | 596,976 | |
Expeditors Int’l. of Wash. | | | 7,996 | | | | 368,656 | |
FedEx Corp. | | | 4,362 | | | | 743,285 | |
Forward Air Corp. | | | 3,900 | | | | 203,814 | |
Generac Hldgs., Inc.* | | | 4,925 | | | | 195,769 | |
General Electric Co. | | | 64,724 | | | | 1,719,717 | |
Healthcare Svcs. Group, Inc. | | | 9,642 | | | | 318,668 | |
Miller (Herman), Inc. | | | 5,536 | | | | 160,156 | |
Miller Industries, Inc. | | | 21,873 | | | | 436,366 | |
Mueller Industries, Inc. | | | 26,700 | | | | 927,024 | |
Old Dominion Freight Line, Inc.* | | | 6,303 | | | | 432,417 | |
Orbital ATK, Inc. | | | 7,356 | | | | 539,636 | |
Precision Castparts Corp. | | | 1,730 | | | | 345,775 | |
Roper Technologies, Inc. | | | 8,718 | | | | 1,503,506 | |
Steelcase, Inc. | | | 13,716 | | | | 259,370 | |
Sun Hydraulics Corp. | | | 8,667 | | | | 330,299 | |
Teledyne Technologies, Inc.* | | | 3,141 | | | | 331,407 | |
The Advisory Board Co.* | | | 5,248 | | | | 286,908 | |
Trex Co., Inc.* | | | 9,026 | | | | 446,155 | |
Tyco International PLC | | | 7,706 | | | | 296,527 | |
Union Pacific Corp. | | | 6,097 | | | | 581,471 | |
Uti Worldwide, Inc.* | | | 28,734 | | | | 287,053 | |
| | | | | | | | |
| | | | | | | 17,091,673 | |
| | | | | | | | |
INFORMATION TECHNOLOGY (7.9%) | | | | | | | | |
Aerohive Networks, Inc.* | | | 15,678 | | | | 109,432 | |
Ambarella, Inc.* | | | 1,858 | | | | 190,798 | |
ANADIGICS, Inc.* | | | 72,855 | | | | 53,184 | |
Analog Devices, Inc. | | | 4,892 | | | | 313,993 | |
Anixter International, Inc.* | | | 2,419 | | | | 157,598 | |
Apple, Inc. | | | 23,706 | | | | 2,973,325 | |
Ashford Hospitality Prime, Inc. | | | 6,363 | | | | 95,572 | |
Automatic Data Processing, Inc. | | | 5,202 | | | | 417,356 | |
Blackhawk Network Hldgs., Inc.* | | | 4,475 | | | | 184,370 | |
Broadcom Corp. Cl A | | | 6,114 | | | | 314,810 | |
CalAmp Corp.* | | | 29,067 | | | | 530,763 | |
Cavium, Inc.* | | | 5,518 | | | | 379,694 | |
Cirrus Logic, Inc.* | | | 6,308 | | | | 214,661 | |
Cisco Systems, Inc. | | | 23,117 | | | | 634,793 | |
comScore, Inc.* | | | 9,579 | | | | 510,178 | |
Comverse, Inc.* | | | 13,201 | | | | 265,076 | |
Constant Contact, Inc.* | | | 3,670 | | | | 105,549 | |
Cornerstone OnDemand, Inc.* | | | 2,960 | | | | 103,008 | |
Envestnet, Inc.* | | | 2,761 | | | | 111,627 | |
Euronet Worldwide, Inc.* | | | 3,424 | | | | 211,261 | |
F5 Networks, Inc.* | | | 1,485 | | | | 178,720 | |
Facebook, Inc. Cl A* | | | 8,302 | | | | 712,021 | |
FARO Technologies, Inc.* | | | 7,700 | | | | 359,590 | |
MUTUAL OF AMERICA INVESTMENT CORPORATION - ALL AMERICA FUND
PORTFOLIO OF INVESTMENTS IN SECURITIES
June 30, 2015 (Unaudited)
| | | | | | | | |
FEI Company | | | 2,687 | | | | 222,833 | |
Globant SA* | | | 5,061 | | | | 154,006 | |
Google, Inc. Cl A* | | | 1,157 | | | | 624,826 | |
Google, Inc. Cl C* | | | 1,160 | | | | 603,786 | |
Guidewire Software, Inc.* | | | 2,597 | | | | 137,459 | |
iGATE Corp.* | | | 3,025 | | | | 144,262 | |
Imation Corp.* | | | 24,758 | | | | 100,517 | |
Imperva, Inc.* | | | 9,033 | | | | 611,534 | |
Intel Corp. | | | 11,918 | | | | 362,486 | |
j2 Global, Inc. | | | 3,130 | | | | 212,652 | |
KLA-Tencor Corp. | | | 2,609 | | | | 146,652 | |
LogMeIn, Inc.* | | | 8,430 | | | | 543,651 | |
Manhattan Associates, Inc.* | | | 6,351 | | | | 378,837 | |
MasterCard, Inc. Cl A | | | 6,601 | | | | 617,061 | |
MAXIMUS, Inc. | | | 3,671 | | | | 241,295 | |
MaxLinear, Inc. Cl A* | | | 30,238 | | | | 365,880 | |
Micron Technology, Inc.* | | | 8,590 | | | | 161,836 | |
Microsoft Corp. | | | 26,468 | | | | 1,168,562 | |
MKS Instruments, Inc. | | | 5,697 | | | | 216,144 | |
Monolithic Power Systems, Inc. | | | 7,611 | | | | 385,954 | |
Nanometrics, Inc.* | | | 6,851 | | | | 110,438 | |
NeuStar, Inc. Cl A* | | | 9,455 | | | | 276,181 | |
New Relic, Inc.* | | | 1,300 | | | | 45,747 | |
Nimble Storage, Inc.* | | | 7,433 | | | | 208,570 | |
Nova Measuring Instruments Ltd.* | | | 10,616 | | | | 132,700 | |
Oracle Corp. | | | 16,658 | | | | 671,317 | |
Plexus Corp.* | | | 3,332 | | | | 146,208 | |
Proofpoint, Inc.* | | | 13,782 | | | | 877,500 | |
Qlik Technologies, Inc.* | | | 11,271 | | | | 394,034 | |
QLogic Corp.* | | | 12,669 | | | | 179,773 | |
QUALCOMM, Inc. | | | 9,418 | | | | 589,849 | |
Richardson Electronics Ltd. | | | 45,433 | | | | 367,099 | |
Rogers Corp.* | | | 8,135 | | | | 538,049 | |
Ruckus Wireless, Inc.* | | | 30,056 | | | | 310,779 | |
Salesforce.com, inc.* | | | 14,642 | | | | 1,019,522 | |
Semtech Corp.* | | | 3,952 | | | | 78,447 | |
Synaptics, Inc.* | | | 3,300 | | | | 286,226 | |
Synchronoss Technologies, Inc.* | | | 4,100 | | | | 187,493 | |
SYNNEX Corp. | | | 4,410 | | | | 322,768 | |
Teradata Corp.* | | | 4,870 | | | | 180,190 | |
Texas Instruments, Inc. | | | 5,747 | | | | 296,028 | |
Tyler Technologies, Inc.* | | | 1,595 | | | | 206,361 | |
Verint Systems, Inc.* | | | 4,571 | | | | 277,665 | |
Western Digital Corp. | | | 6,955 | | | | 545,411 | |
Yahoo!, Inc.* | | | 9,052 | | | | 355,653 | |
| | | | | | | | |
| | | | | | | 25,131,620 | |
| | | | | | | | |
MATERIALS (1.7%) | | | | | | | | |
A. Schulman, Inc. | | | 7,729 | | | | 337,912 | |
Ball Corp. | | | 6,901 | | | | 484,105 | |
Boise Cascade Co.* | | | 6,280 | | | | 230,350 | |
CF Industries Hldgs., Inc. | | | 6,330 | | | | 406,892 | |
Dow Chemical Co. | | | 9,280 | | | | 474,858 | |
Eastman Chemical Co. | | | 7,281 | | | | 595,731 | |
Ferro Corp.* | | | 14,020 | | | | 235,256 | |
FMC Corp. | | | 2,087 | | | | 109,672 | |
Freeport-McMoRan Copper & Gold, Inc. | | | 9,466 | | | | 176,257 | |
Horsehead Hldg. Corp.* | | | 12,621 | | | | 147,918 | |
Kaiser Aluminum Corp. | | | 8,481 | | | | 704,601 | |
Kraton Performance Polymers, Inc.* | | | 10,415 | | | | 248,710 | |
Mueller Water Products, Inc. Cl A | | | 32,680 | | | | 297,388 | |
PolyOne Corp. | | | 6,521 | | | | 255,428 | |
MUTUAL OF AMERICA INVESTMENT CORPORATION - ALL AMERICA FUND
PORTFOLIO OF INVESTMENTS IN SECURITIES
June 30, 2015 (Unaudited)
| | | | | | | | |
Schnitzer Steel Industries, Inc. Cl A | | | 5,470 | | | | 95,561 | |
Silgan Hldgs., Inc. | | | 6,218 | | | | 328,062 | |
TimkenSteel Corp. | | | 1,909 | | | | 51,524 | |
U.S. Concrete, Inc.* | | | 6,404 | | | | 242,648 | |
| | | | | | | | |
| | | | | | | 5,422,873 | |
| | | | | | | | |
TELECOMMUNICATION SERVICES (0.7%) | | | | | | | | |
AT&T, Inc. | | | 22,436 | | | | 796,927 | |
Consolidated Comms. Hldgs., Inc. | | | 9,620 | | | | 202,116 | |
IDT Corp. Cl B | | | 4,456 | | | | 80,564 | |
inContact, Inc.* | | | 14,015 | | | | 138,328 | |
ORBCOMM, Inc.* | | | 43,809 | | | | 295,711 | |
Shenandoah Telecommunications Co. | | | 6,311 | | | | 216,026 | |
Verizon Communications, Inc. | | | 9,524 | | | | 443,914 | |
| | | | | | | | |
| | | | | | | 2,173,586 | |
| | | | | | | | |
UTILITIES (1.1%) | | | | | | | | |
Ameren Corp. | | | 2,548 | | | | 96,009 | |
Avista Corp. | | | 9,191 | | | | 281,704 | |
Black Hills Corp. | | | 3,402 | | | | 148,497 | |
Dominion Resources, Inc. | | | 7,931 | | | | 530,346 | |
Edison International | | | 4,587 | | | | 254,945 | |
Idacorp, Inc. | | | 5,556 | | | | 311,914 | |
Northwest Natural Gas Co. | | | 3,927 | | | | 165,641 | |
NorthWestern Corp. | | | 8,558 | | | | 417,203 | |
PNM Resources, Inc. | | | 10,493 | | | | 258,128 | |
Portland General Electric Co. | | | 6,646 | | | | 220,381 | |
PPL Corp. | | | 5,086 | | | | 149,884 | |
Public Svc. Enterprise Group, Inc. | | | 8,935 | | | | 350,967 | |
Sempra Energy | | | 4,172 | | | | 412,778 | |
| | | | | | | | |
| | | | | | | 3,598,397 | |
| | | | | | | | |
TOTAL ACTIVE ASSETS - COMMON STOCKS
(Cost: $97,536,812) 44.0% | | | | | | | 139,328,854 | |
| | | | | | | | |
| | | | | | | | | | | | | | | | |
| | | Rating** | | Rate(%) | | | Maturity | | Face Amount | | | Value | |
ACTIVE ASSETS: | | | | | | | | | | | | | | | | |
SHORT-TERM DEBT SECURITIES: | | | | | | | | | |
COMMERCIAL PAPER (1.0%) | | | | | | | | | | | | | | | | |
Toyota Motor Credit Corp. | | A-1+ | | | 0.12 | | | 07/20/15 | | | 1,000,000 | | | | 999,937 | |
Toyota Motor Credit Corp. | | A-1+ | | | 0.12 | | | 07/28/15 | | | 700,000 | | | | 699,937 | |
Toyota Motor Credit Corp. | | A-1+ | | | 0.14 | | | 08/10/15 | | | 1,300,000 | | | | 1,299,798 | |
| | | | | | | | | | | | | | | | |
| | | | | | | | | | | | | | | 2,999,672 | |
| | | | | | | | | | | | | | | | |
TOTAL ACTIVE ASSETS - SHORT-TERM DEBT SECURITIES
(Cost: $2,999,672) 1.0% | | | | | | | | | | | | | | | 2,999,672 | |
| | | | | | | | | | | | | | | | |
TOTAL ACTIVE ASSETS
(Cost: $100,536,484) 45.0% | | | | | | | | | | | | | | | 142,328,526 | |
| | | | | | | | | | | | | | | | |
TOTAL INVESTMENTS
(Cost: $218,483,545) 98.9% | | | | | | | | | | | | | | | 312,524,826 | |
| | | | | | | | | | | | | | | | |
OTHER NET ASSETS 1.1% | | | | | | | | | | | | | | | 3,451,957 | |
| | | | | | | | | | | | | | | | |
NET ASSETS 100.0% | | | | | | | | | | | | | | $ | 315,976,783 | |
| | | | | | | | | | | | | | | | |
The accompanying notes are an integral part of these portfolio schedules.
MUTUAL OF AMERICA INVESTMENT CORPORATION - SMALL CAP VALUE FUND
PORTFOLIO OF INVESTMENTS IN SECURITIES
June 30, 2015 (Unaudited)
| | | | | | | | |
| | | Shares | | | Value | |
COMMON STOCKS: | | | | | | | | |
CONSUMER DISCRETIONARY (12.5%) | | | | | | | | |
Bassett Furniture Industries, Inc. | | | 299,180 | | | | 8,499,704 | |
Carmike Cinemas, Inc.* | | | 68,551 | | | | 1,819,344 | |
CST Brands, Inc. | | | 75,404 | | | | 2,945,280 | |
Diamond Resorts Int’l., Inc.* | | | 367,002 | | | | 11,578,913 | |
Eros International PLC* | | | 36,523 | | | | 917,458 | |
FTD Companies, Inc.* | | | 53,681 | | | | 1,513,267 | |
Houghton Mifflin Harcourt Co.* | | | 291,540 | | | | 7,346,808 | |
Intrawest Resorts Hldgs., Inc.* | | | 161,970 | | | | 1,882,091 | |
Ruby Tuesday, Inc.* | | | 389,663 | | | | 2,443,187 | |
Select Comfort Corp.* | | | 126,249 | | | | 3,796,307 | |
Stage Stores, Inc. | | | 64,220 | | | | 1,125,777 | |
The Men’s Wearhouse, Inc. | | | 70,659 | | | | 4,527,122 | |
Vista Outdoor, Inc.* | | | 29,799 | | | | 1,337,975 | |
| | | | | | | | |
| | | | | | | 49,733,233 | |
| | | | | | | | |
CONSUMER STAPLES (2.6%) | | | | | | | | |
Crimson Wine Group Ltd.* | | | 430,428 | | | | 4,024,502 | |
Farmer Brothers Co.* | | | 141,875 | | | | 3,334,063 | |
Vector Group Ltd. | | | 132,036 | | | | 3,097,565 | |
| | | | | | | | |
| | | | | | | 10,456,130 | |
| | | | | | | | |
ENERGY (3.5%) | | | | | | | | |
C&J Energy Services Ltd.* | | | 91,730 | | | | 1,210,836 | |
Carrizo Oil and Gas, Inc.* | | | 33,739 | | | | 1,661,308 | |
Denbury Resources, Inc. | | | 138,307 | | | | 879,633 | |
Gulf Coast Ultra Deep Royalty Trust* | | | 767,207 | | | | 537,045 | |
Helix Energy Solutions Group* | | | 49,573 | | | | 626,107 | |
Matrix Service Co.* | | | 43,866 | | | | 801,870 | |
PBF Energy, Inc. | | | 214,011 | | | | 6,082,193 | |
PDC Energy, Inc.* | | | 40,120 | | | | 2,152,037 | |
| | | | | | | | |
| | | | | | | 13,951,029 | |
| | | | | | | | |
FINANCIALS (36.2%) | | | | | | | | |
Agree Realty Corp. | | | 28,566 | | | | 833,270 | |
Alexander’s, Inc. | | | 3,892 | | | | 1,595,720 | |
Ashford Hospitality Trust, Inc. | | | 131,137 | | | | 1,109,419 | |
Aspen Insurance Hldgs. Ltd. | | | 73,138 | | | | 3,503,310 | |
BancFirst Corp. | | | 53,871 | | | | 3,525,857 | |
Bank of Marin Bancorp | | | 43,392 | | | | 2,207,351 | |
Banner Corp. | | | 88,029 | | | | 4,219,230 | |
Brookline Bancorp, Inc. | | | 345,137 | | | | 3,896,597 | |
Bryn Mawr Bank Corp. | | | 97,072 | | | | 2,927,692 | |
Charter Financial Corp. | | | 158,693 | | | | 1,969,380 | |
Chatham Lodging Trust | | | 131,481 | | | | 3,480,302 | |
Chesapeake Lodging Trust | | | 128,246 | | | | 3,908,938 | |
Columbia Banking System, Inc. | | | 33,849 | | | | 1,101,446 | |
Customers Bancorp, Inc.* | | | 123,291 | | | | 3,315,295 | |
Dime Community Bancshares | | | 155,616 | | | | 2,636,135 | |
Eagle Bancorp, Inc.* | | | 55,493 | | | | 2,439,472 | |
Easterly Government Pptys. | | | 137,450 | | | | 2,188,204 | |
EastGroup Properties, Inc. | | | 21,646 | | | | 1,217,155 | |
Ellington Financial LLC | | | 286,752 | | | | 5,307,780 | |
Enterprise Financial Svcs. Corp. | | | 100,004 | | | | 2,277,091 | |
Equity Lifestyle Properties, Inc. | | | 55,969 | | | | 2,942,850 | |
FBR & Co.* | | | 46,122 | | | | 1,067,263 | |
FelCor Lodging Trust, Inc. | | | 530,785 | | | | 5,244,156 | |
First Connecticut Bancorp, Inc. | | | 53,507 | | | | 849,156 | |
First Interstate BancSytem, Inc. | | | 99,810 | | | | 2,768,729 | |
Flushing Financial Corp. | | | 96,154 | | | | 2,020,196 | |
Forest City Enterprises, Inc. Cl A* | | | 229,701 | | | | 5,076,392 | |
MUTUAL OF AMERICA INVESTMENT CORPORATION - SMALL CAP VALUE FUND
PORTFOLIO OF INVESTMENTS IN SECURITIES
June 30, 2015 (Unaudited)
| | | | | | | | |
Glacier Bancorp, Inc. | | | 122,831 | | | | 3,613,688 | |
Hanmi Financial Corp. | | | 69,342 | | | | 1,722,455 | |
Highwoods Properties, Inc. | | | 100,759 | | | | 4,025,322 | |
Investors Bancorp, Inc. | | | 314,900 | | | | 3,873,270 | |
Janus Capital Group, Inc. | | | 138,753 | | | | 2,375,451 | |
Marlin Business Svcs. Corp. | | | 154,814 | | | | 2,613,260 | |
MB Financial, Inc. | | | 62,790 | | | | 2,162,488 | |
Meadowbrook Insurance Group, Inc.* | | | 472,531 | | | | 4,063,767 | |
Northfield Bancorp, Inc. | | | 236,553 | | | | 3,560,123 | |
Parkway Properties, Inc. | | | 117,474 | | | | 2,048,747 | |
Pennsylvania REIT | | | 144,768 | | | | 3,089,349 | |
PrivateBancorp, Inc. | | | 104,666 | | | | 4,167,800 | |
Prosperity Bancshares, Inc. | | | 45,844 | | | | 2,647,033 | |
Selective Insurance Group, Inc. | | | 81,292 | | | | 2,280,241 | |
Sovran Self Storage, Inc. | | | 20,029 | | | | 1,740,720 | |
Stock Yards Bancorp, Inc. | | | 126,272 | | | | 4,771,819 | |
SVB Financial Group* | | | 54,211 | | | | 7,805,300 | |
Symetra Financial Corp. | | | 261,025 | | | | 6,308,974 | |
Terreno Realty Corp. | | | 97,270 | | | | 1,916,219 | |
The GEO Group, Inc. | | | 70,081 | | | | 2,393,967 | |
UMB Financial Corp. | | | 31,260 | | | | 1,782,445 | |
Urstadt Biddle Pptys., Inc. Cl A | | | 76,931 | | | | 1,437,071 | |
| | | | | | | | |
| | | | | | | 144,027,895 | |
| | | | | | | | |
HEALTH CARE (5.6%) | | | | | | | | |
Albany Molecular Research, Inc* | | | 82,992 | | | | 1,678,098 | |
Computer Programs & Systems, Inc. | | | 52,250 | | | | 2,791,195 | |
Emergent Biosolutions, Inc.* | | | 31,430 | | | | 1,035,619 | |
Ensign Group, Inc. | | | 26,017 | | | | 1,328,428 | |
Harvard Bioscience, Inc.* | | | 405,872 | | | | 2,313,470 | |
Kindred Healthcare, Inc. | | | 68,914 | | | | 1,398,265 | |
Pacific Biosciences of CA, Inc.* | | | 200,108 | | | | 1,152,622 | |
QLT, Inc.* | | | 575,250 | | | | 2,375,783 | |
Rigel Pharmaceuticals, Inc.* | | | 197,471 | | | | 633,882 | |
Supernus Pharmaceuticals, Inc.* | | | 252,052 | | | | 4,279,843 | |
Universal American Corp.* | | | 155,889 | | | | 1,577,597 | |
Wright Medical Group, Inc.* | | | 71,877 | | | | 1,887,490 | |
| | | | | | | | |
| | | | | | | 22,452,292 | |
| | | | | | | | |
INDUSTRIALS (14.7%) | | | | | | | | |
Alaska Air Group, Inc. | | | 82,279 | | | | 5,301,236 | |
AZZ, Inc. | | | 100,873 | | | | 5,225,221 | |
Blount International, Inc.* | | | 312,097 | | | | 3,408,099 | |
Deluxe Corp. | | | 59,599 | | | | 3,695,138 | |
Encore Wire Corp. | | | 100,144 | | | | 4,435,378 | |
EnPro Industries, Inc. | | | 61,154 | | | | 3,499,232 | |
Miller Industries, Inc. | | | 249,665 | | | | 4,980,817 | |
Mueller Industries, Inc. | | | 305,921 | | | | 10,621,577 | |
Old Dominion Freight Line, Inc.* | | | 71,803 | | | | 4,926,045 | |
Orbital ATK, Inc. | | | 83,265 | | | | 6,108,320 | |
Steelcase, Inc. | | | 154,898 | | | | 2,929,121 | |
Uti Worldwide, Inc.* | | | 324,562 | | | | 3,242,374 | |
| | | | | | | | |
| | | | | | | 58,372,558 | |
| | | | | | | | |
INFORMATION TECHNOLOGY (9.8%) | | | | | | | | |
Aerohive Networks, Inc.* | | | 178,862 | | | | 1,248,457 | |
Anixter International, Inc.* | | | 26,225 | | | | 1,708,559 | |
Ashford Hospitality Prime, Inc. | | | 75,938 | | | | 1,140,589 | |
CalAmp Corp.* | | | 128,790 | | | | 2,351,705 | |
Cirrus Logic, Inc.* | | | 30,707 | | | | 1,044,959 | |
Comverse, Inc.* | | | 97,910 | | | | 1,966,033 | |
iGATE Corp.* | | | 34,610 | | | | 1,650,551 | |
Imation Corp.* | | | 283,072 | | | | 1,149,272 | |
LogMeIn, Inc.* | | | 33,433 | | | | 2,156,094 | |
MUTUAL OF AMERICA INVESTMENT CORPORATION - SMALL CAP VALUE FUND
PORTFOLIO OF INVESTMENTS IN SECURITIES
June 30, 2015 (Unaudited)
| | | | | | | | | | | | | | | | |
MaxLinear, Inc. Cl A* | | | | | | | | | | | 32,750 | | | | 396,275 | |
MKS Instruments, Inc. | | | | | | | | | | | 65,200 | | | | 2,473,688 | |
Nanometrics, Inc.* | | | | | | | | | | | 73,839 | | | | 1,190,285 | |
Nova Measuring Instruments Ltd.* | | | | | | | | | | | 128,953 | | | | 1,611,913 | |
Plexus Corp.* | | | | | | | | | | | 36,314 | | | | 1,593,458 | |
Proofpoint, Inc.* | | | | | | | | | | | 66,084 | | | | 4,207,568 | |
QLogic Corp.* | | | | | | | | | | | 144,515 | | | | 2,050,668 | |
Richardson Electronics Ltd. | | | | | | | | | | | 518,914 | | | | 4,192,825 | |
Rogers Corp.* | | | | | | | | | | | 35,514 | | | | 2,348,896 | |
Semtech Corp.* | | | | | | | | | | | 45,253 | | | | 898,272 | |
SYNNEX Corp. | | | | | | | | | | | 49,931 | | | | 3,654,450 | |
| | | | | | | | | | | | | | | | |
| | | | | | | | | | | | | | | 39,034,517 | |
| | | | | | | | | | | | | | | | |
MATERIALS (5.3%) | | | | | | | | | | | | | | | | |
Boise Cascade Co.* | | | | | | | | | | | 72,580 | | | | 2,662,234 | |
Horsehead Hldg. Corp.* | | | | | | | | | | | 147,144 | | | | 1,724,528 | |
Kaiser Aluminum Corp. | | | | | | | | | | | 97,149 | | | | 8,071,139 | |
Kraton Performance Polymers, Inc.* | | | | | | | | | | | 133,485 | | | | 3,187,622 | |
Schnitzer Steel Industries, Inc. Cl A | | | | | | | | | | | 62,437 | | | | 1,090,774 | |
Silgan Hldgs., Inc. | | | | | | | | | | | 70,653 | | | | 3,727,652 | |
TimkenSteel Corp. | | | | | | | | | | | 21,615 | | | | 583,389 | |
| | | | | | | | | | | | | | | | |
| | | | | | | | | | | | | | | 21,047,338 | |
| | | | | | | | | | | | | | | | |
TELECOMMUNICATION SERVICES (1.0%) | | | | | | | | | | | | | | | | |
Consolidated Comms. Hldgs., Inc. | | | | | | | | | | | 79,843 | | | | 1,677,501 | |
IDT Corp. Cl B | | | | | | | | | | | 50,643 | | | | 915,625 | |
ORBCOMM, Inc.* | | | | | | | | | | | 216,312 | | | | 1,460,106 | |
| | | | | | | | | | | | | | | | |
| | | | | | | | | | | | | | | 4,053,232 | |
| | | | | | | | | | | | | | | | |
UTILITIES (4.4%) | | | | | | | | | | | | | | | | |
Avista Corp. | | | | | | | | | | | 99,799 | | | | 3,058,839 | |
Black Hills Corp. | | | | | | | | | | | 38,471 | | | | 1,679,259 | |
Idacorp, Inc. | | | | | | | | | | | 63,669 | | | | 3,574,378 | |
Northwest Natural Gas Co. | | | | | | | | | | | 42,635 | | | | 1,798,344 | |
NorthWestern Corp. | | | | | | | | | | | 45,686 | | | | 2,227,193 | |
PNM Resources, Inc. | | | | | | | | | | | 113,917 | | | | 2,802,358 | |
Portland General Electric Co. | | | | | | | | | | | 72,020 | | | | 2,388,183 | |
| | | | | | | | | | | | | | | | |
| | | | | | | | | | | | | | | 17,528,554 | |
| | | | | | | | | | | | | | | | |
TOTAL COMMON STOCKS
(Cost: $293,749,526) 95.6% | | | | | | | | | | | | | | | 380,656,778 | |
| | | | | | | | | | | | | | | | |
| | | | | |
| | | Rating** | | Rate(%) | | | Maturity | | Face Amount | | | Value | |
SHORT-TERM DEBT SECURITIES: | | | | | | | | | | | | | | | | |
COMMERCIAL PAPER (4.0%) | | | | | | | | | | | | | | | | |
Nestle Finance | | A-1+ | | | 0.03 | | | 08/12/15 | | | 11,000,000 | | | | 10,999,615 | |
Toyota Motor Credit Corp. | | A-1+ | | | 0.13 | | | 07/24/15 | | | 5,000,000 | | | | 4,999,585 | |
| | | | | | | | | | | | | | | | |
| | | | | | | | | | | | | | | 15,999,200 | |
| | | | | | | | | | | | | | | | |
TOTAL SHORT-TERM DEBT SECURITIES
(Cost: $15,999,200) 4.0% | | | | | | | | | | | | | | | 15,999,200 | |
| | | | | | | | | | | | | | | | |
TOTAL INVESTMENTS
(Cost: $309,748,726) 99.6% | | | | | | | | | | | | | | | 396,655,978 | |
| | | | | | | | | | | | | | | | |
OTHER NET ASSETS 0.4% | | | | | | | | | | | | | | | 1,526,234 | |
| | | | | | | | | | | | | | | | |
NET ASSETS 100.0% | | | | | | | | | | | | | | $ | 398,182,212 | |
| | | | | | | | | | | | | | | | |
The accompanying notes are an integral part of these portfolio schedules.
MUTUAL OF AMERICA INVESTMENT CORPORATION - SMALL CAP GROWTH FUND
PORTFOLIO OF INVESTMENTS IN SECURITIES
June 30, 2015 (Unaudited)
| | | | | | | | |
| | | Shares | | | Value | |
COMMON STOCKS: | | | | | | | | |
CONSUMER DISCRETIONARY (15.9%) | | | | | | | | |
American Axle & Mfg. Hldgs., Inc.* | | | 89,527 | | | | 1,872,010 | |
Carmike Cinemas, Inc.* | | | 171,924 | | | | 4,562,850 | |
CST Brands, Inc. | | | 194,642 | | | | 7,602,721 | |
Diamond Resorts Int’l., Inc.* | | | 173,433 | | | | 5,471,799 | |
Drew Industries, Inc. | | | 47,164 | | | | 2,736,473 | |
Eros International PLC* | | | 142,392 | | | | 3,576,877 | |
Five Below, Inc.* | | | 102,370 | | | | 4,046,694 | |
Haverty Furniture Cos., Inc. | | | 155,808 | | | | 3,368,569 | |
Houghton Mifflin Harcourt Co.* | | | 147,006 | | | | 3,704,546 | |
HSN, Inc. | | | 38,401 | | | | 2,695,359 | |
Intrawest Resorts Hldgs., Inc.* | | | 206,722 | | | | 2,402,105 | |
Panera Bread Co. Cl A* | | | 14,236 | | | | 2,488,026 | |
Performance Sports Group Ltd.* | | | 134,305 | | | | 2,417,490 | |
Popeyes Louisiana Kitchen, Inc.* | | | 55,981 | | | | 3,358,270 | |
Red Robin Gourmet Burgers, Inc.* | | | 58,236 | | | | 4,997,788 | |
Select Comfort Corp.* | | | 148,170 | | | | 4,455,457 | |
Sotheby’s | | | 39,834 | | | | 1,802,099 | |
Steve Madden Ltd.* | | | 103,327 | | | | 4,420,346 | |
The Men’s Wearhouse, Inc. | | | 50,779 | | | | 3,253,404 | |
Vista Outdoor, Inc.* | | | 37,655 | | | | 1,690,710 | |
| | | | | | | | |
| | | | | | | 70,923,593 | |
| | | | | | | | |
CONSUMER STAPLES (2.2%) | | | | | | | | |
Boston Beer Co., Inc. Cl A* | | | 6,775 | | | | 1,571,732 | |
United Natural Foods, Inc.* | | | 28,370 | | | | 1,806,602 | |
Village Super Market, Inc. Cl A | | | 80,163 | | | | 2,540,378 | |
WD-40 Co. | | | 46,748 | | | | 4,074,556 | |
| | | | | | | | |
| | | | | | | 9,993,268 | |
| | | | | | | | |
ENERGY (2.5%) | | | | | | | | |
Bonanza Creek Energy, Inc.* | | | 96,053 | | | | 1,752,967 | |
Carrizo Oil and Gas, Inc.* | | | 54,420 | | | | 2,679,641 | |
Matador Resources Co.* | | | 91,295 | | | | 2,282,375 | |
Synergy Resources Corp.* | | | 202,157 | | | | 2,310,656 | |
Targa Resources Corp.* | | | 24,644 | | | | 2,198,738 | |
| | | | | | | | |
| | | | | | | 11,224,377 | |
| | | | | | | | |
FINANCIALS (7.9%) | | | | | | | | |
Chesapeake Lodging Trust | | | 77,540 | | | | 2,363,419 | |
Heritage Financial Corp. | | | 204,812 | | | | 3,659,990 | |
Investors Bancorp, Inc. | | | 351,045 | | | | 4,317,855 | |
iShares Micro-Cap ETF | | | 29,644 | | | | 2,416,900 | |
iShares Russell 2000 Growth ETF | | | 20,000 | | | | 3,091,600 | |
Primerica, Inc. | | | 55,858 | | | | 2,552,143 | |
QTS Realty Trust, Inc. | | | 86,689 | | | | 3,159,814 | |
Sabra Health Care REIT, Inc. | | | 127,314 | | | | 3,277,073 | |
Safety Insurance Group, Inc. | | | 47,271 | | | | 2,728,009 | |
Silvercrest Asset Mgmt. Group, Inc. Cl A | | | 153,133 | | | | 2,153,043 | |
Starwood Property Trust, Inc. | | | 92,613 | | | | 1,997,660 | |
Stifel Financial Corp.* | | | 59,798 | | | | 3,452,760 | |
| | | | | | | | |
| | | | | | | 35,170,266 | |
| | | | | | | | |
HEALTH CARE (25.9%) | | | | | | | | |
Abiomed, Inc.* | | | 63,428 | | | | 4,169,122 | |
Acadia Healthcare Co., Inc.* | | | 25,390 | | | | 1,988,799 | |
ACADIA Pharmaceuticals, Inc.* | | | 70,134 | | | | 2,937,212 | |
Acceleron Pharma, Inc.* | | | 39,333 | | | | 1,244,496 | |
Acorda Therapeutics, Inc.* | | | 59,250 | | | | 1,974,803 | |
Adeptus Health, Inc. Cl A* | | | 26,330 | | | | 2,501,087 | |
Agios Pharmaceuticals, Inc.* | | | 15,589 | | | | 1,732,561 | |
Albany Molecular Research, Inc* | | | 105,059 | | | | 2,124,293 | |
Alexion Pharmaceuticals, Inc.* | | | 8,290 | | | | 1,498,587 | |
MUTUAL OF AMERICA INVESTMENT CORPORATION - SMALL CAP GROWTH FUND
PORTFOLIO OF INVESTMENTS IN SECURITIES
June 30, 2015 (Unaudited)
| | | | | | | | |
Alnylam Pharmaceuticals, Inc.* | | | 19,379 | | | | 2,322,961 | |
Anacor Pharmaceuticals, Inc.* | | | 17,321 | | | | 1,341,165 | |
Ani Pharmaceuticals, Inc.* | | | 20,075 | | | | 1,245,654 | |
Anika Therapeutics, Inc.* | | | 64,193 | | | | 2,120,295 | |
BioSpecifics Technologies Corp.* | | | 50,975 | | | | 2,630,310 | |
bluebird bio, Inc.* | | | 8,011 | | | | 1,348,812 | |
Cambrex Corp.* | | | 53,633 | | | | 2,356,634 | |
Cardiovascular Systems, Inc.* | | | 38,925 | | | | 1,029,566 | |
Catalent, Inc.* | | | 31,756 | | | | 931,403 | |
Cempra, Inc.* | | | 24,377 | | | | 837,594 | |
Cepheid, Inc.* | | | 49,815 | | | | 3,046,175 | |
DexCom, Inc.* | | | 78,117 | | | | 6,247,798 | |
Emergent Biosolutions, Inc.* | | | 145,063 | | | | 4,779,826 | |
Ensign Group, Inc. | | | 57,848 | | | | 2,953,729 | |
Entellus Medical, Inc.* | | | 23,717 | | | | 613,559 | |
Esperion Therapeutics, Inc.* | | | 18,402 | | | | 1,504,548 | |
Exact Sciences Corp.* | | �� | 139,160 | | | | 4,138,612 | |
GW Pharmaceuticals PLC ADR* | | | 18,734 | | | | 2,301,321 | |
Insulet Corp.* | | | 73,084 | | | | 2,264,492 | |
Intersect ENT, Inc.* | | | 47,190 | | | | 1,351,050 | |
Isis Pharmaceuticals, Inc.* | | | 16,995 | | | | 978,056 | |
Karyopharm Therapeutics, Inc.* | | | 35,847 | | | | 975,402 | |
Kite Pharma, Inc.* | | | 11,476 | | | | 699,692 | |
Lannett Co., Inc.* | | | 51,022 | | | | 3,032,748 | |
Medicines Co.* | | | 64,758 | | | | 1,852,729 | |
Medidata Solutions, Inc.* | | | 52,055 | | | | 2,827,622 | |
Neogen Corp.* | | | 43,560 | | | | 2,066,486 | |
Neurocrine Biosciences, Inc.* | | | 44,871 | | | | 2,143,039 | |
NuVasive, Inc.* | | | 19,351 | | | | 916,850 | |
Omeros Corp.* | | | 133,649 | | | | 2,404,344 | |
Omnicell, Inc.* | | | 94,251 | | | | 3,554,220 | |
Pacific Biosciences of CA, Inc.* | | | 168,351 | | | | 969,704 | |
Pacira Pharmaceuticals, Inc.* | | | 21,760 | | | | 1,538,881 | |
PAREXEL International Corp.* | | | 54,356 | | | | 3,495,615 | |
PTC Therapeutics, Inc.* | | | 16,268 | | | | 782,979 | |
Receptos, Inc.* | | | 20,234 | | | | 3,845,472 | |
Sarepta Therapeutics, Inc.* | | | 54,102 | | | | 1,646,327 | |
Sorrento Therapeutics, Inc.* | | | 119,674 | | | | 2,108,656 | |
STAAR Surgical Co.* | | | 194,843 | | | | 1,882,183 | |
Supernus Pharmaceuticals, Inc.* | | | 286,856 | | | | 4,870,811 | |
Team Health Hldgs., Inc.* | | | 43,701 | | | | 2,854,980 | |
Ultragenyx Pharmaceutical, Inc.* | | | 9,045 | | | | 926,118 | |
WellCare Health Plans, Inc.* | | | 45,273 | | | | 3,840,492 | |
| | | | | | | | |
| | | | | | | 115,749,870 | |
| | | | | | | | |
INDUSTRIALS (11.7%) | | | | | | | | |
Allegiant Travel Co. | | | 21,098 | | | | 3,752,912 | |
Astronics Corp.* | | | 87,377 | | | | 6,194,156 | |
AZZ, Inc. | | | 85,491 | | | | 4,428,444 | |
CEB, Inc. | | | 53,159 | | | | 4,628,057 | |
Covenant Transport, Inc. Cl A* | | | 126,000 | | | | 3,157,560 | |
EnPro Industries, Inc. | | | 60,733 | | | | 3,475,137 | |
Forward Air Corp. | | | 45,860 | | | | 2,396,644 | |
Generac Hldgs., Inc.* | | | 58,800 | | | | 2,337,300 | |
Healthcare Svcs. Group, Inc. | | | 111,215 | | | | 3,675,649 | |
Miller (Herman), Inc. | | | 65,694 | | | | 1,900,527 | |
Sun Hydraulics Corp. | | | 103,311 | | | | 3,937,163 | |
Teledyne Technologies, Inc.* | | | 37,873 | | | | 3,996,012 | |
The Advisory Board Co.* | | | 61,627 | | | | 3,369,148 | |
Trex Co., Inc.* | | | 104,260 | | | | 5,153,567 | |
| | | | | | | | |
| | | | | | | 52,402,276 | |
| | | | | | | | |
MUTUAL OF AMERICA INVESTMENT CORPORATION - SMALL CAP GROWTH FUND
PORTFOLIO OF INVESTMENTS IN SECURITIES
June 30, 2015 (Unaudited)
| | | | | | | | | | |
INFORMATION TECHNOLOGY (23.1%) | | | | | | | | | | |
Ambarella, Inc.* | | | | | | | | 21,600 | | 2,218,105 |
ANADIGICS, Inc.* | | | | | | | | 863,988 | | 630,711 |
Blackhawk Network Hldgs., Inc.* | | | | | | | | 50,348 | | 2,074,317 |
CalAmp Corp.* | | | | | | | | 205,408 | | 3,750,750 |
Cavium, Inc.* | | | | | | | | 65,027 | | 4,474,522 |
Cirrus Logic, Inc.* | | | | | | | | 42,934 | | 1,461,044 |
comScore, Inc.* | | | | | | | | 110,160 | | 5,867,095 |
Comverse, Inc.* | | | | | | | | 54,804 | | 1,100,464 |
Constant Contact, Inc.* | | | | | | | | 43,445 | | 1,249,478 |
Cornerstone OnDemand, Inc.* | | | | | | | | 34,317 | | 1,194,232 |
Envestnet, Inc.* | | | | | | | | 32,894 | | 1,329,904 |
Euronet Worldwide, Inc.* | | | | | | | | 39,629 | | 2,445,114 |
FARO Technologies, Inc.* | | | | | | | | 91,750 | | 4,284,725 |
FEI Company | | | | | | | | 31,073 | | 2,576,905 |
Globant SA* | | | | | | | | 60,336 | | 1,836,024 |
Guidewire Software, Inc.* | | | | | | | | 30,639 | | 1,621,696 |
Imperva, Inc.* | | | | | | | | 104,743 | | 7,091,128 |
j2 Global, Inc. | | | | | | | | 37,086 | | 2,519,628 |
LogMeIn, Inc.* | | | | | | | | 64,973 | | 4,190,122 |
Manhattan Associates, Inc.* | | | | | | | | 74,937 | | 4,469,974 |
MAXIMUS, Inc. | | | | | | | | 44,112 | | 2,899,480 |
MaxLinear, Inc. Cl A* | | | | | | | | 319,559 | | 3,866,659 |
Monolithic Power Systems, Inc. | | | | | | | | 89,919 | | 4,559,792 |
NeuStar, Inc. Cl A* | | | | | | | | 112,520 | | 3,286,714 |
New Relic, Inc.* | | | | | | | | 15,695 | | 552,307 |
Nimble Storage, Inc.* | | | | | | | | 88,653 | | 2,487,608 |
Proofpoint, Inc.* | | | | | | | | 97,063 | | 6,179,976 |
Qlik Technologies, Inc.* | | | | | | | | 130,513 | | 4,562,741 |
Rogers Corp.* | | | | | | | | 58,875 | | 3,893,986 |
Ruckus Wireless, Inc.* | | | | | | | | 357,856 | | 3,700,231 |
Synaptics, Inc.* | | | | | | | | 38,413 | | 3,331,757 |
Synchronoss Technologies, Inc.* | | | | | | | | 47,514 | | 2,172,815 |
Tyler Technologies, Inc.* | | | | | | | | 19,302 | | 2,497,298 |
Verint Systems, Inc.* | | | | | | | | 53,987 | | 3,279,451 |
| | | | | | | | | | |
| | | | | | | | | | 103,656,753 |
| | | | | | | | | | |
MATERIALS (3.6%) | | | | | | | | | | |
A. Schulman, Inc. | | | | | | | | 89,267 | | 3,902,731 |
Ferro Corp.* | | | | | | | | 168,415 | | 2,826,004 |
Mueller Water Products, Inc. Cl A | | | | | | | | 379,021 | | 3,449,090 |
PolyOne Corp. | | | | | | | | 77,676 | | 3,042,573 |
U.S. Concrete, Inc.* | | | | | | | | 76,018 | | 2,880,318 |
| | | | | | | | | | |
| | | | | | | | | | 16,100,716 |
| | | | | | | | | | |
TELECOMMUNICATION SERVICES (1.6%) | | | | | | | | | | |
Consolidated Comms. Hldgs., Inc. | | | | | | | | 37,180 | | 781,145 |
inContact, Inc.* | | | | | | | | 167,125 | | 1,649,524 |
ORBCOMM, Inc.* | | | | | | | | 294,427 | | 1,987,382 |
Shenandoah Telecommunications Co. | | | | | | | | 75,083 | | 2,570,095 |
| | | | | | | | | | |
| | | | | | | | | | 6,988,146 |
| | | | | | | | | | |
UTILITIES (0.6%) | | | | | | | | | | |
NorthWestern Corp. | | | | | | | | 52,806 | | 2,574,278 |
| | | | | | | | | | |
TOTAL COMMON STOCKS
(Cost: $328,326,050) 95.0% | | | | | | | | | | 424,783,543 |
| | | | | | | | | | |
| | | | | |
| | | Rating** | | Rate(%) | | Maturity | | Face Amount | | Value |
SHORT-TERM DEBT SECURITIES: | | | | | | | | | | |
U.S. GOVERNMENT (0.2%) | | | | | | | | | | |
U.S. Treasury Bill | | A-1+ | | 0.07 | | 11/19/15 | | 700,000 | | 699,805 |
| | | | | | | | | | |
U.S. GOVERNMENT AGENCIES (2.4%) | | | | | | | | | | |
FHLB | | A-1+ | | 0.02 | | 07/27/15 | | 10,500,000 | | 10,499,849 |
| | | | | | | | | | |
MUTUAL OF AMERICA INVESTMENT CORPORATION - SMALL CAP GROWTH FUND
PORTFOLIO OF INVESTMENTS IN SECURITIES
June 30, 2015 (Unaudited)
| | | | | | | | | | |
COMMERCIAL PAPER (1.3%) | | | | |
General Electric Capital Corp. | | A-1+ | | 0.12 | | 08/03/15 | | 2,500,000 | | 2,499,724 |
Novartis Finance Corp.† | | A-1+ | | 0.13 | | 07/09/15 | | 1,840,000 | | 1,839,947 |
San Diego Gas & Electric Co.† | | A-1 | | 0.14 | | 07/01/15 | | 1,625,000 | | 1,625,000 |
| | | | | | | | | | |
| | | | | | | | | | 5,964,671 |
| | | | | | | | | | |
TOTAL SHORT-TERM DEBT SECURITIES
(Cost: $17,164,325) 3.9% | | | | | | | | | | 17,164,325 |
| | | | | | | | | | |
TOTAL INVESTMENTS
(Cost: $345,490,375) 98.9% | | | | | | | | | | 441,947,868 |
| | | | | | | | | | |
OTHER NET ASSETS 1.1% | | | | | | | | | | 4,962,116 |
| | | | | | | | | | |
NET ASSETS 100.0% | | | | | | | | | | $446,909,984 |
| | | | | | | | | | |
The accompanying notes are an integral part of these portfolio schedules.
MUTUAL OF AMERICA INVESTMENT CORPORATION - MID CAP VALUE FUND
PORTFOLIO OF INVESTMENTS IN SECURITIES
June 30, 2015 (Unaudited)
| | | | | | | | |
| | | Shares | | | Value | |
COMMON STOCKS: | | | | | | | | |
CONSUMER DISCRETIONARY (6.4%) | | | | | | | | |
CST Brands, Inc. | | | 17,956 | | | | 701,361 | |
Diamond Resorts Int’l., Inc.* | | | 53,305 | | | | 1,681,773 | |
Dillard’s, Inc. Cl A | | | 7,895 | | | | 830,475 | |
Jarden Corp.* | | | 12,897 | | | | 667,420 | |
Liberty Interactive Corp Cl A* | | | 15,867 | | | | 440,309 | |
Macy’s, Inc. | | | 6,919 | | | | 466,825 | |
Taylor Morrison Home Corp. Cl A* | | | 12,243 | | | | 249,267 | |
Wiley (John) & Sons, Inc. Cl A | | | 12,799 | | | | 695,882 | |
| | | | | | | | |
| | | | | | | 5,733,312 | |
| | | | | | | | |
CONSUMER STAPLES (3.7%) | | | | | | | | |
Constellation Brands, Inc. Cl A | | | 7,519 | | | | 872,354 | |
Energizer Hldgs., Inc.* | | | 7,185 | | | | 945,187 | |
Ingredion, Inc. | | | 11,357 | | | | 906,402 | |
Vector Group Ltd. | | | 24,735 | | | | 580,283 | |
| | | | | | | | |
| | | | | | | 3,304,226 | |
| | | | | | | | |
ENERGY (5.1%) | | | | | | | | |
Atwood Oceanics, Inc. | | | 16,762 | | | | 443,187 | |
Cameron International Corp.* | | | 9,384 | | | | 491,440 | |
MarkWest Energy Partners LP | | | 7,570 | | | | 426,797 | |
Noble Energy, Inc. | | | 20,888 | | | | 891,500 | |
PBF Energy, Inc. | | | 31,939 | | | | 907,706 | |
Range Resources Corp. | | | 13,910 | | | | 686,876 | |
Tesoro Corp. | | | 8,129 | | | | 686,169 | |
| | | | | | | | |
| | | | | | | 4,533,675 | |
| | | | | | | | |
FINANCIALS (33.1%) | | | | | | | | |
Alexander’s, Inc. | | | 1,034 | | | | 423,940 | |
American Financial Group, Inc. | | | 27,163 | | | | 1,766,682 | |
Ameriprise Financial, Inc. | | | 15,623 | | | | 1,951,783 | |
Aon PLC | | | 10,584 | | | | 1,055,013 | |
Apartment Investment & Management Co. Cl A | | | 14,959 | | | | 552,436 | |
Associated Banc-Corp. | | | 45,648 | | | | 925,285 | |
Assurant, Inc. | | | 4,612 | | | | 309,004 | |
BOK Financial Corp. | | | 9,453 | | | | 657,740 | |
Brandywine Realty Trust | | | 42,191 | | | | 560,296 | |
CBL & Associates Pptys., Inc. | | | 28,544 | | | | 462,413 | |
CIT Group, Inc. | | | 10,414 | | | | 484,147 | |
Comerica, Inc. | | | 15,148 | | | | 777,395 | |
DDR Corp. | | | 25,470 | | | | 393,766 | |
Discover Financial Svcs. | | | 16,715 | | | | 963,118 | |
Duke Realty Corp. | | | 46,529 | | | | 864,044 | |
E*Trade Financial Corp.* | | | 13,026 | | | | 390,129 | |
Equity Lifestyle Properties, Inc. | | | 12,468 | | | | 655,567 | |
Everest Re Group Ltd. | | | 5,652 | | | | 1,028,721 | |
Fifth Third Bancorp | | | 42,465 | | | | 884,121 | |
First Niagara Financial Group, Inc. | | | 33,210 | | | | 313,502 | |
General Growth Pptys., Inc. | | | 27,431 | | | | 703,879 | |
Hartford Financial Svcs. Group, Inc. | | | 26,111 | | | | 1,085,434 | |
Health Care REIT, Inc. | | | 8,403 | | | | 551,489 | |
Home Properties, Inc. | | | 13,120 | | | | 958,416 | |
Host Hotels & Resorts, Inc. | | | 44,839 | | | | 889,157 | |
Huntington Bancshares, Inc. | | | 37,018 | | | | 418,674 | |
KeyCorp | | | 71,319 | | | | 1,071,211 | |
Kilroy Realty Corp. | | | 7,941 | | | | 533,238 | |
Lincoln National Corp. | | | 19,166 | | | | 1,135,011 | |
Progressive Corp. | | | 21,589 | | | | 600,822 | |
ProLogis, Inc. | | | 17,883 | | | | 663,459 | |
Reinsurance Grp. of America, Inc. | | | 11,258 | | | | 1,068,046 | |
RLJ Lodging Trust | | | 26,344 | | | | 784,524 | |
MUTUAL OF AMERICA INVESTMENT CORPORATION - MID CAP VALUE FUND
PORTFOLIO OF INVESTMENTS IN SECURITIES
June 30, 2015 (Unaudited)
| | | | | | | | |
Starwood Property Trust, Inc. | | | 21,119 | | | | 455,537 | |
SVB Financial Group* | | | 4,593 | | | | 661,300 | |
Vornado Realty Trust | | | 11,850 | | | | 1,124,921 | |
Voya Financial, Inc. | | | 24,956 | | | | 1,159,705 | |
Weyerhaeuser Co. | | | 14,356 | | | | 452,214 | |
| | | | | | | | |
| | | | | | | 29,736,139 | |
| | | | | | | | |
HEALTH CARE (11.0%) | | | | | | | | |
Agilent Technologies, Inc. | | | 14,639 | | | | 564,773 | |
Boston Scientific Corp.* | | | 67,726 | | | | 1,198,750 | |
Cardinal Health, Inc. | | | 11,152 | | | | 932,865 | |
CIGNA Corp. | | | 8,265 | | | | 1,338,930 | |
HCA Hldgs., Inc.* | | | 14,838 | | | | 1,346,103 | |
Hospira, Inc.* | | | 11,230 | | | | 996,213 | |
Humana, Inc. | | | 6,040 | | | | 1,155,331 | |
MEDNAX, Inc.* | | | 11,429 | | | | 847,003 | |
Mylan N.V.* | | | 11,583 | | | | 786,022 | |
Zimmer Biomet Hldgs., Inc. | | | 6,840 | | | | 747,133 | |
| | | | | | | | |
| | | | | | | 9,913,123 | |
| | | | | | | | |
INDUSTRIALS (8.7%) | | | | | | | | |
Alaska Air Group, Inc. | | | 16,943 | | | | 1,091,637 | |
AZZ, Inc. | | | 5,666 | | | | 293,499 | |
L-3 Communications Hldgs., Inc. | | | 9,725 | | | | 1,102,621 | |
Old Dominion Freight Line, Inc.* | | | 17,932 | | | | 1,230,225 | |
Orbital ATK, Inc. | | | 10,264 | | | | 752,967 | |
Oshkosh Corp. | | | 22,655 | | | | 960,119 | |
Snap-on, Inc. | | | 4,089 | | | | 651,173 | |
Triumph Group, Inc. | | | 18,065 | | | | 1,192,109 | |
United Rentals, Inc.* | | | 6,066 | | | | 531,503 | |
| | | | | | | | |
| | | | | | | 7,805,853 | |
| | | | | | | | |
INFORMATION TECHNOLOGY (11.1%) | | | | | | | | |
Analog Devices, Inc. | | | 9,350 | | | | 600,130 | |
Avago Technologies Ltd. | | | 10,064 | | | | 1,337,808 | |
Avnet, Inc. | | | 16,581 | | | | 681,645 | |
Broadcom Corp. Cl A | | | 16,105 | | | | 829,246 | |
CA, Inc. | | | 35,125 | | | | 1,028,811 | |
Computer Sciences Corp. | | | 11,791 | | | | 773,961 | |
Comverse, Inc.* | | | 6,690 | | | | 134,335 | |
F5 Networks, Inc.* | | | 3,763 | | | | 452,877 | |
Fidelity Nat’l. Information Svcs., Inc. | | | 9,087 | | | | 561,577 | |
FireEye, Inc.* | | | 7,593 | | | | 371,374 | |
Harris Corp. | | | 8,677 | | | | 667,348 | |
Lam Research Corp. | | | 7,797 | | | | 634,286 | |
Symantec Corp. | | | 23,998 | | | | 557,954 | |
Western Digital Corp. | | | 11,385 | | | | 892,812 | |
Xerox Corp. | | | 48,212 | | | | 512,976 | |
| | | | | | | | |
| | | | | | | 10,037,140 | |
| | | | | | | | |
MATERIALS (7.7%) | | | | | | | | |
Ashland, Inc. | | | 3,630 | | | | 442,497 | |
CF Industries Hldgs., Inc. | | | 13,310 | | | | 855,567 | |
Crown Hldgs., Inc.* | | | 30,019 | | | | 1,588,305 | |
Eastman Chemical Co. | | | 13,709 | | | | 1,121,670 | |
International Paper Co. | | | 19,330 | | | | 919,915 | |
Packaging Corp. of America | | | 22,331 | | | | 1,395,464 | |
RPM International, Inc. | | | 11,582 | | | | 567,171 | |
| | | | | | | | |
| | | | | | | 6,890,589 | |
| | | | | | | | |
UTILITIES (9.2%) | | | | | | | | |
Ameren Corp. | | | 17,204 | | | | 648,247 | |
Atmos Energy Corp. | | | 16,659 | | | | 854,274 | |
Consolidated Edison, Inc. | | | 10,877 | | | | 629,561 | |
Edison International | | | 18,428 | | | | 1,024,228 | |
Entergy Corp. | | | 8,171 | | | | 576,056 | |
Eversource Energy | | | 9,997 | | | | 453,964 | |
MUTUAL OF AMERICA INVESTMENT CORPORATION - MID CAP VALUE FUND
PORTFOLIO OF INVESTMENTS IN SECURITIES
June 30, 2015 (Unaudited)
| | | | | | | | | | | | | | | | |
FirstEnergy Corp. | | | | | | | | | | | 18,086 | | | | 588,699 | |
Great Plains Energy, Inc. | | | | | | | | | | | 33,163 | | | | 801,218 | |
PPL Corp. | | | | | | | | | | | 26,935 | | | | 793,774 | |
Public Svc. Enterprise Group, Inc. | | | | | | | | | | | 24,476 | | | | 961,417 | |
Sempra Energy | | | | | | | | | | | 4,449 | | | | 440,184 | |
Westar Energy, Inc. | | | | | | | | | | | 12,970 | | | | 443,833 | |
| | | | | | | | | | | | | | | | |
| | | | | | | | | | | | | | | 8,215,455 | |
| | | | | | | | | | | | | | | | |
TOTAL COMMON STOCKS
(Cost: $68,674,906) 96.0% | | | | | | | | | | | | | | | 86,169,512 | |
| | | | | | | | | | | | | | | | |
| | | | | |
| | | Rating** | | Rate(%) | | | Maturity | | Face Amount | | | Value | |
SHORT-TERM DEBT SECURITIES: | | | | | | | | | | | | | | | | |
COMMERCIAL PAPER (0.6%) | | | | | | | | | | | | | | | | |
Toyota Motor Credit Corp. | | A-1+ | | | 0.14 | | | 08/10/15 | | | 500,000 | | | | 499,922 | |
| | | | | | | | | | | | | | | | |
TOTAL SHORT-TERM DEBT SECURITIES
(Cost: $499,922) 0.6% | | | | | | | | | | | | | | | 499,922 | |
| | | | | | | | | | | | | | | | |
TOTAL INVESTMENTS
(Cost: $69,174,828) 96.6% | | | | | | | | | | | | | | | 86,669,434 | |
| | | | | | | | | | | | | | | | |
OTHER NET ASSETS 3.4% | | | | | | | | | | | | | | | 3,048,437 | |
| | | | | | | | | | | | | | | | |
NET ASSETS 100.0% | | | | | | | | | | | | | | $ | 89,717,871 | |
| | | | | | | | | | | | | | | | |
The accompanying notes are an integral part of these portfolio schedules.
MUTUAL OF AMERICA INVESTMENT CORPORATION - MID-CAP EQUITY INDEX FUND
PORTFOLIO OF INVESTMENTS IN SECURITIES
June 30, 2015 (Unaudited)
| | | | | | | | |
| | | Shares | | | Value | |
INDEXED ASSETS: | | | | | |
COMMON STOCKS: | | | | | |
CONSUMER DISCRETIONARY (13.6%) | | | | | | | | |
Aaron’s, Inc. | | | 39,274 | | | | 1,422,112 | |
Abercrombie & Fitch Co. Cl A | | | 42,300 | | | | 909,873 | |
Advance Auto Parts, Inc. | | | 44,495 | | | | 7,087,606 | |
AMC Networks, Inc. Cl A* | | | 36,038 | | | | 2,949,710 | |
American Eagle Outfitters, Inc. | | | 106,940 | | | | 1,841,507 | |
ANN, Inc.* | | | 27,965 | | | | 1,350,430 | |
Apollo Education Group, Inc.* | | | 58,647 | | | | 755,373 | |
Ascena Retail Group, Inc.* | | | 80,273 | | | | 1,336,947 | |
Big Lots, Inc. | | | 32,792 | | | | 1,475,312 | |
Brinker International, Inc. | | | 37,171 | | | | 2,142,908 | |
Brunswick Corp. | | | 56,363 | | | | 2,866,622 | |
Buffalo Wild Wings, Inc.* | | | 11,549 | | | | 1,809,613 | |
Cabela’s, Inc.* | | | 29,161 | | | | 1,457,467 | |
Carter’s, Inc. | | | 31,945 | | | | 3,395,754 | |
Cheesecake Factory, Inc. | | | 27,573 | | | | 1,503,694 | |
Chico’s FAS, Inc. | | | 87,165 | | | | 1,449,554 | |
Cinemark Hldgs., Inc. | | | 63,891 | | | | 2,566,501 | |
CST Brands, Inc. | | | 46,843 | | | | 1,829,688 | |
Dana Hldg. Corp. | | | 99,192 | | | | 2,041,371 | |
Deckers Outdoor Corp.* | | | 20,245 | | | | 1,457,033 | |
Devry Education Group Inc. | | | 34,870 | | | | 1,045,403 | |
Dick’s Sporting Goods, Inc. | | | 59,059 | | | | 3,057,484 | |
Domino’s Pizza, Inc. | | | 33,560 | | | | 3,805,704 | |
DreamWorks Animation SKG Cl A* | | | 44,363 | | | | 1,170,296 | |
Dunkin’ Brands Group, Inc. | | | 58,514 | | | | 3,218,270 | |
Foot Locker, Inc. | | | 85,035 | | | | 5,698,195 | |
Gentex Corp. | | | 178,877 | | | | 2,937,160 | |
Graham Hldgs. Co. Cl B | | | 2,696 | | | | 2,898,335 | |
Guess?, Inc. | | | 39,079 | | | | 749,144 | |
HSN, Inc. | | | 19,781 | | | | 1,388,428 | |
International Speedway Corp. Cl A | | | 16,994 | | | | 623,170 | |
Jarden Corp.* | | | 108,889 | | | | 5,635,006 | |
Kate Spade & Co.* | | | 77,618 | | | | 1,671,892 | |
KB Home | | | 55,352 | | | | 918,843 | |
Live Nation Entertainment, Inc.* | | | 88,725 | | | | 2,439,050 | |
LKQ Corp.* | | | 184,957 | | | | 5,594,025 | |
MDC Hldgs., Inc. | | | 23,762 | | | | 712,147 | |
Meredith Corp. | | | 22,231 | | | | 1,159,347 | |
Murphy USA, Inc.* | | | 25,870 | | | | 1,444,063 | |
New York Times Co. Cl A | | | 79,756 | | | | 1,088,669 | |
NVR, Inc.* | | | 2,349 | | | | 3,147,660 | |
Office Depot, Inc.* | | | 299,719 | | | | 2,595,567 | |
Panera Bread Co. Cl A* | | | 15,424 | | | | 2,695,652 | |
Penney (J.C.) Co., Inc.* | | | 185,710 | | | | 1,572,964 | |
Polaris Industries, Inc. | | | 37,177 | | | | 5,506,285 | |
Rent-A-Center, Inc. | | | 32,243 | | | | 914,089 | |
Service Corp. International | | | 122,874 | | | | 3,616,182 | |
Signet Jewelers Ltd. | | | 48,720 | | | | 6,247,853 | |
Skechers U.S.A., Inc. Cl A* | | | 28,811 | | | | 3,163,160 | |
Sotheby’s | | | 37,603 | | | | 1,701,160 | |
Tempur Sealy Int’l., Inc.* | | | 37,106 | | | | 2,445,285 | |
The Wendy’s Co. | | | 165,614 | | | | 1,868,126 | |
Thor Industries, Inc. | | | 27,716 | | | | 1,559,856 | |
Time, Inc. | | | 66,593 | | | | 1,532,305 | |
Toll Brothers, Inc.* | | | 97,440 | | | | 3,721,234 | |
Tupperware Brands Corp. | | | 30,306 | | | | 1,955,949 | |
Vista Outdoor, Inc.* | | | 38,678 | | | | 1,736,642 | |
Wiley (John) & Sons, Inc. Cl A | | | 28,206 | | | | 1,533,560 | |
Williams-Sonoma, Inc. | | | 51,821 | | | | 4,263,314 | |
| | | | | | | | |
| | | | | | | 140,680,549 | |
| | | | | | | | |
MUTUAL OF AMERICA INVESTMENT CORPORATION - MID-CAP EQUITY INDEX FUND
PORTFOLIO OF INVESTMENTS IN SECURITIES
June 30, 2015 (Unaudited)
| | | | | | | | |
CONSUMER STAPLES (4.0%) | | | | | |
Avon Products, Inc. | | | 264,545 | | | | 1,656,052 | |
Boston Beer Co., Inc. Cl A* | | | 5,546 | | | | 1,286,617 | |
Casey’s General Stores, Inc. | | | 26,248 | | | | 2,512,984 | |
Church & Dwight Co., Inc. | | | 79,575 | | | | 6,455,920 | |
Dean Foods Co. | | | 57,373 | | | | 927,721 | |
Energizer Hldgs., Inc.* | | | 37,812 | | | | 4,974,169 | |
Flowers Foods, Inc. | | | 112,405 | | | | 2,377,366 | |
Hain Celestial Group, Inc.* | | | 62,383 | | | | 4,108,544 | |
Ingredion, Inc. | | | 43,505 | | | | 3,472,134 | |
Lancaster Colony Corp. | | | 11,811 | | | | 1,073,029 | |
Post Hldgs., Inc.* | | | 33,346 | | | | 1,798,350 | |
SUPERVALU, Inc.* | | | 125,749 | | | | 1,017,309 | |
Tootsie Roll Industries, Inc. | | | 12,390 | | | | 400,321 | |
TreeHouse Foods, Inc.* | | | 26,070 | | | | 2,112,452 | |
United Natural Foods, Inc.* | | | 30,447 | | | | 1,938,865 | |
WhiteWave Foods Co. Cl A* | | | 106,476 | | | | 5,204,547 | |
| | | | | | | | |
| | | | | | | 41,316,380 | |
| | | | | | | | |
ENERGY (4.3%) | | | | | | | | |
Atwood Oceanics, Inc. | | | 36,554 | | | | 966,488 | |
California Resources Corp. | | | 187,763 | | | | 1,134,089 | |
Denbury Resources, Inc. | | | 216,834 | | | | 1,379,064 | |
Dresser-Rand Group, Inc.* | | | 46,775 | | | | 3,984,295 | |
Dril-Quip, Inc.* | | | 23,681 | | | | 1,781,995 | |
Energen Corp. | | | 48,497 | | | | 3,312,345 | |
Gulfport Energy Corp.* | | | 64,850 | | | | 2,610,213 | |
Helix Energy Solutions Group* | | | 59,891 | | | | 756,423 | |
HollyFrontier Corp. | | | 119,171 | | | | 5,087,410 | |
Nabors Industries Ltd. | | | 177,283 | | | | 2,558,194 | |
Oceaneering Int’l., Inc. | | | 60,040 | | | | 2,797,264 | |
Oil States International, Inc.* | | | 31,370 | | | | 1,167,905 | |
Patterson-UTI Energy, Inc. | | | 89,918 | | | | 1,691,807 | |
QEP Resources, Inc. | | | 109,874 | | | | 2,033,768 | |
Rosetta Resources, Inc.* | | | 46,025 | | | | 1,065,019 | |
Rowan Companies PLC Cl A | | | 75,860 | | | | 1,601,405 | |
SM Energy Co. | | | 41,020 | | | | 1,891,842 | |
Superior Energy Services, Inc. | | | 91,480 | | | | 1,924,739 | |
Tidewater, Inc. | | | 28,596 | | | | 649,987 | |
Unit Corp.* | | | 28,500 | | | | 772,920 | |
Western Refining, Inc. | | | 42,977 | | | | 1,874,657 | |
World Fuel Services Corp. | | | 43,891 | | | | 2,104,573 | |
WPX Energy, Inc.* | | | 124,491 | | | | 1,528,749 | |
| | | | | | | | |
| | | | | | | 44,675,151 | |
| | | | | | | | |
FINANCIALS (22.8%) | | | | | | | | |
Alexander & Baldwin, Inc. | | | 27,624 | | | | 1,088,386 | |
Alexandria Real Estate Equities, Inc. | | | 43,803 | | | | 3,831,010 | |
Alleghany Corp.* | | | 9,765 | | | | 4,577,441 | |
American Campus Communities, Inc. | | | 68,290 | | | | 2,573,850 | |
American Financial Group, Inc. | | | 44,900 | | | | 2,920,296 | |
Aspen Insurance Hldgs. Ltd. | | | 37,465 | | | | 1,794,574 | |
Associated Banc-Corp. | | | 92,739 | | | | 1,879,820 | |
BancorpSouth, Inc. | | | 52,246 | | | | 1,345,857 | |
Bank of Hawaii Corp. | | | 26,520 | | | | 1,768,354 | |
Bank of the Ozarks, Inc. | | | 42,736 | | | | 1,955,172 | |
Berkley (W.R.) Corp. | | | 60,726 | | | | 3,153,501 | |
BioMed Realty Trust, Inc. | | | 123,751 | | | | 2,393,344 | |
Brown & Brown, Inc. | | | 70,223 | | | | 2,307,528 | |
Camden Property Trust | | | 52,804 | | | | 3,922,281 | |
Cathay General Bancorp | | | 45,189 | | | | 1,466,383 | |
CBOE Holdings, Inc. | | | 50,755 | | | | 2,904,201 | |
City National Corp. | | | 29,414 | | | | 2,658,731 | |
CNO Financial Group, Inc. | | | 119,745 | | | | 2,197,321 | |
Commerce Bancshares, Inc. | | | 50,794 | | | | 2,375,635 | |
Communications Sales & Leasing* | | | 72,879 | | | | 1,801,569 | |
MUTUAL OF AMERICA INVESTMENT CORPORATION - MID-CAP EQUITY INDEX FUND
PORTFOLIO OF INVESTMENTS IN SECURITIES
June 30, 2015 (Unaudited)
| | | | | | | | |
Corporate Office Pptys. Trust | | | 57,482 | | | | 1,353,126 | |
Corrections Corp. of America | | | 71,154 | | | | 2,353,774 | |
Cullen/Frost Bankers, Inc. | | | 33,421 | | | | 2,626,222 | |
Douglas Emmett, Inc. | | | 83,367 | | | | 2,245,907 | |
Duke Realty Corp. | | | 209,800 | | | | 3,895,986 | |
East West Bancorp, Inc. | | | 88,020 | | | | 3,945,056 | |
Eaton Vance Corp. | | | 71,709 | | | | 2,805,973 | |
Equity One, Inc. | | | 48,803 | | | | 1,139,062 | |
Everest Re Group Ltd. | | | 27,016 | | | | 4,917,182 | |
Extra Space Storage, Inc. | | | 67,546 | | | | 4,405,350 | |
Federal Realty Investment Trust | | | 41,760 | | | | 5,349,038 | |
Federated Investors, Inc. Cl B | | | 58,096 | | | | 1,945,635 | |
First American Financial Corp. | | | 65,909 | | | | 2,452,474 | |
First Horizon National Corp. | | | 141,975 | | | | 2,224,748 | |
First Niagara Financial Group, Inc. | | | 214,218 | | | | 2,022,218 | |
FirstMerit Corp. | | | 100,805 | | | | 2,099,768 | |
Fulton Financial Corp. | | | 107,433 | | | | 1,403,075 | |
Gallagher (Arthur J.) & Co. | | | 102,119 | | | | 4,830,229 | |
Hancock Hldg. Co. | | | 47,360 | | | | 1,511,258 | |
Hanover Insurance Group, Inc. | | | 26,886 | | | | 1,990,371 | |
HCC Insurance Hldgs., Inc. | | | 58,189 | | | | 4,471,243 | |
Highwoods Properties, Inc. | | | 57,186 | | | | 2,284,581 | |
Home Properties, Inc. | | | 35,215 | | | | 2,572,456 | |
Hospitality Properties Trust | | | 91,180 | | | | 2,627,808 | |
International Bancshares Corp. | | | 35,134 | | | | 944,051 | |
Janus Capital Group, Inc. | | | 89,964 | | | | 1,540,184 | |
Jones Lang LaSalle, Inc. | | | 27,276 | | | | 4,664,196 | |
Kemper Corp. | | | 29,936 | | | | 1,154,033 | |
Kilroy Realty Corp. | | | 53,538 | | | | 3,595,077 | |
Lamar Advertising Co. Cl A | | | 49,196 | | | | 2,827,786 | |
LaSalle Hotel Propertie | | | 68,685 | | | | 2,435,570 | |
Liberty Property Trust | | | 90,883 | | | | 2,928,250 | |
Mack-Cali Realty Corp. | | | 50,942 | | | | 938,861 | |
Mercury General Corp. | | | 22,132 | | | | 1,231,646 | |
Mid-America Apt. Communities, Inc. | | | 45,813 | | | | 3,335,645 | |
MSCI, Inc. Cl A | | | 68,357 | | | | 4,207,373 | |
National Retail Pptys., Inc. | | | 81,481 | | | | 2,852,650 | |
New York Community Bancorp, Inc. | | | 270,135 | | | | 4,965,081 | |
Old Republic Int’l. Corp. | | | 146,672 | | | | 2,292,483 | |
Omega Healthcare Investors, Inc. | | | 97,770 | | | | 3,356,444 | |
PacWest Bancorp | | | 59,522 | | | | 2,783,249 | |
Potlatch Corp. | | | 24,732 | | | | 873,534 | |
Primerica, Inc. | | | 31,409 | | | | 1,435,077 | |
Prosperity Bancshares, Inc. | | | 36,627 | | | | 2,114,843 | |
Raymond James Financial, Inc. | | | 77,841 | | | | 4,637,767 | |
Rayonier, Inc. | | | 77,210 | | | | 1,972,716 | |
Regency Centers Corp. | | | 57,352 | | | | 3,382,621 | |
Reinsurance Grp. of America, Inc. | | | 40,250 | | | | 3,818,518 | |
RenaissanceRe Hldgs. Ltd. | | | 28,001 | | | | 2,842,382 | |
SEI Investments Co. | | | 78,794 | | | | 3,863,270 | |
Senior Housing Pptys. Trust | | | 142,894 | | | | 2,507,790 | |
Signature Bank* | | | 30,908 | | | | 4,524,622 | |
SLM Corp.* | | | 258,829 | | | | 2,554,642 | |
StanCorp Financial Group, Inc. | | | 25,664 | | | | 1,940,455 | |
Stifel Financial Corp.* | | | 41,274 | | | | 2,383,161 | |
SVB Financial Group* | | | 31,156 | | | | 4,485,841 | |
Synovus Financial Corp. | | | 80,992 | | | | 2,496,173 | |
Tanger Factory Outlet Centers, Inc. | | | 58,272 | | | | 1,847,222 | |
Taubman Centers, Inc. | | | 37,581 | | | | 2,611,880 | |
TCF Financial Corp. | | | 102,709 | | | | 1,705,996 | |
Trustmark Corp. | | | 41,076 | | | | 1,026,078 | |
UDR, Inc. | | | 157,472 | | | | 5,043,828 | |
Umpqua Hldgs. Corp. | | | 134,107 | | | | 2,412,585 | |
Urban Edge Pptys. | | | 56,130 | | | | 1,166,943 | |
MUTUAL OF AMERICA INVESTMENT CORPORATION - MID-CAP EQUITY INDEX FUND
PORTFOLIO OF INVESTMENTS IN SECURITIES
June 30, 2015 (Unaudited)
| | | | | | | | |
Valley National Bancorp | | | 134,314 | | | | 1,384,777 | |
Waddell & Reed Financial, Inc. Cl A | | | 51,243 | | | | 2,424,306 | |
Washington Federal, Inc. | | | 57,661 | | | | 1,346,384 | |
Webster Financial Corp. | | | 55,198 | | | | 2,183,081 | |
Weingarten Realty Investors | | | 69,311 | | | | 2,265,777 | |
WisdomTree Investments, Inc. | | | 68,323 | | | | 1,500,715 | |
WP Glimcher, Inc. | | | 112,602 | | | | 1,523,505 | |
| | | | | | | | |
| | | | | | | 236,716,862 | |
| | | | | | | | |
HEALTH CARE (8.8%) | | | | | | | | |
Akorn, Inc.* | | | 48,009 | | | | 2,096,073 | |
Align Technology, Inc.* | | | 44,188 | | | | 2,771,029 | |
Allscripts Healthcare Solutions, Inc.* | | | 103,381 | | | | 1,414,252 | |
Bio-Rad Laboratories, Inc. Cl A* | | | 12,578 | | | | 1,894,373 | |
Bio-Techne Corp. | | | 22,590 | | | | 2,224,437 | |
Centene Corp.* | | | 72,305 | | | | 5,813,322 | |
Charles River Laboratories Int’l., Inc.* | | | 28,796 | | | | 2,025,511 | |
Community Health Systems, Inc.* | | | 71,769 | | | | 4,519,294 | |
Cooper Companies, Inc. | | | 29,544 | | | | 5,257,946 | |
Halyard Health, Inc.* | | | 28,295 | | | | 1,145,948 | |
Health Net, Inc.* | | | 46,903 | | | | 3,007,420 | |
Hill-Rom Hldgs., Inc. | | | 34,451 | | | | 1,871,723 | |
HMS Hldgs. Corp.* | | | 53,836 | | | | 924,364 | |
Hologic, Inc.* | | | 148,629 | | | | 5,656,820 | |
IDEXX Laboratories, Inc.* | | | 56,906 | | | | 3,649,951 | |
LifePoint Health, Inc.* | | | 26,940 | | | | 2,342,433 | |
MEDNAX, Inc.* | | | 56,868 | | | | 4,214,487 | |
Mettler-Toledo Int’l., Inc.* | | | 17,006 | | | | 5,806,869 | |
Molina Healthcare, Inc.* | | | 27,470 | | | | 1,931,141 | |
Omnicare, Inc. | | | 58,909 | | | | 5,552,173 | |
Owens & Minor, Inc. | | | 38,387 | | | | 1,305,158 | |
ResMed, Inc. | | | 85,685 | | | | 4,830,063 | |
Sirona Dental Systems, Inc.* | | | 33,779 | | | | 3,392,087 | |
STERIS Corp. | | | 36,314 | | | | 2,340,074 | |
Teleflex, Inc. | | | 25,250 | | | | 3,420,113 | |
Thoratec Corp.* | | | 32,955 | | | | 1,468,804 | |
United Therapeutics Corp.* | | | 28,104 | | | | 4,888,691 | |
VCA Inc.* | | | 49,958 | | | | 2,717,965 | |
WellCare Health Plans, Inc.* | | | 26,779 | | | | 2,271,663 | |
| | | | | | | | |
| | | | | | | 90,754,184 | |
| | | | | | | | |
INDUSTRIALS (14.2%) | | | | | | | | |
Acuity Brands, Inc. | | | 26,408 | | | | 4,752,912 | |
AECOM* | | | 91,434 | | | | 3,024,637 | |
AGCO Corp. | | | 48,719 | | | | 2,766,265 | |
Alaska Air Group, Inc. | | | 78,822 | | | | 5,078,501 | |
B/E Aerospace, Inc. | | | 64,552 | | | | 3,543,905 | |
Carlisle Cos., Inc. | | | 39,723 | | | | 3,977,067 | |
CEB, Inc. | | | 20,345 | | | | 1,771,236 | |
CLARCOR, Inc. | | | 30,498 | | | | 1,898,196 | |
Clean Harbors, Inc.* | | | 32,461 | | | | 1,744,454 | |
Con-way, Inc. | | | 35,040 | | | | 1,344,485 | |
Copart, Inc.* | | | 69,237 | | | | 2,456,529 | |
Crane Co. | | | 29,623 | | | | 1,739,759 | |
Deluxe Corp. | | | 30,360 | | | | 1,882,320 | |
Donaldson Co., Inc. | | | 76,879 | | | | 2,752,268 | |
Donnelley (R.R.) & Sons Co. | | | 126,835 | | | | 2,210,734 | |
Esterline Technologies Corp.* | | | 18,733 | | | | 1,786,004 | |
Fortune Brands Home & Security, Inc. | | | 96,932 | | | | 4,441,424 | |
FTI Consulting, Inc.* | | | 25,293 | | | | 1,043,083 | |
GATX Corp. | | | 26,692 | | | | 1,418,680 | |
Genesee & Wyoming, Inc. Cl A* | | | 31,202 | | | | 2,376,968 | |
Graco, Inc. | | | 35,679 | | | | 2,534,279 | |
Granite Construction, Inc. | | | 22,107 | | | | 785,020 | |
HNI Corp. | | | 27,048 | | | | 1,383,505 | |
Hubbell, Inc. Cl B | | | 32,364 | | | | 3,504,374 | |
MUTUAL OF AMERICA INVESTMENT CORPORATION - MID-CAP EQUITY INDEX FUND
PORTFOLIO OF INVESTMENTS IN SECURITIES
June 30, 2015 (Unaudited)
| | | | | | | | |
Huntington Ingalls Industries, Inc. | | | 29,573 | | | | 3,329,624 | |
IDEX Corp. | | | 47,392 | | | | 3,724,063 | |
ITT Corp. | | | 54,237 | | | | 2,269,276 | |
JetBlue Airways Corp* | | | 159,999 | | | | 3,321,579 | |
KBR, Inc. | | | 87,710 | | | | 1,708,591 | |
Kennametal, Inc. | | | 48,203 | | | | 1,644,686 | |
Kirby Corp.* | | | 33,922 | | | | 2,600,461 | |
KLX, Inc.* | | | 32,072 | | | | 1,415,337 | |
Landstar System, Inc. | | | 27,003 | | | | 1,805,691 | |
Lennox International, Inc. | | | 25,171 | | | | 2,710,665 | |
Lincoln Electric Hldgs., Inc. | | | 45,959 | | | | 2,798,444 | |
Manpowergroup, Inc. | | | 47,563 | | | | 4,251,181 | |
Miller (Herman), Inc. | | | 36,273 | | | | 1,049,378 | |
MSA Safety, Inc. | | | 19,142 | | | | 928,578 | |
MSC Industrial Direct Co., Inc. Cl A | | | 30,761 | | | | 2,146,195 | |
Nordson Corp. | | | 34,400 | | | | 2,679,416 | |
NOW, Inc.* | | | 65,169 | | | | 1,297,515 | |
Old Dominion Freight Line, Inc.* | | | 41,196 | | | | 2,826,252 | |
Orbital ATK, Inc. | | | 36,135 | | | | 2,650,864 | |
Oshkosh Corp. | | | 47,555 | | | | 2,015,381 | |
Regal Beloit Corp. | | | 27,245 | | | | 1,977,715 | |
Rollins, Inc. | | | 58,497 | | | | 1,668,919 | |
Smith (A.O.) Corp. | | | 45,558 | | | | 3,279,265 | |
SPX Corp. | | | 24,945 | | | | 1,805,769 | |
Teledyne Technologies, Inc.* | | | 21,485 | | | | 2,266,882 | |
Terex Corp. | | | 63,904 | | | | 1,485,768 | |
Timken Co. | | | 44,126 | | | | 1,613,688 | |
Towers Watson & Co. Cl A | | | 42,149 | | | | 5,302,344 | |
Trinity Industries, Inc. | | | 94,211 | | | | 2,489,997 | |
Triumph Group, Inc. | | | 29,960 | | | | 1,977,060 | |
Valmont Industries, Inc. | | | 14,323 | | | | 1,702,575 | |
Wabtec Corp. | | | 58,744 | | | | 5,536,035 | |
Waste Connections, Inc. | | | 75,313 | | | | 3,548,749 | |
Watsco, Inc. | | | 16,696 | | | | 2,065,963 | |
Werner Enterprises, Inc. | | | 27,097 | | | | 711,296 | |
Woodward, Inc. | | | 35,349 | | | | 1,943,842 | |
| | | | | | | | |
| | | | | | | 146,765,649 | |
| | | | | | | | |
INFORMATION TECHNOLOGY (15.5%) | | | | | | | | |
3D Systems Corp.* | | | 63,897 | | | | 1,247,269 | |
ACI Worldwide, Inc.* | | | 70,987 | | | | 1,744,151 | |
Acxiom Corp.* | | | 47,533 | | | | 835,630 | |
Advanced Micro Devices, Inc.* | | | 383,199 | | | | 919,678 | |
Advent Software, Inc.* | | | 27,551 | | | | 1,218,030 | |
ANSYS, Inc.* | | | 54,584 | | | | 4,980,244 | |
ARRIS Group, Inc.* | | | 80,670 | | | | 2,468,502 | |
Arrow Electronics, Inc.* | | | 58,179 | | | | 3,246,393 | |
Atmel Corp. | | | 253,779 | | | | 2,500,992 | |
Avnet, Inc. | | | 82,584 | | | | 3,395,033 | |
Belden, Inc. | | | 25,931 | | | | 2,106,375 | |
Broadridge Financial Solutions, Inc. | | | 72,888 | | | | 3,645,134 | |
Cadence Design Systems, Inc.* | | | 177,955 | | | | 3,498,600 | |
CDK Global, Inc. | | | 97,477 | | | | 5,261,808 | |
Ciena Corp.* | | | 71,562 | | | | 1,694,588 | |
Cognex Corp | | | 52,977 | | | | 2,548,194 | |
CommVault Systems, Inc.* | | | 25,852 | | | | 1,096,383 | |
Convergys Corp. | | | 60,092 | | | | 1,531,745 | |
CoreLogic, Inc.* | | | 54,852 | | | | 2,177,076 | |
Cree, Inc.* | | | 66,345 | | | | 1,726,960 | |
Cypress Semiconductor Corp. | | | 201,811 | | | | 2,373,297 | |
Diebold, Inc. | | | 39,429 | | | | 1,380,015 | |
DST Systems, Inc. | | | 17,181 | | | | 2,164,462 | |
FactSet Research Systems, Inc. | | | 23,618 | | | | 3,838,166 | |
Fair Isaac Corp. | | | 18,881 | | | | 1,714,017 | |
Fairchild Semiconductor Int’l., Inc.* | | | 70,794 | | | | 1,230,400 | |
MUTUAL OF AMERICA INVESTMENT CORPORATION - MID-CAP EQUITY INDEX FUND
PORTFOLIO OF INVESTMENTS IN SECURITIES
June 30, 2015 (Unaudited)
| | | | | | | | |
FEI Company | | | 25,270 | | | | 2,095,641 | |
Fortinet, Inc.* | | | 86,604 | | | | 3,579,343 | |
Gartner, Inc.* | | | 50,482 | | | | 4,330,346 | |
Global Payments, Inc. | | | 40,408 | | | | 4,180,208 | |
Henry (Jack) & Associates, Inc. | | | 49,723 | | | | 3,217,083 | |
Informatica Corp.* | | | 63,668 | | | | 3,085,988 | |
Ingram Micro, Inc. Cl A* | | | 95,010 | | | | 2,378,100 | |
Integrated Device Technology, Inc.* | | | 90,205 | | | | 1,957,449 | |
InterDigital, Inc. | | | 21,929 | | | | 1,247,541 | |
Intersil Corp. Cl A | | | 80,157 | | | | 1,002,764 | |
IPG Photonics Corp.* | | | 21,761 | | | | 1,853,493 | |
Jabil Circuit, Inc. | | | 117,813 | | | | 2,508,239 | |
JDS Uniphase Corp.* | | | 142,368 | | | | 1,648,621 | |
Keysight Technologies, Inc.* | | | 102,962 | | | | 3,211,385 | |
Knowles Corp.* | | | 51,751 | | | | 936,693 | |
Leidos Hldgs., Inc. | | | 37,994 | | | | 1,533,818 | |
Lexmark International, Inc. Cl A | | | 37,272 | | | | 1,647,422 | |
Manhattan Associates, Inc.* | | | 44,862 | | | | 2,676,018 | |
MAXIMUS, Inc. | | | 40,064 | | | | 2,633,407 | |
Mentor Graphics Corp. | | | 60,084 | | | | 1,588,020 | |
National Instruments Corp. | | | 61,557 | | | | 1,813,469 | |
NCR Corp.* | | | 103,062 | | | | 3,102,166 | |
NeuStar, Inc. Cl A* | | | 33,666 | | | | 983,384 | |
Plantronics, Inc. | | | 23,813 | | | | 1,340,910 | |
Polycom, Inc.* | | | 82,118 | | | | 939,430 | |
PTC, Inc.* | | | 69,918 | | | | 2,868,036 | |
Rackspace Hosting, Inc.* | | | 72,075 | | | | 2,680,469 | |
Rovi Corp.* | | | 53,759 | | | | 857,456 | |
Science Applications Int’l. Corp. | | | 24,069 | | | | 1,272,047 | |
Silicon Laboratories, Inc.* | | | 24,151 | | | | 1,304,396 | |
SolarWinds, Inc.* | | | 40,408 | | | | 1,864,021 | |
Solera Hldgs., Inc. | | | 40,810 | | | | 1,818,494 | |
SunEdison, Inc.* | | | 177,251 | | | | 5,301,577 | |
Synopsys, Inc.* | | | 94,297 | | | | 4,776,143 | |
Tech Data Corp.* | | | 22,341 | | | | 1,285,948 | |
Teradyne, Inc. | | | 130,447 | | | | 2,516,323 | |
Trimble Navigation Ltd.* | | | 157,759 | | | | 3,701,031 | |
Tyler Technologies, Inc.* | | | 20,475 | | | | 2,649,056 | |
Ultimate Software Group, Inc.* | | | 17,377 | | | | 2,855,736 | |
VeriFone Systems, Inc.* | | | 69,493 | | | | 2,359,982 | |
Vishay Intertechnology, Inc. | | | 82,549 | | | | 964,172 | |
WEX, Inc.* | | | 23,499 | | | | 2,678,181 | |
Zebra Technologies Corp. Cl A* | | | 31,450 | | | | 3,492,528 | |
| | | | | | | | |
| | | | | | | 161,279,676 | |
| | | | | | | | |
MATERIALS (6.6%) | | | | | | | | |
Albemarle Corp. | | | 68,212 | | | | 3,770,077 | |
AptarGroup, Inc. | | | 38,063 | | | | 2,427,278 | |
Ashland, Inc. | | | 37,802 | | | | 4,608,064 | |
Bemis Co., Inc. | | | 59,247 | | | | 2,666,707 | |
Cabot Corp. | | | 38,590 | | | | 1,439,021 | |
Carpenter Technology Corp. | | | 30,648 | | | | 1,185,465 | |
Commercial Metals Co. | | | 70,367 | | | | 1,131,501 | |
Compass Minerals Int’l., Inc. | | | 20,469 | | | | 1,681,324 | |
Cytec Industries, Inc. | | | 43,412 | | | | 2,627,728 | |
Domtar Corp. | | | 38,920 | | | | 1,611,288 | |
Eagle Materials, Inc. | | | 30,544 | | | | 2,331,424 | |
Greif, Inc. Cl A | | | 20,646 | | | | 740,159 | |
Louisiana-Pacific Corp.* | | | 86,614 | | | | 1,475,036 | |
Minerals Technologies, Inc. | | | 21,118 | | | | 1,438,769 | |
NewMarket Corp. | | | 6,431 | | | | 2,854,657 | |
Olin Corp. | | | 47,130 | | | | 1,270,154 | |
Packaging Corp. of America | | | 60,238 | | | | 3,764,273 | |
PolyOne Corp. | | | 54,231 | | | | 2,124,228 | |
Reliance Steel & Aluminum Co. | | | 45,169 | | | | 2,731,821 | |
MUTUAL OF AMERICA INVESTMENT CORPORATION - MID-CAP EQUITY INDEX FUND
PORTFOLIO OF INVESTMENTS IN SECURITIES
June 30, 2015 (Unaudited)
| | | | | | | | |
Royal Gold, Inc. | | | 39,639 | | | | 2,441,366 | |
RPM International, Inc. | | | 81,004 | | | | 3,966,766 | |
Scotts Miracle-Gro Co. Cl A | | | 27,189 | | | | 1,609,861 | |
Sensient Technologies Corp. | | | 28,416 | | | | 1,941,949 | |
Silgan Hldgs., Inc. | | | 25,389 | | | | 1,339,524 | |
Sonoco Products Co. | | | 61,350 | | | | 2,629,461 | |
Steel Dynamics, Inc. | | | 147,024 | | | | 3,045,602 | |
The Chemours Co.* | | | 132,104 | | | | 2,113,664 | |
TimkenSteel Corp. | | | 22,863 | | | | 617,072 | |
United States Steel Corp. | | | 88,578 | | | | 1,826,478 | |
Valspar Corp. | | | 45,450 | | | | 3,718,719 | |
Worthington Industries, Inc. | | | 29,410 | | | | 884,065 | |
| | | | | | | | |
| | | | | | | 68,013,501 | |
| | | | | | | | |
TELECOMMUNICATION SERVICES (0.2%) | | | | | | | | |
Telephone & Data Systems, Inc. | | | 59,781 | | | | 1,757,561 | |
| | | | | | | | |
UTILITIES (4.2%) | | | | | | | | |
Alliant Energy Corp. | | | 68,694 | | | | 3,965,018 | |
Aqua America, Inc. | | | 107,664 | | | | 2,636,691 | |
Atmos Energy Corp. | | | 61,422 | | | | 3,149,720 | |
Black Hills Corp. | | | 27,253 | | | | 1,189,593 | |
Cleco Corp. | | | 36,775 | | | | 1,980,334 | |
Great Plains Energy, Inc. | | | 93,958 | | | | 2,270,025 | |
Hawaiian Electric Industries, Inc. | | | 65,313 | | | | 1,941,755 | |
Idacorp, Inc. | | | 30,613 | | | | 1,718,614 | |
MDU Resources Group | | | 118,426 | | | | 2,312,860 | |
National Fuel Gas Co. | | | 51,331 | | | | 3,022,883 | |
OGE Energy Corp. | | | 121,348 | | | | 3,466,912 | |
ONE Gas, Inc. | | | 31,979 | | | | 1,361,026 | |
PNM Resources, Inc. | | | 48,432 | | | | 1,191,427 | |
Questar Corp. | | | 106,837 | | | | 2,233,962 | |
Talen Energy Corp.* | | | 50,693 | | | | 869,892 | |
UGI Corp. | | | 104,884 | | | | 3,613,254 | |
Vectren Corp. | | | 50,241 | | | | 1,933,274 | |
Westar Energy, Inc. | | | 80,404 | | | | 2,751,425 | |
WGL Hldgs., Inc. | | | 30,237 | | | | 1,641,567 | |
| | | | | | | | |
| | | | | | | 43,250,232 | |
| | | | | | | | |
TOTAL INDEXED ASSETS - COMMON STOCKS
(Cost: $709,311,534) 94.2% | | | | | | | 975,209,745 | |
| | | | | | | | |
| | | | | | | | | | | | | | | | |
| | | Rating** | | Rate(%) | | | Maturity | | Face Amount | | | Value | |
SHORT-TERM DEBT SECURITIES: | | | | | | | | | | | | | | |
U.S. GOVERNMENT (0.3%) | | | | | | | | | | | | | | | | |
U.S. Treasury Bill (1) | | A-1+ | | | 0.07 | | | 11/19/15 | | | 1,600,000 | | | | 1,599,555 | |
U.S. Treasury Bill (1) | | A-1+ | | | 0.07 | | | 12/17/15 | | | 1,000,000 | | | | 999,671 | |
U.S. Treasury Bill (1) | | A-1+ | | | 0.09 | | | 09/10/15 | | | 500,000 | | | | 499,906 | |
| | | | | | | | | | | | | | | | |
| | | | | | | | | | | | | | | 3,099,132 | |
| | | | | | | | | | | | | | | | |
COMMERCIAL PAPER (5.1%) | | | | | | | | | | | | | | | | |
Coca-Cola Co.† | | A-1+ | | | 0.13 | | | 07/29/15 | | | 680,000 | | | | 679,931 | |
General Electric Capital Corp. | | A-1+ | | | 0.12 | | | 08/03/15 | | | 2,500,000 | | | | 2,499,725 | |
Intercontinental Exchange, Inc.† | | A-1 | | | 0.19 | | | 08/03/15 | | | 750,000 | | | | 749,869 | |
Intercontinental Exchange, Inc.† | | A-1 | | | 0.19 | | | 08/13/15 | | | 700,000 | | | | 699,841 | |
National Rural Utilities | | A-1 | | | 0.10 | | | 07/21/15 | | | 1,150,000 | | | | 1,149,936 | |
Nestle Finance | | A-1+ | | | 0.03 | | | 08/12/15 | | | 21,000,000 | | | | 20,999,265 | |
Private Export Funding Corp.† | | A-1 | | | 0.13 | | | 08/11/15 | | | 300,000 | | | | 299,956 | |
Toyota Motor Credit Corp. | | A-1+ | | | 0.10 | | | 07/16/15 | | | 5,000,000 | | | | 4,999,792 | |
Toyota Motor Credit Corp. | | A-1+ | | | 0.11 | | | 07/13/15 | | | 5,000,000 | | | | 4,999,817 | |
Toyota Motor Credit Corp. | | A-1+ | | | 0.11 | | | 07/21/15 | | | 3,000,000 | | | | 2,999,817 | |
Toyota Motor Credit Corp. | | A-1+ | | | 0.13 | | | 07/24/15 | | | 6,000,000 | | | | 5,999,502 | |
Toyota Motor Credit Corp. | | A-1+ | | | 0.14 | | | 08/10/15 | | | 2,500,000 | | | | 2,499,611 | |
Travelers Cos., Inc.† | | A-1 | | | 0.07 | | | 07/01/15 | | | 4,000,000 | | | | 4,000,000 | |
| | | | | | | | | | | | | | | | |
| | | | | | | | | | | | | | | 52,577,062 | |
| | | | | | | | | | | | | | | | |
MUTUAL OF AMERICA INVESTMENT CORPORATION - MID-CAP EQUITY INDEX FUND
PORTFOLIO OF INVESTMENTS IN SECURITIES
June 30, 2015 (Unaudited)
| | | | | | |
TOTAL SHORT-TERM DEBT SECURITIES
(Cost: $55,676,194) 5.4% | | | | | 55,676,194 | |
| | | | | | |
TOTAL INVESTMENTS
(Cost: $764,987,728) 99.6% | | | | | 1,030,885,939 | |
| | | | | | |
OTHER NET ASSETS 0.4% | | | | | 4,506,992 | |
| | | | | | |
NET ASSETS 100.0% | | | | $ | 1,035,392,931 | |
| | | | | | |
The accompanying notes are an integral part of these portfolio schedules.
MUTUAL OF AMERICA INVESTMENT CORPORATION - INTERNATIONAL FUND
PORTFOLIO OF INVESTMENTS IN SECURITIES
June 30, 2015 (Unaudited)
| | | | | | | | |
| | | Shares | | | Value | |
COMMON STOCKS: | | | | | | | | |
FINANCIALS (96.1%) | | | | | | | | |
iShares Core MSCI Europe ETF | | | 372,200 | | | | 16,868,104 | |
iShares Core MSCI Pacific ETF | | | 167,406 | | | | 8,586,254 | |
iShares MSCI EAFE ETF | | | 1,287,745 | | | | 81,758,930 | |
iShares MSCI EAFE Growth ETF | | | 358,024 | | | | 25,018,717 | |
iShares MSCI EAFE Small-Cap ETF | | | 177,935 | | | | 9,078,244 | |
iShares MSCI EAFE Value ETF | | | 456,586 | | | | 23,893,145 | |
iShares MSCI Emerging Markets Minimum Volatility ETF | | | 179,014 | | | | 10,325,528 | |
Vanguard FTSE Developed Markets ETF | | | 2,416,800 | | | | 95,826,121 | |
Vanguard FTSE Europe ETF | | | 424,630 | | | | 22,921,527 | |
Vanguard FTSE Pacific ETF | | | 220,480 | | | | 13,455,894 | |
| | | | | | | | |
| | | | | | | 307,732,464 | |
| | | | | | | | |
TOTAL COMMON STOCKS
(Cost: $293,205,528) 96.1% | | | | | | | 307,732,464 | |
| | | | | | | | |
| | | | | | | | | | | | | | | | |
| | | Rating** | | Rate(%) | | | Maturity | | Face Amount | | | Value | |
SHORT-TERM DEBT SECURITIES: | | | | | | | | | | | | | | | | |
U.S. GOVERNMENT (0.1%) | | | | | | | | | | | | | | | | |
U.S. Treasury Bill | | A-1+ | | | 0.07 | | | 11/19/15 | | | 400,000 | | | | 399,889 | |
| | | | | | | | | | | | | | | | |
U.S. GOVERNMENT AGENCIES (0.8%) | | | | | | | | | | | | | | | | |
FHLB | | A-1+ | | | 0.02 | | | 07/27/15 | | | 2,371,000 | | | | 2,370,966 | |
| | | | | | | | | | | | | | | | |
COMMERCIAL PAPER (1.4%) | | | | | | | | | | | | | | | | |
Abbott Laboratories† | | A-1+ | | | 0.12 | | | 08/27/15 | | | 600,000 | | | | 599,886 | |
Google, Inc.† | | A-1+ | | | 0.12 | | | 07/08/15 | | | 450,000 | | | | 449,990 | |
Toyota Motor Credit Corp. | | A-1+ | | | 0.12 | | | 08/04/15 | | | 1,000,000 | | | | 999,887 | |
Toyota Motor Credit Corp. | | A-1+ | | | 0.12 | | | 07/28/15 | | | 1,000,000 | | | | 999,910 | |
Toyota Motor Credit Corp. | | A-1+ | | | 0.14 | | | 08/04/15 | | | 1,500,000 | | | | 1,499,800 | |
| | | | | | | | | | | | | | | | |
| | | | | | | | | | | | | | | 4,549,473 | |
| | | | | | | | | | | | | | | | |
TOTAL SHORT-TERM DEBT SECURITIES
(Cost: $7,320,328) 2.3% | | | | | | | | | | | | | | | 7,320,328 | |
| | | | | | | | | | | | | | | | |
TOTAL INVESTMENTS
(Cost: $300,525,856) 98.4% | | | | | | | | | | | | | | | 315,052,792 | |
| | | | | | | | | | | | | | | | |
OTHER NET ASSETS 1.6% | | | | | | | | | | | | | | | 5,097,093 | |
| | | | | | | | | | | | | | | | |
NET ASSETS 100.0% | | | | | | | | | | | | | | $ | 320,149,885 | |
| | | | | | | | | | | | | | | | |
The accompanying notes are an integral part of these portfolio schedules.
MUTUAL OF AMERICA INVESTMENT CORPORATION - COMPOSITE FUND
PORTFOLIO OF INVESTMENTS IN SECURITIES
June 30, 2015 (Unaudited)
| | | | | | | | |
| | | Shares | | | Value | |
COMMON STOCKS: | | | | | |
CONSUMER DISCRETIONARY (8.2%) | | | | | | | | |
Amazon.com, Inc.* | | | 4,037 | | | | 1,752,421 | |
AutoZone, Inc.* | | | 1,077 | | | | 718,251 | |
Discovery Communications, Inc. Cl A* | | | 6,280 | | | | 208,873 | |
Discovery Communications, Inc. Cl C* | | | 6,280 | | | | 195,182 | |
Disney (Walt) Co. | | | 18,641 | | | | 2,127,684 | |
Dollar Tree, Inc.* | | | 4,568 | | | | 360,826 | |
Ford Motor Co. | | | 27,801 | | | | 417,293 | |
General Motors Co. | | | 13,234 | | | | 441,089 | |
Home Depot, Inc. | | | 12,605 | | | | 1,400,794 | |
Johnson Controls, Inc. | | | 6,799 | | | | 336,754 | |
Macy’s, Inc. | | | 12,869 | | | | 868,271 | |
McDonald’s Corp. | | | 10,612 | | | | 1,008,883 | |
Priceline Group Inc.* | | | 419 | | | | 482,424 | |
Starbucks Corp. | | | 27,488 | | | | 1,473,769 | |
Target Corp. | | | 12,793 | | | | 1,044,293 | |
Time Warner Cable, Inc. | | | 6,974 | | | | 1,242,558 | |
Time Warner, Inc. | | | 11,739 | | | | 1,026,106 | |
Viacom, Inc. Cl B | | | 8,381 | | | | 541,748 | |
| | | | | | | | |
| | | | | | | 15,647,219 | |
| | | | | | | | |
CONSUMER STAPLES (5.1%) | | | | | | | | |
Coca-Cola Co. | | | 17,727 | | | | 695,430 | |
Colgate-Palmolive Co. | | | 9,869 | | | | 645,531 | |
Constellation Brands, Inc. Cl A | | | 10,552 | | | | 1,224,243 | |
Estee Lauder Cos., Inc. Cl A | | | 9,410 | | | | 815,471 | |
Mead Johnson Nutrition Co. | | | 3,975 | | | | 358,625 | |
Mondelez International, Inc. Cl A | | | 14,580 | | | | 599,821 | |
PepsiCo, Inc. | | | 11,566 | | | | 1,079,570 | |
Philip Morris Int’l., Inc. | | | 7,681 | | | | 615,786 | |
Proctor & Gamble Co. | | | 19,924 | | | | 1,558,854 | |
Sysco Corp. | | | 14,185 | | | | 512,079 | |
Tyson Foods, Inc. Cl A | | | 11,985 | | | | 510,921 | |
Wal-Mart Stores, Inc. | | | 16,246 | | | | 1,152,329 | |
| | | | | | | | |
| | | | | | | 9,768,660 | |
| | | | | | | | |
ENERGY (4.6%) | | | | | | | | |
Anadarko Petroleum Corp. | | | 8,992 | | | | 701,916 | |
Apache Corp. | | | 6,154 | | | | 354,655 | |
Chevron Corp. | | | 8,205 | | | | 791,536 | |
EOG Resources, Inc. | | | 8,811 | | | | 771,403 | |
Exxon Mobil Corp. | | | 33,205 | | | | 2,762,656 | |
Halliburton Co. | | | 20,454 | | | | 880,954 | |
Hess Corp. | | | 5,954 | | | | 398,204 | |
National Oilwell Varco, Inc. | | | 9,204 | | | | 444,369 | |
Noble Energy, Inc. | | | 15,756 | | | | 672,466 | |
Occidental Petroleum Corp. | | | 9,689 | | | | 753,514 | |
Range Resources Corp. | | | 5,170 | | | | 255,295 | |
| | | | | | | | |
| | | | | | | 8,786,968 | |
| | | | | | | | |
FINANCIALS (9.5%) | | | | | | | | |
American Int’l. Group, Inc. | | | 18,744 | | | | 1,158,754 | |
Aon PLC | | | 5,993 | | | | 597,382 | |
Bank of America Corp. | | | 68,534 | | | | 1,166,449 | |
Berkshire Hathaway, Inc. Cl B* | | | 7,737 | | | | 1,053,083 | |
Capital One Financial Corp. | | | 18,594 | | | | 1,635,714 | |
Citigroup, Inc. | | | 18,048 | | | | 996,972 | |
Comerica, Inc. | | | 12,990 | | | | 666,647 | |
Franklin Resources, Inc. | | | 7,170 | | | | 351,545 | |
Goldman Sachs Group, Inc. | | | 6,399 | | | | 1,336,047 | |
Host Hotels & Resorts, Inc. | | | 25,742 | | | | 510,464 | |
JPMorgan Chase & Co. | | | 41,092 | | | | 2,784,394 | |
MetLife, Inc. | | | 18,672 | | | | 1,045,445 | |
PNC Financial Svcs. Grp., Inc. | | | 8,335 | | | | 797,243 | |
Simon Property Group, Inc. | | | 6,659 | | | | 1,152,140 | |
Wells Fargo & Co. | | | 40,069 | | | | 2,253,481 | |
Zions Bancorporation | | | 17,797 | | | | 564,788 | |
| | | | | | | | |
| | | | | | | 18,070,548 | |
| | | | | | | | |
MUTUAL OF AMERICA INVESTMENT CORPORATION - COMPOSITE FUND
PORTFOLIO OF INVESTMENTS IN SECURITIES
June 30, 2015 (Unaudited)
| | | | | | | | |
HEALTH CARE (9.5%) | | | | | | | | |
Abbott Laboratories | | | 19,167 | | | | 940,716 | |
Allergan PLC* | | | 3,825 | | | | 1,160,735 | |
BIOGEN, Inc.* | | | 2,773 | | | | 1,120,126 | |
Celgene Corp.* | | | 10,545 | | | | 1,220,426 | |
Cerner Corp.* | | | 5,119 | | | | 353,518 | |
Express Scripts Hldg. Co.* | | | 7,997 | | | | 711,253 | |
Gilead Sciences, Inc. | | | 15,496 | | | | 1,814,272 | |
Humana, Inc. | | | 2,811 | | | | 537,688 | |
McKesson Corp. | | | 3,402 | | | | 764,804 | |
Medtronic PLC | | | 18,620 | | | | 1,379,742 | |
Merck & Co., Inc. | | | 28,593 | | | | 1,627,799 | |
Mylan N.V.* | | | 27,880 | | | | 1,891,937 | |
Pfizer, Inc. | | | 64,734 | | | | 2,170,531 | |
St. Jude Medical, Inc. | | | 5,253 | | | | 383,837 | |
Stryker Corp. | | | 7,001 | | | | 669,086 | |
UnitedHealth Group, Inc. | | | 8,051 | | | | 982,222 | |
Vertex Pharmaceuticals, Inc.* | | | 3,433 | | | | 423,907 | |
| | | | | | | | |
| | | | | | | 18,152,599 | |
| | | | | | | | |
INDUSTRIALS (6.2%) | | | | | | | | |
Boeing Co. | | | 9,741 | | | | 1,351,272 | |
Cummins, Inc. | | | 6,979 | | | | 915,575 | |
Delta Air Lines, Inc. | | | 15,762 | | | | 647,503 | |
Expeditors Int’l. of Wash. | | | 12,818 | | | | 590,974 | |
FedEx Corp. | | | 6,990 | | | | 1,191,096 | |
General Electric Co. | | | 103,514 | | | | 2,750,367 | |
Precision Castparts Corp. | | | 2,794 | | | | 558,437 | |
Roper Technologies, Inc. | | | 13,916 | | | | 2,399,953 | |
Tyco International PLC | | | 12,301 | | | | 473,342 | |
Union Pacific Corp. | | | 9,777 | | | | 932,432 | |
| | | | | | | | |
| | | | | | | 11,810,951 | |
| | | | | | | | |
INFORMATION TECHNOLOGY (10.8%) | | | | | | | | |
Analog Devices, Inc. | | | 7,802 | | | | 500,771 | |
Apple, Inc. | | | 38,706 | | | | 4,854,696 | |
Automatic Data Processing, Inc. | | | 8,341 | | | | 669,198 | |
Broadcom Corp. Cl A | | | 9,749 | | | | 501,976 | |
Cisco Systems, Inc. | | | 36,976 | | | | 1,015,361 | |
F5 Networks, Inc.* | | | 2,489 | | | | 299,551 | |
Facebook, Inc. Cl A* | | | 13,236 | | | | 1,135,186 | |
Google, Inc. Cl A* | | | 1,866 | | | | 1,007,715 | |
Google, Inc. Cl C* | | | 1,870 | | | | 973,354 | |
Intel Corp. | | | 19,007 | | | | 578,098 | |
KLA-Tencor Corp. | | | 4,161 | | | | 233,890 | |
MasterCard, Inc. Cl A | | | 10,510 | | | | 982,475 | |
Micron Technology, Inc.* | | | 13,701 | | | | 258,127 | |
Microsoft Corp. | | | 42,426 | | | | 1,873,108 | |
Oracle Corp. | | | 26,425 | | | | 1,064,928 | |
QUALCOMM, Inc. | | | 15,109 | | | | 946,277 | |
Salesforce.com, inc.* | | | 23,464 | | | | 1,633,798 | |
Teradata Corp.* | | | 7,786 | | | | 288,082 | |
Texas Instruments, Inc. | | | 9,167 | | | | 472,192 | |
Western Digital Corp. | | | 11,358 | | | | 890,694 | |
Yahoo!, Inc.* | | | 14,517 | | | | 570,373 | |
| | | | | | | | |
| | | | | | | 20,749,850 | |
| | | | | | | | |
MUTUAL OF AMERICA INVESTMENT CORPORATION - COMPOSITE FUND
PORTFOLIO OF INVESTMENTS IN SECURITIES
June 30, 2015 (Unaudited)
| | | | | | | | |
MATERIALS (1.9%) | | | | | | | | |
Ball Corp. | | | 11,058 | | | | 775,719 | |
CF Industries Hldgs., Inc. | | | 10,065 | | | | 646,978 | |
Dow Chemical Co. | | | 14,878 | | | | 761,307 | |
Eastman Chemical Co. | | | 11,717 | | | | 958,685 | |
FMC Corp. | | | 3,442 | | | | 180,877 | |
Freeport-McMoRan Copper & Gold, Inc. | | | 15,177 | | | | 282,596 | |
| | | | | | | | |
| | | | | | | 3,606,162 | |
| | | | | | | | |
TELECOMMUNICATION SERVICES (1.0%) | | | | | | | | |
AT&T, Inc. | | | 35,507 | | | | 1,261,209 | |
Verizon Communications, Inc. | | | 15,217 | | | | 709,264 | |
| | | | | | | | |
| | | | | | | 1,970,473 | |
| | | | | | | | |
UTILITIES (1.5%) | | | | | | | | |
Ameren Corp. | | | 4,290 | | | | 161,647 | |
Dominion Resources, Inc. | | | 12,713 | | | | 850,118 | |
Edison International | | | 7,354 | | | | 408,735 | |
PPL Corp. | | | 8,158 | | | | 240,416 | |
Public Svc. Enterprise Group, Inc. | | | 14,326 | | | | 562,725 | |
Sempra Energy | | | 6,688 | | | | 661,711 | |
| | | | | | | | |
| | | | | | | 2,885,352 | |
| | | | | | | | |
TOTAL COMMON STOCKS
(Cost: $71,507,620) 58.3% | | | | | | | 111,448,782 | |
| | | | | | | | |
| | | | | | | | | | |
| | | Rating** | | Rate(%) | | Maturity | | Face Amount | | Value |
LONG-TERM DEBT SECURITIES: | | | | | | | | | | |
U.S. GOVERNMENT (8.9%) | | | | | | | | | | |
U.S. Treasury Note | | AA+ | | 0.50 | | 03/31/17 | | 1,500,000 | | 1,498,476 |
U.S. Treasury Note | | AA+ | | 2.00 | | 02/15/25 | | 500,000 | | 485,781 |
U.S. Treasury Note | | AA+ | | 2.13 | | 05/15/25 | | 800,000 | | 785,500 |
U.S. Treasury Strip | | AA+ | | 0.00 | | 08/15/21 | | 300,000 | | 264,757 |
U.S. Treasury Strip | | AA+ | | 0.00 | | 11/15/21 | | 7,050,000 | | 6,182,972 |
U.S. Treasury Strip | | AA+ | | 0.00 | | 08/15/28 | | 6,000,000 | | 4,169,508 |
U.S. Treasury Strip | | AA+ | | 0.00 | | 08/15/29 | | 5,500,000 | | 3,676,580 |
| | | | | | | | | | |
| | | | | | | | | | 17,063,574 |
| | | | | | | | | | |
U.S. GOVERNMENT AGENCIES (12.0%) | | | | | | | | | | |
MORTGAGE-BACKED OBLIGATIONS (11.8%) | | | | | | | | | | |
FHARM | | AA+ | | 2.36 | | 02/01/36 | | 42,266 | | 44,937 |
FHARM | | AA+ | | 2.37 | | 05/01/37 | | 32,535 | | 34,080 |
FHARM | | AA+ | | 2.38 | | 04/01/37 | | 66,471 | | 71,141 |
FHARM | | AA+ | | 4.53 | | 09/01/39 | | 45,034 | | 47,646 |
FHARM | | AA+ | | 5.79 | | 03/01/37 | | 15,643 | | 16,754 |
FHLMC | | AA+ | | 2.50 | | 09/01/27 | | 360,306 | | 368,079 |
FHLMC | | AA+ | | 3.00 | | 06/01/27 | | 208,415 | | 216,275 |
FHLMC | | AA+ | | 3.00 | | 08/01/27 | | 309,977 | | 321,471 |
FHLMC | | AA+ | | 3.00 | | 10/15/37 | | 302,899 | | 309,105 |
FHLMC | | AA+ | | 3.00 | | 11/01/42 | | 286,766 | | 285,533 |
FHLMC | | AA+ | | 3.00 | | 04/01/43 | | 364,545 | | 363,544 |
FHLMC | | AA+ | | 3.50 | | 01/01/43 | | 430,714 | | 444,171 |
FHLMC | | AA+ | | 4.00 | | 02/01/25 | | 62,858 | | 66,489 |
FHLMC | | AA+ | | 4.00 | | 03/01/41 | | 248,549 | | 262,888 |
FHLMC | | AA+ | | 4.00 | | 07/01/41 | | 260,525 | | 277,635 |
FHLMC | | AA+ | | 4.00 | | 11/01/42 | | 185,880 | | 197,017 |
FHLMC | | AA+ | | 4.00 | | 01/01/43 | | 340,823 | | 363,309 |
FHLMC | | AA+ | | 4.00 | | 01/01/44 | | 320,296 | | 340,712 |
FHLMC | | AA+ | | 4.00 | | 06/01/45 | | 399,510 | | 424,608 |
FHLMC | | AA+ | | 4.50 | | 08/01/34 | | 59,022 | | 64,066 |
FHLMC | | AA+ | | 4.50 | | 08/15/35 | | 73,440 | | 78,457 |
FHLMC | | AA+ | | 4.50 | | 02/01/44 | | 309,988 | | 336,307 |
FHLMC | | AA+ | | 5.00 | | 02/01/26 | | 32,916 | | 36,215 |
FHLMC | | AA+ | | 5.00 | | 10/01/40 | | 415,406 | | 458,435 |
MUTUAL OF AMERICA INVESTMENT CORPORATION - COMPOSITE FUND
PORTFOLIO OF INVESTMENTS IN SECURITIES
June 30, 2015 (Unaudited)
| | | | | | | | | | |
FHLMC | | AA+ | | 5.50 | | 07/01/32 | | 66,488 | | 74,760 |
FHLMC | | AA+ | | 5.50 | | 05/01/33 | | 99,479 | | 111,345 |
FHLMC | | AA+ | | 5.50 | | 06/01/37 | | 137,381 | | 154,808 |
FHLMC | | AA+ | | 6.00 | | 03/15/32 | | 58,295 | | 64,818 |
FHLMC Strip | | AA+ | | 3.00 | | 01/15/43 | | 430,137 | | 437,963 |
FNMA | | AA+ | | 2.42 | | 05/01/43 | | 433,006 | | 439,310 |
FNMA | | AA+ | | 3.00 | | 06/01/33 | | 419,253 | | 427,714 |
FNMA | | AA+ | | 3.00 | | 09/01/33 | | 349,990 | | 357,062 |
FNMA | | AA+ | | 3.00 | | 12/01/42 | | 405,810 | | 400,447 |
FNMA | | AA+ | | 3.00 | | 02/01/43 | | 237,588 | | 236,986 |
FNMA | | AA+ | | 3.00 | | 03/01/43 | | 433,491 | | 432,865 |
FNMA | | AA+ | | 3.00 | | 09/01/43 | | 454,848 | | 454,964 |
FNMA | | AA+ | | 3.50 | | 03/25/28 | | 311,991 | | 324,401 |
FNMA | | AA+ | | 3.50 | | 08/01/38 | | 310,809 | | 322,714 |
FNMA | | AA+ | | 3.50 | | 10/01/41 | | 209,071 | | 216,217 |
FNMA | | AA+ | | 3.50 | | 11/01/41 | | 339,518 | | 351,025 |
FNMA | | AA+ | | 3.50 | | 12/01/41 | | 343,331 | | 355,066 |
FNMA | | AA+ | | 3.50 | | 04/01/42 | | 397,023 | | 411,312 |
FNMA | | AA+ | | 3.50 | | 04/01/42 | | 475,768 | | 490,854 |
FNMA | | AA+ | | 3.50 | | 08/01/42 | | 469,458 | | 485,321 |
FNMA | | AA+ | | 3.50 | | 10/01/42 | | 339,115 | | 350,582 |
FNMA | | AA+ | | 3.50 | | 01/01/44 | | 152,730 | | 155,381 |
FNMA | | AA+ | | 4.00 | | 05/01/19 | | 36,019 | | 37,761 |
FNMA | | AA+ | | 4.00 | | 07/25/26 | | 440,627 | | 487,235 |
FNMA | | AA+ | | 4.00 | | 01/01/31 | | 283,222 | | 302,369 |
FNMA | | AA+ | | 4.00 | | 11/01/40 | | 265,929 | | 283,218 |
FNMA | | AA+ | | 4.00 | | 05/01/41 | | 241,849 | | 254,980 |
FNMA | | AA+ | | 4.50 | | 05/01/18 | | 29,213 | | 30,424 |
FNMA | | AA+ | | 4.50 | | 05/01/30 | | 101,410 | | 109,708 |
FNMA | | AA+ | | 4.50 | | 04/01/31 | | 130,570 | | 142,001 |
FNMA | | AA+ | | 4.50 | | 08/01/33 | | 54,145 | | 58,726 |
FNMA | | AA+ | | 4.50 | | 09/01/33 | | 108,670 | | 117,933 |
FNMA | | AA+ | | 4.50 | | 06/01/34 | | 87,979 | | 95,623 |
FNMA | | AA+ | | 4.50 | | 08/01/35 | | 71,981 | | 78,254 |
FNMA | | AA+ | | 4.50 | | 12/01/35 | | 72,025 | | 78,244 |
FNMA | | AA+ | | 4.50 | | 05/01/39 | | 93,845 | | 102,591 |
FNMA | | AA+ | | 4.50 | | 05/01/39 | | 161,267 | | 176,540 |
FNMA | | AA+ | | 4.50 | | 05/01/40 | | 132,135 | | 143,110 |
FNMA | | AA+ | | 5.00 | | 04/01/18 | | 69,894 | | 73,166 |
FNMA | | AA+ | | 5.00 | | 06/01/33 | | 110,619 | | 122,613 |
FNMA | | AA+ | | 5.00 | | 10/01/33 | | 104,880 | | 116,573 |
FNMA | | AA+ | | 5.00 | | 11/01/33 | | 72,832 | | 80,787 |
FNMA | | AA+ | | 5.00 | | 11/01/33 | | 302,642 | | 335,419 |
FNMA | | AA+ | | 5.00 | | 03/01/34 | | 40,510 | | 44,905 |
FNMA | | AA+ | | 5.00 | | 04/01/34 | | 59,458 | | 66,073 |
FNMA | | AA+ | | 5.00 | | 09/01/35 | | 44,482 | | 49,207 |
FNMA | | AA+ | | 5.00 | | 11/25/35 | | 149,191 | | 163,589 |
FNMA | | AA+ | | 5.00 | | 08/01/37 | | 341,416 | | 377,663 |
FNMA | | AA+ | | 5.00 | | 05/01/39 | | 133,520 | | 147,935 |
FNMA | | AA+ | | 5.00 | | 06/01/40 | | 73,577 | | 81,679 |
FNMA | | AA+ | | 5.50 | | 04/01/17 | | 3,273 | | 3,360 |
FNMA | | AA+ | | 5.50 | | 05/01/17 | | 1,043 | | 1,065 |
FNMA | | AA+ | | 5.50 | | 06/01/17 | | 2,067 | | 2,072 |
FNMA | | AA+ | | 5.50 | | 03/01/34 | | 19,680 | | 22,140 |
FNMA | | AA+ | | 5.50 | | 05/01/34 | | 241,294 | | 272,261 |
FNMA | | AA+ | | 5.50 | | 07/01/34 | | 57,520 | | 64,718 |
FNMA | | AA+ | | 5.50 | | 09/01/34 | | 115,706 | | 129,995 |
FNMA | | AA+ | | 5.50 | | 09/01/34 | | 39,797 | | 45,088 |
FNMA | | AA+ | | 5.50 | | 10/01/34 | | 48,965 | | 55,544 |
FNMA | | AA+ | | 5.50 | | 02/01/35 | | 97,047 | | 109,352 |
FNMA | | AA+ | | 5.50 | | 02/01/35 | | 56,550 | | 64,138 |
MUTUAL OF AMERICA INVESTMENT CORPORATION - COMPOSITE FUND
PORTFOLIO OF INVESTMENTS IN SECURITIES
June 30, 2015 (Unaudited)
| | | | | | | | | | |
FNMA | | AA+ | | 5.50 | | 08/01/35 | | 36,738 | | 41,670 |
FNMA | | AA+ | | 5.50 | | 08/01/37 | | 18,266 | | 20,478 |
FNMA | | AA+ | | 5.50 | | 11/01/38 | | 31,016 | | 33,899 |
FNMA | | AA+ | | 5.50 | | 06/01/48 | | 37,309 | | 40,677 |
FNMA | | AA+ | | 6.00 | | 03/01/17 | | 1,582 | | 1,628 |
FNMA | | AA+ | | 6.00 | | 05/01/23 | | 31,355 | | 35,748 |
FNMA | | AA+ | | 6.00 | | 04/01/32 | | 23,769 | | 26,984 |
FNMA | | AA+ | | 6.00 | | 04/01/32 | | 17,361 | | 19,808 |
FNMA | | AA+ | | 6.00 | | 05/01/32 | | 20,270 | | 23,150 |
FNMA | | AA+ | | 6.00 | | 04/01/33 | | 111,694 | | 128,791 |
FNMA | | AA+ | | 6.00 | | 05/01/33 | | 54,559 | | 61,900 |
FNMA | | AA+ | | 6.00 | | 06/01/34 | | 34,408 | | 39,381 |
FNMA | | AA+ | | 6.00 | | 09/01/34 | | 21,490 | | 24,573 |
FNMA | | AA+ | | 6.00 | | 10/01/34 | | 49,129 | | 56,560 |
FNMA | | AA+ | | 6.00 | | 11/01/34 | | 13,950 | | 15,827 |
FNMA | | AA+ | | 6.00 | | 12/01/36 | | 61,988 | | 70,288 |
FNMA | | AA+ | | 6.00 | | 01/01/37 | | 59,979 | | 68,801 |
FNMA | | AA+ | | 6.00 | | 04/01/37 | | 23,022 | | 25,301 |
FNMA | | AA+ | | 6.00 | | 05/01/37 | | 15,411 | | 16,948 |
FNMA | | AA+ | | 6.00 | | 06/01/37 | | 31,097 | | 34,171 |
FNMA | | AA+ | | 6.00 | | 10/25/44 | | 116,282 | | 135,748 |
FNMA | | AA+ | | 6.00 | | 02/25/47 | | 111,970 | | 126,154 |
FNMA | | AA+ | | 6.00 | | 12/25/49 | | 75,534 | | 87,288 |
FNMA | | AA+ | | 6.50 | | 09/01/16 | | 954 | | 961 |
FNMA | | AA+ | | 6.50 | | 03/01/17 | | 3,994 | | 4,092 |
FNMA | | AA+ | | 6.50 | | 05/01/17 | | 1,332 | | 1,344 |
FNMA | | AA+ | | 6.50 | | 06/01/17 | | 7,325 | | 7,533 |
FNMA | | AA+ | | 6.50 | | 05/01/32 | | 11,910 | | 13,678 |
FNMA | | AA+ | | 6.50 | | 05/01/32 | | 26,046 | | 29,912 |
FNMA | | AA+ | | 6.50 | | 07/01/32 | | 4,214 | | 4,839 |
FNMA | | AA+ | | 6.50 | | 07/01/34 | | 42,074 | | 48,318 |
FNMA | | AA+ | | 6.50 | | 05/01/37 | | 73,497 | | 84,809 |
FNMA | | AA+ | | 6.50 | | 09/01/37 | | 26,301 | | 30,204 |
FNMA | | AA+ | | 7.00 | | 09/01/31 | | 17,527 | | 19,925 |
FNMA | | AA+ | | 7.00 | | 04/01/32 | | 12,112 | | 14,675 |
FNMA | | AA+ | | 7.50 | | 06/01/31 | | 8,513 | | 10,088 |
FNMA | | AA+ | | 7.50 | | 02/01/32 | | 6,574 | | 7,940 |
FNMA | | AA+ | | 7.50 | | 06/01/32 | | 6,899 | | 8,596 |
FNMA | | AA+ | | 8.00 | | 04/01/32 | | 1,630 | | 1,751 |
FNMA Strip | | AA+ | | 3.00 | | 08/25/42 | | 368,459 | | 368,682 |
GNMA (2) | | AA+ | | 3.50 | | 09/20/33 | | 102,539 | | 104,234 |
GNMA (2) | | AA+ | | 3.50 | | 01/20/37 | | 17,514 | | 17,575 |
GNMA (2) | | AA+ | | 4.00 | | 08/15/41 | | 264,979 | | 284,712 |
GNMA (2) | | AA+ | | 4.00 | | 01/15/42 | | 306,732 | | 327,581 |
GNMA (2) | | AA+ | | 4.00 | | 03/20/42 | | 242,778 | | 258,272 |
GNMA (2) | | AA+ | | 4.00 | | 08/20/42 | | 223,472 | | 238,415 |
GNMA (2) | | AA+ | | 4.50 | | 04/20/31 | | 175,038 | | 190,795 |
GNMA (2) | | AA+ | | 4.50 | | 10/15/40 | | 239,103 | | 266,128 |
GNMA (2) | | AA+ | | 4.50 | | 10/20/43 | | 433,934 | | 471,978 |
GNMA (2) | | AA+ | | 5.00 | | 10/15/24 | | 267,101 | | 300,171 |
GNMA (2) | | AA+ | | 5.00 | | 04/15/39 | | 190,787 | | 215,951 |
GNMA (2) | | AA+ | | 5.00 | | 06/20/39 | | 269,804 | | 295,415 |
GNMA (2) | | AA+ | | 5.00 | | 11/15/39 | | 144,837 | | 160,783 |
GNMA (2) | | AA+ | | 6.50 | | 04/15/31 | | 4,038 | | 4,608 |
GNMA (2) | | AA+ | | 6.50 | | 10/15/31 | | 4,647 | | 5,401 |
GNMA (2) | | AA+ | | 6.50 | | 12/15/31 | | 3,491 | | 3,982 |
GNMA (2) | | AA+ | | 6.50 | | 05/15/32 | | 7,952 | | 9,071 |
GNMA (2) | | AA+ | | 7.00 | | 05/15/31 | | 3,995 | | 4,848 |
GNMA (2) | | AA+ | | 7.00 | | 05/15/32 | | 1,644 | | 1,851 |
Vendee Mortgage Trust (2) | | AA+ | | 5.25 | | 01/15/32 | | 226,686 | | 251,537 |
| | | | | | | | | | |
| | | | | | | | | | 22,619,276 |
| | | | | | | | | | |
NON-MORTGAGE-BACKED OBLIGATIONS (0.2%) | | | | | | | | | | |
FHLMC | | AA+ | | 0.00 | | 11/29/19 | | 500,000 | | 456,083 |
| | | | | | | | | | |
MUTUAL OF AMERICA INVESTMENT CORPORATION - COMPOSITE FUND
PORTFOLIO OF INVESTMENTS IN SECURITIES
June 30, 2015 (Unaudited)
| | | | | | | | | | |
CORPORATE DEBT (16.7%) | | | | | | | | | | |
CONSUMER DISCRETIONARY (2.8%) | | | | | | | | | | |
Advance Auto Parts, Inc. | | BBB- | | 5.75 | | 05/01/20 | | 270,000 | | 301,049 |
AutoZone, Inc. | | BBB | | 4.00 | | 11/15/20 | | 250,000 | | 265,578 |
Dollar General Corp. | | BBB- | | 3.25 | | 04/15/23 | | 300,000 | | 285,825 |
Expedia, Inc. | | BBB- | | 5.95 | | 08/15/20 | | 250,000 | | 278,654 |
Family Dollar Stores, Inc. | | BBB- | | 5.00 | | 02/01/21 | | 300,000 | | 310,494 |
Harman Int’l. Industries, Inc. | | BBB- | | 4.15 | | 05/15/25 | | 300,000 | | 295,654 |
Home Depot, Inc. | | A | | 5.40 | | 03/01/16 | | 500,000 | | 515,788 |
Hyatt Hotels Corp. | | BBB | | 3.88 | | 08/15/16 | | 100,000 | | 102,709 |
Kohl’s Corp. | | BBB | | 3.25 | | 02/01/23 | | 100,000 | | 97,429 |
Kohl’s Corp. | | BBB | | 4.00 | | 11/01/21 | | 100,000 | | 105,246 |
Lowe’s Cos., Inc. | | A- | | 3.12 | | 04/15/22 | | 300,000 | | 303,562 |
Marriott International, Inc. | | BBB | | 3.13 | | 10/15/21 | | 25,000 | | 24,976 |
Marriott International, Inc. | | BBB | | 3.25 | | 09/15/22 | | 350,000 | | 345,093 |
NVR, Inc. | | BBB+ | | 3.95 | | 09/15/22 | | 300,000 | | 304,158 |
O’Reilly Automotive, Inc. | | BBB+ | | 3.80 | | 09/01/22 | | 300,000 | | 306,003 |
Omnicom Group, Inc. | | BBB+ | | 3.63 | | 05/01/22 | | 100,000 | | 100,580 |
Omnicom Group, Inc. | | BBB+ | | 4.45 | | 08/15/20 | | 250,000 | | 267,337 |
Staples, Inc. | | BBB- | | 4.38 | | 01/12/23 | | 275,000 | | 276,091 |
Tupperware Brands Corp. | | BBB- | | 4.75 | | 06/01/21 | | 350,000 | | 369,212 |
Whirlpool Corp. | | BBB | | 6.50 | | 06/15/16 | | 250,000 | | 262,464 |
Wynn Las Vegas LLC | | BBB- | | 5.38 | | 03/15/22 | | 300,000 | | 304,500 |
| | | | | | | | | | |
| | | | | | | | | | 5,422,402 |
| | | | | | | | | | |
CONSUMER STAPLES (0.9%) | | | | | | | | | | |
Avon Products, Inc. | | B+ | | 4.20 | | 07/15/18 | | 150,000 | | 138,375 |
CVS Health Corp. | | BBB+ | | 6.13 | | 08/15/16 | | 250,000 | | 264,292 |
Energizer Hldgs., Inc. | | BBB- | | 4.70 | | 05/19/21 | | 275,000 | | 278,409 |
Ingredion, Inc. | | BBB | | 4.63 | | 11/01/20 | | 250,000 | | 267,837 |
Molson Coors Brewing Co. | | BBB+ | | 3.50 | | 05/01/22 | | 400,000 | | 403,582 |
Sysco Corp. | | A | | 2.60 | | 06/12/22 | | 300,000 | | 293,090 |
| | | | | | | | | | |
| | | | | | | | | | 1,645,585 |
| | | | | | | | | | |
ENERGY (2.1%) | | | | | | | | | | |
Cameron International Corp. | | BBB+ | | 4.50 | | 06/01/21 | | 300,000 | | 314,375 |
Diamond Offshore Drilling, Inc. | | BBB+ | | 4.88 | | 07/01/15 | | 500,000 | | 500,000 |
Energen Corp. | | BB | | 4.63 | | 09/01/21 | | 250,000 | | 240,361 |
EQT Corp. | | BBB | | 4.88 | | 11/15/21 | | 210,000 | | 221,285 |
FMC Technologies, Inc. | | BBB | | 2.00 | | 10/01/17 | | 250,000 | | 249,660 |
Murphy Oil Corp. | | BBB | | 2.50 | | 12/01/17 | | 200,000 | | 199,628 |
National Oilwell Varco, Inc. | | A | | 6.13 | | 08/15/15 | | 250,000 | | 250,168 |
Noble Corp. | | BBB | | 7.50 | | 03/15/19 | | 800,000 | | 876,167 |
Rowan Companies PLC | | BBB- | | 4.88 | | 06/01/22 | | 300,000 | | 297,967 |
Seacor Hldgs., Inc. | | BB- | | 7.38 | | 10/01/19 | | 250,000 | | 260,625 |
Weatherford Int’l. Ltd. | | BBB- | | 5.50 | | 02/15/16 | | 500,000 | | 510,699 |
| | | | | | | | | | |
| | | | | | | | | | 3,920,935 |
| | | | | | | | | | |
FINANCIALS (3.7%) | | | | | | | | | | |
Aflac, Inc. | | A | | 4.00 | | 02/15/22 | | 300,000 | | 317,187 |
Alleghany Corp. | | BBB+ | | 5.63 | | 09/15/20 | | 300,000 | | 335,930 |
American Express Co. | | BBB | | 3.63 | | 12/05/24 | | 250,000 | | 243,246 |
American Tower Corp. | | BBB- | | 4.50 | | 01/15/18 | | 250,000 | | 264,547 |
Bank of America Corp. | | A- | | 3.70 | | 09/01/15 | | 250,000 | | 251,036 |
Barrick N.A. Finance LLC | | BBB- | | 4.40 | | 05/30/21 | | 250,000 | | 255,377 |
Berkley (W.R.) Corp. | | BBB+ | | 7.38 | | 09/15/19 | | 250,000 | | 296,131 |
Capital One Financial Corp. | | BBB | | 4.75 | | 07/15/21 | | 300,000 | | 327,683 |
CNA Financial Corp. | | BBB | | 6.50 | | 08/15/16 | | 250,000 | | 264,430 |
Fairfax Financial Hldgs. | | BBB- | | 8.25 | | 10/01/15 | | 500,000 | | 508,000 |
First Republic Bank | | A- | | 2.38 | | 06/17/19 | | 150,000 | | 149,849 |
First Tennessee Bank | | BBB- | | 2.95 | | 12/01/19 | | 350,000 | | 349,826 |
MUTUAL OF AMERICA INVESTMENT CORPORATION - COMPOSITE FUND
PORTFOLIO OF INVESTMENTS IN SECURITIES
June 30, 2015 (Unaudited)
| | | | | | | | | | |
Government Pptys. Income Trust | | BBB- | | 3.75 | | 08/15/19 | | 350,000 | | 360,023 |
Health Care REIT, Inc. | | BBB | | 6.13 | | 04/15/20 | | 250,000 | | 285,618 |
Healthcare Realty Trust | | BBB- | | 3.75 | | 04/15/23 | | 250,000 | | 244,273 |
Hospitality Properties Trust | | BBB- | | 5.00 | | 08/15/22 | | 250,000 | | 260,234 |
Moody’s Corp. | | BBB+ | | 4.50 | | 09/01/22 | | 250,000 | | 266,294 |
Morgan Stanley | | A- | | 4.00 | | 07/24/15 | | 250,000 | | 250,418 |
National Retail Pptys., Inc. | | BBB+ | | 3.80 | | 10/15/22 | | 250,000 | | 252,590 |
Pacific LifeCorp.† | | BBB+ | | 6.00 | | 02/10/20 | | 100,000 | | 112,979 |
Penske Truck Leasing Co. LP† | | BBB- | | 3.38 | | 03/15/18 | | 300,000 | | 309,190 |
Prudential Financial, Inc. | | A | | 4.50 | | 11/16/21 | | 250,000 | | 272,278 |
Raymond James Financial, Inc. | | BBB | | 4.25 | | 04/15/16 | | 250,000 | | 256,248 |
Reckson Operating Partnership | | BBB- | | 6.00 | | 03/31/16 | | 100,000 | | 103,286 |
Senior Housing Pptys. Trust | | BBB- | | 4.30 | | 01/15/16 | | 250,000 | | 251,819 |
Ventas Realty LP/Capital Corp. | | BBB+ | | 4.00 | | 04/30/19 | | 100,000 | | 105,664 |
Ventas Realty LP/Capital Corp. | | BBB+ | | 4.75 | | 06/01/21 | | 200,000 | | 216,713 |
| | | | | | | | | | |
| | | | | | | | | | 7,110,869 |
| | | | | | | | | | |
HEALTH CARE (2.1%) | | | | | | | | | | |
Agilent Technologies, Inc. | | BBB+ | | 5.00 | | 07/15/20 | | 290,000 | | 317,564 |
Allergan, Inc. | | BBB- | | 5.75 | | 04/01/16 | | 250,000 | | 259,036 |
Anthem, Inc. | | A | | 4.35 | | 08/15/20 | | 250,000 | | 270,537 |
Bio-Rad Laboratories, Inc. | | BBB | | 4.88 | | 12/15/20 | | 200,000 | | 216,804 |
Hospira, Inc. | | BBB- | | 6.05 | | 03/30/17 | | 300,000 | | 322,787 |
Laboratory Corp. of America | | BBB | | 5.63 | | 12/15/15 | | 500,000 | | 510,069 |
Medco Health Solutions, Inc. | | BBB+ | | 4.13 | | 09/15/20 | | 250,000 | | 265,570 |
Owens & Minor, Inc. | | BBB | | 3.88 | | 09/15/21 | | 400,000 | | 411,412 |
PerkinElmer, Inc. | | BBB | | 5.00 | | 11/15/21 | | 300,000 | | 326,430 |
Quest Diagnostics, Inc. | | BBB+ | | 4.70 | | 04/01/21 | | 150,000 | | 162,222 |
Quest Diagnostics, Inc. | | BBB+ | | 4.75 | | 01/30/20 | | 250,000 | | 272,206 |
Thermo Fisher Scientific, Inc. | | BBB | | 3.60 | | 08/15/21 | | 375,000 | | 381,720 |
Zimmer Biomet Hldgs., Inc. | | BBB | | 3.15 | | 04/01/22 | | 250,000 | | 245,914 |
| | | | | | | | | | |
| | | | | | | | | | 3,962,271 |
| | | | | | | | | | |
INDUSTRIALS (1.1%) | | | | | | | | | | |
Crane Co. | | BBB | | 2.75 | | 12/15/18 | | 350,000 | | 356,917 |
Dun & Bradstreet Corp. | | BBB- | | 3.25 | | 12/01/17 | | 400,000 | | 406,770 |
Equifax, Inc. | | BBB+ | | 3.30 | | 12/15/22 | | 300,000 | | 298,400 |
Harsco Corp. | | BB | | 5.75 | | 05/15/18 | | 250,000 | | 257,500 |
L-3 Communications Corp. | | BBB- | | 4.75 | | 07/15/20 | | 250,000 | | 263,851 |
Pentair PLC | | BBB | | 5.00 | | 05/15/21 | | 250,000 | | 273,461 |
Pitney Bowes, Inc. | | BBB | | 5.25 | | 01/15/37 | | 250,000 | | 257,709 |
| | | | | | | | | | |
| | | | | | | | | | 2,114,608 |
| | | | | | | | | | |
INFORMATION TECHNOLOGY (1.1%) | | | | | | | | | | |
Arrow Electronics, Inc. | | BBB- | | 4.50 | | 03/01/23 | | 300,000 | | 306,604 |
eBay, Inc. | | A | | 2.88 | | 08/01/21 | | 325,000 | | 320,772 |
Fiserv, Inc. | | BBB | | 4.75 | | 06/15/21 | | 360,000 | | 393,589 |
Ingram Micro, Inc. | | BBB- | | 5.00 | | 08/10/22 | | 200,000 | | 209,636 |
Ingram Micro, Inc. | | BBB- | | 5.25 | | 09/01/17 | | 100,000 | | 106,997 |
Symantec Corp. | | BBB | | 4.20 | | 09/15/20 | | 350,000 | | 363,525 |
Tech Data Corp. | | BBB- | | 3.75 | | 09/21/17 | | 100,000 | | 103,611 |
Western Union Co. | | BBB | | 5.93 | | 10/01/16 | | 300,000 | | 314,976 |
| | | | | | | | | | |
| | | | | | | | | | 2,119,710 |
| | | | | | | | | | |
MATERIALS (1.5%) | | | | | | | | | | |
Alcoa, Inc. | | BBB- | | 6.75 | | 07/15/18 | | 250,000 | | 276,604 |
Freeport-McMoRan Copper & Gold | | BBB- | | 3.55 | | 03/01/22 | | 300,000 | | 277,688 |
Geon Co. | | BBB- | | 7.50 | | 12/15/15 | | 1,000,000 | | 1,024,799 |
Methanex Corp. | | BBB- | | 3.25 | | 12/15/19 | | 250,000 | | 251,525 |
Packaging Corp. of America | | BBB | | 3.90 | | 06/15/22 | | 250,000 | | 252,815 |
Packaging Corp. of America | | BBB | | 4.50 | | 11/01/23 | | 150,000 | | 154,694 |
Southern Copper Corp. | | BBB | | 3.50 | | 11/08/22 | | 100,000 | | 97,340 |
Teck Resources Ltd. | | BBB- | | 4.75 | | 01/15/22 | | 300,000 | | 278,744 |
Vulcan Materials Co. | | BB+ | | 7.00 | | 06/15/18 | | 250,000 | | 282,500 |
| | | | | | | | | | |
| | | | | | | | | | 2,896,709 |
| | | | | | | | | | |
MUTUAL OF AMERICA INVESTMENT CORPORATION - COMPOSITE FUND
PORTFOLIO OF INVESTMENTS IN SECURITIES
June 30, 2015 (Unaudited)
| | | | | | | | | | |
TELECOMMUNICATION SERVICES (0.4%) | | | | | | | | | | |
AT&T, Inc. | | BBB+ | | 3.00 | | 06/30/22 | | 350,000 | | 337,947 |
Verizon Communications, Inc. | | BBB+ | | 4.50 | | 09/15/20 | | 325,000 | | 350,589 |
| | | | | | | | | | |
| | | | | | | | | | 688,536 |
| | | | | | | | | | |
UTILITIES (1.0%) | | | | | | | | | | |
Constellation Energy | | BBB- | | 5.15 | | 12/01/20 | | 340,000 | | 376,233 |
Duke Energy Progress, Inc. | | A | | 5.25 | | 12/15/15 | | 500,000 | | 509,937 |
Entergy Corp. | | BBB- | | 5.13 | | 09/15/20 | | 250,000 | | 272,064 |
National Fuel Gas Co. | | BBB | | 4.90 | | 12/01/21 | | 250,000 | | 258,681 |
National Fuel Gas Co. | | BBB | | 5.20 | | 07/15/25 | | 100,000 | | 101,365 |
SCANA Corp. | | BBB | | 4.13 | | 02/01/22 | | 300,000 | | 302,218 |
| | | | | | | | | | |
| | | | | | | | | | 1,820,498 |
| | | | | | | | | | |
TOTAL LONG-TERM DEBT SECURITIES
(Cost: $69,775,478) 37.6% | | | | | | | | | | 71,841,056 |
| | | | | | | | | | |
| | | | | | | | | | |
| | | Rating** | | Rate(%) | | Maturity | | Face Amount | | Value |
SHORT-TERM DEBT SECURITIES: | | | | | | | | | | |
COMMERCIAL PAPER (2.8%) | | | | | | | | | | |
Abbott Laboratories† | | A-1+ | | 0.12 | | 07/27/15 | | 330,000 | | 329,971 |
Abbott Laboratories† | | A-1+ | | 0.12 | | 08/27/15 | | 600,000 | | 599,886 |
Toyota Motor Credit Corp. | | A-1+ | | 0.10 | | 07/16/15 | | 2,000,000 | | 1,999,917 |
Toyota Motor Credit Corp. | | A-1+ | | 0.16 | | 08/17/15 | | 2,500,000 | | 2,499,478 |
| | | | | | | | | | |
| | | | | | | | | | 5,429,252 |
| | | | | | | | | | |
TOTAL SHORT-TERM DEBT SECURITIES
(Cost: $5,429,252) 2.8% | | | | | | | | | | 5,429,252 |
| | | | | | | | | | |
TOTAL INVESTMENTS
(Cost: $146,712,350) 98.7% | | | | | | | | | | 188,719,090 |
| | | | | | | | | | |
OTHER NET ASSETS 1.3% | | | | | | | | | | 2,479,515 |
| | | | | | | | | | |
NET ASSETS 100.0% | | | | | | | | | | $191,198,605 |
| | | | | | | | | | |
The accompanying notes are an integral part of these portfolio schedules.
MUTUAL OF AMERICA INVESTMENT CORPORATION - RETIREMENT INCOME FUND
PORTFOLIO OF INVESTMENTS IN SECURITIES
June 30, 2015 (Unaudited)
| | | | | | | | |
| | | Shares | | | Value | |
COMMON STOCKS: | | | | | | | | |
DIVERSIFIED MUTUAL FUNDS (100.0%) | | | | | | | | |
Mutual of America Investment Corporation | | | | | | | | |
Bond Fund (30.9%) | | | 11,861,154 | | | | 17,371,134 | |
Equity Index Fund (19.9%) | | | 3,233,251 | | | | 11,148,670 | |
Mid-Cap Equity Index Fund (4.9%) | | | 1,232,280 | | | | 2,774,211 | |
Mid-Term Bond Fund (40.3%) | | | 21,141,624 | | | | 22,596,506 | |
Money Market Fund (4.0%) | | | 1,881,444 | | | | 2,250,689 | |
| | | | | | | | |
TOTAL INVESTMENTS
(Cost: $53,932,783) 100.0% | | | | | | | 56,141,210 | |
| | | | | | | | |
OTHER NET ASSETS -0.0% (3) | | | | | | | (77 | ) |
| | | | | | | | |
NET ASSETS 100.0% | | | | | | $ | 56,141,133 | |
| | | | | | | | |
The accompanying notes are an integral part of these portfolio schedules.
MUTUAL OF AMERICA INVESTMENT CORPORATION - 2010 RETIREMENT FUND
PORTFOLIO OF INVESTMENTS IN SECURITIES
June 30, 2015 (Unaudited)
| | | | | | | | |
| | | Shares | | | Value | |
COMMON STOCKS: | | | | | | | | |
DIVERSIFIED MUTUAL FUNDS (100.0%) | | | | | | | | |
Mutual of America Investment Corporation | | | | | | | | |
Bond Fund (26.0%) | | | 4,746,512 | | | | 6,951,457 | |
Equity Index Fund (24.9%) | | | 1,928,885 | | | | 6,651,046 | |
International Fund (3.0%) | | | 970,322 | | | | 796,893 | |
Mid-Cap Equity Index Fund (8.9%) | | | 1,058,792 | | | | 2,383,640 | |
Mid-Term Bond Fund (33.2%) | | | 8,326,129 | | | | 8,899,100 | |
Money Market Fund (4.0%) | | | 901,596 | | | | 1,078,539 | |
| | | | | | | | |
TOTAL INVESTMENTS
(Cost: $24,455,276) 100.0% | | | | | | | 26,760,675 | |
| | | | | | | | |
OTHER NET ASSETS -0.0% (3) | | | | | | | (36 | ) |
| | | | | | | | |
NET ASSETS 100.0% | | | | | | $ | 26,760,639 | |
| | | | | | | | |
The accompanying notes are an integral part of these portfolio schedules.
MUTUAL OF AMERICA INVESTMENT CORPORATION - 2015 RETIREMENT FUND
PORTFOLIO OF INVESTMENTS IN SECURITIES
June 30, 2015 (Unaudited)
| | | | | | | | |
| | | Shares | | | Value | |
COMMON STOCKS: | | | | | | | | |
DIVERSIFIED MUTUAL FUNDS (100.0%) | | | | | | | | |
Mutual of America Investment Corporation | | | | | | | | |
Bond Fund (25.0%) | | | 26,700,082 | | | | 39,103,338 | |
Equity Index Fund (27.9%) | | | 12,656,468 | | | | 43,641,147 | |
International Fund (6.0%) | | | 11,370,244 | | | | 9,337,994 | |
Mid-Cap Equity Index Fund (10.9%) | | | 7,585,323 | | | | 17,076,701 | |
Mid-Term Bond Fund (28.2%) | | | 41,296,666 | | | | 44,138,539 | |
Small Cap Growth Fund (1.0%) | | | 961,279 | | | | 1,605,155 | |
Small Cap Value Fund (1.0%) | | | 944,333 | | | | 1,549,148 | |
| | | | | | | | |
TOTAL INVESTMENTS
(Cost: $138,190,159) 100.0% | | | | | | | 156,452,022 | |
| | | | | | | | |
OTHER NET ASSETS -0.0% (3) | | | | | | | (367 | ) |
| | | | | | | | |
NET ASSETS 100.0% | | | | | | $ | 156,451,655 | |
| | | | | | | | |
The accompanying notes are an integral part of these portfolio schedules.
MUTUAL OF AMERICA INVESTMENT CORPORATION - 2020 RETIREMENT FUND
PORTFOLIO OF INVESTMENTS IN SECURITIES
June 30, 2015 (Unaudited)
| | | | | | | | |
| | | Shares | | | Value | |
COMMON STOCKS: | | | | | | | | |
DIVERSIFIED MUTUAL FUNDS (100.0%) | | | | | | | | |
Mutual of America Investment Corporation | | | | | | | | |
Bond Fund (24.5%) | | | 58,374,910 | | | | 85,492,390 | |
Equity Index Fund (33.4%) | | | 33,675,795 | | | | 116,118,518 | |
International Fund (8.7%) | | | 36,887,697 | | | | 30,294,611 | |
Mid-Cap Equity Index Fund (11.4%) | | | 17,662,667 | | | | 39,763,644 | |
Mid-Term Bond Fund (17.5%) | | | 56,975,170 | | | | 60,895,974 | |
Small Cap Growth Fund (2.3%) | | | 4,803,236 | | | | 8,020,505 | |
Small Cap Value Fund (2.2%) | | | 4,721,737 | | | | 7,745,858 | |
| | | | | | | | |
TOTAL INVESTMENTS
(Cost: $302,835,674) 100.0% | | | | | | | 348,331,500 | |
| | | | | | | | |
OTHER NET ASSETS -0.0% (3) | | | | | | | (736 | ) |
| | | | | | | | |
NET ASSETS 100.0% | | | | | | $ | 348,330,764 | |
| | | | | | | | |
The accompanying notes are an integral part of these portfolio schedules.
MUTUAL OF AMERICA INVESTMENT CORPORATION - 2025 RETIREMENT FUND
PORTFOLIO OF INVESTMENTS IN SECURITIES
June 30, 2015 (Unaudited)
| | | | | | | | |
| | | Shares | | | Value | |
COMMON STOCKS: | | | | | | | | |
DIVERSIFIED MUTUAL FUNDS (100.0%) | | | | | | | | |
Mutual of America Investment Corporation | | | | | | | | |
Bond Fund (22.3%) | | | 56,265,587 | | | | 82,403,203 | |
Equity Index Fund (37.5%) | | | 40,326,605 | | | | 139,051,376 | |
International Fund (9.5%) | | | 42,663,845 | | | | 35,038,365 | |
Mid-Cap Equity Index Fund (16.4%) | | | 26,827,593 | | | | 60,396,477 | |
Mid-Term Bond Fund (7.2%) | | | 24,763,745 | | | | 26,467,887 | |
Small Cap Growth Fund (3.6%) | | | 7,916,941 | | | | 13,219,811 | |
Small Cap Value Fund (3.5%) | | | 7,783,075 | | | | 12,767,886 | |
| | | | | | | | |
TOTAL INVESTMENTS
(Cost: $309,950,282) 100.0% | | | | | | | 369,345,005 | |
| | | | | | | | |
OTHER NET ASSETS -0.0% (3) | | | | | | | (772 | ) |
| | | | | | | | |
NET ASSETS 100.0% | | | | | | $ | 369,344,233 | |
| | | | | | | | |
The accompanying notes are an integral part of these portfolio schedules.
MUTUAL OF AMERICA INVESTMENT CORPORATION - 2030 RETIREMENT FUND
PORTFOLIO OF INVESTMENTS IN SECURITIES
June 30, 2015 (Unaudited)
| | | | | | | | |
| | | Shares | | | Value | |
COMMON STOCKS: | | | | | | | | |
DIVERSIFIED MUTUAL FUNDS (100.0%) | | | | | | | | |
Mutual of America Investment Corporation | | | | | | | | |
Bond Fund (22.3%) | | | 46,884,787 | | | | 68,664,647 | |
Equity Index Fund (40.7%) | | | 36,259,378 | | | | 125,027,048 | |
International Fund (9.5%) | | | 35,619,675 | | | | 29,253,228 | |
Mid-Cap Equity Index Fund (17.4%) | | | 23,772,332 | | | | 53,518,222 | |
Small Cap Growth Fund (5.1%) | | | 9,474,199 | | | | 15,820,140 | |
Small Cap Value Fund (5.0%) | | | 9,314,875 | | | | 15,280,755 | |
| | | | | | | | |
TOTAL INVESTMENTS
(Cost: $252,355,411) 100.0% | | | | | | | 307,564,040 | |
| | | | | | | | |
OTHER NET ASSETS -0.0% (3) | | | | | | | (650 | ) |
| | | | | | | | |
NET ASSETS 100.0% | | | | | | $ | 307,563,390 | |
| | | | | | | | |
The accompanying notes are an integral part of these portfolio schedules.
MUTUAL OF AMERICA INVESTMENT CORPORATION - 2035 RETIREMENT FUND
PORTFOLIO OF INVESTMENTS IN SECURITIES
June 30, 2015 (Unaudited)
| | | | | | | | |
| | | Shares | | | Value | |
COMMON STOCKS: | | | | | | | | |
DIVERSIFIED MUTUAL FUNDS (100.0%) | | | | | | | | |
Mutual of America Investment Corporation | | | | | | | | |
Bond Fund (15.6%) | | | 27,046,047 | | | | 39,610,018 | |
Equity Index Fund (40.6%) | | | 30,057,166 | | | | 103,641,013 | |
International Fund (11.5%) | | | 35,699,096 | | | | 29,318,454 | |
Mid-Cap Equity Index Fund (20.1%) | | | 22,780,596 | | | | 51,285,546 | |
Small Cap Growth Fund (6.2%) | | | 9,421,579 | | | | 15,732,276 | |
Small Cap Value Fund (6.0%) | | | 9,262,342 | | | | 15,194,576 | |
| | | | | | | | |
TOTAL INVESTMENTS
(Cost: $206,687,860) 100.0% | | | | | | | 254,781,883 | |
| | | | | | | | |
OTHER NET ASSETS -0.0% (3) | | | | | | | (544 | ) |
| | | | | | | | |
NET ASSETS 100.0% | | | | | | $ | 254,781,339 | |
| | | | | | | | |
The accompanying notes are an integral part of these portfolio schedules.
MUTUAL OF AMERICA INVESTMENT CORPORATION - 2040 RETIREMENT FUND
PORTFOLIO OF INVESTMENTS IN SECURITIES
June 30, 2015 (Unaudited)
| | | | | | | | |
| | | Shares | | | Value | |
COMMON STOCKS: | | | | | | | | |
DIVERSIFIED MUTUAL FUNDS (100.0%) | | | | | | | | |
Mutual of America Investment Corporation | | | | | | | | |
Bond Fund (11.6%) | | | 16,638,043 | | | | 24,367,079 | |
Equity Index Fund (35.7%) | | | 21,789,820 | | | | 75,134,131 | |
International Fund (13.5%) | | | 34,517,902 | | | | 28,348,379 | |
Mid-Cap Equity Index Fund (23.0%) | | | 21,501,392 | | | | 48,405,698 | |
Small Cap Growth Fund (8.2%) | | | 10,366,216 | | | | 17,309,642 | |
Small Cap Value Fund (8.0%) | | | 10,192,194 | | | | 16,719,968 | |
| | | | | | | | |
TOTAL INVESTMENTS
(Cost: $167,795,232) 100.0% | | | | | | | 210,284,897 | |
| | | | | | | | |
OTHER NET ASSETS -0.0% (3) | | | | (458 | ) |
| | | | | | | | |
NET ASSETS 100.0% | | | $ | 210,284,439 | |
| | | | | | | | |
The accompanying notes are an integral part of these portfolio schedules.
MUTUAL OF AMERICA INVESTMENT CORPORATION - 2045 RETIREMENT FUND
PORTFOLIO OF INVESTMENTS IN SECURITIES
June 30, 2015 (Unaudited)
| | | | | | | | |
| | | Shares | | | Value | |
COMMON STOCKS: | | | | | | | | |
DIVERSIFIED MUTUAL FUNDS (100.0%) | | | | | | | | |
Mutual of America Investment Corporation | | | | | | | | |
Bond Fund (9.6%) | | | 16,850,082 | | | | 24,677,619 | |
Equity Index Fund (35.6%) | | | 26,631,683 | | | | 91,829,505 | |
International Fund (15.5%) | | | 48,463,245 | | | | 39,801,215 | |
Mid-Cap Equity Index Fund (21.1%) | | | 24,200,028 | | | | 54,481,088 | |
Small Cap Growth Fund (9.3%) | | | 14,287,459 | | | | 23,857,384 | |
Small Cap Value Fund (8.9%) | | | 14,047,507 | | | | 23,044,486 | |
| | | | | | | | |
TOTAL INVESTMENTS
(Cost: $203,146,662) 100.0% | | | | | | | 257,691,297 | |
| | | | | | | | |
OTHER NET ASSETS -0.0% (3) | | | | | | | (556 | ) |
| | | | | | | | |
NET ASSETS 100.0% | | | | | | $ | 257,690,741 | |
| | | | | | | | |
The accompanying notes are an integral part of these portfolio schedules.
MUTUAL OF AMERICA INVESTMENT CORPORATION - 2050 RETIREMENT FUND
PORTFOLIO OF INVESTMENTS IN SECURITIES
June 30, 2015 (Unaudited)
| | | | | | | | |
| | | Shares | | | Value | |
COMMON STOCKS: | | | | | |
DIVERSIFIED MUTUAL FUNDS (100.0%) | | | | | | | | |
Mutual of America Investment Corporation | | | | | | | | |
Bond Fund (7.5%) | | | 3,693,732 | | | | 5,409,618 | |
Equity Index Fund (35.4%) | | | 7,429,280 | | | | 25,617,124 | |
International Fund (16.5%) | | | 14,527,066 | | | | 11,930,586 | |
Mid-Cap Equity Index Fund (20.3%) | | | 6,509,860 | | | | 14,655,530 | |
Small Cap Growth Fund (10.3%) | | | 4,448,565 | | | | 7,428,271 | |
Small Cap Value Fund (10.0%) | | | 4,379,055 | | | | 7,183,700 | |
| | | | | | | | |
TOTAL INVESTMENTS
(Cost: $67,715,128) 100.0% | | | | | | | 72,224,829 | |
| | | | | | | | |
OTHER NET ASSETS -0.0% (3) | | | | (98 | ) |
| | | | | | | | |
NET ASSETS 100.0% | | | $ | 72,224,731 | |
| | | | | | | | |
The accompanying notes are an integral part of these portfolio schedules.
MUTUAL OF AMERICA INVESTMENT CORPORATION - CONSERVATIVE ALLOCATION FUND
PORTFOLIO OF INVESTMENTS IN SECURITIES
June 30, 2015 (Unaudited)
| | | | | | | | |
| | | Shares | | | Value | |
COMMON STOCKS: | | | | | |
DIVERSIFIED MUTUAL FUNDS (100.0%) | | | | | | | | |
Mutual of America Investment Corporation | | | | | | | | |
Bond Fund (29.8%) | | | 26,332,435 | | | | 38,564,905 | |
Equity Index Fund (25.1%) | | | 9,433,745 | | | | 32,528,780 | |
International Fund (5.1%) | | | 8,058,550 | | | | 6,618,213 | |
Mid-Cap Equity Index Fund (5.0%) | | | 2,893,536 | | | | 6,514,166 | |
Mid-Term Bond Fund (35.0%) | | | 42,346,108 | | | | 45,260,197 | |
| | | | | | | | |
TOTAL INVESTMENTS
(Cost: $119,820,194) 100.0% | | | | | | | 129,486,261 | |
| | | | | | | | |
OTHER NET ASSETS -0.0% (3) | | | | (127 | ) |
| | | | | | | | |
NET ASSETS 100.0% | | | $ | 129,486,134 | |
| | | | | | | | |
The accompanying notes are an integral part of these portfolio schedules.
MUTUAL OF AMERICA INVESTMENT CORPORATION - MODERATE ALLOCATION FUND
PORTFOLIO OF INVESTMENTS IN SECURITIES
June 30, 2015 (Unaudited)
| | | | | | | | |
| | | Shares | | | Value | |
COMMON STOCKS: | | | | | |
DIVERSIFIED MUTUAL FUNDS (100.0%) | | | | | | | | |
Mutual of America Investment Corporation | | | | | | | | |
Bond Fund (24.7%) | | | 54,969,109 | | | | 80,504,459 | |
Equity Index Fund (35.1%) | | | 33,094,457 | | | | 114,113,989 | |
International Fund (10.2%) | | | 40,397,727 | | | | 33,177,279 | |
Mid-Cap Equity Index Fund (15.1%) | | | 21,751,286 | | | | 48,968,280 | |
Mid-Term Bond Fund (14.9%) | | | 45,462,675 | | | | 48,591,235 | |
| | | | | | | | |
TOTAL INVESTMENTS
(Cost: $267,224,922) 100.0% | | | | | | | 325,355,242 | |
| | | | | | | | |
OTHER NET ASSETS -0.0% (3) | | | | (276 | ) |
| | | | | | | | |
NET ASSETS 100.0% | | | $ | 325,354,966 | |
| | | | | | | | |
The accompanying notes are an integral part of these portfolio schedules.
MUTUAL OF AMERICA INVESTMENT CORPORATION - AGGRESSIVE ALLOCATION FUND
PORTFOLIO OF INVESTMENTS IN SECURITIES
June 30, 2015 (Unaudited)
| | | | | | | | |
| | | Shares | | | Value | |
COMMON STOCKS: | | | | | | | | |
DIVERSIFIED MUTUAL FUNDS (100.0%) | | | | | | | | |
Mutual of America Investment Corporation | | | | | | | | |
Bond Fund (19.7%) | | | 35,161,563 | | | | 51,495,515 | |
Equity Index Fund (34.9%) | | | 26,468,884 | | | | 91,268,154 | |
International Fund (15.2%) | | | 48,479,844 | | | | 39,814,848 | |
Mid-Cap Equity Index Fund (20.0%) | | | 23,195,097 | | | | 52,218,704 | |
Small Cap Growth Fund (5.2%) | | | 8,053,739 | | | | 13,448,238 | |
Small Cap Value Fund (5.0%) | | | 7,923,955 | | | | 12,998,994 | |
| | | | | | | | |
TOTAL INVESTMENTS
(Cost: $195,573,604) 100.0% | | | | | | | 261,244,453 | |
| | | | | | | | |
OTHER NET ASSETS -0.0% (3) | | | | | | | (237 | ) |
| | | | | | | | |
NET ASSETS 100.0% | | | | | | $ | 261,244,216 | |
| | | | | | | | |
The accompanying notes are an integral part of these portfolio schedules.
MUTUAL OF AMERICA INVESTMENT CORPORATION - MONEY MARKET FUND
PORTFOLIO OF INVESTMENTS IN SECURITIES
June 30, 2015 (Unaudited)
| | | | | | | | | | | | | | | | |
| | | Rating** | | Rate(%) | | | Maturity | | Face Amount | | | Value | |
SHORT-TERM DEBT SECURITIES: | | | | | | | | | | | | | | |
U.S. GOVERNMENT (5.7%) | | | | | | | | | | | | | | | | |
U.S. Treasury Bill | | A-1+ | | | 0.06 | | | 12/24/15 | | | 4,000,000 | | | | 3,999,126 | |
| | | | | | | | | | | | | | | | |
U.S. GOVERNMENT AGENCIES (22.6%) | | | | | | | | | | | | | | | | |
FHLB | | A-1+ | | | 0.01 | | | 07/24/15 | | | 5,000,000 | | | | 4,999,968 | |
FHLB | | A-1+ | | | 0.03 | | | 08/05/15 | | | 10,800,000 | | | | 10,799,736 | |
| | | | | | | | | | | | | | | | |
| | | | | | | | | | | | | | | 15,799,704 | |
| | | | | | | | | | | | | | | | |
COMMERCIAL PAPER (70.2%) | | | | | | | | | | | | | | | | |
Abbott Laboratories† | | A-1+ | | | 0.12 | | | 07/27/15 | | | 1,250,000 | | | | 1,249,892 | |
Abbott Laboratories† | | A-1+ | | | 0.12 | | | 07/28/15 | | | 1,700,000 | | | | 1,699,847 | |
Coca-Cola Co.† | | A-1+ | | | 0.23 | | | 10/21/15 | | | 2,800,000 | | | | 2,798,393 | |
Danaher Corp.† | | A-1 | | | 0.17 | | | 07/10/15 | | | 2,875,000 | | | | 2,874,878 | |
EMC Corp.† | | A-1 | | | 0.12 | | | 07/21/15 | | | 3,000,000 | | | | 2,999,800 | |
Emerson Electric Co.† | | A-1 | | | 0.12 | | | 08/10/15 | | | 1,100,000 | | | | 1,099,853 | |
Emerson Electric Co.† | | A-1 | | | 0.13 | | | 08/19/15 | | | 1,900,000 | | | | 1,899,664 | |
General Electric Capital Corp. | | A-1+ | | | 0.14 | | | 08/10/15 | | | 500,000 | | | | 499,922 | |
General Electric Capital Corp. | | A-1+ | | | 0.15 | | | 08/31/15 | | | 2,500,000 | | | | 2,499,786 | |
Google, Inc.† | | A-1+ | | | 0.13 | | | 07/08/15 | | | 450,000 | | | | 449,989 | |
Honeywell International† | | A-1 | | | 0.12 | | | 07/17/15 | | | 600,000 | | | | 599,968 | |
Honeywell International† | | A-1 | | | 0.13 | | | 09/01/15 | | | 800,000 | | | | 799,837 | |
Intercontinental Exchange, Inc.† | | A-1 | | | 0.19 | | | 07/24/15 | | | 1,800,000 | | | | 1,799,781 | |
Intercontinental Exchange, Inc.† | | A-1 | | | 0.19 | | | 07/31/15 | | | 1,000,000 | | | | 999,842 | |
J.P. Morgan Securities LLC | | A-1 | | | 0.18 | | | 07/24/15 | | | 350,000 | | | | 349,960 | |
J.P. Morgan Securities LLC | | A-1 | | | 0.20 | | | 07/06/15 | | | 300,000 | | | | 299,992 | |
J.P. Morgan Securities LLC | | A-1 | | | 0.20 | | | 07/23/15 | | | 500,000 | | | | 499,939 | |
J.P. Morgan Securities LLC† | | A-1 | | | 0.20 | | | 07/28/15 | | | 1,850,000 | | | | 1,849,722 | |
National Oilwell Varco, Inc.† | | A-1 | | | 0.15 | | | 07/22/15 | | | 3,000,000 | | | | 2,999,737 | |
National Rural Utilities | | A-1 | | | 0.10 | | | 07/21/15 | | | 2,400,000 | | | | 2,399,867 | |
Novartis Finance Corp.† | | A-1+ | | | 0.13 | | | 07/09/15 | | | 1,185,000 | | | | 1,184,966 | |
Pfizer, Inc.† | | A-1+ | | | 0.13 | | | 07/16/15 | | | 250,000 | | | | 249,986 | |
Private Export Funding Corp. | | A-1 | | | 0.13 | | | 08/11/15 | | | 2,000,000 | | | | 1,999,704 | |
QUALCOMM, Inc.† | | A-1+ | | | 0.12 | | | 09/08/15 | | | 2,900,000 | | | | 2,900,090 | |
San Diego Gas & Electric Co.† | | A-1 | | | 0.08 | | | 07/01/15 | | | 1,400,000 | | | | 1,400,000 | |
San Diego Gas & Electric Co.† | | A-1 | | | 0.14 | | | 07/01/15 | | | 1,575,000 | | | | 1,575,000 | |
Simon Property Group LP† | | A-1 | | | 0.17 | | | 08/17/15 | | | 2,900,000 | | | | 2,899,356 | |
Toyota Motor Credit Corp. | | A-1+ | | | 0.14 | | | 08/10/15 | | | 3,000,000 | | | | 2,999,533 | |
Unilever Capital† | | A-1 | | | 0.12 | | | 07/06/15 | | | 500,000 | | | | 499,992 | |
United Technologies Corp.† | | A-1 | | | 0.12 | | | 07/27/15 | | | 500,000 | | | | 499,957 | |
Wisconsin Gas Co. | | A-1 | | | 0.12 | | | 07/10/15 | | | 2,200,000 | | | | 2,199,934 | |
| | | | | | | | | | | | | | | | |
| | | | | | | | | | | | | | | 49,079,187 | |
| | | | | | | | | | | | | | | | |
TOTAL SHORT-TERM DEBT SECURITIES
(Cost: $68,876,136) 98.5% | | | | | | | | | | | | | | | 68,878,017 | |
| | | | | | | | | | | | | | | | |
TOTAL INVESTMENTS
(Cost: $68,876,136) 98.5% | | | | | | | | | | | | | | | 68,878,017 | |
| | | | | | | | | | | | | | | | |
OTHER NET ASSETS 1.5% | | | | | | | | | | | | | 1,055,336 | |
| | | | | | | | | | | | | | | | |
NET ASSETS 100.0% | | | | | | | | | | | | $ | 69,933,353 | |
| | | | | | | | | | | | | | | | |
The accompanying notes are an integral part of these portfolio schedules.
MUTUAL OF AMERICA INVESTMENT CORPORATION - MID-TERM BOND FUND
PORTFOLIO OF INVESTMENTS IN SECURITIES
June 30, 2015 (Unaudited)
| | | | | | | | | | |
| | | Rating** | | Rate(%) | | Maturity | | Face Amount | | Value |
LONG-TERM DEBT SECURITIES: | | | | | | | | |
U.S. GOVERNMENT (26.3%) | | | | | | | | | | |
U.S. Treasury Note | | AA+ | | 1.25 | | 11/30/18 | | 3,500,000 | | 3,508,750 |
U.S. Treasury Note | | AA+ | | 1.38 | | 12/31/18 | | 10,750,000 | | 10,811,307 |
U.S. Treasury Note | | AA+ | | 1.50 | | 10/31/19 | | 4,500,000 | | 4,502,462 |
U.S. Treasury Note | | AA+ | | 1.75 | | 09/30/19 | | 5,000,000 | | 5,060,155 |
U.S. Treasury Note | | AA+ | | 1.75 | | 02/28/22 | | 17,000,000 | | 16,703,826 |
U.S. Treasury Note | | AA+ | | 1.88 | | 05/31/22 | | 14,000,000 | | 13,844,684 |
U.S. Treasury Note | | AA+ | | 2.00 | | 11/30/20 | | 7,500,000 | | 7,593,750 |
U.S. Treasury Strip | | AA+ | | 0.00 | | 11/15/17 | | 5,000,000 | | 4,904,680 |
U.S. Treasury Strip | | AA+ | | 0.00 | | 08/15/18 | | 55,000,000 | | 53,211,340 |
| | | | | | | | | | |
| | | | | | | | | | 120,140,954 |
| | | | | | | | | | |
U.S. GOVERNMENT AGENCIES (7.5%) | | | | | | | | | | |
MORTGAGE-BACKED OBLIGATIONS (0.0%) (3) | | | | | | | | | | |
FHLMC | | AA+ | | 7.50 | | 03/15/21 | | 3,837 | | 4,255 |
FHLMC | | AA+ | | 8.00 | | 09/01/18 | | 221 | | 223 |
FHLMC | | AA+ | | 8.50 | | 09/01/17 | | 3 | | 3 |
| | | | | | | | | | |
| | | | | | | | | | 4,481 |
| | | | | | | | | | |
NON-MORTGAGE-BACKED OBLIGATIONS (7.5%) | | | | | | | | | | |
FHLMC | | AA+ | | 0.00 | | 11/29/19 | | 13,500,000 | | 12,314,228 |
FNMA | | AA+ | | 0.00 | | 10/09/19 | | 23,000,000 | | 21,006,540 |
Tennessee Valley Auth. Strip | | AA+ | | 0.00 | | 11/01/20 | | 900,000 | | 808,160 |
| | | | | | | | | | |
| | | | | | | | | | 34,128,928 |
| | | | | | | | | | |
CORPORATE DEBT (62.9%) | | | | | | | | | | |
CONSUMER DISCRETIONARY (9.7%) | | | | | | | | | | |
Advance Auto Parts, Inc. | | BBB- | | 4.50 | | 01/15/22 | | 500,000 | | 524,905 |
Advance Auto Parts, Inc. | | BBB- | | 5.75 | | 05/01/20 | | 1,500,000 | | 1,672,497 |
AutoZone, Inc. | | BBB | | 3.70 | | 04/15/22 | | 300,000 | | 307,593 |
AutoZone, Inc. | | BBB | | 4.00 | | 11/15/20 | | 700,000 | | 743,619 |
Brinker International, Inc. | | BBB- | | 2.60 | | 05/15/18 | | 2,000,000 | | 2,003,908 |
Carnival Corp. | | BBB+ | | 1.88 | | 12/15/17 | | 2,000,000 | | 2,008,350 |
Dollar General Corp. | | BBB- | | 3.25 | | 04/15/23 | | 1,047,000 | | 997,529 |
Dollar General Corp. | | BBB- | | 4.13 | | 07/15/17 | | 962,000 | | 1,005,946 |
Expedia, Inc. | | BBB- | | 5.95 | | 08/15/20 | | 2,000,000 | | 2,229,232 |
Family Dollar Stores, Inc. | | BBB- | | 5.00 | | 02/01/21 | | 2,000,000 | | 2,069,962 |
Harman Int’l. Industries, Inc. | | BBB- | | 4.15 | | 05/15/25 | | 2,000,000 | | 1,971,026 |
Home Depot, Inc. | | A | | 5.40 | | 03/01/16 | | 250,000 | | 257,894 |
Hyatt Hotels Corp. | | BBB | | 3.88 | | 08/15/16 | | 1,525,000 | | 1,566,306 |
Hyatt Hotels Corp. | | BBB | | 5.38 | | 08/15/21 | | 50,000 | | 55,512 |
Kohl’s Corp. | | BBB | | 3.25 | | 02/01/23 | | 700,000 | | 682,000 |
Kohl’s Corp. | | BBB | | 4.00 | | 11/01/21 | | 1,325,000 | | 1,394,513 |
Marriott International, Inc. | | BBB | | 3.00 | | 03/01/19 | | 1,200,000 | | 1,230,451 |
Marriott International, Inc. | | BBB | | 3.38 | | 10/15/20 | | 800,000 | | 822,882 |
Mattel, Inc. | | BBB | | 1.70 | | 03/15/18 | | 2,000,000 | | 1,990,100 |
Newell Rubbermaid, Inc. | | BBB- | | 4.70 | | 08/15/20 | | 525,000 | | 573,373 |
NVR, Inc. | | BBB+ | | 3.95 | | 09/15/22 | | 2,000,000 | | 2,027,720 |
O’Reilly Automotive, Inc. | | BBB+ | | 4.63 | | 09/15/21 | | 281,000 | | 308,753 |
Omnicom Group, Inc. | | BBB+ | | 3.63 | | 05/01/22 | | 2,000,000 | | 2,011,604 |
Scripps Networks Interactive, Inc. | | BBB | | 3.50 | | 06/15/22 | | 2,000,000 | | 1,967,582 |
Staples, Inc. | | BBB- | | 2.75 | | 01/12/18 | | 2,000,000 | | 2,017,860 |
Starwood Hotels & Resorts | | BBB | | 3.13 | | 02/15/23 | | 2,000,000 | | 1,904,914 |
Tupperware Brands Corp. | | BBB- | | 4.75 | | 06/01/21 | | 2,000,000 | | 2,109,782 |
Viacom, Inc. | | BBB | | 3.25 | | 03/15/23 | | 2,000,000 | | 1,900,624 |
Whirlpool Corp. | | BBB | | 2.40 | | 03/01/19 | | 1,445,000 | | 1,458,290 |
Whirlpool Corp. | | BBB | | 6.50 | | 06/15/16 | | 500,000 | | 524,929 |
Wyndham Worldwide Corp. | | BBB- | | 2.95 | | 03/01/17 | | 2,160,000 | | 2,192,607 |
Wynn Las Vegas LLC | | BBB- | | 5.38 | | 03/15/22 | | 2,000,000 | | 2,030,000 |
| | | | | | | | | | |
| | | | | | | | | | 44,562,263 |
| | | | | | | | | | |
MUTUAL OF AMERICA INVESTMENT CORPORATION - MID-TERM BOND FUND
PORTFOLIO OF INVESTMENTS IN SECURITIES
June 30, 2015 (Unaudited)
| | | | | | | | | | |
CONSUMER STAPLES (3.9%) | | | | |
Avon Products, Inc. | | B+ | | 4.60 | | 03/15/20 | | 1,800,000 | | 1,639,125 |
Beam, Inc. | | BBB | | 1.75 | | 06/15/18 | | 2,000,000 | | 1,989,256 |
ConAgra Foods, Inc. | | BBB- | | 1.90 | | 01/25/18 | | 2,000,000 | | 1,970,202 |
CVS Health Corp. | | BBB+ | | 6.13 | | 08/15/16 | | 500,000 | | 528,583 |
Dr. Pepper Snapple Group, Inc. | | BBB+ | | 2.60 | | 01/15/19 | | 150,000 | | 151,253 |
Energizer Hldgs., Inc. | | BBB- | | 4.70 | | 05/19/21 | | 2,000,000 | | 2,024,796 |
Flowers Foods, Inc. | | BBB- | | 4.38 | | 04/01/22 | | 1,500,000 | | 1,565,294 |
General Mills, Inc. | | BBB+ | | 2.20 | | 10/21/19 | | 775,000 | | 770,531 |
Hershey Co. | | A | | 4.85 | | 08/15/15 | | 500,000 | | 502,433 |
Ingredion, Inc. | | BBB | | 4.63 | | 11/01/20 | | 275,000 | | 294,620 |
Kroger Co. | | BBB | | 2.95 | | 11/01/21 | | 2,000,000 | | 1,987,208 |
Mead Johnson Nutrition Co. | | BBB | | 4.90 | | 11/01/19 | | 3,075,000 | | 3,338,933 |
Molson Coors Brewing Co. | | BBB+ | | 3.50 | | 05/01/22 | | 1,000,000 | | 1,008,955 |
| | | | | | | | | | |
| | | | | | | | | | 17,771,189 |
| | | | | | | | | | |
ENERGY (4.4%) | | | | | | | | | | |
Diamond Offshore Drilling, Inc. | | BBB+ | | 3.45 | | 11/01/23 | | 1,500,000 | | 1,418,451 |
Diamond Offshore Drilling, Inc. | | BBB+ | | 4.88 | | 07/01/15 | | 500,000 | | 500,000 |
Energen Corp. | | BB | | 4.63 | | 09/01/21 | | 2,000,000 | | 1,922,886 |
EQT Corp. | | BBB | | 4.88 | | 11/15/21 | | 1,250,000 | | 1,317,175 |
FMC Technologies, Inc. | | BBB | | 2.00 | | 10/01/17 | | 2,000,000 | | 1,997,280 |
Marathon Petroleum Corp. | | BBB | | 3.50 | | 03/01/16 | | 1,500,000 | | 1,525,328 |
Murphy Oil Corp. | | BBB | | 2.50 | | 12/01/17 | | 2,000,000 | | 1,996,280 |
National Oilwell Varco, Inc. | | A | | 6.13 | | 08/15/15 | | 1,000,000 | | 1,000,672 |
Noble Energy, Inc. | | BBB | | 4.15 | | 12/15/21 | | 1,100,000 | | 1,145,944 |
Pioneer Natural Resources Co. | | BBB- | | 6.65 | | 03/15/17 | | 2,000,000 | | 2,162,854 |
Rowan Companies PLC | | BBB- | | 4.88 | | 06/01/22 | | 2,000,000 | | 1,986,446 |
SESI LLC | | BBB- | | 7.13 | | 12/15/21 | | 2,150,000 | | 2,279,000 |
Sunoco, Inc. | | BBB- | | 5.75 | | 01/15/17 | | 290,000 | | 305,512 |
Weatherford Int’l. Ltd. | | BBB- | | 5.50 | | 02/15/16 | | 500,000 | | 510,699 |
| | | | | | | | | | |
| | | | | | | | | | 20,068,527 |
| | | | | | | | | | |
FINANCIALS (17.4%) | | | | | | | | | | |
Aflac, Inc. | | A | | 2.65 | | 02/15/17 | | 1,500,000 | | 1,535,325 |
Aflac, Inc. | | A | | 3.63 | | 06/15/23 | | 500,000 | | 505,281 |
Alleghany Corp. | | BBB+ | | 4.95 | | 06/27/22 | | 2,000,000 | | 2,157,228 |
American Express Credit Corp. | | A- | | 2.25 | | 08/15/19 | | 2,000,000 | | 2,003,368 |
American Tower Corp. | | BBB- | | 4.50 | | 01/15/18 | | 2,000,000 | | 2,116,372 |
Bank of America Corp. | | A- | | 2.65 | | 04/01/19 | | 1,250,000 | | 1,264,809 |
Bank of America Corp. | | A- | | 3.70 | | 09/01/15 | | 250,000 | | 251,036 |
Bank of America Corp. | | BBB+ | | 5.75 | | 08/15/16 | | 500,000 | | 523,576 |
Barrick N.A. Finance LLC | | BBB- | | 4.40 | | 05/30/21 | | 2,000,000 | | 2,043,016 |
Berkley (W.R.) Corp. | | BBB+ | | 4.63 | | 03/15/22 | | 2,000,000 | | 2,126,464 |
Block Financial LLC | | BBB | | 5.50 | | 11/01/22 | | 1,518,000 | | 1,636,533 |
Boston Properties LP | | A- | | 3.70 | | 11/15/18 | | 1,970,000 | | 2,075,572 |
Bunge Ltd. Finance Corp. | | BBB- | | 5.10 | | 07/15/15 | | 1,000,000 | | 1,000,901 |
Capital One Financial Corp. | | BBB | | 4.75 | | 07/15/21 | | 2,000,000 | | 2,184,556 |
Citigroup, Inc. | | A- | | 2.55 | | 04/08/19 | | 1,850,000 | | 1,865,409 |
CNA Financial Corp. | | BBB | | 6.50 | | 08/15/16 | | 1,000,000 | | 1,057,718 |
Erac USA Finance Co.† | | BBB+ | | 2.75 | | 03/15/17 | | 1,000,000 | | 1,024,373 |
Erac USA Finance LLC† | | BBB+ | | 2.35 | | 10/15/19 | | 1,000,000 | | 993,461 |
ERP Operating LP | | A- | | 5.38 | | 08/01/16 | | 500,000 | | 522,688 |
Fairfax Financial Hldgs. | | BBB- | | 8.25 | | 10/01/15 | | 742,000 | | 753,872 |
Fairfax Financial Hldgs.† | | BBB- | | 5.80 | | 05/15/21 | | 1,274,000 | | 1,357,627 |
First Republic Bank | | A- | | 2.38 | | 06/17/19 | | 2,000,000 | | 1,997,984 |
First Tennessee Bank | | BBB- | | 2.95 | | 12/01/19 | | 2,200,000 | | 2,198,907 |
Ford Motor Credit Co. LLC | | BBB- | | 3.00 | | 06/12/17 | | 2,000,000 | | 2,045,780 |
General Electric Capital Corp. | | AA+ | | 5.00 | | 01/08/16 | | 500,000 | | 511,529 |
Goldman Sachs Group, Inc. | | A- | | 3.70 | | 08/01/15 | | 900,000 | | 901,906 |
Government Pptys. Income Trust | | BBB- | | 3.75 | | 08/15/19 | | 2,000,000 | | 2,057,272 |
Harley-Davidson Financial Svcs.† | | A- | | 3.88 | | 03/15/16 | | 500,000 | | 510,190 |
HCP, Inc. | | BBB+ | | 3.15 | | 08/01/22 | | 750,000 | | 722,202 |
MUTUAL OF AMERICA INVESTMENT CORPORATION - MID-TERM BOND FUND
PORTFOLIO OF INVESTMENTS IN SECURITIES
June 30, 2015 (Unaudited)
| | | | | | | | | | |
HCP, Inc. | | BBB+ | | 6.00 | | 01/30/17 | | 1,250,000 | | 1,333,441 |
Health Care REIT, Inc. | | BBB | | 3.63 | | 03/15/16 | | 2,000,000 | | 2,029,872 |
Healthcare Realty Trust | | BBB- | | 5.75 | | 01/15/21 | | 2,000,000 | | 2,214,654 |
Hospitality Properties Trust | | BBB- | | 5.00 | | 08/15/22 | | 1,300,000 | | 1,353,214 |
Hospitality Properties Trust | | BBB- | | 5.63 | | 03/15/17 | | 566,000 | | 597,564 |
Huntington National Bank | | BBB+ | | 1.35 | | 08/02/16 | | 1,995,000 | | 1,996,375 |
Jones Lang LaSalle, Inc. | | BBB | | 4.40 | | 11/15/22 | | 1,410,000 | | 1,446,220 |
JPMorgan Chase & Co. | | A | | 2.00 | | 08/15/17 | | 2,000,000 | | 2,020,284 |
Kemper Corp. | | BBB- | | 6.00 | | 05/15/17 | | 500,000 | | 533,141 |
Mack-Cali Realty LP | | BBB- | | 4.50 | | 04/18/22 | | 1,000,000 | | 988,479 |
Mack-Cali Realty LP | | BBB- | | 5.80 | | 01/15/16 | | 1,000,000 | | 1,019,504 |
Moody’s Corp. | | BBB+ | | 5.50 | | 09/01/20 | | 2,000,000 | | 2,245,056 |
Morgan Stanley | | A- | | 4.00 | | 07/24/15 | | 1,000,000 | | 1,001,673 |
Morgan Stanley | | A- | | 4.75 | | 03/22/17 | | 1,000,000 | | 1,054,946 |
Nasdaq OMX Group, Inc. | | BBB- | | 5.55 | | 01/15/20 | | 2,150,000 | | 2,379,837 |
Penske Truck Leasing Co. LP† | | BBB- | | 3.38 | | 03/15/18 | | 1,300,000 | | 1,339,822 |
Penske Truck Leasing Co. LP† | | BBB- | | 3.75 | | 05/11/17 | | 490,000 | | 506,960 |
Prudential Financial, Inc. | | A | | 4.75 | | 09/17/15 | | 1,000,000 | | 1,007,737 |
Raymond James Financial, Inc. | | BBB | | 4.25 | | 04/15/16 | | 1,600,000 | | 1,639,989 |
Reckson Operating Partnership | | BBB- | | 6.00 | | 03/31/16 | | 1,700,000 | | 1,755,859 |
Reinsurance Grp. of America, Inc. | | A- | | 5.63 | | 03/15/17 | | 1,500,000 | | 1,598,672 |
Senior Housing Pptys. Trust | | BBB- | | 4.30 | | 01/15/16 | | 1,650,000 | | 1,662,002 |
Simon Property Group LP | | A | | 2.80 | | 01/30/17 | | 1,500,000 | | 1,535,313 |
Ventas Realty LP/Capital Corp. | | BBB+ | | 4.00 | | 04/30/19 | | 1,700,000 | | 1,796,295 |
Vornado Realty LP | | BBB | | 2.50 | | 06/30/19 | | 500,000 | | 499,309 |
Vornado Realty LP | | BBB | | 5.00 | | 01/15/22 | | 1,500,000 | | 1,623,569 |
Wells Fargo & Co. | | A+ | | 2.13 | | 04/22/19 | | 2,000,000 | | 2,007,854 |
Zions Bancorporation | | BBB- | | 4.50 | | 03/27/17 | | 400,000 | | 417,649 |
| | | | | | | | | | |
| | | | | | | | | | 79,550,245 |
| | | | | | | | | | |
HEALTH CARE (7.3%) | | | | | | | | | | |
AbbVie, Inc. | | A | | 1.75 | | 11/06/17 | | 2,000,000 | | 2,005,242 |
Agilent Technologies, Inc. | | BBB+ | | 5.00 | | 07/15/20 | | 2,000,000 | | 2,190,096 |
Allergan, Inc. | | BBB- | | 5.75 | | 04/01/16 | | 500,000 | | 518,071 |
Anthem, Inc. | | A | | 3.13 | | 05/15/22 | | 2,000,000 | | 1,943,676 |
Bio-Rad Laboratories, Inc. | | BBB | | 4.88 | | 12/15/20 | | 2,000,000 | | 2,168,036 |
Biogen Idec, Inc. | | A- | | 6.88 | | 03/01/18 | | 1,250,000 | | 1,414,411 |
CareFusion Corp. | | BBB+ | | 1.45 | | 05/15/17 | | 2,000,000 | | 1,994,882 |
Edwards Lifesciences Corp. | | BBB- | | 2.88 | | 10/15/18 | | 2,000,000 | | 2,046,478 |
Express Scripts Hldg. Co. | | BBB+ | | 2.25 | | 06/15/19 | | 2,000,000 | | 1,983,806 |
Hospira, Inc. | | BBB- | | 6.05 | | 03/30/17 | | 2,000,000 | | 2,151,916 |
Laboratory Corp. of America | | BBB | | 3.13 | | 05/15/16 | | 500,000 | | 508,279 |
Laboratory Corp. of America | | BBB | | 3.75 | | 08/23/22 | | 600,000 | | 606,850 |
Laboratory Corp. of America | | BBB | | 4.63 | | 11/15/20 | | 400,000 | | 432,744 |
Laboratory Corp. of America | | BBB | | 5.63 | | 12/15/15 | | 500,000 | | 510,069 |
Lilly (Eli) & Co. | | AA- | | 5.20 | | 03/15/17 | | 500,000 | | 534,928 |
Mylan, Inc. | | BBB- | | 1.35 | | 11/29/16 | | 2,000,000 | | 1,993,928 |
Owens & Minor, Inc. | | BBB | | 3.88 | | 09/15/21 | | 2,000,000 | | 2,057,060 |
PerkinElmer, Inc. | | BBB | | 5.00 | | 11/15/21 | | 2,000,000 | | 2,176,198 |
Quest Diagnostics, Inc. | | BBB+ | | 4.75 | | 01/30/20 | | 2,000,000 | | 2,177,646 |
Thermo Fisher Scientific, Inc. | | BBB | | 3.60 | | 08/15/21 | | 400,000 | | 407,168 |
Thermo Fisher Scientific, Inc. | | BBB | | 4.50 | | 03/01/21 | | 1,600,000 | | 1,705,301 |
Zimmer Biomet Hldgs., Inc. | | BBB | | 3.15 | | 04/01/22 | | 2,000,000 | | 1,967,312 |
| | | | | | | | | | |
| | | | | | | | | | 33,494,097 |
| | | | | | | | | | |
INDUSTRIALS (5.1%) | | | | | | | | | | |
Crane Co. | | BBB | | 2.75 | | 12/15/18 | | 2,000,000 | | 2,039,528 |
Dun & Bradstreet Corp. | | BBB- | | 3.25 | | 12/01/17 | | 2,000,000 | | 2,033,852 |
Equifax, Inc. | | BBB+ | | 3.30 | | 12/15/22 | | 2,000,000 | | 1,989,332 |
Flowserve Corp. | | BBB | | 3.50 | | 09/15/22 | | 2,000,000 | | 1,987,796 |
GATX Corp. | | BBB | | 6.00 | | 02/15/18 | | 2,050,000 | | 2,240,306 |
Harsco Corp. | | BB | | 5.75 | | 05/15/18 | | 2,250,000 | | 2,317,500 |
Kennametal, Inc. | | BBB | | 2.65 | | 11/01/19 | | 2,000,000 | | 1,987,686 |
MUTUAL OF AMERICA INVESTMENT CORPORATION - MID-TERM BOND FUND
PORTFOLIO OF INVESTMENTS IN SECURITIES
June 30, 2015 (Unaudited)
| | | | | | | | | | |
L-3 Communications Corp. | | BBB- | | 5.20 | | 10/15/19 | | 2,000,000 | | 2,167,232 |
Pitney Bowes, Inc. | | BBB | | 5.25 | | 01/15/37 | | 1,500,000 | | 1,546,256 |
Ryder System, Inc. | | BBB | | | | 09/01/15 | | 1,000,000 | | 1,009,806 |
Southwest Airlines Co. | | BBB | | 5.75 | | 12/15/16 | | 735,000 | | 782,167 |
Textron, Inc. | | BBB | | 4.63 | | 09/21/16 | | 750,000 | | 780,078 |
Valmont Industries, Inc. | | BBB+ | | 6.63 | | 04/20/20 | | 2,000,000 | | 2,307,968 |
| | | | | | | | | | |
| | | | | | | | | | 23,189,507 |
| | | | | | | | | | |
INFORMATION TECHNOLOGY (7.4%) | | | | | | | | | | |
Adobe Systems, Inc. | | A- | | 4.75 | | 02/01/20 | | 2,000,000 | | 2,202,186 |
Amphenol Corp. | | BBB+ | | 2.55 | | 01/30/19 | | 2,000,000 | | 2,025,942 |
Arrow Electronics, Inc. | | BBB- | | 3.00 | | 03/01/18 | | 1,250,000 | | 1,269,756 |
Arrow Electronics, Inc. | | BBB- | | 4.50 | | 03/01/23 | | 50,000 | | 51,101 |
Arrow Electronics, Inc. | | BBB- | | 6.88 | | 06/01/18 | | 700,000 | | 777,297 |
Avnet, Inc. | | BBB- | | 5.88 | | 06/15/20 | | 950,000 | | 1,053,802 |
Avnet, Inc. | | BBB- | | 6.00 | | 09/01/15 | | 980,000 | | 987,424 |
eBay, Inc. | | A | | 2.88 | | 08/01/21 | | 2,100,000 | | 2,072,681 |
Fidelity Nat’l. Information | | BBB | | 1.45 | | 06/05/17 | | 2,000,000 | | 1,995,488 |
Fiserv, Inc. | | BBB | | 4.75 | | 06/15/21 | | 1,900,000 | | 2,077,274 |
FLIR Systems, Inc. | | BBB | | 3.75 | | 09/01/16 | | 2,000,000 | | 2,050,206 |
Ingram Micro, Inc. | | BBB- | | 5.25 | | 09/01/17 | | 1,500,000 | | 1,604,948 |
Jabil Circuit, Inc. | | BBB- | | 4.70 | | 09/15/22 | | 1,976,000 | | 1,995,760 |
Lam Research Corp. | | BBB | | 2.75 | | 03/15/20 | | 2,000,000 | | 1,986,304 |
Lender Processing Svcs., Inc. | | BBB | | 5.75 | | 04/15/23 | | 1,311,000 | | 1,379,828 |
Lexmark International, Inc. | | BBB- | | 6.65 | | 06/01/18 | | 2,000,000 | | 2,199,900 |
Motorola Solutions, Inc. | | BBB | | 3.75 | | 05/15/22 | | 2,000,000 | | 1,968,362 |
Symantec Corp. | | BBB | | 4.20 | | 09/15/20 | | 2,000,000 | | 2,077,284 |
Tech Data Corp. | | BBB- | | 3.75 | | 09/21/17 | | 2,000,000 | | 2,072,218 |
Western Union Co. | | BBB | | 5.93 | | 10/01/16 | | 2,000,000 | | 2,099,838 |
| | | | | | | | | | |
| | | | | | | | | | 33,947,599 |
| | | | | | | | | | |
MATERIALS (4.9%) | | | | | | | | | | |
Airgas, Inc. | | BBB | | 3.25 | | 10/01/15 | | 1,500,000 | | 1,505,583 |
Albemarle Corp. | | BBB- | | 4.50 | | 12/15/20 | | 1,065,000 | | 1,127,557 |
Alcoa, Inc. | | BBB- | | 6.75 | | 07/15/18 | | 2,000,000 | | 2,212,828 |
Domtar Corp. | | BBB- | | 4.40 | | 04/01/22 | | 2,000,000 | | 2,032,538 |
Eastman Chemical Co. | | BBB | | 2.40 | | 06/01/17 | | 2,000,000 | | 2,032,928 |
Freeport-McMoRan Copper & Gold | | BBB- | | 3.10 | | 03/15/20 | | 1,750,000 | | 1,725,365 |
Freeport-McMoRan Copper & Gold | | BBB- | | 3.55 | | 03/01/22 | | 250,000 | | 231,407 |
Goldcorp, Inc. | | BBB+ | | 2.13 | | 03/15/18 | | 2,000,000 | | 2,004,618 |
Kinross Gold Corp. | | BBB- | | 3.63 | | 09/01/16 | | 2,000,000 | | 2,005,392 |
Kinross Gold Corp. | | BBB- | | 5.13 | | 09/01/21 | | 750,000 | | 748,512 |
Methanex Corp. | | BBB- | | 3.25 | | 12/15/19 | | 2,000,000 | | 2,012,200 |
Newmont Mining Corp. | | BBB | | 3.50 | | 03/15/22 | | 2,000,000 | | 1,908,682 |
Rock-Tenn Co. | | BBB | | 3.50 | | 03/01/20 | | 622,000 | | 640,544 |
Southern Copper Corp. | | BBB | | 3.50 | | 11/08/22 | | 2,000,000 | | 1,946,800 |
| | | | | | | | | | |
| | | | | | | | | | 22,134,954 |
| | | | | | | | | | |
TELECOMMUNICATION SERVICES (0.9%) | | | | | | | | | | |
AT&T, Inc. | | BBB+ | | 3.00 | | 02/15/22 | | 2,000,000 | | 1,952,214 |
Verizon Communications, Inc. | | BBB+ | | 4.50 | | 09/15/20 | | 2,000,000 | | 2,157,470 |
| | | | | | | | | | |
| | | | | | | | | | 4,109,684 |
| | | | | | | | | | |
UTILITIES (1.9%) | | | | | | | | | | |
AGL Capital Corp. | | BBB+ | | 6.38 | | 07/15/16 | | 500,000 | | 526,852 |
Constellation Energy | | BBB- | | 5.15 | | 12/01/20 | | 1,500,000 | | 1,659,854 |
Entergy Corp. | | BBB- | | 4.70 | | 01/15/17 | | 600,000 | | 624,419 |
Entergy Corp. | | BBB- | | 5.13 | | 09/15/20 | | 1,400,000 | | 1,523,560 |
Exelon Generation Co. LLC | | BBB | | 4.25 | | 06/15/22 | | 1,000,000 | | 1,023,596 |
SCANA Corp. | | BBB | | 4.75 | | 05/15/21 | | 1,165,000 | | 1,225,768 |
Talen Energy Supply LLC | | BB- | | 4.60 | | 12/15/21 | | 1,400,000 | | 1,284,500 |
Talen Energy Supply LLC | | BB- | | 5.70 | | 10/15/15 | | 600,000 | | 600,000 |
| | | | | | | | | | |
| | | | | | | | | | 8,468,549 |
| | | | | | | | | | |
TOTAL LONG-TERM DEBT SECURITIES
(Cost: $434,210,421) 96.7% | | | | | | | | | | 441,570,977 |
| | | | | | | | | | |
MUTUAL OF AMERICA INVESTMENT CORPORATION - MID-TERM BOND FUND
PORTFOLIO OF INVESTMENTS IN SECURITIES
June 30, 2015 (Unaudited)
| | | | | | | | | | |
| | | Rating** | | Rate(%) | | Maturity | | Face Amount | | Value |
SHORT-TERM DEBT SECURITIES: | | | | | | | | | | |
U.S. GOVERNMENT AGENCIES (2.7%) | | | | | | | | | | |
FHLB | | A-1+ | | 0.01 | | 07/31/15 | | 8,500,000 | | 8,499,894 |
FHLB | | A-1+ | | 0.02 | | 07/27/15 | | 4,000,000 | | 3,999,942 |
| | | | | | | | | | |
| | | | | | | | | | 12,499,836 |
| | | | | | | | | | |
TOTAL SHORT-TERM DEBT SECURITIES
(Cost: $12,499,836) 2.7% | | | | | | | | | | 12,499,836 |
| | | | | | | | | | |
TOTAL INVESTMENTS
(Cost: $446,710,257) 99.4% | | | | | | | | | | 454,070,813 |
| | | | | | | | | | |
OTHER NET ASSETS 0.6% | | | | | | | | | | 2,728,577 |
| | | | | | | | | | |
NET ASSETS 100.0% | | | | | | | | | | $456,799,390 |
| | | | | | | | | | |
The accompanying notes are an integral part of these portfolio schedules.
MUTUAL OF AMERICA INVESTMENT CORPORATION - BOND FUND
PORTFOLIO OF INVESTMENTS IN SECURITIES
June 30, 2015 (Unaudited)
| | | | | | | | | | |
| | | Rating** | | Rate(%) | | Maturity | | Face Amount | | Value |
LONG-TERM DEBT SECURITIES: | | | | | | | | |
U.S. GOVERNMENT (7.8%) | | | | | | | | | | |
U.S. Treasury Note | | AA+ | | 2.13 | | 05/15/25 | | 12,500,000 | �� | 12,273,438 |
U.S. Treasury Strip | | AA+ | | 0.00 | | 08/15/24 | | 10,000,000 | | 8,003,320 |
U.S. Treasury Strip | | AA+ | | 0.00 | | 08/15/25 | | 20,000,000 | | 15,511,675 |
U.S. Treasury Strip | | AA+ | | 0.00 | | 08/15/26 | | 20,000,000 | | 14,950,435 |
U.S. Treasury Strip | | AA+ | | 0.00 | | 08/15/28 | | 20,000,000 | | 13,898,358 |
U.S. Treasury Strip | | AA+ | | 0.00 | | 08/15/29 | | 20,000,000 | | 13,369,380 |
| | | | | | | | | | |
| | | | | | | | | | 78,006,606 |
| | | | | | | | | | |
U.S. GOVERNMENT AGENCIES (29.5%) | | | | | | | | | | |
MORTGAGE-BACKED OBLIGATIONS (26.1%) | | | | | | | | | | |
FHARM | | AA+ | | 2.29 | | 04/01/37 | | 383,672 | | 405,152 |
FHARM | | AA+ | | 2.36 | | 02/01/36 | | 186,948 | | 198,758 |
FHARM | | AA+ | | 2.37 | | 05/01/37 | | 119,261 | | 124,923 |
FHARM | | AA+ | | 2.38 | | 04/01/37 | | 274,194 | | 293,457 |
FHARM | | AA+ | | 3.34 | | 04/01/42 | | 647,145 | | 675,088 |
FHARM | | AA+ | | 4.53 | | 09/01/39 | | 363,177 | | 384,242 |
FHARM | | AA+ | | 5.79 | | 03/01/37 | | 70,368 | | 75,367 |
FHLMC | | AA+ | | 2.50 | | 09/01/27 | | 2,161,835 | | 2,208,476 |
FHLMC | | AA+ | | 2.50 | | 12/01/27 | | 2,160,150 | | 2,206,820 |
FHLMC | | AA+ | | 2.50 | | 04/01/28 | | 2,731,732 | | 2,790,822 |
FHLMC | | AA+ | | 3.00 | | 06/01/27 | | 1,137,187 | | 1,180,075 |
FHLMC | | AA+ | | 3.00 | | 08/01/27 | | 1,010,459 | | 1,047,930 |
FHLMC | | AA+ | | 3.00 | | 10/15/37 | | 2,077,024 | | 2,119,576 |
FHLMC | | AA+ | | 3.00 | | 12/15/40 | | 2,367,934 | | 2,368,483 |
FHLMC | | AA+ | | 3.00 | | 07/01/42 | | 1,089,809 | | 1,109,608 |
FHLMC | | AA+ | | 3.00 | | 10/01/42 | | 2,895,108 | | 2,887,158 |
FHLMC | | AA+ | | 3.00 | | 11/01/42 | | 3,071,962 | | 3,060,676 |
FHLMC | | AA+ | | 3.00 | | 11/01/42 | | 1,317,723 | | 1,313,294 |
FHLMC | | AA+ | | 3.00 | | 11/01/42 | | 1,276,402 | | 1,270,727 |
FHLMC | | AA+ | | 3.00 | | 02/01/43 | | 2,744,105 | | 2,735,935 |
FHLMC | | AA+ | | 3.00 | | 04/01/43 | | 2,004,188 | | 1,998,685 |
FHLMC | | AA+ | | 3.00 | | 04/01/43 | | 1,374,804 | | 1,369,535 |
FHLMC | | AA+ | | 3.50 | | 07/01/42 | | 2,925,104 | | 3,021,928 |
FHLMC | | AA+ | | 3.50 | | 10/01/42 | | 2,687,880 | | 2,771,825 |
FHLMC | | AA+ | | 3.50 | | 01/01/43 | | 1,847,897 | | 1,905,627 |
FHLMC | | AA+ | | 3.50 | | 01/01/43 | | 2,325,855 | | 2,398,522 |
FHLMC | | AA+ | | 3.50 | | 04/01/45 | | 2,990,103 | | 3,083,687 |
FHLMC | | AA+ | | 4.00 | | 05/01/24 | | 181,095 | | 191,329 |
FHLMC | | AA+ | | 4.00 | | 02/01/25 | | 464,977 | | 491,837 |
FHLMC | | AA+ | | 4.00 | | 05/01/26 | | 582,597 | | 620,866 |
FHLMC | | AA+ | | 4.00 | | 12/01/33 | | 1,600,751 | | 1,702,208 |
FHLMC | | AA+ | | 4.00 | | 12/15/38 | | 500,000 | | 541,740 |
FHLMC | | AA+ | | 4.00 | | 07/01/41 | | 1,628,282 | | 1,735,221 |
FHLMC | | AA+ | | 4.00 | | 12/01/41 | | 940,800 | | 998,669 |
FHLMC | | AA+ | | 4.00 | | 07/01/42 | | 3,369,038 | | 3,606,943 |
FHLMC | | AA+ | | 4.00 | | 08/01/42 | | 2,482,337 | | 2,636,138 |
FHLMC | | AA+ | | 4.00 | | 09/01/42 | | 1,584,638 | | 1,682,807 |
FHLMC | | AA+ | | 4.00 | | 11/01/42 | | 2,156,213 | | 2,285,402 |
FHLMC | | AA+ | | 4.00 | | 12/01/42 | | 1,760,196 | | 1,887,717 |
FHLMC | | AA+ | | 4.00 | | 01/01/43 | | 2,641,380 | | 2,815,643 |
FHLMC | | AA+ | | 4.00 | | 01/01/44 | | 2,470,858 | | 2,628,353 |
FHLMC | | AA+ | | 4.00 | | 10/01/44 | | 2,859,332 | | 3,027,767 |
FHLMC | | AA+ | | 4.50 | | 03/01/34 | | 708,150 | | 768,368 |
FHLMC | | AA+ | | 4.50 | | 08/01/34 | | 442,664 | | 480,495 |
FHLMC | | AA+ | | 4.50 | | 08/15/35 | | 189,165 | | 202,087 |
FHLMC | | AA+ | | 4.50 | | 12/01/39 | | 1,065,864 | | 1,150,218 |
FHLMC | | AA+ | | 5.00 | | 02/01/26 | | 123,436 | | 135,808 |
MUTUAL OF AMERICA INVESTMENT CORPORATION - BOND FUND
PORTFOLIO OF INVESTMENTS IN SECURITIES
June 30, 2015 (Unaudited)
| | | | | | | | | | |
FHLMC | | AA+ | | 5.00 | | 08/01/35 | | 1,334,046 | | 1,475,805 |
FHLMC | | AA+ | | 5.00 | | 10/01/40 | | 1,869,325 | | 2,062,957 |
FHLMC | | AA+ | | 5.50 | | 03/01/21 | | 164,726 | | 178,363 |
FHLMC | | AA+ | | 5.50 | | 07/01/32 | | 332,442 | | 373,802 |
FHLMC | | AA+ | | 5.50 | | 01/15/33 | | 341,779 | | 378,270 |
FHLMC | | AA+ | | 5.50 | | 05/01/33 | | 587,977 | | 658,112 |
FHLMC | | AA+ | | 5.50 | | 01/15/35 | | 151,540 | | 158,767 |
FHLMC | | AA+ | | 5.50 | | 06/01/37 | | 1,373,809 | | 1,548,079 |
FHLMC | | AA+ | | 6.00 | | 07/15/29 | | 232,227 | | 265,303 |
FHLMC | | AA+ | | 6.00 | | 03/15/32 | | 256,497 | | 285,198 |
FHLMC Strip | | AA+ | | 3.00 | | 01/15/43 | | 2,580,823 | | 2,627,775 |
FNMA | | AA+ | | 2.25 | | 01/01/28 | | 1,743,340 | | 1,709,596 |
FNMA | | AA+ | | 2.42 | | 05/01/43 | | 2,234,316 | | 2,266,848 |
FNMA | | AA+ | | 3.00 | | 09/01/29 | | 2,341,883 | | 2,433,736 |
FNMA | | AA+ | | 3.00 | | 06/01/33 | | 1,928,566 | | 1,967,484 |
FNMA | | AA+ | | 3.00 | | 07/01/33 | | 3,527,494 | | 3,598,693 |
FNMA | | AA+ | | 3.00 | | 09/01/33 | | 3,631,142 | | 3,704,520 |
FNMA | | AA+ | | 3.00 | | 10/01/42 | | 1,129,252 | | 1,134,256 |
FNMA | | AA+ | | 3.00 | | 12/01/42 | | 1,437,036 | | 1,433,227 |
FNMA | | AA+ | | 3.00 | | 12/01/42 | | 2,434,862 | | 2,402,683 |
FNMA | | AA+ | | 3.00 | | 01/01/43 | | 2,798,697 | | 2,803,295 |
FNMA | | AA+ | | 3.00 | | 02/01/43 | | 2,375,877 | | 2,369,859 |
FNMA | | AA+ | | 3.00 | | 03/01/43 | | 2,817,695 | | 2,813,623 |
FNMA | | AA+ | | 3.00 | | 02/01/45 | | 2,492,945 | | 2,490,881 |
FNMA | | AA+ | | 3.50 | | 02/01/26 | | 330,192 | | 349,023 |
FNMA | | AA+ | | 3.50 | | 03/01/32 | | 1,570,412 | | 1,641,887 |
FNMA | | AA+ | | 3.50 | | 08/01/38 | | 2,664,080 | | 2,766,120 |
FNMA | | AA+ | | 3.50 | | 03/01/41 | | 2,229,399 | | 2,307,557 |
FNMA | | AA+ | | 3.50 | | 10/01/41 | | 1,463,498 | | 1,513,520 |
FNMA | | AA+ | | 3.50 | | 12/01/41 | | 1,647,988 | | 1,704,317 |
FNMA | | AA+ | | 3.50 | | 04/01/42 | | 1,746,902 | | 1,809,771 |
FNMA | | AA+ | | 3.50 | | 04/01/42 | | 1,585,894 | | 1,636,178 |
FNMA | | AA+ | | 3.50 | | 07/01/42 | | 2,925,163 | | 3,024,329 |
FNMA | | AA+ | | 3.50 | | 08/01/42 | | 2,807,964 | | 2,902,845 |
FNMA | | AA+ | | 3.50 | | 10/01/42 | | 2,543,359 | | 2,629,365 |
FNMA | | AA+ | | 3.50 | | 12/01/42 | | 2,972,649 | | 3,105,621 |
FNMA | | AA+ | | 3.50 | | 03/01/43 | | 2,638,863 | | 2,728,440 |
FNMA | | AA+ | | 3.50 | | 10/01/43 | | 2,012,650 | | 2,105,546 |
FNMA | | AA+ | | 3.50 | | 01/01/44 | | 1,697,003 | | 1,726,451 |
FNMA | | AA+ | | 4.00 | | 05/01/19 | | 295,352 | | 309,641 |
FNMA | | AA+ | | 4.00 | | 07/25/26 | | 2,203,133 | | 2,436,176 |
FNMA | | AA+ | | 4.00 | | 01/01/31 | | 200,996 | | 214,585 |
FNMA | | AA+ | | 4.00 | | 12/01/33 | | 1,691,707 | | 1,798,220 |
FNMA | | AA+ | | 4.00 | | 03/01/35 | | 616,982 | | 656,632 |
FNMA | | AA+ | | 4.00 | | 11/01/38 | | 2,402,954 | | 2,552,477 |
FNMA | | AA+ | | 4.00 | | 11/01/40 | | 1,470,429 | | 1,566,029 |
FNMA | | AA+ | | 4.00 | | 05/01/41 | | 1,536,067 | | 1,619,470 |
FNMA | | AA+ | | 4.00 | | 08/01/42 | | 3,039,488 | | 3,233,328 |
FNMA | | AA+ | | 4.00 | | 05/01/43 | | 2,294,671 | | 2,446,211 |
FNMA | | AA+ | | 4.50 | | 05/01/18 | | 138,761 | | 144,512 |
FNMA | | AA+ | | 4.50 | | 05/01/19 | | 38,122 | | 39,734 |
FNMA | | AA+ | | 4.50 | | 06/01/19 | | 128,132 | | 134,024 |
FNMA | | AA+ | | 4.50 | | 05/01/30 | | 563,388 | | 609,490 |
FNMA | | AA+ | | 4.50 | | 04/01/31 | | 876,684 | | 953,432 |
FNMA | | AA+ | | 4.50 | | 08/01/33 | | 205,376 | | 222,754 |
FNMA | | AA+ | | 4.50 | | 08/01/33 | | 189,613 | | 205,702 |
FNMA | | AA+ | | 4.50 | | 09/01/33 | | 553,229 | | 600,386 |
FNMA | | AA+ | | 4.50 | | 10/01/33 | | 528,365 | | 574,811 |
FNMA | | AA+ | | 4.50 | | 10/01/33 | | 220,567 | | 238,603 |
FNMA | | AA+ | | 4.50 | | 05/01/34 | | 213,305 | | 231,697 |
FNMA | | AA+ | | 4.50 | | 06/01/34 | | 358,201 | | 389,321 |
MUTUAL OF AMERICA INVESTMENT CORPORATION - BOND FUND
PORTFOLIO OF INVESTMENTS IN SECURITIES
June 30, 2015 (Unaudited)
| | | | | | | | | | |
FNMA | | AA+ | | 4.50 | | 07/01/34 | | 332,209 | | 360,956 |
FNMA | | AA+ | | 4.50 | | 01/01/35 | | 917,250 | | 996,107 |
FNMA | | AA+ | | 4.50 | | 08/01/35 | | 359,907 | | 391,271 |
FNMA | | AA+ | | 4.50 | | 09/01/35 | | 128,337 | | 137,534 |
FNMA | | AA+ | | 4.50 | | 12/01/35 | | 406,881 | | 442,013 |
FNMA | | AA+ | | 4.50 | | 05/01/39 | | 993,295 | | 1,085,870 |
FNMA | | AA+ | | 4.50 | | 05/01/39 | | 1,209,499 | | 1,324,052 |
FNMA | | AA+ | | 4.50 | | 05/01/40 | | 660,676 | | 715,549 |
FNMA | | AA+ | | 4.50 | | 11/01/40 | | 822,284 | | 891,215 |
FNMA | | AA+ | | 4.50 | | 06/01/41 | | 813,337 | | 881,140 |
FNMA | | AA+ | | 4.50 | | 10/01/41 | | 1,251,979 | | 1,359,316 |
FNMA | | AA+ | | 4.50 | | 11/01/41 | | 1,449,378 | | 1,572,052 |
FNMA | | AA+ | | 4.50 | | 01/01/42 | | 189,758 | | 206,006 |
FNMA | | AA+ | | 4.50 | | 07/01/42 | | 3,265,493 | | 3,577,857 |
FNMA | | AA+ | | 4.50 | | 03/01/44 | | 2,317,566 | | 2,511,423 |
FNMA | | AA+ | | 4.50 | | 05/01/44 | | 2,461,918 | | 2,667,512 |
FNMA | | AA+ | | 5.00 | | 04/01/18 | | 37,443 | | 39,196 |
FNMA | | AA+ | | 5.00 | | 09/01/18 | | 223,106 | | 233,550 |
FNMA | | AA+ | | 5.00 | | 09/01/20 | | 138,298 | | 148,362 |
FNMA | | AA+ | | 5.00 | | 10/01/20 | | 238,959 | | 253,272 |
FNMA | | AA+ | | 5.00 | | 10/01/25 | | 200,260 | | 221,042 |
FNMA | | AA+ | | 5.00 | | 09/01/33 | | 1,074,739 | | 1,191,245 |
FNMA | | AA+ | | 5.00 | | 10/01/33 | | 678,635 | | 754,298 |
FNMA | | AA+ | | 5.00 | | 11/01/33 | | 768,245 | | 851,448 |
FNMA | | AA+ | | 5.00 | | 03/01/34 | | 180,046 | | 199,578 |
FNMA | | AA+ | | 5.00 | | 04/01/34 | | 90,579 | | 100,259 |
FNMA | | AA+ | | 5.00 | | 04/01/34 | | 351,085 | | 390,143 |
FNMA | | AA+ | | 5.00 | | 04/01/35 | | 295,455 | | 327,481 |
FNMA | | AA+ | | 5.00 | | 06/01/35 | | 203,420 | | 224,384 |
FNMA | | AA+ | | 5.00 | | 09/01/35 | | 533,788 | | 590,480 |
FNMA | | AA+ | | 5.00 | | 09/01/35 | | 161,493 | | 178,263 |
FNMA | | AA+ | | 5.00 | | 11/25/35 | | 1,243,260 | | 1,363,242 |
FNMA | | AA+ | | 5.00 | | 08/01/37 | | 1,489,817 | | 1,647,985 |
FNMA | | AA+ | | 5.00 | | 05/01/39 | | 909,074 | | 1,007,215 |
FNMA | | AA+ | | 5.00 | | 09/25/40 | | 1,509,093 | | 1,685,275 |
FNMA | | AA+ | | 5.50 | | 04/01/17 | | 12,000 | | 12,321 |
FNMA | | AA+ | | 5.50 | | 05/01/17 | | 13,970 | | 14,271 |
FNMA | | AA+ | | 5.50 | | 01/01/24 | | 235,656 | | 264,407 |
FNMA | | AA+ | | 5.50 | | 03/01/24 | | 485,875 | | 545,103 |
FNMA | | AA+ | | 5.50 | | 09/01/25 | | 204,537 | | 230,784 |
FNMA | | AA+ | | 5.50 | | 11/01/26 | | 147,046 | | 164,933 |
FNMA | | AA+ | | 5.50 | | 01/01/27 | | 86,932 | | 97,507 |
FNMA | | AA+ | | 5.50 | | 03/01/33 | | 389,745 | | 440,880 |
FNMA | | AA+ | | 5.50 | | 09/01/33 | | 389,393 | | 444,147 |
FNMA | | AA+ | | 5.50 | | 10/01/33 | | 624,861 | | 701,006 |
FNMA | | AA+ | | 5.50 | | 03/01/34 | | 379,270 | | 432,454 |
FNMA | | AA+ | | 5.50 | | 03/01/34 | | 84,344 | | 94,886 |
FNMA | | AA+ | | 5.50 | | 07/01/34 | | 230,078 | | 258,873 |
FNMA | | AA+ | | 5.50 | | 09/01/34 | | 291,408 | | 327,395 |
FNMA | | AA+ | | 5.50 | | 09/01/34 | | 155,207 | | 175,842 |
FNMA | | AA+ | | 5.50 | | 09/01/34 | | 85,321 | | 96,774 |
FNMA | | AA+ | | 5.50 | | 10/01/34 | | 644,273 | | 730,843 |
FNMA | | AA+ | | 5.50 | | 02/01/35 | | 349,368 | | 393,666 |
FNMA | | AA+ | | 5.50 | | 02/01/35 | | 203,580 | | 230,896 |
FNMA | | AA+ | | 5.50 | | 04/01/35 | | 329,881 | | 374,002 |
FNMA | | AA+ | | 5.50 | | 08/01/35 | | 680,395 | | 771,727 |
FNMA | | AA+ | | 5.50 | | 02/25/37 | | 176,810 | | 192,934 |
FNMA | | AA+ | | 5.50 | | 05/01/38 | | 818,914 | | 925,466 |
FNMA | | AA+ | | 5.50 | | 11/01/38 | | 171,783 | | 187,749 |
FNMA | | AA+ | | 5.50 | | 06/01/48 | | 211,419 | | 230,503 |
FNMA | | AA+ | | 6.00 | | 03/01/17 | | 20,133 | | 20,728 |
MUTUAL OF AMERICA INVESTMENT CORPORATION - BOND FUND
PORTFOLIO OF INVESTMENTS IN SECURITIES
June 30, 2015 (Unaudited)
| | | | | | | | | | |
FNMA | | AA+ | | 6.00 | | 05/01/23 | | 308,572 | | 351,797 |
FNMA | | AA+ | | 6.00 | | 01/01/25 | | 184,607 | | 209,308 |
FNMA | | AA+ | | 6.00 | | 03/01/28 | | 240,272 | | 272,435 |
FNMA | | AA+ | | 6.00 | | 04/01/32 | | 68,056 | | 77,647 |
FNMA | | AA+ | | 6.00 | | 04/01/32 | | 86,492 | | 98,193 |
FNMA | | AA+ | | 6.00 | | 05/01/32 | | 271,615 | | 310,214 |
FNMA | | AA+ | | 6.00 | | 04/01/33 | | 637,946 | | 735,600 |
FNMA | | AA+ | | 6.00 | | 11/01/34 | | 68,950 | | 78,223 |
FNMA | | AA+ | | 6.00 | | 03/01/36 | | 68,157 | | 76,950 |
FNMA | | AA+ | | 6.00 | | 12/01/36 | | 239,617 | | 271,702 |
FNMA | | AA+ | | 6.00 | | 01/01/37 | | 291,237 | | 334,073 |
FNMA | | AA+ | | 6.00 | | 03/01/37 | | 214,929 | | 235,960 |
FNMA | | AA+ | | 6.00 | | 04/01/37 | | 115,111 | | 126,505 |
FNMA | | AA+ | | 6.00 | | 05/01/37 | | 69,262 | | 76,170 |
FNMA | | AA+ | | 6.00 | | 06/01/37 | | 130,608 | | 143,517 |
FNMA | | AA+ | | 6.00 | | 07/01/37 | | 127,870 | | 145,188 |
FNMA | | AA+ | | 6.00 | | 08/01/37 | | 195,607 | | 222,349 |
FNMA | | AA+ | | 6.00 | | 12/01/37 | | 81,539 | | 92,441 |
FNMA | | AA+ | | 6.00 | | 10/25/44 | | 590,352 | | 689,180 |
FNMA | | AA+ | | 6.00 | | 02/25/47 | | 1,355,285 | | 1,526,967 |
FNMA | | AA+ | | 6.00 | | 12/25/49 | | 755,338 | | 872,881 |
FNMA | | AA+ | | 6.50 | | 09/01/16 | | 3,381 | | 3,406 |
FNMA | | AA+ | | 6.50 | | 03/01/17 | | 53,255 | | 54,565 |
FNMA | | AA+ | | 6.50 | | 05/01/17 | | 5,518 | | 5,568 |
FNMA | | AA+ | | 6.50 | | 05/01/32 | | 161,977 | | 186,016 |
FNMA | | AA+ | | 6.50 | | 05/01/32 | | 102,129 | | 117,286 |
FNMA | | AA+ | | 6.50 | | 09/01/36 | | 85,820 | | 96,761 |
FNMA | | AA+ | | 6.50 | | 05/01/37 | | 330,736 | | 381,640 |
FNMA | | AA+ | | 6.50 | | 07/01/37 | | 43,693 | | 52,155 |
FNMA | | AA+ | | 6.50 | | 09/01/37 | | 100,334 | | 115,225 |
FNMA | | AA+ | | 6.50 | | 05/01/38 | | 144,118 | | 165,506 |
FNMA | | AA+ | | 7.00 | | 09/01/31 | | 63,221 | | 71,874 |
FNMA | | AA+ | | 7.00 | | 01/25/44 | | 479,638 | | 540,639 |
FNMA | | AA+ | | 7.50 | | 06/01/32 | | 97,964 | | 122,061 |
FNMA | | AA+ | | 8.00 | | 04/01/32 | | 21,194 | | 22,764 |
FNMA Strip | | AA+ | | 3.00 | | 08/25/42 | | 2,046,993 | | 2,048,233 |
GNMA (2) | | AA+ | | 2.68 | | 10/16/47 | | 2,000,000 | | 1,987,324 |
GNMA (2) | | AA+ | | 3.00 | | 07/16/36 | | 1,946,484 | | 1,969,500 |
GNMA (2) | | AA+ | | 3.50 | | 11/20/32 | | 2,500,094 | | 2,598,335 |
GNMA (2) | | AA+ | | 3.50 | | 09/20/33 | | 615,232 | | 625,401 |
GNMA (2) | | AA+ | | 3.50 | | 01/20/37 | | 70,058 | | 70,302 |
GNMA (2) | | AA+ | | 3.50 | | 07/15/42 | | 1,805,608 | | 1,879,410 |
GNMA (2) | | AA+ | | 3.50 | | 11/15/42 | | 1,475,242 | | 1,532,493 |
GNMA (2) | | AA+ | | 3.50 | | 05/20/45 | | 2,845,306 | | 2,981,086 |
GNMA (2) | | AA+ | | 3.70 | | 05/15/42 | | 1,162,500 | | 1,222,574 |
GNMA (2) | | AA+ | | 4.00 | | 04/15/24 | | 363,203 | | 387,160 |
GNMA (2) | | AA+ | | 4.00 | | 01/20/41 | | 2,441,727 | | 2,604,685 |
GNMA (2) | | AA+ | | 4.00 | | 08/15/41 | | 1,714,568 | | 1,842,254 |
GNMA (2) | | AA+ | | 4.00 | | 11/15/41 | | 1,115,586 | | 1,208,554 |
GNMA (2) | | AA+ | | 4.00 | | 12/15/41 | | 1,870,379 | | 1,997,430 |
GNMA (2) | | AA+ | | 4.00 | | 01/15/42 | | 615,239 | | 655,425 |
GNMA (2) | | AA+ | | 4.00 | | 03/20/42 | | 1,120,516 | | 1,192,024 |
GNMA (2) | | AA+ | | 4.00 | | 08/20/42 | | 1,549,406 | | 1,653,011 |
GNMA (2) | | AA+ | | 4.25 | | 06/20/36 | | 978,172 | | 1,053,565 |
GNMA (2) | | AA+ | | 4.25 | | 04/20/41 | | 1,087,358 | | 1,164,551 |
GNMA (2) | | AA+ | | 4.29 | | 04/15/41 | �� | 709,816 | | 764,635 |
GNMA (2) | | AA+ | | 4.50 | | 02/20/20 | | 718,032 | | 724,075 |
GNMA (2) | | AA+ | | 4.50 | | 06/20/30 | | 163,650 | | 179,879 |
GNMA (2) | | AA+ | | 4.50 | | 09/15/30 | | 653,664 | | 716,140 |
GNMA (2) | | AA+ | | 4.50 | | 06/20/34 | | 690,625 | | 751,271 |
GNMA (2) | | AA+ | | 4.50 | | 09/15/40 | | 1,216,237 | | 1,321,354 |
MUTUAL OF AMERICA INVESTMENT CORPORATION - BOND FUND
PORTFOLIO OF INVESTMENTS IN SECURITIES
June 30, 2015 (Unaudited)
| | | | | | | | | | |
GNMA (2) | | AA+ | | 4.50 | | 10/15/40 | | 666,048 | | 724,470 |
GNMA (2) | | AA+ | | 4.50 | | 10/15/40 | | 1,942,712 | | 2,162,287 |
GNMA (2) | | AA+ | | 5.00 | | 04/15/39 | | 1,537,516 | | 1,740,313 |
GNMA (2) | | AA+ | | 5.00 | | 06/20/39 | | 2,360,781 | | 2,584,885 |
GNMA (2) | | AA+ | | 5.00 | | 11/15/39 | | 827,637 | | 918,760 |
GNMA (2) | | AA+ | | 5.00 | | 05/15/40 | | 349,669 | | 390,065 |
GNMA (2) | | AA+ | | 5.00 | | 06/20/40 | | 568,253 | | 616,769 |
GNMA (2) | | AA+ | | 5.00 | | 06/20/40 | | 620,378 | | 677,865 |
GNMA (2) | | AA+ | | 5.50 | | 01/15/36 | | 173,581 | | 196,670 |
GNMA (2) | | AA+ | | 6.50 | | 04/15/31 | | 15,073 | | 17,203 |
GNMA (2) | | AA+ | | 6.50 | | 12/15/31 | | 49,741 | | 56,744 |
GNMA (2) | | AA+ | | 6.50 | | 05/15/32 | | 30,362 | | 34,637 |
GNMA (2) | | AA+ | | 7.00 | | 05/15/32 | | 6,393 | | 7,199 |
Vendee Mortgage Trust (2) | | AA+ | | 5.25 | | 01/15/32 | | 1,246,773 | | 1,383,455 |
| | | | | | | | | | |
| | | | | | | | | | 263,276,776 |
| | | | | | | | | | |
NON-MORTGAGE-BACKED OBLIGATIONS (3.4%) | | | | | | | | | | |
FHLMC | | AA+ | | 0.00 | | 11/29/19 | | 11,000,000 | | 10,033,815 |
FNMA | | AA+ | | 0.00 | | 10/09/19 | | 26,000,000 | | 23,746,523 |
| | | | | | | | | | |
| | | | | | | | | | 33,780,338 |
| | | | | | | | | | |
CORPORATE DEBT (60.6%) | | | | | | | | | | |
CONSUMER DISCRETIONARY (9.4%) | | | | | | | | | | |
Advance Auto Parts, Inc. | | BBB- | | 4.50 | | 01/15/22 | | 1,000,000 | | 1,049,810 |
Advance Auto Parts, Inc. | | BBB- | | 5.75 | | 05/01/20 | | 3,000,000 | | 3,344,994 |
AutoZone, Inc. | | BBB | | 3.25 | | 04/15/25 | | 2,000,000 | | 1,931,244 |
AutoZone, Inc. | | BBB | | 3.70 | | 04/15/22 | | 700,000 | | 717,718 |
AutoZone, Inc. | | BBB | | 4.00 | | 11/15/20 | | 3,000,000 | | 3,186,939 |
Brinker International, Inc. | | BBB- | | 3.88 | | 05/15/23 | | 4,000,000 | | 3,900,128 |
Dollar General Corp. | | BBB- | | 3.25 | | 04/15/23 | | 4,000,000 | | 3,811,000 |
Expedia, Inc. | | BBB- | | 5.95 | | 08/15/20 | | 4,000,000 | | 4,458,464 |
Family Dollar Stores, Inc. | | BBB- | | 5.00 | | 02/01/21 | | 4,000,000 | | 4,139,924 |
Harman Int’l. Industries, Inc. | | BBB- | | 4.15 | | 05/15/25 | | 5,000,000 | | 4,927,565 |
Home Depot, Inc. | | A | | 5.40 | | 03/01/16 | | 2,000,000 | | 2,063,152 |
Hyatt Hotels Corp. | | BBB | | 3.88 | | 08/15/16 | | 2,800,000 | | 2,875,841 |
Hyatt Hotels Corp. | | BBB | | 5.38 | | 08/15/21 | | 200,000 | | 222,047 |
Kohl’s Corp. | | BBB | | 3.25 | | 02/01/23 | | 880,000 | | 857,372 |
Kohl’s Corp. | | BBB | | 4.00 | | 11/01/21 | | 2,620,000 | | 2,757,453 |
Lowe’s Cos., Inc. | | A- | | 3.12 | | 04/15/22 | | 2,000,000 | | 2,023,748 |
Marriott International, Inc. | | BBB | | 3.00 | | 03/01/19 | | 1,000,000 | | 1,025,376 |
Marriott International, Inc. | | BBB | | 3.38 | | 10/15/20 | | 3,000,000 | | 3,085,809 |
Mattel, Inc. | | BBB | | 4.35 | | 10/01/20 | | 1,000,000 | | 1,068,095 |
Newell Rubbermaid, Inc. | | BBB- | | 4.70 | | 08/15/20 | | 3,000,000 | | 3,276,417 |
NVR, Inc. | | BBB+ | | 3.95 | | 09/15/22 | | 4,000,000 | | 4,055,440 |
O’Reilly Automotive, Inc. | | BBB+ | | 3.80 | | 09/01/22 | | 3,250,000 | | 3,315,033 |
Omnicom Group, Inc. | | BBB+ | | 3.63 | | 05/01/22 | | 1,000,000 | | 1,005,802 |
Omnicom Group, Inc. | | BBB+ | | 4.45 | | 08/15/20 | | 3,000,000 | | 3,208,044 |
Scripps Networks Interactive, Inc. | | BBB | | 3.50 | | 06/15/22 | | 5,000,000 | | 4,918,955 |
Staples, Inc. | | BBB- | | 4.38 | | 01/12/23 | | 3,700,000 | | 3,714,674 |
Starwood Hotels & Resorts | | BBB | | 3.13 | | 02/15/23 | | 3,000,000 | | 2,857,371 |
Tupperware Brands Corp. | | BBB- | | 4.75 | | 06/01/21 | | 4,000,000 | | 4,219,564 |
Viacom, Inc. | | BBB | | 3.25 | | 03/15/23 | | 4,000,000 | | 3,801,248 |
Whirlpool Corp. | | BBB | | 3.70 | | 05/01/25 | | 2,000,000 | | 1,986,660 |
Whirlpool Corp. | | BBB | | 4.85 | | 06/15/21 | | 1,000,000 | | 1,104,056 |
Whirlpool Corp. | | BBB | | 6.50 | | 06/15/16 | | 2,000,000 | | 2,099,714 |
Wyndham Worldwide Corp. | | BBB- | | 3.90 | | 03/01/23 | | 4,000,000 | | 3,919,040 |
Wynn Las Vegas LLC | | BBB- | | 5.38 | | 03/15/22 | | 4,000,000 | | 4,060,000 |
| | | | | | | | | | |
| | | | | | | | | | 94,988,697 |
| | | | | | | | | | |
CONSUMER STAPLES (2.6%) | | | | | | | | | | |
Avon Products, Inc. | | B+ | | 4.20 | | 07/15/18 | | 900,000 | | 830,250 |
Avon Products, Inc. | | B+ | | 4.60 | | 03/15/20 | | 2,100,000 | | 1,912,313 |
Beam, Inc. | | BBB | | 5.38 | | 01/15/16 | | 344,000 | | 352,369 |
ConAgra Foods, Inc. | | BBB- | | 4.95 | | 08/15/20 | | 1,500,000 | | 1,626,062 |
MUTUAL OF AMERICA INVESTMENT CORPORATION - BOND FUND
PORTFOLIO OF INVESTMENTS IN SECURITIES
June 30, 2015 (Unaudited)
| | | | | | | | | | |
CVS Health Corp. | | BBB+ | | 6.13 | | 08/15/16 | | 2,000,000 | | 2,114,332 |
Energizer Hldgs., Inc. | | BBB- | | 4.70 | | 05/19/21 | | 4,000,000 | | 4,049,592 |
Flowers Foods, Inc. | | BBB- | | 4.38 | | 04/01/22 | | 3,500,000 | | 3,652,352 |
Ingredion, Inc. | | BBB | | 4.63 | | 11/01/20 | | 3,225,000 | | 3,455,091 |
Kroger Co. | | BBB | | 2.95 | | 11/01/21 | | 4,800,000 | | 4,769,299 |
Molson Coors Brewing Co. | | BBB+ | | 3.50 | | 05/01/22 | | 3,000,000 | | 3,026,865 |
| | | | | | | | | | |
| | | | | | | | | | 25,788,525 |
| | | | | | | | | | |
ENERGY (5.5%) | | | | | | | | | | |
Cameron International Corp. | | BBB+ | | 4.50 | | 06/01/21 | | 3,000,000 | | 3,143,754 |
Diamond Offshore Drilling, Inc. | | BBB+ | | 3.45 | | 11/01/23 | | 3,000,000 | | 2,836,902 |
Diamond Offshore Drilling, Inc. | | BBB+ | | 4.88 | | 07/01/15 | | 2,000,000 | | 2,000,000 |
Energen Corp. | | BB | | 4.63 | | 09/01/21 | | 4,000,000 | | 3,845,772 |
EQT Corp. | | BBB | | 4.88 | | 11/15/21 | | 4,000,000 | | 4,214,960 |
FMC Technologies, Inc. | | BBB | | 2.00 | | 10/01/17 | | 4,500,000 | | 4,493,880 |
Kinder Morgan Energy Partners | | BBB- | | 4.30 | | 05/01/24 | | 5,000,000 | | 4,934,220 |
Marathon Oil Corp. | | BBB | | 2.80 | | 11/01/22 | | 2,000,000 | | 1,895,752 |
Marathon Petroleum Corp. | | BBB | | 5.13 | | 03/01/21 | | 3,300,000 | | 3,624,024 |
Murphy Oil Corp. | | BBB | | 2.50 | | 12/01/17 | | 1,250,000 | | 1,247,675 |
Murphy Oil Corp. | | BBB | | 3.70 | | 12/01/22 | | 3,475,000 | | 3,179,729 |
National Oilwell Varco, Inc. | | A | | 6.13 | | 08/15/15 | | 2,000,000 | | 2,001,344 |
Noble Corp. | | BBB | | 7.50 | | 03/15/19 | | 2,000,000 | | 2,190,418 |
Rowan Companies PLC | | BBB- | | 4.88 | | 06/01/22 | | 4,000,000 | | 3,972,892 |
Seacor Hldgs., Inc. | | BB- | | 7.38 | | 10/01/19 | | 2,775,000 | | 2,892,938 |
SESI LLC | | BBB- | | 7.13 | | 12/15/21 | | 4,500,000 | | 4,770,000 |
Sunoco, Inc. | | BBB- | | 5.75 | | 01/15/17 | | 2,000,000 | | 2,106,976 |
Weatherford Int’l. Ltd. | | BBB- | | 5.50 | | 02/15/16 | | 1,500,000 | | 1,532,097 |
| | | | | | | | | | |
| | | | | | | | | | 54,883,333 |
| | | | | | | | | | |
FINANCIALS (16.2%) | | | | | | | | | | |
Aflac, Inc. | | A | | 4.00 | | 02/15/22 | | 3,000,000 | | 3,171,873 |
Alleghany Corp. | | BBB+ | | 4.95 | | 06/27/22 | | 2,000,000 | | 2,157,228 |
Alleghany Corp. | | BBB+ | | 5.63 | | 09/15/20 | | 3,000,000 | | 3,359,298 |
American Express Co. | | BBB | | 3.63 | | 12/05/24 | | 5,000,000 | | 4,864,910 |
American Tower Corp. | | BBB- | | 4.50 | | 01/15/18 | | 5,000,000 | | 5,290,930 |
Bank of America Corp. | | BBB+ | | 3.95 | | 04/21/25 | | 5,000,000 | | 4,815,950 |
Barrick N.A. Finance LLC | | BBB- | | 4.40 | | 05/30/21 | | 4,000,000 | | 4,086,032 |
Berkley (W.R.) Corp. | | BBB+ | | 4.63 | | 03/15/22 | | 2,000,000 | | 2,126,464 |
Berkley (W.R.) Corp. | | BBB+ | | 7.38 | | 09/15/19 | | 2,000,000 | | 2,369,050 |
Block Financial LLC | | BBB | | 5.50 | | 11/01/22 | | 2,250,000 | | 2,425,691 |
Boston Properties LP | | A- | | 3.70 | | 11/15/18 | | 1,000,000 | | 1,053,590 |
Boston Properties LP | | A- | | 3.85 | | 02/01/23 | | 3,000,000 | | 3,071,907 |
Capital One Financial Corp. | | BBB | | 4.75 | | 07/15/21 | | 4,000,000 | | 4,369,112 |
Citigroup, Inc. | | BBB+ | | 3.88 | | 03/26/25 | | 5,000,000 | | 4,789,525 |
CNA Financial Corp. | | BBB | | 6.50 | | 08/15/16 | | 2,000,000 | | 2,115,436 |
Fairfax Financial Hldgs. | | BBB- | | 8.25 | | 10/01/15 | | 2,500,000 | | 2,540,000 |
Fairfax Financial Hldgs.† | | BBB- | | 5.80 | | 05/15/21 | | 1,500,000 | | 1,598,462 |
Fairfax U.S., Inc.† | | BBB- | | 4.88 | | 08/13/24 | | 1,000,000 | | 970,871 |
First Republic Bank | | A- | | 2.38 | | 06/17/19 | | 2,000,000 | | 1,997,984 |
First Tennessee Bank | | BBB- | | 2.95 | | 12/01/19 | | 5,000,000 | | 4,997,515 |
Genworth Financial, Inc. | | BB- | | 7.20 | | 02/15/21 | | 1,750,000 | | 1,833,125 |
Genworth Financial, Inc. | | BB- | | 7.63 | | 09/24/21 | | 1,300,000 | | 1,368,250 |
Government Pptys. Income Trust | | BBB- | | 3.75 | | 08/15/19 | | 4,000,000 | | 4,114,544 |
Harley-Davidson Financial Svcs.† | | A- | | 3.88 | | 03/15/16 | | 2,678,000 | | 2,732,578 |
Hartford Financial Svcs. | | BBB+ | | 5.50 | | 03/30/20 | | 1,000,000 | | 1,121,384 |
HCP, Inc. | | BBB+ | | 3.40 | | 02/01/25 | | 3,750,000 | | 3,520,736 |
HCP, Inc. | | BBB+ | | 6.00 | | 01/30/17 | | 1,250,000 | | 1,333,441 |
Health Care REIT, Inc. | | BBB | | 3.63 | | 03/15/16 | | 750,000 | | 761,202 |
Health Care REIT, Inc. | | BBB | | 3.75 | | 03/15/23 | | 750,000 | | 742,482 |
Health Care REIT, Inc. | | BBB | | 6.13 | | 04/15/20 | | 2,500,000 | | 2,856,180 |
Healthcare Realty Trust | | BBB- | | 3.75 | | 04/15/23 | | 4,000,000 | | 3,908,372 |
Hospitality Properties Trust | | BBB- | | 5.00 | | 08/15/22 | | 4,550,000 | | 4,736,250 |
Jones Lang LaSalle, Inc. | | BBB | | 4.40 | | 11/15/22 | | 4,000,000 | | 4,102,752 |
MUTUAL OF AMERICA INVESTMENT CORPORATION - BOND FUND
PORTFOLIO OF INVESTMENTS IN SECURITIES
June 30, 2015 (Unaudited)
| | | | | | | | | | |
JPMorgan Chase & Co. | | A- | | 3.88 | | 09/10/24 | | 5,000,000 | | 4,919,530 |
JPMorgan Chase Bank NA | | A | | 6.00 | | 10/01/17 | | 2,000,000 | | 2,180,706 |
Kemper Corp. | | BBB- | | 4.35 | | 02/15/25 | | 2,000,000 | | 1,987,292 |
Kemper Corp. | | BBB- | | 6.00 | | 05/15/17 | | 1,091,000 | | 1,163,314 |
Lincoln National Corp. | | A- | | 4.85 | | 06/24/21 | | 1,000,000 | | 1,096,309 |
Mack-Cali Realty LP | | BBB- | | 4.50 | | 04/18/22 | | 5,000,000 | | 4,942,395 |
Markel Corp. | | BBB | | 5.35 | | 06/01/21 | | 1,200,000 | | 1,335,575 |
Marsh & McLennan Cos., Inc. | | A- | | 4.80 | | 07/15/21 | | 3,000,000 | | 3,316,143 |
Moody’s Corp. | | BBB+ | | 4.50 | | 09/01/22 | | 4,000,000 | | 4,260,708 |
Nasdaq OMX Group, Inc. | | BBB- | | 5.55 | | 01/15/20 | | 2,500,000 | | 2,767,253 |
National Retail Pptys., Inc. | | BBB+ | | 3.30 | | 04/15/23 | | 1,000,000 | | 969,103 |
National Retail Pptys., Inc. | | BBB+ | | 3.80 | | 10/15/22 | | 3,000,000 | | 3,031,077 |
Pacific LifeCorp.† | | BBB+ | | 6.00 | | 02/10/20 | | 3,000,000 | | 3,389,370 |
Penske Truck Leasing Co. LP† | | BBB- | | 3.38 | | 03/15/18 | | 3,000,000 | | 3,091,896 |
Prudential Financial, Inc. | | A | | 4.50 | | 11/16/21 | | 1,000,000 | | 1,089,110 |
Raymond James Financial, Inc. | | BBB | | 4.25 | | 04/15/16 | | 3,150,000 | | 3,228,728 |
Reckson Operating Partnership | | BBB- | | 6.00 | | 03/31/16 | | 3,200,000 | | 3,305,146 |
Reinsurance Grp. of America, Inc. | | A- | | 4.70 | | 09/15/23 | | 1,000,000 | | 1,061,242 |
Reinsurance Grp. of America, Inc. | | A- | | 5.00 | | 06/01/21 | | 3,000,000 | | 3,288,111 |
Senior Housing Pptys. Trust | | BBB- | | 4.30 | | 01/15/16 | | 3,000,000 | | 3,021,822 |
Synchrony Financial | | BBB- | | 2.70 | | 02/03/20 | | 2,250,000 | | 2,222,584 |
Travelers Cos., Inc. | | A | | 3.90 | | 11/01/20 | | 2,500,000 | | 2,687,973 |
Ventas Realty LP/Capital Corp. | | BBB+ | | 3.25 | | 08/15/22 | | 500,000 | | 482,906 |
Ventas Realty LP/Capital Corp. | | BBB+ | | 4.75 | | 06/01/21 | | 3,000,000 | | 3,250,689 |
Vornado Realty LP | | BBB | | 2.50 | | 06/30/19 | | 1,000,000 | | 998,618 |
Wells Fargo & Co. | | A | | 3.45 | | 02/13/23 | | 4,000,000 | | 3,978,340 |
Zions Bancorporation | | BBB- | | 4.50 | | 03/27/17 | | 1,000,000 | | 1,044,122 |
| | | | | | | | | | |
| | | | | | | | | | 163,413,186 |
| | | | | | | | | | |
HEALTH CARE (6.7%) | | | | | | | | | | |
Agilent Technologies, Inc. | | BBB+ | | 5.00 | | 07/15/20 | | 4,000,000 | | 4,380,192 |
Allergan, Inc. | | BBB- | | 5.75 | | 04/01/16 | | 2,000,000 | | 2,072,284 |
AmerisourceBergen Corp. | | A- | | 4.88 | | 11/15/19 | | 2,500,000 | | 2,756,675 |
Anthem, Inc. | | A | | 4.35 | | 08/15/20 | | 2,000,000 | | 2,164,292 |
Bio-Rad Laboratories, Inc. | | BBB | | 4.88 | | 12/15/20 | | 4,000,000 | | 4,336,072 |
Biogen Idec, Inc. | | A- | | 6.88 | | 03/01/18 | | 2,500,000 | | 2,828,823 |
CIGNA Corp. | | A | | 5.38 | | 03/15/17 | | 2,000,000 | | 2,136,792 |
Edwards Lifesciences Corp. | | BBB- | | 2.88 | | 10/15/18 | | 4,500,000 | | 4,604,576 |
Express Scripts Hldg. Co. | | BBB+ | | 3.50 | | 06/15/24 | | 2,000,000 | | 1,956,108 |
Hospira, Inc. | | BBB- | | 6.05 | | 03/30/17 | | 4,000,000 | | 4,303,832 |
Humana, Inc. | | BBB+ | | 3.85 | | 10/01/24 | | 3,000,000 | | 2,987,985 |
Humana, Inc. | | BBB+ | | 7.20 | | 06/15/18 | | 2,000,000 | | 2,301,244 |
Laboratory Corp. of America | | BBB | | 3.75 | | 08/23/22 | | 2,000,000 | | 2,022,832 |
Laboratory Corp. of America | | BBB | | 4.63 | | 11/15/20 | | 1,000,000 | | 1,081,860 |
Laboratory Corp. of America | | BBB | | 5.63 | | 12/15/15 | | 1,000,000 | | 1,020,138 |
Medco Health Solutions, Inc. | | BBB+ | | 4.13 | | 09/15/20 | | 3,000,000 | | 3,186,840 |
Owens & Minor, Inc. | | BBB | | 3.88 | | 09/15/21 | | 2,200,000 | | 2,262,766 |
Owens & Minor, Inc. | | BBB | | 4.38 | | 12/15/24 | | 2,800,000 | | 2,860,357 |
PerkinElmer, Inc. | | BBB | | 5.00 | | 11/15/21 | | 4,000,000 | | 4,352,396 |
Quest Diagnostics, Inc. | | BBB+ | | 3.50 | | 03/30/25 | | 700,000 | | 664,285 |
Quest Diagnostics, Inc. | | BBB+ | | 4.75 | | 01/30/20 | | 4,000,000 | | 4,355,292 |
Thermo Fisher Scientific, Inc. | | BBB | | 3.60 | | 08/15/21 | | 1,000,000 | | 1,017,921 |
Thermo Fisher Scientific, Inc. | | BBB | | 4.50 | | 03/01/21 | | 3,000,000 | | 3,197,439 |
Zimmer Biomet Hldgs., Inc. | | BBB | | 3.15 | | 04/01/22 | | 5,000,000 | | 4,918,280 |
| | | | | | | | | | |
| | | | | | | | | | 67,769,281 |
| | | | | | | | | | |
INDUSTRIALS (4.3%) | | | | | | | | | | |
Crane Co. | | BBB | | 2.75 | | 12/15/18 | | 4,000,000 | | 4,079,056 |
Dun & Bradstreet Corp. | | BBB- | | 3.25 | | 12/01/17 | | 3,000,000 | | 3,050,778 |
Dun & Bradstreet Corp. | | BBB- | | 4.38 | | 12/01/22 | | 1,000,000 | | 996,432 |
Equifax, Inc. | | BBB+ | | 3.30 | | 12/15/22 | | 4,000,000 | | 3,978,664 |
Flowserve Corp. | | BBB | | 3.50 | | 09/15/22 | | 4,000,000 | | 3,975,592 |
Harsco Corp. | | BB | | 5.75 | | 05/15/18 | | 4,000,000 | | 4,120,000 |
MUTUAL OF AMERICA INVESTMENT CORPORATION - BOND FUND
PORTFOLIO OF INVESTMENTS IN SECURITIES
June 30, 2015 (Unaudited)
| | | | | | | | | | |
Kennametal, Inc. | | BBB | | 2.65 | | 11/01/19 | | 4,000,000 | | 3,975,372 |
L-3 Communications Corp. | | BBB- | | 4.75 | | 07/15/20 | | 3,000,000 | | 3,166,215 |
L-3 Communications Corp. | | BBB- | | 5.20 | | 10/15/19 | | 1,000,000 | | 1,083,616 |
Pentair PLC | | BBB | | 5.00 | | 05/15/21 | | 3,000,000 | | 3,281,529 |
Pitney Bowes, Inc. | | BBB | | 5.25 | | 01/15/37 | | 3,000,000 | | 3,092,511 |
Textron, Inc. | | BBB | | 4.63 | | 09/21/16 | | 2,900,000 | | 3,016,302 |
Valmont Industries, Inc. | | BBB+ | | 6.63 | | 04/20/20 | | 750,000 | | 865,488 |
Verisk Analytics, Inc. | | BBB- | | 4.00 | | 06/15/25 | | 5,000,000 | | 4,896,520 |
| | | | | | | | | | |
| | | | | | | | | | 43,578,075 |
| | | | | | | | | | |
INFORMATION TECHNOLOGY (7.0%) | | | | | | | | | | |
Adobe Systems, Inc. | | A- | | 4.75 | | 02/01/20 | | 4,000,000 | | 4,404,372 |
Arrow Electronics, Inc. | | BBB- | | 4.00 | | 04/01/25 | | 1,000,000 | | 977,697 |
Arrow Electronics, Inc. | | BBB- | | 4.50 | | 03/01/23 | | 1,100,000 | | 1,124,213 |
Arrow Electronics, Inc. | | BBB- | | 6.88 | | 06/01/18 | | 2,900,000 | | 3,220,230 |
Avnet, Inc. | | BBB- | | 4.88 | | 12/01/22 | | 270,000 | | 281,108 |
Avnet, Inc. | | BBB- | | 5.88 | | 06/15/20 | | 1,100,000 | | 1,220,192 |
Avnet, Inc. | | BBB- | | 6.00 | | 09/01/15 | | 2,000,000 | | 2,015,150 |
eBay, Inc. | | A | | 2.88 | | 08/01/21 | | 5,000,000 | | 4,934,955 |
Fidelity Nat’l. Information | | BBB | | 3.88 | | 06/05/24 | | 5,000,000 | | 4,934,400 |
Fiserv, Inc. | | BBB | | 4.63 | | 10/01/20 | | 2,800,000 | | 3,026,470 |
Fiserv, Inc. | | BBB | | 4.75 | | 06/15/21 | | 1,000,000 | | 1,093,302 |
Ingram Micro, Inc. | | BBB- | | 4.95 | | 12/15/24 | | 750,000 | | 766,605 |
Ingram Micro, Inc. | | BBB- | | 5.00 | | 08/10/22 | | 1,000,000 | | 1,048,181 |
Ingram Micro, Inc. | | BBB- | | 5.25 | | 09/01/17 | | 3,000,000 | | 3,209,895 |
Keysight Technologies, Inc.† | | BBB- | | 4.55 | | 10/30/24 | | 5,000,000 | | 4,825,970 |
Lam Research Corp. | | BBB | | 2.75 | | 03/15/20 | | 5,000,000 | | 4,965,760 |
Lender Processing Svcs., Inc. | | BBB | | 5.75 | | 04/15/23 | | 2,948,000 | | 3,102,770 |
Lexmark International, Inc. | | BBB- | | 6.65 | | 06/01/18 | | 4,000,000 | | 4,399,800 |
Motorola Solutions, Inc. | | BBB | | 3.75 | | 05/15/22 | | 4,000,000 | | 3,936,724 |
Symantec Corp. | | BBB | | 4.20 | | 09/15/20 | | 4,000,000 | | 4,154,568 |
Tech Data Corp. | | BBB- | | 3.75 | | 09/21/17 | | 4,000,000 | | 4,144,436 |
Total System Services, Inc. | | BBB+ | | 3.75 | | 06/01/23 | | 4,000,000 | | 3,929,648 |
Western Union Co. | | BBB | | 5.93 | | 10/01/16 | | 4,000,000 | | 4,199,676 |
| | | | | | | | | | |
| | | | | | | | | | 69,916,122 |
| | | | | | | | | | |
MATERIALS (5.7%) | | | | | | | | | | |
Airgas, Inc. | | BBB | | 3.25 | | 10/01/15 | | 2,000,000 | | 2,007,444 |
Albemarle Corp. | | BBB- | | 4.50 | | 12/15/20 | | 2,000,000 | | 2,117,478 |
Alcoa, Inc. | | BBB- | | 6.75 | | 07/15/18 | | 4,000,000 | | 4,425,656 |
Carpenter Technology Corp. | | BBB | | 4.45 | | 03/01/23 | | 3,600,000 | | 3,581,021 |
Domtar Corp. | | BBB- | | 4.40 | | 04/01/22 | | 5,000,000 | | 5,081,345 |
Eastman Chemical Co. | | BBB | | 4.50 | | 01/15/21 | | 2,500,000 | | 2,704,295 |
Freeport-McMoRan Copper & Gold | | BBB- | | 3.55 | | 03/01/22 | | 4,000,000 | | 3,702,512 |
Geon Co. | | BBB- | | 7.50 | | 12/15/15 | | 3,750,000 | | 3,842,996 |
Goldcorp, Inc. | | BBB+ | | 2.13 | | 03/15/18 | | 4,000,000 | | 4,009,236 |
Kinross Gold Corp. | | BBB- | | 5.13 | | 09/01/21 | | 4,000,000 | | 3,992,064 |
Methanex Corp. | | BBB- | | 3.25 | | 12/15/19 | | 3,400,000 | | 3,420,740 |
Methanex Corp. | | BBB- | | 5.25 | | 03/01/22 | | 600,000 | | 641,898 |
Newmont Mining Corp. | | BBB | | 3.50 | | 03/15/22 | | 4,000,000 | | 3,817,364 |
Packaging Corp. of America | | BBB | | 3.90 | | 06/15/22 | | 2,000,000 | | 2,022,520 |
Packaging Corp. of America | | BBB | | 4.50 | | 11/01/23 | | 2,000,000 | | 2,062,592 |
Southern Copper Corp. | | BBB | | 3.50 | | 11/08/22 | | 4,000,000 | | 3,893,600 |
Teck Resources Ltd. | | BBB- | | 3.75 | | 02/01/23 | | 1,000,000 | | 860,196 |
Teck Resources Ltd. | | BBB- | | 4.75 | | 01/15/22 | | 3,000,000 | | 2,787,435 |
Vulcan Materials Co. | | BB+ | | 7.00 | | 06/15/18 | | 2,000,000 | | 2,260,000 |
| | | | | | | | | | |
| | | | | | | | | | 57,230,392 |
| | | | | | | | | | |
TELECOMMUNICATION SERVICES (0.7%) | | | | | | | | | | |
AT&T, Inc. | | BBB+ | | 3.00 | | 02/15/22 | | 4,000,000 | | 3,904,428 |
AT&T, Inc. | | BBB+ | | 3.00 | | 06/30/22 | | 1,000,000 | | 965,564 |
Verizon Communications, Inc. | | BBB+ | | 4.50 | | 09/15/20 | | 2,000,000 | | 2,157,470 |
| | | | | | | | | | |
| | | | | | | | | | 7,027,462 |
| | | | | | | | | | |
MUTUAL OF AMERICA INVESTMENT CORPORATION - BOND FUND
PORTFOLIO OF INVESTMENTS IN SECURITIES
June 30, 2015 (Unaudited)
| | | | | | | | | | |
UTILITIES (2.5%) | | | | | | | | | | |
AGL Capital Corp. | | BBB+ | | 6.38 | | 07/15/16 | | 500,000 | | 526,852 |
Constellation Energy | | BBB- | | 5.15 | | 12/01/20 | | 3,000,000 | | 3,319,707 |
Duke Energy Progress, Inc. | | A | | 5.25 | | 12/15/15 | | 2,000,000 | | 2,039,748 |
Entergy Corp. | | BBB- | | 4.70 | | 01/15/17 | | 1,500,000 | | 1,561,047 |
Entergy Corp. | | BBB- | | 5.13 | | 09/15/20 | | 2,500,000 | | 2,720,643 |
Exelon Generation Co. LLC | | BBB | | 4.25 | | 06/15/22 | | 1,000,000 | | 1,023,596 |
National Fuel Gas Co. | | BBB | | 4.90 | | 12/01/21 | | 3,000,000 | | 3,104,169 |
National Fuel Gas Co. | | BBB | | 5.20 | | 07/15/25 | | 2,000,000 | | 2,027,302 |
SCANA Corp. | | BBB | | 4.13 | | 02/01/22 | | 4,000,000 | | 4,029,576 |
Talen Energy Supply LLC | | BB- | | 4.60 | | 12/15/21 | | 2,000,000 | | 1,835,000 |
UIL Hldgs. Corp. | | BBB- | | 4.63 | | 10/01/20 | | 2,725,000 | | 2,901,536 |
| | | | | | | | | | |
| | | | | | | | | | 25,089,176 |
| | | | | | | | | | |
SOVEREIGN DEBT (0.4%) | | | | | | | | | | |
Sri Lanka AID | | NR | | 6.59 | | 09/15/28 | | 3,210,686 | | 3,902,909 |
| | | | | | | | | | |
TOTAL LONG-TERM DEBT SECURITIES
(Cost: $968,666,629) 98.3% | | | | | | | | | | 988,650,878 |
| | | | | | | | | | |
| | | | | |
| | | Rating** | | Rate(%) | | Maturity | | Face Amount | | Value |
SHORT-TERM DEBT SECURITIES: | | | | | | | | | | |
U.S. GOVERNMENT AGENCIES (1.4%) | | | | | | | | | | |
FHLB | | A-1+ | | 0.01 | | 07/31/15 | | 8,500,000 | | 8,499,893 |
FHLB | | A-1+ | | 0.02 | | 07/27/15 | | 5,500,000 | | 5,499,921 |
| | | | | | | | | | |
| | | | | | | | | | 13,999,814 |
| | | | | | | | | | |
TOTAL SHORT-TERM DEBT SECURITIES
(Cost: $13,999,814) 1.4% | | | | | | | | | | 13,999,814 |
| | | | | | | | | | |
TOTAL INVESTMENTS
(Cost: $982,666,443) 99.7% | | | | | | | | | | 1,002,650,692 |
| | | | | | | | | | |
OTHER NET ASSETS 0.3% | | | | | | | | | | 2,695,813 |
| | | | | | | | | | |
NET ASSETS 100.0% | | | | | | | | | | $1,005,346,505 |
| | | | | | | | | | |
The accompanying notes are an integral part of these portfolio schedules.
MUTUAL OF AMERICA INVESTMENT CORPORATION
FOOTNOTES TO PORTFOLIOS OF INVESTMENTS IN SECURITIES
June 30, 2015 (Unaudited)
| | |
| Abbreviations: | | FHARM = Federal Home Adjustable Rate Mortgage |
| | FHLB = Federal Home Loan Bank |
| | FHLMC = Federal Home Loan Mortgage Corporation |
| | FNMA = Federal National Mortgage Association |
| | GNMA = Government National Mortgage Association |
| | NR = Not Rated |
| * | Non-income producing security. |
| ** | Ratings as per Standard & Poor's Corporation (unaudited). |
| † | Security is exempt from registration under Rule 144A of the Securities Act of 1933. These securities may be resold in transactions exempt from registration, normally to qualified institutional buyers. At June 30, 2015, the aggregate values of these securities and their percentages of the respective Funds' net assets were as follows: |
| | | | | | | | |
| | | Aggregate | | | Percentage | |
| | | Market | | | of | |
Fund | | Value | | | Net Assets | |
EQUITY INDEX FUND | | $ | 8,399,512 | | | | 0.5 | % |
SMALL CAP GROWTH FUND | | $ | 3,464,947 | | | | 0.8 | % |
MID-CAP EQUITY INDEX FUND | | $ | 6,429,597 | | | | 0.6 | % |
INTERNATIONAL FUND | | $ | 1,049,876 | | | | 0.3 | % |
COMPOSITE FUND | | $ | 1,352,026 | | | | 0.7 | % |
MONEY MARKET FUND | | $ | 35,330,550 | | | | 50.5 | % |
MID-TERM BOND FUND | | $ | 5,732,433 | | | | 1.3 | % |
BOND FUND | | $ | 16,609,147 | | | | 1.7 | % |
| (1) | This security, or a portion thereof, has been segregated to cover initial margin requirements on open futures contracts. |
Information on futures contracts outstanding in the Funds as of June 30, 2015, was as follows:
| | | | | | | | | | | | | | | | | | | | |
Fund | | Number of
Contracts | | Contract Type | | Purchased (P) or Sold (S) | | Expiration Date | | Underlying
Face Amount
at Value(a) | | | Unrealized
Gain(Loss) | | | Face Value
of Futures
as a % of
Total
Investments | |
EQUITY INDEX FUND | | 442 | | E-mini S&P 500 Stock Index | | P | | September 2015 | | $ | 45,402,240 | | | ($ | 671,840 | ) | | | 2.5 | % |
ALL AMERICA FUND | | 50 | | E-mini S&P 500 Stock Index | | P | | September 2015 | | $ | 5,136,000 | | | ($ | 77,666 | ) | | | 1.6 | % |
MID-CAP EQUITY INDEX FUND | | 403 | | E-mini S&P MidCap 400 Stock Index | | P | | September 2015 | | $ | 60,373,430 | | | ($ | 1,104,872 | ) | | | 5.9 | % |
| (a) | Includes the cumulative appreciation(depreciation) of futures contracts. |
| (2) | U.S. Government guaranteed security. |
| (3) | Percentage is less than 0.05%. |
Fair Value—The Investment Company values its investments at fair value. Fair value is an estimate of the price the Fund would receive upon selling a security in an orderly arms-length transaction. Investments are categorized based on a three-level valuation hierarchy for measurement and disclosure of fair value. The valuation hierarchy is based upon the transparency of inputs used to measure fair value. These inputs are summarized in the three broad levels listed below:
| • | | Level 1 – quoted prices in active markets for identical securities. |
| • | | Level 2 – other significant observable inputs (including yield, quality, coupon rate, maturity, issue type, quoted prices for similar securities, prepayment speeds, trading characteristics, etc.). |
| • | | Level 3 – significant unobservable inputs (including the Fund’s own assumptions in determining the fair value of investments). |
MUTUAL OF AMERICA INVESTMENT CORPORATION
FOOTNOTES TO PORTFOLIOS OF INVESTMENTS IN SECURITIES
June 30, 2015 (Unaudited)
As of June 30, 2015, management determined that the fair value inputs for all equity securities, including shares of registered investment companies, were considered Level 1, with the exception of non-registered securities under Rule 144A of the Securities Act of 1933 which were considered Level 2. In addition, certain Rule 144A securities not actively traded were considered Level 3; however, there were no such securities as of June 30, 2015. Fair value inputs for all debt securities were considered Level 2. The inputs used for valuing securities are not necessarily an indication of the risk associated with investing in those securities. Transfers between levels are reflected based on the fair value at the beginning of a reporting period.
The following is a summary of the inputs used to value the Funds’ investments and other financial instruments as of June 30, 2015:
| | | | | | | | | | | | | | | | |
Fund | | Level 1 – Quoted
Prices | | | Level 2 – Significant
Observable Inputs | | | Level 3 – Significant
Unobservable Inputs | | | Total | |
Investments at Fair Value: (See Portfolios of Investments for More Details) | | | | | | | | | | | | | | | | |
Equity Index Fund | | | | | | | | | | | | | | | | |
Common Stock | | $ | 1,769,438,051 | | | | — | | | | — | | | $ | 1,769,438,051 | |
Short-Term Debt Securities | | | — | | | $ | 42,994,642 | | | | — | | | $ | 42,994,642 | |
| | | | | | | | | | | | | | | | |
| | $ | 1,769,438,051 | | | $ | 42,994,642 | | | | — | | | $ | 1,812,432,693 | |
All America Fund | | | | | | | | | | | | | | | | |
Common Stock - Indexed | | $ | 165,696,641 | | | | — | | | | — | | | $ | 165,696,641 | |
Common Stock - Active | | $ | 139,328,854 | | | | — | | | | — | | | $ | 139,328,854 | |
Short-Term Debt Securities - Indexed | | | — | | | $ | 4,499,659 | | | | — | | | $ | 4,499,659 | |
Short-Term Debt Securities - Active | | | — | | | $ | 2,999,672 | | | | — | | | $ | 2,999,672 | |
| | | | | | | | | | | | | | | | |
| | $ | 305,025,495 | | | $ | 7,499,331 | | | | — | | | $ | 312,524,826 | |
Small Cap Value Fund | | | | | | | | | | | | | | | | |
Common Stock | | $ | 380,656,778 | | | | — | | | | — | | | $ | 380,656,778 | |
Short-Term Debt Securities | | | — | | | $ | 15,999,200 | | | | — | | | $ | 15,999,200 | |
| | | | | | | | | | | | | | | | |
| | $ | 380,656,778 | | | $ | 15,999,200 | | | | — | | | $ | 396,655,978 | |
Small Cap Growth Fund | | | | | | | | | | | | | | | | |
Common Stock | | $ | 424,783,543 | | | | — | | | | — | | | $ | 424,783,543 | |
Short-Term Debt Securities | | | — | | | $ | 17,164,325 | | | | — | | | $ | 17,164,325 | |
| | | | | | | | | | | | | | | | |
| | $ | 424,783,543 | | | $ | 17,164,325 | | | | — | | | $ | 441,947,868 | |
Mid Cap Value Fund | | | | | | | | | | | | | | | | |
Common Stock | | $ | 86,169,512 | | | | — | | | | — | | | $ | 86,169,512 | |
Short-Term Debt Securities | | | — | | | $ | 499,922 | | | | — | | | $ | 499,922 | |
| | | | | | | | | | | | | | | | |
| | $ | 86,169,512 | | | $ | 499,922 | | | | — | | | $ | 86,669,434 | |
Mid-Cap Equity Index Fund | | | | | | | | | | | | | | | | |
Common Stock | | $ | 975,209,745 | | | | — | | | | — | | | $ | 975,209,745 | |
Short-Term Debt Securities | | | — | | | $ | 55,676,194 | | | | — | | | $ | 55,676,194 | |
| | | | | | | | | | | | | | | | |
| | $ | 975,209,745 | | | $ | 55,676,194 | | | | — | | | $ | 1,030,885,939 | |
International Fund | | | | | | | | | | | | | | | | |
Common Stock | | $ | 307,732,464 | | | | — | | | | — | | | $ | 307,732,464 | |
Short-Term Debt Securities | | | — | | | $ | 7,320,328 | | | | — | | | $ | 7,320,328 | |
| | | | | | | | | | | | | | | | |
| | $ | 307,732,464 | | | $ | 7,320,328 | | | | — | | | $ | 315,052,792 | |
Composite Fund | | | | | | | | | | | | | | | | |
Common Stock | | $ | 111,448,782 | | | | — | | | | — | | | $ | 111,448,782 | |
U.S. Government Debt | | | — | | | $ | 17,063,574 | | | | — | | | $ | 17,063,574 | |
U.S. Government Agency Residential Mortgage-Backed Obligations | | | — | | | $ | 22,619,276 | | | | — | | | $ | 22,619,276 | |
U.S. Government Agency Non-Mortgage-Backed Obligations | | | — | | | $ | 456,083 | | | | — | | | $ | 456,083 | |
Long-Term Corporate Debt | | | — | | | $ | 31,702,123 | | | | — | | | $ | 31,702,123 | |
Short-Term Debt Securities | | | — | | | $ | 5,429,252 | | | | — | | | $ | 5,429,252 | |
| | | | | | | | | | | | | | | | |
| | $ | 111,448,782 | | | $ | 77,270,308 | | | | — | | | $ | 188,719,090 | |
Retirement Income Fund | | | | | | | | | | | | | | | | |
Common Stock | | $ | 56,141,210 | | | | — | | | | — | | | $ | 56,141,210 | |
MUTUAL OF AMERICA INVESTMENT CORPORATION
FOOTNOTES TO PORTFOLIOS OF INVESTMENTS IN SECURITIES
June 30, 2015 (Unaudited)
| | | | | | | | | | | | | | | | |
2010 Retirement Fund | | | | | | | | | | | | | | | | |
Common Stock | | $ | 26,760,675 | | | | — | | | | — | | | $ | 26,760,675 | |
2015 Retirement Fund | | | | | | | | | | | | | | | | |
Common Stock | | $ | 156,452,022 | | | | — | | | | — | | | $ | 156,452,022 | |
2020 Retirement Fund | | | | | | | | | | | | | | | | |
Common Stock | | $ | 348,331,500 | | | | — | | | | — | | | $ | 348,331,500 | |
2025 Retirement Fund | | | | | | | | | | | | | | | | |
Common Stock | | $ | 369,345,005 | | | | — | | | | — | | | $ | 369,345,005 | |
2030 Retirement Fund | | | | | | | | | | | | | | | | |
Common Stock | | $ | 307,564,040 | | | | — | | | | — | | | $ | 307,564,040 | |
2035 Retirement Fund | | | | | | | | | | | | | | | | |
Common Stock | | $ | 254,781,883 | | | | — | | | | — | | | $ | 254,781,883 | |
2040 Retirement Fund | | | | | | | | | | | | | | | | |
Common Stock | | $ | 210,284,897 | | | | — | | | | — | | | $ | 210,284,897 | |
2045 Retirement Fund | | | | | | | | | | | | | | | | |
Common Stock | | $ | 257,691,297 | | | | — | | | | — | | | $ | 257,691,297 | |
2050 Retirement Fund | | | | | | | | | | | | | | | | |
Common Stock | | $ | 72,224,829 | | | | — | | | | — | | | $ | 72,224,829 | |
Conservative Allocation Fund | | | | | | | | | | | | | | | | |
Common Stock | | $ | 129,486,261 | | | | — | | | | — | | | $ | 129,486,261 | |
Moderate Allocation Fund | | | | | | | | | | | | | | | | |
Common Stock | | $ | 325,355,242 | | | | — | | | | — | | | $ | 325,355,242 | |
Aggressive Allocation Fund | | | | | | | | | | | | | | | | |
Common Stock | | $ | 261,244,453 | | | | — | | | | — | | | $ | 261,244,453 | |
Money Market Fund | | | | | | | | | | | | | | | | |
U.S. Government Debt | | | — | | | $ | 3,999,126 | | | | — | | | $ | 3,999,126 | |
U.S. Government Agency Short-Term Debt | | | — | | | $ | 15,799,704 | | | | — | | | $ | 15,799,704 | |
Commercial Paper | | | — | | | $ | 49,079,187 | | | | — | | | $ | 49,079,187 | |
| | | | | | | | | | | | | | | | |
| | | — | | | $ | 68,878,017 | | | | — | | | $ | 68,878,017 | |
Mid-Term Bond Fund | | | | | | | | | | | | | | | | |
U.S. Government Debt | | | — | | | $ | 120,140,954 | | | | — | | | $ | 120,140,954 | |
U.S. Government Agency Residential Mortgage-Backed Obligations | | | — | | | $ | 4,481 | | | | — | | | $ | 4,481 | |
U.S. Government Agency Non-Mortgage-Backed Obligations | | | — | | | $ | 34,128,928 | | | | — | | | $ | 34,128,928 | |
Long-Term Corporate Debt | | | — | | | $ | 287,296,614 | | | | — | | | $ | 287,296,614 | |
Short-Term Debt Securities | | | — | | | $ | 12,499,836 | | | | — | | | $ | 12,499,836 | |
| | | | | | | | | | | | | | | | |
| | | — | | | $ | 454,070,813 | | | | — | | | $ | 454,070,813 | |
Bond Fund | | | | | | | | | | | | | | | | |
U.S. Government Debt | | | — | | | $ | 78,006,606 | | | | — | | | $ | 78,006,606 | |
U.S. Government Agency Residential Mortgage-Backed Obligations | | | — | | | $ | 263,276,776 | | | | — | | | $ | 263,276,776 | |
U.S. Government Agency Non-Mortgage-Backed Obligations | | | — | | | $ | 33,780,338 | | | | — | | | $ | 33,780,338 | |
Long-Term Corporate Debt | | | — | | | $ | 609,684,249 | | | | — | | | $ | 609,684,249 | |
Sovereign Debt | | | — | | | $ | 3,902,909 | | | | — | | | $ | 3,902,909 | |
Short-Term Debt Securities | | | — | | | $ | 13,999,814 | | | | — | | | $ | 13,999,814 | |
| | | | | | | | | | | | | | | | |
| | | — | | | $ | 1,002,650,692 | | | | — | | | $ | 1,002,650,692 | |
MUTUAL OF AMERICA INVESTMENT CORPORATION
FOOTNOTES TO PORTFOLIOS OF INVESTMENTS IN SECURITIES
June 30, 2015 (Unaudited)
| | | | | | | | | | | | | | | | |
Other Financial Instruments:* | | | | | | | | | | | | | | | | |
Equity Index Fund | | ($ | 671,840 | ) | | | — | | | | — | | | ($ | 671,840 | ) |
All America Fund | | ($ | 77,666 | ) | | | — | | | | — | | | ($ | 77,666 | ) |
Mid-Cap Equity Index Fund | | ($ | 1,104,872 | ) | | | — | | | | — | | | ($ | 1,104,872 | ) |
| * | Other financial instruments are derivative instruments not reflected in the Portfolio of Investments, such as futures, which are valued at the unrealized appreciation/depreciation on the instrument. |
During the six month period ended June 30, 2015, there were no transfers of securities between Level 1, Level 2 or Level 3.
Security Valuation — Investment securities are carried at fair value as follows:
Exchange-traded equity securities are valued at the last reported sales price on the principal exchange on which the security is traded. If there is no trading volume for a particular valuation day, the last bid price is used. For equity securities traded in the over-the-counter market, the security is valued at the last sale price, or if no sale, at the latest bid price available.
Short-term debt securities with a maturity of 60 days or less are valued at amortized cost, which approximates fair value for such securities.
Debt securities, including short-term debt securities maturing in excess of 60 days, are valued on the basis of prices obtained from an independent pricing source. The pricing source may utilize various pricing methodologies that incorporate both models (which consider factors such as yield, quality, coupon rate, maturity, issue type, quoted prices for similar securities, prepayment speeds and trading characteristics) and dealer supplied valuations to derive a valuation.
In the rare instance when a price is not available from an independent pricing source or when prices may not reflect fair value, such as when the price provided by the pricing source is not based on a recent trade, a calculated fair value is used, as determined in good faith by the Adviser and reviewed by a Valuation Committee, in accordance with procedures adopted by the Board of Directors of the Investment Company.
The Advisor uses a market approach to calculate fair value for equity securities which are categorized as Level 3. The Adviser’s valuation is primarily based on information regarding the specific equity issuer, such as the last trade price, financial statements, the relationship of per-share book value to the last trade price, operating information and any corporate actions, such as dividends or returns of capital, that may have occurred since the last trade. The Adviser also considers industry-specific conditions and overall market conditions, to determine whether the last trade price reflects fair value or needs to be adjusted. Generally, absent any significant contrary indications, the last trade price will be used to calculate fair value.
Retirement Funds and the Allocation Funds value their investments in the underlying Funds of the Investment Company at their respective net asset values.
Investment Transactions — Investment transactions are accounted for as of the trade date. Realized gain and loss on the sale of short and long-term debt securities are computed on the basis of amortized cost at the time of sale. Realized gains and losses on the sale of equity securities are based on the identified cost basis of the security, determined on the first-in, first-out (“FIFO”) basis.
Futures Contracts - The Equity Index Fund, Mid-Cap Equity Index Fund and a portion of the All America Fund each maintain indexed asset portfolios which are subject to equity price risk. In order to remain more fully invested in the equity markets while minimizing transaction costs, the funds purchase stock index futures contracts. An initial cash margin deposit (represented by cash or Treasury bills) is made upon entering into a futures contract and serves as collateral for the contract. This initial margin, maintained in a segregated account, is equal to approximately 5%-6% of the contract amount, and does not involve the borrowing of funds to finance the transaction. During the period the futures contract is outstanding, changes in the value of the contract are recognized as unrealized appreciation or depreciation by “marking-to-market” on a daily basis to reflect the market value of the contract at the end of each trading day. The accumulated unrealized appreciation or depreciation on the contract is included in Net Unrealized Appreciation (Depreciation) of Investments and Futures Contracts in the Components of Net Assets section of the Statements of Assets and Liabilities.
Futures contracts are valued at the settlement price established each day by the exchange on which traded. Depending upon whether unrealized appreciation or depreciation are incurred, variation margin payments are received or made daily. The net change in unrealized appreciation or depreciation of futures contracts is recorded in the Statements of Operations. When the contract is closed, a realized gain or loss from futures transactions is recorded in the Statements of Operations, equal to the net variation margin received or paid over the period the contract was outstanding. The “Underlying Face Amount at Value” (appearing in the “Notes to the Portfolios of Investments in Securities”), representing the aggregate of outstanding contractual amounts under futures contracts, reflects the extent of a Fund’s exposure to off-balance sheet risk. The use of futures transactions involves the risk of imperfect correlation in the price movements of the contract and the underlying securities. With futures contracts, there is minimal counterparty credit risk to the Fund since futures are exchange traded and the exchange’s clearinghouse, as counterparty to all exchange traded futures, guarantees the futures against default.
MUTUAL OF AMERICA INVESTMENT CORPORATION
FOOTNOTES TO PORTFOLIOS OF INVESTMENTS IN SECURITIES
June 30, 2015 (Unaudited)
Tax Information - The components of net unrealized appreciation (depreciation) of investments for Federal income tax purposes and the cost of investments for Federal income tax purposes at June 30, 2015 for each of the funds were as follows.
| | | | | | | | | | | | | | | | | | | | |
| | | Equity Index
Fund | | | All America
Fund | | | Small Cap
Value Fund | | | Small Cap
Growth Fund | | | Mid Cap
Value Fund | |
Unrealized Appreciation | | $ | 687,596,921 | | | $ | 98,620,327 | | | $ | 99,991,728 | | | $ | 105,992,749 | | | $ | 19,214,153 | |
Unrealized Depreciation | | | (29,400,807 | ) | | | (11,039,911 | ) | | | (14,257,717 | ) | | | (9,497,511 | ) | | | (1,742,008 | ) |
| | | | | | | | | | | | | | | | | | | | |
Net | | $ | 658,196,114 | | | $ | 87,580,416 | | | $ | 85,734,011 | | | $ | 96,495,238 | | | | 17,472,145 | |
| | | | | | | | | | | | | | | | | | | | |
Cost of Investments | | $ | 1,154,236,580 | | | $ | 224,944,410 | | | $ | 310,921,967 | | | $ | 345,452,630 | | | $ | 69,197,289 | |
| | | | | | | | | | | | | | | | | | | | |
| | | | | |
| | | Mid-Cap
Equity Index
Fund | | | International
Fund | | | Composite
Fund | | | Retirement
Income
Fund | | | 2010
Retirement
Fund | |
Unrealized Appreciation | | $ | 297,433,895 | | | $ | 16,636,606 | | | $ | 44,495,757 | | | $ | 2,212,935 | | | $ | 2,332,508 | |
Unrealized Depreciation | | | (35,996,348 | ) | | | (3,847,846 | ) | | | (3,140,033 | ) | | | (125,281 | ) | | | (41,209 | ) |
| | | | | | | | | | | | | | | | | | | | |
Net | | $ | 261,437,547 | | | $ | 12,788,760 | | | $ | 41,355,724 | | | $ | 2,087,654 | | | | 2,291,299 | |
| | | | | | | | | | | | | | | | | | | | |
Cost of Investments | | $ | 769,448,392 | | | $ | 302,264,032 | | | $ | 147,363,366 | | | $ | 54,053,556 | | | $ | 24,469,376 | |
| | | | | | | | | | | | | | | | | | | | |
| | | | | |
| | | 2015
Retirement
Fund | | | 2020
Retirement
Fund | | | 2025
Retirement
Fund | | | 2030
Retirement
Fund | | | 2035
Retirement
Fund | |
Unrealized Appreciation | | $ | 18,412,551 | | | $ | 45,495,826 | | | $ | 59,394,723 | | | $ | 55,208,629 | | | $ | 48,094,023 | |
Unrealized Depreciation | | | (186,023 | ) | | | (564,049 | ) | | | (694,517 | ) | | | (576,969 | ) | | | (447,433 | ) |
| | | | | | | | | | | | | | | | | | | | |
Net | | $ | 18,226,528 | | | $ | 44,931,777 | | | $ | 58,700,206 | | | $ | 54,631,660 | | | $ | 47,646,590 | |
| | | | | | | | | | | | | | | | | | | | |
Cost of Investments | | $ | 138,225,494 | | | $ | 303,399,723 | | | $ | 310,644,799 | | | $ | 252,932,380 | | | $ | 207,135,293 | |
| | | | | | | | | | | | | | | | | | | | |
| | | | | |
| | | 2040
Retirement
Fund | | | 2045
Retirement
Fund | | | 2050
Retirement
Fund | | | Conservative
Allocation
Fund | | | Moderate
Allocation
Fund | |
Unrealized Appreciation | | $ | 42,489,665 | | | $ | 54,544,635 | | | $ | 4,509,701 | | | $ | 9,797,270 | | | $ | 58,971,680 | |
Unrealized Depreciation | | | (304,157 | ) | | | (375,515 | ) | | | (994 | ) | | | (131,204 | ) | | | (5,842,502 | ) |
| | | | | | | | | | | | | | | | | | | | |
Net | | $ | 42,185,508 | | | $ | 54,169,120 | | | $ | 4,508,707 | | | $ | 9,666,066 | | | $ | 53,129,178 | |
| | | | | | | | | | | | | | | | | | | | |
Cost of Investments | | $ | 168,099,389 | | | $ | 203,522,177 | | | $ | 67,716,122 | | | $ | 119,820,195 | | | $ | 272,226,064 | |
| | | | | | | | | | | | | | | | | | | | |
| | | | | | | | | | | | | | | | |
| | | | |
| | | Aggressive
Allocation
Fund | | | Money
Market
Fund | | | Mid-Term
Bond Fund | | | Bond
Fund | |
Unrealized Appreciation | | $ | 66,723,992 | | | $ | 1,881 | | | $ | 9,404,452 | | | $ | 26,928,521 | |
Unrealized Depreciation | | | (5,176,690 | ) | | | — | | | | (2,043,898 | ) | | | (6,944,272 | ) |
| | | | | | | | | | | | | | | | |
Net | | $ | 61,547,302 | | | $ | 1,881 | | | $ | 7,360,554 | | | $ | 19,984,249 | |
| | | | | | | | | | | | | | | | |
Cost of Investments | | $ | 199,697,151 | | | $ | 68,876,136 | | | $ | 446,710,259 | | | $ | 982,666,443 | |
| | | | | | | | | | | | | | | | |
Differences between amounts reflected in the Summary Portfolios or Portfolios of Investments in Securities and those computed for Federal income tax purposes arise primarily from the Federal income tax treatment of wash sales, REITs, partnerships, corporate actions and futures contracts.
(b) Not applicable.
| ITEM 7. | DISCLOSURE OF PROXY VOTING POLICIES AND PROCEDURES FOR CLOSED-END MANAGEMENT INVESTMENT COMPANIES. |
Not applicable.
| ITEM 8. | PORTFOLIO MANAGERS OF CLOSED-END MANAGEMENT INVESTMENT COMPANIES. |
Not applicable.
| ITEM 9. | PURCHASES OF EQUITY SECURITES BY CLOSED-END MANAGEMENT INVESTMENT COMPANY AND AFFILIATED PURCHASERS. |
Not applicable.
| ITEM 10. | SUBMISSION OF MATTERS TO A VOTE OF SECURITY HOLDERS. |
Not applicable.
| ITEM 11. | CONTROLS AND PROCEDURES. |
| | (a) | The registrant's principal executive officer and principal financial officer have evaluated the registrant's disclosure controls and procedures within 90 days of this filing and have concluded that the registrant's disclosure controls and procedures were effective, as of that date, in ensuring that information required to be disclosed by the registrant in this Form N-CSR was recorded, processed, summarized, and reported in a timely and accurate manner. |
| | (b) | The registrant's principal executive officer and principal financial officer are aware of no changes in the registrant's internal control over financial reporting that occurred during the second fiscal quarter of the period covered by this report that has materially affected, or is likely to materially affect, the registrant's internal control over financial reporting. |
Attached hereto:
| | | | | | | | |
| | (a) | | (1) | | Not applicable to semi-annual report. |
| | | | |
| | | | (2) | | Exhibit 99.CERT | | Certifications by the registrant's principal executive officer and principal financial officer, pursuant to Section 302 of the Sarbanes-Oxley Act of 2002 and required by Rule 30a-2(a) under the Investment Company Act of 1940. |
| | | |
| | | | (3) | | Not applicable. |
| | | | |
| | (b) | | | | Exhibit 99.906CERT | | Certifications pursuant to Section 906 of the Sarbanes-Oxley Act of 2002 and required by Rule 30a-2(b) under the Investment Company Act of 1940. |
SIGNATURES
Pursuant to the requirements of the Securities Exchange Act of 1934 and the Investment Company Act of 1940, the registrant has duly caused this report to be signed on its behalf by the undersigned, thereunto duly authorized.
Mutual of America Investment Corporation
| | |
| By: | | /s/ JAMES J. ROTH |
| | James J. Roth |
| | Chairman of the Board, |
| | President and Chief Executive Officer of |
| | Mutual of America Investment Corporation |
| |
| Date: | | September 3, 2015 |
Pursuant to the requirements of the Securities Exchange Act of 1934 and the Investment Company Act of 1940, this report has been signed below by the following persons on behalf of the registrant and in the capacities and on the dates indicated.
| | |
| By: | | /s/ JAMES J. ROTH |
| | James J. Roth |
| | Chairman of the Board, |
| | President and Chief Executive Officer of |
| | Mutual of America Investment Corporation |
| |
| Date: | | September 3, 2015 |
| |
| By: | | /s/ CHRIS W. FESTOG |
| | Chris W. Festog |
| | Executive Vice President, |
| | Chief Financial Officer and Treasurer of |
| | Mutual of America Investment Corporation |
| |
| Date: | | September 3, 2015 |