UNITED STATES
SECURITIES AND EXCHANGE COMMISSION
Washington, D.C. 20549
FORM N-CSR
CERTIFIED SHAREHOLDER REPORT OF REGISTERED
MANAGEMENT INVESTMENT COMPANIES
Investment Company Act file number 811-05084
Mutual of America Investment Corporation
(Exact name of registrant as specified in charter)
320 Park Avenue, New York, N.Y. 10022
(Address of principal executive offices) (Zip code)
James J. Roth
Chairman of the Board, President and Chief Executive Officer
Mutual of America Investment Corporation
320 Park Avenue
New York, NY 10022
(Name and address of agent for service)
Registrant’s telephone number, including area code:
(212) 224-1600
Date of fiscal year end: December 31
Date of reporting period: June 30, 2016
| ITEM 1. | REPORTS TO STOCKHOLDERS. |
The Semi-Annual Report to Shareholders follows:
JUNE 30, 2016
Semi-Annual Reports of Investment Options Offered by Mutual of America Life Insurance Company
This report is not to be construed as an offering for sale of any Variable Policy. No offering is made except in conjunction with a prospectus which must precede or accompany this report.


320 PARK AVENUE
NEW YORK NY 10022-6839
August 2016
Dear Contract Owner,
As a valued variable annuity owner, variable life insurance policyholder or participant in a group variable annuity, we are pleased to provide you with the semi-annual fund reports for the investment options you have selected. Included in this booklet are the semi-annual reports of the Mutual of America Investment Corporation Funds. If you have also selected other investments options, you will receive semi-annual reports for those funds in a separate booklet or booklets. The reports provide an update on each portfolio’s performance as of June 30, 2016. Please note that portfolio performance does not take into account the fees charged by the annuity contract or life insurance policy. When viewed net of these contract fees, your performance will be lower. As always, past performance cannot predict or guarantee future returns.
Mutual of America has specialized in providing retirement products and related services to organizations and their employees, as well as individuals, for 70 years. As a mutual company, we do not have stockholders and are not publicly traded. We operate solely for the benefit of our customers, managing the Company for their long-term interest, rather than for the short-term demands of stockholders. Today, as in the past, Mutual of America remains financially strong and is rated among the strongest companies in the life insurance industry by the major independent rating agencies.*
Since 1945, Mutual of America has remained committed to offering plan sponsors, plan participants and individuals carefully selected, quality products and services at a competitive price and the personal attention they need to help build and preserve assets for a financially secure future. Integrity, prudence, and reliability are the values that have guided us since our inception and that continue to serve us well.
We hope you will find the enclosed information helpful. We appreciate and value your business and look forward to serving you in the future. If you have any questions, please call your local Mutual of America Regional Office or 1-800-468-3785.
Sincerely,
Mutual of America Life Insurance Company
| * | While these ratings do not apply to the safety or investment performance of the Separate Account investment funds available under Mutual of America’s products, they do reflect the Company’s ability to fulfill its General Account obligations, which include its obligations under the Interest Accumulation Account, annuity purchase rate guarantees and annuity benefit payouts, as well as life insurance and disability income payments. Third party ratings are subject to change. |
JUNE 30, 2016
Semi-Annual Reports of Mutual of America Investment Corporation
This report is not to be construed as an offering for sale of any Variable Policy. No offering is made except in conjunction with a prospectus which must precede or accompany this report.

(This page has been left blank intentionally.)
CONTENTS
MUTUALOF AMERICA INVESTMENT CORPORATION
We are pleased to present the Mutual of America Investment Corporation (the “Investment Company”) Semi-Annual Report. This Report includes important information regarding the performance and financial position of the Investment Company’s funds for the six months ended June 30, 2016.
The decision in June by the citizens of the United Kingdom to exit the European Union (known as Brexit) makes a discussion of the past six months somewhat irrelevant because this event will rearrange a multitude of variables affecting all economies and markets around the globe over an extended period. The problem is that no one really knows exactly which changes will occur and in what order. Nor do they know the policy reactions along the way to deal with dislocations in the global relationships that have been developed and established over the 70 years of the post-World War II world. What we do know is that the future will be characterized by heightened uncertainty.
Brexit Vote Just the Start
Before looking at the uncertainties, it is helpful to examine what is known now, and what is likely. First, it will take a long time to actually negotiate and execute Brexit — at least two years and possibly more. Specifications for leaving the European Union require complex renegotiation of the relations between the EU and the exiting party, involving issues such as trade agreements and defense arrangements. David Cameron, the Prime Minister of the U.K., formally resigned immediately after the results of the referendum were announced. The Conservative Party acted quickly to elect a new prime minister, Theresa May, who immediately appointed a new cabinet comprised of many of the top advocates of pulling out of the EU. The message is clear: the vote of the “people” is sacrosanct in a democracy. However, she also made it clear that the U.K. is in no rush to invoke Article 50, the required formal declaration of intention to sever ties, in order to map out its strategy for negotiation with the EU. In the meantime, the U.K. will remain in the EU with all the obligations and benefits to which it is currently bound. That said, the U.K. has never been a full party to the EU, having negotiated exceptions to strict compliance with all EU regulations.
Global Markets and Economies Marked by Volatility
What else is known is that global markets will likely be volatile because markets do not like uncertainty and tend to react quickly and aggressively to the unexpected. The vote to leave the EU is a perfect case in point. Equity, bond and especially currency markets responded instantly to the results of the U.K. referendum. The aftermath of the U.K.’s departure from the EU will be, as already suggested, full of twists and turns that are almost certain to continue to roil markets.
What is not known, but probable, is that the U.S. dollar will likely reverse its recent decline and begin to strengthen again. The dollar and investments in the U.S. are viewed as safe havens for assets. The heightened uncertainty created by Brexit prompted foreigners to sell non-dollar assets and buy U.S. assets, primarily U.S. Treasury bonds. Similarly, gold is perceived as a safe haven and is priced in U.S. dollars, thus further supporting a stronger U.S. currency, while at the same time contributing to further advances in the price of gold. Also, the relative configuration of interest rates is likely to change. Long-term rates among southern members of the Eurozone have already spiked. Rates among the northern tier will likely fall further into negative territory as the European Central Bank tries additional monetary easing policies to support weak banks and already sluggish economies in Europe.
On the economic front, the unknowns but probables include even slower growth or outright recession both in the U.K. and EU. Likewise, in Japan, the yen — a safe haven currency like the U.S. dollar — will strengthen even more than it has over the past six months, creating a major headwind to exports, a key driver of Japanese growth. Slower growth in Europe and Japan will likely put downward pressure on Chinese growth, which has been receding since 2011. Slower Chinese growth will mean fewer imports from other Asian, as well as South American, markets. In short, slower growth, possibly below 3%, is highly probable.
U.S. Interest Rate Increases Unlikely Soon
Another very important unknown but highly probable outcome of Brexit is that the Federal Reserve’s plan to raise policy rates will be pushed out further in time, and may be curtailed and reversed if the global economy shows signs of sinking into a major recession. Immediately after the Brexit vote, the odds of a December rate hike, as indicated by pricing in the bond futures market, dropped from 50% to 15%. A July increase is already off the table, and September was already unlikely because of the upcoming presidential election in November. The Fed’s independence has been repeatedly questioned for years by many in Congress, especially since its policies have not generated the expected boost to growth. An increase in rates just before the election could be construed as politically motivated, further aggravating the consternation of those in Congress in favor of a more constrained Federal Reserve.
1
The Great Unknowns
We do not know for sure whether or not we are correct on the list of probable consequences of Brexit outlined above. However, one key unknown is whether Brexit will prompt other EU and Eurozone members to exit the EU — thus unraveling decades of integration. Complicating the situation for the U.K. exit from the EU is that Scotland and Northern Ireland, key constituents of the U.K., do not want to leave. On the other hand, the anti-establishment themes that resulted in the Brexit vote seem to be strengthening in other EU nations. For example, recent Italian elections resulted in anti-establishment mayors being elected in Rome and Turin — both major metropolitan centers influential in political trends. In Spain, a recent national election resulted in increased power to a major anti-Europe party, although the current government, which has continued to support the EU and the austerity policies implemented in return for debt support, remained in control. Nationalistic, anti-globalization, anti-immigration, anti-establishment and anti-EU movements have gained strength in the Netherlands and even France. While not currently relevant to the future of Europe, the U.S. presidential bid by Donald Trump is based on similar populist themes, including anti-immigration and anti-globalization. The entire Western world seems to be in the throes of an anti-establishment mood, suggesting that the world order developed over decades may be in for change. The nature of change is uncertainty, and as noted repeatedly in these letters, markets do not like uncertainty.
What Will Come of International Organizations?
Another unknown is the impact of Brexit on international organizations such as the International Monetary Fund, the Bank for International Settlements, NATO, and even the United Nations. Regarding the latter, the U.K. is one of five permanent members of the U.N.’s Security Council, each member of which has veto power over any proposal. Some have held for a long time that the U.K. should not remain on the council, arguing that it is no longer a major global player — economically, politically or militarily. Those claims are questionable given that the U.K. is the second largest economy in the EU behind Germany, and remains among the top 10 globally. It is also one of about a dozen nations possessing nuclear weapons. However, its current status is much diminished since the end of World War II, during which it played a significant role in defeating Hitler’s Germany. It can be argued that other nations could be candidates for inclusion. While that is unlikely to happen, the permanent status of the five members of the Security Council, which includes a U.K. with reduced influence on global affairs, begs the question of the continuing relevance of the United Nations, which is already viewed as ineffectual, at best, in the case of most global crises.
The future of NATO, the military alliance created to provide for European security, is also likely to be impacted by Brexit, as the U.K. is a key contributor, both in terms of money and military support, in the organization. U.S. relations with Europe will likely be impaired by not having the U.K. representing shared interests in its dealings as a member of the EU and, as a result, may complicate the role of the U.S. in NATO. Such potential realignment among defense allies in Europe would be problematic given Russia’s recent activities in the Ukraine and Syria.
Brexit Impact on the U.S.
Finally, it is not clear what impact Brexit will have on the U.S. The so-called “special relationship” we have with the U.K. is likely to become less special as that nation will lose its ability to represent our interests in the EU. As a result, our relationship with the EU will likely change over time.
As for the economic consequences, a stronger dollar and slower European growth will negatively impact our exports, as Europeans will have less to spend on U.S. goods that are more expensive for them. Because the U.S. economy remains stronger than most others, imports will remain strong. However, the combination of higher imports and lower exports reduces the Gross Domestic Product. In other words, slower European and slower global growth will likely prove to be incremental drags on the U.S. economy. Corporate capital investment, which has remained anemic for the past several years, is likely to be further restrained, especially among U.S. multinationals. All of the uncertainties unleashed by Brexit will make businesses more cautious about adding capacity to their operations. Much like the markets, corporate executives dislike uncertainty. Their normal response is to wait until things become clearer. As the consequences of Brexit unfold and we face continuing vicissitudes, corporations’ responses will be on hold. Caterpillar Corporation has already announced a wait-and-see response to Brexit. Others will follow in the same vein.
Fortunately, the U.S. economy is largely driven by the consumer, representing two-thirds of spending. Job growth has been strong and wages are rising, albeit slowly. Unemployment is at 4.7%, the lowest it has been over the past 25 years except for two occasions (2000 = 3.8%; 2007 = 4.4%). Auto sales remain strong, and home sales are improving. Government spending is increasing for the first time since before the Great Recession. Consumer balance sheets are at their strongest in decades because bad debts have been written off and consumers are just beginning to borrow tepidly. Furthermore, the savings rate remains high by historical standards, providing both sounder financial health and incremental buying power. Thus, the U.S. economy is in good shape even though growth is likely to continue to run at around a 2% rate on average. Of course, growth will slow in the event that serious recessions develop abroad.
2
U.S. corporate profits are another matter. S&P 500® earnings growth is flat to negative over the past year-and-a-half. Current projections for the next six quarters call for strong acceleration, but those estimates are almost assured to come down in the face of uncertainties throughout the world. The price-to-earnings ratios for 2016 and 2017 are above and equal to, respectively, the historical average. With earnings estimates coming down for each of the next six quarters, it is difficult to imagine that the S&P 500 will advance substantially, if at all. It is more likely to trade at lower levels. If the economy begins to dip into recession, stocks will decline.
Bonds yields, on the other hand, should remain around current lows or decline further. Concerns about slowing growth and recession tend to lower inflation and draw in money flows to Treasury bonds seeking a safe haven. Corporate bond yields, however, tend to move higher under such a scenario, widening spreads and challenging portfolio performance. This is because slowing growth undermines financial health, especially among more highly leveraged companies.
We still do not see a U.S. recession in the near term. However, the risks have risen in the aftermath of Brexit. There are a number of warning signs flashing. Corporate margins are near historical highs, the Treasury yield curve is flattening, the leading indicator is near its previous peak, and as noted, the unemployment rate is close to historic lows. These conditions typically precede a recession by anywhere from six to 18 months, but the actual lead times vary a lot over different cycles. The current cycle is on the verge of being the second longest in post-World War II history. Expansions do not end because of old age, but the type of slow growth environment we have experienced over the past eight years is more fragile and thus more vulnerable to shocks. Brexit was indeed a shock, but the fact that its consequences will develop slowly reduces the immediate impact. At the same time, Brexit has set in motion an engine of change that will eventually lead to a new world order in all its dimensions.
The total return performance (net of investment management and other operating expenses) for each of the Investment Company Funds is reflected below:
| | | | |
| Total Returns — Six Months Ended June 30, 2016 | |
| |
Equity Index Fund | | | +3.77% | |
All America Fund | | | +2.53% | |
Small Cap Value Fund | | | +3.40% | |
Small Cap Growth Fund | | | -1.21% | |
Mid Cap Value Fund | | | +4.50% | |
Mid-Cap Equity Index Fund | | | +7.83% | |
International Fund | | | -2.37% | |
Composite Fund | | | +3.24% | |
Retirement Income Fund | | | +4.77% | |
2010 Retirement Fund | | | +4.58% | |
2015 Retirement Fund | | | +4.51% | |
2020 Retirement Fund | | | +4.25% | |
2025 Retirement Fund | | | +4.19% | |
2030 Retirement Fund | | | +4.10% | |
2035 Retirement Fund | | | +3.89% | |
2040 Retirement Fund | | | +3.67% | |
2045 Retirement Fund | | | +3.43% | |
2050 Retirement Fund | | | +3.29% | |
Conservative Allocation Fund | | | +4.57% | |
Moderate Allocation Fund | | | +4.42% | |
Aggressive Allocation Fund | | | +3.86% | |
Money Market Fund | | | +0.06% | |
Mid-Term Bond Fund | | | +4.43% | |
Bond Fund | | | +6.07% | |
The above performance figures do not reflect the deduction of respective Separate Account fees and expenses imposed by Mutual of America Life Insurance Company. All Fund performances presented throughout this report are historical, reflect the full reinvestment of dividends paid, and should not be considered indicative of future results.
The pages that immediately follow include brief discussions of each Fund’s performance for the six months ended June 30, 2016, compared with its relevant index.
3
Following the discussions are the graphical representations of the asset allocations of each Fund and an illustration of each Fund’s operating expenses. The summarized portfolios of each Fund and financial statements are presented in the pages that follow.
Thank you for your continued investment in our Funds.
Sincerely,

James J. Roth
Chairman of the Board, President
and Chief Executive Officer
Mutual of America Investment Corporation
The views expressed in this Semi-Annual Report are subject to change at any time based on market and other conditions and should not be construed as a recommendation. This Report contains forward looking statements which speak only as of the date they were made and involve a number of risks and uncertainties that could cause actual results to differ materially from those expressed herein. Readers are cautioned not to place undue reliance on our forward-looking statements, as we assume no obligation to update these forward-looking statements. Readers assume any and all responsibility for any investment decision made as a result of the views expressed herein.
Standard & Poor’s®, S&P® and S&P 500® are trademarks of Standard & Poor’s Financial Services LLC, a subsidiary of The McGraw-Hill Companies, Inc.
4
EQUITY INDEX FUND
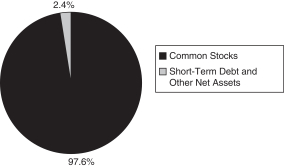
The Equity Index Fund’s objective is to replicate the performance of the S&P 500® Index (S&P 500), which consists of 500 stocks chosen by Standard & Poor’s for market size, liquidity and industry group representation. The S&P 500 is a market-weighted index of 500 stocks traded on the New York Stock Exchange, American Stock Exchange and NASDAQ, with each stock’s weight in the index proportionate to its market value. The weightings make each company’s influence on the S&P 500’s performance directly proportional to that company’s market value.
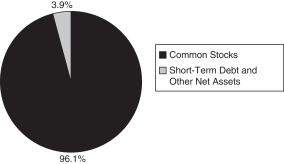
The Equity Index Fund’s performance for the six months ended June 30, 2016, was 3.84% before expenses and 3.77% after expenses, in line with the benchmark return of 3.84%. Note that the Equity Index Fund’s performance includes expenses, such as transaction costs and management fees, which are not applicable to the benchmark.
ALL AMERICA FUND
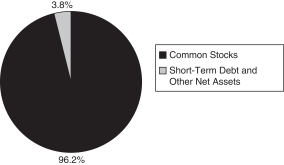
The investment objective of the All America Fund is to outperform the S&P 500® Index (S&P 500). The All America Fund is approximately 60% invested in the 500 stocks that comprise the S&P 500, with the remaining 40% actively managed, comprised of 20% large and mid-cap stocks and 20% small cap stocks. Beginning July 1, 2016, the actively managed portfolio will shift to mid-cap stocks from large cap stocks, thus providing exposure to all levels of market capitalization among domestic stocks.
For the half year ended June 30, 2016, the S&P 500 of large capitalization stocks increased by 3.84% on a total return basis, while the Russell 2000® Growth Index was down -1.59% and the Russell 2000® Value Index was up 6.08%.
The All America Fund’s return for the six months ended June 30, 2016, before expenses was 2.80% and 2.53% after expenses versus the benchmark return of 3.84%. The underperformance of the Fund was the result of underperformance by all three active equity components, namely, the Small Cap Value and Small Cap Growth and the Large Cap components of the Fund. The Equity Index component essentially matched the benchmark return.
SMALL CAP VALUE FUND
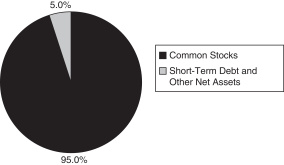
The investment objective of the Small Cap Value Fund is capital appreciation. The Small Cap Value Fund generally invests in companies that are below $3 billion in market capitalization and have lower price-to-book characteristics than the overall market.
For the six months ended June 30, 2016, the Small Cap Value Fund returned 3.82% before expenses and 3.40% after expenses versus a 6.08% return for the Russell 2000® Value Index. Within the benchmark, the best performing sectors were Basic Materials and Utilities while the worst performing sectors were Retail and Health Care.
Stock selection was the primary driver of negative performance versus the benchmark. Sectors contributing to Fund performance included Consumer Cyclicals and Technology, while sectors detracting from Fund performance included Consumer Staples and REITs.
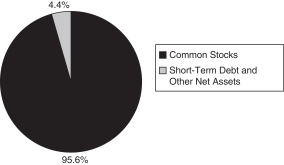
SMALL CAP GROWTH FUND
The investment objective of the Small Cap Growth Fund is capital appreciation. The Small Cap Growth Fund invests in growth stocks within the small capitalization marketplace. The Fund returned -0.80% before expenses and -1.21% after expenses during the six months ended June 30, 2016. The Fund’s benchmark, the Russell 2000® Growth Index, returned -1.59% for the period.
The small capitalization growth marketplace had a difficult time keeping up with other asset classes during the first six-months of the year. Health Care which has been one of the drivers of performance over the last several years in many asset classes declined over 14% in small cap growth. This decline was mostly due to the biotechnology and pharmaceutical industries.
Domestic large and mid capitalization equity classes outperformed the small company sector. The growth style of investing struggled with its large exposure to Health Care, Information Technology and Consumer Discretionary sectors. In addition, the small cap growth equity class has little representation in Utilities and Materials which were two of the best performing sectors during the first half of 2016.
Investors in the small company area were benefitted by the Telecommunications Services sector. This was the best performing sector in our small cap growth index. In addition, we significantly outperformed our benchmark in this area due to holdings of a regional full-service telecommunications company and a satellite communication solutions company.
5
The Industrial sector showed a negative return of almost 8%. This sector detracted from the overall return of the benchmark and the Fund. Poor stock selection in Professional Services and Aerospace & Defense were the industries in which the fund struggled with its results.
We continue to believe that in a slowing global economic environment, investing in domestic small cap growth stocks can provide attractive relative returns over the long term albeit with higher levels of volatility.
MID CAP VALUE FUND
The investment objective of the Mid Cap Value Fund is to outperform the Russell Midcap® Value Index. The Mid Cap Value Fund generally invests in companies that are between $1 billion and $20 billion in market capitalization and have lower price-to-book characteristics.
For the six months ended June 30, 2016, the Mid Cap Value Fund returned 4.85% before expenses and 4.50% after expenses versus a 8.87% return for the Russell Midcap® Value Index. Within the benchmark, the best performing sectors were Basic Materials and Utilities while the worst performing sectors were Finance and Retail.
Stock selection was the primary driver of negative performance versus the benchmark. Sectors contributing to Mid Cap Value Fund performance included Consumer Cyclical and Consumer Staples, while sectors detracting from Fund performance included Energy and Basic Materials.
MID-CAP EQUITY INDEX FUND
The Mid-Cap Equity Index Fund invests in the 400 stocks that comprise the S&P MidCap 400® Index (S&P MidCap 400). The S&P MidCap 400 is a market-weighted index of 400 stocks traded on the New York Stock Exchange, American Stock Exchange and NASDAQ. The weightings make each company’s influence on the S&P MidCap 400’s performance directly proportional to that company’s market value. The companies included in the S&P MidCap 400 tend to be typical of this asset class, the medium-capitalized sector of the U.S. securities market.
The Mid-Cap Equity Index Fund’s performance for the six months ended June 30, 2016, was 7.91% before expenses and 7.83% after expenses, finishing slightly below the 7.93% return of the S&P MidCap 400. Note that the performance of the Mid-Cap Equity Index Fund includes expenses, such as transaction costs and management fees, which are not applicable to the benchmark.
INTERNATIONAL FUND
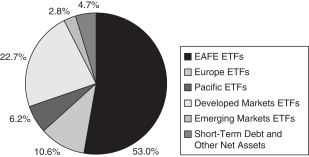
The International Fund seeks capital appreciation by investing, directly or indirectly, mainly in exchange traded funds that invest in stocks of large and mid-cap companies in developed market countries located outside of the United States and Canada that are reflected or contained in the Morgan Stanley Capital International, Inc. Europe, Australasia and Far East® Index (MSCI EAFE® Index). Currently the International Fund is invested mainly in exchange traded funds that reflect, replicate or follow the country weightings of the MSCI EAFE® Index. The Fund also has invested a small percentage of assets in exchange traded funds that provide exposure to emerging markets and to companies with small market capitalizations in developed market countries.
For the six months ended June 30, 2016, the International Fund returned -2.31% before expenses and -2.37% after expenses, outperforming the -4.42% return of the benchmark. The fund’s benchmark closes earlier in the day than the actual market for the fund’s investments. This time lag can result in both positive and negative performance differences.
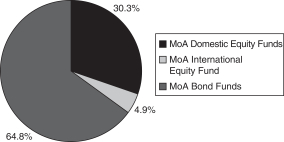
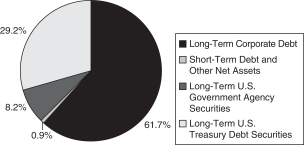
COMPOSITE FUND
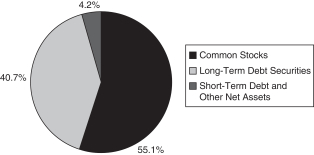
The Composite Fund seeks capital appreciation and current income by investing in a diversified portfolio of common stocks, debt securities and money market instruments.
The primary investment objective of the fixed income portion of the fund is to provide a high level of current income, consistent with capital preservation, while minimizing volatility. It does this by investing primarily in investment grade publicly traded debt securities. The securities held include corporate, U.S. agency and mortgage-backed bonds, all of which normally yield more than U.S. Treasury issues.
For the six months ended June 30, 2016, the fixed income portion of the Fund had a total return of 6.18% before expenses, compared to the Barclays Capital Aggregate Bond Index, which returned 5.31% for the period. The fixed income portion of the Fund focused on income and capital preservation.
6
The fixed income markets experienced positive returns during the first half of 2016. Treasury rates moved lower across the yield curve and most corporate bond spreads tightened. The drop in rates was driven initially by concerns of an economic slowdown in the United States as the S&P 500 fell more than 10% and the price of a barrel of oil plummeted from $37.04 to $26.21, or 29% in just six weeks. As those concerns abated following the strong recovery in stocks and the price of oil, the drop in German and Japanese Ten-year Treasury rates to below zero coupled with the vote by the United Kingdom to leave the European Union put renewed downward pressure on Treasury rates in the U.S.
The yield curve flattened as yields on long-dated Treasuries fell more than those of short-dated Treasuries. Two-year Treasury Notes yielded 0.58% at the end of the 2nd quarter, down from 1.05% at the end of 2015. Yields on ten-year Notes tumbled from 2.27% at 2015 year-end to 1.47% on June 30, close to the then-record low of 1.39% set in July 2012.
In the corporate bond market, high-grade spreads tightened from 172 basis points at the end of 2015 to 156 on June 30. This action was not achieved in a straight line nor did all ratings classes participate. As the S&P 500 Index and the price of oil fell, investment grade credit spreads widened more than 40 basis points and only started to recover as the price of oil found its February 11th bottom. For the six months ending on June 30, AAA-rated corporate spreads widened from 76 to 89 basis points, while BBB-rated bond spreads tightened from 231 to 202 basis points. In general, industrial spreads tightened the most and financial spreads widened as investors assessed the exposure of banks to the energy sector via loans.
The fixed income portion of the Fund’s strategy is to overweight corporates, underweight Treasuries, and market weight MBS securities. The portfolio’s objective is to maintain a similar maturity profile to the Barclays Capital Aggregate Bond Index with an overweighting of BBB issuers. To achieve the duration target, intermediate maturities are emphasized. The Fund also stresses diversification in order to protect the Fund from unexpected credit events, so few holdings exceed one-half of one percent of the Fund’s value. This extreme diversification will be maintained going forward as part of our risk control.
For the six months ended June 30, 2016, the equity portion of the Fund had a total return of 1.88% (before expenses), underperforming the S&P 500® Index (S&P 500) by -1.96%. The positive performance of the S&P 500 for the first half of 2016 obscures the volatility of the period. For the six weeks of 2016, the S&P 500 rapidly declined 11% as concerns about U.S. and global growth, a slowing Chinese economy, questions about the direction of oil prices and the U.S. dollar, worries about when and at what pace the Federal Reserve would continue to raise policy rates, a spreading Middle Eastern war spearheaded by the avowed terrorist group ISIS, and anxiety over the June 23rd vote in the United Kingdom to stay in or leave the European Union, with a leave vote portending a potential breakup of the European Union.
The equity portion of the Composite Fund maintains sector weights within plus or minus 100 basis points of the S&P 500 and does not take positions in individual stocks with over-weights of more than 200 basis points. This structural discipline produces a relatively low-risk portfolio that emphasizes stock selection based on strong fundamental analysis.
The full year 2015 was characterized by a wide dispersion in sector performance (28 percentage points between the top and bottom sector) such that outperformance required over-weights in sectors outperforming the benchmark and underweights in underperforming sectors. Our investment style precludes such an investment posture.
For the six months ended June 30, 2016, the Composite Fund returned 3.51% before expenses compared to the weighted benchmark return of 4.43%, 40% of which is based on the Barclays Capital Aggregate Bond Index and 60% of which is based on the S&P 500. The underperformance of the Composite Fund overall was entirely the result of the equity portion’s underperformance.
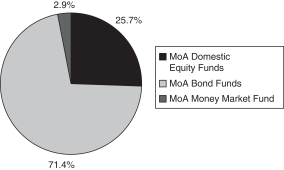
RETIREMENT INCOME FUND
The objective of the Retirement Income Fund is current income consistent with the preservation of capital and, to a lesser extent, capital appreciation. The Retirement Income Fund invests primarily in the fixed-income funds of the Investment Company and also invests in two equity funds of the Investment Company. The Fund’s current target allocation is approximately 75% of net assets in fixed-income funds (approximately 30% in the Bond, 40% in the Mid-Term Bond Funds and 5% in the Money Market Fund) and approximately 25% of net assets in equity funds (20% in the Equity Index Fund and 5% in the Mid-Cap Equity Index Fund).
Performance for the Retirement Income Fund is compared to the Barclays Capital Aggregate Bond Index (70% weighting), the Citigroup 3-Month Treasury Bill Index (5% weighting) and the S&P 500® Index (25% weighting). For the
7
six months ended June 30, 2016, the Fund returned 4.81% before expenses and 4.77% after expenses, versus a 4.68% return in the weighted benchmark.
2010 RETIREMENT FUND
The objective of the 2010 Retirement Fund is current income and capital appreciation appropriate for the asset allocation associated with a retirement in 2010. The 2010 Retirement Fund invests in funds of the Investment Company. The Fund’s current target allocation is approximately 67% of net assets in fixed-income funds (approximately 26% in the Bond Fund, 36% in the Mid-Term Bond Fund and 5% in the Money Market Fund) and approximately 33% of net assets in equity funds (23% in the Equity Index Fund, 7% in the Mid-Cap Equity Index Fund and 3% in the International Fund) (See Note 1 in the Notes to Financial Statements for additional information on changes to Fund target allocations during 2016).
Performance for the 2010 Retirement Fund is compared to the Barclays Capital Aggregate Bond Index (62% weighting), the Citigroup 3-Month Treasury Bill Index (5% weighting) and the S&P 500® Index (33% weighting). For the six months ended June 30, 2016, the Fund returned 4.60% before expenses and 4.58% after expenses, versus a 4.56% return in the weighted benchmark.
2015 RETIREMENT FUND
The objective of the 2015 Retirement Fund is current income and capital appreciation appropriate for the asset allocation associated with a retirement in 2015. The 2015 Retirement Fund invests in funds of the Investment Company. The Fund’s current target allocation is approximately 57% of net assets in fixed-income funds (26% in the Bond Fund and 31% in the Mid-Term Bond Fund) and approximately 43% of net assets in equity funds (approximately 26% in the Equity Index Fund, 9% in the Mid-Cap Equity Index Fund, 6% in the International Fund and 1% each in the Small Cap Growth and Small Cap Value Funds) (See Note 1 in the Notes to Financial Statements for additional information on changes to Fund target allocations during 2016).
Performance for the 2015 Retirement Fund is compared to the S&P 500® Index (43% weighting) and the Barclays Capital Aggregate Bond Index (57% weighting). For the six months ended June 30, 2016, the Fund returned 4.55% before expenses and 4.51% after expenses, versus a 4.68% return in the weighted benchmark.
2020 RETIREMENT FUND
The objective of the 2020 Retirement Fund is current income and capital appreciation appropriate for the asset allocation associated with a target retirement in 2020. The 2020 Retirement Fund invests in funds of the Investment Company. The Fund’s current target allocation is approximately 53% of net assets in equity funds (approximately 30% in the Equity Index Fund, 11% in the Mid-Cap Equity Index Fund, 8% in the International Fund and 2% each in the Small Cap Growth and Small Cap Value Funds) and approximately 47% of net assets in fixed-income funds (26% in the Bond Fund and 21% in the Mid-Term Bond Fund) (See Note 1 in the Notes to Financial Statements for additional information on changes to Fund target allocations during 2016).
Performance for the 2020 Retirement Fund is compared to the S&P 500® Index (53% weighting) and the Barclays Capital Aggregate Bond Index (47% weighting). For the six months ended June 30, 2016, the Fund returned 4.29% before expenses and 4.25% after expenses, versus a 4.53% return in the weighted benchmark.
2025 RETIREMENT FUND
The objective of the 2025 Retirement Fund is current income and capital appreciation appropriate for the asset allocation associated with a target retirement in 2025. The 2025 Retirement Fund invests in funds of the Investment Company. The Fund’s current target allocation is approximately 65% of net assets in equity funds (approximately 35% in the Equity Index Fund, 14% in the Mid-Cap Equity Index Fund, 10% in the International Fund and 3% each in the Small Cap Growth and Small Cap Value Funds) and approximately 35% of net assets in fixed-income funds (25% in the Bond Fund and 10% in the Mid-Term Bond Fund) (See Note 1 in the Notes to Financial Statements for additional information on changes to Fund target allocations during 2016).
Performance for the 2025 Retirement Fund is compared to the S&P 500® Index (65% weighting) and the Barclays Capital Aggregate Bond Index (35% weighting). For the six months ended June 30, 2016, the Fund returned 4.23% before expenses and 4.19% after expenses, versus a 4.35% return in the weighted benchmark.
8
2030 RETIREMENT FUND
The objective of the 2030 Retirement Fund is current income and capital appreciation appropriate for the asset allocation associated with a target retirement in 2030. The 2030 Retirement Fund invests in funds of the Investment Company. The Fund’s current target allocation is approximately 75% of net assets in equity funds (approximately 37% in the Equity Index Fund, 17% in the Mid-Cap Equity Index Fund, 11% in the International Fund and 5% each in the Small Cap Growth and Small Cap Value Funds) and approximately 25% of net assets in the Bond Fund (See Note 1 in the Notes to Financial Statements for additional information on changes to Fund target allocations during 2016).
Performance for the 2030 Retirement Fund is compared to the S&P 500® Index (75% weighting) and the Barclays Capital Aggregate Bond Index (25% weighting). For the six months ended June 30, 2016, the Fund returned 4.14% before expenses and 4.10% after expenses, versus a 4.21% return in the weighted benchmark.
2035 RETIREMENT FUND
The objective of the 2035 Retirement Fund is current income and capital appreciation appropriate for the asset allocation associated with a target retirement in 2035. The 2035 Retirement Fund invests in funds of the Investment Company. The Fund’s current target allocation is approximately 83% of net assets in equity funds (approximately 38% in the Equity Index Fund, 20% in the Mid-Cap Equity Index Fund, 13% in the International Fund and 6% each in the Small Cap Growth and Small Cap Value Funds) and approximately 17% of net assets in the Bond Fund (See Note 1 in the Notes to Financial Statements for additional information on changes to Fund target allocations during 2016).
Performance for the 2035 Retirement Fund is compared to the S&P 500® Index (83% weighting) and the Barclays Capital Aggregate Bond Index (17% weighting). For the six months ended June 30, 2016, the Fund returned 3.93% before expenses and 3.89% after expenses, versus a 4.09% return in the weighted benchmark.
2040 RETIREMENT FUND
The objective of the 2040 Retirement Fund is current income and capital appreciation appropriate for the asset allocation associated with a target retirement in 2040. The 2040 Retirement Fund invests in funds of the Investment Company. The Fund’s current target allocation is approximately 86% of net assets in equity funds (approximately 36% in the Equity Index Fund, 20% in the Mid-Cap Equity Index Fund, 14% in the International Fund and 8% each in the Small Cap Growth and Small Cap Value Funds) and approximately 14% of net assets in the Bond Fund (See Note 1 in the Notes to Financial Statements for additional information on changes to Fund target allocations during 2016).
Performance for the 2040 Retirement Fund is compared to the S&P 500® Index (86% weighting) and the Barclays Capital Aggregate Bond Index (14% weighting). For the six months ended June 30, 2016, the Fund returned 3.71% before expenses and 3.67% after expenses, versus a 4.04% return in the weighted benchmark.
2045 RETIREMENT FUND
The objective of the 2045 Retirement Fund is current income and capital appreciation appropriate for the asset allocation associated with a target retirement in 2045. The 2045 Retirement Fund invests in funds of the Investment Company. The Fund’s current target allocation is approximately 88% of net assets in equity funds (approximately 33% in the Equity Index Fund, 22% in the Mid-Cap Equity Index Fund, 15% in the International Fund and 9% each in the Small Cap Growth and Small Cap Value Funds) and approximately 12% of net assets in the Bond Fund (See Note 1 in the Notes to Financial Statements for additional information on changes to Fund target allocations during 2016).
Performance for the 2045 Retirement Fund is compared to the S&P 500® Index (88% weighting) and the Barclays Capital Aggregate Bond Index (12% weighting). For the six months ended June 30, 2016, the Fund returned 3.47% before expenses and 3.43% after expenses, versus a 4.01% return in the weighted benchmark.
2050 RETIREMENT FUND
The objective of the 2050 Retirement Fund is current income and capital appreciation appropriate for the asset allocation associated with a target retirement in 2050. The 2050 Retirement Fund invests in funds of the Investment Company. The Fund’s current target allocation is approximately 90% of net assets in equity funds (approximately 32% in the Equity Index Fund, 22% in the Mid-Cap Equity Index Fund, 16% in the International Fund and 10% each in the Small Cap Growth and Small Cap Value Funds) and approximately 10% of net assets in the Bond Fund (See Note 1 in the Notes to Financial Statements for additional information on changes to Fund target allocations during 2016).
Performance for the 2050 Retirement Fund is compared to the S&P 500® Index (90% weighting) and the Barclays Capital Aggregate Bond Index (10% weighting). For the six months ended June 30, 2016, the Fund returned 3.33% before expenses and 3.29% after expenses, versus a 3.98% return in the weighted benchmark.
9
CONSERVATIVE ALLOCATION FUND
The objective of the Conservative Allocation Fund is current income and, to a lesser extent, capital appreciation. The Conservative Allocation Fund invests primarily in the fixed-income funds of the Investment Company and also invests in the equity funds of the Investment Company. The Conservative Allocation Fund’s target allocation is approximately 65% of net assets in fixed-income funds (approximately 30% in the Bond Fund and 35% in the Mid-Term Bond Fund) and approximately 35% of net assets in equity funds (approximately 25% in the Equity Index Fund, 5% in the Mid-Cap Equity Index Fund and 5% in the International Fund).
Performance for the Conservative Allocation Fund is compared to the Barclays Capital Aggregate Bond Index (65% weighting) and the S&P 500® Index (35% weighting). For the six months ended June 30, 2016, the Conservative Allocation Fund returned 4.59% before expenses and 4.57% after expenses, versus a 4.80% return in the weighted benchmark.
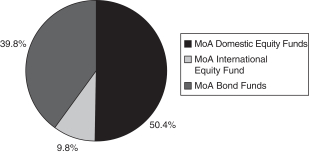
MODERATE ALLOCATION FUND
The objective of the Moderate Allocation Fund is capital appreciation and current income. The Moderate Allocation Fund invests in the equity and fixed-income funds of the Investment Company. The Moderate Allocation Fund’s target allocation is approximately 60% of net assets in equity funds (approximately 35% of its net assets in the Equity Index Fund, 15% in the Mid-Cap Equity Index Fund and 10% in the International Fund) and approximately 40% of net assets in fixed-income funds (approximately 25% of its net assets in the Bond Fund and approximately 15% of its net assets in the Mid-Term Bond Fund).
Performance for the Moderate Allocation Fund is compared to the S&P 500® Index (60% weighting) and the Barclays Capital Aggregate Bond Index (40% weighting). For the six months ended June 30, 2016, the Moderate Allocation Fund returned 4.43% before expenses and 4.42% after expenses, versus a 4.43% return for the weighted benchmark.
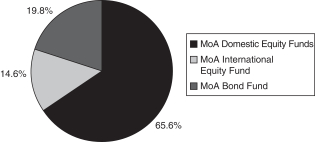
AGGRESSIVE ALLOCATION FUND
The objective of the Aggressive Allocation Fund is capital appreciation and, to a lesser extent, current income. The Aggressive Allocation Fund invests in the equity and fixed-income funds of the Investment Company. The Aggressive Allocation Fund’s target allocation is approximately 80% of net assets in equity funds (approximately 35% of its net assets in the Equity Index Fund, 20% in the Mid-Cap Equity Index Fund, 5% in the Small Cap Value Fund, 5% in the Small Cap Growth Fund and 15% in the International Fund) and approximately 20% of net assets in the Bond Fund.
Performance for the Aggressive Allocation Fund is compared to the S&P 500® Index (80% weighting) and the Barclays Capital Aggregate Bond Index (20% weighting). For the six months ended June 30, 2016, the Aggressive Allocation Fund returned 3.87% before expenses and 3.86% after expenses, versus a 4.13% return for the weighted benchmark.
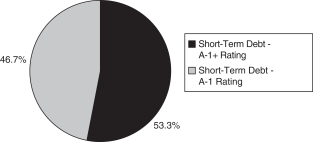
MONEY MARKET FUND
The Money Market Fund’s investment objective is to realize current income while maintaining liquidity, investment quality and stability of capital through investing in high-quality commercial paper issued by U.S. corporations and securities issued by the U.S. government and its agencies. For the six months ended June 30, 2016, the Money Market Fund returned 0.20% before expenses and 0.06% after expenses, compared to a 0.12% return for the Citigroup 3-Month Treasury Bill Index. Note that the benchmark performance does not reflect any expenses.
Entering the year, the market as defined by Fed Fund futures contracts was pricing in a greater than 90% chance of an increase or tightening of the Fed Funds target by the December 2016 meeting. On June 30, that figure had dropped to about 9%, not much more than the probabilities of an interest rate cut which stood close to 7%. Market consensus is that the drop in German and Japanese Ten-year Treasury rates to below zero coupled with the vote by the United Kingdom to leave the European Union has put the Federal Reserve on hold for longer than expected. As a result of these diminished expectations, money market returns remain affected by extremely low yields and a limited supply of eligible investments. The Fund’s strategy continued to focus on quality, liquidity, and maintaining a relatively short weighted average maturity.
The seven-day effective yield as of August 9, 2016, was 0.13%. As with all performance reporting, this yield is not necessarily indicative of future annual yields. Neither the Federal Deposit Insurance Corporation nor any other U.S. government agency insures or guarantees the Separate Account’s investments in shares of the Money Market Fund.
10
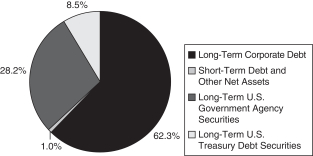
MID-TERM BOND FUND
The Mid-Term Bond Fund seeks a high level of return consistent with the preservation of capital through investment in publicly traded debt securities. The Mid-Term Bond Fund primarily invests in corporate and U.S. government agency securities, which typically yield more than U.S. Treasury issues.
The Mid-Term Bond Fund emphasized corporate issues, particularly BBB-rated bonds, during the first half of 2016 in order to capture incremental income. The Fund will continue to focus on income, rather than market volatility, to achieve superior returns over market cycles. In addition, the Fund’s corporate positions will remain highly diversified in order to shield the portfolio from any credit risks. The objective of the Fund is to maintain a maturity profile similar to the Barclays Capital Intermediate Government/Credit Bond Index.
For the six months ended June 30, 2016, the Mid-Term Bond Fund returned 4.67% before expenses. The Fund’s return is 60 basis points greater than the 4.07% return of the Barclays Capital Intermediate Government/Credit Bond Index during the same period. The Fund’s continuing emphasis on higher-yielding corporate issues was a major contributor to its outperformance.
BOND FUND
The Bond Fund’s primary investment objective is to provide as high a level of current income over time as is believed to be consistent with prudent investment risk. It does this by investing primarily in investment grade publicly traded debt securities. A secondary objective is preservation of capital. The securities held by the Bond Fund include corporate, U.S. agency and mortgage-backed bonds, all of which normally yield more than U.S. Treasury issues.
The fixed income markets experienced positive returns during the first half of 2016. Treasury rates moved lower across the yield curve and most corporate bond spreads tightened. The drop in rates was driven initially by concerns of an economic slowdown in the United States as the S&P 500 fell more than 10% and the price of a barrel of oil plummeted from $37.04 to $26.21, or 29% in just six weeks. As those concerns abated following the strong recovery in stocks and the price of oil, the drop in German and Japanese Ten-year Treasury rates to below zero coupled with the vote by the United Kingdom to leave the European Union put renewed downward pressure on Treasury rates in the U.S.
The yield curve flattened as yields on long-dated Treasuries fell more than those of short-dated Treasuries. Two-year Treasury Notes yielded 0.58% at the end of the 2nd quarter, down from 1.05% at the end of 2015. Yields on ten-year Notes tumbled from 2.27% at 2015 year-end to 1.47% on June 30, close to the then-record low of 1.39% set in July 2012.
In the corporate bond market, high-grade spreads tightened from 172 basis points at the end of 2015 to 156 on June 30. This action was not achieved in a straight line nor did all ratings classes participate. As the S&P 500 and the price of oil fell, investment grade credit spreads widened more than 40 basis points and only started to recover as the price of oil found its February 11th bottom. For the six months ending on June 30, AAA-rated corporate spreads widened from 76 to 89 basis points, while BBB-rated bond spreads tightened from 231 to 202 basis points. In general, industrial spreads tightened the most and financial spreads widened as investors assessed the exposure of banks to the energy sector via loans.
Through the first half of 2016, the Bond Fund returned 6.31% before expenses, besting the Barclays Capital Aggregate Bond Index’s return of 5.31% by 100 basis points. The Fund’s relative outperformance was driven by its’ overweight position in corporate bonds in particular, BBB-rated industrial bonds. Security selection in Treasuries and Mortgage-Backed Securities (MBS) was a net positive as both sleeves outperformed their respective counterparts in the Index.
The Bond Fund’s strategy is to overweight corporates, underweight Treasuries, and market weight MBS securities. The portfolio’s objective is to maintain a similar maturity profile to the Barclays Capital Aggregate Bond Index with an overweighting of BBB issuers. To achieve the duration target, intermediate maturities are emphasized. The Bond Fund also stresses diversification in order to protect the Fund from unexpected credit events, so few corporate holdings exceed one-half of one percent of the Fund’s value. This extreme diversification will be maintained going forward as part of our risk control.
For the six months ended June 30, 2016, the Bond Fund returned 6.31% before expenses and 6.07% after expenses. This compares favorably to the Barclays Capital Aggregate Bond Index, which returned 5.31% for the period. As in past years, the Fund’s emphasis on higher-yielding corporate issues was a major contributor to its outperformance.
11
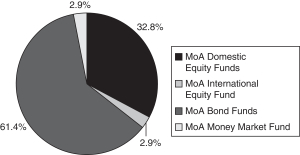
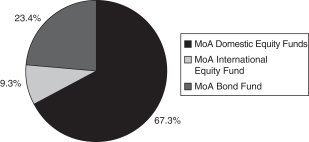
MUTUAL OF AMERICA INVESTMENT CORPORATION
ASSET ALLOCATIONS AS OF JUNE 30, 2016 (Unaudited)
Equity Index Fund
All America Fund
Small Cap Value Fund

Small Cap Growth Fund
Mid Cap Value Fund
Mid-Cap Equity Index Fund
12
MUTUAL OF AMERICA INVESTMENT CORPORATION
ASSET ALLOCATIONS AS OF JUNE 30, 2016 (Unaudited) (Continued)
International Fund
Composite Fund
Retirement Income Fund
2010 Retirement Fund
2015 Retirement Fund
2020 Retirement Fund
13
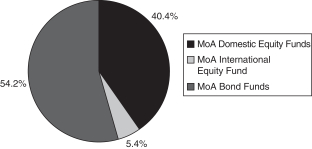
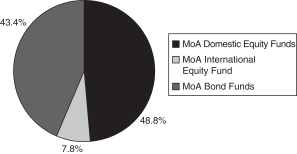
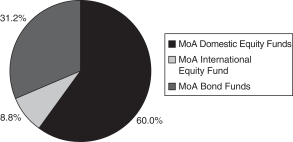
MUTUAL OF AMERICA INVESTMENT CORPORATION
ASSET ALLOCATIONS AS OF JUNE 30, 2016 (Unaudited) (Continued)
2025 Retirement Fund
2030 Retirement Fund
2035 Retirement Fund
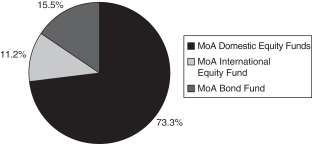
2040 Retirement Fund
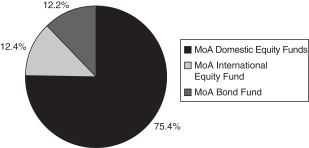
2045 Retirement Fund
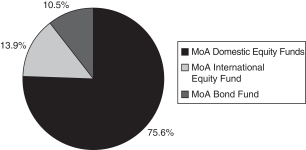
2050 Retirement Fund

14
MUTUAL OF AMERICA INVESTMENT CORPORATION
ASSET ALLOCATIONS AS OF JUNE 30, 2016 (Unaudited) (Continued)
Conservative Allocation Fund
Moderate Allocation Fund
Aggressive Allocation Fund
Money Market Fund
Mid-Term Bond Fund
Bond Fund
15
MUTUAL OF AMERICA INVESTMENT CORPORATION
EXPENSE EXAMPLE (Unaudited)
EXAMPLE
As a shareholder of one of the Mutual of America Investment Corporation Funds, you incur ongoing costs, including management fees and other Fund expenses. You do not incur transactional costs, such as sales charges (loads), redemption fees or exchange fees. Additionally, Mutual of America Capital Management LLC, the Funds’ Adviser, has contractually agreed to reimburse the direct non-advisory operating expenses of any Allocation or Retirement Fund (each a “Fund of Funds”) that has less than $50 million in average daily net assets for the prior calendar year. This contractual obligation remains in effect through April 30, 2017 and will continue for succeeding 12 month periods ending April 30th unless i) The Fund of Funds has at least $50 million in average daily net assets for the prior calendar year, ii) the Investment Company gives not less than 30 days written notice to the Adviser, or iii) the Adviser gives 45 days advance notice to the Investment Company before the next May 1 of a given year to terminate the agreement. In that case, the agreement will terminate on the next May 1 following the written notice.
This Example is intended to help you understand your ongoing costs (in dollars) of investing in a Fund and to compare these costs with the ongoing costs of investing in other mutual funds. The Example is based on an investment of $1,000 invested at January 1, 2016 and held for the entire period ending June 30, 2016 under the expense reimbursement agreement in effect during that period as described above.
ACTUAL EXPENSES
The first line of the tables below provides information about actual account values and actual expenses. You may use the information in this line, together with the amount you invested, to estimate the expenses that you paid over the period. Simply divide your account value by $1,000 (for example, an $8,600 account value divided by $1,000=8.6), then multiply the result by the number in the first line under the heading entitled “Expenses Paid During Period” to estimate the expenses you paid on your account during this period.
HYPOTHETICAL EXAMPLE FOR COMPARISON PURPOSES
The second line of the tables below provides information about hypothetical account values and hypothetical expenses based on each Fund’s actual expense ratio and an assumed rate of return of 5% per year before expenses, which is not the Fund’s actual return. The hypothetical account values and expenses may not be used to estimate the actual ending account balance or expenses you paid for the period. You may use this information to compare the ongoing costs of investing in the Fund with other funds. To do so, compare this 5% hypothetical example with the 5% hypothetical examples that appear in the shareholder reports of the other funds.
Please note that the second line of the table is useful in comparing ongoing costs only, and will not help you determine the relative total costs of owning other non-Mutual of America funds, which may also charge transactional costs, such as sales charges (loads), redemption fees or exchange fees, which the Mutual of America Investment Corporation does not charge.
| | | | | | | | | | | | | | | | | | |
| | | Equity Index Fund | | | | |
| | | | | Beginning
Account Value
January 1, 2016 | | | Ending
Account Value
June 30, 2016 | | | Expenses Paid
During Period*
January 1, 2016 to
June 30, 2016 | | | | |
| | | Actual | | | $1,000.00 | | | | $1,037.93 | | | | $0.71 | | | | | |
| | | Hypothetical
(5% return before expenses) | | | $1,000.00 | | | | $1,023.98 | | | | $0.70 | | | | | |
| | * | Expenses are equal to the Fund’s annual expense ratio of 0.14%, multiplied by the average account value over the period, multiplied by 182/366 (to reflect the one-half year period). |
16
MUTUAL OF AMERICA INVESTMENT CORPORATION
EXPENSE EXAMPLE (Unaudited) (Continued)
| | | | | | | | | | | | | | | | | | |
| | | All America Fund | | | | |
| | | | | Beginning
Account Value
January 1, 2016 | | | Ending
Account Value
June 30, 2016 | | | Expenses Paid
During Period*
January 1, 2016 to
June 30, 2016 | | | | |
| | | Actual | | | $1,000.00 | | | | $1,025.43 | | | | $2.62 | | | | | |
| | | Hypothetical
(5% return before expenses) | | | $1,000.00 | | | | $1,022.03 | | | | $2.61 | | | | | |
| | * | Expenses are equal to the Fund’s annual expense ratio of 0.52%, multiplied by the average account value over the period, multiplied by 182/366 (to reflect the one-half year period). |
| | | | | | | | | | | | | | | | | | |
| | | Small Cap Value Fund | | | | |
| | | | | Beginning
Account Value
January 1, 2016 | | | Ending
Account Value
June 30, 2016 | | | Expenses Paid
During Period*
January 1, 2016 to
June 30, 2016 | | | | |
| | | Actual | | | $1,000.00 | | | | $1,034.17 | | | | $4.15 | | | | | |
| | | Hypothetical
(5% return before expenses) | | | $1,000.00 | | | | $1,020.50 | | | | $4.12 | | | | | |
| | * | Expenses are equal to the Fund’s annual expense ratio of 0.82%, multiplied by the average account value over the period, multiplied by 182/366 (to reflect the one-half year period). |
| | | | | | | | | | | | | | | | | | |
| | | Small Cap Growth Fund | | | | |
| | | | | Beginning
Account Value
January 1, 2016 | | | Ending
Account Value
June 30, 2016 | | | Expenses Paid
During Period*
January 1, 2016 to
June 30, 2016 | | | | |
| | | Actual | | | $1,000.00 | | | | $987.83 | | | | $4.10 | | | | | |
| | | Hypothetical
(5% return before expenses) | | | $1,000.00 | | | | $1,020.45 | | | | $4.17 | | | | | |
| | * | Expenses are equal to the Fund’s annual expense ratio of 0.83%, multiplied by the average account value over the period, multiplied by 182/366 (to reflect the one-half year period). |
| | | | | | | | | | | | | | | | | | |
| | | Mid Cap Value Fund | | | | |
| | | | | Beginning
Account Value
January 1, 2016 | | | Ending
Account Value
June 30, 2016 | | | Expenses Paid
During Period*
January 1, 2016 to
June 30, 2016 | | | | |
| | | Actual | | | $1,000.00 | | | | $1,045.27 | | | | $3.41 | | | | | |
| | | Hypothetical
(5% return before expenses) | | | $1,000.00 | | | | $1,021.27 | | | | $3.37 | | | | | |
| | * | Expenses are equal to the Fund’s annual expense ratio of 0.67%, multiplied by the average account value over the period, multiplied by 182/366 (to reflect the one-half year period). |
17
MUTUAL OF AMERICA INVESTMENT CORPORATION
EXPENSE EXAMPLE (Unaudited) (Continued)
| | | | | | | | | | | | | | | | | | |
| | | Mid-Cap Equity Index Fund | | | | |
| | | | | Beginning
Account Value
January 1, 2016 | | | Ending
Account Value
June 30, 2016 | | | Expenses Paid
During Period*
January 1, 2016 to
June 30, 2016 | | | | |
| | | Actual | | | $1,000.00 | | | | $1,078.75 | | | | $0.77 | | | | | |
| | | Hypothetical
(5% return before expenses) | | | $1,000.00 | | | | $1,023.93 | | | | $0.75 | | | | | |
| | * | Expenses are equal to the Fund’s annual expense ratio of 0.15%, multiplied by the average account value over the period, multiplied by 182/366 (to reflect the one-half year period). |
| | | | | | | | | | | | | | | | | | |
| | | International Fund | | | | |
| | | | | Beginning
Account Value
January 1, 2016 | | | Ending
Account Value
June 30, 2016 | | | Expenses Paid
During Period*
January 1, 2016 to
June 30, 2016 | | | | |
| | | Actual | | | $1,000.00 | | | | $976.17 | | | | $1.72 | | | | | |
| | | Hypothetical
(5% return before expenses) | | | $1,000.00 | | | | $1,022.90 | | | | $1.76 | | | | | |
| | * | Expenses are equal to the Fund’s annual expense ratio of 0.35% (reflecting direct expenses and the proportional expense ratios of the underlying funds in which the Fund invests), multiplied by the average account value over the period, multiplied by 182/366 (to reflect the one-half year period). |
| | | | | | | | | | | | | | | | | | |
| | | Composite Fund | | | | |
| | | | | Beginning
Account Value
January 1, 2016 | | | Ending Account Value
June 30, 2016 | | | Expenses Paid
During Period*
January 1, 2016 to
June 30, 2016 | | | | |
| | | Actual | | | $1,000.00 | | | | $1,032.57 | | | | $2.63 | | | | | |
| | | Hypothetical
(5% return before expenses) | | | $1,000.00 | | | | $1,022.03 | | | | $2.61 | | | | | |
| | * | Expenses are equal to the Fund’s annual expense ratio of 0.52%, multiplied by the average account value over the period, multiplied by 182/366 (to reflect the one-half year period). |
| | | | | | | | | | | | | | | | | | |
| | | Retirement Income Fund | | | | |
| | | | | Beginning
Account Value
January 1, 2016 | | | Ending
Account Value
June 30, 2016 | | | Expenses Paid
During Period*
January 1, 2016 to
June 30, 2016 | | | | |
| | | Actual | | | $1,000.00 | | | | $1,047.95 | | | | $2.34 | | | | | |
| | | Hypothetical
(5% return before expenses) | | | $1,000.00 | | | | $1,022.34 | | | | $2.31 | | | | | |
| | * | Expenses are equal to the Fund’s annual expense ratio of 0.46% (reflecting direct expenses and the proportional expense ratios of the underlying funds in which the Fund invests), multiplied by the average account value over the period, multiplied by 182/366 (to reflect the one-half year period). |
18
MUTUAL OF AMERICA INVESTMENT CORPORATION
EXPENSE EXAMPLE (Unaudited) (Continued)
| | | | | | | | | | | | | | | | | | |
| | | 2010 Retirement Fund | | | | |
| | | | | Beginning
Account Value
January 1, 2016 | | | Ending
Account Value
June 30, 2016 | | | Expenses Paid
During Period*
January 1, 2016 to
June 30, 2016 | | | | |
| | | Actual | | | $1,000.00 | | | | $1,046.04 | | | | $1.98 | | | | | |
| | | Hypothetical
(5% return before expenses) | | | $1,000.00 | | | | $1,022.70 | | | | $1.96 | | | | | |
| | * | Expenses are equal to the Fund’s annual expense ratio of 0.39% (reflecting direct expenses and the proportional expense ratios of the underlying funds in which the Fund invests), multiplied by the average account value over the period, multiplied by 182/366 (to reflect the one-half year period). |
| | | | | | | | | | | | | | | | | | |
| | | 2015 Retirement Fund | | | | |
| | | | | Beginning
Account Value
January 1, 2016 | | | Ending
Account Value
June 30, 2016 | | | Expenses Paid
During Period*
January 1, 2016 to
June 30, 2016 | | | | |
| | | Actual | | | $1,000.00 | | | | $1,045.37 | | | | $2.03 | | | | | |
| | | Hypothetical
(5% return before expenses) | | | $1,000.00 | | | | $1,022.65 | | | | $2.01 | | | | | |
| | * | Expenses are equal to the Fund’s annual expense ratio of 0.40% (reflecting direct expenses and the proportional expense ratios of the underlying funds in which the Fund invests), multiplied by the average account value over the period, multiplied by 182/366 (to reflect the one-half year period). |
| | | | | | | | | | | | | | | | | | |
| | | 2020 Retirement Fund | | | | |
| | | | | Beginning
Account Value
January 1, 2016 | | | Ending
Account Value
June 30, 2016 | | | Expenses Paid
During Period*
January 1, 2016 to
June 30, 2016 | | | | |
| | | Actual | | | $1,000.00 | | | | $1,042.74 | | | | $1.93 | | | | | |
| | | Hypothetical
(5% return before expenses) | | | $1,000.00 | | | | $1,022.75 | | | | $1.91 | | | | | |
| | * | Expenses are equal to the Fund’s annual expense ratio of 0.38% (reflecting direct expenses and the proportional expense ratios of the underlying funds in which the Fund invests), multiplied by the average account value over the period, multiplied by 182/366 (to reflect the one-half year period). |
| | | | | | | | | | | | | | | | | | |
| | | 2025 Retirement Fund | | | | |
| | | | | Beginning
Account Value
January 1, 2016 | | | Ending
Account Value
June 30, 2016 | | | Expenses Paid
During Period*
January 1, 2016 to
June 30, 2016 | | | | |
| | | Actual | | | $1,000.00 | | | | $1,042.11 | | | | $1.78 | | | | | |
| | | Hypothetical
(5% return before expenses) | | | $1,000.00 | | | | $1,022.90 | | | | $1.76 | | | | | |
| | * | Expenses are equal to the Fund’s annual expense ratio of 0.35% (reflecting direct expenses and the proportional expense ratios of the underlying funds in which the Fund invests), multiplied by the average account value over the period, multiplied by 182/366 (to reflect the one-half year period). |
19
MUTUAL OF AMERICA INVESTMENT CORPORATION
EXPENSE EXAMPLE (Unaudited) (Continued)
| | | | | | | | | | | | | | | | | | |
| | | 2030 Retirement Fund | | | | |
| | | | | Beginning
Account Value
January 1, 2016 | | | Ending
Account Value
June 30, 2016 | | | Expenses Paid
During Period*
January 1, 2016 to
June 30, 2016 | | | | |
| | | Actual | | | $1,000.00 | | | | $1,041.25 | | | | $1.78 | | | | | |
| | | Hypothetical
(5% return before expenses) | | | $1,000.00 | | | | $1,022.90 | | | | $1.76 | | | | | |
| | * | Expenses are equal to the Fund’s annual expense ratio of 0.35% (reflecting direct expenses and the proportional expense ratios of the underlying funds in which the Fund invests), multiplied by the average account value over the period, multiplied by 182/366 (to reflect the one-half year period). |
| | | | | | | | | | | | | | | | | | |
| | | 2035 Retirement Fund | | | | |
| | | | | Beginning
Account Value
January 1, 2016 | | | Ending
Account Value
June 30, 2016 | | | Expenses Paid
During Period*
January 1, 2016 to
June 30, 2016 | | | | |
| | | Actual | | | $1,000.00 | | | | $1,039.13 | | | | $1.72 | | | | | |
| | | Hypothetical
(5% return before expenses) | | | $1,000.00 | | | | $1,022.95 | | | | $1.71 | | | | | |
| | * | Expenses are equal to the Fund’s annual expense ratio of 0.34% (reflecting direct expenses and the proportional expense ratios of the underlying funds in which the Fund invests), multiplied by the average account value over the period, multiplied by 182/366 (to reflect the one-half year period). |
| | | | | | | | | | | | | | | | | | |
| | | 2040 Retirement Fund | | | | |
| | | | | Beginning
Account Value
January 1, 2016 | | | Ending
Account Value
June 30, 2016 | | | Expenses Paid
During Period*
January 1, 2016 to
June 30, 2016 | | | | |
| | | Actual | | | $1,000.00 | | | | $1,036.92 | | | | $1.82 | | | | | |
| | | Hypothetical
(5% return before expenses) | | | $1,000.00 | | | | $1,022.85 | | | | $1.81 | | | | | |
| | * | Expenses are equal to the Fund’s annual expense ratio of 0.36% (reflecting direct expenses and the proportional expense ratios of the underlying funds in which the Fund invests), multiplied by the average account value over the period, multiplied by 182/366 (to reflect the one-half year period). |
| | | | | | | | | | | | | | | | | | |
| | | 2045 Retirement Fund | | | | |
| | | | | Beginning
Account Value
January 1, 2016 | | | Ending
Account Value
June 30, 2016 | | | Expenses Paid
During Period*
January 1, 2016 to
June 30, 2016 | | | | |
| | | Actual | | | $1,000.00 | | | | $1,034.50 | | | | $1.82 | | | | | |
| | | Hypothetical
(5% return before expenses) | | | $1,000.00 | | | | $1,022.85 | | | | $1.81 | | | | | |
| | * | Expenses are equal to the Fund’s annual expense ratio of 0.36% (reflecting direct expenses and the proportional expense ratios of the underlying funds in which the Fund invests), multiplied by the average account value over the period, multiplied by 182/366 (to reflect the one-half year period). |
20
MUTUAL OF AMERICA INVESTMENT CORPORATION
EXPENSE EXAMPLE (Unaudited) (Continued)
| | | | | | | | | | | | | | | | | | |
| | | 2050 Retirement Fund | | | | |
| | | | | Beginning
Account Value
January 1, 2016 | | | Ending
Account Value
June 30, 2016 | | | Expenses Paid
During Period*
January 1, 2016 to
June 30, 2016 | | | | |
| | | Actual | | | $1,000.00 | | | | $1,033.10 | | | | $1.87 | | | | | |
| | | Hypothetical
(5% return before expenses) | | | $1,000.00 | | | | $1,022.80 | | | | $1.86 | | | | | |
| | * | Expenses are equal to the Fund’s annual expense ratio of 0.37% (reflecting direct expenses and the proportional expense ratios of the underlying funds in which the Fund invests), multiplied by the average account value over the period, multiplied by 182/366 (to reflect the one-half year period). |
| | | | | | | | | | | | | | | | | | |
| | | Conservative Allocation Fund | | | | |
| | | | | Beginning
Account Value
January 1, 2016 | | | Ending
Account Value
June 30, 2016 | | | Expenses Paid
During Period*
January 1, 2016 to
June 30, 2016 | | | | |
| | | Actual | | | $1,000.00 | | | | $1,045.94 | | | | $1.93 | | | | | |
| | | Hypothetical
(5% return before expenses) | | | $1,000.00 | | | | $1,022.75 | | | | $1.91 | | | | | |
| | * | Expenses are equal to the Fund’s annual expense ratio of 0.38% (reflecting direct operating expenses and the proportional expense ratios of the underlying funds in which the Fund invests), multiplied by the average account value over the period, multiplied by 182/366 (to reflect the one-half year period). |
| | | | | | | | | | | | | | | | | | |
| | | Moderate Allocation Fund | | | | |
| | | | | Beginning
Account Value
January 1, 2016 | | | Ending
Account Value
June 30, 2016 | | | Expenses Paid
During Period*
January 1, 2016 to
June 30, 2016 | | | | |
| | | Actual | | | $1,000.00 | | | | $1,044.46 | | | | $1.47 | | | | | |
| | | Hypothetical
(5% return before expenses) | | | $1,000.00 | | | | $1,023.21 | | | | $1.46 | | | | | |
| | * | Expenses are equal to the Fund’s annual expense ratio of 0.29% (reflecting direct operating expenses and the proportional expense ratios of the underlying funds in which the Fund invests), multiplied by the average account value over the period, multiplied by 182/366 (to reflect the one-half year period). |
| | | | | | | | | | | | | | | | | | |
| | | Aggressive Allocation Fund | | | | |
| | | | | Beginning
Account Value
January 1, 2016 | | | Ending
Account Value
June 30, 2016 | | | Expenses Paid
During Period*
January 1, 2016 to
June 30, 2016 | | | | |
| | | Actual | | | $1,000.00 | | | | $1,038.80 | | | | $1.47 | | | | | |
| | | Hypothetical
(5% return before expenses) | | | $1,000.00 | | | | $1,023.21 | | | | $1.46 | | | | | |
| | * | Expenses are equal to the Fund’s annual expense ratio of 0.29% (reflecting direct operating expenses and the proportional expense ratios of the underlying funds in which the Fund invests), multiplied by the average account value over the period, multiplied by 182/366 (to reflect the one-half year period). |
21
MUTUAL OF AMERICA INVESTMENT CORPORATION
EXPENSE EXAMPLE (Unaudited) (Continued)
| | | | | | | | | | | | | | | | | | |
| | | Money Market Fund | | | | |
| | | | | Beginning
Account Value
January 1, 2016 | | | Ending
Account Value
June 30, 2016 | | | Expenses Paid
During Period*
January 1, 2016 to
June 30, 2016 | | | | |
| | | Actual | | | $1,000.00 | | | | $1,000.60 | | | | $1.39 | | | | | |
| | | Hypothetical
(5% return before expenses) | | | $1,000.00 | | | | $1,023.26 | | | | $1.41 | | | | | |
| | * | Expenses are equal to the Fund’s annual expense ratio of 0.28%, multiplied by the average account value over the period, multiplied by 182/366 (to reflect the one-half year period). |
| | | | | | | | | | | | | | | | | | |
| | | Mid-Term Bond Fund | | | | |
| | | | | Beginning
Account Value
January 1, 2016 | | | Ending
Account Value
June 30, 2016 | | | Expenses Paid
During Period*
January 1, 2016 to
June 30, 2016 | | | | |
| | | Actual | | | $1,000.00 | | | | $1,044.56 | | | | $2.34 | | | | | |
| | | Hypothetical
(5% return before expenses) | | | $1,000.00 | | | | $1,022.34 | | | | $2.31 | | | | | |
| | * | Expenses are equal to the Fund’s annual expense ratio of 0.46%, multiplied by the average account value over the period, multiplied by 182/366 (to reflect the one-half year period). |
| | | | | | | | | | | | | | | | | | |
| | | Bond Fund | | | | |
| | | | | Beginning
Account Value
January 1, 2016 | | | Ending
Account Value
June 30, 2016 | | | Expenses Paid
During Period*
January 1, 2016 to
June 30, 2016 | | | | |
| | | Actual | | | $1,000.00 | | | | $1,061.04 | | | | $2.31 | | | | | |
| | | Hypothetical
(5% return before expenses) | | | $1,000.00 | | | | $1,022.39 | | | | $2.26 | | | | | |
| | * | Expenses are equal to the Fund’s annual expense ratio of 0.45%, multiplied by the average account value over the period, multiplied by 182/366 (to reflect the one-half year period). |
22
MUTUAL OF AMERICA INVESTMENT CORPORATION — EQUITY INDEX FUND
SUMMARY PORTFOLIO OF INVESTMENTS IN SECURITIES
June 30, 2016 (Unaudited)
| | | | | | | | |
| | | Shares | | | Value | |
| | | | | | | | |
| INDEXED ASSETS: | | | | | | | | |
COMMON STOCKS: | |
CONSUMER DISCRETIONARY (12.0%) | |
Amazon.com, Inc.* | | | 40,421 | | | $ | 28,926,076 | |
Comcast Corp. Cl A | | | 252,633 | | | | 16,469,145 | |
Disney (Walt) Co. | | | 155,766 | | | | 15,237,030 | |
Home Depot, Inc. | | | 130,025 | | | | 16,602,892 | |
McDonald’s Corp. | | | 91,654 | | | | 11,029,642 | |
Starbucks Corp. | | | 152,909 | | | | 8,734,162 | |
Other Securities | | | 2,759,485 | | | | 136,297,096 | |
| | | | | | | | |
| | | | | | | 233,296,043 | |
| | | | | | | | |
CONSUMER STAPLES (10.3%) | |
Altria Group, Inc. | | | 204,211 | | | | 14,082,391 | |
Coca-Cola Co. | | | 406,344 | | | | 18,419,574 | |
CVS Health Corp. | | | 112,242 | | | | 10,746,049 | |
PepsiCo, Inc. | | | 150,852 | | | | 15,981,261 | |
Philip Morris Int’l., Inc. | | | 161,928 | | | | 16,471,316 | |
Proctor & Gamble Co. | | | 277,784 | | | | 23,519,971 | |
Wal-Mart Stores, Inc. | | | 159,616 | | | | 11,655,160 | |
Other Securities | | | 1,229,318 | | | | 89,732,248 | |
| | | | | | | | |
| | | | | | | 200,607,970 | |
| | | | | | | | |
ENERGY (7.2%) | |
Chevron Corp. | | | 196,901 | | | | 20,641,132 | |
Exxon Mobil Corp. | | | 433,500 | | | | 40,636,290 | |
Schlumberger Ltd. | | | 144,931 | | | | 11,461,178 | |
Other Securities | | | 1,664,409 | | | | 67,934,842 | |
| | | | | | | | |
| | | | | | | 140,673,442 | |
| | | | | | | | |
FINANCIALS (15.4%) | |
Bank of America Corp. | | | 1,072,775 | | | | 14,235,724 | |
Berkshire Hathaway, Inc. Cl B* | | | 195,881 | | | | 28,361,610 | |
Citigroup, Inc. | | | 306,094 | | | | 12,975,325 | |
JPMorgan Chase & Co. | | | 381,734 | | | | 23,720,951 | |
Wells Fargo & Co. | | | 482,457 | | | | 22,834,690 | |
Other Securities | | | 3,690,224 | | | | 197,049,140 | |
| | | | | | | | |
| | | | | | | 299,177,440 | |
| | | | | | | | |
HEALTH CARE (14.7%) | |
AbbVie, Inc. | | | 168,945 | | | | 10,459,385 | |
Allergan PLC* | | | 41,334 | | | | 9,551,874 | |
Amgen, Inc. | | | 78,375 | | | | 11,924,756 | |
Bristol-Myers Squibb Co. | | | 174,127 | | | | 12,807,041 | |
Gilead Sciences, Inc. | | | 138,976 | | | | 11,593,378 | |
Johnson & Johnson | | | 287,261 | | | | 34,844,759 | |
Lilly (Eli) & Co. | | | 101,479 | | | | 7,991,471 | |
Medtronic PLC | | | 146,666 | | | | 12,726,209 | |
| | | | | | | | |
| | | Shares | | | Value | |
| | | | | | | | |
| INDEXED ASSETS (CONTINUED): | | | | | | | | |
COMMON STOCKS (CONTINUED): | | | | | | | | |
HEALTH CARE (CONTINUED) | | | | | | | | |
Merck & Co., Inc. | | | 289,072 | | | $ | 16,653,438 | |
Pfizer, Inc. | | | 633,547 | | | | 22,307,190 | |
UnitedHealth Group, Inc. | | | 99,306 | | | | 14,022,007 | |
Other Securities | | | 1,423,315 | | | | 120,397,097 | |
| | | | | | | | |
| | | | | | | 285,278,605 | |
| | | | | | | | |
INDUSTRIALS (9.6%) | |
3M Co. | | | 63,399 | | | | 11,102,433 | |
Boeing Co. | | | 62,600 | | | | 8,129,862 | |
General Electric Co. | | | 959,621 | | | | 30,208,869 | |
Honeywell International, Inc. | | | 79,542 | | | | 9,252,325 | |
United Technologies Corp. | | | 81,328 | | | | 8,340,186 | |
Other Securities | | | 1,653,477 | | | | 120,092,502 | |
| | | | | | | | |
| | | | | | | 187,126,177 | |
| | | | | | | | |
INFORMATION TECHNOLOGY (19.3%) | |
Alphabet, Inc. Cl A* | | | 30,668 | | | | 21,575,858 | |
Alphabet, Inc. Cl C* | | | 30,851 | | | | 21,351,811 | |
Apple, Inc. | | | 571,135 | | | | 54,600,511 | |
Cisco Systems, Inc. | | | 523,875 | | | | 15,029,974 | |
Facebook, Inc. Cl A* | | | 241,133 | | | | 27,556,679 | |
Int’l. Business Machines Corp. | | | 92,292 | | | | 14,008,080 | |
Intel Corp. | | | 491,300 | | | | 16,114,640 | |
MasterCard, Inc. Cl A | | | 101,514 | | | | 8,939,323 | |
Microsoft Corp. | | | 819,578 | | | | 41,937,806 | |
Oracle Corp. | | | 325,190 | | | | 13,310,027 | |
QUALCOMM, Inc. | | | 153,289 | | | | 8,211,692 | |
Visa, Inc. Cl A | | | 198,541 | | | | 14,725,786 | |
Other Securities | | | 2,722,821 | | | | 117,942,448 | |
| | | | | | | | |
| | | | | | | 375,304,635 | |
| | | | | | | | |
MATERIALS (2.8%) | |
Other Securities | | | 1,025,057 | | | | 54,716,338 | |
| | | | | | | | |
TELECOMMUNICATION SERVICES (2.8%) | |
AT&T, Inc. | | | 642,217 | | | | 27,750,197 | |
Verizon Communications, Inc. | | | 425,649 | | | | 23,768,240 | |
Other Securities | | | 208,307 | | | | 3,802,966 | |
| | | | | | | | |
| | | | | | | 55,321,403 | |
| | | | | | | | |
UTILITIES (3.5%) | |
Other Securities | | | 1,199,796 | | | | 68,306,603 | |
| | | | | | | | |
TOTAL INDEXED ASSETS-COMMON STOCKS | |
(Cost: $1,239,057,645) 97.6% | | | | | | | 1,899,808,656 | |
| | | | | | | | |
The accompanying notes are an integral part of these portfolio schedules.
23
MUTUAL OF AMERICA INVESTMENT CORPORATION — EQUITY INDEX FUND
SUMMARY PORTFOLIO OF INVESTMENTS IN SECURITIES (Continued)
June 30, 2016 (Unaudited)
| | | | | | | | | | | | | | | | | | | | |
| | | Rating** | | | Rate(%) | | | Maturity | | | Face Amount | | | Value | |
| SHORT-TERM DEBT SECURITIES: | | | | | | | | | | | | | | | | | | | | |
U.S. GOVERNMENT (0.9%) | | | | | | | | | | | | | | | | | | | | |
U.S. Treasury Bill (1) | | | A-1+ | | | | 0.27 - 0.38 | | | | 08/11/16 - 11/03/16 | | | $ | 17,000,000 | | | $ | 16,988,584 | |
| | | | | | | | | | | | | | | | | | | | |
| | | | | | | | | | | | | | | | | | | | |
COMMERCIAL PAPER (1.4%) | | | | | | | | | | | | | | | | | | | | |
Microsoft Corp.† | | | A-1+ | | | | 0.28 | | | | 07/01/16 | | | | 26,400,000 | | | | 26,400,000 | |
| | | | | | | | | | | | | | | | | | | | |
| | | | | | | | | | | | | | | | | | | | |
TOTAL SHORT-TERM DEBT SECURITIES
(Cost: $43,388,584) 2.3% | | | | 43,388,584 | |
| | | | | | | | | | | | | | | | | | | | |
TOTAL INVESTMENTS
(Cost: $1,282,446,229) 99.9% | | | | 1,943,197,240 | |
| | | | | | | | | | | | | | | | | | | | |
OTHER NET ASSETS 0.1% | | | | 2,156,646 | |
| | | | | | | | | | | | | | | | | | | | |
NET ASSETS 100.0% | | | $ | 1,945,353,886 | |
| | | | | | | | | | | | | | | | | | | | |
The accompanying notes are an integral part of these portfolio schedules.
24
MUTUAL OF AMERICA INVESTMENT CORPORATION — ALL AMERICA FUND
SUMMARY PORTFOLIO OF INVESTMENTS IN SECURITIES
June 30, 2016 (Unaudited)
| | | | | | | | |
| | | Shares | | | Value | |
| INDEXED ASSETS: | | | | | | | | |
COMMON STOCKS: | | | | | | | | |
CONSUMER DISCRETIONARY (6.4%) | |
Amazon.com, Inc.* | | | 3,220 | | | $ | 2,304,296 | |
Comcast Corp. Cl A | | | 20,128 | | | | 1,312,144 | |
Disney (Walt) Co. | | | 12,411 | | | | 1,214,044 | |
Home Depot, Inc. | | | 10,360 | | | | 1,322,868 | |
Ralph Lauren Corp. | | | 471 | | | | 42,211 | |
Other Securities | | | 238,876 | | | | 12,392,287 | |
| | | | | | | | |
| | | | | | | 18,587,850 | |
| | | | | | | | |
CONSUMER STAPLES (5.5%) | |
Altria Group, Inc. | | | 16,270 | | | | 1,121,979 | |
Coca-Cola Co. | | | 32,375 | | | | 1,467,559 | |
Constellation Brands, Inc. Cl A | | | 1,463 | | | | 241,980 | |
J.M. Smucker Co. | | | 999 | | | | 152,258 | |
PepsiCo, Inc. | | | 12,019 | | | | 1,273,293 | |
Philip Morris Int’l., Inc. | | | 12,901 | | | | 1,312,290 | |
Proctor & Gamble Co. | | | 22,132 | | | | 1,873,916 | |
Other Securities | | | 117,141 | | | | 8,539,520 | |
| | | | | | | | |
| | | | | | | 15,982,795 | |
| | | | | | | | |
ENERGY (3.9%) | |
Chevron Corp. | | | 15,687 | | | | 1,644,468 | |
Exxon Mobil Corp. | | | 34,538 | | | | 3,237,592 | |
Range Resources Corp. | | | 1,413 | | | | 60,957 | |
Other Securities | | | 142,736 | | | | 6,264,331 | |
| | | | | | | | |
| | | | | | | 11,207,348 | |
| | | | | | | | |
FINANCIALS (8.3%) | |
Bank of America Corp. | | | 85,473 | | | | 1,134,227 | |
Berkshire Hathaway, Inc. Cl B* | | | 15,606 | | | | 2,259,593 | |
Citigroup, Inc. | | | 24,388 | | | | 1,033,807 | |
iShares Core S&P 500 ETF | | | 592 | | | | 124,734 | |
JPMorgan Chase & Co. | | | 30,415 | | | | 1,889,988 | |
Wells Fargo & Co. | | | 38,439 | | | | 1,819,318 | |
Other Securities | | | 294,013 | | | | 15,698,840 | |
| | | | | | | | |
| | | | | | | 23,960,507 | |
| | | | | | | | |
HEALTH CARE (7.9%) | |
Amgen, Inc. | | | 6,244 | | | | 950,025 | |
Bristol-Myers Squibb Co. | | | 13,873 | | | | 1,020,359 | |
Johnson & Johnson | | | 22,887 | | | | 2,776,193 | |
Medtronic PLC | | | 11,685 | | | | 1,013,907 | |
Merck & Co., Inc. | | | 23,031 | | | | 1,326,816 | |
| | | | | | | | |
| | | Shares | | | Value | |
| INDEXED ASSETS (CONTINUED): | | | | | | | | |
COMMON STOCKS (CONTINUED): | | | | | | | | |
HEALTH CARE (CONTINUED) | |
Pfizer, Inc. | | | 50,477 | | | $ | 1,777,295 | |
UnitedHealth Group, Inc. | | | 7,913 | | | | 1,117,316 | |
Other Securities | | | 149,350 | | | | 12,751,745 | |
| | | | | | | | |
| | | | | | | 22,733,656 | |
| | | | | | | | |
INDUSTRIALS (5.2%) | |
General Electric Co. | | | 76,457 | | | | 2,406,866 | |
Other Securities | | | 154,602 | | | | 12,503,107 | |
| | | | | | | | |
| | | | | | | 14,909,973 | |
| | | | | | | | |
INFORMATION TECHNOLOGY (10.4%) | |
Alphabet, Inc. Cl A* | | | 2,443 | | | | 1,718,724 | |
Alphabet, Inc. Cl C* | | | 2,458 | | | | 1,701,189 | |
Apple, Inc. | | | 45,505 | | | | 4,350,273 | |
Cisco Systems, Inc. | | | 41,739 | | | | 1,197,492 | |
Facebook, Inc. Cl A* | | | 19,212 | | | | 2,195,547 | |
Int’l. Business Machines Corp. | | | 7,353 | | | | 1,116,038 | |
Intel Corp. | | | 39,144 | | | | 1,283,923 | |
Microsoft Corp. | | | 65,300 | | | | 3,341,398 | |
Oracle Corp. | | | 25,910 | | | | 1,060,496 | |
Visa, Inc. Cl A | | | 15,819 | | | | 1,173,295 | |
Other Securities | | | 237,248 | | | | 10,763,861 | |
| | | | | | | | |
| | | | | | | 29,902,236 | |
| | | | | | | | |
MATERIALS (1.5%) | |
Other Securities | | | 81,671 | | | | 4,359,581 | |
| | | | | | | | |
TELECOMMUNICATION SERVICES (1.5%) | |
AT&T, Inc. | | | 51,168 | | | | 2,210,969 | |
Verizon Communications, Inc. | | | 33,913 | | | | 1,893,702 | |
Other Securities | | | 16,595 | | | | 302,956 | |
| | | | | | | | |
| | | | | | | 4,407,627 | |
| | | | | | | | |
UTILITIES (1.9%) | |
Edison International | | | 2,710 | | | | 210,486 | |
Sempra Energy | | | 1,966 | | | | 224,163 | |
Other Securities | | | 90,905 | | | | 5,006,861 | |
| | | | | | | | |
| | | | | | | 5,441,510 | |
| | | | | | | | |
TOTAL INDEXED ASSETS-COMMON STOCKS | |
(Cost: $105,855,665) 52.5% | | | | | | | 151,493,083 | |
| | | | | | | | |
| | | | | | | | | | | | | | | | | | | | |
| | | Rating** | | | Rate(%) | | | Maturity | | | Face Amount | | | Value | |
| INDEXED ASSETS: | | | | | | | | | | | | | | | | | | | | |
| SHORT-TERM DEBT SECURITIES: | | | | | | | | | | | | | | | | | | | | |
U.S. GOVERNMENT (0.1%) | | | | | | | | | | | | | | | | | | | | |
U.S. Treasury Bill (1) | | | A-1+ | | | | 0.27 - 0.30 | | | | 10/13/16 - 11/10/16 | | | $ | 300,000 | | | $ | 299,732 | |
| | | | | | | | | | | | | | | | | | | | |
COMMERCIAL PAPER (1.5%) | | | | | | | | | | | | | | | | | | | | |
Ralph Lauren Corp.† | | | A-1 | | | | 0.40 | | | | 07/01/16 | | | | 4,200,000 | | | | 4,200,000 | |
| | | | | | | | | | | | | | | | | | | | |
TOTAL INDEXED ASSETS-SHORT-TERM DEBT SECURITIES
(COST: $4,499,732) 1.6% | | | | 4,499,732 | |
| | | | | | | | | | | | | | | | | | | | |
TOTAL INDEXED ASSETS
(COST: $110,355,397) 54.1% | | | $ | 155,992,815 | |
| | | | | | | | | | | | | | | | | | | | |
The accompanying notes are an integral part of these portfolio schedules.
25
MUTUAL OF AMERICA INVESTMENT CORPORATION — ALL AMERICA FUND
SUMMARY PORTFOLIO OF INVESTMENTS IN SECURITIES (Continued)
June 30, 2016 (Unaudited)
| | | | | | | | |
| | | Shares | | | Value | |
| ACTIVE ASSETS: | | | | | | | | |
COMMON STOCKS: | | | | | | | | |
CONSUMER DISCRETIONARY (6.2%) | | | | | |
CST Brands, Inc. | | | 52,759 | | | $ | 2,272,858 | |
Diamond Resorts Int’l., Inc.* | | | 77,728 | | | | 2,328,731 | |
Panera Bread Co. Cl A* | | | 6,390 | | | | 1,354,297 | |
Ralph Lauren Corp. | | | 3,227 | | | | 289,203 | |
Other Securities | | | 401,430 | | | | 11,592,864 | |
| | | | | | | | |
| | | | | | | 17,837,953 | |
| | | | | | | | |
CONSUMER STAPLES (2.1%) | |
Constellation Brands, Inc. Cl A | | | 6,856 | | | | 1,133,982 | |
J.M. Smucker Co. | | | 5,731 | | | | 873,462 | |
Other Securities | | | 119,902 | | | | 3,967,652 | |
| | | | | | | | |
| | | | | | | 5,975,096 | |
| | | | | | | | |
ENERGY (2.2%) | |
Range Resources Corp. | | | 21,683 | | | | 935,405 | |
Other Securities | | | 217,384 | | | | 5,363,995 | |
| | | | | | | | |
| | | | | | | 6,299,400 | |
| | | | | | | | |
FINANCIALS (11.3%) | |
iShares Russell 2000 Value ETF | | | 3,610 | | | | 351,253 | |
iShares Russell Mid-Cap ETF | | | 2,658 | | | | 446,916 | |
iShares Russell Mid-Cap Value ETF | | | 1,358 | | | | 100,886 | |
Starwood Property Trust, Inc. | | | 45,649 | | | | 945,847 | |
Other Securities | | | 1,075,083 | | | | 30,654,370 | |
| | | | | | | | |
| | | | | | | 32,499,272 | |
| | | | | | | | |
| | | | | | | | |
| | | Shares | | | Value | |
| ACTIVE ASSETS (CONTINUED): | | | | | | | | |
COMMON STOCKS (CONTINUED): | | | | | | | | |
HEALTH CARE (4.6%) | |
Acadia Healthcare Co., Inc.* | | | 20,490 | | | $ | 1,135,146 | |
Other Securities | | | 381,911 | | | | 12,267,703 | |
| | | | | | | | |
| | | | | | | 13,402,849 | |
| | | | | | | | |
INDUSTRIALS (4.9%) | |
AZZ, Inc. | | | 17,885 | | | | 1,072,742 | |
Orbital ATK, Inc. | | | 12,460 | | | | 1,060,845 | |
Other Securities | | | 286,709 | | | | 11,986,546 | |
| | | | | | | | |
| | | | | | | 14,120,133 | |
| | | | | | | | |
INFORMATION TECHNOLOGY (6.5%) | |
Cavium, Inc.* | | | 26,933 | | | | 1,039,613 | |
Other Securities | | | 592,885 | | | | 17,828,660 | |
| | | | | | | | |
| | | | | | | 18,868,273 | |
| | | | | | | | |
MATERIALS (2.3%) | |
Other Securities | | | 224,759 | | | | 6,763,998 | |
| | | | | | | | |
TELECOMMUNICATION SERVICES (0.5%) | | | | | | | | |
Other Securities | | | 73,644 | | | | 1,517,759 | |
| | | | | | | | |
UTILITIES (3.1%) | |
Edison International | | | 9,987 | | | | 775,690 | |
Sempra Energy | | | 8,939 | | | | 1,019,225 | |
Other Securities | | | 146,126 | | | | 7,245,405 | |
| | | | | | | | |
| | | | | | | 9,040,320 | |
| | | | | | | | |
TOTAL ACTIVE ASSETS-COMMON STOCKS
(COST: $116,069,007) 43.7% | | | | 126,325,053 | |
| | | | | | | | |
| | | | | | | | | | | | | | | | | | | | |
| | | Rating** | | | Rate(%) | | | Maturity | | | Face Amount | | | Value | |
| | | | | |
| ACTIVE ASSETS: | | | | | | | | | | | | | | | | | | | | |
SHORT-TERM DEBT SECURITIES: | | | | | | | | | | | | | | | | | | | | |
U.S. GOVERNMENT (0.7%) | | | | | | | | | | | | | | | | | | | | |
U.S. Treasury Bill | | | A-1+ | | | | 0.26 | | | | 08/11/16 | | | $ | 2,100,000 | | | $ | 2,099,366 | |
| | | | | | | | | | | | | | | | | | | | |
COMMERCIAL PAPER (0.4%) | | | | | | | | | | | | | | | | | | | | |
Ralph Lauren Corp.† | | | A-1 | | | | 0.40 | | | | 07/01/16 | | | | 1,200,000 | | | | 1,200,000 | |
| | | | | | | | | | | | | | | | | | | | |
TOTAL ACTIVE ASSETS-SHORT-TERM DEBT SECURITIES
(COST: $3,299,366) 1.1% | | | | 3,299,366 | |
| | | | | | | | | | | | | | | | | | | | |
TOTAL ACTIVE ASSETS
(COST: $119,368,373) 44.8% | | | | 129,624,419 | |
| | | | | | | | | | | | | | | | | | | | |
TOTAL INVESTMENTS
(COST: $229,723,770) 98.9% | | | | 285,617,234 | |
| | | | | | | | | | | | | | | | | | | | |
OTHER NET ASSETS 1.1% | | | | 3,146,566 | |
| | | | | | | | | | | | | | | | | | | | |
NET ASSETS 100.0% | | | $ | 288,763,800 | |
| | | | | | | | | | | | | | | | | | | | |
The accompanying notes are an integral part of these portfolio schedules.
26
MUTUAL OF AMERICA INVESTMENT CORPORATION — SMALL CAP VALUE FUND
SUMMARY PORTFOLIO OF INVESTMENTS IN SECURITIES
June 30, 2016 (Unaudited)
| | | | | | | | |
| | | Shares | | | Value | |
| COMMON STOCKS: | | | | | | | | |
CONSUMER DISCRETIONARY (11.4%) | |
Bassett Furniture Industries, Inc. | | | 172,238 | | | $ | 4,123,378 | |
CST Brands, Inc. | | | 90,217 | | | | 3,886,548 | |
Diamond Resorts Int’l., Inc.* | | | 473,712 | | | | 14,192,417 | |
Houghton Mifflin Harcourt Co.* | | | 337,278 | | | | 5,271,655 | |
Select Comfort Corp.* | | | 166,713 | | | | 3,564,324 | |
Other Securities | | | 937,406 | | | | 13,192,773 | |
| | | | | | | | |
| | | | | | | 44,231,095 | |
| | | | | | | | |
CONSUMER STAPLES (2.6%) | |
Crimson Wine Group Ltd.* | | | 452,245 | | | | 3,780,768 | |
Farmer Brothers Co.* | | | 100,975 | | | | 3,237,259 | |
Vector Group Ltd. | | | 142,559 | | | | 3,196,173 | |
| | | | | | | | |
| | | | | | | 10,214,200 | |
| | | | | | | | |
ENERGY (4.4%) | |
PBF Energy, Inc. | | | 159,091 | | | | 3,783,184 | |
Other Securities | | | 947,128 | | | | 13,254,264 | |
| | | | | | | | |
| | | | | | | 17,037,448 | |
| | | | | | | | |
FINANCIALS (40.0%) | |
Aspen Insurance Hldgs. Ltd. | | | 75,207 | | | | 3,488,101 | |
BancFirst Corp. | | | 55,395 | | | | 3,341,426 | |
Banner Corp. | | | 90,519 | | | | 3,850,678 | |
Brookline Bancorp, Inc. | | | 354,901 | | | | 3,914,558 | |
Chatham Lodging Trust | | | 135,200 | | | | 2,971,696 | |
Chesapeake Lodging Trust | | | 131,874 | | | | 3,066,071 | |
Colony Capital, Inc. Cl A | | | 202,549 | | | | 3,109,127 | |
Customers Bancorp, Inc.* | | | 134,265 | | | | 3,374,079 | |
Easterly Government Pptys. | | | 192,198 | | | | 3,792,067 | |
Ellington Financial LLC | | | 294,864 | | | | 5,051,020 | |
Equity Lifestyle Properties, Inc. | | | 50,252 | | | | 4,022,673 | |
FelCor Lodging Trust, Inc. | | | 545,801 | | | | 3,400,340 | |
Forest City Realty Trust, Inc. Cl A | | | 236,199 | | | | 5,269,600 | |
Highwoods Properties, Inc. | | | 103,609 | | | | 5,470,555 | |
Investors Bancorp, Inc. | | | 323,809 | | | | 3,587,804 | |
iShares Russell 2000 Value ETF | | | 40,690 | | | | 3,959,137 | |
Northfield Bancorp, Inc. | | | 232,775 | | | | 3,452,053 | |
Pennsylvania REIT | | | 148,863 | | | | 3,193,111 | |
PrivateBancorp, Inc. | | | 107,627 | | | | 4,738,817 | |
Selective Insurance Group, Inc. | | | 83,591 | | | | 3,194,012 | |
Stock Yards Bancorp, Inc. | | | 194,766 | | | | 5,498,244 | |
SVB Financial Group* | | | 55,744 | | | | 5,304,599 | |
Other Securities | | | 3,299,122 | | | | 68,537,526 | |
| | | | | | | | |
| | | | | | | 155,587,294 | |
| | | | | | | | |
| | | | | | | | |
| | | Shares | | | Value | |
| COMMON STOCKS (CONTINUED): | |
HEALTH CARE (4.5%) | |
Amsurg Corp.* | | | 42,271 | | | $ | 3,277,693 | |
Supernus Pharmaceuticals, Inc.* | | | 259,183 | | | | 5,279,558 | |
Other Securities | | | 991,262 | | | | 8,834,123 | |
| | | | | | | | |
| | | | | | | 17,391,374 | |
| | | | | | | | |
INDUSTRIALS (10.9%) | |
AZZ, Inc. | | | 103,726 | | | | 6,221,485 | |
Deluxe Corp. | | | 54,645 | | | | 3,626,789 | |
Encore Wire Corp. | | | 92,067 | | | | 3,432,258 | |
Miller Industries, Inc. | | | 249,665 | | | | 5,140,602 | |
Mueller Industries, Inc. | | | 314,576 | | | | 10,028,683 | |
Orbital ATK, Inc. | | | 65,445 | | | | 5,571,987 | |
Other Securities | | | 268,185 | | | | 8,260,954 | |
| | | | | | | | |
| | | | | | | 42,282,758 | |
| | | | | | | | |
INFORMATION TECHNOLOGY (10.3%) | |
MKS Instruments, Inc. | | | 69,625 | | | | 2,998,053 | |
Proofpoint, Inc.* | | | 51,513 | | | | 3,249,955 | |
Xura, Inc.* | | | 128,245 | | | | 3,133,025 | |
Other Securities | | | 2,040,939 | | | | 30,824,298 | |
| | | | | | | | |
| | | | | | | 40,205,331 | |
| | | | | | | | |
MATERIALS (3.7%) | |
Kaiser Aluminum Corp. | | | 65,109 | | | | 5,886,505 | |
Kraton Performance Polymers, Inc.* | | | 145,160 | | | | 4,054,319 | |
Other Securities | | | 255,485 | | | | 4,262,275 | |
| | | | | | | | |
| | | | | | | 14,203,099 | |
| | | | | | | | |
TELECOMMUNICATION SERVICES (1.1%) | |
ORBCOMM, Inc.* | | | 304,993 | | | | 3,034,680 | |
Other Securities | | | 48,921 | | | | 1,332,608 | |
| | | | | | | | |
| | | | | | | 4,367,288 | |
| | | | | | | | |
UTILITIES (7.1%) | |
Avista Corp. | | | 102,622 | | | | 4,597,466 | |
Idacorp, Inc. | | | 65,470 | | | | 5,325,985 | |
Northwest Natural Gas Co. | | | 52,981 | | | | 3,434,228 | |
PNM Resources, Inc. | | | 117,139 | | | | 4,151,406 | |
Portland General Electric Co. | | | 74,057 | | | | 3,267,395 | |
Other Securities | | | 104,760 | | | | 6,731,605 | |
| | | | | | | | |
| | | | | | | 27,508,085 | |
| | | | | | | | |
TOTAL COMMON STOCKS | | | | | | | | |
(Cost: $303,396,808) 96.0% | | | | | | | 373,027,972 | |
| | | | | | | | |
The accompanying notes are an integral part of these portfolio schedules.
27
MUTUAL OF AMERICA INVESTMENT CORPORATION — SMALL CAP VALUE FUND
SUMMARY PORTFOLIO OF INVESTMENTS IN SECURITIES (Continued)
June 30, 2016 (Unaudited)
| | | | | | | | | | | | | | | | | | | | |
| | | Rating** | | | Rate(%) | | | Maturity | | | Face Amount | | | Value | |
| SHORT-TERM DEBT SECURITIES: | | | | | | | | | | | | | | | | | | | | |
U.S. GOVERNMENT (2.5%) | | | | | | | | | | | | | | | | | | | | |
U.S. Treasury Bill | | | A-1+ | | | | 0.29 - 0.32 | | | | 08/11/16 - 08/25/16 | | | $ | 10,000,000 | | | $ | 9,995,903 | |
| | | | | | | | | | | | | | | | | | | | |
COMMERCIAL PAPER (1.2%) | | | | | | | | | | | | | | | | | | | | |
Microsoft Corp.† | | | A-1+ | | | | 0.28 | | | | 07/01/16 | | | | 4,700,000 | | | | 4,700,000 | |
| | | | | | | | | | | | | | | | | | | | |
TOTAL SHORT-TERM DEBT SECURITIES
(COST: $14,695,903) 3.7% | | | | 14,695,903 | |
| | | | | | | | | | | | | | | | | | | | |
TOTAL INVESTMENTS
(COST: $318,092,711) 99.7% | | | | 387,723,875 | |
| | | | | | | | | | | | | | | | | | | | |
OTHER NET ASSETS 0.3% | | | | 1,108,414 | |
| | | | | | | | | | | | | | | | | | | | |
NET ASSETS 100.0% | | | $ | 388,832,289 | |
| | | | | | | | | | | | | | | | | | | | |
The accompanying notes are an integral part of these portfolio schedules.
28
MUTUAL OF AMERICA INVESTMENT CORPORATION — SMALL CAP GROWTH FUND
SUMMARY PORTFOLIO OF INVESTMENTS IN SECURITIES
June 30, 2016 (Unaudited)
| | | | | | | | |
| | | Shares | | | Value | |
| COMMON STOCKS: | | | | | | | | |
CONSUMER DISCRETIONARY (17.4%) | |
CST Brands, Inc. | | | 165,468 | | | $ | 7,128,361 | |
Diamond Resorts Int’l., Inc.* | | | 169,644 | | | | 5,082,534 | |
Drew Industries, Inc. | | | 47,119 | | | | 3,997,576 | |
Five Below, Inc.* | | | 79,702 | | | | 3,698,970 | |
Haverty Furniture Cos., Inc. | | | 201,229 | | | | 3,628,159 | |
HSN, Inc. | | | 68,462 | | | | 3,349,846 | |
Intrawest Resorts Hldgs., Inc.* | | | 256,533 | | | | 3,329,798 | |
Lions Gate Entertainment Corp. | | | 221,111 | | | | 4,473,076 | |
Panera Bread Co. Cl A* | | | 16,133 | | | | 3,419,228 | |
Red Robin Gourmet Burgers, Inc.* | | | 121,519 | | | | 5,763,646 | |
Select Comfort Corp.* | | | 280,238 | | | | 5,991,488 | |
Steve Madden Ltd.* | | | 94,424 | | | | 3,227,412 | |
Other Securities | | | 550,217 | | | | 15,720,951 | |
| | | | | | | | |
| | | | | | | 68,811,045 | |
| | | | | | | | |
CONSUMER STAPLES (3.9%) | |
Village Super Market, Inc. Cl A | | | 107,478 | | | | 3,105,039 | |
WD-40 Co. | | | 55,663 | | | | 6,537,619 | |
Other Securities | | | 155,362 | | | | 5,887,451 | |
| | | | | | | | |
| | | | | | | 15,530,109 | |
| | | | | | | | |
ENERGY (1.4%) | |
Other Securities | | | 223,078 | | | | 5,379,401 | |
| | | | | | | | |
FINANCIALS (8.9%) | |
CubeSmart | | | 122,617 | | | | 3,786,413 | |
Easterly Government Pptys. | | | 218,327 | | | | 4,307,592 | |
FBL Financial Group, Inc. Cl A | | | 51,971 | | | | 3,153,081 | |
Investors Bancorp, Inc. | | | 350,144 | | | | 3,879,596 | |
QTS Realty Trust, Inc. | | | 86,558 | | | | 4,845,517 | |
Safety Insurance Group, Inc. | | | 61,226 | | | | 3,770,297 | |
Other Securities | | | 430,954 | | | | 11,459,688 | |
| | | | | | | | |
| | | | | | | 35,202,184 | |
| | | | | | | | |
HEALTH CARE (20.0%) | |
Abiomed, Inc.* | | | 34,009 | | | | 3,716,844 | |
Acadia Healthcare Co., Inc.* | | | 95,433 | | | | 5,286,988 | |
Emergent Biosolutions, Inc.* | | | 144,748 | | | | 4,070,314 | |
Omnicell, Inc.* | | | 137,107 | | | | 4,693,173 | |
PAREXEL International Corp.* | | | 58,143 | | | | 3,656,032 | |
Supernus Pharmaceuticals, Inc.* | | | 179,870 | | | | 3,663,952 | |
WellCare Health Plans, Inc.* | | | 52,086 | | | | 5,587,786 | |
Other Securities | | | 1,670,437 | | | | 48,406,661 | |
| | | | | | | | |
| | | | | | | 79,081,750 | |
| | | | | | | | |
| | | | | | | | |
| | | Shares | | | Value | |
| COMMON STOCKS (CONTINUED): | |
INDUSTRIALS (11.5%) | |
Astronics Corp.* | | | 239,912 | | | $ | 7,979,468 | |
AZZ, Inc. | | | 87,772 | | | | 5,264,565 | |
Covenant Transportation Group Cl A* | | | 230,319 | | | | 4,161,864 | |
EnPro Industries, Inc. | | | 91,366 | | | | 4,055,737 | |
Healthcare Svcs. Group, Inc. | | | 114,445 | | | | 4,735,734 | |
Mueller Water Products, Inc. Cl A | | | 378,072 | | | | 4,317,582 | |
Sun Hydraulics Corp. | | | 103,070 | | | | 3,060,148 | |
Teledyne Technologies, Inc.* | | | 37,777 | | | | 3,741,812 | |
Trex Co., Inc.* | | | 104,024 | | | | 4,672,758 | |
Other Securities | | | 102,362 | | | | 3,500,319 | |
| | | | | | | | |
| | | | | | | 45,489,987 | |
| | | | | | | | |
INFORMATION TECHNOLOGY (22.6%) | |
Ambarella, Inc.* | | | 94,609 | | | | 4,807,083 | |
Apigee Corp.* | | | 324,253 | | | | 3,962,372 | |
Cavium, Inc.* | | | 108,285 | | | | 4,179,801 | |
Globant S.A.* | | | 108,960 | | | | 4,287,576 | |
LogMeIn, Inc.* | | | 72,057 | | | | 4,570,576 | |
MaxLinear, Inc. Cl A* | | | 223,325 | | | | 4,015,384 | |
Monolithic Power Systems, Inc. | | | 60,722 | | | | 4,148,527 | |
Proofpoint, Inc.* | | | 83,061 | | | | 5,240,318 | |
Tyler Technologies, Inc.* | | | 26,547 | | | | 4,425,650 | |
Other Securities | | | 1,961,406 | | | | 49,856,720 | |
| | | | | | | | |
| | | | | | | 89,494,007 | |
| | | | | | | | |
MATERIALS (4.6%) | |
Ferro Corp.* | | | 395,488 | | | | 5,291,629 | |
Other Securities | | | 498,438 | | | | 13,024,473 | |
| | | | | | | | |
| | | | | | | 18,316,102 | |
| | | | | | | | |
TELECOMMUNICATION SERVICES (2.2%) | |
ORBCOMM, Inc.* | | | 313,867 | | | | 3,122,977 | |
Shenandoah Telecommunications Co. | | | 137,986 | | | | 5,389,733 | |
| | | | | | | | |
| | | | | | | 8,512,710 | |
| | | | | | | | |
UTILITIES (2.5%) | |
Chesapeake Utilities Corp. | | | 58,152 | | | | 3,848,499 | |
Northwest Natural Gas Co. | | | 92,723 | | | | 6,010,305 | |
| | | | | | | | |
| | | | | | | 9,858,804 | |
| | | | | | | | |
TOTAL COMMON STOCKS | |
(Cost: $336,288,463) 95.0% | | | | | | | 375,676,099 | |
| | | | | | | | |
The accompanying notes are an integral part of these portfolio schedules.
29
MUTUAL OF AMERICA INVESTMENT CORPORATION — SMALL CAP GROWTH FUND
SUMMARY PORTFOLIO OF INVESTMENTS IN SECURITIES (Continued)
June 30, 2016 (Unaudited)
| | | | | | | | | | | | | | | | | | | | |
| | | Rating** | | | Rate(%) | | | Maturity | | | Face Amount | | | Value | |
| SHORT-TERM DEBT SECURITIES: | | | | | | | | | | | | | | | | | | | | |
U.S. GOVERNMENT (3.8%) | | | | | | | | | | | | | | | | | | | | |
U.S. Treasury Bill | | | A-1+ | | | | 0.27 - 0.32 | | | | 08/11/16 - 08/25/16 | | | $ | 15,000,000 | | | $ | 14,993,605 | |
| | | | | | | | | | | | | | | | | | | | |
COMMERCIAL PAPER (1.1%) | | | | | | | | | | | | | | | | | | | | |
Microsoft Corp.† | | | A-1+ | | | | 0.28 | | | | 07/01/16 | | | | 4,300,000 | | | | 4,300,000 | |
| | | | | | | | | | | | | | | | | | | | |
TOTAL SHORT-TERM DEBT SECURITIES
(COST: $19,293,605) 4.9% | | | | 19,293,605 | |
| | | | | | | | | | | | | | | | | | | | |
TOTAL INVESTMENTS
(COST: $355,582,068) 99.9% | | | | 394,969,704 | |
| | | | | | | | | | | | | | | | | | | | |
OTHER NET ASSETS 0.1% | | | | 201,254 | |
| | | | | | | | | | | | | | | | | | | | |
NET ASSETS 100.0% | | | $ | 395,170,958 | |
| | | | | | | | | | | | | | | | | | | | |
The accompanying notes are an integral part of these portfolio schedules.
30
MUTUAL OF AMERICA INVESTMENT CORPORATION — MID CAP VALUE FUND
SUMMARY PORTFOLIO OF INVESTMENTS IN SECURITIES
June 30, 2016 (Unaudited)
| | | | | | | | |
| | | Shares | | | Value | |
| COMMON STOCKS: | | | | | | | | |
CONSUMER DISCRETIONARY (6.8%) | |
CST Brands, Inc. | | | 21,146 | | | $ | 910,970 | |
Diamond Resorts Int’l., Inc.* | | | 90,343 | | | | 2,706,676 | |
Ralph Lauren Corp. | | | 2,240 | | | | 200,749 | |
Other Securities | | | 66,343 | | | | 1,980,495 | |
| | | | | | | | |
| | | | | | | 5,798,890 | |
| | | | | | | | |
CONSUMER STAPLES (5.0%) | |
Constellation Brands, Inc. Cl A | | | 7,519 | | | | 1,243,643 | |
Ingredion, Inc. | | | 11,357 | | | | 1,469,709 | |
Other Securities | | | 40,341 | | | | 1,558,712 | |
| | | | | | | | |
| | | | | | | 4,272,064 | |
| | | | | | | | |
ENERGY (9.3%) | |
Baker Hughes, Inc. | | | 16,760 | | | | 756,379 | |
Continental Resources, Inc.* | | | 18,110 | | | | 819,840 | |
Hess Corp. | | | 13,610 | | | | 817,961 | |
Noble Energy, Inc. | | | 24,278 | | | | 870,852 | |
PBF Energy, Inc. | | | 34,399 | | | | 818,008 | |
Range Resources Corp. | | | 31,610 | | | | 1,363,655 | |
Other Securities | | | 138,245 | | | | 2,500,593 | |
| | | | | | | | |
| | | | | | | 7,947,288 | |
| | | | | | | | |
FINANCIALS (29.9%) | |
American Financial Group, Inc. | | | 17,793 | | | | 1,315,436 | |
Ameriprise Financial, Inc. | | | 15,623 | | | | 1,403,727 | |
Associated Banc-Corp. | | | 45,648 | | | | 782,863 | |
Discover Financial Svcs. | | | 16,715 | | | | 895,757 | |
Duke Realty Corp. | | | 46,529 | | | | 1,240,463 | |
Equity Lifestyle Properties, Inc. | | | 12,468 | | | | 998,063 | |
Everest Re Group Ltd. | | | 5,652 | | | | 1,032,451 | |
Fifth Third Bancorp | | | 50,505 | | | | 888,383 | |
General Growth Pptys., Inc. | | | 27,431 | | | | 817,992 | |
Hartford Financial Svcs. Group, Inc. | | | 26,111 | | | | 1,158,806 | |
KeyCorp | | | 71,319 | | | | 788,075 | |
Lincoln National Corp. | | | 19,166 | | | | 743,066 | |
ProLogis, Inc. | | | 17,883 | | | | 876,982 | |
Reinsurance Grp. of America, Inc. | | | 11,258 | | | | 1,091,913 | |
SVB Financial Group* | | | 7,863 | | | | 748,243 | |
Vornado Realty Trust | | | 11,850 | | | | 1,186,422 | |
Other Securities | | | 356,191 | | | | 9,462,039 | |
| | | | | | | | |
| | | | | | | 25,430,681 | |
| | | | | | | | |
HEALTH CARE (6.2%) | |
Boston Scientific Corp.* | | | 41,826 | | | | 977,474 | |
| | | | | | | | |
| | | Shares | | | Value | |
| COMMON STOCKS (CONTINUED): | |
HEALTH CARE (CONTINUED) | |
Zimmer Biomet Hldgs., Inc. | | | 6,840 | | | $ | 823,399 | |
Other Securities | | | 53,076 | | | | 3,475,513 | |
| | | | | | | | |
| | | | | | | 5,276,386 | |
| | | | | | | | |
INDUSTRIALS (8.9%) | |
Alaska Air Group, Inc. | | | 16,943 | | | | 987,607 | |
L-3 Communications Hldgs., Inc. | | | 9,725 | | | | 1,426,560 | |
Old Dominion Freight Line, Inc.* | | | 12,632 | | | | 761,836 | |
Orbital ATK, Inc. | | | 10,264 | | | | 873,877 | |
Other Securities | | | 72,941 | | | | 3,529,515 | |
| | | | | | | | |
| | | | | | | 7,579,395 | |
| | | | | | | | |
INFORMATION TECHNOLOGY (9.6%) | |
ARRIS International PLC* | | | 35,010 | | | | 733,810 | |
Broadcom Ltd. | | | 8,864 | | | | 1,377,466 | |
Fidelity Nat’l. Information Svcs., Inc. | | | 11,447 | | | | 843,415 | |
Other Securities | | | 150,365 | | | | 5,238,495 | |
| | | | | | | | |
| | | | | | | 8,193,186 | |
| | | | | | | | |
MATERIALS (6.4%) | |
Crown Hldgs., Inc.* | | | 25,339 | | | | 1,283,927 | |
Eastman Chemical Co. | | | 13,709 | | | | 930,841 | |
International Paper Co. | | | 19,330 | | | | 819,205 | |
Packaging Corp. of America | | | 18,921 | | | | 1,266,383 | |
Other Securities | | | 52,682 | | | | 1,128,463 | |
| | | | | | | | |
| | | | | | | 5,428,819 | |
| | | | | | | | |
UTILITIES (13.5%) | |
Ameren Corp. | | | 17,204 | | | | 921,790 | |
Atmos Energy Corp. | | | 16,659 | | | | 1,354,710 | |
Consolidated Edison, Inc. | | | 13,337 | | | | 1,072,828 | |
Edison International | | | 18,428 | | | | 1,431,303 | |
Entergy Corp. | | | 10,621 | | | | 864,018 | |
FirstEnergy Corp. | | | 22,966 | | | | 801,743 | |
Great Plains Energy, Inc. | | | 33,163 | | | | 1,008,155 | |
PPL Corp. | | | 26,935 | | | | 1,016,796 | |
Public Svc. Enterprise Group, Inc. | | | 24,476 | | | | 1,140,826 | |
Westar Energy, Inc. | | | 12,970 | | | | 727,487 | |
Other Securities | | | 14,446 | | | | 1,106,095 | |
| | | | | | | | |
| | | | | | | 11,445,751 | |
| | | | | | | | |
TOTAL COMMON STOCKS | |
(Cost: $68,286,859) 95.6% | | | | | | | 81,372,460 | |
| | | | | | | | |
The accompanying notes are an integral part of these portfolio schedules.
31
MUTUAL OF AMERICA INVESTMENT CORPORATION — MID CAP VALUE FUND
SUMMARY PORTFOLIO OF INVESTMENTS IN SECURITIES (Continued)
June 30, 2016 (Unaudited)
| | | | | | | | | | | | | | | | | | | | |
| | | Rating** | | | Rate(%) | | | Maturity | | | Face Amount | | | Value | |
| SHORT-TERM DEBT SECURITIES: | | | | | | | | | | | | | | | | | | | | |
U.S. GOVERNMENT (1.3%) | | | | | | | | | | | | | | | | | | | | |
U.S. Treasury Bill | | | A-1+ | | | | 0.26 - 0.27 | | | | 08/11/16 - 08/25/16 | | | $ | 1,100,000 | | | $ | 1,099,654 | |
| | | | | | | | | | | | | | | | | | | | |
COMMERCIAL PAPER (3.4%) | | | | | | | | | | | | | | | | | | | | |
Ralph Lauren Corp.† | | | A-1 | | | | 0.40 | | | | 07/01/16 | | | | 2,900,000 | | | | 2,900,000 | |
| | | | | | | | | | | | | | | | | | | | |
TOTAL SHORT-TERM DEBT SECURITIES
(COST: $3,999,654) 4.7% | | | | 3,999,654 | |
| | | | | | | | | | | | | | | | | | | | |
TOTAL INVESTMENTS
(COST: $72,286,513) 100.3% | | | | 85,372,114 | |
| | | | | | | | | | | | | | | | | | | | |
OTHER NET ASSETS -0.3% | | | | (279,658 | ) |
| | | | | | | | | | | | | | | | | | | | |
NET ASSETS 100.0% | | | $ | 85,092,456 | |
| | | | | | | | | | | | | | | | | | | | |
The accompanying notes are an integral part of these portfolio schedules.
32
MUTUAL OF AMERICA INVESTMENT CORPORATION — MID-CAP EQUITY INDEX FUND
SUMMARY PORTFOLIO OF INVESTMENTS IN SECURITIES
June 30, 2016 (Unaudited)
| | | | | | | | |
| | | Shares | | | Value | |
| | | | | | | | |
| INDEXED ASSETS: | | | | | | | | |
COMMON STOCKS: | |
CONSUMER DISCRETIONARY (11.4%) | |
Domino’s Pizza, Inc. | | | 35,649 | | | $ | 4,683,566 | |
NVR, Inc.* | | | 2,574 | | | | 4,582,595 | |
Other Securities | | | 3,773,690 | | | | 112,889,008 | |
| | | | | | | | |
| | | | | | | 122,155,169 | |
| | | | | | | | |
CONSUMER STAPLES (4.5%) | |
Ingredion, Inc. | | | 50,744 | | | | 6,566,781 | |
WhiteWave Foods Co. Cl A* | | | 124,234 | | | | 5,831,544 | |
Other Securities | | | 1,168,938 | | | | 35,352,805 | |
| | | | | | | | |
| | | | | | | 47,751,130 | |
| | | | | | | | |
ENERGY (3.5%) | |
Other Securities | | | 2,208,722 | | | | 37,917,459 | |
| | | | | | | | |
FINANCIALS (26.0%) | |
Alexandria Real Estate Equities, Inc. | | | 52,498 | | | | 5,434,593 | |
Alleghany Corp.* | | | 10,985 | | | | 6,037,136 | |
American Campus Communities, Inc. | | | 91,322 | | | | 4,828,194 | |
Camden Property Trust | | | 60,853 | | | | 5,380,622 | |
Duke Realty Corp. | | | 243,791 | | | | 6,499,468 | |
Everest Re Group Ltd. | | | 29,626 | | | | 5,411,781 | |
FactSet Research Systems, Inc. | | | 28,893 | | | | 4,663,908 | |
Kilroy Realty Corp. | | | 64,171 | | | | 4,253,896 | |
Mid-America Apt. Communities, Inc. | | | 53,636 | | | | 5,706,870 | |
MSCI, Inc. Cl A | | | 61,261 | | | | 4,724,448 | |
National Retail Pptys., Inc. | | | 101,284 | | | | 5,238,408 | |
New York Community Bancorp, Inc. | | | 346,108 | | | | 5,188,159 | |
Raymond James Financial, Inc. | | | 89,205 | | | | 4,397,807 | |
Regency Centers Corp. | | | 69,207 | | | | 5,794,702 | |
Reinsurance Grp. of America, Inc. | | | 44,822 | | | | 4,347,286 | |
SEI Investments Co. | | | 95,895 | | | | 4,613,508 | |
Signature Bank* | | | 38,075 | | | | 4,756,329 | |
Other Securities | | | 6,651,702 | | | | 191,998,151 | |
| | | | | | | | |
| | | | | | | 279,275,266 | |
| | | | | | | | |
HEALTH CARE (8.7%) | |
Cooper Companies, Inc. | | | 34,041 | | | | 5,840,414 | |
IDEXX Laboratories, Inc.* | | | 63,508 | | | | 5,897,353 | |
MEDNAX, Inc.* | | | 65,797 | | | | 4,765,677 | |
Mettler-Toledo Int’l., Inc.* | | | 18,926 | | | | 6,906,471 | |
ResMed, Inc. | | | 98,802 | | | | 6,247,250 | |
Teleflex, Inc. | | | 30,289 | | | | 5,370,543 | |
Other Securities | | | 1,118,937 | | | | 58,446,824 | |
| | | | | | | | |
| | | | | | | 93,474,532 | |
| | | | | | | | |
| | | | | | | | |
| | | Shares | | | Value | |
| INDEXED ASSETS (CONTINUED): | | | | | | | | |
COMMON STOCKS (CONTINUED): | |
INDUSTRIALS (13.0%) | |
Carlisle Cos., Inc. | | | 44,810 | | | $ | 4,735,521 | |
Huntington Ingalls Industries, Inc. | | | 32,949 | | | | 5,536,420 | |
IDEX Corp. | | | 52,877 | | | | 4,341,202 | |
Smith (A.O.) Corp. | | | 52,551 | | | | 4,630,269 | |
Wabtec Corp. | | | 63,252 | | | | 4,442,188 | |
Other Securities | | | 2,652,668 | | | | 115,253,341 | |
| | | | | | | | |
| | | | | | | 138,938,941 | |
| | | | | | | | |
INFORMATION TECHNOLOGY (16.1%) | |
ANSYS, Inc.* | | | 61,908 | | | | 5,618,151 | |
Broadridge Financial Solutions, Inc. | | | 82,480 | | | | 5,377,696 | |
Cadence Design Systems, Inc.* | | | 212,201 | | | | 5,156,484 | |
CDK Global, Inc. | | | 108,799 | | | | 6,037,257 | |
Computer Sciences Corp. | | | 97,902 | | | | 4,860,834 | |
Gartner, Inc.* | | | 57,976 | | | | 5,647,442 | |
Henry (Jack) & Associates, Inc. | | | 55,878 | | | | 4,876,473 | |
Synopsys, Inc.* | | | 106,006 | | | | 5,732,804 | |
Trimble Navigation Ltd.* | | | 175,572 | | | | 4,276,934 | |
Other Securities | | | 4,376,433 | | | | 125,246,689 | |
| | | | | | | | |
| | | | | | | 172,830,764 | |
| | | | | | | | |
MATERIALS (6.9%) | |
Ashland, Inc. | | | 43,279 | | | | 4,967,131 | |
Packaging Corp. of America | | | 66,078 | | | | 4,422,601 | |
RPM International, Inc. | | | 93,656 | | | | 4,678,117 | |
Valspar Corp. | | | 51,496 | | | | 5,563,113 | |
Other Securities | | | 1,338,963 | | | | 54,041,183 | |
| | | | | | | | |
| | | | | | | 73,672,145 | |
| | | | | | | | |
TELECOMMUNICATION SERVICES (0.2%) | |
Other Securities | | | 66,548 | | | | 1,973,814 | |
| | | | | | | | |
UTILITIES (5.8%) | |
Aqua America, Inc. | | | 124,832 | | | | 4,451,509 | |
Atmos Energy Corp. | | | 72,095 | | | | 5,862,765 | |
OGE Energy Corp. | | | 140,094 | | | | 4,588,079 | |
UGI Corp. | | | 121,895 | | | | 5,515,749 | |
Westar Energy, Inc. | | | 99,306 | | | | 5,570,074 | |
Other Securities | | | 900,361 | | | | 36,290,134 | |
| | | | | | | | |
| | | | | | | 62,278,310 | |
| | | | | | | | |
TOTAL INDEXED ASSETS-COMMON STOCKS | |
(Cost: $843,603,576) 96.1% | | | | | | | 1,030,267,530 | |
| | | | | | | | |
The accompanying notes are an integral part of these portfolio schedules.
33
MUTUAL OF AMERICA INVESTMENT CORPORATION — MID-CAP EQUITY INDEX FUND
SUMMARY PORTFOLIO OF INVESTMENTS IN SECURITIES (Continued)
June 30, 2016 (Unaudited)
| | | | | | | | | | | | | | | | | | | | |
| | | Rating** | | | Rate(%) | | | Maturity | | | Face Amount | | | Value | |
| SHORT-TERM DEBT SECURITIES: | | | | | | | | | | | | | | | | | | | | |
U.S. GOVERNMENT (0.7%) | | | | | | | | | | | | | | | | | | | | |
U.S. Treasury Bill (1) | | | A-1+ | | | | 0.28 - 0.29 | | | | 08/11/16 - 08/25/16 | | | $ | 7,000,000 | | | $ | 6,997,477 | |
| | | | | | | | | | | | | | | | | | | | |
COMMERCIAL PAPER (2.3%) | | | | | | | | | | | | | | | | | | | | |
Apple, Inc.† | | | A-1+ | | | | 0.42 | | | | 07/05/16 | | | | 2,300,000 | | | | 2,299,893 | |
Microsoft Corp.† | | | A-1+ | | | | 0.28 | | | | 07/01/16 | | | | 22,500,000 | | | | 22,500,000 | |
| | | | | | | | | | | | | | | | | | | | |
| | | | | | | | | | | | | | | | | | | 24,799,893 | |
| | | | | | | | | | | | | | | | | | | | |
TOTAL SHORT-TERM DEBT SECURITIES
(Cost: $31,797,370) 3.0% | | | | 31,797,370 | |
| | | | | | | | | | | | | | | | | | | | |
TOTAL INVESTMENTS
(Cost: $875,400,946) 99.1% | | | | 1,062,064,900 | |
| | | | | | | | | | | | | | | | | | | | |
OTHER NET ASSETS 0.9% | | | | 9,556,591 | |
| | | | | | | | | | | | | | | | | | | | |
NET ASSETS 100.0% | | | $ | 1,071,621,491 | |
| | | | | | | | | | | | | | | | | | | | |
The accompanying notes are an integral part of these portfolio schedules.
34
MUTUAL OF AMERICA INVESTMENT CORPORATION — INTERNATIONAL FUND
PORTFOLIO OF INVESTMENTS IN SECURITIES
June 30, 2016 (Unaudited)
| | | | | | | | |
| | | Shares | | | Value | |
| | | | | | | | |
| COMMON STOCKS: | |
FINANCIALS (95.3%) | |
iShares Core MSCI EAFE ETF | | | 54,650 | | | $ | 2,835,789 | |
iShares Core MSCI Europe ETF | | | 393,284 | | | | 15,530,785 | |
iShares Core MSCI Pacific ETF | | | 177,010 | | | | 8,282,298 | |
iShares Edge MSCI Emerging Markets ETF | | | 179,014 | | | | 9,235,332 | |
iShares MSCI EAFE ETF | | | 2,012,552 | | | | 112,320,526 | |
iShares MSCI EAFE Growth ETF | | | 410,328 | | | | 26,843,658 | |
iShares MSCI EAFE Small-Cap ETF | | | 177,935 | | | | 8,594,261 | |
iShares MSCI EAFE Value ETF | | | 595,783 | | | | 25,582,922 | |
Vanguard FTSE Developed Markets ETF | | | 2,129,980 | | | | 75,316,093 | |
Vanguard FTSE Europe ETF | | | 424,630 | | | | 19,813,236 | |
Vanguard FTSE Pacific ETF | | | 220,480 | | | | 12,287,350 | |
| | | | | | | | |
| | | | | | | 316,642,250 | |
| | | | | | | | |
TOTAL COMMON STOCKS | | | | | | | | |
(Cost: $341,102,487) 95.3% | | | | | | | 316,642,250 | |
| | | | | | | | |
| | | | | | | | | | | | | | | | | | | | |
| | | Rating** | | | Rate(%) | | | Maturity | | | Face Amount | | | Value | |
| SHORT-TERM DEBT SECURITIES: | | | | | | | | | | | | | | | | | | | | |
U.S. GOVERNMENT (2.4%) | | | | | | | | | | | | | | | | | | | | |
U.S. Treasury Bill | | | A-1+ | | | | 0.26 - 0.29 | | | | 08/11/16 - 08/25/16 | | | $ | 8,000,000 | | | $ | 7,997,167 | |
| | | | | | | | | | | | | | | | | | | | |
COMMERCIAL PAPER (2.2%) | | | | | | | | | | | | | | | | | | | | |
Precision Castparts Corp.† | | | A-1+ | | | | 0.30 | | | | 07/01/16 | | | | 1,500,000 | | | | 1,500,000 | |
Wisconsin Power & Light | | | A-1 | | | | 0.35 | | | | 07/01/16 | | | | 5,800,000 | | | | 5,800,000 | |
| | | | | | | | | | | | | | | | | | | | |
| | | | | | | | | | | | | | | | | | | 7,300,000 | |
| | | | | | | | | | | | | | | | | | | | |
TOTAL SHORT-TERM DEBT SECURITIES
(Cost: $15,297,167) 4.6% | | | | 15,297,167 | |
| | | | | | | | | | | | | | | | | | | | |
TOTAL INVESTMENTS
(Cost: $356,399,654) 99.9% | | | | 331,939,417 | |
| | | | | | | | | | | | | | | | | | | | |
OTHER NET ASSETS 0.1% | | | | 220,822 | |
| | | | | | | | | | | | | | | | | | | | |
NET ASSETS 100.0% | | | $ | 332,160,239 | |
| | | | | | | | | | | | | | | | | | | | |
35
The accompanying notes are an integral part of these portfolio schedules.
MUTUAL OF AMERICA INVESTMENT CORPORATION — COMPOSITE FUND
SUMMARY PORTFOLIO OF INVESTMENTS IN SECURITIES
June 30, 2016 (Unaudited)
| | | | | | | | |
| | | Shares | | | Value | |
| | | | | | | |
| COMMON STOCKS: | |
CONSUMER DISCRETIONARY (6.8%) | |
Amazon.com, Inc.* | | | 2,460 | | | $ | 1,760,425 | |
CBS Corp. Cl B | | | 18,667 | | | | 1,016,231 | |
Genuine Parts Co. | | | 10,218 | | | | 1,034,573 | |
Lowe’s Cos., Inc. | | | 13,118 | | | | 1,038,552 | |
Target Corp. | | | 22,140 | | | | 1,545,815 | |
Viacom, Inc. Cl B | | | 19,426 | | | | 805,596 | |
Other Securities | | | 167,772 | | | | 5,055,408 | |
| | | | | | | | |
| | | | | | | 12,256,600 | |
| | | | | | | | |
CONSUMER STAPLES (5.7%) | |
Dr. Pepper Snapple Group, Inc. | | | 13,516 | | | | 1,306,051 | |
PepsiCo, Inc. | | | 15,783 | | | | 1,672,051 | |
Philip Morris Int’l., Inc. | | | 12,466 | | | | 1,268,042 | |
Proctor & Gamble Co. | | | 19,030 | | | | 1,611,270 | |
Sysco Corp. | | | 20,076 | | | | 1,018,656 | |
Walgreens Boots Alliance, Inc. | | | 12,563 | | | | 1,046,121 | |
Other Securities | | | 30,252 | | | | 2,343,846 | |
| | | | | | | | |
| | | | | | | 10,266,037 | |
| | | | | | | | |
ENERGY (3.8%) | |
Chevron Corp. | | | 17,596 | | | | 1,844,589 | |
Schlumberger Ltd. | | | 12,747 | | | | 1,008,033 | |
Other Securities | | | 76,602 | | | | 3,991,488 | |
| | | | | | | | |
| | | | | | | 6,844,110 | |
| | | | | | | | |
FINANCIALS (8.7%) | |
American Tower Corp. | | | 6,739 | | | | 765,618 | |
Berkshire Hathaway, Inc. Cl B* | | | 7,390 | | | | 1,069,998 | |
Capital One Financial Corp. | | | 17,760 | | | | 1,127,938 | |
JPMorgan Chase & Co. | | | 39,248 | | | | 2,438,871 | |
MetLife, Inc. | | | 31,340 | | | | 1,248,272 | |
Wells Fargo & Co. | | | 38,271 | | | | 1,811,366 | |
Other Securities | | | 137,380 | | | | 7,175,615 | |
| | | | | | | | |
| | | | | | | 15,637,678 | |
| | | | | | | | |
HEALTH CARE (7.5%) | |
AbbVie, Inc. | | | 16,342 | | | | 1,011,733 | |
Aetna, Inc. | | | 10,563 | | | | 1,290,059 | |
Amgen, Inc. | | | 9,871 | | | | 1,501,873 | |
Anthem, Inc. | | | 7,620 | | | | 1,000,811 | |
Gilead Sciences, Inc. | | | 14,801 | | | | 1,234,699 | |
McKesson Corp. | | | 5,967 | | | | 1,113,741 | |
Merck & Co., Inc. | | | 27,311 | | | | 1,573,387 | |
| | | | | | | | |
| | | Shares | | | Value | |
| | | | | | | |
| COMMON STOCKS (CONTINUED): | |
HEALTH CARE (CONTINUED) | | | | | | | | |
PerkinElmer, Inc. | | | 13,940 | | | $ | 730,735 | |
Pfizer, Inc. | | | 61,829 | | | | 2,176,999 | |
Other Securities | | | 14,670 | | | | 1,773,176 | |
| | | | | | | | |
| | | | | | | 13,407,213 | |
| | | | | | | | |
INDUSTRIALS (5.3%) | |
Boeing Co. | | | 9,304 | | | | 1,208,310 | |
Eaton Corp. PLC | | | 17,571 | | | | 1,049,516 | |
FedEx Corp. | | | 6,677 | | | | 1,013,435 | |
General Electric Co. | | | 98,869 | | | | 3,112,396 | |
Northrop Grumman Corp. | | | 4,501 | | | | 1,000,482 | |
Other Securities | | | 37,825 | | | | 2,107,033 | |
| | | | | | | | |
| | | | | | | 9,491,172 | |
| | | | | | | | |
INFORMATION TECHNOLOGY (12.3%) | |
Alphabet, Inc. Cl A* | | | 1,782 | | | | 1,253,690 | |
Alphabet, Inc. Cl C* | | | 1,786 | | | | 1,236,091 | |
Apple, Inc. | | | 37,390 | | | | 3,574,484 | |
Applied Materials, Inc. | | | 45,004 | | | | 1,078,746 | |
CA, Inc. | | | 40,115 | | | | 1,316,975 | |
Cisco Systems, Inc. | | | 44,064 | | | | 1,264,196 | |
Facebook, Inc. Cl A* | | | 14,703 | | | | 1,680,259 | |
Intel Corp. | | | 50,920 | | | | 1,670,176 | |
Microsoft Corp. | | | 61,268 | | | | 3,135,084 | |
Oracle Corp. | | | 44,796 | | | | 1,833,500 | |
QUALCOMM, Inc. | | | 19,121 | | | | 1,024,312 | |
Other Securities | | | 97,750 | | | | 3,013,876 | |
| | | | | | | | |
| | | | | | | 22,081,389 | |
| | | | | | | | |
MATERIALS (1.6%) | |
Other Securities | | | 86,716 | | | | 2,862,337 | |
| | | | | | | | |
TELECOMMUNICATION SERVICES (2.0%) | |
AT&T, Inc. | | | 33,914 | | | | 1,465,424 | |
Verizon Communications, Inc. | | | 28,004 | | | | 1,563,743 | |
Other Securities | | | 17,319 | | | | 502,424 | |
| | | | | | | | |
| | | | | | | 3,531,591 | |
| | | | | | | | |
UTILITIES (1.4%) | |
Other Securities | | | 38,225 | | | | 2,514,877 | |
| | | | | | | | |
TOTAL COMMON STOCKS | | | | | | | | |
(Cost: $80,627,957) 55.1% | | | | | | | 98,893,004 | |
| | | | | | | | |
| | | | | | | | | | | | | | | | |
| | | Rating** | | | Rate(%) | | Maturity | | Face Amount | | | Value | |
| LONG-TERM DEBT SECURITIES: | | | | | | | | | | | | | | | | |
U.S. GOVERNMENT (11.9%) | | | | | | | | | | | | | | | | |
U.S. Treasury Note | | | AA+ | | | 0.50 - 2.13 | | 03/31/17 - 02/15/26 | | $ | 5,450,000 | | | $ | 5,553,212 | |
U.S. Treasury Strip | | | AA+ | | | 0.00 | | 11/15/21 - 08/15/29 | | | 18,550,000 | | | | 15,760,813 | |
| | | | | | | | | | | | | | | | |
| | | | | | | | | | | | | | | 21,314,025 | |
| | | | | | | | | | | | | | | | |
U.S. GOVERNMENT AGENCIES (11.8%) | | | | | | | | | | | | | | | | |
MORTGAGE-BACKED OBLIGATIONS (11.5%) | | | | | | | | | | | | | | | | |
FHARM | | | AA+ | | | 2.76 - 5.84 | | 02/01/36 - 09/01/39 | | | 149,387 | | | | 157,738 | |
FHLMC | | | AA+ | | | 2.50 - 6.00 | | 02/01/25 - 07/01/45 | | | 5,242,486 | | | | 5,616,324 | |
FHLMC Strip | | | AA+ | | | 3.00 | | 01/15/43 | | | 373,119 | | | | 389,142 | |
FNMA | | | AA+ | | | 2.41 - 8.00 | | 09/01/16 - 12/25/49 | | | 10,446,473 | | | | 11,305,801 | |
FNMA Strip | | | AA+ | | | 3.00 | | 08/25/42 | | | 324,467 | | | | 333,247 | |
The accompanying notes are an integral part of these portfolio schedules.
36
MUTUAL OF AMERICA INVESTMENT CORPORATION — COMPOSITE FUND
SUMMARY PORTFOLIO OF INVESTMENTS IN SECURITIES (Continued)
June 30, 2016 (Unaudited)
| | | | | | | | | | | | | | | | | | |
| | | Rating** | | | Rate(%) | | Maturity | | | Face Amount | | | Value | |
| LONG-TERM DEBT SECURITIES (CONTINUED): | | | | | | | | | | | | | | | | | | |
U.S. GOVERNMENT AGENCIES (CONTINUED) | | | | | | | | | | | | | | | | | | |
MORTGAGE-BACKED OBLIGATIONS (CONTINUED) | | | | | | | | | | | | | | | | | | |
GNMA (2) | | | AA+ | | | 3.50 - 7.00 | | | 10/15/24 - 10/20/43 | | | $ | 2,370,763 | | | $ | 2,604,667 | |
Other Securities | | | | | | | | | | | | | 182,025 | | | | 202,365 | |
| | | | | | | | | | | | | | | | | | |
| | | | | | | | | | | | | | | | | 20,609,284 | |
| | | | | | | | | | | | | | | | | | |
NON-MORTGAGE-BACKED OBLIGATIONS (0.3%) | | | | | | | | | | | | | | | | | | |
FHLMC | | | AA+ | | | 0.00 | | | 11/29/19 | | | | 500,000 | | | | 479,695 | |
| | | | | | | | | | | | | | | | | | |
CORPORATE DEBT (17.0%) | | | | | | | | | | | | | | | | | | |
CONSUMER DISCRETIONARY (3.3%) | | | | | | | | | | | | | | | | | | |
Lowe’s Cos., Inc. | | | A- | | | 3.12 | | | 04/15/22 | | | | 300,000 | | | | 320,700 | |
Viacom, Inc. | | | BBB- | | | 3.25 | | | 03/15/23 | | | | 350,000 | | | | 344,332 | |
Other Securities | | | | | | | | | | | | | 5,036,000 | | | | 5,284,055 | |
| | | | | | | | | | | | | | | | | | |
| | | | | | | | | | | | | | | | | 5,949,087 | |
| | | | | | | | | | | | | | | | | | |
CONSUMER STAPLES (1.2%) | | | | | | | | | | | | | | | | | | |
Sysco Corp. | | | BBB+ | | | 2.60 - 3.75 | | | 06/12/22 - 10/01/25 | | | | 400,000 | | | | 412,405 | |
Other Securities | | | | | | | | | | | | | 1,625,000 | | | | 1,696,842 | |
| | | | | | | | | | | | | | | | | | |
| | | | | | | | | | | | | | | | | 2,109,247 | |
| | | | | | | | | | | | | | | | | | |
ENERGY (1.6%) | | | | | | | | | | | | | | | | | | |
Other Securities | | | | | | | | | | | | | 2,910,000 | | | | 2,860,541 | |
| | | | | | | | | | | | | | | | | | |
FINANCIALS (3.9%) | | | | | | | | | | | | | | | | | | |
American Tower Corp. | | | BBB- | | | 4.50 | | | 01/15/18 | | | | 250,000 | | | | 260,820 | |
Capital One Financial Corp. | | | BBB | | | 4.75 | | | 07/15/21 | | | | 300,000 | | | | 333,941 | |
Other Securities | | | | | | | | | | | | | 6,050,000 | | | | 6,420,793 | |
| | | | | | | | | | | | | | | | | | |
| | | | | | | | | | | | | | | | | 7,015,554 | |
| | | | | | | | | | | | | | | | | | |
HEALTH CARE (1.8%) | | | | | | | | | | | | | | | | | | |
Anthem, Inc. | | | A | | | 4.35 | | | 08/15/20 | | | | 250,000 | | | | 271,137 | |
PerkinElmer, Inc. | | | BBB | | | 5.00 | | | 11/15/21 | | | | 300,000 | | | | 332,606 | |
Pfizer, Inc. | | | AA | | | 6.05 | | | 03/30/17 | | | | 300,000 | | | | 311,499 | |
Other Securities | | | | | | | | | | | | | 2,165,000 | | | | 2,317,568 | |
| | | | | | | | | | | | | | | | | | |
| | | | | | | | | | | | | | | | | 3,232,810 | |
| | | | | | | | | | | | | | | | | | |
INDUSTRIALS (1.3%) | | | | | | | | | | | | | | | | | | |
Other Securities | | | | | | | | | | | | | 2,250,000 | | | | 2,324,919 | |
| | | | | | | | | | | | | | | | | | |
INFORMATION TECHNOLOGY (1.6%) | | | | | | | | | | | | | | | | | | |
Applied Materials, Inc. | | | A- | | | 3.90 | | | 10/01/25 | | | | 350,000 | | | | 388,072 | |
Other Securities | | | | | | | | | | | | | 2,385,000 | | | | 2,504,388 | |
| | | | | | | | | | | | | | | | | | |
| | | | | | | | | | | | | | | | | 2,892,460 | |
| | | | | | | | | | | | | | | | | | |
MATERIALS (1.2%) | | | | | | | | | | | | | | | | | | |
Other Securities | | | | | | | | | | | | | 2,200,000 | | | | 2,200,497 | |
| | | | | | | | | | | | | | | | | | |
TELECOMMUNICATION SERVICES (0.4%) | | | | | | | | | | | | | | | | | | |
AT&T, Inc. | | | BBB+ | | | 3.00 | | | 06/30/22 | | | | 350,000 | | | | 358,426 | |
Verizon Communications, Inc. | | | BBB+ | | | 4.50 | | | 09/15/20 | | | | 325,000 | | | | 360,736 | |
| | | | | | | | | | | | | | | | | | |
| | | | | | | | | | | | | | | | | 719,162 | |
| | | | | | | | | | | | | | | | | | |
UTILITIES (0.7%) | | | | | | | | | | | | | | | | | | |
Other Securities | | | | | | | | | | | | | 1,240,000 | | | | 1,330,906 | |
| | | | | | | | | | | | | | | | | | |
TOTAL LONG-TERM DEBT SECURITIES
(Cost: $68,930,033) 40.7% | | | | | | | | | | | | | | | | | 73,038,187 | |
| | | | | | | | | | | | | | | | | | |
The accompanying notes are an integral part of these portfolio schedules.
37
MUTUAL OF AMERICA INVESTMENT CORPORATION — COMPOSITE FUND
SUMMARY PORTFOLIO OF INVESTMENTS IN SECURITIES (Continued)
June 30, 2016 (Unaudited)
| | | | | | | | | | | | | | | | |
| | | Rating** | | | Rate(%) | | Maturity | | Face Amount | | | Value | |
| SHORT-TERM DEBT SECURITIES: | | | | | | | | | | | | | | | | |
COMMERCIAL PAPER (2.5%) | | | | | | | | | | | | | | | | |
Ralph Lauren Corp.† | | | A-1 | | | 0.40 | | 07/01/16 | | $ | 3,800,000 | | | $ | 3,800,000 | |
Toyota Motor Credit Corp. | | | A-1+ | | | 0.43 | | 07/12/16 | | | 600,000 | | | | 599,921 | |
| | | | | | | | | | | | | | | | |
| | | | | | | | | | | | | | | 4,399,921 | |
| | | | | | | | | | | | | | | | |
TOTAL SHORT-TERM DEBT SECURITIES
(Cost: $4,399,921) 2.5% | | | | 4,399,921 | |
| | | | | | | | | | | | | | | | |
TOTAL INVESTMENTS
(Cost: $153,957,911) 98.3% | | | | 176,331,112 | |
| | | | | | | | | | | | | | | | |
OTHER NET ASSETS 1.7% | | | | 3,098,026 | |
| | | | | | | | | | | | | | | | |
NET ASSETS 100.0% | | | $ | 179,429,138 | |
| | | | | | | | | | | | | | | | |
The accompanying notes are an integral part of these portfolio schedules.
38
MUTUAL OF AMERICA INVESTMENT CORPORATION — RETIREMENT INCOME FUND
PORTFOLIO OF INVESTMENTS IN SECURITIES
June 30, 2016 (Unaudited)
| | | | | | | | |
| | | Shares | | | Value | |
| COMMON STOCKS: | | | | | | | | |
DIVERSIFIED MUTUAL FUNDS (100.0%) | | | | | | | | |
Mutual of America Investment Corporation | | | | | | | | |
Bond Fund (30.5%) | | | 13,695,642 | | | $ | 20,473,684 | |
Equity Index Fund (20.6%) | | | 4,092,496 | | | | 13,850,049 | |
Mid-Cap Equity Index Fund (5.1%) | | | 1,622,619 | | | | 3,411,161 | |
Mid-Term Bond Fund (40.9%) | | | 25,364,837 | | | | 27,383,523 | |
Money Market Fund (2.9%) | | | 1,649,080 | | | | 1,972,792 | |
| | | | | | | | |
TOTAL INVESTMENTS
(Cost: $64,907,636) 100.0% | | | | | | | 67,091,209 | |
| | | | | | | | |
OTHER NET ASSETS -0.0% (3) | | | | | | | (275 | ) |
| | | | | | | | |
NET ASSETS 100.0% | | | | | | $ | 67,090,934 | |
| | | | | | | | |
MUTUAL OF AMERICA INVESTMENT CORPORATION — 2010 RETIREMENT FUND
PORTFOLIO OF INVESTMENTS IN SECURITIES
June 30, 2016 (Unaudited)
| | | | | | | | |
| | | Shares | | | Value | |
| COMMON STOCKS: | | | | | | | | |
DIVERSIFIED MUTUAL FUNDS (100.0%) | | | | | | | | |
Mutual of America Investment Corporation | | | | | | | | |
Bond Fund (26.5%) | | | 4,435,266 | | | $ | 6,630,302 | |
Equity Index Fund (24.9%) | | | 1,839,898 | | | | 6,226,682 | |
International Fund (2.9%) | | | 1,005,933 | | | | 733,739 | |
Mid-Cap Equity Index Fund (7.9%) | | | 938,601 | | | | 1,973,180 | |
Mid-Term Bond Fund (34.9%) | | | 8,064,308 | | | | 8,706,114 | |
Money Market Fund (2.9%) | | | 608,244 | | | | 727,642 | |
| | | | | | | | |
TOTAL INVESTMENTS
(Cost: $23,584,627) 100.0% | | | | | | | 24,997,659 | |
| | | | | | | | |
OTHER NET ASSETS -0.0% (3) | | | | | | | (97 | ) |
| | | | | | | | |
NET ASSETS 100.0% | | | | | | $ | 24,997,562 | |
| | | | | | | | |
MUTUAL OF AMERICA INVESTMENT CORPORATION — 2015 RETIREMENT FUND
PORTFOLIO OF INVESTMENTS IN SECURITIES
June 30, 2016 (Unaudited)
| | | | | | | | |
| | | Shares | | | Value | |
| COMMON STOCKS: | | | | | | | | |
DIVERSIFIED MUTUAL FUNDS (100.0%) | | | | | | | | |
Mutual of America Investment Corporation | | | | | | | | |
Bond Fund (25.2%) | | | 24,470,045 | | | $ | 36,580,392 | |
Equity Index Fund (28.2%) | | | 12,068,310 | | | | 40,842,238 | |
International Fund (5.4%) | | | 10,680,383 | | | | 7,790,389 | |
Mid-Cap Equity Index Fund (10.2%) | | | 7,007,633 | | | | 14,731,839 | |
Mid-Term Bond Fund (29.0%) | | | 39,048,036 | | | | 42,155,712 | |
Small Cap Growth Fund (1.0%) | | | 1,124,988 | | | | 1,467,610 | |
Small Cap Value Fund (1.0%) | | | 988,018 | | | | 1,469,708 | |
| | | | | | | | |
TOTAL INVESTMENTS
(Cost: $133,248,931) 100.0% | | | | | | | 145,037,888 | |
| | | | | | | | |
OTHER NET ASSETS -0.0% (3) | | | | | | | (1,455 | ) |
| | | | | | | | |
NET ASSETS 100.0% | | | | | | $ | 145,036,433 | |
| | | | | | | | |
The accompanying notes are an integral part of these portfolio schedules.
39
MUTUAL OF AMERICA INVESTMENT CORPORATION — 2020 RETIREMENT FUND
PORTFOLIO OF INVESTMENTS IN SECURITIES
June 30, 2016 (Unaudited)
| | | | | | | | |
| | | Shares | | | Value | |
| COMMON STOCKS: | | | | | | | | |
DIVERSIFIED MUTUAL FUNDS (100.0%) | | | | | | | | |
Mutual of America Investment Corporation | | | | | | | | |
Bond Fund (25.0%) | | | 63,898,782 | | | $ | 95,522,609 | |
Equity Index Fund (33.1%) | | | 37,471,014 | | | | 126,811,466 | |
International Fund (7.8%) | | | 40,976,332 | | | | 29,888,588 | |
Mid-Cap Equity Index Fund (11.4%) | | | 20,770,523 | | | | 43,664,956 | |
Mid-Term Bond Fund (18.4%) | | | 65,175,370 | | | | 70,362,416 | |
Small Cap Growth Fund (2.0%) | | | 5,930,684 | | | | 7,736,909 | |
Small Cap Value Fund (2.3%) | | | 5,857,134 | | | | 8,712,674 | |
| | | | | | | | |
TOTAL INVESTMENTS
(Cost: $350,051,113) 100.0% | | | | | | | 382,699,618 | |
| | | | | | | | |
OTHER NET ASSETS -0.0% (3) | | | | | | | (1,392 | ) |
| | | | | | | | |
NET ASSETS 100.0% | | | | | | $ | 382,698,226 | |
| | | | | | | | |
MUTUAL OF AMERICA INVESTMENT CORPORATION — 2025 RETIREMENT FUND
PORTFOLIO OF INVESTMENTS IN SECURITIES
June 30, 2016 (Unaudited)
| | | | | | | | |
| | | Shares | | | Value | |
| COMMON STOCKS: | | | | | | | | |
DIVERSIFIED MUTUAL FUNDS (100.0%) | | | | | | | | |
Mutual of America Investment Corporation | | | | | | | | |
Bond Fund (23.7%) | | | 69,142,911 | | | $ | 103,362,083 | |
Equity Index Fund (38.0%) | | | 49,110,227 | | | | 166,201,534 | |
International Fund (8.8%) | | | 52,563,623 | | | | 38,340,484 | |
Mid-Cap Equity Index Fund (15.7%) | | | 32,554,492 | | | | 68,437,876 | |
Mid-Term Bond Fund (7.5%) | | | 30,172,072 | | | | 32,573,346 | |
Small Cap Growth Fund (3.0%) | | | 10,128,597 | | | | 13,213,323 | |
Small Cap Value Fund (3.3%) | | | 9,630,175 | | | | 14,325,193 | |
| | | | | | | | |
TOTAL INVESTMENTS
(Cost: $391,811,465) 100.0% | | | | | | | 436,453,839 | |
| | | | | | | | |
OTHER NET ASSETS -0.0% (3) | | | | | | | (1,527 | ) |
| | | | | | | | |
NET ASSETS 100.0% | | | | | | $ | 436,452,312 | |
| | | | | | | | |
MUTUAL OF AMERICA INVESTMENT CORPORATION — 2030 RETIREMENT FUND
PORTFOLIO OF INVESTMENTS IN SECURITIES
June 30, 2016 (Unaudited)
| | | | | | | | |
| | | Shares | | | Value | |
| COMMON STOCKS: | | | | | | | | |
DIVERSIFIED MUTUAL FUNDS (100.0%) | | | | | | | | |
Mutual of America Investment Corporation | | | | | | | | |
Bond Fund (23.4%) | | | 55,882,024 | | | $ | 83,538,318 | |
Equity Index Fund (40.3%) | | | 42,478,596 | | | | 143,758,400 | |
International Fund (9.3%) | | | 45,330,980 | | | | 33,064,916 | |
Mid-Cap Equity Index Fund (17.7%) | | | 30,036,964 | | | | 63,145,389 | |
Small Cap Growth Fund (4.5%) | | | 12,421,763 | | | | 16,204,885 | |
Small Cap Value Fund (4.8%) | | | 11,509,826 | | | | 17,121,234 | |
| | | | | | | | |
TOTAL INVESTMENTS
(Cost: $318,022,381) 100.0% | | | | | | | 356,833,142 | |
| | | | | | | | |
OTHER NET ASSETS -0.0% (3) | | | | | | | (1,239 | ) |
| | | | | | | | |
NET ASSETS 100.0% | | | | | | $ | 356,831,903 | |
| | | | | | | | |
The accompanying notes are an integral part of these portfolio schedules.
40
MUTUAL OF AMERICA INVESTMENT CORPORATION — 2035 RETIREMENT FUND
PORTFOLIO OF INVESTMENTS IN SECURITIES
June 30, 2016 (Unaudited)
| | | | | | | | |
| | | Shares | | | Value | |
| COMMON STOCKS: | | | | | | | | |
DIVERSIFIED MUTUAL FUNDS (100.0%) | | | | | | | | |
Mutual of America Investment Corporation | | | | | | | | |
Bond Fund (15.5%) | | | 30,838,328 | | | $ | 46,100,371 | |
Equity Index Fund (41.0%) | | | 36,183,237 | | | | 122,453,298 | |
International Fund (11.2%) | | | 45,887,030 | | | | 33,470,505 | |
Mid-Cap Equity Index Fund (20.7%) | | | 29,423,621 | | | | 61,855,984 | |
Small Cap Growth Fund (5.8%) | | | 13,263,991 | | | | 17,303,619 | |
Small Cap Value Fund (5.8%) | | | 11,650,827 | | | | 17,330,979 | |
| | | | | | | | |
TOTAL INVESTMENTS
(Cost: $266,012,843) 100.0% | | | | | | | 298,514,756 | |
| | | | | | | | |
OTHER NET ASSETS -0.0% (3) | | | | | | | (1,029 | ) |
| | | | | | | | |
NET ASSETS 100.0% | | | | | | $ | 298,513,727 | |
| | | | | | | | |
MUTUAL OF AMERICA INVESTMENT CORPORATION — 2040 RETIREMENT FUND
PORTFOLIO OF INVESTMENTS IN SECURITIES
June 30, 2016 (Unaudited)
| | | | | | | | |
| | | Shares | | | Value | |
| COMMON STOCKS: | | | | | | | | |
DIVERSIFIED MUTUAL FUNDS (100.0%) | | | | | | | | |
Mutual of America Investment Corporation | | | | | | | | |
Bond Fund (12.2%) | | | 19,799,034 | | | $ | 29,597,675 | |
Equity Index Fund (39.0%) | | | 27,962,539 | | | | 94,632,361 | |
International Fund (12.4%) | | | 41,290,526 | | | | 30,117,764 | |
Mid-Cap Equity Index Fund (21.2%) | | | 24,480,625 | | | | 51,464,540 | |
Small Cap Growth Fund (7.6%) | | | 14,054,951 | | | | 18,335,470 | |
Small Cap Value Fund (7.6%) | | | 12,345,166 | | | | 18,363,829 | |
| | | | | | | | |
TOTAL INVESTMENTS
(Cost: $215,957,553) 100.0% | | | | | | | 242,511,639 | |
| | | | | | | | |
OTHER NET ASSETS -0.0% (3) | | | | | | | (867 | ) |
| | | | | | | | |
NET ASSETS 100.0% | | | | | | $ | 242,510,772 | |
| | | | | | | | |
MUTUAL OF AMERICA INVESTMENT CORPORATION — 2045 RETIREMENT FUND
PORTFOLIO OF INVESTMENTS IN SECURITIES
June 30, 2016 (Unaudited)
| | | | | | | | |
| | | Shares | | | Value | |
| COMMON STOCKS: | | | | | | | | |
DIVERSIFIED MUTUAL FUNDS (100.0%) | |
Mutual of America Investment Corporation | | | | | | | | |
Bond Fund (10.5%) | | | 20,043,928 | | | $ | 29,963,768 | |
Equity Index Fund (36.2%) | | | 30,712,061 | | | | 103,937,447 | |
International Fund (13.9%) | | | 54,497,629 | | | | 39,751,170 | |
Mid-Cap Equity Index Fund (22.0%) | | | 29,974,094 | | | | 63,013,219 | |
Small Cap Growth Fund (8.6%) | | | 18,818,167 | | | | 24,549,352 | |
Small Cap Value Fund (8.8%) | | | 17,010,815 | | | | 25,304,132 | |
| | | | | | | | |
TOTAL INVESTMENTS
(Cost: $251,481,032) 100.0% | | | | | | | 286,519,088 | |
| | | | | | | | |
OTHER NET ASSETS -0.0% (3) | | | | | | | (1,004 | ) |
| | | | | | | | |
NET ASSETS 100.0% | | | | | | $ | 286,518,084 | |
| | | | | | | | |
The accompanying notes are an integral part of these portfolio schedules.
41
MUTUAL OF AMERICA INVESTMENT CORPORATION — 2050 RETIREMENT FUND
PORTFOLIO OF INVESTMENTS IN SECURITIES
June 30, 2016 (Unaudited)
| | | | | | | | |
| | | Shares | | | Value | |
| COMMON STOCKS: | | | | | | | | |
DIVERSIFIED MUTUAL FUNDS (100.0%) | | | | | | | | |
Mutual of America Investment Corporation | | | | | | | | |
Bond Fund (8.5%) | | | 6,847,350 | | | $ | 10,236,137 | |
Equity Index Fund (35.2%) | | | 12,506,310 | | | | 42,324,542 | |
International Fund (14.6%) | | | 24,138,451 | | | | 17,606,852 | |
Mid-Cap Equity Index Fund (22.2%) | | | 12,724,211 | | | | 26,749,549 | |
Small Cap Growth Fund (9.6%) | | | 8,838,019 | | | | 11,529,691 | |
Small Cap Value Fund (9.9%) | | | 7,961,217 | | | | 11,842,565 | |
| | | | | | | | |
TOTAL INVESTMENTS
(Cost: $119,892,423) 100.0% | | | | | | | 120,289,336 | |
| | | | | | | | |
OTHER NET ASSETS -0.0% (3) | | | | | | | (293 | ) |
| | | | | | | | |
NET ASSETS 100.0% | | | | | | $ | 120,289,043 | |
| | | | | | | | |
MUTUAL OF AMERICA INVESTMENT CORPORATION — CONSERVATIVE ALLOCATION FUND
PORTFOLIO OF INVESTMENTS IN SECURITIES
June 30, 2016 (Unaudited)
| | | | | | | | |
| | | Shares | | | Value | |
| COMMON STOCKS: | | | | | | | | |
DIVERSIFIED MUTUAL FUNDS (100.0%) | | | | | | | | |
Mutual of America Investment Corporation | | | | | | | | |
Bond Fund (30.0%) | | | 26,442,718 | | | $ | 39,529,351 | |
Equity Index Fund (25.2%) | | | 9,832,657 | | | | 33,276,218 | |
International Fund (4.9%) | | | 8,847,347 | | | | 6,453,352 | |
Mid-Cap Equity Index Fund (5.1%) | | | 3,211,806 | | | | 6,752,038 | |
Mid-Term Bond Fund (34.8%) | | | 42,514,609 | | | | 45,898,177 | |
| | | | | | | | |
TOTAL INVESTMENTS
(Cost: $124,041,973) 100.0% | | | | | | | 131,909,136 | |
| | | | | | | | |
OTHER NET ASSETS -0.0% (3) | | | | | | | (117 | ) |
| | | | | | | | |
NET ASSETS 100.0% | | | | | | $ | 131,909,019 | |
| | | | | | | | |
MUTUAL OF AMERICA INVESTMENT CORPORATION — MODERATE ALLOCATION FUND
PORTFOLIO OF INVESTMENTS IN SECURITIES
June 30, 2016 (Unaudited)
| | | | | | | | |
| | | Shares | | | Value | |
| COMMON STOCKS: | | | | | | | | |
DIVERSIFIED MUTUAL FUNDS (100.0%) | |
Mutual of America Investment Corporation | | | | | | | | |
Bond Fund (24.9%) | | | 54,964,259 | | | $ | 82,166,347 | |
Equity Index Fund (35.1%) | | | 34,338,314 | | | | 116,209,609 | |
International Fund (9.8%) | | | 44,141,896 | | | | 32,197,584 | |
Mid-Cap Equity Index Fund (15.3%) | | | 24,035,750 | | | | 50,529,300 | |
Mid-Term Bond Fund (14.9%) | | | 45,448,363 | | | | 49,065,417 | |
| | | | | | | | |
TOTAL INVESTMENTS
(Cost: $285,062,551) 100.0% | | | | | | | 330,168,257 | |
| | | | | | | | |
OTHER NET ASSETS -0.0% (3) | | | | | | | (215 | ) |
| | | | | | | | |
NET ASSETS 100.0% | | | | | | $ | 330,168,042 | |
| | | | | | | | |
The accompanying notes are an integral part of these portfolio schedules.
42
MUTUAL OF AMERICA INVESTMENT CORPORATION — AGGRESSIVE ALLOCATION FUND
PORTFOLIO OF INVESTMENTS IN SECURITIES
June 30, 2016 (Unaudited)
| | | | | | | | |
| | | Shares | | | Value | |
| COMMON STOCKS: | | | | | | | | |
DIVERSIFIED MUTUAL FUNDS (100.0%) | |
Mutual of America Investment Corporation | | | | | | | | |
Bond Fund (19.8%) | | | 33,483,091 | | | $ | 50,054,040 | |
Equity Index Fund (35.1%) | | | 26,149,728 | | | | 88,497,348 | |
International Fund (14.6%) | | | 50,413,646 | | | | 36,772,268 | |
Mid-Cap Equity Index Fund (20.3%) | | | 24,409,568 | | | | 51,315,160 | |
Small Cap Growth Fund (5.1%) | | | 9,945,487 | | | | 12,974,444 | |
Small Cap Value Fund (5.1%) | | | 8,641,798 | | | | 12,854,952 | |
| | | | | | | | |
TOTAL INVESTMENTS
(Cost: $206,729,177) 100.0% | | | | | | | 252,468,212 | |
| | | | | | | | |
OTHER NET ASSETS -0.0% (3) | | | | | | | (176 | ) |
| | | | | | | | |
NET ASSETS 100.0% | | | | | | $ | 252,468,036 | |
| | | | | | | | |
The accompanying notes are an integral part of these portfolio schedules.
43
MUTUAL OF AMERICA INVESTMENT CORPORATION — MONEY MARKET FUND
PORTFOLIO OF INVESTMENTS IN SECURITIES
June 30, 2016 (Unaudited)
| | | | | | | | | | | | | | | | | | | | |
| | | Rating** | | | Rate(%) | | | Maturity | | | Face Amount | | | Value | |
| SHORT-TERM DEBT SECURITIES: | | | | | | | | | | | | | | | | | | | | |
U.S. GOVERNMENT (14.7%) | | | | | | | | | | | | | | | | | | | | |
U.S. Treasury Bill | | | A-1+ | | | | 0.24 | | | | 09/15/16 | | | $ | 2,000,000 | | | $ | 1,999,191 | |
U.S. Treasury Bill | | | A-1+ | | | | 0.25 | | | | 09/01/16 | | | | 1,000,000 | | | | 999,611 | |
U.S. Treasury Bill | | | A-1+ | | | | 0.26 | | | | 08/11/16 | | | | 1,000,000 | | | | 999,698 | |
U.S. Treasury Bill | | | A-1+ | | | | 0.28 | | | | 08/11/16 | | | | 2,100,000 | | | | 2,099,318 | |
U.S. Treasury Bill | | | A-1+ | | | | 0.30 | | | | 08/18/16 | | | | 1,500,000 | | | | 1,499,400 | |
U.S. Treasury Bill | | | A-1+ | | | | 0.34 | | | | 08/25/16 | | | | 1,500,000 | | | | 1,499,221 | |
| | | | | | | | | | | | | | | | | | | | |
| | | | | | | | | | | | | | | | | | | 9,096,439 | |
| | | | | | | | | | | | | | | | | | | | |
U.S. GOVERNMENT AGENCIES (9.0%) | | | | | | | | | | | | | | | | | | | | |
FHLB | | | A-1+ | | | | 0.31 | | | | 08/05/16 | | | | 1,900,000 | | | | 1,899,427 | |
FHLB | | | A-1+ | | | | 0.36 | | | | 07/27/16 | | | | 260,000 | | | | 259,933 | |
FHLB | | | A-1+ | | | | 0.40 | | | | 08/08/16 | | | | 2,000,000 | | | | 1,999,155 | |
FHLB | | | A-1+ | | | | 0.40 | | | | 09/16/16 | | | | 1,400,000 | | | | 1,399,041 | |
| | | | | | | | | | | | | | | | | | | | |
| | | | | | | | | | | | | | | | | | | 5,557,556 | |
| | | | | | | | | | | | | | | | | | | | |
COMMERCIAL PAPER (76.3%) | | | | | | | | | | | | | | | | | | | | |
Air Products & Chemicals† | | | A-1 | | | | 0.37 | | | | 07/01/16 | | | | 1,000,000 | | | | 1,000,000 | |
Apple, Inc.† | | | A-1+ | | | | 0.42 | | | | 07/05/16 | | | | 800,000 | | | | 799,963 | |
Archer-Daniels-Midland Co.† | | | A-1 | | | | 0.42 | | | | 07/14/16 | | | | 1,200,000 | | | | 1,199,818 | |
Chevron Corp.† | | | A-1+ | | | | 0.41 | | | | 08/02/16 | | | | 1,800,000 | | | | 1,799,344 | |
Emerson Electric Co.† | | | A-1 | | | | 0.40 | | | | 07/15/16 | | | | 500,000 | | | | 499,922 | |
Emerson Electric Co.† | | | A-1 | | | | 0.43 | | | | 07/20/16 | | | | 1,900,000 | | | | 1,899,569 | |
Exxon Mobil Corp. | | | A-1+ | | | | 0.39 | | | | 07/13/16 | | | | 1,000,000 | | | | 999,870 | |
Exxon Mobil Corp. | | | A-1+ | | | | 0.40 | | | | 07/18/16 | | | | 350,000 | | | | 349,934 | |
Exxon Mobil Corp. | | | A-1+ | | | | 0.43 | | | | 08/02/16 | | | | 1,000,000 | | | | 999,618 | |
Grainger (W.W.), Inc. | | | A-1 | | | | 0.39 | | | | 07/08/16 | | | | 2,300,000 | | | | 2,299,826 | |
Grainger (W.W.) Inc. | | | A-1+ | | | | 0.41 | | | | 07/26/16 | | | | 472,000 | | | | 471,866 | |
Grainger (W.W.), Inc. | | | A-1+ | | | | 0.42 | | | | 07/21/16 | | | | 1,040,000 | | | | 1,039,757 | |
Intercontinental Exchange, Inc.† | | | A-1 | | | | 0.50 | | | | 07/12/16 | | | | 2,500,000 | | | | 2,499,616 | |
J.P. Morgan Securities LLC | | | A-1 | | | | 0.50 | | | | 08/09/16 | | | | 350,000 | | | | 349,810 | |
J.P. Morgan Securities LLC | | | A-1 | | | | 0.53 | | | | 08/26/16 | | | | 1,000,000 | | | | 999,175 | |
J.P. Morgan Securities LLC | | | A-1 | | | | 0.55 | | | | 08/24/16 | | | | 900,000 | | | | 899,257 | |
Microsoft Corp.† | | | A-1+ | | | | 0.40 | | | | 07/27/16 | | | | 598,000 | | | | 597,827 | |
Microsoft Corp.† | | | A-1+ | | | | 0.40 | | | | 08/03/16 | | | | 1,150,000 | | | | 1,149,578 | |
Microsoft Corp.† | | | A-1+ | | | | 0.44 | | | | 08/03/16 | | | | 750,000 | | | | 749,697 | |
National Rural Utilities | | | A-1 | | | | 0.40 | | | | 07/20/16 | | | | 2,300,000 | | | | 2,299,514 | |
Nestle Capital Corp.† | | | A-1+ | | | | 0.44 | | | | 08/23/16 | | | | 1,725,000 | | | | 1,723,883 | |
Novartis Finance Corp.† | | | A-1+ | | | | 0.43 | | | | 08/09/16 | | | | 1,200,000 | | | | 1,199,441 | |
PepsiCo, Inc.† | | | A-1 | | | | 0.40 | | | | 08/17/16 | | | | 2,300,000 | | | | 2,298,799 | |
Pfizer, Inc.† | | | A-1+ | | | | 0.45 | | | | 07/18/16 | | | | 1,400,000 | | | | 1,399,702 | |
Pfizer, Inc.† | | | A-1+ | | | | 0.46 | | | | 07/25/16 | | | | 1,100,000 | | | | 1,099,663 | |
QUALCOMM, Inc.† | | | A-1+ | | | | 0.38 | | | | 07/21/16 | | | | 700,000 | | | | 699,852 | |
QUALCOMM, Inc.† | | | A-1+ | | | | 0.43 | | | | 07/07/16 | | | | 1,550,000 | | | | 1,549,889 | |
Questar Corp.† | | | A-1 | | | | 0.73 | | | | 07/05/16 | | | | 550,000 | | | | 549,955 | |
Ralph Lauren Corp.† | | | A-1 | | | | 0.40 | | | | 07/01/16 | | | | 1,100,000 | | | | 1,100,000 | |
Simon Ppty. Group LP† | | | A-1 | | | | 0.48 | | | | 07/18/16 | | | | 600,000 | | | | 599,864 | |
Simon Ppty. Group LP† | | | A-1 | | | | 0.48 | | | | 08/04/16 | | | | 1,800,000 | | | | 1,799,184 | |
Toyota Motor Credit Corp. | | | A-1+ | | | | 0.44 | | | | 07/15/16 | | | | 1,600,000 | | | | 1,599,726 | |
Travelers Cos., Inc.† | | | A-1 | | | | 0.40 | | | | 07/01/16 | | | | 2,450,000 | | | | 2,450,000 | |
Unilever Capital Corp.† | | | A-1 | | | | 0.38 | | | | 08/01/16 | | | | 1,000,000 | | | | 999,673 | |
Unilever Capital Corp.† | | | A-1 | | | | 0.39 | | | | 07/28/16 | | | | 1,000,000 | | | | 999,707 | |
The accompanying notes are an integral part of these portfolio schedules.
44
MUTUAL OF AMERICA INVESTMENT CORPORATION — MONEY MARKET FUND
PORTFOLIO OF INVESTMENTS IN SECURITIES (Continued)
June 30, 2016 (Unaudited)
| | | | | | | | | | | | | | | | | | | | |
| | | Rating** | | | Rate(%) | | | Maturity | | | Face Amount | | | Value | |
| SHORT-TERM DEBT SECURITIES (CONTINUED): | | | | | | | | | | | | | | | | | | | | |
COMMERCIAL PAPER (CONTINUED) | | | | | | | | | | | | | | | | | | | | |
Washington Gas Light Co. | | | A-1 | | | | 0.43 | | | | 07/15/16 | | | $ | 2,400,000 | | | $ | 2,399,599 | |
Wisconsin Gas Co. | | | A-1 | | | | 0.42 | | | | 07/06/16 | | | | 1,700,000 | | | | 1,699,901 | |
| | | | | | | | | | | | | | | | | | | | |
| | | | | | | | | | | | | | | | | | | 47,072,799 | |
| | | | | | | | | | | | | | | | | | | | |
TOTAL SHORT-TERM DEBT SECURITIES
(Cost: $61,726,316) 100.0% | | | | 61,726,794 | |
| | | | | | | | | | | | | | | | | | | | |
TOTAL INVESTMENTS
(Cost: $61,726,316) 100.0% | | | | 61,726,794 | |
| | | | | | | | | | | | | | | | | | | | |
OTHER NET ASSETS 0.0% (3) | | | | 22,390 | |
| | | | | | | | | | | | | | | | | | | | |
NET ASSETS 100.0% | | | $ | 61,749,184 | |
| | | | | | | | | | | | | | | | | | | | |
The accompanying notes are an integral part of these portfolio schedules.
45
MUTUAL OF AMERICA INVESTMENT CORPORATION — MID-TERM BOND FUND
SUMMARY PORTFOLIO OF INVESTMENTS IN SECURITIES
June 30, 2016 (Unaudited)
| | | | | | | | | | | | | | | | | | | | |
| | | Rating** | | | Rate(%) | | | Maturity | | | Face Amount | | | Value | |
| LONG-TERM DEBT SECURITIES: | | | | | | | | | | | | | | | | | | | | |
U. S. GOVERNMENT (29.2%) | | | | | | | | | | | | | | | | | | | | |
U.S. Treasury Note | | | AA+ | | | | 1.38 - 2.00 | | | | 09/30/19 - 05/15/26 | | | $ | 86,500,000 | | | $ | 88,609,453 | |
U.S. Treasury Strip | | | AA+ | | | | 0.00 | | | | 08/15/18 | | | | 50,000,000 | | | | 49,359,796 | |
| | | | | | | | | | | | | | | | | | | | |
| | | | | | | | | | | | | | | | | | | 137,969,249 | |
| | | | | | | | | | | | | | | | | | | | |
U.S. GOVERNMENT AGENCIES (8.2%) | | | | | | | | | | | | | | | | | | | | |
MORTGAGE-BACKED OBLIGATIONS (0.6%) | | | | | | | | | | | | | | | | | | | | |
FHLMC | | | AA+ | | | | 7.50 - 8.00 | | | | 09/01/18 - 03/15/21 | | | | 3,115 | | | | 3,391 | |
Small Business Administration (2) | | | AA+ | | | | 2.51 | | | | 03/10/26 | | | | 3,000,000 | | | | 3,099,282 | |
| | | | | | | | | | | | | | | | | | | | |
| | | | | | | | | | | | | | | | | | | 3,102,673 | |
| | | | | | | | | | | | | | | | | | | | |
NON-MORTGAGE-BACKED OBLIGATIONS (7.6%) | | | | | | | | | | | | | | | | | | | | |
FHLMC | | | AA+ | | | | 0.00 | | | | 11/29/19 | | | | 13,500,000 | | | | 12,951,765 | |
FNMA | | | AA+ | | | | 0.00 | | | | 10/09/19 | | | | 23,000,000 | | | | 22,093,961 | |
Other Securities | | | | | | | | | | | | | | | 900,000 | | | | 846,459 | |
| | | | | | | | | | | | | | | | | | | | |
| | | | | | | | | | | | | | | | | | | 35,892,185 | |
| | | | | | | | | | | | | | | | | | | | |
CORPORATE DEBT (61.7%) | | | | | | | | | | | | | | | | | | | | |
CONSUMER DISCRETIONARY (9.6%) | | | | | | | | | | | | | | | | | | | | |
Advance Auto Parts, Inc. | | | BBB- | | | | 4.50 - 5.75 | | | | 05/01/20 - 12/01/23 | | | | 2,250,000 | | | | 2,471,845 | |
Expedia, Inc. | | | BBB- | | | | 5.95 | | | | 08/15/20 | | | | 2,000,000 | | | | 2,237,138 | |
Family Dollar Stores, Inc. | | | BBB | | | | 5.00 | | | | 02/01/21 | | | | 2,000,000 | | | | 2,120,000 | |
Kohl’s Corp. | | | BBB | | | | 3.25 - 4.00 | | | | 11/01/21 - 02/01/23 | | | | 2,025,000 | | | | 2,087,657 | |
NVR, Inc. | | | BBB+ | | | | 3.95 | | | | 09/15/22 | | | | 2,000,000 | | | | 2,119,692 | |
Omnicom Group, Inc. | | | BBB+ | | | | 3.63 | | | | 05/01/22 | | | | 2,000,000 | | | | 2,125,002 | |
Tupperware Brands Corp. | | | BBB- | | | | 4.75 | | | | 06/01/21 | | | | 2,000,000 | | | | 2,151,262 | |
Wyndham Worldwide Corp. | | | BBB- | | | | 2.95 | | | | 03/01/17 | | | | 2,160,000 | | | | 2,178,086 | |
Other Securities | | | | | | | | | | | | | | | 27,310,000 | | | | 27,943,602 | |
| | | | | | | | | | | | | | | | | | | | |
| | | | | | | | | | | | | | | | | | | 45,434,284 | |
| | | | | | | | | | | | | | | | | | | | |
CONSUMER STAPLES (4.3%) | | | | | | | | | | | | | | | | | | | | |
Flowers Foods, Inc. | | | BBB | | | | 4.38 | | | | 04/01/22 | | | | 2,000,000 | | | | 2,175,946 | |
Kroger Co. | | | BBB | | | | 2.95 | | | | 11/01/21 | | | | 2,000,000 | | | | 2,101,338 | |
Mead Johnson Nutrition Co. | | | BBB- | | | | 4.90 | | | | 11/01/19 | | | | 3,075,000 | | | | 3,389,726 | |
Other Securities | | | | | | | | | | | | | | | 12,500,000 | | | | 12,486,324 | |
| | | | | | | | | | | | | | | | | | | | |
| | | | | | | | | | | | | | | | | | | 20,153,334 | |
| | | | | | | | | | | | | | | | | | | | |
ENERGY (4.4%) | | | | | | | | | | | | | | | | | | | | |
Noble Energy, Inc. | | | BBB | | | | 4.15 | | | | 12/15/21 | | | | 2,000,000 | | | | 2,102,948 | |
Other Securities | | | | | | | | | | | | | | | 19,404,000 | | | | 18,682,247 | |
| | | | | | | | | | | | | | | | | | | | |
| | | | | | | | | | | | | | | | | | | 20,785,195 | |
| | | | | | | | | | | | | | | | | | | | |
FINANCIALS (15.9%) | | | | | | | | | | | | | | | | | | | | |
Aflac, Inc. | | | A- | | | | 2.65 - 3.63 | | | | 02/15/17 - 06/15/23 | | | | 2,050,000 | | | | 2,104,957 | |
Alleghany Corp. | | | BBB+ | | | | 4.95 | | | | 06/27/22 | | | | 2,000,000 | | | | 2,227,172 | |
Barrick N.A. Finance LLC | | | BBB- | | | | 4.40 | | | | 05/30/21 | | | | 2,000,000 | | | | 2,153,420 | |
Berkley (W.R.) Corp. | | | BBB+ | | | | 4.63 | | | | 03/15/22 | | | | 2,000,000 | | | | 2,184,976 | |
Block Financial LLC | | | BBB | | | | 5.50 | | | | 11/01/22 | | | | 2,472,000 | | | | 2,672,939 | |
Capital One Financial Corp. | | | BBB | | | | 4.75 | | | | 07/15/21 | | | | 2,000,000 | | | | 2,226,274 | |
Fifth Third Bancorp | | | BBB | | | | 4.30 | | | | 01/16/24 | | | | 2,000,000 | | | | 2,130,130 | |
First Tennessee Bank | | | BBB- | | | | 2.95 | | | | 12/01/19 | | | | 2,200,000 | | | | 2,210,030 | |
Healthcare Realty Trust | | | BBB- | | | | 5.75 | | | | 01/15/21 | | | | 2,000,000 | | | | 2,244,320 | |
Moody’s Corp. | | | BBB+ | | | | 5.50 | | | | 09/01/20 | | | | 2,000,000 | | | | 2,277,786 | |
Nasdaq, Inc. | | | BBB | | | | 5.55 | | | | 01/15/20 | | | | 2,150,000 | | | | 2,378,149 | |
Vornado Realty LP | | | BBB | | | | 2.50 - 5.00 | | | | 06/30/19 - 01/15/22 | | | | 2,000,000 | | | | 2,143,893 | |
Other Securities | | | | | | | | | | | | | | | 47,255,000 | | | | 48,350,657 | |
| | | | | | | | | | | | | | | | | | | | |
| | | | | | | | | | | | | | | | | | | 75,304,703 | |
| | | | | | | | | | | | | | | | | | | | |
The accompanying notes are an integral part of these portfolio schedules.
46
MUTUAL OF AMERICA INVESTMENT CORPORATION — MID-TERM BOND FUND
SUMMARY PORTFOLIO OF INVESTMENTS IN SECURITIES (Continued)
June 30, 2016 (Unaudited)
| | | | | | | | | | | | | | | | | | | | |
| | | Rating** | | | Rate(%) | | | Maturity | | | Face Amount | | | Value | |
| LONG-TERM DEBT SECURITIES (CONTINUED): | | | | | | | | | | | | | | | | | | | | |
CORPORATE DEBT (CONTINUED) | | | | | | | | | | | | | | | | | | | | |
HEALTH CARE (6.9%) | | | | | | | | | | | | | | | | | | | | |
Agilent Technologies, Inc. | | | BBB+ | | | | 5.00 | | | | 07/15/20 | | | $ | 2,000,000 | | | $ | 2,204,592 | |
Bio-Rad Laboratories, Inc. | | | BBB | | | | 4.88 | | | | 12/15/20 | | | | 2,000,000 | | | | 2,212,844 | |
PerkinElmer, Inc. | | | BBB | | | | 5.00 | | | | 11/15/21 | | | | 2,000,000 | | | | 2,217,376 | |
Quest Diagnostics, Inc. | | | BBB+ | | | | 4.75 | | | | 01/30/20 | | | | 2,000,000 | | | | 2,193,430 | |
Thermo Fisher Scientific, Inc. | | | BBB | | | | 3.60 - 4.50 | | | | 03/01/21 - 08/15/21 | | | | 2,000,000 | | | | 2,189,792 | |
Other Securities | | | | | | | | | | | | | | | 20,750,000 | | | | 21,304,907 | |
| | | | | | | | | | | | | | | | | | | | |
| | | | | | | | | | | | | | | | | | | 32,322,941 | |
| | | | | | | | | | | | | | | | | | | | |
INDUSTRIALS (5.6%) | | | | | | | | | | | | | | | | | | | | |
Equifax, Inc. | | | BBB+ | | | | 3.30 | | | | 12/15/22 | | | | 2,000,000 | | | | 2,111,580 | |
GATX Corp. | | | BBB | | | | 6.00 | | | | 02/15/18 | | | | 2,050,000 | | | | 2,180,692 | |
Harsco Corp. | | | BB- | | | | 5.75 | | | | 05/15/18 | | | | 2,250,000 | | | | 2,120,625 | |
L-3 Communications Corp. | | | BBB- | | | | 5.20 | | | | 10/15/19 | | | | 2,000,000 | | | | 2,177,504 | |
Valmont Industries, Inc. | | | BBB+ | | | | 6.63 | | | | 04/20/20 | | | | 2,000,000 | | | | 2,264,228 | |
Verisk Analytics, Inc. | | | BBB- | | | | 4.13 | | | | 09/12/22 | | | | 2,000,000 | | | | 2,129,592 | |
Other Securities | | | | | | | | | | | | | | | 12,985,000 | | | | 13,304,148 | |
| | | | | | | | | | | | | | | | | | | | |
| | | | | | | | | | | | | | | | | | | 26,288,369 | |
| | | | | | | | | | | | | | | | | | | | |
INFORMATION TECHNOLOGY (7.6%) | | | | | | | | | | | | | | | | | | | | |
Adobe Systems, Inc. | | | A- | | | | 4.75 | | | | 02/01/20 | | | | 2,000,000 | | | | 2,211,024 | |
eBay, Inc. | | | BBB+ | | | | 2.88 | | | | 08/01/21 | | | | 2,100,000 | | | | 2,168,697 | |
Fiserv, Inc. | | | BBB | | | | 4.75 | | | | 06/15/21 | | | | 1,900,000 | | | | 2,109,234 | |
Juniper Networks, Inc. | | | BBB | | | | 4.50 - 4.60 | | | | 03/15/21 - 03/15/24 | | | | 2,100,000 | | | | 2,232,826 | |
Lexmark International, Inc. | | | BBB- | | | | 6.65 | | | | 06/01/18 | | | | 2,000,000 | | | | 2,128,458 | |
Other Securities | | | | | | | | | | | | | | | 24,687,000 | | | | 25,231,851 | |
| | | | | | | | | | | | | | | | | | | | |
| | | | | | | | | | | | | | | | | | | 36,082,090 | |
| | | | | | | | | | | | | | | | | | | | |
MATERIALS (4.2%) | | | | | | | | | | | | | | | | | | | | |
Alcoa, Inc. | | | BBB- | | | | 6.75 | | | | 07/15/18 | | | | 2,000,000 | | | | 2,165,000 | |
Kinross Gold Corp. | | | BB+ | | | | 3.63 | | | | 09/01/16 - 09/01/21 | | | | 2,750,000 | | | | 2,739,853 | |
Other Securities | | | | | | | | | | | | | | | 14,687,000 | | | | 14,740,396 | |
| | | | | | | | | | | | | | | | | | | | |
| | | | | | | | | | | | | | | | | | | 19,645,249 | |
| | | | | | | | | | | | | | | | | | | | |
TELECOMMUNICATION SERVICES (0.9%) | | | | | | | | | | | | | | | | | | | | |
Verizon Communications, Inc. | | | BBB+ | | | | 4.50 | | | | 09/15/20 | | | | 2,000,000 | | | | 2,219,912 | |
Other Securities | | | | | | | | | | | | | | | 2,000,000 | | | | 2,039,622 | |
| | | | | | | | | | | | | | | | | | | | |
| | | | | | | | | | | | | | | | | | | 4,259,534 | |
| | | | | | | | | | | | | | | | | | | | |
UTILITIES (2.3%) | | | | | | | | | | | | | | | | | | | | |
Entergy Corp. | | | BBB- | | | | 4.70 - 5.13 | | | | 01/15/17 - 09/15/20 | | | | 2,000,000 | | | | 2,142,520 | |
National Fuel Gas Co. | | | BBB | | | | 4.90 | | | | 12/01/21 | | | | 2,000,000 | | | | 2,105,336 | |
SCANA Corp. | | | BBB | | | | 4.75 | | | | 05/15/21 | | | | 2,000,000 | | | | 2,134,766 | |
Other Securities | | | | | | | | | | | | | | | 4,400,000 | | | | 4,265,524 | |
| | | | | | | | | | | | | | | | | | | | |
| | | | | | | | | | | | | | | | | | | 10,648,146 | |
| | | | | | | | | | | | | | | | | | | | |
TOTAL LONG-TERM DEBT SECURITIES
(Cost: $457,012,362) 99.1% | | | | | | | | | | | | | | | | | | | 467,887,952 | |
| | | | | | | | | | | | | | | | | | | | |
| | | | | |
| SHORT-TERM DEBT SECURITIES: | | | | | | | | | | | | | | | | | | | | |
COMMERCIAL PAPER (0.2%) | | | | | | | | | | | | | | | | | | | | |
Ralph Lauren Corp.† | | | A-1 | | | | 0.40 | | | | 07/01/16 | | | | 800,000 | | | | 800,000 | |
| | | | | | | | | | | | | | | | | | | | |
TOTAL SHORT-TERM DEBT SECURITIES
(Cost: $800,000) 0.2% | | | | 800,000 | |
| | | | | | | | | | | | | | | | | | | | |
TOTAL INVESTMENTS
(Cost: $457,812,362) 99.3% | | | | 468,687,952 | |
| | | | | | | | | | | | | | | | | | | | |
OTHER NET ASSETS 0.7% | | | | 3,193,592 | |
| | | | | | | | | | | | | | | | | | | | |
NET ASSETS 100.0% | | | $ | 471,881,544 | |
| | | | | | | | | | | | | | | | | | | | |
The accompanying notes are an integral part of these portfolio schedules.
47
MUTUAL OF AMERICA INVESTMENT CORPORATION — BOND FUND
SUMMARY PORTFOLIO OF INVESTMENTS IN SECURITIES
June 30, 2016 (Unaudited)
| | | | | | | | | | | | | | | | | | | | |
| | | Rating** | | | Rate(%) | | | Maturity | | | Face Amount | | | Value | |
| LONG-TERM DEBT SECURITIES: | | | | | | | | | | | | | | | | | | | | |
U.S. GOVERNMENT (8.5%) | | | | | | | | | | | | | | | | | | | | |
U.S. Treasury Note | | | AA+ | | | | 1.63 - 2.25 | | | | 11/15/25 - 05/15/26 | | | $ | 5,000,000 | | | $ | 5,113,829 | |
U.S. Treasury Strip | | | AA+ | | | | 0.00 | | | | 08/15/25 - 08/15/37 | | | | 110,000,000 | | | | 85,930,169 | |
| | | | | | | | | | | | | | | | | | | | |
| | | | | | | | | | | | | | | | | | | 91,043,998 | |
| | | | | | | | | | | | | | | | | | | | |
U.S. GOVERNMENT AGENCIES (28.2%) | | | | | | | | | | | | | | | | | | | | |
MORTGAGE-BACKED OBLIGATIONS (26.8%) | | | | | | | | | | | | | | | | | | | | |
FHARM | | | AA+ | | | | 2.76 - 5.84 | | | | 02/01/36 - 04/01/42 | | | | 1,585,328 | | | | 1,667,260 | |
FHLMC | | | AA+ | | | | 2.50 - 6.00 | | | | 03/01/21 - 09/01/45 | | | | 91,911,934 | | | | 97,753,360 | |
FHLMC Strip | | | AA+ | | | | 3.00 | | | | 01/15/43 | | | | 2,238,717 | | | | 2,334,851 | |
FNMA | | | AA+ | | | | 2.25 - 8.00 | | | | 09/01/16 - 12/25/49 | | | | 133,952,832 | | | | 144,038,149 | |
FNMA Strip | | | AA+ | | | | 3.00 | | | | 08/25/42 | | | | 1,802,597 | | | | 1,851,375 | |
GNMA (2) | | | AA+ | | | | 2.68 - 7.00 | | | | 4/15/24 - 10/16/47 | | | | 35,554,029 | | | | 38,506,135 | |
Other Securities | | | | | | | | | | | | | | | 1,001,136 | | | | 1,113,006 | |
| | | | | | | | | | | | | | | | | | | | |
| | | | | | | | | | | | | | | | | | | 287,264,136 | |
| | | | | | | | | | | | | | | | | | | | |
NON-MORTGAGE-BACKED OBLIGATIONS (1.4%) | | | | | | | | | | | | | | | | | | | | |
FHLMC | | | AA+ | | | | 0.00 | | | | 11/29/19 | | | | 11,000,000 | | | | 10,553,290 | |
FNMA | | | AA+ | | | | 0.00 | | | | 10/09/19 | | | | 5,050,000 | | | | 4,851,065 | |
| | | | | | | | | | | | | | | | | | | | |
| | | | | | | | | | | | | | | | | | | 15,404,355 | |
| | | | | | | | | | | | | | | | | | | | |
CORPORATE DEBT (61.9%) | | | | | | | | | | | | | | | | | | | | |
CONSUMER DISCRETIONARY (9.6%) | | | | | | | | | | | | | | | | | | | | |
Advance Auto Parts, Inc. | | | BBB- | | | | 4.50 - 5.75 | | | | 05/01/20 - 12/01/23 | | | | 5,000,000 | | | | 5,480,734 | |
AutoZone, Inc. | | | BBB | | | | 3.25 - 4.00 | | | | 11/15/20 - 04/15/25 | | | | 5,700,000 | | | | 6,048,428 | |
Gap, Inc. | | | BB+ | | | | 5.95 | | | | 04/12/21 | | | | 5,000,000 | | | | 5,214,850 | |
Harman Int’l. Industries, Inc. | | | BBB- | | | | 4.15 | | | | 05/15/25 | | | | 5,000,000 | | | | 5,214,355 | |
Scripps Networks Interactive, Inc. | | | BBB | | | | 3.50 | | | | 06/15/22 | | | | 5,000,000 | | | | 5,182,280 | |
Viacom, Inc. | | | BBB- | | | | 3.25 | | | | 03/15/23 | | | | 5,000,000 | | | | 4,919,035 | |
Other Securities | | | | | | | | | | | | | | | 68,074,000 | | | | 71,490,681 | |
| | | | | | | | | | | | | | | | | | | | |
| | | | | | | | | | | | | | | | | | | 103,550,363 | |
| | | | | | | | | | | | | | | | | | | | |
CONSUMER STAPLES (3.5%) | | | | | | | | | | | | | | | | | | | | |
Kroger Co. | | | BBB | | | | 2.95 | | | | 11/01/21 | | | | 4,800,000 | | | | 5,043,211 | |
Whole Foods Market, Inc.† | | | BBB- | | | | 5.20 | | | | 12/03/25 | | | | 5,000,000 | | | | 5,390,925 | |
Other Securities | | | | | | | | | | | | | | | 26,250,000 | | | | 27,409,322 | |
| | | | | | | | | | | | | | | | | | | | |
| | | | | | | | | | | | | | | | | | | 37,843,458 | |
| | | | | | | | | | | | | | | | | | | | |
ENERGY (4.9%) | | | | | | | | | | | | | | | | | | | | |
Kinder Morgan Energy Partners | | | BBB- | | | | 4.30 | | | | 05/01/24 | | | | 5,000,000 | | | | 5,042,950 | |
Other Securities | | | | | | | | | | | | | | | 48,350,000 | | | | 47,318,464 | |
| | | | | | | | | | | | | | | | | | | | |
| | | | | | | | | | | | | | | | | | | 52,361,414 | |
| | | | | | | | | | | | | | | | | | | | |
FINANCIALS (16.7%) | | | | | | | | | | | | | | | | | | | | |
Alleghany Corp. | | | BBB+ | | | | 4.95 - 5.63 | | | | 09/15/20 - 06/27/22 | | | | 5,000,000 | | | | 5,586,269 | |
American Express Co. | | | BBB | | | | 3.63 | | | | 12/05/24 | | | | 5,000,000 | | | | 5,128,055 | |
American Int’l. Group, Inc. | | | A- | | | | 3.75 | | | | 07/10/25 | | | | 5,000,000 | | | | 5,096,025 | |
American Tower Corp. | | | BBB- | | | | 4.50 | | | | 01/15/18 | | | | 5,000,000 | | | | 5,216,400 | |
Bank of America Corp. | | | BBB | | | | 3.95 | | | | 04/21/25 | | | | 5,000,000 | | | | 5,091,725 | |
Block Financial LLC | | | BBB | | | | 5.25 - 5.50 | | | | 11/01/22 - 10/01/25 | | | | 5,250,000 | | | | 5,649,074 | |
Citigroup, Inc. | | | BBB | | | | 3.88 | | | | 03/26/25 | | | | 5,000,000 | | | | 5,050,550 | |
Citizens Financial Group, Inc. | | | BBB | | | | 3.75 | | | | 07/01/24 | | | | 5,000,000 | | | | 5,020,790 | |
Fairfax Financial Hldgs.† | | | BBB- | | | | 5.80 | | | | 05/15/21 | | | | 1,500,000 | | | | 1,619,886 | |
Fairfax U.S., Inc.† | | | BBB- | | | | 4.88 | | | | 08/13/24 | | | | 3,500,000 | | | | 3,531,021 | |
Fifth Third Bancorp | | | BBB | | | | 4.30 | | | | 01/16/24 | | | | 5,000,000 | | | | 5,325,325 | |
First Tennessee Bank | | | BBB- | | | | 2.95 | | | | 12/01/19 | | | | 5,000,000 | | | | 5,022,795 | |
HCP, Inc. | | | BBB | | | | 3.40 - 6.00 | | | | 01/30/17 - 02/01/25 | | | | 5,000,000 | | | | 4,908,705 | |
Hospitality Properties Trust | | | BBB- | | | | 5.00 | | | | 08/15/22 | | | | 4,550,000 | | | | 4,889,830 | |
JPMorgan Chase & Co. | | | BBB+ | | | | 3.88 | | | | 09/10/24 | | | | 5,000,000 | | | | 5,176,685 | |
JPMorgan Chase Bank NA | | | A- | | | | 6.00 | | | | 10/01/17 | | | | 2,000,000 | | | | 2,112,422 | |
Lincoln National Corp. | | | A- | | | | 4.00 - 4.85 | | | | 06/24/21 - 09/01/23 | | | | 5,000,000 | | | | 5,264,294 | |
The accompanying notes are an integral part of these portfolio schedules.
48
MUTUAL OF AMERICA INVESTMENT CORPORATION — BOND FUND
SUMMARY PORTFOLIO OF INVESTMENTS IN SECURITIES (Continued)
June 30, 2016 (Unaudited)
| | | | | | | | | | | | | | | | | | | | |
| | | Rating** | | | Rate(%) | | | Maturity | | | Face Amount | | | Value | |
| LONG-TERM DEBT SECURITIES (CONTINUED): | | | | | | | | | | | | | | | | | | | | |
CORPORATE DEBT (CONTINUED) | | | | | | | | | | | | | | | | | | | | |
FINANCIALS (CONTINUED) | | | | | | | | | | | | | | | | | | | | |
Mack-Cali Realty LP | | | BBB- | | | | 4.50 | | | | 04/18/22 | | | $ | 5,000,000 | | | $ | 5,099,650 | |
Wells Fargo & Co. | | | A- | | | | 3.45 - 4.13 | | | | 02/13/23 - 08/15/23 | | | | 5,000,000 | | | | 5,215,511 | |
Other Securities | | | | | | | | | | | | | | | 84,341,000 | | | | 89,477,441 | |
| | | | | | | | | | | | | | | | | | | | |
| | | | | | | | | | | | | | | | | | | 179,482,453 | |
| | | | | | | | | | | | | | | | | | | | |
HEALTH CARE (6.7%) | | | | | | | | | | | | | | | | | | | | |
Anthem, Inc. | | | A | | | | 3.30 - 4.35 | | | | 08/15/20 - 01/15/23 | | | | 5,539,000 | | | | 5,824,618 | |
Biogen Idec, Inc. | | | A- | | | | 4.05 - 6.88 | | | | 03/01/18 - 09/15/25 | | | | 5,000,000 | | | | 5,412,138 | |
Humana, Inc. | | | A- | | | | 3.85 - 7.20 | | | | 06/15/18 - 10/01/24 | | | | 5,000,000 | | | | 5,418,701 | |
Owens & Minor, Inc. | | | BBB | | | | 3.88 - 4.38 | | | | 09/15/21 - 12/15/24 | | | | 5,000,000 | | | | 5,121,917 | |
Quest Diagnostics, Inc. | | | BBB+ | | | | 3.50 - 4.75 | | | | 01/30/20 - 03/30/25 | | | | 4,700,000 | | | | 5,109,670 | |
Zimmer Biomet Hldgs., Inc. | | | BBB | | | | 3.15 | | | | 04/01/22 | | | | 5,000,000 | | | | 5,125,000 | |
Other Securities | | | | | | | | | | | | | | | 37,000,000 | | | | 39,695,411 | |
| | | | | | | | | | | | | | | | | | | | |
| | | | | | | | | | | | | | | | | | | 71,707,455 | |
| | | | | | | | | | | | | | | | | | | | |
INDUSTRIALS (4.5%) | | | | | | | | | | | | | | | | | | | | |
Verisk Analytics, Inc. | | | BBB- | | | | 4.00 | | | | 06/15/25 | | | | 5,000,000 | | | | 5,251,590 | |
Other Securities | | | | | | | | | | | | | | | 41,550,000 | | | | 42,918,446 | |
| | | | | | | | | | | | | | | | | | | | |
| | | | | | | | | | | | | | | | | | | 48,170,036 | |
| | | | | | | | | | | | | | | | | | | | |
INFORMATION TECHNOLOGY (7.4%) | | | | | | | | | | | | | | | | | | | | |
Applied Materials, Inc. | | | A- | | | | 3.90 | | | | 10/01/25 | | | | 5,000,000 | | | | 5,543,890 | |
Arrow Electronics, Inc. | | | BBB- | | | | 4.00 - 6.88 | | | | 06/01/18 - 04/01/25 | | �� | | 5,000,000 | | | | 5,315,706 | |
eBay, Inc. | | | BBB+ | | | | 2.88 | | | | 08/01/21 | | | | 5,000,000 | | | | 5,163,565 | |
Fidelity Nat’l. Information | | | BBB | | | | 3.88 | | | | 06/05/24 | | | | 5,000,000 | | | | 5,286,375 | |
Juniper Networks, Inc. | | | BBB | | | | 4.50 - 4.60 | | | | 03/15/21 - 03/15/24 | | | | 5,000,000 | | | | 5,324,358 | |
Keysight Technologies, Inc. | | | BBB- | | | | 4.55 | | | | 10/30/24 | | | | 5,000,000 | | | | 5,094,860 | |
Lam Research Corp. | | | BBB | | | | 2.75 | | | | 03/15/20 | | | | 5,000,000 | | | | 5,109,620 | |
Other Securities | | | | | | | | | | | | | | | 40,868,000 | | | | 42,697,208 | |
| | | | | | | | | | | | | | | | | | | | |
| | | | | | | | | | | | | | | | | | | 79,535,582 | |
| | | | | | | | | | | | | | | | | | | | |
MATERIALS (5.7%) | | | | | | | | | | | | | | | | | | | | |
Domtar Corp. | | | BBB- | | | | 4.40 | | | | 04/01/22 | | | | 5,000,000 | | | | 5,184,775 | |
Dow Chemical Co. | | | BBB | | | | 3.50 | | | | 10/01/24 | | | | 4,800,000 | | | | 5,095,037 | |
Valspar Corp. | | | BBB | | | | 3.95 | | | | 01/15/26 | | | | 5,000,000 | | | | 5,265,180 | |
Other Securities | | | | | | | | | | | | | | | 46,100,000 | | | | 45,972,759 | |
| | | | | | | | | | | | | | | | | | | | |
| | | | | | | | | | | | | | | | | | | 61,517,751 | |
| | | | | | | | | | | | | | | | | | | | |
TELECOMMUNICATION SERVICES (0.7%) | | | | | | | | | | | | | | | | | | | | |
AT&T, Inc. | | | BBB+ | | | | 3.00 | | | | 02/15/22 - 06/30/22 | | | | 5,000,000 | | | | 5,103,318 | |
Other Securities | | | | | | | | | | | | | | | 2,000,000 | | | | 2,219,912 | |
| | | | | | | | | | | | | | | | | | | | |
| | | | | | | | | | | | | | | | | | | 7,323,230 | |
| | | | | | | | | | | | | | | | | | | | |
UTILITIES (2.2%) | | | | | | | | | | | | | | | | | | | | |
National Fuel Gas Co. | | | BBB | | | | 4.90 - 5.20 | | | | 12/01/21 - 07/15/25 | | | | 5,000,000 | | | | 5,232,324 | |
SCANA Corp. | | | BBB | | | | 4.13 - 4.75 | | | | 05/15/21 - 02/01/22 | | | | 5,000,000 | | | | 5,223,203 | |
Other Securities | | | | | | | | | | | | | | | 13,225,000 | | | | 13,584,807 | |
| | | | | | | | | | | | | | | | | | | | |
| | | | | | | | | | | | | | | | | | | 24,040,334 | |
| | | | | | | | | | | | | | | | | | | | |
SOVEREIGN DEBT (0.4%) | | | | | | | | | | | | | | | | | | | | |
Sri Lanka AID | | | NR | | | | 6.59 | | | | 09/15/28 | | | | 3,056,968 | | | | 3,874,003 | |
| | | | | | | | | | | | | | | | | | | | |
TOTAL LONG-TERM DEBT SECURITIES
(Cost: $1,023,062,495) 99.0% | | | | | | | | | | | | | | | | | | | 1,063,118,568 | |
| | | | | | | | | | | | | | | | | | | | |
The accompanying notes are an integral part of these portfolio schedules.
49
MUTUAL OF AMERICA INVESTMENT CORPORATION — BOND FUND
SUMMARY PORTFOLIO OF INVESTMENTS IN SECURITIES (Continued)
June 30, 2016 (Unaudited)
| | | | | | | | | | | | | | | | | | | | |
| | | Rating** | | | Rate(%) | | | Maturity | | | Face Amount | | | Value | |
| SHORT-TERM DEBT SECURITIES: | | | | | | | | | | | | | | | | | | | | |
COMMERCIAL PAPER (0.7%) | | | | | | | | | | | | | | | | | | | | |
Ralph Lauren Corp.† | | | A-1 | | | | 0.40 | | | | 07/01/16 | | | $ | 7,100,000 | | | $ | 7,100,000 | |
| | | | | | | | | | | | | | | | | | | | |
TOTAL SHORT-TERM DEBT SECURITIES
(Cost: $7,100,000) 0.7% | | | | 7,100,000 | |
| | | | | | | | | | | | | | | | | | | | |
TOTAL INVESTMENTS
(Cost: $1,030,162,495) 99.7% | | | | 1,070,218,568 | |
| | | | | | | | | | | | | | | | | | | | |
OTHER NET ASSETS 0.3% | | | | 3,453,005 | |
| | | | | | | | | | | | | | | | | | | | |
NET ASSETS 100.0% | | | $ | 1,073,671,573 | |
| | | | | | | | | | | | | | | | | | | | |
The accompanying notes are an integral part of these portfolio schedules.
50
MUTUAL OF AMERICA INVESTMENT CORPORATION
FOOTNOTES TO SUMMARY PORTFOLIOS OF INVESTMENTS IN SECURITIES
June 30, 2016 (Unaudited)
| | |
| Abbreviations: | | FHARM = Federal Home Adjustable Rate Mortgage |
| | FHLB = Federal Home Loan Bank |
| | FHLMC = Federal Home Loan Mortgage Corporation |
| | FNMA = Federal National Mortgage Association |
| | GNMA = Government National Mortgage Association |
| | NR = Not Rated |
| | “Other Securities” represent securities in the respective category that individually, or in the aggregate by issuer, do not exceed 1% of net assets. |
| * | Non-income producing security. |
| ** | Ratings as per Standard & Poor’s Corporation (unaudited). |
| † | Security is exempt from registration under Rule 144A of the Securities Act of 1933. These securities may be resold in transactions exempt from registration, normally to qualified institutional buyers. At June 30, 2016, the aggregate values of these securities and their percentages of the respective Funds’ net assets were as follows: |
| | | | | | | | |
Fund | | Aggregate
Market
Value | | | Percentage
of
Net Assets | |
EQUITY INDEX FUND | | $ | 26,400,000 | | | | 1.4 | % |
ALL AMERICA FUND | | $ | 5,400,000 | | | | 1.9 | % |
SMALL CAP VALUE FUND | | $ | 4,700,000 | | | | 1.2 | % |
SMALL CAP GROWTH FUND | | $ | 4,300,000 | | | | 1.1 | % |
MID CAP VALUE FUND | | $ | 2,900,000 | | | | 3.4 | % |
MID-CAP EQUITY INDEX FUND | | $ | 24,799,893 | | | | 2.3 | % |
INTERNATIONAL FUND | | $ | 1,500,000 | | | | 0.5 | % |
COMPOSITE FUND | | $ | 4,794,809 | | | | 2.7 | % |
MONEY MARKET FUND | | $ | 30,664,946 | | | | 49.7 | % |
MID-TERM BOND FUND | | $ | 6,792,307 | | | | 1.4 | % |
BOND FUND | | $ | 24,069,215 | | | | 2.2 | % |
| (1) | This security, or a portion thereof, has been segregated to cover initial margin requirements on open futures contracts. Information on futures contracts outstanding in the Funds as of June 30, 2016, was as follows: |
| | | | | | | | | | | | | | | | | | | | | | | | | | |
Fund | | Number of
Contracts | | | Contract Type | | Purchased (P)
or Sold (S) | | | Expiration Date | | | Underlying
Face Amount
at Value(a) | | | Unrealized
Gain(Loss) | | | Face Value
of Futures
as a %
of Total
Investments | |
EQUITY INDEX FUND | | | 436 | | | E-mini S&P 500
Stock Index | | | P | | | | September 2016 | | | $ | 45,566,360 | | | $ | 161,461 | | | | 2.3 | % |
ALL AMERICA FUND | | | 47 | | | E-mini S&P 500
Stock Index | | | P | | | | September 2016 | | | $ | 4,911,970 | | | $ | 8,025 | | | | 1.7 | % |
MID-CAP EQUITY INDEX FUND | | | 279 | | | E-mini S&P MidCap
400 Stock Index | | | P | | | | September 2016 | | | $ | 41,654,700 | | | $ | (33,417 | ) | | | 3.9 | % |
| | (a) | Includes the cumulative appreciation(depreciation) of futures contracts, which is included in Net Unrealized Appreciation (Depreciation) of Investments and Futures Contracts in the Components of Net Assets section of the Statements of Assets and Liabilities. The Receivable or Payable for Daily Variation on Futures Contracts in the Statements of Assets and Liabilities only includes the current day’s variation margin payable or receivable. |
| (2) | U.S. Government guaranteed security. |
| (3) | Percentage is less than 0.05%. |
51
MUTUAL OF AMERICA INVESTMENT CORPORATION
STATEMENTS OF ASSETS AND LIABILITIES
June 30, 2016 (Unaudited)
| | | | | | | | | | | | | | | | | | | | | | | | |
| | | Equity Index
Fund | | | All America
Fund | | | Small Cap
Value Fund | | | Small Cap
Growth Fund | | | Mid Cap
Value Fund | | | Mid-Cap
Equity Index
Fund | |
ASSETS: | | | | | | | | | | | | | | | | | | | | | | | | |
Investments at fair value | | | | | | | | | | | | | | | | | | | | | | | | |
(Cost: Equity Index Fund — $1,282,446,229 All America Fund — $229,723,770 Small Cap Value Fund — $318,092,711 Small Cap Growth Fund — $355,582,068 Mid Cap Value Fund — $72,286,513 Mid-Cap Equity Index Fund — $875,400,946 International Fund — $356,399,654 Composite Fund — $153,957,911 Retirement Income Fund — $64,907,636 2010 Retirement Fund — $23,584,627 2015 Retirement Fund — $133,248,931 2020 Retirement Fund — $350,051,113 2025 Retirement Fund — $391,811,465) | |
(Notes 1 and 3) | | $ | 1,943,197,240 | | | $ | 285,617,234 | | | $ | 387,723,875 | | | $ | 394,969,704 | | | $ | 85,372,114 | | | $ | 1,062,064,900 | |
Cash | | | — | | | | 3,074,618 | | | | 155,485 | | | | 588,594 | | | | 66,733 | | | | — | |
Interest and dividends receivable | | | 2,134,923 | | | | 320,629 | | | | 360,786 | | | | 183,658 | | | | 128,181 | | | | 1,081,717 | |
Receivable for securities sold | | | 1,499,475 | | | | 1,024,932 | | | | 1,230,302 | | | | 4,805,610 | | | | — | | | | 12,538,986 | |
Receivable for daily variation on future contracts | | | 516,685 | | | | 54,920 | | | | — | | | | — | | | | — | | | | 644,006 | |
Shareholder subscriptions receivable | | | 830,392 | | | | 105,450 | | | | 141,902 | | | | 125,019 | | | | 138,038 | | | | 543,730 | |
Other receivables | | | — | | | | — | | | | — | | | | — | | | | — | | | | — | |
| | | | | | | | | | | | | | | | | | | | | | | | |
TOTAL ASSETS | | | 1,948,178,715 | | | | 290,197,783 | | | | 389,612,350 | | | | 400,672,585 | | | | 85,705,066 | | | | 1,076,873,339 | |
| | | | | | | | | | | | | | | | | | | | | | | | |
| | | | | | |
LIABILITIES: | | | | | | | | | | | | | | | | | | | | | | | | |
Due to custodian bank | | | 563,543 | | | | — | | | | — | | | | — | | | | — | | | | 259,404 | |
Payable for securities purchased | | | 2,250,564 | | | | 1,430,052 | | | | 763,082 | | | | 5,484,409 | | | | 609,632 | | | | 4,984,345 | |
Shareholder redemptions payable | | | — | | | | — | | | | — | | | | — | | | | — | | | | — | |
Accrued expenses | | | 10,722 | | | | 3,931 | | | | 16,979 | | | | 17,218 | | | | 2,978 | | | | 8,099 | |
| | | | | | | | | | | | | | | | | | | | | | | | |
TOTAL LIABILITIES: | | | 2,824,829 | | | | 1,433,983 | | | | 780,061 | | | | 5,501,627 | | | | 612,610 | | | | 5,251,848 | |
| | | | | | | | | | | | | | | | | | | | | | | | |
NET ASSETS | | $ | 1,945,353,886 | | | $ | 288,763,800 | | | $ | 388,832,289 | | | $ | 395,170,958 | | | $ | 85,092,456 | | | $ | 1,071,621,491 | |
| | | | | | | | | | | | | | | | | | | | | | | | |
NUMBEROF SHARES OUTSTANDING (Note 4) | | | 574,824,844 | | | | 126,965,959 | | | | 261,394,226 | | | | 302,916,171 | | | | 55,923,390 | | | | 509,748,315 | |
| | | | | | | | | | | | | | | | | | | | | | | | |
NET ASSET VALUES, offering and redemption price per share | | | $3.38 | | | | $2.27 | | | | $1.49 | | | | $1.30 | | | | $1.52 | | | | $2.10 | |
| | | | | | | | | | | | | | | | | | | | | | | | |
| | | | | | |
COMPONENTSOF NET ASSETS: | | | | | | | | | | | | | | | | | | | | | | | | |
Paid-in capital | | $ | 1,182,727,474 | | | $ | 189,281,742 | | | $ | 300,802,812 | | | $ | 321,276,923 | | | $ | 64,625,179 | | | $ | 741,325,832 | |
Accumulated undistributed net investment income (loss) | | | 53,446,851 | | | | 6,029,550 | | | | 6,213,963 | | | | — | | | | 1,714,955 | | | | 20,912,154 | |
Accumulated undistributed net realized gain (loss)
on investments and futures contracts | | | 48,267,089 | | | | 37,551,019 | | | | 12,184,350 | | | | 34,506,399 | | | | 5,666,721 | | | | 122,752,968 | |
Net unrealized appreciation (depreciation)
of investments and futures contracts | | | 660,912,472 | | | | 55,901,489 | | | | 69,631,164 | | | | 39,387,636 | | | | 13,085,601 | | | | 186,630,537 | |
| | | | | | | | | | | | | | | | | | | | | | | | |
NET ASSETS | | $ | 1,945,353,886 | | | $ | 288,763,800 | | | $ | 388,832,289 | | | $ | 395,170,958 | | | $ | 85,092,456 | | | $ | 1,071,621,491 | |
| | | | | | | | | | | | | | | | | | | | | | | | |
The accompanying notes are an integral part of these financial statements.
52
| | | | | | | | | | | | | | | | | | | | | | | | | | | | |
International
Fund | | | Composite
Fund | | | Retirement
Income
Fund | | | 2010
Retirement
Fund | | | 2015
Retirement
Fund | | | 2020
Retirement
Fund | | | 2025
Retirement
Fund | | | |
| | | | | | | | | | | | | | | | | | | | | | | | | | | | |
| | | | | | | | | | | | | | | | | | | | | | | | | | | | |
| | | | | | | | | | | | | | | | | | | | | | | | | | | | |
| | | | | | | | | | | | | | | | | | | | | | | | | | | | |
| | | | | | | | | | | | | | | | | | | | | | | | | | | | |
| | | | | | | | | | | | | | | | | | | | | | | | | | | | |
| | | | | | | | | | | | | | | | | | | | | | | | | | | | |
| | | | | | | | | | | | | | | | | | | | | | | | | | | | |
| | | | | | | | | | | | | | | | | | | | | | | | | | | | |
| | | | | | | | | | | | | | | | | | | | | | | | | | | | |
| | | | | | | | | | | | | | | | | | | | | | | | | | | | |
| | | | | | | | | | | | | | | | | | | | | | | | | | | | |
| | | | | | | | | | | | | | | | | | | | | | | | | | | | |
| | | | | | | | | | | | | | | | | | | | | | | | | | | | |
| | | | | | | | | | | | | | | | | | | | | | | | | | | | |
| $ | 331,939,417 | | | $ | 176,331,112 | | | $ | 67,091,209 | | | $ | 24,997,659 | | | $ | 145,037,888 | | | $ | 382,699,618 | | | $ | 436,453,839 | | | |
| | 24,786 | | | | 1,430,962 | | | | — | | | | — | | | | — | | | | — | | | | — | | | |
| | — | | | | 520,763 | | | | — | | | | — | | | | — | | | | — | | | | — | | | |
| | — | | | | 19,672,824 | | | | — | | | | — | | | | — | | | | — | | | | — | | | |
| | — | | | | — | | | | — | | | | — | | | | — | | | | — | | | | — | | | |
| | 199,052 | | | | — | | | | — | | | | — | | | | — | | | | — | | | | — | | | |
| | — | | | | — | | | | — | | | | — | | | | — | | | | — | | | | — | | | |
| | | | | | | | | | | | | | | | | | | | | | | | | | | | |
| | 332,163,255 | | | | 197,955,661 | | | | 67,091,209 | | | | 24,997,659 | | | | 145,037,888 | | | | 382,699,618 | | | | 436,453,839 | | | |
| | | | | | | | | | | | | | | | | | | | | | | | | | | | |
| | | | | | | |
| | | | | | | | | | | | | | | | | | | | | | | | | | | | |
| | — | | | | — | | | | — | | | | — | | | | — | | | | — | | | | — | | | |
| | — | | | | 18,519,790 | | | | — | | | | — | | | | — | | | | — | | | | — | | | |
| | — | | | | 4,581 | | | | — | | | | — | | | | — | | | | — | | | | — | | | |
| | 3,016 | | | | 2,152 | | | | 275 | | | | 97 | | | | 1,455 | | | | 1,392 | | | | 1,527 | | | |
| | | | | | | | | | | | | | | | | | | | | | | | | | | | |
| | 3,016 | | | | 18,526,523 | | | | 275 | | | | 97 | | | | 1,455 | | | | 1,392 | | | | 1,527 | | | |
| | | | | | | | | | | | | | | | | | | | | | | | | | | | |
| $ | 332,160,239 | | | $ | 179,429,138 | | | $ | 67,090,934 | | | $ | 24,997,562 | | | $ | 145,036,433 | | | $ | 382,698,226 | | | $ | 436,452,312 | | | |
| | | | | | | | | | | | | | | | | | | | | | | | | | | | |
| | 455,381,469 | | | | 88,731,653 | | | | 57,211,888 | | | | 23,662,197 | | | | 132,791,042 | | | | 328,925,184 | | | | 358,884,662 | | | |
| | | | | | | | | | | | | | | | | | | | | | | | | | | | |
| | $0.73 | | | | $2.02 | | | | $1.17 | | | | $1.06 | | | | $1.09 | | | | $1.16 | | | | $1.22 | | | |
| | | | | | | | | | | | | | | | | | | | | | | | | | | | |
| | | | | | | |
| | | | | | | | | | | | | | | | | | | | | | | | | | | | |
| $ | 342,974,613 | | | $ | 126,794,094 | | | $ | 61,231,477 | | | $ | 21,204,504 | | | $ | 119,221,613 | | | $ | 324,970,868 | | | $ | 365,393,459 | | | |
| | 13,802,080 | | | | 5,457,474 | | | | 1,417,706 | | | | 579,461 | | | | 3,360,634 | | | | 7,495,794 | | | | 7,530,298 | | | |
| (156,217 | ) | | | 24,804,369 | | | | 2,258,178 | | | | 1,800,565 | | | | 10,665,229 | | | | 17,583,059 | | | | 18,886,181 | | | |
| (24,460,237 | ) | | | 22,373,201 | | | | 2,183,573 | | | | 1,413,032 | | | | 11,788,957 | | | | 32,648,505 | | | | 44,642,374 | | | |
| | | | | | | | | | | | | | | | | | | | | | | | | | | | |
| $ | 332,160,239 | | | $ | 179,429,138 | | | $ | 67,090,934 | | | $ | 24,997,562 | | | $ | 145,036,433 | | | $ | 382,698,226 | | | $ | 436,452,312 | | | |
| | | | | | | | | | | | | | | | | | | | | | | | | | | | |
The accompanying notes are an integral part of these financial statements.
53
MUTUAL OF AMERICA INVESTMENT CORPORATION
STATEMENTS OF ASSETS AND LIABILITIES (Continued)
June 30, 2016 (Unaudited)
| | | | | | | | | | | | | | | | | | | | |
| | | 2030
Retirement
Fund | | | 2035
Retirement
Fund | | | 2040
Retirement
Fund | | | 2045
Retirement
Fund | | | 2050
Retirement
Fund | |
ASSETS: | | | | | | | | | | | | | | | | | | | | |
Investments at fair value | | | | | | | | | | | | | | | | | | | | |
(Cost: 2030 Retirement Fund — $318,022,381 | | | | | | | | | | | | | | | | | | | | |
2035 Retirement Fund — $266,012,843 | | | | | | | | | | | | | | | | | | | | |
2040 Retirement Fund — $215,957,553 | | | | | | | | | | | | | | | | | | | | |
2045 Retirement Fund — $251,481,032 | | | | | | | | | | | | | | | | | | | | |
2050 Retirement Fund — $119,892,423 | | | | | | | | | | | | | | | | | | | | |
Conservative Allocation Fund — $124,041,973 | | | | | | | | | | | | | | | | | | | | |
Moderate Allocation Fund — $285,062,551 | | | | | | | | | | | | | | | | | | | | |
Aggressive Allocation Fund — $206,729,177 | | | | | | | | | | | | | | | | | | | | |
Money Market Fund — $61,726,316 | | | | | | | | | | | | | | | | | | | | |
Mid-Term Bond Fund — $457,812,362 | | | | | | | | | | | | | | | | | | | | |
Bond Fund — $1,030,162,495) | | | | | | | | | | | | | | | | | | | | |
(Notes 1 and 3) | | $ | 356,833,142 | | | $ | 298,514,756 | | | $ | 242,511,639 | | | $ | 286,519,088 | | | $ | 120,289,336 | |
Cash | | | — | | | | — | | | | — | | | | — | | | | — | |
Interest and dividends receivable | | | — | | | | — | | | | — | | | | — | | | | — | |
Receivable for securities sold | | | — | | | | — | | | | — | | | | — | | | | — | |
Receivable for daily variation on future contracts | | | — | | | | — | | | | — | | | | — | | | | — | |
Shareholder subscriptions receivable | | | — | | | | — | | | | — | | | | — | | | | — | |
Other receivables | | | — | | | | — | | | | — | | | | — | | | | — | |
| | | | | | | | | | | | | | | | | | | | |
TOTAL ASSETS | | | 356,833,142 | | | | 298,514,756 | | | | 242,511,639 | | | | 286,519,088 | | | | 120,289,336 | |
| | | | | | | | | | | | | | | | | | | | |
| | | | | |
LIABILITIES: | | | | | | | | | | | | | | | | | | | | |
Due to custodian bank | | | — | | | | — | | | | — | | | | — | | | | — | |
Payable for securities purchased | | | — | | | | — | | | | — | | | | — | | | | — | |
Shareholder redemptions payable | | | — | | | | — | | | | — | | | | — | | | | — | |
Accrued expenses | | | 1,239 | | | | 1,029 | | | | 867 | | | | 1,004 | | | | 293 | |
| | | | | | | | | | | | | | | | | | | | |
TOTAL LIABILITIES | | | 1,239 | | | | 1,029 | | | | 867 | | | | 1,004 | | | | 293 | |
| | | | | | | | | | | | | | | | | | | | |
NET ASSETS | | $ | 356,831,903 | | | $ | 298,513,727 | | | $ | 242,510,772 | | | $ | 286,518,084 | | | $ | 120,289,043 | |
| | | | | | | | | | | | | | | | | | | | |
NUMBEROF SHARES OUTSTANDING (Note 4) | | | 286,304,792 | | | | 239,592,867 | | | | 196,658,278 | | | | 233,177,905 | | | | 86,200,478 | |
| | | | | | | | | | | | | | | | | | | | |
NET ASSET VALUES, offering and redemption price per share | | | $1.25 | | | | $1.25 | | | | $1.23 | | | | $1.23 | | | | $1.40 | |
| | | | | | | | | | | | | | | | | | | | |
| | | | | |
COMPONENTSOF NET ASSETS: | | | | | | | | | | | | | | | | | | | | |
Paid-in capital | | $ | 293,129,988 | | | $ | 244,338,297 | | | $ | 196,577,160 | | | $ | 229,353,240 | | | $ | 114,490,689 | |
Accumulated undistributed net investment income (loss) | | | 5,967,073 | | | | 4,653,592 | | | | 3,629,694 | | | | 4,323,009 | | | | 1,305,214 | |
Accumulated undistributed net realized gain (loss)
on investments and futures contracts | | | 18,924,081 | | | | 17,019,925 | | | | 15,749,832 | | | | 17,803,779 | | | | 4,096,227 | |
Net unrealized appreciation (depreciation)
of investments and futures contracts | | | 38,810,761 | | | | 32,501,913 | | | | 26,554,086 | | | | 35,038,056 | | | | 396,913 | |
| | | | | | | | | | | | | | | | | | | | |
NET ASSETS | | $ | 356,831,903 | | | $ | 298,513,727 | | | $ | 242,510,772 | | | $ | 286,518,084 | | | $ | 120,289,043 | |
| | | | | | | | | | | | | | | | | | | | |
The accompanying notes are an integral part of these financial statements.
54
| | | | | | | | | | | | | | | | | | | | | | | | |
Conservative
Allocation Fund | | | Moderate
Allocation
Fund | | | Aggressive
Allocation
Fund | | | Money
Market
Fund | | | Mid-Term
Bond Fund | | | Bond Fund | | | |
| | | | | | | | | | | | | | | | | | | | | | | | |
| | | | | | | | | | | | | | | | | | | | | | | | |
| | | | | | | | | | | | | | | | | | | | | | | | |
| | | | | | | | | | | | | | | | | | | | | | | | |
| | | | | | | | | | | | | | | | | | | | | | | | |
| | | | | | | | | | | | | | | | | | | �� | | | | | |
| | | | | | | | | | | | | | | | | | | | | | | | |
| | | | | | | | | | | | | | | | | | | | | | | | |
| | | | | | | | | | | | | | | | | | | | | | | | |
| | | | | | | | | | | | | | | | | | | | | | | | |
| | | | | | | | | | | | | | | | | | | | | | | | |
| | | | | | | | | | | | | | | | | | | | | | | | |
| | | | | | | | | | | | | | | | | | | | | | | | |
| $ | 131,909,136 | | | $ | 330,168,257 | | | $ | 252,468,212 | | | $ | 61,726,794 | | | $ | 468,687,952 | | | $ | 1,070,218,568 | | | |
| | — | | | | — | | | | — | | | | 208,398 | | | | 8,163,673 | | | | 2,479,552 | | | |
| | — | | | | — | | | | — | | | | — | | | | 2,989,719 | | | | 7,734,051 | | | |
| | — | | | | — | | | | — | | | | — | | | | — | | | | 2,814 | | | |
| | — | | | | — | | | | — | | | | — | | | | — | | | | — | | | |
| | — | | | | — | | | | — | | | | — | | | | 164,407 | | | | — | | | |
| | — | | | | — | | | | — | | | | — | | | | 5,496 | | | | — | | | |
| | | | | | | | | | | | | | | | | | | | | | | | |
| | 131,909,136 | | | | 330,168,257 | | | | 252,468,212 | | | | 61,935,192 | | | | 480,011,247 | | | | 1,080,434,985 | | | |
| | | | | | | | | | | | | | | | | | | | | | | | |
| | | | | | |
| | | | | | | | | | | | | | | | | | | | | | | | |
| | — | | | | — | | | | — | | | | — | | | | — | | | | — | | | |
| | — | | | | — | | | | — | | | | — | | | | 8,129,703 | | | | 6,505,848 | | | |
| | — | | | | — | | | | — | | | | 185,023 | | | | — | | | | 242,910 | | | |
| | 117 | | | | 215 | | | | 176 | | | | 985 | | | | — | | | | 14,654 | | | |
| | | | | | | | | | | | | | | | | | | | | | | | |
| | 117 | | | | 215 | | | | 176 | | | | 186,008 | | | | 8,129,703 | | | | 6,763,412 | | | |
| | | | | | | | | | | | | | | | | | | | | | | | |
| $ | 131,909,019 | | | $ | 330,168,042 | | | $ | 252,468,036 | | | $ | 61,749,184 | | | $ | 471,881,544 | | | $ | 1,073,671,573 | | | |
| | | | | | | | | | | | | | | | | | | | | | | | |
| | 105,484,314 | | | | 224,356,138 | | | | 151,538,193 | | | | 51,616,858 | | | | 437,095,058 | | | | 718,220,506 | | | |
| | | | | | | | | | | | | | | | | | | | | | | | |
| | $1.25 | | | | $1.47 | | | | $1.67 | | | | $1.20 | | | | $1.08 | | | | $1.49 | | | |
| | | | | | | | | | | | | | | | | | | | | | | | |
| | | | | | |
| | | | | | | | | | | | | | | | | | | | | | | | |
| $ | 116,840,928 | | | $ | 264,029,113 | | | $ | 185,122,287 | | | $ | 61,714,677 | | | $ | 441,799,039 | | | $ | 984,413,634 | | | |
| | 3,062,120 | | | | 7,136,729 | | | | 5,034,207 | | | | 35,685 | | | | 17,805,824 | | | | 45,400,426 | | | |
| 4,138,808 | | | | 13,896,494 | | | | 16,572,507 | | | | (1,656 | ) | | | 1,401,091 | | | | 3,801,440 | | | |
| 7,867,163 | | | | 45,105,706 | | | | 45,739,035 | | | | 478 | | | | 10,875,590 | | | | 40,056,073 | | | |
| | | | | | | | | | | | | | | | | | | | | | | | |
| $ | 131,909,019 | | | $ | 330,168,042 | | | $ | 252,468,036 | | | $ | 61,749,184 | | | $ | 471,881,544 | | | $ | 1,073,671,573 | | | |
| | | | | | | | | | | | | | | | | | | | | | | | |
The accompanying notes are an integral part of these financial statements.
55
MUTUAL OF AMERICA INVESTMENT CORPORATION
STATEMENTS OF OPERATIONS
For the Six Months Ended June 30, 2016 (Unaudited)
| | | | | | | | | | | | | | | | | | | | |
| |
|
Equity Index
Fund |
| |
| All America
Fund |
| |
| Small Cap
Value Fund |
| |
|
Small Cap
Growth Fund |
| |
| Mid Cap
Value Fund |
|
INVESTMENT INCOMEAND EXPENSES: | | | | | | | | | | | | | | | | | | | | |
INCOME: | | | | | | | | | | | | | | | | | | | | |
Dividends | | $ | 20,495,055 | | | $ | 2,871,282 | | | $ | 3,827,702 | | | $ | 1,483,252 | | | $ | 849,371 | |
Interest | | | 97,536 | | | | 9,876 | | | | 28,634 | | | | 35,339 | | | | 4,627 | |
| | | | | | | | | | | | | | | | | | | | |
Total income | | | 20,592,591 | | | | 2,881,158 | | | | 3,856,336 | | | | 1,518,591 | | | | 853,998 | |
| | | | | | | | | | | | | | | | | | | | |
| | | | | |
EXPENSES: | | | | | | | | | | | | | | | | | | | | |
Investment advisory fees (Note 2) | | | 687,024 | | | | 558,581 | | | | 1,373,715 | | | | 1,391,584 | | | | 218,188 | |
Other operating expenses: | | | | | | | | | | | | | | | | | | | | |
Accounting and recordkeeping expenses | | | 187,918 | | | | 55,057 | | | | 39,342 | | | | 41,371 | | | | 12,429 | |
Shareholders reports | | | 8,724 | | | | 10,505 | | | | 8,726 | | | | 9,029 | | | | 7,688 | |
Custodian expenses | | | 30,993 | | | | 35,321 | | | | 6,999 | | | | 8,488 | | | | 4,138 | |
Independent directors’ fees and expenses | | | 70,530 | | | | 10,836 | | | | 14,312 | | | | 15,003 | | | | 3,424 | �� |
Audit | | | 29,734 | | | | 10,445 | | | | 9,423 | | | | 10,184 | | | | 3,300 | |
Legal and Compliance | | | 50,725 | | | | 17,818 | | | | 16,075 | | | | 17,374 | | | | 5,631 | |
Administrative | | | 170,883 | | | | 26,253 | | | | 34,679 | | | | 36,351 | | | | 8,296 | |
Licenses | | | 32,241 | | | | 2,972 | | | | — | | | | — | | | | — | |
Other | | | 28,742 | | | | 4,416 | | | | 5,833 | | | | 6,114 | | | | 1,395 | |
| | | | | | | | | | | | | | | | | | | | |
Total operating expenses | | | 610,490 | | | | 173,623 | | | | 135,389 | | | | 143,914 | | | | 46,301 | |
| | | | | | | | | | | | | | | | | | | | |
Total expenses before reimbursement | | | 1,297,514 | | | | 732,204 | | | | 1,509,104 | | | | 1,535,498 | | | | 264,489 | |
Fee waiver and expense reimbursement (Note 2) | | | — | | | | — | | | | — | | | | — | | | | — | |
| | | | | | | | | | | | | | | | | | | | |
Net Expenses | | | 1,297,514 | | | | 732,204 | | | | 1,509,104 | | | | 1,535,498 | | | | 264,489 | |
| | | | | | | | | | | | | | | | | | | | |
Net Investment Income (Loss) | | | 19,295,077 | | | | 2,148,954 | | | | 2,347,232 | | | | (16,907 | ) | | | 589,509 | |
| | | | | | | | | | | | | | | | | | | | |
NET REALIZEDAND UNREALIZED GAIN (LOSS)ON INVESTMENTSAND
FUTURES CONTRACTS (Note 1): | | | | | | | | | | | | | | | | | | | | |
Net realized gain (loss) on: | | | | | | | | | | | | | | | | | | | | |
Investment securities | | | 21,230,382 | | | | 27,625,097 | | | | 6,604,366 | | | | (4,845,544 | ) | | | 1,036,094 | |
Futures contracts | | | 845,833 | | | | (35,267 | ) | | | — | | | | — | | | | — | |
| | | | | | | | | | | | | | | | | | | | |
| | | 22,076,215 | | | | 27,589,830 | | | | 6,604,366 | | | | (4,845,544 | ) | | | 1,036,094 | |
| | | | | | | | | | | | | | | | | | | | |
Change in net unrealized appreciation (depreciation) of: | | | | | | | | | | | | | | | | | | | | |
Investment securities | | | 28,454,117 | | | | (22,813,642 | ) | | | 3,927,025 | | | | 116,780 | | | | 1,939,317 | |
Futures contracts | | | 340,227 | | | | 40,619 | | | | — | | | | — | | | | — | |
| | | | | | | | | | | | | | | | | | | | |
| | | 28,794,344 | | | | (22,773,023 | ) | | | 3,927,025 | | | | 116,780 | | | | 1,939,317 | |
| | | | | | | | | | | | | | | | | | | | |
NET REALIZEDAND UNREALIZED GAIN (LOSS)ON INVESTMENTSAND
FUTURES CONTRACTS | | | 50,870,559 | | | | 4,816,807 | | | | 10,531,391 | | | | (4,728,764 | ) | | | 2,975,411 | |
| | | | | | | | | | | | | | | | | | | | |
NET INCREASE (DECREASE)IN NET ASSETS RESULTINGFROM OPERATIONS | | $ | 70,165,636 | | | $ | 6,965,761 | | | $ | 12,878,623 | | | $ | (4,745,671 | ) | | $ | 3,564,920 | |
| | | | | | | | | | | | | | | | | | | | |
| (a) | The Retirement and Allocation Funds incur direct investment management expenses of .05% and .00%, respectively. Certain operating expenses that can be attributed only to the Retirement and Allocation Funds were charged directly to those Funds, subject to the Adviser’s agreement to reimburse direct non-advisory operating expenses of any such Fund whose average daily net assets for the prior calendar year was less than $50 million. The Retirement and Allocation Funds will also continue to bear their pro-rata share of the non-advisory operating expenses borne by each of the underlying Funds in which they invest. |
The accompanying notes are an integral part of these financial statements.
56
| | | | | | | | | | | | | | | | | | | | | | | | | | | | | | | | |
Mid-Cap
Equity Index
Fund | | | International
Fund | | | Composite
Fund | | | Retirement
Income
Fund | | | 2010
Retirement
Fund | | | 2015
Retirement
Fund | | | 2020
Retirement
Fund | | | 2025
Retirement
Fund | | | |
| | | | | | | | | | | | | | | | | | | | | | | | | | | | | | | | |
| | | | | | | | | | | | | | | | | | | | | | | | | | | | | | | | |
| $ | 8,167,320 | | | $ | 6,341,566 | | | $ | 1,016,888 | | | $ | — | | | $ | — | | | $ | — | | | $ | — | | | $ | — | | | |
| | 74,010 | | | | 13,676 | | | | 1,236,899 | | | | — | | | | — | | | | — | | | | — | | | | — | | | |
| | | | | | | | | | | | | | | | | | | | | | | | | | | | | | | | |
| | 8,241,330 | | | | 6,355,242 | | | | 2,253,787 | | | | — | | | | — | | | | — | | | | — | | | | — | | | |
| | | | | | | | | | | | | | | | | | | | | | | | | | | | | | | | |
| | | | | | | | |
| | | | | | | | | | | | | | | | | | | | | | | | | | | | | | | | |
| | 368,118 | | | | 116,842 | | | | 350,372 | | | | 16,038 | (a) | | | 6,200 | (a) | | | 35,643 | (a) | | | 90,414 | (a) | | | 100,677 | (a) | | |
| | | | | | | | | | | | | | | | | | | | | | | | | | | | | | | | |
| | 104,900 | | | | 26,427 | | | | 33,932 | | | | — | (a) | | | — | (a) | | | — | (a) | | | — | (a) | | | — | (a) | | |
| | 8,622 | | | | 6,516 | | | | 9,979 | | | | 6,915 | (a) | | | 7,267 | (a) | | | 7,751 | (a) | | | 7,127 | (a) | | | 6,936 | (a) | | |
| | 36,701 | | | | 2,494 | | | | 12,925 | | | | — | (a) | | | — | (a) | | | — | (a) | | | — | (a) | | | — | (a) | | |
| | 37,809 | | | | 10,720 | | | | 7,385 | | | | — | (a) | | | — | (a) | | | — | (a) | | | — | (a) | | | — | (a) | | |
| | 19,328 | | | | 833 | | | | 7,118 | | | | 2,415 | (a) | | | 978 | (a) | | | 6,216 | (a) | | | 14,507 | (a) | | | 15,716 | (a) | | |
| | 32,973 | | | | 1,420 | | | | 12,143 | | | | 2,946 | (a) | | | 1,194 | (a) | | | 7,583 | (a) | | | 17,698 | (a) | | | 19,172 | (a) | | |
| | 91,604 | | | | 25,973 | | | | 17,892 | | | | — | (a) | | | — | (a) | | | — | (a) | | | — | (a) | | | — | (a) | | |
| | 17,283 | | | | — | | | | — | | | | — | (a) | | | — | (a) | | | — | (a) | | | — | (a) | | | — | (a) | | |
| | 15,407 | | | | 4,368 | | | | 3,009 | | | | — | (a) | | | — | (a) | | | — | (a) | | | — | (a) | | | — | (a) | | |
| | | | | | | | | | | | | | | | | | | | | | | | | | | | | | | | |
| | 364,627 | | | | 78,751 | | | | 104,383 | | | | 12,276 | | | | 9,439 | | | | 21,550 | | | | 39,332 | | | | 41,824 | | | |
| | | | | | | | | | | | | | | | | | | | | | | | | | | | | | | | |
| | 732,745 | | | | 195,593 | | | | 454,755 | | | | 28,314 | | | | 15,639 | | | | 57,193 | | | | 129,746 | | | | 142,501 | | | |
| | — | | | | — | | | | — | | | | — | | | | (9,439 | ) | | | — | | | | — | | | | — | | | |
| | | | | | | | | | | | | | | | | | | | | | | | | | | | | | | | |
| | 732,745 | | | | 195,593 | | | | 454,755 | | | | 28,314 | | | | 6,200 | | | | 57,193 | | | | 129,746 | | | | 142,501 | | | |
| | | | | | | | | | | | | | | | | | | | | | | | | | | | | | | | |
| | 7,508,585 | | | | 6,159,649 | | | | 1,799,032 | | | | (28,314 | ) | | | (6,200 | ) | | | (57,193 | ) | | | (129,746 | ) | | | (142,501 | ) | | |
| | | | | | | | | | | | | | | | | | | | | | | | | | | | | | | | |
| | | | | | | | | | | | | | | | | | | | | | | | | | | | | | | | |
| | | | | | | | | | | | | | | | | | | | | | | | | | | | | | | | |
| | 52,032,554 | | | | 1,581,452 | | | | 16,675,805 | | | | 138,642 | | | | 388,260 | | | | 1,769,595 | | | | 2,996,169 | | | | 2,281,943 | | | |
| | 2,930,531 | | | | — | | | | — | | | | — | | | | — | | | | — | | | | — | | | | — | | | |
| | | | | | | | | | | | | | | | | | | | | | | | | | | | | | | | |
| | 54,963,085 | | | | 1,581,452 | | | | 16,675,805 | | | | 138,642 | | | | 388,260 | | | | 1,769,595 | | | | 2,996,169 | | | | 2,281,943 | | | |
| | | | | | | | | | | | | | | | | | | | | | | | | | | | | | | | |
| | | | | | | | | | | | | | | | | | | | | | | | | | | | | | | | |
| | 13,823,921 | | | | (15,168,727 | ) | | | (12,890,094 | ) | | | 2,915,523 | | | | 724,784 | | | | 4,524,280 | | | | 12,469,084 | | | | 15,233,495 | | | |
| | 293,510 | | | | — | | | | — | | | | — | | | | — | | | | — | | | | — | | | | — | | | |
| | | | | | | | | | | | | | | | | | | | | | | | | | | | | | | | |
| | 14,117,431 | | | | (15,168,727 | ) | | | (12,890,094 | ) | | | 2,915,523 | | | | 724,784 | | | | 4,524,280 | | | | 12,469,084 | | | | 15,233,495 | | | |
| | | | | | | | | | | | | | | | | | | | | | | | | | | | | | | | |
| 69,080,516 | | | | (13,587,275 | ) | | | 3,785,711 | | | | 3,054,165 | | | | 1,113,044 | | | | 6,293,875 | | | | 15,465,253 | | | | 17,515,438 | | | |
| | | | | | | | | | | | | | | | | | | | | | | | | | | | | | | | |
| $ | 76,589,101 | | | $ | (7,427,626 | ) | | $ | 5,584,743 | | | $ | 3,025,851 | | | $ | 1,106,844 | | | $ | 6,236,682 | | | $ | 15,335,507 | | | $ | 17,372,937 | | | |
| | | | | | | | | | | | | | | | | | | | | | | | | | | | | | | | |
The accompanying notes are an integral part of these financial statements.
57
MUTUAL OF AMERICA INVESTMENT CORPORATION
STATEMENTS OF OPERATIONS (Continued)
For the Six Months Ended June 30, 2016 (Unaudited)
| | | | | | | | | | | | | | | | |
| | | 2030
Retirement
Fund | | | 2035
Retirement
Fund | | | 2040
Retirement
Fund | | | 2045
Retirement
Fund | |
INVESTMENT INCOMEAND EXPENSES: | | | | | | | | | | | | | | | | |
INCOME: | | | | | | | | | | | | | | | | |
Dividends | | $ | — | | | $ | — | | | $ | — | | | $ | — | |
Interest | | | — | | | | — | | | | — | | | | — | |
| | | | | | | | | | | | | | | | |
Total income | | | — | | | | — | | | | — | | | | — | |
| | | | | | | | | | | | | | | | |
| | | | |
EXPENSES: | | | | | | | | | | | | | | | | |
Investment advisory fees (Note 2) | | | 82,848 | (a) | | | 68,708 | (a) | | | 56,081 | (a) | | | 66,478 | (a) |
Other operating expenses: | | | | | | | | | | | | | | | | |
Accounting and recordkeeping expenses | | | — | (a) | | | — | (a) | | | — | (a) | | | — | (a) |
Shareholders reports | | | 6,746 | (a) | | | 6,790 | (a) | | | 6,875 | (a) | | | 6,889 | (a) |
Custodian expenses | | | — | (a) | | | — | (a) | | | — | (a) | | | — | (a) |
Independent directors’ fees and expenses | | | — | (a) | | | — | (a) | | | — | (a) | | | — | (a) |
Audit | | | 13,211 | (a) | | | 11,031 | (a) | | | 9,121 | (a) | | | 10,828 | (a) |
Legal and Compliance | | | 16,117 | (a) | | | 13,457 | (a) | | | 11,127 | (a) | | | 13,210 | (a) |
Administrative | | | — | (a) | | | — | (a) | | | — | (a) | | | — | (a) |
Licenses | | | — | (a) | | | — | (a) | | | — | (a) | | | — | (a) |
Other | | | — | (a) | | | — | (a) | | | — | (a) | | | — | (a) |
| | | | | | | | | | | | | | | | |
Total operating expenses | | | 36,074 | | | | 31,278 | | | | 27,123 | | | | 30,927 | |
| | | | | | | | | | | | | | | | |
Total expenses before reimbursement | | | 118,922 | | | | 99,986 | | | | 83,204 | | | | 97,405 | |
Fee waiver and expense reimbursement (Note 2) | | | — | | | | — | | | | — | | | | — | |
| | | | | | | | | | | | | | | | |
Net Expenses | | | 118,922 | | | | 99,986 | | | | 83,204 | | | | 97,405 | |
| | | | | | | | | | | | | | | | |
Net Investment Income (Loss) | | | (118,922 | ) | | | (99,986 | ) | | | (83,204 | ) | | | (97,405 | ) |
| | | | | | | | | | | | | | | | |
NET REALIZEDAND UNREALIZED GAIN (LOSS)ON INVESTMENTSAND FUTURES CONTRACTS (Note 1): | | | | | | | | | | | | | | | | |
Net realized gain (loss) on: | | | | | | | | | | | | | | | | |
Investment securities | | | 2,951,405 | | | | 2,157,407 | | | | 2,449,769 | | | | 2,049,359 | |
Futures contracts | | | — | | | | — | | | | — | | | | — | |
| | | | | | | | | | | | | | | | |
| | | 2,951,405 | | | | 2,157,407 | | | | 2,449,769 | | | | 2,049,359 | |
| | | | | | | | | | | | | | | | |
Change in net unrealized appreciation (depreciation) of: | | | | | | | | | | | | | | | | |
Investment securities | | | 11,206,936 | | | | 9,179,196 | | | | 6,361,307 | | | | 7,805,785 | |
Futures contracts | | | — | | | | — | | | | — | | | | — | |
| | | | | | | | | | | | | | | | |
| | | 11,206,936 | | | | 9,179,196 | | | | 6,361,307 | | | | 7,805,785 | |
| | | | | | | | | | | | | | | | |
NET REALIZEDAND UNREALIZED GAIN (LOSS)ON INVESTMENTSAND FUTURES CONTRACTS | | | 14,158,341 | | | | 11,336,603 | | | | 8,811,076 | | | | 9,855,144 | |
| | | | | | | | | | | | | | | | |
NET INCREASE (DECREASE)IN NET ASSETS RESULTINGFROM OPERATIONS | | $ | 14,039,419 | | | $ | 11,236,617 | | | $ | 8,727,872 | | | $ | 9,757,739 | |
| | | | | | | | | | | | | | | | |
| (a) | The Retirement and Allocation Funds incur direct investment management expenses of .05% and .00%, respectively. Certain operating expenses that can be attributed only to the Retirement and Allocation Funds were charged directly to those Funds, subject to the Adviser’s agreement to reimburse direct non-advisory operating expenses of any such Fund whose average daily net assets for the prior calendar year was less than $50 million. The Retirement and Allocation Funds will also continue to bear their pro-rata share of the non-advisory operating expenses borne by each of the underlying Funds in which they invest. |
The accompanying notes are an integral part of these financial statements.
58
| | | | | | | | | | | | | | | | | | | | | | | | | | | | |
2050
Retirement
Fund | | | Conservative
Allocation
Fund | | | Moderate
Allocation
Fund | | | Aggressive
Allocation
Fund | | | Money
Market
Fund | | | Mid-Term
Bond Fund | | | Bond Fund | | | |
| | | | | | | | | | | | | | | | | | | | | | | | | | | | |
| | | | | | | | | | | | | | | | | | | | | | | | | | | | |
| $ | — | | | $ | — | | | $ | — | | | $ | — | | | $ | — | | | $ | — | | | $ | — | | | |
| | — | | | | — | | | | — | | | | — | | | | 124,123 | | | | 6,739,218 | | | | 18,485,987 | | | |
| | | | | | | | | | | | | | | | | | | | | | | | | | | | |
| | — | | | | — | | | | — | | | | — | | | | 124,123 | | | | 6,739,218 | | | | 18,485,987 | | | |
| | | | | | | | | | | | | | | | | | | | | | | | | | | | |
| | | | | | | |
| | | | | | | | | | | | | | | | | | | | | | | | | | | | |
| | 25,800 | (a) | | | — | (a) | | | — | (a) | | | — | (a) | | | 47,494 | | | | 910,819 | | | | 2,002,582 | | | |
| | | | | | | | | | | | | | | | | | | | | | | | | | | | |
| | — | (a) | | | — | (a) | | | — | (a) | | | — | (a) | | | 8,708 | | | | 50,477 | | | | 113,894 | | | |
| | 6,043 | (a) | | | 7,182 | (a) | | | 7,169 | (a) | | | 7,345 | (a) | | | 7,561 | | | | 9,046 | | | | 10,666 | | | |
| | — | (a) | | | — | (a) | | | — | (a) | | | — | (a) | | | 7,740 | | | | 4,315 | | | | 13,843 | | | |
| | — | (a) | | | — | (a) | | | — | (a) | | | — | (a) | | | 2,690 | | | | 17,135 | | | | 37,856 | | | |
| | 3,603 | (a) | | | 5,526 | (a) | | | 13,106 | (a) | | | 10,387 | (a) | | | 2,451 | | | | 6,892 | | | | 14,985 | | | |
| | 4,395 | (a) | | | 6,743 | (a) | | | 15,989 | (a) | | | 12,671 | (a) | | | 4,181 | | | | 11,756 | | | | 25,562 | | | |
| | — | (a) | | | — | (a) | | | — | (a) | | | — | (a) | | | 6,517 | | | | 41,515 | | | | 91,719 | | | |
| | — | (a) | | | — | (a) | | | — | (a) | | | — | (a) | | | — | | | | — | | | | — | | | |
| | — | (a) | | | — | (a) | | | — | (a) | | | — | (a) | | | 1,096 | | | | 6,983 | | | | 15,427 | | | |
| | | | | | | | | | | | | | | | | | | | | | | | | | | | |
| | 14,041 | | | | 19,451 | | | | 36,264 | | | | 30,403 | | | | 40,944 | | | | 148,119 | | | | 323,952 | | | |
| | | | | | | | | | | | | | | | | | | | | | | | | | | | |
| | 39,841 | | | | 19,451 | | | | 36,264 | | | | 30,403 | | | | 88,438 | | | | 1,058,938 | | | | 2,326,534 | | | |
| | — | | | | — | | | | — | | | | — | | | | — | | | | — | | | | — | | | |
| | | | | | | | | | | | | | | | | | | | | | | | | | | | |
| | 39,841 | | | | 19,451 | | | | 36,264 | | | | 30,403 | | | | 88,438 | | | | 1,058,938 | | | | 2,326,534 | | | |
| | | | | | | | | | | | | | | | | | | | | | | | | | | | |
| | (39,841 | ) | | | (19,451 | ) | | | (36,264 | ) | | | (30,403 | ) | | | 35,685 | | | | 5,680,280 | | | | 16,159,453 | | | |
| | | | | | | | | | | | | | | | | | | | | | | | | | | | |
| | | | | | | | | | | | | | | | | | | | | | | | | | | | |
| | | | | | | | | | | | | | | | | | | | | | | | | | | | |
| | 345,198 | | | | 624,451 | | | | 2,960,824 | | | | 4,619,837 | | | | (214 | ) | | | 704,510 | | | | 2,209,928 | | | |
| | — | | | | — | | | | — | | | | — | | | | — | | | | — | | | | — | | | |
| | | | | | | | | | | | | | | | | | | | | | | | | | | | |
| | 345,198 | | | | 624,451 | | | | 2,960,824 | | | | 4,619,837 | | | | (214 | ) | | | 704,510 | | | | 2,209,928 | | | |
| | | | | | | | | | | | | | | | | | | | | | | | | | | | |
| | | | | | | | | | | | | | | | | | | | | | | | | | | | |
| | 3,886,937 | | | | 5,083,425 | | | | 11,023,338 | | | | 4,823,284 | | | | (607 | ) | | | 13,509,869 | | | | 42,694,331 | | | |
| | — | | | | — | | | | — | | | | — | | | | — | | | | — | | | | — | | | |
| | | | | | | | | | | | | | | | | | | | | | | | | | | | |
| | 3,886,937 | | | | 5,083,425 | | | | 11,023,338 | | | | 4,823,284 | | | | (607 | ) | | | 13,509,869 | | | | 42,694,331 | | | |
| | | | | | | | | | | | | | | | | | | | | | | | | | | | |
| | 4,232,135 | | | | 5,707,876 | | | | 13,984,162 | | | | 9,443,121 | | | | (821 | ) | | | 14,214,379 | | | | 44,904,259 | | | |
| | | | | | | | | | | | | | | | | | | | | | | | | | | | |
| $ | 4,192,294 | | | $ | 5,688,425 | | | $ | 13,947,898 | | | $ | 9,412,718 | | | $ | 34,864 | | | $ | 19,894,659 | | | $ | 61,063,712 | | | |
| | | | | | | | | | | | | | | | | | | | | | | | | | | | |
The accompanying notes are an integral part of these financial statements.
59
MUTUAL OF AMERICA INVESTMENT CORPORATION
STATEMENTS OF CHANGES IN NET ASSETS
| | | | | | | | | | | | | | | | |
| | | Equity Index Fund | | | All America Fund | |
| | | For the
Six Months
Ended
June 30,
2016
(Unaudited) | | | For the
Year Ended
December 31,
2015 | | | For the
Six Months
Ended
June 30,
2016
(Unaudited) | | | For the
Year Ended
December 31,
2015 | |
INCREASE (DECREASE)IN NET ASSETS: | | | | | | | | | | | | | | | | |
FROM OPERATIONS: | | | | | | | | | | | | | | | | |
Net investment income (loss) | | $ | 19,295,077 | | | $ | 35,259,619 | | | $ | 2,148,954 | | | $ | 4,112,031 | |
Net realized gain (loss) on investments and futures contracts | | | 22,076,215 | | | | 37,927,338 | | | | 27,589,830 | | | | 16,404,603 | |
Change in net unrealized appreciation (depreciation) of investments and futures contracts | | | 28,794,344 | | | | (50,421,811 | ) | | | (22,773,023 | ) | | | (20,193,366 | ) |
| | | | | | | | | | | | | | | | |
NET INCREASE (DECREASE)IN NET ASSETS RESULTINGFROM OPERATIONS | | | 70,165,636 | | | | 22,765,146 | | | | 6,965,761 | | | | 323,268 | |
| | | | | | | | | | | | | | | | |
| | | | |
DISTRIBUTIONS (Notes 1 and 5) | | | | | | | | | | | | | | | | |
From net investment income | | | — | | | | (29,188,647 | ) | | | — | | | | (4,193,905 | ) |
From net realized gains | | | — | | | | (65,074,652 | ) | | | — | | | | (19,549,735 | ) |
| | | | | | | | | | | | | | | | |
Total distributions | | | — | | | | (94,263,299 | ) | | | — | | | | (23,743,640 | ) |
| | | | | | | | | | | | | | | | |
| | | | |
CAPITAL SHARE TRANSACTIONS (Note 4): | | | | | | | | | | | | | | | | |
Net proceeds from sale of shares | | | 85,820,144 | | | | 204,460,581 | | | | 1,977,065 | | | | 4,787,618 | |
Dividends reinvested | | | — | | | | 94,263,299 | | | | — | | | | 23,743,640 | |
Cost of shares redeemed | | | (64,854,137 | ) | | | (162,113,848 | ) | | | (14,976,151 | ) | | | (34,496,884 | ) |
| | | | | | | | | | | | | | | | |
NET INCREASE (DECREASE)IN NET ASSETSFROM CAPITAL SHARE TRANSACTIONS | | | 20,966,007 | | | | 136,610,032 | | | | (12,999,086 | ) | | | (5,965,626 | ) |
| | | | | | | | | | | | | | | | |
INCREASE (DECREASE)IN NET ASSETS | | | 91,131,643 | | | | 65,111,879 | | | | (6,033,325 | ) | | | (29,385,998 | ) |
NET ASSETS, BEGINNINGOF PERIOD | | | 1,854,222,243 | | | | 1,789,110,364 | | | | 294,797,125 | | | | 324,183,123 | |
| | | | | | | | | | | | | | | | |
NET ASSETS, ENDOF PERIOD | | $ | 1,945,353,886 | | | $ | 1,854,222,243 | | | $ | 288,763,800 | | | $ | 294,797,125 | |
| | | | | | | | | | | | | | | | |
ACCUMULATED UNDISTRIBUTED NET INVESTMENT INCOME (LOSS) | | $ | 53,446,851 | | | $ | 34,349,119 | | | $ | 6,029,550 | | | $ | 3,873,755 | |
| | | | | | | | | | | | | | | | |
| | | | |
OTHER INFORMATION: | | | | | | | | | | | | | | | | |
Shares outstanding at the beginning of period | | | 568,528,724 | | | | 524,974,834 | | | | 132,899,216 | | | | 134,209,249 | |
| | | | | | | | | | | | | | | | |
Shares sold | | | 26,463,611 | | | | 60,445,948 | | | | 919,668 | | | | 1,997,801 | |
Shares issued as reinvestment of dividends | | | — | | | | 30,604,709 | | | | — | | | | 11,136,977 | |
Shares redeemed | | | (20,167,491 | ) | | | (47,496,767 | ) | | | (6,852,925 | ) | | | (14,444,811 | ) |
| | | | | | | | | | | | | | | | |
Net increase (decrease) | | | 6,296,120 | | | | 43,553,890 | | | | (5,933,257 | ) | | | (1,310,033 | ) |
| | | | | | | | | | | | | | | | |
Shares outstanding at the end of period | | | 574,824,844 | | | | 568,528,724 | | | | 126,965,959 | | | | 132,899,216 | |
| | | | | | | | | | | | | | | | |
The accompanying notes are an integral part of these financial statements.
60
| | | | | | | | | | | | | | | | | | | | | | | | | | | | | | | | |
| Small Cap Value Fund | | | Small Cap Growth Fund | | | Mid Cap Value Fund | | | Mid-Cap Equity Index Fund | | | |
For the
Six Months
Ended
June 30,
2016
(Unaudited) | | | For the
Year Ended
December 31,
2015 | | | For the
Six Months
Ended
June 30,
2016
(Unaudited) | | | For the
Year Ended
December 31,
2015 | | | For the
Six Months
Ended
June 30,
2016
(Unaudited) | | | For the
Year Ended
December 31,
2015 | | | For the
Six Months
Ended
June 30,
2016
(Unaudited) | | | For the
Year Ended
December 31,
2015 | | | |
| | | | | | | | | | | | | | | | | | | | | | | | | | | | | | | | |
| | | | | | | | | | | | | | | | | | | | | | | | | | | | | | | | |
| $ | 2,347,232 | | | $ | 4,461,545 | | | $ | (16,907 | ) | | $ | (496,788 | ) | | $ | 589,509 | | | $ | 1,301,152 | | | $ | 7,508,585 | | | $ | 14,666,361 | | | |
| | 6,604,366 | | | | 6,017,598 | | | | (4,845,544 | ) | | | 39,518,825 | | | | 1,036,094 | | | | 4,517,447 | | | | 54,963,085 | | | | 71,340,246 | | | |
| | | | | | | | |
| | 3,927,025 | | | | (23,441,857 | ) | | | 116,780 | | | | (49,504,619 | ) | | | 1,939,317 | | | | (8,503,711 | ) | | | 14,117,431 | | | | (109,187,366 | ) | | |
| | | | | | | | | | | | | | | | | | | | | | | | | | | | | | | | |
| | 12,878,623 | | | | (12,962,714 | ) | | | (4,745,671 | ) | | | (10,482,582 | ) | | | 3,564,920 | | | | (2,685,112 | ) | | | 76,589,101 | | | | (23,180,759 | ) | | |
| | | | | | | | | | | | | | | | | | | | | | | | | | | | | | | | |
| | | | | | | | |
| | | | | | | | | | | | | | | | | | | | | | | | | | | | | | | | |
| | — | | | | (3,251,696 | ) | | | — | | | | — | | | | — | | | | (944,993 | ) | | | — | | | | (11,340,680 | ) | | |
| | — | | | | (23,962,528 | ) | | | — | | | | (50,286,630 | ) | | | — | | | | (5,149,406 | ) | | | — | | | | (62,570,149 | ) | | |
| | | | | | | | | | | | | | | | | | | | | | | | | | | | | | | | |
| | — | | | | (27,214,224 | ) | | | — | | | | (50,286,630 | ) | | | — | | | | (6,094,399 | ) | | | — | | | | (73,910,829 | ) | | |
| | | | | | | | | | | | | | | | | | | | | | | | | | | | | | | | |
| | | | | | | | |
| | | | | | | | | | | | | | | | | | | | | | | | | | | | | | | | |
| | 12,366,796 | | | | 27,883,451 | | | | 15,823,534 | | | | 44,124,233 | | | | 3,527,544 | | | | 7,424,648 | | | | 56,699,765 | | | | 98,724,678 | | | |
| | — | | | | 27,214,224 | | | | — | | | | 50,286,630 | | | | — | | | | 6,094,399 | | | | — | | | | 73,910,829 | | | |
| | (12,881,364 | ) | | | (31,909,045 | ) | | | (17,530,862 | ) | | | (44,366,736 | ) | | | (3,529,515 | ) | | | (15,537,986 | ) | | | (39,064,852 | ) | | | (98,775,032 | ) | | |
| | | | | | | | | | | | | | | | | | | | | | | | | | | | | | | | |
| | (514,568 | ) | | | 23,188,630 | | | | (1,707,328 | ) | | | 50,044,127 | | | | (1,971 | ) | | | (2,018,939 | ) | | | 17,634,913 | | | | 73,860,475 | | | |
| | | | | | | | | | | | | | | | | | | | | | | | | | | | | | | | |
| | 12,364,055 | | | | (16,988,308 | ) | | | (6,452,999 | ) | | | (10,725,085 | ) | | | 3,562,949 | | | | (10,798,450 | ) | | | 94,224,014 | | | | (23,231,113 | ) | | |
| | 376,468,234 | | | | 393,456,542 | | | | 401,623,957 | | | | 412,349,042 | | | | 81,529,507 | | | | 92,327,957 | | | | 977,397,477 | | | | 1,000,628,590 | | | |
| | | | | | | | | | | | | | | | | | | | | | | | | | | | | | | | |
| $ | 388,832,289 | | | $ | 376,468,234 | | | $ | 395,170,958 | | | $ | 401,623,957 | | | $ | 85,092,456 | | | $ | 81,529,507 | | | $ | 1,071,621,491 | | | $ | 977,397,477 | | | |
| | | | | | | | | | | | | | | | | | | | | | | | | | | | | | | | |
| $ | 6,213,963 | | | $ | 4,084,760 | | | $ | — | | | $ | — | | | $ | 1,714,955 | | | $ | 1,149,851 | | | $ | 20,912,154 | | | $ | 13,506,294 | | | |
| | | | | | | | | | | | | | | | | | | | | | | | | | | | | | | | |
| | | | | | | | |
| | | | | | | | | | | | | | | | | | | | | | | | | | | | | | | | |
| | 261,696,017 | | | | 244,764,120 | | | | 304,121,411 | | | | 268,125,197 | | | | 55,990,109 | | | | 56,753,645 | | | | 501,311,878 | | | | 462,801,870 | | | |
| | | | | | | | | | | | | | | | | | | | | | | | | | | | | | | | |
| | 8,765,854 | | | | 17,874,943 | | | | 12,812,644 | | | | 28,422,542 | | | | 2,423,923 | | | | 4,647,065 | | | | 28,502,327 | | | | 46,010,863 | | | |
| | — | | | | 19,225,751 | | | | — | | | | 36,898,275 | | | | — | | | | 4,252,622 | | | | — | | | | 37,933,784 | | | |
| | (9,067,645 | ) | | | (20,168,797 | ) | | | (14,017,884 | ) | | | (29,324,603 | ) | | | (2,490,642 | ) | | | (9,663,223 | ) | | | (20,065,890 | ) | | | (45,434,639 | ) | | |
| | | | | | | | | | | | | | | | | | | | | | | | | | | | | | | | |
| | (301,791 | ) | | | 16,931,897 | | | | (1,205,240 | ) | | | 35,996,214 | | | | (66,719 | ) | | | (763,536 | ) | | | 8,436,437 | | | | 38,510,008 | | | |
| | | | | | | | | | | | | | | | | | | | | | | | | | | | | | | | |
| | 261,394,226 | | | | 261,696,017 | | | | 302,916,171 | | | | 304,121,411 | | | | 55,923,390 | | | | 55,990,109 | | | | 509,748,315 | | | | 501,311,878 | | | |
| | | | | | | | | | | | | | | | | | | | | | | | | | | | | | | | |
The accompanying notes are an integral part of these financial statements.
61
MUTUAL OF AMERICA INVESTMENT CORPORATION
STATEMENTS OF CHANGES IN NET ASSETS (Continued)
| | | | | | | | | | | | | | | | |
| | | International Fund | | | Composite Fund | |
| | | For the
Six Months
Ended
June 30,
2016
(Unaudited) | | | For the
Year Ended
December 31,
2015 | | | For the
Six Months
Ended
June 30,
2016
(Unaudited) | | | For the
Year Ended
December 31,
2015 | |
INCREASE (DECREASE)IN NET ASSETS: | | | | | | | | | | | | | | | | |
FROM OPERATIONS: | | | | | | | | | | | | | | | | |
Net investment income (loss) | | $ | 6,159,649 | | | $ | 7,642,431 | | | $ | 1,799,032 | | | $ | 3,663,278 | |
Net realized gain (loss) on investments and futures contracts | | | 1,581,452 | | | | 507 | | | | 16,675,805 | | | | 8,731,574 | |
Change in net unrealized appreciation (depreciation) of investments and futures contracts | | | (15,168,727 | ) | | | (12,251,849 | ) | | | (12,890,094 | ) | | | (10,775,925 | ) |
| | | | | | | | | | | | | | | | |
NET INCREASE (DECREASE)IN NET ASSETS RESULTINGFROM OPERATIONS | | | (7,427,626 | ) | | | (4,608,911 | ) | | | 5,584,743 | | | | 1,618,927 | |
| | | | | | | | | | | | | | | | |
DISTRIBUTIONS (Notes 1 and 5) | | | | | | | | | | | | | | | | |
From net investment income | | | — | | | | (8,132,055 | ) | | | — | | | | (3,937,658 | ) |
From net realized gains | | | — | | | | (101,057 | ) | | | — | | | | (1,373,297 | ) |
| | | | | | | | | | | | | | | | |
Total distributions | | | — | | | | (8,233,112 | ) | | | — | | | | (5,310,955 | ) |
| | | | | | | | | | | | | | | | |
CAPITAL SHARE TRANSACTIONS (Note 4): | | | | | | | | | | | | | | | | |
Net proceeds from sale of shares | | | 29,064,844 | | | | 75,820,430 | | | | 3,249,830 | | | | 6,788,566 | |
Dividends reinvested | | | — | | | | 8,233,112 | | | | — | | | | 5,310,955 | |
Cost of shares redeemed | | | (8,896,712 | ) | | | (15,625,361 | ) | | | (9,319,683 | ) | | | (22,318,528 | ) |
| | | | | | | | | | | | | | | | |
NET INCREASE (DECREASE)IN NET ASSETSFROM CAPITAL SHARE TRANSACTIONS | | | 20,168,132 | | | | 68,428,181 | | | | (6,069,853 | ) | | | (10,219,007 | ) |
| | | | | | | | | | | | | | | | |
INCREASE (DECREASE)IN NET ASSETS | | | 12,740,506 | | | | 55,586,158 | | | | (485,110 | ) | | | (13,911,035 | ) |
NET ASSETS, BEGINNINGOF PERIOD | | | 319,419,733 | | | | 263,833,575 | | | | 179,914,248 | | | | 193,825,283 | |
| | | | | | | | | | | | | | | | |
NET ASSETS, ENDOF PERIOD | | $ | 332,160,239 | | | $ | 319,419,733 | | | $ | 179,429,138 | | | $ | 179,914,248 | |
| | | | | | | | | | | | | | | | |
ACCUMULATED UNDISTRIBUTED NET INVESTMENT INCOME (LOSS) | | $ | 13,802,080 | | | $ | 7,642,431 | | | $ | 5,457,474 | | | $ | 3,658,946 | |
| | | | | | | | | | | | | | | | |
OTHER INFORMATION: | | | | | | | | | | | | | | | | |
Shares outstanding at the beginning of period | | | 427,541,926 | | | | 341,369,894 | | | | 91,853,422 | | | | 96,812,141 | |
| | | | | | | | | | | | | | | | |
Shares sold | | | 40,170,447 | | | | 94,702,675 | | | | 1,665,961 | | | | 3,377,546 | |
Shares issued as reinvestment of dividends | | | — | | | | 11,091,742 | | | | — | | | | 2,786,254 | |
Shares redeemed | | | (12,330,904 | ) | | | (19,622,385 | ) | | | (4,787,730 | ) | | | (11,122,519 | ) |
| | | | | | | | | | | | | | | | |
Net increase (decrease) | | | 27,839,543 | | | | 86,172,032 | | | | (3,121,769 | ) | | | (4,958,719 | ) |
| | | | | | | | | | | | | | | | |
Shares outstanding at the end of period | | | 455,381,469 | | | | 427,541,926 | | | | 88,731,653 | | | | 91,853,422 | |
| | | | | | | | | | | | | | | | |
The accompanying notes are an integral part of these financial statements.
62
| | | | | | | | | | | | | | | | | | | | | | | | | | | | | | | | |
| Retirement Income Fund | | | 2010 Retirement Fund | | | 2015 Retirement Fund | | | 2020 Retirement Fund | | | |
For the
Six Months
Ended
June 30,
2016
(Unaudited) | | | For the
Year Ended
December 31,
2015 | | | For the
Six Months
Ended
June 30,
2016
(Unaudited) | | | For the
Year Ended
December 31,
2015 | | | For the
Six Months
Ended
June 30,
2016
(Unaudited) | | | For the
Year Ended
December 31,
2015 | | | For the
Six Months
Ended
June 30,
2016
(Unaudited) | | | For the
Year Ended
December 31,
2015 | | | |
| | | | | | | | | | | | | | | | | | | | | | | | | | | | | | | | |
| | | | | | | | | | | | | | | | | | | | | | | | | | | | | | | | |
| $ | (28,314 | ) | | $ | 1,376,527 | | | $ | (6,200 | ) | | $ | 556,007 | | | $ | (57,193 | ) | | $ | 3,205,193 | | | $ | (129,746 | ) | | $ | 7,109,898 | | | |
| | 138,642 | | | | 2,259,915 | | | | 388,260 | | | | 1,450,104 | | | | 1,769,595 | | | | 9,360,361 | | | | 2,996,169 | | | | 15,854,789 | | | |
| | | | | | | | |
| | 2,915,523 | | | | (3,452,698 | ) | | | 724,784 | | | | (1,915,105 | ) | | | 4,524,280 | | | | (12,144,914 | ) | | | 12,469,084 | | | | (23,312,046 | ) | | |
| | | | | | | | | | | | | | | | | | | | | | | | | | | | | | | | |
| | 3,025,851 | | | | 183,744 | | | | 1,106,844 | | | | 91,006 | | | | 6,236,682 | | | | 420,640 | | | | 15,335,507 | | | | (347,359 | ) | | |
| | | | | | | | | | | | | | | | | | | | | | | | | | | | | | | | |
| | | | | | | | | | | | | | | | | | | | | | | | | | | | | | | | |
| | — | | | | (1,043,642 | ) | | | — | | | | (553,391 | ) | | | — | | | | (3,145,220 | ) | | | — | | | | (5,971,939 | ) | | |
| | — | | | | (1,507,057 | ) | | | — | | | | (1,342,011 | ) | | | — | | | | (8,330,888 | ) | | | — | | | | (14,219,639 | ) | | |
| | | | | | | | | | | | | | | | | | | | | | | | | | | | | | | | |
| | — | | | | (2,550,699 | ) | | | — | | | | (1,895,402 | ) | | | — | | | | (11,476,108 | ) | | | — | | | | (20,191,578 | ) | | |
| | | | | | | | | | | | | | | | | | | | | | | | | | | | | | | | |
| | | | | | | | | | | | | | | | | | | | | | | | | | | | | | | | |
| | 5,679,349 | | | | 24,013,651 | | | | 1,874,802 | | | | 4,789,683 | | | | 4,358,812 | | | | 21,012,564 | | | | 18,753,065 | | | | 70,945,700 | | | |
| | — | | | | 2,550,699 | | | | — | | | | 1,895,402 | | | | — | | | | 11,476,108 | | | | — | | | | 20,191,578 | | | |
| | (5,103,990 | ) | | | (14,242,810 | ) | | | (3,546,110 | ) | | | (5,876,669 | ) | | | (14,320,153 | ) | | | (26,833,644 | ) | | | (14,988,625 | ) | | | (27,041,015 | ) | | |
| | | | | | | | | | | | | | | | | | | | | | | | | | | | | | | | |
| | 575,359 | | | | 12,321,540 | | | | (1,671,308 | ) | | | 808,416 | | | | (9,961,341 | ) | | | 5,655,028 | | | | 3,764,440 | | | | 64,096,263 | | | |
| | | | | | | | | | | | | | | | | | | | | | | | | | | | | | | | |
| | 3,601,210 | | | | 9,954,585 | | | | (564,464 | ) | | | (995,980 | ) | | | (3,724,659 | ) | | | (5,400,440 | ) | | | 19,099,947 | | | | 43,557,326 | | | |
| | 63,489,724 | | | | 53,535,139 | | | | 25,562,026 | | | | 26,558,006 | | | | 148,761,092 | | | | 154,161,532 | | | | 363,598,279 | | | | 320,040,953 | | | |
| | | | | | | | | | | | | | | | | | | | | | | | | | | | | | | | |
| $ | 67,090,934 | | | $ | 63,489,724 | | | $ | 24,997,562 | | | $ | 25,562,026 | | | $ | 145,036,433 | | | $ | 148,761,092 | | | $ | 382,698,226 | | | $ | 363,598,279 | | | |
| | | | | | | | | | | | | | | | | | | | | | | | | | | | | | | | |
| $ | 1,417,706 | | | $ | 1,417,706 | | | $ | 579,461 | | | $ | 579,461 | | | $ | 3,360,634 | | | $ | 3,360,634 | | | $ | 7,495,794 | | | $ | 7,495,794 | | | |
| | | | | | | | | | | | | | | | | | | | | | | | | | | | | | | | |
| | | | | | | | | | | | | | | | | | | | | | | | | | | | | | | | |
| | 56,717,917 | | | | 46,045,385 | | | | 25,303,663 | | | | 24,456,165 | | | | 142,339,770 | | | | 136,513,695 | | | | 325,767,231 | | | | 270,183,637 | | | |
| | | | | | | | | | | | | | | | | | | | | | | | | | | | | | | | |
| | 5,006,066 | | | | 20,666,143 | | | | 1,840,470 | | | | 4,464,838 | | | | 4,102,872 | | | | 18,812,865 | | | | 16,643,802 | | | | 60,145,525 | | | |
| | — | | | | 2,293,417 | | | | — | | | | 1,895,626 | | | | — | | | | 11,117,706 | | | | — | | | | 18,386,686 | | | |
| | (4,512,095 | ) | | | (12,287,028 | ) | | | (3,481,936 | ) | | | (5,512,966 | ) | | | (13,651,600 | ) | | | (24,104,496 | ) | | | (13,485,849 | ) | | | (22,948,617 | ) | | |
| | | | | | | | | | | | | | | | | | | | | | | | | | | | | | | | |
| | 493,971 | | | | 10,672,532 | | | | (1,641,466 | ) | | | 847,498 | | | | (9,548,728 | ) | | | 5,826,075 | | | | 3,157,953 | | | | 55,583,594 | | | |
| | | | | | | | | | | | | | | | | | | | | | | | | | | | | | | | |
| | 57,211,888 | | | | 56,717,917 | | | | 23,662,197 | | | | 25,303,663 | | | | 132,791,042 | | | | 142,339,770 | | | | 328,925,184 | | | | 325,767,231 | | | |
| | | | | | | | | | | | | | | | | | | | | | | | | | | | | | | | |
The accompanying notes are an integral part of these financial statements.
63
MUTUAL OF AMERICA INVESTMENT CORPORATION
STATEMENTS OF CHANGES IN NET ASSETS (Continued)
| | | | | | | | | | | | | | | | |
| | | 2025 Retirement Fund | | | 2030 Retirement Fund | |
| | | For the
Six Months
Ended
June 30,
2016
(Unaudited) | | | For the
Year Ended
December 31,
2015 | | | For the
Six Months
Ended
June 30,
2016
(Unaudited) | | | For the
Year Ended
December 31,
2015 | |
INCREASE (DECREASE)IN NET ASSETS: | | | | | | | | | | | | | | | | |
FROM OPERATIONS: | | | | | | | | | | | | | | | | |
Net investment income (loss) | | $ | (142,501 | ) | | $ | 7,016,193 | | | $ | (118,922 | ) | | $ | 5,515,774 | |
Net realized gain (loss) on investments and futures contracts | | | 2,281,943 | | | | 18,034,836 | | | | 2,951,405 | | | | 17,057,812 | |
Change in net unrealized appreciation (depreciation) of investments and futures contracts | | | 15,233,495 | | | | (26,452,633 | ) | | | 11,206,936 | | | | (23,904,450 | ) |
| | | | | | | | | | | | | | | | |
NET INCREASE (DECREASE)IN NET ASSETS RESULTINGFROM OPERATIONS | | | 17,372,937 | | | | (1,401,604 | ) | | | 14,039,419 | | | | (1,330,864 | ) |
| | | | | | | | | | | | | | | | |
| | | | |
DISTRIBUTIONS (Notes 1 and 5) | | | | | | | | | | | | | | | | |
From net investment income | | | — | | | | (5,804,497 | ) | | | — | | | | (4,662,610 | ) |
From net realized gains | | | — | | | | (12,670,849 | ) | | | — | | | | (11,054,574 | ) |
| | | | | | | | | | | | | | | | |
Total distributions | | | — | | | | (18,475,346 | ) | | | — | | | | (15,717,184 | ) |
| | | | | | | | | | | | | | | | |
| | | | |
CAPITAL SHARE TRANSACTIONS (Note 4): | | | | | | | | | | | | | | | | |
Net proceeds from sale of shares | | | 31,064,454 | | | | 82,443,284 | | | | 22,030,505 | | | | 68,504,048 | |
Dividends reinvested | | | — | | | | 18,475,346 | | | | — | | | | 15,717,184 | |
Cost of shares redeemed | | | (7,943,350 | ) | | | (16,173,335 | ) | | | (7,285,352 | ) | | | (16,185,115 | ) |
| | | | | | | | | | | | | | | | |
NET INCREASE (DECREASE)IN NET ASSETSFROM CAPITAL SHARE TRANSACTIONS | | | 23,121,104 | | | | 84,745,295 | | | | 14,745,153 | | | | 68,036,117 | |
| | | | | | | | | | | | | | | | |
INCREASE (DECREASE)IN NET ASSETS | | | 40,494,041 | | | | 64,868,345 | | | | 28,784,572 | | | | 50,988,069 | |
NET ASSETS, BEGINNINGOF PERIOD | | | 395,958,271 | | | | 331,089,926 | | | | 328,047,331 | | | | 277,059,262 | |
| | | | | | | | | | | | | | | | |
NET ASSETS, ENDOF PERIOD | | $ | 436,452,312 | | | $ | 395,958,271 | | | $ | 356,831,903 | | | $ | 328,047,331 | |
| | | | | | | | | | | | | | | | |
ACCUMULATED UNDISTRIBUTED NET INVESTMENT INCOME (LOSS) | | $ | 7,530,298 | | | $ | 7,530,298 | | | $ | 5,967,073 | | | $ | 5,967,073 | |
| | | | | | | | | | | | | | | | |
| | | | |
OTHER INFORMATION: | | | | | | | | | | | | | | | | |
Shares outstanding at the beginning of period | | | 339,214,646 | | | | 268,929,635 | | | | 273,996,553 | | | | 218,780,055 | |
| | | | | | | | | | | | | | | | |
Shares sold | | | 26,568,555 | | | | 67,229,996 | | | | 18,469,341 | | | | 54,499,347 | |
Shares issued as reinvestment of dividends | | | — | | | | 16,139,959 | �� | | | — | | | | 13,413,210 | |
Shares redeemed | | | (6,898,539 | ) | | | (13,084,944 | ) | | | (6,161,102 | ) | | | (12,696,059 | ) |
| | | | | | | | | | | | | | | | |
Net increase (decrease) | | | 19,670,016 | | | | 70,285,011 | | | | 12,308,239 | | | | 55,216,498 | |
| | | | | | | | | | | | | | | | |
Shares outstanding at the end of period | | | 358,884,662 | | | | 339,214,646 | | | | 286,304,792 | | | | 273,996,553 | |
| | | | | | | | | | | | | | | | |
The accompanying notes are an integral part of these financial statements.
64
| | | | | | | | | | | | | | | | | | | | | | | | | | | | | | | | |
| 2035 Retirement Fund | | | 2040 Retirement Fund | | | 2045 Retirement Fund | | | 2050 Retirement Fund | | | |
For the
Six Months
Ended
June 30,
2016
(Unaudited) | | | For the
Year Ended
December 31,
2015 | | | For the
Six Months
Ended
June 30,
2016
(Unaudited) | | | For the
Year Ended
December 31,
2015 | | | For the
Six Months
Ended
June 30,
2016
(Unaudited) | | | For the
Year Ended
December 31,
2015 | | | For the
Six Months
Ended
June 30,
2016
(Unaudited) | | | For the
Year Ended
December 31,
2015 | | | |
| | | | | | | | | | | | | | | | | | | | | | | | | | | | | | | | |
| | | | | | | | | | | | | | | | | | | | | | | | | | | | | | | | |
| $ | (99,986 | ) | | $ | 4,252,445 | | | $ | (83,204 | ) | | $ | 3,284,944 | | | $ | (97,405 | ) | | $ | 3,928,537 | | | $ | (39,841 | ) | | $ | 1,187,955 | | | |
| | 2,157,407 | | | | 15,875,085 | | | | 2,449,769 | | | | 13,971,726 | | | | 2,049,359 | | | | 16,640,145 | | | | 345,198 | | | | 3,869,216 | | | |
| | | | | | | | |
| | 9,179,196 | | | | (21,741,597 | ) | | | 6,361,307 | | | | (19,277,737 | ) | | | 7,805,785 | | | | (23,075,308 | ) | | | 3,886,937 | | | | (6,445,213 | ) | | |
| | | | | | | | | | | | | | | | | | | | | | | | | | | | | | | | |
| | 11,236,617 | | | | (1,614,067 | ) | | | 8,727,872 | | | | (2,021,067 | ) | | | 9,757,739 | | | | (2,506,626 | ) | | | 4,192,294 | | | | (1,388,042 | ) | | |
| | | | | | | | | | | | | | | | | | | | | | | | | | | | | | | | |
| | | | | | | | |
| | | | | | | | | | | | | | | | | | | | | | | | | | | | | | | | |
| | — | | | | (3,637,561 | ) | | | — | | | | (2,857,782 | ) | | | — | | | | (3,540,101 | ) | | | — | | | | (592,908 | ) | | |
| | — | | | | (8,709,705 | ) | | | — | | | | (7,858,679 | ) | | | — | | | | (9,449,171 | ) | | | — | | | | (1,150,118 | ) | | |
| | | | | | | | | | | | | | | | | | | | | | | | | | | | | | | | |
| | — | | | | (12,347,266 | ) | | | — | | | | (10,716,461 | ) | | | — | | | | (12,989,272 | ) | | | — | | | | (1,743,026 | ) | | |
| | | | | | | | | | | | | | | | | | | | | | | | | | | | | | | | |
| | | | | | | | |
| | | | | | | | | | | | | | | | | | | | | | | | | | | | | | | | |
| | 21,247,009 | | | | 55,367,374 | | | | 15,420,403 | | | | 45,547,857 | | | | 16,941,944 | | | | 43,558,908 | | | | 23,736,266 | | | | 47,515,756 | | | |
| | — | | | | 12,347,266 | | | | — | | | | 10,716,461 | | | | — | | | | 12,989,272 | | | | — | | | | 1,743,026 | | | |
| | (5,284,592 | ) | | | (12,291,501 | ) | | | (3,541,854 | ) | | | (10,232,468 | ) | | | (4,731,774 | ) | | | (8,607,985 | ) | | | (1,534,125 | ) | | | (2,444,022 | ) | | |
| | | | | | | | | | | | | | | | | | | | | | | | | | | | | | | | |
| | 15,962,417 | | | | 55,423,139 | | | | 11,878,549 | | | | 46,031,850 | | | | 12,210,170 | | | | 47,940,195 | | | | 22,202,141 | | | | 46,814,760 | | | |
| | | | | | | | | | | | | | | | | | | | | | | | | | | | | | | | |
| | 27,199,034 | | | | 41,461,806 | | | | 20,606,421 | | | | 33,294,322 | | | | 21,967,909 | | | | 32,444,297 | | | | 26,394,435 | | | | 43,683,692 | | | |
| | 271,314,693 | | | | 229,852,887 | | | | 221,904,351 | | | | 188,610,029 | | | | 264,550,175 | | | | 232,105,878 | | | | 93,894,608 | | | | 50,210,916 | | | |
| | | | | | | | | | | | | | | | | | | | | | | | | | | | | | | | |
| $ | 298,513,727 | | | $ | 271,314,693 | | | $ | 242,510,772 | | | $ | 221,904,351 | | | $ | 286,518,084 | | | $ | 264,550,175 | | | $ | 120,289,043 | | | $ | 93,894,608 | | | |
| | | | | | | | | | | | | | | | | | | | | | | | | | | | | | | | |
| $ | 4,653,592 | | | $ | 4,653,592 | | | $ | 3,629,694 | | | $ | 3,629,694 | | | $ | 4,323,009 | | | $ | 4,323,009 | | | $ | 1,305,214 | | | $ | 1,305,214 | | | |
| | | | | | | | | | | | | | | | | | | | | | | | | | | | | | | | |
| | | | | | | | |
| | | | | | | | | | | | | | | | | | | | | | | | | | | | | | | | |
| | 226,218,710 | | | | 181,398,047 | | | | 186,547,652 | | | | 149,253,147 | | | | 222,683,482 | | | | 183,851,790 | | | | 69,495,056 | | | | 36,041,942 | | | |
| | | | | | | | | | | | | | | | | | | | | | | | | | | | | | | | |
| | 17,833,108 | | | | 43,936,915 | | | | 13,135,439 | | | | 36,160,229 | | | | 14,480,865 | | | | 34,477,445 | | | | 17,829,176 | | | | 33,863,211 | | | |
| | — | | | | 10,525,529 | | | | — | | | | 9,186,890 | | | | — | | | | 11,149,772 | | | | — | | | | 1,315,493 | | | |
| | (4,458,951 | ) | | | (9,641,781 | ) | | | (3,024,813 | ) | | | (8,052,614 | ) | | | (3,986,442 | ) | | | (6,795,525 | ) | | | (1,123,754 | ) | | | (1,725,590 | ) | | |
| | | | | | | | | | | | | | | | | | | | | | | | | | | | | | | | |
| | 13,374,157 | | | | 44,820,663 | | | | 10,110,626 | | | | 37,294,505 | | | | 10,494,423 | | | | 38,831,692 | | | | 16,705,422 | | | | 33,453,114 | | | |
| | | | | | | | | | | | | | | | | | | | | | | | | | | | | | | | |
| | 239,592,867 | | | | 226,218,710 | | | | 196,658,278 | | | | 186,547,652 | | | | 233,177,905 | | | | 222,683,482 | | | | 86,200,478 | | | | 69,495,056 | | | |
| | | | | | | | | | | | | | | | | | | | | | | | | | | | | | | | |
The accompanying notes are an integral part of these financial statements.
65
MUTUAL OF AMERICA INVESTMENT CORPORATION
STATEMENTS OF CHANGES IN NET ASSETS (Continued)
| | | | | | | | | | | | | | | | |
| | | Conservative Allocation Fund | | | Moderate Allocation Fund | |
| | | For the
Six Months
Ended
June 30,
2016
(Unaudited) | | | For the
Year Ended
December 31,
2015 | | | For the
Six Months
Ended
June 30,
2016
(Unaudited) | | | For the
Year Ended
December 31,
2015 | |
INCREASE (DECREASE)IN NET ASSETS: | | | | | | | | | | | | | | | | |
FROM OPERATIONS: | | | | | | | | | | | | | | | | |
Net investment income (loss) | | $ | (19,451 | ) | | $ | 2,969,049 | | | $ | (36,264 | ) | | $ | 6,722,983 | |
Net realized gain (loss) on investments and futures contracts | | | 624,451 | | | | 3,665,869 | | | | 2,960,824 | | | | 17,367,764 | |
Change in net unrealized appreciation (depreciation) of investments and futures contracts | | | 5,083,425 | | | | (6,166,634 | ) | | | 11,023,338 | | | | (23,664,759 | ) |
| | | | | | | | | | | | | | | | |
NET INCREASE (DECREASE)IN NET ASSETS RESULTINGFROM OPERATIONS | | | 5,688,425 | | | | 468,284 | | | | 13,947,898 | | | | 425,988 | |
| | | | | | | | | | | | | | | | |
| | | | |
DISTRIBUTIONS (Notes 1 and 5) | | | | | | | | | | | | | | | | |
From net investment income | | | — | | | | (2,608,918 | ) | | | — | | | | (6,514,098 | ) |
From net realized gains | | | — | | | | (3,800,636 | ) | | | — | | | | (15,635,475 | ) |
| | | | | | | | | | | | | | | | |
Total distributions | | | — | | | | (6,409,554 | ) | | | — | | | | (22,149,573 | ) |
| | | | | | | | | | | | | | | | |
| | | | |
CAPITAL SHARE TRANSACTIONS (Note 4): | | | | | | | | | | | | | | | | |
Net proceeds from sale of shares | | | 5,989,631 | | | | 19,677,859 | | | | 10,361,570 | | | | 24,101,254 | |
Dividends reinvested | | | — | | | | 6,409,554 | | | | — | | | | 22,149,573 | |
Cost of shares redeemed | | | (7,531,970 | ) | | | (14,906,335 | ) | | | (10,291,960 | ) | | | (23,584,888 | ) |
| | | | | | | | | | | | | | | | |
NET INCREASE (DECREASE)IN NET ASSETSFROM CAPITAL SHARE TRANSACTIONS | | | (1,542,339 | ) | | | 11,181,078 | | | | 69,610 | | | | 22,665,939 | |
| | | | | | | | | | | | | | | | |
INCREASE (DECREASE)IN NET ASSETS | | | 4,146,086 | | | | 5,239,808 | | | | 14,017,508 | | | | 942,354 | |
NET ASSETS, BEGINNINGOF PERIOD | | | 127,762,933 | | | | 122,523,125 | | | | 316,150,534 | | | | 315,208,180 | |
| | | | | | | | | | | | | | | | |
NET ASSETS, ENDOF PERIOD | | $ | 131,909,019 | | | $ | 127,762,933 | | | $ | 330,168,042 | | | $ | 316,150,534 | |
| | | | | | | | | | | | | | | | |
ACCUMULATED UNDISTRIBUTED NET INVESTMENT INCOME (LOSS) | | $ | 3,062,120 | | | $ | 3,062,120 | | | $ | 7,136,729 | | | $ | 7,136,729 | |
| | | | | | | | | | | | | | | | |
| | | | |
OTHER INFORMATION: | | | | | | | | | | | | | | | | |
Shares outstanding at the beginning of period | | | 106,833,345 | | | | 97,670,821 | | | | 224,315,530 | | | | 208,049,805 | |
| | | | | | | | | | | | | | | | |
Shares sold | | | 4,932,977 | | | | 15,752,829 | | | | 7,337,883 | | | | 16,033,248 | |
Shares issued as reinvestment of dividends | | | — | | | | 5,414,572 | | | | — | | | | 16,001,333 | |
Shares redeemed | | | (6,282,008 | ) | | | (12,004,877 | ) | | | (7,297,275 | ) | | | (15,768,856 | ) |
| | | | | | | | | | | | | | | | |
Net increase (decrease) | | | (1,349,031 | ) | | | 9,162,524 | | | | 40,608 | | | | 16,265,725 | |
| | | | | | | | | | | | | | | | |
Shares outstanding at the end of period | | | 105,484,314 | | | | 106,833,345 | | | | 224,356,138 | | | | 224,315,530 | |
| | | | | | | | | | | | | | | | |
The accompanying notes are an integral part of these financial statements.
66
| | | | | | | | | | | | | | | | | | | | | | | | | | | | | | | | |
| Aggressive Allocation Fund | | | Money Market Fund | | | Mid-Term Bond Fund | | | Bond Fund | | | |
For the
Six Months
Ended
June 30,
2016
(Unaudited) | | | For the
Year Ended
December 31,
2015 | | | For the
Six Months
Ended
June 30,
2016
(Unaudited) | | | For the
Year Ended
December 31,
2015 | | | For the
Six Months
Ended
June 30,
2016
(Unaudited) | | | For the
Year Ended
December 31,
2015 | | | For the
Six Months
Ended
June 30,
2016
(Unaudited) | | | For the
Year Ended
December 31,
2015 | | | |
| | | | | | | | | | | | | | | | | | | | | | | | | | | | | | | | |
| | | | | | | | | | | | | | | | | | | | | | | | | | | | | | | | |
| $ | (30,403 | ) | | $ | 4,650,678 | | | $ | 35,685 | | | $ | (80,292 | ) | | $ | 5,680,280 | | | $ | 12,125,546 | | | $ | 16,159,453 | | | $ | 29,240,973 | | | |
| | 4,619,837 | | | | 16,729,039 | | | | (214 | ) | | | (1,442 | ) | | | 704,510 | | | | 696,581 | | | | 2,209,928 | | | | 1,591,512 | | | |
| | | | | | | | |
| | 4,823,284 | | | | (22,197,912 | ) | | | (607 | ) | | | (3,287 | ) | | | 13,509,869 | | | | (10,264,191 | ) | | | 42,694,331 | | | | (28,238,502 | ) | | |
| | | | | | | | | | | | | | | | | | | | | | | | | | | | | | | | |
| | 9,412,718 | | | | (818,195 | ) | | | 34,864 | | | | (85,021 | ) | | | 19,894,659 | | | | 2,557,936 | | | | 61,063,712 | | | | 2,593,983 | | | |
| | | | | | | | | | | | | | | | | | | | | | | | | | | | | | | | |
| | | | | | | | |
| | | | | | | | | | | | | | | | | | | | | | | | | | | | | | | | |
| | — | | | | (4,669,780 | ) | | | — | | | | — | | | | — | | | | (10,593,944 | ) | | | — | | | | (31,506,309 | ) | | |
| | — | | | | (16,880,272 | ) | | | — | | | | — | | | | — | | | | (1,564,411 | ) | | | — | | | | (1,601,325 | ) | | |
| | | | | | | | | | | | | | | | | | | | | | | | | | | | | | | | |
| | — | | | | (21,550,052 | ) | | | — | | | | — | | | | — | | | | (12,158,355 | ) | | | — | | | | (33,107,634 | ) | | |
| | | | | | | | | | | | | | | | | | | | | | | | | | | | | | | | |
| | | | | | | | |
| | | | | | | | | | | | | | | | | | | | | | | | | | | | | | | | |
| | 4,035,380 | | | | 11,577,351 | | | | 4,012,899 | | | | 8,953,288 | | | | 22,179,985 | | | | 64,053,401 | | | | 49,188,144 | | | | 130,055,610 | | | |
| | — | | | | 21,550,052 | | | | — | | | | — | | | | — | | | | 12,158,355 | | | | — | | | | 33,107,634 | | | |
| | (9,702,693 | ) | | | (16,836,727 | ) | | | (8,978,996 | ) | | | (19,666,616 | ) | | | (22,279,442 | ) | | | (49,758,493 | ) | | | (43,217,185 | ) | | | (81,894,490 | ) | | |
| | | | | | | | | | | | | | | | | | | | | | | | | | | | | | | | |
| | (5,667,313 | ) | | | 16,290,676 | | | | (4,966,097 | ) | | | (10,713,328 | ) | | | (99,457 | ) | | | 26,453,263 | | | | 5,970,959 | | | | 81,268,754 | | | |
| | | | | | | | | | | | | | | | | | | | | | | | | | | | | | | | |
| | 3,745,405 | | | | (6,077,571 | ) | | | (4,931,233 | ) | | | (10,798,349 | ) | | | 19,795,202 | | | | 16,852,844 | | | | 67,034,671 | | | | 50,755,103 | | | |
| | 248,722,631 | | | | 254,800,202 | | | | 66,680,417 | | | | 77,478,766 | | | | 452,086,342 | | | | 435,233,498 | | | | 1,006,636,902 | | | | 955,881,799 | | | |
| | | | | | | | | | | | | | | | | | | | | | | | | | | | | | | | |
| $ | 252,468,036 | | | $ | 248,722,631 | | | $ | 61,749,184 | | | $ | 66,680,417 | | | $ | 471,881,544 | | | $ | 452,086,342 | | | $ | 1,073,671,573 | | | $ | 1,006,636,902 | | | |
| | | | | | | | | | | | | | | | | | | | | | | | | | | | | | | | |
| $ | 5,034,207 | | | $ | 5,034,207 | | | $ | 35,685 | | | $ | — | | | $ | 17,805,824 | | | $ | 12,125,544 | | | $ | 45,400,426 | | | $ | 29,240,973 | | | |
| | | | | | | | | | | | | | | | | | | | | | | | | | | | | | | | |
| | | | | | | | |
| | | | | | | | | | | | | | | | | | | | | | | | | | | | | | | | |
| | 155,044,805 | | | | 144,356,850 | | | | 55,769,535 | | | | 64,724,065 | | | | 437,295,485 | | | | 412,252,911 | | | | 714,259,784 | | | | 658,106,501 | | | |
| | | | | | | | | | | | | | | | | | | | | | | | | | | | | | | | |
| | 2,555,728 | | | | 6,683,214 | | | | 3,355,470 | | | | 7,484,706 | | | | 20,990,528 | | | | 60,357,557 | | | | 33,850,400 | | | | 89,271,323 | | | |
| | — | | | | 13,692,231 | | | | — | | | | — | | | | — | | | | 11,691,052 | | | | — | | | | 23,327,458 | | | |
| | (6,062,340 | ) | | | (9,687,490 | ) | | | (7,508,147 | ) | | | (16,439,236 | ) | | | (21,190,955 | ) | | | (47,006,035 | ) | | | (29,889,678 | ) | | | (56,445,498 | ) | | |
| | | | | | | | | | | | | | | | | | | | | | | | | | | | | | | | |
| | (3,506,612 | ) | | | 10,687,955 | | | | (4,152,677 | ) | | | (8,954,530 | ) | | | (200,427 | ) | | | 25,042,574 | | | | 3,960,722 | | | | 56,153,283 | | | |
| | | | | | | | | | | | | | | | | | | | | | | | | | | | | | | | |
| | 151,538,193 | | | | 155,044,805 | | | | 51,616,858 | | | | 55,769,535 | | | | 437,095,058 | | | | 437,295,485 | | | | 718,220,506 | | | | 714,259,784 | | | |
| | | | | | | | | | | | | | | | | | | | | | | | | | | | | | | | |
The accompanying notes are an integral part of these financial statements.
67
MUTUAL OF AMERICA INVESTMENT CORPORATION
FINANCIAL HIGHLIGHTS
Income from investment operations and distributions per share for a Fund share outstanding throughout the six months ended June 30, 2016 and the five years ended December 31, 2015 (or since the Fund’s inception date if in existence less than five years) and other supplementary data with respect to each Fund are presented below and in the pages following:
| | | | | | | | | | | | | | | | | | | | | | | | |
| | | Equity Index Fund | |
| | | Six Months
Ended
June 30,
2016
(Unaudited) | | | Years Ended December 31, | |
| | | | 2015 | | | 2014 | | | 2013 | | | 2012 | | | 2011 | |
Net Asset Value, Beginning of Period | | $ | 3.26 | | | $ | 3.41 | | | $ | 3.09 | | | $ | 2.40 | | | $ | 2.07 | | | $ | 2.07 | |
| | | | | | | | | | | | | | | | | | | | | | | | |
| | | | | | |
INCOME (LOSS)FROM INVESTMENT OPERATIONS: | | | | | | | | | | | | | | | | | | | | | | | | |
Net Investment Income (Loss) | | | 0.03 | | | | 0.06 | | | | 0.06 | | | | 0.05 | | | | 0.05 | | | | 0.04 | |
Net Realized and Unrealized Gains (Losses) on Investments and Futures Contracts | | | 0.09 | | | | (0.03 | ) | | | 0.35 | | | | 0.70 | | | | 0.28 | | | | — | (f) |
| | | | | | | | | | | | | | | | | | | | | | | | |
Total From Investment Operations | | | 0.12 | | | | 0.03 | | | | 0.41 | | | | 0.75 | | | | 0.33 | | | | 0.04 | |
| | | | | | | | | | | | | | | | | | | | | | | | |
| | | | | | |
Less: Distributions | | | | | | | | | | | | | | | | | | | | | | | | |
From Net Investment Income | | | — | | | | (0.06 | ) | | | (0.05 | ) | | | (0.04 | ) | | | — | (f) | | | (0.04 | ) |
From Net Realized Gains | | | — | | | | (0.12 | ) | | | (0.04 | ) | | | (0.02 | ) | | | — | | | | — | |
| | | | | | | | | | | | | | | | | | | | | | | | |
Total Distributions | | | — | | | | (0.18 | ) | | | (0.09 | ) | | | (0.06 | ) | | | — | | | | (0.04 | ) |
| | | | | | | | | | | | | | | | | | | | | | | | |
Net Asset Value, End of Period | | $ | 3.38 | | | $ | 3.26 | | | $ | 3.41 | | | $ | 3.09 | | | $ | 2.40 | | | $ | 2.07 | |
| | | | | | | | | | | | | | | | | | | | | | | | |
Total Return (%) | | | 3.77 | (b) | | | 1.24 | | | | 13.49 | | | | 32.02 | | | | 15.94 | | | | 1.88 | |
Net Assets, End of Period ($ millions) | | | 1,945 | | | | 1,854 | | | | 1,789 | | | | 1,556 | | | | 1,109 | | | | 929 | |
Ratio of Net Investment Income (Loss) to Average Net Assets (%) | | | 2.11 | (c) | | | 1.94 | | | | 1.82 | | | | 1.87 | | | | 2.03 | | | | 1.81 | |
Ratio of Expenses to Average Net Assets Before Expense Reimbursement (%) | | | 0.14 | (c) | | | 0.15 | | | | 0.17 | | | | 0.19 | | | | 0.22 | | | | 0.23 | |
Ratio of Expenses to Average Net Assets After Expense Reimbursement (%) | | | 0.14 | (c) | | | 0.15 | | | | 0.17 | | | | 0.19 | | | | 0.22 | | | | 0.23 | |
Portfolio Turnover Rate (%)(a) | | | 3.02 | (b) | | | 4.74 | | | | 8.07 | | | | 3.90 | | | | 6.45 | | | | 5.26 | |
| (a) | Portfolio turnover rate excludes all short-term securities. |
| (d) | Allocation and Retirement Funds exclude expenses of the underlying funds. |
| (e) | For the period October 1, 2012 (commencement of operations) through December 31, 2012. |
| (f) | Amount is less than $0.005 per share. |
The accompanying notes are an integral part of these financial statements.
68
| | | | | | | | | | | | | | | | | | | | | | | | | | | | | | | | | | | | | | | | | | | | | | | | |
| All America Fund | | | Small Cap Value Fund | | | |
Six Months
Ended
June 30,
2016
(Unaudited) | | | Years Ended December 31, | | | Six Months
Ended
June 30,
2016
(Unaudited) | | | Years Ended December 31, | | | |
| | 2015 | | | 2014 | | | 2013 | | | 2012 | | | 2011 | | | | 2015 | | | 2014 | | | 2013 | | | 2012 | | | 2011 | | | |
| $ | 2.22 | | | $ | 2.42 | | | $ | 2.38 | | | $ | 1.85 | | | $ | 1.61 | | | $ | 1.65 | | | $ | 1.44 | | | $ | 1.61 | | | $ | 1.72 | | | $ | 1.35 | | | $ | 1.17 | | | $ | 1.21 | | | |
| | | | | | | | | | | | | | | | | | | | | | | | | | | | | | | | | | | | | | | | | | | | | | | | |
| | | | | | | | | | | | |
| | | | | | | | | | | | | | | | | | | | | | | | | | | | | | | | | | | | | | | | | | | | | | | | |
| | 0.02 | | | | 0.03 | | | | 0.03 | | | | 0.03 | | | | 0.03 | | | | 0.02 | | | | 0.01 | | | | 0.02 | | | | 0.02 | | | | 0.03 | | | | 0.02 | | | | 0.01 | | | |
| 0.03 | | | | (0.03 | ) | | | 0.23 | | | | 0.55 | | | | 0.21 | | | | (0.02 | ) | | | 0.04 | | | | (0.08 | ) | | | 0.06 | | | | 0.36 | | | | 0.16 | | | | (0.04 | ) | | |
| | | | | | | | | | | | | | | | | | | | | | | | | | | | | | | | | | | | | | | | | | | | | | | | |
| | 0.05 | | | | — | | | | 0.26 | | | | 0.58 | | | | 0.24 | | | | — | | | | 0.05 | | | | (0.06 | ) | | | 0.08 | | | | 0.39 | | | | 0.18 | | | | (0.03 | ) | | |
| | | | | | | | | | | | | | | | | | | | | | | | | | | | | | | | | | | | | | | | | | | | | | | | |
| | | | | | | | | | | | |
| | | | | | | | | | | | | | | | | | | | | | | | | | | | | | | | | | | | | | | | | | | | | | | | |
| | — | | | | (0.03 | ) | | | (0.03 | ) | | | (0.03 | ) | | | — | | | | (0.04 | ) | | | — | | | | (0.01 | ) | | | (0.02 | ) | | | (0.02 | ) | | | — | | | | (0.01 | ) | | |
| | — | | | | (0.15 | ) | | | (0.19 | ) | | | (0.02 | ) | | | — | | | | — | | | | — | | | | (0.10 | ) | | | (0.17 | ) | | | — | | | | — | | | | — | | | |
| | | | | | | | | | | | | | | | | | | | | | | | | | | | | | | | | | | | | | | | | | | | | | | | |
| | — | | | | (0.18 | ) | | | (0.22 | ) | | | (0.05 | ) | | | — | | | | (0.04 | ) | | | — | | | | (0.11 | ) | | | (0.19 | ) | | | (0.02 | ) | | | — | | | | (0.01 | ) | | |
| | | | | | | | | | | | | | | | | | | | | | | | | | | | | | | | | | | | | | | | | | | | | | | | |
| $ | 2.27 | | | $ | 2.22 | | | $ | 2.42 | | | $ | 2.38 | | | $ | 1.85 | | | $ | 1.61 | | | $ | 1.49 | | | $ | 1.44 | | | $ | 1.61 | | | $ | 1.72 | | | $ | 1.35 | | | $ | 1.17 | | | |
| | | | | | | | | | | | | | | | | | | | | | | | | | | | | | | | | | | | | | | | | | | | | | | | |
| | 2.53 | (b) | | | (0.04 | ) | | | 11.16 | | | | 32.13 | | | | 14.73 | | | | 0.24 | | | | 3.40 | (b) | | | (3.40 | ) | | | 5.17 | | | | 29.35 | | | | 15.46 | | | | (2.46 | ) | | |
| | 289 | | | | 295 | | | | 324 | | | | 318 | | | | 256 | | | | 250 | | | | 389 | | | | 376 | | | | 393 | | | | 382 | | | | 290 | | | | 260 | | | |
| | 1.53 | (c) | | | 1.32 | | | | 1.35 | | | | 1.44 | | | | 1.52 | | | | 1.24 | | | | 1.28 | (c) | | | 1.14 | | | | 1.02 | | | | 1.70 | | | | 1.67 | | | | 0.92 | | | |
| | 0.52 | (c) | | | 0.55 | | | | 0.49 | | | | 0.51 | | | | 0.55 | | | | 0.56 | | | | 0.82 | (c) | | | 0.83 | | | | 0.84 | | | | 0.87 | | | | 0.90 | | | | 0.90 | | | |
| | 0.52 | (c) | | | 0.55 | | | | 0.49 | | | | 0.51 | | | | 0.55 | | | | 0.56 | | | | 0.82 | (c) | | | 0.83 | | | | 0.84 | | | | 0.87 | | | | 0.90 | | | | 0.90 | | | |
| | 28.18 | (b) | | | 14.73 | | | | 15.38 | | | | 28.48 | | | | 17.37 | | | | 24.67 | | | | 11.00 | (b) | | | 19.03 | | | | 38.09 | | | | 41.36 | | | | 24.71 | | | | 23.34 | | | |
The accompanying notes are an integral part of these financial statements.
69
MUTUAL OF AMERICA INVESTMENT CORPORATION
FINANCIAL HIGHLIGHTS (Continued)
| | | | | | | | | | | | | | | | | | | | | | | | |
| | | Small Cap Growth Fund | |
| | | Six Months
Ended
June 30,
2016
(Unaudited) | | | Years Ended December 31, | |
| | | | 2015 | | | 2014 | | | 2013 | | | 2012 | | | 2011 | |
Net Asset Value, Beginning of Period | | $ | 1.32 | | | $ | 1.54 | | | $ | 1.58 | | | $ | 1.22 | | | $ | 1.16 | | | $ | 1.19 | |
| | | | | | | | | | | | | | | | | | | | | | | | |
| | | | | | |
INCOME (LOSS)FROM INVESTMENT OPERATIONS: | | | | | | | | | | | | | | | | | | | | | | | | |
Net Investment Income (Loss) | | | — | (f) | | | — | (f) | | | — | (f) | | | — | (f) | | | — | (f) | | | — | (f) |
Net Realized and Unrealized Gains (Losses) on Investments and Futures Contracts | | | (0.02 | ) | | | (0.03 | ) | | | 0.09 | | | | 0.47 | | | | 0.07 | | | | (0.03 | ) |
| | | | | | | | | | | | | | | | | | | | | | | | |
Total From Investment Operations | | | (0.02 | ) | | | (0.03 | ) | | | 0.09 | | | | 0.47 | | | | 0.07 | | | | (0.03 | ) |
| | | | | | | | | | | | | | | | | | | | | | | | |
| | | | | | |
Less: Distributions | | | | | | | | | | | | | | | | | | | | | | | | |
From Net Investment Income | | | — | | | | — | | | | — | (f) | | | — | | | | — | | | | — | |
From Net Realized Gains | | | — | | | | (0.19 | ) | | | (0.13 | ) | | | (0.11 | ) | | | (0.01 | ) | | | — | |
| | | | | | | | | | | | | | | | | | | | | | | | |
Total Distributions | | | — | | | | (0.19 | ) | | | (0.13 | ) | | | (0.11 | ) | | | (0.01 | ) | | | — | |
| | | | | | | | | | | | | | | | | | | | | | | | |
Net Asset Value, End of Period | | $ | 1.30 | | | $ | 1.32 | | | $ | 1.54 | | | $ | 1.58 | | | $ | 1.22 | | | $ | 1.16 | |
| | | | | | | | | | | | | | | | | | | | | | | | |
Total Return (%) | | | (1.21 | )(b) | | | (2.39 | ) | | | 5.70 | | | | 41.19 | | | | 5.62 | | | | (2.28 | ) |
Net Assets, End of Period ($ millions) | | | 395 | | | | 402 | | | | 412 | | | | 424 | | | | 272 | | | | 271 | |
Ratio of Net Investment Income (Loss) to Average Net Assets (%) | | | (0.01 | )(c) | | | (0.12 | ) | | | (0.09 | ) | | | 0.19 | | | | (0.08 | ) | | | (0.31 | ) |
Ratio of Expenses to Average Net Assets Before Expense Reimbursement (%) | | | 0.83 | (c) | | | 0.83 | | | | 0.84 | | | | 0.86 | | | | 0.90 | | | | 0.90 | |
Ratio of Expenses to Average Net Assets After Expense Reimbursement (%) | | | 0.83 | (c) | | | 0.83 | | | | 0.84 | | | | 0.86 | | | | 0.90 | | | | 0.90 | |
Portfolio Turnover Rate (%)(a) | | | 23.86 | (b) | | | 67.83 | | | | 67.58 | | | | 53.36 | | | | 66.69 | | | | 59.53 | |
| (a) | Portfolio turnover rate excludes all short-term securities. |
| (d) | Allocation and Retirement Funds exclude expenses of the underlying funds. |
| (e) | For the period October 1, 2012 (commencement of operations) through December 31, 2012. |
| (f) | Amount is less than $0.005 per share. |
The accompanying notes are an integral part of these financial statements.
70
| | | | | | | | | | | | | | | | | | | | | | | | | | | | | | | | | | | | | | | | | | | | | | | | |
| Mid Cap Value Fund | | | Mid-Cap Equity Index Fund | | | |
Six Months
Ended
June 30,
2016
(Unaudited) | | | Years Ended December 31, | | | Six Months
Ended
June 30,
2016
(Unaudited) | | | Years Ended December 31, | | | |
| | 2015 | | | 2014 | | | 2013 | | | 2012 | | | 2011 | | | | 2015 | | | 2014 | | | 2013 | | | 2012 | | | 2011 | | | |
| $ | 1.46 | | | $ | 1.63 | | | $ | 1.53 | | | $ | 1.23 | | | $ | 1.11 | | | $ | 1.15 | | | $ | 1.95 | | | $ | 2.16 | | | $ | 2.08 | | | $ | 1.63 | | | $ | 1.43 | | | $ | 1.51 | | | |
| | | | | | | | | | | | | | | | | | | | | | | | | | | | | | | | | | | | | | | | | | | | | | | | |
| | | | | | | | | | | | |
| | | | | | | | | | | | | | | | | | | | | | | | | | | | | | | | | | | | | | | | | | | | | | | | |
| | 0.01 | | | | 0.02 | | | | 0.02 | | | | 0.01 | | | | 0.02 | | | | 0.01 | | | | 0.01 | | | | 0.03 | | | | 0.03 | | | | 0.02 | | | | 0.02 | | | | 0.02 | | | |
| 0.05 | | | | (0.08 | ) | | | 0.19 | | | | 0.33 | | | | 0.10 | | | | (0.04 | ) | | | 0.14 | | | | (0.08 | ) | | | 0.17 | | | | 0.51 | | | | 0.24 | | | | (0.05 | ) | | |
| | | | | | | | | | | | | | | | | | | | | | | | | | | | | | | | | | | | | | | | | | | | | | | | |
| | 0.06 | | | | (0.06 | ) | | | 0.21 | | | | 0.34 | | | | 0.12 | | | | (0.03 | ) | | | 0.15 | | | | (0.05 | ) | | | 0.20 | | | | 0.53 | | | | 0.26 | | | | (0.03 | ) | | |
| | | | | | | | | | | | | | | | | | | | | | | | | | | | | | | | | | | | | | | | | | | | | | | | |
| | | | | | | | | | | | |
| | | | | | | | | | | | | | | | | | | | | | | | | | | | | | | | | | | | | | | | | | | | | | | | |
| | — | | | | (0.02 | ) | | | (0.01 | ) | | | (0.01 | ) | | | — | | | | (0.01 | ) | | | — | | | | (0.02 | ) | | | (0.02 | ) | | | (0.02 | ) | | | — | | | | (0.02 | ) | | |
| | — | | | | (0.10 | ) | | | (0.10 | ) | | | (0.03 | ) | | | — | | | | — | | | | — | | | | (0.14 | ) | | | (0.10 | ) | | | (0.06 | ) | | | (0.06 | ) | | | (0.03 | ) | | |
| | | | | | | | | | | | | | | | | | | | | | | | | | | | | | | | | | | | | | | | | | | | | | | | |
| | — | | | | (0.12 | ) | | | (0.11 | ) | | | (0.04 | ) | | | — | | | | (0.01 | ) | | | — | | | | (0.16 | ) | | | (0.12 | ) | | | (0.08 | ) | | | (0.06 | ) | | | (0.05 | ) | | |
| | | | | | | | | | | | | | | | | | | | | | | | | | | | | | | | | | | | | | | | | | | | | | | | |
| $ | 1.52 | | | $ | 1.46 | | | $ | 1.63 | | | $ | 1.53 | | | $ | 1.23 | | | $ | 1.11 | | | $ | 2.10 | | | $ | 1.95 | | | $ | 2.16 | | | $ | 2.08 | | | $ | 1.63 | | | $ | 1.43 | | | |
| | | | | | | | | | | | | | | | | | | | | | | | | | | | | | | | | | | | | | | | | | | | | | | | |
| | 4.50 | (b) | | | (3.34 | ) | | | 13.82 | | | | 27.78 | | | | 11.01 | | | | (2.12 | ) | | | 7.83 | (b) | | | (2.37 | ) | | | 9.63 | | | | 33.21 | | | | 17.80 | | | | (1.99 | ) | | |
| | 85 | | | | 82 | | | | 92 | | | | 72 | | | | 53 | | | | 51 | | | | 1,072 | | | | 977 | | | | 1,001 | | | | 902 | | | | 610 | | | | 505 | | | |
| | 1.49 | (c) | | | 1.45 | | | | 1.25 | | | | 1.08 | | | | 1.36 | | | | 1.19 | | | | 1.53 | (c) | | | 1.45 | | | | 1.31 | | | | 1.25 | | | | 1.50 | | | | 1.14 | | | |
| | 0.67 | (c) | | | 0.65 | | | | 0.64 | | | | 0.66 | | | | 0.70 | | | | 0.70 | | | | 0.15 | (c) | | | 0.16 | | | | 0.17 | | | | 0.19 | | | | 0.22 | | | | 0.23 | | | |
| | 0.67 | (c) | | | 0.65 | | | | 0.64 | | | | 0.66 | | | | 0.70 | | | | 0.70 | | | | 0.15 | (c) | | | 0.16 | | | | 0.17 | | | | 0.19 | | | | 0.22 | | | | 0.23 | | | |
| | 10.58 | (b) | | | 15.86 | | | | 40.91 | | | | 36.42 | | | | 29.05 | | | | 12.99 | | | | 14.91 | (b) | | | 21.67 | | | | 16.29 | | | | 13.30 | | | | 12.98 | | | | 15.98 | | | |
The accompanying notes are an integral part of these financial statements.
71
MUTUAL OF AMERICA INVESTMENT CORPORATION
FINANCIAL HIGHLIGHTS (Continued)
| | | | | | | | | | | | | | | | | | | | | | | | |
| | | International Fund | |
| | | Six Months
Ended
June 30,
2016
(Unaudited) | | | Years Ended December 31, | |
| | | | 2015 | | | 2014 | | | 2013 | | | 2012 | | | 2011 | |
Net Asset Value, Beginning of Period | | $ | 0.75 | | | $ | 0.77 | | | $ | 0.84 | | | $ | 0.71 | | | $ | 0.60 | | | $ | 0.71 | |
| | | | | | | | | | | | | | | | | | | | | | | | |
| | | | | | |
INCOME (LOSS)FROM INVESTMENT OPERATIONS: | | | | | | | | | | | | | | | | | | | | | | | | |
Net Investment Income (Loss) | | | 0.01 | | | | 0.01 | | | | 0.02 | | | | 0.02 | | | | 0.02 | | | | 0.02 | |
Net Realized and Unrealized Gains (Losses) on Investments and Futures Contracts | | | (0.03 | ) | | | (0.01 | ) | | | (0.08 | ) | | | 0.13 | | | | 0.09 | | | | (0.11 | ) |
| | | | | | | | | | | | | | | | | | | | | | | | |
Total From Investment Operations | | | (0.02 | ) | | | — | | | | (0.06 | ) | | | 0.15 | | | | 0.11 | | | | (0.09 | ) |
| | | | | | | | | | | | | | | | | | | | | | | | |
| | | | | | |
Less: Distributions | | | | | | | | | | | | | | | | | | | | | | | | |
From Net Investment Income | | | — | | | | (0.02 | ) | | | (0.01 | ) | | | (0.02 | ) | | | — | (f) | | | (0.02 | ) |
From Net Realized Gains | | | — | | | | — | (f) | | | — | (f) | | | — | | | | — | (f) | | | — | (f) |
| | | | | | | | | | | | | | | | | | | | | | | | |
Total Distributions | | | — | | | | (0.02 | ) | | | (0.01 | ) | | | (0.02 | ) | | | — | | | | (0.02 | ) |
| | | | | | | | | | | | | | | | | | | | | | | | |
Net Asset Value, End of Period | | $ | 0.73 | | | $ | 0.75 | | | $ | 0.77 | | | $ | 0.84 | | | $ | 0.71 | | | $ | 0.60 | |
| | | | | | | | | | | | | | | | | | | | | | | | |
Total Return (%) | | | (2.37 | )(b) | | | (0.63 | ) | | | (6.03 | ) | | | 21.00 | | | | 18.24 | | | | (12.60 | ) |
Net Assets, End of Period ($ millions) | | | 332 | | | | 319 | | | | 264 | | | | 174 | | | | 115 | | | | 69 | |
Ratio of Net Investment Income (Loss) to Average Net Assets (%) | | | 3.93 | (c) | | | 2.47 | | | | 3.48 | | | | 2.76 | | | | 3.20 | | | | 3.24 | |
Ratio of Expenses to Average Net Assets Before Expense Reimbursement (%)(d) | | | 0.12 | (c) | | | 0.14 | | | | 0.17 | | | | 0.18 | | | | 0.21 | | | | 0.23 | |
Ratio of Expenses to Average Net Assets After Expense Reimbursement (%)(d) | | | 0.12 | (c) | | | 0.14 | | | | 0.17 | | | | 0.18 | | | | 0.21 | | | | 0.23 | |
Portfolio Turnover Rate (%)(a) | | | 3.25 | (b) | | | — | | | | 0.61 | | | | 10.22 | | | | 0.28 | | | | 1.44 | |
| (a) | Portfolio turnover rate excludes all short-term securities. |
| (d) | Allocation and Retirement Funds exclude expenses of the underlying funds. |
| (e) | For the period October 1, 2012 (commencement of operations) through December 31, 2012. |
| (f) | Amount is less than $0.005 per share. |
The accompanying notes are an integral part of these financial statements.
72
| | | | | | | | | | | | | | | | | | | | | | | | | | | | | | | | | | | | | | | | | | | | | | | | |
| Composite Fund | | | Retirement Income Fund | | | |
Six Months
Ended
June 30,
2016
(Unaudited) | | | Years Ended December 31, | | | Six Months
Ended
June 30,
2016
(Unaudited) | | | Years Ended December 31, | | | |
| | 2015 | | | 2014 | | | 2013 | | | 2012 | | | 2011 | | | | 2015 | | | 2014 | | | 2013 | | | 2012 | | | 2011 | | | |
| $ | 1.96 | | | $ | 2.00 | | | $ | 1.87 | | | $ | 1.64 | | | $ | 1.47 | | | $ | 1.50 | | | $ | 1.12 | | | $ | 1.16 | | | $ | 1.13 | | | $ | 1.07 | | | $ | 1.05 | | | $ | 1.03 | | | |
| | | | | | | | | | | | | | | | | | | | | | | | | | | | | | | | | | | | | | | | | | | | | | | | |
| | | | | | | | | | | | |
| | | | | | | | | | | | | | | | | | | | | | | | | | | | | | | | | | | | | | | | | | | | | | | | |
| | 0.02 | | | | 0.04 | | | | 0.04 | | | | 0.04 | | | | 0.04 | | | | 0.04 | | | | — | (f) | | | 0.02 | | | | 0.02 | | | | 0.02 | | | | — | (f) | | | 0.03 | | | |
| | | | | | | | | | | | |
| | 0.04 | | | | (0.02 | ) | | | 0.13 | | | | 0.23 | | | | 0.13 | | | | — | | | | 0.05 | | | | (0.01 | ) | | | 0.05 | | | | 0.06 | | | | 0.07 | | | | 0.02 | | | |
| | | | | | | | | | | | | | | | | | | | | | | | | | | | | | | | | | | | | | | | | | | | | | | | |
| | 0.06 | | | | 0.02 | | | | 0.17 | | | | 0.27 | | | | 0.17 | | | | 0.04 | | | | 0.05 | | | | 0.01 | | | | 0.07 | | | | 0.08 | | | | 0.07 | | | | 0.05 | | | |
| | | | | | | | | | | | | | | | | | | | | | | | | | | | | | | | | | | | | | | | | | | | | | | | |
| | | | | | | | | | | | |
| | | | | | | | | | | | | | | | | | | | | | | | | | | | | | | | | | | | | | | | | | | | | | | | |
| | — | | | | (0.04 | ) | | | (0.04 | ) | | | (0.04 | ) | | | — | (f) | | | (0.07 | ) | | | — | | | | (0.02 | ) | | | (0.02 | ) | | | — | (f) | | | (0.03 | ) | | | (0.03 | ) | | |
| | — | | | | (0.02 | ) | | | — | | | | — | | | | — | | | | — | | | | — | | | | (0.03 | ) | | | (0.02 | ) | | | (0.02 | ) | | | (0.02 | ) | | | — | (f) | | |
| | | | | | | | | | | | | | | | | | | | | | | | | | | | | | | | | | | | | | | | | | | | | | | | |
| | — | | | | (0.06 | ) | | | (0.04 | ) | | | (0.04 | ) | | | — | | | | (0.07 | ) | | | — | | | | (0.05 | ) | | | (0.04 | ) | | | (0.02 | ) | | | (0.05 | ) | | | (0.03 | ) | | |
| | | | | | | | | | | | | | | | | | | | | | | | | | | | | | | | | | | | | | | | | | | | | | | | |
| $ | 2.02 | | | $ | 1.96 | | | $ | 2.00 | | | $ | 1.87 | | | $ | 1.64 | | | $ | 1.47 | | | $ | 1.17 | | | $ | 1.12 | | | $ | 1.16 | | | $ | 1.13 | | | $ | 1.07 | | | $ | 1.05 | | | |
| | | | | | | | | | | | | | | | | | | | | | | | | | | | | | | | | | | | | | | | | | | | | | | | |
| | 3.24 | (b) | | | 0.80 | | | | 9.10 | | | | 16.37 | | | | 11.65 | | | | 2.84 | | | | 4.77 | (b) | | | 0.49 | | | | 6.50 | | | | 7.40 | | | | 7.15 | | | | 4.72 | | | |
| | 179 | | | | 180 | | | | 194 | | | | 186 | | | | 170 | | | | 161 | | | | 67 | | | | 63 | | | | 54 | | | | 40 | | | | 31 | | | | 23 | | | |
| | 2.05 | (c) | | | 1.93 | | | | 2.09 | | | | 2.04 | | | | 2.17 | | | | 2.22 | | | | (0.09 | )(c) | | | 2.35 | | | | 2.21 | | | | 2.18 | | | | (0.03 | ) | | | 3.03 | | | |
| 0.52 | (c) | | | 0.53 | | | | 0.49 | | | | 0.51 | | | | 0.55 | | | | 0.56 | | | | 0.09 | (c) | | | 0.09 | | | | 0.05 | | | | 0.05 | | | | 0.05 | | | | 0.05 | | | |
| 0.52 | (c) | | | 0.53 | | | | 0.49 | | | | 0.51 | | | | 0.55 | | | | 0.56 | | | | 0.09 | (c) | | | 0.05 | | | | 0.05 | | | | 0.05 | | | | 0.05 | | | | 0.05 | | | |
| | 29.53 | (b) | | | 13.13 | | | | 12.31 | | | | 20.98 | | | | 25.42 | | | | 22.69 | | | | 7.99 | (b) | | | 22.64 | | | | 17.63 | | | | 24.01 | | | | 18.07 | | | | 23.77 | | | |
The accompanying notes are an integral part of these financial statements.
73
MUTUAL OF AMERICA INVESTMENT CORPORATION
FINANCIAL HIGHLIGHTS (Continued)
| | | | | | | | | | | | | | | | | | | | | | | | |
| | | 2010 Retirement Fund | |
| | | Six Months
Ended
June 30,
2016
(Unaudited) | | | Years Ended December 31, | |
| | | | 2015 | | | 2014 | | | 2013 | | | 2012 | | | 2011 | |
Net Asset Value, Beginning of Period | | $ | 1.01 | | | $ | 1.09 | | | $ | 1.06 | | | $ | 1.00 | | | $ | 0.97 | | | $ | 0.96 | |
| | | | | | | | | | | | | | | | | | | | | | | | |
| | | | | | |
INCOME (LOSS)FROM INVESTMENT OPERATIONS: | | | | | | | | | | | | | | | | | | | | | | | | |
Net Investment Income (Loss) | | | — | (f) | | | 0.02 | | | | 0.02 | | | | 0.02 | | | | — | (f) | | | 0.02 | |
Net Realized and Unrealized Gains (Losses) on Investments and Futures Contracts | | | 0.05 | | | | (0.02 | ) | | | 0.06 | | | | 0.09 | | | | 0.09 | | | | 0.01 | |
| | | | | | | | | | | | | | | | | | | | | | | | |
Total From Investment Operations | | | 0.05 | | | | — | | | | 0.08 | | | | 0.11 | | | | 0.09 | | | | 0.03 | |
| | | | | | | | | | | | | | | | | | | | | | | | |
| | | | | | |
Less: Distributions | | | | | | | | | | | | | | | | | | | | | | | | |
From Net Investment Income | | | — | | | | (0.02 | ) | | | (0.02 | ) | | | — | (f) | | | (0.02 | ) | | | (0.02 | ) |
From Net Realized Gains | | | — | | | | (0.06 | ) | | | (0.03 | ) | | | (0.05 | ) | | | (0.04 | ) | | | — | (f) |
| | | | | | | | | | | | | | | | | | | | | | | | |
Total Distributions | | | — | | | | (0.08 | ) | | | (0.05 | ) | | | (0.05 | ) | | | (0.06 | ) | | | (0.02 | ) |
| | | | | | | | | | | | | | | | | | | | | | | | |
Net Asset Value, End of Period | | $ | 1.06 | | | $ | 1.01 | | | $ | 1.09 | | | $ | 1.06 | | | $ | 1.00 | | | $ | 0.97 | |
| | | | | | | | | | | | | | | | | | | | | | | | |
Total Return (%) | | | 4.58 | (b) | | | 0.40 | | | | 6.93 | | | | 11.78 | | | | 9.69 | | | | 3.08 | |
Net Assets, End of Period ($ millions) | | | 25 | | | | 26 | | | | 27 | | | | 24 | | | | 21 | | | | 21 | |
Ratio of Net Investment Income (Loss) to Average Net Assets (%) | | | (0.05 | )(c) | | | 2.10 | | | | 2.06 | | | | 2.09 | | | | (0.03 | ) | | | 2.41 | |
Ratio of Expenses to Average Net Assets Before Expense Reimbursement (%)(d) | | | 0.13 | (c) | | | 0.12 | | | | 0.05 | | | | 0.05 | | | | 0.05 | | | | 0.05 | |
Ratio of Expenses to Average Net Assets After Expense Reimbursement (%)(d) | | | 0.05 | (c) | | | 0.05 | | | | 0.05 | | | | 0.05 | | | | 0.05 | | | | 0.05 | |
Portfolio Turnover Rate (%)(a) | | | 8.56 | (b) | | | 23.28 | | | | 20.45 | | | | 19.60 | | | | 26.61 | | | | 21.22 | |
| (a) | Portfolio turnover rate excludes all short-term securities. |
| (d) | Allocation and Retirement Funds exclude expenses of the underlying funds. |
| (e) | For the period October 1, 2012 (commencement of operations) through December 31, 2012. |
| (f) | Amount is less than $0.005 per share. |
NA = Not Applicable
The accompanying notes are an integral part of these financial statements.
74
| | | | | | | | | | | | | | | | | | | | | | | | | | | | | | | | | | | | | | | | | | | | | | | | |
| 2015 Retirement Fund | | | 2020 Retirement Fund | | | |
Six Months
Ended
June 30,
2016
(Unaudited) | | | Years Ended December 31, | | | Six Months
Ended
June 30,
2016
(Unaudited) | | | Years Ended December 31, | | | |
| | 2015 | | | 2014 | | | 2013 | | | 2012 | | | 2011 | | | | 2015 | | | 2014 | | | 2013 | | | 2012 | | | 2011 | | | |
| $ | 1.05 | | | $ | 1.13 | | | $ | 1.10 | | | $ | 1.00 | | | $ | 0.93 | | | $ | 0.93 | | | $ | 1.12 | | | $ | 1.18 | | | $ | 1.13 | | | $ | 0.99 | | | $ | 0.90 | | | $ | 0.91 | | | |
| | | | | | | | | | | | | | | | | | | | | | | | | | | | | | | | | | | | | | | | | | | | | | | | |
| | | | | | | | | | | | |
| | | | | | | | | | | | | | | | | | | | | | | | | | | | | | | | | | | | | | | | | | | | | | | | |
| | — | (f) | | | 0.02 | | | | 0.02 | | | | 0.02 | | | | — | (f) | | | 0.02 | | | | — | (f) | | | 0.02 | | | | 0.02 | | | | 0.02 | | | | — | (f) | | | 0.02 | | | |
| | | | | | | | | | | | |
| | 0.04 | | | | (0.02 | ) | | | 0.06 | | | | 0.12 | | | | 0.10 | | | | — | (f) | | | 0.04 | | | | (0.01 | ) | | | 0.06 | | | | 0.14 | | | | 0.11 | | | | (0.01 | ) | | |
| | | | | | | | | | | | | | | | | | | | | | | | | | | | | | | | | | | | | | | | | | | | | | | | |
| | 0.04 | | | | — | | | | 0.08 | | | | 0.14 | | | | 0.10 | | | | 0.02 | | | | 0.04 | | | | 0.01 | | | | 0.08 | | | | 0.16 | | | | 0.11 | | | | 0.01 | | | |
| | | | | | | | | | | | | | | | | | | | | | | | | | | | | | | | | | | | | | | | | | | | | | | | |
| | | | | | | | | | | | |
| | | | | | | | | | | | | | | | | | | | | | | | | | | | | | | | | | | | | | | | | | | | | | | | |
| | — | | | | (0.02 | ) | | | (0.02 | ) | | | — | (f) | | | (0.02 | ) | | | (0.02 | ) | | | — | | | | (0.02 | ) | | | (0.02 | ) | | | — | (f) | | | (0.02 | ) | | | (0.02 | ) | | |
| | — | | | | (0.06 | ) | | | (0.03 | ) | | | (0.04 | ) | | | (0.01 | ) | | | — | (f) | | | — | | | | (0.05 | ) | | | (0.01 | ) | | | (0.02 | ) | | | — | (f) | | | — | (f) | | |
| | | | | | | | | | | | | | | | | | | | | | | | | | | | | | | | | | | | | | | | | | | | | | | | |
| | — | | | | (0.08 | ) | | | (0.05 | ) | | | (0.04 | ) | | | (0.03 | ) | | | (0.02 | ) | | | — | | | | (0.07 | ) | | | (0.03 | ) | | | (0.02 | ) | | | (0.02 | ) | | | (0.02 | ) | | |
| | | | | | | | | | | | | | | | | | | | | | | | | | | | | | | | | | | | | | | | | | | | | | | | |
| $ | 1.09 | | | $ | 1.05 | | | $ | 1.13 | | | $ | 1.10 | | | $ | 1.00 | | | $ | 0.93 | | | $ | 1.16 | | | $ | 1.12 | | | $ | 1.18 | | | $ | 1.13 | | | $ | 0.99 | | | $ | 0.90 | | | |
| | | | | | | | | | | | | | | | | | | | | | | | | | | | | | | | | | | | | | | | | | | | | | | | |
| | 4.51 | (b) | | | 0.27 | | | | 7.16 | | | | 14.80 | | | | 10.59 | | | | 2.09 | | | | 4.25 | (b) | | | 0.13 | | | | 7.36 | | | | 17.72 | | | | 11.69 | | | | 1.55 | | | |
| | 145 | | | | 149 | | | | 154 | | | | 138 | | | | 112 | | | | 91 | | | | 383 | | | | 364 | | | | 320 | | | | 251 | | | | 169 | | | | 118 | | | |
| | (0.08 | )(c) | | | 2.07 | | | | 2.00 | | | | 2.07 | | | | (0.03 | ) | | | 2.53 | | | | (0.07 | )(c) | | | 2.06 | | | | 1.92 | | | | 1.85 | | | | (0.03 | ) | | | 2.63 | | | |
| 0.08 | (c) | | | 0.07 | | | | 0.05 | | | | 0.05 | | | | 0.05 | | | | 0.05 | | | | 0.07 | (c) | | | 0.07 | | | | 0.05 | | | | 0.05 | | | | 0.05 | | | | 0.05 | | | |
| 0.08 | (c) | | | 0.07 | | | | 0.05 | | | | 0.05 | | | | 0.05 | | | | 0.05 | | | | 0.07 | (c) | | | 0.07 | | | | 0.05 | | | | 0.05 | | | | 0.05 | | | | 0.05 | | | |
| | 2.91 | (b) | | | 17.75 | | | | 16.41 | | | | 11.83 | | | | 19.59 | | | | 8.10 | | | | 3.99 | (b) | | | 7.76 | | | | 9.54 | | | | 3.56 | | | | 9.89 | | | | 4.73 | | | |
The accompanying notes are an integral part of these financial statements.
75
MUTUAL OF AMERICA INVESTMENT CORPORATION
FINANCIAL HIGHLIGHTS (Continued)
| | | | | | | | | | | | | | | | | | | | | | | | |
| | | 2025 Retirement Fund | |
| | | Six Months
Ended
June 30,
2016
(Unaudited) | | | Years Ended December 31, | |
| | | | 2015 | | | 2014 | | | 2013 | | | 2012 | | | 2011 | |
Net Asset Value, Beginning of Period | | $ | 1.17 | | | $ | 1.23 | | | $ | 1.16 | | | $ | 0.98 | | | $ | 0.89 | | | $ | 0.90 | |
| | | | | | | | | | | | | | | | | | | | | | | | |
| | | | | | |
INCOME (LOSS)FROM INVESTMENT OPERATIONS: | | | | | | | | | | | | | | | | | | | | | | | | |
Net Investment Income (Loss) | | | — | (f) | | | 0.02 | | | | 0.02 | | | | 0.02 | | | | — | (f) | | | 0.02 | |
Net Realized and Unrealized Gains (Losses) on Investments and Futures Contracts | | | 0.05 | | | | (0.02 | ) | | | 0.08 | | | | 0.18 | | | | 0.11 | | | | (0.02 | ) |
| | | | | | | | | | | | | | | | | | | | | | | | |
Total From Investment Operations | | | 0.05 | | | | — | | | | 0.10 | | | | 0.20 | | | | 0.11 | | | | — | |
| | | | | | | | | | | | | | | | | | | | | | | | |
| | | | | | |
Less: Distributions | | | | | | | | | | | | | | | | | | | | | | | | |
From Net Investment Income | | | — | | | | (0.02 | ) | | | (0.02 | ) | | | — | (f) | | | (0.02 | ) | | | (0.01 | ) |
From Net Realized Gains | | | — | | | | (0.04 | ) | | | (0.01 | ) | | | (0.02 | ) | | | — | (f) | | | — | (f) |
| | | | | | | | | | | | | | | | | | | | | | | | |
Total Distributions | | | — | | | | (0.06 | ) | | | (0.03 | ) | | | (0.02 | ) | | | (0.02 | ) | | | (0.01 | ) |
| | | | | | | | | | | | | | | | | | | | | | | | |
Net Asset Value, End of Period | | $ | 1.22 | | | $ | 1.17 | | | $ | 1.23 | | | $ | 1.16 | | | $ | 0.98 | | | $ | 0.89 | |
| | | | | | | | | | | | | | | | | | | | | | | | |
Total Return (%) | | | 4.19 | (b) | | | (0.10 | ) | | | 8.00 | | | | 21.11 | | | | 12.90 | | | | 0.83 | |
Net Assets, End of Period ($ millions) | | | 436 | | | | 396 | | | | 331 | | | | 257 | | | | 162 | | | | 109 | |
Ratio of Net Investment Income (Loss) to Average Net Assets (%) | | | (0.07 | )(c) | | | 1.91 | | | | 1.75 | | | | 1.67 | | | | (0.04 | ) | | | 2.49 | |
Ratio of Expenses to Average Net Assets Before Expense Reimbursement (%)(d) | | | 0.07 | (c) | | | 0.07 | | | | 0.05 | | | | 0.05 | | | | 0.05 | | | | 0.05 | |
Ratio of Expenses to Average Net Assets After Expense Reimbursement (%)(d) | | | 0.07 | (c) | | | 0.07 | | | | 0.05 | | | | 0.05 | | | | 0.05 | | | | 0.05 | |
Portfolio Turnover Rate (%)(a) | | | 2.10 | (b) | | | 4.36 | | | | 6.00 | | | | 1.49 | | | | 8.59 | | | | 2.52 | |
| (a) | Portfolio turnover rate excludes all short-term securities. |
| (d) | Allocation and Retirement Funds exclude expenses of the underlying funds. |
| (e) | For the period October 1, 2012 (commencement of operations) through December 31, 2012. |
| (f) | Amount is less than $0.005 per share. |
The accompanying notes are an integral part of these financial statements.
76
| | | | | | | | | | | | | | | | | | | | | | | | | | | | | | | | | | | | | | | | | | | | | | | | |
| 2030 Retirement Fund | | | 2035 Retirement Fund | | | |
Six Months
Ended
June 30,
2016
(Unaudited) | | | Years Ended December 31, | | | Six Months
Ended
June 30,
2016
(Unaudited) | | | Years Ended December 31, | | | |
| | 2015 | | | 2014 | | | 2013 | | | 2012 | | | 2011 | | | | 2015 | | | 2014 | | | 2013 | | | 2012 | | | 2011 | | | |
| $ | 1.20 | | | $ | 1.27 | | | $ | 1.19 | | | $ | 0.98 | | | $ | 0.88 | | | $ | 0.90 | | | $ | 1.20 | | | $ | 1.27 | | | $ | 1.20 | | | $ | 0.97 | | | $ | 0.86 | | | $ | 0.88 | | | |
| | | | | | | | | | | | | | | | | | | | | | | | | | | | | | | | | | | | | | | | | | | | | | | | |
| | | | | | | | | | | | |
| | | | | | | | | | | | | | | | | | | | | | | | | | | | | | | | | | | | | | | | | | | | | | | | |
| | — | (f) | | | 0.02 | | | | 0.02 | | | | 0.02 | | | | — | (f) | | | 0.02 | | | | — | (f) | | | 0.02 | | | | 0.01 | | | | 0.01 | | | | — | (f) | | | 0.01 | | | |
| 0.05 | | | | (0.02 | ) | | | 0.09 | | | | 0.21 | | | | 0.12 | | | | (0.02 | ) | | | 0.05 | | | | (0.03 | ) | | | 0.08 | | | | 0.24 | | | | 0.13 | | | | (0.02 | ) | | |
| | | | | | | | | | | | | | | | | | | | | | | | | | | | | | | | | | | | | | | | | | | | | | | | |
| | 0.05 | | | | — | | | | 0.11 | | | | 0.23 | | | | 0.12 | | | | — | | | | 0.05 | | | | (0.01 | ) | | | 0.09 | | | | 0.25 | | | | 0.13 | | | | (0.01 | ) | | |
| | | | | | | | | | | | | | | | | | | | | | | | | | | | | | | | | | | | | | | | | | | | | | | | |
| | | | | | | | | | | | |
| | | | | | | | | | | | | | | | | | | | | | | | | | | | | | | | | | | | | | | | | | | | | | | | |
| | — | | | | (0.02 | ) | | | (0.02 | ) | | | — | (f) | | | (0.02 | ) | | | (0.02 | ) | | | — | | | | (0.02 | ) | | | (0.01 | ) | | | — | (f) | | | (0.02 | ) | | | (0.01 | ) | | |
| | — | | | | (0.05 | ) | | | (0.01 | ) | | | (0.02 | ) | | | — | (f) | | | — | (f) | | | — | | | | (0.04 | ) | | | (0.01 | ) | | | (0.02 | ) | | | — | (f) | | | — | (f) | | |
| | | | | | | | | | | | | | | | | | | | | | | | | | | | | | | | | | | | | | | | | | | | | | | | |
| | — | | | | (0.07 | ) | | | (0.03 | ) | | | (0.02 | ) | | | (0.02 | ) | | | (0.02 | ) | | | — | | | | (0.06 | ) | | | (0.02 | ) | | | (0.02 | ) | | | (0.02 | ) | | | (0.01 | ) | | |
| | | | | | | | | | | | | | | | | | | | | | | | | | | | | | | | | | | | | | | | | | | | | | | | |
| $ | 1.25 | | | $ | 1.20 | | | $ | 1.27 | | | $ | 1.19 | | | $ | 0.98 | | | $ | 0.88 | | | $ | 1.25 | | | $ | 1.20 | | | $ | 1.27 | | | $ | 1.20 | | | $ | 0.97 | | | $ | 0.86 | | | |
| | | | | | | | | | | | | | | | | | | | | | | | | | | | | | | | | | | | | | | | | | | | | | | | |
| | 4.10 | (b) | | | (0.22 | ) | | | 8.44 | | | | 23.72 | | | | 13.69 | | | | 0.21 | | | | 3.89 | (b) | | | (0.37 | ) | | | 8.26 | | | | 25.92 | | | | 14.39 | | | | (0.63 | ) | | |
| | 357 | | | | 328 | | | | 277 | | | | 212 | | | | 133 | | | | 90 | | | | 299 | | | | 271 | | | | 230 | | | | 173 | | | | 107 | | | | 69 | | | |
| | (0.07 | )(c) | | | 1.81 | | | | 1.66 | | | | 1.60 | | | | (0.04 | ) | | | 2.37 | | | | (0.07 | )(c) | | | 1.68 | | | | 1.52 | | | | 1.47 | | | | (0.04 | ) | | | 2.17 | | | |
| 0.07 | (c) | | | 0.07 | | | | 0.05 | | | | 0.05 | | | | 0.05 | | | | 0.05 | | | | 0.07 | (c) | | | 0.07 | | | | 0.05 | | | | 0.05 | | | | 0.05 | | | | 0.05 | | | |
| 0.07 | (c) | | | 0.07 | | | | 0.05 | | | | 0.05 | | | | 0.05 | | | | 0.05 | | | | 0.07 | (c) | | | 0.07 | | | | 0.05 | | | | 0.05 | | | | 0.05 | | | | 0.05 | | | |
| | 2.50 | (b) | | | 4.83 | | | | 5.52 | | | | 1.58 | | | | 7.61 | | | | 2.66 | | | | 2.68 | (b) | | | 5.16 | | | | 4.29 | | | | 1.76 | | | | 6.51 | | | | 2.78 | | | |
The accompanying notes are an integral part of these financial statements.
77
MUTUAL OF AMERICA INVESTMENT CORPORATION
FINANCIAL HIGHLIGHTS (Continued)
| | | | | | | | | | | | | | | | | | | | | | | | |
| | | 2040 Retirement Fund | |
| | | Six Months
Ended
June 30,
2016
(Unaudited) | | | Years Ended December 31, | |
| | | | 2015 | | | 2014 | | | 2013 | | | 2012 | | | 2011 | |
Net Asset Value, Beginning of Period | | $ | 1.19 | | | $ | 1.26 | | | $ | 1.20 | | | $ | 0.96 | | | $ | 0.85 | | | $ | 0.88 | |
| | | | | | | | | | | | | | | | | | | | | | | | |
| | | | | | |
INCOME (LOSS)FROM INVESTMENT OPERATIONS: | | | | | | | | | | | | | | | | | | | | | | | | |
Net Investment Income (Loss) | | | — | (f) | | | 0.02 | | | | 0.01 | | | | 0.01 | | | | — | (f) | | | 0.01 | |
Net Realized and Unrealized Gains (Losses) on Investments and Futures Contracts | | | 0.04 | | | | (0.03 | ) | | | 0.08 | | | | 0.25 | | | | 0.13 | | | | (0.03 | ) |
| | | | | | | | | | | | | | | | | | | | | | | | |
Total From Investment Operations | | | 0.04 | | | | (0.01 | ) | | | 0.09 | | | | 0.26 | | | | 0.13 | | | | (0.02 | ) |
| | | | | | | | | | | | | | | | | | | | | | | | |
| | | | | | |
Less: Distributions | | | | | | | | | | | | | | | | | | | | | | | | |
From Net Investment Income | | | — | | | | (0.02 | ) | | | (0.01 | ) | | | — | (f) | | | (0.02 | ) | | | (0.01 | ) |
From Net Realized Gains | | | — | | | | (0.04 | ) | | | (0.02 | ) | | | (0.02 | ) | | | — | (f) | | | — | (f) |
| | | | | | | | | | | | | | | | | | | | | | | | |
Total Distributions | | | — | | | | (0.06 | ) | | | (0.03 | ) | | | (0.02 | ) | | | (0.02 | ) | | | (0.01 | ) |
| | | | | | | | | | | | | | | | | | | | | | | | |
Net Asset Value, End of Period | | $ | 1.23 | | | $ | 1.19 | | | $ | 1.26 | | | $ | 1.20 | | | $ | 0.96 | | | $ | 0.85 | |
| | | | | | | | | | | | | | | | | | | | | | | | |
Total Return (%) | | | 3.67 | (b) | | | (0.64 | ) | | | 7.71 | | | | 27.20 | | | | 14.63 | | | | (1.24 | ) |
Net Assets, End of Period ($ millions) | | | 243 | | | | 222 | | | | 189 | | | | 148 | | | | 94 | | | | 62 | |
Ratio of Net Investment Income (Loss) to Average Net Assets (%) | | | (0.07 | )(c) | | | 1.58 | | | | 1.40 | | | | 1.39 | | | | (0.04 | ) | | | 2.09 | |
Ratio of Expenses to Average Net Assets Before Expense Reimbursement (%)(d) | | | 0.07 | (c) | | | 0.07 | | | | 0.05 | | | | 0.05 | | | | 0.05 | | | | 0.05 | |
Ratio of Expenses to Average Net Assets After Expense Reimbursement (%)(d) | | | 0.07 | (c) | | | 0.07 | | | | 0.05 | | | | 0.05 | | �� | | 0.05 | | | | 0.05 | |
Portfolio Turnover Rate (%)(a) | | | 3.24 | (b) | | | 5.17 | | | | 4.31 | | | | 1.37 | | | | 4.99 | | | | 2.28 | |
| (a) | Portfolio turnover rate excludes all short-term securities. |
| (d) | Allocation and Retirement Funds exclude expenses of the underlying funds. |
| (e) | For the period October 1, 2012 (commencement of operations) through December 31, 2012. |
| (f) | Amount is less than $0.005 per share. |
The accompanying notes are an integral part of these financial statements.
78
| | | | | | | | | | | | | | | | | | | | | | | | | | | | | | | | | | | | | | | | | | |
| 2045 Retirement Fund | | | 2050 Retirement Fund | |
Six Months
Ended
June 30,
2016
(Unaudited) | | | Years Ended December 31, | | | Six Months
Ended
June 30,
2016
(Unaudited) | | | Years Ended December 31, | | | Period Ended
December 31
2012(e) | |
| | 2015 | | | 2014 | | | 2013 | | | 2012 | | | 2011 | | | | 2015 | | | 2014 | | | 2013 | | |
| $ | 1.19 | | | $ | 1.26 | | | $ | 1.20 | | | $ | 0.96 | | | $ | 0.85 | | | $ | 0.88 | | | $ | 1.35 | | | $ | 1.39 | | | $ | 1.30 | | | $ | 1.02 | | | $ | 1.00 | |
| | | | | | | | | | | | | | | | | | | | | | | | | | | | | | | | | | | | | | | | | | |
| | | | | | | | | | |
| | | | | | | | | | | | | | | | | | | | | | | | | | | | | | | | | | | | | | | | | | |
| | — | (f) | | | 0.02 | | | | 0.01 | | | | 0.01 | | | | — | (f) | | | 0.01 | | | | — | (f) | | | 0.03 | | | | 0.01 | | | | — | (f) | | | — | (f) |
| 0.04 | | | | (0.03 | ) | | | 0.07 | | | | 0.25 | | | | 0.13 | | | | (0.03 | ) | | | 0.05 | | | | (0.04 | ) | | | 0.08 | | | | 0.28 | | | | 0.02 | |
| | | | | | | | | | | | | | | | | | | | | | | | | | | | | | | | | | | | | | | | | | |
| | 0.04 | | | | (0.01 | ) | | | 0.08 | | | | 0.26 | | | | 0.13 | | | | (0.02 | ) | | | 0.05 | | | | (0.01 | ) | | | 0.09 | | | | 0.28 | | | | 0.02 | |
| | | | | | | | | | | | | | | | | | | | | | | | | | | | | | | | | | | | | | | | | | |
| | | | | | | | | | |
| | | | | | | | | | | | | | | | | | | | | | | | | | | | | | | | | | | | | | | | | | |
| | — | | | | (0.02 | ) | | | (0.01 | ) | | | — | (f) | | | (0.02 | ) | | | (0.01 | ) | | | — | | | | (0.01 | ) | | | — | (f) | | | — | (f) | | | — | |
| | — | | | | (0.04 | ) | | | (0.01 | ) | | | (0.02 | ) | | | — | (f) | | | — | (f) | | | — | | | | (0.02 | ) | | | — | (f) | | | — | (f) | | | — | |
| | | | | | | | | | | | | | | | | | | | | | | | | | | | | | | | | | | | | | | | | | |
| | — | | | | (0.06 | ) | | | (0.02 | ) | | | (0.02 | ) | | | (0.02 | ) | | | (0.01 | ) | | | — | | | | (0.03 | ) | | | — | | | | — | | | | — | |
| | | | | | | | | | | | | | | | | | | | | | | | | | | | | | | | | | | | | | | | | | |
| $ | 1.23 | | | $ | 1.19 | | | $ | 1.26 | | | $ | 1.20 | | | $ | 0.96 | | | $ | 0.85 | | | $ | 1.40 | | | $ | 1.35 | | | $ | 1.39 | | | $ | 1.30 | | | $ | 1.02 | |
| | | | | | | | | | | | | | | | | | | | | | | | | | | | | | | | | | | | | | | | | | |
| | 3.43 | (b) | | | (0.69 | ) | | | 7.36 | | | | 27.68 | | | | 14.45 | | | | (1.45 | ) | | | 3.29 | (b) | | | (0.73 | ) | | | 7.15 | | | | 28.17 | | | | 1.83 | (b) |
| | 287 | | | | 265 | | | | 232 | | | | 186 | | | | 118 | | | | 76 | | | | 120 | | | | 94 | | | | 50 | | | | 20 | | | | 2 | |
| | (0.07 | )(c) | | | 1.55 | | | | 1.37 | | | | 1.37 | | | | (0.04 | ) | | | 2.09 | | | | (0.08 | )(c) | | | 1.65 | | | | 1.47 | | | | 0.54 | | | | (0.01 | )(b) |
| 0.07 | (c) | | | 0.07 | | | | 0.05 | | | | 0.05 | | | | 0.05 | | | | 0.05 | | | | 0.08 | (c) | | | 0.09 | | | | 0.05 | | | | 0.05 | | | | 0.05 | (c) |
| 0.07 | (c) | | | 0.07 | | | | 0.05 | | | | 0.05 | | | | 0.05 | | | | 0.05 | | | | 0.08 | (c) | | | 0.05 | | | | 0.05 | | | | 0.05 | | | | 0.05 | (c) |
| | 2.07 | (b) | | | 4.40 | | | | 3.48 | | | | 0.93 | | | | 4.03 | | | | 1.97 | | | | 1.94 | (b) | | | 2.67 | | | | 1.53 | | | | 1.22 | | | | 0.76 | (b) |
The accompanying notes are an integral part of these financial statements.
79
MUTUAL OF AMERICA INVESTMENT CORPORATION
FINANCIAL HIGHLIGHTS (Continued)
| | | | | | | | | | | | | | | | | | | | | | | | |
| | | Conservative Allocation Fund | |
| | | Six Months
Ended
June 30,
2016
(Unaudited) | | | Years Ended December 31, | |
| | | | 2015 | | | 2014 | | | 2013 | | | 2012 | | | 2011 | |
Net Asset Value, Beginning of Period | | $ | 1.20 | | | $ | 1.25 | | | $ | 1.22 | | | $ | 1.15 | | | $ | 1.11 | | | $ | 1.08 | |
| | | | | | | | | | | | | | | | | | | | | | | | |
| | | | | | |
INCOME (LOSS)FROM INVESTMENT OPERATIONS: | | | | | | | | | | | | | | | | | | | | | | | | |
Net Investment Income (Loss) | | | — | (f) | | | 0.02 | | | | 0.03 | | | | 0.03 | | | | — | (f) | | | 0.03 | |
Net Realized and Unrealized Gains (Losses) on Investments and Futures Contracts | | | 0.05 | | | | (0.01 | ) | | | 0.05 | | | | 0.05 | | | | 0.08 | | | | 0.03 | |
| | | | | | | | | | | | | | | | | | | | | | | | |
Total From Investment Operations | | | 0.05 | | | | 0.01 | | | | 0.08 | | | | 0.08 | | | | 0.08 | | | | 0.06 | |
| | | | | | | | | | | | | | | | | | | | | | | | |
| | | | | | |
Less: Distributions | | | | | | | | | | | | | | | | | | | | | | | | |
From Net Investment Income | | | — | | | | (0.03 | ) | | | (0.03 | ) | | | — | (f) | | | (0.03 | ) | | | (0.03 | ) |
From Net Realized Gains | | | — | | | | (0.03 | ) | | | (0.02 | ) | | | (0.01 | ) | | | (0.01 | ) | | | — | (f) |
| | | | | | | | | | | | | | | | | | | | | | | | |
Total Distributions | | | — | | | | (0.06 | ) | | | (0.05 | ) | | | (0.01 | ) | | | (0.04 | ) | | | (0.03 | ) |
| | | | | | | | | | | | | | | | | | | | | | | | |
Net Asset Value, End of Period | | $ | 1.25 | | | $ | 1.20 | | | $ | 1.25 | | | $ | 1.22 | | | $ | 1.15 | | | $ | 1.11 | |
| | | | | | | | | | | | | | | | | | | | | | | | |
Total Return (%) | | | 4.57 | (b) | | | 0.44 | | | | 6.62 | | | | 7.34 | | | | 7.44 | | | | 5.79 | |
Net Assets, End of Period ($ millions) | | | 132 | | | | 128 | | | | 123 | | | | 98 | | | | 86 | | | | 66 | |
Ratio of Net Investment Income (Loss) to Average Net Assets (%) | | | (0.03 | )(c) | | | 2.32 | | | | 2.31 | | | | 2.45 | | | | 0.03 | | | | 3.40 | |
Ratio of Expenses to Average Net Assets Before Expense Reimbursement (%)(d) | | | 0.03 | (c) | | | 0.02 | | | | — | | | | — | | | | — | | | | — | |
Ratio of Expenses to Average Net Assets After Expense Reimbursement (%)(d) | | | 0.03 | (c) | | | 0.02 | | | | — | | | | — | | | | — | | | | — | |
Portfolio Turnover Rate (%)(a) | | | 4.43 | (b) | | | 10.58 | | | | 17.24 | | | | 10.16 | | | | 10.14 | | | | 12.14 | |
| (a) | Portfolio turnover rate excludes all short-term securities. |
| (d) | Allocation and Retirement Funds exclude expenses of the underlying funds. |
| (e) | For the period October 1, 2012 (commencement of operations) through December 31, 2012. |
| (f) | Amount is less than $0.005 per share. |
The accompanying notes are an integral part of these financial statements.
80
| | | | | | | | | | | | | | | | | | | | | | | | | | | | | | | | | | | | | | | | | | | | | | | | |
| Moderate Allocation Fund | | | Aggressive Allocation Fund | | | |
Six Months
Ended
June 30,
2016
(Unaudited) | | | Years Ended December 31, | | | Six Months
Ended
June 30,
2016
(Unaudited) | | | Years Ended December 31, | | | |
| | 2015 | | | 2014 | | | 2013 | | | 2012 | | | 2011 | | | | 2015 | | | 2014 | | | 2013 | | | 2012 | | | 2011 | | | |
| $ | 1.41 | | | $ | 1.52 | | | $ | 1.45 | | | $ | 1.27 | | | $ | 1.18 | | | $ | 1.16 | | | $ | 1.60 | | | $ | 1.77 | | | $ | 1.69 | | | $ | 1.38 | | | $ | 1.24 | | | $ | 1.24 | | | |
| | | | | | | | | | | | | | | | | | | | | | | | | | | | | | | | | | | | | | | | | | | | | | | | |
| | | | | | | | | | | | |
| | | | | | | | | | | | | | | | | | | | | | | | | | | | | | | | | | | | | | | | | | | | | | | | |
| | — | (f) | | | 0.03 | | | | 0.03 | | | | 0.03 | | | | — | (f) | | | 0.03 | | | | — | (f) | | | 0.03 | | | | 0.03 | | | | 0.03 | | | | — | (f) | | | 0.02 | | | |
| 0.06 | | | | (0.03 | ) | | | 0.09 | | | | 0.16 | | | | 0.13 | | | | 0.02 | | | | 0.07 | | | | (0.05 | ) | | | 0.11 | | | | 0.30 | | | | 0.17 | | | | — | (f) | | |
| | | | | | | | | | | | | | | | | | | | | | | | | | | | | | | | | | | | | | | | | | | | | | | | |
| | 0.06 | | | | — | | | | 0.12 | | | | 0.19 | | | | 0.13 | | | | 0.05 | | | | 0.07 | | | | (0.02 | ) | | | 0.14 | | | | 0.33 | | | | 0.17 | | | | 0.02 | | | |
| | | | | | | | | | | | | | | | | | | | | | | | | | | | | | | | | | | | | | | | | | | | | | | | |
| | | | | | | | | | | | |
| | | | | | | | | | | | | | | | | | | | | | | | | | | | | | | | | | | | | | | | | | | | | | | | |
| | — | | | | (0.03 | ) | | | (0.03 | ) | | | — | (f) | | | (0.03 | ) | | | (0.03 | ) | | | — | | | | (0.03 | ) | | | (0.03 | ) | | | — | (f) | | | (0.03 | ) | | | (0.02 | ) | | |
| | — | | | | (0.08 | ) | | | (0.02 | ) | | | (0.01 | ) | | | (0.01 | ) | | | — | (f) | | | — | | | | (0.12 | ) | | | (0.03 | ) | | | (0.02 | ) | | | — | (f) | | | — | | | |
| | | | | | | | | | | | | | | | | | | | | | | | | | | | | | | | | | | | | | | | | | | | | | | | |
| | — | | | | (0.11 | ) | | | (0.05 | ) | | | (0.01 | ) | | | (0.04 | ) | | | (0.03 | ) | | | — | | | | (0.15 | ) | | | (0.06 | ) | | | (0.02 | ) | | | (0.03 | ) | | | (0.02 | ) | | |
| | | | | | | | | | | | | | | | | | | | | | | | | | | | | | | | | | | | | | | | | | | | | | | | |
| $ | 1.47 | | | $ | 1.41 | | | $ | 1.52 | | | $ | 1.45 | | | $ | 1.27 | | | $ | 1.18 | | | $ | 1.67 | | | $ | 1.60 | | | $ | 1.77 | | | $ | 1.69 | | | $ | 1.38 | | | $ | 1.24 | | | |
| | | | | | | | | | | | | | | | | | | | | | | | | | | | | | | | | | | | | | | | | | | | | | | | |
| | 4.42 | (b) | | | 0.16 | | | | 7.71 | | | | 15.66 | | | | 10.90 | | | | 4.19 | | | | 3.86 | (b) | | | (0.38 | ) | | | 7.66 | | | | 24.19 | | | | 13.41 | | | | 2.31 | | | |
| | 330 | | | | 316 | | | | 315 | | | | 281 | | | | 225 | | | | 182 | | | | 252 | | | | 249 | | | | 255 | | | | 236 | | | | 187 | | | | 158 | | | |
| | (0.02 | )(c) | | | 2.09 | | | | 1.95 | | | | 2.09 | | | | 0.02 | | | | 2.68 | | | | (0.02 | )(c) | | | 1.81 | | | | 1.60 | | | | 1.75 | | | | 0.01 | | | | 2.13 | | | |
| 0.02 | (c) | | | 0.02 | | | | — | | | | — | | | | — | | | | — | | | | 0.02 | (c) | | | 0.02 | | | | — | | | | — | | | | — | | | | — | | | |
| 0.02 | (c) | | | 0.02 | | | | — | | | | — | | | | — | | | | — | | | | 0.02 | (c) | | | 0.02 | | | | — | | | | — | | | | — | | | | — | | | |
| | 3.80 | (b) | | | 8.10 | | | | 13.87 | | | | 4.71 | | | | 8.11 | | | | 11.21 | | | | 3.03 | (b) | | | 7.86 | | | | 19.61 | | | | 4.93 | | | | 7.82 | | | | 7.73 | | | |
The accompanying notes are an integral part of these financial statements.
81
MUTUAL OF AMERICA INVESTMENT CORPORATION
FINANCIAL HIGHLIGHTS (Continued)
| | | | | | | | | | | | | | | | | | | | | | | | |
| | | Money Market Fund | |
| | | Six Months
Ended
June 30,
2016
(Unaudited) | | | Years Ended December 31, | |
| | | | 2015 | | | 2014 | | | 2013 | | | 2012 | | | 2011 | |
Net Asset Value, Beginning of Period | | $ | 1.20 | | | $ | 1.20 | | | $ | 1.20 | | | $ | 1.20 | | | $ | 1.20 | | | $ | 1.20 | |
| | | | | | | | | | | | | | | | | | | | | | | | |
| | | | | | |
INCOME (LOSS)FROM INVESTMENT OPERATIONS: | | | | | | | | | | | | | | | | | | | | | | | | |
Net Investment Income (Loss) | | | — | (f) | | | — | (f) | | | — | (f) | | | — | (f) | | | — | (f) | | | — | (f) |
Net Realized and Unrealized Gains (Losses) on Investments and Futures Contracts | | | — | (f) | | | — | (f) | | | — | (f) | | | — | (f) | | | — | (f) | | | — | (f) |
| | | | | | | | | | | | | | | | | | | | | | | | |
Total From Investment Operations | | | — | | | | — | | | | — | | | | — | | | | — | | | | — | |
| | | | | | | | | | | | | | | | | | | | | | | | |
| | | | | | |
Less: Distributions | | | | | | | | | | | | | | | | | | | | | | | | |
From Net Investment Income | | | — | | | | — | | | | — | | | | — | | | | — | | | | — | |
From Net Realized Gains | | | — | | | | — | | | | — | | | | — | | | | — | | | | — | |
| | | | | | | | | | | | | | | | | | | | | | | | |
Total Distributions | | | — | | | | — | | | | — | | | | — | | | | — | | | | — | |
| | | | | | | | | | | | | | | | | | | | | | | | |
Net Asset Value, End of Period | | $ | 1.20 | | | $ | 1.20 | | | $ | 1.20 | | | $ | 1.20 | | | $ | 1.20 | | | $ | 1.20 | |
| | | | | | | | | | | | | | | | | | | | | | | | |
Total Return (%) | | | 0.06 | (b) | | | (0.11 | ) | | | (0.14 | ) | | | (0.16 | ) | | | (0.17 | ) | | | (0.17 | ) |
Net Assets, End of Period ($ millions) | | | 62 | | | | 67 | | | | 77 | | | | 84 | | | | 90 | | | | 101 | |
Ratio of Net Investment Income (Loss) to Average Net Assets (%) | | | 0.11 | (c) | | | (0.11 | ) | | | (0.14 | ) | | | (0.16 | ) | | | (0.18 | ) | | | (0.17 | ) |
Ratio of Expenses to Average Net Assets Before Expense Reimbursement (%) | | | 0.28 | (c) | | | 0.26 | | | | 0.24 | | | | 0.27 | | | | 0.30 | | | | 0.31 | |
Ratio of Expenses to Average Net Assets After Expense Reimbursement (%) | | | 0.28 | (c) | | | 0.26 | | | | 0.24 | | | | 0.27 | | | | 0.30 | | | | 0.31 | |
Portfolio Turnover Rate (%)(a) | | | NA | | | | NA | | | | NA | | | | NA | | | | NA | | | | NA | |
| (a) | Portfolio turnover rate excludes all short-term securities. |
| (d) | Allocation and Retirement Funds exclude expenses of the underlying funds. |
| (e) | For the period October 1, 2012 (commencement of operations) through December 31, 2012. |
| (f) | Amount is less than $0.005 per share. |
The accompanying notes are an integral part of these financial statements.
82
| | | | | | | | | | | | | | | | | | | | | | | | | | | | | | | | | | | | | | | | | | | | | | | | |
| Mid-Term Bond Fund | | | Bond Fund | | | |
Six Months
Ended
June 30,
2016
(Unaudited) | | | Years Ended December 31, | | | Six Months
Ended
June 30,
2016
(Unaudited) | | | Years Ended December 31, | | | |
| | 2015 | | | 2014 | | | 2013 | | | 2012 | | | 2011 | | | | 2015 | | | 2014 | | | 2013 | | | 2012 | | | 2011 | | | |
| $ | 1.03 | | | $ | 1.06 | | | $ | 1.05 | | | $ | 1.09 | | | $ | 1.06 | | | $ | 1.03 | | | $ | 1.41 | | | $ | 1.45 | | | $ | 1.41 | | | $ | 1.47 | | | $ | 1.39 | | | $ | 1.34 | | | |
| | | | | | | | | | | | | | | | | | | | | | | | | | | | | | | | | | | | | | | | | | | | | | | | |
| | | | | | | | | | | | |
| | | | | | | | | | | | | | | | | | | | | | | | | | | | | | | | | | | | | | | | | | | | | | | | |
| | 0.01 | | | | 0.03 | | | | 0.03 | | | | 0.03 | | | | 0.03 | | | | 0.03 | | | | 0.02 | | | | 0.04 | | | | 0.04 | | | | 0.05 | | | | 0.05 | | | | 0.05 | | | |
| 0.04 | | | | (0.03 | ) | | | 0.02 | | | | (0.04 | ) | | | — | (f) | | | 0.03 | | | | 0.06 | | | | (0.03 | ) | | | 0.04 | | | | (0.06 | ) | | | 0.03 | | | | 0.05 | | | |
| | | | | | | | | | | | | | | | | | | | | | | | | | | | | | | | | | | | | | | | | | | | | | | | |
| | 0.05 | | | | — | | | | 0.05 | | | | (0.01 | ) | | | 0.03 | | | | 0.06 | | | | 0.08 | | | | 0.01 | | | | 0.08 | | | | (0.01 | ) | | | 0.08 | | | | 0.10 | | | |
| | | | | | | | | | | | | | | | | | | | | | | | | | | | | | | | | | | | | | | | | | | | | | | | |
| | | | | | | | | | | | |
| | | | | | | | | | | | | | | | | | | | | | | | | | | | | | | | | | | | | | | | | | | | | | | | |
| | — | | | | (0.03 | ) | | | (0.03 | ) | | | (0.03 | ) | | | — | (f) | | | (0.03 | ) | | | — | | | | (0.05 | ) | | | (0.04 | ) | | | (0.05 | ) | | | — | (f) | | | (0.05 | ) | | |
| | — | | | | — | (f) | | | (0.01 | ) | | | — | (f) | | | — | (f) | | | — | | | | — | | | | — | (f) | | | — | | | | — | (f) | | | — | | | | — | | | |
| | | | | | | | | | | | | | | | | | | | | | | | | | | | | | | | | | | | | | | | | | | | | | | | |
| | — | | | | (0.03 | ) | | | (0.04 | ) | | | (0.03 | ) | | | — | | | | (0.03 | ) | | | — | | | | (0.05 | ) | | | (0.04 | ) | | | (0.05 | ) | | | — | | | | (0.05 | ) | | |
| | | | | | | | | | | | | | | | | | | | | | | | | | | | | | | | | | | | | | | | | | | | | | | | |
| $ | 1.08 | | | $ | 1.03 | | | $ | 1.06 | | | $ | 1.05 | | | $ | 1.09 | | | $ | 1.06 | | | $ | 1.49 | | | $ | 1.41 | | | $ | 1.45 | | | $ | 1.41 | | | $ | 1.47 | | | $ | 1.39 | | | |
| | | | | | | | | | | | | | | | | | | | | | | | | | | | | | | | | | | | | | | | | | | | | | | | |
| | 4.43 | (b) | | | 0.61 | | | | 3.22 | | | | (0.55 | ) | | | 3.33 | | | | 6.34 | | | | 6.07 | (b) | | | 0.33 | | | | 6.31 | | | | (0.91 | ) | | | 5.79 | | | | 7.30 | | | |
| | 472 | | | | 452 | | | | 435 | | | | 392 | | | | 387 | | | | 338 | | | | 1,074 | | | | 1,007 | | | | 956 | | | | 804 | | | | 753 | | | | 635 | | | |
| | 2.49 | (c) | | | 2.68 | | | | 2.57 | | | | 2.77 | | | | 2.94 | | | | 3.02 | | | | 3.15 | (c) | | | 2.93 | | | | 3.59 | | | | 3.35 | | | | 3.55 | | | | 3.61 | | | |
| | 0.46 | (c) | | | 0.46 | | | | 0.49 | | | | 0.51 | | | | 0.55 | | | | 0.55 | | | | 0.45 | (c) | | | 0.45 | | | | 0.48 | | | | 0.51 | | | | 0.55 | | | | 0.55 | | | |
| | 0.46 | (c) | | | 0.46 | | | | 0.49 | | | | 0.51 | | | | 0.55 | | | | 0.55 | | | | 0.45 | (c) | | | 0.45 | | | | 0.48 | | | | 0.51 | | | | 0.55 | | | | 0.55 | | | |
| | 11.12 | (b) | | | 19.07 | | | | 36.56 | | | | 23.94 | | | | 14.30 | | | | 23.69 | | | | 8.79 | (b) | | | 27.51 | | | | 15.00 | | | | 27.41 | | | | 28.89 | | | | 30.24 | | | |
The accompanying notes are an integral part of these financial statements.
83
MUTUAL OF AMERICA INVESTMENT CORPORATION
NOTES TO FINANCIAL STATEMENTS (Unaudited)
June 30, 2016
| 1. | SIGNIFICANT ACCOUNTING POLICIESAND ORGANIZATION |
Mutual of America Investment Corporation (the “Investment Company”) is a diversified, open-end management investment company — a type of company commonly known as a “mutual fund”. It is registered as such under the Investment Company Act of 1940 (the “Investment Company Act”). The Investment Company was formed on February 21, 1986 as a Maryland corporation and principally offers its shares exclusively to separate accounts of Mutual of America Life Insurance Company (“Mutual of America Life”) and a former affiliate that offers the Funds through its separate accounts. As a “series” type mutual fund, the Investment Company issues separate classes (or series) of capital stock, each of which represents a separate Fund of investments. At June 30, 2016, there were 24 active Funds (collectively, “the Funds”): Equity Index Fund, All America Fund, Small Cap Value Fund, Small Cap Growth Fund, Mid Cap Value Fund, Mid-Cap Equity Index Fund, International Fund, Composite Fund, Money Market Fund, Mid-Term Bond Fund, Bond Fund; Retirement Income Fund, 2010 Retirement Fund, 2015 Retirement Fund, 2020 Retirement Fund, 2025 Retirement Fund, 2030 Retirement Fund, 2035 Retirement Fund, 2040 Retirement Fund, 2045 Retirement Fund and 2050 Retirement Fund (collectively, “Retirement Funds”); a Conservative Allocation Fund, a Moderate Allocation Fund and an Aggressive Allocation Fund (collectively, “Allocation Funds”). The International Fund and the Retirement Funds (other than the 2050 Retirement Fund) commenced operations on November 5, 2007. The 2050 Retirement Fund commenced operations on October 1, 2012.
Investment Company shares are issued to Mutual of America Life and, on a limited basis, to Wilton Reassurance Life Company of New York (formerly The American Life Insurance Company of New York), for allocation to their Separate Accounts as a funding medium for variable accumulation annuity contracts and variable life insurance policies. In addition, shares of selected equity and fixed income funds of the Investment Company are directly issued to one or more of the Investment Company’s Retirement Funds and Allocation Funds.
The preparation of financial statements in accordance with U.S. generally accepted accounting principles (“GAAP”) requires management to make estimates and assumptions that affect the reported amounts of assets, liabilities, income, expenses and related disclosures. Changes in the economic environment, financial markets and any other parameters used in determining these estimates could cause actual results to differ.
The following is a summary of the significant accounting policies consistently followed by the Investment Company, which are in conformity with GAAP:
Fair Value — The Investment Company values its investments at fair value. Fair value is an estimate of the price the Fund would receive upon selling a security in an orderly arms-length transaction. Investments are categorized based on a three-level valuation hierarchy for measurement and disclosure of fair value. The valuation hierarchy is based upon the transparency of inputs used to measure fair value. These inputs are summarized in the three broad levels listed below:
| | • | | Level 1 — quoted prices in active markets for identical securities. |
| | • | | Level 2 — other significant observable inputs (including yield, quality, coupon rate, maturity, issue type, quoted prices for similar securities, prepayment speeds, trading characteristics, etc.). |
| | • | | Level 3 — significant unobservable inputs (including the Fund’s own assumptions in determining the fair value of investments). |
As of June 30, 2016 management determined that the fair value inputs for all equity securities, excluding shares of registered investment companies (see Note a below), were considered Level 1, with the exception of non-registered securities under Rule 144A of the Securities Act of 1933 which were considered Level 2. In addition, certain Rule 144A securities not actively traded are considered Level 3; however, there were no such securities as of June 30, 2016. Fair value inputs for all debt securities were considered Level 2. The inputs or methodologies used for valuing securities are not necessarily an indication of the risk associated with investing in those securities. Transfers between levels are reflected based on the fair value at the beginning of a reporting period.
In May 2015, the FASB issued ASU No. 2015-07, “Disclosures for Investments in Certain Entities that Calculate Net Asset Value per Share (or its Equivalent).” The guidance removes the requirement to categorize within the fair value hierarchy all investments for which fair value is measured using the NAV per share practical expedient. Sufficient
84
MUTUAL OF AMERICA INVESTMENT CORPORATION
NOTES TO FINANCIAL STATEMENTS (Unaudited) (Continued)
June 30, 2016
| 1. | SIGNIFICANT ACCOUNTING POLICIESAND ORGANIZATION (CONTINUED) |
information must be provided to permit reconciliation of the fair value of assets categorized within the fair value hierarchy to the amounts presented in the Statements of Assets and Liabilities. The guidance is required to be presented for annual periods beginning after December 15, 2015, and for interim periods within those fiscal years. Accordingly, effective January 1, 2016, the Investment Company has adopted ASU 2015-07, which removes investments measured using the net asset value per share practical expedient from the fair value hierarchy in all periods presented. The adoption of ASU 2015-07 did not have a material impact on the Investment Company’s financial statements.
The following is a summary of the inputs used to value the Funds’ investments and other financial instruments as of June 30, 2016:
| | | | | | | | | | | | | | | | |
Fund | | Level 1 — Quoted
Prices | | | Level 2 — Significant
Observable Inputs | | | Level 3 — Significant
Unobservable Inputs | | | Total | |
Investments at Fair Value: | | | | | | | | | | | | | | | | |
(See Summary Portfolios or Portfolios of Investments for More Details) | | | | | | | | | |
Equity Index Fund | | | | | | | | | | | | | | | | |
Common Stock | | $ | 1,899,808,656 | | | | — | | | | — | | | $ | 1,899,808,656 | |
Short-Term Debt Securities | | | — | | | $ | 43,388,584 | | | | — | | | $ | 43,388,584 | |
| | | | | | | | | | | | | | | | |
| | $ | 1,899,808,656 | | | $ | 43,388,584 | | | | — | | | $ | 1,943,197,240 | |
All America Fund | | | | | | | | | | | | | | | | |
Common Stock-Indexed | | $ | 151,368,349 | | | | — | | | | — | | | $ | 151,368,349 | |
Common Stock-Active | | $ | 125,425,998 | | | | — | | | | — | | | $ | 125,425,998 | |
Short-Term Debt Securities-Indexed | | | — | | | $ | 4,499,732 | | | | — | | | $ | 4,499,732 | |
Short-Term Debt Securities-Active | | | — | | | $ | 3,299,366 | | | | — | | | $ | 3,299,366 | |
Other Investments measured at net asset value (a) | | | — | | | | — | | | | — | | | $ | 1,023,789 | |
| | | | | | | | | | | | | | | | |
| | $ | 276,794,347 | | | $ | 7,799,098 | | | | — | | | $ | 285,617,234 | |
Small Cap Value Fund | | | | | | | | | | | | | | | | |
Common Stock | | $ | 369,068,835 | | | | — | | | | — | | | $ | 369,068,835 | |
Short-Term Debt Securities | | | — | | | $ | 14,695,903 | | | | — | | | $ | 14,695,903 | |
Other Investments measured at net asset value (a) | | | — | | | | — | | | | — | | | $ | 3,959,137 | |
| | | | | | | | | | | | | | | | |
| | $ | 369,068,835 | | | $ | 14,695,903 | | | | — | | | $ | 387,723,875 | |
Small Cap Growth Fund | | | | | | | | | | | | | | | | |
Common Stock | | $ | 375,676,099 | | | | — | | | | — | | | $ | 375,676,099 | |
Short-Term Debt Securities | | | — | | | $ | 19,293,605 | | | | — | | | $ | 19,293,605 | |
| | | | | | | | | | | | | | | | |
| | $ | 375,676,099 | | | $ | 19,293,605 | | | | — | | | $ | 394,969,704 | |
Mid Cap Value Fund | | | | | | | | | | | | | | | | |
Common Stock | | $ | 80,944,550 | | | | — | | | | — | | | $ | 80,944,550 | |
Short-Term Debt Securities | | | — | | | $ | 3,999,654 | | | | — | | | $ | 3,999,654 | |
Other Investments measured at net asset value (a) | | | — | | | | — | | | | — | | | $ | 427,910 | |
| | | | | | | | | | | | | | | | |
| | $ | 80,944,550 | | | $ | 3,999,654 | | | | — | | | $ | 85,372,114 | |
Mid-Cap Equity Index Fund | | | | | | | | | | | | | | | | |
Common Stock | | $ | 1,030,267,530 | | | | — | | | | — | | | $ | 1,030,267,530 | |
Short-Term Debt Securities | | | — | | | $ | 31,797,370 | | | | — | | | $ | 31,797,370 | |
| | | | | | | | | | | | | | | | |
| | $ | 1,030,267,530 | | | $ | 31,797,370 | | | | — | | | $ | 1,062,064,900 | |
International Fund | | | | | | | | | | | | | | | | |
Short-Term Debt Securities | | | — | | | $ | 15,297,167 | | | | — | | | $ | 15,297,167 | |
Other Investments measured at net asset value (a) | | | — | | | | — | | | | — | | | $ | 316,642,250 | |
| | | | | | | | | | | | | | | | |
| | | — | | | $ | 15,297,167 | | | | — | | | $ | 331,939,417 | |
85
MUTUAL OF AMERICA INVESTMENT CORPORATION
NOTES TO FINANCIAL STATEMENTS (Unaudited) (Continued)
June 30, 2016
| 1. | SIGNIFICANT ACCOUNTING POLICIESAND ORGANIZATION (CONTINUED) |
| | | | | | | | | | | | | | | | |
Fund | | Level 1 — Quoted
Prices | | | Level 2 — Significant
Observable Inputs | | | Level 3 — Significant
Unobservable Inputs | | | Total | |
Composite Fund | | | | | | | | | | | | | | | | |
Common Stock | | $ | 98,893,004 | | | | — | | | | — | | | $ | 98,893,004 | |
U.S. Government Debt | | | — | | | $ | 21,314,025 | | | | — | | | $ | 21,314,025 | |
U.S. Government Agency Residential
Mortgage-Backed Obligations | | | — | | | $ | 20,609,284 | | | | — | | | $ | 20,609,284 | |
U.S. Government Agency
Non-Mortgage-Backed Obligations | | | — | | | $ | 479,695 | | | | — | | | $ | 479,695 | |
Long-Term Corporate Debt | | | — | | | $ | 30,635,183 | | | | — | | | $ | 30,635,183 | |
Short-Term Debt Securities | | | — | | | $ | 4,399,921 | | | | — | | | $ | 4,399,921 | |
| | | | | | | | | | | | | | | | |
| | $ | 98,893,004 | | | $ | 77,438,108 | | | | — | | | $ | 176,331,112 | |
Retirement Income Fund | | | | | | | | | | | | | | | | |
Other Investments measured at net asset value (a) | | | — | | | | — | | | | — | | | $ | 67,091,209 | |
2010 Retirement Fund | | | | | | | | | | | | | | | | |
Other Investments measured at net asset value (a) | | | — | | | | — | | | | — | | | $ | 24,997,659 | |
2015 Retirement Fund | | | | | | | | | | | | | | | | |
Other Investments measured at net asset value (a) | | | — | | | | — | | | | — | | | $ | 145,037,888 | |
2020 Retirement Fund | | | | | | | | | | | | | | | | |
Other Investments measured at net asset value (a) | | | — | | | | — | | | | — | | | $ | 382,699,618 | |
2025 Retirement Fund | | | | | | | | | | | | | | | | |
Other Investments measured at net asset value (a) | | | — | | | | — | | | | — | | | $ | 436,453,839 | |
2030 Retirement Fund | | | | | | | | | | | | | | | | |
Other Investments measured at net asset value (a) | | | — | | | | — | | | | — | | | $ | 356,833,142 | |
2035 Retirement Fund | | | | | | | | | | | | | | | | |
Other Investments measured at net asset value (a) | | | — | | | | — | | | | — | | | $ | 298,514,756 | |
2040 Retirement Fund | | | | | | | | | | | | | | | | |
Other Investments measured at net asset value (a) | | | — | | | | — | | | | — | | | $ | 242,511,639 | |
2045 Retirement Fund | | | | | | | | | | | | | | | | |
Other Investments measured at net asset value (a) | | | — | | | | — | | | | — | | | $ | 286,519,088 | |
2050 Retirement Fund | | | | | | | | | | | | | | | | |
Other Investments measured at net asset value (a) | | | — | | | | — | | | | — | | | $ | 120,289,336 | |
Conservative Allocation Fund | | | | | | | | | | | | | | | | |
Other Investments measured at net asset value (a) | | | — | | | | — | | | | — | | | $ | 131,909,136 | |
Moderate Allocation Fund | | | | | | | | | | | | | | | | |
Other Investments measured at net asset value (a) | | | — | | | | — | | | | — | | | $ | 330,168,257 | |
Aggressive Allocation Fund | | | | | | | | | | | | | | | | |
Other Investments measured at net asset value (a) | | | — | | | | — | | | | — | | | $ | 252,468,212 | |
Money Market Fund | | | | | | | | | | | | | | | | |
U.S. Government Debt | | | — | | | $ | 9,096,439 | | | | — | | | $ | 9,096,439 | |
U.S. Government Agency Short-Term Debt | | | — | | | $ | 5,557,556 | | | | — | | | $ | 5,557,556 | |
Commercial Paper | | | — | | | $ | 47,072,799 | | | | — | | | $ | 47,072,799 | |
| | | | | | | | | | | | | | | | |
| | | — | | | $ | 61,726,794 | | | | — | | | $ | 61,726,794 | |
Mid-Term Bond Fund | | | | | | | | | | | | | | | | |
U.S. Government Debt | | | — | | | $ | 137,969,249 | | | | — | | | $ | 137,969,249 | |
U.S. Government Agency Residential
Mortgage-Backed Obligations | | | — | | | $ | 3,102,673 | | | | — | | | $ | 3,102,673 | |
U.S. Government Agency
Non-Mortgage-Backed Obligations | | | — | | | $ | 35,892,185 | | | | — | | | $ | 35,892,185 | |
Long-Term Corporate Debt | | | — | | | $ | 290,923,845 | | | | — | | | $ | 290,923,845 | |
Short-Term Debt Securities | | | — | | | $ | 800,000 | | | | — | | | $ | 800,000 | |
| | | | | | | | | | | | | | | | |
| | | — | | | $ | 468,687,952 | | | | — | | | $ | 468,687,952 | |
86
MUTUAL OF AMERICA INVESTMENT CORPORATION
NOTES TO FINANCIAL STATEMENTS (Unaudited) (Continued)
June 30, 2016
| 1. | SIGNIFICANT ACCOUNTING POLICIESAND ORGANIZATION (CONTINUED) |
| | | | | | | | | | | | | | | | |
Fund | | Level 1 — Quoted
Prices | | | Level 2 — Significant
Observable Inputs | | | Level 3 — Significant
Unobservable Inputs | | | Total | |
Bond Fund | | | | | | | | | | | | | | | | |
U.S. Government Debt | | | — | | | $ | 91,043,998 | | | | — | | | $ | 91,043,998 | |
U.S. Government Agency Residential
Mortgage-Backed Obligations | | | — | | | $ | 287,264,136 | | | | — | | | $ | 287,264,136 | |
U.S. Government Agency
Non-Mortgage-Backed Obligations | | | — | | | $ | 15,404,355 | | | | — | | | $ | 15,404,355 | |
Long-Term Corporate Debt | | | — | | | $ | 665,532,076 | | | | — | | | $ | 665,532,076 | |
Sovereign Debt | | | — | | | $ | 3,874,003 | | | | — | | | $ | 3,874,003 | |
Short-Term Debt Securities | | | — | | | $ | 7,100,000 | | | | — | | | $ | 7,100,000 | |
| | | | | | | | | | | | | | | | |
| | | — | | | $ | 1,070,218,568 | | | | — | | | $ | 1,070,218,568 | |
Other Financial Instruments:* | | | | | | | | | | | | | | | | |
| | | | |
Equity Index Fund | | $ | 161,461 | | | | — | | | | — | | | $ | 161,461 | |
All America Fund | | $ | 8,025 | | | | — | | | | — | | | $ | 8,025 | |
Mid-Cap Equity Index Fund | | $ | (33,417 | ) | | | — | | | | — | | | $ | (33,417 | ) |
| * | Other financial instruments are derivative instruments not reflected in the Portfolio of Investments, such as futures, which are valued at the unrealized appreciation/depreciation on the instrument. |
| (a) | In accordance with Subtopic 820-10, certain investments that are measured at fair value using the net asset value per share (or its equivalent) practical expedient have not been classified in the fair value hierarchy. The fair value amounts presented in this table are intended to permit reconciliation of the fair value hierarchy to the amounts presented in the statement of financial position. |
During the six months ended June 30, 2016, there were no transfers of securities between Level 1, Level 2, or Level 3.
Security Valuation — Investment securities are carried at fair value as follows:
Exchange-traded equity securities are valued at the last reported sales price on the principal exchange on which the security is traded. If there is no trading volume for a particular valuation day, the last bid price is used. For equity securities traded in the over-the-counter market, the security is valued at the last sale price, or if no sale, at the latest bid price available.
Short-term debt securities with a maturity of 60 days or less are valued at amortized cost, which approximates fair value for such securities.
Debt securities, including short-term debt securities maturing in excess of 60 days, are valued on the basis of prices obtained from an independent pricing source. The pricing source may utilize various pricing methodologies that incorporate both models (which consider factors such as yield, quality, coupon rate, maturity, issue type, quoted prices for similar securities, prepayment speeds and trading characteristics) and dealer-supplied valuations to derive a valuation.
In the rare instance when a price is not available from an independent pricing source or when prices may not reflect fair value, such as when the price provided by the pricing source is not based on a recent trade, a calculated fair value is used, as determined in good faith by the Adviser and reviewed by a Valuation Committee, in accordance with procedures adopted by the Board of Directors of the Investment Company.
The Advisor uses a market approach to calculate fair value for equity securities which are categorized as Level 3. The Adviser’s valuation is primarily based on information regarding the specific equity issuer, such as the last trade price, financial statements, the relationship of per-share book value to the last trade price, operating information and any corporate actions, such as dividends or returns of capital, that may have occurred since the last trade. The Adviser also considers industry-specific conditions and
87
MUTUAL OF AMERICA INVESTMENT CORPORATION
NOTES TO FINANCIAL STATEMENTS (Unaudited) (Continued)
June 30, 2016
| 1. | SIGNIFICANT ACCOUNTING POLICIESAND ORGANIZATION (CONTINUED) |
overall market conditions, to determine whether the last trade price reflects fair value or needs to be adjusted. Generally, absent any significant contrary indications, the last trade price will be used as the calculated fair value.
The Retirement Funds and the Allocation Funds value their investments in the underlying Funds of the Investment Company at their respective net asset values.
Investment Transactions — Investment transactions are accounted for as of the trade date. Realized gains and losses on the sale of short and long-term debt securities are computed on the basis of amortized cost at the time of sale. Realized gains and losses on the sale of equity securities are based on the identified cost basis of the security, determined on the first-in, first-out (“FIFO”) basis.
Futures Contracts — The Equity Index Fund, Mid-Cap Equity Index Fund and a portion of the All America Fund each maintain indexed asset portfolios which are subject to equity price risk. In order to remain more fully invested in the equity markets while minimizing transaction costs, the funds purchase stock index futures contracts. An initial cash margin deposit (represented by cash or Treasury bills) is made upon entering into a futures contract and serves as collateral for the contract. This initial margin, maintained in a segregated account, is equal to approximately 5%-6% of the contract amount, and does not involve the borrowing of funds to finance the transaction. During the period the futures contract is outstanding, changes in the value of the contract are recognized as unrealized appreciation or depreciation by “marking-to-market” on a daily basis to reflect the market value of the contract at the end of each trading day. The accumulated unrealized appreciation or depreciation on the contract is included in Net Unrealized Appreciation (Depreciation) of Investments and Futures Contracts in the Components of Net Assets section of the Statements of Assets and Liabilities. Futures contracts are valued at the settlement price established each day by the exchange on which traded. Depending upon whether unrealized appreciation or depreciation are incurred, variation margin payments are received or made daily. The net change in unrealized appreciation or depreciation of futures contracts is recorded in the Statements of Operations. When the contract is closed, a realized gain or loss from futures transactions is recorded in the Statements of Operations, equal to the net variation margin received or paid over the period the contract was outstanding.
The “Underlying Face Amount at Value” (appearing in the “Footnotes to Summary Portfolios of Investments in Securities”) representing the aggregate of outstanding contractual amounts under futures contracts reflects the extent of a Fund’s exposure to off-balance sheet risk. The use of futures transactions involves the risk of imperfect correlation in the price movements of the contract and the underlying securities. With futures contracts, there is minimal counterparty credit risk to the Fund since futures are exchange traded and the exchange’s clearinghouse, as counterparty to all exchange traded futures, guarantees the futures against default.
During the six months ended June 30, 2016, the Equity Index Fund, Mid-Cap Equity Index Fund and the All America Fund purchased futures contracts with total principal amounts of $164,033,826, $174,457,365 and $22,121,239, respectively.
Retirement Funds — Each of the Retirement Funds invests in equity (stock) funds and fixed income (bond) funds and targets different percentages to these asset classes. The targets reflect varying emphases on achieving capital appreciation and gains versus preserving capital and producing income, depending on the specific Fund’s time horizon.
The Retirement Funds target their investments in the following underlying funds of the Investment Company in accordance with the percentage allocations noted:
| | | | | | | | | | | | | | | | | | | | | | | | | | | | | | | | |
| | | Equity
Index
Fund | | | Mid-Cap
Equity
Index
Fund | | | Small Cap
Growth
Fund | | | Small Cap
Value
Fund | | | International
Fund | | | Bond
Fund | | | Mid-Term
Bond
Fund | | | Money
Market
Fund | |
Retirement Income Fund | | | 20% | | | | 5% | | | | — | | | | — | | | | — | | | | 30% | | | | 40% | | | | 5% | |
2010 Retirement Fund | | | 23% | | | | 7% | | | | — | | | | — | | | | 3% | | | | 26% | | | | 36% | | | | 5% | |
2015 Retirement Fund | | | 26% | | | | 9% | | | | 1% | | | | 1% | | | | 6% | | | | 26% | | | | 31% | | | | — | |
2020 Retirement Fund | | | 30% | | | | 11% | | | | 2% | | | | 2% | | | | 8% | | | | 26% | | | | 21% | | | | — | |
88
MUTUAL OF AMERICA INVESTMENT CORPORATION
NOTES TO FINANCIAL STATEMENTS (Unaudited) (Continued)
June 30, 2016
| 1. | SIGNIFICANT ACCOUNTING POLICIESAND ORGANIZATION (CONTINUED) |
| | | | | | | | | | | | | | | | | | | | | | | | | | | | | | | | |
| | | Equity
Index
Fund | | | Mid-Cap
Equity
Index
Fund | | | Small Cap
Growth
Fund | | | Small Cap
Value
Fund | | | International
Fund | | | Bond
Fund | | | Mid-Term
Bond
Fund | | | Money
Market
Fund | |
2025 Retirement Fund | | | 35% | | | | 14% | | | | 3% | | | | 3% | | | | 10% | | | | 25% | | | | 10% | | | | — | |
2030 Retirement Fund | | | 37% | | | | 17% | | | | 5% | | | | 5% | | | | 11% | | | | 25% | | | | — | | | | — | |
2035 Retirement Fund | | | 38% | | | | 20% | | | | 6% | | | | 6% | | | | 13% | | | | 17% | | | | — | | | | — | |
2040 Retirement Fund | | | 36% | | | | 20% | | | | 8% | | | | 8% | | | | 14% | | | | 14% | | | | — | | | | — | |
2045 Retirement Fund | | | 33% | | | | 22% | | | | 9% | | | | 9% | | | | 15% | | | | 12% | | | | — | | | | — | |
2050 Retirement Fund | | | 32% | | | | 22% | | | | 10% | | | | 10% | | | | 16% | | | | 10% | | | | — | | | | — | |
Generally, rebalancing of the Retirement Funds’ holdings is performed on a periodic basis and the mix of underlying Funds is reviewed annually.
Allocation Funds — The Allocation Funds target their investments in the following underlying Funds of the Investment Company in accordance with the percentage allocations noted:
| | | | | | | | | | | | | | | | | | | | | | | | | | | | |
| | | Equity
Index
Fund | | | Mid-Cap
Equity
Index
Fund | | | Small Cap
Growth
Fund | | | Small Cap
Value
Fund | | | International
Fund | | | Bond
Fund | | | Mid-Term
Bond
Fund | |
Conservative Allocation | | | 25 | % | | | 5 | % | | | — | | | | — | | | | 5 | % | | | 30 | % | | | 35 | % |
Moderate Allocation | | | 35 | % | | | 15 | % | | | — | | | | — | | | | 10 | % | | | 25 | % | | | 15 | % |
Aggressive Allocation | | | 35 | % | | | 20 | % | | | 5 | % | | | 5 | % | | | 15 | % | | | 20 | % | | | — | |
Generally, rebalancing of the Allocation Funds’ holdings is performed on a periodic basis.
Change in Target Investments — During the year, the Retirement Funds listed below had changes to their target investments. Overall increases (decreases) to the target percentages were as follows:
| | | | | | | | | | | | | | | | | | | | | | | | | | | | | | | | |
| | | Equity
Index
Fund | | | Mid-Cap
Equity
Index
Fund | | | Small Cap
Growth
Fund | | | Small Cap
Value
Fund | | | International
Fund | | | Bond
Fund | | | Mid-Term
Bond
Fund | | | Money
Market
Fund | |
2010 Retirement Fund | | | (1% | ) | | | (1% | ) | | | — | | | | — | | | | — | | | | 1% | | | | 1% | | | | — | |
2015 Retirement Fund | | | (1% | ) | | | (1% | ) | | | — | | | | — | | | | — | | | | 1% | | | | 1% | | | | — | |
2020 Retirement Fund | | | (1% | ) | | | (1% | ) | | | — | | | | — | | | | — | | | | 1% | | | | 1% | | | | — | |
2025 Retirement Fund | | | (2% | ) | | | (1% | ) | | | — | | | | — | | | | — | | | | 3% | | | | — | | | | — | |
2030 Retirement Fund | | | (2% | ) | | | (1% | ) | | | — | | | | — | | | | — | | | | 3% | | | | — | | | | — | |
2035 Retirement Fund | | | (2% | ) | | | — | | | | — | | | | — | | | | — | | | | 2% | | | | — | | | | — | |
2040 Retirement Fund | | | (1% | ) | | | — | | | | — | | | | — | | | | — | | | | 1% | | | | — | | | | — | |
2045 Retirement Fund | | | (1% | ) | | | — | | | | — | | | | — | | | | — | | | | 1% | | | | — | | | | — | |
2050 Retirement Fund | | | (2% | ) | | | — | | | | — | | | | — | | | | 1% | | | | 1% | | | | — | | | | — | |
Investment Income — Interest income, accretion of discount and amortization of premium are recorded daily on an accrual basis using the effective interest method. A debt obligation may cease accrual of income and result in a reduction to interest income when the collection of all or a portion of current and past due interest is in doubt. Dividend income is recorded on the ex-dividend date. Foreign source tax withheld from dividends is recorded as a reduction from dividend income. Should reclamation efforts succeed, such amounts are recorded as income upon collection.
Distributions to Shareholders (“Dividends”) — Distributions to shareholders are recorded on the ex-dividend date and are made at least annually. It is the Investment Company’s policy to make distributions of its net investment income and net realized gains, if any, in accordance with Federal income tax regulations, which may differ from U.S. generally accepted accounting principles. Accordingly, periodic reclassifications (which do not impact the funds’ net asset values) are made within the funds’ capital accounts to reflect income and gains available for distribution under Federal income tax regulations.
89
MUTUAL OF AMERICA INVESTMENT CORPORATION
NOTES TO FINANCIAL STATEMENTS (Unaudited) (Continued)
June 30, 2016
| 1. | SIGNIFICANT ACCOUNTING POLICIESAND ORGANIZATION (CONTINUED) |
Federal Income Taxes — Each Fund in the Investment Company intends to comply with the requirements of the Internal Revenue Code applicable to regulated investment companies and to distribute substantially all of its taxable income to shareholders. Therefore, no federal income or excise tax provision is required.
GAAP requires the evaluation of tax positions taken in the course of preparing a fund’s tax return to determine whether it is “more-likely-than-not” that tax positions taken in the fund’s tax return will be ultimately sustained, and, if not, a tax liability and expense is recorded.
As of June 30, 2016, management has evaluated the tax positions taken on the Funds’ tax returns for all open tax years and has concluded that no tax provision is required in any of the Funds’ financial statements. Each Fund’s federal and state income, franchise and federal excise tax returns for tax years for which the applicable statutes of limitations have not expired are subject to examination by the Internal Revenue Service and state departments of revenue.
As of June 30, 2016, the Money Market and Small Cap Growth Funds had a capital loss carry forward of $1,656 and $4,802,069, respectively, to offset any future net realized capital gains generated after December 31, 2015.
The Investment Company has an Investment Advisory Agreement with Mutual of America Capital Management LLC (“the Adviser”), an indirect wholly-owned subsidiary of Mutual of America Life. For providing investment management services to each of the Funds of the Investment Company, the Adviser receives a fee, calculated as a daily charge of the value of the net assets of each fund, at the following annual rates:
| | | | |
Fund | | Annual Investment
Management Fee | |
Retirement Funds | | | .05 | % |
Equity Index, Mid-Cap Equity Index, International Funds | | | .075 | % |
Money Market Fund | | | .15 | % |
Bond Fund | | | .39 | % |
All America, Composite, Mid-Term Bond Funds | | | .40 | % |
Mid Cap Value Fund | | | .55 | % |
Small Cap Value, Small Cap Growth Funds | | | .75 | % |
The Adviser does not assess a fee for investment management to the Allocation Funds. However, shareholders in the Allocation Funds (and the Retirement and International Funds) will indirectly bear their pro-rata share of the investment management fees incurred by the underlying Funds in which they invest.
The Retirement and Allocation Funds incur direct investment management expenses of .05% and .00%, respectively. The Funds also bore their pro-rata share of the investment management fees charged to each of the underlying funds in which they invest. Through December 31, 2014, they also did not incur operating expenses other than those included in each of the underlying funds in which they invest. Commencing January 1, 2015, the expense allocation methodology was modified such that certain non-advisory operating expenses that can be attributed only to the Retirement and Allocation Funds are now charged directly to those Funds. Effective January 1, 2015, the Investment Company and the Adviser entered into an agreement under which the Adviser agrees to reimburse the direct non-advisory operating expenses of any Allocation or Retirement Fund (each a “Fund of Funds”) that has less than $50 million in average daily net assets for the prior calendar year. This agreement remains in effect through April 30, 2017 and continues into successive 12 month periods ending April 30 unless i) The Fund of Funds has at least $50 million in average daily net assets for the prior calendar year, ii) the Investment Company gives not less than 30 days written notice to the Adviser, or iii) the Adviser gives 45 days advance notice to the Investment Company before the next May 1 of a given year to terminate the agreement. In that case, the agreement will terminate on the next May 1 following the written notice.
90
MUTUAL OF AMERICA INVESTMENT CORPORATION
NOTES TO FINANCIAL STATEMENTS (Unaudited) (Continued)
June 30, 2016
The cost of investment purchases and proceeds from sales of investments, excluding short-term securities and futures contracts, for the six months ended June 30, 2016, were as follows:
| | | | | | | | | | | | | | | | | | | | |
| | | Equity Index
Fund | | | All America
Fund | | | Small Cap
Value Fund | | | Small Cap
Growth Fund | | | Mid Cap
Value Fund | |
Cost of investment purchases | | $ | 130,278,724 | | | $ | 78,325,640 | | | $ | 40,208,261 | | | $ | 86,185,293 | | | $ | 9,933,553 | |
| | | | | | | | | | | | | | | | | | | | |
Proceeds from sales of investments | | $ | 54,456,405 | | | $ | 92,664,255 | | | $ | 39,244,355 | | | $ | 96,164,370 | | | $ | 8,161,276 | |
| | | | | | | | | | | | | | | | | | | | |
| | | | | |
| | | Mid-Cap Equity
Index Fund | | | International
Fund | | | Composite
Fund | | | Retirement
Income Fund | | | 2010
Retirement
Fund | |
Cost of investment purchases | | $ | 178,886,693 | | | $ | 35,866,548 | | | $ | 51,120,016 | | | $ | 5,732,231 | | | $ | 2,151,252 | |
| | | | | | | | | | | | | | | | | | | | |
Proceeds from sales of investments | | $ | 142,627,017 | | | $ | 10,001,367 | | | $ | 58,028,447 | | | $ | 5,171,197 | | | $ | 3,828,761 | |
| | | | | | | | | | | | | | | | | | | | |
| | | | | |
| | | 2015
Retirement
Fund | | | 2020
Retirement
Fund | | | 2025
Retirement
Fund | | | 2030
Retirement
Fund | | | 2035
Retirement
Fund | |
Cost of investment purchases | | $ | 4,207,649 | | | $ | 18,244,370 | | | $ | 31,546,750 | | | $ | 23,057,788 | | | $ | 23,350,433 | |
| | | | | | | | | | | | | | | | | | | | |
Proceeds from sales of investments | | $ | 14,226,016 | | | $ | 14,609,507 | | | $ | 8,567,962 | | | $ | 8,431,400 | | | $ | 7,487,865 | |
| | | | | | | | | | | | | | | | | | | | |
| | | | | |
| | | 2040
Retirement
Fund | | | 2045
Retirement
Fund | | | 2050
Retirement
Fund | | | Conservative
Allocation
Fund | | | Moderate
Allocation
Fund | |
Cost of investment purchases | | $ | 19,179,311 | | | $ | 17,706,712 | | | $ | 24,210,861 | | | $ | 5,670,512 | | | $ | 12,157,531 | |
| | | | | | | | | | | | | | | | | | | | |
Proceeds from sales of investments | | $ | 7,383,856 | | | $ | 5,593,802 | | | $ | 2,033,539 | | | $ | 7,232,200 | | | $ | 12,123,776 | |
| | | | | | | | | | | | | | | | | | | | |
| | | | | |
| | | Aggressive
Allocation
Fund | | | Money Market
Fund | | | Mid-Term
Bond Fund | | | Bond Fund | | | | |
Cost of investment purchases | | $ | 7,486,641 | | | | — | | | $ | 54,893,333 | | | $ | 109,743,871 | | | | | |
| | | | | | | | | | | | | | | | | | | | |
Proceeds from sales of investments | | $ | 13,183,849 | | | | — | | | $ | 50,558,377 | | | $ | 89,998,821 | | | | | |
| | | | | | | | | | | | | | | | | | | | |
The cost of short-term security purchases for the Money Market Fund for the six months ended June 30, 2016, was $589,584,413; net proceeds from sales for the year were $594,647,952.
The components of net unrealized appreciation (depreciation) of investments for federal income tax purposes and the cost of investments for federal income tax purposes at June 30, 2016 for each of the funds were as follows:
| | | | | | | | | | | | | | | | | | | | |
| | | Equity Index
Fund | | | All America
Fund | | | Small Cap
Value Fund | | | Small Cap
Growth Fund | | | Mid Cap
Value Fund | |
Unrealized Appreciation | | $ | 693,439,626 | | | $ | 63,931,428 | | | $ | 90,837,290 | | | $ | 64,025,530 | | | $ | 17,316,127 | |
Unrealized Depreciation | | | (58,419,466 | ) | | | (15,148,793 | ) | | | (21,079,319 | ) | | | (25,091,447 | ) | | | (4,608,546 | ) |
| | | | | | | | | | | | | | | | | | | | |
Net | | $ | 635,020,160 | | | $ | 48,782,635 | | | $ | 69,757,971 | | | $ | 38,934,083 | | | $ | 12,707,581 | |
| | | | | | | | | | | | | | | | | | | | |
Tax Cost of Investments | | $ | 1,308,177,080 | | | $ | 236,834,599 | | | $ | 317,965,904 | | | $ | 356,035,621 | | | $ | 72,664,533 | |
| | | | | | | | | | | | | | | | | | | | |
| | | | | |
| | | Mid-Cap Equity
Index Fund | | | International
Fund | | | Composite Fund | | | Retirement
Income Fund | | | 2010
Retirement
Fund | |
Unrealized Appreciation | | $ | 249,041,064 | | | $ | 482,360 | | | $ | 23,859,275 | | | $ | 2,184,043 | | | $ | 1,413,843 | |
Unrealized Depreciation | | | (67,327,236 | ) | | | (26,680,773 | ) | | | (3,806,447 | ) | | | (273,890 | ) | | | (49,645 | ) |
| | | | | | | | | | | | | | | | | | | | |
Net | | $ | 181,713,828 | | | $ | (26,198,413 | ) | | $ | 20,052,828 | | | $ | 1,910,153 | | | $ | 1,364,198 | |
| | | | | | | | | | | | | | | | | | | | |
Tax Cost of Investments | | $ | 880,351,072 | | | $ | 358,137,830 | | | $ | 156,278,284 | | | $ | 65,181,056 | | | $ | 23,633,461 | |
| | | | | | | | | | | | | | | | | | | | |
91
MUTUAL OF AMERICA INVESTMENT CORPORATION
NOTES TO FINANCIAL STATEMENTS (Unaudited) (Continued)
June 30, 2016
| 3. | INVESTMENTS (CONTINUED) |
| | | | | | | | | | | | | | | | | | | | |
| | | | | |
| | | 2015
Retirement
Fund | | | 2020
Retirement
Fund | | | 2025
Retirement
Fund | | | 2030
Retirement
Fund | | | 2035
Retirement
Fund | |
Unrealized Appreciation | | $ | 12,004,701 | | | $ | 33,502,668 | | | $ | 45,998,572 | | | $ | 39,786,140 | | | $ | 33,495,858 | |
Unrealized Depreciation | | | (163,805 | ) | | | (1,207,255 | ) | | | (1,933,877 | ) | | | (1,360,672 | ) | | | (1,238,294 | ) |
| | | | | | | | | | | | | | | | | | | | |
Net | | $ | 11,840,896 | | | $ | 32,295,413 | | | $ | 44,064,695 | | | $ | 38,425,468 | | | $ | 32,257,564 | |
| | | | | | | | | | | | | | | | | | | | |
Tax Cost of Investments | | $ | 133,196,992 | | | $ | 350,404,205 | | | $ | 392,389,144 | | | $ | 318,407,674 | | | $ | 266,257,192 | |
| | | | | | | | | | | | | | | | | | | | |
| | | | | |
| | | 2040
Retirement
Fund | | | 2045
Retirement
Fund | | | 2050
Retirement
Fund | | | Conservative
Allocation
Fund | | | Moderate
Allocation
Fund | |
Unrealized Appreciation | | $ | 27,176,033 | | | $ | 35,576,883 | | | $ | 2,682,517 | | | $ | 8,645,978 | | | $ | 49,379,007 | |
Unrealized Depreciation | | | (801,587 | ) | | | (843,619 | ) | | | (2,287,874 | ) | | | (965,711 | ) | | | (7,592,876 | ) |
| | | | | | | | | | | | | | | | | | | | |
Net | | $ | 26,374,446 | | | $ | 34,733,264 | | | $ | 394,643 | | | $ | 7,680,267 | | | $ | 41,786,131 | |
| | | | | | | | | | | | | | | | | | | | |
Tax Cost of Investments | | $ | 216,137,193 | | | $ | 251,785,824 | | | $ | 119,894,693 | | | $ | 124,228,869 | | | $ | 288,382,126 | |
| | | | | | | | | | | | | | | | | | | | |
| | | | | |
| | | Aggressive
Allocation
Fund | | | Money Market
Fund | | | Mid-Term Bond
Fund | | | Bond Fund | | | | |
Unrealized Appreciation | | $ | 50,869,603 | | | $ | 478 | | | $ | 13,159,345 | | | $ | 46,384,093 | | | | | |
Unrealized Depreciation | | | (9,125,895 | ) | | | 0 | | | | (2,283,757 | ) | | | (6,371,628 | ) | | | | |
| | | | | | | | | | | | | | | | | | | | |
Net | | $ | 41,743,708 | | | $ | 478 | | | $ | 10,875,588 | | | $ | 40,012,465 | | | | | |
| | | | | | | | | | | | | | | | | | | | |
Tax Cost of Investments | | $ | 210,724,504 | | | $ | 61,726,316 | | | $ | 457,812,364 | | | $ | 1,030,206,103 | | | | | |
| | | | | | | | | | | | | | | | | | | | |
Differences between amounts reflected in the Statements of Assets and Liabilities and those computed for federal income tax purposes arise primarily from federal income tax treatment of wash sales, REITs, partnerships, corporate actions and futures contracts.
Investments in affiliated investment companies during the six months ended June 30, 2016 were as follows:
| | | | | | | | | | | | | | | | | | | | | | | | |
Affiliated Investment Company | | Value as of
December 31,
2015 | | | Purchases | | | Realized
Gain
(Loss) on
Investment
Securities | | | Change in
Unrealized
Appreciation
(Depreciation)
of Investment
Securities | | | Sales | | | Value as of
June 30,
2016 | |
Retirement Income Fund | | | | | | | | | | | | | | | | | | | | | | | | |
Bond Fund | | $ | 19,608,496 | | | $ | 1,365,395 | | | $ | (20,553 | ) | | $ | 1,202,994 | | | $ | (1,682,648 | ) | | $ | 20,473,684 | |
Equity Index Fund | | | 12,702,069 | | | | 1,454,675 | | | | 195,679 | | | | 295,682 | | | | (798,056 | ) | | | 13,850,049 | |
Mid-Cap Equity Index Fund | | | 2,972,761 | | | | 399,226 | | | | 24,036 | | | | 214,652 | | | | (199,514 | ) | | | 3,411,161 | |
Mid-Term Bond Fund | | | 25,553,991 | | | | 2,285,369 | | | | (58,201 | ) | | | 1,198,477 | | | | (1,596,113 | ) | | | 27,383,523 | |
Money Market Fund | | | 2,638,693 | | | | 227,566 | | | | (2,319 | ) | | | 3,718 | | | | (894,866 | ) | | | 1,972,792 | |
| | | | | | | | | | | | | | | | | | | | | | | | |
Total | | $ | 63,476,010 | | | $ | 5,732,231 | | | $ | 138,642 | | | $ | 2,915,523 | | | $ | (5,171,197 | ) | | $ | 67,091,209 | |
| | | | | | | | | | | | | | | | | | | | | | | | |
2010 Retirement Fund | | | | | | | | | | | | | | | | | | | | | | | | |
Bond Fund | | $ | 6,692,883 | | | $ | 419,659 | | | $ | 24,126 | | | $ | 367,737 | | | $ | (874,103 | ) | | $ | 6,630,302 | |
Equity Index Fund | | | 6,425,681 | | | | 398,334 | | | | 291,643 | | | | (73,089 | ) | | | (815,887 | ) | | | 6,226,682 | |
International Fund | | | 717,952 | | | | 134,067 | | | | 12,473 | | | | (30,346 | ) | | | (100,407 | ) | | | 733,739 | |
Mid-Cap Equity Index Fund | | | 2,163,416 | | | | 131,234 | | | | 91,450 | | | | 58,820 | | | | (471,740 | ) | | | 1,973,180 | |
Mid-Term Bond Fund | | | 8,529,463 | | | | 984,489 | | | | (29,852 | ) | | | 399,557 | | | | (1,177,543 | ) | | | 8,706,114 | |
Money Market Fund | | | 1,032,729 | | | | 83,469 | | | | (1,580 | ) | | | 2,105 | | | | (389,081 | ) | | | 727,642 | |
| | | | | | | | | | | | | | | | | | | | | | | | |
Total | | $ | 25,562,124 | | | $ | 2,151,252 | | | $ | 388,260 | | | $ | 724,784 | | | $ | (3,828,761 | ) | | $ | 24,997,659 | |
| | | | | | | | | | | | | | | | | | | | | | | | |
92
MUTUAL OF AMERICA INVESTMENT CORPORATION
NOTES TO FINANCIAL STATEMENTS (Unaudited) (Continued)
June 30, 2016
| 3. | INVESTMENTS (CONTINUED) |
| | | | | | | | | | | | | | | | | | | | | | | | |
Affiliated Investment Company | | Value as of
December 31,
2015 | | | Purchases | | | Realized
Gain
(Loss) on
Investment
Securities | | | Change in
Unrealized
Appreciation
(Depreciation)
of Investment
Securities | | | Sales | | | Value as of
June 30,
2016 | |
2015 Retirement Fund | | | | | | | | | | | | | | | | | | | | | | | | |
Bond Fund | | $ | 37,588,943 | | | $ | 666,311 | | | $ | 157,096 | | | $ | 2,007,859 | | | $ | (3,839,817 | ) | | $ | 36,580,392 | |
Equity Index Fund | | | 42,183,693 | | | | 700,105 | | | | 1,237,068 | | | | 187,955 | | | | (3,466,583 | ) | | | 40,842,238 | |
International Fund | | | 8,414,559 | | | | 345,227 | | | | 2,496 | | | | (213,128 | ) | | | (758,765 | ) | | | 7,790,389 | |
Mid-Cap Equity Index Fund | | | 15,488,169 | | | | 253,392 | | | | 454,338 | | | | 634,486 | | | | (2,098,546 | ) | | | 14,731,839 | |
Mid-Term Bond Fund | | | 42,281,260 | | | | 1,886,493 | | | | (89,822 | ) | | | 1,887,165 | | | | (3,809,384 | ) | | | 42,155,712 | |
Small Cap Growth Fund | | | 1,391,647 | | | | 219,362 | | | | (422 | ) | | | (16,517 | ) | | | (126,460 | ) | | | 1,467,610 | |
Small Cap Value Fund | | | 1,414,109 | | | | 136,759 | | | | 8,841 | | | | 36,460 | | | | (126,461 | ) | | | 1,469,708 | |
| | | | | | | | | | | | | | | | | | | | | | | | |
Total | | $ | 148,762,380 | | | $ | 4,207,649 | | | $ | 1,769,595 | | | $ | 4,524,280 | | | $ | (14,226,016 | ) | | $ | 145,037,888 | |
| | | | | | | | | | | | | | | | | | | | | | | | |
2020 Retirement Fund | | | | | | | | | | | | | | | | | | | | | | | | |
Bond Fund | | $ | 90,525,095 | | | $ | 3,811,219 | | | $ | 361,374 | | | $ | 5,091,541 | | | $ | (4,266,620 | ) | | $ | 95,522,609 | |
Equity Index Fund | | | 122,942,523 | | | | 4,632,885 | | | | 2,155,485 | | | | 2,388,148 | | | | (5,307,575 | ) | | | 126,811,466 | |
International Fund | | | 30,025,615 | | | | 1,498,748 | | | | 57,950 | | | | (778,214 | ) | | | (915,511 | ) | | | 29,888,588 | |
Mid-Cap Equity Index Fund | | | 39,832,348 | | | | 2,079,067 | | | | 413,470 | | | | 2,689,434 | | | | (1,349,363 | ) | | | 43,664,956 | |
Mid-Term Bond Fund | | | 64,883,901 | | | | 4,900,271 | | | | (45,820 | ) | | | 2,936,746 | | | | (2,312,682 | ) | | | 70,362,416 | |
Small Cap Growth Fund | | | 7,629,541 | | | | 424,222 | | | | 6,144 | | | | (94,120 | ) | | | (228,878 | ) | | | 7,736,909 | |
Small Cap Value Fund | | | 7,760,479 | | | | 897,958 | | | | 47,566 | | | | 235,549 | | | | (228,878 | ) | | | 8,712,674 | |
| | | | | | | | | | | | | | | | | | | | | | | | |
Total | | $ | 363,599,502 | | | $ | 18,244,370 | | | $ | 2,996,169 | | | $ | 12,469,084 | | | $ | (14,609,507 | ) | | $ | 382,699,618 | |
| | | | | | | | | | | | | | | | | | | | | | | | |
2025 Retirement Fund | | | | | | | | | | | | | | | | | | | | | | | | |
Bond Fund | | $ | 89,759,030 | | | $ | 9,111,870 | | | $ | 71,947 | | | $ | 5,568,289 | | | $ | (1,149,053 | ) | | $ | 103,362,083 | |
Equity Index Fund | | | 152,280,291 | | | | 10,291,090 | | | | 1,032,379 | | | | 5,004,526 | | | | (2,406,752 | ) | | | 166,201,534 | |
International Fund | | | 36,226,349 | | | | 3,462,436 | | | | 84,431 | | | | (920,626 | ) | | | (512,106 | ) | | | 38,340,484 | |
Mid-Cap Equity Index Fund | | | 61,818,449 | | | | 4,162,050 | | | | 997,675 | | | | 3,974,128 | | | | (2,514,426 | ) | | | 68,437,876 | |
Mid-Term Bond Fund | | | 29,833,695 | | | | 2,809,985 | | | | 40,963 | | | | 1,309,678 | | | | (1,420,975 | ) | | | 32,573,346 | |
Small Cap Growth Fund | | | 12,909,656 | | | | 842,996 | | | | 17,354 | | | | (145,665 | ) | | | (411,018 | ) | | | 13,213,323 | |
Small Cap Value Fund | | | 13,132,143 | | | | 866,323 | | | | 37,194 | | | | 443,165 | | | | (153,632 | ) | | | 14,325,193 | |
| | | | | | | | | | | | | | | | | | | | | | | | |
Total | | $ | 395,959,613 | | | $ | 31,546,750 | | | $ | 2,281,943 | | | $ | 15,233,495 | | | $ | (8,567,962 | ) | | $ | 436,453,839 | |
| | | | | | | | | | | | | | | | | | | | | | | | |
2030 Retirement Fund | | | | | | | | | | | | | | | | | | | | | | | | |
Bond Fund | | $ | 74,567,584 | | | $ | 5,417,330 | | | $ | 59,535 | | | $ | 4,582,640 | | | $ | (1,088,771 | ) | | $ | 83,538,318 | |
Equity Index Fund | | | 136,327,089 | | | | 7,526,236 | | | | 2,394,946 | | | | 2,886,708 | | | | (5,376,579 | ) | | | 143,758,400 | |
International Fund | | | 30,442,091 | | | | 3,871,757 | | | | 34,018 | | | | (745,148 | ) | | | (537,802 | ) | | | 33,064,916 | |
Mid-Cap Equity Index Fund | | | 55,223,617 | | | | 4,277,599 | | | | 313,547 | | | | 4,206,277 | | | | (875,651 | ) | | | 63,145,389 | |
Small Cap Growth Fund | | | 15,609,140 | | | | 989,091 | | | | 53,450 | | | | (202,340 | ) | | | (244,456 | ) | | | 16,204,885 | |
Small Cap Value Fund | | | 15,878,892 | | | | 975,775 | | | | 95,909 | | | | 478,799 | | | | (308,141 | ) | | | 17,121,234 | |
| | | | | | | | | | | | | | | | | | | | | | | | |
Total | | $ | 328,048,413 | | | $ | 23,057,788 | | | $ | 2,951,405 | | | $ | 11,206,936 | | | $ | (8,431,400 | ) | | $ | 356,833,142 | |
| | | | | | | | | | | | | | | | | | | | | | | | |
2035 Retirement Fund | | | | | | | | | | | | | | | | | | | | | | | | |
Bond Fund | | $ | 43,054,008 | | | $ | 3,004,294 | | | $ | 200,488 | | | $ | 2,440,780 | | | $ | (2,599,199 | ) | | $ | 46,100,371 | |
Equity Index Fund | | | 113,496,377 | | | | 7,688,856 | | | | 1,509,643 | | | | 3,000,648 | | | | (3,242,226 | ) | | | 122,453,298 | |
International Fund | | | 30,519,614 | | | | 4,117,626 | | | | 50,836 | | | | (752,233 | ) | | | (465,338 | ) | | | 33,470,505 | |
Mid-Cap Equity Index Fund | | | 52,857,418 | | | | 5,312,397 | | | | 266,854 | | | | 4,135,220 | | | | (715,905 | ) | | | 61,855,984 | |
Small Cap Growth Fund | | | 15,560,698 | | | | 2,060,734 | | | | 41,772 | | | | (144,813 | ) | | | (214,772 | ) | | | 17,303,619 | |
Small Cap Value Fund | | | 15,827,470 | | | | 1,166,526 | | | | 87,814 | | | | 499,594 | | | | (250,425 | ) | | | 17,330,979 | |
| | | | | | | | | | | | | | | | | | | | | | | | |
Total | | $ | 271,315,585 | | | $ | 23,350,433 | | | $ | 2,157,407 | | | $ | 9,179,196 | | | $ | (7,487,865 | ) | | $ | 298,514,756 | |
| | | | | | | | | | | | | | | | | | | | | | | | |
93
MUTUAL OF AMERICA INVESTMENT CORPORATION
NOTES TO FINANCIAL STATEMENTS (Unaudited) (Continued)
June 30, 2016
| 3. | INVESTMENTS (CONTINUED) |
| | | | | | | | | | | | | | | | | | | | | | | | |
Affiliated Investment Company | | Value as of
December 31,
2015 | | | Purchases | | | Realized
Gain
(Loss) on
Investment
Securities | | | Change in
Unrealized
Appreciation
(Depreciation)
of Investment
Securities | | | Sales | | | Value as of
June 30,
2016 | |
2040 Retirement Fund | | | | | | | | | | | | | | | | | | | | | | | | |
Bond Fund | | $ | 26,755,253 | | | $ | 1,878,088 | | | $ | 46,823 | | | $ | 1,618,847 | | | $ | (701,336 | ) | | $ | 29,597,675 | |
Equity Index Fund | | | 82,389,895 | | | | 9,708,637 | | | | 433,123 | | | | 3,006,679 | | | | (905,973 | ) | | | 94,632,361 | |
International Fund | | | 29,166,549 | | | | 1,995,399 | | | | 45,488 | | | | (712,753 | ) | | | (376,919 | ) | | | 30,117,764 | |
Mid-Cap Equity Index Fund | | | 49,177,993 | | | | 2,850,571 | | | | 1,548,842 | | | | 2,330,439 | | | | (4,443,305 | ) | | | 51,464,540 | |
Small Cap Growth Fund | | | 17,057,928 | | | | 1,606,387 | | | | 63,051 | | | | (195,304 | ) | | | (196,592 | ) | | | 18,335,470 | |
Small Cap Value Fund | | | 17,357,490 | | | | 1,140,229 | | | | 312,442 | | | | 313,399 | | | | (759,731 | ) | | | 18,363,829 | |
| | | | | | | | | | | | | | | | | | | | | | | | |
Total | | $ | 221,905,108 | | | $ | 19,179,311 | | | $ | 2,449,769 | | | $ | 6,361,307 | | | $ | (7,383,856 | ) | | $ | 242,511,639 | |
| | | | | | | | | | | | | | | | | | | | | | | | |
2045 Retirement Fund | | | | | | | | | | | | | | | | | | | | | | | | |
Bond Fund | | $ | 26,387,858 | | | $ | 2,274,665 | | | $ | 34,127 | | | $ | 1,623,452 | | | $ | (356,334 | ) | | $ | 29,963,768 | |
Equity Index Fund | | | 97,604,785 | | | | 5,148,423 | | | | 1,350,271 | | | | 2,512,145 | | | | (2,678,177 | ) | | | 103,937,447 | |
International Fund | | | 39,676,479 | | | | 2,285,509 | | | | 180,980 | | | | (1,082,033 | ) | | | (1,309,765 | ) | | | 39,751,170 | |
Mid-Cap Equity Index Fund | | | 54,684,199 | | | | 4,474,194 | | | | 298,912 | | | | 4,243,154 | | | | (687,240 | ) | | | 63,013,219 | |
Small Cap Growth Fund | | | 22,898,412 | | | | 2,103,765 | | | | 82,667 | | | | (254,349 | ) | | | (281,143 | ) | | | 24,549,352 | |
Small Cap Value Fund | | | 23,299,301 | | | | 1,420,156 | | | | 102,402 | | | | 763,416 | | | | (281,143 | ) | | | 25,304,132 | |
| | | | | | | | | | | | | | | | | | | | | | | | |
Total | | $ | 264,551,034 | | | $ | 17,706,712 | | | $ | 2,049,359 | | | $ | 7,805,785 | | | $ | (5,593,802 | ) | | $ | 286,519,088 | |
| | | | | | | | | | | | | | | | | | | | | | | | |
2050 Retirement Fund | | | | | | | | | | | | | | | | | | | | | | | | |
Bond Fund | | $ | 7,595,596 | | | $ | 2,192,273 | | | $ | 1,627 | | | $ | 526,399 | | | $ | (79,758 | ) | | $ | 10,236,137 | |
Equity Index Fund | | | 34,134,263 | | | | 7,727,446 | | | | 292,621 | | | | 1,343,172 | | | | (1,172,960 | ) | | | 42,324,542 | |
International Fund | | | 14,791,061 | | | | 3,495,952 | | | | 10,768 | | | | (312,364 | ) | | | (378,565 | ) | | | 17,606,852 | |
Mid-Cap Equity Index Fund | | | 19,059,314 | | | | 5,978,407 | | | | 28,707 | | | | 1,863,887 | | | | (180,766 | ) | | | 26,749,549 | |
Small Cap Growth Fund | | | 9,059,531 | | | | 2,516,885 | | | | 3,653 | | | | 31,788 | | | | (82,166 | ) | | | 11,529,691 | |
Small Cap Value Fund | | | 9,240,114 | | | | 2,299,898 | | | | 7,822 | | | | 434,055 | | | | (139,324 | ) | | | 11,842,565 | |
| | | | | | | | | | | | | | | | | | | | | | | | |
Total | | $ | 93,879,879 | | | $ | 24,210,861 | | | $ | 345,198 | | | $ | 3,886,937 | | | $ | (2,033,539 | ) | | $ | 120,289,336 | |
| | | | | | | | | | | | | | | | | | | | | | | | |
Conservative Allocation Fund | | | | | | | | | | | | | | | | | | | | | | | | |
Bond Fund | | $ | 38,252,389 | | | $ | 1,438,947 | | | $ | 106,327 | | | $ | 2,171,651 | | | $ | (2,439,963 | ) | | $ | 39,529,351 | |
Equity Index Fund | | | 32,422,641 | | | | 1,281,034 | | | | 561,078 | | | | 601,010 | | | | (1,589,545 | ) | | | 33,276,218 | |
International Fund | | | 6,166,398 | | | | 757,024 | | | | (59,224 | ) | | | (92,937 | ) | | | (317,909 | ) | | | 6,453,352 | |
Mid-Cap Equity Index Fund | | | 6,085,687 | | | | 514,735 | | | | (33,663 | ) | | | 503,188 | | | | (317,909 | ) | | | 6,752,038 | |
Mid-Term Bond Fund | | | 44,835,833 | | | | 1,678,772 | | | | 49,933 | | | | 1,900,513 | | | | (2,566,874 | ) | | | 45,898,177 | |
| | | | | | | | | | | | | | | | | | | | | | | | |
Total | | $ | 127,762,948 | | | $ | 5,670,512 | | | $ | 624,451 | | | $ | 5,083,425 | | | $ | (7,232,200 | ) | | $ | 131,909,136 | |
| | | | | | | | | | | | | | | | | | | | | | | | |
Moderate Allocation Fund | | | | | | | | | | | | | | | | | | | | | | | | |
Bond Fund | | $ | 79,269,726 | | | $ | 2,113,378 | | | $ | 525,733 | | | $ | 4,241,593 | | | $ | (3,984,083 | ) | | $ | 82,166,347 | |
Equity Index Fund | | | 112,965,487 | | | | 2,958,728 | | | | 2,076,790 | | | | 2,153,145 | | | | (3,944,541 | ) | | | 116,209,609 | |
International Fund | | | 30,701,048 | | | | 3,066,997 | | | | (149,137 | ) | | | (579,349 | ) | | | (841,975 | ) | | | 32,197,584 | |
Mid-Cap Equity Index Fund | | | 45,426,051 | | | | 2,750,401 | | | | 470,292 | | | | 3,145,519 | | | | (1,262,963 | ) | | | 50,529,300 | |
Mid-Term Bond Fund | | | 47,788,028 | | | | 1,268,027 | | | | 37,146 | | | | 2,062,430 | | | | (2,090,214 | ) | | | 49,065,417 | |
| | | | | | | | | | | | | | | | | | | | | | | | |
Total | | $ | 316,150,340 | | | $ | 12,157,531 | | | $ | 2,960,824 | | | $ | 11,023,338 | | | $ | (12,123,776 | ) | | $ | 330,168,257 | |
| | | | | | | | | | | | | | | | | | | | | | | | |
Aggressive Allocation Fund | | | | | | | | | | | | | | | | | | | | | | | | |
Bond Fund | | $ | 50,339,115 | | | $ | 572,889 | | | $ | 465,458 | | | $ | 2,520,555 | | | $ | (3,843,977 | ) | | $ | 50,054,040 | |
Equity Index Fund | | | 89,739,728 | | | | 1,002,555 | | | | 3,142,899 | | | | 99,295 | | | | (5,487,129 | ) | | | 88,497,348 | |
International Fund | | | 36,583,779 | | | | 2,347,606 | | | | (228,644 | ) | | | (646,225 | ) | | | (1,284,248 | ) | | | 36,772,268 | |
Mid-Cap Equity Index Fund | | | 48,095,351 | | | | 1,198,838 | | | | 915,570 | | | | 2,817,730 | | | | (1,712,329 | ) | | | 51,315,160 | |
Small Cap Growth Fund | | | 11,876,597 | | | | 1,598,161 | | | | 193,461 | | | | (265,692 | ) | | | (428,083 | ) | | | 12,974,444 | |
Small Cap Value Fund | | | 12,087,729 | | | | 766,592 | | | | 131,093 | | | | 297,621 | | | | (428,083 | ) | | | 12,854,952 | |
| | | | | | | | | | | | | | | | | | | | | | | | |
Total | | $ | 248,722,299 | | | $ | 7,486,641 | | | $ | 4,619,837 | | | $ | 4,823,284 | | | $ | (13,183,849 | ) | | $ | 252,468,212 | |
| | | | | | | | | | | | | | | | | | | | | | | | |
94
MUTUAL OF AMERICA INVESTMENT CORPORATION
NOTES TO FINANCIAL STATEMENTS (Unaudited) (Continued)
June 30, 2016
The Investment Company has registered an indefinite number of its capital shares pursuant to Rule 24f-2 under the Investment Company Act of 1940. On February 25, 2016, the Board of Directors of the Investment Company increased the number of authorized shares from eight and a quarter billion to nine and a quarter billion. Also on that date, the Board of Directors changed the number of authorized shares as indicated by the following table. As a result of these actions, there remained 1,055,000,000 unallocated shares as of June 30, 2016.
| | | | | | | | | | | | |
| | | Authorized No. of Shares | |
| | | Previous
Allocation | | | Allocation
Increase/
(Decrease) | | | Total Shares
Allocated | |
Equity Index Fund | | | 700,000,000 | | | | — | | | | 700,000,000 | |
All America Fund | | | 200,000,000 | | | | — | | | | 200,000,000 | |
Small Cap Value Fund | | | 325,000,000 | | | | — | | | | 325,000,000 | |
Small Cap Growth Fund | | | 395,000,000 | | | | — | | | | 395,000,000 | |
Mid Cap Value Fund | | | 100,000,000 | | | | — | | | | 100,000,000 | |
Mid-Cap Equity Index Fund | | | 600,000,000 | | | | — | | | | 600,000,000 | |
International Fund | | | 525,000,000 | | | | 100,000,000 | | | | 625,000,000 | |
Composite Fund | | | 150,000,000 | | | | — | | | | 150,000,000 | |
Retirement Income Fund | | | 80,000,000 | | | | 15,000,000 | | | | 95,000,000 | |
2010 Retirement Fund | | | 50,000,000 | | | | — | | | | 50,000,000 | |
2015 Retirement Fund | | | 200,000,000 | | | | — | | | | 200,000,000 | |
2020 Retirement Fund | | | 425,000,000 | | | | 40,000,000 | | | | 465,000,000 | |
2025 Retirement Fund | | | 425,000,000 | | | | — | | | | 425,000,000 | |
2030 Retirement Fund | | | 365,000,000 | | | | 50,000,000 | | | | 415,000,000 | |
2035 Retirement Fund | | | 295,000,000 | | | | 50,000,000 | | | | 345,000,000 | |
2040 Retirement Fund | | | 225,000,000 | | | | 60,000,000 | | | | 285,000,000 | |
2045 Retirement Fund | | | 275,000,000 | | | | 50,000,000 | | | | 325,000,000 | |
2050 Retirement Fund | | | 110,000,000 | | | | 60,000,000 | | | | 170,000,000 | |
2055 Retirement Fund** | | | 100,000,000 | | | | — | | | | 100,000,000 | |
Conservative Allocation Fund | | | 150,000,000 | | | | 15,000,000 | | | | 165,000,000 | |
Moderate Allocation Fund | | | 255,000,000 | | | | 15,000,000 | | | | 270,000,000 | |
Aggressive Allocation Fund | | | 200,000,000 | | | | — | | | | 200,000,000 | |
Money Market Fund | | | 125,000,000 | | | | — | | | | 125,000,000 | |
Mid-Term Bond Fund | | | 540,000,000 | | | | — | | | | 540,000,000 | |
Bond Fund | | | 925,000,000 | | | | — | | | | 925,000,000 | |
| | | | | | | | | | | | |
Sub-Total | | | 7,740,000,000 | | | | 455,000,000 | | | | 8,195,000,000 | |
Shares to be allocated at the discretion of the Board of Directors | | | 510,000,000 | | | | 545,000,000 | | | | 1,055,000,000 | |
| | | | | | | | | | | | |
Total | | | 8,250,000,000 | | | | 1,000,000,000 | | | | 9,250,000,000 | |
| | | | | | | | | | | | |
| ** | The 2055 Retirement Fund to commence operations on, or after, October 1, 2016. |
| 5. | DISTRIBUTIONSTO SHAREHOLDERSAND INCOME TAX INFORMATION |
On September 9, 2015, required distributions of net investment income and, as applicable, net realized gains relating to 2014 were declared and paid for all applicable funds in accordance with Internal Revenue Section 855(a). No such distributions were required for the Money Market Fund.
The Funds of Mutual of America Investment Corporation intend to declare and pay their respective tax year 2015 investment company taxable income and capital gains in 2016 in accordance with Internal Revenue Section 855(a).
95
MUTUAL OF AMERICA INVESTMENT CORPORATION
NOTES TO FINANCIAL STATEMENTS (Unaudited) (Continued)
June 30, 2016
| 5. | DISTRIBUTIONSTO SHAREHOLDERSAND INCOME TAX INFORMATION (CONTINUED) |
Pursuant to shareholders’ instructions, substantially all dividend distributions throughout 2016 and 2015 were immediately reinvested into their respective funds. The tax character of the distributions paid during 2016 and 2015 was as follows:
| | | | | | | | | | | | | | | | | | | | |
| | | Equity Index
Fund | | | All America
Fund | | | Small Cap
Value Fund | | | Small Cap
Growth | | | Mid Cap
Value Fund | |
Ordinary Income (a) | | | | | | | | | | | | | | | | | | | | |
2016 | | $ | 0 | | | $ | 0 | | | $ | 0 | | | $ | 0 | | | $ | 0 | |
2015 | | $ | 31,336,864 | | | $ | 4,193,905 | | | $ | 3,251,696 | | | $ | 0 | | | $ | 1,088,832 | |
Long-Term Capital Gains | | | | | | | | | | | | | | | | | | | | |
2016 | | $ | 0 | | | $ | 0 | | | $ | 0 | | | $ | 0 | | | $ | 0 | |
2015 | | $ | 62,926,435 | | | $ | 19,549,735 | | | $ | 23,962,528 | | | $ | 50,286,630 | | | $ | 5,005,567 | |
| | | | | |
| | | Mid-Cap
Equity Index
Fund | | | International
Fund | | | Composite
Fund | | | Retirement
Fund | | | 2010
Retirement
Fund | |
Ordinary Income (a) | | | | | | | | | | | | | | | | | | | | |
2016 | | $ | 0 | | | $ | 0 | | | $ | 0 | | | $ | 0 | | | $ | 0 | |
2015 | | $ | 16,367,543 | | | $ | 8,147,328 | | | $ | 3,937,658 | | | $ | 1,043,642 | | | $ | 553,391 | |
Long-Term Capital Gains | | | | | | | | | | | | | | | | | | | | |
2016 | | $ | 0 | | | $ | 0 | | | $ | 0 | | | $ | 0 | | | $ | 0 | |
2015 | | $ | 57,543,286 | | | $ | 85,784 | | | $ | 1,373,297 | | | $ | 1,507,057 | | | $ | 1,342,011 | |
| | | | | |
| | | 2015
Retirement
Fund | | | 2020
Retirement
Fund | | | 2025
Retirement
Fund | | | 2030
Retirement
Fund | | | 2035
Retirement
Fund | |
Ordinary Income (a) | | | | | | | | | | | | | | | | | | | | |
2016 | | $ | 0 | | | $ | 0 | | | $ | 0 | | | $ | 0 | | | $ | 0 | |
2015 | | $ | 3,145,220 | | | $ | 5,971,939 | | | $ | 5,804,497 | | | $ | 4,662,610 | | | $ | 3,637,561 | |
Long-Term Capital Gains | | | | | | | | | | | | | | | | | | | | |
2016 | | $ | 0 | | | $ | 0 | | | $ | 0 | | | $ | 0 | | | $ | 0 | |
2015 | | $ | 8,330,888 | | | $ | 14,219,639 | | | $ | 12,670,849 | | | $ | 11,054,574 | | | $ | 8,709,705 | |
| | | | | |
| | | 2040
Retirement
Fund | | | 2045
Retirement
Fund | | | 2050
Retirement
Fund | | | Conservative
Allocation
Fund | | | Moderate
Allocation
Fund | |
Ordinary Income (a) | | | | | | | | | | | | | | | | | | | | |
2016 | | $ | 0 | | | $ | 0 | | | $ | 0 | | | $ | 0 | | | $ | 0 | |
2015 | | $ | 2,857,782 | | | $ | 3,540,101 | | | $ | 592,908 | | | $ | 2,610,734 | | | $ | 6,538,841 | |
Long-Term Capital Gains | | | | | | | | | | | | | | | | | | | | |
2016 | | $ | 0 | | | $ | 0 | | | $ | 0 | | | $ | 0 | | | $ | 0 | |
2015 | | $ | 7,858,679 | | | $ | 9,449,171 | | | $ | 1,150,118 | | | $ | 3,798,820 | | | $ | 15,610,732 | |
| | | | | |
| | | Aggressive
Allocation
Fund | | | Money
Market Fund | | | Mid-Term
Bond Fund | | | Bond Fund | | | | |
Ordinary Income (a) | | | | | | | | | | | | | | | | | | | | |
2016 | | $ | 0 | | | $ | 0 | | | $ | 0 | | | $ | 0 | | | | | |
2015 | | $ | 4,687,286 | | | $ | 0 | | | $ | 10,648,630 | | | $ | 31,972,350 | | | | | |
Long-Term Capital Gains | | | | | | | | | | | | | | | | | | | | |
2016 | | $ | 0 | | | $ | 0 | | | $ | 0 | | | $ | 0 | | | | | |
2015 | | $ | 16,862,766 | | | $ | 0 | | | $ | 1,509,725 | | | $ | 1,135,284 | | | | | |
Notes:
| (a) | Includes distributions from Fund-level net short-term capital gains. |
96
MUTUAL OF AMERICA INVESTMENT CORPORATION
NOTES TO FINANCIAL STATEMENTS (Unaudited) (Continued)
June 30, 2016
| 5. | DISTRIBUTIONSTO SHAREHOLDERSAND INCOME TAX INFORMATION (CONTINUED) |
Undistributed net income and gains (losses) — As of June 30, 2016, undistributed net income and undistributed accumulated gain (loss) for federal income tax purposes were as follows:
| | | | | | | | | | | | | | | | | | | | |
| | | Equity Index
Fund | | | All America
Fund | | | Small Cap
Value Fund | | | Small Cap
Growth Fund | | | Mid Cap
Value Fund | |
Accumulated undistributed net investment income | | $ | 55,776,055 | | | $ | 6,130,612 | | | $ | 6,213,963 | | | $ | 0 | | | $ | 1,714,955 | |
Accumulated undistributed net realized gain/(loss) on investments and futures contracts | | $ | 71,830,197 | | | $ | 44,568,811 | | | $ | 12,057,543 | | | $ | 34,959,952 | | | $ | 6,044,741 | |
Net unrealized appreciation (depreciation) of investments and futures contracts | | $ | 635,020,160 | | | $ | 48,782,635 | | | $ | 69,757,971 | | | $ | 38,934,083 | | | $ | 12,707,581 | |
| | | | | |
| | | Mid-Cap
Equity Index
Fund | | | International
Fund | | | Composite
Fund | | | Retirement
Income
Fund | | | 2010
Retirement
Fund | |
Accumulated undistributed net investment income | | $ | 21,515,152 | | | $ | 13,802,587 | | | $ | 6,096,769 | | | $ | 1,417,706 | | | $ | 579,461 | |
Accumulated undistributed net realized gain/(loss) on investments and futures contracts | | $ | 127,066,679 | | | $ | 1,581,452 | | | $ | 26,485,447 | | | $ | 2,531,598 | | | $ | 1,849,399 | |
Net unrealized appreciation (depreciation) of investments and futures contracts | | $ | 181,713,828 | | | $ | (26,198,413 | ) | | $ | 20,052,828 | | | $ | 1,910,153 | | | $ | 1,364,198 | |
| | | | | |
| | | 2015
Retirement
Fund | | | 2020
Retirement
Fund | | | 2025
Retirement
Fund | | | 2030
Retirement
Fund | | | 2035
Retirement
Fund | |
Accumulated undistributed net investment income | | $ | 3,360,637 | | | $ | 7,495,794 | | | $ | 7,530,298 | | | $ | 5,967,073 | | | $ | 4,653,592 | |
Accumulated undistributed net realized gain/(loss) on investments and futures contracts | | $ | 10,613,287 | | | $ | 17,936,151 | | | $ | 19,463,860 | | | $ | 19,309,374 | | | $ | 17,264,274 | |
Net unrealized appreciation (depreciation) of investments and futures contracts | | $ | 11,840,896 | | | $ | 32,295,413 | | | $ | 44,064,695 | | | $ | 38,425,468 | | | $ | 32,257,564 | |
| | | | | |
| | | 2040
Retirement
Fund | | | 2045
Retirement
Fund | | | 2050
Retirement
Fund | | | Conservative
Allocation
Fund | | | Moderate
Allocation
Fund | |
Accumulated undistributed net investment income | | $ | 3,629,694 | | | $ | 4,323,009 | | | $ | 1,305,214 | | | $ | 3,087,144 | | | $ | 7,137,035 | |
Accumulated undistributed net realized gain/(loss) on investments and futures contracts | | $ | 15,929,472 | | | $ | 18,108,571 | | | $ | 4,098,497 | | | $ | 4,300,680 | | | $ | 17,215,763 | |
Net unrealized appreciation (depreciation) of investments and futures contracts | | $ | 26,374,446 | | | $ | 34,733,264 | | | $ | 394,643 | | | $ | 7,680,267 | | | $ | 41,786,131 | |
| | | | | |
| | | Aggressive
Allocation
Fund | | | Money Market
Fund | | | Mid-Term
Bond Fund | | | Bond Fund | | | | |
Accumulated undistributed net investment income | | $ | 5,034,614 | | | $ | 35,685 | | | $ | 17,900,012 | | | $ | 45,788,587 | | | | | |
Accumulated undistributed net realized gain/(loss) on investments and futures contracts | | $ | 20,567,427 | | | $ | (1,656 | ) | | $ | 1,306,905 | | | $ | 3,456,887 | | | | | |
Net unrealized appreciation (depreciation) of investments and futures contracts | | $ | 41,743,708 | | | $ | 478 | | | $ | 10,875,588 | | | $ | 40,012,465 | | | | | |
The difference between the components of distributable earnings for income tax purposes and the amounts reflected in the statements of assets and liabilities arise primarily from federal income tax treatment of wash sales, REITs, partnerships, corporate actions and futures contracts.
Reclassifications — The Funds make adjustments to the components of net assets for book to tax differences that are considered permanent in nature. For the six months ended June 30, 2016, the Funds reclassified amounts primarily relating to differences in the book to tax treatment of partnership investments, REITs, net operating losses, corporate actions and the character of distributions. Each Fund’s net assets are not affected by these reclassifications.
97
MUTUAL OF AMERICA INVESTMENT CORPORATION
NOTES TO FINANCIAL STATEMENTS (Unaudited) (Continued)
June 30, 2016
| 5. | DISTRIBUTIONSTO SHAREHOLDERSAND INCOME TAX INFORMATION (CONTINUED) |
During the six months ended June 30, 2016, each Fund reclassified the following book to tax differences [increases (decreases)]:
| | | | | | | | | | | | | | | | | | | | |
| | | Equity Index
Fund | | | All America
Fund | | | Small Cap
Value Fund | | | Small Cap
Growth Fund | | | Mid Cap
Value Fund | |
Accumulated undistributed net investment income | | $ | (197,345 | ) | | $ | 6,841 | | | $ | (218,029 | ) | | $ | 16,907 | | | $ | (24,405 | ) |
Accumulated undistributed net realized gains (loss) on investments and futures contracts | | $ | 197,345 | | | $ | (6,841 | ) | | $ | 218,029 | | | $ | (531,917 | ) | | $ | 24,405 | |
| | | | | | | | | | | | | | | | | | | | |
Paid in capital | | $ | 0 | | | $ | 0 | | | $ | 0 | | | $ | 515,010 | | | $ | 0 | |
| | | | | | | | | | | | | | | | | | | | |
| | | | | |
| | | Mid-Cap
Equity Index
Fund | | | International
Fund | | | Composite
Fund | | | Retirement
Income
Fund | | | 2010
Retirement
Fund | |
Accumulated undistributed net investment income | | $ | (102,725 | ) | | $ | 0 | | | $ | (504 | ) | | $ | 28,314 | | | $ | 6,200 | |
Accumulated undistributed net realized gains (loss) on investments and futures contracts | | $ | 102,725 | | | $ | 0 | | | $ | 504 | | | $ | 0 | | | $ | 0 | |
| | | | | | | | | | | | | | | | | | | | |
Paid in capital | | $ | 0 | | | $ | 0 | | | $ | 0 | | | $ | (28,314 | ) | | $ | (6,200 | ) |
| | | | | | | | | | | | | | | | | | | | |
| | | | | |
| | | 2015
Retirement
Fund | | | 2020
Retirement
Fund | | | 2025
Retirement
Fund | | | 2030
Retirement
Fund | | | 2035
Retirement
Fund | |
Accumulated undistributed net investment income | | $ | 57,193 | | | $ | 129,746 | | | $ | 142,501 | | | $ | 118,922 | | | $ | 99,986 | |
Accumulated undistributed net realized gains (loss) on investments and futures contracts | | $ | 0 | | | $ | 0 | | | $ | 0 | | | $ | 0 | | | $ | 0 | |
| | | | | | | | | | | | | | | | | | | | |
Paid in capital | | $ | (57,193 | ) | | $ | (129,746 | ) | | $ | (142,501 | ) | | $ | (118,922 | ) | | $ | (99,986 | ) |
| | | | | | | | | | | | | | | | | | | | |
| | | | | |
| | | 2040
Retirement
Fund | | | 2045
Retirement
Fund | | | 2050
Retirement
Fund | | | Conservative
Allocation
Fund | | | Moderate
Allocation
Fund | |
Accumulated undistributed net investment income | | $ | 83,204 | | | $ | 97,405 | | | $ | 39,841 | | | $ | 19,451 | | | $ | 36,264 | |
Accumulated undistributed net realized gains (loss) on investments and futures contracts | | $ | 0 | | | $ | 0 | | | $ | 0 | | | $ | (3,459 | ) | | $ | (12,805 | ) |
| | | | | | | | | | | | | | | | | | | | |
Paid in capital | | $ | (83,204 | ) | | $ | (97,405 | ) | | $ | (39,841 | ) | | $ | (15,992 | ) | | $ | (23,459 | ) |
| | | | | | | | | | | | | | | | | | | | |
| | | | | |
| | | Aggressive
Allocation
Fund | | | Money
Market Fund | | | Mid-Term
Bond Fund | | | Bond
Fund | | | | |
Accumulated undistributed net investment income | | $ | 30,403 | | | $ | 0 | | | $ | 0 | | | $ | 0 | | | | | |
Accumulated undistributed net realized gains (loss) on investments and futures contracts | | $ | (12,145 | ) | | $ | 0 | | | $ | 0 | | | $ | 0 | | | | | |
| | | | | | | | | | | | | | | | | | | | |
Paid in capital | | $ | (18,258 | ) | �� | $ | 0 | | | $ | 0 | | | $ | 0 | | | | | |
| | | | | | | | | | | | | | | | | | | | |
98
MUTUAL OF AMERICA INVESTMENT CORPORATION
ADDITIONAL INFORMATION
Quarterly Portfolio Schedules
Included in this Semi-Annual Report are summary schedules of Mutual of America Investment Corporation’s (“Investment Company”) Fund portfolio holdings as of June 30, 2016. The Investment Company files complete schedules of Fund portfolio holdings with the Securities and Exchange Commission (“SEC”) for the first and third quarters of each fiscal year on Form N-Q and for the second and fourth quarters of each fiscal year on Form N-CSR. The Forms N-Q and N-CSR are available on the SEC’s website at http://www.sec.gov. Additionally, the Forms N-Q and N-CSR may be reviewed and copied at the SEC’s Public Reference Room in Washington, DC. Information on the operation of the Public Reference Room may be obtained by calling 1-800-SEC-0330.
Proxy Voting Policies and Procedures
A copy of the Investment Company’s proxy voting policies and procedures can be obtained free of charge by calling 1-800-468-3785. It is also available on the SEC’s website at http://www.sec.gov.
Information regarding how the Investment Company voted proxies relating to portfolio securities during the 12-month period ended June 30, 2016 is available without charge by calling 1-800-468-3785. It is also available on the SEC website.
Code of Ethics
The Investment Company has adopted a Code of Ethics that complies with Rule 17j-1 of the Investment Company Act of 1940 and with the requirements of the Sarbanes-Oxley Act of 2002. A copy of the Code of Ethics is available free of charge, upon request. To obtain a free copy of the Code of Ethics, please call (212) 224-1568 or write to:
Ms. Kathryn Lu
Executive Vice President and Chief Compliance Officer
Mutual of America Investment Corporation
320 Park Avenue
New York, NY 10022-6839
Renewal of Investment Advisory Agreements
At its meeting held on February 25, 2016, the Board of Directors of the Investment Company renewed for a one-year period the investment advisory agreement with Mutual of America Capital Management LLC (the “Adviser”). The Board determined that renewing the agreement with the Adviser was in the best interest of the Investment Company based on the following considerations which are further enumerated below. The Board concluded that the Adviser has performed extensive services for the Investment Company and has demonstrated satisfactory performance, that its fee is reasonable in comparison to fees charged for similar services to similar funds by other advisers, that the method of calculating the fee is reasonable, that the Adviser has not made excessive profits from the contract and the fee levels reflect that the Funds are appropriately benefiting from economies of scale.
Nature, Extent and Quality of Services
The Board considered the depth of experience and organizational structure of the Adviser. At December 31, 2015, the Adviser had approximately $14 billion of assets under management. The individual portfolio managers that oversee the investment performance of each of the Investment Company’s Funds have extensive experience and knowledge of the specific markets in which they participate. The Adviser adheres to a strict best execution policy which requires it to select broker/dealers based on their ability to execute trades at a favorable and reasonable price. All else being equal, the Advisor will also consider any research that the broker/dealers may provide. The Adviser maintains a highly qualified staff of research analysts and quantitative analysts who assist in the implementation of the disciplined investment policies employed by the portfolio managers to enhance stock selection and manage risk in the portfolios. The Adviser’s quantitative analysts have developed proprietary models that result in daily risk and attribution reports as well as information on stock movements, to enable the portfolio managers to make fully informed decisions on stock selection and to constantly evaluate the structure of each portfolio. When purchasing research and other services, the
99
Adviser uses its own funds to purchase such services from recognized firms that are utilized by the research staff. The Adviser also receives research services from broker/dealers which are utilized to benefit the Funds. The Board was aware of the receipt of these research services when it considered renewing the advisory agreement with the Adviser. The Adviser, at no cost, provides services beyond those set forth in the advisory agreement, such as assistance in the preparation of marketing materials and attendance at client and prospect meetings.
Investment Performance
The Board considered the short- and long-term performance of the Funds. During 2015, the vast majority of the Funds demonstrated gross performance that was above their benchmarks, when considering minimal tracking error. Performance has continued to improve over the past number of years due to changes made in the Adviser’s investment process and personnel, including the creation of the quantitative research group mentioned above.
Cost and Profit
The Board compared the advisory fees charged to each Fund by the Adviser with fees of numerous similar funds. In the case of each Fund, the Adviser’s fee compared favorably with fees charged by other advisers. Finally, the Adviser has not shown excessively high profits from the fees it is paid by the Investment Company.
Economies of Scale
The Board concluded that the reasonableness of the Adviser’s fees, particularly when compared to fees of similar funds that, in most cases, are many times the asset size of the Funds of the Investment Company demonstrates the fact that the Funds are benefiting from economies of scale. The Adviser utilizes the resources at its disposal efficiently. Its fees reflect cost savings and expense discounts, if any, that it realizes from volume increases.
100
MUTUALOF AMERICA
LIFE INSURANCE COMPANY
320 PARK AVENUE
NEW YORK, NY 10022-6839
www.mutualofamerica.com
320 PARK AVENUE
NEW YORK NY 10022-6839
ADDRESS SERVICE REQUESTED
| | |
 | | You can receive these and other important documents electronically. Sign up for eDocuments and we’ll waive the monthly participant charge. Find out more at mutualofamerica.com or call 15-800-468-3785. |
Item not applicable to semi-annual report.
| ITEM 3. | AUDIT COMMITTEE FINANCIAL EXPERT. |
Item not applicable to semi-annual report.
| ITEM 4. | PRINCIPAL ACCOUNTANT FEES AND SERVICES. |
Item not applicable to semi-annual report.
| ITEM 5. | AUDIT COMMITTEE OF LISTED REGISTRANTS. |
Not applicable.
(a) Schedule I – Portfolios of Investments in Securities follows:
MUTUAL OF AMERICA INVESTMENT CORPORATION - EQUITY INDEX FUND
PORTFOLIO OF INVESTMENTS IN SECURITIES
June 30, 2016 (Unaudited)
| | | | | | | | |
| | | Shares | | | Value | |
INDEXED ASSETS: | | | | | | | | |
COMMON STOCKS: | | | | | | | | |
CONSUMER DISCRETIONARY (12.0%) | | | | | | | | |
Advance Auto Parts, Inc. | | | 7,654 | | | | 1,237,116 | |
Amazon.com, Inc.* | | | 40,421 | | | | 28,926,076 | |
AutoNation, Inc.* | | | 7,467 | | | | 350,800 | |
AutoZone, Inc.* | | | 3,118 | | | | 2,475,193 | |
Bed Bath & Beyond, Inc. | | | 16,282 | | | | 703,708 | |
Best Buy Co., Inc. | | | 29,716 | | | | 909,310 | |
BorgWarner, Inc. | | | 22,510 | | | | 664,495 | |
CarMax, Inc.* | | | 20,134 | | | | 987,170 | |
Carnival Corp. | | | 45,592 | | | | 2,015,166 | |
CBS Corp. Cl B | | | 43,344 | | | | 2,359,647 | |
Chipotle Mexican Grill, Inc.* | | | 3,068 | | | | 1,235,668 | |
Coach, Inc. | | | 29,110 | | | | 1,185,941 | |
Comcast Corp. Cl A | | | 252,633 | | | | 16,469,145 | |
D.R. Horton, Inc. | | | 34,613 | | | | 1,089,617 | |
Darden Restaurants, Inc. | | | 11,957 | | | | 757,356 | |
Delphi Automotive PLC | | | 28,419 | | | | 1,779,029 | |
Discovery Communications, Inc. Cl A* | | | 16,019 | | | | 404,159 | |
Discovery Communications, Inc. Cl C* | | | 24,970 | | | | 595,535 | |
Disney (Walt) Co. | | | 155,766 | | | | 15,237,030 | |
Dollar General Corp. | | | 29,698 | | | | 2,791,612 | |
Dollar Tree, Inc.* | | | 24,668 | | | | 2,324,712 | |
Expedia, Inc. | | | 12,216 | | | | 1,298,561 | |
Foot Locker, Inc. | | | 14,137 | | | | 775,556 | |
Ford Motor Co. | | | 407,433 | | | | 5,121,433 | |
Gap, Inc. | | | 23,399 | | | | 496,527 | |
Garmin Ltd. | | | 12,423 | | | | 526,984 | |
General Motors Co. | | | 146,722 | | | | 4,152,233 | |
Genuine Parts Co. | | | 15,661 | | | | 1,585,676 | |
Goodyear Tire & Rubber Co. | | | 27,653 | | | | 709,576 | |
H&R Block, Inc. | | | 23,491 | | | | 540,293 | |
Hanesbrands, Inc. | | | 39,526 | | | | 993,288 | |
Harley-Davidson, Inc. | | | 18,774 | | | | 850,462 | |
Harman Int’l. Industries, Inc. | | | 7,267 | | | | 521,916 | |
Hasbro, Inc. | | | 11,782 | | | | 989,570 | |
Home Depot, Inc. | | | 130,025 | | | | 16,602,892 | |
Interpublic Group of Cos., Inc. | | | 42,165 | | | | 974,012 | |
Johnson Controls, Inc. | | | 67,777 | | | | 2,999,810 | |
Kohl’s Corp. | | | 19,126 | | | | 725,258 | |
L Brands, Inc. | | | 26,567 | | | | 1,783,443 | |
Leggett & Platt, Inc. | | | 14,199 | | | | 725,711 | |
Lennar Corp. Cl A | | | 19,105 | | | | 880,741 | |
LKQ Corp.* | | | 32,160 | | | | 1,019,472 | |
Lowe’s Cos., Inc. | | | 92,460 | | | | 7,320,058 | |
Macy’s, Inc. | | | 32,211 | | | | 1,082,612 | |
Marriott International, Inc. Cl A | | | 20,022 | | | | 1,330,662 | |
Mattel, Inc. | | | 35,448 | | | | 1,109,168 | |
McDonald’s Corp. | | | 91,654 | | | | 11,029,642 | |
Michael Kors Hldgs. Ltd.* | | | 18,428 | | | | 911,817 | |
Mohawk Industries, Inc.* | | | 6,641 | | | | 1,260,196 | |
Netflix, Inc.* | | | 44,731 | | | | 4,091,992 | |
Newell Brands, Inc. | | | 47,573 | | | | 2,310,621 | |
News Corp. Cl A | | | 39,776 | | | | 451,458 | |
News Corp. Cl B | | | 11,281 | | | | 131,649 | |
NIKE, Inc. Cl B | | | 139,307 | | | | 7,689,746 | |
Nordstrom, Inc. | | | 13,530 | | | | 514,817 | |
O’Reilly Automotive, Inc.* | | | 10,082 | | | | 2,733,230 | |
| | | | | | | | |
Omnicom Group, Inc. | | | 24,706 | | | | 2,013,292 | |
Priceline Group Inc.* | | | 5,178 | | | | 6,464,267 | |
PulteGroup, Inc. | | | 32,545 | | | | 634,302 | |
PVH Corp. | | | 8,408 | | | | 792,286 | |
Ralph Lauren Corp. | | | 5,901 | | | | 528,848 | |
Ross Stores, Inc. | | | 41,733 | | | | 2,365,844 | |
Royal Caribbean Cruises Ltd. | | | 17,616 | | | | 1,182,914 | |
Scripps Networks Interactive, Inc. Cl A | | | 9,927 | | | | 618,154 | |
Signet Jewelers Ltd. | | | 8,169 | | | | 673,207 | |
Staples, Inc. | | | 67,831 | | | | 584,703 | |
Starbucks Corp. | | | 152,909 | | | | 8,734,162 | |
Starwood Hotels & Resorts | | | 17,496 | | | | 1,293,829 | |
Target Corp. | | | 61,431 | | | | 4,289,112 | |
TEGNA, Inc. | | | 22,706 | | | | 526,098 | |
Tiffany & Co. | | | 11,314 | | | | 686,081 | |
Time Warner, Inc. | | | 82,153 | | | | 6,041,532 | |
TJX Cos., Inc. | | | 69,046 | | | | 5,332,423 | |
Tractor Supply Co. | | | 13,870 | | | | 1,264,667 | |
TripAdvisor, Inc.* | | | 11,869 | | | | 763,177 | |
Twenty-First Century Fox, Inc. Cl A | | | 114,668 | | | | 3,101,769 | |
Twenty-First Century Fox, Inc. Cl B | | | 45,166 | | | | 1,230,774 | |
Ulta Salon, Cosmetics & Fragrances, Inc.* | | | 6,507 | | | | 1,585,365 | |
Under Armour, Inc. Cl A* | | | 19,213 | | | | 771,018 | |
Under Armour, Inc. Cl C* | | | 19,307 | | | | 702,775 | |
Urban Outfitters, Inc.* | | | 9,353 | | | | 257,208 | |
V.F. Corp. | | | 34,951 | | | | 2,149,137 | |
Viacom, Inc. Cl B | | | 36,063 | | | | 1,495,533 | |
Whirlpool Corp. | | | 7,922 | | | | 1,320,122 | |
Wyndham Worldwide Corp. | | | 11,825 | | | | 842,295 | |
Wynn Resorts Ltd. | | | 8,570 | | | | 776,785 | |
Yum! Brands, Inc. | | | 42,629 | | | | 3,534,797 | |
| | | | | | | | |
| | | | | | | 233,296,043 | |
| | | | | | | | |
CONSUMER STAPLES (10.3%) | | | | | | | | |
Altria Group, Inc. | | | 204,211 | | | | 14,082,391 | |
Archer-Daniels-Midland Co. | | | 61,301 | | | | 2,629,200 | |
Brown-Forman Corp. Cl B | | | 10,442 | | | | 1,041,694 | |
Campbell Soup Co. | | | 18,665 | | | | 1,241,782 | |
Church & Dwight Co., Inc. | | | 13,285 | | | | 1,366,894 | |
Clorox Co. | | | 13,465 | | | | 1,863,421 | |
Coca-Cola Co. | | | 406,344 | | | | 18,419,574 | |
Colgate-Palmolive Co. | | | 93,285 | | | | 6,828,462 | |
ConAgra Foods, Inc. | | | 45,497 | | | | 2,175,212 | |
Constellation Brands, Inc. Cl A | | | 18,364 | | | | 3,037,406 | |
Costco Wholesale Corp. | | | 45,713 | | | | 7,178,770 | |
CVS Health Corp. | | | 112,242 | | | | 10,746,049 | |
Dr. Pepper Snapple Group, Inc. | | | 19,504 | | | | 1,884,672 | |
Estee Lauder Cos., Inc. Cl A | | | 23,198 | | | | 2,111,482 | |
General Mills, Inc. | | | 61,959 | | | | 4,418,916 | |
Hershey Co. | | | 14,765 | | | | 1,675,680 | |
Hormel Foods Corp. | | | 27,953 | | | | 1,023,080 | |
J.M. Smucker Co. | | | 12,543 | | | | 1,911,679 | |
Kellogg Co. | | | 26,415 | | | | 2,156,785 | |
Kimberly-Clark Corp. | | | 37,656 | | | | 5,176,947 | |
Kraft Heinz Co. | | | 62,139 | | | | 5,498,059 | |
Kroger Co. | | | 99,295 | | | | 3,653,063 | |
McCormick & Co., Inc. | | | 12,013 | | | | 1,281,427 | |
Mead Johnson Nutrition Co. | | | 19,596 | | | | 1,778,337 | |
Molson Coors Brewing Co. Cl B | | | 19,262 | | | | 1,947,966 | |
Mondelez International, Inc. Cl A | | | 161,962 | | | | 7,370,891 | |
Monster Beverage Corp.* | | | 14,757 | | | | 2,371,597 | |
PepsiCo, Inc. | | | 150,852 | | | | 15,981,261 | |
Philip Morris Int’l., Inc. | | | 161,928 | | | | 16,471,316 | |
Proctor & Gamble Co. | | | 277,784 | | | | 23,519,971 | |
Reynolds American, Inc. | | | 86,476 | | | | 4,663,651 | |
Sysco Corp. | | | 54,686 | | | | 2,774,768 | |
| | | | | | | | |
Tyson Foods, Inc. Cl A | | | 31,503 | | | | 2,104,085 | |
Wal-Mart Stores, Inc. | | | 159,616 | | | | 11,655,160 | |
Walgreens Boots Alliance, Inc. | | | 89,913 | | | | 7,487,056 | |
Whole Foods Market, Inc. | | | 33,706 | | | | 1,079,266 | |
| | | | | | | | |
| | | | | | | 200,607,970 | |
| | | | | | | | |
ENERGY (7.2%) | | | | | | | | |
Anadarko Petroleum Corp. | | | 53,449 | | | | 2,846,159 | |
Apache Corp. | | | 39,423 | | | | 2,194,678 | |
Baker Hughes, Inc. | | | 45,579 | | | | 2,056,980 | |
Cabot Oil & Gas Corp. | | | 48,901 | | | | 1,258,712 | |
Chesapeake Energy Corp.* | | | 61,470 | | | | 263,092 | |
Chevron Corp. | | | 196,901 | | | | 20,641,132 | |
Cimarex Energy Co. | | | 9,901 | | | | 1,181,387 | |
Columbia Pipeline Group, Inc. | | | 41,919 | | | | 1,068,515 | |
Concho Resources, Inc.* | | | 13,599 | | | | 1,621,953 | |
ConocoPhillips | | | 129,644 | | | | 5,652,478 | |
Devon Energy Corp. | | | 55,066 | | | | 1,996,143 | |
Diamond Offshore Drilling, Inc. | | | 6,840 | | | | 166,417 | |
EOG Resources, Inc. | | | 57,424 | | | | 4,790,310 | |
EQT Corp. | | | 17,986 | | | | 1,392,656 | |
Exxon Mobil Corp. | | | 433,500 | | | | 40,636,290 | |
FMC Technologies, Inc.* | | | 23,605 | | | | 629,545 | |
Halliburton Co. | | | 89,566 | | | | 4,056,444 | |
Helmerich & Payne, Inc. | | | 11,398 | | | | 765,148 | |
Hess Corp. | | | 27,662 | | | | 1,662,486 | |
Kinder Morgan, Inc. | | | 191,058 | | | | 3,576,606 | |
Marathon Oil Corp. | | | 88,771 | | | | 1,332,453 | |
Marathon Petroleum Corp. | | | 55,777 | | | | 2,117,295 | |
Murphy Oil Corp. | | | 16,635 | | | | 528,161 | |
National Oilwell Varco, Inc. | | | 39,404 | | | | 1,325,945 | |
Newfield Exploration Co.* | | | 20,719 | | | | 915,365 | |
Noble Energy, Inc. | | | 44,590 | | | | 1,599,443 | |
Occidental Petroleum Corp. | | | 79,789 | | | | 6,028,857 | |
ONEOK, Inc. | | | 21,930 | | | | 1,040,579 | |
Phillips 66 | | | 48,957 | | | | 3,884,248 | |
Pioneer Natural Resources Co. | | | 17,027 | | | | 2,574,653 | |
Range Resources Corp. | | | 17,735 | | | | 765,088 | |
Schlumberger Ltd. | | | 144,931 | | | | 11,461,178 | |
Southwestern Energy Co.* | | | 49,188 | | | | 618,785 | |
Spectra Energy Corp. | | | 71,476 | | | | 2,618,166 | |
Tesoro Corp. | | | 12,669 | | | | 949,161 | |
Transocean Ltd. | | | 35,303 | | | | 419,753 | |
Valero Energy Corp. | | | 49,121 | | | | 2,505,171 | |
Williams Cos., Inc. | | | 70,828 | | | | 1,532,010 | |
| | | | | | | | |
| | | | | | | 140,673,442 | |
| | | | | | | | |
FINANCIALS (15.4%) | | | | | | | | |
Affiliated Managers Group, Inc.* | | | 5,675 | | | | 798,870 | |
Aflac, Inc. | | | 43,332 | | | | 3,126,837 | |
Allstate Corp. | | | 39,017 | | | | 2,729,239 | |
American Express Co. | | | 84,369 | | | | 5,126,260 | |
American Int’l. Group, Inc. | | | 116,809 | | | | 6,178,028 | |
American Tower Corp. | | | 44,273 | | | | 5,029,856 | |
Ameriprise Financial, Inc. | | | 17,309 | | | | 1,555,214 | |
Aon PLC | | | 27,648 | | | | 3,019,991 | |
Apartment Investment & Management Co. Cl A | | | 16,246 | | | | 717,423 | |
Assurant, Inc. | | | 6,395 | | | | 551,952 | |
AvalonBay Communities, Inc. | | | 14,377 | | | | 2,593,467 | |
Bank of America Corp. | | | 1,072,775 | | | | 14,235,724 | |
Bank of New York Mellon Corp. | | | 112,507 | | | | 4,370,897 | |
BB&T Corp. | | | 85,679 | | | | 3,051,029 | |
Berkshire Hathaway, Inc. Cl B* | | | 195,881 | | | | 28,361,610 | |
BlackRock, Inc. | | | 13,119 | | | | 4,493,651 | |
Boston Properties, Inc. | | | 15,982 | | | | 2,108,026 | |
Capital One Financial Corp. | | | 53,592 | | | | 3,403,628 | |
CBRE Group, Inc.* | | | 30,603 | | | | 810,367 | |
| | | | | | | | |
Charles Schwab Corp. | | | 125,734 | | | | 3,182,328 | |
Chubb Ltd. | | | 48,410 | | | | 6,327,671 | |
Cincinnati Financial Corp. | | | 15,466 | | | | 1,158,249 | |
Citigroup, Inc. | | | 306,094 | | | | 12,975,325 | |
Citizens Financial Group, Inc. | | | 55,239 | | | | 1,103,675 | |
CME Group, Inc. | | | 35,418 | | | | 3,449,713 | |
Comerica, Inc. | | | 18,299 | | | | 752,638 | |
Crown Castle Int’l. Corp. | | | 35,103 | | | | 3,560,497 | |
Digital Realty Trust, Inc. | | | 15,284 | | | | 1,665,803 | |
Discover Financial Svcs. | | | 43,073 | | | | 2,308,282 | |
E*Trade Financial Corp.* | | | 28,795 | | | | 676,395 | |
Equinix, Inc. | | | 7,212 | | | | 2,796,309 | |
Equity Residential | | | 38,336 | | | | 2,640,584 | |
Essex Property Trust, Inc. | | | 6,857 | | | | 1,564,013 | |
Extra Space Storage, Inc. | | | 13,199 | | | | 1,221,435 | |
Federal Realty Investment Trust | | | 7,381 | | | | 1,221,925 | |
Fifth Third Bancorp | | | 80,337 | | | | 1,413,128 | |
Franklin Resources, Inc. | | | 38,347 | | | | 1,279,639 | |
Gallagher (Arthur J.) & Co. | | | 18,554 | | | | 883,170 | |
General Growth Pptys., Inc. | | | 60,735 | | | | 1,811,118 | |
Goldman Sachs Group, Inc. | | | 40,372 | | | | 5,998,472 | |
Hartford Financial Svcs. Group, Inc. | | | 41,067 | | | | 1,822,553 | |
HCP, Inc. | | | 49,045 | | | | 1,735,212 | |
Host Hotels & Resorts, Inc. | | | 77,889 | | | | 1,262,581 | |
Huntington Bancshares, Inc. | | | 83,099 | | | | 742,905 | |
Intercontinental Exchange, Inc. | | | 12,459 | | | | 3,189,006 | |
Invesco Ltd. | | | 43,348 | | | | 1,107,108 | |
Iron Mountain, Inc. | | | 25,141 | | | | 1,001,366 | |
JPMorgan Chase & Co. | | | 381,734 | | | | 23,720,951 | |
KeyCorp | | | 87,710 | | | | 969,196 | |
Kimco Realty Corp. | | | 43,553 | | | | 1,366,693 | |
Legg Mason, Inc. | | | 10,967 | | | | 323,417 | |
Leucadia National Corp. | | | 35,252 | | | | 610,917 | |
Lincoln National Corp. | | | 25,042 | | | | 970,878 | |
Loews Corp. | | | 27,707 | | | | 1,138,481 | |
M&T Bank Corp. | | | 16,569 | | | | 1,958,953 | |
Marsh & McLennan Cos., Inc. | | | 54,444 | | | | 3,727,236 | |
MetLife, Inc. | | | 114,870 | | | | 4,575,272 | |
Moody’s Corp. | | | 17,605 | | | | 1,649,765 | |
Morgan Stanley | | | 157,991 | | | | 4,104,606 | |
Nasdaq, Inc. | | | 12,023 | | | | 777,527 | |
Navient Corp. | | | 34,306 | | | | 409,957 | |
Northern Trust Corp. | | | 22,563 | | | | 1,495,024 | |
People’s United Financial, Inc. | | | 32,236 | | | | 472,580 | |
PNC Financial Svcs. Grp., Inc. | | | 52,272 | | | | 4,254,418 | |
Principal Financial Grp., Inc. | | | 28,031 | | | | 1,152,354 | |
Progressive Corp. | | | 60,698 | | | | 2,033,383 | |
ProLogis, Inc. | | | 54,805 | | | | 2,687,637 | |
Prudential Financial, Inc. | | | 46,238 | | | | 3,298,619 | |
Public Storage | | | 15,352 | | | | 3,923,818 | |
Realty Income Corp. | | | 26,980 | | | | 1,871,333 | |
Regions Financial Corp. | | | 132,881 | | | | 1,130,817 | |
S&P Global, Inc. | | | 27,747 | | | | 2,976,143 | |
Simon Property Group, Inc. | | | 32,251 | | | | 6,995,242 | |
SL Green Realty Corp | | | 10,506 | | | | 1,118,574 | |
State Street Corp. | | | 41,293 | | | | 2,226,519 | |
SunTrust Banks, Inc. | | | 52,277 | | | | 2,147,539 | |
Synchrony Financial* | | | 86,953 | | | | 2,198,172 | |
T. Rowe Price Group, Inc. | | | 26,029 | | | | 1,899,336 | |
The Macerich Co. | | | 13,174 | | | | 1,124,928 | |
Torchmark Corp. | | | 11,590 | | | | 716,494 | |
Travelers Cos., Inc. | | | 30,504 | | | | 3,631,196 | |
U.S. Bancorp | | | 169,442 | | | | 6,833,596 | |
UDR, Inc. | | | 28,016 | | | | 1,034,351 | |
Unum Group | | | 25,059 | | | | 796,626 | |
| | | | | | | | |
Ventas, Inc. | | | 35,249 | | | | 2,566,832 | |
Vornado Realty Trust | | | 18,593 | | | | 1,861,531 | |
Wells Fargo & Co. | | | 482,457 | | | | 22,834,690 | |
Welltower, Inc. | | | 37,299 | | | | 2,841,065 | |
Weyerhaeuser Co. | | | 77,626 | | | | 2,310,926 | |
Willis Towers Watson PLC | | | 14,529 | | | | 1,806,153 | |
XL Group PLC | | | 29,635 | | | | 987,142 | |
Zions Bancorporation | | | 21,225 | | | | 533,384 | |
| | | | | | | | |
| | | | | | | 299,177,440 | |
| | | | | | | | |
HEALTH CARE (14.7%) | | | | | | | | |
Abbott Laboratories | | | 153,442 | | | | 6,031,805 | |
AbbVie, Inc. | | | 168,945 | | | | 10,459,385 | |
Aetna, Inc. | | | 36,557 | | | | 4,464,706 | |
Agilent Technologies, Inc. | | | 33,983 | | | | 1,507,486 | |
Alexion Pharmaceuticals, Inc.* | | | 23,491 | | | | 2,742,809 | |
Allergan PLC* | | | 41,334 | | | | 9,551,874 | |
AmerisourceBergen Corp. | | | 19,060 | | | | 1,511,839 | |
Amgen, Inc. | | | 78,375 | | | | 11,924,756 | |
Anthem, Inc. | | | 27,466 | | | | 3,607,384 | |
Bard (C.R.), Inc. | | | 7,623 | | | | 1,792,625 | |
Baxter International, Inc. | | | 57,533 | | | | 2,601,642 | |
Becton, Dickinson & Co. | | | 22,092 | | | | 3,746,582 | |
BIOGEN, Inc.* | | | 22,895 | | | | 5,536,469 | |
Boston Scientific Corp.* | | | 141,514 | | | | 3,307,182 | |
Bristol-Myers Squibb Co. | | | 174,127 | | | | 12,807,041 | |
Cardinal Health, Inc. | | | 33,925 | | | | 2,646,489 | |
Celgene Corp.* | | | 80,835 | | | | 7,972,756 | |
Centene Corp.* | | | 17,666 | | | | 1,260,822 | |
Cerner Corp.* | | | 31,306 | | | | 1,834,532 | |
CIGNA Corp. | | | 26,880 | | | | 3,440,371 | |
Danaher Corp. | | | 62,521 | | | | 6,314,621 | |
DaVita HealthCare Partners, Inc.* | | | 16,974 | | | | 1,312,430 | |
DENTSPLY SIRONA, Inc. | | | 24,388 | | | | 1,513,032 | |
Edwards Lifesciences Corp.* | | | 22,114 | | | | 2,205,429 | |
Endo International PLC* | | | 21,670 | | | | 337,835 | |
Express Scripts Hldg. Co.* | | | 65,945 | | | | 4,998,631 | |
Gilead Sciences, Inc. | | | 138,976 | | | | 11,593,378 | |
HCA Hldgs., Inc.* | | | 31,315 | | | | 2,411,568 | |
Hologic, Inc.* | | | 25,127 | | | | 869,394 | |
Humana, Inc. | | | 15,543 | | | | 2,795,875 | |
Illumina, Inc.* | | | 15,341 | | | | 2,153,570 | |
Intuitive Surgical, Inc.* | | | 3,979 | | | | 2,631,750 | |
Johnson & Johnson | | | 287,261 | | | | 34,844,759 | |
Laboratory Corp. of America Hldgs.* | | | 10,714 | | | | 1,395,713 | |
Lilly (Eli) & Co. | | | 101,479 | | | | 7,991,471 | |
Mallinckrodt PLC* | | | 11,388 | | | | 692,163 | |
McKesson Corp. | | | 23,528 | | | | 4,391,501 | |
Medtronic PLC | | | 146,666 | | | | 12,726,209 | |
Merck & Co., Inc. | | | 289,072 | | | | 16,653,438 | |
Mylan NV* | | | 44,639 | | | | 1,930,190 | |
Patterson Cos., Inc. | | | 8,727 | | | | 417,936 | |
PerkinElmer, Inc. | | | 11,465 | | | | 600,995 | |
Perrigo Co. PLC | | | 14,941 | | | | 1,354,700 | |
Pfizer, Inc. | | | 633,547 | | | | 22,307,190 | |
Quest Diagnostics, Inc. | | | 14,854 | | | | 1,209,264 | |
Regeneron Pharmaceuticals, Inc.* | | | 8,141 | | | | 2,843,081 | |
Schein (Henry), Inc.* | | | 8,552 | | | | 1,511,994 | |
St. Jude Medical, Inc. | | | 29,823 | | | | 2,326,194 | |
Stryker Corp. | | | 32,706 | | | | 3,919,160 | |
Thermo Fisher Scientific, Inc. | | | 41,111 | | | | 6,074,561 | |
UnitedHealth Group, Inc. | | | 99,306 | | | | 14,022,007 | |
Universal Health Svcs., Inc. Cl B | | | 9,308 | | | | 1,248,203 | |
Varian Medical Systems, Inc.* | | | 9,942 | | | | 817,531 | |
Vertex Pharmaceuticals, Inc.* | | | 25,839 | | | | 2,222,671 | |
Waters Corp.* | | | 8,406 | | | | 1,182,304 | |
Zimmer Biomet Hldgs., Inc. | | | 20,294 | | | | 2,442,992 | |
Zoetis, Inc. | | | 47,752 | | | | 2,266,310 | |
| | | | | | | | |
| | | | | | | 285,278,605 | |
| | | | | | | | |
| | | | | | | | |
INDUSTRIALS (9.6%) | | | | | | | | |
3M Co. | | | 63,399 | | | | 11,102,433 | |
Acuity Brands, Inc. | | | 4,560 | | | | 1,130,698 | |
Alaska Air Group, Inc. | | | 12,824 | | | | 747,511 | |
Allegion PLC | | | 9,918 | | | | 688,607 | |
American Airlines Group, Inc. | | | 60,145 | | | | 1,702,705 | |
AMETEK, Inc. | | | 24,541 | | | | 1,134,530 | |
Boeing Co. | | | 62,600 | | | | 8,129,862 | |
Caterpillar, Inc. | | | 60,787 | | | | 4,608,262 | |
Cintas Corp. | | | 8,975 | | | | 880,717 | |
CSX Corp. | | | 99,965 | | | | 2,607,087 | |
Cummins, Inc. | | | 16,597 | | | | 1,866,167 | |
Deere & Co. | | | 31,090 | | | | 2,519,534 | |
Delta Air Lines, Inc. | | | 80,439 | | | | 2,930,393 | |
Dover Corp. | | | 16,289 | | | | 1,129,153 | |
Dun & Bradstreet Corp. | | | 3,723 | | | | 453,610 | |
Eaton Corp. PLC | | | 47,755 | | | | 2,852,406 | |
Emerson Electric Co. | | | 67,281 | | | | 3,509,377 | |
Equifax, Inc. | | | 12,377 | | | | 1,589,207 | |
Expeditors Int’l. of Wash. | | | 19,034 | | | | 933,427 | |
Fastenal Co. | | | 30,076 | | | | 1,335,074 | |
FedEx Corp. | | | 26,023 | | | | 3,949,771 | |
Flowserve Corp. | | | 13,530 | | | | 611,150 | |
Fluor Corp. | | | 14,390 | | | | 709,139 | |
Fortune Brands Home & Security, Inc. | | | 16,177 | | | | 937,781 | |
General Dynamics Corp. | | | 30,070 | | | | 4,186,947 | |
General Electric Co. | | | 959,621 | | | | 30,208,869 | |
Grainger (W.W.), Inc. | | | 5,925 | | | | 1,346,456 | |
Honeywell International, Inc. | | | 79,542 | | | | 9,252,325 | |
Hunt (J.B.) Transport Svcs., Inc. | | | 9,363 | | | | 757,748 | |
Illinois Tool Works, Inc. | | | 33,845 | | | | 3,525,295 | |
Ingersoll-Rand PLC | | | 26,828 | | | | 1,708,407 | |
Jacobs Engineering Group, Inc.* | | | 12,789 | | | | 637,020 | |
Kansas City Southern | | | 11,241 | | | | 1,012,702 | |
L-3 Communications Hldgs., Inc. | | | 8,076 | | | | 1,184,668 | |
Lockheed Martin Corp. | | | 27,365 | | | | 6,791,172 | |
Masco Corp. | | | 34,682 | | | | 1,073,061 | |
Nielsen Hldgs. PLC | | | 37,791 | | | | 1,963,998 | |
Norfolk Southern Corp. | | | 30,926 | | | | 2,632,730 | |
Northrop Grumman Corp. | | | 18,821 | | | | 4,183,532 | |
PACCAR, Inc. | | | 36,411 | | | | 1,888,639 | |
Parker Hannifin Corp. | | | 14,060 | | | | 1,519,183 | |
PENTAIR PLC | | | 18,824 | | | | 1,097,251 | |
Pitney Bowes, Inc. | | | 19,912 | | | | 354,434 | |
Quanta Services, Inc.* | | | 15,411 | | | | 356,302 | |
Raytheon Co. | | | 31,035 | | | | 4,219,208 | |
Republic Services, Inc. | | | 24,682 | | | | 1,266,433 | |
Robert Half Int’l., Inc. | | | 13,642 | | | | 520,579 | |
Robinson (C.H.) Worldwide, Inc. | | | 14,894 | | | | 1,105,880 | |
Rockwell Automation, Inc. | | | 13,665 | | | | 1,569,015 | |
Rockwell Collins, Inc. | | | 13,686 | | | | 1,165,226 | |
Roper Technologies, Inc. | | | 10,513 | | | | 1,793,097 | |
Ryder System, Inc. | | | 5,479 | | | | 334,986 | |
Snap-on, Inc. | | | 6,014 | | | | 949,129 | |
Southwest Airlines Co. | | | 66,851 | | | | 2,621,228 | |
Stanley Black & Decker, Inc. | | | 15,682 | | | | 1,744,152 | |
Stericycle, Inc.* | | | 8,894 | | | | 926,043 | |
Textron, Inc. | | | 27,931 | | | | 1,021,157 | |
TransDigm Group, Inc.* | | | 5,519 | | | | 1,455,305 | |
Tyco International PLC | | | 44,310 | | | | 1,887,606 | |
Union Pacific Corp. | | | 87,793 | | | | 7,659,939 | |
United Continental Hldgs., Inc* | | | 35,136 | | | | 1,441,981 | |
| | | | | | | | |
United Parcel Service, Inc. Cl B | | | 72,099 | | | | 7,766,504 | |
United Rentals, Inc.* | | | 9,124 | | | | 612,220 | |
United Technologies Corp. | | | 81,328 | | | | 8,340,186 | |
Verisk Analytics, Inc. Cl A* | | | 16,123 | | | | 1,307,253 | |
Waste Management, Inc. | | | 43,046 | | | | 2,852,658 | |
Xylem, Inc. | | | 18,523 | | | | 827,052 | |
| | | | | | | | |
| | | | | | | 187,126,177 | |
| | | | | | | | |
INFORMATION TECHNOLOGY (19.3%) | | | | | | | | |
Accenture Ltd. Cl A | | | 65,091 | | | | 7,374,159 | |
Activision, Blizzard Inc. | | | 52,947 | | | | 2,098,290 | |
Adobe Systems, Inc.* | | | 52,135 | | | | 4,994,012 | |
Akamai Technologies, Inc.* | | | 18,258 | | | | 1,021,170 | |
Alliance Data Systems Corp.* | | | 6,134 | | | | 1,201,773 | |
Alphabet, Inc. Cl A* | | | 30,668 | | | | 21,575,858 | |
Alphabet, Inc. Cl C* | | | 30,851 | | | | 21,351,811 | |
Amphenol Corp. Cl A | | | 32,108 | | | | 1,840,752 | |
Analog Devices, Inc. | | | 32,071 | | | | 1,816,501 | |
Apple, Inc. | | | 571,135 | | | | 54,600,511 | |
Applied Materials, Inc. | | | 113,430 | | | | 2,718,917 | |
Autodesk, Inc.* | | | 23,434 | | | | 1,268,717 | |
Automatic Data Processing, Inc. | | | 47,505 | | | | 4,364,284 | |
Broadcom Ltd. | | | 38,715 | | | | 6,016,311 | |
CA, Inc. | | | 30,974 | | | | 1,016,876 | |
Cisco Systems, Inc. | | | 523,875 | | | | 15,029,974 | |
Citrix Systems, Inc.* | | | 16,285 | | | | 1,304,266 | |
Cognizant Technology Solutions* | | | 63,026 | | | | 3,607,608 | |
Corning, Inc. | | | 111,961 | | | | 2,292,961 | |
CSRA, Inc. | | | 14,026 | | | | 328,629 | |
eBay, Inc.* | | | 110,350 | | | | 2,583,294 | |
Electronic Arts, Inc.* | | | 31,423 | | | | 2,380,606 | |
EMC Corp. | | | 204,254 | | | | 5,549,581 | |
F5 Networks, Inc.* | | | 7,094 | | | | 807,581 | |
Facebook, Inc. Cl A* | | | 241,133 | | | | 27,556,679 | |
Fidelity Nat’l. Information Svcs., Inc. | | | 28,973 | | | | 2,134,731 | |
First Solar, Inc.* | | | 8,142 | | | | 394,724 | |
Fiserv, Inc.* | | | 23,268 | | | | 2,529,930 | |
FLIR Systems, Inc. | | | 14,640 | | | | 453,108 | |
Global Payments, Inc. | | | 15,957 | | | | 1,139,011 | |
Harris Corp. | | | 13,059 | | | | 1,089,643 | |
Hewlett Packard Enterprise Co. | | | 173,027 | | | | 3,161,203 | |
HP, Inc. | | | 179,179 | | | | 2,248,696 | |
Int’l. Business Machines Corp. | | | 92,292 | | | | 14,008,080 | |
Intel Corp. | | | 491,300 | | | | 16,114,640 | |
Intuit, Inc. | | | 26,722 | | | | 2,982,442 | |
Juniper Networks, Inc. | | | 37,229 | | | | 837,280 | |
KLA-Tencor Corp. | | | 16,170 | | | | 1,184,453 | |
Lam Research Corp. | | | 16,745 | | | | 1,407,585 | |
Linear Technology Corp. | | | 24,776 | | | | 1,152,827 | |
MasterCard, Inc. Cl A | | | 101,514 | | | | 8,939,323 | |
Microchip Technology, Inc. | | | 22,234 | | | | 1,128,598 | |
Micron Technology, Inc.* | | | 107,808 | | | | 1,483,438 | |
Microsoft Corp. | | | 819,578 | | | | 41,937,806 | |
Motorola Solutions, Inc. | | | 16,649 | | | | 1,098,335 | |
NetApp, Inc. | | | 30,188 | | | | 742,323 | |
NVIDIA Corp. | | | 52,778 | | | | 2,481,094 | |
Oracle Corp. | | | 325,190 | | | | 13,310,027 | |
Paychex, Inc. | | | 33,266 | | | | 1,979,327 | |
PayPal Hldgs., Inc.* | | | 114,920 | | | | 4,195,729 | |
Qorvo, Inc.* | | | 13,414 | | | | 741,258 | |
QUALCOMM, Inc. | | | 153,289 | | | | 8,211,692 | |
Red Hat, Inc.* | | | 18,957 | | | | 1,376,278 | |
Salesforce.com, inc.* | | | 66,320 | | | | 5,266,471 | |
Seagate Technology PLC | | | 31,455 | | | | 766,244 | |
Skyworks Solutions, Inc. | | | 19,683 | | | | 1,245,540 | |
Symantec Corp. | | | 63,642 | | | | 1,307,207 | |
| | | | | | | | |
TE Connectivity Ltd. | | | 37,264 | | | | 2,128,147 | |
Teradata Corp.* | | | 13,690 | | | | 343,208 | |
Texas Instruments, Inc. | | | 104,856 | | | | 6,569,228 | |
Total System Services, Inc. | | | 17,584 | | | | 933,886 | |
VeriSign, Inc.* | | | 9,996 | | | | 864,254 | |
Visa, Inc. Cl A | | | 198,541 | | | | 14,725,786 | |
Western Digital Corp. | | | 29,274 | | | | 1,383,489 | |
Western Union Co. | | | 51,513 | | | | 988,019 | |
Xerox Corp. | | | 99,984 | | | | 948,848 | |
Xilinx, Inc. | | | 26,673 | | | | 1,230,425 | |
Yahoo!, Inc.* | | | 91,565 | | | | 3,439,181 | |
| | | | | | | | |
| | | | | | | 375,304,635 | |
| | | | | | | | |
MATERIALS (2.8%) | | | | | | | | |
Air Products & Chemicals, Inc. | | | 20,383 | | | | 2,895,201 | |
Albemarle Corp. | | | 11,707 | | | | 928,482 | |
Alcoa, Inc. | | | 136,744 | | | | 1,267,617 | |
Avery Dennison Corp. | | | 9,248 | | | | 691,288 | |
Ball Corp. | | | 18,303 | | | | 1,323,124 | |
CF Industries Hldgs., Inc. | | | 24,191 | | | | 583,003 | |
Dow Chemical Co. | | | 117,428 | | | | 5,837,346 | |
Du Pont (E.I.) de Nemours & Co. | | | 91,184 | | | | 5,908,723 | |
Eastman Chemical Co. | | | 15,486 | | | | 1,051,499 | |
Ecolab, Inc. | | | 27,560 | | | | 3,268,616 | |
FMC Corp. | | | 13,961 | | | | 646,534 | |
Freeport-McMoRan Copper & Gold, Inc. | | | 131,364 | | | | 1,463,395 | |
Int’l. Flavors & Fragrances, Inc. | | | 8,354 | | | | 1,053,189 | |
International Paper Co. | | | 42,757 | | | | 1,812,042 | |
LyondellBasell Inds. NV Cl A | | | 35,688 | | | | 2,655,901 | |
Martin Marietta Materials, Inc. | | | 6,604 | | | | 1,267,968 | |
Monsanto Co. | | | 45,691 | | | | 4,724,906 | |
Newmont Mining Corp. | | | 55,407 | | | | 2,167,522 | |
Nucor Corp. | | | 33,071 | | | | 1,634,038 | |
Owens-Illinois, Inc.* | | | 16,863 | | | | 303,703 | |
PPG Industries, Inc. | | | 27,671 | | | | 2,881,935 | |
Praxair, Inc. | | | 29,873 | | | | 3,357,426 | |
Sealed Air Corp. | | | 20,418 | | | | 938,615 | |
Sherwin-Williams Co. | | | 8,187 | | | | 2,404,276 | |
The Mosaic Co. | | | 36,832 | | | | 964,262 | |
Vulcan Materials Co. | | | 13,839 | | | | 1,665,662 | |
WestRock Co. | | | 26,243 | | | | 1,020,065 | |
| | | | | | | | |
| | | | | | | 54,716,338 | |
| | | | | | | | |
TELECOMMUNICATION SERVICES (2.8%) | | | | | | | | |
AT&T, Inc. | | | 642,217 | | | | 27,750,197 | |
CenturyLink, Inc. | | | 57,021 | | | | 1,654,179 | |
Frontier Communications Corp. | | | 121,180 | | | | 598,629 | |
Level 3 Communications, Inc.* | | | 30,106 | | | | 1,550,158 | |
Verizon Communications, Inc. | | | 425,649 | | | | 23,768,240 | |
| | | | | | | | |
| | | | | | | 55,321,403 | |
| | | | | | | | |
UTILITIES (3.5%) | | | | | | | | |
AES Corp. | | | 68,606 | | | | 856,203 | |
Alliant Energy Corp. | | | 23,778 | | | | 943,987 | |
Ameren Corp. | | | 25,332 | | | | 1,357,289 | |
American Electric Power Co., Inc. | | | 51,205 | | | | 3,588,958 | |
American Water Works Co., Inc. | | | 18,495 | | | | 1,563,012 | |
CenterPoint Energy, Inc. | | | 44,785 | | | | 1,074,840 | |
CMS Energy Corp. | | | 29,168 | | | | 1,337,644 | |
Consolidated Edison, Inc. | | | 31,877 | | | | 2,564,186 | |
Dominion Resources, Inc. | | | 64,526 | | | | 5,028,511 | |
DTE Energy Co. | | | 18,729 | | | | 1,856,418 | |
Duke Energy Corp. | | | 71,873 | | | | 6,165,985 | |
Edison International | | | 34,013 | | | | 2,641,790 | |
Entergy Corp. | | | 18,641 | | | | 1,516,445 | |
Eversource Energy | | | 33,047 | | | | 1,979,515 | |
Exelon Corp. | | | 96,082 | | | | 3,493,542 | |
FirstEnergy Corp. | | | 44,498 | | | | 1,553,425 | |
| | | | | | | | |
NextEra Energy, Inc. | | | 48,193 | | | | 6,284,367 | |
NiSource, Inc. | | | 33,429 | | | | 886,537 | |
NRG Energy, Inc. | | | 32,809 | | | | 491,807 | |
PG&E Corp. | | | 51,815 | | | | 3,312,015 | |
Pinnacle West Capital Corp. | | | 11,621 | | | | 941,998 | |
PPL Corp. | | | 70,499 | | | | 2,661,337 | |
Public Svc. Enterprise Group, Inc. | | | 53,015 | | | | 2,471,029 | |
SCANA Corp. | | | 14,971 | | | | 1,132,706 | |
Sempra Energy | | | 24,687 | | | | 2,814,812 | |
Southern Co. | | | 98,084 | | | | 5,260,245 | |
WEC Energy Group, Inc. | | | 32,949 | | | | 2,151,570 | |
Xcel Energy, Inc. | | | 53,069 | | | | 2,376,430 | |
| | | | | | | | |
| | | | | | | 68,306,603 | |
| | | | | | | | |
TOTAL INDEXED ASSETS - COMMON STOCKS
(Cost: $1,239,057,645) 97.6% | | | | | | | 1,899,808,656 | |
| | | | | | | | |
| | | | | | | | | | | | | | | | | | | | |
| | | Rating** | | | Rate(%) | | | Maturity | | | Face Amount | | | Value | |
SHORT-TERM DEBT SECURITIES: | | | | | | | | | | | | | | | | | | | | |
U.S. GOVERNMENT (0.9%) | | | | | | | | | | | | | | | | | |
U.S. Treasury Bill (1) | | | A-1+ | | | | 0.27 | | | | 08/25/16 | | | | 5,000,000 | | | | 4,997,937 | |
U.S. Treasury Bill (1) | | | A-1+ | | | | 0.28 | | | | 08/25/16 | | | | 5,000,000 | | | | 4,997,822 | |
U.S. Treasury Bill (1) | | | A-1+ | | | | 0.29 | | | | 08/11/16 | | | | 2,000,000 | | | | 1,999,339 | |
U.S. Treasury Bill (1) | | | A-1+ | | | | 0.38 | | | | 11/03/16 | | | | 5,000,000 | | | | 4,993,486 | |
| | | | | | | | | | | | | | | | | | | | |
| | | | | | | | | | | | | | | | | | | 16,988,584 | |
| | | | | | | | | | | | | | | | | | | | |
COMMERCIAL PAPER (1.4%) | | | | | | | | | | | | | | | | | |
Microsoft Corp.† | | | A-1+ | | | | 0.28 | | | | 07/01/16 | | | | 26,400,000 | | | | 26,400,000 | |
| | | | | | | | | | | | | | | | | | | | |
TOTAL SHORT-TERM DEBT SECURITIES
(Cost: $43,388,584) 2.3% | | | | | | | | | | | | | | | | | | | 43,388,584 | |
| | | | | | | | | | | | | | | | | | | | |
TOTAL INVESTMENTS
(Cost: $1,282,446,229) 99.9% | | | | | | | | | | | | | | | | | | | 1,943,197,240 | |
| | | | | | | | | | | | | | | | | | | | |
OTHER NET ASSETS 0.1% | | | | | | | | | | | | | | | | | | | 2,156,646 | |
| | | | | | | | | | | | | | | | | | | | |
NET ASSETS 100.0% | | | | | | | | | | | | | | | | | | $ | 1,945,353,886 | |
| | | | | | | | | | | | | | | | | | | | |
The accompanying notes are an integral part of these portfolio schedules.
MUTUAL OF AMERICA INVESTMENT CORPORATION - ALL AMERICA FUND
PORTFOLIO OF INVESTMENTS IN SECURITIES
June 30, 2016 (Unaudited)
| | | | | | | | |
| | | Shares | | | Value | |
INDEXED ASSETS: | | | | | | | | |
COMMON STOCKS: | | | | | | | | |
CONSUMER DISCRETIONARY (6.4%) | | | | | |
Advance Auto Parts, Inc. | | | 609 | | | | 98,433 | |
Amazon.com, Inc.* | | | 3,220 | | | | 2,304,296 | |
AutoNation, Inc.* | | | 595 | | | | 27,953 | |
AutoZone, Inc.* | | | 249 | | | | 197,666 | |
Bed Bath & Beyond, Inc. | | | 1,298 | | | | 56,100 | |
Best Buy Co., Inc. | | | 2,367 | | | | 72,430 | |
BorgWarner, Inc. | | | 1,794 | | | | 52,959 | |
CarMax, Inc.* | | | 1,605 | | | | 78,693 | |
Carnival Corp. | | | 3,633 | | | | 160,579 | |
CBS Corp. Cl B | | | 3,454 | | | | 188,036 | |
Chipotle Mexican Grill, Inc.* | | | 245 | | | | 98,676 | |
Coach, Inc. | | | 2,319 | | | | 94,476 | |
Comcast Corp. Cl A | | | 20,128 | | | | 1,312,144 | |
D.R. Horton, Inc. | | | 2,757 | | | | 86,790 | |
Darden Restaurants, Inc. | | | 953 | | | | 60,363 | |
Delphi Automotive PLC | | | 2,265 | | | | 141,789 | |
Discovery Communications, Inc. Cl A* | | | 1,276 | | | | 32,193 | |
Discovery Communications, Inc. Cl C* | | | 1,989 | | | | 47,438 | |
Disney (Walt) Co. | | | 12,411 | | | | 1,214,044 | |
Dollar General Corp. | | | 2,367 | | | | 222,498 | |
Dollar Tree, Inc.* | | | 1,965 | | | | 185,182 | |
Expedia, Inc. | | | 974 | | | | 103,536 | |
Foot Locker, Inc. | | | 1,127 | | | | 61,827 | |
Ford Motor Co. | | | 32,461 | | | | 408,035 | |
Gap, Inc. | | | 1,864 | | | | 39,554 | |
Garmin Ltd. | | | 989 | | | | 41,953 | |
General Motors Co. | | | 11,689 | | | | 330,799 | |
Genuine Parts Co. | | | 1,247 | | | | 126,259 | |
Goodyear Tire & Rubber Co. | | | 2,204 | | | | 56,555 | |
H&R Block, Inc. | | | 1,872 | | | | 43,056 | |
Hanesbrands, Inc. | | | 3,150 | | | | 79,160 | |
Harley-Davidson, Inc. | | | 1,496 | | | | 67,769 | |
Harman Int’l. Industries, Inc. | | | 579 | | | | 41,584 | |
Hasbro, Inc. | | | 938 | | | | 78,783 | |
Home Depot, Inc. | | | 10,360 | | | | 1,322,868 | |
Interpublic Group of Cos., Inc. | | | 3,359 | | | | 77,593 | |
Johnson Controls, Inc. | | | 5,400 | | | | 239,004 | |
Kohl’s Corp. | | | 1,524 | | | | 57,790 | |
L Brands, Inc. | | | 2,116 | | | | 142,047 | |
Leggett & Platt, Inc. | | | 1,131 | | | | 57,805 | |
Lennar Corp. Cl A | | | 1,522 | | | | 70,164 | |
LKQ Corp.* | | | 2,562 | | | | 81,215 | |
Lowe’s Cos., Inc. | | | 7,367 | | | | 583,245 | |
Macy’s, Inc. | | | 2,566 | | | | 86,243 | |
Marriott International, Inc. Cl A | | | 1,595 | | | | 106,004 | |
Mattel, Inc. | | | 2,824 | | | | 88,363 | |
McDonald’s Corp. | | | 7,303 | | | | 878,843 | |
Michael Kors Hldgs. Ltd.* | | | 1,469 | | | | 72,686 | |
Mohawk Industries, Inc.* | | | 529 | | | | 100,383 | |
Netflix, Inc.* | | | 3,563 | | | | 325,943 | |
Newell Brands, Inc. | | | 3,790 | | | | 184,080 | |
News Corp. Cl A | | | 3,169 | | | | 35,968 | |
News Corp. Cl B | | | 898 | | | | 10,480 | |
NIKE, Inc. Cl B | | | 11,100 | | | | 612,720 | |
Nordstrom, Inc. | | | 1,078 | | | | 41,018 | |
O’Reilly Automotive, Inc.* | | | 804 | | | | 217,964 | |
Omnicom Group, Inc. | | | 1,969 | | | | 160,454 | |
MUTUAL OF AMERICA INVESTMENT CORPORATION - ALL AMERICA FUND
PORTFOLIO OF INVESTMENTS IN SECURITIES
June 30, 2016 (Unaudited)
| | | | | | | | |
Priceline Group Inc.* | | | 412 | | | | 514,345 | |
PulteGroup, Inc. | | | 2,593 | | | | 50,538 | |
PVH Corp. | | | 670 | | | | 63,134 | |
Ralph Lauren Corp. | | | 471 | | | | 42,211 | |
Ross Stores, Inc. | | | 3,326 | | | | 188,551 | |
Royal Caribbean Cruises Ltd. | | | 1,404 | | | | 94,279 | |
Scripps Networks Interactive, Inc. Cl A | | | 790 | | | | 49,193 | |
Signet Jewelers Ltd. | | | 651 | | | | 53,649 | |
Staples, Inc. | | | 5,404 | | | | 46,582 | |
Starbucks Corp. | | | 12,183 | | | | 695,893 | |
Starwood Hotels & Resorts | | | 1,394 | | | | 103,086 | |
Target Corp. | | | 4,895 | | | | 341,769 | |
TEGNA, Inc. | | | 1,810 | | | | 41,938 | |
Tiffany & Co. | | | 902 | | | | 54,697 | |
Time Warner, Inc. | | | 6,545 | | | | 481,319 | |
TJX Cos., Inc. | | | 5,502 | | | | 424,919 | |
Tractor Supply Co. | | | 1,105 | | | | 100,754 | |
TripAdvisor, Inc.* | | | 945 | | | | 60,764 | |
Twenty-First Century Fox, Inc. Cl A | | | 9,137 | | | | 247,156 | |
Twenty-First Century Fox, Inc. Cl B | | | 3,598 | | | | 98,046 | |
Ulta Salon, Cosmetics & Fragrances, Inc.* | | | 519 | | | | 126,449 | |
Under Armour, Inc. Cl A* | | | 1,530 | | | | 61,399 | |
Under Armour, Inc. Cl C* | | | 1,538 | | | | 55,983 | |
Urban Outfitters, Inc.* | | | 745 | | | | 20,488 | |
V.F. Corp. | | | 2,785 | | | | 171,250 | |
Viacom, Inc. Cl B | | | 2,873 | | | | 119,143 | |
Whirlpool Corp. | | | 632 | | | | 105,316 | |
Wyndham Worldwide Corp. | | | 942 | | | | 67,099 | |
Wynn Resorts Ltd. | | | 682 | | | | 61,816 | |
Yum! Brands, Inc. | | | 3,396 | | | | 281,596 | |
| | | | | | | | |
| | | | | | | 18,587,850 | |
| | | | | | | | |
CONSUMER STAPLES (5.5%) | | | | | | | | |
Altria Group, Inc. | | | 16,270 | | | | 1,121,979 | |
Archer-Daniels-Midland Co. | | | 4,885 | | | | 209,518 | |
Brown-Forman Corp. Cl B | | | 831 | | | | 82,901 | |
Campbell Soup Co. | | | 1,488 | | | | 98,997 | |
Church & Dwight Co., Inc. | | | 1,059 | | | | 108,961 | |
Clorox Co. | | | 1,073 | | | | 148,492 | |
Coca-Cola Co. | | | 32,375 | | | | 1,467,559 | |
Colgate-Palmolive Co. | | | 7,432 | | | | 544,022 | |
ConAgra Foods, Inc. | | | 3,624 | | | | 173,263 | |
Constellation Brands, Inc. Cl A | | | 1,463 | | | | 241,980 | |
Costco Wholesale Corp. | | | 3,642 | | | | 571,940 | |
CVS Health Corp. | | | 8,943 | | | | 856,203 | |
Dr. Pepper Snapple Group, Inc. | | | 1,553 | | | | 150,066 | |
Estee Lauder Cos., Inc. Cl A | | | 1,848 | | | | 168,205 | |
General Mills, Inc. | | | 4,936 | | | | 352,036 | |
Hershey Co. | | | 1,177 | | | | 133,578 | |
Hormel Foods Corp. | | | 2,228 | | | | 81,545 | |
J.M. Smucker Co. | | | 999 | | | | 152,258 | |
Kellogg Co. | | | 2,104 | | | | 171,792 | |
Kimberly-Clark Corp. | | | 3,000 | | | | 412,440 | |
Kraft Heinz Co. | | | 4,950 | | | | 437,976 | |
Kroger Co. | | | 7,912 | | | | 291,082 | |
McCormick & Co., Inc. | | | 958 | | | | 102,190 | |
Mead Johnson Nutrition Co. | | | 1,561 | | | | 141,661 | |
Molson Coors Brewing Co. Cl B | | | 1,534 | | | | 155,133 | |
Mondelez International, Inc. Cl A | | | 12,905 | | | | 587,307 | |
Monster Beverage Corp.* | | | 1,175 | | | | 188,834 | |
PepsiCo, Inc. | | | 12,019 | | | | 1,273,293 | |
Philip Morris Int’l., Inc. | | | 12,901 | | | | 1,312,290 | |
MUTUAL OF AMERICA INVESTMENT CORPORATION - ALL AMERICA FUND
PORTFOLIO OF INVESTMENTS IN SECURITIES
June 30, 2016 (Unaudited)
| | | | | | | | |
Proctor & Gamble Co. | | | 22,132 | | | | 1,873,916 | |
Reynolds American, Inc. | | | 6,889 | | | | 371,524 | |
Sysco Corp. | | | 4,357 | | | | 221,074 | |
Tyson Foods, Inc. Cl A | | | 2,510 | | | | 167,643 | |
Wal-Mart Stores, Inc. | | | 12,718 | | | | 928,668 | |
Walgreens Boots Alliance, Inc. | | | 7,163 | | | | 596,463 | |
Whole Foods Market, Inc. | | | 2,686 | | | | 86,006 | |
| | | | | | | | |
| | | | | | | 15,982,795 | |
| | | | | | | | |
ENERGY (3.9%) | | | | | | | | |
Anadarko Petroleum Corp. | | | 4,258 | | | | 226,739 | |
Apache Corp. | | | 3,141 | | | | 174,859 | |
Baker Hughes, Inc. | | | 3,632 | | | | 163,912 | |
Cabot Oil & Gas Corp. | | | 3,896 | | | | 100,283 | |
Chesapeake Energy Corp.* | | | 4,897 | | | | 20,959 | |
Chevron Corp. | | | 15,687 | | | | 1,644,468 | |
Cimarex Energy Co. | | | 788 | | | | 94,024 | |
Columbia Pipeline Group, Inc. | | | 3,339 | | | | 85,111 | |
Concho Resources, Inc.* | | | 1,083 | | | | 129,169 | |
ConocoPhillips | | | 10,329 | | | | 450,344 | |
Devon Energy Corp. | | | 4,387 | | | | 159,029 | |
Diamond Offshore Drilling, Inc. | | | 545 | | | | 13,260 | |
EOG Resources, Inc. | | | 4,575 | | | | 381,647 | |
EQT Corp. | | | 1,433 | | | | 110,957 | |
Exxon Mobil Corp. | | | 34,538 | | | | 3,237,592 | |
FMC Technologies, Inc.* | | | 1,881 | | | | 50,166 | |
Halliburton Co. | | | 7,137 | | | | 323,235 | |
Helmerich & Payne, Inc. | | | 908 | | | | 60,954 | |
Hess Corp. | | | 2,203 | | | | 132,400 | |
Kinder Morgan, Inc. | | | 15,222 | | | | 284,956 | |
Marathon Oil Corp. | | | 7,072 | | | | 106,151 | |
Marathon Petroleum Corp. | | | 4,444 | | | | 168,694 | |
Murphy Oil Corp. | | | 1,326 | | | | 42,101 | |
National Oilwell Varco, Inc. | | | 3,139 | | | | 105,627 | |
Newfield Exploration Co.* | | | 1,650 | | | | 72,897 | |
Noble Energy, Inc. | | | 3,552 | | | | 127,410 | |
Occidental Petroleum Corp. | | | 6,357 | | | | 480,335 | |
ONEOK, Inc. | | | 1,747 | | | | 82,895 | |
Phillips 66 | | | 3,901 | | | | 309,505 | |
Pioneer Natural Resources Co. | | | 1,356 | | | | 205,041 | |
Range Resources Corp. | | | 1,413 | | | | 60,957 | |
Schlumberger Ltd. | | | 11,547 | | | | 913,137 | |
Southwestern Energy Co.* | | | 3,919 | | | | 49,301 | |
Spectra Energy Corp. | | | 5,694 | | | | 208,571 | |
Tesoro Corp. | | | 1,009 | | | | 75,594 | |
Transocean Ltd. | | | 2,813 | | | | 33,447 | |
Valero Energy Corp. | | | 3,913 | | | | 199,563 | |
Williams Cos., Inc. | | | 5,643 | | | | 122,058 | |
| | | | | | | | |
| | | | | | | 11,207,348 | |
| | | | | | | | |
FINANCIALS (8.3%) | | | | | | | | |
Affiliated Managers Group, Inc.* | | | 452 | | | | 63,628 | |
Aflac, Inc. | | | 3,453 | | | | 249,168 | |
Allstate Corp. | | | 3,109 | | | | 217,475 | |
American Express Co. | | | 6,722 | | | | 408,429 | |
American Int’l. Group, Inc. | | | 9,307 | | | | 492,247 | |
American Tower Corp. | | | 3,527 | | | | 400,702 | |
Ameriprise Financial, Inc. | | | 1,380 | | | | 123,993 | |
Aon PLC | | | 2,203 | | | | 240,634 | |
Apartment Investment & Management Co. Cl A | | | 1,295 | | | | 57,187 | |
Assurant, Inc. | | | 510 | | | | 44,018 | |
AvalonBay Communities, Inc. | | | 1,145 | | | | 206,547 | |
Bank of America Corp. | | | 85,473 | | | | 1,134,227 | |
MUTUAL OF AMERICA INVESTMENT CORPORATION - ALL AMERICA FUND
PORTFOLIO OF INVESTMENTS IN SECURITIES
June 30, 2016 (Unaudited)
| | | | | | | | |
Bank of New York Mellon Corp. | | | 8,963 | | | | 348,213 | |
BB&T Corp. | | | 6,826 | | | | 243,074 | |
Berkshire Hathaway, Inc. Cl B* | | | 15,606 | | | | 2,259,593 | |
BlackRock, Inc. | | | 1,046 | | | | 358,286 | |
Boston Properties, Inc. | | | 1,273 | | | | 167,909 | |
Capital One Financial Corp. | | | 4,270 | | | | 271,188 | |
CBRE Group, Inc.* | | | 2,438 | | | | 64,558 | |
Charles Schwab Corp. | | | 10,017 | | | | 253,530 | |
Chubb Ltd. | | | 3,857 | | | | 504,148 | |
Cincinnati Financial Corp. | | | 1,232 | | | | 92,264 | |
Citigroup, Inc. | | | 24,388 | | | | 1,033,807 | |
Citizens Financial Group, Inc. | | | 4,401 | | | | 87,932 | |
CME Group, Inc. | | | 2,821 | | | | 274,765 | |
Comerica, Inc. | | | 1,457 | | | | 59,926 | |
Crown Castle Int’l. Corp. | | | 2,796 | | | | 283,598 | |
Digital Realty Trust, Inc. | | | 1,217 | | | | 132,641 | |
Discover Financial Svcs. | | | 3,432 | | | | 183,921 | |
E*Trade Financial Corp.* | | | 2,295 | | | | 53,910 | |
Equinix, Inc. | | | 574 | | | | 222,495 | |
Equity Residential | | | 3,054 | | | | 210,360 | |
Essex Property Trust, Inc. | | | 546 | | | | 124,537 | |
Extra Space Storage, Inc. | | | 1,051 | | | | 97,260 | |
Federal Realty Investment Trust | | | 588 | | | | 97,343 | |
Fifth Third Bancorp | | | 6,401 | | | | 112,594 | |
Franklin Resources, Inc. | | | 3,056 | | | | 101,979 | |
Gallagher (Arthur J.) & Co. | | | 1,478 | | | | 70,353 | |
General Growth Pptys., Inc. | | | 4,839 | | | | 144,299 | |
Goldman Sachs Group, Inc. | | | 3,217 | | | | 477,982 | |
Hartford Financial Svcs. Group, Inc. | | | 3,272 | | | | 145,211 | |
HCP, Inc. | | | 3,907 | | | | 138,230 | |
Host Hotels & Resorts, Inc. | | | 6,206 | | | | 100,599 | |
Huntington Bancshares, Inc. | | | 6,620 | | | | 59,183 | |
Intercontinental Exchange, Inc. | | | 992 | | | | 253,912 | |
Invesco Ltd. | | | 3,454 | | | | 88,215 | |
Iron Mountain, Inc. | | | 2,003 | | | | 79,779 | |
iShares Core S&P 500 ETF | | | 592 | | | | 124,734 | |
JPMorgan Chase & Co. | | | 30,415 | | | | 1,889,988 | |
KeyCorp | | | 6,988 | | | | 77,217 | |
Kimco Realty Corp. | | | 3,470 | | | | 108,889 | |
Legg Mason, Inc. | | | 874 | | | | 25,774 | |
Leucadia National Corp. | | | 2,808 | | | | 48,663 | |
Lincoln National Corp. | | | 1,996 | | | | 77,385 | |
Loews Corp. | | | 2,208 | | | | 90,727 | |
M&T Bank Corp. | | | 1,320 | | | | 156,064 | |
Marsh & McLennan Cos., Inc. | | | 4,337 | | | | 296,911 | |
MetLife, Inc. | | | 9,152 | | | | 364,524 | |
Moody’s Corp. | | | 1,403 | | | | 131,475 | |
Morgan Stanley | | | 12,588 | | | | 327,036 | |
Nasdaq, Inc. | | | 957 | | | | 61,889 | |
Navient Corp. | | | 2,734 | | | | 32,671 | |
Northern Trust Corp. | | | 1,797 | | | | 119,069 | |
People’s United Financial, Inc. | | | 2,569 | | | | 37,662 | |
PNC Financial Svcs. Grp., Inc. | | | 4,165 | | | | 338,989 | |
Principal Financial Grp., Inc. | | | 2,234 | | | | 91,840 | |
Progressive Corp. | | | 4,837 | | | | 162,040 | |
ProLogis, Inc. | | | 4,366 | | | | 214,109 | |
Prudential Financial, Inc. | | | 3,685 | | | | 262,888 | |
Public Storage | | | 1,223 | | | | 312,587 | |
Realty Income Corp. | | | 2,149 | | | | 149,055 | |
Regions Financial Corp. | | | 10,588 | | | | 90,104 | |
S&P Global, Inc. | | | 2,210 | | | | 237,045 | |
MUTUAL OF AMERICA INVESTMENT CORPORATION - ALL AMERICA FUND
PORTFOLIO OF INVESTMENTS IN SECURITIES
June 30, 2016 (Unaudited)
| | | | | | | | |
Simon Property Group, Inc. | | | 2,569 | | | | 557,216 | |
SL Green Realty Corp | | | 837 | | | | 89,115 | |
State Street Corp. | | | 3,290 | | | | 177,397 | |
SunTrust Banks, Inc. | | | 4,166 | | | | 171,139 | |
Synchrony Financial* | | | 6,928 | | | | 175,140 | |
T. Rowe Price Group, Inc. | | | 2,073 | | | | 151,267 | |
The Macerich Co. | | | 1,050 | | | | 89,660 | |
Torchmark Corp. | | | 924 | | | | 57,122 | |
Travelers Cos., Inc. | | | 2,431 | | | | 289,386 | |
U.S. Bancorp | | | 13,501 | | | | 544,495 | |
UDR, Inc. | | | 2,232 | | | | 82,405 | |
Unum Group | | | 1,996 | | | | 63,453 | |
Ventas, Inc. | | | 2,808 | | | | 204,479 | |
Vornado Realty Trust | | | 1,481 | | | | 148,278 | |
Wells Fargo & Co. | | | 38,439 | | | | 1,819,318 | |
Welltower, Inc. | | | 2,971 | | | | 226,301 | |
Weyerhaeuser Co. | | | 6,185 | | | | 184,127 | |
Willis Towers Watson PLC | | | 1,157 | | | | 143,827 | |
XL Group PLC | | | 2,362 | | | | 78,678 | |
Zions Bancorporation | | | 1,692 | | | | 42,520 | |
| | | | | | | | |
| | | | | | | 23,960,507 | |
| | | | | | | | |
HEALTH CARE (7.9%) | | | | | | | | |
Abbott Laboratories | | | 12,225 | | | | 480,565 | |
AbbVie, Inc. | | | 13,460 | | | | 833,309 | |
Aetna, Inc. | | | 2,912 | | | | 355,643 | |
Agilent Technologies, Inc. | | | 2,708 | | | | 120,127 | |
Alexion Pharmaceuticals, Inc.* | | | 1,871 | | | | 218,458 | |
Allergan PLC* | | | 3,293 | | | | 760,979 | |
AmerisourceBergen Corp. | | | 1,519 | | | | 120,487 | |
Amgen, Inc. | | | 6,244 | | | | 950,025 | |
Anthem, Inc. | | | 2,188 | | | | 287,372 | |
Bard (C.R.), Inc. | | | 608 | | | | 142,977 | |
Baxter International, Inc. | | | 4,583 | | | | 207,243 | |
Becton, Dickinson & Co. | | | 1,760 | | | | 298,483 | |
BIOGEN, Inc.* | | | 1,824 | | | | 441,080 | |
Boston Scientific Corp.* | | | 11,275 | | | | 263,497 | |
Bristol-Myers Squibb Co. | | | 13,873 | | | | 1,020,359 | |
Cardinal Health, Inc. | | | 2,703 | | | | 210,861 | |
Celgene Corp.* | | | 6,441 | | | | 635,276 | |
Centene Corp.* | | | 1,408 | | | | 100,489 | |
Cerner Corp.* | | | 2,495 | | | | 146,207 | |
CIGNA Corp. | | | 2,141 | | | | 274,027 | |
Danaher Corp. | | | 4,981 | | | | 503,081 | |
DaVita HealthCare Partners, Inc.* | | | 1,353 | | | | 104,614 | |
DENTSPLY SIRONA, Inc. | | | 1,944 | | | | 120,606 | |
Edwards Lifesciences Corp.* | | | 1,762 | | | | 175,724 | |
Endo International PLC* | | | 1,726 | | | | 26,908 | |
Express Scripts Hldg. Co.* | | | 5,254 | | | | 398,253 | |
Gilead Sciences, Inc. | | | 11,073 | | | | 923,710 | |
HCA Hldgs., Inc.* | | | 2,495 | | | | 192,140 | |
Hologic, Inc.* | | | 2,002 | | | | 69,269 | |
Humana, Inc. | | | 1,238 | | | | 222,691 | |
Illumina, Inc.* | | | 1,222 | | | | 171,544 | |
Intuitive Surgical, Inc.* | | | 317 | | | | 209,667 | |
Johnson & Johnson | | | 22,887 | | | | 2,776,193 | |
Laboratory Corp. of America Hldgs.* | | | 853 | | | | 111,120 | |
Lilly (Eli) & Co. | | | 8,085 | | | | 636,694 | |
Mallinckrodt PLC* | | | 908 | | | | 55,188 | |
McKesson Corp. | | | 1,875 | | | | 349,969 | |
Medtronic PLC | | | 11,685 | | | | 1,013,907 | |
Merck & Co., Inc. | | | 23,031 | | | | 1,326,816 | |
MUTUAL OF AMERICA INVESTMENT CORPORATION - ALL AMERICA FUND
PORTFOLIO OF INVESTMENTS IN SECURITIES
June 30, 2016 (Unaudited)
| | | | | | | | |
Mylan NV* | | | 3,556 | | | | 153,761 | |
Patterson Cos., Inc. | | | 695 | | | | 33,284 | |
PerkinElmer, Inc. | | | 913 | | | | 47,859 | |
Perrigo Co. PLC | | | 1,191 | | | | 107,988 | |
Pfizer, Inc. | | | 50,477 | | | | 1,777,295 | |
Quest Diagnostics, Inc. | | | 1,184 | | | | 96,389 | |
Regeneron Pharmaceuticals, Inc.* | | | 648 | | | | 226,301 | |
Schein (Henry), Inc.* | | | 682 | | | | 120,578 | |
St. Jude Medical, Inc. | | | 2,376 | | | | 185,328 | |
Stryker Corp. | | | 2,605 | | | | 312,157 | |
Thermo Fisher Scientific, Inc. | | | 3,276 | | | | 484,062 | |
UnitedHealth Group, Inc. | | | 7,913 | | | | 1,117,316 | |
Universal Health Svcs., Inc. Cl B | | | 742 | | | | 99,502 | |
Varian Medical Systems, Inc.* | | | 792 | | | | 65,126 | |
Vertex Pharmaceuticals, Inc.* | | | 2,058 | | | | 177,029 | |
Waters Corp.* | | | 670 | | | | 94,236 | |
Zimmer Biomet Hldgs., Inc. | | | 1,656 | | | | 199,349 | |
Zoetis, Inc. | | | 3,804 | | | | 180,538 | |
| | | | | | | | |
| | | | | | | 22,733,656 | |
| | | | | | | | |
INDUSTRIALS (5.2%) | | | | | | | | |
3M Co. | | | 5,051 | | | | 884,531 | |
Acuity Brands, Inc. | | | 364 | | | | 90,257 | |
Alaska Air Group, Inc. | | | 1,022 | | | | 59,572 | |
Allegion PLC | | | 791 | | | | 54,919 | |
American Airlines Group, Inc. | | | 4,792 | | | | 135,662 | |
AMETEK, Inc. | | | 1,955 | | | | 90,380 | |
Boeing Co. | | | 4,988 | | | | 647,792 | |
Caterpillar, Inc. | | | 4,843 | | | | 367,148 | |
Cintas Corp. | | | 716 | | | | 70,261 | |
CSX Corp. | | | 7,964 | | | | 207,701 | |
Cummins, Inc. | | | 1,323 | | | | 148,758 | |
Deere & Co. | | | 2,477 | | | | 200,736 | |
Delta Air Lines, Inc. | | | 6,409 | | | | 233,480 | |
Dover Corp. | | | 1,297 | | | | 89,908 | |
Dun & Bradstreet Corp. | | | 297 | | | | 36,186 | |
Eaton Corp. PLC | | | 3,804 | | | | 227,213 | |
Emerson Electric Co. | | | 5,360 | | | | 279,578 | |
Equifax, Inc. | | | 986 | | | | 126,602 | |
Expeditors Int’l. of Wash. | | | 1,516 | | | | 74,345 | |
Fastenal Co. | | | 2,396 | | | | 106,358 | |
FedEx Corp. | | | 2,074 | | | | 314,792 | |
Flowserve Corp. | | | 1,078 | | | | 48,693 | |
Fluor Corp. | | | 1,147 | | | | 56,524 | |
Fortune Brands Home & Security, Inc. | | | 1,288 | | | | 74,665 | |
General Dynamics Corp. | | | 2,396 | | | | 333,619 | |
General Electric Co. | | | 76,457 | | | | 2,406,866 | |
Grainger (W.W.), Inc. | | | 472 | | | | 107,262 | |
Honeywell International, Inc. | | | 6,338 | | | | 737,236 | |
Hunt (J.B.) Transport Svcs., Inc. | | | 746 | | | | 60,374 | |
Illinois Tool Works, Inc. | | | 2,697 | | | | 280,920 | |
Ingersoll-Rand PLC | | | 2,138 | | | | 136,148 | |
Jacobs Engineering Group, Inc.* | | | 1,019 | | | | 50,756 | |
Kansas City Southern | | | 896 | | | | 80,721 | |
L-3 Communications Hldgs., Inc. | | | 644 | | | | 94,468 | |
Lockheed Martin Corp. | | | 2,180 | | | | 541,011 | |
Masco Corp. | | | 2,763 | | | | 85,487 | |
Nielsen Hldgs. PLC | | | 3,011 | | | | 156,482 | |
Norfolk Southern Corp. | | | 2,465 | | | | 209,845 | |
Northrop Grumman Corp. | | | 1,500 | | | | 333,420 | |
PACCAR, Inc. | | | 2,902 | | | | 150,527 | |
Parker Hannifin Corp. | | | 1,120 | | | | 121,016 | |
MUTUAL OF AMERICA INVESTMENT CORPORATION - ALL AMERICA FUND
PORTFOLIO OF INVESTMENTS IN SECURITIES
June 30, 2016 (Unaudited)
| | | | | | | | |
PENTAIR PLC | | | 1,500 | | | | 87,435 | |
Pitney Bowes, Inc. | | | 1,587 | | | | 28,249 | |
Quanta Services, Inc.* | | | 1,228 | | | | 28,391 | |
Raytheon Co. | | | 2,473 | | | | 336,204 | |
Republic Services, Inc. | | | 1,967 | | | | 100,927 | |
Robert Half Int’l., Inc. | | | 1,087 | | | | 41,480 | |
Robinson (C.H.) Worldwide, Inc. | | | 1,187 | | | | 88,135 | |
Rockwell Automation, Inc. | | | 1,089 | | | | 125,039 | |
Rockwell Collins, Inc. | | | 1,090 | | | | 92,803 | |
Roper Technologies, Inc. | | | 838 | | | | 142,929 | |
Ryder System, Inc. | | | 437 | | | | 26,718 | |
Snap-on, Inc. | | | 479 | | | | 75,596 | |
Southwest Airlines Co. | | | 5,326 | | | | 208,832 | |
Stanley Black & Decker, Inc. | | | 1,250 | | | | 139,025 | |
Stericycle, Inc.* | | | 708 | | | | 73,717 | |
Textron, Inc. | | | 2,226 | | | | 81,383 | |
TransDigm Group, Inc.* | | | 440 | | | | 116,024 | |
Tyco International PLC | | | 3,530 | | | | 150,378 | |
Union Pacific Corp. | | | 6,995 | | | | 610,314 | |
United Continental Hldgs., Inc* | | | 2,800 | | | | 114,912 | |
United Parcel Service, Inc. Cl B | | | 5,744 | | | | 618,744 | |
United Rentals, Inc.* | | | 727 | | | | 48,782 | |
United Technologies Corp. | | | 6,479 | | | | 664,421 | |
Verisk Analytics, Inc. Cl A* | | | 1,284 | | | | 104,107 | |
Waste Management, Inc. | | | 3,430 | | | | 227,306 | |
Xylem, Inc. | | | 1,476 | | | | 65,903 | |
| | | | | | | | |
| | | | | | | 14,909,973 | |
| | | | | | | | |
INFORMATION TECHNOLOGY (10.4%) | | | | | | | | |
Accenture Ltd. Cl A | | | 5,187 | | | | 587,635 | |
Activision, Blizzard Inc. | | | 4,218 | | | | 167,159 | |
Adobe Systems, Inc.* | | | 4,153 | | | | 397,816 | |
Akamai Technologies, Inc.* | | | 1,455 | | | | 81,378 | |
Alliance Data Systems Corp.* | | | 489 | | | | 95,805 | |
Alphabet, Inc. Cl A* | | | 2,443 | | | | 1,718,724 | |
Alphabet, Inc. Cl C* | | | 2,458 | | | | 1,701,189 | |
Amphenol Corp. Cl A | | | 2,558 | | | | 146,650 | |
Analog Devices, Inc. | | | 2,556 | | | | 144,772 | |
Apple, Inc. | | | 45,505 | | | | 4,350,273 | |
Applied Materials, Inc. | | | 9,038 | | | | 216,641 | |
Autodesk, Inc.* | | | 1,868 | | | | 101,134 | |
Automatic Data Processing, Inc. | | | 3,785 | | | | 347,728 | |
Broadcom Ltd. | | | 3,085 | | | | 479,409 | |
CA, Inc. | | | 2,467 | | | | 80,992 | |
Cisco Systems, Inc. | | | 41,739 | | | | 1,197,492 | |
Citrix Systems, Inc.* | | | 1,297 | | | | 103,877 | |
Cognizant Technology Solutions* | | | 5,022 | | | | 287,459 | |
Corning, Inc. | | | 8,921 | | | | 182,702 | |
CSRA, Inc. | | | 1,118 | | | | 26,195 | |
eBay, Inc.* | | | 8,793 | | | | 205,844 | |
Electronic Arts, Inc.* | | | 2,504 | | | | 189,703 | |
EMC Corp. | | | 16,273 | | | | 442,137 | |
F5 Networks, Inc.* | | | 566 | | | | 64,433 | |
Facebook, Inc. Cl A* | | | 19,212 | | | | 2,195,547 | |
Fidelity Nat’l. Information Svcs., Inc. | | | 2,308 | | | | 170,053 | |
First Solar, Inc.* | | | 648 | | | | 31,415 | |
Fiserv, Inc.* | | | 1,853 | | | | 201,477 | |
FLIR Systems, Inc. | | | 1,166 | | | | 36,088 | |
Global Payments, Inc. | | | 1,272 | | | | 90,795 | |
Harris Corp. | | | 1,040 | | | | 86,778 | |
Hewlett Packard Enterprise Co. | | | 13,786 | | | | 251,870 | |
HP, Inc. | | | 14,277 | | | | 179,176 | |
MUTUAL OF AMERICA INVESTMENT CORPORATION - ALL AMERICA FUND
PORTFOLIO OF INVESTMENTS IN SECURITIES
June 30, 2016 (Unaudited)
| | | | | | | | |
Int’l. Business Machines Corp. | | | 7,353 | | | | 1,116,038 | |
Intel Corp. | | | 39,144 | | | | 1,283,923 | |
Intuit, Inc. | | | 2,128 | | | | 237,506 | |
Juniper Networks, Inc. | | | 2,966 | | | | 66,705 | |
KLA-Tencor Corp. | | | 1,289 | | | | 94,419 | |
Lam Research Corp. | | | 1,334 | | | | 112,136 | |
Linear Technology Corp. | | | 1,974 | | | | 91,850 | |
MasterCard, Inc. Cl A | | | 8,089 | | | | 712,317 | |
Microchip Technology, Inc. | | | 1,772 | | | | 89,947 | |
Micron Technology, Inc.* | | | 8,590 | | | | 118,198 | |
Microsoft Corp. | | | 65,300 | | | | 3,341,398 | |
Motorola Solutions, Inc. | | | 1,326 | | | | 87,476 | |
NetApp, Inc. | | | 2,406 | | | | 59,164 | |
NVIDIA Corp. | | | 4,205 | | | | 197,677 | |
Oracle Corp. | | | 25,910 | | | | 1,060,496 | |
Paychex, Inc. | | | 2,651 | | | | 157,735 | |
PayPal Hldgs., Inc.* | | | 9,157 | | | | 334,322 | |
Qorvo, Inc.* | | | 1,069 | | | | 59,073 | |
QUALCOMM, Inc. | | | 12,214 | | | | 654,304 | |
Red Hat, Inc.* | | | 1,510 | | | | 109,626 | |
Salesforce.com, inc.* | | | 5,284 | | | | 419,602 | |
Seagate Technology PLC | | | 2,506 | | | | 61,046 | |
Skyworks Solutions, Inc. | | | 1,569 | | | | 99,286 | |
Symantec Corp. | | | 5,070 | | | | 104,138 | |
TE Connectivity Ltd. | | | 2,969 | | | | 169,560 | |
Teradata Corp.* | | | 1,091 | | | | 27,351 | |
Texas Instruments, Inc. | | | 8,354 | | | | 523,378 | |
Total System Services, Inc. | | | 1,400 | | | | 74,354 | |
VeriSign, Inc.* | | | 797 | | | | 68,909 | |
Visa, Inc. Cl A | | | 15,819 | | | | 1,173,295 | |
Western Digital Corp. | | | 2,333 | | | | 110,258 | |
Western Union Co. | | | 4,105 | | | | 78,734 | |
Xerox Corp. | | | 7,966 | | | | 75,597 | |
Xilinx, Inc. | | | 2,126 | | | | 98,072 | |
Yahoo!, Inc.* | | | 7,295 | | | | 274,000 | |
| | | | | | | | |
| | | | | | | 29,902,236 | |
| | | | | | | | |
MATERIALS (1.5%) | | | | | | | | |
Air Products & Chemicals, Inc. | | | 1,624 | | | | 230,673 | |
Albemarle Corp. | | | 932 | | | | 73,917 | |
Alcoa, Inc. | | | 10,895 | | | | 100,997 | |
Avery Dennison Corp. | | | 737 | | | | 55,091 | |
Ball Corp. | | | 1,458 | | | | 105,399 | |
CF Industries Hldgs., Inc. | | | 1,928 | | | | 46,465 | |
Dow Chemical Co. | | | 9,356 | | | | 465,087 | |
Du Pont (E.I.) de Nemours & Co. | | | 7,265 | | | | 470,772 | |
Eastman Chemical Co. | | | 1,233 | | | | 83,721 | |
Ecolab, Inc. | | | 2,196 | | | | 260,446 | |
FMC Corp. | | | 1,112 | | | | 51,497 | |
Freeport-McMoRan Copper & Gold, Inc. | | | 10,466 | | | | 116,591 | |
Int’l. Flavors & Fragrances, Inc. | | | 665 | | | | 83,837 | |
International Paper Co. | | | 3,407 | | | | 144,389 | |
LyondellBasell Inds. NV Cl A | | | 2,844 | | | | 211,650 | |
Martin Marietta Materials, Inc. | | | 527 | | | | 101,184 | |
Monsanto Co. | | | 3,641 | | | | 376,516 | |
Newmont Mining Corp. | | | 4,414 | | | | 172,676 | |
Nucor Corp. | | | 2,635 | | | | 130,195 | |
Owens-Illinois, Inc.* | | | 1,343 | | | | 24,187 | |
PPG Industries, Inc. | | | 2,205 | | | | 229,651 | |
Praxair, Inc. | | | 2,380 | | | | 267,488 | |
Sealed Air Corp. | | | 1,627 | | | | 74,793 | |
Sherwin-Williams Co. | | | 652 | | | | 191,473 | |
MUTUAL OF AMERICA INVESTMENT CORPORATION - ALL AMERICA FUND
PORTFOLIO OF INVESTMENTS IN SECURITIES
June 30, 2016 (Unaudited)
| | | | | | | | |
The Mosaic Co. | | | 2,935 | | | | 76,838 | |
Vulcan Materials Co. | | | 1,103 | | | | 132,757 | |
WestRock Co. | | | 2,091 | | | | 81,291 | |
| | | | | | | | |
| | | | | | | 4,359,581 | |
| | | | | | | | |
TELECOMMUNICATION SERVICES (1.5%) | | | | | |
AT&T, Inc. | | | 51,168 | | | | 2,210,969 | |
CenturyLink, Inc. | | | 4,543 | | | | 131,792 | |
Frontier Communications Corp. | | | 9,654 | | | | 47,691 | |
Level 3 Communications, Inc.* | | | 2,398 | | | | 123,473 | |
Verizon Communications, Inc. | | | 33,913 | | | | 1,893,702 | |
| | | | | | | | |
| | | | | | | 4,407,627 | |
| | | | | | | | |
UTILITIES (1.9%) | | | | | |
AES Corp. | | | 5,466 | | | | 68,216 | |
Alliant Energy Corp. | | | 1,894 | | | | 75,192 | |
Ameren Corp. | | | 2,018 | | | | 108,124 | |
American Electric Power Co., Inc. | | | 4,079 | | | | 285,897 | |
American Water Works Co., Inc. | | | 1,474 | | | | 124,568 | |
CenterPoint Energy, Inc. | | | 3,568 | | | | 85,632 | |
CMS Energy Corp. | | | 2,323 | | | | 106,533 | |
Consolidated Edison, Inc. | | | 2,539 | | | | 204,237 | |
Dominion Resources, Inc. | | | 5,141 | | | | 400,638 | |
DTE Energy Co. | | | 1,492 | | | | 147,887 | |
Duke Energy Corp. | | | 5,726 | | | | 491,234 | |
Edison International | | | 2,710 | | | | 210,486 | |
Entergy Corp. | | | 1,485 | | | | 120,805 | |
Eversource Energy | | | 2,633 | | | | 157,717 | |
Exelon Corp. | | | 7,655 | | | | 278,336 | |
FirstEnergy Corp. | | | 3,545 | | | | 123,756 | |
NextEra Energy, Inc. | | | 3,839 | | | | 500,606 | |
NiSource, Inc. | | | 2,663 | | | | 70,623 | |
NRG Energy, Inc. | | | 2,614 | | | | 39,184 | |
PG&E Corp. | | | 4,128 | | | | 263,862 | |
Pinnacle West Capital Corp. | | | 925 | | | | 74,981 | |
PPL Corp. | | | 5,616 | | | | 212,004 | |
Public Svc. Enterprise Group, Inc. | | | 4,223 | | | | 196,834 | |
SCANA Corp. | | | 1,192 | | | | 90,187 | |
Sempra Energy | | | 1,966 | | | | 224,163 | |
Southern Co. | | | 7,814 | | | | 419,065 | |
WEC Energy Group, Inc. | | | 2,625 | | | | 171,413 | |
Xcel Energy, Inc. | | | 4,228 | | | | 189,330 | |
| | | | | | | | |
| | | | | | | 5,441,510 | |
| | | | | | | | |
TOTAL INDEXED ASSETS - COMMON STOCKS
(Cost: $105,855,665) 52.5% | | | | | | | 151,493,083 | |
| | | | | | | | |
| | | | | | | | | | | | | | | | | | | | |
| | | Rating** | | | Rate(%) | | | Maturity | | | Face Amount | | | Value | |
INDEXED ASSETS: | | | | | | | | | | | | | | | | | | | | |
SHORT-TERM DEBT SECURITIES: | | | | | | | | | | | | | | | | | | | | |
U.S. GOVERNMENT (0.1%) | | | | | | | | | | | | | |
U.S. Treasury Bill (1) | | | A-1+ | | | | 0.27 | | | | 10/13/16 | | | | 100,000 | | | | 99,922 | |
U.S. Treasury Bill (1) | | | A-1+ | | | | 0.28 | | | | 11/10/16 | | | | 100,000 | | | | 99,897 | |
U.S. Treasury Bill (1) | | | A-1+ | | | | 0.30 | | | | 10/13/16 | | | | 100,000 | | | | 99,913 | |
| | | | | | | | | | | | | | | | | | | | |
| | | | | | | | | | | | | | | | | | | 299,732 | |
| | | | | | | | | | | | | | | | | | | | |
COMMERCIAL PAPER (1.5%) | | | | | | | | | | | | | |
Ralph Lauren Corp.† | | | A-1 | | | | 0.40 | | | | 07/01/16 | | | | 4,200,000 | | | | 4,200,000 | |
| | | | | | | | | | | | | | | | | | | | |
TOTAL INDEXED ASSETS - SHORT-TERM DEBT SECURITIES
(Cost: $4,499,732) 1.6% | | | | | | | | | | | | 4,499,732 | |
| | | | | | | | | | | | | | | | | | | | |
TOTAL INDEXED ASSETS
(Cost: $110,355,397) 54.1% | | | | | | | | | | | | | | | | | | | 155,992,815 | |
| | | | | | | | | | | | | | | | | | | | |
MUTUAL OF AMERICA INVESTMENT CORPORATION - ALL AMERICA FUND
PORTFOLIO OF INVESTMENTS IN SECURITIES
June 30, 2016 (Unaudited)
| | | | | | | | |
| | | Shares | | | Value | |
ACTIVE ASSETS: | | | | | | | | |
COMMON STOCKS: | | | | | | | | |
CONSUMER DISCRETIONARY (6.2%) | | | | | | | | |
AMC Networks, Inc. Cl A* | | | 4,003 | | | | 241,861 | |
AutoZone, Inc.* | | | 845 | | | | 670,795 | |
Bassett Furniture Industries, Inc. | | | 15,322 | | | | 366,809 | |
Bloomin’ Brands, Inc. | | | 12,318 | | | | 220,123 | |
BorgWarner, Inc. | | | 11,921 | | | | 351,908 | |
Bright Horizons Family Solutions, Inc.* | | | 1,960 | | | | 129,968 | |
Carmike Cinemas, Inc.* | | | 6,259 | | | | 188,521 | |
Chipotle Mexican Grill, Inc.* | | | 269 | | | | 108,342 | |
Cooper Tire & Rubber Co. | | | 4,825 | | | | 143,882 | |
CST Brands, Inc. | | | 52,759 | | | | 2,272,858 | |
Diamond Resorts Int’l., Inc.* | | | 77,728 | | | | 2,328,731 | |
Dick’s Sporting Goods, Inc. | | | 4,138 | | | | 186,458 | |
Dillard’s, Inc. Cl A | | | 595 | | | | 36,057 | |
Dollar Tree, Inc.* | | | 2,960 | | | | 278,950 | |
DreamWorks Animation SKG Cl A* | | | 4,160 | | | | 170,019 | |
Drew Industries, Inc. | | | 4,124 | | | | 349,880 | |
Eros International PLC* | | | 6,020 | | | | 97,945 | |
Five Below, Inc.* | | | 6,783 | | | | 314,799 | |
FTD Companies, Inc.* | | | 3,838 | | | | 95,796 | |
Gentherm, Inc.* | | | 4,723 | | | | 161,763 | |
Haverty Furniture Cos., Inc. | | | 16,846 | | | | 303,733 | |
Houghton Mifflin Harcourt Co.* | | | 42,726 | | | | 667,807 | |
HSN, Inc. | | | 5,763 | | | | 281,984 | |
Intrawest Resorts Hldgs., Inc.* | | | 36,598 | | | | 475,042 | |
Liberty Interactive Corp. Ser. A Liberty Ventures* | | | 2,546 | | | | 94,380 | |
Liberty Interactive Corp. Ser. A QVC Group* | | | 13,557 | | | | 343,942 | |
Lions Gate Entertainment Corp. | | | 43,137 | | | | 872,661 | |
Macy’s, Inc. | | | 2,891 | | | | 97,167 | |
MSG Networks, Inc.* | | | 2,511 | | | | 38,519 | |
NVR, Inc.* | | | 161 | | | | 286,635 | |
Panera Bread Co. Cl A* | | | 6,390 | | | | 1,354,297 | |
Popeyes Louisiana Kitchen, Inc.* | | | 2,003 | | | | 109,444 | |
Ralph Lauren Corp. | | | 3,227 | | | | 289,203 | |
Red Robin Gourmet Burgers, Inc.* | | | 10,374 | | | | 492,039 | |
Ruby Tuesday, Inc.* | | | 31,836 | | | | 114,928 | |
Scripps Networks Interactive, Inc. Cl A | | | 3,841 | | | | 239,179 | |
Select Comfort Corp.* | | | 38,748 | | | | 828,432 | |
Stage Stores, Inc. | | | 7,107 | | | | 34,682 | |
Steve Madden Ltd.* | | | 8,047 | | | | 275,046 | |
Taylor Morrison Home Corp. Cl A* | | | 2,887 | | | | 42,843 | |
Tractor Supply Co. | | | 6,702 | | | | 611,088 | |
TripAdvisor, Inc.* | | | 1,844 | | | | 118,569 | |
Unifi, Inc.* | | | 9,304 | | | | 253,348 | |
V.F. Corp. | | | 5,497 | | | | 338,011 | |
Vista Outdoor, Inc.* | | | 8,423 | | | | 402,030 | |
Wiley (John) & Sons, Inc. Cl A | | | 3,018 | | | | 157,479 | |
| | | | | | | | |
| | | | | | | 17,837,953 | |
| | | | | | | | |
CONSUMER STAPLES (2.1%) | | | | | | | | |
Casey’s General Stores, Inc. | | | 1,879 | | | | 247,107 | |
Church & Dwight Co., Inc. | | | 6,504 | | | | 669,197 | |
Constellation Brands, Inc. Cl A | | | 6,856 | | | | 1,133,982 | |
Crimson Wine Group Ltd.* | | | 40,324 | | | | 337,109 | |
Edgewell Personal Care Co. | | | 1,694 | | | | 142,991 | |
Energizer Hldgs., Inc. | | | 1,694 | | | | 87,224 | |
Farmer Brothers Co.* | | | 8,971 | | | | 287,610 | |
Ingredion, Inc. | | | 2,678 | | | | 346,560 | |
MUTUAL OF AMERICA INVESTMENT CORPORATION - ALL AMERICA FUND
PORTFOLIO OF INVESTMENTS IN SECURITIES
June 30, 2016 (Unaudited)
| | | | | | | | |
J.M. Smucker Co. | | | 5,731 | | | | 873,462 | |
Vector Group Ltd. | | | 29,630 | | | | 664,305 | |
Village Super Market, Inc. Cl A | | | 21,795 | | | | 629,658 | |
WD-40 Co. | | | 4,733 | | | | 555,891 | |
| | | | | | | | |
| | | 5,975,096 | |
| | | | | | | | |
ENERGY (2.2%) | | | | | | | | |
Abraxas Petroleum Corp.* | | | 37,364 | | | | 42,221 | |
Atwood Oceanics, Inc. | | | 6,710 | | | | 84,009 | |
Baker Hughes, Inc. | | | 3,952 | | | | 178,354 | |
Carrizo Oil and Gas, Inc.* | | | 5,296 | | | | 189,862 | |
Cheniere Energy, Inc.* | | | 3,349 | | | | 125,755 | |
Continental Resources, Inc.* | | | 13,500 | | | | 611,145 | |
CrossAmerica Partners LP | | | 5,933 | | | | 145,477 | |
FMC Technologies, Inc.* | | | 9,536 | | | | 254,325 | |
Gulfport Energy Corp.* | | | 23,345 | | | | 729,765 | |
Hess Corp. | | | 3,210 | | | | 192,921 | |
Matador Resources Co.* | | | 11,804 | | | | 233,719 | |
Matrix Service Co.* | | | 3,765 | | | | 62,085 | |
MPLX LP | | | 3,645 | | | | 122,581 | |
Nabors Industries Ltd. | | | 28,488 | | | | 286,304 | |
Newfield Exploration Co.* | | | 7,197 | | | | 317,963 | |
Noble Energy, Inc. | | | 5,726 | | | | 205,392 | |
Parsley Energy, Inc. Cl A* | | | 2,710 | | | | 73,333 | |
PBF Energy, Inc. | | | 22,271 | | | | 529,604 | |
PDC Energy, Inc.* | | | 3,744 | | | | 215,692 | |
Pioneer Natural Resources Co. | | | 2,474 | | | | 374,094 | |
Range Resources Corp. | | | 21,683 | | | | 935,405 | |
Tesoro Corp. | | | 4,544 | | | | 340,437 | |
Weatherford Int’l. PLC* | | | 8,821 | | | | 48,957 | |
| | | | | | | | |
| | | | | | | 6,299,400 | |
| | | | | | | | |
FINANCIALS (11.3%) | | | | | | | | |
Agree Realty Corp. | | | 2,498 | | | | 120,504 | |
Alexander’s, Inc. | | | 568 | | | | 232,443 | |
Allied World Assurance Co. Hldgs. AG | | | 13,092 | | | | 460,053 | |
American Equity Investment Life Hldg. Co. | | | 12,060 | | | | 171,855 | |
American Financial Group, Inc. | | | 4,234 | | | | 313,020 | |
Ameriprise Financial, Inc. | | | 5,708 | | | | 512,863 | |
Aon PLC | | | 3,454 | | | | 377,280 | |
Apartment Investment & Management Co. Cl A | | | 3,528 | | | | 155,796 | |
Ashford Hospitality Trust, Inc. | | | 3,838 | | | | 20,610 | |
Aspen Insurance Hldgs. Ltd. | | | 6,457 | | | | 299,476 | |
Associated Banc-Corp. | | | 10,766 | | | | 184,637 | |
Assurant, Inc. | | | 1,087 | | | | 93,819 | |
BancFirst Corp. | | | 4,762 | | | | 287,244 | |
Bank of Marin Bancorp | | | 3,913 | | | | 189,272 | |
Bank of the Ozarks, Inc. | | | 4,906 | | | | 184,073 | |
BankUnited, Inc. | | | 3,613 | | | | 110,991 | |
Banner Corp. | | | 7,818 | | | | 332,578 | |
Brandywine Realty Trust | | | 9,951 | | | | 167,177 | |
Brookline Bancorp, Inc. | | | 29,527 | | | | 325,683 | |
Bryn Mawr Bank Corp. | | | 8,415 | | | | 245,718 | |
Camden Property Trust | | | 3,103 | | | | 274,367 | |
CBRE Group, Inc.* | | | 6,297 | | | | 166,745 | |
Charter Financial Corp. | | | 14,405 | | | | 191,298 | |
Chatham Lodging Trust | | | 12,559 | | | | 276,047 | |
Chesapeake Lodging Trust | | | 11,604 | | | | 269,793 | |
Colony Capital, Inc. Cl A | | | 18,027 | | | | 276,714 | |
Columbia Banking System, Inc. | | | 3,067 | | | | 86,060 | |
Commerce Bancshares, Inc. | | | 5,857 | | | | 280,550 | |
Crown Castle Int’l. Corp. | | | 3,175 | | | | 322,040 | |
CubeSmart | | | 10,411 | | | | 321,492 | |
MUTUAL OF AMERICA INVESTMENT CORPORATION - ALL AMERICA FUND
PORTFOLIO OF INVESTMENTS IN SECURITIES
June 30, 2016 (Unaudited)
| | | | | | | | |
Customers Bancorp, Inc.* | | | 12,016 | | | | 301,962 | |
DDR Corp. | | | 6,007 | | | | 108,967 | |
Dime Community Bancshares | | | 13,840 | | | | 235,418 | |
Discover Financial Svcs. | | | 3,942 | | | | 211,252 | |
Duke Realty Corp. | | | 35,176 | | | | 937,792 | |
Eagle Bancorp, Inc.* | | | 4,763 | | | | 229,148 | |
East West Bancorp, Inc. | | | 6,477 | | | | 221,384 | |
Easterly Acquisition Corp.* | | | 26,084 | | | | 263,970 | |
Easterly Government Pptys. | | | 35,770 | | | | 705,743 | |
EastGroup Properties, Inc. | | | 1,957 | | | | 134,876 | |
Ellington Financial LLC | | | 25,901 | | | | 443,684 | |
Enterprise Financial Svcs. Corp. | | | 9,454 | | | | 263,672 | |
Equity Lifestyle Properties, Inc. | | | 7,423 | | | | 594,211 | |
Essex Property Trust, Inc. | | | 1,349 | | | | 307,693 | |
Everest Re Group Ltd. | | | 2,889 | | | | 527,734 | |
Extra Space Storage, Inc. | | | 2,879 | | | | 266,423 | |
FBL Financial Group, Inc. Cl A | | | 4,421 | | | | 268,222 | |
FBR & Co. | | | 2,088 | | | | 31,174 | |
FelCor Lodging Trust, Inc. | | | 46,524 | | | | 289,845 | |
Fifth Third Bancorp | | | 25,092 | | | | 441,368 | |
First Connecticut Bancorp, Inc. | | | 5,708 | | | | 94,524 | |
First Interstate BancSytem, Inc. | | | 9,539 | | | | 268,046 | |
First Niagara Financial Group, Inc. | | | 7,832 | | | | 76,284 | |
First Republic Bank/CA | | | 7,017 | | | | 491,120 | |
Flushing Financial Corp. | | | 8,703 | | | | 173,016 | |
Forest City Realty Trust, Inc. Cl A | | | 21,702 | | | | 484,172 | |
Gallagher (Arthur J.) & Co. | | | 3,661 | | | | 174,264 | |
General Growth Pptys., Inc. | | | 26,847 | | | | 800,578 | |
Glacier Bancorp, Inc. | | | 9,696 | | | | 257,720 | |
Gramercy Property Trust | | | 9,370 | | | | 86,391 | |
Hanmi Financial Corp. | | | 6,804 | | | | 159,826 | |
Hartford Financial Svcs. Group, Inc. | | | 16,144 | | | | 716,471 | |
Heritage Financial Corp. | | | 11,049 | | | | 194,241 | |
Highwoods Properties, Inc. | | | 9,105 | | | | 480,744 | |
Host Hotels & Resorts, Inc. | | | 19,931 | | | | 323,082 | |
Huntington Bancshares, Inc. | | | 8,731 | | | | 78,055 | |
Intercontinental Exchange, Inc. | | | 1,799 | | | | 460,472 | |
Investors Bancorp, Inc. | | | 58,724 | | | | 650,662 | |
iShares Russell 2000 Value ETF | | | 3,610 | | | | 351,253 | |
iShares Russell Mid-Cap ETF | | | 2,658 | | | | 446,916 | |
iShares Russell Mid-Cap Value ETF | | | 1,358 | | | | 100,886 | |
Janus Capital Group, Inc. | | | 12,617 | | | | 175,629 | |
KeyCorp | | | 16,821 | | | | 185,872 | |
Kilroy Realty Corp. | | | 9,969 | | | | 660,845 | |
Lincoln National Corp. | | | 4,520 | | | | 175,240 | |
Marlin Business Svcs. Corp. | | | 13,515 | | | | 220,295 | |
MB Financial, Inc. | | | 6,031 | | | | 218,805 | |
NMI Hldgs., Inc. Cl A* | | | 26,386 | | | | 144,595 | |
Northfield Bancorp, Inc. | | | 20,705 | | | | 307,055 | |
Pace Hldgs. Corp.* | | | 24,200 | | | | 242,000 | |
Parkway Properties, Inc. | | | 10,798 | | | | 180,651 | |
Pennsylvania REIT | | | 12,810 | | | | 274,775 | |
Pinnacle Financial Partners, Inc. | | | 4,713 | | | | 230,230 | |
PrivateBancorp, Inc. | | | 9,541 | | | | 420,090 | |
Progressive Corp. | | | 5,091 | | | | 170,549 | |
ProLogis, Inc. | | | 4,217 | | | | 206,802 | |
Prosperity Bancshares, Inc. | | | 3,564 | | | | 181,728 | |
QTS Realty Trust, Inc. | | | 7,452 | | | | 417,163 | |
Raymond James Financial, Inc. | | | 6,028 | | | | 297,180 | |
Regency Centers Corp. | | | 1,667 | | | | 139,578 | |
Reinsurance Grp. of America, Inc. | | | 7,423 | | | | 719,956 | |
MUTUAL OF AMERICA INVESTMENT CORPORATION - ALL AMERICA FUND
PORTFOLIO OF INVESTMENTS IN SECURITIES
June 30, 2016 (Unaudited)
| | | | | | | | |
RLJ Lodging Trust | | | 6,213 | | | | 133,269 | |
Safety Insurance Group, Inc. | | | 5,202 | | | | 320,339 | |
SEI Investments Co. | | | 6,765 | | | | 325,464 | |
Selective Insurance Group, Inc. | | | 7,457 | | | | 284,932 | |
Sovran Self Storage, Inc. | | | 1,754 | | | | 184,030 | |
Starwood Property Trust, Inc. | | | 45,649 | | | | 945,847 | |
Stock Yards Bancorp, Inc. | | | 16,683 | | | | 470,961 | |
Stonegate Bank | | | 2,494 | | | | 80,481 | |
SunTrust Banks, Inc. | | | 7,512 | | | | 308,593 | |
SVB Financial Group* | | | 6,767 | | | | 643,948 | |
Terreno Realty Corp. | | | 20,666 | | | | 534,630 | |
The GEO Group, Inc. | | | 6,439 | | | | 220,085 | |
TriCo Bancshares | | | 3,848 | | | | 106,205 | |
UMB Financial Corp. | | | 3,009 | | | | 160,109 | |
Urstadt Biddle Pptys., Inc. Cl A | | | 7,063 | | | | 175,021 | |
Vornado Realty Trust | | | 2,794 | | | | 279,735 | |
Voya Financial, Inc. | | | 5,886 | | | | 145,737 | |
Welltower, Inc. | | | 7,964 | | | | 606,618 | |
Weyerhaeuser Co. | | | 3,385 | | | | 100,771 | |
| | | | | | | | |
| | | | | | | 32,499,272 | |
| | | | | | | | |
HEALTH CARE (4.6%) | | | | | | | | |
Abiomed, Inc.* | | | 2,886 | | | | 315,411 | |
Acadia Healthcare Co., Inc.* | | | 20,490 | | | | 1,135,146 | |
ACADIA Pharmaceuticals, Inc.* | | | 6,110 | | | | 198,331 | |
Acceleron Pharma, Inc.* | | | 3,430 | | | | 116,551 | |
Acorda Therapeutics, Inc.* | | | 5,173 | | | | 131,937 | |
Agilent Technologies, Inc. | | | 3,452 | | | | 153,131 | |
Agios Pharmaceuticals, Inc.* | | | 1,323 | | | | 55,427 | |
Akorn, Inc.* | | | 6,028 | | | | 171,708 | |
Albany Molecular Research, Inc.* | | | 6,595 | | | | 88,637 | |
Align Technology, Inc.* | | | 3,688 | | | | 297,068 | |
Alnylam Pharmaceuticals, Inc.* | | | 2,423 | | | | 134,452 | |
Amsurg Corp.* | | | 3,738 | | | | 289,845 | |
Ani Pharmaceuticals, Inc.* | | | 2,268 | | | | 126,600 | |
Anika Therapeutics, Inc.* | | | 4,209 | | | | 225,813 | |
Bard (C.R.), Inc. | | | 1,934 | | | | 454,799 | |
BioMarin Pharmaceutical, Inc.* | | | 1,619 | | | | 125,958 | |
BioSpecifics Technologies Corp.* | | | 4,456 | | | | 177,973 | |
Boston Scientific Corp.* | | | 25,564 | | | | 597,431 | |
Cardinal Health, Inc. | | | 1,292 | | | | 100,789 | |
Catalent, Inc.* | | | 5,225 | | | | 120,123 | |
Cepheid, Inc.* | | | 4,333 | | | | 133,240 | |
CIGNA Corp. | | | 2,925 | | | | 374,371 | |
Civitas Solutions, Inc.* | | | 4,234 | | | | 88,194 | |
DexCom, Inc.* | | | 4,363 | | | | 346,117 | |
Dynavax Technologies Corp.* | | | 1,650 | | | | 24,057 | |
Emergent Biosolutions, Inc.* | | | 15,169 | | | | 426,553 | |
Ensign Group, Inc. | | | 13,508 | | | | 283,803 | |
Harvard Bioscience, Inc.* | | | 20,998 | | | | 60,054 | |
Hill-Rom Hldgs., Inc. | | | 1,110 | | | | 56,000 | |
Humana, Inc. | | | 1,912 | | | | 343,930 | |
Insulet Corp.* | | | 2,417 | | | | 73,090 | |
Integra LifeSciences Hldgs. Corp.* | | | 1,300 | | | | 103,714 | |
Intersect ENT, Inc.* | | | 7,051 | | | | 91,169 | |
Juno Therapeutics, Inc.* | | | 1,196 | | | | 45,974 | |
Karyopharm Therapeutics, Inc.* | | | 6,724 | | | | 45,118 | |
Kindred Healthcare, Inc. | | | 7,746 | | | | 87,452 | |
Kite Pharma, Inc.* | | | 1,217 | | | | 60,850 | |
Medicines Co.* | | | 3,429 | | | | 115,317 | |
MEDNAX, Inc.* | | | 5,213 | | | | 377,578 | |
Mettler-Toledo Int’l., Inc.* | | | 746 | | | | 272,230 | |
MUTUAL OF AMERICA INVESTMENT CORPORATION - ALL AMERICA FUND
PORTFOLIO OF INVESTMENTS IN SECURITIES
June 30, 2016 (Unaudited)
| | | | | | | | |
Mylan NV* | | | 2,731 | | | | 118,088 | |
Neogen Corp.* | | | 3,623 | | | | 203,794 | |
Neurocrine Biosciences, Inc.* | | | 5,421 | | | | 246,384 | |
NuVasive, Inc.* | | | 2,847 | | | | 170,023 | |
Omeros Corp.* | | | 8,781 | | | | 92,376 | |
Omnicell, Inc.* | | | 11,593 | | | | 396,828 | |
OSI Pharmaceuticals, Inc. - rights* | | | 1,570 | | | | 16 | |
Pacific Biosciences of CA, Inc.* | | | 31,831 | | | | 223,931 | |
Pacira Pharmaceuticals, Inc.* | | | 2,472 | | | | 83,381 | |
PAREXEL International Corp.* | | | 4,998 | | | | 314,274 | |
Prestige Brands Hldgs., Inc.* | | | 3,055 | | | | 169,247 | |
QLT, Inc.* | | | 11,709 | | | | 16,627 | |
Radius Health, Inc.* | | | 2,777 | | | | 102,055 | |
Sorrento Therapeutics, Inc.* | | | 11,706 | | | | 65,554 | |
Supernus Pharmaceuticals, Inc.* | | | 37,334 | | | | 760,493 | |
TESARO, Inc.* | | | 3,010 | | | | 252,991 | |
Ultragenyx Pharmaceutical, Inc.* | | | 2,531 | | | | 123,791 | |
United Therapeutics Corp.* | | | 818 | | | | 86,643 | |
Universal American Corp. | | | 3,089 | | | | 23,415 | |
WellCare Health Plans, Inc.* | | | 4,436 | | | | 475,894 | |
West Pharmaceutical Svcs, Inc. | | | 1,125 | | | | 85,365 | |
Wright Medical Group NV* | | | 16,540 | | | | 287,300 | |
Zimmer Biomet Hldgs., Inc. | | | 3,277 | | | | 394,485 | |
Zoetis, Inc. | | | 5,983 | | | | 283,953 | |
| | | | | | | | |
| | | | | | | 13,402,849 | |
| | | | | | | | |
INDUSTRIALS (4.9%) | | | | | | | | |
Alaska Air Group, Inc. | | | 11,979 | | | | 698,256 | |
AMERCO | | | 665 | | | | 249,076 | |
Astronics Corp.* | | | 20,398 | | | | 678,438 | |
AZZ, Inc. | | | 17,885 | | | | 1,072,742 | |
BMC Stock Hldgs., Inc.* | | | 2,324 | | | | 41,414 | |
Carlisle Cos., Inc. | | | 5,150 | | | | 544,252 | |
Covenant Transportation Group Cl A* | | | 29,684 | | | | 536,390 | |
Deluxe Corp. | | | 4,874 | | | | 323,487 | |
Dover Corp. | | | 4,948 | | | | 342,995 | |
Encore Wire Corp. | | | 8,219 | | | | 306,404 | |
EnPro Industries, Inc. | | | 7,718 | | | | 342,602 | |
Equifax, Inc. | | | 224 | | | | 28,762 | |
Flowserve Corp. | | | 5,686 | | | | 256,837 | |
Fortune Brands Home & Security, Inc. | | | 6,162 | | | | 357,211 | |
Generac Hldgs., Inc.* | | | 4,976 | | | | 173,961 | |
Genesee & Wyoming, Inc. Cl A* | | | 1,405 | | | | 82,825 | |
Healthcare Svcs. Group, Inc. | | | 9,743 | | | | 403,165 | |
Kansas City Southern | | | 1,844 | | | | 166,126 | |
L-3 Communications Hldgs., Inc. | | | 2,293 | | | | 336,360 | |
Lincoln Electric Hldgs., Inc. | | | 4,363 | | | | 257,766 | |
Miller Industries, Inc. | | | 21,873 | | | | 450,365 | |
Mueller Industries, Inc. | | | 27,696 | | | | 882,948 | |
Mueller Water Products, Inc. Cl A | | | 33,022 | | | | 377,111 | |
Old Dominion Freight Line, Inc.* | | | 8,934 | | | | 538,809 | |
Orbital ATK, Inc. | | | 12,460 | | | | 1,060,845 | |
Oshkosh Corp. | | | 2,614 | | | | 124,714 | |
Pitney Bowes, Inc. | | | 4,662 | | | | 82,984 | |
Robert Half Int’l., Inc. | | | 5,056 | | | | 192,937 | |
Rockwell Automation, Inc. | | | 3,868 | | | | 444,124 | |
Roper Technologies, Inc. | | | 1,061 | | | | 180,964 | |
Smith (A.O.) Corp. | | | 4,048 | | | | 356,669 | |
Snap-on, Inc. | | | 511 | | | | 80,646 | |
Steelcase, Inc. | | | 6,238 | | | | 84,650 | |
Sun Hydraulics Corp. | | | 8,757 | | | | 259,995 | |
Teledyne Technologies, Inc.* | | | 3,173 | | | | 314,286 | |
MUTUAL OF AMERICA INVESTMENT CORPORATION - ALL AMERICA FUND
PORTFOLIO OF INVESTMENTS IN SECURITIES
June 30, 2016 (Unaudited)
| | | | | | | | |
TransDigm Group, Inc.* | | | 1,907 | | | | 502,857 | |
TransUnion* | | | 1,799 | | | | 60,159 | |
Trex Co., Inc.* | | | 9,120 | | | | 409,670 | |
Triumph Group, Inc. | | | 4,260 | | | | 151,230 | |
United Rentals, Inc.* | | | 2,355 | | | | 158,021 | |
VSE Corp. | | | 3,100 | | | | 207,080 | |
| | | | | | | | |
| | | | | | | 14,120,133 | |
| | | | | | | | |
INFORMATION TECHNOLOGY (6.5%) | | | | | | | | |
Aerohive Networks, Inc.* | | | 32,500 | | | | 215,150 | |
Akamai Technologies, Inc.* | | | 5,263 | | | | 294,360 | |
Ambarella, Inc.* | | | 10,914 | | | | 554,541 | |
Amphenol Corp. Cl A | | | 6,288 | | | | 360,491 | |
Analog Devices, Inc. | | | 2,205 | | | | 124,891 | |
Anixter International, Inc.* | | | 2,509 | | | | 133,680 | |
Apigee Corp.* | | | 31,951 | | | | 390,441 | |
ARRIS International PLC* | | | 25,474 | | | | 533,935 | |
Avnet, Inc. | | | 9,758 | | | | 395,296 | |
Blackhawk Network Hldgs., Inc.* | | | 5,360 | | | | 179,506 | |
Broadcom Ltd. | | | 2,090 | | | | 324,786 | |
CA, Inc. | | | 5,206 | | | | 170,913 | |
CalAmp Corp.* | | | 27,699 | | | | 410,222 | |
Callidus Software, Inc.* | | | 3,830 | | | | 76,523 | |
Cavium, Inc.* | | | 26,933 | | | | 1,039,613 | |
Cimpress NV* | | | 1,389 | | | | 128,455 | |
Cirrus Logic, Inc.* | | | 2,780 | | | | 107,836 | |
Cognex Corp | | | 4,693 | | | | 202,269 | |
Computer Sciences Corp. | | | 1,776 | | | | 88,178 | |
Comtech Telecommunications Corp. | | | 10,570 | | | | 135,719 | |
Cornerstone OnDemand, Inc.* | | | 4,296 | | | | 163,506 | |
CSRA, Inc. | | | 1,483 | | | | 34,747 | |
DTS, Inc.* | | | 11,368 | | | | 300,684 | |
EPAM Systems, Inc.* | | | 3,005 | | | | 193,252 | |
Euronet Worldwide, Inc.* | | | 2,747 | | | | 190,065 | |
ExlService Hldgs., Inc.* | | | 1,640 | | | | 85,952 | |
Extreme Networks, Inc.* | | | 28,338 | | | | 96,066 | |
F5 Networks, Inc.* | | | 408 | | | | 46,447 | |
FARO Technologies, Inc.* | | | 4,794 | | | | 162,181 | |
Fidelity Nat’l. Information Svcs., Inc. | | | 6,297 | | | | 463,963 | |
Genpact Ltd.* | | | 12,370 | | | | 332,011 | |
Global Payments, Inc. | | | 5,218 | | | | 372,461 | |
Globant S.A.* | | | 9,263 | | | | 364,499 | |
Harris Corp. | | | 2,046 | | | | 170,718 | |
Imation Corp.* | | | 21,768 | | | | 27,210 | |
Imperva, Inc.* | | | 2,686 | | | | 115,525 | |
inContact, Inc.* | | | 10,417 | | | | 144,275 | |
j2 Global, Inc. | | | 3,162 | | | | 199,744 | |
LinkedIn Corp. Cl A* | | | 1,061 | | | | 200,794 | |
LogMeIn, Inc.* | | | 9,132 | | | | 579,243 | |
Manhattan Associates, Inc.* | | | 2,126 | | | | 136,340 | |
MAXIMUS, Inc. | | | 4,240 | | | | 234,769 | |
MaxLinear, Inc. Cl A* | | | 27,749 | | | | 498,927 | |
Microchip Technology, Inc. | | | 4,498 | | | | 228,318 | |
MKS Instruments, Inc. | | | 6,210 | | | | 267,403 | |
Monolithic Power Systems, Inc. | | | 5,186 | | | | 354,308 | |
NetSuite, Inc.* | | | 3,040 | | | | 221,312 | |
New Relic, Inc.* | | | 8,306 | | | | 244,030 | |
Nova Measuring Instruments Ltd.* | | | 8,936 | | | | 97,760 | |
NXP Semiconductors NV* | | | 4,393 | | | | 344,148 | |
Palo Alto Networks, Inc.* | | | 1,889 | | | | 231,667 | |
Paycom Software, Inc.* | | | 3,486 | | | | 150,630 | |
Perficient, Inc.* | | | 7,338 | | | | 149,035 | |
MUTUAL OF AMERICA INVESTMENT CORPORATION - ALL AMERICA FUND
PORTFOLIO OF INVESTMENTS IN SECURITIES
June 30, 2016 (Unaudited)
| | | | | | | | |
Plexus Corp.* | | | 3,456 | | | | 149,299 | |
Proofpoint, Inc.* | | | 11,722 | | | | 739,541 | |
PTC, Inc.* | | | 7,017 | | | | 263,699 | |
Qlik Technologies, Inc.* | | | 8,070 | | | | 238,711 | |
QLogic Corp.* | | | 14,781 | | | | 217,872 | |
Rapid7, Inc.* | | | 4,290 | | | | 53,968 | |
Red Hat, Inc.* | | | 2,699 | | | | 195,947 | |
Richardson Electronics Ltd. | | | 45,433 | | | | 239,432 | |
Rogers Corp.* | | | 5,698 | | | | 348,148 | |
Rubicon Project, Inc.* | | | 6,324 | | | | 86,323 | |
Science Applications Int’l. Corp. | | | 3,191 | | | | 186,195 | |
Skyworks Solutions, Inc. | | | 4,165 | | | | 263,561 | |
Splunk, Inc.* | | | 5,308 | | | | 287,587 | |
SS&C Technologies Hldgs., Inc. | | | 2,518 | | | | 70,705 | |
Symantec Corp. | | | 3,820 | | | | 78,463 | |
Synaptics, Inc.* | | | 1,587 | | | | 85,301 | |
SYNNEX Corp. | | | 2,595 | | | | 246,058 | |
Tyler Technologies, Inc.* | | | 2,250 | | | | 375,098 | |
Ultimate Software Group, Inc.* | | | 1,484 | | | | 312,070 | |
Vantiv, Inc. Cl A* | | | 8,466 | | | | 479,176 | |
Virtusa Corp.* | | | 5,134 | | | | 148,270 | |
Western Digital Corp. | | | 1,527 | | | | 72,166 | |
Workday, Inc.* | | | 1,529 | | | | 114,170 | |
Xerox Corp. | | | 7,255 | | | | 68,850 | |
Xura, Inc.* | | | 11,415 | | | | 278,868 | |
| | | | | | | | |
| | | | | | | 18,868,273 | |
| | | | | | | | |
MATERIALS (2.3%) | | | | | | | | |
Ashland, Inc. | | | 4,796 | | | | 550,437 | |
Axalta Coating Systems Ltd.* | | | 8,097 | | | | 214,813 | |
Berry Plastics Group, Inc.* | | | 6,089 | | | | 236,558 | |
Boise Cascade Co.* | | | 7,464 | | | | 171,299 | |
Calgon Carbon Corp. | | | 12,772 | | | | 167,952 | |
Crown Hldgs., Inc.* | | | 13,020 | | | | 659,723 | |
Eastman Chemical Co. | | | 3,233 | | | | 219,521 | |
Ferro Corp.* | | | 39,912 | | | | 534,022 | |
Freeport-McMoRan Copper & Gold, Inc. | | | 10,564 | | | | 117,683 | |
Huntsman Corp. | | | 33,289 | | | | 447,737 | |
International Paper Co. | | | 4,559 | | | | 193,210 | |
Kaiser Aluminum Corp. | | | 5,797 | | | | 524,107 | |
Kraton Performance Polymers, Inc.* | | | 12,920 | | | | 360,856 | |
LSB Industries, Inc.* | | | 6,090 | | | | 73,567 | |
Olin Corp. | | | 18,172 | | | | 451,392 | |
Orion Engineered Carbons S.A. | | | 4,506 | | | | 71,600 | |
Packaging Corp. of America | | | 8,689 | | | | 581,555 | |
PolyOne Corp. | | | 7,245 | | | | 255,314 | |
RPM International, Inc. | | | 1,005 | | | | 50,200 | |
Schnitzer Steel Industries, Inc. Cl A | | | 2,664 | | | | 46,886 | |
The Mosaic Co. | | | 7,422 | | | | 194,308 | |
U.S. Concrete, Inc.* | | | 2,280 | | | | 138,875 | |
Vulcan Materials Co. | | | 4,174 | | | | 502,383 | |
| | | | | | | | |
| | | | | | | 6,763,998 | |
| | | | | | | | |
TELECOMMUNICATION SERVICES (0.5%) | | | | | | | | |
Consolidated Comms. Hldgs., Inc. | | | 4,357 | | | | 118,685 | |
ORBCOMM, Inc.* | | | 53,805 | | | | 535,359 | |
SBA Communications Corp. Cl A* | | | 3,760 | | | | 405,854 | |
Shenandoah Telecommunications Co. | | | 11,722 | | | | 457,861 | |
| | | | | | | | |
| | | | | | | 1,517,759 | |
| | | | | | | | |
UTILITIES (3.1%) | | | | | | | | |
Ameren Corp. | | | 4,057 | | | | 217,374 | |
Atmos Energy Corp. | | | 3,929 | | | | 319,506 | |
Avista Corp. | | | 9,534 | | | | 427,123 | |
MUTUAL OF AMERICA INVESTMENT CORPORATION - ALL AMERICA FUND
PORTFOLIO OF INVESTMENTS IN SECURITIES
June 30, 2016 (Unaudited)
| | | | | | | | |
Black Hills Corp. | | | 3,709 | | | | 233,815 | |
Chesapeake Utilities Corp. | | | 4,918 | | | | 325,473 | |
Consolidated Edison, Inc. | | | 3,145 | | | | 252,984 | |
Edison International | | | 9,987 | | | | 775,690 | |
Entergy Corp. | | | 2,505 | | | | 203,782 | |
Eversource Energy | | | 10,184 | | | | 610,021 | |
FirstEnergy Corp. | | | 5,416 | | | | 189,073 | |
Great Plains Energy, Inc. | | | 7,821 | | | | 237,758 | |
Idacorp, Inc. | | | 5,763 | | | | 468,820 | |
NiSource, Inc. | | | 17,598 | | | | 466,699 | |
Northwest Natural Gas Co. | | | 12,582 | | | | 815,566 | |
NorthWestern Corp. | | | 4,200 | | | | 264,894 | |
PNM Resources, Inc. | | | 10,884 | | | | 385,729 | |
Portland General Electric Co. | | | 6,894 | | | | 304,163 | |
PPL Corp. | | | 6,352 | | | | 239,788 | |
Public Svc. Enterprise Group, Inc. | | | 5,772 | | | | 269,033 | |
Sempra Energy | | | 8,939 | | | | 1,019,225 | |
Spire, Inc. | | | 1,430 | | | | 101,301 | |
UGI Corp. | | | 16,374 | | | | 740,924 | |
Westar Energy, Inc. | | | 3,059 | | | | 171,579 | |
| | | | | | | | |
| | | | | | | 9,040,320 | |
| | | | | | | | |
TOTAL ACTIVE ASSETS - COMMON STOCKS
(Cost: $116,069,007) 43.7% | | | | | | | 126,325,053 | |
| | | | | | | | |
| | | | | | | | | | | | | | | | | | | | |
| | | Rating** | | | Rate(%) | | | Maturity | | | Face Amount | | | Value | |
ACTIVE ASSETS: | | | | | | | | | | | | | | | | | | | | |
SHORT-TERM DEBT SECURITIES: | | | | | | | | | | | | | | | | | | | | |
U.S. GOVERNMENT (0.7%) | | | | | | | | | | | | | | | | | | | | |
U.S. Treasury Bill | | | A-1+ | | | | 0.26 | | | | 08/11/16 | | | | 1,000,000 | | | | 999,698 | |
U.S. Treasury Bill | | | A-1+ | | | | 0.26 | | | | 08/11/16 | | | | 600,000 | | | | 599,819 | |
U.S. Treasury Bill | | | A-1+ | | | | 0.26 | | | | 08/11/16 | | | | 500,000 | | | | 499,849 | |
| | | | | | | | | | | | | | | | | | | | |
| | | | | | | | | | | | | | | | | | | 2,099,366 | |
| | | | | | | | | | | | | | | | | | | | |
COMMERCIAL PAPER (0.4%) | | | | | | | | | | | | | | | | | | | | |
Ralph Lauren Corp.† | | | A-1 | | | | 0.40 | | | | 07/01/16 | | | | 1,200,000 | | | | 1,200,000 | |
| | | | | | | | | | | | | | | | | | | | |
TOTAL ACTIVE ASSETS - SHORT-TERM DEBT SECURITIES
(Cost: $3,299,366) 1.1% | | | | | | | | | | | | | | | | 3,299,366 | |
| | | | | | | | | | | | | | | | | | | | |
TOTAL ACTIVE ASSETS
(Cost: $119,368,373) 44.8% | | | | | | | | | | | | | | | | | | | 129,624,419 | |
| | | | | | | | | | | | | | | | | | | | |
TOTAL INVESTMENTS
(Cost: $229,723,770) 98.9% | | | | | | | | | | | | | | | | | | | 285,617,234 | |
| | | | | | | | | | | | | | | | | | | | |
OTHER NET ASSETS 1.1% | | | | | | | | | | | | | | | | | | | 3,146,566 | |
| | | | | | | | | | | | | | | | | | | | |
NET ASSETS 100.0% | | | | | | | | | | | | | | | | | | $ | 288,763,800 | |
| | | | | | | | | | | | | | | | | | | | |
The accompanying notes are an integral part of these portfolio schedules.
MUTUAL OF AMERICA INVESTMENT CORPORATION - SMALL CAP VALUE FUND
PORTFOLIO OF INVESTMENTS IN SECURITIES
June 30, 2016 (Unaudited)
| | | | | | | | |
| | | Shares | | | Value | |
COMMON STOCKS: | | | | | | | | |
CONSUMER DISCRETIONARY (11.4%) | | | | | | | | |
Bassett Furniture Industries, Inc. | | | 172,238 | | | | 4,123,378 | |
Carmike Cinemas, Inc.* | | | 70,490 | | | | 2,123,159 | |
CST Brands, Inc. | | | 90,217 | | | | 3,886,548 | |
Diamond Resorts Int’l., Inc.* | | | 473,712 | | | | 14,192,417 | |
Eros International PLC* | | | 67,620 | | | | 1,100,177 | |
FTD Companies, Inc.* | | | 43,149 | | | | 1,076,999 | |
Houghton Mifflin Harcourt Co.* | | | 337,278 | | | | 5,271,655 | |
Intrawest Resorts Hldgs., Inc.* | | | 166,552 | | | | 2,161,845 | |
Ruby Tuesday, Inc.* | | | 358,843 | | | | 1,295,423 | |
Select Comfort Corp.* | | | 166,713 | | | | 3,564,324 | |
Stage Stores, Inc. | | | 79,949 | | | | 390,151 | |
Unifi, Inc.* | | | 105,015 | | | | 2,859,558 | |
Vista Outdoor, Inc.* | | | 45,788 | | | | 2,185,461 | |
| | | | | | | | |
| | | | | | | 44,231,095 | |
| | | | | | | | |
CONSUMER STAPLES (2.6%) | | | | | | | | |
Crimson Wine Group Ltd.* | | | 452,245 | | | | 3,780,768 | |
Farmer Brothers Co.* | | | 100,975 | | | | 3,237,259 | |
Vector Group Ltd. | | | 142,559 | | | | 3,196,173 | |
| | | | | | | | |
| | | | | | | 10,214,200 | |
| | | | | | | | |
ENERGY (4.4%) | | | | | | | | |
Abraxas Petroleum Corp.* | | | 417,311 | | | | 471,561 | |
Atwood Oceanics, Inc. | | | 75,400 | | | | 944,008 | |
Carrizo Oil and Gas, Inc.* | | | 59,403 | | | | 2,129,598 | |
CrossAmerica Partners LP | | | 66,854 | | | | 1,639,260 | |
Matrix Service Co.* | | | 45,107 | | | | 743,814 | |
Nabors Industries Ltd. | | | 151,200 | | | | 1,519,560 | |
Parsley Energy, Inc. Cl A* | | | 30,520 | | | | 825,871 | |
PBF Energy, Inc. | | | 159,091 | | | | 3,783,184 | |
PDC Energy, Inc.* | | | 42,093 | | | | 2,424,978 | |
Range Resources Corp. | | | 59,240 | | | | 2,555,614 | |
| | | | | | | | |
| | | | | | | 17,037,448 | |
| | | | | | | | |
FINANCIALS (40.0%) | | | | | | | | |
Agree Realty Corp. | | | 29,374 | | | | 1,417,002 | |
Alexander’s, Inc. | | | 4,002 | | | | 1,637,738 | |
Allied World Assurance Co. Hldgs. AG | | | 57,750 | | | | 2,029,335 | |
American Equity Investment Life Hldg. Co. | | | 136,051 | | | | 1,938,727 | |
Ashford Hospitality Trust, Inc. | | | 42,967 | | | | 230,733 | |
Aspen Insurance Hldgs. Ltd. | | | 75,207 | | | | 3,488,101 | |
BancFirst Corp. | | | 55,395 | | | | 3,341,426 | |
Bank of Marin Bancorp | | | 44,619 | | | | 2,158,221 | |
Banner Corp. | | | 90,519 | | | | 3,850,678 | |
Brookline Bancorp, Inc. | | | 354,901 | | | | 3,914,558 | |
Bryn Mawr Bank Corp. | | | 99,818 | | | | 2,914,686 | |
Charter Financial Corp. | | | 163,182 | | | | 2,167,057 | |
Chatham Lodging Trust | | | 135,200 | | | | 2,971,696 | |
Chesapeake Lodging Trust | | | 131,874 | | | | 3,066,071 | |
Colony Capital, Inc. Cl A | | | 202,549 | | | | 3,109,127 | |
Columbia Banking System, Inc. | | | 34,806 | | | | 976,656 | |
Customers Bancorp, Inc.* | | | 134,265 | | | | 3,374,079 | |
Dime Community Bancshares | | | 160,018 | | | | 2,721,906 | |
Eagle Bancorp, Inc.* | | | 55,493 | | | | 2,669,768 | |
Easterly Acquisition Corp.* | | | 293,383 | | | | 2,969,036 | |
Easterly Government Pptys. | | | 192,198 | | | | 3,792,067 | |
EastGroup Properties, Inc. | | | 22,258 | | | | 1,534,021 | |
Ellington Financial LLC | | | 294,864 | | | | 5,051,020 | |
Enterprise Financial Svcs. Corp. | | | 106,323 | | | | 2,965,348 | |
Equity Lifestyle Properties, Inc. | | | 50,252 | | | | 4,022,673 | |
FBR & Co. | | | 23,352 | | | | 348,645 | |
MUTUAL OF AMERICA INVESTMENT CORPORATION - SMALL CAP VALUE FUND
PORTFOLIO OF INVESTMENTS IN SECURITIES
June 30, 2016 (Unaudited)
| | | | | | | | |
FelCor Lodging Trust, Inc. | | | 545,801 | | | | 3,400,340 | |
First Connecticut Bancorp, Inc. | | | 64,210 | | | | 1,063,318 | |
First Interstate BancSytem, Inc. | | | 102,633 | | | | 2,883,987 | |
Flushing Financial Corp. | | | 98,874 | | | | 1,965,615 | |
Forest City Realty Trust, Inc. Cl A | | | 236,199 | | | | 5,269,600 | |
Glacier Bancorp, Inc. | | | 109,482 | | | | 2,910,032 | |
Gramercy Property Trust | | | 105,460 | | | | 972,341 | |
Hanmi Financial Corp. | | | 76,743 | | | | 1,802,693 | |
Highwoods Properties, Inc. | | | 103,609 | | | | 5,470,555 | |
Investors Bancorp, Inc. | | | 323,809 | | | | 3,587,804 | |
iShares Russell 2000 Value ETF | | | 40,690 | | | | 3,959,137 | |
Janus Capital Group, Inc. | | | 142,678 | | | | 1,986,078 | |
Marlin Business Svcs. Corp. | | | 154,814 | | | | 2,523,468 | |
MB Financial, Inc. | | | 64,566 | | | | 2,342,454 | |
NMI Hldgs., Inc. Cl A* | | | 296,211 | | | | 1,623,236 | |
Northfield Bancorp, Inc. | | | 232,775 | | | | 3,452,053 | |
Pace Hldgs. Corp.* | | | 273,830 | | | | 2,738,300 | |
Parkway Properties, Inc. | | | 120,797 | | | | 2,020,934 | |
Pennsylvania REIT | | | 148,863 | | | | 3,193,111 | |
PrivateBancorp, Inc. | | | 107,627 | | | | 4,738,817 | |
Prosperity Bancshares, Inc. | | | 40,001 | | | | 2,039,651 | |
Selective Insurance Group, Inc. | | | 83,591 | | | | 3,194,012 | |
Sovran Self Storage, Inc. | | | 20,595 | | | | 2,160,827 | |
Stock Yards Bancorp, Inc. | | | 194,766 | | | | 5,498,244 | |
Stonegate Bank | | | 28,070 | | | | 905,819 | |
SVB Financial Group* | | | 55,744 | | | | 5,304,599 | |
Terreno Realty Corp. | | | 100,021 | | | | 2,587,543 | |
The GEO Group, Inc. | | | 72,063 | | | | 2,463,113 | |
TriCo Bancshares | | | 43,427 | | | | 1,198,585 | |
UMB Financial Corp. | | | 32,144 | | | | 1,710,382 | |
Urstadt Biddle Pptys., Inc. Cl A | | | 79,107 | | | | 1,960,271 | |
| | | | | | | | |
| | | 155,587,294 | |
| | | | | | | | |
HEALTH CARE (4.5%) | | | | | | | | |
Albany Molecular Research, Inc.* | | | 73,895 | | | | 993,149 | |
Amsurg Corp.* | | | 42,271 | | | | 3,277,693 | |
Civitas Solutions, Inc.* | | | 47,688 | | | | 993,341 | |
Emergent Biosolutions, Inc.* | | | 32,319 | | | | 908,810 | |
Ensign Group, Inc. | | | 42,872 | | | | 900,741 | |
Harvard Bioscience, Inc.* | | | 236,652 | | | | 676,825 | |
Kindred Healthcare, Inc. | | | 86,534 | | | | 976,969 | |
Pacific Biosciences of CA, Inc.* | | | 229,139 | | | | 1,611,993 | |
QLT, Inc.* | | | 131,370 | | | | 186,545 | |
Supernus Pharmaceuticals, Inc.* | | | 259,183 | | | | 5,279,558 | |
Universal American Corp. | | | 34,599 | | | | 262,260 | |
Wright Medical Group NV* | | | 76,194 | | | | 1,323,490 | |
| | | | | | | | |
| | | 17,391,374 | |
| | | | | | | | |
INDUSTRIALS (10.9%) | | | | | | | | |
Alaska Air Group, Inc. | | | 40,240 | | | | 2,345,590 | |
AZZ, Inc. | | | 103,726 | | | | 6,221,485 | |
Covenant Transportation Group Cl A* | | | 113,280 | | | | 2,046,970 | |
Deluxe Corp. | | | 54,645 | | | | 3,626,789 | |
Encore Wire Corp. | | | 92,067 | | | | 3,432,258 | |
Miller Industries, Inc. | | | 249,665 | | | | 5,140,602 | |
Mueller Industries, Inc. | | | 314,576 | | | | 10,028,683 | |
Old Dominion Freight Line, Inc.* | | | 9,707 | | | | 585,429 | |
Orbital ATK, Inc. | | | 65,445 | | | | 5,571,987 | |
Steelcase, Inc. | | | 70,040 | | | | 950,443 | |
VSE Corp. | | | 34,918 | | | | 2,332,522 | |
| | | | | | | | |
| | | 42,282,758 | |
| | | | | | | | |
MUTUAL OF AMERICA INVESTMENT CORPORATION - SMALL CAP VALUE FUND
PORTFOLIO OF INVESTMENTS IN SECURITIES
June 30, 2016 (Unaudited)
| | | | | | | | |
INFORMATION TECHNOLOGY (10.3%) | | | | | | | | |
Aerohive Networks, Inc.* | | | 243,756 | | | | 1,613,665 | |
Ambarella, Inc.* | | | 32,290 | | | | 1,640,655 | |
Anixter International, Inc.* | | | 26,966 | | | | 1,436,748 | |
Apigee Corp.* | | | 48,304 | | | | 590,275 | |
CalAmp Corp.* | | | 140,983 | | | | 2,087,958 | |
Cavium, Inc.* | | | 34,560 | | | | 1,334,016 | |
Cirrus Logic, Inc.* | | | 31,575 | | | | 1,224,794 | |
Comtech Telecommunications Corp. | | | 118,800 | | | | 1,525,392 | |
DTS, Inc.* | | | 46,150 | | | | 1,220,668 | |
Imation Corp.* | | | 244,312 | | | | 305,390 | |
LogMeIn, Inc.* | | | 34,158 | | | | 2,166,642 | |
MaxLinear, Inc. Cl A* | | | 98,150 | | | | 1,764,737 | |
MKS Instruments, Inc. | | | 69,625 | | | | 2,998,053 | |
Nova Measuring Instruments Ltd.* | | | 104,593 | | | | 1,144,247 | |
Perficient, Inc.* | | | 28,506 | | | | 578,957 | |
Plexus Corp.* | | | 37,341 | | | | 1,613,131 | |
Proofpoint, Inc.* | | | 51,513 | | | | 3,249,955 | |
QLogic Corp.* | | | 165,385 | | | | 2,437,775 | |
Richardson Electronics Ltd. | | | 518,914 | | | | 2,734,677 | |
Rogers Corp.* | | | 30,830 | | | | 1,883,713 | |
SYNNEX Corp. | | | 29,146 | | | | 2,763,624 | |
Virtusa Corp.* | | | 26,220 | | | | 757,234 | |
Xura, Inc.* | | | 128,245 | | | | 3,133,025 | |
| | | | | | | | |
| | | | | | | 40,205,331 | |
| | | | | | | | |
MATERIALS (3.7%) | | | | | | | | |
Boise Cascade Co.* | | | 84,253 | | | | 1,933,606 | |
Ferro Corp.* | | | 72,619 | | | | 971,642 | |
Kaiser Aluminum Corp. | | | 65,109 | | | | 5,886,505 | |
Kraton Performance Polymers, Inc.* | | | 145,160 | | | | 4,054,319 | |
LSB Industries, Inc.* | | | 68,580 | | | | 828,446 | |
Schnitzer Steel Industries, Inc. Cl A | | | 30,033 | | | | 528,581 | |
| | | | | | | | |
| | | | | | | 14,203,099 | |
| | | | | | | | |
TELECOMMUNICATION SERVICES (1.1%) | | | | | | | | |
Consolidated Comms. Hldgs., Inc. | | | 48,921 | | | | 1,332,608 | |
ORBCOMM, Inc.* | | | 304,993 | | | | 3,034,680 | |
| | | | | | | | |
| | | | | | | 4,367,288 | |
| | | | | | | | |
UTILITIES (7.1%) | | | | | | | | |
Avista Corp. | | | 102,622 | | | | 4,597,466 | |
Black Hills Corp. | | | 41,612 | | | | 2,623,220 | |
Idacorp, Inc. | | | 65,470 | | | | 5,325,985 | |
Northwest Natural Gas Co. | | | 52,981 | | | | 3,434,228 | |
NorthWestern Corp. | | | 46,978 | | | | 2,962,902 | |
PNM Resources, Inc. | | | 117,139 | | | | 4,151,406 | |
Portland General Electric Co. | | | 74,057 | | | | 3,267,395 | |
Spire, Inc. | | | 16,170 | | | | 1,145,483 | |
| | | | | | | | |
| | | | | | | 27,508,085 | |
| | | | | | | | |
TOTAL COMMON STOCKS
(Cost: $303,396,808) 96.0% | | | | | | | 373,027,972 | |
| | | | | | | | |
| | | | | | | | | | | | | | | | | | | | |
| | | Rating** | | | Rate(%) | | | Maturity | | | Face Amount | | | Value | |
SHORT-TERM DEBT SECURITIES: | | | | | | | | | | | | | | | | | | | | |
U.S. GOVERNMENT (2.5%) | | | | | | | | | | | | | |
U.S. Treasury Bill | | | A-1+ | | | | 0.29 | | | | 08/11/16 | | | | 5,000,000 | | | | 4,998,348 | |
U.S. Treasury Bill | | | A-1+ | | | | 0.32 | | | | 08/25/16 | | | | 5,000,000 | | | | 4,997,555 | |
| | | | | | | | | | | | | | | | | | | | |
| | | | | | | | | | | | | | | | | | | 9,995,903 | |
| | | | | | | | | | | | | | | | | | | | |
COMMERCIAL PAPER (1.2%) | | | | | | | | | | | | | |
Microsoft Corp.† | | | A-1+ | | | | 0.28 | | | | 07/01/16 | | | | 4,700,000 | | | | 4,700,000 | |
| | | | | | | | | | | | | | | | | | | | |
TOTAL SHORT-TERM DEBT SECURITIES
(Cost: $14,695,903) 3.7% | | | | | | | | 14,695,903 | |
| | | | | | | | | | | | | | | | | | | | |
MUTUAL OF AMERICA INVESTMENT CORPORATION - SMALL CAP VALUE FUND
PORTFOLIO OF INVESTMENTS IN SECURITIES
June 30, 2016 (Unaudited)
| | | | |
TOTAL INVESTMENTS
(Cost: $318,092,711) 99.7% | | | 387,723,875 | |
| | | | |
OTHER NET ASSETS 0.3% | | | 1,108,414 | |
| | | | |
NET ASSETS 100.0% | | $ | 388,832,289 | |
| | | | |
The accompanying notes are an integral part of these portfolio schedules.
MUTUAL OF AMERICA INVESTMENT CORPORATION - SMALL CAP GROWTH FUND
PORTFOLIO OF INVESTMENTS IN SECURITIES
June 30, 2016 (Unaudited)
| | | | | | | | |
| | | Shares | | | Value | |
COMMON STOCKS: | |
CONSUMER DISCRETIONARY (17.4%) | |
Bloomin’ Brands, Inc. | | | 145,022 | | | | 2,591,543 | |
Bright Horizons Family Solutions, Inc.* | | | 23,205 | | | | 1,538,724 | |
Cooper Tire & Rubber Co. | | | 56,600 | | | | 1,687,812 | |
CST Brands, Inc. | | | 165,468 | | | | 7,128,361 | |
Diamond Resorts Int’l., Inc.* | | | 169,644 | | | | 5,082,534 | |
DreamWorks Animation SKG Cl A* | | | 48,705 | | | | 1,990,573 | |
Drew Industries, Inc. | | | 47,119 | | | | 3,997,576 | |
Five Below, Inc.* | | | 79,702 | | | | 3,698,970 | |
Gentherm, Inc.* | | | 55,538 | | | | 1,902,177 | |
Haverty Furniture Cos., Inc. | | | 201,229 | | | | 3,628,159 | |
Houghton Mifflin Harcourt Co.* | | | 146,701 | | | | 2,292,937 | |
HSN, Inc. | | | 68,462 | | | | 3,349,846 | |
Intrawest Resorts Hldgs., Inc.* | | | 256,533 | | | | 3,329,798 | |
Lions Gate Entertainment Corp. | | | 221,111 | | | | 4,473,076 | |
Panera Bread Co. Cl A* | | | 16,133 | | | | 3,419,228 | |
Popeyes Louisiana Kitchen, Inc.* | | | 23,716 | | | | 1,295,842 | |
Red Robin Gourmet Burgers, Inc.* | | | 121,519 | | | | 5,763,646 | |
Select Comfort Corp.* | | | 280,238 | | | | 5,991,488 | |
Steve Madden Ltd.* | | | 94,424 | | | | 3,227,412 | |
Vista Outdoor, Inc.* | | | 50,730 | | | | 2,421,343 | |
| | | | | | | | |
| | | | 68,811,045 | |
| | | | | | | | |
CONSUMER STAPLES (3.9%) | | | | | |
Casey’s General Stores, Inc. | | | 22,039 | | | | 2,898,349 | |
Vector Group Ltd. | | | 133,323 | | | | 2,989,102 | |
Village Super Market, Inc. Cl A | | | 107,478 | | | | 3,105,039 | |
WD-40 Co. | | | 55,663 | | | | 6,537,619 | |
| | | | | | | | |
| | | | | | | 15,530,109 | |
| | | | | | | | |
ENERGY (1.4%) | | | | | |
Gulfport Energy Corp.* | | | 83,984 | | | | 2,625,340 | |
Matador Resources Co.* | | | 139,094 | | | | 2,754,061 | |
| | | | | | | | |
| | | | | | | 5,379,401 | |
| | | | | | | | |
FINANCIALS (8.9%) | | | | | |
Bank of the Ozarks, Inc. | | | 58,571 | | | | 2,197,584 | |
CubeSmart | | | 122,617 | | | | 3,786,413 | |
Easterly Government Pptys. | | | 218,327 | | | | 4,307,592 | |
FBL Financial Group, Inc. Cl A | | | 51,971 | | | | 3,153,081 | |
Heritage Financial Corp. | | | 131,037 | | | | 2,303,630 | |
Investors Bancorp, Inc. | | | 350,144 | | | | 3,879,596 | |
Pinnacle Financial Partners, Inc. | | | 55,887 | | | | 2,730,080 | |
QTS Realty Trust, Inc. | | | 86,558 | | | | 4,845,517 | |
Safety Insurance Group, Inc. | | | 61,226 | | | | 3,770,297 | |
Starwood Property Trust, Inc. | | | 110,569 | | | | 2,290,990 | |
Terreno Realty Corp. | | | 74,890 | | | | 1,937,404 | |
| | | | | | | | |
| | | | | | | 35,202,184 | |
| | | | | | | | |
HEALTH CARE (20.0%) | | | | | | | | |
Abiomed, Inc.* | | | 34,009 | | | | 3,716,844 | |
Acadia Healthcare Co., Inc.* | | | 95,433 | | | | 5,286,988 | |
ACADIA Pharmaceuticals, Inc.* | | | 70,013 | | | | 2,272,622 | |
Acceleron Pharma, Inc.* | | | 39,245 | | | | 1,333,545 | |
Acorda Therapeutics, Inc.* | | | 59,170 | | | | 1,509,131 | |
Agios Pharmaceuticals, Inc.* | | | 15,573 | | | | 652,431 | |
Alnylam Pharmaceuticals, Inc.* | | | 14,218 | | | | 788,957 | |
Ani Pharmaceuticals, Inc.* | | | 27,187 | | | | 1,517,578 | |
Anika Therapeutics, Inc.* | | | 48,250 | | | | 2,588,613 | |
BioSpecifics Technologies Corp.* | | | 50,850 | | | | 2,030,949 | |
Catalent, Inc.* | | | 61,107 | | | | 1,404,850 | |
Cepheid, Inc.* | | | 49,684 | | | | 1,527,783 | |
DexCom, Inc.* | | | 31,175 | | | | 2,473,113 | |
MUTUAL OF AMERICA INVESTMENT CORPORATION - SMALL CAP GROWTH FUND
PORTFOLIO OF INVESTMENTS IN SECURITIES
June 30, 2016 (Unaudited)
| | | | | | | | |
Dynavax Technologies Corp.* | | | 19,875 | | | | 289,778 | |
Emergent Biosolutions, Inc.* | | | 144,748 | | | | 4,070,314 | |
Ensign Group, Inc. | | | 114,002 | | | | 2,395,182 | |
Insulet Corp.* | | | 28,298 | | | | 855,732 | |
Integra LifeSciences Hldgs. Corp.* | | | 15,405 | | | | 1,229,011 | |
Intersect ENT, Inc.* | | | 83,080 | | | | 1,074,224 | |
Karyopharm Therapeutics, Inc.* | | | 79,236 | | | | 531,674 | |
Kite Pharma, Inc.* | | | 14,750 | | | | 737,500 | |
Medicines Co.* | | | 40,844 | | | | 1,373,584 | |
Neogen Corp.* | | | 43,495 | | | | 2,446,594 | |
Neurocrine Biosciences, Inc.* | | | 64,455 | | | | 2,929,480 | |
NuVasive, Inc.* | | | 33,625 | | | | 2,008,085 | |
Omeros Corp.* | | | 104,606 | | | | 1,100,455 | |
Omnicell, Inc.* | | | 137,107 | | | | 4,693,173 | |
Pacific Biosciences of CA, Inc.* | | | 134,271 | | | | 944,596 | |
Pacira Pharmaceuticals, Inc.* | | | 29,073 | | | | 980,632 | |
PAREXEL International Corp.* | | | 58,143 | | | | 3,656,032 | |
Prestige Brands Hldgs., Inc.* | | | 36,070 | | | | 1,998,278 | |
Radius Health, Inc.* | | | 32,884 | | | | 1,208,487 | |
Sorrento Therapeutics, Inc.* | | | 137,696 | | | | 771,098 | |
Supernus Pharmaceuticals, Inc.* | | | 179,870 | | | | 3,663,952 | |
TESARO, Inc.* | | | 35,629 | | | | 2,994,617 | |
Ultragenyx Pharmaceutical, Inc.* | | | 29,905 | | | | 1,462,654 | |
WellCare Health Plans, Inc.* | | | 52,086 | | | | 5,587,786 | |
West Pharmaceutical Svcs., Inc. | | | 13,220 | | | | 1,003,134 | |
Wright Medical Group NV* | | | 113,546 | | | | 1,972,294 | |
| | | | | | | | |
| | | | | | | 79,081,750 | |
| | | | | | | | |
INDUSTRIALS (11.5%) | | | | | | | | |
Astronics Corp.* | | | 239,912 | | | | 7,979,468 | |
AZZ, Inc. | | | 87,772 | | | | 5,264,565 | |
BMC Stock Hldgs., Inc.* | | | 27,359 | | | | 487,537 | |
Covenant Transportation Group Cl A* | | | 230,319 | | | | 4,161,864 | |
EnPro Industries, Inc. | | | 91,366 | | | | 4,055,737 | |
Generac Hldgs., Inc.* | | | 58,718 | | | | 2,052,781 | |
Genesee & Wyoming, Inc. Cl A* | | | 16,285 | | | | 960,001 | |
Healthcare Svcs. Group, Inc. | | | 114,445 | | | | 4,735,734 | |
Mueller Water Products, Inc. Cl A | | | 378,072 | | | | 4,317,582 | |
Sun Hydraulics Corp. | | | 103,070 | | | | 3,060,148 | |
Teledyne Technologies, Inc.* | | | 37,777 | | | | 3,741,812 | |
Trex Co., Inc.* | | | 104,024 | | | | 4,672,758 | |
| | | | | | | | |
| | | | 45,489,987 | |
| | | | | | | | |
INFORMATION TECHNOLOGY (22.6%) | | | | | |
Aerohive Networks, Inc.* | | | 127,419 | | | | 843,514 | |
Ambarella, Inc.* | | | 94,609 | | | | 4,807,083 | |
Apigee Corp.* | | | 324,253 | | | | 3,962,372 | |
ARRIS International PLC* | | | 93,220 | | | | 1,953,891 | |
Blackhawk Network Hldgs., Inc.* | | | 63,809 | | | | 2,136,963 | |
CalAmp Corp.* | | | 178,230 | | | | 2,639,586 | |
Callidus Software, Inc.* | | | 45,020 | | | | 899,500 | |
Cavium, Inc.* | | | 108,285 | | | | 4,179,801 | |
Cimpress NV* | | | 16,293 | | | | 1,506,777 | |
Cognex Corp | | | 19,040 | | | | 820,624 | |
Cornerstone OnDemand, Inc.* | | | 50,824 | | | | 1,934,361 | |
DTS, Inc.* | | | 85,701 | | | | 2,266,791 | |
EPAM Systems, Inc.* | | | 35,230 | | | | 2,265,641 | |
Euronet Worldwide, Inc.* | | | 32,746 | | | | 2,265,696 | |
ExlService Hldgs., Inc.* | | | 18,990 | | | | 995,266 | |
Extreme Networks, Inc.* | | | 333,887 | | | | 1,131,877 | |
FARO Technologies, Inc.* | | | 56,662 | | | | 1,916,875 | |
Globant S.A.* | | | 108,960 | | | | 4,287,576 | |
Imperva, Inc.* | | | 31,665 | | | | 1,361,912 | |
MUTUAL OF AMERICA INVESTMENT CORPORATION - SMALL CAP GROWTH FUND
PORTFOLIO OF INVESTMENTS IN SECURITIES
June 30, 2016 (Unaudited)
| | | | | | | | |
inContact, Inc.* | | | 122,154 | | | | 1,691,833 | |
j2 Global, Inc. | | | 37,086 | | | | 2,342,723 | |
LogMeIn, Inc.* | | | 72,057 | | | | 4,570,576 | |
Manhattan Associates, Inc.* | | | 24,914 | | | | 1,597,735 | |
MAXIMUS, Inc. | | | 49,419 | | | | 2,736,330 | |
MaxLinear, Inc. Cl A* | | | 223,325 | | | | 4,015,384 | |
Monolithic Power Systems, Inc. | | | 60,722 | | | | 4,148,527 | |
New Relic, Inc.* | | | 97,594 | | | | 2,867,312 | |
Paycom Software, Inc.* | | | 41,042 | | | | 1,773,425 | |
Perficient, Inc.* | | | 55,419 | | | | 1,125,560 | |
Proofpoint, Inc.* | | | 83,061 | | | | 5,240,318 | |
Qlik Technologies, Inc.* | | | 95,903 | | | | 2,836,811 | |
Rapid7, Inc.* | | | 50,458 | | | | 634,762 | |
Rogers Corp.* | | | 35,176 | | | | 2,149,254 | |
Rubicon Project, Inc.* | | | 74,257 | | | | 1,013,608 | |
Science Applications Int’l. Corp. | | | 37,596 | | | | 2,193,727 | |
Synaptics, Inc.* | | | 18,603 | | | | 999,911 | |
Tyler Technologies, Inc.* | | | 26,547 | | | | 4,425,650 | |
Virtusa Corp.* | | | 33,049 | | | | 954,455 | |
| | | | | | | | |
| | | | | | | 89,494,007 | |
| | | | | | | | |
MATERIALS (4.6%) | | | | | | | | |
Berry Plastics Group, Inc.* | | | 71,672 | | | | 2,784,457 | |
Calgon Carbon Corp. | | | 151,562 | | | | 1,993,040 | |
Ferro Corp.* | | | 395,488 | | | | 5,291,629 | |
Olin Corp. | | | 108,270 | | | | 2,689,427 | |
Orion Engineered Carbons S.A. | | | 53,567 | | | | 851,180 | |
PolyOne Corp. | | | 85,657 | | | | 3,018,553 | |
U.S. Concrete, Inc.* | | | 27,710 | | | | 1,687,816 | |
| | | | | | | | |
| | | | | | | 18,316,102 | |
| | | | | | | | |
TELECOMMUNICATION SERVICES (2.2%) | | | | | | | | |
ORBCOMM, Inc.* | | | 313,867 | | | | 3,122,977 | |
Shenandoah Telecommunications Co. | | | 137,986 | | | | 5,389,733 | |
| | | | | | | | |
| | | | | | | 8,512,710 | |
| | | | | | | | |
UTILITIES (2.5%) | | | | | | | | |
Chesapeake Utilities Corp. | | | 58,152 | | | | 3,848,499 | |
Northwest Natural Gas Co. | | | 92,723 | | | | 6,010,305 | |
| | | | | | | | |
| | | | | | | 9,858,804 | |
| | | | | | | | |
TOTAL COMMON STOCKS
(Cost: $336,288,463) 95.0% | | | | 375,676,099 | |
| | | | | | | | |
| | | | | | | | | | | | | | | | | | | | |
| | | Rating** | | | Rate(%) | | | Maturity | | | Face Amount | | | Value | |
SHORT-TERM DEBT SECURITIES: | | | | | | | | | | | | | | | | | | | | |
U.S. GOVERNMENT (3.8%) | | | | | | | | | | | | | |
U.S. Treasury Bill | | | A-1+ | | | | 0.27 | | | | 08/25/16 | | | | 4,000,000 | | | | 3,998,350 | |
U.S. Treasury Bill | | | A-1+ | | | | 0.29 | | | | 08/11/16 | | | | 4,000,000 | | | | 3,998,678 | |
U.S. Treasury Bill | | | A-1+ | | | | 0.32 | | | | 08/25/16 | | | | 7,000,000 | | | | 6,996,577 | |
| | | | | | | | | | | | | | | | | | | | |
| | | | | | | | | | | | | | | | | | | 14,993,605 | |
| | | | | | | | | | | | | | | | | | | | |
COMMERCIAL PAPER (1.1%) | | | | | | | | | | | | | |
Microsoft Corp.† | | | A-1+ | | | | 0.28 | | | | 07/01/16 | | | | 4,300,000 | | | | 4,300,000 | |
| | | | | | | | | | | | | | | | | | | | |
TOTAL SHORT-TERM DEBT SECURITIES
(Cost: $19,293,605) 4.9% | | | | | | | | 19,293,605 | |
| | | | | | | | | |
TOTAL INVESTMENTS
(Cost: $355,582,068) 99.9% | | | | | | | | | | | | | | | | | | | 394,969,704 | |
| | | | | | | | | | | | | | | | | | | | |
OTHER NET ASSETS 0.1% | | | | | | | | | | | | | | | | | | | 201,254 | |
| | | | | | | | | | | | | | | | | | | | |
NET ASSETS 100.0% | | | | | | | | | | | | | | | | | | $ | 395,170,958 | |
| | | | | | | | | | | | | | | | | | | | |
The accompanying notes are an integral part of these portfolio schedules.
MUTUAL OF AMERICA INVESTMENT CORPORATION - MID CAP VALUE FUND
PORTFOLIO OF INVESTMENTS IN SECURITIES
June 30, 2016 (Unaudited)
| | | | | | | | |
| | | Shares | | | Value | |
COMMON STOCKS: | | | | | | | | |
CONSUMER DISCRETIONARY (6.8%) | | | | | | | | |
CST Brands, Inc. | | | 21,146 | | | | 910,970 | |
Diamond Resorts Int’l., Inc.* | | | 90,343 | | | | 2,706,676 | |
Dillard’s, Inc. Cl A | | | 2,525 | | | | 153,015 | |
Liberty Interactive Corp. Ser. A QVC Group* | | | 15,867 | | | | 402,546 | |
Macy’s, Inc. | | | 12,259 | | | | 412,025 | |
MSG Networks, Inc.* | | | 10,650 | | | | 163,371 | |
Ralph Lauren Corp. | | | 2,240 | | | | 200,749 | |
Taylor Morrison Home Corp. Cl A* | | | 12,243 | | | | 181,686 | |
Wiley (John) & Sons, Inc. Cl A | | | 12,799 | | | | 667,852 | |
| | | | | | | | |
| | | | | | | 5,798,890 | |
| | | | | | | | |
CONSUMER STAPLES (5.0%) | | | | | | | | |
Constellation Brands, Inc. Cl A | | | 7,519 | | | | 1,243,643 | |
Edgewell Personal Care Co. | | | 7,185 | | | | 606,486 | |
Energizer Hldgs., Inc. | | | 7,185 | | | | 369,956 | |
Ingredion, Inc. | | | 11,357 | | | | 1,469,709 | |
Vector Group Ltd. | | | 25,971 | | | | 582,270 | |
| | | | | | | | |
| | | | | | | 4,272,064 | |
| | | | | | | | |
ENERGY (9.3%) | | | | | | | | |
Baker Hughes, Inc. | | | 16,760 | | | | 756,379 | |
Cheniere Energy, Inc.* | | | 14,100 | | | | 529,455 | |
Continental Resources, Inc.* | | | 18,110 | | | | 819,840 | |
Hess Corp. | | | 13,610 | | | | 817,961 | |
MPLX LP | | | 15,456 | | | | 519,785 | |
Nabors Industries Ltd. | | | 63,160 | | | | 634,758 | |
Noble Energy, Inc. | | | 24,278 | | | | 870,852 | |
PBF Energy, Inc. | | | 34,399 | | | | 818,008 | |
Range Resources Corp. | | | 31,610 | | | | 1,363,655 | |
Tesoro Corp. | | | 8,129 | | | | 609,025 | |
Weatherford Int’l. PLC* | | | 37,400 | | | | 207,570 | |
| | | | | | | | |
| | | | | | | 7,947,288 | |
| | | | | | | | |
FINANCIALS (29.9%) | | | | | | | | |
Alexander’s, Inc. | | | 1,034 | | | | 423,144 | |
American Financial Group, Inc. | | | 17,793 | | | | 1,315,436 | |
Ameriprise Financial, Inc. | | | 15,623 | | | | 1,403,727 | |
Apartment Investment & Management Co. Cl A | | | 14,959 | | | | 660,589 | |
Associated Banc-Corp. | | | 45,648 | | | | 782,863 | |
Assurant, Inc. | | | 4,612 | | | | 398,062 | |
BankUnited, Inc. | | | 15,320 | | | | 470,630 | |
Brandywine Realty Trust | | | 42,191 | | | | 708,809 | |
DDR Corp. | | | 25,470 | | | | 462,026 | |
Discover Financial Svcs. | | | 16,715 | | | | 895,757 | |
Duke Realty Corp. | | | 46,529 | | | | 1,240,463 | |
Equity Lifestyle Properties, Inc. | | | 12,468 | | | | 998,063 | |
Everest Re Group Ltd. | | | 5,652 | | | | 1,032,451 | |
Fifth Third Bancorp | | | 50,505 | | | | 888,383 | |
First Niagara Financial Group, Inc. | | | 33,210 | | | | 323,465 | |
General Growth Pptys., Inc. | | | 27,431 | | | | 817,992 | |
Hartford Financial Svcs. Group, Inc. | | | 26,111 | | | | 1,158,806 | |
Host Hotels & Resorts, Inc. | | | 44,839 | | | | 726,840 | |
Huntington Bancshares, Inc. | | | 37,018 | | | | 330,941 | |
iShares Russell Mid-Cap Value ETF | | | 5,760 | | | | 427,910 | |
KeyCorp | | | 71,319 | | | | 788,075 | |
Kilroy Realty Corp. | | | 7,941 | | | | 526,409 | |
Lincoln National Corp. | | | 19,166 | | | | 743,066 | |
Progressive Corp. | | | 21,589 | | | | 723,232 | |
ProLogis, Inc. | | | 17,883 | | | | 876,982 | |
Regency Centers Corp. | | | 7,070 | | | | 591,971 | |
Reinsurance Grp. of America, Inc. | | | 11,258 | | | | 1,091,913 | |
MUTUAL OF AMERICA INVESTMENT CORPORATION - MID CAP VALUE FUND
PORTFOLIO OF INVESTMENTS IN SECURITIES
June 30, 2016 (Unaudited)
| | | | | | | | |
RLJ Lodging Trust | | | 26,344 | | | | 565,079 | |
Starwood Property Trust, Inc. | | | 21,119 | | | | 437,586 | |
SVB Financial Group* | | | 7,863 | | | | 748,243 | |
Vornado Realty Trust | | | 11,850 | | | | 1,186,422 | |
Voya Financial, Inc. | | | 24,956 | | | | 617,911 | |
Welltower, Inc. | | | 8,403 | | | | 640,057 | |
Weyerhaeuser Co. | | | 14,356 | | | | 427,378 | |
| | | | | | | | |
| | | | | | | 25,430,681 | |
| | | | | | | | |
HEALTH CARE (6.2%) | | | | | | | | |
Acadia Healthcare Co., Inc.* | | | 8,130 | | | | 450,402 | |
Agilent Technologies, Inc. | | | 14,639 | | | | 649,386 | |
Boston Scientific Corp.* | | | 41,826 | | | | 977,474 | |
CIGNA Corp. | | | 4,585 | | | | 586,834 | |
Hill-Rom Hldgs., Inc. | | | 4,710 | | | | 237,620 | |
Humana, Inc. | | | 3,420 | | | | 615,190 | |
MEDNAX, Inc.* | | | 6,009 | | | | 435,232 | |
Mylan NV* | | | 11,583 | | | | 500,849 | |
Zimmer Biomet Hldgs., Inc. | | | 6,840 | | | | 823,399 | |
| | | | | | | | |
| | | | | | | 5,276,386 | |
| | | | | | | | |
INDUSTRIALS (8.9%) | | | | | | | | |
Alaska Air Group, Inc. | | | 16,943 | | | | 987,607 | |
AZZ, Inc. | | | 5,666 | | | | 339,847 | |
Carlisle Cos., Inc. | | | 6,200 | | | | 655,216 | |
L-3 Communications Hldgs., Inc. | | | 9,725 | | | | 1,426,560 | |
Old Dominion Freight Line, Inc.* | | | 12,632 | | | | 761,836 | |
Orbital ATK, Inc. | | | 10,264 | | | | 873,877 | |
Oshkosh Corp. | | | 11,085 | | | | 528,865 | |
Pitney Bowes, Inc. | | | 19,770 | | | | 351,906 | |
Snap-on, Inc. | | | 2,169 | | | | 342,312 | |
Triumph Group, Inc. | | | 18,065 | | | | 641,308 | |
United Rentals, Inc.* | | | 9,986 | | | | 670,061 | |
| | | | | | | | |
| | | | | | | 7,579,395 | |
| | | | | | | | |
INFORMATION TECHNOLOGY (9.6%) | | | | | | | | |
Analog Devices, Inc. | | | 9,350 | | | | 529,584 | |
ARRIS International PLC* | | | 35,010 | | | | 733,810 | |
Avnet, Inc. | | | 16,581 | | | | 671,696 | |
Broadcom Ltd. | | | 8,864 | | | | 1,377,466 | |
CA, Inc. | | | 22,075 | | | | 724,722 | |
Cavium, Inc.* | | | 11,720 | | | | 452,392 | |
Computer Sciences Corp. | | | 7,531 | | | | 373,914 | |
CSRA, Inc. | | | 6,291 | | | | 147,398 | |
F5 Networks, Inc.* | | | 1,733 | | | | 197,285 | |
Fidelity Nat’l. Information Svcs., Inc. | | | 11,447 | | | | 843,415 | |
Harris Corp. | | | 8,677 | | | | 724,009 | |
NXP Semiconductors NV* | | | 2,420 | | | | 189,583 | |
SS&C Technologies Hldgs., Inc. | | | 10,680 | | | | 299,894 | |
Symantec Corp. | | | 16,070 | | | | 330,078 | |
Western Digital Corp. | | | 6,475 | | | | 306,009 | |
Xerox Corp. | | | 30,762 | | | | 291,931 | |
| | | | | | | | |
| | | | | | | 8,193,186 | |
| | | | | | | | |
MATERIALS (6.4%) | | | | | | | | |
Ashland, Inc. | | | 3,630 | | | | 416,615 | |
Crown Hldgs., Inc.* | | | 25,339 | | | | 1,283,927 | |
Eastman Chemical Co. | | | 13,709 | | | | 930,841 | |
Freeport-McMoRan Copper & Gold, Inc. | | | 44,790 | | | | 498,961 | |
International Paper Co. | | | 19,330 | | | | 819,205 | |
Packaging Corp. of America | | | 18,921 | | | | 1,266,383 | |
RPM International, Inc. | | | 4,262 | | | | 212,887 | |
| | | | | | | | |
| | | | | | | 5,428,819 | |
| | | | | | | | |
UTILITIES (13.5%) | | | | | | | | |
Ameren Corp. | | | 17,204 | | | | 921,790 | |
Atmos Energy Corp. | | | 16,659 | | | | 1,354,710 | |
MUTUAL OF AMERICA INVESTMENT CORPORATION - MID CAP VALUE FUND
PORTFOLIO OF INVESTMENTS IN SECURITIES
June 30, 2016 (Unaudited)
| | | | | | | | |
Consolidated Edison, Inc. | | | 13,337 | | | | 1,072,828 | |
Edison International | | | 18,428 | | | | 1,431,303 | |
Entergy Corp. | | | 10,621 | | | | 864,018 | |
Eversource Energy | | | 9,997 | | | | 598,820 | |
FirstEnergy Corp. | | | 22,966 | | | | 801,743 | |
Great Plains Energy, Inc. | | | 33,163 | | | | 1,008,155 | |
PPL Corp. | | | 26,935 | | | | 1,016,796 | |
Public Svc. Enterprise Group, Inc. | | | 24,476 | | | | 1,140,826 | |
Sempra Energy | | | 4,449 | | | | 507,275 | |
Westar Energy, Inc. | | | 12,970 | | | | 727,487 | |
| | | | | | | | |
| | | | | | | 11,445,751 | |
| | | | | | | | |
TOTAL COMMON STOCKS
(Cost: $68,286,859) 95.6% | | | | 81,372,460 | |
| | | | | |
| | | | | | | | | | | | | | | | | | | | |
| | | Rating** | | | Rate(%) | | | Maturity | | | Face Amount | | | Value | |
SHORT-TERM DEBT SECURITIES: | | | | | | | | | | | | | | | | | | | | |
U.S. GOVERNMENT (1.3%) | | | | | | | | | | | | | |
U.S. Treasury Bill | | | A-1+ | | | | 0.26 | | | | 08/11/16 | | | | 900,000 | | | | 899,733 | |
U.S. Treasury Bill | | | A-1+ | | | | 0.27 | | | | 08/25/16 | | | | 200,000 | | | | 199,921 | |
| | | | | | | | | | | | | | | | | | | | |
| | | | | | | | | | | | | | | | | | | 1,099,654 | |
| | | | | | | | | | | | | | | | | | | | |
COMMERCIAL PAPER (3.4%) | | | | | | | | | | | | | |
Ralph Lauren Corp.† | | | A-1 | | | | 0.40 | | | | 07/01/16 | | | | 2,900,000 | | | | 2,900,000 | |
| | | | | | | | | | | | | | | | | | | | |
TOTAL SHORT-TERM DEBT SECURITIES
(Cost: $3,999,654) 4.7% | | | | | | | | 3,999,654 | |
| | | | | | | | | |
TOTAL INVESTMENTS
(Cost: $72,286,513) 100.3% | | | | | | | | | | | | | | | | | | | 85,372,114 | |
| | | | | | | | | | | | | | | | | | | | |
OTHER NET ASSETS -0.3% | | | | | | | | | | | | | | | | | | | (279,658 | ) |
| | | | | | | | | | | | | | | | | | | | |
NET ASSETS 100.0% | | | | | | | | | | | | | | | | | | $ | 85,092,456 | |
| | | | | | | | | | | | | | | | | | | | |
The accompanying notes are an integral part of these portfolio schedules.
MUTUAL OF AMERICA INVESTMENT CORPORATION - MID-CAP EQUITY INDEX FUND
PORTFOLIO OF INVESTMENTS IN SECURITIES
June 30, 2016 (Unaudited)
| | | | | | | | |
| | | Shares | | | Value | |
INDEXED ASSETS: | | | | | | | | |
COMMON STOCKS: | | | | | | | | |
CONSUMER DISCRETIONARY (11.4%) | | | | | | | | |
Aaron’s, Inc. | | | 45,316 | | | | 991,967 | |
Abercrombie & Fitch Co. Cl A | | | 48,841 | | | | 869,858 | |
AMC Networks, Inc. Cl A* | | | 43,198 | | | | 2,610,023 | |
American Eagle Outfitters, Inc. | | | 116,503 | | | | 1,855,893 | |
Ascena Retail Group, Inc.* | | | 127,688 | | | | 892,538 | |
Big Lots, Inc. | | | 30,505 | | | | 1,528,606 | |
Brinker International, Inc. | | | 39,051 | | | | 1,777,992 | |
Brunswick Corp. | | | 64,348 | | | | 2,916,251 | |
Buffalo Wild Wings, Inc.* | | | 12,935 | | | | 1,797,318 | |
Cabela’s, Inc.* | | | 33,355 | | | | 1,669,751 | |
Cable One, Inc. | | | 3,137 | | | | 1,604,293 | |
CalAtlantic Group, Inc. | | | 52,936 | | | | 1,943,281 | |
Carter’s, Inc. | | | 35,641 | | | | 3,794,697 | |
Cheesecake Factory, Inc. | | | 31,327 | | | | 1,508,082 | |
Chico’s FAS, Inc. | | | 92,879 | | | | 994,734 | |
Churchill Downs, Inc. | | | 8,574 | | | | 1,083,411 | |
Cinemark Hldgs., Inc. | | | 75,669 | | | | 2,758,892 | |
Cracker Barrel Old Country Store, Inc. | | | 16,617 | | | | 2,849,317 | |
CST Brands, Inc. | | | 52,516 | | | | 2,262,389 | |
Dana Hldg. Corp. | | | 102,320 | | | | 1,080,499 | |
Deckers Outdoor Corp.* | | | 21,862 | | | | 1,257,502 | |
Devry Education Group Inc. | | | 40,529 | | | | 723,037 | |
Dick’s Sporting Goods, Inc. | | | 63,238 | | | | 2,849,504 | |
Domino’s Pizza, Inc. | | | 35,649 | | | | 4,683,566 | |
DreamWorks Animation SKG Cl A* | | | 51,054 | | | | 2,086,577 | |
Dunkin’ Brands Group, Inc. | | | 63,878 | | | | 2,786,358 | |
Fossil Group, Inc.* | | | 27,924 | | | | 796,672 | |
GameStop Corp. Cl A | | | 74,639 | | | | 1,983,905 | |
Gentex Corp. | | | 201,075 | | | | 3,106,609 | |
Graham Hldgs. Co. Cl B | | | 3,113 | | | | 1,523,938 | |
Guess?, Inc. | | | 46,457 | | | | 699,178 | |
Helen of Troy Ltd.* | | | 19,129 | | | | 1,967,226 | |
HSN, Inc. | | | 21,428 | | | | 1,048,472 | |
International Speedway Corp. Cl A | | | 18,471 | | | | 617,855 | |
Jack in the Box, Inc. | | | 22,365 | | | | 1,921,601 | |
Kate Spade & Co.* | | | 89,957 | | | | 1,854,014 | |
KB Home | | | 57,584 | | | | 875,853 | |
Live Nation Entertainment, Inc.* | | | 101,633 | | | | 2,388,376 | |
Meredith Corp. | | | 26,521 | | | | 1,376,705 | |
Murphy USA, Inc.* | | | 25,866 | | | | 1,918,223 | |
New York Times Co. Cl A | | | 87,289 | | | | 1,056,197 | |
NVR, Inc.* | | | 2,574 | | | | 4,582,595 | |
Office Depot, Inc.* | | | 343,861 | | | | 1,138,180 | |
Panera Bread Co. Cl A* | | | 16,025 | | | | 3,396,339 | |
Penney (J.C.) Co., Inc.* | | | 218,121 | | | | 1,936,914 | |
Polaris Industries, Inc. | | | 42,382 | | | | 3,465,152 | |
Pool Corp. | | | 29,932 | | | | 2,814,506 | |
Restoration Hardware Hldgs., Inc.* | | | 27,498 | | | | 788,643 | |
Service Corp. International | | | 138,390 | | | | 3,742,066 | |
Skechers U.S.A., Inc. Cl A* | | | 92,346 | | | | 2,744,523 | |
Sotheby’s | | | 35,965 | | | | 985,441 | |
Tempur Sealy Int’l., Inc.* | | | 42,410 | | | | 2,346,121 | |
Texas Roadhouse, Inc. | | | 45,555 | | | | 2,077,308 | |
The Wendy’s Co. | | | 154,658 | | | | 1,487,810 | |
Thor Industries, Inc. | | | 32,112 | | | | 2,078,931 | |
Time, Inc. | | | 74,235 | | | | 1,221,908 | |
Toll Brothers, Inc.* | | | 107,487 | | | | 2,892,475 | |
TRI Pointe Group, Inc.* | | | 103,432 | | | | 1,222,566 | |
Tupperware Brands Corp. | | | 36,486 | | | | 2,053,432 | |
Vista Outdoor, Inc.* | | | 43,718 | | | | 2,086,660 | |
Wiley (John) & Sons, Inc. Cl A | | | 32,974 | | | | 1,720,583 | |
Williams-Sonoma, Inc. | | | 58,735 | | | | 3,061,856 | |
| | | | | | | | |
| | | | | | | 122,155,169 | |
| | | | | | | | |
MUTUAL OF AMERICA INVESTMENT CORPORATION - MID-CAP EQUITY INDEX FUND
PORTFOLIO OF INVESTMENTS IN SECURITIES
June 30, 2016 (Unaudited)
| | | | | | | | |
CONSUMER STAPLES (4.5%) | | | | | | | | |
Avon Products, Inc. | | | 309,005 | | | | 1,168,039 | |
Boston Beer Co., Inc. Cl A* | | | 6,470 | | | | 1,106,564 | |
Casey’s General Stores, Inc. | | | 27,278 | | | | 3,587,330 | |
Dean Foods Co. | | | 64,744 | | | | 1,171,219 | |
Edgewell Personal Care Co. | | | 41,937 | | | | 3,539,902 | |
Energizer Hldgs., Inc. | | | 42,978 | | | | 2,212,937 | |
Flowers Foods, Inc. | | | 126,313 | | | | 2,368,369 | |
Hain Celestial Group, Inc.* | | | 71,879 | | | | 3,575,980 | |
Ingredion, Inc. | | | 50,744 | | | | 6,566,781 | |
Lancaster Colony Corp. | | | 13,455 | | | | 1,716,993 | |
Post Hldgs., Inc.* | | | 45,840 | | | | 3,790,510 | |
Snyder’s-Lance, Inc. | | | 55,554 | | | | 1,882,725 | |
Sprouts Farmers Market, Inc.* | | | 99,651 | | | | 2,282,008 | |
SUPERVALU, Inc.* | | | 178,552 | | | | 842,765 | |
Tootsie Roll Industries, Inc. | | | 11,285 | | | | 434,811 | |
TreeHouse Foods, Inc.* | | | 39,563 | | | | 4,061,142 | |
United Natural Foods, Inc.* | | | 34,434 | | | | 1,611,511 | |
WhiteWave Foods Co. Cl A* | | | 124,234 | | | | 5,831,544 | |
| | | | | | | | |
| | | | | | | 47,751,130 | |
| | | | | | | | |
ENERGY (3.5%) | | | | | | | | |
CONSOL Energy, Inc. | | | 164,061 | | | | 2,639,741 | |
Denbury Resources, Inc. | | | 243,215 | | | | 873,142 | |
Dril-Quip, Inc.* | | | 27,276 | | | | 1,593,737 | |
Energen Corp. | | | 68,038 | | | | 3,280,112 | |
Ensco PLC Cl A | | | 212,270 | | | | 2,061,142 | |
Gulfport Energy Corp.* | | | 89,151 | | | | 2,786,860 | |
HollyFrontier Corp. | | | 121,921 | | | | 2,898,062 | |
Nabors Industries Ltd. | | | 199,809 | | | | 2,008,080 | |
Noble Corp. PLC | | | 165,954 | | | | 1,367,461 | |
Oceaneering Int’l., Inc. | | | 68,171 | | | | 2,035,586 | |
Oil States International, Inc.* | | | 34,618 | | | | 1,138,240 | |
Patterson-UTI Energy, Inc. | | | 103,247 | | | | 2,201,226 | |
QEP Resources, Inc. | | | 165,935 | | | | 2,925,434 | |
Rowan Companies PLC Cl A | | | 86,411 | | | | 1,526,018 | |
SM Energy Co. | | | 46,722 | | | | 1,261,494 | |
Superior Energy Services, Inc. | | | 109,227 | | | | 2,010,869 | |
Western Refining, Inc. | | | 55,320 | | | | 1,141,252 | |
World Fuel Services Corp. | | | 48,872 | | | | 2,320,931 | |
WPX Energy, Inc.* | | | 198,504 | | | | 1,848,072 | |
| | | | | | | | |
| | | | | | | 37,917,459 | |
| | | | | | | | |
FINANCIALS (26.0%) | | | | | | | | |
Alexander & Baldwin, Inc. | | | 31,136 | | | | 1,125,255 | |
Alexandria Real Estate Equities, Inc. | | | 52,498 | | | | 5,434,593 | |
Alleghany Corp.* | | | 10,985 | | | | 6,037,136 | |
American Campus Communities, Inc. | | | 91,322 | | | | 4,828,194 | |
American Financial Group, Inc. | | | 49,458 | | | | 3,656,430 | |
Aspen Insurance Hldgs. Ltd. | | | 43,596 | | | | 2,021,982 | |
Associated Banc-Corp. | | | 106,614 | | | | 1,828,430 | |
BancorpSouth, Inc. | | | 61,394 | | | | 1,393,030 | |
Bank of Hawaii Corp. | | | 30,623 | | | | 2,106,862 | |
Bank of the Ozarks, Inc. | | | 56,163 | | | | 2,107,236 | |
Berkley (W.R.) Corp. | | | 68,250 | | | | 4,089,540 | |
Brown & Brown, Inc. | | | 81,218 | | | | 3,043,238 | |
Camden Property Trust | | | 60,853 | | | | 5,380,622 | |
Care Capital Pptys., Inc. | | | 60,024 | | | | 1,573,229 | |
Cathay General Bancorp | | | 51,046 | | | | 1,439,497 | |
CBOE Holdings, Inc. | | | 58,248 | | | | 3,880,482 | |
CNO Financial Group, Inc. | | | 127,573 | | | | 2,227,425 | |
Commerce Bancshares, Inc. | | | 57,692 | | | | 2,763,447 | |
Communications Sales & Leasing* | | | 95,912 | | | | 2,771,857 | |
Corporate Office Pptys. Trust | | | 67,714 | | | | 2,002,303 | |
Corrections Corp. of America | | | 82,280 | | | | 2,881,446 | |
Cullen/Frost Bankers, Inc. | | | 37,796 | | | | 2,408,739 | |
DCT Industrial Trust, Inc. | | | 61,082 | | | | 2,934,379 | |
MUTUAL OF AMERICA INVESTMENT CORPORATION - MID-CAP EQUITY INDEX FUND
PORTFOLIO OF INVESTMENTS IN SECURITIES
June 30, 2016 (Unaudited)
| | | | | | | | |
Douglas Emmett, Inc. | | | 100,119 | | | | 3,556,227 | |
Duke Realty Corp. | | | 243,791 | | | | 6,499,468 | |
East West Bancorp, Inc. | | | 101,924 | | | | 3,483,762 | |
Eaton Vance Corp. | | | 78,828 | | | | 2,785,782 | |
Education Realty Trust, Inc. | | | 47,216 | | | | 2,178,546 | |
Endurance Specialty Hldgs. Ltd. | | | 44,172 | | | | 2,966,592 | |
EPR Properties | | | 44,374 | | | | 3,580,094 | |
Equity One, Inc. | | | 65,387 | | | | 2,104,154 | |
Everest Re Group Ltd. | | | 29,626 | | | | 5,411,781 | |
FactSet Research Systems, Inc. | | | 28,893 | | | | 4,663,908 | |
Federated Investors, Inc. Cl B | | | 65,344 | | | | 1,880,600 | |
First American Financial Corp. | | | 77,605 | | | | 3,121,273 | |
First Horizon National Corp. | | | 160,582 | | | | 2,212,820 | |
First Industrial Realty Trust, Inc. | | | 81,196 | | | | 2,258,873 | |
First Niagara Financial Group, Inc. | | | 246,220 | | | | 2,398,183 | |
FirstMerit Corp. | | | 119,077 | | | | 2,413,691 | |
FNB Corp. | | | 146,797 | | | | 1,840,834 | |
Fulton Financial Corp. | | | 122,895 | | | | 1,659,083 | |
Genworth Financial, Inc.* | | | 365,490 | | | | 942,964 | |
Hancock Hldg. Co. | | | 55,870 | | | | 1,458,766 | |
Hanover Insurance Group, Inc. | | | 30,041 | | | | 2,542,069 | |
Healthcare Realty Trust | | | 80,934 | | | | 2,831,881 | |
Highwoods Properties, Inc. | | | 69,248 | | | | 3,656,294 | |
Hospitality Properties Trust | | | 107,213 | | | | 3,087,734 | |
International Bancshares Corp. | | | 38,564 | | | | 1,006,135 | |
Janus Capital Group, Inc. | | | 106,187 | | | | 1,478,123 | |
Jones Lang LaSalle, Inc. | | | 31,485 | | | | 3,068,213 | |
Kemper Corp. | | | 32,637 | | | | 1,011,094 | |
Kilroy Realty Corp. | | | 64,171 | | | | 4,253,896 | |
Lamar Advertising Co. Cl A | | | 58,202 | | | | 3,858,793 | |
LaSalle Hotel Pptys. | | | 78,963 | | | | 1,861,948 | |
Liberty Property Trust | | | 104,420 | | | | 4,147,562 | |
Mack-Cali Realty Corp. | | | 64,781 | | | | 1,749,087 | |
MarketAxess Hldgs., Inc. | | | 26,294 | | | | 3,823,148 | |
Medical Properties Trust, Inc. | | | 166,244 | | | | 2,528,571 | |
Mercury General Corp. | | | 26,229 | | | | 1,394,334 | |
Mid-America Apt. Communities, Inc. | | | 53,636 | | | | 5,706,870 | |
MSCI, Inc. Cl A | | | 61,261 | | | | 4,724,448 | |
National Retail Pptys., Inc. | | | 101,284 | | | | 5,238,408 | |
New York Community Bancorp, Inc. | | | 346,108 | | | | 5,188,159 | |
Old Republic Int’l. Corp. | | | 174,293 | | | | 3,362,112 | |
Omega Healthcare Investors, Inc. | | | 115,733 | | | | 3,929,135 | |
PacWest Bancorp | | | 80,638 | | | | 3,207,780 | |
Post Properties, Inc. | | | 37,033 | | | | 2,260,865 | |
Potlatch Corp. | | | 27,764 | | | | 946,752 | |
Primerica, Inc. | | | 33,073 | | | | 1,893,099 | |
PrivateBancorp, Inc. | | | 55,620 | | | | 2,448,949 | |
Prosperity Bancshares, Inc. | | | 45,522 | | | | 2,321,167 | |
Raymond James Financial, Inc. | | | 89,205 | | | | 4,397,807 | |
Rayonier, Inc. | | | 84,826 | | | | 2,225,834 | |
Regency Centers Corp. | | | 69,207 | | | | 5,794,702 | |
Reinsurance Grp. of America, Inc. | | | 44,822 | | | | 4,347,286 | |
RenaissanceRe Hldgs. Ltd. | | | 30,220 | | | | 3,549,037 | |
SEI Investments Co. | | | 95,895 | | | | 4,613,508 | |
Senior Housing Pptys. Trust | | | 165,798 | | | | 3,453,572 | |
Signature Bank* | | | 38,075 | | | | 4,756,329 | |
SLM Corp.* | | | 299,762 | | | | 1,852,529 | |
Sovran Self Storage, Inc. | | | 32,473 | | | | 3,407,067 | |
Stifel Financial Corp.* | | | 48,146 | | | | 1,514,192 | |
SVB Financial Group* | | | 36,820 | | | | 3,503,791 | |
Synovus Financial Corp. | | | 87,617 | | | | 2,540,017 | |
Tanger Factory Outlet Centers, Inc. | | | 65,922 | | | | 2,648,746 | |
Taubman Centers, Inc. | | | 42,556 | | | | 3,157,655 | |
TCF Financial Corp. | | | 118,575 | | | | 1,499,974 | |
Trustmark Corp. | | | 47,289 | | | | 1,175,132 | |
Umpqua Hldgs. Corp. | | | 155,858 | | | | 2,411,123 | |
MUTUAL OF AMERICA INVESTMENT CORPORATION - MID-CAP EQUITY INDEX FUND
PORTFOLIO OF INVESTMENTS IN SECURITIES
June 30, 2016 (Unaudited)
| | | | | | | | |
Urban Edge Pptys. | | | 63,192 | | | | 1,886,913 | |
Valley National Bancorp | | | 160,940 | | | | 1,467,773 | |
Waddell & Reed Financial, Inc. Cl A | | | 55,647 | | | | 958,241 | |
Washington Federal, Inc. | | | 64,322 | | | | 1,560,452 | |
Webster Financial Corp. | | | 64,449 | | | | 2,188,044 | |
Weingarten Realty Investors | | | 81,082 | | | | 3,309,767 | |
WisdomTree Investments, Inc. | | | 77,373 | | | | 757,482 | |
WP Glimcher, Inc. | | | 126,802 | | | | 1,418,914 | |
| | | | | | | | |
| | | | | | | 279,275,266 | |
| | | | | | | | |
HEALTH CARE (8.7%) | | | | | | | | |
Abiomed, Inc.* | | | 27,986 | | | | 3,058,590 | |
Akorn, Inc.* | | | 59,864 | | | | 1,705,226 | |
Align Technology, Inc.* | | | 50,843 | | | | 4,095,404 | |
Allscripts Healthcare Solutions, Inc.* | | | 132,479 | | | | 1,682,483 | |
Amsurg Corp.* | | | 38,003 | | | | 2,946,753 | |
Bio-Rad Laboratories, Inc. Cl A* | | | 14,595 | | | | 2,087,377 | |
Bio-Techne Corp. | | | 26,152 | | | | 2,949,161 | |
Catalent, Inc.* | | | 76,831 | | | | 1,766,345 | |
Charles River Laboratories Int’l., Inc.* | | | 32,644 | | | | 2,691,171 | |
Community Health Systems, Inc.* | | | 79,354 | | | | 956,216 | |
Cooper Companies, Inc. | | | 34,041 | | | | 5,840,414 | |
Halyard Health, Inc.* | | | 32,038 | | | | 1,041,876 | |
Hill-Rom Hldgs., Inc. | | | 40,408 | | | | 2,038,584 | |
IDEXX Laboratories, Inc.* | | | 63,508 | | | | 5,897,353 | |
LifePoint Health, Inc.* | | | 30,039 | | | | 1,963,649 | |
LivaNova PLC* | | | 29,791 | | | | 1,496,402 | |
MEDNAX, Inc.* | | | 65,797 | | | | 4,765,677 | |
Mettler-Toledo Int’l., Inc.* | | | 18,926 | | | | 6,906,471 | |
Molina Healthcare, Inc.* | | | 28,226 | | | | 1,408,477 | |
Owens & Minor, Inc. | | | 45,300 | | | | 1,693,314 | |
PAREXEL International Corp.* | | | 37,881 | | | | 2,381,957 | |
Prestige Brands Hldgs., Inc.* | | | 37,462 | | | | 2,075,395 | |
ResMed, Inc. | | | 98,802 | | | | 6,247,250 | |
STERIS PLC | | | 60,154 | | | | 4,135,588 | |
Teleflex, Inc. | | | 30,289 | | | | 5,370,543 | |
Tenet Healthcare Corp.* | | | 68,390 | | | | 1,890,300 | |
United Therapeutics Corp.* | | | 31,058 | | | | 3,289,663 | |
VCA Inc.* | | | 56,759 | | | | 3,837,476 | |
WellCare Health Plans, Inc.* | | | 31,263 | | | | 3,353,895 | |
West Pharmaceutical Svcs., Inc. | | | 51,417 | | | | 3,901,522 | |
| | | | | | | | |
| | | | | | | 93,474,532 | |
| | | | | | | | |
INDUSTRIALS (13.0%) | | | | | | | | |
AECOM* | | | 108,793 | | | | 3,456,354 | |
AGCO Corp. | | | 49,133 | | | | 2,315,638 | |
B/E Aerospace, Inc. | | | 72,566 | | | | 3,350,735 | |
Carlisle Cos., Inc. | | | 44,810 | | | | 4,735,521 | |
CEB, Inc. | | | 23,124 | | | | 1,426,288 | |
CLARCOR, Inc. | | | 34,191 | | | | 2,079,839 | |
Clean Harbors, Inc.* | | | 36,043 | | | | 1,878,201 | |
Copart, Inc.* | | | 69,696 | | | | 3,415,801 | |
Crane Co. | | | 35,426 | | | | 2,009,363 | |
Curtiss-Wright Corp. | | | 30,670 | | | | 2,583,948 | |
Deluxe Corp. | | | 34,723 | | | | 2,304,566 | |
Donaldson Co., Inc. | | | 86,799 | | | | 2,982,414 | |
Donnelley (R.R.) & Sons Co. | | | 145,074 | | | | 2,454,652 | |
EMCOR Group, Inc. | | | 42,882 | | | | 2,112,367 | |
Esterline Technologies Corp.* | | | 21,534 | | | | 1,335,969 | |
FTI Consulting, Inc.* | | | 29,719 | | | | 1,208,969 | |
GATX Corp. | | | 29,501 | | | | 1,297,159 | |
Genesee & Wyoming, Inc. Cl A* | | | 40,564 | | | | 2,391,248 | |
Graco, Inc. | | | 38,805 | | | | 3,065,207 | |
Granite Construction, Inc. | | | 28,717 | | | | 1,308,059 | |
HNI Corp. | | | 30,998 | | | | 1,441,097 | |
Hubbell, Inc. | | | 36,490 | | | | 3,848,600 | |
Huntington Ingalls Industries, Inc. | | | 32,949 | | | | 5,536,420 | |
IDEX Corp. | | | 52,877 | | | | 4,341,202 | |
MUTUAL OF AMERICA INVESTMENT CORPORATION - MID-CAP EQUITY INDEX FUND
PORTFOLIO OF INVESTMENTS IN SECURITIES
June 30, 2016 (Unaudited)
| | | | | | | | |
ITT, Inc. | | | 62,175 | | | | 1,988,357 | |
JetBlue Airways Corp* | | | 226,378 | | | | 3,748,820 | |
Joy Global, Inc. | | | 70,132 | | | | 1,482,590 | |
KBR, Inc. | | | 98,314 | | | | 1,301,677 | |
Kennametal, Inc. | | | 54,901 | | | | 1,213,861 | |
Kirby Corp.* | | | 37,234 | | | | 2,323,029 | |
KLX, Inc.* | | | 37,729 | | | | 1,169,599 | |
Landstar System, Inc. | | | 29,779 | | | | 2,044,626 | |
Lennox International, Inc. | | | 27,342 | | | | 3,898,969 | |
Lincoln Electric Hldgs., Inc. | | | 44,486 | | | | 2,628,233 | |
Manpowergroup, Inc. | | | 50,273 | | | | 3,234,565 | |
Miller (Herman), Inc. | | | 42,671 | | | | 1,275,436 | |
MSA Safety, Inc. | | | 23,085 | | | | 1,212,655 | |
MSC Industrial Direct Co., Inc. Cl A | | | 34,286 | | | | 2,419,220 | |
Nordson Corp. | | | 37,810 | | | | 3,161,294 | |
NOW, Inc.* | | | 78,200 | | | | 1,418,548 | |
Old Dominion Freight Line, Inc.* | | | 48,816 | | | | 2,944,093 | |
Orbital ATK, Inc. | | | 41,187 | | | | 3,506,661 | |
Oshkosh Corp. | | | 52,496 | | | | 2,504,584 | |
Regal Beloit Corp. | | | 32,098 | | | | 1,766,995 | |
Rollins, Inc. | | | 66,596 | | | | 1,949,265 | |
Smith (A.O.) Corp. | | | 52,551 | | | | 4,630,269 | |
Teledyne Technologies, Inc.* | | | 24,025 | | | | 2,379,676 | |
Terex Corp. | | | 77,517 | | | | 1,574,370 | |
Timken Co. | | | 47,148 | | | | 1,445,558 | |
Toro Co. | | | 39,327 | | | | 3,468,641 | |
Trinity Industries, Inc. | | | 104,655 | | | | 1,943,443 | |
Triumph Group, Inc. | | | 34,852 | | | | 1,237,246 | |
Valmont Industries, Inc. | | | 16,287 | | | | 2,203,142 | |
Wabtec Corp. | | | 63,252 | | | | 4,442,188 | |
Watsco, Inc. | | | 18,497 | | | | 2,602,343 | |
Werner Enterprises, Inc. | | | 29,807 | | | | 684,667 | |
Woodward, Inc. | | | 39,117 | | | | 2,254,704 | |
| | | | | | | | |
| | | | | | | 138,938,941 | |
| | | | | | | | |
INFORMATION TECHNOLOGY (16.1%) | | | | | | | | |
3D Systems Corp.* | | | 77,212 | | | | 1,057,032 | |
ACI Worldwide, Inc.* | | | 80,041 | | | | 1,561,600 | |
Acxiom Corp.* | | | 52,431 | | | | 1,152,958 | |
Advanced Micro Devices, Inc.* | | | 441,294 | | | | 2,268,251 | |
ANSYS, Inc.* | | | 61,908 | | | | 5,618,151 | |
ARRIS International PLC* | | | 121,338 | | | | 2,543,244 | |
Arrow Electronics, Inc.* | | | 64,454 | | | | 3,989,703 | |
Avnet, Inc. | | | 91,327 | | | | 3,699,657 | |
Belden, Inc. | | | 30,334 | | | | 1,831,264 | |
Broadridge Financial Solutions, Inc. | | | 82,480 | | | | 5,377,696 | |
Brocade Communications Systems, Inc. | | | 324,416 | | | | 2,978,139 | |
Cadence Design Systems, Inc.* | | | 212,201 | | | | 5,156,484 | |
CDK Global, Inc. | | | 108,799 | | | | 6,037,257 | |
Ciena Corp.* | | | 89,481 | | | | 1,677,769 | |
Cognex Corp | | | 59,240 | | | | 2,553,244 | |
CommVault Systems, Inc.* | | | 29,617 | | | | 1,279,158 | |
Computer Sciences Corp. | | | 97,902 | | | | 4,860,834 | |
comScore, Inc.* | | | 33,002 | | | | 788,088 | |
Convergys Corp. | | | 67,322 | | | | 1,683,050 | |
CoreLogic, Inc.* | | | 62,425 | | | | 2,402,114 | |
Cree, Inc.* | | | 70,607 | | | | 1,725,635 | |
Cypress Semiconductor Corp. | | | 214,588 | | | | 2,263,903 | |
Diebold, Inc. | | | 44,276 | | | | 1,099,373 | |
DST Systems, Inc. | | | 21,737 | | | | 2,530,839 | |
Fair Isaac Corp. | | | 21,751 | | | | 2,458,081 | |
Fairchild Semiconductor Int’l., Inc.* | | | 77,836 | | | | 1,545,045 | |
FEI Company | | | 29,080 | | | | 3,108,070 | |
Fortinet, Inc.* | | | 102,536 | | | | 3,239,112 | |
Gartner, Inc.* | | | 57,976 | | | | 5,647,442 | |
Henry (Jack) & Associates, Inc. | | | 55,878 | | | | 4,876,473 | |
Ingram Micro, Inc. Cl A | | | 103,327 | | | | 3,593,713 | |
MUTUAL OF AMERICA INVESTMENT CORPORATION - MID-CAP EQUITY INDEX FUND
PORTFOLIO OF INVESTMENTS IN SECURITIES
June 30, 2016 (Unaudited)
| | | | | | | | |
Integrated Device Technology, Inc.* | | | 95,327 | | | | 1,918,933 | |
InterDigital, Inc. | | | 24,768 | | | | 1,379,082 | |
Intersil Corp. Cl A | | | 94,630 | | | | 1,281,290 | |
IPG Photonics Corp.* | | | 25,935 | | | | 2,074,800 | |
j2 Global, Inc. | | | 32,088 | | | | 2,026,999 | |
Jabil Circuit, Inc. | | | 137,519 | | | | 2,539,976 | |
Keysight Technologies, Inc.* | | | 118,313 | | | | 3,441,725 | |
Knowles Corp.* | | | 61,109 | | | | 835,971 | |
Leidos Hldgs., Inc. | | | 46,139 | | | | 2,208,674 | |
Lexmark International, Inc. Cl A | | | 43,598 | | | | 1,645,825 | |
Manhattan Associates, Inc.* | | | 51,197 | | | | 3,283,264 | |
MAXIMUS, Inc. | | | 45,218 | | | | 2,503,721 | |
Mentor Graphics Corp. | | | 71,661 | | | | 1,523,513 | |
Microsemi Corp.* | | | 78,222 | | | | 2,556,295 | |
National Instruments Corp. | | | 70,524 | | | | 1,932,358 | |
NCR Corp.* | | | 88,246 | | | | 2,450,591 | |
NetScout Systems, Inc.* | | | 64,377 | | | | 1,432,388 | |
NeuStar, Inc. Cl A* | | | 38,722 | | | | 910,354 | |
Plantronics, Inc. | | | 23,352 | | | | 1,027,488 | |
Polycom, Inc.* | | | 96,550 | | | | 1,086,188 | |
PTC, Inc.* | | | 79,847 | | | | 3,000,650 | |
Rackspace Hosting, Inc.* | | | 73,903 | | | | 1,541,617 | |
Science Applications Int’l. Corp. | | | 29,388 | | | | 1,714,790 | |
Silicon Laboratories, Inc.* | | | 27,366 | | | | 1,333,819 | |
Synaptics, Inc.* | | | 26,674 | | | | 1,433,728 | |
SYNNEX Corp. | | | 20,288 | | | | 1,923,708 | |
Synopsys, Inc.* | | | 106,006 | | | | 5,732,804 | |
Tech Data Corp.* | | | 24,339 | | | | 1,748,757 | |
Teradyne, Inc. | | | 140,802 | | | | 2,772,391 | |
Trimble Navigation Ltd.* | | | 175,572 | | | | 4,276,934 | |
Tyler Technologies, Inc.* | | | 22,593 | | | | 3,766,479 | |
Ultimate Software Group, Inc.* | | | 20,081 | | | | 4,222,833 | |
VeriFone Systems, Inc.* | | | 76,541 | | | | 1,419,070 | |
ViaSat, Inc.* | | | 32,367 | | | | 2,311,004 | |
Vishay Intertechnology, Inc. | | | 94,823 | | | | 1,174,857 | |
WebMD Health Corp.* | | | 26,495 | | | | 1,539,624 | |
WEX, Inc.* | | | 27,497 | | | | 2,438,159 | |
Zebra Technologies Corp. Cl A* | | | 36,262 | | | | 1,816,726 | |
| | | | | | | | |
| | | | | | | 172,830,764 | |
| | | | | | | | |
MATERIALS (6.9%) | | | | | | | | |
Allegheny Technologies, Inc. | | | 76,017 | | | | 969,217 | |
AptarGroup, Inc. | | | 44,665 | | | | 3,534,341 | |
Ashland, Inc. | | | 43,279 | | | | 4,967,131 | |
Bemis Co., Inc. | | | 65,988 | | | | 3,397,722 | |
Cabot Corp. | | | 44,445 | | | | 2,029,359 | |
Carpenter Technology Corp. | | | 33,177 | | | | 1,092,519 | |
Commercial Metals Co. | | | 78,536 | | | | 1,327,258 | |
Compass Minerals Int’l., Inc. | | | 23,410 | | | | 1,736,788 | |
Domtar Corp. | | | 44,978 | | | | 1,574,680 | |
Eagle Materials, Inc. | | | 34,618 | | | | 2,670,779 | |
Greif, Inc. Cl A | | | 18,421 | | | | 686,551 | |
Louisiana-Pacific Corp.* | | | 102,100 | | | | 1,771,435 | |
Minerals Technologies, Inc. | | | 24,892 | | | | 1,413,866 | |
NewMarket Corp. | | | 7,148 | | | | 2,961,988 | |
MUTUAL OF AMERICA INVESTMENT CORPORATION - MID-CAP EQUITY INDEX FUND
PORTFOLIO OF INVESTMENTS IN SECURITIES
June 30, 2016 (Unaudited)
| | | | | | | | |
Olin Corp. | | | 116,703 | | | | 2,898,903 | |
Packaging Corp. of America | | | 66,078 | | | | 4,422,601 | |
PolyOne Corp. | | | 58,429 | | | | 2,059,038 | |
Reliance Steel & Aluminum Co. | | | 50,405 | | | | 3,876,145 | |
Royal Gold, Inc. | | | 45,321 | | | | 3,264,018 | |
RPM International, Inc. | | | 93,656 | | | | 4,678,117 | |
Scotts Miracle-Gro Co. Cl A | | | 32,332 | | | | 2,260,330 | |
Sensient Technologies Corp. | | | 30,883 | | | | 2,193,928 | |
Silgan Hldgs., Inc. | | | 28,748 | | | | 1,479,372 | |
Sonoco Products Co. | | | 71,861 | | | | 3,568,617 | |
Steel Dynamics, Inc. | | | 172,003 | | | | 4,214,074 | |
United States Steel Corp. | | | 102,319 | | | | 1,725,098 | |
Valspar Corp. | | | 51,496 | | | | 5,563,113 | |
Worthington Industries, Inc. | | | 31,564 | | | | 1,335,157 | |
| | | | | | | | |
| | | | | | | 73,672,145 | |
| | | | | | | | |
TELECOMMUNICATION SERVICES (0.2%) | | | | | |
Telephone & Data Systems, Inc. | | | 66,548 | | | | 1,973,814 | |
| | | | | | | | |
UTILITIES (5.8%) | | | | | |
Aqua America, Inc. | | | 124,832 | | | | 4,451,509 | |
Atmos Energy Corp. | | | 72,095 | | | | 5,862,765 | |
Black Hills Corp. | | | 36,566 | | | | 2,305,121 | |
Great Plains Energy, Inc. | | | 107,620 | | | | 3,271,648 | |
Hawaiian Electric Industries, Inc. | | | 75,982 | | | | 2,491,450 | |
Idacorp, Inc. | | | 35,865 | | | | 2,917,618 | |
MDU Resources Group, Inc. | | | 138,108 | | | | 3,314,592 | |
National Fuel Gas Co. | | | 59,819 | | | | 3,402,505 | |
New Jersey Resources Corp. | | | 59,116 | | | | 2,278,922 | |
OGE Energy Corp. | | | 140,094 | | | | 4,588,079 | |
ONE Gas, Inc. | | | 36,555 | | | | 2,434,197 | |
PNM Resources, Inc. | | | 55,065 | | | | 1,951,504 | |
Questar Corp. | | | 123,602 | | | | 3,135,783 | |
Southwest Gas Corp. | | | 33,263 | | | | 2,618,131 | |
Talen Energy Corp.* | | | 45,442 | | | | 615,739 | |
UGI Corp. | | | 121,895 | | | | 5,515,749 | |
Vectren Corp. | | | 58,272 | | | | 3,069,186 | |
Westar Energy, Inc. | | | 99,306 | | | | 5,570,074 | |
WGL Hldgs., Inc. | | | 35,086 | | | | 2,483,738 | |
| | | | | | | | |
| | | | | | | 62,278,310 | |
| | | | | | | | |
TOTAL INDEXED ASSETS - COMMON STOCKS
(Cost: $843,603,576) 96.1% | | | | | | | 1,030,267,530 | |
| | | | | | | | |
| | | | | | | | | | | | | | | | | | | | |
| | | Rating** | | | Rate(%) | | | Maturity | | | Face Amount | | | Value | |
SHORT-TERM DEBT SECURITIES: | | | | | | | | | | | | | | | | | | | | |
U.S. GOVERNMENT (0.7%) | | | | | | | | | | | | | |
U.S. Treasury Bill (1) | | | A-1+ | | | | 0.28 | | | | 08/25/16 | | | | 2,000,000 | | | | 1,999,129 | |
U.S. Treasury Bill (1) | | | A-1+ | | | | 0.29 | | | | 08/11/16 | | | | 5,000,000 | | | | 4,998,348 | |
| | | | | | | | | | | | | | | | | | | | |
| | | | | | | | | | | | | | | | | | | 6,997,477 | |
| | | | | | | | | | | | | | | | | | | | |
COMMERCIAL PAPER (2.3%) | | | | | | | | | | | | | |
Apple, Inc.† | | | A-1+ | | | | 0.42 | | | | 07/05/16 | | | | 2,300,000 | | | | 2,299,893 | |
Microsoft Corp.† | | | A-1+ | | | | 0.28 | | | | 07/01/16 | | | | 22,500,000 | | | | 22,500,000 | |
| | | | | | | | | | | | | | | | | | | | |
| | | | | | | | | | | | | | | | | | | 24,799,893 | |
| | | | | | | | | | | | | | | | | | | | |
TOTAL SHORT-TERM DEBT SECURITIES
(Cost: $31,797,370) 3.0% | | | | | | | | 31,797,370 | |
| | | | | | | | | |
TOTAL INVESTMENTS
(Cost: $875,400,946) 99.1% | | | | | | | | | | | | | | | | | | | 1,062,064,900 | |
| | | | | | | | | | | | | | | | | | | | |
OTHER NET ASSETS 0.9% | | | | | | | | | | | | | | | | | | | 9,556,591 | |
| | | | | | | | | | | | | | | | | | | | |
NET ASSETS 100.0% | | | | | | | | | | | | | | | | | | $ | 1,071,621,491 | |
| | | | | | | | | | | | | | | | | | | | |
The accompanying notes are an integral part of these portfolio schedules.
MUTUAL OF AMERICA INVESTMENT CORPORATION - INTERNATIONAL FUND
PORTFOLIO OF INVESTMENTS IN SECURITIES
June 30, 2016 (Unaudited)
| | | | | | | | |
| | | Shares | | | Value | |
COMMON STOCKS: | | | | | | | | |
FINANCIALS (95.3%) | | | | | | | | |
iShares Core MSCI EAFE ETF | | | 54,650 | | | | 2,835,789 | |
iShares Core MSCI Europe ETF | | | 393,284 | | | | 15,530,785 | |
iShares Core MSCI Pacific ETF | | | 177,010 | | | | 8,282,298 | |
iShares Edge MSCI Min Vol Emerging Markets ETF | | | 179,014 | | | | 9,235,332 | |
iShares MSCI EAFE ETF | | | 2,012,552 | | | | 112,320,526 | |
iShares MSCI EAFE Growth ETF | | | 410,328 | | | | 26,843,658 | |
iShares MSCI EAFE Small-Cap ETF | | | 177,935 | | | | 8,594,261 | |
iShares MSCI EAFE Value ETF | | | 595,783 | | | | 25,582,922 | |
Vanguard FTSE Developed Markets ETF | | | 2,129,980 | | | | 75,316,093 | |
Vanguard FTSE Europe ETF | | | 424,630 | | | | 19,813,236 | |
Vanguard FTSE Pacific ETF | | | 220,480 | | | | 12,287,350 | |
| | | | | | | | |
| | | | | | | 316,642,250 | |
| | | | | | | | |
TOTAL COMMON STOCKS
(Cost: $341,102,487) 95.3% | | | | 316,642,250 | |
| | | | | | | | |
| | | | | | | | | | | | | | | | | | | | |
| | | Rating** | | | Rate(%) | | | Maturity | | | Face Amount | | | Value | |
SHORT-TERM DEBT SECURITIES: | | | | | | | | | | | | | | | | | | | | |
U.S. GOVERNMENT (2.4%) | | | | | | | | | | | | | |
U.S. Treasury Bill | | | A-1+ | | | | 0.26 | | | | 08/11/16 | | | | 2,000,000 | | | | 1,999,396 | |
U.S. Treasury Bill | | | A-1+ | | | | 0.27 | | | | 08/25/16 | | | | 3,000,000 | | | | 2,998,762 | |
U.S. Treasury Bill | | | A-1+ | | | | 0.29 | | | | 08/11/16 | | | | 3,000,000 | | | | 2,999,009 | |
| | | | | | | | | | | | | | | | | | | | |
| | | | | | | | | | | | | | | | | | | 7,997,167 | |
| | | | | | | | | | | | | | | | | | | | |
COMMERCIAL PAPER (2.2%) | | | | | | | | | | | | | |
Precision Castparts Corp.† | | | A-1+ | | | | 0.30 | | | | 07/01/16 | | | | 1,500,000 | | | | 1,500,000 | |
Wisconsin Power & Light | | | A-1 | | | | 0.35 | | | | 07/01/16 | | | | 5,800,000 | | | | 5,800,000 | |
| | | | | | | | | | | | | | | | | | | | |
| | | | | | | | | | | | | | | | | | | 7,300,000 | |
| | | | | | | | | | | | | | | | | | | | |
TOTAL SHORT-TERM DEBT SECURITIES
(Cost: $15,297,167) 4.6% | | | | | | | | 15,297,167 | |
| | | | | | | | | |
TOTAL INVESTMENTS
(Cost: $356,399,654) 99.9% | | | | | | | | | | | | | | | | | | | 331,939,417 | |
| | | | | | | | | | | | | | | | | | | | |
OTHER NET ASSETS 0.1% | | | | | | | | | | | | | | | | | | | 220,822 | |
| | | | | | | | | | | | | | | | | | | | |
NET ASSETS 100.0% | | | | | | | | | | | | | | | | | | $ | 332,160,239 | |
| | | | | | | | | | | | | | | | | | | | |
| | | | | | | | | | | | | | | | | |
The accompanying notes are an integral part of these portfolio schedules.
MUTUAL OF AMERICA INVESTMENT CORPORATION - COMPOSITE FUND
PORTFOLIO OF INVESTMENTS IN SECURITIES
June 30, 2016 (Unaudited)
| | | | | | | | |
| | | Shares | | | Value | |
COMMON STOCKS: | | | | | | | | |
CONSUMER DISCRETIONARY (6.8%) | | | | | | | | |
Amazon.com, Inc.* | | | 2,460 | | | | 1,760,425 | |
CBS Corp. Cl B | | | 18,667 | | | | 1,016,231 | |
D.R. Horton, Inc. | | | 16,097 | | | | 506,734 | |
Ford Motor Co. | | | 66,958 | | | | 841,662 | |
Genuine Parts Co. | | | 10,218 | | | | 1,034,573 | |
Interpublic Group of Cos., Inc. | | | 41,442 | | | | 957,310 | |
Lowe’s Cos., Inc. | | | 13,118 | | | | 1,038,552 | |
PVH Corp. | | | 4,940 | | | | 465,496 | |
Ross Stores, Inc. | | | 13,779 | | | | 781,132 | |
Starbucks Corp. | | | 17,438 | | | | 996,059 | |
Target Corp. | | | 22,140 | | | | 1,545,815 | |
Viacom, Inc. Cl B | | | 19,426 | | | | 805,596 | |
Wyndham Worldwide Corp. | | | 7,118 | | | | 507,015 | |
| | | | | | | | |
| | | | | | | 12,256,600 | |
| | | | | | | | |
CONSUMER STAPLES (5.7%) | | | | | | | | |
Church & Dwight Co., Inc. | | | 7,543 | | | | 776,099 | |
Dr. Pepper Snapple Group, Inc. | | | 13,516 | | | | 1,306,051 | |
General Mills, Inc. | | | 11,261 | | | | 803,135 | |
PepsiCo, Inc. | | | 15,783 | | | | 1,672,051 | |
Philip Morris Int’l., Inc. | | | 12,466 | | | | 1,268,042 | |
Proctor & Gamble Co. | | | 19,030 | | | | 1,611,270 | |
Sysco Corp. | | | 20,076 | | | | 1,018,656 | |
Tyson Foods, Inc. Cl A | | | 11,448 | | | | 764,612 | |
Walgreens Boots Alliance, Inc. | | | 12,563 | | | | 1,046,121 | |
| | | | | | | | |
| | | | | | | 10,266,037 | |
| | | | | | | | |
ENERGY (3.8%) | | | | | | | | |
Chevron Corp. | | | 17,596 | | | | 1,844,589 | |
Helmerich & Payne, Inc. | | | 7,495 | | | | 503,139 | |
Hess Corp. | | | 9,873 | | | | 593,367 | |
National Oilwell Varco, Inc. | | | 22,816 | | | | 767,758 | |
Occidental Petroleum Corp. | | | 12,570 | | | | 949,789 | |
Range Resources Corp. | | | 4,938 | | | | 213,025 | |
Schlumberger Ltd. | | | 12,747 | | | | 1,008,033 | |
Valero Energy Corp. | | | 18,910 | | | | 964,410 | |
| | | | | | | | |
| | | | | | | 6,844,110 | |
| | | | | | | | |
FINANCIALS (8.7%) | | | | | | | | |
American Int’l. Group, Inc. | | | 17,903 | | | | 946,890 | |
American Tower Corp. | | | 6,739 | | | | 765,618 | |
Berkshire Hathaway, Inc. Cl B* | | | 7,390 | | | | 1,069,998 | |
Boston Properties, Inc. | | | 3,894 | | | | 513,619 | |
Capital One Financial Corp. | | | 17,760 | | | | 1,127,938 | |
Discover Financial Svcs. | | | 18,504 | | | | 991,629 | |
Goldman Sachs Group, Inc. | | | 6,112 | | | | 908,121 | |
Host Hotels & Resorts, Inc. | | | 24,587 | | | | 398,555 | |
Iron Mountain, Inc. | | | 12,600 | | | | 501,858 | |
JPMorgan Chase & Co. | | | 39,248 | | | | 2,438,871 | |
MetLife, Inc. | | | 31,340 | | | | 1,248,272 | |
Northern Trust Corp. | | | 11,969 | | | | 793,066 | |
PNC Financial Svcs. Grp., Inc. | | | 7,962 | | | | 648,027 | |
ProLogis, Inc. | | | 10,469 | | | | 513,400 | |
SunTrust Banks, Inc. | | | 23,380 | | | | 960,450 | |
Wells Fargo & Co. | | | 38,271 | | | | 1,811,366 | |
| | | | | | | | |
| | | | | | | 15,637,678 | |
| | | | | | | | |
HEALTH CARE (7.5%) | | | | | | | | |
AbbVie, Inc. | | | 16,342 | | | | 1,011,733 | |
Aetna, Inc. | | | 10,563 | | | | 1,290,059 | |
Amgen, Inc. | | | 9,871 | | | | 1,501,873 | |
Anthem, Inc. | | | 7,620 | | | | 1,000,811 | |
Becton, Dickinson & Co. | | | 4,598 | | | | 779,775 | |
Celgene Corp.* | | | 10,072 | | | | 993,401 | |
Gilead Sciences, Inc. | | | 14,801 | | | | 1,234,699 | |
McKesson Corp. | | | 5,967 | | | | 1,113,741 | |
Merck & Co., Inc. | | | 27,311 | | | | 1,573,387 | |
PerkinElmer, Inc. | | | 13,940 | | | | 730,735 | |
Pfizer, Inc. | | | 61,829 | | | | 2,176,999 | |
| | | | | | | | |
| | | | | | | 13,407,213 | |
| | | | | | | | |
INDUSTRIALS (5.3%) | | | | | | | | |
Boeing Co. | | | 9,304 | | | | 1,208,310 | |
Delta Air Lines, Inc. | | | 15,055 | | | | 548,454 | |
Eaton Corp. PLC | | | 17,571 | | | | 1,049,516 | |
FedEx Corp. | | | 6,677 | | | | 1,013,435 | |
General Electric Co. | | | 98,869 | | | | 3,112,396 | |
Ingersoll-Rand PLC | | | 12,497 | | | | 795,809 | |
Northrop Grumman Corp. | | | 4,501 | | | | 1,000,482 | |
Robinson (C.H.) Worldwide, Inc. | | | 10,273 | | | | 762,770 | |
| | | | | | | | |
| | | | | | | 9,491,172 | |
| | | | | | | | |
INFORMATION TECHNOLOGY (12.3%) | | | | | | | | |
Alphabet, Inc. Cl A* | | | 1,782 | | | | 1,253,690 | |
MUTUAL OF AMERICA INVESTMENT CORPORATION - COMPOSITE FUND
PORTFOLIO OF INVESTMENTS IN SECURITIES
June 30, 2016 (Unaudited)
| | | | | | | | |
Alphabet, Inc. Cl C* | | | 1,786 | | | | 1,236,091 | |
Apple, Inc. | | | 37,390 | | | | 3,574,484 | |
Applied Materials, Inc. | | | 45,004 | | | | 1,078,746 | |
Automatic Data Processing, Inc. | | | 7,967 | | | | 731,928 | |
CA, Inc. | | | 40,115 | | | | 1,316,975 | |
Cisco Systems, Inc. | | | 44,064 | | | | 1,264,196 | |
Facebook, Inc. Cl A* | | | 14,703 | | | | 1,680,259 | |
HP, Inc. | | | 58,962 | | | | 739,973 | |
Intel Corp. | | | 50,920 | | | | 1,670,176 | |
Microsoft Corp. | | | 61,268 | | | | 3,135,084 | |
NVIDIA Corp. | | | 15,562 | | | | 731,570 | |
Oracle Corp. | | | 44,796 | | | | 1,833,500 | |
QUALCOMM, Inc. | | | 19,121 | | | | 1,024,312 | |
Total System Services, Inc. | | | 15,259 | | | | 810,405 | |
| | | | | | | | |
| | | | | | | 22,081,389 | |
| | | | | | | | |
MATERIALS (1.6%) | | | | | | | | |
Eastman Chemical Co. | | | 9,247 | | | | 627,871 | |
Freeport-McMoRan Copper & Gold, Inc. | | | 43,933 | | | | 489,414 | |
International Paper Co. | | | 23,430 | | | | 992,963 | |
LyondellBasell Inds. NV Cl A | | | 10,106 | | | | 752,089 | |
| | | | | | | | |
| | | | | | | 2,862,337 | |
| | | | | | | | |
TELECOMMUNICATION SERVICES (2.0%) | | | | | | | | |
AT&T, Inc. | | | 33,914 | | | | 1,465,424 | |
CenturyLink, Inc. | | | 17,319 | | | | 502,424 | |
Verizon Communications, Inc. | | | 28,004 | | | | 1,563,743 | |
| | | | | | | | |
| | | | | | | 3,531,591 | |
| | | | | | | | |
UTILITIES (1.4%) | | | | | | | | |
Ameren Corp. | | | 4,097 | | | | 219,517 | |
Duke Energy Corp. | | | 5,861 | | | | 502,815 | |
Edison International | | | 7,025 | | | | 545,632 | |
FirstEnergy Corp. | | | 14,854 | | | | 518,553 | |
Sempra Energy | | | 6,388 | | | | 728,360 | |
| | | | | | | | |
| | | | | | | 2,514,877 | |
| | | | | | | | |
TOTAL COMMON STOCKS
(Cost: $80,627,957) 55.1% | | | | 98,893,004 | |
| | | | | |
| | | | | | | | | | | | | | | | |
| | | Rating** | | Rate(%) | | | Maturity | | Face Amount | | | Value | |
LONG-TERM DEBT SECURITIES: | | | | | | | | | | | | | | | | |
U.S. GOVERNMENT (11.9%) | | | | | | | | | | | |
U.S. Treasury Note | | AA+ | | | 0.50 | | | 03/31/17 | | | 1,200,000 | | | | 1,200,106 | |
U.S. Treasury Note | | AA+ | | | 0.88 | | | 11/30/17 | | | 1,250,000 | | | | 1,255,176 | |
U.S. Treasury Note | | AA+ | | | 1.50 | | | 02/28/23 | | | 500,000 | | | | 507,266 | |
U.S. Treasury Note | | AA+ | | | 1.63 | | | 02/15/26 | | | 1,000,000 | | | | 1,011,250 | |
U.S. Treasury Note | | AA+ | | | 2.00 | | | 02/15/25 | | | 500,000 | | | | 523,125 | |
U.S. Treasury Note | | AA+ | | | 2.13 | | | 05/15/25 | | | 1,000,000 | | | | 1,056,289 | |
U.S. Treasury Strip | | AA+ | | | 0.00 | | | 11/15/21 | | | 7,050,000 | | | | 6,620,209 | |
U.S. Treasury Strip | | AA+ | | | 0.00 | | | 08/15/28 | | | 6,000,000 | | | | 4,826,767 | |
U.S. Treasury Strip | | AA+ | | | 0.00 | | | 08/15/29 | | | 5,500,000 | | | | 4,313,837 | |
| | | | | | | | | | | | | | | | |
| | | | | | | | | | | | | | | 21,314,025 | |
| | | | | | | | | | | | | | | | |
U.S. GOVERNMENT AGENCIES (11.8%) | | | | | | | | | | | | | | | | |
MORTGAGE-BACKED OBLIGATIONS (11.5%) | | | | | | | | | | | |
FHARM | | AA+ | | | 2.76 | | | 02/01/36 | | | 30,045 | | | | 31,788 | |
FHARM | | AA+ | | | 2.90 | | | 04/01/37 | | | 46,745 | | | | 49,765 | |
FHARM | | AA+ | | | 2.93 | | | 05/01/37 | | | 31,292 | | | | 32,690 | |
FHARM | | AA+ | | | 4.54 | | | 09/01/39 | | | 31,934 | | | | 33,622 | |
FHARM | | AA+ | | | 5.84 | | | 03/01/37 | | | 9,371 | | | | 9,873 | |
FHLMC | | AA+ | | | 2.50 | | | 09/01/27 | | | 292,380 | | | | 302,922 | |
FHLMC | | AA+ | | | 3.00 | | | 06/01/27 | | | 172,015 | | | | 180,889 | |
FHLMC | | AA+ | | | 3.00 | | | 08/01/27 | | | 184,532 | | | | 194,049 | |
FHLMC | | AA+ | | | 3.00 | | | 10/15/37 | | | 262,678 | | | | 274,081 | |
FHLMC | | AA+ | | | 3.00 | | | 11/01/42 | | | 262,193 | | | | 274,714 | |
FHLMC | | AA+ | | | 3.00 | | | 04/01/43 | | | 290,651 | | | | 305,145 | |
FHLMC | | AA+ | | | 3.50 | | | 01/01/43 | | | 387,546 | | | | 409,367 | |
FHLMC | | AA+ | | | 3.50 | | | 06/01/45 | | | 392,164 | | | | 416,788 | |
FHLMC | | AA+ | | | 3.50 | | | 07/01/45 | | | 449,540 | | | | 480,739 | |
FHLMC | | AA+ | | | 4.00 | | | 02/01/25 | | | 46,189 | | | | 49,033 | |
FHLMC | | AA+ | | | 4.00 | | | 03/01/41 | | | 193,060 | | | | 207,521 | |
FHLMC | | AA+ | | | 4.00 | | | 07/01/41 | | | 232,192 | | | | 253,493 | |
FHLMC | | AA+ | | | 4.00 | | | 11/01/42 | | | 158,928 | | | | 171,450 | |
FHLMC | | AA+ | | | 4.00 | | | 01/01/43 | | | 306,928 | | | | 331,588 | |
FHLMC | | AA+ | | | 4.00 | | | 01/01/44 | | | 278,117 | | | | 299,527 | |
FHLMC | | AA+ | | | 4.00 | | | 06/01/45 | | | 392,307 | | | | 425,051 | |
FHLMC | | AA+ | | | 4.50 | | | 08/01/34 | | | 44,690 | | | | 48,916 | |
FHLMC | | AA+ | | | 4.50 | | | 08/15/35 | | | 48,765 | | | | 52,414 | |
FHLMC | | AA+ | | | 4.50 | | | 02/01/44 | | | 263,268 | | | | 287,299 | |
FHLMC | | AA+ | | | 5.00 | | | 02/01/26 | | | 25,315 | | | | 27,938 | |
FHLMC | | AA+ | | | 5.00 | | | 10/01/40 | | | 291,814 | | | | 322,622 | |
FHLMC | | AA+ | | | 5.50 | | | 07/01/32 | | | 49,682 | | | | 55,767 | |
FHLMC | | AA+ | | | 5.50 | | | 05/01/33 | | | 59,540 | | | | 66,630 | |
FHLMC | | AA+ | | | 5.50 | | | 06/01/37 | | | 112,752 | | | | 127,685 | |
MUTUAL OF AMERICA INVESTMENT CORPORATION - COMPOSITE FUND
PORTFOLIO OF INVESTMENTS IN SECURITIES
June 30, 2016 (Unaudited)
| | | | | | | | | | | | | | | | |
FHLMC | | AA+ | | | 6.00 | | | 03/15/32 | | | 45,240 | | | | 50,696 | |
FHLMC Strip | | AA+ | | | 3.00 | | | 01/15/43 | | | 373,119 | | | | 389,142 | |
FNMA | | AA+ | | | 2.41 | | | 05/01/43 | | | 393,785 | | | | 406,325 | |
FNMA | | AA+ | | | 3.00 | | | 06/01/33 | | | 365,777 | | | | 385,603 | |
FNMA | | AA+ | | | 3.00 | | | 09/01/33 | | | 311,327 | | | | 328,194 | |
FNMA | | AA+ | | | 3.00 | | | 12/01/42 | | | 364,224 | | | | 373,871 | |
FNMA | | AA+ | | | 3.00 | | | 02/01/43 | | | 206,938 | | | | 214,949 | |
FNMA | | AA+ | | | 3.00 | | | 03/01/43 | | | 395,991 | | | | 415,897 | |
FNMA | | AA+ | | | 3.00 | | | 09/01/43 | | | 411,193 | | | | 427,604 | |
FNMA | | AA+ | | | 3.50 | | | 03/25/28 | | | 291,966 | | | | 313,700 | |
FNMA | | AA+ | | | 3.50 | | | 08/01/38 | | | 270,039 | | | | 285,432 | |
FNMA | | AA+ | | | 3.50 | | | 10/01/41 | | | 165,696 | | | | 176,487 | |
FNMA | | AA+ | | | 3.50 | | | 11/01/41 | | | 309,027 | | | | 327,321 | |
FNMA | | AA+ | | | 3.50 | | | 12/01/41 | | | 299,026 | | | | 318,512 | |
FNMA | | AA+ | | | 3.50 | | | 04/01/42 | | | 359,514 | | | | 383,677 | |
FNMA | | AA+ | | | 3.50 | | | 04/01/42 | | | 422,909 | | | | 447,767 | |
FNMA | | AA+ | | | 3.50 | | | 08/01/42 | | | 335,010 | | | | 354,287 | |
FNMA | | AA+ | | | 3.50 | | | 10/01/42 | | | 319,558 | | | | 338,201 | |
FNMA | | AA+ | | | 3.50 | | | 01/01/44 | | | 127,486 | | | | 132,521 | |
FNMA | | AA+ | | | 4.00 | | | 05/01/19 | | | 20,434 | | | | 21,169 | |
FNMA | | AA+ | | | 4.00 | | | 07/25/26 | | | 407,798 | | | | 456,522 | |
FNMA | | AA+ | | | 4.00 | | | 01/01/31 | | | 225,417 | | | | 244,046 | |
FNMA | | AA+ | | | 4.00 | | | 11/01/40 | | | 211,081 | | | | 226,226 | |
FNMA | | AA+ | | | 4.00 | | | 05/01/41 | | | 228,366 | | | | 250,453 | |
FNMA | | AA+ | | | 4.00 | | | 11/01/45 | | | 489,565 | | | | 532,102 | |
FNMA | | AA+ | | | 4.50 | | | 05/01/18 | | | 13,745 | | | | 14,097 | |
FNMA | | AA+ | | | 4.50 | | | 05/01/30 | | | 77,753 | | | | 84,824 | |
FNMA | | AA+ | | | 4.50 | | | 04/01/31 | | | 101,969 | | | | 111,919 | |
FNMA | | AA+ | | | 4.50 | | | 08/01/33 | | | 38,089 | | | | 41,724 | |
FNMA | | AA+ | | | 4.50 | | | 09/01/33 | | | 87,555 | | | | 95,709 | |
FNMA | | AA+ | | | 4.50 | | | 06/01/34 | | | 65,714 | | | | 72,051 | |
FNMA | | AA+ | | | 4.50 | | | 08/01/35 | | | 53,854 | | | | 58,745 | |
FNMA | | AA+ | | | 4.50 | | | 12/01/35 | | | 54,888 | | | | 60,076 | |
FNMA | | AA+ | | | 4.50 | | | 05/01/39 | | | 126,362 | | | | 139,177 | |
FNMA | | AA+ | | | 4.50 | | | 05/01/39 | | | 76,580 | | | | 84,702 | |
FNMA | | AA+ | | | 4.50 | | | 05/01/40 | | | 107,376 | | | | 118,416 | |
FNMA | | AA+ | | | 5.00 | | | 04/01/18 | | | 35,505 | | | | 36,528 | |
FNMA | | AA+ | | | 5.00 | | | 06/01/33 | | | 85,268 | | | | 95,198 | |
FNMA | | AA+ | | | 5.00 | | | 10/01/33 | | | 82,901 | | | | 93,031 | |
FNMA | | AA+ | | | 5.00 | | | 11/01/33 | | | 246,649 | | | | 275,260 | |
FNMA | | AA+ | | | 5.00 | | | 11/01/33 | | | 57,389 | | | | 64,067 | |
FNMA | | AA+ | | | 5.00 | | | 03/01/34 | | | 31,389 | | | | 35,036 | |
FNMA | | AA+ | | | 5.00 | | | 04/01/34 | | | 51,735 | | | | 58,107 | |
FNMA | | AA+ | | | 5.00 | | | 09/01/35 | | | 32,861 | | | | 36,577 | |
FNMA | | AA+ | | | 5.00 | | | 11/25/35 | | | 117,328 | | | | 130,807 | |
FNMA | | AA+ | | | 5.00 | | | 08/01/37 | | | 258,571 | | | | 287,888 | |
FNMA | | AA+ | | | 5.00 | | | 05/01/39 | | | 110,307 | | | | 123,983 | |
FNMA | | AA+ | | | 5.00 | | | 06/01/40 | | | 59,428 | | | | 66,404 | |
FNMA | | AA+ | | | 5.50 | | | 04/01/17 | | | 1,184 | | | | 1,196 | |
FNMA | | AA+ | | | 5.50 | | | 05/01/17 | | | 247 | | | | 248 | |
FNMA | | AA+ | | | 5.50 | | | 06/01/17 | | | 1,064 | | | | 1,066 | |
FNMA | | AA+ | | | 5.50 | | | 03/01/34 | | | 15,826 | | | | 17,894 | |
FNMA | | AA+ | | | 5.50 | | | 05/01/34 | | | 209,033 | | | | 237,053 | |
FNMA | | AA+ | | | 5.50 | | | 07/01/34 | | | 55,078 | | | | 62,448 | |
FNMA | | AA+ | | | 5.50 | | | 09/01/34 | | | 27,691 | | | | 31,325 | |
FNMA | | AA+ | | | 5.50 | | | 09/01/34 | | | 87,009 | | | | 98,568 | |
FNMA | | AA+ | | | 5.50 | | | 10/01/34 | | | 36,651 | | | | 41,131 | |
FNMA | | AA+ | | | 5.50 | | | 02/01/35 | | | 43,938 | | | | 49,866 | |
FNMA | | AA+ | | | 5.50 | | | 02/01/35 | | | 73,119 | | | | 83,652 | |
FNMA | | AA+ | | | 5.50 | | | 08/01/35 | | | 28,165 | | | | 31,945 | |
FNMA | | AA+ | | | 5.50 | | | 08/01/37 | | | 15,053 | | | | 16,918 | |
FNMA | | AA+ | | | 5.50 | | | 11/01/38 | | | 15,300 | | | | 16,333 | |
FNMA | | AA+ | | | 5.50 | | | 06/01/48 | | | 27,026 | | | | 29,473 | |
FNMA | | AA+ | | | 6.00 | | | 03/01/17 | | | 452 | | | | 457 | |
FNMA | | AA+ | | | 6.00 | | | 05/01/23 | | | 24,409 | | | | 27,986 | |
FNMA | | AA+ | | | 6.00 | | | 04/01/32 | | | 11,578 | | | | 13,222 | |
FNMA | | AA+ | | | 6.00 | | | 05/01/32 | | | 16,502 | | | | 19,088 | |
FNMA | | AA+ | | | 6.00 | | | 04/01/33 | | | 107,377 | | | | 125,341 | |
FNMA | | AA+ | | | 6.00 | | | 05/01/33 | | | 51,617 | | | | 59,224 | |
FNMA | | AA+ | | | 6.00 | | | 06/01/34 | | | 25,626 | | | | 29,451 | |
FNMA | | AA+ | | | 6.00 | | | 09/01/34 | | | 18,131 | | | | 21,027 | |
FNMA | | AA+ | | | 6.00 | | | 10/01/34 | | | 40,228 | | | | 46,654 | |
FNMA | | AA+ | | | 6.00 | | | 11/01/34 | | | 13,575 | | | | 15,502 | |
FNMA | | AA+ | | | 6.00 | | | 12/01/36 | | | 45,034 | | | | 51,842 | |
FNMA | | AA+ | | | 6.00 | | | 01/01/37 | | | 48,856 | | | | 56,468 | |
FNMA | | AA+ | | | 6.00 | | | 04/01/37 | | | 15,737 | | | | 17,463 | |
FNMA | | AA+ | | | 6.00 | | | 05/01/37 | | | 13,040 | | | | 14,617 | |
FNMA | | AA+ | | | 6.00 | | | 06/01/37 | | | 19,495 | | | | 21,079 | |
FNMA | | AA+ | | | 6.00 | | | 10/25/44 | | | 102,861 | | | | 123,152 | |
FNMA | | AA+ | | | 6.00 | | | 02/25/47 | | | 95,195 | | | | 108,686 | |
FNMA | | AA+ | | | 6.00 | | | 12/25/49 | | | 59,699 | | | | 69,183 | |
MUTUAL OF AMERICA INVESTMENT CORPORATION - COMPOSITE FUND
PORTFOLIO OF INVESTMENTS IN SECURITIES
June 30, 2016 (Unaudited)
| | | | | | | | | | | | | | | | |
FNMA | | AA+ | | | 6.50 | | | 09/01/16 | | | 73 | | | | 73 | |
FNMA | | AA+ | | | 6.50 | | | 03/01/17 | | | 1,014 | | | | 1,019 | |
FNMA | | AA+ | | | 6.50 | | | 05/01/17 | | | 522 | | | | 525 | |
FNMA | | AA+ | | | 6.50 | | | 06/01/17 | | | 2,671 | | | | 2,705 | |
FNMA | | AA+ | | | 6.50 | | | 05/01/32 | | | 25,160 | | | | 28,954 | |
FNMA | | AA+ | | | 6.50 | | | 05/01/32 | | | 11,501 | | | | 13,235 | |
FNMA | | AA+ | | | 6.50 | | | 07/01/32 | | | 4,065 | | | | 4,678 | |
FNMA | | AA+ | | | 6.50 | | | 07/01/34 | | | 36,489 | | | | 42,068 | |
FNMA | | AA+ | | | 6.50 | | | 05/01/37 | | | 51,170 | | | | 55,283 | |
FNMA | | AA+ | | | 6.50 | | | 09/01/37 | | | 17,983 | | | | 20,695 | |
FNMA | | AA+ | | | 7.00 | | | 09/01/31 | | | 16,723 | | | | 19,066 | |
FNMA | | AA+ | | | 7.00 | | | 04/01/32 | | | 8,159 | | | | 9,046 | |
FNMA | | AA+ | | | 7.50 | | | 06/01/31 | | | 6,297 | | | | 7,450 | |
FNMA | | AA+ | | | 7.50 | | | 02/01/32 | | | 6,267 | | | | 7,585 | |
FNMA | | AA+ | | | 7.50 | | | 06/01/32 | | | 5,655 | | | | 6,973 | |
FNMA | | AA+ | | | 8.00 | | | 04/01/32 | | | 1,585 | | | | 1,696 | |
FNMA Strip | | AA+ | | | 3.00 | | | 08/25/42 | | | 324,467 | | | | 333,247 | |
GNMA (2) | | AA+ | | | 3.50 | | | 09/20/33 | | | 36,904 | | | | 37,164 | |
GNMA (2) | | AA+ | | | 4.00 | | | 08/15/41 | | | 244,784 | | | | 265,920 | |
GNMA (2) | | AA+ | | | 4.00 | | | 01/15/42 | | | 277,363 | | | | 299,994 | |
GNMA (2) | | AA+ | | | 4.00 | | | 03/20/42 | | | 177,809 | | | | 190,134 | |
GNMA (2) | | AA+ | | | 4.00 | | | 08/20/42 | | | 197,870 | | | | 212,152 | |
GNMA (2) | | AA+ | | | 4.50 | | | 04/20/31 | | | 113,194 | | | | 122,877 | |
GNMA (2) | | AA+ | | | 4.50 | | | 10/15/40 | | | 201,214 | | | | 227,336 | |
GNMA (2) | | AA+ | | | 4.50 | | | 10/20/43 | | | 384,797 | | | | 418,939 | |
GNMA (2) | | AA+ | | | 5.00 | | | 10/15/24 | | | 216,205 | | | | 243,946 | |
GNMA (2) | | AA+ | | | 5.00 | | | 04/15/39 | | | 164,914 | | | | 188,062 | |
GNMA (2) | | AA+ | | | 5.00 | | | 06/20/39 | | | 219,959 | | | | 245,223 | |
GNMA (2) | | AA+ | | | 5.00 | | | 11/15/39 | | | 114,837 | | | | 128,585 | |
GNMA (2) | | AA+ | | | 6.50 | | | 04/15/31 | | | 3,892 | | | | 4,466 | |
GNMA (2) | | AA+ | | | 6.50 | | | 10/15/31 | | | 3,770 | | | | 4,503 | |
GNMA (2) | | AA+ | | | 6.50 | | | 12/15/31 | | | 1,581 | | | | 1,804 | |
GNMA (2) | | AA+ | | | 6.50 | | | 05/15/32 | | | 7,581 | | | | 8,649 | |
GNMA (2) | | AA+ | | | 7.00 | | | 05/15/31 | | | 3,375 | | | | 4,173 | |
GNMA (2) | | AA+ | | | 7.00 | | | 05/15/32 | | | 714 | | | | 740 | |
Vendee Mortgage Trust (2) | | AA+ | | | 5.25 | | | 01/15/32 | | | 182,025 | | | | 202,365 | |
| | | | | | | | | | | | | | | | |
| | | | | | | | | | | | | | | 20,609,284 | |
| | | | | | | | | | | | | | | | |
NON-MORTGAGE-BACKED OBLIGATIONS (0.3%) | | | | | | | | | | | |
FHLMC | | AA+ | | | 0.00 | | | 11/29/19 | | | 500,000 | | | | 479,695 | |
| | | | | | | | | | | | | | | | |
CORPORATE DEBT (17.0%) | | | | | | | | | | | | | | | | |
CONSUMER DISCRETIONARY (3.3%) | | | | | | | | | | | |
Advance Auto Parts, Inc. | | BBB- | | | 4.50 | | | 12/01/23 | | | 100,000 | | | | 107,409 | |
Advance Auto Parts, Inc. | | BBB- | | | 5.75 | | | 05/01/20 | | | 270,000 | | | | 299,671 | |
AutoZone, Inc. | | BBB | | | 4.00 | | | 11/15/20 | | | 250,000 | | | | 269,017 | |
Coach, Inc. | | BBB- | | | 4.25 | | | 04/01/25 | | | 100,000 | | | | 102,115 | |
Dollar General Corp. | | BBB | | | 3.25 | | | 04/15/23 | | | 300,000 | | | | 311,451 | |
Expedia, Inc. | | BBB- | | | 5.95 | | | 08/15/20 | | | 250,000 | | | | 279,642 | |
Family Dollar Stores, Inc. | | BBB | | | 5.00 | | | 02/01/21 | | | 300,000 | | | | 318,000 | |
Harman Int’l. Industries, Inc. | | BBB- | | | 4.15 | | | 05/15/25 | | | 300,000 | | | | 312,861 | |
Kohl’s Corp. | | BBB | | | 3.25 | | | 02/01/23 | | | 250,000 | | | | 250,613 | |
Kohl’s Corp. | | BBB | | | 4.00 | | | 11/01/21 | | | 100,000 | | | | 104,599 | |
Lowe’s Cos., Inc. | | A- | | | 3.12 | | | 04/15/22 | | | 300,000 | | | | 320,700 | |
Macy’s Retail Hldgs., Inc. | | BBB | | | 2.88 | | | 02/15/23 | | | 216,000 | | | | 205,486 | |
Marriott International, Inc. | | BBB | | | 3.13 | | | 10/15/21 | | | 25,000 | | | | 25,984 | |
Marriott International, Inc. | | BBB | | | 3.25 | | | 09/15/22 | | | 350,000 | | | | 363,550 | |
Mattel, Inc. | | BBB | | | 3.15 | | | 03/15/23 | | | 350,000 | | | | 352,209 | |
NVR, Inc. | | BBB+ | | | 3.95 | | | 09/15/22 | | | 300,000 | | | | 317,954 | |
O’Reilly Automotive, Inc. | | BBB+ | | | 3.80 | | | 09/01/22 | | | 300,000 | | | | 323,032 | |
Omnicom Group, Inc. | | BBB+ | | | 3.63 | | | 05/01/22 | | | 100,000 | | | | 106,250 | |
Omnicom Group, Inc. | | BBB+ | | | 4.45 | | | 08/15/20 | | | 250,000 | | | | 275,804 | |
Staples, Inc. | | BBB- | | | 4.38 | | | 01/12/23 | | | 275,000 | | | | 280,062 | |
Tupperware Brands Corp. | | BBB- | | | 4.75 | | | 06/01/21 | | | 350,000 | | | | 376,471 | |
Viacom, Inc. | | BBB- | | | 3.25 | | | 03/15/23 | | | 350,000 | | | | 344,332 | |
Wynn Las Vegas LLC | | BB+ | | | 5.38 | | | 03/15/22 | | | 300,000 | | | | 301,875 | |
| | | | | | | | | | | | | | | | |
| | | | | | | | | | | | | | | 5,949,087 | |
| | | | | | | | | | | | | | | | |
CONSUMER STAPLES (1.2%) | | | | | | | | | | | |
Avon Products, Inc. | | B | | | 4.20 | | | 07/15/18 | | | 150,000 | | | | 138,375 | |
CVS Health Corp. | | BBB+ | | | 6.13 | | | 08/15/16 | | | 250,000 | | | | 251,494 | |
Edgewell Personal Care Co. | | BB+ | | | 4.70 | | | 05/19/21 | | | 275,000 | | | | 284,835 | |
Ingredion, Inc. | | BBB | | | 4.63 | | | 11/01/20 | | | 250,000 | | | | 274,268 | |
Molson Coors Brewing Co. | | BBB- | | | 3.50 | | | 05/01/22 | | | 400,000 | | | | 424,414 | |
Sysco Corp. | | BBB+ | | | 2.60 | | | 06/12/22 | | | 300,000 | | | | 305,409 | |
Sysco Corp. | | BBB+ | | | 3.75 | | | 10/01/25 | | | 100,000 | | | | 106,996 | |
Whole Foods Market, Inc.† | | BBB- | | | 5.20 | | | 12/03/25 | | | 300,000 | | | | 323,456 | |
| | | | | | | | | | | | | | | | |
| | | | | | | | | | | | | | | 2,109,247 | |
| | | | | | | | | | | | | | | | |
ENERGY (1.6%) | | | | | | | | | | | |
Cameron International Corp. | | AA- | | | 4.50 | | | 06/01/21 | | | 300,000 | | | | 322,878 | |
Energen Corp. | | BB | | | 4.63 | | | 09/01/21 | | | 250,000 | | | | 235,000 | |
EQT Corp. | | BBB | | | 4.88 | | | 11/15/21 | | | 210,000 | | | | 223,298 | |
FMC Technologies, Inc. | | BBB | | | 2.00 | | | 10/01/17 | | | 250,000 | | | | 248,279 | |
MUTUAL OF AMERICA INVESTMENT CORPORATION - COMPOSITE FUND
PORTFOLIO OF INVESTMENTS IN SECURITIES
June 30, 2016 (Unaudited)
| | | | | | | | | | | | | | | | |
Marathon Oil Corp. | | BBB- | | | 2.80 | | | 11/01/22 | | | 350,000 | | | | 317,424 | |
Murphy Oil Corp. | | BBB- | | | 2.50 | | | 12/01/17 | | | 200,000 | | | | 199,412 | |
Noble Corp. | | BBB | | | 7.50 | | | 03/15/19 | | | 800,000 | | | | 808,000 | |
Rowan Companies PLC | | BBB- | | | 4.88 | | | 06/01/22 | | | 300,000 | | | | 262,500 | |
Seacor Hldgs., Inc. | | B | | | 7.38 | | | 10/01/19 | | | 250,000 | | | | 243,750 | |
| | | | | | | | | | | | | | | | |
| | | | | | | | | | | | | | | 2,860,541 | |
| | | | | | | | | | | | | | | | |
FINANCIALS (3.9%) | | | | | | | | | | | |
Aflac, Inc. | | A- | | | 4.00 | | | 02/15/22 | | | 300,000 | | | | 330,957 | |
Alleghany Corp. | | BBB+ | | | 5.63 | | | 09/15/20 | | | 300,000 | | | | 335,910 | |
American Express Co. | | BBB | | | 3.63 | | | 12/05/24 | | | 250,000 | | | | 256,403 | |
American Tower Corp. | | BBB- | | | 4.50 | | | 01/15/18 | | | 250,000 | | | | 260,820 | |
Barrick N.A. Finance LLC | | BBB- | | | 4.40 | | | 05/30/21 | | | 250,000 | | | | 269,178 | |
Berkley (W.R.) Corp. | | BBB+ | | | 7.38 | | | 09/15/19 | | | 250,000 | | | | 289,955 | |
Block Financial LLC | | BBB | | | 5.25 | | | 10/01/25 | | | 350,000 | | | | 375,221 | |
Capital One Financial Corp. | | BBB | | | 4.75 | | | 07/15/21 | | | 300,000 | | | | 333,941 | |
Citizens Financial Group, Inc. | | BBB | | | 3.75 | | | 07/01/24 | | | 250,000 | | | | 251,040 | |
Fairfax U.S., Inc.† | | BBB- | | | 4.88 | | | 08/13/24 | | | 250,000 | | | | 252,216 | |
Fifth Third Bancorp | | BBB | | | 4.30 | | | 01/16/24 | | | 300,000 | | | | 319,520 | |
First Republic Bank | | A- | | | 2.38 | | | 06/17/19 | | | 150,000 | | | | 151,754 | |
First Tennessee Bank | | BBB- | | | 2.95 | | | 12/01/19 | | | 350,000 | | | | 351,596 | |
Government Pptys. Income Trust | | BBB- | | | 3.75 | | | 08/15/19 | | | 350,000 | | | | 359,014 | |
Healthcare Realty Trust | | BBB- | | | 3.75 | | | 04/15/23 | | | 250,000 | | | | 250,842 | |
Hospitality Properties Trust | | BBB- | | | 5.00 | | | 08/15/22 | | | 250,000 | | | | 268,672 | |
Lincoln National Corp. | | A- | | | 4.00 | | | 09/01/23 | | | 250,000 | | | | 259,909 | |
Moody’s Corp. | | BBB+ | | | 4.50 | | | 09/01/22 | | | 250,000 | | | | 277,940 | |
National Retail Pptys., Inc. | | BBB+ | | | 3.80 | | | 10/15/22 | | | 250,000 | | | | 264,091 | |
Pacific LifeCorp.† | | BBB+ | | | 6.00 | | | 02/10/20 | | | 100,000 | | | | 111,800 | |
Penske Truck Leasing Co. LP† | | BBB- | | | 3.38 | | | 03/15/18 | | | 300,000 | | | | 307,337 | |
Prudential Financial, Inc. | | A | | | 4.50 | | | 11/16/21 | | | 250,000 | | | | 280,793 | |
Signet UK Finance PLC | | BBB- | | | 4.70 | | | 06/15/24 | | | 250,000 | | | | 243,986 | |
Ventas Realty LP/Capital Corp. | | BBB+ | | | 4.00 | | | 04/30/19 | | | 100,000 | | | | 105,378 | |
Ventas Realty LP/Capital Corp. | | BBB+ | | | 4.75 | | | 06/01/21 | | | 200,000 | | | | 222,493 | |
Welltower, Inc. | | BBB | | | 6.13 | | | 04/15/20 | | | 250,000 | | | | 284,788 | |
| | | | | | | | | | | | | | | | |
| | | | | | | | | | | | | | | 7,015,554 | |
| | | | | | | | | | | | | | | | |
HEALTH CARE (1.8%) | | | | | | | | | | | |
Agilent Technologies, Inc. | | BBB+ | | | 5.00 | | | 07/15/20 | | | 290,000 | | | | 319,666 | |
Anthem, Inc. | | A | | | 4.35 | | | 08/15/20 | | | 250,000 | | | | 271,137 | |
Bio-Rad Laboratories, Inc. | | BBB | | | 4.88 | | | 12/15/20 | | | 200,000 | | | | 221,284 | |
Medco Health Solutions, Inc. | | BBB+ | | | 4.13 | | | 09/15/20 | | | 250,000 | | | | 269,628 | |
Owens & Minor, Inc. | | BBB | | | 3.88 | | | 09/15/21 | | | 400,000 | | | | 413,978 | |
PerkinElmer, Inc. | | BBB | | | 5.00 | | | 11/15/21 | | | 300,000 | | | | 332,606 | |
Pfizer, Inc. | | AA | | | 6.05 | | | 03/30/17 | | | 300,000 | | | | 311,499 | |
MUTUAL OF AMERICA INVESTMENT CORPORATION - COMPOSITE FUND
PORTFOLIO OF INVESTMENTS IN SECURITIES
June 30, 2016 (Unaudited)
| | | | | | | | | | | | | | | | |
Quest Diagnostics, Inc. | | BBB+ | | | 4.70 | | | 04/01/21 | | | 150,000 | | | | 165,050 | |
Quest Diagnostics, Inc. | | BBB+ | | | 4.75 | | | 01/30/20 | | | 250,000 | | | | 274,179 | |
Thermo Fisher Scientific, Inc. | | BBB | | | 3.60 | | | 08/15/21 | | | 375,000 | | | | 397,533 | |
Zimmer Biomet Hldgs., Inc. | | BBB | | | 3.15 | | | 04/01/22 | | | 250,000 | | | | 256,250 | |
| | | | | | | | | | | | | | | | |
| | | | | | | | | | | | | | | 3,232,810 | |
| | | | | | | | | | | | | | | | |
INDUSTRIALS (1.3%) | | | | | | | | | | | | | | | | |
Crane Co. | | BBB | | | 2.75 | | | 12/15/18 | | | 350,000 | | | | 359,728 | |
Dun & Bradstreet Corp. | | BBB- | | | 3.25 | | | 12/01/17 | | | 400,000 | | | | 402,811 | |
Equifax, Inc. | | BBB+ | | | 3.30 | | | 12/15/22 | | | 300,000 | | | | 316,737 | |
Harsco Corp. | | BB- | | | 5.75 | | | 05/15/18 | | | 250,000 | | | | 235,625 | |
Hunt (J.B.) Transport Svcs., Inc. | | BBB+ | | | 3.30 | | | 08/15/22 | | | 200,000 | | | | 208,697 | |
L-3 Communications Corp. | | BBB- | | | 4.75 | | | 07/15/20 | | | 250,000 | | | | 269,833 | |
Pentair PLC | | BBB- | | | 5.00 | | | 05/15/21 | | | 250,000 | | | | 269,476 | |
Pitney Bowes, Inc. | | BBB | | | 5.25 | | | 01/15/37 | | | 250,000 | | | | 262,012 | |
| | | | | | | | | | | | | | | | |
| | | | | | | | | | | | | | | 2,324,919 | |
| | | | | | | | | | | | | | | | |
INFORMATION TECHNOLOGY (1.6%) | | | | | | | | | | | | | | | | |
Applied Materials, Inc. | | A- | | | 3.90 | | | 10/01/25 | | | 350,000 | | | | 388,072 | |
Arrow Electronics, Inc. | | BBB- | | | 4.50 | | | 03/01/23 | | | 300,000 | | | | 317,618 | |
eBay, Inc. | | BBB+ | | | 2.88 | | | 08/01/21 | | | 325,000 | | | | 335,632 | |
Fiserv, Inc. | | BBB | | | 4.75 | | | 06/15/21 | | | 360,000 | | | | 399,644 | |
Ingram Micro, Inc. | | BBB- | | | 5.00 | | | 08/10/22 | | | 200,000 | | | | 202,787 | |
Ingram Micro, Inc. | | BBB- | | | 5.25 | | | 09/01/17 | | | 100,000 | | | | 102,775 | |
Juniper Networks, Inc. | | BBB | | | 4.60 | | | 03/15/21 | | | 350,000 | | | | 375,684 | |
Symantec Corp. | | BBB- | | | 4.20 | | | 09/15/20 | | | 350,000 | | | | 364,846 | |
Tech Data Corp. | | BBB- | | | 3.75 | | | 09/21/17 | | | 100,000 | | | | 102,468 | |
Western Union Co. | | BBB | | | 5.93 | | | 10/01/16 | | | 300,000 | | | | 302,934 | |
| | | | | | | | | | | | | | | | |
| | | | | | | | | | | | | | | 2,892,460 | |
| | | | | | | | | | | | | | | | |
MATERIALS (1.2%) | | | | | | | | | | | | | | | | |
Alcoa, Inc. | | BBB- | | | 6.75 | | | 07/15/18 | | | 250,000 | | | | 270,625 | |
Freeport-McMoRan Copper & Gold | | BB | | | 3.55 | | | 03/01/22 | | | 300,000 | | | | 264,000 | |
Methanex Corp. | | BB+ | | | 3.25 | | | 12/15/19 | | | 250,000 | | | | 242,808 | |
Packaging Corp. of America | | BBB | | | 3.90 | | | 06/15/22 | | | 250,000 | | | | 265,053 | |
Packaging Corp. of America | | BBB | | | 4.50 | | | 11/01/23 | | | 150,000 | | | | 162,929 | |
Southern Copper Corp. | | BBB | | | 3.50 | | | 11/08/22 | | | 100,000 | | | | 99,299 | |
Teck Resources Ltd. | | B+ | | | 4.75 | | | 01/15/22 | | | 300,000 | | | | 253,470 | |
Valspar Corp. | | BBB | | | 3.95 | | | 01/15/26 | | | 350,000 | | | | 368,563 | |
Vulcan Materials Co. | | BBB | | | 7.00 | | | 06/15/18 | | | 250,000 | | | | 273,750 | |
| | | | | | | | | | | | | | | | |
| | | | | | | | | | | | | | | 2,200,497 | |
| | | | | | | | | | | | | | | | |
TELECOMMUNICATION SERVICES (0.4%) | | | | | | | | | | | | | | | | |
AT&T, Inc. | | BBB+ | | | 3.00 | | | 06/30/22 | | | 350,000 | | | | 358,426 | |
Verizon Communications, Inc. | | BBB+ | | | 4.50 | | | 09/15/20 | | | 325,000 | | | | 360,736 | |
| | | | | | | | | | | | | | | | |
| | | | | | | | | | | | | | | 719,162 | |
| | | | | | | | | | | | | | | | |
UTILITIES (0.7%) | | | | | | | | | | | | | | | | |
Constellation Energy | | BBB- | | | 5.15 | | | 12/01/20 | | | 340,000 | | | | 378,395 | |
Entergy Corp. | | BBB- | | | 5.13 | | | 09/15/20 | | | 250,000 | | | | 273,941 | |
National Fuel Gas Co. | | BBB | | | 4.90 | | | 12/01/21 | | | 250,000 | | | | 263,167 | |
National Fuel Gas Co. | | BBB | | | 5.20 | | | 07/15/25 | | | 100,000 | | | | 103,716 | |
SCANA Corp. | | BBB | | | 4.13 | | | 02/01/22 | | | 300,000 | | | | 311,687 | |
| | | | | | | | | | | | | | | | |
| | | | | | | | | | | | | | | 1,330,906 | |
| | | | | | | | | | | | | | | | |
TOTAL LONG-TERM DEBT SECURITIES
(Cost: $68,930,033) 40.7% | | | | | | | | | | | | | | | 73,038,187 | |
| | | | | | | | | | | | | | | | |
| | | | | |
| | | Rating** | | Rate(%) | | | Maturity | | Face Amount | | | Value | |
SHORT-TERM DEBT SECURITIES: | | | | | | | | | | | | | | | | |
COMMERCIAL PAPER (2.5%) | | | | | | | | | | | | | | | | |
Ralph Lauren Corp.† | | A-1 | | | 0.40 | | | 07/01/16 | | | 2,800,000 | | | | 2,800,000 | |
Ralph Lauren Corp.† | | A-1 | | | 0.40 | | | 07/01/16 | | | 1,000,000 | | | | 1,000,000 | |
Toyota Motor Credit Corp. | | A-1+ | | | 0.43 | | | 07/12/16 | | | 600,000 | | | | 599,921 | |
| | | | | | | | | | | | | | | | |
| | | | | | | | | | | | | | | 4,399,921 | |
| | | | | | | | | | | | | | | | |
TOTAL SHORT-TERM DEBT SECURITIES
(Cost: $4,399,921) 2.5% | | | | | | | | | | | | | | | 4,399,921 | |
| | | | | | | | | | | | | | | | |
TOTAL INVESTMENTS
(Cost: $153,957,911) 98.3% | | | | | | | | | | | | | | | 176,331,112 | |
| | | | | | | | | | | | | | | | |
OTHER NET ASSETS 1.7% | | | | | | | | | | | | | | | 3,098,026 | |
| | | | | | | | | | | | | | | | |
NET ASSETS 100.0% | | | | | | | | | | | | | | $ | 179,429,138 | |
| | | | | | | | | | | | | | | | |
The accompanying notes are an integral part of these portfolio schedules.
MUTUAL OF AMERICA INVESTMENT CORPORATION - RETIREMENT INCOME FUND
PORTFOLIO OF INVESTMENTS IN SECURITIES
June 30, 2016 (Unaudited)
| | | | | | | | |
| | | Shares | | | Value | |
COMMON STOCKS: | | | | | | | | |
DIVERSIFIED MUTUAL FUNDS (100.0%) | | | | | | | | |
Mutual of America Investment Corporation | | | | | | | | |
Bond Fund (30.5%) | | | 13,695,642 | | | | 20,473,684 | |
Equity Index Fund (20.6%) | | | 4,092,496 | | | | 13,850,049 | |
Mid-Cap Equity Index Fund (5.1%) | | | 1,622,619 | | | | 3,411,161 | |
Mid-Term Bond Fund (40.9%) | | | 25,364,837 | | | | 27,383,523 | |
Money Market Fund (2.9%) | | | 1,649,080 | | | | 1,972,792 | |
| | | | | | | | |
TOTAL INVESTMENTS
(Cost: $64,907,636) 100.0% | | | | | | | 67,091,209 | |
| | | | | | | | |
OTHER NET ASSETS -0.0% (3) | | | | | | | (275 | ) |
| | | | | | | | |
NET ASSETS 100.0% | | | | | | $ | 67,090,934 | |
| | | | | | | | |
The accompanying notes are an integral part of these portfolio schedules.
MUTUAL OF AMERICA INVESTMENT CORPORATION - 2010 RETIREMENT FUND
PORTFOLIO OF INVESTMENTS IN SECURITIES
June 30, 2016 (Unaudited)
| | | | | | | | |
| | | Shares | | | Value | |
COMMON STOCKS: | | | | | | | | |
DIVERSIFIED MUTUAL FUNDS (100.0%) | | | | | | | | |
Mutual of America Investment Corporation | | | | | | | | |
Bond Fund (26.5%) | | | 4,435,266 | | | | 6,630,302 | |
Equity Index Fund (24.9%) | | | 1,839,898 | | | | 6,226,682 | |
International Fund (2.9%) | | | 1,005,933 | | | | 733,739 | |
Mid-Cap Equity Index Fund (7.9%) | | | 938,601 | | | | 1,973,180 | |
Mid-Term Bond Fund (34.9%) | | | 8,064,308 | | | | 8,706,114 | |
Money Market Fund (2.9%) | | | 608,244 | | | | 727,642 | |
| | | | | | | | |
TOTAL INVESTMENTS
(Cost: $23,584,627) 100.0% | | | | | | | 24,997,659 | |
| | | | | | | | |
OTHER NET ASSETS -0.0% (3) | | | | | | | (97 | ) |
| | | | | | | | |
NET ASSETS 100.0% | | | | | | $ | 24,997,562 | |
| | | | | | | | |
The accompanying notes are an integral part of these portfolio schedules.
MUTUAL OF AMERICA INVESTMENT CORPORATION - 2015 RETIREMENT FUND
PORTFOLIO OF INVESTMENTS IN SECURITIES
June 30, 2016 (Unaudited)
| | | | | | | | |
| | | Shares | | | Value | |
COMMON STOCKS: | | | | | | | | |
DIVERSIFIED MUTUAL FUNDS (100.0%) | | | | | | | | |
Mutual of America Investment Corporation | | | | | | | | |
Bond Fund (25.2%) | | | 24,470,045 | | | | 36,580,392 | |
Equity Index Fund (28.2%) | | | 12,068,310 | | | | 40,842,238 | |
International Fund (5.4%) | | | 10,680,383 | | | | 7,790,389 | |
Mid-Cap Equity Index Fund (10.2%) | | | 7,007,633 | | | | 14,731,839 | |
Mid-Term Bond Fund (29.0%) | | | 39,048,036 | | | | 42,155,712 | |
Small Cap Growth Fund (1.0%) | | | 1,124,988 | | | | 1,467,610 | |
Small Cap Value Fund (1.0%) | | | 988,018 | | | | 1,469,708 | |
| | | | | | | | |
TOTAL INVESTMENTS
(Cost: $133,248,931) 100.0% | | | | | | | 145,037,888 | |
| | | | | | | | |
OTHER NET ASSETS -0.0% (3) | | | | | | | (1,455 | ) |
| | | | | | | | |
NET ASSETS 100.0% | | | | | | $ | 145,036,433 | |
| | | | | | | | |
The accompanying notes are an integral part of these portfolio schedules.
MUTUAL OF AMERICA INVESTMENT CORPORATION - 2020 RETIREMENT FUND
PORTFOLIO OF INVESTMENTS IN SECURITIES
June 30, 2016 (Unaudited)
| | | | | | | | |
| | | Shares | | | Value | |
COMMON STOCKS: | | | | | | | | |
DIVERSIFIED MUTUAL FUNDS (100.0%) | | | | | | | | |
Mutual of America Investment Corporation | | | | | | | | |
Bond Fund (25.0%) | | | 63,898,782 | | | | 95,522,609 | |
Equity Index Fund (33.1%) | | | 37,471,014 | | | | 126,811,466 | |
International Fund (7.8%) | | | 40,976,332 | | | | 29,888,588 | |
Mid-Cap Equity Index Fund (11.4%) | | | 20,770,523 | | | | 43,664,956 | |
Mid-Term Bond Fund (18.4%) | | | 65,175,370 | | | | 70,362,416 | |
Small Cap Growth Fund (2.0%) | | | 5,930,684 | | | | 7,736,909 | |
Small Cap Value Fund (2.3%) | | | 5,857,134 | | | | 8,712,674 | |
| | | | | | | | |
TOTAL INVESTMENTS
(Cost: $350,051,113) 100.0% | | | | | | | 382,699,618 | |
| | | | | | | | |
OTHER NET ASSETS -0.0% (3) | | | | | | | (1,392 | ) |
| | | | | | | | |
NET ASSETS 100.0% | | | | | | $ | 382,698,226 | |
| | | | | | | | |
The accompanying notes are an integral part of these portfolio schedules.
MUTUAL OF AMERICA INVESTMENT CORPORATION - 2025 RETIREMENT FUND
PORTFOLIO OF INVESTMENTS IN SECURITIES
June 30, 2016 (Unaudited)
| | | | | | | | |
| | | Shares | | | Value | |
COMMON STOCKS: | | | | | | | | |
DIVERSIFIED MUTUAL FUNDS (100.0%) | | | | | | | | |
Mutual of America Investment Corporation | | | | | | | | |
Bond Fund (23.7%) | | | 69,142,911 | | | | 103,362,083 | |
Equity Index Fund (38.0%) | | | 49,110,227 | | | | 166,201,534 | |
International Fund (8.8%) | | | 52,563,623 | | | | 38,340,484 | |
Mid-Cap Equity Index Fund (15.7%) | | | 32,554,492 | | | | 68,437,876 | |
Mid-Term Bond Fund (7.5%) | | | 30,172,072 | | | | 32,573,346 | |
Small Cap Growth Fund (3.0%) | | | 10,128,597 | | | | 13,213,323 | |
Small Cap Value Fund (3.3%) | | | 9,630,175 | | | | 14,325,193 | |
| | | | | | | | |
TOTAL INVESTMENTS
(Cost: $391,811,465) 100.0% | | | | | | | 436,453,839 | |
| | | | | | | | |
OTHER NET ASSETS -0.0% (3) | | | | | | | (1,527 | ) |
| | | | | | | | |
NET ASSETS 100.0% | | | | | | $ | 436,452,312 | |
| | | | | | | | |
The accompanying notes are an integral part of these portfolio schedules.
MUTUAL OF AMERICA INVESTMENT CORPORATION - 2030 RETIREMENT FUND
PORTFOLIO OF INVESTMENTS IN SECURITIES
June 30, 2016 (Unaudited)
| | | | | | | | |
| | | Shares | | | Value | |
COMMON STOCKS: | | | | | | | | |
DIVERSIFIED MUTUAL FUNDS (100.0%) | | | | | | | | |
Mutual of America Investment Corporation | | | | | | | | |
Bond Fund (23.4%) | | | 55,882,024 | | | | 83,538,318 | |
Equity Index Fund (40.3%) | | | 42,478,596 | | | | 143,758,400 | |
International Fund (9.3%) | | | 45,330,980 | | | | 33,064,916 | |
Mid-Cap Equity Index Fund (17.7%) | | | 30,036,964 | | | | 63,145,389 | |
Small Cap Growth Fund (4.5%) | | | 12,421,763 | | | | 16,204,885 | |
Small Cap Value Fund (4.8%) | | | 11,509,826 | | | | 17,121,234 | |
| | | | | | | | |
TOTAL INVESTMENTS
(Cost: $318,022,381) 100.0% | | | | | | | 356,833,142 | |
| | | | | | | | |
OTHER NET ASSETS -0.0% (3) | | | | | | | (1,239 | ) |
| | | | | | | | |
NET ASSETS 100.0% | | | | | | $ | 356,831,903 | |
| | | | | | | | |
The accompanying notes are an integral part of these portfolio schedules.
MUTUAL OF AMERICA INVESTMENT CORPORATION - 2035 RETIREMENT FUND
PORTFOLIO OF INVESTMENTS IN SECURITIES
June 30, 2016 (Unaudited)
| | | | | | | | |
| | | Shares | | | Value | |
COMMON STOCKS: | | | | | | | | |
DIVERSIFIED MUTUAL FUNDS (100.0%) | | | | | | | | |
Mutual of America Investment Corporation | | | | | | | | |
Bond Fund (15.5%) | | | 30,838,328 | | | | 46,100,371 | |
Equity Index Fund (41.0%) | | | 36,183,237 | | | | 122,453,298 | |
International Fund (11.2%) | | | 45,887,030 | | | | 33,470,505 | |
Mid-Cap Equity Index Fund (20.7%) | | | 29,423,621 | | | | 61,855,984 | |
Small Cap Growth Fund (5.8%) | | | 13,263,991 | | | | 17,303,619 | |
Small Cap Value Fund (5.8%) | | | 11,650,827 | | | | 17,330,979 | |
| | | | | | | | |
TOTAL INVESTMENTS
(Cost: $266,012,843) 100.0% | | | | | | | 298,514,756 | |
| | | | | | | | |
OTHER NET ASSETS -0.0% (3) | | | | | | | (1,029 | ) |
| | | | | | | | |
NET ASSETS 100.0% | | | | | | $ | 298,513,727 | |
| | | | | | | | |
The accompanying notes are an integral part of these portfolio schedules.
MUTUAL OF AMERICA INVESTMENT CORPORATION - 2040 RETIREMENT FUND
PORTFOLIO OF INVESTMENTS IN SECURITIES
June 30, 2016 (Unaudited)
| | | | | | | | |
| | | Shares | | | Value | |
COMMON STOCKS: | | | | | | | | |
DIVERSIFIED MUTUAL FUNDS (100.0%) | | | | | | | | |
Mutual of America Investment Corporation | | | | | | | | |
Bond Fund (12.2%) | | | 19,799,034 | | | | 29,597,675 | |
Equity Index Fund (39.0%) | | | 27,962,539 | | | | 94,632,361 | |
International Fund (12.4%) | | | 41,290,526 | | | | 30,117,764 | |
Mid-Cap Equity Index Fund (21.2%) | | | 24,480,625 | | | | 51,464,540 | |
Small Cap Growth Fund (7.6%) | | | 14,054,951 | | | | 18,335,470 | |
Small Cap Value Fund (7.6%) | | | 12,345,166 | | | | 18,363,829 | |
| | | | | | | | |
TOTAL INVESTMENTS
(Cost: $215,957,553) 100.0% | | | | | | | 242,511,639 | |
| | | | | | | | |
OTHER NET ASSETS -0.0% (3) | | | | | | | (867 | ) |
| | | | | | | | |
NET ASSETS 100.0% | | | | | | $ | 242,510,772 | |
| | | | | | | | |
The accompanying notes are an integral part of these portfolio schedules.
MUTUAL OF AMERICA INVESTMENT CORPORATION - 2045 RETIREMENT FUND
PORTFOLIO OF INVESTMENTS IN SECURITIES
June 30, 2016 (Unaudited)
| | | | | | | | |
| | | Shares | | | Value | |
COMMON STOCKS: | | | | | | | | |
DIVERSIFIED MUTUAL FUNDS (100.0%) | | | | | | | | |
Mutual of America Investment Corporation | | | | | | | | |
Bond Fund (10.5%) | | | 20,043,928 | | | | 29,963,768 | |
Equity Index Fund (36.2%) | | | 30,712,061 | | | | 103,937,447 | |
International Fund (13.9%) | | | 54,497,629 | | | | 39,751,170 | |
Mid-Cap Equity Index Fund (22.0%) | | | 29,974,094 | | | | 63,013,219 | |
Small Cap Growth Fund (8.6%) | | | 18,818,167 | | | | 24,549,352 | |
Small Cap Value Fund (8.8%) | | | 17,010,815 | | | | 25,304,132 | |
| | | | | | | | |
TOTAL INVESTMENTS
(Cost: $251,481,032) 100.0% | | | | | | | 286,519,088 | |
| | | | | | | | |
OTHER NET ASSETS -0.0% (3) | | | | | | | (1,004 | ) |
| | | | | | | | |
NET ASSETS 100.0% | | | | | | $ | 286,518,084 | |
| | | | | | | | |
The accompanying notes are an integral part of these portfolio schedules.
MUTUAL OF AMERICA INVESTMENT CORPORATION - 2050 RETIREMENT FUND
PORTFOLIO OF INVESTMENTS IN SECURITIES
June 30, 2016 (Unaudited)
| | | | | | | | |
| | | Shares | | | Value | |
COMMON STOCKS: | | | | | | | | |
DIVERSIFIED MUTUAL FUNDS (100.0%) | | | | | �� | | | |
Mutual of America Investment Corporation | | | | | | | | |
Bond Fund (8.5%) | | | 6,847,350 | | | | 10,236,137 | |
Equity Index Fund (35.2%) | | | 12,506,310 | | | | 42,324,542 | |
International Fund (14.6%) | | | 24,138,451 | | | | 17,606,852 | |
Mid-Cap Equity Index Fund (22.2%) | | | 12,724,211 | | | | 26,749,549 | |
Small Cap Growth Fund (9.6%) | | | 8,838,019 | | | | 11,529,691 | |
Small Cap Value Fund (9.9%) | | | 7,961,217 | | | | 11,842,565 | |
| | | | | | | | |
TOTAL INVESTMENTS
(Cost: $119,892,423) 100.0% | | | | | | | 120,289,336 | |
| | | | | | | | |
OTHER NET ASSETS -0.0% (3) | | | | | | | (293 | ) |
| | | | | | | | |
NET ASSETS 100.0% | | | | | | $ | 120,289,043 | |
| | | | | | | | |
The accompanying notes are an integral part of these portfolio schedules.
MUTUAL OF AMERICA INVESTMENT CORPORATION - CONSERVATIVE ALLOCATION FUND
PORTFOLIO OF INVESTMENTS IN SECURITIES
June 30, 2016 (Unaudited)
| | | | | | | | |
| | | Shares | | | Value | |
COMMON STOCKS: | | | | | | | | |
DIVERSIFIED MUTUAL FUNDS (100.0%) | | | | | | | | |
Mutual of America Investment Corporation | | | | | | | | |
Bond Fund (30.0%) | | | 26,442,718 | | | | 39,529,351 | |
Equity Index Fund (25.2%) | | | 9,832,657 | | | | 33,276,218 | |
International Fund (4.9%) | | | 8,847,347 | | | | 6,453,352 | |
Mid-Cap Equity Index Fund (5.1%) | | | 3,211,806 | | | | 6,752,038 | |
Mid-Term Bond Fund (34.8%) | | | 42,514,609 | | | | 45,898,177 | |
| | | | | | | | |
TOTAL INVESTMENTS
(Cost: $124,041,973) 100.0% | | | | | | | 131,909,136 | |
| | | | | | | | |
OTHER NET ASSETS -0.0% (3) | | | | | | | (117 | ) |
| | | | | | | | |
NET ASSETS 100.0% | | | | | | $ | 131,909,019 | |
| | | | | | | | |
The accompanying notes are an integral part of these portfolio schedules.
MUTUAL OF AMERICA INVESTMENT CORPORATION - MODERATE ALLOCATION FUND
PORTFOLIO OF INVESTMENTS IN SECURITIES
June 30, 2016 (Unaudited)
| | | | | | | | |
| | | Shares | | | Value | |
COMMON STOCKS: | | | | | | | | |
DIVERSIFIED MUTUAL FUNDS (100.0%) | | | | | | | | |
Mutual of America Investment Corporation | | | | | | | | |
Bond Fund (24.9%) | | | 54,964,259 | | | | 82,166,347 | |
Equity Index Fund (35.1%) | | | 34,338,314 | | | | 116,209,609 | |
International Fund (9.8%) | | | 44,141,896 | | | | 32,197,584 | |
Mid-Cap Equity Index Fund (15.3%) | | | 24,035,750 | | | | 50,529,300 | |
Mid-Term Bond Fund (14.9%) | | | 45,448,363 | | | | 49,065,417 | |
| | | | | | | | |
TOTAL INVESTMENTS
(Cost: $285,062,551) 100.0% | | | | | | | 330,168,257 | |
| | | | | | | | |
OTHER NET ASSETS -0.0% (3) | | | | | | | (215 | ) |
| | | | | | | | |
NET ASSETS 100.0% | | | | | | $ | 330,168,042 | |
| | | | | | | | |
The accompanying notes are an integral part of these portfolio schedules.
MUTUAL OF AMERICA INVESTMENT CORPORATION - AGGRESSIVE ALLOCATION FUND
PORTFOLIO OF INVESTMENTS IN SECURITIES
June 30, 2016 (Unaudited)
| | | | | | | | |
| | | Shares | | | Value | |
COMMON STOCKS: | | | | | | | | |
DIVERSIFIED MUTUAL FUNDS (100.0%) | | | | | | | | |
Mutual of America Investment Corporation | | | | | | | | |
Bond Fund (19.8%) | | | 33,483,091 | | | | 50,054,040 | |
Equity Index Fund (35.1%) | | | 26,149,728 | | | | 88,497,348 | |
International Fund (14.6%) | | | 50,413,646 | | | | 36,772,268 | |
Mid-Cap Equity Index Fund (20.3%) | | | 24,409,568 | | | | 51,315,160 | |
Small Cap Growth Fund (5.1%) | | | 9,945,487 | | | | 12,974,444 | |
Small Cap Value Fund (5.1%) | | | 8,641,798 | | | | 12,854,952 | |
| | | | | | | | |
TOTAL INVESTMENTS
(Cost: $206,729,177) 100.0% | | | | | | | 252,468,212 | |
| | | | | | | | |
OTHER NET ASSETS -0.0% (3) | | | | | | | (176 | ) |
| | | | | | | | |
NET ASSETS 100.0% | | | | | | $ | 252,468,036 | |
| | | | | | | | |
The accompanying notes are an integral part of these portfolio schedules.
MUTUAL OF AMERICA INVESTMENT CORPORATION - MONEY MARKET FUND
PORTFOLIO OF INVESTMENTS IN SECURITIES
June 30, 2016 (Unaudited)
| | | | | | | | | | | | | | | | | | | | |
| | | Rating** | | | Rate(%) | | | Maturity | | | Face Amount | | | Value | |
SHORT-TERM DEBT SECURITIES: | | | | | | | | | | | | | | | | | | | | |
U.S. GOVERNMENT (14.7%) | | | | | | | | | | | | | |
U.S. Treasury Bill | | | A-1+ | | | | 0.24 | | | | 09/15/16 | | | | 2,000,000 | | | | 1,999,191 | |
U.S. Treasury Bill | | | A-1+ | | | | 0.25 | | | | 09/01/16 | | | | 1,000,000 | | | | 999,611 | |
U.S. Treasury Bill | | | A-1+ | | | | 0.26 | | | | 08/11/16 | | | | 1,000,000 | | | | 999,698 | |
U.S. Treasury Bill | | | A-1+ | | | | 0.28 | | | | 08/11/16 | | | | 2,100,000 | | | | 2,099,318 | |
U.S. Treasury Bill | | | A-1+ | | | | 0.30 | | | | 08/18/16 | | | | 1,500,000 | | | | 1,499,400 | |
U.S. Treasury Bill | | | A-1+ | | | | 0.34 | | | | 08/25/16 | | | | 1,500,000 | | | | 1,499,221 | |
| | | | | | | | | | | | | | | | | | | | |
| | | | | | | | | | | | | | | | | | | 9,096,439 | |
| | | | | | | | | | | | | | | | | | | | |
U.S. GOVERNMENT AGENCIES (9.0%) | | | | | | | | | | | | | |
FHLB | | | A-1+ | | | | 0.31 | | | | 08/05/16 | | | | 1,900,000 | | | | 1,899,427 | |
FHLB | | | A-1+ | | | | 0.36 | | | | 07/27/16 | | | | 260,000 | | | | 259,933 | |
FHLB | | | A-1+ | | | | 0.40 | | | | 08/08/16 | | | | 2,000,000 | | | | 1,999,155 | |
FHLB | | | A-1+ | | | | 0.40 | | | | 09/16/16 | | | | 1,400,000 | | | | 1,399,041 | |
| | | | | | | | | | | | | | | | | | | | |
| | | | | | | | | | | | | | | | | | | 5,557,556 | |
| | | | | | | | | | | | | | | | | | | | |
COMMERCIAL PAPER (76.3%) | | | | | | | | | | | | | |
Air Products & Chemicals† | | | A-1 | | | | 0.37 | | | | 07/01/16 | | | | 1,000,000 | | | | 1,000,000 | |
Apple, Inc.† | | | A-1+ | | | | 0.42 | | | | 07/05/16 | | | | 800,000 | | | | 799,963 | |
Archer-Daniels-Midland Co.† | | | A-1 | | | | 0.42 | | | | 07/14/16 | | | | 1,200,000 | | | | 1,199,818 | |
Chevron Corp.† | | | A-1+ | | | | 0.41 | | | | 08/02/16 | | | | 1,800,000 | | | | 1,799,344 | |
Emerson Electric Co.† | | | A-1 | | | | 0.40 | | | | 07/15/16 | | | | 500,000 | | | | 499,922 | |
Emerson Electric Co.† | | | A-1 | | | | 0.43 | | | | 07/20/16 | | | | 1,900,000 | | | | 1,899,569 | |
Exxon Mobil Corp. | | | A-1+ | | | | 0.39 | | | | 07/13/16 | | | | 1,000,000 | | | | 999,870 | |
Exxon Mobil Corp. | | | A-1+ | | | | 0.40 | | | | 07/18/16 | | | | 350,000 | | | | 349,934 | |
Exxon Mobil Corp. | | | A-1+ | | | | 0.43 | | | | 08/02/16 | | | | 1,000,000 | | | | 999,618 | |
Grainger (W.W.), Inc. | | | A-1 | | | | 0.39 | | | | 07/08/16 | | | | 2,300,000 | | | | 2,299,826 | |
Grainger (W.W.) Inc. | | | A-1+ | | | | 0.41 | | | | 07/26/16 | | | | 472,000 | | | | 471,866 | |
Grainger (W.W.), Inc. | | | A-1+ | | | | 0.42 | | | | 07/21/16 | | | | 1,040,000 | | | | 1,039,757 | |
Intercontinental Exchange, Inc.† | | | A-1 | | | | 0.50 | | | | 07/12/16 | | | | 2,500,000 | | | | 2,499,616 | |
J.P. Morgan Securities LLC | | | A-1 | | | | 0.50 | | | | 08/09/16 | | | | 350,000 | | | | 349,810 | |
J.P. Morgan Securities LLC | | | A-1 | | | | 0.53 | | | | 08/26/16 | | | | 1,000,000 | | | | 999,175 | |
J.P. Morgan Securities LLC | | | A-1 | | | | 0.55 | | | | 08/24/16 | | | | 900,000 | | | | 899,257 | |
Microsoft Corp.† | | | A-1+ | | | | 0.40 | | | | 07/27/16 | | | | 598,000 | | | | 597,827 | |
Microsoft Corp.† | | | A-1+ | | | | 0.40 | | | | 08/03/16 | | | | 1,150,000 | | | | 1,149,578 | |
Microsoft Corp.† | | | A-1+ | | | | 0.44 | | | | 08/03/16 | | | | 750,000 | | | | 749,697 | |
National Rural Utilities | | | A-1 | | | | 0.40 | | | | 07/20/16 | | | | 2,300,000 | | | | 2,299,514 | |
Nestle Capital Corp.† | | | A-1+ | | | | 0.44 | | | | 08/23/16 | | | | 1,725,000 | | | | 1,723,883 | |
Novartis Finance Corp.† | | | A-1+ | | | | 0.43 | | | | 08/09/16 | | | | 1,200,000 | | | | 1,199,441 | |
PepsiCo, Inc.† | | | A-1 | | | | 0.40 | | | | 08/17/16 | | | | 2,300,000 | | | | 2,298,799 | |
Pfizer, Inc.† | | | A-1+ | | | | 0.45 | | | | 07/18/16 | | | | 1,400,000 | | | | 1,399,702 | |
Pfizer, Inc.† | | | A-1+ | | | | 0.46 | | | | 07/25/16 | | | | 1,100,000 | | | | 1,099,663 | |
QUALCOMM, Inc.† | | | A-1+ | | | | 0.38 | | | | 07/21/16 | | | | 700,000 | | | | 699,852 | |
QUALCOMM, Inc.† | | | A-1+ | | | | 0.43 | | | | 07/07/16 | | | | 1,550,000 | | | | 1,549,889 | |
Questar Corp.† | | | A-1 | | | | 0.73 | | | | 07/05/16 | | | | 550,000 | | | | 549,955 | |
Ralph Lauren Corp.† | | | A-1 | | | | 0.40 | | | | 07/01/16 | | | | 1,100,000 | | | | 1,100,000 | |
Simon Ppty. Group LP† | | | A-1 | | | | 0.48 | | | | 07/18/16 | | | | 600,000 | | | | 599,864 | |
Simon Ppty. Group LP† | | | A-1 | | | | 0.48 | | | | 08/04/16 | | | | 1,800,000 | | | | 1,799,184 | |
Toyota Motor Credit Corp. | | | A-1+ | | | | 0.44 | | | | 07/15/16 | | | | 1,600,000 | | | | 1,599,726 | |
Travelers Cos., Inc.† | | | A-1 | | | | 0.40 | | | | 07/01/16 | | | | 2,450,000 | | | | 2,450,000 | |
Unilever Capital Corp.† | | | A-1 | | | | 0.38 | | | | 08/01/16 | | | | 1,000,000 | | | | 999,673 | |
Unilever Capital Corp.† | | | A-1 | | | | 0.39 | | | | 07/28/16 | | | | 1,000,000 | | | | 999,707 | |
Washington Gas Light Co. | | | A-1 | | | | 0.43 | | | | 07/15/16 | | | | 2,400,000 | | | | 2,399,599 | |
Wisconsin Gas Co. | | | A-1 | | | | 0.42 | | | | 07/06/16 | | | | 1,700,000 | | | | 1,699,901 | |
| | | | | | | | | | | | | | | | | | | | |
| | | | | | | | | | | | | | | | | | | 47,072,799 | |
| | | | | | | | | | | | | | | | | | | | |
TOTAL SHORT-TERM DEBT SECURITIES
(Cost: $61,726,316) 100.0% | | | | | | | | 61,726,794 | |
| | | | | | | | | | | | | | | | | | | | |
TOTAL INVESTMENTS
(Cost: $61,726,316) 100.0% | | | | | | | | | | | | | | | | | | | 61,726,794 | |
| | | | | | | | | | | | | | | | | | | | |
OTHER NET ASSETS 0.0% (3) | | | | | | | | | | | | | | | | | | | 22,390 | |
| | | | | | | | | | | | | | | | | | | | |
NET ASSETS 100.0% | | | | | | | | | | | | | | | | | | $ | 61,749,184 | |
| | | | | | | | | | | | | | | | | | | | |
| | | | | | | | | | | | | | | | | |
The accompanying notes are an integral part of these portfolio schedules.
MUTUAL OF AMERICA INVESTMENT CORPORATION - MID-TERM BOND FUND
PORTFOLIO OF INVESTMENTS IN SECURITIES
June 30, 2016 (Unaudited)
| | | | | | | | | | | | | | | | | | | | |
| | | Rating** | | | Rate(%) | | | Maturity | | | Face Amount | | | Value | |
LONG-TERM DEBT SECURITIES: | | | | | | | | | | | | | | | | | | | | |
U. S. GOVERNMENT (29.2%) | | | | | | | | | | | | | |
U.S. Treasury Note | | | AA+ | | | | 1.38 | | | | 06/30/23 | | | | 15,000,000 | | | | 15,077,340 | |
U.S. Treasury Note | | | AA+ | | | | 1.50 | | | | 10/31/19 | | | | 3,000,000 | | | | 3,069,843 | |
U.S. Treasury Note | | | AA+ | | | | 1.50 | | | | 02/28/23 | | | | 13,000,000 | | | | 13,188,903 | |
U.S. Treasury Note | | | AA+ | | | | 1.63 | | | | 06/30/20 | | | | 5,500,000 | | | | 5,655,975 | |
U.S. Treasury Note | | | AA+ | | | | 1.63 | | | | 05/15/26 | | | | 10,000,000 | | | | 10,122,270 | |
U.S. Treasury Note | | | AA+ | | | | 1.75 | | | | 09/30/19 | | | | 3,000,000 | | | | 3,093,867 | |
U.S. Treasury Note | | | AA+ | | | | 1.75 | | | | 12/31/20 | | | | 3,500,000 | | | | 3,620,449 | |
U.S. Treasury Note | | | AA+ | | | | 1.75 | | | | 02/28/22 | | | | 15,000,000 | | | | 15,502,740 | |
U.S. Treasury Note | | | AA+ | | | | 1.88 | | | | 05/31/22 | | | | 11,000,000 | | | | 11,440,858 | |
U.S. Treasury Note | | | AA+ | | | | 2.00 | | | | 11/30/20 | | | | 7,500,000 | | | | 7,837,208 | |
U.S. Treasury Strip | | | AA+ | | | | 0.00 | | | | 08/15/18 | | | | 50,000,000 | | | | 49,359,796 | |
| | | | | | | | | | | | | | | | | | | | |
| | | | | | | | | | | | | | | | | | | 137,969,249 | |
| | | | | | | | | | | | | | | | | | | | |
U.S. GOVERNMENT AGENCIES (8.2%) | | | | | | | | | | | | | | | | | | | | |
MORTGAGE-BACKED OBLIGATIONS (0.6%) | | | | | | | | | | | | | |
FHLMC | | | AA+ | | | | 7.50 | | | | 03/15/21 | | | | 3,070 | | | | 3,345 | |
FHLMC | | | AA+ | | | | 8.00 | | | | 09/01/18 | | | | 45 | | | | 46 | |
Small Business Administration (2) | | | AA+ | | | | 2.51 | | | | 03/10/26 | | | | 3,000,000 | | | | 3,099,282 | |
| | | | | | | | | | | | | | | | | | | | |
| | | | | | | | | | | | | | | | | | | 3,102,673 | |
| | | | | | | | | | | | | | | | | | | | |
NON-MORTGAGE-BACKED OBLIGATIONS (7.6%) | | | | | | | | | | | | | |
FHLMC | | | AA+ | | | | 0.00 | | | | 11/29/19 | | | | 13,500,000 | | | | 12,951,765 | |
FNMA | | | AA+ | | | | 0.00 | | | | 10/09/19 | | | | 23,000,000 | | | | 22,093,961 | |
Tennessee Valley Auth. Strip | | | AA+ | | | | 0.00 | | | | 11/01/20 | | | | 900,000 | | | | 846,459 | |
| | | | | | | | | | | | | | | | | | | | |
| | | | | | | | | | | | | | | | | | | 35,892,185 | |
| | | | | | | | | | | | | | | | | | | | |
CORPORATE DEBT (61.7%) | | | | | | | | | | | | | | | | | | | | |
CONSUMER DISCRETIONARY (9.6%) | | | | | | | | | | | | | |
Advance Auto Parts, Inc. | | | BBB- | | | | 4.50 | | | | 01/15/22 | | | | 500,000 | | | | 538,482 | |
Advance Auto Parts, Inc. | | | BBB- | | | | 4.50 | | | | 12/01/23 | | | | 250,000 | | | | 268,523 | |
Advance Auto Parts, Inc. | | | BBB- | | | | 5.75 | | | | 05/01/20 | | | | 1,500,000 | | | | 1,664,840 | |
AutoZone, Inc. | | | BBB | | | | 3.70 | | | | 04/15/22 | | | | 300,000 | | | | 320,111 | |
AutoZone, Inc. | | | BBB | | | | 4.00 | | | | 11/15/20 | | | | 700,000 | | | | 753,248 | |
Brinker International, Inc. | | | BBB- | | | | 2.60 | | | | 05/15/18 | | | | 2,000,000 | | | | 2,023,726 | |
Carnival Corp. | | | BBB+ | | | | 1.88 | | | | 12/15/17 | | | | 2,000,000 | | | | 2,018,514 | |
Dollar General Corp. | | | BBB | | | | 3.25 | | | | 04/15/23 | | | | 1,047,000 | | | | 1,086,963 | |
Dollar General Corp. | | | BBB | | | | 4.13 | | | | 07/15/17 | | | | 962,000 | | | | 989,081 | |
Expedia, Inc. | | | BBB- | | | | 5.95 | | | | 08/15/20 | | | | 2,000,000 | | | | 2,237,138 | |
Family Dollar Stores, Inc. | | | BBB | | | | 5.00 | | | | 02/01/21 | | | | 2,000,000 | | | | 2,120,000 | |
Gap, Inc. | | | BB+ | | | | 5.95 | | | | 04/12/21 | | | | 2,000,000 | | | | 2,085,940 | |
Harman Int’l. Industries, Inc. | | | BBB- | | | | 4.15 | | | | 05/15/25 | | | | 2,000,000 | | | | 2,085,742 | |
Hyatt Hotels Corp. | | | BBB | | | | 5.38 | | | | 08/15/21 | | | | 50,000 | | | | 56,659 | |
Kohl’s Corp. | | | BBB | | | | 3.25 | | | | 02/01/23 | | | | 700,000 | | | | 701,716 | |
Kohl’s Corp. | | | BBB | | | | 4.00 | | | | 11/01/21 | | | | 1,325,000 | | | | 1,385,941 | |
Marriott International, Inc. | | | BBB | | | | 3.00 | | | | 03/01/19 | | | | 1,200,000 | | | | 1,238,388 | |
Marriott International, Inc. | | | BBB | | | | 3.38 | | | | 10/15/20 | | | | 800,000 | | | | 842,285 | |
Mattel, Inc. | | | BBB | | | | 1.70 | | | | 03/15/18 | | | | 2,000,000 | | | | 2,003,814 | |
Newell Rubbermaid, Inc. | | | BBB- | | | | 4.70 | | | | 08/15/20 | | | | 525,000 | | | | 566,630 | |
NVR, Inc. | | | BBB+ | | | | 3.95 | | | | 09/15/22 | | | | 2,000,000 | | | | 2,119,692 | |
O’Reilly Automotive, Inc. | | | BBB+ | | | | 4.63 | | | | 09/15/21 | | | | 281,000 | | | | 310,248 | |
Omnicom Group, Inc. | | | BBB+ | | | | 3.63 | | | | 05/01/22 | | | | 2,000,000 | | | | 2,125,002 | |
Scripps Networks Interactive, Inc. | | | BBB | | | | 3.50 | | | | 06/15/22 | | | | 2,000,000 | | | | 2,072,912 | |
Staples, Inc. | | | BBB- | | | | 2.75 | | | | 01/12/18 | | | | 2,000,000 | | | | 2,008,774 | |
Starwood Hotels & Resorts | | | BBB | | | | 3.13 | | | | 02/15/23 | | | | 2,000,000 | | | | 2,021,982 | |
Tupperware Brands Corp. | | | BBB- | | | | 4.75 | | | | 06/01/21 | | | | 2,000,000 | | | | 2,151,262 | |
Viacom, Inc. | | | BBB- | | | | 3.25 | | | | 03/15/23 | | | | 2,000,000 | | | | 1,967,614 | |
Whirlpool Corp. | | | BBB | | | | 2.40 | | | | 03/01/19 | | | | 1,445,000 | | | | 1,478,471 | |
Wyndham Worldwide Corp. | | | BBB- | | | | 2.95 | | | | 03/01/17 | | | | 2,160,000 | | | | 2,178,086 | |
Wynn Las Vegas LLC | | | BB+ | | | | 5.38 | | | | 03/15/22 | | | | 2,000,000 | | | | 2,012,500 | |
| | | | | | | | | | | | | | | | | | | | |
| | | | | | | | | | | | | | | | | | | 45,434,284 | |
| | | | | | | | | | | | | | | | | | | | |
CONSUMER STAPLES (4.3%) | | | | | | | | | | | | | |
Avon Products, Inc. | | | B | | | | 6.35 | | | | 03/15/20 | | | | 1,800,000 | | | | 1,506,960 | |
Beam Suntory, Inc. | | | BBB | | | | 1.75 | | | | 06/15/18 | | | | 2,000,000 | | | | 2,013,884 | |
ConAgra Foods, Inc. | | | BBB- | | | | 1.90 | | | | 01/25/18 | | | | 2,000,000 | | | | 2,015,808 | |
CVS Health Corp. | | | BBB+ | | | | 6.13 | | | | 08/15/16 | | | | 500,000 | | | | 502,988 | |
Dr. Pepper Snapple Group, Inc. | | | BBB+ | | | | 2.60 | | | | 01/15/19 | | | | 150,000 | | | | 153,721 | |
Edgewell Personal Care Co. | | | BB+ | | | | 4.70 | | | | 05/19/21 | | | | 2,000,000 | | | | 2,071,526 | |
Flowers Foods, Inc. | | | BBB | | | | 4.38 | | | | 04/01/22 | | | | 2,000,000 | | | | 2,175,946 | |
MUTUAL OF AMERICA INVESTMENT CORPORATION - MID-TERM BOND FUND
PORTFOLIO OF INVESTMENTS IN SECURITIES
June 30, 2016 (Unaudited)
| | | | | | | | | | | | | | | | |
General Mills, Inc. | | BBB+ | | | 2.20 | | | 10/21/19 | | | 775,000 | | | | 793,588 | |
Ingredion, Inc. | | BBB | | | 4.63 | | | 11/01/20 | | | 275,000 | | | | 301,694 | |
Kroger Co. | | BBB | | | 2.95 | | | 11/01/21 | | | 2,000,000 | | | | 2,101,338 | |
Mead Johnson Nutrition Co. | | BBB- | | | 4.90 | | | 11/01/19 | | | 3,075,000 | | | | 3,389,726 | |
Molson Coors Brewing Co. | | BBB- | | | 3.50 | | | 05/01/22 | | | 1,000,000 | | | | 1,061,035 | |
Sysco Corp. | | BBB+ | | | 2.60 | | | 10/01/20 | | | 2,000,000 | | | | 2,065,120 | |
| | | | | | | | | | | | | | | | |
| | | | | | | | | | | | | | | 20,153,334 | |
| | | | | | | | | | | | | | | | |
ENERGY (4.4%) | | | | | | | | | | | |
Cameron International Corp. | | AA- | | | 3.60 | | | 04/30/22 | | | 214,000 | | | | 219,730 | |
Diamond Offshore Drilling, Inc. | | BBB+ | | | 3.45 | | | 11/01/23 | | | 1,500,000 | | | | 1,253,540 | |
Energen Corp. | | BB | | | 4.63 | | | 09/01/21 | | | 2,000,000 | | | | 1,880,000 | |
EQT Corp. | | BBB | | | 4.88 | | | 11/15/21 | | | 1,250,000 | | | | 1,329,153 | |
FMC Technologies, Inc. | | BBB | | | 2.00 | | | 10/01/17 | | | 2,000,000 | | | | 1,986,228 | |
Kinder Morgan, Inc. | | BBB- | | | 3.05 | | | 12/01/19 | | | 2,000,000 | | | | 2,020,888 | |
Marathon Oil Corp. | | BBB- | | | 2.80 | | | 11/01/22 | | | 2,000,000 | | | | 1,813,852 | |
Murphy Oil Corp. | | BBB- | | | 2.50 | | | 12/01/17 | | | 2,000,000 | | | | 1,994,122 | |
Noble Energy, Inc. | | BBB | | | 4.15 | | | 12/15/21 | | | 2,000,000 | | | | 2,102,948 | |
Pioneer Natural Resources Co. | | BBB- | | | 6.65 | | | 03/15/17 | | | 2,000,000 | | | | 2,069,910 | |
Rowan Companies PLC | | BBB- | | | 4.88 | | | 06/01/22 | | | 2,000,000 | | | | 1,750,000 | |
SESI LLC | | BB | | | 7.13 | | | 12/15/21 | | | 2,150,000 | | | | 2,069,375 | |
Sunoco, Inc. | | BBB- | | | 5.75 | | | 01/15/17 | | | 290,000 | | | | 295,449 | |
| | | | | | | | | | | | | | | | |
| | | | | | | | | | | | | | | 20,785,195 | |
| | | | | | | | | | | | | | | | |
FINANCIALS (15.9%) | | | | | | | | | | | |
Aflac, Inc. | | A- | | | 2.65 | | | 02/15/17 | | | 1,500,000 | | | | 1,516,440 | |
Aflac, Inc. | | A- | | | 3.63 | | | 06/15/23 | | | 550,000 | | | | 588,517 | |
Alleghany Corp. | | BBB+ | | | 4.95 | | | 06/27/22 | | | 2,000,000 | | | | 2,227,172 | |
American Express Credit Corp. | | A- | | | 2.25 | | | 08/15/19 | | | 2,000,000 | | | | 2,041,636 | |
American Tower Corp. | | BBB- | | | 4.50 | | | 01/15/18 | | | 2,000,000 | | | | 2,086,560 | |
Bank of America Corp. | | BBB+ | | | 2.65 | | | 04/01/19 | | | 1,250,000 | | | | 1,280,593 | |
Bank of America Corp. | | BBB | | | 5.75 | | | 08/15/16 | | | 500,000 | | | | 502,375 | |
Barrick N.A. Finance LLC | | BBB- | | | 4.40 | | | 05/30/21 | | | 2,000,000 | | | | 2,153,420 | |
Berkley (W.R.) Corp. | | BBB+ | | | 4.63 | | | 03/15/22 | | | 2,000,000 | | | | 2,184,976 | |
Block Financial LLC | | BBB | | | 5.50 | | | 11/01/22 | | | 2,472,000 | | | | 2,672,939 | |
Boston Properties LP | | A- | | | 3.70 | | | 11/15/18 | | | 1,970,000 | | | | 2,062,478 | |
Capital One Financial Corp. | | BBB | | | 4.75 | | | 07/15/21 | | | 2,000,000 | | | | 2,226,274 | |
Citigroup, Inc. | | BBB+ | | | 2.55 | | | 04/08/19 | | | 1,850,000 | | | | 1,893,273 | |
Citizens Financial Group, Inc. | | BBB | | | 3.75 | | | 07/01/24 | | | 2,000,000 | | | | 2,008,316 | |
Erac USA Finance Co.† | | BBB+ | | | 2.75 | | | 03/15/17 | | | 1,000,000 | | | | 1,009,899 | |
Erac USA Finance LLC† | | BBB+ | | | 2.35 | | | 10/15/19 | | | 1,000,000 | | | | 1,018,879 | |
Fairfax Financial Hldgs.† | | BBB- | | | 5.80 | | | 05/15/21 | | | 1,274,000 | | | | 1,375,823 | |
Fairfax U.S., Inc.† | | BBB- | | | 4.88 | | | 08/13/24 | | | 750,000 | | | | 756,647 | |
Fifth Third Bancorp | | BBB | | | 4.30 | | | 01/16/24 | | | 2,000,000 | | | | 2,130,130 | |
First Republic Bank | | A- | | | 2.38 | | | 06/17/19 | | | 2,000,000 | | | | 2,023,392 | |
First Tennessee Bank | | BBB- | | | 2.95 | | | 12/01/19 | | | 2,200,000 | | | | 2,210,030 | |
Ford Motor Credit Co. LLC | | BBB | | | 3.00 | | | 06/12/17 | | | 2,000,000 | | | | 2,030,466 | |
Government Pptys. Income Trust | | BBB- | | | 3.75 | | | 08/15/19 | | | 2,000,000 | | | | 2,051,506 | |
HCP, Inc. | | BBB | | | 3.15 | | | 08/01/22 | | | 750,000 | | | | 743,321 | |
HCP, Inc. | | BBB | | | 6.00 | | | 01/30/17 | | | 1,250,000 | | | | 1,282,729 | |
Healthcare Realty Trust | | BBB- | | | 5.75 | | | 01/15/21 | | | 2,000,000 | | | | 2,244,320 | |
Hospitality Properties Trust | | BBB- | | | 5.00 | | | 08/15/22 | | | 1,300,000 | | | | 1,397,094 | |
Hospitality Properties Trust | | BBB- | | | 5.63 | | | 03/15/17 | | | 566,000 | | | | 580,092 | |
Huntington National Bank | | BBB+ | | | 1.35 | | | 08/02/16 | | | 1,995,000 | | | | 1,995,110 | |
Jones Lang LaSalle, Inc. | | BBB+ | | | 4.40 | | | 11/15/22 | | | 1,410,000 | | | | 1,472,140 | |
JPMorgan Chase & Co. | | A- | | | 2.00 | | | 08/15/17 | | | 2,000,000 | | | | 2,018,634 | |
Kemper Corp. | | BBB- | | | 6.00 | | | 05/15/17 | | | 500,000 | | | | 517,623 | |
Lincoln National Corp. | | A- | | | 4.00 | | | 09/01/23 | | | 2,000,000 | | | | 2,079,270 | |
Mack-Cali Realty LP | | BBB- | | | 4.50 | | | 04/18/22 | | | 1,000,000 | | | | 1,019,930 | |
Moody’s Corp. | | BBB+ | | | 5.50 | | | 09/01/20 | | | 2,000,000 | | | | 2,277,786 | |
Morgan Stanley | | BBB+ | | | 4.75 | | | 03/22/17 | | | 1,000,000 | | | | 1,024,800 | |
Nasdaq, Inc. | | BBB | | | 5.55 | | | 01/15/20 | | | 2,150,000 | | | | 2,378,149 | |
Penske Truck Leasing Co. LP† | | BBB- | | | 3.38 | | | 03/15/18 | | | 1,300,000 | | | | 1,331,795 | |
Penske Truck Leasing Co. LP† | | BBB- | | | 3.75 | | | 05/11/17 | | | 490,000 | | | | 499,264 | |
Reinsurance Grp. of America, Inc. | | A- | | | 5.63 | | | 03/15/17 | | | 1,500,000 | | | | 1,542,906 | |
Signet UK Finance PLC | | BBB- | | | 4.70 | | | 06/15/24 | | | 2,000,000 | | | | 1,951,888 | |
Simon Property Group LP | | A | | | 2.80 | | | 01/30/17 | | | 1,500,000 | | | | 1,509,668 | |
Synchrony Financial | | BBB- | | | 2.70 | | | 02/03/20 | | | 1,000,000 | | | | 1,002,737 | |
Ventas Realty LP/Capital Corp. | | BBB+ | | | 4.00 | | | 04/30/19 | | | 1,700,000 | | | | 1,791,423 | |
Vornado Realty LP | | BBB | | | 2.50 | | | 06/30/19 | | | 500,000 | | | | 509,406 | |
MUTUAL OF AMERICA INVESTMENT CORPORATION - MID-TERM BOND FUND
PORTFOLIO OF INVESTMENTS IN SECURITIES
June 30, 2016 (Unaudited)
| | | | | | | | | | | | | | | | | | | | |
Vornado Realty LP | | | BBB | | | | 5.00 | | | | 01/15/22 | | | | 1,500,000 | | | | 1,634,487 | |
Wells Fargo & Co. | | | A | | | | 2.13 | | | | 04/22/19 | | | | 2,000,000 | | | | 2,043,062 | |
Zions Bancorporation | | | BBB- | | | | 4.50 | | | | 03/27/17 | | | | 400,000 | | | | 405,328 | |
| | | | | | | | | | | | | | | | | | | | |
| | | | | | | | | | | | | | | | | | | 75,304,703 | |
| | | | | | | | | | | | | | | | | | | | |
HEALTH CARE (6.9%) | | | | | | | | | | | | | |
AbbVie, Inc. | | | A- | | | | 1.75 | | | | 11/06/17 | | | | 2,000,000 | | | | 2,011,812 | |
Agilent Technologies, Inc. | | | BBB+ | | | | 5.00 | | | | 07/15/20 | | | | 2,000,000 | | | | 2,204,592 | |
Anthem, Inc. | | | A | | | | 3.13 | | | | 05/15/22 | | | | 2,000,000 | | | | 2,069,136 | |
Becton, Dickinson & Co. | | | BBB+ | | | | 1.45 | | | | 05/15/17 | | | | 2,000,000 | | | | 2,005,198 | |
Bio-Rad Laboratories, Inc. | | | BBB | | | | 4.88 | | | | 12/15/20 | | | | 2,000,000 | | | | 2,212,844 | |
Biogen Idec, Inc. | | | A- | | | | 6.88 | | | | 03/01/18 | | | | 1,250,000 | | | | 1,360,505 | |
Edwards Lifesciences Corp. | | | BBB- | | | | 2.88 | | | | 10/15/18 | | | | 2,000,000 | | | | 2,048,656 | |
Express Scripts Hldg. Co. | | | BBB+ | | | | 2.25 | | | | 06/15/19 | | | | 2,000,000 | | | | 2,032,514 | |
Laboratory Corp. of America | | | BBB | | | | 3.75 | | | | 08/23/22 | | | | 600,000 | | | | 631,762 | |
Laboratory Corp. of America | | | BBB | | | | 4.63 | | | | 11/15/20 | | | | 400,000 | | | | 436,219 | |
Lilly (Eli) & Co. | | | AA- | | | | 5.20 | | | | 03/15/17 | | | | 500,000 | | | | 514,765 | |
Mylan, Inc. | | | BBB- | | | | 1.35 | | | | 11/29/16 | | | | 2,000,000 | | | | 1,997,792 | |
Owens & Minor, Inc. | | | BBB | | | | 3.88 | | | | 09/15/21 | | | | 2,000,000 | | | | 2,069,890 | |
PerkinElmer, Inc. | | | BBB | | | | 5.00 | | | | 11/15/21 | | | | 2,000,000 | | | | 2,217,376 | |
Pfizer, Inc. | | | AA | | | | 6.05 | | | | 03/30/17 | | | | 2,000,000 | | | | 2,076,658 | |
Quest Diagnostics, Inc. | | | BBB+ | | | | 4.75 | | | | 01/30/20 | | | | 2,000,000 | | | | 2,193,430 | |
Thermo Fisher Scientific, Inc. | | | BBB | | | | 3.60 | | | | 08/15/21 | | | | 400,000 | | | | 424,035 | |
Thermo Fisher Scientific, Inc. | | | BBB | | | | 4.50 | | | | 03/01/21 | | | | 1,600,000 | | | | 1,765,757 | |
Zimmer Biomet Hldgs., Inc. | | | BBB | | | | 3.15 | | | | 04/01/22 | | | | 2,000,000 | | | | 2,050,000 | |
| | | | | | | | | | | | | | | | | | | | |
| | | | | | | | | | | | | | | | | | | 32,322,941 | |
| | | | | | | | | | | | | | | | | | | | |
INDUSTRIALS (5.6%) | | | | | | | | | | | | | |
Crane Co. | | | BBB | | | | 2.75 | | | | 12/15/18 | | | | 2,000,000 | | | | 2,055,590 | |
Dun & Bradstreet Corp. | | | BBB- | | | | 3.25 | | | | 12/01/17 | | | | 2,000,000 | | | | 2,014,054 | |
Equifax, Inc. | | | BBB+ | | | | 3.30 | | | | 12/15/22 | | | | 2,000,000 | | | | 2,111,580 | |
Flowserve Corp. | | | BBB | | | | 3.50 | | | | 09/15/22 | | | | 2,000,000 | | | | 2,061,382 | |
GATX Corp. | | | BBB | | | | 6.00 | | | | 02/15/18 | | | | 2,050,000 | | | | 2,180,692 | |
Harsco Corp. | | | BB- | | | | 5.75 | | | | 05/15/18 | | | | 2,250,000 | | | | 2,120,625 | |
Hunt (J.B.) Transport Svcs., Inc. | | | BBB+ | | | | 3.30 | | | | 08/15/22 | | | | 2,000,000 | | | | 2,086,972 | |
Kennametal, Inc. | | | BBB | | | | 2.65 | | | | 11/01/19 | | | | 2,000,000 | | | | 2,010,732 | |
L-3 Communications Corp. | | | BBB- | | | | 5.20 | | | | 10/15/19 | | | | 2,000,000 | | | | 2,177,504 | |
Pitney Bowes, Inc. | | | BBB | | | | 5.25 | | | | 01/15/37 | | | | 1,500,000 | | | | 1,572,072 | |
Southwest Airlines Co. | | | BBB | | | | 5.75 | | | | 12/15/16 | | | | 735,000 | | | | 749,228 | |
Textron, Inc. | | | BBB | | | | 4.63 | | | | 09/21/16 | | | | 750,000 | | | | 754,118 | |
Valmont Industries, Inc. | | | BBB+ | | | | 6.63 | | | | 04/20/20 | | | | 2,000,000 | | | | 2,264,228 | |
Verisk Analytics, Inc. | | | BBB- | | | | 4.13 | | | | 09/12/22 | | | | 2,000,000 | | | | 2,129,592 | |
| | | | | | | | | | | | | | | | | | | | |
| | | | | | | | | | | | | | | | | | | 26,288,369 | |
| | | | | | | | | | | | | | | | | | | | |
INFORMATION TECHNOLOGY (7.6%) | | | | | | | | | | | | | |
Adobe Systems, Inc. | | | A- | | | | 4.75 | | | | 02/01/20 | | | | 2,000,000 | | | | 2,211,024 | |
Amphenol Corp. | | | BBB+ | | | | 2.55 | | | | 01/30/19 | | | | 2,000,000 | | | | 2,034,590 | |
Arrow Electronics, Inc. | | | BBB- | | | | 3.00 | | | | 03/01/18 | | | | 1,250,000 | | | | 1,262,809 | |
Arrow Electronics, Inc. | | | BBB- | | | | 4.50 | | | | 03/01/23 | | | | 50,000 | | | | 52,936 | |
Arrow Electronics, Inc. | | | BBB- | | | | 6.88 | | | | 06/01/18 | | | | 700,000 | | | | 755,051 | |
MUTUAL OF AMERICA INVESTMENT CORPORATION - MID-TERM BOND FUND
PORTFOLIO OF INVESTMENTS IN SECURITIES
June 30, 2016 (Unaudited)
| | | | | | | | | | | | | | | | | | | | |
Avnet, Inc. | | | BBB- | | | | 5.88 | | | | 06/15/20 | | | | 950,000 | | | | 1,057,516 | |
eBay, Inc. | | | BBB+ | | | | 2.88 | | | | 08/01/21 | | | | 2,100,000 | | | | 2,168,697 | |
Fidelity Nat’l. Information | | | BBB | | | | 1.45 | | | | 06/05/17 | | | | 2,000,000 | | | | 1,997,638 | |
Fiserv, Inc. | | | BBB | | | | 4.75 | | | | 06/15/21 | | | | 1,900,000 | | | | 2,109,234 | |
FLIR Systems, Inc. | | | BBB | | | | 3.75 | | | | 09/01/16 | | | | 2,000,000 | | | | 2,008,970 | |
Ingram Micro, Inc. | | | BBB- | | | | 5.25 | | | | 09/01/17 | | | | 1,500,000 | | | | 1,541,625 | |
Jabil Circuit, Inc. | | | BBB- | | | | 4.70 | | | | 09/15/22 | | | | 1,976,000 | | | | 1,985,880 | |
Juniper Networks, Inc. | | | BBB | | | | 4.50 | | | | 03/15/24 | | | | 1,500,000 | | | | 1,588,797 | |
Juniper Networks, Inc. | | | BBB | | | | 4.60 | | | | 03/15/21 | | | | 600,000 | | | | 644,029 | |
Lam Research Corp. | | | BBB | | | | 2.75 | | | | 03/15/20 | | | | 2,000,000 | | | | 2,043,848 | |
Lender Processing Svcs., Inc. | | | BBB | | | | 5.75 | | | | 04/15/23 | | | | 1,311,000 | | | | 1,373,273 | |
Lexmark International, Inc. | | | BBB- | | | | 6.65 | | | | 06/01/18 | | | | 2,000,000 | | | | 2,128,458 | |
Motorola Solutions, Inc. | | | BBB- | | | | 3.75 | | | | 05/15/22 | | | | 2,000,000 | | | | 1,999,112 | |
Symantec Corp. | | | BBB- | | | | 4.20 | | | | 09/15/20 | | | | 2,000,000 | | | | 2,084,832 | |
Tech Data Corp. | | | BBB- | | | | 3.75 | | | | 09/21/17 | | | | 2,000,000 | | | | 2,049,364 | |
Total System Services, Inc. | | | BBB- | | | | 3.75 | | | | 06/01/23 | | | | 950,000 | | | | 964,845 | |
Western Union Co. | | | BBB | | | | 5.93 | | | | 10/01/16 | | | | 2,000,000 | | | | 2,019,562 | |
| | | | | | | | | | | | | | | | | | | | |
| | | | | | | | | | | | | | | | | | | 36,082,090 | |
| | | | | | | | | | | | | | | | | | | | |
MATERIALS (4.2%) | | | | | | | | | | | | | |
Albemarle Corp. | | | BBB- | | | | 4.50 | | | | 12/15/20 | | | | 1,065,000 | | | | 1,133,239 | |
Alcoa, Inc. | | | BBB- | | | | 6.75 | | | | 07/15/18 | | | | 2,000,000 | | | | 2,165,000 | |
Domtar Corp. | | | BBB- | | | | 4.40 | | | | 04/01/22 | | | | 2,000,000 | | | | 2,073,910 | |
Eastman Chemical Co. | | | BBB | | | | 2.40 | | | | 06/01/17 | | | | 1,000,000 | | | | 1,009,251 | |
Freeport-McMoRan Copper & Gold | | | BB | | | | 3.10 | | | | 03/15/20 | | | | 1,750,000 | | | | 1,653,750 | |
Freeport-McMoRan Copper & Gold | | | BB | | | | 3.55 | | | | 03/01/22 | | | | 250,000 | | | | 220,000 | |
Goldcorp, Inc. | | | BBB+ | | | | 2.13 | | | | 03/15/18 | | | | 2,000,000 | | | | 2,002,930 | |
Kinross Gold Corp. | | | BB+ | | | | 3.63 | | | | 09/01/16 | | | | 2,000,000 | | | | 1,995,478 | |
Kinross Gold Corp. | | | BB+ | | | | 5.13 | | | | 09/01/21 | | | | 750,000 | | | | 744,375 | |
Methanex Corp. | | | BB+ | | | | 3.25 | | | | 12/15/19 | | | | 2,000,000 | | | | 1,942,466 | |
Newmont Mining Corp. | | | BBB | | | | 3.50 | | | | 03/15/22 | | | | 2,000,000 | | | | 2,076,762 | |
Southern Copper Corp. | | | BBB | | | | 3.50 | | | | 11/08/22 | | | | 2,000,000 | | | | 1,985,986 | |
WestRock Co. | | | BBB | | | | 3.50 | | | | 03/01/20 | | | | 622,000 | | | | 642,102 | |
| | | | | | | | | | | | | | | | | | | | |
| | | | | | | | | | | | | | | | | | | 19,645,249 | |
| | | | | | | | | | | | | | | | | | | | |
TELECOMMUNICATION SERVICES (0.9%) | | | | | | | | | | | | | |
AT&T, Inc. | | | BBB+ | | | | 3.00 | | | | 02/15/22 | | | | 2,000,000 | | | | 2,039,622 | |
Verizon Communications, Inc. | | | BBB+ | | | | 4.50 | | | | 09/15/20 | | | | 2,000,000 | | | | 2,219,912 | |
| | | | | | | | | | | | | | | | | | | | |
| | | | | | | | | | | | | | | | | | | 4,259,534 | |
| | | | | | | | | | | | | | | | | | | | |
UTILITIES (2.3%) | | | | | | | | | | | | | |
AGL Capital Corp. | | | A- | | | | 6.38 | | | | 07/15/16 | | | | 500,000 | | | | 500,573 | |
Constellation Energy | | | BBB- | | | | 5.15 | | | | 12/01/20 | | | | 1,500,000 | | | | 1,669,391 | |
Entergy Corp. | | | BBB- | | | | 4.70 | | | | 01/15/17 | | | | 600,000 | | | | 608,449 | |
Entergy Corp. | | | BBB- | | | | 5.13 | | | | 09/15/20 | | | | 1,400,000 | | | | 1,534,071 | |
Exelon Generation Co. LLC | | | BBB | | | | 4.25 | | | | 06/15/22 | | | | 1,000,000 | | | | 1,066,560 | |
National Fuel Gas Co. | | | BBB | | | | 4.90 | | | | 12/01/21 | | | | 2,000,000 | | | | 2,105,336 | |
SCANA Corp. | | | BBB | | | | 4.75 | | | | 05/15/21 | | | | 2,000,000 | | | | 2,134,766 | |
Talen Energy Supply LLC | | | B+ | | | | 4.60 | | | | 12/15/21 | | | | 1,400,000 | | | | 1,029,000 | |
| | | | | | | | | | | | | | | | | | | | |
| | | | | | | | | | | | | | | | | | | 10,648,146 | |
| | | | | | | | | | | | | | | | | | | | |
TOTAL LONG-TERM DEBT SECURITIES
(Cost: $457,012,362) 99.1% | | | | | | | | 467,887,952 | |
| | | | | | | | | |
| | | | | |
| | | Rating** | | | Rate(%) | | | Maturity | | | Face Amount | | | Value | |
SHORT-TERM DEBT SECURITIES: | | | | | | | | | | | | | | | | | | | | |
COMMERCIAL PAPER (0.2%) | | | | | | | | | | | | | |
Ralph Lauren Corp.† | | | A-1 | | | | 0.40 | | | | 07/01/16 | | | | 800,000 | | | | 800,000 | |
| | | | | | | | | | | | | | | | | | | | |
TOTAL SHORT-TERM DEBT SECURITIES
(Cost: $800,000) 0.2% | | | | | | | | 800,000 | |
| | | | | | | | | |
TOTAL INVESTMENTS
(Cost: $457,812,362) 99.3% | | | | | | | | | | | | | | | | | | | 468,687,952 | |
| | | | | | | | | | | | | | | | | | | | |
OTHER NET ASSETS 0.7% | | | | | | | | | | | | | | | | | | | 3,193,592 | |
| | | | | | | | | | | | | | | | | | | | |
NET ASSETS 100.0% | | | | | | | | | | | | | | | | | | $ | 471,881,544 | |
| | | | | | | | | | | | | | | | | | | | |
The accompanying notes are an integral part of these portfolio schedules.
MUTUAL OF AMERICA INVESTMENT CORPORATION - BOND FUND
PORTFOLIO OF INVESTMENTS IN SECURITIES
June 30, 2016 (Unaudited)
| | | | | | | | | | | | | | | | | | | | |
| | | Rating** | | | Rate(%) | | | Maturity | | | Face Amount | | | Value | |
LONG-TERM DEBT SECURITIES: | | | | | | | | | | | | | | | | | | | | |
U.S. GOVERNMENT (8.5%) | | | | | | | | | | | | | |
U.S. Treasury Note | | | AA+ | | | | 1.63 | | | | 02/15/26 | | | | 2,000,000 | | | | 2,022,500 | |
U.S. Treasury Note | | | AA+ | | | | 1.63 | | | | 05/15/26 | | | | 2,000,000 | | | | 2,024,454 | |
U.S. Treasury Note | | | AA+ | | | | 2.25 | | | | 11/15/25 | | | | 1,000,000 | | | | 1,066,875 | |
U.S. Treasury Strip | | | AA+ | | | | 0.00 | | | | 08/15/25 | | | | 20,000,000 | | | | 17,305,099 | |
U.S. Treasury Strip | | | AA+ | | | | 0.00 | | | | 08/15/26 | | | | 20,000,000 | | | | 16,907,840 | |
U.S. Treasury Strip | | | AA+ | | | | 0.00 | | | | 08/15/28 | | | | 20,000,000 | | | | 16,089,220 | |
U.S. Treasury Strip | | | AA+ | | | | 0.00 | | | | 08/15/29 | | | | 20,000,000 | | | | 15,686,680 | |
U.S. Treasury Strip | | | AA+ | | | | 0.00 | | | | 08/15/33 | | | | 10,000,000 | | | | 7,040,140 | |
U.S. Treasury Strip | | | AA+ | | | | 0.00 | | | | 08/15/35 | | | | 10,000,000 | | | | 6,637,230 | |
U.S. Treasury Strip | | | AA+ | | | | 0.00 | | | | 08/15/37 | | | | 10,000,000 | | | | 6,263,960 | |
| | | | | | | | | | | | | | | | | | | | |
| | | | | | | | | | | | | | | | | | | 91,043,998 | |
| | | | | | | | | | | | | | | | | | | | |
U.S. GOVERNMENT AGENCIES (28.2%) | | | | | | | | | | | | | | | | | | | | |
MORTGAGE-BACKED OBLIGATIONS (26.8%) | | | | | | | | | | | | | |
FHARM | | | AA+ | | | | 2.76 | | | | 02/01/36 | | | | 132,890 | | | | 140,601 | |
FHARM | | | AA+ | | | | 2.90 | | | | 04/01/37 | | | | 192,823 | | | | 205,279 | |
FHARM | | | AA+ | | | | 2.90 | | | | 04/01/37 | | | | 311,742 | | | | 327,664 | |
FHARM | | | AA+ | | | | 2.93 | | | | 05/01/37 | | | | 115,176 | | | | 120,321 | |
FHARM | | | AA+ | | | | 3.34 | | | | 04/01/42 | | | | 533,012 | | | | 557,848 | |
FHARM | | | AA+ | | | | 4.54 | | | | 09/01/39 | | | | 257,535 | | | | 271,141 | |
FHARM | | | AA+ | | | | 5.84 | | | | 03/01/37 | | | | 42,150 | | | | 44,406 | |
FHLMC | | | AA+ | | | | 2.50 | | | | 09/01/27 | | | | 1,754,277 | | | | 1,817,353 | |
FHLMC | | | AA+ | | | | 2.50 | | | | 12/01/27 | | | | 1,846,382 | | | | 1,911,237 | |
FHLMC | | | AA+ | | | | 2.50 | | | | 04/01/28 | | | | 2,283,960 | | | | 2,368,439 | |
FHLMC | | | AA+ | | | | 3.00 | | | | 06/01/27 | | | | 938,576 | | | | 987,000 | |
FHLMC | | | AA+ | | | | 3.00 | | | | 08/01/27 | | | | 601,535 | | | | 632,559 | |
FHLMC | | | AA+ | | | | 3.00 | | | | 10/15/37 | | | | 1,801,223 | | | | 1,879,410 | |
FHLMC | | | AA+ | | | | 3.00 | | | | 12/15/40 | | | | 2,065,803 | | | | 2,140,901 | |
FHLMC | | | AA+ | | | | 3.00 | | | | 07/01/42 | | | | 937,871 | | | | 988,050 | |
FHLMC | | | AA+ | | | | 3.00 | | | | 10/01/42 | | | | 2,614,782 | | | | 2,717,270 | |
FHLMC | | | AA+ | | | | 3.00 | | | | 11/01/42 | | | | 2,698,222 | | | | 2,829,955 | |
FHLMC | | | AA+ | | | | 3.00 | | | | 11/01/42 | | | | 1,104,497 | | | | 1,151,124 | |
FHLMC | | | AA+ | | | | 3.00 | | | | 11/01/42 | | | | 1,180,188 | | | | 1,239,920 | |
FHLMC | | | AA+ | | | | 3.00 | | | | 02/01/43 | | | | 2,440,969 | | | | 2,535,622 | |
FHLMC | | | AA+ | | | | 3.00 | | | | 04/01/43 | | | | 1,198,899 | | | | 1,245,817 | |
FHLMC | | | AA+ | | | | 3.00 | | | | 04/01/43 | | | | 2,559,752 | | | | 2,659,277 | |
FHLMC | | | AA+ | | | | 3.00 | | | | 04/01/43 | | | | 1,597,934 | | | | 1,677,452 | |
FHLMC | | | AA+ | | | | 3.50 | | | | 02/01/35 | | | | 4,330,936 | | | | 4,608,114 | |
FHLMC | | | AA+ | | | | 3.50 | | | | 02/01/35 | | | | 2,219,112 | | | | 2,361,070 | |
FHLMC | | | AA+ | | | | 3.50 | | | | 04/01/35 | | | | 1,759,712 | | | | 1,873,643 | |
FHLMC | | | AA+ | | | | 3.50 | | | | 01/01/41 | | | | 2,057,154 | | | | 2,171,922 | |
FHLMC | | | AA+ | | | | 3.50 | | | | 07/01/42 | | | | 2,589,241 | | | | 2,771,782 | |
FHLMC | | | AA+ | | | | 3.50 | | | | 10/01/42 | | | | 2,308,339 | | | | 2,435,397 | |
FHLMC | | | AA+ | | | | 3.50 | | | | 01/01/43 | | | | 2,092,748 | | | | 2,210,363 | |
FHLMC | | | AA+ | | | | 3.50 | | | | 01/01/43 | | | | 1,280,687 | | | | 1,350,530 | |
FHLMC | | | AA+ | | | | 3.50 | | | | 05/01/43 | | | | 2,943,632 | | | | 3,108,211 | |
FHLMC | | | AA+ | | | | 3.50 | | | | 07/01/43 | | | | 1,011,179 | | | | 1,066,568 | |
FHLMC | | | AA+ | | | | 3.50 | | | | 01/01/44 | | | | 3,393,453 | | | | 3,581,023 | |
FHLMC | | | AA+ | | | | 3.50 | | | | 04/01/45 | | | | 2,678,806 | | | | 2,846,707 | |
FHLMC | | | AA+ | | | | 3.50 | | | | 07/01/45 | | | | 2,697,238 | | | | 2,884,146 | |
FHLMC | | | AA+ | | | | 3.50 | | | | 09/01/45 | | | | 2,364,772 | | | | 2,505,007 | |
FHLMC | | | AA+ | | | | 4.00 | | | | 02/01/25 | | | | 341,675 | | | | 362,713 | |
FHLMC | | | AA+ | | | | 4.00 | | | | 05/01/25 | | | | 134,604 | | | | 143,323 | |
FHLMC | | | AA+ | | | | 4.00 | | | | 05/01/26 | | | | 436,858 | | | | 465,190 | |
FHLMC | | | AA+ | | | | 4.00 | | | | 12/01/33 | | | | 1,462,245 | | | | 1,572,343 | |
FHLMC | | | AA+ | | | | 4.00 | | | | 12/15/38 | | | | 500,000 | | | | 544,956 | |
FHLMC | | | AA+ | | | | 4.00 | | | | 07/01/41 | | | | 1,451,201 | | | | 1,584,176 | |
FHLMC | | | AA+ | | | | 4.00 | | | | 12/01/41 | | | | 753,866 | | | | 808,731 | |
MUTUAL OF AMERICA INVESTMENT CORPORATION - BOND FUND
PORTFOLIO OF INVESTMENTS IN SECURITIES
June 30, 2016 (Unaudited)
| | | | | | | | | | | | | | | | |
FHLMC | | AA+ | | | 4.00 | | | 07/01/42 | | | 2,853,967 | | | | 3,098,770 | |
FHLMC | | AA+ | | | 4.00 | | | 08/01/42 | | | 2,014,925 | | | | 2,156,753 | |
FHLMC | | AA+ | | | 4.00 | | | 08/01/42 | | | 1,143,478 | | | | 1,227,479 | |
FHLMC | | AA+ | | | 4.00 | | | 09/01/42 | | | 1,546,167 | | | | 1,663,548 | |
FHLMC | | AA+ | | | 4.00 | | | 11/01/42 | | | 1,843,559 | | | | 1,988,625 | |
FHLMC | | AA+ | | | 4.00 | | | 12/01/42 | | | 1,528,104 | | | | 1,662,688 | |
FHLMC | | AA+ | | | 4.00 | | | 01/01/43 | | | 2,378,695 | | | | 2,569,549 | |
FHLMC | | AA+ | | | 4.00 | | | 01/01/44 | | | 2,145,471 | | | | 2,310,409 | |
FHLMC | | AA+ | | | 4.00 | | | 10/01/44 | | | 2,393,252 | | | | 2,560,976 | |
FHLMC | | AA+ | | | 4.50 | | | 03/01/34 | | | 561,113 | | | | 611,473 | |
FHLMC | | AA+ | | | 4.50 | | | 08/01/34 | | | 335,173 | | | | 366,873 | |
FHLMC | | AA+ | | | 4.50 | | | 08/15/35 | | | 125,608 | | | | 135,006 | |
FHLMC | | AA+ | | | 4.50 | | | 12/01/39 | | | 622,086 | | | | 681,110 | |
FHLMC | | AA+ | | | 4.50 | | | 03/01/41 | | | 740,634 | | | | 822,992 | |
FHLMC | | AA+ | | | 5.00 | | | 02/01/26 | | | 94,930 | | | | 104,768 | |
FHLMC | | AA+ | | | 5.00 | | | 08/01/35 | | | 1,278,411 | | | | 1,425,983 | |
FHLMC | | AA+ | | | 5.00 | | | 10/01/40 | | | 1,313,161 | | | | 1,451,652 | |
FHLMC | | AA+ | | | 5.50 | | | 03/01/21 | | | 109,377 | | | | 115,893 | |
FHLMC | | AA+ | | | 5.50 | | | 07/01/32 | | | 248,412 | | | | 278,833 | |
FHLMC | | AA+ | | | 5.50 | | | 01/15/33 | | | 278,619 | | | | 315,079 | |
FHLMC | | AA+ | | | 5.50 | | | 05/01/33 | | | 351,912 | | | | 393,822 | |
FHLMC | | AA+ | | | 5.50 | | | 01/15/35 | | | 69,426 | | | | 71,021 | |
FHLMC | | AA+ | | | 5.50 | | | 06/01/37 | | | 1,127,519 | | | | 1,276,723 | |
FHLMC | | AA+ | | | 6.00 | | | 07/15/29 | | | 176,551 | | | | 202,973 | |
FHLMC | | AA+ | | | 6.00 | | | 03/15/32 | | | 199,056 | | | | 223,061 | |
FHLMC Strip | | AA+ | | | 3.00 | | | 01/15/43 | | | 2,238,717 | | | | 2,334,851 | |
FNMA | | AA+ | | | 2.25 | | | 01/01/28 | | | 1,631,175 | | | | 1,670,278 | |
FNMA | | AA+ | | | 2.41 | | | 05/01/43 | | | 2,031,935 | | | | 2,096,432 | |
FNMA | | AA+ | | | 3.00 | | | 09/01/29 | | | 1,994,282 | | | | 2,105,268 | |
FNMA | | AA+ | | | 3.00 | | | 06/01/33 | | | 1,682,575 | | | | 1,773,599 | |
FNMA | | AA+ | | | 3.00 | | | 07/01/33 | | | 3,097,082 | | | | 3,264,500 | |
FNMA | | AA+ | | | 3.00 | | | 09/01/33 | | | 3,230,015 | | | | 3,404,676 | |
FNMA | | AA+ | | | 3.00 | | | 04/25/42 | | | 1,933,483 | | | | 2,013,336 | |
FNMA | | AA+ | | | 3.00 | | | 10/01/42 | | | 938,987 | | | | 978,322 | |
FNMA | | AA+ | | | 3.00 | | | 12/01/42 | | | 1,339,824 | | | | 1,396,989 | |
FNMA | | AA+ | | | 3.00 | | | 12/01/42 | | | 2,185,346 | | | | 2,243,001 | |
FNMA | | AA+ | | | 3.00 | | | 01/01/43 | | | 2,490,596 | | | | 2,596,408 | |
FNMA | | AA+ | | | 3.00 | | | 02/01/43 | | | 2,069,380 | | | | 2,149,273 | |
FNMA | | AA+ | | | 3.00 | | | 03/01/43 | | | 2,573,943 | | | | 2,703,060 | |
FNMA | | AA+ | | | 3.00 | | | 02/01/45 | | | 2,368,270 | | | | 2,487,495 | |
FNMA | | AA+ | | | 3.50 | | | 02/01/26 | | | 263,078 | | | | 278,992 | |
FNMA | | AA+ | | | 3.50 | | | 03/01/32 | | | 1,316,393 | | | | 1,401,966 | |
FNMA | | AA+ | | | 3.50 | | | 08/01/38 | | | 2,314,623 | | | | 2,446,316 | |
FNMA | | AA+ | | | 3.50 | | | 03/01/41 | | | 1,968,706 | | | | 2,108,523 | |
FNMA | | AA+ | | | 3.50 | | | 10/01/41 | | | 1,159,871 | | | | 1,235,283 | |
FNMA | | AA+ | | | 3.50 | | | 12/01/41 | | | 1,435,324 | | | | 1,528,703 | |
FNMA | | AA+ | | | 3.50 | | | 04/01/42 | | | 1,581,861 | | | | 1,688,011 | |
FNMA | | AA+ | | | 3.50 | | | 04/01/42 | | | 1,409,697 | | | | 1,492,409 | |
FNMA | | AA+ | | | 3.50 | | | 07/01/42 | | | 2,578,759 | | | | 2,727,948 | |
FNMA | | AA+ | | | 3.50 | | | 08/01/42 | | | 2,003,793 | | | | 2,118,880 | |
FNMA | | AA+ | | | 3.50 | | | 09/01/42 | | | 1,949,379 | | | | 2,062,875 | |
FNMA | | AA+ | | | 3.50 | | | 10/01/42 | | | 2,396,687 | | | | 2,536,253 | |
FNMA | | AA+ | | | 3.50 | | | 12/01/42 | | | 3,715,227 | | | | 3,930,577 | |
FNMA | | AA+ | | | 3.50 | | | 12/01/42 | | | 2,368,333 | | | | 2,557,235 | |
FNMA | | AA+ | | | 3.50 | | | 03/01/43 | | | 2,237,470 | | | | 2,366,569 | |
FNMA | | AA+ | | | 3.50 | | | 06/01/43 | | | 4,245,393 | | | | 4,489,062 | |
FNMA | | AA+ | | | 3.50 | | | 10/01/43 | | | 1,632,313 | | | | 1,766,448 | |
FNMA | | AA+ | | | 3.50 | | | 01/01/44 | | | 1,416,512 | | | | 1,472,310 | |
FNMA | | AA+ | | | 3.50 | | | 04/01/45 | | | 4,507,125 | | | | 4,819,451 | |
FNMA | | AA+ | | | 3.50 | | | 05/01/45 | | | 5,272,901 | | | | 5,589,190 | |
FNMA | | AA+ | | | 3.50 | | | 03/01/46 | | | 2,981,642 | | | | 3,160,759 | |
MUTUAL OF AMERICA INVESTMENT CORPORATION - BOND FUND
PORTFOLIO OF INVESTMENTS IN SECURITIES
June 30, 2016 (Unaudited)
| | | | | | | | | | | | | | | | |
FNMA | | AA+ | | | 4.00 | | | 05/01/19 | | | 167,557 | | | | 173,588 | |
FNMA | | AA+ | | | 4.00 | | | 07/25/26 | | | 2,038,988 | | | | 2,282,382 | |
FNMA | | AA+ | | | 4.00 | | | 01/01/31 | | | 159,973 | | | | 173,194 | |
FNMA | | AA+ | | | 4.00 | | | 12/01/33 | | | 1,629,568 | | | | 1,754,865 | |
FNMA | | AA+ | | | 4.00 | | | 03/01/35 | | | 465,095 | | | | 500,605 | |
FNMA | | AA+ | | | 4.00 | | | 11/01/38 | | | 2,156,095 | | | | 2,316,460 | |
FNMA | | AA+ | | | 4.00 | | | 11/01/40 | | | 1,167,152 | | | | 1,250,771 | |
FNMA | | AA+ | | | 4.00 | | | 05/01/41 | | | 1,450,433 | | | | 1,590,559 | |
FNMA | | AA+ | | | 4.00 | | | 08/01/42 | | | 2,655,568 | | | | 2,860,377 | |
FNMA | | AA+ | | | 4.00 | | | 05/01/43 | | | 1,848,599 | | | | 1,993,931 | |
FNMA | | AA+ | | | 4.00 | | | 09/01/45 | | | 1,880,698 | | | | 2,033,930 | |
FNMA | | AA+ | | | 4.00 | | | 11/01/45 | | | 2,937,387 | | | | 3,192,292 | |
FNMA | | AA+ | | | 4.50 | | | 05/01/18 | | | 65,289 | | | | 66,963 | |
FNMA | | AA+ | | | 4.50 | | | 05/01/19 | | | 23,968 | | | | 24,628 | |
FNMA | | AA+ | | | 4.50 | | | 06/01/19 | | | 87,287 | | | | 89,674 | |
FNMA | | AA+ | | | 4.50 | | | 05/01/30 | | | 431,961 | | | | 471,244 | |
FNMA | | AA+ | | | 4.50 | | | 04/01/31 | | | 684,647 | | | | 751,459 | |
FNMA | | AA+ | | | 4.50 | | | 08/01/33 | | | 182,449 | | | | 199,700 | |
FNMA | | AA+ | | | 4.50 | | | 08/01/33 | | | 144,475 | | | | 158,264 | |
FNMA | | AA+ | | | 4.50 | | | 09/01/33 | | | 445,734 | | | | 487,248 | |
FNMA | | AA+ | | | 4.50 | | | 10/01/33 | | | 166,173 | | | | 182,073 | |
FNMA | | AA+ | | | 4.50 | | | 10/01/33 | | | 412,300 | | | | 453,599 | |
FNMA | | AA+ | | | 4.50 | | | 05/01/34 | | | 171,438 | | | | 187,975 | |
FNMA | | AA+ | | | 4.50 | | | 06/01/34 | | | 267,548 | | | | 293,352 | |
FNMA | | AA+ | | | 4.50 | | | 07/01/34 | | | 234,077 | | | | 256,635 | |
FNMA | | AA+ | | | 4.50 | | | 01/01/35 | | | 777,380 | | | | 852,035 | |
FNMA | | AA+ | | | 4.50 | | | 08/01/35 | | | 269,272 | | | | 293,727 | |
FNMA | | AA+ | | | 4.50 | | | 09/01/35 | | | 52,443 | | | | 54,000 | |
FNMA | | AA+ | | | 4.50 | | | 12/01/35 | | | 310,074 | | | | 339,382 | |
FNMA | | AA+ | | | 4.50 | | | 05/01/39 | | | 947,712 | | | | 1,043,725 | |
FNMA | | AA+ | | | 4.50 | | | 05/01/39 | | | 1,266,055 | | | | 1,400,195 | |
FNMA | | AA+ | | | 4.50 | | | 05/01/40 | | | 536,882 | | | | 592,079 | |
FNMA | | AA+ | | | 4.50 | | | 11/01/40 | | | 647,873 | | | | 710,330 | |
FNMA | | AA+ | | | 4.50 | | | 06/01/41 | | | 637,375 | | | | 697,390 | |
FNMA | | AA+ | | | 4.50 | | | 10/01/41 | | | 876,802 | | | | 956,834 | |
FNMA | | AA+ | | | 4.50 | | | 11/01/41 | | | 1,048,550 | | | | 1,149,597 | |
FNMA | | AA+ | | | 4.50 | | | 01/01/42 | | | 147,151 | | | | 161,319 | |
FNMA | | AA+ | | | 4.50 | | | 07/01/42 | | | 2,146,711 | | | | 2,342,042 | |
FNMA | | AA+ | | | 4.50 | | | 03/01/44 | | | 1,877,378 | | | | 2,053,643 | |
FNMA | | AA+ | | | 4.50 | | | 05/01/44 | | | 2,145,874 | | | | 2,341,826 | |
FNMA | | AA+ | | | 5.00 | | | 04/01/18 | | | 19,021 | | | | 19,569 | |
FNMA | | AA+ | | | 5.00 | | | 09/01/18 | | | 123,675 | | | | 127,683 | |
FNMA | | AA+ | | | 5.00 | | | 09/01/20 | | | 87,010 | | | | 89,826 | |
FNMA | | AA+ | | | 5.00 | | | 10/01/20 | | | 157,681 | | | | 165,788 | |
FNMA | | AA+ | | | 5.00 | | | 10/01/25 | | | 150,826 | | | | 167,365 | |
FNMA | | AA+ | | | 5.00 | | | 09/01/33 | | | 833,134 | | | | 930,038 | |
FNMA | | AA+ | | | 5.00 | | | 10/01/33 | | | 536,421 | | | | 601,967 | |
FNMA | | AA+ | | | 5.00 | | | 11/01/33 | | | 626,110 | | | | 698,738 | |
FNMA | | AA+ | | | | | | 03/01/34 | | | 139,507 | | | | 155,716 | |
FNMA | | AA+ | | | 5.00 | | | 04/01/34 | | | 71,949 | | | | 80,222 | |
FNMA | | AA+ | | | 5.00 | | | 04/01/34 | | | 305,484 | | | | 343,106 | |
FNMA | | AA+ | | | 5.00 | | | 04/01/35 | | | 252,449 | | | | 283,524 | |
FNMA | | AA+ | | | 5.00 | | | 06/01/35 | | | 154,760 | | | | 171,884 | |
FNMA | | AA+ | | | 5.00 | | | 09/01/35 | | | 394,328 | | | | 438,924 | |
FNMA | | AA+ | | | 5.00 | | | 09/01/35 | | | 156,972 | | | | 174,198 | |
FNMA | | AA+ | | | 5.00 | | | 11/25/35 | | | 977,735 | | | | 1,089,948 | |
FNMA | | AA+ | | | 5.00 | | | 08/01/37 | | | 1,128,309 | | | | 1,256,114 | |
FNMA | | AA+ | | | 5.00 | | | 05/01/39 | | | 751,028 | | | | 844,142 | |
FNMA | | AA+ | | | 5.00 | | | 09/25/40 | | | 1,446,776 | | | | 1,619,154 | |
FNMA | | AA+ | | | 5.50 | | | 04/01/17 | | | 4,341 | | | | 4,385 | |
FNMA | | AA+ | | | 5.50 | | | 05/01/17 | | | 3,309 | | | | 3,325 | |
FNMA | | AA+ | | | 5.50 | | | 01/01/24 | | | 181,351 | | | | 203,584 | |
MUTUAL OF AMERICA INVESTMENT CORPORATION - BOND FUND
PORTFOLIO OF INVESTMENTS IN SECURITIES
June 30, 2016 (Unaudited)
| | | | | | | | | | | | | | | | |
FNMA | | AA+ | | | 5.50 | | | 03/01/24 | | | 372,722 | | | | 418,356 | |
FNMA | | AA+ | | | 5.50 | | | 09/01/25 | | | 161,431 | | | | 182,321 | |
FNMA | | AA+ | | | 5.50 | | | 11/01/26 | | | 115,439 | | | | 129,595 | |
FNMA | | AA+ | | | 5.50 | | | 01/01/27 | | | 65,435 | | | | 73,434 | |
FNMA | | AA+ | | | 5.50 | | | 03/01/33 | | | 277,391 | | | | 305,217 | |
FNMA | | AA+ | | | 5.50 | | | 09/01/33 | | | 293,669 | | | | 329,776 | |
FNMA | | AA+ | | | 5.50 | | | 10/01/33 | | | 482,963 | | | | 544,562 | |
FNMA | | AA+ | | | 5.50 | | | 03/01/34 | | | 67,827 | | | | 76,689 | |
FNMA | | AA+ | | | 5.50 | | | 03/01/34 | | | 312,586 | | | | 359,289 | |
FNMA | | AA+ | | | 5.50 | | | 07/01/34 | | | 220,312 | | | | 249,791 | |
FNMA | | AA+ | | | 5.50 | | | 09/01/34 | | | 50,853 | | | | 57,333 | |
FNMA | | AA+ | | | 5.50 | | | 09/01/34 | | | 107,994 | | | | 122,167 | |
FNMA | | AA+ | | | 5.50 | | | 09/01/34 | | | 219,134 | | | | 248,246 | |
FNMA | | AA+ | | | 5.50 | | | 10/01/34 | | | 482,251 | | | | 541,200 | |
FNMA | | AA+ | | | 5.50 | | | 02/01/35 | | | 158,178 | | | | 179,519 | |
FNMA | | AA+ | | | 5.50 | | | 02/01/35 | | | 263,229 | | | | 301,148 | |
FNMA | | AA+ | | | 5.50 | | | 04/01/35 | | | 252,988 | | | | 287,009 | |
FNMA | | AA+ | | | 5.50 | | | 08/01/35 | | | 521,612 | | | | 591,622 | |
FNMA | | AA+ | | | 5.50 | | | 02/25/37 | | | 118,208 | | | | 128,912 | |
FNMA | | AA+ | | | 5.50 | | | 05/01/38 | | | 498,080 | | | | 558,965 | |
FNMA | | AA+ | | | 5.50 | | | 11/01/38 | | | 84,739 | | | | 90,462 | |
FNMA | | AA+ | | | 5.50 | | | 06/01/48 | | | 153,148 | | | | 167,015 | |
FNMA | | AA+ | | | 6.00 | | | 03/01/17 | | | 5,755 | | | | 5,814 | |
FNMA | | AA+ | | | 6.00 | | | 05/01/23 | | | 240,215 | | | | 275,412 | |
FNMA | | AA+ | | | 6.00 | | | 01/01/25 | | | 148,492 | | | | 169,566 | |
FNMA | | AA+ | | | 6.00 | | | 03/01/28 | | | 191,275 | | | | 218,420 | |
FNMA | | AA+ | | | 6.00 | | | 04/01/32 | | | 45,387 | | | | 51,830 | |
FNMA | | AA+ | | | 6.00 | | | 05/01/32 | | | 221,133 | | | | 255,777 | |
FNMA | | AA+ | | | 6.00 | | | 04/01/33 | | | 613,289 | | | | 715,896 | |
FNMA | | AA+ | | | 6.00 | | | 11/01/34 | | | 67,093 | | | | 76,621 | |
FNMA | | AA+ | | | 6.00 | | | 03/01/36 | | | 49,537 | | | | 55,957 | |
FNMA | | AA+ | | | 6.00 | | | 12/01/36 | | | 174,082 | | | | 200,399 | |
FNMA | | AA+ | | | 6.00 | | | 01/01/37 | | | 237,227 | | | | 274,188 | |
FNMA | | AA+ | | | 6.00 | | | 03/01/37 | | | 151,035 | | | | 168,630 | |
FNMA | | AA+ | | | 6.00 | | | 04/01/37 | | | 78,687 | | | | 87,317 | |
FNMA | | AA+ | | | 6.00 | | | 05/01/37 | | | 58,608 | | | | 65,696 | |
FNMA | | AA+ | | | 6.00 | | | 06/01/37 | | | 81,880 | | | | 88,532 | |
FNMA | | AA+ | | | 6.00 | | | 07/01/37 | | | 100,213 | | | | 114,533 | |
FNMA | | AA+ | | | 6.00 | | | 08/01/37 | | | 144,176 | | | | 164,828 | |
FNMA | | AA+ | | | 6.00 | | | 12/01/37 | | | 49,725 | | | | 56,907 | |
FNMA | | AA+ | | | 6.00 | | | 10/25/44 | | | 522,217 | | | | 625,233 | |
FNMA | | AA+ | | | 6.00 | | | 02/25/47 | | | 1,152,242 | | | | 1,315,404 | |
FNMA | | AA+ | | | 6.00 | | | 12/25/49 | | | 596,989 | | | | 691,829 | |
FNMA | | AA+ | | | 6.50 | | | 09/01/16 | | | 258 | | | | 258 | |
FNMA | | AA+ | | | 6.50 | | | 03/01/17 | | | 13,521 | | | | 13,589 | |
FNMA | | AA+ | | | 6.50 | | | 05/01/17 | | | 2,164 | | | | 2,175 | |
FNMA | | AA+ | | | 6.50 | | | 05/01/32 | | | 156,417 | | | | 180,002 | |
FNMA | | AA+ | | | 6.50 | | | 05/01/32 | | | 98,655 | | | | 113,531 | |
FNMA | | AA+ | | | 6.50 | | | 09/01/36 | | | 60,068 | | | | 68,137 | |
FNMA | | AA+ | | | 6.50 | | | 05/01/37 | | | 230,267 | | | | 248,775 | |
FNMA | | AA+ | | | 6.50 | | | 07/01/37 | | | 31,253 | | | | 35,965 | |
FNMA | | AA+ | | | 6.50 | | | 09/01/37 | | | 68,602 | | | | 78,946 | |
FNMA | | AA+ | | | 6.50 | | | 05/01/38 | | | 104,897 | | | | 124,378 | |
FNMA | | AA+ | | | 7.00 | | | 09/01/31 | | | 60,322 | | | | 68,773 | |
FNMA | | AA+ | | | 7.00 | | | 01/25/44 | | | 429,911 | | | | 497,654 | |
FNMA | | AA+ | | | 7.50 | | | 06/01/32 | | | 80,303 | | | | 99,014 | |
FNMA | | AA+ | | | 8.00 | | | 04/01/32 | | | 20,601 | | | | 22,046 | |
FNMA Strip | | AA+ | | | 3.00 | | | 08/25/42 | | | 1,802,597 | | | | 1,851,375 | |
GNMA (2) | | AA+ | | | 2.68 | | | 10/16/47 | | | 2,000,000 | | | | 2,042,900 | |
GNMA (2) | | AA+ | | | 3.00 | | | 07/16/36 | | | 1,872,984 | | | | 2,044,173 | |
MUTUAL OF AMERICA INVESTMENT CORPORATION - BOND FUND
PORTFOLIO OF INVESTMENTS IN SECURITIES
June 30, 2016 (Unaudited)
| | | | | | | | | | | | | | | | | | | | |
GNMA (2) | | | AA+ | | | | 3.50 | | | | 11/20/32 | | | | 2,388,736 | | | | 2,537,588 | |
GNMA (2) | | | AA+ | | | | 3.50 | | | | 09/20/33 | | | | 221,422 | | | | 222,982 | |
GNMA (2) | | | AA+ | | | | 3.50 | | | | 07/15/42 | | | | 1,765,283 | | | | 1,882,977 | |
GNMA (2) | | | AA+ | | | | 3.50 | | | | 11/15/42 | | | | 1,178,796 | | | | 1,257,932 | |
GNMA (2) | | | AA+ | | | | 3.50 | | | | 05/20/45 | | | | 2,718,213 | | | | 2,923,423 | |
GNMA (2) | | | AA+ | | | | 3.70 | | | | 05/15/42 | | | | 1,014,646 | | | | 1,082,782 | |
GNMA (2) | | | AA+ | | | | 4.00 | | | | 04/15/24 | | | | 301,157 | | | | 321,530 | |
GNMA (2) | | | AA+ | | | | 4.00 | | | | 01/20/41 | | | | 2,336,744 | | | | 2,505,493 | |
GNMA (2) | | | AA+ | | | | 4.00 | | | | 03/15/41 | | | | 951,687 | | | | 1,034,018 | |
GNMA (2) | | | AA+ | | | | 4.00 | | | | 08/15/41 | | | | 1,583,898 | | | | 1,720,487 | |
GNMA (2) | | | AA+ | | | | 4.00 | | | | 11/15/41 | | | | 981,685 | | | | 1,073,939 | |
GNMA (2) | | | AA+ | | | | 4.00 | | | | 12/15/41 | | | | 1,710,087 | | | | 1,843,231 | |
GNMA (2) | | | AA+ | | | | 4.00 | | | | 01/15/42 | | | | 478,649 | | | | 514,390 | |
GNMA (2) | | | AA+ | | | | 4.00 | | | | 03/20/42 | | | | 820,657 | | | | 877,541 | |
GNMA (2) | | | AA+ | | | | 4.00 | | | | 08/20/42 | | | | 1,371,900 | | | | 1,470,777 | |
GNMA (2) | | | AA+ | | | | 4.25 | | | | 06/20/36 | | | | 803,945 | | | | 871,203 | |
GNMA (2) | | | AA+ | | | | 4.25 | | | | 04/20/41 | | | | 990,790 | | | | 1,067,237 | |
GNMA (2) | | | AA+ | | | | 4.29 | | | | 04/15/41 | | | | 502,542 | | | | 550,702 | |
GNMA (2) | | | AA+ | | | | 4.50 | | | | 06/20/30 | | | | 135,296 | | | | 148,007 | |
GNMA (2) | | | AA+ | | | | 4.50 | | | | 09/15/30 | | | | 582,789 | | | | 646,660 | |
GNMA (2) | | | AA+ | | | | 4.50 | | | | 06/20/34 | | | | 512,114 | | | | 551,784 | |
GNMA (2) | | | AA+ | | | | 4.50 | | | | 09/15/40 | | | | 1,187,040 | | | | 1,311,247 | |
GNMA (2) | | | AA+ | | | | 4.50 | | | | 10/15/40 | | | | 1,634,868 | | | | 1,846,921 | |
GNMA (2) | | | AA+ | | | | 4.50 | | | | 10/15/40 | | | | 475,207 | | | | 524,496 | |
GNMA (2) | | | AA+ | | | | 5.00 | | | | 04/15/39 | | | | 1,329,012 | | | | 1,515,406 | |
GNMA (2) | | | AA+ | | | | 5.00 | | | | 06/20/39 | | | | 1,924,645 | | | | 2,145,484 | |
GNMA (2) | | | AA+ | | | | 5.00 | | | | 11/15/39 | | | | 656,209 | | | | 734,771 | |
GNMA (2) | | | AA+ | | | | 5.00 | | | | 05/15/40 | | | | 251,941 | | | | 283,991 | |
GNMA (2) | | | AA+ | | | | 5.00 | | | | 06/20/40 | | | | 346,971 | | | | 374,757 | |
GNMA (2) | | | AA+ | | | | 5.00 | | | | 06/20/40 | | | | 331,093 | | | | 359,432 | |
GNMA (2) | | | AA+ | | | | 5.50 | | | | 01/15/36 | | | | 124,243 | | | | 139,598 | |
GNMA (2) | | | AA+ | | | | 6.50 | | | | 04/15/31 | | | | 14,531 | | | | 16,672 | |
GNMA (2) | | | AA+ | | | | 6.50 | | | | 12/15/31 | | | | 22,529 | | | | 25,703 | |
GNMA (2) | | | AA+ | | | | 6.50 | | | | 05/15/32 | | | | 28,945 | | | | 33,022 | |
GNMA (2) | | | AA+ | | | | 7.00 | | | | 05/15/32 | | | | 2,775 | | | | 2,879 | |
Vendee Mortgage Trust (2) | | | AA+ | | | | 5.25 | | | | 01/15/32 | | | | 1,001,136 | | | | 1,113,006 | |
| | | | | | | | | | | | | | | | | | | | |
| | | | | | | | | | | | | | | | | | | 287,264,136 | |
| | | | | | | | | | | | | | | | | | | | |
NON-MORTGAGE-BACKED OBLIGATIONS (1.4%) | | | | | | | | | | | | | |
FHLMC | | | AA+ | | | | 0.00 | | | | 11/29/19 | | | | 11,000,000 | | | | 10,553,290 | |
FNMA | | | AA+ | | | | 0.00 | | | | 10/09/19 | | | | 5,050,000 | | | | 4,851,065 | |
| | | | | | | | | | | | | | | | | | | | |
| | | | | | | | | | | | | | | | | | | 15,404,355 | |
| | | | | | | | | | | | | | | | | | | | |
CORPORATE DEBT (61.9%) | | | | | | | | | | | | | | | | | | | | |
CONSUMER DISCRETIONARY (9.6%) | | | | | | | | | | | | | |
Advance Auto Parts, Inc. | | | BBB- | | | | 4.50 | | | | 01/15/22 | | | | 1,000,000 | | | | 1,076,964 | |
Advance Auto Parts, Inc. | | | BBB- | | | | 4.50 | | | | 12/01/23 | | | | 1,000,000 | | | | 1,074,091 | |
Advance Auto Parts, Inc. | | | BBB- | | | | 5.75 | | | | 05/01/20 | | | | 3,000,000 | | | | 3,329,679 | |
AutoZone, Inc. | | | BBB | | | | 3.25 | | | | 04/15/25 | | | | 2,000,000 | | | | 2,073,296 | |
AutoZone, Inc. | | | BBB | | | | 3.70 | | | | 04/15/22 | | | | 700,000 | | | | 746,925 | |
AutoZone, Inc. | | | BBB | | | | 4.00 | | | | 11/15/20 | | | | 3,000,000 | | | | 3,228,207 | |
Brinker International, Inc. | | | BBB- | | | | 3.88 | | | | 05/15/23 | | | | 4,000,000 | | | | 4,058,688 | |
Coach, Inc. | | | BBB- | | | | 4.25 | | | | 04/01/25 | | | | 2,500,000 | | | | 2,552,865 | |
Dollar General Corp. | | | BBB | | | | 3.25 | | | | 04/15/23 | | | | 4,000,000 | | | | 4,152,676 | |
Expedia, Inc. | | | BBB- | | | | 5.95 | | | | 08/15/20 | | | | 4,000,000 | | | | 4,474,276 | |
Family Dollar Stores, Inc. | | | BBB | | | | 5.00 | | | | 02/01/21 | | | | 4,000,000 | | | | 4,240,000 | |
Gap, Inc. | | | BB+ | | | | 5.95 | | | | 04/12/21 | | | | 5,000,000 | | | | 5,214,850 | |
Harman Int’l. Industries, Inc. | | | BBB- | | | | 4.15 | | | | 05/15/25 | | | | 5,000,000 | | | | 5,214,355 | |
Hyatt Hotels Corp. | | | BBB | | | | 5.38 | | | | 08/15/21 | | | | 200,000 | | | | 226,637 | |
Kohl’s Corp. | | | BBB | | | | 3.25 | | | | 02/01/23 | | | | 1,804,000 | | | | 1,808,423 | |
Kohl’s Corp. | | | BBB | | | | 4.00 | | | | 11/01/21 | | | | 2,620,000 | | | | 2,740,502 | |
Lowe’s Cos., Inc. | | | A- | | | | 3.12 | | | | 04/15/22 | | | | 2,000,000 | | | | 2,138,000 | |
Marriott International, Inc. | | | BBB | | | | 3.00 | | | | 03/01/19 | | | | 1,000,000 | | | | 1,031,990 | |
MUTUAL OF AMERICA INVESTMENT CORPORATION - BOND FUND
PORTFOLIO OF INVESTMENTS IN SECURITIES
June 30, 2016 (Unaudited)
| | | | | | | | | | | | | | | | |
Marriott International, Inc. | | BBB | | | 3.38 | | | 10/15/20 | | | 3,000,000 | | | | 3,158,568 | |
Mattel, Inc. | | BBB | | | 3.15 | | | 03/15/23 | | | 2,000,000 | | | | 2,012,624 | |
Mattel, Inc. | | BBB | | | 4.35 | | | 10/01/20 | | | 1,000,000 | | | | 1,073,905 | |
Newell Rubbermaid, Inc. | | BBB- | | | 4.70 | | | 08/15/20 | | | 3,000,000 | | | | 3,237,888 | |
NVR, Inc. | | BBB+ | | | 3.95 | | | 09/15/22 | | | 4,000,000 | | | | 4,239,384 | |
O’Reilly Automotive, Inc. | | BBB+ | | | 3.80 | | | 09/01/22 | | | 3,250,000 | | | | 3,499,516 | |
Omnicom Group, Inc. | | BBB+ | | | 3.63 | | | 05/01/22 | | | 1,000,000 | | | | 1,062,501 | |
Omnicom Group, Inc. | | BBB+ | | | 4.45 | | | 08/15/20 | | | 3,000,000 | | | | 3,309,651 | |
Scripps Networks Interactive, Inc. | | BBB | | | 3.50 | | | 06/15/22 | | | 5,000,000 | | | | 5,182,280 | |
Staples, Inc. | | BBB- | | | 4.38 | | | 01/12/23 | | | 3,700,000 | | | | 3,768,102 | |
Starwood Hotels & Resorts | | BBB | | | 3.13 | | | 02/15/23 | | | 3,000,000 | | | | 3,032,973 | |
Tupperware Brands Corp. | | BBB- | | | 4.75 | | | 06/01/21 | | | 4,000,000 | | | | 4,302,524 | |
Viacom, Inc. | | BBB- | | | 3.25 | | | 03/15/23 | | | 5,000,000 | | | | 4,919,035 | |
Whirlpool Corp. | | BBB | | | 3.70 | | | 05/01/25 | | | 2,000,000 | | | | 2,127,814 | |
Whirlpool Corp. | | BBB | | | 4.85 | | | 06/15/21 | | | 1,000,000 | | | | 1,120,970 | |
Wyndham Worldwide Corp. | | BBB- | | | 3.90 | | | 03/01/23 | | | 4,000,000 | | | | 4,095,204 | |
Wynn Las Vegas LLC | | BB+ | | | 5.38 | | | 03/15/22 | | | 4,000,000 | | | | 4,025,000 | |
| | | | | | | | | | | | | | | | |
| | | | | | | | | | | | | | | 103,550,363 | |
| | | | | | | | | | | | | | | | |
CONSUMER STAPLES (3.5%) | | | | | | | | | | | |
Avon Products, Inc. | | B | | | 4.20 | | | 07/15/18 | | | 900,000 | | | | 830,250 | |
Avon Products, Inc. | | B | | | 6.35 | | | 03/15/20 | | | 2,100,000 | | | | 1,758,120 | |
ConAgra Foods, Inc. | | BBB- | | | 4.95 | | | 08/15/20 | | | 1,500,000 | | | | 1,640,834 | |
CVS Health Corp. | | BBB+ | | | 6.13 | | | 08/15/16 | | | 2,000,000 | | | | 2,011,952 | |
Edgewell Personal Care Co. | | BB+ | | | 4.70 | | | 05/19/21 | | | 4,000,000 | | | | 4,143,052 | |
Flowers Foods, Inc. | | BBB | | | 4.38 | | | 04/01/22 | | | 4,000,000 | | | | 4,351,892 | |
Ingredion, Inc. | | BBB | | | 4.63 | | | 11/01/20 | | | 3,225,000 | | | | 3,538,051 | |
Kroger Co. | | BBB | | | 2.95 | | | 11/01/21 | | | 4,800,000 | | | | 5,043,211 | |
Mead Johnson Nutrition Co. | | BBB- | | | 4.13 | | | 11/15/25 | | | 1,950,000 | | | | 2,126,970 | |
Molson Coors Brewing Co. | | BBB- | | | 3.50 | | | 05/01/22 | | | 3,000,000 | | | | 3,183,105 | |
Sysco Corp. | | BBB+ | | | 3.75 | | | 10/01/25 | | | 3,575,000 | | | | 3,825,096 | |
Whole Foods Market, Inc.† | | BBB- | | | 5.20 | | | 12/03/25 | | | 5,000,000 | | | | 5,390,925 | |
| | | | | | | | | | | | | | | | |
| | | | | | | | | | | | | | | 37,843,458 | |
| | | | | | | | | | | | | | | | |
ENERGY (4.9%) | | | | | | | | | | | |
Cameron International Corp. | | AA- | | | 4.50 | | | 06/01/21 | | | 3,000,000 | | | | 3,228,780 | |
Devon Energy | | BBB | | | 5.85 | | | 12/15/25 | | | 2,500,000 | | | | 2,757,713 | |
Diamond Offshore Drilling, Inc. | | BBB+ | | | 3.45 | | | 11/01/23 | | | 3,000,000 | | | | 2,507,079 | |
Energen Corp. | | BB | | | 4.63 | | | 09/01/21 | | | 4,000,000 | | | | 3,760,000 | |
EQT Corp. | | BBB | | | 4.88 | | | 11/15/21 | | | 4,000,000 | | | | 4,253,288 | |
FMC Technologies, Inc. | | BBB | | | 2.00 | | | 10/01/17 | | | 4,500,000 | | | | 4,469,013 | |
Kinder Morgan Energy Partners | | BBB- | | | 4.30 | | | 05/01/24 | | | 5,000,000 | | | | 5,042,950 | |
Marathon Oil Corp. | | BBB- | | | 2.80 | | | 11/01/22 | | | 4,000,000 | | | | 3,627,704 | |
Marathon Petroleum Corp. | | BBB | | | 5.13 | | | 03/01/21 | | | 3,300,000 | | | | 3,649,186 | |
Murphy Oil Corp. | | BBB- | | | 2.50 | | | 12/01/17 | | | 1,250,000 | | | | 1,246,326 | |
Murphy Oil Corp. | | BBB- | | | 3.70 | | | 12/01/22 | | | 3,525,000 | | | | 3,224,924 | |
Noble Corp. | | BBB | | | 7.50 | | | 03/15/19 | | | 2,000,000 | | | | 2,020,000 | |
Rowan Companies PLC | | BBB- | | | 4.88 | | | 06/01/22 | | | 4,000,000 | | | | 3,500,000 | |
Seacor Hldgs., Inc. | | B | | | 7.38 | | | 10/01/19 | | | 2,775,000 | | | | 2,705,625 | |
SESI LLC | | BB | | | 7.13 | | | 12/15/21 | | | 4,500,000 | | | | 4,331,250 | |
Sunoco, Inc. | | BBB- | | | 5.75 | | | 01/15/17 | | | 2,000,000 | | | | 2,037,576 | |
| | | | | | | | | | | | | | | | |
| | | | | | | | | | | | | | | 52,361,414 | |
| | | | | | | | | | | | | | | | |
FINANCIALS (16.7%) | | | | | | | | | | | |
Aflac, Inc. | | A- | | | 4.00 | | | 02/15/22 | | | 3,000,000 | | | | 3,309,570 | |
Alleghany Corp. | | BBB+ | | | 4.95 | | | 06/27/22 | | | 2,000,000 | | | | 2,227,172 | |
Alleghany Corp. | | BBB+ | | | 5.63 | | | 09/15/20 | | | 3,000,000 | | | | 3,359,097 | |
American Express Co. | | BBB | | | 3.63 | | | 12/05/24 | | | 5,000,000 | | | | 5,128,055 | |
American Int’l. Group, Inc. | | A- | | | 3.75 | | | 07/10/25 | | | 5,000,000 | | | | 5,096,025 | |
American Tower Corp. | | BBB- | | | 4.50 | | | 01/15/18 | | | 5,000,000 | | | | 5,216,400 | |
Bank of America Corp. | | BBB | | | 3.95 | | | 04/21/25 | | | 5,000,000 | | | | 5,091,725 | |
Barrick N.A. Finance LLC | | BBB- | | | 4.40 | | | 05/30/21 | | | 4,000,000 | | | | 4,306,840 | |
Berkley (W.R.) Corp. | | BBB+ | | | 4.63 | | | 03/15/22 | | | 2,000,000 | | | | 2,184,976 | |
Berkley (W.R.) Corp. | | BBB+ | | | 7.38 | | | 09/15/19 | | | 2,000,000 | | | | 2,319,642 | |
MUTUAL OF AMERICA INVESTMENT CORPORATION - BOND FUND
PORTFOLIO OF INVESTMENTS IN SECURITIES
June 30, 2016 (Unaudited)
| | | | | | | | | | | | | | | | |
Block Financial LLC | | BBB | | | 5.25 | | | 10/01/25 | | | 3,000,000 | | | | 3,216,180 | |
Block Financial LLC | | BBB | | | 5.50 | | | 11/01/22 | | | 2,250,000 | | | | 2,432,894 | |
Boston Properties LP | | A- | | | 3.70 | | | 11/15/18 | | | 1,000,000 | | | | 1,046,943 | |
Boston Properties LP | | A- | | | 3.85 | | | 02/01/23 | | | 3,000,000 | | | | 3,210,420 | |
Capital One Financial Corp. | | BBB | | | 4.75 | | | 07/15/21 | | | 4,000,000 | | | | 4,452,548 | |
Citigroup, Inc. | | BBB | | | 3.88 | | | 03/26/25 | | | 5,000,000 | | | | 5,050,550 | |
Citizens Financial Group, Inc. | | BBB | | | 3.75 | | | 07/01/24 | | | 5,000,000 | | | | 5,020,790 | |
Fairfax Financial Hldgs.† | | BBB- | | | 5.80 | | | 05/15/21 | | | 1,500,000 | | | | 1,619,886 | |
Fairfax U.S., Inc.† | | BBB- | | | 4.88 | | | 08/13/24 | | | 3,500,000 | | | | 3,531,021 | |
Fifth Third Bancorp | | BBB | | | 4.30 | | | 01/16/24 | | | 5,000,000 | | | | 5,325,325 | |
First Republic Bank | | A- | | | 2.38 | | | 06/17/19 | | | 2,000,000 | | | | 2,023,392 | |
First Tennessee Bank | | BBB- | | | 2.95 | | | 12/01/19 | | | 5,000,000 | | | | 5,022,795 | |
Genworth Financial, Inc. | | B | | | 7.20 | | | 02/15/21 | | | 1,750,000 | | | | 1,474,375 | |
Genworth Financial, Inc. | | B | | | 7.63 | | | 09/24/21 | | | 1,300,000 | | | | 1,106,625 | |
Government Pptys. Income Trust | | BBB- | | | 3.75 | | | 08/15/19 | | | 4,000,000 | | | | 4,103,012 | |
Hartford Financial Svcs. | | BBB+ | | | 5.50 | | | 03/30/20 | | | 1,000,000 | | | | 1,129,193 | |
HCP, Inc. | | BBB | | | 3.40 | | | 02/01/25 | | | 3,750,000 | | | | 3,625,976 | |
HCP, Inc. | | BBB | | | 6.00 | | | 01/30/17 | | | 1,250,000 | | | | 1,282,729 | |
Healthcare Realty Trust | | BBB- | | | 3.75 | | | 04/15/23 | | | 4,000,000 | | | | 4,013,472 | |
Hospitality Properties Trust | | BBB- | | | 5.00 | | | 08/15/22 | | | 4,550,000 | | | | 4,889,830 | |
Jones Lang LaSalle, Inc. | | BBB+ | | | 4.40 | | | 11/15/22 | | | 4,000,000 | | | | 4,176,284 | |
JPMorgan Chase & Co. | | BBB+ | | | 3.88 | | | 09/10/24 | | | 5,000,000 | | | | 5,176,685 | |
JPMorgan Chase Bank NA | | A- | | | 6.00 | | | 10/01/17 | | | 2,000,000 | | | | 2,112,422 | |
Kemper Corp. | | BBB- | | | 4.35 | | | 02/15/25 | | | 2,000,000 | | | | 2,073,492 | |
Kemper Corp. | | BBB- | | | 6.00 | | | 05/15/17 | | | 1,091,000 | | | | 1,129,453 | |
Lincoln National Corp. | | A- | | | 4.00 | | | 09/01/23 | | | 4,000,000 | | | | 4,158,540 | |
Lincoln National Corp. | | A- | | | 4.85 | | | 06/24/21 | | | 1,000,000 | | | | 1,105,754 | |
Mack-Cali Realty LP | | BBB- | | | 4.50 | | | 04/18/22 | | | 5,000,000 | | | | 5,099,650 | |
Markel Corp. | | BBB+ | | | 5.35 | | | 06/01/21 | | | 1,200,000 | | | | 1,344,212 | |
Marsh & McLennan Cos., Inc. | | A- | | | 4.80 | | | 07/15/21 | | | 3,000,000 | | | | 3,326,700 | |
Moody’s Corp. | | BBB+ | | | 4.50 | | | 09/01/22 | | | 4,000,000 | | | | 4,447,044 | |
Nasdaq, Inc. | | BBB | | | 5.55 | | | 01/15/20 | | | 2,500,000 | | | | 2,765,290 | |
National Retail Pptys., Inc. | | BBB+ | | | 3.30 | | | 04/15/23 | | | 1,000,000 | | | | 1,014,827 | |
National Retail Pptys., Inc. | | BBB+ | | | 3.80 | | | 10/15/22 | | | 3,000,000 | | | | 3,169,095 | |
Pacific LifeCorp.† | | BBB+ | | | 6.00 | | | 02/10/20 | | | 3,000,000 | | | | 3,354,009 | |
Penske Truck Leasing Co. LP† | | BBB- | | | 3.38 | | | 03/15/18 | | | 3,000,000 | | | | 3,073,374 | |
Prudential Financial, Inc. | | A | | | 4.50 | | | 11/16/21 | | | 1,000,000 | | | | 1,123,170 | |
Reinsurance Grp. of America, Inc. | | A- | | | 4.70 | | | 09/15/23 | | | 1,000,000 | | | | 1,087,426 | |
Reinsurance Grp. of America, Inc. | | A- | | | 5.00 | | | 06/01/21 | | | 3,000,000 | | | | 3,321,336 | |
Signet UK Finance PLC | | BBB- | | | 4.70 | | | 06/15/24 | | | 5,000,000 | | | | 4,879,720 | |
Synchrony Financial | | BBB- | | | 2.70 | | | 02/03/20 | | | 2,250,000 | | | | 2,256,158 | |
Travelers Cos., Inc. | | A | | | 3.90 | | | 11/01/20 | | | 2,500,000 | | | | 2,743,380 | |
Ventas Realty LP/Capital Corp. | | BBB+ | | | 3.25 | | | 08/15/22 | | | 500,000 | | | | 516,735 | |
Ventas Realty LP/Capital Corp. | | BBB+ | | | 4.75 | | | 06/01/21 | | | 3,000,000 | | | | 3,337,395 | |
Vornado Realty LP | | BBB | | | 2.50 | | | 06/30/19 | | | 1,000,000 | | | | 1,018,812 | |
Wells Fargo & Co. | | A- | | | 3.45 | | | 02/13/23 | | | 4,000,000 | | | | 4,138,912 | |
Wells Fargo & Co. | | A- | | | 4.13 | | | 08/15/23 | | | 1,000,000 | | | | 1,076,599 | |
Welltower, Inc. | | BBB | | | 3.75 | | | 03/15/23 | | | 750,000 | | | | 777,320 | |
Welltower, Inc. | | BBB | | | 6.13 | | | 04/15/20 | | | 2,500,000 | | | | 2,847,880 | |
Zions Bancorporation | | BBB- | | | 4.50 | | | 03/27/17 | | | 1,000,000 | | | | 1,013,321 | |
| | | | | | | | | | | | | | | | |
| | | | | | | | | | | | | | | 179,482,453 | |
| | | | | | | | | | | | | | | | |
HEALTH CARE (6.7%) | | | | | | | | | | | |
Agilent Technologies, Inc. | | BBB+ | | | 5.00 | | | 07/15/20 | | | 4,000,000 | | | | 4,409,184 | |
AmerisourceBergen Corp. | | A- | | | 4.88 | | | 11/15/19 | | | 2,500,000 | | | | 2,748,123 | |
Anthem, Inc. | | A | | | 3.30 | | | 01/15/23 | | | 3,539,000 | | | | 3,655,522 | |
Anthem, Inc. | | A | | | 4.35 | | | 08/15/20 | | | 2,000,000 | | | | 2,169,096 | |
Bio-Rad Laboratories, Inc. | | BBB | | | 4.88 | | | 12/15/20 | | | 4,000,000 | | | | 4,425,688 | |
Biogen Idec, Inc. | | A- | | | 4.05 | | | 09/15/25 | | | 2,500,000 | | | | 2,691,128 | |
Biogen Idec, Inc. | | A- | | | 6.88 | | | 03/01/18 | | | 2,500,000 | | | | 2,721,010 | |
CIGNA Corp. | | A | | | 5.38 | | | 03/15/17 | | | 2,000,000 | | | | 2,047,332 | |
Edwards Lifesciences Corp. | | BBB- | | | 2.88 | | | 10/15/18 | | | 4,500,000 | | | | 4,609,476 | |
MUTUAL OF AMERICA INVESTMENT CORPORATION - BOND FUND
PORTFOLIO OF INVESTMENTS IN SECURITIES
June 30, 2016 (Unaudited)
| | | | | | | | | | | | | | | | |
Express Scripts Hldg. Co. | | BBB+ | | | 3.50 | | | 06/15/24 | | | 2,000,000 | | | | 2,064,708 | |
Humana, Inc. | | A- | | | 3.85 | | | 10/01/24 | | | 3,000,000 | | | | 3,204,015 | |
Humana, Inc. | | A- | | | 7.20 | | | 06/15/18 | | | 2,000,000 | | | | 2,214,686 | |
Laboratory Corp. of America | | BBB | | | 3.75 | | | 08/23/22 | | | 2,000,000 | | | | 2,105,872 | |
Laboratory Corp. of America | | BBB | | | 4.63 | | | 11/15/20 | | | 1,000,000 | | | | 1,090,548 | |
Medco Health Solutions, Inc. | | BBB+ | | | 4.13 | | | 09/15/20 | | | 3,000,000 | | | | 3,235,530 | |
Owens & Minor, Inc. | | BBB | | | 3.88 | | | 09/15/21 | | | 2,200,000 | | | | 2,276,879 | |
Owens & Minor, Inc. | | BBB | | | 4.38 | | | 12/15/24 | | | 2,800,000 | | | | 2,845,038 | |
PerkinElmer, Inc. | | BBB | | | 5.00 | | | 11/15/21 | | | 4,000,000 | | | | 4,434,752 | |
Pfizer, Inc. | | AA | | | 6.05 | | | 03/30/17 | | | 4,000,000 | | | | 4,153,316 | |
Quest Diagnostics, Inc. | | BBB+ | | | 3.50 | | | 03/30/25 | | | 700,000 | | | | 722,810 | |
Quest Diagnostics, Inc. | | BBB+ | | | 4.75 | | | 01/30/20 | | | 4,000,000 | | | | 4,386,860 | |
Thermo Fisher Scientific, Inc. | | BBB | | | 3.60 | | | 08/15/21 | | | 1,000,000 | | | | 1,060,088 | |
Thermo Fisher Scientific, Inc. | | BBB | | | 4.50 | | | 03/01/21 | | | 3,000,000 | | | | 3,310,794 | |
Zimmer Biomet Hldgs., Inc. | | BBB | | | 3.15 | | | 04/01/22 | | | 5,000,000 | | | | 5,125,000 | |
| | | | | | | | | | | | | | | | |
| | | | | | | | | | | | | | | 71,707,455 | |
| | | | | | | | | | | | | | | | |
INDUSTRIALS (4.5%) | | | | | | | | | | | |
Crane Co. | | BBB | | | 2.75 | | | 12/15/18 | | | 4,000,000 | | | | 4,111,180 | |
Dun & Bradstreet Corp. | | BBB- | | | 3.25 | | | 12/01/17 | | | 3,000,000 | | | | 3,021,081 | |
Dun & Bradstreet Corp. | | BBB- | | | 4.38 | | | 12/01/22 | | | 1,000,000 | | | | 1,024,177 | |
Equifax, Inc. | | BBB+ | | | 3.30 | | | 12/15/22 | | | 4,000,000 | | | | 4,223,160 | |
Flowserve Corp. | | BBB | | | 3.50 | | | 09/15/22 | | | 4,000,000 | | | | 4,122,764 | |
Harsco Corp. | | BB- | | | 5.75 | | | 05/15/18 | | | 4,000,000 | | | | 3,770,000 | |
Hexcel Corp. | | BBB- | | | 4.70 | | | 08/15/25 | | | 3,900,000 | | | | 4,155,009 | |
Kennametal, Inc. | | BBB | | | 2.65 | | | 11/01/19 | | | 4,000,000 | | | | 4,021,464 | |
L-3 Communications Corp. | | BBB- | | | 4.75 | | | 07/15/20 | | | 3,000,000 | | | | 3,237,993 | |
L-3 Communications Corp. | | BBB- | | | 5.20 | | | 10/15/19 | | | 1,000,000 | | | | 1,088,752 | |
Pentair PLC | | BBB- | | | 5.00 | | | 05/15/21 | | | 3,000,000 | | | | 3,233,712 | |
Pitney Bowes, Inc. | | BBB | | | 5.25 | | | 01/15/37 | | | 3,000,000 | | | | 3,144,144 | |
Textron, Inc. | | BBB | | | 4.63 | | | 09/21/16 | | | 2,900,000 | | | | 2,915,924 | |
Valmont Industries, Inc. | | BBB+ | | | 6.63 | | | 04/20/20 | | | 750,000 | | | | 849,086 | |
Verisk Analytics, Inc. | | BBB- | | | 4.00 | | | 06/15/25 | | | 5,000,000 | | | | 5,251,590 | |
| | | | | | | | | | | | | | | | |
| | | | | | | | | | | | | | | 48,170,036 | |
| | | | | | | | | | | | | | | | |
INFORMATION TECHNOLOGY (7.4%) | | | | | | | | | | | |
Adobe Systems, Inc. | | A- | | | 4.75 | | | 02/01/20 | | | 4,000,000 | | | | 4,422,048 | |
Applied Materials, Inc. | | A- | | | 3.90 | | | 10/01/25 | | | 5,000,000 | | | | 5,543,890 | |
Arrow Electronics, Inc. | | BBB- | | | 4.00 | | | 04/01/25 | | | 1,000,000 | | | | 1,023,037 | |
Arrow Electronics, Inc. | | BBB- | | | 4.50 | | | 03/01/23 | | | 1,100,000 | | | | 1,164,601 | |
Arrow Electronics, Inc. | | BBB- | | | 6.88 | | | 06/01/18 | | | 2,900,000 | | | | 3,128,068 | |
Avnet, Inc. | | BBB- | | | 4.88 | | | 12/01/22 | | | 270,000 | | | | 293,283 | |
Avnet, Inc. | | BBB- | | | 5.88 | | | 06/15/20 | | | 1,100,000 | | | | 1,224,493 | |
eBay, Inc. | | BBB+ | | | 2.88 | | | 08/01/21 | | | 5,000,000 | | | | 5,163,565 | |
Fidelity Nat’l. Information | | BBB | | | 3.88 | | | 06/05/24 | | | 5,000,000 | | | | 5,286,375 | |
Fiserv, Inc. | | BBB | | | 4.63 | | | 10/01/20 | | | 2,800,000 | | | | 3,089,870 | |
Fiserv, Inc. | | BBB | | | 4.75 | | | 06/15/21 | | | 1,000,000 | | | | 1,110,123 | |
Ingram Micro, Inc. | | BBB- | | | 4.95 | | | 12/15/24 | | | 750,000 | | | | 747,017 | |
Ingram Micro, Inc. | | BBB- | | | 5.00 | | | 08/10/22 | | | 1,000,000 | | | | 1,013,934 | |
Ingram Micro, Inc. | | BBB- | | | 5.25 | | | 09/01/17 | | | 3,000,000 | | | | 3,083,250 | |
Juniper Networks, Inc. | | BBB | | | 4.50 | | | 03/15/24 | | | 3,000,000 | | | | 3,177,594 | |
Juniper Networks, Inc. | | BBB | | | 4.60 | | | 03/15/21 | | | 2,000,000 | | | | 2,146,764 | |
Keysight Technologies, Inc. | | BBB- | | | 4.55 | | | 10/30/24 | | | 5,000,000 | | | | 5,094,860 | |
Lam Research Corp. | | BBB | | | 2.75 | | | 03/15/20 | | | 5,000,000 | | | | 5,109,620 | |
Lender Processing Svcs., Inc. | | BBB | | | 5.75 | | | 04/15/23 | | | 2,948,000 | | | | 3,088,030 | |
Lexmark International, Inc. | | BBB- | | | 6.65 | | | 06/01/18 | | | 4,000,000 | | | | 4,256,916 | |
Motorola Solutions, Inc. | | BBB- | | | 3.75 | | | 05/15/22 | | | 4,000,000 | | | | 3,998,224 | |
Symantec Corp. | | BBB- | | | 4.20 | | | 09/15/20 | | | 4,000,000 | | | | 4,169,664 | |
Tech Data Corp. | | BBB- | | | 3.75 | | | 09/21/17 | | | 4,000,000 | | | | 4,098,728 | |
Total System Services, Inc. | | BBB- | | | 3.75 | | | 06/01/23 | | | 4,000,000 | | | | 4,062,504 | |
Western Union Co. | | BBB | | | 5.93 | | | 10/01/16 | | | 4,000,000 | | | | 4,039,124 | |
| | | | | | | | | | | | | | | | |
| | | | | | | | | | | | | | | 79,535,582 | |
| | | | | | | | | | | | | | | | |
MUTUAL OF AMERICA INVESTMENT CORPORATION - BOND FUND
| | |
PORTFOLIO OF INVESTMENTS IN SECURITIES June 30, 2016 (Unaudited) | | |
| | | | | | | | | | | | | | | | | | | | |
MATERIALS (5.7%) | | | | | | | | | | | | | | | | | | | | |
Albemarle Corp. | | | BBB- | | | | 4.50 | | | | 12/15/20 | | | | 2,000,000 | | | | 2,128,148 | |
Alcoa, Inc. | | | BBB- | | | | 6.75 | | | | 07/15/18 | | | | 4,000,000 | | | | 4,330,000 | |
Carpenter Technology Corp. | | | BBB | | | | 4.45 | | | | 03/01/23 | | | | 3,600,000 | | | | 3,473,442 | |
Domtar Corp. | | | BBB- | | | | 4.40 | | | | 04/01/22 | | | | 5,000,000 | | | | 5,184,775 | |
Dow Chemical Co. | | | BBB | | | | 3.50 | | | | 10/01/24 | | | | 4,800,000 | | | | 5,095,037 | |
Eastman Chemical Co. | | | BBB | | | | 4.50 | | | | 01/15/21 | | | | 2,500,000 | | | | 2,726,120 | |
Freeport-McMoRan Copper & Gold | | | BB | | | | 3.55 | | | | 03/01/22 | | | | 4,000,000 | | | | 3,520,000 | |
Goldcorp, Inc. | | | BBB+ | | | | 2.13 | | | | 03/15/18 | | | | 4,000,000 | | | | 4,005,860 | |
Kinross Gold Corp. | | | BB+ | | | | 5.13 | | | | 09/01/21 | | | | 4,000,000 | | | | 3,970,000 | |
Methanex Corp. | | | BB+ | | | | 3.25 | | | | 12/15/19 | | | | 3,400,000 | | | | 3,302,192 | |
Methanex Corp. | | | BB+ | | | | 5.25 | | | | 03/01/22 | | | | 600,000 | | | | 613,997 | |
Newmont Mining Corp. | | | BBB | | | | 3.50 | | | | 03/15/22 | | | | 4,000,000 | | | | 4,153,524 | |
Packaging Corp. of America | | | BBB | | | | 3.90 | | | | 06/15/22 | | | | 2,000,000 | | | | 2,120,420 | |
Packaging Corp. of America | | | BBB | | | | 4.50 | | | | 11/01/23 | | | | 2,000,000 | | | | 2,172,384 | |
Southern Copper Corp. | | | BBB | | | | 3.50 | | | | 11/08/22 | | | | 4,000,000 | | | | 3,971,972 | |
Teck Resources Ltd. | | | B+ | | | | 3.75 | | | | 02/01/23 | | | | 1,000,000 | | | | 760,000 | |
Teck Resources Ltd. | | | B+ | | | | 4.75 | | | | 01/15/22 | | | | 3,000,000 | | | | 2,534,700 | |
Valspar Corp. | | | BBB | | | | 3.95 | | | | 01/15/26 | | | | 5,000,000 | | | | 5,265,180 | |
Vulcan Materials Co. | | | BBB | | | | 7.00 | | | | 06/15/18 | | | | 2,000,000 | | | | 2,190,000 | |
| | | | | | | | | | | | | | | | | | | | |
| | | | | | | | | | | | | | | | | | | 61,517,751 | |
| | | | | | | | | | | | | | | | | | | | |
TELECOMMUNICATION SERVICES (0.7%) | | | | | | | | | | | | | | | | | | | | |
AT&T, Inc. | | | BBB+ | | | | 3.00 | | | | 02/15/22 | | | | 4,000,000 | | | | 4,079,244 | |
AT&T, Inc. | | | BBB+ | | | | 3.00 | | | | 06/30/22 | | | | 1,000,000 | | | | 1,024,074 | |
Verizon Communications, Inc. | | | BBB+ | | | | 4.50 | | | | 09/15/20 | | | | 2,000,000 | | | | 2,219,912 | |
| | | | | | | | | | | | | | | | | | | | |
| | | | | | | | | | | | | | | | | | | 7,323,230 | |
| | | | | | | | | | | | | | | | | | | | |
UTILITIES (2.2%) | | | | | | | | | | | | | | | | | | | | |
AGL Capital Corp. | | | A- | | | | 6.38 | | | | 07/15/16 | | | | 500,000 | | | | 500,573 | |
Constellation Energy | | | BBB- | | | | 5.15 | | | | 12/01/20 | | | | 3,000,000 | | | | 3,338,781 | |
Entergy Corp. | | | BBB- | | | | 4.70 | | | | 01/15/17 | | | | 1,500,000 | | | | 1,521,123 | |
Entergy Corp. | | | BBB- | | | | 5.13 | | | | 09/15/20 | | | | 2,500,000 | | | | 2,739,413 | |
Exelon Generation Co. LLC | | | BBB | | | | 4.25 | | | | 06/15/22 | | | | 1,000,000 | | | | 1,066,560 | |
National Fuel Gas Co. | | | BBB | | | | 4.90 | | | | 12/01/21 | | | | 3,000,000 | | | | 3,158,004 | |
National Fuel Gas Co. | | | BBB | | | | 5.20 | | | | 07/15/25 | | | | 2,000,000 | | | | 2,074,320 | |
SCANA Corp. | | | BBB | | | | 4.13 | | | | 02/01/22 | | | | 4,000,000 | | | | 4,155,820 | |
SCANA Corp. | | | BBB | | | | 4.75 | | | | 05/15/21 | | | | 1,000,000 | | | | 1,067,383 | |
Talen Energy Supply LLC | | | B+ | | | | 4.60 | | | | 12/15/21 | | | | 2,000,000 | | | | 1,470,000 | |
UIL Hldgs. Corp. | | | BBB | | | | 4.63 | | | | 10/01/20 | | | | 2,725,000 | | | | 2,948,357 | |
| | | | | | | | | | | | | | | | | | | | |
| | | | | | | | | | | | | | | | | | | 24,040,334 | |
| | | | | | | | | | | | | | | | | | | | |
SOVEREIGN DEBT (0.4%) | | | | | | | | | | | | | | | | | | | | |
Sri Lanka AID | | | NR | | | | 6.59 | | | | 09/15/28 | | | | 3,056,968 | | | | 3,874,003 | |
| | | | | | | | | | | | | | | | | | | | |
TOTAL LONG-TERM DEBT SECURITIES
(Cost: $1,023,062,495) 99.0% | | | | | | | | | | | | | | | | | | | 1,063,118,568 | |
| | | | | | | | | | | | | | | | | | | | |
| | | | | |
| | | Rating** | | | Rate(%) | | | Maturity | | | Face Amount | | | Value | |
SHORT-TERM DEBT SECURITIES: | | | | | | | | | | | | | | | | | | | | |
COMMERCIAL PAPER (0.7%) | | | | | | | | | | | | | | | | | | | | |
Ralph Lauren Corp.† | | | A-1 | | | | 0.40 | | | | 07/01/16 | | | | 7,100,000 | | | | 7,100,000 | |
| | | | | | | | | | | | | | | | | | | | |
TOTAL SHORT-TERM DEBT SECURITIES
(Cost: $7,100,000) 0.7% | | | | | | | | | | | | | | | | | | | 7,100,000 | |
| | | | | | | | | | | | | | | | | | | | |
TOTAL INVESTMENTS
(Cost: $1,030,162,495) 99.7% | | | | | | | | | | | | | | | | | | | 1,070,218,568 | |
| | | | | | | | | | | | | | | | | | | | |
OTHER NET ASSETS 0.3% | | | | | | | | | | | | | | | | | | | 3,453,005 | |
| | | | | | | | | | | | | | | | | | | | |
NET ASSETS 100.0% | | | | | | | | | | | | | | | | | | $ | 1,073,671,573 | |
| | | | | | | | | | | | | | | | | | | | |
The accompanying notes are an integral part of these portfolio schedules.
MUTUAL OF AMERICA INVESTMENT CORPORATION
FOOTNOTES TO PORTFOLIOS OF INVESTMENTS IN SECURITIES
June 30, 2016 (Unaudited)
| | | | |
| Abbreviations: | | FHARM = Federal Home Adjustable Rate Mortgage | | |
| | FHLB = Federal Home Loan Bank | | |
| | FHLMC = Federal Home Loan Mortgage Corporation | | |
| | FNMA = Federal National Mortgage Association | | |
| | GNMA = Government National Mortgage Association | | |
| | NR = Not Rated | | |
| * | Non-income producing security. |
| ** | Ratings as per Standard & Poor’s Corporation (unaudited). |
| † | Security is exempt from registration under Rule 144A of the Securities Act of 1933. These securities may be resold in transactions exempt from registration, normally to qualified institutional buyers. At June 30, 2016, the aggregate values of these securities and their percentages of the respective Funds’ net assets were as follows: |
| | | | | | | | |
Fund | | Aggregate
Market
Value | | | Percentage
of
Net Assets | |
EQUITY INDEX FUND | | $ | 26,400,000 | | | | 1.4 | % |
ALL AMERICA FUND | | $ | 5,400,000 | | | | 1.9 | % |
SMALL CAP VALUE FUND | | $ | 4,700,000 | | | | 1.2 | % |
SMALL CAP GROWTH FUND | | $ | 4,300,000 | | | | 1.1 | % |
MID CAP VALUE FUND | | $ | 2,900,000 | | | | 3.4 | % |
MID-CAP EQUITY INDEX FUND | | $ | 24,799,893 | | | | 2.3 | % |
INTERNATIONAL FUND | | $ | 1,500,000 | | | | 0.5 | % |
COMPOSITE FUND | | $ | 4,794,809 | | | | 2.7 | % |
MONEY MARKET FUND | | $ | 30,664,946 | | | | 49.7 | % |
MID-TERM BOND FUND | | $ | 6,792,307 | | | | 1.4 | % |
BOND FUND | | $ | 24,069,215 | | | | 2.2 | % |
| (1) | This security, or a portion thereof, has been segregated to cover initial margin requirements on open futures contracts. |
| | Information on futures contracts outstanding in the Funds as of June 30, 2016, was as follows: |
| | | | | | | | | | | | | | | | | | | | |
Fund | | Number of
Contracts | | Contract Type | | Purchased (P)
or Sold (S) | | Expiration Date | | Underlying
Face Amount
at Value(a) | | | Unrealized
Gain(Loss) | | | Face Value
of Futures
as a % of
Total
Investments | |
EQUITY INDEX FUND | | 436 | | E-mini S&P 500 Stock Index | | P | | September 2016 | | $ | 45,566,360 | | | $ | 161,461 | | | | 2.3 | % |
ALL AMERICA FUND | | 47 | | E-mini S&P 500 Stock Index | | P | | September 2016 | | $ | 4,911,970 | | | $ | 8,025 | | | | 1.7 | % |
MID-CAP EQUITY INDEX FUND | | 279 | | E-mini S&P MidCap 400 Stock Index | | P | | September 2016 | | $ | 41,654,700 | | | ($ | 33,417 | ) | | | 3.9 | % |
| (a) | Includes the cumulative appreciation(depreciation) of futures contracts. |
| (2) | U.S. Government guaranteed security. |
| (3) | Percentage is less than 0.05%. |
MUTUAL OF AMERICA INVESTMENT CORPORATION
FOOTNOTES TO PORTFOLIOS OF INVESTMENTS IN SECURITIES
June 30, 2016 (Unaudited)
Fair Value—The Investment Company values its investments at fair value. Fair value is an estimate of the price the Fund would receive upon selling a security in an orderly arms-length transaction. Investments are categorized based on a three-level valuation hierarchy for measurement and disclosure of fair value. The valuation hierarchy is based upon the transparency of inputs used to measure fair value. These inputs are summarized in the three broad levels listed below:
| • | | Level 1 – quoted prices in active markets for identical securities. |
| • | | Level 2 – other significant observable inputs (including yield, quality, coupon rate, maturity, issue type, quoted prices for similar securities, prepayment speeds, trading characteristics, etc.). |
| • | | Level 3 – significant unobservable inputs (including the Fund’s own assumptions in determining the fair value of investments). |
As of June 30, 2016, management determined that the fair value inputs for all equity securities, excluding shares of registered investment companies (see Note b below), were considered Level 1, with the exception of non-registered securities under Rule 144A of the Securities Act of 1933 which were considered Level 2. In addition, certain Rule 144A securities not actively traded were considered Level 3; however, there were no such securities as of June 30, 2016. Fair value inputs for all debt securities were considered Level 2. The inputs used for valuing securities are not necessarily an indication of the risk associated with investing in those securities. Transfers between levels are reflected based on the fair value at the beginning of a reporting period.
In May 2015, the FASB issued ASU No. 2015-07, “Disclosures for Investments in Certain Entities that Calculate Net Asset Value per Share (or its Equivalent).” The guidance removes the requirement to categorize within the fair value hierarchy all investments for which fair value is measured using the NAV per share practical expedient. Sufficient information must be provided to permit reconciliation of the fair value of assets categorized within the fair value hierarchy to the amounts presented in the Statements of Assets and Liabilities. The guidance is required to be presented for annual periods beginning after December 15, 2015, and for interim periods within those fiscal years. Accordingly, effective January 1, 2016, the Investment Company has adopted ASU 2015-07, which removes investments measured using the net asset value per share practical expedient from the fair value hierarchy in all periods presented. The adoption of ASU 2015-07 did not have a material impact on the Investment Company’s financial statements.
The following is a summary of the inputs used to value the Funds’ investments and other financial instruments as of June 30, 2016:
| | | | | | | | | | | | | | | | |
Fund | | Level 1 – Quoted
Prices | | | Level 2 – Significant
Observable Inputs | | | Level 3 – Significant
Unobservable Inputs | | | Total | |
Investments at Fair Value: | | | | | | | | | | | | | |
(See Portfolios of Investments for More Details) | | | | | | | | | | | | | |
Equity Index Fund | | | | | | | | | | | | | | | | |
Common Stock | | $ | 1,899,808,656 | | | | — | | | | — | | | $ | 1,899,808,656 | |
Short-Term Debt Securities | | | — | | | $ | 43,388,584 | | | | — | | | $ | 43,388,584 | |
| | | | | | | | | | | | | | | | |
| | $ | 1,899,808,656 | | | $ | 43,388,584 | | | | — | | | $ | 1,943,197,240 | |
| | | | |
All America Fund | | | | | | | | | | | | | | | | |
Common Stock - Indexed | | $ | 151,368,349 | | | | — | | | | — | | | $ | 151,368,349 | |
Common Stock - Active | | $ | 125,425,998 | | | | — | | | | — | | | $ | 125,425,998 | |
Short-Term Debt Securities - Indexed | | | — | | | $ | 4,499,732 | | | | — | | | $ | 4,499,732 | |
Short-Term Debt Securities - Active | | | — | | | $ | 3,299,366 | | | | — | | | $ | 3,299,366 | |
Other Investments measured at net asset value (b) | | | — | | | | — | | | | — | | | $ | 1,023,789 | |
| | | | | | | | | | | | | | | | |
| | $ | 276,794,347 | | | $ | 7,799,098 | | | | — | | | $ | 285,617,234 | |
| | | | |
Small Cap Value Fund | | | | | | | | | | | | | | | | |
Common Stock | | $ | 369,068,835 | | | | — | | | | — | | | $ | 369,068,835 | |
Short-Term Debt Securities | | | — | | | $ | 14,695,903 | | | | — | | | $ | 14,695,903 | |
Other Investments measured at net asset value (b) | | | — | | | | — | | | | — | | | $ | 3,959,137 | |
| | | | | | | | | | | | | | | | |
| | $ | 369,068,835 | | | $ | 14,695,903 | | | | — | | | $ | 387,723,875 | |
| | | | |
Small Cap Growth Fund | | | | | | | | | | | | | | | | |
Common Stock | | $ | 375,676,099 | | | | — | | | | — | | | $ | 375,676,099 | |
Short-Term Debt Securities | | | — | | | $ | 19,293,605 | | | | — | | | $ | 19,293,605 | |
| | | | | | | | | | | | | | | | |
| | $ | 375,676,099 | | | $ | 19,293,605 | | | | — | | | $ | 394,969,704 | |
| | | | |
Mid Cap Value Fund | | | | | | | | | | | | | | | | |
Common Stock | | $ | 80,944,550 | | | | — | | | | — | | | $ | 80,944,550 | |
Short-Term Debt Securities | | | — | | | $ | 3,999,654 | | | | — | | | $ | 3,999,654 | |
Other Investments measured at net asset value (b) | | | — | | | | — | | | | — | | | $ | 427,910 | |
| | | | | | | | | | | | | | | | |
| | $ | 80,944,550 | | | $ | 3,999,654 | | | | — | | | $ | 85,372,114 | |
| | | | |
Mid-Cap Equity Index Fund | | | | | | | | | | | | | | | | |
Common Stock | | $ | 1,030,267,530 | | | | — | | | | — | | | $ | 1,030,267,530 | |
Short-Term Debt Securities | | | — | | | $ | 31,797,370 | | | | — | | | $ | 31,797,370 | |
| | | | | | | | | | | | | | | | |
| | $ | 1,030,267,530 | | | $ | 31,797,370 | | | | — | | | $ | 1,062,064,900 | |
| | | | |
International Fund | | | | | | | | | | | | | | | | |
Short-Term Debt Securities | | | — | | | $ | 15,297,167 | | | | — | | | $ | 15,297,167 | |
Other Investments measured at net asset value (b) | | | — | | | | — | | | | — | | | $ | 316,642,250 | |
| | | | | | | | | | | | | | | | |
| | | — | | | $ | 15,297,167 | | | | — | | | $ | 331,939,417 | |
| | | | |
Composite Fund | | | | | | | | | | | | | | | | |
Common Stock | | $ | 98,893,004 | | | | — | | | | — | | | $ | 98,893,004 | |
U.S. Government Debt | | | — | | | $ | 21,314,025 | | | | — | | | $ | 21,314,025 | |
U.S. Government Agency Residential Mortgage-Backed Obligations | | | — | | | $ | 20,609,284 | | | | — | | | $ | 20,609,284 | |
U.S. Government Agency Non-Mortgage-Backed Obligations | | | — | | | $ | 479,695 | | | | — | | | $ | 479,695 | |
Long-Term Corporate Debt | | | — | | | $ | 30,635,183 | | | | — | | | $ | 30,635,183 | |
Short-Term Debt Securities | | | — | | | $ | 4,399,921 | | | | — | | | $ | 4,399,921 | |
| | | | | | | | | | | | | | | | |
| | $ | 98,893,004 | | | $ | 77,438,108 | | | | — | | | $ | 176,331,112 | |
MUTUAL OF AMERICA INVESTMENT CORPORATION
FOOTNOTES TO PORTFOLIOS OF INVESTMENTS IN SECURITIES
June 30, 2016 (Unaudited)
| | | | | | | | | | | | | | | | |
Retirement Income Fund | | | | | | | | | | | | | | | | |
Other Investments measured at net asset value (b) | | | — | | | | — | | | | — | | | $ | 67,091,209 | |
| | | | |
2010 Retirement Fund | | | | | | | | | | | | | | | | |
Other Investments measured at net asset value (b) | | | — | | | | — | | | | — | | | $ | 24,997,659 | |
| | | | |
2015 Retirement Fund | | | | | | | | | | | | | | | | |
Other Investments measured at net asset value (b) | | | — | | | | — | | | | — | | | $ | 145,037,888 | |
| | | | |
2020 Retirement Fund | | | | | | | | | | | | | | | | |
Other Investments measured at net asset value (b) | | | — | | | | — | | | | — | | | $ | 382,699,618 | |
| | | | |
2025 Retirement Fund | | | | | | | | | | | | | | | | |
Other Investments measured at net asset value (b) | | | — | | | | — | | | | — | | | $ | 436,453,839 | |
| | | | |
2030 Retirement Fund | | | | | | | | | | | | | | | | |
Other Investments measured at net asset value (b) | | | — | | | | — | | | | — | | | $ | 356,833,142 | |
| | | | |
2035 Retirement Fund | | | | | | | | | | | | | | | | |
Other Investments measured at net asset value (b) | | | — | | | | — | | | | — | | | $ | 298,514,756 | |
| | | | |
2040 Retirement Fund | | | | | | | | | | | | | | | | |
Other Investments measured at net asset value (b) | | | — | | | | — | | | | — | | | $ | 242,511,639 | |
| | | | |
2045 Retirement Fund | | | | | | | | | | | | | | | | |
Other Investments measured at net asset value (b) | | | — | | | | — | | | | — | | | $ | 286,519,088 | |
| | | | |
2050 Retirement Fund | | | | | | | | | | | | | | | | |
Other Investments measured at net asset value (b) | | | — | | | | — | | | | — | | | $ | 120,289,336 | |
| | | | |
Conservative Allocation Fund | | | | | | | | | | | | | | | | |
Other Investments measured at net asset value (b) | | | — | | | | — | | | | — | | | $ | 131,909,136 | |
| | | | |
Moderate Allocation Fund | | | | | | | | | | | | | | | | |
Other Investments measured at net asset value (b) | | | — | | | | — | | | | — | | | $ | 330,168,257 | |
| | | | |
Aggressive Allocation Fund | | | | | | | | | | | | | | | | |
Other Investments measured at net asset value (b) | | | — | | | | — | | | | — | | | $ | 252,468,212 | |
| | | | |
Money Market Fund | | | | | | | | | | | | | | | | |
U.S. Government Debt | | | — | | | $ | 9,096,439 | | | | — | | | $ | 9,096,439 | |
U.S. Government Agency Short-Term Debt | | | — | | | $ | 5,557,556 | | | | — | | | $ | 5,557,556 | |
Commercial Paper | | | — | | | $ | 47,072,799 | | | | — | | | $ | 47,072,799 | |
| | | | | | | | | | | | | | | | |
| | | — | | | $ | 61,726,794 | | | | — | | | $ | 61,726,794 | |
| | | | |
Mid-Term Bond Fund | | | | | | | | | | | | | | | | |
U.S. Government Debt | | | — | | | $ | 137,969,249 | | | | — | | | $ | 137,969,249 | |
U.S. Government Agency Residential Mortgage-Backed Obligations | | | — | | | $ | 3,102,673 | | | | — | | | $ | 3,102,673 | |
U.S. Government Agency Non-Mortgage-Backed Obligations | | | — | | | $ | 35,892,185 | | | | — | | | $ | 35,892,185 | |
Long-Term Corporate Debt | | | — | | | $ | 290,923,845 | | | | — | | | $ | 290,923,845 | |
Short-Term Debt Securities | | | — | | | $ | 800,000 | | | | — | | | $ | 800,000 | |
| | | | | | | | | | | | | | | | |
| | | — | | | $ | 468,687,952 | | | | — | | | $ | 468,687,952 | |
| | | | |
Bond Fund | | | | | | | | | | | | | | | | |
U.S. Government Debt | | | — | | | $ | 91,043,998 | | | | — | | | $ | 91,043,998 | |
U.S. Government Agency Residential Mortgage-Backed Obligations | | | — | | | $ | 287,264,136 | | | | — | | | $ | 287,264,136 | |
U.S. Government Agency Non-Mortgage-Backed Obligations | | | — | | | $ | 15,404,355 | | | | — | | | $ | 15,404,355 | |
Long-Term Corporate Debt | | | — | | | $ | 665,532,076 | | | | — | | | $ | 665,532,076 | |
Sovereign Debt | | | — | | | $ | 3,874,003 | | | | — | | | $ | 3,874,003 | |
Short-Term Debt Securities | | | — | | | $ | 7,100,000 | | | | — | | | $ | 7,100,000 | |
| | | | | | | | | | | | | | | | |
| | | — | | | $ | 1,070,218,568 | | | | — | | | $ | 1,070,218,568 | |
| | | | |
Other Financial Instruments:* | | | | | | | | | | | | | | | | |
Equity Index Fund | | $ | 161,461 | | | | — | | | | — | | | $ | 161,461 | |
All America Fund | | $ | 8,025 | | | | — | | | | — | | | $ | 8,025 | |
Mid-Cap Equity Index Fund | | ($ | 33,417 | ) | | | — | | | | — | | | ($ | 33,417 | ) |
| * | Other financial instruments are derivative instruments not reflected in the Portfolio of Investments, such as futures, which are valued at the unrealized appreciation/depreciation on the instrument. |
| (b) | In accordance with Subtopic 820-10, certain investments that are measured at fair value using the net asset value per share (or its equivalent) practical expedient have not been classified in the fair value hierarchy. The fair value amounts presented in this table are intended to permit reconciliation of the fair value hierarchy to the amounts presented in the statement of financial position. |
During the six month period ended June 30, 2016, there were no transfers of securities between Level 1, Level 2 or Level 3.
MUTUAL OF AMERICA INVESTMENT CORPORATION
FOOTNOTES TO PORTFOLIOS OF INVESTMENTS IN SECURITIES
June 30, 2016 (Unaudited)
Security Valuation — Investment securities are carried at fair value as follows:
Exchange-traded equity securities are valued at the last reported sales price on the principal exchange on which the security is traded. If there is no trading volume for a particular valuation day, the last bid price is used. For equity securities traded in the over-the-counter market, the security is valued at the last sale price, or if no sale, at the latest bid price available.
Short-term debt securities with a maturity of 60 days or less are valued at amortized cost, which approximates fair value for such securities.
Debt securities, including short-term debt securities maturing in excess of 60 days, are valued on the basis of prices obtained from an independent pricing source. The pricing source may utilize various pricing methodologies that incorporate both models (which consider factors such as yield, quality, coupon rate, maturity, issue type, quoted prices for similar securities, prepayment speeds and trading characteristics) and dealer supplied valuations to derive a valuation.
In the rare instance when a price is not available from an independent pricing source or when prices may not reflect fair value, such as when the price provided by the pricing source is not based on a recent trade, a calculated fair value is used, as determined in good faith by the Adviser and reviewed by a Valuation Committee, in accordance with procedures adopted by the Board of Directors of the Investment Company.
The Advisor uses a market approach to calculate fair value for equity securities which are categorized as Level 3. The Adviser’s valuation is primarily based on information regarding the specific equity issuer, such as the last trade price, financial statements, the relationship of per-share book value to the last trade price, operating information and any corporate actions, such as dividends or returns of capital, that may have occurred since the last trade. The Adviser also considers industry-specific conditions and overall market conditions, to determine whether the last trade price reflects fair value or needs to be adjusted. Generally, absent any significant contrary indications, the last trade price will be used to calculate fair value.
Retirement Funds and the Allocation Funds value their investments in the underlying Funds of the Investment Company at their respective net asset values.
Investment Transactions — Investment transactions are accounted for as of the trade date. Realized gain and loss on the sale of short and long-term debt securities are computed on the basis of amortized cost at the time of sale. Realized gains and losses on the sale of equity securities are based on the identified cost basis of the security, determined on the first-in, first-out (“FIFO”) basis.
Futures Contracts - The Equity Index Fund, Mid-Cap Equity Index Fund and a portion of the All America Fund each maintain indexed asset portfolios which are subject to equity price risk. In order to remain more fully invested in the equity markets while minimizing transaction costs, the funds purchase stock index futures contracts. An initial cash margin deposit (represented by cash or Treasury bills) is made upon entering into a futures contract and serves as collateral for the contract. This initial margin, maintained in a segregated account, is equal to approximately 5%-6% of the contract amount, and does not involve the borrowing of funds to finance the transaction. During the period the futures contract is outstanding, changes in the value of the contract are recognized as unrealized appreciation or depreciation by “marking-to-market” on a daily basis to reflect the market value of the contract at the end of each trading day. The accumulated unrealized appreciation or depreciation on the contract is included in Net Unrealized Appreciation (Depreciation) of Investments and Futures Contracts in the Components of Net Assets section of the Statements of Assets and Liabilities.
Futures contracts are valued at the settlement price established each day by the exchange on which traded. Depending upon whether unrealized appreciation or depreciation are incurred, variation margin payments are received or made daily. The net change in unrealized appreciation or depreciation of futures contracts is recorded in the Statements of Operations. When the contract is closed, a realized gain or loss from futures transactions is recorded in the Statements of Operations, equal to the net variation margin received or paid over the period the contract was outstanding. The “Underlying Face Amount at Value” (appearing in the “Notes to the Portfolios of Investments in Securities”), representing the aggregate of outstanding contractual amounts under futures contracts, reflects the extent of a Fund’s exposure to off-balance sheet risk. The use of futures transactions involves the risk of imperfect correlation in the price movements of the contract and the underlying securities. With futures contracts, there is minimal counterparty credit risk to the Fund since futures are exchange traded and the exchange’s clearinghouse, as counterparty to all exchange traded futures, guarantees the futures against default.
MUTUAL OF AMERICA INVESTMENT CORPORATION
FOOTNOTES TO PORTFOLIOS OF INVESTMENTS IN SECURITIES
June 30, 2016 (Unaudited)
Tax Information - The components of net unrealized appreciation (depreciation) of investments for federal income tax purposes and the cost of investments for federal income tax purposes at June 30, 2016 for each of the funds were as follows.
| | | | | | | | | | | | | | | | | | | | |
| | | Equity Index
Fund | | | All America
Fund | | | Small Cap
Value Fund | | | Small Cap
Growth Fund | | | Mid Cap
Value Fund | |
Unrealized Appreciation | | $ | 693,439,626 | | | $ | 63,931,428 | | | $ | 90,837,290 | | | $ | 64,025,530 | | | $ | 17,316,127 | |
Unrealized Depreciation | | | (58,419,466 | ) | | | (15,148,793 | ) | | | (21,079,319 | ) | | | (25,091,447 | ) | | | (4,608,546 | ) |
| | | | | | | | | | | | | | | | | | | | |
Net | | $ | 635,020,160 | | | $ | 48,782,635 | | | $ | 69,757,971 | | | $ | 38,934,083 | | | | 12,707,581 | |
| | | | | | | | | | | | | | | | | | | | |
Cost of Investments | | $ | 1,308,177,080 | | | $ | 236,834,599 | | | $ | 317,965,904 | | | $ | 356,035,621 | | | $ | 72,664,533 | |
| | | | | | | | | | | | | | | | | | | | |
| | | | | |
| | | Mid-Cap
Equity Index
Fund | | | International
Fund | | | Composite
Fund | | | Retirement
Income
Fund | | | 2010
Retirement
Fund | |
Unrealized Appreciation | | $ | 249,041,064 | | | $ | 482,360 | | | $ | 23,859,275 | | | $ | 2,184,043 | | | $ | 1,413,843 | |
Unrealized Depreciation | | | (67,327,236 | ) | | | (26,680,773 | ) | | | (3,806,447 | ) | | | (273,890 | ) | | | (49,645 | ) |
| | | | | | | | | | | | | | | | | | | | |
Net | | $ | 181,713,828 | | | $ | (26,198,413 | ) | | $ | 20,052,828 | | | $ | 1,910,153 | | | | 1,364,198 | |
| | | | | | | | | | | | | | | | | | | | |
Cost of Investments | | $ | 880,351,072 | | | $ | 358,137,830 | | | $ | 156,278,284 | | | $ | 65,181,056 | | | $ | 23,633,461 | |
| | | | | | | | | | | | | | | | | | | | |
| | | | | |
| | | 2015
Retirement
Fund | | | 2020
Retirement
Fund | | | 2025
Retirement
Fund | | | 2030
Retirement
Fund | | | 2035
Retirement
Fund | |
Unrealized Appreciation | | $ | 12,004,701 | | | $ | 33,502,668 | | | $ | 45,998,572 | | | $ | 39,786,140 | | | $ | 33,495,858 | |
Unrealized Depreciation | | | (163,805 | ) | | | (1,207,255 | ) | | | (1,933,877 | ) | | | (1,360,672 | ) | | | (1,238,294 | ) |
| | | | | | | | | | | | | | | | | | | | |
Net | | $ | 11,840,896 | | | $ | 32,295,413 | | | $ | 44,064,695 | | | $ | 38,425,468 | | | $ | 32,257,564 | |
| | | | | | | | | | | | | | | | | | | | |
Cost of Investments | | $ | 133,196,992 | | | $ | 350,404,205 | | | $ | 392,389,144 | | | $ | 318,407,674 | | | $ | 266,257,192 | |
| | | | | | | | | | | | | | | | | | | | |
| | | | | |
| | | 2040
Retirement
Fund | | | 2045
Retirement
Fund | | | 2050
Retirement
Fund | | | Conservative
Allocation
Fund | | | Moderate
Allocation
Fund | |
Unrealized Appreciation | | $ | 27,176,033 | | | $ | 35,576,883 | | | $ | 2,682,517 | | | $ | 8,645,978 | | | $ | 49,379,007 | |
Unrealized Depreciation | | | (801,587 | ) | | | (843,619 | ) | | | (2,287,874 | ) | | | (965,711 | ) | | | (7,592,876 | ) |
| | | | | | | | | | | | | | | | | | | | |
Net | | $ | 26,374,446 | | | $ | 34,733,264 | | | $ | 394,643 | | | $ | 7,680,267 | | | $ | 41,786,131 | |
| | | | | | | | | | | | | | | | | | | | |
Cost of Investments | | $ | 216,137,193 | | | $ | 251,785,824 | | | $ | 119,894,693 | | | $ | 124,228,869 | | | $ | 288,382,126 | |
| | | | | | | | | | | | | | | | | | | | |
| | | | | | | | | | | | | | | | |
| | | | |
| | | Aggressive
Allocation
Fund | | | Money
Market
Fund | | | Mid-Term
Bond Fund | | | Bond
Fund | |
Unrealized Appreciation | | $ | 50,869,603 | | | $ | 478 | | | $ | 13,159,345 | | | $ | 46,384,093 | |
Unrealized Depreciation | | | (9,125,895 | ) | | | — | | | | (2,283,757 | ) | | | (6,371,628 | ) |
| | | | | | | | | | | | | | | | |
Net | | $ | 41,743,708 | | | $ | 478 | | | $ | 10,875,588 | | | $ | 40,012,465 | |
| | | | | | | | | | | | | | | | |
Cost of Investments | | $ | 210,724,504 | | | $ | 61,726,316 | | | $ | 457,812,364 | | | $ | 1,030,206,103 | |
| | | | | | | | | | | | | | | | |
Differences in basis between amounts reflected in the Portfolios of Investments in Securities and those computed for federal income tax purposes arise from the federal income tax treatment of wash sales and futures contracts.
(b) Not applicable.
| ITEM 7. | DISCLOSURE OF PROXY VOTING POLICIES AND PROCEDURES FOR CLOSED-END MANAGEMENT INVESTMENT COMPANIES. |
Not applicable.
| ITEM 8. | PORTFOLIO MANAGERS OF CLOSED-END MANAGEMENT INVESTMENT COMPANIES. |
Not applicable.
| ITEM 9. | PURCHASES OF EQUITY SECURITES BY CLOSED-END MANAGEMENT INVESTMENT COMPANY AND AFFILIATED PURCHASERS. |
Not applicable.
| ITEM 10. | SUBMISSION OF MATTERS TO A VOTE OF SECURITY HOLDERS. |
Not applicable.
| ITEM 11. | CONTROLS AND PROCEDURES. |
| | (a) | The registrant’s principal executive officer and principal financial officer have evaluated the registrant’s disclosure controls and procedures within 90 days of this filing and have concluded that the registrant’s disclosure controls and procedures were effective, as of that date, in ensuring that information required to be disclosed by the registrant in this Form N-CSR was recorded, processed, summarized, and reported in a timely and accurate manner. |
| | (b) | The registrant’s principal executive officer and principal financial officer are aware of no changes in the registrant’s internal control over financial reporting that occurred during the second fiscal quarter of the period covered by this report that has materially affected, or is likely to materially affect, the registrant’s internal control over financial reporting. |
Attached hereto:
| | | | |
(a) | | (1) Not applicable to semi-annual report. |
| | |
| | (2) Exhibit 99.CERT | | Certifications by the registrant’s principal executive officer and principal financial officer, pursuant to Section 302 of the Sarbanes-Oxley Act of 2002 and required by Rule 30a-2(a) under the Investment Company Act of 1940. |
| |
| | (3) Not applicable. |
| | |
(b) | | Exhibit 99.906CERT | | Certifications pursuant to Section 906 of the Sarbanes-Oxley Act of 2002 and required by Rule 30a-2(b) under the Investment Company Act of 1940. |
SIGNATURES
Pursuant to the requirements of the Securities Exchange Act of 1934 and the Investment Company Act of 1940, the registrant has duly caused this report to be signed on its behalf by the undersigned, thereunto duly authorized.
| | |
| | Mutual of America Investment Corporation |
| |
| By: | | /s/ JAMES J. ROTH |
| | James J. Roth |
| | Chairman of the Board, |
| | President and Chief Executive Officer of |
| | Mutual of America Investment Corporation |
| |
| Date: | | September 6, 2016 |
Pursuant to the requirements of the Securities Exchange Act of 1934 and the Investment Company Act of 1940, this report has been signed below by the following persons on behalf of the registrant and in the capacities and on the dates indicated.
| | |
| By: | | /s/ JAMES J. ROTH |
| | James J. Roth |
| | Chairman of the Board, |
| | President and Chief Executive Officer of |
| | Mutual of America Investment Corporation |
| |
| Date: | | September 6, 2016 |
| |
| By: | | /s/ CHRIS W. FESTOG |
| | Chris W. Festog |
| | Executive Vice President, |
| | Chief Financial Officer and Treasurer of |
| | Mutual of America Investment Corporation |
| |
| Date: | | September 6, 2016 |