UNITED STATES
SECURITIES AND EXCHANGE COMMISSION
Washington, D.C. 20549
FORM N-CSR
CERTIFIED SHAREHOLDER REPORT OF REGISTERED
MANAGEMENT INVESTMENT COMPANIES
Investment Company Act file number 811-05084
Mutual of America Investment Corporation
(Exact name of registrant as specified in charter)
320 Park Avenue, New York, N.Y. 10022
(Address of principal executive offices) (Zip code)
Chris W. Festog
Chairman of the Board, President and Chief Executive Officer
Mutual of America Investment Corporation
320 Park Avenue
New York, NY 10022
(Name and address of agent for service)
Registrant’s telephone number, including area code: (212) 224-1600
Date of fiscal year end: December 31
Date of reporting period: June 30, 2022
| ITEM 1. | REPORTS TO STOCKHOLDERS. |
The Semi-Annual Report to Shareholders follows:
JUNE 30, 2022
Semi-Annual Reports of Mutual of America Investment Corporation Funds
This report is not to be construed as an offering for sale of any Variable Policy. No offering is made except in conjunction with a prospectus, which must precede or accompany this report.

CONTENTS
MUTUALOF AMERICA INVESTMENT CORPORATION
We are pleased to present the Mutual of America Investment Corporation (the “Investment Company”) Semi-Annual Report. This Report includes important information regarding the performance and financial position of the Investment Company’s funds for the six months ended June 30, 2022.
Mid-Year Economic Perspective: Volatility and Uncertainty Reign
A look into the rearview mirror at U.S. financial markets from the first half of 2022 is dismal, and the view ahead — at least for the short-term — is murky. The stock market just weathered its worst first six months of a year since 1970, with the S&P 500® Index down 20.0% through June 30. Bond prices also underperformed, with the 10-year Treasury down 11.3%.
There were some bright spots in the economy, including strong jobs growth, near-record-low unemployment rates, sturdy corporate balance sheets, healthy consumer spending and a still relatively low interest rate environment.
However, four key issues continue to drive a historically turbulent period for both stock and bond investors: the combination of inflation at multidecade highs, the U.S. Federal Reserve (Fed) continuing to tighten monetary policy by raising interest rates, the ongoing war between Russia and Ukraine, and the lingering impact of the global pandemic.
Inflation Takes Centerstage
The volatility seen in the first half of 2022 represents a departure from recent years, which were characterized by steady growth and, until April of 2021, inflation rates below 3.0%. By June of this year, inflation reached a 40-year high, with the government reporting that consumer prices climbed 9.1% year over year — the highest level since November of 1981.
Commodity prices helped drive up inflation last year and were already elevated at the start of 2022; however, the war in Ukraine exacerbated the problem. With fears of potential supply disruption in the oil markets, crude oil prices surged above $100 per barrel. At the same time, costs skyrocketed for major inputs in the products Americans use daily, from aluminum to coffee to wheat, and manufacturers passed those along through higher prices.
Consumers Hit Hard
Faced with price increases on everything from gas and food to housing and entertainment, consumers are feeling the pain. The U.S. Department of Agriculture’s forecasts for consumer food price inflation continue to rise, with all food prices rising 5% to 6% — at least double the 20-year average for food price increases of 2.4%. And gas prices topped an average of $5.00 per gallon for the first time ever in June, but did ease during July, providing a modicum of relief during the summer travel season.
Still, the price increases have not stopped consumer demand for products and services. The unleashing of savings amassed during the pandemic (including from government support) and steady wage increases, helped exacerbate manufacturing backlogs and supply-chain bottlenecks.
Federal Reserve Balancing Act
Faced with the persistent rise of inflation, the Fed shifted (arguably too late) from an accommodative monetary posture to a more aggressive approach — triggering a series of interest rate hikes designed to slow the economy down and reduce inflation. With further rates hikes likely and a Fed target interest rate at 3.66% by year-end, it remains to be seen whether the Fed’s efforts will succeed without tipping the economy into a recession.
Regardless of whether the country is heading into a recession, the short-to-intermediate term economic outlook is likely to remain murky and the markets unsettled. Most advisors are recommending that investors should continue to monitor the current economic environment, and ensure their portfolio aligns with their risk tolerance and time horizon.
The total return performance (net of investment management and other operating expenses) for each of the Investment Company Funds is reflected below:
| | | | |
| Total Returns — Six Months Ended June 30, 2022 | |
| |
Equity Index Fund | | | -20.03% | |
All America Fund | | | -20.00% | |
Small Cap Value Fund | | | -14.13% | |
Small Cap Growth Fund | | | -30.09% | |
Small Cap Equity Index Fund | | | -19.09% | |
Mid Cap Value Fund | | | -13.67% | |
Mid-Cap Equity Index Fund | | | -19.62% | |
1
| | | | |
| Total Returns — Six Months Ended June 30, 2022 (Continued) | |
Composite Fund | | | -13.64% | |
International Fund | | | -15.99% | |
Catholic Values Index Fund | | | -21.81% | |
Retirement Income Fund | | | -10.48% | |
2015 Retirement Fund | | | -11.94% | |
2020 Retirement Fund | | | -13.17% | |
2025 Retirement Fund | | | -14.21% | |
2030 Retirement Fund | | | -15.56% | |
2035 Retirement Fund | | | -17.31% | |
2040 Retirement Fund | | | -17.74% | |
2045 Retirement Fund | | | -18.25% | |
2050 Retirement Fund | | | -18.37% | |
2055 Retirement Fund | | | -18.55% | |
2060 Retirement Fund | | | -18.56% | |
2065 Retirement Fund | | | -18.72% | |
Conservative Allocation Fund | | | -12.10% | |
Moderate Allocation Fund | | | -15.16% | |
Aggressive Allocation Fund | | | -17.60% | |
Money Market Fund | | | 0.04% | |
Mid-Term Bond Fund | | | - 5.97% | |
Bond Fund | | | - 9.72% | |
For variable annuity owners or participants in a group variable annuity, the above performance figures do not reflect the deduction of respective Separate Account fees and expenses imposed by Mutual of America Life Insurance Company. All Fund performances presented throughout this report are historical, reflect the full reinvestment of dividends paid, and should not be considered indicative of future results.
The pages that immediately follow include brief discussions of each Fund’s performance for the six months ended June 30, 2022, compared to its relevant index.
Following the discussions are the graphical representations of the asset allocations of each Fund and an illustration of each Fund’s operating expenses. The portfolios of each Fund and financial statements are presented in the pages that follow.
Thank you for your continued investment in our Funds.
Sincerely,

Chris W. Festog
Chairman of the Board,
President and Chief Executive Officer
Mutual of America Investment Corporation
The views expressed in this Semi-Annual Report are subject to change at any time based on market and other conditions and should not be construed as a recommendation. This Report contains forward-looking statements which speak only as of the date they were made and involve a number of risks and uncertainties that could cause actual results to differ materially from those expressed herein. Readers are cautioned not to place undue reliance on our forward-looking statements, as we assume no obligation to update these forward-looking statements. Readers assume any and all responsibility for any investment decision made as a result of the views expressed herein.
S&P® and S&P 500® are trademarks of Standard & Poor’s Financial Services LLC.
2
EQUITY INDEX FUND (Unaudited)
The Equity Index Fund’s objective is to replicate the performance of the S&P 500® Index (S&P 500), which consists of 500 stocks chosen by Standard & Poor’s for market size, liquidity and industry group representation. The S&P 500 is a market-weighted index of 500 stocks traded on the New York Stock Exchange, American Stock Exchange and NASDAQ, with each stock’s weight in the index proportionate to its market value. The weightings make each company’s influence on the S&P 500’s performance directly proportional to that company’s market value.
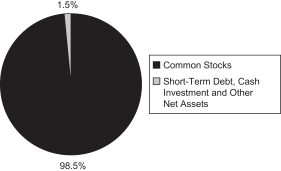
The Equity Index Fund’s performance for the six months ended June 30, 2022, was -19.97% before expenses and -20.03% after expenses. The benchmark returned -19.96%. Note that the Equity Index Fund’s performance includes expenses, such as transaction costs and management fees, which are not applicable to the benchmark.
ALL AMERICA FUND (Unaudited)
The investment objective of the All America Fund is to outperform the S&P 500® Index (S&P 500). The All America Fund is approximately 60% passively invested in the 500 stocks that comprise the S&P 500, with the remaining 40% actively managed, comprised of 20% mid-cap capitalization stocks and 20% small cap stocks, thus providing exposure to all levels of market capitalization among domestic stocks.
For the six months ended June 30, 2022, the S&P 500 of large capitalization stocks decreased by 19.96% on a total return basis, while the Russell® Midcap Core Index was down 21.57% and the Russell Midcap® Value Index was down 16.23%. The Russell 2000® Growth Index decreased 29.45% and the Russell 2000® Value Index decreased 17.31%.
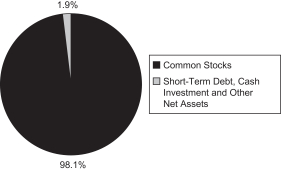
The All America Fund’s return for the six months ended June 30, 2022, before expenses was -19.79% and -20.00% after expenses versus the benchmark return of -19.96%.
SMALL CAP VALUE FUND (Unaudited)
The investment objective of the Small Cap Value Fund is capital appreciation. The Small Cap Value Fund generally invests in companies that are below $3 billion in market capitalization and have lower price-to-book characteristics than the overall market.
For the six months ended June 30, 2022, the Small Cap Value Fund returned -13.78% before expenses and -14.13% after expenses versus a -17.31% return for the Russell 2000® Value Index.
SMALL CAP GROWTH FUND (Unaudited)
The investment objective of the Small Cap Growth Fund is capital appreciation. The Small Cap Growth Fund invests in growth stocks within the small capitalization marketplace. The Fund returned -29.80% before expenses and -30.09% after expenses during the six months ended June 30, 2022. The Fund’s benchmark, the Russell 2000® Growth Index, returned -29.45% for the comparable period.
SMALL CAP EQUITY INDEX FUND (Unaudited)
The Small Cap Equity Index Fund invests in the 600 stocks that comprise the S&P SmallCap 600® Index (S&P SmallCap 600). The S&P SmallCap 600 is a market-weighted index of 600 stocks traded on the New York Stock Exchange, American Stock Exchange and NASDAQ. The weightings make each company’s influence on the S&P SmallCap 600’s performance directly proportional to that company’s market value.
The Small Cap Equity Index Fund’s return for six months ended June 30, 2022 was -19.03% before expenses and -19.09% after expenses. The return of the S&P SmallCap 600 was -18.94%. Note that the performance of the Small Cap Equity Index Fund includes expenses, such as transaction costs and management fees, which are not applicable to the benchmark.
MID CAP VALUE FUND (Unaudited)
The investment objective of the Mid Cap Value Fund is to outperform the Russell Midcap® Value Index. The Mid Cap Value Fund generally invests in companies that are between $1 billion and $20 billion in market capitalization and have lower price-to-book characteristics.
For the six months ended June 30, 2022, the Mid Cap Value Fund returned -13.38% before expenses and -13.67% after expenses versus a -16.23% return for the Russell Midcap® Value Index.
3
MID-CAP EQUITY INDEX FUND (Unaudited)
The Mid-Cap Equity Index Fund invests in the 400 stocks that comprise the S&P MidCap 400® Index (S&P MidCap 400). The S&P MidCap 400 is a market-weighted index of 400 stocks traded on the New York Stock Exchange, American Stock Exchange and NASDAQ. The weightings make each company’s influence on the S&P MidCap 400’s performance directly proportional to that company’s market value. The companies included in the S&P MidCap 400 tend to be typical of this asset class, the medium-capitalized sector of the U.S. securities market.
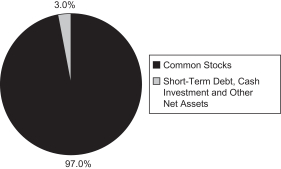
The Mid-Cap Equity Index Fund’s performance for the six months ended June 30, 2022, was -19.56% before expenses and -19.62% after expenses. The return of the S&P MidCap 400 was -19.54%. Note that the performance of the Mid-Cap Equity Index Fund includes expenses, such as transaction costs and management fees, which are not applicable to the benchmark.
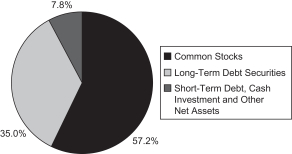
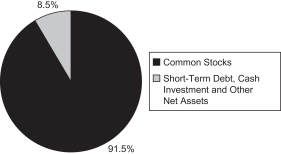
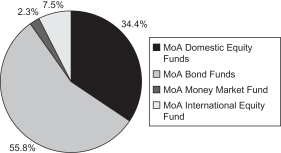
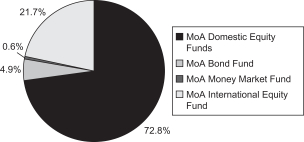
COMPOSITE FUND (Unaudited)
The Composite Fund seeks capital appreciation and current income by investing in a diversified portfolio of common stocks, debt securities and money market instruments.
The primary investment objective of the fixed income portion of the fund is to provide a high level of current income, consistent with capital preservation, while minimizing volatility. It does this by investing primarily in investment grade publicly traded debt securities. The securities held include corporate, U.S. agency and mortgage-backed securities, all of which normally yield more than U.S. Treasury issues.
For the six months ended June 30, 2022, the fixed income portion of the Fund had a total return of -9.02% before expenses. The Bloomberg U.S. Aggregate Index returned -10.35% for the six months ended June 30, 2022.
The primary objective of the equity portion of the Composite Fund is to provide exposure to a diversified portfolio of primarily large capitalization, domestic equity securities that have the potential to outperform their peer group over the medium to long term. The portfolio has a focus on dividend income and aims to continually earn a dividend yield that is higher than that of its benchmark without taking significant over or under weights in any sector.
For the six months ended June 30, 2022, the equity portion of the Fund had a total return of -16.76% (before expenses), outperforming the S&P 500® Index (S&P 500) which decreased 19.96%.
The Fund’s aggregate performance for the six months ended June 30, 2022 was -13.41% before expenses and -13.64% after expenses, versus a -16.08% return in the weighted benchmark.
INTERNATIONAL FUND (Unaudited)
The International Fund seeks capital appreciation by investing in stocks of large and mid-cap companies in developed market countries located outside of the United States and Canada that are reflected or contained in the Morgan Stanley Capital International, Inc. Europe, Australasia and Far East® Index (MSCI EAFE® Index). Previously, the International Fund was invested mainly in exchange traded funds that reflect, replicate or follow the country weightings of the MSCI EAFE® Index. The Fund had also invested a small percentage of assets in exchange traded funds that provide exposure to emerging markets and to companies with small market capitalizations in developed market countries. The Securities and Exchange Commission revoked the exemptive orders that allowed these investments in exchange traded funds effective on January 19, 2022. The International Fund is, and shall continue to be, invested directly in the stocks of companies represented in the MSCI EAFE® Index, except to the extent that it is permissible to invest in exchange traded funds within the general limitations of the Investment Company Act of 1940.
For the six months ended June 30, 2022, the International Fund returned -15.93% before expenses and -15.99% after expenses. The return of the MSCI EAFE benchmark was -19.57%. The fund’s benchmark closes earlier in the day than the actual market for the fund’s investments. This time lag can result in both positive and negative performance differences.
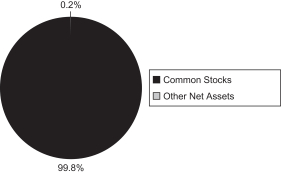
CATHOLIC VALUES INDEX FUND (Unaudited)
The Catholic Values Index Fund’s objective is to replicate the performance of the S&P 500® Catholic Values Index (Catholic Values Index). The Catholic Values Index is designed to provide exposure to U.S. large capitalization stocks included in the S&P 500® Index (S&P 500) while maintaining alignment with the moral and social teachings of the Catholic Church. The Catholic Values Index is based on the S&P 500, and generally comprises approximately 500 or less U.S. listed common stocks. All index constituents are members of the S&P 500 and follow the eligibility criteria for that index. From this starting universe, constituents are screened to exclude companies involved in activities which are perceived to be inconsistent with Catholic values as outlined in the Socially Responsible Investment Guidelines of the
4
United States Conference of Catholic Bishops, currently including the protection of human life, promotion of human dignity, reducing arms production, affordable housing and banking, protection of the environment and encouraging corporate responsibility. The Catholic Values Index then reweights the remaining constituents so that the Catholic Values Index’s sector exposures approximate the sector exposures on the S&P 500.
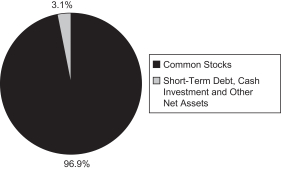
The Catholic Values Index Fund’s performance for the six months ended June 30, 2022, was -21.72% before expenses and -21.81% after expenses. The benchmark returned -21.70%. Note that the Catholic Values Index Fund’s performance includes expenses, such as transaction costs and management fees, which are not applicable to the benchmark.
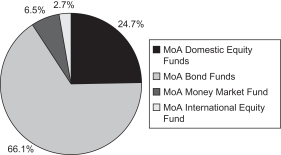
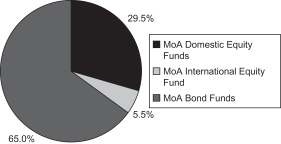
RETIREMENT INCOME FUND (Unaudited)
The objective of the Retirement Income Fund is current income consistent with the preservation of capital and, to a lesser extent, capital appreciation. The Retirement Income Fund invests primarily in the fixed-income funds of the Investment Company and also invests in two equity funds of the Investment Company. The Fund’s current target allocation is approximately 70% of net assets in fixed-income funds (approximately 35% in the Bond, 30% in the Mid-Term Bond Funds and 5% in the Money Market Fund) and approximately 30% of net assets in equity funds (20% in the Equity Index Fund, 5% in the Mid-Cap Equity Index Fund and 5% in the International Fund) (See Note 1 in the Notes to Financial Statements for additional information on changes to Fund target allocations during 2022).
Performance for the Retirement Income Fund is compared to the Morningstar Lifetime Allocation Conservative Income Index. For the six months ended June 30, 2022, the Fund returned -10.43% before expenses and -10.48% after expenses, versus a -10.56% return in the benchmark.
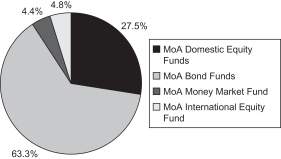
2015 RETIREMENT FUND (Unaudited)
The objective of the 2015 Retirement Fund is current income and capital appreciation appropriate for the asset allocation associated with a retirement in 2015. The 2015 Retirement Fund invests in funds of the Investment Company. The Fund’s current target allocation is approximately 67% of net assets in fixed-income funds (35% in the Bond Fund, 27% in the Mid-Term Bond Fund and 5% in the Money Market Fund) and approximately 33% of net assets in equity funds (approximately 23% in the Equity Index Fund, 5% in the Mid-Cap Equity Index Fund and 5% in the International Fund) (See Note 1 in the Notes to Financial Statements for additional information on changes to Fund target allocations during 2022).
Performance for the 2015 Retirement Fund is compared to the Morningstar Lifetime Allocation Conservative 2015 Index. For the year six months ended June 30, 2022, the Fund returned -11.87% before expenses and -11.94% after expenses, versus a -14.04% return in the benchmark.
2020 RETIREMENT FUND (Unaudited)
The objective of the 2020 Retirement Fund is current income and capital appreciation appropriate for the asset allocation associated with a retirement in 2020. The 2020 Retirement Fund invests in funds of the Investment Company. The Fund’s current target allocation is approximately 59% of net assets in fixed-income funds (35% in the Bond Fund, 19% in the Mid-Term Bond Fund and 5% in the Money Market Fund) and approximately 41% of net assets in equity funds (approximately 25% in the Equity Index Fund, 7% in the Mid-Cap Equity Index Fund, 7% in the International Fund and 2% in Small Cap Funds, which consists of the Small Cap Growth and Small Cap Value Funds) (See Note 1 in the Notes to Financial Statements for additional information on changes to Fund target allocations during 2022).
Performance for the 2020 Retirement Fund is compared to the Morningstar Lifetime Allocation Moderate 2020 Index. For the six months ended June 30, 2022, the Fund returned -13.14% before expenses and -13.17% after expenses, versus a -16.74% return in the benchmark.
2025 RETIREMENT FUND (Unaudited)
The objective of the 2025 Retirement Fund is current income and capital appreciation appropriate for the asset allocation associated with a target retirement in 2025. The 2025 Retirement Fund invests in funds of the Investment Company. The Fund’s current target allocation is approximately 51% of net assets in equity funds (approximately 30% in the Equity Index Fund, 8% in the Mid-Cap Equity Index Fund, 10% in the International Fund and 3% in Small Cap Funds, which consists of the Small Cap Growth, Small Cap Value and Small Cap Equity Index Funds) and approximately 49% of net assets in fixed-income funds (32% in the Bond Fund, 14% in the Mid-Term Bond Fund and 3% in the Money Market Fund) (See Note 1 in the Notes to Financial Statements for additional information on changes to Fund target allocations during 2021).
5
Performance for the 2025 Retirement Fund is compared to the Morningstar Lifetime Allocation Moderate 2025 Index. For the six months ended June 30, 2022, the Fund returned -14.18% before expenses and -14.21% after expenses, versus a -17.79% return in the benchmark.
2030 RETIREMENT FUND (Unaudited)
The objective of the 2030 Retirement Fund is current income and capital appreciation appropriate for the asset allocation associated with a target retirement in 2030. The 2030 Retirement Fund invests in funds of the Investment Company. The Fund’s current target allocation is approximately 61% of net assets in equity funds (approximately 35% in the Equity Index Fund, 10% in the Mid-Cap Equity Index Fund, 12% in the International Fund and 4% in Small Cap Funds, which consists of Small Cap Growth, Small Cap Value and Small Cap Equity Index Funds) and approximately 39% of net assets in fixed-income funds (26% in the Bond Fund, 10% in the Mid-Term Bond Fund and 3% in the Money Market Fund) (See Note 1 in the Notes to Financial Statements for additional information on changes to Fund target allocations during 2022).
Performance for the 2030 Retirement Fund is compared to the Morningstar Lifetime Allocation Moderate 2030 Index. For the six months ended June 30, 2022, the Fund returned -15.53% before expenses and -15.56% after expenses, versus a -18.62% return in the benchmark.
2035 RETIREMENT FUND (Unaudited)
The objective of the 2035 Retirement Fund is current income and capital appreciation appropriate for the asset allocation associated with a target retirement in 2035. The 2035 Retirement Fund invests in funds of the Investment Company. The Fund’s current target allocation is approximately 73% of net assets in equity funds (approximately 40% in the Equity Index Fund, 13% in the Mid-Cap Equity Index Fund, 15% in the International Fund and 5% in Small Cap Funds, which consists of the Small Cap Growth, Small Cap Value and Small Cap Equity Index Funds) and approximately 27% of net assets in fixed-income funds (20% in the Bond Fund, 4% in the Mid-term Bond Fund and 3% in the Money Market Fund) (See Note 1 in the Notes to Financial Statements for additional information on changes to Fund target allocations during 2022).
Performance for the 2035 Retirement Fund is compared to the Morningstar Lifetime Allocation Moderate 2035 Index. For the six months ended June 30, 2022, the Fund returned -17.28% before expenses and -17.31% after expenses, versus a -19.14% return in the benchmark.
2040 RETIREMENT FUND (Unaudited)
The objective of the 2040 Retirement Fund is current income and capital appreciation appropriate for the asset allocation associated with a target retirement in 2040. The 2040 Retirement Fund invests in funds of the Investment Company. The Fund’s current target allocation is approximately 82% of net assets in equity funds (approximately 44% in the Equity Index Fund, 14% in the Mid-Cap Equity Index Fund, 18% in the International Fund and 6% in the Small Cap Funds, which consists of the Small Cap Growth, Small Cap Value and Small-Cap Equity Index Funds) and approximately 18% of net assets in fixed-income funds (16% in the Bond Fund and 2% in the Money Market Fund) (See Note 1 in the Notes to Financial Statements for additional information on changes to Fund target allocations during 2022).
Performance for the 2040 Retirement Fund is compared to Morningstar Lifetime Allocation Moderate 2040 Index. For the six months ended June 30, 2022, the Fund returned -17.71% before expenses and -17.74% after expenses, versus a -19.48% return in the benchmark.
2045 RETIREMENT FUND (Unaudited)
The objective of the 2045 Retirement Fund is current income and capital appreciation appropriate for the asset allocation associated with a target retirement in 2045. The 2045 Retirement Fund invests in funds of the Investment Company. The Fund’s current target allocation is approximately 87% of net assets in equity funds (approximately 47% in the Equity Index Fund, 14% in the Mid-Cap Equity Index Fund, 19% in the International Fund and 7% in the Small Cap Funds, which consists of the Small Cap Growth, Small Cap Value and Small Cap Equity Index Funds) and approximately 13% of net assets in fixed-income funds (11% in the Bond Fund and 2% in the Money Market Fund) (See Note 1 in the Notes to Financial Statements for additional information on changes to Fund target allocations during 2022).
6
Performance for the 2045 Retirement Fund is compared to the Morningstar Lifetime Allocation Moderate 2045 Index. For the six months ended June 30, 2022, the Fund returned -18.22% before expenses and -18.25% after expenses, versus a -19.67% return in the benchmark.
2050 RETIREMENT FUND (Unaudited)
The objective of the 2050 Retirement Fund is current income and capital appreciation appropriate for the asset allocation associated with a target retirement in 2050. The 2050 Retirement Fund invests in funds of the Investment Company. The Fund’s current target allocation is approximately 90% of net assets in equity funds (approximately 48% in the Equity Index Fund, 14% in the Mid-Cap Equity Index Fund, 20% in the International Fund and 8% in the Small Cap Funds, which consists of the Small Cap Growth, Small Cap Value and the Small Cap Equity Index Funds) and approximately 10% of net assets in fixed-income funds (8% in the Bond Fund and 2% in the Money Market Fund) (See Note 1 in the Notes to Financial Statements for additional information on changes to Fund target allocations during 2022).
Performance for the 2050 Retirement Fund is compared to the Morningstar Lifetime Allocation Moderate 2050 Index. For the six months ended June 30, 2022, the Fund returned -18.34% before expenses and -18.37% after expenses, versus a -19.73% return in the benchmark.
2055 RETIREMENT FUND (Unaudited)
The objective of the 2055 Retirement Fund is current income and capital appreciation appropriate for the asset allocation associated with a target retirement in 2055. The 2055 Retirement Fund invests in funds of the Investment Company. The Fund’s current target allocation is approximately 92% of net assets in equity funds (approximately 47% in the Equity Index Fund, 15% in the Mid-Cap Equity Index Fund, 21% in the International Fund and 9% in the Small Cap Funds, which consists of the Small Cap Growth, Small Cap Value and Small Cap Equity Index Funds) and approximately 8% of net assets in fixed-income funds (7% in the Bond Fund and 1% in the Money Market Fund) (See Note 1 in the Notes to Financial Statements for additional information on changes to Fund target allocations during 2022).
Performance for the 2055 Retirement Fund is compared to the Morningstar Lifetime Allocation Moderate 2055 Index. For the six months ended June 30, 2022, the Fund returned -18.50% before expenses and -18.55% after expenses, versus a -19.75% return in the benchmark.
2060 RETIREMENT FUND (Unaudited)
The objective of the 2060 Retirement Fund is current income and capital appreciation appropriate for the asset allocation associated with a target retirement in 2060. The 2060 Retirement Fund invests in funds of the Investment Company. The Fund’s current target allocation is approximately 94% of net assets in equity funds (approximately 47% in the Equity Index Fund, 15% in the Mid-Cap Equity Index Fund, 22% in the International Fund and 10% in the Small Cap Funds, which consists of the Small Cap Growth, Small Cap Value and Small Cap Equity Index Funds) and approximately 6% of net assets in fixed-income funds (5% in the Bond Fund and 1% in the Money Market Fund) (See Note 1 in the Notes to Financial Statements for additional information on changes to Fund target allocations during 2022).
Performance for the 2060 Retirement Fund is compared to the Morningstar Lifetime Allocation Moderate 2060 Index. For the six months ended June 30, 2022, the Fund returned -18.49% before expenses and -18.56% after expenses, versus a -19.77% return in the benchmark.
2065 RETIREMENT FUND (Unaudited)
The objective of the 2065 Retirement Fund is current income and capital appreciation appropriate for the asset allocation associated with a target retirement in 2065. The 2065 Retirement Fund invests in funds of the Investment Company. The Fund’s current target allocation is approximately 95% of net assets in equity funds (approximately 48% in the Equity Index Fund, 15% in the Mid-Cap Equity Index Fund, 22% in the International Fund and 10% in the Small Cap Funds, which consists of Small Cap Growth, Small Cap Value and Small Cap Equity Index Funds) and approximately 5% of net assets in fixed-income funds (4% in the Bond Fund and 1% in the Money Market Fund) (See Note 1 in the Notes to Financial Statements for additional information on changes to Fund target allocations during 2022).
7
Performance for the 2065 Retirement Fund is compared to the Morningstar Lifetime Allocation Moderate 2065 Index. For the six months ended June 30, 2022, the Fund returned -18.70% before expenses and -18.72% after expenses, versus a -19.75% return in the benchmark.
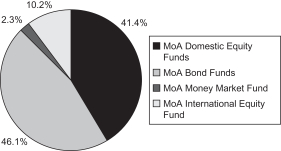
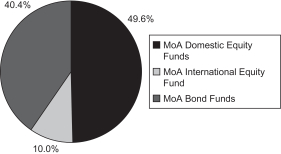
CONSERVATIVE ALLOCATION FUND (Unaudited)
The objective of the Conservative Allocation Fund is current income and, to a lesser extent, capital appreciation. The Conservative Allocation Fund invests primarily in the fixed-income funds of the Investment Company and also invests in the equity funds of the Investment Company. The Conservative Allocation Fund’s target allocation is approximately 65% of net assets in fixed-income funds (approximately 30% in the Bond Fund and 35% in the Mid-Term Bond Fund) and approximately 35% of net assets in equity funds (approximately 25% in the Equity Index Fund, 5% in the Mid-Cap Equity Index Fund and 5% in the International Fund).
Performance for the Conservative Allocation Fund is compared to the Morningstar US Moderately Conservative Target Allocation Index. For the six months ended June 30, 2022, the Conservative Allocation Fund returned -12.06% before expenses and -12.10% after expenses, versus a -13.85% return in the benchmark.
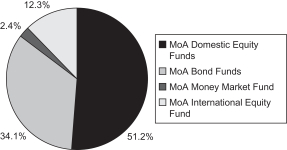
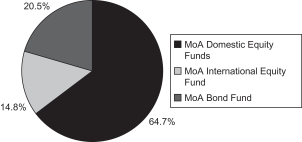
MODERATE ALLOCATION FUND (Unaudited)
The objective of the Moderate Allocation Fund is capital appreciation and current income. The Moderate Allocation Fund invests in the equity and fixed-income funds of the Investment Company. The Moderate Allocation Fund’s target allocation is approximately 60% of net assets in equity funds (approximately 35% of its net assets in the Equity Index Fund, 15% in the Mid-Cap Equity Index Fund and 10% in the International Fund) and approximately 40% of net assets in fixed-income funds (approximately 25% of its net assets in the Bond Fund and approximately 15% of its net assets in the Mid-Term Bond Fund).
Performance for the Moderate Allocation Fund is compared to the Morningstar US Moderate Target Allocation Index. For the six months ended June 30, 2022, the Moderate Allocation Fund returned -15.14% before expenses and -15.16% after expenses, versus a -16.05% return for the benchmark.
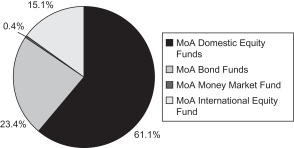
AGGRESSIVE ALLOCATION FUND (Unaudited)
The objective of the Aggressive Allocation Fund is capital appreciation and, to a lesser extent, current income. The Aggressive Allocation Fund invests in the equity and fixed-income funds of the Investment Company. The Aggressive Allocation Fund’s target allocation is approximately 80% of net assets in equity funds (approximately 35% of its net assets in the Equity Index Fund, 20% in the Mid-Cap Equity Index Fund, 5% each in the Small Cap Value Fund and Small Cap Growth Funds and 15% in the International Fund) and approximately 20% of net assets in the Bond Fund.
Performance for the Aggressive Allocation Fund is compared to the Morningstar US Moderately Aggressive Target Allocation Index. For the six months ended June 30, 2022, the Aggressive Allocation Fund returned -17.58% before expenses and -17.60% after expenses, versus an -17.89% return for the benchmark.
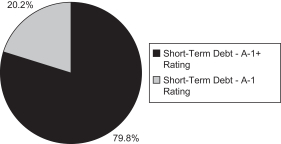
MONEY MARKET FUND (Unaudited)
The Money Market Fund’s investment objective is to realize current income while maintaining liquidity, investment quality and stability of capital through investing in high-quality commercial paper issued by U.S. corporations and securities issued by the U.S. government and its agencies. For the six months ended June 30, 2022, the Money Market Fund returned 0.16% before expenses and 0.04% after expenses, compared to a 0.17% return for the FTSE 3-Month Treasury Bill Index. Note that the benchmark performance does not reflect any expenses.
The Fund’s strategy will continue to focus on quality, liquidity, and maintaining a relatively short weighted average maturity. On June 30, 2022, the fund held 24% in U.S. Treasury Bills, 25% in U.S. agency discount notes and the remainder in commercial paper. The average maturity was 25 days.
The seven-day effective yield as of August 16, 2022, was 1.83%. As with all performance reporting, this yield is not necessarily indicative of future annual yields. Neither the Federal Deposit Insurance Corporation nor any other U.S. government agency insures or guarantees investments in shares of the Money Market Fund.
Many of the stimulus measures put into place by the Federal Reserve (the Fed) to combat the effects of the Covid-19 have ended or are in the process of being wound down. The emergence and economic impact of the virus prompted the Fed to cut the Fed Funds target twice: an inter-meeting cut of 50 basis points on March 3, 2020 and a 100 basis point, or 1.00% easing on March 15, 2020. Additionally, the Fed pledged to increase its holdings of Treasury securities by at least $80 billion per month and of agency mortgage-backed securities (MBS) by at least $40 billion per month until progress had been made toward the goals of maximum employment and price stability.
8
The highest inflation rate since the 1980s, as measured by the Consumer Price Index (CPI), prompted the Fed to raise the Fed Funds rate in March of this year. Rising energy prices, the lagged effect on supply chains from the pandemic and the general increase in the money supply all contributed to the higher figure. The year-over-year (YoY) CPI in June was 9.1%. This is in contrast to the 7.0% YoY recorded in December 2021 and the 1.4% YoY level in December 2020. To combat this, the Fed increased the Fed Funds target range by 25, 50 and 75 basis points at the March, May and June meetings, respectively. Expectations are that the Fed will continue to increase the range at the remaining meetings this year until the target level is greater than 3.00%.
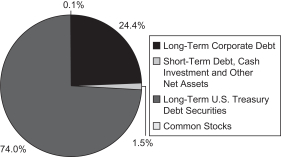
MID-TERM BOND FUND (Unaudited)
The Mid-Term Bond Fund seeks a high level of return consistent with the preservation of capital through investment in publicly traded debt securities. Under normal circumstances, the portfolio emphasizes corporate issues, particularly BBB-rated bonds, in order to capture incremental income. At this time, we’ve chosen to add U.S. Treasury exposure to increase the overall quality of the Fund. The objective of the Fund is to maintain a maturity profile similar to that of the Bloomberg U.S. Intermediate Government/Credit Bond Index benchmark. To achieve the duration target, intermediate corporate and U.S. Treasury maturities are emphasized. In addition, the Fund’s corporate positions will remain highly diversified in order to help shield the portfolio from any credit risks.
For the six months ended June 30, 2022, the Mid-Term Bond Fund returned -5.75% before expenses and -5.97% after expenses versus a -6.77% return of the Bloomberg Intermediate U.S. Government/Credit Bond Index during the same period. The Fund’s outperformance can be attributed in part to its’ greater exposure to Treasuries and lower exposure to credit relative to its’ benchmark. We maintained our “up-in-quality” and short duration stance through this period and expect to continue to do so for the time being.
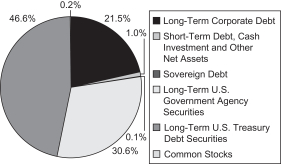
BOND FUND (Unaudited)
The Bond Fund’s primary investment objective is to provide as high a level of current income over time as is believed to be consistent with prudent investment risk. It does this by investing primarily in investment grade publicly traded debt securities. A secondary objective is preservation of capital. The securities held by the Bond Fund include corporate, U.S. agency and mortgage-backed securities, all of which normally yield more than U.S. Treasury issues.
Over the long term, the Bond Fund’s strategy is to overweight corporate bonds, underweight U.S. Treasuries, and market weight mortgage-backed securities. The portfolio’s aim is to maintain a similar maturity profile to the benchmark, the Bloomberg U.S. Aggregate Bond Index, with an overweighting of BBB-rated issuers. To achieve the duration target, intermediate corporate and longer U.S. Treasury maturities are emphasized. The Bond Fund also stresses diversification in order to protect it from unexpected credit events.
The benchmark returned -10.35% for the six months ended June 30, 2022. The Bond Fund returned -9.52% before expenses and -9.72% after expenses during the same period. The Fund’s outperformance can be attributed to the contribution of our mortgage-backed securities (MBS) holdings and our decision to hold shorter maturity corporates relative to the benchmark. We maintained our “up-in-quality” stance through this period and expect to do so for the time being.
Many of the stimulus measures put into place by the Federal Reserve (the Fed) to combat the effects of the Covid-19 have ended or are in the process of being wound down. The emergence and economic impact of the virus prompted the Fed to cut the Fed Funds target twice: an inter-meeting cut of 50 basis points on March 3, 2020 and a 100 basis point, or 1.00% easing on March 15, 2020. Additionally, the Fed pledged to increase its holdings of Treasury securities by at least $80 billion per month and of agency MBS by at least $40 billion per month until progress had been made toward the goals of maximum employment and price stability.
The highest inflation rate since the 1980s, as measured by the Consumer Price Index (CPI), prompted the Fed to raise the Fed Funds rate in March of this year. Rising energy prices, the lagged effect on supply chains from the pandemic and the general increase in the money supply all contributed to the higher figure. The year-over-year (YoY) CPI in June was 9.1%. This is in contrast to the 7.0% YoY recorded in December 2021 and the 1.4% YoY level in December 2020. To combat this, the Fed increased the Fed Funds target range by 25, 50 and 75 basis points at the March, May and June meetings, respectively. Expectations are that the Fed will continue to increase the range at the remaining meetings this year until the target level is greater than 3.00%.
The Treasury curve bear flattened year-to-date as shorter-term rates rose more than long term rates. Through June 30, the two-year yield rose 222 basis points or 2.22% and stood at 2.95%. The five-year rate has risen 177 basis points to 3.03% and the long bond, or the thirty year, is 128 basis points higher at 3.18%. The changes in the yield curve are fairly consistent with expected Fed hikes in the Fed Funds rate. It is often said that the Fed controls the front
9
part of the curve and inflation the back end. The Fed’s influence is felt directly out to about five years and the longer end of the curve reflects the Fed’s efforts to slow the economy and curtail inflation.
The Fed’s purchase of $80 billion Treasuries per month and $40 billion MBS per month ended in March. In June, the Fed took additional measures to shrink its balance sheet by starting to reinvest fewer Treasuries and MBS than is produced from the cash flows of its existing portfolio. By September, the Fed plans to buy $60 billion fewer Treasuries and $35 billion fewer MBS per month from the proceeds of the portfolio than it was at the beginning year. This withdrawal of liquidity will take an uneconomic buyer of size out the market and could put additional upward pressure on rates.
Investment grade spreads have moved wider over the course of the last six months. Spreads entered 2022 close to post-economic crisis tights and exited the second quarter at the widest levels since June 2020. Concerns that inflation would hurt corporate and consumer personal finances or the Fed would inadvertently tighten too much and cause a recession were partly responsible for the move.
10
MUTUAL OF AMERICA INVESTMENT CORPORATION
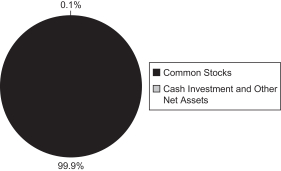
ASSET ALLOCATIONS AS OF JUNE 30, 2022 (Unaudited)
Equity Index Fund
All America Fund
Small Cap Value Fund
Small Cap Growth Fund
Small Cap Equity Index Fund
Mid Cap Value Fund
11
MUTUAL OF AMERICA INVESTMENT CORPORATION
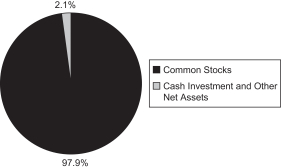
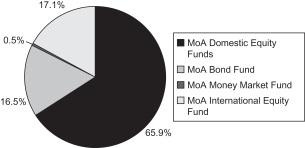
ASSET ALLOCATIONS AS OF JUNE 30, 2022 (Unaudited) (Continued)
Mid-Cap Equity Index Fund
Composite Fund
International Fund
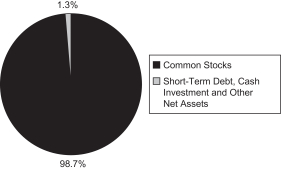
Catholic Values Index Fund
Retirement Income Fund
2015 Retirement Fund
12
MUTUAL OF AMERICA INVESTMENT CORPORATION
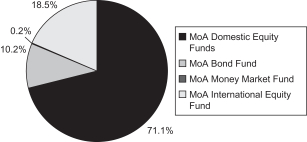
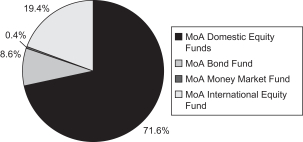
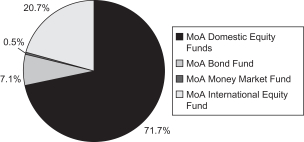
ASSET ALLOCATIONS AS OF JUNE 30, 2022 (Unaudited) (Continued)
2020 Retirement Fund
2025 Retirement Fund
2030 Retirement Fund
2035 Retirement Fund
2040 Retirement Fund
2045 Retirement Fund

13
MUTUAL OF AMERICA INVESTMENT CORPORATION
ASSET ALLOCATIONS AS OF JUNE 30, 2022 (Unaudited) (Continued)
2050 Retirement Fund
2055 Retirement Fund
2060 Retirement Fund
2065 Retirement Fund
Conservative Allocation Fund
Moderate Allocation Fund
14
MUTUAL OF AMERICA INVESTMENT CORPORATION
ASSET ALLOCATIONS AS OF JUNE 30, 2022 (Unaudited) (Continued)
Aggressive Allocation Fund
Money Market Fund
Mid-Term Bond Fund
Bond Fund
15
MUTUAL OF AMERICA INVESTMENT CORPORATION
EXPENSE EXAMPLE (Unaudited)
EXAMPLE
As a shareholder of one of the Mutual of America Investment Corporation Funds, you incur ongoing costs, including management fees and other Fund expenses. You do not incur transactional costs, such as sales charges (loads), redemption fees or exchange fees. Additionally, Mutual of America Capital Management LLC, the Funds’ Adviser, has contractually agreed to reimburse the direct non-advisory operating expenses of any Allocation or Retirement Fund (each a “Fund of Funds”) that has less than $50 million in average daily net assets for the prior calendar year. This contractual obligation remains in effect through April 30, 2023 and will continue for succeeding 12 month periods ending April 30th unless i) The Fund of Funds has at least $50 million in average daily net assets for the prior calendar year, ii) the Investment Company gives not less than 30 days written notice to the Adviser, or iii) the Adviser gives 45 days advance notice to the Investment Company before the next May 1 of a given year to terminate the agreement. In that case, the agreement will terminate on the next May 1 following the written notice. Furthermore, the Funds’ Adviser has contractually agreed to reimburse the non-advisory operating expenses of the Small Cap Equity Index and the Catholic Values Index Funds to the extent that such operating expenses exceed 0.07% of the respective fund’s net assets. This contractual obligation remains in effect through April 30, 2023, and continues into successive 12 month periods ending April 30 unless i) the Investment Company gives not less than 30 days written notice to the Adviser, or ii) the Adviser gives 45 days advance notice to the Investment Company before the next May 1 of a given year to terminate the agreement. In that case, the agreement will terminate on the next May 1 following the written notice.
This Example is intended to help you understand your ongoing costs (in dollars) of investing in a Fund and to compare these costs with the ongoing costs of investing in other mutual funds. The Example is based on an investment of $1,000 invested at January 1, 2022 and held for the entire period ending June 30, 2022 under the expense reimbursement agreement in effect during that period as described above.
For variable annuity owners or participants in a group variable annuity, the estimate of expenses does not include fees and charges associated with your variable annuity. If those fees and charges were included, the estimate of expenses for the period would be higher and your ending account value would be lower.
ACTUAL EXPENSES
The first line of the tables below provides information about actual account values and actual expenses. You may use the information in this line, together with the amount you invested, to estimate the expenses that you paid over the period. Simply divide your account value by $1,000 (for example, an $8,600 account value divided by $1,000=8.6), then multiply the result by the number in the first line under the heading entitled “Expenses Paid During Period” to estimate the expenses you paid on your account during this period.
HYPOTHETICAL EXAMPLE FOR COMPARISON PURPOSES
The second line of the tables below provides information about hypothetical account values and hypothetical expenses based on each Fund’s actual expense ratio and an assumed rate of return of 5% per year before expenses, which is not the Fund’s actual return. The hypothetical account values and expenses may not be used to estimate the actual ending account balance or expenses you paid for the period. You may use this information to compare the ongoing costs of investing in the Fund with other funds. To do so, compare this 5% hypothetical example with the 5% hypothetical examples that appear in the shareholder reports of the other funds.
Please note that the second line of the table is useful in comparing ongoing costs only, and will not help you determine the relative total costs of owning other non-Mutual of America funds, which may also charge transactional costs, such as sales charges (loads), redemption fees or exchange fees, which the Mutual of America Investment Corporation does not charge.
| | | | | | | | | | | | | | | | | | |
| | | Equity Index Fund | | | | |
| | | | | Beginning
Account Value
January 1, 2022 | | | Ending
Account Value
June 30, 2022 | | | Expenses Paid
During Period*
January 1, 2022 to
June 30, 2022 | | | | |
| | | Actual | | | $1,000.00 | | | | $799.73 | | | | $0.67 | | | | | |
| | | Hypothetical
(5% return before expenses) | | | $1,000.00 | | | | $1,023.73 | | | | $0.75 | | | | | |
| | * | Expenses are equal to the Fund’s annual expense ratio of 0.15%, multiplied by the average account value over the period, multiplied by 181/365 (to reflect the one-half year period). |
16
MUTUAL OF AMERICA INVESTMENT CORPORATION
EXPENSE EXAMPLE (Unaudited) (Continued)
| | | | | | | | | | | | | | | | | | |
| | | All America Fund | | | | |
| | | | | Beginning
Account Value
January 1, 2022 | | | Ending
Account Value
June 30, 2022 | | | Expenses Paid
During Period*
January 1, 2022 to
June 30, 2022 | | | | |
| | | Actual | | | $1,000.00 | | | | $799.98 | | | | $2.35 | | | | | |
| | | Hypothetical
(5% return before expenses) | | | $1,000.00 | | | | $1,021.80 | | | | $2.66 | | | | | |
| | * | Expenses are equal to the Fund’s annual expense ratio of 0.53%, multiplied by the average account value over the period, multiplied by 181/365 (to reflect the one-half year period). |
| | | | | | | | | | | | | | | | | | |
| | | Small Cap Value Fund | | | | |
| | | | | Beginning
Account Value
January 1, 2022 | | | Ending
Account Value
June 30, 2022 | | | Expenses Paid
During Period*
January 1, 2022 to
June 30, 2022 | | | | |
| | | Actual | | | $1,000.00 | | | | $858.70 | | | | $3.77 | | | | | |
| | | Hypothetical
(5% return before expenses) | | | $1,000.00 | | | | $1,020.33 | | | | $4.11 | | | | | |
| | * | Expenses are equal to the Fund’s annual expense ratio of 0.82%, multiplied by the average account value over the period, multiplied by 181/365 (to reflect the one-half year period). |
| | | | | | | | | | | | | | | | | | |
| | | Small Cap Growth Fund | | | | |
| | | | | Beginning
Account Value
January 1, 2022 | | | Ending
Account Value
June 30, 2022 | | | Expenses Paid
During Period*
January 1, 2022 to
June 30, 2022 | | | | |
| | | Actual | | | $1,000.00 | | | | $699.14 | | | | $3.41 | | | | | |
| | | Hypothetical
(5% return before expenses) | | | $1,000.00 | | | | $1,020.33 | | | | $4.11 | | | | | |
| | * | Expenses are equal to the Fund’s annual expense ratio of 0.82%, multiplied by the average account value over the period, multiplied by 181/365 (to reflect the one-half year period). |
| | | | | | | | | | | | | | | | | | |
| | | Small Cap Equity Index Fund | | | | |
| | | | | Beginning
Account Value
January 1, 2022 | | | Ending
Account Value
June 30, 2022 | | | Expenses Paid
During Period*
January 1, 2022 to
June 30, 2022 | | | | |
| | | Actual | | | $1,000.00 | | | | $809.13 | | | | $0.67 | | | | | |
| | | Hypothetical
(5% return before expenses) | | | $1,000.00 | | | | $1,023.73 | | | | $0.75 | | | | | |
| | * | Expenses are equal to the Fund’s annual expense ratio of 0.15%, multiplied by the average account value over the period, multiplied by 181/365 (to reflect the one-half year period). |
17
MUTUAL OF AMERICA INVESTMENT CORPORATION
EXPENSE EXAMPLE (Unaudited) (Continued)
| | | | | | | | | | | | | | | | | | |
| | | Mid Cap Value Fund | | | | |
| | | | | Beginning
Account Value
January 1, 2022 | | | Ending
Account Value
June 30, 2022 | | | Expenses Paid
During Period*
January 1, 2022 to
June 30, 2022 | | | | |
| | | Actual | | | $1,000.00 | | | | $863.26 | | | | $3.13 | | | | | |
| | | Hypothetical
(5% return before expenses) | | | $1,000.00 | | | | $1,021.04 | | | | $3.41 | | | | | |
| | * | Expenses are equal to the Fund’s annual expense ratio of 0.68%, multiplied by the average account value over the period, multiplied by 181/365 (to reflect the one-half year period). |
| | | | | | | | | | | | | | | | | | |
| | | Mid-Cap Equity Index Fund | | | | |
| | | | | Beginning
Account Value
January 1, 2022 | | | Ending
Account Value
June 30, 2022 | | | Expenses Paid
During Period*
January 1, 2022 to
June 30, 2022 | | | | |
| | | Actual | | | $1,000.00 | | | | $803.83 | | | | $0.67 | | | | | |
| | | Hypothetical
(5% return before expenses) | | | $1,000.00 | | | | $1,023.73 | | | | $0.75 | | | | | |
| | * | Expenses are equal to the Fund’s annual expense ratio of 0.15%, multiplied by the average account value over the period, multiplied by 181/365 (to reflect the one-half year period). |
| | | | | | | | | | | | | | | | | | |
| | | Composite Fund | | | | |
| | | | | Beginning
Account Value
January 1, 2022 | | | Ending
Account Value
June 30, 2022 | | | Expenses Paid
During Period*
January 1, 2022 to
June 30, 2022 | | | | |
| | | Actual | | | $1,000.00 | | | | $863.60 | | | | $2.40 | | | | | |
| | | Hypothetical
(5% return before expenses) | | | $1,000.00 | | | | $1,021.85 | | | | $2.61 | | | | | |
| | * | Expenses are equal to the Fund’s annual expense ratio of 0.52%, multiplied by the average account value over the period, multiplied by 181/365 (to reflect the one-half year period). |
| | | | | | | | | | | | | | | | | | |
| | | International Fund | | | | |
| | | | | Beginning
Account Value
January 1, 2022 | | | Ending
Account Value
June 30, 2022 | | | Expenses Paid
During Period*
January 1, 2022 to
June 30, 2022 | | | | |
| | | Actual | | | $1,000.00 | | | | $840.14 | | | | $0.68 | | | | | |
| | | Hypothetical
(5% return before expenses) | | | $1,000.00 | | | | $1,023.73 | | | | $0.75 | | | | | |
| | * | Expenses are equal to the Fund’s annual expense ratio of 0.15% (reflecting direct expenses and the proportional expense ratios of the underlying funds in which the Fund invests), multiplied by the average account value over the period, multiplied by 181/365 (to reflect the one-half year period). |
18
MUTUAL OF AMERICA INVESTMENT CORPORATION
EXPENSE EXAMPLE (Unaudited) (Continued)
| | | | | | | | | | | | | | | | | | |
| | | Catholic Values Index Fund | | | | |
| | | | | Beginning
Account Value
January 1, 2022 | | | Ending
Account Value
June 30, 2022 | | | Expenses Paid
During Period*
January 1, 2022 to
June 30, 2022 | | | | |
| | | Actual | | | $1,000.00 | | | | $781.85 | | | | $0.97 | | | | | |
| | | Hypothetical
(5% return before expenses) | | | $1,000.00 | | | | $1,023.37 | | | | $1.10 | | | | | |
| | * | Expenses are equal to the Fund’s annual expense ratio of 0.22%, multiplied by the average account value over the period, multiplied by 181/365 (to reflect the one-half year period). |
| | | | | | | | | | | | | | | | | | |
| | | Retirement Income Fund | | | | |
| | | | | Beginning
Account Value
January 1, 2022 | | | Ending
Account Value
June 30, 2022 | | | Expenses Paid
During Period*
January 1, 2022 to
June 30, 2022 | | | | |
| | | Actual | | | $1,000.00 | | | | $895.19 | | | | $2.21 | | | | | |
| | | Hypothetical
(5% return before expenses) | | | $1,000.00 | | | | $1,022.10 | | | | $2.36 | | | | | |
| | * | Expenses are equal to the Fund’s annual expense ratio of 0.47% (reflecting direct expenses and the proportional expense ratios of the underlying funds in which the Fund invests), multiplied by the average account value over the period, multiplied by 181/365 (to reflect the one-half year period). |
| | | | | | | | | | | | | | | | | | |
| | | 2015 Retirement Fund | | | | |
| | | | | Beginning
Account Value
January 1, 2022 | | | Ending
Account Value
June 30, 2022 | | | Expenses Paid
During Period*
January 1, 2022 to
June 30, 2022 | | | | |
| | | Actual | | | $1,000.00 | | | | $880.64 | | | | $2.28 | | | | | |
| | | Hypothetical
(5% return before expenses) | | | $1,000.00 | | | | $1,022.00 | | | | $2.46 | | | | | |
| | * | Expenses are equal to the Fund’s annual expense ratio of 0.49% (reflecting direct expenses and the proportional expense ratios of the underlying funds in which the Fund invests), multiplied by the average account value over the period, multiplied by 181/365 (to reflect the one-half year period). |
| | | | | | | | | | | | | | | | | | |
| | | 2020 Retirement Fund | | | | |
| | | | | Beginning
Account Value
January 1, 2022 | | | Ending
Account Value
June 30, 2022 | | | Expenses Paid
During Period*
January 1, 2022 to
June 30, 2022 | | | | |
| | | Actual | | | $1,000.00 | | | | $868.31 | | | | $1.94 | | | | | |
| | | Hypothetical
(5% return before expenses) | | | $1,000.00 | | | | $1,022.36 | | | | $2.11 | | | | | |
| | * | Expenses are equal to the Fund’s annual expense ratio of 0.42% (reflecting direct expenses and the proportional expense ratios of the underlying funds in which the Fund invests), multiplied by the average account value over the period, multiplied by 181/365 (to reflect the one-half year period). |
19
MUTUAL OF AMERICA INVESTMENT CORPORATION
EXPENSE EXAMPLE (Unaudited) (Continued)
| | | | | | | | | | | | | | | | | | |
| | | 2025 Retirement Fund | | | | |
| | | | | Beginning
Account Value
January 1, 2022 | | | Ending
Account Value
June 30, 2022 | | | Expenses Paid
During Period*
January 1, 2022 to
June 30, 2022 | | | | |
| | | Actual | | | $1,000.00 | | | | $857.94 | | | | $1.75 | | | | | |
| | | Hypothetical
(5% return before expenses) | | | $1,000.00 | | | | $1,022.56 | | | | $1.91 | | | | | |
| | * | Expenses are equal to the Fund’s annual expense ratio of 0.38% (reflecting direct expenses and the proportional expense ratios of the underlying funds in which the Fund invests), multiplied by the average account value over the period, multiplied by 181/365 (to reflect the one-half year period). |
| | | | | | | | | | | | | | | | | | |
| | | 2030 Retirement Fund | | | | |
| | | | | Beginning
Account Value
January 1, 2022 | | | Ending
Account Value
June 30, 2022 | | | Expenses Paid
During Period*
January 1, 2022 to
June 30, 2022 | | | | |
| | | Actual | | | $1,000.00 | | | | $844.33 | | | | $1.60 | | | | | |
| | | Hypothetical
(5% return before expenses) | | | $1,000.00 | | | | $1,022.71 | | | | $1.76 | | | | | |
| | * | Expenses are equal to the Fund’s annual expense ratio of 0.35% (reflecting direct expenses and the proportional expense ratios of the underlying funds in which the Fund invests), multiplied by the average account value over the period, multiplied by 181/365 (to reflect the one-half year period). |
| | | | | | | | | | | | | | | | | | |
| | | 2035 Retirement Fund | | | | |
| | | | | Beginning
Account Value
January 1, 2022 | | | Ending
Account Value
June 30, 2022 | | | Expenses Paid
During Period*
January 1, 2022 to
June 30, 2022 | | | | |
| | | Actual | | | $1,000.00 | | | | $826.89 | | | | $1.49 | | | | | |
| | | Hypothetical
(5% return before expenses) | | | $1,000.00 | | | | $1,022.81 | | | | $1.66 | | | | | |
| | * | Expenses are equal to the Fund’s annual expense ratio of 0.33% (reflecting direct expenses and the proportional expense ratios of the underlying funds in which the Fund invests), multiplied by the average account value over the period, multiplied by 181/365 (to reflect the one-half year period). |
| | | | | | | | | | | | | | | | | | |
| | | 2040 Retirement Fund | | | | |
| | | | | Beginning
Account Value
January 1, 2022 | | | Ending
Account Value
June 30, 2022 | | | Expenses Paid
During Period*
January 1, 2022 to
June 30, 2022 | | | | |
| | | Actual | | | $1,000.00 | | | | $822.61 | | | | $1.44 | | | | | |
| | | Hypothetical
(5% return before expenses) | | | $1,000.00 | | | | $1,022.87 | | | | $1.61 | | | | | |
| | * | Expenses are equal to the Fund’s annual expense ratio of 0.32% (reflecting direct expenses and the proportional expense ratios of the underlying funds in which the Fund invests), multiplied by the average account value over the period, multiplied by 181/365 (to reflect the one-half year period). |
20
MUTUAL OF AMERICA INVESTMENT CORPORATION
EXPENSE EXAMPLE (Unaudited) (Continued)
| | | | | | | | | | | | | | | | | | |
| | | 2045 Retirement Fund | | | | |
| | | | | Beginning
Account Value
January 1, 2022 | | | Ending
Account Value
June 30, 2022 | | | Expenses Paid
During Period*
January 1, 2022 to
June 30, 2022 | | | | |
| | | Actual | | | $1,000.00 | | | | $817.51 | | | | $1.44 | | | | | |
| | | Hypothetical
(5% return before expenses) | | | $1,000.00 | | | | $1,022.87 | | | | $1.61 | | | | | |
| | * | Expenses are equal to the Fund’s annual expense ratio of 0.32% (reflecting direct expenses and the proportional expense ratios of the underlying funds in which the Fund invests), multiplied by the average account value over the period, multiplied by 181/365 (to reflect the one-half year period). |
| | | | | | | | | | | | | | | | | | |
| | | 2050 Retirement Fund | | | | |
| | | | | Beginning
Account Value
January 1, 2022 | | | Ending
Account Value
June 30, 2022 | | | Expenses Paid
During Period*
January 1, 2022 to
June 30, 2022 | | | | |
| | | Actual | | | $1,000.00 | | | | $816.30 | | | | $1.44 | | | | | |
| | | Hypothetical
(5% return before expenses) | | | $1,000.00 | | | | $1,022.87 | | | | $1.61 | | | | | |
| | * | Expenses are equal to the Fund’s annual expense ratio of 0.32% (reflecting direct expenses and the proportional expense ratios of the underlying funds in which the Fund invests), multiplied by the average account value over the period, multiplied by 181/365 (to reflect the one-half year period). |
| | | | | | | | | | | | | | | | | | |
| | | 2055 Retirement Fund | | | | |
| | | | | Beginning
Account Value
January 1, 2022 | | | Ending
Account Value
June 30, 2022 | | | Expenses Paid
During Period*
January 1, 2022 to
June 30, 2022 | | | | |
| | | Actual | | | $1,000.00 | | | | $814.47 | | | | $1.57 | | | | | |
| | | Hypothetical
(5% return before expenses) | | | $1,000.00 | | | | $1,022.71 | | | | $1.76 | | | | | |
| | * | Expenses are equal to the Fund’s annual expense ratio of 0.35% (reflecting direct expenses and the proportional expense ratios of the underlying funds in which the Fund invests), multiplied by the average account value over the period, multiplied by 181/365 (to reflect the one-half year period). |
| | | | | | | | | | | | | | | | | | |
| | | 2060 Retirement Fund | | | | |
| | | | | Beginning
Account Value
January 1, 2022 | | | Ending
Account Value
June 30, 2022 | | | Expenses Paid
During Period*
January 1, 2022 to
June 30, 2022 | | | | |
| | | Actual | | | $1,000.00 | | | | $814.41 | | | | $1.93 | | | | | |
| | | Hypothetical
(5% return before expenses) | | | $1,000.00 | | | | $1,022.31 | | | | $2.16 | | | | | |
| | * | Expenses are equal to the Fund’s annual expense ratio of 0.43% (reflecting direct expenses and the proportional expense ratios of the underlying funds in which the Fund invests), multiplied by the average account value over the period, multiplied by 181/365 (to reflect the one-half year period). |
21
MUTUAL OF AMERICA INVESTMENT CORPORATION
EXPENSE EXAMPLE (Unaudited) (Continued)
| | | | | | | | | | | | | | | | | | |
| | | 2065 Retirement Fund | | | | |
| | | | | Beginning
Account Value
January 1, 2022 | | | Ending
Account Value
June 30, 2022 | | | Expenses Paid
During Period*
January 1, 2022 to
June 30, 2022 | | | | |
| | | Actual | | | $1,000.00 | | | | $812.81 | | | | $1.25 | | | | | |
| | | Hypothetical
(5% return before expenses) | | | $1,000.00 | | | | $1,023.07 | | | | $1.40 | | | | | |
| | * | Expenses are equal to the Fund’s annual expense ratio of 0.28% (reflecting direct expenses and the proportional expense ratios of the underlying funds in which the Fund invests), multiplied by the average account value over the period, multiplied by 181/365 (to reflect the one-half year period). |
| | | | | | | | | | | | | | | | | | |
| | | Conservative Allocation Fund | | | | |
| | | | | Beginning
Account Value
January 1, 2022 | | | Ending
Account Value
June 30, 2022 | | | Expenses Paid
During Period*
January 1, 2022 to
June 30, 2022 | | | | |
| | | Actual | | | $1,000.00 | | | | $878.95 | | | | $1.95 | | | | | |
| | | Hypothetical
(5% return before expenses) | | | $1,000.00 | | | | $1,022.36 | | | | $2.11 | | | | | |
| | * | Expenses are equal to the Fund’s annual expense ratio of 0.42% (reflecting direct operating expenses and the proportional expense ratios of the underlying funds in which the Fund invests), multiplied by the average account value over the period, multiplied by 181/365 (to reflect the one-half year period). |
| | | | | | | | | | | | | | | | | | |
| | | Moderate Allocation Fund | | | | |
| | | | | Beginning
Account Value
January 1, 2022 | | | Ending
Account Value
June 30, 2022 | | | Expenses Paid
During Period*
January 1, 2022 to
June 30, 2022 | | | | |
| | | Actual | | | $1,000.00 | | | | $848.39 | | | | $1.37 | | | | | |
| | | Hypothetical
(5% return before expenses) | | | $1,000.00 | | | | $1,022.97 | | | | $1.50 | | | | | |
| | * | Expenses are equal to the Fund’s annual expense ratio of 0.30% (reflecting direct operating expenses and the proportional expense ratios of the underlying funds in which the Fund invests), multiplied by the average account value over the period, multiplied by 181/365 (to reflect the one-half year period). |
| | | | | | | | | | | | | | | | | | |
| | | Aggressive Allocation Fund | | | | |
| | | | | Beginning
Account Value
January 1, 2022 | | | Ending
Account Value
June 30, 2022 | | | Expenses Paid
During Period*
January 1, 2022 to
June 30, 2022 | | | | |
| | | Actual | | | $1,000.00 | | | | $824.00 | | | | $1.44 | | | | | |
| | | Hypothetical
(5% return before expenses) | | | $1,000.00 | | | | $1,022.87 | | | | $1.61 | | | | | |
| | * | Expenses are equal to the Fund’s annual expense ratio of 0.32% (reflecting direct operating expenses and the proportional expense ratios of the underlying funds in which the Fund invests), multiplied by the average account value over the period, multiplied by 181/365 (to reflect the one-half year period). |
22
MUTUAL OF AMERICA INVESTMENT CORPORATION
EXPENSE EXAMPLE (Unaudited) (Continued)
| | | | | | | | | | | | | | | | | | |
| | | Money Market Fund | | | | |
| | | | | Beginning
Account Value
January 1, 2022 | | | Ending
Account Value
June 30, 2022 | | | Expenses Paid
During Period*
January 1, 2022 to
June 30, 2022 | | | | |
| | | Actual | | | $1,000.00 | | | | $1,000.40 | | | | $1.19 | | | | | |
| | | Hypothetical
(5% return before expenses) | | | $1,000.00 | | | | $1,023.27 | | | | $1.20 | | | | | |
| | * | Expenses are equal to the Fund’s annual expense ratio of 0.24%, multiplied by the average account value over the period, multiplied by 181/365 (to reflect the one-half year period). |
| | | | | | | | | | | | | | | | | | |
| | | Mid-Term Bond Fund | | | | |
| | | | | Beginning
Account Value
January 1, 2022 | | | Ending
Account Value
June 30, 2022 | | | Expenses Paid
During Period*
January 1, 2022 to
June 30, 2022 | | | | |
| | | Actual | | | $1,000.00 | | | | $940.32 | | | | $2.21 | | | | | |
| | | Hypothetical
(5% return before expenses) | | | $1,000.00 | | | | $1,022.16 | | | | $2.31 | | | | | |
| | * | Expenses are equal to the Fund’s annual expense ratio of 0.46%, multiplied by the average account value over the period, multiplied by 181/365 (to reflect the one-half year period). |
| | | | | | | | | | | | | | | | | | |
| | | Bond Fund | | | | |
| | | | | Beginning
Account Value
January 1, 2022 | | | Ending
Account Value
June 30, 2022 | | | Expenses Paid
During Period*
January 1, 2022 to
June 30, 2022 | | | | |
| | | Actual | | | $1,000.00 | | | | $902.76 | | | | $2.07 | | | | | |
| | | Hypothetical
(5% return before expenses) | | | $1,000.00 | | | | $1,022.26 | | | | $2.21 | | | | | |
| | * | Expenses are equal to the Fund’s annual expense ratio of 0.44%, multiplied by the average account value over the period, multiplied by 181/365 (to reflect the one-half year period). |
23
MUTUAL OF AMERICA INVESTMENT CORPORATION — EQUITY INDEX FUND
PORTFOLIO OF INVESTMENTS IN SECURITIES
June 30, 2022 (Unaudited)
| | | | | | | | |
| | | Shares | | | Value | |
| INDEXED ASSETS: | |
| COMMON STOCKS: | |
| COMMUNICATION SERVICES (8.7%) | |
Activision Blizzard, Inc. | | | 98,850 | | | $ | 7,696,461 | |
Alphabet, Inc. Cl A* | | | 38,024 | | | | 82,864,182 | |
Alphabet, Inc. Cl C* | | | 34,864 | | | | 76,263,257 | |
AT&T, Inc. | | | 905,080 | | | | 18,970,477 | |
Charter Communications, Inc. Cl A* | | | 14,643 | | | | 6,860,685 | |
Comcast Corp. Cl A | | | 565,194 | | | | 22,178,212 | |
DISH Network Corp. Cl A* | | | 31,700 | | | | 568,381 | |
Electronic Arts, Inc. | | | 35,554 | | | | 4,325,144 | |
Fox Corp. Cl A | | | 39,405 | | | | 1,267,265 | |
Fox Corp. Cl B | | | 18,280 | | | | 542,916 | |
Interpublic Group of Cos., Inc. | | | 49,769 | | | | 1,370,141 | |
Live Nation Entertainment, Inc.* | | | 17,313 | | | | 1,429,707 | |
Lumen Technologies, Inc. | | | 117,544 | | | | 1,282,405 | |
Match Group, Inc.* | | | 36,106 | | | | 2,516,227 | |
Meta Platforms, Inc. Cl A* | | | 289,959 | | | | 46,755,889 | |
Netflix, Inc.* | | | 56,168 | | | | 9,822,098 | |
News Corp. Cl A | | | 49,112 | | | | 765,165 | |
News Corp. Cl B | | | 15,214 | | | | 241,750 | |
Omnicom Group, Inc. | | | 26,010 | | | | 1,654,496 | |
Paramount Global Cl B | | | 76,917 | | | | 1,898,312 | |
Take-Two Interactive Software, Inc.* | | | 19,986 | | | | 2,448,885 | |
T-Mobile US, Inc.* | | | 74,488 | | | | 10,021,615 | |
Twitter, Inc.* | | | 96,435 | | | | 3,605,705 | |
Verizon Communications, Inc. | | | 530,942 | | | | 26,945,306 | |
Walt Disney Co.* | | | 230,282 | | | | 21,738,621 | |
Warner Bros Discovery, Inc.* | | | 279,202 | | | | 3,746,891 | |
| | | | | | | | |
| | | | | | | 357,780,193 | |
| | | | | | | | |
| CONSUMER DISCRETIONARY (10.4%) | |
Advance Auto Parts, Inc. | | | 7,723 | | | | 1,336,774 | |
Amazon.com, Inc.* | | | 1,106,221 | | | | 117,491,732 | |
Aptiv PLC* | | | 34,253 | | | | 3,050,915 | |
AutoZone, Inc.* | | | 2,509 | | | | 5,392,142 | |
Bath & Body Works, Inc. | | | 30,151 | | | | 811,665 | |
Best Buy Co., Inc. | | | 25,598 | | | | 1,668,734 | |
Booking Hldgs., Inc.* | | | 5,136 | | | | 8,982,813 | |
BorgWarner, Inc. | | | 30,288 | | | | 1,010,710 | |
Caesars Entertainment, Inc.* | | | 27,101 | | | | 1,037,968 | |
CarMax, Inc.* | | | 20,296 | | | | 1,836,382 | |
Carnival Corp.* | | | 102,601 | | | | 887,499 | |
Chipotle Mexican Grill, Inc.
Cl A* | | | 3,535 | | | | 4,621,164 | |
Darden Restaurants, Inc. | | | 15,770 | | | | 1,783,902 | |
Dollar General Corp. | | | 28,924 | | | | 7,099,107 | |
| | | | | | | | |
| | | Shares | | | Value | |
| INDEXED ASSETS (CONTINUED): | |
| COMMON STOCKS (CONTINUED): | |
| CONSUMER DISCRETIONARY (CONTINUED) | |
Dollar Tree, Inc.* | | | 28,460 | | | $ | 4,435,491 | |
Domino’s Pizza, Inc. | | | 4,557 | | | | 1,775,908 | |
DR Horton, Inc. | | | 40,500 | | | | 2,680,695 | |
eBay, Inc. | | | 70,778 | | | | 2,949,319 | |
Etsy, Inc.* | | | 16,071 | | | | 1,176,558 | |
Expedia Group, Inc.* | | | 19,163 | | | | 1,817,227 | |
Ford Motor Co. | | | 499,243 | | | | 5,556,575 | |
Garmin Ltd. | | | 19,289 | | | | 1,895,144 | |
General Motors Co.* | | | 184,331 | | | | 5,854,353 | |
Genuine Parts Co. | | | 17,901 | | | | 2,380,833 | |
Hasbro, Inc. | | | 16,571 | | | | 1,356,833 | |
Hilton Worldwide Hldgs., Inc. | | | 35,188 | | | | 3,921,351 | |
Home Depot, Inc. | | | 130,644 | | | | 35,831,730 | |
Las Vegas Sands Corp.* | | | 43,471 | | | | 1,460,191 | |
Lennar Corp. Cl A | | | 32,696 | | | | 2,307,357 | |
LKQ Corp. | | | 32,897 | | | | 1,614,914 | |
Lowe’s Cos., Inc. | | | 83,583 | | | | 14,599,443 | |
Marriott International, Inc. Cl A | | | 34,758 | | | | 4,727,436 | |
McDonald’s Corp. | | | 93,498 | | | | 23,082,786 | |
MGM Resorts International | | | 44,707 | | | | 1,294,268 | |
Mohawk Industries, Inc.* | | | 6,507 | | | | 807,454 | |
Newell Brands, Inc. | | | 46,526 | | | | 885,855 | |
NIKE, Inc. Cl B | | | 160,404 | | | | 16,393,289 | |
Norwegian Cruise Line Hldgs. Ltd.* | | | 52,985 | | | | 589,193 | |
NVR, Inc.* | | | 391 | | | | 1,565,619 | |
O’Reilly Automotive, Inc.* | | | 8,309 | | | | 5,249,294 | |
Penn National Gaming, Inc.* | | | 20,666 | | | | 628,660 | |
Pool Corp. | | | 5,066 | | | | 1,779,331 | |
PulteGroup, Inc. | | | 30,042 | | | | 1,190,564 | |
PVH Corp. | | | 8,537 | | | | 485,755 | |
Ralph Lauren Corp. Cl A | | | 5,852 | | | | 524,632 | |
Ross Stores, Inc. | | | 44,425 | | | | 3,119,968 | |
Royal Caribbean Cruises Ltd.* | | | 28,365 | | | | 990,222 | |
Starbucks Corp. | | | 144,997 | | | | 11,076,321 | |
Tapestry, Inc. | | | 31,834 | | | | 971,574 | |
Target Corp. | | | 58,461 | | | | 8,256,447 | |
Tesla, Inc.* | | | 106,092 | | | | 71,444,475 | |
TJX Cos., Inc. | | | 148,478 | | | | 8,292,496 | |
Tractor Supply Co. | | | 14,145 | | | | 2,742,008 | |
Ulta Beauty, Inc.* | | | 6,603 | | | | 2,545,324 | |
VF Corp. | | | 40,809 | | | | 1,802,533 | |
Whirlpool Corp. | | | 7,105 | | | | 1,100,351 | |
Wynn Resorts Ltd.* | | | 13,341 | | | | 760,170 | |
Yum! Brands, Inc. | | | 36,052 | | | | 4,092,262 | |
| | | | | | | | |
| | | | | | | 425,023,716 | |
| | | | | | | | |
| CONSUMER STAPLES (6.9%) | |
Altria Group, Inc. | | | 228,901 | | | | 9,561,195 | |
Archer-Daniels-Midland Co. | | | 71,141 | | | | 5,520,542 | |
The accompanying notes are an integral part of these portfolio schedules.
24
MUTUAL OF AMERICA INVESTMENT CORPORATION — EQUITY INDEX FUND
PORTFOLIO OF INVESTMENTS IN SECURITIES (Continued)
June 30, 2022 (Unaudited)
| | | | | | | | |
| | | Shares | | | Value | |
| INDEXED ASSETS (CONTINUED): | |
| COMMON STOCKS (CONTINUED): | |
| CONSUMER STAPLES (CONTINUED) | |
Brown-Forman Corp. Cl B | | | 23,108 | | | $ | 1,621,257 | |
Campbell Soup Co. | | | 25,556 | | | | 1,227,966 | |
Church & Dwight Co., Inc. | | | 30,692 | | | | 2,843,921 | |
Clorox Co. | | | 15,560 | | | | 2,193,649 | |
Coca-Cola Co. | | | 493,253 | | | | 31,030,546 | |
Colgate-Palmolive Co. | | | 105,937 | | | | 8,489,791 | |
Conagra Brands, Inc. | | | 60,668 | | | | 2,077,272 | |
Constellation Brands, Inc. Cl A | | | 20,577 | | | | 4,795,676 | |
Costco Wholesale Corp. | | | 56,035 | | | | 26,856,455 | |
Estee Lauder Cos., Inc. Cl A | | | 29,306 | | | | 7,463,359 | |
General Mills, Inc. | | | 76,135 | | | | 5,744,386 | |
Hershey Co. | | | 18,457 | | | | 3,971,208 | |
Hormel Foods Corp. | | | 35,829 | | | | 1,696,861 | |
JM Smucker Co. | | | 13,712 | | | | 1,755,273 | |
Kellogg Co. | | | 32,037 | | | | 2,285,519 | |
Keurig Dr Pepper, Inc. | | | 93,257 | | | | 3,300,365 | |
Kimberly-Clark Corp. | | | 42,596 | | | | 5,756,849 | |
Kraft Heinz Co. | | | 89,749 | | | | 3,423,027 | |
Kroger Co. | | | 82,942 | | | | 3,925,645 | |
Lamb Weston Hldgs., Inc. | | | 18,262 | | | | 1,305,002 | |
McCormick & Co., Inc. | | | 31,635 | | | | 2,633,614 | |
Molson Coors Beverage Co.
Cl B | | | 23,811 | | | | 1,297,938 | |
Mondelez International, Inc.
Cl A | | | 174,963 | | | | 10,863,453 | |
Monster Beverage Corp.* | | | 47,544 | | | | 4,407,329 | |
PepsiCo, Inc. | | | 174,807 | | | | 29,133,335 | |
Philip Morris International, Inc. | | | 195,974 | | | | 19,350,473 | |
Procter & Gamble Co. | | | 303,332 | | | | 43,616,108 | |
Sysco Corp. | | | 64,411 | | | | 5,456,256 | |
Tyson Foods, Inc. Cl A | | | 36,858 | | | | 3,171,999 | |
Walgreens Boots Alliance, Inc. | | | 90,638 | | | | 3,435,180 | |
Walmart, Inc. | | | 177,491 | | | | 21,579,356 | |
| | | | | | | | |
| | | | | | | 281,790,805 | |
| | | | | | | | |
| ENERGY (4.3%) | |
APA Corp. | | | 42,761 | | | | 1,492,359 | |
Baker Hughes Co. Cl A | | | 118,252 | | | �� | 3,413,935 | |
Chevron Corp. | | | 248,403 | | | | 35,963,786 | |
ConocoPhillips | | | 163,525 | | | | 14,686,180 | |
Coterra Energy, Inc. | | | 101,874 | | | | 2,627,330 | |
Devon Energy Corp. | | | 77,600 | | | | 4,276,536 | |
Diamondback Energy, Inc. | | | 21,093 | | | | 2,555,417 | |
EOG Resources, Inc. | | | 74,049 | | | | 8,177,972 | |
Exxon Mobil Corp. | | | 532,573 | | | | 45,609,552 | |
Halliburton Co. | | | 114,033 | | | | 3,576,075 | |
Hess Corp. | | | 35,023 | | | | 3,710,337 | |
Kinder Morgan, Inc. | | | 246,533 | | | | 4,131,893 | |
Marathon Oil Corp. | | | 89,470 | | | | 2,011,286 | |
Marathon Petroleum Corp. | | | 68,396 | | | | 5,622,835 | |
Occidental Petroleum Corp. | | | 112,561 | | | | 6,627,592 | |
| | | | | | | | |
| | | Shares | | | Value | |
| INDEXED ASSETS (CONTINUED): | |
| COMMON STOCKS (CONTINUED): | |
| ENERGY (CONTINUED) | |
ONEOK, Inc. | | | 56,464 | | | $ | 3,133,752 | |
Phillips 66 | | | 60,823 | | | | 4,986,878 | |
Pioneer Natural Resources Co. | | | 28,449 | | | | 6,346,403 | |
Schlumberger NV | | | 178,698 | | | | 6,390,240 | |
Valero Energy Corp. | | | 51,594 | | | | 5,483,410 | |
Williams Cos., Inc. | | | 153,988 | | | | 4,805,965 | |
| | | | | | | | |
| | | | | | | 175,629,733 | |
| | | | | | | | |
| FINANCIALS (10.7%) | |
Aflac, Inc. | | | 74,924 | | | | 4,145,545 | |
Allstate Corp. | | | 34,764 | | | | 4,405,642 | |
American Express Co. | | | 77,117 | | | | 10,689,959 | |
American International Group, Inc. | | | 100,153 | | | | 5,120,823 | |
Ameriprise Financial, Inc. | | | 13,895 | | | | 3,302,564 | |
Aon PLC Cl A | | | 26,851 | | | | 7,241,178 | |
Arthur J. Gallagher & Co. | | | 26,558 | | | | 4,330,016 | |
Assurant, Inc. | | | 6,838 | | | | 1,181,948 | |
Bank of America Corp. | | | 896,364 | | | | 27,903,811 | |
Bank of New York Mellon Corp. | | | 93,956 | | | | 3,918,905 | |
Berkshire Hathaway, Inc. Cl B* | | | 228,726 | | | | 62,446,773 | |
BlackRock, Inc. Cl A | | | 18,005 | | | | 10,965,765 | |
Brown & Brown, Inc. | | | 29,620 | | | | 1,728,031 | |
Capital One Financial Corp. | | | 49,692 | | | | 5,177,409 | |
Cboe Global Markets, Inc. | | | 13,426 | | | | 1,519,689 | |
Charles Schwab Corp. | | | 190,670 | | | | 12,046,531 | |
Chubb Ltd. | | | 53,568 | | | | 10,530,397 | |
Cincinnati Financial Corp. | | | 18,854 | | | | 2,243,249 | |
Citigroup, Inc. | | | 245,508 | | | | 11,290,913 | |
Citizens Financial Group, Inc. | | | 62,011 | | | | 2,213,173 | |
CME Group, Inc. Cl A | | | 45,440 | | | | 9,301,568 | |
Comerica, Inc. | | | 16,531 | | | | 1,213,045 | |
Discover Financial Svcs. | | | 35,521 | | | | 3,359,576 | |
Everest Re Group Ltd. | | | 4,986 | | | | 1,397,476 | |
FactSet Research Systems, Inc. | | | 4,791 | | | | 1,842,475 | |
Fifth Third Bancorp | | | 86,739 | | | | 2,914,430 | |
First Republic Bank | | | 22,690 | | | | 3,271,898 | |
Franklin Resources, Inc. | | | 35,394 | | | | 825,034 | |
Globe Life, Inc. | | | 11,468 | | | | 1,117,786 | |
Goldman Sachs Group, Inc. | | | 43,420 | | | | 12,896,608 | |
Hartford Financial Svcs. Group, Inc. | | | 41,577 | | | | 2,720,383 | |
Huntington Bancshares, Inc. | | | 181,948 | | | | 2,188,834 | |
Intercontinental Exchange, Inc. | | | 70,579 | | | | 6,637,249 | |
Invesco Ltd. | | | 42,570 | | | | 686,654 | |
JPMorgan Chase & Co. | | | 371,318 | | | | 41,814,120 | |
KeyCorp. | | | 117,888 | | | | 2,031,210 | |
The accompanying notes are an integral part of these portfolio schedules.
25
MUTUAL OF AMERICA INVESTMENT CORPORATION — EQUITY INDEX FUND
PORTFOLIO OF INVESTMENTS IN SECURITIES (Continued)
June 30, 2022 (Unaudited)
| | | | | | | | |
| | | Shares | | | Value | |
| INDEXED ASSETS (CONTINUED): | |
| COMMON STOCKS (CONTINUED): | |
| FINANCIALS (CONTINUED) | |
Lincoln National Corp. | | | 20,434 | | | $ | 955,698 | |
Loews Corp. | | | 24,580 | | | | 1,456,611 | |
M&T Bank Corp. | | | 22,683 | | | | 3,615,443 | |
MarketAxess Hldgs., Inc. | | | 4,772 | | | | 1,221,680 | |
Marsh & McLennan Cos., Inc. | | | 63,455 | | | | 9,851,389 | |
MetLife, Inc. | | | 87,389 | | | | 5,487,155 | |
Moody’s Corp. | | | 20,293 | | | | 5,519,087 | |
Morgan Stanley | | | 176,923 | | | | 13,456,763 | |
MSCI, Inc. Cl A | | | 10,256 | | | | 4,227,010 | |
Nasdaq, Inc. | | | 14,574 | | | | 2,223,118 | |
Northern Trust Corp. | | | 26,345 | | | | 2,541,766 | |
PNC Financial Svcs. Group, Inc. | | | 52,287 | | | | 8,249,320 | |
Principal Financial Group, Inc. | | | 29,710 | | | | 1,984,331 | |
Progressive Corp. | | | 73,943 | | | | 8,597,353 | |
Prudential Financial, Inc. | | | 47,410 | | | | 4,536,189 | |
Raymond James Financial, Inc. | | | 24,577 | | | | 2,197,430 | |
Regions Financial Corp. | | | 118,145 | | | | 2,215,219 | |
S&P Global, Inc. | | | 43,882 | | | | 14,790,867 | |
Signature Bank | | | 7,956 | | | | 1,425,795 | |
State Street Corp. | | | 46,413 | | | | 2,861,361 | |
SVB Financial Group* | | | 7,440 | | | | 2,938,726 | |
Synchrony Financial | | | 63,401 | | | | 1,751,136 | |
T. Rowe Price Group, Inc. | | | 28,736 | | | | 3,264,697 | |
Travelers Cos., Inc. | | | 30,337 | | | | 5,130,897 | |
Truist Financial Corp. | | | 168,325 | | | | 7,983,655 | |
U.S. Bancorp | | | 170,930 | | | | 7,866,199 | |
Wells Fargo & Co. | | | 479,197 | | | | 18,770,146 | |
Willis Towers Watson PLC | | | 14,095 | | | | 2,782,212 | |
WR Berkley Corp. | | | 26,486 | | | | 1,807,934 | |
Zions Bancorp NA | | | 19,136 | | | | 974,022 | |
| | | | | | | | |
| | | | | | | 437,303,876 | |
| | | | | | | | |
| HEALTH CARE (14.9%) | |
Abbott Laboratories | | | 221,364 | | | | 24,051,199 | |
AbbVie, Inc. | | | 223,408 | | | | 34,217,169 | |
ABIOMED, Inc.* | | | 5,760 | | | | 1,425,658 | |
Agilent Technologies, Inc. | | | 37,942 | | | | 4,506,371 | |
Align Technology, Inc.* | | | 9,266 | | | | 2,192,984 | |
AmerisourceBergen Corp. Cl A | | | 19,067 | | | | 2,697,599 | |
Amgen, Inc. | | | 67,537 | | | | 16,431,752 | |
Baxter International, Inc. | | | 63,659 | | | | 4,088,818 | |
Becton Dickinson & Co. | | | 36,039 | | | | 8,884,695 | |
Biogen, Inc.* | | | 18,515 | | | | 3,775,949 | |
Bio-Rad Laboratories, Inc. Cl A* | | | 2,736 | | | | 1,354,320 | |
Bio-Techne Corp. | | | 4,960 | | | | 1,719,334 | |
Boston Scientific Corp.* | | | 180,734 | | | | 6,735,956 | |
Bristol-Myers Squibb Co. | | | 269,168 | | | | 20,725,936 | |
Cardinal Health, Inc. | | | 34,442 | | | | 1,800,283 | |
Catalent, Inc.* | | | 22,657 | | | | 2,430,870 | |
Centene Corp.* | | | 73,945 | | | | 6,256,486 | |
| | | | | | | | |
| | | Shares | | | Value | |
| INDEXED ASSETS (CONTINUED): | |
| COMMON STOCKS (CONTINUED): | |
| HEALTH CARE (CONTINUED) | |
Charles River Laboratories International, Inc.* | | | 6,423 | | | $ | 1,374,329 | |
Cigna Corp. | | | 40,111 | | | | 10,570,051 | |
Cooper Cos., Inc. | | | 6,233 | | | | 1,951,677 | |
CVS Health Corp. | | | 165,783 | | | | 15,361,453 | |
Danaher Corp. | | | 81,810 | | | | 20,740,471 | |
DaVita, Inc.* | | | 7,654 | | | | 612,014 | |
DENTSPLY SIRONA, Inc. | | | 27,239 | | | | 973,249 | |
Dexcom, Inc.* | | | 49,623 | | | | 3,698,402 | |
Edwards Lifesciences Corp.* | | | 78,605 | | | | 7,474,549 | |
Elevance Health, Inc. | | | 30,479 | | | | 14,708,556 | |
Eli Lilly & Co. | | | 99,703 | | | | 32,326,704 | |
Gilead Sciences, Inc. | | | 158,577 | | | | 9,801,644 | |
HCA Healthcare, Inc. | | | 28,765 | | | | 4,834,246 | |
Henry Schein, Inc.* | | | 17,453 | | | | 1,339,343 | |
Hologic, Inc.* | | | 31,528 | | | | 2,184,890 | |
Humana, Inc. | | | 15,992 | | | | 7,485,375 | |
IDEXX Laboratories, Inc.* | | | 10,621 | | | | 3,725,103 | |
Illumina, Inc.* | | | 19,861 | | | | 3,661,574 | |
Incyte Corp.* | | | 23,803 | | | | 1,808,314 | |
Intuitive Surgical, Inc.* | | | 45,381 | | | | 9,108,421 | |
IQVIA Hldgs., Inc.* | | | 23,930 | | | | 5,192,571 | |
Johnson & Johnson | | | 332,676 | | | | 59,053,317 | |
Laboratory Corp. of America Hldgs. | | | 11,720 | | | | 2,746,699 | |
McKesson Corp. | | | 18,378 | | | | 5,995,087 | |
Medtronic PLC | | | 169,605 | | | | 15,222,049 | |
Merck & Co., Inc. | | | 319,706 | | | | 29,147,596 | |
Mettler-Toledo International, Inc.* | | | 2,867 | | | | 3,293,524 | |
Moderna, Inc.* | | | 43,750 | | | | 6,249,688 | |
Molina Healthcare, Inc.* | | | 7,421 | | | | 2,074,986 | |
Organon & Co. | | | 32,066 | | | | 1,082,228 | |
PerkinElmer, Inc. | | | 15,948 | | | | 2,268,125 | |
Pfizer, Inc. | | | 709,361 | | | | 37,191,797 | |
Quest Diagnostics, Inc. | | | 14,838 | | | | 1,973,157 | |
Regeneron Pharmaceuticals, Inc.* | | | 13,657 | | | | 8,073,062 | |
ResMed, Inc. | | | 18,494 | | | | 3,876,897 | |
STERIS PLC | | | 12,659 | | | | 2,609,653 | |
Stryker Corp. | | | 42,549 | | | | 8,464,273 | |
Teleflex, Inc. | | | 5,929 | | | | 1,457,645 | |
Thermo Fisher Scientific, Inc. | | | 49,491 | | | | 26,887,470 | |
UnitedHealth Group, Inc. | | | 118,609 | | | | 60,921,141 | |
Universal Health Svcs., Inc. Cl B | | | 8,487 | | | | 854,726 | |
Vertex Pharmaceuticals, Inc.* | | | 32,334 | | | | 9,111,398 | |
Viatris, Inc. | | | 153,269 | | | | 1,604,726 | |
Waters Corp.* | | | 7,615 | | | | 2,520,413 | |
West Pharmaceutical Svcs., Inc. | | | 9,365 | | | | 2,831,695 | |
Zimmer Biomet Hldgs., Inc. | | | 26,496 | | | | 2,783,670 | |
The accompanying notes are an integral part of these portfolio schedules.
26
MUTUAL OF AMERICA INVESTMENT CORPORATION — EQUITY INDEX FUND
PORTFOLIO OF INVESTMENTS IN SECURITIES (Continued)
June 30, 2022 (Unaudited)
| | | | | | | | |
| | | Shares | | | Value | |
| INDEXED ASSETS (CONTINUED): | |
| COMMON STOCKS (CONTINUED): | |
| HEALTH CARE (CONTINUED) | |
Zoetis, Inc. Cl A | | | 59,500 | | | $ | 10,227,455 | |
| | | | | | | | |
| | | | | | | 610,750,792 | |
| | | | | | | | |
| INDUSTRIALS (7.7%) | |
3M Co. | | | 71,944 | | | | 9,310,273 | |
Alaska Air Group, Inc.* | | | 15,941 | | | | 638,437 | |
Allegion PLC | | | 11,101 | | | | 1,086,788 | |
American Airlines Group, Inc.* | | | 82,115 | | | | 1,041,218 | |
AMETEK, Inc. | | | 29,193 | | | | 3,208,019 | |
AO Smith Corp. | | | 16,440 | | | | 898,939 | |
Boeing Co.* | | | 70,310 | | | | 9,612,783 | |
Carrier Global Corp. | | | 107,239 | | | | 3,824,143 | |
Caterpillar, Inc. | | | 67,432 | | | | 12,054,144 | |
CH Robinson Worldwide, Inc. | | | 16,090 | | | | 1,631,043 | |
Cintas Corp. | | | 10,996 | | | | 4,107,336 | |
Copart, Inc.* | | | 27,023 | | | | 2,936,319 | |
CSX Corp. | | | 274,882 | | | | 7,988,071 | |
Cummins, Inc. | | | 17,838 | | | | 3,452,188 | |
Deere & Co. | | | 35,295 | | | | 10,569,794 | |
Delta Air Lines, Inc.* | | | 81,046 | | | | 2,347,903 | |
Dover Corp. | | | 18,226 | | | | 2,211,178 | |
Eaton Corp. PLC | | | 50,444 | | | | 6,355,440 | |
Emerson Electric Co. | | | 75,097 | | | | 5,973,215 | |
Equifax, Inc. | | | 15,466 | | | | 2,826,876 | |
Expeditors International of Washington, Inc. | | | 21,208 | | | | 2,066,932 | |
Fastenal Co. | | | 72,771 | | | | 3,632,728 | |
FedEx Corp. | | | 30,145 | | | | 6,834,173 | |
Fortive Corp. | | | 45,317 | | | | 2,464,339 | |
Fortune Brands Home & Security, Inc. | | | 16,537 | | | | 990,236 | |
Generac Hldgs., Inc.* | | | 8,070 | | | | 1,699,381 | |
General Dynamics Corp. | | | 29,140 | | | | 6,447,225 | |
General Electric Co. | | | 139,152 | | | | 8,859,808 | |
Honeywell International, Inc. | | | 86,062 | | | | 14,958,436 | |
Howmet Aerospace, Inc. | | | 47,552 | | | | 1,495,510 | |
Huntington Ingalls Industries, Inc. | | | 5,063 | | | | 1,102,823 | |
IDEX Corp. | | | 9,610 | | | | 1,745,464 | |
Illinois Tool Works, Inc. | | | 35,831 | | | | 6,530,200 | |
Ingersoll Rand, Inc. | | | 51,320 | | | | 2,159,546 | |
Jacobs Engineering Group, Inc. | | | 16,262 | | | | 2,067,388 | |
JB Hunt Transport Svcs., Inc. | | | 10,598 | | | | 1,668,867 | |
Johnson Controls International PLC | | | 87,950 | | | | 4,211,046 | |
L-3 Harris Technologies, Inc. | | | 24,384 | | | | 5,893,613 | |
Leidos Hldgs., Inc. | | | 17,278 | | | | 1,740,067 | |
Lockheed Martin Corp. | | | 29,942 | | | | 12,873,862 | |
Masco Corp. | | | 29,829 | | | | 1,509,347 | |
Nielsen Hldgs. PLC | | | 45,474 | | | | 1,055,906 | |
| | | | | | | | |
| | | Shares | | | Value | |
| INDEXED ASSETS (CONTINUED): | |
| COMMON STOCKS (CONTINUED): | |
| INDUSTRIALS (CONTINUED) | |
Nordson Corp. | | | 6,812 | | | $ | 1,379,021 | |
Norfolk Southern Corp. | | | 30,131 | | | | 6,848,475 | |
Northrop Grumman Corp. | | | 18,473 | | | | 8,840,624 | |
Old Dominion Freight Line, Inc. | | | 11,608 | | | | 2,974,898 | |
Otis Worldwide Corp. | | | 53,452 | | | | 3,777,453 | |
PACCAR, Inc. | | | 43,956 | | | | 3,619,337 | |
Parker-Hannifin Corp. | | | 16,230 | | | | 3,993,392 | |
Pentair PLC | | | 20,911 | | | | 957,097 | |
Quanta Svcs., Inc. | | | 18,168 | | | | 2,277,177 | |
Raytheon Technologies Corp. | | | 188,022 | | | | 18,070,794 | |
Republic Svcs., Inc. Cl A | | | 26,358 | | | | 3,449,472 | |
Robert Half International, Inc. | | | 13,972 | | | | 1,046,363 | |
Rockwell Automation, Inc. | | | 14,698 | | | | 2,929,458 | |
Rollins, Inc. | | | 28,639 | | | | 1,000,074 | |
Snap-on, Inc. | | | 6,748 | | | | 1,329,558 | |
Southwest Airlines Co.* | | | 74,965 | | | | 2,707,736 | |
Stanley Black & Decker, Inc. | | | 19,086 | | | | 2,001,358 | |
Textron, Inc. | | | 27,192 | | | | 1,660,615 | |
Trane Technologies PLC | | | 29,566 | | | | 3,839,736 | |
TransDigm Group, Inc.* | | | 6,556 | | | | 3,518,409 | |
Union Pacific Corp. | | | 79,398 | | | | 16,934,005 | |
United Airlines Hldgs., Inc.* | | | 41,307 | | | | 1,463,094 | |
United Parcel Svc., Inc. Cl B | | | 92,852 | | | | 16,949,204 | |
United Rentals, Inc.* | | | 9,054 | | | | 2,199,307 | |
Verisk Analytics, Inc. Cl A | | | 19,963 | | | | 3,455,396 | |
Waste Management, Inc. | | | 48,293 | | | | 7,387,863 | |
Westinghouse Air Brake Technologies Corp. | | | 23,091 | | | | 1,895,309 | |
WW Grainger, Inc. | | | 5,427 | | | | 2,466,192 | |
Xylem, Inc. | | | 22,768 | | | | 1,780,002 | |
| | | | | | | | |
| | | | | | | 314,832,423 | |
| | | | | | | | |
| INFORMATION TECHNOLOGY (26.4%) | |
Accenture PLC Cl A | | | 80,078 | | | | 22,233,657 | |
Adobe, Inc.* | | | 59,736 | | | | 21,866,960 | |
Advanced Micro Devices, Inc.* | | | 204,874 | | | | 15,666,715 | |
Akamai Technologies, Inc.* | | | 20,267 | | | | 1,850,985 | |
Amphenol Corp. Cl A | | | 75,494 | | | | 4,860,304 | |
Analog Devices, Inc. | | | 66,160 | | | | 9,665,314 | |
ANSYS, Inc.* | | | 10,998 | | | | 2,631,711 | |
Apple, Inc. | | | 1,943,909 | | | | 265,771,238 | |
Applied Materials, Inc. | | | 111,684 | | | | 10,161,010 | |
Arista Networks, Inc.* | | | 28,450 | | | | 2,666,903 | |
The accompanying notes are an integral part of these portfolio schedules.
27
MUTUAL OF AMERICA INVESTMENT CORPORATION — EQUITY INDEX FUND
PORTFOLIO OF INVESTMENTS IN SECURITIES (Continued)
June 30, 2022 (Unaudited)
| | | | | | | | |
| | | Shares | | | Value | |
| INDEXED ASSETS (CONTINUED): | |
| COMMON STOCKS (CONTINUED): | |
| INFORMATION TECHNOLOGY (CONTINUED) | |
Autodesk, Inc.* | | | 27,501 | | | $ | 4,729,072 | |
Automatic Data Processing, Inc. | | | 52,814 | | | | 11,093,053 | |
Broadcom, Inc. | | | 51,617 | | | | 25,076,055 | |
Broadridge Financial Solutions, Inc. | | | 14,820 | | | | 2,112,591 | |
Cadence Design Systems, Inc.* | | | 34,863 | | | | 5,230,496 | |
CDW Corp. | | | 17,082 | | | | 2,691,440 | |
Ceridian HCM Hldg., Inc.* | | | 17,369 | | | | 817,733 | |
Cisco Systems, Inc. | | | 525,193 | | | | 22,394,230 | |
Citrix Systems, Inc. | | | 15,768 | | | | 1,532,177 | |
Cognizant Technology Solutions Corp. Cl A | | | 65,890 | | | | 4,446,916 | |
Corning, Inc. | | | 96,102 | | | | 3,028,174 | |
DXC Technology Co.* | | | 30,908 | | | | 936,821 | |
Enphase Energy, Inc.* | | | 17,071 | | | | 3,332,942 | |
EPAM Systems, Inc.* | | | 7,225 | | | | 2,129,785 | |
F5, Inc.* | | | 7,645 | | | | 1,169,991 | |
Fidelity National Information Svcs., Inc. | | | 77,217 | | | | 7,078,482 | |
Fiserv, Inc.* | | | 73,549 | | | | 6,543,655 | |
FleetCor Technologies, Inc.* | | | 9,778 | | | | 2,054,456 | |
Fortinet, Inc.* | | | 84,515 | | | | 4,781,859 | |
Gartner, Inc.* | | | 10,182 | | | | 2,462,313 | |
Global Payments, Inc. | | | 35,594 | | | | 3,938,120 | |
Hewlett Packard Enterprise Co. | | | 164,370 | | | | 2,179,546 | |
HP, Inc. | | | 133,172 | | | | 4,365,378 | |
Intel Corp. | | | 516,954 | | | | 19,339,249 | |
International Business Machines Corp. | | | 113,712 | | | | 16,054,997 | |
Intuit, Inc. | | | 35,755 | | | | 13,781,407 | |
Jack Henry & Associates, Inc. | | | 9,212 | | | | 1,658,344 | |
Juniper Networks, Inc. | | | 40,847 | | | | 1,164,139 | |
Keysight Technologies, Inc.* | | | 23,006 | | | | 3,171,377 | |
KLA Corp. | | | 18,867 | | | | 6,020,082 | |
Lam Research Corp. | | | 17,537 | | | | 7,473,393 | |
Mastercard, Inc. Cl A | | | 108,572 | | | | 34,252,295 | |
Microchip Technology, Inc. | | | 70,291 | | | | 4,082,501 | |
Micron Technology, Inc. | | | 141,175 | | | | 7,804,154 | |
Microsoft Corp. | | | 945,541 | | | | 242,843,295 | |
Monolithic Power Systems, Inc. | | | 5,543 | | | | 2,128,734 | |
Motorola Solutions, Inc. | | | 21,151 | | | | 4,433,250 | |
NetApp, Inc. | | | 28,134 | | | | 1,835,462 | |
NortonLifeLock, Inc. | | | 73,562 | | | | 1,615,422 | |
NVIDIA Corp. | | | 316,571 | | | | 47,988,998 | |
NXP Semiconductors NV | | | 33,195 | | | | 4,913,856 | |
ON Semiconductor Corp.* | | | 54,933 | | | | 2,763,679 | |
Oracle Corp. | | | 199,021 | | | | 13,905,597 | |
Paychex, Inc. | | | 40,621 | | | | 4,625,513 | |
| | | | | | | | |
| | | Shares | | | Value | |
| INDEXED ASSETS (CONTINUED): | |
| COMMON STOCKS (CONTINUED): | |
| INFORMATION TECHNOLOGY (CONTINUED) | |
Paycom Software, Inc.* | | | 6,088 | | | $ | 1,705,371 | |
PayPal Hldgs., Inc.* | | | 146,406 | | | | 10,224,995 | |
PTC, Inc.* | | | 13,310 | | | | 1,415,385 | |
Qorvo, Inc.* | | | 13,709 | | | | 1,293,033 | |
QUALCOMM, Inc. | | | 141,597 | | | | 18,087,601 | |
Roper Technologies, Inc. | | | 13,390 | | | | 5,284,364 | |
Salesforce, Inc.* | | | 125,607 | | | | 20,730,179 | |
Seagate Technology Hldgs. PLC | | | 24,989 | | | | 1,785,214 | |
ServiceNow, Inc.* | | | 25,343 | | | | 12,051,103 | |
Skyworks Solutions, Inc. | | | 20,345 | | | | 1,884,761 | |
SolarEdge Technologies, Inc.* | | | 7,002 | | | | 1,916,307 | |
Synopsys, Inc.* | | | 19,356 | | | | 5,878,417 | |
TE Connectivity Ltd. | | | 40,731 | | | | 4,608,713 | |
Teledyne Technologies, Inc.* | | | 5,922 | | | | 2,221,401 | |
Teradyne, Inc. | | | 20,254 | | | | 1,813,746 | |
Texas Instruments, Inc. | | | 116,581 | | | | 17,912,671 | |
Trimble, Inc.* | | | 31,624 | | | | 1,841,466 | |
Tyler Technologies, Inc.* | | | 5,243 | | | | 1,743,193 | |
VeriSign, Inc.* | | | 12,049 | | | | 2,016,159 | |
Visa, Inc. Cl A | | | 208,061 | | | | 40,965,130 | |
Western Digital Corp.* | | | 39,592 | | | | 1,774,909 | |
Zebra Technologies Corp. Cl A* | | | 6,639 | | | | 1,951,534 | |
| | | | | | | | |
| | | | | | | 1,082,461,478 | |
| | | | | | | | |
| MATERIALS (2.5%) | |
Air Products & Chemicals, Inc. | | | 28,038 | | | | 6,742,578 | |
Albemarle Corp. | | | 14,806 | | | | 3,094,158 | |
Amcor PLC | | | 189,988 | | | | 2,361,551 | |
Avery Dennison Corp. | | | 10,331 | | | | 1,672,279 | |
Ball Corp. | | | 40,429 | | | | 2,780,302 | |
Celanese Corp. Cl A | | | 13,693 | | | | 1,610,434 | |
CF Industries Hldgs., Inc. | | | 26,373 | | | | 2,260,957 | |
Corteva, Inc. | | | 91,494 | | | | 4,953,485 | |
Dow, Inc. | | | 92,051 | | | | 4,750,752 | |
DuPont de Nemours, Inc. | | | 64,291 | | | | 3,573,294 | |
Eastman Chemical Co. | | | 16,294 | | | | 1,462,712 | |
Ecolab, Inc. | | | 31,419 | | | | 4,830,986 | |
FMC Corp. | | | 15,922 | | | | 1,703,813 | |
Freeport-McMoRan, Inc. | | | 183,224 | | | | 5,361,134 | |
International Flavors & Fragrances, Inc. | | | 32,218 | | | | 3,837,808 | |
International Paper Co. | | | 46,857 | | | | 1,960,028 | |
Linde PLC | | | 63,628 | | | | 18,294,959 | |
LyondellBasell Industries NV Cl A | | | 32,722 | | | | 2,861,866 | |
Martin Marietta Materials, Inc. | | | 7,885 | | | | 2,359,507 | |
Mosaic Co. | | | 45,765 | | | | 2,161,481 | |
Newmont Corp. | | | 100,338 | | | | 5,987,169 | |
Nucor Corp. | | | 33,637 | | | | 3,512,039 | |
Packaging Corp. of America | | | 11,846 | | | | 1,628,825 | |
The accompanying notes are an integral part of these portfolio schedules.
28
MUTUAL OF AMERICA INVESTMENT CORPORATION — EQUITY INDEX FUND
PORTFOLIO OF INVESTMENTS IN SECURITIES (Continued)
June 30, 2022 (Unaudited)
| | | | | | | | |
| | | Shares | | | Value | |
| INDEXED ASSETS (CONTINUED): | |
| COMMON STOCKS (CONTINUED): | |
| MATERIALS (CONTINUED) | |
PPG Industries, Inc. | | | 29,861 | | | $ | 3,414,307 | |
Sealed Air Corp. | | | 18,469 | | | | 1,066,031 | |
Sherwin-Williams Co. | | | 30,256 | | | | 6,774,621 | |
Vulcan Materials Co. | | | 16,801 | | | | 2,387,422 | |
Westrock Co. | | | 32,220 | | | | 1,283,645 | |
| | | | | | | | |
| | | | | | | 104,688,143 | |
| | | | | | | | |
| REAL ESTATE (2.9%) | |
Alexandria Real Estate Equities, Inc. | | | 18,778 | | | | 2,723,373 | |
American Tower Corp. | | | 58,750 | | | | 15,015,912 | |
AvalonBay Communities, Inc. | | | 17,677 | | | | 3,433,757 | |
Boston Properties, Inc. | | | 18,029 | | | | 1,604,220 | |
Camden Property Trust | | | 13,467 | | | | 1,811,042 | |
CBRE Group, Inc. Cl A* | | | 41,324 | | | | 3,041,860 | |
Crown Castle International Corp. | | | 54,746 | | | | 9,218,131 | |
Digital Realty Trust, Inc. | | | 35,990 | | | | 4,672,582 | |
Duke Realty Corp. | | | 48,605 | | | | 2,670,845 | |
Equinix, Inc. | | | 11,508 | | | | 7,560,986 | |
Equity Residential | | | 43,263 | | | | 3,124,454 | |
Essex Property Trust, Inc. | | | 8,260 | | | | 2,160,073 | |
Extra Space Storage, Inc. | | | 16,976 | | | | 2,887,957 | |
Federal Realty OP LP | | | 9,037 | | | | 865,202 | |
Healthpeak Properties, Inc. | | | 68,214 | | | | 1,767,425 | |
Host Hotels & Resorts, Inc. | | | 90,366 | | | | 1,416,939 | |
Iron Mountain, Inc. | | | 36,734 | | | | 1,788,578 | |
Kimco Realty Corp. | | | 78,132 | | | | 1,544,670 | |
Mid-America Apartment Communities, Inc. | | | 14,593 | | | | 2,548,959 | |
Prologis, Inc. | | | 93,589 | | | | 11,010,746 | |
Public Storage | | | 19,306 | | | | 6,036,407 | |
Realty Income Corp. | | | 76,057 | | | | 5,191,651 | |
Regency Centers Corp. | | | 19,612 | | | | 1,163,188 | |
SBA Communications Corp.
Cl A | | | 13,632 | | | | 4,362,922 | |
Simon Property Group, Inc. | | | 41,511 | | | | 3,940,224 | |
UDR, Inc. | | | 37,839 | | | | 1,742,108 | |
Ventas, Inc. | | | 50,532 | | | | 2,598,861 | |
VICI Properties, Inc. | | | 121,748 | | | | 3,626,873 | |
Vornado Realty Trust | | | 20,120 | | | | 575,231 | |
Welltower, Inc. | | | 57,393 | | | | 4,726,313 | |
Weyerhaeuser Co. | | | 94,124 | | | | 3,117,387 | |
| | | | | | | | |
| | | | | | | 117,948,876 | |
| | | | | | | | |
| | | | | | | | |
| | | Shares | | | Value | |
| INDEXED ASSETS (CONTINUED): | |
| COMMON STOCKS (CONTINUED): | |
| UTILITIES (3.1%) | |
AES Corp. | | | 84,435 | | | $ | 1,773,979 | |
Alliant Energy Corp. | | | 31,709 | | | | 1,858,464 | |
Ameren Corp. | | | 32,646 | | | | 2,949,893 | |
American Electric Power Co., Inc. | | | 64,925 | | | | 6,228,905 | |
American Water Works Co., Inc. | | | 22,978 | | | | 3,418,437 | |
Atmos Energy Corp. | | | 17,575 | | | | 1,970,158 | |
CenterPoint Energy, Inc. | | | 79,578 | | | | 2,353,917 | |
CMS Energy Corp. | | | 36,680 | | | | 2,475,900 | |
Consolidated Edison, Inc. | | | 44,792 | | | | 4,259,719 | |
Constellation Energy Corp. | | | 41,303 | | | | 2,365,010 | |
Dominion Energy, Inc. | | | 102,565 | | | | 8,185,713 | |
DTE Energy Co. | | | 24,494 | | | | 3,104,615 | |
Duke Energy Corp. | | | 97,335 | | | | 10,435,285 | |
Edison International | | | 48,193 | | | | 3,047,725 | |
Entergy Corp. | | | 25,712 | | | | 2,896,200 | |
Evergy, Inc. | | | 29,012 | | | | 1,893,033 | |
Eversource Energy | | | 43,601 | | | | 3,682,976 | |
Exelon Corp. | | | 123,924 | | | | 5,616,236 | |
FirstEnergy Corp. | | | 72,180 | | | | 2,770,990 | |
NextEra Energy, Inc. | | | 248,363 | | | | 19,238,198 | |
NiSource, Inc. | | | 51,303 | | | | 1,512,925 | |
NRG Energy, Inc. | | | 29,999 | | | | 1,145,062 | |
Pinnacle West Capital Corp. | | | 14,286 | | | | 1,044,592 | |
PPL Corp. | | | 93,037 | | | | 2,524,094 | |
Public Svc. Enterprise Group, Inc. | | | 63,119 | | | | 3,994,170 | |
Sempra Energy | | | 39,736 | | | | 5,971,129 | |
Southern Co. | | | 134,330 | | | | 9,579,072 | |
WEC Energy Group, Inc. | | | 39,879 | | | | 4,013,423 | |
Xcel Energy, Inc. | | | 68,858 | | | | 4,872,392 | |
| | | | | | | | |
| | | | | | | 125,182,212 | |
| | | | | | | | |
TOTAL INDEXED ASSETS- COMMON STOCKS | | | | | | | | |
(Cost: $2,427,109,445) 98.5% | | | | | | | 4,033,392,247 | |
| | | | | | | | |
The accompanying notes are an integral part of these portfolio schedules.
29
MUTUAL OF AMERICA INVESTMENT CORPORATION — EQUITY INDEX FUND
PORTFOLIO OF INVESTMENTS IN SECURITIES (Continued)
June 30, 2022 (Unaudited)
| | | | | | | | | | | | | | | | | | |
| | | Rating** | | Rate(%) | | | Maturity | | | Face Amount | | | Value | |
| SHORT-TERM DEBT SECURITIES: | | | | | | | | | | | | | | |
| U.S. GOVERNMENT (1.4%) | | | | | | | | | | | | | | |
U.S. Treasury Bill | | A-1+ | | | 0.80 | | | | 07/05/22 | | | $ | 11,000,000 | | | $ | 10,999,027 | |
U.S. Treasury Bill (1) | | A-1+ | | | 0.90 | | | | 08/02/22 | | | | 10,000,000 | | | | 9,992,045 | |
U.S. Treasury Bill | | A-1+ | | | 1.00 | | | | 07/26/22 | | | | 12,000,000 | | | | 11,991,683 | |
U.S. Treasury Bill | | A-1+ | | | 1.05 | | | | 07/19/22 | | | | 13,500,000 | | | | 13,492,941 | |
U.S. Treasury Bill | | A-1+ | | | 1.13 | | | | 07/12/22 | | | | 11,000,000 | | | | 10,996,211 | |
| | | | | | | | | | | | | | | | | | |
| | | | | | | | | | | | | | | | | 57,471,907 | |
| | | | | | | | | | | | | | | | | | |
| COMMERCIAL PAPER (0.0%) (2) | | | | | | | | | | | | | | |
Exxon Mobil Corp. | | A-1+ | | | 1.58 | | | | 07/26/22 | | | | 125,000 | | | | 124,863 | |
J.P. Morgan Securities LLC | | A-1 | | | 1.08 | | | | 07/18/22 | | | | 1,305,000 | | | | 1,304,334 | |
| | | | | | | | | | | | | | | | | | |
| | | | | | | | | | | | | | | | | 1,429,197 | |
| | | | | | | | | | | | | | | | | | |
TOTAL SHORT-TERM DEBT SECURITIES
(Cost: $58,901,104) 1.4% | | | | 58,901,104 | |
| | | | | | | | | | | | | | | | | | |
| | | | | |
| | | | | | | | | | | Shares | | | Value | |
| WARRANTS | | | | | | | | | | | | | | |
| ENERGY (0.0%) (2) | | | | | | | | | | | | | | |
Occidental Petroleum Corp. — expiring 08/03/2027* | | | | 13,817 | | | $ | 510,815 | |
| | | | | | | | | | | | | | | | | | |
TOTAL WARRANTS
(Cost: $68,394) 0.0% (2) | | | | 510,815 | |
| | | | | | | | | | | | | | | | | | |
| | | | | |
| | | | | Rate(%) | | | Maturity | | | Face Amount | | | Value | |
| TEMPORARY CASH INVESTMENT (0.2%) | | | | | | | | | | | | | | |
JP Morgan Chase, New York Time Deposit | | | 0.91 | | | | 07/01/22 | | | $ | 6,495,702 | | | $ | 6,495,702 | |
| | | | | | | | | | | | | | | | | | |
TOTAL TEMPORARY CASH INVESTMENT
(Cost: $6,495,702) 0.2% | | | | 6,495,702 | |
| | | | | | | | | | | | | | | | | | |
TOTAL INVESTMENTS
(Cost: $2,492,574,645) 100.1% | | | | 4,099,299,868 | |
| | | | | | | | | | | | | | | | | | |
OTHER NET ASSETS -0.1% | | | | (2,227,591 | ) |
| | | | | | | | | | | | | | | | | | |
NET ASSETS 100.0% | | | $ | 4,097,072,277 | |
| | | | | | | | | | | | | | | | | | |
The accompanying notes are an integral part of these portfolio schedules.
30
MUTUAL OF AMERICA INVESTMENT CORPORATION — ALL AMERICA FUND
PORTFOLIO OF INVESTMENTS IN SECURITIES
June 30, 2022 (Unaudited)
| | | | | | | | |
| | | Shares | | | Value | |
| INDEXED ASSETS: | |
| COMMON STOCKS: | |
| COMMUNICATION SERVICES (5.0%) | |
Activision Blizzard, Inc. | | | 3,930 | | | $ | 305,990 | |
Alphabet, Inc. Cl A* | | | 1,512 | | | | 3,295,041 | |
Alphabet, Inc. Cl C* | | | 1,386 | | | | 3,031,806 | |
AT&T, Inc. | | | 35,988 | | | | 754,309 | |
Charter Communications, Inc. Cl A* | | | 582 | | | | 272,684 | |
Comcast Corp. Cl A | | | 22,473 | | | | 881,841 | |
DISH Network Corp. Cl A* | | | 1,260 | | | | 22,592 | |
Electronic Arts, Inc. | | | 1,414 | | | | 172,013 | |
Fox Corp. Cl A | | | 1,567 | | | | 50,395 | |
Fox Corp. Cl B | | | 727 | | | | 21,592 | |
Interpublic Group of Cos., Inc. | | | 1,979 | | | | 54,482 | |
Live Nation Entertainment, Inc.* | | | 689 | | | | 56,898 | |
Lumen Technologies, Inc. | | | 4,674 | | | | 50,993 | |
Match Group, Inc.* | | | 1,436 | | | | 100,075 | |
Meta Platforms, Inc. Cl A* | | | 11,529 | | | | 1,859,051 | |
Netflix, Inc.* | | | 2,233 | | | | 390,485 | |
News Corp. Cl A | | | 1,953 | | | | 30,428 | |
News Corp. Cl B | | | 605 | | | | 9,613 | |
Omnicom Group, Inc. | | | 1,034 | | | | 65,773 | |
Paramount Global Cl B | | | 3,058 | | | | 75,471 | |
Take-Two Interactive Software, Inc.* | | | 795 | | | | 97,411 | |
T-Mobile US, Inc.* | | | 2,962 | | | | 398,508 | |
Twitter, Inc.* | | | 3,834 | | | | 143,353 | |
Verizon Communications, Inc. | | | 21,111 | | | | 1,071,383 | |
Walt Disney Co.* | | | 9,156 | | | | 864,326 | |
Warner Bros Discovery, Inc.* | | | 11,102 | | | | 148,989 | |
| | | | | | | | |
| | | | | | | 14,225,502 | |
| | | | | | | | |
| CONSUMER DISCRETIONARY (5.9%) | |
Advance Auto Parts, Inc. | | | 308 | | | | 53,312 | |
Amazon.com, Inc.* | | | 43,985 | | | | 4,671,647 | |
Aptiv PLC* | | | 1,362 | | | | 121,313 | |
AutoZone, Inc.* | | | 100 | | | | 214,912 | |
Bath & Body Works, Inc. | | | 1,199 | | | | 32,277 | |
Best Buy Co., Inc. | | | 1,018 | | | | 66,363 | |
Booking Hldgs., Inc.* | | | 205 | | | | 358,543 | |
BorgWarner, Inc. | | | 1,204 | | | | 40,178 | |
Caesars Entertainment, Inc.* | | | 1,078 | | | | 41,288 | |
CarMax, Inc.* | | | 808 | | | | 73,108 | |
Carnival Corp.* | | | 4,080 | | | | 35,292 | |
Chipotle Mexican Grill, Inc. Cl A* | | | 141 | | | | 184,324 | |
Darden Restaurants, Inc. | | | 628 | | | | 71,039 | |
Dollar General Corp. | | | 1,150 | | | | 282,256 | |
Dollar Tree, Inc.* | | | 1,132 | | | | 176,422 | |
Domino’s Pizza, Inc. | | | 182 | | | | 70,927 | |
DR Horton, Inc. | | | 1,610 | | | | 106,566 | |
eBay, Inc. | | | 2,814 | | | | 117,259 | |
Etsy, Inc.* | | | 640 | | | | 46,854 | |
Expedia Group, Inc.* | | | 762 | | | | 72,260 | |
Ford Motor Co. | | | 19,851 | | | | 220,942 | |
| | | | | | | | |
| | | Shares | | | Value | |
| INDEXED ASSETS (CONTINUED): | |
| COMMON STOCKS (CONTINUED): | |
| CONSUMER DISCRETIONARY (CONTINUED) | |
Garmin Ltd. | | | 767 | | | $ | 75,358 | |
General Motors Co.* | | | 7,329 | | | | 232,769 | |
Genuine Parts Co. | | | 712 | | | | 94,696 | |
Hasbro, Inc. | | | 659 | | | | 53,959 | |
Hilton Worldwide Hldgs., Inc. | | | 1,399 | | | | 155,905 | |
Home Depot, Inc. | | | 5,195 | | | | 1,424,833 | |
Las Vegas Sands Corp.* | | | 1,729 | | | | 58,077 | |
Lennar Corp. Cl A | | | 1,300 | | | | 91,741 | |
LKQ Corp. | | | 1,308 | | | | 64,210 | |
Lowe’s Cos., Inc. | | | 3,323 | | | | 580,428 | |
Marriott International, Inc. Cl A | | | 1,382 | | | | 187,966 | |
McDonald’s Corp. | | | 3,718 | | | | 917,900 | |
MGM Resorts International | | | 1,778 | | | | 51,473 | |
Mohawk Industries, Inc.* | | | 259 | | | | 32,139 | |
Newell Brands, Inc. | | | 1,850 | | | | 35,224 | |
NIKE, Inc. Cl B | | | 6,378 | | | | 651,832 | |
Norwegian Cruise Line Hldgs. Ltd.* | | | 2,107 | | | | 23,430 | |
NVR, Inc.* | | | 16 | | | | 64,066 | |
O’Reilly Automotive, Inc.* | | | 331 | | | | 209,113 | |
Penn National Gaming, Inc.* | | | 822 | | | | 25,005 | |
Pool Corp. | | | 202 | | | | 70,948 | |
PulteGroup, Inc. | | | 1,195 | | | | 47,358 | |
PVH Corp. | | | 339 | | | | 19,289 | |
Ralph Lauren Corp. Cl A | | | 233 | | | | 20,888 | |
Ross Stores, Inc. | | | 1,766 | | | | 124,026 | |
Royal Caribbean Cruises Ltd.* | | | 1,128 | | | | 39,379 | |
Starbucks Corp. | | | 5,765 | | | | 440,388 | |
Tapestry, Inc. | | | 1,266 | | | | 38,638 | |
Target Corp. | | | 2,325 | | | | 328,360 | |
Tesla, Inc.* | | | 4,218 | | | | 2,840,486 | |
TJX Cos., Inc. | | | 5,904 | | | | 329,738 | |
Tractor Supply Co. | | | 562 | | | | 108,944 | |
Ulta Beauty, Inc.* | | | 263 | | | | 101,381 | |
VF Corp. | | | 1,623 | | | | 71,688 | |
Whirlpool Corp. | | | 283 | | | | 43,828 | |
Wynn Resorts Ltd.* | | | 531 | | | | 30,256 | |
Yum! Brands, Inc. | | | 1,433 | | | | 162,660 | |
| | | | | | | | |
| | | | | | | 16,905,461 | |
| | | | | | | | |
| CONSUMER STAPLES (3.9%) | |
Altria Group, Inc. | | | 9,102 | | | | 380,191 | |
Archer-Daniels-Midland Co. | | | 2,829 | | | | 219,530 | |
Brown-Forman Corp. Cl B | | | 919 | | | | 64,477 | |
Campbell Soup Co. | | | 1,016 | | | | 48,819 | |
Church & Dwight Co., Inc. | | | 1,220 | | | | 113,045 | |
Clorox Co. | | | 619 | | | | 87,267 | |
Coca-Cola Co. | | | 19,613 | | | | 1,233,854 | |
Colgate-Palmolive Co. | | | 4,212 | | | | 337,550 | |
Conagra Brands, Inc. | | | 2,412 | | | | 82,587 | |
Constellation Brands, Inc. Cl A | | | 818 | | | | 190,643 | |
Costco Wholesale Corp. | | | 2,228 | | | | 1,067,836 | |
Estee Lauder Cos., Inc. Cl A | | | 1,165 | | | | 296,691 | |
The accompanying notes are an integral part of these portfolio schedules.
31
MUTUAL OF AMERICA INVESTMENT CORPORATION — ALL AMERICA FUND
PORTFOLIO OF INVESTMENTS IN SECURITIES (Continued)
June 30, 2022 (Unaudited)
| | | | | | | | |
| | | Shares | | | Value | |
| INDEXED ASSETS (CONTINUED): | |
| COMMON STOCKS (CONTINUED): | |
| CONSUMER STAPLES (CONTINUED) | |
General Mills, Inc. | | | 3,027 | | | $ | 228,387 | |
Hershey Co. | | | 734 | | | | 157,927 | |
Hormel Foods Corp. | | | 1,425 | | | | 67,488 | |
J M Smucker Co. | | | 546 | | | | 69,893 | |
Kellogg Co. | | | 1,274 | | | | 90,887 | |
Keurig Dr Pepper, Inc. | | | 3,708 | | | | 131,226 | |
Kimberly-Clark Corp. | | | 1,694 | | | | 228,944 | |
Kraft Heinz Co. | | | 3,569 | | | | 136,122 | |
Kroger Co. | | | 3,298 | | | | 156,094 | |
Lamb Weston Hldgs., Inc. | | | 726 | | | | 51,880 | |
McCormick & Co., Inc. | | | 1,258 | | | | 104,729 | |
Molson Coors Beverage Co. Cl B | | | 947 | | | | 51,621 | |
Mondelez International, Inc. Cl A | | | 6,957 | | | | 431,960 | |
Monster Beverage Corp.* | | | 1,890 | | | | 175,203 | |
PepsiCo, Inc. | | | 6,951 | | | | 1,158,454 | |
Philip Morris International, Inc. | | | 7,792 | | | | 769,382 | |
Procter & Gamble Co. | | | 12,061 | | | | 1,734,251 | |
Sysco Corp. | | | 2,561 | | | | 216,942 | |
Tyson Foods, Inc. Cl A | | | 1,466 | | | | 126,164 | |
Walgreens Boots Alliance, Inc. | | | 3,604 | | | | 136,592 | |
Walmart, Inc. | | | 7,057 | | | | 857,990 | |
| | | | | | | | |
| | | | | | | 11,204,626 | |
| | | | | | | | |
| ENERGY (2.4%) | |
APA Corp. | | | 1,700 | | | | 59,330 | |
Baker Hughes Co. Cl A | | | 4,702 | | | | 135,747 | |
Chevron Corp. | | | 9,877 | | | | 1,429,992 | |
ConocoPhillips | | | 6,502 | | | | 583,945 | |
Coterra Energy, Inc. | | | 4,051 | | | | 104,475 | |
Devon Energy Corp. | | | 3,086 | | | | 170,069 | |
Diamondback Energy, Inc. | | | 839 | | | | 101,645 | |
EOG Resources, Inc. | | | 2,944 | | | | 325,135 | |
Exxon Mobil Corp. | | | 21,176 | | | | 1,813,513 | |
Halliburton Co. | | | 4,534 | | | | 142,186 | |
Hess Corp. | | | 1,393 | | | | 147,574 | |
Kinder Morgan, Inc. | | | 9,803 | | | | 164,298 | |
Marathon Oil Corp. | | | 3,558 | | | | 79,984 | |
Marathon Petroleum Corp. | | | 2,720 | | | | 223,611 | |
Occidental Petroleum Corp. | | | 4,476 | | | | 263,547 | |
ONEOK, Inc. | | | 2,245 | | | | 124,598 | |
Phillips 66 | | | 2,418 | | | | 198,252 | |
Pioneer Natural Resources Co. | | | 1,131 | | | | 252,304 | |
Schlumberger NV | | | 7,105 | | | | 254,075 | |
Valero Energy Corp. | | | 2,051 | | | | 217,980 | |
Williams Cos., Inc. | | | 6,123 | | | | 191,099 | |
| | | | | | | | |
| | | | | | | 6,983,359 | |
| | | | | | | | |
| FINANCIALS (6.1%) | |
Aflac, Inc. | | | 2,979 | | | | 164,828 | |
Allstate Corp. | | | 1,382 | | | | 175,141 | |
American Express Co. | | | 3,066 | | | | 425,009 | |
| | | | | | | | |
| | | Shares | | | Value | |
| INDEXED ASSETS (CONTINUED): | |
| COMMON STOCKS (CONTINUED): | |
| FINANCIALS (CONTINUED) | |
American International Group, Inc. | | | 3,982 | | | $ | 203,600 | |
Ameriprise Financial, Inc. | | | 552 | | | | 131,199 | |
Aon PLC Cl A | | | 1,068 | | | | 288,018 | |
Arthur J. Gallagher & Co. | | | 1,056 | | | | 172,170 | |
Assurant, Inc. | | | 272 | | | | 47,015 | |
Bank of America Corp. | | | 35,641 | | | | 1,109,504 | |
Bank of New York Mellon Corp. | | | 3,736 | | | | 155,829 | |
Berkshire Hathaway, Inc. Cl B* | | | 9,095 | | | | 2,483,117 | |
BlackRock, Inc. Cl A | | | 716 | | | | 436,073 | |
Brown & Brown, Inc. | | | 1,178 | | | | 68,725 | |
Capital One Financial Corp. | | | 1,976 | | | | 205,879 | |
Cboe Global Markets, Inc. | | | 534 | | | | 60,443 | |
Charles Schwab Corp. | | | 7,581 | | | | 478,968 | |
Chubb Ltd. | | | 2,130 | | | | 418,715 | |
Cincinnati Financial Corp. | | | 750 | | | | 89,235 | |
Citigroup, Inc. | | | 9,762 | | | | 448,954 | |
Citizens Financial Group, Inc. | | | 2,466 | | | | 88,012 | |
CME Group, Inc. Cl A | | | 1,807 | | | | 369,893 | |
Comerica, Inc. | | | 658 | | | | 48,284 | |
Discover Financial Svcs. | | | 1,412 | | | | 133,547 | |
Everest Re Group Ltd. | | | 198 | | | | 55,495 | |
FactSet Research Systems, Inc. | | | 191 | | | | 73,453 | |
Fifth Third Bancorp | | | 3,449 | | | | 115,886 | |
First Republic Bank | | | 902 | | | | 130,068 | |
Franklin Resources, Inc. | | | 1,407 | | | | 32,797 | |
Globe Life, Inc. | | | 457 | | | | 44,544 | |
Goldman Sachs Group, Inc. | | | 1,726 | | | | 512,656 | |
Hartford Financial Svcs. Group, Inc. | | | 1,653 | | | | 108,156 | |
Huntington Bancshares, Inc. | | | 7,235 | | | | 87,037 | |
Intercontinental Exchange, Inc. | | | 2,806 | | | | 263,876 | |
Invesco Ltd. | | | 1,693 | | | | 27,308 | |
JPMorgan Chase & Co. | | | 14,764 | | | | 1,662,574 | |
KeyCorp. | | | 4,687 | | | | 80,757 | |
Lincoln National Corp. | | | 813 | | | | 38,024 | |
Loews Corp. | | | 977 | | | | 57,897 | |
M&T Bank Corp. | | | 902 | | | | 143,770 | |
MarketAxess Hldgs., Inc. | | | 190 | | | | 48,642 | |
Marsh & McLennan Cos., Inc. | | | 2,523 | | | | 391,696 | |
MetLife, Inc. | | | 3,475 | | | | 218,195 | |
Moody’s Corp. | | | 807 | | | | 219,480 | |
Morgan Stanley | | | 7,035 | | | | 535,082 | |
MSCI, Inc. Cl A | | | 408 | | | | 168,157 | |
Nasdaq, Inc. | | | 579 | | | | 88,321 | |
Northern Trust Corp. | | | 1,048 | | | | 101,111 | |
PNC Financial Svcs. Group, Inc. | | | 2,079 | | | | 328,004 | |
Principal Financial Group, Inc. | | | 1,181 | | | | 78,879 | |
Progressive Corp. | | | 2,940 | | | | 341,834 | |
Prudential Financial, Inc. | | | 1,885 | | | | 180,357 | |
The accompanying notes are an integral part of these portfolio schedules.
32
MUTUAL OF AMERICA INVESTMENT CORPORATION — ALL AMERICA FUND
PORTFOLIO OF INVESTMENTS IN SECURITIES (Continued)
June 30, 2022 (Unaudited)
| | | | | | | | |
| | | Shares | | | Value | |
| INDEXED ASSETS (CONTINUED): | |
| COMMON STOCKS (CONTINUED): | |
| FINANCIALS (CONTINUED) | |
Raymond James Financial, Inc. | | | 978 | | | $ | 87,443 | |
Regions Financial Corp. | | | 4,698 | | | | 88,088 | |
S&P Global, Inc. | | | 1,745 | | | | 588,170 | |
Signature Bank | | | 316 | | | | 56,630 | |
State Street Corp. | | | 1,845 | | | | 113,744 | |
SVB Financial Group* | | | 296 | | | | 116,917 | |
Synchrony Financial | | | 2,521 | | | | 69,630 | |
T. Rowe Price Group, Inc. | | | 1,143 | | | | 129,856 | |
Travelers Cos., Inc. | | | 1,206 | | | | 203,971 | |
Truist Financial Corp. | | | 6,693 | | | | 317,449 | |
U.S. Bancorp | | | 6,797 | | | | 312,798 | |
Wells Fargo & Co. | | | 19,054 | | | | 746,345 | |
Willis Towers Watson PLC | | | 560 | | | | 110,538 | |
WR Berkley Corp. | | | 1,054 | | | | 71,946 | |
Zions Bancorp NA | | | 761 | | | | 38,735 | |
| | | | | | | | |
| | | | | | | 17,388,474 | |
| | | | | | | | |
| HEALTH CARE (8.5%) | |
Abbott Laboratories | | | 8,802 | | | | 956,337 | |
AbbVie, Inc. | | | 8,883 | | | | 1,360,520 | |
ABIOMED, Inc.* | | | 229 | | | | 56,680 | |
Agilent Technologies, Inc. | | | 1,509 | | | | 179,224 | |
Align Technology, Inc.* | | | 369 | | | | 87,331 | |
AmerisourceBergen Corp. Cl A | | | 759 | | | | 107,383 | |
Amgen, Inc. | | | 2,685 | | | | 653,260 | |
Baxter International, Inc. | | | 2,531 | | | | 162,566 | |
Becton Dickinson & Co. | | | 1,433 | | | | 353,277 | |
Biogen, Inc.* | | | 737 | | | | 150,304 | |
Bio-Rad Laboratories, Inc. Cl A* | | | 109 | | | | 53,955 | |
Bio-Techne Corp. | | | 198 | | | | 68,635 | |
Boston Scientific Corp.* | | | 7,186 | | | | 267,822 | |
Bristol-Myers Squibb Co. | | | 10,703 | | | | 824,131 | |
Cardinal Health, Inc. | | | 1,369 | | | | 71,558 | |
Catalent, Inc.* | | | 901 | | | | 96,668 | |
Centene Corp.* | | | 2,940 | | | | 248,753 | |
Charles River Laboratories International, Inc.* | | | 255 | | | | 54,562 | |
Cigna Corp. | | | 1,595 | | | | 420,314 | |
Cooper Cos., Inc. | | | 248 | | | | 77,654 | |
CVS Health Corp. | | | 6,592 | | | | 610,815 | |
Danaher Corp. | | | 3,253 | | | | 824,701 | |
DaVita, Inc.* | | | 305 | | | | 24,388 | |
DENTSPLY SIRONA, Inc. | | | 1,083 | | | | 38,696 | |
Dexcom, Inc.* | | | 1,973 | | | | 147,048 | |
Edwards Lifesciences Corp.* | | | 3,125 | | | | 297,156 | |
Elevance Health, Inc. | | | 1,212 | | | | 584,887 | |
Eli Lilly & Co. | | | 3,964 | | | | 1,285,248 | |
Gilead Sciences, Inc. | | | 6,305 | | | | 389,712 | |
HCA Healthcare, Inc. | | | 1,144 | | | | 192,261 | |
Henry Schein, Inc.* | | | 694 | | | | 53,258 | |
Hologic, Inc.* | | | 1,254 | | | | 86,902 | |
Humana, Inc. | | | 636 | | | | 297,692 | |
IDEXX Laboratories, Inc.* | | | 422 | | | | 148,008 | |
| | | | | | | | |
| | | Shares | | | Value | |
| INDEXED ASSETS (CONTINUED): | |
| COMMON STOCKS (CONTINUED): | |
| HEALTH CARE (CONTINUED) | |
Illumina, Inc.* | | | 790 | | | $ | 145,644 | |
Incyte Corp.* | | | 946 | | | | 71,868 | |
Intuitive Surgical, Inc.* | | | 1,804 | | | | 362,081 | |
IQVIA Hldgs., Inc.* | | | 951 | | | | 206,357 | |
Johnson & Johnson | | | 13,228 | | | | 2,348,102 | |
Laboratory Corp. of America Hldgs. | | | 466 | | | | 109,212 | |
McKesson Corp. | | | 731 | | | | 238,459 | |
Medtronic PLC | | | 6,744 | | | | 605,274 | |
Merck & Co., Inc. | | | 12,712 | | | | 1,158,953 | |
Mettler-Toledo International, Inc.* | | | 115 | | | | 132,109 | |
Moderna, Inc.* | | | 1,740 | | | | 248,559 | |
Molina Healthcare, Inc.* | | | 295 | | | | 82,485 | |
Organon & Co. | | | 1,276 | | | | 43,065 | |
PerkinElmer, Inc. | | | 634 | | | | 90,167 | |
Pfizer, Inc. | | | 28,205 | | | | 1,478,788 | |
Quest Diagnostics, Inc. | | | 590 | | | | 78,458 | |
Regeneron Pharmaceuticals, Inc.* | | | 544 | | | | 321,575 | |
ResMed, Inc. | | | 736 | | | | 154,288 | |
STERIS PLC | | | 504 | | | | 103,899 | |
Stryker Corp. | | | 1,692 | | | | 336,590 | |
Teleflex, Inc. | | | 236 | | | | 58,021 | |
Thermo Fisher Scientific, Inc. | | | 1,968 | | | | 1,069,175 | |
UnitedHealth Group, Inc. | | | 4,716 | | | | 2,422,279 | |
Universal Health Svcs., Inc. Cl B | | | 338 | | | | 34,040 | |
Vertex Pharmaceuticals, Inc.* | | | 1,286 | | | | 362,382 | |
Viatris, Inc. | | | 6,094 | | | | 63,804 | |
Waters Corp.* | | | 303 | | | | 100,287 | |
West Pharmaceutical Svcs., Inc. | | | 373 | | | | 112,784 | |
Zimmer Biomet Hldgs., Inc. | | | 1,054 | | | | 110,733 | |
Zoetis, Inc. Cl A | | | 2,366 | | | | 406,692 | |
| | | | | | | | |
| | | | | | | 24,287,836 | |
| | | | | | | | |
| INDUSTRIALS (4.4%) | |
3M Co. | | | 2,861 | | | | 370,242 | |
Alaska Air Group, Inc.* | | | 634 | | | | 25,392 | |
Allegion PLC | | | 441 | | | | 43,174 | |
American Airlines Group, Inc.* | | | 3,265 | | | | 41,400 | |
AMETEK, Inc. | | | 1,161 | | | | 127,582 | |
AO Smith Corp. | | | 654 | | | | 35,761 | |
Boeing Co.* | | | 2,796 | | | | 382,269 | |
Carrier Global Corp. | | | 4,264 | | | | 152,054 | |
Caterpillar, Inc. | | | 2,681 | | | | 479,256 | |
CH Robinson Worldwide, Inc. | | | 640 | | | | 64,877 | |
Cintas Corp. | | | 437 | | | | 163,233 | |
Copart, Inc.* | | | 1,074 | | | | 116,701 | |
CSX Corp. | | | 10,930 | | | | 317,626 | |
Cummins, Inc. | | | 709 | | | | 137,213 | |
Deere & Co. | | | 1,403 | | | | 420,156 | |
Delta Air Lines, Inc.* | | | 3,223 | | | | 93,370 | |
Dover Corp. | | | 725 | | | | 87,957 | |
The accompanying notes are an integral part of these portfolio schedules.
33
MUTUAL OF AMERICA INVESTMENT CORPORATION — ALL AMERICA FUND
PORTFOLIO OF INVESTMENTS IN SECURITIES (Continued)
June 30, 2022 (Unaudited)
| | | | | | | | |
| | | Shares | | | Value | |
| INDEXED ASSETS (CONTINUED): | |
| COMMON STOCKS (CONTINUED): | |
| INDUSTRIALS (CONTINUED) | |
Eaton Corp. PLC | | | 2,006 | | | $ | 252,736 | |
Emerson Electric Co. | | | 2,986 | | | | 237,507 | |
Equifax, Inc. | | | 615 | | | | 112,410 | |
Expeditors International of Washington, Inc. | | | 843 | | | | 82,159 | |
Fastenal Co. | | | 2,894 | | | | 144,468 | |
FedEx Corp. | | | 1,199 | | | | 271,825 | |
Fortive Corp. | | | 1,802 | | | | 97,993 | |
Fortune Brands Home & Security, Inc. | | | 658 | | | | 39,401 | |
Generac Hldgs., Inc.* | | | 321 | | | | 67,596 | |
General Dynamics Corp. | | | 1,159 | | | | 256,429 | |
General Electric Co. | | | 5,533 | | | | 352,286 | |
Honeywell International, Inc. | | | 3,422 | | | | 594,778 | |
Howmet Aerospace, Inc. | | | 1,891 | | | | 59,472 | |
Huntington Ingalls Industries, Inc. | | | 202 | | | | 43,999 | |
IDEX Corp. | | | 382 | | | | 69,383 | |
Illinois Tool Works, Inc. | | | 1,425 | | | | 259,706 | |
Ingersoll Rand, Inc. | | | 2,041 | | | | 85,885 | |
Jacobs Engineering Group, Inc. | | | 647 | | | | 82,253 | |
JB Hunt Transport Svcs., Inc. | | | 422 | | | | 66,452 | |
Johnson Controls International PLC | | | 3,497 | | | | 167,436 | |
L-3 Harris Technologies, Inc. | | | 970 | | | | 234,449 | |
Leidos Hldgs., Inc. | | | 687 | | | | 69,188 | |
Lockheed Martin Corp. | | | 1,191 | | | | 512,082 | |
Masco Corp. | | | 1,186 | | | | 60,012 | |
Nielsen Hldgs. PLC | | | 1,808 | | | | 41,982 | |
Nordson Corp. | | | 271 | | | | 54,861 | |
Norfolk Southern Corp. | | | 1,198 | | | | 272,294 | |
Northrop Grumman Corp. | | | 735 | | | | 351,749 | |
Old Dominion Freight Line, Inc. | | | 462 | | | | 118,401 | |
Otis Worldwide Corp. | | | 2,125 | | | | 150,174 | |
PACCAR, Inc. | | | 1,748 | | | | 143,930 | |
Parker-Hannifin Corp. | | | 646 | | | | 158,948 | |
Pentair PLC | | | 831 | | | | 38,035 | |
Quanta Svcs., Inc. | | | 722 | | | | 90,495 | |
Raytheon Technologies Corp. | | | 7,476 | | | | 718,518 | |
Republic Svcs., Inc. Cl A | | | 1,049 | | | | 137,283 | |
Robert Half International, Inc. | | | 556 | | | | 41,639 | |
Rockwell Automation, Inc. | | | 585 | | | | 116,596 | |
Rollins, Inc. | | | 1,139 | | | | 39,774 | |
Snap-on, Inc. | | | 269 | | | | 53,001 | |
Southwest Airlines Co.* | | | 2,981 | | | | 107,674 | |
Stanley Black & Decker, Inc. | | | 759 | | | | 79,589 | |
Textron, Inc. | | | 1,081 | | | | 66,017 | |
Trane Technologies PLC | | | 1,176 | | | | 152,727 | |
TransDigm Group, Inc.* | | | 261 | | | | 140,071 | |
Union Pacific Corp. | | | 3,157 | | | | 673,325 | |
United Airlines Hldgs., Inc.* | | | 1,642 | | | | 58,160 | |
United Parcel Svc., Inc. Cl B | | | 3,692 | | | | 673,938 | |
United Rentals, Inc.* | | | 360 | | | | 87,448 | |
Verisk Analytics, Inc. Cl A | | | 794 | | | | 137,433 | |
| | | | | | | | |
| | | Shares | | | Value | |
| INDEXED ASSETS (CONTINUED): | |
| COMMON STOCKS (CONTINUED): | |
| INDUSTRIALS (CONTINUED) | |
Waste Management, Inc. | | | 1,920 | | | $ | 293,721 | |
Westinghouse Air Brake Technologies Corp. | | | 918 | | | | 75,349 | |
WW Grainger, Inc. | | | 216 | | | | 98,157 | |
Xylem, Inc. | | | 905 | | | | 70,753 | |
| | | | | | | | |
| | | | | | | 12,520,210 | |
| | | | | | | | |
| INFORMATION TECHNOLOGY (15.1%) | |
Accenture PLC Cl A | | | 3,184 | | | | 884,038 | |
Adobe, Inc.* | | | 2,375 | | | | 869,392 | |
Advanced Micro Devices, Inc.* | | | 8,146 | | | | 622,925 | |
Akamai Technologies, Inc.* | | | 806 | | | | 73,612 | |
Amphenol Corp. Cl A | | | 3,002 | | | | 193,269 | |
Analog Devices, Inc. | | | 2,631 | | | | 384,363 | |
ANSYS, Inc.* | | | 438 | | | | 104,809 | |
Apple, Inc. | | | 77,293 | | | | 10,567,499 | |
Applied Materials, Inc. | | | 4,441 | | | | 404,042 | |
Arista Networks, Inc.* | | | 1,132 | | | | 106,114 | |
Autodesk, Inc.* | | | 1,093 | | | | 187,952 | |
Automatic Data Processing, Inc. | | | 2,100 | | | | 441,084 | |
Broadcom, Inc. | | | 2,052 | | | | 996,882 | |
Broadridge Financial Solutions, Inc. | | | 590 | | | | 84,104 | |
Cadence Design Systems, Inc.* | | | 1,386 | | | | 207,942 | |
CDW Corp. | | | 679 | | | | 106,983 | |
Ceridian HCM Hldg., Inc.* | | | 691 | | | | 32,533 | |
Cisco Systems, Inc. | | | 20,883 | | | | 890,451 | |
Citrix Systems, Inc. | | | 627 | | | | 60,926 | |
Cognizant Technology Solutions Corp. Cl A | | | 2,620 | | | | 176,824 | |
Corning, Inc. | | | 3,821 | | | | 120,399 | |
DXC Technology Co.* | | | 1,229 | | | | 37,251 | |
Enphase Energy, Inc.* | | | 679 | | | | 132,568 | |
EPAM Systems, Inc.* | | | 287 | | | | 84,602 | |
F5, Inc.* | | | 304 | | | | 46,524 | |
Fidelity National Information Svcs., Inc. | | | 3,070 | | | | 281,427 | |
Fiserv, Inc.* | | | 2,924 | | | | 260,148 | |
FleetCor Technologies, Inc.* | | | 389 | | | | 81,733 | |
Fortinet, Inc.* | | | 3,350 | | | | 189,543 | |
Gartner, Inc.* | | | 405 | | | | 97,941 | |
Global Payments, Inc. | | | 1,415 | | | | 156,556 | |
Hewlett Packard Enterprise Co. | | | 6,536 | | | | 86,667 | |
HP, Inc. | | | 5,295 | | | | 173,570 | |
Intel Corp. | | | 20,555 | | | | 768,962 | |
International Business Machines Corp. | | | 4,521 | | | | 638,320 | |
Intuit, Inc. | | | 1,422 | | | | 548,096 | |
Jack Henry & Associates, Inc. | | | 367 | | | | 66,067 | |
Juniper Networks, Inc. | | | 1,624 | | | | 46,284 | |
Keysight Technologies, Inc.* | | | 915 | | | | 126,133 | |
The accompanying notes are an integral part of these portfolio schedules.
34
MUTUAL OF AMERICA INVESTMENT CORPORATION — ALL AMERICA FUND
PORTFOLIO OF INVESTMENTS IN SECURITIES (Continued)
June 30, 2022 (Unaudited)
| | | | | | | | |
| | | Shares | | | Value | |
| INDEXED ASSETS (CONTINUED): | |
| COMMON STOCKS (CONTINUED): | |
| INFORMATION TECHNOLOGY (CONTINUED) | |
KLA Corp. | | | 750 | | | $ | 239,310 | |
Lam Research Corp. | | | 697 | | | | 297,026 | |
Mastercard, Inc. Cl A | | | 4,317 | | | | 1,361,927 | |
Microchip Technology, Inc. | | | 2,795 | | | | 162,333 | |
Micron Technology, Inc. | | | 5,613 | | | | 310,287 | |
Microsoft Corp. | | | 37,596 | | | | 9,655,781 | |
Monolithic Power Systems, Inc. | | | 220 | | | | 84,489 | |
Motorola Solutions, Inc. | | | 841 | | | | 176,274 | |
NetApp, Inc. | | | 1,119 | | | | 73,004 | |
NortonLifeLock, Inc. | | | 2,925 | | | | 64,233 | |
NVIDIA Corp. | | | 12,587 | | | | 1,908,063 | |
NXP Semiconductors NV | | | 1,320 | | | | 195,400 | |
ON Semiconductor Corp.* | | | 2,184 | | | | 109,877 | |
Oracle Corp. | | | 7,913 | | | | 552,881 | |
Paychex, Inc. | | | 1,615 | | | | 183,900 | |
Paycom Software, Inc.* | | | 242 | | | | 67,789 | |
PayPal Hldgs., Inc.* | | | 5,821 | | | | 406,539 | |
PTC, Inc.* | | | 530 | | | | 56,360 | |
Qorvo, Inc.* | | | 546 | | | | 51,499 | |
QUALCOMM, Inc. | | | 5,630 | | | | 719,176 | |
Roper Technologies, Inc. | | | 533 | | | | 210,348 | |
Salesforce, Inc.* | | | 4,994 | | | | 824,210 | |
Seagate Technology Hldgs. PLC | | | 994 | | | | 71,011 | |
ServiceNow, Inc.* | | | 1,008 | | | | 479,324 | |
Skyworks Solutions, Inc. | | | 809 | | | | 74,946 | |
SolarEdge Technologies, Inc.* | | | 278 | | | | 76,083 | |
Synopsys, Inc.* | | | 770 | | | | 233,849 | |
TE Connectivity Ltd. | | | 1,620 | | | | 183,303 | |
Teledyne Technologies, Inc.* | | | 235 | | | | 88,151 | |
Teradyne, Inc. | | | 805 | | | | 72,088 | |
Texas Instruments, Inc. | | | 4,635 | | | | 712,168 | |
Trimble, Inc.* | | | 1,257 | | | | 73,195 | |
Tyler Technologies, Inc.* | | | 208 | | | | 69,156 | |
VeriSign, Inc.* | | | 479 | | | | 80,151 | |
Visa, Inc. Cl A | | | 8,273 | | | | 1,628,871 | |
Western Digital Corp.* | | | 1,574 | | | | 70,562 | |
Zebra Technologies Corp. Cl A* | | | 264 | | | | 77,603 | |
| | | | | | | | |
| | | | | | | 43,039,702 | |
| | | | | | | | |
| MATERIALS (1.5%) | |
Air Products & Chemicals, Inc. | | | 1,115 | | | | 268,135 | |
Albemarle Corp. | | | 589 | | | | 123,089 | |
Amcor PLC | | | 7,554 | | | | 93,896 | |
Avery Dennison Corp. | | | 411 | | | | 66,529 | |
Ball Corp. | | | 1,608 | | | | 110,582 | |
Celanese Corp. Cl A | | | 545 | | | | 64,097 | |
CF Industries Hldgs., Inc. | | | 1,049 | | | | 89,931 | |
Corteva, Inc. | | | 3,638 | | | | 196,961 | |
Dow, Inc. | | | 3,660 | | | | 188,893 | |
DuPont de Nemours, Inc. | | | 2,556 | | | | 142,063 | |
Eastman Chemical Co. | | | 648 | | | | 58,171 | |
| | | | | | | | |
| | | Shares | | | Value | |
| INDEXED ASSETS (CONTINUED): | |
| COMMON STOCKS (CONTINUED): | |
| MATERIALS (CONTINUED) | |
Ecolab, Inc. | | | 1,249 | | | $ | 192,046 | |
FMC Corp. | | | 634 | | | | 67,844 | |
Freeport-McMoRan, Inc. | | | 7,285 | | | | 213,159 | |
International Flavors & Fragrances, Inc. | | | 1,282 | | | | 152,712 | |
International Paper Co. | | | 1,863 | | | | 77,929 | |
Linde PLC | | | 2,530 | | | | 727,451 | |
LyondellBasell Industries NV Cl A | | | 1,301 | | | | 113,785 | |
Martin Marietta Materials, Inc. | | | 314 | | | | 93,961 | |
Mosaic Co. | | | 1,820 | | | | 85,959 | |
Newmont Corp. | | | 3,990 | | | | 238,084 | |
Nucor Corp. | | | 1,337 | | | | 139,596 | |
Packaging Corp. of America | | | 471 | | | | 64,763 | |
PPG Industries, Inc. | | | 1,187 | | | | 135,722 | |
Sealed Air Corp. | | | 734 | | | | 42,366 | |
Sherwin-Williams Co. | | | 1,203 | | | | 269,364 | |
Vulcan Materials Co. | | | 669 | | | | 95,065 | |
Westrock Co. | | | 1,282 | | | | 51,075 | |
| | | | | | | | |
| | | | | | | 4,163,228 | |
| | | | | | | | |
| REAL ESTATE (1.6%) | |
Alexandria Real Estate Equities, Inc. | | | 747 | | | | 108,338 | |
American Tower Corp. | | | 2,336 | | | | 597,058 | |
AvalonBay Communities, Inc. | | | 703 | | | | 136,558 | |
Boston Properties, Inc. | | | 717 | | | | 63,799 | |
Camden Property Trust | | | 536 | | | | 72,081 | |
CBRE Group, Inc. Cl A* | | | 1,643 | | | | 120,941 | |
Crown Castle International Corp. | | | 2,177 | | | | 366,563 | |
Digital Realty Trust, Inc. | | | 1,431 | | | | 185,787 | |
Duke Realty Corp. | | | 1,933 | | | | 106,218 | |
Equinix, Inc. | | | 458 | | | | 300,915 | |
Equity Residential | | | 1,720 | | | | 124,218 | |
Essex Property Trust, Inc. | | | 329 | | | | 86,037 | |
Extra Space Storage, Inc. | | | 676 | | | | 115,001 | |
Federal Realty OP LP | | | 359 | | | | 34,371 | |
Healthpeak Properties, Inc. | | | 2,712 | | | | 70,268 | |
Host Hotels & Resorts, Inc. | | | 3,593 | | | | 56,338 | |
Iron Mountain, Inc. | | | 1,461 | | | | 71,136 | |
Kimco Realty Corp. | | | 3,107 | | | | 61,425 | |
Mid-America Apartment Communities, Inc. | | | 581 | | | | 101,483 | |
Prologis, Inc. | | | 3,721 | | | | 437,776 | |
Public Storage | | | 768 | | | | 240,131 | |
Realty Income Corp. | | | 3,024 | | | | 206,418 | |
Regency Centers Corp. | | | 780 | | | | 46,262 | |
SBA Communications Corp. Cl A | | | 542 | | | | 173,467 | |
Simon Property Group, Inc. | | | 1,651 | | | | 156,713 | |
UDR, Inc. | | | 1,505 | | | | 69,290 | |
Ventas, Inc. | | | 2,009 | | | | 103,323 | |
VICI Properties, Inc. | | | 4,841 | | | | 144,213 | |
Vornado Realty Trust | | | 800 | | | | 22,872 | |
Welltower, Inc. | | | 2,282 | | | | 187,923 | |
The accompanying notes are an integral part of these portfolio schedules.
35
MUTUAL OF AMERICA INVESTMENT CORPORATION — ALL AMERICA FUND
PORTFOLIO OF INVESTMENTS IN SECURITIES (Continued)
June 30, 2022 (Unaudited)
| | | | | | | | |
| | | Shares | | | Value | |
| INDEXED ASSETS (CONTINUED): | |
| COMMON STOCKS (CONTINUED): | |
| REAL ESTATE (CONTINUED) | |
Weyerhaeuser Co. | | | 3,743 | | | $ | 123,968 | |
| | | | | | | | |
| | | | | | | 4,690,891 | |
| | | | | | | | |
| UTILITIES (1.7%) | |
AES Corp. | | | 3,357 | | | | 70,531 | |
Alliant Energy Corp. | | | 1,261 | | | | 73,907 | |
Ameren Corp. | | | 1,298 | | | | 117,287 | |
American Electric Power Co., Inc. | | | 2,582 | | | | 247,717 | |
American Water Works Co., Inc. | | | 914 | | | | 135,976 | |
Atmos Energy Corp. | | | 699 | | | | 78,358 | |
CenterPoint Energy, Inc. | | | 3,164 | | | | 93,591 | |
CMS Energy Corp. | | | 1,458 | | | | 98,415 | |
Consolidated Edison, Inc. | | | 1,781 | | | | 169,373 | |
Constellation Energy Corp. | | | 1,642 | | | | 94,021 | |
Dominion Energy, Inc. | | | 4,078 | | | | 325,465 | |
DTE Energy Co. | | | 974 | | | | 123,454 | |
Duke Energy Corp. | | | 3,870 | | | | 414,903 | |
Edison International | | | 1,916 | | | | 121,168 | |
Entergy Corp. | | | 1,022 | | | | 115,118 | |
| | | | | | | | |
| | | Shares | | | Value | |
| INDEXED ASSETS (CONTINUED): | |
| COMMON STOCKS (CONTINUED): | |
| UTILITIES (CONTINUED) | |
Evergy, Inc. | | | 1,154 | | | $ | 75,298 | |
Eversource Energy | | | 1,734 | | | | 146,471 | |
Exelon Corp. | | | 4,927 | | | | 223,292 | |
FirstEnergy Corp. | | | 2,870 | | | | 110,179 | |
NextEra Energy, Inc. | | | 9,875 | | | | 764,917 | |
NiSource, Inc. | | | 2,040 | | | | 60,160 | |
NRG Energy, Inc. | | | 1,193 | | | | 45,537 | |
Pinnacle West Capital Corp. | | | 569 | | | | 41,605 | |
PPL Corp. | | | 3,699 | | | | 100,354 | |
Public Svc. Enterprise Group, Inc. | | | 2,510 | | | | 158,833 | |
Sempra Energy | | | 1,580 | | | | 237,427 | |
Southern Co. | | | 5,341 | | | | 380,867 | |
WEC Energy Group, Inc. | | | 1,586 | | | | 159,615 | |
Xcel Energy, Inc. | | | 2,738 | | | | 193,741 | |
| | | | | | | | |
| | | | | | | 4,977,580 | |
| | | | | | | | |
TOTAL INDEXED ASSETS-COMMON STOCKS | | | | | | | | |
(Cost: $108,177,737) 56.2% | | | | 160,386,869 | |
| | | | | | | | |
| | | | | | | | | | | | | | |
| | | Rating** | �� | Rate(%) | | Maturity | | Face Amount | | | Value | |
| SHORT-TERM DEBT SECURITIES: | | | | | | | | | | | | |
| U.S. GOVERNMENT (0.2%) | | | | | | | | | | | | |
U.S. Treasury Bill (1) | | A-1+ | | 0.82 | | 08/02/22 | | $ | 500,000 | | | $ | 499,638 | |
| | | | | | | | | | | | | | |
TOTAL INDEXED ASSETS-SHORT TERM-DEBT (0.2%)
(Cost: $499,638) 0.2% | | | | 499,638 | |
| | | | | | | | |
| | | | | |
| | | | | | | | | Shares | | | Value | |
| WARRANTS: | | | | | | | | | | | | |
| ENERGY (0.0%) (2) | | | | | | | | | | | | |
Occidental Petroleum Corp. — expiring 08/03/2027* | | | 16 | | | $ | 591 | |
| | | | | | | | |
TOTAL INDEXED ASSETS-WARRANTS
(Cost: $79) 0.0% | | | | 591 | |
| | | | | | | | |
TOTAL INDEXED ASSETS
(Cost: $108,677,454) 56.4% | | | | 160,887,098 | |
| | | | | | | | | | | | | | |
The accompanying notes are an integral part of these portfolio schedules.
36
MUTUAL OF AMERICA INVESTMENT CORPORATION — ALL AMERICA FUND
PORTFOLIO OF INVESTMENTS IN SECURITIES (Continued)
June 30, 2022 (Unaudited)
| | | | | | | | |
| | | Shares | | | Value | |
| ACTIVE ASSETS: | |
| COMMON STOCKS: | |
| COMMUNICATION SERVICES (1.0%) | |
Cardlytics, Inc.* | | | 4,723 | | | $ | 105,370 | |
EchoStar Corp. Cl A* | | | 13,577 | | | | 262,036 | |
Fox Corp. Cl A | | | 10,289 | | | | 330,894 | |
Take-Two Interactive Software, Inc.* | | | 5,570 | | | | 682,492 | |
TEGNA, Inc. | | | 49,428 | | | | 1,036,505 | |
Twitter, Inc.* | | | 5,440 | | | | 203,402 | |
Warner Bros Discovery, Inc.* | | | 11,287 | | | | 151,471 | |
| | | | | | | | |
| | | | | | | 2,772,170 | |
| | | | | | | | |
| CONSUMER DISCRETIONARY (4.2%) | |
Aptiv PLC* | | | 1,891 | | | | 168,432 | |
AutoZone, Inc.* | | | 488 | | | | 1,048,771 | |
Bloomin’ Brands, Inc. | | | 42,650 | | | | 708,843 | |
Bright Horizons Family Solutions, Inc.* | | | 1,630 | | | | 137,768 | |
Burlington Stores, Inc.* | | | 815 | | | | 111,027 | |
Caesars Entertainment, Inc.* | | | 3,643 | | | | 139,527 | |
Capri Hldgs. Ltd.* | | | 13,792 | | | | 565,610 | |
Darden Restaurants, Inc. | | | 3,807 | | | | 430,648 | |
Everi Hldgs., Inc.* | | | 10,570 | | | | 172,397 | |
Five Below, Inc.* | | | 5,562 | | | | 630,898 | |
Ford Motor Co. | | | 15,208 | | | | 169,265 | |
Fox Factory Hldg. Corp.* | | | 1,853 | | | | 149,241 | |
Golden Entertainment, Inc.* | | | 12,576 | | | | 497,381 | |
Hanesbrands, Inc. | | | 19,213 | | | | 197,702 | |
Lithia Motors, Inc. Cl A | | | 1,250 | | | | 343,512 | |
Marriott Vacations Worldwide Corp. | | | 10,602 | | | | 1,231,952 | |
Murphy USA, Inc. | | | 815 | | | | 189,789 | |
NVR, Inc.* | | | 84 | | | | 336,348 | |
Ollie’s Bargain Outlet Hldgs., Inc.* | | | 11,011 | | | | 646,896 | |
Ralph Lauren Corp. Cl A | | | 2,051 | | | | 183,873 | |
Skyline Champion Corp.* | | | 3,727 | | | | 176,734 | |
Sonic Automotive, Inc. Cl A | | | 17,832 | | | | 653,186 | |
Sonos, Inc.* | | | 13,457 | | | | 242,764 | |
Steven Madden Ltd. | | | 29,784 | | | | 959,343 | |
Taylor Morrison Home Corp. Cl A* | | | 23,912 | | | | 558,584 | |
Tractor Supply Co. | | | 3,245 | | | | 629,043 | |
Williams-Sonoma, Inc. | | | 3,081 | | | | 341,837 | |
XPEL, Inc.* | | | 5,845 | | | | 268,461 | |
| | | | | | | | |
| | | | | | | 11,889,832 | |
| | | | | | | | |
| CONSUMER STAPLES (1.5%) | |
BJ’s Wholesale Club Hldgs., Inc.* | | | 2,930 | | | | 182,598 | |
Boston Beer Co., Inc. Cl A* | | | 1,588 | | | | 481,116 | |
Church & Dwight Co., Inc. | | | 6,537 | | | | 605,719 | |
Constellation Brands, Inc. Cl A | | | 3,907 | | | | 910,565 | |
Crimson Wine Group Ltd.* | | | 39,259 | | | | 280,309 | |
Freshpet, Inc.* | | | 4,436 | | | | 230,184 | |
TreeHouse Foods, Inc.* | | | 35,278 | | | | 1,475,326 | |
| | | | | | | | |
| | | | | | | 4,165,817 | |
| | | | | | | | |
| | | | | | | | |
| | | Shares | | | Value | |
| ACTIVE ASSETS (CONTINUED): | |
| COMMON STOCKS (CONTINUED): | |
| ENERGY (3.0%) | |
Baker Hughes Co. Cl A | | | 34,461 | | | $ | 994,889 | |
ChampionX Corp. | | | 38,983 | | | | 773,813 | |
Cheniere Energy, Inc. | | | 6,617 | | | | 880,260 | |
Chesapeake Energy Corp. | | | 10,990 | | | | 891,289 | |
Devon Energy Corp. | | | 20,391 | | | | 1,123,748 | |
EQT Corp. | | | 22,291 | | | | 766,810 | |
Hess Corp. | | | 1,772 | | | | 187,726 | |
Magnolia Oil & Gas Corp. Cl A | | | 10,871 | | | | 228,182 | |
MPLX LP | | | 4,656 | | | | 135,722 | |
Northern Oil & Gas, Inc. | | | 13,693 | | | | 345,885 | |
Ovintiv, Inc. | | | 10,350 | | | | 457,366 | |
PDC Energy, Inc. | | | 11,980 | | | | 738,088 | |
Southwestern Energy Co.* | | | 53,305 | | | | 333,156 | |
Williams Cos., Inc. | | | 27,052 | | | | 844,293 | |
| | | | | | | | |
| | | | | | | 8,701,227 | |
| | | | | | | | |
| FINANCIALS (6.6%) | |
American Equity Investment Life Hldg. Co. | | | 9,629 | | | | 352,133 | |
American Financial Group, Inc. | | | 4,147 | | | | 575,645 | |
Ameriprise Financial, Inc. | | | 4,434 | | | | 1,053,873 | |
Argo Group International Hldgs. Ltd. | | | 5,843 | | | | 215,373 | |
Bank of Marin Bancorp | | | 4,344 | | | | 138,052 | |
Banner Corp. | | | 8,966 | | | | 503,979 | |
Brookline Bancorp, Inc. | | | 27,237 | | | | 362,524 | |
Brown & Brown, Inc. | | | 9,289 | | | | 541,920 | |
Dime Community Bancshares, Inc. | | | 7,763 | | | | 230,173 | |
Discover Financial Svcs. | | | 5,857 | | | | 553,955 | |
Eastern Bankshares, Inc. | | | 40,706 | | | | 751,433 | |
Ellington Financial, Inc. | | | 25,574 | | | | 375,171 | |
Enterprise Financial Svcs. Corp. | | | 11,185 | | | | 464,178 | |
Essent Group Ltd. | | | 12,107 | | | | 470,962 | |
Everest Re Group Ltd. | | | 937 | | | | 262,623 | |
Fifth Third Bancorp | | | 17,833 | | | | 599,189 | |
First Financial Bankshares, Inc. | | | 3,401 | | | | 133,557 | |
First Foundation, Inc. | | | 8,135 | | | | 166,605 | |
First Interstate BancSystem, Inc. Cl A | | | 15,419 | | | | 587,618 | |
First Republic Bank | | | 3,660 | | | | 527,772 | |
Glacier Bancorp, Inc. | | | 4,161 | | | | 197,315 | |
Goosehead Insurance, Inc. Cl A | | | 2,215 | | | | 101,159 | |
Green Dot Corp. Cl A* | | | 18,705 | | | | 469,683 | |
Hancock Whitney Corp. | | | 11,708 | | | | 519,016 | |
Hannon Armstrong Sustainable Infrastructure Capital, Inc. | | | 2,667 | | | | 100,973 | |
Hartford Financial Svcs. Group, Inc. | | | 12,649 | | | | 827,624 | |
Home BancShares, Inc. | | | 19,771 | | | | 410,644 | |
Houlihan Lokey, Inc. Cl A | | | 1,896 | | | | 149,651 | |
The accompanying notes are an integral part of these portfolio schedules.
37
MUTUAL OF AMERICA INVESTMENT CORPORATION — ALL AMERICA FUND
PORTFOLIO OF INVESTMENTS IN SECURITIES (Continued)
June 30, 2022 (Unaudited)
| | | | | | | | |
| | | Shares | | | Value | |
| ACTIVE ASSETS (CONTINUED): | |
| COMMON STOCKS (CONTINUED): | |
| FINANCIALS (CONTINUED) | |
iShares Micro-Cap ETF | | | 1,049 | | | $ | 109,054 | |
iShares Russell 2000 Growth ETF | | | 1,177 | | | | 242,827 | |
iShares Russell Mid-Cap ETF | | | 2,800 | | | | 181,048 | |
KeyCorp. | | | 14,892 | | | | 256,589 | |
Metropolitan Bank Hldg. Corp.* | | | 3,780 | | | | 262,408 | |
Moelis & Co. Cl A | | | 4,363 | | | | 171,684 | |
MSCI, Inc. Cl A | | | 624 | | | | 257,182 | |
Primerica, Inc. | | | 6,435 | | | | 770,205 | |
Raymond James Financial, Inc. | | | 4,311 | | | | 385,446 | |
Reinsurance Group of America, Inc. Cl A | | | 1,693 | | | | 198,572 | |
RLI Corp. | | | 1,835 | | | | 213,943 | |
Selective Insurance Group, Inc. | | | 6,293 | | | | 547,113 | |
Signature Bank | | | 1,111 | | | | 199,103 | |
Silvergate Capital Corp. Cl A* | | | 1,438 | | | | 76,976 | |
Starwood Property Trust, Inc. | | | 22,687 | | | | 473,931 | |
Stifel Financial Corp. | | | 2,878 | | | | 161,226 | |
Stock Yards Bancorp, Inc. | | | 10,261 | | | | 613,813 | |
SVB Financial Group* | | | 1,309 | | | | 517,042 | |
Synchrony Financial | | | 4,564 | | | | 126,058 | |
TriCo Bancshares | | | 7,031 | | | | 320,895 | |
UMB Financial Corp. | | | 4,801 | | | | 413,366 | |
Voya Financial, Inc. | | | 2,999 | | | | 178,530 | |
Webster Financial Corp. | | | 7,060 | | | | 297,579 | |
Zions Bancorp NA | | | 2,388 | | | | 121,549 | |
| | | | | | | | |
| | | | | | | 18,738,939 | |
| | | | | | | | |
| HEALTH CARE (4.2%) | |
Addus HomeCare Corp.* | | | 3,751 | | | | 312,383 | |
Agilent Technologies, Inc. | | | 5,936 | | | | 705,019 | |
Align Technology, Inc.* | | | 811 | | | | 191,940 | |
Amicus Therapeutics, Inc.* | | | 9,076 | | | | 97,476 | |
AMN Healthcare Svcs., Inc.* | | | 2,072 | | | | 227,319 | |
Arrowhead Pharmaceuticals, Inc.* | | | 2,214 | | | | 77,955 | |
BioCryst Pharmaceuticals, Inc.* | | | 13,541 | | | | 143,264 | |
Biohaven Pharmaceutical Hldg. Co. Ltd.* | | | 1,672 | | | | 243,627 | |
Blueprint Medicines Corp.* | | | 1,983 | | | | 100,161 | |
CareDx, Inc.* | | | 3,454 | | | | 74,192 | |
Centene Corp.* | | | 3,108 | | | | 262,968 | |
Chemed Corp. | | | 611 | | | | 286,797 | |
ChemoCentryx, Inc.* | | | 4,551 | | | | 112,774 | |
CONMED Corp. | | | 2,262 | | | | 216,609 | |
Emergent BioSolutions, Inc.* | | | 3,817 | | | | 118,480 | |
Encompass Health Corp. | | | 5,900 | | | | 330,695 | |
Envista Hldgs. Corp.* | | | 7,422 | | | | 286,044 | |
Exact Sciences Corp.* | | | 1,499 | | | | 59,046 | |
Fate Therapeutics, Inc.* | | | 2,935 | | | | 72,729 | |
Halozyme Therapeutics, Inc.* | | | 4,317 | | | | 189,948 | |
Horizon Therapeutics PLC* | | | 5,919 | | | | 472,099 | |
| | | | | | | | |
| | | Shares | | | Value | |
| ACTIVE ASSETS (CONTINUED): | |
| COMMON STOCKS (CONTINUED): | |
| HEALTH CARE (CONTINUED) | |
Humana, Inc. | | | 402 | | | $ | 188,164 | |
IDEXX Laboratories, Inc.* | | | 556 | | | | 195,006 | |
Inmode Ltd.* | | | 4,212 | | | | 94,391 | |
Insmed, Inc.* | | | 4,192 | | | | 82,666 | |
Inspire Medical Systems, Inc.* | | | 851 | | | | 155,452 | |
Insulet Corp.* | | | 910 | | | | 198,325 | |
iRhythm Technologies, Inc.* | | | 1,308 | | | | 141,303 | |
Krystal Biotech, Inc.* | | | 1,405 | | | | 92,252 | |
LHC Group, Inc.* | | | 1,365 | | | | 212,585 | |
Madrigal Pharmaceuticals, Inc.* | | | 843 | | | | 60,342 | |
Medpace Hldgs., Inc.* | | | 1,142 | | | | 170,923 | |
Mettler-Toledo International, Inc.* | | | 303 | | | | 348,077 | |
NanoString Technologies, Inc.* | | | 7,566 | | | | 96,088 | |
Neogen Corp.* | | | 4,217 | | | | 101,588 | |
NextGen Healthcare, Inc.* | | | 37,162 | | | | 648,105 | |
Omnicell, Inc.* | | | 2,989 | | | | 339,999 | |
OrthoPediatrics Corp.* | | | 3,447 | | | | 148,738 | |
Penumbra, Inc.* | | | 923 | | | | 114,932 | |
QuidelOrtho Corp.* | | | 4,034 | | | | 392,024 | |
Repligen Corp.* | | | 798 | | | | 129,595 | |
SeaSpine Hldgs. Corp.* | | | 24,867 | | | | 140,499 | |
Sientra, Inc.* | | | 60,926 | | | | 51,038 | |
Silk Road Medical, Inc.* | | | 2,423 | | | | 88,173 | |
Simulations Plus, Inc. | | | 3,817 | | | | 188,293 | |
STAAR Surgical Co.* | | | 2,328 | | | | 165,125 | |
Supernus Pharmaceuticals, Inc.* | | | 22,064 | | | | 638,091 | |
Syneos Health, Inc. Cl A* | | | 9,064 | | | | 649,708 | |
Tactile Systems Technology, Inc.* | | | 8,348 | | | | 60,940 | |
Tandem Diabetes Care, Inc.* | | | 3,527 | | | | 208,763 | |
Tenet Healthcare Corp.* | | | 4,144 | | | | 217,809 | |
Veeva Systems, Inc. Cl A* | | | 1,197 | | | | 237,054 | |
Vericel Corp.* | | | 10,421 | | | | 262,401 | |
Xencor, Inc.* | | | 2,730 | | | | 74,720 | |
Zimmer Biomet Hldgs., Inc. | | | 6,030 | | | | 633,512 | |
Zimvie, Inc.* | | | 346 | | | | 5,539 | |
| | | | | | | | |
| | | | | | | 12,113,745 | |
| | | | | | | | |
| INDUSTRIALS (7.3%) | |
Alaska Air Group, Inc.* | | | 12,344 | | | | 494,377 | |
Arcosa, Inc. | | | 7,538 | | | | 349,989 | |
Atkore, Inc.* | | | 3,119 | | | | 258,908 | |
Axon Enterprise, Inc.* | | | 3,496 | | | | 325,722 | |
AZEK Co., Inc. Cl A* | | | 4,943 | | | | 82,746 | |
Bloom Energy Corp. Cl A* | | | 6,895 | | | | 113,768 | |
Builders FirstSource, Inc.* | | | 15,588 | | | | 837,076 | |
Carlisle Cos., Inc. | | | 4,476 | | | | 1,068,018 | |
Casella Waste Systems, Inc. Cl A* | | | 2,691 | | | | 195,582 | |
Chart Industries, Inc.* | | | 2,219 | | | | 371,416 | |
Clean Harbors, Inc.* | | | 6,046 | | | | 530,053 | |
The accompanying notes are an integral part of these portfolio schedules.
38
MUTUAL OF AMERICA INVESTMENT CORPORATION — ALL AMERICA FUND
PORTFOLIO OF INVESTMENTS IN SECURITIES (Continued)
June 30, 2022 (Unaudited)
| | | | | | | | |
| | | Shares | | | Value | |
| ACTIVE ASSETS (CONTINUED): | |
| COMMON STOCKS (CONTINUED): | |
| INDUSTRIALS (CONTINUED) | |
Crane Hldgs. Co. | | | 5,036 | | | $ | 440,952 | |
Deluxe Corp. | | | 23,591 | | | | 511,217 | |
Dover Corp. | | | 5,080 | | | | 616,306 | |
Ducommun, Inc.* | | | 6,967 | | | | 299,860 | |
EMCOR Group, Inc. | | | 3,435 | | | | 353,668 | |
Encore Wire Corp. | | | 4,098 | | | | 425,864 | |
EnPro Industries, Inc. | | | 8,023 | | | | 657,324 | |
ESCO Technologies, Inc. | | | 10,206 | | | | 697,784 | |
Federal Signal Corp. | | | 10,995 | | | | 391,422 | |
Franklin Electric Co., Inc. | | | 3,027 | | | | 221,758 | |
Generac Hldgs., Inc.* | | | 1,787 | | | | 376,307 | |
Graco, Inc. | | | 5,559 | | | | 330,260 | |
HEICO Corp. Cl A | | | 1,745 | | | | 183,888 | |
IAA, Inc.* | | | 4,408 | | | | 144,450 | |
ICF International, Inc. | | | 5,731 | | | | 544,445 | |
Jacobs Engineering Group, Inc. | | | 3,309 | | | | 420,673 | |
KBR, Inc. | | | 24,849 | | | | 1,202,443 | |
L-3 Harris Technologies, Inc. | | | 1,419 | | | | 342,972 | |
ManTech International Corp. Cl A | | | 2,740 | | | | 261,533 | |
Masonite International Corp.* | | | 1,472 | | | | 113,094 | |
Miller Industries, Inc. | | | 21,319 | | | | 483,302 | |
Mueller Industries, Inc. | | | 29,574 | | | | 1,575,998 | |
Old Dominion Freight Line, Inc. | | | 3,744 | | | | 959,513 | |
Oshkosh Corp. | | | 4,907 | | | | 403,061 | |
Quanta Svcs., Inc. | | | 3,631 | | | | 455,110 | |
Saia, Inc.* | | | 692 | | | | 130,096 | |
Simpson Manufacturing Co., Inc. | | | 1,383 | | | | 139,144 | |
Stanley Black & Decker, Inc. | | | 2,008 | | | | 210,559 | |
Tetra Tech, Inc. | | | 948 | | | | 129,449 | |
TransUnion | | | 3,794 | | | | 303,482 | |
Trex Co., Inc.* | | | 6,288 | | | | 342,193 | |
UFP Industries, Inc. | | | 11,770 | | | | 802,008 | |
Univar Solutions, Inc.* | | | 25,728 | | | | 639,855 | |
Vicor Corp.* | | | 1,873 | | | | 102,509 | |
VSE Corp. | | | 13,842 | | | | 520,182 | |
Werner Enterprises, Inc. | | | 8,697 | | | | 335,182 | |
Willdan Group, Inc.* | | | 4,430 | | | | 122,179 | |
| | | | | | | | |
| | | | | | | 20,817,697 | |
| | | | | | | | |
| INFORMATION TECHNOLOGY (5.9%) | |
Altair Engineering, Inc. Cl A* | | | 2,903 | | | | 152,408 | |
Ambarella, Inc.* | | | 2,295 | | | | 150,231 | |
Amphenol Corp. Cl A | | | 5,649 | | | | 363,682 | |
Arteris, Inc.* | | | 11,143 | | | | 77,667 | |
Belden, Inc. | | | 7,780 | | | | 414,441 | |
Blackline, Inc.* | | | 1,896 | | | | 126,274 | |
Cambium Networks Corp.* | | | 7,898 | | | | 115,706 | |
Ciena Corp.* | | | 5,270 | | | | 240,839 | |
CMC Materials, Inc. | | | 3,389 | | | | 591,347 | |
Cohu, Inc.* | | | 18,638 | | | | 517,204 | |
Credo Technology Group Hldg. Ltd.* | | | 7,456 | | | | 87,086 | |
| | | | | | | | |
| | | Shares | | | Value | |
| ACTIVE ASSETS (CONTINUED): | |
| COMMON STOCKS (CONTINUED): | |
| INFORMATION TECHNOLOGY (CONTINUED) | |
Digi International, Inc.* | | | 3,776 | | | $ | 91,455 | |
Domo, Inc. Cl B* | | | 6,066 | | | | 168,635 | |
DXC Technology Co.* | | | 20,794 | | | | 630,266 | |
EPAM Systems, Inc.* | | | 803 | | | | 236,708 | |
Euronet Worldwide, Inc.* | | | 9,685 | | | | 974,214 | |
Fabrinet* | | | 1,460 | | | | 118,406 | |
Five9, Inc.* | | | 8,966 | | | | 817,161 | |
ForgeRock, Inc. Cl A* | | | 4,622 | | | | 99,003 | |
Globant S.A.* | | | 1,085 | | | | 188,790 | |
Guidewire Software, Inc.* | | | 1,947 | | | | 138,218 | |
Hewlett Packard Enterprise Co. | | | 16,811 | | | | 222,914 | |
II-VI, Inc.* | | | 7,479 | | | | 381,055 | |
Keysight Technologies, Inc.* | | | 1,293 | | | | 178,240 | |
LivePerson, Inc.* | | | 7,244 | | | | 102,430 | |
Lumentum Hldgs., Inc.* | | | 6,973 | | | | 553,796 | |
Marvell Technology, Inc. | | | 4,682 | | | | 203,807 | |
Maximus, Inc. | | | 2,353 | | | | 147,086 | |
MaxLinear, Inc. Cl A* | | | 8,729 | | | | 296,611 | |
Microchip Technology, Inc. | | | 3,406 | | | | 197,820 | |
MKS Instruments, Inc. | | | 1,772 | | | | 181,860 | |
MongoDB, Inc. Cl A* | | | 502 | | | | 130,269 | |
Monolithic Power Systems, Inc. | | | 1,032 | | | | 396,329 | |
Motorola Solutions, Inc. | | | 1,472 | | | | 308,531 | |
Novanta, Inc.* | | | 1,504 | | | | 182,390 | |
Okta, Inc. Cl A* | | | 1,382 | | | | 124,933 | |
Palo Alto Networks, Inc.* | | | 896 | | | | 442,570 | |
PDF Solutions, Inc.* | | | 5,590 | | | | 120,241 | |
Perficient, Inc.* | | | 7,540 | | | | 691,343 | |
Ping Identity Hldg. Corp.* | | | 12,245 | | | | 222,124 | |
PTC, Inc.* | | | 4,502 | | | | 478,743 | |
Q2 Hldgs., Inc.* | | | 2,602 | | | | 100,359 | |
Qualys, Inc.* | | | 286 | | | | 36,076 | |
Rapid7, Inc.* | | | 5,736 | | | | 383,165 | |
Richardson Electronics Ltd.* | | | 4,461 | | | | 65,398 | |
Sailpoint Technologies Hldgs., Inc.* | | | 6,537 | | | | 409,739 | |
Sequans Communications S.A.* | | | 9,765 | | | | 26,268 | |
Silicon Laboratories, Inc.* | | | 1,263 | | | | 177,098 | |
Splunk, Inc.* | | | 3,129 | | | | 276,791 | |
Synaptics, Inc.* | | | 1,421 | | | | 167,749 | |
Synopsys, Inc.* | | | 943 | | | | 286,389 | |
Teledyne Technologies, Inc.* | | | 1,511 | | | | 566,791 | |
Tenable Hldgs., Inc.* | | | 830 | | | | 37,690 | |
Teradyne, Inc. | | | 4,589 | | | | 410,945 | |
Varonis Systems, Inc. Cl B* | | | 1,607 | | | | 47,117 | |
Viasat, Inc.* | | | 22,202 | | | | 680,047 | |
Xperi Hldg. Corp. | | | 25,069 | | | | 361,746 | |
Zendesk, Inc.* | | | 7,703 | | | | 570,561 | |
Zuora, Inc. Cl A* | | | 41,632 | | | | 372,606 | |
| | | | | | | | |
| | | | | | | 16,839,368 | |
| | | | | | | | |
| MATERIALS (2.7%) | |
Albemarle Corp. | | | 448 | | | | 93,623 | |
Ashland Global Hldgs., Inc. | | | 9,655 | | | | 994,948 | |
The accompanying notes are an integral part of these portfolio schedules.
39
MUTUAL OF AMERICA INVESTMENT CORPORATION — ALL AMERICA FUND
PORTFOLIO OF INVESTMENTS IN SECURITIES (Continued)
June 30, 2022 (Unaudited)
| | | | | | | | |
| | | Shares | | | Value | |
| ACTIVE ASSETS (CONTINUED): | |
| COMMON STOCKS (CONTINUED): | |
| MATERIALS (CONTINUED) | |
Avient Corp. | | | 6,361 | | | $ | 254,949 | |
Coeur Mining, Inc.* | | | 36,343 | | | | 110,483 | |
Crown Hldgs., Inc. | | | 17,059 | | | | 1,572,329 | |
Ferroglobe Representation & Warranty Insurance Trust* | | | 6,270 | | | | 0 | †† |
FMC Corp. | | | 3,698 | | | | 395,723 | |
Freeport-McMoRan, Inc. | | | 3,732 | | | | 109,198 | |
Innospec, Inc. | | | 2,146 | | | | 205,565 | |
Kaiser Aluminum Corp. | | | 8,601 | | | | 680,253 | |
Livent Corp.* | | | 5,116 | | | | 116,082 | |
Materion Corp. | | | 12,579 | | | | 927,450 | |
Newmont Corp. | | | 6,798 | | | | 405,637 | |
Orion Engineered Carbons S.A. | | | 13,361 | | | | 207,496 | |
Packaging Corp. of America | | | 2,538 | | | | 348,976 | |
PPG Industries, Inc. | | | 1,592 | | | | 182,029 | |
Steel Dynamics, Inc. | | | 3,517 | | | | 232,650 | |
Stepan Co. | | | 1,784 | | | | 180,808 | |
Valvoline, Inc. | | | 13,211 | | | | 380,873 | |
Vulcan Materials Co. | | | 1,925 | | | | 273,542 | |
| | | | | | | | |
| | | | | | | 7,672,614 | |
| | | | | | | | |
| REAL ESTATE (3.2%) | |
Alexander’s, Inc. | | | 667 | | | | 148,181 | |
Alexandria Real Estate Equities, Inc. | | | 1,299 | | | | 188,394 | |
American Campus Communities, Inc. | | | 3,313 | | | | 213,589 | |
Apartment Income REIT Corp. | | | 4,273 | | | | 177,757 | |
Apartment Investment & Management Co. Cl A* | | | 26,464 | | | | 169,370 | |
AvalonBay Communities, Inc. | | | 1,157 | | | | 224,747 | |
Brandywine Realty Trust | | | 13,159 | | | | 126,853 | |
Camden Property Trust | | | 3,257 | | | | 438,002 | |
Cousins Properties, Inc. | | | 9,032 | | | | 264,005 | |
CTO Realty Growth, Inc. | | | 2,366 | | | | 144,610 | |
Duke Realty Corp. | | | 21,694 | | | | 1,192,086 | |
Easterly Government Properties, Inc. Cl A | | | 26,266 | | | | 500,105 | |
EastGroup Properties, Inc. | | | 1,457 | | | | 224,859 | |
Equity Commonwealth* | | | 13,153 | | | | 362,102 | |
Essential Properties Realty Trust, Inc. | | | 4,866 | | | | 104,570 | |
Gaming & Leisure Properties, Inc. | | | 4,587 | | | | 210,360 | |
Highwoods Properties, Inc. | | | 7,122 | | | | 243,501 | |
| | | | | | | | |
| | | Shares | | | Value | |
| ACTIVE ASSETS (CONTINUED): | |
| COMMON STOCKS (CONTINUED): | |
| REAL ESTATE (CONTINUED) | |
Host Hotels & Resorts, Inc. | | | 27,432 | | | $ | 430,134 | |
Industrial Logistics Properties Trust | | | 1,829 | | | | 25,752 | |
Innovative Industrial Properties, Inc. Cl A | | | 734 | | | | 80,645 | |
Kilroy Realty Corp. | | | 6,791 | | | | 355,373 | |
Life Storage, Inc. | | | 1,116 | | | | 124,613 | |
LXP Industrial Trust | | | 22,639 | | | | 243,143 | |
PotlatchDeltic Corp. | | | 10,592 | | | | 468,060 | |
Realty Income Corp. | | | 4,195 | | | | 286,351 | |
Sabra Health Care REIT, Inc. | | | 25,341 | | | | 354,014 | |
SBA Communications Corp. Cl A | | | 824 | | | | 263,721 | |
Sun Communities, Inc. | | | 3,119 | | | | 497,044 | |
Welltower, Inc. | | | 7,878 | | | | 648,753 | |
Weyerhaeuser Co. | | | 10,097 | | | | 334,413 | |
Xenia Hotels & Resorts, Inc.* | | | 9,238 | | | | 134,228 | |
| | | | | | | | |
| | | | | | | 9,179,335 | |
| | | | | | | | |
| UTILITIES (2.4%) | |
AES Corp. | | | 9,675 | | | | 203,271 | |
Ameren Corp. | | | 4,137 | | | | 373,820 | |
Atmos Energy Corp. | | | 1,812 | | | | 203,125 | |
Avista Corp. | | | 7,554 | | | | 328,675 | |
Black Hills Corp. | | | 6,994 | | | | 508,953 | |
Chesapeake Utilities Corp. | | | 2,285 | | | | 296,022 | |
DTE Energy Co. | | | 2,302 | | | | 291,779 | |
Entergy Corp. | | | 2,555 | | | | 287,795 | |
Evergy, Inc. | | | 15,157 | | | | 988,995 | |
Fortis, Inc. | | | 9,095 | | | | 429,921 | |
IDACORP, Inc. | | | 1,022 | | | | 108,250 | |
NiSource, Inc. | | | 15,555 | | | | 458,717 | |
NorthWestern Corp. | | | 5,144 | | | | 303,136 | |
NRG Energy, Inc. | | | 10,476 | | | | 399,869 | |
ONE Gas, Inc. | | | 1,431 | | | | 116,183 | |
Portland General Electric Co. | | | 6,319 | | | | 305,397 | |
PPL Corp. | | | 6,482 | | | | 175,857 | |
Public Svc. Enterprise Group, Inc. | | | 6,504 | | | | 411,573 | |
Sempra Energy | | | 1,938 | | | | 291,223 | |
Spire, Inc. | | | 3,717 | | | | 276,532 | |
| | | | | | | | |
| | | | | | | 6,759,093 | |
| | | | | | | | |
TOTAL ACTIVE ASSETS-COMMON
STOCKS | | | | | |
(Cost: $108,153,734) 41.9% | | | | 119,649,837 | |
| | | | | | | | |
The accompanying notes are an integral part of these portfolio schedules.
40
MUTUAL OF AMERICA INVESTMENT CORPORATION — ALL AMERICA FUND
PORTFOLIO OF INVESTMENTS IN SECURITIES (Continued)
June 30, 2022 (Unaudited)
| | | | | | | | | | | | | | | | |
| | | Rate(%) | | | Maturity | | | Face Amount | | | Value | |
| TEMPORARY CASH INVESTMENT (1.8%) | | | | | | | | | | | | |
Citibank, New York Time Deposit | | | 0.91 | | | | 07/01/22 | | | $ | 1,947,535 | | | $ | 1,947,535 | |
JP Morgan Chase, New York Time Deposit | | | 0.91 | | | | 07/01/22 | | | | 3,188,874 | | | | 3,188,874 | |
| | | | | | | | | | | | | | | | |
| | | | | | | | | | | | | | | 5,136,409 | |
| | | | | | | | | | | | | | | | |
TOTAL TEMPORARY CASH INVESTMENT
(Cost: $5,136,409) 1.8% | | | | 5,136,409 | |
| | | | | | | | | | | | | | | | |
TOTAL INVESTMENTS
(Cost: $221,967,597) 100.1% | | | | 285,673,344 | |
| | | | | | | | | | | | | | | | |
OTHER NET ASSETS -0.1% | | | | (256,541 | ) |
| | | | | | | | | | | | | | | | |
NET ASSETS 100.0% | | | $ | 285,416,803 | |
| | | | | | | | | | | | | | | | |
The accompanying notes are an integral part of these portfolio schedules.
41
MUTUAL OF AMERICA INVESTMENT CORPORATION — SMALL CAP VALUE FUND
PORTFOLIO OF INVESTMENTS IN SECURITIES
June 30, 2022 (Unaudited)
| | | | | | | | |
| | | Shares | | | Value | |
| COMMON STOCKS: | | | | | | |
| COMMUNICATION SERVICES (3.8%) | | | | | | |
EchoStar Corp. Cl A* | | | 182,460 | | | $ | 3,521,478 | |
TEGNA, Inc. | | | 654,124 | | | | 13,716,980 | |
| | | | | | | | |
| | | | | | | 17,238,458 | |
| | | | | | | | |
| CONSUMER DISCRETIONARY (7.7%) | | | | | | |
Bloomin’ Brands, Inc. | | | 321,759 | | | | 5,347,635 | |
Capri Hldgs. Ltd.* | | | 95,429 | | | | 3,913,543 | |
Golden Entertainment, Inc.* | | | 78,924 | | | | 3,121,444 | |
Marriott Vacations Worldwide Corp. | | | 55,280 | | | | 6,423,536 | |
Sonic Automotive, Inc. Cl A | | | 146,301 | | | | 5,359,006 | |
Steven Madden Ltd. | | | 221,954 | | | | 7,149,138 | |
Taylor Morrison Home Corp. Cl A* | | | 170,557 | | | | 3,984,212 | |
| | | | | | | | |
| | | | | | | 35,298,514 | |
| | | | | | | | |
| CONSUMER STAPLES (3.5%) | | | | | | |
Crimson Wine Group Ltd.* | | | 594,624 | | | | 4,245,615 | |
TreeHouse Foods, Inc.* | | | 288,367 | | | | 12,059,508 | |
| | | | | | | | |
| | | | | | | 16,305,123 | |
| | | | | | | | |
| ENERGY (7.7%) | | | | | | |
ChampionX Corp. | | | 452,916 | | | | 8,990,383 | |
EQT Corp. | | | 298,041 | | | | 10,252,610 | |
Ovintiv, Inc. | | | 143,255 | | | | 6,330,438 | |
PDC Energy, Inc. | | | 162,609 | | | | 10,018,341 | |
| | | | | | | | |
| | | | | | | 35,591,772 | |
| | | | | | | | |
| FINANCIALS (24.7%) | | | | | | |
American Equity Investment Life Hldg. Co. | | | 127,866 | | | | 4,676,060 | |
Argo Group International Hldgs. Ltd. | | | 77,230 | | | | 2,846,698 | |
Bank of Marin Bancorp | | | 67,596 | | | | 2,148,201 | |
Banner Corp. | | | 122,534 | | | | 6,887,636 | |
Brookline Bancorp, Inc. | | | 359,537 | | | | 4,785,437 | |
Dime Community Bancshares, Inc. | | | 92,756 | | | | 2,750,215 | |
Eastern Bankshares, Inc. | | | 539,896 | | | | 9,966,480 | |
Ellington Financial, Inc. | | | 368,730 | | | | 5,409,269 | |
Enterprise Financial Svcs. Corp. | | | 148,603 | | | | 6,167,024 | |
Essent Group Ltd. | | | 160,294 | | | | 6,235,437 | |
First Interstate BancSystem, Inc. Cl A | | | 213,561 | | | | 8,138,810 | |
Green Dot Corp. Cl A* | | | 258,722 | | | | 6,496,509 | |
Hancock Whitney Corp. | | | 159,149 | | | | 7,055,075 | |
Hannon Armstrong Sustainable Infrastructure Capital, Inc. | | | 34,951 | | | | 1,323,245 | |
Home BancShares, Inc. | | | 263,375 | | | | 5,470,299 | |
Metropolitan Bank Hldg. Corp.* | | | 50,011 | | | | 3,471,764 | |
Moelis & Co. Cl A | | | 57,525 | | | | 2,263,609 | |
Selective Insurance Group, Inc. | | | 84,952 | | | | 7,385,727 | |
Stifel Financial Corp. | | | 38,176 | | | | 2,138,619 | |
Stock Yards Bancorp, Inc. | | | 135,803 | | | | 8,123,735 | |
TriCo Bancshares | | | 90,895 | | | | 4,148,448 | |
| | | | | | | | |
| | | Shares | | | Value | |
| COMMON STOCKS (CONTINUED): | |
| FINANCIALS (CONTINUED) | | | | | | |
UMB Financial Corp. | | | 65,627 | | | $ | 5,650,485 | |
| | | | | | | | |
| | | | | | | 113,538,782 | |
| | | | | | | | |
| HEALTH CARE (5.3%) | | | | | | |
BioCryst Pharmaceuticals, Inc.* | | | 179,117 | | | | 1,895,058 | |
NanoString Technologies, Inc.* | | | 101,012 | | | | 1,282,853 | |
NextGen Healthcare, Inc.* | | | 340,666 | | | | 5,941,215 | |
SeaSpine Hldgs. Corp.* | | | 331,999 | | | | 1,875,794 | |
Sientra, Inc.* | | | 822,488 | | | | 688,998 | |
Supernus Pharmaceuticals, Inc.* | | | 204,617 | | | | 5,917,524 | |
Syneos Health, Inc. Cl A* | | | 64,738 | | | | 4,640,420 | |
Vericel Corp.* | | | 77,413 | | | | 1,949,259 | |
| | | | | | | | |
| | | | | | | 24,191,121 | |
| | | | | | | | |
| INDUSTRIALS (18.9%) | | | | | | |
Arcosa, Inc. | | | 102,808 | | | | 4,773,375 | |
Builders FirstSource, Inc.* | | | 98,100 | | | | 5,267,970 | |
Deluxe Corp. | | | 314,958 | | | | 6,825,140 | |
Encore Wire Corp. | | | 54,230 | | | | 5,635,582 | |
EnPro Industries, Inc. | | | 106,146 | | | | 8,696,542 | |
ICF International, Inc. | | | 52,554 | | | | 4,992,630 | |
KBR, Inc. | | | 120,115 | | | | 5,812,365 | |
ManTech International Corp. Cl A | | | 37,272 | | | | 3,557,612 | |
Miller Industries, Inc. | | | 281,571 | | | | 6,383,214 | |
Mueller Industries, Inc. | | | 277,582 | | | | 14,792,345 | |
UFP Industries, Inc. | | | 131,364 | | | | 8,951,143 | |
VSE Corp. | | | 187,679 | | | | 7,052,977 | |
Werner Enterprises, Inc. | | | 114,665 | | | | 4,419,189 | |
| | | | | | | | |
| | | | | | | 87,160,084 | |
| | | | | | | | |
| INFORMATION TECHNOLOGY (7.4%) | | | | | | |
Belden, Inc. | | | 104,868 | | | | 5,586,318 | |
CMC Materials, Inc. | | | 39,256 | | | | 6,849,779 | |
Cohu, Inc.* | | | 173,997 | | | | 4,828,417 | |
Digi International, Inc.* | | | 49,930 | | | | 1,209,305 | |
II-VI, Inc.* | | | 50,455 | | | | 2,570,682 | |
Perficient, Inc.* | | | 23,381 | | | | 2,143,804 | |
Richardson Electronics Ltd.* | | | 61,816 | | | | 906,223 | |
Sequans Communications S.A.* | | | 133,838 | | | | 360,024 | |
Viasat, Inc.* | | | 73,607 | | | | 2,254,582 | |
Xperi Hldg. Corp. | | | 331,982 | | | | 4,790,500 | |
Zuora, Inc. Cl A* | | | 292,847 | | | | 2,620,981 | |
| | | | | | | | |
| | | | | | | 34,120,615 | |
| | | | | | | | |
| MATERIALS (5.2%) | | | | | | |
Avient Corp. | | | 81,816 | | | | 3,279,185 | |
Coeur Mining, Inc.* | | | 489,296 | | | | 1,487,460 | |
Kaiser Aluminum Corp. | | | 78,741 | | | | 6,227,626 | |
Materion Corp. | | | 141,449 | | | | 10,429,035 | |
Stepan Co. | | | 25,023 | | | | 2,536,081 | |
| | | | | | | | |
| | | | | | | 23,959,387 | |
| | | | | | | | |
The accompanying notes are an integral part of these portfolio schedules.
42
MUTUAL OF AMERICA INVESTMENT CORPORATION — SMALL CAP VALUE FUND
PORTFOLIO OF INVESTMENTS IN SECURITIES (Continued)
June 30, 2022 (Unaudited)
| | | | | | | | |
| | | Shares | | | Value | |
| COMMON STOCKS (CONTINUED): | |
| REAL ESTATE (7.8%) | | | | | | |
Alexander’s, Inc. | | | 5,402 | | | $ | 1,200,108 | |
Apartment Investment & Management Co. Cl A* | | | 357,945 | | | | 2,290,848 | |
Cousins Properties, Inc. | | | 117,868 | | | | 3,445,282 | |
CTO Realty Growth, Inc. | | | 32,139 | | | | 1,964,336 | |
Easterly Government Properties, Inc. Cl A | | | 241,988 | | | | 4,607,451 | |
Equity Commonwealth* | | | 177,460 | | | | 4,885,474 | |
Highwoods Properties, Inc. | | | 93,443 | | | | 3,194,816 | |
Industrial Logistics Properties Trust | | | 24,173 | | | | 340,356 | |
LXP Industrial Trust | | | 301,716 | | | | 3,240,430 | |
PotlatchDeltic Corp. | | | 140,377 | | | | 6,203,260 | |
Sabra Health Care REIT, Inc. | | | 336,227 | | | | 4,697,091 | |
| | | | | | | | |
| | | | | | | 36,069,452 | |
| | | | | | | | |
| | | | | | | | |
| | | Shares | | | Value | |
| COMMON STOCKS (CONTINUED): | | | | | | |
| UTILITIES (4.9%) | | | | | | |
Avista Corp. | | | 98,762 | | | $ | 4,297,135 | |
Black Hills Corp. | | | 90,242 | | | | 6,566,910 | |
NorthWestern Corp. | | | 68,255 | | | | 4,022,267 | |
Portland General Electric Co. | | | 87,212 | | | | 4,214,956 | |
Spire, Inc. | | | 48,955 | | | | 3,640,783 | |
| | | | | | | | |
| | | | | | | 22,742,051 | |
| | | | | | | | |
TOTAL COMMON STOCKS | | | | | | | | |
(Cost: $417,165,911) 96.9% | | | | 446,215,359 | |
| | | | | | | | |
| | | | | | | | | | | | | | | | | | | | |
| | | Rating** | | | Rate(%) | | | Maturity | | | Face Amount | | | Value | |
| SHORT-TERM DEBT SECURITIES: | | | | | | | | | | | | | | | |
| U.S. GOVERNMENT (2.6%) | | | | | | | | | | | | | | | |
U.S. Treasury Bill | | | A-1+ | | | | 0.84 | | | | 07/05/22 | | | $ | 4,500,000 | | | $ | 4,499,580 | |
U.S. Treasury Bill | | | A-1+ | | | | 1.02 | | | | 07/19/22 | | | | 7,500,000 | | | | 7,496,175 | |
| | | | | | | | | | | | | | | | | | | | |
TOTAL SHORT-TERM DEBT SECURITIES
(Cost: $11,995,755) 2.6% | | | | 11,995,755 | |
| | | | | | | | | | | | | | | | | | | | |
| | | | | |
| | | | | | Rate(%) | | | Maturity | | | Face Amount | | | Value | |
| TEMPORARY CASH INVESTMENT (0.5%) | | | | | | | | | | | | | | | |
JP Morgan Chase, New York Time Deposit | | | | 0.91 | | | | 07/01/22 | | | $ | 2,428,882 | | | $ | 2,428,882 | |
| | | | | | | | | | | | | | | | | | | | |
TOTAL TEMPORARY CASH INVESTMENT
(Cost: $2,428,882) 0.5% | | | | 2,428,882 | |
| | | | | | | | | | | | | | | | | | | | |
TOTAL INVESTMENTS
(Cost: $431,590,548) 100.0% | | | | 460,639,996 | |
| | | | | | | | | | | | | | | | | | | | |
OTHER NET ASSETS 0.0% (2) | | | | 67,496 | |
| | | | | | | | | | | | | | | | | | | | |
NET ASSETS 100.0% | | | $ | 460,707,492 | |
| | | | | | | | | | | | | | | | | | | | |
The accompanying notes are an integral part of these portfolio schedules.
43
MUTUAL OF AMERICA INVESTMENT CORPORATION — SMALL CAP GROWTH FUND
PORTFOLIO OF INVESTMENTS IN SECURITIES
June 30, 2022 (Unaudited)
| | | | | | | | |
| | | Shares | | | Value | |
| COMMON STOCKS: | | | | | | |
| COMMUNICATION SERVICES (0.4%) | | | | | | |
Cardlytics, Inc.* | | | 90,296 | | | $ | 2,014,504 | |
| | | | | | | | |
| | | | | | | | |
| CONSUMER DISCRETIONARY (12.1%) | | | | | | |
Bloomin’ Brands, Inc. | | | 379,588 | | | | 6,308,753 | |
Everi Hldgs., Inc.* | | | 204,004 | | | | 3,327,305 | |
Five Below, Inc.* | | | 29,472 | | | | 3,343,009 | |
Fox Factory Hldg. Corp.* | | | 35,914 | | | | 2,892,514 | |
Golden Entertainment, Inc.* | | | 129,906 | | | | 5,137,782 | |
Marriott Vacations Worldwide Corp. | | | 33,226 | | | | 3,860,861 | |
Murphy USA, Inc. | | | 15,794 | | | | 3,677,949 | |
Ollie’s Bargain Outlet Hldgs., Inc.* | | | 68,809 | | | | 4,042,529 | |
Skyline Champion Corp.* | | | 71,577 | | | | 3,394,181 | |
Sonic Automotive, Inc. Cl A | | | 127,542 | | | | 4,671,863 | |
Sonos, Inc.* | | | 260,491 | | | | 4,699,258 | |
Steven Madden Ltd. | | | 78,086 | | | | 2,515,150 | |
Taylor Morrison Home Corp. Cl A* | | | 92,068 | | | | 2,150,708 | |
XPEL, Inc.* | | | 113,162 | | | | 5,197,531 | |
| | | | | | | | |
| | | | | | | 55,219,393 | |
| | | | | | | | |
| CONSUMER STAPLES (2.5%) | | | | | | |
BJ’s Wholesale Club Hldgs., Inc.* | | | 56,324 | | | | 3,510,112 | |
Boston Beer Co., Inc. Cl A* | | | 9,529 | | | | 2,887,001 | |
Freshpet, Inc.* | | | 44,570 | | | | 2,312,737 | |
TreeHouse Foods, Inc.* | | | 62,652 | | | | 2,620,107 | |
| | | | | | | | |
| | | | | | | 11,329,957 | |
| | | | | | | | |
| ENERGY (5.8%) | | | | | | |
ChampionX Corp. | | | 114,432 | | | | 2,271,475 | |
Chesapeake Energy Corp. | | | 81,847 | | | | 6,637,792 | |
Magnolia Oil & Gas Corp. Cl A | | | 209,273 | | | | 4,392,640 | |
Northern Oil & Gas, Inc. | | | 265,703 | | | | 6,711,658 | |
Southwestern Energy Co.* | | | 1,025,097 | | | | 6,406,856 | |
| | | | | | | | |
| | | | | | | 26,420,421 | |
| | | | | | | | |
| FINANCIALS (7.2%) | | | | | | |
First Financial Bankshares, Inc. | | | 65,345 | | | | 2,566,098 | |
First Foundation, Inc. | | | 156,979 | | | | 3,214,930 | |
Glacier Bancorp, Inc. | | | 80,398 | | | | 3,812,473 | |
Goosehead Insurance, Inc. Cl A | | | 42,673 | | | | 1,948,876 | |
Houlihan Lokey, Inc. Cl A | | | 36,464 | | | | 2,878,103 | |
iShares Micro-Cap ETF | | | 21,047 | | | | 2,188,046 | |
iShares Russell 2000 Growth ETF | | | 32,047 | | | | 6,611,617 | |
Primerica, Inc. | | | 33,998 | | | | 4,069,221 | |
RLI Corp. | | | 34,544 | | | | 4,027,485 | |
Silvergate Capital Corp. Cl A* | | | 27,860 | | | | 1,491,346 | |
| | | | | | | | |
| | | | | | | 32,808,195 | |
| HEALTH CARE (21.0%) | | | | | | |
Addus HomeCare Corp.* | | | 72,158 | | | | 6,009,318 | |
Amicus Therapeutics, Inc.* | | | 171,207 | | | | 1,838,763 | |
AMN Healthcare Svcs., Inc.* | | | 39,885 | | | | 4,375,783 | |
Arrowhead Pharmaceuticals, Inc.* | | | 42,554 | | | | 1,498,326 | |
Biohaven Pharmaceutical Hldg. Co. Ltd.* | | | 32,367 | | | | 4,716,196 | |
Blueprint Medicines Corp.* | | | 37,421 | | | | 1,890,135 | |
| | | | | | | | |
| | | Shares | | | Value | |
| COMMON STOCKS (CONTINUED): | | | | | | |
| HEALTH CARE (CONTINUED) | | | | | | |
CareDx, Inc.* | | | 65,708 | | | $ | 1,411,408 | |
ChemoCentryx, Inc.* | | | 87,647 | | | | 2,171,893 | |
CONMED Corp. | | | 43,654 | | | | 4,180,307 | |
Emergent BioSolutions, Inc.* | | | 73,153 | | | | 2,270,669 | |
Fate Therapeutics, Inc.* | | | 56,704 | | | | 1,405,125 | |
Halozyme Therapeutics, Inc.* | | | 82,926 | | | | 3,648,744 | |
Inmode Ltd.* | | | 80,910 | | | | 1,813,193 | |
Insmed, Inc.* | | | 79,054 | | | | 1,558,945 | |
Inspire Medical Systems, Inc.* | | | 16,533 | | | | 3,020,083 | |
iRhythm Technologies, Inc.* | | | 24,529 | | | | 2,649,868 | |
Krystal Biotech, Inc.* | | | 26,734 | | | | 1,755,354 | |
LHC Group, Inc.* | | | 26,268 | | | | 4,090,978 | |
Madrigal Pharmaceuticals, Inc.* | | | 15,916 | | | | 1,139,267 | |
Medpace Hldgs., Inc.* | | | 21,959 | | | | 3,286,604 | |
Neogen Corp.* | | | 79,637 | | | | 1,918,455 | |
NextGen Healthcare, Inc.* | | | 219,268 | | | | 3,824,034 | |
Omnicell, Inc.* | | | 57,412 | | | | 6,530,615 | |
OrthoPediatrics Corp.* | | | 66,968 | | | | 2,889,669 | |
QuidelOrtho Corp.* | | | 35,525 | | | | 3,452,320 | |
Silk Road Medical, Inc.* | | | 46,197 | | | | 1,681,109 | |
Simulations Plus, Inc. | | | 73,155 | | | | 3,608,736 | |
STAAR Surgical Co.* | | | 45,018 | | | | 3,193,127 | |
Supernus Pharmaceuticals, Inc.* | | | 127,688 | | | | 3,692,737 | |
Tactile Systems Technology, Inc.* | | | 160,920 | | | | 1,174,716 | |
Tandem Diabetes Care, Inc.* | | | 28,037 | | | | 1,659,510 | |
Tenet Healthcare Corp.* | | | 79,661 | | | | 4,186,982 | |
Vericel Corp.* | | | 88,066 | | | | 2,217,502 | |
Xencor, Inc.* | | | 55,468 | | | | 1,518,159 | |
| | | | | | | | |
| | | | | | | 96,278,630 | |
| | | | | | | | |
| INDUSTRIALS (16.0%) | | | | | | |
Atkore, Inc.* | | | 59,996 | | | | 4,980,268 | |
AZEK Co., Inc. Cl A* | | | 95,511 | | | | 1,598,854 | |
Bloom Energy Corp. Cl A* | | | 133,543 | | | | 2,203,460 | |
Casella Waste Systems, Inc. Cl A* | | | 51,744 | | | | 3,760,754 | |
Chart Industries, Inc.* | | | 42,943 | | | | 7,187,799 | |
Ducommun, Inc.* | | | 134,506 | | | | 5,789,138 | |
EMCOR Group, Inc. | | | 66,060 | | | | 6,801,538 | |
ESCO Technologies, Inc. | | | 90,984 | | | | 6,220,576 | |
Federal Signal Corp. | | | 209,266 | | | | 7,449,870 | |
Franklin Electric Co., Inc. | | | 58,340 | | | | 4,273,988 | |
ICF International, Inc. | | | 34,465 | | | | 3,274,175 | |
KBR, Inc. | | | 68,435 | | | | 3,311,570 | |
Masonite International Corp.* | | | 28,454 | | | | 2,186,121 | |
Saia, Inc.* | | | 13,317 | | | | 2,503,596 | |
Simpson Manufacturing Co., Inc. | | | 26,739 | | | | 2,690,211 | |
Tetra Tech, Inc. | | | 18,197 | | | | 2,484,800 | |
UFP Industries, Inc. | | | 35,886 | | | | 2,445,272 | |
Vicor Corp.* | | | 36,258 | | | | 1,984,400 | |
Willdan Group, Inc.* | | | 84,831 | | | | 2,339,639 | |
| | | | | | | | |
| | | | | | | 73,486,029 | |
| | | | | | | | |
| INFORMATION TECHNOLOGY (22.9%) | | | | |
Altair Engineering, Inc. Cl A* | | | 54,720 | | | | 2,872,800 | |
Ambarella, Inc.* | | | 44,268 | | | | 2,897,783 | |
Arteris, Inc.* | | | 217,760 | | | | 1,517,787 | |
Blackline, Inc.* | | | 36,745 | | | | 2,447,217 | |
Cambium Networks Corp.* | | | 152,660 | | | | 2,236,469 | |
CMC Materials, Inc. | | | 8,080 | | | | 1,409,879 | |
The accompanying notes are an integral part of these portfolio schedules.
44
MUTUAL OF AMERICA INVESTMENT CORPORATION — SMALL CAP GROWTH FUND
PORTFOLIO OF INVESTMENTS IN SECURITIES (Continued)
June 30, 2022 (Unaudited)
| | | | | | | | |
| | | Shares | | | Value | |
| COMMON STOCKS (CONTINUED): | | | | | | |
| INFORMATION TECHNOLOGY (CONTINUED) | | | | |
Cohu, Inc.* | | | 105,075 | | | $ | 2,915,831 | |
Credo Technology Group Hldg. Ltd.* | | | 144,241 | | | | 1,684,735 | |
Domo, Inc. Cl B* | | | 117,511 | | | | 3,266,806 | |
Fabrinet* | | | 28,418 | | | | 2,304,700 | |
Five9, Inc.* | | | 60,196 | | | | 5,486,263 | |
ForgeRock, Inc. Cl A* | | | 89,061 | | | | 1,907,687 | |
Globant S.A.* | | | 21,074 | | | | 3,666,876 | |
II-VI, Inc.* | | | 69,672 | | | | 3,549,788 | |
LivePerson, Inc.* | | | 140,366 | | | | 1,984,775 | |
Lumentum Hldgs., Inc.* | | | 41,407 | | | | 3,288,544 | |
Maximus, Inc. | | | 45,342 | | | | 2,834,328 | |
MaxLinear, Inc. Cl A* | | | 168,416 | | | | 5,722,776 | |
Novanta, Inc.* | | | 29,024 | | | | 3,519,741 | |
PDF Solutions, Inc.* | | | 108,146 | | | | 2,326,221 | |
Perficient, Inc.* | | | 111,265 | | | | 10,201,888 | |
Ping Identity Hldg. Corp.* | | | 235,594 | | | | 4,273,675 | |
Q2 Hldgs., Inc.* | | | 50,050 | | | | 1,930,429 | |
Qualys, Inc.* | | | 5,508 | | | | 694,779 | |
Rapid7, Inc.* | | | 110,980 | | | | 7,413,464 | |
Sailpoint Technologies Hldgs., Inc.* | | | 125,950 | | | | 7,894,546 | |
Silicon Laboratories, Inc.* | | | 24,064 | | | | 3,374,254 | |
Synaptics, Inc.* | | | 27,523 | | | | 3,249,090 | |
Tenable Hldgs., Inc.* | | | 15,947 | | | | 724,153 | |
Varonis Systems, Inc. Cl B* | | | 30,999 | | | | 908,891 | |
Viasat, Inc.* | | | 92,250 | | | | 2,825,618 | |
Zuora, Inc. Cl A* | | | 376,815 | | | | 3,372,494 | |
| | | | | | | | |
| | | | | | | 104,704,287 | |
| | | | | | | | |
| | | | | | | | |
| | | Shares | | | Value | |
| COMMON STOCKS (CONTINUED): | | | | | | |
| MATERIALS (4.1%) | | | | | | |
Ferroglobe Representation & Warranty Insurance Trust* | | | 73,530 | | | $ | 0 | †† |
Innospec, Inc. | | | 41,265 | | | | 3,952,774 | |
Kaiser Aluminum Corp. | | | 50,750 | | | | 4,013,817 | |
Livent Corp.* | | | 98,382 | | | | 2,232,288 | |
Materion Corp. | | | 35,616 | | | | 2,625,968 | |
Orion Engineered Carbons S.A. | | | 257,782 | | | | 4,003,353 | |
Valvoline, Inc. | | | 67,761 | | | | 1,953,558 | |
| | | | | | | | |
| | | | | | | 18,781,758 | |
| | | | | | | | |
| REAL ESTATE (2.9%) | | | | | | |
Easterly Government Properties, Inc. Cl A | | | 154,120 | | | | 2,934,445 | |
EastGroup Properties, Inc. | | | 28,066 | | | | 4,331,426 | |
Essential Properties Realty Trust, Inc. | | | 92,477 | | | | 1,987,330 | |
Innovative Industrial Properties, Inc. Cl A | | | 14,114 | | | | 1,550,705 | |
Xenia Hotels & Resorts, Inc.* | | | 177,460 | | | | 2,578,494 | |
| | | | | | | | |
| | | | | | | 13,382,400 | |
| | | | | | | | |
| UTILITIES (2.1%) | | | | | | |
Chesapeake Utilities Corp. | | | 42,760 | | | | 5,539,558 | |
IDACORP, Inc. | | | 19,640 | | | | 2,080,269 | |
ONE Gas, Inc. | | | 27,528 | | | | 2,234,998 | |
| | | | | | | | |
| | | | | | | 9,854,825 | |
| | | | | | | | |
| TOTAL COMMON STOCKS | | | | | | |
(Cost: $463,925,511) 97.0% | | | | 444,280,399 | |
| | | | | | | | |
| | | | | | | | | | | | | | | | | | | | |
| | | Rating** | | | Rate(%) | | | Maturity | | | Face Amount | | | Value | |
| SHORT-TERM DEBT SECURITIES: | | | | | | | | | | | | | | | |
| U.S. GOVERNMENT (2.4%) | | | | | | | | | | | | | | | |
U.S. Treasury Bill | | | A-1+ | | | | 0.83 | | | | 07/05/22 | | | $ | 1,500,000 | | | $ | 1,499,862 | |
U.S. Treasury Bill | | | A-1+ | | | | 1.03 | | | | 07/19/22 | | | | 9,500,000 | | | | 9,495,118 | |
| | | | | | | | | | | | | | | | | | | | |
| | | | | | | | | | | | | | | | | | | 10,994,980 | |
| | | | | | | | | | | | | | | | | | | | |
| TOTAL SHORT-TERM DEBT SECURITIES | | | | | | | | | | | | | | | |
(Cost: $10,994,980) 2.4% | | | | 10,994,980 | |
| | | | | | | | | | | | | | | | | | | | |
| | | | | |
| | | | | | Rate(%) | | | Maturity | | | Face Amount | | | Value | |
| TEMPORARY CASH INVESTMENT (0.5%) | | | | | | | | | | | | | | | |
JP Morgan Chase, New York Time Deposit | | | | 0.91 | | | | 07/01/22 | | | $ | 2,007,473 | | | $ | 2,007,473 | |
| | | | | | | | | | | | | | | | | | | | |
| TOTAL TEMPORARY CASH INVESTMENT | | | | | | | | | | | | | | | |
(Cost: $2,007,473) 0.5% | | | | 2,007,473 | |
| | | | | | | | | | | | | | | | | | | | |
| TOTAL INVESTMENTS | | | | | | | | | | | | | | | |
(Cost: $476,927,964) 99.9% | | | | 457,282,852 | |
| | | | | | | | | | | | | | | | | | | | |
| OTHER NET ASSETS 0.1% | | | 589,714 | |
| | | | | | | | | | | | | | | | | | | | |
| NET ASSETS 100.0% | | | $457,872,566 | |
| | | | | | | | | | | | | | | | | | | | |
The accompanying notes are an integral part of these portfolio schedules.
45
MUTUAL OF AMERICA INVESTMENT CORPORATION — SMALL CAP EQUITY INDEX FUND
PORTFOLIO OF INVESTMENTS IN SECURITIES
June 30, 2022 (Unaudited)
| | | | | | | | |
| | | Shares | | | Value | |
| INDEXED ASSETS: | | | | | | |
| COMMON STOCKS: | | | | | | |
| COMMUNICATION SERVICES (2.0%) | | | | | | |
AMC Networks, Inc. Cl A* | | | 4,794 | | | $ | 139,601 | |
ATN International, Inc. | | | 1,744 | | | | 81,811 | |
Cars.com, Inc.* | | | 10,487 | | | | 98,892 | |
Cinemark Hldgs., Inc.* | | | 17,209 | | | | 258,479 | |
Cogent Communications Hldgs., Inc. | | | 6,849 | | | | 416,145 | |
Consolidated Communications Hldgs., Inc.* | | | 11,671 | | | | 81,697 | |
EW Scripps Co. Cl A* | | | 9,279 | | | | 115,709 | |
Gannett Co., Inc.* | | | 23,533 | | | | 68,246 | |
Gogo, Inc.* | | | 10,968 | | | | 177,572 | |
Loyalty Ventures, Inc.* | | | 3,200 | | | | 11,424 | |
Marcus Corp.* | | | 3,540 | | | | 52,286 | |
QuinStreet, Inc.* | | | 8,095 | | | | 81,436 | |
Scholastic Corp. | | | 4,892 | | | | 175,965 | |
Shenandoah Telecommunications Co. | | | 8,036 | | | | 178,399 | |
TechTarget, Inc.* | | | 4,269 | | | | 280,559 | |
Telephone & Data Systems, Inc. | | | 15,839 | | | | 250,098 | |
Thryv Hldgs., Inc.* | | | 2,748 | | | | 61,528 | |
Yelp, Inc. Cl A* | | | 10,693 | | | | 296,945 | |
| | | | | | | | |
| | | | | | | 2,826,792 | |
| | | | | | | | |
| CONSUMER DISCRETIONARY (11.2%) | | | | | | |
Aaron’s Co., Inc. | | | 4,930 | | | | 71,731 | |
Abercrombie & Fitch Co. Cl A* | | | 8,093 | | | | 136,934 | |
Academy Sports & Outdoors, Inc. | | | 13,710 | | | | 487,253 | |
Adtalem Global Education, Inc.* | | | 7,247 | | | | 260,675 | |
American Axle & Manufacturing Hldgs., Inc.* | | | 18,379 | | | | 138,394 | |
American Public Education, Inc.* | | | 3,027 | | | | 48,916 | |
America’s Car-Mart, Inc.* | | | 961 | | | | 96,677 | |
Asbury Automotive Group, Inc.* | | | 3,553 | | | | 601,665 | |
Bed Bath & Beyond, Inc.* | | | 12,818 | | | | 63,705 | |
Big Lots, Inc. | | | 4,585 | | | | 96,147 | |
BJ’s Restaurants, Inc.* | | | 3,763 | | | | 81,582 | |
Bloomin’ Brands, Inc. | | | 12,958 | | | | 215,362 | |
Boot Barn Hldgs., Inc.* | | | 4,774 | | | | 328,976 | |
Brinker International, Inc.* | | | 7,038 | | | | 155,047 | |
Buckle, Inc. | | | 4,745 | | | | 131,389 | |
Caleres, Inc. | | | 6,096 | | | | 159,959 | |
Cato Corp. Cl A | | | 2,811 | | | | 32,636 | |
Cavco Industries, Inc.* | | | 1,368 | | | | 268,114 | |
Century Communities, Inc. | | | 4,651 | | | | 209,155 | |
Cheesecake Factory, Inc. | | | 7,881 | | | | 208,216 | |
Chico’s FAS, Inc.* | | | 20,090 | | | | 99,847 | |
Children’s Place, Inc.* | | | 2,066 | | | | 80,409 | |
Chuy’s Hldgs., Inc.* | | | 3,040 | | | | 60,557 | |
Conn’s, Inc.* | | | 2,482 | | | | 19,906 | |
Dave & Buster’s Entertainment, Inc.* | | | 6,249 | | | | 204,842 | |
Designer Brands, Inc. Cl A | | | 9,741 | | | | 127,217 | |
Dine Brands Global, Inc. | | | 2,689 | | | | 175,000 | |
Dorman Products, Inc.* | | | 4,544 | | | | 498,522 | |
El Pollo Loco Hldgs., Inc.* | | | 3,127 | | | | 30,770 | |
| | | | | | | | |
| | | Shares | | | Value | |
| INDEXED ASSETS (CONTINUED): | | | | | | |
| COMMON STOCKS (CONTINUED): | | | | | | |
| CONSUMER DISCRETIONARY (CONTINUED) | | | | | | |
Ethan Allen Interiors, Inc. | | | 3,537 | | | $ | 71,483 | |
Fossil Group, Inc.* | | | 7,563 | | | | 39,101 | |
Genesco, Inc.* | | | 2,072 | | | | 103,414 | |
Gentherm, Inc.* | | | 5,319 | | | | 331,959 | |
G-III Apparel Group Ltd.* | | | 6,923 | | | | 140,052 | |
Golden Entertainment, Inc.* | | | 3,257 | | | | 128,814 | |
Group 1 Automotive, Inc. | | | 2,664 | | | | 452,347 | |
Guess?, Inc. | | | 5,757 | | | | 98,157 | |
Haverty Furniture Cos., Inc. | | | 2,228 | | | | 51,645 | |
Hibbett, Inc. | | | 1,958 | | | | 85,584 | |
Installed Building Products, Inc. | | | 3,715 | | | | 308,939 | |
iRobot Corp.* | | | 4,353 | | | | 159,973 | |
Jack in the Box, Inc. | | | 3,378 | | | | 189,371 | |
Kontoor Brands, Inc. | | | 7,465 | | | | 249,107 | |
La-Z-Boy, Inc. | | | 6,939 | | | | 164,524 | |
LCI Industries | | | 4,080 | | | | 456,470 | |
LGI Homes, Inc.* | | | 3,343 | | | | 290,507 | |
Liquidity Svcs., Inc.* | | | 4,283 | | | | 57,564 | |
LL Flooring Hldgs., Inc.* | | | 4,781 | | | | 44,798 | |
M/I Homes, Inc.* | | | 4,541 | | | | 180,096 | |
MarineMax, Inc.* | | | 3,457 | | | | 124,867 | |
MDC Hldgs., Inc. | | | 9,139 | | | | 295,281 | |
Meritage Homes Corp.* | | | 5,891 | | | | 427,097 | |
Monarch Casino & Resort, Inc.* | | | 2,121 | | | | 124,439 | |
Monro, Inc. | | | 5,385 | | | | 230,909 | |
Motorcar Parts of America, Inc.* | | | 3,067 | | | | 40,239 | |
Movado Group, Inc. | | | 2,585 | | | | 79,954 | |
National Vision Hldgs., Inc.* | | | 13,071 | | | | 359,452 | |
ODP Corp.* | | | 7,029 | | | | 212,557 | |
Oxford Industries, Inc. | | | 2,467 | | | | 218,922 | |
Patrick Industries, Inc. | | | 3,508 | | | | 181,855 | |
Perdoceo Education Corp.* | | | 11,042 | | | | 130,075 | |
PetMed Express, Inc. | | | 3,368 | | | | 67,023 | |
Rent-A-Center, Inc. | | | 8,640 | | | | 168,048 | |
Ruth’s Hospitality Group, Inc. | | | 5,026 | | | | 81,723 | |
Sally Beauty Hldgs., Inc.* | | | 17,178 | | | | 204,762 | |
Shake Shack, Inc. Cl A* | | | 6,297 | | | | 248,606 | |
Shoe Carnival, Inc. | | | 2,746 | | | | 59,341 | |
Shutterstock, Inc. | | | 3,723 | | | | 213,365 | |
Signet Jewelers Ltd. | | | 7,608 | | | | 406,724 | |
Sleep Number Corp.* | | | 3,569 | | | | 110,461 | |
Sonic Automotive, Inc. Cl A | | | 3,138 | | | | 114,945 | |
Sonos, Inc.* | | | 20,531 | | | | 370,379 | |
Standard Motor Products, Inc. | | | 3,049 | | | | 137,174 | |
Steven Madden Ltd. | | | 12,052 | | | | 388,195 | |
Strategic Education, Inc. | | | 3,686 | | | | 260,158 | |
Sturm Ruger & Co., Inc. | | | 2,827 | | | | 179,939 | |
Tri Pointe Homes, Inc.* | | | 16,606 | | | | 280,143 | |
Tupperware Brands Corp.* | | | 7,360 | | | | 46,662 | |
Unifi, Inc.* | | | 2,225 | | | | 31,283 | |
Universal Electronics, Inc.* | | | 2,028 | | | | 51,856 | |
Urban Outfitters, Inc.* | | | 10,289 | | | | 191,993 | |
Vista Outdoor, Inc.* | | | 9,005 | | | | 251,239 | |
Winnebago Industries, Inc. | | | 5,262 | | | | 255,523 | |
Wolverine World Wide, Inc. | | | 12,961 | | | | 261,294 | |
The accompanying notes are an integral part of these portfolio schedules.
46
MUTUAL OF AMERICA INVESTMENT CORPORATION — SMALL CAP EQUITY INDEX FUND
PORTFOLIO OF INVESTMENTS IN SECURITIES (Continued)
June 30, 2022 (Unaudited)
| | | | | | | | |
| | | Shares | | | Value | |
| INDEXED ASSETS (CONTINUED): | | | | | | |
| COMMON STOCKS (CONTINUED): | | | | | | |
| CONSUMER DISCRETIONARY (CONTINUED) | | | | |
WW International, Inc.* | | | 8,581 | | | $ | 54,833 | |
XPEL, Inc.* | | | 2,660 | | | | 122,174 | |
Zumiez, Inc.* | | | 2,652 | | | | 68,952 | |
| | | | | | | | |
| | | | | | | 15,745,950 | |
| | | | | | | | |
| CONSUMER STAPLES (5.4%) | | | | | | |
Andersons, Inc. | | | 5,051 | | | | 166,633 | |
B&G Foods, Inc. | | | 11,059 | | | | 262,983 | |
Calavo Growers, Inc. | | | 2,844 | | | | 118,652 | |
Cal-Maine Foods, Inc. | | | 6,023 | | | | 297,596 | |
Celsius Hldgs., Inc.* | | | 6,170 | | | | 402,654 | |
Central Garden & Pet Co.* | | | 1,565 | | | | 66,387 | |
Central Garden & Pet Co. Cl A* | | | 6,358 | | | | 254,384 | |
Chefs’ Warehouse, Inc.* | | | 5,278 | | | | 205,261 | |
Coca-Cola Consolidated, Inc. | | | 739 | | | | 416,722 | |
Edgewell Personal Care Co. | | | 8,477 | | | | 292,626 | |
elf Beauty, Inc.* | | | 7,698 | | | | 236,175 | |
Fresh Del Monte Produce, Inc. | | | 5,374 | | | | 158,694 | |
Hostess Brands, Inc. Cl A* | | | 22,200 | | | | 470,862 | |
Inter Parfums, Inc. | | | 2,863 | | | | 209,171 | |
J&J Snack Foods Corp. | | | 2,401 | | | | 335,324 | |
John B Sanfilippo & Son, Inc. | | | 1,433 | | | | 103,878 | |
Medifast, Inc. | | | 1,848 | | | | 333,582 | |
MGP Ingredients, Inc. | | | 2,012 | | | | 201,381 | |
National Beverage Corp. | | | 3,746 | | | | 183,329 | |
PriceSmart, Inc. | | | 3,866 | | | | 276,922 | |
Seneca Foods Corp. Cl A* | | | 973 | | | | 54,040 | |
Simply Good Foods Co.* | | | 14,179 | | | | 535,541 | |
SpartanNash Co. | | | 5,803 | | | | 175,077 | |
Tootsie Roll Industries, Inc. | | | 2,860 | | | | 101,101 | |
TreeHouse Foods, Inc.* | | | 8,993 | | | | 376,087 | |
United Natural Foods, Inc.* | | | 9,354 | | | | 368,548 | |
Universal Corp. | | | 3,950 | | | | 238,975 | |
USANA Health Sciences, Inc.* | | | 1,848 | | | | 133,721 | |
Vector Group Ltd. | | | 21,142 | | | | 221,991 | |
WD-40 Co. | | | 2,193 | | | | 441,582 | |
| | | | | | | | |
| | | | | | | 7,639,879 | |
| | | | | | | | |
| ENERGY (5.1%) | | | | | | |
Archrock, Inc. | | | 21,678 | | | | 179,277 | |
Bristow Group, Inc.* | | | 3,726 | | | | 87,188 | |
Callon Petroleum Co.* | | | 7,626 | | | | 298,939 | |
Civitas Resources, Inc. | | | 11,594 | | | | 606,250 | |
CONSOL Energy, Inc.* | | | 5,142 | | | | 253,912 | |
Core Laboratories N.V. | | | 7,434 | | | | 147,268 | |
DMC Global, Inc.* | | | 3,130 | | | | 56,434 | |
Dorian LPG Ltd. | | | 4,446 | | | | 67,579 | |
Dril-Quip, Inc.* | | | 5,542 | | | | 142,984 | |
Green Plains, Inc.* | | | 8,640 | | | | 234,749 | |
Helix Energy Solutions Group, Inc.* | | | 22,885 | | | | 70,944 | |
Helmerich & Payne, Inc. | | | 16,902 | | | | 727,800 | |
Laredo Petroleum, Inc.* | | | 2,333 | | | | 160,837 | |
Nabors Industries Ltd.* | | | 1,420 | | | | 190,138 | |
| | | | | | | | |
| | | Shares | | | Value | |
| INDEXED ASSETS (CONTINUED): | | | | | | |
| COMMON STOCKS (CONTINUED): | | | | | | |
| ENERGY (CONTINUED) | | | | | | |
Oceaneering International, Inc.* | | | 16,094 | | | $ | 171,884 | |
Oil States International, Inc.* | | | 9,936 | | | | 53,853 | |
Par Pacific Hldgs., Inc.* | | | 7,335 | | | | 114,353 | |
Patterson-UTI Energy, Inc. | | | 34,724 | | | | 547,250 | |
PBF Energy, Inc. Cl A* | | | 15,324 | | | | 444,702 | |
ProPetro Hldg. Corp.* | | | 13,722 | | | | 137,220 | |
Ranger Oil Corp. Cl A* | | | 3,397 | | | | 111,659 | |
REX American Resources Corp.* | | | 836 | | | | 70,893 | |
RPC, Inc.* | | | 11,302 | | | | 78,097 | |
SM Energy Co. | | | 19,564 | | | | 668,893 | |
Southwestern Energy Co.* | | | 179,186 | | | | 1,119,913 | |
Talos Energy, Inc.* | | | 6,625 | | | | 102,489 | |
US Silica Hldgs., Inc.* | | | 12,117 | | | | 138,376 | |
World Fuel Svcs. Corp. | | | 10,116 | | | | 206,973 | |
| | | | | | | | |
| | | | | | | 7,190,854 | |
| | | | | | | | |
| FINANCIALS (19.8%) | | | | | | |
Allegiance Bancshares, Inc. | | | 3,042 | | | | 114,866 | |
Ambac Financial Group, Inc.* | | | 7,231 | | | | 82,072 | |
American Equity Investment Life Hldg. Co. | | | 12,400 | | | | 453,468 | |
Ameris Bancorp | | | 10,590 | | | | 425,506 | |
AMERISAFE, Inc. | | | 3,102 | | | | 161,335 | |
Apollo Commercial Real Estate Finance, Inc. | | | 21,216 | | | | 221,495 | |
ARMOUR Residential REIT, Inc. | | | 16,562 | | | | 116,596 | |
Assured Guaranty Ltd. | | | 10,289 | | | | 574,023 | |
Axos Financial, Inc.* | | | 8,620 | | | | 309,027 | |
B Riley Financial, Inc. | | | 2,600 | | | | 109,850 | |
Banc of California, Inc. | | | 8,507 | | | | 149,893 | |
BancFirst Corp. | | | 3,048 | | | | 291,724 | |
Bancorp, Inc.* | | | 9,082 | | | | 177,281 | |
BankUnited, Inc. | | | 13,130 | | | | 467,034 | |
Banner Corp. | | | 5,519 | | | | 310,223 | |
Berkshire Hills Bancorp, Inc. | | | 7,597 | | | | 188,178 | |
Blucora, Inc.* | | | 7,585 | | | | 140,019 | |
Brightsphere Investment Group, Inc. | | | 5,187 | | | | 93,418 | |
Brookline Bancorp, Inc. | | | 12,436 | | | | 165,523 | |
Capitol Federal Financial, Inc. | | | 20,731 | | | | 190,311 | |
Central Pacific Financial Corp. | | | 4,423 | | | | 94,873 | |
City Hldg. Co. | | | 2,402 | | | | 191,872 | |
Columbia Banking System, Inc. | | | 12,498 | | | | 358,068 | |
Community Bank System, Inc. | | | 8,654 | | | | 547,625 | |
Customers Bancorp, Inc.* | | | 4,871 | | | | 165,127 | |
CVB Financial Corp. | | | 21,286 | | | | 528,106 | |
Dime Community Bancshares, Inc. | | | 5,166 | | | | 153,172 | |
Donnelley Financial Solutions, Inc.* | | | 4,491 | | | | 131,541 | |
Eagle Bancorp, Inc. | | | 5,150 | | | | 244,161 | |
eHealth, Inc.* | | | 3,877 | | | | 36,172 | |
Ellington Financial, Inc. | | | 9,099 | | | | 133,482 | |
The accompanying notes are an integral part of these portfolio schedules.
47
MUTUAL OF AMERICA INVESTMENT CORPORATION — SMALL CAP EQUITY INDEX FUND
PORTFOLIO OF INVESTMENTS IN SECURITIES (Continued)
June 30, 2022 (Unaudited)
| | | | | | | | |
| | | Shares | | | Value | |
| INDEXED ASSETS (CONTINUED): | | | | | | |
| COMMON STOCKS (CONTINUED): | | | | | | |
| FINANCIALS (CONTINUED) | | | | | | |
Employers Hldgs., Inc. | | | 4,453 | | | $ | 186,536 | |
Encore Capital Group, Inc.* | | | 3,894 | | | | 224,956 | |
Enova International, Inc.* | | | 5,227 | | | | 150,642 | |
EZCORP, Inc. Cl A* | | | 8,618 | | | | 64,721 | |
FB Financial Corp. | | | 5,687 | | | | 223,044 | |
First BanCorp. | | | 31,708 | | | | 409,350 | |
First Bancorp/Southern Pines NC | | | 5,550 | | | | 193,695 | |
First Commonwealth Financial Corp. | | | 15,141 | | | | 203,192 | |
First Financial Bancorp | | | 15,161 | | | | 294,123 | |
First Hawaiian, Inc. | | | 20,559 | | | | 466,895 | |
Flagstar Bancorp, Inc. | | | 8,548 | | | | 303,027 | |
Franklin BSP Realty Trust, Inc. | | | 13,435 | | | | 181,104 | |
Genworth Financial, Inc. Cl A* | | | 81,954 | | | | 289,298 | |
Granite Point Mortgage Trust, Inc. | | | 8,646 | | | | 82,742 | |
Green Dot Corp. Cl A* | | | 8,703 | | | | 218,532 | |
Hanmi Financial Corp. | | | 4,891 | | | | 109,754 | |
HCI Group, Inc. | | | 1,267 | | | | 85,852 | |
Heritage Financial Corp. | | | 5,635 | | | | 141,777 | |
Hilltop Hldgs., Inc. | | | 7,981 | | | | 212,773 | |
HomeStreet, Inc. | | | 3,002 | | | | 104,079 | |
Hope Bancorp, Inc. | | | 19,328 | | | | 267,500 | |
Horace Mann Educators Corp. | | | 6,651 | | | | 255,265 | |
Independent Bank Corp. | | | 7,510 | | | | 596,519 | |
Independent Bank Group, Inc. | | | 5,836 | | | | 396,323 | |
Invesco Mortgage Capital, Inc. | | | 5,296 | | | | 77,745 | |
iShares Core S&P Small-Cap ETF | | | 29,714 | | | | 2,745,871 | |
James River Group Hldgs. Ltd. | | | 6,012 | | | | 148,977 | |
KKR Real Estate Finance Trust, Inc. | | | 7,961 | | | | 138,919 | |
Lakeland Financial Corp. | | | 4,069 | | | | 270,263 | |
LendingTree, Inc.* | | | 1,762 | | | | 77,211 | |
Meta Financial Group, Inc. | | | 4,714 | | | | 182,290 | |
Mr Cooper Group, Inc.* | | | 11,865 | | | | 435,920 | |
National Bank Hldgs. Corp. Cl A | | | 4,824 | | | | 184,614 | |
NBT Bancorp, Inc. | | | 6,875 | | | | 258,431 | |
New York Mortgage Trust, Inc. | | | 61,204 | | | | 168,923 | |
NMI Hldgs., Inc. Cl A* | | | 13,819 | | | | 230,086 | |
Northfield Bancorp, Inc. | | | 6,908 | | | | 90,011 | |
Northwest Bancshares, Inc. | | | 20,342 | | | | 260,378 | |
OFG Bancorp | | | 7,802 | | | | 198,171 | |
Pacific Premier Bancorp, Inc. | | | 15,240 | | | | 445,618 | |
Palomar Hldgs., Inc.* | | | 3,840 | | | | 247,296 | |
Park National Corp. | | | 2,322 | | | | 281,543 | |
PennyMac Mortgage Investment Trust | | | 14,762 | | | | 204,158 | |
Piper Sandler Cos. | | | 2,271 | | | | 257,441 | |
PRA Group, Inc.* | | | 6,388 | | | | 232,268 | |
Preferred Bank | | | 2,186 | | | | 148,692 | |
ProAssurance Corp. | | | 8,677 | | | | 205,038 | |
PROG Hldgs., Inc.* | | | 8,676 | | | | 143,154 | |
Provident Financial Svcs., Inc. | | | 12,092 | | | | 269,168 | |
Ready Capital Corp. | | | 10,802 | | | | 128,760 | |
| | | | | | | | |
| | | Shares | | | Value | |
| INDEXED ASSETS (CONTINUED): | | | | | | |
| COMMON STOCKS (CONTINUED): | | | | | | |
| FINANCIALS (CONTINUED) | | | | | | |
Redwood Trust, Inc. | | | 19,312 | | | $ | 148,896 | |
Renasant Corp. | | | 8,974 | | | | 258,541 | |
S&T Bancorp, Inc. | | | 6,311 | | | | 173,111 | |
Safety Insurance Group, Inc. | | | 2,248 | | | | 218,281 | |
Seacoast Banking Corp. of Florida | | | 9,831 | | | | 324,816 | |
Selectquote, Inc.* | | | 20,058 | | | | 49,744 | |
ServisFirst Bancshares, Inc. | | | 7,844 | | | | 619,048 | |
Simmons First National Corp. Cl A | | | 20,345 | | | | 432,535 | |
SiriusPoint Ltd.* | | | 13,889 | | | | 75,278 | |
Southside Bancshares, Inc. | | | 5,157 | | | | 192,975 | |
Stewart Information Svcs. Corp. | | | 4,337 | | | | 215,766 | |
StoneX Group, Inc.* | | | 2,755 | | | | 215,083 | |
Tompkins Financial Corp. | | | 1,889 | | | | 136,197 | |
Triumph Bancorp, Inc.* | | | 3,797 | | | | 237,540 | |
Trupanion, Inc.* | | | 5,556 | | | | 334,805 | |
TrustCo Bank Corp. | | | 3,082 | | | | 95,049 | |
Trustmark Corp. | | | 9,867 | | | | 288,018 | |
Two Harbors Investment Corp. | | | 55,247 | | | | 275,130 | |
United Community Banks, Inc. | | | 16,851 | | | | 508,732 | |
United Fire Group, Inc. | | | 3,469 | | | | 118,744 | |
Universal Insurance Hldgs., Inc. | | | 4,471 | | | | 58,257 | |
Veritex Hldgs., Inc. | | | 8,656 | | | | 253,275 | |
Virtus Investment Partners, Inc. | | | 1,128 | | | | 192,911 | |
Walker & Dunlop, Inc. | | | 4,893 | | | | 471,392 | |
Westamerica BanCorp | | | 4,316 | | | | 240,229 | |
WisdomTree Investments, Inc. | | | 17,646 | | | | 89,465 | |
World Acceptance Corp.* | | | 587 | | | | 65,885 | |
WSFS Financial Corp. | | | 10,392 | | | | 416,615 | |
| | | | | | | | |
| | | | | | | 27,725,004 | |
| | | | | | | | |
| HEALTH CARE (12.2%) | | | | | | |
Addus HomeCare Corp.* | | | 2,580 | | | | 214,862 | |
Allscripts Healthcare Solutions, Inc.* | | | 18,625 | | | | 276,209 | |
AMN Healthcare Svcs., Inc.* | | | 7,179 | | | | 787,608 | |
Amphastar Pharmaceuticals, Inc.* | | | 6,036 | | | | 209,992 | |
AngioDynamics, Inc.* | | | 6,226 | | | | 120,473 | |
ANI Pharmaceuticals, Inc.* | | | 2,103 | | | | 62,396 | |
Anika Therapeutics, Inc.* | | | 2,335 | | | | 52,117 | |
Apollo Medical Hldgs., Inc.* | | | 6,119 | | | | 236,132 | |
Arcus Biosciences, Inc.* | | | 7,484 | | | | 189,645 | |
Artivion, Inc.* | | | 6,454 | | | | 121,852 | |
Avanos Medical, Inc.* | | | 7,597 | | | | 207,702 | |
Avid Bioservices, Inc.* | | | 9,912 | | | | 151,257 | |
BioLife Solutions, Inc.* | | | 4,902 | | | | 67,697 | |
Cara Therapeutics, Inc.* | | | 6,797 | | | | 62,057 | |
Cardiovascular Systems, Inc.* | | | 6,547 | | | | 94,015 | |
Coherus Biosciences, Inc.* | | | 10,316 | | | | 74,688 | |
Collegium Pharmaceutical, Inc.* | | | 5,454 | | | | 96,645 | |
Community Health Systems, Inc.* | | | 20,326 | | | | 76,222 | |
Computer Programs & Systems, Inc.* | | | 2,370 | | | | 75,769 | |
CONMED Corp. | | | 4,740 | | | | 453,902 | |
The accompanying notes are an integral part of these portfolio schedules.
48
MUTUAL OF AMERICA INVESTMENT CORPORATION — SMALL CAP EQUITY INDEX FUND
PORTFOLIO OF INVESTMENTS IN SECURITIES (Continued)
June 30, 2022 (Unaudited)
| | | | | | | | |
| | | Shares | | | Value | |
| INDEXED ASSETS (CONTINUED): | | | | | | |
| COMMON STOCKS (CONTINUED): | | | | | | |
| HEALTH CARE (CONTINUED) | | | | | | |
Contra Progenics Pharmaceuticals, Inc. — contingent value rights* | | | 3,670 | | | $ | 0 | †† |
Corcept Therapeutics, Inc.* | | | 15,351 | | | | 365,047 | |
CorVel Corp.* | | | 1,499 | | | | 220,758 | |
Covetrus, Inc.* | | | 16,785 | | | | 348,289 | |
Cross Country Healthcare, Inc.* | | | 5,705 | | | | 118,835 | |
Cutera, Inc.* | | | 2,653 | | | | 99,488 | |
Cytokinetics, Inc.* | | | 13,750 | | | | 540,238 | |
Dynavax Technologies Corp.* | | | 18,858 | | | | 237,422 | |
Eagle Pharmaceuticals, Inc.* | | | 1,794 | | | | 79,707 | |
Embecta Corp.* | | | 9,279 | | | | 234,944 | |
Emergent BioSolutions, Inc.* | | | 7,179 | | | | 222,836 | |
Enanta Pharmaceuticals, Inc.* | | | 2,959 | | | | 139,872 | |
Ensign Group, Inc. | | | 8,461 | | | | 621,630 | |
Fulgent Genetics, Inc.* | | | 3,165 | | | | 172,587 | |
Glaukos Corp.* | | | 7,599 | | | | 345,147 | |
Hanger, Inc.* | | | 5,952 | | | | 85,233 | |
Harmony Biosciences Hldgs., Inc.* | | | 3,697 | | | | 180,303 | |
HealthStream, Inc.* | | | 3,903 | | | | 84,734 | |
Heska Corp.* | | | 1,732 | | | | 163,691 | |
Innoviva, Inc.* | | | 10,070 | | | | 148,633 | |
Inogen, Inc.* | | | 3,299 | | | | 79,770 | |
Integer Hldgs. Corp.* | | | 5,314 | | | | 375,487 | |
Ironwood Pharmaceuticals, Inc.
Cl A* | | | 24,697 | | | | 284,756 | |
iTeos Therapeutics, Inc.* | | | 3,252 | | | | 66,991 | |
Joint Corp.* | | | 2,322 | | | | 35,550 | |
Lantheus Hldgs., Inc.* | | | 11,018 | | | | 727,519 | |
LeMaitre Vascular, Inc. | | | 3,101 | | | | 141,251 | |
Ligand Pharmaceuticals, Inc.* | | | 2,707 | | | | 241,519 | |
MEDNAX, Inc.* | | | 13,825 | | | | 290,463 | |
Meridian Bioscience, Inc.* | | | 6,995 | | | | 212,788 | |
Merit Medical Systems, Inc.* | | | 8,189 | | | | 444,417 | |
Mesa Laboratories, Inc. | | | 845 | | | | 172,329 | |
ModivCare, Inc.* | | | 1,984 | | | | 167,648 | |
Myriad Genetics, Inc.* | | | 12,898 | | | | 234,357 | |
Natus Medical, Inc.* | | | 5,552 | | | | 181,939 | |
Nektar Therapeutics Cl A* | | | 29,904 | | | | 113,635 | |
NeoGenomics, Inc.* | | | 20,028 | | | | 163,228 | |
NextGen Healthcare, Inc.* | | | 9,017 | | | | 157,256 | |
Omnicell, Inc.* | | | 7,095 | | | | 807,056 | |
OptimizeRx Corp.* | | | 2,914 | | | | 79,814 | |
OraSure Technologies, Inc.* | | | 11,632 | | | | 31,523 | |
Organogenesis Hldgs., Inc. Cl A* | | | 10,158 | | | | 49,571 | |
Orthofix Medical, Inc.* | | | 3,197 | | | | 75,257 | |
Owens & Minor, Inc. | | | 12,218 | | | | 384,256 | |
Pacira BioSciences, Inc.* | | | 7,294 | | | | 425,240 | |
Pennant Group, Inc.* | | | 4,352 | | | | 55,749 | |
Phibro Animal Health Corp. Cl A | | | 3,265 | | | | 62,459 | |
Prestige Consumer Healthcare, Inc.* | | | 8,072 | | | | 474,634 | |
RadNet, Inc.* | | | 7,491 | | | | 129,444 | |
REGENXBIO, Inc.* | | | 6,094 | | | | 150,522 | |
Select Medical Hldgs. Corp. | | | 16,567 | | | | 391,313 | |
| | | | | | | | |
| | | Shares | | | Value | |
| INDEXED ASSETS (CONTINUED): | | | | | | |
| COMMON STOCKS (CONTINUED): | | | | | | |
| HEALTH CARE (CONTINUED) | | | | | | |
Simulations Plus, Inc. | | | 2,530 | | | $ | 124,805 | |
Supernus Pharmaceuticals, Inc.* | | | 8,575 | | | | 247,989 | |
Surmodics, Inc.* | | | 2,246 | | | | 83,619 | |
uniQure NV* | | | 5,841 | | | | 108,876 | |
US Physical Therapy, Inc. | | | 2,086 | | | | 227,791 | |
Vanda Pharmaceuticals, Inc.* | | | 9,069 | | | | 98,852 | |
Varex Imaging Corp.* | | | 6,389 | | | | 136,661 | |
Vericel Corp.* | | | 7,564 | | | | 190,462 | |
Vir Biotechnology, Inc.* | | | 11,901 | | | | 303,118 | |
Xencor, Inc.* | | | 9,559 | | | | 261,630 | |
Zimvie, Inc.* | | | 3,349 | | | | 53,617 | |
Zynex, Inc. | | | 3,573 | | | | 28,513 | |
| | | | | | | | |
| | | | | | | 17,114,308 | |
| | | | | | | | |
| INDUSTRIALS (15.9%) | | | | | | |
AAON, Inc. | | | 6,731 | | | | 368,590 | |
AAR Corp.* | | | 5,311 | | | | 222,212 | |
ABM Industries, Inc. | | | 10,735 | | | | 466,114 | |
Aerojet Rocketdyne Hldgs., Inc.* | | | 12,014 | | | | 487,768 | |
AeroVironment, Inc.* | | | 3,720 | | | | 305,784 | |
Alamo Group, Inc. | | | 1,593 | | | | 185,473 | |
Albany International Corp. Cl A | | | 5,057 | | | | 398,441 | |
Allegiant Travel Co.* | | | 2,443 | | | | 276,279 | |
American Woodmark Corp.* | | | 2,660 | | | | 119,727 | |
Apogee Enterprises, Inc. | | | 3,563 | | | | 139,741 | |
Applied Industrial Technologies, Inc. | | | 6,172 | | | | 593,561 | |
ArcBest Corp. | | | 3,931 | | | | 276,624 | |
Arcosa, Inc. | | | 7,757 | | | | 360,157 | |
Astec Industries, Inc. | | | 3,667 | | | | 149,540 | |
Atlas Air Worldwide Hldgs., Inc.* | | | 4,209 | | | | 259,737 | |
AZZ, Inc. | | | 3,963 | | | | 161,770 | |
Barnes Group, Inc. | | | 7,488 | | | | 233,176 | |
Boise Cascade Co. | | | 6,333 | | | | 376,750 | |
Brady Corp. Cl A | | | 7,716 | | | | 364,504 | |
CIRCOR International, Inc.* | | | 3,252 | | | | 53,300 | |
Comfort Systems USA, Inc. | | | 5,777 | | | | 480,358 | |
CoreCivic, Inc.* | | | 19,520 | | | | 216,867 | |
Deluxe Corp. | | | 6,902 | | | | 149,566 | |
DXP Enterprises, Inc.* | | | 2,753 | | | | 84,324 | |
Encore Wire Corp. | | | 3,167 | | | | 329,115 | |
Enerpac Tool Group Corp. Cl A | | | 9,721 | | | | 184,893 | |
EnPro Industries, Inc. | | | 3,339 | | | | 273,564 | |
ESCO Technologies, Inc. | | | 4,150 | | | | 283,735 | |
Exponent, Inc. | | | 8,319 | | | | 760,939 | |
Federal Signal Corp. | | | 9,730 | | | | 346,388 | |
Forrester Research, Inc.* | | | 1,758 | | | | 84,103 | |
Forward Air Corp. | | | 4,312 | | | | 396,531 | |
Franklin Electric Co., Inc. | | | 6,245 | | | | 457,509 | |
GEO Group, Inc.* | | | 19,922 | | | | 131,485 | |
Gibraltar Industries, Inc.* | | | 5,264 | | | | 203,980 | |
GMS, Inc.* | | | 6,910 | | | | 307,495 | |
Granite Construction, Inc. | | | 7,283 | | | | 212,227 | |
The accompanying notes are an integral part of these portfolio schedules.
49
MUTUAL OF AMERICA INVESTMENT CORPORATION — SMALL CAP EQUITY INDEX FUND
PORTFOLIO OF INVESTMENTS IN SECURITIES (Continued)
June 30, 2022 (Unaudited)
| | | | | | | | |
| | | Shares | | | Value | |
| INDEXED ASSETS (CONTINUED): | | | | | | |
| COMMON STOCKS (CONTINUED): | | | | | | |
| INDUSTRIALS (CONTINUED) | | | | | | |
Greenbrier Cos., Inc. | | | 5,232 | | | $ | 188,300 | |
Griffon Corp. | | | 7,691 | | | | 215,579 | |
Harsco Corp.* | | | 12,749 | | | | 90,645 | |
Hawaiian Hldgs., Inc.* | | | 8,240 | | | | 117,914 | |
Healthcare Svcs. Group, Inc. | | | 11,885 | | | | 206,918 | |
Heartland Express, Inc. | | | 7,476 | | | | 103,991 | |
Heidrick & Struggles International, Inc. | | | 3,165 | | | | 102,419 | |
Hillenbrand, Inc. | | | 11,513 | | | | 471,572 | |
HNI Corp. | | | 6,804 | | | | 236,031 | |
Hub Group, Inc. Cl A* | | | 5,458 | | | | 387,190 | |
Insteel Industries, Inc. | | | 3,121 | | | | 105,084 | |
Interface, Inc. Cl A | | | 9,547 | | | | 119,719 | |
John Bean Technologies Corp. | | | 5,102 | | | | 563,363 | |
Kaman Corp. | | | 4,491 | | | | 140,344 | |
KAR Auction Svcs., Inc.* | | | 19,510 | | | | 288,163 | |
Kelly Svcs., Inc. Cl A | | | 5,548 | | | | 110,017 | |
Korn Ferry | | | 8,653 | | | | 502,047 | |
Lindsay Corp. | | | 1,762 | | | | 234,029 | |
ManTech International Corp. Cl A | | | 4,422 | | | | 422,080 | |
Marten Transport Ltd. | | | 9,472 | | | | 159,319 | |
Matson, Inc. | | | 6,508 | | | | 474,303 | |
Matthews International Corp. Cl A | | | 5,026 | | | | 144,095 | |
Meritor, Inc.* | | | 11,362 | | | | 412,781 | |
Moog, Inc. Cl A | | | 4,656 | | | | 369,640 | |
Mueller Industries, Inc. | | | 9,135 | | | | 486,804 | |
MYR Group, Inc.* | | | 2,730 | | | | 240,595 | |
National Presto Industries, Inc. | | | 815 | | | | 53,497 | |
NOW, Inc.* | | | 17,773 | | | | 173,820 | |
NV5 Global, Inc.* | | | 1,915 | | | | 223,557 | |
Park Aerospace Corp. | | | 3,120 | | | | 39,811 | |
PGT Innovations, Inc.* | | | 9,619 | | | | 160,060 | |
Pitney Bowes, Inc. | | | 26,172 | | | | 94,743 | |
Powell Industries, Inc. | | | 1,456 | | | | 34,027 | |
Proto Labs, Inc.* | | | 4,414 | | | | 211,166 | |
Quanex Building Products Corp. | | | 5,360 | | | | 121,940 | |
Resideo Technologies, Inc.* | | | 23,342 | | | | 453,302 | |
Resources Connection, Inc. | | | 4,996 | | | | 101,768 | |
SkyWest, Inc.* | | | 8,111 | | | | 172,359 | |
SPX Corp.* | | | 7,350 | | | | 388,374 | |
Standex International Corp. | | | 1,938 | | | | 164,304 | |
Tennant Co. | | | 2,983 | | | | 176,743 | |
Titan International, Inc.* | | | 8,248 | | | | 124,545 | |
Trinity Industries, Inc. | | | 11,239 | | | | 272,209 | |
Triumph Group, Inc.* | | | 10,375 | | | | 137,884 | |
TrueBlue, Inc.* | | | 5,341 | | | | 95,604 | |
UFP Industries, Inc. | | | 10,071 | | | | 686,238 | |
UniFirst Corp. | | | 2,437 | | | | 419,603 | |
Veritiv Corp.* | | | 2,240 | | | | 243,152 | |
Viad Corp.* | | | 3,306 | | | | 91,279 | |
Wabash National Corp. | | | 7,872 | | | | 106,902 | |
| | | | | | | | |
| | | | | | | 22,342,156 | |
| | | | | | | | |
| | | | | | | | |
| | | Shares | | | Value | |
| INDEXED ASSETS (CONTINUED): | | | | | | |
| COMMON STOCKS (CONTINUED): | | | | | | |
INFORMATION TECHNOLOGY (13.2%) | | | | | | | | |
3D Systems Corp.* | | | 20,924 | | | $ | 202,963 | |
8x8, Inc.* | | | 18,996 | | | | 97,829 | |
A10 Networks, Inc. | | | 9,373 | | | | 134,784 | |
ADTRAN, Inc. | | | 7,886 | | | | 138,242 | |
Advanced Energy Industries, Inc. | | | 6,030 | | | | 440,069 | |
Agilysys, Inc.* | | | 3,136 | | | | 148,239 | |
Alarm.com Hldgs., Inc.* | | | 7,398 | | | | 457,640 | |
Alpha & Omega Semiconductor Ltd.* | | | 3,476 | | | | 115,890 | |
Arlo Technologies, Inc.* | | | 13,944 | | | | 87,429 | |
Axcelis Technologies, Inc.* | | | 5,301 | | | | 290,707 | |
Badger Meter, Inc. | | | 4,699 | | | | 380,102 | |
Benchmark Electronics, Inc. | | | 5,640 | | | | 127,238 | |
BM Technologies, Inc.* | | | 527 | | | | 3,104 | |
CalAmp Corp.* | | | 5,789 | | | | 24,140 | |
Cerence, Inc.* | | | 6,310 | | | | 159,201 | |
CEVA, Inc.* | | | 3,726 | | | | 125,045 | |
Cohu, Inc.* | | | 7,808 | | | | 216,672 | |
Comtech Telecommunications Corp. | | | 4,257 | | | | 38,611 | |
Consensus Cloud Solutions, Inc.* | | | 2,568 | | | | 112,170 | |
Corsair Gaming, Inc.* | | | 5,360 | | | | 70,377 | |
CSG Systems International, Inc. | | | 4,994 | | | | 298,042 | |
CTS Corp. | | | 5,151 | | | | 175,392 | |
Diebold Nixdorf, Inc.* | | | 11,790 | | | | 26,763 | |
Digi International, Inc.* | | | 5,636 | | | | 136,504 | |
Digital Turbine, Inc.* | | | 14,158 | | | | 247,340 | |
Diodes, Inc.* | | | 7,264 | | | | 469,036 | |
Ebix, Inc. | | | 3,820 | | | | 64,558 | |
ePlus, Inc.* | | | 4,316 | | | | 229,266 | |
EVERTEC, Inc. | | | 9,533 | | | | 351,577 | |
ExlService Hldgs., Inc.* | | | 5,344 | | | | 787,331 | |
Extreme Networks, Inc.* | | | 21,004 | | | | 187,356 | |
Fabrinet* | | | 5,905 | | | | 478,895 | |
FARO Technologies, Inc.* | | | 2,932 | | | | 90,394 | |
FormFactor, Inc.* | | | 12,532 | | | | 485,364 | |
Harmonic, Inc.* | | | 16,774 | | | | 145,431 | |
Ichor Hldgs. Ltd.* | | | 4,596 | | | | 119,404 | |
Insight Enterprises, Inc.* | | | 5,631 | | | | 485,843 | |
InterDigital, Inc. | | | 4,956 | | | | 301,325 | |
Itron, Inc.* | | | 7,234 | | | | 357,577 | |
Knowles Corp.* | | | 14,730 | | | | 255,271 | |
Kulicke & Soffa Industries, Inc. | | | 9,492 | | | | 406,353 | |
LivePerson, Inc.* | | | 11,115 | | | | 157,166 | |
LiveRamp Hldgs., Inc.* | | | 10,945 | | | | 282,490 | |
MaxLinear, Inc. Cl A* | | | 11,425 | | | | 388,221 | |
Methode Electronics, Inc. | | | 5,929 | | | | 219,610 | |
NETGEAR, Inc.* | | | 4,619 | | | | 85,544 | |
NetScout Systems, Inc.* | | | 11,852 | | | | 401,190 | |
OneSpan, Inc.* | | | 5,525 | | | | 65,747 | |
The accompanying notes are an integral part of these portfolio schedules.
50
MUTUAL OF AMERICA INVESTMENT CORPORATION — SMALL CAP EQUITY INDEX FUND
PORTFOLIO OF INVESTMENTS IN SECURITIES (Continued)
June 30, 2022 (Unaudited)
| | | | | | | | |
| | | Shares | | | Value | |
| INDEXED ASSETS (CONTINUED): | | | | | | |
| COMMON STOCKS (CONTINUED): | | | | | | |
| INFORMATION TECHNOLOGY (CONTINUED) | | | | |
Onto Innovation, Inc.* | | | 7,956 | | | $ | 554,851 | |
OSI Systems, Inc.* | | | 2,545 | | | | 217,445 | |
PC Connection, Inc. | | | 1,771 | | | | 78,013 | |
PDF Solutions, Inc.* | | | 4,746 | | | | 102,086 | |
Perficient, Inc.* | | | 5,562 | | | | 509,980 | |
Photronics, Inc.* | | | 9,910 | | | | 193,047 | |
Plantronics, Inc.* | | | 6,868 | | | | 272,522 | |
Plexus Corp.* | | | 4,451 | | | | 349,403 | |
Progress Software Corp. | | | 7,026 | | | | 318,278 | |
Rambus, Inc.* | | | 17,697 | | | | 380,309 | |
Rogers Corp.* | | | 3,007 | | | | 788,105 | |
Sanmina Corp.* | | | 9,768 | | | | 397,851 | |
ScanSource, Inc.* | | | 4,051 | | | | 126,148 | |
SMART Global Hldgs., Inc.* | | | 7,590 | | | | 124,248 | |
SPS Commerce, Inc.* | | | 5,795 | | | | 655,125 | |
TTEC Hldgs., Inc. | | | 2,945 | | | | 199,936 | |
TTM Technologies, Inc.* | | | 16,216 | | | | 202,700 | |
Ultra Clean Hldgs., Inc.* | | | 7,240 | | | | 215,535 | |
Unisys Corp.* | | | 10,858 | | | | 130,622 | |
Veeco Instruments, Inc.* | | | 8,226 | | | | 159,584 | |
Viavi Solutions, Inc.* | | | 36,575 | | | | 483,887 | |
Vonage Hldgs. Corp.* | | | 40,531 | | | | 763,604 | |
Xperi Hldg. Corp. | | | 16,688 | | | | 240,808 | |
| | | | | | | | |
| | | | | | | 18,533,529 | |
| | | | | | | | |
| MATERIALS (5.3%) | | | | | | |
AdvanSix, Inc. | | | 4,512 | | | | 150,881 | |
Allegheny Technologies, Inc.* | | | 19,928 | | | | 452,565 | |
American Vanguard Corp. | | | 4,304 | | | | 96,194 | |
Arconic Corp.* | | | 16,982 | | | | 476,345 | |
Balchem Corp. | | | 5,156 | | | | 668,939 | |
Carpenter Technology Corp. | | | 7,751 | | | | 216,330 | |
Century Aluminum Co.* | | | 8,202 | | | | 60,449 | |
Clearwater Paper Corp.* | | | 2,711 | | | | 91,171 | |
Compass Minerals International, Inc. | | | 5,482 | | | | 194,008 | |
FutureFuel Corp. | | | 4,145 | | | | 30,176 | |
GCP Applied Technologies, Inc.* | | | 8,665 | | | | 271,041 | |
Glatfelter Corp. | | | 7,179 | | | | 49,392 | |
Hawkins, Inc. | | | 3,017 | | | | 108,702 | |
Haynes International, Inc. | | | 2,000 | | | | 65,540 | |
HB Fuller Co. | | | 8,517 | | | | 512,809 | |
Innospec, Inc. | | | 3,984 | | | | 381,627 | |
Kaiser Aluminum Corp. | | | 2,553 | | | | 201,917 | |
Koppers Hldgs., Inc. | | | 3,394 | | | | 76,840 | |
Livent Corp.* | | | 25,966 | | | | 589,169 | |
Materion Corp. | | | 3,293 | | | | 242,793 | |
Mercer International, Inc.* | | | 6,476 | | | | 85,159 | |
Myers Industries, Inc. | | | 5,835 | | | | 132,630 | |
Neenah, Inc. | | | 2,695 | | | | 92,007 | |
O-I Glass, Inc.* | | | 25,078 | | | | 351,092 | |
Olympic Steel, Inc. | | | 1,501 | | | | 38,651 | |
Quaker Chemical Corp. | | | 2,157 | | | | 322,515 | |
Rayonier Advanced Materials, Inc.* | | | 10,250 | | | | 26,855 | |
| | | | | | | | |
| | | Shares | | | Value | |
| INDEXED ASSETS (CONTINUED): | | | | | | |
| COMMON STOCKS (CONTINUED): | | | | | | |
| MATERIALS (CONTINUED) | | | | | | |
Schweitzer-Mauduit International, Inc. | | | 5,117 | | | $ | 128,539 | |
Stepan Co. | | | 3,411 | | | | 345,705 | |
SunCoke Energy, Inc. | | | 13,386 | | | | 91,159 | |
Sylvamo Corp. | | | 5,665 | | | | 185,132 | |
TimkenSteel Corp.* | | | 6,662 | | | | 124,646 | |
Tredegar Corp. | | | 4,130 | | | | 41,300 | |
Trinseo PLC | | | 5,804 | | | | 223,222 | |
Warrior Met Coal, Inc. | | | 8,292 | | | | 253,818 | |
| | | | | | | | |
| | | | | | | 7,379,318 | |
| | | | | | | | |
| REAL ESTATE (7.5%) | | | | | | |
Acadia Realty Trust | | | 15,232 | | | | 237,924 | |
Agree Realty Corp. | | | 12,068 | | | | 870,465 | |
Alexander & Baldwin, Inc. | | | 11,668 | | | | 209,441 | |
American Assets Trust, Inc. | | | 8,453 | | | | 251,054 | |
Anywhere Real Estate, Inc.* | | | 18,969 | | | | 186,465 | |
Armada Hoffler Properties, Inc. | | | 10,869 | | | | 139,558 | |
Brandywine Realty Trust | | | 27,513 | | | | 265,225 | |
CareTrust REIT, Inc. | | | 15,766 | | | | 290,725 | |
Centerspace | | | 2,467 | | | | 201,184 | |
Chatham Lodging Trust* | | | 7,835 | | | | 81,876 | |
Community Healthcare Trust, Inc. | | | 3,783 | | | | 136,982 | |
DiamondRock Hospitality Co.* | | | 33,851 | | | | 277,917 | |
Diversified Healthcare Trust | | | 38,366 | | | | 69,826 | |
Douglas Elliman, Inc. | | | 11,085 | | | | 53,097 | |
Easterly Government Properties, Inc. Cl A | | | 14,573 | | | | 277,470 | |
Essential Properties Realty Trust, Inc. | | | 21,055 | | | | 452,472 | |
Four Corners Property Trust, Inc. | | | 12,901 | | | | 343,038 | |
Franklin Street Properties Corp. | | | 14,904 | | | | 62,150 | |
Getty Realty Corp. | | | 6,527 | | | | 172,965 | |
Global Net Lease, Inc. | | | 16,636 | | | | 235,566 | |
Hersha Hospitality Trust Cl A* | | | 5,307 | | | | 52,062 | |
Industrial Logistics Properties Trust | | | 10,500 | | | | 147,840 | |
Innovative Industrial Properties, Inc. Cl A | | | 4,490 | | | | 493,316 | |
iStar, Inc. | | | 13,300 | | | | 182,343 | |
LTC Properties, Inc. | | | 6,335 | | | | 243,201 | |
LXP Industrial Trust | | | 46,017 | | | | 494,222 | |
Marcus & Millichap, Inc. | | | 3,933 | | | | 145,482 | |
NexPoint Residential Trust, Inc. | | | 3,713 | | | | 232,100 | |
Office Properties Income Trust | | | 7,774 | | | | 155,091 | |
Orion Office REIT, Inc. | | | 9,091 | | | | 99,637 | |
RE/MAX Hldgs., Inc. Cl A | | | 3,093 | | | | 75,840 | |
Retail Opportunity Investments Corp. | | | 19,939 | | | | 314,637 | |
RPT Realty | | | 13,663 | | | | 134,307 | |
Safehold, Inc. | | | 2,486 | | | | 87,930 | |
Saul Centers, Inc. | | | 2,110 | | | | 99,402 | |
Service Properties Trust | | | 26,503 | | | | 138,611 | |
SITE Centers Corp. | | | 29,178 | | | | 393,028 | |
The accompanying notes are an integral part of these portfolio schedules.
51
MUTUAL OF AMERICA INVESTMENT CORPORATION — SMALL CAP EQUITY INDEX FUND
PORTFOLIO OF INVESTMENTS IN SECURITIES (Continued)
June 30, 2022 (Unaudited)
| | | | | | | | |
| | | Shares | | | Value | |
| INDEXED ASSETS (CONTINUED): | | | | | | |
| COMMON STOCKS (CONTINUED): | | | | | | |
| REAL ESTATE (CONTINUED) | | | | | | |
St Joe Co. | | | 5,296 | | | $ | 209,510 | |
Summit Hotel Properties, Inc.* | | | 17,188 | | | | 124,957 | |
Tanger Factory Outlet Centers, Inc. | | | 16,759 | | | | 238,313 | |
Uniti Group, Inc. | | | 38,064 | | | | 358,563 | |
Universal Health Realty Income Trust | | | 2,058 | | | | 109,506 | |
Urban Edge Properties | | | 17,720 | | | | 269,521 | |
Urstadt Biddle Properties, Inc. Cl A | | | 4,842 | | | | 78,440 | |
Veris Residential, Inc.* | | | 12,860 | | | | 170,266 | |
Washington Real Estate Investment Trust | | | 14,035 | | | | 299,086 | |
Whitestone REIT Cl B | | | 7,416 | | | | 79,722 | |
Xenia Hotels & Resorts, Inc.* | | | 18,358 | | | | 266,742 | |
| | | | | | | | |
| | | | | | | 10,509,075 | |
| | | | | | | | |
| | | | | | | | |
| | | Shares | | | Value | |
| INDEXED ASSETS (CONTINUED): | | | | | | |
| COMMON STOCKS (CONTINUED): | | | | | | |
| UTILITIES (2.3%) | | | | | | |
American States Water Co. | | | 5,933 | | | $ | 483,599 | |
Avista Corp. | | | 11,629 | | | | 505,978 | |
California Water Svc. Group | | | 8,632 | | | | 479,508 | |
Chesapeake Utilities Corp. | | | 2,846 | | | | 368,699 | |
Middlesex Water Co. | | | 2,819 | | | | 247,170 | |
Northwest Natural Hldg. Co. | | | 5,499 | | | | 291,997 | |
South Jersey Industries, Inc. | | | 19,651 | | | | 670,885 | |
Unitil Corp. | | | 2,574 | | | | 151,145 | |
| | | | | | | | |
| | | | | | | 3,198,981 | |
| | | | | | | | |
TOTAL INDEXED ASSETS-COMMON
STOCKS | | | | | | |
(Cost: $146,971,859) 99.9% | | | | 140,205,846 | |
| | | | | | | | |
| | | | | | | | | | | | | | | | |
| | | | | | | | | Shares | | | Value | |
| WARRANTS | | | | | | | | | | | | |
| ENERGY (0.0%) (2) | | | | | | | | | | | | |
Nabors Industries Ltd. — expiring 06/11/2026* | | | | 347 | | | $ | 11,097 | |
| | | | | | | | | | | | | | | | |
| TOTAL INDEXED ASSETS — WARRANTS | | | | | | | | | | | | |
(Cost: $2,521) 0.0% (2) | | | | 11,097 | |
| | | | | | | | | | | | | | | | |
| | | | |
| | | Rate(%) | | | Maturity | | | Face Amount | | | Value | |
| TEMPORARY CASH INVESTMENT (0.1%) | | | | | | | | | | | | |
JP Morgan Chase, New York Time Deposit | | | 0.91 | | | | 07/01/22 | | | $ | 136,079 | | | $ | 136,079 | |
| | | | | | | | | | | | | | | | |
TOTAL TEMPORARY CASH INVESTMENT | | | | | | | | | | | | | | | | |
(Cost: $136,079) 0.1% | | | | 136,079 | |
| | | | | | | | | | | | | | | | |
TOTAL INVESTMENTS
(Cost: $147,110,459) 100.0% | | | | 140,353,022 | |
| | | | | | | | | | | | | | | | |
OTHER NET ASSETS -0.0% (2) | | | | (61,094 | ) |
| | | | | | | | | | | | | | | | |
NET ASSETS 100.0% | | | $ | 140,291,928 | |
| | | | | | | | | | | | | | | | |
The accompanying notes are an integral part of these portfolio schedules.
52
MUTUAL OF AMERICA INVESTMENT CORPORATION — MID CAP VALUE FUND
PORTFOLIO OF INVESTMENTS IN SECURITIES
June 30, 2022 (Unaudited)
| | | | | | | | |
| | | Shares | | | Value | |
COMMON STOCKS: | |
| COMMUNICATION SERVICES (1.6%) | |
Take-Two Interactive Software, Inc.* | | | 9,509 | | | $ | 1,165,138 | |
Warner Bros Discovery, Inc.* | | | 53,290 | | | | 715,152 | |
| | | | | | | | |
| | | | | | | 1,880,290 | |
| | | | | | | | |
| CONSUMER DISCRETIONARY (6.8%) | | | | | | |
Burlington Stores, Inc.* | | | 3,887 | | | | 529,526 | |
Capri Hldgs. Ltd.* | | | 31,239 | | | | 1,281,111 | |
Hanesbrands, Inc. | | | 91,711 | | | | 943,706 | |
Marriott Vacations Worldwide Corp. | | | 15,508 | | | | 1,802,030 | |
Ollie’s Bargain Outlet Hldgs., Inc.* | | | 14,190 | | | | 833,662 | |
Steven Madden Ltd. | | | 45,274 | | | | 1,458,276 | |
Taylor Morrison Home Corp. Cl A* | | | 31,160 | | | | 727,898 | |
Williams-Sonoma, Inc. | | | 4,394 | | | | 487,514 | |
| | | | | | | | |
| | | | | | | 8,063,723 | |
| | | | | | | | |
| CONSUMER STAPLES (3.7%) | | | | | | |
Boston Beer Co., Inc. Cl A* | | | 4,139 | | | | 1,253,993 | |
Constellation Brands, Inc. Cl A | | | 4,898 | | | | 1,141,528 | |
TreeHouse Foods, Inc.* | | | 47,558 | | | | 1,988,875 | |
| | | | | | | | |
| | | | | | | 4,384,396 | |
| | | | | | | | |
| ENERGY (8.1%) | | | | | | |
Baker Hughes Co. Cl A | | | 105,276 | | | | 3,039,318 | |
Cheniere Energy, Inc. | | | 11,280 | | | | 1,500,579 | |
Devon Energy Corp. | | | 47,983 | | | | 2,644,343 | |
Hess Corp. | | | 8,558 | | | | 906,635 | |
MPLX LP | | | 23,135 | | | | 674,385 | |
Williams Cos., Inc. | | | 29,234 | | | | 912,393 | |
| | | | | | | | |
| | | | | | | 9,677,653 | |
| | | | | | | | |
| FINANCIALS (14.1%) | | | | | | |
American Financial Group, Inc. | | | 19,543 | | | | 2,712,764 | |
Ameriprise Financial, Inc. | | | 11,403 | | | | 2,710,265 | |
Discover Financial Svcs. | | | 9,424 | | | | 891,322 | |
Everest Re Group Ltd. | | | 4,662 | | | | 1,306,665 | |
Fifth Third Bancorp | | | 37,663 | | | | 1,265,477 | |
Hartford Financial Svcs. Group, Inc. | | | 15,896 | | | | 1,040,075 | |
KeyCorp. | | | 70,831 | | | | 1,220,418 | |
Reinsurance Group of America, Inc. | | | 8,391 | | | | 984,180 | |
Signature Bank | | | 5,256 | | | | 941,928 | |
Starwood Property Trust, Inc. | | | 38,652 | | | | 807,440 | |
SVB Financial Group* | | | 2,746 | | | | 1,084,643 | |
Synchrony Financial | | | 20,124 | | | | 555,825 | |
Voya Financial, Inc. | | | 13,194 | | | | 785,439 | |
Zions Bancorporation | | | 11,165 | | | | 568,298 | |
| | | | | | | | |
| | | | | | | 16,874,739 | |
| | | | | | | | |
| HEALTH CARE (7.8%) | | | | | | |
Agilent Technologies, Inc. | | | 14,989 | | | | 1,780,243 | |
Centene Corp.* | | | 15,956 | | | | 1,350,037 | |
Envista Hldgs. Corp.* | | | 35,689 | | | | 1,375,454 | |
| | | | | | | | |
| | | Shares | | | Value | |
COMMON STOCKS (CONTINUED): | |
| HEALTH CARE (CONTINUED) | | | | | | |
Horizon Therapeutics PLC* | | | 9,585 | | | $ | 764,500 | |
Humana, Inc. | | | 1,891 | | | | 885,120 | |
Syneos Health, Inc. Cl A* | | | 19,923 | | | | 1,428,081 | |
Zimmer Biomet Hldgs., Inc. | | | 16,461 | | | | 1,729,393 | |
Zimvie, Inc.* | | | 1,572 | | | | 25,168 | |
| | | | | | | | |
| | | | | | | 9,337,996 | |
| | | | | | | | |
| INDUSTRIALS (18.5%) | | | | | | |
Alaska Air Group, Inc.* | | | 24,612 | | | | 985,711 | |
Builders FirstSource, Inc.* | | | 38,989 | | | | 2,093,709 | |
Carlisle Cos., Inc. | | | 8,253 | | | | 1,969,248 | |
Clean Harbors, Inc.* | | | 13,847 | | | | 1,213,966 | |
Crane Hldgs. Co. | | | 24,117 | | | | 2,111,685 | |
Dover Corp. | | | 7,308 | | | | 886,607 | |
Jacobs Engineering Group, Inc. | | | 15,738 | | | | 2,000,772 | |
KBR, Inc. | | | 29,859 | | | | 1,444,877 | |
L-3 Harris Technologies, Inc. | | | 6,835 | | | | 1,652,020 | |
Mueller Industries, Inc. | | | 41,447 | | | | 2,208,711 | |
Old Dominion Freight Line, Inc. | | | 5,843 | | | | 1,497,444 | |
Oshkosh Corp. | | | 12,103 | | | | 994,140 | |
Stanley Black & Decker, Inc. | | | 9,637 | | | | 1,010,536 | |
Univar Solutions, Inc.* | | | 82,435 | | | | 2,050,158 | |
| | | | | | | | |
| | | | | | | 22,119,584 | |
| | | | | | | | |
| INFORMATION TECHNOLOGY (9.4%) | | | | | | |
Ciena Corp.* | | | 25,657 | | | | 1,172,525 | |
DXC Technology Co.* | | | 97,167 | | | | 2,945,132 | |
Euronet Worldwide, Inc.* | | | 23,641 | | | | 2,378,048 | |
MKS Instruments, Inc. | | | 8,483 | | | | 870,610 | |
PTC, Inc.* | | | 7,948 | | | | 845,190 | |
Teledyne Technologies, Inc.* | | | 3,908 | | | | 1,465,930 | |
Teradyne, Inc. | | | 9,908 | | | | 887,261 | |
Viasat, Inc.* | | | 21,096 | | | | 646,171 | |
| | | | | | | | |
| | | | | | | 11,210,867 | |
| | | | | | | | |
| MATERIALS (10.1%) | | | | | | |
Ashland Global Hldgs., Inc. | | | 28,941 | | | | 2,982,370 | |
Crown Hldgs., Inc. | | | 36,929 | | | | 3,403,746 | |
FMC Corp. | | | 6,258 | | | | 669,669 | |
Freeport-McMoRan, Inc. | | | 17,656 | | | | 516,615 | |
Newmont Corp. | | | 16,044 | | | | 957,345 | |
Packaging Corp. of America | | | 11,134 | | | | 1,530,925 | |
PPG Industries, Inc. | | | 7,653 | | | | 875,044 | |
Steel Dynamics, Inc. | | | 16,853 | | | | 1,114,826 | |
| | | | | | | | |
| | | | | | | 12,050,540 | |
| | | | | | | | |
| REAL ESTATE (8.9%) | | | | | | |
Alexander’s, Inc. | | | 1,291 | | | | 286,808 | |
American Campus Communities, Inc. | | | 16,053 | | | | 1,034,937 | |
Apartment Income REIT Corp. | | | 20,953 | | | | 871,645 | |
AvalonBay Communities, Inc. | | | 5,905 | | | | 1,147,046 | |
Brandywine Realty Trust | | | 62,565 | | | | 603,127 | |
Duke Realty Corp. | | | 44,056 | | | | 2,420,877 | |
Gaming & Leisure Properties, Inc. | | | 21,702 | | | | 995,254 | |
The accompanying notes are an integral part of these portfolio schedules.
53
MUTUAL OF AMERICA INVESTMENT CORPORATION — MID CAP VALUE FUND
PORTFOLIO OF INVESTMENTS IN SECURITIES (Continued)
June 30, 2022 (Unaudited)
| | | | | | | | |
| | | Shares | | | Value | |
COMMON STOCKS (Continued): | |
| REAL ESTATE (CONTINUED) | | | | | | |
Kilroy Realty Corp. | | | 9,406 | | | $ | 492,216 | |
Welltower, Inc. | | | 15,135 | | | | 1,246,367 | |
Weyerhaeuser Co. | | | 47,960 | | | | 1,588,435 | |
| | | | | | | | |
| | | | | | | 10,686,712 | |
| | | | | | | | |
| UTILITIES (8.9%) | | | | | | |
AES Corp. | | | 47,068 | | | | 988,899 | |
Ameren Corp. | | | 20,670 | | | | 1,867,741 | |
Atmos Energy Corp. | | | 8,373 | | | | 938,613 | |
| | | | | | | | |
| | | Shares | | | Value | |
COMMON STOCKS (CONTINUED): | |
| UTILITIES (CONTINUED) | | | | | | |
Entergy Corp. | | | 12,057 | | | $ | 1,358,101 | |
Evergy, Inc. | | | 41,153 | | | | 2,685,233 | |
PPL Corp. | | | 32,363 | | | | 878,008 | |
Public Svc. Enterprise Group, Inc. | | | 30,769 | | | | 1,947,062 | |
| | | | | | | | |
| | | | | | | 10,663,657 | |
| | | | | | | | |
TOTAL COMMON STOCKS | | | | | | | | |
(Cost: $98,813,267) 97.9% | | | | 116,950,157 | |
| | | | | | | | |
| | | | | | | | | | | | | | | | |
| | | Rate(%) | | | Maturity | | | Face Amount | | | Value | |
| TEMPORARY CASH INVESTMENT (2.1%) | | | | | | | | | | | | |
JP Morgan Chase, New York Time Deposit | | | 0.91 | | | | 07/01/22 | | | $ | 2,499,899 | | | | 2,499,899 | |
| | | | | | | | | | | | | | | | |
TOTAL TEMPORARY CASH INVESTMENT | | | | | | | | | | | | | | | | |
(Cost: $2,499,899) 2.1% | | | | 2,499,899 | |
| | | | | | | | | | | | | | | | |
TOTAL INVESTMENTS | | | | | | | | | | | | | | | | |
(Cost: $101,313,166) 100.0% | | | | 119,450,056 | |
| | | | | | | | | | | | | | | | |
OTHER NET ASSETS -0.0% (2) | | | | (29,759 | ) |
| | | | | | | | | | | | | | | | |
NET ASSETS 100.0% | | | $ | 119,420,297 | |
| | | | | | | | | | | | | | | | |
The accompanying notes are an integral part of these portfolio schedules.
54
MUTUAL OF AMERICA INVESTMENT CORPORATION — MID-CAP EQUITY INDEX FUND
PORTFOLIO OF INVESTMENTS IN SECURITIES
June 30, 2022 (Unaudited)
| | | | | | | | |
| | | Shares | | | Value | |
| INDEXED ASSETS: | |
| COMMON STOCKS: | |
| COMMUNICATION SERVICES (1.6%) | |
Cable One, Inc. | | | 3,850 | | | $ | 4,963,882 | |
Iridium Communications, Inc.* | | | 100,271 | | | | 3,766,179 | |
John Wiley & Sons, Inc. Cl A | | | 34,015 | | | | 1,624,556 | |
New York Times Co. Cl A | | | 130,592 | | | | 3,643,517 | |
TEGNA, Inc. | | | 173,369 | | | | 3,635,548 | |
TripAdvisor, Inc.* | | | 78,442 | | | | 1,396,267 | |
World Wrestling Entertainment, Inc. Cl A | | | 33,889 | | | | 2,117,724 | |
Ziff Davis, Inc.* | | | 37,055 | | | | 2,761,709 | |
| | | | | | | | |
| | | | | | | 23,909,382 | |
| | | | | | | | |
| CONSUMER DISCRETIONARY (13.4%) | |
Adient PLC* | | | 74,248 | | | | 2,199,968 | |
American Eagle Outfitters, Inc. | | | 120,722 | | | | 1,349,672 | |
AutoNation, Inc.* | | | 27,865 | | | | 3,114,192 | |
Boyd Gaming Corp. | | | 62,672 | | | | 3,117,932 | |
Brunswick Corp. | | | 59,320 | | | | 3,878,342 | |
Callaway Golf Co.* | | | 91,168 | | | | 1,859,827 | |
Capri Hldgs. Ltd.* | | | 115,642 | | | | 4,742,478 | |
Carter’s, Inc. | | | 31,568 | | | | 2,224,913 | |
Choice Hotels International, Inc. | | | 25,777 | | | | 2,877,487 | |
Churchill Downs, Inc. | | | 26,805 | | | | 5,133,962 | |
Columbia Sportswear Co. | | | 26,110 | | | | 1,868,954 | |
Cracker Barrel Old Country Store, Inc. | | | 18,191 | | | | 1,518,767 | |
Crocs, Inc.* | | | 48,234 | | | | 2,347,549 | |
Dana, Inc. | | | 112,283 | | | | 1,579,822 | |
Deckers Outdoor Corp.* | | | 21,337 | | | | 5,448,403 | |
Dick’s Sporting Goods, Inc. | | | 45,473 | | | | 3,427,300 | |
Five Below, Inc.* | | | 43,492 | | | | 4,933,298 | |
Foot Locker, Inc. | | | 65,481 | | | | 1,653,395 | |
Fox Factory Hldg. Corp.* | | | 33,027 | | | | 2,659,995 | |
GameStop Corp. Cl A* | | | 48,435 | | | | 5,923,600 | |
Gap, Inc. | | | 165,184 | | | | 1,361,116 | |
Gentex Corp. | | | 183,645 | | | | 5,136,551 | |
Goodyear Tire & Rubber Co.* | | | 221,285 | | | | 2,369,962 | |
Graham Hldgs. Co. Cl B | | | 3,068 | | | | 1,739,065 | |
Grand Canyon Education, Inc.* | | | 25,321 | | | | 2,384,985 | |
H&R Block, Inc. | | | 125,000 | | | | 4,415,000 | |
Hanesbrands, Inc. | | | 273,192 | | | | 2,811,146 | |
Harley-Davidson, Inc. | | | 115,464 | | | | 3,655,590 | |
Helen of Troy Ltd.* | | | 18,678 | | | | 3,033,494 | |
KB Home | | | 67,954 | | | | 1,933,971 | |
Kohl’s Corp. | | | 100,729 | | | | 3,595,018 | |
Lear Corp. | | | 46,826 | | | | 5,894,925 | |
Leggett & Platt, Inc. | | | 104,627 | | | | 3,618,002 | |
Light & Wonder, Inc.* | | | 74,932 | | | | 3,521,055 | |
Lithia Motors, Inc. Cl A | | | 22,664 | | | | 6,228,294 | |
Macy’s, Inc. | | | 223,127 | | | | 4,087,687 | |
Marriott Vacations Worldwide Corp. | | | 32,450 | | | | 3,770,690 | |
| | | | | | | | |
| | | Shares | | | Value | |
| INDEXED ASSETS (CONTINUED): | |
| COMMON STOCKS (CONTINUED): | |
| CONSUMER DISCRETIONARY (CONTINUED) | |
Mattel, Inc.* | | | 276,110 | | | $ | 6,165,536 | |
Murphy USA, Inc. | | | 17,445 | | | | 4,062,417 | |
Nordstrom, Inc. | | | 87,379 | | | | 1,846,318 | |
Ollie’s Bargain Outlet Hldgs., Inc.* | | | 45,703 | | | | 2,685,051 | |
Papa John’s International, Inc. | | | 24,948 | | | | 2,083,657 | |
Polaris, Inc. | | | 43,818 | | | | 4,350,251 | |
RH* | | | 13,774 | | | | 2,923,669 | |
Service Corp. International | | | 124,362 | | | | 8,595,901 | |
Six Flags Entertainment Corp.* | | | 60,950 | | | | 1,322,615 | |
Skechers USA, Inc. Cl A* | | | 105,656 | | | | 3,759,240 | |
Taylor Morrison Home Corp.
Cl A* | | | 93,738 | | | | 2,189,720 | |
Tempur Sealy International, Inc. | | | 137,482 | | | | 2,937,990 | |
Texas Roadhouse, Inc. Cl A | | | 53,402 | | | | 3,909,026 | |
Thor Industries, Inc. | | | 43,115 | | | | 3,221,984 | |
Toll Brothers, Inc. | | | 86,386 | | | | 3,852,816 | |
TopBuild Corp.* | | | 25,681 | | | | 4,292,836 | |
Travel + Leisure Co. | | | 66,928 | | | | 2,598,145 | |
Under Armour, Inc. Cl A* | | | 147,833 | | | | 1,231,449 | |
Under Armour, Inc. Cl C* | | | 158,725 | | | | 1,203,135 | |
Victoria’s Secret & Co.* | | | 53,216 | | | | 1,488,452 | |
Visteon Corp.* | | | 22,027 | | | | 2,281,557 | |
Wendy’s Co. | | | 134,269 | | | | 2,534,999 | |
Williams-Sonoma, Inc. | | | 54,854 | | | | 6,086,051 | |
Wingstop, Inc. | | | 23,395 | | | | 1,749,244 | |
Wyndham Hotels & Resorts, Inc. | | | 72,156 | | | | 4,742,092 | |
YETI Hldgs., Inc.* | | | 67,508 | | | | 2,921,071 | |
| | | | | | | | |
| | | | | | | 206,451,629 | |
| | | | | | | | |
| CONSUMER STAPLES (4.0%) | |
BellRing Brands, Inc.* | | | 85,475 | | | | 2,127,473 | |
BJ’s Wholesale Club Hldgs., Inc.* | | | 105,683 | | | | 6,586,165 | |
Boston Beer Co., Inc. Cl A* | | | 7,364 | | | | 2,231,071 | |
Casey’s General Stores, Inc. | | | 29,067 | | | | 5,376,814 | |
Coty, Inc. Cl A* | | | 269,619 | | | | 2,159,648 | |
Darling Ingredients, Inc.* | | | 126,540 | | | | 7,567,092 | |
Energizer Hldgs., Inc. | | | 51,357 | | | | 1,455,971 | |
Flowers Foods, Inc. | | | 156,104 | | | | 4,108,657 | |
Grocery Outlet Hldg. Corp.* | | | 68,686 | | | | 2,928,084 | |
Hain Celestial Group, Inc.* | | | 70,327 | | | | 1,669,563 | |
Ingredion, Inc. | | | 51,866 | | | | 4,572,507 | |
Lancaster Colony Corp. | | | 15,517 | | | | 1,998,279 | |
Nu Skin Enterprises, Inc.
Cl A | | | 39,328 | | | | 1,702,902 | |
Performance Food Group Co.* | | | 121,408 | | | | 5,582,340 | |
Pilgrim’s Pride Corp.* | | | 37,676 | | | | 1,176,622 | |
Post Hldgs., Inc.* | | | 43,778 | | | | 3,605,118 | |
Sanderson Farms, Inc. | | | 16,616 | | | | 3,581,246 | |
The accompanying notes are an integral part of these portfolio schedules.
55
MUTUAL OF AMERICA INVESTMENT CORPORATION — MID-CAP EQUITY INDEX FUND
PORTFOLIO OF INVESTMENTS IN SECURITIES (Continued)
June 30, 2022 (Unaudited)
| | | | | | | | |
| | | Shares | | | Value | |
| INDEXED ASSETS (CONTINUED): | |
| COMMON STOCKS (CONTINUED): | |
| CONSUMER STAPLES (CONTINUED) | |
Sprouts Farmers Market, Inc.* | | | 85,889 | | | $ | 2,174,709 | |
| | | | | | | | |
| | | | | | | 60,604,261 | |
| | | | | | | | |
| ENERGY (3.9%) | |
Antero Midstream Corp. | | | 254,816 | | | | 2,306,085 | |
ChampionX Corp. | | | 159,301 | | | | 3,162,125 | |
CNX Resources Corp.* | | | 152,808 | | | | 2,515,220 | |
DT Midstream, Inc. | | | 75,769 | | | | 3,714,196 | |
EQT Corp. | | | 231,632 | | | | 7,968,141 | |
Equitrans Midstream Corp. | | | 318,682 | | | | 2,026,817 | |
HF Sinclair Corp. | | | 117,152 | | | | 5,290,584 | |
Matador Resources Co. | | | 86,971 | | | | 4,051,979 | |
Murphy Oil Corp. | | | 114,394 | | | | 3,453,555 | |
NOV, Inc. | | | 307,726 | | | | 5,203,646 | |
PDC Energy, Inc. | | | 74,749 | | | | 4,605,286 | |
Range Resources Corp.* | | | 203,061 | | | | 5,025,760 | |
Targa Resources Corp. | | | 178,625 | | | | 10,658,554 | |
| | | | | | | | |
| | | | | | | 59,981,948 | |
| | | | | | | | |
| FINANCIALS (14.7%) | |
Affiliated Managers Group, Inc. | | | 30,296 | | | | 3,532,514 | |
Alleghany Corp.* | | | 10,543 | | | | 8,783,373 | |
American Financial Group, Inc. | | | 51,992 | | | | 7,217,009 | |
Associated Banc-Corp. | | | 117,542 | | | | 2,146,317 | |
Bank of Hawaii Corp. | | | 31,565 | | | | 2,348,436 | |
Bank OZK | | | 88,428 | | | | 3,318,703 | |
Brighthouse Financial, Inc.* | | | 58,680 | | | | 2,407,054 | |
Cadence Bank | | | 143,716 | | | | 3,374,452 | |
Cathay General Bancorp | | | 58,857 | | | | 2,304,252 | |
CNO Financial Group, Inc. | | | 90,749 | | | | 1,641,649 | |
Commerce Bancshares, Inc. | | | 86,070 | | | | 5,650,495 | |
Cullen/Frost Bankers, Inc. | | | 44,683 | | | | 5,203,335 | |
East West Bancorp, Inc. | | | 111,162 | | | | 7,203,298 | |
Essent Group Ltd. | | | 84,273 | | | | 3,278,220 | |
Evercore, Inc. Cl A | | | 31,804 | | | | 2,977,172 | |
Federated Hermes, Inc. Cl B | | | 71,784 | | | | 2,282,013 | |
First American Financial Corp. | | | 84,136 | | | | 4,452,477 | |
First Financial Bankshares, Inc. | | | 100,600 | | | | 3,950,562 | |
First Horizon Corp. | | | 419,091 | | | | 9,161,329 | |
FirstCash Hldgs., Inc. | | | 30,854 | | | | 2,144,662 | |
FNB Corp. | | | 264,272 | | | | 2,869,994 | |
Fulton Financial Corp. | | | 125,973 | | | | 1,820,310 | |
Glacier Bancorp, Inc. | | | 85,020 | | | | 4,031,648 | |
Hancock Whitney Corp. | | | 67,644 | | | | 2,998,658 | |
Hanover Insurance Group, Inc. | | | 27,874 | | | | 4,076,572 | |
Home BancShares, Inc. | | | 148,208 | | | | 3,078,280 | |
Interactive Brokers Group, Inc. Cl A | | | 68,504 | | | | 3,768,405 | |
International Bancshares Corp. | | | 41,569 | | | | 1,666,086 | |
| | | | | | | | |
| | | Shares | | | Value | |
| INDEXED ASSETS (CONTINUED): | |
| COMMON STOCKS (CONTINUED): | |
| FINANCIALS (CONTINUED) | |
Janus Henderson Group PLC | | | 131,411 | | | $ | 3,089,473 | |
Jefferies Financial Group, Inc. | | | 150,085 | | | | 4,145,348 | |
Kemper Corp. | | | 46,974 | | | | 2,250,055 | |
Kinsale Capital Group, Inc. | | | 16,870 | | | | 3,874,027 | |
Mercury General Corp. | | | 20,823 | | | | 922,459 | |
MGIC Investment Corp. | | | 242,519 | | | | 3,055,739 | |
Navient Corp. | | | 115,805 | | | | 1,620,112 | |
New York Community Bancorp, Inc. | | | 365,856 | | | | 3,340,265 | |
Old National Bancorp | | | 229,470 | | | | 3,393,861 | |
Old Republic International Corp. | | | 224,587 | | | | 5,021,765 | |
PacWest Bancorp | | | 92,022 | | | | 2,453,307 | |
Pinnacle Financial Partners, Inc. | | | 59,838 | | | | 4,326,886 | |
Primerica, Inc. | | | 30,143 | | | | 3,607,816 | |
Prosperity Bancshares, Inc. | | | 72,205 | | | | 4,929,435 | |
Reinsurance Group of America, Inc. | | | 52,474 | | | | 6,154,675 | |
RenaissanceRe Hldgs. Ltd. | | | 34,616 | | | | 5,412,904 | |
RLI Corp. | | | 31,236 | | | | 3,641,805 | |
SEI Investments Co. | | | 81,728 | | | | 4,414,947 | |
Selective Insurance Group, Inc. | | | 47,271 | | | | 4,109,741 | |
SLM Corp. | | | 210,850 | | | | 3,360,949 | |
Stifel Financial Corp. | | | 83,488 | | | | 4,676,998 | |
Synovus Financial Corp. | | | 113,871 | | | | 4,105,050 | |
Texas Capital Bancshares, Inc.* | | | 39,742 | | | | 2,092,019 | |
UMB Financial Corp. | | | 33,751 | | | | 2,905,961 | |
Umpqua Hldgs. Corp. | | | 170,030 | | | | 2,851,403 | |
United Bankshares, Inc. | | | 106,329 | | | | 3,728,958 | |
Unum Group | | | 157,528 | | | | 5,359,103 | |
Valley National Bancorp | | | 329,201 | | | | 3,426,982 | |
Voya Financial, Inc. | | | 80,051 | | | | 4,765,436 | |
Washington Federal, Inc. | | | 51,139 | | | | 1,535,193 | |
Webster Financial Corp. | | | 139,522 | | | | 5,880,852 | |
Wintrust Financial Corp. | | | 47,212 | | | | 3,784,042 | |
| | | | | | | | |
| | | | | | | 225,924,841 | |
| | | | | | | | |
| HEALTH CARE (10.1%) | |
Acadia Healthcare Co., Inc.* | | | 70,904 | | | | 4,795,237 | |
Amedisys, Inc.* | | | 25,511 | | | | 2,681,716 | |
Arrowhead Pharmaceuticals, Inc.* | | | 82,803 | | | | 2,915,494 | |
Azenta, Inc. | | | 58,730 | | | | 4,234,433 | |
Bruker Corp. | | | 78,333 | | | | 4,916,179 | |
Chemed Corp. | | | 11,725 | | | | 5,503,598 | |
Encompass Health Corp. | | | 78,191 | | | | 4,382,606 | |
Enovis Corp.* | | | 36,814 | | | | 2,024,770 | |
Envista Hldgs. Corp.* | | | 127,402 | | | | 4,910,073 | |
Exelixis, Inc.* | | | 251,238 | | | | 5,230,775 | |
Globus Medical, Inc. Cl A* | | | 62,109 | | | | 3,486,799 | |
Haemonetics Corp.* | | | 40,031 | | | | 2,609,221 | |
The accompanying notes are an integral part of these portfolio schedules.
56
MUTUAL OF AMERICA INVESTMENT CORPORATION — MID-CAP EQUITY INDEX FUND
PORTFOLIO OF INVESTMENTS IN SECURITIES (Continued)
June 30, 2022 (Unaudited)
| | | | | | | | |
| | | Shares | | | Value | |
| INDEXED ASSETS (CONTINUED): | |
| COMMON STOCKS (CONTINUED): | |
| HEALTH CARE (CONTINUED) | |
Halozyme Therapeutics, Inc.* | | | 108,050 | | | $ | 4,754,200 | |
HealthEquity, Inc.* | | | 66,092 | | | | 4,057,388 | |
ICU Medical, Inc.* | | | 15,720 | | | | 2,584,211 | |
Inari Medical, Inc.* | | | 26,630 | | | | 1,810,574 | |
Integra LifeSciences Hldgs. Corp.* | | | 56,002 | | | | 3,025,788 | |
Jazz Pharmaceuticals PLC* | | | 48,815 | | | | 7,615,628 | |
LHC Group, Inc.* | | | 24,309 | | | | 3,785,884 | |
LivaNova PLC* | | | 41,861 | | | | 2,615,057 | |
Masimo Corp.* | | | 40,003 | | | | 5,227,192 | |
Medpace Hldgs., Inc.* | | | 21,084 | | | | 3,155,642 | |
Neogen Corp.* | | | 84,478 | | | | 2,035,075 | |
Neurocrine Biosciences, Inc.* | | | 74,869 | | | | 7,298,230 | |
NuVasive, Inc.* | | | 40,756 | | | | 2,003,565 | |
Option Care Health, Inc.* | | | 108,603 | | | | 3,018,077 | |
Patterson Cos., Inc. | | | 68,077 | | | | 2,062,733 | |
Penumbra, Inc.* | | | 27,740 | | | | 3,454,185 | |
Perrigo Co. PLC | | | 105,386 | | | | 4,275,510 | |
Progyny, Inc.* | | | 55,448 | | | | 1,610,764 | |
QuidelOrtho Corp.* | | | 39,184 | | | | 3,807,901 | |
R1 RCM, Inc.* | | | 105,174 | | | | 2,204,447 | |
Repligen Corp.* | | | 40,382 | | | | 6,558,037 | |
Shockwave Medical, Inc.* | | | 28,033 | | | | 5,359,069 | |
Sotera Health Co.* | | | 77,543 | | | | 1,519,067 | |
STAAR Surgical Co.* | | | 37,456 | | | | 2,656,754 | |
Syneos Health, Inc. Cl A* | | | 80,364 | | | | 5,760,491 | |
Tandem Diabetes Care, Inc.* | | | 50,108 | | | | 2,965,893 | |
Tenet Healthcare Corp.* | | | 84,386 | | | | 4,435,328 | |
United Therapeutics Corp.* | | | 35,492 | | | | 8,363,335 | |
| | | | | | | | |
| | | | | | | 155,710,926 | |
| | | | | | | | |
| INDUSTRIALS (18.1%) | |
Acuity Brands, Inc. | | | 27,091 | | | | 4,173,098 | |
AECOM | | | 110,723 | | | | 7,221,354 | |
AGCO Corp. | | | 47,884 | | | | 4,726,151 | |
ASGN, Inc.* | | | 40,030 | | | | 3,612,707 | |
Avis Budget Group, Inc.* | | | 26,857 | | | | 3,950,128 | |
Axon Enterprise, Inc.* | | | 55,620 | | | | 5,182,115 | |
Brink’s Co. | | | 36,833 | | | | 2,236,131 | |
Builders FirstSource, Inc.* | | | 135,329 | | | | 7,267,167 | |
CACI International, Inc.
Cl A* | | | 18,339 | | | | 5,167,563 | |
Carlisle Cos., Inc. | | | 40,503 | | | | 9,664,421 | |
Chart Industries, Inc.* | | | 28,083 | | | | 4,700,533 | |
Clean Harbors, Inc.* | | | 39,219 | | | | 3,438,330 | |
Crane Hldgs. Co. | | | 37,324 | | | | 3,268,089 | |
Curtiss-Wright Corp. | | | 30,112 | | | | 3,976,591 | |
Donaldson Co., Inc. | | | 96,799 | | | | 4,659,904 | |
Dycom Industries, Inc.* | | | 23,205 | | | | 2,158,993 | |
EMCOR Group, Inc. | | | 40,064 | | | | 4,124,989 | |
EnerSys | | | 32,304 | | | | 1,904,644 | |
Esab Corp. | | | 35,742 | | | | 1,563,713 | |
Flowserve Corp. | | | 102,320 | | | | 2,929,422 | |
Fluor Corp.* | | | 111,234 | | | | 2,707,436 | |
| | | | | | | | |
| | | Shares | | | Value | |
| INDEXED ASSETS (CONTINUED): | |
| COMMON STOCKS (CONTINUED): | |
| INDUSTRIALS (CONTINUED) | |
FTI Consulting, Inc.* | | | 26,999 | | | $ | 4,882,769 | |
GATX Corp. | | | 27,893 | | | | 2,626,405 | |
Graco, Inc. | | | 132,556 | | | | 7,875,152 | |
GXO Logistics, Inc.* | | | 79,726 | | | | 3,449,744 | |
Hexcel Corp. | | | 65,851 | | | | 3,444,666 | |
Hubbell, Inc. Cl B | | | 42,035 | | | | 7,506,610 | |
IAA, Inc.* | | | 104,961 | | | | 3,439,572 | |
Insperity, Inc. | | | 27,912 | | | | 2,786,455 | |
ITT, Inc. | | | 65,416 | | | | 4,398,572 | |
JetBlue Airways Corp.* | | | 251,326 | | | | 2,103,599 | |
KBR, Inc. | | | 109,331 | | | | 5,290,527 | |
Kennametal, Inc. | | | 64,752 | | | | 1,504,189 | |
Kirby Corp.* | | | 47,244 | | | | 2,874,325 | |
Knight-Swift Transportation Hldgs., Inc. Cl A | | | 128,138 | | | | 5,931,508 | |
Landstar System, Inc. | | | 29,085 | | | | 4,229,541 | |
Lennox International, Inc. | | | 25,882 | | | | 5,346,962 | |
Lincoln Electric Hldgs., Inc. | | | 45,512 | | | | 5,614,360 | |
ManpowerGroup, Inc. | | | 41,312 | | | | 3,156,650 | |
MasTec, Inc.* | | | 44,759 | | | | 3,207,430 | |
MDU Resources Group, Inc. | | | 159,287 | | | | 4,299,156 | |
Mercury Systems, Inc.* | | | 45,182 | | | | 2,906,558 | |
Middleby Corp.* | | | 42,606 | | | | 5,341,088 | |
MillerKnoll, Inc. | | | 59,398 | | | | 1,560,385 | |
MSA Safety, Inc. | | | 28,657 | | | | 3,469,503 | |
MSC Industrial Direct Co., Inc. Cl A | | | 36,971 | | | | 2,776,892 | |
nVent Electric PLC | | | 130,295 | | | | 4,082,142 | |
Oshkosh Corp. | | | 51,543 | | | | 4,233,742 | |
Owens Corning | | | 76,056 | | | | 5,651,721 | |
Regal Rexnord Corp. | | | 52,489 | | | | 5,958,551 | |
Ryder System, Inc. | | | 40,063 | | | | 2,846,877 | |
Saia, Inc.* | | | 20,686 | | | | 3,888,968 | |
Science Applications International Corp. | | | 43,731 | | | | 4,071,356 | |
Simpson Manufacturing Co., Inc. | | | 33,810 | | | | 3,401,624 | |
Stericycle, Inc.* | | | 72,124 | | | | 3,162,637 | |
Sunrun, Inc.* | | | 164,570 | | | | 3,844,355 | |
Terex Corp. | | | 54,300 | | | | 1,486,191 | |
Tetra Tech, Inc. | | | 42,050 | | | | 5,741,928 | |
Timken Co. | | | 52,841 | | | | 2,803,215 | |
Toro Co. | | | 81,890 | | | | 6,206,443 | |
Trex Co., Inc.* | | | 88,661 | | | | 4,824,932 | |
Univar Solutions, Inc.* | | | 132,585 | | | | 3,297,389 | |
Valmont Industries, Inc. | | | 16,693 | | | | 3,749,749 | |
Vicor Corp.* | | | 16,892 | | | | 924,499 | |
Watsco, Inc. | | | 25,976 | | | | 6,203,588 | |
Watts Water Technologies, Inc. Cl A | | | 21,490 | | | | 2,639,832 | |
Werner Enterprises, Inc. | | | 46,390 | | | | 1,787,871 | |
Woodward, Inc. | | | 47,514 | | | | 4,394,570 | |
XPO Logistics, Inc.* | | | 77,487 | | | | 3,731,774 | |
| | | | | | | | |
| | | | | | | 277,590,051 | |
| | | | | | | | |
The accompanying notes are an integral part of these portfolio schedules.
57
MUTUAL OF AMERICA INVESTMENT CORPORATION — MID-CAP EQUITY INDEX FUND
PORTFOLIO OF INVESTMENTS IN SECURITIES (Continued)
June 30, 2022 (Unaudited)
| | | | | | | | |
| | | Shares | | | Value | |
| INDEXED ASSETS (CONTINUED): | |
| COMMON STOCKS (CONTINUED): | |
| INFORMATION TECHNOLOGY (12.9%) | |
ACI Worldwide, Inc.* | | | 89,890 | | | $ | 2,327,252 | |
Amkor Technology, Inc. | | | 78,573 | | | | 1,331,812 | |
Arrow Electronics, Inc.* | | | 51,725 | | | | 5,797,855 | |
Aspen Technology, Inc.* | | | 21,931 | | | | 4,028,286 | |
Avnet, Inc. | | | 76,527 | | | | 3,281,478 | |
Belden, Inc. | | | 34,670 | | | | 1,846,871 | |
Blackbaud, Inc.* | | | 35,661 | | | | 2,070,834 | |
Bread Financial Hldgs., Inc. | | | 38,992 | | | | 1,445,044 | |
Calix, Inc.* | | | 43,527 | | | | 1,486,012 | |
CDK Global, Inc. | | | 91,485 | | | | 5,010,633 | |
Ciena Corp.* | | | 119,184 | | | | 5,446,709 | |
Cirrus Logic, Inc.* | | | 44,865 | | | | 3,254,507 | |
CMC Materials, Inc. | | | 22,416 | | | | 3,911,368 | |
Cognex Corp. | | | 136,109 | | | | 5,787,355 | |
Coherent, Inc.* | | | 19,438 | | | | 5,174,784 | |
CommVault Systems, Inc.* | | | 34,935 | | | | 2,197,412 | |
Concentrix Corp. | | | 33,707 | | | | 4,572,018 | |
Envestnet, Inc.* | | | 43,238 | | | | 2,281,669 | |
Euronet Worldwide, Inc.* | | | 39,604 | | | | 3,983,766 | |
Fair Isaac Corp.* | | | 20,316 | | | | 8,144,684 | |
First Solar, Inc.* | | | 77,651 | | | | 5,290,363 | |
Genpact Ltd. | | | 133,443 | | | | 5,652,645 | |
II-VI, Inc.* | | | 83,391 | | | | 4,248,771 | |
IPG Photonics Corp.* | | | 27,222 | | | | 2,562,407 | |
Jabil, Inc. | | | 110,622 | | | | 5,664,953 | |
Kyndryl Hldgs., Inc.* | | | 140,781 | | | | 1,376,838 | |
Lattice Semiconductor Corp.* | | | 107,804 | | | | 5,228,494 | |
Littelfuse, Inc. | | | 19,377 | | | | 4,922,533 | |
Lumentum Hldgs., Inc.* | | | 54,046 | | | | 4,292,333 | |
Manhattan Associates, Inc.* | | | 49,435 | | | | 5,665,251 | |
Maximus, Inc. | | | 48,113 | | | | 3,007,544 | |
MKS Instruments, Inc. | | | 43,605 | | | | 4,475,181 | |
National Instruments Corp. | | | 102,762 | | | | 3,209,257 | |
NCR Corp.* | | | 107,007 | | | | 3,328,988 | |
Paylocity Hldg. Corp.* | | | 31,092 | | | | 5,423,067 | |
Power Integrations, Inc. | | | 45,674 | | | | 3,426,007 | |
Qualys, Inc.* | | | 26,157 | | | | 3,299,444 | |
Sabre Corp.* | | | 255,605 | | | | 1,490,177 | |
Sailpoint Technologies Hldgs., Inc.* | | | 73,856 | | | | 4,629,294 | |
Semtech Corp.* | | | 49,710 | | | | 2,732,559 | |
Silicon Laboratories, Inc.* | | | 28,652 | | | | 4,017,583 | |
SiTime Corp.* | | | 12,195 | | | | 1,988,151 | |
SunPower Corp. Cl A* | | | 65,337 | | | | 1,032,978 | |
Synaptics, Inc.* | | | 31,020 | | | | 3,661,911 | |
TD SYNNEX Corp. | | | 32,372 | | | | 2,949,089 | |
Teradata Corp.* | | | 82,012 | | | | 3,035,264 | |
Universal Display Corp. | | | 34,023 | | | | 3,441,086 | |
Viasat, Inc.* | | | 58,317 | | | | 1,786,250 | |
Vishay Intertechnology, Inc. | | | 103,344 | | | | 1,841,590 | |
Vontier Corp. | | | 126,107 | | | | 2,899,200 | |
Western Union Co. | | | 302,430 | | | | 4,981,022 | |
WEX, Inc.* | | | 35,247 | | | | 5,483,023 | |
Wolfspeed, Inc.* | | | 96,839 | | | | 6,144,435 | |
Xerox Hldgs. Corp. | | | 93,449 | | | | 1,387,718 | |
| | | | | | | | |
| | | | | | | 197,955,755 | |
| | | | | | | | |
| | | | | | | | |
| | | Shares | | | Value | |
| INDEXED ASSETS (CONTINUED): | |
| COMMON STOCKS (CONTINUED): | |
| MATERIALS (6.8%) | |
Alcoa Corp. | | | 144,483 | | | $ | 6,585,535 | |
AptarGroup, Inc. | | | 51,366 | | | | 5,301,485 | |
Ashland Global Hldgs., Inc. | | | 39,729 | | | | 4,094,073 | |
Avient Corp. | | | 71,620 | | | | 2,870,530 | |
Cabot Corp. | | | 44,210 | | | | 2,820,156 | |
Chemours Co. | | | 121,794 | | | | 3,899,844 | |
Cleveland-Cliffs, Inc.* | | | 374,024 | | | | 5,748,749 | |
Commercial Metals Co. | | | 95,165 | | | | 3,149,961 | |
Eagle Materials, Inc. | | | 30,946 | | | | 3,402,203 | |
Greif, Inc. Cl A | | | 20,851 | | | | 1,300,685 | |
Ingevity Corp.* | | | 30,358 | | | | 1,916,804 | |
Louisiana-Pacific Corp. | | | 64,321 | | | | 3,371,064 | |
Minerals Technologies, Inc. | | | 25,824 | | | | 1,584,044 | |
NewMarket Corp. | | | 5,303 | | | | 1,595,991 | |
Olin Corp. | | | 108,714 | | | | 5,031,284 | |
Reliance Steel & Aluminum Co. | | | 48,538 | | | | 8,244,665 | |
Royal Gold, Inc. | | | 51,415 | | | | 5,490,094 | |
RPM International, Inc. | | | 101,441 | | | | 7,985,435 | |
Scotts Miracle-Gro Co. | | | 31,678 | | | | 2,502,245 | |
Sensient Technologies Corp. | | | 32,920 | | | | 2,652,035 | |
Silgan Hldgs., Inc. | | | 65,971 | | | | 2,727,901 | |
Sonoco Products Co. | | | 76,364 | | | | 4,355,802 | |
Steel Dynamics, Inc. | | | 140,439 | | | | 9,290,040 | |
United States Steel Corp. | | | 204,147 | | | | 3,656,273 | |
Valvoline, Inc. | | | 139,576 | | | | 4,023,976 | |
Worthington Industries, Inc. | | | 25,116 | | | | 1,107,616 | |
| | | | | | | | |
| | | | | | | 104,708,490 | |
| | | | | | | | |
| REAL ESTATE (9.1%) | |
American Campus Communities, Inc. | | | 109,254 | | | | 7,043,605 | |
Apartment Income REIT Corp. | | | 123,049 | | | | 5,118,838 | |
Brixmor Property Group, Inc. | | | 234,657 | | | | 4,742,418 | |
Corporate Office Properties Trust | | | 88,040 | | | | 2,305,768 | |
Cousins Properties, Inc. | | | 116,539 | | | | 3,406,435 | |
Douglas Emmett, Inc. | | | 137,711 | | | | 3,081,972 | |
EastGroup Properties, Inc. | | | 32,654 | | | | 5,039,492 | |
EPR Properties | | | 58,719 | | | | 2,755,683 | |
First Industrial Realty Trust, Inc. | | | 103,394 | | | | 4,909,147 | |
Healthcare Realty Trust, Inc. | | | 118,759 | | | | 3,230,245 | |
Highwoods Properties, Inc. | | | 82,358 | | | | 2,815,820 | |
Hudson Pacific Properties, Inc. | | | 113,262 | | | | 1,680,808 | |
Independence Realty Trust, Inc. | | | 173,025 | | | | 3,586,808 | |
JBG SMITH Properties | | | 85,179 | | | | 2,013,632 | |
Jones Lang LaSalle, Inc.* | | | 38,278 | | | | 6,693,291 | |
Kilroy Realty Corp. | | | 82,272 | | | | 4,305,294 | |
Kite Realty Group Trust | | | 171,623 | | | | 2,967,362 | |
Lamar Advertising Co. Cl A | | | 68,195 | | | | 5,999,114 | |
Life Storage, Inc. | | | 66,091 | | | | 7,379,721 | |
Macerich Co. | | | 168,107 | | | | 1,464,212 | |
Medical Properties Trust, Inc. | | | 470,140 | | | | 7,179,038 | |
National Retail Properties, Inc. | | | 137,818 | | | | 5,926,174 | |
National Storage Affiliates Trust | | | 65,913 | | | | 3,300,264 | |
The accompanying notes are an integral part of these portfolio schedules.
58
MUTUAL OF AMERICA INVESTMENT CORPORATION — MID-CAP EQUITY INDEX FUND
PORTFOLIO OF INVESTMENTS IN SECURITIES (Continued)
June 30, 2022 (Unaudited)
| | | | | | | | |
| - | | Shares | | | Value | |
| INDEXED ASSETS (CONTINUED): | |
| COMMON STOCKS (CONTINUED): | |
| REAL ESTATE (CONTINUED) | |
Omega Healthcare Investors, Inc. | | | 184,234 | | | $ | 5,193,556 | |
Park Hotels & Resorts, Inc. | | | 182,784 | | | | 2,480,379 | |
Pebblebrook Hotel Trust | | | 102,931 | | | | 1,705,567 | |
Physicians Realty Trust | | | 176,460 | | | | 3,079,227 | |
PotlatchDeltic Corp. | | | 54,339 | | | | 2,401,240 | |
PS Business Parks, Inc. | | | 15,796 | | | | 2,956,221 | |
Rayonier, Inc. | | | 114,616 | | | | 4,284,346 | |
Rexford Industrial Realty, Inc. | | | 129,259 | | | | 7,444,026 | |
Sabra Health Care REIT, Inc. | | | 180,878 | | | | 2,526,866 | |
SL Green Realty Corp. | | | 50,220 | | | | 2,317,653 | |
Spirit Realty Capital, Inc. | | | 105,223 | | | | 3,975,325 | |
STORE Capital Corp. | | | 197,806 | | | | 5,158,780 | |
| | | | | | | | |
| | | | | | | 140,468,327 | |
| | | | | | | | |
| UTILITIES (4.1%) | |
ALLETE, Inc. | | | 44,649 | | | | 2,624,468 | |
Black Hills Corp. | | | 50,795 | | | | 3,696,352 | |
Essential Utilities, Inc. | | | 180,351 | | | | 8,269,093 | |
| | | | | | | | |
| | | Shares | | | Value | |
| INDEXED ASSETS (CONTINUED): | |
| COMMON STOCKS (CONTINUED): | |
| UTILITIES (CONTINUED) | |
Hawaiian Electric Industries, Inc. | | | 85,706 | | | $ | 3,505,376 | |
IDACORP, Inc. | | | 39,610 | | | | 4,195,491 | |
National Fuel Gas Co. | | | 71,645 | | | | 4,732,152 | |
New Jersey Resources Corp. | | | 75,313 | | | | 3,353,688 | |
NorthWestern Corp. | | | 42,418 | | | | 2,499,693 | |
OGE Energy Corp. | | | 156,819 | | | | 6,046,941 | |
ONE Gas, Inc. | | | 42,373 | | | | 3,440,264 | |
PNM Resources, Inc. | | | 67,246 | | | | 3,213,014 | |
Portland General Electric Co. | | | 69,786 | | | | 3,372,757 | |
Southwest Gas Hldgs., Inc. | | | 52,375 | | | | 4,560,815 | |
Spire, Inc. | | | 40,824 | | | | 3,036,081 | |
UGI Corp. | | | 164,513 | | | | 6,351,847 | |
| | | | | | | | |
| | | | | | | 62,898,032 | |
| | | | | | | | |
TOTAL INDEXED ASSETS—
COMMON STOCKS (COST:
$1,409,124,997) 98.7% | | | | | 1,516,203,642 | |
| | | | | | | | |
| | | | | | | | | | | | | | | | | | | | |
| | | Rating** | | | Rate(%) | | | Maturity | | | Face Amount | | | Value | |
| SHORT-TERM DEBT SECURITIES: | | | | | | | | | | | | | | | |
| U.S. GOVERNMENT (1.1%) | | | | | | | | | | | | | | | |
U.S. Treasury Bill | | | A-1+ | | | | 0.79 | | | | 07/05/22 | | | $ | 4,400,000 | | | $ | 4,399,612 | |
U.S. Treasury Bill (1) | | | A-1+ | | | | 0.82 | | | | 08/02/22 | | | | 2,100,000 | | | | 2,098,478 | |
U.S. Treasury Bill | | | A-1+ | | | | 1.00 | | | | 07/26/22 | | | | 4,500,000 | | | | 4,496,881 | |
U.S. Treasury Bill | | | A-1+ | | | | 1.02 | | | | 07/19/22 | | | | 1,000,000 | | | | 999,490 | |
U.S. Treasury Bill | | | A-1+ | | | | 1.13 | | | | 07/12/22 | | | | 5,000,000 | | | | 4,998,278 | |
| | | | | | | | | | | | | | | | | | | | |
| | | | | | | | | | | | | | | | | | | 16,992,739 | |
| | | | | | | | | | | | | | | | | | | | |
| COMMERCIAL PAPER (0.1%) | | | | | | | | | | | | | | | |
J.P. Morgan Securities LLC | | | A-1 | | | | 1.08 | | | | 07/18/22 | | | | 1,000,000 | | | | 999,490 | |
| | | | | | | | | | | | | | | | | | | | |
TOTAL SHORT-TERM DEBT SECURITIES
(COST: $17,992,229) 1.2% | | | 17,992,229 | |
| | | | | | | | | | | | | | | | | | | | |
| | | | | | Rate(%) | | | Maturity | | | Face Amount | | | Value | |
| TEMPORARY CASH INVESTMENT (0.0%) (2) | | | | | | | | | | | | | | | |
JP Morgan Chase, New York Time Deposit | | | | 0.91 | | | | 07/01/22 | | | $ | 970,839 | | | $ | 970,839 | |
| | | | | | | | | | | | | | | | | | | | |
| | | | | | | | | | | | | | | | | | | | |
| TOTAL TEMPORARY CASH INVESTMENT | | | | | | | | | | | | | | | |
(Cost: $970,839) 0.0% (2) | | | | 970,839 | |
| | | | | | | | | | | | | | | | | | | | |
| TOTAL INVESTMENTS | | | | | | | | | | | | | | | |
(Cost: $1,428,088,065) 99.9% | | | | 1,535,166,710 | |
| | | | | | | | | | | | | | | | | | | | |
| OTHER NET ASSETS 0.1% | | | 1,177,617 | |
| | | | | | | | | | | | | | | | | | | | |
| NET ASSETS 100.0% | | | $1,536,344,327 | |
| | | | | | | | | | | | | | | | | | | | |
The accompanying notes are an integral part of these portfolio schedules.
59
MUTUAL OF AMERICA INVESTMENT CORPORATION — COMPOSITE FUND
PORTFOLIO OF INVESTMENTS IN SECURITIES
June 30, 2022 (Unaudited)
| | | | | | | | |
| | | Shares | | | Value | |
| COMMON STOCKS: | | | | | | |
| COMMUNICATION SERVICES (3.4%) | | | | | | |
AT&T, Inc. | | | 48,322 | | | $ | 1,012,829 | |
Comcast Corp. Cl A | | | 48,122 | | | | 1,888,307 | |
Interpublic Group of Cos., Inc. | | | 52,010 | | | | 1,431,835 | |
Verizon Communications, Inc. | | | 22,285 | | | | 1,130,964 | |
Warner Bros Discovery, Inc.* | | | 56,556 | | | | 758,982 | |
| | | | | | | | |
| | | | | | | 6,222,917 | |
| | | | | | | | |
| CONSUMER DISCRETIONARY (5.9%) | | | | | | |
Advance Auto Parts, Inc. | | | 4,525 | | | | 783,232 | |
Amazon.com, Inc.* | | | 13,520 | | | | 1,435,959 | |
Bath & Body Works, Inc. | | | 16,140 | | | | 434,489 | |
Best Buy Co., Inc. | | | 8,723 | | | | 568,652 | |
Home Depot, Inc. | | | 5,877 | | | | 1,611,885 | |
Ralph Lauren Corp. Cl A | | | 8,098 | | | | 725,986 | |
Tapestry, Inc. | | | 27,750 | | | | 846,930 | |
Target Corp. | | | 12,261 | | | | 1,731,621 | |
TJX Cos., Inc. | | | 18,656 | | | | 1,041,938 | |
Ulta Beauty, Inc.* | | | 2,657 | | | | 1,024,220 | |
Whirlpool Corp. | | | 4,995 | | | | 773,576 | |
| | | | | | | | |
| | | | | | | 10,978,488 | |
| | | | | | | | |
| CONSUMER STAPLES (2.1%) | | | | | | |
Constellation Brands, Inc. Cl A | | | 4,430 | | | | 1,032,456 | |
Procter & Gamble Co. | | | 12,540 | | | | 1,803,127 | |
Walmart, Inc. | | | 8,423 | | | | 1,024,068 | |
| | | | | | | | |
| | | | | | | 3,859,651 | |
| | | | | | | | |
| ENERGY (4.1%) | | | | | | |
Baker Hughes Co. Cl A | | | 27,086 | | | | 781,973 | |
ConocoPhillips | | | 20,693 | | | | 1,858,438 | |
Coterra Energy, Inc. | | | 17,339 | | | | 447,173 | |
EOG Resources, Inc. | | | 11,021 | | | | 1,217,159 | |
Exxon Mobil Corp. | | | 14,610 | | | | 1,251,200 | |
Valaris Ltd.* | | | 1,341 | | | | 56,644 | |
Valero Energy Corp. | | | 9,449 | | | | 1,004,240 | |
Williams Cos., Inc. | | | 28,110 | | | | 877,313 | |
| | | | | | | | |
| | | | | | | 7,494,140 | |
| | | | | | | | |
| FINANCIALS (5.3%) | | | | | | |
Allstate Corp. | | | 6,231 | | | | 789,655 | |
Comerica, Inc. | | | 13,902 | | | | 1,020,129 | |
Goldman Sachs Group, Inc. | | | 2,692 | | | | 799,578 | |
Intercontinental Exchange, Inc. | | | 6,617 | | | | 622,263 | |
JPMorgan Chase & Co. | | | 18,148 | | | | 2,043,646 | |
KeyCorp. | | | 38,254 | | | | 659,116 | |
Morgan Stanley | | | 29,224 | | | | 2,222,777 | |
Synchrony Financial | | | 25,353 | | | | 700,250 | |
Wells Fargo & Co. | | | 25,811 | | | | 1,011,017 | |
| | | | | | | | |
| | | | | | | 9,868,431 | |
| | | | | | | | |
| HEALTH CARE (10.7%) | | | | | | |
Abbott Laboratories | | | 9,053 | | | | 983,609 | |
AbbVie, Inc. | | �� | 19,056 | | | | 2,918,617 | |
Bristol-Myers Squibb Co. | | | 17,534 | | | | 1,350,118 | |
Cigna Corp. | | | 5,783 | | | | 1,523,936 | |
CVS Health Corp. | | | 17,005 | | | | 1,575,683 | |
Eli Lilly & Co. | | | 5,334 | | | | 1,729,443 | |
| | | | | | | | |
| | | Shares | | | Value | |
| COMMON STOCKS (CONTINUED): | | | | | | |
| HEALTH CARE (CONTINUED) | | | | | | |
Gilead Sciences, Inc. | | | 16,317 | | | $ | 1,008,554 | |
HCA Healthcare, Inc. | | | 6,073 | | | | 1,020,628 | |
Johnson & Johnson | | | 11,758 | | | | 2,087,163 | |
Pfizer, Inc. | | | 30,924 | | | | 1,621,345 | |
UnitedHealth Group, Inc. | | | 7,560 | | | | 3,883,043 | |
| | | | | | | | |
| | | | | | | 19,702,139 | |
| | | | | | | | |
| INDUSTRIALS (4.8%) | | | | | | |
Caterpillar, Inc. | | | 4,297 | | | | 768,132 | |
Deere & Co. | | | 3,363 | | | | 1,007,118 | |
Delta Air Lines, Inc.* | | | 13,174 | | | | 381,651 | |
FedEx Corp. | | | 3,876 | | | | 878,728 | |
Honeywell International, Inc. | | | 4,809 | | | | 835,852 | |
Masco Corp. | | | 10,971 | | | | 555,132 | |
Parker-Hannifin Corp. | | | 3,472 | | | | 854,286 | |
Quanta Svcs., Inc. | | | 5,563 | | | | 697,266 | |
Snap-on, Inc. | | | 3,927 | | | | 773,737 | |
Trane Technologies PLC | | | 6,815 | | | | 885,064 | |
Union Pacific Corp. | | | 6,019 | | | | 1,283,732 | |
| | | | | | | | |
| | | | | | | 8,920,698 | |
| | | | | | | | |
| INFORMATION TECHNOLOGY (16.8%) | | | | | | |
Adobe, Inc.* | | | 3,793 | | | | 1,388,466 | |
Apple, Inc. | | | 63,013 | | | | 8,615,137 | |
Broadcom, Inc. | | | 4,849 | | | | 2,355,693 | |
Fortinet, Inc.* | | | 21,535 | | | | 1,218,450 | |
HP, Inc. | | | 49,914 | | | | 1,636,181 | |
Lam Research Corp. | | | 3,555 | | | | 1,514,963 | |
Micron Technology, Inc. | | | 12,301 | | | | 679,999 | |
Microsoft Corp. | | | 31,326 | | | | 8,045,457 | |
NetApp, Inc. | | | 10,955 | | | | 714,704 | |
NVIDIA Corp. | | | 10,436 | | | | 1,581,993 | |
QUALCOMM, Inc. | | | 9,377 | | | | 1,197,818 | |
Visa, Inc. Cl A | | | 10,420 | | | | 2,051,594 | |
| | | | | | | 31,000,455 | |
| | | | | | | | |
| MATERIALS (1.8%) | | | | | | |
Eastman Chemical Co. | | | 7,806 | | | | 700,745 | |
Freeport-McMoRan, Inc. | | | 27,034 | | | | 791,015 | |
LyondellBasell Industries NV Cl A | | | 5,643 | | | | 493,537 | |
Newmont Corp. | | | 23,020 | | | | 1,373,603 | |
| | | | | | | | |
| | | | | | | 3,358,900 | |
| | | | | | | | |
REAL ESTATE (1.5%) | | | | | | | | |
Alexandria Real Estate Equities, Inc. | | | 3,208 | | | | 465,256 | |
American Tower Corp. | | | 3,697 | | | | 944,916 | |
Equinix, Inc. | | | 1,101 | | | | 723,379 | |
Extra Space Storage, Inc. | | | 4,258 | | | | 724,371 | |
| | | | | | | | |
| | | | | | | 2,857,922 | |
| | | | | | | | |
| UTILITIES (0.8%) | | | | | | |
NextEra Energy, Inc. | | | 18,964 | | | | 1,468,951 | |
| | | | | | | | |
| | | | | | | | |
| TOTAL COMMON STOCKS | | | | | | |
(Cost: $74,353,252) 57.2% | | | | 105,732,692 | |
| | | | | | | | |
The accompanying notes are an integral part of these portfolio schedules.
60
MUTUAL OF AMERICA INVESTMENT CORPORATION — COMPOSITE FUND
PORTFOLIO OF INVESTMENTS IN SECURITIES (Continued)
June 30, 2022 (Unaudited)
| | | | | | | | | | | | | | | | | | |
| | | Rating** | | Rate(%) | | | Maturity | | | Face Amount | | | Value | |
| LONG-TERM DEBT SECURITIES: | | | | | | | | | | | | | | |
| U.S. GOVERNMENT (16.1%) | | | | | | | | | | | | | | |
U.S. Treasury Bond | | AA+ | | | 1.13 | | | | 05/15/40 | | | $ | 2,025,000 | | | $ | 1,409,590 | |
U.S. Treasury Bond | | AA+ | | | 1.13 | | | | 08/15/40 | | | | 1,100,000 | | | | 759,945 | |
U.S. Treasury Bond | | AA+ | | | 1.38 | | | | 11/15/40 | | | | 750,000 | | | | 540,146 | |
U.S. Treasury Bond | | AA+ | | | 1.75 | | | | 08/15/41 | | | | 1,900,000 | | | | 1,445,262 | |
U.S. Treasury Bond | | AA+ | | | 1.88 | | | | 02/15/41 | | | | 2,000,000 | | | | 1,568,516 | |
U.S. Treasury Note | | AA+ | | | 0.63 | | | | 05/15/30 | | | | 725,000 | | | | 604,525 | |
U.S. Treasury Note | | AA+ | | | 1.13 | | | | 02/15/31 | | | | 450,000 | | | | 386,684 | |
U.S. Treasury Note | | AA+ | | | 1.50 | | | | 02/15/30 | | | | 900,000 | | | | 808,383 | |
U.S. Treasury Note | | AA+ | | | 1.63 | | | | 08/15/29 | | | | 1,750,000 | | | | 1,593,320 | |
U.S. Treasury Note | | AA+ | | | 1.63 | | | | 05/15/31 | | | | 1,000,000 | | | | 893,516 | |
U.S. Treasury Note | | AA+ | | | 1.75 | | | | 01/31/29 | | | | 700,000 | | | | 645,395 | |
U.S. Treasury Note | | AA+ | | | 2.25 | | | | 02/15/27 | | | | 745,000 | | | | 718,314 | |
U.S. Treasury Note | | AA+ | | | 2.25 | | | | 08/15/27 | | | | 2,000,000 | | | | 1,921,016 | |
U.S. Treasury Note | | AA+ | | | 2.25 | | | | 11/15/27 | | | | 2,150,000 | | | | 2,061,228 | |
U.S. Treasury Note | | AA+ | | | 2.38 | | | | 05/15/27 | | | | 1,400,000 | | | | 1,355,266 | |
U.S. Treasury Note | | AA+ | | | 2.63 | | | | 04/15/25 | | | | 3,000,000 | | | | 2,967,422 | |
U.S. Treasury Note | | AA+ | | | 2.63 | | | | 02/15/29 | | | | 1,500,000 | | | | 1,460,449 | |
U.S. Treasury Note | | AA+ | | | 2.88 | | | | 05/15/28 | | | | 4,250,000 | | | | 4,200,361 | |
U.S. Treasury Strip | | AA+ | | | 0.00 | | | | 08/15/29 | | | | 5,500,000 | | | | 4,413,036 | |
| | | | | | | | | | | | | | | | | | |
| | | | | | | | | | | | | | | | | 29,752,374 | |
| | | | | | | | | | | | | | | | | | |
| U.S. GOVERNMENT AGENCIES (11.1%) | | | | | | | | | | | | | | |
| MORTGAGE-BACKED OBLIGATIONS (11.1%) | | | | | | | | | | | | | | |
FHLMC | | AA+ | | | 2.00 | | | | 11/01/50 | | | | 169,904 | | | | 148,119 | |
FHLMC | | AA+ | | | 2.50 | | | | 09/01/27 | | | | 71,754 | | | | 70,804 | |
FHLMC | | AA+ | | | 2.50 | | | | 06/01/35 | | | | 183,696 | | | | 175,840 | |
FHLMC | | AA+ | | | 2.50 | | | | 06/01/50 | | | | 159,454 | | | | 144,239 | |
FHLMC | | AA+ | | | 2.50 | | | | 11/01/50 | | | | 443,030 | | | | 401,322 | |
FHLMC | | AA+ | | | 2.50 | | | | 10/01/51 | | | | 237,531 | | | | 214,014 | |
FHLMC | | AA+ | | | 3.00 | | | | 06/01/27 | | | | 49,921 | | | | 49,071 | |
FHLMC | | AA+ | | | 3.00 | | | | 08/01/27 | | | | 48,485 | | | | 47,513 | |
FHLMC | | AA+ | | | 3.00 | | | | 02/01/32 | | | | 119,611 | | | | 119,325 | |
FHLMC | | AA+ | | | 3.00 | | | | 10/15/37 | | | | 31 | | | | 31 | |
FHLMC | | AA+ | | | 3.00 | | | | 11/01/42 | | | | 101,250 | | | | 96,378 | |
FHLMC | | AA+ | | | 3.00 | | | | 04/01/43 | | | | 90,077 | | | | 86,169 | |
FHLMC | | AA+ | | | 3.00 | | | | 11/01/49 | | | | 260,298 | | | | 244,629 | |
FHLMC | | AA+ | | | 3.00 | | | | 11/01/49 | | | | 187,241 | | | | 174,878 | |
FHLMC | | AA+ | | | 3.50 | | | | 02/01/32 | | | | 50,746 | | | | 50,794 | |
FHLMC | | AA+ | | | 3.50 | | | | 01/01/43 | | | | 115,132 | | | | 113,298 | |
FHLMC | | AA+ | | | 3.50 | | | | 06/01/45 | | | | 158,447 | | | | 155,065 | |
FHLMC | | AA+ | | | 3.50 | | | | 07/01/45 | | | | 161,527 | | | | 158,830 | |
FHLMC | | AA+ | | | 3.50 | | | | 03/01/52 | | | | 1,492,567 | | | | 1,438,386 | |
FHLMC | | AA+ | | | 4.00 | | | | 11/01/33 | | | | 43,419 | | | | 44,033 | |
FHLMC | | AA+ | | | 4.00 | | | | 01/01/38 | | | | 102,295 | | | | 105,891 | |
FHLMC | | AA+ | | | 4.00 | | | | 03/01/41 | | | | 33,796 | | | | 34,214 | |
FHLMC | | AA+ | | | 4.00 | | | | 07/01/41 | | | | 64,925 | | | | 65,727 | |
FHLMC | | AA+ | | | 4.00 | | | | 11/01/42 | | | | 20,354 | | | | 20,511 | |
FHLMC | | AA+ | | | 4.00 | | | | 01/01/43 | | | | 72,131 | | | | 72,867 | |
FHLMC | | AA+ | | | 4.00 | | | | 10/01/44 | | | | 56,406 | | | | 56,747 | |
FHLMC | | AA+ | | | 4.00 | | | | 06/01/45 | | | | 137,337 | | | | 138,439 | |
FHLMC | | AA+ | | | 4.00 | | | | 04/01/52 | | | | 478,880 | | | | 475,306 | |
FHLMC | | AA+ | | | 4.50 | | | | 08/15/35 | | | | 5,818 | | | | 5,968 | |
FHLMC | | AA+ | | | 4.50 | | | | 02/01/44 | | | | 60,043 | | | | 61,735 | |
FHLMC | | AA+ | | | 4.50 | | | | 05/01/48 | | | | 69,765 | | | | 71,042 | |
FHLMC | | AA+ | | | 5.00 | | | | 02/01/26 | | | | 3,549 | | | | 3,629 | |
FHLMC | | AA+ | | | 5.00 | | | | 06/01/52 | | | | 980,685 | | | | 1,003,508 | |
FHLMC | | AA+ | | | 5.50 | | | | 07/01/32 | | | | 14,492 | | | | 15,375 | |
The accompanying notes are an integral part of these portfolio schedules.
61
MUTUAL OF AMERICA INVESTMENT CORPORATION — COMPOSITE FUND
PORTFOLIO OF INVESTMENTS IN SECURITIES (Continued)
June 30, 2022 (Unaudited)
| | | | | | | | | | | | | | | | | | |
| | | Rating** | | Rate(%) | | | Maturity | | | Face Amount | | | Value | |
| LONG-TERM DEBT SECURITIES (CONTINUED): | | | | | | | | | | | | | | |
| U.S. GOVERNMENT AGENCIES (CONTINUED) | | | | | | | | | | | | | | |
| MORTGAGE-BACKED OBLIGATIONS (CONTINUED) | | | | | | | | | | | | | | |
FHLMC | | AA+ | | | 5.50 | | | | 05/01/33 | | | $ | 7,391 | | | $ | 7,689 | |
FHLMC | | AA+ | | | 5.50 | | | | 06/01/37 | | | | 60,118 | | | | 64,608 | |
FHLMC ARM | | AA+ | | | 1.92 | | | | 10/01/51 | | | | 636,919 | | | | 584,252 | |
FHLMC Strip | | AA+ | | | 3.00 | | | | 06/15/42 | | | | 195,671 | | | | 188,114 | |
FHLMC Strip | | AA+ | | | 3.00 | | | | 01/15/43 | | | | 67,304 | | | | 63,585 | |
FNMA | | AA+ | | | 1.83 | | | | 09/01/51 | | | | 717,879 | | | | 657,135 | |
FNMA | | AA+ | | | 2.00 | | | | 11/01/35 | | | | 238,277 | | | | 222,696 | |
FNMA | | AA+ | | | 2.00 | | | | 07/01/36 | | | | 922,954 | | | | 862,863 | |
FNMA | | AA+ | | | 2.00 | | | | 10/01/50 | | | | 150,946 | | | | 131,636 | |
FNMA | | AA+ | | | 2.50 | | | | 02/01/33 | | | | 128,160 | | | | 117,689 | |
FNMA | | AA+ | | | 2.50 | | | | 06/01/35 | | | | 378,571 | | | | 362,383 | |
FNMA | | AA+ | | | 2.50 | | | | 10/01/35 | | | | 378,083 | | | | 364,503 | |
FNMA | | AA+ | | | 2.50 | | | | 05/01/46 | | | | 230,553 | | | | 209,049 | |
FNMA | | AA+ | | | 2.50 | | | | 10/01/50 | | | | 412,797 | | | | 372,364 | |
FNMA | | AA+ | | | 2.50 | | | | 12/01/50 | | | | 67,273 | | | | 61,306 | |
FNMA | | AA+ | | | 2.50 | | | | 01/01/51 | | | | 430,979 | | | | 391,125 | |
FNMA | | AA+ | | | 2.50 | | | | 03/01/51 | | | | 942,910 | | | | 858,192 | |
FNMA | | AA+ | | | 2.50 | | | | 03/01/51 | | | | 382,761 | | | | 347,137 | |
FNMA | | AA+ | | | 2.50 | | | | 04/01/51 | | | | 180,474 | | | | 162,772 | |
FNMA | | AA+ | | | 2.50 | | | | 08/01/51 | | | | 540,189 | | | | 488,635 | |
FNMA | | AA+ | | | 2.50 | | | | 12/01/51 | | | | 388,978 | | | | 350,464 | |
FNMA | | AA+ | | | 3.00 | | | | 06/01/33 | | | | 150,130 | | | | 147,446 | |
FNMA | | AA+ | | | 3.00 | | | | 09/01/33 | | | | 93,592 | | | | 91,924 | |
FNMA | | AA+ | | | 3.00 | | | | 12/01/42 | | | | 58,265 | | | | 53,911 | |
FNMA | | AA+ | | | 3.00 | | | | 01/01/43 | | | | 254,459 | | | | 243,240 | |
FNMA | | AA+ | | | 3.00 | | | | 02/01/43 | | | | 77,478 | | | | 73,192 | |
FNMA | | AA+ | | | 3.00 | | | | 03/01/43 | | | | 151,296 | | | | 143,773 | |
FNMA | | AA+ | | | 3.00 | | | | 09/01/43 | | | | 133,295 | | | | 127,308 | |
FNMA | | AA+ | | | 3.00 | | | | 12/01/47 | | | | 25,508 | | | | 23,910 | |
FNMA | | AA+ | | | 3.00 | | | | 03/01/48 | | | | 59,550 | | | | 56,296 | |
FNMA | | AA+ | | | 3.00 | | | | 03/01/50 | | | | 70,914 | | | | 66,247 | |
FNMA | | AA+ | | | 3.00 | | | | 09/01/50 | | | | 285,827 | | | | 266,996 | |
FNMA | | AA+ | | | 3.00 | | | | 01/01/52 | | | | 595,298 | | | | 555,554 | |
FNMA | | AA+ | | | 3.50 | | | | 08/01/38 | | | | 96,723 | | | | 95,176 | |
FNMA | | AA+ | | | 3.50 | | | | 10/01/41 | | | | 66,051 | | | | 64,320 | |
FNMA | | AA+ | | | 3.50 | | | | 11/01/41 | | | | 93,654 | | | | 92,038 | |
FNMA | | AA+ | | | 3.50 | | | | 12/01/41 | | | | 78,578 | | | | 76,414 | |
FNMA | | AA+ | | | 3.50 | | | | 04/01/42 | | | | 180,557 | | | | 177,448 | |
FNMA | | AA+ | | | 3.50 | | | | 04/01/42 | | | | 102,746 | | | | 99,809 | |
FNMA | | AA+ | | | 3.50 | | | | 08/01/42 | | | | 109,710 | | | | 107,821 | |
FNMA | | AA+ | | | 3.50 | | | | 08/01/43 | | | | 132,763 | | | | 130,005 | |
FNMA | | AA+ | | | 3.50 | | | | 08/01/43 | | | | 161,842 | | | | 159,055 | |
FNMA | | AA+ | | | 3.50 | | | | 01/01/44 | | | | 13,659 | | | | 13,090 | |
FNMA | | AA+ | | | 3.50 | | | | 04/01/45 | | | | 126,386 | | | | 124,000 | |
FNMA | | AA+ | | | 3.50 | | | | 09/01/47 | | | | 64,217 | | | | 62,800 | |
FNMA | | AA+ | | | 4.00 | | | | 01/01/31 | | | | 50,969 | | | | 51,828 | |
FNMA | | AA+ | | | 4.00 | | | | 07/01/40 | | | | 79,959 | | | | 80,865 | |
FNMA | | AA+ | | | 4.00 | | | | 11/01/40 | | | | 34,401 | | | | 34,791 | |
FNMA | | AA+ | | | 4.00 | | | | 05/01/41 | | | | 30,488 | | | | 30,072 | |
FNMA | | AA+ | | | 4.00 | | | | 11/01/45 | | | | 87,147 | | | | 87,337 | |
FNMA | | AA+ | | | 4.00 | | | | 02/01/47 | | | | 74,328 | | | | 74,837 | |
FNMA | | AA+ | | | 4.00 | | | | 04/01/49 | | | | 291,650 | | | | 291,904 | |
FNMA | | AA+ | | | 4.00 | | | | 03/01/50 | | | | 302,638 | | | | 300,257 | |
FNMA | | AA+ | | | 4.00 | | | | 07/01/56 | | | | 305,798 | | | | 305,694 | |
FNMA | | AA+ | | | 4.50 | | | | 05/01/30 | | | | 15,652 | | | | 15,844 | |
FNMA | | AA+ | | | 4.50 | | | | 06/01/34 | | | | 19,709 | | | | 19,884 | |
The accompanying notes are an integral part of these portfolio schedules.
62
MUTUAL OF AMERICA INVESTMENT CORPORATION — COMPOSITE FUND
PORTFOLIO OF INVESTMENTS IN SECURITIES (Continued)
June 30, 2022 (Unaudited)
| | | | | | | | | | | | | | | | | | |
| | | Rating** | | Rate(%) | | | Maturity | | | Face Amount | | | Value | |
| LONG-TERM DEBT SECURITIES (CONTINUED): | | | | | | | | | | | | | | |
| U.S. GOVERNMENT AGENCIES (CONTINUED) | | | | | | | | | | | | | | |
| MORTGAGE-BACKED OBLIGATIONS (CONTINUED) | | | | | | | | | | | | | | |
FNMA | | AA+ | | | 4.50 | | | | 08/01/35 | | | $ | 10,453 | | | $ | 10,620 | |
FNMA | | AA+ | | | 4.50 | | | | 05/01/39 | | | | 22,047 | | | | 22,755 | |
FNMA | | AA+ | | | 4.50 | | | | 05/01/39 | | | | 34,426 | | | | 35,534 | |
FNMA | | AA+ | | | 4.50 | | | | 05/01/40 | | | | 38,347 | | | | 37,807 | |
FNMA | | AA+ | | | 4.50 | | | | 10/01/40 | | | | 166,225 | | | | 171,108 | |
FNMA | | AA+ | | | 4.50 | | | | 11/01/47 | | | | 30,442 | | | | 30,912 | |
FNMA | | AA+ | | | 4.50 | | | | 11/01/47 | | | | 54,166 | | | | 55,911 | |
FNMA | | AA+ | | | 4.50 | | | | 05/01/50 | | | | 404,835 | | | | 407,828 | |
FNMA | | AA+ | | | 5.00 | | | | 06/01/33 | | | | 21,735 | | | | 22,836 | |
FNMA | | AA+ | | | 5.00 | | | | 10/01/33 | | | | 23,899 | | | | 25,123 | |
FNMA | | AA+ | | | 5.00 | | | | 11/01/33 | | | | 14,968 | | | | 15,734 | |
FNMA | | AA+ | | | 5.00 | | | | 11/01/33 | | | | 66,713 | | | | 70,120 | |
FNMA | | AA+ | | | 5.00 | | | | 03/01/34 | | | | 8,143 | | | | 8,562 | |
FNMA | | AA+ | | | 5.00 | | | | 04/01/34 | | | | 14,053 | | | | 14,581 | |
FNMA | | AA+ | | | 5.00 | | | | 09/01/35 | | | | 7,384 | | | | 7,769 | |
FNMA | | AA+ | | | 5.00 | | | | 11/25/35 | | | | 29,946 | | | | 31,144 | |
FNMA | | AA+ | | | 5.00 | | | | 08/01/37 | | | | 63,452 | | | | 66,864 | |
FNMA | | AA+ | | | 5.00 | | | | 05/01/39 | | | | 29,342 | | | | 30,405 | |
FNMA | | AA+ | | | 5.00 | | | | 06/01/40 | | | | 10,852 | | | | 11,420 | |
FNMA | | AA+ | | | 5.00 | | | | 05/01/52 | | | | 420,285 | | | | 430,132 | |
FNMA | | AA+ | | | 5.00 | | | | 06/01/52 | | | | 499,759 | | | | 511,143 | |
FNMA | | AA+ | | | 5.50 | | | | 03/01/34 | | | | 4,233 | | | | 4,401 | |
FNMA | | AA+ | | | 5.50 | | | | 05/01/34 | | | | 42,834 | | | | 45,896 | |
FNMA | | AA+ | | | 5.50 | | | | 07/01/34 | | | | 23,961 | | | | 25,156 | |
FNMA | | AA+ | | | 5.50 | | | | 09/01/34 | | | | 6,809 | | | | 7,148 | |
FNMA | | AA+ | | | 5.50 | | | | 10/01/34 | | | | 15,260 | | | | 16,331 | |
FNMA | | AA+ | | | 5.50 | | | | 02/01/35 | | | | 18,754 | | | | 20,031 | |
FNMA | | AA+ | | | 5.50 | | | | 02/01/35 | | | | 15,822 | | | | 16,966 | |
FNMA | | AA+ | | | 5.50 | | | | 08/01/35 | | | | 5,085 | | | | 5,327 | |
FNMA | | AA+ | | | 5.50 | | | | 08/01/37 | | | | 3,191 | | | | 3,414 | |
FNMA | | AA+ | | | 5.50 | | | | 06/01/48 | | | | 6,845 | | | | 7,046 | |
FNMA | | AA+ | | | 6.00 | | | | 05/01/32 | | | | 4,647 | | | | 5,066 | |
FNMA | | AA+ | | | 6.00 | | | | 04/01/33 | | | | 18,320 | | | | 19,271 | |
FNMA | | AA+ | | | 6.00 | | | | 05/01/33 | | | | 8,387 | | | | 8,816 | |
FNMA | | AA+ | | | 6.00 | | | | 06/01/34 | | | | 7,046 | | | | 7,459 | |
FNMA | | AA+ | | | 6.00 | | | | 09/01/34 | | | | 1,972 | | | | 2,072 | |
FNMA | | AA+ | | | 6.00 | | | | 10/01/34 | | | | 15,179 | | | | 15,973 | |
FNMA | | AA+ | | | 6.00 | | | | 01/01/37 | | | | 11,963 | | | | 13,100 | |
FNMA | | AA+ | | | 6.00 | | | | 04/01/37 | | | | 1,770 | | | | 1,842 | |
FNMA | | AA+ | | | 6.00 | | | | 05/01/37 | | | | 2,782 | | | | 2,903 | |
FNMA | | AA+ | | | 6.00 | | | | 10/25/44 | | | | 49,542 | | | | 51,698 | |
FNMA | | AA+ | | | 6.00 | | | | 12/25/49 | | | | 13,132 | | | | 13,838 | |
FNMA | | AA+ | | | 6.50 | | | | 05/01/32 | | | | 18,394 | | | | 19,297 | |
FNMA | | AA+ | | | 6.50 | | | | 07/01/34 | | | | 8,255 | | | | 8,751 | |
FNMA | | AA+ | | | 6.50 | | | | 05/01/37 | | | | 17,121 | | | | 17,595 | |
FNMA | | AA+ | | | 7.00 | | | | 04/01/32 | | | | 1,305 | | | | 1,357 | |
FNMA | | AA+ | | | 7.50 | | | | 06/01/31 | | | | 2,263 | | | | 2,401 | |
FNMA | | AA+ | | | 7.50 | | | | 02/01/32 | | | | 2,397 | | | | 2,572 | |
FNMA | | AA+ | | | 7.50 | | | | 06/01/32 | | | | 1,468 | | | | 1,611 | |
FNMA | | AA+ | | | 8.00 | | | | 04/01/32 | | | | 1,205 | | | | 1,237 | |
FNMA Strip | | AA+ | | | 3.00 | | | | 08/25/42 | | | | 61,389 | | | | 58,044 | |
FRESB Multifamily Mortgage | | AA+ | | | 2.37 | | | | 10/25/26 | | | | 66,581 | | | | 63,458 | |
GNMA(3) | | AA+ | | | 3.00 | | | | 07/15/46 | | | | 204,391 | | | | 194,035 | |
GNMA(3) | | AA+ | | | 4.00 | | | | 08/15/41 | | | | 59,978 | | | | 61,459 | |
GNMA(3) | | AA+ | | | 4.00 | | | | 01/15/42 | | | | 142,992 | | | | 146,513 | |
GNMA(3) | | AA+ | | | 4.00 | | | | 08/20/42 | | | | 43,688 | | | | 44,526 | |
The accompanying notes are an integral part of these portfolio schedules.
63
MUTUAL OF AMERICA INVESTMENT CORPORATION — COMPOSITE FUND
PORTFOLIO OF INVESTMENTS IN SECURITIES (Continued)
June 30, 2022 (Unaudited)
| | | | | | | | | | | | | | | | | | |
| | | Rating** | | Rate(%) | | | Maturity | | | Face Amount | | | Value | |
| LONG-TERM DEBT SECURITIES (CONTINUED): | | | | | | | | | | | | | | |
| U.S. GOVERNMENT AGENCIES (CONTINUED) | | | | | | | | | | | | | | |
| MORTGAGE-BACKED OBLIGATIONS (CONTINUED) | | | | | | | | | | | | | | |
GNMA(3) | | AA+ | | | 4.50 | | | | 04/20/31 | | | $ | 36,840 | | | $ | 37,844 | |
GNMA(3) | | AA+ | | | 4.50 | | | | 10/15/40 | | | | 64,808 | | | | 68,786 | |
GNMA(3) | | AA+ | | | 4.50 | | | | 10/20/43 | | | | 114,809 | | | | 119,737 | |
GNMA(3) | | AA+ | | | 5.00 | | | | 06/20/39 | | | | 50,720 | | | | 52,881 | |
GNMA(3) | | AA+ | | | 6.50 | | | | 04/15/31 | | | | 1,428 | | | | 1,499 | |
GNMA(3) | | AA+ | | | 6.50 | | | | 10/15/31 | | | | 985 | | | | 1,064 | |
GNMA(3) | | AA+ | | | 6.50 | | | | 12/15/31 | | | | 674 | | | | 708 | |
GNMA(3) | | AA+ | | | 6.50 | | | | 05/15/32 | | | | 3,434 | | | | 3,607 | |
GNMA(3) | | AA+ | | | 7.00 | | | | 05/15/31 | | | | 1,095 | | | | 1,180 | |
GNMA(3) | | AA+ | | | 7.00 | | | | 05/15/32 | | | | 535 | | | | 544 | |
| | | | | | | | | | | | | | | | | | |
| | | | | | | | | | | | | | | | | 20,499,748 | |
| | | | | | | | | | | | | | | | | | |
| CORPORATE DEBT (7.8%) | | | | | | | | | | | | | | |
| COMMUNICATION SERVICES (0.5%) | | | | | | | | | | | | | | |
AT&T, Inc. | | BBB | | | 2.75 | | | | 06/01/31 | | | | 290,000 | | | | 250,417 | |
Comcast Corp. | | A- | | | 3.40 | | | | 04/01/30 | | | | 300,000 | | | | 281,483 | |
Verizon Communications, Inc. | | BBB+ | | | 4.02 | | | | 12/03/29 | | | | 415,000 | | | | 401,936 | |
| | | | | | | | | | | | | | | | | | |
| | | | | | | | | | | | | | | | | 933,836 | |
| | | | | | | | | | | | | | | | | | |
| CONSUMER DISCRETIONARY (1.5%) | | | | | | | | | | | | | | |
Amazon.com, Inc. | | AA | | | 1.20 | | | | 06/03/27 | | | | 65,000 | | | | 57,834 | |
Amazon.com, Inc. | | AA | | | 5.20 | | | | 12/03/25 | | | | 300,000 | | | | 314,767 | |
AutoZone, Inc. | | BBB | | | 3.25 | | | | 04/15/25 | | | | 200,000 | | | | 196,207 | |
AutoZone, Inc. | | BBB | | | 3.75 | | | | 04/18/29 | | | | 65,000 | | | | 61,408 | |
Best Buy Co., Inc. | | BBB+ | | | 1.95 | | | | 10/01/30 | | | | 250,000 | | | | 198,567 | |
Brunswick Corp. | | BBB- | | | 2.40 | | | | 08/18/31 | | | | 275,000 | | | | 203,501 | |
Dick’s Sporting Goods, Inc. | | BBB | | | 3.15 | | | | 01/15/32 | | | | 155,000 | | | | 122,462 | |
Dollar General Corp. | | BBB | | | 3.25 | | | | 04/15/23 | | | | 300,000 | | | | 298,523 | |
Harman International Industries, Inc. | | A- | | | 4.15 | | | | 05/15/25 | | | | 300,000 | | | | 301,473 | |
Kohl’s Corp. | | BBB- | | | 3.25 | | | | 02/01/23 | | | | 250,000 | | | | 248,826 | |
Lowe’s Cos., Inc. | | BBB+ | | | 4.00 | | | | 04/15/25 | | | | 150,000 | | | | 150,495 | |
Mattel, Inc. | | BB- | | | 3.15 | | | | 03/15/23 | | | | 350,000 | | | | 344,750 | |
O’Reilly Automotive, Inc. | | BBB | | | 3.80 | | | | 09/01/22 | | | | 300,000 | | | | 300,357 | |
| | | | | | | | | | | | | | | | | | |
| | | | | | | | | | | | | | | | | 2,799,170 | |
| | | | | | | | | | | | | | | | | | |
| CONSUMER STAPLES (0.2%) | | | | | | | | | | | | | | |
Bunge Ltd. Finance Corp. | | BBB | | | 2.75 | | | | 05/14/31 | | | | 115,000 | | | | 94,919 | |
Hormel Foods Corp. | | A | | | 1.80 | | | | 06/11/30 | | | | 140,000 | | | | 117,381 | |
Sysco Corp. | | BBB | | | 3.75 | | | | 10/01/25 | | | | 100,000 | | | | 99,180 | |
| | | | | | | | | | | | | | | | | | |
| | | | | | | | | | | | | | | | | 311,480 | |
| | | | | | | | | | | | | | | | | | |
| ENERGY (0.1%) | | | | | | | | | | | | | | |
Targa Resources Partners LP/Targa Resources Partners Finance Corp. | | BBB- | | | 5.50 | | | | 03/01/30 | | | | 120,000 | | | | 114,502 | |
| | | | | | | | | | | | | | | | | | |
| FINANCIALS (2.5%) | | | | | | | | | | | | | | |
Aflac, Inc. | | A- | | | 1.13 | | | | 03/15/26 | | | | 165,000 | | | | 148,866 | |
Allstate Corp. | | A- | | | 0.75 | | | | 12/15/25 | | | | 350,000 | | | | 314,976 | |
American Express Co. | | BBB | | | 3.63 | | | | 12/05/24 | | | | 250,000 | | | | 248,540 | |
Bank of America Corp. | | A- | | | 3.37 | | | | 01/23/26 | | | | 165,000 | | | | 159,801 | |
Bank of America Corp. | | BBB+ | | | 3.95 | | | | 04/21/25 | | | | 300,000 | | | | 295,891 | |
Block Financial LLC | | BBB | | | 5.25 | | | | 10/01/25 | | | | 350,000 | | | | 355,902 | |
Capital One Financial Corp. | | BBB | | | 4.93 | | | | 05/10/28 | | | | 115,000 | | | | 113,894 | |
Citigroup, Inc. | | BBB+ | | | 3.79 | | | | 03/17/33 | | | | 195,000 | | | | 175,694 | |
Citizens Financial Group, Inc. | | BBB | | | 3.75 | | | | 07/01/24 | | | | 250,000 | | | | 246,216 | |
Citizens Financial Group, Inc. | | BBB | | | 4.35 | | | | 08/01/25 | | | | 100,000 | | | | 99,207 | |
Fairfax U.S., Inc.† | | BBB | | | 4.88 | | | | 08/13/24 | | | | 250,000 | | | | 249,338 | |
Fifth Third Bancorp | | BBB | | | 4.30 | | | | 01/16/24 | | | | 300,000 | | | | 301,327 | |
The accompanying notes are an integral part of these portfolio schedules.
64
MUTUAL OF AMERICA INVESTMENT CORPORATION — COMPOSITE FUND
PORTFOLIO OF INVESTMENTS IN SECURITIES (Continued)
June 30, 2022 (Unaudited)
| | | | | | | | | | | | | | | | | | |
| | | Rating** | | Rate(%) | | | Maturity | | | Face Amount | | | Value | |
| LONG-TERM DEBT SECURITIES (CONTINUED): | | | | | | | | | | | | | | |
| FINANCIALS (CONTINUED) | | | | | | | | | | | | | | |
JPMorgan Chase & Co. | | A- | | | 1.47 | | | | 09/22/27 | | | $ | 350,000 | | | $ | 306,971 | |
Kemper Corp. | | BBB | | | 3.80 | | | | 02/23/32 | | | | 165,000 | | | | 145,790 | |
Lincoln National Corp. | | A- | | | 4.00 | | | | 09/01/23 | | | | 250,000 | | | | 251,306 | |
Mercury General Corp. | | BBB | | | 4.40 | | | | 03/15/27 | | | | 125,000 | | | | 122,112 | |
Signet UK Finance PLC | | BB- | | | 4.70 | | | | 06/15/24 | | | | 250,000 | | | | 241,250 | |
Synchrony Financial | | BBB- | | | 3.70 | | | | 08/04/26 | | | | 400,000 | | | | 370,356 | |
Unum Group | | BBB | | | 4.00 | | | | 03/15/24 | | | | 150,000 | | | | 149,962 | |
Voya Financial, Inc. | | BBB+ | | | 3.65 | | | | 06/15/26 | | | | 250,000 | | | | 242,018 | |
Wells Fargo & Co. | | BBB+ | | | 3.53 | | | | 03/24/28 | | | | 115,000 | | | | 108,922 | |
| | | | | | | | | | | | | | | | | | |
| | | | | | | | | | | | | | | | | 4,648,339 | |
| | | | | | | | | | | | | | | | | | |
| HEALTH CARE (0.7%) | | | | | | | | | | | | | | |
AbbVie, Inc. | | BBB+ | | | 4.25 | | | | 11/14/28 | | | | 175,000 | | | | 173,319 | |
Baxter International, Inc. | | BBB | | | 2.54 | | | | 02/01/32 | | | | 100,000 | | | | 84,416 | |
CVS Health Corp. | | BBB | | | 3.75 | | | | 04/01/30 | | | | 389,000 | | | | 363,854 | |
Elevance Health, Inc. | | A | | | 2.88 | | | | 09/15/29 | | | | 255,000 | | | | 229,733 | |
Merck & Co., Inc. | | A+ | | | 2.15 | | | | 12/10/31 | | | | 165,000 | | | | 141,930 | |
Thermo Fisher Scientific, Inc. | | A- | | | 2.00 | | | | 10/15/31 | | | | 375,000 | | | | 314,395 | |
| | | | | | | | | | | | | | | | | | |
| | | | | | | | | | | | | | | | | 1,307,647 | |
| | | | | | | | | | | | | | | | | | |
| INDUSTRIALS (0.5%) | | | | | | | | | | | | | | |
Boeing Co. | | BBB- | | | 4.88 | | | | 05/01/25 | | | | 180,000 | | | | 179,335 | |
Deere & Co. | | A | | | 2.75 | | | | 04/15/25 | | | | 200,000 | | | | 195,625 | |
General Dynamics Corp. | | A- | | | 3.25 | | | | 04/01/25 | | | | 150,000 | | | | 148,755 | |
JB Hunt Transport Svcs., Inc. | | BBB+ | | | 3.30 | | | | 08/15/22 | | | | 200,000 | | | | 199,990 | |
Verisk Analytics, Inc. | | BBB | | | 4.00 | | | | 06/15/25 | | | | 175,000 | | | | 173,592 | |
| | | | | | | | | | | | | | | | | | |
| | | | | | | | | | | | | | | | | 897,297 | |
| | | | | | | | | | | | | | | | | | |
| INFORMATION TECHNOLOGY (1.0%) | | | | | | | | | | | | | | |
Apple, Inc. | | AA+ | | | 2.05 | | | | 09/11/26 | | | | 200,000 | | | | 188,301 | |
Applied Materials, Inc. | | A | | | 3.90 | | | | 10/01/25 | | | | 350,000 | | | | 352,185 | |
Arrow Electronics, Inc. | | BBB- | | | 4.50 | | | | 03/01/23 | | | | 300,000 | | | | 301,132 | |
Intel Corp. | | A+ | | | 3.40 | | | | 03/25/25 | | | | 135,000 | | | | 134,781 | |
Mastercard, Inc. | | A+ | | | 3.30 | | | | 03/26/27 | | | | 300,000 | | | | 294,786 | |
PayPal Hldgs., Inc. | | A- | | | 2.65 | | | | 10/01/26 | | | | 350,000 | | | | 331,894 | |
QUALCOMM, Inc. | | A | | | 4.25 | | | | 05/20/32 | | | | 65,000 | | | | 66,170 | |
Teledyne Technologies, Inc. | | BBB | | | 2.75 | | | | 04/01/31 | | | | 250,000 | | | | 208,986 | |
| | | | | | | | | | | | | | | | | | |
| | | | | | | | | | | | | | | | | 1,878,235 | |
| | | | | | | | | | | | | | | | | | |
| MATERIALS (0.4%) | | | | | | | | | | | | | | |
AptarGroup, Inc. | | BBB- | | | 3.60 | | | | 03/15/32 | | | | 165,000 | | | | 146,352 | |
Eagle Materials, Inc. | | BBB | | | 2.50 | | | | 07/01/31 | | | | 200,000 | | | | 157,959 | |
Sherwin-Williams Co. | | BBB | | | 3.95 | | | | 01/15/26 | | | | 350,000 | | | | 346,703 | |
Southern Copper Corp. | | BBB+ | | | 3.50 | | | | 11/08/22 | | | | 100,000 | | | | 99,952 | |
| | | | | | | | | | | | | | | | | 750,966 | |
| REAL ESTATE (0.2%) | | | | | | | | | | | | | | |
Boston Properties LP | | BBB+ | | | 3.25 | | | | 01/30/31 | | | | 300,000 | | | | 257,312 | |
Duke Realty LP | | BBB+ | | | 1.75 | | | | 07/01/30 | | | | 140,000 | | | | 114,505 | |
| | | | | | | | | | | | | | | | | | |
| | | | | | | | | | | | | | | | | 371,817 | |
| | | | | | | | | | | | | | | | | | |
| UTILITIES (0.2%) | | | | | | | | | | | | | | |
National Fuel Gas Co. | | BBB- | | | 5.20 | | | | 07/15/25 | | | | 100,000 | | | | 101,237 | |
NextEra Energy Capital Hldgs., Inc. | | BBB+ | | | 3.55 | | | | 05/01/27 | | | | 180,000 | | | | 173,777 | |
Southern Co. | | BBB | | | 3.25 | | | | 07/01/26 | | | | 50,000 | | | | 47,846 | |
| | | | | | | | | | | | | | | | | | |
| | | | | | | | | | | | | | | | | 322,860 | |
| | | | | | | | | | | | | | | | | | |
TOTAL CORPORATE DEBT | | | | 14,336,149 | |
| | | | | | | | | | | | | | | | | | |
TOTAL LONG-TERM DEBT SECURITIES
(Cost: $69,836,442) 35.0% | | | | 64,588,271 | |
| | | | | | | | | | | | | | | | | | |
The accompanying notes are an integral part of these portfolio schedules.
65
MUTUAL OF AMERICA INVESTMENT CORPORATION — COMPOSITE FUND
PORTFOLIO OF INVESTMENTS IN SECURITIES (Continued)
June 30, 2022 (Unaudited)
| | | | | | | | | | | | | | | | | | | | |
| | | | | |
| | | Rating** | | | Rate(%) | | | Maturity | | | Face Amount | | | Value | |
| | | | | |
| SHORT-TERM DEBT SECURITIES: | | | | | | | | | | | | | | | |
U.S. GOVERNMENT (5.7%) | | | | | | | | | | | | | | | | | | | | |
U.S. Treasury Bill | | | A-1+ | | | | 0.83 | | | | 07/07/22 | | | $ | 1,500,000 | | | $ | 1,499,792 | |
U.S. Treasury Bill | | | A-1+ | | | | 0.95 | | | | 07/14/22 | | | | 1,000,000 | | | | 999,658 | |
U.S. Treasury Bill | | | A-1+ | | | | 0.96 | | | | 07/05/22 | | | | 6,100,000 | | | | 6,099,352 | |
U.S. Treasury Bill | | | A-1+ | | | | 1.05 | | | | 07/12/22 | | | | 2,000,000 | | | | 1,999,358 | |
| | | | | | | | | | | | | | | | | | | | |
| | | | | | | | | | | | | | | | | | | 10,598,160 | |
| | | | | | | | | | | | | | | | | | | | |
| COMMERCIAL PAPER (0.8%) | | | | | | | | | | | | | | | |
Travelers Corp.† | | | A-1 | | | | 1.53 | | | | 07/01/22 | | | | 1,500,000 | | | | 1,500,000 | |
| | | | | | | | | | | | | | | | | | | | |
| | | | | | | | | | | | | | | | | | | | |
TOTAL SHORT-TERM DEBT SECURITIES
(Cost: $12,098,160) 6.5% | | | | 12,098,160 | |
| | | | | | | | | | | | | | | | | | | | |
| | | | | |
| | | | | | Rate(%) | | | Maturity | | | Face Amount | | | Value | |
| | | | | |
| TEMPORARY CASH INVESTMENT (1.8%) | | | | | | | | | | | | | | | |
JP Morgan Chase, New York Time Deposit | | | | 0.91 | | | | 07/01/22 | | | $ | 3,271,481 | | | $ | 3,271,481 | |
| | | | | | | | | | | | | | | | | | | | |
| | | | | | | | | | | | | | | | | | | | |
TOTAL TEMPORARY CASH INVESTMENT
(Cost: $3,271,481) 1.8% | | | | 3,271,481 | |
| | | | | | | | | | | | | | | | | | | | |
TOTAL INVESTMENTS
(Cost: $159,559,335) 100.5% | | | | 185,690,604 | |
| | | | | | | | | | | | | | | | | | | | |
OTHER NET ASSETS -0.5% | | | | (915,134 | ) |
| | | | | | | | | | | | | | | | | | | | |
NET ASSETS 100.0% | | | $ | 184,775,470 | |
| | | | | | | | | | | | | | | | | | | | |
The accompanying notes are an integral part of these portfolio schedules.
66
MUTUAL OF AMERICA INVESTMENT CORPORATION — INTERNATIONAL FUND
PORTFOLIO OF INVESTMENTS IN SECURITIES
June 30, 2022 (Unaudited)
| | | | | | | | |
| | | Shares | | | Value | |
| COMMON STOCKS: | |
| AUSTRALIA (5.4%) | | | | | | |
| CONSUMER DISCRETIONARY (0.3%) | |
Aristocrat Leisure Ltd. | | | 148,678 | | | $ | 3,535,947 | |
| | | | | | | | |
| CONSUMER STAPLES (0.3%) | | | | | | |
Woolworths Group Ltd. | | | 115,935 | | | | 2,847,222 | |
| | | | | | | | |
| ENERGY (0.2%) | | | | | | |
Woodside Energy Group Ltd.* | | | 67,885 | | | | 1,491,796 | |
Woodside Energy Group Ltd.* | | | 58,606 | | | | 1,241,131 | |
| | | | | | | | |
| | | | | | | 2,732,927 | |
| | | | | | | | |
| FINANCIALS (1.6%) | | | | | | |
Australia & New Zealand Banking Group Ltd. | | | 294,783 | | | | 4,489,104 | |
National Australia Bank Ltd. | | | 292,444 | | | | 5,544,766 | |
Suncorp Group Ltd. | | | 1,047,121 | | | | 7,983,923 | |
| | | | | | | | |
| | | | | | | 18,017,793 | |
| | | | | | | | |
| HEALTH CARE (0.6%) | | | | | | |
Sonic Healthcare Ltd. | | | 289,941 | | | | 6,607,750 | |
| | | | | | | | |
| INDUSTRIALS (0.8%) | | | | | | |
Aurizon Hldgs. Ltd. | | | 3,257,215 | | | | 8,565,336 | |
| | | | | | | | |
| INFORMATION TECHNOLOGY (0.1%) | | | | | | |
WiseTech Global Ltd. | | | 47,887 | | | | 1,255,523 | |
| | | | | | | | |
| MATERIALS (1.5%) | | | | | | |
BHP Group Ltd. | | | 569,906 | | | | 16,316,105 | |
| | | | | | | | |
TOTAL AUSTRALIA | | | | 59,878,603 | |
| | | | | | | | |
| AUSTRIA (0.9%) | | | | | | |
| ENERGY (0.6%) | | | | | | |
OMV AG | | | 142,823 | | | | 6,717,074 | |
| | | | | | | | |
| FINANCIALS (0.1%) | | | | | | |
Raiffeisen Bank International AG | | | 118,348 | | | | 1,293,014 | |
| | | | | | | | |
| MATERIALS (0.2%) | | | | | | |
voestalpine AG | | | 81,087 | | | | 1,733,011 | |
| | | | | | | | |
| TOTAL AUSTRIA | | | 9,743,099 | |
| | | | | | | | |
| DENMARK (3.4%) | | | | | | |
| CONSUMER DISCRETIONARY (0.6%) | |
Pandora A/S | | | 104,455 | | | | 6,636,333 | |
| | | | | | | | |
| FINANCIALS (0.3%) | | | | | | |
Danske Bank A/S | | | 231,038 | | | | 3,288,321 | |
| | | | | | | | |
| HEALTH CARE (1.8%) | | | | | | |
Novo Nordisk A/S Cl B | | | 173,229 | | | | 19,211,646 | |
| | | | | | | | |
| INDUSTRIALS (0.7%) | | | | | | |
AP Moller - Maersk A/S Cl B | | | 3,118 | | | | 7,319,862 | |
| | | | | | | | |
| TOTAL DENMARK | | | 36,456,162 | |
| | | | | | | | |
| FINLAND (1.8%) | | | | | | |
| FINANCIALS (0.7%) | | | | | | |
Nordea Bank Abp | | | 837,405 | | | | 7,396,189 | |
| | | | | | | | |
| INFORMATION TECHNOLOGY (0.7%) | | | | | | |
Nokia OYJ | | | 1,641,814 | | | | 7,609,894 | |
| | | | | | | | |
| | | | | | | | |
| | | Shares | | | Value | |
| COMMON STOCKS (CONTINUED): | |
| FINLAND (CONTINUED) | | | | | | |
| UTILITIES (0.4%) | | | | | | |
Fortum OYJ | | | 319,753 | | | $ | 4,833,023 | |
| | | | | | | | |
TOTAL FINLAND | | | | 19,839,106 | |
| | | | | | | | |
| FRANCE (11.4%) | | | | | | |
| COMMUNICATION SERVICES (1.3%) | | | | | | |
Orange S.A. | | | 607,049 | | | | 7,153,207 | |
Publicis Groupe S.A.* | | | 132,464 | | | | 6,514,651 | |
| | | | | | | | |
| | | | | | | 13,667,858 | |
| | | | | | | | |
| CONSUMER DISCRETIONARY (2.2%) | | | | | | |
Faurecia SE* | | | 168,109 | | | | 3,368,968 | |
Hermes International | | | 2,401 | | | | 2,702,153 | |
La Francaise des Jeux SAEM† | | | 84,953 | | | | 2,949,931 | |
LVMH Moet Hennessy Louis Vuitton SE | | | 23,922 | | | | 14,661,268 | |
| | | | | | | | |
| | | | | | | 23,682,320 | |
| | | | | | | | |
| CONSUMER STAPLES (1.6%) | | | | | | |
Carrefour S.A. | | | 484,381 | | | | 8,598,397 | |
L’Oreal S.A. | | | 26,411 | | | | 9,170,046 | |
| | | | | | | | |
| | | | | | | 17,768,443 | |
| | | | | | | | |
| ENERGY (0.6%) | | | | | | |
TotalEnergies SE | | | 119,344 | | | | 6,281,906 | |
| | | | | | | | |
| FINANCIALS (1.8%) | | | | | | |
AXA S.A. | | | 197,246 | | | | 4,505,403 | |
BNP Paribas S.A. | | | 185,535 | | | | 8,874,505 | |
Societe Generale S.A. | | | 285,013 | | | | 6,301,555 | |
| | | | | | | | |
| | | | | | | 19,681,463 | |
| | | | | | | | |
| HEALTH CARE (1.3%) | | | | | | |
Sanofi | | | 137,935 | | | | 13,910,202 | |
| | | | | | | | |
| INDUSTRIALS (1.9%) | | | | | | |
Bouygues S.A. | | | 230,949 | | | | 7,127,899 | |
Cie de Saint-Gobain | | | 148,602 | | | | 6,420,980 | |
Eiffage S.A. | | | 84,057 | | | | 7,603,797 | |
| | | | | | | | |
| | | | | | | 21,152,676 | |
| | | | | | | | |
| INFORMATION TECHNOLOGY (0.2%) | | | | | | |
Dassault Systemes SE | | | 58,195 | | | | 2,155,593 | |
| | | | | | | | |
| UTILITIES (0.5%) | | | | | | |
Engie S.A. | | | 497,431 | | | | 5,759,735 | |
| | | | | | | | |
| TOTAL FRANCE | | | 124,060,196 | |
| | | | | | | | |
| GERMANY (5.8%) | | | | | | |
| COMMUNICATION SERVICES (0.7%) | | | | | | |
Deutsche Telekom AG | | | 359,340 | | | | 7,147,007 | |
| | | | | | | | |
| CONSUMER DISCRETIONARY (1.4%) | |
Bayerische Motoren Werke AG | | | 95,399 | | | | 7,395,389 | |
Mercedes-Benz Group AG | | | 129,775 | | | | 7,537,119 | |
| | | | | | | | |
| | | | | | | 14,932,508 | |
| | | | | | | | |
| HEALTH CARE (0.6%) | | | | | | |
Merck KGaA | | | 39,983 | | | | 6,781,969 | |
| | | | | | | | |
| INDUSTRIALS (0.7%) | | | | | | |
Deutsche Post AG | | | 195,129 | | | | 7,367,321 | |
| | | | | | | | |
The accompanying notes are an integral part of these portfolio schedules.
67
MUTUAL OF AMERICA INVESTMENT CORPORATION — INTERNATIONAL FUND
PORTFOLIO OF INVESTMENTS IN SECURITIES (Continued)
June 30, 2022 (Unaudited)
| | | | | | | | |
| | | Shares | | | Value | |
| COMMON STOCKS (CONTINUED): | |
| GERMANY (CONTINUED) | |
| INFORMATION TECHNOLOGY (0.9%) | |
SAP SE | | | 107,653 | | | $ | 9,812,621 | |
| | | | | | | | |
| MATERIALS (0.5%) | | | | | | |
Covestro AG† | | | 139,031 | | | | 4,831,147 | |
HeidelbergCement AG | | | 29,223 | | | | 1,410,925 | |
| | | | | | | | |
| | | | | | | 6,242,072 | |
| | | | | | | | |
| REAL ESTATE (0.4%) | | | | | | |
LEG Immobilien SE | | | 59,485 | | | | 4,950,438 | |
| | | | | | | | |
| UTILITIES (0.6%) | | | | | | |
E.ON SE | | | 770,617 | | | | 6,490,966 | |
| | | | | | | | |
| TOTAL GERMANY | | | 63,724,902 | |
| | | | | | | | |
| HONG KONG (2.0%) | | | | | | |
| INDUSTRIALS (0.8%) | | | | | | |
CK Hutchison Hldgs. Ltd. | | | 1,378,500 | | | | 9,352,043 | |
| | | | | | | | |
| REAL ESTATE (1.2%) | | | | | | |
Henderson Land Development Co. Ltd. | | | 1,963,000 | | | | 7,377,925 | |
Sun Hung Kai Properties Ltd. | | | 447,000 | | | | 5,292,676 | |
| | | | | | | | |
| | | | | | | 12,670,601 | |
| | | | | | | | |
| TOTAL HONG KONG | | | 22,022,644 | |
| | | | | | | | |
| ISRAEL (0.9%) | | | | | | |
| INFORMATION TECHNOLOGY (0.9%) | |
Check Point Software Technologies Ltd.* | | | 76,150 | | | | 9,273,547 | |
| | | | | | | | |
| ITALY (1.0%) | | | | | | |
| COMMUNICATION SERVICES (0.3%) | |
Telecom Italia SpA* | | | 11,674,969 | | | | 3,061,265 | |
| | | | | | | | |
| FINANCIALS (0.7%) | | | | | | |
Assicurazioni Generali SpA | | | 118,590 | | | | 1,894,211 | |
Poste Italiane SpA† | | | 610,040 | | | | 5,707,826 | |
| | | | | | | | |
| | | | | | | 7,602,037 | |
| | | | | | | | |
| TOTAL ITALY | | | 10,663,302 | |
| | | | | | | | |
| JAPAN (18.9%) | | | | | | |
| COMMUNICATION SERVICES (1.0%) | |
Nintendo Co. Ltd. | | | 25,300 | | | | 10,878,424 | |
| | | | | | | | |
| CONSUMER DISCRETIONARY (3.1%) | | | | | | |
Aisin Corp. | | | 218,300 | | | | 6,755,351 | |
Honda Motor Co. Ltd. | | | 376,400 | | | | 9,073,747 | |
Iida Group Hldgs. Co. Ltd. | | | 349,900 | | | | 5,370,804 | |
Toyota Motor Corp. | | | 197,700 | | | | 3,049,812 | |
Yamaha Motor Co. Ltd. | | | 309,200 | | | | 5,676,719 | |
ZOZO, Inc. | | | 250,400 | | | | 4,529,580 | |
| | | | | | | | |
| | | | | | | 34,456,013 | |
| | | | | | | | |
| CONSUMER STAPLES (1.4%) | | | | | | |
Japan Tobacco, Inc. | | | 457,400 | | | | 7,924,727 | |
Suntory Beverage & Food Ltd. | | | 204,300 | | | | 7,713,559 | |
| | | | | | | | |
| | | | | | | 15,638,286 | |
| | | | | | | | |
| | | | | | | | |
| | | Shares | | | Value | |
| COMMON STOCKS (CONTINUED): | |
| JAPAN (CONTINUED) | |
| ENERGY (0.9%) | | | | | | |
ENEOS Hldgs., Inc. | | | 2,183,600 | | | $ | 8,214,922 | |
Inpex Corp. | | | 135,300 | | | | 1,450,187 | |
| | | | | | | | |
| | | | | | | 9,665,109 | |
| | | | | | | | |
| FINANCIALS (2.5%) | | | | | | |
Dai-ichi Life Hldgs., Inc. | | | 383,200 | | | | 7,086,128 | |
Daiwa Securities Group, Inc. | | | 1,465,700 | | | | 6,561,654 | |
Japan Post Insurance Co. Ltd. | | | 505,000 | | | | 8,080,891 | |
Mitsubishi UFJ Financial Group, Inc. | | | 1,000,200 | | | | 5,350,136 | |
| | | | | | | | |
| | | | | | | 27,078,809 | |
| | | | | | | | |
| HEALTH CARE (1.3%) | | | | | | |
Otsuka Hldgs. Co. Ltd. | | | 104,600 | | | | 3,733,188 | |
Takeda Pharmaceutical Co. Ltd. | | | 400,600 | | | | 11,250,121 | |
| | | | | | | | |
| | | | | | | 14,983,309 | |
| | | | | | | | |
| INDUSTRIALS (5.6%) | | | | | | |
AGC, Inc. | | | 167,500 | | | | 5,884,478 | |
ITOCHU Corp. | | | 340,400 | | | | 9,181,609 | |
Marubeni Corp. | | | 960,200 | | | | 8,612,928 | |
Mitsubishi Corp. | | | 326,800 | | | | 9,730,695 | |
Mitsui & Co. Ltd. | | | 437,700 | | | | 9,616,483 | |
Nippon Yusen KK | | | 124,600 | | | | 8,541,618 | |
Sumitomo Corp. | | | 613,300 | | | | 8,335,327 | |
Yamato Hldgs. Co. Ltd. | | | 57,300 | | | | 916,812 | |
| | | | | | | | |
| | | | | | | 60,819,950 | |
| | | | | | | | |
| INFORMATION TECHNOLOGY (2.5%) | |
Brother Industries Ltd. | | | 410,700 | | | | 7,224,689 | |
Canon, Inc. | | | 402,900 | | | | 9,128,589 | |
Keyence Corp. | | | 13,472 | | | | 4,619,213 | |
Seiko Epson Corp. | | | 469,400 | | | | 6,639,371 | |
| | | | | | | | |
| | | | | | | 27,611,862 | |
| | | | | | | | |
| MATERIALS (0.6%) | | | | | | |
Sumitomo Chemical Co. Ltd. | | | 1,687,100 | | | | 6,601,583 | |
| | | | | | | | |
| TOTAL JAPAN | | | 207,733,345 | |
| | | | | | | | |
| LUXEMBOURG (0.9%) | | | | | | |
| MATERIALS (0.5%) | | | | | | |
ArcelorMittal S.A. | | | 257,349 | | | | 5,771,150 | |
| | | | | | | | |
| REAL ESTATE (0.4%) | | | | | | |
Aroundtown S.A. | | | 1,255,065 | | | | 4,014,199 | |
| | | | | | | | |
| TOTAL LUXEMBOURG | | | 9,785,349 | |
| | | | | | | | |
| NETHERLANDS (4.0%) | | | | | | |
| CONSUMER STAPLES (0.7%) | | | | | | |
Koninklijke Ahold Delhaize N.V. | | | 298,951 | | | | 7,781,401 | |
| | | | | | | | |
| FINANCIALS (0.7%) | | | | | | |
ING Groep N.V. | | | 818,949 | | | | 8,067,963 | |
| | | | | | | | |
| INDUSTRIALS (1.0%) | | | | | | |
Wolters Kluwer N.V. | | | 111,882 | | | | 10,843,378 | |
| | | | | | | | |
The accompanying notes are an integral part of these portfolio schedules.
68
MUTUAL OF AMERICA INVESTMENT CORPORATION — INTERNATIONAL FUND
PORTFOLIO OF INVESTMENTS IN SECURITIES (Continued)
June 30, 2022 (Unaudited)
| | | | | | | | |
| | | Shares | | | Value | |
| COMMON STOCKS (CONTINUED): | |
| NETHERLANDS (CONTINUED) | |
| INFORMATION TECHNOLOGY (1.6%) | |
ASML Hldg. N.V. | | | 36,239 | | | $ | 17,120,678 | |
| | | | | | | | |
| TOTAL NETHERLANDS | | | 43,813,420 | |
| | | | | | | | |
| NORWAY (0.5%) | | | | | | |
| ENERGY (0.3%) | | | | | | |
Aker BP ASA* | | | 81,223 | | | | 2,589,583 | |
| | | | | | | | |
| FINANCIALS (0.2%) | | | | | | |
Gjensidige Forsikring ASA | | | 87,239 | | | | 1,776,063 | |
| | | | | | | | |
| TOTAL NORWAY | | | 4,365,646 | |
| | | | | | | | |
| PORTUGAL (0.7%) | | | | | | |
| CONSUMER STAPLES (0.7%) | | | | | | |
Jeronimo Martins SGPS S.A. | | | 361,921 | | | | 7,845,852 | |
| | | | | | | | |
| SPAIN (2.8%) | | | | | | |
| COMMUNICATION SERVICES (1.0%) | | | | | | |
Telefonica S.A. | | | 2,222,895 | | | | 11,349,070 | |
| | | | | | | | |
| CONSUMER DISCRETIONARY (0.2%) | |
Industria de Diseno Textil S.A. | | | 88,596 | | | | 2,013,386 | |
| | | | | | | | |
| FINANCIALS (0.7%) | | | | | | |
Banco Bilbao Vizcaya Argentaria S.A. | | | 592,000 | | | | 2,689,208 | |
Banco Santander S.A. | | | 1,409,869 | | | | 3,989,106 | |
| | | | | | | | |
| | | | | | | 6,678,314 | |
| | | | | | | | |
| UTILITIES (0.9%) | | | | | | |
Red Electrica Corp. S.A. | | | 506,195 | | | | 9,582,059 | |
| | | | | | | | |
| TOTAL SPAIN | | | 29,622,829 | |
| | | | | | | | |
| SWEDEN (0.7%) | | | | | | |
| CONSUMER DISCRETIONARY (0.5%) | |
H & M Hennes & Mauritz AB Cl B | | | 466,679 | | | | 5,600,590 | |
| | | | | | | | |
| ENERGY (0.0%) (2) | | | | | | |
Lundin Energy AB | | | 85,410 | | | | 58,067 | |
| | | | | | | | |
| FINANCIALS (0.2%) | | | | | | |
Svenska Handelsbanken AB Cl A | | | 281,369 | | | | 2,414,903 | |
| | | | | | | | |
| TOTAL SWEDEN | | | 8,073,560 | |
| | | | | | | | |
| SWITZERLAND (9.7%) | | | | | | |
| CONSUMER DISCRETIONARY (1.5%) | |
Cie Financiere Richemont S.A. Cl A | | | 86,482 | | | | 9,303,254 | |
Swatch Group AG | | | 28,795 | | | | 6,840,639 | |
| | | | | | | | |
| | | | | | | 16,143,893 | |
| | | | | | | | |
| CONSUMER STAPLES (1.5%) | | | | | | |
Nestle S.A. | | | 135,000 | | | | 15,779,475 | |
| | | | | | | | |
| FINANCIALS (1.8%) | | | | | | |
Partners Group Hldg. AG | | | 3,973 | | | | 3,588,380 | |
UBS Group AG | | | 657,160 | | | | 10,625,241 | |
Zurich Insurance Group AG | | | 12,375 | | | | 5,396,974 | |
| | | | | | | | |
| | | | | | | 19,610,595 | |
| | | | | | | | |
| HEALTH CARE (4.9%) | |
Novartis AG | | | 250,311 | | | | 21,223,748 | |
| | | | | | | | |
| | | Shares | | | Value | |
| COMMON STOCKS (CONTINUED): | |
| SWITZERLAND (CONTINUED) | |
| HEALTH CARE (CONTINUED) | |
Roche Hldg. AG | | | 63,929 | | | $ | 21,373,694 | |
Sonova Hldg. AG | | | 30,483 | | | | 9,742,826 | |
| | | | | | | | |
| | | | | | | 52,340,268 | |
| | | | | | | | |
| TOTAL SWITZERLAND | | | 103,874,231 | |
| | | | | | | | |
| UNITED KINGDOM (14.1%) | | | | | | |
| COMMUNICATION SERVICES (1.4%) | |
Vodafone Group PLC | | | 7,092,690 | | | | 11,026,559 | |
WPP PLC | | | 469,828 | | | | 4,745,070 | |
| | | | | | | | |
| | | | | | | 15,771,629 | |
| | | | | | | | |
| CONSUMER DISCRETIONARY (1.2%) | |
Barratt Developments PLC | | | 294,798 | | | | 1,648,730 | |
Burberry Group PLC | | | 295,336 | | | | 5,923,903 | |
Persimmon PLC | | | 231,114 | | | | 5,257,418 | |
| | | | | | | | |
| | | | | | | 12,830,051 | |
| | | | | | | | |
| CONSUMER STAPLES (2.8%) | | | | | | |
British American Tobacco PLC | | | 367,971 | | | | 15,770,218 | |
Imperial Brands PLC | | | 438,962 | | | | 9,825,749 | |
J Sainsbury PLC | | | 2,149,145 | | | | 5,347,616 | |
| | | | | | | | |
| | | | | | | 30,943,583 | |
| | | | | | | | |
| ENERGY (1.5%) | | | | | | |
Shell PLC | | | 636,477 | | | | 16,572,908 | |
| | | | | | | | |
| FINANCIALS (2.8%) | | | | | | |
3i Group PLC | | | 343,652 | | | | 4,657,034 | |
Barclays PLC | | | 4,106,747 | | | | 7,678,182 | |
Direct Line Insurance Group PLC | | | 1,406,843 | | | | 4,317,509 | |
Lloyds Banking Group PLC | | | 16,302,538 | | | | 8,386,383 | |
NatWest Group PLC | | | 2,106,401 | | | | 5,605,818 | |
| | | | | | | | |
| | | | | | | 30,644,926 | |
| | | | | | | | |
| HEALTH CARE (0.8%) | | | | | | |
GSK PLC | | | 425,895 | | | | 9,177,211 | |
| | | | | | | | |
| INDUSTRIALS (2.2%) | | | | | | |
BAE Systems PLC | | | 1,250,113 | | | | 12,654,057 | |
RELX PLC | | | 399,940 | | | | 10,857,131 | |
| | | | | | | | |
| | | | | | | 23,511,188 | |
| | | | | | | | |
| MATERIALS (1.4%) | | | | | | |
Anglo American PLC | | | 247,566 | | | | 8,848,676 | |
Rio Tinto PLC | | | 102,650 | | | | 6,136,091 | |
| | | | | | | | |
| | | | | | | 14,984,767 | |
| | | | | | | | |
| TOTAL UNITED KINGDOM | | | 154,436,263 | |
| | | | | | | | |
| UNITED STATES (6.6%) | | | | | | |
| FINANCIALS (6.6%) | | | | | | |
iShares Core MSCI Emerging Markets ETF | | | 616,570 | | | | 30,248,924 | |
iShares MSCI Emerging Markets ex China ETF | | | 200,000 | | | | 9,552,000 | |
Vanguard FTSE Emerging Markets ETF | | | 769,298 | | | | 32,041,262 | |
| | | | | | | | |
| | | | | | | 71,842,186 | |
| | | | | | | | |
| TOTAL COMMON STOCKS | | | | | | |
(Cost: $1,198,551,717) 91.5% | | | | 997,054,242 | |
| | | | | | | | |
The accompanying notes are an integral part of these portfolio schedules.
69
MUTUAL OF AMERICA INVESTMENT CORPORATION — INTERNATIONAL FUND
PORTFOLIO OF INVESTMENTS IN SECURITIES (Continued)
June 30, 2022 (Unaudited)
| | | | | | | | | | | | | | | | | | | | |
| | | Rating** | | | Rate(%) | | | Maturity | | | Face Amount | | | Value | |
| SHORT-TERM DEBT SECURITIES: | | | | | | | | | | | | | | | |
| UNITED STATES (0.3%) | | | | | | | | | | | | | | | |
| U.S. GOVERNMENT (0.3%) | | | | | | | | | | | | | | | |
U.S. Treasury Bill (1) | | | A-1+ | | | | 0.82 | | | | 08/02/22 | | | $ | 3,000,000 | | | $ | 2,997,826 | |
| | | | | | | | | | | | | | | | | | | | |
TOTAL SHORT-TERM DEBT SECURITIES
(Cost: $2,997,826) 0.3% | | | | 2,997,826 | |
| | | | | | | | | | | | | | | | | | | | |
| | | | | |
| | | | | | Rate(%) | | | Maturity | | | Face Amount | | | Value | |
| TEMPORARY CASH INVESTMENT (5.7%) | | | | | | | | | | | | | | | |
BBVA, Madrid Time Deposit | | | | (0.78 | ) | | | 07/01/22 | | | | EUR 899 | | | $ | 942 | |
BNP Paribas, Paris Time Deposit | | | | (0.73 | ) | | | 07/01/22 | | | | DKK 1,338 | | | | 189 | |
BNP Paribas, Paris Time Deposit | | | | 0.52 | | | | 07/01/22 | | | | GBP 87,152 | | | | 106,073 | |
Royal Bank of Canada, Toronto Time Deposit | | | | 0.91 | | | | 07/01/22 | | | | USD 61,802,320 | | | | 61,802,320 | |
| | | | | | | | | | | | | | | | | | | | |
| | | | | | | | | | | | | | | | | | | 61,909,524 | |
| | | | | | | | | | | | | | | | | | | | |
TOTAL TEMPORARY CASH INVESTMENT
(Cost: $61,909,524) 5.7% | | | | 61,909,524 | |
| | | | | | | | | | | | | | | | | | | | |
TOTAL INVESTMENTS
(Cost: $1,263,459,067) 97.5% | | | | 1,061,961,592 | |
| | | | | | | | | | | | | | | | | | | | |
OTHER NET ASSETS 2.5% | | | | 26,926,333 | |
| | | | | | | | | | | | | | | | | | | | |
NET ASSETS 100.0% | | | $ | 1,088,887,925 | |
| | | | | | | | | | | | | | | | | | | | |
The accompanying notes are an integral part of these portfolio schedules.
70
MUTUAL OF AMERICA INVESTMENT CORPORATION — CATHOLIC VALUES INDEX FUND
PORTFOLIO OF INVESTMENTS IN SECURITIES
June 30, 2022 (Unaudited)
| | | | | | | | |
| | | Shares | | | Value | |
| INDEXED ASSETS: | | | | |
| COMMON STOCKS: | |
| COMMUNICATION SERVICES (8.8%) | |
Activision Blizzard, Inc. | | | 94 | | | $ | 7,319 | |
Alphabet, Inc. Cl A* | | | 37 | | | | 80,633 | |
Alphabet, Inc. Cl C* | | | 34 | | | | 74,373 | |
AT&T, Inc. | | | 863 | | | | 18,089 | |
Charter Communications, Inc. Cl A* | | | 14 | | | | 6,559 | |
Comcast Corp. Cl A | | | 539 | | | | 21,150 | |
DISH Network Corp. Cl A* | | | 30 | | | | 538 | |
Electronic Arts, Inc. | | | 34 | | | | 4,136 | |
Fox Corp. Cl A | | | 38 | | | | 1,222 | |
Fox Corp. Cl B | | | 17 | | | | 505 | |
Interpublic Group of Cos., Inc. | | | 47 | | | | 1,294 | |
Lumen Technologies, Inc. | | | 112 | | | | 1,222 | |
Match Group, Inc.* | | | 34 | | | | 2,370 | |
Meta Platforms, Inc. Cl A* | | | 277 | | | | 44,666 | |
Netflix, Inc.* | | | 53 | | | | 9,268 | |
News Corp. Cl A | | | 47 | | | | 732 | |
News Corp. Cl B | | | 14 | | | | 223 | |
Omnicom Group, Inc. | | | 25 | | | | 1,590 | |
Paramount Global Cl B | | | 73 | | | | 1,802 | |
Take-Two Interactive Software, Inc.* | | | 19 | | | | 2,328 | |
T-Mobile US, Inc.* | | | 71 | | | | 9,552 | |
Twitter, Inc.* | | | 92 | | | | 3,440 | |
Verizon Communications, Inc. | | | 507 | | | | 25,730 | |
Walt Disney Co.* | | | 220 | | | | 20,768 | |
Warner Bros Discovery, Inc.* | | | 267 | | | | 3,583 | |
| | | | | | | | |
| | | | | | | 343,092 | |
| | | | | | | | |
| CONSUMER DISCRETIONARY (10.6%) | |
Advance Auto Parts, Inc. | | | 7 | | | | 1,212 | |
Amazon.com, Inc.* | | | 1,070 | | | | 113,645 | |
Aptiv PLC* | | | 33 | | | | 2,939 | |
AutoZone, Inc.* | | | 3 | | | | 6,447 | |
Bath & Body Works, Inc. | | | 29 | | | | 781 | |
Best Buy Co., Inc. | | | 25 | | | | 1,630 | |
Booking Hldgs., Inc.* | | | 5 | | | | 8,745 | |
BorgWarner, Inc. | | | 29 | | | | 968 | |
CarMax, Inc.* | | | 19 | | | | 1,719 | |
Carnival Corp.* | | | 99 | | | | 856 | |
Chipotle Mexican Grill, Inc. Cl A* | | | 4 | | | | 5,229 | |
Darden Restaurants, Inc. | | | 15 | | | | 1,697 | |
Dollar General Corp. | | | 28 | | | | 6,872 | |
Dollar Tree, Inc.* | | | 27 | | | | 4,208 | |
Domino’s Pizza, Inc. | | | 4 | | | | 1,559 | |
DR Horton, Inc. | | | 39 | | | | 2,581 | |
eBay, Inc. | | | 68 | | | | 2,834 | |
Etsy, Inc.* | | | 15 | | | | 1,098 | |
Expedia Group, Inc.* | | | 18 | | | | 1,707 | |
Ford Motor Co. | | | 480 | | | | 5,342 | |
Garmin Ltd. | | | 18 | | | | 1,769 | |
General Motors Co.* | | | 178 | | | | 5,653 | |
Genuine Parts Co. | | | 17 | | | | 2,261 | |
Hasbro, Inc. | | | 15 | | | | 1,228 | |
Hilton Worldwide Hldgs., Inc. | | | 34 | | | | 3,789 | |
| | | | | | | | |
| | | Shares | | | Value | |
| INDEXED ASSETS (CONTINUED): | | | | |
| COMMON STOCKS (CONTINUED): | |
| CONSUMER DISCRETIONARY (CONTINUED) | |
Home Depot, Inc. | | | 126 | | | $ | 34,558 | |
Las Vegas Sands Corp.* | | | 42 | | | | 1,411 | |
Lennar Corp. Cl A | | | 32 | | | | 2,258 | |
LKQ Corp. | | | 32 | | | | 1,571 | |
Lowe’s Cos., Inc. | | | 81 | | | | 14,148 | |
Marriott International, Inc. Cl A | | | 33 | | | | 4,488 | |
McDonald’s Corp. | | | 91 | | | | 22,466 | |
Mohawk Industries, Inc.* | | | 6 | | | | 745 | |
NIKE, Inc. Cl B | | | 154 | | | | 15,739 | |
Norwegian Cruise Line Hldgs. Ltd.* | | | 51 | | | | 567 | |
NVR, Inc.* | | | 1 | | | | 4,004 | |
O’Reilly Automotive, Inc.* | | | 8 | | | | 5,054 | |
Penn National Gaming, Inc.* | | | 20 | | | | 608 | |
Pool Corp. | | | 4 | | | | 1,405 | |
PulteGroup, Inc. | | | 29 | | | | 1,149 | |
PVH Corp. | | | 8 | | | | 455 | |
Ralph Lauren Corp. Cl A | | | 5 | | | | 448 | |
Ross Stores, Inc. | | | 43 | | | | 3,020 | |
Starbucks Corp. | | | 140 | | | | 10,695 | |
Tapestry, Inc. | | | 31 | | | | 946 | |
Target Corp. | | | 56 | | | | 7,909 | |
Tesla, Inc.* | | | 103 | | | | 69,362 | |
TJX Cos., Inc. | | | 143 | | | | 7,987 | |
Tractor Supply Co. | | | 13 | | | | 2,520 | |
Ulta Beauty, Inc.* | | | 6 | | | | 2,313 | |
VF Corp. | | | 39 | | | | 1,723 | |
Whirlpool Corp. | | | 7 | | | | 1,084 | |
Wynn Resorts Ltd.* | | | 12 | | | | 684 | |
Yum! Brands, Inc. | | | 35 | | | | 3,973 | |
| | | | | | | | |
| | | | | | | 410,059 | |
| | | | | | | | |
| CONSUMER STAPLES (6.8%) | |
Altria Group, Inc. | | | 319 | | | | 13,325 | |
Archer-Daniels-Midland Co. | | | 99 | | | | 7,682 | |
Brown-Forman Corp. Cl B | | | 32 | | | | 2,245 | |
Campbell Soup Co. | | | 35 | | | | 1,682 | |
Clorox Co. | | | 21 | | | | 2,961 | |
Coca-Cola Co. | | | 688 | | | | 43,282 | |
Colgate-Palmolive Co. | | | 148 | | | | 11,861 | |
Conagra Brands, Inc. | | | 84 | | | | 2,876 | |
Constellation Brands, Inc. Cl A | | | 28 | | | | 6,526 | |
Costco Wholesale Corp. | | | 78 | | | | 37,384 | |
Estee Lauder Cos., Inc. Cl A | | | 40 | | | | 10,187 | |
General Mills, Inc. | | | 106 | | | | 7,998 | |
Hormel Foods Corp. | | | 49 | | | | 2,321 | |
JM Smucker Co. | | | 19 | | | | 2,432 | |
Kellogg Co. | | | 45 | | | | 3,210 | |
Kimberly-Clark Corp. | | | 59 | | | | 7,974 | |
Kraft Heinz Co. | | | 125 | | | | 4,767 | |
Kroger Co. | | | 116 | | | | 5,490 | |
Lamb Weston Hldgs., Inc. | | | 25 | | | | 1,787 | |
McCormick & Co., Inc. | | | 44 | | | | 3,663 | |
Molson Coors Beverage Co. Cl B | | | 33 | | | | 1,799 | |
Monster Beverage Corp.* | | | 66 | | | | 6,118 | |
The accompanying notes are an integral part of these portfolio schedules.
71
MUTUAL OF AMERICA INVESTMENT CORPORATION — CATHOLIC VALUES INDEX FUND
PORTFOLIO OF INVESTMENTS IN SECURITIES (Continued)
June 30, 2022 (Unaudited)
| | | | | | | | |
| | | Shares | | | Value | |
| INDEXED ASSETS (CONTINUED): | | | | |
| COMMON STOCKS (CONTINUED): | |
| CONSUMER STAPLES (CONTINUED) | |
Procter & Gamble Co. | | | 423 | | | $ | 60,823 | |
Sysco Corp. | | | 89 | | | | 7,539 | |
Tyson Foods, Inc. Cl A | | | 51 | | | | 4,389 | |
Walgreens Boots Alliance, Inc. | | | 126 | | | | 4,775 | |
| | | | | | | | |
| | | | | | | 265,096 | |
| | | | | | | | |
| ENERGY (4.3%) | |
APA Corp. | | | 41 | | | | 1,431 | |
Baker Hughes Co. Cl A | | | 112 | | | | 3,233 | |
Chevron Corp. | | | 236 | | | | 34,168 | |
ConocoPhillips | | | 155 | | | | 13,920 | |
Coterra Energy, Inc. | | | 97 | | | | 2,502 | |
Devon Energy Corp. | | | 74 | | | | 4,078 | |
Diamondback Energy, Inc. | | | 20 | | | | 2,423 | |
EOG Resources, Inc. | | | 70 | | | | 7,731 | |
Exxon Mobil Corp. | | | 506 | | | | 43,334 | |
Halliburton Co. | | | 108 | | | | 3,387 | |
Hess Corp. | | | 33 | | | | 3,496 | |
Kinder Morgan, Inc. | | | 235 | | | | 3,939 | |
Marathon Oil Corp. | | | 85 | | | | 1,911 | |
Marathon Petroleum Corp. | | | 65 | | | | 5,344 | |
Occidental Petroleum Corp. | | | 107 | | | | 6,300 | |
ONEOK, Inc. | | | 53 | | | | 2,941 | |
Phillips 66 | | | 58 | | | | 4,755 | |
Pioneer Natural Resources Co. | | | 27 | | | | 6,023 | |
Schlumberger NV | | | 169 | | | | 6,043 | |
Valero Energy Corp. | | | 49 | | | | 5,208 | |
Williams Cos., Inc. | | | 146 | | | | 4,557 | |
| | | | | | | | |
| | | | | | | 166,724 | |
| | | | | | | | |
| FINANCIALS (12.3%) | |
Aflac, Inc. | | | 71 | | | | 3,928 | |
Allstate Corp. | | | 33 | | | | 4,182 | |
American Express Co. | | | 74 | | | | 10,258 | |
American International Group, Inc. | | | 95 | | | | 4,857 | |
Ameriprise Financial, Inc. | | | 13 | | | | 3,090 | |
Aon PLC Cl A | | | 25 | | | | 6,742 | |
Arthur J. Gallagher & Co. | | | 25 | | | | 4,076 | |
Assurant, Inc. | | | 6 | | | | 1,037 | |
Bank of America Corp. | | | 852 | | | | 26,523 | |
Bank of New York Mellon Corp. | | | 89 | | | | 3,712 | |
Berkshire Hathaway, Inc. Cl B* | | | 218 | | | | 59,518 | |
BlackRock, Inc. Cl A | | | 17 | | | | 10,354 | |
Brown & Brown, Inc. | | | 28 | | | | 1,634 | |
Capital One Financial Corp. | | | 47 | | | | 4,897 | |
Cboe Global Markets, Inc. | | | 12 | | | | 1,358 | |
Charles Schwab Corp. | | | 181 | | | | 11,436 | |
Chubb Ltd. | | | 51 | | | | 10,026 | |
Cincinnati Financial Corp. | | | 18 | | | | 2,142 | |
Citigroup, Inc. | | | 233 | | | | 10,716 | |
Citizens Financial Group, Inc. | | | 59 | | | | 2,106 | |
CME Group, Inc. Cl A | | | 43 | | | | 8,802 | |
Comerica, Inc. | | | 15 | | | | 1,101 | |
Discover Financial Svcs. | | | 34 | | | | 3,216 | |
Everest Re Group Ltd. | | | 4 | | | | 1,121 | |
| | | | | | | | |
| | | Shares | | | Value | |
| INDEXED ASSETS (CONTINUED): | | | | |
| COMMON STOCKS (CONTINUED): | |
| FINANCIALS (CONTINUED) | |
FactSet Research Systems, Inc. | | | 4 | | | $ | 1,538 | |
Fifth Third Bancorp | | | 83 | | | | 2,789 | |
First Republic Bank | | | 21 | | | | 3,028 | |
Franklin Resources, Inc. | | | 33 | | | | 769 | |
Global X S&P 500 Catholic Values ETF | | | 1,402 | | | | 64,380 | |
Globe Life, Inc. | | | 11 | | | | 1,072 | |
Goldman Sachs Group, Inc. | | | 41 | | | | 12,178 | |
Hartford Financial Svcs. Group, Inc. | | | 40 | | | | 2,617 | |
Huntington Bancshares, Inc. | | | 173 | | | | 2,081 | |
Intercontinental Exchange, Inc. | | | 67 | | | | 6,301 | |
Invesco Ltd. | | | 41 | | | | 661 | |
JPMorgan Chase & Co. | | | 353 | | | | 39,751 | |
KeyCorp. | | | 112 | | | | 1,930 | |
Lincoln National Corp. | | | 20 | | | | 935 | |
Loews Corp. | | | 23 | | | | 1,363 | |
M&T Bank Corp. | | | 21 | | | | 3,347 | |
MarketAxess Hldgs., Inc. | | | 4 | | | | 1,024 | |
Marsh & McLennan Cos., Inc. | | | 61 | | | | 9,470 | |
MetLife, Inc. | | | 84 | | | | 5,274 | |
Moody’s Corp. | | | 19 | | | | 5,167 | |
Morgan Stanley | | | 168 | | | | 12,778 | |
MSCI, Inc. Cl A | | | 10 | | | | 4,122 | |
Nasdaq, Inc. | | | 14 | | | | 2,136 | |
Northern Trust Corp. | | | 25 | | | | 2,412 | |
PNC Financial Svcs. Group, Inc. | | | 50 | | | | 7,889 | |
Principal Financial Group, Inc. | | | 29 | | | | 1,937 | |
Progressive Corp. | | | 70 | | | | 8,139 | |
Prudential Financial, Inc. | | | 45 | | | | 4,306 | |
Raymond James Financial, Inc. | | | 23 | | | | 2,056 | |
Regions Financial Corp. | | | 113 | | | | 2,119 | |
S&P Global, Inc. | | | 42 | | | | 14,157 | |
Signature Bank | | | 7 | | | | 1,254 | |
State Street Corp. | | | 44 | | | | 2,713 | |
SVB Financial Group* | | | 7 | | | | 2,765 | |
Synchrony Financial | | | 60 | | | | 1,657 | |
T. Rowe Price Group, Inc. | | | 27 | | | | 3,067 | |
Travelers Cos., Inc. | | | 29 | | | | 4,905 | |
Truist Financial Corp. | | | 160 | | | | 7,589 | |
U.S. Bancorp | | | 163 | | | | 7,501 | |
Wells Fargo & Co. | | | 455 | | | | 17,822 | |
Willis Towers Watson PLC | | | 14 | | | | 2,763 | |
WR Berkley Corp. | | | 25 | | | | 1,706 | |
Zions Bancorp N.A. | | | 18 | | | | 916 | |
| | | | | | | | |
| | | | | | | 479,216 | |
| | | | | | | | |
| HEALTH CARE (14.6%) | |
ABIOMED, Inc.* | | | 18 | | | | 4,455 | |
Align Technology, Inc.* | | | 29 | | | | 6,863 | |
AmerisourceBergen Corp. Cl A | | | 60 | | | | 8,489 | |
Baxter International, Inc. | | | 201 | | | | 12,910 | |
Boston Scientific Corp.* | | | 572 | | | | 21,319 | |
Cardinal Health, Inc. | | | 109 | | | | 5,697 | |
Cigna Corp. | | | 127 | | | | 33,467 | |
CVS Health Corp. | | | 524 | | | | 48,554 | |
The accompanying notes are an integral part of these portfolio schedules.
72
MUTUAL OF AMERICA INVESTMENT CORPORATION — CATHOLIC VALUES INDEX FUND
PORTFOLIO OF INVESTMENTS IN SECURITIES (Continued)
June 30, 2022 (Unaudited)
| | | | | | | | |
| | | Shares | | | Value | |
| INDEXED ASSETS (CONTINUED): | | | | |
| COMMON STOCKS (CONTINUED): | |
| HEALTH CARE (CONTINUED) | |
DaVita, Inc.* | | | 24 | | | $ | 1,919 | |
DENTSPLY SIRONA, Inc. | | | 86 | | | | 3,073 | |
Dexcom, Inc.* | | | 157 | | | | 11,701 | |
Edwards Lifesciences Corp.* | | | 249 | | | | 23,677 | |
Elevance Health, Inc. | | | 97 | | | | 46,810 | |
Gilead Sciences, Inc. | | | 502 | | | | 31,029 | |
Henry Schein, Inc.* | | | 55 | | | | 4,221 | |
Hologic, Inc.* | | | 100 | | | | 6,930 | |
Humana, Inc. | | | 51 | | | | 23,872 | |
IDEXX Laboratories, Inc.* | | | 34 | | | | 11,925 | |
Incyte Corp.* | | | 75 | | | | 5,698 | |
Intuitive Surgical, Inc.* | | | 144 | | | | 28,902 | |
IQVIA Hldgs., Inc.* | | | 76 | | | | 16,491 | |
Laboratory Corp. of America Hldgs. | | | 37 | | | | 8,671 | |
McKesson Corp. | | | 58 | | | | 18,920 | |
Medtronic PLC | | | 536 | | | | 48,106 | |
Mettler-Toledo International, Inc.* | | | 9 | | | | 10,339 | |
Molina Healthcare, Inc.* | | | 23 | | | | 6,431 | |
Quest Diagnostics, Inc. | | | 47 | | | | 6,250 | |
ResMed, Inc. | | | 59 | | | | 12,368 | |
STERIS PLC | | | 40 | | | | 8,246 | |
Stryker Corp. | | | 135 | | | | 26,856 | |
Teleflex, Inc. | | | 19 | | | | 4,671 | |
Waters Corp.* | | | 24 | | | | 7,944 | |
West Pharmaceutical Svcs., Inc. | | | 30 | | | | 9,071 | |
Zimmer Biomet Hldgs., Inc. | | | 84 | | | | 8,825 | |
Zoetis, Inc. Cl A | | | 188 | | | | 32,315 | |
| | | | | | | | |
| | | | | | | 567,015 | |
| | | | | | | | |
| INDUSTRIALS (7.6%) | |
3M Co. | | | 95 | | | | 12,294 | |
Alaska Air Group, Inc.* | | | 21 | | | | 841 | |
Allegion PLC | | | 15 | | | | 1,469 | |
American Airlines Group, Inc.* | | | 109 | | | | 1,382 | |
AMETEK, Inc. | | | 39 | | | | 4,286 | |
AO Smith Corp. | | | 22 | | | | 1,203 | |
Carrier Global Corp. | | | 142 | | | | 5,064 | |
Caterpillar, Inc. | | | 89 | | | | 15,910 | |
CH Robinson Worldwide, Inc. | | | 22 | | | | 2,230 | |
Cintas Corp. | | | 15 | | | | 5,603 | |
Copart, Inc.* | | | 36 | | | | 3,912 | |
CSX Corp. | | | 364 | | | | 10,578 | |
Cummins, Inc. | | | 24 | | | | 4,645 | |
Deere & Co. | | | 47 | | | | 14,075 | |
Delta Air Lines, Inc.* | | | 107 | | | | 3,100 | |
Dover Corp. | | | 24 | | | | 2,912 | |
Eaton Corp. PLC | | | 67 | | | | 8,441 | |
Emerson Electric Co. | | | 100 | | | | 7,954 | |
Equifax, Inc. | | | 20 | | | | 3,656 | |
Expeditors International of Washington, Inc. | | | 29 | | | | 2,826 | |
Fastenal Co. | | | 96 | | | | 4,792 | |
FedEx Corp. | | | 40 | | | | 9,068 | |
Fortive Corp. | | | 61 | | | | 3,317 | |
| | | | | | | | |
| | | Shares | | | Value | |
| INDEXED ASSETS (CONTINUED): | | | | |
| COMMON STOCKS (CONTINUED): | |
| INDUSTRIALS (CONTINUED) | |
Fortune Brands Home & Security, Inc. | | | 22 | | | $ | 1,317 | |
Generac Hldgs., Inc.* | | | 10 | | | | 2,106 | |
Howmet Aerospace, Inc. | | | 63 | | | | 1,981 | |
IDEX Corp. | | | 13 | | | | 2,361 | |
Illinois Tool Works, Inc. | | | 48 | | | | 8,748 | |
Ingersoll Rand, Inc. | | | 69 | | | | 2,904 | |
JB Hunt Transport Svcs., Inc. | | | 14 | | | | 2,205 | |
Johnson Controls International PLC | | | 117 | | | | 5,602 | |
Masco Corp. | | | 40 | | | | 2,024 | |
Nielsen Hldgs. PLC | | | 61 | | | | 1,416 | |
Nordson Corp. | | | 9 | | | | 1,822 | |
Norfolk Southern Corp. | | | 40 | | | | 9,092 | |
Old Dominion Freight Line, Inc. | | | 15 | | | | 3,844 | |
Otis Worldwide Corp. | | | 71 | | | | 5,018 | |
PACCAR, Inc. | | | 59 | | | | 4,858 | |
Parker-Hannifin Corp. | | | 22 | | | | 5,413 | |
Pentair PLC | | | 28 | | | | 1,282 | |
Quanta Svcs., Inc. | | | 24 | | | | 3,008 | |
Republic Svcs., Inc. Cl A | | | 35 | | | | 4,580 | |
Robert Half International, Inc. | | | 18 | | | | 1,348 | |
Rockwell Automation, Inc. | | | 19 | | | | 3,787 | |
Rollins, Inc. | | | 38 | | | | 1,327 | |
Snap-on, Inc. | | | 9 | | | | 1,773 | |
Southwest Airlines Co.* | | | 99 | | | | 3,576 | |
Stanley Black & Decker, Inc. | | | 25 | | | | 2,622 | |
Trane Technologies PLC | | | 40 | | | | 5,195 | |
TransDigm Group, Inc.* | | | 9 | | | | 4,830 | |
Union Pacific Corp. | | | 105 | | | | 22,394 | |
United Airlines Hldgs., Inc.* | | | 55 | | | | 1,948 | |
United Parcel Svc., Inc. Cl B | | | 123 | | | | 22,452 | |
United Rentals, Inc.* | | | 12 | | | | 2,915 | |
Verisk Analytics, Inc. Cl A | | | 27 | | | | 4,673 | |
Waste Management, Inc. | | | 65 | | | | 9,944 | |
Westinghouse Air Brake Technologies Corp. | | | 31 | | | | 2,544 | |
WW Grainger, Inc. | | | 7 | | | | 3,181 | |
Xylem, Inc. | | | 30 | | | | 2,345 | |
| | | | | | | | |
| | | | | | | 295,993 | |
| | | | | | | | |
| INFORMATION TECHNOLOGY (26.4%) | |
Accenture PLC Cl A | | | 76 | | | | 21,101 | |
Adobe, Inc.* | | | 57 | | | | 20,865 | |
Advanced Micro Devices, Inc.* | | | 195 | | | | 14,912 | |
Akamai Technologies, Inc.* | | | 19 | | | | 1,735 | |
Amphenol Corp. Cl A | | | 72 | | | | 4,635 | |
Analog Devices, Inc. | | | 63 | | | | 9,204 | |
ANSYS, Inc.* | | | 10 | | | | 2,393 | |
Apple, Inc. | | | 1,860 | | | | 254,299 | |
Applied Materials, Inc. | | | 107 | | | | 9,735 | |
Arista Networks, Inc.* | | | 27 | | | | 2,531 | |
Autodesk, Inc.* | | | 26 | | | | 4,471 | |
Automatic Data Processing, Inc. | | | 50 | | | | 10,502 | |
Broadcom, Inc. | | | 50 | | | | 24,290 | |
The accompanying notes are an integral part of these portfolio schedules.
73
MUTUAL OF AMERICA INVESTMENT CORPORATION — CATHOLIC VALUES INDEX FUND
PORTFOLIO OF INVESTMENTS IN SECURITIES (Continued)
June 30, 2022 (Unaudited)
| | | | | | | | |
| | | Shares | | | Value | |
| INDEXED ASSETS (CONTINUED): | | | | |
| COMMON STOCKS (CONTINUED): | |
| INFORMATION TECHNOLOGY (CONTINUED) | |
Broadridge Financial Solutions, Inc. | | | 14 | | | $ | 1,996 | |
Cadence Design Systems, Inc.* | | | 33 | | | | 4,951 | |
CDW Corp. | | | 16 | | | | 2,521 | |
Ceridian HCM Hldg., Inc.* | | | 16 | | | | 753 | |
Cisco Systems, Inc. | | | 501 | | | | 21,363 | |
Citrix Systems, Inc. | | | 15 | | | | 1,458 | |
Cognizant Technology Solutions Corp. Cl A | | | 63 | | | | 4,252 | |
DXC Technology Co.* | | | 29 | | | | 879 | |
Enphase Energy, Inc.* | | | 16 | | | | 3,124 | |
EPAM Systems, Inc.* | | | 6 | | | | 1,769 | |
F5, Inc.* | | | 7 | | | | 1,071 | |
Fidelity National Information Svcs., Inc. | | | 73 | | | | 6,692 | |
Fiserv, Inc.* | | | 70 | | | | 6,228 | |
FleetCor Technologies, Inc.* | | | 9 | | | | 1,891 | |
Fortinet, Inc.* | | | 80 | | | | 4,526 | |
Gartner, Inc.* | | | 9 | | | | 2,176 | |
Global Payments, Inc. | | | 34 | | | | 3,762 | |
Hewlett Packard Enterprise Co. | | | 156 | | | | 2,069 | |
HP, Inc. | | | 127 | | | | 4,163 | |
Intel Corp. | | | 493 | | | | 18,443 | |
International Business Machines Corp. | | | 108 | | | | 15,249 | |
Intuit, Inc. | | | 34 | | | | 13,105 | |
Jack Henry & Associates, Inc. | | | 8 | | | | 1,440 | |
Juniper Networks, Inc. | | | 39 | | | | 1,111 | |
Keysight Technologies, Inc.* | | | 22 | | | | 3,033 | |
KLA Corp. | | | 18 | | | | 5,743 | |
Lam Research Corp. | | | 17 | | | | 7,245 | |
Mastercard, Inc. Cl A | | | 104 | | | | 32,810 | |
Microchip Technology, Inc. | | | 67 | | | | 3,891 | |
Micron Technology, Inc. | | | 135 | | | | 7,463 | |
Microsoft Corp. | | | 905 | | | | 232,431 | |
Monolithic Power Systems, Inc. | | | 5 | | | | 1,920 | |
Motorola Solutions, Inc. | | | 20 | | | | 4,192 | |
NetApp, Inc. | | | 26 | | | | 1,696 | |
NortonLifeLock, Inc. | | | 71 | | | | 1,559 | |
NVIDIA Corp. | | | 302 | | | | 45,780 | |
NXP Semiconductors NV | | | 32 | | | | 4,737 | |
Oracle Corp. | | | 190 | | | | 13,275 | |
Paychex, Inc. | | | 38 | | | | 4,327 | |
Paycom Software, Inc.* | | | 5 | | | | 1,401 | |
PayPal Hldgs., Inc.* | | | 140 | | | | 9,778 | |
PTC, Inc.* | | | 12 | | | | 1,276 | |
Qorvo, Inc.* | | | 13 | | | | 1,226 | |
QUALCOMM, Inc. | | | 135 | | | | 17,245 | |
Roper Technologies, Inc. | | | 13 | | | | 5,130 | |
Salesforce, Inc.* | | | 119 | | | | 19,640 | |
Seagate Technology Hldgs. PLC | | | 24 | | | | 1,715 | |
ServiceNow, Inc.* | | | 24 | | | | 11,412 | |
Skyworks Solutions, Inc. | | | 19 | | | | 1,760 | |
SolarEdge Technologies, Inc.* | | | 6 | | | | 1,642 | |
| | | | | | | | |
| | | Shares | | | Value | |
| INDEXED ASSETS (CONTINUED): | | | | |
| COMMON STOCKS (CONTINUED): | |
| INFORMATION TECHNOLOGY (CONTINUED) | |
Synopsys, Inc.* | | | 18 | | | $ | 5,467 | |
TE Connectivity Ltd. | | | 39 | | | | 4,413 | |
Teledyne Technologies, Inc.* | | | 6 | | | | 2,251 | |
Teradyne, Inc. | | | 19 | | | | 1,701 | |
Texas Instruments, Inc. | | | 111 | | | | 17,055 | |
Trimble, Inc.* | | | 30 | | | | 1,747 | |
Tyler Technologies, Inc.* | | | 5 | | | | 1,662 | |
VeriSign, Inc.* | | | 11 | | | | 1,841 | |
Visa, Inc. Cl A | | | 198 | | | | 38,984 | |
Western Digital Corp.* | | | 37 | | | | 1,659 | |
Zebra Technologies Corp. Cl A* | | | 6 | | | | 1,764 | |
| | | | | | | | |
| | | | | | | 1,026,536 | |
| | | | | | | | |
| MATERIALS (2.6%) | |
Air Products & Chemicals, Inc. | | | 26 | | | | 6,252 | |
Albemarle Corp. | | | 14 | | | | 2,926 | |
Amcor PLC | | | 180 | | | | 2,237 | |
Avery Dennison Corp. | | | 10 | | | | 1,619 | |
Ball Corp. | | | 39 | | | | 2,682 | |
Celanese Corp. Cl A | | | 13 | | | | 1,529 | |
CF Industries Hldgs., Inc. | | | 25 | | | | 2,143 | |
Corteva, Inc. | | | 87 | | | | 4,710 | |
Dow, Inc. | | | 88 | | | | 4,542 | |
DuPont de Nemours, Inc. | | | 62 | | | | 3,446 | |
Eastman Chemical Co. | | | 15 | | | | 1,347 | |
Ecolab, Inc. | | | 30 | | | | 4,613 | |
FMC Corp. | | | 15 | | | | 1,605 | |
Freeport-McMoRan, Inc. | | | 174 | | | | 5,091 | |
International Flavors & Fragrances, Inc. | | | 30 | | | | 3,574 | |
International Paper Co. | | | 45 | | | | 1,882 | |
Linde PLC | | | 61 | | | | 17,539 | |
LyondellBasell Industries NV Cl A | | | 31 | | | | 2,711 | |
Martin Marietta Materials, Inc. | | | 7 | | | | 2,095 | |
Mosaic Co. | | | 44 | | | | 2,078 | |
Newmont Corp. | | | 96 | | | | 5,728 | |
Nucor Corp. | | | 32 | | | | 3,341 | |
Packaging Corp. of America | | | 11 | | | | 1,513 | |
PPG Industries, Inc. | | | 28 | | | | 3,202 | |
Sealed Air Corp. | | | 17 | | | | 981 | |
Sherwin-Williams Co. | | | 29 | | | | 6,493 | |
Vulcan Materials Co. | | | 16 | | | | 2,274 | |
Westrock Co. | | | 31 | | | | 1,235 | |
| | | | | | | | |
| | | | | | | 99,388 | |
| | | | | | | | |
| REAL ESTATE (2.8%) | |
Alexandria Real Estate Equities, Inc. | | | 18 | | | | 2,611 | |
American Tower Corp. | | | 58 | | | | 14,824 | |
AvalonBay Communities, Inc. | | | 17 | | | | 3,302 | |
Boston Properties, Inc. | | | 17 | | | | 1,513 | |
Camden Property Trust | | | 13 | | | | 1,748 | |
CBRE Group, Inc. Cl A* | | | 41 | | | | 3,018 | |
Crown Castle International Corp. | | | 54 | | | | 9,093 | |
The accompanying notes are an integral part of these portfolio schedules.
74
MUTUAL OF AMERICA INVESTMENT CORPORATION — CATHOLIC VALUES INDEX FUND
PORTFOLIO OF INVESTMENTS IN SECURITIES (Continued)
June 30, 2022 (Unaudited)
| | | | | | | | |
| | | Shares | | | Value | |
| INDEXED ASSETS (CONTINUED): | | | | |
| COMMON STOCKS (CONTINUED): | |
| REAL ESTATE (CONTINUED) | |
Digital Realty Trust, Inc. | | | 35 | | | $ | 4,544 | |
Duke Realty Corp. | | | 48 | | | | 2,638 | |
Equinix, Inc. | | | 11 | | | | 7,227 | |
Equity Residential | | | 42 | | | | 3,033 | |
Essex Property Trust, Inc. | | | 8 | | | | 2,092 | |
Extra Space Storage, Inc. | | | 16 | | | | 2,722 | |
Federal Realty OP LP | | | 8 | | | | 766 | |
Host Hotels & Resorts, Inc. | | | 89 | | | | 1,396 | |
Iron Mountain, Inc. | | | 36 | | | | 1,753 | |
Kimco Realty Corp. | | | 78 | | | | 1,542 | |
Mid-America Apartment Communities, Inc. | | | 14 | | | | 2,445 | |
Prologis, Inc. | | | 93 | | | | 10,941 | |
Public Storage | | | 19 | | | | 5,941 | |
Realty Income Corp. | | | 75 | | | | 5,119 | |
Regency Centers Corp. | | | 19 | | | | 1,127 | |
SBA Communications Corp. Cl A | | | 13 | | | | 4,161 | |
Simon Property Group, Inc. | | | 41 | | | | 3,892 | |
UDR, Inc. | | | 37 | | | | 1,703 | |
Vornado Realty Trust | | | 20 | | | | 572 | |
Welltower, Inc. | | | 57 | | | | 4,694 | |
Weyerhaeuser Co. | | | 94 | | | | 3,113 | |
| | | | | | | | |
| | | | | | | 107,530 | |
| | | | | | | | |
| UTILITIES (3.0%) | |
AES Corp. | | | 81 | | | | 1,702 | |
Alliant Energy Corp. | | | 30 | | | | 1,758 | |
Ameren Corp. | | | 31 | | | | 2,801 | |
American Electric Power Co., Inc. | | | 62 | | | | 5,948 | |
American Water Works Co., Inc. | | | 21 | | | | 3,124 | |
Atmos Energy Corp. | | | 16 | | | | 1,794 | |
| | | | | | | | |
| | | Shares | | | Value | |
| INDEXED ASSETS (CONTINUED): | | | | |
| COMMON STOCKS (CONTINUED): | |
| UTILITIES (CONTINUED) | |
CenterPoint Energy, Inc. | | | 76 | | | $ | 2,248 | |
CMS Energy Corp. | | | 35 | | | | 2,363 | |
Consolidated Edison, Inc. | | | 42 | | | | 3,994 | |
Constellation Energy Corp. | | | 39 | | | | 2,233 | |
Dominion Energy, Inc. | | | 97 | | | | 7,742 | |
DTE Energy Co. | | | 23 | | | | 2,915 | |
Duke Energy Corp. | | | 92 | | | | 9,863 | |
Edison International | | | 45 | | | | 2,846 | |
Entergy Corp. | | | 24 | | | | 2,703 | |
Evergy, Inc. | | | 27 | | | | 1,762 | |
Eversource Energy | | | 41 | | | | 3,463 | |
Exelon Corp. | | | 118 | | | | 5,348 | |
FirstEnergy Corp. | | | 68 | | | | 2,611 | |
NextEra Energy, Inc. | | | 236 | | | | 18,281 | |
NiSource, Inc. | | | 49 | | | | 1,445 | |
NRG Energy, Inc. | | | 29 | | | | 1,107 | |
Pinnacle West Capital Corp. | | | 13 | | | | 951 | |
PPL Corp. | | | 88 | | | | 2,387 | |
Public Svc. Enterprise Group, Inc. | | | 60 | | | | 3,797 | |
Sempra Energy | | | 38 | | | | 5,710 | |
Southern Co. | | | 128 | | | | 9,128 | |
WEC Energy Group, Inc. | | | 38 | | | | 3,824 | |
Xcel Energy, Inc. | | | 65 | | | | 4,599 | |
| | | | | | | | |
| | | | | | | 118,447 | |
| | | | | | | | |
TOTAL COMMON STOCKS | | | | | | | | |
(Cost: $3,734,614) 99.8% | | | | 3,879,096 | |
| | | | | | | | |
TOTAL INVESTMENTS | | | | | | | | |
(Cost: $3,734,614) 99.8% | | | | 3,879,096 | |
| | | | | | | | |
OTHER NET ASSETS 0.2% | | | | 6,518 | |
| | | | | | | | |
NET ASSETS 100.0% | | | $ | 3,885,614 | |
| | | | | | | | |
The accompanying notes are an integral part of these portfolio schedules.
75
MUTUAL OF AMERICA INVESTMENT CORPORATION — RETIREMENT INCOME FUND
PORTFOLIO OF INVESTMENTS IN SECURITIES
June 30, 2022 (Unaudited)
| | | | | | | | |
| | | Shares | | | Value | |
| COMMON STOCKS: | | | | | | |
| DIVERSIFIED MUTUAL FUNDS (100.0%) | | | | | | |
Mutual of America Investment Corporation | | | | | | | | |
Bond Fund (33.2%) | | | 5,248,444 | | | $ | 67,337,537 | |
Equity Index Fund (20.0%) | | | 816,885 | | | | 40,501,175 | |
International Fund (2.7%) | | | 731,434 | | | | 5,551,587 | |
Mid-Cap Equity Index Fund (4.7%) | | | 474,284 | | | | 9,509,401 | |
Mid-Term Bond Fund (32.9%) | | | 6,880,532 | | | | 66,672,355 | |
Money Market Fund (6.5%) | | | 1,109,168 | | | | 13,121,461 | |
| | | | | | | | |
TOTAL INVESTMENTS
(Cost: $222,646,693) 100.0% | | | | 202,693,516 | |
| | | | | | | | |
OTHER NET ASSETS -0.0% (2) | | | | (32,789 | ) |
| | | | | | | | |
NET ASSETS 100.0% | | | $ | 202,660,727 | |
| | | | | | | | |
MUTUAL OF AMERICA INVESTMENT CORPORATION — 2015 RETIREMENT FUND
PORTFOLIO OF INVESTMENTS IN SECURITIES
June 30, 2022 (Unaudited)
| | | | | | | | |
| | | Shares | | | Value | |
| COMMON STOCKS: | |
| DIVERSIFIED MUTUAL FUNDS (100.0%) | |
Mutual of America Investment Corporation | | | | | | | | |
Bond Fund (34.1%) | | | 3,177,448 | | | $ | 40,766,662 | |
Equity Index Fund (22.1%) | | | 534,406 | | | | 26,495,867 | |
International Fund (4.8%) | | | 755,958 | | | | 5,737,720 | |
Mid-Cap Equity Index Fund (5.4%) | | | 324,517 | | | | 6,506,567 | |
Mid-Term Bond Fund (29.2%) | | | 3,604,180 | | | | 34,924,500 | |
Money Market Fund (4.4%) | | | 445,139 | | | | 5,265,993 | |
| | | | | | | | |
TOTAL INVESTMENTS
(Cost: $127,987,480) 100.0% | | | | 119,697,309 | |
| | | | | | | | |
OTHER NET ASSETS -0.0% (2) | | | | (21,139 | ) |
| | | | | | | | |
NET ASSETS 100.0% | | | $ | 119,676,170 | |
| | | | | | | | |
MUTUAL OF AMERICA INVESTMENT CORPORATION — 2020 RETIREMENT FUND
PORTFOLIO OF INVESTMENTS IN SECURITIES
June 30, 2022 (Unaudited)
| | | | | | | | |
| | | Shares | | | Value | |
| COMMON STOCKS: | |
| DIVERSIFIED MUTUAL FUNDS (100.0%) | |
Mutual of America Investment Corporation | | | | | | | | |
Bond Fund (32.9%) | | | 13,275,163 | | | $ | 170,320,347 | |
Equity Index Fund (24.0%) | | | 2,501,947 | | | | 124,046,553 | |
International Fund (7.5%) | | | 5,113,443 | | | | 38,811,036 | |
Mid-Cap Equity Index Fund (7.0%) | | | 1,805,665 | | | | 36,203,587 | |
Mid-Term Bond Fund (22.9%) | | | 12,222,381 | | | | 118,434,868 | |
Money Market Fund (2.3%) | | | 1,002,663 | | | | 11,861,499 | |
Small Cap Growth Fund (1.4%) | | | 636,485 | | | | 7,217,741 | |
Small Cap Value Fund (2.0%) | | | 734,308 | | | | 10,368,422 | |
| | | | | | | | |
TOTAL INVESTMENTS
(Cost: $551,724,091) 100.0% | | | | 517,264,053 | |
| | | | | | | | |
OTHER NET ASSETS -0.0% (2) | | | | (63,678 | ) |
| | | | | | | | |
NET ASSETS 100.0% | | | $ | 517,200,375 | |
| | | | | | | | |
The accompanying notes are an integral part of these portfolio schedules.
76
MUTUAL OF AMERICA INVESTMENT CORPORATION — 2025 RETIREMENT FUND
PORTFOLIO OF INVESTMENTS IN SECURITIES
June 30, 2022 (Unaudited)
| | | | | | | | |
| | | Shares | | | Value | |
| COMMON STOCKS: | | | | | | |
| DIVERSIFIED MUTUAL FUNDS (100.0%) | | | | | | |
Mutual of America Investment Corporation | | | | | | | | |
Bond Fund (28.2%) | | | 22,651,378 | | | $ | 290,617,178 | |
Equity Index Fund (28.7%) | | | 5,984,693 | | | | 296,721,059 | |
International Fund (10.2%) | | | 13,871,227 | | | | 105,282,616 | |
Mid-Cap Equity Index Fund (8.7%) | | | 4,501,015 | | | | 90,245,350 | |
Mid-Term Bond Fund (17.9%) | | | 19,095,224 | | | | 185,032,723 | |
Money Market Fund (2.3%) | | | 2,010,339 | | | | 23,782,311 | |
Small Cap Equity Index Fund (0.3%) | | | 298,027 | | | | 2,780,595 | |
Small Cap Growth Fund (1.5%) | | | 1,393,998 | | | | 15,807,936 | |
Small Cap Value Fund (2.2%) | | | 1,587,384 | | | | 22,413,858 | |
| | | | | | | | |
TOTAL INVESTMENTS
(Cost: $1,096,380,431) 100.0% | | | | 1,032,683,626 | |
| | | | | | | | |
OTHER NET ASSETS -0.0% (2) | | | | (102,907 | ) |
| | | | | | | | |
NET ASSETS 100.0% | | | $ | 1,032,580,719 | |
| | | | | | | | |
MUTUAL OF AMERICA INVESTMENT CORPORATION — 2030 RETIREMENT FUND
PORTFOLIO OF INVESTMENTS IN SECURITIES
June 30, 2022 (Unaudited)
| | | | | | | | |
| | | Shares | | | Value | |
| COMMON STOCKS: | | | | | | |
| DIVERSIFIED MUTUAL FUNDS (100.0%) | | | | | | |
Mutual of America Investment Corporation | | | | | | | | |
Bond Fund (22.2%) | | | 18,421,998 | | | $ | 236,354,230 | |
Equity Index Fund (34.5%) | | | 7,419,224 | | | | 367,845,113 | |
International Fund (12.3%) | | | 17,351,025 | | | | 131,694,276 | |
Mid-Cap Equity Index Fund (11.2%) | | | 5,941,519 | | | | 119,127,452 | |
Mid-Term Bond Fund (11.9%) | | | 13,120,908 | | | | 127,141,595 | |
Money Market Fund (2.4%) | | | 2,197,685 | | | | 25,998,615 | |
Small Cap Equity Index Fund (0.7%) | | | 852,570 | | | | 7,954,477 | |
Small Cap Growth Fund (1.9%) | | | 1,759,936 | | | | 19,957,678 | |
Small Cap Value Fund (2.9%) | | | 2,164,065 | | | | 30,556,604 | |
| | | | | | | | |
TOTAL INVESTMENTS
(Cost: $1,115,810,953) 100.0% | | | | 1,066,630,040 | |
| | | | | | | | |
OTHER NET ASSETS -0.0% (2) | | | | (104,085 | ) |
| | | | | | | | |
NET ASSETS 100.0% | | | $ | 1,066,525,955 | |
| | | | | | | | |
The accompanying notes are an integral part of these portfolio schedules.
77
MUTUAL OF AMERICA INVESTMENT CORPORATION — 2035 RETIREMENT FUND
PORTFOLIO OF INVESTMENTS IN SECURITIES
June 30, 2022 (Unaudited)
| | | | | | | | |
| | | Shares | | | Value | |
| COMMON STOCKS: | | | | | | |
| DIVERSIFIED MUTUAL FUNDS (100.0%) | | | | | | |
Mutual of America Investment Corporation | | | | | | | | |
Bond Fund (21.6%) | | | 15,913,340 | | | $ | 204,168,158 | |
Equity Index Fund (39.2%) | | | 7,477,679 | | | | 370,743,320 | |
International Fund (15.1%) | | | 18,888,104 | | | | 143,360,706 | |
Mid-Cap Equity Index Fund (14.0%) | | | 6,618,435 | | | | 132,699,621 | |
Mid-Term Bond Fund (1.8%) | | | 1,789,136 | | | | 17,336,732 | |
Money Market Fund (0.4%) | | | 323,385 | | | | 3,825,643 | |
Small Cap Equity Index Fund (1.9%) | | | 1,934,805 | | | | 18,051,733 | |
Small Cap Growth Fund (2.8%) | | | 2,328,649 | | | | 26,406,879 | |
Small Cap Value Fund (3.2%) | | | 2,135,415 | | | | 30,152,054 | |
| | | | | | | | |
TOTAL INVESTMENTS
(Cost: $992,603,300) 100.0% | | | | 946,744,846 | |
| | | | | | | | |
OTHER NET ASSETS -0.0% (2) | | | | (91,141 | ) |
| | | | | | | | |
NET ASSETS 100.0% | | | $ | 946,653,705 | |
| | | | | | | | |
MUTUAL OF AMERICA INVESTMENT CORPORATION — 2040 RETIREMENT FUND
PORTFOLIO OF INVESTMENTS IN SECURITIES
June 30, 2022 (Unaudited)
| | | | | | | | |
| | | Shares | | | Value | |
| COMMON STOCKS: | | | | | | |
| DIVERSIFIED MUTUAL FUNDS (100.0%) | | | | | | |
Mutual of America Investment Corporation | | | | | | | | |
Bond Fund (16.5%) | | | 10,082,349 | | | $ | 129,356,532 | |
Equity Index Fund (42.6%) | | | 6,739,226 | | | | 334,130,843 | |
International Fund (17.1%) | | | 17,717,613 | | | | 134,476,680 | |
Mid-Cap Equity Index Fund (15.4%) | | | 6,022,122 | | | | 120,743,546 | |
Money Market Fund (0.5%) | | | 356,255 | | | | 4,214,492 | |
Small Cap Equity Index Fund (2.0%) | | | 1,689,959 | | | | 15,767,319 | |
Small Cap Growth Fund (2.5%) | | | 1,722,328 | | | | 19,531,202 | |
Small Cap Value Fund (3.4%) | | | 1,865,989 | | | | 26,347,769 | |
| | | | | | | | |
TOTAL INVESTMENTS
(Cost: $815,836,159) 100.0% | | | | 784,568,383 | |
| | | | | | | | |
OTHER NET ASSETS -0.0% (2) | | | | (82,986 | ) |
| | | | | | | | |
NET ASSETS 100.0% | | | $ | 784,485,397 | |
| | | | | | | | |
The accompanying notes are an integral part of these portfolio schedules.
78
MUTUAL OF AMERICA INVESTMENT CORPORATION — 2045 RETIREMENT FUND
PORTFOLIO OF INVESTMENTS IN SECURITIES
June 30, 2022 (Unaudited)
| | | | | | | | |
| | | Shares | | | Value | |
| COMMON STOCKS: | | | | | | |
| DIVERSIFIED MUTUAL FUNDS (100.0%) | | | | | | |
Mutual of America Investment Corporation | | | | | | | | |
Bond Fund (12.1%) | | | 7,670,205 | | | $ | 98,408,735 | |
Equity Index Fund (44.5%) | | | 7,276,144 | | | | 360,751,220 | |
International Fund (18.5%) | | | 19,720,088 | | | | 149,675,468 | |
Mid-Cap Equity Index Fund (15.2%) | | | 6,135,942 | | | | 123,025,628 | |
Money Market Fund (0.1%) | | | 103,789 | | | | 1,227,821 | |
Small Cap Equity Index Fund (2.4%) | | | 2,107,216 | | | | 19,660,325 | |
Small Cap Growth Fund (3.2%) | | | 2,286,058 | | | | 25,923,901 | |
Small Cap Value Fund (4.0%) | | | 2,298,489 | | | | 32,454,670 | |
| | | | | | | | |
TOTAL INVESTMENTS
(Cost: $840,939,295) 100.0% | | | | 811,127,768 | |
| | | | | | | | |
OTHER NET ASSETS -0.0% (2) | | | | (85,688 | ) |
| | | | | | | | |
NET ASSETS 100.0% | | | $ | 811,042,080 | |
| | | | | | | | |
MUTUAL OF AMERICA INVESTMENT CORPORATION — 2050 RETIREMENT FUND
PORTFOLIO OF INVESTMENTS IN SECURITIES
June 30, 2022 (Unaudited)
| | | | | | | | |
| | | Shares | | | Value | |
| COMMON STOCKS: | | | | | | |
| DIVERSIFIED MUTUAL FUNDS (100.0%) | | | | | | |
Mutual of America Investment Corporation | | | | | | | | |
Bond Fund (10.2%) | | | 4,850,544 | | | $ | 62,232,480 | |
Equity Index Fund (46.1%) | | | 5,661,566 | | | | 280,700,431 | |
International Fund (18.5%) | | | 14,853,682 | | | | 112,739,445 | |
Mid-Cap Equity Index Fund (15.2%) | | | 4,617,000 | | | | 92,570,855 | |
Money Market Fund (0.2%) | | | 101,483 | | | | 1,200,548 | |
Small Cap Equity Index Fund (2.9%) | | | 1,920,489 | | | | 17,918,160 | |
Small Cap Growth Fund (3.3%) | | | 1,785,031 | | | | 20,242,249 | |
Small Cap Value Fund (3.6%) | | | 1,534,191 | | | | 21,662,772 | |
| | | | | | | | |
TOTAL INVESTMENTS
(Cost: $639,065,102) 100.0% | | | | 609,266,940 | |
| | | | | | | | |
OTHER NET ASSETS -0.0% (2) | | | | (69,579 | ) |
| | | | | | | | |
NET ASSETS 100.0% | | | $ | 609,197,361 | |
| | | | | | | | |
The accompanying notes are an integral part of these portfolio schedules.
79
MUTUAL OF AMERICA INVESTMENT CORPORATION — 2055 RETIREMENT FUND
PORTFOLIO OF INVESTMENTS IN SECURITIES
June 30, 2022 (Unaudited)
| | | | | | | | |
| | | Shares | | | Value | |
| COMMON STOCKS: | | | | | | |
| DIVERSIFIED MUTUAL FUNDS (100.0%) | | | | | | |
Mutual of America Investment Corporation | | | | | | | | |
Bond Fund (8.6%) | | | 1,985,944 | | | $ | 25,479,662 | |
Equity Index Fund (45.6%) | | | 2,709,253 | | | | 134,324,770 | |
International Fund (19.4%) | | | 7,514,944 | | | | 57,038,422 | |
Mid-Cap Equity Index Fund (14.7%) | | | 2,166,006 | | | | 43,428,415 | |
Money Market Fund (0.4%) | | | 93,747 | | | | 1,109,029 | |
Small Cap Equity Index Fund (1.9%) | | | 594,072 | | | | 5,542,691 | |
Small Cap Growth Fund (4.1%) | | | 1,062,415 | | | | 12,047,786 | |
Small Cap Value Fund (5.3%) | | | 1,115,697 | | | | 15,753,638 | |
| | | | | | | | |
TOTAL INVESTMENTS
(Cost: $321,268,224) 100.0% | | | | 294,724,413 | |
| | | | | | | | |
OTHER NET ASSETS -0.0% (2) | | | | (39,672 | ) |
| | | | | | | | |
NET ASSETS 100.0% | | | $ | 294,684,741 | |
| | | | | | | | |
MUTUAL OF AMERICA INVESTMENT CORPORATION — 2060 RETIREMENT FUND
PORTFOLIO OF INVESTMENTS IN SECURITIES
June 30, 2022 (Unaudited)
| | | | | | | | |
| | | Shares | | | Value | |
| COMMON STOCKS: | | | | | | |
| DIVERSIFIED MUTUAL FUNDS (100.0%) | | | | | | |
Mutual of America Investment Corporation | | | | | | | | |
Bond Fund (7.1%) | | | 694,616 | | | $ | 8,911,923 | |
Equity Index Fund (45.5%) | | | 1,154,851 | | | | 57,257,515 | |
International Fund (20.7%) | | | 3,441,437 | | | | 26,120,507 | |
Mid-Cap Equity Index Fund (14.5%) | | | 911,770 | | | | 18,280,981 | |
Money Market Fund (0.5%) | | | 49,265 | | | | 582,805 | |
Small Cap Equity Index Fund (2.5%) | | | 340,928 | | | | 3,180,855 | |
Small Cap Growth Fund (3.8%) | | | 425,495 | | | | 4,825,114 | |
Small Cap Value Fund (5.4%) | | | 481,292 | | | | 6,795,836 | |
| | | | | | | | |
TOTAL INVESTMENTS
(Cost: $142,114,913) 100.0% | | | | 125,955,536 | |
| | | | | | | | |
OTHER NET ASSETS -0.0% (2) | | | | (22,712 | ) |
| | | | | | | | |
NET ASSETS 100.0% | | | $ | 125,932,824 | |
| | | | | | | | |
The accompanying notes are an integral part of these portfolio schedules.
80
MUTUAL OF AMERICA INVESTMENT CORPORATION — 2065 RETIREMENT FUND
PORTFOLIO OF INVESTMENTS IN SECURITIES
June 30, 2022 (Unaudited)
| | | | | | | | |
| | | Shares | | | Value | |
| COMMON STOCKS: | | | | | | |
| DIVERSIFIED MUTUAL FUNDS (100.0%) | | | | | | |
Mutual of America Investment Corporation | | | | | | | | |
Bond Fund (4.9%) | | | 81,737 | | | $ | 1,048,692 | |
Equity Index Fund (45.4%) | | | 196,723 | | | | 9,753,531 | |
International Fund (21.7%) | | | 614,599 | | | | 4,664,805 | |
Mid-Cap Equity Index Fund (15.7%) | | | 168,991 | | | | 3,388,260 | |
Money Market Fund (0.6%) | | | 10,436 | | | | 123,459 | |
Small Cap Equity Index Fund (3.1%) | | | 71,967 | | | | 671,456 | |
Small Cap Growth Fund (4.3%) | | | 80,981 | | | | 918,321 | |
Small Cap Value Fund (4.3%) | | | 65,210 | | | | 920,760 | |
| | | | | | | | |
TOTAL INVESTMENTS
(Cost: $25,689,352) 100.0% | | | | 21,489,284 | |
| | | | | | | | |
OTHER NET ASSETS 0.0% (2) | | | | 5,184 | |
| | | | | | | | |
NET ASSETS 100.0% | | | $ | 21,494,468 | |
| | | | | | | | |
MUTUAL OF AMERICA INVESTMENT CORPORATION — CONSERVATIVE ALLOCATION FUND
PORTFOLIO OF INVESTMENTS IN SECURITIES
June 30, 2022 (Unaudited)
| | | | | | | | |
| | | Shares | | | Value | |
| COMMON STOCKS: | | | | | | |
| DIVERSIFIED MUTUAL FUNDS (100.0%) | | | | | | |
Mutual of America Investment Corporation | | | | | | | | |
Bond Fund (27.9%) | | | 3,736,662 | | | $ | 47,941,375 | |
Equity Index Fund (24.1%) | | | 835,502 | | | | 41,424,190 | |
International Fund (5.5%) | | | 1,238,212 | | | | 9,398,031 | |
Mid-Cap Equity Index Fund (5.4%) | | | 461,693 | | | | 9,256,936 | |
Mid-Term Bond Fund (37.1%) | | | 6,578,358 | | | | 63,744,289 | |
| | | | | | | | |
TOTAL INVESTMENTS
(Cost: $183,470,879) 100.0% | | | | 171,764,821 | |
| | | | | | | | |
OTHER NET ASSETS -0.0% (2) | | | | (17,789 | ) |
| | | | | | | | |
NET ASSETS 100.0% | | | $ | 171,747,032 | |
| | | | | | | | |
MUTUAL OF AMERICA INVESTMENT CORPORATION — MODERATE ALLOCATION FUND
PORTFOLIO OF INVESTMENTS IN SECURITIES
June 30, 2022 (Unaudited)
| | | | | | | | |
| | | Shares | | | Value | |
| COMMON STOCKS: | | | | | | |
| DIVERSIFIED MUTUAL FUNDS (100.0%) | | | | | | |
Mutual of America Investment Corporation | | | | | | | | |
Bond Fund (24.1%) | | | 7,485,775 | | | $ | 96,042,495 | |
Equity Index Fund (34.5%) | | | 2,770,971 | | | | 137,384,748 | |
International Fund (10.0%) | | | 5,255,142 | | | | 39,886,525 | |
Mid-Cap Equity Index Fund (15.1%) | | | 2,985,732 | | | | 59,863,924 | |
Mid-Term Bond Fund (16.3%) | | | 6,705,127 | | | | 64,972,679 | |
| | | | | | | | |
TOTAL INVESTMENTS
(Cost: $402,735,869) 100.0% | | | | 398,150,371 | |
| | | | | | | | |
OTHER NET ASSETS -0.0% (2) | | | | (25,781 | ) |
| | | | | | | | |
NET ASSETS 100.0% | | | $ | 398,124,590 | |
| | | | | | | | |
The accompanying notes are an integral part of these portfolio schedules.
81
MUTUAL OF AMERICA INVESTMENT CORPORATION — AGGRESSIVE ALLOCATION FUND
PORTFOLIO OF INVESTMENTS IN SECURITIES
June 30, 2022 (Unaudited)
| | | | | | | | |
| | | Shares | | | Value | |
| COMMON STOCKS: | | | | | | |
| DIVERSIFIED MUTUAL FUNDS (100.0%) | | | | | | |
Mutual of America Investment Corporation | | | | | | | | |
Bond Fund (20.5%) | | | 4,961,600 | | | $ | 63,657,331 | |
Equity Index Fund (35.2%) | | | 2,209,868 | | | | 109,565,266 | |
International Fund (14.8%) | | | 6,087,255 | | | | 46,202,268 | |
Mid-Cap Equity Index Fund (20.2%) | | | 3,130,227 | | | | 62,761,042 | |
Small Cap Growth Fund (4.0%) | | | 1,098,624 | | | | 12,458,396 | |
Small Cap Value Fund (5.3%) | | | 1,163,969 | | | | 16,435,249 | |
| | | | | | | | |
TOTAL INVESTMENTS
(Cost: $310,263,879) 100.0% | | | | 311,079,552 | |
| | | | | | | | |
OTHER NET ASSETS -0.0% (2) | | | | (24,607 | ) |
| | | | | | | | |
NET ASSETS 100.0% | | | $ | 311,054,945 | |
| | | | | | | | |
The accompanying notes are an integral part of these portfolio schedules.
82
MUTUAL OF AMERICA INVESTMENT CORPORATION — MONEY MARKET FUND
PORTFOLIO OF INVESTMENTS IN SECURITIES
June 30, 2022 (Unaudited)
| | | | | | | | | | | | | | | | | | | | |
| | | Rating** | | | Rate(%) | | | Maturity | | | Face Amount | | | Value | |
| SHORT-TERM DEBT SECURITIES: | | | | | | | | | | | | | | | |
| U.S. GOVERNMENT (24.0%) | | | | | | | | | | | | | | | |
U.S. Treasury Bill | | | A-1+ | | | | 0.76 | | | | 07/12/22 | | | $ | 5,200,000 | | | $ | 5,198,795 | |
U.S. Treasury Bill | | | A-1+ | | | | 0.84 | | | | 07/19/22 | | | | 17,000,000 | | | | 16,992,911 | |
U.S. Treasury Bill | | | A-1+ | | | | 0.85 | | | | 07/05/22 | | | | 7,300,000 | | | | 7,299,312 | |
U.S. Treasury Bill | | | A-1+ | | | | 1.00 | | | | 07/26/22 | | | | 4,500,000 | | | | 4,496,873 | |
U.S. Treasury Bill | | | A-1+ | | | | 1.01 | | | | 08/02/22 | | | | 13,000,000 | | | | 12,988,329 | |
| | | | | | | | | | | | | | | | | | | | |
| | | | | | | | | | | | | | | | | | | 46,976,220 | |
| | | | | | | | | | | | | | | | | | | | |
| U.S. GOVERNMENT AGENCIES (25.1%) | | | | | | | | | | | | | | | |
FHLB | | | A-1+ | | | | 0.82 | | | | 07/06/22 | | | | 5,000,000 | | | | 4,999,431 | |
FHLB | | | A-1+ | | | | 0.83 | | | | 07/19/22 | | | | 10,000,000 | | | | 9,995,875 | |
FHLB | | | A-1+ | | | | 0.84 | | | | 07/08/22 | | | | 10,000,000 | | | | 9,998,367 | |
FHLB | | | A-1+ | | | | 0.93 | | | | 07/15/22 | | | | 2,000,000 | | | | 1,999,279 | |
FHLB | | | A-1+ | | | | 1.60 | | | | 08/24/22 | | | | 8,500,000 | | | | 8,479,664 | |
FHLB | | | A-1+ | | | | 1.60 | | | | 08/29/22 | | | | 1,360,000 | | | | 1,356,434 | |
FHLB | | | A-1+ | | | | 1.67 | | | | 09/02/22 | | | | 7,000,000 | | | | 6,976,741 | |
FHLB | | | A-1+ | | | | 1.71 | | | | 09/01/22 | | | | 5,300,000 | | | | 5,282,669 | |
| | | | | | | | | | | | | | | | | | | | |
| | | | | | | | | | | | | | | | | | | 49,088,460 | |
| | | | | | | | | | | | | | | | | | | | |
| COMMERCIAL PAPER (50.8%) | | | | | | | | | | | | | | | |
Apple, Inc.† | | | A-1+ | | | | 1.55 | | | | 08/02/22 | | | | 4,600,000 | | | | 4,593,662 | |
Apple, Inc.† | | | A-1+ | | | | 1.65 | | | | 08/19/22 | | | | 3,000,000 | | | | 2,993,263 | |
Coca-Cola Co.† | | | A-1 | | | | 0.95 | | | | 07/20/22 | | | | 450,000 | | | | 449,774 | |
Eli Lilly & Co.† | | | A-1+ | | | | 0.88 | | | | 07/01/22 | | | | 7,400,000 | | | | 7,400,000 | |
Emerson Electric Co.† | | | A-1 | | | | 1.83 | | | | 08/23/22 | | | | 7,500,000 | | | | 7,479,904 | |
Exxon Mobil Corp. | | | A-1+ | | | | 1.58 | | | | 07/26/22 | | | | 7,700,000 | | | | 7,691,551 | |
Illinois Tool Works, Inc.† | | | A-1 | | | | 1.00 | | | | 07/27/22 | | | | 7,300,000 | | | | 7,294,728 | |
J.P. Morgan Securities LLC | | | A-1 | | | | 1.08 | | | | 07/18/22 | | | | 5,000,000 | | | | 4,997,450 | |
Johnson & Johnson† | | | A-1+ | | | | 1.62 | | | | 08/29/22 | | | | 7,500,000 | | | | 7,480,087 | |
Kimberly-Clark Corp.† | | | A-1 | | | | 1.55 | | | | 07/06/22 | | | | 2,475,000 | | | | 2,474,467 | |
Nestle Capital Corp.† | | | A-1+ | | | | 0.95 | | | | 07/25/22 | | | | 7,270,000 | | | | 7,265,396 | |
Novartis Financial Corp.† | | | A-1+ | | | | 1.58 | | | | 07/11/22 | | | | 7,500,000 | | | | 7,496,721 | |
PepsiCo, Inc.† | | | A-1 | | | | 1.75 | | | | 08/23/22 | | | | 1,975,000 | | | | 1,969,912 | |
Toyota Motor Credit Corp. | | | A-1+ | | | | 1.14 | | | | 07/14/22 | | | | 7,400,000 | | | | 7,396,954 | |
Travelers Cos., Inc.† | | | A-1 | | | | 1.53 | | | | 07/01/22 | | | | 7,500,000 | | | | 7,500,000 | |
Unilever Capital Corp.† | | | A-1 | | | | 0.97 | | | | 07/18/22 | | | | 7,300,000 | | | | 7,296,656 | |
Walmart, Inc.† | | | A-1+ | | | | 0.93 | | | | 07/11/22 | | | | 5,000,000 | | | | 4,998,708 | |
Walmart, Inc.† | | | A-1+ | | | | 1.01 | | | | 07/18/22 | | | | 2,500,000 | | | | 2,498,808 | |
| | | | | | | | | | | | | | | | | | | | |
| | | | | | | | | | | | | | | | | | | 99,278,041 | |
| | | | | | | | | | | | | | | | | | | | |
TOTAL SHORT-TERM DEBT SECURITIES
(Cost: $195,347,458) 99.9% | | | | 195,342,721 | |
| | | | | | | | | | | | | | | | | | | | |
| | | | | |
| | | | | | Rate(%) | | | Maturity | | | Face Amount | | | Value | |
| TEMPORARY CASH INVESTMENT (2.7%) | | | | | | | | | | | | | | | |
JP Morgan Chase, New York Time Deposit | | | | 0.91 | | | | 07/01/22 | | | $ | 5,312,066 | | | $ | 5,312,066 | |
| | | | | | | | | | | | | | | | | | | | |
TOTAL TEMPORARY CASH INVESTMENT
(Cost: $5,312,066) 2.7% | | | | 5,312,066 | |
| | | | | | | | | | | | | | | | | | | | |
TOTAL INVESTMENTS
(Cost: $200,659,524) 102.6% | | | | 200,654,787 | |
| | | | | | | | | | | | | | | | | | | | |
OTHER NET ASSETS -2.6% | | | | (5,066,833 | ) |
| | | | | | | | | | | | | | | | | | | | |
NET ASSETS 100.0% | | | $ | 195,587,954 | |
| | | | | | | | | | | | | | | | | | | | |
The accompanying notes are an integral part of these portfolio schedules.
83
MUTUAL OF AMERICA INVESTMENT CORPORATION — MID-TERM BOND FUND
PORTFOLIO OF INVESTMENTS IN SECURITIES
June 30, 2022 (Unaudited)
| | | | | | | | | | | | | | |
| | | Rating** | | Rate(%) | | Maturity | | Face Amount | | | Value | |
| LONG-TERM DEBT SECURITIES: | | | | | | | | | | | | |
| U.S. GOVERNMENT (74.0%) | | | | | | | | | | | | |
U.S. Treasury Note | | AA+ | | 0.25 | | 09/30/23 | | $ | 22,000,000 | | | $ | 21,274,688 | |
U.S. Treasury Note | | AA+ | | 0.25 | | 03/15/24 | | | 5,000,000 | | | | 4,774,023 | |
U.S. Treasury Note | | AA+ | | 0.25 | | 06/15/24 | | | 11,000,000 | | | | 10,431,094 | |
U.S. Treasury Note | | AA+ | | 0.38 | | 09/30/27 | | | 41,300,000 | | | | 35,924,547 | |
U.S. Treasury Note | | AA+ | | 0.50 | | 04/30/27 | | | 18,500,000 | | | | 16,373,945 | |
U.S. Treasury Note | | AA+ | | 0.50 | | 06/30/27 | | | 46,500,000 | | | | 40,987,207 | |
U.S. Treasury Note | | AA+ | | 0.50 | | 10/31/27 | | | 41,000,000 | | | | 35,820,547 | |
U.S. Treasury Note | | AA+ | | 0.63 | | 10/15/24 | | | 22,000,000 | | | | 20,844,141 | |
U.S. Treasury Note | | AA+ | | 0.63 | | 03/31/27 | | | 23,100,000 | | | | 20,621,262 | |
U.S. Treasury Note | | AA+ | | 0.63 | | 11/30/27 | | | 26,000,000 | | | | 22,831,250 | |
U.S. Treasury Note | | AA+ | | 0.63 | | 05/15/30 | | | 6,250,000 | | | | 5,211,426 | |
U.S. Treasury Note | | AA+ | | 0.63 | | 08/15/30 | | | 45,000,000 | | | | 37,307,812 | |
U.S. Treasury Note | | AA+ | | 0.75 | | 05/31/26 | | | 31,000,000 | | | | 28,363,789 | |
U.S. Treasury Note | | AA+ | | 0.88 | | 06/30/26 | | | 6,500,000 | | | | 5,967,051 | |
U.S. Treasury Note | | AA+ | | 1.25 | | 08/31/24 | | | 22,855,000 | | | | 22,018,471 | |
U.S. Treasury Note | | AA+ | | 1.25 | | 06/30/28 | | | 500,000 | | | | 449,785 | |
U.S. Treasury Note | | AA+ | | 1.38 | | 06/30/23 | | | 19,450,000 | | | | 19,152,172 | |
U.S. Treasury Note | | AA+ | | 1.38 | | 09/30/23 | | | 24,315,000 | | | | 23,842,947 | |
U.S. Treasury Note | | AA+ | | 1.50 | | 02/28/23 | | | 9,315,000 | | | | 9,237,860 | |
U.S. Treasury Note | | AA+ | | 1.50 | | 09/30/24 | | | 4,865,000 | | | | 4,706,127 | |
U.S. Treasury Note | | AA+ | | 1.50 | | 08/15/26 | | | 16,175,000 | | | | 15,190,600 | |
U.S. Treasury Note | | AA+ | | 1.50 | | 11/30/28 | | | 17,000,000 | | | | 15,436,797 | |
U.S. Treasury Note | | AA+ | | 1.63 | | 10/31/23 | | | 8,755,000 | | | | 8,603,497 | |
U.S. Treasury Note | | AA+ | | 1.63 | | 05/15/26 | | | 29,175,000 | | | | 27,649,011 | |
U.S. Treasury Note | | AA+ | | 1.63 | | 09/30/26 | | | 4,620,000 | | | | 4,358,140 | |
U.S. Treasury Note | | AA+ | | 1.75 | | 01/31/29 | | | 28,500,000 | | | | 26,276,777 | |
U.S. Treasury Note | | AA+ | | 2.00 | | 05/31/24 | | | 24,315,000 | | | | 23,875,240 | |
U.S. Treasury Note | | AA+ | | 2.00 | | 06/30/24 | | | 24,315,000 | | | | 23,856,244 | |
U.S. Treasury Note | | AA+ | | 2.38 | | 04/30/26 | | | 18,480,000 | | | | 18,036,769 | |
U.S. Treasury Note | | AA+ | | 2.38 | | 05/15/29 | | | 19,450,000 | | | | 18,633,252 | |
U.S. Treasury Note | | AA+ | | 2.50 | | 01/31/24 | | | 19,450,000 | | | | 19,304,125 | |
U.S. Treasury Note | | AA+ | | 2.50 | | 05/31/24 | | | 12,000,000 | | | | 11,891,719 | |
U.S. Treasury Note | | AA+ | | 2.50 | | 02/28/26 | | | 14,450,000 | | | | 14,172,289 | |
U.S. Treasury Note | | AA+ | | 2.75 | | 05/31/23 | | | 13,500,000 | | | | 13,482,070 | |
U.S. Treasury Note | | AA+ | | 2.75 | | 05/15/25 | | | 10,000,000 | | | | 9,923,438 | |
U.S. Treasury Note | | AA+ | | 2.88 | | 05/31/25 | | | 10,495,000 | | | | 10,449,904 | |
| | | | | | | | | | | | | | |
| | | | | | | | | | | | | 647,280,016 | |
| | | | | | | | | | | | | | |
| CORPORATE DEBT (24.4%) | | | | | | | | | | | | |
| COMMUNICATION SERVICES (1.1%) | | | | | | | | | | | | |
AT&T, Inc. | | BBB | | 2.75 | | 06/01/31 | | | 4,050,000 | | | | 3,497,207 | |
Comcast Corp. | | A- | | 2.35 | | 01/15/27 | | | 4,100,000 | | | | 3,821,844 | |
Verizon Communications, Inc. | | BBB+ | | 4.02 | | 12/03/29 | | | 2,700,000 | | | | 2,615,004 | |
| | | | | | | | | | | | | | |
| | | | | | | | | | | | | 9,934,055 | |
| | | | | | | | | | | | | | |
| CONSUMER DISCRETIONARY (3.1%) | | | | | | | | | | | | |
Amazon.com, Inc. | | AA | | 1.20 | | 06/03/27 | | | 4,009,000 | | | | 3,567,021 | |
AutoZone, Inc. | | BBB | | 3.25 | | 04/15/25 | | | 2,300,000 | | | | 2,256,385 | |
Best Buy Co., Inc. | | BBB+ | | 1.95 | | 10/01/30 | | | 3,935,000 | | | | 3,125,438 | |
Booking Hldgs., Inc. | | A- | | 3.65 | | 03/15/25 | | | 1,827,000 | | | | 1,823,884 | |
Brunswick Corp. | | BBB- | | 0.85 | | 08/18/24 | | | 4,520,000 | | | | 4,177,074 | |
Dollar General Corp. | | BBB | | 3.25 | | 04/15/23 | | | 1,017,000 | | | | 1,011,992 | |
Genuine Parts Co. | | BBB | | 1.75 | | 02/01/25 | | | 2,765,000 | | | | 2,605,099 | |
Harman International Industries, Inc. | | A- | | 4.15 | | 05/15/25 | | | 1,945,000 | | | | 1,954,546 | |
Kohl’s Corp. | | BBB- | | 3.25 | | 02/01/23 | | | 680,000 | | | | 676,806 | |
Lowe’s Cos., Inc. | | BBB+ | | 4.00 | | 04/15/25 | | | 1,320,000 | | | | 1,324,359 | |
Marriott International, Inc. | | BBB | | 3.13 | | 02/15/23 | | | 1,945,000 | | | | 1,939,856 | |
The accompanying notes are an integral part of these portfolio schedules.
84
MUTUAL OF AMERICA INVESTMENT CORPORATION — MID-TERM BOND FUND
PORTFOLIO OF INVESTMENTS IN SECURITIES (Continued)
June 30, 2022 (Unaudited)
| | | | | | | | | | | | | | | | | | | | |
| | | Rating** | | | Rate(%) | | | Maturity | | | Face Amount | | | Value | |
| LONG-TERM DEBT SECURITIES (CONTINUED): | | | | | | | | | | | | | | | |
| CORPORATE DEBT (CONTINUED) | | | | | | | | | | | | | | | |
| CONSUMER DISCRETIONARY (CONTINUED) | | | | | | | | | | | | | | | |
Travel + Leisure Co. | | | BB- | | | | 5.65 | | | | 04/01/24 | | | $ | 2,430,000 | | | $ | 2,387,475 | |
| | | | | | | | | | | | | | | | | | | | |
| | | | | | | | | | | | | | | | | | | 26,849,935 | |
| | | | | | | | | | | | | | | | | | | | |
| CONSUMER STAPLES (1.0%) | | | | | | | | | | | | | | | |
Bunge Ltd. Finance Corp. | | | BBB | | | | 3.25 | | | | 08/15/26 | | | | 4,400,000 | | | | 4,175,989 | |
Kellogg Co. | | | BBB | | | | 2.65 | | | | 12/01/23 | | | | 1,945,000 | | | | 1,926,215 | |
Keurig Dr Pepper, Inc. | | | BBB | | | | 3.13 | | | | 12/15/23 | | | | 2,910,000 | | | | 2,908,724 | |
| | | | | | | | | | | | | | | | | | | | |
| | | | | | | | | | | | | | | | | | | 9,010,928 | |
| | | | | | | | | | | | | | | | | | | | |
| ENERGY (0.7%) | | | | | | | | | | | | | | | |
Devon Energy Corp. | | | BBB | | | | 5.25 | | | | 09/15/24 | | | | 4,400,000 | | | | 4,488,607 | |
Targa Resources Partners LP/Targa Resources Partners Finance Corp. | | | BBB- | | | | 5.50 | | | | 03/01/30 | | | | 1,480,000 | | | | 1,412,186 | |
| | | | | | | | | | | | | | | | | | | | |
| | | | | | | | | | | | | | | | | | | 5,900,793 | |
| | | | | | | | | | | | | | | | | | | | |
| FINANCIALS (8.0%) | | | | | | | | | | | | | | | |
Aflac, Inc. | | | A- | | | | 1.13 | | | | 03/15/26 | | | | 2,075,000 | | | | 1,872,102 | |
Allstate Corp. | | | A- | | | | 0.75 | | | | 12/15/25 | | | | 4,460,000 | | | | 4,013,695 | |
American International Group, Inc. | | | BBB+ | | | | 4.13 | | | | 02/15/24 | | | | 1,945,000 | | | | 1,957,120 | |
Bank of America Corp. | | | A- | | | | 3.37 | | | | 01/23/26 | | | | 4,000,000 | | | | 3,873,967 | |
Brown & Brown, Inc. | | | BBB- | | | | 4.20 | | | | 09/15/24 | | | | 2,574,000 | | | | 2,565,116 | |
Capital One Financial Corp. | | | BBB | | | | 4.93 | | | | 05/10/28 | | | | 1,475,000 | | | | 1,460,814 | |
Citigroup, Inc. | | | BBB+ | | | | 4.14 | | | | 05/24/25 | | | | 1,950,000 | | | | 1,942,034 | |
Citizens Financial Group, Inc. | | | BBB | | | | 3.75 | | | | 07/01/24 | | | | 3,693,000 | | | | 3,637,106 | |
FactSet Research Systems, Inc. | | | BBB- | | | | 2.90 | | | | 03/01/27 | | | | 2,940,000 | | | | 2,748,900 | |
Fairfax U.S., Inc.† | | | BBB | | | | 4.88 | | | | 08/13/24 | | | | 730,000 | | | | 728,067 | |
Fifth Third Bancorp | | | BBB | | | | 4.30 | | | | 01/16/24 | | | | 2,430,000 | | | | 2,440,746 | |
Goldman Sachs Group, Inc. | | | BBB+ | | | | 2.64 | | | | 02/24/28 | | | | 2,935,000 | | | | 2,663,738 | |
Goldman Sachs Group, Inc. | | | BBB+ | | | | 3.20 | | | | 02/23/23 | | | | 2,430,000 | | | | 2,430,846 | |
JPMorgan Chase & Co. | | | A- | | | | 1.47 | | | | 09/22/27 | | | | 2,620,000 | | | | 2,297,900 | |
JPMorgan Chase & Co. | | | BBB+ | | | | 3.88 | | | | 09/10/24 | | | | 1,480,000 | | | | 1,477,093 | |
Legg Mason, Inc. | | | A | | | | 3.95 | | | | 07/15/24 | | | | 1,945,000 | | | | 1,955,019 | |
Lincoln National Corp. | | | A- | | | | 4.00 | | | | 09/01/23 | | | | 1,945,000 | | | | 1,955,162 | |
M&T Bank Corp. | | | BBB+ | | | | 4.00 | | | | 07/15/24 | | | | 1,750,000 | | | | 1,740,314 | |
Mercury General Corp. | | | BBB | | | | 4.40 | | | | 03/15/27 | | | | 3,530,000 | | | | 3,448,440 | |
Morgan Stanley | | | A- | | | | 1.16 | | | | 10/21/25 | | | | 1,500,000 | | | | 1,389,707 | |
Morgan Stanley | | | A- | | | | 3.13 | | | | 01/23/23 | | | | 2,430,000 | | | | 2,429,163 | |
PNC Bank N.A. | | | A- | | | | 3.80 | | | | 07/25/23 | | | | 2,500,000 | | | | 2,506,789 | |
Progressive Corp. | | | A | | | | 2.50 | | | | 03/15/27 | | | | 1,950,000 | | | | 1,843,184 | |
Prospect Capital Corp. | | | BBB- | | | | 4.95 | | | | 07/15/22 | | | | 2,430,000 | | | | 2,429,765 | |
Prospect Capital Corp. | | | BBB- | | | | 5.88 | | | | 03/15/23 | | | | 1,870,000 | | | | 1,878,444 | |
Signet UK Finance PLC | | | BB- | | | | 4.70 | | | | 06/15/24 | | | | 1,945,000 | | | | 1,876,925 | |
Stifel Financial Corp. | | | BBB- | | | | 4.25 | | | | 07/18/24 | | | | 1,945,000 | | | | 1,946,282 | |
Synchrony Financial | | | BBB- | | | | 3.70 | | | | 08/04/26 | | | | 1,460,000 | | | | 1,351,801 | |
Unum Group | | | BBB | | | | 4.00 | | | | 03/15/24 | | | | 3,905,000 | | | | 3,904,007 | |
Voya Financial, Inc. | | | BBB+ | | | | 3.65 | | | | 06/15/26 | | | | 1,945,000 | | | | 1,882,901 | |
Wells Fargo & Co. | | | BBB+ | | | | 3.53 | | | | 03/24/28 | | | | 1,480,000 | | | | 1,401,778 | |
| | | | | | | | | | | | | | | | | | | | |
| | | | | | | | | | | | | | | | | | | 70,048,925 | |
| | | | | | | | | | | | | | | | | | | | |
| HEALTH CARE (2.4%) | | | | | | | | | | | | | | | |
AbbVie, Inc. | | | BBB+ | | | | 4.25 | | | | 11/14/28 | | | | 4,046,000 | | | | 4,007,132 | |
Aetna, Inc. | | | BBB | | | | 2.80 | | | | 06/15/23 | | | | 2,430,000 | | | | 2,399,857 | |
Baxter International, Inc. | | | BBB | | | | 1.92 | | | | 02/01/27 | | | | 4,500,000 | | | | 4,029,869 | |
CVS Health Corp. | | | BBB | | | | 3.38 | | | | 08/12/24 | | | | 575,000 | | | | 571,471 | |
CVS Health Corp. | | | BBB | | | | 3.88 | | | | 07/20/25 | | | | 1,460,000 | | | | 1,450,811 | |
Elevance Health, Inc. | | | A | | | | 2.88 | | | | 09/15/29 | | | | 2,900,000 | | | | 2,612,649 | |
Humana, Inc. | | | BBB+ | | | | 3.85 | | | | 10/01/24 | | | | 2,430,000 | | | | 2,426,601 | |
The accompanying notes are an integral part of these portfolio schedules.
85
MUTUAL OF AMERICA INVESTMENT CORPORATION — MID-TERM BOND FUND
PORTFOLIO OF INVESTMENTS IN SECURITIES (Continued)
June 30, 2022 (Unaudited)
| | | | | | | | | | | | | | |
| | | Rating** | | Rate(%) | | Maturity | | Face Amount | | | Value | |
| LONG-TERM DEBT SECURITIES (CONTINUED): | | | | | | | | | | | | |
| CORPORATE DEBT (CONTINUED) | | | | | | | | | | | | |
| HEALTH CARE (CONTINUED) | | | | | | | | | | | | |
Thermo Fisher Scientific, Inc. | | A- | | 1.75 | | 10/15/28 | | $ | 4,410,000 | | | $ | 3,855,437 | |
| | | | | | | | | | | | | | |
| | | | | | | | | | | | | 21,353,827 | |
| | | | | | | | | | | | | | |
| INDUSTRIALS (2.6%) | | | | | | | | | | | | |
3M Co. | | A+ | | 2.65 | | 04/15/25 | | | 3,000,000 | | | | 2,941,918 | |
Boeing Co. | | BBB- | | 4.88 | | 05/01/25 | | | 3,290,000 | | | | 3,277,855 | |
Deere & Co. | | A | | 2.75 | | 04/15/25 | | | 2,540,000 | | | | 2,484,432 | |
General Dynamics Corp. | | A- | | 3.25 | | 04/01/25 | | | 1,320,000 | | | | 1,309,045 | |
JB Hunt Transport Svcs., Inc. | | BBB+ | | 3.30 | | 08/15/22 | | | 1,945,000 | | | | 1,944,905 | |
Lennox International, Inc. | | BBB | | 1.70 | | 08/01/27 | | | 2,186,000 | | | | 1,910,409 | |
Stanley Black & Decker, Inc. | | A | | 2.30 | | 02/24/25 | | | 4,900,000 | | | | 4,742,223 | |
Verisk Analytics, Inc. | | BBB | | 4.00 | | 06/15/25 | | | 2,010,000 | | | | 1,993,825 | |
Verisk Analytics, Inc. | | BBB | | 4.13 | | 09/12/22 | | | 1,945,000 | | | | 1,948,366 | |
| | | | | | | | | | | | | | |
| | | | | | | | | | | | | 22,552,978 | |
| | | | | | | | | | | | | | |
| INFORMATION TECHNOLOGY (1.8%) | | | | | | | | | | | | |
Apple, Inc. | | AA+ | | 2.05 | | 09/11/26 | | | 2,050,000 | | | | 1,930,087 | |
Applied Materials, Inc. | | A | | 3.90 | | 10/01/25 | | | 3,300,000 | | | | 3,320,604 | |
Arrow Electronics, Inc. | | BBB- | | 4.50 | | 03/01/23 | | | 50,000 | | | | 50,189 | |
Global Payments, Inc. | | BBB- | | 3.75 | | 06/01/23 | | | 925,000 | | | | 918,334 | |
Intel Corp. | | A+ | | 3.40 | | 03/25/25 | | | 2,000,000 | | | | 1,996,749 | |
PayPal Hldgs., Inc. | | A- | | 2.65 | | 10/01/26 | | | 3,960,000 | | | | 3,755,149 | |
Teledyne Technologies, Inc. | | BBB | | 2.75 | | 04/01/31 | | | 4,175,000 | | | | 3,490,062 | |
| | | | | | | | | | | | | | |
| | | | | | | | | | | | | 15,461,174 | |
| | | | | | | | | | | | | | |
| MATERIALS (1.7%) | | | | | | | | | | | | |
Ecolab, Inc. | | A- | | 1.65 | | 02/01/27 | | | 2,780,000 | | | | 2,541,929 | |
International Flavors & Fragrances, Inc.† | | BBB | | 1.23 | | 10/01/25 | | | 4,019,000 | | | | 3,625,758 | |
Nucor Corp. | | A- | | 3.95 | | 05/23/25 | | | 1,950,000 | | | | 1,939,061 | |
Packaging Corp. of America | | BBB | | 3.65 | | 09/15/24 | | | 4,400,000 | | | | 4,380,051 | |
Southern Copper Corp. | | BBB+ | | 3.50 | | 11/08/22 | | | 1,945,000 | | | | 1,944,066 | |
| | | | | | | | | | | | | | |
| | | | | | | | | | | | | 14,430,865 | |
| | | | | | | | | | | | | | |
| REAL ESTATE (1.2%) | | | | | | | | | | | | |
Boston Properties LP | | BBB+ | | 3.25 | | 01/30/31 | | | 3,100,000 | | | | 2,658,889 | |
Crown Castle International Corp. | | BBB- | | 3.15 | | 07/15/23 | | | 2,430,000 | | | | 2,403,571 | |
Duke Realty LP | | BBB+ | | 1.75 | | 07/01/30 | | | 2,320,000 | | | | 1,897,507 | |
Jones Lang LaSalle, Inc. | | BBB+ | | 4.40 | | 11/15/22 | | | 1,370,000 | | | | 1,371,496 | |
Omega Healthcare Investors, Inc. | | BBB- | | 4.38 | | 08/01/23 | | | 1,700,000 | | | | 1,705,228 | |
Omega Healthcare Investors, Inc. | | BBB- | | 4.50 | | 01/15/25 | | | 730,000 | | | | 723,508 | |
| | | | | | | | | | | | | | |
| | | | | | | | | | | | | 10,760,199 | |
| | | | | | | | | | | | | | |
| UTILITIES (0.8%) | | | | | | | | | | | | |
American Electric Power Co., Inc. | | BBB+ | | 2.03 | | 03/15/24 | | | 2,770,000 | | | | 2,679,665 | |
NextEra Energy Capital Hldgs., Inc. | | BBB+ | | 3.55 | | 05/01/27 | | | 2,270,000 | | | | 2,191,527 | |
Southern Co. | | BBB | | 3.25 | | 07/01/26 | | | 2,430,000 | | | | 2,325,314 | |
| | | | | | | | | | | | | | |
| | | | | | | | | | | | | 7,196,506 | |
| | | | | | | | | | | | | | |
TOTAL CORPORATE DEBT | | | | 213,500,185 | |
| | | | | | | | | | | | | | |
TOTAL LONG-TERM DEBT SECURITIES
(Cost: $920,471,412) 98.4% | | | | 860,780,201 | |
| | | | | | | | | | | | | | |
The accompanying notes are an integral part of these portfolio schedules.
86
MUTUAL OF AMERICA INVESTMENT CORPORATION — MID-TERM BOND FUND
PORTFOLIO OF INVESTMENTS IN SECURITIES (Continued)
June 30, 2022 (Unaudited)
| | | | | | | | | | | | | | | | | | | | |
| | | Rating** | | | Rate(%) | | | Maturity | | | Face Amount | | | Value | |
| SHORT-TERM DEBT SECURITIES: | | | | | | | | | | | | | | | |
| U.S. GOVERNMENT (0.9%) | | | | | | | | | | | | | | | |
U.S. Treasury Bill | | | A-1+ | | | | 1.00 | | | | 07/19/22 | | | $ | 6,000,000 | | | $ | 5,997,000 | |
U.S. Treasury Bill | | | A-1+ | | | | 1.01 | | | | 07/05/22 | | | | 1,800,000 | | | | 1,799,797 | |
| | | | | | | | | | | | | | | | | | | | |
TOTAL SHORT-TERM DEBT SECURITIES
(Cost: $7,796,797) 0.9% | | | | 7,796,797 | |
| | | | | | | | | | | | | | | | | | | | |
| | | | | |
| | | | | | | | | | | | Shares | | | Value | |
| COMMON STOCKS: | | | | | | | | | | | | | | | |
| ENERGY (0.1%) | | | | | | | | | | | | | | | |
Diamond Offshore Drilling, Inc.* | | | | 50,816 | | | $ | 299,307 | |
Superior Energy Svcs., Inc.* | | | | 32,351 | | | | 815,096 | †† |
Valaris Ltd.* | | | | 8,695 | | | | 367,277 | |
| | | | | | | | | | | | | | | | | | | | |
| | | | | | | | | | | | | | | | | | | 1,481,680 | |
| | | | | | | | | | | | | | | | | | | | |
TOTAL COMMON STOCKS
(Cost: $5,319,577) 0.1% | | | | 1,481,680 | |
| | | | | | | | | | | | | | | | | | | | |
| | | | | |
| | | | | | Rate(%) | | | Maturity | | | Face Amount | | | Value | |
TEMPORARY CASH INVESTMENT (0.2%) | | | | | | | | | | | | | | | | | | | | |
JP Morgan Chase, New York Time Deposit | | | | 0.91 | | | | 07/01/22 | | | $ | 1,560,252 | | | $ | 1,560,252 | |
| | | | | | | | | | | | | | | | | | | | |
TOTAL TEMPORARY CASH INVESTMENT
(Cost: $1,560,252) 0.2% | | | | 1,560,252 | |
| | | | | | | | | | | | | | | | | | | | |
TOTAL INVESTMENTS
(Cost: $935,148,038) 99.6% | | | | 871,618,930 | |
| | | | | | | | | | | | | | | | | | | | |
OTHER NET ASSETS 0.4% | | | | 3,180,451 | |
| | | | | | | | | | | | | | | | | | | | |
NET ASSETS 100.0% | | | $ | 874,799,381 | |
| | | | | | | | | | | | | | | | | | | | |
The accompanying notes are an integral part of these portfolio schedules.
87
MUTUAL OF AMERICA INVESTMENT CORPORATION — BOND FUND
PORTFOLIO OF INVESTMENTS IN SECURITIES
June 30, 2022 (Unaudited)
| | | | | | | | | | | | | | |
| | | Rating** | | Rate(%) | | Maturity | | Face Amount | | | Value | |
| LONG-TERM DEBT SECURITIES: | | | | | | | | | | | | |
| U.S. GOVERNMENT (46.6%) | | | | | | | | | | | | |
U.S. Treasury Bond | | AA+ | | 1.13 | | 05/15/40 | | $ | 71,625,000 | | | $ | 49,857,715 | |
U.S. Treasury Bond | | AA+ | | 1.13 | | 08/15/40 | | | 60,750,000 | | | | 41,969,707 | |
U.S. Treasury Bond | | AA+ | | 1.38 | | 11/15/40 | | | 22,500,000 | | | | 16,204,394 | |
U.S. Treasury Bond | | AA+ | | 2.25 | | 08/15/46 | | | 28,985,000 | | | | 23,371,421 | |
U.S. Treasury Bond | | AA+ | | 2.75 | | 08/15/47 | | | 9,790,000 | | | | 8,754,402 | |
U.S. Treasury Bond | | AA+ | | 2.88 | | 05/15/43 | | | 200,000 | | | | 182,375 | |
U.S. Treasury Bond | | AA+ | | 2.88 | | 05/15/49 | | | 6,000,000 | | | | 5,594,297 | |
U.S. Treasury Note | | AA+ | | 0.63 | | 12/31/27 | | | 60,000,000 | | | | 52,577,344 | |
U.S. Treasury Note | | AA+ | | 0.63 | | 05/15/30 | | | 69,425,000 | | | | 57,888,517 | |
U.S. Treasury Note | | AA+ | | 1.13 | | 02/29/28 | | | 50,000,000 | | | | 44,957,031 | |
U.S. Treasury Note | | AA+ | | 1.13 | | 08/31/28 | | | 5,000,000 | | | | 4,449,805 | |
U.S. Treasury Note | | AA+ | | 1.25 | | 05/31/28 | | | 18,400,000 | | | | 16,574,375 | |
U.S. Treasury Note | | AA+ | | 1.25 | | 06/30/28 | | | 36,950,000 | | | | 33,239,123 | |
U.S. Treasury Note | | AA+ | | 1.25 | | 09/30/28 | | | 7,000,000 | | | | 6,269,648 | |
U.S. Treasury Note | | AA+ | | 1.38 | | 11/15/31 | | | 14,000,000 | | | | 12,142,812 | |
U.S. Treasury Note | | AA+ | | 1.50 | | 02/15/25 | | | 12,000,000 | | | | 11,533,125 | |
U.S. Treasury Note | | AA+ | | 1.50 | | 11/30/28 | | | 14,000,000 | | | | 12,712,656 | |
U.S. Treasury Note | | AA+ | | 1.50 | | 02/15/30 | | | 5,800,000 | | | | 5,209,578 | |
U.S. Treasury Note | | AA+ | | 1.63 | | 08/15/29 | | | 49,705,000 | | | | 45,254,849 | |
U.S. Treasury Note | | AA+ | | 2.25 | | 03/31/24 | | | 35,000,000 | | | | 34,559,766 | |
U.S. Treasury Note | | AA+ | | 2.25 | | 08/15/27 | | | 66,000,000 | | | | 63,393,515 | |
U.S. Treasury Note | | AA+ | | 2.25 | | 11/15/27 | | | 50,535,000 | | | | 48,448,457 | |
U.S. Treasury Note | | AA+ | | 2.38 | | 05/15/27 | | | 39,395,000 | | | | 38,136,207 | |
U.S. Treasury Note | | AA+ | | 2.38 | | 05/15/29 | | | 2,000,000 | | | | 1,916,016 | |
U.S. Treasury Note | | AA+ | | 2.50 | | 05/31/24 | | | 35,000,000 | | | | 34,684,180 | |
U.S. Treasury Note | | AA+ | | 2.63 | | 04/15/25 | | | 17,450,000 | | | | 17,260,504 | |
U.S. Treasury Note | | AA+ | | 2.63 | | 02/15/29 | | | 49,655,000 | | | | 48,345,737 | |
U.S. Treasury Note | | AA+ | | 2.75 | | 05/15/25 | | | 30,000,000 | | | | 29,770,312 | |
U.S. Treasury Note | | AA+ | | 2.88 | | 05/15/28 | | | 39,165,000 | | | | 38,707,565 | |
U.S. Treasury Note | | AA+ | | 3.13 | | 11/15/28 | | | 3,915,000 | | | | 3,923,105 | |
U.S. Treasury Strip | | AA+ | | 0.00 | | 08/15/26 | | | 14,080,000 | | | | 12,434,717 | |
U.S. Treasury Strip | | AA+ | | 0.00 | | 08/15/28 | | | 20,580,000 | | | | 17,040,327 | |
U.S. Treasury Strip | | AA+ | | 0.00 | | 08/15/29 | | | 20,680,000 | | | | 16,593,017 | |
U.S. Treasury Strip | | AA+ | | 0.00 | | 08/15/33 | | | 9,790,000 | | | | 6,894,925 | |
U.S. Treasury Strip | | AA+ | | 0.00 | | 08/15/35 | | | 9,790,000 | | | | 6,430,336 | |
U.S. Treasury Strip | | AA+ | | 0.00 | | 08/15/37 | | | 9,790,000 | | | | 6,004,740 | |
| | | | | | | | | | | | | | |
| | | | | | | | | | | | | 873,286,600 | |
| | | | | | | | | | | | | | |
| U.S. GOVERNMENT AGENCIES (30.6%) | | | | | | | | | | | | |
| MORTGAGE-BACKED OBLIGATIONS (30.6%) | | | | | | | | | | | | |
FHLMC | | AA+ | | 2.00 | | 11/01/50 | | | 3,513,932 | | | | 3,063,380 | |
FHLMC | | AA+ | | 2.00 | | 02/01/51 | | | 3,895,155 | | | | 3,406,733 | |
FHLMC | | AA+ | | 2.50 | | 09/01/27 | | | 430,525 | | | | 424,436 | |
FHLMC | | AA+ | | 2.50 | | 09/01/27 | | | 14,968 | | | | 14,770 | |
FHLMC | | AA+ | | 2.50 | | 12/01/27 | | | 453,891 | | | | 440,125 | |
FHLMC | | AA+ | | 2.50 | | 06/01/35 | | | 2,193,383 | | | | 2,099,582 | |
FHLMC | | AA+ | | 2.50 | | 10/01/40 | | | 3,543,333 | | | | 3,261,467 | |
FHLMC | | AA+ | | 2.50 | | 10/01/49 | | | 1,951,811 | | | | 1,770,080 | |
FHLMC | | AA+ | | 2.50 | | 01/01/50 | | | 1,257,834 | | | | 1,175,403 | |
FHLMC | | AA+ | | 2.50 | | 01/01/50 | | | 1,505,414 | | | | 1,358,924 | |
FHLMC | | AA+ | | 2.50 | | 05/01/50 | | | 3,837,807 | | | | 3,468,413 | |
FHLMC | | AA+ | | 2.50 | | 06/01/50 | | | 4,117,142 | | | | 3,724,290 | |
FHLMC | | AA+ | | 2.50 | | 10/01/50 | | | 4,165,828 | | | | 3,753,619 | |
FHLMC | | AA+ | | 2.50 | | 02/01/51 | | | 1,053,768 | | | | 951,530 | |
FHLMC | | AA+ | | 2.50 | | 02/01/51 | | | 1,224,938 | | | | 1,117,403 | |
FHLMC | | AA+ | | 2.50 | | 04/01/51 | | | 2,233,041 | | | | 2,024,612 | |
FHLMC | | AA+ | | 2.50 | | 04/01/51 | | | 5,578,295 | | | | 5,065,426 | |
The accompanying notes are an integral part of these portfolio schedules.
88
MUTUAL OF AMERICA INVESTMENT CORPORATION — BOND FUND
PORTFOLIO OF INVESTMENTS IN SECURITIES (Continued)
June 30, 2022 (Unaudited)
| | | | | | | | | | | | | | |
| | | Rating** | | Rate(%) | | Maturity | | Face Amount | | | Value | |
| LONG-TERM DEBT SECURITIES (CONTINUED): | | | | | | | | | | | | |
| U.S. GOVERNMENT AGENCIES (CONTINUED) | | | | | | | | | | | | |
| MORTGAGE-BACKED OBLIGATIONS (CONTINUED) | | | | | | | | | | | | |
FHLMC | | AA+ | | 2.50 | | 04/01/51 | | $ | 6,454,533 | | | $ | 5,815,523 | |
FHLMC | | AA+ | | 2.50 | | 04/01/51 | | | 1,183,666 | | | | 1,066,477 | |
FHLMC | | AA+ | | 2.50 | | 05/01/51 | | | 9,164,677 | | | | 8,306,832 | |
FHLMC | | AA+ | | 2.50 | | 05/01/51 | | | 6,727,475 | | | | 6,101,444 | |
FHLMC | | AA+ | | 2.50 | | 09/01/51 | | | 4,642,612 | | | | 4,195,202 | |
FHLMC | | AA+ | | 2.50 | | 10/01/51 | | | 3,325,438 | | | | 2,996,190 | |
FHLMC | | AA+ | | 3.00 | | 06/01/27 | | | 272,390 | | | | 267,505 | |
FHLMC | | AA+ | | 3.00 | | 06/01/27 | | | 10,414 | | | | 10,236 | |
FHLMC | | AA+ | | 3.00 | | 08/01/27 | | | 10,114 | | | | 9,911 | |
FHLMC | | AA+ | | 3.00 | | 08/01/27 | | | 158,051 | | | | 154,739 | |
FHLMC | | AA+ | | 3.00 | | 02/01/32 | | | 1,881,874 | | | | 1,875,663 | |
FHLMC | | AA+ | | 3.00 | | 07/01/35 | | | 799,740 | | | | 784,368 | |
FHLMC | | AA+ | | 3.00 | | 10/15/37 | | | 211 | | | | 211 | |
FHLMC | | AA+ | | 3.00 | | 07/01/42 | | | 199,925 | | | | 192,895 | |
FHLMC | | AA+ | | 3.00 | | 11/01/42 | | | 475,810 | | | | 440,210 | |
FHLMC | | AA+ | | 3.00 | | 11/01/42 | | | 21,121 | | | | 20,105 | |
FHLMC | | AA+ | | 3.00 | | 03/01/43 | | | 815,555 | | | | 779,080 | |
FHLMC | | AA+ | | 3.00 | | 04/01/43 | | | 5,785,402 | | | | 5,531,155 | |
FHLMC | | AA+ | | 3.00 | | 04/01/43 | | | 18,790 | | | | 17,975 | |
FHLMC | | AA+ | | 3.00 | | 04/01/43 | | | 3,588,154 | | | | 3,414,965 | |
FHLMC | | AA+ | | 3.00 | | 04/01/43 | | | 1,107,889 | | | | 1,058,797 | |
FHLMC | | AA+ | | 3.00 | | 09/15/43 | | | 239,908 | | | | 239,296 | |
FHLMC | | AA+ | | 3.00 | | 04/15/44 | | | 251,028 | | | | 245,506 | |
FHLMC | | AA+ | | 3.00 | | 04/15/45 | | | 147,448 | | | | 147,208 | |
FHLMC | | AA+ | | 3.00 | | 09/01/46 | | | 2,312,075 | | | | 2,189,295 | |
FHLMC | | AA+ | | 3.00 | | 09/01/46 | | | 1,026,110 | | | | 987,447 | |
FHLMC | | AA+ | | 3.00 | | 11/01/46 | | | 279,316 | | | | 258,401 | |
FHLMC | | AA+ | | 3.00 | | 05/01/49 | | | 2,604,225 | | | | 2,432,266 | |
FHLMC | | AA+ | | 3.00 | | 11/01/49 | | | 1,561,786 | | | | 1,467,775 | |
FHLMC | | AA+ | | 3.00 | | 11/01/49 | | | 1,778,794 | | | | 1,661,343 | |
FHLMC | | AA+ | | 3.00 | | 12/01/49 | | | 1,667,537 | | | | 1,557,344 | |
FHLMC | | AA+ | | 3.00 | | 02/01/50 | | | 2,263,424 | | | | 2,135,288 | |
FHLMC | | AA+ | | 3.00 | | 11/01/50 | | | 3,772,304 | | | | 3,520,887 | |
FHLMC | | AA+ | | 3.00 | | 04/01/51 | | | 1,246,014 | | | | 1,162,922 | |
FHLMC | | AA+ | | 3.50 | | 02/01/35 | | | 479,549 | | | | 479,560 | |
FHLMC | | AA+ | | 3.50 | | 02/01/35 | | | 873,100 | | | | 873,120 | |
FHLMC | | AA+ | | 3.50 | | 04/01/35 | | | 436,884 | | | | 436,895 | |
FHLMC | | AA+ | | 3.50 | | 02/01/36 | | | 401,118 | | | | 400,138 | |
FHLMC | | AA+ | | 3.50 | | 11/01/39 | | | 2,242,656 | | | | 2,192,775 | |
FHLMC | | AA+ | | 3.50 | | 01/01/41 | | | 384,548 | | | | 378,375 | |
FHLMC | | AA+ | | 3.50 | | 05/01/42 | | | 27,738 | | | | 27,284 | |
FHLMC | | AA+ | | 3.50 | | 07/01/42 | | | 1,065,890 | | | | 1,050,171 | |
FHLMC | | AA+ | | 3.50 | | 01/01/43 | | | 24,017 | | | | 23,634 | |
FHLMC | | AA+ | | 3.50 | | 04/01/43 | | | 22,005 | | | | 21,645 | |
FHLMC | | AA+ | | 3.50 | | 06/01/43 | | | 736,546 | | | | 720,334 | |
FHLMC | | AA+ | | 3.50 | | 11/01/43 | | | 21,831 | | | | 21,474 | |
FHLMC | | AA+ | | 3.50 | | 01/01/44 | | | 9,740,736 | | | | 9,572,302 | |
FHLMC | | AA+ | | 3.50 | | 04/01/45 | | | 885,043 | | | | 869,720 | |
FHLMC | | AA+ | | 3.50 | | 07/01/45 | | | 969,162 | | | | 952,075 | |
FHLMC | | AA+ | | 3.50 | | 07/01/45 | | | 32,305 | | | | 31,766 | |
FHLMC | | AA+ | | 3.50 | | 09/01/45 | | | 548,648 | | | | 536,431 | |
FHLMC | | AA+ | | 3.50 | | 11/01/45 | | | 2,740,282 | | | | 2,691,451 | |
FHLMC | | AA+ | | 3.50 | | 08/01/46 | | | 955,473 | | | | 934,189 | |
FHLMC | | AA+ | | 3.50 | | 08/01/47 | | | 2,840,221 | | | | 2,779,713 | |
FHLMC | | AA+ | | 3.50 | | 12/01/47 | | | 486,474 | | | | 475,635 | |
The accompanying notes are an integral part of these portfolio schedules.
89
MUTUAL OF AMERICA INVESTMENT CORPORATION — BOND FUND
PORTFOLIO OF INVESTMENTS IN SECURITIES (Continued)
June 30, 2022 (Unaudited)
| | | | | | | | | | | | | | |
| | | Rating** | | Rate(%) | | Maturity | | Face Amount | | | Value | |
| LONG-TERM DEBT SECURITIES (CONTINUED): | | | | | | | | | | | | |
| U.S. GOVERNMENT AGENCIES (CONTINUED) | | | | | | | | | | | | |
| MORTGAGE-BACKED OBLIGATIONS (CONTINUED) | | | | | | | | | | | | |
FHLMC | | AA+ | | 3.50 | | 02/01/50 | | $ | 1,563,519 | | | $ | 1,517,633 | |
FHLMC | | AA+ | | 3.50 | | 03/01/52 | | | 9,898,819 | | | | 9,539,487 | |
FHLMC | | AA+ | | 4.00 | | 02/01/25 | | | 13,013 | | | | 13,153 | |
FHLMC | | AA+ | | 4.00 | | 05/01/26 | | | 54,685 | | | | 55,378 | |
FHLMC | | AA+ | | 4.00 | | 11/01/33 | | | 17,368 | | | | 17,613 | |
FHLMC | | AA+ | | 4.00 | | 12/01/33 | | | 546,277 | | | | 552,478 | |
FHLMC | | AA+ | | 4.00 | | 01/01/38 | | | 1,368,318 | | | | 1,415,140 | |
FHLMC | | AA+ | | 4.00 | | 01/01/38 | | | 76,721 | | | | 79,418 | |
FHLMC | | AA+ | | 4.00 | | 01/15/40 | | | 2,000,000 | | | | 1,967,469 | |
FHLMC | | AA+ | | 4.00 | | 03/01/41 | | | 7,050 | | | | 7,137 | |
FHLMC | | AA+ | | 4.00 | | 07/01/41 | | | 405,781 | | | | 410,410 | |
FHLMC | | AA+ | | 4.00 | | 07/01/41 | | | 13,543 | | | | 13,711 | |
FHLMC | | AA+ | | 4.00 | | 11/01/42 | | | 5,944 | | | | 5,990 | |
FHLMC | | AA+ | | 4.00 | | 10/01/44 | | | 347,342 | | | | 349,799 | |
FHLMC | | AA+ | | 4.00 | | 10/01/44 | | | 838,725 | | | | 844,655 | |
FHLMC | | AA+ | | 4.00 | | 10/01/44 | | | 18,802 | | | | 18,916 | |
FHLMC | | AA+ | | 4.00 | | 10/01/44 | | | 564,060 | | | | 566,933 | |
FHLMC | | AA+ | | 4.00 | | 02/01/45 | | | 2,393,430 | | | | 2,420,592 | |
FHLMC | | AA+ | | 4.00 | | 06/01/45 | | | 29,184 | | | | 29,418 | |
FHLMC | | AA+ | | 4.00 | | 05/01/47 | | | 423,456 | | | | 424,438 | |
FHLMC | | AA+ | | 4.00 | | 02/01/48 | | | 365,403 | | | | 365,731 | |
FHLMC | | AA+ | | 4.00 | | 05/01/48 | | | 177,383 | | | | 177,311 | |
FHLMC | | AA+ | | 4.00 | | 03/01/52 | | | 7,068,727 | | | | 6,999,343 | |
FHLMC | | AA+ | | 4.00 | | 04/01/52 | | | 3,352,163 | | | | 3,327,141 | |
FHLMC | | AA+ | | 4.50 | | 03/01/34 | | | 3,508 | | | | 3,595 | |
FHLMC | | AA+ | | 4.50 | | 02/01/44 | | | 12,525 | | | | 12,878 | |
FHLMC | | AA+ | | 4.50 | | 05/01/48 | | | 1,009,778 | | | | 1,026,567 | |
FHLMC | | AA+ | | 4.50 | | 05/01/48 | | | 547,655 | | | | 557,147 | |
FHLMC | | AA+ | | 5.00 | | 02/01/26 | | | 555 | | | | 568 | |
FHLMC | | AA+ | | 5.00 | | 10/01/40 | | | 266,064 | | | | 280,068 | |
FHLMC | | AA+ | | 5.00 | | 04/01/52 | | | 7,408,392 | | | | 7,572,360 | |
FHLMC | | AA+ | | 5.00 | | 04/01/52 | | | 3,926,310 | | | | 4,027,603 | |
FHLMC | | AA+ | | 5.00 | | 06/01/52 | | | 7,742,007 | | | | 7,922,185 | |
FHLMC | | AA+ | | 5.50 | | 07/01/32 | | | 2,015 | | | | 2,138 | |
FHLMC | | AA+ | | 5.50 | | 01/15/33 | | | 73,428 | | | | 77,218 | |
FHLMC | | AA+ | | 5.50 | | 05/01/33 | | | 685 | | | | 713 | |
FHLMC | | AA+ | | 5.50 | | 06/01/37 | | | 12,541 | | | | 13,477 | |
FHLMC | | AA+ | | 6.00 | | 07/15/29 | | | 42,591 | | | | 44,766 | |
FHLMC ARM | | AA+ | | 1.92 | | 10/01/51 | | | 12,618,678 | | | | 11,575,226 | |
FHLMC ARM | | AA+ | | 2.91 | | 04/01/37 | | | 32,435 | | | | 33,478 | |
FHLMC Strip | | AA+ | | 3.00 | | 06/15/42 | | | 4,737,973 | | | | 4,554,986 | |
FHLMC Strip | | AA+ | | 3.00 | | 01/15/43 | | | 794,762 | | | | 750,846 | |
FHLMC Strip | | AA+ | | 3.50 | | 10/15/47 | | | 514,843 | | | | 498,472 | |
FNMA | | AA+ | | 1.83 | | 09/01/51 | | | 10,299,398 | | | | 9,427,908 | |
FNMA | | AA+ | | 2.00 | | 07/01/36 | | | 28,497,496 | | | | 26,485,585 | |
FNMA | | AA+ | | 2.00 | | 10/01/50 | | | 4,244,078 | | | | 3,702,729 | |
FNMA | | AA+ | | 2.00 | | 10/01/50 | | | 3,493,318 | | | | 3,046,435 | |
FNMA | | AA+ | | 2.00 | | 03/01/51 | | | 7,098,491 | | | | 6,216,893 | |
FNMA | | AA+ | | 2.50 | | 01/01/33 | | | 205,980 | | | | 189,152 | |
FNMA | | AA+ | | 2.50 | | 02/01/33 | | | 618,128 | | | | 567,621 | |
FNMA | | AA+ | | 2.50 | | 05/01/35 | | | 695,347 | | | | 665,289 | |
FNMA | | AA+ | | 2.50 | | 06/01/35 | | | 3,073,014 | | | | 2,941,609 | |
FNMA | | AA+ | | 2.50 | | 07/01/35 | | | 940,533 | | | | 900,318 | |
FNMA | | AA+ | | 2.50 | | 07/01/35 | | | 3,028,174 | | | | 2,901,341 | |
FNMA | | AA+ | | 2.50 | | 09/01/35 | | | 4,082,129 | | | | 3,907,760 | |
The accompanying notes are an integral part of these portfolio schedules.
90
MUTUAL OF AMERICA INVESTMENT CORPORATION — BOND FUND
PORTFOLIO OF INVESTMENTS IN SECURITIES (Continued)
June 30, 2022 (Unaudited)
| | | | | | | | | | | | | | |
| | | Rating** | | Rate(%) | | Maturity | | Face Amount | | | Value | |
| LONG-TERM DEBT SECURITIES (CONTINUED): | | | | | | | | | | | | |
| U.S. GOVERNMENT AGENCIES (CONTINUED) | | | | | | | | | | | | |
| MORTGAGE-BACKED OBLIGATIONS (CONTINUED) | | | | | | | | | | | | |
FNMA | | AA+ | | 2.50 | | 10/01/35 | | $ | 7,473,231 | | | $ | 7,204,806 | |
FNMA | | AA+ | | 2.50 | | 05/01/43 | | | 956,536 | | | | 859,701 | |
FNMA | | AA+ | | 2.50 | | 05/01/46 | | | 8,392,137 | | | | 7,609,391 | |
FNMA | | AA+ | | 2.50 | | 06/01/50 | | | 4,510,952 | | | | 4,072,494 | |
FNMA | | AA+ | | 2.50 | | 10/01/50 | | | 3,460,604 | | | | 3,121,638 | |
FNMA | | AA+ | | 2.50 | | 10/01/50 | | | 1,689,327 | | | | 1,530,230 | |
FNMA | | AA+ | | 2.50 | | 10/01/50 | | | 3,053,166 | | | | 2,752,129 | |
FNMA | | AA+ | | 2.50 | | 10/01/50 | | | 863,680 | | | | 787,936 | |
FNMA | | AA+ | | 2.50 | | 11/01/50 | | | 1,757,256 | | | | 1,603,064 | |
FNMA | | AA+ | | 2.50 | | 12/01/50 | | | 1,969,564 | | | | 1,775,494 | |
FNMA | | AA+ | | 2.50 | | 12/01/50 | | | 1,826,207 | | | | 1,658,913 | |
FNMA | | AA+ | | 2.50 | | 12/01/50 | | | 2,690,934 | | | | 2,452,242 | |
FNMA | | AA+ | | 2.50 | | 01/01/51 | | | 10,496,847 | | | | 9,526,179 | |
FNMA | | AA+ | | 2.50 | | 03/01/51 | | | 7,272,466 | | | | 6,595,609 | |
FNMA | | AA+ | | 2.50 | | 03/01/51 | | | 7,194,831 | | | | 6,548,399 | |
FNMA | | AA+ | | 2.50 | | 03/01/51 | | | 1,648,965 | | | | 1,488,310 | |
FNMA | | AA+ | | 2.50 | | 04/01/51 | | | 10,828,427 | | | | 9,766,294 | |
FNMA | | AA+ | | 2.50 | | 04/01/51 | | | 5,978,708 | | | | 5,422,788 | |
FNMA | | AA+ | | 2.50 | | 04/01/51 | | | 4,831,739 | | | | 4,395,180 | |
FNMA | | AA+ | | 2.50 | | 04/01/51 | | | 4,114,810 | | | | 3,725,423 | |
FNMA | | AA+ | | 2.50 | | 04/01/51 | | | 2,327,517 | | | | 2,097,099 | |
FNMA | | AA+ | | 2.50 | | 05/01/51 | | | 1,781,527 | | | | 1,605,864 | |
FNMA | | AA+ | | 2.50 | | 05/01/51 | | | 933,341 | | | | 840,871 | |
FNMA | | AA+ | | 2.50 | | 05/01/51 | | | 3,862,128 | | | | 3,480,128 | |
FNMA | | AA+ | | 2.50 | | 05/01/51 | | | 3,134,384 | | | | 2,846,276 | |
FNMA | | AA+ | | 2.50 | | 06/01/51 | | | 2,105,813 | | | | 1,897,332 | |
FNMA | | AA+ | | 2.50 | | 08/01/51 | | | 1,338,890 | | | | 1,206,749 | |
FNMA | | AA+ | | 2.50 | | 08/01/51 | | | 12,669,884 | | | | 11,460,710 | |
FNMA | | AA+ | | 2.50 | | 08/01/51 | | | 2,868,243 | | | | 2,587,278 | |
FNMA | | AA+ | | 2.50 | | 08/01/51 | | | 5,070,665 | | | | 4,570,201 | |
FNMA | | AA+ | | 2.50 | | 09/01/51 | | | 870,137 | | | | 784,273 | |
FNMA | | AA+ | | 2.50 | | 11/01/51 | | | 4,940,272 | | | | 4,451,114 | |
FNMA | | AA+ | | 2.50 | | 12/01/51 | | | 13,710,848 | | | | 12,353,315 | |
FNMA | | AA+ | | 3.00 | | 06/01/33 | | | 661,182 | | | | 649,360 | |
FNMA | | AA+ | | 3.00 | | 07/01/33 | | | 885,078 | | | | 869,249 | |
FNMA | | AA+ | | 3.00 | | 09/01/33 | | | 1,061,105 | | | | 1,042,194 | |
FNMA | | AA+ | | 3.00 | | 03/01/36 | | | 921,788 | | | | 905,336 | |
FNMA | | AA+ | | 3.00 | | 09/01/40 | | | 1,031,667 | | | | 977,781 | |
FNMA | | AA+ | | 3.00 | | 04/25/42 | | | 155,872 | | | | 155,527 | |
FNMA | | AA+ | | 3.00 | | 12/01/42 | | | 355,919 | | | | 329,319 | |
FNMA | | AA+ | | 3.00 | | 12/01/42 | | | 601,667 | | | | 581,725 | |
FNMA | | AA+ | | 3.00 | | 02/01/43 | | | 16,162 | | | | 15,268 | |
FNMA | | AA+ | | 3.00 | | 03/01/43 | | | 14,202 | | | | 13,496 | |
FNMA | | AA+ | | 3.00 | | 09/01/43 | | | 39,988 | | | | 38,192 | |
FNMA | | AA+ | | 3.00 | | 02/01/45 | | | 931,469 | | | | 887,281 | |
FNMA | | AA+ | | 3.00 | | 03/01/45 | | | 251,899 | | | | 233,176 | |
FNMA | | AA+ | | 3.00 | | 09/01/46 | | | 1,670,380 | | | | 1,585,190 | |
FNMA | | AA+ | | 3.00 | | 01/01/47 | | | 303,272 | | | | 280,713 | |
FNMA | | AA+ | | 3.00 | | 12/01/47 | | | 151,307 | | | | 141,832 | |
FNMA | | AA+ | | 3.00 | | 03/01/48 | | | 379,266 | | | | 358,542 | |
FNMA | | AA+ | | 3.00 | | 03/01/50 | | | 9,535,593 | | | | 8,908,023 | |
FNMA | | AA+ | | 3.00 | | 03/01/50 | | | 1,471,444 | | | | 1,374,850 | |
FNMA | | AA+ | | 3.00 | | 05/01/50 | | | 2,703,400 | | | | 2,524,900 | |
FNMA | | AA+ | | 3.00 | | 06/01/50 | | | 4,613,190 | | | | 4,308,658 | |
FNMA | | AA+ | | 3.00 | | 08/01/50 | | | 2,941,198 | | | | 2,749,069 | |
The accompanying notes are an integral part of these portfolio schedules.
91
MUTUAL OF AMERICA INVESTMENT CORPORATION — BOND FUND
PORTFOLIO OF INVESTMENTS IN SECURITIES (Continued)
June 30, 2022 (Unaudited)
| | | | | | | | | | | | | | |
| | | Rating** | | Rate(%) | | Maturity | | Face Amount | | | Value | |
| LONG-TERM DEBT SECURITIES (CONTINUED): | | | | | | | | | | | | |
| U.S. GOVERNMENT AGENCIES (CONTINUED) | | | | | | | | | | | | |
| MORTGAGE-BACKED OBLIGATIONS (CONTINUED) | | | | | | | | | | | | |
FNMA | | AA+ | | 3.00 | | 09/01/50 | | $ | 5,716,543 | | | $ | 5,339,923 | |
FNMA | | AA+ | | 3.00 | | 01/01/52 | | | 9,989,076 | | | | 9,322,161 | |
FNMA | | AA+ | | 3.50 | | 03/01/32 | | | 327,807 | | | | 327,815 | |
FNMA | | AA+ | | 3.50 | | 09/01/32 | | | 19,777 | | | | 19,778 | |
FNMA | | AA+ | | 3.50 | | 07/01/34 | | | 589,373 | | | | 589,664 | |
FNMA | | AA+ | | 3.50 | | 10/01/34 | | | 777,606 | | | | 777,624 | |
FNMA | | AA+ | | 3.50 | | 02/01/35 | | | 646,693 | | | | 645,151 | |
FNMA | | AA+ | | 3.50 | | 08/01/38 | | | 20,176 | | | | 19,854 | |
FNMA | | AA+ | | 3.50 | | 03/01/41 | | | 747,648 | | | | 735,660 | |
FNMA | | AA+ | | 3.50 | | 10/01/41 | | | 481,648 | | | | 469,026 | |
FNMA | | AA+ | | 3.50 | | 12/01/41 | | | 393,565 | | | | 382,729 | |
FNMA | | AA+ | | 3.50 | | 04/01/42 | | | 473,515 | | | | 459,979 | |
FNMA | | AA+ | | 3.50 | | 08/01/42 | | | 22,885 | | | | 22,491 | |
FNMA | | AA+ | | 3.50 | | 12/01/42 | | | 905,639 | | | | 873,400 | |
FNMA | | AA+ | | 3.50 | | 01/01/43 | | | 456,725 | | | | 446,672 | |
FNMA | | AA+ | | 3.50 | | 08/01/43 | | | 1,739,201 | | | | 1,703,070 | |
FNMA | | AA+ | | 3.50 | | 08/01/43 | | | 840,336 | | | | 825,861 | |
FNMA | | AA+ | | 3.50 | | 10/01/43 | | | 218,008 | | | | 214,840 | |
FNMA | | AA+ | | 3.50 | | 01/01/44 | | | 154,301 | | | | 147,877 | |
FNMA | | AA+ | | 3.50 | | 08/01/44 | | | 1,290,455 | | | | 1,236,606 | |
FNMA | | AA+ | | 3.50 | | 04/01/45 | | | 1,637,254 | | | | 1,591,224 | |
FNMA | | AA+ | | 3.50 | | 04/01/45 | | | 995,290 | | | | 976,500 | |
FNMA | | AA+ | | 3.50 | | 05/01/45 | | | 1,185,116 | | | | 1,162,952 | |
FNMA | | AA+ | | 3.50 | | 10/01/45 | | | 1,404,367 | | | | 1,366,736 | |
FNMA | | AA+ | | 3.50 | | 02/01/46 | | | 623,586 | | | | 608,878 | |
FNMA | | AA+ | | 3.50 | | 02/01/46 | | | 1,973,782 | | | | 1,930,011 | |
FNMA | | AA+ | | 3.50 | | 08/01/46 | | | 823,570 | | | | 805,303 | |
FNMA | | AA+ | | 3.50 | | 12/01/46 | | | 318,946 | | | | 310,748 | |
FNMA | | AA+ | | 3.50 | | 09/01/47 | | | 1,412,770 | | | | 1,381,606 | |
FNMA | | AA+ | | 3.50 | | 11/01/47 | | | 6,318,603 | | | | 6,176,584 | |
FNMA | | AA+ | | 3.50 | | 04/01/48 | | | 215,290 | | | | 207,079 | |
FNMA | | AA+ | | 3.50 | | 02/01/50 | | | 1,701,062 | | | | 1,653,215 | |
FNMA | | AA+ | | 3.50 | | 03/01/50 | | | 3,582,033 | | | | 3,475,321 | |
FNMA | | AA+ | | 4.00 | | 01/01/31 | | | 21,657 | | | | 22,022 | |
FNMA | | AA+ | | 4.00 | | 03/01/35 | | | 178,762 | | | | 180,781 | |
FNMA | | AA+ | | 4.00 | | 06/01/36 | | | 339,024 | | | | 344,743 | |
FNMA | | AA+ | | 4.00 | | 10/01/36 | | | 353,330 | | | | 359,278 | |
FNMA | | AA+ | | 4.00 | | 10/01/40 | | | 422,093 | | | | 426,911 | |
FNMA | | AA+ | | 4.00 | | 11/01/40 | | | 7,176 | | | | 7,257 | |
FNMA | | AA+ | | 4.00 | | 01/01/41 | | | 30,154 | | | | 30,495 | |
FNMA | | AA+ | | 4.00 | | 05/01/41 | | | 199,997 | | | | 197,269 | |
FNMA | | AA+ | | 4.00 | | 05/01/43 | | | 2,408,779 | | | | 2,436,075 | |
FNMA | | AA+ | | 4.00 | | 01/01/44 | | | 4,799,540 | | | | 4,854,312 | |
FNMA | | AA+ | | 4.00 | | 09/01/45 | | | 260,222 | | | | 258,397 | |
FNMA | | AA+ | | 4.00 | | 11/01/45 | | | 522,880 | | | | 524,022 | |
FNMA | | AA+ | | 4.00 | | 02/01/47 | | | 1,362,680 | | | | 1,372,019 | |
FNMA | | AA+ | | 4.00 | | 11/01/47 | | | 612,780 | | | | 613,512 | |
FNMA | | AA+ | | 4.00 | | 04/01/48 | | | 264,153 | | | | 264,466 | |
FNMA | | AA+ | | 4.00 | | 04/01/49 | | | 6,469,176 | | | | 6,474,810 | |
FNMA | | AA+ | | 4.00 | | 03/01/50 | | | 347,831 | | | | 344,681 | |
FNMA | | AA+ | | 4.00 | | 03/01/50 | | | 4,457,836 | | | | 4,422,774 | |
FNMA | | AA+ | | 4.00 | | 03/01/52 | | | 2,276,099 | | | | 2,278,849 | |
FNMA | | AA+ | | 4.00 | | 07/01/56 | | | 2,951,530 | | | | 2,950,527 | |
FNMA | | AA+ | | 4.50 | | 05/01/30 | | | 3,265 | | | | 3,305 | |
FNMA | | AA+ | | 4.50 | | 05/01/34 | | | 2,260 | | | | 2,313 | |
The accompanying notes are an integral part of these portfolio schedules.
92
MUTUAL OF AMERICA INVESTMENT CORPORATION — BOND FUND
PORTFOLIO OF INVESTMENTS IN SECURITIES (Continued)
June 30, 2022 (Unaudited)
| | | | | | | | | | | | | | |
| | | Rating** | | Rate(%) | | Maturity | | Face Amount | | | Value | |
| LONG-TERM DEBT SECURITIES (CONTINUED): | | | | | | | | | | | | |
| U.S. GOVERNMENT AGENCIES (CONTINUED) | | | | | | | | | | | | |
| MORTGAGE-BACKED OBLIGATIONS (CONTINUED) | | | | | | | | | | | | |
FNMA | | AA+ | | 4.50 | | 06/01/34 | | $ | 2,144 | | | $ | 2,163 | |
FNMA | | AA+ | | 4.50 | | 08/01/35 | | | 2,180 | | | | 2,215 | |
FNMA | | AA+ | | 4.50 | | 05/01/39 | | | 369,095 | | | | 380,936 | |
FNMA | | AA+ | | 4.50 | | 05/01/39 | | | 265,378 | | | | 273,915 | |
FNMA | | AA+ | | 4.50 | | 12/01/39 | | | 1,590,474 | | | | 1,634,784 | |
FNMA | | AA+ | | 4.50 | | 05/01/40 | | | 199,736 | | | | 196,920 | |
FNMA | | AA+ | | 4.50 | | 07/01/40 | | | 1,032,012 | | | | 1,032,524 | |
FNMA | | AA+ | | 4.50 | | 10/01/40 | | | 55,408 | | | | 57,036 | |
FNMA | | AA+ | | 4.50 | | 07/01/42 | | | 3,662,705 | | | | 3,779,926 | |
FNMA | | AA+ | | 4.50 | | 03/01/44 | | | 494,331 | | | | 508,889 | |
FNMA | | AA+ | | 4.50 | | 04/01/44 | | | 828,074 | | | | 848,250 | |
FNMA | | AA+ | | 4.50 | | 11/01/47 | | | 974,151 | | | | 989,189 | |
FNMA | | AA+ | | 4.50 | | 11/01/47 | | | 1,217,449 | | | | 1,248,947 | |
FNMA | | AA+ | | 4.50 | | 11/01/47 | | | 974,991 | | | | 1,006,399 | |
FNMA | | AA+ | | 4.50 | | 02/01/49 | | | 365,067 | | | | 368,758 | |
FNMA | | AA+ | | 4.50 | | 05/01/50 | | | 17,515,083 | | | | 17,644,593 | |
FNMA | | AA+ | | 5.00 | | 06/01/33 | | | 3,526 | | | | 3,705 | |
FNMA | | AA+ | | 5.00 | | 09/01/33 | | | 2,825 | | | | 2,935 | |
FNMA | | AA+ | | 5.00 | | 10/01/33 | | | 4,106 | | | | 4,316 | |
FNMA | | AA+ | | 5.00 | | 11/01/33 | | | 5,709 | | | | 6,001 | |
FNMA | | AA+ | | 5.00 | | 03/01/34 | | | 944 | | | | 992 | |
FNMA | | AA+ | | 5.00 | | 04/01/34 | | | 752 | | | | 791 | |
FNMA | | AA+ | | 5.00 | | 04/01/34 | | | 1,759 | | | | 1,825 | |
FNMA | | AA+ | | 5.00 | | 04/01/35 | | | 2,348 | | | | 2,470 | |
FNMA | | AA+ | | 5.00 | | 06/01/35 | | | 983 | | | | 1,033 | |
FNMA | | AA+ | | 5.00 | | 09/01/35 | | | 1,540 | | | | 1,621 | |
FNMA | | AA+ | | 5.00 | | 11/25/35 | | | 254,751 | | | | 264,944 | |
FNMA | | AA+ | | 5.00 | | 10/01/36 | | | 1,862 | | | | 1,959 | |
FNMA | | AA+ | | 5.00 | | 08/01/37 | | | 1,802,933 | | | | 1,895,716 | |
FNMA | | AA+ | | 5.00 | | 05/01/39 | | | 205,637 | | | | 213,082 | |
FNMA | | AA+ | | 5.00 | | 06/01/40 | | | 3,405 | | | | 3,584 | |
FNMA | | AA+ | | 5.00 | | 04/01/52 | | | 2,725,243 | | | | 2,788,856 | |
FNMA | | AA+ | | 5.00 | | 05/01/52 | | | 6,939,387 | | | | 7,101,969 | |
FNMA | | AA+ | | 5.00 | | 06/01/52 | | | 1,040,500 | | | | 1,063,439 | |
FNMA | | AA+ | | 5.00 | | 06/01/52 | | | 2,201,071 | | | | 2,252,645 | |
FNMA | | AA+ | | 5.00 | | 06/01/52 | | | 3,984,779 | | | | 4,075,548 | |
FNMA | | AA+ | | 5.50 | | 01/01/24 | | | 14,143 | | | | 14,684 | |
FNMA | | AA+ | | 5.50 | | 03/01/24 | | | 27,969 | | | | 29,038 | |
FNMA | | AA+ | | 5.50 | | 08/01/25 | | | 824 | | | | 864 | |
FNMA | | AA+ | | 5.50 | | 11/01/26 | | | 18,830 | | | | 19,556 | |
FNMA | | AA+ | | 5.50 | | 03/01/33 | | | 93,487 | | | | 95,830 | |
FNMA | | AA+ | | 5.50 | | 09/01/33 | | | 1,624 | | | | 1,702 | |
FNMA | | AA+ | | 5.50 | | 10/01/33 | | | 4,044 | | | | 4,236 | |
FNMA | | AA+ | | 5.50 | | 03/01/34 | | | 1,554 | | | | 1,665 | |
FNMA | | AA+ | | 5.50 | | 03/01/34 | | | 378 | | | | 393 | |
FNMA | | AA+ | | 5.50 | | 07/01/34 | | | 2,352 | | | | 2,469 | |
FNMA | | AA+ | | 5.50 | | 09/01/34 | | | 3,344 | | | | 3,477 | |
FNMA | | AA+ | | 5.50 | | 09/01/34 | | | 663 | | | | 696 | |
FNMA | | AA+ | | 5.50 | | 10/01/34 | | | 1,508 | | | | 1,614 | |
FNMA | | AA+ | | 5.50 | | 02/01/35 | | | 1,980 | | | | 2,123 | |
FNMA | | AA+ | | 5.50 | | 02/01/35 | | | 2,134 | | | | 2,279 | |
FNMA | | AA+ | | 5.50 | | 04/01/35 | | | 1,975 | | | | 2,090 | |
FNMA | | AA+ | | 5.50 | | 08/01/35 | | | 1,994 | | | | 2,089 | |
FNMA | | AA+ | | 5.50 | | 02/25/37 | | | 10,222 | | | | 10,445 | |
FNMA | | AA+ | | 5.50 | | 06/01/37 | | | 2,356 | | | | 2,529 | |
The accompanying notes are an integral part of these portfolio schedules.
93
MUTUAL OF AMERICA INVESTMENT CORPORATION — BOND FUND
PORTFOLIO OF INVESTMENTS IN SECURITIES (Continued)
June 30, 2022 (Unaudited)
| | | | | | | | | | | | | | |
| | | Rating** | | Rate(%) | | Maturity | | Face Amount | | | Value | |
| LONG-TERM DEBT SECURITIES (CONTINUED): | | | | | | | | | | | | |
| U.S. GOVERNMENT AGENCIES (CONTINUED) | | | | | | | | | | | | |
| MORTGAGE-BACKED OBLIGATIONS (CONTINUED) | | | | | | | | | | | | |
FNMA | | AA+ | | 5.50 | | 05/01/38 | | $ | 1,729,862 | | | $ | 1,854,088 | |
FNMA | | AA+ | | 5.50 | | 06/01/48 | | | 39,859 | | | | 41,031 | |
FNMA | | AA+ | | 6.00 | | 04/01/23 | | | 108 | | | | 113 | |
FNMA | | AA+ | | 6.00 | | 03/01/28 | | | 42,539 | | | | 44,697 | |
FNMA | | AA+ | | 6.00 | | 05/01/32 | | | 62,613 | | | | 68,255 | |
FNMA | | AA+ | | 6.00 | | 04/01/33 | | | 104,636 | | | | 110,067 | |
FNMA | | AA+ | | 6.00 | | 05/01/33 | | | 2,624 | | | | 2,758 | |
FNMA | | AA+ | | 6.00 | | 09/01/34 | | | 960 | | | | 1,008 | |
FNMA | | AA+ | | 6.00 | | 10/01/34 | | | 5,094 | | | | 5,360 | |
FNMA | | AA+ | | 6.00 | | 01/01/37 | | | 59,812 | | | | 65,499 | |
FNMA | | AA+ | | 6.00 | | 05/01/37 | | | 12,947 | | | | 13,510 | |
FNMA | | AA+ | | 6.00 | | 08/01/37 | | | 42,950 | | | | 47,031 | |
FNMA | | AA+ | | 6.00 | | 12/01/37 | | | 373 | | | | 405 | |
FNMA | | AA+ | | 6.00 | | 10/25/44 | | | 259,074 | | | | 270,345 | |
FNMA | | AA+ | | 6.00 | | 12/25/49 | | | 134,061 | | | | 141,271 | |
FNMA | | AA+ | | 6.50 | | 05/01/32 | | | 73,334 | | | | 76,937 | |
FNMA | | AA+ | | 6.50 | | 07/01/34 | | | 1,531 | | | | 1,623 | |
FNMA | | AA+ | | 6.50 | | 09/01/34 | | | 382 | | | | 401 | |
FNMA | | AA+ | | 6.50 | | 09/01/36 | | | 8,284 | | | | 8,686 | |
FNMA | | AA+ | | 6.50 | | 05/01/37 | | | 79,278 | | | | 81,472 | |
FNMA | | AA+ | | 6.50 | | 07/01/37 | | | 4,423 | | | | 4,655 | |
FNMA | | AA+ | | 6.50 | | 05/01/38 | | | 6,569 | | | | 7,137 | |
FNMA | | AA+ | | 7.00 | | 04/01/32 | | | 272 | | | | 283 | |
FNMA | | AA+ | | 7.50 | | 06/01/31 | | | 124 | | | | 132 | |
FNMA | | AA+ | | 7.50 | | 02/01/32 | | | 500 | | | | 537 | |
FNMA | | AA+ | | 7.50 | | 06/01/32 | | | 20,937 | | | | 22,973 | |
FNMA | | AA+ | | 8.00 | | 04/01/32 | | | 15,750 | | | | 16,173 | |
FNMA Strip | | AA+ | | 3.00 | | 08/25/42 | | | 545,679 | | | | 515,951 | |
FRESB Multifamily Mortgage | | AA+ | | 2.37 | | 10/25/26 | | | 865,548 | | | | 824,950 | |
FRESB Multifamily Mortgage | | AA+ | | 3.61 | | 10/25/28 | | | 790,256 | | | | 772,346 | |
GNMA (3) | | AA+ | | 2.00 | | 04/20/32 | | | 561,167 | | | | 525,177 | |
GNMA (3) | | AA+ | | 2.00 | | 09/20/50 | | | 1,829,991 | | | | 1,617,799 | |
GNMA (3) | | AA+ | | 2.50 | | 12/20/50 | | | 5,675,661 | | | | 5,131,667 | |
GNMA (3) | | AA+ | | 2.50 | | 03/20/51 | | | 2,003,280 | | | | 1,810,443 | |
GNMA (3) | | AA+ | | 3.00 | | 07/16/36 | | | 1,338,597 | | | | 1,273,376 | |
GNMA (3) | | AA+ | | 3.00 | | 01/15/46 | | | 920,511 | | | | 873,917 | |
GNMA (3) | | AA+ | | 3.00 | | 03/15/46 | | | 3,644,514 | | | | 3,460,428 | |
GNMA (3) | | AA+ | | 3.00 | | 07/15/46 | | | 1,975,120 | | | | 1,875,042 | |
GNMA (3) | | AA+ | | 3.00 | | 02/20/47 | | | 1,253,706 | | | | 1,183,909 | |
GNMA (3) | | AA+ | | 3.50 | | 02/20/42 | | | 354,543 | | | | 342,452 | |
GNMA (3) | | AA+ | | 3.50 | | 07/15/42 | | | 898,969 | | | | 898,152 | |
GNMA (3) | | AA+ | | 3.50 | | 11/15/42 | | | 286,417 | | | | 285,628 | |
GNMA (3) | | AA+ | | 3.50 | | 03/20/45 | | | 1,075,011 | | | | 1,053,295 | |
GNMA (3) | | AA+ | | 3.50 | | 05/20/45 | | | 1,034,506 | | | | 1,020,396 | |
GNMA (3) | | AA+ | | 3.50 | | 12/20/50 | | | 926,821 | | | | 902,117 | |
GNMA (3) | | AA+ | | 3.70 | | 05/15/42 | | | 517,254 | | | | 522,082 | |
GNMA (3) | | AA+ | | 4.00 | | 01/20/41 | | | 585,381 | | | | 590,101 | |
GNMA (3) | | AA+ | | 4.00 | | 03/15/41 | | | 210,587 | | | | 214,683 | |
GNMA (3) | | AA+ | | 4.00 | | 08/15/41 | | | 386,492 | | | | 396,032 | |
GNMA (3) | | AA+ | | 4.00 | | 11/15/41 | | | 344,195 | | | | 352,574 | |
GNMA (3) | | AA+ | | 4.00 | | 12/15/41 | | | 556,692 | | | | 564,522 | |
GNMA (3) | | AA+ | | 4.00 | | 01/15/42 | | | 29,828 | | | | 30,563 | |
GNMA (3) | | AA+ | | 4.00 | | 08/20/42 | | | 294,166 | | | | 299,805 | |
GNMA (3) | | AA+ | | 4.00 | | 09/20/50 | | | 443,009 | | | | 442,846 | |
GNMA (3) | | AA+ | | 4.25 | | 04/20/41 | | | 339,943 | | | | 343,846 | |
The accompanying notes are an integral part of these portfolio schedules.
94
MUTUAL OF AMERICA INVESTMENT CORPORATION — BOND FUND
PORTFOLIO OF INVESTMENTS IN SECURITIES (Continued)
June 30, 2022 (Unaudited)
| | | | | | | | | | | | | | |
| | | Rating** | | Rate(%) | | Maturity | | Face Amount | | | Value | |
| LONG-TERM DEBT SECURITIES (CONTINUED): | | | | | | | | | | | | |
| U.S. GOVERNMENT AGENCIES (CONTINUED) | | | | | | | | | | | | |
| MORTGAGE-BACKED OBLIGATIONS (CONTINUED) | | | | | | | | | | | | |
GNMA (3) | | AA+ | | 4.29 | | 04/15/41 | | $ | 14,918 | | | $ | 15,388 | |
GNMA (3) | | AA+ | | 4.50 | | 06/20/30 | | | 18,131 | | | | 18,775 | |
GNMA (3) | | AA+ | | 4.50 | | 09/15/30 | | | 207,561 | | | | 213,200 | |
GNMA (3) | | AA+ | | 4.50 | | 04/20/31 | | | 7,685 | | | | 7,894 | |
GNMA (3) | | AA+ | | 4.50 | | 06/20/34 | | | 115,876 | | | | 121,166 | |
GNMA (3) | | AA+ | | 4.50 | | 09/15/40 | | | 411,319 | | | | 425,923 | |
GNMA (3) | | AA+ | | 4.50 | | 10/15/40 | | | 507,683 | | | | 538,844 | |
GNMA (3) | | AA+ | | 4.50 | | 10/20/43 | | | 14,370 | | | | 14,986 | |
GNMA (3) | | AA+ | | 5.00 | | 06/20/39 | | | 441,698 | | | | 460,520 | |
GNMA (3) | | AA+ | | 5.00 | | 05/15/40 | | | 44,321 | | | | 46,578 | |
GNMA (3) | | AA+ | | 5.00 | | 06/20/40 | | | 25,034 | | | | 25,697 | |
GNMA (3) | | AA+ | | 5.50 | | 01/15/36 | | | 5,547 | | | | 5,806 | |
GNMA (3) | | AA+ | | 6.50 | | 04/15/31 | | | 5,409 | | | | 5,681 | |
GNMA (3) | | AA+ | | 6.50 | | 10/15/31 | | | 205 | | | | 222 | |
GNMA (3) | | AA+ | | 6.50 | | 12/15/31 | | | 9,657 | | | | 10,143 | |
GNMA (3) | | AA+ | | 6.50 | | 05/15/32 | | | 13,307 | | | | 13,976 | |
GNMA (3) | | AA+ | | 7.00 | | 05/15/31 | | | 228 | | | | 249 | |
GNMA (3) | | AA+ | | 7.00 | | 05/15/32 | | | 2,119 | | | | 2,152 | |
| | | | | | | | | | | | | | |
| | | | | | | | | | | | | 574,040,233 | |
| | | | | | | | | | | | | | |
| CORPORATE DEBT (21.5%) | | | | | | | | | | | | |
| COMMUNICATION SERVICES (1.2%) | | | | | | | | | | | | |
AT&T, Inc. | | BBB | | 2.75 | | 06/01/31 | | | 10,048,000 | | | | 8,676,527 | |
Comcast Corp. | | A- | | 3.40 | | 04/01/30 | | | 9,395,000 | | | | 8,815,117 | |
Verizon Communications, Inc. | | BBB+ | | 4.02 | | 12/03/29 | | | 5,450,000 | | | | 5,278,433 | |
| | | | | | | | | | | | | | |
| | | | | | | | | | | | | 22,770,077 | |
| | | | | | | | | | | | | | |
| CONSUMER DISCRETIONARY (3.5%) | | | | | | | | | | | | |
Amazon.com, Inc. | | AA | | 1.20 | | 06/03/27 | | | 4,100,000 | | | | 3,647,989 | |
Amazon.com, Inc. | | AA | | 5.20 | | 12/03/25 | | | 4,995,000 | | | | 5,240,864 | |
AutoZone, Inc. | | BBB | | 3.25 | | 04/15/25 | | | 7,363,000 | | | | 7,223,374 | |
AutoZone, Inc. | | BBB | | 3.75 | | 04/18/29 | | | 1,795,000 | | | | 1,695,815 | |
Best Buy Co., Inc. | | BBB+ | | 1.95 | | 10/01/30 | | | 3,615,000 | | | | 2,871,272 | |
Brinker International, Inc. | | B | | 3.88 | | 05/15/23 | | | 3,925,000 | | | | 3,865,811 | |
Brunswick Corp. | | BBB- | | 2.40 | | 08/18/31 | | | 7,970,000 | | | | 5,897,838 | |
Dick’s Sporting Goods, Inc. | | BBB | | 3.15 | | 01/15/32 | | | 4,440,000 | | | | 3,507,938 | |
Dollar General Corp. | | BBB | | 3.25 | | 04/15/23 | | | 4,000,000 | | | | 3,980,304 | |
Harman International Industries, Inc. | | A- | | 4.15 | | 05/15/25 | | | 4,970,000 | | | | 4,994,393 | |
Kohl’s Corp. | | BBB- | | 3.25 | | 02/01/23 | | | 1,794,000 | | | | 1,785,573 | |
Lowe’s Cos., Inc. | | BBB+ | | 4.00 | | 04/15/25 | | | 3,270,000 | | | | 3,280,799 | |
Marriott International, Inc. | | BBB | | 3.13 | | 02/15/23 | | | 2,935,000 | | | | 2,927,238 | |
Mattel, Inc. | | BB- | | 3.15 | | 03/15/23 | | | 1,960,000 | | | | 1,930,600 | |
McDonald’s Corp. | | BBB+ | | 3.50 | | 07/01/27 | | | 4,305,000 | | | | 4,218,136 | |
O’Reilly Automotive, Inc. | | BBB | | 3.80 | | 09/01/22 | | | 3,255,000 | | | | 3,258,876 | |
Travel + Leisure Co. | | BB- | | 3.90 | | 03/01/23 | | | 4,000,000 | | | | 3,932,726 | |
Whirlpool Corp. | | BBB | | 3.70 | | 05/01/25 | | | 1,960,000 | | | | 1,946,970 | |
| | | | | | | | | | | | | | |
| | | | | | | | | | | | | 66,206,516 | |
| | | | | | | | | | | | | | |
| CONSUMER STAPLES (0.6%) | | | | | | | | | | | | |
Bunge Ltd. Finance Corp. | | BBB | | 2.75 | | 05/14/31 | | | 4,150,000 | | | | 3,425,324 | |
Church & Dwight Co., Inc. | | BBB+ | | 2.88 | | 10/01/22 | | | 50,000 | | | | 49,988 | |
Hormel Foods Corp. | | A | | 1.80 | | 06/11/30 | | | 3,600,000 | | | | 3,018,374 | |
Mead Johnson Nutrition Co. | | A- | | 4.13 | | 11/15/25 | | | 1,910,000 | | | | 1,929,459 | |
Sysco Corp. | | BBB | | 3.75 | | 10/01/25 | | | 3,550,000 | | | | 3,520,901 | |
| | | | | | | | | | | | | | |
| | | | | | | | | | | | | 11,944,046 | |
| | | | | | | | | | | | | | |
The accompanying notes are an integral part of these portfolio schedules.
95
MUTUAL OF AMERICA INVESTMENT CORPORATION — BOND FUND
PORTFOLIO OF INVESTMENTS IN SECURITIES (Continued)
June 30, 2022 (Unaudited)
| | | | | | | | | | | | | | |
| | | Rating** | | Rate(%) | | Maturity | | Face Amount | | | Value | |
| LONG-TERM DEBT SECURITIES (CONTINUED): | | | | | | | | | | | | |
| CORPORATE DEBT (CONTINUED) | | | | | | | | | | | | |
| ENERGY (0.6%) | | | | | | | | | | | | |
Devon Energy Corp. | | BBB | | 5.85 | | 12/15/25 | | $ | 2,450,000 | | | $ | 2,550,121 | |
Kinder Morgan Energy Partners LP | | BBB | | 4.30 | | 05/01/24 | | | 4,895,000 | | | | 4,904,887 | |
Targa Resources Partners LP/Targa Resources Partners Finance Corp. | | BBB- | | 5.50 | | 03/01/30 | | | 3,100,000 | | | | 2,957,958 | |
| | | | | | | | | | | | | | |
| | | | | | | | | | | | | 10,412,966 | |
| | | | | | | | | | | | | | |
| FINANCIALS (6.3%) | | | | | | | | | | | | |
Aflac, Inc. | | A- | | 1.13 | | 03/15/26 | | | 4,380,000 | | | | 3,951,714 | |
Allstate Corp. | | A- | | 0.75 | | 12/15/25 | | | 10,375,000 | | | | 9,336,791 | |
American Express Co. | | BBB | | 3.63 | | 12/05/24 | | | 4,895,000 | | | | 4,866,407 | |
American International Group, Inc. | | BBB+ | | 3.75 | | 07/10/25 | | | 4,895,000 | | | | 4,828,570 | |
Bank of America Corp. | | A- | | 3.37 | | 01/23/26 | | | 5,160,000 | | | | 4,997,417 | |
Bank of America Corp. | | BBB+ | | 3.95 | | 04/21/25 | | | 4,970,000 | | | | 4,901,926 | |
Block Financial LLC | | BBB | | 5.25 | | 10/01/25 | | | 2,985,000 | | | | 3,035,339 | |
Capital One Financial Corp. | | BBB | | 4.93 | | 05/10/28 | | | 3,165,000 | | | | 3,134,560 | |
Citigroup, Inc. | | BBB+ | | 3.79 | | 03/17/33 | | | 5,330,000 | | | | 4,802,293 | |
Citigroup, Inc. | | BBB | | 3.88 | | 03/26/25 | | | 4,895,000 | | | | 4,826,643 | |
Citizens Financial Group, Inc. | | BBB | | 3.75 | | 07/01/24 | | | 5,000,000 | | | | 4,924,324 | |
Fairfax U.S., Inc.† | | BBB | | 4.88 | | 08/13/24 | | | 3,475,000 | | | | 3,465,800 | |
Fifth Third Bancorp | | BBB | | 4.30 | | 01/16/24 | | | 4,895,000 | | | | 4,916,646 | |
Goldman Sachs Group, Inc. | | BBB+ | | 3.63 | | 01/22/23 | | | 25,000 | | | | 25,078 | |
JPMorgan Chase & Co. | | A- | | 1.47 | | 09/22/27 | | | 6,245,000 | | | | 5,477,246 | |
JPMorgan Chase & Co. | | BBB+ | | 3.88 | | 09/10/24 | | | 4,895,000 | | | | 4,885,386 | |
Kemper Corp. | | BBB | | 3.80 | | 02/23/32 | | | 4,500,000 | | | | 3,976,079 | |
Kemper Corp. | | BBB | | 4.35 | | 02/15/25 | | | 1,960,000 | | | | 1,952,570 | |
Lincoln National Corp. | | A- | | 4.00 | | 09/01/23 | | | 3,915,000 | | | | 3,935,455 | |
M&T Bank Corp. | | BBB+ | | 4.00 | | 07/15/24 | | | 2,000,000 | | | | 1,988,931 | |
Mercury General Corp. | | BBB | | 4.40 | | 03/15/27 | | | 3,330,000 | | | | 3,253,061 | |
Old Republic International Corp. | | BBB+ | | 3.88 | | 08/26/26 | | | 4,895,000 | | | | 4,757,186 | |
Reinsurance Group of America, Inc. | | A | | 4.70 | | 09/15/23 | | | 980,000 | | | | 988,454 | |
Signet UK Finance PLC | | BB- | | 4.70 | | 06/15/24 | | | 4,945,000 | | | | 4,771,925 | |
Stifel Financial Corp. | | BBB- | | 4.25 | | 07/18/24 | | | 1,520,000 | | | | 1,521,001 | |
Synchrony Financial | | BBB- | | 3.70 | | 08/04/26 | | | 2,745,000 | | | | 2,541,571 | |
Unum Group | | BBB | | 4.00 | | 03/15/24 | | | 7,620,000 | | | | 7,618,062 | |
Voya Financial, Inc. | | BBB+ | | 3.65 | | 06/15/26 | | | 4,970,000 | | | | 4,811,319 | |
Wells Fargo & Co. | | BBB+ | | 3.53 | | 03/24/28 | | | 3,105,000 | | | | 2,940,892 | |
Wells Fargo & Co. | | BBB | | 4.13 | | 08/15/23 | | | 980,000 | | | | 987,090 | |
| | | | | | | | | | | | | | |
| | | | | | | | | | | | | 118,419,736 | |
| | | | | | | | | | | | | | |
| HEALTH CARE (2.9%) | | | | | | | | | | | | |
AbbVie, Inc. | | BBB+ | | 4.25 | | 11/14/28 | | | 8,830,000 | | | | 8,745,175 | |
Baxter International, Inc. | | BBB | | 2.54 | | 02/01/32 | | | 2,697,000 | | | | 2,276,711 | |
Biogen, Inc. | | BBB+ | | 4.05 | | 09/15/25 | | | 2,450,000 | | | | 2,424,749 | |
CVS Health Corp. | | BBB | | 3.75 | | 04/01/30 | | | 9,660,000 | | | | 9,035,554 | |
Elevance Health, Inc. | | A | | 2.88 | | 09/15/29 | | | 7,245,000 | | | | 6,527,118 | |
Elevance Health, Inc. | | A | | 3.30 | | 01/15/23 | | | 3,464,000 | | | | 3,468,731 | |
Evernorth Health, Inc. | | A- | | 3.50 | | 06/15/24 | | | 1,960,000 | | | | 1,946,709 | |
Humana, Inc. | | BBB+ | | 3.85 | | 10/01/24 | | | 2,935,000 | | | | 2,930,894 | |
Merck & Co., Inc. | | A+ | | 2.15 | | 12/10/31 | | | 6,450,000 | | | | 5,548,171 | |
Owens & Minor, Inc. | | BB- | | 4.38 | | 12/15/24 | | | 2,740,000 | | | | 2,672,847 | |
Quest Diagnostics, Inc. | | BBB+ | | 3.50 | | 03/30/25 | | | 685,000 | | | | 674,399 | |
Thermo Fisher Scientific, Inc. | | A- | | 2.00 | | 10/15/31 | | | 10,046,000 | | | | 8,422,433 | |
| | | | | | | | | | | | | | |
| | | | | | | | | | | | | 54,673,491 | |
| | | | | | | | | | | | | | |
| INDUSTRIALS (1.3%) | | | | | | | | | | | | |
Boeing Co. | | BBB- | | 4.88 | | 05/01/25 | | | 4,870,000 | | | | 4,852,023 | |
Deere & Co. | | A | | 2.75 | | 04/15/25 | | | 6,535,000 | | | | 6,392,034 | |
The accompanying notes are an integral part of these portfolio schedules.
96
MUTUAL OF AMERICA INVESTMENT CORPORATION — BOND FUND
PORTFOLIO OF INVESTMENTS IN SECURITIES (Continued)
June 30, 2022 (Unaudited)
| | | | | | | | | | | | | | |
| | | Rating** | | Rate(%) | | Maturity | | Face Amount | | | Value | |
| LONG-TERM DEBT SECURITIES (CONTINUED): | | | | | | | | | | | | |
| CORPORATE DEBT (CONTINUED) | | | | | | | | | | | | |
| INDUSTRIALS (CONTINUED) | | | | | | | | | | | | |
General Dynamics Corp. | | A- | | 3.25 | | 04/01/25 | | $ | 3,235,000 | | | $ | 3,208,150 | |
Hexcel Corp. | | BB+ | | 4.95 | | 08/15/25 | | | 3,820,000 | | | | 3,731,210 | |
JB Hunt Transport Svcs., Inc. | | BBB+ | | 3.30 | | 08/15/22 | | | 75,000 | | | | 74,997 | |
Verisk Analytics, Inc. | | BBB | | 4.00 | | 06/15/25 | | | 5,895,000 | | | | 5,847,561 | |
| | | | | | | | | | | | | | |
| | | | | | | | | | | | | 24,105,975 | |
| | | | | | | | | | | | | | |
| INFORMATION TECHNOLOGY (2.8%) | | | | | | | | | | | | |
Apple, Inc. | | AA+ | | 2.05 | | 09/11/26 | | | 5,750,000 | | | | 5,413,659 | |
Applied Materials, Inc. | | A | | 3.90 | | 10/01/25 | | | 9,920,000 | | | | 9,981,936 | |
Arrow Electronics, Inc. | | BBB- | | 4.00 | | 04/01/25 | | | 980,000 | | | | 974,196 | |
Arrow Electronics, Inc. | | BBB- | | 4.50 | | 03/01/23 | | | 1,160,000 | | | | 1,164,375 | |
Global Payments, Inc. | | BBB- | | 3.75 | | 06/01/23 | | | 4,000,000 | | | | 3,971,176 | |
Intel Corp. | | A+ | | 3.40 | | 03/25/25 | | | 2,550,000 | | | | 2,545,855 | |
Keysight Technologies, Inc. | | BBB | | 4.55 | | 10/30/24 | | | 4,895,000 | | | | 4,957,297 | |
Mastercard, Inc. | | A+ | | 3.30 | | 03/26/27 | | | 2,300,000 | | | | 2,260,026 | |
Motorola Solutions, Inc. | | BBB- | | 4.00 | | 09/01/24 | | | 980,000 | | | | 975,542 | |
PayPal Hldgs., Inc. | | A- | | 2.65 | | 10/01/26 | | | 9,880,000 | | | | 9,368,908 | |
QUALCOMM, Inc. | | A | | 4.25 | | 05/20/32 | | | 1,785,000 | | | | 1,817,125 | |
Teledyne Technologies, Inc. | | BBB | | 2.75 | | 04/01/31 | | | 10,450,000 | | | | 8,735,604 | |
| | | | | | | | | | | | | | |
| | | | | | | | | | | | | 52,165,699 | |
| | | | | | | | | | | | | | |
| MATERIALS (1.0%) | | | | | | | | | | | | |
AptarGroup, Inc. | | BBB- | | 3.60 | | 03/15/32 | | | 4,430,000 | | | | 3,929,332 | |
Eagle Materials, Inc. | | BBB | | 2.50 | | 07/01/31 | | | 5,700,000 | | | | 4,501,832 | |
Sherwin-Williams Co. | | BBB | | 3.95 | | 01/15/26 | | | 4,895,000 | | | | 4,848,891 | |
Southern Copper Corp. | | BBB+ | | 3.50 | | 11/08/22 | | | 4,000,000 | | | | 3,998,080 | |
Teck Resources Ltd. | | BBB- | | 3.75 | | 02/01/23 | | | 980,000 | | | | 975,878 | |
| | | | | | | | | | | | | | |
| | | | | | | | | | | | | 18,254,013 | |
| | | | | | | | | | | | | | |
| REAL ESTATE (0.9%) | | | | | | | | | | | | |
Boston Properties LP | | BBB+ | | 3.25 | | 01/30/31 | | | 6,488,000 | | | | 5,564,796 | |
Duke Realty LP | | BBB+ | | 1.75 | | 07/01/30 | | | 3,906,000 | | | | 3,194,683 | |
Healthpeak Properties, Inc. | | BBB+ | | 3.40 | | 02/01/25 | | | 3,670,000 | | | | 3,609,945 | |
Jones Lang LaSalle, Inc. | | BBB+ | | 4.40 | | 11/15/22 | | | 4,000,000 | | | | 4,004,367 | |
| | | | | | | | | | | | | | |
| | | | | | | | | | | | | 16,373,791 | |
| | | | | | | | | | | | | | |
| UTILITIES (0.4%) | | | | | | | | | | | | |
National Fuel Gas Co. | | BBB- | | 5.20 | | 07/15/25 | | | 1,960,000 | | | | 1,984,237 | |
NextEra Energy Capital Hldgs., Inc. | | BBB+ | | 3.55 | | 05/01/27 | | | 4,777,000 | | | | 4,611,861 | |
Southern Co. | | BBB | | 3.25 | | 07/01/26 | | | 50,000 | | | | 47,846 | |
| | | | | | | | | | | | | | |
| | | | | | | | | | | | | 6,643,944 | |
| | | | | | | | | | | | | | |
TOTAL CORPORATE DEBT | | | | 401,970,254 | |
| | | | | | | | | | | | | | |
SOVEREIGN DEBT (0.1%)
Sri Lanka AID | | NR | | 6.59 | | 09/15/28 | | | 1,892,809 | | | | 2,017,243 | †† |
| | | | | | | | | | | | | | |
TOTAL LONG-TERM DEBT SECURITIES
(Cost: $2,028,427,773) 98.8% | | | | 1,851,314,330 | |
| | | | | | | | | | | | | | |
The accompanying notes are an integral part of these portfolio schedules.
97
MUTUAL OF AMERICA INVESTMENT CORPORATION — BOND FUND
PORTFOLIO OF INVESTMENTS IN SECURITIES (Continued)
June 30, 2022 (Unaudited)
| | | | | | | | | | | | | | | | | | | | |
| | | Rating** | | | Rate(%) | | | Maturity | | | Face Amount | | | Value | |
| | | | | |
| SHORT-TERM DEBT SECURITIES: | | | | | | | | | | | | | | | |
| U.S. GOVERNMENT (1.1%) | | | | | | | | | | | | | | | |
U.S. Treasury Bill | | | A-1+ | | | | 0.95 | | | | 07/14/22 | | | $ | 11,000,000 | | | $ | 10,996,237 | |
U.S. Treasury Bill | | | A-1+ | | | | 1.00 | | | | 07/19/22 | | | | 3,500,000 | | | | 3,498,250 | |
U.S. Treasury Bill | | | A-1+ | | | | 1.01 | | | | 07/05/22 | | | | 5,000,000 | | | | 4,999,436 | |
| | | | | | | | | | | | | | | | | | | | |
| | | | | | | | | | | | | | | | | | | 19,493,923 | |
| | | | | | | | | | | | | | | | | | | | |
TOTAL SHORT-TERM DEBT SECURITIES
(Cost: $19,493,923) 1.1% | | | | 19,493,923 | |
| | | | | | | | | | | | | | | | | | | | |
| | | | | |
| | | | | | | | | | | | Shares | | | Value | |
| | | | | |
| COMMON STOCKS: | | | | | | | | | | | | | | | |
| ENERGY (0.2%) | | | | | | | | | | | | | | | |
Diamond Offshore Drilling, Inc.* | | | | 102,155 | | | $ | 601,693 | |
Superior Energy Svcs., Inc.* | | | | 68,184 | | | | 1,717,923 | †† |
Valaris Ltd.* | | | | 17,882 | | | | 755,335 | |
| | | | | | | | | | | | | | | | | | | | |
| | | | | | | | | | | | | | | | | | | 3,074,951 | |
| | | | | | | | | | | | | | | | | | | | |
TOTAL COMMON STOCKS
(Cost: $10,964,416) 0.2% | | | | 3,074,951 | |
| | | | | | | | | | | | | | | | | | | | |
| | | | | |
| | | | | | Rate(%) | | | Maturity | | | Face Amount | | | Value | |
| | | | | |
| TEMPORARY CASH INVESTMENT (0.1%) | | | | | | | | | | | | | | | |
JP Morgan Chase, New York Time Deposit | | | | 0.91 | | | | 07/01/22 | | | $ | 2,238,467 | | | $ | 2,238,467 | |
| | | | | | | | | | | | | | | | | | | | |
TOTAL TEMPORARY CASH INVESTMENT
(Cost: $2,238,467) 0.1% | | | | 2,238,467 | |
| | | | | | | | | | | | | | | | | | | | |
TOTAL INVESTMENTS
(Cost: $2,061,124,579) 100.2% | | | | 1,876,121,671 | |
| | | | | | | | | | | | | | | | | | | | |
OTHER NET ASSETS -0.2% | | | | (2,877,039 | ) |
| | | | | | | | | | | | | | | | | | | | |
NET ASSETS 100.0% | | | $ | 1,873,244,632 | |
| | | | | | | | | | | | | | | | | | | | |
The accompanying notes are an integral part of these portfolio schedules.
98
MUTUAL OF AMERICA INVESTMENT CORPORATION
FOOTNOTES TO PORTFOLIOS OF INVESTMENTS IN SECURITIES
June 30, 2022 (Unaudited)
| | |
| Abbreviations: | | ARM = Adjustable Rate Mortgage |
| | FHLB = Federal Home Loan Bank |
| | FHLMC = Federal Home Loan Mortgage Corporation |
| | FNMA = Federal National Mortgage Association |
| | FRESB = Federal Home Loan Mortgage Corporation Multifamily Securitization Small Loan Balance |
| | GNMA = Government National Mortgage Association |
| | NR = Not Rated |
| * | Non-income producing security. |
| ** | Ratings as per Standard & Poor’s Corporation (unaudited). |
| † | Security is exempt from registration under Rule 144A of the Securities Act of 1933. These securities may be resold in transactions exempt from registration, normally to qualified institutional buyers. At June 30, 2022, the aggregate values of these securities and their percentages of the respective Funds’ net assets were as follows: |
| | | | | | | | |
Fund | | Aggregate
Market
Value | | | Percentage
of
Net Assets | |
COMPOSITE FUND | | $ | 1,749,338 | | | | 0.9 | % |
INTERNATIONAL FUND | | $ | 13,488,904 | | | | 1.2 | % |
MONEY MARKET FUND | | $ | 79,192,086 | | | | 40.5 | % |
MID-TERM BOND FUND | | $ | 4,353,825 | | | | 0.5 | % |
BOND FUND | | $ | 3,465,800 | | | | 0.2 | % |
| (1) | This security, or a portion thereof, has been segregated to cover initial margin requirements on open futures contracts. Information on futures contracts outstanding in the Funds as of June 30, 2022, was as follows: |
| | | | | | | | | | | | | | | | | | | | | | | | | | |
Fund | | Number of
Contracts | | | Contract Type | | Purchased (P)
or Sold (S) | | | Expiration
Date | | | Underlying
Face Amount
at Value | | | Unrealized
Gain(Loss)(a) | | | Face Value
of Futures
as a %
of Total
Investments | |
EQUITY INDEX FUND | | | 332 | | | E-mini S&P 500
Stock Index | | | P | | | | September 2022 | | | $ | 62,905,700 | | | $ | (1,600,123 | ) | | | 1.5 | % |
ALL AMERICA FUND | | | 9 | | | E-mini S&P 500
Stock Index | | | P | | | | September 2022 | | | $ | 1,705,275 | | | $ | (49,793 | ) | | | 0.6 | % |
MID-CAP EQUITY INDEX FUND | | | 90 | | | E-mini S&P
MidCap 400
Stock Index | | | P | | | | September 2022 | | | $ | 20,412,000 | | | $ | (1,044,365 | ) | | | 1.3 | % |
INTERNATIONAL FUND | | | 311 | | | MSCI EAFE
Stock Index | | | P | | | | September 2022 | | | $ | 28,870,130 | | | $ | (216,510 | ) | | | 2.7 | % |
| | (a) | Includes the cumulative appreciation(depreciation) of futures contracts, which is included in Total Distributable Earnings (Loss) in the Components of Net Assets section of the Statements of Assets and Liabilities. The Receivable or Payable for Daily Variation on Futures Contracts in the Statements of Assets and Liabilities only includes the current day’s variation margin payable or receivable. |
| (2) | Percentage is less than 0.05%. |
| (3) | U.S. Government guaranteed security. |
99
MUTUAL OF AMERICA INVESTMENT CORPORATION
STATEMENTS OF ASSETS AND LIABILITIES
June 30, 2022 (Unaudited)
| | | | | | | | | | | | | | | | | | | | |
| | | Equity Index
Fund | | | All America
Fund | | | Small Cap
Value Fund | | | Small Cap
Growth Fund | | | Small Cap
Equity Index
Fund | |
ASSETS | | | | | | | | | | | | | | | | | | | | |
Investments at fair value | | | | | | | | | | | | | | | | | | | | |
(Cost: Equity Index Fund — $2,492,574,645 All America Fund — $221,967,597 Small Cap Value Fund — $431,590,548 Small Cap Growth Fund — $476,927,964 Small Cap Equity Index Fund — $147,110,459 Mid Cap Value Fund — $101,313,166 Mid-Cap Equity Index Fund — $1,428,088,065 Composite Fund — $159,559,335 International Fund — $1,263,459,067 Catholic Values Index Fund — $3,734,614 Retirement Income Fund — $222,646,693 2015 Retirement Fund — $127,987,480 2020 Retirement Fund — $551,724,091 2025 Retirement Fund — $1,096,380,431) | | | | | | | | | | | | | | | | | | | | |
(Notes 1 and 3) | | $ | 4,099,299,868 | | | $ | 285,673,344 | | | $ | 460,639,996 | | | $ | 457,282,852 | | | $ | 140,353,022 | |
Cash | | | 862 | | | | 3,180 | | | | 652 | | | | 886 | | | | 173 | |
Interest and dividends receivable | | | 3,183,809 | | | | 228,928 | | | | 407,786 | | | | 236,529 | | | | 162,845 | |
Receivable for securities sold | | | — | | | | 80,244 | | | | — | | | | 2,014,114 | | | | — | |
Shareholder subscriptions receivable | | | 1,478,369 | | | | — | | | | 98,750 | | | | 124,606 | | | | 74,315 | |
Due from the Adviser | | | — | | | | — | | | | — | | | | — | | | | — | |
Other receivables | | | — | | | | — | | | | — | | | | — | | | | — | |
| | | | | | | | | | | | | | | | | | | | |
| | | | | |
TOTAL ASSETS | | | 4,103,962,908 | | | | 285,985,696 | | | | 461,147,184 | | | | 459,658,987 | | | | 140,590,355 | |
| | | | | | | | | | | | | | | | | | | | |
| | | | | |
LIABILITIES | | | | | | | | | | | | | | | | | | | | |
Payable for securities purchased | | | 4,995,404 | | | | 75,092 | | | | — | | | | 1,416,639 | | | | 126,006 | |
Payable for daily variation on future contracts | | | 518,490 | | | | 14,287 | | | | — | | | | — | | | | — | |
Shareholder redemptions payable | | | 383,331 | | | | 273,433 | | | | 72,840 | | | | 20,760 | | | | 65,055 | |
Payable to the Adviser | | | 259,854 | | | | 97,578 | | | | 300,877 | | | | 294,632 | | | | 8,934 | |
Accrued expenses | | | 733,552 | | | | 108,503 | | | | 65,975 | | | | 54,390 | | | | 56,218 | |
Other payables | | | — | | | | — | | | | — | | | | — | | | | 42,214 | |
| | | | | | | | | | | | | | | | | | | | |
| | | | | |
TOTAL LIABILITIES: | | | 6,890,631 | | | | 568,893 | | | | 439,692 | | | | 1,786,421 | | | | 298,427 | |
| | | | | | | | | | | | | | | | | | | | |
| | | | | |
NET ASSETS | | $ | 4,097,072,277 | | | $ | 285,416,803 | | | $ | 460,707,492 | | | $ | 457,872,566 | | | $ | 140,291,928 | |
| | | | | | | | | | | | | | | | | | | | |
| | | | | |
NUMBEROF SHARES OUTSTANDING (Note 4) | | | 82,628,793 | | | | 12,927,746 | | | | 32,620,984 | | | | 40,387,516 | | | | 15,030,559 | |
| | | | | | | | | | | | | | | | | | | | |
| | | | | |
NET ASSET VALUES, offering and redemption price per share | | | $49.58 | | | | $22.08 | | | | $14.12 | | | | $11.34 | | | | $9.33 | |
| | | | | | | | | | | | | | | | | | | | |
| | | | | |
COMPONENTSOF NET ASSETS | | | | | | | | | | | | | | | | | | | | |
Paid-in capital | | $ | 2,411,603,896 | | | $ | 194,130,268 | | | $ | 400,557,685 | | | $ | 470,563,423 | | | $ | 142,702,708 | |
Total Distributable Earnings (Loss) (Notes 1 and 5) | | | 1,685,468,381 | | | | 91,286,535 | | | | 60,149,807 | | | | (12,690,857 | ) | | | (2,410,780 | ) |
| | | | | | | | | | | | | | | | | | | | |
| | | | | |
NET ASSETS | | $ | 4,097,072,277 | | | $ | 285,416,803 | | | $ | 460,707,492 | | | $ | 457,872,566 | | | $ | 140,291,928 | |
| | | | | | | | | | | | | | | | | | | | |
| (a) | The Retirement and Allocation Funds are invested in affiliated investment companies of Mutual of America Investment Corporation. |
The accompanying notes are an integral part of these financial statements.
100
| | | | | | | | | | | | | | | | | | | | | | | | | | | | | | | | | | | | |
Mid Cap
Value Fund | | | Mid-Cap
Equity Index
Fund | | | Composite
Fund | | | International
Fund | | | Catholic
Values
Index Fund | | | Retirement
Income
Fund | | | 2015
Retirement
Fund | | | 2020
Retirement
Fund | | | 2025
Retirement
Fund | | | |
| | | | | | | | | | | | | | | | | | | | | | | | | | | | | | | | | | | | |
| | | | | | | | | | | | | | | | | | | | | | | | | | | | | | | | | | | | |
| | | | | | | | | |
| | | | | | | | | | | | | | | | | | | | | | | | | | | | | | | | | | | | |
| $ | 119,450,056 | | | $ | 1,535,166,710 | | | $ | 185,690,604 | | | $ | 1,061,961,592 | | | $ | 3,879,096 | | | $ | 202,693,516 | (a) | | $ | 119,697,309 | (a) | | $ | 517,264,053 | (a) | | $ | 1,032,683,626 | (a) | | |
| | 853 | | | | 471 | | | | 3,058 | | | | 31,353 | | | | 6,736 | | | | 11,943 | | | | 3,230 | | | | 100 | | | | 100 | | | |
| | 89,521 | | | | 1,630,255 | | | | 436,281 | | | | 7,267,908 | | | | 3,374 | | | | — | | | | — | | | | — | | | | — | | | |
| | — | | | | — | | | | 20,273 | | | | 19,712,464 | | | | — | | | | — | | | | — | | | | — | | | | — | | | |
| | 19,327 | | | | 366,425 | | | | 13,229 | | | | 437,689 | | | | 1,291 | | | | — | | | | — | | | | — | | | | — | | | |
| | — | | | | — | | | | — | | | | — | | | | 10,305 | | | | — | | | | — | | | | — | | | | — | | | |
| | 2,139 | | | | — | | | | — | | | | — | | | | — | | | | — | | | | — | | | | — | | | | — | | | |
| | | | | | | | | | | | | | | | | | | | | | | | | | | | | | | | | | | | |
| | | | | | | | | |
| | 119,561,896 | | | | 1,537,163,861 | | | | 186,163,445 | | | | 1,089,411,006 | | | | 3,900,802 | | | | 202,705,459 | | | | 119,700,539 | | | | 517,264,153 | | | | 1,032,683,726 | | | |
| | | | | | | | | | | | | | | | | | | | | | | | | | | | | | | | | | | | |
| | | | | | | | | |
| | | | | | | | | | | | | | | | | | | | | | | | | | | | | | | | | | | | |
| | — | | | | — | | | | 997,779 | | | | — | | | | 1,695 | | | | — | | | | — | | | | — | | | | — | | | |
| | — | | | | 196,640 | | | | — | | | | 144,616 | | | | — | | | | — | | | | — | | | | — | | | | — | | | |
| | 84,308 | | | | 228,542 | | | | 307,846 | | | | 111,868 | | | | — | | | | — | | | | — | | | | — | | | | — | | | |
| | 57,291 | | | | 99,026 | | | | 62,199 | | | | 69,349 | | | | 494 | | | | 8,394 | | | | 4,998 | | | | 21,634 | | | | 43,247 | | | |
| | — | | | | 295,326 | | | | 20,151 | | | | 197,248 | | | | 12,999 | | | | 36,338 | | | | 19,371 | | | | 42,144 | | | | 59,760 | | | |
| | — | | | | — | | | | — | | | | — | | | | — | | | | — | | | | — | | | | — | | | | — | | | |
| | | | | | | | | | | | | | | | | | | | | | | | | | | | | | | | | | | | |
| | | | | | | | | |
| | 141,599 | | | | 819,534 | | | | 1,387,975 | | | | 523,081 | | | | 15,188 | | | | 44,732 | | | | 24,369 | | | | 63,778 | | | | 103,007 | | | |
| | | | | | | | | | | | | | | | | | | | | | | | | | | | | | | | | | | | |
| | | | | | | | | |
| $ | 119,420,297 | | | $ | 1,536,344,327 | | | $ | 184,775,470 | | | $ | 1,088,887,925 | | | $ | 3,885,614 | | | $ | 202,660,727 | | | $ | 119,676,170 | | | $ | 517,200,375 | | | $ | 1,032,580,719 | | | |
| | | | | | | | | | | | | | | | | | | | | | | | | | | | | | | | | | | | |
| | | | | | | | | |
| | 7,245,481 | | | | 76,620,429 | | | | 10,181,820 | | | | 143,484,219 | | | | 355,350 | | | | 18,580,745 | | | | 14,477,147 | | | | 49,362,293 | | | | 86,842,764 | | | |
| | | | | | | | | | | | | | | | | | | | | | | | | | | | | | | | | | | | |
| | | | | | | | | |
|
$16.48 |
| | | $20.05 | | | | $18.15 | | | | $7.59 | | | | $10.93 | | | | $10.91 | | | | $8.27 | | | | $10.48 | | | | $11.89 | | | |
| | | | | | | | | | | | | | | | | | | | | | | | | | | | | | | | | | | | |
| | | | | | | | | |
| | | | | | | | | | | | | | | | | | | | | | | | | | | | | | | | | | | | |
| $ | 94,309,867 | | | $ | 1,288,425,306 | | | $ | 150,291,788 | | | $ | 1,201,380,502 | | | $ | 3,721,403 | | | $ | 214,799,791 | | | $ | 130,120,081 | | | $ | 522,221,451 | | | $ | 1,042,498,502 | | | |
| | 25,110,430 | | | | 247,919,021 | | | | 34,483,682 | | | | (112,492,577 | ) | | | 164,211 | | | | (12,139,064 | ) | | | (10,443,911 | ) | | | (5,021,076 | ) | | | (9,917,783 | ) | | |
| | | | | | | | | | | | | | | | | | | | | | | | | | | | | | | | | | | | |
| | | | | | | | | |
| $ | 119,420,297 | | | $ | 1,536,344,327 | | | $ | 184,775,470 | | | $ | 1,088,887,925 | | | $ | 3,885,614 | | | $ | 202,660,727 | | | $ | 119,676,170 | | | $ | 517,200,375 | | | $ | 1,032,580,719 | | | |
| | | | | | | | | | | | | | | | | | | | | | | | | | | | | | | | | | | | |
The accompanying notes are an integral part of these financial statements.
101
MUTUAL OF AMERICA INVESTMENT CORPORATION
STATEMENTS OF ASSETS AND LIABILITIES (Continued)
June 30, 2022 (Unaudited)
| | | | | | | | | | | | | | | | | | | | |
| | | 2030
Retirement
Fund | | | 2035
Retirement
Fund | | | 2040
Retirement
Fund | | | 2045
Retirement
Fund | | | 2050
Retirement
Fund | |
ASSETS | | | | | | | | | | | | | | | | | | | | |
Investments at fair value | | | | | | | | | | | | | | | | | | | | |
(Cost: 2030 Retirement Fund — $1,115,810,953 2035 Retirement Fund — $992,603,300 2040 Retirement Fund — $815,836,159 2045 Retirement Fund — $840,939,295 2050 Retirement Fund — $639,065,102 2055 Retirement Fund — $321,268,224 2060 Retirement Fund — $142,114,913 2065 Retirement Fund — $25,689,352 Conservative Allocation Fund — $183,470,879 Moderate Allocation Fund — $402,735,869 Aggressive Allocation Fund — $310,263,879 Money Market Fund — $200,659,524 Mid-Term Bond Fund — $935,148,038 Bond Fund — $2,061,124,579) | | | | | | | | | | | | | | | | | | | | |
(Notes 1 and 3) | | $ | 1,066,630,040 | (a) | | $ | 946,744,846 | (a) | | $ | 784,568,383 | (a) | | $ | 811,127,768 | (a) | | $ | 609,266,940 | (a) |
Cash | | | 100 | | | | 100 | | | | 100 | | | | 100 | | | | 100 | |
Interest and dividends receivable | | | — | | | | — | | | | — | | | | — | | | | — | |
Receivable for securities sold | | | — | | | | — | | | | — | | | | — | | | | — | |
Shareholder subscriptions receivable | | | — | | | | — | | | | — | | | | — | | | | — | |
Due from the Adviser | | | — | | | | — | | | | — | | | | — | | | | — | |
Other receivables | | | — | | | | — | | | | — | | | | — | | | | — | |
| | | | | | | | | | | | | | | | | | | | |
| | | | | |
TOTAL ASSETS | | | 1,066,630,140 | | | | 946,744,946 | | | | 784,568,483 | | | | 811,127,868 | | | | 609,267,040 | |
| | | | | | | | | | | | | | | | | | | | |
| | | | | |
LIABILITIES | | | | | | | | | | | | | | | | | | | | |
Payable for securities purchased | | | — | | | | — | | | | — | | | | — | | | | — | |
Payable for daily variation on future contracts | | | — | | | | — | | | | — | | | | — | | | | — | |
Shareholder redemptions payable | | | — | | | | — | | | | — | | | | — | | | | — | |
Payable to the Adviser | | | 44,699 | | | | 39,863 | | | | 33,041 | | | | 34,237 | | | | 25,730 | |
Accrued expenses | | | 59,486 | | | | 51,378 | | | | 50,045 | | | | 51,551 | | | | 43,949 | |
Other payables | | | — | | | | — | | | | — | | | | — | | | | — | |
| | | | | | | | | | | | | | | | | | | | |
| | | | | |
TOTAL LIABILITIES | | | 104,185 | | | | 91,241 | | | | 83,086 | | | | 85,788 | | | | 69,679 | |
| | | | | | | | | | | | | | | | | | | | |
| | | | | |
NET ASSETS | | $ | 1,066,525,955 | | | $ | 946,653,705 | | | $ | 784,485,397 | | | $ | 811,042,080 | | | $ | 609,197,361 | |
| | | | | | | | | | | | | | | | | | | | |
| | | | | |
NUMBEROF SHARES OUTSTANDING (Note 4) | | | 83,524,330 | | | | 72,185,492 | | | | 59,626,447 | | | | 62,706,330 | | | | 37,093,020 | |
| | | | | | | | | | | | | | | | | | | | |
| | | | | |
NET ASSET VALUES, offering and redemption price per share | | | $12.77 | | | | $13.11 | | | | $13.16 | | | | $12.93 | | | | $16.42 | |
| | | | | | | | | | | | | | | | | | | | |
| | | | | |
COMPONENTSOF NET ASSETS | | | | | | | | | | | | | | | | | | | | |
Paid-in capital | | $ | 1,059,129,157 | | | $ | 931,430,843 | | | $ | 761,941,032 | | | $ | 782,030,649 | | | $ | 599,279,958 | |
Total Distributable Earnings (Loss) (Notes 1 and 5) | | | 7,396,798 | | | | 15,222,862 | | | | 22,544,365 | | | | 29,011,431 | | | | 9,917,403 | |
| | | | | | | | | | | | | | | | | | | | |
| | | | | |
NET ASSETS | | $ | 1,066,525,955 | | | $ | 946,653,705 | | | $ | 784,485,397 | | | $ | 811,042,080 | | | $ | 609,197,361 | |
| | | | | | | | | | | | | | | | | | | | |
| (a) | The Retirement and Allocation Funds are invested in affiliated investment companies of Mutual of America Investment Corporation. |
The accompanying notes are an integral part of these financial statements.
102
| | | | | | | | | | | | | | | | | | | | | | | | | | | | | | | | | | | | |
2055
Retirement
Fund | | | 2060
Retirement
Fund | | | 2065
Retirement
Fund | | | Conservative
Allocation
Fund | | | Moderate
Allocation
Fund | | | Aggressive
Allocation
Fund | | | Money
Market
Fund | | | Mid-Term
Bond Fund | | | Bond Fund | | | |
| | | | | | | | | | | | | | | | | | | | | | | | | | | | | | | | | | | | |
| | | | | | | | | | | | | | | | | | | | | | | | | | | | | | | | | | | | |
| | | | | | | | | |
| | | | | | | | | | | | | | | | | | | | | | | | | | | | | | | | | | | | |
| $ | 294,724,413 | (a) | | $ | 125,955,536 | (a) | | $ | 21,489,284 | (a) | | $ | 171,764,821 | (a) | | $ | 398,150,371 | (a) | | $ | 311,079,552 | (a) | | $ | 200,654,787 | | | $ | 871,618,930 | | | $ | 1,876,121,671 | | | |
| | 100 | | | | 100 | | | | 100 | | | | 100 | | | | 100 | | | | 100 | | | | 475 | | | | 208 | | | | 251 | | | |
| | — | | | | — | | | | — | | | | — | | | | — | | | | — | | | | — | | | | 3,647,330 | | | | 8,732,716 | | | |
| | — | | | | — | | | | — | | | | — | | | | — | | | | — | | | | — | | | | — | | | | 401,752 | | | |
| | — | | | | — | | | | — | | | | — | | | | — | | | | — | | | | 340,675 | | | | 183,009 | | | | 521,020 | | | |
| | — | | | | 15,353 | | | | 39,405 | | | | — | | | | — | | | | — | | | | — | | | | — | | | | — | | | |
| | — | | | | — | | | | — | | | | — | | | | — | | | | — | | | | — | | | | — | | | | — | | | |
| | | | | | | | | | | | | | | | | | | | | | | | | | | | | | | | | | | | |
| | | | | | | | | |
| | 294,724,513 | | | | 125,970,989 | | | | 21,528,789 | | | | 171,764,921 | | | | 398,150,471 | | | | 311,079,652 | | | | 200,995,937 | | | | 875,449,477 | | | | 1,885,777,410 | | | |
| | | | | | | | | | | | | | | | | | | | | | | | | | | | | | | | | | | | |
| | | | | | | | | |
| | | | | | | | | | | | | | | | | | | | | | | | | | | | | | | | | | | | |
| | — | | | | — | | | | — | | | | — | | | | — | | | | — | | | | 5,284,232 | | | | — | | | | 11,011,935 | | | |
| | — | | | | — | | | | — | | | | — | | | | — | | | | — | | | | — | | | | — | | | | — | | | |
| | — | | | | — | | | | — | | | | — | | | | — | | | | — | | | | 79,617 | | | | 246,910 | | | | 736,087 | | | |
| | 12,378 | | | | 5,249 | | | | 881 | | | | — | | | | — | | | | — | | | | 23,730 | | | | 286,847 | | | | 597,313 | | | |
| | 27,394 | | | | 32,916 | | | | 33,440 | | | | 17,889 | | | | 25,881 | | | | 24,707 | | | | 20,404 | | | | 116,339 | | | | 187,443 | | | |
| | — | | | | — | | | | — | | | | — | | | | — | | | | — | | | | — | | | | — | | | | — | | | |
| | | | | | | | | | | | | | | | | | | | | | | | | | | | | | | | | | | | |
| | | | | | | | | |
| | 39,772 | | | | 38,165 | | | | 34,321 | | | | 17,889 | | | | 25,881 | | | | 24,707 | | | | 5,407,983 | | | | 650,096 | | | | 12,532,778 | | | |
| | | | | | | | | | | | | | | | | | | | | | | | | | | | | | | | | | | | |
| | | | | | | | | |
| $ | 294,684,741 | | | $ | 125,932,824 | | | $ | 21,494,468 | | | $ | 171,747,032 | | | $ | 398,124,590 | | | $ | 311,054,945 | | | $ | 195,587,954 | | | $ | 874,799,381 | | | $ | 1,873,244,632 | | | |
| | | | | | | | | | | | | | | | | | | | | | | | | | | | | | | | | | | | |
| | | | | | | | | |
| | 22,844,535 | | | | 11,502,922 | | | | 2,023,203 | | | | 15,312,755 | | | | 29,615,436 | | | | 21,335,446 | | | | 16,534,122 | | | | 90,290,147 | | | | 145,974,222 | | | |
| | | | | | | | | | | | | | | | | | | | | | | | | | | | | | | | | | | | |
| | | | | | | | | |
|
$12.90 |
| | | $10.95 | | | | $10.62 | | | | $11.22 | | | | $13.44 | | | | $14.58 | | | | $11.8294 | | | | $9.69 | | | | $12.83 | | | |
| | | | | | | | | | | | | | | | | | | | | | | | | | | | | | | | | | | | |
| | | | | | | | | |
| | | | | | | | | | | | | | | | | | | | | | | | | | | | | | | | | | | | |
| $ | 302,625,075 | | | $ | 133,420,152 | | | $ | 24,872,563 | | | $ | 177,173,144 | | | $ | 375,389,999 | | | $ | 288,939,143 | | | $ | 195,544,587 | | | $ | 936,726,309 | | | $ | 2,064,858,281 | | | |
| | (7,940,334 | ) | | | (7,487,328 | ) | | | (3,378,095 | ) | | | (5,426,112 | ) | | | 22,734,591 | | | | 22,115,802 | | | | 43,367 | | | | (61,926,928 | ) | | | (191,613,649 | ) | | |
| | | | | | | | | | | | | | | | | | | | | | | | | | | | | | | | | | | | |
| | | | | | | | | |
| $ | 294,684,741 | | | $ | 125,932,824 | | | $ | 21,494,468 | | | $ | 171,747,032 | | | $ | 398,124,590 | | | $ | 311,054,945 | | | $ | 195,587,954 | | | $ | 874,799,381 | | | $ | 1,873,244,632 | | | |
| | | | | | | | | | | | | | | | | | | | | | | | | | | | | | | | | | | | |
The accompanying notes are an integral part of these financial statements.
103
MUTUAL OF AMERICA INVESTMENT CORPORATION
STATEMENTS OF OPERATIONS
For the Six Months Ended June 30, 2022 (Unaudited)
| | | | | | | | | | | | | | | | | | | | |
| | | Equity Index
Fund | | | All America
Fund | | | Small Cap
Value Fund | | | Small Cap
Growth Fund | | | Small Cap
Equity
Index Fund | |
INVESTMENT INCOMEAND EXPENSES | | | | | | | | | | | | | | | | | | | | |
INVESTMENT INCOME | | | | | | | | | | | | | | | | | | | | |
Dividends | | $ | 34,725,756 | | | $ | 2,465,226 | | | $ | 4,689,510 | | | $ | 1,637,728 | | | $ | 1,022,356 | |
Non-cash dividends | | | — | | | | — | | | | — | | | | — | | | | — | |
Interest | | | 80,165 | | | | 9,609 | | | | 20,093 | | | | 16,673 | | | | 477 | |
| | | | | | | | | | | | | | | | | | | | |
| | | | | |
Total investment income | | | 34,805,921 | | | | 2,474,835 | | | | 4,709,603 | | | | 1,654,401 | | | | 1,022,833 | |
| | | | | | | | | | | | | | | | | | | | |
| | | | | |
EXPENSES | | | | | | | | | | | | | | | | | | | | |
Investment advisory fees (Note 2) | | | 1,692,733 | | | | 656,811 | | | | 2,002,846 | | | | 2,026,983 | | | | 51,932 | |
| | | | | |
Other operating expenses | | | | | | | | | | | | | | | | | | | | |
Accounting and recordkeeping expenses | | | 456,903 | | | | 58,767 | | | | 74,828 | | | | 81,337 | | | | 38,219 | |
Shareholders reports | | | 1,255 | | | | 1,941 | | | | 1,136 | | | | 1,275 | | | | 1,971 | |
Custodian expenses | | | 52,494 | | | | 26,714 | | | | 3,566 | | | | 4,205 | | | | 9,386 | |
Independent directors’ fees and expenses | | | 109,431 | | | | 8,074 | | | | 13,029 | | | | 13,570 | | | | 3,248 | |
Professional fees | | | 20,669 | | | | 20,668 | | | | 20,668 | | | | 20,668 | | | | 20,666 | |
Legal and Compliance | | | 162,732 | | | | 25,562 | | | | 24,138 | | | | 18,574 | | | | 4,852 | |
Administrative | | | 186,931 | | | | 13,543 | | | | 21,778 | | | | 22,330 | | | | 5,418 | |
Licenses | | | 450,773 | | | | 32,658 | | | | — | | | | — | | | | 13,065 | |
Fees and registration | | | 153,812 | | | | 20,206 | | | | 21,132 | | | | 24,015 | | | | 12,506 | |
| | | | | | | | | | | | | | | | | | | | |
| | | | | |
Total operating expenses | | | 1,595,000 | | | | 208,133 | | | | 180,275 | | | | 185,974 | | | | 109,331 | |
| | | | | | | | | | | | | | | | | | | | |
| | | | | |
Total expenses before reimbursement | | | 3,287,733 | | | | 864,944 | | | | 2,183,121 | | | | 2,212,957 | | | | 161,263 | |
Fee waiver and expense reimbursement (Note 2) | | | — | | | | — | | | | — | | | | — | | | | (60,861 | ) |
| | | | | | | | | | | | | | | | | | | | |
| | | | | |
Net expenses | | | 3,287,733 | | | | 864,944 | | | | 2,183,121 | | | | 2,212,957 | | | | 100,402 | |
| | | | | | | | | | | | | | | | | | | | |
| | | | | |
Net Investment Income (Loss) | | | 31,518,188 | | | | 1,609,891 | | | | 2,526,482 | | | | (558,556 | ) | | | 922,431 | |
| | | | | | | | | | | | | | | | | | | | |
| | | | | |
NET REALIZEDAND UNREALIZED GAIN (LOSS)ON
INVESTMENTSAND FUTURES CONTRACTS (Note 1) | | | | | | | | | | | | | | | | | | | | |
Net realized gain (loss) on: | | | | | | | | | | | | | | | | | | | | |
Investment securities | | | 48,791,534 | | | | 12,213,847 | | | | 15,424,724 | | | | 3,038,136 | | | | 2,713,680 | |
Futures contracts (Note 1) | | | (10,726,634 | ) | | | (402,822 | ) | | | — | | | | — | | | | — | |
Foreign currency translations | | | — | | | | — | | | | — | | | | — | | | | — | |
| | | | | | | | | | | | | | | | | | | | |
| | | | | |
| | | 38,064,900 | | | | 11,811,025 | | | | 15,424,724 | | | | 3,038,136 | | | | 2,713,680 | |
| | | | | | | | | | | | | | | | | | | | |
| | | | | |
Change in net unrealized appreciation (depreciation) of: | | | | | | | | | | | | | | | | | | | | |
Investment securities | | | (1,075,573,327 | ) | | | (86,435,845 | ) | | | (96,878,566 | ) | | | (201,903,255 | ) | | | (33,351,979 | ) |
Futures contracts (Note 1) | | | (3,073,343 | ) | | | (127,058 | ) | | | — | | | | — | | | | — | |
Foreign currency translations | | | — | | | | — | | | | — | | | | — | | | | — | |
| | | | | | | | | | | | | | | | | | | | |
| | | | | |
| | | (1,078,646,670 | ) | | | (86,562,903 | ) | | | (96,878,566 | ) | | | (201,903,255 | ) | | | (33,351,979 | ) |
| | | | | | | | | | | | | | | | | | | | |
| | | | | |
NET REALIZEDAND UNREALIZED GAIN (LOSS) ON
INVESTMENTSAND FUTURES CONTRACTS | | | (1,040,581,770 | ) | | | (74,751,878 | ) | | | (81,453,842 | ) | | | (198,865,119 | ) | | | (30,638,299 | ) |
| | | | | | | | | | | | | | | | | | | | |
| | | | | |
NET INCREASE (DECREASE)IN NET ASSETS RESULTING
FROM OPERATIONS | | $ | (1,009,063,582 | ) | | $ | (73,141,987 | ) | | $ | (78,927,360 | ) | | $ | (199,423,675 | ) | | $ | (29,715,868 | ) |
| | | | | | | | | | | | | | | | | | | | |
| (a) | The Retirement and Allocation Funds are invested in affiliated funds of Mutual of America Investment Corporation and receive dividend income entirely from these affiliated funds. |
| (b) | The Retirement and Allocation Funds incur direct investment management expenses of .05% and .00%, respectively. Certain operating expenses that can be attributed only to the Retirement and Allocation Funds were charged directly to those Funds, subject to the Adviser’s agreement to reimburse direct non-advisory operating expenses of any such Fund whose average daily net assets for the prior calendar year was less than $50 million. The Retirement and Allocation Funds will also continue to bear their pro-rata share of the non-advisory operating expenses borne by each of the underlying Funds in which they invest. |
| (c) | Realized gains and losses for the Retirement and Allocation Funds result from the disposition of shares of the underlying funds. |
| (d) | The Retirement and Allocation Funds are invested in affiliated funds of Mutual of America Investment Corporation and derive unrealized gains and losses entirely from these affiliated funds. |
The accompanying notes are an integral part of these financial statements.
104
| | | | | | | | | | | | | | | | | | | | | | | | | | | | | | | | | | | | |
Mid Cap
Value Fund | | | Mid-Cap
Equity Index
Fund | | | Composite
Fund | | | International
Fund | | | Catholic Values
Index Fund | | | Retirement
Income
Fund | | | 2015
Retirement
Fund | | | 2020
Retirement
Fund | | | 2025
Retirement
Fund | | | |
| | | | | | | | | | | | | | | | | | | | | | | | | | | | | | | | | | | | |
| | | | | | | | | | | | | | | | | | | | | | | | | | | | | | | | | | | | |
| $ | 1,350,265 | | | $ | 14,505,983 | | | $ | 1,319,383 | | | $ | 28,067,488 | | | $ | 31,207 | | | $ | 1,316,836 | (a) | | $ | 843,118 | (a) | | $ | 4,095,487 | (a) | | $ | 8,614,549 | (a) | | |
| | — | | | | — | | | | — | | | | 3,104,210 | | | | — | | | | — | | | | — | | | | — | | | | — | | | |
| | 5,816 | | | | 34,040 | | | | 879,887 | | | | 57,592 | | | | (19 | ) | | | — | | | | — | | | | — | | | | — | | | |
| | | | | | | | | | | | | | | | | | | | | | | | | | | | | | | | | | | | |
| | | | | | | | | |
| | 1,356,081 | | | | 14,540,023 | | | | 2,199,270 | | | | 31,229,290 | | | | 31,188 | | | | 1,316,836 | | | | 843,118 | | | | 4,095,487 | | | | 8,614,549 | | | |
| | | | | | | | | | | | | | | | | | | | | | | | | | | | | | | | | | | | |
| | | | | | | | | |
| | | | | | | | | | | | | | | | | | | | | | | | | | | | | | | | | | | | |
| | 359,504 | | | | 697,895 | | | | 402,527 | | | | 435,881 | | | | 3,183 | | | | 52,738 | (b) | | | 32,188 | (b) | | | 140,429 | (b) | | | 276,707 | (b) | | |
| | | | | | | | | |
| | | | | | | | | | | | | | | | | | | | | | | | | | | | | | | | | | | | |
| | 35,805 | | | | 210,759 | | | | 52,078 | | | | 133,205 | | | | 18,307 | | | | 24,111 | (b) | | | 24,007 | (b) | | | 24,571 | (b) | | | 25,284 | (b) | | |
| | 1,345 | | | | 1,841 | | | | 1,618 | | | | 1,273 | | | | 2,001 | | | | 1,136 | (b) | | | 1,273 | (b) | | | 1,268 | (b) | | | 1,270 | (b) | | |
| | 977 | | | | 30,744 | | | | 3,169 | | | | 110,983 | | | | 28 | | | | 19,935 | (b) | | | 17,612 | (b) | | | 39,459 | (b) | | | 57,941 | (b) | | |
| | 3,172 | | | | 47,192 | | | | 4,839 | | | | 27,984 | | | | 63 | | | | — | (b) | | | — | (b) | | | — | (b) | | | — | (b) | | |
| | 20,668 | | | | 20,668 | | | | 20,668 | | | | 19,623 | | | | 6,892 | | | | 19,623 | (b) | | | 19,621 | (b) | | | 19,621 | (b) | | | 19,621 | (b) | | |
| | 8,478 | | | | 70,183 | | | | 15,456 | | | | 35,197 | | | | 173 | | | | 198 | (b) | | | 153 | (b) | | | 668 | (b) | | | 985 | (b) | | |
| | 5,384 | | | | 79,022 | | | | 8,105 | | | | 46,856 | | | | 179 | | | | — | (b) | | | — | (b) | | | — | (b) | | | — | (b) | | |
| | — | | | | 190,557 | | | | — | | | | — | | | | — | | | | — | (b) | | | — | (b) | | | — | (b) | | | — | (b) | | |
| | 8,684 | | | | 45,862 | | | | 11,223 | | | | 31,626 | | | | 5,136 | | | | 17,422 | (b) | | | 8,205 | (b) | | | 21,700 | (b) | | | 37,161 | (b) | | |
| | | | | | | | | | | | | | | | | | | | | | | | | | | | | | | | | | | | |
| | | | | | | | | |
| | 84,513 | | | | 696,828 | | | | 117,156 | | | | 406,747 | | | | 32,779 | | | | 82,425 | | | | 70,871 | | | | 107,287 | | | | 142,262 | | | |
| | | | | | | | | | | | | | | | | | | | | | | | | | | | | | | | | | | | |
| | | | | | | | | |
| | 444,017 | | | | 1,394,723 | | | | 519,683 | | | | 842,628 | | | | 35,962 | | | | 135,163 | | | | 103,059 | | | | 247,716 | | | | 418,969 | | | |
| | — | | | | — | | | | — | | | | — | | | | (31,294 | ) | | | — | | | | — | | | | — | | | | — | | | |
| | | | | | | | | | | | | | | | | | | | | | | | | | | | | | | | | | | | |
| | | | | | | | | |
| | 444,017 | | | | 1,394,723 | | | | 519,683 | | | | 842,628 | | | | 4,668 | | | | 135,163 | | | | 103,059 | | | | 247,716 | | | | 418,969 | | | |
| | | | | | | | | | | | | | | | | | | | | | | | | | | | | | | | | | | | |
| | | | | | | | | |
| | 912,064 | | | | 13,145,300 | | | | 1,679,587 | | | | 30,386,662 | | | | 26,520 | | | | 1,181,673 | | | | 740,059 | | | | 3,847,771 | | | | 8,195,580 | | | |
| | | | | | | | | | | | | | | | | | | | | | | | | | | | | | | | | | | | |
| | | | | | | | | |
|
|
| | | | | | | | | | | | | | | | | | | | | | | | | | | | | | | | | | |
| | | | | | | | | | | | | | | | | | | | | | | | | | | | | | | | | | | | |
| | 2,281,363 | | | | 93,042,879 | | | | 5,048,869 | | | | (7,079,281 | ) | | | 7,626 | | | | 1,151,458 | (c) | | | 1,715,526 | (c) | | | 4,525,061 | (c) | | | 7,142,270 | (c) | | |
| | — | | | | (5,207,768 | ) | | | — | | | | (5,999,140 | ) | | | — | | | | — | | | | — | | | | — | | | | — | | | |
| | — | | | | — | | | | — | | | | (506,661 | ) | | | — | | | | — | | | | — | | | | — | | | | — | | | |
| | | | | | | | | | | | | | | | | | | | | | | | | | | | | | | | | | | | |
| | | | | | | | | |
| | 2,281,363 | | | | 87,835,111 | | | | 5,048,869 | | | | (13,585,082 | ) | | | 7,626 | | | | 1,151,458 | | | | 1,715,526 | | | | 4,525,061 | | | | 7,142,270 | | | |
| | | | | | | | | | | | | | | | | | | | | | | | | | | | | | | | | | | | |
| | | | | | | | | |
| | | | | | | | | | | | | | | | | | | | | | | | | | | | | | | | | | | | | |
| | (22,218,236 | ) | | | (494,453,126 | ) | | | (36,200,528 | ) | | | (218,120,631 | ) | | | (1,075,159 | ) | | | (25,898,323 | )(d) | | | (18,756,764 | )(d) | | | (88,402,360 | )(d) | | | (186,424,117 | )(d) | | |
| | — | | | | (2,364,883 | ) | | | — | | | | (623,400 | ) | | | — | | | | — | | | | — | | | | — | | | | — | | | |
| | — | | | | — | | | | — | | | | (316,301 | ) | | | — | | | | — | | | | — | | | | — | | | | — | | | |
| | | | | | | | | | | | | | | | | | | | | | | | | | | | | | | | | | | | |
| | | | | | | | | |
| | (22,218,236 | ) | | | (496,818,009 | ) | | | (36,200,528 | ) | | | (219,060,332 | ) | | | (1,075,159 | ) | | | (25,898,323 | ) | | | (18,756,764 | ) | | | (88,402,360 | ) | | | (186,424,117 | ) | | |
| | | | | | | | | | | | | | | | | | | | | | | | | | | | | | | | | | | | |
| | | | | | | | | |
| (19,936,873 | ) | | | (408,982,898 | ) | | | (31,151,659 | ) | | | (232,645,414 | ) | | | (1,067,533 | ) | | | (24,746,865 | ) | | | (17,041,238 | ) | | | (83,877,299 | ) | | | (179,281,847 | ) | | |
| | | | | | | | | | | | | | | | | | | | | | | | | | | | | | | | | | | | |
| | | | | | | | | |
$ | (19,024,809 | ) | | $ | (395,837,598 | ) | | $ | (29,472,072 | ) | | $ | (202,258,752 | ) | | $ | (1,041,013 | ) | | $ | (23,565,192 | ) | | $ | (16,301,179 | ) | | $ | (80,029,528 | ) | | $ | (171,086,267 | ) | | |
| | | | | | | | | | | | | | | | | | | | | | | | | | | | | | | | | | | | |
The accompanying notes are an integral part of these financial statements.
105
MUTUAL OF AMERICA INVESTMENT CORPORATION
STATEMENTS OF OPERATIONS (Continued)
For the Six Months Ended June 30, 2022 (Unaudited)
| | | | | | | | | | | | | | | | | | | | |
| | | 2030
Retirement
Fund | | | 2035
Retirement
Fund | | | 2040
Retirement
Fund | | | 2045
Retirement
Fund | | | 2050
Retirement
Fund | |
INVESTMENT INCOMEAND EXPENSES | | | | | | | | | | | | | | | | | | | | |
INVESTMENT INCOME | | | | | | | | | | | | | | | | | | | | |
Dividends | | $ | 9,218,368 | (a) | | $ | 8,973,974 | (a) | | $ | 7,705,153 | (a) | | $ | 8,168,333 | (a) | | $ | 6,108,283 | (a) |
Interest | | | — | | | | — | | | | — | | | | — | | | | — | |
| | | | | | | | | | | | | | | | | | | | |
| | | | | |
Total investment income | | | 9,218,368 | | | | 8,973,974 | | | | 7,705,153 | | | | 8,168,333 | | | | 6,108,283 | |
| | | | | | | | | | | | | | | | | | | | |
| | | | | |
EXPENSES | | | | | | | | | | | | | | | | | | | | |
Investment advisory fees (Note 2) | | | 285,094 | (b) | | | 254,874 | (b) | | | 212,175 | (b) | | | 220,162 | (b) | | | 164,974 | (b) |
| | | | | |
Other operating expenses | | | | | | | | | | | | | | | | | | | | |
Accounting and recordkeeping expenses | | | 25,341 | (b) | | | 27,278 | (b) | | | 24,967 | (b) | | | 25,016 | (b) | | | 24,722 | (b) |
Shareholders reports | | | 1,280 | (b) | | | 1,284 | (b) | | | 1,281 | (b) | | | 1,283 | (b) | | | 1,281 | (b) |
Custodian expenses | | | 60,883 | (b) | | | 50,934 | (b) | | | 46,369 | (b) | | | 47,623 | (b) | | | 39,911 | (b) |
Independent directors’ fees and expenses | | | — | (b) | | | — | (b) | | | — | (b) | | | — | (b) | | | — | (b) |
Professional fees | | | 19,621 | (b) | | | 19,621 | (b) | | | 19,620 | (b) | | | 19,621 | (b) | | | 19,620 | (b) |
Legal and Compliance | | | 968 | (b) | | | 803 | (b) | | | 662 | (b) | | | 715 | (b) | | | 501 | (b) |
Administrative | | | — | (b) | | | — | (b) | | | — | (b) | | | — | (b) | | | — | (b) |
Licenses | | | — | (b) | | | — | (b) | | | — | (b) | | | — | (b) | | | — | (b) |
Fees and registration | | | 37,379 | (b) | | | 33,692 | (b) | | | 30,804 | (b) | | | 30,705 | (b) | | | 27,305 | (b) |
| | | | | | | | | | | | | | | | | | | | |
| | | | | |
Total operating expenses | | | 145,472 | | | | 133,612 | | | | 123,703 | | | | 124,963 | | | | 113,340 | |
| | | | | | | | | | | | | | | | | | | | |
| | | | | |
Total expenses before reimbursement | | | 430,566 | | | | 388,486 | | | | 335,878 | | | | 345,125 | | | | 278,314 | |
Fee waiver and expense reimbursement (Note 2) | | | — | | | | — | | | | — | | | | — | | | | — | |
| | | | | | | | | | | | | | | | | | | | |
| | | | | |
Net expenses | | | 430,566 | | | | 388,486 | | | | 335,878 | | | | 345,125 | | | | 278,314 | |
| | | | | | | | | | | | | | | | | | | | |
| | | | | |
Net Investment Income (Loss) | | | 8,787,802 | | | | 8,585,488 | | | | 7,369,275 | | | | 7,823,208 | | | | 5,829,969 | |
| | | | | | | | | | | | | | | | | | | | |
| | | | | |
NET REALIZEDAND UNREALIZED GAIN (LOSS)ON INVESTMENTSAND FUTURES CONTRACTS (Note 1) | | | | | | | | | | | | | | | | | | | | |
Net realized gain (loss) on: | | | | | | | | | | | | | | | | | | | | |
Investment securities | | | 4,775,466 | (c) | | | 6,702,721 | (c) | | | 6,430,346 | (c) | | | 7,723,843 | (c) | | | 918,163 | (c) |
Futures contracts (Note 1) | | | — | | | | — | | | | — | | | | — | | | | — | |
Foreign currency translations | | | — | | | | — | | | | — | | | | — | | | | — | |
| | | | | | | | | | | | | | | | | | | | |
| | | | | |
| | | 4,775,466 | | | | 6,702,721 | | | | 6,430,346 | | | | 7,723,843 | | | | 918,163 | |
| | | | | | | | | | | | | | | | | | | | |
| | | | | |
Change in net unrealized appreciation (depreciation) of: | | | | | | | | | | | | | | | | | | | | |
Investment securities | | | (207,808,753 | )(d) | | | (209,860,169 | )(d) | | | (180,361,322 | )(d) | | | (192,451,345 | )(d) | | | (140,856,321 | )(d) |
Futures contracts (Note 1) | | | — | | | | — | | | | — | | | | — | | | | — | |
Foreign currency translations | | | — | | | | — | | | | — | | | | — | | | | — | |
| | | | | | | | | | | | | | | | | | | | |
| | | | | |
| | | (207,808,753 | ) | | | (209,860,169 | ) | | | (180,361,322 | ) | | | (192,451,345 | ) | | | (140,856,321 | ) |
| | | | | | | | | | | | | | | | | | | | |
| | | | | |
NET REALIZEDAND UNREALIZED GAIN (LOSS)ON INVESTMENTSAND FUTURES CONTRACTS | | | (203,033,287 | ) | | | (203,157,448 | ) | | | (173,930,976 | ) | | | (184,727,502 | ) | | | (139,938,158 | ) |
| | | | | | | | | | | | | | | | | | | | |
| | | | | |
NET INCREASE (DECREASE)IN NET ASSETS RESULTINGFROM OPERATIONS | | $ | (194,245,485 | ) | | $ | (194,571,960 | ) | | $ | (166,561,701 | ) | | $ | (176,904,294 | ) | | $ | (134,108,189 | ) |
| | | | | | | | | | | | | | | | | | | | |
| (a) | The Retirement and Allocation Funds are invested in affiliated funds of Mutual of America Investment Corporation and receive dividend income entirely from these affiliated funds. |
| (b) | The Retirement and Allocation Funds incur direct investment management expenses of .05% and .00%, respectively. Certain operating expenses that can be attributed only to the Retirement and Allocation Funds were charged directly to those Funds, subject to the Adviser’s agreement to reimburse direct non-advisory operating expenses of any such Fund whose average daily net assets for the prior calendar year was less than $50 million. The Retirement and Allocation Funds will also continue to bear their pro-rata share of the non-advisory operating expenses borne by each of the underlying Funds in which they invest. |
| (c) | Realized gains and losses for the Retirement and Allocation Funds result from the disposition of shares of the underlying funds. |
| (d) | The Retirement and Allocation Funds are invested in affiliated funds of Mutual of America Investment Corporation and derive unrealized gains and losses entirely from these affiliated funds. |
The accompanying notes are an integral part of these financial statements.
106
| | | | | | | | | | | | | | | | | | | | | | | | | | | | | | | | | | |
2055
Retirement
Fund | | | 2060
Retirement
Fund | | | 2065
Retirement
Fund | | | Conservative
Allocation
Fund | | | Moderate
Allocation
Fund | | | Aggressive
Allocation
Fund | | | Money
Market
Fund | | | Mid-Term
Bond Fund | | | Bond Fund | |
| | | | | | | | | | | | | | | | | | | | | | | | | | | | | | | | | | |
| | | | | | | | | | | | | | | | | | | | | | | | | | | | | | | | | | |
| $ | 2,952,078 | (a) | | $ | 1,278,011 | (a) | | $ | 217,661 | (a) | | $ | 1,324,005 | (a) | | $ | 3,551,327 | (a) | | $ | 2,986,168 | (a) | | $ | — | | | $ | — | | | $ | — | |
| | — | | | | — | | | | — | | | | — | | | | — | | | | — | | | | 350,919 | | | | 7,626,755 | | | | 21,355,885 | |
| | | | | | | | | | | | | | | | | | | | | | | | | | | | | | | | | | |
| | | | | | | | |
| | 2,952,078 | | | | 1,278,011 | | | | 217,661 | | | | 1,324,005 | | | | 3,551,327 | | | | 2,986,168 | | | | 350,919 | | | | 7,626,755 | | | | 21,355,885 | |
| | | | | | | | | | | | | | | | | | | | | | | | | | | | | | | | | | |
| | | | | | | | |
| | | | | | | | | | | | | | | | | | | | | | | | | | | | | | | | | | |
| | 77,580 | (b) | | | 31,863 | (b) | | | 4,919 | (b) | | | — | (b) | | | — | (b) | | | — | (b) | | | 137,140 | | | | 1,736,753 | | | | 3,642,847 | |
| | | | | | | | |
| | | | | | | | | | | | | | | | | | | | | | | | | | | | | | | | | | |
| | 24,256 | (b) | | | 24,010 | (b) | | | 18,163 | (b) | | | 24,005 | (b) | | | 24,417 | (b) | | | 24,299 | (b) | | | 33,221 | | | | 106,180 | | | | 206,627 | |
| | 1,280 | (b) | | | 1,280 | (b) | | | 1,668 | (b) | | | 1,189 | (b) | | | 1,185 | (b) | | | 1,189 | (b) | | | 2,341 | | | | 1,809 | | | | 2,349 | |
| | 26,853 | (b) | | | 20,068 | (b) | | | 13,915 | (b) | | | 17,620 | (b) | | | 26,797 | (b) | | | 26,082 | (b) | | | 1,783 | | | | 8,040 | | | | 16,148 | |
| | — | (b) | | | — | (b) | | | — | (b) | | | — | (b) | | | — | (b) | | | — | (b) | | | 4,228 | | | | 20,129 | | | | 42,331 | |
| | 19,620 | (b) | | | 19,620 | (b) | | | 19,620 | (b) | | | 19,623 | (b) | | | 19,623 | (b) | | | 21,028 | (b) | | | 18,919 | | | | 19,623 | | | | 19,623 | |
| | 174 | (b) | | | 61 | (b) | | | 10 | (b) | | | 182 | (b) | | | 438 | (b) | | | 331 | (b) | | | 5,622 | | | | 28,230 | | | | 55,230 | |
| | — | (b) | | | — | (b) | | | — | (b) | | | — | (b) | | | — | (b) | | | — | (b) | | | 4,708 | | | | 33,908 | | | | 70,239 | |
| | — | (b) | | | — | (b) | | | — | (b) | | | — | (b) | | | — | (b) | | | — | (b) | | | — | | | | — | | | | — | |
| | 22,971 | (b) | | | 14,827 | (b) | | | 8,219 | (b) | | | 9,252 | (b) | | | 12,710 | (b) | | | 12,022 | (b) | | | 16,040 | | | | 28,129 | | | | 38,481 | |
| | | | | | | | | | | | | | | | | | | | | | | | | | | | | | | | | | |
| | | | | | | | |
| | 95,154 | | | | 79,866 | | | | 61,595 | | | | 71,871 | | | | 85,170 | | | | 84,951 | | | | 86,862 | | | | 246,048 | | | | 451,028 | |
| | | | | | | | | | | | | | | | | | | | | | | | | | | | | | | | | | |
| | | | | | | | |
| | 172,734 | | | | 111,729 | | | | 66,514 | | | | 71,871 | | | | 85,170 | | | | 84,951 | | | | 224,002 | | | | 1,982,801 | | | | 4,093,875 | |
| | — | | | | — | | | | (61,595 | ) | | | — | | | | — | | | | — | | | | — | | | | — | | | | — | |
| | | | | | | | | | | | | | | | | | | | | | | | | | | | | | | | | | |
| | | | | | | | |
| | 172,734 | | | | 111,729 | | | | 4,919 | | | | 71,871 | | | | 85,170 | | | | 84,951 | | | | 224,002 | | | | 1,982,801 | | | | 4,093,875 | |
| | | | | | | | | | | | | | | | | | | | | | | | | | | | | | | | | | |
| | | | | | | | |
| | 2,779,344 | | | | 1,166,282 | | | | 212,742 | | | | 1,252,134 | | | | 3,466,157 | | | | 2,901,217 | | | | 126,917 | | | | 5,643,954 | | | | 17,262,010 | |
| | | | | | | | | | | | | | | | | | | | | | | | | | | | | | | | | | |
| | | | | | | | |
|
|
| | | | | | | | | | | | | | | | | | | | | | | | | | | | | | | | |
| | | | | | | | | | | | | | | | | | | | | | | | | | | | | | | | | | |
| | 1,390,135 | (c) | | | 1,241,826 | (c) | | | (186,038 | )(c) | | | 712,175 | (c) | | | 3,292,496 | (c) | | | 4,331,958 | (c) | | | (157 | ) | | | 330,927 | | | | (9,504,572 | ) |
| | — | | | | — | | | | — | | | | — | | | | — | | | | — | | | | — | | | | — | | | | — | |
| | — | | | | — | | | | — | | | | — | | | | — | | | | — | | | | — | | | | — | | | | — | |
| | | | | | | | | | | | | | | | | | | | | | | | | | | | | | | | | | |
| | | | | | | | |
| | 1,390,135 | | | | 1,241,826 | | | | (186,038 | ) | | | 712,175 | | | | 3,292,496 | | | | 4,331,958 | | | | (157 | ) | | | 330,927 | | | | (9,504,572 | ) |
| | | | | | | | | | | | | | | | | | | | | | | | | | | | | | | | | | |
| | | | | | | | |
| | | | | | | | | | | | | | | | | | | | | | | | | | | | | | | | | | |
| | (68,036,358 | )(d) | | | (28,796,525 | )(d) | | | (4,173,236 | )(d) | | | (26,053,022 | )(d) | | | (79,547,441 | )(d) | | | (74,870,711 | )(d) | | | (4,737 | ) | | | (60,211,364 | ) | | | (199,884,935 | ) |
| | — | | | | — | | | | — | | | | — | | | | — | | | | — | | | | — | | | | — | | | | — | |
| | — | | | | — | | | | — | | | | — | | | | — | | | | — | | | | — | | | | — | | | | — | |
| | | | | | | | | | | | | | | | | | | | | | | | | | | | | | | | | | |
| | | | | | | | |
| | (68,036,358 | ) | | | (28,796,525 | ) | | | (4,173,236 | ) | | | (26,053,022 | ) | | | (79,547,441 | ) | | | (74,870,711 | ) | | | (4,737 | ) | | | (60,211,364 | ) | | | (199,884,935 | ) |
| | | | | | | | | | | | | | | | | | | | | | | | | | | | | | | | | | |
| | | | | | | | |
| (66,646,223 | ) | | | (27,554,699 | ) | | | (4,359,274 | ) | | | (25,340,847 | ) | | | (76,254,945 | ) | | | (70,538,753 | ) | | | (4,894 | ) | | | (59,880,437 | ) | | | (209,389,507 | ) |
| | | | | | | | | | | | | | | | | | | | | | | | | | | | | | | | | | |
| | | | | | | | |
$ | (63,866,879 | ) | | $ | (26,388,417 | ) | | $ | (4,146,532 | ) | | $ | (24,088,713 | ) | | $ | (72,788,788 | ) | | $ | (67,637,536 | ) | | $ | 122,023 | | | $ | (54,236,483 | ) | | $ | (192,127,497 | ) |
| | | | | | | | | | | | | | | | | | | | | | | | | | | | | | | | | | |
The accompanying notes are an integral part of these financial statements.
107
MUTUAL OF AMERICA INVESTMENT CORPORATION
STATEMENTS OF CHANGES IN NET ASSETS
| | | | | | | | | | | | | | | | |
| | | Equity Index Fund | | |
All America Fund | |
| | | For the
Six Months
Ended
June 30,
2022
(Unaudited) | | | For the
Year Ended
December 31,
2021 | | | For the
Six Months
Ended
June 30,
2022
(Unaudited) | | | For the
Year Ended
December 31,
2021 | |
INCREASE (DECREASE)IN NET ASSETS | | | | | | | | | | | | | | | | |
FROM OPERATIONS | | | | | | | | | | | | | | | | |
Net investment income (loss) | | $ | 31,518,188 | | | $ | 55,676,909 | | | $ | 1,609,891 | | | $ | 3,169,290 | |
Net realized gain (loss) on investments and futures contracts | | | 38,064,900 | | | | 203,128,598 | | | | 11,811,025 | | | | 45,115,237 | |
Change in net unrealized appreciation (depreciation) of investments and futures contracts | | | (1,078,646,670 | ) | | | 834,757,538 | | | | (86,562,903 | ) | | | 34,836,849 | |
| | | | | | | | | | | | | | | | |
| | | | |
NET INCREASE (DECREASE)IN NET ASSETS RESULTINGFROM OPERATIONS | | | (1,009,063,582 | ) | | | 1,093,563,045 | | | | (73,141,987 | ) | | | 83,121,376 | |
| | | | | | | | | | | | | | | | |
| | | | |
DISTRIBUTIONS (Notes 1 and 5) | | | | | | | | | | | | | | | | |
From Distributable Earnings | | | (27,846,940 | ) | | | (242,994,218 | ) | | | (1,396,719 | ) | | | (35,961,072 | ) |
| | | | | | | | | | | | | | | | |
| | | | |
Total distributions | | | (27,846,940 | ) | | | (242,994,218 | ) | | | (1,396,719 | ) | | | (35,961,072 | ) |
| | | | | | | | | | | | | | | | |
| | | | |
CAPITAL TRANSACTIONS (Note 4) | | | | | | | | | | | | | | | | |
Net proceeds from sale of shares | | | 293,920,268 | | | | 630,621,733 | | | | 3,364,345 | | | | 21,551,560 | |
Dividends reinvested | | | 27,846,037 | | | | 242,985,966 | | | | 1,396,319 | | | | 35,952,399 | |
Cost of shares redeemed | | | (179,295,474 | ) | | | (446,727,106 | ) | | | (19,224,867 | ) | | | (50,188,312 | ) |
| | | | | | | | | | | | | | | | |
| | | | |
NET INCREASE (DECREASE)IN NET ASSETSFROM CAPITAL TRANSACTIONS | | | 142,470,831 | | | | 426,880,593 | | | | (14,464,203 | ) | | | 7,315,647 | |
| | | | | | | | | | | | | | | | |
INCREASE (DECREASE)IN NET ASSETS | | | (894,439,691 | ) | | | 1,277,449,420 | | | | (89,002,909 | ) | | | 54,475,951 | |
NET ASSETS, BEGINNINGOF PERIOD | | | 4,991,511,968 | | | | 3,714,062,548 | | | | 374,419,712 | | | | 319,943,761 | |
| | | | | | | | | | | | | | | | |
| | | | |
NET ASSETS, ENDOF PERIOD | | $ | 4,097,072,277 | | | $ | 4,991,511,968 | | | $ | 285,416,803 | | | $ | 374,419,712 | |
| | | | | | | | | | | | | | | | |
| | | | |
OTHER INFORMATION (Note 4): | | | | | | | | | | | | | | | | |
Shares outstanding at the beginning of period | | | 79,982,941 | | | | 72,617,764 | | | | 13,500,649 | | | | 13,230,675 | |
| | | | | | | | | | | | | | | | |
Shares sold | | | 5,278,243 | | | | 10,887,031 | | | | 132,812 | | | | 753,416 | |
Shares issued as reinvestment of dividends | | | 545,466 | | | | 4,025,477 | | | | 60,762 | | | | 1,323,948 | |
Shares redeemed | | | (3,177,857 | ) | | | (7,547,331 | ) | | | (766,477 | ) | | | (1,807,390 | ) |
| | | | | | | | | | | | | | | | |
| | | | |
Net Increase (decrease) | | | 2,645,852 | | | | 7,365,177 | | | | (572,903 | ) | | | 269,974 | |
| | | | | | | | | | | | | | | | |
| | | | |
Shares outstanding at the end of period | | | 82,628,793 | | | | 79,982,941 | | | | 12,927,746 | | | | 13,500,649 | |
| | | | | | | | | | | | | | | | |
The accompanying notes are an integral part of these financial statements.
108
| | | | | | | | | | | | | | | | | | | | | | | | | | | | | | | | | | | | | | |
| Small Cap Value Fund | | | Small Cap Growth Fund | | | Small Cap Equity Index
Fund | | | Mid Cap Value Fund | | | Mid-Cap Equity Index Fund | |
For the
Six Months
Ended
June 30,
2022
(Unaudited) | | | For the
Year Ended
December 31,
2021 | | | For the
Six Months
Ended
June 30,
2022
(Unaudited) | | | For the
Year Ended
December 31,
2021 | | | For the
Six Months
Ended
June 30,
2022
(Unaudited) | | | For the
Year Ended
December 31,
2021 | | | For the
Six Months
Ended
June 30,
2022
(Unaudited) | | | For the
Year Ended
December 31,
2021 | | | For the
Six Months
Ended
June 30,
2022
(Unaudited) | | | For the
Year Ended
December 31,
2021 | |
| | | | | | | | | | | | | | | | | | | | | | | | | | | | | | | | | | | | | | |
| | | | | | | | | | | | | | | | | | | | | | | | | | | | | | | | | | | | | | |
| $ | 2,526,482 | | | $ | 5,645,023 | | | $ | (558,556 | ) | | $ | (1,675,655 | ) | | $ | 922,431 | | | $ | 1,763,037 | | | $ | 912,064 | | | $ | 1,678,437 | | | $ | 13,145,300 | | | $ | 24,834,831 | |
| | 15,424,724 | | | | 91,970,648 | | | | 3,038,136 | | | | 111,174,573 | | | | 2,713,680 | | | | 20,608,774 | | | | 2,281,363 | | | | 12,682,385 | | | | 87,835,111 | | | | 279,514,843 | |
| (96,878,566 | ) | | | 49,877,797 | | | | (201,903,255 | ) | | | (43,094,161 | ) | | | (33,351,979 | ) | | | 7,090,640 | | | | (22,218,236 | ) | | | 17,071,365 | | | | (496,818,009 | ) | | | 130,296,309 | |
| | | | | | | | | | | | | | | | | | | | | | | | | | | | | | | | | | | | | | |
| | | | | | | | | |
| (78,927,360 | ) | | | 147,493,468 | | | | (199,423,675 | ) | | | 66,404,757 | | | | (29,715,868 | ) | | | 29,462,451 | | | | (19,024,809 | ) | | | 31,432,187 | | | | (395,837,598 | ) | | | 434,645,983 | |
| | | | | | | | | | | | | | | | | | | | | | | | | | | | | | | | | | | | | | |
| | | | | | | | | |
| | | | | | | | | | | | | | | | | | | | | | | | | | | | | | | | | | | | | | | |
| | (2,306,665 | ) | | | (40,135,620 | ) | | | — | | | | (105,443,054 | ) | | | (746,313 | ) | | | (20,275,131 | ) | | | (801,142 | ) | | | (9,993,931 | ) | | | (11,416,992 | ) | | | (257,518,766 | ) |
| | | | | | | | | | | | | | | | | | | | | | | | | | | | | | | | | | | | | | |
| | | | | | | | | |
| | (2,306,665 | ) | | | (40,135,620 | ) | | | — | | | | (105,443,054 | ) | | | (746,313 | ) | | | (20,275,131 | ) | | | (801,142 | ) | | | (9,993,931 | ) | | | (11,416,992 | ) | | | (257,518,766 | ) |
| | | | | | | | | | | | | | | | | | | | | | | | | | | | | | | | | | | | | | |
| | | | | | | | | |
| | | | | | | | | | | | | | | | | | | | | | | | | | | | | | | | | | | | | | | |
| | 15,719,311 | | | | 70,193,019 | | | | 14,490,095 | | | | 66,153,279 | | | | 36,621,331 | | | | 64,351,125 | | | | 16,222,405 | | | | 28,792,535 | | | | 81,365,607 | | | | 208,074,838 | |
| | 2,306,553 | | | | 40,133,649 | | | | — | | | | 105,443,019 | | | | 746,313 | | | | 20,275,131 | | | | 801,142 | | | | 9,993,931 | | | | 11,416,512 | | | | 257,507,697 | |
| | (56,209,664 | ) | | | (109,991,877 | ) | | | (30,351,515 | ) | | | (126,473,415 | ) | | | (9,389,809 | ) | | | (58,214,615 | ) | | | (8,904,803 | ) | | | (18,629,960 | ) | | | (267,526,995 | ) | | | (380,171,782 | ) |
| | | | | | | | | | | | | | | | | | | | | | | | | | | | | | | | | | | | | | |
| | | | | | | | | |
| | (38,183,800 | ) | | | 334,791 | | | | (15,861,420 | ) | | | 45,122,883 | | | | 27,977,835 | | | | 26,411,641 | | | | 8,118,744 | | | | 20,156,506 | | | | (174,744,876 | ) | | | 85,410,753 | |
| | | | | | | | | | | | | | | | | | | | | | | | | | | | | | | | | | | | | | |
| | (119,417,825 | ) | | | 107,692,639 | | | | (215,285,095 | ) | | | 6,084,586 | | | | (2,484,346 | ) | | | 35,598,961 | | | | (11,707,207 | ) | | | 41,594,762 | | | | (581,999,466 | ) | | | 262,537,970 | |
| | 580,125,317 | | | | 472,432,678 | | | | 673,157,661 | | | | 667,073,075 | | | | 142,776,274 | | | | 107,177,313 | | | | 131,127,504 | | | | 89,532,742 | | | | 2,118,343,793 | | | | 1,855,805,823 | |
| | | | | | | | | | | | | | | | | | | | | | | | | | | | | | | | | | | | | | |
| | | | | | | | | |
| $ | 460,707,492 | | | $ | 580,125,317 | | | $ | 457,872,566 | | | $ | 673,157,661 | | | $ | 140,291,928 | | | $ | 142,776,274 | | | $ | 119,420,297 | | | $ | 131,127,504 | | | $ | 1,536,344,327 | | | $ | 2,118,343,793 | |
| | | | | | | | | | | | | | | | | | | | | | | | | | | | | | | | | | | | | | |
| | | | | | | | | |
| | | | | | | | | | | | | | | | | | | | | | | | | | | | | | | | | | | | | | | |
| | 35,118,423 | | | | 35,115,373 | | | | 41,508,728 | | | | 38,046,457 | | | | 12,322,568 | | | | 9,975,863 | | | | 6,825,903 | | | | 5,764,324 | | | | 84,330,880 | | | | 80,440,238 | |
| | | | | | | | | | | | | | | | | | | | | | | | | | | | | | | | | | | | | | |
| | 1,002,640 | | | | 4,244,420 | | | | 1,081,725 | | | | 3,479,903 | | | | 3,529,332 | | | | 5,070,974 | | | | 870,004 | | | | 1,516,493 | | | | 3,551,806 | | | | 7,784,589 | |
| | 153,463 | | | | 2,506,842 | | | | — | | | | 6,704,131 | | | | 75,922 | | | | 1,805,561 | | | | 45,963 | | | | 538,613 | | | | 538,261 | | | | 10,565,990 | |
| | (3,653,542 | ) | | | (6,748,212 | ) | | | (2,202,937 | ) | | | (6,721,763 | ) | | | (897,263 | ) | | | (4,529,830 | ) | | | (496,389 | ) | | | (993,527 | ) | | | (11,800,518 | ) | | | (14,459,937 | ) |
| | | | | | | | | | | | | | | | | | | | | | | | | | | | | | | | | | | | | | |
| | | | | | | | | |
| | (2,497,439 | ) | | | 3,050 | | | | (1,121,212 | ) | | | 3,462,271 | | | | 2,707,991 | | | | 2,346,705 | | | | 419,578 | | | | 1,061,579 | | | | (7,710,451 | ) | | | 3,890,642 | |
| | | | | | | | | | | | | | | | | | | | | | | | | | | | | | | | | | | | | | |
| | | | | | | | | |
| | 32,620,984 | | | | 35,118,423 | | | | 40,387,516 | | | | 41,508,728 | | | | 15,030,559 | | | | 12,322,568 | | | | 7,245,481 | | | | 6,825,903 | | | | 76,620,429 | | | | 84,330,880 | |
| | | | | | | | | | | | | | | | | | | | | | | | | | | | | | | | | | | | | | |
The accompanying notes are an integral part of these financial statements.
109
MUTUAL OF AMERICA INVESTMENT CORPORATION
STATEMENTS OF CHANGES IN NET ASSETS (Continued)
| | | | | | | | | | | | | | | | |
| | | Composite Fund | | | International Fund | |
| | | For the
Six Months
Ended
June 30,
2022
(Unaudited) | | | For the
Year Ended
December 31,
2021 | | | For the
Six Months
Ended
June 30,
2022
(Unaudited) | | | For the
Year Ended
December 31,
2021 | |
INCREASE (DECREASE)IN NET ASSETS | | | | | | | | | | | | | | | | |
FROM OPERATIONS | | | | | | | | | | | | | | | | |
Net investment income (loss) | | $ | 1,679,587 | | | $ | 3,157,621 | | | $ | 30,386,662 | | | $ | 22,676,620 | |
Net realized gain (loss) on investments and futures contracts | | | 5,048,869 | | | | 10,018,834 | | | | (13,585,082 | ) | | | 207,617,117 | |
Change in net unrealized appreciation (depreciation) of investments and futures contracts | | | (36,200,528 | ) | | | 18,110,882 | | | | (219,060,332 | ) | | | (128,159,264 | ) |
| | | | | | | | | | | | | | | | |
| | | | |
NET INCREASE (DECREASE)IN NET ASSETS RESULTINGFROM OPERATIONS | | | (29,472,072 | ) | | | 31,287,337 | | | | (202,258,752 | ) | | | 102,134,473 | |
| | | | | | | | | | | | | | | | |
| | | | |
DISTRIBUTIONS (Notes 1 and 5) | | | | | | | | | | | | | | | | |
From Distributable Earnings | | | (1,461,529 | ) | | | (10,995,338 | ) | | | (27,617,080 | ) | | | (118,846,144 | ) |
| | | | | | | | | | | | | | | | |
| | | | |
Total distributions | | | (1,461,529 | ) | | | (10,995,338 | ) | | | (27,617,080 | ) | | | (118,846,144 | ) |
| | | | | | | | | | | | | | | | |
| | | | |
CAPITAL TRANSACTIONS (Note 4) | | | | | | | | | | | | | | | | |
Net proceeds from sale of shares | | | 4,069,407 | | | | 13,189,190 | | | | 126,366,332 | | | | 230,652,095 | |
Dividends reinvested | | | 1,461,539 | | | | 10,995,328 | | | | 27,617,080 | | | | 118,846,144 | |
Cost of shares redeemed | | | (7,900,141 | ) | | | (17,696,981 | ) | | | (38,030,400 | ) | | | (70,392,826 | ) |
| | | | | | | | | | | | | | | | |
| | | | |
NET INCREASE (DECREASE)IN NET ASSETSFROM CAPITAL TRANSACTIONS | | | (2,369,195 | ) | | | 6,487,537 | | | | 115,953,012 | | | | 279,105,413 | |
| | | | | | | | | | | | | | | | |
INCREASE (DECREASE)IN NET ASSETS | | | (33,302,796 | ) | | | 26,779,536 | | | | (113,922,820 | ) | | | 262,393,742 | |
NET ASSETS, BEGINNINGOF PERIOD | | | 218,078,266 | | | | 191,298,730 | | | | 1,202,810,745 | | | | 940,417,003 | |
| | | | | | | | | | | | | | | | |
| | | | |
NET ASSETS, ENDOF PERIOD | | $ | 184,775,470 | | | $ | 218,078,266 | | | $ | 1,088,887,925 | | | $ | 1,202,810,745 | |
| | | | | | | | | | | | | | | | |
| | | | |
OTHER INFORMATION (Note 4): | | | | | | | | | | | | | | | | |
Shares outstanding at the beginning of period | | | 10,298,831 | | | | 9,984,951 | | | | 129,918,710 | | | | 100,642,322 | |
| | | | | | | | | | | | | | | | |
Shares sold | | | 204,022 | | | | 637,935 | | | | 14,462,957 | | | | 23,352,619 | |
Shares issued as reinvestment of dividends | | | 78,789 | | | | 528,353 | | | | 3,491,413 | | | | 13,050,626 | |
Shares redeemed | | | (399,822 | ) | | | (852,408 | ) | | | (4,388,861 | ) | | | (7,126,857 | ) |
| | | | | | | | | | | | | | | | |
| | | | |
Net Increase (decrease) | | | (117,011 | ) | | | 313,880 | | | | 13,565,509 | | | | 29,276,388 | |
| | | | | | | | | | | | | | | | |
| | | | |
Shares outstanding at the end of period | | | 10,181,820 | | | | 10,298,831 | | | | 143,484,219 | | | | 129,918,710 | |
| | | | | | | | | | | | | | | | |
| (a) | In 2021, the Fund had accrued a non-recurring capital contribution from Mutual of America Capital Management LLC of $410,599 to reflect the estimated lost opportunity cost arising when a portion of the portfolio was uninvested. The 2022 amount disclosed includes adjustments to the prior accrual to record the final settlement amount of the capital contribution accrued as of December 31, 2021. |
The accompanying notes are an integral part of these financial statements.
110
| | | | | | | | | | | | | | | | | | | | | | | | | | | | | | | | | | | | | | | | |
| Catholic Values Index Fund | | | Retirement Income Fund | | | 2015 Retirement Fund | | | 2020 Retirement Fund | | | 2025 Retirement Fund | | | |
For the
Six Months
Ended
June 30,
2022
(Unaudited) | | | For the
Year Ended
December 31,
2021 | | | For the
Six Months
Ended
June 30,
2022
(Unaudited) | | | For the
Year Ended
December 31,
2021 | | | For the
Six Months
Ended
June 30,
2022
(Unaudited) | | | For the
Year Ended
December 31,
2021 | | | For the
Six Months
Ended
June 30,
2022
(Unaudited) | | | For the
Year Ended
December 31,
2021 | | | For the
Six Months
Ended
June 30,
2022
(Unaudited) | | | For the
Year Ended
December 31,
2021 | | | |
| | | | | | | | | | | | | | | | | | | | | | | | | | | | | | | | | | | | | | | | |
| | | | | | | | | | | | | | | | | | | | | | | | | | | | | | | | | | | | | | | | |
| $ | 26,520 | | | $ | 44,932 | | | $ | 1,181,673 | | | $ | 2,471,494 | | | $ | 740,059 | | | $ | 1,768,048 | | | $ | 3,847,771 | | | $ | 7,897,617 | | | $ | 8,195,580 | | | $ | 14,342,551 | | | |
| | 7,626 | | | | 55,115 | | | | 1,151,458 | | | | 8,348,098 | | | | 1,715,526 | | | | 9,248,151 | | | | 4,525,061 | | | | 46,329,497 | | | | 7,142,270 | | | | 80,782,114 | | | |
| (1,075,159 | ) | | | 879,011 | | | | (25,898,323 | ) | | | 409,403 | | | | (18,756,764 | ) | | | (466,636 | ) | | | (88,402,360 | ) | | | 2,470,047 | | | | (186,424,117 | ) | | | 28,859,205 | | | |
| | | | | | | | | | | | | | | | | | | | | | | | | | | | | | | | | | | | | | | | |
| | | | | | | | | | |
| | (1,041,013 | ) | | | 979,058 | | | | (23,565,192 | ) | | | 11,228,995 | | | | (16,301,179 | ) | | | 10,549,563 | | | | (80,029,528 | ) | | | 56,697,161 | | | | (171,086,267 | ) | | | 123,983,870 | | | |
| | | | | | | | | | | | | | | | | | | | | | | | | | | | | | | | | | | | | | | | |
| | | | | | | | | | |
| | | | | | | | | | | | | | | | | | | | | | | | | | | | | | | | | | | | | | | | |
| | (22,883 | ) | | | (101,804 | ) | | | (1,193,372 | ) | | | (8,892,185 | ) | | | (748,946 | ) | | | (16,637,227 | ) | | | (3,868,683 | ) | | | (40,224,129 | ) | | | (8,230,617 | ) | | | (72,513,821 | ) | | |
| | | | | | | | | | | | | | | | | | | | | | | | | | | | | | | | | | | | | | | | |
| | | | | | | | | | |
| | | | | | | | | | | | | | | | | | | | | | | | | | | | | | | | | | | | | | | | |
| | 349,005 | | | | 236,296 | | | | 18,160,105 | | | | 52,213,839 | | | | 4,085,731 | (a) | | | 12,258,619 | (a) | | | 18,954,326 | | | | 43,652,920 | | | | 51,120,142 | | | | 126,192,454 | | | |
| | 22,883 | | | | 101,803 | | | | 1,193,372 | | | | 8,892,184 | | | | 748,946 | | | | 16,637,214 | | | | 3,868,587 | | | | 40,224,177 | | | | 8,230,617 | | | | 72,513,741 | | | |
| | (859 | ) | | | (195 | ) | | | (15,654,104 | ) | | | (32,312,844 | ) | | | (8,620,876 | ) | | | (22,098,034 | ) | | | (42,829,105 | ) | | | (73,701,015 | ) | | | (50,261,043 | ) | | | (67,718,261 | ) | | |
| | | | | | | | | | | | | | | | | | | | | | | | | | | | | | | | | | | | | | | | |
| | | | | | | | | | |
| | 371,029 | | | | 337,904 | | | | 3,699,373 | | | | 28,793,179 | | | | (3,786,199 | ) | | | 6,797,799 | | | | (20,006,192 | ) | | | 10,176,082 | | | | 9,089,716 | | | | 130,987,934 | | | |
| | | | | | | | | | | | | | | | | | | | | | | | | | | | | | | | | | | | | | | | |
| | (692,867 | ) | | | 1,215,158 | | | | (21,059,191 | ) | | | 31,129,989 | | | | (20,836,324 | ) | | | 710,135 | | | | (103,904,403 | ) | | | 26,649,114 | | | | (170,227,168 | ) | | | 182,457,983 | | | |
| | 4,578,481 | | | | 3,363,323 | | | | 223,719,918 | | | | 192,589,929 | | | | 140,512,494 | | | | 139,802,359 | | | | 621,104,778 | | | | 594,455,664 | | | | 1,202,807,887 | | | | 1,020,349,904 | | | |
| | | | | | | | | | | | | | | | | | | | | | | | | | | | | | | | | | | | | | | | |
| | | | | | | | | | |
| $ | 3,885,614 | | | $ | 4,578,481 | | | $ | 202,660,727 | | | $ | 223,719,918 | | | $ | 119,676,170 | | | $ | 140,512,494 | | | $ | 517,200,375 | | | $ | 621,104,778 | | | $ | 1,032,580,719 | | | $ | 1,202,807,887 | | | |
| | | | | | | | | | | | | | | | | | | | | | | | | | | | | | | | | | | | | | | | |
| | | | | | | | | | |
| | | | | | | | | | | | | | | | | | | | | | | | | | | | | | | | | | | | | | | | |
| | 325,700 | | | | 301,135 | | | | 18,254,992 | | | | 15,926,251 | | | | 14,861,652 | | | | 14,119,917 | | | | 51,097,902 | | | | 50,203,998 | | | | 86,096,717 | | | | 76,786,323 | | | |
| | | | | | | | | | | | | | | | | | | | | | | | | | | | | | | | | | | | | | | | |
| | 27,698 | | | | 16,992 | | | | 1,572,365 | | | | 4,219,877 | | | | 505,528 | | | | 1,158,254 | | | | 1,687,940 | | | | 3,527,159 | | | | 3,949,963 | | | | 8,918,442 | | | |
| | 2,023 | | | | 7,587 | | | | 110,191 | | | | 726,833 | | | | 91,224 | | | | 1,750,775 | | | | 370,554 | | | | 3,307,226 | | | | 693,397 | | | | 5,211,134 | | | |
| | (71 | ) | | | (14 | ) | | | (1,356,803 | ) | | | (2,617,969 | ) | | | (981,257 | ) | | | (2,167,294 | ) | | | (3,794,103 | ) | | | (5,940,481 | ) | | | (3,897,313 | ) | | | (4,819,182 | ) | | |
| | | | | | | | | | | | | | | | | | | | | | | | | | | | | | | | | | | | | | | | |
| | | | | | | | | | |
| | 29,650 | | | | 24,565 | | | | 325,753 | | | | 2,328,741 | | | | (384,505 | ) | | | 741,735 | | | | (1,735,609 | ) | | | 893,904 | | | | 746,047 | | | | 9,310,394 | | | |
| | | | | | | | | | | | | | | | | | | | | | | | | | | | | | | | | | | | | | | | |
| | | | | | | | | | |
| | 355,350 | | | | 325,700 | | | | 18,580,745 | | | | 18,254,992 | | | | 14,477,147 | | | | 14,861,652 | | | | 49,362,293 | | | | 51,097,902 | | | | 86,842,764 | | | | 86,096,717 | | | |
| | | | | | | | | | | | | | | | | | | | | | | | | | | | | | | | | | | | | | | | |
The accompanying notes are an integral part of these financial statements.
111
MUTUAL OF AMERICA INVESTMENT CORPORATION
STATEMENTS OF CHANGES IN NET ASSETS (Continued)
| | | | | | | | | | | | | | | | |
| | | 2030 Retirement Fund | | | 2035 Retirement Fund | |
| | | For the
Six Months
Ended
June 30,
2022
(Unaudited) | | | For the
Year Ended
December 31,
2021 | | | For the
Six Months
Ended
June 30,
2022
(Unaudited) | | | For the
Year Ended
December 31,
2021 | |
INCREASE (DECREASE)IN NET ASSETS | | | | | | | | | | | | | | | | |
FROM OPERATIONS | | | | | | | | | | | | | | | | |
Net investment income (loss) | | $ | 8,787,802 | | | $ | 13,835,531 | | | $ | 8,585,488 | | | $ | 12,221,239 | |
Net realized gain (loss) on investments and futures contracts | | | 4,775,466 | | | | 85,324,397 | | | | 6,702,721 | | | | 82,429,431 | |
Change in net unrealized appreciation (depreciation) of investments and futures contracts | | | (207,808,753 | ) | | | 54,751,574 | | | | (209,860,169 | ) | | | 61,221,396 | |
| | | | | | | | | | | | | | | | |
| | | | |
NET INCREASE (DECREASE)IN NET ASSETS RESULTINGFROM OPERATIONS | | | (194,245,485 | ) | | | 153,911,502 | | | | (194,571,960 | ) | | | 155,872,066 | |
| | | | | | | | | | | | | | | | |
| | | | |
DISTRIBUTIONS (Notes 1 and 5) | | | | | | | | | | | | | | | | |
From Distributable Earnings | | | (8,823,943 | ) | | | (72,519,277 | ) | | | (8,618,452 | ) | | | (60,726,019 | ) |
| | | | | | | | | | | | | | | | |
| | | | |
Total distributions | | | (8,823,943 | ) | | | (72,519,277 | ) | | | (8,618,452 | ) | | | (60,726,019 | ) |
| | | | | | | | | | | | | | | | |
| | | | |
CAPITAL TRANSACTIONS (Note 4) | | | | | | | | | | | | | | | | |
Net proceeds from sale of shares | | | 59,871,177 | | | | 140,945,047 | | | | 64,952,390 | | | | 141,579,441 | |
Dividends reinvested | | | 8,823,943 | | | | 72,519,276 | | | | 8,618,452 | | | | 60,726,019 | |
Cost of shares redeemed | | | (29,761,930 | ) | | | (45,542,303 | ) | | | (24,868,679 | ) | | | (42,732,339 | ) |
| | | | | | | | | | | | | | | | |
| | | | |
NET INCREASE (DECREASE)IN NET ASSETSFROM CAPITAL TRANSACTIONS | | | 38,933,190 | | | | 167,922,020 | | | | 48,702,163 | | | | 159,573,121 | |
| | | | | | | | | | | | | | | | |
INCREASE (DECREASE)IN NET ASSETS | | | (164,136,238 | ) | | | 249,314,245 | | | | (154,488,249 | ) | | | 254,719,168 | |
NET ASSETS, BEGINNINGOF PERIOD | | | 1,230,662,193 | | | | 981,347,948 | | | | 1,101,141,954 | | | | 846,422,786 | |
| | | | | | | | | | | | | | | | |
| | | | |
NET ASSETS, ENDOF PERIOD | | $ | 1,066,525,955 | | | $ | 1,230,662,193 | | | $ | 946,653,705 | | | $ | 1,101,141,954 | |
| | | | | | | | | | | | | | | | |
| | | | |
OTHER INFORMATION (Note 4): | | | | | | | | | | | | | | | | |
Shares outstanding at the beginning of period | | | 80,707,269 | | | | 69,679,174 | | | | 68,807,569 | | | | 58,765,329 | |
| | | | | | | | | | | | | | | | |
Shares sold | | | 4,247,264 | | | | 9,224,072 | | | | 4,417,022 | | | | 8,909,667 | |
Shares issued as reinvestment of dividends | | | 690,449 | | | | 4,795,538 | | | | 654,898 | | | | 3,844,043 | |
Shares redeemed | | | (2,120,652 | ) | | | (2,991,515 | ) | | | (1,693,997 | ) | | | (2,711,470 | ) |
| | | | | | | | | | | | | | | | |
| | | | |
Net Increase (decrease) | | | 2,817,061 | | | | 11,028,095 | | | | 3,377,923 | | | | 10,042,240 | |
| | | | | | | | | | | | | | | | |
| | | | |
Shares outstanding at the end of period | | | 83,524,330 | | | | 80,707,269 | | | | 72,185,492 | | | | 68,807,569 | |
| | | | | | | | | | | | | | | | |
The accompanying notes are an integral part of these financial statements.
112
| | | | | | | | | | | | | | | | | | | | | | | | | | | | | | | | | | | | | | | | |
| 2040 Retirement Fund | | | 2045 Retirement Fund | | | 2050 Retirement Fund | | | 2055 Retirement Fund | | | 2060 Retirement Fund | | | |
For the
Six Months
Ended
June 30,
2022
(Unaudited) | | | For the
Year Ended
December 31,
2021 | | | For the
Six Months
Ended
June 30,
2022
(Unaudited) | | | For the
Year Ended
December 31,
2021 | | | For the
Six Months
Ended
June 30,
2022
(Unaudited) | | | For the
Year Ended
December 31,
2021 | | | For the
Six Months
Ended
June 30,
2022
(Unaudited) | | | For the
Year Ended
December 31,
2021 | | | For the
Six Months
Ended
June 30,
2022
(Unaudited) | | | For the
Year Ended
December 31,
2021 | | | |
| | | | | | | | | | | | | | | | | | | | | | | | | | | | | | | | | | | | | | | | |
| | | | | | | | | | | | | | | | | | | | | | | | | | | | | | | | | | | | | | | | |
| $ | 7,369,275 | | | $ | 10,082,773 | | | $ | 7,823,208 | | | $ | 10,148,542 | | | $ | 5,829,969 | | | $ | 7,485,024 | | | $ | 2,779,344 | | | $ | 3,214,289 | | | $ | 1,166,282 | | | $ | 1,247,042 | | | |
| | 6,430,346 | | | | 80,364,732 | | | | 7,723,843 | | | | 89,159,452 | | | | 918,163 | | | | 61,931,032 | | | | 1,390,135 | | | | 27,028,897 | | | | 1,241,826 | | | | 11,751,768 | | | |
| | | | | | | | | | |
| | (180,361,322 | ) | | | 54,845,275 | | | | (192,451,345 | ) | | | 55,263,833 | | | | (140,856,321 | ) | | | 46,655,659 | | | | (68,036,358 | ) | | | 20,261,616 | | | | (28,796,525 | ) | | | 5,196,328 | | | |
| | | | | | | | | | | | | | | | | | | | | | | | | | | | | | | | | | | | | | | | |
| | | | | | | | | | |
| | (166,561,701 | ) | | | 145,292,780 | | | | (176,904,294 | ) | | | 154,571,827 | | | | (134,108,189 | ) | | | 116,071,715 | | | | (63,866,879 | ) | | | 50,504,802 | | | | (26,388,417 | ) | | | 18,195,138 | | | |
| | | | | | | | | | | | | | | | | | | | | | | | | | | | | | | | | | | | | | | | |
| | | | | | | | | | |
| | | | | | | | | | | | | | | | | | | | | | | | | | | | | | | | | | | | | | | | |
| | (7,397,329 | ) | | | (60,303,681 | ) | | | (7,851,986 | ) | | | (67,410,365 | ) | | | (5,853,272 | ) | | | (42,920,507 | ) | | | (2,794,177 | ) | | | (17,476,074 | ) | | | (1,239,212 | ) | | | (7,148,245 | ) | | |
| | | | | | | | | | | | | | | | | | | | | | | | | | | | | | | | | | | | | | | | |
| | | | | | | | | | |
| | | | | | | | | | | | | | | | | | | | | | | | | | | | | | | | | | | | | | | | |
| | 49,587,424 | | | | 107,205,422 | | | | 51,172,913 | | | | 100,357,118 | | | | 41,277,318 | | | | 92,838,414 | | | | 37,818,431 | | | | 68,045,914 | | | | 24,770,844 | | | | 44,933,830 | | | |
| | 7,397,329 | | | | 60,303,681 | | | | 7,851,987 | | | | 67,410,365 | | | | 5,853,272 | | | | 42,920,475 | | | | 2,794,177 | | | | 17,476,074 | | | | 1,239,212 | | | | 7,148,245 | | | |
| | (23,965,329 | ) | | | (34,857,331 | ) | | | (20,081,325 | ) | | | (31,415,886 | ) | | | (15,428,387 | ) | | | (27,218,319 | ) | | | (9,087,310 | ) | | | (8,500,846 | ) | | | (2,747,430 | ) | | | (5,211,682 | ) | | |
| | | | | | | | | | | | | | | | | | | | | | | | | | | | | | | | | | | | | | | | |
| | | | | | | | | | |
| | 33,019,424 | | | | 132,651,772 | | | | 38,943,575 | | | | 136,351,597 | | | | 31,702,203 | | | | 108,540,570 | | | | 31,525,298 | | | | 77,021,142 | | | | 23,262,626 | | | | 46,870,393 | | | |
| | | | | | | | | | | | | | | | | | | | | | | | | | | | | | | | | | | | | | | | |
| | (140,939,606 | ) | | | 217,640,871 | | | | (145,812,705 | ) | | | 223,513,059 | | | | (108,259,258 | ) | | | 181,691,778 | | | | (35,135,758 | ) | | | 110,049,870 | | | | (4,365,003 | ) | | | 57,917,286 | | | |
| | 925,425,003 | | | | 707,784,132 | | | | 956,854,785 | | | | 733,341,726 | | | | 717,456,619 | | | | 535,764,841 | | | | 329,820,499 | | | | 219,770,629 | | | | 130,297,827 | | | | 72,380,541 | | | |
| | | | | | | | | | | | | | | | | | | | | | | | | | | | | | | | | | | | | | | | |
| | | | | | | | | | |
| $ | 784,485,397 | | | $ | 925,425,003 | | | $ | 811,042,080 | | | $ | 956,854,785 | | | $ | 609,197,361 | | | $ | 717,456,619 | | | $ | 294,684,741 | | | $ | 329,820,499 | | | $ | 125,932,824 | | | $ | 130,297,827 | | | |
| | | | | | | | | | | | | | | | | | | | | | | | | | | | | | | | | | | | | | | | |
| | | | | | | | | | |
| | | | | | | | | | | | | | | | | | | | | | | | | | | | | | | | | | | | | | | | |
| | 57,286,669 | | | | 49,008,583 | | | | 59,930,841 | | | | 51,349,800 | | | | 35,318,488 | | | | 29,903,295 | | | | 20,628,628 | | | | 15,724,944 | | | | 9,594,249 | | | | 6,098,095 | | | |
| | | | | | | | | | | | | | | | | | | | | | | | | | | | | | | | | | | | | | | | |
| | 3,377,934 | | | | 6,659,929 | | | | 3,524,607 | | | | 6,282,162 | | | | 2,235,838 | | | | 4,627,732 | | | | 2,608,217 | | | | 4,334,405 | | | | 2,016,533 | | | | 3,356,560 | | | |
| | 559,133 | | | | 3,779,500 | | | | 603,071 | | | | 4,270,949 | | | | 353,886 | | | | 2,144,103 | | | | 214,937 | | | | 1,111,407 | | | | 112,146 | | | | 535,001 | | | |
| | (1,597,289 | ) | | | (2,161,343 | ) | | | (1,352,189 | ) | | | (1,972,070 | ) | | | (815,192 | ) | | | (1,356,642 | ) | | | (607,247 | ) | | | (542,128 | ) | | | (220,006 | ) | | | (395,407 | ) | | |
| | | | | | | | | | | | | | | | | | | | | | | | | | | | | | | | | | | | | | | | |
| | | | | | | | | | |
| | 2,339,778 | | | | 8,278,086 | | | | 2,775,489 | | | | 8,581,041 | | | | 1,774,532 | | | | 5,415,193 | | | | 2,215,907 | | | | 4,903,684 | | | | 1,908,673 | | | | 3,496,154 | | | |
| | | | | | | | | | | | | | | | | | | | | | | | | | | | | | | | | | | | | | | | |
| | | | | | | | | | |
| | 59,626,447 | | | | 57,286,669 | | | | 62,706,330 | | | | 59,930,841 | | | | 37,093,020 | | | | 35,318,488 | | | | 22,844,535 | | | | 20,628,628 | | | | 11,502,922 | | | | 9,594,249 | | | |
| | | | | | | | | | | | | | | | | | | | | | | | | | | | | | | | | | | | | | | | |
The accompanying notes are an integral part of these financial statements.
113
MUTUAL OF AMERICA INVESTMENT CORPORATION
STATEMENTS OF CHANGES IN NET ASSETS (Continued)
| | | | | | | | | | | | | | | | |
| | | 2065 Retirement Fund | | | Conservative Allocation Fund | |
| | | For the
Six Months
Ended
June 30,
2022
(Unaudited) | | | For the
Year Ended
December 31,
2021 | | | For the
Six Months
Ended
June 30,
2022
(Unaudited) | | | For the
Year Ended
December 31,
2021 | |
INCREASE (DECREASE)IN NET ASSETS | | | | | | | | | | | | | | | | |
FROM OPERATIONS | | | | | | | | | | | | | | | | |
Net investment income (loss) | | $ | 212,742 | | | $ | 140,337 | | | $ | 1,252,134 | | | $ | 2,663,383 | |
Net realized gain (loss) on investments and futures contracts | | | (186,038 | ) | | | 1,601,285 | | | | 712,175 | | | | 13,106,619 | |
Change in net unrealized appreciation (depreciation) of investments and futures contracts | | | (4,173,236 | ) | | | (180,693 | ) | | | (26,053,022 | ) | | | (1,210,700 | ) |
| | | | | | | | | | | | | | | | |
| | | | |
NET INCREASE (DECREASE)IN NET ASSETS RESULTINGFROM OPERATIONS | | | (4,146,532 | ) | | | 1,560,929 | | | | (24,088,713 | ) | | | 14,559,302 | |
| | | | | | | | | | | | | | | | |
| | | | |
DISTRIBUTIONS (Notes 1 and 5) | | | | | | | | | | | | | | | | |
From Distributable Earnings | | | (213,205 | ) | | | (798,991 | ) | | | (1,258,493 | ) | | | (11,828,438 | ) |
| | | | | | | | | | | | | | | | |
| | | | |
Total distributions | | | (213,205 | ) | | | (798,991 | ) | | | (1,258,493 | ) | | | (11,828,438 | ) |
| | | | | | | | | | | | | | | | |
| | | | |
CAPITAL TRANSACTIONS (Note 4) | | | | | | | | | | | | | | | | |
Net proceeds from sale of shares | | | 9,313,686 | | | | 14,789,318 | | | | 6,837,452 | | | | 18,231,133 | |
Dividends reinvested | | | 213,205 | | | | 798,991 | | | | 1,258,493 | | | | 11,828,438 | |
Cost of shares redeemed | | | (939,532 | ) | | | (2,188,183 | ) | | | (11,808,998 | ) | | | (20,315,447 | ) |
| | | | | | | | | | | | | | | | |
| | | | |
NET INCREASE (DECREASE)IN NET ASSETSFROM CAPITAL TRANSACTIONS | | | 8,587,359 | | | | 13,400,126 | | | | (3,713,053 | ) | | | 9,744,124 | |
| | | | | | | | | | | | | | | | |
INCREASE (DECREASE)IN NET ASSETS | | | 4,227,622 | | | | 14,162,064 | | | | (29,060,259 | ) | | | 12,474,988 | |
NET ASSETS, BEGINNINGOF PERIOD | | | 17,266,846 | | | | 3,104,782 | | | | 200,807,291 | | | | 188,332,303 | |
| | | | | | | | | | | | | | | | |
| | | | |
NET ASSETS, ENDOF PERIOD | | $ | 21,494,468 | | | $ | 17,266,846 | | | $ | 171,747,032 | | | $ | 200,807,291 | |
| | | | | | | | | | | | | | | | |
| | | | |
OTHER INFORMATION (Note 4): | | | | | | | | | | | | | | | | |
Shares outstanding at the beginning of period | | | 1,308,482 | | | | 271,146 | | | | 15,617,735 | | | | 14,861,052 | |
| | | | | | | | | | | | | | | | |
Shares sold | | | 774,993 | | | | 1,143,853 | | | | 569,046 | | | | 1,390,281 | |
Shares issued as reinvestment of dividends | | | 19,889 | | | | 61,824 | | | | 112,869 | | | | 919,044 | |
Shares redeemed | | | (80,161 | ) | | | (168,341 | ) | | | (986,895 | ) | | | (1,552,642 | ) |
| | | | | | | | | | | | | | | | |
| | | | |
Net Increase (decrease) | | | 714,721 | | | | 1,037,336 | | | | (304,980 | ) | | | 756,683 | |
| | | | | | | | | | | | | | | | |
| | | | |
Shares outstanding at the end of period | | | 2,023,203 | | | | 1,308,482 | | | | 15,312,755 | | | | 15,617,735 | |
| | | | | | | | | | | | | | | | |
The accompanying notes are an integral part of these financial statements.
114
| | | | | | | | | | | | | | | | | | | | | | | | | | | | | | | | | | | | | | |
Moderate Allocation Fund | | | Aggressive Allocation Fund | | | Money Market Fund | | | Mid-Term Bond Fund | | | Bond Fund | |
For the
Six Months
Ended
June 30,
2022
(Unaudited) | | | For the
Year Ended
December 31,
2021 | | | For the
Six Months
Ended
June 30,
2022
(Unaudited) | | | For the
Year Ended
December 31,
2021 | | | For the
Six Months
Ended
June 30,
2022
(Unaudited) | | | For the
Year Ended
December 31,
2021 | | | For the
Six Months
Ended
June 30,
2022
(Unaudited) | | | For the
Year Ended
December 31,
2021 | | | For the
Six Months
Ended
June 30,
2022
(Unaudited) | | | For the
Year Ended
December 31,
2021 | |
| | | | | | | | | | | | | | | | | | | | | | | | | | | | | | | | | | | | | | |
| | | | | | | | | | | | | | | | | | | | | | | | | | | | | | | | | | | | | | |
| $ | 3,466,157 | | | $ | 6,336,806 | | | $ | 2,901,217 | | | $ | 4,497,212 | | | $ | 126,917 | | | $ | (295,996 | ) | | $ | 5,643,954 | | | $ | 10,801,409 | | | $ | 17,262,010 | | | $ | 30,896,440 | |
| | 3,292,496 | | | | 46,560,069 | | | | 4,331,958 | | | | 43,362,347 | | | | (157 | ) | | | 251 | | | | 330,927 | | | | 5,885,928 | | | | (9,504,572 | ) | | | 13,764,131 | |
| (79,547,441 | ) | | | 9,143,168 | | | | (74,870,711 | ) | | | 12,981,339 | | | | (4,737 | ) | | | — | | | | (60,211,364 | ) | | | (34,332,267 | ) | | | (199,884,935 | ) | | | (90,223,096 | ) |
| | | | | | | | | | | | | | | | | | | | | | | | | | | | | | | | | | | | | | |
| | | | | | | | | |
| | (72,788,788 | ) | | | 62,040,043 | | | | (67,637,536 | ) | | | 60,840,898 | | | | 122,023 | | | | (295,745 | ) | | | (54,236,483 | ) | | | (17,644,930 | ) | | | (192,127,497 | ) | | | (45,562,525 | ) |
| | | | | | | | | | | | | | | | | | | | | | | | | | | | | | | | | | | | | | |
| | | | | | | | | |
| | | | | | | | | | | | | | | | | | | | | | | | | | | | | | | | | | | | | | |
| | (3,473,679 | ) | | | (36,972,663 | ) | | | (2,908,733 | ) | | | (39,180,662 | ) | | | (72,191 | ) | | | — | | | | (4,655,625 | ) | | | (16,840,881 | ) | | | (14,109,276 | ) | | | (44,496,157 | ) |
| | | | | | | | | | | | | | | | | | | | | | | | | | | | | | | | | | | | | | |
| | | | | | | | | |
| | (3,473,679 | ) | | | (36,972,663 | ) | | | (2,908,733 | ) | | | (39,180,662 | ) | | | (72,191 | ) | | | — | | | | (4,655,625 | ) | | | (16,840,881 | ) | | | (14,109,276 | ) | | | (44,496,157 | ) |
| | | | | | | | | | | | | | | | | | | | | | | | | | | | | | | | | | | | | | |
| | | | | | | | | |
| | | | | | | | | | | | | | | | | | | | | | | | | | | | | | | | | | | | | | |
| | 6,882,482 | | | | 18,844,093 | | | | 5,454,717 | | | | 21,119,419 | | | | 63,884,953 | | | | 115,507,732 | | | | 106,866,455 | | | | 183,293,118 | | | | 220,310,687 | | | | 488,695,431 | |
| | 3,473,679 | | | | 36,972,663 | | | | 2,908,733 | | | | 39,180,662 | | | | 72,181 | | | | — | | | | 4,655,624 | | | | 16,840,881 | | | | 14,106,129 | | | | 44,486,141 | |
| | (23,193,673 | ) | | | (37,399,631 | ) | | | (17,139,593 | ) | | | (28,737,119 | ) | | | (41,623,779 | ) | | | (64,362,964 | ) | | | (43,376,366 | ) | | | (129,344,184 | ) | | | (203,694,261 | ) | | | (267,793,837 | ) |
| | | | | | | | | | | | | | | | | | | | | | | | | | | | | | | | | | | | | | |
| | | | | | | | | |
| | (12,837,512 | ) | | | 18,417,125 | | | | (8,776,143 | ) | | | 31,562,962 | | | | 22,333,355 | | | | 51,144,768 | | | | 68,145,713 | | | | 70,789,815 | | | | 30,722,555 | | | | 265,387,735 | |
| | | | | | | | | | | | | | | | | | | | | | | | | | | | | | | | | | | | | | |
| | (89,099,979 | ) | | | 43,484,505 | | | | (79,322,412 | ) | | | 53,223,198 | | | | 22,383,187 | | | | 50,849,023 | | | | 9,253,605 | | | | 36,304,004 | | | | (175,514,218 | ) | | | 175,329,053 | |
| | 487,224,569 | | | | 443,740,064 | | | | 390,377,357 | | | | 337,154,159 | | | | 173,204,767 | | | | 122,355,744 | | | | 865,545,776 | | | | 829,241,772 | | | | 2,048,758,850 | | | | 1,873,429,797 | |
| | | | | | | | | | | | | | | | | | | | | | | | | | | | | | | | | | | | | | |
| | | | | | | | | |
| $ | 398,124,590 | | | $ | 487,224,569 | | | $ | 311,054,945 | | | $ | 390,377,357 | | | $ | 195,587,954 | | | $ | 173,204,767 | | | $ | 874,799,381 | | | $ | 865,545,776 | | | $ | 1,873,244,632 | | | $ | 2,048,758,850 | |
| | | | | | | | | | | | | | | | | | | | | | | | | | | | | | | | | | | | | | |
| | | | | | | | | |
| | | | | | | | | | | | | | | | | | | | | | | | | | | | | | | | | | | | | | |
| | 30,481,824 | | | | 29,300,241 | | | | 21,851,624 | | | | 20,068,269 | | | | 14,644,716 | | | | 10,323,603 | | | | 83,549,456 | | | | 76,820,349 | | | | 143,116,787 | | | | 124,823,606 | |
| | | | | | | | | | | | | | | | | | | | | | | | | | | | | | | | | | | | | | |
| | 460,027 | | | | 1,168,456 | | | | 336,694 | | | | 1,143,715 | | | | 5,404,389 | | | | 9,757,870 | | | | 10,652,808 | | | | 17,349,137 | | | | 16,694,917 | | | | 33,602,801 | |
| | 258,458 | | | | 2,321,482 | | | | 198,413 | | | | 2,200,396 | | | | 6,107 | | | | — | | | | 468,563 | | | | 1,605,385 | | | | 1,053,166 | | | | 3,071,975 | |
| | (1,584,873 | ) | | | (2,308,355 | ) | | | (1,051,285 | ) | | | (1,560,756 | ) | | | (3,521,090 | ) | | | (5,436,757 | ) | | | (4,380,680 | ) | | | (12,225,415 | ) | | | (14,890,648 | ) | | | (18,381,595 | ) |
| | | | | | | | | | | | | | | | | | | | | | | | | | | | | | | | | | | | | | |
| | | | | | | | | |
| | (866,388 | ) | | | 1,181,583 | | | | (516,178 | ) | | | 1,783,355 | | | | 1,889,406 | | | | 4,321,113 | | | | 6,740,691 | | | | 6,729,107 | | | | 2,857,435 | | | | 18,293,181 | |
| | | | | | | | | | | | | | | | | | | | | | | | | | | | | | | | | | | | | | |
| | | | | | | | | |
| | 29,615,436 | | | | 30,481,824 | | | | 21,335,446 | | | | 21,851,624 | | | | 16,534,122 | | | | 14,644,716 | | | | 90,290,147 | | | | 83,549,456 | | | | 145,974,222 | | | | 143,116,787 | |
| | | | | | | | | | | | | | | | | | | | | | | | | | | | | | | | | | | | | | |
The accompanying notes are an integral part of these financial statements.
115
MUTUAL OF AMERICA INVESTMENT CORPORATION
FINANCIAL HIGHLIGHTS
Income from investment operations and distributions per share for a Fund share outstanding throughout the six months ended June 30, 2022 and the five years ended December 31, 2021 (or since the Fund’s inception date if in existence less than five years) and other supplementary data with respect to each Fund are presented below and in the pages following:
| | | | | | | | | | | | | | | | | | | | | | | | |
| | | Equity Index Fund | |
| | | Six Months
Ended
June 30,
2022
(Unaudited) | | | Years Ended December 31, |
| | | 2021 | | | 2020(f) | | | 2019(f) | | | 2018(f) | | | 2017(f) | |
| | | | | | |
Net Asset Value, Beginning of Period | | $ | 62.41 | | | $ | 51.15 | | | $ | 47.89 | | | $ | 37.75 | | | $ | 41.04 | | | $ | 34.92 | |
| | | | | | | | | | | | | | | | | | | | | | | | |
| | | | | | |
INCOME (LOSS)FROM INVESTMENT OPERATIONS | | | | | | | | | | | | | | | | | | | | | | | | |
Net Investment Income (Loss) | | | 0.38 | | | | 0.73 | | | | 0.92 | | | | 0.81 | | | | 0.74 | | | | 0.66 | |
Net Realized and Unrealized Gains (Losses) on Investments and Futures Contracts | | | (12.87 | ) | | | 13.70 | | | | 7.52 | | | | 10.88 | | | | (2.41 | ) | | | 6.82 | |
| | | | | | | | | | | | | | | | | | | | | | | | |
| | | | | | |
Total From Investment Operations | | | (12.49 | ) | | | 14.43 | | | | 8.44 | | | | 11.69 | | | | (1.67 | ) | | | 7.48 | |
| | | | | | | | | | | | | | | | | | | | | | | | |
| | | | | | |
Less Distributions | | | | | | | | | | | | | | | | | | | | | | | | |
From Net Investment Income | | | (0.34 | ) | | | (0.70 | ) | | | (1.68 | ) | | | (0.74 | ) | | | (0.67 | ) | | | (0.62 | ) |
From Net Realized Gains | | | — | | | | (2.47 | ) | | | (3.50 | ) | | | (0.81 | ) | | | (0.95 | ) | | | (0.74 | ) |
| | | | | | | | | | | | | | | | | | | | | | | | |
| | | | | | |
Total Distributions | | | (0.34 | ) | | | (3.17 | ) | | | (5.18 | ) | | | (1.55 | ) | | | (1.62 | ) | | | (1.36 | ) |
| | | | | | | | | | | | | | | | | | | | | | | | |
| | | | | | |
Net Asset Value, End of Period | | $ | 49.58 | | | $ | 62.41 | | | $ | 51.15 | | | $ | 47.89 | | | $ | 37.75 | | | $ | 41.04 | |
| | | | | | | | | | | | | | | | | | | | | | | | |
| | | | | | |
Total Return (%)(i) | | | (20.03 | )(b) | | | 28.50 | | | | 18.20 | | | | 31.31 | | | | (4.56 | ) | | | 21.65 | |
Net Assets, End of Period ($ millions) | | | 4,097 | | | | 4,992 | | | | 3,714 | | | | 3,478 | | | | 2,629 | | | | 2,712 | |
Ratio of Net Investment Income (Loss) to Average Net Assets (%) | | | 1.40 | (c) | | | 1.27 | | | | 1.72 | | | | 1.90 | | | | 1.83 | | | | 1.85 | |
Ratio of Expenses to Average Net Assets Before Expense Reimbursement (%) | | | 0.15 | (c) | | | 0.13 | | | | 0.15 | | | | 0.13 | | | | 0.13 | | | | 0.14 | |
Ratio of Expenses to Average Net Assets After Expense Reimbursement (%) | | | 0.15 | (c) | | | 0.13 | | | | 0.15 | | | | 0.13 | | | | 0.13 | | | | 0.13 | (e) |
Portfolio Turnover Rate (%)(a) | | | 1.72 | (b) | | | 7.01 | | | | 5.77 | | | | 3.01 | | | | 3.48 | | | | 5.23 | |
| (a) | Portfolio turnover rate excludes all short-term securities. |
| (d) | Allocation and Retirement Funds exclude expenses of the underlying funds. |
| (e) | Includes one time reimbursement from Adviser for non-advisory operating expenses (Note 2). |
| (f) | On September 25, 2020, the Mutual of America Investment Corporation Funds, with the exception of the Catholic Values Index Fund which commenced operations on September 30, 2020, had a 1 for 10 reverse share split. Historical net asset value per share and per share activity have been adjusted to reflect the split on a retroactive basis (Note 4). |
| (g) | For the period July 2, 2018 (commencement of operations) through December 31, 2018. |
| (h) | Amount is less than $0.005 per share. |
| (i) | Total return is calculated assuming a purchase of a share on the first day and a sale on the last day of each year or period reported and includes reinvestment of distributions, if any. For variable annuity owners or participants in a group variable annuity, the total return does not reflect the effect of fees and charges associated with your variable annuity contract and does not reflect expenses associated with the separate account such as administrative fees and account charges which, if reflected, would reduce the total returns for all years and periods shown. The total return for 2017 for the Funds subject to the one time reimbursement from the Adviser (Note 2) includes the impact of this reimbursement which was determined not to be material. Past performance is no guarantee of future results. Total returns for periods less than one full year are not annualized. |
| (j) | International Fund excludes the expenses of its ETF investments. |
| (k) | Amount is less than $0.00005 per share. |
| (l) | For the period September 30, 2020 (commencement of operations) through December 31, 2020. |
| (m) | For the period August 3, 2020 (commencement of operations) through December 31, 2020. |
The accompanying notes are an integral part of these financial statements.
116
| | | | | | | | | | | | | | | | | | | | | | | | | | | | | | | | | | | | | | | | | | | | | | | | |
| All America Fund | | | Small Cap Value Fund | | | |
Six Months
Ended
June 30,
2022
(Unaudited) | | | Years Ended December 31, | | | Six Months
Ended
June 30,
2022
(Unaudited) | | | Years Ended December 31, | | | |
| | 2021 | | | 2020(f) | | | 2019(f) | | | 2018(f) | | | 2017(f) | | | 2021 | | | 2020(f) | | | 2019(f) | | | 2018(f) | | | 2017(f) | | | |
| | | | | | | | | | | | |
| $ | 27.73 | | | $ | 24.18 | | | $ | 24.24 | | | $ | 20.50 | | | $ | 23.83 | | | $ | 22.91 | | | $ | 16.52 | | | $ | 13.45 | | | $ | 15.11 | | | $ | 13.58 | | | $ | 17.35 | | | $ | 16.88 | | | |
| | | | | | | | | | | | | | | | | | | | | | | | | | | | | | | | | | | | | | | | | | | | | | | | |
| | | | | | | | | | | | |
| | | | | | | | | | | | | | | | | | | | | | | | | | | | | | | | | | | | | | | | | | | | | | | | |
| | 0.13 | | | | 0.25 | | | | 0.34 | | | | 0.35 | | | | 0.32 | | | | 0.32 | | | | 0.08 | | | | 0.17 | | | | 0.23 | | | | 0.23 | | | | 0.18 | | | | 0.28 | | | |
| (5.67 | ) | | | 6.18 | | | | 3.31 | | | | 5.31 | | | | (2.04 | ) | | | 3.96 | | | | (2.41 | ) | | | 4.12 | | | | (1.03 | ) | | | 2.30 | | | | (2.42 | ) | | | 1.11 | | | |
| | | | | | | | | | | | | | | | | | | | | | | | | | | | | | | | | | | | | | | | | | | | | | | | |
| | | | | | | | | | | | |
| | (5.54 | ) | | | 6.43 | | | | 3.65 | | | | 5.66 | | | | (1.72 | ) | | | 4.28 | | | | (2.33 | ) | | | 4.29 | | | | (0.80 | ) | | | 2.53 | | | | (2.24 | ) | | | 1.39 | | | |
| | | | | | | | | | | | | | | | | | | | | | | | | | | | | | | | | | | | | | | | | | | | | | | | |
| | | | | | | | | | | | |
| | | | | | | | | | | | | | | | | | | | | | | | | | | | | | | | | | | | | | | | | | | | | | | | |
| | (0.11 | ) | | | (0.20 | ) | | | (0.63 | ) | | | (0.30 | ) | | | (0.31 | ) | | | (0.31 | ) | | | (0.07 | ) | | | (0.09 | ) | | | (0.41 | ) | | | (0.13 | ) | | | (0.25 | ) | | | (0.10 | ) | | |
| | — | | | | (2.68 | ) | | | (3.08 | ) | | | (1.62 | ) | | | (1.30 | ) | | | (3.05 | ) | | | — | | | | (1.13 | ) | | | (0.45 | ) | | | (0.87 | ) | | | (1.28 | ) | | | (0.82 | ) | | |
| | | | | | | | | | | | | | | | | | | | | | | | | | | | | | | | | | | | | | | | | | | | | | | | |
| | | | | | | | | | | | |
| | (0.11 | ) | | | (2.88 | ) | | | (3.71 | ) | | | (1.92 | ) | | | (1.61 | ) | | | (3.36 | ) | | | (0.07 | ) | | | (1.22 | ) | | | (0.86 | ) | | | (1.00 | ) | | | (1.53 | ) | | | (0.92 | ) | | |
| | | | | | | | | | | | | | | | | | | | | | | | | | | | | | | | | | | | | | | | | | | | | | | | |
| | | | | | | | | | | | |
| $ | 22.08 | | | $ | 27.73 | | | $ | 24.18 | | | $ | 24.24 | | | $ | 20.50 | | | $ | 23.83 | | | $ | 14.12 | | | $ | 16.52 | | | $ | 13.45 | | | $ | 15.11 | | | $ | 13.58 | | | $ | 17.35 | | | |
| | | | | | | | | | | | | | | | | | | | | | | | | | | | | | | | | | | | | | | | | | | | | | | | |
| | | | | | | | | | | | |
| | (20.00 | )(b) | | | 27.07 | | | | 16.78 | | | | 28.36 | | | | (8.27 | ) | | | 19.41 | | | | (14.13 | )(b) | | | 32.29 | | | | (4.01 | ) | | | 19.10 | | | | (14.57 | ) | | | 8.29 | | | |
| | 285 | | | | 374 | | | | 320 | | | | 312 | | | | 268 | | | | 325 | | | | 461 | | | | 580 | | | | 472 | | | | 518 | | | | 428 | | | | 506 | | | |
| | 0.98 | (c) | | | 0.90 | | | | 1.33 | | | | 1.43 | | | | 1.26 | | | | 1.33 | | | | 0.95 | (c) | | | 1.03 | | | | 1.90 | | | | 1.68 | | | | 1.10 | | | | 1.75 | | | |
|
0.53 |
(c) | | | 0.49 | | | | 0.52 | | | | 0.49 | | | | 0.52 | | | | 0.51 | | | | 0.82 | (c) | | | 0.80 | | | | 0.82 | | | | 0.81 | | | | 0.81 | | | | 0.81 | | | |
|
0.53 |
(c) | | | 0.49 | | | | 0.52 | | | | 0.49 | | | | 0.52 | | | | 0.51 | | | | 0.82 | (c) | | | 0.80 | | | | 0.82 | | | | 0.81 | | | | 0.81 | | | | 0.80 | (e) | | |
| | 6.26 | (b) | | | 19.84 | | | | 24.07 | | | | 26.06 | | | | 17.60 | | | | 22.28 | | | | 6.09 | (b) | | | 33.93 | | | | 42.64 | | | | 43.17 | | | | 29.58 | | | | 34.36 | | | |
The accompanying notes are an integral part of these financial statements.
117
MUTUAL OF AMERICA INVESTMENT CORPORATION
FINANCIAL HIGHLIGHTS (Continued)
| | | | | | | | | | | | | | | | | | | | | | | | |
| | | Small Cap Growth Fund | |
| | | Six Months
Ended
June 30,
2022
(Unaudited) | | |
Years Ended December 31, |
| | | 2021 | | | 2020(f) | | | 2019(f) | | | 2018(f) | | | 2017(f) | |
| | | | | | |
Net Asset Value, Beginning of Period | | $ | 16.22 | | | $ | 17.53 | | | $ | 14.63 | | | $ | 12.62 | | | $ | 15.44 | | | $ | 12.91 | |
| | | | | | | | | | | | | | | | | | | | | | | | |
| | | | | | |
INCOME (LOSS)FROM INVESTMENT OPERATIONS | | | | | | | | | | | | | | | | | | | | | | | | |
Net Investment Income (Loss) | | | (0.01 | ) | | | (0.03 | ) | | | (0.02 | ) | | | 0.02 | | | | 0.02 | | | | 0.01 | |
Net Realized and Unrealized Gains (Losses) on Investments and Futures Contracts | | | (4.87 | ) | | | 1.74 | | | | 6.01 | | | | 3.24 | | | | (1.72 | ) | | | 3.04 | |
| | | | | | | | | | | | | | | | | | | | | | | | |
| | | | | | |
Total From Investment Operations | | | (4.88 | ) | | | 1.71 | | | | 5.99 | | | | 3.26 | | | | (1.70 | ) | | | 3.05 | |
| | | | | | | | | | | | | | | | | | | | | | | | |
| | | | | | |
Less Distributions | | | | | | | | | | | | | | | | | | | | | | | | |
From Net Investment Income | | | — | | | | (0.01 | ) | | | (0.06 | ) | | | (0.01 | ) | | | — | (h) | | | — | (h) |
From Net Realized Gains | | | — | | | | (3.01 | ) | | | (3.03 | ) | | | (1.24 | ) | | | (1.12 | ) | | | (0.52 | ) |
Return of Capital | | | — | | | | — | | | | — | | | | — | | | | — | | | | — | |
| | | | | | | | | | | | | | | | | | | | | | | | |
| | | | | | |
Total Distributions | | | — | | | | (3.02 | ) | | | (3.09 | ) | | | (1.25 | ) | | | (1.12 | ) | | | (0.52 | ) |
| | | | | | | | | | | | | | | | | | | | | | | | |
| | | | | | |
Net Asset Value, End of Period | | $ | 11.34 | | | $ | 16.22 | | | $ | 17.53 | | | $ | 14.63 | | | $ | 12.62 | | | $ | 15.44 | |
| | | | | | | | | | | | | | | | | | | | | | | | |
| | | | | | |
Total Return (%)(i) | | | (30.09 | )(b) | | | 10.38 | | | | 43.31 | | | | 26.59 | | | | (12.53 | ) | | | 23.82 | |
Net Assets, End of Period ($ millions) | | | 458 | | | | 673 | | | | 667 | | | | 609 | | | | 483 | | | | 555 | |
Ratio of Net Investment Income (Loss) to Average Net Assets (%) | | | (0.21 | )(c) | | | (0.24 | ) | | | (0.17 | ) | | | 0.17 | | | | 0.13 | | | | 0.06 | |
Ratio of Expenses to Average Net Assets Before Expense Reimbursement (%) | | | 0.82 | (c) | | | 0.80 | | | | 0.81 | | | | 0.81 | | | | 0.81 | | | | 0.82 | |
Ratio of Expenses to Average Net Assets After Expense Reimbursement (%) | | | 0.82 | (c) | | | 0.80 | | | | 0.81 | | | | 0.81 | | | | 0.81 | | | | 0.80 | (e) |
Portfolio Turnover Rate (%)(a) | | | 28.99 | (b) | | | 45.18 | | | | 70.58 | | | | 56.25 | | | | 60.57 | | | | 62.33 | |
| (a) | Portfolio turnover rate excludes all short-term securities. |
| (d) | Allocation and Retirement Funds exclude expenses of the underlying funds. |
| (e) | Includes one time reimbursement from Adviser for non-advisory operating expenses (Note 2). |
| (f) | On September 25, 2020, the Mutual of America Investment Corporation Funds, with the exception of the Catholic Values Index Fund which commenced operations on September 30, 2020, had a 1 for 10 reverse share split. Historical net asset value per share and per share activity have been adjusted to reflect the split on a retroactive basis (Note 4). |
| (g) | For the period July 2, 2018 (commencement of operations) through December 31, 2018. |
| (h) | Amount is less than $0.005 per share. |
| (i) | Total return is calculated assuming a purchase of a share on the first day and a sale on the last day of each year or period reported and includes reinvestment of distributions, if any. For variable annuity owners or participants in a group variable annuity, the total return does not reflect the effect of fees and charges associated with your variable annuity contract and does not reflect expenses associated with the separate account such as administrative fees and account charges which, if reflected, would reduce the total returns for all years and periods shown. The total return for 2017 for the Funds subject to the one time reimbursement from the Adviser (Note 2) includes the impact of this reimbursement which was determined not to be material. Past performance is no guarantee of future results. Total returns for periods less than one full year are not annualized. |
| (j) | International Fund excludes the expenses of its ETF investments. |
| (k) | Amount is less than $0.00005 per share. |
| (l) | For the period September 30, 2020 (commencement of operations) through December 31, 2020. |
| (m) | For the period August 3, 2020 (commencement of operations) through December 31, 2020. |
The accompanying notes are an integral part of these financial statements.
118
| | | | | | | | | | | | | | | | | | | | | | | | | | | | | | | | | | | | | | | | | | | | | | | | | | | | | | | | | | | | | | | | | | | | |
| Small Cap Equity Index Fund | | | Mid Cap Value Fund | | | Mid-Cap Equity Index Fund | | | |
Six Months
Ended
June 30,
2022
(Unaudited) | | | Years Ended
December 31, | | | Period Ended
December 31,
2018(f)(g) | | | Six Months
Ended
June 30,
2022
(Unaudited) | | | Years Ended December 31, | | | Six Months
Ended
June 30,
2022
(Unaudited) | | | Years Ended December 31, |
| | 2021 | | | 2020(f) | | | 2019(f) | | | 2021 | | | 2020(f) | | | 2019(f) | | | 2018(f) | | | 2017(f) | | | 2021 | | | 2020(f) | | | 2019(f) | | | 2018(f) | | | 2017(f) | | | |
| | | | | | | | | | | | | | | | | |
| $ | 11.59 | | | $ | 10.74 | | | $ | 9.93 | | | $ | 8.28 | | | $ | 10.00 | | | $ | 19.21 | | | $ | 15.53 | | | $ | 16.36 | | | $ | 13.39 | | | $ | 17.12 | | | $ | 15.73 | | | $ | 25.12 | | | $ | 23.07 | | | $ | 22.45 | | | $ | 19.31 | | | $ | 23.42 | | | $ | 21.68 | | | |
| | | | | | | | | | | | | | | | | | | | | | | | | | | | | | | | | | | | | | | | | | | | | | | | | | | | | | | | | | | | | | | | | | | | |
| | | | | | | | | | | | | | | | | |
| | | | | | | | | | | | | | | | | | | | | | | | | | | | | | | | | | | | | | | | | | | | | | | | | | | | | | | | | | | | | | | | | | | | |
| | 0.06 | | | | 0.16 | | | | 0.07 | | | | 0. 14 | | | | 0.06 | | | | 0.12 | | | | 0.26 | | | | 0.44 | | | | 0.29 | | | | 0.27 | | | | 0.27 | | | | 0.17 | | | | 0.33 | | | | 0.32 | | | | 0.33 | | | | 0.34 | | | | 0.31 | | | |
| | (2.27 | ) | | | 2.62 | | | | 0.94 | | | | 1.72 | | | | (1.72 | ) | | | (2.74 | ) | | | 5.01 | | | | (0.14 | ) | | | 3.28 | | | | (2.41 | ) | | | 2.03 | | | | (5.09 | ) | | | 5.21 | | | | 2.37 | | | | 4.57 | | | | (2.66 | ) | | | 3.08 | | | |
| | | | | | | | | | | | | | | | | | | | | | | | | | | | | | | | | | | | | | | | | | | | | | | | | | | | | | | | | | | | | | | | | | | | |
| | | | | | | | | | | | | | | | | |
| | (2.21 | ) | | | 2.78 | | | | 1.01 | | | | 1.86 | | | | (1.66 | ) | | | (2.62 | ) | | | 5.27 | | | | 0.30 | | | | 3.57 | | | | (2.14 | ) | | | 2.30 | | | | (4.92 | ) | | | 5.54 | | | | 2.69 | | | | 4.90 | | | | (2.32 | ) | | | 3.39 | | | |
| | | | | | | | | | | | | | | | | | | | | | | | | | | | | | | | | | | | | | | | | | | | | | | | | | | | | | | | | | | | | | | | | | | | |
| | | | | | | | | | | | | | | | | |
| | | | | | | | | | | | | | | | | | | | | | | | | | | | | | | | | | | | | | | | | | | | | | | | | | | | | | | | | | | | | | | | | | | | |
| | (0.05 | ) | | | (0.15 | ) | | | (0.07 | ) | | | (0.13 | ) | | | (0.06 | ) | | | (0.11 | ) | | | (0.14 | ) | | | (0.53 | ) | | | (0.21 | ) | | | (0.29 | ) | | | (0.18 | ) | | | (0.15 | ) | | | (0.30 | ) | | | (0.59 | ) | | | (0.27 | ) | | | (0.32 | ) | | | (0.27 | ) | | |
| | — | | | | (1.78 | ) | | | (0.13 | ) | | | (0.08 | ) | | | — | (h) | | | — | | | | (1.45 | ) | | | (0.48 | ) | | | (0.39 | ) | | | (1.30 | ) | | | (0.73 | ) | | | — | | | | (3.19 | ) | | | (1.48 | ) | | | (1.49 | ) | | | (1.47 | ) | | | (1.38 | ) | | |
| | — | | | | — | | | | — | | | | — | | | | — | (h) | | | — | | | | — | | | | (0.12 | ) | | | — | | | | — | | | | — | | | | — | | | | — | | | | — | | | | — | | | | — | | | | — | | | |
| | | | | | | | | | | | | | | | | | | | | | | | | | | | | | | | | | | | | | | | | | | | | | | | | | | | | | | | | | | | | | | | | | | | |
| | | | | | | | | | | | | | | | | |
| | (0.05 | ) | | | (1.93 | ) | | | (0.20 | ) | | | (0.21 | ) | | | (0.06 | ) | | | (0.11 | ) | | | (1.59 | ) | | | (1.13 | ) | | | (0.60 | ) | | | (1.59 | ) | | | (0.91 | ) | | | (0.15 | ) | | | (3.49 | ) | | | (2.07 | ) | | | (1.76 | ) | | | (1.79 | ) | | | (1.65 | ) | | |
| | | | | | | | | | | | | | | | | | | | | | | | | | | | | | | | | | | | | | | | | | | | | | | | | | | | | | | | | | | | | | | | | | | | |
| | | | | | | | | | | | | | | | | |
| $ | 9.33 | | | $ | 11.59 | | | $ | 10.74 | | | $ | 9.93 | | | $ | 8.28 | | | $ | 16.48 | | | $ | 19.21 | | | $ | 15.53 | | | $ | 16.36 | | | $ | 13.39 | | | $ | 17.12 | | | $ | 20.05 | | | $ | 25.12 | | | $ | 23.07 | | | $ | 22.45 | | | $ | 19.31 | | | $ | 23.42 | | | |
| | | | | | | | | | | | | | | | | | | | | | | | | | | | | | | | | | | | | | | | | | | | | | | | | | | | | | | | | | | | | | | | | | | | |
| | | | | | | | | | | | | | | | | |
| | (19.09 | )(b) | | | 26.56 | | | | 10.62 | | | | 22.40 | | | | (16.54 | )(b) | | | (13.67 | )(b) | | | 34.35 | | | | 2.82 | | | | 27.04 | | | | (14.08 | ) | | | 14.92 | | | | (19.62 | )(b) | | | 24.56 | | | | 13.50 | | | | 26.01 | | | | (11.26 | ) | | | 16.05 | | | |
| | 140 | | | | 143 | | | | 107 | | | | 29 | | | | 17 | | | | 119 | | | | 131 | | | | 90 | | | | 99 | | | | 80 | | | | 103 | | | | 1,536 | | | | 2,118 | | | | 1,856 | | | | 1,681 | | | | 1,281 | | | | 1,452 | | | |
| | 1.33 | (c) | | | 1.29 | | | | 1.51 | | | | 1.50 | | | | 1.51 | (c) | | | 1.40 | (c) | | | 1.47 | | | | 2.96 | | | | 1.85 | | | | 1.51 | | | | 1.55 | | | | 1.41 | (c) | | | 1.24 | | | | 1.56 | | | | 1.67 | | | | 1.52 | | | | 1.46 | | | |
| | 0.23 | (c) | | | 0.25 | | | | 0.39 | | | | 0.42 | | | | 1.61 | (c) | | | 0.68 | (c) | | | 0.65 | | | | 0.74 | | | | 0.66 | | | | 0.65 | | | | 0.64 | | | | 0.15 | (c) | | | 0.14 | | | | 0.15 | | | | 0.13 | | | | 0.14 | | | | 0.14 | | | |
| | 0.15 | (c) | | | 0.14 | | | | 0.12 | | | | 0.14 | | | | 0.14 | (c) | | | 0.68 | (c) | | | 0.65 | | | | 0.74 | | | | 0.66 | | | | 0.65 | | | | 0.64 | | | | 0.15 | (c) | | | 0.14 | | | | 0.15 | | | | 0.13 | | | | 0.14 | | | | 0.14 | (e) | | |
| | 13.59 | (b) | | | 69.91 | | | | 42.67 | | | | 97.06 | | | | 81.79 | | | | 5.27 | (b) | | | 23.84 | | | | 23.65 | | | | 17.65 | | | | 10.75 | | | | 24.09 | | | | 8.38 | (b) | | | 25.62 | | | | 13.14 | | | | 14.30 | | | | 20.26 | | | | 19.36 | | | |
The accompanying notes are an integral part of these financial statements.
119
MUTUAL OF AMERICA INVESTMENT CORPORATION
FINANCIAL HIGHLIGHTS (Continued)
| | | | | | | | | | | | | | | | | | | | | | | | |
| | | Composite Fund | |
| | | Six Months
Ended
June 30,
2022
(Unaudited) | | | Years Ended December 31, |
| | | 2021 | | | 2020(f) | | | 2019(f) | | | 2018(f) | | | 2017(f) | |
| | | | | | |
Net Asset Value, Beginning of Period | | $ | 21.18 | | | $ | 19.16 | | | $ | 18.68 | | | $ | 16.75 | | | $ | 19.08 | | | $ | 19.48 | |
| | | | | | | | | | | | | | | | | | | | | | | | |
| | | | | | |
INCOME (LOSS)FROM INVESTMENT OPERATIONS | | | | | | | | | | | | | | | | | | | | | | | | |
Net Investment Income (Loss) | | | 0.17 | | | | 0.32 | | | | 0.37 | | | | 0.39 | | | | 0.41 | | | | 0.41 | |
Net Realized and Unrealized Gains (Losses) on Investments and Futures Contracts | | | (3.06 | ) | | | 2.80 | | | | 1.75 | | | | 2.78 | | | | (0.86 | ) | | | 2.08 | |
| | | | | | | | | | | | | | | | | | | | | | | | |
| | | | | | |
Total From Investment Operations | | | (2.89 | ) | | | 3.12 | | | | 2.12 | | | | 3.17 | | | | (0.45 | ) | | | 2.49 | |
| | | | | | | | | | | | | | | | | | | | | | | | |
| | | | | | |
Less Distributions | | | | | | | | | | | | | | | | | | | | | | | | |
From Net Investment Income | | | (0.14 | ) | | | (0.32 | ) | | | (0.77 | ) | | | (0.41 | ) | | | (0.40 | ) | | | (0.43 | ) |
From Net Realized Gains | | | — | | | | (0.78 | ) | | | (0.87 | ) | | | (0.83 | ) | | | (1.48 | ) | | | (2.46 | ) |
Return of Capital | | | — | | | | — | | | | — | | | | — | | | | — | | | | — | |
| | | | | | | | | | | | | | | | | | | | | | | | |
| | | | | | |
Total Distributions | | | (0.14 | ) | | | (1.10 | ) | | | (1.64 | ) | | | (1.24 | ) | | | (1.88 | ) | | | (2.89 | ) |
| | | | | | | | | | | | | | | | | | | | | | | | |
| | | | | | |
Net Asset Value, End of Period | | $ | 18.15 | | | $ | 21.18 | | | $ | 19.16 | | | $ | 18.68 | | | $ | 16.75 | | | $ | 19.08 | |
| | | | | | | | | | | | | | | | | | | | | | | | |
| | | | | | |
Total Return (%)(i) | | | (13.64 | )(b) | | | 16.48 | | | | 11.77 | | | | 19.37 | | | | (3.20 | ) | | | 13.37 | |
Net Assets, End of Period ($ millions) | | | 185 | | | | 218 | | | | 191 | | | | 194 | | | | 172 | | | | 190 | |
Ratio of Net Investment Income (Loss) to Average Net Assets (%) | | | 1.67 | (c) | | | 1.53 | | | | 1.76 | | | | 2.12 | | | | 2.16 | | | | 2.11 | |
Ratio of Expenses to Average Net Assets Before Expense Reimbursement (%)(d)(j) | | | 0.52 | (c) | | | 0.46 | | | | 0.54 | | | | 0.50 | | | | 0.51 | | | | 0.51 | |
Ratio of Expenses to Average Net Assets After Expense Reimbursement (%)(d)(j) | | | 0.52 | (c) | | | 0.46 | | | | 0.54 | | | | 0.50 | | | | 0.51 | | | | 0.50 | (e) |
Portfolio Turnover Rate (%)(a) | | | 15.20 | (b) | | | 23.68 | | | | 38.58 | | | | 41.92 | | | | 37.37 | | | | 60.13 | |
| (a) | Portfolio turnover rate excludes all short-term securities. |
| (d) | Allocation and Retirement Funds exclude expenses of the underlying funds. |
| (e) | Includes one time reimbursement from Adviser for non-advisory operating expenses (Note 2). |
| (f) | On September 25, 2020, the Mutual of America Investment Corporation Funds, with the exception of the Catholic Values Index Fund which commenced operations on September 30, 2020, had a 1 for 10 reverse share split. Historical net asset value per share and per share activity have been adjusted to reflect the split on a retroactive basis (Note 4). |
| (g) | For the period July 2, 2018 (commencement of operations) through December 31, 2018. |
| (h) | Amount is less than $0.005 per share. |
| (i) | Total return is calculated assuming a purchase of a share on the first day and a sale on the last day of each year or period reported and includes reinvestment of distributions, if any. For variable annuity owners or participants in a group variable annuity, the total return does not reflect the effect of fees and charges associated with your variable annuity contract and does not reflect expenses associated with the separate account such as administrative fees and account charges which, if reflected, would reduce the total returns for all years and periods shown. The total return for 2017 for the Funds subject to the one time reimbursement from the Adviser (Note 2) includes the impact of this reimbursement which was determined not to be material. Past performance is no guarantee of future results. Total returns for periods less than one full year are not annualized. |
| (j) | International Fund excludes the expenses of its ETF investments. |
| (k) | Amount is less than $0.00005 per share. |
| (l) | For the period September 30, 2020 (commencement of operations) through December 31, 2020. |
| (m) | For the period August 3, 2020 (commencement of operations) through December 31, 2020. |
The accompanying notes are an integral part of these financial statements.
120
| | | | | | | | | | | | | | | | | | | | | | | | | | | | | | | | | | | | | | | | | | | | | | | | | | | | | | | | | | | | |
| International Fund | | | Catholic Values Index Fund | | | Retirement Income Fund | | | |
Six Months
Ended
June 30,
2022
(Unaudited) | | | Years Ended December 31, | | | Six Months
Ended
June 30,
2022
(Unaudited) | | | Period Ended
December 31, | | | Six Months
Ended
June 30,
2022
(Unaudited) | | | Years Ended December 31, | | | |
| | 2021 | | | 2020(f) | | | 2019(f) | | | 2018(f) | | | 2017(f) | | | 2021 | | | 2020(l) | | | 2021 | | | 2020(f) | | | 2019(f) | | | 2018(f) | | | 2017(f) | | | |
| | | | | | | | | | | | | | | |
| $ | 9.26 | | | $ | 9.34 | | | $ | 9.05 | | | $ | 7.66 | | | $ | 9.04 | | | $ | 7.43 | | | $ | 14.06 | | | $ | 11.17 | | | $ | 10.00 | | | $ | 12.26 | | | $ | 12.09 | | | $ | 12.09 | | | $ | 11.18 | | | $ | 11.67 | | | $ | 11.25 | | | |
| | | | | | | | | | | | | | | | | | | | | | | | | | | | | | | | | | | | | | | | | | | | | | | | | | | | | | | | | | | | |
| | | | | | | | | | | | | | | |
| | | | | | | | | | | | | | | | | | | | | | | | | | | | | | | | | | | | | | | | | | | | | | | | | | | | | | | | | | | | |
| | 0.21 | | | | 0.20 | | | | 0.14 | | | | 0.23 | | | | 0.22 | | | | 0.19 | | | | 0.07 | | | | 0.15 | | | | 0.04 | | | | 0.06 | | | | 0.15 | | | | 0.41 | | | | 0.18 | | | | 0.20 | | | | 0.19 | | | |
| | (1.68 | ) | | | 0.74 | | | | 0.56 | | | | 1.36 | | | | (1.40 | ) | | | 1.62 | | | | (3.13 | ) | | | 3.07 | | | | 1.17 | | | | (1.35 | ) | | | 0.54 | | | | 0.49 | | | | 1.14 | | | | (0.33 | ) | | | 0.63 | | | |
| | | | | | | | | | | | | | | | | | | | | | | | | | | | | | | | | | | | | | | | | | | | | | | | | | | | | | | | | | | | |
| | | | | | | | | | | | | | | |
| | (1.47 | ) | | | 0.94 | | | | 0.70 | | | | 1.59 | | | | (1.18 | ) | | | 1.81 | | | | (3.06 | ) | | | 3.22 | | | | 1.21 | | | | (1.29 | ) | | | 0.69 | | | | 0.90 | | | | 1.32 | | | | (0.13 | ) | | | 0.82 | | | |
| | | | | | | | | | | | | | | | | | | | | | | | | | | | | | | | | | | | | | | | | | | | | | | | | | | | | | | | | | | | |
| | | | | | | | | | | | | | | |
| | | | | | | | | | | | | | | | | | | | | | | | | | | | | | | | | | | | | | | | | | | | | | | | | | | | | | | | | | | | |
| | (0.20 | ) | | | (0.16 | ) | | | (0.38 | ) | | | (0.20 | ) | | | (0.20 | ) | | | (0.18 | ) | | | (0.07 | ) | | | (0.14 | ) | | | (0.04 | ) | | | (0.06 | ) | | | (0.16 | ) | | | (0.60 | ) | | | (0.20 | ) | | | (0.20 | ) | | | (0.21 | ) | | |
| | — | | | | (0.86 | ) | | | (0.03 | ) | | | — | | | | — | (h) | | | (0.02 | ) | | | — | | | | (0.19 | ) | | | — | (h) | | | — | | | | (0.36 | ) | | | (0.30 | ) | | | (0.21 | ) | | | (0.16 | ) | | | (0.19 | ) | | |
| | — | | | | — | | | | — | (h) | | | — | | | | — | | | | — | | | | — | | | | — | | | | — | | | | — | | | | — | | | | — | | | | — | | | | — | | | | — | | | |
| | | | | | | | | | | | | | | | | | | | | | | | | | | | | | | | | | | | | | | | | | | | | | | | | | | | | | | | | | | | |
| | | | | | | | | | | | | | | |
| | (0.20 | ) | | | (1.02 | ) | | | (0.41 | ) | | | (0.20 | ) | | | (0.20 | ) | | | (0.20 | ) | | | (0.07 | ) | | | (0.33 | ) | | | (0.04 | ) | | | (0.06 | ) | | | (0.52 | ) | | | (0.90 | ) | | | (0.41 | ) | | | (0.36 | ) | | | (0.40 | ) | | |
| | | | | | | | | | | | | | | | | | | | | | | | | | | | | | | | | | | | | | | | | | | | | | | | | | | | | | | | | | | | |
| | | | | | | | | | | | | | | |
| $ | 7.59 | | | $ | 9.26 | | | $ | 9.34 | | | $ | 9.05 | | | $ | 7.66 | | | $ | 9.04 | | | $ | 10.93 | | | $ | 14.06 | | | $ | 11.17 | | | $ | 10.91 | | | $ | 12.26 | | | $ | 12.09 | | | $ | 12.09 | | | $ | 11.18 | | | $ | 11.67 | | | |
| | | | | | | | | | | | | | | | | | | | | | | | | | | | | | | | | | | | | | | | | | | | | | | | | | | | | | | | | | | | |
| | | | | | | | | | | | | | | |
| | (15.99 | )(b) | | | 10.37 | | | | 8.19 | | | | 21.01 | | | | (13.36 | ) | | | 24.47 | | | | (21.81 | )(b) | | | 28.99 | | | | 12.12 | (b) | | | (10.48 | )(b) | | | 5.77 | | | | 7.59 | | | | 11.85 | | | | (1.21 | ) | | | 7.35 | | | |
| | 1,089 | | | | 1,203 | | | | 940 | | | | 720 | | | | 509 | | | | 537 | | | | 4 | | | | 5 | | | | 3 | | | | 203 | | | | 224 | | | | 193 | | | | 138 | | | | 101 | | | | 101 | | | |
| | 5.23 | (c) | | | 2.05 | | | | 2.20 | | | | 3.26 | | | | 2.75 | | | | 2.67 | | | | 1.25 | (c) | | | 1.16 | | | | 1.57 | (c) | | | 1.12 | (c) | | | 1.22 | | | | 4.25 | | | | 1.87 | | | | 1.82 | | | | 2.01 | | | |
| | 0.15 | (c) | | | 0.12 | | | | 0.13 | | | | 0.12 | | | | 0.12 | | | | 0.12 | | | | 1.70 | (c) | | | 2.14 | | | | 2.18 | (c) | | | 0.13 | (c) | | | 0.11 | | | | 0.11 | | | | 0.12 | | | | 0.08 | | | | 0.08 | | | |
| | 0.15 | (c) | | | 0.12 | | | | 0.13 | | | | 0.12 | | | | 0.12 | | | | 0.12 | (e) | | | 0.22 | (c) | | | 0.22 | | | | 0.15 | (c) | | | 0.13 | (c) | | | 0.11 | | | | 0.11 | | | | 0.12 | | | | 0.08 | | | | 0.06 | (e) | | |
| | 9.44 | (b) | | | 123.53 | | | | 4.69 | | | | 3.61 | | | | — | | | | — | | | | 6.39 | (b) | | | 9.54 | | | | 16.38 | (b) | | | 22.15 | (b) | | | 28.07 | | | | 23.13 | | | | 10.49 | | | | 21.90 | | | | 18.54 | | | |
The accompanying notes are an integral part of these financial statements.
121
MUTUAL OF AMERICA INVESTMENT CORPORATION
FINANCIAL HIGHLIGHTS (Continued)
| | | | | | | | | | | | | | | | | | | | | | | | |
| | | 2015 Retirement Fund | |
| | | Six Months
Ended
June 30,
2022
(Unaudited) | | | Years Ended December 31, |
| | | 2021 | | | 2020(f) | | | 2019(f) | | | 2018(f) | | | 2017(f) | |
| | | | | | |
Net Asset Value, Beginning of Period | | $ | 9.45 | | | $ | 9.90 | | | $ | 10.49 | | | $ | 9.73 | | | $ | 10.67 | | | $ | 10.30 | |
| | | | | | | | | | | | | | | | | | | | | | | | |
| | | | | | |
INCOME (LOSS)FROM INVESTMENT OPERATIONS | | | | | | | | | | | | | | | | | | | | | | | | |
Net Investment Income (Loss) | | | 0.05 | | | | 0.13 | | | | 0.39 | | | | 0.20 | | | | 0.21 | | | | 0.23 | |
Net Realized and Unrealized Gains (Losses) on Investments and Futures Contracts | | | (1.15 | ) | | | 0.63 | | | | 0.37 | | | | 1.27 | | | | (0.49 | ) | | | 0.84 | |
| | | | | | | | | | | | | | | | | | | | | | | | |
| | | | | | |
Total From Investment Operations | | | (1.10 | ) | | | 0.76 | | | | 0.76 | | | | 1.47 | | | | (0.28 | ) | | | 1.07 | |
| | | | | | | | | | | | | | | | | | | | | | | | |
| | | | | | |
Less Distributions | | | | | | | | | | | | | | | | | | | | | | | | |
From Net Investment Income | | | (0.05 | ) | | | (0.15 | ) | | | (0.59 | ) | | | (0.22 | ) | | | (0.21 | ) | | | (0.22 | ) |
From Net Realized Gains | | | — | | | | (1.09 | ) | | | (0.76 | ) | | | (0.49 | ) | | | (0.45 | ) | | | (0.48 | ) |
| | | | | | | | | | | | | | | | | | | | | | | | |
| | | | | | |
Total Distributions | | | (0.05 | ) | | | (1.24 | ) | | | (1.35 | ) | | | (0.71 | ) | | | (0.66 | ) | | | (0.70 | ) |
| | | | | | | | | | | | | | | | | | | | | | | | |
| | | | | | |
Capital Contribution from Adviser | | | (0.03 | )(n) | | | 0.03 | (n) | | | — | | | | — | | | | — | | | | — | |
| | | | | | | | | | | | | | | | | | | | | | | | |
| | | | | | |
Net Asset Value, End of Period | | $ | 8.27 | | | $ | 9.45 | | | $ | 9.90 | | | $ | 10.49 | | | $ | 9.73 | | | $ | 10.67 | |
| | | | | | | | | | | | | | | | | | | | | | | | |
| | | | | | |
Total Return (%)(i) | | | (11.94 | )(b) | | | 8.11 | | | | 7.65 | | | | 15.34 | | | | (3.01 | ) | | | 10.64 | |
Net Assets, End of Period ($ millions) | | | 120 | | | | 141 | | | | 140 | | | | 149 | | | | 138 | | | | 155 | |
Ratio of Net Investment Income (Loss) to Average Net Assets (%) | | | 1.15 | (c) | | | 1.26 | | | | 3.63 | | | | 1.81 | | | | 1.83 | | | | 1.85 | |
Ratio of Expenses to Average Net Assets Before Expense
Reimbursement (%)(d) | | | 0.16 | (c) | | | 0.13 | | | | 0.12 | | | | 0.11 | | | | 0.07 | | | | 0.07 | |
Ratio of Expenses to Average Net Assets After Expense Reimbursement (%)(d) | | | 0.16 | (c) | | | 0.13 | | | | 0.12 | | | | 0.11 | | | | 0.07 | | | | 0.07 | |
Portfolio Turnover Rate (%)(a) | | | 15.23 | (b) | | | 24.63 | | | | 25.28 | | | | 13.69 | | | | 14.75 | | | | 14.98 | |
| (a) | Portfolio turnover rate excludes all short-term securities. |
| (d) | Allocation and Retirement Funds exclude expenses of the underlying funds. |
| (e) | Includes one time reimbursement from Adviser for non-advisory operating expenses (Note 2). |
| (f) | On September 25, 2020, the Mutual of America Investment Corporation Funds, with the exception of the Catholic Values Index Fund which commenced operations on September 30, 2020, had a 1 for 10 reverse share split. Historical net asset value per share and per share activity have been adjusted to reflect the split on a retroactive basis (Note 4). |
| (g) | For the period July 2, 2018 (commencement of operations) through December 31, 2018. |
| (h) | Amount is less than $0.005 per share. |
| (i) | Total return is calculated assuming a purchase of a share on the first day and a sale on the last day of each year or period reported and includes reinvestment of distributions, if any. For variable annuity owners or participants in a group variable annuity, the total return does not reflect the effect of fees and charges associated with your variable annuity contract and does not reflect expenses associated with the separate account such as administrative fees and account charges which, if reflected, would reduce the total returns for all years and periods shown. The total return for 2017 for the Funds subject to the one time reimbursement from the Adviser (Note 2) includes the impact of this reimbursement which was determined not to be material. Past performance is no guarantee of future results. Total returns for periods less than one full year are not annualized. |
| (j) | International Fund excludes the expenses of its ETF investments. |
| (k) | Amount is less than $0.00005 per share. |
| (l) | For the period September 30, 2020 (commencement of operations) through December 31, 2020. |
| (m) | For the period August 3, 2020 (commencement of operations) through December 31, 2020. |
| (n) | In 2021, the Fund had accrued a non-recurring capital contribution from Mutual of America Capital Management LLC of $410,599 to reflect the estimated lost opportunity cost arising when a portion of the portfolio was uninvested. The 2022 amount disclosed includes adjustments to the prior accrual to record the final settlement amount of the capital contribution accrued as of December 31, 2021. |
The accompanying notes are an integral part of these financial statements.
122
| | | | | | | | | | | | | | | | | | | | | | | | | | | | | | | | | | | | | | | | | | | | | | | | |
| 2020 Retirement Fund | | | 2025 Retirement Fund | | | |
Six Months
Ended
June 30,
2022
(Unaudited) | | | Years Ended December 31, | | | Six Months
Ended
June 30,
2022
(Unaudited) | | | Years Ended December 31, | | | |
| | 2021 | | | 2020(f) | | | 2019(f) | | | 2018(f) | | | 2017(f) | | | 2021 | | | 2020(f) | | | 2019(f) | | | 2018(f) | | | 2017(f) | | | |
| | | | | | | | | | | | |
| $ | 12.16 | | | $ | 11.84 | | | $ | 12.42 | | | $ | 11.25 | | | $ | 12.25 | | | $ | 11.43 | | | $ | 13.97 | | | $ | 13.29 | | | $ | 13.65 | | | $ | 12.02 | | | $ | 13.29 | | | $ | 12.12 | | | |
| | | | | | | | | | | | | | | | | | | | | | | | | | | | | | | | | | | | | | | | | | | | | | | | |
| | | | | | | | | | | | |
| | | | | | | | | | | | | | | | | | | | | | | | | | | | | | | | | | | | | | | | | | | | | | | | |
| | 0.08 | | | | 0.16 | | | | 0.46 | | | | 0.22 | | | | 0.22 | | | | 0.20 | | | | 0.09 | | | | 0.18 | | | | 0.48 | | | | 0.20 | | | | 0.21 | | | | 0.17 | | | |
| | (1.68 | ) | |
|
0.99 |
| | | 0.62 | | | | 1.71 | | | | (0.67 | ) | | | 1.21 | | | | (2.07 | ) | | | 1.39 | | | | 0.85 | | | | 2.15 | | | | (0.84 | ) | | | 1.56 | | | |
| | | | | | | | | | | | | | | | | | | | | | | | | | | | | | | | | | | | | | | | | | | | | | | | |
| | | | | | | | | | | | |
| | (1.60 | ) | | | 1.15 | | | | 1.08 | | | | 1.93 | | | | (0.45 | ) | | | 1.41 | | | | (1.98 | ) | | | 1.57 | | | | 1.33 | | | | 2.35 | | | | (0.63 | ) | | | 1.73 | | | |
| | | | | | | | | | | | | | | | | | | | | | | | | | | | | | | | | | | | | | | | | | | | | | | | |
| | | | | | | | | | | | |
| | | | | | | | | | | | | | | | | | | | | | | | | | | | | | | | | | | | | | | | | | | | | | | | |
| | (0.08 | ) | | | (0.20 | ) | | | (0.70 | ) | | | (0.23 | ) | | | (0.22 | ) | | | (0.20 | ) | | | (0.10 | ) | | | (0.23 | ) | | | (0.72 | ) | | | (0.23 | ) | | | (0.21 | ) | | | (0.18 | ) | | |
| | — | | | | (0.63 | ) | | | (0.96 | ) | | | (0.53 | ) | | | (0.33 | ) | | | (0.39 | ) | | | — | | | | (0.66 | ) | | | (0.97 | ) | | | (0.49 | ) | | | (0.43 | ) | | | (0.38 | ) | | |
| | | | | | | | | | | | | | | | | | | | | | | | | | | | | | | | | | | | | | | | | | | | | | | | |
| | | | | | | | | | | | |
| | (0.08 | ) | | | (0.83 | ) | | | (1.66 | ) | | | (0.76 | ) | | | (0.55 | ) | | | (0.59 | ) | | | (0.10 | ) | | | (0.89 | ) | | | (1.69 | ) | | | (0.72 | ) | | | (0.64 | ) | | | (0.56 | ) | | |
| | | | | | | | | | | | | | | | | | | | | | | | | | | | | | | | | | | | | | | | | | | | | | | | |
| | | | | | | | | | | | |
| | — | | | | — | | | | — | | | | — | | | | — | | | | — | | | | — | | | | — | | | | — | | | | — | | | | — | | | | — | | | |
| | | | | | | | | | | | | | | | | | | | | | | | | | | | | | | | | | | | | | | | | | | | | | | | |
| | | | | | | | | | | | |
| $ | 10.48 | | | $ | 12.16 | | | $ | 11.84 | | | $ | 12.42 | | | $ | 11.25 | | | $ | 12.25 | | | $ | 11.89 | | | $ | 13.97 | | | $ | 13.29 | | | $ | 13.65 | | | $ | 12.02 | | | $ | 13.29 | | | |
| | | | | | | | | | | | | | | | | | | | | | | | | | | | | | | | | | | | | | | | | | | | | | | | |
| | | | | | | | | | | | |
| | (13.17 | )(b) | | | 9.80 | | | | 9.11 | | | | 17.53 | | | | (4.04 | ) | | | 12.52 | | | | (14.21 | )(b) | | | 11.96 | | | | 10.26 | | | | 19.79 | | | | (5.22 | ) | | | 14.44 | | | |
| | 517 | | | | 621 | | | | 594 | | | | 608 | | | | 515 | | | | 525 | | | | 1,033 | | | | 1,203 | | | | 1,020 | | | | 946 | | | | 710 | | | | 686 | | | |
| | 1.37 | (c) | | | 1.29 | | | | 3.66 | | | | 1.85 | | | | 1.89 | | | | 1.89 | | | | 1.48 | (c) | | | 1.29 | | | | 3.68 | | | | 1.81 | | | | 1.81 | | | | 1.81 | | | |
| | 0.09 | (c) | | | 0.08 | | | | 0.07 | | | | 0.08 | | | | 0.07 | | | | 0.07 | | | | 0.08 | (c) | | | 0.08 | | | | 0.07 | | | | 0.07 | | | | 0.06 | | | | 0.07 | | | |
| | 0.09 | (c) | | | 0.08 | | | | 0.07 | | | | 0.08 | | | | 0.07 | | | | 0.07 | | | | 0.08 | (c) | | | 0.08 | | | | 0.07 | | | | 0.07 | | | | 0.06 | | | | 0.07 | | | |
| | 9.67 | (b) | | | 22.78 | | | | 22.40 | | | | 10.33 | | | | 10.84 | | | | 7.09 | | | | 9.61 | (b) | | | 15.42 | | | | 16.72 | | | | 5.08 | | | | 6.74 | | | | 5.78 | | | |
The accompanying notes are an integral part of these financial statements.
123
MUTUAL OF AMERICA INVESTMENT CORPORATION
FINANCIAL HIGHLIGHTS (Continued)
| | | | | | | | | | | | | | | | | | | | | | | | |
| | | 2030 Retirement Fund |
| | | Six Months
Ended
June 30,
2022
(Unaudited) | | | Years Ended December 31, |
| | | 2021 | | | 2020(f) | | | 2019(f) | | | 2018(f) | | | 2017(f) | |
| | | | | | |
Net Asset Value, Beginning of Period | | $ | 15.25 | | | $ | 14.08 | | | $ | 14.32 | | | $ | 12.36 | | | $ | 13.82 | | | $ | 12.46 | |
| | | | | | | | | | | | | | | | | | | | | | | | |
| | | | | | |
INCOME (LOSS)FROM INVESTMENT OPERATIONS | | | | | | | | | | | | | | | | | | | | | | | | |
Net Investment Income (Loss) | | | 0.11 | | | | 0.19 | | | | 0.48 | | | | 0.20 | | | | 0.20 | | | | 0.16 | |
Net Realized and Unrealized Gains (Losses) on Investments and Futures Contracts | | | (2.48 | ) | | | 1.94 | | | | 1.10 | | | | 2.47 | | | | (1.02 | ) | | | 1.81 | |
| | | | | | | | | | | | | | | | | | | | | | | | |
| | | | | | |
Total From Investment Operations | | | (2.37 | ) | | | 2.13 | | | | 1.58 | | | | 2.67 | | | | (0.82 | ) | | | 1.97 | |
| | | | | | | | | | | | | | | | | | | | | | | | |
| | | | | | |
Less Distributions | | | | | | | | | | | | | | | | | | | | | | | | |
From Net Investment Income | | | (0.11 | ) | | | (0.26 | ) | | | (0.73 | ) | | | (0.22 | ) | | | (0.20 | ) | | | (0.17 | ) |
From Net Realized Gains | | | — | | | | (0.70 | ) | | | (1.09 | ) | | | (0.49 | ) | | | (0.44 | ) | | | (0.44 | ) |
| | | | | | | | | | | | | | | | | | | | | | | | |
| | | | | | |
Total Distributions | | | (0.11 | ) | | | (0.96 | ) | | | (1.82 | ) | | | (0.71 | ) | | | (0.64 | ) | | | (0.61 | ) |
| | | | | | | | | | | | | | | | | | | | | | | | |
| | | | | | |
Net Asset Value, End of Period | | $ | 12.77 | | | $ | 15.25 | | | $ | 14.08 | | | $ | 14.32 | | | $ | 12.36 | | | $ | 13.82 | |
| | | | | | | | | | | | | | | | | | | | | | | | |
| | | | | | |
Total Return (%)(i) | | | (15.56 | )(b) | | | 15.29 | | | | 11.67 | | | | 21.93 | | | | (6.49 | ) | | | 16.01 | |
Net Assets, End of Period ($ millions) | | | 1,067 | | | | 1,231 | | | | 981 | | | | 854 | | | | 617 | | | | 578 | |
Ratio of Net Investment Income (Loss) to Average Net Assets (%) | | | 1.54 | (c) | | | 1.25 | | | | 3.67 | | | | 1.71 | | | | 1.74 | | | | 1.69 | |
Ratio of Expenses to Average Net Assets Before Expense Reimbursement (%)(d) | | | 0.08 | (c) | | | 0.08 | | | | 0.07 | | | | 0.07 | | | | 0.07 | | | | 0.07 | |
Ratio of Expenses to Average Net Assets After Expense Reimbursement (%)(d) | | | 0.08 | (c) | | | 0.08 | | | | 0.07 | | | | 0.07 | | | | 0.07 | | | | 0.07 | |
Portfolio Turnover Rate (%)(a) | | | 7.55 | (b) | | | 13.45 | | | | 12.53 | | | | 4.23 | | | | 5.01 | | | | 5.75 | |
| (a) | Portfolio turnover rate excludes all short-term securities. |
| (d) | Allocation and Retirement Funds exclude expenses of the underlying funds. |
| (e) | Includes one time reimbursement from Adviser for non-advisory operating expenses (Note 2). |
| (f) | On September 25, 2020, the Mutual of America Investment Corporation Funds, with the exception of the Catholic Values Index Fund which commenced operations on September 30, 2020, had a 1 for 10 reverse share split. Historical net asset value per share and per share activity have been adjusted to reflect the split on a retroactive basis (Note 4). |
| (g) | For the period July 2, 2018 (commencement of operations) through December 31, 2018. |
| (h) | Amount is less than $0.005 per share. |
| (i) | Total return is calculated assuming a purchase of a share on the first day and a sale on the last day of each year or period reported and includes reinvestment of distributions, if any. For variable annuity owners or participants in a group variable annuity, the total return does not reflect the effect of fees and charges associated with your variable annuity contract and does not reflect expenses associated with the separate account such as administrative fees and account charges which, if reflected, would reduce the total returns for all years and periods shown. The total return for 2017 for the Funds subject to the one time reimbursement from the Adviser (Note 2) includes the impact of this reimbursement which was determined not to be material. Past performance is no guarantee of future results. Total returns for periods less than one full year are not annualized. |
| (j) | International Fund excludes the expenses of its ETF investments. |
| (k) | Amount is less than $0.00005 per share. |
| (l) | For the period September 30, 2020 (commencement of operations) through December 31, 2020. |
| (m) | For the period August 3, 2020 (commencement of operations) through December 31, 2020. |
The accompanying notes are an integral part of these financial statements.
124
| | | | | | | | | | | | | | | | | | | | | | | | | | | | | | | | | | | | | | | | | | | | | | | | |
| 2035 Retirement Fund | | | 2040 Retirement Fund | | | |
Six Months
Ended
June 30,
2022
(Unaudited) | | | Years Ended December 31, | | | Six Months
Ended
June 30,
2022
(Unaudited) | | | Years Ended December 31, | | | |
| | 2021 | | | 2020(f) | | | 2019(f) | | | 2018(f) | | | 2017(f) | | | 2021 | | | 2020(f) | | | 2019(f) | | | 2018(f) | | | 2017(f) | | | |
| | | | | | | | | | | | |
| $ | 16.00 | | | $ | 14.40 | | | $ | 14.59 | | | $ | 12.43 | | | $ | 14.01 | | | $ | 12.52 | | | $ | 16.15 | | | $ | 14.44 | | | $ | 14.48 | | | $ | 12.23 | | | $ | 13.86 | | | $ | 12.39 | | | |
| | | | | | | | | | | | | | | | | | | | | | | | | | | | | | | | | | | | | | | | | | | | | | | | |
| | | | | | | | | | | | |
| | | | | | | | | | | | | | | | | | | | | | | | | | | | | | | | | | | | | | | | | | | | | | | | |
| | 0.12 | | | | 0.20 | | | | 0.48 | | | | 0.19 | | | | 0.19 | | | | 0.15 | | | | 0.13 | | | | 0.20 | | | | 0.47 | | | | 0.18 | | | | 0.18 | | | | 0.14 | | | |
| | (2.89 | ) | | | 2.34 | | | | 1.25 | | | | 2.70 | | | | (1.14 | ) | | | 1.96 | | | | (2.99 | ) | | | 2.64 | | | | 1.37 | | | | 2.74 | | | | (1.20 | ) | | | 1.97 | | | |
| | | | | | | | | | | | | | | | | | | | | | | | | | | | | | | | | | | | | | | | | | | | | | | | |
| | | | | | | | | | | | |
| | (2.77 | ) | | | 2.54 | | | | 1.73 | | | | 2.89 | | | | (0.95 | ) | | | 2.11 | | | | (2.86 | ) | | | 2.84 | | | | 1.84 | | | | 2.92 | | | | (1.02 | ) | | | 2.11 | | | |
| | | | | | | | | | | | | | | | | | | | | | | | | | | | | | | | | | | | | | | | | | | | | | | | |
| | | | | | | | | | | | |
| | | | | | | | | | | | | | | | | | | | | | | | | | | | | | | | | | | | | | | | | | | | | | | | |
| | (0.12 | ) | | | (0.29 | ) | | | (0.72 | ) | | | (0.22 | ) | | | (0.19 | ) | | | (0.16 | ) | | | (0.13 | ) | | | (0.30 | ) | | | (0.70 | ) | | | (0.21 | ) | | | (0.19 | ) | | | (0.14 | ) | | |
| | — | | | | (0.65 | ) | | | (1.20 | ) | | | (0.51 | ) | | | (0.44 | ) | | | (0.46 | ) | | | — | | | | (0.83 | ) | | | (1.18 | ) | | | (0.46 | ) | | | (0.42 | ) | | | (0.50 | ) | | |
| | | | | | | | | | | | | | | | | | | | | | | | | | | | | | | | | | | | | | | | | | | | | | | | |
| | | | | | | | | | | | |
| | (0.12 | ) | | | (0.94 | ) | | | (1.92 | ) | | | (0.73 | ) | | | (0.63 | ) | | | (0.62 | ) | | | (0.13 | ) | | | (1.13 | ) | | | (1.88 | ) | | | (0.67 | ) | | | (0.61 | ) | | | (0.64 | ) | | |
| | | | | | | | | | | | | | | | | | | | | | | | | | | | | | | | | | | | | | | | | | | | | | | | |
| | | | | | | | | | | | |
| $ | 13.11 | | | $ | 16.00 | | | $ | 14.40 | | | $ | 14.59 | | | $ | 12.43 | | | $ | 14.01 | | | $ | 13.16 | | | $ | 16.15 | | | $ | 14.44 | | | $ | 14.48 | | | $ | 12.23 | | | $ | 13.86 | | | |
| | | | | | | | | | | | | | | | | | | | | | | | | | | | | | | | | | | | | | | | | | | | | | | | |
| | | | | | | | | | | | |
| | (17.31 | )(b) | | | 17.84 | | | | 12.61 | | | | 23.62 | | | | (7.36 | ) | | | 17.15 | | | | (17.74 | )(b) | | | 19.89 | | | | 13.43 | | | | 24.25 | | | | (7.94 | ) | | | 17.40 | | | |
| | 947 | | | | 1,101 | | | | 846 | | | | 712 | | | | 509 | | | | 484 | | | | 784 | | | | 925 | | | | 708 | | | | 587 | | | | 413 | | | | 393 | | | |
| | 1.69 | (c) | | | 1.25 | | | | 3.67 | | | | 1.64 | | | | 1.64 | | | | 1.57 | | | | 1.74 | (c) | | | 1.22 | | | | 3.59 | | | | 1.59 | | | | 1.60 | | | | 1.53 | | | |
| | 0.08 | (c) | | | 0.08 | | | | 0.07 | | | | 0.08 | | | | 0.07 | | | | 0.07 | | | | 0.08 | (c) | | | 0.08 | | | | 0.07 | | | | 0.08 | | | | 0.07 | | | | 0.07 | | | |
| | 0.08 | (c) | | | 0.08 | | | | 0.07 | | | | 0.08 | | | | 0.07 | | | | 0.07 | | | | 0.08 | (c) | | | 0.08 | | | | 0.07 | | | | 0.08 | | | | 0.07 | | | | 0.07 | | | |
| | 6.32 | (b) | | | 8.93 | | | | 11.53 | | | | 3.33 | | | | 4.00 | | | | 4.02 | | | | 5.38 | (b) | | | 11.55 | | | | 12.53 | | | | 2.38 | | | | 2.65 | | | | 4.07 | | | |
The accompanying notes are an integral part of these financial statements.
125
MUTUAL OF AMERICA INVESTMENT CORPORATION
FINANCIAL HIGHLIGHTS (Continued)
| | | | | | | | | | | | | | | | | | | | | | | | |
| | | 2045 Retirement Fund | |
| | | Six Months
Ended
June 30,
2022
(Unaudited) | | | Years Ended December 31, |
| | | 2021 | | | 2020(f) | | | 2019(f) | | | 2018(f) | | | 2017(f) | |
| | | | | | |
Net Asset Value, Beginning of Period | | $ | 15.97 | | | $ | 14.28 | | | $ | 14.32 | | | $ | 12.14 | | | $ | 13.87 | | | $ | 12.36 | |
| | | | | | | | | | | | | | | | | | | | | | | | |
| | | | | | |
INCOME (LOSS)FROM INVESTMENT OPERATIONS | | | | | | | | | | | | | | | | | | | | | | | | |
Net Investment Income (Loss) | | | 0.13 | | | | 0.19 | | | | 0.45 | | | | 0.18 | | | | 0.19 | | | | 0.15 | |
Net Realized and Unrealized Gains (Losses) on Investments and Futures Contracts | | | (3.04 | ) | | | 2.71 | | | | 1.34 | | | | 2.75 | | | | (1.25 | ) | | | 1.99 | |
| | | | | | | | | | | | | | | | | | | | | | | | |
| | | | | | |
Total From Investment Operations | | | (2.91 | ) | | | 2.90 | | | | 1.79 | | | | 2.93 | | | | (1.06 | ) | | | 2.14 | |
| | | | | | | | | | | | | | | | | | | | | | | | |
| | | | | | |
Less Distributions | | | | | | | | | | | | | | | | | | | | | | | | |
From Net Investment Income | | | (0.13 | ) | | | (0.29 | ) | | | (0.68 | ) | | | (0.21 | ) | | | (0.19 | ) | | | (0.15 | ) |
From Net Realized Gains | | | — | | | | (0.92 | ) | | | (1.15 | ) | | | (0.54 | ) | | | (0.48 | ) | | | (0.48 | ) |
| | | | | | | | | | | | | | | | | | | | | | | | |
| | | | | | |
Total Distributions | | | (0.13 | ) | | | (1.21 | ) | | | (1.83 | ) | | | (0.75 | ) | | | (0.67 | ) | | | (0.63 | ) |
| | | | | | | | | | | | | | | | | | | | | | | | |
| | | | | | |
Net Asset Value, End of Period | | $ | 12.93 | | | $ | 15.97 | | | $ | 14.28 | | | $ | 14.32 | | | $ | 12.14 | | | $ | 13.87 | |
| | | | | | | | | | | | | | | | | | | | | | | | |
| | | | | | |
Total Return (%)(i) | | | (18.25 | )(b) | | | 20.57 | | | | 13.31 | | | | 24.54 | | | | (8.29 | ) | | | 17.62 | |
Net Assets, End of Period ($ millions) | | | 811 | | | | 957 | | | | 733 | | | | 611 | | | | 438 | | | | 437 | |
Ratio of Net Investment Income (Loss) to Average Net Assets (%) | | | 1.78 | (c) | | | 1.19 | | | | 3.54 | | | | 1.54 | | | | 1.55 | | | | 1.45 | |
Ratio of Expenses to Average Net Assets Before Expense Reimbursement (%)(d) | | | 0.08 | (c) | | | 0.08 | | | | 0.07 | | | | 0.08 | | | | 0.07 | | | | 0.07 | |
Ratio of Expenses to Average Net Assets After Expense Reimbursement (%)(d) | | | 0.08 | (c) | | | 0.08 | | | | 0.07 | | | | 0.08 | | | | 0.07 | | | | 0.07 | |
Portfolio Turnover Rate (%)(a) | | | 5.37 | (b) | | | 11.96 | | | | 10.77 | | | | 2.56 | | | | 3.67 | | | | 4.46 | |
| (a) | Portfolio turnover rate excludes all short-term securities. |
| (d) | Allocation and Retirement Funds exclude expenses of the underlying funds. |
| (e) | Includes one time reimbursement from Adviser for non-advisory operating expenses (Note 2). |
| (f) | On September 25, 2020, the Mutual of America Investment Corporation Funds, with the exception of the Catholic Values Index Fund which commenced operations on September 30, 2020, had a 1 for 10 reverse share split. Historical net asset value per share and per share activity have been adjusted to reflect the split on a retroactive basis (Note 4). |
| (g) | For the period July 2, 2018 (commencement of operations) through December 31, 2018. |
| (h) | Amount is less than $0.005 per share. |
| (i) | Total return is calculated assuming a purchase of a share on the first day and a sale on the last day of each year or period reported and includes reinvestment of distributions, if any. For variable annuity owners or participants in a group variable annuity, the total return does not reflect the effect of fees and charges associated with your variable annuity contract and does not reflect expenses associated with the separate account such as administrative fees and account charges which, if reflected, would reduce the total returns for all years and periods shown. The total return for 2017 for the Funds subject to the one time reimbursement from the Adviser (Note 2) includes the impact of this reimbursement which was determined not to be material. Past performance is no guarantee of future results. Total returns for periods less than one full year are not annualized. |
| (j) | International Fund excludes the expenses of its ETF investments. |
| (k) | Amount is less than $0.00005 per share. |
| (l) | For the period September 30, 2020 (commencement of operations) through December 31, 2020. |
| (m) | For the period August 3, 2020 (commencement of operations) through December 31, 2020. |
The accompanying notes are an integral part of these financial statements.
126
| | | | | | | | | | | | | | | | | | | | | | | | | | | | | | | | | | | | | | | | | | | | | | | | |
| 2050 Retirement Fund | | | 2055 Retirement Fund | | | |
Six Months
Ended
June 30,
2022
(Unaudited) | | | Years Ended December 31, | | | Six Months
Ended
June 30,
2022
(Unaudited) | | | Years Ended December 31, | | | |
| | 2021 | | | 2020(f) | | | 2019(f) | | | 2018(f) | | | 2017(f) | | | 2021 | | | 2020(f) | | | 2019(f) | | | 2018(f) | | | 2017(f) | | | |
| | | | | | | | | | | | |
| $ | 20.31 | | | $ | 17.92 | | | $ | 17.47 | | | $ | 14.64 | | | $ | 16.59 | | | $ | 14.53 | | | $ | 15.99 | | | $ | 13.98 | | | $ | 13.31 | | | $ | 11.02 | | | $ | 12.27 | | | $ | 10.40 | | | |
| | | | | | | | | | | | | | | | | | | | | | | | | | | | | | | | | | | | | | | | | | | | | | | | |
| | | | | | | | | | | | |
| | | | | | | | | | | | | | | | | | | | | | | | | | | | | | | | | | | | | | | | | | | | | | | | |
| | 0.16 | | | | 0.24 | | | | 0.54 | | | | 0.19 | | | | 0.20 | | | | 0.12 | | | | 0.12 | | | | 0.18 | | | | 0.38 | | | | 0.10 | | | | 0.10 | | | | — | (h) | | |
| | (3.89 | ) | | | 3.45 | | | | 1.68 | | | | 3.37 | | | | (1.57 | ) | | | 2.45 | | | | (3.09 | ) | | | 2.74 | | | | 1.41 | | | | 2.56 | | | | (1.17 | ) | | | 1.87 | | | |
| | | | | | | | | | | | | | | | | | | | | | | | | | | | | | | | | | | | | | | | | | | | | | | | |
| | | | | | | | | | | | |
| | (3.73 | ) | | | 3.69 | | | | 2.22 | | | | 3.56 | | | | (1.37 | ) | | | 2.57 | | | | (2.97 | ) | | | 2.92 | | | | 1.79 | | | | 2.66 | | | | (1.07 | ) | | | 1.87 | | | |
| | | | | | | | | | | | | | | | | | | | | | | | | | | | | | | | | | | | | | | | | | | | | | | | |
| | | | | | | | | | | | |
| | | | | | | | | | | | | | | | | | | | | | | | | | | | | | | | | | | | | | | | | | | | | | | | |
| | (0.16 | ) | | | (0.38 | ) | | | (0.81 | ) | | | (0.23 | ) | | | (0.20 | ) | | | (0.14 | ) | | | (0.12 | ) | | | (0.29 | ) | | | (0.57 | ) | | | (0.12 | ) | | | (0.06 | ) | | | — | | | |
| | — | | | | (0.92 | ) | | | (0.96 | ) | | | (0.50 | ) | | | (0.38 | ) | | | (0.37 | ) | | | — | | | | (0.62 | ) | | | (0.55 | ) | | | (0.25 | ) | | | (0.12 | ) | | | — | | | |
| | | | | | | | | | | | | | | | | | | | | | | | | | | | | | | | | | | | | | | | | | | | | | | | |
| | | | | | | | | | | | |
| | (0.16 | ) | | | (1.30 | ) | | | (1.77 | ) | | | (0.73 | ) | | | (0.58 | ) | | | (0.51 | ) | | | (0.12 | ) | | | (0.91 | ) | | | (1.12 | ) | | | (0.37 | ) | | | (0.18 | ) | | | — | | | |
| | | | | | | | | | | | | | | | | | | | | | | | | | | | | | | | | | | | | | | | | | | | | | | | |
| | | | | | | | | | | | |
| $ | 16.42 | | | $ | 20.31 | | | $ | 17.92 | | | $ | 17.47 | | | $ | 14.64 | | | $ | 16.59 | | | $ | 12.90 | | | $ | 15.99 | | | $ | 13.98 | | | $ | 13.31 | | | $ | 11.02 | | | $ | 12.27 | | | |
| | | | | | | | | | | | | | | | | | | | | | | | | | | | | | | | | | | | | | | | | | | | | | | | |
| | | | | | | | | | | | |
| | (18.37 | )(b) | | | 20.82 | | | | 13.39 | | | | 24.65 | | | | (8.74 | ) | | | 17.86 | | | | (18.55 | )(b) | | | 21.11 | | | | 13.93 | | | | 24.39 | | | | (8.88 | ) | | | 17.9 | | | |
| | 609 | | | | 717 | | | | 536 | | | | 425 | | | | 285 | | | | 256 | | | | 295 | | | | 330 | | | | 220 | | | | 144 | | | | 70 | | | | 34 | | | |
| | 1.77 | (c) | | | 1.18 | | | | 3.56 | | | | 1.53 | | | | 1.55 | | | | 1.47 | | | | 1.79 | (c) | | | 1.16 | | | | 3.66 | | | | 1.58 | | | | 1.73 | | | | 1.90 | | | |
| | 0.08 | (c) | | | 0.08 | | | | 0.08 | | | | 0.08 | | | | 0.07 | | | | 0.07 | | | | 0.11 | (c) | | | 0.10 | | | | 0.11 | | | | 0.12 | | | | 0.11 | | | | 0.14 | | | |
| | 0.08 | (c) | | | 0.08 | | | | 0.08 | | | | 0.08 | | | | 0.07 | | | | 0.07 | (e) | | | 0.11 | (c) | | | 0.10 | | | | 0.11 | | | | 0.12 | | | | 0.05 | | | | 0.05 | | | |
| | 6.69 | (b) | | | 11.57 | | | | 9.80 | | | | 2.11 | | | | 2.26 | | | | 3.75 | | | | 8.19 | (b) | | | 10.49 | | | | 7.28 | | | | 0.57 | | | | 3.42 | | | | 4.32 | | | |
The accompanying notes are an integral part of these financial statements.
127
MUTUAL OF AMERICA INVESTMENT CORPORATION
FINANCIAL HIGHLIGHTS (Continued)
| | | | | | | | | | | | | | | | | | | | | | | | | | | | | | | | |
| | | 2060 Retirement Fund | | | 2065 Retirement Fund | |
| | | Six Months
Ended
June 30,
2022
(Unaudited) | | | Years Ended
December 31, | | | Period Ended
December 31,
2018(f)(g) | | | Six Months
Ended
June 30,
2022
(Unaudited) | | | 2021 | | | Period Ended
December 31,
2020(m)(f) | |
| | | 2021 | | | 2020(f) | | | 2019(f) | |
| | | | | | | | |
Net Asset Value, Beginning of Period | | $ | 13.58 | | | $ | 11.87 | | | $ | 11.12 | | | $ | 8.95 | | | $ | 10.00 | | | $ | 13.20 | | | $ | 11.45 | | | $ | 10.00 | |
| | | | | | | | | | | | | | | | | | | | | | | | | | | | | | | | |
| | | | | | | | |
INCOME (LOSS)FROM INVESTMENT OPERATIONS | | | | | | | | | | | | | | | | | | | | | | | | | | | | | | | | |
Net Investment Income (Loss) | | | 0.10 | | | | 0.16 | | | | 0.28 | | | | 0.08 | | | | 0.02 | | | | 0.11 | | | | 0.16 | | | | 0.22 | |
Net Realized and Unrealized Gains (Losses) on Investments and Futures Contracts | | | (2.62 | ) | | | 2.38 | | | | 1.25 | | | | 2.11 | | | | (1.07 | ) | | | (2.58 | ) | | | 2.31 | | | | 1.59 | |
| | | | | | | | | | | | | | | | | | | | | | | | | | | | | | | | |
| | | | | | | | |
Total From Investment Operations | | | (2.52 | ) | | | 2.54 | | | | 1.53 | | | | 2.19 | | | | (1.05 | ) | | | (2.47 | ) | | | 2.47 | | | | 1.81 | |
| | | | | | | | | | | | | | | | | | | | | | | | | | | | | | | | |
| | | | | | | | |
Less Distributions | | | | | | | | | | | | | | | | | | | | | | | | | | | | | | | | |
From Net Investment Income | | | (0.11 | ) | | | (0.26 | ) | | | (0.42 | ) | | | (0.01 | ) | | | — | | | | (0.11 | ) | | | (0.26 | ) | | | (0.24 | ) |
From Net Realized Gains | | | — | | | | (0.57 | ) | | | (0.36 | ) | | | (0.01 | ) | | | — | | | | — | | | | (0.46 | ) | | | (0.12 | ) |
| | | | | | | | | | | | | | | | | | | | | | | | | | | | | | | | |
| | | | | | | | |
Total Distributions | | | (0.11 | ) | | | (0.83 | ) | | | (0.78 | ) | | | (0.02 | ) | | | — | | | | (0.11 | ) | | | (0.72 | ) | | | (0.36 | ) |
| | | | | | | | | | | | | | | | | | | | | | | | | | | | | | | | |
| | | | | | | | |
Net Asset Value, End of Period | | $ | 10.95 | | | $ | 13.58 | | | $ | 11.87 | | | $ | 11.12 | | | $ | 8.95 | | | $ | 10.62 | | | $ | 13.20 | | | $ | 11.45 | |
| | | | | | | | | | | | | | | | | | | | | | | | | | | | | | | | |
| | | | | | | | |
Total Return (%)(i) | | | (18.56 | )(b) | | | 21.60 | | | | 14.08 | | | | 24.53 | | | | (10.54 | )(b) | | | (18.72 | )(b) | | | 21.73 | | | | 18.16 | (b) |
Net Assets, End of Period ($ millions) | | | 126 | | | | 130 | | | | 72 | | | | 30 | | | | 4 | | | | 21 | | | | 17 | | | | 3 | |
Ratio of Net Investment Income (Loss) to Average Net Assets (%) | | | 1.83 | (c) | | | 1.25 | | | | 4.14 | | | | 1.95 | | | | 0.74 | (b) | | | 2.16 | (c) | | | 1.44 | | | | 3.40 | (b) |
Ratio of Expenses to Average Net Assets Before Expense Reimbursement (%)(d) | | | 0.18 | (c) | | | 0.16 | | | | 0.22 | | | | 0.51 | | | | 1.54 | (c) | | | 0.68 | (c) | | | 1.15 | | | | 4.61 | (c) |
Ratio of Expenses to Average Net Assets After Expense Reimbursement (%)(d) | | | 0.18 | (c) | | | 0.05 | | | | 0.05 | | | | 0.05 | | | | 0.05 | (c) | | | 0.05 | (c) | | | 0.05 | | | | 0.05 | (c) |
Portfolio Turnover Rate (%)(a) | | | 8.78 | (b) | | | 14.26 | | | | 6.70 | | | | 1.73 | | | | 6.10 | (b) | | | 12.44 | (b) | | | 28.10 | | | | 10.76 | (b) |
| (a) | Portfolio turnover rate excludes all short-term securities. |
| (d) | Allocation and Retirement Funds exclude expenses of the underlying funds. |
| (e) | Includes one time reimbursement from Adviser for non-advisory operating expenses (Note 2). |
| (f) | On September 25, 2020, the Mutual of America Investment Corporation Funds, with the exception of the Catholic Values Index Fund which commenced operations on September 30, 2020, had a 1 for 10 reverse share split. Historical net asset value per share and per share activity have been adjusted to reflect the split on a retroactive basis (Note 4). |
| (g) | For the period July 2, 2018 (commencement of operations) through December 31, 2018. |
| (h) | Amount is less than $0.005 per share. |
| (i) | Total return is calculated assuming a purchase of a share on the first day and a sale on the last day of each year or period reported and includes reinvestment of distributions, if any. For variable annuity owners or participants in a group variable annuity, the total return does not reflect the effect of fees and charges associated with your variable annuity contract and does not reflect expenses associated with the separate account such as administrative fees and account charges which, if reflected, would reduce the total returns for all years and periods shown. The total return for 2017 for the Funds subject to the one time reimbursement from the Adviser (Note 2) includes the impact of this reimbursement which was determined not to be material. Past performance is no guarantee of future results. Total returns for periods less than one full year are not annualized. |
| (j) | International Fund excludes the expenses of its ETF investments. |
| (k) | Amount is less than $0.00005 per share. |
| (l) | For the period September 30, 2020 (commencement of operations) through December 31, 2020. |
| (m) | For the period August 3, 2020 (commencement of operations) through December 31, 2020. |
The accompanying notes are an integral part of these financial statements.
128
| | | | | | | | | | | | | | | | | | | | | | | | | | | | | | | | | | | | | | | | | | | | | | | | | | | | | | | | | | | | | | | | | | | | | | |
| Conservative Allocation Fund | | | Moderate Allocation Fund | | | Aggressive Allocation Fund | |
SIx Months
Ended
June 30,
2022
(Unaudited) | | |
Years Ended December 31, | | | SIx Months
Ended
June 30,
2022
(Unaudited) | | | Years Ended December 31, | | | SIx Months
Ended
June 30,
2022
(Unaudited) | | | Years Ended December 31, | |
| | 2021 | | | 2020(f) | | | 2019(f) | | | 2018(f) | | | 2017(f) | | | 2021 | | | 2020(f) | | | 2019(f) | | | 2018(f) | | | 2017(f) | | | 2021 | | | 2020(f) | | | 2019(f) | | | 2018(f) | | | 2017(f) | |
| | | | | | | | | | | | | | | | | |
| $ | 12.86 | | | $ | 12.67 | | | $ | 12.71 | | | $ | 11.65 | | | $ | 12.69 | | | $ | 12.12 | | | $ | 15.98 | | | $ | 15.14 | | | $ | 15.51 | | | $ | 13.85 | | | $ | 15.55 | | | $ | 14.35 | | | $ | 17.86 | | | $ | 16.80 | | | $ | 17.36 | | | $ | 15.30 | | | $ | 17.72 | | | $ | 16.31 | |
| | | | | | | | | | | | | | | | | | | | | | | | | | | | | | | | | | | | | | | | | | | | | | | | | | | | | | | | | | | | | | | | | | | | | | |
| | | | | | | | | | | | | | | | | |
| | | | | | | | | | | | | | | | | | | | | | | | | | | | | | | | | | | | | | | | | | | | | | | | | | | | | | | | | | | | | | | | | | | | | | |
| | 0.08 | | | | 0.18 | | | | 0.48 | | | | 0.24 | | | | 0.27 | | | | 0.26 | | | | 0.12 | | | | 0.22 | | | | 0.58 | | | | 0.29 | | | | 0.31 | | | | 0.28 | | | | 0.14 | | | | 0.23 | | | | 0.59 | | | | 0.29 | | | | 0.31 | | | | 0.28 | |
| | (1.64 | ) | |
|
0.80 |
| | | 0.67 | | | | 1.38 | | | | (0.49 | ) | | | 0.81 | | | | (2.54 | ) | | | 1.90 | | | | 1.13 | | | | 2.32 | | | | (0.90 | ) | | | 1.66 | | | | (3.28 | ) | | | 2.78 | | | | 1.60 | | | | 3.10 | | | | (1.41 | ) | | | 2.39 | |
| | | | | | | | | | | | | | | | | | | | | | | | | | | | | | | | | | | | | | | | | | | | | | | | | | | | | | | | | | | | | | | | | | | | | | |
| | | | | | | | | | | | | | | | | |
| | (1.56 | ) | | | 0.98 | | | | 1.15 | | | | 1.62 | | | | (0.22 | ) | | | 1.07 | | | | (2.42 | ) | | | 2.12 | | | | 1.71 | | | | 2.61 | | | | (0.59 | ) | | | 1.94 | | | | (3.14 | ) | | | 3.01 | | | | 2.19 | | | | 3.39 | | | | (1.10 | ) | | | 2.67 | |
| | | | | | | | | | | | | | | | | | | | | | | | | | | | | | | | | | | | | | | | | | | | | | | | | | | | | | | | | | | | | | | | | | | | | | |
| | | | | | | | | | | | | | | | | |
| | | | | | | | | | | | | | | | | | | | | | | | | | | | | | | | | | | | | | | | | | | | | | | | | | | | | | | | | | | | | | | | | | | | | | |
| | (0.08 | ) | | | (0.20 | ) | | | (0.74 | ) | | | (0.26 | ) | | | (0.27 | ) | | | (0.27 | ) | | | (0.12 | ) | | | (0.28 | ) | | | (0.89 | ) | | | (0.31 | ) | | | (0.30 | ) | | | (0.29 | ) | | | (0.14 | ) | | | (0.35 | ) | | | (0.92 | ) | | | (0.33 | ) | | | (0.31 | ) | | | (0.28 | ) |
| | — | | | | (0.59 | ) | | | (0.45 | ) | | | (0.30 | ) | | | (0.55 | ) | | | (0.23 | ) | | | — | | | | (1.00 | ) | | | (1.19 | ) | | | (0.64 | ) | | | (0.81 | ) | | | (0.45 | ) | | | — | | | | (1.60 | ) | | | (1.83 | ) | | | (1.00 | ) | | | (1.01 | ) | | | (0.98 | ) |
| | | | | | | | | | | | | | | | | | | | | | | | | | | | | | | | | | | | | | | | | | | | | | | | | | | | | | | | | | | | | | | | | | | | | | |
| | | | | | | | | | | | | | | | | |
| | (0.08 | ) | | | (0.79 | ) | | | (1.19 | ) | | | (0.56 | ) | | | (0.82 | ) | | | (0.50 | ) | | | (0.12 | ) | | | (1.28 | ) | | | (2.08 | ) | | | (0.95 | ) | | | (1.11 | ) | | | (0.74 | ) | | | (0.14 | ) | | | (1.95 | ) | | | (2.75 | ) | | | (1.33 | ) | | | (1.32 | ) | | | (1.26 | ) |
| | | | | | | | | | | | | | | | | | | | | | | | | | | | | | | | | | | | | | | | | | | | | | | | | | | | | | | | | | | | | | | | | | | | | | |
| | | | | | | | | | | | | | | | | |
| $ | 11.22 | | | $ | 12.86 | | | $ | 12.67 | | | $ | 12.71 | | | $ | 11.65 | | | $ | 12.69 | | | $ | 13.44 | | | $ | 15.98 | | | $ | 15.14 | | | $ | 15.51 | | | $ | 13.85 | | | $ | 15.55 | | | $ | 14.58 | | | $ | 17.86 | | | $ | 16.80 | | | $ | 17.36 | | | $ | 15.30 | | | $ | 17.72 | |
| | | | | | | | | | | | | | | | | | | | | | | | | | | | | | | | | | | | | | | | | | | | | | | | | | | | | | | | | | | | | | | | | | | | | | |
| | | | | | | | | | | | | | | | | |
| | (12.10 | )(b) | | | 7.82 | | | | 9.32 | | | | 13.99 | | | | (2.04 | ) | | | 8.92 | | | | (15.16 | )(b) | | | 14.19 | | | | 11.67 | | | | 19.15 | | | | (4.41 | ) | | | 13.72 | | | | (17.60 | )(b) | | | 18.21 | | | | 13.72 | | | | 22.74 | | | | (7.13 | ) | | | 16.64 | |
| | 172 | | | | 201 | | | | 188 | | | | 178 | | | | 150 | | | | 157 | | | | 398 | | | | 487 | | | | 444 | | | | 433 | | | | 371 | | | | 397 | | | | 311 | | | | 390 | | | | 337 | | | | 320 | | | | 271 | | | | 304 | |
| | 1.36 | (c) | | | 1.36 | | | | 3.81 | | | | 2.07 | | | | 2.11 | | | | 2.20 | | | | 1.58 | (c) | | | 1.34 | | | | 3.69 | | | | 1.91 | | | | 1.95 | | | | 1.90 | | | | 1.67 | (c) | | | 1.22 | | | | 3.50 | | | | 1.69 | | | | 1.74 | | | | 1.65 | |
|
0.08 |
(c) | | | 0.06 | | | | 0.06 | | | | 0.05 | | | | 0.02 | | | | 0.02 | | | | 0.04 | (c) | | | 0.03 | | | | 0.03 | | | | 0.03 | | | | 0.02 | | | | 0.02 | | | | 0.05 | (c) | | | 0.04 | | | | 0.04 | | | | 0.04 | | | | 0.02 | | | | 0.02 | |
|
0.08 |
(c) | | | 0.06 | | | | 0.06 | | | | 0.05 | | | | 0.02 | | | | 0.02 | | | | 0.04 | (c) | | | 0.03 | | | | 0.03 | | | | 0.03 | | | | 0.02 | | | | 0.02 | | | | 0.05 | (c) | | | 0.04 | | | | 0.04 | | | | 0.04 | | | | 0.02 | | | | 0.02 | |
| | 4.37 | (b) | | | 16.91 | | | | 10.07 | | | | 9.54 | | | | 11.70 | | | | 23.64 | | | | 2.34 | (b) | | | 14.83 | | | | 10.69 | | | | 8.40 | | | | 9.50 | | | | 12.05 | | | | 2.39 | (b) | | | 13.06 | | | | 10.23 | | | | 9.06 | | | | 9.13 | | | | 9.55 | |
The accompanying notes are an integral part of these financial statements.
129
MUTUAL OF AMERICA INVESTMENT CORPORATION
FINANCIAL HIGHLIGHTS (Continued)
| | | | | | | | | | | | | | | | | | | | | | | | |
| | | Money Market Fund | |
| | | Six Months
Ended
June 30,
2022
(Unaudited) | | | Years Ended December 31, |
| | | 2021 | | | 2020(f) | | | 2019(f) | | | 2018(f) | | | 2017(f) | |
| | | | | | |
Net Asset Value, Beginning of Period | | $ | 11.8271 | | | $ | 11.8520 | | | $ | 12.3148 | | | $ | 12.2150 | | | $ | 12.0402 | | | $ | 11.9721 | |
| | | | | | | | | | | | | | | | | | | | | | | | |
| | | | | | |
INCOME (LOSS)FROM INVESTMENT OPERATIONS | | | | | | | | | | | | | | | | | | | | | | | | |
Net Investment Income (Loss) | | | 0.0079 | | | | (0.0202 | ) | | | 0.1845 | | | | 0.3293 | | | | 0.0810 | | | | 0.0773 | |
Net Realized and Unrealized Gains (Losses) on Investments and Futures Contracts | | | (0.0010 | ) | | | (0.0047 | ) | | | (0.1478 | ) | | | (0.0838 | ) | | | 0.1242 | | | | 0.0052 | |
| | | | | | | | | | | | | | | | | | | | | | | | |
| | | | | | |
Total From Investment Operations | | | 0.0069 | | | | (0.0249 | ) | | | 0.0367 | | | | 0.2455 | | | | 0.2052 | | | | 0.0825 | |
| | | | | | | | | | | | | | | | | | | | | | | | |
| | | | | | |
Less Distributions | | | | | | | | | | | | | | | | | | | | | | | | |
From Net Investment Income | | | (0.0046 | ) | | | — | | | | (0.4986 | ) | | | (0.1457 | ) | | | (0.0304 | ) | | | (0.0144 | ) |
From Net Realized Gains | | | — | | | | — | | | | (0.0009 | ) | | | — | (k) | | | — | | | | — | |
Return of Capital | | | — | | | | — | | | | — | (k) | | | — | | | | — | | | | — | |
| | | | | | | | | | | | | | | | | | | | | | | | |
| | | | | | |
Total Distributions | | | (0.0046 | ) | | | — | | | | (0.4995 | ) | | | (0.1457 | ) | | | (0.0304 | ) | | | (0.0144 | ) |
| | | | | | | | | | | | | | | | | | | | | | | | |
| | | | | | |
Net Asset Value, End of Period | | $ | 11.8294 | | | $ | 11.8271 | | | $ | 11.8520 | | | $ | 12.3148 | | | $ | 12.2150 | | | $ | 12.0402 | |
| | | | | | | | | | | | | | | | | | | | | | | | |
| | | | | | |
Total Return (%)(i) | | | 0.04 | (b) | | | (0.17 | ) | | | 0.28 | | | | 2.01 | | | | 1.71 | | | | 0.70 | |
Net Assets, End of Period ($ millions) | | | 196 | | | | 173 | | | | 122 | | | | 154 | | | | 210 | | | | 71 | |
Ratio of Net Investment Income (Loss) to Average Net Assets (%) | | | 0.14 | (c) | | | (0.20 | ) | | | 0.40 | | | | 2.02 | | | | 1.82 | | | | 0.70 | |
Ratio of Expenses to Average Net Assets Before Expense Reimbursement (%) | | | 0.24 | (c) | | | 0.26 | | | | 0.27 | | | | 0.24 | | | | 0.20 | | | | 0.25 | |
Ratio of Expenses to Average Net Assets After Expense Reimbursement (%) | | | 0.24 | (c) | | | 0.26 | | | | 0.27 | | | | 0.24 | | | | 0.20 | | | | 0.24 | (e) |
Portfolio Turnover Rate (%)(a) | | | NA | | | | NA | | | | NA | | | | NA | | | | NA | | | | NA | |
| (a) | Portfolio turnover rate excludes all short-term securities. |
| (d) | Allocation and Retirement Funds exclude expenses of the underlying funds. |
| (e) | Includes one time reimbursement from Adviser for non-advisory operating expenses (Note 2). |
| (f) | On September 25, 2020, the Mutual of America Investment Corporation Funds, with the exception of the Catholic Values Index Fund which commenced operations on September 30, 2020, had a 1 for 10 reverse share split. Historical net asset value per share and per share activity have been adjusted to reflect the split on a retroactive basis (Note 4). |
| (g) | For the period July 2, 2018 (commencement of operations) through December 31, 2018. |
| (h) | Amount is less than $0.005 per share. |
| (i) | Total return is calculated assuming a purchase of a share on the first day and a sale on the last day of each year or period reported and includes reinvestment of distributions, if any. For variable annuity owners or participants in a group variable annuity, the total return does not reflect the effect of fees and charges associated with your variable annuity contract and does not reflect expenses associated with the separate account such as administrative fees and account charges which, if reflected, would reduce the total returns for all years and periods shown. The total return for 2017 for the Funds subject to the one time reimbursement from the Adviser (Note 2) includes the impact of this reimbursement which was determined not to be material. Past performance is no guarantee of future results. Total returns for periods less than one full year are not annualized. |
| (j) | International Fund excludes the expenses of its ETF investments. |
| (k) | Amount is less than $0.00005 per share. |
| (l) | For the period September 30, 2020 (commencement of operations) through December 31, 2020. |
| (m) | For the period August 3, 2020 (commencement of operations) through December 31, 2020. |
The accompanying notes are an integral part of these financial statements.
130
| | | | | | | | | | | | | | | | | | | | | | | | | | | | | | | | | | | | | | | | | | | | | | | | |
| Mid-Term Bond Fund | | | Bond Fund | | | |
Six Months
Ended
June 30,
2022
(Unaduited) | | | Years Ended December 31, | | | Six Months
Ended
June 30,
2022
(Unaduited) | | | Years Ended December 31, | | | |
| | 2021 | | | 2020(f) | | | 2019(f) | | | 2018(f) | | | 2017(f) | | | 2021 | | | 2020(f) | | | 2019(f) | | | 2018(f) | | | 2017(f) | | | |
| | | | | | | | | | | | |
| $ | 10.36 | | | $ | 10.79 | | | $ | 10.63 | | | $ | 10.24 | | | $ | 10.41 | | | $ | 10.41 | | | $ | 14.32 | | | $ | 15.01 | | | $ | 14.77 | | | $ | 14.07 | | | $ | 14.43 | | | $ | 14.34 | | | |
| | | | | | | | | | | | | | | | | | | | | | | | | | | | | | | | | | | | | | | | | | | | | | | | |
| | | | | | | | | | | | |
| | | | | | | | | | | | | | | | | | | | | | | | | | | | | | | | | | | | | | | | | | | | | | | | |
| | 0.06 | | | | 0.14 | | | | 0.15 | | | | 0.21 | | | | 0.23 | | | | 0.21 | | | | 0.12 | | | | 0.23 | | | | 0.28 | | | | 0.35 | | | | 0.38 | | | | 0.37 | | | |
| | (0.68 | ) | |
|
(0.36 |
) | | | 0.39 | | | | 0.41 | | | | (0.18 | ) | | | 0.03 | | | | (1.51 | ) | | | (0.60 | ) | | | 0.67 | | | | 0.72 | | | | (0.36 | ) | | | 0.15 | | | |
| | | | | | | | | | | | | | | | | | | | | | | | | | | | | | | | | | | | | | | | | | | | | | | | |
| | (0.62 | ) | | | (0.22 | ) | | | 0.54 | | | | 0.62 | | | | 0.05 | | | | 0.24 | | | | (1.39 | ) | | | (0.37 | ) | | | 0.95 | | | | 1.07 | | | | 0.02 | | | | 0.52 | | | |
| | | | | | | | | | | | | | | | | | | | | | | | | | | | | | | | | | | | | | | | | | | | | | | | |
| | | | | | | | | | | | |
| | | | | | | | | | | | | | | | | | | | | | | | | | | | | | | | | | | | | | | | | | | | | | | | |
| | (0.05 | ) | | | (0.14 | ) | | | (0.38 | ) | | | (0.23 | ) | | | (0.22 | ) | | | (0.23 | ) | | | (0.10 | ) | | | (0.27 | ) | | | (0.70 | ) | | | (0.37 | ) | | | (0.38 | ) | | | (0.40 | ) | | |
| | — | | | | (0.07 | ) | | | — | (h) | | | — | | | | — | (h) | | | (0.01 | ) | | | — | | | | (0.05 | ) | | | (0.01 | ) | | | — | | | | — | | | | (0.03 | ) | | |
| | — | | | | — | | | | — | | | | — | | | | — | | | | — | | | | — | | | | — | | | | — | (h) | | | — | | | | — | | | | — | | | |
| | | | | | | | | | | | | | | | | | | | | | | | | | | | | | | | | | | | | | | | | | | | | | | | |
| | | | | | | | | | | | |
| | (0.05 | ) | | | (0.21 | ) | | | (0.38 | ) | | | (0.23 | ) | | | (0.22 | ) | | | (0.24 | ) | | | (0.10 | ) | | | (0.32 | ) | | | (0.71 | ) | | | (0.37 | ) | | | (0.38 | ) | | | (0.43 | ) | | |
| | | | | | | | | | | | | | | | | | | | | | | | | | | | | | | | | | | | | | | | | | | | | | | | |
| | | | | | | | | | | | |
| $ | 9.69 | | | $ | 10.36 | | | $ | 10.79 | | | $ | 10.63 | | | $ | 10.24 | | | $ | 10.41 | | | $ | 12.83 | | | $ | 14.32 | | | $ | 15.01 | | | $ | 14.77 | | | $ | 14.07 | | | $ | 14.43 | | | |
| | | | | | | | | | | | | | | | | | | | | | | | | | | | | | | | | | | | | | | | | | | | | | | | |
| | | | | | | | | | | | |
| | (5.97 | )(b) | | | (2.02 | ) | | | 5.05 | | | | 6.04 | | | | 0.57 | | | | 2.32 | | | | (9.72 | )(b) | | | (2.45 | ) | | | 6.40 | | | | 7.65 | | | | 0.17 | | | | 3.62 | | | |
| | 875 | | | | 866 | | | | 829 | | | | 672 | | | | 587 | | | | 558 | | | | 1,873 | | | | 2,049 | | | | 1,873 | | | | 1,574 | | | | 1,346 | | | | 1,274 | | | |
| | 1.30 | (c) | | | 1.32 | | | | 1.79 | | | | 2.26 | | | | 2.44 | | | | 2.37 | | | | 1.85 | (c) | | | 1.56 | | | | 2.03 | | | | 2.70 | | | | 2.93 | | | | 2.98 | | | |
|
0.46 |
(c) | | | 0.44 | | | | 0.46 | | | | 0.45 | | | | 0.45 | | | | 0.47 | | | | 0.44 | (c) | | | 0.43 | | | | 0.45 | | | | 0.44 | | | | 0.45 | | | | 0.45 | | | |
| | | | | | | | | | | | |
| | 0.46 | (c) | | | 0.44 | | | | 0.46 | | | | 0.45 | | | | 0.45 | | | | 0.45 | (e) | | | 0.44 | (c) | | | 0.43 | | | | 0.45 | | | | 0.44 | | | | 0.45 | | | | 0.44 | (e) | | |
| | 9.12 | (b) | | | 17.57 | | | | 10.72 | | | | 19.47 | | | | 20.12 | | | | 14.18 | | | | 15.79 | (b) | | | 31.53 | | | | 28.98 | | | | 13.36 | | | | 10.71 | | | | 10.65 | | | |
The accompanying notes are an integral part of these financial statements.
131
MUTUAL OF AMERICA INVESTMENT CORPORATION
NOTES TO FINANCIAL STATEMENTS (Unaudited)
June 30, 2022
| 1. | SIGNIFICANT ACCOUNTING POLICIESAND ORGANIZATION |
Mutual of America Investment Corporation (the “Investment Company”) is a diversified, open-end management investment company — a type of company commonly known as a “mutual fund”. It is registered as such under the Investment Company Act of 1940 (the “Investment Company Act”). The Investment Company was formed on February 21, 1986 as a Maryland corporation and offers its shares to institutions, individual investors, certain financial intermediaries and separate accounts of both affiliated and non-affiliated insurance companies. As a “series” type mutual fund, the Investment Company issues separate classes (or series) of capital stock, each of which represents a separate Fund of investments. At June 30, 2022, there were 28 active funds (collectively, “the Funds”): Equity Index Fund, All America Fund, Small Cap Value Fund, Small Cap Growth Fund, Small Cap Equity Index Fund, Mid Cap Value Fund, Mid-Cap Equity Index Fund, Composite Fund, International Fund, Catholic Values Index Fund, Money Market Fund, Mid-Term Bond Fund, Bond Fund; Retirement Income Fund, 2015 Retirement Fund, 2020 Retirement Fund, 2025 Retirement Fund, 2030 Retirement Fund, 2035 Retirement Fund, 2040 Retirement Fund, 2045 Retirement Fund, 2050 Retirement Fund, 2055 Retirement Fund, 2060 Retirement Fund and 2065 Retirement Fund, (collectively, “Retirement Funds”); a Conservative Allocation Fund, a Moderate Allocation Fund and an Aggressive Allocation Fund (collectively, “Allocation Funds”). The Small Cap Equity Index Fund and the 2060 Retirement Fund commenced operations on July 2, 2018. The 2065 Retirement Fund commenced operations on August 3, 2020. The Catholic Values Index Fund commenced operations on September 30, 2020
Before December 16, 2020, Investment Company shares were issued to Mutual of America Life Insurance Company (“Mutual of America Life”) and, on a limited basis, to Wilton Reassurance Life Company of New York (formerly The American Life Insurance Company of New York), for allocation to their Separate Accounts as a funding medium for variable accumulation annuity contracts and variable life insurance policies. Starting December 16, 2020, shares were also issued to institutional investors, such as endowments, foundations, corporations, municipalities and other public entities, and trusts. In addition, shares of selected equity and fixed income funds of the Investment Company are directly issued to one or more of the Investment Company’s Retirement Funds and Allocation Funds. Starting on December 17, 2020, shares were also available to retail investors.
The Funds follow investment company accounting and reporting guidance of the Financial Accounting Standards Board (“FASB”) Accounting Codification Topic 946 Financial Services — Investment Companies. The preparation of financial statements in accordance with U.S. generally accepted accounting principles (“GAAP”) requires management to make estimates and assumptions that affect the reported amounts of assets, liabilities, income, expenses and related disclosures. Changes in the economic environment, financial markets and any other parameters used in determining these estimates could cause actual results to differ.
The following is a summary of the significant accounting policies consistently followed by the Investment Company, which are in conformity with GAAP:
Fair Value — The Investment Company values its investments at fair value. Fair value is an estimate of the price the Fund would receive upon selling a security in an orderly arms-length transaction. Investments are categorized based on a three-level valuation hierarchy for measurement and disclosure of fair value. The valuation hierarchy is based upon the transparency of inputs used to measure fair value. These inputs are summarized in the three broad levels listed below:
| | • | | Level 1 — quoted prices in active markets for identical securities. |
| | • | | Level 2 — other significant observable inputs (including yield, quality, coupon rate, maturity, issue type, quoted prices for similar securities, prepayment speeds, trading characteristics, etc.). |
| | • | | Level 3 — significant unobservable inputs (including the Fund’s own assumptions in determining the fair value of investments). |
132
MUTUAL OF AMERICA INVESTMENT CORPORATION
NOTES TO FINANCIAL STATEMENTS (Unaudited) (Continued)
June 30, 2022
| 1. | SIGNIFICANT ACCOUNTING POLICIESAND ORGANIZATION (CONTINUED) |
As of June 30, 2022, management determined that the fair value inputs for all equity securities were considered Level 1, with the exception of four securities in the All America, Small Cap Growth, Small Cap Equity Index, Mid-Term Bond and Bond Funds (see Note a below) which were considered Level 3 and securities listed on foreign exchanges which were considered Level 2. In addition, non-registered securities under Rule 144A of the Securities Act of 1933 were considered Level 2. Furthermore, certain Rule 144A securities not actively traded are considered Level 3; however, there were no such 144A securities as of June 30, 2022. Fair value inputs for all debt securities and temporary cash investments were considered Level 2, with the exception of one security in the Bond Fund (see Note a below) which was considered Level 3. The inputs or methodologies used for valuing securities are not necessarily an indication of the risk associated with investing in those securities.
The following is a summary of the inputs used to value the Funds’ investments and other financial instruments as of June 30, 2022:
| | | | | | | | | | | | | | | | |
Fund | | Level 1 — Quoted
Prices | | | Level 2 — Significant
Observable Inputs | | | Level 3 — Significant
Unobservable Inputs | | | Total | |
| | | | |
Investments at Fair Value:* | | | | | | | | | | | | | | | | |
Equity Index Fund | | | | | | | | | | | | | | | | |
Common Stock-Indexed | | $ | 4,033,392,247 | | | | — | | | | — | | | $ | 4,033,392,247 | |
Short-Term Debt Securities | | | — | | | $ | 58,901,104 | | | | — | | | $ | 58,901,104 | |
Warrants | | $ | 510,815 | | | | — | | | | — | | | $ | 510,815 | |
Temporary Cash Investment | | | — | | | $ | 6,495,702 | | | | — | | | $ | 6,495 702 | |
| | | | | | | | | | | | | | | | |
| | $ | 4,033,903,062 | | | $ | 65,396,806 | | | | — | | | $ | 4,099,299,868 | |
All America Fund | | | | | | | | | | | | | | | | |
Common Stock-Indexed | | $ | 160,386,869 | | | | — | | | | — | | | $ | 160,386,869 | |
Common Stock-Active | | $ | 119,649,837 | | | | — | | | | — | (a) | | $ | 119,649,837 | |
Short-Term Debt Securities-Indexed | | | — | | | $ | 499,638 | | | | — | | | $ | 499,638 | |
Warrants-Indexed | | $ | 591 | | | | — | | | | — | | | $ | 591 | |
Temporary Cash Investment | | | — | | | $ | 5,136,409 | | | | — | | | $ | 5,136,409 | |
| | | | | | | | | | | | | | | | |
| | $ | 280,037,297 | | | $ | 5,636,047 | | | | — | | | $ | 285,673,344 | |
Small Cap Value Fund | | | | | | | | | | | | | | | | |
Common Stock | | $ | 446,215,359 | | | | — | | | | — | | | $ | 446,215,359 | |
Short-Term Debt Securities | | | — | | | $ | 11,995,755 | | | | — | | | $ | 11,995,755 | |
Temporary Cash Investment | | | — | | | $ | 2,428,882 | | | | — | | | $ | 2,428,882 | |
| | | | | | | | | | | | | | | | |
| | $ | 446,215,359 | | | $ | 14,424,637 | | | | — | | | $ | 460,639,996 | |
Small Cap Growth Fund | | | | | | | | | | | | | | | | |
Common Stock | | $ | 444,280,399 | | | | — | | | | — | (a) | | $ | 444,280,399 | |
Short-Term Debt Securities | | | — | | | $ | 10,994,980 | | | | — | | | $ | 10,994,980 | |
Temporary Cash Investment | | | — | | | $ | 2,007,473 | | | | — | | | $ | 2,007,473 | |
| | | | | | | | | | | | | | | | |
| | $ | 444,280,399 | | | $ | 13,002,453 | | | | — | | | $ | 457,282,852 | |
Small Cap Equity Index Fund | | | | | | | | | | | | | | | | |
Common Stock-Indexed | | $ | 140,205,846 | | | | — | | | | — | (a) | | $ | 140,205,846 | |
Warrants | | $ | 11,097 | | | | — | | | | — | | | $ | 11,097 | |
Temporary Cash Investment | | | — | | | $ | 136,079 | | | | — | | | $ | 136,079 | |
| | �� | | | | | | | | | | | | | | |
| | $ | 140,216,943 | | | $ | 136,079 | | | | — | | | $ | 140,353,022 | |
Mid Cap Value Fund | | | | | | | | | | | | | | | | |
Common Stock | | $ | 116,950,157 | | | | — | | | | — | | | $ | 116,950,157 | |
Temporary Cash Investment | | | — | | | $ | 2,499,899 | | | | — | | | $ | 2,499,899 | |
| | | | | | | | | | | | | | | | |
| | $ | 116,950,157 | | | $ | 2,499,899 | | | | — | | | $ | 119,450,056 | |
133
MUTUAL OF AMERICA INVESTMENT CORPORATION
NOTES TO FINANCIAL STATEMENTS (Unaudited) (Continued)
June 30, 2022
| 1. | SIGNIFICANT ACCOUNTING POLICIESAND ORGANIZATION (CONTINUED) |
| | | | | | | | | | | | | | | | |
Fund | | Level 1 — Quoted
Prices | | | Level 2 — Significant
Observable Inputs | | | Level 3 — Significant
Unobservable Inputs | | | Total | |
Mid-Cap Equity Index Fund | | | | | | | | | | | | | | | | |
Common Stock-Indexed | | $ | 1,516,203,642 | | | | — | | | | — | | | $ | 1,516,203,642 | |
Short-Term Debt Securities | | | — | | | $ | 17,992,229 | | | | — | | | $ | 17,992,229 | |
Temporary Cash Investment | | | — | | | $ | 970,839 | | | | — | | | $ | 970,839 | |
| | | | | | | | | | | | | | | | |
| | $ | 1,516,203,642 | | | $ | 18,963,068 | | | | — | | | $ | 1,535,166,710 | |
Composite Fund | | | | | | | | | | | | | | | | |
Common Stock | | $ | 105,732,692 | | | | — | | | | — | | | $ | 105,732,692 | |
U.S. Government Debt | | | — | | | $ | 29,752,374 | | | | — | | | $ | 29,752,374 | |
U.S. Government Agency
Residential Mortgage-Backed Obligations | | | — | | | $ | 20,499,748 | | | | — | | | $ | 20,499,748 | |
Long-Term Corporate Debt | | | — | | | $ | 14,336,149 | | | | — | | | $ | 14,336,149 | |
Short-Term Debt Securities | | | — | | | $ | 12,098,160 | | | | — | | | $ | 12,098,160 | |
Temporary Cash Investment | | | — | | | $ | 3,721,481 | | | | — | | | $ | 3,271,481 | |
| | | | | | | | | | | | | | | | |
| | $ | 105,732,692 | | | $ | 79,957,912 | | | | — | | | $ | 185,690,604 | |
International Fund | | | | | | | | | | | | | | | | |
Common Stock | | $ | 71,842,186 | | | $ | 925,212,056 | | | | — | | | $ | 997,054,242 | |
Short-Term Debt Securities | | | — | | | $ | 2,997,826 | | | | — | | | $ | 2,997,826 | |
Temporary Cash Investment | | | — | | | $ | 61,909,524 | | | | — | | | $ | 61,909,524 | |
| | | | | | | | | | | | | | | | |
| | $ | 71,842,186 | | | $ | 990,119,406 | | | | — | | | $ | 1,061,961,592 | |
Catholic Values Index Fund | | | | | | | | | | | | | | | | |
Common Stock-Indexed | | $ | 3,879,096 | | | | — | | | | — | | | $ | 3,879,096 | |
Retirement Income Fund | | | | | | | | | | | | | | | | |
Common Stock | | $ | 202,693,516 | | | | — | | | | — | | | $ | 202,693,516 | |
2015 Retirement Fund | | | | | | | | | | | | | | | | |
Common Stock | | $ | 119,697,309 | | | | — | | | | — | | | $ | 119,697,309 | |
2020 Retirement Fund | | | | | | | | | | | | | | | | |
Common Stock | | $ | 517,264,053 | | | | — | | | | — | | | $ | 517,264,053 | |
2025 Retirement Fund | | | | | | | | | | | | | | | | |
Common Stock | | $ | 1,032,683,626 | | | | — | | | | — | | | $ | 1,032,683,626 | |
2030 Retirement Fund | | | | | | | | | | | | | | | | |
Common Stock | | $ | 1,066,630,040 | | | | — | | | | — | | | $ | 1,066,630,040 | |
2035 Retirement Fund | | | | | | | | | | | | | | | | |
Common Stock | | $ | 946,744,846 | | | | — | | | | — | | | $ | 946,744,846 | |
2040 Retirement Fund | | | | | | | | | | | | | | | | |
Common Stock | | $ | 784,568,383 | | | | — | | | | — | | | $ | 784,568,383 | |
2045 Retirement Fund | | | | | | | | | | | | | | | | |
Common Stock | | $ | 811,127,768 | | | | — | | | | — | | | $ | 811,127,768 | |
2050 Retirement Fund | | | | | | | | | | | | | | | | |
Common Stock | | $ | 609,266,940 | | | | — | | | | — | | | $ | 609,266,940 | |
2055 Retirement Fund | | | | | | | | | | | | | | | | |
Common Stock | | $ | 294,724,413 | | | | — | | | | — | | | $ | 294,724,413 | |
2060 Retirement Fund | | | | | | | | | | | | | | | | |
Common Stock | | $ | 125,955,536 | | | | — | | | | — | | | $ | 125,955,536 | |
2065 Retirement Fund | | | | | | | | | | | | | | | | |
Common Stock | | $ | 21,489,284 | | | | — | | | | — | | | $ | 21,489,284 | |
Conservative Allocation Fund | | | | | | | | | | | | | | | | |
Common Stock | | $ | 171,764,821 | | | | — | | | | — | | | $ | 171,764,821 | |
134
MUTUAL OF AMERICA INVESTMENT CORPORATION
NOTES TO FINANCIAL STATEMENTS (Unaudited) (Continued)
June 30, 2022
| 1. | SIGNIFICANT ACCOUNTING POLICIESAND ORGANIZATION (CONTINUED) |
| | | | | | | | | | | | | | | | |
Fund | | Level 1 — Quoted
Prices | | | Level 2 — Significant
Observable Inputs | | | Level 3 — Significant
Unobservable Inputs | | | Total | |
Moderate Allocation Fund | | | | | | | | | | | | | | | | |
Common Stock | | $ | 398,150,371 | | | | — | | | | — | | | $ | 398,150,371 | |
Aggressive Allocation Fund | | | | | | | | | | | | | | | | |
Common Stock | | $ | 311,079,552 | | | | — | | | | — | | | $ | 311,079,552 | |
Money Market Fund | | | | | | | | | | | | | | | | |
U.S. Government Debt | | | — | | | $ | 46,976,220 | | | | — | | | $ | 46,976,220 | |
U.S. Government Agency Short Term Debt | | | — | | | $ | 49,088,460 | | | | — | | | $ | 49,088,460 | |
Commercial Paper | | | — | | | $ | 99,278,041 | | | | — | | | $ | 99,278,041 | |
Temporary Cash Investment | | | — | | | $ | 5,312,066 | | | | — | | | $ | 5,312,066 | |
| | | | | | | | | | | | | | | | |
| | | — | | | $ | 200,654,787 | | | | | | | $ | 200,654,787 | |
Mid-Term Bond Fund | | | | | | | | | | | | | | | | |
U.S. Government Debt | | | — | | | $ | 647,280,016 | | | | — | | | $ | 647,280,016 | |
Long-Term Corporate Debt | | | — | | | $ | 213,500,185 | | | | — | | | $ | 213,500,185 | |
Common Stock | | $ | 666,584 | | | | — | | | $ | 815,096 | (a) | | $ | 1,481,680 | |
Short-Term Debt Securities | | | — | | | $ | 7,796,797 | | | | — | | | $ | 7,796,797 | |
Temporary Cash Investment | | | — | | | $ | 1,560,252 | | | | — | | | $ | 1,560,252 | |
| | | | | | | | | | | | | | | | |
| | $ | 666,584 | | | $ | 870,137,250 | | | $ | 815,096 | | | $ | 871,618,930 | |
Bond Fund | | | | | | | | | | | | | | | | |
U.S. Government Debt | | | — | | | $ | 873,286,600 | | | | — | | | $ | 873,286,600 | |
U.S. Government Agency Residential Mortgage-Backed Obligations | | | — | | | $ | 574,040,233 | | | | — | | | $ | 574,040,233 | |
Long-Term Corporate Debt | | | — | | | $ | 401,970,254 | | | | — | | | $ | 401,970,254 | |
Sovereign Debt | | | — | | | | — | | | $ | 2,017,243 | (a) | | $ | 2,017,243 | |
Common Stock | | $ | 1,357,028 | | | | — | | | $ | 1,717,923 | (a) | | $ | 3,074,951 | |
Short-Term Debt Securities | | | — | | | $ | 19,493,923 | | | | — | | | $ | 19,493,923 | |
Temporary Cash Investment | | | — | | | $ | 2,238,467 | | | | — | | | $ | 2,238,467 | |
| | | | | | | | | | | | | | | | |
| | $ | 1,357,028 | | | $ | 1,871,029,477 | | | $ | 3,735,166 | | | $ | 1,876,121,671 | |
| | | | |
Other Financial Instruments:** | | | | | | | | | | | | | | | | |
| | | | |
Equity Index Fund | | $ | (1,600,123 | ) | | | — | | | | — | | | $ | (1,600,123 | ) |
All America Fund | | $ | (49,793 | ) | | | — | | | | — | | | $ | (49,793 | ) |
Mid-Cap Equity Index Fund | | $ | (1,044,365 | ) | | | — | | | | — | | | $ | (1,044,365 | ) |
International Fund | | $ | (216,510 | ) | | | — | | | | — | | | $ | (216,510 | ) |
| * | See Portfolios of Investments for more details on industry or country classifications, as applicable. |
| ** | Other financial instruments are derivative instruments not reflected in the Portfolio of Investments, such as futures, which are valued at the unrealized appreciation/depreciation on the instrument. |
| (a) | Includes securities fair valued using methods determined in good faith by the Adviser and reviewed by the Investment Company Valuation Committee, in accordance with procedures adopted by the Board of Directors of the Investment Company. |
135
MUTUAL OF AMERICA INVESTMENT CORPORATION
NOTES TO FINANCIAL STATEMENTS (Unaudited) (Continued)
June 30, 2022
| 1. | SIGNIFICANT ACCOUNTING POLICIESAND ORGANIZATION (CONTINUED) |
| | | | | | | | | | | | | | | | | | | | | | | | | | | | | | | | | | | | | | | | |
| | | Fair Value Measurement Using Significant Unobservable
Inputs (Level 3) for the Six Months Ended June 30, 2022 | |
| | | Balance
December 31,
2021(a) | | | Change in
Unrealized
Gains
(Losses) | | | Change
in
Realized
Gains
(Losses) | | | Accrued
Discounts/
Premiums | | | Transfers
Into
Level 3 | | | Transfers
Out of
Level 3 | | | Purchases | | | Sales | | | Balance
June 30,
2022(a) | | | Net Change in
Unrealized
Gains/
(Losses)
of Level 3
Assets
Held as of
June 30, 2022 | |
All America Fund — Active Common Stock | | $ | 5,463 | | | $ | (5,462 | ) | | $ | 12,415 | | | | — | | | | — | | | | — | | | | — | | | $ | (12,416 | ) | | | — | (b) | | $ | (5,462 | ) |
Small Cap Growth Fund — Common Stock | | $ | 91,218 | | | $ | (91,208 | ) | | $ | 207,304 | | | | — | | | | — | | | | — | | | | — | | | $ | (207,314 | ) | | | — | (c) | | $ | (91,208 | ) |
Small Cap Equity Index Fund — Common Stock | | | — | | | | — | | | | — | | | | — | | | | — | | | | — | | | | — | | | | — | | | | — | (d) | | | — | |
Mid-Term Bond Fund — Common Stock | | $ | 815,096 | | | | — | | | | — | | | | — | | | | — | | | | — | | | | — | | | | — | | | $ | 815,096 | (e) | | | — | |
Bond Fund — Common Stock | | $ | 1,717,923 | | | | — | | | | — | | | | — | | | | — | | | | — | | | | — | | | | — | | | $ | 1,717,923 | (f) | | | — | |
Bond Fund — Sovereign Debt | | $ | 2,301,760 | | | $ | (122,945 | ) | | | — | | | $ | (46,360 | ) | | | — | | | | — | | | | — | | | $ | (115,212 | ) | | $ | 2,017,243 | (g) | | $ | (122,945 | ) |
| (a) | Includes securities fair valued using methods determined in good faith by the Adviser and reviewed by the Investment Company Valuation Committee, in accordance with procedures adopted by the Board of Directors of the Investment Company. |
| (b) | Level 3 security, Ferroglobe Representation & Warranty Insurance Trust with $0 fair value and Alder Biopharmaceuticals, Inc. — contingent value rights with change in unrealized loss of $5,462, change in realized gain of $12,415 and sales of $12,416. |
| (c) | Level 3 security, Ferroglobe Representation & Warranty Insurance Trust with $0 fair value and Alder Biopharmaceuticals, Inc. — contingent value rights with change in unrealized loss of $91,208, change in realized gain of $207,304 and sales of $207,314. |
| (d) | Level 3 security, Contra Progenics Pharmaceuticals, Inc. — contingent value rights with $0 fair value. |
| (e) | Level 3 security, Superior Energy Svcs., Inc. — common stock with $815,096 fair value. |
| (f) | Level 3 security, Superior Energy Svcs., Inc. — common stock with $1,717,923 fair value. |
| (g) | Level 3 security, Sri Lanka AID, with change in unrealized loss of $122,945, accrued premiums of $46,360, sales of $115,212 and $2,017,243 fair value. |
Security Valuation — Investment securities are carried at fair value as follows:
The Funds’ investments are fair valued as of the close of trading on the New York Stock Exchange (“Exchange”) on each day the Exchange is open for trading. The Exchange usually closes at 4:00 pm Eastern Time but sometimes closes earlier. For Funds that invest in securities listed on foreign exchanges, the value of the securities may change on days when there is no possibility to purchase or redeem shares of the Funds. The Board of Directors of the Investment Company (the “Board”) has adopted valuation procedures for security valuation under which fair valuation responsibilities have been delegated to the Adviser. Pursuant to the Board’s delegation, the Adviser has established a Valuation Committee responsible for supervising the fair valuation of portfolio securities. The valuation procedures permit the Funds to utilize independent pricing vendor services, quotations from market makers and alternative valuation methods when market quotations are either not readily available or not deemed representative of fair value. A record of the Valuation Committee’s actions is subject to the Board’s review, approval and ratification at its next regularly scheduled quarterly meeting. For fiscal reporting year-end, securities were fair valued at the close of the last business day.
Exchange-traded equity securities are valued at the last reported sales price on the principal exchange on which the security is traded. If there is no trading volume for a particular valuation day, the last bid
136
MUTUAL OF AMERICA INVESTMENT CORPORATION
NOTES TO FINANCIAL STATEMENTS (Unaudited) (Continued)
June 30, 2022
| 1. | SIGNIFICANT ACCOUNTING POLICIESAND ORGANIZATION (CONTINUED) |
price is used. For equity securities traded in the over-the-counter market, the security is valued at the last sale price, or if no sale, at the latest bid price available.
Short-term debt securities with a maturity of 60 days or less are valued at amortized cost, which approximates fair value for such securities.
Debt securities, including short-term debt securities maturing in excess of 60 days, are valued on the basis of prices obtained from an independent pricing source. The pricing source may utilize various pricing methodologies that incorporate both models (which consider factors such as yield, quality, coupon rate, maturity, issue type, quoted prices for similar securities, prepayment speeds and trading characteristics) and dealer-supplied valuations to derive a valuation.
Temporary cash investments are amounts on deposit with financial institutions that are swept daily into an overnight investment and returned the next business day. Cash equivalents such as short-term temporary cash investments are valued at amortized cost.
In the rare instance when a price is not available from an independent pricing source or when prices may not reflect fair value, such as when the price provided by the pricing source is not based on a recent trade, a calculated fair value is used, as determined in good faith by the Adviser and reviewed by a Valuation Committee, in accordance with procedures adopted by the Board of Directors of the Investment Company.
Mutual of America Capital Management LLC (“the Adviser”) uses a market approach to calculate fair value for equity securities which are categorized as Level 3. The Adviser’s valuation is primarily based on information regarding the specific equity issuer, such as the last trade price, financial statements, the relationship of per-share book value to the last trade price, operating information and any corporate actions, such as dividends or returns of capital, that may have occurred since the last trade. The Adviser also considers industry-specific conditions and overall market conditions, to determine whether the last trade price reflects fair value or needs to be adjusted. Generally, absent any significant contrary indications, the last trade price will be used as the calculated fair value.
The Retirement Funds and the Allocation Funds value their investments in the underlying Funds of the Investment Company at their respective net asset values.
Investment Transactions — Investment transactions are accounted for as of the trade date. Realized gains and losses on the sale of short and long-term debt securities are computed on the basis of amortized cost at the time of sale. Realized gains and losses on the sale of equity securities are based on the identified cost basis of the security, determined on the first-in, first-out (“FIFO”) basis.
Futures Contracts — The Equity Index Fund, Mid-Cap Equity Index Fund and a portion of the All America Fund each maintain indexed asset portfolios which are subject to equity price risk. In order to remain more fully invested in the equity markets while minimizing transaction costs, the funds purchase stock index futures contracts. These purchases of futures contracts allow the funds to invest available cash to attempt to efficiently and cost effectively keep the funds fully invested on a daily basis in an attempt to minimize deviation from the performance of the indices.
An initial cash margin deposit (represented by cash or Treasury bills) is made upon entering into a futures contract and serves as collateral for the contract. This initial margin, maintained in a segregated account, is equal to approximately 5%-6% of the contract amount, and does not involve the borrowing of funds to finance the transaction. During the period the futures contract is outstanding, changes in the value of the contract are recognized as unrealized appreciation or depreciation by “marking-to-market” on a daily basis to reflect the market value of the contract at the end of each trading day. The accumulated unrealized appreciation or depreciation on the contract is included in Total Distributable Earnings (Loss) in the Components of Net Assets section of the Statements of Assets and Liabilities. Futures contracts are valued at the settlement price established each day by the exchange on which traded. Depending upon whether unrealized appreciation or depreciation are incurred, variation margin payments are received or made daily. The net change in unrealized appreciation or depreciation of futures contracts is recorded in the
137
MUTUAL OF AMERICA INVESTMENT CORPORATION
NOTES TO FINANCIAL STATEMENTS (Unaudited) (Continued)
June 30, 2022
| 1. | SIGNIFICANT ACCOUNTING POLICIESAND ORGANIZATION (CONTINUED) |
Statements of Operations. When the contract is closed, a realized gain or loss from futures transactions is recorded in the Statements of Operations, equal to the net variation margin received or paid over the period the contract was outstanding.
The “Underlying Face Amount at Value” (appearing in the “Footnotes to Portfolios of Investments in Securities”) representing the aggregate of outstanding contractual amounts under futures contracts reflects the extent of a Fund’s exposure to off-balance sheet risk. The use of futures transactions involves the risk of imperfect correlation in the price movements of the contract and the underlying securities. With futures contracts, there is minimal counterparty credit risk to the Fund since futures are exchange traded and the exchange’s clearinghouse, as counterparty to all exchange traded futures, guarantees the futures against default.
The following table presents the financial statement impacts resulting from the funds’ use of futures contracts at their fair values as of June 30, 2022 and for the six months ended June 30, 2022:
| | | | | | | | | | | | | | | | | | | | | | |
Derivatives not accounted
for as hedging instruments | | Risk
Type | | | Location on Statements of
Assets and Liabilities | | Equity Index
Fund | | | All America
Fund | | | Mid-Cap Equity
Index Fund | | | International
Fund | |
Futures Contracts | | | Equity | | | Total Distributable Earnings (Loss) | | $ | (1,600,123 | ) | | $ | (49,793 | ) | | $ | (1,044,365 | ) | | $ | (216,510 | ) |
| | | | | | | | | | | | | | | | | | | | | | |
| | | | | | |
Derivatives not accounted
for as hedging instruments | | Risk
Type | | | Location on Statements of
Operations | | Equity Index
Fund | | | All America
Fund | | | Mid-Cap Equity
Index Fund | | | International
Fund | |
Futures Contracts | | | Equity | | | Net realized gain (loss) on Futures contracts | | $ | (10,726,634 | ) | | $ | (402,822 | ) | | $ | (5,207,768 | ) | | $ | (5,999,140 | ) |
| | | | | | | | | | | | | | | | | | | | | | |
Futures Contracts | | | Equity | | | Change in net unrealized appreciation (depreciation) of Futures contracts | | $ | (3,073,343 | ) | | $ | (127,058 | ) | | $ | (2,364,883 | ) | | $ | (623,400 | ) |
| | | | | | | | | | | | | | | | | | | | | | |
During the six months ended June 30, 2022, the Equity Index Fund, All America Fund, Mid-Cap Equity Index Fund and International Fund held futures contracts with average notional amounts of $63,552,236, $2,994,313, $31,927,743 and $32,024,637, respectively.
Warrants — A warrant is an option to purchase common stock of an issuer and is issued in conjunction with another security, such as a debt obligation. A warrant specifies the price at which the holder may purchase shares of common stock and usually expires after a period of time. A warrant holder generally may pay cash for the common stock to be purchased or may surrender the principal amount of the related debt security the warrant holder owns equal to the purchase price for the stock.
The common stock underlying a warrant may not increase in value after the date the warrant was issued, or may not increase up to the warrant exercise price. In this case, the warrant generally would have little value and could expire unexercised.
Retirement Funds — Each of the Retirement Funds invests in equity (stock) funds and fixed income (bond) funds and targets different percentages to these asset classes. The targets reflect varying emphases on achieving capital appreciation and gains versus preserving capital and producing income, depending on the specific Fund’s time horizon.
The Retirement Funds target their investments in the following underlying funds of the Investment Company in accordance with the percentage allocations noted (unaudited):
| | | | | | | | | | | | | | | | | | | | | | | | | | | | |
| | | Equity
Index
Fund | | | Mid-Cap
Equity
Index
Fund | | | Small Cap
Funds* | | | International
Fund | | | Bond
Fund | | | Mid-Term
Bond
Fund | | | Money
Market
Fund | |
Retirement Income Fund | | | 20% | | | | 5% | | | | — | | | | 5% | | | | 35% | | | | 30% | | | | 5% | |
2015 Retirement Fund | | | 23% | | | | 5% | | | | — | | | | 5% | | | | 35% | | | | 27% | | | | 5% | |
2020 Retirement Fund | | | 25% | | | | 7% | | | | 2% | | | | 7% | | | | 35% | | | | 19% | | | | 5% | |
138
MUTUAL OF AMERICA INVESTMENT CORPORATION
NOTES TO FINANCIAL STATEMENTS (Unaudited) (Continued)
June 30, 2022
| 1. | SIGNIFICANT ACCOUNTING POLICIESAND ORGANIZATION (CONTINUED) |
| | | | | | | | | | | | | | | | | | | | | | | | | | | | |
| | | Equity
Index
Fund | | | Mid-Cap
Equity
Index
Fund | | | Small Cap
Funds* | | | International
Fund | | | Bond
Fund | | | Mid-Term
Bond
Fund | | | Money
Market
Fund | |
2025 Retirement Fund | | | 30% | | | | 8% | | | | 3% | | | | 10% | | | | 32% | | | | 14% | | | | 3% | |
2030 Retirement Fund | | | 35% | | | | 10% | | | | 4% | | | | 12% | | | | 26% | | | | 10% | | | | 3% | |
2035 Retirement Fund | | | 40% | | | | 13% | | | | 5% | | | | 15% | | | | 20% | | | | 4% | | | | 3% | |
2040 Retirement Fund | | | 44% | | | | 14% | | | | 6% | | | | 18% | | | | 16% | | | | — | | | | 2% | |
2045 Retirement Fund | | | 47% | | | | 14% | | | | 7% | | | | 19% | | | | 11% | | | | — | | | | 2% | |
2050 Retirement Fund | | | 48% | | | | 14% | | | | 8% | | | | 20% | | | | 8% | | | | — | | | | 2% | |
2055 Retirement Fund | | | 47% | | | | 15% | | | | 9% | | | | 21% | | | | 7% | | | | — | | | | 1% | |
2060 Retirement Fund | | | 47% | | | | 15% | | | | 10% | | | | 22% | | | | 5% | | | | — | | | | 1% | |
2065 Retirement Fund | | | 48% | | | | 15% | | | | 10% | | | | 22% | | | | 4% | | | | — | | | | 1% | |
| * | May include the Small Cap Growth, Small Cap Value and Small Cap Equity Index Funds |
Generally, rebalancing of the Retirement Funds’ holdings is performed on a periodic basis and the mix of underlying Funds is reviewed annually.
Allocation Funds — The Allocation Funds target their investments in the following underlying Funds of the Investment Company in accordance with the percentage allocations noted (unaudited):
| | | | | | | | | | | | | | | | | | | | | | | | | | | | |
| | | Equity
Index
Fund | | | Mid-Cap
Equity
Index
Fund | | | Small Cap
Growth
Fund | | | Small Cap
Value
Fund | | | International
Fund | | | Bond
Fund | | | Mid-Term
Bond
Fund | |
Conservative Allocation | | | 25% | | | | 5% | | | | — | | | | — | | | | 5% | | | | 30% | | | | 35% | |
Moderate Allocation | | | 35% | | | | 15% | | | | — | | | | — | | | | 10% | | | | 25% | | | | 15% | |
Aggressive Allocation | | | 35% | | | | 20% | | | | 5% | | | | 5% | | | | 15% | | | | 20% | | | | — | |
Generally, rebalancing of the Allocation Funds’ holdings is performed on a periodic basis.
Change in Target Investments — During the year, the Retirement Funds listed below had changes to their target investments. Overall increases (decreases) to the target percentages were as follows (unaudited):
| | | | | | | | | | | | | | | | | | | | | | | | | | | | |
| | | Equity
Index
Fund | | | Mid-Cap
Equity
Index
Fund | | | Small Cap
Funds* | | | International
Fund | | | Bond
Fund | | | Mid-Term
Bond
Fund | | | Money
Market
Fund | |
Retirement Income Fund | | | — | | | | — | | | | — | | | | 5% | | | | — | | | | 5% | | | | (10% | ) |
2015 Retirement Fund | | | 1% | | | | (1% | ) | | | — | | | | — | | | | (2% | ) | | | 7% | | | | (5% | ) |
2020 Retirement Fund | | | 2% | | | | (1% | ) | | | (2% | ) | | | (1% | ) | | | (2% | ) | | | 4% | | | | — | |
2025 Retirement Fund | | | 3% | | | | (4% | ) | | | (1% | ) | | | — | | | | — | | | | 4% | | | | (2% | ) |
2030 Retirement Fund | | | 2% | | | | (5% | ) | | | (1% | ) | | | — | | | | 1% | | | | 5% | | | | (2% | ) |
2035 Retirement Fund | | | 3% | | | | (3% | ) | | | (2% | ) | | | — | | | | (5% | ) | | | 4% | | | | 3% | |
2040 Retirement Fund | | | 3% | | | | (3% | ) | | | (2% | ) | | | 1% | | | | (1% | ) | | | — | | | | 2% | |
2045 Retirement Fund | | | 5% | | | | (3% | ) | | | (2% | ) | | | 1% | | | | (3% | ) | | | — | | | | 2% | |
2050 Retirement Fund | | | 7% | | | | (4% | ) | | | (2% | ) | | | 1% | | | | (4% | ) | | | — | | | | 2% | |
2055 Retirement Fund | | | 7% | | | | (4% | ) | | | (2% | ) | | | 1% | | | | (3% | ) | | | — | | | | 1% | |
2060 Retirement Fund | | | 8% | | | | (5% | ) | | | (2% | ) | | | 1% | | | | (3% | ) | | | — | | | | 1% | |
2065 Retirement Fund | | | 10% | | | | (6% | ) | | | (3% | ) | | | — | | | | (2% | ) | | | — | | | | 1% | |
| * | May include the Small Cap Growth, Small Cap Value and Small Cap Equity Index Funds |
Change in International Fund Investments — unaudited. — Previously, the International Fund was invested mainly in exchange traded funds that reflect, replicate or follow the country weightings of the MSCI EAFE® Index. The Fund had also invested a small percentage of assets in exchange traded funds that provide exposure to emerging markets and to companies with small market capitalizations in developed market countries. The Securities and Exchange Commission revoked the exemptive orders that allowed these investments effective on January 19, 2022. As of that
139
MUTUAL OF AMERICA INVESTMENT CORPORATION
NOTES TO FINANCIAL STATEMENTS (Unaudited) (Continued)
June 30, 2022
| 1. | SIGNIFICANT ACCOUNTING POLICIESAND ORGANIZATION (CONTINUED) |
date, the International Fund is invested directly in the stocks of companies represented in the MSCI EAFE® Index, except to the extent that it is permissible to invest in exchange traded funds within the general limitations of the Investment Company Act.
Investment Income — Interest income, accretion of discount and amortization of premium are recorded daily on an accrual basis using the effective interest method. A debt obligation may cease accrual of income and result in a reduction to interest income when the collection of all or a portion of current and past due interest is in doubt. Dividend income is recorded on the ex-dividend date. Foreign source tax withheld from dividends is recorded as a reduction from dividend income. Should reclamation efforts succeed, such amounts are recorded as income upon collection.
Foreign Currency Translations — The accounting records of the Funds are maintained in U.S. dollars. Foreign currency amounts are translated into U.S. dollars at the current rate of exchange of such currency against the U.S. dollar to determine the value of investments, assets and liabilities. Purchases and sales of securities, and income and expenses are translated at the prevailing rate of exchange on the respective dates of such transactions. Reported net realized gains and losses arise from the sales of portfolio securities, sales of foreign currencies, currency gains or losses realized between the trade and settlement dates on securities transactions, and the difference between the amounts of dividends, interest and foreign withholding taxes recorded on the Fund’s books and the U.S. dollar equivalent of the amounts actually received or paid. The effect of changes in foreign exchange rates on foreign denominated securities is reflected in the net realized gain (loss) on foreign currency translations and change in net unrealized appreciation (depreciation) of foreign currency translations within the Statement of Operations.
Distributions to Shareholders (“Dividends”) — Distributions to shareholders are recorded on the ex-dividend date and are made at least annually. It is the Investment Company’s policy to make distributions of its net investment income and net realized gains, if any, in accordance with Federal income tax regulations, which may differ from U.S. generally accepted accounting principles. Accordingly, periodic reclassifications (which do not impact the funds’ net asset values) are made within the funds’ capital accounts to reflect income and gains available for distribution under Federal income tax regulations.
Federal Income Taxes — Each Fund in the Investment Company intends to comply with the requirements of the Internal Revenue Code applicable to regulated investment companies and to distribute substantially all of its taxable income to shareholders. Therefore, no federal income or excise tax provision is required.
GAAP requires the evaluation of tax positions taken in the course of preparing a fund’s tax return to determine whether it is “more-likely-than-not” that tax positions taken in the fund’s tax return will be ultimately sustained, and, if not, a tax liability and expense is recorded.
As of June 30, 2022, management has evaluated the tax positions taken on the Funds’ filed tax returns for all open tax years and has concluded that no tax provision is required in any of the Funds’ financial statements. Generally, the statute of limitations is open for 3 years after the tax returns are filed. Each Fund’s federal, state and local income and federal excise tax returns for tax years for which the applicable statutes of limitations have not expired are subject to examination by the Internal Revenue Service and state departments of revenue.
As of June 30, 2022, the following Funds had capital loss carry-forwards available to offset net realized capital gains generated after December 31, 2021.
| | | | | | | | | | | | | | | | |
| | | Money
Market
Fund | | | Bond
Fund | | | International
Fund | | | Catholic
Values
Fund | |
Capital loss carry-forward — (short-term) | | $ | (6,619 | ) | | $ | (6,621,531 | ) | | $ | (7,748,345 | ) | | $ | (3,407 | ) |
Capital loss carry-forward — (long-term) | | $ | (3 | ) | | $ | (5,519,738 | ) | | $ | (5,953,476 | ) | | $ | (0 | ) |
| | | | |
| | | 2015
Retirement
Fund | | | 2065
Retirement
Fund | | | | | | | |
Capital loss carry-forward — (short-term) | | $ | (0 | ) | | $ | (56,791 | ) | | | | | | | | |
Capital loss carry-forward — (long-term) | | $ | (1,215,130 | ) | | $ | (129,247 | ) | | | | | | | | |
The ability to utilize capital loss carryforwards in the future may be limited under the Internal Revenue Code and related regulations based on the results of future transactions.
140
MUTUAL OF AMERICA INVESTMENT CORPORATION
NOTES TO FINANCIAL STATEMENTS (Unaudited) (Continued)
June 30, 2022
The Investment Company has an Investment Advisory Agreement with Mutual of America Capital Management LLC (“the Adviser”), an indirect wholly-owned subsidiary of Mutual of America Life. For providing investment management services to each of the Funds of the Investment Company, the Adviser receives a fee, calculated as a daily charge of the value of the net assets of each fund, at the following annual rates:
| | | | |
Fund | | Annual Investment
Management Fee | |
Retirement Funds | | | .05 | % |
Equity Index, Mid-Cap Equity Index, Small Cap Equity Index, International Funds | | | .075 | % |
Catholic Values Index and Money Market Funds | | | .15 | % |
Bond Fund | | | .39 | % |
All America, Composite, Mid-Term Bond Funds | | | .40 | % |
Mid Cap Value Fund | | | .55 | % |
Small Cap Value, Small Cap Growth Funds | | | .75 | % |
The Retirement and Allocation Funds incur direct investment management expenses of .05% and .00%, respectively. Shareholders in the Allocation and Retirement Funds indirectly bear their pro-rata share of the investment management fees incurred by the underlying funds in which they invest. Through December 31, 2014, they also did not incur operating expenses other than those included in each of the underlying funds in which they invest. Commencing January 1, 2015, the expense allocation methodology was modified such that certain non-advisory operating expenses that can be attributed only to the Retirement and Allocation Funds are now charged directly to those Funds. During 2017, Mutual of America reimbursed the applicable funds $492,285 to reflect the change in the operating expense allocation methodology.
Effective January 1, 2015, the Investment Company and the Adviser entered into an agreement under which the Adviser agrees to reimburse the direct non-advisory operating expenses of any Allocation or Retirement Fund (each a “Fund of Funds”) that has less than $50 million in average daily net assets for the prior calendar year. This agreement remains in effect through April 30, 2023 and continues into successive 12 month periods ending April 30 unless i) The Fund of Funds has at least $50 million in average daily net assets for the prior calendar year, ii) the Investment Company gives not less than 30 days written notice to the Adviser, or iii) the Adviser gives 45 days advance notice to the Investment Company before the next May 1 of a given year to terminate the agreement. In that case, the agreement will terminate on the next May 1 following the written notice.
Effective July 2, 2018, the Investment Company and the Adviser entered into an agreement under which the Adviser agrees to reimburse the non-advisory operating expenses of the Small Cap Equity Index Fund to the extent that such operating expenses exceed 0.07% of net assets. This agreement remains in effect through April 30, 2023 and continues into successive 12 month periods ending April 30 unless i) the Investment Company gives not less than 30 days written notice to the Adviser, or ii) the Adviser gives 45 days advance notice to the Investment Company before the next May 1 of a given year to terminate the agreement. In that case, the agreement will terminate on the next May 1 following the written notice.
Effective September 30, 2020, the Investment Company and the Adviser entered into an agreement under which the Adviser agrees to reimburse the non-advisory operating expenses of the Catholic Values Index Fund to the extent that such operating expenses exceed 0.07% of net assets. This agreement remains in effect through April 30, 2023 and continues into successive 12 month periods ending April 30 unless i) the Investment Company gives not less than 30 days written notice to the Adviser, or ii) the Adviser gives 45 days advance notice to the Investment Company before the next May 1 of a given year to terminate the agreement. In that case, the agreement will terminate on the next May 1 following the written notice.
141
MUTUAL OF AMERICA INVESTMENT CORPORATION
NOTES TO FINANCIAL STATEMENTS (Unaudited) (Continued)
June 30, 2022
The cost of investment purchases and proceeds from sales of investments, excluding short-term securities and futures contracts, for the year ended June 30, 2022, were as follows:
| | | | | | | | | | | | | | | | | | | | |
| | | Equity Index
Fund | | | All America
Fund | | | Small Cap
Value Fund | | | Small Cap
Growth Fund | | | Small Cap
Equity Index
Fund | |
Cost of investment purchases | | $ | 221,335,592 | | | $ | 20,465,131 | | | $ | 32,063,956 | | | $ | 157,220,751 | | | $ | 49,838,471 | |
| | | | | | | | | | | | | | | | | | | | |
Proceeds from sales of investments | | $ | 77,867,391 | | | $ | 32,055,840 | | | $ | 53,004,077 | | | $ | 175,995,200 | | | $ | 19,029,319 | |
| | | | | | | | | | | | | | | | | | | | |
| | | | | |
| | | Mid Cap Value
Fund | | | Mid-Cap Equity
Index Fund | | | Composite
Fund | | | International
Fund | | | Catholic
Values Index
Fund | |
Cost of investment purchases | | $ | 19,133,979 | | | $ | 155,514,426 | | | $ | 29,398,038 | | | $ | 184,577,270 | | | $ | 650,142 | |
| | | | | | | | | | | | | | | | | | | | |
Proceeds from sales of investments | | $ | 6,691,506 | | | $ | 294,717,721 | | | $ | 34,309,325 | | | $ | 108,823,217 | | | $ | 274,721 | |
| | | | | | | | | | | | | | | | | | | | |
| | | | | |
| | | Retirement
Income Fund | | | 2015
Retirement
Fund | | | 2020
Retirement
Fund | | | 2025
Retirement
Fund | | | 2030
Retirement
Fund | |
Cost of investment purchases | | $ | 50,976,934 | | | $ | 19,858,371 | | | $ | 55,049,806 | | | $ | 116,735,665 | | | $ | 126,089,536 | |
| | | | | | | | | | | | | | | | | | | | |
Proceeds from sales of investments | | $ | 47,296,052 | | | $ | 23,240,868 | | | $ | 75,101,382 | | | $ | 107,713,383 | | | $ | 87,224,965 | |
| | | | | | | | | | | | | | | | | | | | |
| | | | | |
| | | 2035
Retirement
Fund | | | 2040
Retirement
Fund | | | 2045
Retirement
Fund | | | 2050
Retirement
Fund | | | 2055
Retirement
Fund | |
Cost of investment purchases | | $ | 113,926,355 | | | $ | 79,292,680 | | | $ | 86,841,239 | | | $ | 76,385,591 | | | $ | 57,271,150 | |
| | | | | | | | | | | | | | | | | | | | |
Proceeds from sales of investments | | $ | 65,285,465 | | | $ | 46,327,272 | | | $ | 47,953,495 | | | $ | 44,727,664 | | | $ | 25,772,244 | |
| | | | | | | | | | | | | | | | | | | | |
| | | | | |
| | | 2060
Retirement
Fund | | | 2065
Retirement
Fund | | | Conservative
Allocation
Fund | | | Moderate
Allocation
Fund | | | Aggressive
Allocation
Fund | |
Cost of investment purchases | | $ | 34,548,851 | | | $ | 11,061,347 | | | $ | 8,161,446 | | | $ | 10,433,800 | | | $ | 8,440,880 | |
| | | | | | | | | | | | | | | | | | | | |
Proceeds from sales of investments | | $ | 11,333,760 | | | $ | 2,474,231 | | | $ | 11,893,216 | | | $ | 23,297,484 | | | $ | 17,239,827 | |
| | | | | | | | | | | | | | | | | | | | |
| | | | | |
| | | Mid-Term Bond
Fund | | | Bond Fund | | | | | | | | | | |
Cost of investment purchases | | $ | 140,466,468 | | | $ | 332,813,702 | | | | | | | | | | | | | |
| | | | | | | | | | | | | | | | | | | | |
Proceeds from sales of investments | | $ | 79,176,493 | | | $ | 297,971,418 | | | | | | | | | | | | | |
| | | | | | | | | | | | | | | | | | | | |
The cost of short-term security purchases for the Money Market Fund for the year ended June 30, 2022, was $1,432,126,237; proceeds from sales for the year were $1,410,212,025.
The components of net unrealized appreciation (depreciation) of investments for federal income tax purposes and the cost of investments for federal income tax purposes at June 30, 2022 for each of the Funds were as follows:
| | | | | | | | | | | | | | | | | | | | |
| | | Equity Index
Fund | | | All America
Fund | | | Small Cap
Value Fund | | | Small Cap
Growth Fund | | | Small Cap
Equity Index
Fund | |
Unrealized Appreciation | | $ | 1,713,480,673 | | | $ | 80,241,475 | | | $ | 75,959,265 | | | $ | 51,370,396 | | | $ | 11,756,547 | |
Unrealized Depreciation | | | (130,852,137 | ) | | | (18,770,589 | ) | | | (45,101,139 | ) | | | (72,586,759 | ) | | | (20,859,103 | ) |
| | | | | | | | | | | | | | | | | | | | |
Net | | $ | 1,582,628,536 | | | $ | 61,470,886 | | | $ | 30,858,126 | | | $ | (21,216,363 | ) | | $ | (9,102,556 | ) |
| | | | | | | | | | | | | | | | | | | | |
Tax Cost of Investments | | $ | 2,516,671,332 | | | $ | 224,202,458 | | | $ | 429,781,870 | | | $ | 478,499,215 | | | $ | 149,455,578 | |
| | | | | | | | | | | | | | | | | | | | |
142
MUTUAL OF AMERICA INVESTMENT CORPORATION
NOTES TO FINANCIAL STATEMENTS (Unaudited) (Continued)
June 30, 2022
| 3. | INVESTMENTS (CONTINUED) |
| | | | | | | | | | | | | | | | | | | | |
| | | Mid Cap Value
Fund | | | Mid-Cap Equity
Index Fund | | | Composite
Fund | | | International
Fund | | | Catholic
Values Index
Fund | |
Unrealized Appreciation | | $ | 26,176,165 | | | $ | 248,815,205 | | | $ | 36,408,226 | | | $ | 42,929,753 | | | $ | 437,888 | |
Unrealized Depreciation | | | (7,632,296 | ) | | | (146,201,719 | ) | | | (10,851,576 | ) | | | (244,815,683 | ) | | | (293,975 | ) |
| | | | | | | | | | | | | | | | | | | | |
Net | | $ | 18,543,869 | | | $ | 102,613,486 | | | $ | 25,556,650 | | | $ | (201,885,930 | ) | | $ | 143,913 | |
| | | | | | | | | | | | | | | | | | | | |
Tax Cost of Investments | | $ | 100,906,187 | | | $ | 1,432,553,224 | | | $ | 160,133,954 | | | $ | 1,263,538,244 | | | $ | 3,735,183 | |
| | | | | | | | | | | | | | | | | | | | |
| | | | | |
| | | Retirement
Income Fund | | | 2015
Retirement
Fund | | | 2020
Retirement
Fund | | | 2025
Retirement
Fund | | | 2030
Retirement
Fund | |
Unrealized Appreciation | | $ | 2,145,112 | | | $ | 1,335,334 | | | $ | 11,238,060 | | | $ | 24,735,676 | | | $ | 37,082,396 | |
Unrealized Depreciation | | | (21,018,047 | ) | | | (10,529,946 | ) | | | (47,321,304 | ) | | | (90,316,556 | ) | | | (87,272,574 | ) |
| | | | | | | | | | | | | | | | | | | | |
Net | | $ | (18,872,935 | ) | | $ | (9,194,612 | ) | | $ | (36,083,244 | ) | | $ | (65,580,880 | ) | | $ | (50,190,178 | ) |
| | | | | | | | | | | | | | | | | | | | |
Tax Cost of Investments | | $ | 221,566,451 | | | $ | 128,891,921 | | | $ | 553,347,297 | | | $ | 1,098,264,506 | | | $ | 1,116,820,218 | |
| | | | | | | | | | | | | | | | | | | | |
| | | | | |
| | | 2035
Retirement
Fund | | | 2040
Retirement
Fund | | | 2045
Retirement
Fund | | | 2050
Retirement
Fund | | | 2055
Retirement
Fund | |
Unrealized Appreciation | | $ | 34,575,720 | | | $ | 26,423,867 | | | $ | 31,497,660 | | | $ | 14,373,691 | | | $ | 894 | |
Unrealized Depreciation | | | (80,725,470 | ) | | | (59,064,451 | ) | | | (62,061,414 | ) | | | (45,634,656 | ) | | | (27,894,063 | ) |
| | | | | | | | | | | | | | | | | | | | |
Net | | $ | (46,149,750 | ) | | $ | (32,640,584 | ) | | $ | (30,563,754 | ) | | $ | (31,260,965 | ) | | $ | (27,893,169 | ) |
| | | | | | | | | | | | | | | | | | | | |
Tax Cost of Investments | | $ | 992,894,596 | | | $ | 817,208,967 | | | $ | 841,691,522 | | | $ | 640,527,905 | | | $ | 322,617,582 | |
| | | | | | | | | | | | | | | | | | | | |
| | | | | |
| | | 2060
Retirement
Fund | | | 2065
Retirement
Fund | | | Conservative
Allocation
Fund | | | Moderate
Allocation
Fund | | | Aggressive
Allocation
Fund | |
Unrealized Appreciation | | $ | 44,755 | | | $ | 97 | | | $ | 2,912,579 | | | $ | 23,051,855 | | | $ | 23,687,684 | |
Unrealized Depreciation | | | (16,316,796 | ) | | | (4,208,709 | ) | | | (15,914,017 | ) | | | (29,066,686 | ) | | | (23,684,788 | ) |
| | | | �� | | | | | | | | | | | | | | | | |
Net | | $ | (16,272,041 | ) | | $ | (4,208,612 | ) | | $ | (13,001,438 | ) | | $ | (6,014,831 | ) | | $ | 2,896 | |
| | | | | | | | | | | | | | | | | | | | |
Tax Cost of Investments | | $ | 142,227,577 | | | $ | 25,697,896 | | | $ | 184,766,259 | | | $ | 404,165,202 | | | $ | 311,076,656 | |
| | | | | | | | | | | | | | | | | | | | |
| | | | | |
| | | Money Market
Fund | | | Mid-Term Bond
Fund | | | Bond Fund | | | | | | | |
Unrealized Appreciation | | $ | 0 | | | $ | 82,351 | | | $ | 1,319,006 | | | | | | | | | |
Unrealized Depreciation | | | (4,737 | ) | | | (63,592,466 | ) | | | (186,320,762 | ) | | | | | | | | |
| | | | | | | | | | | | | | | | | | | | |
Net | | $ | (4,737 | ) | | $ | (63,510,115 | ) | | $ | (185,001,756 | ) | | | | | | | | |
| | | | | | | | | | | | | | | | | | | | |
Tax Cost of Investments | | $ | 200,659,524 | | | $ | 935,129,045 | | | $ | 2,061,123,427 | | | | | | | | | |
| | | | | | | | | | | | | | | | | | | | |
Differences between amounts reflected in the Statements of Assets and Liabilities and those computed for federal income tax purposes arise primarily from federal income tax treatment of wash sales, REITs, PFICs, partnerships, corporate actions and futures contracts.
143
MUTUAL OF AMERICA INVESTMENT CORPORATION
NOTES TO FINANCIAL STATEMENTS (Unaudited) (Continued)
June 30, 2022
| 3. | INVESTMENTS (CONTINUED) |
Investments in affiliated investment companies during the six months ended June 30, 2022 were as follows:
| | | | | | | | | | | | | | | | | | | | | | | | | | | | |
Affiliated Investment
Company | | Value as of
December 31,
2021 | | | Purchases | | | Realized
Gain
(Loss) on
Investment
Securities | | | Change in
Unrealized
Appreciation
(Depreciation)
of Investment
Securities | | | Sales | | | Value as of
June 30,
2022 | | | Dividends | |
Retirement Income Fund | |
Bond Fund | | $ | 67,233,587 | | | $ | 19,320,556 | | | $ | (787,481 | ) | | $ | (5,805,746 | ) | | $ | (12,623,379 | ) | | $ | 67,337,537 | | | $ | 464,521 | |
Equity Index Fund | | | 51,649,348 | | | | 8,907,937 | | | | 2,361,523 | | | | (12,787,581 | ) | | | (9,630,052 | ) | | | 40,501,175 | | | | 275,918 | |
International Fund | | | — | | | | 6,484,459 | | | | (4,420 | ) | | | (635,352 | ) | | | (293,100 | ) | | | 5,551,587 | | | | 141,335 | |
Mid-Cap Equity Index Fund | | | 13,922,598 | | | | 1,978,689 | | | | 51,714 | | | | (2,661,087 | ) | | | (3,782,513 | ) | | | 9,509,401 | | | | 70,684 | |
Mid-Term Bond Fund | | | 63,101,442 | | | | 12,242,285 | | | | (116,495 | ) | | | (4,349,210 | ) | | | (4,205,667 | ) | | | 66,672,355 | | | | 359,136 | |
Money Market Fund | | | 27,852,524 | | | | 2,043,008 | | | | (353,383 | ) | | | 340,653 | | | | (16,761,341 | ) | | | 13,121,461 | | | | 5,242 | |
| | | | | | | | | | | | | | | | | | | | | | | | | | | | |
Total | | $ | 223,759,499 | | | $ | 50,976,934 | | | $ | 1,151,458 | | | $ | (25,898,323 | ) | | $ | (47,296,052 | ) | | $ | 202,693,516 | | | $ | 1,316,836 | |
| | | | | | | | | | | | | | | | | | | | | | | | | | | | |
|
2015 Retirement Fund | |
Bond Fund | | $ | 44,868,290 | | | $ | 8,425,215 | | | $ | (442,463 | ) | | $ | (3,834,412 | ) | | $ | (8,249,968 | ) | | $ | 40,766,662 | | | $ | 289,094 | |
Equity Index Fund | | | 35,336,648 | | | | 4,185,301 | | | | 2,328,762 | | | | (9,428,671 | ) | | | (5,926,173 | ) | | | 26,495,867 | | | | 182,349 | |
International Fund | | | 7,056,427 | | | | 372,222 | | | | 47,888 | | | | (1,307,617 | ) | | | (431,200 | ) | | | 5,737,720 | | | | 147,405 | |
Mid-Cap Equity Index Fund | | | 11,163,777 | | | | 304,805 | | | | (17,687 | ) | | | (1,955,779 | ) | | | (2,988,549 | ) | | | 6,506,567 | | | | 29,863 | |
Mid-Term Bond Fund | | | 36,094,620 | | | | 3,187,927 | | | | (148,013 | ) | | | (2,283,012 | ) | | | (1,927,022 | ) | | | 34,924,500 | | | | 192,337 | |
Money Market Fund | | | 5,601,283 | | | | 3,382,901 | | | | (52,962 | ) | | | 52,727 | | | | (3,717,956 | ) | | | 5,265,993 | | | | 2,070 | |
| | | | | | | | | | | | | | | | | | | | | | | | | | | | |
Total | | $ | 140,121,045 | | | $ | 19,858,371 | | | $ | 1,715,525 | | | $ | (18,756,764 | ) | | $ | (23,240,868 | ) | | $ | 119,697,309 | | | $ | 843,118 | |
| | | | | | | | | | | | | | | | | | | | | | | | | | | | |
|
2020 Retirement Fund | |
Bond Fund | | $ | 192,782,745 | | | $ | 26,111,046 | | | $ | (1,767,876 | ) | | $ | (16,981,463 | ) | | $ | (29,824,105 | ) | | $ | 170,320,347 | | | $ | 1,275,585 | |
Equity Index Fund | | | 163,324,585 | | | | 7,387,348 | | | | 5,878,461 | | | | (38,398,222 | ) | | | (14,145,619 | ) | | | 124,046,553 | | | | 850,216 | |
International Fund | | | 48,155,862 | | | | 2,419,737 | | | | 242,231 | | | | (8,727,920 | ) | | | (3,278,874 | ) | | | 38,811,036 | | | | 992,210 | |
Mid-Cap Equity Index Fund | | | 62,737,849 | | | | 1,698,141 | | | | 788,513 | | | | (11,742,042 | ) | | | (17,278,874 | ) | | | 36,203,587 | | | | 270,615 | |
Mid-Term Bond Fund | | | 121,821,746 | | | | 11,849,397 | | | | (472,202 | ) | | | (7,749,869 | ) | | | (7,014,204 | ) | | | 118,434,868 | | | | 650,971 | |
Money Market Fund | | | 9,047,886 | | | | 4,952,416 | | | | (85,576 | ) | | | 88,230 | | | | (2,141,457 | ) | | | 11,861,499 | | | | 4,702 | |
Small Cap Growth Fund | | | 10,810,355 | | | | 290,267 | | | | (128,335 | ) | | | (3,045,421 | ) | | | (709,125 | ) | | | 7,217,741 | | | | — | |
Small Cap Value Fund | | | 12,511,900 | | | | 341,454 | | | | 69,845 | | | | (1,845,653 | ) | | | (709,124 | ) | | | 10,368,422 | | | | 51,188 | |
| | | | | | | | | | | | | | | | | | | | | | | | | | | | |
Total | | $ | 621,192,928 | | | $ | 55,049,806 | | | $ | 4,525,061 | | | $ | (88,402,360 | ) | | $ | (75,101,382 | ) | | $ | 517,264,053 | | | $ | 4,095,487 | |
| | | | | | | | | | | | | | | | | | | | | | | | | | | | |
|
2025 Retirement Fund | |
Bond Fund | | $ | 295,886,015 | | | $ | 53,447,266 | | | $ | (1,812,055 | ) | | $ | (28,368,888 | ) | | $ | (28,535,160 | ) | | $ | 290,617,178 | | | $ | 2,088,507 | |
Equity Index Fund | | | 363,009,300 | | | | 23,323,812 | | | | 5,743,786 | | | | (81,265,343 | ) | | | (14,090,496 | ) | | | 296,721,059 | | | | 2,029,397 | |
International Fund | | | 125,222,837 | | | | 7,799,197 | | | | 202,301 | | | | (22,915,510 | ) | | | (5,026,209 | ) | | | 105,282,616 | | | | 2,687,084 | |
Mid-Cap Equity Index Fund | | | 161,830,646 | | | | 6,151,833 | | | | 3,635,126 | | | | (31,033,776 | ) | | | (50,338,479 | ) | | | 90,245,350 | | | | 672,922 | |
Mid-Term Bond Fund | | | 190,645,741 | | | | 12,769,449 | | | | (410,916 | ) | | | (12,252,369 | ) | | | (5,719,182 | ) | | | 185,032,723 | | | | 1,001,713 | |
Money Market Fund | | | 17,706,130 | | | | 8,237,532 | | | | (3,291 | ) | | | 8,558 | | | | (2,166,618 | ) | | | 23,782,311 | | | | 9,288 | |
Small Cap Equity Index Fund | | | — | | | | 3,179,023 | | | | (5,591 | ) | | | (219,595 | ) | | | (173,242 | ) | | | 2,780,595 | | | | 15,117 | |
Small Cap Growth Fund | | | 22,565,637 | | | | 858,516 | | | | (148,457 | ) | | | (6,635,762 | ) | | | (831,998 | ) | | | 15,807,936 | | | | — | |
Small Cap Value Fund | | | 26,076,885 | | | | 969,037 | | | | (58,633 | ) | | | (3,741,432 | ) | | | (831,999 | ) | | | 22,413,858 | | | | 110,521 | |
| | | | | | | | | | | | | | | | | | | | | | | | | | | | |
Total | | $ | 1,202,943,191 | | | $ | 116,735,665 | | | $ | 7,142,270 | | | $ | (186,424,117 | ) | | $ | (107,713,383 | ) | | $ | 1,032,683,626 | | | $ | 8,614,549 | |
| | | | | | | | | | | | | | | | | | | | | | | | | | | | |
|
2030 Retirement Fund | |
Bond Fund | | $ | 222,573,668 | | | $ | 56,756,100 | | | $ | (1,089,273 | ) | | $ | (21,885,434 | ) | | $ | (20,000,831 | ) | | $ | 236,354,230 | | | $ | 1,603,673 | |
Equity Index Fund | | | 448,984,007 | | | | 22,628,566 | | | | 3,833,682 | | | | (97,585,093 | ) | | | (10,016,049 | ) | | | 367,845,113 | | | | 2,501,818 | |
International Fund | | | 152,898,493 | | | | 10,528,318 | | | | 191,989 | | | | (28,353,094 | ) | | | (3,571,430 | ) | | | 131,694,276 | | | | 3,343,777 | |
Mid-Cap Equity Index Fund | | | 190,317,399 | | | | 8,941,491 | | | | 2,622,315 | | | | (36,775,992 | ) | | | (45,977,761 | ) | | | 119,127,452 | | | | 883,977 | |
Mid-Term Bond Fund | | | 127,108,936 | | | | 10,599,068 | | | | (150,633 | ) | | | (8,441,154 | ) | | | (1,974,622 | ) | | | 127,141,595 | | | | 682,346 | |
Money Market Fund | | | 18,651,787 | | | | 8,634,335 | | | | (1,999 | ) | | | 7,977 | | | | (1,293,485 | ) | | | 25,998,615 | | | | 10,042 | |
Small Cap Equity Index Fund | | | 3,864,723 | | | | 5,825,764 | | | | (108,115 | ) | | | (1,232,972 | ) | | | (394,923 | ) | | | 7,954,477 | | | | 42,421 | |
Small Cap Growth Fund | | | 31,351,186 | | | | 1,012,790 | | | | (484,024 | ) | | | (8,424,342 | ) | | | (3,497,932 | ) | | | 19,957,678 | | | | — | |
Small Cap Value Fund | | | 35,048,557 | | | | 1,163,104 | | | | (38,476 | ) | | | (5,118,649 | ) | | | (497,932 | ) | | | 30,556,604 | | | | 150,314 | |
| | | | | | | | | | | | | | | | | | | | | | | | | | | | |
Total | | $ | 1,230,798,756 | | | $ | 126,089,536 | | | $ | 4,775,466 | | | $ | (207,808,753 | ) | | $ | (87,224,965 | ) | | $ | 1,066,630,040 | | | $ | 9,218,368 | |
| | | | | | | | | | | | | | | | | | | | | | | | | | | | |
144
MUTUAL OF AMERICA INVESTMENT CORPORATION
NOTES TO FINANCIAL STATEMENTS (Unaudited) (Continued)
June 30, 2022
| 3. | INVESTMENTS (CONTINUED) |
| | | | | | | | | | | | | | | | | | | | | | | | | | | | |
Affiliated Investment
Company | | Value as of
December 31,
2021 | | | Purchases | | | Realized
Gain
(Loss) on
Investment
Securities | | | Change in
Unrealized
Appreciation
(Depreciation)
of Investment
Securities | | | Sales | | | Value as of
June 30,
2022 | | | Dividends | |
2035 Retirement Fund | |
Bond Fund | | $ | 216,377,707 | | | $ | 16,924,815 | | | $ | (512,448 | ) | | $ | (22,341,067 | ) | | $ | (6,280,849 | ) | | $ | 204,168,158 | | | $ | 1,575,806 | |
Equity Index Fund | | | 436,452,028 | | | | 37,086,920 | | | | 3,876,370 | | | | (97,258,759 | ) | | | (9,413,239 | ) | | | 370,743,320 | | | | 2,521,086 | |
International Fund | | | 164,225,295 | | | | 13,382,189 | | | | 259,557 | | | | (30,775,966 | ) | | | (3,730,369 | ) | | | 143,360,706 | | | | 3,639,330 | |
Mid-Cap Equity Index Fund | | | 188,857,119 | | | | 10,843,439 | | | | 2,958,742 | | | | (38,692,281 | ) | | | (31,267,398 | ) | | | 132,699,621 | | | | 984,510 | |
Mid-Term Bond Fund | | | — | | | | 17,719,230 | | | | (1,386 | ) | | | (98,895 | ) | | | (282,217 | ) | | | 17,336,732 | | | | 7,961 | |
Money Market Fund | | | — | | | | 4,034,122 | | | | 87 | | | | 3,097 | | | | (211,663 | ) | | | 3,825,643 | | | | 670 | |
Small Cap Equity Index Fund | | | 11,485,524 | | | | 10,601,451 | | | | 75,399 | | | | (3,720,842 | ) | | | (389,799 | ) | | | 18,051,733 | | | | 96,293 | |
Small Cap Growth Fund | | | 38,864,933 | | | | 1,592,936 | | | | (156,928 | ) | | | (11,289,097 | ) | | | (2,604,965 | ) | | | 26,406,879 | | | | — | |
Small Cap Value Fund | | | 44,998,798 | | | | 1,741,253 | | | | 203,328 | | | | (5,686,359 | ) | | | (11,104,966 | ) | | | 30,152,054 | | | | 148,318 | |
| | | | | | | | | | | | | | | | | | | | | | | | | | | | |
Total | | $ | 1,101,261,404 | | | $ | 113,926,355 | | | $ | 6,702,721 | | | $ | (209,860,169 | ) | | $ | (65,285,465 | ) | | $ | 946,744,846 | | | $ | 8,973,974 | |
| | | | | | | | | | | | | | | | | | | | | | | | | | | | |
|
2040 Retirement Fund | |
Bond Fund | | $ | 131,159,781 | | | $ | 18,187,655 | | | $ | (426,402 | ) | | $ | (13,194,921 | ) | | $ | (6,369,581 | ) | | $ | 129,356,532 | | | $ | 929,436 | |
Equity Index Fund | | | 403,269,103 | | | | 25,111,153 | | | | 4,390,132 | | | | (88,614,568 | ) | | | (10,024,977 | ) | | | 334,130,843 | | | | 2,265,283 | |
International Fund | | | 147,851,465 | | | | 19,004,831 | | | | 724,662 | | | | (28,963,769 | ) | | | (4,140,509 | ) | | | 134,476,680 | | | | 3,403,292 | |
Mid-Cap Equity Index Fund | | | 161,021,553 | | | | 8,808,356 | | | | 2,044,726 | | | | (33,256,116 | ) | | | (17,874,973 | ) | | | 120,743,546 | | | | 893,458 | |
Money Market Fund | | | — | | | | 4,343,753 | | | | 57 | | | | 3,449 | | | | (132,767 | ) | | | 4,214,492 | | | | 432 | |
Small Cap Equity Index Fund | | | 18,907,320 | | | | 1,075,646 | | | | 84,339 | | | | (3,820,677 | ) | | | (479,309 | ) | | | 15,767,319 | | | | 83,895 | |
Small Cap Growth Fund | | | 27,082,878 | | | | 1,315,965 | | | | (94,649 | ) | | | (8,120,414 | ) | | | (652,578 | ) | | | 19,531,202 | | | | — | |
Small Cap Value Fund | | | 36,241,851 | | | | 1,445,321 | | | | (292,519 | ) | | | (4,394,306 | ) | | | (6,652,578 | ) | | | 26,347,769 | | | | 129,357 | |
| | | | | | | | | | | | | | | | | | | | | | | | | | | | |
Total | | $ | 925,533,951 | | | $ | 79,292,680 | | | $ | 6,430,346 | | | $ | (180,361,322 | ) | | $ | (46,327,272 | ) | | $ | 784,568,383 | | | $ | 7,705,153 | |
| | | | | | | | | | | | | | | | | | | | | | | | | | | | |
|
2045 Retirement Fund | |
Bond Fund | | $ | 106,073,619 | | | $ | 7,429,923 | | | $ | (179,815 | ) | | $ | (10,887,237 | ) | | $ | (4,027,755 | ) | | $ | 98,408,735 | | | $ | 761,124 | |
Equity Index Fund | | | 425,092,970 | | | | 33,763,426 | | | | 4,913,592 | | | | (94,324,932 | ) | | | (8,693,836 | ) | | | 360,751,220 | | | | 2,445,128 | |
International Fund | | | 163,017,267 | | | | 21,663,856 | | | | 790,042 | | | | (32,129,124 | ) | | | (3,666,573 | ) | | | 149,675,468 | | | | 3,787,596 | |
Mid-Cap Equity Index Fund | | | 160,088,200 | | | | 13,114,156 | | | | 2,173,314 | | | | (34,092,026 | ) | | | (18,258,016 | ) | | | 123,025,628 | | | | 910,167 | |
Money Market Fund | | | — | | | | 1,330,712 | | | | 45 | | | | 935 | | | | (103,871 | ) | | | 1,227,821 | | | | 440 | |
Small Cap Equity Index Fund | | | 17,778,224 | | | | 5,946,499 | | | | 46,730 | | | | (3,806,443 | ) | | | (304,685 | ) | | | 19,660,325 | | | | 104,498 | |
Small Cap Growth Fund | | | 36,945,133 | | | | 1,716,643 | | | | (138,075 | ) | | | (10,900,420 | ) | | | (1,699,380 | ) | | | 25,923,901 | | | | — | |
Small Cap Value Fund | | | 47,972,113 | | | | 1,876,024 | | | | 118,010 | | | | (6,312,098 | ) | | | (11,199,379 | ) | | | 32,454,670 | | | | 159,380 | |
| | | | | | | | | | | | | | | | | | | | | | | | | | | | |
Total | | $ | 956,967,526 | | | $ | 86,841,239 | | | $ | 7,723,843 | | | $ | (192,451,345 | ) | | $ | (47,953,495 | ) | | $ | 811,127,768 | | | $ | 8,168,333 | |
| | | | | | | | | | | | | | | | | | | | | | | | | | | | |
|
2050 Retirement Fund | |
Bond Fund | | $ | 66,313,995 | | | $ | 4,885,756 | | | $ | (86,606 | ) | | $ | (6,879,388 | ) | | $ | (2,001,277 | ) | | $ | 62,232,480 | | | $ | 480,176 | |
Equity Index Fund | | | 307,654,157 | | | | 45,742,809 | | | | 2,804,272 | | | | (68,913,733 | ) | | | (6,587,074 | ) | | | 280,700,431 | | | | 1,860,639 | |
International Fund | | | 128,729,948 | | | | 10,830,689 | | | | 151,534 | | | | (24,003,981 | ) | | | (2,968,745 | ) | | | 112,739,445 | | | | 2,851,076 | |
Mid-Cap Equity Index Fund | | | 133,191,121 | | | | 7,566,806 | | | | (100,469 | ) | | | (25,458,874 | ) | | | (22,627,729 | ) | | | 92,570,855 | | | | 684,588 | |
Money Market Fund | | | — | | | | 1,274,279 | | | | 41 | | | | 921 | | | | (74,693 | ) | | | 1,200,548 | | | | 431 | |
Small Cap Equity Index Fund | | | 18,970,680 | | | | 3,194,532 | | | | 95,729 | | | | (3,959,521 | ) | | | (383,260 | ) | | | 17,918,160 | | | | 95,138 | |
Small Cap Growth Fund | | | 29,048,305 | | | | 1,377,243 | | | | (200,757 | ) | | | (8,440,099 | ) | | | (1,542,443 | ) | | | 20,242,249 | | | | — | |
Small Cap Value Fund | | | 33,638,965 | | | | 1,513,477 | | | | (1,745,581 | ) | | | (3,201,646 | ) | | | (8,542,443 | ) | | | 21,662,772 | | | | 136,235 | |
| | | | | | | | | | | | | | | | | | | | | | | | | | | | |
Total | | $ | 717,547,171 | | | $ | 76,385,591 | | | $ | 918,163 | | | $ | (140,856,321 | ) | | $ | (44,727,664 | ) | | $ | 609,266,940 | | | $ | 6,108,283 | |
| | | | | | | | | | | | | | | | | | | | | | | | | | | | |
|
2055 Retirement Fund | |
Bond Fund | | $ | 27,717,806 | | | $ | 3,590,528 | | | $ | (89,462 | ) | | $ | (2,705,872 | ) | | $ | (3,033,338 | ) | | $ | 25,479,662 | | | $ | 191,515 | |
Equity Index Fund | | | 139,811,410 | | | | 29,424,642 | | | | 1,232,581 | | | | (32,369,270 | ) | | | (3,774,593 | ) | | | 134,324,770 | | | | 903,592 | |
International Fund | | | 59,535,870 | | | | 11,123,125 | | | | 805 | | | | (11,783,871 | ) | | | (1,837,507 | ) | | | 57,038,422 | | | | 1,431,678 | |
Mid-Cap Equity Index Fund | | | 62,103,970 | | | | 7,993,879 | | | | 10,082 | | | | (12,032,470 | ) | | | (14,647,046 | ) | | | 43,428,415 | | | | 318,781 | |
Money Market Fund | | | — | | | | 1,128,039 | | | | 13 | | | | 894 | | | | (19,917 | ) | | | 1,109,029 | | | | 408 | |
Small Cap Equity Index Fund | | | 7,356,268 | | | | 662,528 | | | | 243,903 | | | | (1,589,296 | ) | | | (1,130,712 | ) | | �� | 5,542,691 | | | | 29,074 | |
Small Cap Growth Fund | | | 16,294,110 | | | | 1,635,690 | | | | (33,209 | ) | | | (4,934,239 | ) | | | (914,566 | ) | | | 12,047,786 | | | | — | |
Small Cap Value Fund | | | 17,052,296 | | | | 1,712,719 | | | | 25,422 | | | | (2,622,234 | ) | | | (414,565 | ) | | | 15,753,638 | | | | 77,030 | |
| | | | | | | | | | | | | | | | | | | | | | | | | | | | |
Total | | $ | 329,871,730 | | | $ | 57,271,150 | | | $ | 1,390,135 | | | $ | (68,036,358 | ) | | $ | (25,772,244 | ) | | $ | 294,724,413 | | | $ | 2,952,078 | |
| | | | | | | | | | | | | | | | | | | | | | | | | | | | |
145
MUTUAL OF AMERICA INVESTMENT CORPORATION
NOTES TO FINANCIAL STATEMENTS (Unaudited) (Continued)
June 30, 2022
| 3. | INVESTMENTS (CONTINUED) |
| | | | | | | | | | | | | | | | | | | | | | | | | | | | |
Affiliated Investment
Company | | Value as of
December 31,
2021 | | | Purchases | | | Realized
Gain
(Loss) on
Investment
Securities | | | Change in
Unrealized
Appreciation
(Depreciation)
of Investment
Securities | | | Sales | | | Value as of
June 30,
2022 | | | Dividends | |
2060 Retirement Fund | |
Bond Fund | | $ | 9,365,406 | | | $ | 1,780,608 | | | $ | (84,287 | ) | | $ | (863,457 | ) | | $ | (1,286,347 | ) | | $ | 8,911,923 | | | $ | 65,114 | |
Equity Index Fund | | | 53,394,630 | | | | 17,751,722 | | | | 269,932 | | | | (13,034,519 | ) | | | (1,124,250 | ) | | | 57,257,515 | | | | 381,298 | |
International Fund | | | 26,002,709 | | | | 5,939,682 | | | | 18,751 | | | | (5,257,082 | ) | | | (583,553 | ) | | | 26,120,507 | | | | 649,080 | |
Mid-Cap Equity Index Fund | | | 25,566,672 | | | | 5,143,372 | | | | 1,023,592 | | | | (5,936,142 | ) | | | (7,516,513 | ) | | | 18,280,981 | | | | 132,826 | |
Money Market Fund | | | — | | | | 588,934 | | | | 4 | | | | 462 | | | | (6,595 | ) | | | 582,805 | | | | 210 | |
Small Cap Equity Index Fund | | | 2,709,056 | | | | 1,189,294 | | | | 13,077 | | | | (662,435 | ) | | | (68,137 | ) | | | 3,180,855 | | | | 16,430 | |
Small Cap Growth Fund | | | 6,332,000 | | | | 1,061,093 | | | | (8,115 | ) | | | (1,935,681 | ) | | | (624,183 | ) | | | 4,825,114 | | | | — | |
Small Cap Value Fund | | | 6,924,671 | | | | 1,094,146 | | | | 8,872 | | | | (1,107,671 | ) | | | (124,182 | ) | | | 6,795,836 | | | | 33,053 | |
| | | | | | | | | | | | | | | | | | | | | | | | | | | | |
Total | | $ | 130,295,144 | | | $ | 34,548,851 | | | $ | 1,241,826 | | | $ | (28,796,525 | ) | | $ | (11,333,760 | ) | | $ | 125,955,536 | | | $ | 1,278,011 | |
| | | | | | | | | | | | | | | | | | | | | | | | | | | | |
|
2065 Retirement Fund | |
Bond Fund | | $ | 934,265 | | | $ | 510,731 | | | $ | (34,055 | ) | | $ | (80,706 | ) | | $ | (281,543 | ) | | $ | 1,048,692 | | | $ | 8,078 | |
Equity Index Fund | | | 6,814,257 | | | | 5,283,679 | | | | 25,527 | | | | (1,965,266 | ) | | | (404,666 | ) | | | 9,753,531 | | | | 63,640 | |
International Fund | | | 3,592,379 | | | | 2,162,874 | | | | (22,027 | ) | | | (861,725 | ) | | | (206,696 | ) | | | 4,664,805 | | | | 113,864 | |
Mid-Cap Equity Index Fund | | | 3,622,064 | | | | 1,841,597 | | | | (140,171 | ) | | | (666,514 | ) | | | (1,268,716 | ) | | | 3,388,260 | | | | 24,225 | |
Money Market Fund | | | — | | | | 128,126 | | | | 1 | | | | 96 | | | | (4,764 | ) | | | 123,459 | | | | 42 | |
Small Cap Equity Index Fund | | | 525,877 | | | | 310,902 | | | | (3,404 | ) | | | (128,969 | ) | | | (32,950 | ) | | | 671,456 | | | | 3,406 | |
Small Cap Growth Fund | | | 868,977 | | | | 409,516 | | | | (13,128 | ) | | | (309,596 | ) | | | (37,448 | ) | | | 918,321 | | | | — | |
Small Cap Value Fund | | | 903,623 | | | | 413,922 | | | | 1,219 | | | | (160,556 | ) | | | (237,448 | ) | | | 920,760 | | | | 4,406 | |
| | | | | | | | | | | | | | | | | | | | | | | | | | | | |
Total | | $ | 17,261,442 | | | $ | 11,061,347 | | | $ | (186,038 | ) | | $ | (4,173,236 | ) | | $ | (2,474,231 | ) | | $ | 21,489,284 | | | $ | 217,661 | |
| | | | | | | | | | | | | | | | | | | | | | | | | | | | |
|
Conservative Allocation Fund | |
Bond Fund | | $ | 54,768,871 | | | $ | 2,435,768 | | | $ | (261,868 | ) | | $ | (5,374,468 | ) | | $ | (3,626,928 | ) | | $ | 47,941,375 | | | $ | 384,535 | |
Equity Index Fund | | | 53,196,438 | | | | 1,990,910 | | | | 1,186,259 | | | | (11,997,174 | ) | | | (2,952,243 | ) | | | 41,424,190 | | | | 281,549 | |
International Fund | | | 11,459,195 | | | | 580,366 | | | | 77,104 | | | | (2,128,186 | ) | | | (590,448 | ) | | | 9,398,031 | | | | 238,495 | |
Mid-Cap Equity Index Fund | | | 11,796,459 | | | | 410,521 | | | | 2,278 | | | | (2,361,873 | ) | | | (590,449 | ) | | | 9,256,936 | | | | 68,651 | |
Mid-Term Bond Fund | | | 69,616,475 | | | | 2,743,881 | | | | (291,598 | ) | | | (4,191,321 | ) | | | (4,133,148 | ) | | | 63,744,289 | | | | 350,775 | |
| | | | | | | | | | | | | | | | | | | | | | | | | | | | |
Total | | $ | 200,837,438 | | | $ | 8,161,446 | | | $ | 712,175 | | | $ | (26,053,022 | ) | | $ | (11,893,216 | ) | | $ | 171,764,821 | | | $ | 1,324,005 | |
| | | | | | | | | | | | | | | | | | | | | | | | | | | | |
|
Moderate Allocation Fund | |
Bond Fund | | $ | 110,793,879 | | | $ | 2,494,686 | | | $ | (436,823 | ) | | $ | (10,907,010 | ) | | $ | (5,902,237 | ) | | $ | 96,042,495 | | | $ | 774,068 | |
Equity Index Fund | | | 178,309,934 | | | | 3,353,856 | | | | 3,787,298 | | | | (39,948,558 | ) | | | (8,117,782 | ) | | | 137,384,748 | | | | 944,991 | |
International Fund | | | 49,249,914 | | | | 1,712,167 | | | | 13,517 | | | | (8,769,705 | ) | | | (2,319,368 | ) | | | 39,886,525 | | | | 1,023,920 | |
Mid-Cap Equity Index Fund | | | 77,263,564 | | | | 1,481,517 | | | | 197,332 | | | | (15,599,440 | ) | | | (3,479,049 | ) | | | 59,863,924 | | | | 449,146 | |
Mid-Term Bond Fund | | | 71,651,709 | | | | 1,391,574 | | | | (268,828 | ) | | | (4,322,728 | ) | | | (3,479,048 | ) | | | 64,972,679 | | | | 359,202 | |
| | | | | | | | | | | | | | | | | | | | | | | | | | | | |
Total | | $ | 487,269,000 | | | $ | 10,433,800 | | | $ | 3,292,496 | | | $ | (79,547,441 | ) | | $ | (23,297,484 | ) | | $ | 398,150,371 | | | $ | 3,551,327 | |
| | | | | | | | | | | | | | | | | | | | | | | | | | | | |
|
Aggressive Allocation Fund | |
Bond Fund | | $ | 73,030,856 | | | $ | 1,599,437 | | | $ | (263,374 | ) | | $ | (7,181,430 | ) | | $ | (3,528,158 | ) | | $ | 63,657,331 | | | $ | 508,494 | |
Equity Index Fund | | | 141,566,114 | | | | 2,658,248 | | | | 3,575,772 | | | | (32,236,014 | ) | | | (5,998,854 | ) | | | 109,565,266 | | | | 749,099 | |
International Fund | | | 56,859,133 | | | | 1,997,435 | | | | 43,503 | | | | (10,126,865 | ) | | | (2,570,938 | ) | | | 46,202,268 | | | | 1,179,228 | |
Mid-Cap Equity Index Fund | | | 80,688,456 | | | | 1,559,063 | | | | 1,013,883 | | | | (17,072,441 | ) | | | (3,427,919 | ) | | | 62,761,042 | | | | 468,120 | |
Small Cap Growth Fund | | | 18,514,389 | | | | 272,734 | | | | 4,901 | | | | (5,476,649 | ) | | | (856,979 | ) | | | 12,458,396 | | | | — | |
Small Cap Value Fund | | | 19,758,304 | | | | 353,963 | | | | (42,727 | ) | | | (2,777,312 | ) | | | (856,979 | ) | | | 16,435,249 | | | | 81,227 | |
| | | | | | | | | | | | | | | | | | | | | | | | | | | | |
Total | | $ | 390,417,252 | | | $ | 8,440,880 | | | $ | 4,331,958 | | | $ | (74,870,711 | ) | | $ | (17,239,827 | ) | | $ | 311,079,552 | | | $ | 2,986,168 | |
| | | | | | | | | | | | | | | | | | | | | | | | | | | | |
146
MUTUAL OF AMERICA INVESTMENT CORPORATION
NOTES TO FINANCIAL STATEMENTS (Unaudited) (Continued)
June 30, 2022
The Investment Company has registered an indefinite number of its capital shares pursuant to Rule 24f-2 under the Investment Company Act of 1940. As of June 30, 2022, shares authorized at par value $0.01 per share were allocated into the 28 series of Funds as follows:
| | | | |
| | | Authorized No. of Shares | |
| | | Total Shares
Allocated | |
Equity Index Fund | | | 900,000,000 | |
All America Fund | | | 200,000,000 | |
Small Cap Value Fund | | | 475,000,000 | |
Small Cap Growth Fund | | | 570,000,000 | |
Small Cap Equity Index Fund | | | 200,000,000 | |
Mid Cap Value Fund | | | 100,000,000 | |
Mid-Cap Equity Index Fund | | | 1,050,000,000 | |
Composite Fund | | | 150,000,000 | |
International Fund | | | 1,275,000,000 | |
Catholic Values Index Fund | | | 100,000,000 | |
Retirement Income Fund | | | 270,000,000 | |
2015 Retirement Fund | | | 200,000,000 | |
2020 Retirement Fund | | | 665,000,000 | |
2025 Retirement Fund | | | 1,025,000,000 | |
2030 Retirement Fund | | | 915,000,000 | |
2035 Retirement Fund | | | 845,000,000 | |
2040 Retirement Fund | | | 685,000,000 | |
2045 Retirement Fund | | | 675,000,000 | |
2050 Retirement Fund | | | 470,000,000 | |
2055 Retirement Fund | | | 350,000,000 | |
2060 Retirement Fund | | | 200,000,000 | |
2065 Retirement Fund | | | 100,000,000 | |
Conservative Allocation Fund | | | 215,000,000 | |
Moderate Allocation Fund | | | 370,000,000 | |
Aggressive Allocation Fund | | | 265,000,000 | |
Money Market Fund | | | 425,000,000 | |
Mid-Term Bond Fund | | | 840,000,000 | |
Bond Fund | | | 1,525,000,000 | |
| | | | |
Sub-Total | | | 15,060,000,000 | |
Shares to be allocated at the discretion of the Board of Directors | | | 3,690,000,000 | |
| | | | |
Total | | | 18,750,000,000 | |
| | | | |
On September 25, 2020, after the close of trading on the New York Stock Exchange, the Funds listed below effected a 1 for 10 reverse split, and post-split shares began trading on September 28, 2020. As a result of the reverse split, every ten pre-split shares were automatically exchanged for one post-split share. The effect of the reverse split transaction was to reduce the number of shares outstanding by the reverse split factor and resulted in a proportionate increase in the net asset value per share. These transactions had not changed the net assets or the value of a shareholder’s investment. Shares issued and outstanding immediately prior to and after the reverse share split, not accounting for fractional shares, are listed below.
| | | | | | | | | | | | | | | | |
| | | Pre-split | | | Post-split | |
Fund | | Shares
Outstanding | | | NAV | | | Shares
Outstanding | | | NAV | |
Equity Index Fund | | | 659,329,198 | | | $ | 4.95 | | | | 65,932,920 | | | $ | 49.52 | |
All America Fund | | | 114,078,711 | | | $ | 2.38 | | | | 11,407,871 | | | $ | 23.84 | |
147
MUTUAL OF AMERICA INVESTMENT CORPORATION
NOTES TO FINANCIAL STATEMENTS (Unaudited) (Continued)
June 30, 2022
| 4. | CAPITAL SHARE ACTIVITY (CONTINUED) |
| | | | | | | | | | | | | | | | |
| | | Pre-split | | | Post-split | |
Fund | | Shares
Outstanding | | | NAV | | | Shares
Outstanding | | | NAV | |
Small Cap Value Fund | | | 326,943,951 | | | $ | 1.10 | | | | 32,694,395 | | | $ | 11.04 | |
Small Cap Growth Fund | | | 337,150,569 | | | $ | 1.60 | | | | 33,715,057 | | | $ | 16.03 | |
Small Cap Equity Index Fund | | | 60,189,271 | | | $ | 0.82 | | | | 6,018,927 | | | $ | 8.17 | |
Mid Cap Value Fund | | | 56,363,755 | | | $ | 1.36 | | | | 5,636,375 | | | $ | 13.62 | |
Mid-Cap Equity Index Fund | | | 715,581,162 | | | $ | 2.00 | | | | 71,558,116 | | | $ | 20.00 | |
Composite Fund | | | 94,147,376 | | | $ | 1.92 | | | | 9,414,738 | | | $ | 19.22 | |
International Fund | | | 893,902,865 | | | $ | 0.84 | | | | 89,390,286 | | | $ | 8.36 | |
Retirement Income Fund | | | 138,682,344 | | | $ | 1.25 | | | | 13,868,234 | | | $ | 12.51 | |
2015 Retirement Fund | | | 126,950,894 | | | $ | 1.07 | | | | 12,695,089 | | | $ | 10.66 | |
2020 Retirement Fund | | | 442,847,490 | | | $ | 1.26 | | | | 44,284,749 | | | $ | 12.56 | |
2025 Retirement Fund | | | 673,812,746 | | | $ | 1.37 | | | | 67,381,275 | | | $ | 13.68 | |
2030 Retirement Fund | | | 602,098,143 | | | $ | 1.42 | | | | 60,209,814 | | | $ | 14.18 | |
2035 Retirement Fund | | | 504,138,850 | | | $ | 1.43 | | | | 50,413,885 | | | $ | 14.29 | |
2040 Retirement Fund | | | 423,201,240 | | | $ | 1.41 | | | | 42,320,124 | | | $ | 14.08 | |
2045 Retirement Fund | | | 444,420,114 | | | $ | 1.38 | | | | 44,442,011 | | | $ | 13.84 | |
2050 Retirement Fund | | | 265,094,673 | | | $ | 1.68 | | | | 26,509,467 | | | $ | 16.80 | |
2055 Retirement Fund | | | 136,094,192 | | | $ | 1.28 | | | | 13,609,419 | | | $ | 12.79 | |
2060 Retirement Fund | | | 49,822,684 | | | $ | 1.06 | | | | 4,982,268 | | | $ | 10.63 | |
2065 Retirement Fund | | | 1,138,924 | | | $ | 0.98 | | | | 113,892 | | | $ | 9.85 | |
Conservative Allocation Fund | | | 135,747,628 | | | $ | 1.32 | | | | 13,574,763 | | | $ | 13.17 | |
Moderate Allocation Fund | | | 259,103,116 | | | $ | 1.57 | | | | 25,910,312 | | | $ | 15.68 | |
Aggressive Allocation Fund | | | 173,940,219 | | | $ | 1.70 | | | | 17,394,022 | | | $ | 17.04 | |
Money Market Fund | | | 90,939,944 | | | $ | 1.24 | | | | 9,093,994 | | | $ | 12.36 | |
Mid-Term Bond Fund | | | 688,855,309 | | | $ | 1.12 | | | | 68,885,531 | | | $ | 11.19 | |
Bond Fund | | | 1,133,121,793 | | | $ | 1.58 | | | | 113,312,179 | | | $ | 15.79 | |
| 5. | DISTRIBUTIONSTO SHAREHOLDERSAND INCOME TAX INFORMATION |
On the last business day of each month in 2021, excluding December 31, 2021, ordinary dividend distributions from net investment income were declared and paid for the Mid-Term Bond and Bond Funds. On June 15, 2021 and June 17, 2021, required distributions of net investment income were declared and paid for each of the remaining Funds other than the Small Cap Growth and Money Market Funds.
On October 15, 2021, required distributions of net investment income and, as applicable, net realized gains relating to 2020 were declared and paid for all applicable funds in accordance with Internal Revenue Code Section 855(a). No such distributions were required for the Small Cap Value, Mid Cap Value, International, Money Market and Bond Funds.
On December 14, 2021 and December 21, 2021, required distributions of net investment income and net realized gains were declared and paid for all applicable funds.
On the first business day of each month in 2022, excluding January 3, 2022, ordinary dividend distributions from net investment income were declared and paid for the Mid-Term Bond and Bond Funds. On the first business day of May 2022 and June 2022, ordinary dividend distributions from net investment income were declared and paid for the Money Market Fund. On June 10, 2022 and June 15, 2022, required distributions of net investment income were declared and paid for each of the remaining Funds other than the Small Cap Growth Fund.
148
MUTUAL OF AMERICA INVESTMENT CORPORATION
NOTES TO FINANCIAL STATEMENTS (Unaudited) (Continued)
June 30, 2022
| 5. | DISTRIBUTIONSTO SHAREHOLDERSAND INCOME TAX INFORMATION (CONTINUED) |
Pursuant to shareholders’ instructions, substantially all dividend distributions throughout 2022 and 2021 were immediately reinvested into their respective funds. The tax character of the distributions paid during 2022 and 2021 were as follows:
| | | | | | | | | | | | | | | | | | | | |
| | | Equity Index
Fund | | | All America
Fund | | | Small Cap
Value Fund | | | Small Cap
Growth Fund | | | Small Cap
Equity Index
Fund | |
Ordinary Income (a) | | | | | | | | | | | | | | | | | | | | |
2022 | | $ | 27,846,940 | | | $ | 1,396,719 | | | $ | 2,306,665 | | | $ | 0 | | | $ | 746,313 | |
2021 | | $ | 62,086,163 | | | $ | 8,266,406 | | | $ | 7,657,057 | | | $ | 23,466,428 | | | $ | 8,590,561 | |
Long-Term Capital Gains | | | | | | | | | | | | | | | | | | | | |
2022 | | $ | 0 | | | $ | 0 | | | $ | 0 | | | $ | 0 | | | $ | 0 | |
2021 | | $ | 180,908,055 | | | $ | 27,694,666 | | | $ | 32,478,563 | | | $ | 81,976,626 | | | $ | 11,684,570 | |
| | | | | |
| | | Mid Cap
Value Fund | | | Mid-Cap
Equity Index
Fund | | | Composite
Fund | | | International
Fund | | | Catholic
Values
Index
Fund | |
Ordinary Income (a) | | | | | | | | | | | | | | | | | | | | |
2022 | | $ | 801,142 | | | $ | 11,416,992 | | | $ | 1,461,529 | | | $ | 27,617,080 | | | $ | 22,883 | |
2021 | | $ | 3,027,617 | | | $ | 59,210,368 | | | $ | 4,668,574 | | | $ | 18,164,824 | | | $ | 101,687 | |
Long-Term Capital Gains | | | | | | | | | | | | | | | | | | | | |
2022 | | $ | 0 | | | $ | 0 | | | $ | 0 | | | $ | 0 | | | $ | 0 | |
2021 | | $ | 6,966,314 | | | $ | 198,308,398 | | | $ | 6,326,764 | | | $ | 100,681,320 | | | $ | 117 | |
| | | | | |
| | | Retirement
Fund | | | 2015
Retirement
Fund | | | 2020
Retirement
Fund | | | 2025
Retirement
Fund | | | 2030
Retirement
Fund | |
Ordinary Income (a) | | | | | | | | | | | | | | | | | | | | |
2022 | | $ | 1,193,372 | | | $ | 748,946 | | | $ | 3,868,683 | | | $ | 8,230,617 | | | $ | 8,823,943 | |
2021 | | $ | 2,781,857 | | | $ | 2,019,752 | | | $ | 9,766,005 | | | $ | 18,823,493 | | | $ | 19,503,823 | |
Long-Term Capital Gains | | | | | | | | | | | | | | | | | | | | |
2022 | | $ | 0 | | | $ | 0 | | | $ | 0 | | | $ | 0 | | | $ | 0 | |
2021 | | $ | 6,110,328 | | | $ | 14,617,476 | | | $ | 30,458,124 | | | $ | 53,690,328 | | | $ | 53,015,454 | |
| | | | | |
| | | 2035
Retirement
Fund | | | 2040
Retirement
Fund | | | 2045
Retirement
Fund | | | 2050
Retirement
Fund | | | 2055
Retirement
Fund | |
Ordinary Income (a) | | | | | | | | | | | | | | | | | | | | |
2022 | | $ | 8,618,452 | | | $ | 7,397,329 | | | $ | 7,851,986 | | | $ | 5,853,272 | | | $ | 2,794,177 | |
2021 | | $ | 19,606,071 | | | $ | 17,068,129 | | | $ | 17,768,985 | | | $ | 13,083,679 | | | $ | 7,009,819 | |
Long-Term Capital Gains | | | | | | | | | | | | | | | | | | | | |
2022 | | $ | 0 | | | $ | 0 | | | $ | 0 | | | $ | 0 | | | $ | 0 | |
2021 | | $ | 41,119,948 | | | $ | 43,235,552 | | | $ | 49,641,380 | | | $ | 29,836,828 | | | $ | 10,466,255 | |
| | | | | |
| | | 2060
Retirement
Fund | | | 2065
Retirement
Fund | | | Conservative
Allocation
Fund | | | Moderate
Allocation
Fund | | | Aggressive
Allocation
Fund | |
Ordinary Income (a) | | | | | | | | | | | | | | | | | | | | |
2022 | | $ | 1,239,212 | | | $ | 213,205 | | | $ | 1,258,493 | | | $ | 3,473,679 | | | $ | 2,908,733 | |
2021 | | $ | 2,891,737 | | | $ | 676,296 | | | $ | 2,961,310 | | | $ | 8,032,183 | | | $ | 6,972,589 | |
Long-Term Capital Gains | | | | | | | | | | | | | | | | | | | | |
2022 | | $ | 0 | | | $ | 0 | | | $ | 0 | | | $ | 0 | | | $ | 0 | |
2021 | | $ | 4,256,508 | | | $ | 122,695 | | | $ | 8,867,128 | | | $ | 28,940,480 | | | $ | 32,208,073 | |
149
MUTUAL OF AMERICA INVESTMENT CORPORATION
NOTES TO FINANCIAL STATEMENTS (Unaudited) (Continued)
June 30, 2022
| 5. | DISTRIBUTIONSTO SHAREHOLDERSAND INCOME TAX INFORMATION (CONTINUED) |
| | | | | | | | | | | | | | | | | | | | |
| | | Money
Market Fund | | | Mid-Term
Bond Fund | | | Bond Fund | | | | | | | |
Ordinary Income (a) | | | | | | | | | | | | | | | | | | | | |
2022 | | $ | 72,191 | | | $ | 4,655,625 | | | $ | 14,109,276 | | | | | | | | | |
2021 | | $ | 0 | | | $ | 10,662,885 | | | $ | 37,094,616 | | | | | | | | | |
Long-Term Capital Gains | | | | | | | | | | | | | | | | | | | | |
2022 | | $ | 0 | | | $ | 0 | | | $ | 0 | | | | | | | | | |
2021 | | $ | 0 | | | $ | 6,177,996 | | | $ | 7,401,541 | | | | | | | | | |
Notes:
| (a) | Includes distributions from Fund-level net short-term capital gains. |
Undistributed net income and gains (losses) — As of June 30, 2022, undistributed net income and undistributed accumulated gain (loss) for federal income tax purposes were as follows:
| | | | | | | | | | | | | | | | | | | | |
| | | Equity Index
Fund | | | All America
Fund | | | Small Cap
Value Fund | | | Small Cap
Growth Fund | | | Small Cap
Equity
Index Fund | |
Accumulated undistributed net investment income | | $ | 5,618,407 | | | $ | 703,045 | | | $ | 7,694,905 | | | $ | 229 | | | $ | 568,752 | |
Accumulated undistributed net realized gain/(loss) on investments and futures contracts | | $ | 97,221,451 | | | $ | 29,112,605 | | | $ | 21,596,776 | | | $ | 8,525,277 | | | $ | 6,123,024 | |
Net unrealized appreciation (depreciation) of investments and futures contracts | | $ | 1,582,628,523 | | | $ | 61,470,885 | | | $ | 30,858,126 | | | $ | (21,216,363 | ) | | $ | (9,102,556 | ) |
| | | | | |
| | | Mid Cap
Value Fund | | | Mid-Cap Equity
Index Fund | | | Composite
Fund | | | International
Fund | | | Catholic Value
Index Fund | |
Accumulated undistributed net investment income | | $ | 1,059,001 | | | $ | 4,169,247 | | | $ | 654,580 | | | $ | 6,581,898 | | | $ | 3,696 | |
Accumulated undistributed net realized gain/(loss) on investments and futures contracts | | $ | 5,507,560 | | | $ | 141,136,284 | | | $ | 8,272,452 | | | $ | 82,811,455 | | | $ | 16,602 | |
Net unrealized appreciation (depreciation) of investments and futures contracts | | $ | 18,543,869 | | | $ | 102,613,490 | | | $ | 25,556,650 | | | $ | (201,885,930 | ) | | $ | 143,913 | |
| | | | | |
| | | Retirement
Income Fund | | | 2015
Retirement
Fund | | | 2020
Retirement
Fund | | | 2025
Retirement
Fund | | | 2030
Retirement
Fund | |
Accumulated undistributed net investment income | | $ | 9,274 | | | $ | 1,834 | | | $ | 0 | | | $ | 0 | | | $ | 0 | |
Accumulated undistributed net realized gain/(loss) on investments and futures contracts | | $ | 6,724,598 | | | $ | (1,251,130 | ) | | $ | 31,062,168 | | | $ | 55,663,097 | | | $ | 57,586,976 | |
Net unrealized appreciation (depreciation) of investments and futures contracts | | $ | (18,872,936 | ) | | $ | (9,194,616 | ) | | $ | (36,083,244 | ) | | $ | (65,580,880 | ) | | $ | (50,190,178 | ) |
150
MUTUAL OF AMERICA INVESTMENT CORPORATION
NOTES TO FINANCIAL STATEMENTS (Unaudited) (Continued)
June 30, 2022
| 5. | DISTRIBUTIONSTO SHAREHOLDERSAND INCOME TAX INFORMATION (CONTINUED) |
| | | | | | | | | | | | | | | | | | | | |
| | | 2035
Retirement
Fund | | | 2040
Retirement
Fund | | | 2045
Retirement
Fund | | | 2050
Retirement
Fund | | | 2055
Retirement
Fund | |
Accumulated undistributed net investment income | | $ | 0 | | | $ | 0 | | | $ | 0 | | | $ | 0 | | | $ | 0 | |
Accumulated undistributed net realized gain/(loss) on investments and futures contracts | | $ | 61,372,613 | | | $ | 55,184,949 | | | $ | 59,575,185 | | | $ | 41,178,368 | | | $ | 19,952,835 | |
Net unrealized appreciation (depreciation) of investments and futures contracts | | $ | (46,149,751 | ) | | $ | (32,640,584 | ) | | $ | (30,563,754 | ) | | $ | (31,260,965 | ) | | $ | (27,893,169 | ) |
| | | | | |
| | | 2060
Retirement
Fund | | | 2065
Retirement
Fund | | | Conservative
Allocation
Fund | | | Moderate
Allocation
Fund | | | Aggressive
Allocation
Fund | |
Accumulated undistributed net investment income | | $ | 0 | | | $ | 0 | | | $ | 0 | | | $ | 0 | | | $ | 0 | |
Accumulated undistributed net realized gain/(loss) on investments and futures contracts | | $ | 8,784,713 | | | $ | 830,517 | | | $ | 7,575,327 | | | $ | 28,749,422 | | | $ | 22,112,906 | |
Net unrealized appreciation (depreciation) of investments and futures contracts | | $ | (16,272,041 | ) | | $ | (4,208,612 | ) | | $ | (13,001,439 | ) | | $ | (6,014,831 | ) | | $ | 2,896 | |
| | | | | |
| | | Money
Market Fund | | | Mid-Term
Bond Fund | | | Bond Fund | | | | | | | |
Accumulated undistributed net investment income | | $ | 54,726 | | | $ | 1,126,853 | | | $ | 5,529,376 | | | | | | | | | |
Accumulated undistributed net realized gain/(loss) on investments and futures contracts | | $ | (6,622 | ) | | $ | 456,336 | | | $ | (12,141,269 | ) | | | | | | | | |
Net unrealized appreciation (depreciation) of investments and futures contracts | | $ | (4,737 | ) | | $ | (63,510,117 | ) | | $ | (185,001,756 | ) | | | | | | | | |
The difference between the components of distributable earnings for income tax purposes and the amounts reflected in the statements of assets and liabilities arise primarily from federal income tax treatment of wash sales, REITs, PFICs, partnerships, corporate actions and futures contracts.
| 6. | RECENT ACCOUNTING PRONOUNCEMENTS |
In March 2020, the FASB issued ASU No. 2020-04, Reference Rate Reform (Topic 848) — Facilitation of the Effects of Reference Rate Reform on Financial Reporting (“ASU 2020-04”), which provides optional, temporary relief with respect to the financial reporting of contracts subject to certain types of modifications due to the planned discontinuation of the London Interbank Offered Rate (“LIBOR”) and other IBOR-based reference rates as of the end of 2021. The temporary relief provided by ASU 2020-04 is effective for certain reference rate-related contract modifications that occur during the period from March 12, 2020 through December 31, 2022. Management is evaluating the impact of ASU 2020-04 on the fund’s investments that will undergo reference rate-related modifications as a result of the reference rate reform.
On December 3, 2020, the SEC announced that it voted to adopt a new rule that establishes an updated regulatory framework for fund valuation practices (the “Rule”). The Rule, in part, provides (i) a framework for determining fair value in good faith and (ii) provides for a fund Board’s assignment of its responsibility for execution of valuation-related activities to a fund’s investment adviser. Further, the SEC is rescinding previously issued guidance on related issues. The Rule became effective March 8, 2021 and will have a compliance date of September 8, 2022. Management is currently evaluating the Rule and its impact to the Funds.
151
MUTUAL OF AMERICA INVESTMENT CORPORATION
NOTES TO FINANCIAL STATEMENTS (Unaudited) (Continued)
June 30, 2022
During 2020, the COVID-19 outbreak was declared a pandemic by the World Health Organization. The situation is dynamic with various cities and countries around the world responding in different ways to address the outbreak. The rapid development and fluidity of this situation precludes any prediction as to its ultimate impact, which may have a continued adverse impact on economic and market conditions and trigger a period of global economic slowdown.
Management is still monitoring developments relating to COVID-19 and are coordinating its operational response based on existing business continuity plans and on guidance from global health organizations, relevant governments and general pandemic response best practices.
Brown Brothers Harriman & Co. (“BBH”) has entered into an agreement with State Street Corporation (“State Street”) under which State Street will acquire BBH’s Investor Services business; which includes its custody, fund accounting and administration, transfer agency, depositary, foreign exchange, trustee and securities lending services. The completion of the transaction is subject to customary closing conditions and regulatory approvals. BBH and State Street are committed to providing uninterrupted service and a seamless transition.
On July 31, 2020, the Investment Company 2010 Retirement Fund (“Transferor Fund”), was reorganized into the Retirement Income Fund, (“Surviving Fund”) in accordance with an Agreement and Plan of Reorganization (the “Agreement”) made on February 28, 2020. The Agreement provided for the transfer of all assets of the Transferor Fund for shares of the Surviving Fund and the assumption of the liabilities of the Transferor Fund by the Surviving Fund. The Transferor Fund then ceased operations.
On the reorganization date, the Transferor Fund had the following total investment cost and value, representing the principal assets acquired by the Surviving Fund:
| | | | | | | | | | | | |
Transferor Fund | | Total
Investment Value | | | Total
Investment Cost | | | Unrealized Gain
on Investments | |
2010 Retirement Fund | | $ | 28,038,777 | | | $ | 25,894,980 | | | $ | 2,143,797 | |
The purpose of the transaction was to combine two portfolios with substantially similar investment objectives and policies.
The acquisition was accomplished by a tax-free exchange, for tax purposes only, of the following shares on July 31, 2020:
| | | | | | | | | | | | | | | | |
Transferor Fund | | Shares(a) | | | Surviving Fund | | | Shares(a) | | | Value | |
2010 Retirement Fund | | | 2,883,078 | | | | Retirement Income Fund | | | | 2,244,332 | | | $ | 28,086,782 | |
| (a) | Shares adjusted for the 1 for 10 reverse share split on September 25, 2020. |
For financial reporting purposes, assets received and shares issued by the Surviving Fund, including the associated cost basis of the acquired investments, were recorded at fair value.
The net assets and net unrealized appreciation immediately before the acquisition were as follows:
| | | | | | | | | | | | | | | | |
Transferor Fund | | Net Assets | | | Unrealized
Appreciation
on Investments | | | Surviving Fund | | | Net Assets | |
2010 Retirement Fund | | $ | 28,086,782 | | | $ | 2,143,797 | | | | Retirement Income Fund | | | $ | 142,889,403 | |
152
MUTUAL OF AMERICA INVESTMENT CORPORATION
NOTES TO FINANCIAL STATEMENTS (Unaudited) (Continued)
June 30, 2022
| 8. | REORGANIZATIONS (CONTINUED) |
Assuming the acquisition had been completed on January 1, 2020, the Surviving Fund’s unaudited pro forma results of operations for the year ended December 31, 2020 would have been as follows:
| | | | | | | | | | | | |
Surviving Fund | | Net
Investment
Income(a) | | | Net Realized and
Unrealized Gain
on Investments(b) | | | Net Increase in
Net Assets Resulting
from Operations | |
Retirement Income Fund | | $ | 6,536,553 | | | $ | 5,075,702 | | | $ | 12,328,323 | |
| (a) | Net investment income (loss) as reported in the Statement of Operations (Year ended December 31, 2020) of the Surviving Fund, plus net investment income from the Transferor Fund pre-merger were as follows: |
| | | | |
Transferor Fund | | Net Investment
Income (Loss) | |
2010 Retirement Fund | | $ | (7,730 | ) |
| (b) | Net realized and unrealized gain (loss) on investments as reported in the Statement of Operations (Year ended December 31, 2020) of the Surviving Fund, plus net realized and unrealized gain (loss) on investments from the Transferor Fund pre-merger were as follows: |
| | | | |
Transferor Fund | | Net Realized and
Change in
Unrealized Gain (Loss)
on Investments | |
2010 Retirement Fund | | $ | 716,068 | |
Since both the Transferor Fund and the Surviving Fund sold and redeemed shares throughout the period, it is not practicable to provide pro-forma information on a per-share basis.
Since the combined investment fund had been managed as a single integrated fund since the acquisition was completed, it is also not practicable to separate the amounts of revenue and earnings of the Transferor Fund that have been included in the Surviving Fund’s Statement of Operations since July 31, 2020.
Furthermore, after the close of trading on the New York Stock Exchange on December 16, 2020, each of the funds of the Mutual of America Institutional Funds, Inc. (“Target Funds”) were reorganized into the Funds of the Investment Company (“Acquiring Funds”) in accordance with an Agreement and Plan of Reorganization (the “Agreement”) made on September 14, 2020. The Agreement provided for the transfer of all assets of the Target Funds for shares of the Acquiring Funds and the assumption of the liabilities of the Target Funds by the Acquiring Funds as follows:
| | |
Target Funds | | Acquiring Funds |
Equity Index Fund | | Equity Index Fund |
All America Fund | | All America Fund |
Small Cap Value Fund | | Small Cap Value Fund |
Small Cap Growth Fund | | Small Cap Growth Fund |
Mid-Cap Equity Index Fund | | Mid-Cap Equity Index Fund |
International Fund | | International Fund |
Money Market Fund | | Money Market Fund |
Bond Fund | | Bond Fund |
153
MUTUAL OF AMERICA INVESTMENT CORPORATION
NOTES TO FINANCIAL STATEMENTS (Unaudited) (Continued)
June 30, 2022
| 8. | REORGANIZATIONS (CONTINUED) |
On the reorganization date, the Target Funds had the following total investment cost and value, representing the principal assets acquired by the Acquiring Funds:
| | | | | | | | | | | | |
Target Funds | | Total Investment
Value | | | Total Investment
Cost | | | Unrealized Gain
on Investments | |
Equity Index Fund | | $ | 82,913,803 | | | $ | 55,736,046 | | | $ | 27,177,757 | |
All America Fund | | $ | 7,900,806 | | | $ | 6,061,710 | | | $ | 1,839,096 | |
Small Cap Value Fund | | $ | 14,503,579 | | | $ | 11,920,798 | | | $ | 2,582,781 | |
Small Cap Growth Fund | | $ | 17,430,326 | | | $ | 12,003,678 | | | $ | 5,426,648 | |
Mid-Cap Equity Index Fund | | $ | 41,255,421 | | | $ | 31,679,947 | | | $ | 9,575,474 | |
International Fund | | $ | 10,139,839 | | | $ | 8,742,930 | | | $ | 1,396,909 | |
Money Market Fund | | $ | 21,824,002 | | | $ | 21,824,002 | | | $ | — | |
Bond Fund | | $ | 58,042,483 | | | $ | 56,721,878 | | | $ | 1,320,605 | |
The purpose of the transaction was to combine two portfolios with substantially similar investment objectives and policies as a result of the transfer/reorganization detailed above.
The reorganization was accomplished by a tax-free exchange of the following shares on December 16, 2020:
| | | | | | | | | | | | | | |
Target Funds | | Shares | | | Acquiring Funds | | Shares | | | Value | |
Equity Index Fund | | | 5,870,059 | | | Equity Index Fund | | | 1,645,958 | | | $ | 82,906,910 | |
All America Fund | | | 1,036,340 | | | All America Fund | | | 335,915 | | | $ | 7,991,417 | |
Small Cap Value Fund | | | 1,343,107 | | | Small Cap Value Fund | | | 1,134,296 | | | $ | 15,029,422 | |
Small Cap Growth Fund | | | 1,081,026 | | | Small Cap Growth Fund | | | 1,021,931 | | | $ | 17,526,115 | |
Mid-Cap Equity Index Fund | | | 3,390,230 | | | Mid-Cap Equity Index Fund | | | 1,818,600 | | | $ | 41,427,718 | |
International Fund | | | 929,469 | | | International Fund | | | 1,103,190 | | | $ | 10,248,633 | |
Money Market Fund | | | 2,089,129 | | | Money Market Fund | | | 1,852,591 | | | $ | 21,953,211 | |
Bond Fund | | | 5,699,620 | | | Bond Fund | | | 3,959,362 | | | $ | 59,390,437 | |
For financial reporting purposes, assets received and shares issued by the Acquiring Funds were recorded at fair value; however, the cost basis of the investments received from the Target Funds were carried forward to align ongoing reporting of the Acquiring Funds’ realized and unrealized gains and losses with amounts distributable to shareholders for tax purposes.
The net assets and net unrealized appreciation immediately before the reorganization were as follows:
| | | | | | | | | | | | | | |
Target Funds | | Net Assets | | | Unrealized
Appreciation
on Investments | | | Acquiring Funds | | Net Assets | |
Equity Index Fund | | $ | 82,906,910 | | | $ | 27,177,757 | | | Equity Index Fund | | $ | 3,350,558,625 | |
All America Fund | | $ | 7,991,417 | | | $ | 1,839,096 | | | All America Fund | | $ | 291,290,052 | |
Small Cap Value Fund | | $ | 15,029,422 | | | $ | 2,582,781 | | | Small Cap Value Fund | | $ | 442,295,936 | |
Small Cap Growth Fund | | $ | 17,526,115 | | | $ | 5,426,648 | | | Small Cap Growth Fund | | $ | 567,007,609 | |
Mid-Cap Equity Index Fund | | $ | 41,427,718 | | | $ | 9,575,474 | | | Mid-Cap Equity Index Fund | | $ | 1,728,497,274 | |
International Fund | | $ | 10,248,633 | | | $ | 1,396,909 | | | International Fund | | $ | 901,140,207 | |
Money Market Fund | | $ | 21,953,211 | | | $ | — | | | Money Market Fund | | $ | 99,357,507 | |
Bond Fund | | $ | 59,390,437 | | | $ | 1,320,605 | | | Bond Fund | | $ | 1,760,581,111 | |
154
MUTUAL OF AMERICA INVESTMENT CORPORATION
NOTES TO FINANCIAL STATEMENTS (Unaudited) (Continued)
June 30, 2022
| 8. | REORGANIZATIONS (CONTINUED) |
Assuming the reorganization had been completed on January 1, 2020, the Acquiring Funds’ unaudited pro forma results of operations for the year ended December 31, 2020 would have been as follows:
| | | | | | | | | | | | |
Acquiring Funds | | Net Investment
Income(a) | | | Net Realized and Unrealized
Gain on Investments and
Futures Contracts(b) | | | Net Increase in Net
Assets Resulting from
Operations | |
Equity Index Fund | | $ | 57,126,039 | | | $ | 533,961,466 | | | $ | 591,087,505 | |
All America Fund | | $ | 3,772,468 | | | $ | 43,455,965 | | | $ | 47,228,433 | |
Small Cap Value Fund | | $ | 7,761,575 | | | $ | (32,430,942 | ) | | $ | (24,669,367 | ) |
Small Cap Growth Fund | | $ | (993,059 | ) | | $ | 208,328,020 | | | $ | 207,334,961 | |
Mid-Cap Equity Index Fund | | $ | 23,715,375 | | | $ | 201,903,147 | | | $ | 225,618,522 | |
International Fund | | $ | 15,947,999 | | | $ | 70,079,941 | | | $ | 86,027,940 | |
Money Market Fund | | $ | 629,645 | | | $ | (6,736 | ) | | $ | 622,909 | |
Bond Fund | | $ | 35,336,713 | | | $ | 67,668,880 | | | $ | 103,005,593 | |
| a) | Net investment income (loss) as reported in the Statement of Operations (Year ended December 31, 2020) of the Acquiring Funds, plus net investment income from the Target Funds pre-merger were as follows: |
| | | | |
Target Funds | | Net Investment
Income (Loss) | |
Equity Index Fund | | $ | 1,080,975 | |
All America Fund | | $ | 88,879 | |
Small Cap Value Fund | | $ | 197,971 | |
Small Cap Growth Fund | | $ | (26,542 | ) |
Mid-Cap Equity Index Fund | | $ | 455,325 | |
International Fund | | $ | 97,387 | |
Money Market Fund | | $ | 80,524 | |
Bond Fund | | $ | 531,666 | |
| b) | Net realized and unrealized gain (loss) on investments as reported in the Statement of Operations (Year ended December 31, 2020) of the Acquiring Funds, plus net realized and unrealized gain (loss) on investments from the Target Funds pre-merger were as follows: |
| | | | |
Target Funds | | Net Realized and Change in
Unrealized Gain (Loss) on
Investments and Futures
Contracts | |
Equity Index Fund | | $ | 10,714,249 | |
All America Fund | | $ | 980,496 | |
Small Cap Value Fund | | $ | 41,213 | |
Small Cap Growth Fund | | $ | 4,979,447 | |
Mid-Cap Equity Index Fund | | $ | 5,347,004 | |
International Fund | | $ | 1,262,513 | |
Money Market Fund | | $ | (424 | ) |
Bond Fund | | $ | 663,646 | |
Since both the Target Funds and the Acquiring Funds sold and redeemed shares throughout the period, it is not practicable to provide pro-forma information on a per-share basis.
Since the combined investment portfolio had been managed as a single integrated portfolio since the reorganization was completed, it is also not practicable to separate the amounts of revenue and earnings of the Target Portfolio that have been included in the Acquiring Funds’ Statement of Operations since December 16, 2020.
155
MUTUAL OF AMERICA INVESTMENT CORPORATION
ADDITIONAL INFORMATION
Quarterly Portfolio Schedules
Included in this Semi-Annual Report are schedules of Mutual of America Investment Corporation’s (“Investment Company”) Fund portfolio holdings as of June 30, 2022. The Investment Company files complete schedules of Fund portfolio holdings, excluding the Money Market Fund, with the Securities and Exchange Commission (“SEC”) for the first and third quarters of each fiscal year as an exhibit to its reports on Form N-PORT. The Investment Company fund portfolio holdings are also available for the first and third quarters of the most recent fiscal year through the website, mutualofamerica.com.
The Money Market Fund files its complete schedule of portfolio holdings with the SEC each month on Form N-MFP. The fund portfolio holdings for the prior six months are also available through the website, mutualofamerica.com.
The Form N-PORT and Form N-MFP are available on the SEC’s website at sec.gov.
Proxy Voting Policies and Procedures
A copy of the Investment Company’s proxy voting policies and procedures can be obtained free of charge by calling 800.468.3785. It is also available on the SEC’s website at sec.gov.
Information regarding how the Investment Company voted proxies relating to portfolio securities during the 12-month period ended June 30, 2022 is available without charge by calling 800.468.3785. It is also available on the SEC website.
Code of Ethics
The Investment Company has adopted a Code of Ethics that complies with Rule 17j-1 of the Investment Company Act of 1940 and with the requirements of the Sarbanes-Oxley Act of 2002. A copy of the Code of Ethics is available free of charge, upon request. To obtain a free copy of the Code of Ethics, please call 212.224.1568 or write to:
Ms. Kathryn A. Lu
Executive Vice President and Chief Compliance Officer
Mutual of America Investment Corporation
320 Park Avenue
New York, NY 10022-6839
Renewal of Investment Advisory Agreements
At its meeting held on February 24, 2022, the Board of Directors of the Investment Company renewed for a one-year period the investment advisory agreement with Mutual of America Capital Management Corporation (the “Adviser”). The Board determined that renewing the agreement with the Adviser was in the best interest of the Investment Company based on the following considerations which are further enumerated below. The Board concluded that Mutual of America Capital Management Corporation has performed extensive services for the Investment Company and has demonstrated satisfactory performance, that its fee is reasonable in comparison to fees charged for similar services to similar funds by other advisers, that the method of calculating the fee is reasonable, that the Adviser has not made excessive profits from the contract and the fee levels reflect that the Funds are appropriately benefiting from economies of scale.
Nature, Extent and Quality of Services
The Board considered the depth of experience and organizational structure of the Adviser. At December 31, 2021, the Adviser had approximately $21 billion of assets under management. The individual portfolio managers that oversee the investment performance of each of the Investment Company’s Funds have extensive experience and knowledge of the specific markets in which they participate. The Adviser adheres to a strict best execution policy which requires it to select broker/dealers based on their ability to execute trades at a favorable and reasonable price. All else being equal, the Advisor will also consider any research that the broker/dealers may provide. The Adviser maintains a highly qualified staff of research analysts and quantitative analysts who assist in the implementation of the disciplined investment policies employed by the portfolio managers to enhance stock selection and manage risk in the portfolios. The Adviser’s quantitative analysts have developed proprietary models that result in daily risk and attribution reports as
156
well as information on stock movements, to enable the portfolio managers to make fully informed decisions on stock selection and to constantly evaluate the structure of each portfolio. When purchasing research and other services, the Adviser uses its own funds to purchase such services from recognized firms that are utilized by the research staff. The Adviser also receives research services from broker/dealers which are utilized to benefit the Funds. The Board was aware of the receipt of these research services when it considered renewing the advisory agreement with the Adviser. The Adviser, at no cost, provides services beyond those set forth in the advisory agreement, such as assistance in the preparation of marketing materials and attendance at client and prospect meetings.
Investment Performance
The Board considered the short- and long-term performance of the Funds. During 2021, the vast majority of the Funds demonstrated gross performance that was above their benchmarks, when considering minimal tracking error. Performance has continued to improve over the past number of years due to changes made in the Adviser’s investment process and personnel, including the creation of the quantitative research group mentioned above.
Cost and Profit
The Board compared the advisory fees charged to each Fund by the Adviser with fees of numerous similar funds. In the case of each Fund, the Adviser’s fee compared favorably with fees charged by other advisers. Finally, the Adviser has not shown excessively high profits from the fees it is paid by the Investment Company.
Economies of Scale
The Board concluded that the reasonableness of the Adviser’s fees, particularly when compared to fees of similar funds that, in most cases, are many times the asset size of the Funds of the Investment Company demonstrates the fact that the Funds are benefiting from economies of scale. The Adviser utilizes the resources at its disposal efficiently. Its fees reflect cost savings and expense discounts, if any, that it realizes from volume increases.
Liquidity Risk Management Program
In accordance with Rule 22e-4 (the “Liquidity Rule”) under the Investment Company Act of 1940, the Investment Company has adopted a liquidity risk management program (the “Program”) that is designed to assess and manage the liquidity risk of each Fund (the risk that the Fund would be unable to meet requests to redeem shares issued by the Fund without significant dilution of remaining investors’ interests in the Fund). The Liquidity Rule requires each registered open-end investment company (not including money market funds) to adopt and implement a written Program. The Liquidity Rule further requires that the Board of Directors shall be responsible for reviewing, no less frequently than annually, a written report from the Program Administrator that addresses the operation of the Program and its effectiveness of implementation. The Board has appointed a Liquidity Risk Management Committee (“LRMC”) comprised of officers from multiple departments within Mutual of America Life Insurance Company to serve as the Program Administrator. The Program Administrator is responsible for the implementation and ongoing administration of the Program, which includes assessing each Fund’s liquidity risk under both normal and reasonably foreseeable stressed conditions. Under the Program, each of the Fund’s portfolio investments is classified on a daily basis into one of four liquidity categories based on estimations of the number of days an investment is expected to reasonably be converted into cash in current market conditions without significantly changing the investment’s market value.
In April 2022, as required by the Program and the Liquidity Rule, the LRMC provided the Board with an annual written report (the “Report”) addressing the operation of the Program and assessing the adequacy and effectiveness of its implementation during the past year (the “Reporting Period”). During the Reporting Period, all of the Funds were primarily invested in highly liquid investments (investments that the Fund anticipates can be converted to cash within three business days or less in current market conditions without significantly changing their market value). Each of the Funds were well above the 50% threshold of assets in highly liquid investments to be designated as a Primarily Highly Liquid Fund. As a result, the Funds were not required to adopt, and have not adopted, a “Highly Liquid Investment Minimum” as defined in the Liquidity Rule. During the Reporting Period, the Funds did not approach the 15% limit imposed by the Liquidity Rule on holdings in illiquid investments (investments that cannot be sold or disposed of in seven days or less in current market conditions without the sale of the investment significantly changing the market value of the investment). The Funds did not experience any issues meeting investor redemptions at any time during the Reporting Period. In the Report, the LRMC stated that it believes the Program has operated adequately and effectively to manage each Fund’s liquidity risk during the Reporting Period in compliance with the statutory requirements of the Liquidity Rule. The LRMC also did not recommend any changes to the Program during the Reporting Period.
157
Item not applicable to semi-annual report.
| ITEM 3. | AUDIT COMMITTEE FINANCIAL EXPERT. |
Item not applicable to semi-annual report.
| ITEM 4. | PRINCIPAL ACCOUNTANT FEES AND SERVICES. |
Item not applicable to semi-annual report.
| ITEM 5. | AUDIT COMMITTEE OF LISTED REGISTRANTS. |
Not applicable.
(a) Not applicable. The complete Schedules of Investment are included as part of the Reports to Stockholders in Item 1.
(b) Not applicable.
| ITEM 7. | DISCLOSURE OF PROXY VOTING POLICIES AND PROCEDURES FOR CLOSED-END MANAGEMENT INVESTMENT COMPANIES. |
Not applicable.
| ITEM 8. | PORTFOLIO MANAGERS OF CLOSED-END MANAGEMENT INVESTMENT COMPANIES. |
Not applicable.
| ITEM 9. | PURCHASES OF EQUITY SECURITES BY CLOSED-END MANAGEMENT INVESTMENT COMPANY AND AFFILIATED PURCHASERS. |
Not applicable.
| ITEM 10. | SUBMISSION OF MATTERS TO A VOTE OF SECURITY HOLDERS. |
Not applicable.
| ITEM 11. | CONTROLS AND PROCEDURES. |
| | (a) | The registrant’s principal executive officer and principal financial officer have evaluated the registrant’s disclosure controls and procedures within 90 days of this filing and have concluded that the registrant’s disclosure controls and procedures were effective, as of that date, in ensuring that information required to be disclosed by the registrant in this Form N-CSR was recorded, processed, summarized, and reported in a timely and accurate manner. |
| | (b) | The registrant’s principal executive officer and principal financial officer are aware of no changes in the registrant’s internal control over financial reporting that occurred during the period covered by this report that has materially affected, or is likely to materially affect, the registrant’s internal control over financial reporting. |
| ITEM 12. | DISCLOSURE OF SECURITIES LENDING FOR CLOSED-END MANAGEMENT INVESTMENT COMPANIES. |
Not applicable.
Attached hereto:
SIGNATURES
Pursuant to the requirements of the Securities Exchange Act of 1934 and the Investment Company Act of 1940, the registrant has duly caused this report to be signed on its behalf by the undersigned, thereunto duly authorized.
| | |
| | Mutual of America Investment Corporation |
| |
| By: | | /s/ CHRIS W. FESTOG |
| | Chris W. Festog |
| | Chairman of the Board, |
| | President and Chief Executive Officer of |
| | Mutual of America Investment Corporation |
Date: September 8, 2022
Pursuant to the requirements of the Securities Exchange Act of 1934 and the Investment Company Act of 1940, this report has been signed below by the following persons on behalf of the registrant and in the capacities and on the dates indicated.
| | |
| By: | | /s/ CHRIS W. FESTOG |
| | Chris W. Festog |
| | Chairman of the Board, |
| | President and Chief Executive Officer of |
| | Mutual of America Investment Corporation |
Date: September 8, 2022
| | |
| By: | | /s/ AFERDITA GUTIERREZ |
| | Aferdita Gutierrez |
| | Executive Vice President, |
| | Chief Financial Officer and Treasurer of |
| | Mutual of America Investment Corporation |
Date: September 8, 2022