UNITED STATES
SECURITIES AND EXCHANGE COMMISSION
Washington, D.C. 20549
FORM N-CSR
CERTIFIED SHAREHOLDER REPORT OF REGISTERED
MANAGEMENT INVESTMENT COMPANIES
Investment Company Act file number 811-05084
MoA Funds Corporation
(Exact name of registrant as specified in charter)
320 Park Avenue, New York, N.Y. 10022
(Address of principal executive offices) (Zip code)
Joseph R. Gaffoglio
Chief Executive Officer and Principal Executive Officer
MoA Funds Corporation
320 Park Avenue
New York, NY 10022
(Name and address of agent for service)
Registrant’s telephone number, including area code:
(212) 224-1600
Date of fiscal year end: December 31
Date of reporting period: June 30, 2024
| ITEM 1. | REPORTS TO STOCKHOLDERS. |
MoA Equity Index Fund - MAEIX
Semi-Annual Shareholder Report - June 30, 2024
This semi-annual shareholder report contains important information about MoA Equity Index Fund for the period of January 1, 2024 to June 30, 2024. You can find additional information about the fund at https://moafunds.com/docs. You can also request this information by contacting us at 800.914.8716.
What were the Fund costs for the last 6 months?
(based on hypothetical $10,000 investment)
| Fund name | Cost of a $10,000 investment | Cost paid as a % of a $10,000 investment |
|---|
| MoA Equity Index Fund | $7 | 0.14% |
How did the Fund perform during the reporting period?
The Fund's performance for the six months ended June 30, 2024 was 15.29% before expenses and 15.20% after expenses. The Fund's benchmark, the S&P 500® Index, returned 15.29% over the same period. During the period a small number of large-cap growth stocks accounted for a disproportionate percentage of the Index's return. A long-term view and potential overall portfolio diversification benefits should be considered when reviewing the Fund's performance.
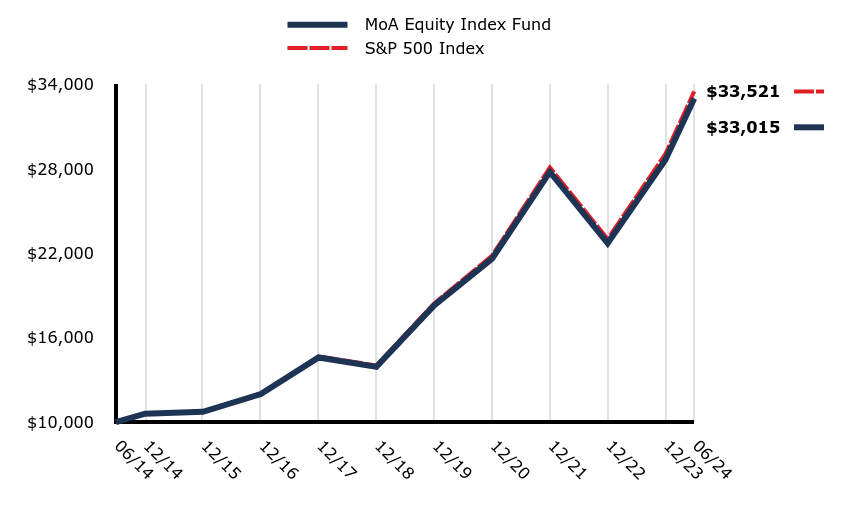
How did the Fund perform over the past 10 years?
The Fund underperformed on a net basis compared to its benchmark over the 10-year period. The Fund seeks investment results that correspond to the performance of the benchmark.
Total Return Based on $10,000 Investment
| MoA Equity Index Fund | S&P 500 Index |
|---|
| 06/14 | $10,000 | $10,000 |
| 12/14 | $10,605 | $10,612 |
| 12/15 | $10,736 | $10,758 |
| 12/16 | $12,002 | $12,045 |
| 12/17 | $14,600 | $14,675 |
| 12/18 | $13,934 | $14,031 |
| 12/19 | $18,297 | $18,449 |
| 12/20 | $21,628 | $21,844 |
| 12/21 | $27,793 | $28,114 |
| 12/22 | $22,724 | $23,023 |
| 12/23 | $28,659 | $29,075 |
| 06/24 | $33,015 | $33,521 |
The graph above represents historical performance of the hypothetical investment of $10,000 in the Fund over the past ten years (or since inception if shorter). The graph and table below show changes in the Fund's performance from year to year as compared to the performance of a broad-based, unmanaged index. A fund's past performance does not necessarily indicate how it will perform in the future. Returns shown are total returns, which assume the reinvestment of dividends and capital gains. The graph and table presented do not reflect the deduction of taxes that a shareholder would pay on fund distributions or redemption of fund shares.
| Total Net Assets | $5,653,462,948 |
| # of Portfolio Holdings | 507 |
| Portfolio Turnover Rate | 4.14% |
| Advisory Fees Paid | $2,042,628 |
The fund's past performance is not a good predictor of how the fund will perform in the future. The graph and table do not reflect the deduction of taxes that a shareholder would pay on fund distributions or redemption of fund shares.
Average Annual Total Returns (%)
| 1 Year | 5 Years | 10 Years |
|---|
| MoA Equity Index Fund | 24.36% | 14.87% | 12.69% |
| S&P 500 Index | 24.56% | 15.05% | 12.86% |
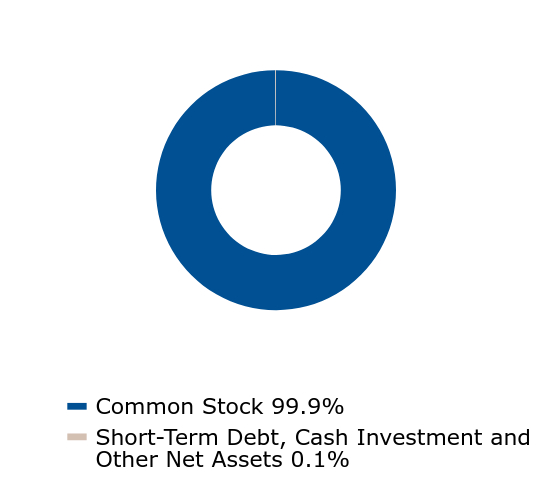
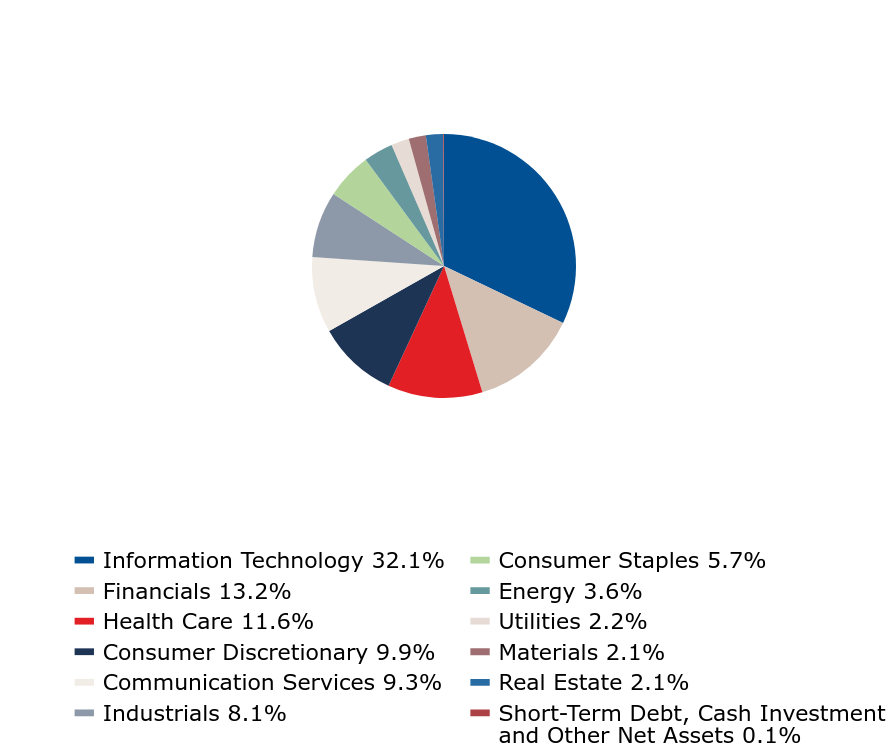
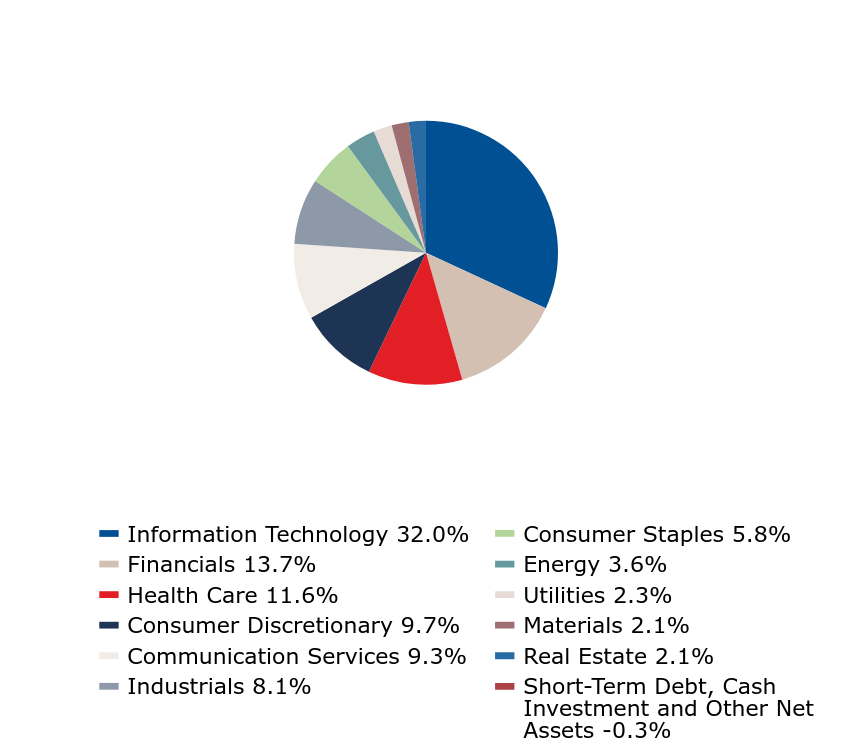
What did the Fund invest in?
The MoA Equity Index Fund seeks investment results that correspond to the performance of the S&P 500® Index.
| Value | Value |
|---|
| Common Stock | 99.9% |
| Short-Term Debt, Cash Investment and Other Net Assets | 0.1% |
| Value | Value |
|---|
| Information Technology | 32.1% |
| Financials | 13.2% |
| Health Care | 11.6% |
| Consumer Discretionary | 9.9% |
| Communication Services | 9.3% |
| Industrials | 8.1% |
| Consumer Staples | 5.7% |
| Energy | 3.6% |
| Utilities | 2.2% |
| Materials | 2.1% |
| Real Estate | 2.1% |
| Short-Term Debt, Cash Investment and Other Net Assets | 0.1% |
| Microsoft Corp. | 7.2% |
| NVIDIA Corp. | 6.6% |
| Apple, Inc. | 6.6% |
| Amazon.com, Inc. | 3.8% |
| Meta Platforms, Inc. Cl A | 2.4% |
| Alphabet, Inc. Cl A | 2.3% |
| Alphabet, Inc. Cl C | 1.9% |
| Berkshire Hathaway, Inc. Cl B | 1.6% |
| Eli Lilly & Co. | 1.6% |
| Broadcom, Inc. | 1.5% |
During the period, the Fund did not have any material fund changes.
Change in or Disagreements with Accountants
During the period, the Fund did not have any changes or disagreements with Accountants.
To reduce expense, the Funds may mail only one copy of the prospectus, and each annual and semiannual Tailored Shareholder report to those addresses shared by two or more accounts. If you wish to receive individual copies of these documents, please contact your advisor, administrator or the Funds at 800-914-8716.
MoA Equity Index Fund - MAEIX
Semi-Annual Shareholder Report - June 30, 2024
If you wish to view additional information about the Fund; including but not limited to financial statements or holdings, please visit https://moafunds.com/docs. The MoA Funds are distributed by Foreside Fund Services LLC.
MoA Small Cap Equity Index Fund - MASOX
Semi-Annual Shareholder Report - June 30, 2024
This semi-annual shareholder report contains important information about MoA Small Cap Equity Index Fund for the period of January 1, 2024 to June 30, 2024. You can find additional information about the fund at https://moafunds.com/docs. You can also request this information by contacting us at 800.914.8716.
What were the Fund costs for the last 6 months?
(based on hypothetical $10,000 investment)
| Fund name | Cost of a $10,000 investment | Cost paid as a % of a $10,000 investment |
|---|
| MoA Small Cap Equity Index Fund | $7 | 0.14% |
How did the Fund perform during the reporting period?
The Fund's performance for the six months ended June 30, 2024 was -0.72% before expenses and -0.79% after expenses. The Fund's benchmark, the S&P SmallCap® 600 Index, returned -0.72% over the same period. Small-cap stocks lagged large-caps, as measured by the S&P 500® Index, as a few large-cap growth stocks accounted for a disproportionate percentage of the S&P's return. A long-term view and potential overall portfolio diversification benefits, which include holding companies of various sizes, should be considered when reviewing the performance of small-cap stocks.
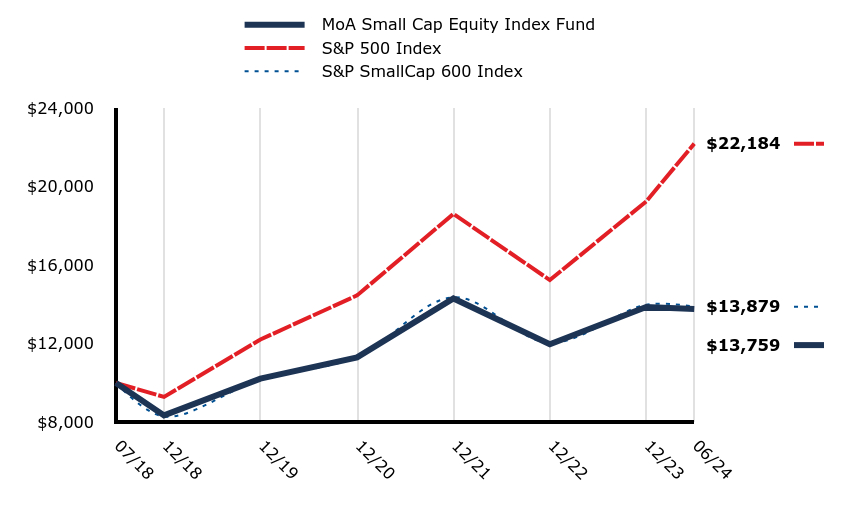
How did the Fund perform since inception?
The Fund underperformed its benchmark since inception on July 2, 2018. The Fund seeks investment results that correspond to the performance of the benchmark.
Total Return Based on $10,000 Investment
| MoA Small Cap Equity Index Fund | S&P 500 Index | S&P SmallCap 600 Index |
|---|
| 07/18 | $10,000 | $10,000 | $10,000 |
| 12/18 | $8,346 | $9,286 | $8,286 |
| 12/19 | $10,216 | $12,210 | $10,173 |
| 12/20 | $11,304 | $14,456 | $11,322 |
| 12/21 | $14,302 | $18,606 | $14,358 |
| 12/22 | $11,970 | $15,236 | $12,047 |
| 12/23 | $13,869 | $19,241 | $13,980 |
| 06/24 | $13,759 | $22,184 | $13,879 |
The graph above represents historical performance of the hypothetical investment of $10,000 in the Fund over the past ten years (or since inception if shorter). The graph and table below show changes in the Fund's performance from year to year as compared to the performance of a broad-based, unmanaged index. A fund's past performance does not necessarily indicate how it will perform in the future. Returns shown are total returns, which assume the reinvestment of dividends and capital gains. The graph and table presented do not reflect the deduction of taxes that a shareholder would pay on fund distributions or redemption of fund shares.
| Total Net Assets | $199,379,691 |
| # of Portfolio Holdings | 606 |
| Portfolio Turnover Rate | 17.64% |
| Advisory Fees Paid | $0 |
The fund's past performance is not a good predictor of how the fund will perform in the future. The graph and table do not reflect the deduction of taxes that a shareholder would pay on fund distributions or redemption of fund shares.
Average Annual Total Returns (%)
| 1 Year | 5 Years | Since Inception |
|---|
| MoA Small Cap Equity Index Fund (Incp: July 2, 2018) | 8.42% | 7.74% | 5.47% |
| S&P 500 Index | 24.56% | 15.05% | 14.22% |
| S&P SmallCap 600 Index | 8.66% | 8.06% | 5.62% |
What did the Fund invest in?
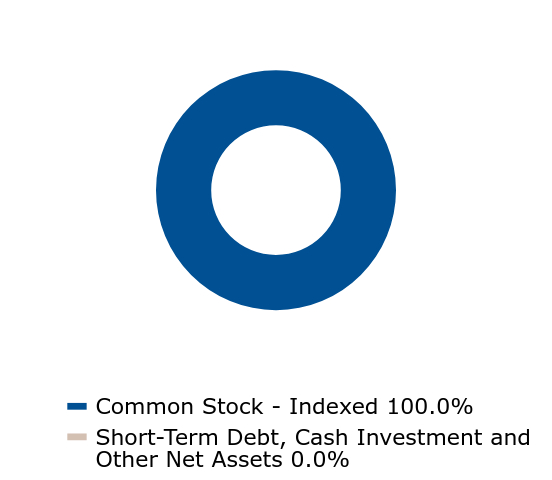
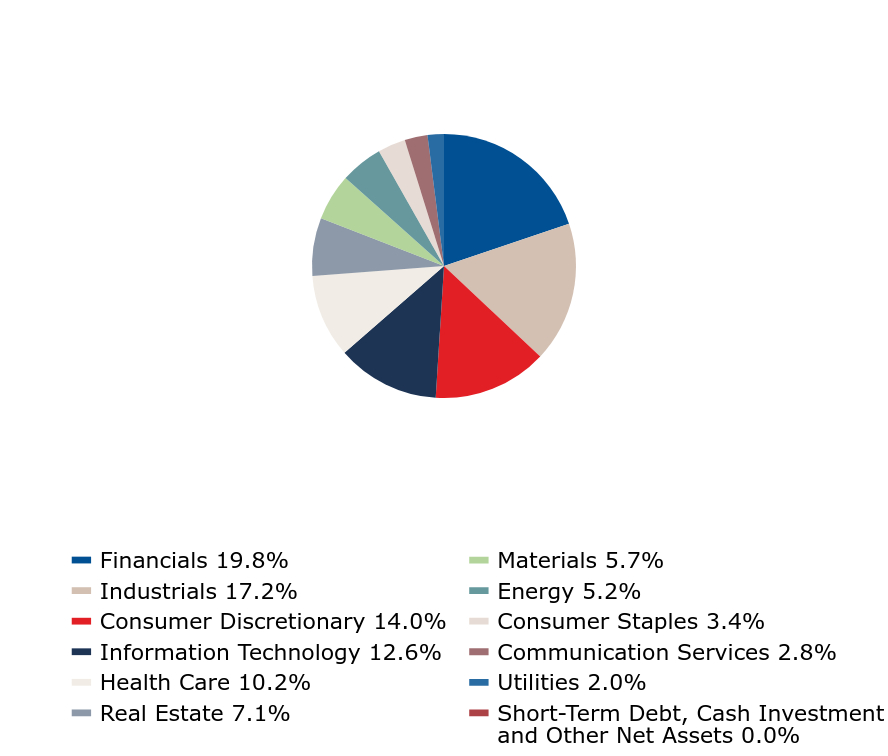
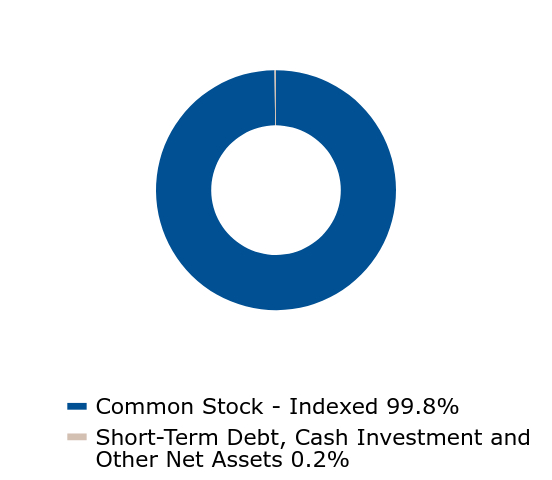
The MoA Small Cap Equity Index Fund seeks investment results that correspond to the performance of the S&P SmallCap® 600 Index.
| Value | Value |
|---|
| Common Stock - Indexed | 100.0% |
| Short-Term Debt, Cash Investment and Other Net Assets | 0.0% |
| Value | Value |
|---|
| Financials | 19.8% |
| Industrials | 17.2% |
| Consumer Discretionary | 14.0% |
| Information Technology | 12.6% |
| Health Care | 10.2% |
| Real Estate | 7.1% |
| Materials | 5.7% |
| Energy | 5.2% |
| Consumer Staples | 3.4% |
| Communication Services | 2.8% |
| Utilities | 2.0% |
| Short-Term Debt, Cash Investment and Other Net Assets | 0.0% |
| iShares Core S&P Small-Cap ETF | 1.7% |
| Abercrombie & Fitch Co. Cl A | 0.8% |
| Fabrinet | 0.7% |
| Ensign Group, Inc. | 0.6% |
| SPS Commerce, Inc. | 0.6% |
| ATI, Inc. | 0.6% |
| Comerica, Inc. | 0.6% |
| Robert Half, Inc. | 0.6% |
| SPX Technologies, Inc. | 0.5% |
| Mueller Industries, Inc. | 0.5% |
During the period, the Fund did not have any material fund changes.
Change in or Disagreements with Accountants
During the period, the Fund did not have any changes or disagreements with Accountants.
To reduce expense, the Funds may mail only one copy of the prospectus, and each annual and semiannual Tailored Shareholder report to those addresses shared by two or more accounts. If you wish to receive individual copies of these documents, please contact your advisor, administrator or the Funds at 800-914-8716.
MoA Small Cap Equity Index Fund - MASOX
Semi-Annual Shareholder Report - June 30, 2024
If you wish to view additional information about the Fund; including but not limited to financial statements or holdings, please visit https://moafunds.com/docs. The MoA Funds are distributed by Foreside Fund Services LLC.
MoA Clear Passage 2060 Fund - MURPX
Semi-Annual Shareholder Report - June 30, 2024
This semi-annual shareholder report contains important information about MoA Clear Passage 2060 Fund for the period of January 1, 2024 to June 30, 2024. You can find additional information about the fund at https://moafunds.com/docs. You can also request this information by contacting us at 800.914.8716.
What were the Fund costs for the last 6 months?
(based on hypothetical $10,000 investment)
| Fund name | Cost of a $10,000 investment | Cost paid as a % of a $10,000 investment |
|---|
| MoA Clear Passage 2060 Fund | $19 | 0.36% |
How did the Fund perform during the reporting period?
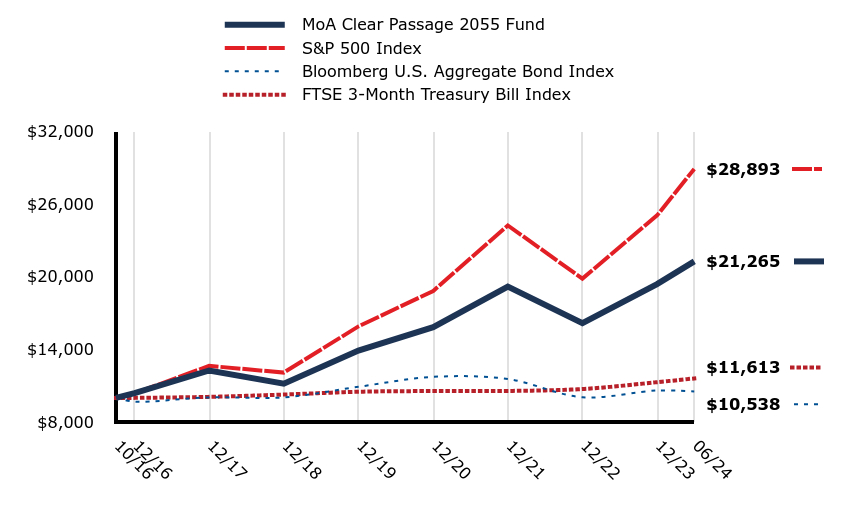
The Fund's performance for the six months ended June 30, 2024 was 9.72% before expenses and 9.64% after expenses. The Fund's benchmark, the Morningstar Lifetime Allocation Moderate 2060 Index was 7.29% over the same period. The Fund's return was influenced by its portfolio allocation and risk relative to the Index. A long-term view, asset composition and risk characteristics between the Fund and the Index should be considered when reviewing the Fund's performance.
How did the Fund perform since inception?
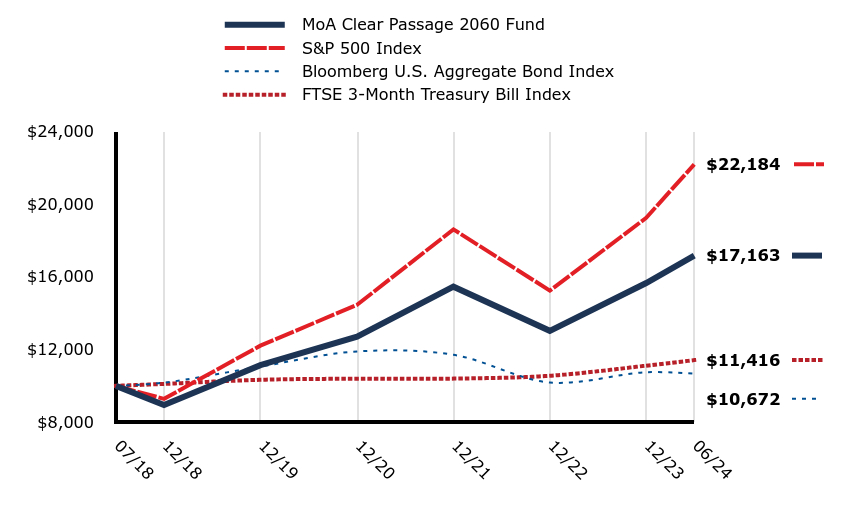
The Fund outperformed its benchmark since its inception on July 2, 2018, due to asset composition and stock selection.
Total Return Based on $10,000 Investment
| MoA Clear Passage 2060 Fund | S&P 500 Index | Bloomberg U.S. Aggregate Bond Index | FTSE 3-Month Treasury Bill Index |
|---|
| 07/18 | $10,000 | $10,000 | $10,000 | $10,000 |
| 12/18 | $8,946 | $9,286 | $10,174 | $10,106 |
| 12/19 | $11,140 | $12,210 | $11,061 | $10,333 |
| 12/20 | $12,708 | $14,456 | $11,892 | $10,393 |
| 12/21 | $15,454 | $18,606 | $11,708 | $10,398 |
| 12/22 | $13,025 | $15,236 | $10,185 | $10,554 |
| 12/23 | $15,654 | $19,241 | $10,748 | $11,109 |
| 06/24 | $17,163 | $22,184 | $10,672 | $11,416 |
The graph above represents historical performance of the hypothetical investment of $10,000 in the Fund over the past ten years (or since inception if shorter). The graph and table below show changes in the Fund's performance from year to year as compared to the performance of a broad-based, unmanaged index. A fund's past performance does not necessarily indicate how it will perform in the future. Returns shown are total returns, which assume the reinvestment of dividends and capital gains. The graph and table presented do not reflect the deduction of taxes that a shareholder would pay on fund distributions or redemption of fund shares.
| Total Net Assets | $277,656,392 |
| # of Portfolio Holdings | 10 |
| Portfolio Turnover Rate | 5.84% |
| Advisory Fees Paid | $63,587 |
The fund's past performance is not a good predictor of how the fund will perform in the future. The graph and table do not reflect the deduction of taxes that a shareholder would pay on fund distributions or redemption of fund shares.
Average Annual Total Returns (%)
| 1 Year | 5 Years | Since Inception |
|---|
| MoA Clear Passage 2060 Fund (Incp: July 2, 2018) | 17.35% | 10.69% | 9.43% |
| S&P 500 Index | 24.56% | 15.05% | 14.22% |
| Bloomberg U.S. Aggregate Bond Index | 2.63% | | 1.09% |
| FTSE 3-Month Treasury Bill Index | 5.64% | 2.22% | 2.23% |
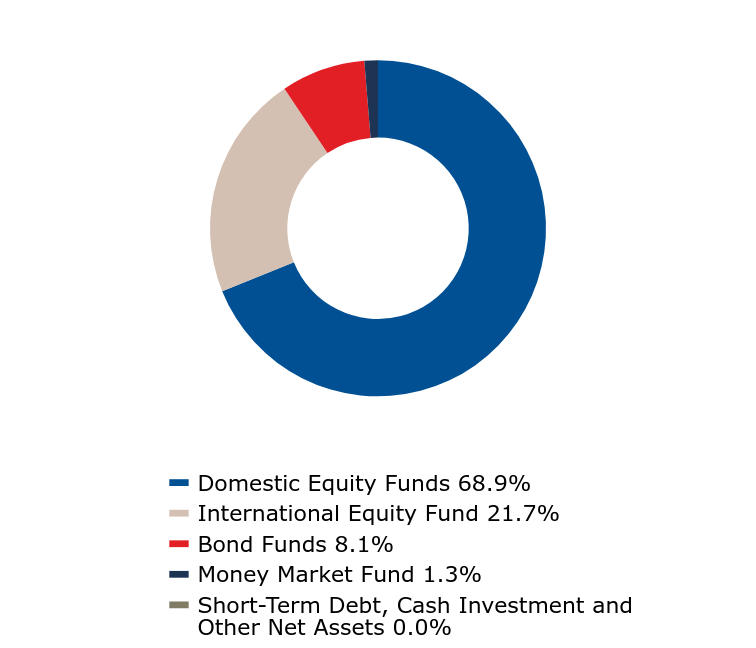
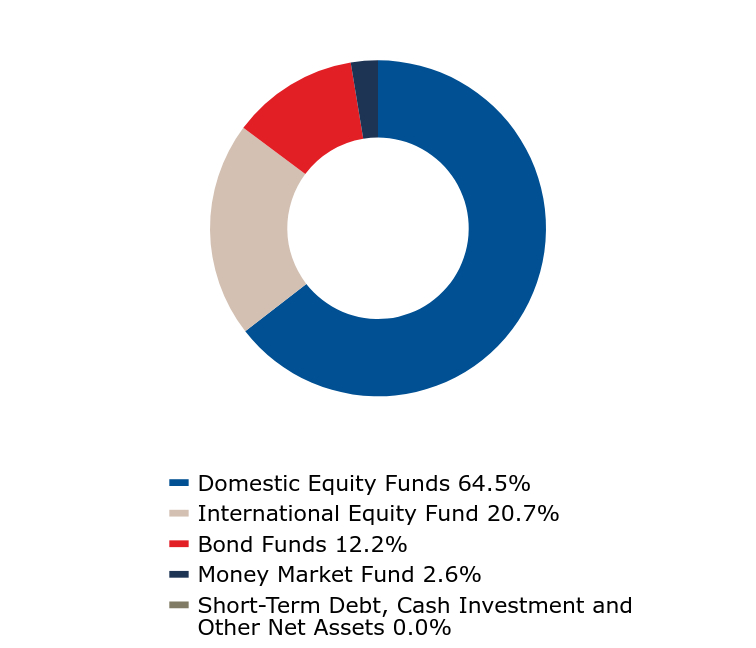
What did the Fund invest in?
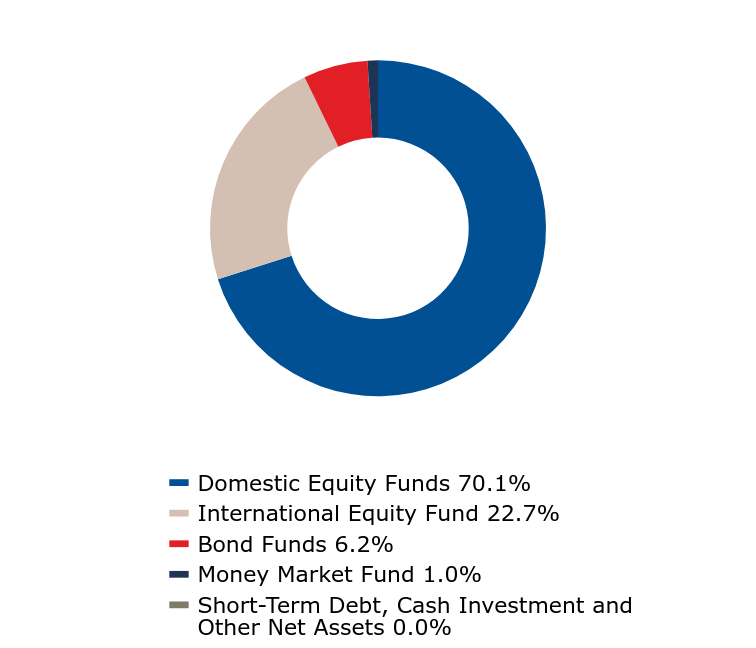
The MoA Clear Passage 2060 Fund™ is designed for investors with a specific target date in mind - whether for retirement or another longterm investment goal. This Fund uses our time-tested investment management and allocation expertise to dynamically manage an investment over time approaching the target year 2060.
| Value | Value |
|---|
| Domestic Equity Funds | 70.1% |
| International Equity Fund | 22.7% |
| Bond Funds | 6.2% |
| Money Market Fund | 1.0% |
| Short-Term Debt, Cash Investment and Other Net Assets | 0.0% |
| Equity Index Fund | 48.7% |
| International Fund | 22.7% |
| Mid Cap Equity Index Fund | 12.1% |
| Core Bond Fund | 4.7% |
| Small Cap Equity Index Fund | 3.0% |
| Small Cap Value Fund | 2.7% |
| Small Cap Growth Fund | 2.0% |
| Mid Cap Value Fund | 1.6% |
| Intermediate Bond Fund | 1.5% |
| Money Market Fund | 1.0% |
During the period, the Fund did not have any material fund changes.
Change in or Disagreements with Accountants
During the period, the Fund did not have any changes or disagreements with Accountants.
To reduce expense, the Funds may mail only one copy of the prospectus, and each annual and semiannual Tailored Shareholder report to those addresses shared by two or more accounts. If you wish to receive individual copies of these documents, please contact your advisor, administrator or the Funds at 800-914-8716.
MoA Clear Passage 2060 Fund - MURPX
Semi-Annual Shareholder Report - June 30, 2024
If you wish to view additional information about the Fund; including but not limited to financial statements or holdings, please visit https://moafunds.com/docs. The MoA Funds are distributed by Foreside Fund Services LLC.
MoA Clear Passage 2030 Fund - MURIX
Semi-Annual Shareholder Report - June 30, 2024
This semi-annual shareholder report contains important information about MoA Clear Passage 2030 Fund for the period of January 1, 2024 to June 30, 2024. You can find additional information about the fund at https://moafunds.com/docs. You can also request this information by contacting us at 800.914.8716.
What were the Fund costs for the last 6 months?
(based on hypothetical $10,000 investment)
| Fund name | Cost of a $10,000 investment | Cost paid as a % of a $10,000 investment |
|---|
| MoA Clear Passage 2030 Fund | $20 | 0.39% |
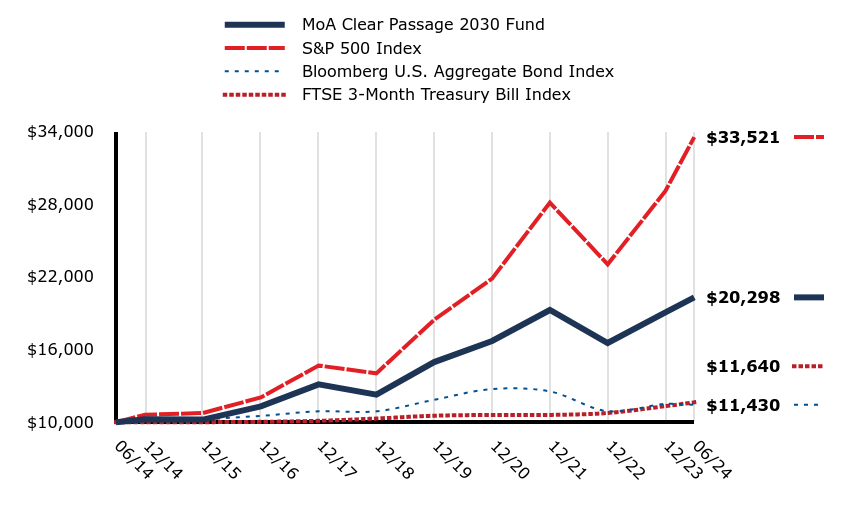
How did the Fund perform during the reporting period?
The Fund's performance for the six months ended June 30, 2024 was 6.58% before expenses and 6.52% after expenses. The Fund's benchmark, the Morningstar Lifetime Allocation Moderate 2030 Index was 4.33% over the same period. The Fund's return was influenced by its portfolio allocation and risk relative to the Index. A long-term view, asset composition and risk characteristics between the Fund and the Index should be considered when reviewing the Fund's performance.
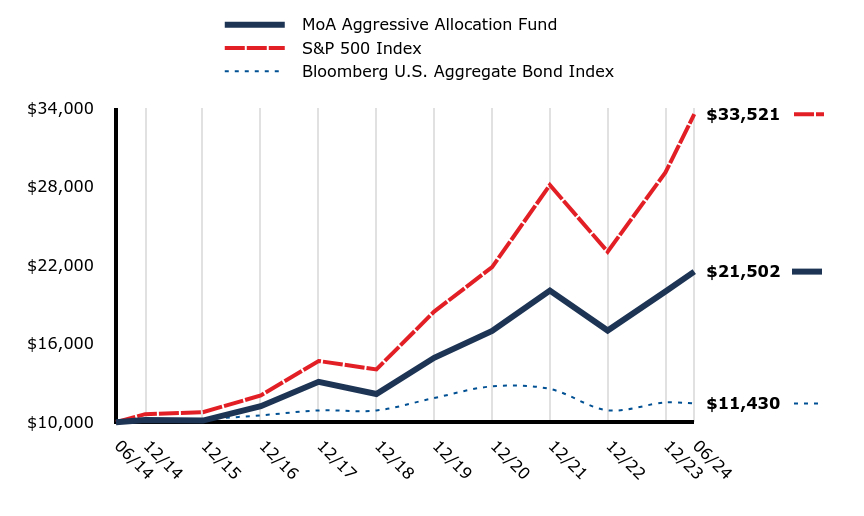
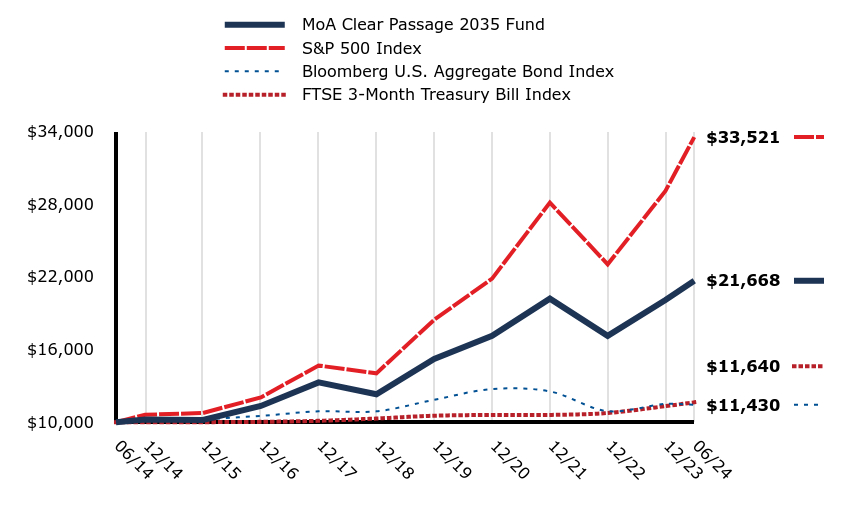
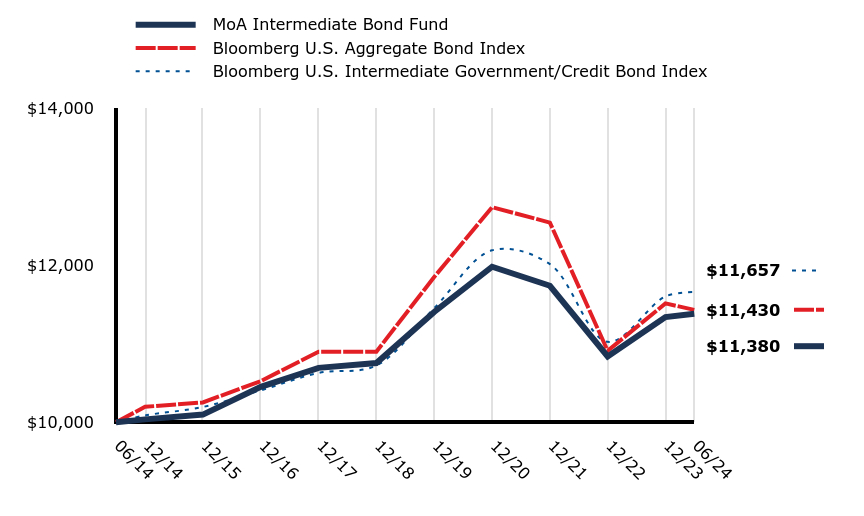
How did the Fund perform over the past 10 years?
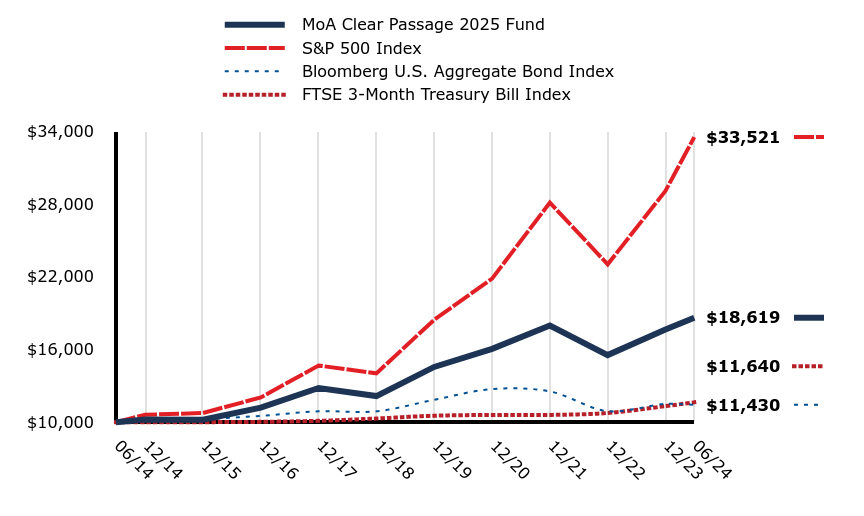
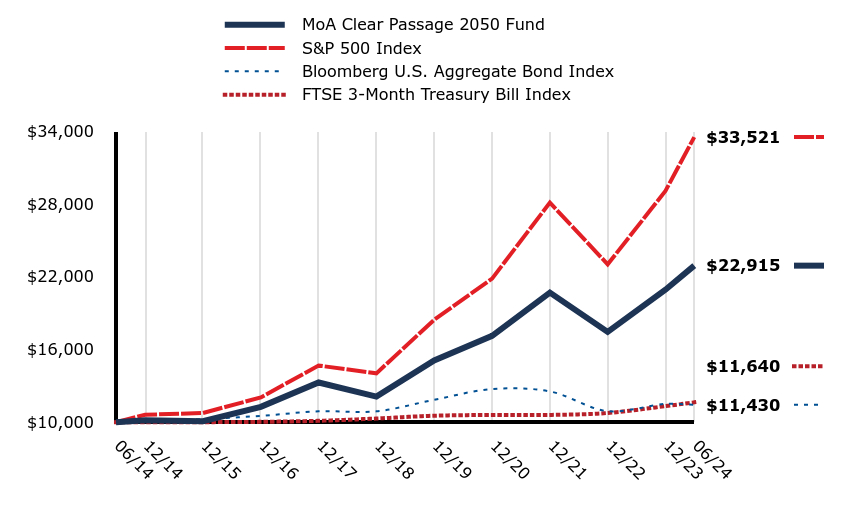
The Fund outperformed its benchmark over the 10-year period due to asset composition and stock selection.
Total Return Based on $10,000 Investment
| MoA Clear Passage 2030 Fund | S&P 500 Index | Bloomberg U.S. Aggregate Bond Index | FTSE 3-Month Treasury Bill Index |
|---|
| 06/14 | $10,000 | $10,000 | $10,000 | $10,000 |
| 12/14 | $10,239 | $10,612 | $10,196 | $10,001 |
| 12/15 | $10,215 | $10,758 | $10,252 | $10,004 |
| 12/16 | $11,310 | $12,045 | $10,524 | $10,031 |
| 12/17 | $13,119 | $14,675 | $10,897 | $10,116 |
| 12/18 | $12,267 | $14,031 | $10,898 | $10,304 |
| 12/19 | $14,958 | $18,449 | $11,848 | $10,536 |
| 12/20 | $16,704 | $21,844 | $12,737 | $10,597 |
| 12/21 | $19,257 | $28,114 | $12,541 | $10,602 |
| 12/22 | $16,534 | $23,023 | $10,909 | $10,761 |
| 12/23 | $19,056 | $29,075 | $11,512 | $11,327 |
| 06/24 | $20,298 | $33,521 | $11,430 | $11,640 |
The graph above represents historical performance of the hypothetical investment of $10,000 in the Fund over the past ten years (or since inception if shorter). The graph and table below show changes in the Fund's performance from year to year as compared to the performance of a broad-based, unmanaged index. A fund's past performance does not necessarily indicate how it will perform in the future. Returns shown are total returns, which assume the reinvestment of dividends and capital gains. The graph and table presented do not reflect the deduction of taxes that a shareholder would pay on fund distributions or redemption of fund shares.
| Total Net Assets | $1,352,279,047 |
| # of Portfolio Holdings | 10 |
| Portfolio Turnover Rate | 8.87% |
| Advisory Fees Paid | $332,216 |
The fund's past performance is not a good predictor of how the fund will perform in the future. The graph and table do not reflect the deduction of taxes that a shareholder would pay on fund distributions or redemption of fund shares.
Average Annual Total Returns (%)
| 1 Year | 5 Years | 10 Years |
|---|
| MoA Clear Passage 2030 Fund | 12.60% | 7.73% | 7.34% |
| S&P 500 Index | 24.56% | 15.05% | 12.86% |
| Bloomberg U.S. Aggregate Bond Index | 2.63% | | 1.35% |
| FTSE 3-Month Treasury Bill Index | 5.64% | 2.22% | 1.53% |
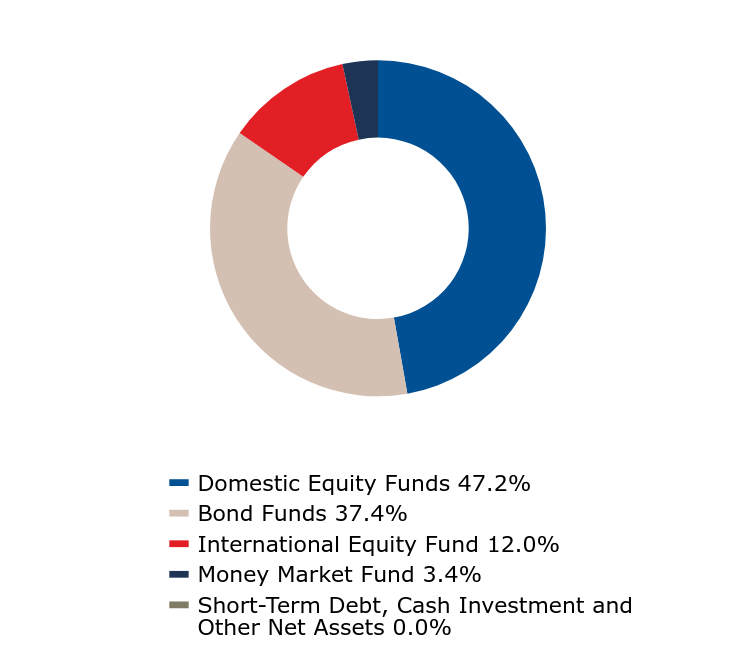
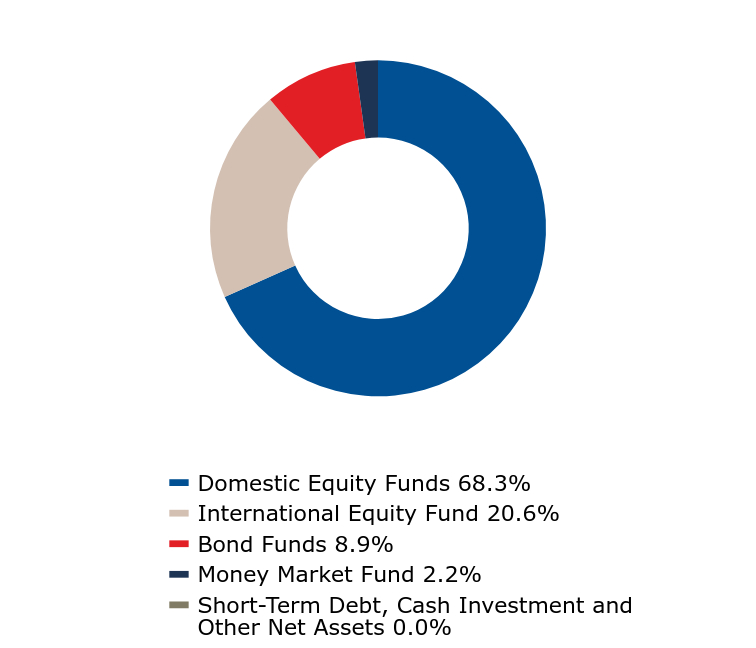
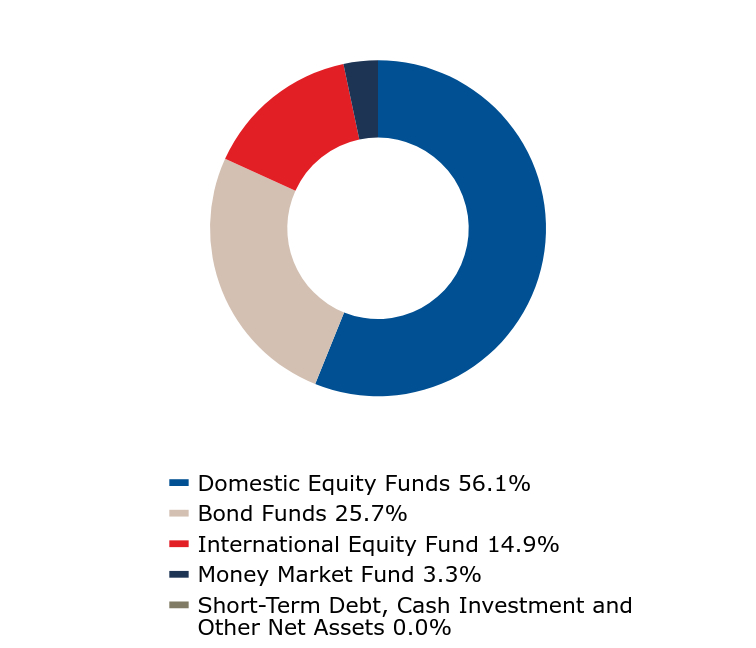
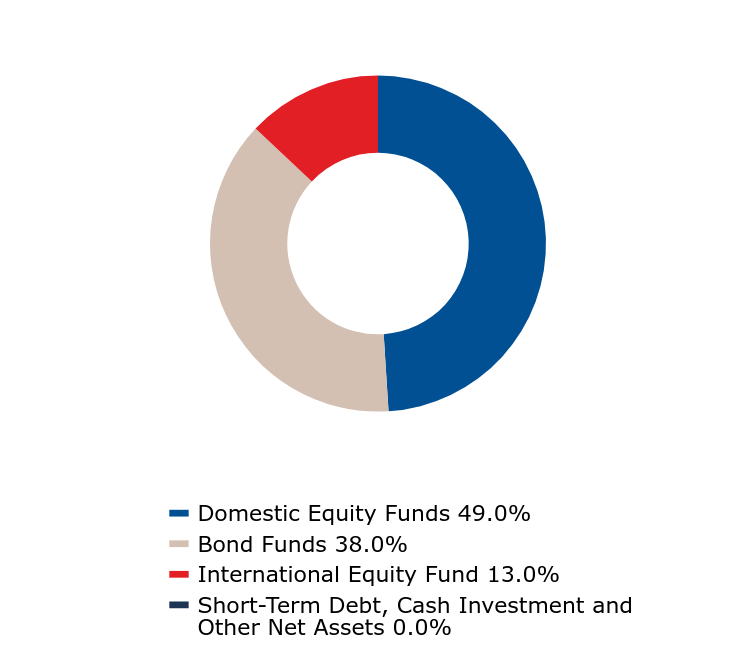
What did the Fund invest in?
The MoA Clear Passage 2030 Fund™ is designed for investors with a specific target date in mind - whether for retirement or another longterm investment goal. This Fund uses our time-tested investment management and allocation expertise to dynamically manage an investment over time approaching the target year 2030.
| Value | Value |
|---|
| Domestic Equity Funds | 47.2% |
| Bond Funds | 37.4% |
| International Equity Fund | 12.0% |
| Money Market Fund | 3.4% |
| Short-Term Debt, Cash Investment and Other Net Assets | 0.0% |
| Equity Index Fund | 36.2% |
| Core Bond Fund | 26.5% |
| International Fund | 12.0% |
| Intermediate Bond Fund | 10.9% |
| Mid Cap Equity Index Fund | 6.2% |
| Money Market Fund | 3.4% |
| Small Cap Value Fund | 1.6% |
| Small Cap Equity Index Fund | 1.2% |
| Small Cap Growth Fund | 1.1% |
| Mid Cap Value Fund | 0.9% |
During the period, the Fund did not have any material fund changes.
Change in or Disagreements with Accountants
During the period, the Fund did not have any changes or disagreements with Accountants.
To reduce expense, the Funds may mail only one copy of the prospectus, and each annual and semiannual Tailored Shareholder report to those addresses shared by two or more accounts. If you wish to receive individual copies of these documents, please contact your advisor, administrator or the Funds at 800-914-8716.
MoA Clear Passage 2030 Fund - MURIX
Semi-Annual Shareholder Report - June 30, 2024
If you wish to view additional information about the Fund; including but not limited to financial statements or holdings, please visit https://moafunds.com/docs. The MoA Funds are distributed by Foreside Fund Services LLC.
MoA Mid Cap Value Fund - MAMVX
Semi-Annual Shareholder Report - June 30, 2024
This semi-annual shareholder report contains important information about MoA Mid Cap Value Fund for the period of January 1, 2024 to June 30, 2024. You can find additional information about the fund at https://moafunds.com/docs. You can also request this information by contacting us at 800.914.8716.
What were the Fund costs for the last 6 months?
(based on hypothetical $10,000 investment)
| Fund name | Cost of a $10,000 investment | Cost paid as a % of a $10,000 investment |
|---|
| MoA Mid Cap Value Fund | $33 | 0.66% |
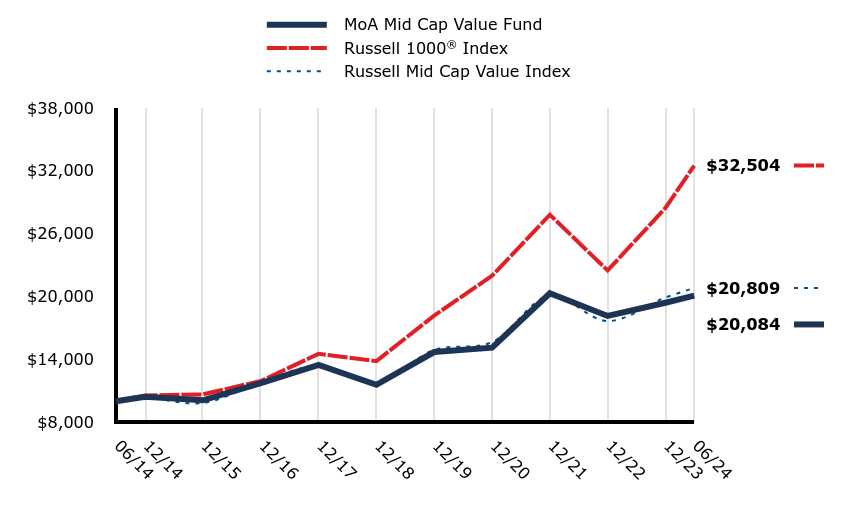
How did the Fund perform during the reporting period?
The Fund's performance for the six months ended June 30, 2024 was 3.84% before expenses and 3.51% after expenses. The Fund's benchmark, the Russell Midcap® Value Index, returned 4.54% over the same period. Mid-cap stocks lagged large-caps, as measured by the S&P 500® Index, as a few large-cap growth stocks accounted for a disproportionate percentage of the S&P's return. A long-term view and potential overall portfolio diversification benefits, which include holding companies of various sizes, should be considered when reviewing the performance of mid-cap stocks.
How did the Fund perform over the past 10 years?
The Fund underperformed its benchmark over the 10-year period. In general, mid-cap stocks have lagged large-cap stocks, as measured by the S&P 500® Index, over the past several years.
Total Return Based on $10,000 Investment
| MoA Mid Cap Value Fund | Russell 1000® Index | Russell Mid Cap Value Index |
|---|
| 06/14 | $10,000 | $10,000 | $10,000 |
| 12/14 | $10,438 | $10,557 | $10,325 |
| 12/15 | $10,089 | $10,653 | $9,831 |
| 12/16 | $11,720 | $11,938 | $11,797 |
| 12/17 | $13,468 | $14,526 | $13,372 |
| 12/18 | $11,572 | $13,831 | $11,728 |
| 12/19 | $14,700 | $18,178 | $14,902 |
| 12/20 | $15,116 | $21,989 | $15,642 |
| 12/21 | $20,308 | $27,806 | $20,075 |
| 12/22 | $18,141 | $22,488 | $17,659 |
| 12/23 | $19,404 | $28,453 | $19,905 |
| 06/24 | $20,084 | $32,504 | $20,809 |
The graph above represents historical performance of the hypothetical investment of $10,000 in the Fund over the past ten years (or since inception if shorter). The graph and table below show changes in the Fund's performance from year to year as compared to the performance of a broad-based, unmanaged index. A fund's past performance does not necessarily indicate how it will perform in the future. Returns shown are total returns, which assume the reinvestment of dividends and capital gains. The graph and table presented do not reflect the deduction of taxes that a shareholder would pay on fund distributions or redemption of fund shares.
| Total Net Assets | $164,384,731 |
| # of Portfolio Holdings | 79 |
| Portfolio Turnover Rate | 16.02% |
| Advisory Fees Paid | $445,757 |
The fund's past performance is not a good predictor of how the fund will perform in the future. The graph and table do not reflect the deduction of taxes that a shareholder would pay on fund distributions or redemption of fund shares.
Average Annual Total Returns (%)
| 1 Year | 5 Years | 10 Years |
|---|
| MoA Mid Cap Value Fund | 6.95% | 8.28% | 7.22% |
Russell 1000® Index | 23.88% | 14.61% | 12.51% |
| Russell Mid Cap Value Index | 11.98% | 8.49% | 7.60% |
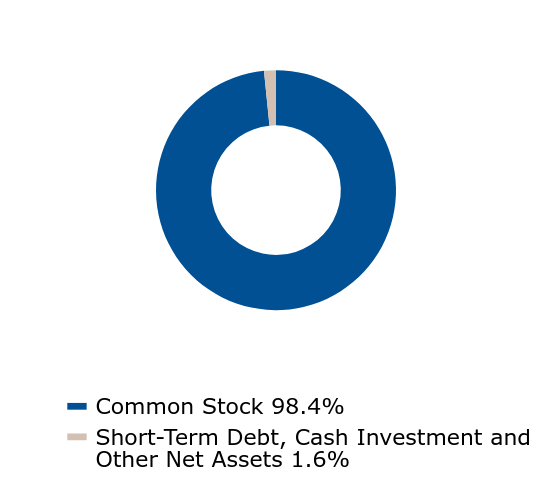
What did the Fund invest in?
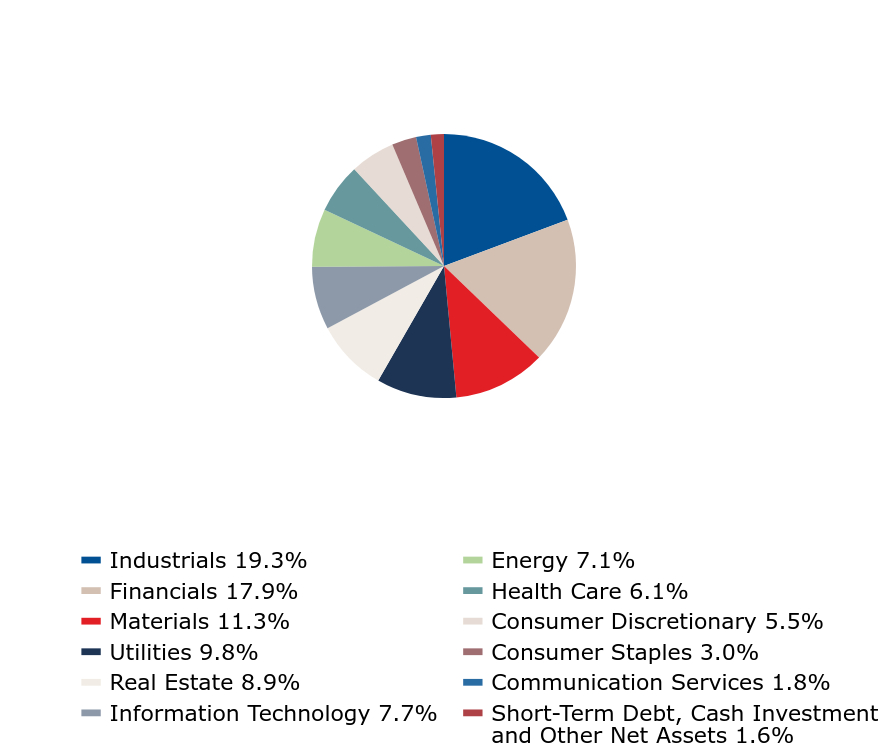
The actively managed MoA Mid Cap Value Fund seeks capital appreciation, and to a lesser extent, current income. We seek companies that are undervalued with respect to their operating results and potential.
| Value | Value |
|---|
| Common Stock | 98.4% |
| Short-Term Debt, Cash Investment and Other Net Assets | 1.6% |
| Value | Value |
|---|
| Industrials | 19.3% |
| Financials | 17.9% |
| Materials | 11.3% |
| Utilities | 9.8% |
| Real Estate | 8.9% |
| Information Technology | 7.7% |
| Energy | 7.1% |
| Health Care | 6.1% |
| Consumer Discretionary | 5.5% |
| Consumer Staples | 3.0% |
| Communication Services | 1.8% |
| Short-Term Debt, Cash Investment and Other Net Assets | 1.6% |
| Ameriprise Financial, Inc. | 2.9% |
| Crane Co. | 2.8% |
| Crown Hldgs., Inc. | 2.8% |
| Baker Hughes Co. Cl A | 2.7% |
| Ashland, Inc. | 2.5% |
| Clean Harbors, Inc. | 2.4% |
| American Financial Group, Inc. | 2.4% |
| Carlisle Cos., Inc. | 2.3% |
| Public Svc. Enterprise Group, Inc. | 2.2% |
| Evergy, Inc. | 2.2% |
During the period, the Fund did not have any material fund changes.
Change in or Disagreements with Accountants
During the period, the Fund did not have any changes or disagreements with Accountants.
To reduce expense, the Funds may mail only one copy of the prospectus, and each annual and semiannual Tailored Shareholder report to those addresses shared by two or more accounts. If you wish to receive individual copies of these documents, please contact your advisor, administrator or the Funds at 800-914-8716.
MoA Mid Cap Value Fund - MAMVX
Semi-Annual Shareholder Report - June 30, 2024
If you wish to view additional information about the Fund; including but not limited to financial statements or holdings, please visit https://moafunds.com/docs. The MoA Funds are distributed by Foreside Fund Services LLC.
MoA Balanced Fund - MACHX
Semi-Annual Shareholder Report - June 30, 2024
This semi-annual shareholder report contains important information about MoA Balanced Fund for the period of January 1, 2024 to June 30, 2024. You can find additional information about the fund at https://moafunds.com/docs. You can also request this information by contacting us at 800.914.8716.
What were the Fund costs for the last 6 months?
(based on hypothetical $10,000 investment)
| Fund name | Cost of a $10,000 investment | Cost paid as a % of a $10,000 investment |
|---|
| MoA Balanced Fund | $27 | 0.52% |
How did the Fund perform during the reporting period?
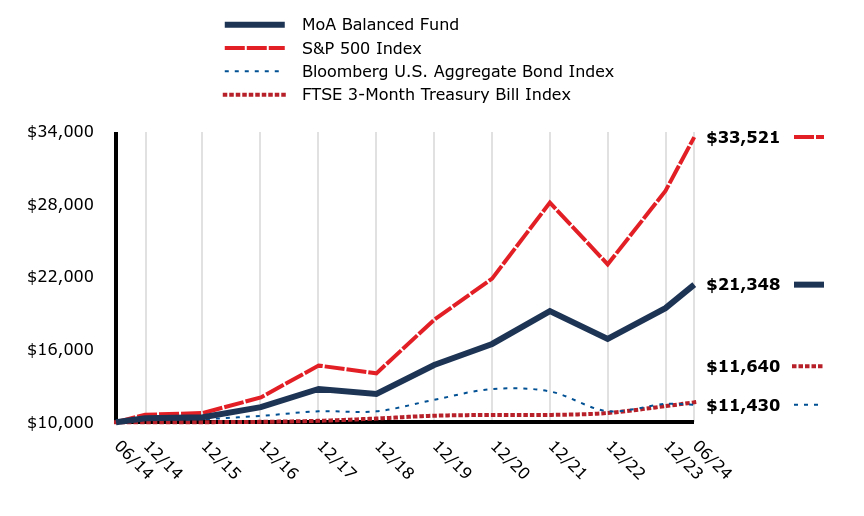
The Fund's performance for the six months ended June 30, 2024 was 10.28% before expenses and 10.01% after expenses. The Fund's benchmark, the 60% S&P 500® Index, 40% Bloomberg U.S. Aggregate Bond Index, returned 8.68% over the same period. A long-term view, asset composition and risk characteristics between the Fund and the Index should be considered when reviewing the Fund's performance.
How did the Fund perform over the past 10 years?
The Fund underperformed its benchmark over the 10-year period due to asset composition and stock selection.
Total Return Based on $10,000 Investment
| MoA Balanced Fund | S&P 500 Index | Bloomberg U.S. Aggregate Bond Index | FTSE 3-Month Treasury Bill Index |
|---|
| 06/14 | $10,000 | $10,000 | $10,000 | $10,000 |
| 12/14 | $10,334 | $10,612 | $10,196 | $10,001 |
| 12/15 | $10,416 | $10,758 | $10,252 | $10,004 |
| 12/16 | $11,240 | $12,045 | $10,524 | $10,031 |
| 12/17 | $12,742 | $14,675 | $10,897 | $10,116 |
| 12/18 | $12,334 | $14,031 | $10,898 | $10,304 |
| 12/19 | $14,723 | $18,449 | $11,848 | $10,536 |
| 12/20 | $16,456 | $21,844 | $12,737 | $10,597 |
| 12/21 | $19,168 | $28,114 | $12,541 | $10,602 |
| 12/22 | $16,864 | $23,023 | $10,909 | $10,761 |
| 12/23 | $19,406 | $29,075 | $11,512 | $11,327 |
| 06/24 | $21,348 | $33,521 | $11,430 | $11,640 |
The graph above represents historical performance of the hypothetical investment of $10,000 in the Fund over the past ten years (or since inception if shorter). The graph and table below show changes in the Fund's performance from year to year as compared to the performance of a broad-based, unmanaged index. A fund's past performance does not necessarily indicate how it will perform in the future. Returns shown are total returns, which assume the reinvestment of dividends and capital gains. The graph and table presented do not reflect the deduction of taxes that a shareholder would pay on fund distributions or redemption of fund shares.
| Total Net Assets | $194,658,155 |
| # of Portfolio Holdings | 361 |
| Portfolio Turnover Rate | 22.00% |
| Advisory Fees Paid | $375,765 |
The fund's past performance is not a good predictor of how the fund will perform in the future. The graph and table do not reflect the deduction of taxes that a shareholder would pay on fund distributions or redemption of fund shares.
Average Annual Total Returns (%)
| 1 Year | 5 Years | 10 Years |
|---|
| MoA Balanced Fund | 16.24% | 9.27% | 7.88% |
| S&P 500 Index | 24.56% | 15.05% | 12.86% |
| Bloomberg U.S. Aggregate Bond Index | 2.63% | | 1.35% |
| FTSE 3-Month Treasury Bill Index | 5.64% | 2.22% | 1.53% |
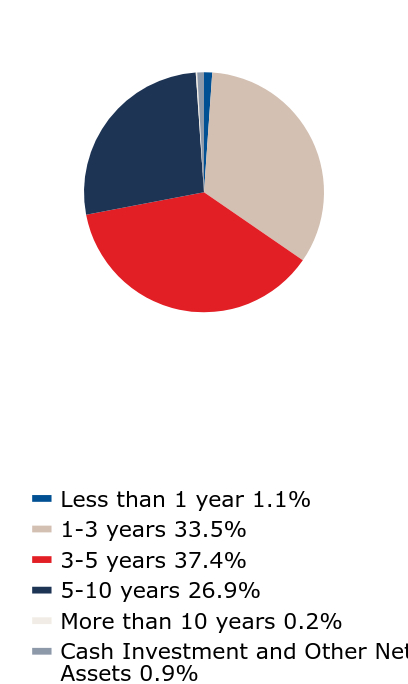
What did the Fund invest in?
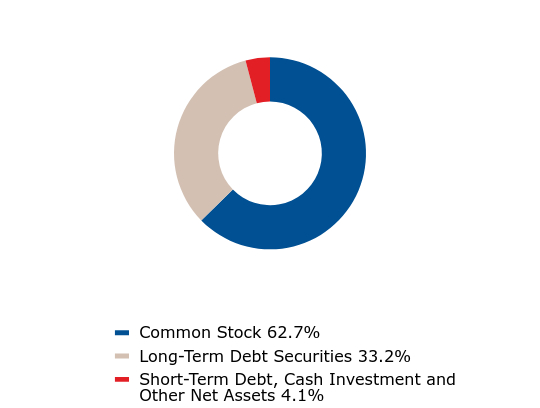
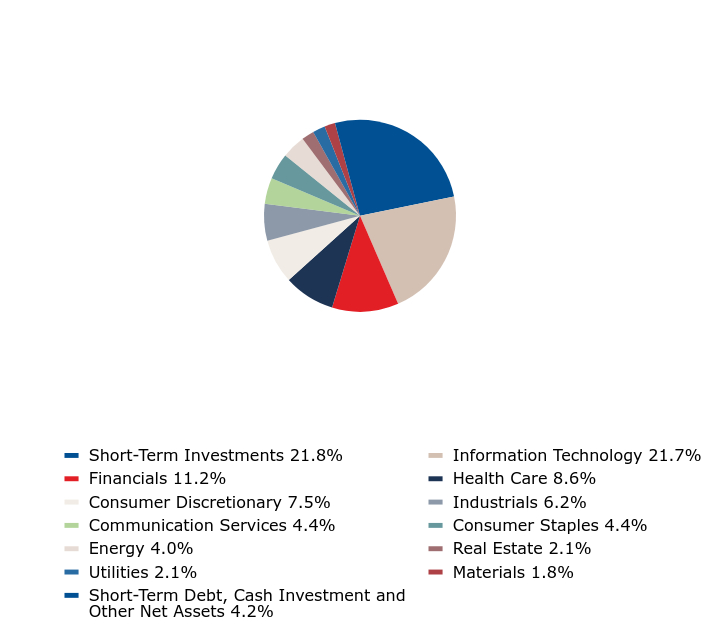
The actively managed MoA Balanced Fund provides a ready-made solution for investors looking for a combined portfolio of domestic equities and investment grade fixed income securities that seeks to provide capital appreciation and current income.
| Value | Value |
|---|
| Common Stock | 62.7% |
| Long-Term Debt Securities | 33.2% |
| Short-Term Debt, Cash Investment and Other Net Assets | 4.1% |
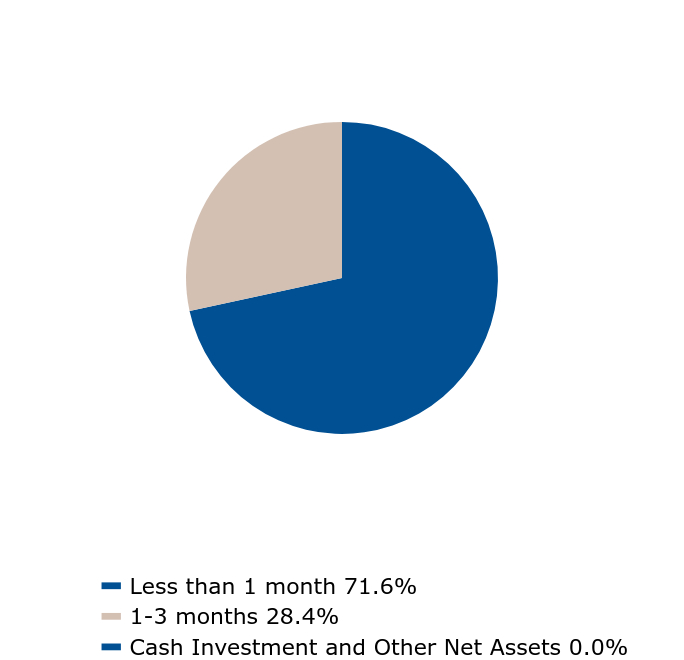
| Value | Value |
|---|
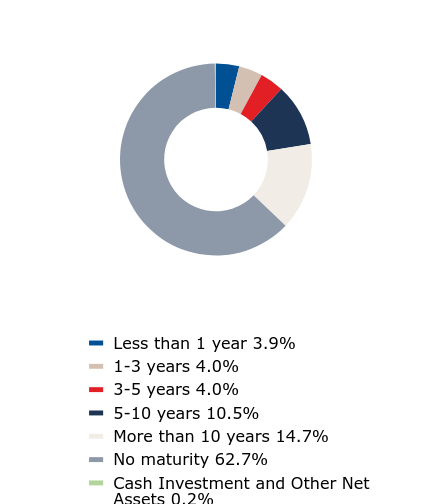
| Less than 1 year | 3.9% |
| 1-3 years | 4.0% |
| 3-5 years | 4.0% |
| 5-10 years | 10.5% |
| More than 10 years | 14.7% |
| No maturity | 62.7% |
| Cash Investment and Other Net Assets | 0.2% |
| Microsoft Corp. | 5.4% |
| Apple, Inc. | 5.0% |
| NVIDIA Corp. | 4.5% |
| Broadcom, Inc. | 1.7% |
| Eli Lilly & Co. | 1.7% |
| JPMorgan Chase & Co. | 1.7% |
| U.S. Treasury Strip | 1.5% |
| Amazon.com, Inc. | 1.4% |
| Costco Wholesale Corp. | 1.4% |
| Visa, Inc. Cl A | 1.2% |
| Value | Value |
|---|
| Short-Term Investments | 21.8% |
| Information Technology | 21.7% |
| Financials | 11.2% |
| Health Care | 8.6% |
| Consumer Discretionary | 7.5% |
| Industrials | 6.2% |
| Communication Services | 4.4% |
| Consumer Staples | 4.4% |
| Energy | 4.0% |
| Real Estate | 2.1% |
| Utilities | 2.1% |
| Materials | 1.8% |
| Short-Term Debt, Cash Investment and Other Net Assets | 4.2% |
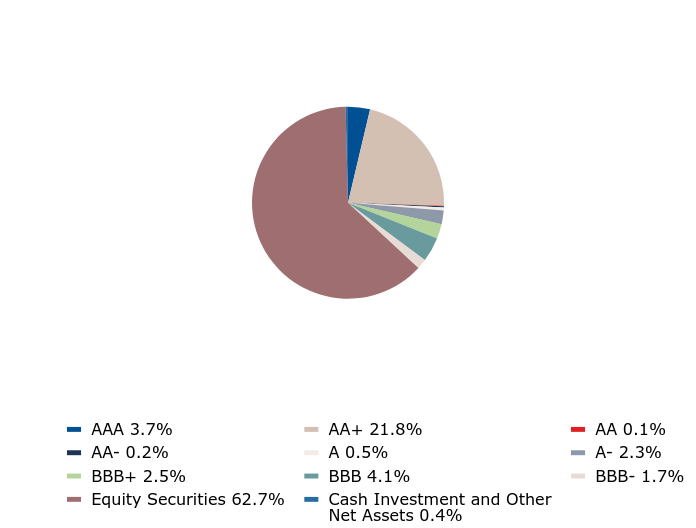
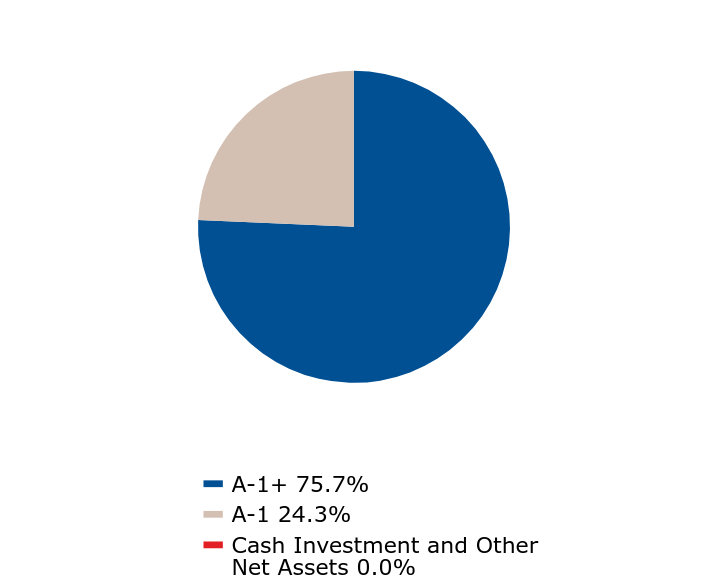
Credit Quality AllocationFootnote Reference*
| Value | Value |
|---|
| AAA | 3.7% |
| AA+ | 21.8% |
| AA | 0.1% |
| AA- | 0.2% |
| A | 0.5% |
| A- | 2.3% |
| BBB+ | 2.5% |
| BBB | 4.1% |
| BBB- | 1.7% |
| Equity Securities | 62.7% |
| Cash Investment and Other Net Assets | 0.4% |
| Footnote | Description |
Footnote* | Ratings are based on Standard & Poor's Corporation ratings. Credit Quality ratings reflect the credit quality of the underlying securities in the Fund's portfolio and not that of the fund itself. Quality ratings are subject to change. Ratings range from AAA as the highest to Below B as the lowest credit quality rating. |
During the period, the Fund did not have any material fund changes.
Change in or Disagreements with Accountants
During the period, the Fund did not have any changes or disagreements with Accountants.
To reduce expense, the Funds may mail only one copy of the prospectus, and each annual and semiannual Tailored Shareholder report to those addresses shared by two or more accounts. If you wish to receive individual copies of these documents, please contact your advisor, administrator or the Funds at 800-914-8716.
MoA Balanced Fund - MACHX
Semi-Annual Shareholder Report - June 30, 2024
If you wish to view additional information about the Fund; including but not limited to financial statements or holdings, please visit https://moafunds.com/docs. The MoA Funds are distributed by Foreside Fund Services LLC.
MoA Clear Passage 2040 Fund - MURLX
Semi-Annual Shareholder Report - June 30, 2024
This semi-annual shareholder report contains important information about MoA Clear Passage 2040 Fund for the period of January 1, 2024 to June 30, 2024. You can find additional information about the fund at https://moafunds.com/docs. You can also request this information by contacting us at 800.914.8716.
What were the Fund costs for the last 6 months?
(based on hypothetical $10,000 investment)
| Fund name | Cost of a $10,000 investment | Cost paid as a % of a $10,000 investment |
|---|
| MoA Clear Passage 2040 Fund | $18 | 0.34% |
How did the Fund perform during the reporting period?
The Fund's performance for the six months ended June 30, 2024 was 8.94% before expenses and 8.88% after expenses. The Fund's benchmark, the Morningstar Lifetime Allocation Moderate 2040 Index was 6.29% over the same period. The Fund's return was influenced by its portfolio allocation and risk relative to the Index. A long-term view, asset composition and risk characteristics between the Fund and the Index should be considered when reviewing the Fund's performance.
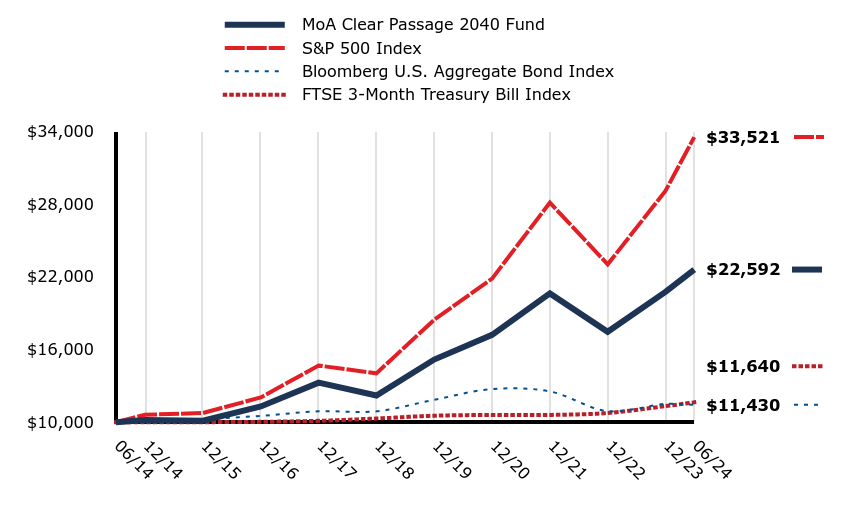
How did the Fund perform over the past 10 years?
The Fund outperformed its benchmark over the 10-year period due to asset composition and stock selection.
Total Return Based on $10,000 Investment
| MoA Clear Passage 2040 Fund | S&P 500 Index | Bloomberg U.S. Aggregate Bond Index | FTSE 3-Month Treasury Bill Index |
|---|
| 06/14 | $10,000 | $10,000 | $10,000 | $10,000 |
| 12/14 | $10,184 | $10,612 | $10,196 | $10,001 |
| 12/15 | $10,118 | $10,758 | $10,252 | $10,004 |
| 12/16 | $11,297 | $12,045 | $10,524 | $10,031 |
| 12/17 | $13,260 | $14,675 | $10,897 | $10,116 |
| 12/18 | $12,207 | $14,031 | $10,898 | $10,304 |
| 12/19 | $15,167 | $18,449 | $11,848 | $10,536 |
| 12/20 | $17,204 | $21,844 | $12,737 | $10,597 |
| 12/21 | $20,625 | $28,114 | $12,541 | $10,602 |
| 12/22 | $17,455 | $23,023 | $10,909 | $10,761 |
| 12/23 | $20,750 | $29,075 | $11,512 | $11,327 |
| 06/24 | $22,592 | $33,521 | $11,430 | $11,640 |
The graph above represents historical performance of the hypothetical investment of $10,000 in the Fund over the past ten years (or since inception if shorter). The graph and table below show changes in the Fund's performance from year to year as compared to the performance of a broad-based, unmanaged index. A fund's past performance does not necessarily indicate how it will perform in the future. Returns shown are total returns, which assume the reinvestment of dividends and capital gains. The graph and table presented do not reflect the deduction of taxes that a shareholder would pay on fund distributions or redemption of fund shares.
| Total Net Assets | $1,130,891,540 |
| # of Portfolio Holdings | 10 |
| Portfolio Turnover Rate | 9.93% |
| Advisory Fees Paid | $270,572 |
The fund's past performance is not a good predictor of how the fund will perform in the future. The graph and table do not reflect the deduction of taxes that a shareholder would pay on fund distributions or redemption of fund shares.
Average Annual Total Returns (%)
| 1 Year | 5 Years | 10 Years |
|---|
| MoA Clear Passage 2040 Fund | 16.17% | 9.93% | 8.49% |
| S&P 500 Index | 24.56% | 15.05% | 12.86% |
| Bloomberg U.S. Aggregate Bond Index | 2.63% | | 1.35% |
| FTSE 3-Month Treasury Bill Index | 5.64% | 2.22% | 1.53% |
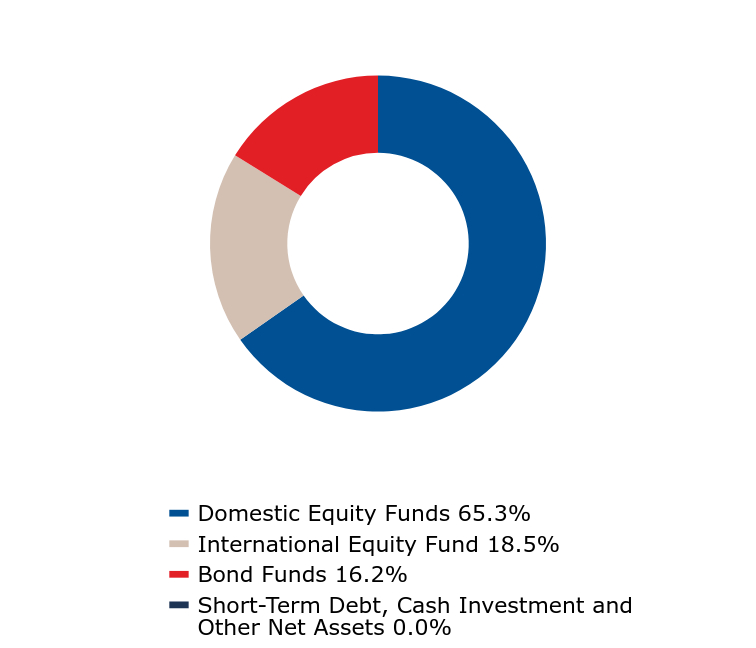
What did the Fund invest in?
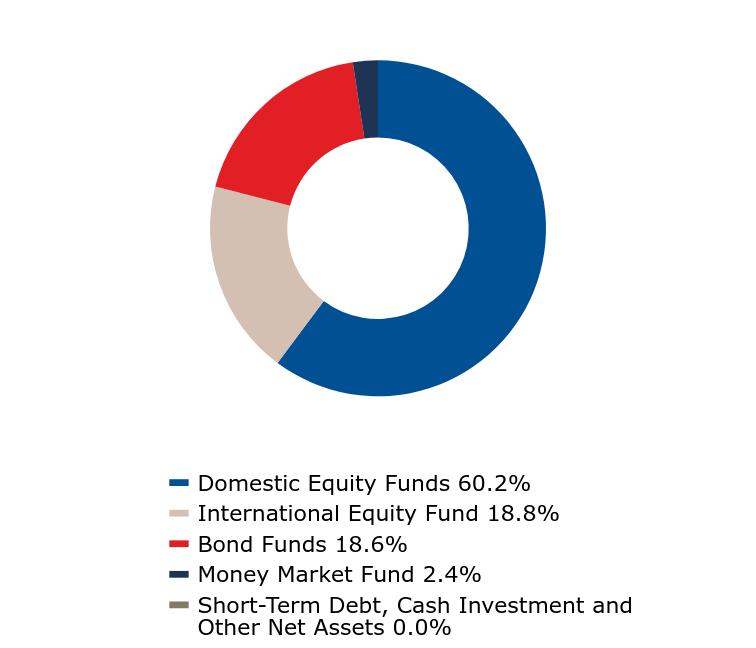
The MoA Clear Passage 2040 Fund™ is designed for investors with a specific target date in mind - whether for retirement or another longterm investment goal. This Fund uses our time-tested investment management and allocation expertise to dynamically manage an investment over time approaching the target year 2040.
| Value | Value |
|---|
| Domestic Equity Funds | 60.2% |
| International Equity Fund | 18.8% |
| Bond Funds | 18.6% |
| Money Market Fund | 2.4% |
| Short-Term Debt, Cash Investment and Other Net Assets | 0.0% |
| Equity Index Fund | 45.3% |
| International Fund | 18.8% |
| Core Bond Fund | 13.7% |
| Mid Cap Equity Index Fund | 9.3% |
| Intermediate Bond Fund | 4.9% |
| Money Market Fund | 2.4% |
| Small Cap Equity Index Fund | 1.9% |
| Small Cap Value Fund | 1.9% |
| Small Cap Growth Fund | 1.0% |
| Mid Cap Value Fund | 0.8% |
During the period, the Fund did not have any material fund changes.
Change in or Disagreements with Accountants
During the period, the Fund did not have any changes or disagreements with Accountants.
To reduce expense, the Funds may mail only one copy of the prospectus, and each annual and semiannual Tailored Shareholder report to those addresses shared by two or more accounts. If you wish to receive individual copies of these documents, please contact your advisor, administrator or the Funds at 800-914-8716.
MoA Clear Passage 2040 Fund - MURLX
Semi-Annual Shareholder Report - June 30, 2024
If you wish to view additional information about the Fund; including but not limited to financial statements or holdings, please visit https://moafunds.com/docs. The MoA Funds are distributed by Foreside Fund Services LLC.
MoA Clear Passage 2015 Fund - MURFX
Semi-Annual Shareholder Report - June 30, 2024
This semi-annual shareholder report contains important information about MoA Clear Passage 2015 Fund for the period of January 1, 2024 to June 30, 2024. You can find additional information about the fund at https://moafunds.com/docs. You can also request this information by contacting us at 800.914.8716.
What were the Fund costs for the last 6 months?
(based on hypothetical $10,000 investment)
| Fund name | Cost of a $10,000 investment | Cost paid as a % of a $10,000 investment |
|---|
| MoA Clear Passage 2015 Fund | $27 | 0.53% |
How did the Fund perform during the reporting period?
The Fund's performance for the six months ended June 30, 2024 was 4.04% before expenses and 3.94% after expenses. The Fund's benchmark, the Morningstar Lifetime Allocation Conservative 2015 Index returned 3.32% over the same period. The Fund's return was influenced by its portfolio allocation and risk relative to the Index. A long-term view, asset composition and risk characteristics between the Fund and the Index should be considered when reviewing the Fund's performance.
How did the Fund perform over the past 10 years?
The Fund outperformed its benchmark over the 10-year period due to asset composition and stock selection.
Total Return Based on $10,000 Investment
| MoA Clear Passage 2015 Fund | S&P 500 Index | Bloomberg U.S. Aggregate Bond Index | FTSE 3-Month Treasury Bill Index |
|---|
| 06/14 | $10,000 | $10,000 | $10,000 | $10,000 |
| 12/14 | $10,181 | $10,612 | $10,196 | $10,001 |
| 12/15 | $10,207 | $10,758 | $10,252 | $10,004 |
| 12/16 | $10,994 | $12,045 | $10,524 | $10,031 |
| 12/17 | $12,161 | $14,675 | $10,897 | $10,116 |
| 12/18 | $11,795 | $14,031 | $10,898 | $10,304 |
| 12/19 | $13,604 | $18,449 | $11,848 | $10,536 |
| 12/20 | $14,645 | $21,844 | $12,737 | $10,597 |
| 12/21 | $15,833 | $28,114 | $12,541 | $10,602 |
| 12/22 | $13,874 | $23,023 | $10,909 | $10,761 |
| 12/23 | $15,338 | $29,075 | $11,512 | $11,327 |
| 06/24 | $15,942 | $33,521 | $11,430 | $11,640 |
The graph above represents historical performance of the hypothetical investment of $10,000 in the Fund over the past ten years (or since inception if shorter). The graph and table below show changes in the Fund's performance from year to year as compared to the performance of a broad-based, unmanaged index. A fund's past performance does not necessarily indicate how it will perform in the future. Returns shown are total returns, which assume the reinvestment of dividends and capital gains. The graph and table presented do not reflect the deduction of taxes that a shareholder would pay on fund distributions or redemption of fund shares.
| Total Net Assets | $109,009,443 |
| # of Portfolio Holdings | 7 |
| Portfolio Turnover Rate | 9.99% |
| Advisory Fees Paid | $27,256 |
The fund's past performance is not a good predictor of how the fund will perform in the future. The graph and table do not reflect the deduction of taxes that a shareholder would pay on fund distributions or redemption of fund shares.
Average Annual Total Returns (%)
| 1 Year | 5 Years | 10 Years |
|---|
| MoA Clear Passage 2015 Fund | 8.56% | 4.17% | 4.77% |
| S&P 500 Index | 24.56% | 15.05% | 12.86% |
| Bloomberg U.S. Aggregate Bond Index | 2.63% | | 1.35% |
| FTSE 3-Month Treasury Bill Index | 5.64% | 2.22% | 1.53% |
What did the Fund invest in?
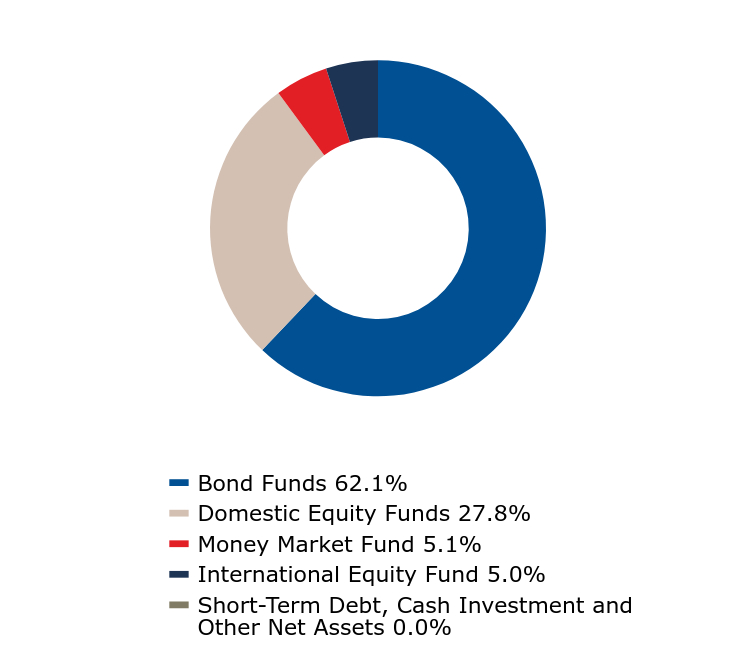
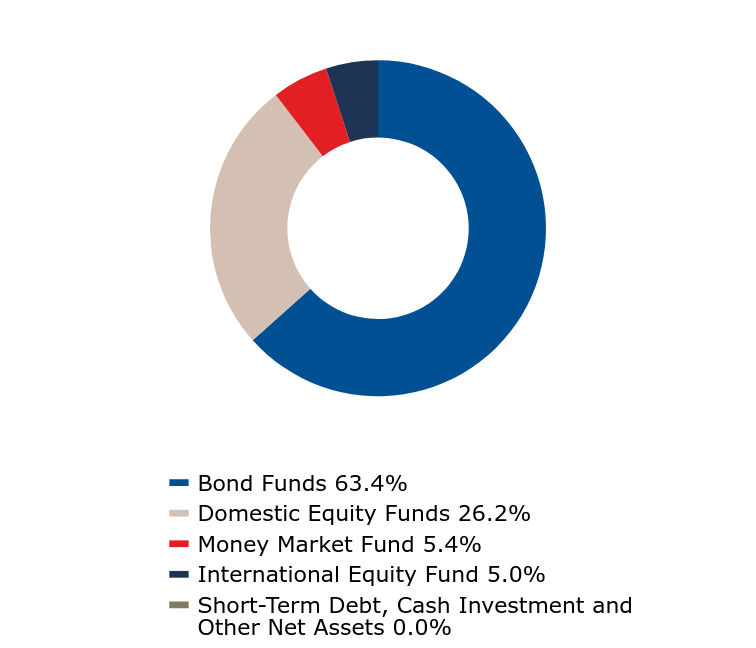
The MoA Clear Passage 2015 Fund™ is designed to continue an individual's investment horizon beyond the target retirement date. Our allocation approach seeks to achieve current income and capital appreciation aligned with needs of an individual entering the retirement years.
| Value | Value |
|---|
| Bond Funds | 62.1% |
| Domestic Equity Funds | 27.8% |
| Money Market Fund | 5.1% |
| International Equity Fund | 5.0% |
| Short-Term Debt, Cash Investment and Other Net Assets | 0.0% |
| Core Bond Fund | 33.7% |
| Intermediate Bond Fund | 28.4% |
| Equity Index Fund | 23.0% |
| Money Market Fund | 5.1% |
| International Fund | 5.0% |
| Mid Cap Equity Index Fund | 4.3% |
| Mid Cap Value Fund | 0.5% |
During the period, the Fund did not have any material fund changes.
Change in or Disagreements with Accountants
During the period, the Fund did not have any changes or disagreements with Accountants.
To reduce expense, the Funds may mail only one copy of the prospectus, and each annual and semiannual Tailored Shareholder report to those addresses shared by two or more accounts. If you wish to receive individual copies of these documents, please contact your advisor, administrator or the Funds at 800-914-8716.
MoA Clear Passage 2015 Fund - MURFX
Semi-Annual Shareholder Report - June 30, 2024
If you wish to view additional information about the Fund; including but not limited to financial statements or holdings, please visit https://moafunds.com/docs. The MoA Funds are distributed by Foreside Fund Services LLC.
MoA All America Fund - MAAKX
Semi-Annual Shareholder Report - June 30, 2024
This semi-annual shareholder report contains important information about MoA All America Fund for the period of January 1, 2024 to June 30, 2024. You can find additional information about the fund at https://moafunds.com/docs. You can also request this information by contacting us at 800.914.8716.
What were the Fund costs for the last 6 months?
(based on hypothetical $10,000 investment)
| Fund name | Cost of a $10,000 investment | Cost paid as a % of a $10,000 investment |
|---|
| MoA All America Fund | $27 | 0.51% |
How did the Fund perform during the reporting period?
The Fund's performance for the six months ended June 30, 2024 was 10.24% before expenses and 9.96% after expenses. The Fund's benchmark, the Russell 3000® Index, returned 13.56% over the same period. Small- and mid-cap stocks lagged large-caps, as measured by the S&P 500® Index, as a few large-cap growth stocks accounted for a disproportionate percentage of the S&P's return. A long-term view and potential overall portfolio diversification benefits, which include holding companies of various sizes, should be considered when reviewing the Fund's performance.
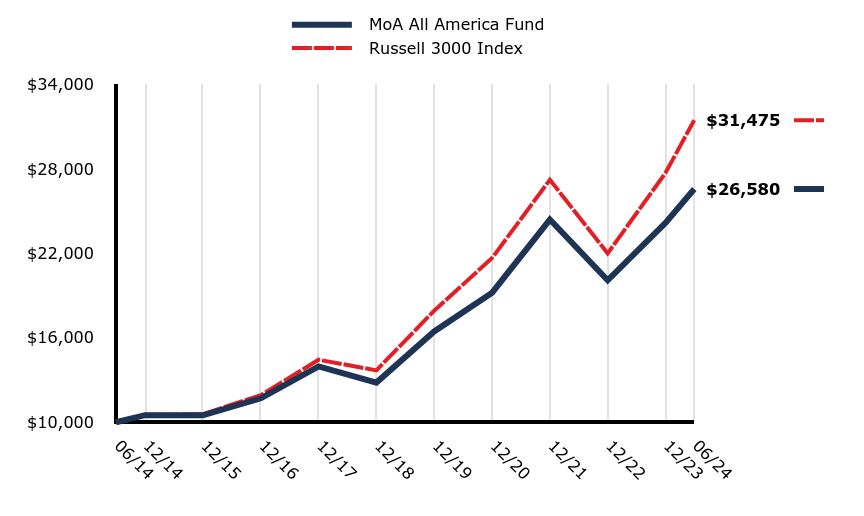
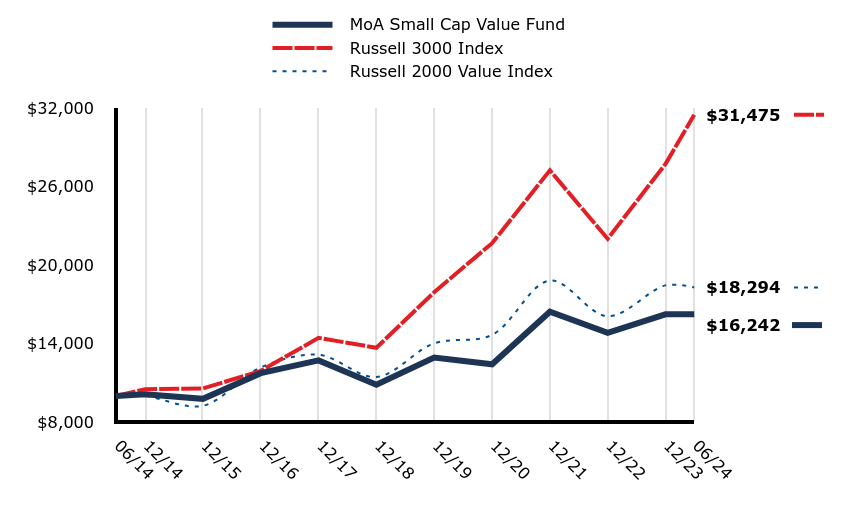
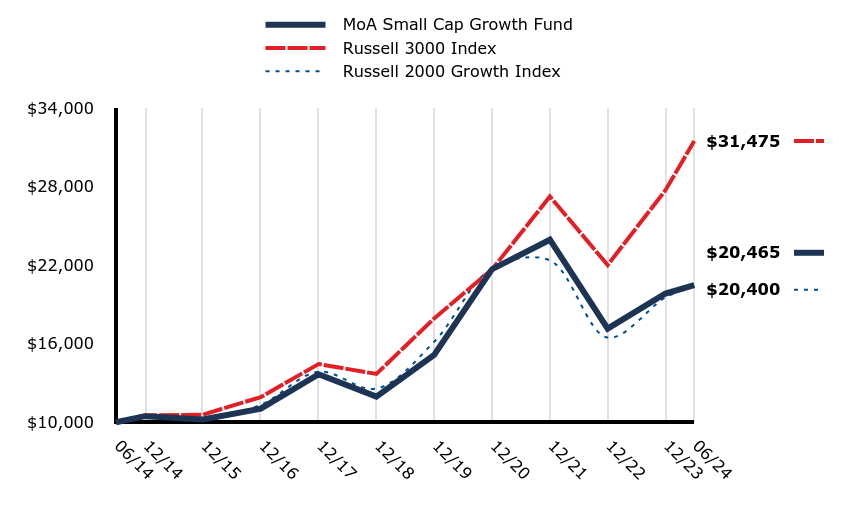
How did the Fund perform over the past 10 years?
The Fund underperformed its benchmark over the 10-year period. In general, small- and mid-cap stocks have lagged large-cap stocks, as measured by the S&P 500® Index, over the past several years.
Total Return Based on $10,000 Investment
| MoA All America Fund | Russell 3000 Index |
|---|
| 06/14 | $10,000 | $10,000 |
| 12/14 | $10,499 | $10,525 |
| 12/15 | $10,494 | $10,576 |
| 12/16 | $11,699 | $11,922 |
| 12/17 | $13,970 | $14,442 |
| 12/18 | $12,815 | $13,685 |
| 12/19 | $16,449 | $17,929 |
| 12/20 | $19,209 | $21,675 |
| 12/21 | $24,408 | $27,236 |
| 12/22 | $20,088 | $22,005 |
| 12/23 | $24,173 | $27,717 |
| 06/24 | $26,580 | $31,475 |
The graph above represents historical performance of the hypothetical investment of $10,000 in the Fund over the past ten years (or since inception if shorter). The graph and table below show changes in the Fund's performance from year to year as compared to the performance of a broad-based, unmanaged index. A fund's past performance does not necessarily indicate how it will perform in the future. Returns shown are total returns, which assume the reinvestment of dividends and capital gains. The graph and table presented do not reflect the deduction of taxes that a shareholder would pay on fund distributions or redemption of fund shares.
| Total Net Assets | $306,368,728 |
| # of Portfolio Holdings | 733 |
| Portfolio Turnover Rate | 12.83% |
| Advisory Fees Paid | $603,283 |
The fund's past performance is not a good predictor of how the fund will perform in the future. The graph and table do not reflect the deduction of taxes that a shareholder would pay on fund distributions or redemption of fund shares.
Average Annual Total Returns (%)
| 1 Year | 5 Years | 10 Years |
|---|
| MoA All America Fund | 16.96% | 12.00% | 10.27% |
| Russell 3000 Index | 23.13% | 14.14% | 12.15% |
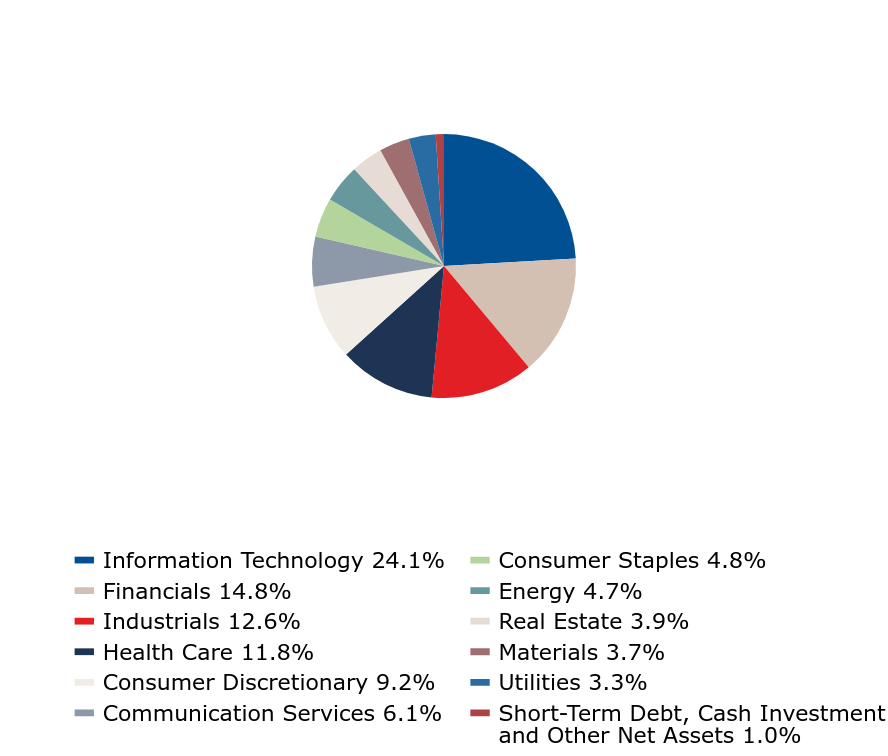
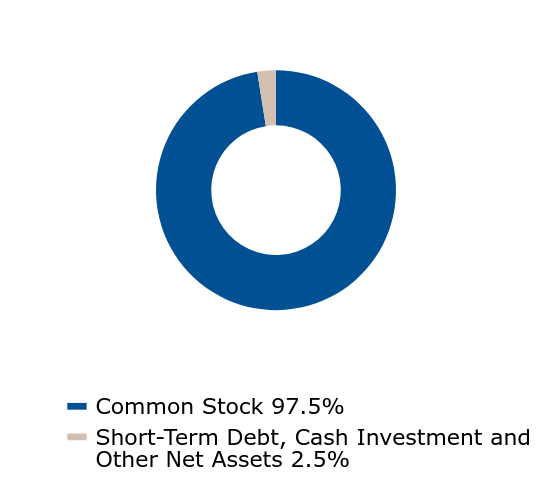
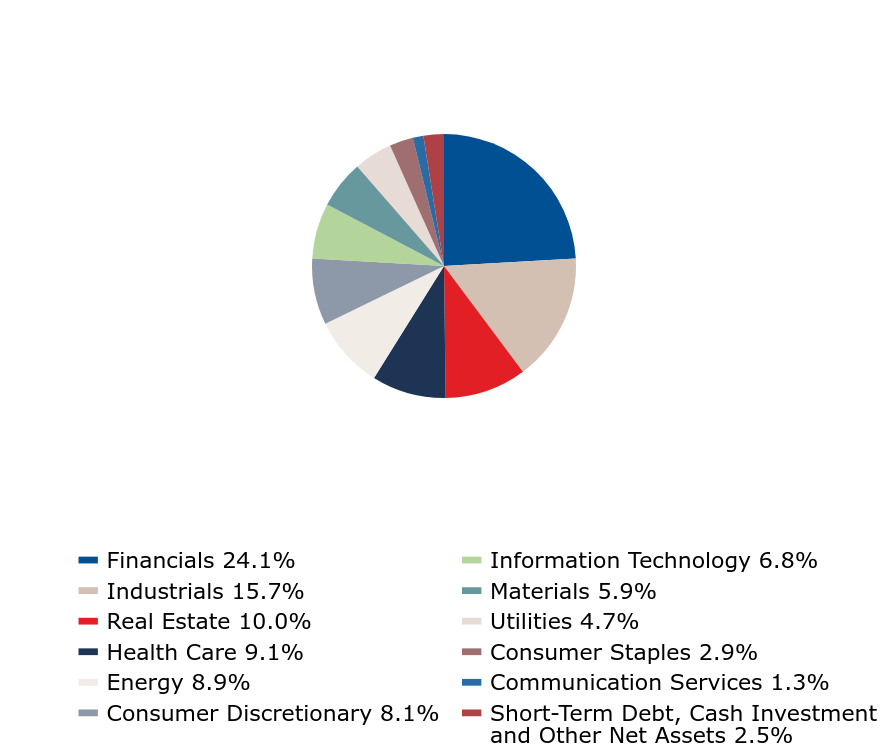
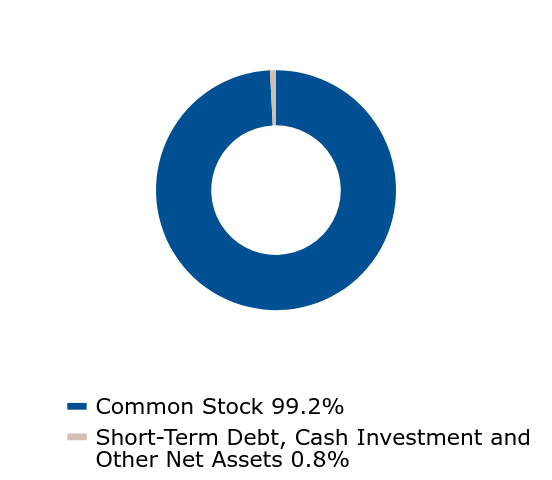
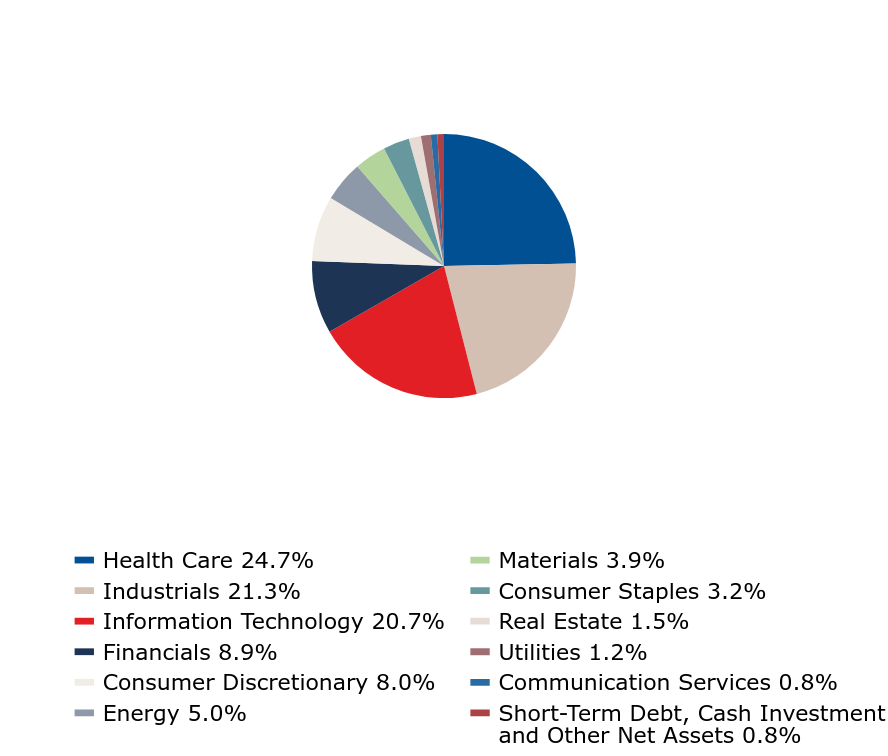
What did the Fund invest in?
The MoA All America Fund provides access to a broad spectrum of the U.S. equity market, including small-, mid- and large-capitalization companies. This Fund seeks to outperform the Russell 3000® Index.
| Value | Value |
|---|
| Common Stock | 99.0% |
| Short-Term Debt, Cash Investment and Other Net Assets | 1.0% |
| Value | Value |
|---|
| Information Technology | 24.1% |
| Financials | 14.8% |
| Industrials | 12.6% |
| Health Care | 11.8% |
| Consumer Discretionary | 9.2% |
| Communication Services | 6.1% |
| Consumer Staples | 4.8% |
| Energy | 4.7% |
| Real Estate | 3.9% |
| Materials | 3.7% |
| Utilities | 3.3% |
| Short-Term Debt, Cash Investment and Other Net Assets | 1.0% |
| Microsoft Corp. | 4.3% |
| NVIDIA Corp. | 3.9% |
| Apple, Inc. | 3.9% |
| Amazon.com, Inc. | 2.3% |
| Meta Platforms, Inc. Cl A | 1.4% |
| Alphabet, Inc. Cl A | 1.4% |
| Alphabet, Inc. Cl C | 1.2% |
| Berkshire Hathaway, Inc. Cl B | 1.0% |
| Eli Lilly & Co. | 0.9% |
| Broadcom, Inc. | 0.9% |
During the period, the Fund did not have any material fund changes.
Change in or Disagreements with Accountants
During the period, the Fund did not have any changes or disagreements with Accountants.
To reduce expense, the Funds may mail only one copy of the prospectus, and each annual and semiannual Tailored Shareholder report to those addresses shared by two or more accounts. If you wish to receive individual copies of these documents, please contact your advisor, administrator or the Funds at 800-914-8716.
MoA All America Fund - MAAKX
Semi-Annual Shareholder Report - June 30, 2024
If you wish to view additional information about the Fund; including but not limited to financial statements or holdings, please visit https://moafunds.com/docs. The MoA Funds are distributed by Foreside Fund Services LLC.
MoA Clear Passage 2065 Fund - MURQX
Semi-Annual Shareholder Report - June 30, 2024
This semi-annual shareholder report contains important information about MoA Clear Passage 2065 Fund for the period of January 1, 2024 to June 30, 2024. You can find additional information about the fund at https://moafunds.com/docs. You can also request this information by contacting us at 800.914.8716.
What were the Fund costs for the last 6 months?
(based on hypothetical $10,000 investment)
| Fund name | Cost of a $10,000 investment | Cost paid as a % of a $10,000 investment |
|---|
| MoA Clear Passage 2065 Fund | $14 | 0.26% |
How did the Fund perform during the reporting period?
The Fund's performance for the six months ended June 30, 2024 was 9.89% before expenses and 9.86% after expenses. The Fund's benchmark, the Morningstar Lifetime Allocation Moderate 2065 Index was 7.16% over the same period. The Fund's return was influenced by its portfolio allocation and risk relative to the Index. A long-term view, asset composition and risk characteristics between the Fund and the Index should be considered when reviewing the Fund's performance.
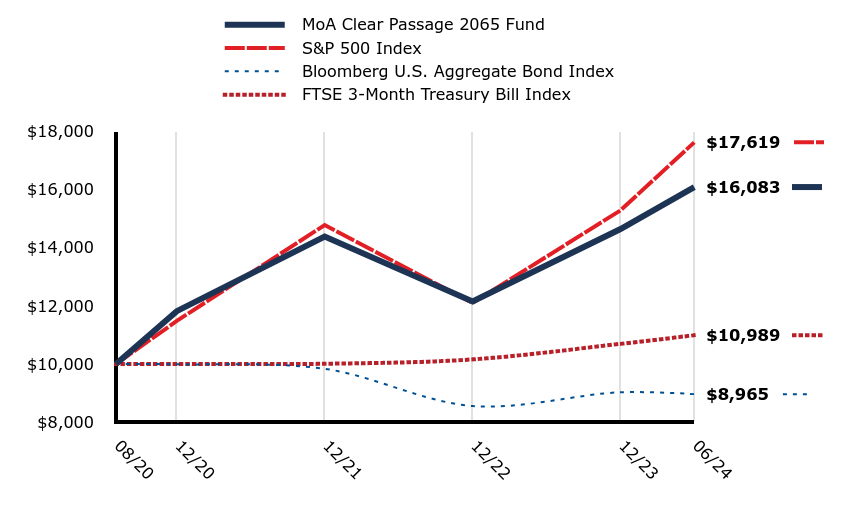
How did the Fund perform since inception?
The Fund outperformed its benchmark since its inception on August 3, 2020, due to asset composition and stock selection.
Total Return Based on $10,000 Investment
| MoA Clear Passage 2065 Fund | S&P 500 Index | Bloomberg U.S. Aggregate Bond Index | FTSE 3-Month Treasury Bill Index |
|---|
| 08/20 | $10,000 | $10,000 | $10,000 | $10,000 |
| 12/20 | $11,816 | $11,481 | $9,990 | $10,004 |
| 12/21 | $14,383 | $14,777 | $9,836 | $10,009 |
| 12/22 | $12,148 | $12,101 | $8,556 | $10,159 |
| 12/23 | $14,639 | $15,282 | $9,029 | $10,694 |
| 06/24 | $16,083 | $17,619 | $8,965 | $10,989 |
The graph above represents historical performance of the hypothetical investment of $10,000 in the Fund over the past ten years (or since inception if shorter). The graph and table below show changes in the Fund's performance from year to year as compared to the performance of a broad-based, unmanaged index. A fund's past performance does not necessarily indicate how it will perform in the future. Returns shown are total returns, which assume the reinvestment of dividends and capital gains. The graph and table presented do not reflect the deduction of taxes that a shareholder would pay on fund distributions or redemption of fund shares.
| Total Net Assets | $95,491,571 |
| # of Portfolio Holdings | 11 |
| Portfolio Turnover Rate | 5.70% |
| Advisory Fees Paid | $0 |
The fund's past performance is not a good predictor of how the fund will perform in the future. The graph and table do not reflect the deduction of taxes that a shareholder would pay on fund distributions or redemption of fund shares.
Average Annual Total Returns (%)
| 1 Year | Since Inception |
|---|
| MoA Clear Passage 2065 Fund (Incp: August 3, 2020) | 17.82% | 12.93% |
| S&P 500 Index | 24.56% | 15.60% |
| Bloomberg U.S. Aggregate Bond Index | 2.63% | |
| FTSE 3-Month Treasury Bill Index | 5.64% | 2.44% |
What did the Fund invest in?
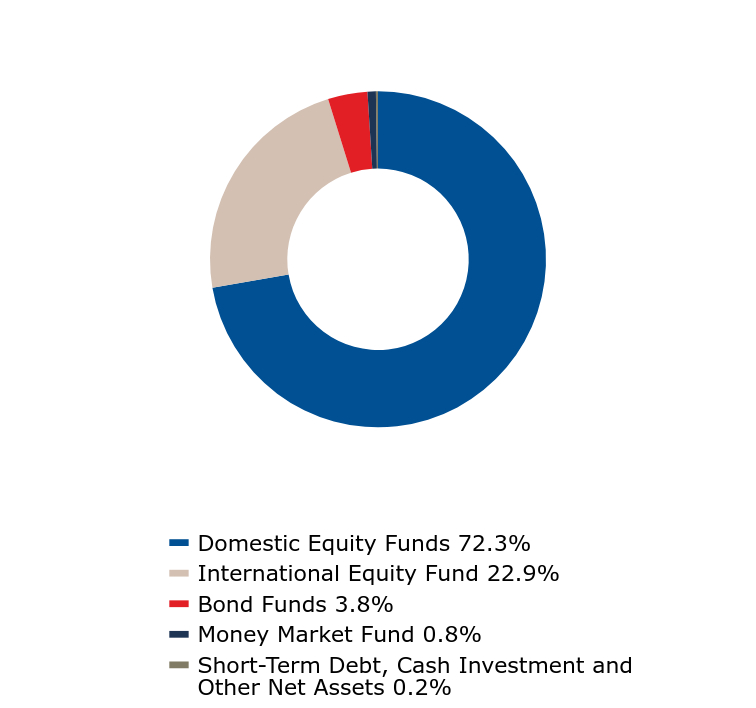
The MoA Clear Passage 2065 Fund™ is designed for investors with a specific target date in mind - whether for retirement or another longterm investment goal. This Fund uses our time-tested investment management and allocation expertise to dynamically manage an investment over time approaching the target year 2065.
| Value | Value |
|---|
| Domestic Equity Funds | 72.3% |
| International Equity Fund | 22.9% |
| Bond Funds | 3.8% |
| Money Market Fund | 0.8% |
| Short-Term Debt, Cash Investment and Other Net Assets | 0.2% |
| Equity Index Fund | 48.9% |
| International Fund | 22.9% |
| Mid Cap Equity Index Fund | 12.0% |
| Core Bond Fund | 3.3% |
| Small Cap Equity Index Fund | 3.0% |
| Small Cap Value Fund | 3.0% |
| Small Cap Growth Fund | 2.8% |
| Mid Cap Value Fund | 2.6% |
| Money Market Fund | 0.8% |
| Intermediate Bond Fund | 0.5% |
During the period, the Fund did not have any material fund changes.
Change in or Disagreements with Accountants
During the period, the Fund did not have any changes or disagreements with Accountants.
To reduce expense, the Funds may mail only one copy of the prospectus, and each annual and semiannual Tailored Shareholder report to those addresses shared by two or more accounts. If you wish to receive individual copies of these documents, please contact your advisor, administrator or the Funds at 800-914-8716.
MoA Clear Passage 2065 Fund - MURQX
Semi-Annual Shareholder Report - June 30, 2024
If you wish to view additional information about the Fund; including but not limited to financial statements or holdings, please visit https://moafunds.com/docs. The MoA Funds are distributed by Foreside Fund Services LLC.
MoA Clear Passage 2020 Fund - MURGX
Semi-Annual Shareholder Report - June 30, 2024
This semi-annual shareholder report contains important information about MoA Clear Passage 2020 Fund for the period of January 1, 2024 to June 30, 2024. You can find additional information about the fund at https://moafunds.com/docs. You can also request this information by contacting us at 800.914.8716.
What were the Fund costs for the last 6 months?
(based on hypothetical $10,000 investment)
| Fund name | Cost of a $10,000 investment | Cost paid as a % of a $10,000 investment |
|---|
| MoA Clear Passage 2020 Fund | $23 | 0.45% |
How did the Fund perform during the reporting period?
The Fund's performance for the six months ended June 30, 2024 was 4.37% before expenses and 4.31% after expenses. The Fund's benchmark, the Morningstar Lifetime Allocation Moderate 2020 Index returned 3.44% over the same period. The Fund's return was influenced by its portfolio allocation and risk relative to the Index. A long-term view, asset composition and risk characteristics between the Fund and the Index should be considered when reviewing the Fund's performance.
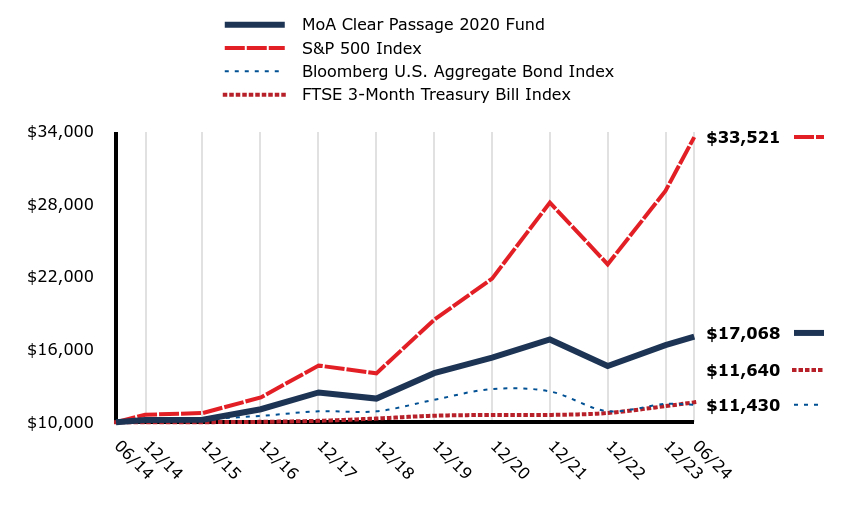
How did the Fund perform over the past 10 years?
The Fund outperformed its benchmark over the 10-year period due to asset composition and stock selection.
Total Return Based on $10,000 Investment
| MoA Clear Passage 2020 Fund | S&P 500 Index | Bloomberg U.S. Aggregate Bond Index | FTSE 3-Month Treasury Bill Index |
|---|
| 06/14 | $10,000 | $10,000 | $10,000 | $10,000 |
| 12/14 | $10,185 | $10,612 | $10,196 | $10,001 |
| 12/15 | $10,198 | $10,758 | $10,252 | $10,004 |
| 12/16 | $11,071 | $12,045 | $10,524 | $10,031 |
| 12/17 | $12,455 | $14,675 | $10,897 | $10,116 |
| 12/18 | $11,951 | $14,031 | $10,898 | $10,304 |
| 12/19 | $14,047 | $18,449 | $11,848 | $10,536 |
| 12/20 | $15,327 | $21,844 | $12,737 | $10,597 |
| 12/21 | $16,830 | $28,114 | $12,541 | $10,602 |
| 12/22 | $14,631 | $23,023 | $10,909 | $10,761 |
| 12/23 | $16,363 | $29,075 | $11,512 | $11,327 |
| 06/24 | $17,068 | $33,521 | $11,430 | $11,640 |
The graph above represents historical performance of the hypothetical investment of $10,000 in the Fund over the past ten years (or since inception if shorter). The graph and table below show changes in the Fund's performance from year to year as compared to the performance of a broad-based, unmanaged index. A fund's past performance does not necessarily indicate how it will perform in the future. Returns shown are total returns, which assume the reinvestment of dividends and capital gains. The graph and table presented do not reflect the deduction of taxes that a shareholder would pay on fund distributions or redemption of fund shares.
| Total Net Assets | $473,244,866 |
| # of Portfolio Holdings | 9 |
| Portfolio Turnover Rate | 6.18% |
| Advisory Fees Paid | $119,350 |
The fund's past performance is not a good predictor of how the fund will perform in the future. The graph and table do not reflect the deduction of taxes that a shareholder would pay on fund distributions or redemption of fund shares.
Average Annual Total Returns (%)
| 1 Year | 5 Years | 10 Years |
|---|
| MoA Clear Passage 2020 Fund | 9.36% | 5.08% | 5.49% |
| S&P 500 Index | 24.56% | 15.05% | 12.86% |
| Bloomberg U.S. Aggregate Bond Index | 2.63% | | 1.35% |
| FTSE 3-Month Treasury Bill Index | 5.64% | 2.22% | 1.53% |
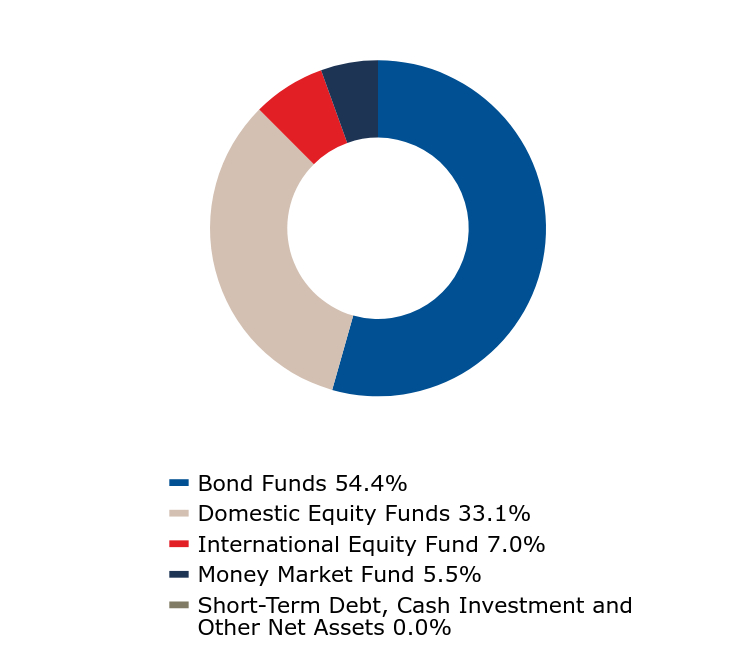
What did the Fund invest in?
The MoA Clear Passage 2020 Fund™ is designed to continue an individual's investment horizon beyond the target retirement date. Our allocation approach seeks to achieve current income and capital appreciation aligned with needs of an individual entering the retirement years.
| Value | Value |
|---|
| Bond Funds | 54.4% |
| Domestic Equity Funds | 33.1% |
| International Equity Fund | 7.0% |
| Money Market Fund | 5.5% |
| Short-Term Debt, Cash Investment and Other Net Assets | 0.0% |
| Core Bond Fund | 33.7% |
| Equity Index Fund | 25.0% |
| Intermediate Bond Fund | 20.7% |
| International Fund | 7.0% |
| Money Market Fund | 5.5% |
| Mid Cap Equity Index Fund | 5.4% |
| Small Cap Value Fund | 1.9% |
| Small Cap Equity Index Fund | 0.7% |
| Mid Cap Value Fund | 0.1% |
During the period, the Fund did not have any material fund changes.
Change in or Disagreements with Accountants
During the period, the Fund did not have any changes or disagreements with Accountants.
To reduce expense, the Funds may mail only one copy of the prospectus, and each annual and semiannual Tailored Shareholder report to those addresses shared by two or more accounts. If you wish to receive individual copies of these documents, please contact your advisor, administrator or the Funds at 800-914-8716.
MoA Clear Passage 2020 Fund - MURGX
Semi-Annual Shareholder Report - June 30, 2024
If you wish to view additional information about the Fund; including but not limited to financial statements or holdings, please visit https://moafunds.com/docs. The MoA Funds are distributed by Foreside Fund Services LLC.
MoA Core Bond Fund - MABDX
Semi-Annual Shareholder Report - June 30, 2024
This semi-annual shareholder report contains important information about MoA Core Bond Fund for the period of January 1, 2024 to June 30, 2024. You can find additional information about the fund at https://moafunds.com/docs. You can also request this information by contacting us at 800.914.8716.
What were the Fund costs for the last 6 months?
(based on hypothetical $10,000 investment)
| Fund name | Cost of a $10,000 investment | Cost paid as a % of a $10,000 investment |
|---|
| MoA Core Bond Fund | $22 | 0.45% |
How did the Fund perform during the reporting period?
The Fund's performance for the six months ended June 30, 2024 was -0.41% before expenses and -0.64% after expenses. The Fund's benchmark, the Bloomberg U.S. Aggregate Bond Index, returned -0.71% over the same period. The interest rate environment during the period was characterized by relatively higher rates and the anticipation of rate cuts by the Federal Reserve in the near term. The potential benefits of including fixed income in a diversified portfolio should be considered when reviewing the performance of various fixed income asset classes.
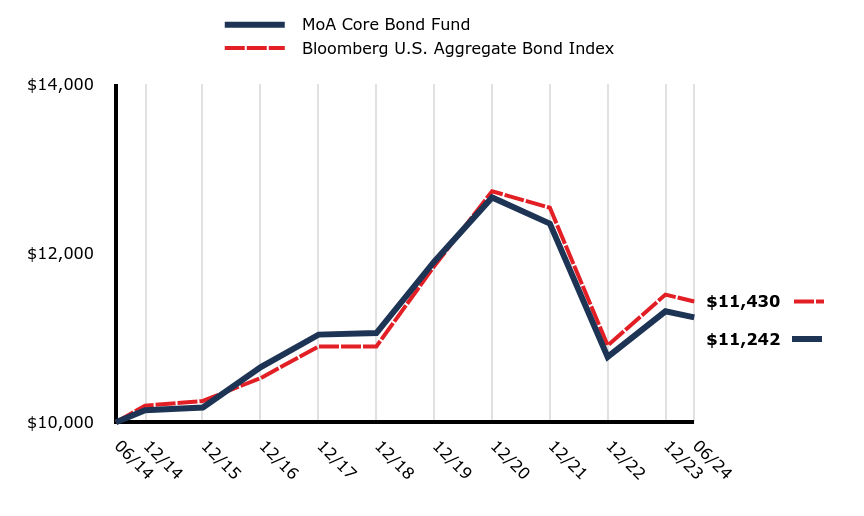
How did the Fund perform over the past 10 years?
The Fund underperformed its benchmark over the 10-year period. The period includes an environment of historically low interest rates and a sharp rise in rates over the past two years to quell inflation.
Total Return Based on $10,000 Investment
| MoA Core Bond Fund | Bloomberg U.S. Aggregate Bond Index |
|---|
| 06/14 | $10,000 | $10,000 |
| 12/14 | $10,141 | $10,196 |
| 12/15 | $10,175 | $10,252 |
| 12/16 | $10,654 | $10,524 |
| 12/17 | $11,038 | $10,897 |
| 12/18 | $11,056 | $10,898 |
| 12/19 | $11,902 | $11,848 |
| 12/20 | $12,663 | $12,737 |
| 12/21 | $12,353 | $12,541 |
| 12/22 | $10,773 | $10,909 |
| 12/23 | $11,314 | $11,512 |
| 06/24 | $11,242 | $11,430 |
The graph above represents historical performance of the hypothetical investment of $10,000 in the Fund over the past ten years (or since inception if shorter). The graph and table below show changes in the Fund's performance from year to year as compared to the performance of a broad-based, unmanaged index. A fund's past performance does not necessarily indicate how it will perform in the future. Returns shown are total returns, which assume the reinvestment of dividends and capital gains. The graph and table presented do not reflect the deduction of taxes that a shareholder would pay on fund distributions or redemption of fund shares.
| Total Net Assets | $2,111,228,181 |
| # of Portfolio Holdings | 552 |
| Portfolio Turnover Rate | 24.96% |
| Advisory Fees Paid | $4,043,589 |
The fund's past performance is not a good predictor of how the fund will perform in the future. The graph and table do not reflect the deduction of taxes that a shareholder would pay on fund distributions or redemption of fund shares.
Average Annual Total Returns (%)
| 1 Year | 5 Years | 10 Years |
|---|
| MoA Core Bond Fund | 2.34% | | 1.18% |
| Bloomberg U.S. Aggregate Bond Index | 2.63% | | 1.35% |
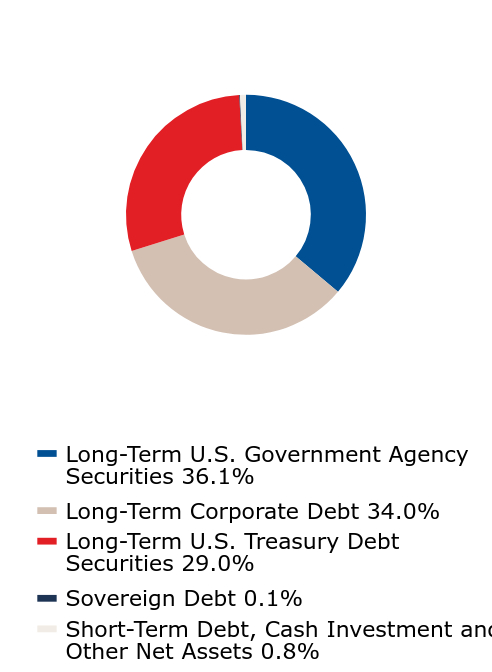
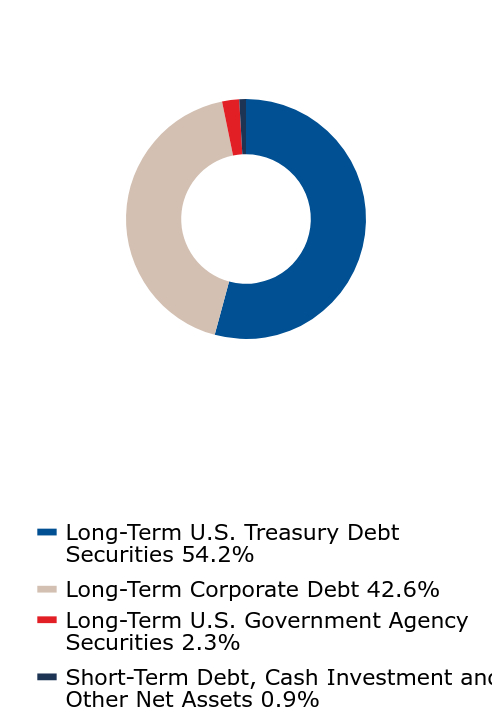
What did the Fund invest in?
The actively managed MoA Core Bond Fund seeks a high level of current income and capital preservation.
| Value | Value |
|---|
| Long-Term U.S. Government Agency Securities | 36.1% |
| Long-Term Corporate Debt | 34.0% |
| Long-Term U.S. Treasury Debt Securities | 29.0% |
| Sovereign Debt | 0.1% |
| Short-Term Debt, Cash Investment and Other Net Assets | 0.8% |
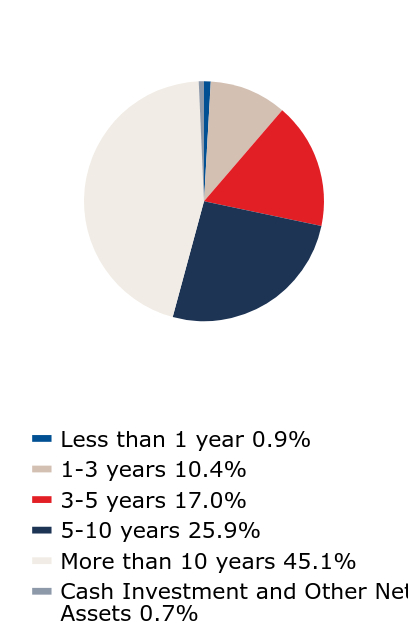
| Value | Value |
|---|
| Less than 1 year | 0.9% |
| 1-3 years | 10.4% |
| 3-5 years | 17.0% |
| 5-10 years | 25.9% |
| More than 10 years | 45.1% |
| Cash Investment and Other Net Assets | 0.7% |
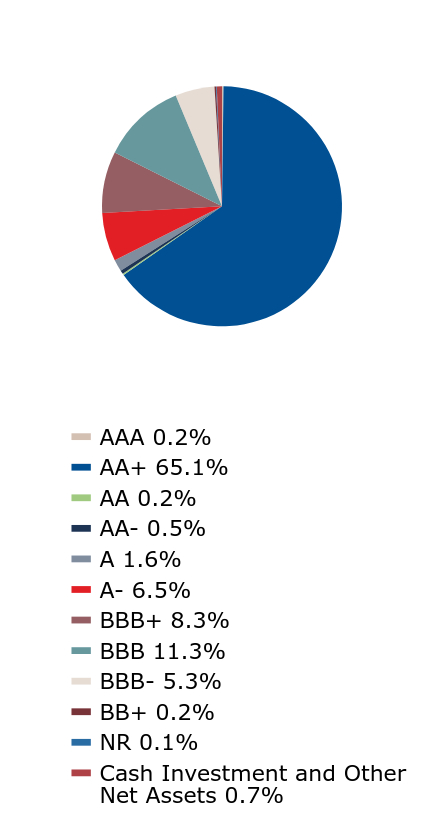
Credit Quality AllocationFootnote Reference*
| Value | Value |
|---|
| AAA | 0.2% |
| AA+ | 65.1% |
| AA | 0.2% |
| AA- | 0.5% |
| A | 1.6% |
| A- | 6.5% |
| BBB+ | 8.3% |
| BBB | 11.3% |
| BBB- | 5.3% |
| BB+ | 0.2% |
| NR | 0.1% |
| Cash Investment and Other Net Assets | 0.7% |
| Footnote | Description |
Footnote* | Ratings are based on Standard & Poor's Corporation ratings. Credit Quality ratings reflect the credit quality of the underlying securities in the Fund's portfolio and not that of the fund itself. Quality ratings are subject to change. Ratings range from AAA as the highest to Below B as the lowest credit quality rating. |
During the period, the Fund did not have any material fund changes.
Change in or Disagreements with Accountants
During the period, the Fund did not have any changes or disagreements with Accountants.
To reduce expense, the Funds may mail only one copy of the prospectus, and each annual and semiannual Tailored Shareholder report to those addresses shared by two or more accounts. If you wish to receive individual copies of these documents, please contact your advisor, administrator or the Funds at 800-914-8716.
MoA Core Bond Fund - MABDX
Semi-Annual Shareholder Report - June 30, 2024
If you wish to view additional information about the Fund; including but not limited to financial statements or holdings, please visit https://moafunds.com/docs. The MoA Funds are distributed by Foreside Fund Services LLC.
MoA Mid Cap Equity Index Fund - MAMEX
Semi-Annual Shareholder Report - June 30, 2024
This semi-annual shareholder report contains important information about MoA Mid Cap Equity Index Fund for the period of January 1, 2024 to June 30, 2024. You can find additional information about the fund at https://moafunds.com/docs. You can also request this information by contacting us at 800.914.8716.
What were the Fund costs for the last 6 months?
(based on hypothetical $10,000 investment)
| Fund name | Cost of a $10,000 investment | Cost paid as a % of a $10,000 investment |
|---|
| MoA Mid Cap Equity Index Fund | $8 | 0.15% |
How did the Fund perform during the reporting period?
The Fund's performance for the six months ended June 30, 2024 was 6.20% before expenses and 6.12% after expenses. The Fund's benchmark, the S&P MidCap® 400 Index, returned 6.17% over the same period. Mid-cap stocks lagged large-caps, as measured by the S&P 500® Index, as a few large-cap growth stocks accounted for a disproportionate percentage of the S&P's return. A long-term view and potential overall portfolio diversification benefits, which include holding companies of various sizes, should be considered when reviewing the Fund's performance.
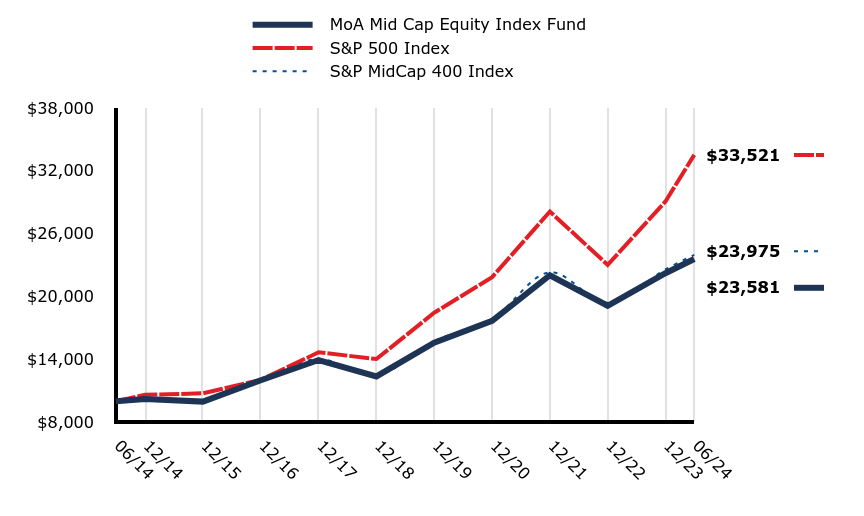
How did the Fund perform over the past 10 years?
The Fund underperformed slightly on a net basis compared to its benchmark over the 10-year period. The Fund seeks investment results that correspond to the performance of the benchmark.
Total Return Based on $10,000 Investment
| MoA Mid Cap Equity Index Fund | S&P 500 Index | S&P MidCap 400 Index |
|---|
| 06/14 | $10,000 | $10,000 | $10,000 |
| 12/14 | $10,209 | $10,612 | $10,211 |
| 12/15 | $9,967 | $10,758 | $9,989 |
| 12/16 | $12,010 | $12,045 | $12,061 |
| 12/17 | $13,936 | $14,675 | $14,020 |
| 12/18 | $12,367 | $14,031 | $12,466 |
| 12/19 | $15,583 | $18,449 | $15,732 |
| 12/20 | $17,687 | $21,844 | $17,881 |
| 12/21 | $22,031 | $28,114 | $22,308 |
| 12/22 | $19,116 | $23,023 | $19,395 |
| 12/23 | $22,222 | $29,075 | $22,583 |
| 06/24 | $23,581 | $33,521 | $23,975 |
The graph above represents historical performance of the hypothetical investment of $10,000 in the Fund over the past ten years (or since inception if shorter). The graph and table below show changes in the Fund's performance from year to year as compared to the performance of a broad-based, unmanaged index. A fund's past performance does not necessarily indicate how it will perform in the future. Returns shown are total returns, which assume the reinvestment of dividends and capital gains. The graph and table presented do not reflect the deduction of taxes that a shareholder would pay on fund distributions or redemption of fund shares.
| Total Net Assets | $1,503,284,838 |
| # of Portfolio Holdings | 403 |
| Portfolio Turnover Rate | 14.14% |
| Advisory Fees Paid | $566,228 |
The fund's past performance is not a good predictor of how the fund will perform in the future. The graph and table do not reflect the deduction of taxes that a shareholder would pay on fund distributions or redemption of fund shares.
Average Annual Total Returns (%)
| 1 Year | 5 Years | 10 Years |
|---|
| MoA Mid Cap Equity Index Fund | 13.39% | 10.09% | 8.96% |
| S&P 500 Index | 24.56% | 15.05% | 12.86% |
| S&P MidCap 400 Index | 13.57% | 10.27% | 9.14% |
What did the Fund invest in?
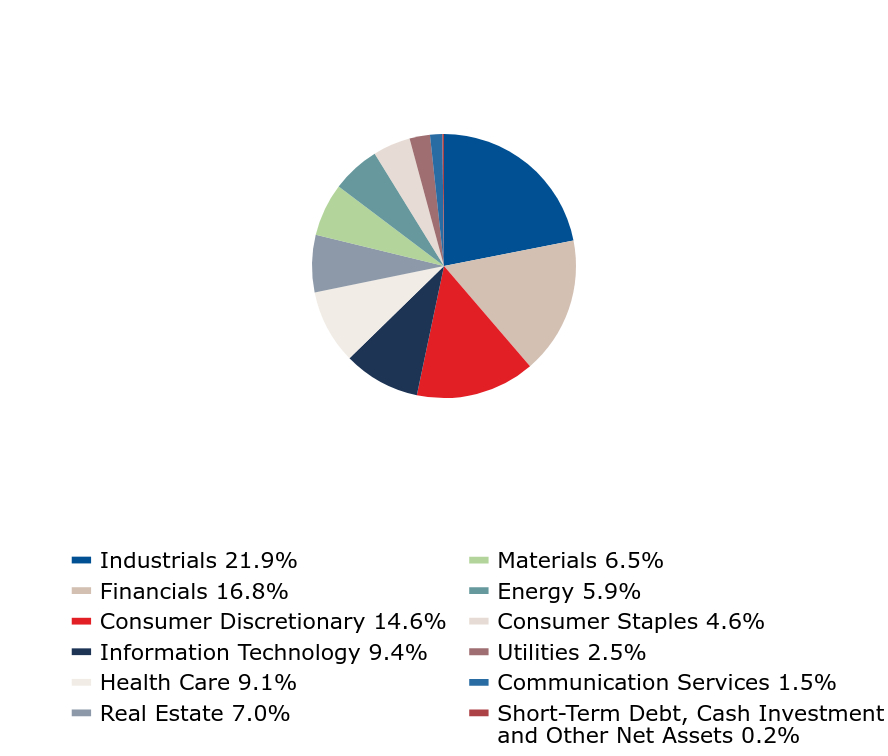
The MoA Mid Cap Equity Index Fund seeks investment results that correspond to the performance of the S&P MidCap® 400 Index.
| Value | Value |
|---|
| Common Stock - Indexed | 99.8% |
| Short-Term Debt, Cash Investment and Other Net Assets | 0.2% |
| Value | Value |
|---|
| Industrials | 21.9% |
| Financials | 16.8% |
| Consumer Discretionary | 14.6% |
| Information Technology | 9.4% |
| Health Care | 9.1% |
| Real Estate | 7.0% |
| Materials | 6.5% |
| Energy | 5.9% |
| Consumer Staples | 4.6% |
| Utilities | 2.5% |
| Communication Services | 1.5% |
| Short-Term Debt, Cash Investment and Other Net Assets | 0.2% |
| iShares Core S&P Mid-Cap ETF | 1.0% |
| Pure Storage, Inc. Cl A | 0.7% |
| Carlisle Cos., Inc. | 0.7% |
| Williams-Sonoma, Inc. | 0.7% |
| EMCOR Group, Inc. | 0.6% |
| Lennox International, Inc. | 0.6% |
| Illumina, Inc. | 0.6% |
| Reliance, Inc. | 0.6% |
| BioMarin Pharmaceutical, Inc. | 0.6% |
| Burlington Stores, Inc. | 0.6% |
During the period, the Fund did not have any material fund changes.
Change in or Disagreements with Accountants
During the period, the Fund did not have any changes or disagreements with Accountants.
To reduce expense, the Funds may mail only one copy of the prospectus, and each annual and semiannual Tailored Shareholder report to those addresses shared by two or more accounts. If you wish to receive individual copies of these documents, please contact your advisor, administrator or the Funds at 800-914-8716.
MoA Mid Cap Equity Index Fund - MAMEX
Semi-Annual Shareholder Report - June 30, 2024
If you wish to view additional information about the Fund; including but not limited to financial statements or holdings, please visit https://moafunds.com/docs. The MoA Funds are distributed by Foreside Fund Services LLC.
MoA International Fund - MAIFX
Semi-Annual Shareholder Report - June 30, 2024
This semi-annual shareholder report contains important information about MoA International Fund for the period of January 1, 2024 to June 30, 2024. You can find additional information about the fund at https://moafunds.com/docs. You can also request this information by contacting us at 800.914.8716.
What were the Fund costs for the last 6 months?
(based on hypothetical $10,000 investment)
| Fund name | Cost of a $10,000 investment | Cost paid as a % of a $10,000 investment |
|---|
| MoA International Fund | $11 | 0.21% |
How did the Fund perform during the reporting period?
The International Fund's performance for the six months ended June 30, 2024 was 7.20% before expenses and 7.11% after expenses. The Fund's benchmark, the MSCI EAFE Index, returned 5.34% over the same period. In general, international stocks, as measured by the benchmark, lagged in performance relative to the S&P 500® Index, an index of U.S. based companies. A long-term view and potential overall portfolio diversification benefits, which include companies with varying geographic exposure, should be considered when reviewing the performance of international stocks.
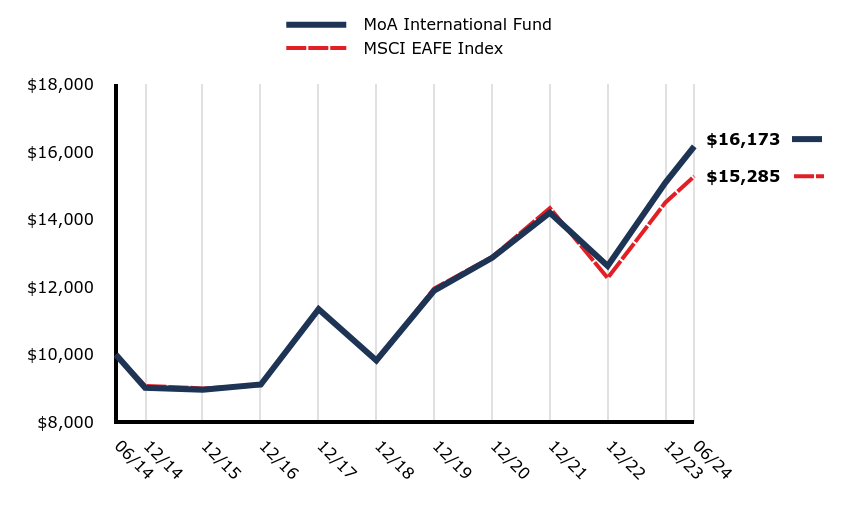
How did the Fund perform over the past 10 years?
The Fund outperformed its benchmark over the 10-year period due to stock selection and geographic allocation.
Total Return Based on $10,000 Investment
| MoA International Fund | MSCI EAFE Index |
|---|
| 06/14 | $10,000 | $10,000 |
| 12/14 | $9,022 | $9,076 |
| 12/15 | $8,965 | $9,002 |
| 12/16 | $9,117 | $9,092 |
| 12/17 | $11,347 | $11,369 |
| 12/18 | $9,831 | $9,801 |
| 12/19 | $11,897 | $11,958 |
| 12/20 | $12,872 | $12,893 |
| 12/21 | $14,207 | $14,345 |
| 12/22 | $12,631 | $12,272 |
| 12/23 | $15,100 | $14,510 |
| 06/24 | $16,173 | $15,285 |
The graph above represents historical performance of the hypothetical investment of $10,000 in the Fund over the past ten years (or since inception if shorter). The graph and table below show changes in the Fund's performance from year to year as compared to the performance of a broad-based, unmanaged index. A fund's past performance does not necessarily indicate how it will perform in the future. Returns shown are total returns, which assume the reinvestment of dividends and capital gains. The graph and table presented do not reflect the deduction of taxes that a shareholder would pay on fund distributions or redemption of fund shares.
| Total Net Assets | $1,591,594,622 |
| # of Portfolio Holdings | 146 |
| Portfolio Turnover Rate | 13.84% |
| Advisory Fees Paid | $1,022,984 |
The fund's past performance is not a good predictor of how the fund will perform in the future. The graph and table do not reflect the deduction of taxes that a shareholder would pay on fund distributions or redemption of fund shares.
Average Annual Total Returns (%)
| 1 Year | 5 Years | 10 Years |
|---|
| MoA International Fund | 15.49% | 7.78% | 4.93% |
| MSCI EAFE Index | 11.54% | 6.46% | 4.33% |
What did the Fund invest in?
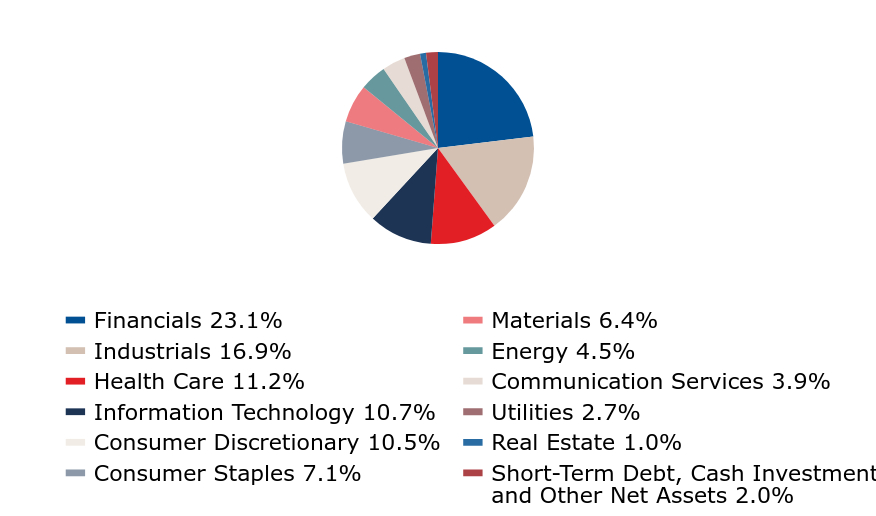
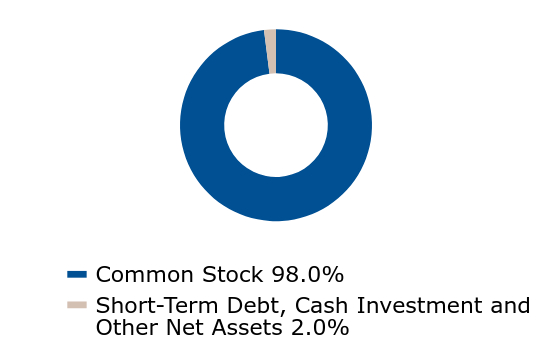
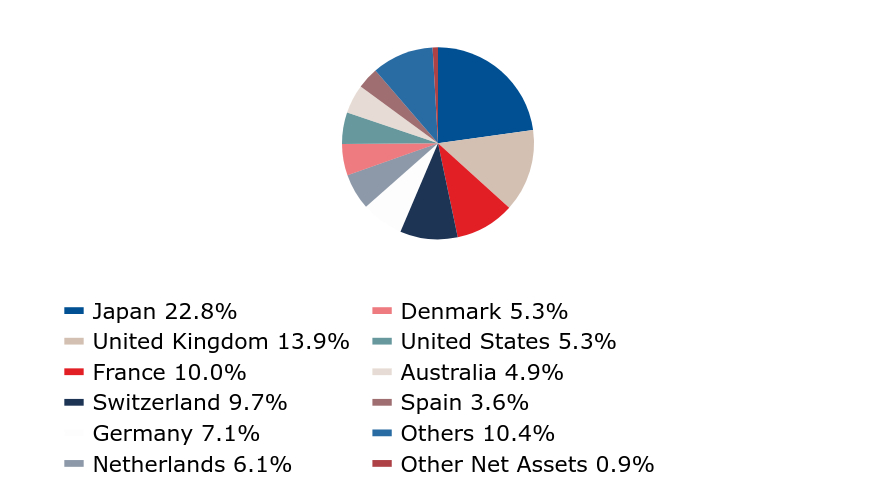
The actively managed MoA International Fund, which seeks capital appreciation, scans developed markets outside the U.S. for companies we believe have the potential to help the Fund outperform its benchmark, the MSCI EAFE Index.
| Value | Value |
|---|
| Financials | 23.1% |
| Industrials | 16.9% |
| Health Care | 11.2% |
| Information Technology | 10.7% |
| Consumer Discretionary | 10.5% |
| Consumer Staples | 7.1% |
| Materials | 6.4% |
| Energy | 4.5% |
| Communication Services | 3.9% |
| Utilities | 2.7% |
| Real Estate | 1.0% |
| Short-Term Debt, Cash Investment and Other Net Assets | 2.0% |
| Value | Value |
|---|
| Common Stock | 98.0% |
| Short-Term Debt, Cash Investment and Other Net Assets | 2.0% |
| Value | Value |
|---|
| Japan | 22.8% |
| United Kingdom | 13.9% |
| France | 10.0% |
| Switzerland | 9.7% |
| Germany | 7.1% |
| Netherlands | 6.1% |
| Denmark | 5.3% |
| United States | 5.3% |
| Australia | 4.9% |
| Spain | 3.6% |
| Others | 10.4% |
| Other Net Assets | 0.9% |
| Novo Nordisk A/S Cl B | 4.0% |
| ASML Hldg. N.V. | 2.9% |
| BHP Group Ltd. | 1.8% |
| Novartis AG | 1.7% |
| Shell PLC | 1.7% |
| Roche Hldg. AG | 1.5% |
| SAP SE | 1.5% |
| Hermes International SCA | 1.4% |
| Hitachi Ltd. | 1.4% |
| RELX PLC | 1.4% |
During the period, the Fund did not have any material fund changes.
Change in or Disagreements with Accountants
During the period, the Fund did not have any changes or disagreements with Accountants.
To reduce expense, the Funds may mail only one copy of the prospectus, and each annual and semiannual Tailored Shareholder report to those addresses shared by two or more accounts. If you wish to receive individual copies of these documents, please contact your advisor, administrator or the Funds at 800-914-8716.
MoA International Fund - MAIFX
Semi-Annual Shareholder Report - June 30, 2024
If you wish to view additional information about the Fund; including but not limited to financial statements or holdings, please visit https://moafunds.com/docs. The MoA Funds are distributed by Foreside Fund Services LLC.
MoA Conservative Allocation Fund - MACAX
Semi-Annual Shareholder Report - June 30, 2024
This semi-annual shareholder report contains important information about MoA Conservative Allocation Fund for the period of January 1, 2024 to June 30, 2024. You can find additional information about the fund at https://moafunds.com/docs. You can also request this information by contacting us at 800.914.8716.
What were the Fund costs for the last 6 months?
(based on hypothetical $10,000 investment)
| Fund name | Cost of a $10,000 investment | Cost paid as a % of a $10,000 investment |
|---|
| MoA Conservative Allocation Fund | $22 | 0.43% |
How did the Fund perform during the reporting period?
The Fund's performance for the six months ended June 30, 2024 was 4.35% before expenses and 4.31% after expenses. The Fund's benchmark, the Morningstar US Moderately Conservative Target Allocation Index, returned 4.66% over the same period. A long-term view, asset composition and risk characteristics between the Fund and the Index should be considered when reviewing the Fund's performance.
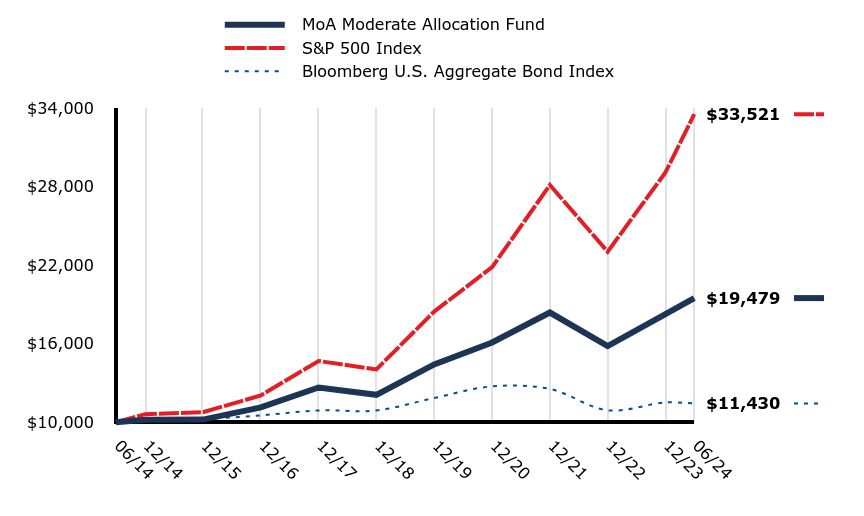
How did the Fund perform over the past 10 years?
The Fund underperformed its benchmark over the 10-year period.
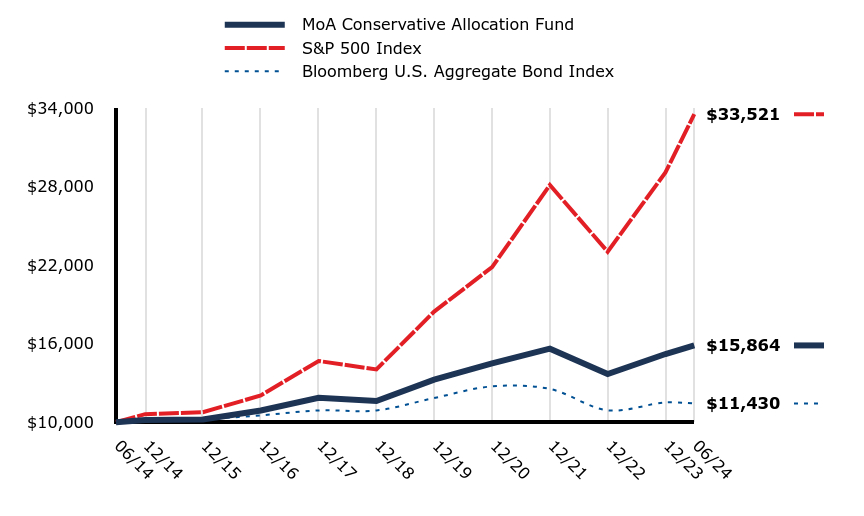
Total Return Based on $10,000 Investment
| MoA Conservative Allocation Fund | S&P 500 Index | Bloomberg U.S. Aggregate Bond Index |
|---|
| 06/14 | $10,000 | $10,000 | $10,000 |
| 12/14 | $10,166 | $10,612 | $10,196 |
| 12/15 | $10,211 | $10,758 | $10,252 |
| 12/16 | $10,895 | $12,045 | $10,524 |
| 12/17 | $11,866 | $14,675 | $10,897 |
| 12/18 | $11,624 | $14,031 | $10,898 |
| 12/19 | $13,250 | $18,449 | $11,848 |
| 12/20 | $14,485 | $21,844 | $12,737 |
| 12/21 | $15,617 | $28,114 | $12,541 |
| 12/22 | $13,674 | $23,023 | $10,909 |
| 12/23 | $15,209 | $29,075 | $11,512 |
| 06/24 | $15,864 | $33,521 | $11,430 |
The graph above represents historical performance of the hypothetical investment of $10,000 in the Fund over the past ten years (or since inception if shorter). The graph and table below show changes in the Fund's performance from year to year as compared to the performance of a broad-based, unmanaged index. A fund's past performance does not necessarily indicate how it will perform in the future. Returns shown are total returns, which assume the reinvestment of dividends and capital gains. The graph and table presented do not reflect the deduction of taxes that a shareholder would pay on fund distributions or redemption of fund shares.
| Total Net Assets | $155,421,551 |
| # of Portfolio Holdings | 6 |
| Portfolio Turnover Rate | 11.72% |
| Advisory Fees Paid | $0 |
The fund's past performance is not a good predictor of how the fund will perform in the future. The graph and table do not reflect the deduction of taxes that a shareholder would pay on fund distributions or redemption of fund shares.
Average Annual Total Returns (%)
| 1 Year | 5 Years | 10 Years |
|---|
| MoA Conservative Allocation Fund | 9.25% | 4.58% | 4.72% |
| S&P 500 Index | 24.56% | 15.05% | 12.86% |
| Bloomberg U.S. Aggregate Bond Index | 2.63% | | 1.35% |
What did the Fund invest in?
The MoA Conservative Allocation Fund uses our asset allocation expertise to build a portfolio that seeks to provide income and, to a lesser extent, capital appreciation.
| Value | Value |
|---|
| Bond Funds | 58.9% |
| Domestic Equity Funds | 31.9% |
| International Equity Fund | 5.2% |
| Money Market Fund | 4.0% |
| Short-Term Debt, Cash Investment and Other Net Assets | 0.0% |
| Core Bond Fund | 31.8% |
| Intermediate Bond Fund | 27.1% |
| Equity Index Fund | 26.8% |
| International Fund | 5.2% |
| Mid Cap Equity Index Fund | 5.1% |
| Money Market Fund | 4.0% |
During the period, the Fund did not have any material fund changes.
Change in or Disagreements with Accountants
During the period, the Fund did not have any changes or disagreements with Accountants.
To reduce expense, the Funds may mail only one copy of the prospectus, and each annual and semiannual Tailored Shareholder report to those addresses shared by two or more accounts. If you wish to receive individual copies of these documents, please contact your advisor, administrator or the Funds at 800-914-8716.
MoA Conservative Allocation Fund - MACAX
Semi-Annual Shareholder Report - June 30, 2024
If you wish to view additional information about the Fund; including but not limited to financial statements or holdings, please visit https://moafunds.com/docs. The MoA Funds are distributed by Foreside Fund Services LLC.
MoA Clear Passage 2025 Fund - MURHX
Semi-Annual Shareholder Report - June 30, 2024
This semi-annual shareholder report contains important information about MoA Clear Passage 2025 Fund for the period of January 1, 2024 to June 30, 2024. You can find additional information about the fund at https://moafunds.com/docs. You can also request this information by contacting us at 800.914.8716.
What were the Fund costs for the last 6 months?
(based on hypothetical $10,000 investment)
| Fund name | Cost of a $10,000 investment | Cost paid as a % of a $10,000 investment |
|---|
| MoA Clear Passage 2025 Fund | $21 | 0.41% |
How did the Fund perform during the reporting period?
The Fund's performance for the six months ended June 30, 2024 was 5.54% before expenses and 5.48% after expenses. The Fund's benchmark, the Morningstar Lifetime Allocation Moderate 2025 Index was 3.75% over the same period. The Fund's return was influenced by its portfolio allocation and risk relative to the Index. A long-term view, asset composition and risk characteristics between the Fund and the Index should be considered when reviewing the Fund's performance.
How did the Fund perform over the past 10 years?
The Fund outperformed its benchmark over the 10-year period due to asset composition and stock selection.
Total Return Based on $10,000 Investment
| MoA Clear Passage 2025 Fund | S&P 500 Index | Bloomberg U.S. Aggregate Bond Index | FTSE 3-Month Treasury Bill Index |
|---|
| 06/14 | $10,000 | $10,000 | $10,000 | $10,000 |
| 12/14 | $10,217 | $10,612 | $10,196 | $10,001 |
| 12/15 | $10,205 | $10,758 | $10,252 | $10,004 |
| 12/16 | $11,208 | $12,045 | $10,524 | $10,031 |
| 12/17 | $12,824 | $14,675 | $10,897 | $10,116 |
| 12/18 | $12,155 | $14,031 | $10,898 | $10,304 |
| 12/19 | $14,561 | $18,449 | $11,848 | $10,536 |
| 12/20 | $16,055 | $21,844 | $12,737 | $10,597 |
| 12/21 | $17,976 | $28,114 | $12,541 | $10,602 |
| 12/22 | $15,539 | $23,023 | $10,909 | $10,761 |
| 12/23 | $17,651 | $29,075 | $11,512 | $11,327 |
| 06/24 | $18,619 | $33,521 | $11,430 | $11,640 |
The graph above represents historical performance of the hypothetical investment of $10,000 in the Fund over the past ten years (or since inception if shorter). The graph and table below show changes in the Fund's performance from year to year as compared to the performance of a broad-based, unmanaged index. A fund's past performance does not necessarily indicate how it will perform in the future. Returns shown are total returns, which assume the reinvestment of dividends and capital gains. The graph and table presented do not reflect the deduction of taxes that a shareholder would pay on fund distributions or redemption of fund shares.
| Total Net Assets | $1,114,313,538 |
| # of Portfolio Holdings | 9 |
| Portfolio Turnover Rate | 8.44% |
| Advisory Fees Paid | $279,185 |
The fund's past performance is not a good predictor of how the fund will perform in the future. The graph and table do not reflect the deduction of taxes that a shareholder would pay on fund distributions or redemption of fund shares.
Average Annual Total Returns (%)
| 1 Year | 5 Years | 10 Years |
|---|
| MoA Clear Passage 2025 Fund | 11.08% | 6.33% | 6.41% |
| S&P 500 Index | 24.56% | 15.05% | 12.86% |
| Bloomberg U.S. Aggregate Bond Index | 2.63% | | 1.35% |
| FTSE 3-Month Treasury Bill Index | 5.64% | 2.22% | 1.53% |
What did the Fund invest in?
The MoA Clear Passage 2025 Fund™ is designed for investors with a specific target date in mind - whether for retirement or another longterm investment goal. This Fund uses our time-tested investment management and allocation expertise to dynamically manage an investment over time approaching the target year 2025.
| Value | Value |
|---|
| Bond Funds | 47.4% |
| Domestic Equity Funds | 39.2% |
| International Equity Fund | 10.0% |
| Money Market Fund | 3.4% |
| Short-Term Debt, Cash Investment and Other Net Assets | 0.0% |
| Core Bond Fund | 32.4% |
| Equity Index Fund | 31.2% |
| Intermediate Bond Fund | 15.0% |
| International Fund | 10.0% |
| Mid Cap Equity Index Fund | 5.3% |
| Money Market Fund | 3.4% |
| Small Cap Value Fund | 1.6% |
| Small Cap Equity Index Fund | 0.8% |
| Mid Cap Value Fund | 0.3% |
During the period, the Fund did not have any material fund changes.
Change in or Disagreements with Accountants
During the period, the Fund did not have any changes or disagreements with Accountants.
To reduce expense, the Funds may mail only one copy of the prospectus, and each annual and semiannual Tailored Shareholder report to those addresses shared by two or more accounts. If you wish to receive individual copies of these documents, please contact your advisor, administrator or the Funds at 800-914-8716.
MoA Clear Passage 2025 Fund - MURHX
Semi-Annual Shareholder Report - June 30, 2024
If you wish to view additional information about the Fund; including but not limited to financial statements or holdings, please visit https://moafunds.com/docs. The MoA Funds are distributed by Foreside Fund Services LLC.
MoA Small Cap Value Fund - MAVKX
Semi-Annual Shareholder Report - June 30, 2024
This semi-annual shareholder report contains important information about MoA Small Cap Value Fund for the period of January 1, 2024 to June 30, 2024. You can find additional information about the fund at https://moafunds.com/docs. You can also request this information by contacting us at 800.914.8716.
What were the Fund costs for the last 6 months?
(based on hypothetical $10,000 investment)
| Fund name | Cost of a $10,000 investment | Cost paid as a % of a $10,000 investment |
|---|
| MoA Small Cap Value Fund | $40 | 0.81% |
How did the Fund perform during the reporting period?
The Fund's performance for the six months ended June 30, 2024 was 0.42% before expenses and 0.01% after expenses. The Fund's benchmark, the Russell 2000® Value Index, returned -0.85% over the same period. Small-cap stocks lagged large-caps, as measured by the S&P 500® Index, as a few large-cap growth stocks accounted for a disproportionate percentage of the S&P's return. A long-term view and potential overall portfolio diversification benefits, which include holding companies of various sizes, should be considered when reviewing the performance of small-cap stocks.
How did the Fund perform over the past 10 years?
The Fund underperformed its benchmark over the 10-year period. In general, small-cap stocks have lagged large-cap stocks, as measured by the S&P 500® Index, over the past several years.
Total Return Based on $10,000 Investment
| MoA Small Cap Value Fund | Russell 3000 Index | Russell 2000 Value Index |
|---|
| 06/14 | $10,000 | $10,000 | $10,000 |
| 12/14 | $10,128 | $10,525 | $10,001 |
| 12/15 | $9,785 | $10,576 | $9,254 |
| 12/16 | $11,745 | $11,922 | $12,192 |
| 12/17 | $12,718 | $14,442 | $13,148 |
| 12/18 | $10,865 | $13,685 | $11,456 |
| 12/19 | $12,940 | $17,929 | $14,022 |
| 12/20 | $12,422 | $21,675 | $14,672 |
| 12/21 | $16,433 | $27,236 | $18,819 |
| 12/22 | $14,819 | $22,005 | $16,094 |
| 12/23 | $16,240 | $27,717 | $18,451 |
| 06/24 | $16,242 | $31,475 | $18,294 |
The graph above represents historical performance of the hypothetical investment of $10,000 in the Fund over the past ten years (or since inception if shorter). The graph and table below show changes in the Fund's performance from year to year as compared to the performance of a broad-based, unmanaged index. A fund's past performance does not necessarily indicate how it will perform in the future. Returns shown are total returns, which assume the reinvestment of dividends and capital gains. The graph and table presented do not reflect the deduction of taxes that a shareholder would pay on fund distributions or redemption of fund shares.
| Total Net Assets | $376,487,187 |
| # of Portfolio Holdings | 94 |
| Portfolio Turnover Rate | 28.72% |
| Advisory Fees Paid | $1,441,538 |
The fund's past performance is not a good predictor of how the fund will perform in the future. The graph and table do not reflect the deduction of taxes that a shareholder would pay on fund distributions or redemption of fund shares.
Average Annual Total Returns (%)
| 1 Year | 5 Years | 10 Years |
|---|
| MoA Small Cap Value Fund | 5.62% | 5.96% | 4.97% |
| Russell 3000 Index | 23.13% | 14.14% | 12.15% |
| Russell 2000 Value Index | 10.90% | 7.07% | 6.23% |
What did the Fund invest in?
The actively managed MoA Small Cap Value Fund, which seeks capital appreciation, invests in smaller companies we believe to be undervalued and have the potential for share price appreciation.
| Value | Value |
|---|
| Common Stock | 97.5% |
| Short-Term Debt, Cash Investment and Other Net Assets | 2.5% |
| Value | Value |
|---|
| Financials | 24.1% |
| Industrials | 15.7% |
| Real Estate | 10.0% |
| Health Care | 9.1% |
| Energy | 8.9% |
| Consumer Discretionary | 8.1% |
| Information Technology | 6.8% |
| Materials | 5.9% |
| Utilities | 4.7% |
| Consumer Staples | 2.9% |
| Communication Services | 1.3% |
| Short-Term Debt, Cash Investment and Other Net Assets | 2.5% |
| Taylor Morrison Home Corp. Cl A | 2.9% |
| Mueller Industries, Inc. | 2.8% |
| Ashland, Inc. | 2.4% |
| VSE Corp. | 2.3% |
| Essent Group Ltd. | 2.3% |
| Selective Insurance Group, Inc. | 2.0% |
| UFP Industries, Inc. | 1.9% |
| Hancock Whitney Corp. | 1.9% |
| Ovintiv, Inc. | 1.9% |
| Northern Oil & Gas, Inc. | 1.8% |
During the period, the Fund did not have any material fund changes.
Change in or Disagreements with Accountants
During the period, the Fund did not have any changes or disagreements with Accountants.
To reduce expense, the Funds may mail only one copy of the prospectus, and each annual and semiannual Tailored Shareholder report to those addresses shared by two or more accounts. If you wish to receive individual copies of these documents, please contact your advisor, administrator or the Funds at 800-914-8716.
MoA Small Cap Value Fund - MAVKX
Semi-Annual Shareholder Report - June 30, 2024
If you wish to view additional information about the Fund; including but not limited to financial statements or holdings, please visit https://moafunds.com/docs. The MoA Funds are distributed by Foreside Fund Services LLC.
MoA Clear Passage 2050 Fund - MURNX
Semi-Annual Shareholder Report - June 30, 2024
This semi-annual shareholder report contains important information about MoA Clear Passage 2050 Fund for the period of January 1, 2024 to June 30, 2024. You can find additional information about the fund at https://moafunds.com/docs. You can also request this information by contacting us at 800.914.8716.
What were the Fund costs for the last 6 months?
(based on hypothetical $10,000 investment)
| Fund name | Cost of a $10,000 investment | Cost paid as a % of a $10,000 investment |
|---|
| MoA Clear Passage 2050 Fund | $17 | 0.33% |
How did the Fund perform during the reporting period?
The Fund's performance for the six months ended June 30, 2024 was 9.56% before expenses and 9.49% after expenses. The Fund's benchmark, the Morningstar Lifetime Allocation Moderate 2050 Index was 7.40% over the same period. The Fund's return was influenced by its portfolio allocation and risk relative to the Index. A long-term view, asset composition and risk characteristics between the Fund and the Index should be considered when reviewing the Fund's performance.
How did the Fund perform over the past 10 years?
The Fund outperformed its benchmark over the 10-year period due to asset composition and stock selection.
Total Return Based on $10,000 Investment
| MoA Clear Passage 2050 Fund | S&P 500 Index | Bloomberg U.S. Aggregate Bond Index | FTSE 3-Month Treasury Bill Index |
|---|
| 06/14 | $10,000 | $10,000 | $10,000 | $10,000 |
| 12/14 | $10,153 | $10,612 | $10,196 | $10,001 |
| 12/15 | $10,078 | $10,758 | $10,252 | $10,004 |
| 12/16 | $11,264 | $12,045 | $10,524 | $10,031 |
| 12/17 | $13,275 | $14,675 | $10,897 | $10,116 |
| 12/18 | $12,115 | $14,031 | $10,898 | $10,304 |
| 12/19 | $15,101 | $18,449 | $11,848 | $10,536 |
| 12/20 | $17,123 | $21,844 | $12,737 | $10,597 |
| 12/21 | $20,689 | $28,114 | $12,541 | $10,602 |
| 12/22 | $17,450 | $23,023 | $10,909 | $10,761 |
| 12/23 | $20,929 | $29,075 | $11,512 | $11,327 |
| 06/24 | $22,915 | $33,521 | $11,430 | $11,640 |
The graph above represents historical performance of the hypothetical investment of $10,000 in the Fund over the past ten years (or since inception if shorter). The graph and table below show changes in the Fund's performance from year to year as compared to the performance of a broad-based, unmanaged index. A fund's past performance does not necessarily indicate how it will perform in the future. Returns shown are total returns, which assume the reinvestment of dividends and capital gains. The graph and table presented do not reflect the deduction of taxes that a shareholder would pay on fund distributions or redemption of fund shares.
| Total Net Assets | $912,808,458 |
| # of Portfolio Holdings | 10 |
| Portfolio Turnover Rate | 6.39% |
| Advisory Fees Paid | $217,207 |
The fund's past performance is not a good predictor of how the fund will perform in the future. The graph and table do not reflect the deduction of taxes that a shareholder would pay on fund distributions or redemption of fund shares.
Average Annual Total Returns (%)
| 1 Year | 5 Years | 10 Years |
|---|
| MoA Clear Passage 2050 Fund | 17.09% | 10.36% | 8.65% |
| S&P 500 Index | 24.56% | 15.05% | 12.86% |
| Bloomberg U.S. Aggregate Bond Index | 2.63% | | 1.35% |
| FTSE 3-Month Treasury Bill Index | 5.64% | 2.22% | 1.53% |
What did the Fund invest in?
The MoA Clear Passage 2050 Fund™ is designed for investors with a specific target date in mind - whether for retirement or another longterm investment goal. This Fund uses our time-tested investment management and allocation expertise to dynamically manage an investment over time approaching the target year 2050.
| Value | Value |
|---|
| Domestic Equity Funds | 68.3% |
| International Equity Fund | 20.6% |
| Bond Funds | 8.9% |
| Money Market Fund | 2.2% |
| Short-Term Debt, Cash Investment and Other Net Assets | 0.0% |
| Equity Index Fund | 49.5% |
| International Fund | 20.6% |
| Mid Cap Equity Index Fund | 11.1% |
| Core Bond Fund | 7.5% |
| Small Cap Equity Index Fund | 2.3% |
| Money Market Fund | 2.2% |
| Small Cap Growth Fund | 2.0% |
| Small Cap Value Fund | 1.8% |
| Mid Cap Value Fund | 1.6% |
| Intermediate Bond Fund | 1.4% |
During the period, the Fund did not have any material fund changes.
Change in or Disagreements with Accountants
During the period, the Fund did not have any changes or disagreements with Accountants.
To reduce expense, the Funds may mail only one copy of the prospectus, and each annual and semiannual Tailored Shareholder report to those addresses shared by two or more accounts. If you wish to receive individual copies of these documents, please contact your advisor, administrator or the Funds at 800-914-8716.
MoA Clear Passage 2050 Fund - MURNX
Semi-Annual Shareholder Report - June 30, 2024
If you wish to view additional information about the Fund; including but not limited to financial statements or holdings, please visit https://moafunds.com/docs. The MoA Funds are distributed by Foreside Fund Services LLC.
MoA Retirement Income Fund - MARMX
Semi-Annual Shareholder Report - June 30, 2024
This semi-annual shareholder report contains important information about MoA Retirement Income Fund for the period of January 1, 2024 to June 30, 2024. You can find additional information about the fund at https://moafunds.com/docs. You can also request this information by contacting us at 800.914.8716.
What were the Fund costs for the last 6 months?
(based on hypothetical $10,000 investment)
| Fund name | Cost of a $10,000 investment | Cost paid as a % of a $10,000 investment |
|---|
| MoA Retirement Income Fund | $25 | 0.50% |
How did the Fund perform during the reporting period?
The Fund's performance for the six months ended June 30, 2024 was 3.72% before expenses and 3.64% after expenses. The Fund's benchmark, the Morningstar Lifetime Allocation Conservative Income Index returned 2.14% over the same period. The Fund's return was influenced by its portfolio allocation and risk relative to the Index composition. A long-term view, asset composition and risk characteristics between the Fund and the Index should be considered when reviewing the Fund's performance.
How did the Fund perform over the past 10 years?
The Fund outperformed its benchmark over the 10-year period due to asset composition and stock selection.
Total Return Based on $10,000 Investment
| MoA Retirement Income Fund | S&P 500 Index | Bloomberg U.S. Aggregate Bond Index |
|---|
| 06/14 | $10,000 | $10,000 | $10,000 |
| 12/14 | $10,190 | $10,612 | $10,196 |
| 12/15 | $10,239 | $10,758 | $10,252 |
| 12/16 | $10,871 | $12,045 | $10,524 |
| 12/17 | $11,668 | $14,675 | $10,897 |
| 12/18 | $11,527 | $14,031 | $10,898 |
| 12/19 | $12,893 | $18,449 | $11,848 |
| 12/20 | $13,872 | $21,844 | $12,737 |
| 12/21 | $14,673 | $28,114 | $12,541 |
| 12/22 | $13,041 | $23,023 | $10,909 |
| 12/23 | $14,333 | $29,075 | $11,512 |
| 06/24 | $14,855 | $33,521 | $11,430 |
The graph above represents historical performance of the hypothetical investment of $10,000 in the Fund over the past ten years (or since inception if shorter). The graph and table below show changes in the Fund's performance from year to year as compared to the performance of a broad-based, unmanaged index. A fund's past performance does not necessarily indicate how it will perform in the future. Returns shown are total returns, which assume the reinvestment of dividends and capital gains. The graph and table presented do not reflect the deduction of taxes that a shareholder would pay on fund distributions or redemption of fund shares.
| Total Net Assets | $198,988,511 |
| # of Portfolio Holdings | 7 |
| Portfolio Turnover Rate | 10.01% |
| Advisory Fees Paid | $50,440 |
The fund's past performance is not a good predictor of how the fund will perform in the future. The graph and table do not reflect the deduction of taxes that a shareholder would pay on fund distributions or redemption of fund shares.
Average Annual Total Returns (%)
| 1 Year | 5 Years | 10 Years |
|---|
| MoA Retirement Income Fund | 8.26% | 3.63% | 4.04% |
| S&P 500 Index | 24.56% | 15.05% | 12.86% |
| Bloomberg U.S. Aggregate Bond Index | 2.63% | | 1.35% |
What did the Fund invest in?
The MoA Retirement Income Fund is designed for investors who seek a continued income stream and have already reached and generally are 10 years beyond their retirement goal. The Fund seeks to achieve current income consistent with the preservation of capital and, to a lesser extent, capital appreciation.
| Value | Value |
|---|
| Bond Funds | 63.4% |
| Domestic Equity Funds | 26.2% |
| Money Market Fund | 5.4% |
| International Equity Fund | 5.0% |
| Short-Term Debt, Cash Investment and Other Net Assets | 0.0% |
| Core Bond Fund | 33.5% |
| Intermediate Bond Fund | 29.9% |
| Equity Index Fund | 21.9% |
| Money Market Fund | 5.4% |
| International Fund | 5.0% |
| Mid Cap Equity Index Fund | 4.1% |
| Mid Cap Value Fund | 0.2% |
During the period, the Fund did not have any material fund changes.
Change in or Disagreements with Accountants
During the period, the Fund did not have any changes or disagreements with Accountants.
To reduce expense, the Funds may mail only one copy of the prospectus, and each annual and semiannual Tailored Shareholder report to those addresses shared by two or more accounts. If you wish to receive individual copies of these documents, please contact your advisor, administrator or the Funds at 800-914-8716.
MoA Retirement Income Fund - MARMX
Semi-Annual Shareholder Report - June 30, 2024
If you wish to view additional information about the Fund; including but not limited to financial statements or holdings, please visit https://moafunds.com/docs. The MoA Funds are distributed by Foreside Fund Services LLC.
MoA Money Market Fund - MAAXX
Semi-Annual Shareholder Report - June 30, 2024
This semi-annual shareholder report contains important information about MoA Money Market Fund for the period of January 1, 2024 to June 30, 2024. You can find additional information about the fund at https://moafunds.com/docs. You can also request this information by contacting us at 800.914.8716.
What were the Fund costs for the last 6 months?
(based on hypothetical $10,000 investment)
| Fund name | Cost of a $10,000 investment | Cost paid as a % of a $10,000 investment |
|---|
| MoA Money Market Fund | $12 | 0.24% |
| Total Net Assets | $517,459,359 |
| # of Portfolio Holdings | 28 |
| Advisory Fees Paid | $403,062 |
What did the Fund invest in?
The MoA Money Market Fund seeks current income to the extent consistent with maintenance of liquidity, investment quality, and stability of capital.
| Value | Value |
|---|
| Short-Term Debt Securities | 54.8% |
| Commercial Paper | 45.2% |
| Temporary Cash Investment | 0.0% |
| Short-Term Debt, Cash Investment and Other Net Assets | 0.0% |
| Value | Value |
|---|
| Less than 1 month | 71.6% |
| 1-3 months | 28.4% |
| Cash Investment and Other Net Assets | 0.0% |
Credit Quality AllocationFootnote Reference*
| Value | Value |
|---|
| A-1+ | 75.7% |
| A-1 | 24.3% |
| Cash Investment and Other Net Assets | 0.0% |
| Footnote | Description |
Footnote* | Ratings are based on Standard & Poor's Corporation ratings. Credit Quality ratings reflect the credit quality of the underlying securities in the Fund's portfolio and not that of the fund itself. Quality ratings are subject to change. Ratings range from AAA as the highest to Below B as the lowest credit quality rating. |
During the period, the Fund did not have any material fund changes.
Change in or Disagreements with Accountants
During the period, the Fund did not have any changes or disagreements with Accountants.
To reduce expense, the Funds may mail only one copy of the prospectus, and each annual and semiannual Tailored Shareholder report to those addresses shared by two or more accounts. If you wish to receive individual copies of these documents, please contact your advisor, administrator or the Funds at 800-914-8716.
MoA Money Market Fund - MAAXX
Semi-Annual Shareholder Report - June 30, 2024
If you wish to view additional information about the Fund; including but not limited to financial statements or holdings, please visit https://moafunds.com/docs. The MoA Funds are distributed by Foreside Fund Services LLC.
MoA Aggressive Allocation Fund - MAANX
Semi-Annual Shareholder Report - June 30, 2024
This semi-annual shareholder report contains important information about MoA Aggressive Allocation Fund for the period of January 1, 2024 to June 30, 2024. You can find additional information about the fund at https://moafunds.com/docs. You can also request this information by contacting us at 800.914.8716.
What were the Fund costs for the last 6 months?
(based on hypothetical $10,000 investment)
| Fund name | Cost of a $10,000 investment | Cost paid as a % of a $10,000 investment |
|---|
| MoA Aggressive Allocation Fund | $18 | 0.34% |
How did the Fund perform during the reporting period?
The Fund's performance for the six months ended June 30, 2024 was 7.68% before expenses and 7.64% after expenses. The Fund's benchmark, the Morningstar US Moderately Aggressive Target Allocation Index, returned 9.05% over the same period. A long-term view, asset composition and risk characteristics between the Fund and the Index should be considered when reviewing the Fund's performance.
How did the Fund perform over the past 10 years?
The Fund underperformed its benchmark over the 10-year period.
Total Return Based on $10,000 Investment
| MoA Aggressive Allocation Fund | S&P 500 Index | Bloomberg U.S. Aggregate Bond Index |
|---|
| 06/14 | $10,000 | $10,000 | $10,000 |
| 12/14 | $10,161 | $10,612 | $10,196 |
| 12/15 | $10,122 | $10,758 | $10,252 |
| 12/16 | $11,221 | $12,045 | $10,524 |
| 12/17 | $13,087 | $14,675 | $10,897 |
| 12/18 | $12,154 | $14,031 | $10,898 |
| 12/19 | $14,918 | $18,449 | $11,848 |
| 12/20 | $16,965 | $21,844 | $12,737 |
| 12/21 | $20,055 | $28,114 | $12,541 |
| 12/22 | $16,999 | $23,023 | $10,909 |
| 12/23 | $19,977 | $29,075 | $11,512 |
| 06/24 | $21,502 | $33,521 | $11,430 |
The graph above represents historical performance of the hypothetical investment of $10,000 in the Fund over the past ten years (or since inception if shorter). The graph and table below show changes in the Fund's performance from year to year as compared to the performance of a broad-based, unmanaged index. A fund's past performance does not necessarily indicate how it will perform in the future. Returns shown are total returns, which assume the reinvestment of dividends and capital gains. The graph and table presented do not reflect the deduction of taxes that a shareholder would pay on fund distributions or redemption of fund shares.
| Total Net Assets | $340,884,561 |
| # of Portfolio Holdings | 6 |
| Portfolio Turnover Rate | 6.08% |
| Advisory Fees Paid | $0 |
The fund's past performance is not a good predictor of how the fund will perform in the future. The graph and table do not reflect the deduction of taxes that a shareholder would pay on fund distributions or redemption of fund shares.
Average Annual Total Returns (%)
| 1 Year | 5 Years | 10 Years |
|---|
| MoA Aggressive Allocation Fund | 14.45% | 9.12% | 7.96% |
| S&P 500 Index | 24.56% | 15.05% | 12.86% |
| Bloomberg U.S. Aggregate Bond Index | 2.63% | | 1.35% |
What did the Fund invest in?
The MoA Aggressive Allocation Fund uses our asset allocation expertise to build a portfolio that seeks capital appreciation, and to a lesser extent, current income.
| Value | Value |
|---|
| Domestic Equity Funds | 65.3% |
| International Equity Fund | 18.5% |
| Bond Funds | 16.2% |
| Short-Term Debt, Cash Investment and Other Net Assets | 0.0% |
| Equity Index Fund | 36.8% |
| Mid Cap Equity Index Fund | 19.7% |
| International Fund | 18.5% |
| Core Bond Fund | 16.2% |
| Small Cap Value Fund | 4.7% |
| Small Cap Growth Fund | 4.1% |
During the period, the Fund did not have any material fund changes.
Change in or Disagreements with Accountants
During the period, the Fund did not have any changes or disagreements with Accountants.
To reduce expense, the Funds may mail only one copy of the prospectus, and each annual and semiannual Tailored Shareholder report to those addresses shared by two or more accounts. If you wish to receive individual copies of these documents, please contact your advisor, administrator or the Funds at 800-914-8716.
MoA Aggressive Allocation Fund - MAANX
Semi-Annual Shareholder Report - June 30, 2024
If you wish to view additional information about the Fund; including but not limited to financial statements or holdings, please visit https://moafunds.com/docs. The MoA Funds are distributed by Foreside Fund Services LLC.
MoA Clear Passage 2055 Fund - MUROX
Semi-Annual Shareholder Report - June 30, 2024
This semi-annual shareholder report contains important information about MoA Clear Passage 2055 Fund for the period of January 1, 2024 to June 30, 2024. You can find additional information about the fund at https://moafunds.com/docs. You can also request this information by contacting us at 800.914.8716.
What were the Fund costs for the last 6 months?
(based on hypothetical $10,000 investment)
| Fund name | Cost of a $10,000 investment | Cost paid as a % of a $10,000 investment |
|---|
| MoA Clear Passage 2055 Fund | $18 | 0.34% |
How did the Fund perform during the reporting period?
The Fund's performance for the six months ended June 30, 2024 was 9.72% before expenses and 9.65% after expenses. The Fund's benchmark, the Morningstar Lifetime Allocation Moderate 2055 Index was 7.39% over the same period. The Fund's return was influenced by its portfolio allocation and risk relative to the Index. A long-term view, asset composition and risk characteristics between the Fund and the Index should be considered when reviewing the Fund's performance.
How did the Fund perform since inception?
The Fund outperformed its benchmark since its inception on October 1, 2016, due to asset composition and stock selection.
Total Return Based on $10,000 Investment
| MoA Clear Passage 2055 Fund | S&P 500 Index | Bloomberg U.S. Aggregate Bond Index | FTSE 3-Month Treasury Bill Index |
|---|
| 10/16 | $10,000 | $10,000 | $10,000 | $10,000 |
| 12/16 | $10,400 | $10,382 | $9,702 | $10,008 |
| 12/17 | $12,269 | $12,649 | $10,046 | $10,092 |
| 12/18 | $11,180 | $12,094 | $10,047 | $10,280 |
| 12/19 | $13,907 | $15,903 | $10,923 | $10,512 |
| 12/20 | $15,840 | $18,829 | $11,743 | $10,573 |
| 12/21 | $19,189 | $24,233 | $11,562 | $10,578 |
| 12/22 | $16,163 | $19,844 | $10,058 | $10,737 |
| 12/23 | $19,393 | $25,061 | $10,614 | $11,301 |
| 06/24 | $21,265 | $28,893 | $10,538 | $11,613 |
The graph above represents historical performance of the hypothetical investment of $10,000 in the Fund over the past ten years (or since inception if shorter). The graph and table below show changes in the Fund's performance from year to year as compared to the performance of a broad-based, unmanaged index. A fund's past performance does not necessarily indicate how it will perform in the future. Returns shown are total returns, which assume the reinvestment of dividends and capital gains. The graph and table presented do not reflect the deduction of taxes that a shareholder would pay on fund distributions or redemption of fund shares.
| Total Net Assets | $510,154,067 |
| # of Portfolio Holdings | 10 |
| Portfolio Turnover Rate | 7.20% |
| Advisory Fees Paid | $119,881 |
The fund's past performance is not a good predictor of how the fund will perform in the future. The graph and table do not reflect the deduction of taxes that a shareholder would pay on fund distributions or redemption of fund shares.
Average Annual Total Returns (%)
| 1 Year | 5 Years | Since Inception |
|---|
| MoA Clear Passage 2055 Fund (Incp: October 1, 2016) | 17.35% | 10.51% | 10.23% |
| S&P 500 Index | 24.56% | 15.05% | 14.68% |
| Bloomberg U.S. Aggregate Bond Index | 2.63% | | 0.68% |
| FTSE 3-Month Treasury Bill Index | 5.64% | 2.22% | 1.95% |
What did the Fund invest in?
The MoA Clear Passage 2055 Fund™ is designed for investors with a specific target date in mind - whether for retirement or another longterm investment goal. This Fund uses our time-tested investment management and allocation expertise to dynamically manage an investment over time approaching the target year 2055.
| Value | Value |
|---|
| Domestic Equity Funds | 68.9% |
| International Equity Fund | 21.7% |
| Bond Funds | 8.1% |
| Money Market Fund | 1.3% |
| Short-Term Debt, Cash Investment and Other Net Assets | 0.0% |
| Equity Index Fund | 49.7% |
| International Fund | 21.7% |
| Mid Cap Equity Index Fund | 10.9% |
| Core Bond Fund | 6.2% |
| Small Cap Equity Index Fund | 2.5% |
| Small Cap Value Fund | 2.3% |
| Small Cap Growth Fund | 1.9% |
| Intermediate Bond Fund | 1.9% |
| Mid Cap Value Fund | 1.6% |
| Money Market Fund | 1.3% |
During the period, the Fund did not have any material fund changes.
Change in or Disagreements with Accountants
During the period, the Fund did not have any changes or disagreements with Accountants.
To reduce expense, the Funds may mail only one copy of the prospectus, and each annual and semiannual Tailored Shareholder report to those addresses shared by two or more accounts. If you wish to receive individual copies of these documents, please contact your advisor, administrator or the Funds at 800-914-8716.
MoA Clear Passage 2055 Fund - MUROX
Semi-Annual Shareholder Report - June 30, 2024
If you wish to view additional information about the Fund; including but not limited to financial statements or holdings, please visit https://moafunds.com/docs. The MoA Funds are distributed by Foreside Fund Services LLC.
MoA Catholic Values Index Fund - MACCX
Semi-Annual Shareholder Report - June 30, 2024
This semi-annual shareholder report contains important information about MoA Catholic Values Index Fund for the period of January 1, 2024 to June 30, 2024. You can find additional information about the fund at https://moafunds.com/docs. You can also request this information by contacting us at 800.914.8716.
What were the Fund costs for the last 6 months?
(based on hypothetical $10,000 investment)
| Fund name | Cost of a $10,000 investment | Cost paid as a % of a $10,000 investment |
|---|
| MoA Catholic Values Index Fund | $11 | 0.21% |
How did the Fund perform during the reporting period?
The Fund's performance for the six months ended June 30, 2024 was 13.14% before expenses and 13.02% after expenses. The Fund's benchmark, the S&P 500® Catholic Values Index, returned 13.39% over the same period. During the period a small number of large-cap growth stocks accounted for a disproportionate percentage of the Index's return. A long-term view and potential overall portfolio diversification benefits should be considered when reviewing the Fund's performance.
How did the Fund perform since inception?
The Fund underperformed its benchmark since its inception on September 30, 2020. The Fund seeks investment results that correspond to the performance of the benchmark.
Total Return Based on $10,000 Investment
| MoA Catholic Values Index Fund | S&P 500 Index | S&P 500 Catholic Values Index |
|---|
| 09/20 | $10,000 | $10,000 | $10,000 |
| 12/20 | $11,211 | $11,215 | $11,233 |
| 12/21 | $14,463 | $14,434 | $14,527 |
| 12/22 | $11,556 | $11,820 | $11,639 |
| 12/23 | $14,603 | $14,927 | $14,754 |
| 06/24 | $16,504 | $17,210 | $16,729 |
The graph above represents historical performance of the hypothetical investment of $10,000 in the Fund over the past ten years (or since inception if shorter). The graph and table below show changes in the Fund's performance from year to year as compared to the performance of a broad-based, unmanaged index. A fund's past performance does not necessarily indicate how it will perform in the future. Returns shown are total returns, which assume the reinvestment of dividends and capital gains. The graph and table presented do not reflect the deduction of taxes that a shareholder would pay on fund distributions or redemption of fund shares.
| Total Net Assets | $6,667,318 |
| # of Portfolio Holdings | 439 |
| Portfolio Turnover Rate | 11.04% |
| Advisory Fees Paid | $0 |
The fund's past performance is not a good predictor of how the fund will perform in the future. The graph and table do not reflect the deduction of taxes that a shareholder would pay on fund distributions or redemption of fund shares.
Average Annual Total Returns (%)
| 1 Year | Since Inception |
|---|
| MoA Catholic Values Index Fund (Incp: September 30, 2020) | 21.12% | 14.30% |
| S&P 500 Index | 24.56% | 15.58% |
| S&P 500 Catholic Values Index | 21.75% | 14.71% |
What did the Fund invest in?
The MoA Catholic Values Index Fund seeks investment results that correspond to the performance of the S&P 500® Catholic Values Index.
| Value | Value |
|---|
| Common Stock | 100.3% |
| Short-Term Debt, Cash Investment and Other Net Assets | |
| Value | Value |
|---|
| Information Technology | 32.0% |
| Financials | 13.7% |
| Health Care | 11.6% |
| Consumer Discretionary | 9.7% |
| Communication Services | 9.3% |
| Industrials | 8.1% |
| Consumer Staples | 5.8% |
| Energy | 3.6% |
| Utilities | 2.3% |
| Materials | 2.1% |
| Real Estate | 2.1% |
| Short-Term Debt, Cash Investment and Other Net Assets | |
| Microsoft Corp. | 7.3% |
| NVIDIA Corp. | 6.6% |
| Apple, Inc. | 6.6% |
| Meta Platforms, Inc. Cl A | 2.4% |
| Alphabet, Inc. Cl A | 2.3% |
| Alphabet, Inc. Cl C | 2.0% |
| Tesla, Inc. | 1.9% |
| Berkshire Hathaway, Inc. Cl B | 1.6% |
| Procter & Gamble Co. | 1.6% |
| Costco Wholesale Corp. | 1.5% |
During the period, the Fund did not have any material fund changes.
Change in or Disagreements with Accountants
During the period, the Fund did not have any changes or disagreements with Accountants.
To reduce expense, the Funds may mail only one copy of the prospectus, and each annual and semiannual Tailored Shareholder report to those addresses shared by two or more accounts. If you wish to receive individual copies of these documents, please contact your advisor, administrator or the Funds at 800-914-8716.
MoA Catholic Values Index Fund - MACCX
Semi-Annual Shareholder Report - June 30, 2024
If you wish to view additional information about the Fund; including but not limited to financial statements or holdings, please visit https://moafunds.com/docs. The MoA Funds are distributed by Foreside Fund Services LLC.
MoA Clear Passage 2035 Fund - MURJX
Semi-Annual Shareholder Report - June 30, 2024
This semi-annual shareholder report contains important information about MoA Clear Passage 2035 Fund for the period of January 1, 2024 to June 30, 2024. You can find additional information about the fund at https://moafunds.com/docs. You can also request this information by contacting us at 800.914.8716.
What were the Fund costs for the last 6 months?
(based on hypothetical $10,000 investment)
| Fund name | Cost of a $10,000 investment | Cost paid as a % of a $10,000 investment |
|---|
| MoA Clear Passage 2035 Fund | $19 | 0.36% |
How did the Fund perform during the reporting period?
The Fund's performance for the six months ended June 30, 2024 was 7.98% before expenses and 7.92% after expenses. The Fund's benchmark, the Morningstar Lifetime Allocation Moderate 2035 Index was 5.25% over the same period. The Fund's return was influenced by its portfolio allocation and risk relative to the Index. A long-term view, asset composition and risk characteristics between the Fund and the Index should be considered when reviewing the Fund's performance.
How did the Fund perform over the past 10 years?
The Fund outperformed its benchmark over the 10-year period due to asset composition and stock selection.
Total Return Based on $10,000 Investment
| MoA Clear Passage 2035 Fund | S&P 500 Index | Bloomberg U.S. Aggregate Bond Index | FTSE 3-Month Treasury Bill Index |
|---|
| 06/14 | $10,000 | $10,000 | $10,000 | $10,000 |
| 12/14 | $10,221 | $10,612 | $10,196 | $10,001 |
| 12/15 | $10,182 | $10,758 | $10,252 | $10,004 |
| 12/16 | $11,345 | $12,045 | $10,524 | $10,031 |
| 12/17 | $13,288 | $14,675 | $10,897 | $10,116 |
| 12/18 | $12,310 | $14,031 | $10,898 | $10,304 |
| 12/19 | $15,217 | $18,449 | $11,848 | $10,536 |
| 12/20 | $17,136 | $21,844 | $12,737 | $10,597 |
| 12/21 | $20,193 | $28,114 | $12,541 | $10,602 |
| 12/22 | $17,123 | $23,023 | $10,909 | $10,761 |
| 12/23 | $20,079 | $29,075 | $11,512 | $11,327 |
| 06/24 | $21,668 | $33,521 | $11,430 | $11,640 |
The graph above represents historical performance of the hypothetical investment of $10,000 in the Fund over the past ten years (or since inception if shorter). The graph and table below show changes in the Fund's performance from year to year as compared to the performance of a broad-based, unmanaged index. A fund's past performance does not necessarily indicate how it will perform in the future. Returns shown are total returns, which assume the reinvestment of dividends and capital gains. The graph and table presented do not reflect the deduction of taxes that a shareholder would pay on fund distributions or redemption of fund shares.
| Total Net Assets | $1,330,429,739 |
| # of Portfolio Holdings | 10 |
| Portfolio Turnover Rate | 9.53% |
| Advisory Fees Paid | $318,758 |
The fund's past performance is not a good predictor of how the fund will perform in the future. The graph and table do not reflect the deduction of taxes that a shareholder would pay on fund distributions or redemption of fund shares.
Average Annual Total Returns (%)
| 1 Year | 5 Years | 10 Years |
|---|
| MoA Clear Passage 2035 Fund | 14.77% | 8.89% | 8.04% |
| S&P 500 Index | 24.56% | 15.05% | 12.86% |
| Bloomberg U.S. Aggregate Bond Index | 2.63% | | 1.35% |
| FTSE 3-Month Treasury Bill Index | 5.64% | 2.22% | 1.53% |
What did the Fund invest in?
The MoA Clear Passage 2035 Fund™ is designed for investors with a specific target date in mind - whether for retirement or another longterm investment goal. This Fund uses our time-tested investment management and allocation expertise to dynamically manage an investment over time approaching the target year 2035.
| Value | Value |
|---|
| Domestic Equity Funds | 56.1% |
| Bond Funds | 25.7% |
| International Equity Fund | 14.9% |
| Money Market Fund | 3.3% |
| Short-Term Debt, Cash Investment and Other Net Assets | 0.0% |
| Equity Index Fund | 42.5% |
| Core Bond Fund | 20.0% |
| International Fund | 14.9% |
| Mid Cap Equity Index Fund | 8.3% |
| Intermediate Bond Fund | 5.7% |
| Money Market Fund | 3.3% |
| Small Cap Value Fund | 1.8% |
| Small Cap Equity Index Fund | 1.6% |
| Small Cap Growth Fund | 1.1% |
| Mid Cap Value Fund | 0.8% |
During the period, the Fund did not have any material fund changes.
Change in or Disagreements with Accountants
During the period, the Fund did not have any changes or disagreements with Accountants.
To reduce expense, the Funds may mail only one copy of the prospectus, and each annual and semiannual Tailored Shareholder report to those addresses shared by two or more accounts. If you wish to receive individual copies of these documents, please contact your advisor, administrator or the Funds at 800-914-8716.
MoA Clear Passage 2035 Fund - MURJX
Semi-Annual Shareholder Report - June 30, 2024
If you wish to view additional information about the Fund; including but not limited to financial statements or holdings, please visit https://moafunds.com/docs. The MoA Funds are distributed by Foreside Fund Services LLC.
MoA Moderate Allocation Fund - MAMOX
Semi-Annual Shareholder Report - June 30, 2024
This semi-annual shareholder report contains important information about MoA Moderate Allocation Fund for the period of January 1, 2024 to June 30, 2024. You can find additional information about the fund at https://moafunds.com/docs. You can also request this information by contacting us at 800.914.8716.
What were the Fund costs for the last 6 months?
(based on hypothetical $10,000 investment)
| Fund name | Cost of a $10,000 investment | Cost paid as a % of a $10,000 investment |
|---|
| MoA Moderate Allocation Fund | $17 | 0.33% |
How did the Fund perform during the reporting period?
The Fund's performance for the six months ended June 30, 2024 was 6.79% before expenses and 6.75% after expenses. The Fund's benchmark, the Morningstar US Moderate Target Allocation Index, returned 7.30% over the same period. A long-term view, asset composition and risk characteristics between the Fund and the Index should be considered when reviewing the Fund's performance.
How did the Fund perform over the past 10 years?
The Fund outperformed its benchmark over the 10-year period.
Total Return Based on $10,000 Investment
| MoA Moderate Allocation Fund | S&P 500 Index | Bloomberg U.S. Aggregate Bond Index |
|---|
| 06/14 | $10,000 | $10,000 | $10,000 |
| 12/14 | $10,185 | $10,612 | $10,196 |
| 12/15 | $10,201 | $10,758 | $10,252 |
| 12/16 | $11,127 | $12,045 | $10,524 |
| 12/17 | $12,652 | $14,675 | $10,897 |
| 12/18 | $12,094 | $14,031 | $10,898 |
| 12/19 | $14,411 | $18,449 | $11,848 |
| 12/20 | $16,092 | $21,844 | $12,737 |
| 12/21 | $18,376 | $28,114 | $12,541 |
| 12/22 | $15,820 | $23,023 | $10,909 |
| 12/23 | $18,247 | $29,075 | $11,512 |
| 06/24 | $19,479 | $33,521 | $11,430 |
The graph above represents historical performance of the hypothetical investment of $10,000 in the Fund over the past ten years (or since inception if shorter). The graph and table below show changes in the Fund's performance from year to year as compared to the performance of a broad-based, unmanaged index. A fund's past performance does not necessarily indicate how it will perform in the future. Returns shown are total returns, which assume the reinvestment of dividends and capital gains. The graph and table presented do not reflect the deduction of taxes that a shareholder would pay on fund distributions or redemption of fund shares.
| Total Net Assets | $406,565,264 |
| # of Portfolio Holdings | 5 |
| Portfolio Turnover Rate | 6.87% |
| Advisory Fees Paid | $0 |
The fund's past performance is not a good predictor of how the fund will perform in the future. The graph and table do not reflect the deduction of taxes that a shareholder would pay on fund distributions or redemption of fund shares.
Average Annual Total Returns (%)
| 1 Year | 5 Years | 10 Years |
|---|
| MoA Moderate Allocation Fund | 13.01% | 7.50% | 6.89% |
| S&P 500 Index | 24.56% | 15.05% | 12.86% |
| Bloomberg U.S. Aggregate Bond Index | 2.63% | | 1.35% |
What did the Fund invest in?
The MoA Moderate Allocation uses our asset allocation expertise to build a portfolio that seeks capital appreciation and current income.
| Value | Value |
|---|
| Domestic Equity Funds | 49.0% |
| Bond Funds | 38.0% |
| International Equity Fund | 13.0% |
| Short-Term Debt, Cash Investment and Other Net Assets | 0.0% |
| Equity Index Fund | 37.0% |
| Core Bond Fund | 23.8% |
| Intermediate Bond Fund | 14.2% |
| International Fund | 13.0% |
| Mid Cap Equity Index Fund | 12.0% |
During the period, the Fund did not have any material fund changes.
Change in or Disagreements with Accountants
During the period, the Fund did not have any changes or disagreements with Accountants.
To reduce expense, the Funds may mail only one copy of the prospectus, and each annual and semiannual Tailored Shareholder report to those addresses shared by two or more accounts. If you wish to receive individual copies of these documents, please contact your advisor, administrator or the Funds at 800-914-8716.
MoA Moderate Allocation Fund - MAMOX
Semi-Annual Shareholder Report - June 30, 2024
If you wish to view additional information about the Fund; including but not limited to financial statements or holdings, please visit https://moafunds.com/docs. The MoA Funds are distributed by Foreside Fund Services LLC.
MoA Clear Passage 2045 Fund - MURMX
Semi-Annual Shareholder Report - June 30, 2024
This semi-annual shareholder report contains important information about MoA Clear Passage 2045 Fund for the period of January 1, 2024 to June 30, 2024. You can find additional information about the fund at https://moafunds.com/docs. You can also request this information by contacting us at 800.914.8716.
What were the Fund costs for the last 6 months?
(based on hypothetical $10,000 investment)
| Fund name | Cost of a $10,000 investment | Cost paid as a % of a $10,000 investment |
|---|
| MoA Clear Passage 2045 Fund | $17 | 0.33% |
How did the Fund perform during the reporting period?
The Fund's performance for the six months ended June 30, 2024 was 9.32% before expenses and 9.26% after expenses. The Fund's benchmark, the Morningstar Lifetime Allocation Moderate 2045 Index was 7.07% over the same period. The Fund's return was influenced by its portfolio allocation and risk relative to the Index. A long-term view, asset composition and risk characteristics between the Fund and the Index should be considered when reviewing the Fund's performance.
How did the Fund perform over the past 10 years?
The Fund outperformed its benchmark over the 10-year period due to asset composition and stock selection.
Total Return Based on $10,000 Investment
| MoA Clear Passage 2045 Fund | S&P 500 Index | Bloomberg U.S. Aggregate Bond Index | FTSE 3-Month Treasury Bill Index |
|---|
| 06/14 | $10,000 | $10,000 | $10,000 | $10,000 |
| 12/14 | $10,164 | $10,612 | $10,196 | $10,001 |
| 12/15 | $10,093 | $10,758 | $10,252 | $10,004 |
| 12/16 | $11,271 | $12,045 | $10,524 | $10,031 |
| 12/17 | $13,255 | $14,675 | $10,897 | $10,116 |
| 12/18 | $12,157 | $14,031 | $10,898 | $10,304 |
| 12/19 | $15,140 | $18,449 | $11,848 | $10,536 |
| 12/20 | $17,154 | $21,844 | $12,737 | $10,597 |
| 12/21 | $20,683 | $28,114 | $12,541 | $10,602 |
| 12/22 | $17,460 | $23,023 | $10,909 | $10,761 |
| 12/23 | $20,888 | $29,075 | $11,512 | $11,327 |
| 06/24 | $22,822 | $33,521 | $11,430 | $11,640 |
The graph above represents historical performance of the hypothetical investment of $10,000 in the Fund over the past ten years (or since inception if shorter). The graph and table below show changes in the Fund's performance from year to year as compared to the performance of a broad-based, unmanaged index. A fund's past performance does not necessarily indicate how it will perform in the future. Returns shown are total returns, which assume the reinvestment of dividends and capital gains. The graph and table presented do not reflect the deduction of taxes that a shareholder would pay on fund distributions or redemption of fund shares.
| Total Net Assets | $1,167,115,647 |
| # of Portfolio Holdings | 10 |
| Portfolio Turnover Rate | 8.26% |
| Advisory Fees Paid | $278,223 |
The fund's past performance is not a good predictor of how the fund will perform in the future. The graph and table do not reflect the deduction of taxes that a shareholder would pay on fund distributions or redemption of fund shares.
Average Annual Total Returns (%)
| 1 Year | 5 Years | 10 Years |
|---|
| MoA Clear Passage 2045 Fund | 16.75% | 10.21% | 8.60% |
| S&P 500 Index | 24.56% | 15.05% | 12.86% |
| Bloomberg U.S. Aggregate Bond Index | 2.63% | | 1.35% |
| FTSE 3-Month Treasury Bill Index | 5.64% | 2.22% | 1.53% |
What did the Fund invest in?
The MoA Clear Passage 2045 Fund™ is designed for investors with a specific target date in mind - whether for retirement or another longterm investment goal. This Fund uses our time-tested investment management and allocation expertise to dynamically manage an investment over time approaching the target year 2045.
| Value | Value |
|---|
| Domestic Equity Funds | 64.5% |
| International Equity Fund | 20.7% |
| Bond Funds | 12.2% |
| Money Market Fund | 2.6% |
| Short-Term Debt, Cash Investment and Other Net Assets | 0.0% |
| Equity Index Fund | 47.5% |
| International Fund | 20.7% |
| Mid Cap Equity Index Fund | 10.3% |
| Core Bond Fund | 9.3% |
| Intermediate Bond Fund | 2.9% |
| Money Market Fund | 2.6% |
| Small Cap Growth Fund | 2.1% |
| Small Cap Equity Index Fund | 2.0% |
| Small Cap Value Fund | 1.8% |
| Mid Cap Value Fund | 0.8% |
During the period, the Fund did not have any material fund changes.
Change in or Disagreements with Accountants
During the period, the Fund did not have any changes or disagreements with Accountants.
To reduce expense, the Funds may mail only one copy of the prospectus, and each annual and semiannual Tailored Shareholder report to those addresses shared by two or more accounts. If you wish to receive individual copies of these documents, please contact your advisor, administrator or the Funds at 800-914-8716.
MoA Clear Passage 2045 Fund - MURMX
Semi-Annual Shareholder Report - June 30, 2024
If you wish to view additional information about the Fund; including but not limited to financial statements or holdings, please visit https://moafunds.com/docs. The MoA Funds are distributed by Foreside Fund Services LLC.
MoA Intermediate Bond Fund - MAMBX
Semi-Annual Shareholder Report - June 30, 2024
This semi-annual shareholder report contains important information about MoA Intermediate Bond Fund for the period of January 1, 2024 to June 30, 2024. You can find additional information about the fund at https://moafunds.com/docs. You can also request this information by contacting us at 800.914.8716.
What were the Fund costs for the last 6 months?
(based on hypothetical $10,000 investment)
| Fund name | Cost of a $10,000 investment | Cost paid as a % of a $10,000 investment |
|---|
| MoA Intermediate Bond Fund | $23 | 0.47% |
How did the Fund perform during the reporting period?
The Fund's performance for the six months ended June 30, 2024 was 0.61% before expenses and 0.37% after expenses. The Fund's benchmark, the Bloomberg U.S. Intermediate Government/Credit Bond Index, returned 0.49% over the same period. The interest rate environment during the period was characterized by relatively higher rates and the anticipation of rate cuts by the Federal Reserve in the near term. The potential benefits of including fixed income in a diversified portfolio should be considered when reviewing the performance of various fixed income asset classes.
How did the Fund perform over the past 10 years?
The Fund underperformed its benchmark over the 10-year period. The period includes an environment of historically low interest rates and a sharp rise in rates over the past two years to quell inflation.
Total Return Based on $10,000 Investment
| MoA Intermediate Bond Fund | Bloomberg U.S. Aggregate Bond Index | Bloomberg U.S. Intermediate Government/Credit Bond Index |
|---|
| 06/14 | $10,000 | $10,000 | $10,000 |
| 12/14 | $10,036 | $10,196 | $10,086 |
| 12/15 | $10,097 | $10,252 | $10,194 |
| 12/16 | $10,451 | $10,524 | $10,406 |
| 12/17 | $10,692 | $10,897 | $10,628 |
| 12/18 | $10,754 | $10,898 | $10,722 |
| 12/19 | $11,403 | $11,848 | $11,451 |
| 12/20 | $11,979 | $12,737 | $12,188 |
| 12/21 | $11,737 | $12,541 | $12,012 |
| 12/22 | $10,838 | $10,909 | $11,023 |
| 12/23 | $11,338 | $11,512 | $11,601 |
| 06/24 | $11,380 | $11,430 | $11,657 |
The graph above represents historical performance of the hypothetical investment of $10,000 in the Fund over the past ten years (or since inception if shorter). The graph and table below show changes in the Fund's performance from year to year as compared to the performance of a broad-based, unmanaged index. A fund's past performance does not necessarily indicate how it will perform in the future. Returns shown are total returns, which assume the reinvestment of dividends and capital gains. The graph and table presented do not reflect the deduction of taxes that a shareholder would pay on fund distributions or redemption of fund shares.
| Total Net Assets | $931,173,242 |
| # of Portfolio Holdings | 168 |
| Portfolio Turnover Rate | 30.54% |
| Advisory Fees Paid | $1,836,367 |
The fund's past performance is not a good predictor of how the fund will perform in the future. The graph and table do not reflect the deduction of taxes that a shareholder would pay on fund distributions or redemption of fund shares.
Average Annual Total Returns (%)
| 1 Year | 5 Years | 10 Years |
|---|
| MoA Intermediate Bond Fund | 3.81% | 0.25% | 1.30% |
| Bloomberg U.S. Aggregate Bond Index | 2.63% | | 1.35% |
| Bloomberg U.S. Intermediate Government/Credit Bond Index | 4.19% | 0.71% | 1.55% |
What did the Fund invest in?
The actively managed MoA Intermediate Bond Fund seeks a high level of current income and capital preservation.
| Value | Value |
|---|
| Long-Term U.S. Treasury Debt Securities | 54.2% |
| Long-Term Corporate Debt | 42.6% |
| Long-Term U.S. Government Agency Securities | 2.3% |
| Short-Term Debt, Cash Investment and Other Net Assets | 0.9% |
| Value | Value |
|---|
| Less than 1 year | 1.1% |
| 1-3 years | 33.5% |
| 3-5 years | 37.4% |
| 5-10 years | 26.9% |
| More than 10 years | 0.2% |
| Cash Investment and Other Net Assets | 0.9% |
Credit Quality AllocationFootnote Reference*
| Value | Value |
|---|
| AA+ | 56.5% |
| AA | 0.2% |
| AA- | 0.5% |
| A | 2.7% |
| A- | 9.7% |
| BBB+ | 9.3% |
| BBB | 13.3% |
| BBB- | 6.8% |
| Cash Investment and Other Net Assets | 1.0% |
| Footnote | Description |
Footnote* | Ratings are based on Standard & Poor's Corporation ratings. Credit Quality ratings reflect the credit quality of the underlying securities in the Fund's portfolio and not that of the fund itself. Quality ratings are subject to change. Ratings range from AAA as the highest to Below B as the lowest credit quality rating. |
During the period, the Fund did not have any material fund changes.
Change in or Disagreements with Accountants
During the period, the Fund did not have any changes or disagreements with Accountants.
To reduce expense, the Funds may mail only one copy of the prospectus, and each annual and semiannual Tailored Shareholder report to those addresses shared by two or more accounts. If you wish to receive individual copies of these documents, please contact your advisor, administrator or the Funds at 800-914-8716.
MoA Intermediate Bond Fund - MAMBX
Semi-Annual Shareholder Report - June 30, 2024
If you wish to view additional information about the Fund; including but not limited to financial statements or holdings, please visit https://moafunds.com/docs. The MoA Funds are distributed by Foreside Fund Services LLC.
MoA Small Cap Growth Fund - MAGKX
Semi-Annual Shareholder Report - June 30, 2024
This semi-annual shareholder report contains important information about MoA Small Cap Growth Fund for the period of January 1, 2024 to June 30, 2024. You can find additional information about the fund at https://moafunds.com/docs. You can also request this information by contacting us at 800.914.8716.
What were the Fund costs for the last 6 months?
(based on hypothetical $10,000 investment)
| Fund name | Cost of a $10,000 investment | Cost paid as a % of a $10,000 investment |
|---|
| MoA Small Cap Growth Fund | $41 | 0.81% |
How did the Fund perform during the reporting period?
The Fund's performance for the six months ended June 30, 2024 was 3.65% before expenses and 3.22% after expenses. The Fund's benchmark, the Russell 2000® Growth Index, returned 4.44% over the same period. Small-cap stocks lagged large-caps, as measured by the S&P 500® Index, as a few large-cap growth stocks accounted for a disproportionate percentage of the S&P's return. A long-term view and potential overall portfolio diversification benefits, which include holding companies of various sizes, should be considered when reviewing the performance of small-cap stocks.
How did the Fund perform over the past 10 years?
The Fund performed in line with its benchmark over the 10-year period. In general, small-cap stocks have lagged large-cap stocks, as measured by the S&P 500® Index, over the past several years.
Total Return Based on $10,000 Investment
| MoA Small Cap Growth Fund | Russell 3000 Index | Russell 2000 Growth Index |
|---|
| 06/14 | $10,000 | $10,000 | $10,000 |
| 12/14 | $10,460 | $10,525 | $10,331 |
| 12/15 | $10,210 | $10,576 | $10,189 |
| 12/16 | $11,037 | $11,922 | $11,342 |
| 12/17 | $13,666 | $14,442 | $13,856 |
| 12/18 | $11,954 | $13,685 | $12,566 |
| 12/19 | $15,133 | $17,929 | $16,145 |
| 12/20 | $21,686 | $21,675 | $21,737 |
| 12/21 | $23,938 | $27,236 | $22,353 |
| 12/22 | $17,147 | $22,005 | $16,461 |
| 12/23 | $19,826 | $27,717 | $19,533 |
| 06/24 | $20,465 | $31,475 | $20,400 |
The graph above represents historical performance of the hypothetical investment of $10,000 in the Fund over the past ten years (or since inception if shorter). The graph and table below show changes in the Fund's performance from year to year as compared to the performance of a broad-based, unmanaged index. A fund's past performance does not necessarily indicate how it will perform in the future. Returns shown are total returns, which assume the reinvestment of dividends and capital gains. The graph and table presented do not reflect the deduction of taxes that a shareholder would pay on fund distributions or redemption of fund shares.
| Total Net Assets | $392,549,957 |
| # of Portfolio Holdings | 131 |
| Portfolio Turnover Rate | 25.79% |
| Advisory Fees Paid | $1,499,409 |
The fund's past performance is not a good predictor of how the fund will perform in the future. The graph and table do not reflect the deduction of taxes that a shareholder would pay on fund distributions or redemption of fund shares.
Average Annual Total Returns (%)
| 1 Year | 5 Years | 10 Years |
|---|
| MoA Small Cap Growth Fund | 5.55% | 7.91% | 7.42% |
| Russell 3000 Index | 23.13% | 14.14% | 12.15% |
| Russell 2000 Growth Index | 9.14% | 6.17% | 7.39% |
What did the Fund invest in?
The actively managed MoA Small Cap Growth Fund, which seeks capital appreciation, invests in smaller companies we believe have the potential to outperform their peers while being mindful of risk.
| Value | Value |
|---|
| Common Stock | 99.2% |
| Short-Term Debt, Cash Investment and Other Net Assets | 0.8% |
| Value | Value |
|---|
| Health Care | 24.7% |
| Industrials | 21.3% |
| Information Technology | 20.7% |
| Financials | 8.9% |
| Consumer Discretionary | 8.0% |
| Energy | 5.0% |
| Materials | 3.9% |
| Consumer Staples | 3.2% |
| Real Estate | 1.5% |
| Utilities | 1.2% |
| Communication Services | 0.8% |
| Short-Term Debt, Cash Investment and Other Net Assets | 0.8% |
| Federal Signal Corp. | 2.3% |
| Northern Oil & Gas, Inc. | 2.0% |
| ESCO Technologies, Inc. | 1.7% |
| Freshpet, Inc. | 1.6% |
| Addus HomeCare Corp. | 1.5% |
| UFP Industries, Inc. | 1.5% |
| Fabrinet | 1.4% |
| Sterling Infrastructure, Inc. | 1.4% |
| ATI, Inc. | 1.4% |
| First Financial Bankshares, Inc. | 1.4% |
During the period, the Fund did not have any material fund changes.
Change in or Disagreements with Accountants
During the period, the Fund did not have any changes or disagreements with Accountants.
To reduce expense, the Funds may mail only one copy of the prospectus, and each annual and semiannual Tailored Shareholder report to those addresses shared by two or more accounts. If you wish to receive individual copies of these documents, please contact your advisor, administrator or the Funds at 800-914-8716.
MoA Small Cap Growth Fund - MAGKX
Semi-Annual Shareholder Report - June 30, 2024
If you wish to view additional information about the Fund; including but not limited to financial statements or holdings, please visit https://moafunds.com/docs. The MoA Funds are distributed by Foreside Fund Services LLC.
MoA Funds Corporation (”MoA Funds”) has adopted a Code of Ethics that applies to its principal executive and financial officers, as well as all Access Persons as defined under Rule 17j-1 of the Investment Company Act of 1940. The Code of Ethics consists of two sections. The first section, designated as Section A, is the Code of Ethics required under Rule 17j-1. Section A requires those subject to it to submit periodic reports detailing their securities holdings and transactions (subject to several exemptions contained in the rules) and requires pre-approval for certain securities transactions by such persons, including purchases and sales of reportable securities, investments in initial public offerings and private placements.
The second section, designated as Section B, is to assure compliance with the Code of Ethics requirements of Section 406 of the Sarbanes-Oxley Act of 2002. It applies specifically to MoA Funds’ principal executive and financial officers.
The two sections are not mutually exclusive and must be observed independently by each person to whom they are intended to apply. Section A applies to all individuals while Section B applies to the individuals designated in Section B. Both Sections explicitly require those individuals subject to the provisions of the Code of Ethics to promptly report violations of the Code of Ethics to the Chief Compliance Officer.
There have been no amendments to Section A or B during the period covered by this report.
The Annual Report to Shareholders includes information on how to obtain a copy of the Code of Ethics at no charge.
| ITEM 3. | AUDIT COMMITTEE FINANCIAL EXPERT. |
| | (a) | (1) MoA Funds’ Board of Directors has determined that one audit committee financial expert serves on its Audit Committee. |
| | (a) | (2) The audit committee financial expert is Margaret M. Smyth. She is a Certified Public Accountant and is currently a Partner at QIC (Queensland Investment Corporation), an ESG-themed global infrastructure investment company, and a member of Deloitte’s Finance Advisory Council. She was formerly U.S. Chief Financial Officer at National Grid. Her experience also includes previously held senior finance positions at Con Edison, Hamilton Sundstrand and United Technologies, and was a partner at Deloitte Touche and Arthur Andersen. Ms. Smyth is considered an independent director. |
| ITEM 4. | PRINCIPAL ACCOUNTANT FEES AND SERVICES. |
(a) Aggregate Audit Fees:
2023: $876,262
2022: $871,273
(b), (c), (d) There were no Audit-Related, Tax or Other Fees.
(e) All non-audit fees are pre-approved by the Audit Committee in advance.
(f), (g), (h), (i), (j) Not applicable.
| ITEM 5. | AUDIT COMMITTEE OF LISTED REGISTRANTS. |
Not applicable.
| | (a) | Not applicable. The complete Schedules of Investment are included as part of the Reports to Stockholders in Item 1. |
| ITEM 7. | FINANCIAL STATEMENTS AND FINANCIAL HIGHLIGHTS FOR OPEN END MANAGEMENT INVESTMENT COMPANIES. |

JUNE 30, 2024
MoA Funds Semi-Annual Report
(Unaudited)
Equity Funds
| • | | MoA Small Cap Value Fund (MAVKX) |
| • | | MoA Mid Cap Value Fund (MAMVX) |
| • | | MoA Small Cap Growth Fund (MAGKX) |
| • | | MoA International Fund (MAIFX) |
| • | | MoA Equity Index Fund (MAEIX) |
| • | | MoA Mid Cap Equity Index Fund (MAMEX) |
| • | | MoA Small Cap Equity Index Fund (MASOX) |
| • | | MoA Catholic Values Index FundTM (MACCX) |
| • | | MoA All America Fund (MAAKX) |
Fixed Income Funds
| • | | MoA Intermediate Bond Fund (MAMBX) |
| • | | MoA Core Bond FundTM (MABDX) |
| • | | MoA Money Market Fund (MAAXX) |
Asset Allocation Funds
| • | | MoA Conservative Allocation Fund (MACAX) |
| • | | MoA Moderate Allocation Fund (MAMOX) |
| • | | MoA Aggressive Allocation Fund (MAANX) |
| • | | MoA Balanced Fund (MACHX) |
Target Date Funds
| • | | MoA Retirement Income Fund (MARMX) |
| • | | MoA Clear Passage 2015 FundTM (MURFX) |
| • | | MoA Clear Passage 2020 FundTM (MURGX) |
| • | | MoA Clear Passage 2025 FundTM (MURHX) |
| • | | MoA Clear Passage 2030 FundTM (MURIX) |
| • | | MoA Clear Passage 2035 FundTM (MURJX) |
| • | | MoA Clear Passage 2040 FundTM (MURLX) |
| • | | MoA Clear Passage 2045 FundTM (MURMX) |
| • | | MoA Clear Passage 2050 FundTM (MURNX) |
| • | | MoA Clear Passage 2055 FundTM (MUROX) |
| • | | MoA Clear Passage 2060 FundTM (MURPX) |
| • | | MoA Clear Passage 2065 FundTM (MURQX) |
|
|
This report and the financial statements contained herein are submitted for the general information of the shareholders of the Fund. The report is not authorized for distribution to prospective investors in the Fund unless preceded or accompanied by an effective prospectus. MoA Funds distributed by Foreside Fund Services, LLC. NOT FDIC INSURED • MAY LOSE VALUE • NO BANK GUARANTEE |
moafunds.com
CONTENTS
MOA FUNDS
We are pleased to present the MoA Funds Corporation (the “Investment Company”) Semi-Annual Report. This Report includes important information regarding the performance and financial position of the Investment Company’s Funds for the six months ended June 30, 2024.
Economic and Market Perspective
In the first half of 2024 the equity market posted strong returns, as investors were optimistic around declining inflation numbers and the potential for several Federal Reserve interest rate cuts during this year. The S&P 500 Index advanced 15.3%, driven by large cap growth stocks, and in particular, stocks tied to the A.I. (artificial intelligence) theme. Large cap stocks outperformed mid and small caps in the first half, as the S&P 400 and Russell 2000 gained 6.1% and 1.7%, respectively. Growth stocks led value, with the Russell 1000 Growth gaining 20.7% versus 6.6% for the Russell 1000 Value. International markets, as measured by the MSCI EAFE Index, returned 5.3% for the six-month period. The bond market continued to be volatile, as yields marched higher for the first four months of the year before receding in May and June. The yield on the 10-year Treasury bond yield started the year at 3.9%, rose to a peak of 4.7% in late April, before declining to 4.4% at the end of the second quarter, as the expectations for interest rate increases coming into the year got pushed out into the back half. The result of all the rate volatility is that the Bloomberg US Aggregate Bond Index declined 0.7% in the first half of the year.
The US economy has continued to be quite resilient thus far in 2024. Growth in Gross Domestic Product (GDP) averaged 3% in the first half of the year and price inflation continued to decline from peak levels. However, there are some cracks starting to develop. A GDP forecast calculated by the Atlanta Fed predicts economic growth slowing in the second half of the year versus the first half. The labor market is showing some signs of weakness as the unemployment rate hit 4.1% in June, the first time it has crossed the 4% threshold since November 2021. Any action by the Fed to lower borrowing costs this year will be welcome news to consumers and may lend some support to equity markets that are trading at somewhat optimistic valuation levels. However, inflation remains “sticky” above the Federal Reserve’s target rate of 2%, and it is possible that the Fed will not cut rates as quickly as many hope as it continues to be “data dependent”.
Lastly, we can’t forget about ongoing geopolitical risks across the globe, and of course the upcoming US election, which could lead to increased news flow and market volatility. As the election gets closer, market participants may look to bet on certain parts of the economy that may react favorably, or unfavorably, to one candidate versus another. However, it is extremely difficult, and certainly not advisable, to try to trade around macro or geopolitical events and typically any market movements resulting from a geopolitical event have tended to be short lived. Instead, investors should make sure to be invested in a diversified portfolio that reflects investment time horizon and risk tolerance and should refrain from making sudden or significant changes to their investment lineup, particularly in times of heightened volatility. Our investment professionals have a long history of investing through many different market cycles and economic events, and every day we are balancing risk and return to ensure that we achieve attractive results for our clients for their long-term success.
The total return performance (net of expenses) for each of the Funds is reflected below:
| | | | |
| Total Returns — Six Months Ended June 30, 2024 | |
| |
MoA Equity Index Fund | | | 15.20% | |
MoA All America Fund | | | 9.96% | |
MoA Small Cap Value Fund | | | 0.01% | |
MoA Small Cap Growth Fund | | | 3.22% | |
MoA Small Cap Equity Index Fund | | | -0.79% | |
MoA Mid Cap Value Fund | | | 3.51% | |
MoA Mid Cap Equity Index Fund | | | 6.12% | |
MoA Balanced Fund | | | 10.01% | |
MoA International Fund | | | 7.11% | |
MoA Catholic Values Index FundTM | | | 13.02% | |
MoA Retirement Income Fund | | | 3.64% | |
MoA Clear Passage 2015 FundTM | | | 3.94% | |
MoA Clear Passage 2020 FundTM | | | 4.31% | |
MoA Clear Passage 2025 FundTM | | | 5.48% | |
MoA Clear Passage 2030 FundTM | | | 6.52% | |
1
| | | | |
| Total Returns — Six Months Ended June 30, 2024 | |
| |
MoA Clear Passage 2035 FundTM | | | 7.92% | |
MoA Clear Passage 2040 FundTM | | | 8.88% | |
MoA Clear Passage 2045 FundTM | | | 9.26% | |
MoA Clear Passage 2050 FundTM | | | 9.49% | |
MoA Clear Passage 2055 FundTM | | | 9.65% | |
MoA Clear Passage 2060 FundTM | | | 9.64% | |
MoA Clear Passage 2065 FundTM | | | 9.86% | |
MoA Conservative Allocation Fund | | | 4.31% | |
MoA Moderate Allocation Fund | | | 6.75% | |
MoA Aggressive Allocation Fund | | | 7.64% | |
MoA Money Market Fund | | | 2.60% | |
MoA Intermediate Bond Fund | | | 0.37% | |
MoA Core Bond FundTM | | | -0.64% | |
For variable annuity owners or participants in a group variable annuity, the above performance figures do not reflect the deduction of respective Separate Account fees and expenses imposed by Mutual of America Life Insurance Company. All Fund performances presented throughout this report are historical, reflect the full reinvestment of dividends paid, and should not be considered indicative of future results.
The pages that immediately follow include brief discussions of each Fund’s performance for the six months ended June 30, 2024, compared to its relevant index.
Following the discussions are the graphical representations of the asset allocations of each Fund and an illustration of each Fund’s operating expenses. The portfolios of each Fund and financial statements are presented in the pages that follow.
Thank you for your continued investment in our Funds.
| | |
| Sincerely, | | |
| |
 | |  |
| |
| Joseph R. Gaffoglio | | R. Jeffrey Young |
| Chief Executive Officer and Principal Executive Officer | | President |
| MoA Funds Corporation | | MoA Funds Corporation |
The views expressed in this Semi-Annual Report are subject to change at any time based on market and other conditions and should not be construed as a recommendation. This Report contains forward-looking statements which speak only as of the date they were made and involve a number of risks and uncertainties that could cause actual results to differ materially from those expressed herein. Readers are cautioned not to place undue reliance on our forward-looking statements, as we assume no obligation to update these forward-looking statements. Readers assume any and all responsibility for any investment decision made as a result of the views expressed herein.
2
Index Definitions
The Bloomberg U.S. Aggregate Bond Index broad base, market capitalization-weighted bond market index representing intermediate term investment grade bonds traded in the U.S.
The Bloomberg U.S. Corporate Bond Index measures the investment grade, fixed-rate, taxable corporate bond market.
The Bloomberg U.S. Intermediate Government/Credit Bond Index is a broad-based benchmark that measures the non-securitized component of the U.S. Aggregate Index with less than 10 years to maturity.
The Dow Jones Industrial Average (DJIA) is a price-weighted average of 30 significant stocks traded on the New York Stock Exchange (NYSE) and the NASDAQ.
The FTSE 3-month Treasury Bill Index is intended to track the daily performance of 3-month U.S. Treasury bills.
Morningstar Lifetime Allocation Conservative Income Index: The index measures the performance of a portfolio of global equities, bonds and traditional inflation hedges such as commodities and TIPS. This portfolio is held in proportions appropriate for a U.S. investor who has a target conservative income. The Conservative risk profile is for investors who are comfortable with below-average exposure to equity market volatility.
Morningstar Lifetime Allocation Conservative 2015 Index: The index measures the performance of a portfolio of global equities, bonds and traditional inflation hedges such as commodities and TIPS. This portfolio is held in proportions appropriate for a U.S. investor who has a target maturity date of 2015. The Conservative risk profile is for investors who are comfortable with below-average exposure to equity market volatility.
Morningstar Lifetime Allocation Moderate 2020 Index: The index measures the performance of a portfolio of global equities, bonds and traditional inflation hedges such as commodities and TIPS. This portfolio is held in proportions appropriate for a U.S. investor who has a target maturity date of 2020. The Moderate risk profile is for investors who are comfortable with average exposure to equity market volatility.
Morningstar Lifetime Allocation Moderate 2025 Index: The index measures the performance of a portfolio of global equities, bonds and traditional inflation hedges such as commodities and TIPS. This portfolio is held in proportions appropriate for a U.S. investor who has a target maturity date of 2025. The Moderate risk profile is for investors who are comfortable with average exposure to equity market volatility.
Morningstar Lifetime Allocation Moderate 2030 Index: The index measures the performance of a portfolio of global equities, bonds and traditional inflation hedges such as commodities and TIPS. This portfolio is held in proportions appropriate for a U.S. investor who has a target maturity date of 2030. The Moderate risk profile is for investors who are comfortable with average exposure to equity market volatility.
Morningstar Lifetime Allocation Moderate 2035 Index: The index measures the performance of a portfolio of global equities, bonds and traditional inflation hedges such as commodities and TIPS. This portfolio is held in proportions appropriate for a U.S. investor who has a target maturity date of 2035. The Moderate risk profile is for investors who are comfortable with average exposure to equity market volatility.
Morningstar Lifetime Allocation Moderate 2040 Index: The index measures the performance of a portfolio of global equities, bonds and traditional inflation hedges such as commodities and TIPS. This portfolio is held in proportions appropriate for a U.S. investor who has a target maturity date of 2040. The Moderate risk profile is for investors who are comfortable with average exposure to equity market volatility.
Morningstar Lifetime Allocation Moderate 2045 Index: The index measures the performance of a portfolio of global equities, bonds and traditional inflation hedges such as commodities and TIPS. This portfolio is held in proportions
appropriate for a U.S. investor who has a target maturity date of 2045. The Moderate risk profile is for investors who are comfortable with average exposure to equity market volatility.
Morningstar Lifetime Allocation Moderate 2050 Index: The index measures the performance of a portfolio of global equities, bonds and traditional inflation hedges such as commodities and TIPS. This portfolio is held in proportions appropriate for a U.S. investor who has a target maturity date of 2050. The Moderate risk profile is for investors who are comfortable with average exposure to equity market volatility.
Morningstar Lifetime Allocation Moderate 2055 Index: The index measures the performance of a portfolio of global equities, bonds and traditional inflation hedges such as commodities and TIPS. This portfolio is held in proportions appropriate for a U.S. investor who has a target maturity date of 2055. The Moderate risk profile is for investors who are comfortable with average exposure to equity market volatility.
Morningstar Lifetime Allocation Moderate 2060 Index: The index measures the performance of a portfolio of global equities, bonds and traditional inflation hedges such as commodities and TIPS. This portfolio is held in proportions appropriate for a U.S. investor who has a target maturity date of 2060. The Moderate risk profile is for investors who are comfortable with average exposure to equity market volatility.
3
Morningstar Lifetime Allocation Moderate 2065 Index: The index measures the performance of a portfolio of global equities, bonds and traditional inflation hedges such as commodities and TIPS. This portfolio is held in proportions appropriate for a U.S. investor who has a target maturity date of 2065. The Moderate risk profile is for well-funded investors who are comfortable with an average exposure to equity market volatility.
Morningstar US Moderate Target Allocation Index: The Morningstar Target Allocation Index family consists of indexes that offer a diversified mix of stocks and bonds created for local investors to benchmark their allocation funds. Morningstar’s Category classification system defines the level of equity and bond exposure for each index. The Morningstar US Moderate Target Allocation Index seeks 60% exposure to global equity markets.
Morningstar US Moderately Aggressive Target Allocation Index: The Morningstar Target Allocation Index family consists of indexes that offer a diversified mix of stocks and bonds created for local investors to benchmark their allocation funds. Morningstar’s Category classification system defines the level of equity and bond exposure for each index. The Morningstar US Moderately Aggressive Target Allocation Index seeks 77.5% exposure to global equity markets.
Morningstar US Moderately Conservative Target Allocation Index: The Morningstar Target Allocation Index family consists of indexes that offer a diversified mix of stocks and bonds created for local investors to benchmark their allocation funds. Morningstar’s Category classification system defines the level of equity and bond exposure for each index. The Morningstar US Moderate Target Allocation Index seeks 60% exposure to global equity markets.
The MSCI EAFE Index is an equity index which captures large and mid cap representation across 21 developed markets countries around the world, excluding the U.S and Canada. With 798 constituents, the index covers approximately 85% of the free float-adjusted market capitalization in each country.
The Nasdaq Composite Index is a broad-based market index that includes more than 3700 stocks listed on the Nasdaq stock exchange.
The Russell 1000® Growth Index measures the performance of the large-cap growth segment of the U.S. equity universe. It includes those Russell 1000 companies with relatively higher price-to-book ratios, higher I/B/E/S forecast medium term (2 year) growth and higher sales per share historical growth (5 years).
The Russell 1000® Index represents the 1000 top companies by market capitalization in the United States.
The Russell 1000® Value Index is a market capitalization weighted index that measures the performance of those Russell 1000 companies with lower price-to-book ratios and lower forecasted growth rates.
The Russell 2000® Index measures the performance of the small-cap segment of the U.S. equity universe.
The Russell 2000® Growth Index measures the performance of the small-cap growth segment of the U.S. equity universe. It includes those Russell 2000 companies with higher price-to-value ratios and higher forecasted growth values.
The Russell 2000® Value Index measures the performance of the small-cap value segment of the U.S. equity universe. It includes those Russell 2000 companies with lower price-to-book ratios and lower forecasted growth values.
The Russell 3000® Index is a market-capitalization-weighted index that tracks the largest 3,000 U.S. companies.
The Russell Midcap® Value Index measures the performance of the mid-cap value segment of the U.S. equity universe.
The S&P 500® Catholic Values Index excludes from the S&P 500 certain activities that are not aligned with the Responsible Investment Guidelines of the U.S. Conference of Catholic Bishops (USCCB). The index is designed for investors who do not want to breach religious norms in their passive investing strategies. It is not possible to invest directly in an index.
The S&P 500® Equal Weight Index (EWI) is the equal-weight version of the S&P 500. The index includes the same constituents as the capitalization weighted S&P 500, but each company in the S&P 500 EWI is allocated a fixed weight — or 0.2% of the index total at each quarterly rebalance.
The S&P 500® Index is a market-capitalization-weighted index of 500 leading publicly traded companies in the U.S.
The S&P/Case-Shiller U.S. National Home Price Index is a composite of single-family home price indices for the nine U.S. Census divisions and is calculated monthly.
The S&P GSCI Commodity Index is a composite index of commodities that measures the performance of the commodities market.
The S&P MidCap 400® Index measures the performance of 400 mid-sized companies.
The S&P SmallCap 600® Index measures the small-cap segment of the U.S. equity market.
4
EQUITY INDEX FUND (Unaudited)
How did the Fund perform over the past six months?
The Fund’s performance for the six months ended June 30, 2024 was 15.29% before expenses and 15.20% after expenses. The Fund’s benchmark, the S&P 500® Index, returned 15.29% over the same period. During the period a small number of large-cap growth stocks accounted for a disproportionate percentage of the Index’s return. A long-term view and potential overall portfolio diversification benefits should be considered when reviewing the Fund’s performance.
ALL AMERICA FUND (Unaudited)
How did the Fund perform over the past six months?
The Fund’s performance for the six months ended June 30, 2024 was 10.24% before expenses and 9.96% after expenses. The Fund’s benchmark, the Russell 3000® Index, returned 13.56% over the same period. Small- and mid-cap stocks lagged large-caps, as measured by the S&P 500® Index, as a few large-cap growth stocks accounted for a disproportionate percentage of the S&P’s return. A long-term view and potential overall portfolio diversification benefits, which include holding companies of various sizes, should be considered when reviewing the Fund’s performance.
SMALL CAP VALUE FUND (Unaudited)
How did the Fund perform over the past six months?
The Fund’s performance for the six months ended June 30, 2024 was 0.42% before expenses and 0.01% after expenses. The Fund’s benchmark, the Russell 2000® Value Index, returned -0.85% over the same period. Small-cap stocks lagged large-caps, as measured by the S&P 500® Index, as a few large-cap growth stocks accounted for a disproportionate percentage of the S&P’s return. A long-term view and potential overall portfolio diversification benefits, which include holding companies of various sizes, should be considered when reviewing the performance of small-cap stocks.
SMALL CAP GROWTH FUND (Unaudited)
How did the Fund perform over the past six months?
The Fund’s performance for the six months ended June 30, 2024 was 3.65% before expenses and 3.22% after expenses. The Fund’s benchmark, the Russell 2000® Growth Index, returned 4.44% over the same period. Small-cap stocks lagged large-caps, as measured by the S&P 500® Index, as a few large-cap growth stocks accounted for a disproportionate percentage of the S&P’s return. A long-term view and potential overall portfolio diversification benefits, which include holding companies of various sizes, should be considered when reviewing the performance of small-cap stocks.
SMALL CAP EQUITY INDEX FUND (Unaudited)
How did the Fund perform over the past six months?
The Fund’s performance for the six months ended June 30, 2024 was -0.72% before expenses and -0.79% after expenses. The Fund’s benchmark, the S&P SmallCap® 600 Index, returned -0.72% over the same period. Small-cap stocks lagged large-caps, as measured by the S&P 500® Index, as a few large-cap growth stocks accounted for a disproportionate percentage of the S&P’s return. A long-term view and potential overall portfolio diversification benefits, which include holding companies of various sizes, should be considered when reviewing the performance of small-cap stocks.
MID CAP VALUE FUND (Unaudited)
How did the Fund perform over the past six months?
The Fund’s performance for the six months ended June 30, 2024 was 3.84% before expenses and 3.51% after expenses. The Fund’s benchmark, the Russell Midcap® Value Index, returned 4.54% over the same period. Mid-cap stocks lagged large-caps, as measured by the S&P 500® Index, as a few large-cap growth stocks accounted for a disproportionate percentage of the S&P’s return. A long-term view and potential overall portfolio diversification benefits, which include holding companies of various sizes, should be considered when reviewing the performance of mid-cap stocks.
5
MID CAP EQUITY INDEX FUND (Unaudited)
How did the Fund perform over the past six months?
The Fund’s performance for the six months ended June 30, 2024 was 6.20% before expenses and 6.12% after expenses. The Fund’s benchmark, the S&P MidCap® 400 Index, returned 6.17% over the same period. Mid-cap stocks lagged large-caps, as measured by the S&P 500® Index, as a few large-cap growth stocks accounted for a disproportionate percentage of the S&P’s return. A long-term view and potential overall portfolio diversification benefits, which include holding companies of various sizes, should be considered when reviewing the Fund’s performance.
BALANCED FUND (Unaudited)
How did the Fund perform over the past six months?
The Fund’s performance for the six months ended June 30, 2024 was 10.28% before expenses and 10.01% after expenses. The Fund’s benchmark, the 60% S&P 500® Index, 40% Bloomberg U.S. Aggregate Bond Index, returned 8.68% over the same period. A long-term view, asset composition and risk characteristics between the Fund and the Index should be considered when reviewing the Fund’s performance.
INTERNATIONAL FUND (Unaudited)
How did the Fund perform over the past six months?
The International Fund’s performance for the six months ended June 30, 2024 was 7.20% before expenses and 7.11% after expenses. The Fund’s benchmark, the MSCI EAFE Index, returned 5.34% over the same period. In general, international stocks, as measured by the benchmark, lagged in performance relative to the S&P 500® Index, an index of U.S. based companies. A long-term view and potential overall portfolio diversification benefits, which include companies with varying geographic exposure, should be considered when reviewing the performance of international stocks.
CATHOLIC VALUES INDEX FUND (Unaudited)
How did the Fund perform over the past six months?
The Fund’s performance for the six months ended June 30, 2024 was 13.14% before expenses and 13.02% after expenses. The Fund’s benchmark, the S&P 500® Catholic Values Index, returned 13.39% over the same period. During the period a small number of large-cap growth stocks accounted for a disproportionate percentage of the Index’s return. A long-term view and potential overall portfolio diversification benefits should be considered when reviewing the Fund’s performance.
RETIREMENT INCOME FUND (Unaudited)
How did the Fund perform over the past six months?
The Fund’s performance for the six months ended June 30, 2024 was 3.72% before expenses and 3.64% after expenses. The Fund’s benchmark, the Morningstar Lifetime Allocation Conservative Income Index returned 2.14% over the same period. The Fund’s return was influenced by its portfolio allocation and risk relative to the Index composition. A long-term view, asset composition and risk characteristics between the Fund and the Index should be considered when reviewing the Fund’s performance.
CLEAR PASSAGE 2015 FUND (Unaudited)
How did the Fund perform over the past six months?
The Fund’s performance for the six months ended June 30, 2024 was 4.04% before expenses and 3.94% after expenses. The Fund’s benchmark, the Morningstar Lifetime Allocation Conservative 2015 Index returned 3.32% over the same period. The Fund’s return was influenced by its portfolio allocation and risk relative to the Index. A long-term view, asset composition and risk characteristics between the Fund and the Index should be considered when reviewing the Fund’s performance.
6
CLEAR PASSAGE 2020 FUND (Unaudited)
How did the Fund perform over the past six months?
The Fund’s performance for the six months ended June 30, 2024 was 4.37% before expenses and 4.31% after expenses. The Fund’s benchmark, the Morningstar Lifetime Allocation Moderate 2020 Index returned 3.44% over the same period. The Fund’s return was influenced by its portfolio allocation and risk relative to the Index. A long-term view, asset composition and risk characteristics between the Fund and the Index should be considered when reviewing the Fund’s performance.
CLEAR PASSAGE 2025 FUND (Unaudited)
How did the Fund perform over the past six months?
The Fund’s performance for the six months ended June 30, 2024 was 5.54% before expenses and 5.48% after expenses. The Fund’s benchmark, the Morningstar Lifetime Allocation Moderate 2025 Index was 3.75% over the same period. The Fund’s return was influenced by its portfolio allocation and risk relative to the Index. A long-term view, asset composition and risk characteristics between the Fund and the Index should be considered when reviewing the Fund’s performance.
CLEAR PASSAGE 2030 FUND (Unaudited)
How did the Fund perform over the past six months?
The Fund’s performance for the six months ended June 30, 2024 was 6.58% before expenses and 6.52% after expenses. The Fund’s benchmark, the Morningstar Lifetime Allocation Moderate 2030 Index was 4.33% over the same period. The Fund’s return was influenced by its portfolio allocation and risk relative to the Index. A long-term view, asset composition and risk characteristics between the Fund and the Index should be considered when reviewing the Fund’s performance.
CLEAR PASSAGE 2035 FUND (Unaudited)
How did the Fund perform over the past six months?
The Fund’s performance for the six months ended June 30, 2024 was 7.98% before expenses and 7.92% after expenses. The Fund’s benchmark, the Morningstar Lifetime Allocation Moderate 2035 Index was 5.25% over the same period. The Fund’s return was influenced by its portfolio allocation and risk relative to the Index. A long-term view, asset composition and risk characteristics between the Fund and the Index should be considered when reviewing the Fund’s performance.
CLEAR PASSAGE 2040 FUND (Unaudited)
How did the Fund perform over the past six months?
The Fund’s performance for the six months ended June 30, 2024 was 8.94% before expenses and 8.88% after expenses. The Fund’s benchmark, the Morningstar Lifetime Allocation Moderate 2040 Index was 6.29% over the same period. The Fund’s return was influenced by its portfolio allocation and risk relative to the Index. A long-term view, asset composition and risk characteristics between the Fund and the Index should be considered when reviewing the Fund’s performance.
CLEAR PASSAGE 2045 FUND (Unaudited)
How did the Fund perform over the past six months?
The Fund’s performance for the six months ended June 30, 2024 was 9.32% before expenses and 9.26% after expenses. The Fund’s benchmark, the Morningstar Lifetime Allocation Moderate 2045 Index was 7.07% over the same period. The Fund’s return was influenced by its portfolio allocation and risk relative to the Index. A long-term view, asset composition and risk characteristics between the Fund and the Index should be considered when reviewing the Fund’s performance.
7
CLEAR PASSAGE 2050 FUND (Unaudited)
How did the Fund perform over the past six months?
The Fund’s performance for the six months ended June 30, 2024 was 9.56% before expenses and 9.49% after expenses. The Fund’s benchmark, the Morningstar Lifetime Allocation Moderate 2050 Index was 7.40% over the same period. The Fund’s return was influenced by its portfolio allocation and risk relative to the Index. A long-term view, asset composition and risk characteristics between the Fund and the Index should be considered when reviewing the Fund’s performance.
CLEAR PASSAGE 2055 FUND (Unaudited)
How did the Fund perform over the past six months?
The Fund’s performance for the six months ended June 30, 2024 was 9.72% before expenses and 9.65% after expenses. The Fund’s benchmark, the Morningstar Lifetime Allocation Moderate 2055 Index was 7.39% over the same period. The Fund’s return was influenced by its portfolio allocation and risk relative to the Index. A long-term view, asset composition and risk characteristics between the Fund and the Index should be considered when reviewing the Fund’s performance.
CLEAR PASSAGE 2060 FUND (Unaudited)
How did the Fund perform over the past six months?
The Fund’s performance for the six months ended June 30, 2024 was 9.72% before expenses and 9.64% after expenses. The Fund’s benchmark, the Morningstar Lifetime Allocation Moderate 2060 Index was 7.29% over the same period. The Fund’s return was influenced by its portfolio allocation and risk relative to the Index. A long-term view, asset composition and risk characteristics between the Fund and the Index should be considered when reviewing the Fund’s performance.
CLEAR PASSAGE 2065 FUND (Unaudited)
How did the Fund perform over the past six months?
The Fund’s performance for the six months ended June 30, 2024 was 9.89% before expenses and 9.86% after expenses. The Fund’s benchmark, the Morningstar Lifetime Allocation Moderate 2065 Index was 7.16% over the same period. The Fund’s return was influenced by its portfolio allocation and risk relative to the Index. A long-term view, asset composition and risk characteristics between the Fund and the Index should be considered when reviewing the Fund’s performance.
CONSERVATIVE ALLOCATION FUND (Unaudited)
How did the Fund perform over the past six months?
The Fund’s performance for the six months ended June 30, 2024 was 4.35% before expenses and 4.31% after expenses. The Fund’s benchmark, the Morningstar US Moderately Conservative Target Allocation Index, returned 4.66% over the same period. A long-term view, asset composition and risk characteristics between the Fund and the Index should be considered when reviewing the Fund’s performance.
MODERATE ALLOCATION FUND (Unaudited)
How did the Fund perform over the past six months?
The Fund’s performance for the six months ended June 30, 2024 was 6.79% before expenses and 6.75% after expenses. The Fund’s benchmark, the Morningstar US Moderate Target Allocation Index, returned 7.30% over the same period. A long-term view, asset composition and risk characteristics between the Fund and the Index should be considered when reviewing the Fund’s performance.
8
AGGRESSIVE ALLOCATION FUND (Unaudited)
How did the Fund perform over the past six months?
The Fund’s performance for the six months ended June 30, 2024 was 7.68% before expenses and 7.64% after expenses. The Fund’s benchmark, the Morningstar US Moderately Aggressive Target Allocation Index, returned 9.05% over the same period. A long-term view, asset composition and risk characteristics between the Fund and the Index should be considered when reviewing the Fund’s performance.
MONEY MARKET FUND (Unaudited)
How did the Fund perform over the past six months?
The Fund’s performance for the six months ended June 30, 2024 was 2.72% before expenses and 2.60% after expenses. The Fund’s benchmark, the FTSE 3-Month Treasury Bill Index, returned 2.76% over the same period. The interest rate environment during the period was characterized by relatively higher rates and the anticipation of rate cuts by the Federal Reserve in the near term. The potential benefits of including money market funds in a diversified portfolio should be considered when reviewing the performance of various asset classes.
INTERMEDIATE BOND FUND (Unaudited)
How did the Fund perform over the past six months?
The Fund’s performance for the six months ended June 30, 2024 was 0.61% before expenses and 0.37% after expenses. The Fund’s benchmark, the Bloomberg U.S. Intermediate Government/Credit Bond Index, returned 0.49% over the same period. The interest rate environment during the period was characterized by relatively higher rates and the anticipation of rate cuts by the Federal Reserve in the near term. The potential benefits of including fixed income in a diversified portfolio should be considered when reviewing the performance of various fixed income asset classes.
CORE BOND FUND (Unaudited)
How did the Fund perform over the past six months?
The Fund’s performance for the six months ended June 30, 2024 was -0.41% before expenses and -0.64% after expenses. The Fund’s benchmark, the Bloomberg U.S. Aggregate Bond Index, returned -0.71% over the same period. The interest rate environment during the period was characterized by relatively higher rates and the anticipation of rate cuts by the Federal Reserve in the near term. The potential benefits of including fixed income in a diversified portfolio should be considered when reviewing the performance of various fixed income asset classes.
9
MoA FUNDS
ASSET ALLOCATIONS AS OF JUNE 30, 2024 (Unaudited)
Equity Index Fund
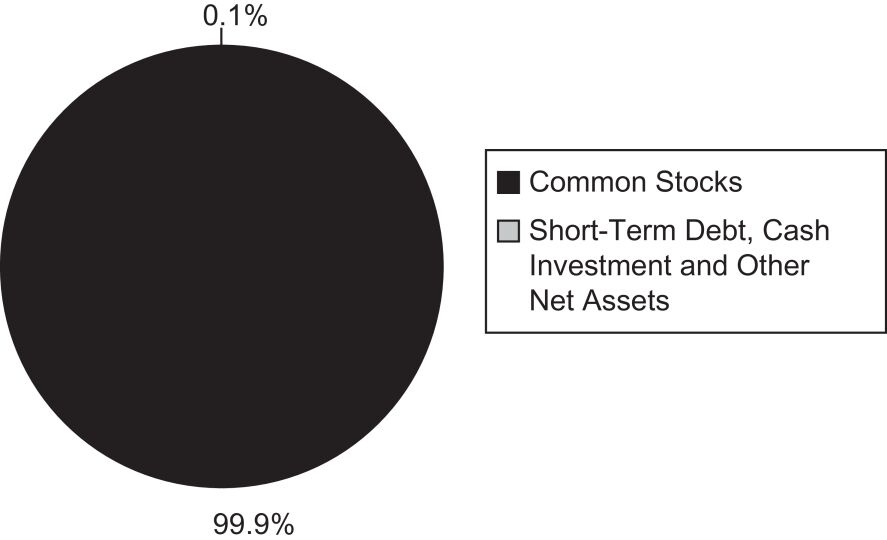
All America Fund
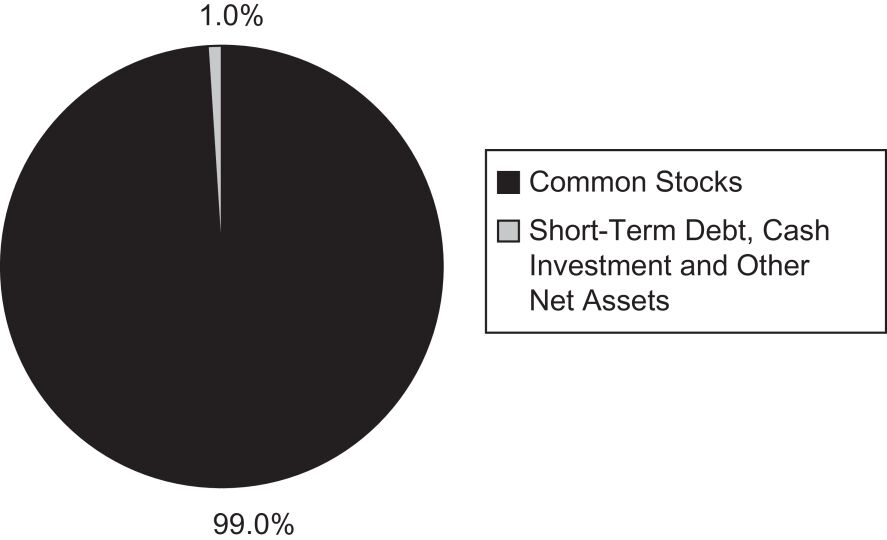
Small Cap Value Fund
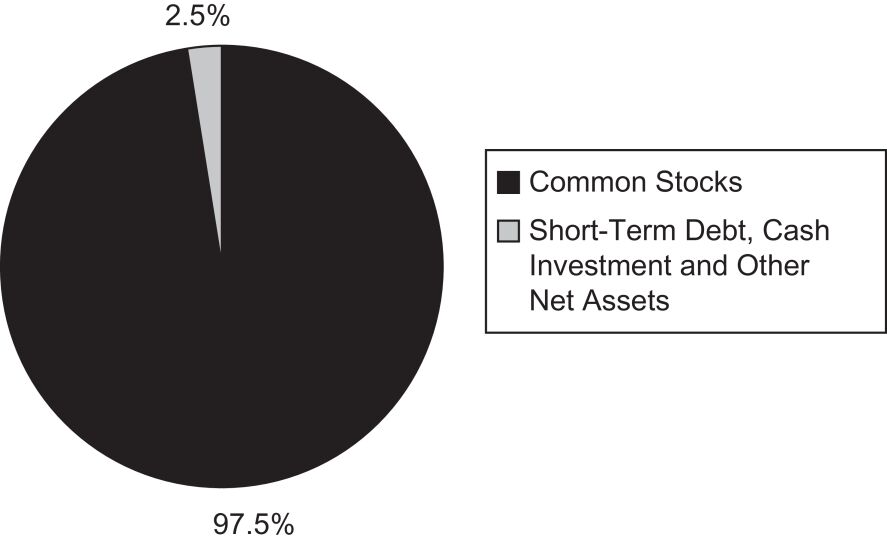
Small Cap Growth Fund
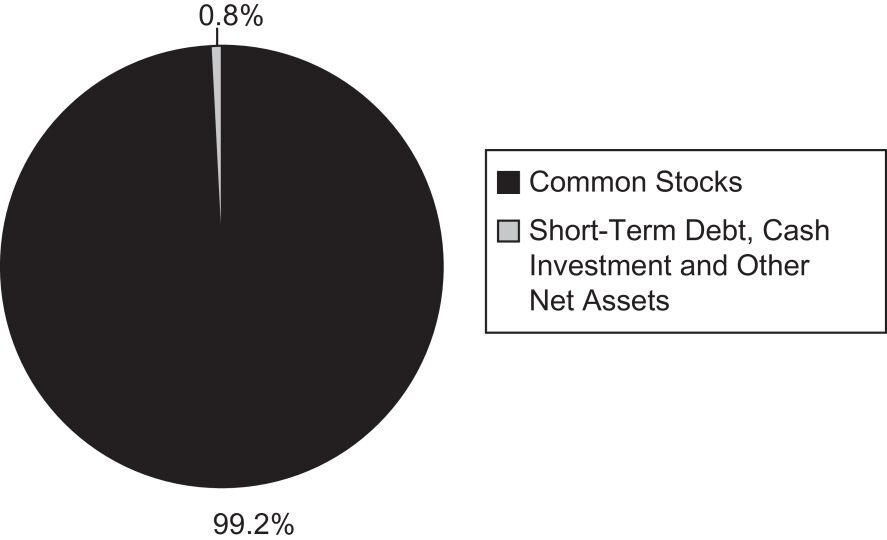
Small Cap Equity Index Fund
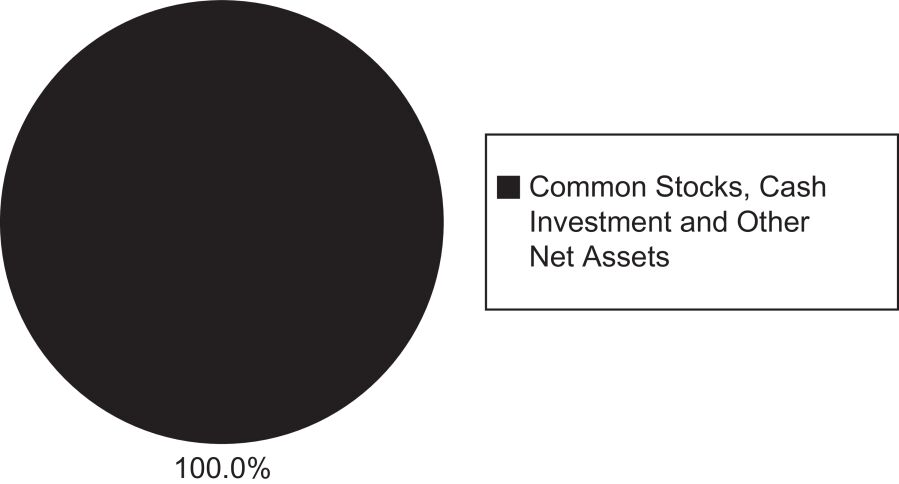
Mid Cap Value Fund
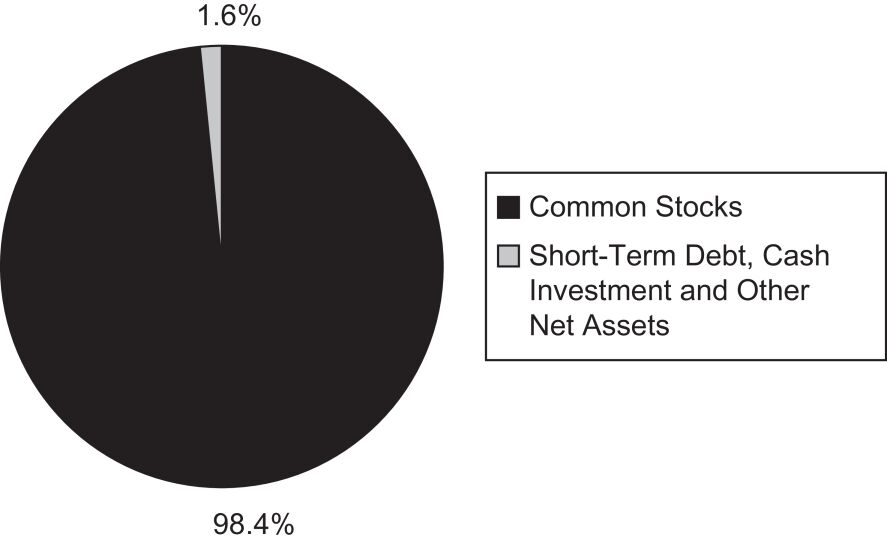
10
MoA FUNDS
ASSET ALLOCATIONS AS OF JUNE 30, 2024 (Unaudited) (Continued)
Mid Cap Equity Index Fund
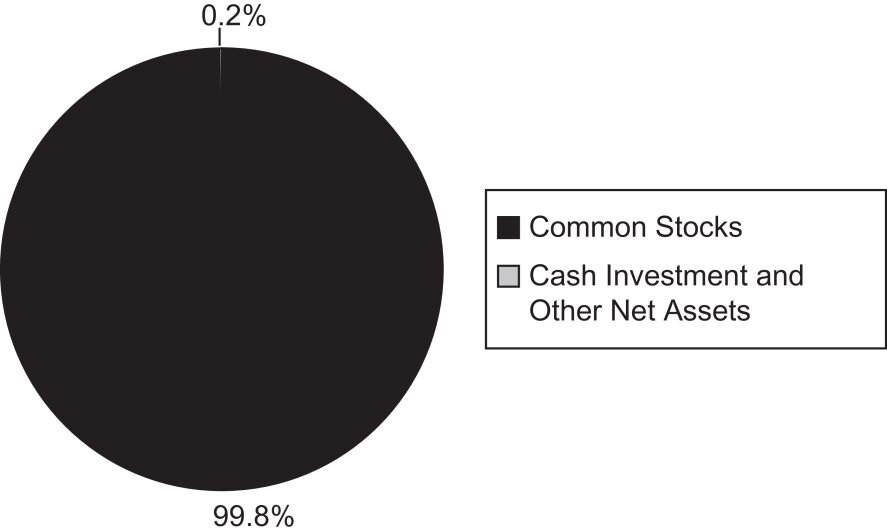
Balanced Fund

International Fund
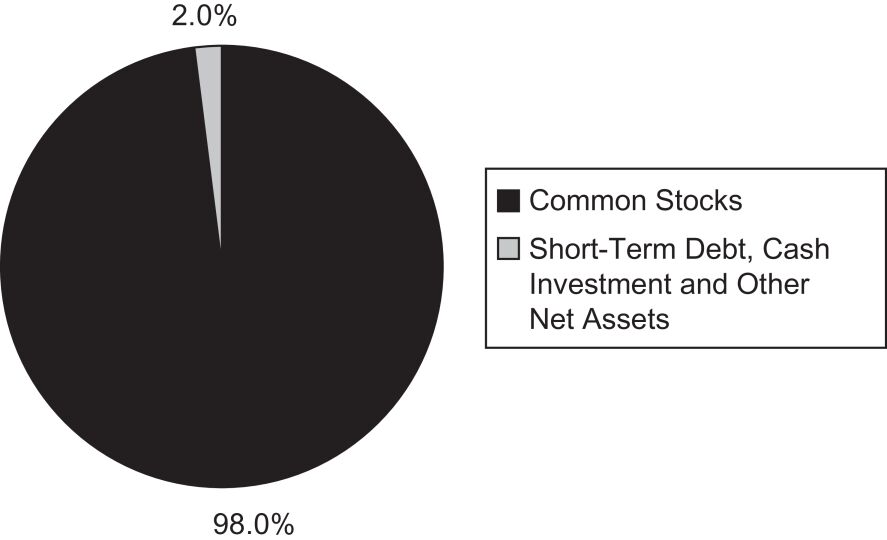
Catholic Values Index Fund
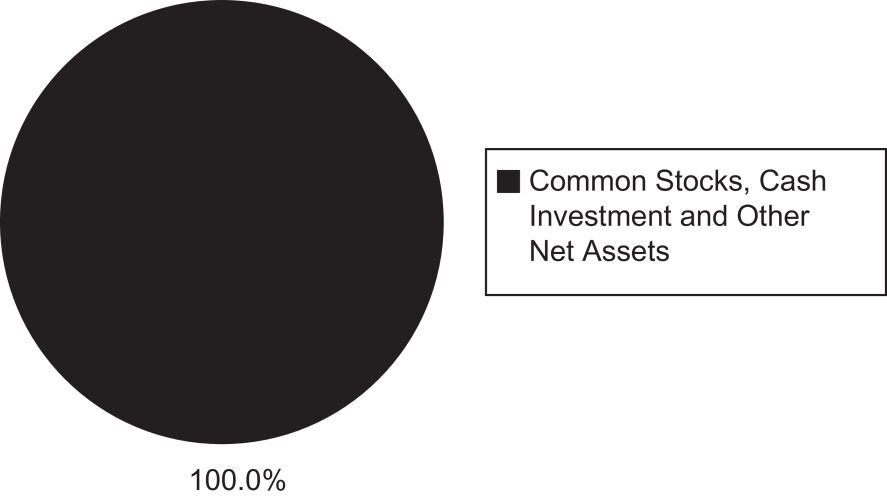
Retirement Income Fund
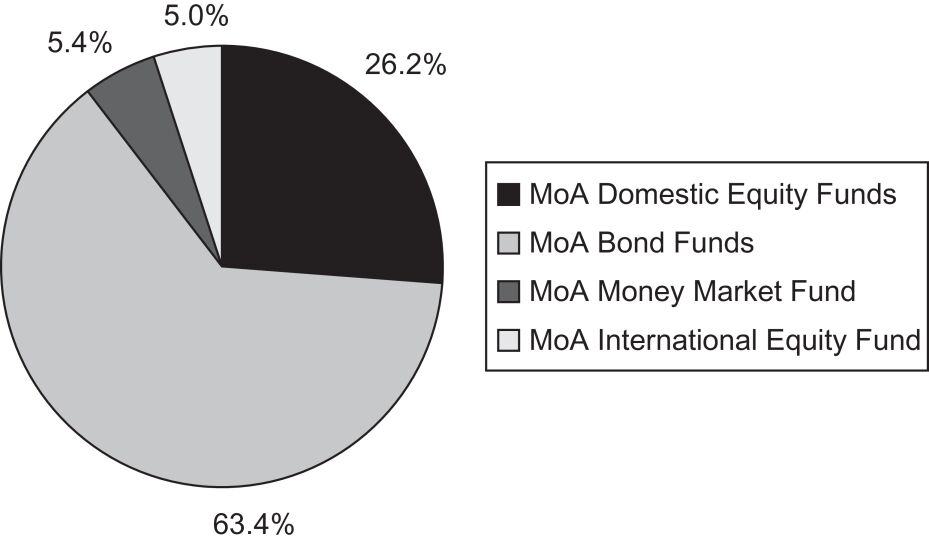
Clear Passage 2015 Fund
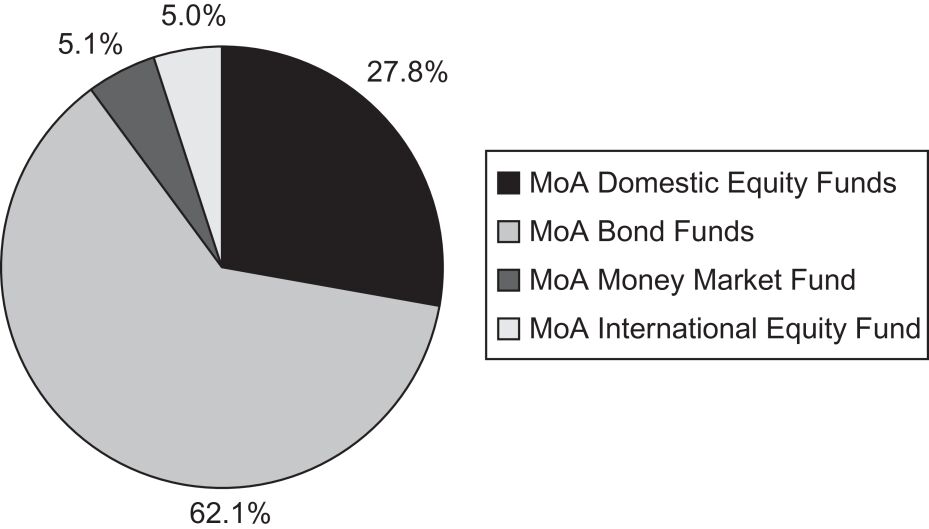
11
MoA FUNDS
ASSET ALLOCATIONS AS OF JUNE 30, 2024 (Unaudited) (Continued)
Clear Passage 2020 Fund
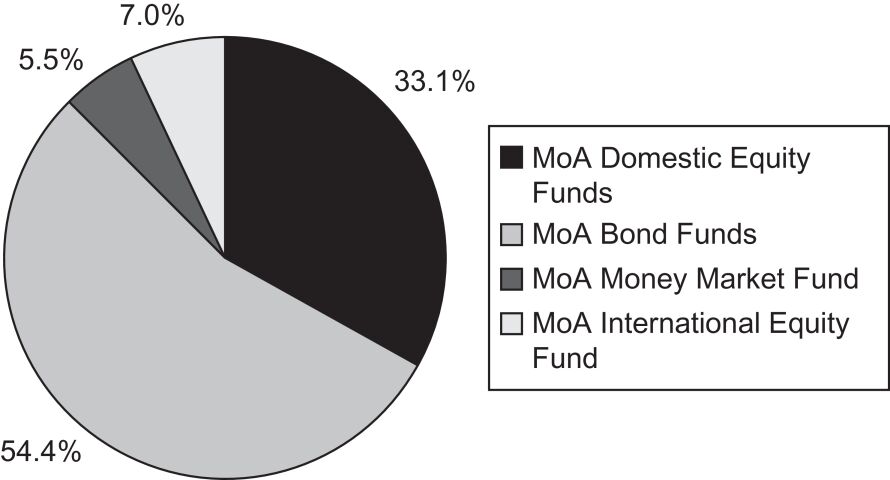
Clear Passage 2025 Fund
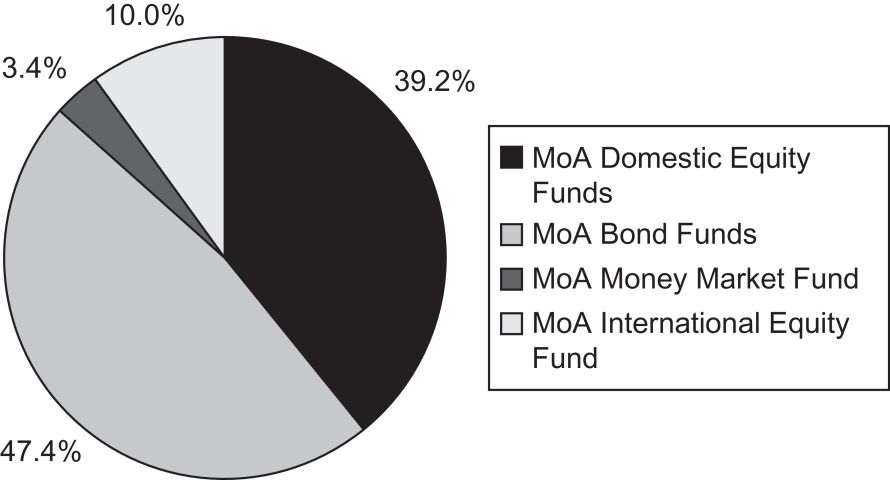
Clear Passage 2030 Fund
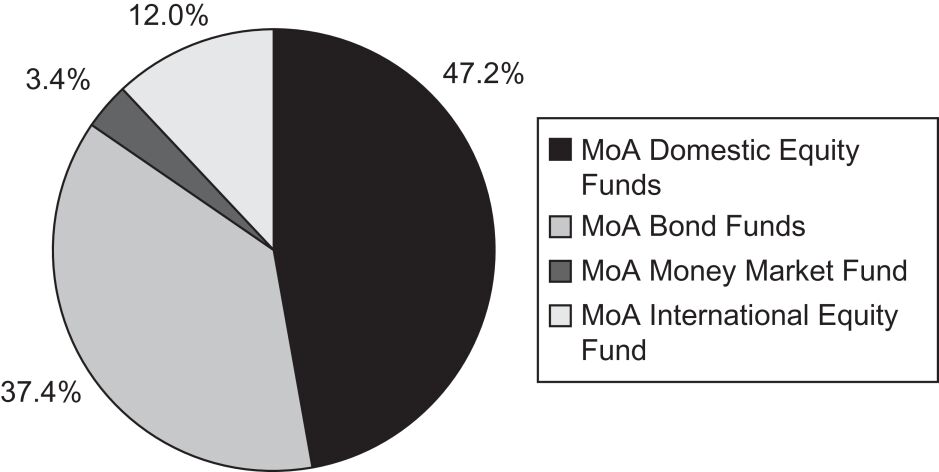
Clear Passage 2035 Fund
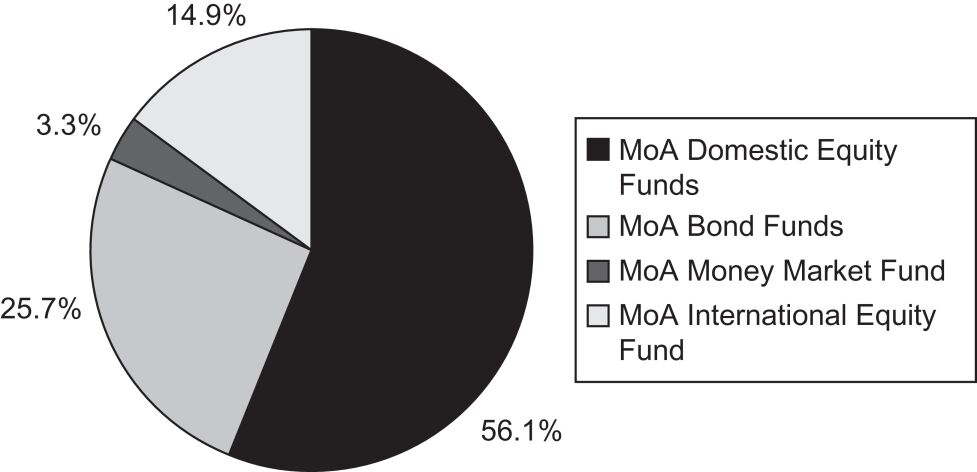
Clear Passage 2040 Fund
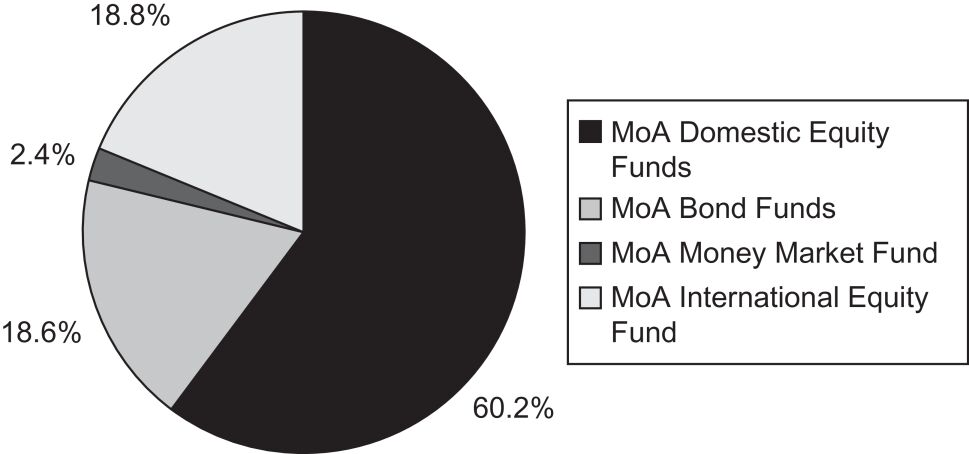
Clear Passage 2045 Fund
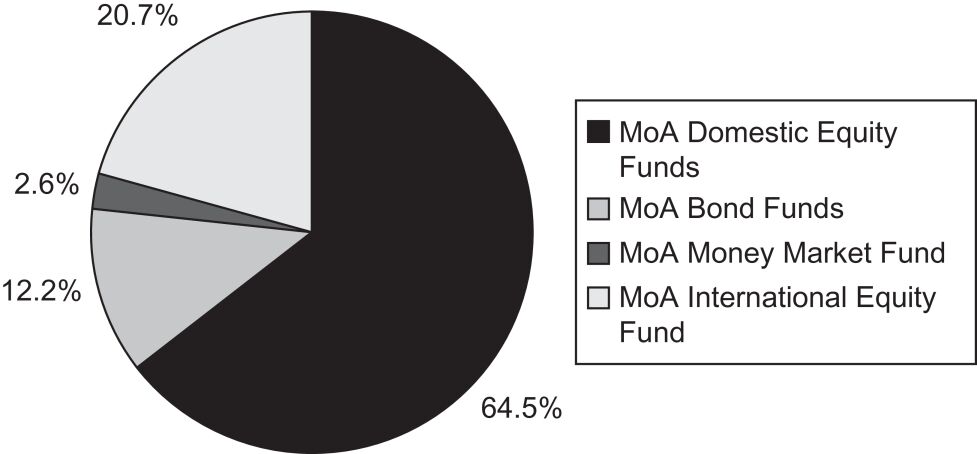
12
MoA FUNDS
ASSET ALLOCATIONS AS OF JUNE 30, 2024 (Unaudited) (Continued)
Clear Passage 2050 Fund
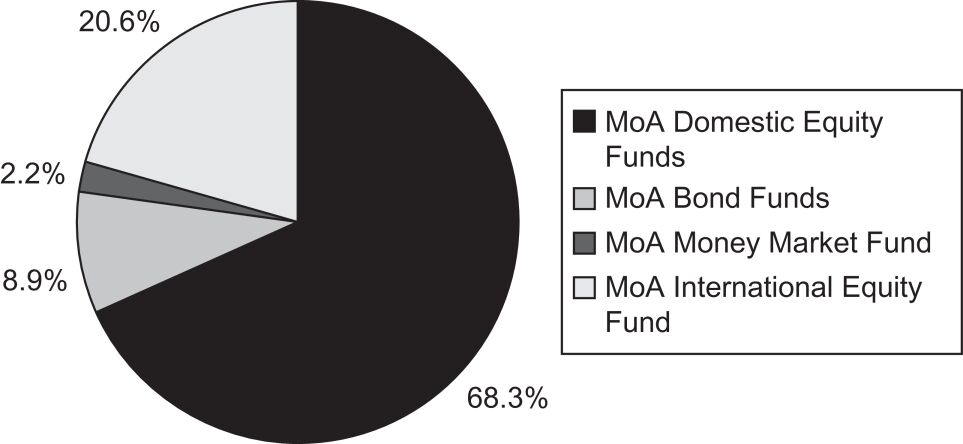
Clear Passage 2055 Fund
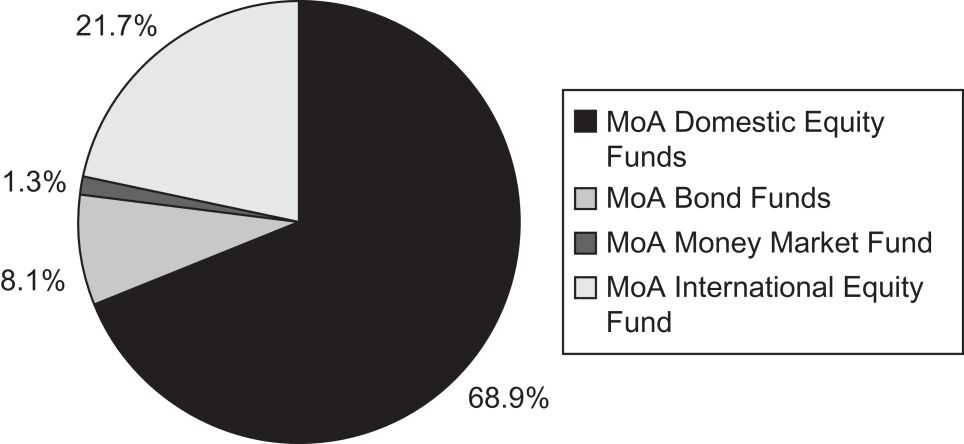
Clear Passage 2060 Fund
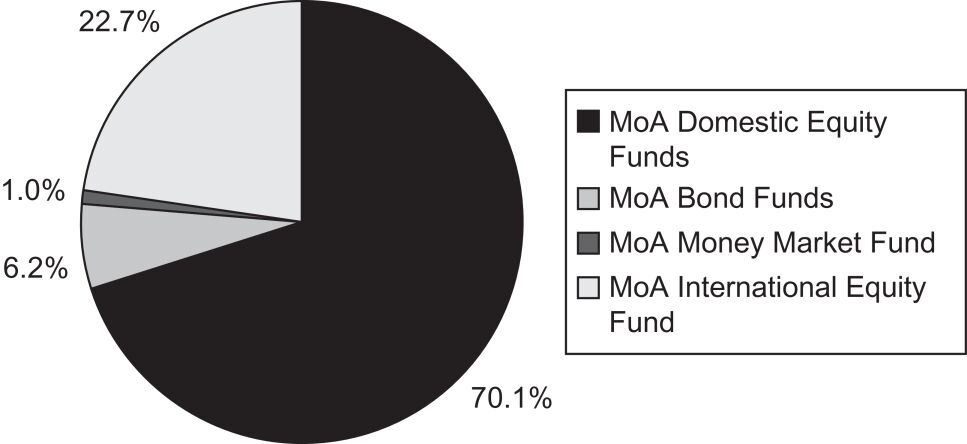
Clear Passage 2065 Fund
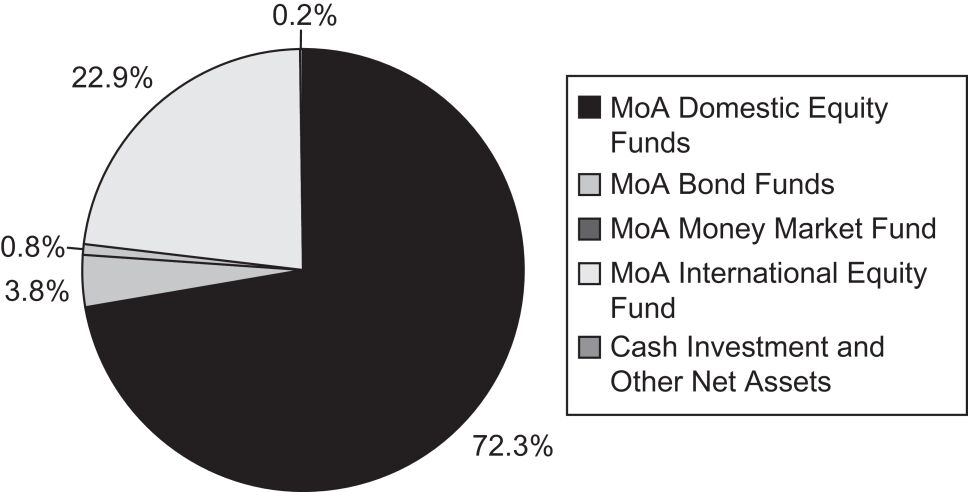
Conservative Allocation Fund
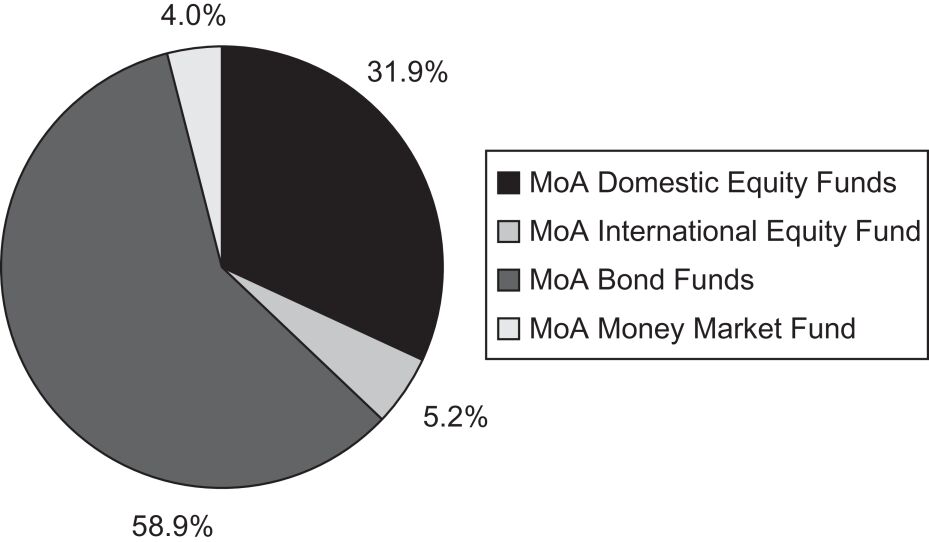
Moderate Allocation Fund
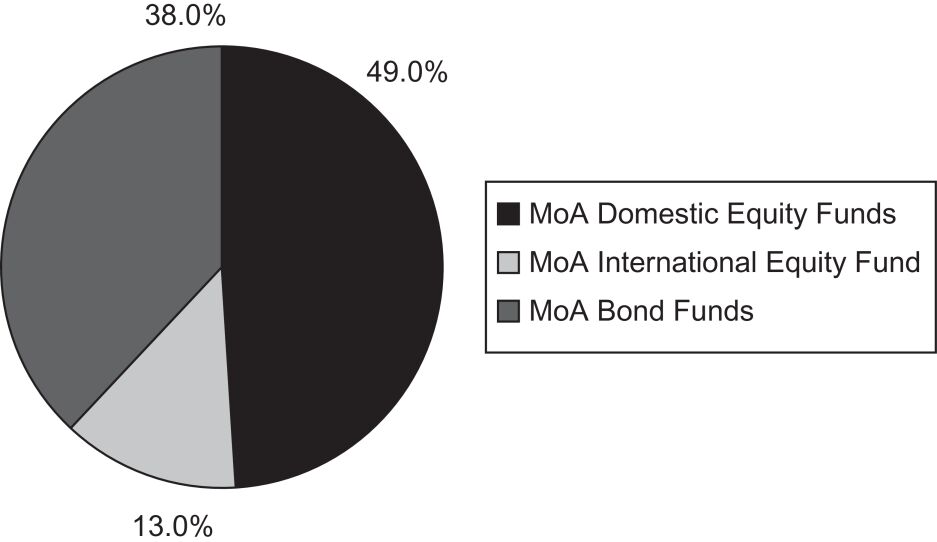
13
MoA FUNDS
ASSET ALLOCATIONS AS OF JUNE 30, 2024 (Unaudited) (Continued)
Aggressive Allocation Fund

Money Market Fund
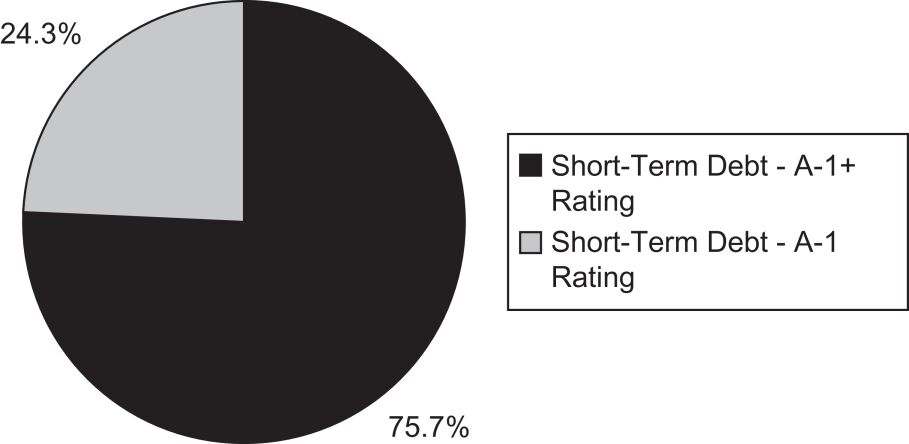
Intermediate Bond Fund

Core Bond Fund
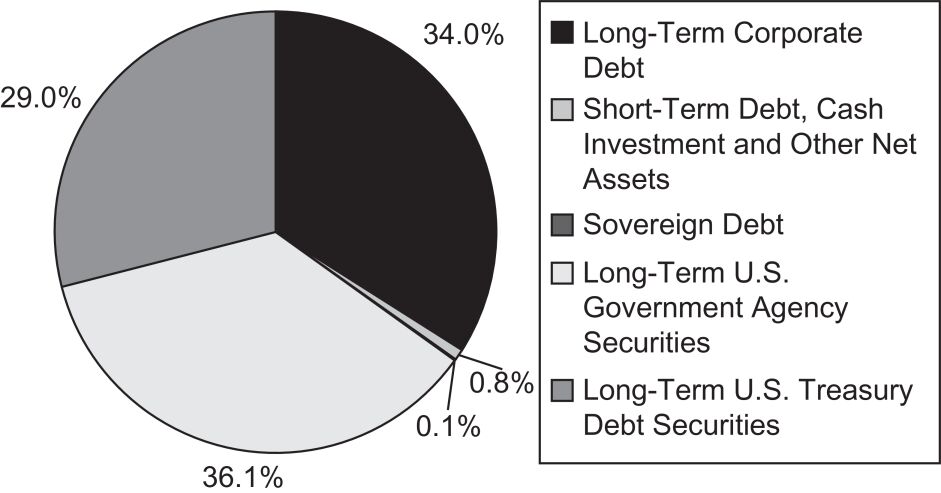
14
MoA FUNDS
EXPENSE EXAMPLE (Unaudited)
EXAMPLE
This Example is intended to help you understand your ongoing costs (in dollars) of investing in a Fund and to compare these costs with the ongoing costs of investing in other mutual funds. The Example is based on an investment of $10,000 invested at January 1, 2024 and held for the entire period ending June 30, 2024.
Had Mutual of America Capital Management LLC (the “Adviser”) and/or certain of its affiliates not waived/reimbursed certain fees and expenses, account values at the end of the period would have been reduced for those applicable Funds.
For variable annuity owners or participants in a group variable annuity, the estimate of expenses does not include fees and charges associated with your variable annuity. If those fees and charges were included, the estimate of expenses for the period would be higher and your ending account value would be lower.
ACTUAL EXPENSES
The first line of the tables below provides information about actual account values and actual expenses. You may use the information in this line, together with the amount you invested, to estimate the expenses that you paid over the period. Simply divide your account value by $10,000 (for example, an $8,600 account value divided by $10,000=0.86), then multiply the result by the number in the first line under the heading entitled “Expenses Paid During Period” to estimate the expenses you paid on your account during this period.
HYPOTHETICAL EXAMPLE FOR COMPARISON PURPOSES
The second line of the tables below provides information about hypothetical account values and hypothetical expenses based on each Fund’s actual expense ratio and an assumed rate of return of 5% per year before expenses, which is not the Fund’s actual return. The hypothetical account values and expenses may not be used to estimate the actual ending account balance or expenses you paid for the period. You may use this information to compare the ongoing costs of investing in the Fund with other funds. To do so, compare this 5% hypothetical example with the 5% hypothetical examples that appear in the shareholder reports of the other funds.
Please note that the second line of the table is useful in comparing ongoing costs only, and will not help you determine the relative total costs of owning other non-Mutual of America funds, which may also charge transactional costs, such as sales charges (loads), redemption fees or exchange fees, which the MoA Funds does not charge.
| | | | | | | | | | | | | | | | | | |
| | | Equity Index Fund | | | | |
| | | | | Beginning Account Value January 1, 2024 | | | Ending Account Value June 30, 2024 | | | Expense Paid During Period* January 1, 2024 to
June 30, 2024 | | | | |
| | | Actual | | | $10,000.00 | | | | $11,519.96 | | | | $7.49 | | | | | |
| | | Hypothetical
(5% return before expense) | | | $10,000.00 | | | | $10,241.67 | | | | $7.05 | | | | | |
| | * | Expenses are equal to the Fund’s annual expense ratio of 0.14%, multiplied by the average account value over the period, multiplied by 182/366 (to reflect the one-half year period). |
| | | | | | | | | | | | | | | | | | |
| | | All America Fund | | | | |
| | | | | Beginning Account Value January 1, 2024 | | | Ending Account Value June 30, 2024 | | | Expense Paid During Period* January 1, 2024 to June 30, 2024 | | | | |
| | | Actual | | | $10,000.00 | | | | $10,995.76 | | | | $26.62 | | | | | |
| | | Hypothetical
(5% return before expense) | | | $10,000.00 | | | | $10,223.27 | | | | $25.64 | | | | | |
| | * | Expenses are equal to the Fund’s annual expense ratio of 0.51%, multiplied by the average account value over the period, multiplied by 182/366 (to reflect the one-half year period). |
15
MoA FUNDS
EXPENSE EXAMPLE (Unaudited) (Continued)
| | | | | | | | | | | | | | | | | | |
| | | Small Cap Value Fund | | | | |
| | | | | Beginning Account Value January 1, 2024 | | | Ending Account Value June 30, 2024 | | | Expense Paid During Period* January 1, 2024 to June 30, 2024 | | | | |
| | | Actual | | | $10,000.00 | | | | $10,001.26 | | | | $40.28 | | | | | |
| | | Hypothetical
(5% return before expense) | | | $10,000.00 | | | | $10,208.36 | | | | $40.70 | | | | | |
| | * | Expenses are equal to the Fund’s annual expense ratio of 0.81%, multiplied by the average account value over the period, multiplied by 182/366 (to reflect the one-half year period). |
| | | | | | | | | | | | | | | | | | |
| | | Small Cap Growth Fund | | | | |
| | | | | Beginning Account Value January 1, 2024 | | | Ending Account Value June 30, 2024 | | | Expense Paid
During Period* January 1, 2024 to
June 30, 2024 | | | | |
| | | Actual | | | $10,000.00 | | | | $10,322.24 | | | | $40.93 | | | | | |
| | | Hypothetical
(5% return before expense) | | | $10,000.00 | | | | $10,208.36 | | | | $40.70 | | | | | |
| | * | Expenses are equal to the Fund’s annual expense ratio of 0.81%, multiplied by the average account value over the period, multiplied by 182/366 (to reflect the one-half year period). |
| | | | | | | | | | | | | | | | | | |
| | | Small Cap Equity Index Fund | | | | |
| | | | | Beginning Account Value January 1, 2024 | | | Ending Account Value June 30, 2024 | | | Expense Paid During Period* January 1, 2024 to June 30, 2024 | | | | |
| | | Actual | | | $10,000.00 | | | | $9,920.55 | | | | $6.93 | | | | | |
| | | Hypothetical
(5% return before expense) | | | $10,000.00 | | | | $10,241.67 | | | | $7.05 | | | | | |
| | * | Expenses are equal to the Fund’s annual expense ratio of 0.14%, multiplied by the average account value over the period, multiplied by 182/366 (to reflect the one-half year period). |
| | | | | | | | | | | | | | | | | | |
| | | Mid Cap Value Fund | | | | |
| | | | | Beginning Account Value January 1, 2024 | | | Ending Account Value
June 30, 2024 | | | Expense Paid During Period* January 1, 2024 to June 30, 2024 | | | | |
| | | Actual | | | $10,000.00 | | | | $10,350.53 | | | | $33.39 | | | | | |
| | | Hypothetical
(5% return before expense) | | | $10,000.00 | | | | $10,215.81 | | | | $33.17 | | | | | |
| | * | Expenses are equal to the Fund’s annual expense ratio of 0.66%, multiplied by the average account value over the period, multiplied by 182/366 (to reflect the one-half year period). |
16
MoA FUNDS
EXPENSE EXAMPLE (Unaudited) (Continued)
| | | | | | | | | | | | | | | | | | |
| | | Mid Cap Equity Index Fund | | | | |
| | | | | Beginning Account Value January 1, 2024 | | | Ending Account Value June 30, 2024 | | | Expense Paid During Period* January 1, 2024 to June 30, 2024 | | | | |
| | | Actual | | | $10,000.00 | | | | $10,611.55 | | | | $7.69 | | | | | |
| | | Hypothetical
(5% return before expense) | | | $10,000.00 | | | | $10,241.17 | | | | $7.55 | | | | | |
| | * | Expenses are equal to the Fund’s annual expense ratio of 0.15%, multiplied by the average account value over the period, multiplied by 182/366 (to reflect the one-half year period). |
| | | | | | | | | | | | | | | | | | |
| | | Balanced Fund | | | | |
| | | | | Beginning Account Value January 1, 2024 | | | Ending Account Value June 30, 2024 | | | Expense Paid During Period* January 1, 2024 to June 30, 2024 | | | | |
| | | Actual | | | $10,000.00 | | | | $11,000.56 | | | | $27.15 | | | | | |
| | | Hypothetical
(5% return before expense) | | | $10,000.00 | | | | $10,222.78 | | | | $26.15 | | | | | |
| | * | Expenses are equal to the Fund’s annual expense ratio of 0.52%, multiplied by the average account value over the period, multiplied by 182/366 (to reflect the one-half year period). |
| | | | | | | | | | | | | | | | | | |
| | | International Fund | | | | |
| | | | | Beginning Account Value January 1, 2024 | | | Ending Account Value June 30, 2024 | | | Expense Paid During Period* January 1, 2024 to June 30, 2024 | | | | |
| | | Actual | | | $10,000.00 | | | | $10,710.50 | | | | $10.81 | | | | | |
| | | Hypothetical
(5% return before expense) | | | $10,000.00 | | | | $10,237.69 | | | | $11.07 | | | | | |
| | * | Expenses are equal to the Fund’s annual expense ratio of 0.22% (reflecting direct expenses and the proportional expense ratios of the underlying funds in which the Fund invests), multiplied by the average account value over the period, multiplied by 182/366 (to reflect the one-half year period). |
| | | | | | | | | | | | | | | | | | |
| | | Catholic Values Index Fund | | | | |
| | | | | Beginning Account Value January 1, 2024 | | | Ending Account Value June 30, 2024 | | | Expense Paid During Period* January 1, 2024 to June 30, 2024 | | | | |
| | | Actual | | | $10,000.00 | | | | $11,301.64 | | | | $11.12 | | | | | |
| | | Hypothetical
(5% return before expense) | | | $10,000.00 | | | | $10,238.19 | | | | $10.57 | | | | | |
| | * | Expenses are equal to the Fund’s annual expense ratio of 0.21%, multiplied by the average account value over the period, multiplied by 182/366 (to reflect the one-half year period). |
17
MoA FUNDS
EXPENSE EXAMPLE (Unaudited) (Continued)
| | | | | | | | | | | | | | | | | | |
| | | Retirement Income Fund | | | | |
| | | | | Beginning Account Value January 1, 2024 | | | Ending Account Value June 30, 2024 | | | Expense Paid During Period* January 1, 2024 to June 30, 2024 | | | | |
| | | Actual | | | $10,000.00 | | | | $10,364.39 | | | | $25.32 | | | | | |
| | | Hypothetical
(5% return before expense) | | | $10,000.00 | | | | $10,223.77 | | | | $25.14 | | | | | |
| | * | Expenses are equal to the Fund’s annual expense ratio of 0.50% (reflecting direct expenses and the proportional expense ratios of the underlying funds in which the Fund invests), multiplied by the average account value over the period, multiplied by 182/366 (to reflect the one-half year period). |
| | | | | | | | | | | | | | | | | | |
| | | Clear Passage 2015 Fund | | | | |
| | | | | Beginning Account Value January 1, 2024 | | | Ending Account Value June 30, 2024 | | | Expense Paid During Period* January 1, 2024 to June 30, 2024 | | | | |
| | | Actual | | | $10,000.00 | | | | $10,394.36 | | | | $26.87 | | | | | |
| | | Hypothetical
(5% return before expense) | | | $10,000.00 | | | | $10,222.28 | | | | $26.65 | | | | | |
| | * | Expenses are equal to the Fund’s annual expense ratio of 0.53% (reflecting direct expenses and the proportional expense ratios of the underlying funds in which the Fund invests), multiplied by the average account value over the period, multiplied by 182/366 (to reflect the one-half year period). |
| | | | | | | | | | | | | | | | | | |
| | | Clear Passage 2020 Fund | | | | |
| | | | | Beginning Account Value January 1, 2024 | | | Ending Account Value June 30, 2024 | | | Expense Paid During Period* January 1, 2024 to June 30, 2024 | | | | |
| | | Actual | | | $10,000.00 | | | | $10,430.91 | | | | $22.86 | | | | | |
| | | Hypothetical
(5% return before expense) | | | $10,000.00 | | | | $10,226.26 | | | | $22.63 | | | | | |
| | * | Expenses are equal to the Fund’s annual expense ratio of 0.45% (reflecting direct expenses and the proportional expense ratios of the underlying funds in which the Fund invests), multiplied by the average account value over the period, multiplied by 182/366 (to reflect the one-half year period). |
| | | | | | | | | | | | | | | | | | |
| | | Clear Passage 2025 Fund | | | | |
| | | | | Beginning Account Value January 1, 2024 | | | Ending Account Value June 30, 2024 | | | Expense Paid During Period* January 1, 2024 to June 30, 2024 | | | | |
| | | Actual | | | $10,000.00 | | | | $10,548.36 | | | | $20.95 | | | | | |
| | | Hypothetical
(5% return before expense) | | | $10,000.00 | | | | $10,228.25 | | | | $20.62 | | | | | |
| | * | Expenses are equal to the Fund’s annual expense ratio of 0.41% (reflecting direct expenses and the proportional expense ratios of the underlying funds in which the Fund invests), multiplied by the average account value over the period, multiplied by 182/366 (to reflect the one-half year period). |
18
MoA FUNDS
EXPENSE EXAMPLE (Unaudited) (Continued)
| | | | | | | | | | | | | | | | | | |
| | | Clear Passage 2030 Fund | | | | |
| | | | | Beginning Account Value January 1, 2024 | | | Ending Account Value June 30, 2024 | | | Expense Paid During Period* January 1, 2024 to June 30, 2024 | | | | |
| | | Actual | | | $10,000.00 | | | | $10,651.60 | | | | $20.03 | | | | | |
| | | Hypothetical
(5% return before expense) | | | $10,000.00 | | | | $10,229.24 | | | | $19.62 | | | | | |
| | * | Expenses are equal to the Fund’s annual expense ratio of 0.39% (reflecting direct expenses and the proportional expense ratios of the underlying funds in which the Fund invests), multiplied by the average account value over the period, multiplied by 182/366 (to reflect the one-half year period). |
| | | | | | | | | | | | | | | | | | |
| | | Clear Passage 2035 Fund | | | | |
| | | | | Beginning Account Value January 1, 2024 | | | Ending Account Value June 30, 2024 | | | Expense Paid During Period* January 1, 2024 to June 30, 2024 | | | | |
| | | Actual | | | $10,000.00 | | | | $10,791.54 | | | | $18.61 | | | | | |
| | | Hypothetical
(5% return before expense) | | | $10,000.00 | | | | $10,230.73 | | | | $18.11 | | | | | |
| | * | Expenses are equal to the Fund’s annual expense ratio of 0.36% (reflecting direct expenses and the proportional expense ratios of the underlying funds in which the Fund invests), multiplied by the average account value over the period, multiplied by 182/366 (to reflect the one-half year period). |
| | | | | | | | | | | | | | | | | | |
| | | Clear Passage 2040 Fund | | | | |
| | | | | Beginning Account Value January 1, 2024 | | | Ending Account Value June 30, 2024 | | | Expense Paid During Period* January 1, 2024 to June 30, 2024 | | | | |
| | | Actual | | | $10,000.00 | | | | $10,887.88 | | | | $17.66 | | | | | |
| | | Hypothetical
(5% return before expense) | | | $10,000.00 | | | | $10,231.73 | | | | $17.10 | | | | | |
| | * | Expenses are equal to the Fund’s annual expense ratio of 0.34% (reflecting direct expenses and the proportional expense ratios of the underlying funds in which the Fund invests), multiplied by the average account value over the period, multiplied by 182/366 (to reflect the one-half year period). |
| | | | | | | | | | | | | | | | | | |
| | | Clear Passage 2045 Fund | | | | |
| | | | | Beginning Account Value January 1, 2024 | | | Ending Account Value June 30, 2024 | | | Expense Paid During Period* January 1, 2024 to June 30, 2024 | | | | |
| | | Actual | | | $10,000.00 | | | | $10,925.87 | | | | $17.17 | | | | | |
| | | Hypothetical
(5% return before expense) | | | $10,000.00 | | | | $10,232.22 | | | | $16.60 | | | | | |
| | * | Expenses are equal to the Fund’s annual expense ratio of 0.33% (reflecting direct expenses and the proportional expense ratios of the underlying funds in which the Fund invests), multiplied by the average account value over the period, multiplied by 182/366 (to reflect the one-half year period). |
19
MoA FUNDS
EXPENSE EXAMPLE (Unaudited) (Continued)
| | | | | | | | | | | | | | | | | | |
| | | Clear Passage 2050 Fund | | | | |
| | | | | Beginning Account Value January 1, 2024 | | | Ending Account Value June 30, 2024 | | | Expense Paid During Period* January 1, 2024 to June 30, 2024 | | | | |
| | | Actual | | | $10,000.00 | | | | $10,949.29 | | | | $17.19 | | | | | |
| | | Hypothetical
(5% return before expense) | | | $10,000.00 | | | | $10,232.22 | | | | $16.60 | | | | | |
| | * | Expenses are equal to the Fund’s annual expense ratio of 0.33% (reflecting direct expenses and the proportional expense ratios of the underlying funds in which the Fund invests), multiplied by the average account value over the period, multiplied by 182/366 (to reflect the one-half year period). |
| | | | | | | | | | | | | | | | | | |
| | | Clear Passage 2055 Fund | | | | |
| | | | | Beginning Account Value January 1, 2024 | | | Ending Account Value June 30, 2024 | | | Expense Paid During Period* January 1, 2024 to June 30, 2024 | | | | |
| | | Actual | | | $10,000.00 | | | | $10,964.85 | | | | $17.72 | | | | | |
| | | Hypothetical
(5% return before expense) | | | $10,000.00 | | | | $10,231.73 | | | | $17.10 | | | | | |
| | * | Expenses are equal to the Fund’s annual expense ratio of 0.34% (reflecting direct expenses and the proportional expense ratios of the underlying funds in which the Fund invests), multiplied by the average account value over the period, multiplied by 182/366 (to reflect the one-half year period). |
| | | | | | | | | | | | | | | | | | |
| | | Clear Passage 2060 Fund | | | | |
| | | | | Beginning Account Value January 1, 2024 | | | Ending Account Value June 30, 2024 | | | Expense Paid During Period* January 1, 2024 to June 30, 2024 | | | | |
| | | Actual | | | $10,000.00 | | | | $10,963.76 | | | | $18.76 | | | | | |
| | | Hypothetical
(5% return before expense) | | | $10,000.00 | | | | $10,230.73 | | | | $18.11 | | | | | |
| | * | Expenses are equal to the Fund’s annual expense ratio of 0.36% (reflecting direct expenses and the proportional expense ratios of the underlying funds in which the Fund invests), multiplied by the average account value over the period, multiplied by 182/366 (to reflect the one-half year period). |
| | | | | | | | | | | | | | | | | | |
| | | Clear Passage 2065 Fund | | | | |
| | | | | Beginning Account Value January 1, 2024 | | | Ending Account Value June 30, 2024 | | | Expense Paid During Period* January 1, 2024 to June 30, 2024 | | | | |
| | | Actual | | | $10,000.00 | | | | $10,985.82 | | | | $13.57 | | | | | |
| | | Hypothetical
(5% return before expense) | | | $10,000.00 | | | | $10,235.70 | | | | $13.08 | | | | | |
| | * | Expenses are equal to the Fund’s annual expense ratio of 0.26% (reflecting direct expenses and the proportional expense ratios of the underlying funds in which the Fund invests), multiplied by the average account value over the period, multiplied by 182/366 (to reflect the one-half year period). |
20
MoA FUNDS
EXPENSE EXAMPLE (Unaudited) (Continued)
| | | | | | | | | | | | | | | | | | |
| | | Conservative Allocation Fund | | | | |
| | | | | Beginning Account Value January 1, 2024 | | | Ending Account Value June 30, 2024 | | | Expense Paid During Period* January 1, 2024 to June 30, 2024 | | | | |
| | | Actual | | | $10,000.00 | | | | $10,430.51 | | | | $21.84 | | | | | |
| | | Hypothetical
(5% return before expense) | | | $10,000.00 | | | | $10,227.25 | | | | $21.63 | | | | | |
| | * | Expenses are equal to the Fund’s annual expense ratio of 0.43% (reflecting direct expenses and the proportional expense ratios of the underlying funds in which the Fund invests), multiplied by the average account value over the period, multiplied by 182/366 (to reflect the one-half year period). |
| | | | | | | | | | | | | | | | | | |
| | | Moderate Allocation Fund | | | | |
| | | | | Beginning Account Value January 1, 2024 | | | Ending Account Value June 30, 2024 | | | Expense Paid During Period* January 1, 2024 to June 30, 2024 | | | | |
| | | Actual | | | $10,000.00 | | | | $10,675.11 | | | | $16.96 | | | | | |
| | | Hypothetical
(5% return before expense) | | | $10,000.00 | | | | $10,232.22 | | | | $16.60 | | | | | |
| | * | Expenses are equal to the Fund’s annual expense ratio of 0.33% (reflecting direct expenses and the proportional expense ratios of the underlying funds in which the Fund invests), multiplied by the average account value over the period, multiplied by 182/366 (to reflect the one-half year period). |
| | | | | | | | | | | | | | | | | | |
| | | Aggressive Allocation Fund | | | | |
| | | | | Beginning Account Value January 1, 2024 | | | Ending Account Value June 30, 2024 | | | Expense Paid During Period* January 1, 2024 to June 30, 2024 | | | | |
| | | Actual | | | $10,000.00 | | | | $10,763.66 | | | | $17.55 | | | | | |
| | | Hypothetical
(5% return before expense) | | | $10,000.00 | | | | $10,231.73 | | | | $17.10 | | | | | |
| | * | Expenses are equal to the Fund’s annual expense ratio of 0.34% (reflecting direct expenses and the proportional expense ratios of the underlying funds in which the Fund invests), multiplied by the average account value over the period, multiplied by 182/366 (to reflect the one-half year period). |
| | | | | | | | | | | | | | | | | | |
| | | Money Market Fund | | | | |
| | | | | Beginning Account Value January 1, 2024 | | | Ending Account Value June 30, 2024 | | | Expense Paid During Period* January 1, 2024 to June 30, 2024 | | | | |
| | | Actual | | | $10,000.00 | | | | $10,259.58 | | | | $12.09 | | | | | |
| | | Hypothetical
(5% return before expense) | | | $10,000.00 | | | | $10,236.70 | | | | $12.08 | | | | | |
| | * | Expenses are equal to the Fund’s annual expense ratio of 0.24%, multiplied by the average account value over the period, multiplied by 182/366 (to reflect the one-half year period). |
21
MoA FUNDS
EXPENSE EXAMPLE (Unaudited) (Continued)
| | | | | | | | | | | | | | | | | | |
| | | Intermediate Bond Fund | | | | |
| | | | | Beginning Account Value January 1, 2024 | | | Ending Account Value June 30, 2024 | | | Expense Paid During Period* January 1, 2024 to June 30, 2024 | | | | |
| | | Actual | | | $10,000.00 | | | | $10,036.62 | | | | $23.41 | | | | | |
| | | Hypothetical
(5% return before expense) | | | $10,000.00 | | | | $10,225.26 | | | | $23.63 | | | | | |
| | * | Expenses are equal to the Fund’s annual expense ratio of 0.47%, multiplied by the average account value over the period, multiplied by 182/366 (to reflect the one-half year period). |
| | | | | | | | | | | | | | | | | | |
| | | Core Bond Fund | | | | |
| | | | | Beginning Account Value January 1, 2024 | | | Ending Account Value June 30, 2024 | | | Expense Paid During Period* January 1, 2024 to June 30, 2024 | | | | |
| | | Actual | | | $10,000.00 | | | | $9,936.08 | | | | $22.31 | | | | | |
| | | Hypothetical
(5% return before expense) | | | $10,000.00 | | | | $10,226.26 | | | | $22.63 | | | | | |
| | * | Expenses are equal to the Fund’s annual expense ratio of 0.45%, multiplied by the average account value over the period, multiplied by 182/366 (to reflect the one-half year period). |
22
MoA FUNDS — EQUITY INDEX FUND
PORTFOLIO OF INVESTMENTS IN SECURITIES
June 30, 2024 (Unaudited)
| | | | | | | | |
| | | Shares | | | Value | |
| COMMON STOCKS (99.9%): | |
| COMMUNICATION SERVICES (9.3%) | | | | |
Alphabet, Inc. Cl A | | | 716,779 | | | $ | 130,561,295 | |
Alphabet, Inc. Cl C | | | 596,314 | | | | 109,375,914 | |
AT&T, Inc. | | | 874,943 | | | | 16,720,161 | |
Charter Communications, Inc. Cl A* | | | 11,952 | | | | 3,573,170 | |
Comcast Corp. Cl A | | | 477,631 | | | | 18,704,030 | |
Electronic Arts, Inc. | | | 29,688 | | | | 4,136,429 | |
Fox Corp. Cl A | | | 28,207 | | | | 969,474 | |
Fox Corp. Cl B | | | 16,099 | | | | 515,490 | |
Interpublic Group of Cos., Inc. | | | 46,056 | | | | 1,339,769 | |
Live Nation Entertainment, Inc.* | | | 17,381 | | | | 1,629,295 | |
Match Group, Inc.* | | | 32,419 | | | | 984,889 | |
Meta Platforms, Inc. Cl A | | | 267,413 | | | | 134,834,983 | |
Netflix, Inc.* | | | 52,581 | | | | 35,485,865 | |
News Corp. Cl A | | | 46,273 | | | | 1,275,747 | |
News Corp. Cl B | | | 13,961 | | | | 396,353 | |
Omnicom Group, Inc. | | | 23,897 | | | | 2,143,561 | |
Paramount Global Cl B | | | 60,324 | | | | 626,766 | |
Take-Two Interactive Software, Inc.* | | | 19,376 | | | | 3,012,774 | |
T-Mobile US, Inc. | | | 62,919 | | | | 11,085,069 | |
Verizon Communications, Inc. | | | 513,636 | | | | 21,182,349 | |
Walt Disney Co. | | | 222,458 | | | | 22,087,855 | |
Warner Bros Discovery, Inc.* | | | 272,090 | | | | 2,024,350 | |
| | | | | | | | |
| | | | | | | 522,665,588 | |
| | | | | | | | |
| CONSUMER DISCRETIONARY (9.9%) | | | | |
Airbnb, Inc. Cl A* | | | 53,874 | | | | 8,168,915 | |
Amazon.com, Inc.* | | | 1,117,489 | | | | 215,954,749 | |
Aptiv PLC* | | | 33,199 | | | | 2,337,874 | |
AutoZone, Inc.* | | | 2,111 | | | | 6,257,215 | |
Bath & Body Works, Inc. | | | 27,293 | | | | 1,065,792 | |
Best Buy Co., Inc. | | | 23,496 | | | | 1,980,478 | |
Booking Hldgs., Inc. | | | 4,141 | | | | 16,404,571 | |
BorgWarner, Inc. | | | 27,803 | | | | 896,369 | |
Caesars Entertainment, Inc.* | | | 26,408 | | | | 1,049,454 | |
CarMax, Inc.* | | | 19,206 | | | | 1,408,568 | |
Carnival Corp.* | | | 123,256 | | | | 2,307,352 | |
Chipotle Mexican Grill, Inc. Cl A* | | | 167,550 | | | | 10,497,007 | |
Darden Restaurants, Inc. | | | 14,565 | | | | 2,203,976 | |
Deckers Outdoor Corp.* | | | 3,133 | | | | 3,032,587 | |
Domino’s Pizza, Inc. | | | 4,257 | | | | 2,198,017 | |
DR Horton, Inc. | | | 36,167 | | | | 5,097,015 | |
eBay, Inc. | | | 61,745 | | | | 3,316,941 | |
Etsy, Inc.* | | | 14,269 | | | | 841,586 | |
Expedia Group, Inc.* | | | 15,491 | | | | 1,951,711 | |
Ford Motor Co. | | | 478,521 | | | | 6,000,653 | |
Garmin Ltd. | | | 18,750 | | | | 3,054,750 | |
General Motors Co. | | | 139,227 | | | | 6,468,486 | |
Genuine Parts Co. | | | 16,999 | | | | 2,351,302 | |
| | | | | | | | |
| | | Shares | | | Value | |
| COMMON STOCKS (CONTINUED): | |
| CONSUMER DISCRETIONARY (CONTINUED) | | | | |
Hasbro, Inc. | | | 15,968 | | | $ | 934,128 | |
Hilton Worldwide Hldgs., Inc. | | | 30,513 | | | | 6,657,937 | |
Home Depot, Inc. | | | 120,932 | | | | 41,629,632 | |
Las Vegas Sands Corp. | | | 44,548 | | | | 1,971,249 | |
Lennar Corp. Cl A | | | 29,880 | | | | 4,478,116 | |
LKQ Corp. | | | 32,554 | | | | 1,353,921 | |
Lowe’s Cos., Inc. | | | 69,823 | | | | 15,393,179 | |
Lululemon Athletica, Inc.* | | | 13,982 | | | | 4,176,423 | |
Marriott International, Inc. Cl A | | | 29,277 | | | | 7,078,300 | |
McDonald’s Corp. | | | 87,942 | | | | 22,411,139 | |
MGM Resorts International* | | | 30,622 | | | | 1,360,842 | |
Mohawk Industries, Inc.* | | | 6,468 | | | | 734,700 | |
NIKE, Inc. Cl B | | | 147,830 | | | | 11,141,947 | |
Norwegian Cruise Line Hldgs. Ltd.* | | | 52,353 | | | | 983,713 | |
NVR, Inc.* | | | 383 | | | | 2,906,418 | |
O’Reilly Automotive, Inc.* | | | 7,187 | | | | 7,589,903 | |
Pool Corp. | | | 4,678 | | | | 1,437,690 | |
PulteGroup, Inc. | | | 25,668 | | | | 2,826,047 | |
Ralph Lauren Corp. Cl A | | | 4,765 | | | | 834,161 | |
Ross Stores, Inc. | | | 40,917 | | | | 5,946,058 | |
Royal Caribbean Cruises Ltd.* | | | 28,890 | | | | 4,605,933 | |
Starbucks Corp. | | | 138,218 | | | | 10,760,271 | |
Tapestry, Inc. | | | 28,038 | | | | 1,199,746 | |
Tesla, Inc.* | | | 338,572 | | | | 66,996,627 | |
TJX Cos., Inc. | | | 138,195 | | | | 15,215,270 | |
Tractor Supply Co. | | | 13,156 | | | | 3,552,120 | |
Ulta Beauty, Inc.* | | | 5,850 | | | | 2,257,340 | |
Wynn Resorts Ltd. | | | 11,523 | | | | 1,031,309 | |
Yum! Brands, Inc. | | | 34,366 | | | | 4,552,120 | |
| | | | | | | | |
| | | | | | | 556,861,607 | |
| | | | | | | | |
| CONSUMER STAPLES (5.7%) | |
Altria Group, Inc. | | | 209,595 | | | | 9,547,052 | |
Archer-Daniels-Midland Co. | | | 60,335 | | | | 3,647,251 | |
Brown-Forman Corp. Cl B | | | 21,845 | | | | 943,485 | |
Bunge Global S.A. | | | 17,279 | | | | 1,844,879 | |
Campbell Soup Co. | | | 24,009 | | | | 1,084,967 | |
Church & Dwight Co., Inc. | | | 29,839 | | | | 3,093,707 | |
Clorox Co. | | | 15,154 | | | | 2,068,066 | |
Coca-Cola Co. | | | 473,113 | | | | 30,113,642 | |
Colgate-Palmolive Co. | | | 100,115 | | | | 9,715,160 | |
Conagra Brands, Inc. | | | 58,336 | | | | 1,657,909 | |
Constellation Brands, Inc. Cl A | | | 19,645 | | | | 5,054,266 | |
Costco Wholesale Corp. | | | 54,119 | | | | 46,000,609 | |
Dollar General Corp. | | | 26,805 | | | | 3,544,425 | |
Dollar Tree, Inc.* | | | 25,287 | | | | 2,699,893 | |
Estee Lauder Cos., Inc. Cl A | | | 28,434 | | | | 3,025,378 | |
General Mills, Inc. | | | 68,890 | | | | 4,357,981 | |
Hershey Co. | | | 18,013 | | | | 3,311,330 | |
Hormel Foods Corp. | | | 35,420 | | | | 1,079,956 | |
The accompanying notes are an integral part of these portfolio schedules.
23
MoA FUNDS — EQUITY INDEX FUND
PORTFOLIO OF INVESTMENTS IN SECURITIES (Continued)
June 30, 2024 (Unaudited)
| | | | | | | | |
| | | Shares | | | Value | |
| COMMON STOCKS (CONTINUED): | |
| CONSUMER STAPLES (CONTINUED) | |
J M Smucker Co. | | | 12,956 | | | $ | 1,412,722 | |
Kellanova | | | 32,124 | | | | 1,852,912 | |
Kenvue, Inc. | | | 233,657 | | | | 4,247,884 | |
Keurig Dr Pepper, Inc. | | | 127,369 | | | | 4,254,125 | |
Kimberly-Clark Corp. | | | 41,088 | | | | 5,678,362 | |
Kraft Heinz Co. | | | 96,315 | | | | 3,103,269 | |
Kroger Co. | | | 81,682 | | | | 4,078,382 | |
Lamb Weston Hldgs., Inc. | | | 17,620 | | | | 1,481,490 | |
McCormick & Co., Inc. | | | 30,719 | | | | 2,179,206 | |
Molson Coors Beverage Co. Cl B | | | 22,189 | | | | 1,127,867 | |
Mondelez International, Inc. Cl A | | | 163,681 | | | | 10,711,285 | |
Monster Beverage Corp.* | | | 86,552 | | | | 4,323,272 | |
PepsiCo, Inc. | | | 167,760 | | | | 27,668,657 | |
Philip Morris International, Inc. | | | 189,695 | | | | 19,221,794 | |
Procter & Gamble Co. | | | 287,996 | | | | 47,496,300 | |
Sysco Corp. | | | 60,766 | | | | 4,338,085 | |
Target Corp. | | | 56,452 | | | | 8,357,154 | |
Tyson Foods, Inc. Cl A | | | 34,902 | | | | 1,994,300 | |
Walgreens Boots Alliance, Inc. | | | 87,376 | | | | 1,056,813 | |
Walmart, Inc. | | | 521,256 | | | | 35,294,244 | |
| | | | | | | | |
| | | | | | | 322,668,079 | |
| | | | | | | | |
| ENERGY (3.6%) | |
APA Corp. | | | 43,937 | | | | 1,293,505 | |
Baker Hughes Co. Cl A | | | 121,782 | | | | 4,283,073 | |
Chevron Corp. | | | 209,147 | | | | 32,714,774 | |
ConocoPhillips | | | 142,714 | | | | 16,323,627 | |
Coterra Energy, Inc. | | | 90,816 | | | | 2,422,063 | |
Devon Energy Corp. | | | 77,121 | | | | 3,655,535 | |
Diamondback Energy, Inc. | | | 21,763 | | | | 4,356,735 | |
EOG Resources, Inc. | | | 70,130 | | | | 8,827,263 | |
EQT Corp. | | | 53,885 | | | | 1,992,667 | |
Exxon Mobil Corp. | | | 547,398 | | | | 63,016,458 | |
Halliburton Co. | | | 108,030 | | | | 3,649,253 | |
Hess Corp. | | | 33,725 | | | | 4,975,112 | |
Kinder Morgan, Inc. | | | 235,615 | | | | 4,681,670 | |
Marathon Oil Corp. | | | 68,827 | | | | 1,973,270 | |
Marathon Petroleum Corp. | | | 42,994 | | | | 7,458,599 | |
Occidental Petroleum Corp. | | | 81,144 | | | | 5,114,506 | |
ONEOK, Inc. | | | 71,219 | | | | 5,807,909 | |
Phillips 66 | | | 51,733 | | | | 7,303,148 | |
Schlumberger N.V. | | | 174,415 | | | | 8,228,900 | |
Targa Resources Corp. | | | 27,056 | | | | 3,484,272 | |
Valero Energy Corp. | | | 39,902 | | | | 6,255,038 | |
Williams Cos., Inc. | | | 148,719 | | | | 6,320,558 | |
| | | | | | | | |
| | | | | | | 204,137,935 | |
| | | | | | | | |
| FINANCIALS (13.2%) | |
Aflac, Inc. | | | 63,098 | | | | 5,635,282 | |
Allstate Corp. | | | 32,204 | | | | 5,141,691 | |
American Express Co. | | | 69,341 | | | | 16,055,908 | |
American International Group, Inc. | | | 80,985 | | | | 6,012,326 | |
Ameriprise Financial, Inc. | | | 12,121 | | | | 5,177,970 | |
| | | | | | | | |
| | | Shares | | | Value | |
| COMMON STOCKS (CONTINUED): | |
| FINANCIALS (CONTINUED) | |
Aon PLC Cl A | | | 26,532 | | | $ | 7,789,265 | |
Arch Capital Group Ltd.* | | | 45,633 | | | | 4,603,913 | |
Arthur J. Gallagher & Co. | | | 26,662 | | | | 6,913,723 | |
Assurant, Inc. | | | 6,343 | | | | 1,054,524 | |
Bank of America Corp. | | | 830,228 | | | | 33,018,168 | |
Bank of New York Mellon Corp. | | | 91,253 | | | | 5,465,142 | |
Berkshire Hathaway, Inc. Cl B* | | | 220,911 | | | | 89,866,595 | |
BlackRock, Inc. Cl A | | | 17,046 | | | | 13,420,657 | |
Blackstone, Inc. | | | 87,206 | | | | 10,796,103 | |
Brown & Brown, Inc. | | | 28,890 | | | | 2,583,055 | |
Capital One Financial Corp. | | | 46,626 | | | | 6,455,370 | |
Cboe Global Markets, Inc. | | | 12,832 | | | | 2,182,210 | |
Charles Schwab Corp. | | | 182,173 | | | | 13,424,328 | |
Chubb Ltd. | | | 49,549 | | | | 12,638,959 | |
Cincinnati Financial Corp. | | | 19,105 | | | | 2,256,300 | |
Citigroup, Inc. | | | 232,756 | | | | 14,770,696 | |
Citizens Financial Group, Inc. | | | 55,525 | | | | 2,000,566 | |
CME Group, Inc. Cl A | | | 43,937 | | | | 8,638,014 | |
Corpay, Inc.* | | | 8,575 | | | | 2,284,466 | |
Discover Financial Svcs. | | | 30,579 | | | | 4,000,039 | |
Everest Group Ltd. | | | 5,302 | | | | 2,020,168 | |
FactSet Research Systems, Inc. | | | 4,651 | | | | 1,898,864 | |
Fidelity National Information Svcs., Inc. | | | 67,877 | | | | 5,115,211 | |
Fifth Third Bancorp | | | 83,470 | | | | 3,045,820 | |
Fiserv, Inc.* | | | 71,398 | | | | 10,641,158 | |
Franklin Resources, Inc. | | | 36,593 | | | | 817,854 | |
Global Payments, Inc. | | | 31,148 | | | | 3,012,012 | |
Globe Life, Inc. | | | 10,246 | | | | 843,041 | |
Goldman Sachs Group, Inc. | | | 39,349 | | | | 17,798,340 | |
Hartford Financial Svcs. Group, Inc. | | | 36,090 | | | | 3,628,489 | |
Huntington Bancshares, Inc. | | | 176,846 | | | | 2,330,830 | |
Intercontinental Exchange, Inc. | | | 69,992 | | | | 9,581,205 | |
Invesco Ltd. | | | 54,890 | | | | 821,154 | |
iShares Core S&P 500 ETF | | | 95,702 | | | | 52,371,005 | |
Jack Henry & Associates, Inc. | | | 8,895 | | | | 1,476,748 | |
JPMorgan Chase & Co. | | | 350,417 | | | | 70,875,342 | |
KeyCorp. | | | 115,053 | | | | 1,634,903 | |
KKR & Co., Inc. | | | 81,214 | | | | 8,546,961 | |
Loews Corp. | | | 22,155 | | | | 1,655,865 | |
M&T Bank Corp. | | | 20,360 | | | | 3,081,690 | |
MarketAxess Hldgs., Inc. | | | 4,625 | | | | 927,451 | |
Marsh & McLennan Cos., Inc. | | | 60,124 | | | | 12,669,329 | |
Mastercard, Inc. Cl A | | | 100,183 | | | | 44,196,732 | |
MetLife, Inc. | | | 72,892 | | | | 5,116,289 | |
Moody’s Corp. | | | 19,163 | | | | 8,066,282 | |
The accompanying notes are an integral part of these portfolio schedules.
24
MoA FUNDS — EQUITY INDEX FUND
PORTFOLIO OF INVESTMENTS IN SECURITIES (Continued)
June 30, 2024 (Unaudited)
| | | | | | | | |
| | | Shares | | | Value | |
| COMMON STOCKS (CONTINUED): | |
| FINANCIALS (CONTINUED) | |
Morgan Stanley | | | 152,700 | | | $ | 14,840,913 | |
MSCI, Inc. Cl A | | | 9,667 | | | | 4,657,077 | |
Nasdaq, Inc. | | | 46,432 | | | | 2,797,992 | |
Northern Trust Corp. | | | 24,966 | | | | 2,096,645 | |
PayPal Hldgs., Inc.* | | | 127,645 | | | | 7,407,239 | |
PNC Financial Svcs. Group, Inc. | | | 48,555 | | | | 7,549,331 | |
Principal Financial Group, Inc. | | | 26,313 | | | | 2,064,255 | |
Progressive Corp. | | | 71,470 | | | | 14,845,034 | |
Prudential Financial, Inc. | | | 43,808 | | | | 5,133,859 | |
Raymond James Financial, Inc. | | | 22,764 | | | | 2,813,858 | |
Regions Financial Corp. | | | 111,755 | | | | 2,239,570 | |
S&P Global, Inc. | | | 39,061 | | | | 17,421,206 | |
State Street Corp. | | | 36,762 | | | | 2,720,388 | |
Synchrony Financial | | | 48,999 | | | | 2,312,263 | |
T. Rowe Price Group, Inc. | | | 27,249 | | | | 3,142,082 | |
Travelers Cos., Inc. | | | 27,942 | | | | 5,681,726 | |
Truist Financial Corp. | | | 163,281 | | | | 6,343,467 | |
U.S. Bancorp | | | 190,416 | | | | 7,559,515 | |
Visa, Inc. Cl A | | | 192,087 | | | | 50,417,075 | |
Wells Fargo & Co. | | | 425,420 | | | | 25,265,694 | |
Willis Towers Watson PLC | | | 12,476 | | | | 3,270,459 | |
WR Berkley Corp. | | | 24,646 | | | | 1,936,683 | |
| | | | | | | | |
| | | | | | | 746,874,344 | |
| | | | | | | | |
| HEALTH CARE (11.6%) | |
Abbott Laboratories | | | 212,279 | | | | 22,057,911 | |
AbbVie, Inc. | | | 215,482 | | | | 36,959,473 | |
Agilent Technologies, Inc. | | | 35,761 | | | | 4,635,698 | |
Align Technology, Inc.* | | | 8,544 | | | | 2,062,778 | |
Amgen, Inc. | | | 65,458 | | | | 20,452,352 | |
Baxter International, Inc. | | | 62,181 | | | | 2,079,954 | |
Becton Dickinson & Co. | | | 35,266 | | | | 8,242,017 | |
Biogen, Inc.* | | | 17,766 | | | | 4,118,514 | |
Bio-Rad Laboratories, Inc. Cl A* | | | 2,490 | | | | 680,044 | |
Bio-Techne Corp. | | | 19,229 | | | | 1,377,758 | |
Boston Scientific Corp.* | | | 179,399 | | | | 13,815,517 | |
Bristol-Myers Squibb Co. | | | 247,359 | | | | 10,272,819 | |
Cardinal Health, Inc. | | | 29,721 | | | | 2,922,169 | |
Catalent, Inc.* | | | 22,084 | | | | 1,241,783 | |
Cencora, Inc. | | | 20,201 | | | | 4,551,285 | |
Centene Corp.* | | | 65,120 | | | | 4,317,456 | |
Charles River Laboratories International, Inc.* | | | 6,285 | | | | 1,298,355 | |
Cigna Group | | | 34,665 | | | | 11,459,209 | |
Cooper Cos., Inc. | | | 24,254 | | | | 2,117,374 | |
CVS Health Corp. | | | 153,188 | | | | 9,047,283 | |
Danaher Corp. | | | 80,440 | | | | 20,097,934 | |
DaVita, Inc.* | | | 6,314 | | | | 874,931 | |
Dexcom, Inc.* | | | 48,527 | | | | 5,501,991 | |
Edwards Lifesciences Corp.* | | | 73,533 | | | | 6,792,243 | |
Elevance Health, Inc. | | | 28,361 | | | | 15,367,691 | |
Eli Lilly & Co. | | | 97,417 | | | | 88,199,403 | |
GE HealthCare Technologies, Inc. | | | 51,801 | | | | 4,036,334 | |
| | | | | | | | |
| | | Shares | | | Value | |
| COMMON STOCKS (CONTINUED): | |
| HEALTH CARE (CONTINUED) | |
Gilead Sciences, Inc. | | | 152,026 | | | $ | 10,430,504 | |
HCA Healthcare, Inc. | | | 23,651 | | | | 7,598,593 | |
Henry Schein, Inc.* | | | 15,626 | | | | 1,001,627 | |
Hologic, Inc.* | | | 28,478 | | | | 2,114,492 | |
Humana, Inc. | | | 14,705 | | | | 5,494,523 | |
IDEXX Laboratories, Inc.* | | | 10,078 | | | | 4,910,002 | |
Incyte Corp.* | | | 19,611 | | | | 1,188,819 | |
Insulet Corp.* | | | 8,546 | | | | 1,724,583 | |
Intuitive Surgical, Inc.* | | | 43,283 | | | | 19,254,443 | |
IQVIA Hldgs., Inc.* | | | 22,234 | | | | 4,701,157 | |
Johnson & Johnson | | | 293,677 | | | | 42,923,830 | |
Labcorp Hldgs., Inc. | | | 10,287 | | | | 2,093,507 | |
McKesson Corp. | | | 15,862 | | | | 9,264,043 | |
Medtronic PLC | | | 162,029 | | | | 12,753,303 | |
Merck & Co., Inc. | | | 309,068 | | | | 38,262,618 | |
Mettler-Toledo International, Inc.* | | | 2,607 | | | | 3,643,517 | |
Moderna, Inc.* | | | 40,685 | | | | 4,831,344 | |
Molina Healthcare, Inc.* | | | 7,150 | | | | 2,125,695 | |
Pfizer, Inc. | | | 691,469 | | | | 19,347,303 | |
Quest Diagnostics, Inc. | | | 13,556 | | | | 1,855,545 | |
Regeneron Pharmaceuticals, Inc.* | | | 12,942 | | | | 13,602,430 | |
ResMed, Inc. | | | 17,927 | | | | 3,431,586 | |
Revvity, Inc. | | | 15,058 | | | | 1,578,982 | |
Solventum Corp.* | | | 16,861 | | | | 891,610 | |
STERIS PLC | | | 12,058 | | | | 2,647,213 | |
Stryker Corp. | | | 41,372 | | | | 14,076,823 | |
Teleflex, Inc. | | | 5,747 | | | | 1,208,767 | |
Thermo Fisher Scientific, Inc. | | | 46,580 | | | | 25,758,740 | |
UnitedHealth Group, Inc. | | | 112,311 | | | | 57,195,500 | |
Universal Health Svcs., Inc. Cl B | | | 7,283 | | | | 1,346,845 | |
Vertex Pharmaceuticals, Inc.* | | | 31,489 | | | | 14,759,524 | |
Viatris, Inc. | | | 145,293 | | | | 1,544,465 | |
Waters Corp.* | | | 7,238 | | | | 2,099,889 | |
West Pharmaceutical Svcs., Inc. | | | 8,889 | | | | 2,927,948 | |
Zimmer Biomet Hldgs., Inc. | | | 25,105 | | | | 2,724,646 | |
Zoetis, Inc. Cl A | | | 55,680 | | | | 9,652,685 | |
| | | | | | | | |
| | | | | | | 655,547,377 | |
| | | | | | | | |
| INDUSTRIALS (8.1%) | |
3M Co. | | | 67,524 | | | | 6,900,278 | |
Allegion PLC | | | 10,671 | | | | 1,260,779 | |
American Airlines Group, Inc.* | | | 80,059 | | | | 907,068 | |
AMETEK, Inc. | | | 28,245 | | | | 4,708,724 | |
AO Smith Corp. | | | 14,739 | | | | 1,205,355 | |
Automatic Data Processing, Inc. | | | 49,944 | | | | 11,921,133 | |
Axon Enterprise, Inc.* | | | 8,656 | | | | 2,546,941 | |
Boeing Co.* | | | 70,414 | | | | 12,816,052 | |
Broadridge Financial Solutions, Inc. | | | 14,420 | | | | 2,840,740 | |
The accompanying notes are an integral part of these portfolio schedules.
25
MoA FUNDS — EQUITY INDEX FUND
PORTFOLIO OF INVESTMENTS IN SECURITIES (Continued)
June 30, 2024 (Unaudited)
| | | | | | | | |
| | | Shares | | | Value | |
| COMMON STOCKS (CONTINUED): | |
| INDUSTRIALS (CONTINUED) | |
Builders FirstSource, Inc.* | | | 14,895 | | | $ | 2,061,617 | |
Carrier Global Corp. | | | 102,250 | | | | 6,449,930 | |
Caterpillar, Inc. | | | 59,677 | | | | 19,878,409 | |
CH Robinson Worldwide, Inc. | | | 14,288 | | | | 1,259,059 | |
Cintas Corp. | | | 10,523 | | | | 7,368,836 | |
Copart, Inc.* | | | 106,763 | | | | 5,782,284 | |
CSX Corp. | | | 238,552 | | | | 7,979,564 | |
Cummins, Inc. | | | 16,690 | | | | 4,621,962 | |
Dayforce, Inc.* | | | 19,267 | | | | 955,643 | |
Deere & Co. | | | 31,590 | | | | 11,802,972 | |
Delta Air Lines, Inc. | | | 78,744 | | | | 3,735,615 | |
Dover Corp. | | | 16,770 | | | | 3,026,146 | |
Eaton Corp. PLC | | | 48,785 | | | | 15,296,537 | |
Emerson Electric Co. | | | 69,810 | | | | 7,690,270 | |
Equifax, Inc. | | | 15,083 | | | | 3,657,024 | |
Expeditors International of Washington, Inc. | | | 17,237 | | | | 2,151,005 | |
Fastenal Co. | | | 69,865 | | | | 4,390,317 | |
FedEx Corp. | | | 27,626 | | | | 8,283,380 | |
Fortive Corp. | | | 42,956 | | | | 3,183,040 | |
GE Vernova, Inc.* | | | 33,445 | | | | 5,736,152 | |
Generac Hldgs., Inc.* | | | 7,397 | | | | 978,031 | |
General Dynamics Corp. | | | 27,743 | | | | 8,049,354 | |
General Electric Co. | | | 133,570 | | | | 21,233,623 | |
Honeywell International, Inc. | | | 79,462 | | | | 16,968,315 | |
Howmet Aerospace, Inc. | | | 47,319 | | | | 3,673,374 | |
Hubbell, Inc. Cl B | | | 6,551 | | | | 2,394,259 | |
Huntington Ingalls Industries, Inc. | | | 4,812 | | | | 1,185,340 | |
IDEX Corp. | | | 9,236 | | | | 1,858,283 | |
Illinois Tool Works, Inc. | | | 33,136 | | | | 7,851,907 | |
Ingersoll Rand, Inc. | | | 49,230 | | | | 4,472,053 | |
Jacobs Solutions, Inc. | | | 15,280 | | | | 2,134,769 | |
JB Hunt Transport Svcs., Inc. | | | 9,949 | | | | 1,591,840 | |
Johnson Controls International PLC | | | 82,206 | | | | 5,464,233 | |
L-3 Harris Technologies, Inc. | | | 23,145 | | | | 5,197,904 | |
Leidos Hldgs., Inc. | | | 16,500 | | | | 2,407,020 | |
Lockheed Martin Corp. | | | 26,058 | | | | 12,171,692 | |
Masco Corp. | | | 26,875 | | | | 1,791,756 | |
Nordson Corp. | | | 6,629 | | | | 1,537,530 | |
Norfolk Southern Corp. | | | 27,568 | | | | 5,918,574 | |
Northrop Grumman Corp. | | | 16,976 | | | | 7,400,687 | |
Old Dominion Freight Line, Inc. | | | 21,742 | | | | 3,839,637 | |
Otis Worldwide Corp. | | | 49,338 | | | | 4,749,276 | |
PACCAR, Inc. | | | 63,959 | | | | 6,583,939 | |
Parker-Hannifin Corp. | | | 15,685 | | | | 7,933,630 | |
Paychex, Inc. | | | 39,092 | | | | 4,634,747 | |
Paycom Software, Inc. | | | 5,866 | | | | 839,073 | |
Pentair PLC | | | 20,259 | | | | 1,553,258 | |
Quanta Svcs., Inc. | | | 17,863 | | | | 4,538,810 | |
Republic Svcs., Inc. Cl A | | | 24,979 | | | | 4,854,419 | |
| | | | | | | | |
| | | Shares | | | Value | |
| COMMON STOCKS (CONTINUED): | |
| INDUSTRIALS (CONTINUED) | |
Rockwell Automation, Inc. | | | 13,912 | | | $ | 3,829,695 | |
Rollins, Inc. | | | 34,271 | | | | 1,672,082 | |
RTX Corp. | | | 162,233 | | | | 16,286,571 | |
Snap-on, Inc. | | | 6,434 | | | | 1,681,783 | |
Southwest Airlines Co. | | | 73,026 | | | | 2,089,274 | |
Stanley Black & Decker, Inc. | | | 18,777 | | | | 1,500,095 | |
Textron, Inc. | | | 23,271 | | | | 1,998,048 | |
Trane Technologies PLC | | | 27,621 | | | | 9,085,376 | |
TransDigm Group, Inc. | | | 6,828 | | | | 8,723,521 | |
Uber Technologies, Inc.* | | | 254,974 | | | | 18,531,510 | |
Union Pacific Corp. | | | 74,450 | | | | 16,845,057 | |
United Airlines Hldgs., Inc.* | | | 40,122 | | | | 1,952,337 | |
United Parcel Svc., Inc. Cl B | | | 89,005 | | | | 12,180,334 | |
United Rentals, Inc. | | | 8,126 | | | | 5,255,328 | |
Veralto Corp. | | | 26,808 | | | | 2,559,360 | |
Verisk Analytics, Inc. Cl A | | | 17,410 | | | | 4,692,865 | |
Waste Management, Inc. | | | 44,538 | | | | 9,501,737 | |
Westinghouse Air Brake Technologies Corp. | | | 21,524 | | | | 3,401,868 | |
WW Grainger, Inc. | | | 5,336 | | | | 4,814,353 | |
Xylem, Inc. | | | 29,584 | | | | 4,012,478 | |
| | | | | | | | |
| | | | | | | 454,837,837 | |
| | | | | | | | |
| INFORMATION TECHNOLOGY (32.1%) | |
Accenture PLC Cl A | | | 76,721 | | | | 23,277,919 | |
Adobe, Inc.* | | | 54,668 | | | | 30,370,261 | |
Advanced Micro Devices, Inc.* | | | 197,231 | | | | 31,992,841 | |
Akamai Technologies, Inc.* | | | 18,586 | | | | 1,674,227 | |
Amphenol Corp. Cl A | | | 146,578 | | | | 9,874,960 | |
Analog Devices, Inc. | | | 60,514 | | | | 13,812,926 | |
ANSYS, Inc.* | | | 10,652 | | | | 3,424,618 | |
Apple, Inc. | | | 1,758,881 | | | | 370,455,516 | |
Applied Materials, Inc. | | | 101,391 | | | | 23,927,262 | |
Arista Networks, Inc.* | | | 30,973 | | | | 10,855,417 | |
Autodesk, Inc.* | | | 26,104 | | | | 6,459,435 | |
Broadcom, Inc. | | | 53,157 | | | | 85,345,158 | |
Cadence Design Systems, Inc.* | | | 33,207 | | | | 10,219,454 | |
CDW Corp. | | | 16,399 | | | | 3,670,752 | |
Cisco Systems, Inc. | | | 494,105 | | | | 23,474,929 | |
Cognizant Technology Solutions Corp. Cl A | | | 60,671 | | | | 4,125,628 | |
Corning, Inc. | | | 94,076 | | | | 3,654,853 | |
Crowdstrike Hldgs., Inc.* | | | 28,147 | | | | 10,785,649 | |
Enphase Energy, Inc.* | | | 16,603 | | | | 1,655,485 | |
EPAM Systems, Inc.* | | | 7,074 | | | | 1,330,690 | |
F5, Inc.* | | | 7,153 | | | | 1,231,961 | |
Fair Isaac Corp.* | | | 3,016 | | | | 4,489,799 | |
First Solar, Inc.* | | | 13,061 | | | | 2,944,733 | |
The accompanying notes are an integral part of these portfolio schedules.
26
MoA FUNDS — EQUITY INDEX FUND
PORTFOLIO OF INVESTMENTS IN SECURITIES (Continued)
June 30, 2024 (Unaudited)
| | | | | | | | |
| | | Shares | | | Value | |
| COMMON STOCKS (CONTINUED): | |
| INFORMATION TECHNOLOGY (CONTINUED) | |
Fortinet, Inc.* | | | 77,373 | | | $ | 4,663,271 | |
Gartner, Inc.* | | | 9,473 | | | | 4,253,945 | |
Gen Digital, Inc. | | | 67,238 | | | | 1,679,605 | |
GoDaddy, Inc. Cl A* | | | 17,198 | | | | 2,402,733 | |
Hewlett Packard Enterprise Co. | | | 158,634 | | | | 3,358,282 | |
HP, Inc. | | | 105,314 | | | | 3,688,096 | |
Intel Corp. | | | 519,462 | | | | 16,087,738 | |
International Business Machines Corp. | | | 112,093 | | | | 19,386,484 | |
Intuit, Inc. | | | 34,165 | | | | 22,453,580 | |
Jabil, Inc. | | | 14,716 | | | | 1,600,954 | |
Juniper Networks, Inc. | | | 39,656 | | | | 1,445,858 | |
Keysight Technologies, Inc.* | | | 21,301 | | | | 2,912,912 | |
KLA Corp. | | | 16,430 | | | | 13,546,699 | |
Lam Research Corp. | | | 15,954 | | | | 16,988,617 | |
Microchip Technology, Inc. | | | 65,942 | | | | 6,033,693 | |
Micron Technology, Inc. | | | 135,127 | | | | 17,773,254 | |
Microsoft Corp. | | | 906,932 | | | | 405,353,257 | |
Monolithic Power Systems, Inc. | | | 5,939 | | | | 4,879,958 | |
Motorola Solutions, Inc. | | | 20,352 | | | | 7,856,890 | |
NetApp, Inc. | | | 25,183 | | | | 3,243,570 | |
NVIDIA Corp. | | | 3,001,627 | | | | 370,821,000 | |
NXP Semiconductors N.V. | | | 31,200 | | | | 8,395,608 | |
ON Semiconductor Corp.* | | | 52,499 | | | | 3,598,806 | |
Oracle Corp. | | | 194,526 | | | | 27,467,071 | |
Palo Alto Networks, Inc.* | | | 39,426 | | | | 13,365,808 | |
PTC, Inc.* | | | 14,611 | | | | 2,654,380 | |
Qorvo, Inc.* | | | 11,782 | | | | 1,367,183 | |
QUALCOMM, Inc. | | | 136,424 | | | | 27,172,932 | |
Roper Technologies, Inc. | | | 13,062 | | | | 7,362,527 | |
Salesforce, Inc. | | | 118,517 | | | | 30,470,721 | |
Seagate Technology Hldgs. PLC | | | 23,830 | | | | 2,460,924 | |
ServiceNow, Inc.* | | | 25,016 | | | | 19,679,337 | |
Skyworks Solutions, Inc. | | | 19,578 | | | | 2,086,623 | |
Super Micro Computer, Inc.* | | | 6,146 | | | | 5,035,725 | |
Synopsys, Inc.* | | | 18,615 | | | | 11,077,042 | |
TE Connectivity Ltd. | | | 37,368 | | | | 5,621,268 | |
Teledyne Technologies, Inc.* | | | 5,786 | | | | 2,244,852 | |
Teradyne, Inc. | | | 19,049 | | | | 2,824,776 | |
Texas Instruments, Inc. | | | 111,102 | | | | 21,612,672 | |
Trimble, Inc.* | | | 29,800 | | | | 1,666,416 | |
Tyler Technologies, Inc.* | | | 5,180 | | | | 2,604,400 | |
VeriSign, Inc.* | | | 10,574 | | | | 1,880,057 | |
Western Digital Corp.* | | | 39,844 | | | | 3,018,980 | |
| | | | | | | | |
| | | Shares | | | Value | |
| COMMON STOCKS (CONTINUED): | |
| INFORMATION TECHNOLOGY (CONTINUED) | |
Zebra Technologies Corp. Cl A* | | | 6,274 | | | $ | 1,938,227 | |
| | | | | | | | |
| | | | | | | 1,815,091,204 | |
| | | | | | | | |
| MATERIALS (2.1%) | |
Air Products & Chemicals, Inc. | | | 27,128 | | | | 7,000,380 | |
Albemarle Corp. | | | 14,341 | | | | 1,369,852 | |
Amcor PLC | | | 176,369 | | | | 1,724,889 | |
Avery Dennison Corp. | | | 9,829 | | | | 2,149,111 | |
Ball Corp. | | | 37,875 | | | | 2,273,258 | |
Celanese Corp. Cl A | | | 12,261 | | | | 1,653,886 | |
CF Industries Hldgs., Inc. | | | 22,305 | | | | 1,653,247 | |
Corteva, Inc. | | | 85,049 | | | | 4,587,543 | |
Dow, Inc. | | | 85,809 | | | | 4,552,167 | |
DuPont de Nemours, Inc. | | | 51,020 | | | | 4,106,600 | |
Eastman Chemical Co. | | | 14,356 | | | | 1,406,457 | |
Ecolab, Inc. | | | 31,013 | | | | 7,381,094 | |
FMC Corp. | | | 15,230 | | | | 876,487 | |
Freeport-McMoRan, Inc. | | | 175,288 | | | | 8,518,997 | |
International Flavors & Fragrances, Inc. | | | 31,159 | | | | 2,966,648 | |
International Paper Co. | | | 42,383 | | | | 1,828,826 | |
Linde PLC | | | 58,660 | | | | 25,740,595 | |
LyondellBasell Industries N.V. Cl A | | | 31,390 | | | | 3,002,767 | |
Martin Marietta Materials, Inc. | | | 7,522 | | | | 4,075,420 | |
Mosaic Co. | | | 39,219 | | | | 1,133,429 | |
Newmont Corp. | | | 140,712 | | | | 5,891,611 | |
Nucor Corp. | | | 29,258 | | | | 4,625,105 | |
Packaging Corp. of America | | | 10,877 | | | | 1,985,705 | |
PPG Industries, Inc. | | | 28,721 | | | | 3,615,687 | |
Sherwin-Williams Co. | | | 28,465 | | | | 8,494,810 | |
Steel Dynamics, Inc. | | | 18,024 | | | | 2,334,108 | |
Vulcan Materials Co. | | | 16,139 | | | | 4,013,447 | |
Westrock Co. | | | 31,500 | | | | 1,583,190 | |
| | | | | | | | |
| | | | | | | 120,545,316 | |
| | | | | | | | |
| REAL ESTATE (2.1%) | |
Alexandria Real Estate Equities, Inc. | | | 19,207 | | | | 2,246,643 | |
American Tower Corp. | | | 56,982 | | | | 11,076,161 | |
AvalonBay Communities, Inc. | | | 17,326 | | | | 3,584,576 | |
Boston Properties, Inc. | | | 17,631 | | | | 1,085,364 | |
Camden Property Trust | | | 13,000 | | | | 1,418,430 | |
CBRE Group, Inc. Cl A* | | | 36,803 | | | | 3,279,515 | |
CoStar Group, Inc.* | | | 49,829 | | | | 3,694,322 | |
Crown Castle, Inc. | | | 53,022 | | | | 5,180,250 | |
Digital Realty Trust, Inc. | | | 39,597 | | | | 6,020,724 | |
Equinix, Inc. | | | 11,580 | | | | 8,761,428 | |
Equity Residential | | | 42,083 | | | | 2,918,035 | |
Essex Property Trust, Inc. | | | 7,836 | | | | 2,132,959 | |
Extra Space Storage, Inc. | | | 25,835 | | | | 4,015,017 | |
Federal Realty Investment Trust | | | 9,110 | | | | 919,837 | |
The accompanying notes are an integral part of these portfolio schedules.
27
MoA FUNDS — EQUITY INDEX FUND
PORTFOLIO OF INVESTMENTS IN SECURITIES (Continued)
June 30, 2024 (Unaudited)
| | | | | | | | |
| | | Shares | | | Value | |
| COMMON STOCKS (CONTINUED): | |
| REAL ESTATE (CONTINUED) | |
Healthpeak Properties, Inc. | | | 85,880 | | | $ | 1,683,248 | |
Host Hotels & Resorts, Inc. | | | 86,034 | | | | 1,546,891 | |
Invitation Homes, Inc. | | | 70,260 | | | | 2,521,632 | |
Iron Mountain, Inc. | | | 35,769 | | | | 3,205,618 | |
Kimco Realty Corp. | | | 81,436 | | | | 1,584,745 | |
Mid-America Apartment Communities, Inc. | | | 14,255 | | | | 2,032,906 | |
Prologis, Inc. | | | 112,976 | | | | 12,688,335 | |
Public Storage | | | 19,299 | | | | 5,551,357 | |
Realty Income Corp. | | | 106,256 | | | | 5,612,442 | |
Regency Centers Corp. | | | 20,067 | | | | 1,248,168 | |
SBA Communications Corp. Cl A | | | 13,111 | | | | 2,573,689 | |
Simon Property Group, Inc. | | | 39,773 | | | | 6,037,541 | |
UDR, Inc. | | | 36,969 | | | | 1,521,274 | |
Ventas, Inc. | | | 49,392 | | | | 2,531,834 | |
VICI Properties, Inc. Cl A | | | 127,294 | | | | 3,645,700 | |
Welltower, Inc. | | | 72,961 | | | | 7,606,184 | |
Weyerhaeuser Co. | | | 88,959 | | | | 2,525,546 | |
| | | | | | | | |
| | | | | | | 120,450,371 | |
| | | | | | | | |
| UTILITIES (2.2%) | |
AES Corp. | | | 86,719 | | | | 1,523,653 | |
Alliant Energy Corp. | | | 31,284 | | | | 1,592,356 | |
Ameren Corp. | | | 32,540 | | | | 2,313,919 | |
American Electric Power Co., Inc. | | | 64,322 | | | | 5,643,612 | |
American Water Works Co., Inc. | | | 23,773 | | | | 3,070,521 | |
Atmos Energy Corp. | | | 18,411 | | | | 2,147,643 | |
| | | | | | | | |
| | | Shares | | | Value | |
| COMMON STOCKS (CONTINUED): | |
| UTILITIES (CONTINUED) | |
CenterPoint Energy, Inc. | | | 78,062 | | | $ | 2,418,361 | |
CMS Energy Corp. | | | 36,441 | | | | 2,169,333 | |
Consolidated Edison, Inc. | | | 42,200 | | | | 3,773,524 | |
Constellation Energy Corp. | | | 38,467 | | | | 7,703,786 | |
Dominion Energy, Inc. | | | 102,283 | | | | 5,011,867 | |
DTE Energy Co. | | | 25,251 | | | | 2,803,114 | |
Duke Energy Corp. | | | 94,175 | | | | 9,439,160 | |
Edison International | | | 46,949 | | | | 3,371,408 | |
Entergy Corp. | | | 26,056 | | | | 2,787,992 | |
Evergy, Inc. | | | 28,051 | | | | 1,485,861 | |
Eversource Energy | | | 42,984 | | | | 2,437,623 | |
Exelon Corp. | | | 122,028 | | | | 4,223,389 | |
FirstEnergy Corp. | | | 63,204 | | | | 2,418,817 | |
NextEra Energy, Inc. | | | 250,705 | | | | 17,752,421 | |
NiSource, Inc. | | | 54,704 | | | | 1,576,022 | |
NRG Energy, Inc. | | | 25,440 | | | | 1,980,758 | |
PG&E Corp. | | | 260,772 | | | | 4,553,079 | |
Pinnacle West Capital Corp. | | | 13,857 | | | | 1,058,398 | |
PPL Corp. | | | 90,023 | | | | 2,489,136 | |
Public Svc. Enterprise Group, Inc. | | | 60,779 | | | | 4,479,412 | |
Sempra | | | 77,223 | | | | 5,873,581 | |
Southern Co. | | | 133,425 | | | | 10,349,777 | |
Vistra Corp. | | | 39,856 | | | | 3,426,819 | |
WEC Energy Group, Inc. | | | 38,538 | | | | 3,023,692 | |
Xcel Energy, Inc. | | | 67,802 | | | | 3,621,305 | |
| | | | | | | | |
| | | | | | | 126,520,339 | |
| | | | | | | | |
TOTAL COMMON STOCKS | | | | | | | | |
(Cost: $2,728,018,406) | | | | | | | 5,646,199,997 | |
| | | | | | | | |
| | | | | | | | | | | | | | | | | | | | |
| | | Rating** | | | Rate(%) | | | Maturity | | | Face Amount | | | Value | |
| SHORT-TERM DEBT SECURITIES (0.1%): | | | | | | | | | | | | | | | |
| U.S. GOVERNMENT (0.1%) | | | | | | | | | | | | | | | |
U.S. Treasury Bill | | | A-1+ | | | | 5.27 | | | | 07/16/24 | | | $ | 2,000,000 | | | $ | 1,995,626 | |
U.S. Treasury Bill | | | A-1+ | | | | 5.31 | | | | 07/30/24 | | | | 2,300,000 | | | | 2,290,233 | |
| | | | | | | | | | | | | | | | | | | | |
| | | | | | | | | | | | | | | | | | | 4,285,859 | |
| | | | | | | | | | | | | | | | | | | | |
TOTAL SHORT-TERM DEBT SECURITIES
(Cost: $4,285,859) | | | | 4,285,859 | |
| | | | | | | | | | | | | | | | | | | | |
| TEMPORARY CASH INVESTMENT (0.0%) (1) | | | | | | | | | | | | | | | |
JP Morgan Chase, New York Time Deposit | | | | | | | 4.58 | | | | 07/01/24 | | | | 2,010,055 | | | | 2,010,055 | |
| | | | | | | | | | | | | | | | | | | | |
TOTAL TEMPORARY CASH INVESTMENT
(Cost: $2,010,055) | | | | 2,010,055 | |
| | | | | | | | | | | | | | | | | | | | |
TOTAL INVESTMENTS
(Cost: $2,734,314,320) 100.0% | | | | 5,652,495,911 | |
| | | | | | | | | | | | | | | | | | | | |
OTHER NET ASSETS 0.0% (1) | | | | 967,037 | |
| | | | | | | | | | | | | | | | | | | | |
NET ASSETS 100.0% | | | $ | 5,653,462,948 | |
| | | | | | | | | | | | | | | | | | | | |
FOOTNOTES TO PORTFOLIO OF INVESTMENTS IN SECURITIES
| * | Non-income producing security. |
| ** | Ratings as per Standard & Poor’s Corporation (unaudited). |
| (1) | Percentage is less than 0.05%. |
The accompanying notes are an integral part of these portfolio schedules.
28
MoA FUNDS — ALL AMERICA FUND
PORTFOLIO OF INVESTMENTS IN SECURITIES
June 30, 2024 (Unaudited)
| | | | | | | | |
| | | Shares | | | Value | |
| COMMON STOCKS (99.0%): | |
| COMMUNICATION SERVICES (6.1%) | |
Alphabet, Inc. Cl A | | | 23,126 | | | $ | 4,212,401 | |
Alphabet, Inc. Cl C | | | 19,239 | | | | 3,528,817 | |
AT&T, Inc. | | | 28,227 | | | | 539,418 | |
Charter Communications, Inc. Cl A* | | | 386 | | | | 115,399 | |
Comcast Corp. Cl A | | | 15,410 | | | | 603,456 | |
Electronic Arts, Inc. | | | 958 | | | | 133,478 | |
Fox Corp. Cl A | | | 9,488 | | | | 326,103 | |
Fox Corp. Cl B | | | 520 | | | | 16,650 | |
IMAX Corp.* | | | 11,852 | | | | 198,758 | |
Interpublic Group of Cos., Inc. | | | 1,486 | | | | 43,228 | |
Live Nation Entertainment, Inc.* | | | 560 | | | | 52,494 | |
Match Group, Inc.* | | | 1,046 | | | | 31,777 | |
Meta Platforms, Inc. Cl A | | | 8,628 | | | | 4,350,410 | |
Netflix, Inc.* | | | 1,697 | | | | 1,145,271 | |
News Corp. Cl A | | | 1,493 | | | | 41,162 | |
News Corp. Cl B | | | 451 | | | | 12,804 | |
Omnicom Group, Inc. | | | 771 | | | | 69,159 | |
Paramount Global Cl B | | | 1,946 | | | | 20,219 | |
Take-Two Interactive Software, Inc.* | | | 5,238 | | | | 814,457 | |
TEGNA, Inc. | | | 26,199 | | | | 365,214 | |
T-Mobile US, Inc. | | | 2,030 | | | | 357,645 | |
Verizon Communications, Inc. | | | 16,571 | | | | 683,388 | |
Walt Disney Co. | | | 7,178 | | | | 712,704 | |
Warner Bros Discovery, Inc.* | | | 28,715 | | | | 213,640 | |
ZipRecruiter, Inc. Cl A* | | | 6,078 | | | | 55,249 | |
| | | | | | | | |
| | | | | | | 18,643,301 | |
| | | | | | | | |
| CONSUMER DISCRETIONARY (9.2%) | |
Airbnb, Inc. Cl A* | | | 1,738 | | | | 263,533 | |
Amazon.com, Inc.* | | | 36,053 | | | | 6,967,242 | |
Aptiv PLC* | | | 1,072 | | | | 75,490 | |
AutoZone, Inc.* | | | 211 | | | | 625,425 | |
Bath & Body Works, Inc. | | | 881 | | | | 34,403 | |
Best Buy Co., Inc. | | | 758 | | | | 63,892 | |
Bloomin’ Brands, Inc. | | | 22,193 | | | | 426,771 | |
Booking Hldgs., Inc. | | | 134 | | | | 530,841 | |
BorgWarner, Inc. | | | 897 | | | | 28,919 | |
Caesars Entertainment, Inc.* | | | 5,410 | | | | 214,993 | |
CarMax, Inc.* | | | 620 | | | | 45,471 | |
Carnival Corp.* | | | 3,976 | | | | 74,431 | |
Chipotle Mexican Grill, Inc. Cl A* | | | 5,400 | | | | 338,310 | |
Darden Restaurants, Inc. | | | 3,644 | | | | 551,410 | |
Deckers Outdoor Corp.* | | | 101 | | | | 97,763 | |
Domino’s Pizza, Inc. | | | 137 | | | | 70,737 | |
DR Horton, Inc. | | | 1,167 | | | | 164,465 | |
eBay, Inc. | | | 1,993 | | | | 107,064 | |
Etsy, Inc.* | | | 461 | | | | 27,190 | |
Everi Hldgs., Inc.* | | | 16,824 | | | | 141,322 | |
Expedia Group, Inc.* | | | 500 | | | | 62,995 | |
Five Below, Inc.* | | | 4,310 | | | | 469,661 | |
Ford Motor Co. | | | 15,438 | | | | 193,593 | |
| | | | | | | | |
| | | Shares | | | Value | |
| COMMON STOCKS (CONTINUED): | |
| CONSUMER DISCRETIONARY (CONTINUED) | |
Garmin Ltd. | | | 604 | | | $ | 98,404 | |
General Motors Co. | | | 4,492 | | | | 208,698 | |
Genuine Parts Co. | | | 549 | | | | 75,938 | |
Golden Entertainment, Inc. | | | 16,489 | | | | 512,973 | |
Hasbro, Inc. | | | 515 | | | | 30,128 | |
Hilton Worldwide Hldgs., Inc. | | | 985 | | | | 214,927 | |
Home Depot, Inc. | | | 3,902 | | | | 1,343,224 | |
Las Vegas Sands Corp. | | | 1,438 | | | | 63,632 | |
Lennar Corp. Cl A | | | 964 | | | | 144,475 | |
LKQ Corp. | | | 1,051 | | | | 43,711 | |
Lowe’s Cos., Inc. | | | 2,253 | | | | 496,696 | |
Lululemon Athletica, Inc.* | | | 452 | | | | 135,012 | |
Marriott International, Inc. Cl A | | | 945 | | | | 228,473 | |
Marriott Vacations Worldwide Corp. | | | 3,847 | | | | 335,920 | |
McDonald’s Corp. | | | 2,838 | | | | 723,236 | |
MGM Resorts International* | | | 988 | | | | 43,907 | |
Mohawk Industries, Inc.* | | | 208 | | | | 23,627 | |
Murphy USA, Inc. | | | 1,280 | | | | 600,909 | |
NIKE, Inc. Cl B | | | 4,770 | | | | 359,515 | |
Norwegian Cruise Line Hldgs. Ltd.* | | | 1,689 | | | | 31,736 | |
NVR, Inc.* | | | 97 | | | | 736,090 | |
Ollie’s Bargain Outlet Hldgs., Inc.* | | | 10,791 | | | | 1,059,352 | |
OneSpaWorld Hldgs. Ltd.* | | | 37,978 | | | | 583,722 | |
O’Reilly Automotive, Inc.* | | | 232 | | | | 245,006 | |
Polaris, Inc. | | | 4,936 | | | | 386,538 | |
Pool Corp. | | | 151 | | | | 46,407 | |
PulteGroup, Inc. | | | 829 | | | | 91,273 | |
Ralph Lauren Corp. Cl A | | | 154 | | | | 26,959 | |
Ross Stores, Inc. | | | 1,321 | | | | 191,968 | |
Royal Caribbean Cruises Ltd.* | | | 932 | | | | 148,589 | |
Skyline Champion Corp.* | | | 6,380 | | | | 432,245 | |
Starbucks Corp. | | | 4,459 | | | | 347,133 | |
Steven Madden Ltd. | | | 3,890 | | | | 164,547 | |
Tapestry, Inc. | | | 904 | | | | 38,682 | |
Taylor Morrison Home Corp. Cl A* | | | 25,576 | | | | 1,417,933 | |
Tesla, Inc.* | | | 10,923 | | | | 2,161,443 | |
TJX Cos., Inc. | | | 4,459 | | | | 490,936 | |
Tractor Supply Co. | | | 4,019 | | | | 1,085,130 | |
Ulta Beauty, Inc.* | | | 189 | | | | 72,929 | |
Valvoline, Inc.* | | | 11,997 | | | | 518,270 | |
Williams-Sonoma, Inc. | | | 1,587 | | | | 448,121 | |
Wynn Resorts Ltd. | | | 372 | | | | 33,294 | |
XPEL, Inc.* | | | 4,494 | | | | 159,807 | |
Yum! Brands, Inc. | | | 1,108 | | | | 146,766 | |
| | | | | | | | |
| | | | | | | 28,324,202 | |
| | | | | | | | |
| CONSUMER STAPLES (4.8%) | |
Altria Group, Inc. | | | 6,763 | | | | 308,055 | |
Archer-Daniels-Midland Co. | | | 1,947 | | | | 117,696 | |
Brown-Forman Corp. Cl B | | | 705 | | | | 30,449 | |
Bunge Global S.A. | | | 558 | | | | 59,578 | |
The accompanying notes are an integral part of these portfolio schedules.
29
MoA FUNDS — ALL AMERICA FUND
PORTFOLIO OF INVESTMENTS IN SECURITIES (Continued)
June 30, 2024 (Unaudited)
| | | | | | | | |
| | | Shares | | | Value | |
| COMMON STOCKS (CONTINUED): | |
| CONSUMER STAPLES (CONTINUED) | |
Campbell Soup Co. | | | 775 | | | $ | 35,022 | |
Church & Dwight Co., Inc. | | | 6,412 | | | | 664,796 | |
Clorox Co. | | | 489 | | | | 66,734 | |
Coca-Cola Co. | | | 15,264 | | | | 971,554 | |
Coca-Cola Consolidated, Inc. | | | 195 | | | | 211,575 | |
Colgate-Palmolive Co. | | | 3,230 | | | | 313,439 | |
Conagra Brands, Inc. | | | 1,882 | | | | 53,486 | |
Constellation Brands, Inc. Cl A | | | 4,087 | | | | 1,051,503 | |
Costco Wholesale Corp. | | | 1,747 | | | | 1,484,932 | |
Crimson Wine Group Ltd.* | | | 37,737 | | | | 225,290 | |
Dollar General Corp. | | | 864 | | | | 114,247 | |
Dollar Tree, Inc.* | | | 815 | | | | 87,017 | |
Estee Lauder Cos., Inc. Cl A | | | 917 | | | | 97,569 | |
Freshpet, Inc.* | | | 7,920 | | | | 1,024,769 | |
General Mills, Inc. | | | 2,223 | | | | 140,627 | |
Hershey Co. | | | 582 | | | | 106,989 | |
Hormel Foods Corp. | | | 1,142 | | | | 34,820 | |
J M Smucker Co. | | | 418 | | | | 45,579 | |
Kellanova | | | 1,037 | | | | 59,814 | |
Kenvue, Inc. | | | 16,502 | | | | 300,006 | |
Keurig Dr Pepper, Inc. | | | 4,109 | | | | 137,241 | |
Kimberly-Clark Corp. | | | 1,326 | | | | 183,253 | |
Kraft Heinz Co. | | | 3,108 | | | | 100,140 | |
Kroger Co. | | | 2,635 | | | | 131,565 | |
Lamb Weston Hldgs., Inc. | | | 3,220 | | | | 270,738 | |
McCormick & Co., Inc. | | | 991 | | | | 70,301 | |
MGP Ingredients, Inc. | | | 4,119 | | | | 306,454 | |
Molson Coors Beverage Co. Cl B | | | 716 | | | | 36,394 | |
Mondelez International, Inc. Cl A | | | 5,281 | | | | 345,589 | |
Monster Beverage Corp.* | | | 2,793 | | | | 139,510 | |
Nomad Foods Ltd. | | | 12,805 | | | | 211,026 | |
PepsiCo, Inc. | | | 5,412 | | | | 892,601 | |
Philip Morris International, Inc. | | | 6,120 | | | | 620,140 | |
Procter & Gamble Co. | | | 9,291 | | | | 1,532,272 | |
Simply Good Foods Co.* | | | 9,769 | | | | 352,954 | |
Sysco Corp. | | | 1,960 | | | | 139,924 | |
Target Corp. | | | 1,821 | | | | 269,581 | |
Tyson Foods, Inc. Cl A | | | 1,127 | | | | 64,397 | |
Walgreens Boots Alliance, Inc. | | | 2,819 | | | | 34,096 | |
Walmart, Inc. | | | 16,818 | | | | 1,138,747 | |
| | | | | | | | |
| | | | | | | 14,582,469 | |
| | | | | | | | |
| ENERGY (4.7%) | |
APA Corp. | | | 1,418 | | | | 41,746 | |
Baker Hughes Co. Cl A | | | 29,610 | | | | 1,041,384 | |
ChampionX Corp. | | | 16,832 | | | | 558,991 | |
Cheniere Energy, Inc. | | | 3,187 | | | | 557,183 | |
Chesapeake Energy Corp. | | | 4,936 | | | | 405,690 | |
Chevron Corp. | | | 6,748 | | | | 1,055,522 | |
ConocoPhillips | | | 4,605 | | | | 526,720 | |
Coterra Energy, Inc. | | | 2,930 | | | | 78,143 | |
Devon Energy Corp. | | | 11,566 | | | | 548,228 | |
| | | | | | | | |
| | | Shares | | | Value | |
| COMMON STOCKS (CONTINUED): | |
| ENERGY (CONTINUED) | |
Diamondback Energy, Inc. | | | 703 | | | $ | 140,734 | |
EOG Resources, Inc. | | | 2,263 | | | | 284,844 | |
EQT Corp. | | | 9,179 | | | | 339,439 | |
Exxon Mobil Corp. | | | 17,661 | | | | 2,033,134 | |
Halliburton Co. | | | 3,486 | | | | 117,757 | |
Hess Corp. | | | 2,423 | | | | 357,441 | |
Kinder Morgan, Inc. | | | 7,602 | | | | 151,052 | |
Liberty Energy, Inc. Cl A | | | 23,928 | | | | 499,856 | |
Marathon Oil Corp. | | | 2,221 | | | | 63,676 | |
Marathon Petroleum Corp. | | | 1,388 | | | | 240,790 | |
MPLX LP* | | | 5,027 | | | | 214,100 | |
Murphy Oil Corp. | | | 9,429 | | | | 388,852 | |
Northern Oil & Gas, Inc. | | | 29,948 | | | | 1,113,167 | |
Occidental Petroleum Corp. | | | 2,617 | | | | 164,950 | |
ONEOK, Inc. | | | 2,297 | | | | 187,320 | |
Ovintiv, Inc. | | | 10,977 | | | | 514,492 | |
Permian Resources Corp. Cl A | | | 24,273 | | | | 392,009 | |
Phillips 66 | | | 1,670 | | | | 235,754 | |
Schlumberger N.V. | | | 5,627 | | | | 265,482 | |
Southwestern Energy Co.* | | | 62,125 | | | | 418,101 | |
Targa Resources Corp. | | | 873 | | | | 112,425 | |
Valaris Ltd.* | | | 2,616 | | | | 194,892 | |
Valero Energy Corp. | | | 1,288 | | | | 201,907 | |
Williams Cos., Inc. | | | 21,202 | | | | 901,085 | |
| | | | | | | | |
| | | | | | | 14,346,866 | |
| | | | | | | | |
| FINANCIALS (14.8%) | |
Aflac, Inc. | | | 2,036 | | | | 181,835 | |
Allstate Corp. | | | 1,038 | | | | 165,727 | |
American Express Co. | | | 2,238 | | | | 518,209 | |
American Financial Group, Inc. | | | 7,652 | | | | 941,349 | |
American International Group, Inc. | | | 2,613 | | | | 193,989 | |
Ameriprise Financial, Inc. | | | 3,689 | | | | 1,575,904 | |
Aon PLC Cl A | | | 855 | | | | 251,011 | |
Arch Capital Group Ltd.* | | | 4,214 | | | | 425,150 | |
Arthur J. Gallagher & Co. | | | 860 | | | | 223,007 | |
Assurant, Inc. | | | 205 | | | | 34,081 | |
Bank of America Corp. | | | 26,786 | | | | 1,065,279 | |
Bank of New York Mellon Corp. | | | 2,945 | | | | 176,376 | |
Banner Corp. | | | 9,649 | | | | 478,976 | |
Berkshire Hathaway, Inc. Cl B* | | | 7,128 | | | | 2,899,670 | |
BlackRock, Inc. Cl A | | | 550 | | | | 433,026 | |
Blackstone, Inc. | | | 2,814 | | | | 348,373 | |
Brookfield Asset Management Ltd. Cl A | | | 2,966 | | | | 112,856 | |
Brown & Brown, Inc. | | | 8,676 | | | | 775,721 | |
Capital One Financial Corp. | | | 1,504 | | | | 208,229 | |
Cboe Global Markets, Inc. | | | 414 | | | | 70,405 | |
Charles Schwab Corp. | | | 5,877 | | | | 433,076 | |
Chubb Ltd. | | | 1,598 | | | | 407,618 | |
Cincinnati Financial Corp. | | | 617 | | | | 72,868 | |
Citigroup, Inc. | | | 7,509 | | | | 476,521 | |
The accompanying notes are an integral part of these portfolio schedules.
30
MoA FUNDS — ALL AMERICA FUND
PORTFOLIO OF INVESTMENTS IN SECURITIES (Continued)
June 30, 2024 (Unaudited)
| | | | | | | | |
| | | Shares | | | Value | |
| COMMON STOCKS (CONTINUED): | |
| FINANCIALS (CONTINUED) | |
Citizens Financial Group, Inc. | | | 1,792 | | | $ | 64,566 | |
CME Group, Inc. Cl A | | | 1,418 | | | | 278,779 | |
Corpay, Inc.* | | | 277 | | | | 73,796 | |
Discover Financial Svcs. | | | 986 | | | | 128,979 | |
East West Bancorp, Inc. | | | 4,450 | | | | 325,874 | |
Eastern Bankshares, Inc. | | | 22,159 | | | | 309,783 | |
Enterprise Financial Svcs. Corp. | | | 9,847 | | | | 402,841 | |
Essent Group Ltd. | | | 11,371 | | | | 638,937 | |
Euronet Worldwide, Inc.* | | | 1,646 | | | | 170,361 | |
Everest Group Ltd. | | | 2,248 | | | | 856,533 | |
FactSet Research Systems, Inc. | | | 150 | | | | 61,241 | |
Fidelity National Information Svcs., Inc. | | | 2,190 | | | | 165,038 | |
Fifth Third Bancorp | | | 20,787 | | | | 758,518 | |
First Financial Bankshares, Inc. | | | 14,170 | | | | 418,440 | |
Fiserv, Inc.* | | | 2,304 | | | | 343,388 | |
Franklin Resources, Inc. | | | 1,181 | | | | 26,395 | |
German American Bancorp, Inc. | | | 11,564 | | | | 408,787 | |
Global Payments, Inc. | | | 1,005 | | | | 97,184 | |
Globe Life, Inc. | | | 331 | | | | 27,235 | |
Goldman Sachs Group, Inc. | | | 1,270 | | | | 574,446 | |
Goosehead Insurance, Inc. Cl A* | | | 3,384 | | | | 194,377 | |
Hancock Whitney Corp. | | | 10,992 | | | | 525,747 | |
Hartford Financial Svcs. Group, Inc. | | | 10,965 | | | | 1,102,421 | |
Home BancShares, Inc. | | | 14,978 | | | | 358,873 | |
Houlihan Lokey, Inc. Cl A | | | 2,119 | | | | 285,768 | |
Huntington Bancshares, Inc. | | | 5,705 | | | | 75,192 | |
Intercontinental Exchange, Inc. | | | 2,258 | | | | 309,098 | |
Invesco Ltd. | | | 1,770 | | | | 26,479 | |
iShares Core S&P 500 ETF | | | 4,586 | | | | 2,509,597 | |
iShares Micro-Cap ETF | | | 3,178 | | | | 362,292 | |
iShares Russell 2000 Growth ETF | | | 1,123 | | | | 294,821 | |
iShares Russell Mid-Cap ETF | | | 6,876 | | | | 557,506 | |
Jack Henry & Associates, Inc. | | | 287 | | | | 47,648 | |
JPMorgan Chase & Co. | | | 11,306 | | | | 2,286,752 | |
KeyCorp. | | | 3,711 | | | | 52,733 | |
KKR & Co., Inc. | | | 2,620 | | | | 275,729 | |
Loews Corp. | | | 715 | | | | 53,439 | |
M&T Bank Corp. | | | 4,424 | | | | 669,617 | |
MarketAxess Hldgs., Inc. | | | 149 | | | | 29,879 | |
Marsh & McLennan Cos., Inc. | | | 1,939 | | | | 408,586 | |
Mastercard, Inc. Cl A | | | 3,233 | | | | 1,426,270 | |
MetLife, Inc. | | | 2,352 | | | | 165,087 | |
Moelis & Co. Cl A | | | 4,433 | | | | 252,060 | |
Moody’s Corp. | | | 619 | | | | 260,556 | |
Morgan Stanley | | | 4,927 | | | | 478,855 | |
MSCI, Inc. Cl A | | | 311 | | | | 149,824 | |
Nasdaq, Inc. | | | 1,498 | | | | 90,269 | |
| | | | | | | | |
| | | Shares | | | Value | |
| COMMON STOCKS (CONTINUED): | |
| FINANCIALS (CONTINUED) | |
Northern Trust Corp. | | | 806 | | | $ | 67,688 | |
PayPal Hldgs., Inc.* | | | 4,119 | | | | 239,026 | |
PJT Partners, Inc. Cl A | | | 3,161 | | | | 341,104 | |
PNC Financial Svcs. Group, Inc. | | | 1,567 | | | | 243,637 | |
Primerica, Inc. | | | 4,388 | | | | 1,038,113 | |
Principal Financial Group, Inc. | | | 849 | | | | 66,604 | |
Progressive Corp. | | | 2,305 | | | | 478,772 | |
Prudential Financial, Inc. | | | 1,414 | | | | 165,707 | |
Raymond James Financial, Inc. | | | 6,331 | | | | 782,575 | |
Regions Financial Corp. | | | 3,606 | | | | 72,264 | |
Reinsurance Group of America, Inc. | | | 1,823 | | | | 374,207 | |
S&P Global, Inc. | | | 1,261 | | | | 562,406 | |
Selective Insurance Group, Inc. | | | 8,201 | | | | 769,500 | |
ServisFirst Bancshares, Inc. | | | 10,191 | | | | 643,969 | |
Skyward Specialty Insurance Group, Inc.* | | | 12,612 | | | | 456,302 | |
Starwood Property Trust, Inc. | | | 35,700 | | | | 676,158 | |
State Street Corp. | | | 1,187 | | | | 87,838 | |
Stifel Financial Corp. | | | 2,636 | | | | 221,819 | |
Stock Yards Bancorp, Inc. | | | 9,572 | | | | 475,441 | |
Synchrony Financial | | | 5,954 | | | | 280,969 | |
T. Rowe Price Group, Inc. | | | 880 | | | | 101,473 | |
Travelers Cos., Inc. | | | 901 | | | | 183,209 | |
TriCo Bancshares | | | 9,674 | | | | 382,800 | |
Truist Financial Corp. | | | 5,267 | | | | 204,623 | |
U.S. Bancorp | | | 6,143 | | | | 243,877 | |
UMB Financial Corp. | | | 5,700 | | | | 475,494 | |
Visa, Inc. Cl A | | | 6,198 | | | | 1,626,789 | |
Voya Financial, Inc. | | | 7,921 | | | | 563,579 | |
W.R. Berkley Corp. | | | 796 | | | | 62,550 | |
Webster Financial Corp. | | | 6,963 | | | | 303,517 | |
Wells Fargo & Co. | | | 13,726 | | | | 815,187 | |
Willis Towers Watson PLC | | | 403 | | | | 105,642 | |
Wintrust Financial Corp. | | | 4,617 | | | | 455,052 | |
| | | | | | | | |
| | | | | | | 45,417,743 | |
| | | | | | | | |
| HEALTH CARE (11.8%) | |
Abbott Laboratories | | | 6,848 | | | | 711,576 | |
AbbVie, Inc. | | | 6,952 | | | | 1,192,407 | |
Addus HomeCare Corp.* | | | 3,920 | | | | 455,151 | |
Agilent Technologies, Inc. | | | 4,605 | | | | 596,946 | |
Align Technology, Inc.* | | | 276 | | | | 66,635 | |
Alnylam Pharmaceuticals, Inc.* | | | 959 | | | | 233,037 | |
Amgen, Inc. | | | 2,111 | | | | 659,582 | |
Amicus Therapeutics, Inc.* | | | 17,604 | | | | 174,632 | |
AMN Healthcare Svcs., Inc.* | | | 2,988 | | | | 153,075 | |
Amphastar Pharmaceuticals, Inc.* | | | 6,140 | | | | 245,600 | |
Annexon, Inc.* | | | 44,436 | | | | 217,736 | |
Apellis Pharmaceuticals, Inc.* | | | 1,929 | | | | 73,996 | |
Avidity Biosciences, Inc.* | | | 12,334 | | | | 503,844 | |
The accompanying notes are an integral part of these portfolio schedules.
31
MoA FUNDS — ALL AMERICA FUND
PORTFOLIO OF INVESTMENTS IN SECURITIES (Continued)
June 30, 2024 (Unaudited)
| | | | | | | | |
| | | Shares | | | Value | |
| COMMON STOCKS (CONTINUED): | |
| HEALTH CARE (CONTINUED) | |
Axsome Therapeutics, Inc.* | | | 2,807 | | | $ | 225,964 | |
Baxter International, Inc. | | | 2,006 | | | | 67,101 | |
Becton Dickinson & Co. | | | 1,138 | | | | 265,962 | |
Biogen, Inc.* | | | 1,738 | | | | 402,903 | |
BioLife Solutions, Inc.* | | | 27,617 | | | | 591,832 | |
Bio-Rad Laboratories, Inc. Cl A* | | | 81 | | | | 22,122 | |
Bio-Techne Corp. | | | 2,154 | | | | 154,334 | |
Blueprint Medicines Corp.* | | | 2,282 | | | | 245,954 | |
Boston Scientific Corp.* | | | 5,787 | | | | 445,657 | |
Bristol-Myers Squibb Co. | | | 7,981 | | | | 331,451 | |
Cardinal Health, Inc. | | | 958 | | | | 94,191 | |
Catalent, Inc.* | | | 712 | | | | 40,036 | |
Cencora, Inc. | | | 652 | | | | 146,896 | |
Centene Corp.* | | | 5,568 | | | | 369,158 | |
Charles River Laboratories International, Inc.* | | | 202 | | | | 41,729 | |
Cigna Group | | | 1,119 | | | | 369,908 | |
Collegium Pharmaceutical, Inc.* | | | 4,962 | | | | 159,776 | |
CONMED Corp. | | | 1,898 | | | | 131,569 | |
Cooper Cos., Inc. | | | 783 | | | | 68,356 | |
Corcept Therapeutics, Inc.* | | | 17,231 | | | | 559,835 | |
CVS Health Corp. | | | 4,943 | | | | 291,934 | |
Danaher Corp. | | | 2,595 | | | | 648,361 | |
DaVita, Inc.* | | | 204 | | | | 28,268 | |
Dexcom, Inc.* | | | 4,600 | | | | 521,548 | |
Dyne Therapeutics, Inc.* | | | 3,435 | | | | 121,221 | |
Edwards Lifesciences Corp.* | | | 2,373 | | | | 219,194 | |
Elevance Health, Inc. | | | 915 | | | | 495,802 | |
Eli Lilly & Co. | | | 3,142 | | | | 2,844,704 | |
Encompass Health Corp. | | | 6,721 | | | | 576,595 | |
Envista Hldgs. Corp.* | | | 14,976 | | | | 249,051 | |
Exact Sciences Corp.* | | | 1,990 | | | | 84,078 | |
Fortrea Hldgs., Inc.* | | | 40,179 | | | | 937,778 | |
GE HealthCare Technologies, Inc. | | | 1,671 | | | | 130,204 | |
Gilead Sciences, Inc. | | | 4,905 | | | | 336,532 | |
Halozyme Therapeutics, Inc.* | | | 6,379 | | | | 334,004 | |
HCA Healthcare, Inc. | | | 764 | | | | 245,458 | |
HealthEquity, Inc.* | | | 5,294 | | | | 456,343 | |
Henry Schein, Inc.* | | | 505 | | | | 32,371 | |
Hologic, Inc.* | | | 919 | | | | 68,236 | |
Humana, Inc. | | | 934 | | | | 348,989 | |
IDEXX Laboratories, Inc.* | | | 790 | | | | 384,888 | |
Incyte Corp.* | | | 636 | | | | 38,554 | |
Inmode Ltd.* | | | 4,847 | | | | 88,409 | |
Insmed, Inc.* | | | 5,476 | | | | 366,892 | |
Insulet Corp.* | | | 1,033 | | | | 208,459 | |
Intra-Cellular Therapies, Inc.* | | | 3,114 | | | | 213,278 | |
Intuitive Surgical, Inc.* | | | 1,396 | | | | 621,011 | |
IQVIA Hldgs., Inc.* | | | 718 | | | | 151,814 | |
iRhythm Technologies, Inc.* | | | 1,470 | | | | 158,231 | |
Johnson & Johnson | | | 9,475 | | | | 1,384,866 | |
Krystal Biotech, Inc.* | | | 2,274 | | | | 417,597 | |
Labcorp Hldgs., Inc. | | | 1,640 | | | | 333,756 | |
| | | | | | | | |
| | | Shares | | | Value | |
| COMMON STOCKS (CONTINUED): | |
| HEALTH CARE (CONTINUED) | |
Lantheus Hldgs., Inc.* | | | 2,921 | | | $ | 234,527 | |
LeMaitre Vascular, Inc. | | | 2,148 | | | | 176,737 | |
Madrigal Pharmaceuticals, Inc.* | | | 806 | | | | 225,809 | |
McKesson Corp. | | | 512 | | | | 299,028 | |
Medtronic PLC | | | 5,228 | | | | 411,496 | |
Merck & Co., Inc. | | | 9,972 | | | | 1,234,534 | |
Mettler-Toledo International, Inc.* | | | 85 | | | | 118,795 | |
Moderna, Inc.* | | | 1,312 | | | | 155,800 | |
Molina Healthcare, Inc.* | | | 230 | | | | 68,379 | |
Neogen Corp.* | | | 10,980 | | | | 171,617 | |
Omnicell, Inc.* | | | 7,820 | | | | 211,687 | |
Option Care Health, Inc.* | | | 5,192 | | | | 143,818 | |
Orthofix Medical, Inc.* | | | 11,494 | | | | 152,410 | |
OrthoPediatrics Corp.* | | | 2,602 | | | | 74,834 | |
Penumbra, Inc.* | | | 585 | | | | 105,282 | |
Pfizer, Inc. | | | 22,308 | | | | 624,178 | |
Quest Diagnostics, Inc. | | | 437 | | | | 59,817 | |
Regeneron Pharmaceuticals, Inc.* | | | 417 | | | | 438,280 | |
Repligen Corp.* | | | 2,455 | | | | 309,477 | |
ResMed, Inc. | | | 579 | | | | 110,832 | |
Revvity, Inc. | | | 486 | | | | 50,962 | |
Roivant Sciences Ltd.* | | | 9,326 | | | | 98,576 | |
Simulations Plus, Inc. | | | 4,862 | | | | 236,390 | |
Solventum Corp.* | | | 544 | | | | 28,767 | |
SpringWorks Therapeutics, Inc.* | | | 8,094 | | | | 304,901 | |
STAAR Surgical Co.* | | | 1,268 | | | | 60,369 | |
STERIS PLC | | | 389 | | | | 85,401 | |
Stryker Corp. | | | 1,334 | | | | 453,894 | |
Supernus Pharmaceuticals, Inc.* | | | 18,481 | | | | 494,367 | |
Tactile Systems Technology, Inc.* | | | 8,275 | | | | 98,804 | |
Teleflex, Inc. | | | 185 | | | | 38,911 | |
Tenet Healthcare Corp.* | | | 2,137 | | | | 284,285 | |
Thermo Fisher Scientific, Inc. | | | 1,503 | | | | 831,159 | |
Ultragenyx Pharmaceutical, Inc.* | | | 2,424 | | | | 99,626 | |
UnitedHealth Group, Inc. | | | 3,624 | | | | 1,845,558 | |
Universal Health Svcs., Inc. Cl B | | | 235 | | | | 43,459 | |
Vaxcyte, Inc.* | | | 3,574 | | | | 269,873 | |
Veeva Systems, Inc. Cl A* | | | 1,430 | | | | 261,704 | |
Vericel Corp.* | | | 8,578 | | | | 393,559 | |
Vertex Pharmaceuticals, Inc.* | | | 1,015 | | | | 475,751 | |
Viatris, Inc. | | | 4,688 | | | | 49,833 | |
Waters Corp.* | | | 233 | | | | 67,598 | |
West Pharmaceutical Svcs., Inc. | | | 287 | | | | 94,535 | |
Zimmer Biomet Hldgs., Inc. | | | 4,928 | | | | 534,836 | |
Zoetis, Inc. Cl A | | | 1,797 | | | | 311,528 | |
| | | | | | | | |
| | | | | | | 36,199,360 | |
| | | | | | | | |
The accompanying notes are an integral part of these portfolio schedules.
32
MoA FUNDS — ALL AMERICA FUND
PORTFOLIO OF INVESTMENTS IN SECURITIES (Continued)
June 30, 2024 (Unaudited)
| | | | | | | | |
| | | Shares | | | Value | |
| COMMON STOCKS (CONTINUED): | |
| INDUSTRIALS (12.6%) | |
3M Co. | | | 2,178 | | | $ | 222,570 | |
Advanced Drainage Systems, Inc. | | | 3,419 | | | | 548,373 | |
Allegion PLC | | | 345 | | | | 40,762 | |
American Airlines Group, Inc.* | | | 2,582 | | | | 29,254 | |
AMETEK, Inc. | | | 1,928 | | | | 321,417 | |
AO Smith Corp. | | | 476 | | | | 38,927 | |
Applied Industrial Technologies, Inc. | | | 4,954 | | | | 961,076 | |
ArcBest Corp. | | | 4,150 | | | | 444,382 | |
Arcosa, Inc. | | | 5,517 | | | | 460,173 | |
Atkore, Inc. | | | 2,631 | | | | 355,001 | |
Automatic Data Processing, Inc. | | | 1,612 | | | | 384,768 | |
Axon Enterprise, Inc.* | | | 2,915 | | | | 857,710 | |
Boeing Co.* | | | 2,271 | | | | 413,345 | |
Broadridge Financial Solutions, Inc. | | | 465 | | | | 91,605 | |
Builders FirstSource, Inc.* | | | 4,661 | | | | 645,129 | |
Carlisle Cos., Inc. | | | 2,605 | | | | 1,055,572 | |
Carrier Global Corp. | | | 3,298 | | | | 208,038 | |
Casella Waste Systems, Inc. Cl A* | | | 3,686 | | | | 365,725 | |
Caterpillar, Inc. | | | 1,926 | | | | 641,551 | |
CH Robinson Worldwide, Inc. | | | 460 | | | | 40,535 | |
Chart Industries, Inc.* | | | 2,525 | | | | 364,458 | |
Cintas Corp. | | | 339 | | | | 237,388 | |
Clean Harbors, Inc.* | | | 5,424 | | | | 1,226,638 | |
Copart, Inc.* | | | 3,444 | | | | 186,527 | |
Crane Co. | | | 4,299 | | | | 623,269 | |
CSX Corp. | | | 7,697 | | | | 257,465 | |
Cummins, Inc. | | | 538 | | | | 148,988 | |
Dayforce, Inc.* | | | 621 | | | | 30,802 | |
Deere & Co. | | | 1,020 | | | | 381,103 | |
Delta Air Lines, Inc. | | | 2,540 | | | | 120,498 | |
Dover Corp. | | | 6,398 | | | | 1,154,519 | |
Eaton Corp. PLC | | | 1,573 | | | | 493,214 | |
EMCOR Group, Inc. | | | 1,400 | | | | 511,112 | |
Emerson Electric Co. | | | 2,252 | | | | 248,080 | |
Enpro, Inc. | | | 3,380 | | | | 492,027 | |
Equifax, Inc. | | | 486 | | | | 117,836 | |
ESCO Technologies, Inc. | | | 8,440 | | | | 886,538 | |
ExlService Hldgs., Inc.* | | | 5,469 | | | | 171,508 | |
Expeditors International of Washington, Inc. | | | 557 | | | | 69,508 | |
Fastenal Co. | | | 2,254 | | | | 141,641 | |
Federal Signal Corp. | | | 8,068 | | | | 675,050 | |
FedEx Corp. | | | 892 | | | | 267,457 | |
Fortive Corp. | | | 1,385 | | | | 102,628 | |
Franklin Electric Co., Inc. | | | 3,187 | | | | 306,972 | |
GE Vernova, Inc.* | | | 1,079 | | | | 185,059 | |
Generac Hldgs., Inc.* | | | 2,884 | | | | 381,322 | |
General Dynamics Corp. | | | 895 | | | | 259,675 | |
General Electric Co. | | | 4,309 | | | | 685,002 | |
Graco, Inc. | | | 4,634 | | | | 367,383 | |
HEICO Corp. Cl A | | | 2,269 | | | | 402,793 | |
| | | | | | | | |
| | | Shares | | | Value | |
| COMMON STOCKS (CONTINUED): | |
| INDUSTRIALS (CONTINUED) | |
Honeywell International, Inc. | | | 2,564 | | | $ | 547,517 | |
Howmet Aerospace, Inc. | | | 1,527 | | | | 118,541 | |
Hubbell, Inc. Cl B | | | 211 | | | | 77,116 | |
Huntington Ingalls Industries, Inc. | | | 156 | | | | 38,427 | |
Huron Consulting Group, Inc.* | | | 4,119 | | | | 405,721 | |
ICF International, Inc. | | | 4,933 | | | | 732,353 | |
IDEX Corp. | | | 298 | | | | 59,958 | |
Illinois Tool Works, Inc. | | | 1,070 | | | | 253,547 | |
Ingersoll Rand, Inc. | | | 1,589 | | | | 144,345 | |
Jacobs Solutions, Inc. | | | 3,151 | | | | 440,226 | |
Janus International Group, Inc.* | | | 48,816 | | | | 616,546 | |
JB Hunt Transport Svcs., Inc. | | | 321 | | | | 51,360 | |
Johnson Controls International PLC | | | 2,653 | | | | 176,345 | |
KBR, Inc. | | | 10,714 | | | | 687,196 | |
Korn Ferry | | | 2,888 | | | | 193,900 | |
L-3 Harris Technologies, Inc. | | | 746 | | | | 167,537 | |
Leidos Hldgs., Inc. | | | 3,202 | | | | 467,108 | |
Lockheed Martin Corp. | | | 841 | | | | 392,831 | |
Masco Corp. | | | 867 | | | | 57,803 | |
Mercury Systems, Inc.* | | | 4,192 | | | | 113,142 | |
Miller Industries, Inc. | | | 9,370 | | | | 515,537 | |
Montrose Environmental Group, Inc.* | | | 5,792 | | | | 258,091 | |
Mueller Industries, Inc. | | | 20,606 | | | | 1,173,306 | |
Nordson Corp. | | | 214 | | | | 49,635 | |
Norfolk Southern Corp. | | | 889 | | | | 190,859 | |
Northrop Grumman Corp. | | | 548 | | | | 238,901 | |
Old Dominion Freight Line, Inc. | | | 702 | | | | 123,973 | |
Otis Worldwide Corp. | | | 1,592 | | | | 153,246 | |
PACCAR, Inc. | | | 2,063 | | | | 212,365 | |
Parker-Hannifin Corp. | | | 506 | | | | 255,940 | |
Paychex, Inc. | | | 1,261 | | | | 149,504 | |
Paycom Software, Inc. | | | 189 | | | | 27,035 | |
Pentair PLC | | | 653 | | | | 50,065 | |
Proficient Auto Logistics, Inc.* | | | 6,883 | | | | 110,541 | |
Quanta Svcs., Inc. | | | 2,755 | | | | 700,018 | |
Republic Svcs., Inc. Cl A | | | 805 | | | | 156,444 | |
Rockwell Automation, Inc. | | | 449 | | | | 123,601 | |
Rollins, Inc. | | | 1,106 | | | | 53,962 | |
RTX Corp. | | | 5,234 | | | | 525,441 | |
Saia, Inc.* | | | 1,864 | | | | 884,077 | |
Snap-on, Inc. | | | 208 | | | | 54,369 | |
Southwest Airlines Co. | | | 2,356 | | | | 67,405 | |
Stanley Black & Decker, Inc. | | | 605 | | | | 48,333 | |
Sterling Infrastructure, Inc.* | | | 3,606 | | | | 426,734 | |
Textron, Inc. | | | 751 | | | | 64,481 | |
Trane Technologies PLC | | | 892 | | | | 293,406 | |
TransDigm Group, Inc. | | | 220 | | | | 281,074 | |
TransUnion | | | 3,163 | | | | 234,568 | |
Trex Co., Inc.* | | | 7,705 | | | | 571,095 | |
Uber Technologies, Inc.* | | | 8,226 | | | | 597,866 | |
The accompanying notes are an integral part of these portfolio schedules.
33
MoA FUNDS — ALL AMERICA FUND
PORTFOLIO OF INVESTMENTS IN SECURITIES (Continued)
June 30, 2024 (Unaudited)
| | | | | | | | |
| | | Shares | | | Value | |
| COMMON STOCKS (CONTINUED): | |
| INDUSTRIALS (CONTINUED) | |
UFP Industries, Inc. | | | 8,955 | | | $ | 1,002,960 | |
Union Pacific Corp. | | | 2,401 | | | | 543,250 | |
United Airlines Hldgs., Inc.* | | | 1,294 | | | | 62,966 | |
United Parcel Svc., Inc. Cl B | | | 2,871 | | | | 392,896 | |
United Rentals, Inc. | | | 263 | | | | 170,090 | |
Veralto Corp. | | | 4,960 | | | | 473,531 | |
Verisk Analytics, Inc. Cl A | | | 562 | | | | 151,487 | |
Vestis Corp. | | | 13,355 | | | | 163,332 | |
VSE Corp. | | | 7,434 | | | | 656,273 | |
Waste Management, Inc. | | | 1,437 | | | | 306,570 | |
Westinghouse Air Brake Technologies Corp. | | | 695 | | | | 109,845 | |
WW Grainger, Inc. | | | 522 | | | | 470,969 | |
Xylem, Inc. | | | 954 | | | | 129,391 | |
| | | | | | | | |
| | | | | | | 38,589,324 | |
| | | | | | | | |
| INFORMATION TECHNOLOGY (24.1%) | |
Accenture PLC Cl A | | | 2,475 | | | | 750,940 | |
Adeia, Inc. | | | 28,127 | | | | 314,600 | |
Adobe, Inc.* | | | 1,764 | | | | 979,973 | |
Advanced Energy Industries, Inc. | | | 2,230 | | | | 242,535 | |
Advanced Micro Devices, Inc.* | | | 6,363 | | | | 1,032,142 | |
Akamai Technologies, Inc.* | | | 599 | | | | 53,958 | |
Altair Engineering, Inc. Cl A* | | | 2,316 | | | | 227,153 | |
Amphenol Corp. Cl A | | | 17,184 | | | | 1,157,686 | |
Analog Devices, Inc. | | | 1,953 | | | | 445,792 | |
ANSYS, Inc.* | | | 343 | | | | 110,274 | |
Apple, Inc. | | | 56,746 | | | | 11,951,843 | |
Applied Materials, Inc. | | | 3,272 | | | | 772,159 | |
Arista Networks, Inc.* | | | 999 | | | | 350,130 | |
Arlo Technologies, Inc.* | | | 41,326 | | | | 538,891 | |
Asana, Inc. Cl A* | | | 4,132 | | | | 57,807 | |
Autodesk, Inc.* | | | 842 | | | | 208,353 | |
Axcelis Technologies, Inc.* | | | 1,122 | | | | 159,537 | |
BlackLine, Inc.* | | | 1,816 | | | | 87,985 | |
Broadcom, Inc. | | | 1,715 | | | | 2,753,484 | |
C3.ai, Inc. Cl A* | | | 6,014 | | | | 174,165 | |
Cadence Design Systems, Inc.* | | | 1,071 | | | | 329,600 | |
CDW Corp. | | | 529 | | | | 118,411 | |
Ciena Corp.* | | | 5,844 | | | | 281,564 | |
Cisco Systems, Inc. | | | 15,942 | | | | 757,404 | |
Cognizant Technology Solutions Corp. Cl A | | | 1,958 | | | | 133,144 | |
Corning, Inc. | | | 3,035 | | | | 117,910 | |
Couchbase, Inc.* | | | 4,982 | | | | 90,971 | |
Credo Technology Group Hldg. Ltd.* | | | 7,348 | | | | 234,695 | |
Crowdstrike Hldgs., Inc. Cl A* | | | 908 | | | | 347,937 | |
CyberArk Software Ltd.* | | | 2,619 | | | | 716,087 | |
Digi International, Inc.* | | | 9,654 | | | | 221,366 | |
Enphase Energy, Inc.* | | | 535 | | | | 53,345 | |
Envestnet, Inc.* | | | 2,261 | | | | 141,516 | |
EPAM Systems, Inc.* | | | 1,228 | | | | 230,999 | |
F5, Inc.* | | | 231 | | | | 39,785 | |
| | | | | | | | |
| | | Shares | | | Value | |
| COMMON STOCKS (CONTINUED): | |
| INFORMATION TECHNOLOGY (CONTINUED) | |
Fabrinet* | | | 1,750 | | | $ | 428,383 | |
Fair Isaac Corp.* | | | 98 | | | | 145,889 | |
First Solar, Inc.* | | | 421 | | | | 94,919 | |
Five9, Inc.* | | | 10,228 | | | | 451,055 | |
Fortinet, Inc.* | | | 2,497 | | | | 150,494 | |
Gartner, Inc.* | | | 306 | | | | 137,412 | |
Gen Digital, Inc. | | | 2,170 | | | | 54,207 | |
GoDaddy, Inc. Cl A* | | | 554 | | | | 77,399 | |
Grid Dynamics Hldgs., Inc.* | | | 12,968 | | | | 136,294 | |
Guidewire Software, Inc.* | | | 1,623 | | | | 223,795 | |
Harmonic, Inc.* | | | 18,313 | | | | 215,544 | |
Hewlett Packard Enterprise Co. | | | 19,132 | | | | 405,024 | |
HP, Inc. | | | 3,398 | | | | 118,998 | |
Ichor Hldgs. Ltd.* | | | 5,147 | | | | 198,417 | |
indie Semiconductor, Inc. Cl A* | | | 33,940 | | | | 209,410 | |
Intel Corp. | | | 16,759 | | | | 519,026 | |
International Business Machines Corp. | | | 3,616 | | | | 625,387 | |
Intuit, Inc. | | | 1,102 | | | | 724,245 | |
Jabil, Inc. | | | 475 | | | | 51,675 | |
Juniper Networks, Inc. | | | 1,279 | | | | 46,632 | |
Keysight Technologies, Inc.* | | | 688 | | | | 94,084 | |
KLA Corp. | | | 531 | | | | 437,815 | |
Lam Research Corp. | | | 515 | | | | 548,398 | |
Marathon Digital Hldgs., Inc.* | | | 3,529 | | | | 70,051 | |
Microchip Technology, Inc. | | | 6,577 | | | | 601,795 | |
Micron Technology, Inc. | | | 4,359 | | | | 573,339 | |
Microsoft Corp. | | | 29,260 | | | | 13,077,757 | |
MKS Instruments, Inc. | | | 1,843 | | | | 240,659 | |
MongoDB, Inc. Cl A* | | | 629 | | | | 157,225 | |
Monolithic Power Systems, Inc. | | | 606 | | | | 497,938 | |
Motorola Solutions, Inc. | | | 1,262 | | | | 487,195 | |
NetApp, Inc. | | | 812 | | | | 104,586 | |
Novanta, Inc.* | | | 1,525 | | | | 248,743 | |
NVIDIA Corp. | | | 96,841 | | | | 11,963,737 | |
NXP Semiconductors N.V. | | | 1,007 | | | | 270,974 | |
Okta, Inc. Cl A* | | | 3,644 | | | | 341,115 | |
ON Semiconductor Corp.* | | | 1,693 | | | | 116,055 | |
Onto Innovation, Inc.* | | | 1,825 | | | | 400,697 | |
Oracle Corp. | | | 6,276 | | | | 886,171 | |
Palo Alto Networks, Inc.* | | | 2,706 | | | | 917,361 | |
PDF Solutions, Inc.* | | | 6,486 | | | | 235,961 | |
Perficient, Inc.* | | | 3,062 | | | | 229,007 | |
PTC, Inc.* | | | 3,656 | | | | 664,186 | |
Q2 Hldgs., Inc.* | | | 2,930 | | | | 176,767 | |
Qorvo, Inc.* | | | 380 | | | | 44,095 | |
QUALCOMM, Inc. | | | 4,401 | | | | 876,591 | |
Qualys, Inc.* | | | 825 | | | | 117,645 | |
Rambus, Inc.* | | | 3,393 | | | | 199,373 | |
Rapid7, Inc.* | | | 5,618 | | | | 242,866 | |
Roper Technologies, Inc. | | | 421 | | | | 237,301 | |
Salesforce, Inc. | | | 3,823 | | | | 982,893 | |
Seagate Technology Hldgs. PLC | | | 768 | | | | 79,311 | |
The accompanying notes are an integral part of these portfolio schedules.
34
MoA FUNDS — ALL AMERICA FUND
PORTFOLIO OF INVESTMENTS IN SECURITIES (Continued)
June 30, 2024 (Unaudited)
| | | | | | | | |
| | | Shares | | | Value | |
| COMMON STOCKS (CONTINUED): | |
| INFORMATION TECHNOLOGY (CONTINUED) | |
SEMrush Hldgs., Inc. Cl A* | | | 5,308 | | | $ | 71,074 | |
ServiceNow, Inc.* | | | 807 | | | | 634,843 | |
Silicon Laboratories, Inc.* | | | 1,168 | | | | 129,216 | |
Skyworks Solutions, Inc. | | | 631 | | | | 67,252 | |
Super Micro Computer, Inc.* | | | 424 | | | | 347,404 | |
Synopsys, Inc.* | | | 1,282 | | | | 762,867 | |
TE Connectivity Ltd. | | | 1,206 | | | | 181,419 | |
Teledyne Technologies, Inc.* | | | 2,072 | | | | 803,895 | |
Tenable Hldgs., Inc.* | | | 5,136 | | | | 223,827 | |
Teradyne, Inc. | | | 614 | | | | 91,050 | |
Texas Instruments, Inc. | | | 3,584 | | | | 697,196 | |
Trimble, Inc.* | | | 962 | | | | 53,795 | |
TTM Technologies, Inc.* | | | 10,959 | | | | 212,933 | |
Tyler Technologies, Inc.* | | | 167 | | | | 83,964 | |
Varonis Systems, Inc. Cl B* | | | 6,048 | | | | 290,123 | |
VeriSign, Inc.* | | | 342 | | | | 60,808 | |
Viasat, Inc.* | | | 39,800 | | | | 505,460 | |
Viavi Solutions, Inc.* | | | 10,915 | | | | 74,986 | |
Vontier Corp. | | | 9,646 | | | | 368,477 | |
Western Digital Corp.* | | | 1,285 | | | | 97,364 | |
Workiva, Inc. Cl A* | | | 1,573 | | | | 114,813 | |
Xperi, Inc.* | | | 12,047 | | | | 98,906 | |
Zebra Technologies Corp. Cl A* | | | 202 | | | | 62,404 | |
Zuora, Inc. Cl A* | | | 51,612 | | | | 512,507 | |
| | | | | | | | |
| | | | | | | 73,866,620 | |
| | | | | | | | |
| MATERIALS (3.7%) | |
Air Products & Chemicals, Inc. | | | 875 | | | | 225,794 | |
Albemarle Corp. | | | 462 | | | | 44,130 | |
Amcor PLC | | | 5,691 | | | | 55,658 | |
Ashland, Inc. | | | 18,830 | | | | 1,779,247 | |
ATI, Inc.* | | | 7,653 | | | | 424,359 | |
Avery Dennison Corp. | | | 2,046 | | | | 447,358 | |
Avient Corp. | | | 5,651 | | | | 246,666 | |
Axalta Coating Systems Ltd.* | | | 9,219 | | | | 315,013 | |
Ball Corp. | | | 1,222 | | | | 73,345 | |
Celanese Corp. Cl A | | | 395 | | | | 53,282 | |
CF Industries Hldgs., Inc. | | | 720 | | | | 53,366 | |
Corteva, Inc. | | | 2,744 | | | | 148,011 | |
Crown Hldgs., Inc. | | | 18,069 | | | | 1,344,153 | |
Dow, Inc. | | | 2,768 | | | | 146,842 | |
DuPont de Nemours, Inc. | | | 1,647 | | | | 132,567 | |
Eastman Chemical Co. | | | 463 | | | | 45,360 | |
Ecolab, Inc. | | | 1,000 | | | | 238,000 | |
FMC Corp. | | | 10,569 | | | | 608,246 | |
Freeport-McMoRan, Inc. | | | 9,491 | | | | 461,263 | |
HB Fuller Co. | | | 6,536 | | | | 503,011 | |
International Flavors & Fragrances, Inc. | | | 1,005 | | | | 95,686 | |
International Paper Co. | | | 1,367 | | | | 58,986 | |
Linde PLC | | | 1,893 | | | | 830,667 | |
LyondellBasell Industries N.V. Cl A | | | 1,012 | | | | 96,808 | |
Martin Marietta Materials, Inc. | | | 243 | | | | 131,657 | |
Materion Corp. | | | 1,654 | | | | 178,847 | |
| | | | | | | | |
| | | Shares | | | Value | |
| COMMON STOCKS (CONTINUED): | |
| MATERIALS (CONTINUED) | |
Mosaic Co. | | | 1,266 | | | $ | 36,587 | |
Newmont Corp. | | | 9,130 | | | | 382,273 | |
Nucor Corp. | | | 944 | | | | 149,228 | |
Orion S.A. | | | 22,388 | | | | 491,193 | |
Packaging Corp. of America | | | 350 | | | | 63,896 | |
PPG Industries, Inc. | | | 927 | | | | 116,700 | |
Quaker Chemical Corp. | | | 1,762 | | | | 299,011 | |
Sherwin-Williams Co. | | | 919 | | | | 274,257 | |
Steel Dynamics, Inc. | | | 582 | | | | 75,369 | |
Vulcan Materials Co. | | | 2,125 | | | | 528,445 | |
Westrock Co. | | | 1,016 | | | | 51,064 | |
| | | | | | | | |
| | | | | | | 11,206,345 | |
| | | | | | | | |
| REAL ESTATE (3.9%) | |
Alexandria Real Estate Equities, Inc. | | | 4,992 | | | | 583,914 | |
American Healthcare REIT, Inc.* | | | 24,440 | | | | 357,068 | |
American Tower Corp. | | | 1,838 | | | | 357,270 | |
Apartment Investment & Management Co. Cl A* | | | 22,107 | | | | 183,267 | |
AvalonBay Communities, Inc. | | | 559 | | | | 115,651 | |
Boston Properties, Inc. | | | 569 | | | | 35,028 | |
Camden Property Trust | | | 4,693 | | | | 512,053 | |
CBRE Group, Inc. Cl A* | | | 1,187 | | | | 105,774 | |
CoStar Group, Inc.* | | | 1,608 | | | | 119,217 | |
Cousins Properties, Inc. | | | 10,437 | | | | 241,617 | |
Crown Castle, Inc. | | | 1,710 | | | | 167,067 | |
CTO Realty Growth, Inc. | | | 8,680 | | | | 151,553 | |
Digital Realty Trust, Inc. | | | 3,093 | | | | 470,291 | |
EastGroup Properties, Inc. | | | 2,746 | | | | 467,095 | |
Equinix, Inc. | | | 373 | | | | 282,212 | |
Equity Residential | | | 1,358 | | | | 94,164 | |
Essex Property Trust, Inc. | | | 253 | | | | 68,867 | |
Extra Space Storage, Inc. | | | 3,572 | | | | 555,124 | |
Federal Realty Investment Trust | | | 293 | | | | 29,584 | |
Gaming & Leisure Properties, Inc. | | | 7,386 | | | | 333,921 | |
Healthcare Realty Trust, Inc. Cl A | | | 9,533 | | | | 157,104 | |
Healthpeak Properties, Inc. | | | 18,416 | | | | 360,954 | |
Host Hotels & Resorts, Inc. | | | 20,257 | | | | 364,221 | |
Invitation Homes, Inc. | | | 2,266 | | | | 81,327 | |
Iron Mountain, Inc. | | | 1,154 | | | | 103,421 | |
Kimco Realty Corp. | | | 2,627 | | | | 51,121 | |
Kite Realty Group Trust | | | 13,148 | | | | 294,252 | |
Mid-America Apartment Communities, Inc. | | | 460 | | | | 65,601 | |
Phillips Edison & Co., Inc. | | | 5,631 | | | | 184,190 | |
PotlatchDeltic Corp. | | | 9,696 | | | | 381,925 | |
Prologis, Inc. | | | 3,644 | | | | 409,258 | |
Public Storage | | | 623 | | | | 179,206 | |
Realty Income Corp. | | | 6,925 | | | | 365,778 | |
Regency Centers Corp. | | | 647 | | | | 40,243 | |
Ryman Hospitality Properties, Inc. | | | 1,689 | | | | 168,663 | |
The accompanying notes are an integral part of these portfolio schedules.
35
MoA FUNDS — ALL AMERICA FUND
PORTFOLIO OF INVESTMENTS IN SECURITIES (Continued)
June 30, 2024 (Unaudited)
| | | | | | | | |
| | | Shares | | | Value | |
| COMMON STOCKS (CONTINUED): | |
| REAL ESTATE (CONTINUED) | |
Sabra Health Care REIT, Inc. | | | 23,224 | | | $ | 357,650 | |
SBA Communications Corp. Cl A | | | 423 | | | | 83,035 | |
Simon Property Group, Inc. | | | 1,283 | | | | 194,759 | |
Sun Communities, Inc. | | | 2,684 | | | | 322,993 | |
Terreno Realty Corp. | | | 7,100 | | | | 420,178 | |
UDR, Inc. | | | 1,192 | | | | 49,051 | |
Urban Edge Properties | | | 18,058 | | | | 333,531 | |
Ventas, Inc. | | | 5,760 | | | | 295,258 | |
VICI Properties, Inc. Cl A | | | 4,106 | | | | 117,596 | |
Welltower, Inc. | | | 6,332 | | | | 660,111 | |
Weyerhaeuser Co. | | | 13,292 | | | | 377,360 | |
Xenia Hotels & Resorts, Inc. | | | 20,239 | | | | 290,025 | |
| | | | | | | | |
| | | | | | | 11,939,548 | |
| | | | | | | | |
| UTILITIES (3.3%) | | | | | | |
AES Corp. | | | 12,330 | | | | 216,638 | |
ALLETE, Inc. | | | 3,494 | | | | 217,851 | |
Alliant Energy Corp. | | | 1,009 | | | | 51,358 | |
Ameren Corp. | | | 5,540 | | | | 393,949 | |
American Electric Power Co., Inc. | | | 2,075 | | | | 182,061 | |
American Water Works Co., Inc. | | | 767 | | | | 99,066 | |
Atmos Energy Corp. | | | 2,413 | | | | 281,476 | |
Avista Corp. | | | 6,821 | | | | 236,075 | |
Black Hills Corp. | | | 6,233 | | | | 338,951 | |
CenterPoint Energy, Inc. | | | 2,518 | | | | 78,008 | |
Chesapeake Utilities Corp. | | | 3,390 | | | | 360,018 | |
CMS Energy Corp. | | | 1,175 | | | | 69,948 | |
Consolidated Edison, Inc. | | | 1,361 | | | | 121,701 | |
| | | | | | | | |
| | | Shares | | | Value | |
| COMMON STOCKS (CONTINUED): | |
| UTILITIES (CONTINUED) | | | | | | |
Constellation Energy Corp. | | | 1,242 | | | $ | 248,735 | |
Dominion Energy, Inc. | | | 3,299 | | | | 161,651 | |
DTE Energy Co. | | | 4,604 | | | | 511,090 | |
Duke Energy Corp. | | | 3,038 | | | | 304,499 | |
Edison International | | | 1,514 | | | | 108,720 | |
Entergy Corp. | | | 3,460 | | | | 370,220 | |
Evergy, Inc. | | | 17,924 | | | | 949,434 | |
Eversource Energy | | | 1,386 | | | | 78,600 | |
Exelon Corp. | | | 3,936 | | | | 136,225 | |
FirstEnergy Corp. | | | 2,039 | | | | 78,033 | |
NextEra Energy, Inc. | | | 8,088 | | | | 572,711 | |
NiSource, Inc. | | | 21,417 | | | | 617,024 | |
Northwestern Energy Group, Inc. | | | 4,714 | | | | 236,077 | |
NRG Energy, Inc. | | | 11,919 | | | | 928,013 | |
PG&E Corp. | | | 8,413 | | | | 146,891 | |
Pinnacle West Capital Corp. | | | 447 | | | | 34,142 | |
Portland General Electric Co. | | | 2,005 | | | | 86,696 | |
PPL Corp. | | | 9,936 | | | | 274,730 | |
Public Svc. Enterprise Group, Inc. | | | 8,647 | | | | 637,284 | |
Sempra | | | 2,491 | | | | 189,465 | |
Southern Co. | | | 4,304 | | | | 333,861 | |
Spire, Inc. | | | 3,381 | | | | 205,328 | |
Vistra Corp. | | | 1,286 | | | | 110,570 | |
WEC Energy Group, Inc. | | | 1,243 | | | | 97,526 | |
Xcel Energy, Inc. | | | 2,187 | | | | 116,808 | |
| | | | | | | | |
| | | | | | | 10,181,433 | |
| | | | | | | | |
TOTAL COMMON STOCKS | | | | | | | | |
(Cost: $206,364,029) | | | | | | | 303,297,211 | |
| | | | | | | | |
| | | | | | | | | | | | | | | | | | | | |
| | | Rating** | | | Rate(%) | | | Maturity | | | Amount | | | Value | |
| SHORT-TERM DEBT SECURITIES (0.6%): | | | | | | | | | | | | | | | |
| U.S. GOVERNMENT (0.6%) | | | | | | | | | | | | | | | |
U.S. Treasury Bill | | | A-1+ | | | | 5.28 | | | | 07/02/24 | | | $ | 600,000 | | | $ | 599,912 | |
U.S. Treasury Bill | | | A-1+ | | | | 5.28 | | | | 08/20/24 | | | | 500,000 | | | | 496,361 | |
U.S. Treasury Bill | | | A-1+ | | | | 5.29 | | | | 07/25/24 | | | | 600,000 | | | | 597,899 | |
| | | | | | | | | | | | | | | | | | | | |
| | | | | | | | | | | | | | | | | | | 1,694,172 | |
| | | | | | | | | | | | | | | | | | | | |
TOTAL SHORT-TERM DEBT SECURITIES
(Cost: $1,694,172) | | | | 1,694,172 | |
| | | | | | | | | | | | | | | | | | | | |
| TEMPORARY CASH INVESTMENT (0.8%) | | | | | | | | | | | | | | | |
JP Morgan Chase, New York Time Deposit | | | | | | | 4.58 | | | | 07/01/24 | | | | 2,605,199 | | | | 2,605,199 | |
| | | | | | | | | | | | | | | | | | | | |
TOTAL TEMPORARY CASH INVESTMENT
(Cost: $2,605,199) | | | | 2,605,199 | |
| | | | | | | | | | | | | | | | | | | | |
TOTAL INVESTMENTS
(Cost: $210,663,400) 100.4% | | | | 307,596,582 | |
| | | | | | | | | | | | | | | | | | | | |
OTHER NET ASSETS -0.4% | | | | (1,227,854 | ) |
| | | | | | | | | | | | | | | | | | | | |
NET ASSETS 100.0% | | | $ | 306,368,728 | |
| | | | | | | | | | | | | | | | | | | | |
FOOTNOTES TO PORTFOLIO OF INVESTMENTS IN SECURITIES
| * | Non-income producing security. |
| ** | Ratings as per Standard & Poor’s Corporation (unaudited). |
The accompanying notes are an integral part of these portfolio schedules.
36
MoA FUNDS — SMALL CAP VALUE FUND
PORTFOLIO OF INVESTMENTS IN SECURITIES
June 30, 2024 (Unaudited)
| | | | | | | | |
| | | Shares | | | Value | |
| | | | | | | | |
| COMMON STOCKS (97.5%): | | | | | | |
| COMMUNICATION SERVICES (1.3%) | | | | | | |
TEGNA, Inc. | | | 346,644 | | | $ | 4,832,217 | |
| | | | | | | | |
| CONSUMER DISCRETIONARY (8.1%) | | | | | | |
Bloomin’ Brands, Inc. | | | 167,744 | | | | 3,225,717 | |
Golden Entertainment, Inc. | | | 92,598 | | | | 2,880,724 | |
Marriott Vacations Worldwide Corp. | | | 21,472 | | | | 1,874,935 | |
OneSpaWorld Hldgs. Ltd.* | | | 300,047 | | | | 4,611,722 | |
Polaris, Inc. | | | 57,504 | | | | 4,503,138 | |
Skyline Champion Corp.* | | | 36,384 | | | | 2,465,016 | |
Taylor Morrison Home Corp. Cl A* | | | 198,052 | | | | 10,980,003 | |
| | | | | | | | |
| | | | | | | 30,541,255 | |
| | | | | | | | |
| CONSUMER STAPLES (2.9%) | | | | | | |
Crimson Wine Group Ltd.* | | | 507,142 | | | | 3,027,638 | |
MGP Ingredients, Inc. | | | 34,497 | | | | 2,566,577 | |
Nomad Foods Ltd. | | | 164,560 | | | | 2,711,949 | |
Simply Good Foods Co.* | | | 71,350 | | | | 2,577,875 | |
| | | | | | | | |
| | | | | | | 10,884,039 | |
| | | | | | | | |
| ENERGY (8.9%) | | | | | | |
ChampionX Corp. | | | 112,280 | | | | 3,728,819 | |
EQT Corp. | | | 96,804 | | | | 3,579,812 | |
Liberty Energy, Inc. Cl A | | | 118,897 | | | | 2,483,758 | |
Murphy Oil Corp. | | | 120,519 | | | | 4,970,204 | |
Northern Oil & Gas, Inc. | | | 183,243 | | | | 6,811,142 | |
Ovintiv, Inc. | | | 148,149 | | | | 6,943,744 | |
Permian Resources Corp. Cl A | | | 310,253 | | | | 5,010,586 | |
| | | | | | | | |
| | | | | | | 33,528,065 | |
| | | | | | | | |
| FINANCIALS (24.1%) | | | | | | |
Banner Corp. | | | 130,543 | | | | 6,480,154 | |
Brookfield Asset Management Ltd. Cl A | | | 40,877 | | | | 1,555,370 | |
Eastern Bankshares, Inc. | | | 284,343 | | | | 3,975,115 | |
Enterprise Financial Svcs. Corp. | | | 126,359 | | | | 5,169,347 | |
Essent Group Ltd. | | | 150,593 | | | | 8,461,821 | |
German American Bancorp, Inc. | | | 147,864 | | | | 5,226,992 | |
Hancock Whitney Corp. | | | 149,264 | | | | 7,139,297 | |
Home BancShares, Inc. | | | 202,625 | | | | 4,854,895 | |
Moelis & Co. Cl A | | | 60,042 | | | | 3,413,988 | |
Selective Insurance Group, Inc. | | | 80,932 | | | | 7,593,849 | |
ServisFirst Bancshares, Inc. | | | 77,578 | | | | 4,902,154 | |
Skyward Specialty Insurance Group, Inc.* | | | 161,160 | | | | 5,830,769 | |
Stifel Financial Corp. | | | 35,805 | | | | 3,012,991 | |
Stock Yards Bancorp, Inc. | | | 126,711 | | | | 6,293,735 | |
TriCo Bancshares | | | 122,196 | | | | 4,835,296 | |
UMB Financial Corp. | | | 72,003 | | | | 6,006,490 | |
Wintrust Financial Corp. | | | 61,203 | | | | 6,032,168 | |
| | | | | | | | |
| | | | | | | 90,784,431 | |
| | | | | | | | |
| HEALTH CARE (9.1%) | | | | | | |
Annexon, Inc.* | | | 287,067 | | | | 1,406,628 | |
| | | | | | | | |
| | | Shares | | | Value | |
| COMMON STOCKS (CONTINUED): | | | | |
| HEALTH CARE (CONTINUED) | | | | | | |
Avidity Biosciences, Inc.* | | | 126,959 | | | $ | 5,186,275 | |
BioLife Solutions, Inc.* | | | 181,376 | | | | 3,886,888 | |
Corcept Therapeutics, Inc.* | | | 60,387 | | | | 1,961,974 | |
Fortrea Hldgs., Inc.* | | | 276,588 | | | | 6,455,564 | |
Krystal Biotech, Inc.* | | | 12,685 | | | | 2,329,473 | |
Omnicell, Inc.* | | | 76,363 | | | | 2,067,146 | |
Orthofix Medical, Inc.* | | | 155,582 | | | | 2,063,017 | |
SpringWorks Therapeutics, Inc.* | | | 41,171 | | | | 1,550,912 | |
Supernus Pharmaceuticals, Inc.* | | | 158,889 | | | | 4,250,281 | |
Vericel Corp.* | | | 71,037 | | | | 3,259,178 | |
| | | | | | | | |
| | | | | | | 34,417,336 | |
| | | | | | | | |
| INDUSTRIALS (15.7%) | | | | | | |
ArcBest Corp. | | | 17,327 | | | | 1,855,375 | |
Arcosa, Inc. | | | 70,257 | | | | 5,860,136 | |
Enpro, Inc. | | | 43,273 | | | | 6,299,251 | |
ICF International, Inc. | | | 35,867 | | | | 5,324,815 | |
Janus International Group, Inc.* | | | 258,344 | | | | 3,262,885 | |
Miller Industries, Inc. | | | 119,759 | | | | 6,589,140 | |
Mueller Industries, Inc. | | | 187,229 | | | | 10,660,819 | |
Proficient Auto Logistics, Inc.* | | | 89,072 | | | | 1,430,496 | |
UFP Industries, Inc. | | | 64,188 | | | | 7,189,056 | |
Vestis Corp. | | | 173,718 | | | | 2,124,571 | |
VSE Corp. | | | 96,203 | | | | 8,492,801 | |
| | | | | | | | |
| | | | | | | 59,089,345 | |
| | | | | | | | |
| INFORMATION TECHNOLOGY (6.8%) | | | | | | |
Adeia, Inc. | | | 375,943 | | | | 4,204,922 | |
Arlo Technologies, Inc.* | | | 261,623 | | | | 3,411,564 | |
Digi International, Inc.* | | | 130,358 | | | | 2,989,109 | |
Envestnet, Inc.* | | | 29,435 | | | | 1,842,337 | |
Ichor Hldgs. Ltd.* | | | 67,100 | | | | 2,586,705 | |
TTM Technologies, Inc.* | | | 148,502 | | | | 2,885,394 | |
Viasat, Inc.* | | | 180,128 | | | | 2,287,626 | |
Viavi Solutions, Inc.* | | | 146,158 | | | | 1,004,105 | |
Xperi, Inc.* | | | 162,080 | | | | 1,330,677 | |
Zuora, Inc. Cl A* | | | 317,913 | | | | 3,156,876 | |
| | | | | | | | |
| | | | | | | 25,699,315 | |
| | | | | | | | |
| MATERIALS (5.9%) | | | | | | |
Ashland, Inc. | | | 94,342 | | | | 8,914,376 | |
Avient Corp. | | | 76,732 | | | | 3,349,352 | |
HB Fuller Co. | | | 50,733 | | | | 3,904,412 | |
Materion Corp. | | | 21,903 | | | | 2,368,371 | |
Orion S.A. | | | 160,894 | | | | 3,530,014 | |
| | | | | | | | |
| | | | | | | 22,066,525 | |
| | | | | | | | |
| REAL ESTATE (10.0%) | | | | | | |
American Healthcare REIT, Inc.* | | | 312,947 | | | | 4,572,156 | |
Apartment Investment & Management Co. Cl A* | | | 287,639 | | | | 2,384,527 | |
Cousins Properties, Inc. | | | 140,886 | | | | 3,261,511 | |
CTO Realty Growth, Inc. | | | 113,274 | | | | 1,977,764 | |
The accompanying notes are an integral part of these portfolio schedules.
37
MoA FUNDS — SMALL CAP VALUE FUND
PORTFOLIO OF INVESTMENTS IN SECURITIES (Continued)
June 30, 2024 (Unaudited)
| | | | | | | | |
| | | Shares | | | Value | |
| COMMON STOCKS (CONTINUED): | | | | |
| REAL ESTATE (CONTINUED) | | | | | | |
Kite Realty Group Trust | | | 168,356 | | | $ | 3,767,807 | |
PotlatchDeltic Corp. | | | 131,658 | | | | 5,186,009 | |
Sabra Health Care REIT, Inc. | | | 315,343 | | | | 4,856,282 | |
Terreno Realty Corp. | | | 57,233 | | | | 3,387,049 | |
Urban Edge Properties | | | 239,379 | | | | 4,421,330 | |
Xenia Hotels & Resorts, Inc. | | | 259,144 | | | | 3,713,534 | |
| | | | | | | | |
| | | | | | | 37,527,969 | |
| | | | | | | | |
| UTILITIES (4.7%) | | | | | | |
ALLETE, Inc. | | | 45,945 | | | | 2,864,671 | |
Avista Corp. | | | 92,628 | | | | 3,205,855 | |
Black Hills Corp. | | | 84,638 | | | | 4,602,615 | |
Northwestern Energy Group, Inc. | | | 64,016 | | | | 3,205,921 | |
Portland General Electric Co. | | | 26,039 | | | | 1,125,926 | |
Spire, Inc. | | | 45,915 | | | | 2,788,418 | |
| | | | | | | | |
| | | | | | | 17,793,406 | |
| | | | | | | | |
TOTAL COMMON STOCKS | | | | | | | | |
(Cost: $326,655,953) | | | | | | | 367,163,903 | |
| | | | | | | | |
| | | | | | | | | | | | | | | | | | | | |
| | | Rating** | | | Rate(%) | | | Maturity | | | Face Amount | | | Value | |
| SHORT-TERM DEBT SECURITIES (2.0%): | | | | | | | | | | | | | | | |
| U.S. GOVERNMENT (2.0%) | | | | | | | | | | | | | | | |
U.S. Treasury Bill | | | A-1+ | | | | 5.24 | | | | 07/02/24 | | | | 2,000,000 | | | | 1,999,709 | |
U.S. Treasury Bill | | | A-1+ | | | | 5.28 | | | | 08/20/24 | | | | 1,000,000 | | | | 992,722 | |
U.S. Treasury Bill | | | A-1+ | | | | 5.29 | | | | 07/25/24 | | | | 2,500,000 | | | | 2,491,242 | |
U.S. Treasury Bill | | | A-1+ | | | | 5.31 | | | | 07/30/24 | | | | 2,000,000 | | | | 1,991,507 | |
TOTAL SHORT-TERM DEBT SECURITIES
(Cost: $7,475,180) | | | | | | | | | | | | | | | | | | | 7,475,180 | |
| | | | | | | | | | | | | | | | | | | | |
| TEMPORARY CASH INVESTMENT (0.4%) | | | | | | | | | | | | | | | |
JP Morgan Chase, New York Time Deposit | | | | | | | 4.58 | | | | 07/01/24 | | | | 1,392,112 | | | | 1,392,112 | |
| | | | | | | | | | | | | | | | | | | | |
TOTAL TEMPORARY CASH INVESTMENT
(Cost: $1,392,112) | | | | 1,392,112 | |
| | | | | | | | | | | | | | | | | | | | |
TOTAL INVESTMENTS
(Cost: $335,523,245) 99.9% | | | | 376,031,195 | |
| | | | | | | | | | | | | | | | | | | | |
OTHER NET ASSETS 0.1% | | | | 455,992 | |
| | | | | | | | | | | | | | | | | | | | |
NET ASSETS 100.0% | | | $ | 376,487,187 | |
| | | | | | | | | | | | | | | | | | | | |
FOOTNOTES TO PORTFOLIO OF INVESTMENTS IN SECURITIES
| * | Non-income producing security. |
| ** | Ratings as per Standard & Poor’s Corporation (unaudited). |
The accompanying notes are an integral part of these portfolio schedules.
38
MoA FUNDS — SMALL CAP GROWTH FUND
PORTFOLIO OF INVESTMENTS IN SECURITIES
June 30, 2024 (Unaudited)
| | | | | | | | |
| | | Shares | | | Value | |
| COMMON STOCKS (99.2%): | |
| COMMUNICATION SERVICES (0.8%) | |
IMAX Corp.* | | | 156,977 | | | $ | 2,632,504 | |
ZipRecruiter, Inc. Cl A* | | | 80,804 | | | | 734,509 | |
| | | | | | | | |
| | | | | | | 3,367,013 | |
| | | | | | | | |
| CONSUMER DISCRETIONARY (8.0%) | |
Bloomin’ Brands, Inc. | | | 123,108 | | | | 2,367,367 | |
Everi Hldgs., Inc.* | | | 222,057 | | | | 1,865,279 | |
Five Below, Inc.* | | | 12,558 | | | | 1,368,445 | |
Golden Entertainment, Inc. | | | 129,468 | | | | 4,027,749 | |
Murphy USA, Inc. | | | 5,121 | | | | 2,404,105 | |
Ollie’s Bargain Outlet Hldgs., Inc.* | | | 42,240 | | | | 4,146,701 | |
OneSpaWorld Hldgs. Ltd.* | | | 206,415 | | | | 3,172,598 | |
Skyline Champion Corp.* | | | 47,169 | | | | 3,195,700 | |
Steven Madden Ltd. | | | 51,725 | | | | 2,187,967 | |
Taylor Morrison Home Corp. Cl A* | | | 41,765 | | | | 2,315,452 | |
Valvoline, Inc.* | | | 51,613 | | | | 2,229,682 | |
XPEL, Inc.* | | | 61,429 | | | | 2,184,415 | |
| | | | | | | | |
| | | | | | | 31,465,460 | |
| | | | | | | | |
| CONSUMER STAPLES (3.2%) | |
Coca-Cola Consolidated, Inc. | | | 2,585 | | | | 2,804,725 | |
Freshpet, Inc.* | | | 47,830 | | | | 6,188,724 | |
MGP Ingredients, Inc. | | | 20,768 | | | | 1,545,139 | |
Simply Good Foods Co.* | | | 55,723 | | | | 2,013,272 | |
| | | | | | | | |
| | | | | | | 12,551,860 | |
| | | | | | | | |
| ENERGY (5.0%) | |
ChampionX Corp. | | | 107,826 | | | | 3,580,902 | |
Liberty Energy, Inc. Cl A | | | 193,213 | | | | 4,036,220 | |
Northern Oil & Gas, Inc. | | | 206,207 | | | | 7,664,714 | |
Southwestern Energy Co.* | | | 253,028 | | | | 1,702,878 | |
Valaris Ltd.* | | | 34,688 | | | | 2,584,256 | |
| | | | | | | | |
| | | | | | | 19,568,970 | |
| | | | | | | | |
| FINANCIALS (8.9%) | |
First Financial Bankshares, Inc. | | | 187,296 | | | | 5,530,851 | |
Goosehead Insurance, Inc. Cl A* | | | 44,799 | | | | 2,573,255 | |
Houlihan Lokey, Inc. Cl A | | | 28,027 | | | | 3,779,721 | |
iShares Micro-Cap ETF | | | 41,984 | | | | 4,786,176 | |
iShares Russell 2000 Growth ETF | | | 14,839 | | | | 3,895,683 | |
PJT Partners, Inc. Cl A | | | 41,865 | | | | 4,517,652 | |
Primerica, Inc. | | | 14,675 | | | | 3,471,811 | |
Selective Insurance Group, Inc. | | | 28,621 | | | | 2,685,508 | |
ServisFirst Bancshares, Inc. | | | 57,193 | | | | 3,614,026 | |
| | | | | | | | |
| | | | | | | 34,854,683 | |
| | | | | | | | |
| HEALTH CARE (24.7%) | |
Addus HomeCare Corp.* | | | 51,746 | | | | 6,008,228 | |
Amicus Therapeutics, Inc.* | | | 232,689 | | | | 2,308,275 | |
AMN Healthcare Svcs., Inc.* | | | 39,450 | | | | 2,021,024 | |
Amphastar Pharmaceuticals, Inc.* | | | 81,319 | | | | 3,252,760 | |
Annexon, Inc.* | | | 294,321 | | | | 1,442,173 | |
| | | | | | | | |
| | | Shares | | | Value | |
| COMMON STOCKS (CONTINUED): | |
| HEALTH CARE (CONTINUED) | |
Apellis Pharmaceuticals, Inc.* | | | 25,537 | | | $ | 979,599 | |
Avidity Biosciences, Inc.* | | | 39,190 | | | | 1,600,912 | |
Axsome Therapeutics, Inc.* | | | 37,086 | | | | 2,985,423 | |
BioLife Solutions, Inc.* | | | 177,466 | | | | 3,803,096 | |
Blueprint Medicines Corp.* | | | 30,164 | | | | 3,251,076 | |
Collegium Pharmaceutical, Inc.* | | | 65,588 | | | | 2,111,934 | |
CONMED Corp. | | | 25,083 | | | | 1,738,754 | |
Corcept Therapeutics, Inc.* | | | 167,813 | | | | 5,452,244 | |
Dyne Therapeutics, Inc.* | | | 45,410 | | | | 1,602,519 | |
Fortrea Hldgs., Inc.* | | | 53,429 | | | | 1,247,033 | |
Halozyme Therapeutics, Inc.* | | | 84,650 | | | | 4,432,274 | |
HealthEquity, Inc.* | | | 40,655 | | | | 3,504,461 | |
Inmode Ltd.* | | | 64,025 | | | | 1,167,816 | |
Insmed, Inc.* | | | 72,363 | | | | 4,848,321 | |
Intra-Cellular Therapies, Inc.* | | | 41,390 | | | | 2,834,801 | |
iRhythm Technologies, Inc.* | | | 19,400 | | | | 2,088,216 | |
Krystal Biotech, Inc.* | | | 17,710 | | | | 3,252,264 | |
Lantheus Hldgs., Inc.* | | | 39,122 | | | | 3,141,105 | |
LeMaitre Vascular, Inc. | | | 28,355 | | | | 2,333,049 | |
Madrigal Pharmaceuticals, Inc.* | | | 10,542 | | | | 2,953,447 | |
Neogen Corp.* | | | 145,251 | | | | 2,270,273 | |
Omnicell, Inc.* | | | 27,923 | | | | 755,876 | |
Option Care Health, Inc.* | | | 68,886 | | | | 1,908,142 | |
OrthoPediatrics Corp.* | | | 33,861 | | | | 973,842 | |
Roivant Sciences Ltd.* | | | 123,971 | | | | 1,310,373 | |
Simulations Plus, Inc. | | | 64,367 | | | | 3,129,524 | |
SpringWorks Therapeutics, Inc.* | | | 65,704 | | | | 2,475,070 | |
STAAR Surgical Co.* | | | 17,117 | | | | 814,940 | |
Supernus Pharmaceuticals, Inc.* | | | 84,580 | | | | 2,262,515 | |
Tactile Systems Technology, Inc.* | | | 109,819 | | | | 1,311,239 | |
Tenet Healthcare Corp.* | | | 28,208 | | | | 3,752,510 | |
Vaxcyte, Inc.* | | | 47,239 | | | | 3,567,017 | |
Vericel Corp.* | | | 44,177 | | | | 2,026,841 | |
| | | | | | | | |
| | | | | | | 96,918,966 | |
| | | | | | | | |
| INDUSTRIALS (21.3%) | |
Applied Industrial Technologies, Inc. | | | 16,657 | | | | 3,231,458 | |
ArcBest Corp. | | | 37,253 | | | | 3,989,051 | |
Atkore, Inc. | | | 34,763 | | | | 4,690,572 | |
Casella Waste Systems, Inc. Cl A* | | | 48,727 | | | | 4,834,693 | |
Chart Industries, Inc.* | | | 33,403 | | | | 4,821,389 | |
EMCOR Group, Inc. | | | 10,211 | | | | 3,727,832 | |
ESCO Technologies, Inc. | | | 63,997 | | | | 6,722,245 | |
ExlService Hldgs., Inc.* | | | 73,168 | | | | 2,294,548 | |
Federal Signal Corp. | | | 107,214 | | | | 8,970,595 | |
Franklin Electric Co., Inc. | | | 42,072 | | | | 4,052,375 | |
Huron Consulting Group, Inc.* | | | 54,419 | | | | 5,360,272 | |
ICF International, Inc. | | | 30,138 | | | | 4,474,287 | |
The accompanying notes are an integral part of these portfolio schedules.
39
MoA FUNDS — SMALL CAP GROWTH FUND
PORTFOLIO OF INVESTMENTS IN SECURITIES (Continued)
June 30, 2024 (Unaudited)
| | | | | | | | |
| | | Shares | | | Value | |
| COMMON STOCKS (CONTINUED): | |
| INDUSTRIALS (CONTINUED) | |
Janus International Group, Inc.* | | | 382,808 | | | $ | 4,834,865 | |
Korn Ferry | | | 38,275 | | | | 2,569,784 | |
Mercury Systems, Inc.* | | | 55,533 | | | | 1,498,836 | |
Montrose Environmental Group, Inc.* | | | 76,725 | | | | 3,418,866 | |
Saia, Inc.* | | | 5,132 | | | | 2,434,056 | |
Sterling Infrastructure, Inc.* | | | 47,674 | | | | 5,641,741 | |
UFP Industries, Inc. | | | 52,782 | | | | 5,911,584 | |
| | | | | | | | |
| | | | | | | 83,479,049 | |
| | | | | | | | |
| INFORMATION TECHNOLOGY (20.7%) | |
Advanced Energy Industries, Inc. | | | 29,465 | | | | 3,204,613 | |
Altair Engineering, Inc. Cl A* | | | 30,461 | | | | 2,987,615 | |
Arlo Technologies, Inc.* | | | 275,496 | | | | 3,592,468 | |
Asana, Inc. Cl A* | | | 55,312 | | | | 773,815 | |
Axcelis Technologies, Inc.* | | | 14,859 | | | | 2,112,801 | |
Blackline, Inc.* | | | 24,340 | | | | 1,179,273 | |
C3.ai, Inc. Cl A* | | | 79,801 | | | | 2,311,037 | |
Couchbase, Inc.* | | | 66,718 | | | | 1,218,271 | |
Credo Technology Group Hldg. Ltd.* | | | 95,819 | | | | 3,060,459 | |
CyberArk Software Ltd.* | | | 14,331 | | | | 3,918,382 | |
Fabrinet* | | | 23,123 | | | | 5,660,279 | |
Five9, Inc.* | | | 56,839 | | | | 2,506,600 | |
Grid Dynamics Hldgs., Inc.* | | | 172,494 | | | | 1,812,912 | |
Harmonic, Inc.* | | | 242,528 | | | | 2,854,555 | |
indie Semiconductor, Inc. Cl A* | | | 452,312 | | | | 2,790,765 | |
Marathon Digital Hldgs., Inc.* | | | 47,619 | | | | 945,237 | |
Novanta, Inc.* | | | 20,516 | | | | 3,346,365 | |
| | | | | | | | |
| | | Shares | | | Value | |
| COMMON STOCKS (CONTINUED): | |
| INFORMATION TECHNOLOGY (CONTINUED) | |
Onto Innovation, Inc.* | | | 24,815 | | | $ | 5,448,381 | |
PDF Solutions, Inc.* | | | 87,659 | | | | 3,189,034 | |
Perficient, Inc.* | | | 40,771 | | | | 3,049,263 | |
Q2 Hldgs., Inc.* | | | 40,079 | | | | 2,417,966 | |
Qualys, Inc.* | | | 10,914 | | | | 1,556,336 | |
Rambus, Inc.* | | | 45,998 | | | | 2,702,843 | |
Rapid7, Inc.* | | | 74,113 | | | | 3,203,905 | |
SEMrush Hldgs., Inc. Cl A* | | | 70,451 | | | | 943,339 | |
Silicon Laboratories, Inc.* | | | 15,401 | | | | 1,703,813 | |
Tenable Hldgs., Inc.* | | | 68,318 | | | | 2,977,298 | |
Varonis Systems, Inc. Cl B* | | | 79,795 | | | | 3,827,766 | |
Viasat, Inc.* | | | 53,527 | | | | 679,793 | |
Workiva, Inc. Cl A* | | | 21,065 | | | | 1,537,534 | |
Zuora, Inc. Cl A* | | | 361,561 | | | | 3,590,301 | |
| | | | | | | | |
| | | | | | | 81,103,019 | |
| | | | | | | | |
| MATERIALS (3.9%) | |
ATI, Inc.* | | | 101,722 | | | | 5,640,485 | |
HB Fuller Co. | | | 34,834 | | | | 2,680,824 | |
Orion S.A. | | | 133,555 | | | | 2,930,197 | |
Quaker Chemical Corp. | | | 23,283 | | | | 3,951,125 | |
| | | | | | | | |
| | | | | | | 15,202,631 | |
| | | | | | | | |
| REAL ESTATE (1.5%) | |
EastGroup Properties, Inc. | | | 8,006 | | | | 1,361,821 | |
Phillips Edison & Co., Inc. | | | 74,434 | | | | 2,434,736 | |
Ryman Hospitality Properties, Inc. | | | 22,238 | | | | 2,220,687 | |
| | | | | | | | |
| | | | | | | 6,017,244 | |
| | | | | | | | |
| UTILITIES (1.2%) | |
Chesapeake Utilities Corp. | | | 44,789 | | | | 4,756,592 | |
| | | | | | | | |
TOTAL COMMON STOCKS | | | | |
(Cost: $342,107,289) | | | | | | | 389,285,487 | |
| | | | | | | | |
| | | | | | | | | | | | | | | | | | | | |
| | | Rating** | | | Rate(%) | | | Maturity | | | Face Amount | | | Value | |
| SHORT-TERM DEBT SECURITIES (0.8%): | | | | | | | | | | | | |
| U.S. GOVERNMENT (0.8%) | | | | | | | | | | | | |
U.S. Treasury Bill | | | A-1+ | | | | 5.24 | | | | 07/02/24 | | | $ | 2,300,000 | | | $ | 2,299,666 | |
U.S. Treasury Bill | | | A-1+ | | | | 5.28 | | | | 08/20/24 | | | | 1,000,000 | | | | 992,721 | |
| | | | | | | | | | | | | | | | | | | | |
| | | | | | | | | | | | | | | | | | | 3,292,387 | |
| | | | | | | | | | | | | | | | | | | | |
TOTAL SHORT-TERM DEBT SECURITIES
(Cost: $3,292,387) | | | | 3,292,387 | |
| | | | | | | | | | | | | | | | | | | | |
| | | | | |
| | | | | | Rate(%) | | | Maturity | | | Face Amount | | | Value | |
| TEMPORARY CASH INVESTMENT (0.5%) | | | | | | | | | | | | |
JP Morgan Chase, New York Time Deposit | | | | | | | 4.58 | | | | 07/01/24 | | | $ | 1,931,145 | | | $ | 1,931,145 | |
| | | | | | | | | | | | | | | | | | | | |
TOTAL TEMPORARY CASH INVESTMENT
(Cost: $1,931,145) | | | | 1,931,145 | |
| | | | | | | | | | | | | | | | | | | | |
TOTAL INVESTMENTS
(Cost: $347,330,821) 100.5% | | | | 394,509,019 | |
| | | | | | | | | | | | | | | | | | | | |
OTHER NET ASSETS -0.5% | | | | (1,959,062 | ) |
| | | | | | | | | | | | | | | | | | | | |
NET ASSETS 100.0% | | | $ | 392,549,957 | |
| | | | | | | | | | | | | | | | | | | | |
FOOTNOTES TO PORTFOLIO OF INVESTMENTS IN SECURITIES
| * | Non-income producing security. |
| ** | Ratings as per Standard & Poor’s Corporation (unaudited). |
The accompanying notes are an integral part of these portfolio schedules.
40
MoA FUNDS — SMALL CAP EQUITY INDEX FUND
PORTFOLIO OF INVESTMENTS IN SECURITIES
June 30, 2024 (Unaudited)
| | | | | | | | |
| | | Shares | | | Value | |
| COMMON STOCKS (100.0%): | |
| COMMUNICATION SERVICES (2.8%) | |
AMC Networks, Inc. Cl A* | | | 5,084 | | | $ | 49,111 | |
Cable One, Inc. | | | 749 | | | | 265,146 | |
Cargurus, Inc. Cl A* | | | 12,902 | | | | 338,032 | |
Cars.com, Inc.* | | | 10,107 | | | | 199,108 | |
Cinemark Hldgs., Inc.* | | | 17,538 | | | | 379,172 | |
Cogent Communications Hldgs., Inc. | | | 6,938 | | | | 391,581 | |
Consolidated Communications Hldgs., Inc.* | | | 12,458 | | | | 54,815 | |
EchoStar Corp. Cl A* | | | 19,814 | | | | 352,887 | |
Gogo, Inc.* | | | 10,028 | | | | 96,469 | |
IAC, Inc.* | | | 11,484 | | | | 538,025 | |
John Wiley & Sons, Inc. Cl A | | | 6,914 | | | | 281,400 | |
Lumen Technologies, Inc.* | | | 166,836 | | | | 183,520 | |
Madison Square Garden Sports Corp. Cl A* | | | 2,745 | | | | 516,417 | |
QuinStreet, Inc.* | | | 8,632 | | | | 143,205 | |
Scholastic Corp. | | | 4,185 | | | | 148,442 | |
Shenandoah Telecommunications Co. | | | 8,249 | | | | 134,706 | |
Shutterstock, Inc. | | | 3,948 | | | | 152,788 | |
TechTarget, Inc.* | | | 4,271 | | | | 133,127 | |
Telephone & Data Systems, Inc. | | | 16,203 | | | | 335,888 | |
Thryv Hldgs., Inc.* | | | 5,183 | | | | 92,361 | |
TripAdvisor, Inc.* | | | 17,879 | | | | 318,425 | |
Yelp, Inc. Cl A* | | | 11,088 | | | | 409,702 | |
| | | | | | | | |
| | | | | | | 5,514,327 | |
| | | | | | | | |
| CONSUMER DISCRETIONARY (14.0%) | |
Abercrombie & Fitch Co. Cl A* | | | 8,399 | | | | 1,493,678 | |
Academy Sports & Outdoors, Inc. | | | 12,129 | | | | 645,869 | |
Adtalem Global Education, Inc.* | | | 6,182 | | | | 421,674 | |
Advance Auto Parts, Inc. | | | 9,798 | | | | 620,507 | |
American Axle & Manufacturing Hldgs., Inc.* | | | 19,322 | | | | 135,061 | |
American Eagle Outfitters, Inc. | | | 30,398 | | | | 606,744 | |
Asbury Automotive Group, Inc.* | | | 3,316 | | | | 755,617 | |
BJ’s Restaurants, Inc.* | | | 3,844 | | | | 133,387 | |
Bloomin’ Brands, Inc. | | | 14,214 | | | | 273,335 | |
Boot Barn Hldgs., Inc.* | | | 4,997 | | | | 644,263 | |
Brinker International, Inc.* | | | 7,313 | | | | 529,388 | |
Buckle, Inc. | | | 4,862 | | | | 179,602 | |
Caleres, Inc. | | | 5,435 | | | | 182,616 | |
Cavco Industries, Inc.* | | | 1,276 | | | | 441,713 | |
Century Communities, Inc. | | | 4,651 | | | | 379,801 | |
Cheesecake Factory, Inc. | | | 7,706 | | | | 302,769 | |
Chuy’s Hldgs., Inc.* | | | 2,832 | | | | 73,405 | |
Cracker Barrel Old Country Store, Inc. | | | 3,650 | | | | 153,884 | |
| | | | | | | | |
| | | Shares | | | Value | |
| COMMON STOCKS (CONTINUED): | |
| CONSUMER DISCRETIONARY (CONTINUED) | |
Dana, Inc. | | | 21,206 | | | $ | 257,017 | |
Dave & Buster’s Entertainment, Inc.* | | | 5,301 | | | | 211,033 | |
Designer Brands, Inc. Cl A | | | 7,155 | | | | 48,869 | |
Dine Brands Global, Inc. | | | 2,533 | | | | 91,695 | |
Dorman Products, Inc.* | | | 4,588 | | | | 419,710 | |
Ethan Allen Interiors, Inc. | | | 3,760 | | | | 104,866 | |
Foot Locker, Inc. | | | 13,513 | | | | 336,744 | |
Fox Factory Hldg. Corp.* | | | 6,841 | | | | 329,668 | |
Frontdoor, Inc.* | | | 12,786 | | | | 432,039 | |
Gentherm, Inc.* | | | 5,202 | | | | 256,563 | |
G-III Apparel Group Ltd.* | | | 6,578 | | | | 178,066 | |
Golden Entertainment, Inc. | | | 3,569 | | | | 111,032 | |
Green Brick Partners, Inc.* | | | 4,136 | | | | 236,745 | |
Group 1 Automotive, Inc. | | | 2,172 | | | | 645,692 | |
Guess?, Inc. | | | 4,482 | | | | 91,433 | |
Hanesbrands, Inc.* | | | 57,785 | | | | 284,880 | |
Haverty Furniture Cos., Inc. | | | 2,189 | | | | 55,360 | |
Hibbett, Inc. | | | 1,964 | | | | 171,280 | |
Installed Building Products, Inc. | | | 3,859 | | | | 793,719 | |
Jack in the Box, Inc. | | | 3,188 | | | | 162,397 | |
Kohl’s Corp. | | | 18,230 | | | | 419,108 | |
Kontoor Brands, Inc. | | | 8,168 | | | | 540,313 | |
La-Z-Boy, Inc. | | | 7,009 | | | | 261,295 | |
LCI Industries | | | 4,184 | | | | 432,542 | |
Leggett & Platt, Inc. | | | 22,030 | | | | 252,464 | |
Leslie’s, Inc.* | | | 30,366 | | | | 127,233 | |
LGI Homes, Inc.* | | | 3,370 | | | | 301,581 | |
M/I Homes, Inc.* | | | 4,562 | | | | 557,203 | |
MarineMax, Inc.* | | | 3,336 | | | | 107,986 | |
Meritage Homes Corp. | | | 5,970 | | | | 966,244 | |
Mister Car Wash, Inc.* | | | 15,230 | | | | 108,438 | |
Monarch Casino & Resort, Inc. | | | 2,156 | | | | 146,888 | |
Monro, Inc. | | | 4,915 | | | | 117,272 | |
Movado Group, Inc. | | | 2,572 | | | | 63,940 | |
National Vision Hldgs., Inc.* | | | 12,913 | | | | 169,031 | |
Newell Brands, Inc. | | | 62,785 | | | | 402,452 | |
ODP Corp.* | | | 5,251 | | | | 206,207 | |
Oxford Industries, Inc. | | | 2,417 | | | | 242,063 | |
Papa John’s International, Inc. | | | 5,420 | | | | 254,632 | |
Patrick Industries, Inc. | | | 3,462 | | | | 375,800 | |
Penn Entertainment, Inc.* | | | 24,562 | | | | 475,397 | |
Perdoceo Education Corp. | | | 10,783 | | | | 230,972 | |
Phinia, Inc. | | | 7,509 | | | | 295,554 | |
Sabre Corp.* | | | 62,776 | | | | 167,612 | |
Sally Beauty Hldgs., Inc.* | | | 17,014 | | | | 182,560 | |
Shake Shack, Inc. Cl A* | | | 6,189 | | | | 557,010 | |
Shoe Carnival, Inc. | | | 2,944 | | | | 108,604 | |
Signet Jewelers Ltd. | | | 7,340 | | | | 657,517 | |
Six Flags Entertainment Corp.* | | | 11,912 | | | | 394,764 | |
Sonic Automotive, Inc. Cl A | | | 2,444 | | | | 133,125 | |
Sonos, Inc.* | | | 20,201 | | | | 298,167 | |
The accompanying notes are an integral part of these portfolio schedules.
41
MoA FUNDS — SMALL CAP EQUITY INDEX FUND
PORTFOLIO OF INVESTMENTS IN SECURITIES (Continued)
June 30, 2024 (Unaudited)
| | | | | | | | |
| | | Shares | | | Value | |
| COMMON STOCKS (CONTINUED): | |
| CONSUMER DISCRETIONARY (CONTINUED) | |
Standard Motor Products, Inc. | | | 3,084 | | | $ | 85,519 | |
Steven Madden Ltd. | | | 11,338 | | | | 479,597 | |
Strategic Education, Inc. | | | 3,605 | | | | 398,929 | |
Stride, Inc.* | | | 6,566 | | | | 462,903 | |
Sturm Ruger & Co., Inc. | | | 2,861 | | | | 119,161 | |
Topgolf Callaway Brands Corp.* | | | 23,233 | | | | 355,465 | |
Tri Pointe Homes, Inc.* | | | 15,595 | | | | 580,914 | |
Upbound Group, Inc. | | | 7,363 | | | | 226,044 | |
Urban Outfitters, Inc.* | | | 9,322 | | | | 382,668 | |
VF Corp. | | | 54,322 | | | | 733,347 | |
Victoria’s Secret & Co.* | | | 12,868 | | | | 227,378 | |
Vista Outdoor, Inc.* | | | 9,567 | | | | 360,198 | |
Winnebago Industries, Inc. | | | 4,811 | | | | 260,756 | |
Wolverine World Wide, Inc. | | | 13,138 | | | | 177,626 | |
Worthington Enterprises, Inc. | | | 5,028 | | | | 237,975 | |
XPEL, Inc.* | | | 3,498 | | | | 124,389 | |
| | | | | | | | |
| | | | | | | 27,958,964 | |
| | | | | | | | |
| CONSUMER STAPLES (3.4%) | |
Andersons, Inc. | | | 5,223 | | | | 259,061 | |
B&G Foods, Inc. | | | 12,994 | | | | 104,992 | |
Calavo Growers, Inc. | | | 2,926 | | | | 66,420 | |
Cal-Maine Foods, Inc. | | | 6,690 | | | | 408,826 | |
Central Garden & Pet Co.* | | | 1,566 | | | | 60,291 | |
Central Garden & Pet Co. Cl A* | | | 8,905 | | | | 294,132 | |
Chefs’ Warehouse, Inc.* | | | 5,818 | | | | 227,542 | |
Edgewell Personal Care Co. | | | 8,145 | | | | 327,348 | |
Energizer Hldgs., Inc. | | | 10,974 | | | | 324,172 | |
Fresh Del Monte Produce, Inc. | | | 5,511 | | | | 120,415 | |
Grocery Outlet Hldg. Corp.* | | | 16,413 | | | | 363,056 | |
Hain Celestial Group, Inc.* | | | 14,768 | | | | 102,047 | |
Inter Parfums, Inc. | | | 2,948 | | | | 342,056 | |
J&J Snack Foods Corp. | | | 2,550 | | | | 414,043 | |
John B Sanfilippo & Son, Inc. | | | 1,481 | | | | 143,909 | |
MGP Ingredients, Inc. | | | 2,570 | | | | 191,208 | |
National Beverage Corp. | | | 3,844 | | | | 196,967 | |
Nu Skin Enterprises, Inc. Cl A | | | 8,164 | | | | 86,049 | |
PriceSmart, Inc. | | | 4,136 | | | | 335,843 | |
Simply Good Foods Co.* | | | 14,956 | | | | 540,360 | |
SpartanNash Co. | | | 5,665 | | | | 106,275 | |
Tootsie Roll Industries, Inc.* | | | 2,913 | | | | 89,050 | |
TreeHouse Foods, Inc.* | | | 7,868 | | | | 288,284 | |
United Natural Foods, Inc.* | | | 9,770 | | | | 127,987 | |
Universal Corp. | | | 4,039 | | | | 194,639 | |
USANA Health Sciences, Inc.* | | | 1,817 | | | | 82,201 | |
Vector Group Ltd. | | | 21,993 | | | | 232,466 | |
WD-40 Co. | | | 2,228 | | | | 489,358 | |
WK Kellogg Co. | | | 10,869 | | | | 178,904 | |
| | | | | | | | |
| | | | | | | 6,697,901 | |
| | | | | | | | |
| ENERGY (5.2%) | |
Archrock, Inc. | | | 22,606 | | | | 457,093 | |
Bristow Group, Inc.* | | | 3,967 | | | | 133,014 | |
| | | | | | | | |
| | | Shares | | | Value | |
| COMMON STOCKS (CONTINUED): | |
| ENERGY (CONTINUED) | |
Cactus, Inc. Cl A | | | 10,799 | | | $ | 569,539 | |
California Resources Corp. | | | 10,548 | | | | 561,365 | |
Comstock Resources, Inc. | | | 15,849 | | | | 164,513 | |
CONSOL Energy, Inc.* | | | 4,348 | | | | 443,626 | |
Core Laboratories, Inc. | | | 7,709 | | | | 156,416 | |
CVR Energy, Inc. | | | 4,792 | | | | 128,282 | |
Dorian LPG Ltd. | | | 5,605 | | | | 235,186 | |
Dril-Quip, Inc.* | | | 5,658 | | | | 105,239 | |
Green Plains, Inc.* | | | 10,622 | | | | 168,465 | |
Helix Energy Solutions Group, Inc.* | | | 23,555 | | | | 281,247 | |
Helmerich & Payne, Inc. | | | 16,227 | | | | 586,444 | |
Liberty Energy, Inc. Cl A | | | 24,927 | | | | 520,725 | |
Magnolia Oil & Gas Corp. Cl A | | | 29,739 | | | | 753,586 | |
Nabors Industries Ltd.* | | | 1,474 | | | | 104,890 | |
Northern Oil & Gas, Inc. | | | 15,044 | | | | 559,185 | |
Oceaneering International, Inc.* | | | 16,665 | | | | 394,294 | |
Par Pacific Hldgs., Inc.* | | | 8,762 | | | | 221,241 | |
Patterson-UTI Energy, Inc. | | | 50,840 | | | | 526,702 | |
Peabody Energy Corp. | | | 17,369 | | | | 384,202 | |
ProPetro Hldg. Corp.* | | | 13,547 | | | | 117,452 | |
REX American Resources Corp.* | | | 2,504 | | | | 114,157 | |
RPC, Inc. | | | 13,884 | | | | 86,775 | |
SM Energy Co. | | | 18,908 | | | | 817,393 | |
Talos Energy, Inc.* | | | 25,695 | | | | 312,194 | |
Tidewater, Inc.* | | | 7,978 | | | | 759,585 | |
US Silica Hldgs., Inc.* | | | 12,843 | | | | 198,424 | |
Vital Energy, Inc.* | | | 4,195 | | | | 188,020 | |
World Kinect Corp. | | | 9,852 | | | | 254,182 | |
| | | | | | | | |
| | | | | | | 10,303,436 | |
| | | | | | | | |
| FINANCIALS (19.8%) | |
Ambac Financial Group, Inc.* | | | 7,434 | | | | 95,304 | |
Ameris Bancorp | | | 10,638 | | | | 535,623 | |
AMERISAFE, Inc. | | | 3,144 | | | | 137,990 | |
Apollo Commercial Real Estate Finance, Inc. | | | 21,497 | | | | 210,456 | |
Arbor Realty Trust, Inc. | | | 30,986 | | | | 444,649 | |
ARMOUR Residential REIT, Inc. | | | 8,014 | | | | 155,311 | |
Artisan Partners Asset Management, Inc. Cl A | | | 11,491 | | | | 474,234 | |
Assured Guaranty Ltd. | | | 8,498 | | | | 655,621 | |
Atlantic Union Bankshares Corp. | | | 14,755 | | | | 484,702 | |
Axos Financial, Inc.* | | | 8,334 | | | | 476,288 | |
B Riley Financial, Inc. | | | 2,689 | | | | 47,434 | |
Banc of California, Inc. | | | 22,817 | | | | 291,601 | |
BancFirst Corp. | | | 2,386 | | | | 209,252 | |
Bancorp, Inc.* | | | 8,509 | | | | 321,300 | |
Bank of Hawaii Corp. | | | 6,525 | | | | 373,295 | |
BankUnited, Inc. | | | 12,288 | | | | 359,670 | |
Banner Corp. | | | 5,663 | | | | 281,111 | |
Berkshire Hills Bancorp, Inc. | | | 6,987 | | | | 159,304 | |
The accompanying notes are an integral part of these portfolio schedules.
42
MoA FUNDS — SMALL CAP EQUITY INDEX FUND
PORTFOLIO OF INVESTMENTS IN SECURITIES (Continued)
June 30, 2024 (Unaudited)
| | | | | | | | |
| | | Shares | | | Value | |
| COMMON STOCKS (CONTINUED): | |
| FINANCIALS (CONTINUED) | |
BGC Group, Inc. Cl A | | | 63,099 | | | $ | 523,722 | |
Blackstone Mortgage Trust, Inc. Cl A | | | 28,531 | | | | 497,010 | |
Bread Financial Hldgs., Inc. | | | 8,150 | | | | 363,164 | |
Brightsphere Investment Group, Inc. | | | 4,842 | | | | 107,347 | |
Brookline Bancorp, Inc. | | | 14,612 | | | | 122,010 | |
Capitol Federal Financial, Inc. | | | 20,290 | | | | 111,392 | |
Cathay General Bancorp | | | 11,968 | | | | 451,433 | |
Central Pacific Financial Corp. | | | 4,445 | | | | 94,234 | |
City Hldg. Co. | | | 2,427 | | | | 257,869 | |
Cohen & Steers, Inc. | | | 4,320 | | | | 313,459 | |
Comerica, Inc. | | | 21,792 | | | | 1,112,264 | |
Community Financial System, Inc. | | | 8,674 | | | | 409,499 | |
Customers Bancorp, Inc.* | | | 4,683 | | | | 224,690 | |
CVB Financial Corp. | | | 21,805 | | | | 375,918 | |
Dime Community Bancshares, Inc. | | | 5,765 | | | | 117,606 | |
Donnelley Financial Solutions, Inc.* | | | 4,096 | | | | 244,203 | |
Eagle Bancorp, Inc. | | | 4,963 | | | | 93,801 | |
Ellington Financial, Inc. | | | 13,977 | | | | 168,842 | |
Employers Hldgs., Inc. | | | 4,166 | | | | 177,597 | |
Encore Capital Group, Inc.* | | | 3,894 | | | | 162,497 | |
Enova International, Inc.* | | | 4,458 | | | | 277,510 | |
EVERTEC, Inc. | | | 10,587 | | | | 352,018 | |
EZCORP, Inc. Cl A* | | | 8,543 | | | | 89,445 | |
FB Financial Corp. | | | 5,793 | | | | 226,101 | |
First BanCorp. | | | 27,185 | | | | 497,214 | |
First Bancorp/Southern Pines NC | | | 6,767 | | | | 216,003 | |
First Commonwealth Financial Corp. | | | 16,762 | | | | 231,483 | |
First Financial Bancorp | | | 15,691 | | | | 348,654 | |
First Hawaiian, Inc. | | | 21,013 | | | | 436,230 | |
Franklin BSP Realty Trust, Inc. | | | 13,457 | | | | 169,558 | |
Fulton Financial Corp. | | | 29,875 | | | | 507,277 | |
Genworth Financial, Inc. Cl A* | | | 71,946 | | | | 434,554 | |
Goosehead Insurance, Inc. Cl A* | | | 4,149 | | | | 238,319 | |
Green Dot Corp. Cl A* | | | 7,522 | | | | 71,083 | |
Hanmi Financial Corp. | | | 4,963 | | | | 82,981 | |
Hannon Armstrong Sustainable Infrastructure Capital, Inc. | | | 18,692 | | | | 553,283 | |
HCI Group, Inc. | | | 1,205 | | | | 111,065 | |
Heritage Financial Corp. | | | 5,702 | | | | 102,807 | |
Hilltop Hldgs., Inc. | | | 7,617 | | | | 238,260 | |
Hope Bancorp, Inc. | | | 19,825 | | | | 212,920 | |
Horace Mann Educators Corp. | | | 6,733 | | | | 219,630 | |
Independent Bank Corp. | | | 6,980 | | | | 354,026 | |
| | | | | | | | |
| | | Shares | | | Value | |
| COMMON STOCKS (CONTINUED): | |
| FINANCIALS (CONTINUED) | |
Independent Bank Group, Inc. | | | 5,918 | | | $ | 269,387 | |
iShares Core S&P Small-Cap ETF | | | 31,692 | | | | 3,380,269 | |
Jackson Financial, Inc. Cl A | | | 11,157 | | | | 828,519 | |
KKR Real Estate Finance Trust, Inc. | | | 9,570 | | | | 86,608 | |
Lakeland Financial Corp. | | | 4,192 | | | | 257,892 | |
Lincoln National Corp. | | | 27,947 | | | | 869,152 | |
Mercury General Corp. | | | 4,369 | | | | 232,169 | |
Moelis & Co. Cl A | | | 11,563 | | | | 657,472 | |
Mr Cooper Group, Inc.* | | | 10,638 | | | | 864,125 | |
National Bank Hldgs. Corp. Cl A | | | 6,218 | | | | 242,813 | |
Navient Corp. | | | 13,234 | | | | 192,687 | |
NBT Bancorp, Inc. | | | 7,750 | | | | 299,150 | |
NCR Atleos Corp.* | | | 11,261 | | | | 304,272 | |
New York Mortgage Trust, Inc. | | | 14,995 | | | | 87,571 | |
NMI Hldgs., Inc. Cl A* | | | 13,195 | | | | 449,158 | |
Northwest Bancshares, Inc. | | | 20,918 | | | | 241,603 | |
OFG Bancorp | | | 7,726 | | | | 289,339 | |
Pacific Premier Bancorp, Inc. | | | 15,850 | | | | 364,074 | |
Palomar Hldgs., Inc.* | | | 4,097 | | | | 332,472 | |
Park National Corp. | | | 2,363 | | | | 336,349 | |
Pathward Financial, Inc. | | | 4,154 | | | | 234,992 | |
Payoneer Global, Inc.* | | | 41,637 | | | | 230,669 | |
PennyMac Mortgage Investment Trust | | | 14,275 | | | | 196,281 | |
Piper Sandler Cos. | | | 2,557 | | | | 588,545 | |
PJT Partners, Inc. Cl A | | | 3,627 | | | | 391,390 | |
PRA Group, Inc.* | | | 6,469 | | | | 127,180 | |
Preferred Bank | | | 2,026 | | | | 152,943 | |
ProAssurance Corp.* | | | 8,385 | | | | 102,465 | |
PROG Hldgs., Inc. | | | 7,097 | | | | 246,124 | |
Provident Financial Svcs., Inc. | | | 21,453 | | | | 307,851 | |
Radian Group, Inc. | | | 24,750 | | | | 769,725 | |
Ready Capital Corp. | | | 25,537 | | | | 208,893 | |
Redwood Trust, Inc. | | | 21,722 | | | | 140,976 | |
Renasant Corp. | | | 9,260 | | | | 282,800 | |
S&T Bancorp, Inc. | | | 6,285 | | | | 209,856 | |
Safety Insurance Group, Inc. | | | 2,439 | | | | 182,998 | |
Seacoast Banking Corp. of Florida | | | 13,835 | | | | 327,059 | |
ServisFirst Bancshares, Inc. | | | 8,064 | | | | 509,564 | |
Simmons First National Corp. Cl A | | | 20,625 | | | | 362,587 | |
SiriusPoint Ltd.* | | | 15,132 | | | | 184,610 | |
Southside Bancshares, Inc. | | | 4,729 | | | | 130,568 | |
Stellar Bancorp, Inc. | | | 7,749 | | | | 177,917 | |
StepStone Group, Inc. Cl A | | | 8,550 | | | | 392,359 | |
Stewart Information Svcs. Corp. | | | 4,534 | | | | 281,471 | |
StoneX Group, Inc.* | | | 4,484 | | | | 337,690 | |
Tompkins Financial Corp. | | | 2,060 | | | | 100,734 | |
The accompanying notes are an integral part of these portfolio schedules.
43
MoA FUNDS — SMALL CAP EQUITY INDEX FUND
PORTFOLIO OF INVESTMENTS IN SECURITIES (Continued)
June 30, 2024 (Unaudited)
| | | | | | | | |
| | | Shares | | | Value | |
| COMMON STOCKS (CONTINUED): | |
| FINANCIALS (CONTINUED) | |
Triumph Financial, Inc.* | | | 3,549 | | | $ | 290,131 | |
Trupanion, Inc.* | | | 5,940 | | | | 174,636 | |
TrustCo Bank Corp. | | | 3,127 | | | | 89,964 | |
Trustmark Corp. | | | 10,060 | | | | 302,202 | |
Two Harbors Investment Corp. | | | 17,011 | | | | 224,715 | |
United Community Banks, Inc. | | | 19,583 | | | | 498,583 | |
United Fire Group, Inc. | | | 3,493 | | | | 75,065 | |
Veritex Hldgs., Inc. | | | 8,962 | | | | 189,009 | |
Virtu Financial, Inc. Cl A | | | 14,545 | | | | 326,535 | |
Virtus Investment Partners, Inc. | | | 1,102 | | | | 248,887 | |
WaFd, Inc. | | | 11,107 | | | | 317,438 | |
Walker & Dunlop, Inc. | | | 5,543 | | | | 544,323 | |
Westamerica BanCorp | | | 4,385 | | | | 212,804 | |
WisdomTree, Inc. | | | 18,350 | | | | 181,848 | |
World Acceptance Corp.* | | | 552 | | | | 68,216 | |
WSFS Financial Corp. | | | 9,878 | | | | 464,266 | |
| | | | | | | | |
| | | | | | | 39,584,073 | |
| | | | | | | | |
| HEALTH CARE (10.2%) | |
AdaptHealth Corp. Cl A* | | | 12,841 | | | | 128,410 | |
Addus HomeCare Corp.* | | | 2,953 | | | | 342,873 | |
Alkermes PLC* | | | 27,814 | | | | 670,317 | |
AMN Healthcare Svcs., Inc.* | | | 6,246 | | | | 319,983 | |
Amphastar Pharmaceuticals, Inc.* | | | 6,270 | | | | 250,800 | |
ANI Pharmaceuticals, Inc.* | | | 2,521 | | | | 160,537 | |
Arcus Biosciences, Inc.* | | | 8,970 | | | | 136,613 | |
Artivion, Inc.* | | | 6,517 | | | | 167,161 | |
Astrana Health, Inc.* | | | 6,957 | | | | 282,176 | |
Avanos Medical, Inc.* | | | 7,545 | | | | 150,296 | |
BioLife Solutions, Inc.* | | | 5,978 | | | | 128,109 | |
Catalyst Pharmaceuticals, Inc.* | | | 18,444 | | | | 285,698 | |
Certara, Inc.* | | | 17,713 | | | | 245,325 | |
Collegium Pharmaceutical, Inc.* | | | 5,378 | | | | 173,172 | |
CONMED Corp. | | | 5,063 | | | | 350,967 | |
Corcept Therapeutics, Inc.* | | | 15,059 | | | | 489,267 | |
CorVel Corp.* | | | 1,490 | | | | 378,862 | |
Cross Country Healthcare, Inc.* | | | 5,373 | | | | 74,362 | |
Cytek Biosciences, Inc.* | | | 15,751 | | | | 87,891 | |
Dynavax Technologies Corp.* | | | 21,514 | | | | 241,602 | |
Embecta Corp. | | | 9,479 | | | | 118,488 | |
Enhabit, Inc.* | | | 8,244 | | | | 73,537 | |
Ensign Group, Inc. | | | 9,281 | | | | 1,147,967 | |
Fortrea Hldgs., Inc.* | | | 14,695 | | | | 342,981 | |
Fulgent Genetics, Inc.* | | | 3,345 | | | | 65,629 | |
Glaukos Corp.* | | | 8,279 | | | | 979,820 | |
Harmony Biosciences Hldgs., Inc.* | | | 5,228 | | | | 157,729 | |
HealthStream, Inc. | | | 3,948 | | | | 110,149 | |
ICU Medical, Inc.* | | | 3,365 | | | | 399,594 | |
| | | | | | | | |
| | | Shares | | | Value | |
| COMMON STOCKS (CONTINUED): | |
| HEALTH CARE (CONTINUED) | |
Inari Medical, Inc.* | | | 8,505 | | | $ | 409,516 | |
Innoviva, Inc.* | | | 9,033 | | | | 148,141 | |
Integer Hldgs. Corp.* | | | 5,507 | | | | 637,656 | |
Integra LifeSciences Hldgs. Corp.* | | | 11,268 | | | | 328,350 | |
Ironwood Pharmaceuticals, Inc. Cl A* | | | 22,992 | | | | 149,908 | |
Krystal Biotech, Inc.* | | | 4,083 | | | | 749,802 | |
LeMaitre Vascular, Inc. | | | 3,284 | | | | 270,208 | |
Ligand Pharmaceuticals, Inc.* | | | 2,776 | | | | 233,906 | |
Merit Medical Systems, Inc.* | | | 9,551 | | | | 820,908 | |
Mesa Laboratories, Inc. | | | 843 | | | | 73,147 | |
Myriad Genetics, Inc.* | | | 14,877 | | | | 363,891 | |
National HealthCare Corp. | | | 2,228 | | | | 241,515 | |
NeoGenomics, Inc.* | | | 20,992 | | | | 291,159 | |
OmniAb, Inc. Cl CR3* | | | 1,207 | | | | 0 | † |
OmniAb, Inc. Cl CR4* | | | 1,207 | | | | 0 | † |
Omnicell, Inc.* | | | 7,549 | | | | 204,351 | |
Organon & Co. | | | 42,270 | | | | 874,989 | |
Owens & Minor, Inc.* | | | 12,048 | | | | 162,648 | |
Pacira BioSciences, Inc.* | | | 7,651 | | | | 218,895 | |
Patterson Cos., Inc. | | | 13,106 | | | | 316,117 | |
Pediatrix Medical Group, Inc.* | | | 13,608 | | | | 102,740 | |
Phibro Animal Health Corp. Cl A | | | 3,343 | | | | 56,062 | |
Premier, Inc. Cl A | | | 17,229 | | | | 321,665 | |
Prestige Consumer Healthcare, Inc.* | | | 8,205 | | | | 564,914 | |
Privia Health Group, Inc.* | | | 17,063 | | | | 296,555 | |
RadNet, Inc.* | | | 10,929 | | | | 643,937 | |
REGENXBIO, Inc.* | | | 7,448 | | | | 87,142 | |
Schrodinger, Inc.* | | | 9,083 | | | | 175,665 | |
Select Medical Hldgs. Corp. | | | 17,526 | | | | 614,462 | |
Simulations Plus, Inc. | | | 2,628 | | | | 127,773 | |
STAAR Surgical Co.* | | | 8,074 | | | | 384,403 | |
Supernus Pharmaceuticals, Inc.* | | | 9,036 | | | | 241,713 | |
Tandem Diabetes Care, Inc.* | | | 10,617 | | | | 427,759 | |
UFP Technologies, Inc.* | | | 1,160 | | | | 306,089 | |
US Physical Therapy, Inc. | | | 2,477 | | | | 228,924 | |
Varex Imaging Corp.* | | | 6,723 | | | | 99,030 | |
Vericel Corp.* | | | 7,989 | | | | 366,535 | |
Vir Biotechnology, Inc.* | | | 14,313 | | | | 127,386 | |
Xencor, Inc.* | | | 10,136 | | | | 191,874 | |
| | | | | | | | |
| | | | | | | 20,320,050 | |
| | | | | | | | |
| INDUSTRIALS (17.2%) | |
3D Systems Corp.* | | | 21,932 | | | | 67,331 | |
AAR Corp.* | | | 5,443 | | | | 395,706 | |
ABM Industries, Inc. | | | 10,403 | | | | 526,080 | |
AeroVironment, Inc.* | | | 4,595 | | | | 837,025 | |
Air Lease Corp. Cl A | | | 17,024 | | | | 809,151 | |
Alamo Group, Inc. | | | 1,704 | | | | 294,792 | |
Alaska Air Group, Inc.* | | | 20,857 | | | | 842,623 | |
The accompanying notes are an integral part of these portfolio schedules.
44
MoA FUNDS — SMALL CAP EQUITY INDEX FUND
PORTFOLIO OF INVESTMENTS IN SECURITIES (Continued)
June 30, 2024 (Unaudited)
| | | | | | | | |
| | | Shares | | | Value | |
| COMMON STOCKS (CONTINUED): | |
| INDUSTRIALS (CONTINUED) | |
Albany International Corp. Cl A | | | 5,129 | | | $ | 433,144 | |
Allegiant Travel Co. | | | 2,376 | | | | 119,347 | |
American Woodmark Corp.* | | | 2,605 | | | | 204,753 | |
Apogee Enterprises, Inc. | | | 3,638 | | | | 228,594 | |
ArcBest Corp. | | | 3,852 | | | | 412,472 | |
Arcosa, Inc. | | | 7,986 | | | | 666,112 | |
Armstrong World Industries, Inc. | | | 7,193 | | | | 814,535 | |
Astec Industries, Inc. | | | 3,742 | | | | 110,988 | |
AZZ, Inc. | | | 4,882 | | | | 377,135 | |
Barnes Group, Inc. | | | 8,334 | | | | 345,111 | |
Boise Cascade Co. | | | 6,489 | | | | 773,619 | |
Brady Corp. Cl A | | | 7,363 | | | | 486,105 | |
CoreCivic, Inc.* | | | 18,287 | | | | 237,365 | |
CSG Systems International, Inc. | | | 4,675 | | | | 192,470 | |
Deluxe Corp. | | | 7,240 | | | | 162,610 | |
DNOW, Inc.* | | | 17,555 | | | | 241,030 | |
DXP Enterprises, Inc.* | | | 2,147 | | | | 98,419 | |
Dycom Industries, Inc.* | | | 4,782 | | | | 807,010 | |
Encore Wire Corp. | | | 2,596 | | | | 752,399 | |
Enerpac Tool Group Corp. Cl A | | | 8,918 | | | | 340,489 | |
Enpro, Inc. | | | 3,444 | | | | 501,343 | |
Enviri Corp.* | | | 13,167 | | | | 113,631 | |
ESCO Technologies, Inc. | | | 4,233 | | | | 444,634 | |
Federal Signal Corp. | | | 10,043 | | | | 840,298 | |
Forward Air Corp. | | | 5,190 | | | | 98,818 | |
Franklin Electric Co., Inc. | | | 6,514 | | | | 627,429 | |
GEO Group, Inc.* | | | 21,907 | | | | 314,585 | |
Gibraltar Industries, Inc.* | | | 5,009 | | | | 343,367 | |
GMS, Inc.* | | | 6,548 | | | | 527,834 | |
Granite Construction, Inc. | | | 7,257 | | | | 449,716 | |
Greenbrier Cos., Inc. | | | 5,117 | | | | 253,547 | |
Griffon Corp. | | | 6,109 | | | | 390,121 | |
Hayward Hldgs., Inc.* | | | 20,836 | | | | 256,283 | |
Healthcare Svcs. Group, Inc.* | | | 12,105 | | | | 128,071 | |
Heartland Express, Inc. | | | 7,537 | | | | 92,931 | |
Heidrick & Struggles International, Inc. | | | 3,329 | | | | 105,130 | |
Hertz Global Hldgs., Inc.* | | | 21,613 | | | | 76,294 | |
Hillenbrand, Inc. | | | 11,538 | | | | 461,751 | |
HNI Corp. | | | 7,774 | | | | 349,985 | |
Hub Group, Inc. Cl A | | | 10,148 | | | | 436,871 | |
Insteel Industries, Inc. | | | 3,201 | | | | 99,103 | |
Interface, Inc. Cl A | | | 9,574 | | | | 140,546 | |
JetBlue Airways Corp.* | | | 55,906 | | | | 340,468 | |
John Bean Technologies Corp. | | | 5,232 | | | | 496,883 | |
Kelly Svcs., Inc. Cl A | | | 5,293 | | | | 113,323 | |
Kennametal, Inc. | | | 12,930 | | | | 304,372 | |
Korn Ferry | | | 8,577 | | | | 575,860 | |
Lindsay Corp. | | | 1,815 | | | | 223,027 | |
Liquidity Svcs., Inc.* | | | 3,658 | | | | 73,087 | |
Marten Transport Ltd. | | | 9,495 | | | | 175,183 | |
| | | | | | | | |
| | | Shares | | | Value | |
| COMMON STOCKS (CONTINUED): | |
| INDUSTRIALS (CONTINUED) | |
Masterbrand, Inc.* | | | 20,875 | | | $ | 306,445 | |
Matson, Inc. | | | 5,616 | | | | 735,528 | |
Matthews International Corp. Cl A | | | 5,048 | | | | 126,452 | |
Mercury Systems, Inc.* | | | 8,584 | | | | 231,682 | |
MillerKnoll, Inc. | | | 11,775 | | | | 311,920 | |
Moog, Inc. Cl A | | | 4,727 | | | | 790,827 | |
Mueller Industries, Inc. | | | 18,672 | | | | 1,063,184 | |
MYR Group, Inc.* | | | 2,756 | | | | 374,017 | |
National Presto Industries, Inc. | | | 864 | | | | 64,912 | |
NV5 Global, Inc.* | | | 2,124 | | | | 197,468 | |
OPENLANE, Inc.* | | | 17,801 | | | | 295,319 | |
Pitney Bowes, Inc. | | | 25,579 | | | | 129,941 | |
Powell Industries, Inc. | | | 1,518 | | | | 217,681 | |
Proto Labs, Inc.* | | | 4,162 | | | | 128,564 | |
Quanex Building Products Corp. | | | 5,443 | | | | 150,499 | |
Resideo Technologies, Inc.* | | | 24,000 | | | | 469,440 | |
Robert Half, Inc. | | | 16,990 | | | | 1,087,020 | |
Rush Enterprises, Inc. Cl A | | | 10,175 | | | | 426,027 | |
RXO, Inc.* | | | 19,321 | | | | 505,244 | |
SkyWest, Inc.* | | | 6,618 | | | | 543,139 | |
SPX Technologies, Inc.* | | | 7,599 | | | | 1,080,122 | |
Standex International Corp. | | | 1,949 | | | | 314,081 | |
Sun Country Airlines Hldgs., Inc.* | | | 6,232 | | | | 78,274 | |
SunPower Corp. Cl A* | | | 14,133 | | | | 41,834 | |
Sunrun, Inc.* | | | 36,434 | | | | 432,107 | |
Tennant Co. | | | 3,125 | | | | 307,625 | |
Titan International, Inc.* | | | 8,385 | | | | 62,133 | |
Trinity Industries, Inc. | | | 13,451 | | | | 402,454 | |
Triumph Group, Inc.* | | | 12,634 | | | | 194,690 | |
UniFirst Corp. | | | 2,477 | | | | 424,880 | |
Verra Mobility Corp. Cl A* | | | 27,371 | | | | 744,491 | |
Vestis Corp. | | | 21,606 | | | | 264,241 | |
Viad Corp.* | | | 3,473 | | | | 118,082 | |
Vicor Corp.* | | | 3,721 | | | | 123,388 | |
Wabash National Corp. | | | 7,401 | | | | 161,638 | |
Werner Enterprises, Inc. | | | 10,422 | | | | 373,420 | |
| | | | | | | | |
| | | | | | | 34,209,675 | |
| | | | | | | | |
| INFORMATION TECHNOLOGY (12.6%) | |
A10 Networks, Inc. | | | 11,504 | | | | 159,330 | |
ACI Worldwide, Inc.* | | | 17,331 | | | | 686,134 | |
Adeia, Inc. | | | 17,835 | | | | 199,485 | |
Advanced Energy Industries, Inc. | | | 6,155 | | | | 669,418 | |
Agilysys, Inc.* | | | 3,319 | | | | 345,641 | |
Alarm.com Hldgs., Inc.* | | | 8,250 | | | | 524,205 | |
Alpha & Omega Semiconductor Ltd.* | | | 3,822 | | | | 142,828 | |
Arlo Technologies, Inc.* | | | 16,039 | | | | 209,149 | |
Axcelis Technologies, Inc.* | | | 5,348 | | | | 760,432 | |
Badger Meter, Inc. | | | 4,832 | | | | 900,443 | |
Benchmark Electronics, Inc. | | | 5,925 | | | | 233,801 | |
Blackline, Inc.* | | | 8,434 | | | | 408,627 | |
The accompanying notes are an integral part of these portfolio schedules.
45
MoA FUNDS — SMALL CAP EQUITY INDEX FUND
PORTFOLIO OF INVESTMENTS IN SECURITIES (Continued)
June 30, 2024 (Unaudited)
| | | | | | | | |
| | | Shares | | | Value | |
| COMMON STOCKS (CONTINUED): | |
| INFORMATION TECHNOLOGY (CONTINUED) | |
Box, Inc. Cl A* | | | 23,727 | | | $ | 627,342 | |
Calix, Inc.* | | | 9,586 | | | | 339,632 | |
CEVA, Inc.* | | | 3,877 | | | | 74,787 | |
Cohu, Inc.* | | | 7,740 | | | | 256,194 | |
Corsair Gaming, Inc.* | | | 7,173 | | | | 79,190 | |
CTS Corp. | | | 5,025 | | | | 254,416 | |
Digi International, Inc.* | | | 5,979 | | | | 137,099 | |
DigitalOcean Hldgs., Inc.* | | | 8,833 | | | | 306,947 | |
Diodes, Inc.* | | | 7,581 | | | | 545,301 | |
DoubleVerify Hldgs., Inc.* | | | 23,155 | | | | 450,828 | |
DXC Technology Co.* | | | 29,407 | | | | 561,380 | |
Envestnet, Inc.* | | | 8,243 | | | | 515,929 | |
ePlus, Inc.* | | | 4,380 | | | | 322,718 | |
Extreme Networks, Inc.* | | | 21,359 | | | | 287,279 | |
Fabrinet* | | | 5,941 | | | | 1,454,297 | |
FormFactor, Inc.* | | | 12,684 | | | | 767,763 | |
Harmonic, Inc.* | | | 19,155 | | | | 225,454 | |
Ichor Hldgs. Ltd.* | | | 5,502 | | | | 212,102 | |
Insight Enterprises, Inc.* | | | 4,549 | | | | 902,340 | |
InterDigital, Inc. | | | 4,148 | | | | 483,491 | |
Itron, Inc.* | | | 7,540 | | | | 746,158 | |
Knowles Corp.* | | | 14,751 | | | | 254,602 | |
Kulicke & Soffa Industries, Inc. | | | 9,117 | | | | 448,465 | |
LiveRamp Hldgs., Inc.* | | | 10,879 | | | | 336,596 | |
Marathon Digital Hldgs., Inc.* | | | 44,864 | | | | 890,550 | |
MaxLinear, Inc. Cl A* | | | 12,417 | | | | 250,078 | |
N-able, Inc.* | | | 11,540 | | | | 175,754 | |
NCR Voyix Corp.* | | | 22,644 | | | | 279,653 | |
NetScout Systems, Inc.* | | | 11,739 | | | | 214,706 | |
OSI Systems, Inc.* | | | 2,579 | | | | 354,664 | |
PC Connection, Inc. | | | 1,864 | | | | 119,669 | |
PDF Solutions, Inc.* | | | 5,050 | | | | 183,719 | |
Perficient, Inc.* | | | 5,780 | | | | 432,286 | |
Photronics, Inc.* | | | 10,414 | | | | 256,913 | |
Plexus Corp.* | | | 4,502 | | | | 464,516 | |
Progress Software Corp. | | | 7,104 | | | | 385,463 | |
Rogers Corp.* | | | 2,760 | | | | 332,884 | |
Sanmina Corp.* | | | 9,115 | | | | 603,869 | |
ScanSource, Inc.* | | | 4,062 | | | | 179,987 | |
Semtech Corp.* | | | 10,612 | | | | 317,087 | |
SiTime Corp.* | | | 2,895 | | | | 360,080 | |
SMART Global Hldgs., Inc.* | | | 8,596 | | | | 196,591 | |
SolarEdge Technologies, Inc.* | | | 9,418 | | | | 237,899 | |
Sprinklr, Inc. Cl A* | | | 19,693 | | | | 189,447 | |
SPS Commerce, Inc.* | | | 6,087 | | | | 1,145,330 | |
TTM Technologies, Inc.* | | | 16,729 | | | | 325,045 | |
Ultra Clean Hldgs., Inc.* | | | 7,381 | | | | 361,669 | |
Veeco Instruments, Inc.* | | | 9,310 | | | | 434,870 | |
Viasat, Inc.* | | | 12,359 | | | | 156,959 | |
Viavi Solutions, Inc.* | | | 36,693 | | | | 252,081 | |
Xerox Hldgs. Corp. | | | 18,781 | | | | 218,235 | |
| | | | | | | | |
| | | | | | | 25,149,807 | |
| | | | | | | | |
| | | | | | | | |
| | | Shares | | | Value | |
| COMMON STOCKS (CONTINUED): | |
| MATERIALS (5.7%) | |
AdvanSix, Inc. | | | 4,409 | | | $ | 101,054 | |
Alpha Metallurgical Resources, Inc. | | | 1,903 | | | | 533,849 | |
Arch Resources, Inc. | | | 2,978 | | | | 453,341 | |
ATI, Inc.* | | | 20,454 | | | | 1,134,174 | |
Balchem Corp. | | | 5,330 | | | | 820,553 | |
Carpenter Technology Corp. | | | 8,154 | | | | 893,515 | |
Century Aluminum Co.* | | | 8,533 | | | | 142,928 | |
Clearwater Paper Corp.* | | | 2,742 | | | | 132,905 | |
Compass Minerals International, Inc. | | | 5,571 | | | | 57,548 | |
Hawkins, Inc. | | | 3,128 | | | | 284,648 | |
Haynes International, Inc. | | | 2,087 | | | | 122,507 | |
HB Fuller Co. | | | 8,957 | | | | 689,331 | |
Ingevity Corp.* | | | 5,554 | | | | 242,765 | |
Innospec, Inc. | | | 4,099 | | | | 506,595 | |
Kaiser Aluminum Corp. | | | 2,617 | | | | 230,034 | |
Koppers Hldgs., Inc. | | | 3,485 | | | | 128,910 | |
Materion Corp. | | | 3,408 | | | | 368,507 | |
Mativ Hldgs., Inc. | | | 8,929 | | | | 151,436 | |
Mercer International, Inc.* | | | 7,246 | | | | 61,881 | |
Metallus, Inc.* | | | 6,417 | | | | 130,073 | |
Minerals Technologies, Inc. | | | 5,301 | | | | 440,831 | |
Myers Industries, Inc. | | | 6,112 | | | | 81,779 | |
O-I Glass, Inc.* | | | 25,596 | | | | 284,883 | |
Olympic Steel, Inc. | | | 1,611 | | | | 72,221 | |
Quaker Chemical Corp. | | | 2,277 | | | | 386,407 | |
Sealed Air Corp. | | | 23,934 | | | | 832,664 | |
Sensient Technologies Corp. | | | 6,964 | | | | 516,659 | |
Stepan Co. | | | 3,510 | | | | 294,700 | |
SunCoke Energy, Inc. | | | 13,819 | | | | 135,426 | |
Sylvamo Corp. | | | 5,746 | | | | 394,176 | |
Warrior Met Coal, Inc. | | | 8,597 | | | | 539,634 | |
Worthington Steel, Inc. | | | 5,052 | | | | 168,535 | |
| | | | | | | | |
| | | | | | | 11,334,469 | |
| | | | | | | | |
| REAL ESTATE (7.1%) | |
Acadia Realty Trust | | | 16,960 | | | | 303,923 | |
Alexander & Baldwin, Inc. | | | 11,932 | | | | 202,367 | |
American Assets Trust, Inc. | | | 8,008 | | | | 179,219 | |
Apple Hospitality REIT, Inc. | | | 37,044 | | | | 538,620 | |
Armada Hoffler Properties, Inc. | | | 11,025 | | | | 122,267 | |
Brandywine Realty Trust | | | 28,316 | | | | 126,856 | |
CareTrust REIT, Inc. | | | 23,350 | | | | 586,085 | |
Centerspace | | | 2,451 | | | | 165,761 | |
Community Healthcare Trust, Inc. | | | 4,024 | | | | 94,121 | |
Cushman & Wakefield PLC* | | | 32,377 | | | | 336,721 | |
DiamondRock Hospitality Co. | | | 34,527 | | | | 291,753 | |
Douglas Emmett, Inc. | | | 27,512 | | | | 366,185 | |
Easterly Government Properties, Inc. Cl A | | | 16,929 | | | | 209,412 | |
Elme Communities | | | 14,465 | | | | 230,427 | |
Essential Properties Realty Trust, Inc. | | | 28,813 | | | | 798,408 | |
eXp World Hldgs., Inc. | | | 12,726 | | | | 143,613 | |
The accompanying notes are an integral part of these portfolio schedules.
46
MoA FUNDS — SMALL CAP EQUITY INDEX FUND
PORTFOLIO OF INVESTMENTS IN SECURITIES (Continued)
June 30, 2024 (Unaudited)
| | | | | | | | |
| | | Shares | | | Value | |
| COMMON STOCKS (CONTINUED): | |
| REAL ESTATE (CONTINUED) | |
Four Corners Property Trust, Inc. | | | 15,120 | | | $ | 373,010 | |
Getty Realty Corp. | | | 8,072 | | | | 215,200 | |
Global Net Lease, Inc. | | | 32,115 | | | | 236,045 | |
Highwoods Properties, Inc. | | | 17,422 | | | | 457,676 | |
Hudson Pacific Properties, Inc. | | | 20,852 | | | | 100,298 | |
Innovative Industrial Properties, Inc. Cl A | | | 4,657 | | | | 508,638 | |
JBG SMITH Properties | | | 13,747 | | | | 209,367 | |
Kennedy-Wilson Hldgs., Inc. | | | 19,214 | | | | 186,760 | |
LTC Properties, Inc. | | | 7,145 | | | | 246,503 | |
LXP Industrial Trust | | | 48,375 | | | | 441,180 | |
Macerich Co. | | | 35,462 | | | | 547,533 | |
Marcus & Millichap, Inc. | | | 3,940 | | | | 124,189 | |
Medical Properties Trust, Inc. | | | 98,669 | | | | 425,263 | |
NexPoint Residential Trust, Inc. | | | 3,756 | | | | 148,400 | |
Outfront Media, Inc. | | | 23,994 | | | | 343,114 | |
Pebblebrook Hotel Trust | | | 19,807 | | | | 272,346 | |
Phillips Edison & Co., Inc. | | | 20,119 | | | | 658,093 | |
Retail Opportunity Investments Corp. | | | 20,949 | | | | 260,396 | |
Safehold, Inc. | | | 7,398 | | | | 142,707 | |
Saul Centers, Inc. | | | 2,129 | | | | 78,283 | |
Service Properties Trust | | | 27,245 | | | | 140,039 | |
SITE Centers Corp. | | | 29,620 | | | | 429,490 | |
SL Green Realty Corp. | | | 10,652 | | | | 603,329 | |
St Joe Co. | | | 5,856 | | | | 320,323 | |
| | | | | | | | |
| | | Shares | | | Value | |
| COMMON STOCKS (CONTINUED): | |
| REAL ESTATE (CONTINUED) | |
Summit Hotel Properties, Inc. | | | 17,783 | | | $ | 106,520 | |
Sunstone Hotel Investors, Inc. | | | 33,477 | | | | 350,169 | |
Tanger, Inc. | | | 17,974 | | | | 487,275 | |
Uniti Group, Inc. | | | 39,490 | | | | 115,311 | |
Universal Health Realty Income Trust | | | 2,091 | | | | 81,842 | |
Urban Edge Properties | | | 19,529 | | | | 360,701 | |
Veris Residential, Inc. | | | 13,232 | | | | 198,480 | |
Whitestone REIT Cl B | | | 7,802 | | | | 103,845 | |
Xenia Hotels & Resorts, Inc. | | | 16,760 | | | | 240,171 | |
| | | | | | | | |
| | | | | | | 14,208,234 | |
| | | | | | | | |
| UTILITIES (2.0%) | |
American States Water Co. | | | 6,120 | | | | 444,128 | |
Avista Corp. | | | 12,852 | | | | 444,808 | |
California Water Svc. Group | | | 9,493 | | | | 460,315 | |
Chesapeake Utilities Corp. | | | 3,661 | | | | 388,798 | |
Clearway Energy, Inc. Cl A | | | 5,690 | | | | 128,935 | |
Clearway Energy, Inc. Cl C | | | 13,553 | | | | 334,624 | |
MGE Energy, Inc. | | | 5,947 | | | | 444,360 | |
Middlesex Water Co. | | | 2,931 | | | | 153,174 | |
Northwest Natural Hldg. Co. | | | 6,251 | | | | 225,724 | |
Otter Tail Corp. | | | 6,873 | | | | 602,006 | |
SJW Group | | | 4,822 | | | | 261,449 | |
Unitil Corp. | | | 2,658 | | | | 137,658 | |
| | | | | | | | |
| | | | | | | 4,025,979 | |
| | | | | | | | |
TOTAL COMMON STOCKS | | | | | | | | |
(Cost: $189,401,852) | | | | | | | 199,306,915 | |
| | | | | | | | |
| | | | | | | | | | | | | | | | |
| | | | | | Rate(%) | | Maturity | | Face Amount | | | Value | |
| TEMPORARY CASH INVESTMENT (0.1%) | | | | | | | | | | | | | |
JP Morgan Chase, New York Time Deposit | | | | | | 4.58 | | 07/01/24 | | $ | 188,220 | | | $ | 188,220 | |
| | | | | | | | | | | | | | | | |
TOTAL TEMPORARY CASH INVESTMENT
(Cost: $188,220) | | | | 188,220 | |
| | | | | | | | | | | | | | | | |
TOTAL INVESTMENTS
(Cost: $189,590,072) 100.1% | | | | 199,495,135 | |
| | | | | | | | | | | | | | | | |
OTHER NET ASSETS -0.1% | | | | (115,444 | ) |
| | | | | | | | | | | | | | | | |
NET ASSETS 100.0% | | | $ | 199,379,691 | |
| | | | | | | | | | | | | | | | |
FOOTNOTES TO PORTFOLIO OF INVESTMENTS IN SECURITIES
| * | Non-income producing security. |
The accompanying notes are an integral part of these portfolio schedules.
47
MoA FUNDS — MID CAP VALUE FUND
PORTFOLIO OF INVESTMENTS IN SECURITIES
June 30, 2024 (Unaudited)
| | | | | | | | |
| | | Shares | | | Value | |
| COMMON STOCKS (98.4%): | |
| COMMUNICATION SERVICES (1.8%) | |
Take-Two Interactive Software, Inc.* | | | 12,346 | | | $ | 1,919,680 | |
Warner Bros Discovery, Inc.* | | | 148,883 | | | | 1,107,689 | |
| | | | | | | | |
| | | | | | | 3,027,369 | |
| | | | | | | | |
CONSUMER DISCRETIONARY (5.5%) | |
Marriott Vacations Worldwide Corp. | | | 16,377 | | | | 1,430,040 | |
Ollie’s Bargain Outlet Hldgs., Inc.* | | | 23,025 | | | | 2,260,364 | |
Polaris, Inc. | | | 4,579 | | | | 358,581 | |
Taylor Morrison Home Corp. Cl A* | | | 53,713 | | | | 2,977,849 | |
Tractor Supply Co. | | | 4,542 | | | | 1,226,340 | |
Williams-Sonoma, Inc. | | | 2,972 | | | | 839,204 | |
| | | | | | | | |
| | | | | | | 9,092,378 | |
| | | | | | | | |
| CONSUMER STAPLES (3.0%) | |
Constellation Brands, Inc. Cl A | | | 7,948 | | | | 2,044,861 | |
Kenvue, Inc. | | | 66,831 | | | | 1,214,988 | |
Lamb Weston Hldgs., Inc. | | | 19,767 | | | | 1,662,009 | |
| | | | | | | | |
| | | | | | | 4,921,858 | |
| | | | | | | | |
| ENERGY (7.1%) | |
Baker Hughes Co. Cl A | | | 127,508 | | | | 4,484,456 | |
Devon Energy Corp. | | | 67,785 | | | | 3,213,009 | |
MPLX LP* | | | 37,540 | | | | 1,598,829 | |
Williams Cos., Inc. | | | 55,831 | | | | 2,372,818 | |
| | | | | | | | |
| | | | | | | 11,669,112 | |
| | | | | | | | |
| FINANCIALS (17.9%) | |
American Financial Group, Inc. | | | 31,711 | | | | 3,901,087 | |
Ameriprise Financial, Inc. | | | 11,024 | | | | 4,709,343 | |
Arch Capital Group Ltd.* | | | 20,473 | | | | 2,065,521 | |
East West Bancorp, Inc. | | | 33,233 | | | | 2,433,653 | |
Euronet Worldwide, Inc.* | | | 12,291 | | | | 1,272,119 | |
Everest Group Ltd. | | | 7,564 | | | | 2,882,035 | |
Fifth Third Bancorp | | | 44,508 | | | | 1,624,097 | |
Hartford Financial Svcs. Group, Inc. | | | 25,793 | | | | 2,593,228 | |
M&T Bank Corp. | | | 12,255 | | | | 1,854,917 | |
Reinsurance Group of America, Inc. | | | 13,616 | | | | 2,794,956 | |
Starwood Property Trust, Inc. | | | 93,453 | | | | 1,770,000 | |
Synchrony Financial | | | 32,654 | | | | 1,540,942 | |
| | | | | | | | |
| | | | | | | 29,441,898 | |
| | | | | | | | |
| HEALTH CARE (6.1%) | |
Agilent Technologies, Inc. | | | 8,470 | | | | 1,097,966 | |
Biogen, Inc.* | | | 4,056 | | | | 940,262 | |
Bio-Techne Corp. | | | 11,438 | | | | 819,533 | |
Centene Corp.* | | | 25,889 | | | | 1,716,441 | |
Envista Hldgs. Corp.* | | | 75,642 | | | | 1,257,926 | |
Fortrea Hldgs., Inc.* | | | 52,146 | | | | 1,217,087 | |
| | | | | | | | |
| | | Shares | | | Value | |
| COMMON STOCKS (CONTINUED): | |
| HEALTH CARE (CONTINUED) | |
Humana, Inc. | | | 3,429 | | | $ | 1,281,246 | |
Zimmer Biomet Hldgs., Inc. | | | 15,060 | | | | 1,634,462 | |
| | | | | | | | |
| | | | | | | 9,964,923 | |
| | | | | | | | |
| INDUSTRIALS (19.3%) | |
AMETEK, Inc. | | | 7,593 | | | | 1,265,829 | |
Applied Industrial Technologies, Inc. | | | 10,844 | | | | 2,103,736 | |
Builders FirstSource, Inc.* | | | 17,501 | | | | 2,422,313 | |
Carlisle Cos., Inc. | | | 9,416 | | | | 3,815,457 | |
Clean Harbors, Inc.* | | | 17,482 | | | | 3,953,554 | |
Crane Co. | | | 32,102 | | | | 4,654,148 | |
Dover Corp. | | | 16,577 | | | | 2,991,320 | |
Jacobs Solutions, Inc. | | | 19,850 | | | | 2,773,244 | |
KBR, Inc. | | | 35,395 | | | | 2,270,235 | |
Mueller Industries, Inc. | | | 44,526 | | | | 2,535,311 | |
Veralto Corp. | | | 30,586 | | | | 2,920,045 | |
| | | | | | | | |
| | | | | | | 31,705,192 | |
| | | | | | | | |
| INFORMATION TECHNOLOGY (7.7%) | |
Amphenol Corp. Cl A | | | 18,876 | | | | 1,271,676 | |
Ciena Corp.* | | | 43,641 | | | | 2,102,623 | |
MKS Instruments, Inc. | | | 13,766 | | | | 1,797,564 | |
PTC, Inc.* | | | 6,384 | | | | 1,159,781 | |
Teledyne Technologies, Inc.* | | | 6,773 | | | | 2,627,789 | |
Viasat, Inc.* | | | 74,744 | | | | 949,249 | |
Vontier Corp. | | | 72,035 | | | | 2,751,737 | |
| | | | | | | | |
| | | | | | | 12,660,419 | |
| | | | | | | | |
| MATERIALS (11.3%) | |
Ashland, Inc. | | | 43,526 | | | | 4,112,772 | |
Avery Dennison Corp. | | | 12,890 | | | | 2,818,399 | |
Axalta Coating Systems Ltd.* | | | 68,842 | | | | 2,352,331 | |
Crown Hldgs., Inc. | | | 61,121 | | | | 4,546,791 | |
FMC Corp. | | | 33,525 | | | | 1,929,364 | |
Freeport-McMoRan, Inc. | | | 28,649 | | | | 1,392,341 | |
Newmont Corp. | | | 34,284 | | | | 1,435,471 | |
| | | | | | | | |
| | | | | | | 18,587,469 | |
| | | | | | | | |
| REAL ESTATE (8.9%) | |
Alexandria Real Estate Equities, Inc. | | | 9,801 | | | | 1,146,423 | |
Camden Property Trust | | | 15,088 | | | | 1,646,252 | |
Gaming & Leisure Properties, Inc. | | | 55,155 | | | | 2,493,557 | |
Healthcare Realty Trust, Inc. Cl A | | | 71,187 | | | | 1,173,162 | |
Healthpeak Properties, Inc. | | | 116,837 | | | | 2,290,005 | |
Sun Communities, Inc. | | | 7,505 | | | | 903,152 | |
Terreno Realty Corp. | | | 19,645 | | | | 1,162,591 | |
Ventas, Inc. | | | 31,120 | | | | 1,595,211 | |
Weyerhaeuser Co. | | | 77,822 | | | | 2,209,367 | |
| | | | | | | | |
| | | | | | | 14,619,720 | |
| | | | | | | | |
The accompanying notes are an integral part of these portfolio schedules.
48
MoA FUNDS — MID CAP VALUE FUND
PORTFOLIO OF INVESTMENTS IN SECURITIES (Continued)
June 30, 2024 (Unaudited)
| | | | | | | | |
| | | Shares | | | Value | |
| COMMON STOCKS (CONTINUED): | |
| UTILITIES (9.8%) | | | | | | |
AES Corp. | | | 76,373 | | | $ | 1,341,874 | |
Ameren Corp. | | | 33,541 | | | | 2,385,100 | |
Atmos Energy Corp. | | | 13,587 | | | | 1,584,924 | |
Entergy Corp. | | | 19,564 | | | | 2,093,348 | |
Evergy, Inc. | | | 66,777 | | | | 3,537,178 | |
PPL Corp. | | | 52,513 | | | | 1,451,984 | |
Public Svc. Enterprise Group, Inc. | | | 49,927 | | | | 3,679,620 | |
| | | | | | | | |
| | | | | | | 16,074,028 | |
| | | | | | | | |
TOTAL COMMON STOCKS | | | | | | | | |
(Cost: $136,508,626) | | | | | | | 161,764,366 | |
| | | | | | | | |
| | | | | | | | | | | | | | | | | | | | |
| | | Rating** | | | Rate(%) | | | Maturity | | | Face Amount | | | Value | |
| SHORT-TERM DEBT SECURITIES (3.8%): | | | | | | | | | | | | | | | |
| U.S. GOVERNMENT (1.7%) | | | | | | | | | | | | | | | |
U.S. Treasury Bill | | | A-1+ | | | | 5.29 | | | | 07/16/24 | | | $ | 2,800,000 | | | $ | 2,793,870 | |
| COMMERCIAL PAPER (2.1%) | | | | | | | | | | | | | | | |
Novartis Finance Corp.† | | | A-1+ | | | | 5.29 | | | | 07/01/24 | | | | 3,500,000 | | | | 3,500,000 | |
TOTAL SHORT-TERM DEBT SECURITIES
(Cost: $6,293,870) | | | | | | | | | | | | | | | | | | | 6,293,870 | |
| | | | | | | | | | | | | | | | | | | | |
| TEMPORARY CASH INVESTMENT (0.1%) | | | | | | | | | | | | | | | |
JP Morgan Chase, New York Time Deposit | | | | | | | 4.58 | | | | 07/01/24 | | | | 71,424 | | | | 71,424 | |
| | | | | | | | | | | | | | | | | | | | |
TOTAL TEMPORARY CASH INVESTMENT
(Cost: $71,424) | | | | | | | | | | | | | | | | | | | 71,424 | |
| | | | | | | | | | | | | | | | | | | | |
TOTAL INVESTMENTS
(Cost: $142,873,920) 102.3% | | | | | | | | | | | | | | | | | | | 168,129,660 | |
| | | | | | | | | | | | | | | | | | | | |
OTHER NET ASSETS -2.3% | | | | | | | | | | | | | | | | | | | (3,744,929 | ) |
| | | | | | | | | | | | | | | | | | | | |
NET ASSETS 100.0% | | | | | | | | | | | | | | | | | | $ | 164,384,731 | |
| | | | | | | | | | | | | | | | | | | | |
FOOTNOTES TO PORTFOLIO OF INVESTMENTS IN SECURITIES
| * | Non-income producing security. |
| ** | Ratings as per Standard & Poor’s Corporation (unaudited). |
| † | Security is exempt from registration under Rule 144A of the Securities Act of 1933. These securities may be resold in transactions exempt from registration, normally to qualified institutional buyers. At June 30, 2024, the aggregate values of these securities amounts to $3,500,000 and represents 2.1% of net assets. |
The accompanying notes are an integral part of these portfolio schedules.
49
MoA FUNDS — MID CAP EQUITY INDEX FUND
PORTFOLIO OF INVESTMENTS IN SECURITIES
June 30, 2024 (Unaudited)
| | | | | | | | |
| | | Shares | | | Value | |
| COMMON STOCKS (99.8%): | |
| COMMUNICATION SERVICES (1.5%) | |
Frontier Communications Parent, Inc.* | | | 124,938 | | | $ | 3,270,877 | |
Iridium Communications, Inc. | | | 67,820 | | | | 1,805,369 | |
New York Times Co. Cl A | | | 91,334 | | | | 4,677,214 | |
Nexstar Media Group, Inc. Cl A | | | 17,420 | | | | 2,891,894 | |
TEGNA, Inc. | | | 94,727 | | | | 1,320,494 | |
TKO Group Hldgs., Inc. Cl A | | | 32,899 | | | | 3,552,763 | |
Warner Music Group Corp. Cl A | | | 79,085 | | | | 2,423,955 | |
Ziff Davis, Inc.* | | | 25,764 | | | | 1,418,308 | |
ZoomInfo Technologies, Inc. Cl A* | | | 158,718 | | | | 2,026,829 | |
| | | | | | | | |
| | | | | | | 23,387,703 | |
| | | | | | | | |
| CONSUMER DISCRETIONARY (14.6%) | |
Adient PLC* | | | 50,168 | | | | 1,239,651 | |
Aramark | | | 146,885 | | | | 4,997,028 | |
Autoliv, Inc. | | | 40,450 | | | | 4,327,745 | |
AutoNation, Inc.* | | | 13,719 | | | | 2,186,534 | |
Boyd Gaming Corp. | | | 37,624 | | | | 2,073,082 | |
Brunswick Corp. | | | 37,738 | | | | 2,746,194 | |
Burlington Stores, Inc.* | | | 35,670 | | | | 8,560,800 | |
Capri Hldgs. Ltd.* | | | 65,105 | | | | 2,153,673 | |
Carter’s, Inc. | | | 20,386 | | | | 1,263,320 | |
Choice Hotels International, Inc. | | | 13,346 | | | | 1,588,174 | |
Churchill Downs, Inc. | | | 37,359 | | | | 5,215,316 | |
Columbia Sportswear Co. | | | 18,823 | | | | 1,488,523 | |
Crocs, Inc.* | | | 33,904 | | | | 4,947,950 | |
Dick’s Sporting Goods, Inc. | | | 32,521 | | | | 6,987,137 | |
Duolingo, Inc. Cl A* | | | 20,658 | | | | 4,310,705 | |
Five Below, Inc.* | | | 30,826 | | | | 3,359,109 | |
Floor & Decor Hldgs., Inc. Cl A* | | | 59,768 | | | | 5,941,537 | |
GameStop Corp. Cl A* | | | 150,489 | | | | 3,715,573 | |
Gap, Inc. | | | 120,996 | | | | 2,890,594 | |
Gentex Corp. | | | 129,120 | | | | 4,352,635 | |
Goodyear Tire & Rubber Co.* | | | 159,002 | | | | 1,804,673 | |
Graham Hldgs. Co. Cl B | | | 1,941 | | | | 1,357,827 | |
Grand Canyon Education, Inc.* | | | 16,374 | | | | 2,290,886 | |
H&R Block, Inc. | | | 77,930 | | | | 4,226,144 | |
Harley-Davidson, Inc. | | | 68,363 | | | | 2,292,895 | |
Helen of Troy Ltd.* | | | 13,299 | | | | 1,233,349 | |
Hilton Grand Vacations, Inc.* | | | 38,227 | | | | 1,545,518 | |
Hyatt Hotels Corp. Cl A | | | 25,233 | | | | 3,833,397 | |
KB Home | | | 41,069 | | | | 2,882,222 | |
Lear Corp. | | | 31,717 | | | | 3,622,399 | |
Light & Wonder, Inc. Cl A* | | | 50,344 | | | | 5,280,079 | |
Lithia Motors, Inc. Cl A | | | 15,307 | | | | 3,864,252 | |
Macy’s, Inc. | | | 153,680 | | | | 2,950,656 | |
| | | | | | | | |
| | | Shares | | | Value | |
| COMMON STOCKS (CONTINUED): | |
| CONSUMER DISCRETIONARY (CONTINUED) | |
Marriott Vacations Worldwide Corp. | | | 18,265 | | | $ | 1,594,900 | |
Mattel, Inc.* | | | 192,185 | | | | 3,124,928 | |
Murphy USA, Inc. | | | 10,530 | | | | 4,943,414 | |
Nordstrom, Inc. | | | 54,710 | | | | 1,160,946 | |
Ollie’s Bargain Outlet Hldgs., Inc.* | | | 34,232 | | | | 3,360,555 | |
Penske Automotive Group, Inc. | | | 10,833 | | | | 1,614,334 | |
Planet Fitness, Inc. Cl A* | | | 48,886 | | | | 3,597,521 | |
Polaris, Inc. | | | 29,671 | | | | 2,323,536 | |
PVH Corp. | | | 31,619 | | | | 3,347,504 | |
RH* | | | 8,606 | | | | 2,103,651 | |
Service Corp. International | | | 81,327 | | | | 5,784,790 | |
Skechers USA, Inc. Cl A* | | | 73,945 | | | | 5,111,078 | |
Taylor Morrison Home Corp. Cl A* | | | 59,071 | | | | 3,274,896 | |
Tempur Sealy International, Inc. | | | 96,973 | | | | 4,590,702 | |
Texas Roadhouse, Inc. Cl A | | | 37,304 | | | | 6,405,470 | |
Thor Industries, Inc. | | | 29,783 | | | | 2,783,221 | |
Toll Brothers, Inc. | | | 58,181 | | | | 6,701,288 | |
TopBuild Corp.* | | | 17,666 | | | | 6,806,180 | |
Travel + Leisure Co. | | | 39,802 | | | | 1,790,294 | |
Under Armour, Inc. Cl A* | | | 105,449 | | | | 703,345 | |
Under Armour, Inc. Cl C* | | | 106,580 | | | | 695,967 | |
Vail Resorts, Inc. | | | 21,206 | | | | 3,819,837 | |
Valvoline, Inc.* | | | 71,968 | | | | 3,109,018 | |
Visteon Corp.* | | | 15,414 | | | | 1,644,674 | |
Wendy’s Co. | | | 92,802 | | | | 1,573,922 | |
Whirlpool Corp. | | | 30,515 | | | | 3,118,633 | |
Williams-Sonoma, Inc. | | | 35,886 | | | | 10,133,130 | |
Wingstop, Inc. | | | 16,404 | | | | 6,933,315 | |
Wyndham Hotels & Resorts, Inc. | | | 45,004 | | | | 3,330,296 | |
YETI Hldgs., Inc.* | | | 47,607 | | | | 1,816,207 | |
| | | | | | | | |
| | | | | | | 218,827,129 | |
| | | | | | | | |
| CONSUMER STAPLES (4.6%) | | | | | | |
BellRing Brands, Inc.* | | | 72,850 | | | | 4,162,649 | |
BJ’s Wholesale Club Hldgs., Inc.* | | | 74,261 | | | | 6,523,086 | |
Boston Beer Co., Inc. Cl A* | | | 5,107 | | | | 1,557,890 | |
Casey’s General Stores, Inc. | | | 20,675 | | | | 7,888,753 | |
Celsius Hldgs., Inc.* | | | 83,315 | | | | 4,756,453 | |
Coca-Cola Consolidated, Inc. | | | 2,618 | | | | 2,840,530 | |
Coty, Inc. Cl A* | | | 203,575 | | | | 2,039,822 | |
Darling Ingredients, Inc.* | | | 89,240 | | | | 3,279,570 | |
elf Beauty, Inc.* | | | 31,002 | | | | 6,532,741 | |
Flowers Foods, Inc. | | | 107,313 | | | | 2,382,349 | |
Ingredion, Inc. | | | 36,665 | | | | 4,205,476 | |
Lancaster Colony Corp. | | | 11,377 | | | | 2,149,912 | |
The accompanying notes are an integral part of these portfolio schedules.
50
MoA FUNDS — MID CAP EQUITY INDEX FUND
PORTFOLIO OF INVESTMENTS IN SECURITIES (Continued)
June 30, 2024 (Unaudited)
| | | | | | | | |
| | | Shares | | | Value | |
| COMMON STOCKS (CONTINUED): | |
| CONSUMER STAPLES (CONTINUED) | | | | | | |
Performance Food Group Co.* | | | 86,911 | | | $ | 5,745,686 | |
Pilgrim’s Pride Corp.* | | | 22,498 | | | | 865,948 | |
Post Hldgs., Inc.* | | | 28,086 | | | | 2,925,438 | |
Sprouts Farmers Market, Inc.* | | | 56,118 | | | | 4,694,832 | |
US Foods Hldg. Corp.* | | | 126,335 | | | | 6,693,228 | |
| | | | | | | | |
| | | | | | | 69,244,363 | |
| | | | | | | | |
| ENERGY (5.9%) | | | | | | |
Antero Midstream Corp. | | | 190,834 | | | | 2,812,893 | |
Antero Resources Corp.* | | | 163,174 | | | | 5,324,368 | |
ChampionX Corp. | | | 106,342 | | | | 3,531,618 | |
Chesapeake Energy Corp. | | | 62,214 | | | | 5,113,369 | |
Chord Energy Corp. | | | 34,730 | | | | 5,823,526 | |
Civitas Resources, Inc. | | | 51,431 | | | | 3,548,739 | |
CNX Resources Corp.* | | | 85,590 | | | | 2,079,837 | |
DT Midstream, Inc. | | | 54,237 | | | | 3,852,454 | |
Equitrans Midstream Corp. | | | 242,206 | | | | 3,143,834 | |
HF Sinclair Corp. | | | 83,712 | | | | 4,465,198 | |
Matador Resources Co. | | | 64,813 | | | | 3,862,855 | |
Murphy Oil Corp. | | | 80,956 | | | | 3,338,625 | |
NOV, Inc. | | | 220,913 | | | | 4,199,556 | |
Ovintiv, Inc. | | | 139,024 | | | | 6,516,055 | |
PBF Energy, Inc. Cl A | | | 58,936 | | | | 2,712,235 | |
Permian Resources Corp. Cl A | | | 286,856 | | | | 4,632,724 | |
Range Resources Corp. | | | 135,511 | | | | 4,543,684 | |
Southwestern Energy Co.* | | | 615,891 | | | | 4,144,946 | |
Texas Pacific Land Corp. | | | 10,400 | | | | 7,636,408 | |
Valaris Ltd.* | | | 34,781 | | | | 2,591,185 | |
Weatherford International PLC* | | | 40,858 | | | | 5,003,062 | |
| | | | | | | | |
| | | | | | | 88,877,171 | |
| | | | | | | | |
| FINANCIALS (16.8%) | | | | | | |
Affiliated Managers Group, Inc. | | | 17,797 | | | | 2,780,425 | |
Ally Financial, Inc. | | | 152,800 | | | | 6,061,576 | |
American Financial Group, Inc. | | | 36,536 | | | | 4,494,659 | |
Annaly Capital Management, Inc. | | | 279,503 | | | | 5,327,327 | |
Associated Banc-Corp. | | | 82,801 | | | | 1,751,241 | |
Bank OZK | | | 58,921 | | | | 2,415,761 | |
Brighthouse Financial, Inc.* | | | 34,690 | | | | 1,503,465 | |
Cadence Bank | | | 102,030 | | | | 2,885,408 | |
Carlyle Group, Inc. | | | 120,599 | | | | 4,842,050 | |
CNO Financial Group, Inc. | | | 60,465 | | | | 1,676,090 | |
Columbia Banking System, Inc. | | | 116,941 | | | | 2,325,957 | |
Commerce Bancshares, Inc. | | | 65,837 | | | | 3,672,388 | |
Cullen/Frost Bankers, Inc. | | | 35,887 | | | | 3,647,196 | |
East West Bancorp, Inc. | | | 77,714 | | | | 5,690,996 | |
| | | | | | | | |
| | | Shares | | | Value | |
| COMMON STOCKS (CONTINUED): | |
| FINANCIALS (CONTINUED) | | | | | | |
Equitable Hldgs., Inc. | | | 170,755 | | | $ | 6,977,049 | |
Erie Indemnity Co. Cl A | | | 13,931 | | | | 5,048,594 | |
Essent Group Ltd. | | | 59,579 | | | | 3,347,744 | |
Euronet Worldwide, Inc.* | | | 24,339 | | | | 2,519,087 | |
Evercore, Inc. Cl A | | | 19,791 | | | | 4,125,038 | |
Federated Hermes, Inc. Cl B | | | 44,829 | | | | 1,473,978 | |
Fidelity National Financial, Inc. | | | 144,977 | | | | 7,164,763 | |
First American Financial Corp. | | | 57,932 | | | | 3,125,431 | |
First Financial Bankshares, Inc. | | | 71,801 | | | | 2,120,284 | |
First Horizon Corp. | | | 305,434 | | | | 4,816,694 | |
FirstCash Hldgs., Inc. | | | 20,826 | | | | 2,184,231 | |
FNB Corp. | | | 200,928 | | | | 2,748,695 | |
Glacier Bancorp, Inc. | | | 63,329 | | | | 2,363,438 | |
Hancock Whitney Corp. | | | 48,385 | | | | 2,314,255 | |
Hanover Insurance Group, Inc. | | | 20,075 | | | | 2,518,208 | |
Home BancShares, Inc. | | | 104,051 | | | | 2,493,062 | |
Houlihan Lokey, Inc. Cl A | | | 29,247 | | | | 3,944,250 | |
Interactive Brokers Group, Inc. Cl A | | | 59,823 | | | | 7,334,300 | |
International Bancshares Corp. | | | 29,866 | | | | 1,708,634 | |
iShares Core S&P Mid-Cap ETF | | | 246,452 | | | | 14,422,371 | |
Janus Henderson Group PLC | | | 71,697 | | | | 2,416,906 | |
Jefferies Financial Group, Inc. | | | 94,744 | | | | 4,714,462 | |
Kemper Corp. | | | 33,798 | | | | 2,005,235 | |
Kinsale Capital Group, Inc. | | | 12,350 | | | | 4,758,208 | |
MGIC Investment Corp. | | | 148,893 | | | | 3,208,644 | |
Morningstar, Inc. | | | 14,564 | | | | 4,308,759 | |
New York Community Bancorp, Inc. | | | 435,462 | | | | 1,402,188 | |
Old National Bancorp | | | 176,369 | | | | 3,031,783 | |
Old Republic International Corp. | | | 141,196 | | | | 4,362,956 | |
Pinnacle Financial Partners, Inc. | | | 42,723 | | | | 3,419,549 | |
Primerica, Inc. | | | 19,220 | | | | 4,547,068 | |
Prosperity Bancshares, Inc. | | | 53,582 | | | | 3,276,004 | |
Reinsurance Group of America, Inc. Cl A | | | 36,746 | | | | 7,542,851 | |
RenaissanceRe Hldgs. Ltd. | | | 29,534 | | | | 6,601,144 | |
RLI Corp. | | | 22,467 | | | | 3,160,882 | |
Ryan Specialty Hldgs., Inc. Cl A | | | 57,169 | | | | 3,310,657 | |
SEI Investments Co. | | | 55,771 | | | | 3,607,826 | |
Selective Insurance Group, Inc. | | | 33,954 | | | | 3,185,904 | |
The accompanying notes are an integral part of these portfolio schedules.
51
MoA FUNDS — MID CAP EQUITY INDEX FUND
PORTFOLIO OF INVESTMENTS IN SECURITIES (Continued)
June 30, 2024 (Unaudited)
| | | | | | | | |
| | | Shares | | | Value | |
| COMMON STOCKS (CONTINUED): | |
| FINANCIALS (CONTINUED) | | | | | | |
SLM Corp. | | | 122,715 | | | $ | 2,551,245 | |
SouthState Corp. | | | 42,550 | | | | 3,251,671 | |
Starwood Property Trust, Inc. | | | 167,646 | | | | 3,175,215 | |
Stifel Financial Corp. | | | 57,224 | | | | 4,815,400 | |
Synovus Financial Corp. | | | 81,789 | | | | 3,287,100 | |
Texas Capital Bancshares, Inc.* | | | 26,057 | | | | 1,593,125 | |
UMB Financial Corp. | | | 24,502 | | | | 2,043,957 | |
United Bankshares, Inc. | | | 75,328 | | | | 2,443,640 | |
Unum Group | | | 99,427 | | | | 5,081,714 | |
Valley National Bancorp | | | 238,885 | | | | 1,667,417 | |
Voya Financial, Inc. | | | 56,243 | | | | 4,001,690 | |
Webster Financial Corp. | | | 95,778 | | | | 4,174,963 | |
Western Union Co. | | | 188,965 | | | | 2,309,152 | |
WEX, Inc.* | | | 23,403 | | | | 4,145,607 | |
Wintrust Financial Corp. | | | 34,491 | | | | 3,399,433 | |
Zions Bancorporation | | | 82,468 | | | | 3,576,637 | |
| | | | | | | | |
| | | | | | | 252,203,637 | |
| | | | | | | | |
| HEALTH CARE (9.1%) | | | | | | |
Acadia Healthcare Co., Inc.* | | | 51,817 | | | | 3,499,720 | |
Amedisys, Inc.* | | | 18,227 | | | | 1,673,239 | |
Arrowhead Pharmaceuticals, Inc.* | | | 69,368 | | | | 1,802,874 | |
Azenta, Inc.* | | | 30,115 | | | | 1,584,651 | |
BioMarin Pharmaceutical, Inc.* | | | 106,050 | | | | 8,731,097 | |
Bruker Corp. | | | 54,385 | | | | 3,470,307 | |
Chemed Corp. | | | 8,456 | | | | 4,588,056 | |
Cytokinetics, Inc.* | | | 64,038 | | | | 3,469,579 | |
DENTSPLY SIRONA, Inc. | | | 115,965 | | | | 2,888,688 | |
Doximity, Inc. Cl A* | | | 68,230 | | | | 1,908,393 | |
Encompass Health Corp. | | | 56,235 | | | | 4,824,401 | |
Enovis Corp.* | | | 27,878 | | | | 1,260,086 | |
Envista Hldgs. Corp.* | | | 95,986 | | | | 1,596,247 | |
Exelixis, Inc.* | | | 162,692 | | | | 3,655,689 | |
Globus Medical, Inc. Cl A* | | | 62,904 | | | | 4,308,295 | |
Haemonetics Corp.* | | | 28,365 | | | | 2,346,636 | |
Halozyme Therapeutics, Inc.* | | | 71,085 | | | | 3,722,011 | |
HealthEquity, Inc.* | | | 48,597 | | | | 4,189,061 | |
Illumina, Inc.* | | | 88,971 | | | | 9,286,793 | |
Jazz Pharmaceuticals PLC* | | | 35,209 | | | | 3,757,857 | |
Lantheus Hldgs., Inc.* | | | 38,713 | | | | 3,108,267 | |
LivaNova PLC* | | | 30,245 | | | | 1,658,031 | |
Masimo Corp.* | | | 24,906 | | | | 3,136,662 | |
Medpace Hldgs., Inc.* | | | 13,152 | | | | 5,416,651 | |
Neogen Corp.* | | | 110,091 | | | | 1,720,722 | |
Neurocrine Biosciences, Inc.* | | | 56,208 | | | | 7,738,155 | |
Option Care Health, Inc.* | | | 97,079 | | | | 2,689,088 | |
Penumbra, Inc.* | | | 21,651 | | | | 3,896,530 | |
Perrigo Co. PLC | | | 76,137 | | | | 1,955,198 | |
Progyny, Inc.* | | | 46,269 | | | | 1,323,756 | |
| | | | | | | | |
| | | Shares | | | Value | |
| COMMON STOCKS (CONTINUED): | |
| HEALTH CARE (CONTINUED) | | | | | | |
QuidelOrtho Corp.* | | | 27,680 | | | $ | 919,530 | |
R1 RCM, Inc.* | | | 110,581 | | | | 1,388,897 | |
Repligen Corp.* | | | 29,024 | | | | 3,658,765 | |
Roivant Sciences Ltd.* | | | 189,033 | | | | 1,998,079 | |
Sarepta Therapeutics, Inc.* | | | 52,794 | | | | 8,341,452 | |
Sotera Health Co.* | | | 69,564 | | | | 825,725 | |
Tenet Healthcare Corp.* | | | 54,558 | | | | 7,257,851 | |
United Therapeutics Corp.* | | | 24,774 | | | | 7,891,758 | |
| | | | | | | | |
| | | | | | | 137,488,797 | |
| | | | | | | | |
| INDUSTRIALS (21.9%) | | | | | | |
AAON, Inc. | | | 38,110 | | | | 3,324,716 | |
Acuity Brands, Inc. | | | 17,034 | | | | 4,112,689 | |
Advanced Drainage Systems, Inc. | | | 38,055 | | | | 6,103,641 | |
AECOM | | | 76,029 | | | | 6,701,196 | |
AGCO Corp. | | | 34,592 | | | | 3,385,865 | |
Applied Industrial Technologies, Inc. | | | 21,561 | | | | 4,182,834 | |
Avis Budget Group, Inc. | | | 10,154 | | | | 1,061,296 | |
Brink’s Co. | | | 24,833 | | | | 2,542,899 | |
BWX Technologies, Inc. | | | 51,054 | | | | 4,850,130 | |
CACI International, Inc. Cl A* | | | 12,453 | | | | 5,356,409 | |
Carlisle Cos., Inc. | | | 26,517 | | | | 10,744,954 | |
Chart Industries, Inc.* | | | 23,480 | | | | 3,389,103 | |
Clean Harbors, Inc.* | | | 28,015 | | | | 6,335,592 | |
Comfort Systems USA, Inc. | | | 19,889 | | | | 6,048,643 | |
Concentrix Corp. | | | 26,169 | | | | 1,655,974 | |
Core & Main, Inc. Cl A* | | | 95,515 | | | | 4,674,504 | |
Crane Co. | | | 27,455 | | | | 3,980,426 | |
Curtiss-Wright Corp. | | | 21,391 | | | | 5,796,533 | |
Donaldson Co., Inc. | | | 67,228 | | | | 4,810,836 | |
EMCOR Group, Inc. | | | 26,248 | | | | 9,582,620 | |
EnerSys | | | 22,573 | | | | 2,336,757 | |
Esab Corp. | | | 31,723 | | | | 2,995,603 | |
ExlService Hldgs., Inc.* | | | 90,724 | | | | 2,845,105 | |
Exponent, Inc. | | | 28,300 | | | | 2,691,896 | |
Flowserve Corp. | | | 73,531 | | | | 3,536,841 | |
Fluor Corp.* | | | 95,613 | | | | 4,163,946 | |
Fortune Brands Innovations, Inc. | | | 69,859 | | | | 4,536,643 | |
FTI Consulting, Inc.* | | | 19,592 | | | | 4,222,664 | |
GATX Corp. | | | 19,884 | | | | 2,631,846 | |
Genpact Ltd. | | | 92,480 | | | | 2,976,931 | |
Graco, Inc. | | | 94,465 | | | | 7,489,185 | |
GXO Logistics, Inc.* | | | 66,705 | | | | 3,368,602 | |
Hexcel Corp. | | | 46,421 | | | | 2,898,991 | |
Insperity, Inc. | | | 19,980 | | | | 1,822,376 | |
ITT, Inc. | | | 45,966 | | | | 5,937,888 | |
KBR, Inc. | | | 74,996 | | | | 4,810,243 | |
Kirby Corp.* | | | 32,562 | | | | 3,898,648 | |
Knight-Swift Transportation Hldgs., Inc. Cl A | | | 90,263 | | | | 4,505,929 | |
The accompanying notes are an integral part of these portfolio schedules.
52
MoA FUNDS — MID CAP EQUITY INDEX FUND
PORTFOLIO OF INVESTMENTS IN SECURITIES (Continued)
June 30, 2024 (Unaudited)
| | | | | | | | |
| | | Shares | | | Value | |
| COMMON STOCKS (CONTINUED): | |
| INDUSTRIALS (CONTINUED) | | | | | | |
Landstar System, Inc. | | | 19,974 | | | $ | 3,684,804 | |
Lennox International, Inc. | | | 17,907 | | | | 9,579,887 | |
Lincoln Electric Hldgs., Inc. | | | 31,784 | | | | 5,995,734 | |
ManpowerGroup, Inc. | | | 26,643 | | | | 1,859,681 | |
MasTec, Inc.* | | | 33,936 | | | | 3,630,813 | |
Maximus, Inc. | | | 33,956 | | | | 2,910,029 | |
MDU Resources Group, Inc. | | | 113,875 | | | | 2,858,263 | |
Middleby Corp.* | | | 30,031 | | | | 3,682,101 | |
MSA Safety, Inc. | | | 20,676 | | | | 3,880,678 | |
MSC Industrial Direct Co., Inc. Cl A | | | 25,471 | | | | 2,020,105 | |
NEXTracker, Inc. Cl A* | | | 68,634 | | | | 3,217,562 | |
nVent Electric PLC | | | 92,725 | | | | 7,103,662 | |
Oshkosh Corp. | | | 36,528 | | | | 3,952,330 | |
Owens Corning | | | 48,400 | | | | 8,408,048 | |
Paylocity Hldg. Corp.* | | | 24,269 | | | | 3,199,868 | |
RB Global, Inc. | | | 102,609 | | | | 7,835,223 | |
RBC Bearings, Inc.* | | | 16,219 | | | | 4,375,562 | |
Regal Rexnord Corp. | | | 37,152 | | | | 5,023,693 | |
Ryder System, Inc. | | | 24,480 | | | | 3,032,582 | |
Saia, Inc.* | | | 14,850 | | | | 7,043,207 | |
Science Applications International Corp. | | | 28,636 | | | | 3,366,162 | |
Sensata Technologies Hldg. PLC | | | 84,190 | | | | 3,147,864 | |
Simpson Manufacturing Co., Inc. | | | 23,546 | | | | 3,968,207 | |
Stericycle, Inc.* | | | 51,822 | | | | 3,012,413 | |
Terex Corp. | | | 37,589 | | | | 2,061,381 | |
Tetra Tech, Inc. | | | 29,879 | | | | 6,109,658 | |
Timken Co. | | | 36,181 | | | | 2,899,184 | |
Toro Co. | | | 58,313 | | | | 5,452,849 | |
Trex Co., Inc.* | | | 60,707 | | | | 4,499,603 | |
UFP Industries, Inc. | | | 34,491 | | | | 3,862,992 | |
Valmont Industries, Inc. | | | 11,278 | | | | 3,095,247 | |
Watsco, Inc. | | | 17,878 | | | | 8,281,805 | |
Watts Water Technologies, Inc. Cl A | | | 15,310 | | | | 2,807,395 | |
WESCO International, Inc. | | | 24,414 | | | | 3,870,107 | |
Woodward, Inc. | | | 34,025 | | | | 5,933,280 | |
XPO, Inc.* | | | 64,973 | | | | 6,896,884 | |
| | | | | | | | |
| | | | | | | 328,869,817 | |
| | | | | | | | |
| INFORMATION TECHNOLOGY (9.4%) | | | | | | |
Allegro MicroSystems, Inc.* | | | 39,910 | | | | 1,127,058 | |
Altair Engineering, Inc. Cl A* | | | 31,806 | | | | 3,119,532 | |
Amkor Technology, Inc. | | | 57,746 | | | | 2,310,995 | |
Appfolio, Inc. Cl A* | | | 11,721 | | | | 2,866,605 | |
Arrow Electronics, Inc.* | | | 29,730 | | | | 3,590,195 | |
ASGN, Inc.* | | | 25,636 | | | | 2,260,326 | |
Aspen Technology, Inc.* | | | 15,563 | | | | 3,091,279 | |
Avnet, Inc. | | | 50,479 | | | | 2,599,164 | |
Belden, Inc. | | | 22,720 | | | | 2,131,136 | |
| | | | | | | | |
| | | Shares | | | Value | |
| COMMON STOCKS (CONTINUED): | |
| INFORMATION TECHNOLOGY (CONTINUED) | |
Blackbaud, Inc.* | | | 22,575 | | | $ | 1,719,538 | |
Ciena Corp.* | | | 80,763 | | | | 3,891,161 | |
Cirrus Logic, Inc.* | | | 30,124 | | | | 3,845,630 | |
Cognex Corp. | | | 95,876 | | | | 4,483,162 | |
Coherent Corp.* | | | 74,082 | | | | 5,367,982 | |
CommVault Systems, Inc.* | | | 24,241 | | | | 2,946,978 | |
Crane NXT Co. | | | 27,121 | | | | 1,665,772 | |
Dolby Laboratories, Inc. Cl A | | | 33,372 | | | | 2,644,064 | |
Dropbox, Inc. Cl A* | | | 134,963 | | | | 3,032,619 | |
Dynatrace, Inc.* | | | 134,346 | | | | 6,010,640 | |
IPG Photonics Corp.* | | | 16,034 | | | | 1,353,109 | |
Kyndryl Hldgs., Inc.* | | | 128,516 | | | | 3,381,256 | |
Lattice Semiconductor Corp.* | | | 76,822 | | | | 4,454,908 | |
Littelfuse, Inc. | | | 13,843 | | | | 3,538,132 | |
Lumentum Hldgs., Inc.* | | | 37,756 | | | | 1,922,535 | |
MACOM Technology Solutions Hldgs., Inc.* | | | 30,608 | | | | 3,411,874 | |
Manhattan Associates, Inc.* | | | 34,388 | | | | 8,482,832 | |
MKS Instruments, Inc. | | | 35,279 | | | | 4,606,732 | |
Novanta, Inc.* | | | 20,048 | | | | 3,270,029 | |
Onto Innovation, Inc.* | | | 27,522 | | | | 6,042,730 | |
Power Integrations, Inc. | | | 31,704 | | | | 2,225,304 | |
Pure Storage, Inc. Cl A* | | | 170,676 | | | | 10,959,106 | |
Qualys, Inc.* | | | 20,631 | | | | 2,941,981 | |
Rambus, Inc.* | | | 60,198 | | | | 3,537,234 | |
Silicon Laboratories, Inc.* | | | 17,831 | | | | 1,972,643 | |
Synaptics, Inc.* | | | 22,061 | | | | 1,945,780 | |
TD SYNNEX Corp. | | | 43,405 | | | | 5,008,937 | |
Teradata Corp.* | | | 54,009 | | | | 1,866,551 | |
Universal Display Corp. | | | 24,376 | | | | 5,125,054 | |
Vishay Intertechnology, Inc. | | | 69,893 | | | | 1,558,614 | |
Vontier Corp. | | | 86,235 | | | | 3,294,177 | |
Wolfspeed, Inc.* | | | 70,292 | | | | 1,599,846 | |
| | | | | | | | |
| | | | | | | 141,203,200 | |
| | | | | | | | |
| MATERIALS (6.5%) | | | | | | |
Alcoa Corp. | | | 100,287 | | | | 3,989,417 | |
AptarGroup, Inc. | | | 37,010 | | | | 5,211,378 | |
Arcadium Lithium PLC* | | | 576,490 | | | | 1,937,006 | |
Ashland, Inc. | | | 27,997 | | | | 2,645,436 | |
Avient Corp. | | | 50,968 | | | | 2,224,753 | |
Axalta Coating Systems Ltd.* | | | 123,234 | | | | 4,210,906 | |
Berry Global Group, Inc. | | | 63,895 | | | | 3,760,221 | |
Cabot Corp. | | | 30,863 | | | | 2,836,001 | |
Chemours Co. | | | 83,161 | | | | 1,876,944 | |
Cleveland-Cliffs, Inc.* | | | 265,561 | | | | 4,086,984 | |
Commercial Metals Co. | | | 64,625 | | | | 3,553,729 | |
Crown Hldgs., Inc. | | | 66,638 | | | | 4,957,201 | |
Eagle Materials, Inc. | | | 19,241 | | | | 4,184,148 | |
Graphic Packaging Hldg. Co. | | | 171,629 | | | | 4,498,396 | |
The accompanying notes are an integral part of these portfolio schedules.
53
MoA FUNDS — MID CAP EQUITY INDEX FUND
PORTFOLIO OF INVESTMENTS IN SECURITIES (Continued)
June 30, 2024 (Unaudited)
| | | | | | | | |
| | | Shares | | | Value | |
| COMMON STOCKS (CONTINUED): | |
| MATERIALS (CONTINUED) | | | | | | |
Greif, Inc. Cl A | | | 14,405 | | | $ | 827,855 | |
Knife River Corp.* | | | 31,618 | | | | 2,217,686 | |
Louisiana-Pacific Corp. | | | 35,627 | | | | 2,933,171 | |
MP Materials Corp.* | | | 74,789 | | | | 952,064 | |
NewMarket Corp. | | | 3,859 | | | | 1,989,585 | |
Olin Corp. | | | 66,699 | | | | 3,144,858 | |
Reliance, Inc. | | | 32,074 | | | | 9,160,334 | |
Royal Gold, Inc. | | | 36,713 | | | | 4,594,999 | |
RPM International, Inc. | | | 71,916 | | | | 7,743,915 | |
Scotts Miracle-Gro Co. | | | 23,476 | | | | 1,527,348 | |
Silgan Hldgs., Inc. | | | 45,323 | | | | 1,918,523 | |
Sonoco Products Co. | | | 54,878 | | | | 2,783,412 | |
United States Steel Corp. | | | 124,957 | | | | 4,723,375 | |
Westlake Corp. | | | 17,953 | | | | 2,599,953 | |
| | | | | | | | |
| | | | | | | 97,089,598 | |
| | | | | | | | |
| REAL ESTATE (7.0%) | | | | | | |
Agree Realty Corp. | | | 56,073 | | | | 3,473,162 | |
American Homes 4 Rent Cl A | | | 179,733 | | | | 6,678,878 | |
Brixmor Property Group, Inc. | | | 168,280 | | | | 3,885,585 | |
COPT Defense Properties | | | 62,781 | | | | 1,571,408 | |
Cousins Properties, Inc. | | | 84,935 | | | | 1,966,245 | |
CubeSmart | | | 125,651 | | | | 5,675,656 | |
EastGroup Properties, Inc. | | | 26,845 | | | | 4,566,334 | |
EPR Properties | | | 42,265 | | | | 1,774,285 | |
Equity LifeStyle Properties, Inc. | | | 104,161 | | | | 6,784,006 | |
First Industrial Realty Trust, Inc. | | | 73,915 | | | | 3,511,702 | |
Gaming & Leisure Properties, Inc. | | | 151,637 | | | | 6,855,509 | |
Healthcare Realty Trust, Inc. Cl A | | | 211,423 | | | | 3,484,251 | |
Independence Realty Trust, Inc. | | | 125,481 | | | | 2,351,514 | |
Jones Lang LaSalle, Inc.* | | | 26,564 | | | | 5,453,058 | |
Kilroy Realty Corp. | | | 59,653 | | | | 1,859,384 | |
Kite Realty Group Trust | | | 122,652 | | | | 2,744,952 | |
Lamar Advertising Co. Cl A | | | 49,050 | | | | 5,862,946 | |
| | | | | | | | |
| | | Shares | | | Value | |
| COMMON STOCKS (CONTINUED): | |
| REAL ESTATE (CONTINUED) | | | | | | |
National Storage Affiliates Trust | | | 38,927 | | | $ | 1,604,571 | |
NNN REIT, Inc. | | | 102,404 | | | | 4,362,410 | |
Omega Healthcare Investors, Inc. | | | 138,009 | | | | 4,726,808 | |
Park Hotels & Resorts, Inc. | | | 117,623 | | | | 1,761,992 | |
PotlatchDeltic Corp. | | | 44,407 | | | | 1,749,192 | |
Rayonier, Inc. | | | 76,497 | | | | 2,225,298 | |
Rexford Industrial Realty, Inc. | | | 121,410 | | | | 5,413,672 | |
Sabra Health Care REIT, Inc. | | | 129,294 | | | | 1,991,128 | |
STAG Industrial, Inc. | | | 101,695 | | | | 3,667,122 | |
Vornado Realty Trust | | | 89,366 | | | | 2,349,432 | |
WP Carey, Inc. | | | 122,217 | | | | 6,728,046 | |
| | | | | | | | |
| | | | | | | 105,078,546 | |
| | | | | | | | |
| UTILITIES (2.5%) | | | | | | |
ALLETE, Inc. | | | 32,222 | | | | 2,009,042 | |
Black Hills Corp. | | | 38,501 | | | | 2,093,684 | |
Essential Utilities, Inc. | | | 140,546 | | | | 5,246,582 | |
IDACORP, Inc. | | | 28,314 | | | | 2,637,449 | |
National Fuel Gas Co. | | | 51,338 | | | | 2,782,006 | |
New Jersey Resources Corp. | | | 55,194 | | | | 2,358,992 | |
Northwestern Energy Group, Inc. | | | 34,230 | | | | 1,714,238 | |
OGE Energy Corp. | | | 112,009 | | | | 3,998,721 | |
ONE Gas, Inc. | | | 31,594 | | | | 2,017,277 | |
Ormat Technologies, Inc. | | | 30,035 | | | | 2,153,510 | |
PNM Resources, Inc. | | | 50,378 | | | | 1,861,971 | |
Portland General Electric Co. | | | 57,544 | | | | 2,488,203 | |
Southwest Gas Hldgs., Inc. | | | 33,624 | | | | 2,366,457 | |
Spire, Inc. | | | 32,253 | | | | 1,958,725 | |
UGI Corp. | | | 117,077 | | | | 2,681,063 | |
| | | | | | | | |
| | | | | | | 38,367,920 | |
| | | | | | | | |
TOTAL COMMON STOCKS | | | | | | | | |
(Cost: $1,229,663,185) | | | | | | | 1,500,637,881 | |
| | | | | | | | |
| | | | | | | | | | | | | | |
| | | | | | Rate(%) | | Maturity | | Face Amount | | Value | |
| TEMPORARY CASH INVESTMENT (0.1%) | | | | | | | | | | | | |
JP Morgan Chase, New York Time Deposit | | | | | | 4.58 | | 07/01/24 | | $1,623,587 | | $ | 1,623,587 | |
| | | | | | | | | | | | | | |
TOTAL TEMPORARY CASH INVESTMENT
(Cost: $1,623,587) | | | 1,623,587 | |
| | | | | | | | | | | | | | |
TOTAL INVESTMENTS
(Cost: $1,231,286,772) 99.9% | | | 1,502,261,468 | |
| | | | | | | | | | | | | | |
OTHER NET ASSETS 0.1% | | | 1,023,370 | |
| | | | | | | | | | | | | | |
NET ASSETS 100.0% | | $ | 1,503,284,838 | |
| | | | |
FOOTNOTES TO PORTFOLIO OF INVESTMENTS IN SECURITIES
| * | Non-income producing security |
The accompanying notes are an integral part of these portfolio schedules.
54
MoA FUNDS — BALANCED FUND
PORTFOLIO OF INVESTMENTS IN SECURITIES
June 30, 2024 (Unaudited)
| | | | | | | | |
| | | Shares | | | Value | |
| COMMON STOCKS (62.7%): | | | | | | |
| COMMUNICATION SERVICES (3.5%) | | | | | | |
AT&T, Inc. | | | 104,329 | | | $ | 1,993,727 | |
Comcast Corp. Cl A | | | 46,948 | | | | 1,838,484 | |
Electronic Arts, Inc. | | | 7,296 | | | | 1,016,552 | |
Fox Corp. Cl A | | | 20,888 | | | | 717,920 | |
T-Mobile US, Inc. | | | 6,790 | | | | 1,196,262 | |
| | | | | | | | |
| | | | | | | 6,762,945 | |
| | | | | | | | |
| CONSUMER DISCRETIONARY (6.8%) | | | | | | |
Amazon.com, Inc.* | | | 14,414 | | | | 2,785,505 | |
AutoZone, Inc.* | | | 340 | | | | 1,007,794 | |
Booking Hldgs., Inc. | | | 493 | | | | 1,953,019 | |
DR Horton, Inc. | | | 8,102 | | | | 1,141,815 | |
Hilton Worldwide Hldgs., Inc. | | | 4,029 | | | | 879,128 | |
Home Depot, Inc. | | | 4,423 | | | | 1,522,574 | |
Ralph Lauren Corp. Cl A | | | 6,095 | | | | 1,066,991 | |
Tapestry, Inc. | | | 32,465 | | | | 1,389,177 | |
TJX Cos., Inc. | | | 14,041 | | | | 1,545,914 | |
| | | | | | | | |
| | | | | | | 13,291,917 | |
| | | | | | | | |
| CONSUMER STAPLES (4.0%) | | | | | | |
Colgate-Palmolive Co. | | | 16,926 | | | | 1,642,499 | |
Costco Wholesale Corp. | | | 3,210 | | | | 2,728,468 | |
Philip Morris International, Inc. | | | 14,103 | | | | 1,429,057 | |
Walmart, Inc. | | | 28,314 | | | | 1,917,141 | |
| | | | | | | | |
| | | | | | | 7,717,165 | |
| | | | | | | | |
| ENERGY (3.1%) | | | | | | |
Baker Hughes Co. Cl A | | | 20,385 | | | | 716,940 | |
ConocoPhillips | | | 10,836 | | | | 1,239,422 | |
Exxon Mobil Corp. | | | 14,238 | | | | 1,639,079 | |
Valero Energy Corp. | | | 7,112 | | | | 1,114,877 | |
Williams Cos., Inc. | | | 29,830 | | | | 1,267,775 | |
| | | | | | | | |
| | | | | | | 5,978,093 | |
| | | | | | | | |
| FINANCIALS (6.6%) | | | | | | |
Citigroup, Inc. | | | 20,276 | | | | 1,286,715 | |
Corpay, Inc.* | | | 4,771 | | | | 1,271,042 | |
Goldman Sachs Group, Inc. | | | 2,742 | | | | 1,240,261 | |
JPMorgan Chase & Co. | | | 15,976 | | | | 3,231,306 | |
KeyCorp. | | | 45,950 | | | | 652,950 | |
Morgan Stanley | | | 18,031 | | | | 1,752,433 | |
U.S. Bancorp | | | 25,176 | | | | 999,487 | |
Visa, Inc. Cl A | | | 9,075 | | | | 2,381,915 | |
| | | | | | | | |
| | | | | | | 12,816,109 | |
| | | | | | | | |
| HEALTH CARE (7.8%) | | | | | | |
AbbVie, Inc. | | | 11,081 | | | | 1,900,613 | |
Bristol-Myers Squibb Co. | | | 13,197 | | | | 548,072 | |
Cigna Group | | | 3,900 | | | | 1,289,223 | |
Elevance Health, Inc. | | | 2,319 | | | | 1,256,573 | |
Eli Lilly & Co. | | | 3,589 | | | | 3,249,409 | |
Gilead Sciences, Inc. | | | 12,279 | | | | 842,462 | |
Hologic, Inc.* | | | 8,072 | | | | 599,346 | |
Johnson & Johnson | | | 11,693 | | | | 1,709,049 | |
McKesson Corp. | | | 2,624 | | | | 1,532,521 | |
| | | | | | | | |
| | | Shares | | | Value | |
| COMMON STOCKS (CONTINUED): | | | | | | |
| HEALTH CARE (CONTINUED) | | | | | | |
UnitedHealth Group, Inc. | | | 4,549 | | | $ | 2,316,624 | |
| | | | | | | | |
| | | | | | | 15,243,892 | |
| | | | | | | | |
| INDUSTRIALS (5.8%) | | | | | | |
Caterpillar, Inc. | | | 3,233 | | | | 1,076,912 | |
Deere & Co. | | | 4,176 | | | | 1,560,279 | |
FedEx Corp. | | | 5,154 | | | | 1,545,375 | |
GE Vernova, Inc.* | | | 6,056 | | | | 1,038,665 | |
General Electric Co. | | | 3,358 | | | | 533,821 | |
Honeywell International, Inc. | | | 4,888 | | | | 1,043,784 | |
Parker-Hannifin Corp. | | | 2,109 | | | | 1,066,753 | |
Snap-on, Inc. | | | 2,957 | | | | 772,930 | |
Trane Technologies PLC | | | 5,129 | | | | 1,687,082 | |
Union Pacific Corp. | | | 4,530 | | | | 1,024,958 | |
| | | | | | | | |
| | | | | | | 11,350,559 | |
| | | | | | | | |
| INFORMATION TECHNOLOGY (21.2%) | | | | | | |
Adobe, Inc.* | | | 3,585 | | | | 1,991,611 | |
Apple, Inc. | | | 45,864 | | | | 9,659,876 | |
Broadcom, Inc. | | | 2,049 | | | | 3,289,731 | |
Cisco Systems, Inc. | | | 22,902 | | | | 1,088,074 | |
Fortinet, Inc.* | | | 20,538 | | | | 1,237,825 | |
Intuit, Inc. | | | 2,181 | | | | 1,433,375 | |
Lam Research Corp. | | | 1,976 | | | | 2,104,144 | |
Microsoft Corp. | | | 23,576 | | | | 10,537,293 | |
NetApp, Inc. | | | 9,609 | | | | 1,237,639 | |
NVIDIA Corp. | | | 70,350 | | | | 8,691,039 | |
| | | | | | | | |
| | | | | | | 41,270,607 | |
| | | | | | | | |
| MATERIALS (1.6%) | | | | | | |
Freeport-McMoRan, Inc. | | | 31,360 | | | | 1,524,096 | |
Newmont Corp. | | | 36,213 | | | | 1,516,238 | |
| | | | | | | | |
| | | | | | | 3,040,334 | |
| | | | | | | | |
| REAL ESTATE (1.0%) | | | | | | |
Alexandria Real Estate Equities, Inc. | | | 6,480 | | | | 757,966 | |
Equinix, Inc. | | | 828 | | | | 626,465 | |
Public Storage | | | 1,948 | | | | 560,342 | |
| | | | | | | | |
| | | | | | | 1,944,773 | |
| | | | | | | | |
| UTILITIES (1.3%) | | | | | | |
NextEra Energy, Inc. | | | 20,119 | | | | 1,424,626 | |
NRG Energy, Inc. | | | 14,568 | | | | 1,134,265 | |
| | | | | | | | |
| | | | | | | 2,558,891 | |
| | | | | | | | |
TOTAL COMMON STOCKS | | | | | | | | |
(Cost: $68,867,885) | | | | | | | 121,975,285 | |
| | | | | | | | |
The accompanying notes are an integral part of these portfolio schedules.
55
MoA FUNDS — BALANCED FUND
PORTFOLIO OF INVESTMENTS IN SECURITIES (Continued)
June 30, 2024 (Unaudited)
| | | | | | | | | | | | | | | | | | | | |
| | | Rating** | | | Rate(%) | | | Maturity | | | Face Amount | | | Value | |
| LONG-TERM DEBT SECURITIES (33.2%): | | | | | | | | | | | | | | | |
| U.S. GOVERNMENT (9.2%) | | | | | | | | | | | | | | | |
U.S. Treasury Bond | | | AA+ | | | | 1.38 | | | | 11/15/40 | | | $ | 750,000 | | | $ | 473,086 | |
U.S. Treasury Bond | | | AA+ | | | | 1.75 | | | | 08/15/41 | | | | 1,900,000 | | | | 1,254,891 | |
U.S. Treasury Bond | | | AA+ | | | | 1.88 | | | | 02/15/41 | | | | 1,700,000 | | | | 1,163,172 | |
U.S. Treasury Bond | | | AA+ | | | | 3.63 | | | | 02/15/53 | | | | 465,000 | | | | 395,613 | |
U.S. Treasury Bond | | | AA+ | | | | 4.00 | | | | 11/15/52 | | | | 620,000 | | | | 564,878 | |
U.S. Treasury Bond | | | AA+ | | | | 4.13 | | | | 08/15/53 | | | | 2,095,000 | | | | 1,951,296 | |
U.S. Treasury Bond | | | AA+ | | | | 4.25 | | | | 02/15/54 | | | | 655,000 | | | | 623,888 | |
U.S. Treasury Bond | | | AA+ | | | | 4.63 | | | | 05/15/44 | | | | 50,000 | | | | 49,906 | |
U.S. Treasury Note | | | AA+ | | | | 1.50 | | | | 02/15/30 | | | | 900,000 | | | | 772,664 | |
U.S. Treasury Note | | | AA+ | | | | 1.63 | | | | 08/15/29 | | | | 1,450,000 | | | | 1,270,902 | |
U.S. Treasury Note | | | AA+ | | | | 1.75 | | | | 01/31/29 | | | | 335,000 | | | | 298,778 | |
U.S. Treasury Note | | | AA+ | | | | 2.63 | | | | 02/15/29 | | | | 1,500,000 | | | | 1,390,547 | |
U.S. Treasury Note | | | AA+ | | | | 2.88 | | | | 05/15/28 | | | | 1,125,000 | | | | 1,062,773 | |
U.S. Treasury Note | | | AA+ | | | | 2.88 | | | | 05/15/32 | | | | 1,735,000 | | | | 1,563,127 | |
U.S. Treasury Note | | | AA+ | | | | 3.63 | | | | 03/31/30 | | | | 660,000 | | | | 635,559 | |
U.S. Treasury Note | | | AA+ | | | | 4.00 | | | | 02/15/34 | | | | 1,460,000 | | | | 1,417,569 | |
U.S. Treasury Note | | | AA+ | | | | 4.50 | | | | 11/15/33 | | | | 190,000 | | | | 191,781 | |
U.S. Treasury Strip | | | AA+ | | | | 0.00 | | | | 08/15/29 | | | | 3,645,000 | | | | 2,912,298 | |
| | | | | | | | | | | | | | | | | | | | |
| | | | | | | | | | | | | | | | | | | 17,992,728 | |
| | | | | | | | | | | | | | | | | | | | |
| U.S. GOVERNMENT AGENCIES (12.6%) | | | | | | | | | | | | | | | |
| MORTGAGE-BACKED OBLIGATIONS (11.6%) | | | | | | | | | | | | | | | |
FHLMC | | | AA+ | | | | 2.50 | | | | 09/01/27 | | | | 32,314 | | | | 31,155 | |
FHLMC | | | AA+ | | | | 2.50 | | | | 06/01/35 | | | | 135,571 | | | | 123,221 | |
FHLMC | | | AA+ | | | | 2.50 | | | | 06/01/50 | | | | 150,255 | | | | 123,859 | |
FHLMC | | | AA+ | | | | 2.50 | | | | 11/01/50 | | | | 595,582 | | | | 495,206 | |
FHLMC | | | AA+ | | | | 2.50 | | | | 10/01/51 | | | | 198,160 | | | | 162,490 | |
FHLMC | | | AA+ | | | | 3.00 | | | | 06/01/27 | | | | 22,341 | | | | 21,683 | |
FHLMC | | | AA+ | | | | 3.00 | | | | 08/01/27 | | | | 27,621 | | | | 26,808 | |
FHLMC | | | AA+ | | | | 3.00 | | | | 11/01/42 | | | | 77,772 | | | | 69,099 | |
FHLMC | | | AA+ | | | | 3.00 | | | | 04/01/43 | | | | 73,223 | | | | 64,976 | |
FHLMC | | | AA+ | | | | 3.00 | | | | 11/01/49 | | | | 220,433 | | | | 190,182 | |
FHLMC | | | AA+ | | | | 3.00 | | | | 11/01/49 | | | | 146,641 | | | | 126,517 | |
FHLMC | | | AA+ | | | | 3.00 | | | | 10/01/51 | | | | 369,739 | | | | 314,546 | |
FHLMC | | | AA+ | | | | 3.00 | | | | 06/01/52 | | | | 436,689 | | | | 374,960 | |
FHLMC | | | AA+ | | | | 3.50 | | | | 02/01/32 | | | | 33,651 | | | | 32,303 | |
FHLMC | | | AA+ | | | | 3.50 | | | | 01/01/43 | | | | 92,281 | | | | 84,406 | |
FHLMC | | | AA+ | | | | 3.50 | | | | 06/01/45 | | | | 129,507 | | | | 117,547 | |
FHLMC | | | AA+ | | | | 3.50 | | | | 07/01/45 | | | | 147,605 | | | | 134,320 | |
FHLMC | | | AA+ | | | | 4.00 | | | | 11/01/33 | | | | 28,331 | | | | 27,488 | |
FHLMC | | | AA+ | | | | 4.00 | | | | 01/01/38 | | | | 72,243 | | | | 69,494 | |
FHLMC | | | AA+ | | | | 4.00 | | | | 03/01/41 | | | | 28,318 | | | | 26,780 | |
FHLMC | | | AA+ | | | | 4.00 | | | | 07/01/41 | | | | 44,936 | | | | 42,494 | |
FHLMC | | | AA+ | | | | 4.00 | | | | 11/01/42 | | | | 18,365 | | | | 17,297 | |
FHLMC | | | AA+ | | | | 4.00 | | | | 01/01/43 | | | | 95,127 | | | | 89,592 | |
FHLMC | | | AA+ | | | | 4.00 | | | | 10/01/44 | | | | 38,217 | | | | 35,794 | |
FHLMC | | | AA+ | | | | 4.00 | | | | 06/01/45 | | | | 129,015 | | | | 120,660 | |
FHLMC | | | AA+ | | | | 4.00 | | | | 04/01/52 | | | | 412,634 | | | | 379,379 | |
FHLMC | | | AA+ | | | | 4.00 | | | | 08/01/52 | | | | 257,784 | | | | 238,416 | |
FHLMC | | | AA+ | | | | 4.23 | | | | 05/01/30 | | | | 400,000 | | | | 384,738 | |
FHLMC | | | AA+ | | | | 4.50 | | | | 02/01/44 | | | | 46,351 | | | | 44,879 | |
FHLMC | | | AA+ | | | | 4.50 | | | | 05/01/48 | | | | 52,366 | | | | 50,178 | |
FHLMC | | | AA+ | | | | 5.00 | | | | 02/01/26 | | | | 915 | | | | 909 | |
FHLMC | | | AA+ | | | | 5.00 | | | | 06/01/52 | | | | 796,139 | | | | 771,531 | |
FHLMC | | | AA+ | | | | 5.00 | | | | 12/01/52 | | | | 507,583 | | | | 494,171 | |
FHLMC | | | AA+ | | | | 5.50 | | | | 07/01/32 | | | | 10,790 | | | | 10,854 | |
FHLMC | | | AA+ | | | | 5.50 | | | | 05/01/33 | | | | 6,328 | | | | 6,383 | |
The accompanying notes are an integral part of these portfolio schedules.
56
MoA FUNDS — BALANCED FUND
PORTFOLIO OF INVESTMENTS IN SECURITIES (Continued)
June 30, 2024 (Unaudited)
| | | | | | | | | | | | | | |
| | | Rating** | | Rate(%) | | Maturity | | Face Amount | | | Value | |
| LONG-TERM DEBT SECURITIES (CONTINUED): | | | | | | | | | | | | |
| U.S. GOVERNMENT AGENCIES (CONTINUED) | | | | | | | | | | | | |
| MORTGAGE-BACKED OBLIGATIONS (CONTINUED) | | | | | | | | | | | | |
FHLMC | | AA+ | | 5.50 | | 06/01/37 | | $ | 45,946 | | | $ | 46,575 | |
FHLMC | | AA+ | | 5.50 | | 07/01/53 | | | 479,066 | | | | 475,492 | |
FHLMC | | AA+ | | 5.50 | | 07/01/53 | | | 235,640 | | | | 232,769 | |
FHLMC | | AA+ | | 6.00 | | 09/01/53 | | | 187,669 | | | | 189,927 | |
FHLMC | | AA+ | | 6.00 | | 02/01/54 | | | 198,862 | | | | 199,337 | |
FHLMC ARM | | AA+ | | 1.93 | | 10/01/51 | | | 557,041 | | | | 481,086 | |
FHLMC REMICS | | AA+ | | 2.50 | | 04/25/50 | | | 77,838 | | | | 61,125 | |
FHLMC Strip | | AA+ | | 3.00 | | 06/15/42 | | | 157,222 | | | | 141,115 | |
FHLMC Strip | | AA+ | | 3.00 | | 01/15/43 | | | 51,993 | | | | 45,495 | |
FNMA | | AA+ | | 1.81 | | 09/01/51 | | | 621,293 | | | | 535,650 | |
FNMA | | AA+ | | 2.00 | | 11/01/35 | | | 334,344 | | | | 296,134 | |
FNMA | | AA+ | | 2.00 | | 07/01/36 | | | 700,105 | | | | 620,363 | |
FNMA | | AA+ | | 2.00 | | 09/01/50 | | | 339,759 | | | | 267,922 | |
FNMA | | AA+ | | 2.00 | | 10/01/50 | | | 153,700 | | | | 122,531 | |
FNMA | | AA+ | | 2.00 | | 02/01/51 | | | 397,264 | | | | 310,585 | |
FNMA | | AA+ | | 2.34 | | 05/01/36 | | | 539,433 | | | | 425,850 | |
FNMA | | AA+ | | 2.50 | | 02/01/33 | | | 92,220 | | | | 85,385 | |
FNMA | | AA+ | | 2.50 | | 06/01/35 | | | 319,968 | | | | 290,722 | |
FNMA | | AA+ | | 2.50 | | 10/01/35 | | | 310,868 | | | | 282,072 | |
FNMA | | AA+ | | 2.50 | | 04/01/42 | | | 1,057,307 | | | | 908,900 | |
FNMA | | AA+ | | 2.50 | | 03/01/51 | | | 900,000 | | | | 752,144 | |
FNMA | | AA+ | | 2.50 | | 04/01/51 | | | 151,668 | | | | 124,906 | |
FNMA | | AA+ | | 2.50 | | 05/01/51 | | | 650,000 | | | | 541,156 | |
FNMA | | AA+ | | 2.50 | | 05/01/52 | | | 874,901 | | | | 721,240 | |
FNMA | | AA+ | | 3.00 | | 06/01/33 | | | 107,847 | | | | 100,913 | |
FNMA | | AA+ | | 3.00 | | 09/01/33 | | | 67,102 | | | | 62,765 | |
FNMA | | AA+ | | 3.00 | | 01/01/43 | | | 209,690 | | | | 186,060 | |
FNMA | | AA+ | | 3.00 | | 02/01/43 | | | 52,193 | | | | 46,302 | |
FNMA | | AA+ | | 3.00 | | 03/01/43 | | | 112,199 | | | | 99,443 | |
FNMA | | AA+ | | 3.00 | | 09/01/43 | | | 110,970 | | | | 98,324 | |
FNMA | | AA+ | | 3.00 | | 12/01/47 | | | 18,049 | | | | 15,747 | |
FNMA | | AA+ | | 3.00 | | 03/01/48 | | | 53,952 | | | | 46,643 | |
FNMA | | AA+ | | 3.00 | | 03/01/50 | | | 58,195 | | | | 49,590 | |
FNMA | | AA+ | | 3.00 | | 01/01/52 | | | 540,683 | | | | 462,316 | |
FNMA | | AA+ | | 3.00 | | 03/01/52 | | | 436,484 | | | | 371,126 | |
FNMA | | AA+ | | 3.10 | | 06/01/29 | | | 150,000 | | | | 138,354 | |
FNMA | | AA+ | | 3.50 | | 08/01/38 | | | 76,580 | | | | 69,956 | |
FNMA | | AA+ | | 3.50 | | 10/01/41 | | | 50,835 | | | | 46,454 | |
FNMA | | AA+ | | 3.50 | | 11/01/41 | | | 73,983 | | | | 67,624 | |
FNMA | | AA+ | | 3.50 | | 12/01/41 | | | 56,679 | | | | 51,795 | |
FNMA | | AA+ | | 3.50 | | 04/01/42 | | | 85,442 | | | | 78,053 | |
FNMA | | AA+ | | 3.50 | | 08/01/42 | | | 101,435 | | | | 92,651 | |
FNMA | | AA+ | | 3.50 | | 08/01/43 | | | 104,871 | | | | 95,508 | |
FNMA | | AA+ | | 3.50 | | 08/01/43 | | | 130,703 | | | | 119,356 | |
FNMA | | AA+ | | 3.50 | | 04/01/45 | | | 88,128 | | | | 79,892 | |
FNMA | | AA+ | | 3.50 | | 09/01/47 | | | 51,510 | | | | 46,584 | |
FNMA | | AA+ | | 3.50 | | 06/01/51 | | | 509,589 | | | | 451,827 | |
FNMA | | AA+ | | 3.50 | | 05/01/52 | | | 604,131 | | | | 538,219 | |
FNMA | | AA+ | | 3.75 | | 08/01/28 | | | 135,000 | | | | 129,185 | |
FNMA | | AA+ | | 4.00 | | 01/01/31 | | | 32,685 | | | | 31,805 | |
FNMA | | AA+ | | 4.00 | | 07/01/40 | | | 62,378 | | | | 58,934 | |
FNMA | | AA+ | | 4.00 | | 11/01/40 | | | 31,502 | | | | 29,753 | |
FNMA | | AA+ | | 4.00 | | 05/01/41 | | | 27,060 | | | | 25,558 | |
FNMA | | AA+ | | 4.00 | | 11/01/45 | | | 60,977 | | | | 56,972 | |
FNMA | | AA+ | | 4.00 | | 02/01/47 | | | 59,931 | | | | 55,916 | |
The accompanying notes are an integral part of these portfolio schedules.
57
MoA FUNDS — BALANCED FUND
PORTFOLIO OF INVESTMENTS IN SECURITIES (Continued)
June 30, 2024 (Unaudited)
| | | | | | | | | | | | | | |
| | | Rating** | | Rate(%) | | Maturity | | Face Amount | | | Value | |
| LONG-TERM DEBT SECURITIES (CONTINUED): | | | | | | | | | | | | |
| U.S. GOVERNMENT AGENCIES (CONTINUED) | | | | | | | | | | | | |
| MORTGAGE-BACKED OBLIGATIONS (CONTINUED) | | | | | | | | | | | | |
FNMA | | AA+ | | 4.00 | | 04/01/49 | | $ | 231,622 | | | $ | 215,150 | |
FNMA | | AA+ | | 4.00 | | 03/01/50 | | | 209,338 | | | | 193,877 | |
FNMA | | AA+ | | 4.00 | | 07/01/52 | | | 168,645 | | | | 156,156 | |
FNMA | | AA+ | | 4.00 | | 07/01/56 | | | 259,781 | | | | 238,496 | |
FNMA | | AA+ | | 4.50 | | 05/01/30 | | | 9,136 | | | | 8,994 | |
FNMA | | AA+ | | 4.50 | | 06/01/34 | | | 14,350 | | | | 13,989 | |
FNMA | | AA+ | | 4.50 | | 08/01/35 | | | 9,151 | | | | 8,920 | |
FNMA | | AA+ | | 4.50 | | 05/01/39 | | | 16,689 | | | | 16,220 | |
FNMA | | AA+ | | 4.50 | | 05/01/39 | | | 28,355 | | | | 27,564 | |
FNMA | | AA+ | | 4.50 | | 05/01/40 | | | 35,321 | | | | 34,306 | |
FNMA | | AA+ | | 4.50 | | 10/01/40 | | | 127,750 | | | | 124,079 | |
FNMA | | AA+ | | 4.50 | | 11/01/47 | | | 24,527 | | | | 23,604 | |
FNMA | | AA+ | | 4.50 | | 11/01/47 | | | 39,116 | | | | 37,565 | |
FNMA | | AA+ | | 4.50 | | 05/01/50 | | | 329,066 | | | | 314,642 | |
FNMA | | AA+ | | 4.57 | | 02/01/53 | | | 280,571 | | | | 271,837 | |
FNMA | | AA+ | | 5.00 | | 06/01/33 | | | 14,793 | | | | 14,663 | |
FNMA | | AA+ | | 5.00 | | 10/01/33 | | | 15,398 | | | | 15,263 | |
FNMA | | AA+ | | 5.00 | | 11/01/33 | | | 10,536 | | | | 10,444 | |
FNMA | | AA+ | | 5.00 | | 11/01/33 | | | 41,479 | | | | 41,115 | |
FNMA | | AA+ | | 5.00 | | 03/01/34 | | | 6,048 | | | | 5,995 | |
FNMA | | AA+ | | 5.00 | | 04/01/34 | | | 11,832 | | | | 11,732 | |
FNMA | | AA+ | | 5.00 | | 09/01/35 | | | 5,647 | | | | 5,597 | |
FNMA | | AA+ | | 5.00 | | 08/01/37 | | | 49,865 | | | | 49,501 | |
FNMA | | AA+ | | 5.00 | | 05/01/39 | | | 21,293 | | | | 21,145 | |
FNMA | | AA+ | | 5.00 | | 06/01/52 | | | 766,452 | | | | 742,981 | |
FNMA | | AA+ | | 5.50 | | 06/01/48 | | | 4,353 | | | | 4,372 | |
FNMA | | AA+ | | 6.00 | | 05/01/32 | | | 3,237 | | | | 3,322 | |
FNMA | | AA+ | | 6.00 | | 04/01/33 | | | 15,772 | | | | 16,185 | |
FNMA | | AA+ | | 6.00 | | 05/01/33 | | | 6,972 | | | | 7,155 | |
FNMA | | AA+ | | 6.00 | | 06/01/34 | | | 5,173 | | | | 5,310 | |
FNMA | | AA+ | | 6.00 | | 09/01/34 | | | 1,260 | | | | 1,293 | |
FNMA | | AA+ | | 6.00 | | 10/01/34 | | | 13,323 | | | | 13,673 | |
FNMA | | AA+ | | 6.00 | | 01/01/37 | | | 5,796 | | | | 5,998 | |
FNMA | | AA+ | | 6.00 | | 05/01/37 | | | 1,448 | | | | 1,499 | |
FNMA | | AA+ | | 6.00 | | 11/01/52 | | | 652,105 | | | | 660,087 | |
FNMA | | AA+ | | 6.00 | | 09/01/53 | | | 47,225 | | | | 47,956 | |
FNMA | | AA+ | | 6.50 | | 05/01/32 | | | 15,447 | | | | 15,951 | |
FNMA | | AA+ | | 6.50 | | 07/01/34 | | | 2,802 | | | | 2,922 | |
FNMA | | AA+ | | 6.50 | | 05/01/37 | | | 15,682 | | | | 16,478 | |
FNMA | | AA+ | | 6.50 | | 11/01/53 | | | 244,139 | | | | 249,603 | |
FNMA | | AA+ | | 7.00 | | 04/01/32 | | | 552 | | | | 578 | |
FNMA | | AA+ | | 7.50 | | 06/01/31 | | | 1,067 | | | | 1,119 | |
FNMA | | AA+ | | 7.50 | | 02/01/32 | | | 1,573 | | | | 1,665 | |
FNMA | | AA+ | | 7.50 | | 06/01/32 | | | 1,166 | | | | 1,245 | |
FNMA | | AA+ | | 8.00 | | 04/01/32 | | | 1,026 | | | | 1,069 | |
FNMA Strip | | AA+ | | 3.00 | | 08/25/42 | | | 47,204 | | | | 42,136 | |
FRESB Multifamily Mortgage | | AA+ | | 2.37 | | 10/25/26 | | | 44,248 | | | | 41,404 | |
GNMA (1) | | AA+ | | 2.50 | | 10/20/51 | | | 168,761 | | | | 140,583 | |
GNMA (1) | | AA+ | | 2.50 | | 08/20/52 | | | 167,918 | | | | 141,183 | |
GNMA (1) | | AA+ | | 2.50 | | 03/20/53 | | | 486,171 | | | | 409,166 | |
GNMA (1) | | AA+ | | 2.50 | | 06/20/53 | | | 457,784 | | | | 385,134 | |
GNMA (1) | | AA+ | | 3.00 | | 10/20/51 | | | 170,329 | | | | 146,653 | |
GNMA (1) | | AA+ | | 4.00 | | 01/15/42 | | | 101,730 | | | | 96,388 | |
GNMA (1) | | AA+ | | 4.00 | | 08/20/42 | | | 34,399 | | | | 32,586 | |
GNMA (1) | | AA+ | | 4.50 | | 04/20/31 | | | 19,288 | | | | 19,002 | |
The accompanying notes are an integral part of these portfolio schedules.
58
MoA FUNDS — BALANCED FUND
PORTFOLIO OF INVESTMENTS IN SECURITIES (Continued)
June 30, 2024 (Unaudited)
| | | | | | | | | | | | | | |
| | | Rating** | | Rate(%) | | Maturity | | Face Amount | | | Value | |
| LONG-TERM DEBT SECURITIES (CONTINUED): | | | | | | | | | | | | |
| U.S. GOVERNMENT AGENCIES (CONTINUED) | | | | | | | | | | | | |
| MORTGAGE-BACKED OBLIGATIONS (CONTINUED) | | | | | | | | | | | | |
GNMA (1) | | AA+ | | 4.50 | | 10/15/40 | | $ | 51,116 | | | $ | 50,004 | |
GNMA (1) | | AA+ | | 4.50 | | 10/20/43 | | | 84,846 | | | | 82,509 | |
GNMA (1) | | AA+ | | 5.00 | | 06/20/39 | | | 38,798 | | | | 38,615 | |
GNMA (1) | | AA+ | | 6.50 | | 04/15/31 | | | 1,175 | | | | 1,201 | |
GNMA (1) | | AA+ | | 6.50 | | 10/15/31 | | | 676 | | | | 694 | |
GNMA (1) | | AA+ | | 6.50 | | 12/15/31 | | | 285 | | | | 286 | |
GNMA (1) | | AA+ | | 6.50 | | 05/15/32 | | | 1,691 | | | | 1,719 | |
GNMA (1) | | AA+ | | 7.00 | | 05/15/31 | | | 672 | | | | 696 | |
GNMA (1) | | AA+ | | 7.00 | | 05/15/32 | | | 155 | | | | 155 | |
| | | | | | | | | | | | | | |
| | | | | | | | | | | | | 22,557,850 | |
| | | | | | | | | | | | | | |
| NON-MORTGAGE-BACKED OBLIGATIONS (1.0%) | | | | | | | | | | | | |
FFCB | | AA+ | | 5.95 | | 05/24/34 | | | 190,000 | | | | 189,354 | |
FHLB | | AA+ | | 5.65 | | 05/21/29 | | | 145,000 | | | | 144,381 | |
FHLB | | AA+ | | 5.70 | | 05/01/29 | | | 100,000 | | | | 99,772 | |
FHLB | | AA+ | | 5.78 | | 04/22/31 | | | 120,000 | | | | 119,472 | |
FHLMC | | AA+ | | 4.88 | | 07/24/26 | | | 220,000 | | | | 218,794 | |
FHLMC | | AA+ | | 5.00 | | 03/14/29 | | | 300,000 | | | | 296,210 | |
FHLMC | | AA+ | | 5.60 | | 05/03/27 | | | 820,000 | | | | 819,067 | |
| | | | | | | | | | | | | | |
| | | | | | | | | | | | | 1,887,050 | |
| | | | | | | | | | | | | | |
| CORPORATE DEBT (11.4%) | | | | | | | | | | | | |
| COMMUNICATION SERVICES (0.9%) | | | | | | | | | | | | |
AT&T, Inc. | | BBB | | 2.75 | | 06/01/31 | | | 290,000 | | | | 248,369 | |
Comcast Corp. | | A- | | 3.40 | | 04/01/30 | | | 300,000 | | | | 275,787 | |
Sprint LLC | | BBB- | | 7.63 | | 03/01/26 | | | 255,000 | | | | 262,010 | |
T-Mobile USA, Inc. | | BBB | | 3.38 | | 04/15/29 | | | 165,000 | | | | 152,382 | |
T-Mobile USA, Inc. | | BBB | | 3.75 | | 04/15/27 | | | 205,000 | | | | 197,060 | |
Verizon Communications, Inc. | | BBB+ | | 4.02 | | 12/03/29 | | | 415,000 | | | | 392,149 | |
Warnermedia Hldgs., Inc. | | BBB- | | 4.28 | | 03/15/32 | | | 355,000 | | | | 309,767 | |
| | | | | | | | | | | | | | |
| | | | | | | | | | | | | 1,837,524 | |
| | | | | | | | | | | | | | |
| CONSUMER DISCRETIONARY (0.7%) | | | | | | | | | | | | |
AutoZone, Inc. | | BBB | | 3.75 | | 04/18/29 | | | 65,000 | | | | 61,204 | |
AutoZone, Inc. | | BBB | | 6.25 | | 11/01/28 | | | 175,000 | | | | 182,541 | |
Best Buy Co., Inc. | | BBB+ | | 1.95 | | 10/01/30 | | | 110,000 | | | | 91,157 | |
Expedia Group, Inc. | | BBB | | 5.00 | | 02/15/26 | | | 260,000 | | | | 257,978 | |
General Motors Financial Co., Inc. | | BBB | | 5.75 | | 02/08/31 | | | 285,000 | | | | 285,733 | |
Lowe’s Cos., Inc. | | BBB+ | | 4.50 | | 04/15/30 | | | 165,000 | | | | 160,162 | |
Tapestry, Inc. | | BBB | | 7.00 | | 11/27/26 | | | 50,000 | | | | 51,388 | |
Tapestry, Inc. | | BBB | | 7.05 | | 11/27/25 | | | 50,000 | | | | 50,842 | |
Toll Brothers Finance Corp. | | BBB- | | 4.88 | | 03/15/27 | | | 165,000 | | | | 162,550 | |
| | | | | | | | | | | | | | |
| | | | | | | | | | | | | 1,303,555 | |
| | | | | | | | | | | | | | |
| CONSUMER STAPLES (0.4%) | | | | | | | | | | | | |
Bunge Ltd. Finance Corp. | | BBB+ | | 2.75 | | 05/14/31 | | | 115,000 | | | | 98,489 | |
Constellation Brands, Inc. | | BBB | | 4.80 | | 01/15/29 | | | 230,000 | | | | 226,836 | |
J M Smucker Co. | | BBB | | 6.20 | | 11/15/33 | | | 245,000 | | | | 257,255 | |
Keurig Dr Pepper, Inc. | | BBB | | 5.10 | | 03/15/27 | | | 100,000 | | | | 100,028 | |
| | | | | | | | | | | | | | |
| | | | | | | | | | | | | 682,608 | |
| | | | | | | | | | | | | | |
| ENERGY (0.9%) | | | | | | | | | | | | |
Energy Transfer LP | | BBB | | 5.25 | | 07/01/29 | | | 105,000 | | | | 104,381 | |
Energy Transfer LP | | BBB | | 5.55 | | 02/15/28 | | | 276,000 | | | | 278,252 | |
EQT Corp.† | | BBB- | | 3.13 | | 05/15/26 | | | 165,000 | | | | 157,645 | |
HF Sinclair Corp.† | | BBB- | | 6.38 | | 04/15/27 | | | 245,000 | | | | 245,599 | |
Pioneer Natural Resources Co. | | AA- | | 5.10 | | 03/29/26 | | | 325,000 | | | | 324,410 | |
The accompanying notes are an integral part of these portfolio schedules.
59
MoA FUNDS — BALANCED FUND
PORTFOLIO OF INVESTMENTS IN SECURITIES (Continued)
June 30, 2024 (Unaudited)
| | | | | | | | | | | | | | | | | | | | |
| | | Rating** | | | Rate(%) | | | Maturity | | | Face Amount | | | Value | |
| LONG-TERM DEBT SECURITIES (CONTINUED): | | | | | | | | | | | | | | | |
| CORPORATE DEBT (CONTINUED) | | | | | | | | | | | | | | | |
| ENERGY (CONTINUED) | | | | | | | | | | | | | | | |
Targa Resources Partners LP/Targa Resources Partners Finance Corp. | | | BBB | | | | 5.50 | | | | 03/01/30 | | | $ | 120,000 | | | $ | 119,256 | |
Targa Resources Partners LP/Targa Resources Partners Finance Corp. | | | BBB | | | | 6.88 | | | | 01/15/29 | | | | 75,000 | | | | 76,922 | |
Western Midstream Operating LP | | | BBB- | | | | 4.65 | | | | 07/01/26 | | | | 100,000 | | | | 98,060 | |
Williams Cos., Inc. | | | BBB | | | | 5.40 | | | | 03/02/26 | | | | 320,000 | | | | 319,713 | |
| | | | | | | | | | | | | | | | | | | | |
| | | | | | | | | | | | | | | | | | | 1,724,238 | |
| | | | | | | | | | | | | | | | | | | | |
| FINANCIALS (4.6%) | | | | | | | | | | | | | | | |
Aflac, Inc. | | | A- | | | | 1.13 | | | | 03/15/26 | | | | 165,000 | | | | 154,112 | |
Alleghany Corp. | | | AA | | | | 3.63 | | | | 05/15/30 | | | | 160,000 | | | | 148,853 | |
American Express Co. | | | BBB+ | | | | 5.39 | | | | 07/28/27 | | | | 210,000 | | | | 210,239 | |
American Express Co. | | | BBB+ | | | | 5.53 | | | | 04/25/30 | | | | 165,000 | | | | 166,885 | |
Aon North America, Inc. | | | A- | | | | 5.45 | | | | 03/01/34 | | | | 450,000 | | | | 447,997 | |
Bank of America Corp. | | | A- | | | | 2.97 | | | | 02/04/33 | | | | 985,000 | | | | 833,857 | |
BankUnited, Inc. | | | BBB | | | | 4.88 | | | | 11/17/25 | | | | 160,000 | | | | 157,082 | |
Block Financial LLC | | | BBB | | | | 5.25 | | | | 10/01/25 | | | | 350,000 | | | | 347,251 | |
Capital One Financial Corp. | | | BBB | | | | 4.93 | | | | 05/10/28 | | | | 115,000 | | | | 113,505 | |
Capital One Financial Corp. | | | BBB | | | | 6.38 | | | | 06/08/34 | | | | 140,000 | | | | 143,758 | |
Citigroup, Inc. | | | BBB+ | | | | 3.79 | | | | 03/17/33 | | | | 195,000 | | | | 173,817 | |
Citigroup, Inc. | | | BBB+ | | | | 3.98 | | | | 03/20/30 | | | | 220,000 | | | | 207,567 | |
Citigroup, Inc. | | | BBB | | | | 5.83 | | | | 02/13/35 | | | | 300,000 | | | | 297,365 | |
Citizens Financial Group, Inc. | | | BBB | | | | 4.35 | | | | 08/01/25 | | | | 100,000 | | | | 98,226 | |
Citizens Financial Group, Inc. | | | BBB+ | | | | 5.84 | | | | 01/23/30 | | | | 160,000 | | | | 159,466 | |
Discover Financial Svcs. | | | BBB- | | | | 4.10 | | | | 02/09/27 | | | | 335,000 | | | | 321,997 | |
Fairfax Financial Hldgs. Ltd.† | | | BBB+ | | | | 6.00 | | | | 12/07/33 | | | | 160,000 | | | | 162,506 | |
Fifth Third Bancorp | | | BBB+ | | | | 6.34 | | | | 07/27/29 | | | | 155,000 | | | | 158,936 | |
Goldman Sachs Group, Inc. | | | BBB+ | | | | 2.60 | | | | 02/07/30 | | | | 450,000 | | | | 394,287 | |
Goldman Sachs Group, Inc. | | | BBB+ | | | | 6.56 | | | | 10/24/34 | | | | 235,000 | | | | 252,748 | |
JPMorgan Chase & Co. | | | A- | | | | 1.47 | | | | 09/22/27 | | | | 350,000 | | | | 321,388 | |
JPMorgan Chase & Co. | | | A- | | | | 5.35 | | | | 06/01/34 | | | | 200,000 | | | | 199,126 | |
JPMorgan Chase & Co. | | | BBB+ | | | | 5.72 | | | | 09/14/33 | | | | 155,000 | | | | 158,061 | |
Kemper Corp. | | | BBB- | | | | 3.80 | | | | 02/23/32 | | | | 165,000 | | | | 141,304 | |
KeyCorp | | | BBB | | | | 2.25 | | | | 04/06/27 | | | | 310,000 | | | | 281,659 | |
Mercury General Corp. | | | BBB | | | | 4.40 | | | | 03/15/27 | | | | 125,000 | | | | 120,596 | |
Morgan Stanley | | | A- | | | | 2.70 | | | | 01/22/31 | | | | 450,000 | | | | 394,474 | |
Morgan Stanley | | | A- | | | | 5.17 | | | | 01/16/30 | | | | 40,000 | | | | 39,880 | |
Morgan Stanley | | | A- | | | | 5.45 | | | | 07/20/29 | | | | 35,000 | | | | 35,208 | |
Morgan Stanley | | | A- | | | | 6.14 | | | | 10/16/26 | | | | 175,000 | | | | 176,172 | |
PNC Financial Svcs. Group, Inc. | | | A- | | | | 5.81 | | | | 06/12/26 | | | | 180,000 | | | | 180,187 | |
PNC Financial Svcs. Group, Inc. | | | A- | | | | 6.88 | | | | 10/20/34 | | | | 120,000 | | | | 130,746 | |
Synchrony Financial | | | BBB- | | | | 3.70 | | | | 08/04/26 | | | | 400,000 | | | | 381,580 | |
Truist Financial Corp. | | | A- | | | | 4.87 | | | | 01/26/29 | | | | 250,000 | | | | 245,218 | |
US Bancorp | | | A | | | | 4.65 | | | | 02/01/29 | | | | 270,000 | | | | 264,336 | |
US Bancorp | | | A | | | | 5.78 | | | | 06/12/29 | | | | 60,000 | | | | 60,916 | |
Voya Financial, Inc. | | | BBB+ | | | | 3.65 | | | | 06/15/26 | | | | 250,000 | | | | 241,295 | |
Wells Fargo & Co. | | | BBB+ | | | | 3.35 | | | | 03/02/33 | | | | 315,000 | | | | 273,452 | |
Wells Fargo & Co. | | | BBB+ | | | | 3.53 | | | | 03/24/28 | | | | 190,000 | | | | 181,193 | |
Wells Fargo & Co. | | | BBB+ | | | | 5.20 | | | | 01/23/30 | | | | 220,000 | | | | 219,055 | |
| | | | | | | | | | | | | | | | | | | | |
| | | | | | | | | | | | | | | | | | | 8,996,300 | |
| | | | | | | | | | | | | | | | | | | | |
| HEALTH CARE (0.8%) | | | | | | | | | | | | | | | |
AbbVie, Inc. | | | A- | | | | 5.05 | | | | 03/15/34 | | | | 455,000 | | | | 453,593 | |
Amgen, Inc. | | | BBB+ | | | | 5.15 | | | | 03/02/28 | | | | 235,000 | | | | 234,980 | |
Amgen, Inc. | | | BBB+ | | | | 5.25 | | | | 03/02/33 | | | | 100,000 | | | | 99,705 | |
Baxter International, Inc. | | | BBB | | | | 2.54 | | | | 02/01/32 | | | | 100,000 | | | | 82,026 | |
Bristol-Myers Squibb Co. | | | A | | | | 5.20 | | | | 02/22/34 | | | | 90,000 | | | | 89,830 | |
The accompanying notes are an integral part of these portfolio schedules.
60
MoA FUNDS — BALANCED FUND
PORTFOLIO OF INVESTMENTS IN SECURITIES (Continued)
June 30, 2024 (Unaudited)
| | | | | | | | | | | | | | | | | | |
| | | Rating** | | Rate(%) | | | Maturity | | | Face Amount | | | Value | |
| LONG-TERM DEBT SECURITIES (CONTINUED): | | | | | | | | | | | | | | |
| CORPORATE DEBT (CONTINUED) | | | | | | | | | | | | | | |
| HEALTH CARE (CONTINUED) | | | | | | | | | | | | | | |
CVS Health Corp. | | BBB | | | 3.75 | | | | 04/01/30 | | | $ | 389,000 | | | $ | 357,974 | |
Elevance Health, Inc. | | A | | | 2.88 | | | | 09/15/29 | | | | 255,000 | | | | 229,375 | |
| | | | | | | | | | | | | | | | | | |
| | | | | | | | | | | | | | | | | 1,547,483 | |
| | | | | | | | | | | | | | | | | | |
| INDUSTRIALS (0.4%) | | | | | | | | | | | | | | |
Boeing Co. | | BBB- | | | 2.20 | | | | 02/04/26 | | | | 185,000 | | | | 174,014 | |
Boeing Co. | | BBB- | | | 2.75 | | | | 02/01/26 | | | | 130,000 | | | | 123,449 | |
L3Harris Technologies, Inc. | | BBB | | | 5.40 | | | | 01/15/27 | | | | 210,000 | | | | 210,816 | |
Lennox International, Inc. | | BBB | | | 1.70 | | | | 08/01/27 | | | | 155,000 | | | | 139,332 | |
Verisk Analytics, Inc. | | BBB | | | 4.00 | | | | 06/15/25 | | | | 26,000 | | | | 25,568 | |
| | | | | | | | | | | | | | | | | | |
| | | | | | | | | | | | | | | | | 673,179 | |
| | | | | | | | | | | | | | | | | | |
| INFORMATION TECHNOLOGY (0.5%) | | | | | | | | | | | | | | |
Broadcom Corp./Broadcom Cayman Finance Ltd. | | BBB | | | 3.88 | | | | 01/15/27 | | | | 225,000 | | | | 217,794 | |
Intel Corp. | | A- | | | 5.20 | | | | 02/10/33 | | | | 165,000 | | | | 164,721 | |
Oracle Corp. | | BBB | | | 4.90 | | | | 02/06/33 | | | | 265,000 | | | | 257,185 | |
QUALCOMM, Inc. | | A | | | 4.25 | | | | 05/20/32 | | | | 65,000 | | | | 62,125 | |
Teledyne Technologies, Inc. | | BBB | | | 2.75 | | | | 04/01/31 | | | | 150,000 | | | | 128,251 | |
VMware LLC | | BBB | | | 1.40 | | | | 08/15/26 | | | | 240,000 | | | | 220,965 | |
| | | | | | | | | | | | | | | | | | |
| | | | | | | | | | | | | | | | | 1,051,041 | |
| | | | | | | | | | | | | | | | | | |
| MATERIALS (0.3%) | | | | | | | | | | | | | | |
Celanese US Hldgs. LLC | | BBB- | | | 6.17 | | | | 07/15/27 | | | | 160,000 | | | | 162,386 | |
International Flavors & Fragrances, Inc.† | | BBB- | | | 1.83 | | | | 10/15/27 | | | | 180,000 | | | | 160,783 | |
Sherwin-Williams Co. | | BBB | | | 3.95 | | | | 01/15/26 | | | | 350,000 | | | | 342,625 | |
| | | | | | | | | | | | | | | | | | |
| | | | | | | | | | | | | | | | | 665,794 | |
| | | | | | | | | | | | | | | | | | |
| REAL ESTATE (1.1%) | | | | | | | | | | | | | | |
Alexandria Real Estate Equities, Inc. | | BBB+ | | | 4.75 | | | | 04/15/35 | | | | 225,000 | | | | 208,742 | |
Boston Properties LP | | BBB | | | 3.25 | | | | 01/30/31 | | | | 300,000 | | | | 253,661 | |
Boston Properties LP | | BBB | | | 6.50 | | | | 01/15/34 | | | | 50,000 | | | | 50,937 | |
Digital Realty Trust LP | | BBB | | | 5.55 | | | | 01/15/28 | | | | 215,000 | | | | 216,926 | |
Equinix, Inc. | | BBB | | | 1.45 | | | | 05/15/26 | | | | 260,000 | | | | 241,376 | |
Host Hotels & Resorts LP | | BBB- | | | 5.70 | | | | 07/01/34 | | | | 180,000 | | | | 176,934 | |
Kimco Realty OP LLC | | BBB+ | | | 6.40 | | | | 03/01/34 | | | | 200,000 | | | | 211,570 | |
NNN REIT, Inc. | | BBB+ | | | 3.60 | | | | 12/15/26 | | | | 110,000 | | | | 105,527 | |
Prologis LP | | A | | | 1.75 | | | | 07/01/30 | | | | 140,000 | | | | 115,811 | |
Realty Income Corp. | | A- | | | 4.85 | | | | 03/15/30 | | | | 65,000 | | | | 63,714 | |
Realty Income Corp. | | A- | | | 5.13 | | | | 02/15/34 | | | | 325,000 | | | | 315,390 | |
Tanger Properties LP | | BBB- | | | 3.13 | | | | 09/01/26 | | | | 175,000 | | | | 165,119 | |
Tanger Properties LP | | BBB- | | | 3.88 | | | | 07/15/27 | | | | 110,000 | | | | 104,319 | |
| | | | | | | | | | | | | | | | | | |
| | | | | | | | | | | | | | | | | 2,230,026 | |
| | | | | | | | | | | | | | | | | | |
| UTILITIES (0.8%) | | | | | | | | | | | | | | |
American Electric Power Co., Inc. | | BBB | | | 5.20 | | | | 01/15/29 | | | | 315,000 | | | | 313,423 | |
DTE Energy Co. | | BBB | | | 5.10 | | | | 03/01/29 | | | | 325,000 | | | | 322,454 | |
Duke Energy Carolinas LLC | | A | | | 4.85 | | | | 01/15/34 | | | | 295,000 | | | | 285,512 | |
Duke Energy Corp. | | BBB | | | 4.85 | | | | 01/05/29 | | | | 35,000 | | | | 34,582 | |
National Fuel Gas Co. | | BBB- | | | 5.20 | | | | 07/15/25 | | | | 100,000 | | | | 99,233 | |
NextEra Energy Capital Hldgs., Inc. | | BBB+ | | | 3.55 | | | | 05/01/27 | | | | 275,000 | | | | 262,642 | |
Southern Co. | | BBB+ | | | 3.25 | | | | 07/01/26 | | | | 50,000 | | | | 48,076 | |
Southern Co. | | BBB+ | | | 5.70 | | | | 03/15/34 | | | | 115,000 | | | | 117,005 | |
| | | | | | | | | | | | | | | | | | |
| | | | | | | | | | | | | | | | | 1,482,927 | |
| | | | | | | | | | | | | | | | | | |
TOTAL CORPORATE DEBT | | | | 22,194,675 | |
| | | | | | | | | | | | | | | | | | |
TOTAL LONG-TERM DEBT SECURITIES
(Cost: $69,246,736) | | | | 64,632,303 | |
| | | | | | | | | | | | | | | | | | |
The accompanying notes are an integral part of these portfolio schedules.
61
MoA FUNDS — BALANCED FUND
PORTFOLIO OF INVESTMENTS IN SECURITIES (Continued)
June 30, 2024 (Unaudited)
| | | | | | | | | | | | | | | | | | |
| | | Rating** | | Rate(%) | | | Maturity | | | Face Amount | | | Value | |
| | | | | |
| SHORT-TERM DEBT SECURITIES (3.7%): | | | | | | | | | | | | | | |
| U.S. GOVERNMENT (2.6%) | | | | | | | | | | | | | | |
U.S. Treasury Bill | | A-1+ | | | 5.31 | | | | 07/30/24 | | | $ | 5,000,000 | | | $ | 4,978,769 | |
| | | | | | | | | | | | | | | | | | |
| COMMERCIAL PAPER (1.1%) | | | | | | | | | | | | | | |
Novartis Finance Corp.† | | A-1+ | | | 5.29 | | | | 07/01/24 | | | | 2,200,000 | | | | 2,200,000 | |
| | | | | | | | | | | | | | | | | | |
TOTAL SHORT-TERM DEBT SECURITIES
(Cost: $7,178,769) | | | | 7,178,769 | |
| | | | | | | | | | | | | | | | | | |
| | | | | |
| | | | | Rate(%) | | | Maturity | | | Face Amount | | | Value | |
| TEMPORARY CASH INVESTMENT (0.2%) | | | | | | | | | | | | | | |
JP Morgan Chase, New York Time Deposit | | | | | 4.58 | | | | 07/01/24 | | | $ | 478,746 | | | $ | 478,746 | |
| | | | | | | | | | | | | | | | | | |
TOTAL TEMPORARY CASH INVESTMENT
(Cost: $478,746) | | | | 478,746 | |
| | | | | | | | | | | | | | | | | | |
TOTAL INVESTMENTS
(Cost: $145,772,136) 99.8% | | | | 194,265,103 | |
| | | | | | | | | | | | | | | | | | |
OTHER NET ASSETS 0.2% | | | | 393,052 | |
| | | | | | | | | | | | | | | | | | |
NET ASSETS 100.0% | | | $ | 194,658,155 | |
| | | | | | | | | | | | | | | | | | |
FOOTNOTES TO PORTFOLIO OF INVESTMENTS IN SECURITIES
| | |
| Abbreviations: | | ARM = Adjustable Rate Mortgage |
| | FFCB = Federal Farm Credit Bank |
| | FHLB = Federal Home Loan Bank |
| | FHLMC = Federal Home Loan Mortgage Corporation |
| | FNMA = Federal National Mortgage Association |
| | FRESB = Federal Home Loan Mortgage Corporation Multifamily Securitization Small Loan Balance |
| | GNMA = Government National Mortgage Association |
| | REMICS = Real Estate Mortgage Investment Conduits |
| * | Non-income producing security. |
| ** | Ratings as per Standard & Poor’s Corporation. |
| † | Security is exempt from registration under Rule 144A of the Securities Act of 1933. These securities may be resold in transactions exempt from registration, normally to qualified institutional buyers. At June 30, 2024, the aggregate values of these securities amounts to $2,926,533 and represents 1.5% of net assets. |
| (1) | U.S. Government guaranteed security. |
The accompanying notes are an integral part of these portfolio schedules.
62
MoA FUNDS — INTERNATIONAL FUND
PORTFOLIO OF INVESTMENTS IN SECURITIES
June 30, 2024 (Unaudited)
| | | | | | | | |
| | | Shares | | | Value | |
| COMMON STOCKS (98.0%): | |
| AUSTRALIA (4.9%) | |
| CONSUMER DISCRETIONARY (1.1%) | | | | |
Aristocrat Leisure Ltd. | | | 197,153 | | | $ | 6,528,827 | |
Wesfarmers Ltd. | | | 263,126 | | | | 11,393,753 | |
| | | | | | | | |
| | | | | | | 17,922,580 | |
| | | | | | | | |
| FINANCIALS (0.7%) | | | | | | |
ANZ Group Hldgs. Ltd. | | | 559,263 | | | | 10,507,266 | |
| | | | | | | | |
| HEALTH CARE (0.3%) | | | | | | |
Cochlear Ltd. | | | 21,463 | | | | 4,737,742 | |
| | | | | | | | |
| INFORMATION TECHNOLOGY (0.2%) | | | | | | |
WiseTech Global Ltd. | | | 47,887 | | | | 3,183,475 | |
| | | | | | | | |
| MATERIALS (2.6%) | | | | | | |
BHP Group Ltd. | | | 973,315 | | | | 27,819,250 | |
BlueScope Steel Ltd. | | | 484,231 | | | | 6,573,263 | |
Fortescue Ltd. | | | 517,846 | | | | 7,372,293 | |
| | | | | | | | |
| | | | | | | 41,764,806 | |
| | | | | | | | |
TOTAL AUSTRALIA | | | | | | | 78,115,869 | |
| | | | | | | | |
| AUSTRIA (0.5%) | | | | | | |
| ENERGY (0.4%) | | | | | | |
OMV AG | | | 142,823 | | | | 6,208,414 | |
| | | | | | | | |
| MATERIALS (0.1%) | | | | | | |
voestalpine AG | | | 81,087 | | | | 2,192,276 | |
| | | | | | | | |
TOTAL AUSTRIA | | | | | | | 8,400,690 | |
| | | | | | | | |
| DENMARK (5.3%) | | | | | | |
| CONSUMER DISCRETIONARY (1.0%) | | | | |
Pandora A/S | | | 104,455 | | | | 15,722,175 | |
| | | | | | | | |
| HEALTH CARE (4.0%) | | | | | | |
Novo Nordisk A/S Cl B | | | 439,540 | | | | 62,892,879 | |
| | | | | | | | |
| INDUSTRIALS (0.3%) | | | | | | |
AP Moller - Maersk A/S Cl B | | | 3,224 | | | | 5,591,654 | |
| | | | | | | | |
TOTAL DENMARK | | | | | | | 84,206,708 | |
| | | | | | | | |
| FINLAND (1.1%) | | | | | | |
| FINANCIALS (1.1%) | | | | | | |
Nordea Bank Abp | | | 837,405 | | | | 9,984,164 | |
Sampo OYJ Cl A | | | 166,456 | | | | 7,178,625 | |
| | | | | | | | |
| | | | | | | 17,162,789 | |
| | | | | | | | |
| FRANCE (10.0%) | | | | | | |
| COMMUNICATION SERVICES (1.3%) | | | | |
Orange S.A. | | | 607,049 | | | | 6,089,294 | |
Publicis Groupe S.A. | | | 132,464 | | | | 14,070,853 | |
| | | | | | | | |
| | | | | | | 20,160,147 | |
| | | | | | | | |
| CONSUMER DISCRETIONARY (1.4%) | | | | |
Hermes International SCA | | | 9,538 | | | | 22,030,228 | |
| | | | | | | | |
| CONSUMER STAPLES (1.1%) | | | | | | |
Danone S.A. | | | 119,054 | | | | 7,292,372 | |
L’Oreal S.A. | | | 25,148 | | | | 11,069,800 | |
| | | | | | | | |
| | | | | | | 18,362,172 | |
| | | | | | | | |
| ENERGY (1.1%) | | | | | | |
TotalEnergies SE | | | 271,580 | | | | 18,184,152 | |
| | | | | | | | |
| | | | | | | | |
| | | Shares | | | Value | |
| COMMON STOCKS (CONTINUED): | |
| FRANCE (CONTINUED) | | | | | | |
| FINANCIALS (1.0%) | | | | | | |
AXA S.A. | | | 197,246 | | | $ | 6,464,295 | |
BNP Paribas S.A. | | | 153,811 | | | | 9,836,996 | |
| | | | | | | | |
| | | | | | | 16,301,291 | |
| | | | | | | | |
| HEALTH CARE (0.4%) | | | | | | |
EssilorLuxottica S.A. | | | 27,547 | | | | 5,919,676 | |
| | | | | | | | |
| INDUSTRIALS (2.7%) | | | | | | |
Cie de Saint-Gobain S.A. | | | 148,602 | | | | 11,557,933 | |
Eiffage S.A. | | | 84,057 | | | | 7,725,740 | |
Schneider Electric SE | | | 70,880 | | | | 16,993,965 | |
Vinci S.A. | | | 57,759 | | | | 6,088,336 | |
| | | | | | | | |
| | | | | | | 42,365,974 | |
| | | | | | | | |
| INFORMATION TECHNOLOGY (0.4%) | |
Capgemini SE | | | 30,500 | | | | 6,058,728 | |
| | | | | | | | |
| UTILITIES (0.6%) | | | | | | |
Engie S.A. | | | 667,115 | | | | 9,553,767 | |
| | | | | | | | |
TOTAL FRANCE | | | | | | | 158,936,135 | |
| | | | | | | | |
| GERMANY (7.1%) | | | | | | |
| COMMUNICATION SERVICES (0.7%) | |
Deutsche Telekom AG | | | 474,748 | | | | 11,933,585 | |
| | | | | | | | |
| CONSUMER DISCRETIONARY (1.5%) | | | | |
Bayerische Motoren Werke AG | | | 149,414 | | | | 14,133,941 | |
Mercedes-Benz Group AG | | | 129,775 | | | | 8,982,345 | |
| | | | | | | | |
| | | | | | | 23,116,286 | |
| | | | | | | | |
| FINANCIALS (1.6%) | | | | |
Allianz SE | | | 44,400 | | | | 12,331,827 | |
Deutsche Bank AG | | | 774,076 | | | | 12,372,293 | |
| | | | | | | | |
| | | | | | | 24,704,120 | |
| | | | | | | | |
| INDUSTRIALS (1.2%) | | | | | | |
Siemens AG | | | 106,996 | | | | 19,915,606 | |
| | | | | | | | |
| INFORMATION TECHNOLOGY (1.5%) | | | | |
SAP SE | | | 117,706 | | | | 23,645,365 | |
| | | | | | | | |
| MATERIALS (0.6%) | | | | | | |
BASF SE | | | 106,340 | | | | 5,140,989 | |
Heidelberg Materials AG | | | 43,967 | | | | 4,545,263 | |
| | | | | | | | |
| | | | | | | 9,686,252 | |
| | | | | | | | |
TOTAL GERMANY | | | | | | | 113,001,214 | |
| | | | | | | | |
| HONG KONG (0.6%) | | | | | | |
| INDUSTRIALS (0.4%) | | | | | | |
CK Hutchison Hldgs. Ltd. | | | 1,378,500 | | | | 6,575,636 | |
| | | | | | | | |
| REAL ESTATE (0.2%) | | | | | | |
Sun Hung Kai Properties Ltd. | | | 447,000 | | | | 3,873,100 | |
| | | | | | | | |
TOTAL HONG KONG | | | | | | | 10,448,736 | |
| | | | | | | | |
The accompanying notes are an integral part of these portfolio schedules.
63
MoA FUNDS — INTERNATIONAL FUND
PORTFOLIO OF INVESTMENTS IN SECURITIES (Continued)
June 30, 2024 (Unaudited)
| | | | | | | | |
| | | Shares | | | Value | |
| COMMON STOCKS (CONTINUED): | |
| ISRAEL (0.8%) | | | | | | |
| INFORMATION TECHNOLOGY (0.8%) | | | | |
Check Point Software Technologies Ltd.* | | | 76,150 | | | $ | 12,564,750 | |
| | | | | | | | |
| ITALY (3.1%) | | | | | | |
| CONSUMER DISCRETIONARY (0.5%) | | | | |
Ferrari N.V. | | | 18,461 | | | | 7,534,130 | |
| | | | | | | | |
| FINANCIALS (1.9%) | | | | | | |
Assicurazioni Generali SpA | | | 118,590 | | | | 2,952,314 | |
Intesa Sanpaolo SpA | | | 2,602,244 | | | | 9,671,467 | |
Poste Italiane SpA† | | | 610,040 | | | | 7,762,842 | |
UniCredit SpA | | | 257,688 | | | | 9,536,453 | |
| | | | | | | | |
| | | | | | | 29,923,076 | |
| | | | | | | | |
| UTILITIES (0.7%) | | | | | | |
Enel SpA | | | 1,692,608 | | | | 11,745,205 | |
| | | | | | | | |
TOTAL ITALY | | | | | | | 49,202,411 | |
| | | | | | | | |
| JAPAN (22.8%) | | | | | | |
| COMMUNICATION SERVICES (1.2%) | |
Konami Group Corp. | | | 66,900 | | | | 4,837,020 | |
Nintendo Co. Ltd. | | | 253,000 | | | | 13,510,180 | |
| | | | | | | | |
| | | | | | | 18,347,200 | |
| | | | | | | | |
| CONSUMER DISCRETIONARY (2.5%) | |
Bridgestone Corp. | | | 86,500 | | | | 3,413,132 | |
Honda Motor Co. Ltd. | | | 727,100 | | | | 7,816,077 | |
Toyota Motor Corp. | | | 957,800 | | | | 19,651,028 | |
Yamaha Motor Co. Ltd. | | | 927,600 | | | | 8,623,446 | |
| | | | | | | | |
| | | | | | | 39,503,683 | |
| | | | | | | | |
| CONSUMER STAPLES (1.3%) | | | | | | |
Japan Tobacco, Inc. | | | 747,400 | | | | 20,238,549 | |
| | | | | | | | |
| ENERGY (0.5%) | | | | | | |
ENEOS Hldgs., Inc. | | | 561,900 | | | | 2,895,635 | |
Inpex Corp. | | | 329,200 | | | | 4,834,311 | |
| | | | | | | | |
| | | | | | | 7,729,946 | |
| | | | | | | | |
| FINANCIALS (2.3%) | | | | | | |
Daiwa Securities Group, Inc. | | | 1,465,700 | | | | 11,252,280 | |
Japan Post Insurance Co. Ltd. | | | 715,200 | | | | 13,908,868 | |
Tokio Marine Hldgs., Inc. | | | 323,400 | | | | 12,152,689 | |
| | | | | | | | |
| | | | | | | 37,313,837 | |
| | | | | | | | |
| HEALTH CARE (1.4%) | |
Chugai Pharmaceutical Co. Ltd. | | | 184,700 | | | | 6,576,657 | |
Hoya Corp. | | | 91,500 | | | | 10,699,618 | |
Shionogi & Co. Ltd. | | | 108,100 | | | | 4,210,205 | |
| | | | | | | | |
| | | | | | | 21,486,480 | |
| | | | | | | | |
| INDUSTRIALS (7.5%) | |
Hitachi Ltd. | | | 963,500 | | | | 21,693,806 | |
ITOCHU Corp. | | | 323,300 | | | | 15,892,354 | |
Marubeni Corp. | | | 923,100 | | | | 17,116,117 | |
| | | | | | | | |
| | | Shares | | | Value | |
| COMMON STOCKS (CONTINUED): | |
| JAPAN (CONTINUED) | | | | | | |
| INDUSTRIALS (CONTINUED) | |
Mitsubishi Corp. | | | 944,300 | | | $ | 18,562,372 | |
Mitsui & Co. Ltd. | | | 844,200 | | | | 19,252,751 | |
Mitsui OSK Lines Ltd. | | | 219,700 | | | | 6,605,438 | |
Nippon Yusen KK | | | 192,500 | | | | 5,616,382 | |
Sumitomo Corp. | | | 583,900 | | | | 14,668,247 | |
| | | | | | | | |
| | | | | | | 119,407,467 | |
| | | | | | | | |
| INFORMATION TECHNOLOGY (3.3%) | |
Brother Industries Ltd. | | | 410,700 | | | | 7,254,461 | |
Canon, Inc. | | | 402,900 | | | | 10,929,394 | |
Disco Corp. | | | 20,400 | | | | 7,770,111 | |
Seiko Epson Corp. | | | 469,400 | | | | 7,337,938 | |
Tokyo Electron Ltd. | | | 87,300 | | | | 19,109,413 | |
| | | | | | | | |
| | | | | | | 52,401,317 | |
| | | | | | | | |
| MATERIALS (1.4%) | |
Nitto Denko Corp. | | | 91,000 | | | | 7,217,611 | |
Shin-Etsu Chemical Co. Ltd. | | | 406,900 | | | | 15,820,448 | |
| | | | | | | | |
| | | | | | | 23,038,059 | |
| | | | | | | | |
| REAL ESTATE (0.8%) | |
Daito Trust Construction Co. Ltd. | | | 40,900 | | | | 4,233,485 | |
Daiwa House Industry Co. Ltd. | | | 184,200 | | | | 4,689,564 | |
Mitsui Fudosan Co. Ltd. | | | 441,600 | | | | 4,064,323 | |
| | | | | | | | |
| | | | | | | 12,987,372 | |
| | | | | | | | |
| UTILITIES (0.6%) | |
Osaka Gas Co. Ltd. | | | 137,200 | | | | 3,032,070 | |
Tokyo Gas Co. Ltd. | | | 311,800 | | | | 6,712,218 | |
| | | | | | | | |
| | | | | | | 9,744,288 | |
| | | | | | | | |
TOTAL JAPAN | | | | | | | 362,198,198 | |
| | | | | | | | |
| LUXEMBOURG (0.4%) | | | | | | |
| MATERIALS (0.4%) | | | | | | |
ArcelorMittal S.A. | | | 257,349 | | | | 5,895,951 | |
| | | | | | | | |
| NETHERLANDS (6.1%) | | | | | | |
| COMMUNICATION SERVICES (0.3%) | | | | |
Koninklijke KPN N.V. | | | 1,386,999 | | | | 5,316,248 | |
| | | | | | | | |
| CONSUMER DISCRETIONARY (0.6%) | |
Stellantis N.V. | | | 465,839 | | | | 9,209,464 | |
| | | | | | | | |
| CONSUMER STAPLES (0.6%) | | | | | | |
Koninklijke Ahold Delhaize N.V. | | | 298,951 | | | | 8,797,670 | |
| | | | | | | | |
| FINANCIALS (0.6%) | | | | | | |
ING Groep N.V. | | | 597,562 | | | | 10,268,184 | |
| | | | | | | | |
| INFORMATION TECHNOLOGY (4.0%) | |
ASM International N.V. | | | 13,247 | | | | 10,126,159 | |
ASML Hldg. N.V. | | | 45,057 | | | | 45,922,720 | |
BE Semiconductor Industries N.V. | | | 46,215 | | | | 7,720,636 | |
| | | | | | | | |
| | | | | | | 63,769,515 | |
| | | | | | | | |
TOTAL NETHERLANDS | | | | | | | 97,361,081 | |
| | | | | | | | |
The accompanying notes are an integral part of these portfolio schedules.
64
MoA FUNDS — INTERNATIONAL FUND
PORTFOLIO OF INVESTMENTS IN SECURITIES (Continued)
June 30, 2024 (Unaudited)
| | | | | | | | |
| | | Shares | | | Value | |
| COMMON STOCKS (CONTINUED): | |
| NORWAY (0.9%) | | | | | | |
| ENERGY (0.9%) | | | | | | |
Equinor ASA | | | 510,858 | | | $ | 14,634,089 | |
| | | | | | | | |
| SINGAPORE (0.7%) | | | | | | |
| FINANCIALS (0.7%) | | | | | | |
DBS Group Hldgs. Ltd. | | | 437,580 | | | | 11,525,333 | |
| | | | | | | | |
| SPAIN (3.6%) | | | | | | |
| CONSUMER DISCRETIONARY (0.5%) | |
Industria de Diseno Textil S.A. | | | 174,034 | | | | 8,636,558 | |
| | | | | | | | |
| FINANCIALS (2.3%) | | | | | | |
Banco Bilbao Vizcaya Argentaria S.A. | | | 1,781,542 | | | | 17,884,828 | |
Banco Santander S.A. | | | 3,920,468 | | | | 18,241,904 | |
| | | | | | | | |
| | | | | | | 36,126,732 | |
| | | | | | | | |
| UTILITIES (0.8%) | | | | | | |
Iberdrola S.A. | | | 914,221 | | | | 11,862,500 | |
| | | | | | | | |
TOTAL SPAIN | | | | | | | 56,625,790 | |
| | | | | | | | |
| SWEDEN (2.3%) | | | | | | |
| FINANCIALS (1.0%) | |
Investor AB Cl B | | | 365,801 | | | | 10,025,867 | |
Svenska Handelsbanken AB Cl A | | | 590,861 | | | | 5,647,363 | |
| | | | | | | | |
| | | | | | | 15,673,230 | |
| | | | | | | | |
| INDUSTRIALS (1.3%) | |
Atlas Copco AB Cl A | | | 753,362 | | | | 14,147,854 | |
Trelleborg AB Cl B | | | 162,578 | | | | 6,328,051 | |
| | | | | | | | |
| | | | | | | 20,475,905 | |
| | | | | | | | |
TOTAL SWEDEN | | | | | | | 36,149,135 | |
| | | | | | | | |
| SWITZERLAND (9.7%) | | | | | | |
| CONSUMER DISCRETIONARY (0.8%) | |
Cie Financiere Richemont S.A. Cl A | | | 86,482 | | | | 13,516,415 | |
| | | | | | | | |
| CONSUMER STAPLES (1.5%) | | | | | | |
Chocoladefabriken Lindt & Spruengli AG | | | 29 | | | | 3,343,091 | |
Nestle S.A. | | | 203,179 | | | | 20,740,506 | |
| | | | | | | | |
| | | | | | | 24,083,597 | |
| | | | | | | | |
| FINANCIALS (2.0%) | | | | | | |
Partners Group Hldg. AG | | | 8,102 | | | | 10,375,645 | |
UBS Group AG | | | 508,106 | | | | 14,923,988 | |
Zurich Insurance Group AG | | | 12,375 | | | | 6,592,480 | |
| | | | | | | | |
| | | | | | | 31,892,113 | |
| | | | | | | | |
| HEALTH CARE (3.8%) | | | | | | |
Novartis AG | | | 250,311 | | | | 26,652,514 | |
Roche Hldg. AG | | | 85,771 | | | | 23,764,935 | |
Sonova Hldg. AG | | | 30,483 | | | | 9,391,318 | |
| | | | | | | | |
| | | | | | | 59,808,767 | |
| | | | | | | | |
| | | | | | | | |
| | | Shares | | | Value | |
| COMMON STOCKS (CONTINUED): | |
| SWITZERLAND (CONTINUED) | | | | | | |
| INDUSTRIALS (0.8%) | | | | | | |
ABB Ltd. | | | 222,361 | | | $ | 12,330,809 | |
| | | | | | | | |
| INFORMATION TECHNOLOGY (0.5%) | |
Logitech International S.A. | | | 76,370 | | | | 7,350,320 | |
| | | | | | | | |
| MATERIALS (0.3%) | | | | | | |
Glencore PLC | | | 989,638 | | | | 5,630,867 | |
| | | | | | | | |
TOTAL SWITZERLAND | | | | | | | 154,612,888 | |
| | | | | | | | |
| UNITED KINGDOM (13.9%) | | | | | | |
| COMMUNICATION SERVICES (0.4%) | | | | |
Vodafone Group PLC | | | 7,092,690 | | | | 6,275,397 | |
| | | | | | | | |
| CONSUMER DISCRETIONARY (0.6%) | | | | |
Burberry Group PLC | | | 297,311 | | | | 3,301,401 | |
Next PLC | | | 53,913 | | | | 6,151,962 | |
| | | | | | | | |
| | | | | | | 9,453,363 | |
| | | | | | | | |
| CONSUMER STAPLES (2.6%) | | | | | | |
British American Tobacco PLC | | | 367,971 | | | | 11,303,058 | |
Imperial Brands PLC | | | 704,947 | | | | 18,037,341 | |
J Sainsbury PLC | | | 1,881,056 | | | | 6,060,012 | |
Tesco PLC | | | 1,636,674 | | | | 6,321,599 | |
| | | | | | | | |
| | | | | | | 41,722,010 | |
| | | | | | | | |
| ENERGY (1.6%) | | | | | | |
Shell PLC | | | 732,076 | | | | 26,256,026 | |
| | | | | | | | |
| | | | | | | |
| FINANCIALS (3.7%) | | | | | | |
3i Group PLC | | | 343,652 | | | | 13,243,613 | |
Barclays PLC | | | 5,504,642 | | | | 14,544,413 | |
HSBC Hldgs. PLC | | | 2,262,591 | | | | 19,529,164 | |
Lloyds Banking Group PLC | | | 16,302,538 | | | | 11,243,227 | |
| | | | | | | | |
| | | | | | | 58,560,417 | |
| | | | | | | | |
| HEALTH CARE (1.3%) | | | | | | |
AstraZeneca PLC | | | 45,185 | | | | 7,031,723 | |
GSK PLC | | | 703,418 | | | | 13,528,625 | |
| | | | | | | | |
| | | | | | | 20,560,348 | |
| | | | | | | | |
| INDUSTRIALS (2.7%) | | | | | | |
BAE Systems PLC | | | 1,265,791 | | | | 21,082,155 | |
RELX PLC | | | 468,949 | | | | 21,485,023 | |
| | | | | | | | |
| | | | | | | 42,567,178 | |
| | | | | | | | |
| MATERIALS (1.0%) | | | | | | |
Rio Tinto PLC | | | 254,051 | | | | 16,669,074 | |
| | | | | | | | |
TOTAL UNITED KINGDOM | | | | | | | 222,063,813 | |
| | | | | | | | |
UNITED STATES (4.2%) | | | | | | | | |
| FINANCIALS (4.2%) | | | | | | |
iShares Core MSCI Emerging Markets ETF | | | 363,035 | | | | 19,433,263 | |
iShares MSCI Emerging Markets ex China ETF | | | 200,000 | | | | 11,840,000 | |
The accompanying notes are an integral part of these portfolio schedules.
65
MoA FUNDS — INTERNATIONAL FUND
PORTFOLIO OF INVESTMENTS IN SECURITIES (Continued)
June 30, 2024 (Unaudited)
| | | | | | | | |
| | | Shares | | | Value | |
| COMMON STOCKS (CONTINUED): | |
| UNITED STATES (CONTINUED) | | | | | | |
| FINANCIALS (CONTINUED) | | | | | | |
iShares MSCI India ETF | | | 300,761 | | | $ | 16,776,449 | |
Vanguard FTSE Emerging Markets ETF | | | 434,975 | | | | 19,034,506 | |
| | | | | | | | |
| | | | | | | 67,084,218 | |
| | | | | | | | |
TOTAL COMMON STOCKS | | | | | | | | |
(Cost: $1,351,882,086) | | | | | | | 1,560,189,798 | |
| | | | | | | | |
| | | | | | | | | | | | | | | | |
| | | Rating** | | Rate(%) | | | Maturity | | Face Amount | | | Value | |
| SHORT-TERM DEBT SECURITIES (1.1%): | | | | | | | | | | | | | |
| UNITED STATES (1.1%) | | | | | | | | | |
| U.S. GOVERNMENT (1.1%) | | | | | | | | | |
U.S. Treasury Bill | | A-1+ | | | 5.28 | | | 8/20/2024 | | $ | 14,000,000 | | | $ | 13,898,222 | |
U.S. Treasury Bill | | A-1+ | | | 5.29 | | | 8/13/2024 | | | 3,000,000 | | | | 2,981,184 | |
| | | | | | | | | | | | | | | | |
| | | | | | | | | | | | | | | 16,879,406 | |
| | | | | | | | | | | | | | | | |
TOTAL SHORT-TERM DEBT SECURITIES
(Cost: $16,879,406) | | | | 16,879,406 | |
| | | | | | | | | | | | | | | | |
| | | | | | | | | | | | | | | | | | |
| | | | | |
| | | | | | Rate(%) | | | Maturity | | Face Amount | | | Value | |
| TEMPORARY CASH INVESTMENT (0.4%) | | | | | | | | | | | | | | |
Brown Brothers Harriman, New York Time Deposit | | | | | | | (0.14) | | | 7/1/2024 | | JPY | 119,531,239 | | | $ | 742,915 | |
Brown Brothers Harriman, New York Time Deposit | | | | | | | 0.32 | | | 7/1/2024 | | CHF | 4 | | | | 4 | |
Brown Brothers Harriman, New York Time Deposit | | | | | | | 2.25 | | | 7/1/2024 | | DKK | 5,305 | | | | 762 | |
Brown Brothers Harriman, New York Time Deposit | | | | | | | 2.51 | | | 7/1/2024 | | SEK | 346 | | | | 33 | |
Brown Brothers Harriman, New York Time Deposit | | | | | | | 3.13 | | | 7/1/2024 | | NOK | 3,552 | | | | 333 | |
Brown Brothers Harriman, New York Time Deposit | | | | | | | 3.68 | | | 7/2/2024 | | HKD | 677 | | | | 87 | |
Brown Brothers Harriman, New York Time Deposit | | | | | | | 4.15 | | | 7/1/2024 | | GBP | 100,401 | | | | 126,907 | |
Citibank, New York Time Deposit | | | | | | | 2.59 | | | 7/1/2024 | | EUR | 306,701 | | | | 328,477 | |
JP Morgan Chase, New York Time Deposit | | | | | | | 4.58 | | | 7/1/2024 | | USD | 5,570,955 | | | | 5,570,954 | |
| | | | | | | | | | | | | | | | | | |
| | | | | | | | | | | | | | | | | 6,770,472 | |
| | | | | | | | | | | | | | | | | | |
TOTAL TEMPORARY CASH INVESTMENT
(Cost: $6,770,472) | | | | 6,770,472 | |
| | | | | | | | | | | | | | | | | | |
TOTAL INVESTMENTS
(Cost: $1,375,531,964) 99.5% | | | | 1,583,839,676 | |
| | | | | | | | | | | | | | | | | | |
OTHER NET ASSETS 0.5% | | | | 7,754,946 | |
| | | | | | | | | | | | | | | | | | |
NET ASSETS 100.0% | | | $ | 1,591,594,622 | |
| | | | | | | | | | | | | | | | | | |
FOOTNOTES TO PORTFOLIO OF INVESTMENTS IN SECURITIES
| * | Non-income producing security. |
| ** | Ratings as per Standard & Poor’s Corporation (unaudited). |
| † | Security is exempt from registration under Rule 144A of the Securities Act of 1933. These securities may be resold in transactions exempt from registration, normally to qualified institutional buyers. At June 30, 2024, the aggregate values of these securities amounts to $7,762,842 and represents 0.5% of net assets. |
The accompanying notes are an integral part of these portfolio schedules.
66
MoA FUNDS — CATHOLIC VALUES INDEX FUND
PORTFOLIO OF INVESTMENTS IN SECURITIES
June 30, 2024 (Unaudited)
| | | | | | | | |
| | | Shares | | | Value | |
| COMMON STOCKS (100.3%): | | | | | | |
| COMMUNICATION SERVICES (9.3%) | | | | | | |
Alphabet, Inc. Cl A | | | 853 | | | $ | 155,374 | |
Alphabet, Inc. Cl C | | | 709 | | | | 130,045 | |
AT&T, Inc. | | | 1,041 | | | | 19,894 | |
Charter Communications, Inc. Cl A* | | | 14 | | | | 4,185 | |
Comcast Corp. Cl A | | | 568 | | | | 22,243 | |
Electronic Arts, Inc. | | | 35 | | | | 4,877 | |
Fox Corp. Cl A | | | 33 | | | | 1,134 | |
Fox Corp. Cl B | | | 19 | | | | 608 | |
Interpublic Group of Cos., Inc. | | | 55 | | | | 1,600 | |
Live Nation Entertainment, Inc.* | | | 20 | | | | 1,875 | |
Match Group, Inc.* | | | 38 | | | | 1,154 | |
Meta Platforms, Inc. Cl A | | | 318 | | | | 160,342 | |
Netflix, Inc.* | | | 63 | | | | 42,517 | |
News Corp. Cl A | | | 55 | | | | 1,516 | |
News Corp. Cl B | | | 16 | | | | 454 | |
Omnicom Group, Inc. | | | 28 | | | | 2,512 | |
Paramount Global Cl B | | | 72 | | | | 748 | |
Take-Two Interactive Software, Inc.* | | | 23 | | | | 3,576 | |
T-Mobile US, Inc. | | | 75 | | | | 13,213 | |
Verizon Communications, Inc. | | | 611 | | | | 25,198 | |
Walt Disney Co. | | | 265 | | | | 26,312 | |
Warner Bros Discovery, Inc.* | | | 324 | | | | 2,411 | |
| | | | | | | | |
| | | | | | | 621,788 | |
| | | | | | | | |
| CONSUMER DISCRETIONARY (9.7%) | | | | | | |
Airbnb, Inc. Cl A* | | | 104 | | | | 15,769 | |
Aptiv PLC* | | | 64 | | | | 4,507 | |
AutoZone, Inc.* | | | 4 | | | | 11,856 | |
Bath & Body Works, Inc. | | | 52 | | | | 2,031 | |
Best Buy Co., Inc. | | | 45 | | | | 3,793 | |
Booking Hldgs., Inc. | | | 8 | | | | 31,692 | |
BorgWarner, Inc. | | | 53 | | | | 1,709 | |
CarMax, Inc.* | | | 36 | | | | 2,640 | |
Carnival Corp.* | | | 237 | | | | 4,437 | |
Chipotle Mexican Grill, Inc. Cl A* | | | 322 | | | | 20,173 | |
Darden Restaurants, Inc. | | | 28 | | | | 4,237 | |
Deckers Outdoor Corp.* | | | 6 | | | | 5,808 | |
Domino’s Pizza, Inc. | | | 8 | | | | 4,131 | |
DR Horton, Inc. | | | 70 | | | | 9,865 | |
eBay, Inc. | | | 119 | | | | 6,393 | |
Etsy, Inc.* | | | 27 | | | | 1,592 | |
Expedia Group, Inc.* | | | 30 | | | | 3,780 | |
Ford Motor Co. | | | 920 | | | | 11,537 | |
Garmin Ltd. | | | 36 | | | | 5,865 | |
General Motors Co. | | | 268 | | | | 12,451 | |
Genuine Parts Co. | | | 32 | | | | 4,426 | |
Hasbro, Inc. | | | 30 | | | | 1,755 | |
Hilton Worldwide Hldgs., Inc. | | | 58 | | | | 12,656 | |
Home Depot, Inc. | | | 233 | | | | 80,208 | |
Lennar Corp. Cl A | | | 57 | | | | 8,543 | |
LKQ Corp. | | | 63 | | | | 2,620 | |
Lowe’s Cos., Inc. | | | 134 | | | | 29,542 | |
Lululemon Athletica, Inc.* | | | 26 | | | | 7,766 | |
Marriott International, Inc. Cl A | | | 56 | | | | 13,539 | |
| | | | | | | | |
| | | Shares | | | Value | |
| COMMON STOCKS (CONTINUED): | | | | | | |
| CONSUMER DISCRETIONARY (CONTINUED) | | | | | | |
McDonald’s Corp. | | | 169 | | | $ | 43,068 | |
Mohawk Industries, Inc.* | | | 12 | | | | 1,363 | |
NIKE, Inc. Cl B | | | 284 | | | | 21,405 | |
Norwegian Cruise Line Hldgs. Ltd.* | | | 101 | | | | 1,898 | |
NVR, Inc.* | | | 1 | | | | 7,588 | |
O’Reilly Automotive, Inc.* | | | 13 | | | | 13,729 | |
Pool Corp. | | | 8 | | | | 2,459 | |
PulteGroup, Inc. | | | 49 | | | | 5,395 | |
Ross Stores, Inc. | | | 79 | | | | 11,480 | |
Royal Caribbean Cruises Ltd.* | | | 56 | | | | 8,928 | |
Starbucks Corp. | | | 266 | | | | 20,708 | |
Tapestry, Inc. | | | 53 | | | | 2,268 | |
Tesla, Inc.* | | | 651 | | | | 128,820 | |
TJX Cos., Inc. | | | 266 | | | | 29,287 | |
Tractor Supply Co. | | | 25 | | | | 6,750 | |
Ulta Beauty, Inc.* | | | 11 | | | | 4,244 | |
Yum! Brands, Inc. | | | 66 | | | | 8,742 | |
| | | | | | | | |
| | | | | | | 643,453 | |
| | | | | | | | |
| CONSUMER STAPLES (5.8%) | | | | | | |
Archer-Daniels-Midland Co. | | | 133 | | | | 8,040 | |
Brown-Forman Corp. Cl B | | | 48 | | | | 2,073 | |
Bunge Global S.A. | | | 37 | | | | 3,950 | |
Campbell Soup Co. | | | 52 | | | | 2,350 | |
Clorox Co. | | | 33 | | | | 4,504 | |
Colgate-Palmolive Co. | | | 220 | | | | 21,349 | |
Conagra Brands, Inc. | | | 128 | | | | 3,638 | |
Constellation Brands, Inc. Cl A | | | 43 | | | | 11,063 | |
Costco Wholesale Corp. | | | 119 | | | | 101,149 | |
Dollar General Corp. | | | 58 | | | | 7,669 | |
Dollar Tree, Inc.* | | | 56 | | | | 5,979 | |
Estee Lauder Cos., Inc. Cl A | | | 62 | | | | 6,597 | |
General Mills, Inc. | | | 151 | | | | 9,552 | |
Hormel Foods Corp. | | | 78 | | | | 2,378 | |
J M Smucker Co. | | | 28 | | | | 3,053 | |
Kellanova | | | 71 | | | | 4,095 | |
Kenvue, Inc. | | | 514 | | | | 9,345 | |
Keurig Dr Pepper, Inc. | | | 280 | | | | 9,352 | |
Kimberly-Clark Corp. | | | 90 | | | | 12,438 | |
Kraft Heinz Co. | | | 212 | | | | 6,831 | |
Kroger Co. | | | 180 | | | | 8,987 | |
Lamb Weston Hldgs., Inc. | | | 38 | | | | 3,195 | |
McCormick & Co., Inc. | | | 68 | | | | 4,824 | |
Molson Coors Beverage Co. Cl B | | | 48 | | | | 2,440 | |
Monster Beverage Corp.* | | | 190 | | | | 9,491 | |
Procter & Gamble Co. | | | 633 | | | | 104,394 | |
Sysco Corp. | | | 134 | | | | 9,566 | |
Tyson Foods, Inc. Cl A | | | 77 | | | | 4,400 | |
Walgreens Boots Alliance, Inc. | | | 192 | | | | 2,322 | |
| | | | | | | | |
| | | | | | | 385,024 | |
| | | | | | | | |
| ENERGY (3.6%) | | | | | | |
APA Corp. | | | 52 | | | | 1,531 | |
Baker Hughes Co. Cl A | | | 145 | | | | 5,100 | |
Chevron Corp. | | | 249 | | | | 38,948 | |
The accompanying notes are an integral part of these portfolio schedules.
67
MoA FUNDS — CATHOLIC VALUES INDEX FUND
PORTFOLIO OF INVESTMENTS IN SECURITIES (Continued)
June 30, 2024 (Unaudited)
| | | | | | | | |
| | | Shares | | | Value | |
| COMMON STOCKS (CONTINUED): | | | | | | |
| ENERGY (CONTINUED) | | | | | | |
ConocoPhillips | | | 170 | | | $ | 19,445 | |
Coterra Energy, Inc. | | | 108 | | | | 2,880 | |
Devon Energy Corp. | | | 92 | | | | 4,361 | |
Diamondback Energy, Inc. | | | 25 | | | | 5,005 | |
EOG Resources, Inc. | | | 83 | | | | 10,447 | |
EQT Corp. | | | 64 | | | | 2,367 | |
Exxon Mobil Corp. | | | 651 | | | | 74,943 | |
Halliburton Co. | | | 128 | | | | 4,324 | |
Hess Corp. | | | 40 | | | | 5,901 | |
Kinder Morgan, Inc. | | | 280 | | | | 5,564 | |
Marathon Oil Corp. | | | 82 | | | | 2,351 | |
Marathon Petroleum Corp. | | | 51 | | | | 8,847 | |
Occidental Petroleum Corp. | | | 97 | | | | 6,114 | |
ONEOK, Inc. | | | 85 | | | | 6,932 | |
Phillips 66 | | | 62 | | | | 8,752 | |
Schlumberger N.V. | | | 207 | | | | 9,766 | |
Targa Resources Corp. | | | 32 | | | | 4,121 | |
Valero Energy Corp. | | | 47 | | | | 7,368 | |
Williams Cos., Inc. | | | 177 | | | | 7,522 | |
| | | | | | | | |
| | | | | | | 242,589 | |
| | | | | | | | |
| FINANCIALS (13.7%) | | | | | | |
Aflac, Inc. | | | 75 | | | | 6,698 | |
Allstate Corp. | | | 38 | | | | 6,067 | |
American Express Co. | | | 83 | | | | 19,219 | |
American International Group, Inc. | | | 97 | | | | 7,201 | |
Ameriprise Financial, Inc. | | | 14 | | | | 5,981 | |
Aon PLC Cl A | | | 31 | | | | 9,101 | |
Arch Capital Group Ltd.* | | | 55 | | | | 5,549 | |
Arthur J. Gallagher & Co. | | | 31 | | | | 8,039 | |
Assurant, Inc. | | | 7 | | | | 1,164 | |
Bank of America Corp. | | | 992 | | | | 39,452 | |
Bank of New York Mellon Corp. | | | 109 | | | | 6,528 | |
Berkshire Hathaway, Inc. Cl B* | | | 264 | | | | 107,395 | |
BlackRock, Inc. Cl A | | | 20 | | | | 15,746 | |
Blackstone, Inc. | | | 104 | | | | 12,875 | |
Brown & Brown, Inc. | | | 34 | | | | 3,040 | |
Capital One Financial Corp. | | | 55 | | | | 7,615 | |
Cboe Global Markets, Inc. | | | 15 | | | | 2,551 | |
Charles Schwab Corp. | | | 218 | | | | 16,064 | |
Chubb Ltd. | | | 59 | | | | 15,050 | |
Cincinnati Financial Corp. | | | 22 | | | | 2,598 | |
Citigroup, Inc. | | | 278 | | | | 17,642 | |
Citizens Financial Group, Inc. | | | 66 | | | | 2,378 | |
CME Group, Inc. Cl A | | | 52 | | | | 10,223 | |
Corpay, Inc.* | | | 10 | | | | 2,664 | |
Discover Financial Svcs. | | | 36 | | | | 4,709 | |
FactSet Research Systems, Inc. | | | 5 | | | | 2,041 | |
Fidelity National Information Svcs., Inc. | | | 81 | | | | 6,104 | |
Fifth Third Bancorp | | | 100 | | | | 3,649 | |
Fiserv, Inc.* | | | 85 | | | | 12,668 | |
Franklin Resources, Inc. | | | 43 | | | | 961 | |
Global Payments, Inc. | | | 37 | | | | 3,578 | |
Global X S&P 500 Catholic Values ETF | | | 1,484 | | | | 97,054 | |
| | | | | | | | |
| | | Shares | | | Value | |
| COMMON STOCKS (CONTINUED): | | | | | | |
| FINANCIALS (CONTINUED) | | | | | | |
Globe Life, Inc. | | | 12 | | | $ | 987 | |
Goldman Sachs Group, Inc. | | | 46 | | | | 20,807 | |
Hartford Financial Svcs. Group, Inc. | | | 43 | | | | 4,323 | |
Huntington Bancshares, Inc. | | | 211 | | | | 2,781 | |
Intercontinental Exchange, Inc. | | | 84 | | | | 11,499 | |
Invesco Ltd. | | | 66 | | | | 987 | |
Jack Henry & Associates, Inc. | | | 10 | | | | 1,660 | |
JPMorgan Chase & Co. | | | 419 | | | | 84,747 | |
KeyCorp. | | | 137 | | | | 1,947 | |
Loews Corp. | | | 26 | | | | 1,943 | |
M&T Bank Corp. | | | 24 | | | | 3,633 | |
MarketAxess Hldgs., Inc. | | | 5 | | | | 1,003 | |
Marsh & McLennan Cos., Inc. | | | 71 | | | | 14,961 | |
Mastercard, Inc. Cl A | | | 120 | | | | 52,939 | |
MetLife, Inc. | | | 87 | | | | 6,107 | |
Moody’s Corp. | | | 22 | | | | 9,261 | |
Morgan Stanley | | | 182 | | | | 17,689 | |
MSCI, Inc. Cl A | | | 11 | | | | 5,299 | |
Nasdaq, Inc. | | | 55 | | | | 3,314 | |
Northern Trust Corp. | | | 29 | | | | 2,435 | |
PayPal Hldgs., Inc.* | | | 152 | | | | 8,821 | |
PNC Financial Svcs. Group, Inc. | | | 57 | | | | 8,862 | |
Principal Financial Group, Inc. | | | 31 | | | | 2,432 | |
Progressive Corp. | | | 85 | | | | 17,655 | |
Prudential Financial, Inc. | | | 52 | | | | 6,094 | |
Raymond James Financial, Inc. | | | 27 | | | | 3,338 | |
Regions Financial Corp. | | | 133 | | | | 2,665 | |
S&P Global, Inc. | | | 46 | | | | 20,516 | |
State Street Corp. | | | 43 | | | | 3,182 | |
Synchrony Financial | | | 58 | | | | 2,737 | |
T. Rowe Price Group, Inc. | | | 32 | | | | 3,690 | |
Travelers Cos., Inc. | | | 33 | | | | 6,710 | |
Truist Financial Corp. | | | 195 | | | | 7,576 | |
U.S. Bancorp | | | 227 | | | | 9,012 | |
Visa, Inc. Cl A | | | 229 | | | | 60,106 | |
Wells Fargo & Co. | | | 508 | | | | 30,170 | |
Willis Towers Watson PLC | | | 15 | | | | 3,932 | |
WR Berkley Corp. | | | 29 | | | | 2,279 | |
| | | | | | | | |
| | | | | | | 909,703 | |
| | | | | | | | |
| HEALTH CARE (11.6%) | | | | | | |
Align Technology, Inc.* | | | 30 | | | | 7,243 | |
Amgen, Inc. | | | 228 | | | | 71,239 | |
Baxter International, Inc. | | | 217 | | | | 7,259 | |
Biogen, Inc.* | | | 61 | | | | 14,141 | |
Boston Scientific Corp.* | | | 626 | | | | 48,208 | |
Cardinal Health, Inc. | | | 104 | | | | 10,225 | |
Cencora, Inc. | | | 70 | | | | 15,771 | |
Cigna Group | | | 121 | | | | 39,999 | |
Contra ABIOMED, Inc. - contingent value rights* | | | 20 | | | | 0 | † |
CVS Health Corp. | | | 534 | | | | 31,538 | |
DaVita, Inc.* | | | 22 | | | | 3,049 | |
Dexcom, Inc.* | | | 169 | | | | 19,161 | |
Edwards Lifesciences Corp.* | | | 256 | | | | 23,647 | |
Elevance Health, Inc. | | | 99 | | | | 53,644 | |
The accompanying notes are an integral part of these portfolio schedules.
68
MoA FUNDS — CATHOLIC VALUES INDEX FUND
PORTFOLIO OF INVESTMENTS IN SECURITIES (Continued)
June 30, 2024 (Unaudited)
| | | | | | | | |
| | | Shares | | | Value | |
| COMMON STOCKS (CONTINUED): | | | | | | |
| HEALTH CARE (CONTINUED) | | | | | | |
GE HealthCare Technologies, Inc. | | | 181 | | | $ | 14,104 | |
Gilead Sciences, Inc. | | | 530 | | | | 36,363 | |
Henry Schein, Inc.* | | | 54 | | | | 3,461 | |
Hologic, Inc.* | | | 99 | | | | 7,351 | |
Humana, Inc. | | | 51 | | | | 19,056 | |
IDEXX Laboratories, Inc.* | | | 35 | | | | 17,052 | |
Incyte Corp.* | | | 79 | | | | 4,789 | |
Insulet Corp.* | | | 30 | | | | 6,054 | |
Intuitive Surgical, Inc.* | | | 151 | | | | 67,172 | |
IQVIA Hldgs., Inc.* | | | 78 | | | | 16,492 | |
Labcorp Hldgs., Inc. | | | 35 | | | | 7,123 | |
McKesson Corp. | | | 55 | | | | 32,122 | |
Medtronic PLC | | | 565 | | | | 44,471 | |
Mettler-Toledo International, Inc.* | | | 9 | | | | 12,578 | |
Molina Healthcare, Inc.* | | | 25 | | | | 7,433 | |
Quest Diagnostics, Inc. | | | 47 | | | | 6,433 | |
ResMed, Inc. | | | 63 | | | | 12,059 | |
STERIS PLC | | | 42 | | | | 9,221 | |
Stryker Corp. | | | 144 | | | | 48,996 | |
Teleflex, Inc. | | | 20 | | | | 4,207 | |
West Pharmaceutical Svcs., Inc. | | | 31 | | | | 10,211 | |
Zimmer Biomet Hldgs., Inc. | | | 88 | | | | 9,551 | |
Zoetis, Inc. Cl A | | | 194 | | | | 33,632 | |
| | | | | | | | |
| | | | | | | 775,055 | |
| | | | | | | | |
| INDUSTRIALS (8.1%) | | | | | | |
3M Co. | | | 110 | | | | 11,241 | |
Allegion PLC | | | 17 | | | | 2,008 | |
American Airlines Group, Inc.* | | | 131 | | | | 1,484 | |
AMETEK, Inc. | | | 46 | | | | 7,669 | |
AO Smith Corp. | | | 24 | | | | 1,963 | |
Automatic Data Processing, Inc. | | | 82 | | | | 19,573 | |
Axon Enterprise, Inc.* | | | 14 | | | | 4,119 | |
Broadridge Financial Solutions, Inc. | | | 23 | | | | 4,531 | |
Builders FirstSource, Inc.* | | | 24 | | | | 3,322 | |
Carrier Global Corp. | | | 167 | | | | 10,534 | |
Caterpillar, Inc. | | | 97 | | | | 32,311 | |
CH Robinson Worldwide, Inc. | | | 23 | | | | 2,027 | |
Cintas Corp. | | | 17 | | | | 11,904 | |
Copart, Inc.* | | | 174 | | | | 9,424 | |
CSX Corp. | | | 390 | | | | 13,045 | |
Cummins, Inc. | | | 27 | | | | 7,477 | |
Dayforce, Inc.* | | | 31 | | | | 1,538 | |
Deere & Co. | | | 52 | | | | 19,429 | |
Delta Air Lines, Inc. | | | 129 | | | | 6,120 | |
Dover Corp. | | | 27 | | | | 4,872 | |
Eaton Corp. PLC | | | 80 | | | | 25,084 | |
Emerson Electric Co. | | | 114 | | | | 12,558 | |
Equifax, Inc. | | | 24 | | | | 5,819 | |
Expeditors International of Washington, Inc. | | | 28 | | | | 3,494 | |
Fastenal Co. | | | 114 | | | | 7,164 | |
FedEx Corp. | | | 45 | | | | 13,493 | |
Fortive Corp. | | | 70 | | | | 5,187 | |
| | | | | | | | |
| | | Shares | | | Value | |
| COMMON STOCKS (CONTINUED): | | | | | | |
| INDUSTRIALS (CONTINUED) | | | | | | |
Generac Hldgs., Inc.* | | | 12 | | | $ | 1,587 | |
Howmet Aerospace, Inc. | | | 77 | | | | 5,977 | |
Hubbell, Inc. Cl B | | | 10 | | | | 3,655 | |
IDEX Corp. | | | 15 | | | | 3,018 | |
Illinois Tool Works, Inc. | | | 54 | | | | 12,796 | |
Ingersoll Rand, Inc. | | | 80 | | | | 7,267 | |
JB Hunt Transport Svcs., Inc. | | | 16 | | | | 2,560 | |
Johnson Controls International PLC | | | 134 | | | | 8,907 | |
Masco Corp. | | | 43 | | | | 2,867 | |
Nordson Corp. | | | 10 | | | | 2,319 | |
Norfolk Southern Corp. | | | 45 | | | | 9,661 | |
Old Dominion Freight Line, Inc. | | | 35 | | | | 6,181 | |
Otis Worldwide Corp. | | | 81 | | | | 7,797 | |
PACCAR, Inc. | | | 104 | | | | 10,706 | |
Parker-Hannifin Corp. | | | 25 | | | | 12,645 | |
Paychex, Inc. | | | 63 | | | | 7,469 | |
Paycom Software, Inc. | | | 9 | | | | 1,287 | |
Pentair PLC | | | 33 | | | | 2,530 | |
Quanta Svcs., Inc. | | | 29 | | | | 7,369 | |
Republic Svcs., Inc. Cl A | | | 40 | | | | 7,774 | |
Rockwell Automation, Inc. | | | 22 | | | | 6,056 | |
Rollins, Inc. | | | 55 | | | | 2,683 | |
Snap-on, Inc. | | | 10 | | | | 2,614 | |
Southwest Airlines Co. | | | 119 | | | | 3,405 | |
Stanley Black & Decker, Inc. | | | 30 | | | | 2,397 | |
Trane Technologies PLC | | | 45 | | | | 14,802 | |
Uber Technologies, Inc.* | | | 416 | | | | 30,235 | |
Union Pacific Corp. | | | 122 | | | | 27,604 | |
United Airlines Hldgs., Inc.* | | | 66 | | | | 3,212 | |
United Parcel Svc., Inc. Cl B | | | 145 | | | | 19,843 | |
United Rentals, Inc. | | | 13 | | | | 8,407 | |
Veralto Corp. | | | 43 | | | | 4,105 | |
Verisk Analytics, Inc. Cl A | | | 28 | | | | 7,547 | |
Waste Management, Inc. | | | 73 | | | | 15,574 | |
Westinghouse Air Brake Technologies Corp. | | | 35 | | | | 5,532 | |
WW Grainger, Inc. | | | 8 | | | | 7,218 | |
Xylem, Inc. | | | 48 | | | | 6,510 | |
| | | | | | | | |
| | | | | | | 539,506 | |
| | | | | | | | |
| INFORMATION TECHNOLOGY (32.0%) | | | | | | |
Accenture PLC Cl A | | | 91 | | | | 27,610 | |
Adobe, Inc.* | | | 65 | | | | 36,110 | |
Advanced Micro Devices, Inc.* | | | 235 | | | | 38,119 | |
Akamai Technologies, Inc.* | | | 22 | | | | 1,982 | |
Amphenol Corp. Cl A | | | 175 | | | | 11,790 | |
Analog Devices, Inc. | | | 72 | | | | 16,435 | |
ANSYS, Inc.* | | | 12 | | | | 3,858 | |
Apple, Inc. | | | 2,096 | | | | 441,460 | |
Applied Materials, Inc. | | | 121 | | | | 28,555 | |
Arista Networks, Inc.* | | | 36 | | | | 12,617 | |
Autodesk, Inc.* | | | 31 | | | | 7,671 | |
Broadcom, Inc. | | | 63 | | | | 101,148 | |
Cadence Design Systems, Inc.* | | | 39 | | | | 12,002 | |
CDW Corp. | | | 19 | | | | 4,253 | |
Cisco Systems, Inc. | | | 589 | | | | 27,983 | |
The accompanying notes are an integral part of these portfolio schedules.
69
MoA FUNDS — CATHOLIC VALUES INDEX FUND
PORTFOLIO OF INVESTMENTS IN SECURITIES (Continued)
June 30, 2024 (Unaudited)
| | | | | | | | |
| | | Shares | | | Value | |
| COMMON STOCKS (CONTINUED): | | | | | | |
| INFORMATION TECHNOLOGY (CONTINUED) | | | | |
Cognizant Technology Solutions Corp. Cl A | | | 72 | | | $ | 4,896 | |
Enphase Energy, Inc.* | | | 19 | | | | 1,895 | |
EPAM Systems, Inc.* | | | 8 | | | | 1,505 | |
F5, Inc.* | | | 8 | | | | 1,378 | |
Fair Isaac Corp.* | | | 3 | | | | 4,466 | |
First Solar, Inc.* | | | 15 | | | | 3,382 | |
Fortinet, Inc.* | | | 92 | | | | 5,545 | |
Gartner, Inc.* | | | 11 | | | | 4,940 | |
Gen Digital, Inc. | | | 80 | | | | 1,998 | |
Hewlett Packard Enterprise Co. | | | 189 | | | | 4,001 | |
HP, Inc. | | | 126 | | | | 4,413 | |
Intel Corp. | | | 619 | | | | 19,170 | |
International Business Machines Corp. | | | 134 | | | | 23,175 | |
Intuit, Inc. | | | 40 | | | | 26,288 | |
Jabil, Inc. | | | 18 | | | | 1,958 | |
Juniper Networks, Inc. | | | 47 | | | | 1,714 | |
Keysight Technologies, Inc.* | | | 25 | | | | 3,419 | |
KLA Corp. | | | 19 | | | | 15,666 | |
Lam Research Corp. | | | 19 | | | | 20,232 | |
Microchip Technology, Inc. | | | 79 | | | | 7,229 | |
Micron Technology, Inc. | | | 161 | | | | 21,176 | |
Microsoft Corp. | | | 1,081 | | | | 483,153 | |
Monolithic Power Systems, Inc. | | | 7 | | | | 5,752 | |
Motorola Solutions, Inc. | | | 24 | | | | 9,265 | |
NetApp, Inc. | | | 30 | | | | 3,864 | |
NVIDIA Corp. | | | 3,578 | | | | 442,026 | |
NXP Semiconductors N.V. | | | 37 | | | | 9,956 | |
ON Semiconductor Corp.* | | | 62 | | | | 4,250 | |
Oracle Corp. | | | 232 | | | | 32,758 | |
Palo Alto Networks, Inc.* | | | 46 | | | | 15,595 | |
PTC, Inc.* | | | 17 | | | | 3,088 | |
Qorvo, Inc.* | | | 14 | | | | 1,625 | |
QUALCOMM, Inc. | | | 163 | | | | 32,466 | |
Roper Technologies, Inc. | | | 15 | | | | 8,455 | |
Salesforce, Inc. | | | 141 | | | | 36,251 | |
Seagate Technology Hldgs. PLC | | | 28 | | | | 2,892 | |
ServiceNow, Inc.* | | | 29 | | | | 22,813 | |
Skyworks Solutions, Inc. | | | 23 | | | | 2,451 | |
Super Micro Computer, Inc.* | | | 7 | | | | 5,736 | |
Synopsys, Inc.* | | | 22 | | | | 13,091 | |
TE Connectivity Ltd. | | | 44 | | | | 6,619 | |
Teledyne Technologies, Inc.* | | | 6 | | | | 2,328 | |
Teradyne, Inc. | | | 22 | | | | 3,262 | |
Texas Instruments, Inc. | | | 132 | | | | 25,678 | |
Trimble, Inc.* | | | 35 | | | | 1,957 | |
Tyler Technologies, Inc.* | | | 6 | | | | 3,017 | |
VeriSign, Inc.* | | | 13 | | | | 2,311 | |
Western Digital Corp.* | | | 47 | | | | 3,561 | |
Zebra Technologies Corp. Cl A* | | | 7 | | | | 2,163 | |
| | | | | | | | |
| | | | | | | 2,136,422 | |
| | | | | | | | |
| MATERIALS (2.1%) | | | | | | |
Air Products & Chemicals, Inc. | | | 33 | | | | 8,516 | |
Albemarle Corp. | | | 17 | | | | 1,624 | |
| | | | | | | | |
| | | Shares | | | Value | |
| COMMON STOCKS (CONTINUED): | | | | | | |
| MATERIALS (CONTINUED) | | | | | | |
Amcor PLC | | | 215 | | | $ | 2,103 | |
Avery Dennison Corp. | | | 12 | | | | 2,624 | |
Ball Corp. | | | 46 | | | | 2,761 | |
CF Industries Hldgs., Inc. | | | 27 | | | | 2,001 | |
Corteva, Inc. | | | 104 | | | | 5,610 | |
Dow, Inc. | | | 105 | | | | 5,570 | |
DuPont de Nemours, Inc. | | | 62 | | | | 4,990 | |
Ecolab, Inc. | | | 37 | | | | 8,806 | |
FMC Corp. | | | 18 | | | | 1,036 | |
Freeport-McMoRan, Inc. | | | 214 | | | | 10,400 | |
International Flavors & Fragrances, Inc. | | | 38 | | | | 3,618 | |
International Paper Co. | | | 51 | | | | 2,201 | |
Linde PLC | | | 72 | | | | 31,594 | |
LyondellBasell Industries N.V. Cl A | | | 38 | | | | 3,635 | |
Martin Marietta Materials, Inc. | | | 9 | | | | 4,876 | |
Mosaic Co. | | | 47 | | | | 1,358 | |
Newmont Corp. | | | 172 | | | | 7,202 | |
Nucor Corp. | | | 35 | | | | 5,533 | |
Packaging Corp. of America | | | 13 | | | | 2,373 | |
PPG Industries, Inc. | | | 35 | | | | 4,406 | |
Sherwin-Williams Co. | | | 34 | | | | 10,147 | |
Steel Dynamics, Inc. | | | 22 | | | | 2,849 | |
Vulcan Materials Co. | | | 19 | | | | 4,725 | |
Westrock Co. | | | 38 | | | | 1,910 | |
| | | | | | | | |
| | | | | | | 142,468 | |
| | | | | | | | |
| REAL ESTATE (2.1%) | | | | | | |
American Tower Corp. | | | 74 | | | | 14,384 | |
AvalonBay Communities, Inc. | | | 22 | | | | 4,552 | |
Boston Properties, Inc. | | | 22 | | | | 1,354 | |
Camden Property Trust | | | 16 | | | | 1,746 | |
CBRE Group, Inc. Cl A* | | | 47 | | | | 4,188 | |
CoStar Group, Inc.* | | | 64 | | | | 4,745 | |
Crown Castle, Inc. | | | 68 | | | | 6,644 | |
Digital Realty Trust, Inc. | | | 52 | | | | 7,907 | |
Equinix, Inc. | | | 15 | | | | 11,349 | |
Equity Residential | | | 54 | | | | 3,744 | |
Essex Property Trust, Inc. | | | 10 | | | | 2,722 | |
Extra Space Storage, Inc. | | | 33 | | | | 5,128 | |
Federal Realty Investment Trust | | | 11 | | | | 1,111 | |
Host Hotels & Resorts, Inc. | | | 112 | | | | 2,014 | |
Invitation Homes, Inc. | | | 91 | | | | 3,266 | |
Iron Mountain, Inc. | | | 47 | | | | 4,212 | |
Kimco Realty Corp. | | | 106 | | | | 2,063 | |
Mid-America Apartment Communities, Inc. | | | 18 | | | | 2,567 | |
Prologis, Inc. | | | 147 | | | | 16,509 | |
Public Storage | | | 25 | | | | 7,191 | |
Realty Income Corp. | | | 138 | | | | 7,289 | |
Regency Centers Corp. | | | 26 | | | | 1,617 | |
SBA Communications Corp. Cl A | | | 17 | | | | 3,337 | |
Simon Property Group, Inc. | | | 51 | | | | 7,742 | |
UDR, Inc. | | | 48 | | | | 1,975 | |
Welltower, Inc. | | | 95 | | | | 9,904 | |
The accompanying notes are an integral part of these portfolio schedules.
70
MoA FUNDS — CATHOLIC VALUES INDEX FUND
PORTFOLIO OF INVESTMENTS IN SECURITIES (Continued)
June 30, 2024 (Unaudited)
| | | | | | | | |
| | | Shares | | | Value | |
| COMMON STOCKS (CONTINUED): | | | | | | |
| REAL ESTATE (CONTINUED) | | | | | | |
Weyerhaeuser Co. | | | 116 | | | $ | 3,293 | |
| | | | | | | | |
| | | | | | | 142,553 | |
| | | | | | | | |
| UTILITIES (2.3%) | | | | | | |
AES Corp. | | | 103 | | | | 1,810 | |
Alliant Energy Corp. | | | 37 | | | | 1,883 | |
Ameren Corp. | | | 38 | | | | 2,702 | |
American Electric Power Co., Inc. | | | 77 | | | | 6,756 | |
American Water Works Co., Inc. | | | 28 | | | | 3,616 | |
Atmos Energy Corp. | | | 21 | | | | 2,450 | |
CenterPoint Energy, Inc. | | | 93 | | | | 2,881 | |
CMS Energy Corp. | | | 43 | | | | 2,560 | |
Consolidated Edison, Inc. | | | 50 | | | | 4,471 | |
Constellation Energy Corp. | | | 45 | | | | 9,012 | |
Dominion Energy, Inc. | | | 122 | | | | 5,978 | |
DTE Energy Co. | | | 30 | | | | 3,330 | |
Duke Energy Corp. | | | 112 | | | | 11,226 | |
Edison International | | | 55 | | | | 3,950 | |
Entergy Corp. | | | 30 | | | | 3,210 | |
Evergy, Inc. | | | 33 | | | | 1,748 | |
| | | | | | | | |
| | | Shares | | | Value | |
| COMMON STOCKS (CONTINUED): | | | | | | |
| UTILITIES (CONTINUED) | | | | | | |
Eversource Energy | | | 51 | | | $ | 2,892 | |
Exelon Corp. | | | 145 | | | | 5,018 | |
FirstEnergy Corp. | | | 75 | | | | 2,870 | |
NextEra Energy, Inc. | | | 298 | | | | 21,101 | |
NiSource, Inc. | | | 65 | | | | 1,873 | |
NRG Energy, Inc. | | | 30 | | | | 2,336 | |
PG&E Corp. | | | 310 | | | | 5,413 | |
Pinnacle West Capital Corp. | | | 16 | | | | 1,222 | |
PPL Corp. | | | 107 | | | | 2,959 | |
Public Svc. Enterprise Group, Inc. | | | 72 | | | | 5,306 | |
Sempra | | | 92 | | | | 6,997 | |
Southern Co. | | | 159 | | | | 12,334 | |
Vistra Corp. | | | 47 | | | | 4,041 | |
WEC Energy Group, Inc. | | | 45 | | | | 3,531 | |
Xcel Energy, Inc. | | | 81 | | | | 4,326 | |
| | | | | | | | |
| | | | | | | 149,802 | |
| | | | | | | | |
TOTAL COMMON STOCKS | | | | | | | | |
(Cost: $4,905,675) 100.3% | | | | | | | 6,688,363 | |
| | | | | | | | |
| | | | | | | | | | | | | | | | |
| | | | | | Rate(%) | | Maturity | | Face Amount | | | Value | |
| TEMPORARY CASH INVESTMENT (2.4%) | | | | | | | | | | | | | |
Citibank, New York Time Deposit | | | | | | 4.58 | | 07/01/24 | | $ | 159,280 | | | $ | 159,280 | |
| | | | | | | | | | | | | | | | |
TOTAL TEMPORARY CASH INVESTMENT
(Cost: $159,280) 2.4% | | | | 159,280 | |
| | | | | | | | | | | | | | | | |
TOTAL INVESTMENTS
(Cost: $5,064,955) 102.7% | | | | 6,847,643 | |
| | | | | | | | | | | | | | | | |
OTHER NET ASSETS -2.7% | | | | (180,325 | ) |
| | | | | | | | | | | | | | | | |
NET ASSETS 100.0% | | | $ | 6,667,318 | |
| | | | | | | | | | | | | | | | |
FOOTNOTES TO PORTFOLIO OF INVESTMENTS IN SECURITIES
| * | Non-income producing security. |
The accompanying notes are an integral part of these portfolio schedules.
71
MoA FUNDS — CLEAR PASSAGE 2015 FUND
PORTFOLIO OF INVESTMENTS IN SECURITIES
June 30, 2024 (Unaudited)
| | | | | | | | |
| | | Shares | | | Value | |
| COMMON STOCKS (100.0%): | | | | | | |
| AFFILIATED MUTUAL FUNDS (100.0%) | | | | | | |
MoA Funds | | | | | | | | |
Core Bond Fund (33.7%) | | | 3,013,817 | | | $ | 36,738,423 | |
Equity Index Fund (23.0%) | | | 374,849 | | | | 25,036,146 | |
Intermediate Bond Fund (28.4%) | | | 3,245,620 | | | | 30,963,213 | |
International Fund (5.0%) | | | 640,683 | | | | 5,522,685 | |
Mid Cap Equity Index Fund (4.3%) | | | 221,864 | | | | 4,705,744 | |
Mid Cap Value Fund (0.5%) | | | 30,975 | | | | 518,835 | |
Money Market Fund (5.1%) | | | 467,202 | | | | 5,562,035 | |
| | | | | | | | |
TOTAL INVESTMENTS
(Cost: $109,994,920) 100.0% | | | | | | | 109,047,081 | |
| | | | | | | | |
OTHER NET ASSETS -0.0% (1) | | | | | | | (37,638 | ) |
| | | | | | | | |
NET ASSETS 100.0% | | | | | | $ | 109,009,443 | |
| | | | | | | | |
FOOTNOTES TO PORTFOLIO OF INVESTMENTS IN SECURITIES
| (1) | Percentage is less than 0.05%. |
MoA FUNDS — CLEAR PASSAGE 2020 FUND
PORTFOLIO OF INVESTMENTS IN SECURITIES
June 30, 2024 (Unaudited)
| | | | | | | | |
| | | Shares | | | Value | |
| COMMON STOCKS (100.0%): | | | | | | |
| AFFILIATED MUTUAL FUNDS (100.0%) | | | | | | |
MoA Funds | | | | | | | | |
Core Bond Fund (33.7%) | | | 13,103,433 | | | $ | 159,730,846 | |
Equity Index Fund (25.0%) | | | 1,768,488 | | | | 118,117,286 | |
Intermediate Bond Fund (20.7%) | | | 10,263,303 | | | | 97,911,911 | |
International Fund (7.0%) | | | 3,872,188 | | | | 33,378,260 | |
Mid Cap Equity Index Fund (5.4%) | | | 1,200,358 | | | | 25,459,592 | |
Mid Cap Value Fund (0.1%) | | | 26,146 | | | | 437,950 | |
Money Market Fund (5.5%) | | | 2,189,297 | | | | 26,063,576 | |
Small Cap Equity Index Fund (0.7%) | | | 323,123 | | | | 3,250,618 | |
Small Cap Value Fund (1.9%) | | | 654,565 | | | | 8,980,634 | |
| | | | | | | | |
TOTAL INVESTMENTS
(Cost: $468,925,854) 100.0% | | | | | | | 473,330,673 | |
| | | | | | | | |
OTHER NET ASSETS -0.0% (1) | | | | | | | (85,807 | ) |
| | | | | | | | |
NET ASSETS 100.0% | | | | | | $ | 473,244,866 | |
| | | | | | | | |
FOOTNOTES TO PORTFOLIO OF INVESTMENTS IN SECURITIES
| (1) | Percentage is less than 0.05%. |
The accompanying notes are an integral part of these portfolio schedules.
72
MoA FUNDS — CLEAR PASSAGE 2025 FUND
PORTFOLIO OF INVESTMENTS IN SECURITIES
June 30, 2024 (Unaudited)
| | | | | | | | |
| | | Shares | | | Value | |
| COMMON STOCKS (100.0%): | | | | | | |
| AFFILIATED MUTUAL FUNDS (100.0%) | | | | | | |
MoA Funds | | | | | | | | |
Core Bond Fund (32.4%) | | | 29,634,952 | | | $ | 361,250,060 | |
Equity Index Fund (31.2%) | | | 5,195,109 | | | | 346,981,331 | |
Intermediate Bond Fund (15.0%) | | | 17,520,866 | | | | 167,149,058 | |
International Fund (10.0%) | | | 12,972,738 | | | | 111,825,003 | |
Mid Cap Equity Index Fund (5.3%) | | | 2,790,328 | | | | 59,182,864 | |
Mid Cap Value Fund (0.3%) | | | 211,236 | | | | 3,538,203 | |
Money Market Fund (3.4%) | | | 3,160,181 | | | | 37,621,951 | |
Small Cap Equity Index Fund (0.8%) | | | 888,520 | | | | 8,938,514 | |
Small Cap Value Fund (1.6%) | | | 1,310,660 | | | | 17,982,252 | |
| | | | | | | | |
TOTAL INVESTMENTS
(Cost: $1,077,200,317) 100.0% | | | | | | | 1,114,469,236 | |
| | | | | | | | |
OTHER NET ASSETS -0.0% (1) | | | | | | | (155,698 | ) |
| | | | | | | | |
NET ASSETS 100.0% | | | | | | $ | 1,114,313,538 | |
| | | | | | | | |
FOOTNOTES TO PORTFOLIO OF INVESTMENTS IN SECURITIES
| (1) | Percentage is less than 0.05%. |
MoA FUNDS — CLEAR PASSAGE 2030 FUND
PORTFOLIO OF INVESTMENTS IN SECURITIES
June 30, 2024 (Unaudited)
| | | | | | | | |
| | | Shares | | | Value | |
| COMMON STOCKS (100.0%): | | | | | | |
| AFFILIATED MUTUAL FUNDS (100.0%) | | | | | | |
MoA Funds | | | | | | | | |
Core Bond Fund (26.5%) | | | 29,386,680 | | | $ | 358,223,626 | |
Equity Index Fund (36.2%) | | | 7,332,508 | | | | 489,738,189 | |
Intermediate Bond Fund (10.9%) | | | 15,440,607 | | | | 147,303,388 | |
International Fund (12.0%) | | | 18,876,883 | | | | 162,718,729 | |
Mid Cap Equity Index Fund (6.2%) | | | 3,967,688 | | | | 84,154,667 | |
Mid Cap Value Fund (0.9%) | | | 695,861 | | | | 11,655,668 | |
Money Market Fund (3.4%) | | | 3,878,639 | | | | 46,175,202 | |
Small Cap Equity Index Fund (1.2%) | | | 1,576,229 | | | | 15,856,867 | |
Small Cap Growth Fund (1.1%) | | | 1,162,622 | | | | 15,253,596 | |
Small Cap Value Fund (1.6%) | | | 1,558,855 | | | | 21,387,496 | |
| | | | | | | | |
TOTAL INVESTMENTS
(Cost: $1,273,927,913) 100.0% | | | | | | | 1,352,467,428 | |
| | | | | | | | |
OTHER NET ASSETS -0.0% (1) | | | | | | | (188,381 | ) |
| | | | | | | | |
NET ASSETS 100.0% | | | | | | $ | 1,352,279,047 | |
| | | | | | | | |
FOOTNOTES TO PORTFOLIO OF INVESTMENTS IN SECURITIES
| (1) | Percentage is less than 0.05%. |
The accompanying notes are an integral part of these portfolio schedules.
73
MoA FUNDS — CLEAR PASSAGE 2035 FUND
PORTFOLIO OF INVESTMENTS IN SECURITIES
June 30, 2024 (Unaudited)
| | | | | | | | |
| | | Shares | | | Value | |
| COMMON STOCKS (100.0%): | | | | | | |
| AFFILIATED MUTUAL FUNDS (100.0%) | | | | | | |
MoA Funds | | | | | | | | |
Core Bond Fund (20.0%) | | | 21,785,590 | | | $ | 265,566,346 | |
Equity Index Fund (42.5%) | | | 8,464,583 | | | | 565,349,508 | |
Intermediate Bond Fund (5.7%) | | | 7,989,550 | | | | 76,220,311 | |
International Fund (14.9%) | | | 23,066,520 | | | | 198,833,400 | |
Mid Cap Equity Index Fund (8.3%) | | | 5,221,835 | | | | 110,755,122 | |
Mid Cap Value Fund (0.8%) | | | 631,932 | | | | 10,584,863 | |
Money Market Fund (3.3%) | | | 3,686,993 | | | | 43,893,654 | |
Small Cap Equity Index Fund (1.6%) | | | 2,057,623 | | | | 20,699,689 | |
Small Cap Growth Fund (1.1%) | | | 1,135,899 | | | | 14,902,996 | |
Small Cap Value Fund (1.8%) | | | 1,735,677 | | | | 23,813,493 | |
| | | | | | | | |
TOTAL INVESTMENTS
(Cost: $1,229,977,548) 100.0% | | | | | | | 1,330,619,382 | |
| | | | | | | | |
OTHER NET ASSETS -0.0% (1) | | | | | | | (189,643 | ) |
| | | | | | | | |
NET ASSETS 100.0% | | | | | | $ | 1,330,429,739 | |
| | | | | | | | |
FOOTNOTES TO PORTFOLIO OF INVESTMENTS IN SECURITIES
| (1) | Percentage is less than 0.05%. |
MoA FUNDS — CLEAR PASSAGE 2040 FUND
PORTFOLIO OF INVESTMENTS IN SECURITIES
June 30, 2024 (Unaudited)
| | | | | | | | |
| | | Shares | | | Value | |
| COMMON STOCKS (100.0%): | | | | | | |
| AFFILIATED MUTUAL FUNDS (100.0%): | | | | | | |
MoA Funds | | | | | | | | |
Core Bond Fund (13.7%) | | | 12,758,449 | | | $ | 155,525,497 | |
Equity Index Fund (45.3%) | | | 7,673,157 | | | | 512,490,158 | |
Intermediate Bond Fund (4.9%) | | | 5,815,661 | | | | 55,481,410 | |
International Fund (18.8%) | | | 24,666,770 | | | | 212,627,558 | |
Mid Cap Equity Index Fund (9.3%) | | | 4,947,284 | | | | 104,931,898 | |
Mid Cap Value Fund (0.8%) | | | 524,605 | | | | 8,787,137 | |
Money Market Fund (2.4%) | | | 2,269,444 | | | | 27,017,731 | |
Small Cap Equity Index Fund (1.9%) | | | 2,184,395 | | | | 21,975,009 | |
Small Cap Growth Fund (1.0%) | | | 821,345 | | | | 10,776,044 | |
Small Cap Value Fund (1.9%) | | | 1,563,051 | | | | 21,445,053 | |
| | | | | | | | |
TOTAL INVESTMENTS
(Cost: $1,033,151,155) 100.0% | | | | | | | 1,131,057,495 | |
| | | | | | | | |
OTHER NET ASSETS -0.0% (1) | | | | | | | (165,955 | ) |
| | | | | | | | |
NET ASSETS 100.0% | | | | | | $ | 1,130,891,540 | |
| | | | | | | | |
FOOTNOTES TO PORTFOLIO OF INVESTMENTS IN SECURITIES
| (1) | Percentage is less than 0.05%. |
The accompanying notes are an integral part of these portfolio schedules.
74
MoA FUNDS — CLEAR PASSAGE 2045 FUND
PORTFOLIO OF INVESTMENTS IN SECURITIES
June 30, 2024 (Unaudited)
| | | | | | | | |
| | | Shares | | | Value | |
| COMMON STOCKS (100.0%): | | | | | | |
| AFFILIATED MUTUAL FUNDS (100.0%) | | | | | | |
MoA Funds | | | | | | | | |
Core Bond Fund (9.3%) | | | 8,906,400 | | | $ | 108,569,011 | |
Equity Index Fund (47.5%) | | | 8,300,952 | | | | 554,420,596 | |
Intermediate Bond Fund (2.9%) | | | 3,591,861 | | | | 34,266,352 | |
International Fund (20.7%) | | | 28,029,968 | | | | 241,618,324 | |
Mid Cap Equity Index Fund (10.3%) | | | 5,683,542 | | | | 120,547,922 | |
Mid Cap Value Fund (0.8%) | | | 557,560 | | | | 9,339,122 | |
Money Market Fund (2.6%) | | | 2,504,687 | | | | 29,818,297 | |
Small Cap Equity Index Fund (2.0%) | | | 2,302,711 | | | | 23,165,272 | |
Small Cap Growth Fund (2.1%) | | | 1,828,445 | | | | 23,989,205 | |
Small Cap Value Fund (1.8%) | | | 1,570,611 | | | | 21,548,783 | |
| | | | | | | | |
TOTAL INVESTMENTS
(Cost: $1,056,734,875) 100.0% | | | | | | | 1,167,282,884 | |
| | | | | | | | |
OTHER NET ASSETS -0.0% (1) | | | | | | | (167,237 | ) |
| | | | | | | | |
NET ASSETS 100.0% | | | | | | $ | 1,167,115,647 | |
| | | | | | | | |
FOOTNOTES TO PORTFOLIO OF INVESTMENTS IN SECURITIES
| (1) | Percentage is less than 0.05%. |
MoA FUNDS — CLEAR PASSAGE 2050 FUND
PORTFOLIO OF INVESTMENTS IN SECURITIES
June 30, 2024 (Unaudited)
| | | | | | | | |
| | | Shares | | | Value | |
| COMMON STOCKS (100.0%): | | | | | | |
| AFFILIATED MUTUAL FUNDS (100.0%) | | | | | | |
MoA Funds | | | | | | | | |
Core Bond Fund (7.5%) | | | 5,638,853 | | | $ | 68,737,614 | |
Equity Index Fund (49.5%) | | | 6,768,849 | | | | 452,091,420 | |
Intermediate Bond Fund (1.4%) | | | 1,339,957 | | | | 12,783,187 | |
International Fund (20.6%) | | | 21,847,343 | | | | 188,324,095 | |
Mid Cap Equity Index Fund (11.1%) | | | 4,775,380 | | | | 101,285,815 | |
Mid Cap Value Fund (1.6%) | | | 862,766 | | | | 14,451,330 | |
Money Market Fund (2.2%) | | | 1,657,049 | | | | 19,727,167 | |
Small Cap Equity Index Fund (2.3%) | | | 2,045,994 | | | | 20,582,697 | |
Small Cap Growth Fund (2.0%) | | | 1,386,178 | | | | 18,186,651 | |
Small Cap Value Fund (1.8%) | | | 1,222,360 | | | | 16,770,778 | |
| | | | | | | | |
TOTAL INVESTMENTS
(Cost: $823,707,293) 100.0% | | | | | | | 912,940,754 | |
| | | | | | | | |
OTHER NET ASSETS -0.0% (1) | | | | | | | (132,296 | ) |
| | | | | | | | |
NET ASSETS 100.0% | | | | | | $ | 912,808,458 | |
| | | | | | | | |
FOOTNOTES TO PORTFOLIO OF INVESTMENTS IN SECURITIES
| (1) | Percentage is less than 0.05%. |
The accompanying notes are an integral part of these portfolio schedules.
75
MoA FUNDS — CLEAR PASSAGE 2055 FUND
PORTFOLIO OF INVESTMENTS IN SECURITIES
June 30, 2024 (Unaudited)
| | | | | | | | |
| | | Shares | | | Value | |
| COMMON STOCKS (100.0%): | | | | | | |
| AFFILIATED MUTUAL FUNDS (100.0%) | | | | | | |
MoA Funds | | | | | | | | |
Core Bond Fund (6.2%) | | | 2,587,738 | | | $ | 31,544,522 | |
Equity Index Fund (49.7%) | | | 3,793,790 | | | | 253,387,266 | |
Intermediate Bond Fund (1.9%) | | | 1,029,949 | | | | 9,825,710 | |
International Fund (21.7%) | | | 12,839,308 | | | | 110,674,832 | |
Mid Cap Equity Index Fund (10.9%) | | | 2,619,783 | | | | 55,565,588 | |
Mid Cap Value Fund (1.6%) | | | 494,614 | | | | 8,284,788 | |
Money Market Fund (1.3%) | | | 546,307 | | | | 6,503,789 | |
Small Cap Equity Index Fund (2.5%) | | | 1,289,719 | | | | 12,974,577 | |
Small Cap Growth Fund (1.9%) | | | 750,916 | | | | 9,852,018 | |
Small Cap Value Fund (2.3%) | | | 847,240 | | | | 11,624,134 | |
| | | | | | | | |
TOTAL INVESTMENTS
(Cost: $464,718,319) 100.0% | | | | | | | 510,237,224 | |
| | | | | | | | |
OTHER NET ASSETS -0.0% (1) | | | | | | | (83,157 | ) |
| | | | | | | | |
NET ASSETS 100.0% | | | | | | $ | 510,154,067 | |
| | | | | | | | |
FOOTNOTES TO PORTFOLIO OF INVESTMENTS IN SECURITIES
| (1) | Percentage is less than 0.05%. |
MoA FUNDS — CLEAR PASSAGE 2060 FUND
PORTFOLIO OF INVESTMENTS IN SECURITIES
June 30, 2024 (Unaudited)
| | | | | | | | |
| | | Shares | | | Value | |
| COMMON STOCKS (100.0%): | | | | | | |
| AFFILIATED MUTUAL FUNDS (100.0%) | | | | | | |
MoA Funds | | | | | | | | |
Core Bond Fund (4.7%) | | | 1,076,343 | | | $ | 13,120,618 | |
Equity Index Fund (48.7%) | | | 2,024,650 | | | | 135,226,394 | |
Intermediate Bond Fund (1.5%) | | | 449,029 | | | | 4,283,739 | |
International Fund (22.7%) | | | 7,310,397 | | | | 63,015,624 | |
Mid Cap Equity Index Fund (12.1%) | | | 1,584,364 | | | | 33,604,351 | |
Mid Cap Value Fund (1.6%) | | | 266,383 | | | | 4,461,923 | |
Money Market Fund (1.0%) | | | 222,606 | | | | 2,650,126 | |
Small Cap Equity Index Fund (3.0%) | | | 820,586 | | | | 8,255,099 | |
Small Cap Growth Fund (2.0%) | | | 419,279 | | | | 5,500,945 | |
Small Cap Value Fund (2.7%) | | | 553,750 | | | | 7,597,456 | |
| | | | | | | | |
TOTAL INVESTMENTS
(Cost: $254,638,620) 100.0% | | | | | | | 277,716,275 | |
| | | | | | | | |
OTHER NET ASSETS -0.0% (1) | | | | | | | (59,883 | ) |
| | | | | | | | |
NET ASSETS 100.0% | | | | | | $ | 277,656,392 | |
| | | | | | | | |
FOOTNOTES TO PORTFOLIO OF INVESTMENTS IN SECURITIES
| (1) | Percentage is less than 0.05%. |
The accompanying notes are an integral part of these portfolio schedules.
76
MoA FUNDS — CLEAR PASSAGE 2065 FUND
PORTFOLIO OF INVESTMENTS IN SECURITIES
June 30, 2024 (Unaudited)
| | | | | | | | | | | | | | | | |
| | | | | | | | | Shares | | | Value | |
| COMMON STOCKS (99.8%): | | | | | | | | | | | | |
| AFFILIATED MUTUAL FUNDS (99.8%) | | | | | | | | | | | | |
MoA Funds | | | | | | | | | | | | | | | | |
Core Bond Fund (3.3%) | | | | | | | | | | | 260,622 | | | $ | 3,176,985 | |
Equity Index Fund (48.9%) | | | | | | | | | | | 699,420 | | | | 46,714,237 | |
Intermediate Bond Fund (0.5%) | | | | | | | | | | | 50,098 | | | | 477,936 | |
International Fund (22.9%) | | | | | | | | | | | 2,536,343 | | | | 21,863,275 | |
Mid Cap Equity Index Fund (12.0%) | | | | | | | | | | | 539,618 | | | | 11,445,299 | |
Mid Cap Value Fund (2.6%) | | | | | | | | | | | 147,596 | | | | 2,472,235 | |
Money Market Fund (0.8%) | | | | | | | | | | | 69,551 | | | | 828,009 | |
Small Cap Equity Index Fund (3.0%) | | | | | | | | | | | 282,160 | | | | 2,838,528 | |
Small Cap Growth Fund (2.8%) | | | | | | | | | | | 206,810 | | | | 2,713,346 | |
Small Cap Value Fund (3.0%) | | | | | | | | | | | 206,537 | | | | 2,833,687 | |
| | | | | | | | | | | | | | | | |
TOTAL COMMON STOCKS
(Cost: $85,477,346) | | | | | | | | | | | | | | | 95,363,537 | |
| | | | | | | | | | | | | | | | |
| | | | |
| | | Rate(%) | | | Maturity | | | Face Amount | | | Value | |
TEMPORARY CASH INVESTMENT (0.2%) | | | | | | | | | | | | | | | | |
Citibank, New York Time Deposit | | | 4.58 | | | | 07/01/24 | | | $ | 161,465 | | | $ | 161,465 | |
| | | | | | | | | | | | | | | | |
TOTAL TEMPORARY CASH INVESTMENT
(Cost: $161,465) | | | | 161,465 | |
| | | | | | | | | | | | | | | | |
TOTAL INVESTMENTS
(Cost: $85,638,811) 100.0% | | | | 95,525,002 | |
| | | | | | | | | | | | | | | | |
OTHER NET ASSETS -0.0% (1) | | | | (33,431 | ) |
| | | | | | | | | | | | | | | | |
NET ASSETS 100.0% | | | $ | 95,491,571 | |
| | | | | | | | | | | | | | | | |
FOOTNOTES TO PORTFOLIO OF INVESTMENTS IN SECURITIES
| (1) | Percentage is less than 0.05%. |
The accompanying notes are an integral part of these portfolio schedules.
77
MoA FUNDS — CONSERVATIVE ALLOCATION FUND
PORTFOLIO OF INVESTMENTS IN SECURITIES
June 30, 2024 (Unaudited)
| | | | | | | | |
| | | Shares | | | Value | |
| COMMON STOCKS (100.0%): | | | | | | |
| AFFILIATED MUTUAL FUNDS (100.0%) | | | | | | |
MoA Funds | | | | | | | | |
Core Bond Fund (31.8%) | | | 4,060,733 | | | $ | 49,500,331 | |
Equity Index Fund (26.8%) | | | 623,625 | | | | 41,651,931 | |
Intermediate Bond Fund (27.1%) | | | 4,407,728 | | | | 42,049,728 | |
International Fund (5.2%) | | | 943,074 | | | | 8,129,301 | |
Mid Cap Equity Index Fund (5.1%) | | | 374,149 | | | | 7,935,691 | |
Money Market Fund (4.0%) | | | 518,913 | | | | 6,177,659 | |
| | | | | | | | |
TOTAL INVESTMENTS
(Cost: $154,768,772) 100.0% | | | | | | | 155,444,641 | |
| | | | | | | | |
OTHER NET ASSETS -0.0% (1) | | | | | | | (23,090 | ) |
| | | | | | | | |
NET ASSETS 100.0% | | | | | | $ | 155,421,551 | |
| | | | | | | | |
FOOTNOTES TO PORTFOLIO OF INVESTMENTS IN SECURITIES
| (1) | Percentage is less than 0.05%. |
MoA FUNDS — MODERATE ALLOCATION FUND
PORTFOLIO OF INVESTMENTS IN SECURITIES
June 30, 2024 (Unaudited)
| | | | | | | | |
| | | Shares | | | Value | |
| COMMON STOCKS (100.0%): | | | | | | |
| AFFILIATED MUTUAL FUNDS (100.0%) | | | | | | |
MoA Funds | | | | | | | | |
Core Bond Fund (23.8%) | | | 7,936,497 | | | $ | 96,745,898 | |
Equity Index Fund (37.0%) | | | 2,248,770 | | | | 150,195,346 | |
Intermediate Bond Fund (14.2%) | | | 6,053,006 | | | | 57,745,673 | |
International Fund (13.0%) | | | 6,148,922 | | | | 53,003,705 | |
Mid Cap Equity Index Fund (12.0%) | | | 2,306,291 | | | | 48,916,431 | |
| | | | | | | | |
TOTAL INVESTMENTS
(Cost: $377,812,983) 100.0% | | | | | | | 406,607,053 | |
| | | | | | | | |
OTHER NET ASSETS -0.0% (1) | | | | | | | (41,789 | ) |
| | | | | | | | |
NET ASSETS 100.0% | | | | | | $ | 406,565,264 | |
| | | | | | | | |
FOOTNOTES TO PORTFOLIO OF INVESTMENTS IN SECURITIES
| (1) | Percentage is less than 0.05%. |
The accompanying notes are an integral part of these portfolio schedules.
78
MoA FUNDS — AGGRESSIVE ALLOCATION FUND
PORTFOLIO OF INVESTMENTS IN SECURITIES
June 30, 2024 (Unaudited)
| | | | | | | | |
| | | Shares | | | Value | |
| COMMON STOCKS (100.0%): | | | | | | |
| AFFILIATED MUTUAL FUNDS (100.0%) | | | | | | |
MoA Funds | | | | | | | | |
Core Bond Fund (16.2%) | | | 4,541,286 | | | $ | 55,358,278 | |
Equity Index Fund (36.8%) | | | 1,879,603 | | | | 125,538,697 | |
International Fund (18.5%) | | | 7,302,133 | | | | 62,944,386 | |
Mid Cap Equity Index Fund (19.7%) | | | 3,170,959 | | | | 67,256,039 | |
Small Cap Growth Fund (4.1%) | | | 1,057,231 | | | | 13,870,876 | |
Small Cap Value Fund (4.7%) | | | 1,162,919 | | | | 15,955,244 | |
| | | | | | | | |
TOTAL INVESTMENTS
(Cost: $308,034,200) 100.0% | | | | | | | 340,923,520 | |
| | | | | | | | |
OTHER NET ASSETS -0.0% (1) | | | | | | | (38,959 | ) |
| | | | | | | | |
NET ASSETS 100.0% | | | | | | $ | 340,884,561 | |
| | | | | | | | |
FOOTNOTES TO PORTFOLIO OF INVESTMENTS IN SECURITIES
| (1) | Percentage is less than 0.05%. |
MoA FUNDS — RETIREMENT INCOME FUND
PORTFOLIO OF INVESTMENTS IN SECURITIES
June 30, 2024 (Unaudited)
| | | | | | | | |
| | | Shares | | | Value | |
| COMMON STOCKS (100.0%): | | | | | | |
| AFFILIATED MUTUAL FUNDS (100.0%) | | | | | | |
MoA Funds | | | | | | | | |
Core Bond Fund (33.5%) | | | 5,467,568 | | | $ | 66,649,657 | |
Equity Index Fund (21.9%) | | | 652,282 | | | | 43,565,901 | |
Intermediate Bond Fund (29.9%) | | | 6,236,981 | | | | 59,500,797 | |
International Fund (5.0%) | | | 1,148,788 | | | | 9,902,549 | |
Mid Cap Equity Index Fund (4.1%) | | | 385,615 | | | | 8,178,888 | |
Mid Cap Value Fund (0.2%) | | | 22,783 | | | | 381,620 | |
Money Market Fund (5.4%) | | | 913,333 | | | | 10,873,235 | |
| | | | | | | | |
TOTAL INVESTMENTS
(Cost: $198,893,879) 100.0% | | | | | | | 199,052,647 | |
| | | | | | | | |
OTHER NET ASSETS -0.0% (1) | | | | | | | (64,136 | ) |
| | | | | | | | |
NET ASSETS 100.0% | | | | | | $ | 198,988,511 | |
| | | | | | | | |
FOOTNOTES TO PORTFOLIO OF INVESTMENTS IN SECURITIES
| (1) | Percentage is less than 0.05%. |
The accompanying notes are an integral part of these portfolio schedules.
79
MoA FUNDS — MONEY MARKET FUND
PORTFOLIO OF INVESTMENTS IN SECURITIES
June 30, 2024 (Unaudited)
| | | | | | | | | | | | | | | | | | | | |
| | | Rating* | | | Rate(%) | | | Maturity | | | Face Amount | | | Value | |
| SHORT-TERM DEBT SECURITIES (100.0%): | | | | | | | | | | | | | | | |
| U.S. GOVERNMENT (54.8%) | | | | | | | | | | |
U.S. Treasury Bill | | | A-1+ | | | | 5.28 | | | | 08/20/24 | | | $ | 46,000,000 | | | $ | 45,665,141 | |
U.S. Treasury Bill | | | A-1+ | | | | 5.28 | | | | 08/29/24 | | | | 4,400,000 | | | | 4,362,072 | |
U.S. Treasury Bill | | | A-1+ | | | | 5.30 | | | | 07/09/24 | | | | 21,500,000 | | | | 21,474,880 | |
U.S. Treasury Bill | | | A-1+ | | | | 5.30 | | | | 07/11/24 | | | | 27,000,000 | | | | 26,960,588 | |
U.S. Treasury Bill | | | A-1+ | | | | 5.30 | | | | 08/06/24 | | | | 21,500,000 | | | | 21,387,004 | |
U.S. Treasury Bill | | | A-1+ | | | | 5.30 | | | | 08/13/24 | | | | 56,500,000 | | | | 56,145,506 | |
U.S. Treasury Bill | | | A-1+ | | | | 5.31 | | | | 07/02/24 | | | | 7,800,000 | | | | 7,798,858 | |
U.S. Treasury Bill | | | A-1+ | | | | 5.31 | | | | 07/16/24 | | | | 43,800,000 | | | | 43,703,938 | |
U.S. Treasury Bill | | | A-1+ | | | | 5.31 | | | | 07/23/24 | | | | 27,100,000 | | | | 27,012,725 | |
U.S. Treasury Bill | | | A-1+ | | | | 5.31 | | | | 07/25/24 | | | | 28,000,000 | | | | 27,901,726 | |
U.S. Treasury Bill | | | A-1+ | | | | 5.32 | | | | 07/30/24 | | | | 1,300,000 | | | | 1,294,478 | |
| | | | | | | | | | | | | | | | | | | | |
| | | | | | | | | | | | | | | | | | | 283,706,916 | |
| | | | | | | | | | | | | | | | | | | | |
| COMMERCIAL PAPER (45.2%) | | | | | | | | | | | | | | | |
Chevron Corp.† | | | A-1+ | | | | 5.33 | | | | 07/09/24 | | | | 19,000,000 | | | | 18,977,538 | |
Cisco Systems, Inc.† | | | A-1+ | | | | 5.35 | | | | 07/29/24 | | | | 5,000,000 | | | | 4,979,311 | |
Cisco Systems, Inc.† | | | A-1+ | | | | 5.37 | | | | 07/30/24 | | | | 4,000,000 | | | | 3,982,858 | |
Coca-Cola Co.† | | | A-1 | | | | 5.33 | | | | 07/11/24 | | | | 5,850,000 | | | | 5,841,387 | |
Cummins, Inc.† | | | A-1 | | | | 5.41 | | | | 07/12/24 | | | | 20,000,000 | | | | 19,967,183 | |
Eli Lilly & Co.† | | | A-1 | | | | 5.35 | | | | 08/05/24 | | | | 20,000,000 | | | | 19,896,556 | |
Emerson Electric Co.† | | | A-1 | | | | 5.35 | | | | 07/08/24 | | | | 5,000,000 | | | | 4,994,828 | |
Emerson Electric Co.† | | | A-1 | | | | 5.35 | | | | 07/23/24 | | | | 15,000,000 | | | | 14,951,264 | |
Home Depot, Inc.† | | | A-1 | | | | 5.40 | | | | 07/23/24 | | | | 20,000,000 | | | | 19,934,367 | |
Illinois Tool Works, Inc.† | | | A-1 | | | | 5.35 | | | | 07/24/24 | | | | 20,000,000 | | | | 19,932,022 | |
John Deere Capital Corp.† | | | A-1 | | | | 5.36 | | | | 07/09/24 | | | | 20,500,000 | | | | 20,475,764 | |
Johnson & Johnson† | | | A-1+ | | | | 5.35 | | | | 07/01/24 | | | | 20,000,000 | | | | 20,000,000 | |
Microsoft Corp.† | | | A-1+ | | | | 5.35 | | | | 07/19/24 | | | | 20,000,000 | | | | 19,947,000 | |
Novartis Finance Corp.† | | | A-1+ | | | | 5.34 | | | | 07/29/24 | | | | 20,000,000 | | | | 19,917,400 | |
Walmart, Inc.† | | | A-1+ | | | | 5.30 | | | | 07/05/24 | | | | 13,750,000 | | | | 13,741,918 | |
Walmart, Inc.† | | | A-1+ | | | | 5.31 | | | | 07/08/24 | | | | 6,250,000 | | | | 6,243,559 | |
| | | | | | | | | | | | | | | | | | | | |
| | | | | | | | | | | | | | | | | | | 233,782,955 | |
| | | | | | | | | | | | | | | | | | | | |
TOTAL SHORT-TERM DEBT SECURITIES
(Cost: $517,490,035) | | | | 517,489,871 | |
| | | | | | | | | | | | | | | | | | | | |
| | | | | |
| | | | | | Rate(%) | | | Maturity | | | Face Amount | | | Value | |
| TEMPORARY CASH INVESTMENT (0.0%) (1) | | | | | | | | | | | | | | | |
JP Morgan Chase, New York Time Deposit | | | | | | | 4.58 | | | | 07/01/24 | | | $ | 82,783 | | | $ | 82,783 | |
| | | | | | | | | | | | | | | | | | | | |
TOTAL TEMPORARY CASH INVESTMENT
(Cost: $82,783) | | | | 82,783 | |
| | | | | | | | | | | | | | | | | | | | |
TOTAL INVESTMENTS
(Cost: $517,572,818) 100.0% | | | | 517,572,654 | |
| | | | | | | | | | | | | | | | | | | | |
OTHER NET ASSETS -0.0% (1) | | | | (113,295 | ) |
| | | | | | | | | | | | | | | | | | | | |
NET ASSETS 100.0% | | | $ | 517,459,359 | |
| | | | | | | | | | | | | | | | | | | | |
FOOTNOTES TO PORTFOLIO OF INVESTMENTS IN SECURITIES
| * | Ratings as per Standard & Poor’s Corporation (unaudited). |
| † | Security is exempt from registration under Rule 144A of the Securities Act of 1933. These securities may be resold in transactions exempt from registration, normally to qualified institutional buyers. At June 30, 2024, the aggregate values of these securities amounts to $233,782,955 and represents 45.2% of net assets. |
| (1) | Percentage is less than 0.05%. |
The accompanying notes are an integral part of these portfolio schedules.
80
MoA FUNDS — INTERMEDIATE BOND FUND
PORTFOLIO OF INVESTMENTS IN SECURITIES
June 30, 2024 (Unaudited)
| | | | | | | | | | | | | | |
| | | Rating* | | Rate(%) | | Maturity | | Face Amount | | | Value | |
| LONG-TERM DEBT SECURITIES (99.1%): | | | | | | | | | | | | |
| U.S. GOVERNMENT (54.2%) | | | | | | | | |
U.S. Treasury Note | | AA+ | | 0.50 | | 06/30/27 | | $ | 16,750,000 | | | $ | 14,885,254 | |
U.S. Treasury Note | | AA+ | | 0.63 | | 08/15/30 | | | 44,500,000 | | | | 35,662,578 | |
U.S. Treasury Note | | AA+ | | 1.50 | | 11/30/28 | | | 10,800,000 | | | | 9,558,844 | |
U.S. Treasury Note | | AA+ | | 1.63 | | 05/15/26 | | | 19,475,000 | | | | 18,386,378 | |
U.S. Treasury Note | | AA+ | | 1.75 | | 01/31/29 | | | 9,980,000 | | | | 8,900,912 | |
U.S. Treasury Note | | AA+ | | 2.13 | | 05/31/26 | | | 23,000,000 | | | | 21,903,008 | |
U.S. Treasury Note | | AA+ | | 2.38 | | 04/30/26 | | | 12,680,000 | | | | 12,149,520 | |
U.S. Treasury Note | | AA+ | | 2.38 | | 05/15/29 | | | 13,650,000 | | | | 12,465,223 | |
U.S. Treasury Note | | AA+ | | 2.63 | | 05/31/27 | | | 54,315,000 | | | | 51,510,140 | |
U.S. Treasury Note | | AA+ | | 2.75 | | 07/31/27 | | | 25,600,000 | | | | 24,308,000 | |
U.S. Treasury Note | | AA+ | | 3.25 | | 06/30/27 | | | 12,255,000 | | | | 11,825,118 | |
U.S. Treasury Note | | AA+ | | 3.38 | | 05/15/33 | | | 6,010,000 | | | | 5,570,519 | |
U.S. Treasury Note | | AA+ | | 3.50 | | 04/30/28 | | | 30,300,000 | | | | 29,308,149 | |
U.S. Treasury Note | | AA+ | | 3.63 | | 03/31/28 | | | 35,000,000 | | | | 34,015,625 | |
U.S. Treasury Note | | AA+ | | 3.63 | | 03/31/30 | | | 5,700,000 | | | | 5,488,922 | |
U.S. Treasury Note | | AA+ | | 3.75 | | 05/31/30 | | | 2,800,000 | | | | 2,711,844 | |
U.S. Treasury Note | | AA+ | | 3.88 | | 11/30/27 | | | 30,000,000 | | | | 29,428,125 | |
U.S. Treasury Note | | AA+ | | 3.88 | | 08/15/33 | | | 31,420,000 | | | | 30,231,931 | |
U.S. Treasury Note | | AA+ | | 4.13 | | 07/31/28 | | | 26,100,000 | | | | 25,824,727 | |
U.S. Treasury Note | | AA+ | | 4.13 | | 11/15/32 | | | 27,660,000 | | | | 27,197,559 | |
U.S. Treasury Note | | AA+ | | 4.38 | | 11/30/28 | | | 27,400,000 | | | | 27,400,000 | |
U.S. Treasury Note | | AA+ | | 4.38 | | 11/30/30 | | | 7,500,000 | | | | 7,507,617 | |
U.S. Treasury Note | | AA+ | | 4.38 | | 05/15/34 | | | 11,300,000 | | | | 11,303,531 | |
U.S. Treasury Note | | AA+ | | 4.50 | | 11/15/33 | | | 2,500,000 | | | | 2,523,438 | |
U.S. Treasury Note | | AA+ | | 4.63 | | 04/30/31 | | | 20,000,000 | | | | 20,325,000 | |
U.S. Treasury Note | | AA+ | | 4.63 | | 05/31/31 | | | 7,350,000 | | | | 7,469,438 | |
U.S. Treasury Note | | AA+ | | 5.00 | | 09/30/25 | | | 17,000,000 | | | | 16,993,359 | |
| | | | | | | | | | | | | | |
| | | | | | | | | | | | | 504,854,759 | |
| | | | | | | | | | | | | | |
| U.S. GOVERNMENT AGENCIES (2.3%) | | | | | | | | |
| NON-MORTGAGE-BACKED OBLIGATIONS (2.3%) | | | | | | | | |
FFCB | | AA+ | | 5.95 | | 05/24/34 | | | 2,700,000 | | | | 2,690,825 | |
FHLB | | AA+ | | 5.65 | | 05/21/29 | | | 2,075,000 | | | | 2,066,140 | |
FHLB | | AA+ | | 5.70 | | 05/01/29 | | | 1,000,000 | | | | 997,717 | |
FHLB | | AA+ | | 5.78 | | 04/22/31 | | | 2,970,000 | | | | 2,956,939 | |
FHLMC | | AA+ | | 4.88 | | 07/24/26 | | | 2,900,000 | | | | 2,884,096 | |
FHLMC | | AA+ | | 5.00 | | 03/14/29 | | | 3,000,000 | | | | 2,962,105 | |
FHLMC | | AA+ | | 5.60 | | 04/17/29 | | | 4,303,000 | | | | 4,292,289 | |
FHLMC | | AA+ | | 5.68 | | 04/30/29 | | | 1,957,000 | | | | 1,953,912 | |
| | | | | | | | | | | | | | |
| | | | | | | | | | | | | 20,804,023 | |
| | | | | | | | | | | | | | |
| CORPORATE DEBT (42.6%) | | | | | | | | |
| COMMUNICATION SERVICES (2.6%) | | | | | | | | |
AT&T, Inc. | | BBB | | 1.70 | | 03/25/26 | | | 1,200,000 | | | | 1,126,439 | |
AT&T, Inc. | | BBB | | 2.75 | | 06/01/31 | | | 4,050,000 | | | | 3,468,609 | |
Comcast Corp. | | A- | | 2.35 | | 01/15/27 | | | 4,100,000 | | | | 3,839,482 | |
Sprint LLC | | BBB- | | 7.63 | | 03/01/26 | | | 3,605,000 | | | | 3,704,101 | |
T-Mobile USA, Inc. | | BBB | | 3.38 | | 04/15/29 | | | 2,295,000 | | | | 2,119,489 | |
T-Mobile USA, Inc. | | BBB | | 3.75 | | 04/15/27 | | | 1,840,000 | | | | 1,768,736 | |
Verizon Communications, Inc. | | BBB+ | | 4.02 | | 12/03/29 | | | 3,200,000 | | | | 3,023,800 | |
Verizon Communications, Inc. | | BBB+ | | 4.13 | | 03/16/27 | | | 980,000 | | | | 955,287 | |
Warnermedia Hldgs., Inc. | | BBB- | | 3.76 | | 03/15/27 | | | 2,830,000 | | | | 2,684,363 | |
Warnermedia Hldgs., Inc. | | BBB- | | 6.41 | | 03/15/26 | | | 1,500,000 | | | | 1,499,676 | |
| | | | | | | | | | | | | | |
| | | | | | | | | | | | | 24,189,982 | |
| | | | | | | | | | | | | | |
| CONSUMER DISCRETIONARY (2.6%) | | | | | | | | | | |
Best Buy Co., Inc. | | BBB+ | | 1.95 | | 10/01/30 | | | 1,735,000 | | | | 1,437,792 | |
Booking Hldgs., Inc. | | A- | | 3.65 | | 03/15/25 | | | 1,827,000 | | | | 1,801,346 | |
The accompanying notes are an integral part of these portfolio schedules.
81
MoA FUNDS — INTERMEDIATE BOND FUND
PORTFOLIO OF INVESTMENTS IN SECURITIES (Continued)
June 30, 2024 (Unaudited)
| | | | | | | | | | | | | | |
| | | Rating* | | Rate(%) | | Maturity | | Face Amount | | | Value | |
| LONG-TERM DEBT SECURITIES (CONTINUED): | | | | | | | | | | | | |
| CORPORATE DEBT (CONTINUED) | | | | | | | | | | | | |
| CONSUMER DISCRETIONARY (CONTINUED) | | | | | | | | | | |
Expedia Group, Inc. | | BBB | | 5.00 | | 02/15/26 | | $ | 3,388,000 | | | $ | 3,361,651 | |
Ford Motor Credit Co. LLC | | BBB- | | 2.70 | | 08/10/26 | | | 2,411,000 | | | | 2,264,955 | |
General Motors Financial Co., Inc. | | BBB | | 5.75 | | 02/08/31 | | | 4,315,000 | | | | 4,326,099 | |
Lowe’s Cos., Inc. | | BBB+ | | 4.50 | | 04/15/30 | | | 2,340,000 | | | | 2,271,389 | |
Mattel, Inc.† | | BBB | | 3.38 | | 04/01/26 | | | 2,814,000 | | | | 2,702,700 | |
Tapestry, Inc. | | BBB | | 7.00 | | 11/27/26 | | | 1,517,000 | | | | 1,559,115 | |
Tapestry, Inc. | | BBB | | 7.05 | | 11/27/25 | | | 1,310,000 | | | | 1,332,068 | |
Toll Brothers Finance Corp. | | BBB- | | 4.88 | | 03/15/27 | | | 3,731,000 | | | | 3,675,610 | |
| | | | | | | | | | | | | | |
| | | | | | | | | | | | | 24,732,725 | |
| | | | | | | | | | | | | | |
| CONSUMER STAPLES (1.2%) | | | | | | | | | | |
Bunge Ltd. Finance Corp. | | BBB+ | | 3.25 | | 08/15/26 | | | 3,900,000 | | | | 3,732,425 | |
Constellation Brands, Inc. | | BBB | | 4.80 | | 01/15/29 | | | 2,875,000 | | | | 2,835,456 | |
J M Smucker Co. | | BBB | | 5.90 | | 11/15/28 | | | 3,300,000 | | | | 3,398,945 | |
Keurig Dr Pepper, Inc. | | BBB | | 5.10 | | 03/15/27 | | | 1,450,000 | | | | 1,450,401 | |
| | | | | | | | | | | | | | |
| | | | | | | | | | | | | 11,417,227 | |
| | | | | | | | | | | | | | |
| ENERGY (3.1%) | | | | | | | | | | |
Energy Transfer LP | | BBB | | 5.25 | | 07/01/29 | | | 1,465,000 | | | | 1,456,360 | |
Energy Transfer LP | | BBB | | 5.55 | | 02/15/28 | | | 2,000,000 | | | | 2,016,319 | |
Energy Transfer LP | | BBB | | 6.05 | | 12/01/26 | | | 2,000,000 | | | | 2,026,843 | |
EQT Corp.† | | BBB- | | 3.13 | | 05/15/26 | | | 2,475,000 | | | | 2,364,675 | |
EQT Corp. | | BBB- | | 3.90 | | 10/01/27 | | | 875,000 | | | | 836,173 | |
HF Sinclair Corp. | | BBB- | | 5.88 | | 04/01/26 | | | 1,628,000 | | | | 1,631,146 | |
HF Sinclair Corp.† | | BBB- | | 6.38 | | 04/15/27 | | | 3,000,000 | | | | 3,007,333 | |
Pioneer Natural Resources Co. | | AA- | | 5.10 | | 03/29/26 | | | 4,720,000 | | | | 4,711,432 | |
Targa Resources Partners LP/Targa Resources Partners Finance Corp. | | BBB | | 5.50 | | 03/01/30 | | | 1,480,000 | | | | 1,470,828 | |
Targa Resources Partners LP/Targa Resources Partners Finance Corp. | | BBB | | 6.88 | | 01/15/29 | | | 2,250,000 | | | | 2,307,671 | |
Western Midstream Operating LP | | BBB- | | 4.65 | | 07/01/26 | | | 2,110,000 | | | | 2,069,068 | |
Williams Cos., Inc. | | BBB | | 5.40 | | 03/02/26 | | | 4,584,000 | | | | 4,579,886 | |
| | | | | | | | | | | | | | |
| | | | | | | | | | | | | 28,477,734 | |
| | | | | | | | | | | | | | |
| FINANCIALS (16.3%) | | | | | | | | | | |
Aflac, Inc. | | A- | | 1.13 | | 03/15/26 | | | 2,075,000 | | | | 1,938,081 | |
Alleghany Corp. | | AA | | 3.63 | | 05/15/30 | | | 2,200,000 | | | | 2,046,730 | |
American Express Co. | | BBB+ | | 5.39 | | 07/28/27 | | | 3,085,000 | | | | 3,088,511 | |
American Express Co. | | BBB+ | | 5.53 | | 04/25/30 | | | 2,270,000 | | | | 2,295,939 | |
Aon North America, Inc. | | A- | | 5.15 | | 03/01/29 | | | 5,000,000 | | | | 4,986,610 | |
Bank of America Corp. | | A- | | 2.97 | | 02/04/33 | | | 3,130,000 | | | | 2,649,720 | |
Bank of America Corp. | | A- | | 3.42 | | 12/20/28 | | | 12,535,000 | | | | 11,784,237 | |
Bank of New York Mellon Corp. | | A | | 4.41 | | 07/24/26 | | | 6,500,000 | | | | 6,426,002 | |
BankUnited, Inc. | | BBB | | 4.88 | | 11/17/25 | | | 3,470,000 | | | | 3,406,709 | |
Barclays PLC | | BBB+ | | 5.83 | | 05/09/27 | | | 2,000,000 | | | | 2,002,072 | |
Bristol-Myers Squibb Co. | | A | | 4.90 | | 02/22/29 | | | 5,000,000 | | | | 4,989,660 | |
Capital One Financial Corp. | | BBB | | 4.93 | | 05/10/28 | | | 1,475,000 | | | | 1,455,826 | |
Capital One Financial Corp. | | BBB | | 5.70 | | 02/01/30 | | | 3,000,000 | | | | 3,012,103 | |
Citigroup, Inc. | | BBB+ | | 3.98 | | 03/20/30 | | | 9,675,000 | | | | 9,128,236 | |
Citizens Bank N.A. | | A- | | 5.28 | | 01/26/26 | | | 2,300,000 | | | | 2,286,781 | |
Citizens Financial Group, Inc. | | BBB+ | | 5.84 | | 01/23/30 | | | 2,250,000 | | | | 2,242,489 | |
Discover Financial Svcs. | | BBB- | | 4.10 | | 02/09/27 | | | 4,895,000 | | | | 4,705,002 | |
Fifth Third Bancorp | | BBB+ | | 6.34 | | 07/27/29 | | | 2,200,000 | | | | 2,255,866 | |
Fifth Third Bank N.A. | | A- | | 5.85 | | 10/27/25 | | | 1,600,000 | | | | 1,598,267 | |
Goldman Sachs Group, Inc. | | BBB+ | | 2.60 | | 02/07/30 | | | 1,000,000 | | | | 876,192 | |
Goldman Sachs Group, Inc. | | BBB+ | | 2.64 | | 02/24/28 | | | 2,935,000 | | | | 2,737,303 | |
Goldman Sachs Group, Inc. | | BBB+ | | 3.85 | | 01/26/27 | | | 5,620,000 | | | | 5,431,371 | |
JPMorgan Chase & Co. | | A- | | 1.47 | | 09/22/27 | | | 2,620,000 | | | | 2,405,816 | |
The accompanying notes are an integral part of these portfolio schedules.
82
MoA FUNDS — INTERMEDIATE BOND FUND
PORTFOLIO OF INVESTMENTS IN SECURITIES (Continued)
June 30, 2024 (Unaudited)
| | | | | | | | | | | | | | |
| | | Rating* | | Rate(%) | | Maturity | | Face Amount | | | Value | |
| LONG-TERM DEBT SECURITIES (CONTINUED): | | | | | | | | | | | | |
| CORPORATE DEBT (CONTINUED) | | | | | | | | | | | | |
| FINANCIALS (CONTINUED) | | | | | | | | | | |
JPMorgan Chase & Co. | | A- | | 3.51 | | 01/23/29 | | $ | 5,030,000 | | | $ | 4,756,589 | |
JPMorgan Chase & Co. | | A- | | 5.35 | | 06/01/34 | | | 2,800,000 | | | | 2,787,763 | |
JPMorgan Chase & Co. | | BBB+ | | 5.72 | | 09/14/33 | | | 800,000 | | | | 815,801 | |
KeyBank N.A. | | BBB+ | | 5.85 | | 11/15/27 | | | 1,000,000 | | | | 996,531 | |
KeyCorp | | BBB | | 2.25 | | 04/06/27 | | | 3,073,000 | | | | 2,792,054 | |
KeyCorp | | BBB | | 2.55 | | 10/01/29 | | | 1,200,000 | | | | 1,018,116 | |
Mercury General Corp. | | BBB- | | 4.40 | | 03/15/27 | | | 3,030,000 | | | | 2,923,242 | |
Morgan Stanley | | A- | | 4.43 | | 01/23/30 | | | 2,425,000 | | | | 2,344,330 | |
Morgan Stanley | | A- | | 5.12 | | 02/01/29 | | | 4,670,000 | | | | 4,651,641 | |
Morgan Stanley | | A- | | 5.45 | | 07/20/29 | | | 3,920,000 | | | | 3,943,272 | |
Nasdaq, Inc. | | BBB | | 5.65 | | 06/28/25 | | | 2,000,000 | | | | 2,001,072 | |
PNC Financial Svcs. Group, Inc. | | A- | | 5.81 | | 06/12/26 | | | 4,230,000 | | | | 4,234,400 | |
PNC Financial Svcs. Group, Inc. | | A- | | 6.62 | | 10/20/27 | | | 2,200,000 | | | | 2,253,021 | |
Progressive Corp. | | A | | 2.50 | | 03/15/27 | | | 1,950,000 | | | | 1,825,950 | |
Synchrony Financial | | BBB- | | 3.70 | | 08/04/26 | | | 4,290,000 | | | | 4,092,448 | |
Truist Financial Corp. | | A- | | 4.87 | | 01/26/29 | | | 5,060,000 | | | | 4,963,217 | |
US Bancorp | | A | | 4.65 | | 02/01/29 | | | 6,440,000 | | | | 6,304,910 | |
US Bancorp | | A | | 5.78 | | 06/12/29 | | | 1,340,000 | | | | 1,360,462 | |
Voya Financial, Inc. | | BBB+ | | 3.65 | | 06/15/26 | | | 1,945,000 | | | | 1,877,275 | |
Wells Fargo & Co. | | BBB+ | | 3.35 | | 03/02/33 | | | 3,390,000 | | | | 2,942,864 | |
Wells Fargo & Co. | | BBB+ | | 3.53 | | 03/24/28 | | | 3,660,000 | | | | 3,490,356 | |
Wells Fargo & Co. | | BBB+ | | 5.20 | | 01/23/30 | | | 3,000,000 | | | | 2,987,109 | |
Zions Bancorp N.A. | | BBB | | 3.25 | | 10/29/29 | | | 3,319,000 | | | | 2,771,072 | |
| | | | | | | | | | | | | | |
| | | | | | | | | | | | | 151,883,018 | |
| | | | | | | | | | | | | | |
| HEALTH CARE (2.9%) | | | | | | | | | | | | |
AbbVie, Inc. | | A- | | 4.25 | | 11/14/28 | | | 4,046,000 | | | | 3,948,870 | |
AbbVie, Inc. | | A- | | 4.80 | | 03/15/29 | | | 3,500,000 | | | | 3,479,609 | |
Amgen, Inc. | | BBB+ | | 5.15 | | 03/02/28 | | | 4,775,000 | | | | 4,774,600 | |
Baxter International, Inc. | | BBB | | 1.92 | | 02/01/27 | | | 4,000,000 | | | | 3,665,644 | |
CVS Health Corp. | | BBB | | 1.30 | | 08/21/27 | | | 2,331,000 | | | | 2,064,885 | |
CVS Health Corp. | | BBB | | 5.40 | | 06/01/29 | | | 2,500,000 | | | | 2,502,740 | |
Elevance Health, Inc. | | A | | 2.88 | | 09/15/29 | | | 2,900,000 | | | | 2,608,576 | |
Thermo Fisher Scientific, Inc. | | A- | | 1.75 | | 10/15/28 | | | 4,410,000 | | | | 3,890,421 | |
| | | | | | | | | | | | | | |
| | | | | | | | | | | | | 26,935,345 | |
| | | | | | | | | | | | | | |
| INDUSTRIALS (2.3%) | | | | | | | | | | | | |
AutoZone, Inc. | | BBB | | 6.25 | | 11/01/28 | | | 3,500,000 | | | | 3,650,815 | |
Boeing Co. | | BBB- | | 2.20 | | 02/04/26 | | | 3,300,000 | | | | 3,104,027 | |
Boeing Co. | | BBB- | | 2.75 | | 02/01/26 | | | 490,000 | | | | 465,307 | |
L3Harris Technologies, Inc. | | BBB | | 5.40 | | 01/15/27 | | | 3,400,000 | | | | 3,413,218 | |
Lennox International, Inc. | | BBB | | 1.70 | | 08/01/27 | | | 3,796,000 | | | | 3,412,274 | |
Owens Corning | | BBB | | 5.50 | | 06/15/27 | | | 2,000,000 | | | | 2,017,992 | |
Stanley Black & Decker, Inc. | | A- | | 2.30 | | 02/24/25 | | | 4,900,000 | | | | 4,789,539 | |
Verisk Analytics, Inc. | | BBB | | 4.00 | | 06/15/25 | | | 297,000 | | | | 292,067 | |
| | | | | | | | | | | | | | |
| | | | | | | | | | | | | 21,145,239 | |
| | | | | | | | | | | | | | |
| INFORMATION TECHNOLOGY (3.2%) | | | | | | | | | | | | |
Broadcom Corp./Broadcom Cayman Finance Ltd. | | BBB | | 3.88 | | 01/15/27 | | | 4,545,000 | | | | 4,399,427 | |
Flex Ltd. | | BBB- | | 3.75 | | 02/01/26 | | | 3,008,000 | | | | 2,918,782 | |
Intel Corp. | | A- | | 4.88 | | 02/10/28 | | | 3,225,000 | | | | 3,212,804 | |
Jabil, Inc. | | BBB- | | 1.70 | | 04/15/26 | | | 3,500,000 | | | | 3,269,938 | |
Kyndryl Hldgs., Inc. | | BBB- | | 2.05 | | 10/15/26 | | | 3,500,000 | | | | 3,226,809 | |
Micron Technology, Inc. | | BBB- | | 4.98 | | 02/06/26 | | | 2,500,000 | | | | 2,479,732 | |
Oracle Corp. | | BBB | | 2.80 | | 04/01/27 | | | 2,115,000 | | | | 1,986,002 | |
Oracle Corp. | | BBB | | 2.88 | | 03/25/31 | | | 2,860,000 | | | | 2,470,560 | |
Teledyne Technologies, Inc. | | BBB | | 2.75 | | 04/01/31 | | | 2,375,000 | | | | 2,030,638 | |
The accompanying notes are an integral part of these portfolio schedules.
83
MoA FUNDS — INTERMEDIATE BOND FUND
PORTFOLIO OF INVESTMENTS IN SECURITIES (Continued)
June 30, 2024 (Unaudited)
| | | | | | | | | | | | | | |
| | | Rating* | | Rate(%) | | Maturity | | Face Amount | | | Value | |
| LONG-TERM DEBT SECURITIES (CONTINUED): | | | | | | | | | | | | |
| CORPORATE DEBT (CONTINUED) | | | | | | | | | | | | |
| INFORMATION TECHNOLOGY (CONTINUED) | | | | | | | | | | | | |
VMware LLC | | BBB | | 1.40 | | 08/15/26 | | $ | 3,960,000 | | | $ | 3,645,918 | |
| | | | | | | | | | | | | | |
| | | | | | | | | | | | | 29,640,610 | |
| | | | | | | | | | | | | | |
| MATERIALS (1.4%) | | | | | | | | | | | | |
Celanese US Hldgs. LLC | | BBB- | | 6.17 | | 07/15/27 | | | 3,000,000 | | | | 3,044,748 | |
International Flavors & Fragrances, Inc.† | | BBB- | | 1.83 | | 10/15/27 | | | 4,000,000 | | | | 3,572,952 | |
Nucor Corp. | | A- | | 3.95 | | 05/23/25 | | | 1,950,000 | | | | 1,923,469 | |
Sherwin-Williams Co. | | BBB | | 3.95 | | 01/15/26 | | | 4,500,000 | | | | 4,405,179 | |
| | | | | | | | | | | | | | |
| | | | | | | | | | | | | 12,946,348 | |
| | | | | | | | | | | | | | |
| REAL ESTATE (4.1%) | | | | | | | | | | | | |
Alexandria Real Estate Equities, Inc. | | BBB+ | | 4.50 | | 07/30/29 | | | 4,700,000 | | | | 4,531,668 | |
Boston Properties LP | | BBB | | 3.25 | | 01/30/31 | | | 3,100,000 | | | | 2,621,164 | |
Boston Properties LP | | BBB | | 6.50 | | 01/15/34 | | | 1,945,000 | | | | 1,981,435 | |
Digital Realty Trust LP | | BBB | | 5.55 | | 01/15/28 | | | 3,160,000 | | | | 3,188,304 | |
Equinix, Inc. | | BBB | | 1.45 | | 05/15/26 | | | 2,295,000 | | | | 2,130,609 | |
Host Hotels & Resorts LP | | BBB- | | 5.70 | | 07/01/34 | | | 2,090,000 | | | | 2,054,397 | |
Kimco Realty OP LLC | | BBB+ | | 3.25 | | 08/15/26 | | | 1,905,000 | | | | 1,813,046 | |
Kimco Realty OP LLC | | BBB+ | | 6.40 | | 03/01/34 | | | 3,600,000 | | | | 3,808,264 | |
NNN REIT, Inc. | | BBB+ | | 3.60 | | 12/15/26 | | | 4,460,000 | | | | 4,278,627 | |
Prologis LP | | A | | 1.75 | | 07/01/30 | | | 2,320,000 | | | | 1,919,156 | |
Realty Income Corp. | | A- | | 5.13 | | 02/15/34 | | | 6,250,000 | | | | 6,065,189 | |
Tanger Properties LP | | BBB- | | 3.13 | | 09/01/26 | | | 2,485,000 | | | | 2,344,687 | |
Tanger Properties LP | | BBB- | | 3.88 | | 07/15/27 | | | 1,655,000 | | | | 1,569,536 | |
| | | | | | | | | | | | | | |
| | | | | | | | | | | | | 38,306,082 | |
| | | | | | | | | | | | | | |
| UTILITIES (2.9%) | | | | | | | | | | | | |
American Electric Power Co., Inc. | | BBB | | 5.20 | | 01/15/29 | | | 4,565,000 | | | | 4,542,153 | |
DTE Energy Co. | | BBB | | 5.10 | | 03/01/29 | | | 4,660,000 | | | | 4,623,489 | |
Duke Energy Corp. | | BBB | | 4.85 | | 01/05/29 | | | 4,900,000 | | | | 4,841,446 | |
NextEra Energy Capital Hldgs., Inc. | | BBB+ | | 3.55 | | 05/01/27 | | | 3,210,000 | | | | 3,065,750 | |
Southern Co. | | BBB+ | | 3.25 | | 07/01/26 | | | 2,430,000 | | | | 2,336,482 | |
Southern Co. | | BBB+ | | 5.50 | | 03/15/29 | | | 5,000,000 | | | | 5,066,457 | |
WEC Energy Group, Inc. | | BBB+ | | 4.75 | | 01/09/26 | | | 2,500,000 | | | | 2,473,856 | |
| | | | | | | | | | | | | | |
| | | | | | | | | | | | | 26,949,633 | |
| | | | | | | | | | | | | | |
TOTAL CORPORATE DEBT | | | | 396,623,943 | |
| | | | | | | | | | | | | | |
TOTAL LONG-TERM DEBT SECURITIES
(Cost: $949,543,698) | | | | 922,282,725 | |
| | | | | | | | | | | | | | |
| | | | | |
| | | | | Rate(%) | | Maturity | | Face Amount | | | Value | |
| TEMPORARY CASH INVESTMENT (0.0%) (1) | | | | | | | | | | | | |
JP Morgan Chase, New York Time Deposit | | | | 4.58 | | 07/01/24 | | $ | 320,839 | | | $ | 320,839 | |
| | | | | | | | | | | | | | |
TOTAL TEMPORARY CASH INVESTMENT
(Cost: $320,839) | | | | 320,839 | |
| | | | | | | | | | | | | | |
TOTAL INVESTMENTS
(Cost: $949,864,537) 99.1% | | | | 922,603,564 | |
| | | | | | | | | | | | | | |
OTHER NET ASSETS 0.9% | | | | 8,569,678 | |
| | | | | | | | | | | | | | |
NET ASSETS 100.0% | | | $ | 931,173,242 | |
| | | | | | | | | | | | | | |
The accompanying notes are an integral part of these portfolio schedules.
84
MoA FUNDS — INTERMEDIATE BOND FUND
PORTFOLIO OF INVESTMENTS IN SECURITIES (Continued)
June 30, 2024 (Unaudited)
FOOTNOTES TO PORTFOLIO OF INVESTMENTS IN SECURITIES
| | |
| Abbreviations: | | FFCB = Federal Farm Credit Bank |
| | FHLB = Federal Home Loan Bank |
| | FHLMC = Federal Home Loan Mortgage Corporation |
| * | Ratings as per Standard & Poor’s Corporation (unaudited). |
| † | Security is exempt from registration under Rule 144A of the Securities Act of 1933. These securities may be resold in transactions exempt from registration, normally to qualified institutional buyers. At June 30, 2024, the aggregate values of these securities amounts to $11,647,660 and represents 1.3% of net assets. |
| (1) | Percentage is less than 0.05%. |
The accompanying notes are an integral part of these portfolio schedules.
85
MoA FUNDS — CORE BOND FUND
PORTFOLIO OF INVESTMENTS IN SECURITIES
June 30, 2024 (Unaudited)
| | | | | | | | | | | | | | |
| | | Rating* | | Rate(%) | | Maturity | | Face Amount | | | Value | |
| LONG-TERM DEBT SECURITIES (99.2%): | | | | | | | | | | | | |
| U.S. GOVERNMENT (29.0%) | | | | | | | | | | | | |
U.S. Treasury Bond | | AA+ | | 1.13 | | 05/15/40 | | $ | 71,625,000 | | | $ | 44,038,184 | |
U.S. Treasury Bond | | AA+ | | 1.13 | | 08/15/40 | | | 46,250,000 | | | | 28,161,914 | |
U.S. Treasury Bond | | AA+ | | 1.38 | | 11/15/40 | | | 22,500,000 | | | | 14,192,578 | |
U.S. Treasury Bond | | AA+ | | 2.25 | | 08/15/46 | | | 29,985,000 | | | | 19,982,191 | |
U.S. Treasury Bond | | AA+ | | 2.75 | | 08/15/47 | | | 9,790,000 | | | | 7,131,403 | |
U.S. Treasury Bond | | AA+ | | 2.88 | | 05/15/43 | | | 200,000 | | | | 155,250 | |
U.S. Treasury Bond | | AA+ | | 2.88 | | 05/15/49 | | | 7,500,000 | | | | 5,539,453 | |
U.S. Treasury Bond | | AA+ | | 3.63 | | 02/15/53 | | | 23,570,000 | | | | 20,052,914 | |
U.S. Treasury Bond | | AA+ | | 4.00 | | 11/15/52 | | | 30,665,000 | | | | 27,938,690 | |
U.S. Treasury Bond | | AA+ | | 4.13 | | 08/15/53 | | | 42,025,000 | | | | 39,142,348 | |
U.S. Treasury Bond | | AA+ | | 4.25 | | 02/15/54 | | | 11,530,000 | | | | 10,982,325 | |
U.S. Treasury Bond | | AA+ | | 4.63 | | 05/15/44 | | | 3,500,000 | | | | 3,493,438 | |
U.S. Treasury Note | | AA+ | | 1.50 | | 11/30/28 | | | 11,000,000 | | | | 9,735,860 | |
U.S. Treasury Note | | AA+ | | 1.50 | | 02/15/30 | | | 5,800,000 | | | | 4,979,391 | |
U.S. Treasury Note | | AA+ | | 1.63 | | 08/15/29 | | | 38,705,000 | | | | 33,924,328 | |
U.S. Treasury Note | | AA+ | | 2.25 | | 08/15/27 | | | 25,900,000 | | | | 24,202,336 | |
U.S. Treasury Note | | AA+ | | 2.25 | | 11/15/27 | | | 23,090,000 | | | | 21,482,720 | |
U.S. Treasury Note | | AA+ | | 2.38 | | 05/15/29 | | | 2,000,000 | | | | 1,826,406 | |
U.S. Treasury Note | | AA+ | | 2.63 | | 02/15/29 | | | 50,655,000 | | | | 46,958,768 | |
U.S. Treasury Note | | AA+ | | 2.88 | | 05/15/28 | | | 20,140,000 | | | | 19,026,006 | |
U.S. Treasury Note | | AA+ | | 2.88 | | 08/15/28 | | | 55,450,000 | | | | 52,239,965 | |
U.S. Treasury Note | | AA+ | | 2.88 | | 05/15/32 | | | 23,665,000 | | | | 21,320,686 | |
U.S. Treasury Note | | AA+ | | 3.13 | | 08/31/27 | | | 2,675,000 | | | | 2,566,537 | |
U.S. Treasury Note | | AA+ | | 3.63 | | 03/31/30 | | | 45,720,000 | | | | 44,026,931 | |
U.S. Treasury Note | | AA+ | | 3.75 | | 05/31/30 | | | 5,500,000 | | | | 5,326,836 | |
U.S. Treasury Note | | AA+ | | 3.88 | | 11/30/29 | | | 35,925,000 | | | | 35,091,428 | |
U.S. Treasury Note | | AA+ | | 3.88 | | 08/15/33 | | | 18,100,000 | | | | 17,415,594 | |
U.S. Treasury Note | | AA+ | | 4.00 | | 02/15/34 | | | 8,410,000 | | | | 8,165,584 | |
U.S. Treasury Note | | AA+ | | 4.13 | | 07/31/28 | | | 17,000,000 | | | | 16,820,703 | |
U.S. Treasury Note | | AA+ | | 4.50 | | 11/15/33 | | | 5,690,000 | | | | 5,743,344 | |
U.S. Treasury Strip | | AA+ | | 0.00 | | 08/15/29 | | | 3,280,000 | | | | 2,620,669 | |
U.S. Treasury Strip | | AA+ | | 0.00 | | 08/15/33 | | | 9,790,000 | | | | 6,530,618 | |
U.S. Treasury Strip | | AA+ | | 0.00 | | 08/15/35 | | | 9,790,000 | | | | 5,936,717 | |
U.S. Treasury Strip | | AA+ | | 0.00 | | 08/15/37 | | | 9,790,000 | | | | 5,361,937 | |
| | | | | | | | | | | | | | |
| | | | | | | | | | | | | 612,114,052 | |
| | | | | | | | | | | | | | |
| U.S. GOVERNMENT AGENCIES (36.1%) | | | | | | | | | | | | |
| MORTGAGE-BACKED OBLIGATIONS (34.5%) | | | | | | | | | | | | |
FHLMC | | AA+ | | 2.00 | | 02/01/51 | | | 3,433,496 | | | | 2,734,458 | |
FHLMC | | AA+ | | 2.50 | | 09/01/27 | | | 35,546 | | | | 34,270 | |
FHLMC | | AA+ | | 2.50 | | 09/01/27 | | | 193,885 | | | | 186,700 | |
FHLMC | | AA+ | | 2.50 | | 12/01/27 | | | 298,698 | | | | 286,248 | |
FHLMC | | AA+ | | 2.50 | | 06/01/35 | | | 1,649,110 | | | | 1,498,884 | |
FHLMC | | AA+ | | 2.50 | | 05/01/42 | | | 12,892,347 | | | | 11,082,732 | |
FHLMC | | AA+ | | 2.50 | | 10/01/49 | | | 1,712,532 | | | | 1,416,352 | |
FHLMC | | AA+ | | 2.50 | | 01/01/50 | | | 1,118,354 | | | | 924,936 | |
FHLMC | | AA+ | | 2.50 | | 01/01/50 | | | 979,804 | | | | 810,346 | |
FHLMC | | AA+ | | 2.50 | | 04/25/50 | | | 12,787,735 | | | | 10,041,968 | |
FHLMC | | AA+ | | 2.50 | | 05/01/50 | | | 3,309,262 | | | | 2,745,995 | |
FHLMC | | AA+ | | 2.50 | | 06/01/50 | | | 3,879,611 | | | | 3,198,062 | |
FHLMC | | AA+ | | 2.50 | | 02/01/51 | | | 597,557 | | | | 498,279 | |
FHLMC | | AA+ | | 2.50 | | 02/01/51 | | | 928,672 | | | | 777,069 | |
FHLMC | | AA+ | | 2.50 | | 04/01/51 | | | 4,237,063 | | | | 3,529,425 | |
FHLMC | | AA+ | | 2.50 | | 04/01/51 | | | 5,981,906 | | | | 4,918,080 | |
FHLMC | | AA+ | | 2.50 | | 05/01/51 | | | 15,263,932 | | | | 12,687,983 | |
FHLMC | | AA+ | | 2.50 | | 09/01/51 | | | 3,959,046 | | | | 3,271,968 | |
FHLMC | | AA+ | | 2.50 | | 10/01/51 | | | 2,873,319 | | | | 2,356,100 | |
The accompanying notes are an integral part of these portfolio schedules.
86
MoA FUNDS — CORE BOND FUND
PORTFOLIO OF INVESTMENTS IN SECURITIES (Continued)
June 30, 2024 (Unaudited)
| | | | | | | | | | | | | | |
| | | Rating* | | Rate(%) | | Maturity | | Face Amount | | | Value | |
| LONG-TERM DEBT SECURITIES (CONTINUED): | | | | | | | | | | | | |
| U.S. GOVERNMENT AGENCIES (CONTINUED) | | | | | | | | | | | | |
| MORTGAGE-BACKED OBLIGATIONS (CONTINUED) | | | | | | | | | | | | |
FHLMC | | AA+ | | 2.50 | | 11/01/51 | | $ | 2,821,166 | | | $ | 2,328,998 | |
FHLMC | | AA+ | | 3.00 | | 06/01/27 | | | 4,660 | | | | 4,523 | |
FHLMC | | AA+ | | 3.00 | | 06/01/27 | | | 121,903 | | | | 118,169 | |
FHLMC | | AA+ | | 3.00 | | 08/01/27 | | | 5,762 | | | | 5,592 | |
FHLMC | | AA+ | | 3.00 | | 08/01/27 | | | 90,037 | | | | 87,284 | |
FHLMC | | AA+ | | 3.00 | | 02/01/32 | | | 1,335,355 | | | | 1,260,723 | |
FHLMC | | AA+ | | 3.00 | | 07/01/42 | | | 173,689 | | | | 154,106 | |
FHLMC | | AA+ | | 3.00 | | 11/01/42 | | | 16,223 | | | | 14,414 | |
FHLMC | | AA+ | | 3.00 | | 11/01/42 | | | 414,712 | | | | 363,976 | |
FHLMC | | AA+ | | 3.00 | | 03/01/43 | | | 710,532 | | | | 629,421 | |
FHLMC | | AA+ | | 3.00 | | 04/01/43 | | | 2,873,638 | | | | 2,549,562 | |
FHLMC | | AA+ | | 3.00 | | 04/01/43 | | | 4,725,746 | | | | 4,192,732 | |
FHLMC | | AA+ | | 3.00 | | 04/01/43 | | | 952,041 | | | | 843,360 | |
FHLMC | | AA+ | | 3.00 | | 04/01/43 | | | 15,274 | | | | 13,554 | |
FHLMC | | AA+ | | 3.00 | | 09/15/43 | | | 124,431 | | | | 121,162 | |
FHLMC | | AA+ | | 3.00 | | 04/15/44 | | | 198,952 | | | | 181,996 | |
FHLMC | | AA+ | | 3.00 | | 04/15/45 | | | 65,881 | | | | 64,659 | |
FHLMC | | AA+ | | 3.00 | | 09/01/46 | | | 939,161 | | | | 820,438 | |
FHLMC | | AA+ | | 3.00 | | 09/01/46 | | | 2,012,714 | | | | 1,729,943 | |
FHLMC | | AA+ | | 3.00 | | 11/01/46 | | | 248,317 | | | | 213,826 | |
FHLMC | | AA+ | | 3.00 | | 05/01/49 | | | 2,051,102 | | | | 1,769,623 | |
FHLMC | | AA+ | | 3.00 | | 11/01/49 | | | 1,631,201 | | | | 1,407,346 | |
FHLMC | | AA+ | | 3.00 | | 11/01/49 | | | 1,631,385 | | | | 1,407,505 | |
FHLMC | | AA+ | | 3.00 | | 12/01/49 | | | 1,352,078 | | | | 1,166,632 | |
FHLMC | | AA+ | | 3.00 | | 02/01/50 | | | 1,914,578 | | | | 1,651,835 | |
FHLMC | | AA+ | | 3.00 | | 11/01/50 | | | 3,203,285 | | | | 2,752,883 | |
FHLMC | | AA+ | | 3.00 | | 04/01/51 | | | 1,189,898 | | | | 1,022,149 | |
FHLMC | | AA+ | | 3.00 | | 10/01/51 | | | 10,648,484 | | | | 9,058,936 | |
FHLMC | | AA+ | | 3.00 | | 06/01/52 | | | 6,528,505 | | | | 5,605,652 | |
FHLMC | | AA+ | | 3.00 | | 07/01/53 | | | 5,291,061 | | | | 4,500,362 | |
FHLMC | | AA+ | | 3.50 | | 02/01/35 | | | 680,030 | | | | 643,769 | |
FHLMC | | AA+ | | 3.50 | | 02/01/35 | | | 349,995 | | | | 331,719 | |
FHLMC | | AA+ | | 3.50 | | 04/01/35 | | | 321,603 | | | | 304,403 | |
FHLMC | | AA+ | | 3.50 | | 02/01/36 | | | 319,573 | | | | 301,815 | |
FHLMC | | AA+ | | 3.50 | | 11/01/39 | | | 1,822,951 | | | | 1,701,511 | |
FHLMC | | AA+ | | 3.50 | | 01/01/41 | | | 327,643 | | | | 299,480 | |
FHLMC | | AA+ | | 3.50 | | 05/01/42 | | | 22,045 | | | | 20,164 | |
FHLMC | | AA+ | | 3.50 | | 07/01/42 | | | 868,837 | | | | 795,304 | |
FHLMC | | AA+ | | 3.50 | | 01/01/43 | | | 19,250 | | | | 17,607 | |
FHLMC | | AA+ | | 3.50 | | 04/01/43 | | | 20,501 | | | | 18,752 | |
FHLMC | | AA+ | | 3.50 | | 06/01/43 | | | 605,330 | | | | 551,275 | |
FHLMC | | AA+ | | 3.50 | | 08/15/43 | | | 1,066,138 | | | | 1,015,888 | |
FHLMC | | AA+ | | 3.50 | | 11/01/43 | | | 16,692 | | | | 15,268 | |
FHLMC | | AA+ | | 3.50 | | 01/01/44 | | | 8,004,005 | | | | 7,311,446 | |
FHLMC | | AA+ | | 3.50 | | 04/01/45 | | | 776,298 | | | | 703,751 | |
FHLMC | | AA+ | | 3.50 | | 07/01/45 | | | 885,632 | | | | 804,817 | |
FHLMC | | AA+ | | 3.50 | | 07/01/45 | | | 29,521 | | | | 26,864 | |
FHLMC | | AA+ | | 3.50 | | 09/01/45 | | | 427,456 | | | | 387,168 | |
FHLMC | | AA+ | | 3.50 | | 11/01/45 | | | 1,797,890 | | | | 1,636,210 | |
FHLMC | | AA+ | | 3.50 | | 08/01/46 | | | 749,897 | | | | 678,177 | |
FHLMC | | AA+ | | 3.50 | | 12/01/47 | | | 416,447 | | | | 375,036 | |
FHLMC | | AA+ | | 3.50 | | 02/01/50 | | | 1,162,957 | | | | 1,049,850 | |
FHLMC | | AA+ | | 3.50 | | 09/01/50 | | | 2,324,219 | | | | 2,079,183 | |
FHLMC | | AA+ | | 4.00 | | 02/01/25 | | | 3,655 | | | | 3,624 | |
FHLMC | | AA+ | | 4.00 | | 05/01/25 | | | 2,780 | | | | 2,753 | |
The accompanying notes are an integral part of these portfolio schedules.
87
MoA FUNDS — CORE BOND FUND
PORTFOLIO OF INVESTMENTS IN SECURITIES (Continued)
June 30, 2024 (Unaudited)
| | | | | | | | | | | | | | |
| | | Rating* | | Rate(%) | | Maturity | | Face Amount | | | Value | |
| LONG-TERM DEBT SECURITIES (CONTINUED): | | | | | | | | | | | | |
| U.S. GOVERNMENT AGENCIES (CONTINUED) | | | | | | | | | | | | |
| MORTGAGE-BACKED OBLIGATIONS (CONTINUED) | | | | | | | | | | | | |
FHLMC | | AA+ | | 4.00 | | 05/01/26 | | $ | 16,028 | | | $ | 15,792 | |
FHLMC | | AA+ | | 4.00 | | 11/01/33 | | | 11,332 | | | | 10,995 | |
FHLMC | | AA+ | | 4.00 | | 12/01/33 | | | 412,191 | | | | 393,749 | |
FHLMC | | AA+ | | 4.00 | | 01/01/38 | | | 279,942 | | | | 269,289 | |
FHLMC | | AA+ | | 4.00 | | 01/01/38 | | | 984,401 | | | | 945,755 | |
FHLMC | | AA+ | | 4.00 | | 01/15/40 | | | 1,278,993 | | | | 1,257,472 | |
FHLMC | | AA+ | | 4.00 | | 03/01/41 | | | 5,907 | | | | 5,586 | |
FHLMC | | AA+ | | 4.00 | | 07/01/41 | | | 280,852 | | | | 265,271 | |
FHLMC | | AA+ | | 4.00 | | 07/01/41 | | | 9,374 | | | | 8,864 | |
FHLMC | | AA+ | | 4.00 | | 11/01/42 | | | 5,363 | | | | 5,051 | |
FHLMC | | AA+ | | 4.00 | | 10/01/44 | | | 291,866 | | | | 272,968 | |
FHLMC | | AA+ | | 4.00 | | 10/01/44 | | | 382,169 | | | | 357,401 | |
FHLMC | | AA+ | | 4.00 | | 10/01/44 | | | 688,880 | | | | 644,234 | |
FHLMC | | AA+ | | 4.00 | | 10/01/44 | | | 12,739 | | | | 11,931 | |
FHLMC | | AA+ | | 4.00 | | 02/01/45 | | | 1,832,661 | | | | 1,725,989 | |
FHLMC | | AA+ | | 4.00 | | 06/01/45 | | | 27,416 | | | | 25,640 | |
FHLMC | | AA+ | | 4.00 | | 05/01/47 | | | 329,169 | | | | 305,980 | |
FHLMC | | AA+ | | 4.00 | | 02/01/48 | | | 284,358 | | | | 264,287 | |
FHLMC | | AA+ | | 4.00 | | 05/01/48 | | | 131,512 | | | | 122,160 | |
FHLMC | | AA+ | | 4.00 | | 04/01/52 | | | 3,713,705 | | | | 3,414,413 | |
FHLMC | | AA+ | | 4.00 | | 06/01/52 | | | 4,723,513 | | | | 4,368,623 | |
FHLMC | | AA+ | | 4.00 | | 08/01/52 | | | 4,439,439 | | | | 4,105,892 | |
FHLMC | | AA+ | | 4.23 | | 05/01/30 | | | 7,361,000 | | | | 7,080,145 | |
FHLMC | | AA+ | | 4.25 | | 12/01/29 | | | 3,250,000 | | | | 3,150,378 | |
FHLMC | | AA+ | | 4.50 | | 03/01/34 | | | 2,453 | | | | 2,394 | |
FHLMC | | AA+ | | 4.50 | | 09/01/41 | | | 5,661 | | | | 5,499 | |
FHLMC | | AA+ | | 4.50 | | 02/01/44 | | | 61,580 | | | | 59,625 | |
FHLMC | | AA+ | | 4.50 | | 05/01/48 | | | 838,065 | | | | 802,052 | |
FHLMC | | AA+ | | 4.50 | | 05/01/48 | | | 418,927 | | | | 400,925 | |
FHLMC | | AA+ | | 5.00 | | 02/01/26 | | | 3,430 | | | | 3,404 | |
FHLMC | | AA+ | | 5.00 | | 02/01/26 | | | 143 | | | | 142 | |
FHLMC | | AA+ | | 5.00 | | 10/01/40 | | | 217,964 | | | | 216,423 | |
FHLMC | | AA+ | | 5.00 | | 09/01/47 | | | 359,387 | | | | 350,259 | |
FHLMC | | AA+ | | 5.00 | | 04/01/52 | | | 3,492,243 | | | | 3,387,488 | |
FHLMC | | AA+ | | 5.00 | | 06/01/52 | | | 6,163,711 | | | | 5,973,196 | |
FHLMC | | AA+ | | 5.00 | | 12/01/52 | | | 17,630,948 | | | | 17,165,067 | |
FHLMC | | AA+ | | 5.50 | | 07/01/32 | | | 1,501 | | | | 1,509 | |
FHLMC | | AA+ | | 5.50 | | 01/15/33 | | | 49,500 | | | | 49,798 | |
FHLMC | | AA+ | | 5.50 | | 05/01/33 | | | 587 | | | | 592 | |
FHLMC | | AA+ | | 5.50 | | 06/01/37 | | | 9,584 | | | | 9,716 | |
FHLMC | | AA+ | | 5.50 | | 09/25/47 | | | 4,310,951 | | | | 4,282,669 | |
FHLMC | | AA+ | | 5.50 | | 06/01/53 | | | 4,716,943 | | | | 4,671,552 | |
FHLMC | | AA+ | | 5.50 | | 07/01/53 | | | 2,395,330 | | | | 2,377,461 | |
FHLMC | | AA+ | | 5.50 | | 07/01/53 | | | 35,575,118 | | | | 35,141,628 | |
FHLMC | | AA+ | | 6.00 | | 07/15/29 | | | 21,855 | | | | 21,964 | |
FHLMC | | AA+ | | 6.00 | | 09/01/53 | | | 2,908,873 | | | | 2,943,871 | |
FHLMC | | AA+ | | 6.00 | | 02/01/54 | | | 7,756,319 | | | | 7,774,844 | |
FHLMC | | AA+ | | 6.50 | | 12/01/52 | | | 5,143,002 | | | | 5,282,445 | |
FHLMC | | AA+ | | 6.50 | | 12/01/52 | | | 1,468,704 | | | | 1,511,919 | |
FHLMC ARM | | AA+ | | 1.93 | | 10/01/51 | | | 11,752,320 | | | | 10,149,829 | |
FHLMC ARM | | AA+ | | 4.43 | | 04/01/53 | | | 7,095,737 | | | | 6,797,077 | |
FHLMC ARM | | AA+ | | 6.74 | | 04/01/37 | | | 17,230 | | | | 17,292 | |
FHLMC Strip | | AA+ | | 3.00 | | 06/15/42 | | | 4,113,544 | | | | 3,692,134 | |
FHLMC Strip | | AA+ | | 3.00 | | 01/15/43 | | | 675,904 | | | | 591,441 | |
FHLMC Strip | | AA+ | | 3.50 | | 10/15/47 | | | 405,548 | | | | 362,908 | |
The accompanying notes are an integral part of these portfolio schedules.
88
MoA FUNDS — CORE BOND FUND
PORTFOLIO OF INVESTMENTS IN SECURITIES (Continued)
June 30, 2024 (Unaudited)
| | | | | | | | | | | | | | |
| | | Rating* | | Rate(%) | | Maturity | | Face Amount | | | Value | |
| LONG-TERM DEBT SECURITIES (CONTINUED): | | | | | | | | | | | | |
| U.S. GOVERNMENT AGENCIES (CONTINUED) | | | | | | | | | | | | |
| MORTGAGE-BACKED OBLIGATIONS (CONTINUED) | | | | | | | | | | | | |
FNMA | | AA+ | | 1.00 | | 08/01/36 | | $ | 754,541 | | | $ | 629,600 | |
FNMA | | AA+ | | 1.00 | | 12/01/36 | | | 793,687 | | | | 659,681 | |
FNMA | | AA+ | | 1.81 | | 09/01/51 | | | 10,156,259 | | | | 8,756,255 | |
FNMA | | AA+ | | 2.00 | | 07/01/36 | | | 21,966,773 | | | | 19,464,760 | |
FNMA | | AA+ | | 2.00 | | 09/01/50 | | | 3,873,249 | | | | 3,054,316 | |
FNMA | | AA+ | | 2.00 | | 10/01/50 | | | 3,266,128 | | | | 2,603,788 | |
FNMA | | AA+ | | 2.00 | | 10/01/50 | | | 3,761,413 | | | | 2,992,559 | |
FNMA | | AA+ | | 2.00 | | 02/01/51 | | | 8,223,371 | | | | 6,429,109 | |
FNMA | | AA+ | | 2.00 | | 03/01/51 | | | 5,775,024 | | | | 4,623,463 | |
FNMA | | AA+ | | 2.16 | | 02/01/32 | | | 5,000,000 | | | | 4,082,344 | |
FNMA | | AA+ | | 2.34 | | 05/01/36 | | | 9,365,157 | | | | 7,393,226 | |
FNMA | | AA+ | | 2.50 | | 01/01/33 | | | 146,980 | | | | 136,068 | |
FNMA | | AA+ | | 2.50 | | 02/01/33 | | | 458,973 | | | | 424,953 | |
FNMA | | AA+ | | 2.50 | | 05/01/35 | | | 363,282 | | | | 330,189 | |
FNMA | | AA+ | | 2.50 | | 06/01/35 | | | 2,645,299 | | | | 2,403,513 | |
FNMA | | AA+ | | 2.50 | | 07/01/35 | | | 809,907 | | | | 735,631 | |
FNMA | | AA+ | | 2.50 | | 07/01/35 | | | 2,181,197 | | | | 1,980,311 | |
FNMA | | AA+ | | 2.50 | | 09/01/35 | | | 2,804,444 | | | | 2,546,387 | |
FNMA | | AA+ | | 2.50 | | 10/01/35 | | | 6,237,912 | | | | 5,660,081 | |
FNMA | | AA+ | | 2.50 | | 04/01/42 | | | 12,472,321 | | | | 10,721,662 | |
FNMA | | AA+ | | 2.50 | | 05/01/42 | | | 4,739,582 | | | | 4,098,597 | |
FNMA | | AA+ | | 2.50 | | 06/01/42 | | | 8,109,746 | | | | 6,971,433 | |
FNMA | | AA+ | | 2.50 | | 05/01/43 | | | 813,386 | | | | 685,316 | |
FNMA | | AA+ | | 2.50 | | 10/01/50 | | | 1,610,968 | | | | 1,339,467 | |
FNMA | | AA+ | | 2.50 | | 03/01/51 | | | 1,551,318 | | | | 1,284,522 | |
FNMA | | AA+ | | 2.50 | | 03/01/51 | | | 10,864,883 | | | | 9,079,954 | |
FNMA | | AA+ | | 2.50 | | 04/01/51 | | | 9,251,720 | | | | 7,619,244 | |
FNMA | | AA+ | | 2.50 | | 04/01/51 | | | 3,456,882 | | | | 2,870,246 | |
FNMA | | AA+ | | 2.50 | | 04/01/51 | | | 4,215,879 | | | | 3,514,606 | |
FNMA | | AA+ | | 2.50 | | 05/01/51 | | | 17,959,986 | | | | 14,952,541 | |
FNMA | | AA+ | | 2.50 | | 05/01/51 | | | 2,295,743 | | | | 1,911,618 | |
FNMA | | AA+ | | 2.50 | | 06/01/51 | | | 1,757,570 | | | | 1,442,960 | |
FNMA | | AA+ | | 2.50 | | 04/01/52 | | | 5,045,384 | | | | 4,162,915 | |
FNMA | | AA+ | | 2.50 | | 05/01/52 | | | 1,859,165 | | | | 1,532,636 | |
FNMA | | AA+ | | 2.77 | | 03/01/32 | | | 5,122,000 | | | | 4,422,563 | |
FNMA | | AA+ | | 3.00 | | 06/01/33 | | | 474,962 | | | | 444,425 | |
FNMA | | AA+ | | 3.00 | | 07/01/33 | | | 631,041 | | | | 590,525 | |
FNMA | | AA+ | | 3.00 | | 09/01/33 | | | 760,773 | | | | 711,599 | |
FNMA | | AA+ | | 3.00 | | 03/01/36 | | | 730,173 | | | | 675,602 | |
FNMA | | AA+ | | 3.00 | | 09/01/40 | | | 805,378 | | | | 718,044 | |
FNMA | | AA+ | | 3.00 | | 04/25/42 | | | 18,057 | | | | 17,935 | |
FNMA | | AA+ | | 3.00 | | 12/01/42 | | | 491,482 | | | | 433,793 | |
FNMA | | AA+ | | 3.00 | | 02/01/43 | | | 10,887 | | | | 9,659 | |
FNMA | | AA+ | | 3.00 | | 03/01/43 | | | 10,532 | | | | 9,335 | |
FNMA | | AA+ | | 3.00 | | 09/01/43 | | | 124,286 | | | | 110,123 | |
FNMA | | AA+ | | 3.00 | | 02/01/45 | | | 854,314 | | | | 754,159 | |
FNMA | | AA+ | | 3.00 | | 03/01/45 | | | 219,145 | | | | 189,187 | |
FNMA | | AA+ | | 3.00 | | 09/01/46 | | | 1,470,513 | | | | 1,284,585 | |
FNMA | | AA+ | | 3.00 | | 01/01/47 | | | 278,234 | | | | 239,588 | |
FNMA | | AA+ | | 3.00 | | 12/01/47 | | | 143,161 | | | | 124,904 | |
FNMA | | AA+ | | 3.00 | | 03/01/48 | | | 343,614 | | | | 297,064 | |
FNMA | | AA+ | | 3.00 | | 03/01/50 | | | 8,213,272 | | | | 6,998,781 | |
FNMA | | AA+ | | 3.00 | | 03/01/50 | | | 1,306,077 | | | | 1,126,070 | |
FNMA | | AA+ | | 3.00 | | 05/01/50 | | | 2,085,123 | | | | 1,797,280 | |
FNMA | | AA+ | | 3.00 | | 06/01/50 | | | 3,973,877 | | | | 3,422,499 | |
The accompanying notes are an integral part of these portfolio schedules.
89
MoA FUNDS — CORE BOND FUND
PORTFOLIO OF INVESTMENTS IN SECURITIES (Continued)
June 30, 2024 (Unaudited)
| | | | | | | | | | | | | | |
| | | Rating* | | Rate(%) | | Maturity | | Face Amount | | | Value | |
| LONG-TERM DEBT SECURITIES (CONTINUED): | | | | | | | | | | | | |
| U.S. GOVERNMENT AGENCIES (CONTINUED) | | | | | | | | | | | | |
| MORTGAGE-BACKED OBLIGATIONS (CONTINUED) | | | | | | | | | | | | |
FNMA | | AA+ | | 3.00 | | 08/01/50 | | $ | 2,407,092 | | | $ | 2,070,873 | |
FNMA | | AA+ | | 3.00 | | 12/01/50 | | | 7,415,708 | | | | 6,315,886 | |
FNMA | | AA+ | | 3.00 | | 01/01/52 | | | 9,973,764 | | | | 8,528,173 | |
FNMA | | AA+ | | 3.00 | | 03/01/52 | | | 10,481,165 | | | | 8,911,738 | |
FNMA | | AA+ | | 3.03 | | 04/01/34 | | | 8,634,249 | | | | 7,450,614 | |
FNMA | | AA+ | | 3.10 | | 06/01/29 | | | 9,800,000 | | | | 9,039,161 | |
FNMA | | AA+ | | 3.50 | | 03/01/32 | | | 221,926 | | | | 212,758 | |
FNMA | | AA+ | | 3.50 | | 09/01/32 | | | 13,434 | | | | 12,851 | |
FNMA | | AA+ | | 3.50 | | 07/01/34 | | | 395,600 | | | | 376,434 | |
FNMA | | AA+ | | 3.50 | | 10/01/34 | | | 587,957 | | | | 557,254 | |
FNMA | | AA+ | | 3.50 | | 02/01/35 | | | 485,958 | | | | 459,844 | |
FNMA | | AA+ | | 3.50 | | 08/01/38 | | | 15,975 | | | | 14,593 | |
FNMA | | AA+ | | 3.50 | | 10/01/40 | | | 29,256 | | | | 26,740 | |
FNMA | | AA+ | | 3.50 | | 03/01/41 | | | 476,723 | | | | 436,911 | |
FNMA | | AA+ | | 3.50 | | 10/01/41 | | | 467,274 | | | | 427,009 | |
FNMA | | AA+ | | 3.50 | | 12/01/41 | | | 357,564 | | | | 326,752 | |
FNMA | | AA+ | | 3.50 | | 04/01/42 | | | 812,438 | | | | 742,172 | |
FNMA | | AA+ | | 3.50 | | 08/01/42 | | | 21,159 | | | | 19,327 | |
FNMA | | AA+ | | 3.50 | | 12/01/42 | | | 412,037 | | | | 375,383 | |
FNMA | | AA+ | | 3.50 | | 01/01/43 | | | 374,250 | | | | 340,830 | |
FNMA | | AA+ | | 3.50 | | 01/01/43 | | | 81,435 | | | | 74,392 | |
FNMA | | AA+ | | 3.50 | | 04/01/43 | | | 101,900 | | | | 93,089 | |
FNMA | | AA+ | | 3.50 | | 08/01/43 | | | 1,552,085 | | | | 1,413,515 | |
FNMA | | AA+ | | 3.50 | | 08/01/43 | | | 848,565 | | | | 774,894 | |
FNMA | | AA+ | | 3.50 | | 10/01/43 | | | 199,798 | | | | 182,028 | |
FNMA | | AA+ | | 3.50 | | 08/01/44 | | | 1,053,981 | | | | 949,271 | |
FNMA | | AA+ | | 3.50 | | 04/01/45 | | | 1,353,653 | | | | 1,232,076 | |
FNMA | | AA+ | | 3.50 | | 04/01/45 | | | 694,009 | | | | 629,153 | |
FNMA | | AA+ | | 3.50 | | 05/01/45 | | | 992,894 | | | | 899,313 | |
FNMA | | AA+ | | 3.50 | | 10/01/45 | | | 1,156,649 | | | | 1,049,875 | |
FNMA | | AA+ | | 3.50 | | 02/01/46 | | | 1,611,417 | | | | 1,446,517 | |
FNMA | | AA+ | | 3.50 | | 02/01/46 | | | 493,410 | | | | 446,846 | |
FNMA | | AA+ | | 3.50 | | 08/01/46 | | | 604,727 | | | | 547,790 | |
FNMA | | AA+ | | 3.50 | | 10/01/46 | | | 165,976 | | | | 149,559 | |
FNMA | | AA+ | | 3.50 | | 12/01/46 | | | 259,372 | | | | 233,722 | |
FNMA | | AA+ | | 3.50 | | 01/01/47 | | | 288,025 | | | | 259,536 | |
FNMA | | AA+ | | 3.50 | | 09/01/47 | | | 1,184,737 | | | | 1,071,429 | |
FNMA | | AA+ | | 3.50 | | 11/01/47 | | | 5,064,410 | | | | 4,560,804 | |
FNMA | | AA+ | | 3.50 | | 04/01/48 | | | 156,106 | | | | 141,377 | |
FNMA | | AA+ | | 3.50 | | 03/01/50 | | | 2,465,680 | | | | 2,219,725 | |
FNMA | | AA+ | | 3.50 | | 06/01/51 | | | 6,974,847 | | | | 6,184,246 | |
FNMA | | AA+ | | 3.50 | | 01/01/52 | | | 2,915,056 | | | | 2,583,590 | |
FNMA | | AA+ | | 3.50 | | 02/01/52 | | | 6,559,347 | | | | 5,813,496 | |
FNMA | | AA+ | | 3.50 | | 05/01/52 | | | 412,905 | | | | 367,857 | |
FNMA | | AA+ | | 3.50 | | 05/01/52 | | | 4,389,594 | | | | 3,920,638 | |
FNMA | | AA+ | | 3.75 | | 08/01/28 | | | 5,050,000 | | | | 4,832,483 | |
FNMA | | AA+ | | 4.00 | | 01/01/31 | | | 77,600 | | | | 75,511 | |
FNMA | | AA+ | | 4.00 | | 03/01/35 | | | 117,038 | | | | 111,565 | |
FNMA | | AA+ | | 4.00 | | 06/01/36 | | | 264,614 | | | | 254,476 | |
FNMA | | AA+ | | 4.00 | | 10/01/36 | | | 281,908 | | | | 271,145 | |
FNMA | | AA+ | | 4.00 | | 10/01/40 | | | 325,847 | | | | 307,778 | |
FNMA | | AA+ | | 4.00 | | 11/01/40 | | | 6,571 | | | | 6,206 | |
FNMA | | AA+ | | 4.00 | | 01/01/41 | | | 23,080 | | | | 21,805 | |
FNMA | | AA+ | | 4.00 | | 05/01/41 | | | 177,513 | | | | 167,659 | |
FNMA | | AA+ | | 4.00 | | 05/01/43 | | | 1,973,701 | | | | 1,864,105 | |
The accompanying notes are an integral part of these portfolio schedules.
90
MoA FUNDS — CORE BOND FUND
PORTFOLIO OF INVESTMENTS IN SECURITIES (Continued)
June 30, 2024 (Unaudited)
| | | | | | | | | | | | | | |
| | | Rating* | | Rate(%) | | Maturity | | Face Amount | | | Value | |
| LONG-TERM DEBT SECURITIES (CONTINUED): | | | | | | | | | | | | |
| U.S. GOVERNMENT AGENCIES (CONTINUED) | | | | | | | | | | | | |
| MORTGAGE-BACKED OBLIGATIONS (CONTINUED) | | | | | | | | | | | | |
FNMA | | AA+ | | 4.00 | | 01/01/44 | | $ | 3,859,785 | | | $ | 3,630,806 | |
FNMA | | AA+ | | 4.00 | | 09/01/45 | | | 187,639 | | | | 175,251 | |
FNMA | | AA+ | | 4.00 | | 11/01/45 | | | 378,055 | | | | 353,225 | |
FNMA | | AA+ | | 4.00 | | 02/01/47 | | | 1,218,598 | | | | 1,136,960 | |
FNMA | | AA+ | | 4.00 | | 11/01/47 | | | 502,900 | | | | 467,409 | |
FNMA | | AA+ | | 4.00 | | 04/01/48 | | | 208,092 | | | | 193,293 | |
FNMA | | AA+ | | 4.00 | | 04/01/49 | | | 5,633,781 | | | | 5,233,122 | |
FNMA | | AA+ | | 4.00 | | 03/01/50 | | | 3,509,697 | | | | 3,250,470 | |
FNMA | | AA+ | | 4.00 | | 03/01/52 | | | 1,925,120 | | | | 1,782,555 | |
FNMA | | AA+ | | 4.00 | | 07/01/52 | | | 4,496,340 | | | | 4,163,364 | |
FNMA | | AA+ | | 4.00 | | 07/01/56 | | | 3,368,999 | | | | 3,092,963 | |
FNMA | | AA+ | | 4.50 | | 05/01/30 | | | 59,895 | | | | 58,958 | |
FNMA | | AA+ | | 4.50 | | 05/01/34 | | | 1,956 | | | | 1,907 | |
FNMA | | AA+ | | 4.50 | | 06/01/34 | | | 1,561 | | | | 1,522 | |
FNMA | | AA+ | | 4.50 | | 08/01/35 | | | 1,909 | | | | 1,861 | |
FNMA | | AA+ | | 4.50 | | 05/01/39 | | | 279,398 | | | | 271,536 | |
FNMA | | AA+ | | 4.50 | | 05/01/39 | | | 218,580 | | | | 212,477 | |
FNMA | | AA+ | | 4.50 | | 12/01/39 | | | 1,207,944 | | | | 1,177,570 | |
FNMA | | AA+ | | 4.50 | | 05/01/40 | | | 183,971 | | | | 178,684 | |
FNMA | | AA+ | | 4.50 | | 07/01/40 | | | 868,693 | | | | 844,238 | |
FNMA | | AA+ | | 4.50 | | 10/01/40 | | | 168,204 | | | | 163,371 | |
FNMA | | AA+ | | 4.50 | | 03/01/44 | | | 385,449 | | | | 372,765 | |
FNMA | | AA+ | | 4.50 | | 04/01/44 | | | 749,424 | | | | 724,796 | |
FNMA | | AA+ | | 4.50 | | 11/01/47 | | | 946,726 | | | | 911,109 | |
FNMA | | AA+ | | 4.50 | | 11/01/47 | | | 1,136,244 | | | | 1,093,497 | |
FNMA | | AA+ | | 4.50 | | 11/01/47 | | | 800,094 | | | | 768,371 | |
FNMA | | AA+ | | 4.50 | | 02/01/49 | | | 349,848 | | | | 334,815 | |
FNMA | | AA+ | | 4.50 | | 05/01/50 | | | 8,012,130 | | | | 7,660,929 | |
FNMA | | AA+ | | 4.57 | | 02/01/53 | | | 8,767,317 | | | | 8,494,400 | |
FNMA | | AA+ | | 5.00 | | 06/01/33 | | | 2,400 | | | | 2,379 | |
FNMA | | AA+ | | 5.00 | | 09/01/33 | | | 1,937 | | | | 1,920 | |
FNMA | | AA+ | | 5.00 | | 10/01/33 | | | 2,645 | | | | 2,622 | |
FNMA | | AA+ | | 5.00 | | 11/01/33 | | | 3,550 | | | | 3,519 | |
FNMA | | AA+ | | 5.00 | | 03/01/34 | | | 701 | | | | 695 | |
FNMA | | AA+ | | 5.00 | | 04/01/34 | | | 497 | | | | 493 | |
FNMA | | AA+ | | 5.00 | | 04/01/34 | | | 1,481 | | | | 1,468 | |
FNMA | | AA+ | | 5.00 | | 04/01/35 | | | 1,778 | | | | 1,762 | |
FNMA | | AA+ | | 5.00 | | 06/01/35 | | | 759 | | | | 753 | |
FNMA | | AA+ | | 5.00 | | 09/01/35 | | | 1,178 | | | | 1,168 | |
FNMA | | AA+ | | 5.00 | | 10/01/36 | | | 1,394 | | | | 1,382 | |
FNMA | | AA+ | | 5.00 | | 08/01/37 | | | 1,280,244 | | | | 1,269,428 | |
FNMA | | AA+ | | 5.00 | | 05/01/39 | | | 149,224 | | | | 148,186 | |
FNMA | | AA+ | | 5.00 | | 06/01/40 | | | 2,821 | | | | 2,801 | |
FNMA | | AA+ | | 5.00 | | 06/01/52 | | | 12,362,503 | | | | 11,983,935 | |
FNMA | | AA+ | | 5.00 | | 09/01/52 | | | 12,597,793 | | | | 12,196,847 | |
FNMA | | AA+ | | 5.00 | | 10/01/52 | | | 2,118,341 | | | | 2,050,196 | |
FNMA | | AA+ | | 5.00 | | 11/01/52 | | | 3,140,085 | | | | 3,063,616 | |
FNMA | | AA+ | | 5.50 | | 08/01/25 | | | 181 | | | | 180 | |
FNMA | | AA+ | | 5.50 | | 11/01/26 | | | 7,558 | | | | 7,534 | |
FNMA | | AA+ | | 5.50 | | 03/01/33 | | | 71,057 | | | | 71,392 | |
FNMA | | AA+ | | 5.50 | | 02/25/37 | | | 4,324 | | | | 4,370 | |
FNMA | | AA+ | | 5.50 | | 05/01/38 | | | 1,329,361 | | | | 1,346,028 | |
FNMA | | AA+ | | 5.50 | | 06/01/48 | | | 25,348 | | | | 25,458 | |
FNMA | | AA+ | | 5.50 | | 06/01/52 | | | 1,024,156 | | | | 1,013,963 | |
FNMA | | AA+ | | 5.50 | | 04/01/53 | | | 2,753,972 | | | | 2,727,812 | |
The accompanying notes are an integral part of these portfolio schedules.
91
MoA FUNDS — CORE BOND FUND
PORTFOLIO OF INVESTMENTS IN SECURITIES (Continued)
June 30, 2024 (Unaudited)
| | | | | | | | | | | | | | |
| | | Rating* | | Rate(%) | | Maturity | | Face Amount | | | Value | |
| LONG-TERM DEBT SECURITIES (CONTINUED): | | | | | | | | | | | | |
| U.S. GOVERNMENT AGENCIES (CONTINUED) | | | | | | | | | | | | |
| MORTGAGE-BACKED OBLIGATIONS (CONTINUED) | | | | | | | | | | | | |
FNMA | | AA+ | | 6.00 | | 03/01/28 | | $ | 22,456 | | | $ | 22,568 | |
FNMA | | AA+ | | 6.00 | | 05/01/32 | | | 43,616 | | | | 44,754 | |
FNMA | | AA+ | | 6.00 | | 04/01/33 | | | 90,085 | | | | 92,442 | |
FNMA | | AA+ | | 6.00 | | 05/01/33 | | | 2,182 | | | | 2,239 | |
FNMA | | AA+ | | 6.00 | | 09/01/34 | | | 613 | | | | 629 | |
FNMA | | AA+ | | 6.00 | | 10/01/34 | | | 4,471 | | | | 4,588 | |
FNMA | | AA+ | | 6.00 | | 03/01/36 | | | 8,580 | | | | 8,843 | |
FNMA | | AA+ | | 6.00 | | 01/01/37 | | | 28,977 | | | | 29,988 | |
FNMA | | AA+ | | 6.00 | | 05/01/37 | | | 6,741 | | | | 6,977 | |
FNMA | | AA+ | | 6.00 | | 08/01/37 | | | 34,763 | | | | 35,982 | |
FNMA | | AA+ | | 6.00 | | 12/01/37 | | | 17,064 | | | | 17,663 | |
FNMA | | AA+ | | 6.00 | | 11/01/52 | | | 4,937,594 | | | | 4,998,032 | |
FNMA | | AA+ | | 6.00 | | 09/01/53 | | | 10,939,755 | | | | 11,109,076 | |
FNMA | | AA+ | | 6.00 | | 02/01/54 | | | 5,460,410 | | | | 5,505,278 | |
FNMA | | AA+ | | 6.00 | | 03/01/54 | | | 9,854,300 | | | | 9,885,901 | |
FNMA | | AA+ | | 6.50 | | 05/01/32 | | | 61,588 | | | | 63,595 | |
FNMA | | AA+ | | 6.50 | | 07/01/34 | | | 520 | | | | 542 | |
FNMA | | AA+ | | 6.50 | | 09/01/34 | | | 333 | | | | 347 | |
FNMA | | AA+ | | 6.50 | | 09/01/36 | | | 7,581 | | | | 7,948 | |
FNMA | | AA+ | | 6.50 | | 05/01/37 | | | 72,612 | | | | 76,299 | |
FNMA | | AA+ | | 6.50 | | 07/01/37 | | | 4,041 | | | | 4,246 | |
FNMA | | AA+ | | 6.50 | | 11/01/53 | | | 6,900,762 | | | | 7,055,190 | |
FNMA | | AA+ | | 6.50 | | 02/01/54 | | | 4,826,403 | | | | 4,940,570 | |
FNMA | | AA+ | | 7.00 | | 04/01/32 | | | 115 | | | | 121 | |
FNMA | | AA+ | | 7.50 | | 06/01/31 | | | 59 | | | | 61 | |
FNMA | | AA+ | | 7.50 | | 02/01/32 | | | 328 | | | | 347 | |
FNMA | | AA+ | | 7.50 | | 06/01/32 | | | 16,627 | | | | 17,761 | |
FNMA | | AA+ | | 8.00 | | 04/01/32 | | | 13,408 | | | | 13,969 | |
FNMA Strip | | AA+ | | 3.00 | | 08/25/42 | | | 419,594 | | | | 374,546 | |
FRESB Multifamily Mortgage | | AA+ | | 2.37 | | 10/25/26 | | | 663,716 | | | | 621,065 | |
FRESB Multifamily Mortgage | | AA+ | | 2.92 | | 09/25/24 | | | 10,184,955 | | | | 10,102,237 | |
FRESB Multifamily Mortgage | | AA+ | | 3.61 | | 10/25/28 | | | 588,625 | | | | 558,772 | |
GNMA (1) | | AA+ | | 2.00 | | 04/20/32 | | | 365,561 | | | | 334,823 | |
GNMA (1) | | AA+ | | 2.00 | | 09/20/50 | | | 1,739,173 | | | | 1,380,653 | |
GNMA (1) | | AA+ | | 2.50 | | 12/20/50 | | | 4,553,698 | | | | 3,770,646 | |
GNMA (1) | | AA+ | | 2.50 | | 10/20/51 | | | 4,087,282 | | | | 3,404,834 | |
GNMA (1) | | AA+ | | 2.50 | | 08/20/52 | | | 11,175,955 | | | | 9,396,568 | |
GNMA (1) | | AA+ | | 2.50 | | 03/20/53 | | | 12,961,333 | | | | 10,908,386 | |
GNMA (1) | | AA+ | | 2.50 | | 06/20/53 | | | 7,682,207 | | | | 6,463,050 | |
GNMA (1) | | AA+ | | 3.00 | | 07/16/36 | | | 1,177,453 | | | | 1,032,785 | |
GNMA (1) | | AA+ | | 3.00 | | 01/15/46 | | | 789,598 | | | | 687,803 | |
GNMA (1) | | AA+ | | 3.00 | | 02/20/47 | | | 1,089,276 | | | | 955,518 | |
GNMA (1) | | AA+ | | 3.00 | | 10/20/51 | | | 5,798,976 | | | | 4,992,917 | |
GNMA (1) | | AA+ | | 3.00 | | 08/20/52 | | | 4,759,747 | | | | 4,145,147 | |
GNMA (1) | | AA+ | | 3.50 | | 02/20/42 | | | 283,807 | | | | 257,743 | |
GNMA (1) | | AA+ | | 3.50 | | 07/15/42 | | | 842,090 | | | | 772,021 | |
GNMA (1) | | AA+ | | 3.50 | | 11/15/42 | | | 163,711 | | | | 150,081 | |
GNMA (1) | | AA+ | | 3.50 | | 03/20/45 | | | 718,054 | | | | 654,805 | |
GNMA (1) | | AA+ | | 3.50 | | 05/20/45 | | | 832,313 | | | | 759,000 | |
GNMA (1) | | AA+ | | 3.50 | | 12/20/50 | | | 330,335 | | | | 295,972 | |
GNMA (1) | | AA+ | | 3.70 | | 05/15/42 | | | 373,796 | | | | 347,226 | |
GNMA (1) | | AA+ | | 4.00 | | 03/15/41 | | | 172,717 | | | | 163,656 | |
GNMA (1) | | AA+ | | 4.00 | | 11/15/41 | | | 257,153 | | | | 243,664 | |
GNMA (1) | | AA+ | | 4.00 | | 01/15/42 | | | 21,221 | | | | 20,106 | |
GNMA (1) | | AA+ | | 4.00 | | 08/20/42 | | | 238,503 | | | | 225,929 | |
The accompanying notes are an integral part of these portfolio schedules.
92
MoA FUNDS — CORE BOND FUND
PORTFOLIO OF INVESTMENTS IN SECURITIES (Continued)
June 30, 2024 (Unaudited)
| | | | | | | | | | | | | | | | | | | | |
| | | Rating* | | | Rate(%) | | | Maturity | | | Face Amount | | | Value | |
| LONG-TERM DEBT SECURITIES (CONTINUED): | | | | | | | | | | | | | | | |
| U.S. GOVERNMENT AGENCIES (CONTINUED) | | | | | | | | | | | | | | | |
| MORTGAGE-BACKED OBLIGATIONS (CONTINUED) | | | | | | | | | | | | | | | |
GNMA (1) | | | AA+ | | | | 4.25 | | | | 04/20/41 | | | $ | 313,545 | | | $ | 302,058 | |
GNMA (1) | | | AA+ | | | | 4.29 | | | | 04/15/41 | | | | 5,375 | | | | 5,318 | |
GNMA (1) | | | AA+ | | | | 4.50 | | | | 06/20/30 | | | | 10,558 | | | | 10,431 | |
GNMA (1) | | | AA+ | | | | 4.50 | | | | 09/15/30 | | | | 138,899 | | | | 137,374 | |
GNMA (1) | | | AA+ | | | | 4.50 | | | | 04/20/31 | | | | 4,023 | | | | 3,964 | |
GNMA (1) | | | AA+ | | | | 4.50 | | | | 06/20/34 | | | | 79,108 | | | | 77,628 | |
GNMA (1) | | | AA+ | | | | 4.50 | | | | 09/15/40 | | | | 289,586 | | | | 283,287 | |
GNMA (1) | | | AA+ | | | | 4.50 | | | | 10/15/40 | | | | 400,422 | | | | 391,713 | |
GNMA (1) | | | AA+ | | | | 4.50 | | | | 10/20/43 | | | | 10,619 | | | | 10,327 | |
GNMA (1) | | | AA+ | | | | 5.00 | | | | 06/20/39 | | | | 378,282 | | | | 376,499 | |
GNMA (1) | | | AA+ | | | | 5.00 | | | | 05/15/40 | | | | 38,743 | | | | 38,757 | |
GNMA (1) | | | AA+ | | | | 5.00 | | | | 06/20/40 | | | | 22,169 | | | | 22,176 | |
GNMA (1) | | | AA+ | | | | 5.50 | | | | 01/15/36 | | | | 50,867 | | | | 51,389 | |
GNMA (1) | | | AA+ | | | | 6.50 | | | | 04/15/31 | | | | 4,450 | | | | 4,552 | |
GNMA (1) | | | AA+ | | | | 6.50 | | | | 10/15/31 | | | | 141 | | | | 145 | |
GNMA (1) | | | AA+ | | | | 6.50 | | | | 12/15/31 | | | | 4,084 | | | | 4,099 | |
GNMA (1) | | | AA+ | | | | 6.50 | | | | 05/15/32 | | | | 6,553 | | | | 6,662 | |
GNMA (1) | | | AA+ | | | | 7.00 | | | | 05/15/31 | | | | 140 | | | | 145 | |
GNMA (1) | | | AA+ | | | | 7.00 | | | | 05/15/32 | | | | 613 | | | | 615 | |
| | | | | | | | | | | | | | | | | | | | |
| | | | | | | | | | | | | | | | | | | 727,841,662 | |
| | | | | | | | | | | | | | | | | | | | |
| NON-MORTGAGE-BACKED OBLIGATIONS (1.6%) | | | | | | | | | | | | | | | |
FFCB | | | AA+ | | | | 5.95 | | | | 05/24/34 | | | | 6,156,000 | | | | 6,135,080 | |
FHLB | | | AA+ | | | | 5.65 | | | | 05/21/29 | | | | 4,700,000 | | | | 4,679,932 | |
FHLB | | | AA+ | | | | 5.70 | | | | 05/01/29 | | | | 2,000,000 | | | | 1,995,434 | |
FHLB | | | AA+ | | | | 5.78 | | | | 04/22/31 | | | | 3,730,000 | | | | 3,713,597 | |
FHLB | | | AA+ | | | | 6.00 | | | | 05/24/34 | | | | 4,365,000 | | | | 4,350,288 | |
FHLMC | | | AA+ | | | | 4.88 | | | | 07/24/26 | | | | 6,300,000 | | | | 6,265,451 | |
FHLMC | | | AA+ | | | | 5.00 | | | | 03/14/29 | | | | 6,600,000 | | | | 6,516,631 | |
FHLMC | | | AA+ | | | | 5.60 | | | | 05/03/27 | | | | 1,000,000 | | | | 998,862 | |
| | | | | | | | | | | | | | | | | | | | |
| | | | | | | | | | | | | | | | | | | 34,655,275 | |
| | | | | | | | | | | | | | | | | | | | |
| CORPORATE DEBT (34.0%) | | | | | | | | | | | | | | | |
| COMMUNICATION SERVICES (2.7%) | | | | | | | | | | | | | | | |
AT&T, Inc. | | | BBB | | | | 2.75 | | | | 06/01/31 | | | | 10,048,000 | | | | 8,605,576 | |
Comcast Corp. | | | A- | | | | 3.40 | | | | 04/01/30 | | | | 9,395,000 | | | | 8,636,735 | |
Sprint LLC | | | BBB- | | | | 7.63 | | | | 03/01/26 | | | | 7,970,000 | | | | 8,189,095 | |
T-Mobile USA, Inc. | | | BBB | | | | 3.38 | | | | 04/15/29 | | | | 4,580,000 | | | | 4,229,743 | |
T-Mobile USA, Inc. | | | BBB | | | | 3.75 | | | | 04/15/27 | | | | 6,105,000 | | | | 5,868,549 | |
Verizon Communications, Inc. | | | BBB+ | | | | 4.02 | | | | 12/03/29 | | | | 5,450,000 | | | | 5,149,910 | |
Verizon Communications, Inc. | | | BBB+ | | | | 4.40 | | | | 11/01/34 | | | | 5,555,000 | | | | 5,147,326 | |
Warnermedia Hldgs., Inc. | | | BBB- | | | | 4.28 | | | | 03/15/32 | | | | 7,905,000 | | | | 6,897,769 | |
Warnermedia Hldgs., Inc. | | | BBB- | | | | 6.41 | | | | 03/15/26 | | | | 3,420,000 | | | | 3,419,261 | |
| | | | | | | | | | | | | | | | | | | | |
| | | | | | | | | | | | | | | | | | | 56,143,964 | |
| | | | | | | | | | | | | | | | | | | | |
| CONSUMER DISCRETIONARY (2.0%) | | | | | | | | | | | | | | | |
AutoZone, Inc. | | | BBB | | | | 3.75 | | | | 04/18/29 | | | | 1,795,000 | | | | 1,690,161 | |
Best Buy Co., Inc. | | | BBB+ | | | | 1.95 | | | | 10/01/30 | | | | 1,625,000 | | | | 1,346,635 | |
Expedia Group, Inc. | | | BBB | | | | 5.00 | | | | 02/15/26 | | | | 9,590,000 | | | | 9,515,416 | |
Ford Motor Credit Co. LLC | | | BBB- | | | | 2.70 | | | | 08/10/26 | | | | 5,510,000 | | | | 5,176,236 | |
General Motors Co. | | | BBB | | | | 6.13 | | | | 10/01/25 | | | | 500,000 | | | | 502,547 | |
General Motors Financial Co., Inc. | | | BBB | | | | 5.75 | | | | 02/08/31 | | | | 9,225,000 | | | | 9,248,729 | |
Lowe’s Cos., Inc. | | | BBB+ | | | | 4.50 | | | | 04/15/30 | | | | 5,050,000 | | | | 4,901,930 | |
Tapestry, Inc. | | | BBB | | | | 7.00 | | | | 11/27/26 | | | | 1,435,000 | | | | 1,474,838 | |
Tapestry, Inc. | | | BBB | | | | 7.05 | | | | 11/27/25 | | | | 1,770,000 | | | | 1,799,817 | |
Toll Brothers Finance Corp. | | | BBB- | | | | 4.88 | | | | 03/15/27 | | | | 5,350,000 | | | | 5,270,574 | |
The accompanying notes are an integral part of these portfolio schedules.
93
MoA FUNDS — CORE BOND FUND
PORTFOLIO OF INVESTMENTS IN SECURITIES (Continued)
June 30, 2024 (Unaudited)
| | | | | | | | | | | | | | |
| | | Rating* | | Rate(%) | | Maturity | | Face Amount | | | Value | |
| LONG-TERM DEBT SECURITIES (CONTINUED): | | | | | | | | | | | | |
| CORPORATE DEBT (CONTINUED) | | | | | | | | | | | | |
| CONSUMER DISCRETIONARY (CONTINUED) | | | | | | | | | | | | |
Whirlpool Corp. | | BBB- | | 3.70 | | 05/01/25 | | $ | 1,960,000 | | | $ | 1,926,341 | |
| | | | | | | | | | | | | | |
| | | | | | | | | | | | | 42,853,224 | |
| | | | | | | | | | | | | | |
| CONSUMER STAPLES (1.2%) | | | | | | | | | | | | |
Bunge Ltd. Finance Corp. | | BBB+ | | 2.75 | | 05/14/31 | | | 4,150,000 | | | | 3,554,152 | |
Constellation Brands, Inc. | | BBB | | 4.80 | | 01/15/29 | | | 7,450,000 | | | | 7,347,529 | |
Hormel Foods Corp. | | A- | | 1.80 | | 06/11/30 | | | 3,490,000 | | | | 2,931,333 | |
J M Smucker Co. | | BBB | | 6.20 | | 11/15/33 | | | 7,890,000 | | | | 8,284,665 | |
Keurig Dr Pepper, Inc. | | BBB | | 5.10 | | 03/15/27 | | | 3,450,000 | | | | 3,450,955 | |
| | | | | | | | | | | | | | |
| | | | | | | | | | | | | 25,568,634 | |
| | | | | | | | | | | | | | |
| ENERGY (2.8%) | | | | | | | | | | | | |
Devon Energy Corp. | | BBB | | 5.85 | | 12/15/25 | | | 2,450,000 | | | | 2,455,871 | |
Energy Transfer LP | | BBB | | 5.25 | | 07/01/29 | | | 3,400,000 | | | | 3,379,949 | |
Energy Transfer LP | | BBB | | 5.55 | | 02/15/28 | | | 8,915,000 | | | | 8,987,744 | |
EQT Corp.† | | BBB- | | 3.13 | | 05/15/26 | | | 4,715,000 | | | | 4,504,824 | |
EQT Corp. | | BBB- | | 3.90 | | 10/01/27 | | | 500,000 | | | | 477,813 | |
HF Sinclair Corp.† | | BBB- | | 6.38 | | 04/15/27 | | | 7,931,000 | | | | 7,950,385 | |
Pioneer Natural Resources Co. | | AA- | | 5.10 | | 03/29/26 | | | 10,595,000 | | | | 10,575,767 | |
Targa Resources Partners LP/Targa Resources Partners Finance Corp. | | BBB | | 5.50 | | 03/01/30 | | | 3,100,000 | | | | 3,080,789 | |
Targa Resources Partners LP/Targa Resources Partners Finance Corp. | | BBB | | 6.88 | | 01/15/29 | | | 3,125,000 | | | | 3,205,098 | |
Western Midstream Operating LP | | BBB- | | 4.65 | | 07/01/26 | | | 4,370,000 | | | | 4,285,227 | |
Williams Cos., Inc. | | BBB | | 5.40 | | 03/02/26 | | | 10,130,000 | | | | 10,120,909 | |
| | | | | | | | | | | | | | |
| | | | | | | | | | | | | 59,024,376 | |
| | | | | | | | | | | | | | |
| FINANCIALS (13.6%) | | | | | | | | | | | | |
Aflac, Inc. | | A- | | 1.13 | | 03/15/26 | | | 4,380,000 | | | | 4,090,985 | |
Alleghany Corp. | | AA | | 3.63 | | 05/15/30 | | | 4,660,000 | | | | 4,335,346 | |
American Express Co. | | BBB+ | | 5.39 | | 07/28/27 | | | 6,650,000 | | | | 6,657,567 | |
American Express Co. | | BBB+ | | 5.53 | | 04/25/30 | | | 5,525,000 | | | | 5,588,135 | |
Aon North America, Inc. | | A- | | 5.45 | | 03/01/34 | | | 14,345,000 | | | | 14,281,138 | |
Bank of America Corp. | | A- | | 2.97 | | 02/04/33 | | | 26,230,000 | | | | 22,205,159 | |
BankUnited, Inc. | | BBB | | 4.88 | | 11/17/25 | | | 5,315,000 | | | | 5,218,058 | |
Barclays PLC | | BBB+ | | 5.83 | | 05/09/27 | | | 3,000,000 | | | | 3,003,107 | |
Block Financial LLC | | BBB | | 5.25 | | 10/01/25 | | | 2,985,000 | | | | 2,961,551 | |
Capital One Financial Corp. | | BBB | | 4.93 | | 05/10/28 | | | 3,165,000 | | | | 3,123,857 | |
Capital One Financial Corp. | | BBB | | 6.38 | | 06/08/34 | | | 5,040,000 | | | | 5,175,283 | |
Citigroup, Inc. | | BBB+ | | 3.79 | | 03/17/33 | | | 10,865,000 | | | | 9,684,733 | |
Citigroup, Inc. | | BBB+ | | 3.98 | | 03/20/30 | | | 4,460,000 | | | | 4,207,951 | |
Citigroup, Inc. | | BBB+ | | 4.41 | | 03/31/31 | | | 1,000,000 | | | | 953,065 | |
Citigroup, Inc. | | BBB | | 5.83 | | 02/13/35 | | | 6,620,000 | | | | 6,561,843 | |
Citizens Bank N.A. | | A- | | 5.28 | | 01/26/26 | | | 4,700,000 | | | | 4,672,988 | |
Citizens Financial Group, Inc. | | BBB+ | | 5.84 | | 01/23/30 | | | 5,510,000 | | | | 5,491,606 | |
Discover Financial Svcs. | | BBB- | | 4.10 | | 02/09/27 | | | 10,885,000 | | | | 10,462,503 | |
Fairfax Financial Hldgs. Ltd.† | | BBB+ | | 6.00 | | 12/07/33 | | | 5,010,000 | | | | 5,088,466 | |
Fifth Third Bancorp | | BBB+ | | 1.71 | | 11/01/27 | | | 1,000,000 | | | | 916,533 | |
Fifth Third Bancorp | | BBB+ | | 6.34 | | 07/27/29 | | | 4,762,000 | | | | 4,882,924 | |
Fifth Third Bank N.A. | | A- | | 5.85 | | 10/27/25 | | | 2,400,000 | | | | 2,397,400 | |
Goldman Sachs Group, Inc. | | BBB+ | | 2.60 | | 02/07/30 | | | 9,000,000 | | | | 7,885,731 | |
Goldman Sachs Group, Inc. | | BBB+ | | 2.64 | | 02/24/28 | | | 500,000 | | | | 466,321 | |
Goldman Sachs Group, Inc. | | BBB+ | | 6.56 | | 10/24/34 | | | 12,145,000 | | | | 13,062,222 | |
JPMorgan Chase & Co. | | A- | | 1.47 | | 09/22/27 | | | 6,245,000 | | | | 5,734,473 | |
JPMorgan Chase & Co. | | A- | | 5.35 | | 06/01/34 | | | 4,625,000 | | | | 4,604,787 | |
JPMorgan Chase & Co. | | BBB+ | | 5.72 | | 09/14/33 | | | 11,590,000 | | | | 11,818,918 | |
Kemper Corp. | | BBB- | | 3.80 | | 02/23/32 | | | 4,500,000 | | | | 3,853,749 | |
The accompanying notes are an integral part of these portfolio schedules.
94
MoA FUNDS — CORE BOND FUND
PORTFOLIO OF INVESTMENTS IN SECURITIES (Continued)
June 30, 2024 (Unaudited)
| | | | | | | | | | | | | | |
| | | Rating* | | Rate(%) | | Maturity | | Face Amount | | | Value | |
| LONG-TERM DEBT SECURITIES (CONTINUED): | | | | | | | | | | | | |
| CORPORATE DEBT (CONTINUED) | | | | | | | | | | | | |
| FINANCIALS (CONTINUED) | | | | | | | | | | | | |
KeyBank N.A. | | BBB+ | | 5.85 | | 11/15/27 | | $ | 2,000,000 | | | $ | 1,993,063 | |
KeyCorp | | BBB | | 2.25 | | 04/06/27 | | | 3,565,000 | | | | 3,239,073 | |
KeyCorp | | BBB | | 2.55 | | 10/01/29 | | | 3,800,000 | | | | 3,224,035 | |
KeyCorp | | BBB | | 6.40 | | 03/06/35 | | | 2,000,000 | | | | 2,028,448 | |
Mercury General Corp. | | BBB- | | 4.40 | | 03/15/27 | | | 3,330,000 | | | | 3,212,672 | |
Morgan Stanley | | A- | | 2.70 | | 01/22/31 | | | 10,000,000 | | | | 8,766,099 | |
Morgan Stanley | | A- | | 5.17 | | 01/16/30 | | | 1,910,000 | | | | 1,904,248 | |
Morgan Stanley | | A- | | 5.45 | | 07/20/29 | | | 5,455,000 | | | | 5,487,384 | |
Morgan Stanley | | A- | | 6.14 | | 10/16/26 | | | 4,790,000 | | | | 4,822,092 | |
Old Republic International Corp. | | BBB+ | | 3.88 | | 08/26/26 | | | 4,895,000 | | | | 4,730,726 | |
PNC Financial Svcs. Group, Inc. | | A- | | 4.76 | | 01/26/27 | | | 1,000,000 | | | | 988,014 | |
PNC Financial Svcs. Group, Inc. | | A- | | 5.81 | | 06/12/26 | | | 5,020,000 | | | | 5,025,221 | |
PNC Financial Svcs. Group, Inc. | | A- | | 6.88 | | 10/20/34 | | | 3,635,000 | | | | 3,960,514 | |
Synchrony Financial | | BBB- | | 3.70 | | 08/04/26 | | | 9,735,000 | | | | 9,286,710 | |
Truist Financial Corp. | | A- | | 4.87 | | 01/26/29 | | | 7,855,000 | | | | 7,704,756 | |
U.S. Bancorp | | A | | 4.65 | | 02/01/29 | | | 7,920,000 | | | | 7,753,865 | |
U.S. Bancorp | | A | | 5.78 | | 06/12/29 | | | 2,500,000 | | | | 2,538,175 | |
Voya Financial, Inc. | | BBB+ | | 3.65 | | 06/15/26 | | | 4,970,000 | | | | 4,796,945 | |
Wells Fargo & Co. | | BBB+ | | 2.57 | | 02/11/31 | | | 1,000,000 | | | | 865,159 | |
Wells Fargo & Co. | | BBB+ | | 3.35 | | 03/02/33 | | | 9,115,000 | | | | 7,912,746 | |
Wells Fargo & Co. | | BBB+ | | 3.53 | | 03/24/28 | | | 6,200,000 | | | | 5,912,624 | |
Wells Fargo & Co. | | BBB+ | | 5.20 | | 01/23/30 | | | 6,595,000 | | | | 6,566,661 | |
Zions Bancorporation | | BBB | | 3.25 | | 10/29/29 | | | 6,580,000 | | | | 5,493,720 | |
| | | | | | | | | | | | | | |
| | | | | | | | | | | | | 287,599,349 | |
| | | | | | | | | | | | | | |
| HEALTH CARE (2.3%) | | | | | | | | | | | | |
AbbVie, Inc. | | A- | | 5.05 | | 03/15/34 | | | 14,690,000 | | | | 14,644,555 | |
Amgen, Inc. | | BBB+ | | 5.15 | | 03/02/28 | | | 8,125,000 | | | | 8,124,319 | |
Amgen, Inc. | | BBB+ | | 5.25 | | 03/02/33 | | | 2,800,000 | | | | 2,791,736 | |
Baxter International, Inc. | | BBB | | 2.54 | | 02/01/32 | | | 2,697,000 | | | | 2,212,252 | |
Bristol-Myers Squibb Co. | | A | | 5.20 | | 02/22/34 | | | 2,860,000 | | | | 2,854,609 | |
CVS Health Corp. | | BBB | | 3.75 | | 04/01/30 | | | 9,660,000 | | | | 8,889,533 | |
CVS Health Corp. | | BBB | | 5.40 | | 06/01/29 | | | 2,045,000 | | | | 2,047,241 | |
Elevance Health, Inc. | | A | | 2.88 | | 09/15/29 | | | 7,245,000 | | | | 6,516,942 | |
| | | | | | | | | | | | | | |
| | | | | | | | | | | | | 48,081,187 | |
| | | | | | | | | | | | | | |
| INDUSTRIALS (1.5%) | | | | | | | | | | | | |
AutoZone, Inc. | | BBB | | 6.25 | | 11/01/28 | | | 6,195,000 | | | | 6,461,943 | |
Boeing Co. | | BBB- | | 2.20 | | 02/04/26 | | | 5,370,000 | | | | 5,051,099 | |
Boeing Co. | | BBB- | | 2.75 | | 02/01/26 | | | 4,901,000 | | | | 4,654,021 | |
Hexcel Corp. | | BB+ | | 4.95 | | 08/15/25 | | | 3,820,000 | | | | 3,779,262 | |
L3Harris Technologies, Inc. | | BBB | | 5.40 | | 01/15/27 | | | 6,840,000 | | | | 6,866,591 | |
Lennox International, Inc. | | BBB | | 1.70 | | 08/01/27 | | | 4,935,000 | | | | 4,436,135 | |
Verisk Analytics, Inc. | | BBB | | 4.00 | | 06/15/25 | | | 871,000 | | | | 856,533 | |
| | | | | | | | | | | | | | |
| | | | | | | | | | | | | 32,105,584 | |
| | | | | | | | | | | | | | |
| INFORMATION TECHNOLOGY (1.6%) | | | | | | | | | | | | |
Arrow Electronics, Inc. | | BBB- | | 4.00 | | 04/01/25 | | | 980,000 | | | | 966,729 | |
Broadcom Corp./Broadcom Cayman Finance Ltd. | | BBB | | 3.88 | | 01/15/27 | | | 6,470,000 | | | | 6,262,771 | |
Broadcom, Inc. | | BBB | | 3.15 | | 11/15/25 | | | 500,000 | | | | 484,582 | |
Intel Corp. | | A- | | 5.20 | | 02/10/33 | | | 4,670,000 | | | | 4,662,115 | |
Motorola Solutions, Inc. | | BBB | | 4.00 | | 09/01/24 | | | 980,000 | | | | 975,776 | |
Oracle Corp. | | BBB | | 2.80 | | 04/01/27 | | | 3,410,000 | | | | 3,202,017 | |
Oracle Corp. | | BBB | | 4.90 | | 02/06/33 | | | 4,580,000 | | | | 4,444,932 | |
QUALCOMM, Inc. | | A | | 4.25 | | 05/20/32 | | | 1,785,000 | | | | 1,706,053 | |
Teledyne Technologies, Inc. | | BBB | | 2.75 | | 04/01/31 | | | 5,800,000 | | | | 4,959,032 | |
The accompanying notes are an integral part of these portfolio schedules.
95
MoA FUNDS — CORE BOND FUND
PORTFOLIO OF INVESTMENTS IN SECURITIES (Continued)
June 30, 2024 (Unaudited)
| | | | | | | | | | | | | | |
| | | Rating* | | Rate(%) | | Maturity | | Face Amount | | | Value | |
| LONG-TERM DEBT SECURITIES (CONTINUED): | | | | | | | | | | | | |
| CORPORATE DEBT (CONTINUED) | | | | | | | | | | | | |
| INFORMATION TECHNOLOGY (CONTINUED) | | | | | | | | | | | | |
VMware LLC | | BBB | | 1.40 | | 08/15/26 | | $ | 6,860,000 | | | $ | 6,315,909 | |
| | | | | | | | | | | | | | |
| | | | | | | | | | | | | 33,979,916 | |
| | | | | | | | | | | | | | |
| MATERIALS (0.8%) | | | | | | | | | | | | |
Celanese US Hldgs. LLC | | BBB- | | 6.17 | | 07/15/27 | | | 5,300,000 | | | | 5,379,055 | |
International Flavors & Fragrances, Inc.† | | BBB- | | 1.83 | | 10/15/27 | | | 5,795,000 | | | | 5,176,315 | |
Sherwin-Williams Co. | | BBB | | 3.95 | | 01/15/26 | | | 4,895,000 | | | | 4,791,855 | |
Sherwin-Williams Co. | | BBB | | 4.25 | | 08/08/25 | | | 500,000 | | | | 493,315 | |
| | | | | | | | | | | | | | |
| | | | | | | | | | | | | 15,840,540 | |
| | | | | | | | | | | | | | |
| REAL ESTATE (3.3%) | | | | | | | | | | | | |
Alexandria Real Estate Equities, Inc. | | BBB+ | | 4.75 | | 04/15/35 | | | 9,853,000 | | | | 9,141,048 | |
Boston Properties LP | | BBB | | 3.25 | | 01/30/31 | | | 6,488,000 | | | | 5,485,843 | |
Boston Properties LP | | BBB | | 6.50 | | 01/15/34 | | | 3,435,000 | | | | 3,499,346 | |
Digital Realty Trust LP | | BBB | | 5.55 | | 01/15/28 | | | 6,971,000 | | | | 7,033,438 | |
Equinix, Inc. | | BBB | | 1.45 | | 05/15/26 | | | 7,345,000 | | | | 6,818,878 | |
Host Hotels & Resorts LP | | BBB- | | 5.70 | | 07/01/34 | | | 5,545,000 | | | | 5,450,540 | |
Kimco Realty OP LLC | | BBB+ | | 6.40 | | 03/01/34 | | | 6,800,000 | | | | 7,193,389 | |
NNN REIT, Inc. | | BBB+ | | 3.60 | | 12/15/26 | | | 3,145,000 | | | | 3,017,103 | |
NNN REIT, Inc. | | BBB+ | | 4.00 | | 11/15/25 | | | 500,000 | | | | 489,696 | |
Prologis LP | | A | | 1.75 | | 07/01/30 | | | 3,906,000 | | | | 3,231,131 | |
Realty Income Corp. | | A- | | 4.85 | | 03/15/30 | | | 1,780,000 | | | | 1,744,782 | |
Realty Income Corp. | | A- | | 5.13 | | 02/15/34 | | | 8,865,000 | | | | 8,602,864 | |
Tanger Properties LP | | BBB- | | 3.13 | | 09/01/26 | | | 5,800,000 | | | | 5,472,510 | |
Tanger Properties LP | | BBB- | | 3.88 | | 07/15/27 | | | 3,500,000 | | | | 3,319,260 | |
| | | | | | | | | | | | | | |
| | | | | | | | | | | | | 70,499,828 | |
| | | | | | | | | | | | | | |
| UTILITIES (2.2%) | | | | | | | | | | | | |
American Electric Power Co., Inc. | | BBB | | 5.20 | | 01/15/29 | | | 10,175,000 | | | | 10,124,076 | |
DTE Energy Co. | | BBB | | 5.10 | | 03/01/29 | | | 10,596,000 | | | | 10,512,980 | |
Duke Energy Carolinas LLC | | A | | 4.85 | | 01/15/34 | | | 9,330,000 | | | | 9,029,915 | |
Duke Energy Corp. | | BBB | | 4.85 | | 01/05/29 | | | 1,704,000 | | | | 1,683,637 | |
National Fuel Gas Co. | | BBB- | | 5.20 | | 07/15/25 | | | 1,960,000 | | | | 1,944,957 | |
NextEra Energy Capital Hldgs., Inc. | | BBB+ | | 3.55 | | 05/01/27 | | | 6,722,000 | | | | 6,419,928 | |
Southern Co. | | BBB+ | | 3.25 | | 07/01/26 | | | 50,000 | | | | 48,076 | |
Southern Co. | | BBB+ | | 5.70 | | 03/15/34 | | | 6,040,000 | | | | 6,145,304 | |
| | | | | | | | | | | | | | |
| | | | | | | | | | | | | 45,908,873 | |
| | | | | | | | | | | | | | |
TOTAL CORPORATE DEBT | | | | 717,605,475 | |
| | | | | | | | | | | | | | |
| SOVEREIGN DEBT (0.1%) | | | | | | | | | | | | |
Sri Lanka AID | | NR | | 6.59 | | 09/15/28 | | | 1,392,858 | | | | 1,408,800 | †† |
| | | | | | | | | | | | | | |
TOTAL LONG-TERM DEBT SECURITIES
(Cost: $2,254,340,055) | | | | 2,093,625,264 | |
| | | | | | | | | | | | | | |
| | | | | |
| SHORT-TERM DEBT SECURITIES (0.1%): | | | | | | | | | | | | |
| COMMERCIAL PAPER (0.1%) | | | | |
Novartis Finance Corp.† | | A-1+ | | 5.29 | | 07/01/24 | | | 3,100,000 | | | | 3,100,000 | |
| | | | | | | | | | | | | | |
TOTAL SHORT-TERM DEBT SECURITIES
(Cost: $3,100,000) | | | | 3,100,000 | |
| | | | | | | | | | | | | | |
The accompanying notes are an integral part of these portfolio schedules.
96
MoA FUNDS — CORE BOND FUND
PORTFOLIO OF INVESTMENTS IN SECURITIES (Continued)
June 30, 2024 (Unaudited)
| | | | | | | | | | | | | | | | |
| | | | | |
| | | | | | Rate(%) | | Maturity | | Face Amount | | | Value | |
| TEMPORARY CASH INVESTMENT (0.0%) (2) | | | | | | | | | | | | | |
JP Morgan Chase, New York Time Deposit | | | | | | 4.58 | | 07/01/24 | | $ | 22,457 | | | $ | 22,457 | |
| | | | | | | | | | | | | | | | |
TOTAL TEMPORARY CASH INVESTMENT
(Cost: $22,457) | | | | 22,457 | |
| | | | | | | | | | | | | | | | |
TOTAL INVESTMENTS
(Cost: $2,257,462,512) 99.3% | | | | 2,096,747,721 | |
| | | | | | | | | | | | | | | | |
OTHER NET ASSETS 0.7% | | | | 14,480,460 | |
| | | | | | | | | | | | | | | | |
NET ASSETS 100.0% | | | $ | 2,111,228,181 | |
| | | | | | | | | | | | | | | | |
FOOTNOTES TO PORTFOLIO OF INVESTMENTS IN SECURITIES
| | |
Abbreviations: | | ARM = Adjustable Rate Mortgage |
| | FFCB = Federal Farm Credit Banks Funding Corporation |
| | FHLB = Federal Home Loan Bank |
| | FHLMC = Federal Home Loan Mortgage Corporation |
| | FNMA = Federal National Mortgage Association |
| | FRESB = Federal Home Loan Mortgage Corporation Multifamily Securitization Small Loan Balance |
| | GNMA = Government National Mortgage Association |
| | NR = Not Rated |
| * | Ratings as per Standard & Poor’s Corporation (unaudited). |
| † | Security is exempt from registration under Rule 144A of the Securities Act of 1933. These securities may be resold in transactions exempt from registration, normally to qualified institutional buyers. At June 30, 2024, the aggregate values of these securities amounts to $25,819,990 and represents 1.2% of net assets. |
| (1) | U.S. Government guaranteed security. |
| (2) | Percentage is less than 0.05%. |
The accompanying notes are an integral part of these portfolio schedules.
97
MoA FUNDS
STATEMENTS OF ASSETS AND LIABILITIES
As of June 30, 2024 (Unaudited)
| | | | | | | | | | | | | | | | | | | | |
| | | Equity Index
Fund | | | All America
Fund | | | Small Cap
Value Fund | | | Small Cap
Growth Fund | | |
Small Cap
Equity Index
Fund | |
ASSETS | | | | | | | | | | | | | | | | | | | | |
Investments at fair value (a) (Note 2 and 4) | | $ | 5,652,495,911 | | | $ | 307,596,582 | | | $ | 376,031,195 | | | $ | 394,509,019 | | | $ | 199,495,135 | |
Cash | | | — | | | | 14,761 | | | | — | | | | — | | | | — | |
Foreign cash (b) | | | — | | | | 1,482 | | | | — | | | | — | | | | — | |
Interest and dividends receivable | | | 2,915,741 | | | | 215,046 | | | | 420,204 | | | | 213,880 | | | | 243,480 | |
Receivable for securities sold | | | 189,735 | | | | 1,008,170 | | | | 2,226,395 | | | | 10,506,659 | | | | 33,914 | |
Receivable for daily variation on future contracts | | | — | | | | — | | | | — | | | | — | | | | — | |
Shareholder subscription receivable | | | 1,311,573 | | | | 7,551 | | | | 69,498 | | | | 56,759 | | | | 60,871 | |
Due from the Adviser | | | — | | | | — | | | | — | | | | — | | | | 17,805 | |
| | | | | | | | | | | | | | | | | | | | |
TOTAL ASSETS | | | 5,656,912,960 | | | | 308,843,592 | | | | 378,747,292 | | | | 405,286,317 | | | | 199,851,205 | |
| | | | | | | | | | | | | | | | | | | | |
| | | | | |
LIABILITIES | | | | | | | | | | | | | | | | | | | | |
Due to custodian bank | | | — | | | | — | | | | — | | | | — | | | | 97 | |
Payable for securities purchased | | | 849,089 | | | | 2,214,481 | | | | 1,824,325 | | | | 12,314,617 | | | | 211,708 | |
Shareholder redemptions payable | | | 1,275,022 | | | | 14,475 | | | | 100,347 | | | | 63,873 | | | | 129,410 | |
Payable to the Adviser | | | 445,995 | | | | 105,577 | | | | 236,027 | | | | 247,128 | | | | 15,797 | |
Accrued expenses | | | 879,906 | | | | 140,331 | | | | 99,406 | | | | 110,742 | | | | 114,502 | |
| | | | | | | | | | | | | | | | | | | | |
| | | | | |
TOTAL LIABILITIES | | | 3,450,012 | | | | 2,474,864 | | | | 2,260,105 | | | | 12,736,360 | | | | 471,514 | |
| | | | | | | | | | | | | | | | | | | | |
| | | | | |
NET ASSETS | | $ | 5,653,462,948 | | | $ | 306,368,728 | | | $ | 376,487,187 | | | $ | 392,549,957 | | | $ | 199,379,691 | |
| | | | | | | | | | | | | | | | | | | | |
| | | | | |
NUMBER OF SHARES OUTSTANDING (Note 5) | | | 84,649,534 | | | | 12,963,399 | | | | 27,445,940 | | | | 29,897,440 | | | | 19,810,002 | |
| | | | | | | | | | | | | | | | | | | | |
| | | | | |
NET ASSET VALUE PER SHARE REDEMPTION PRICE PER SHARE | | | $66.79 | | | | $23.63 | | | | $13.72 | | | | $13.13 | | | | $10.06 | |
| | | | | | | | | | | | | | | | | | | | |
| | | | | |
COMPONENTS OF NET ASSETS | | | | | | | | | | | | | | | | | | | | |
Paid-in capital | | $ | 2,456,003,163 | | | $ | 191,161,667 | | | $ | 323,681,093 | | | $ | 341,535,751 | | | $ | 187,987,609 | |
Total Distributable Earnings (Loss) (Note 2 and 6) | | | 3,197,459,785 | | | | 115,207,061 | | | | 52,806,094 | | | | 51,014,206 | | | | 11,392,082 | |
| | | | | | | | | | | | | | | | | | | | |
| | | | | |
NET ASSETS | | $ | 5,653,462,948 | | | $ | 306,368,728 | | | $ | 376,487,187 | | | $ | 392,549,957 | | | $ | 199,379,691 | |
| | | | | | | | | | | | | | | | | | | | |
(a) Investments at cost | | $ | 2,734,314,320 | | | $ | 210,663,400 | | | $ | 335,523,245 | | | $ | 347,330,821 | | | $ | 189,590,072 | |
(b) Foreign cash, at cost, translated to US Dollars | | $ | — | | | $ | 1,494 | | | $ | — | | | $ | — | | | $ | — | |
The accompanying notes are an integral part of these financial statements.
98
| | | | | | | | | | | | | | | | | | | | | | | | | | | | | | |
Mid Cap
Value Fund | | | Mid Cap
Equity Index
Fund | | | Balanced
Fund | | | International
Fund | | | Catholic Values
Index Fund | | | Retirement
Income
Fund | | | Clear
Passage
2015
Fund | | | Clear
Passage
2020
Fund | |
| | | | | | | | | | | | | | | | | | | | | | | | | | | | | | |
| $ | 168,129,660 | | | $ | 1,502,261,468 | | | $ | 194,265,103 | | | $ | 1,583,839,676 | | | $ | 6,847,643 | | | $ | 199,052,647 | | | $ | 109,047,081 | | | $ | 473,330,673 | |
| | — | | | | — | | | | 11,329 | | | | — | | | | — | | | | 995 | | | | 545 | | | | 3,165 | |
| | — | | | | — | | | | — | | | | 38 | | | | — | | | | — | | | | — | | | | — | |
| | 188,077 | | | | 1,473,445 | | | | 619,558 | | | | 7,998,420 | | | | 3,622 | | | | — | | | | — | | | | — | |
| | 307,749 | | | | — | | | | 1,497 | | | | — | | | | — | | | | — | | | | — | | | | 154,249 | |
|
— |
| | | — | | | | — | | | | — | | | | — | | | | — | | | | — | | | | — | |
| | 67,095 | | | | 270,172 | | | | 17,270 | | | | 546,250 | | | | 121 | | | | — | | | | — | | | | 39,252 | |
| | — | | | | — | | | | — | | | | 393,925 | | | | 12,348 | | | | — | | | | — | | | | — | |
| | | | | | | | | | | | | | | | | | | | | | | | | | | | | | |
| | 168,692,581 | | | | 1,504,005,085 | | | | 194,914,757 | | | | 1,592,778,309 | | | | 6,863,734 | | | | 199,053,642 | | | | 109,047,626 | | | | 473,527,339 | |
| | | | | | | | | | | | | | | | | | | | | | | | | | | | | | |
| | | | | | | |
| | | | | | | | | | | | | | | | | | | | | | | | | | | | | | | |
| | — | | | | 55 | | | | — | | | | — | | | | 13 | | | | — | | | | — | | | | — | |
| | 4,165,817 | | | | 178,974 | | | | 149,235 | | | | — | | | | 147,670 | | | | — | | | | — | | | | 39,252 | |
| | 41,990 | | | | 152,618 | | | | 8 | | | | 222,051 | | | | — | | | | — | | | | — | | | | 154,249 | |
| | 77,574 | | | | 119,777 | | | | 66,796 | | | | 747,149 | | | | 938 | | | | 11,751 | | | | 6,474 | | | | 28,013 | |
| | 22,469 | | | | 268,823 | | | | 40,563 | | | | 214,487 | | | | 47,795 | | | | 53,380 | | | | 31,709 | | | | 60,959 | |
| | | | | | | | | | | | | | | | | | | | | | | | | | | | | | |
| | | | | | | |
| | 4,307,850 | | | | 720,247 | | | | 256,602 | | | | 1,183,687 | | | | 196,416 | | | | 65,131 | | | | 38,183 | | | | 282,473 | |
| | | | | | | | | | | | | | | | | | | | | | | | | | | | | | |
| | | | | | | |
| $ | 164,384,731 | | | $ | 1,503,284,838 | | | $ | 194,658,155 | | | $ | 1,591,594,622 | | | $ | 6,667,318 | | | $ | 198,988,511 | | | $ | 109,009,443 | | | $ | 473,244,866 | |
| | | | | | | | | | | | | | | | | | | | | | | | | | | | | | |
| | | | | | | |
| | 9,818,298 | | | | 70,880,306 | | | | 9,484,866 | | | | 184,661,722 | | | | 438,649 | | | | 17,834,170 | | | | 12,295,870 | | | | 45,104,278 | |
| | | | | | | | | | | | | | | | | | | | | | | | | | | | | | |
| | | | | | | |
| | $16.74 | | | | $21.21 | | | | $20.52 | | | | $ 8.62 | | | | $15.20 | | | | $11.16 | | | | $8.87 | | | | $10.49 | |
| | | | | | | | | | | | | | | | | | | | | | | | | | | | | | |
| | | | | | | |
| | | | | | | | | | | | | | | | | | | | | | | | | | | | | | |
| $ | 132,276,516 | | | $ | 1,150,386,123 | | | $ | 136,823,568 | | | $ | 1,500,365,170 | | | $ | 4,753,112 | | | $ | 206,436,160 | | | $ | 111,833,771 | | | $ | 476,639,554 | |
| 32,108,215 | | | | 352,898,715 | | | | 57,834,587 | | | | 91,229,452 | | | | 1,914,206 | | | | (7,447,649 | ) | | | (2,824,328 | ) | | | (3,394,688 | ) |
| | | | | | | | | | | | | | | | | | | | | | | | | | | | | | |
| | | | | | | |
| $ | 164,384,731 | | | $ | 1,503,284,838 | | | $ | 194,658,155 | | | $ | 1,591,594,622 | | | $ | 6,667,318 | | | $ | 198,988,511 | | | $ | 109,009,443 | | | $ | 473,244,866 | |
| | | | | | | | | | | | | | | | | | | | | | | | | | | | | | |
| $ | 142,873,920 | | | $ | 1,231,286,772 | | | $ | 145,772,136 | | | $ | 1,375,531,964 | | | $ | 5,064,955 | | | $ | 198,893,879 | | | $ | 109,994,920 | | | $ | 468,925,854 | |
| | | | | | | |
| $ | — | | | $ | — | | | $ | — | | | $ | 130 | | | $ | — | | | $ | — | | | $ | — | | | $ | — | |
The accompanying notes are an integral part of these financial statements.
99
MoA FUNDS
STATEMENTS OF ASSETS AND LIABILITIES (Continued)
As of June 30, 2024 (Unaudited)
| | | | | | | | | | | | | | | | | | | | |
| | | Clear
Passage
2025
Fund | | | Clear
Passage
2030
Fund | | | Clear
Passage
2035
Fund | | | Clear
Passage
2040
Fund | | | Clear
Passage
2045
Fund | |
ASSETS | | | | | | | | | | | | | | | | | | | | |
Investments at fair value (a) (Notes 2 and 4) | | $ | 1,114,469,236 | | | $ | 1,352,467,428 | | | $ | 1,330,619,382 | | | $ | 1,131,057,495 | | | $ | 1,167,282,884 | |
Cash | | | 7,216 | | | | 7,330 | | | | 5,512 | | | | 4,615 | | | | 6,747 | |
Foreign cash (b) | | | — | | | | — | | | | — | | | | — | | | | — | |
Interest and dividends receivable | | | — | | | | — | | | | — | | | | — | | | | — | |
Receivable for securities sold | | | — | | | | — | | | | — | | | | — | | | | — | |
Receivable for daily variation on future contracts | | | — | | | | — | | | | — | | | | — | | | | — | |
Shareholder subscription receivable | | | — | | | | — | | | | — | | | | — | | | | — | |
Due from the Adviser | | | — | | | | — | | | | — | | | | — | | | | — | |
| | | | | | | | | | | | | | | | | | | | |
TOTAL ASSETS | | | 1,114,476,452 | | | | 1,352,474,758 | | | | 1,330,624,894 | | | | 1,131,062,110 | | | | 1,167,289,631 | |
| | | | | | | | | | | | | | | | | | | | |
| | | | | |
LIABILITIES | | | | | | | | | | | | | | | | | | | | |
Due to custodian bank | | | — | | | | — | | | | — | | | | — | | | | — | |
Payable for securities purchased | | | — | | | | — | | | | — | | | | — | | | | — | |
Shareholder redemptions payable | | | — | | | | — | | | | — | | | | — | | | | — | |
Payable to the Adviser | | | 65,940 | | | | 79,729 | | | | 78,199 | | | | 66,406 | | | | 68,440 | |
Accrued expenses | | | 96,974 | | | | 115,982 | | | | 116,956 | | | | 104,164 | | | | 105,544 | |
| | | | | | | | | | | | | | | | | | | | |
| | | | | |
TOTAL LIABILITIES | | | 162,914 | | | | 195,711 | | | | 195,155 | | | | 170,570 | | | | 173,984 | |
| | | | | | | | | | | | | | | | | | | | |
| | | | | |
NET ASSETS | | $ | 1,114,313,538 | | | $ | 1,352,279,047 | | | $ | 1,330,429,739 | | | $ | 1,130,891,540 | | | $ | 1,167,115,647 | |
| | | | | | | | | | | | | | | | | | | | |
| | | | | |
NUMBER OF SHARES OUTSTANDING (Note 5) | | | 90,312,279 | | | | 99,296,024 | | | | 92,065,631 | | | | 77,303,371 | | | | 80,619,020 | |
| | | | | | | | | | | | | | | | | | | | |
| | | | | |
NET ASSET VALUE PER SHARE REDEMPTION PRICE PER SHARE | | | $12.34 | | | | $13.62 | | | | $14.45 | | | | $14.63 | | | | $14.48 | |
| | | | | | | | | | | | | | | | | | | | |
| | | | | |
COMPONENTS OF NET ASSETS | | | | | | | | | | | | | | | | | | | | |
Paid-in capital | | $ | 1,076,071,976 | | | $ | 1,251,191,172 | | | $ | 1,185,157,902 | | | $ | 986,849,732 | | | $ | 1,005,811,865 | |
Total Distributable Earnings (Loss) (Notes 2 and 6) | | | 38,241,562 | | | | 101,087,875 | | | | 145,271,837 | | | | 144,041,808 | | | | 161,303,782 | |
| | | | | | | | | | | | | | | | | | | | |
| | | | | |
NET ASSETS | | $ | 1,114,313,538 | | | $ | 1,352,279,047 | | | $ | 1,330,429,739 | | | $ | 1,130,891,540 | | | $ | 1,167,115,647 | |
| | | | | | | | | | | | | | | | | | | | |
(a) Investments at cost | | $ | 1,077,200,317 | | | $ | 1,273,927,913 | | | $ | 1,229,977,548 | | | $ | 1,033,151,155 | | | $ | 1,056,734,875 | |
(b) Foreign cash, at cost, translated to US Dollars | | $ | — | | | $ | — | | | $ | — | | | $ | — | | | $ | — | |
The accompanying notes are an integral part of these financial statements.
100
| | | | | | | | | | | | | | | | | | | | | | | | | | | | | | |
Clear
Passage
2050
Fund | | | Clear
Passage
2055
Fund | | | Clear
Passage
2060
Fund | | | Clear
Passage
2065
Fund | | | Conservative
Allocation
Fund | | | Moderate
Allocation
Fund | | | Aggressive
Allocation
Fund | | | Money
Market
Fund | |
| | | | | | | | | | | | | | | | | | | | | | | | | | | | | | |
| | | | | | | |
| $ | 912,940,754 | | | $ | 510,237,224 | | | $ | 277,716,275 | | | $ | 95,525,002 | | | $ | 155,444,641 | | | $ | 406,607,053 | | | $ | 340,923,520 | | | $ | 517,572,654 | |
| | 5,971 | | | | 4,167 | | | | 16,347 | | | | — | | | | 2,071 | | | | 3,973 | | | | 3,646 | | | | — | |
| | — | | | | — | | | | — | | | | — | | | | — | | | | — | | | | — | | | | — | |
| | — | | | | — | | | | — | | | | — | | | | — | | | | — | | | | — | | | | — | |
| | — | | | | — | | | | — | | | | — | | | | — | | | | — | | | | — | | | | — | |
|
— |
| | | — | | | | — | | | | — | | | | — | | | | — | | | | — | | | | — | |
| | — | | | | — | | | | — | | | | — | | | | — | | | | — | | | | — | | | | 270,880 | |
| | — | | | | — | | | | — | | | | 15,778 | | | | — | | | | — | | | | — | | | | — | |
| | | | | | | | | | | | | | | | | | | | | | | | | | | | | | |
| | 912,946,725 | | | | 510,241,391 | | | | 277,732,622 | | | | 95,540,780 | | | | 155,446,712 | | | | 406,611,026 | | | | 340,927,166 | | | | 517,843,534 | |
| | | | | | | | | | | | | | | | | | | | | | | | | | | | | | |
| | | | | | | |
| | | | | | | | | | | | | | | | | | | | | | | | | | | | | | | |
| | — | | | | — | | | | — | | | | — | | | | — | | | | — | | | | — | | | | — | |
| | — | | | | — | | | | — | | | | — | | | | — | | | | — | | | | — | | | | — | |
| | — | | | | — | | | | — | | | | — | | | | — | | | | — | | | | — | | | | 190,071 | |
| | 53,543 | | | | 29,845 | | | | 16,170 | | | | 5,514 | | | | 2,801 | | | | 7,345 | | | | 6,145 | | | | 72,532 | |
| | 84,724 | | | | 57,479 | | | | 60,060 | | | | 43,695 | | | | 22,360 | | | | 38,417 | | | | 36,460 | | | | 121,572 | |
| | | | | | | | | | | | | | | | | | | | | | | | | | | | | | |
| | | | | | | |
| | 138,267 | | | | 87,324 | | | | 76,230 | | | | 49,209 | | | | 25,161 | | | | 45,762 | | | | 42,605 | | | | 384,175 | |
| | | | | | | | | | | | | | | | | | | | | | | | | | | | | | |
| | | | | | | |
| $ | 912,808,458 | | | $ | 510,154,067 | | | $ | 277,656,392 | | | $ | 95,491,571 | | | $ | 155,421,551 | | | $ | 406,565,264 | | | $ | 340,884,561 | | | $ | 517,459,359 | |
| | | | | | | | | | | | | | | | | | | | | | | | | | | | | | |
| | | | | | | |
| | 49,323,614 | | | | 34,327,187 | | | | 21,864,299 | | | | 7,372,126 | | | | 13,506,501 | | | | 29,214,924 | | | | 22,181,612 | | | | 43,467,103 | |
| | | | | | | | | | | | | | | | | | | | | | | | | | | | | | |
| | | | | | | |
| | $18.51 | | | | $14.86 | | | | $12.70 | | | | $12.95 | | | | $ 11.51 | | | | $ 13.92 | | | | $ 15.37 | | | | $11.905 | |
| | | | | | | | | | | | | | | | | | | | | | | | | | | | | | |
| | | | | | | |
| | | | | | | | | | | | | | | | | | | | | | | | | | | | | | |
| $ | 795,499,698 | | | $ | 450,316,999 | | | $ | 248,581,455 | | | $ | 85,936,824 | | | $ | 156,990,180 | | | $ | 367,548,177 | | | $ | 297,820,500 | | | $ | 514,641,568 | |
| | | | | | | |
| | 117,308,760 | | | | 59,837,068 | | | | 29,074,937 | | | | 9,554,747 | | | | (1,568,629 | ) | | | 39,017,087 | | | | 43,064,061 | | | | 2,817,791 | |
| | | | | | | | | | | | | | | | | | | | | | | | | | | | | | |
| | | | | | | |
| $ | 912,808,458 | | | $ | 510,154,067 | | | $ | 277,656,392 | | | $ | 95,491,571 | | | $ | 155,421,551 | | | $ | 406,565,264 | | | $ | 340,884,561 | | | $ | 517,459,359 | |
| | | | | | | | | | | | | | | | | | | | | | | | | | | | | | |
| $ | 823,707,293 | | | $ | 464,718,319 | | | $ | 254,638,620 | | | $ | 85,638,811 | | | $ | 154,768,772 | | | $ | 377,812,983 | | | $ | 308,034,200 | | | $ | 517,572,818 | |
| | | | | | | |
| $ | — | | | $ | — | | | $ | — | | | $ | — | | | $ | — | | | $ | — | | | $ | — | | | $ | — | |
The accompanying notes are an integral part of these financial statements.
101
MoA FUNDS
STATEMENTS OF ASSETS AND LIABILITIES (Continued)
As of June 30, 2024 (Unaudited)
| | | | | | | | | | | | | | | | |
| | | Intermediate
Bond Fund | | | Core Bond
Fund | | | | | |
| |
ASSETS | | | | | | | | | | | | | | | | |
Investments at fair value (a) (Note 2 and 4) | | $ | 922,603,564 | | | $ | 2,096,747,721 | | | | | | | | | |
Cash | | | — | | | | — | | | | | | | | | |
Foreign cash (b) | | | — | | | | — | | | | | | | | | |
Interest and dividends receivable | | | 9,015,396 | | | | 18,271,052 | | | | | | | | | |
Receivable for securities sold | | | — | | | | 433,025 | | | | | | | | | |
Receivable for daily variation on future contracts | | | — | | | | — | | | | | | | | | |
Shareholder subscription receivable | | | 259,170 | | | | 585,570 | | | | | | | | | |
Due from the Adviser | | | — | | | | — | | | | | | | | | |
| | | | | | | | | | | | | | | | |
TOTAL ASSETS | | | 931,878,130 | | | | 2,116,037,368 | | | | | | | | | |
| | | | | | | | | | | | | | | | |
| | | | |
LIABILITIES | | | | | | | | | | | | | | | | |
Due to custodian bank | | | — | | | | — | | | | | | | | | |
Payable for securities purchased | | | — | | | | 3,473,089 | | | | | | | | | |
Shareholder redemptions payable | | | 235,735 | | | | 422,700 | | | | | | | | | |
Payable to the Adviser | | | 323,907 | | | | 661,064 | | | | | | | | | |
Accrued expenses | | | 145,246 | | | | 252,334 | | | | | | | | | |
| | | | | | | | | | | | | | | | |
| | | | |
TOTAL LIABILITIES | | | 704,888 | | | | 4,809,187 | | | | | | | | | |
| | | | | | | | | | | | | | | | |
| | | | |
NET ASSETS | | $ | 931,173,242 | | | $ | 2,111,228,181 | | | | | | | | | |
| | | | | | | | | | | | | | | | |
| | | | |
NUMBER OF SHARES OUTSTANDING (Note 5) | | | 97,600,781 | | | | 173,224,898 | | | | | | | | | |
| | | | | | | | | | | | | | | | |
| | | | |
NET ASSET VALUE PER SHARE REDEMPTION PRICE PER SHARE | | | $9.54 | | | | $12.19 | | | | | | | | | |
| | | | | | | | | | | | | | | | |
| | | | |
COMPONENTS OF NET ASSETS | | | | | | | | | | | | | | | | |
Paid-in capital | | $ | 1,006,692,766 | | | $ | 2,395,579,966 | | | | | | | | | |
Total Distributable Earnings (Loss) (Note 2 and 6) | | | (75,519,524 | ) | | | (284,351,785 | ) | | | | | | | | |
| | | | | | | | | | | | | | | | |
NET ASSETS | | $ | 931,173,242 | | | $ | 2,111,228,181 | | | | | | | | | |
| | | | | | | | | | | | | | | | |
(a) Investments at cost | | $ | 949,864,537 | | | $ | 2,257,462,512 | | | | | | | | | |
(b) Foreign cash, at cost, translated to US Dollars | | $ | — | | | $ | — | | | | | | | | | |
The accompanying notes are an integral part of these financial statements.
102
(This page has been left blank intentionally.)
MoA FUNDS
STATEMENTS OF OPERATIONS
For Six Months Ended June 30, 2024 (Unaudited)
| | | | | | | | | | | | | | | | | | | | |
| | | Equity Index
Fund | | | All America
Fund | | | Small Cap
Value Fund | | | Small Cap
Growth Fund | | |
Small Cap
Equity Index
Fund | |
INVESTMENT INCOME AND EXPENSES | | | | | | | | | | | | | | | | | | | | |
INVESTMENT INCOME | | | | | | | | | | | | | | | | | | | | |
Dividends (Notes 2 and 4) | | $ | 38,642,287 | (a) | | $ | 2,148,227 | (a) | | $ | 4,237,694 | (a) | | $ | 1,037,751 | (a) | | $ | 1,851,211 | (a) |
Interest | | | 841,670 | | | | 117,397 | | | | 251,122 | | | | 222,374 | | | | 336 | |
| | | | | | | | | | | | | | | | | | | | |
| | | | | |
Total investment income | | | 39,483,957 | | | | 2,265,624 | | | | 4,488,816 | | | | 1,260,125 | | | | 1,851,547 | |
| | | | | | | | | | | | | | | | | | | | |
| | | | | |
EXPENSES | | | | | | | | | | | | | | | | | | | | |
Investment advisory fees (Note 3) | | | 2,042,628 | | | | 603,283 | | | | 1,441,538 | | | | 1,499,409 | | | | 74,738 | |
Administrative fee (Note 3) | | | 816,801 | | | | 45,224 | | | | 57,635 | | | | 59,938 | | | | 29,893 | |
Other operating expenses | | | | | | | | | | | | | | | | | | | | |
Fund administration expenses | | | 486,320 | | | | (7,186 | ) | | | (1,748 | ) | | | 8 | | | | (13,448 | ) |
Shareholders reports | | | 17,320 | | | | 17,318 | | | | 17,324 | | | | 17,323 | | | | 17,320 | |
Custodian expenses | | | 36,949 | | | | 21,747 | | | | 5,043 | | | | 5,518 | | | | 16,488 | |
Transfer agent fees | | | 53,438 | | | | 3,902 | | | | 4,744 | | | | 3,961 | | | | 3,345 | |
Independent directors’ fees and expenses | | | 17,769 | | | | 15,820 | | | | 15,871 | | | | 15,890 | | | | 22,696 | |
Audit and Tax Expense | | | 23,136 | | | | 21,924 | | | | 21,924 | | | | 21,924 | | | | 39,080 | |
Legal | | | 77,456 | | | | 4,233 | | | | 5,874 | | | | 5,751 | | | | 16,726 | |
Licenses | | | 411,623 | | | | 34,425 | | | | — | | | | — | | | | 52,559 | |
Registration fees | | | 73,703 | | | | 12,076 | | | | 5,187 | | | | 6,794 | | | | 18,423 | |
Miscellaneous fees | | | 45,437 | | | | 3,375 | | | | 4,116 | | | | 4,269 | | | | 2,538 | |
| | | | | | | | | | | | | | | | | | | | |
| | | | | |
Total other operating expenses | | | 1,243,151 | | | | 127,634 | | | | 78,335 | | | | 81,438 | | | | 175,727 | |
| | | | | | | | | | | | | | | | | | | | |
| | | | | |
Total expenses before waiver/reimbursement | | | 4,102,580 | | | | 776,141 | | | | 1,577,508 | | | | 1,640,785 | | | | 280,358 | |
Fee waiver and expense reimbursement (Note 3) | | | (217,814 | ) | | | (12,060 | ) | | | (15,369 | ) | | | (15,984 | ) | | | (143,837 | ) |
| | | | | | | | | | | | | | | | | | | | |
| | | | | |
Net expenses | | | 3,884,766 | | | | 764,081 | | | | 1,562,139 | | | | 1,624,801 | | | | 136,521 | |
| | | | | | | | | | | | | | | | | | | | |
| | | | | |
Net Investment Income (Loss) | | | 35,599,191 | | | | 1,501,543 | | | | 2,926,677 | | | | (364,676 | ) | | | 1,715,026 | |
| | | | | | | | | | | | | | | | | | | | |
| | | | | |
NET REALIZED AND UNREALIZED GAIN (LOSS) ON INVESTMENTS, FUTURES CONTRACTS AND FOREIGN CURRENCY TRANSLATIONS (Note 2) | | | | | | | | | | | | | | | | | | | | |
Net realized gain (loss) on: | | | | | | | | | | | | | | | | | | | | |
Investment securities (Notes 2 and 4) | | | 233,613,341 | | | | 15,513,492 | | | | 14,377,800 | | | | 16,157,924 | | | | 3,070,809 | |
Futures contracts (Note 2) | | | 7,617,738 | | | | 278,592 | | | | — | | | | — | | | | — | |
Foreign currency translation | | | — | | | | — | | | | — | | | | — | | | | — | |
| | | | | | | | | | | | | | | | | | | | |
| | | | | |
| | | 241,231,079 | | | | 15,792,084 | | | | 14,377,800 | | | | 16,157,924 | | | | 3,070,809 | |
| | | | | | | | | | | | | | | | | | | | |
| | | | | |
Change in net unrealized appreciation (depreciation) of: | | | | | | | | | | | | | | | | | | | | |
Investment securities (Notes 2 and 4) | | | 498,967,803 | | | | 11,541,194 | | | | (17,786,457 | ) | | | (3,031,421 | ) | | | (6,350,941 | ) |
Futures contracts (Note 2) | | | (2,007,303 | ) | | | (35,588 | ) | | | — | | | | — | | | | — | |
Foreign currency translation | | | — | | | | (48 | ) | | | — | | | | — | | | | — | |
| | | | | | | | | | | | | | | | | | | | |
| | | | | |
| | | 496,960,500 | | | | 11,505,558 | | | | (17,786,457 | ) | | | (3,031,421 | ) | | | (6,350,941 | ) |
| | | | | | | | | | | | | | | | | | | | |
| | | | | |
NET REALIZED AND UNREALIZED GAIN (LOSS) ON INVESTMENTS, FUTURES CONTRACTS AND FOREIGN CURRENCY TRANSLATIONS | | | 738,191,579 | | | | 27,297,642 | | | | (3,408,657 | ) | | | 13,126,503 | | | | (3,280,132 | ) |
| | | | | | | | | | | | | | | | | | | | |
| | | | | |
NET INCREASE (DECREASE) IN NET ASSETS RESULTING FROM OPERATIONS | | $ | 773,790,770 | | | $ | 28,799,185 | | | $ | (481,980 | ) | | $ | 12,761,827 | | | $ | (1,565,106 | ) |
| | | | | | | | | | | | | | | | | | | | |
| (a) | Net of foreign taxes as follows: |
| | | | |
Equity Index Fund | | $ | 9,778 | |
All America Fund | | $ | 685 | |
Small Cap Value Fund | | $ | 3,095 | |
Small Cap Growth Fund | | $ | 732 | |
Small Cap Equity Index Fund | | $ | 2,002 | |
International Fund | | $ | 4,048,642 | |
Catholic Values Index Fund | | $ | 73 | |
The accompanying notes are an integral part of these financial statements.
104
| | | | | | | | | | | | | | | | | | | | | | | | | | | | | | |
Mid Cap
Value Fund | | | Mid Cap
Equity Index
Fund | | | Balanced
Fund | | | International
Fund | | | Catholic Values
Index Fund | | | Retirement
Income
Fund | | | Clear
Passage
2015
Fund | | | Clear
Passage
2020
Fund | |
| | | | | | | | | | | | | | | | | | | | | | | | | | | | | | |
| | | | | | | | | | | | | | | | | | | | | | | | | | | | | | |
| $ | 1,704,787 | | | $ | 11,946,693 | | | $ | 962,170 | | | $ | 33,686,768 | (a) | | $ | 41,445 | (a) | | $ | 2,593,247 | | | $ | 1,372,981 | | | $ | 5,901,041 | |
| | 106,573 | | | | 155,340 | | | | 1,493,967 | | | | 759,839 | | | | 81 | | | | 32 | | | | 31 | | | | 42 | |
| | | | | | | | | | | | | | | | | | | | | | | | | | | | | | |
| | | | | | | |
| | 1,811,360 | | | | 12,102,033 | | | | 2,456,137 | | | | 34,446,607 | | | | 41,526 | | | | 2,593,279 | | | | 1,373,012 | | | | 5,901,083 | |
| | | | | | | | | | | | | | | | | | | | | | | | | | | | | | |
| | | | | | | |
| | | | | | | | | | | | | | | | | | | | | | | | | | | | | | |
| | 445,757 | | | | 566,228 | | | | 375,765 | | | | 1,416,910 | | | | 4,627 | | | | 50,440 | | | | 27,256 | | | | 119,350 | |
| | 24,312 | | | | 226,414 | | | | 28,174 | | | | 225,446 | | | | 926 | | | | 30,253 | | | | 16,348 | | | | 71,571 | |
| | | | | | | | | | | | | | | | | | | | | | | | | | | | | | |
| | (26,064 | ) | | | 110,658 | | | | (11,356 | ) | | | 106,002 | | | | 3,697 | | | | (2,824 | ) | | | (12,274 | ) | | | 25,229 | |
| | 17,324 | | | | 17,321 | | | | 17,319 | | | | 17,321 | | | | 17,320 | | | | 17,324 | | | | 17,322 | | | | 9,853 | |
| | 4,327 | | | | 18,444 | | | | 4,752 | | | | 70,730 | | | | 4,177 | | | | 8,057 | | | | 6,606 | | | | 10,586 | |
| | 2,197 | | | | 15,769 | | | | 2,731 | | | | 23,935 | | | | 802 | | | | 2,955 | | | | 1,922 | | | | 2,802 | |
| | 15,742 | | | | 16,433 | | | | 22,693 | | | | 23,194 | | | | 22,611 | | | | 12,619 | | | | 15,948 | | | | 7,172 | |
| | 36,651 | | | | 23,136 | | | | 35,771 | | | | 40,449 | | | | 33,162 | | | | 18,042 | | | | 17,989 | | | | 12,989 | |
| | 5,559 | | | | 15,545 | | | | 2,664 | | | | 40,961 | | | | 89 | | | | 3,063 | | | | 1,652 | | | | 4,591 | |
| | — | | | | 124,607 | | | | 8,011 | | | | — | | | | 23,790 | | | | — | | | | — | | | | — | |
| | 9,580 | | | | 25,052 | | | | 7,609 | | | | 42,748 | | | | 4,956 | | | | 14,401 | | | | 9,240 | | | | 15,948 | |
| | 2,150 | | | | 13,335 | | | | 2,433 | | | | 12,895 | | | | 918 | | | | 1,861 | | | | 1,402 | | | | 3,208 | |
| | | | | | | | | | | | | | | | | | | | | | | | | | | | | | |
| | | | | | | |
| | 67,466 | | | | 380,300 | | | | 92,627 | | | | 378,235 | | | | 111,522 | | | | 75,498 | | | | 59,807 | | | | 92,378 | |
| | | | | | | | | | | | | | | | | | | | | | | | | | | | | | |
| | | | | | | |
| | 537,535 | | | | 1,172,942 | | | | 496,566 | | | | 2,020,591 | | | | 117,075 | | | | 156,191 | | | | 103,411 | | | | 283,299 | |
| | (6,483 | ) | | | (60,377 | ) | | | (7,513 | ) | | | (454,045 | ) | | | (110,535 | ) | | | (8,068 | ) | | | (4,359 | ) | | | (19,086 | ) |
| | | | | | | | | | | | | | | | | | | | | | | | | | | | | | |
| | | | | | | |
| | 531,052 | | | | 1,112,565 | | | | 489,053 | | | | 1,566,546 | | | | 6,540 | | | | 148,123 | | | | 99,052 | | | | 264,213 | |
| | | | | | | | | | | | | | | | | | | | | | | | | | | | | | |
| | | | | | | |
| | 1,280,308 | | | | 10,989,468 | | | | 1,967,084 | | | | 32,880,061 | | | | 34,986 | | | | 2,445,156 | | | | 1,273,960 | | | | 5,636,870 | |
| | | | | | | | | | | | | | | | | | | | | | | | | | | | | | |
| | | | | | | |
| | | | | | | | | | | | | | | | | | | | | | | | | | | | | | |
| | | | | | | | | | | | | | | | | | | | | | | | | | | | | | |
| | 3,767,787 | | | | 68,267,495 | | | | 8,165,372 | | | | (26,988,449 | ) | | | 122,940 | | | | (2,480,927 | ) | | | 138,103 | | | | (242,757 | ) |
| | — | | | | 1,598,743 | | | | — | | | | 2,174,653 | | | | — | | | | — | | | | — | | | | — | |
| | — | | | | — | | | | — | | | | (217,387 | ) | | | — | | | | — | | | | — | | | | — | |
| | | | | | | | | | | | | | | | | | | | | | | | | | | | | | |
| | | | | | | |
| | 3,767,787 | | | | 69,866,238 | | | | 8,165,372 | | | | (25,031,183 | ) | | | 122,940 | | | | (2,480,927 | ) | | | 138,103 | | | | (242,757 | ) |
| | | | | | | | | | | | | | | | | | | | | | | | | | | | | | |
| | | | | | | |
| | | | | | | | | | | | | | | | | | | | | | | | | | | | | | |
| | 375,328 | | | | 10,120,175 | | | | 8,004,965 | | | | 95,412,470 | | | | 596,780 | | | | 7,161,641 | | | | 2,800,286 | | | | 14,610,747 | |
| | — | | | | (609,100 | ) | | | — | | | | (1,031,225 | ) | | | — | | | | — | | | | — | | | | — | |
| | — | | | | — | | | | — | | | | (201,037 | ) | | | — | | | | — | | | | — | | | | — | |
| | | | | | | | | | | | | | | | | | | | | | | | | | | | | | |
| | | | | | | |
| | 375,328 | | | | 9,511,075 | | | | 8,004,965 | | | | 94,180,208 | | | | 596,780 | | | | 7,161,641 | | | | 2,800,286 | | | | 14,610,747 | |
| | | | | | | | | | | | | | | | | | | | | | | | | | | | | | |
| | | | | | | |
| | 4,143,115 | | | | 79,377,313 | | | | 16,170,337 | | | | 69,149,025 | | | | 719,720 | | | | 4,680,714 | | | | 2,938,389 | | | | 14,367,990 | |
| | | | | | | | | | | | | | | | | | | | | | | | | | | | | | |
| | | | | | | |
| $ | 5,423,423 | | | $ | 90,366,781 | | | $ | 18,137,421 | | | $ | 102,029,086 | | | $ | 754,706 | | | $ | 7,125,870 | | | $ | 4,212,349 | | | $ | 20,004,860 | |
| | | | | | | | | | | | | | | | | | | | | | | | | | | | | | |
The accompanying notes are an integral part of these financial statements.
105
MoA FUNDS
STATEMENTS OF OPERATIONS (Continued)
For Six Months Ended June 30, 2024 (Unaudited)
| | | | | | | | | | | | | | | | | | | | |
| | | Clear
Passage
2025
Fund | | | Clear
Passage
2030
Fund | | | Clear
Passage
2035
Fund | | | Clear
Passage
2040
Fund | | | Clear
Passage
2045
Fund | |
INVESTMENT INCOME AND EXPENSES | | | | | | | | | | | | | | | | | | | | |
INVESTMENT INCOME | | | | | | | | | | | | | | | | | | | | |
Dividends (Notes 2 and 4) | | $ | 13,103,148 | | | $ | 14,711,335 | | | $ | 13,280,292 | | | $ | 10,803,217 | | | $ | 10,972,576 | |
Interest | | | 62 | | | | 79 | | | | 66 | | | | 60 | | | | 61 | |
| | | | | | | | | | | | | | | | | | | | |
| | | | | |
Total investment income | | | 13,103,210 | | | | 14,711,414 | | | | 13,280,358 | | | | 10,803,277 | | | | 10,972,637 | |
| | | | | | | | | | | | | | | | | | | | |
| | | | | |
EXPENSES | | | | | | | | | | | | | | | | | | | | |
Investment advisory fees (Note 3) | | | 279,185 | | | | 332,216 | | | | 318,758 | | | | 270,572 | | | | 278,223 | |
Administrative fee (Note 3) | | | 167,432 | | | | 199,284 | | | | 191,266 | | | | 162,347 | | | | 166,932 | |
Other operating expenses | | | | | | | | | | | | | | | | | | | | |
Fund administration expenses | | | 88,342 | | | | 106,503 | | | | 99,888 | | | | 80,561 | | | | 83,583 | |
Shareholders reports | | | 9,853 | | | | 9,853 | | | | 9,853 | | | | 9,854 | | | | 9,852 | |
Custodian expenses | | | 11,885 | | | | 12,736 | | | | 12,014 | | | | 9,641 | | | | 15,993 | |
Transfer agent fees | | | 6,788 | | | | 8,943 | | | | 8,754 | | | | 7,725 | | | | 7,877 | |
Independent directors’ fees and expenses | | | 7,172 | | | | 7,172 | | | | 7,172 | | | | 7,172 | | | | 8,904 | |
Audit and Tax Expense | | | 12,990 | | | | 12,989 | | | | 12,981 | | | | 17,981 | | | | 14,482 | |
Legal | | | 2,754 | | | | 5,352 | | | | 10,111 | | | | 10,023 | | | | 10,869 | |
Licenses | | | — | | | | — | | | | — | | | | — | | | | — | |
Registration fees | | | 12,259 | | | | 29,655 | | | | 19,982 | | | | 24,899 | | | | 31,772 | |
Miscellaneous fees | | | 6,276 | | | | 7,181 | | | | 6,833 | | | | 5,910 | | | | 6,059 | |
| | | | | | | | | | | | | | | | | | | | |
| | | | | |
Total other operating expenses | | | 158,319 | | | | 200,384 | | | | 187,588 | | | | 173,766 | | | | 189,391 | |
| | | | | | | | | | | | | | | | | | | | |
| | | | | |
Total expenses before waiver/reimbursement | | | 604,936 | | | | 731,884 | | | | 697,612 | | | | 606,685 | | | | 634,546 | |
Fee waiver and expense reimbursement (Note 3) | | | (44,649 | ) | | | (53,142 | ) | | | (51,004 | ) | | | (43,292 | ) | | | (44,515 | ) |
| | | | | | | | | | | | | | | | | | | | |
| | | | | |
Net expenses | | | 560,287 | | | | 678,742 | | | | 646,608 | | | | 563,393 | | | | 590,031 | |
| | | | | | | | | | | | | | | | | | | | |
| | | | | |
Net Investment Income (Loss) | | | 12,542,923 | | | | 14,032,672 | | | | 12,633,750 | | | | 10,239,884 | | | | 10,382,606 | |
| | | | | | | | | | | | | | | | | | | | |
| | | | | |
NET REALIZED AND UNREALIZED GAIN (LOSS) ON INVESTMENTS, FUTURES CONTRACTS AND FOREIGN CURRENCY TRANSLATIONS (Note 2) | | | | | | | | | | | | | | | | | | | | |
Net realized gain (loss) on: | | | | | | | | | | | | | | | | | | | | |
Investment securities (Notes 2 and 4) | | | 5,609,286 | | | | 14,008,830 | | | | 22,723,410 | | | | 26,150,808 | | | | 28,140,721 | |
Futures contracts (Note 2) | | | — | | | | — | | | | — | | | | — | | | | — | |
Foreign currency translation | | | — | | | | — | | | | — | | | | — | | | | — | |
| | | | | | | | | | | | | | | | | | | | |
| | | | | |
| | | 5,609,286 | | | | 14,008,830 | | | | 22,723,410 | | | | 26,150,808 | | | | 28,140,721 | |
| | | | | | | | | | | | | | | | | | | | |
| | | | | |
Change in net unrealized appreciation (depreciation) of: | | | | | | | | | | | | | | | | | | | | |
Investment securities (Notes 2 and 4) | | | 41,558,401 | | | | 56,851,670 | | | | 62,725,707 | | | | 55,611,099 | | | | 60,423,324 | |
Futures contracts (Note 2) | | | — | | | | — | | | | — | | | | — | | | | — | |
Foreign currency translation | | | — | | | | — | | | | — | | | | — | | | | — | |
| | | | | | | | | | | | | | | | | | | | |
| | | | | |
| | | 41,558,401 | | | | 56,851,670 | | | | 62,725,707 | | | | 55,611,099 | | | | 60,423,324 | |
| | | | | | | | | | | | | | | | | | | | |
| | | | | |
NET REALIZED AND UNREALIZED GAIN (LOSS) ON INVESTMENTS, FUTURES CONTRACTS AND FOREIGN CURRENCY TRANSLATIONS | | | 47,167,687 | | | | 70,860,500 | | | | 85,449,117 | | | | 81,761,907 | | | | 88,564,045 | |
| | | | | | | | | | | | | | | | | | | | |
| | | | | |
NET INCREASE (DECREASE) IN NET ASSETS RESULTING FROM OPERATIONS | | $ | 59,710,610 | | | $ | 84,893,172 | | | $ | 98,082,867 | | | $ | 92,001,791 | | | $ | 98,946,651 | |
| | | | | | | | | | | | | | | | | | | | |
The accompanying notes are an integral part of these financial statements.
106
| | | | | | | | | | | | | | | | | | | | | | | | | | | | | | |
Clear
Passage
2050
Fund | | | Clear
Passage
2055
Fund | | | Clear
Passage
2060
Fund | | | Clear
Passage
2065
Fund | | | Conservative
Allocation
Fund | | | Moderate
Allocation
Fund | | | Aggressive
Allocation
Fund | | | Money
Market
Fund | |
| | | | | | | | | | | | | | | | | | | | | | | | | | | | | | |
| | | | | | | | | | | | | | | | | | | | | | | | | | | | | | |
| $ | 8,325,044 | | | $ | 4,574,580 | | | $ | 2,451,414 | | | $ | 811,282 | | | $ | 1,839,158 | | | $ | 4,265,633 | | | $ | 3,248,298 | | | $ | — | |
| | 54 | | | | 42 | | | | 33 | | | | 31 | | | | 32 | | | | 33 | | | | 34 | | | | 14,490,225 | |
| | | | | | | | | | | | | | | | | | | | | | | | | | | | | | |
| | | | | | | |
| | 8,325,098 | | | | 4,574,622 | | | | 2,451,447 | | | | 811,313 | | | | 1,839,190 | | | | 4,265,666 | | | | 3,248,332 | | | | 14,490,225 | |
| | | | | | | | | | | | | | | | | | | | | | | | | | | | | | |
| | | | | | | |
| | | | | | | | | | | | | | | | | | | | | | | | | | | | | | |
| | 217,207 | | | | 119,881 | | | | 63,587 | | | | 20,420 | | | | — | | | | — | | | | — | | | | 403,062 | |
| | 130,332 | | | | 71,944 | | | | 38,176 | | | | 12,276 | | | | 23,183 | | | | 60,348 | | | | 50,592 | | | | 80,553 | |
| | | | | | | | | | | | | | | | | | | | | | | | | | | | | | |
| | 59,785 | | | | 21,894 | | | | 188 | | | | (16,149 | ) | | | (7,505 | ) | | | 16,842 | | | | 10,176 | | | | 15,329 | |
| | 9,853 | | | | 17,322 | | | | 17,322 | | | | 17,322 | | | | 17,322 | | | | 17,322 | | | | 17,323 | | | | 17,098 | |
| | 14,847 | | | | 10,335 | | | | 10,223 | | | | 8,533 | | | | 3,517 | | | | 6,378 | | | | 4,742 | | | | 5,210 | |
| | 6,500 | | | | 4,268 | | | | 3,055 | | | | 1,404 | | | | 1,439 | | | | 2,574 | | | | 2,491 | | | | 9,581 | |
| | 7,172 | | | | 7,172 | | | | 15,948 | | | | 7,542 | | | | 7,172 | | | | 7,172 | | | | 7,172 | | | | 22,397 | |
| | 17,981 | | | | 17,981 | | | | 17,981 | | | | 17,981 | | | | 18,043 | | | | 18,043 | | | | 18,043 | | | | 33,957 | |
| | 7,316 | | | | 6,699 | | | | 3,463 | | | | 1,025 | | | | 2,336 | | | | 264 | | | | 4,023 | | | | 18,236 | |
| | — | | | | — | | | | — | | | | — | | | | — | | | | — | | | | — | | | | — | |
| | 23,082 | | | | 24,753 | | | | 19,508 | | | | 13,456 | | | | 4,572 | | | | 10,412 | | | | 10,406 | | | | 59,786 | |
| | 4,902 | | | | 3,056 | | | | 2,015 | | | | 1,213 | | | | 1,622 | | | | 2,796 | | | | 2,478 | | | | 5,517 | |
| | | | | | | | | | | | | | | | | | | | | | | | | | | | | | |
| | | | | | | |
| | 151,438 | | | | 113,480 | | | | 89,703 | | | | 52,327 | | | | 48,518 | | | | 81,803 | | | | 76,854 | | | | 187,111 | |
| | | | | | | | | | | | | | | | | | | | | | | | | | | | | | |
| | | | | | | |
| | 498,977 | | | | 305,305 | | | | 191,466 | | | | 85,023 | | | | 71,701 | | | | 142,151 | | | | 127,446 | | | | 670,726 | |
| | (34,755 | ) | | | (19,185 | ) | | | (10,181 | ) | | | (67,877 | ) | | | (6,182 | ) | | | (16,093 | ) | | | (13,491 | ) | | | (21,481 | ) |
| | | | | | | | | | | | | | | | | | | | | | | | | | | | | | |
| | | | | | | |
| | 464,222 | | | | 286,120 | | | | 181,285 | | | | 17,146 | | | | 65,519 | | | | 126,058 | | | | 113,955 | | | | 649,245 | |
| | | | | | | | | | | | | | | | | | | | | | | | | | | | | | |
| | | | | | | |
| | 7,860,876 | | | | 4,288,502 | | | | 2,270,162 | | | | 794,167 | | | | 1,773,671 | | | | 4,139,608 | | | | 3,134,377 | | | | 13,840,980 | |
| | | | | | | | | | | | | | | | | | | | | | | | | | | | | | |
| | | | | | | |
| | | | | | | | | | | | | | | | | | | | | | | | | | | | | | |
| | | | | | | | | | | | | | | | | | | | | | | | | | | | | | |
| | 11,268,904 | | | | 5,265,751 | | | | 1,821,354 | | | | (57,298 | ) | | | (601,076 | ) | | | 3,830,335 | | | | 3,320,702 | | | | 4,077 | |
| | — | | | | — | | | | — | | | | — | | | | — | | | | — | | | | — | | | | — | |
| | — | | | | — | | | | — | | | | — | | | | — | | | | — | | | | — | | | | — | |
| | | | | | | | | | | | | | | | | | | | | | | | | | | | | | |
| | | | | | | |
| | 11,268,904 | | | | 5,265,751 | | | | 1,821,354 | | | | (57,298 | ) | | | (601,076 | ) | | | 3,830,335 | | | | 3,320,702 | | | | 4,077 | |
| | | | | | | | | | | | | | | | | | | | | | | | | | | | | | |
| | | | | | | |
| | | | | | | | | | | | | | | | | | | | | | | | | | | | | | |
| | 60,004,409 | | | | 34,695,930 | | | | 19,255,330 | | | | 6,839,146 | | | | 5,392,277 | | | | 18,533,902 | | | | 18,534,487 | | | | (164 | ) |
| | — | | | | — | | | | — | | | | — | | | | — | | | | — | | | | — | | | | — | |
| | — | | | | — | | | | — | | | | — | | | | — | | | | — | | | | — | | | | — | |
| | | | | | | | | | | | | | | | | | | | | | | | | | | | | | |
| | | | | | | |
| | 60,004,409 | | | | 34,695,930 | | | | 19,255,330 | | | | 6,839,146 | | | | 5,392,277 | | | | 18,533,902 | | | | 18,534,487 | | | | (164 | ) |
| | | | | | | | | | | | | | | | | | | | | | | | | | | | | | |
| | | | | | | |
| | 71,273,313 | | | | 39,961,681 | | | | 21,076,684 | | | | 6,781,848 | | | | 4,791,201 | | | | 22,364,237 | | | | 21,855,189 | | | | 3,913 | |
| | | | | | | | | | | | | | | | | | | | | | | | | | | | | | |
| | | | | | | |
| $ | 79,134,189 | | | $ | 44,250,183 | | | $ | 23,346,846 | | | $ | 7,576,015 | | | $ | 6,564,872 | | | $ | 26,503,845 | | | $ | 24,989,566 | | | $ | 13,844,893 | |
| | | | | | | | | | | | | | | | | | | | | | | | | | | | | | |
The accompanying notes are an integral part of these financial statements.
107
MoA FUNDS
STATEMENTS OF OPERATIONS (Continued)
For Six Months Ended June 30, 2024 (Unaudited)
| | | | | | | | |
| | |
Intermediate
Bond Fund | | | Core Bond
Fund | |
INVESTMENT INCOME AND EXPENSES | | | | | | | | |
INVESTMENT INCOME | | | | | | | | |
Dividends (Notes 2 and 4) | | $ | — | | | $ | — | |
Interest | | | 17,912,979 | | | | 42,430,058 | |
| | | | | | | | |
| | |
Total investment income | | | 17,912,979 | | | | 42,430,058 | |
| | | | | | | | |
| | |
EXPENSES | | | | | | | | |
Investment advisory fees (Note 3) | | | 1,836,367 | | | | 4,043,589 | |
Administrative fee (Note 3) | | | 137,708 | | | | 311,101 | |
Other operating expenses | | | | | | | | |
Fund administration expenses | | | 60,104 | | | | 194,424 | |
Shareholders reports | | | 17,323 | | | | 17,318 | |
Custodian expenses | | | 5,553 | | | | 11,294 | |
Transfer agent fees | | | 10,641 | | | | 25,858 | |
Independent directors’ fees and expenses | | | 23,005 | | | | 23,445 | |
Audit and Tax Expense | | | 43,416 | | | | 43,416 | |
Legal | | | 17,739 | | | | 33,981 | |
Licenses | | | — | | | | — | |
Registration fees | | | 20,583 | | | | 43,206 | |
Miscellaneous fees | | | 8,652 | | | | 18,092 | |
| | | | | | | | |
| | |
Total other operating expenses | | | 207,016 | | | | 411,034 | |
| | | | | | | | |
| | |
Total expenses before waiver/reimbursement | | | 2,181,091 | | | | 4,765,724 | |
Fee waiver and expense reimbursement (Note 3) | | | (36,722 | ) | | | (82,960 | ) |
| | | | | | | | |
| | |
Net expenses | | | 2,144,369 | | | | 4,682,764 | |
| | | | | | | | |
| | |
Net Investment Income (Loss) | | | 15,768,610 | | | | 37,747,294 | |
| | | | | | | | |
| | |
NET REALIZED AND UNREALIZED GAIN (LOSS) ON INVESTMENTS, FUTURES CONTRACTS AND FOREIGN CURRENCY TRANSLATIONS (Note 2) | | | | | | | | |
Net realized gain (loss) on: | | | | | | | | |
Investment securities (Notes 2 and 4) | | | (10,176,683 | ) | | | (40,765,566 | ) |
Futures contracts (Note 2) | | | — | | | | — | |
Foreign currency translation | | | — | | | | — | |
| | | | | | | | |
| | |
| | | (10,176,683 | ) | | | (40,765,566 | ) |
| | | | | | | | |
| | |
Change in net unrealized appreciation (depreciation) of: | | | | | | | | |
Investment securities (Notes 2 and 4) | | | (2,572,618 | ) | | | (10,365,020 | ) |
Futures contracts (Note 2) | | | — | | | | — | |
Foreign currency translation | | | — | | | | — | |
| | | | | | | | |
| | |
| | | (2,572,618 | ) | | | (10,365,020 | ) |
| | | | | | | | |
| | |
NET REALIZED AND UNREALIZED GAIN (LOSS) ON INVESTMENTS, FUTURES CONTRACTS AND FOREIGN CURRENCY TRANSLATIONS | | | (12,749,301 | ) | | | (51,130,586 | ) |
| | | | | | | | |
| | |
NET INCREASE (DECREASE) IN NET ASSETS RESULTING FROM OPERATIONS | | $ | 3,019,309 | | | $ | (13,383,292 | ) |
| | | | | | | | |
The accompanying notes are an integral part of these financial statements.
108
(This page has been left blank intentionally.)
MoA FUNDS
STATEMENTS OF CHANGES IN NET ASSETS
| | | | | | | | | | | | | | | | |
| | | Equity Index Fund | | | All America Fund | |
| | | For the
Six Months
Ended
June 30,
2024
(Unaudited) | | | For the
Year Ended
December 31,
2023 | | | For the
Six Months
Ended
June 30,
2024
(Unaudited) | | | For the
Year Ended
December 31,
2023 | |
INCREASE (DECREASE) IN NET ASSETS | | | | | | | | | | | | | | | | |
FROM OPERATIONS | | | | | | | | | | | | | | | | |
Net investment income (loss) | | $ | 35,599,191 | | | $ | 75,271,850 | | | $ | 1,501,543 | | | $ | 3,369,905 | |
| | | | |
Net realized and unrealized gain (loss): | | | | | | | | | | | | | | | | |
Net realized gain (loss) on investments, futures contracts and foreign currency translations | | | 241,231,079 | | | | 234,299,112 | | | | 15,792,084 | | | | 21,955,860 | |
Change in net unrealized appreciation (depreciation) of investments, futures contracts and foreign currency translations | | | 496,960,500 | | | | 800,629,761 | | | | 11,505,558 | | | | 27,941,199 | |
| | | | | | | | | | | | | | | | |
| | | | |
NET INCREASE (DECREASE) IN NET ASSETS RESULTING FROM OPERATIONS | | | 773,790,770 | | | | 1,110,200,723 | | | | 28,799,185 | | | | 53,266,964 | |
| | | | | | | | | | | | | | | | |
| | | | |
DISTRIBUTIONS (Notes 2 and 6) | | | | | | | | | | | | | | | | |
Distributions from distributable earnings | | | (30,052,159 | ) | | | (272,893,639 | ) | | | (1,219,751 | ) | | | (27,503,248 | ) |
| | | | | | | | | | | | | | | | |
| | | | |
NET INCREASE (DECREASE) IN NET ASSETS FROM DISTRIBUTIONS | | | (30,052,159 | ) | | | (272,893,639 | ) | | | (1,219,751 | ) | | | (27,503,248 | ) |
| | | | | | | | | | | | | | | | |
| | | | |
CAPITAL TRANSACTIONS (Note 5) | | | | | | | | | | | | | | | | |
Proceeds from the sale of shares | | | 223,767,123 | | | | 561,250,860 | | | | 2,934,130 | | | | 4,277,338 | |
Distributions reinvested | | | 30,051,214 | | | | 272,885,172 | | | | 1,219,343 | | | | 27,498,410 | |
Cost of shares redeemed | | | (544,682,704 | ) | | | (801,125,488 | ) | | | (24,509,387 | ) | | | (39,538,366 | ) |
| | | | | | | | | | | | | | | | |
| | | | |
NET INCREASE (DECREASE) IN NET ASSETS FROM CAPITAL TRANSACTIONS | | | (290,864,367 | ) | | | 33,010,544 | | | | (20,355,914 | ) | | | (7,762,618 | ) |
| | | | | | | | | | | | | | | | |
| | | | |
TOTAL INCREASE (DECREASE) IN NET ASSETS | | | 452,874,244 | | | | 870,317,628 | | | | 7,223,520 | | | | 18,001,098 | |
| | | | |
NET ASSETS, BEGINNING OF PERIOD | | | 5,200,588,704 | | | | 4,330,271,076 | | | | 299,145,208 | | | | 281,144,110 | |
| | | | | | | | | | | | | | | | |
| | | | |
NET ASSETS, END OF PERIOD | | $ | 5,653,462,948 | | | $ | 5,200,588,704 | | | $ | 306,368,728 | | | $ | 299,145,208 | |
| | | | | | | | | | | | | | | | |
| | | | |
OTHER INFORMATION (Note 5) | | | | | | | | | | | | | | | | |
Shares outstanding at beginning of period | | | 89,220,905 | | | | 88,695,161 | | | | 13,864,620 | | | | 14,228,687 | |
| | | | | | | | | | | | | | | | |
Shares issued | | | 3,586,413 | | | | 10,268,431 | | | | 130,897 | | | | 202,111 | |
Shares issued as reinvestment of distributions | | | 459,850 | | | | 4,783,972 | | | | 52,490 | | | | 1,303,928 | |
Shares redeemed | | | (8,617,634 | ) | | | (14,526,659 | ) | | | (1,084,608 | ) | | | (1,870,106 | ) |
| | | | | | | | | | | | | | | | |
Net increase (decrease) | | | (4,571,371 | ) | | | 525,744 | | | | (901,221 | ) | | | (364,067 | ) |
| | | | | | | | | | | | | | | | |
Shares outstanding at end of period | | | 84,649,534 | | | | 89,220,905 | | | | 12,963,399 | | | | 13,864,620 | |
| | | | | | | | | | | | | | | | |
The accompanying notes are an integral part of these financial statements.
110
| | | | | | | | | | | | | | | | | | | | | | | | | | | | | | |
| Small Cap Value Fund | | | Small Cap Growth Fund | | | Small Cap Equity Index Fund | | | Mid Cap Value Fund | |
For the
Six Months
Ended
June 30,
2024
(Unaudited) | | | For the
Year Ended
December 31,
2023 | | | For the
Six Months
Ended
June 30,
2024
(Unaudited) | | | For the
Year Ended
December 31,
2023 | | | For the
Six Months
Ended
June 30,
2024
(Unaudited) | | | For the
Year Ended
December 31,
2023 | | | For the
Six Months
Ended
June 30,
2024
(Unaudited) | | | For the
Year Ended
December 31,
2023 | |
| | | | | | | | | | | | | | | | | | | | | | | | | | | | | | |
| | | | | | | | | | | | | | | | | | | | | | | | | | | | | | |
| $ | 2,926,677 | | | $ | 6,955,838 | | | $ | (364,676 | ) | | $ | (487,599 | ) | | $ | 1,715,026 | | | $ | 3,213,218 | | | $ | 1,280,308 | | | $ | 1,899,632 | |
| | | | | | | |
| | | | | | | | | | | | | | | | | | | | | | | | | | | | | | |
| | | | | | | |
| | 14,377,800 | | | | 6,761,421 | | | | 16,157,924 | | | | 5,352,858 | | | | 3,070,809 | | | | 3,345,321 | | | | 3,767,787 | | | | 4,175,249 | |
| | | | | | | |
| | (17,786,457 | ) | | | 22,652,196 | | | | (3,031,421 | ) | | | 56,274,192 | | | | (6,350,941 | ) | | | 21,369,619 | | | | 375,328 | | | | 5,967,408 | |
| | | | | | | | | | | | | | | | | | | | | | | | | | | | | | |
| | | | | | | |
| (481,980 | ) | | | 36,369,455 | | | | 12,761,827 | | | | 61,139,451 | | | | (1,565,106 | ) | | | 27,928,158 | | | | 5,423,423 | | | | 12,042,289 | |
| | | | | | | | | | | | | | | | | | | | | | | | | | | | | | |
| | | | | | | |
| | | | | | | | | | | | | | | | | | | | | | | | | | | | | | |
| | (2,281,990 | ) | | | (24,891,911 | ) | | | — | | | | (313,463 | ) | | | (1,354,022 | ) | | | (5,743,901 | ) | | | (989,722 | ) | | | (3,979,115 | ) |
| | | | | | | | | | | | | | | | | | | | | | | | | | | | | | |
| | | | | | | |
| | (2,281,990 | ) | | | (24,891,911 | ) | | | — | | | | (313,463 | ) | | | (1,354,022 | ) | | | (5,743,901 | ) | | | (989,722 | ) | | | (3,979,115 | ) |
| | | | | | | | | | | | | | | | | | | | | | | | | | | | | | |
| | | | | | | |
| | | | | | | | | | | | | | | | | | | | | | | | | | | | | | |
| | 10,771,234 | | | | 34,984,683 | | | | 9,097,332 | | | | 22,355,063 | | | | 14,142,820 | | | | 38,912,496 | | | | 23,658,469 | | | | 69,168,632 | |
| | 2,281,856 | | | | 24,890,500 | | | | — | | | | 313,463 | | | | 1,354,022 | | | | 5,743,901 | | | | 989,722 | | | | 3,979,115 | |
| | (43,178,469 | ) | | | (74,899,376 | ) | | | (45,398,926 | ) | | | (99,782,265 | ) | | | (18,232,070 | ) | | | (40,312,283 | ) | | | (21,842,938 | ) | | | (39,049,305 | ) |
| | | | | | | | | | | | | | | | | | | | | | | | | | | | | | |
| | | | | | | |
| | (30,125,379 | ) | | | (15,024,193 | ) | | | (36,301,594 | ) | | | (77,113,739 | ) | | | (2,735,228 | ) | | | 4,344,114 | | | | 2,805,253 | | | | 34,098,442 | |
| | | | | | | | | | | | | | | | | | | | | | | | | | | | | | |
| | | | | | | |
| | (32,889,349 | ) | | | (3,546,649 | ) | | | (23,539,767 | ) | | | (16,287,751 | ) | | | (5,654,356 | ) | | | 26,528,371 | | | | 7,238,954 | | | | 42,161,616 | |
| | | | | | | |
| | 409,376,536 | | | | 412,923,185 | | | | 416,089,724 | | | | 432,377,475 | | | | 205,034,047 | | | | 178,505,676 | | | | 157,145,777 | | | | 114,984,161 | |
| | | | | | | | | | | | | | | | | | | | | | | | | | | | | | |
| | | | | | | |
| $ | 376,487,187 | | | $ | 409,376,536 | | | $ | 392,549,957 | | | $ | 416,089,724 | | | $ | 199,379,691 | | | $ | 205,034,047 | | | $ | 164,384,731 | | | $ | 157,145,777 | |
| | | | | | | | | | | | | | | | | | | | | | | | | | | | | | |
| | | | | | | |
| | | | | | | | | | | | | | | | | | | | | | | | | | | | | | |
| | 29,655,222 | | | | 30,715,648 | | | | 32,712,005 | | | | 39,257,270 | | | | 20,074,684 | | | | 19,649,648 | | | | 9,654,349 | | | | 7,347,633 | |
| | | | | | | | | | | | | | | | | | | | | | | | | | | | | | |
| | 788,844 | | | | 2,597,500 | | | | 705,931 | | | | 1,886,345 | | | | 1,406,625 | | | | 4,143,071 | | | | 1,422,170 | | | | 4,533,937 | |
| | 168,403 | | | | 1,869,933 | | | | — | | | | 27,691 | | | | 134,729 | | | | 588,376 | | | | 59,017 | | | | 248,803 | |
| | (3,166,529 | ) | | | (5,527,859 | ) | | | (3,520,496 | ) | | | (8,459,301 | ) | | | (1,806,036 | ) | | | (4,306,411 | ) | | | (1,317,238 | ) | | | (2,476,024 | ) |
| | | | | | | | | | | | | | | | | | | | | | | | | | | | | | |
| | (2,209,282 | ) | | | (1,060,426 | ) | | | (2,814,565 | ) | | | (6,545,265 | ) | | | (264,682 | ) | | | 425,036 | | | | 163,949 | | | | 2,306,716 | |
| | | | | | | | | | | | | | | | | | | | | | | | | | | | | | |
| | 27,445,940 | | | | 29,655,222 | | | | 29,897,440 | | | | 32,712,005 | | | | 19,810,002 | | | | 20,074,684 | | | | 9,818,298 | | | | 9,654,349 | |
| | | | | | | | | | | | | | | | | | | | | | | | | | | | | | |
The accompanying notes are an integral part of these financial statements.
111
MoA FUNDS
STATEMENTS OF CHANGES IN NET ASSETS (Continued)
| | | | | | | | | | | | | | | | |
| | | Mid Cap Equity Index Fund | | | Balanced Fund | |
| | | For the
Six Months
Ended
June 30,
2024
(Unaudited) | | | For the
Year Ended
December 31,
2023 | | | For the
Six Months
Ended
June 30,
2024
(Unaudited) | | | For the
Year Ended
December 31,
2023 | |
INCREASE (DECREASE) IN NET ASSETS | | | | | | | | | | | | | | | | |
FROM OPERATIONS | | | | | | | | | | | | | | | | |
Net investment income (loss) | | $ | 10,989,468 | | | $ | 24,941,132 | | | $ | 1,967,084 | | | $ | 3,788,007 | |
| | | | |
Net realized and unrealized gain (loss): | | | | | | | | | | | | | | | | |
Net realized gain (loss) on investments, futures contracts and foreign currency translations | | | 69,866,238 | | | | 104,145,230 | | | | 8,165,372 | | | | 8,019,421 | |
Change in net unrealized appreciation (depreciation) of investments, futures contracts and foreign currency translations | | | 9,511,075 | | | | 99,207,336 | | | | 8,004,965 | | | | 13,578,314 | |
| | | | | | | | | | | | | | | | |
| | | | |
NET INCREASE (DECREASE) IN NET ASSETS RESULTING FROM OPERATIONS | | | 90,366,781 | | | | 228,293,698 | | | | 18,137,421 | | | | 25,385,742 | |
| | | | | | | | | | | | | | | | |
| | | | |
DISTRIBUTIONS (Notes 2 and 6) | | | | | | | | | | | | | | | | |
Distributions from distributable earnings | | | (8,487,211 | ) | | | (127,782,556 | ) | | | (1,660,537 | ) | | | (11,120,619 | ) |
| | | | | | | | | | | | | | | | |
| | | | |
NET INCREASE (DECREASE) IN NET ASSETS FROM DISTRIBUTIONS | | | (8,487,211 | ) | | | (127,782,556 | ) | | | (1,660,537 | ) | | | (11,120,619 | ) |
| | | | | | | | | | | | | | | | |
| | | | |
CAPITAL TRANSACTIONS (Note 5) | | | | | | | | | | | | | | | | |
Proceeds from the sale of shares | | | 49,379,402 | | | | 129,626,886 | | | | 3,149,387 | | | | 5,512,608 | |
Distributions reinvested | | | 8,486,828 | | | | 127,776,762 | | | | 1,660,537 | | | | 11,120,619 | |
Cost of shares redeemed | | | (137,361,879 | ) | | | (457,086,919 | ) | | | (13,166,360 | ) | | | (24,347,307 | ) |
| | | | | | | | | | | | | | | | |
| | | | |
NET INCREASE (DECREASE) IN NET ASSETS FROM CAPITAL TRANSACTIONS | | | (79,495,649 | ) | | | (199,683,271 | ) | | | (8,356,436 | ) | | | (7,714,080 | ) |
| | | | | | | | | | | | | | | | |
| | | | |
TOTAL INCREASE (DECREASE) IN NET ASSETS | | | 2,383,921 | | | | (99,172,129 | ) | | | 8,120,448 | | | | 6,551,043 | |
| | | | |
NET ASSETS, BEGINNING OF PERIOD | | | 1,500,900,917 | | | | 1,600,073,046 | | | | 186,537,707 | | | | 179,986,664 | |
| | | | | | | | | | | | | | | | |
| | | | |
NET ASSETS, END OF PERIOD | | $ | 1,503,284,838 | | | $ | 1,500,900,917 | | | $ | 194,658,155 | | | $ | 186,537,707 | |
| | | | | | | | | | | | | | | | |
| | | | |
OTHER INFORMATION (Note 5) | | | | | | | | | | | | | | | | |
Shares outstanding at beginning of period | | | 74,653,665 | | | | 84,605,273 | | | | 9,913,926 | | | | 10,349,539 | |
| | | | | | | | | | | | | | | | |
Shares issued | | | 2,373,100 | | | | 6,512,947 | | | | 160,668 | | | | 296,111 | |
Shares issued as reinvestment of distributions | | | 402,029 | | | | 6,499,082 | | | | 82,779 | | | | 597,384 | |
Shares redeemed | | | (6,548,488 | ) | | | (22,963,637 | ) | | | (672,507 | ) | | | (1,329,108 | ) |
| | | | | | | | | | | | | | | | |
Net increase (decrease) | | | (3,773,359 | ) | | | (9,951,608 | ) | | | (429,060 | ) | | | (435,613 | ) |
| | | | | | | | | | | | | | | | |
Shares outstanding at end of period | | | 70,880,306 | | | | 74,653,665 | | | | 9,484,866 | | | | 9,913,926 | |
| | | | | | | | | | | | | | | | |
The accompanying notes are an integral part of these financial statements.
112
| | | | | | | | | | | | | | | | | | | | | | | | | | | | | | |
| International Fund | | | Catholic Values Index Fund | | | Retirement Income Fund | | | Clear Passage 2015 Fund | |
For the
Six Months
Ended
June 30,
2024
(Unaudited) | | | For the
Year Ended
December 31,
2023 | | | For the
Six Months
Ended
June 30,
2024
(Unaudited) | | | For the
Year Ended
December 31,
2023 | | | For the
Six Months
Ended
June 30,
2024
(Unaudited) | | | For the
Year Ended
December 31,
2023 | | | For the
Six Months
Ended
June 30,
2024
(Unaudited) | | | For the
Year Ended
December 31,
2023 | |
| | | | | | | | | | | | | | | | | | | | | | | | | | | | | | |
| | | | | | | | | | | | | | | | | | | | | | | | | | | | | | |
| $ | 32,880,061 | | | $ | 50,691,837 | | | $ | 34,986 | | | $ | 70,190 | | | $ | 2,445,156 | | | $ | 4,886,306 | | | $ | 1,273,960 | | | $ | 2,570,700 | |
| | | | | | | |
| | | | | | | | | | | | | | | | | | | | | | | | | | | | | | |
| | | | | | | |
| | (25,031,183 | ) | | | (48,151,180 | ) | | | 122,940 | | | | 82,259 | | | | (2,480,927 | ) | | | (2,926,915 | ) | | | 138,103 | | | | 796,929 | |
| | | | | | | |
| | 94,180,208 | | | | 234,409,415 | | | | 596,780 | | | | 1,010,543 | | | | 7,161,641 | | | | 17,208,934 | | | | 2,800,286 | | | | 7,589,493 | |
| | | | | | | | | | | | | | | | | | | | | | | | | | | | | | |
| | | | | | | |
| 102,029,086 | | | | 236,950,072 | | | | 754,706 | | | | 1,162,992 | | | | 7,125,870 | | | | 19,168,325 | | | | 4,212,349 | | | | 10,957,122 | |
| | | | | | | | | | | | | | | | | | | | | | | | | | | | | | |
| | | | | | | |
| | | | | | | | | | | | | | | | | | | | | | | | | | | | | | |
| | (29,552,480 | ) | | | (71,735,676 | ) | | | (29,552 | ) | | | (139,550 | ) | | | (2,463,034 | ) | | | (6,433,914 | ) | | | (1,286,744 | ) | | | (4,339,140 | ) |
| | | | | | | | | | | | | | | | | | | | | | | | | | | | | | |
| | | | | | | |
| | (29,552,480 | ) | | | (71,735,676 | ) | | | (29,552 | ) | | | (139,550 | ) | | | (2,463,034 | ) | | | (6,433,914 | ) | | | (1,286,744 | ) | | | (4,339,140 | ) |
| | | | | | | | | | | | | | | | | | | | | | | | | | | | | | |
| | | | | | | |
| | | | | | | | | | | | | | | | | | | | | | | | | | | | | | |
| | 163,590,430 | | | | 190,924,234 | | | | 361,685 | | | | 687,494 | | | | 11,933,986 | | | | 33,437,306 | | | | 4,808,647 | | | | 11,046,350 | |
| | 29,552,480 | | | | 71,735,676 | | | | 29,552 | | | | 139,550 | | | | 2,463,034 | | | | 6,433,914 | | | | 1,286,744 | | | | 4,339,140 | |
| | (133,751,572 | ) | | | (169,726,954 | ) | | | (186,229 | ) | | | (532,969 | ) | | | (27,431,045 | ) | | | (48,345,483 | ) | | | (11,507,933 | ) | | | (23,105,040 | ) |
| | | | | | | | | | | | | | | | | | | | | | | | | | | | | | |
| | | | | | | |
| | 59,391,338 | | | | 92,932,956 | | | | 205,008 | | | | 294,075 | | | | (13,034,025 | ) | | | (8,474,263 | ) | | | (5,412,542 | ) | | | (7,719,550 | ) |
| | | | | | | | | | | | | | | | | | | | | | | | | | | | | | |
| | | | | | | |
| | 131,867,944 | | | | 258,147,352 | | | | 930,162 | | | | 1,317,517 | | | | (8,371,189 | ) | | | 4,260,148 | | | | (2,486,937 | ) | | | (1,101,568 | ) |
| | | | | | | |
| | 1,459,726,678 | | | | 1,201,579,326 | | | | 5,737,156 | | | | 4,419,639 | | | | 207,359,700 | | | | 203,099,552 | | | | 111,496,380 | | | | 112,597,948 | |
| | | | | | | | | | | | | | | | | | | | | | | | | | | | | | |
| | | | | | | |
| $ | 1,591,594,622 | | | $ | 1,459,726,678 | | | | $ 6,667,318 | | | $ | 5,737,156 | | | $ | 198,988,511 | | | $ | 207,359,700 | | | $ | 109,009,443 | | | $ | 111,496,380 | |
| | | | | | | | | | | | | | | | | | | | | | | | | | | | | | |
| | | | | | | |
| | | | | | | | | | | | | | | | | | | | | | | | | | | | | | |
| | 177,964,034 | | | | 166,036,582 | | | | 424,687 | | | | 402,782 | | | | 19,017,410 | | | | 19,840,515 | | | | 12,914,287 | | | | 13,852,904 | |
| | | | | | | | | | | | | | | | | | | | | | | | | | | | | | |
| | 19,027,172 | | | | 24,538,784 | | | | 25,095 | | | | 54,609 | | | | 1,080,183 | | | | 3,145,079 | | | | 547,471 | | | | 1,301,857 | |
| | 3,358,236 | | | | 9,317,776 | | | | 1,985 | | | | 10,659 | | | | 220,900 | | | | 603,501 | | | | 145,231 | | | | 516,862 | |
| | (15,687,720 | ) | | | (21,929,108 | ) | | | (13,118 | ) | | | (43,363 | ) | | | (2,484,323 | ) | | | (4,571,685 | ) | | | (1,311,119 | ) | | | (2,757,336 | ) |
| | | | | | | | | | | | | | | | | | | | | | | | | | | | | | |
| | 6,697,688 | | | | 11,927,452 | | | | 13,962 | | | | 21,905 | | | | (1,183,240 | ) | | | (823,105 | ) | | | (618,417 | ) | | | (938,617 | ) |
| | | | | | | | | | | | | | | | | | | | | | | | | | | | | | |
| | 184,661,722 | | | | 177,964,034 | | | | 438,649 | | | | 424,687 | | | | 17,834,170 | | | | 19,017,410 | | | | 12,295,870 | | | | 12,914,287 | |
| | | | | | | | | | | | | | | | | | | | | | | | | | | | | | |
The accompanying notes are an integral part of these financial statements.
113
MoA FUNDS
STATEMENTS OF CHANGES IN NET ASSETS (Continued)
| | | | | | | | | | | | | | | | |
| | | Clear Passage 2020 Fund | | | Clear Passage 2025 Fund | |
| | | For the
Six Months
Ended
June 30,
2024
(Unaudited) | | | For the
Year Ended
December 31,
2023 | | | For the
Six Months
Ended
June 30,
2024
(Unaudited) | | | For the
Year Ended
December 31,
2023 | |
INCREASE (DECREASE) IN NET ASSETS | | | | | | | | | | | | | | | | |
FROM OPERATIONS | | | | | | | | | | | | | | | | |
Net investment income (loss) | | $ | 5,636,870 | | | $ | 12,115,766 | | | $ | 12,542,923 | | | $ | 27,000,825 | |
| | | | |
Net realized and unrealized gain (loss): | | | | | | | | | | | | | | | | |
Net realized gain (loss) on investments, futures contracts and foreign currency translations | | | (242,757 | ) | | | 3,712,633 | | | | 5,609,286 | | | | 23,109,748 | |
Change in net unrealized appreciation (depreciation) of investments, futures contracts and foreign currency translations | | | 14,610,747 | | | | 39,233,618 | | | | 41,558,401 | | | | 88,078,173 | |
| | | | | | | | | | | | | | | | |
| | | | |
NET INCREASE (DECREASE) IN NET ASSETS RESULTING FROM OPERATIONS | | | 20,004,860 | | | | 55,062,017 | | | | 59,710,610 | | | | 138,188,746 | |
| | | | | | | | | | | | | | | | |
| | | | |
DISTRIBUTIONS (Notes 2 and 6) | | | | | | | | | | | | | | | | |
Distributions from distributable earnings | | | (5,668,652 | ) | | | (22,899,461 | ) | | | (12,607,040 | ) | | | (57,398,524 | ) |
| | | | | | | | | | | | | | | | |
| | | | |
NET INCREASE (DECREASE) IN NET ASSETS FROM DISTRIBUTIONS | | | (5,668,652 | ) | | | (22,899,461 | ) | | | (12,607,040 | ) | | | (57,398,524 | ) |
| | | | | | | | | | | | | | | | |
| | | | |
CAPITAL TRANSACTIONS (Note 5) | | | | | | | | | | | | | | | | |
Proceeds from the sale of shares | | | 9,582,303 | | | | 36,143,624 | | | | 33,664,055 | | | | 111,356,373 | |
Distributions reinvested | | | 5,668,652 | | | | 22,899,461 | | | | 12,607,040 | | | | 57,398,524 | |
Cost of shares redeemed | | | (47,682,833 | ) | | | (103,471,027 | ) | | | (107,907,121 | ) | | | (177,368,777 | ) |
| | | | | | | | | | | | | | | | |
| | | | |
NET INCREASE (DECREASE) IN NET ASSETS FROM CAPITAL TRANSACTIONS | | | (32,431,878 | ) | | | (44,427,942 | ) | | | (61,636,026 | ) | | | (8,613,880 | ) |
| | | | | | | | | | | | | | | | |
| | | | |
TOTAL INCREASE (DECREASE) IN NET ASSETS | | | (18,095,670 | ) | | | (12,265,386 | ) | | | (14,532,456 | ) | | | 72,176,342 | |
| | | | |
NET ASSETS, BEGINNING OF PERIOD | | | 491,340,536 | | | | 503,605,922 | | | | 1,128,845,994 | | | | 1,056,669,652 | |
| | | | | | | | | | | | | | | | |
| | | | |
NET ASSETS, END OF PERIOD | | $ | 473,244,866 | | | $ | 491,340,536 | | | $ | 1,114,313,538 | | | $ | 1,128,845,994 | |
| | | | | | | | | | | | | | | | |
| | | | |
OTHER INFORMATION (Note 5) | | | | | | | | | | | | | | | | |
Shares outstanding at beginning of period | | | 48,246,361 | | | | 52,737,634 | | | | 95,398,941 | | | | 96,200,741 | |
| | | | | | | | | | | | | | | | |
Shares issued | | | 924,550 | | | | 3,625,135 | | | | 2,791,167 | | | | 9,635,433 | |
Shares issued as reinvestment of distributions | | | 540,386 | | | | 2,295,120 | | | | 1,021,640 | | | | 4,945,749 | |
Shares redeemed | | | (4,607,019 | ) | | | (10,411,528 | ) | | | (8,899,469 | ) | | | (15,382,982 | ) |
| | | | | | | | | | | | | | | | |
Net increase (decrease) | | | (3,142,083 | ) | | | (4,491,273 | ) | | | (5,086,662 | ) | | | (801,800 | ) |
| | | | | | | | | | | | | | | | |
Shares outstanding at end of period | | | 45,104,278 | | | | 48,246,361 | | | | 90,312,279 | | | | 95,398,941 | |
| | | | | | | | | | | | | | | | |
The accompanying notes are an integral part of these financial statements.
114
| | | | | | | | | | | | | | | | | | | | | | | | | | | | | | |
| Clear Passage 2030 Fund | | | Clear Passage 2035 Fund | | | Clear Passage 2040 Fund | | | Clear Passage 2045 Fund | |
For the
Six Months
Ended
June 30,
2024
(Unaudited) | | | For the
Year Ended
December 31,
2023 | | | For the
Six Months
Ended
June 30,
2024
(Unaudited) | | | For the
Year Ended
December 31,
2023 | | | For the
Six Months
Ended
June 30,
2024
(Unaudited) | | | For the
Year Ended
December 31,
2023 | | | For the
Six Months
Ended
June 30,
2024
(Unaudited) | | | For the
Year Ended
December 31,
2023 | |
| | | | | | | | | | | | | | | | | | | | | | | | | | | | | | |
| | | | | | | | | | | | | | | | | | | | | | | | | | | | | | |
| $ | 14,032,672 | | | $ | 29,565,831 | | | $ | 12,633,750 | | | $ | 27,209,856 | | | $ | 10,239,884 | | | $ | 22,339,765 | | | $ | 10,382,606 | | | $ | 22,832,038 | |
| | | | | | | |
| | | | | | | | | | | | | | | | | | | | | | | | | | | | | | |
| | | | | | | |
| | 14,008,830 | | | | 42,769,347 | | | | 22,723,410 | | | | 43,275,627 | | | | 26,150,808 | | | | 42,290,853 | | | | 28,140,721 | | | | 43,505,045 | |
| | | | | | | |
| | 56,851,670 | | | | 98,615,265 | | | | 62,725,707 | | | | 108,464,009 | | | | 55,611,099 | | | | 97,973,374 | | | | 60,423,324 | | | | 107,248,024 | |
| | | | | | | | | | | | | | | | | | | | | | | | | | | | | | |
| | | | | | | |
| 84,893,172 | | | | 170,950,443 | | | | 98,082,867 | | | | 178,949,492 | | | | 92,001,791 | | | | 162,603,992 | | | | 98,946,651 | | | | 173,585,107 | |
| | | | | | | | | | | | | | | | | | | | | | | | | | | | | | |
| | | | | | | |
| | | | | | | | | | | | | | | | | | | | | | | | | | | | | | |
| | (14,109,032 | ) | | | (73,897,218 | ) | | | (12,709,185 | ) | | | (65,036,438 | ) | | | (10,304,983 | ) | | | (58,597,797 | ) | | | (10,449,287 | ) | | | (61,440,943 | ) |
| | | | | | | | | | | | | | | | | | | | | | | | | | | | | | |
| | | | | | | |
| | (14,109,032 | ) | | | (73,897,218 | ) | | | (12,709,185 | ) | | | (65,036,438 | ) | | | (10,304,983 | ) | | | (58,597,797 | ) | | | (10,449,287 | ) | | | (61,440,943 | ) |
| | | | | | | | | | | | | | | | | | | | | | | | | | | | | | |
| | | | | | | |
| | | | | | | | | | | | | | | | | | | | | | | | | | | | | | |
| | 53,780,488 | | | | 144,218,851 | | | | 73,633,246 | | | | 155,310,004 | | | | 51,183,431 | | | | 126,765,781 | | | | 50,876,771 | | | | 106,970,849 | |
| | 14,109,032 | | | | 73,897,218 | | | | 12,709,185 | | | | 65,036,438 | | | | 10,304,983 | | | | 58,597,797 | | | | 10,449,287 | | | | 61,440,943 | |
| | (95,469,094 | ) | | | (131,145,428 | ) | | | (72,355,670 | ) | | | (126,628,726 | ) | | | (50,118,475 | ) | | | (99,080,596 | ) | | | (51,332,575 | ) | | | (86,751,838 | ) |
| | | | | | | | | | | | | | | | | | | | | | | | | | | | | | |
| | | | | | | |
| (27,579,574 | ) | | | 86,970,641 | | | | 13,986,761 | | | | 93,717,716 | | | | 11,369,939 | | | | 86,282,982 | | | | 9,993,483 | | | | 81,659,954 | |
| | | | | | | | | | | | | | | | | | | | | | | | | | | | | | |
| | | | | | | |
| | 43,204,566 | | | | 184,023,866 | | | | 99,360,443 | | | | 207,630,770 | | | | 93,066,747 | | | | 190,289,177 | | | | 98,490,847 | | | | 193,804,118 | |
| | | | | | | |
| | 1,309,074,481 | | | | 1,125,050,615 | | | | 1,231,069,296 | | | | 1,023,438,526 | | | | 1,037,824,793 | | | | 847,535,616 | | | | 1,068,624,800 | | | | 874,820,682 | |
| | | | | | | | | | | | | | | | | | | | | | | | | | | | | | |
| | | | | | | |
| $ | 1,352,279,047 | | | $ | 1,309,074,481 | | | $ | 1,330,429,739 | | | $ | 1,231,069,296 | | | $ | 1,130,891,540 | | | $ | 1,037,824,793 | | | $ | 1,167,115,647 | | | $ | 1,068,624,800 | |
| | | | | | | | | | | | | | | | | | | | | | | | | | | | | | |
| | | | | | | |
| | | | | | | | | | | | | | | | | | | | | | | | | | | | | | |
| | 101,358,436 | | | | 94,524,726 | | | | 91,087,947 | | | | 83,915,573 | | | | 76,507,647 | | | | 69,936,961 | | | | 79,927,633 | | | | 73,598,703 | |
| | | | | | | | | | | | | | | | | | | | | | | | | | | | | | |
| | 4,056,952 | | | | 11,410,972 | | | | 5,246,565 | | | | 11,913,020 | | | | 3,624,415 | | | | 9,714,297 | | | | 3,636,275 | | | | 8,327,566 | |
| | 1,035,905 | | | | 5,831,430 | | | | 878,920 | | | | 4,969,516 | | | | 703,412 | | | | 4,464,920 | | | | 720,641 | | | | 4,764,609 | |
| | (7,155,269 | ) | | | (10,408,692 | ) | | | (5,147,801 | ) | | | (9,710,162 | ) | | | (3,532,103 | ) | | | (7,608,531 | ) | | | (3,665,529 | ) | | | (6,763,245 | ) |
| | | | | | | | | | | | | | | | | | | | | | | | | | | | | | |
| | (2,062,412 | ) | | | 6,833,710 | | | | 977,684 | | | | 7,172,374 | | | | 795,724 | | | | 6,570,686 | | | | 691,387 | | | | 6,328,930 | |
| | | | | | | | | | | | | | | | | | | | | | | | | | | | | | |
| | 99,296,024 | | | | 101,358,436 | | | | 92,065,631 | | | | 91,087,947 | | | | 77,303,371 | | | | 76,507,647 | | | | 80,619,020 | | | | 79,927,633 | |
| | | | | | | | | | | | | | | | | | | | | | | | | | | | | | |
The accompanying notes are an integral part of these financial statements.
115
MoA FUNDS
STATEMENTS OF CHANGES IN NET ASSETS (Continued)
| | | | | | | | | | | | | | | | |
| | | Clear Passage 2050 Fund | | | Clear Passage 2055 Fund | |
| | | For the
Six Months
Ended
June 30,
2024
(Unaudited) | | | For the
Year Ended
December 31,
2023 | | | For the
Six Months
Ended
June 30,
2024
(Unaudited) | | | For the
Year Ended
December 31,
2023 | |
INCREASE (DECREASE) IN NET ASSETS | | | | | | | | | | | | | | | | |
FROM OPERATIONS | | | | | | | | | | | | | | | | |
Net investment income (loss) | | $ | 7,860,876 | | | $ | 17,417,096 | | | $ | 4,288,502 | | | $ | 9,220,327 | |
| | | | |
Net realized and unrealized gain (loss): | | | | | | | | | | | | | | | | |
Net realized gain (loss) on investments, futures contracts and foreign currency translations | | | 11,268,904 | | | | 39,088,485 | | | | 5,265,751 | | | | 15,407,087 | |
Change in net unrealized appreciation (depreciation) of investments, futures contracts and foreign currency translations | | | 60,004,409 | | | | 78,824,585 | | | | 34,695,930 | | | | 46,935,365 | |
| | | | | | | | | | | | | | | | |
| | | | |
NET INCREASE (DECREASE) IN NET ASSETS RESULTING FROM OPERATIONS | | | 79,134,189 | | | | 135,330,166 | | | | 44,250,183 | | | | 71,562,779 | |
| | | | | | | | | | | | | | | | |
| | | | |
DISTRIBUTIONS (Notes 2 and 6) | | | | | | | | | | | | | | | | |
Distributions from distributable earnings | | | (7,914,983 | ) | | | (51,541,323 | ) | | | (4,322,467 | ) | | | (20,852,274 | ) |
| | | | | | | | | | | | | | | | |
| | | | |
NET INCREASE (DECREASE) IN NET ASSETS FROM DISTRIBUTIONS | | | (7,914,983 | ) | | | (51,541,323 | ) | | | (4,322,467 | ) | | | (20,852,274 | ) |
| | | | | | | | | | | | | | | | |
| | | | |
CAPITAL TRANSACTIONS (Note 5) | | | | | | | | | | | | | | | | |
Proceeds from the sale of shares | | | 46,289,861 | | | | 100,928,790 | | | | 37,824,770 | | | | 74,424,549 | |
Distributions reinvested | | | 7,914,983 | | | | 51,541,323 | | | | 4,322,466 | | | | 20,852,274 | |
Cost of shares redeemed | | | (42,362,411 | ) | | | (71,231,167 | ) | | | (22,400,376 | ) | | | (34,565,212 | ) |
| | | | | | | | | | | | | | | | |
| | | | |
NET INCREASE (DECREASE) IN NET ASSETS FROM CAPITAL TRANSACTIONS | | | 11,842,433 | | | | 81,238,946 | | | | 19,746,860 | | | | 60,711,611 | |
| | | | | | | | | | | | | | | | |
| | | | |
TOTAL INCREASE (DECREASE) IN NET ASSETS | | | 83,061,639 | | | | 165,027,789 | | | | 59,674,576 | | | | 111,422,116 | |
| | | | |
NET ASSETS, BEGINNING OF PERIOD | | | 829,746,819 | | | | 664,719,030 | | | | 450,479,491 | | | | 339,057,375 | |
| | | | | | | | | | | | | | | | |
| | | | |
NET ASSETS, END OF PERIOD | | $ | 912,808,458 | | | $ | 829,746,819 | | | $ | 510,154,067 | | | $ | 450,479,491 | |
| | | | | | | | | | | | | | | | |
| | | | |
OTHER INFORMATION (Note 5) | | | | | | | | | | | | | | | | |
Shares outstanding at beginning of period | | | 48,668,561 | | | | 43,738,784 | | | | 32,950,909 | | | | 28,269,738 | |
| | | | | | | | | | | | | | | | |
Shares issued | | | 2,598,655 | | | | 6,138,291 | | | | 2,642,941 | | | | 5,748,087 | |
Shares issued as reinvestment of distributions | | | 427,144 | | | | 3,117,169 | | | | 290,488 | | | | 1,597,155 | |
Shares redeemed | | | (2,370,746 | ) | | | (4,325,683 | ) | | | (1,557,151 | ) | | | (2,664,071 | ) |
| | | | | | | | | | | | | | | | |
Net increase (decrease) | | | 655,053 | | | | 4,929,777 | | | | 1,376,278 | | | | 4,681,171 | |
| | | | | | | | | | | | | | | | |
Shares outstanding at end of period | | | 49,323,614 | | | | 48,668,561 | | | | 34,327,187 | | | | 32,950,909 | |
| | | | | | | | | | | | | | | | |
The accompanying notes are an integral part of these financial statements.
116
| | | | | | | | | | | | | | | | | | | | | | | | | | | | | | |
| Clear Passage 2060 Fund | | | Clear Passage 2065 Fund | | | Conservative Allocation Fund | | | Moderate Allocation Fund | |
For the
Six Months
Ended
June 30,
2024
(Unaudited) | | | For the
Year Ended
December 31,
2023 | | | For the
Six Months
Ended
June 30,
2024
(Unaudited) | | | For the
Year Ended
December 31,
2023 | | | For the
Six Months
Ended
June 30,
2024
(Unaudited) | | | For the
Year Ended
December 31,
2023 | | | For the
Six Months
Ended
June 30,
2024
(Unaudited) | | | For the
Year Ended
December 31,
2023 | |
| | | | | | | | | | | | | | | | | | | | | | | | | | | | | | |
| | | | | | | | | | | | | | | | | | | | | | | | | | | | | | |
| $ | 2,270,162 | | | $ | 4,535,947 | | | $ | 794,167 | | | $ | 1,295,780 | | | $ | 1,773,671 | | | $ | 3,560,825 | | | $ | 4,139,608 | | | $ | 8,832,337 | |
| | | | | | | |
| | | | | | | | | | | | | | | | | | | | | | | | | | | | | | |
| | | | | | | |
| | 1,821,354 | | | | 6,165,329 | | | | (57,298 | ) | | | 350,501 | | | | (601,076 | ) | | | 1,391,775 | | | | 3,830,335 | | | | 18,129,724 | |
| | | | | | | |
| | 19,255,330 | | | | 24,876,342 | | | | 6,839,146 | | | | 7,896,117 | | | | 5,392,277 | | | | 11,860,687 | | | | 18,533,902 | | | | 28,967,265 | |
| | | | | | | | | | | | | | | | | | | | | | | | | | | | | | |
| | | | | | | |
| | 23,346,846 | | | | 35,577,618 | | | | 7,576,015 | | | | 9,542,398 | | | | 6,564,872 | | | | 16,813,287 | | | | 26,503,845 | | | | 55,929,326 | |
| | | | | | | | | | | | | | | | | | | | | | | | | | | | | | |
| | | | | | | |
| | | | | | | | | | | | | | | | | | | | | | | | | | | | | | |
| | (2,292,255 | ) | | | (9,588,157 | ) | | | (783,584 | ) | | | (2,176,121 | ) | | | (1,784,172 | ) | | | (5,593,392 | ) | | | (4,155,812 | ) | | | (25,506,727 | ) |
| | | | | | | | | | | | | | | | | | | | | | | | | | | | | | |
| | | | | | | |
| | (2,292,255 | ) | | | (9,588,157 | ) | | | (783,584 | ) | | | (2,176,121 | ) | | | (1,784,172 | ) | | | (5,593,392 | ) | | | (4,155,812 | ) | | | (25,506,727 | ) |
| | | | | | | | | | | | | | | | | | | | | | | | | | | | | | |
| | | | | | | |
| | | | | | | | | | | | | | | | | | | | | | | | | | | | | | |
| | 30,082,034 | | | | 57,819,106 | | | | 22,930,747 | | | | 30,794,535 | | | | 4,651,889 | | | | 5,611,685 | | | | 5,247,584 | | | | 14,144,412 | |
| | 2,292,255 | | | | 9,588,157 | | | | 783,584 | | | | 2,176,121 | | | | 1,784,172 | | | | 5,593,392 | | | | 4,155,812 | | | | 25,506,727 | |
| | (9,063,079 | ) | | | (14,836,038 | ) | | | (2,722,990 | ) | | | (6,788,364 | ) | | | (13,736,471 | ) | | | (25,961,885 | ) | | | (28,276,561 | ) | | | (59,891,956 | ) |
| | | | | | | | | | | | | | | | | | | | | | | | | | | | | | |
| | | | | | | |
| | 23,311,210 | | | | 52,571,225 | | | | 20,991,341 | | | | 26,182,292 | | | | (7,300,410 | ) | | | (14,756,808 | ) | | | (18,873,165 | ) | | | (20,240,817 | ) |
| | | | | | | | | | | | | | | | | | | | | | | | | | | | | | |
| | | | | | | |
| | 44,365,801 | | | | 78,560,686 | | | | 27,783,772 | | | | 33,548,569 | | | | (2,519,710 | ) | | | (3,536,913 | ) | | | 3,474,868 | | | | 10,181,782 | |
| | | | | | | |
| | 233,290,591 | | | | 154,729,905 | | | | 67,707,799 | | | | 34,159,230 | | | | 157,941,261 | | | | 161,478,174 | | | | 403,090,396 | | | | 392,908,614 | |
| | | | | | | | | | | | | | | | | | | | | | | | | | | | | | |
| | | | | | | |
| $ | 277,656,392 | | | $ | 233,290,591 | | | $ | 95,491,571 | | | $ | 67,707,799 | | | $ | 155,421,551 | | | $ | 157,941,261 | | | $ | 406,565,264 | | | $ | 403,090,396 | |
| | | | | | | | | | | | | | | | | | | | | | | | | | | | | | |
| | | | | | | |
| | | | | | | | | | | | | | | | | | | | | | | | | | | | | | |
| | 19,968,768 | | | | 15,192,348 | | | | 5,692,295 | | | | 3,333,354 | | | | 14,155,969 | | | | 15,529,615 | | | | 30,615,098 | | | | 32,217,749 | |
| | | | | | | | | | | | | | | | | | | | | | | | | | | | | | |
| | 2,454,055 | | | | 5,258,267 | | | | 1,837,429 | | | | 2,773,642 | | | | 409,536 | | | | 519,616 | | | | 390,935 | | | | 1,091,011 | |
| | 180,209 | | | | 861,075 | | | | 60,369 | | | | 192,652 | | | | 155,145 | | | | 512,992 | | | | 298,335 | | | | 1,981,984 | |
| | (738,733 | ) | | | (1,342,922 | ) | | | (217,967 | ) | | | (607,353 | ) | | | (1,214,149 | ) | | | (2,406,254 | ) | | | (2,089,444 | ) | | | (4,675,646 | ) |
| | | | | | | | | | | | | | | | | | | | | | | | | | | | | | |
| | 1,895,531 | | | | 4,776,420 | | | | 1,679,831 | | | | 2,358,941 | | | | (649,468 | ) | | | (1,373,646 | ) | | | (1,400,174 | ) | | | (1,602,651 | ) |
| | | | | | | | | | | | | | | | | | | | | | | | | | | | | | |
| | 21,864,299 | | | | 19,968,768 | | | | 7,372,126 | | | | 5,692,295 | | | | 13,506,501 | | | | 14,155,969 | | | | 29,214,924 | | | | 30,615,098 | |
| | | | | | | | | | | | | | | | | | | | | | | | | | | | | | |
The accompanying notes are an integral part of these financial statements.
117
MoA FUNDS
STATEMENTS OF CHANGES IN NET ASSETS (Continued)
| | | | | | | | | | | | | | | | |
| | | Aggressive Allocation Fund | | | Money Market Fund | |
| | | For the
Six Months
Ended
June 30,
2024
(Unaudited) | | | For the
Year Ended
December 31,
2023 | | | For the
Six Months
Ended
June 30,
2024
(Unaudited) | | | For the
Year Ended
December 31,
2023 | |
INCREASE (DECREASE) IN NET ASSETS | | | | | | | | | | | | | | | | |
FROM OPERATIONS | | | | | | | | | | | | | | | | |
Net investment income (loss) | | $ | 3,134,377 | | | $ | 7,113,089 | | | $ | 13,840,980 | | | $ | 21,906,612 | |
| | | | |
Net realized and unrealized gain (loss): | | | | | | | | | | | | | | | | |
Net realized gain (loss) on investments, futures contracts and foreign currency translations | | | 3,320,702 | | | | 18,336,397 | | | | 4,077 | | | | 19,453 | |
Change in net unrealized appreciation (depreciation) of investments, futures contracts and foreign currency translations | | | 18,534,487 | | | | 26,593,289 | | | | (164 | ) | | | (6,226 | ) |
| | | | | | | | | | | | | | | | |
| | | | |
NET INCREASE (DECREASE) IN NET ASSETS RESULTING FROM OPERATIONS | | | 24,989,566 | | | | 52,042,775 | | | | 13,844,893 | | | | 21,919,839 | |
| | | | | | | | | | | | | | | | |
| | | | |
DISTRIBUTIONS (Notes 2 and 6) | | | | | | | | | | | | | | | | |
Distributions from distributable earnings | | | (3,149,196 | ) | | | (25,881,807 | ) | | | (11,657,644 | ) | | | (21,370,350 | ) |
| | | | | | | | | | | | | | | | |
| | | | |
NET INCREASE (DECREASE) IN NET ASSETS FROM DISTRIBUTIONS | | | (3,149,196 | ) | | | (25,881,807 | ) | | | (11,657,644 | ) | | | (21,370,350 | ) |
| | | | | | | | | | | | | | | | |
| | | | |
CAPITAL TRANSACTIONS (Note 5) | | | | | | | | | | | | | | | | |
Proceeds from the sale of shares | | | 4,878,912 | | | | 7,980,634 | | | | 81,837,370 | | | | 344,546,840 | |
Distributions reinvested | | | 3,149,196 | | | | 25,881,807 | | | | 11,657,026 | | | | 21,369,066 | |
Cost of shares redeemed | | | (24,521,247 | ) | | | (37,193,382 | ) | | | (164,621,768 | ) | | | (114,942,828 | ) |
| | | | | | | | | | | | | | | | |
| | | | |
NET INCREASE (DECREASE) IN NET ASSETS FROM CAPITAL TRANSACTIONS | | | (16,493,139 | ) | | | (3,330,941 | ) | | | (71,127,372 | ) | | | 250,973,078 | |
| | | | | | | | | | | | | | | | |
| | | | |
TOTAL INCREASE (DECREASE) IN NET ASSETS | | | 5,347,231 | | | | 22,830,027 | | | | (68,940,123 | ) | | | 251,522,567 | |
| | | | |
NET ASSETS, BEGINNING OF PERIOD | | | 335,537,330 | | | | 312,707,303 | | | | 586,399,482 | | | | 334,876,915 | |
| | | | | | | | | | | | | | | | |
| | | | |
NET ASSETS, END OF PERIOD | | $ | 340,884,561 | | | $ | 335,537,330 | | | $ | 517,459,359 | | | $ | 586,399,482 | |
| | | | | | | | | | | | | | | | |
| | | | |
OTHER INFORMATION (Note 5) | | | | | | | | | | | | | | | | |
Shares outstanding at beginning of period | | | 23,285,344 | | | | 23,506,156 | | | | 49,452,048 | | | | 28,299,649 | |
| | | | | | | | | | | | | | | | |
Shares issued | | | 328,959 | | | | 567,811 | | | | 6,887,282 | | | | 29,040,621 | |
Shares issued as reinvestment of distributions | | | 204,493 | | | | 1,847,936 | | | | 983,119 | | | | 1,804,718 | |
Shares redeemed | | | (1,637,184 | ) | | | (2,636,559 | ) | | | (13,855,346 | ) | | | (9,692,940 | ) |
| | | | | | | | | | | | | | | | |
Net increase (decrease) | | | (1,103,732 | ) | | | (220,812 | ) | | | (5,984,945 | ) | | | 21,152,399 | |
| | | | | | | | | | | | | | | | |
Shares outstanding at end of period | | | 22,181,612 | | | | 23,285,344 | | | | 43,467,103 | | | | 49,452,048 | |
| | | | | | | | | | | | | | | | |
The accompanying notes are an integral part of these financial statements.
118
| | | | | | | | | | | | | | |
| Intermediate Bond Fund | | | Core Bond Fund | |
For the
Six Months
Ended
June 30,
2024
(Unaudited) | | | For the
Year Ended
December 31,
2023 | | | For the
Six Months
Ended
June 30,
2024
(Unaudited) | | | For the
Year Ended
December 31,
2023 | |
| | | | | | | | | | | | | | |
| | | | | | | | | | | | | | |
| $ | 15,768,610 | | | $ | 21,287,726 | | | $ | 37,747,294 | | | $ | 55,387,583 | |
| | | |
| | | | | | | | | | | | | | |
| (10,176,683 | ) | | | (37,964,215 | ) | | | (40,765,566 | ) | | | (53,609,907 | ) |
| (2,572,618 | ) | | | 58,344,928 | | | | (10,365,020 | ) | | | 95,878,693 | |
| | | | | | | | | | | | | | |
| | | |
| | 3,019,309 | | | | 41,668,439 | | | | (13,383,292 | ) | | | 97,656,369 | |
| | | | | | | | | | | | | | |
| | | |
| | | | | | | | | | | | | | |
| | (12,894,697 | ) | | | (20,734,790 | ) | | | (30,994,311 | ) | | | (56,075,190 | ) |
| | | | | | | | | | | | | | |
| | | |
| | (12,894,697 | ) | | | (20,734,790 | ) | | | (30,994,311 | ) | | | (56,075,190 | ) |
| | | | | | | | | | | | | | |
| | | |
| | | | | | | | | | | | | | |
| | 103,706,101 | | | | 189,611,880 | | | | 280,376,152 | | | | 454,212,820 | |
| | 12,894,697 | | | | 20,734,790 | | | | 30,988,686 | | | | 56,064,005 | |
| | (125,102,261 | ) | | | (160,132,833 | ) | | | (215,872,286 | ) | | | (332,811,407 | ) |
| | | | | | | | | | | | | | |
| | | |
| | (8,501,463 | ) | | | 50,213,837 | | | | 95,492,552 | | | | 177,465,418 | |
| | | | | | | | | | | | | | |
| | | |
| | (18,376,851 | ) | | | 71,147,486 | | | | 51,114,949 | | | | 219,046,597 | |
| | | |
| | 949,550,093 | | | | 878,402,607 | | | | 2,060,113,232 | | | | 1,841,066,635 | |
| | | | | | | | | | | | | | |
| | | |
| $ | 931,173,242 | | | $ | 949,550,093 | | | $ | 2,111,228,181 | | | $ | 2,060,113,232 | |
| | | | | | | | | | | | | | |
| | | |
| | | | | | | | | | | | | | |
| | 98,461,581 | | | | 93,142,276 | | | | 165,444,728 | | | | 150,726,687 | |
| | | | | | | | | | | | | | |
| | 10,905,762 | | | | 20,040,800 | | | | 22,925,708 | | | | 37,294,206 | |
| | 1,353,936 | | | | 2,191,840 | | | | 2,545,044 | | | | 4,604,851 | |
| | (13,120,498 | ) | | | (16,913,335 | ) | | | (17,690,582 | ) | | | (27,181,016 | ) |
| | | | | | | | | | | | | | |
| | (860,800 | ) | | | 5,319,305 | | | | 7,780,170 | | | | 14,718,041 | |
| | | | | | | | | | | | | | |
| | 97,600,781 | | | | 98,461,581 | | | | 173,224,898 | | | | 165,444,728 | |
| | | | | | | | | | | | | | |
The accompanying notes are an integral part of these financial statements.
119
MoA FUNDS
FINANCIAL HIGHLIGHTS
Income from investment operations and distributions per share for a Fund share outstanding throughout the six months ended June 30, 2024 and five years ended December 31, 2023 (or since the Fund’s inception date if in existence less than five years) and other supplementary data with respect to each Fund are presented below and in the pages following:
| | | | | | | | | | | | | | | | | | | | | | | | |
| | | MoA Equity Index Fund | |
| | | Six Months
Ended
June 30,
2024
(Unaudited) | | | Years Ended December 31, | |
| | | 2023 | | | 2022 | | | 2021 | | | 2020(e) | | | 2019(e) | |
| | | | | | |
Net Asset Value, Beginning of Period | | $ | 58.29 | | | $ | 48.82 | | | $ | 62.41 | | | $ | 51.15 | | | $ | 47.89 | | | $ | 37.75 | |
| | | | | | | | | | | | | | | | | | | | | | | | |
| | | | | | |
INCOME (LOSS) FROM INVESTMENT OPERATIONS | | | | | | | | | | | | | | | | | | | | | | | | |
Net Investment Income (Loss) | | | 0.42 | | | | 0.87 | | | | 0.79 | | | | 0.73 | | | | 0.92 | | | | 0.81 | |
Net Realized and Unrealized Gains (Losses) on Investments, Futures Contracts and Foreign Currency Translations | | | 8.44 | | | | 11.79 | | | | (12.20 | ) | | | 13.70 | | | | 7.52 | | | | 10.88 | |
| | | | | | | | | | | | | | | | | | | | | | | | |
| | | | | | |
Total From Investment Operations | | | 8.86 | | | | 12.66 | | | | (11.41 | ) | | | 14.43 | | | | 8.44 | | | | 11.69 | |
| | | | | | | | | | | | | | | | | | | | | | | | |
| | | | | | |
Less Distributions | | | | | | | | | | | | | | | | | | | | | | | | |
From Net Investment Income | | | (0.36 | ) | | | (0.85 | ) | | | (0.78 | ) | | | (0.70 | ) | | | (1.68 | ) | | | (0.74 | ) |
From Net Realized Gains | | | — | | | | (2.34 | ) | | | (1.40 | ) | | | (2.47 | ) | | | (3.50 | ) | | | (0.81 | ) |
| | | | | | | | | | | | | | | | | | | | | | | | |
| | | | | | |
Total Distributions | | | (0.36 | ) | | | (3.19 | ) | | | (2.18 | ) | | | (3.17 | ) | | | (5.18 | ) | | | (1.55 | ) |
| | | | | | | | | | | | | | | | | | | | | | | | |
| | | | | | |
Net Asset Value, End of Period | | $ | 66.79 | | | $ | 58.29 | | | $ | 48.82 | | | $ | 62.41 | | | $ | 51.15 | | | $ | 47.89 | |
| | | | | | | | | | | | | | | | | | | | | | | | |
| | | | | | |
Total Return (%)(g) | | | 15.20 | (b) | | | 26.12 | | | | (18.24 | ) | | | 28.50 | | | | 18.20 | | | | 31.31 | |
Net Assets, End of Period ($ millions) | | | 5,653 | | | | 5,201 | | | | 4,330 | | | | 4,992 | | | | 3,714 | | | | 3,478 | |
Ratio of Net Income (Loss) to Average Net Assets (%) | | | 1.31 | (c) | | | 1.57 | | | | 1.51 | | | | 1.27 | | | | 1.72 | | | | 1.90 | |
Ratio of Expenses to Average Net Assets Before Expense Reimbursement (%) | | | 0.15 | (c) | | | 0.14 | | | | 0.14 | | | | 0.13 | | | | 0.15 | | | | 0.13 | |
Ratio of Expenses to Average Net Assets After Expense Reimbursement (%) | | | 0.14 | (c) | | | 0.14 | | | | 0.14 | | | | 0.13 | | | | 0.15 | | | | 0.13 | |
Portfolio Turnover Rate (%)(a) | | | 4.14 | (b) | | | 4.07 | | | | 3.14 | | | | 7.01 | | | | 5.77 | | | | 3.01 | |
| (a) | Portfolio turnover rate excludes all short-term securities. |
| (d) | Asset Allocation Funds and Target Date Funds exclude expenses of the underlying funds. |
| (e) | On September 25, 2020, the MoA Funds, with the exception of the Catholic Values Index Fund which commenced operations on September 30, 2020, had a 1 for 10 reverse share split. Historical net asset value per share and per share activity have been adjusted to reflect the split on a retroactive basis. |
| (f) | Amount is less than $0.005 per share. |
| (g) | Total return is calculated assuming a purchase of a share on the first day and a sale on the last day of each year or period reported and includes reinvestment of distributions, if any. For variable annuity owners or participants in a group variable annuity, the total return does not reflect the effect of fees and charges associated with your variable annuity contract and does not reflect expenses associated with the separate account such as administrative fees and account charges which, if reflected, would reduce the total returns for all years and periods shown. Past performance is no guarantee of future results. Total returns for periods less than one full year are not annualized. |
| (h) | International Fund excludes the expenses of its ETF investments. |
| (i) | Amount is less than $0.00005 per share. |
| (j) | For the period September 30, 2020 (commencement of operations) through December 31, 2020. |
| (k) | For the period August 3, 2020 (commencement of operations) through December 31, 2020. |
NA = Not Applicable.
The accompanying notes are an integral part of these financial statements.
120
| | | | | | | | | | | | | | | | | | | | | | | | | | | | | | | | | | | | | | | | | | | | | | |
| MoA All America Fund | | | MoA Small Cap Value Fund | |
Six Months
Ended
June 30,
2024
(Unaudited) | | | Years Ended December 31, | | | Six Months
Ended
June 30,
2024
(Unaudited) | | | Years Ended December 31, | |
| | 2023 | | | 2022 | | | 2021 | | | 2020(e) | | | 2019(e) | | | 2023 | | | 2022 | | | 2021 | | | 2020(e) | | | 2019(e) | |
| | | | | | | | | | | |
| $ | 21.58 | | | $ | 19.76 | | | $ | 27.73 | | | $ | 24.18 | | | $ | 24.24 | | | $ | 20.50 | | | $ | 13.80 | | | $ | 13.44 | | | $ | 16.52 | | | $ | 13.45 | | | $ | 15.11 | | | $ | 13.58 | |
| | | | | | | | | | | | | | | | | | | | | | | | | | | | | | | | | | | | | | | | | | | | | | |
| | | | | | | | | | | |
| | | | | | | | | | | | | | | | | | | | | | | | | | | | | | | | | | | | | | | | | | | | | | |
| | 0.12 | | | | 0.25 | | | | 0.25 | | | | 0.25 | | | | 0.34 | | | | 0.35 | | | | 0.11 | | | | 0.24 | | | | 0.19 | | | | 0.17 | | | | 0.23 | | | | 0.23 | |
|
2.02 |
| | | 3.67 | | | | (5.21 | ) | | | 6.18 | | | | 3.31 | | | | 5.31 | | | | (0.11 | ) | | | 1.00 | | | | (1.83 | ) | | | 4.12 | | | | (1.03 | ) | | | 2.30 | |
| | | | | | | | | | | | | | | | | | | | | | | | | | | | | | | | | | | | | | | | | | | | | | |
| | | | | | | | | | | |
| | 2.14 | | | | 3.92 | | | | (4.96 | ) | | | 6.43 | | | | 3.65 | | | | 5.66 | | | | — | (f) | | | 1.24 | | | | (1.64 | ) | | | 4.29 | | | | (0.80 | ) | | | 2.53 | |
| | | | | | | | | | | | | | | | | | | | | | | | | | | | | | | | | | | | | | | | | | | | | | |
| | | | | | | | | | | |
| | | | | | | | | | | | | | | | | | | | | | | | | | | | | | | | | | | | | | | | | | | | | | |
| | (0.09 | ) | | | (0.24 | ) | | | (0.25 | ) | | | (0.20 | ) | | | (0.63 | ) | | | (0.30 | ) | | | (0.08 | ) | | | (0.22 | ) | | | (0.18 | ) | | | (0.09 | ) | | | (0.41 | ) | | | (0.13 | ) |
| | — | | | | (1.86 | ) | | | (2.76 | ) | | | (2.68 | ) | | | (3.08 | ) | | | (1.62 | ) | | | — | | | | (0.66 | ) | | | (1.26 | ) | | | (1.13 | ) | | | (0.45 | ) | | | (0.87 | ) |
| | | | | | | | | | | | | | | | | | | | | | | | | | | | | | | | | | | | | | | | | | | | | | |
| | | | | | | | | | | |
| | (0.09 | ) | | | (2.10 | ) | | | (3.01 | ) | | | (2.88 | ) | | | (3.71 | ) | | | (1.92 | ) | | | (0.08 | ) | | | (0.88 | ) | | | (1.44 | ) | | | (1.22 | ) | | | (0.86 | ) | | | (1.00 | ) |
| | | | | | | | | | | | | | | | | | | | | | | | | | | | | | | | | | | | | | | | | | | | | | |
| | | | | | | | | | | |
| $ | 23.63 | | | $ | 21.58 | | | $ | 19.76 | | | $ | 27.73 | | | $ | 24.18 | | | $ | 24.24 | | | $ | 13.72 | | | $ | 13.80 | | | $ | 13.44 | | | $ | 16.52 | | | $ | 13.45 | | | $ | 15.11 | |
| | | | | | | | | | | | | | | | | | | | | | | | | | | | | | | | | | | | | | | | | | | | | | |
| | | | | | | | | | | |
| | 9.96 | (b) | | | 20.33 | | | | (17.70 | ) | | | 27.07 | | | | 16.78 | | | | 28.36 | | | | 0.01 | (b) | | | 9.59 | | | | (9.82 | ) | | | 32.29 | | | | (4.01 | ) | | | 19.10 | |
| | 306 | | | | 299 | | | | 281 | | | | 374 | | | | 320 | | | | 312 | | | | 376 | | | | 409 | | | | 413 | | | | 580 | | | | 472 | | | | 518 | |
| | 1.00 | (c) | | | 1.17 | | | | 1.07 | | | | 0.90 | | | | 1.33 | | | | 1.43 | | | | 1.52 | (c) | | | 1.78 | | | | 1.15 | | | | 1.03 | | | | 1.90 | | | | 1.68 | |
|
0.51 |
(c) | | | 0.53 | | | | 0.54 | | | | 0.49 | | | | 0.52 | | | | 0.49 | | | | 0.82 | (c) | | | 0.84 | | | | 0.82 | | | | 0.80 | | | | 0.82 | | | | 0.81 | |
|
0.51 |
(c) | | | 0.53 | | | | 0.54 | | | | 0.49 | | | | 0.52 | | | | 0.49 | | | | 0.81 | (c) | | | 0.84 | | | | 0.82 | | | | 0.80 | | | | 0.82 | | | | 0.81 | |
| | 12.83 | (b) | | | 31.84 | | | | 19.24 | | | | 19.84 | | | | 24.07 | | | | 26.06 | | | | 28.72 | (b) | | | 22.33 | | | | 8.40 | | | | 33.93 | | | | 42.64 | | | | 43.17 | |
The accompanying notes are an integral part of these financial statements.
121
MoA FUNDS
FINANCIAL HIGHLIGHTS (Continued)
| | | | | | | | | | | | | | | | | | | | | | | | |
| | | MoA Small Cap Growth Fund | |
| | | Six Months
Ended
June 30,
2024
(Unaudited) | | | Years Ended December 31, | |
| | | 2023 | | | 2022 | | | 2021 | | | 2020(e) | | | 2019(e) | |
| | | | | | |
Net Asset Value, Beginning of Period | | $ | 12.72 | | | $ | 11.01 | | | $ | 16.22 | | | $ | 17.53 | | | $ | 14.63 | | | $ | 12.62 | |
| | | | | | | | | | | | | | | | | | | | | | | | |
| | | | | | |
INCOME (LOSS) FROM INVESTMENT OPERATIONS | | | | | | | | | | | | | | | | | | | | | | | | |
Net Investment Income (Loss) | | | (0.01 | ) | | | (0.01 | ) | | | (0.01 | ) | | | (0.03 | ) | | | (0.02 | ) | | | 0.02 | |
Net Realized and Unrealized Gains (Losses) on Investments, Futures Contracts and Foreign Currency Translations | | | 0.42 | | | | 1.73 | | | | (4.60 | ) | | | 1.74 | | | | 6.01 | | | | 3.24 | |
| | | | | | | | | | | | | | | | | | | | | | | | |
| | | | | | |
Total From Investment Operations | | | 0.41 | | | | 1.72 | | | | (4.61 | ) | | | 1.71 | | | | 5.99 | | | | 3.26 | |
| | | | | | | | | | | | | | | | | | | | | | | | |
| | | | | | |
Less Distributions | | | | | | | | | | | | | | | | | | | | | | | | |
From Net Investment Income | | | — | | | | — | | | | — | | | | (0.01 | ) | | | (0.06 | ) | | | (0.01 | ) |
From Net Realized Gains | | | — | | | | (0.01 | ) | | | (0.60 | ) | | | (3.01 | ) | | | (3.03 | ) | | | (1.24 | ) |
Return of Capital | | | — | | | | — | | | | — | | | | — | | | | — | | | | — | |
| | | | | | | | | | | | | | | | | | | | | | | | |
| | | | | | |
Total Distributions | | | — | | | | (0.01 | ) | | | (0.60 | ) | | | (3.02 | ) | | | (3.09 | ) | | | (1.25 | ) |
| | | | | | | | | | | | | | | | | | | | | | | | |
| | | | | | |
Net Asset Value, End of Period | | $ | 13.13 | | | $ | 12.72 | | | $ | 11.01 | | | $ | 16.22 | | | $ | 17.53 | | | $ | 14.63 | |
| | | | | | | | | | | | | | | | | | | | | | | | |
| | | | | | |
Total Return (%)(g) | | | 3.22 | (b) | | | 15.63 | | | | (28.37 | ) | | | 10.38 | | | | 43.31 | | | | 26.59 | |
Net Assets, End of Period ($ millions) | | | 393 | | | | 416 | | | | 432 | | | | 673 | | | | 667 | | | | 609 | |
Ratio of Net Income (Loss) to Average Net Assets (%) | | | (0.18 | )(c) | | | (0.12 | ) | | | (0.05 | ) | | | (0.24 | ) | | | (0.17 | ) | | | 0.17 | |
Ratio of Expenses to Average Net Assets Before Expense Reimbursement (%) | | | 0.82 | (c) | | | 0.84 | | | | 0.83 | | | | 0.80 | | | | 0.81 | | | | 0.81 | |
Ratio of Expenses to Average Net Assets After Expense Reimbursement (%) | | | 0.81 | (c) | | | 0.84 | | | | 0.83 | | | | 0.80 | | | | 0.81 | | | | 0.81 | |
Portfolio Turnover Rate (%)(a) | | | 25.79 | (b) | | | 49.48 | | | | 61.61 | | | | 45.18 | | | | 70.58 | | | | 56.25 | |
| (a) | Portfolio turnover rate excludes all short-term securities. |
| (d) | Asset Allocation Funds and Target Date Funds exclude expenses of the underlying funds. |
| (e) | On September 25, 2020, the MoA Funds, with the exception of the Catholic Values Index Fund which commenced operations on September 30, 2020, had a 1 for 10 reverse share split. Historical net asset value per share and per share activity have been adjusted to reflect the split on a retroactive basis. |
| (f) | Amount is less than $0.005 per share. |
| (g) | Total return is calculated assuming a purchase of a share on the first day and a sale on the last day of each year or period reported and includes reinvestment of distributions, if any. For variable annuity owners or participants in a group variable annuity, the total return does not reflect the effect of fees and charges associated with your variable annuity contract and does not reflect expenses associated with the separate account such as administrative fees and account charges which, if reflected, would reduce the total returns for all years and periods shown. Past performance is no guarantee of future results. Total returns for periods less than one full year are not annualized. |
| (h) | International Fund excludes the expenses of its ETF investments. |
| (i) | Amount is less than $0.00005 per share. |
| (j) | For the period September 30, 2020 (commencement of operations) through December 31, 2020. |
| (k) | For the period August 3, 2020 (commencement of operations) through December 31, 2020. |
NA = Not Applicable.
The accompanying notes are an integral part of these financial statements.
122
| | | | | | | | | | | | | | | | | | | | | | | | | | | | | | | | | | | | | | | | | | | | | | |
| MoA Small Cap Equity Index Fund | | | MoA Mid Cap Value Fund | |
Six Months
Ended
June 30,
2024
(Unaudited) | | | Years Ended December 31, | | | Six Months
Ended
June 30,
2024
(Unaudited) | | | Years Ended December 31, | |
| | 2023 | | | 2022 | | | 2021 | | | 2020(e) | | | 2019(e) | | | 2023 | | | 2022 | | | 2021 | | | 2020(e) | | | 2019(e) | |
| | | | | | | | | | | |
| $ | 10.21 | | | $ | 9.08 | | | $ | 11.59 | | | $ | 10.74 | | | $ | 9.93 | | | $ | 8.28 | | | $ | 16.28 | | | $ | 15.65 | | | $ | 19.21 | | | $ | 15.53 | | | $ | 16.36 | | | $ | 13.39 | |
| | | | | | | | | | | | | | | | | | | | | | | | | | | | | | | | | | | | | | | | | | | | | | |
| | | | | | | | | | | |
| | | | | | | | | | | | | | | | | | | | | | | | | | | | | | | | | | | | | | | | | | | | | | |
| | 0.09 | | | | 0.16 | | | | 0.13 | | | | 0.16 | | | | 0.07 | | | | 0.14 | | | | 0.13 | | | | 0.23 | | | | 0.23 | | | | 0.26 | | | | 0.44 | | | | 0.29 | |
| (0.17 | ) | | | 1.26 | | | | (2.03 | ) | | | 2.62 | | | | 0.94 | | | | 1.72 | | | | 0.43 | | | | 0.85 | | | | (2.32 | ) | | | 5.01 | | | | (0.14 | ) | | | 3.28 | |
| | | | | | | | | | | | | | | | | | | | | | | | | | | | | | | | | | | | | | | | | | | | | | |
| | | | | | | | | | | |
| | (0.08 | ) | | | 1.42 | | | | (1.90 | ) | | | 2.78 | | | | 1.01 | | | | 1.86 | | | | 0.56 | | | | 1.08 | | | | (2.09 | ) | | | 5.27 | | | | 0.30 | | | | 3.57 | |
| | | | | | | | | | | | | | | | | | | | | | | | | | | | | | | | | | | | | | | | | | | | | | |
| | | | | | | | | | | |
| | | | | | | | | | | | | | | | | | | | | | | | | | | | | | | | | | | | | | | | | | | | | | |
| | (0.07 | ) | | | (0.15 | ) | | | (0.12 | ) | | | (0.15 | ) | | | (0.07 | ) | | | (0.13 | ) | | | (0.10 | ) | | | (0.20 | ) | | | (0.29 | ) | | | (0.14 | ) | | | (0.53 | ) | | | (0.21 | ) |
| | — | | | | (0.14 | ) | | | (0.49 | ) | | | (1.78 | ) | | | (0.13 | ) | | | (0.08 | ) | | | — | | | | (0.25 | ) | | | (1.18 | ) | | | (1.45 | ) | | | (0.48 | ) | | | (0.39 | ) |
| | — | | | | — | | | | — | | | | — | | | | — | | | | — | | | | — | | | | — | | | | — | | | | — | | | | (0.12 | ) | | | — | |
| | | | | | | | | | | | | | | | | | | | | | | | | | | | | | | | | | | | | | | | | | | | | | |
| | | | | | | | | | | |
| | (0.07 | ) | | | (0.29 | ) | | | (0.61 | ) | | | (1.93 | ) | | | (0.20 | ) | | | (0.21 | ) | | | (0.10 | ) | | | (0.45 | ) | | | (1.47 | ) | | | (1.59 | ) | | | (1.13 | ) | | | (0.60 | ) |
| | | | | | | | | | | | | | | | | | | | | | | | | | | | | | | | | | | | | | | | | | | | | | |
| | | | | | | | | | | |
| $ | 10.06 | | | $ | 10.21 | | | $ | 9.08 | | | $ | 11.59 | | | $ | 10.74 | | | $ | 9.93 | | | $ | 16.74 | | | $ | 16.28 | | | $ | 15.65 | | | $ | 19.21 | | | $ | 15.53 | | | $ | 16.36 | |
| | | | | | | | | | | | | | | | | | | | | | | | | | | | | | | | | | | | | | | | | | | | | | |
| | | | | | | | | | | |
| | (0.79 | )(b) | | | 15.87 | | | | (16.31 | ) | | | 26.56 | | | | 10.62 | | | | 22.40 | | | | 3.51 | (b) | | | 6.96 | | | | (10.67 | ) | | | 34.35 | | | | 2.82 | | | | 27.04 | |
| | 199 | | | | 205 | | | | 179 | | | | 143 | | | | 107 | | | | 29 | | | | 164 | | | | 157 | | | | 115 | | | | 131 | | | | 90 | | | | 99 | |
| | 1.72 | (c) | | | 1.76 | | | | 1.54 | | | | 1.29 | | | | 1.51 | | | | 1.50 | | | | 1.58 | (c) | | | 1.61 | | | | 1.34 | | | | 1.47 | | | | 2.96 | | | | 1.85 | |
| 0.28 | (c) | | | 0.24 | | | | 0.25 | | | | 0.25 | | | | 0.39 | | | | 0.42 | | | | 0.66 | (c) | | | 0.74 | | | | 0.70 | | | | 0.65 | | | | 0.74 | | | | 0.66 | |
| 0.14 | (c) | | | 0.14 | | | | 0.14 | | | | 0.14 | | | | 0.12 | | | | 0.14 | | | | 0.66 | (c) | | | 0.73 | | | | 0.70 | | | | 0.65 | | | | 0.74 | | | | 0.66 | |
| | 17.64 | (b) | | | 43.99 | | | | 29.55 | | | | 69.91 | | | | 42.67 | | | | 97.06 | | | | 16.02 | (b) | | | 29.02 | | | | 11.44 | | | | 23.84 | | | | 23.65 | | | | 17.65 | |
The accompanying notes are an integral part of these financial statements.
123
MoA FUNDS
FINANCIAL HIGHLIGHTS (Continued)
| | | | | | | | | | | | | | | | | | | | | | | | |
| | | MoA Mid Cap Equity Index Fund | |
| | | Six Months
Ended
June 30,
2024
(Unaudited) | | | Years Ended December 31, | |
| | | 2023 | | | 2022 | | | 2021 | | | 2020(e) | | | 2019(e) | |
| | | | | | |
Net Asset Value, Beginning of Period | | $ | 20.10 | | | $ | 18.91 | | | $ | 25.12 | | | $ | 23.07 | | | $ | 22.45 | | | $ | 19.31 | |
| | | | | | | | | | | | | | | | | | | | | | | | |
| | | | | | |
INCOME (LOSS) FROM INVESTMENT OPERATIONS | | | | | | | | | | | | | | | | | | | | | | | | |
Net Investment Income (Loss) | | | 0.16 | | | | 0.34 | | | | 0.36 | | | | 0.33 | | | | 0.32 | | | | 0.33 | |
Net Realized and Unrealized Gains (Losses) on Investments, Futures Contracts and Foreign Currency Translations | | | 1.07 | | | | 2.66 | | | | (3.76 | ) | | | 5.21 | | | | 2.37 | | | | 4.57 | |
| | | | | | | | | | | | | | | | | | | | | | | | |
| | | | | | |
Total From Investment Operations | | | 1.23 | | | | 3.00 | | | | (3.40 | ) | | | 5.54 | | | | 2.69 | | | | 4.90 | |
| | | | | | | | | | | | | | | | | | | | | | | | |
| | | | | | |
Less Distributions | | | | | | | | | | | | | | | | | | | | | | | | |
From Net Investment Income | | | (0.12 | ) | | | (0.28 | ) | | | (0.31 | ) | | | (0.30 | ) | | | (0.59 | ) | | | (0.27 | ) |
From Net Realized Gains | | | — | | | | (1.53 | ) | | | (2.50 | ) | | | (3.19 | ) | | | (1.48 | ) | | | (1.49 | ) |
Return of Capital | | | — | | | | — | | | | — | | | | — | | | | — | | | | — | |
| | | | | | | | | | | | | | | | | | | | | | | | |
| | | | | | |
Total Distributions | | | (0.12 | ) | | | (1.81 | ) | | | (2.81 | ) | | | (3.49 | ) | | | (2.07 | ) | | | (1.76 | ) |
| | | | | | | | | | | | | | | | | | | | | | | | |
| | | | | | |
Net Asset Value, End of Period | | $ | 21.21 | | | $ | 20.10 | | | $ | 18.91 | | | $ | 25.12 | | | $ | 23.07 | | | $ | 22.45 | |
| | | | | | | | | | | | | | | | | | | | | | | | |
| | | | | | |
Total Return (%)(g) | | | 6.12 | (b) | | | 16.25 | | | | (13.23 | ) | | | 24.56 | | | | 13.50 | | | | 26.01 | |
Net Assets, End of Period ($ millions) | | | 1,503 | | | | 1,501 | | | | 1,600 | | | | 2,118 | | | | 1,856 | | | | 1,681 | |
Ratio of Net Income (Loss) to Average Net Assets (%) | | | 1.46 | (c) | | | 1.63 | | | | 1.58 | | | | 1.24 | | | | 1.56 | | | | 1.67 | |
Ratio of Expenses to Average Net Assets Before Expense Reimbursement (%) | | | 0.16 | (c) | | | 0.15 | | | | 0.16 | | | | 0.14 | | | | 0.15 | | | | 0.13 | |
Ratio of Expenses to Average Net Assets After Expense Reimbursement (%) | | | 0.15 | (c) | | | 0.15 | | | | 0.16 | | | | 0.14 | | | | 0.15 | | | | 0.13 | |
Portfolio Turnover Rate (%)(a) | | | 14.14 | (b) | | | 19.60 | | | | 19.54 | | | | 25.62 | | | | 13.14 | | | | 14.30 | |
| (a) | Portfolio turnover rate excludes all short-term securities. |
| (d) | Asset Allocation Funds and Target Date Funds exclude expenses of the underlying funds. |
| (e) | On September 25, 2020, the MoA Funds, with the exception of the Catholic Values Index Fund which commenced operations on September 30, 2020, had a 1 for 10 reverse share split. Historical net asset value per share and per share activity have been adjusted to reflect the split on a retroactive basis. |
| (f) | Amount is less than $0.005 per share. |
| (g) | Total return is calculated assuming a purchase of a share on the first day and a sale on the last day of each year or period reported and includes reinvestment of distributions, if any. For variable annuity owners or participants in a group variable annuity, the total return does not reflect the effect of fees and charges associated with your variable annuity contract and does not reflect expenses associated with the separate account such as administrative fees and account charges which, if reflected, would reduce the total returns for all years and periods shown. Past performance is no guarantee of future results. Total returns for periods less than one full year are not annualized. |
| (h) | International Fund excludes the expenses of its ETF investments. |
| (i) | Amount is less than $0.00005 per share. |
| (j) | For the period September 30, 2020 (commencement of operations) through December 31, 2020. |
| (k) | For the period August 3, 2020 (commencement of operations) through December 31, 2020. |
NA = Not Applicable.
The accompanying notes are an integral part of these financial statements.
124
| | | | | | | | | | | | | | | | | | | | | | | | |
| MoA Balanced Fund | | | |
Six Months
Ended
June 30,
2024
(Unaudited) | | | Years Ended December 31, | | | |
| | 2023 | | | 2022 | | | 2021 | | | 2020(e) | | | 2019(e) | | | |
| | | | | | |
| $ | 18.82 | | | $ | 17.39 | | | $ | 21.18 | | | $ | 19.16 | | | $ | 18.68 | | | $ | 16.75 | | | |
| | | | | | | | | | | | | | | | | | | | | | | | |
| | | | | | |
| | | | | | | | | | | | | | | | | | | | | | | | |
| | 0.21 | | | | 0.39 | | | | 0.35 | | | | 0.32 | | | | 0.37 | | | | 0.39 | | | |
| 1.67 | | | | 2.21 | | | | (2.91 | ) | | | 2.80 | | | | 1.75 | | | | 2.78 | | | |
| | | | | | | | | | | | | | | | | | | | | | | | |
| | | | | | |
| | 1.88 | | | | 2.60 | | | | (2.56 | ) | | | 3.12 | | | | 2.12 | | | | 3.17 | | | |
| | | | | | | | | | | | | | | | | | | | | | | | |
| | | | | | |
| | | | | | | | | | | | | | | | | | | | | | | | |
| | (0.18 | ) | | | (0.40 | ) | | | (0.36 | ) | | | (0.32 | ) | | | (0.77 | ) | | | (0.41 | ) | | |
| | — | | | | (0.77 | ) | | | (0.87 | ) | | | (0.78 | ) | | | (0.87 | ) | | | (0.83 | ) | | |
| | — | | | | — | | | | — | | | | — | | | | — | | | | — | | | |
| | | | | | | | | | | | | | | | | | | | | | | | |
| | | | | | |
| | (0.18 | ) | | | (1.17 | ) | | | (1.23 | ) | | | (1.10 | ) | | | (1.64 | ) | | | (1.24 | ) | | |
| | | | | | | | | | | | | | | | | | | | | | | | |
| | | | | | |
| $ | 20.52 | | | $ | 18.82 | | | $ | 17.39 | | | $ | 21.18 | | | $ | 19.16 | | | $ | 18.68 | | | |
| | | | | | | | | | | | | | | | | | | | | | | | |
| | | | | | |
| | 10.01 | (b) | | | 15.07 | | | | (12.02 | ) | | | 16.48 | | | | 11.77 | | | | 19.37 | | | |
| | 195 | | | | 187 | | | | 180 | | | | 218 | | | | 191 | | | | 194 | | | |
| | 2.09 | (c) | | | 2.09 | | | | 1.81 | | | | 1.53 | | | | 1.76 | | | | 2.12 | | | |
| 0.53 | (c) | | | 0.54 | | | | 0.54 | | | | 0.46 | | | | 0.54 | | | | 0.50 | | | |
| 0.52 | (c) | | | 0.54 | | | | 0.54 | | | | 0.46 | | | | 0.54 | | | | 0.50 | | | |
| | 22.00 | (b) | | | 50.33 | | | | 25.01 | | | | 23.68 | | | | 38.58 | | | | 41.92 | | | |
The accompanying notes are an integral part of these financial statements.
125
MoA FUNDS
FINANCIAL HIGHLIGHTS (Continued)
| | | | | | | | | | | | | | | | | | | | | | | | |
| | | MoA International Fund | |
| | | Six Months
Ended
June 30,
2024
(Unaudited) | | | Years Ended December 31, | |
| | | 2023 | | | 2022 | | | 2021 | | | 2020(e) | | | 2019(e) | |
| | | | | | |
Net Asset Value, Beginning of Period | | $ | 8.20 | | | $ | 7.24 | | | $ | 9.26 | | | $ | 9.34 | | | $ | 9.05 | | | $ | 7.66 | |
| | | | | | | | | | | | | | | | | | | | | | | | |
| | | | | | |
INCOME (LOSS) FROM INVESTMENT OPERATIONS | | | | | | | | | | | | | | | | | | | | | | | | |
Net Investment Income (Loss) | | | 0.18 | | | | 0.29 | | | | 0.31 | | | | 0.20 | | | | 0.14 | | | | 0.23 | |
Net Realized and Unrealized Gains (Losses) on Investments, Futures Contracts and Foreign Currency Translations | | | 0.41 | | | | 1.09 | | | | (1.44 | ) | | | 0.74 | | | | 0.56 | | | | 1.36 | |
| | | | | | | | | | | | | | | | | | | | | | | | |
| | | | | | |
Total From Investment Operations | | | 0.59 | | | | 1.38 | | | | (1.13 | ) | | | 0.94 | | | | 0.70 | | | | 1.59 | |
| | | | | | | | | | | | | | | | | | | | | | | | |
| | | | | | |
Less Distributions | | | | | | | | | | | | | | | | | | | | | | | | |
From Net Investment Income | | | (0.17 | ) | | | (0.42 | ) | | | (0.23 | ) | | | (0.16 | ) | | | (0.38 | ) | | | (0.20 | ) |
From Net Realized Gains | | | — | | | | — | | | | (0.66 | ) | | | (0.86 | ) | | | (0.03 | ) | | | — | |
Return of Capital | | | — | | | | — | | | | — | | | | — | | | | — | (f) | | | — | |
| | | | | | | | | | | | | | | | | | | | | | | | |
| | | | | | |
Total Distributions | | | (0.17 | ) | | | (0.42 | ) | | | (0.89 | ) | | | (1.02 | ) | | | (0.41 | ) | | | (0.20 | ) |
| | | | | | | | | | | | | | | | | | | | | | | | |
| | | | | | |
Net Asset Value, End of Period | | $ | 8.62 | | | $ | 8.20 | | | $ | 7.24 | | | $ | 9.26 | | | $ | 9.34 | | | $ | 9.05 | |
| | | | | | | | | | | | | | | | | | | | | | | | |
| | | | | | |
Total Return (%)(g) | | | 7.11 | (b) | | | 19.55 | | | | (11.09 | ) | | | 10.37 | | | | 8.19 | | | | 21.01 | |
Net Assets, End of Period ($ millions) | | | 1,592 | | | | 1,460 | | | | 1,202 | | | | 1,203 | | | | 940 | | | | 720 | |
Ratio of Net Income (Loss) to Average Net Assets (%) | | | 4.38 | (c) | | | 3.83 | | | | 4.10 | | | | 2.05 | | | | 2.20 | | | | 3.26 | |
Ratio of Expenses to Average Net Assets Before Expense Reimbursement (%)(d)(h) | | | 0.27 | (c) | | | 0.14 | | | | 0.13 | | | | 0.12 | | | | 0.13 | | | | 0.12 | |
Ratio of Expenses to Average Net Assets After Expense Reimbursement (%)(d)(h) | | | 0.21 | (c) | | | 0.13 | | | | 0.13 | | | | 0.12 | | | | 0.13 | | | | 0.12 | |
Portfolio Turnover Rate (%)(a) | | | 13.84 | (b) | | | 20.14 | | | | 18.25 | | | | 123.53 | | | | 4.69 | | | | 3.61 | |
| (a) | Portfolio turnover rate excludes all short-term securities. |
| (d) | Asset Allocation Funds and Target Date Funds exclude expenses of the underlying funds. |
| (e) | On September 25, 2020, the MoA Funds, with the exception of the Catholic Values Index Fund which commenced operations on September 30, 2020, had a 1 for 10 reverse share split. Historical net asset value per share and per share activity have been adjusted to reflect the split on a retroactive basis. |
| (f) | Amount is less than $0.005 per share. |
| (g) | Total return is calculated assuming a purchase of a share on the first day and a sale on the last day of each year or period reported and includes reinvestment of distributions, if any. For variable annuity owners or participants in a group variable annuity, the total return does not reflect the effect of fees and charges associated with your variable annuity contract and does not reflect expenses associated with the separate account such as administrative fees and account charges which, if reflected, would reduce the total returns for all years and periods shown. Past performance is no guarantee of future results. Total returns for periods less than one full year are not annualized. |
| (h) | International Fund excludes the expenses of its ETF investments. |
| (i) | Amount is less than $0.00005 per share. |
| (j) | For the period September 30, 2020 (commencement of operations) through December 31, 2020. |
| (k) | For the period August 3, 2020 (commencement of operations) through December 31, 2020. |
NA = Not Applicable.
The accompanying notes are an integral part of these financial statements.
126
| | | | | | | | | | | | | | | | | | | | | | | | | | | | | | | | | | | | | | | | | | |
| MoA Catholic Values Index Fund | | | MoA Retirement Income Fund | |
Six Months
Ended
June 30,
2024
(Unaudited) | | | Years Ended December 31, | | | Period Ended
December 31, | | | Six Months
Ended
June 30,
2024
(Unaudited) | | | Years Ended December 31, | |
| | 2023 | | | 2022 | | | 2021 | | | 2020(j) | | | 2023 | | | 2022 | | | 2021 | | | 2020(e) | | | 2019(e) | |
| | | | | | | | | | |
| $ | 13.51 | | | $ | 10.97 | | | $ | 14.06 | | | $ | 11.17 | | | $ | 10.00 | | | $ | 10.90 | | | $ | 10.24 | | | $ | 12.26 | | | $ | 12.09 | | | $ | 12.09 | | | $ | 11.18 | |
| | | | | | | | | | | | | | | | | | | | | | | | | | | | | | | | | | | | | | | | | | |
| | | | | | | | | | |
| | | | | | | | | | | | | | | | | | | | | | | | | | | | | | | | | | | | | | | | | | |
| | 0.08 | | | | 0.17 | | | | 0.15 | | | | 0.15 | | | | 0.04 | | | | 0.14 | | | | 0.26 | | | | 0.17 | | | | 0.15 | | | | 0.41 | | | | 0.18 | |
| 1.68 | | | | 2.71 | | | | (2.98 | ) | | | 3.07 | | | | 1.17 | | | | 0.26 | | | | 0.74 | | | | (1.54 | ) | | | 0.54 | | | | 0.49 | | | | 1.14 | |
| | | | | | | | | | | | | | | | | | | | | | | | | | | | | | | | | | | | | | | | | | |
| | | | | | | | | | |
| | 1.76 | | | | 2.88 | | | | (2.83 | ) | | | 3.22 | | | | 1.21 | | | | 0.40 | | | | 1.00 | | | | (1.37 | ) | | | 0.69 | | | | 0.90 | | | | 1.32 | |
| | | | | | | | | | | | | | | | | | | | | | | | | | | | | | | | | | | | | | | | | | |
| | | | | | | | | | |
| | | | | | | | | | | | | | | | | | | | | | | | | | | | | | | | | | | | | | | | | | |
| | (0.07 | ) | | | (0.17 | ) | | | (0.15 | ) | | | (0.14 | ) | | | (0.04 | ) | | | (0.14 | ) | | | (0.26 | ) | | | (0.17 | ) | | | (0.16 | ) | | | (0.60 | ) | | | (0.20 | ) |
| | — | | | | (0.17 | ) | | | (0.11 | ) | | | (0.19 | ) | | | — | (f) | | | — | | | | (0.08 | ) | | | (0.48 | ) | | | (0.36 | ) | | | (0.30 | ) | | | (0.21 | ) |
| | — | | | | — | | | | — | | | | — | | | | — | | | | — | | | | — | | | | — | | | | — | | | | — | | | | — | |
| | | | | | | | | | | | | | | | | | | | | | | | | | | | | | | | | | | | | | | | | | |
| | | | | | | | | | |
| | (0.07 | ) | | | (0.34 | ) | | | (0.26 | ) | | | (0.33 | ) | | | (0.04 | ) | | | (0.14 | ) | | | (0.34 | ) | | | (0.65 | ) | | | (0.52 | ) | | | (0.90 | ) | | | (0.41 | ) |
| | | | | | | | | | | | | | | | | | | | | | | | | | | | | | | | | | | | | | | | | | |
| | | | | | | | | | |
| $ | 15.20 | | | $ | 13.51 | | | $ | 10.97 | | | $ | 14.06 | | | $ | 11.17 | | | $ | 11.16 | | | $ | 10.90 | | | $ | 10.24 | | | $ | 12.26 | | | $ | 12.09 | | | $ | 12.09 | |
| | | | | | | | | | | | | | | | | | | | | | | | | | | | | | | | | | | | | | | | | | |
| | | | | | | | | | |
| | 13.02 | (b) | | | 26.37 | | | | (20.10 | ) | | | 28.99 | | | | 12.12 | (b) | | | 3.64 | (b) | | | 9.91 | | | | (11.12 | ) | | | 5.77 | | | | 7.59 | | | | 11.85 | |
| | 7 | | | | 6 | | | | 4 | | | | 5 | | | | 3 | | | | 199 | | | | 207 | | | | 203 | | | | 224 | | | | 193 | | | | 138 | |
| | 1.13 | (c) | | | 1.39 | | | | 1.36 | | | | 1.16 | | | | 1.57 | (c) | | | 2.42 | (c) | | | 2.40 | | | | 1.58 | | | | 1.22 | | | | 4.25 | | | | 1.87 | |
| 3.79 | (c) | | | 2.94 | | | | 2.53 | | | | 2.14 | | | | 2.18 | (c) | | | 0.15 | (c) | | | 0.16 | | | | 0.13 | | | | 0.11 | | | | 0.11 | | | | 0.12 | |
| 0.21 | (c) | | | 0.22 | | | | 0.22 | | | | 0.22 | | | | 0.15 | (c) | | | 0.15 | (c) | | | 0.16 | | | | 0.13 | | | | 0.11 | | | | 0.11 | | | | 0.12 | |
| | 11.04 | (b) | | | 25.23 | | | | 13.48 | | | | 9.54 | | | | 16.38 | (b) | | | 10.01 | (b) | | | 25.22 | | | | 32.16 | | | | 28.07 | | | | 23.13 | | | | 10.49 | |
The accompanying notes are an integral part of these financial statements.
127
MoA FUNDS
FINANCIAL HIGHLIGHTS (Continued)
| | | | | | | | | | | | | | | | | | | | | | | | |
| | | MoA Clear Passage 2015 Fund | |
| | | Six Months
Ended
June 30,
2024
(Unaudited) | | | Years Ended December 31, | |
| | | 2023 | | | 2022 | | | 2021 | | | 2020(e) | | | 2019(e) | |
| | | | | | |
Net Asset Value, Beginning of Period | | $ | 8.63 | | | $ | 8.13 | | | $ | 9.45 | | | $ | 9.90 | | | $ | 10.49 | | | $ | 9.73 | |
| | | | | | | | | | | | | | | | | | | | | | | | |
| | | | | | |
INCOME (LOSS) FROM INVESTMENT OPERATIONS | | | | | | | | | | | | | | | | | | | | | | | | |
Net Investment Income (Loss) | | | 0.10 | | | | 0.20 | | | | 0.13 | | | | 0.13 | | | | 0.39 | | | | 0.20 | |
Net Realized and Unrealized Gains (Losses) on Investments, Futures Contracts and Foreign Currency Translations | | | 0.24 | | | | 0.65 | | | | (1.27 | ) | | | 0.63 | | | | 0.37 | | | | 1.27 | |
| | | | | | | | | | | | | | | | | | | | | | | | |
| | | | | | |
Total From Investment Operations | | | 0.34 | | | | 0.85 | | | | (1.14 | ) | | | 0.76 | | | | 0.76 | | | | 1.47 | |
| | | | | | | | | | | | | | | | | | | | | | | | |
| | | | | | |
Less Distributions | | | | | | | | | | | | | | | | | | | | | | | | |
From Net Investment Income | | | (0.10 | ) | | | (0.21 | ) | | | (0.13 | ) | | | (0.15 | ) | | | (0.59 | ) | | | (0.22 | ) |
From Net Realized Gains | | | — | | | | (0.14 | ) | | | (0.02 | ) | | | (1.09 | ) | | | (0.76 | ) | | | (0.49 | ) |
| | | | | | | | | | | | | | | | | | | | | | | | |
| | | | | | |
Total Distributions | | | (0.10 | ) | | | (0.35 | ) | | | (0.15 | ) | | | (1.24 | ) | | | (1.35 | ) | | | (0.71 | ) |
| | | | | | | | | | | | | | | | | | | | | | | | |
| | | | | | |
Capital Contribution from Adviser | | | — | | | | — | | | | (0.03 | )(l) | | | 0.03 | (l) | | | — | | | | — | |
| | | | | | | | | | | | | | | | | | | | | | | | |
| | | | | | |
Net Asset Value, End of Period | | $ | 8.87 | | | $ | 8.63 | | | $ | 8.13 | | | $ | 9.45 | | | $ | 9.90 | | | $ | 10.49 | |
| | | | | | | | | | | | | | | | | | | | | | | | |
| | | | | | |
Total Return (%)(g) | | | 3.94 | (b) | | | 10.55 | | | | (12.38 | ) | | | 8.11 | | | | 7.65 | | | | 15.34 | |
Net Assets, End of Period ($ millions) | | | 109 | | | | 111 | | | | 113 | | | | 141 | | | | 140 | | | | 149 | |
Ratio of Net Income (Loss) to Average Net Assets (%) | | | 2.34 | (c) | | | 2.34 | | | | 1.53 | | | | 1.26 | | | | 3.63 | | | | 1.81 | |
Ratio of Expenses to Average Net Assets Before Expense Reimbursement (%)(d) | | | 0.19 | (c) | | | 0.22 | | | | 0.16 | | | | 0.13 | | | | 0.12 | | | | 0.11 | |
Ratio of Expenses to Average Net Assets After Expense Reimbursement (%)(d) | | | 0.18 | (c) | | | 0.22 | | | | 0.16 | | | | 0.13 | | | | 0.12 | | | | 0.11 | |
Portfolio Turnover Rate (%)(a) | | | 9.99 | (b) | | | 19.08 | | | | 24.14 | | | | 24.63 | | | | 25.28 | | | | 13.69 | |
| (a) | Portfolio turnover rate excludes all short-term securities. |
| (d) | Asset Allocation Funds and Target Date Funds exclude expenses of the underlying funds. |
| (e) | On September 25, 2020, the MoA Funds, with the exception of the Catholic Values Index Fund which commenced operations on September 30, 2020, had a 1 for 10 reverse share split. Historical net asset value per share and per share activity have been adjusted to reflect the split on a retroactive basis. |
| (f) | Amount is less than $0.005 per share. |
| (g) | Total return is calculated assuming a purchase of a share on the first day and a sale on the last day of each year or period reported and includes reinvestment of distributions, if any. For variable annuity owners or participants in a group variable annuity, the total return does not reflect the effect of fees and charges associated with your variable annuity contract and does not reflect expenses associated with the separate account such as administrative fees and account charges which, if reflected, would reduce the total returns for all years and periods shown. Past performance is no guarantee of future results. Total returns for periods less than one full year are not annualized. |
| (h) | International Fund excludes the expenses of its ETF investments. |
| (i) | Amount is less than $0.00005 per share. |
| (j) | For the period September 30, 2020 (commencement of operations) through December 31, 2020. |
| (k) | For the period August 3, 2020 (commencement of operations) through December 31, 2020. |
| (l) | In 2021, the Clear Passage 2015 Fund had accrued a non-recurring capital contribution from the Adviser of $410,599 to reflect the estimated lost opportunity cost arising when a portion of the portfolio was uninvested. The 2022 amount disclosed includes adjustments to the prior accrual to record the final settlement amount of the capital contribution accrued as of December 31, 2021. |
NA = Not Applicable.
The accompanying notes are an integral part of these financial statements.
128
| | | | | | | | | | | | | | | | | | | | | | | | | | | | | | | | | | | | | | | | | | | | | | |
| MoA Clear Passage 2020 Fund | | | MoA Clear Passage 2025 Fund | |
Six Months
Ended
June 30,
2024
(Unaudited) | | | Years Ended December 31, | | | Six Months
Ended
June 30,
2024
(Unaudited) | | | Years Ended December 31, | |
| | 2023 | | | 2022 | | | 2021 | | | 2020(e) | | | 2019(e) | | | 2023 | | | 2022 | | | 2021 | | | 2020(e) | | | 2019(e) | |
| | | | | | | | | | | |
| $ | 10.18 | | | $ | 9.55 | | | $ | 12.16 | | | $ | 11.84 | | | $ | 12.42 | | | $ | 11.25 | | | $ | 11.83 | | | $ | 10.98 | | | $ | 13.97 | | | $ | 13.29 | | | $ | 13.65 | | | $ | 12.02 | |
| | | | | | | | | | | | | | | | | | | | | | | | | | | | | | | | | | | | | | | | | | | | | | |
| | | | | | | | | | | |
| | | | | | | | | | | | | | | | | | | | | | | | | | | | | | | | | | | | | | | | | | | | | | |
| | 0.13 | | | | 0.26 | | | | 0.18 | | | | 0.16 | | | | 0.46 | | | | 0.22 | | | | 0.16 | | | | 0.29 | | | | 0.20 | | | | 0.18 | | | | 0.48 | | | | 0.20 | |
| 0.31 | | | | 0.86 | | | | (1.78 | ) | | | 0.99 | | | | 0.62 | | | | 1.71 | | | | 0.49 | | | | 1.18 | | | | (2.11 | ) | | | 1.39 | | | | 0.85 | | | | 2.15 | |
| | | | | | | | | | | | | | | | | | | | | | | | | | | | | | | | | | | | | | | | | | | | | | |
| | | | | | | | | | | |
| | 0.44 | | | | 1.12 | | | | (1.60 | ) | | | 1.15 | | | | 1.08 | | | | 1.93 | | | | 0.65 | | | | 1.47 | | | | (1.91 | ) | | | 1.57 | | | | 1.33 | | | | 2.35 | |
| | | | | | | | | | | | | | | | | | | | | | | | | | | | | | | | | | | | | | | | | | | | | | |
| | | | | | | | | | | |
| | | | | | | | | | | | | | | | | | | | | | | | | | | | | | | | | | | | | | | | | | | | | | |
| | (0.13 | ) | | | (0.26 | ) | | | (0.18 | ) | | | (0.20 | ) | | | (0.70 | ) | | | (0.23 | ) | | | (0.14 | ) | | | (0.29 | ) | | | (0.21 | ) | | | (0.23 | ) | | | (0.72 | ) | | | (0.23 | ) |
| | — | | | | (0.23 | ) | | | (0.83 | ) | | | (0.63 | ) | | | (0.96 | ) | | | (0.53 | ) | | | — | | | | (0.33 | ) | | | (0.87 | ) | | | (0.66 | ) | | | (0.97 | ) | | | (0.49 | ) |
| | | | | | | | | | | | | | | | | | | | | | | | | | | | | | | | | | | | | | | | | | | | | | |
| | | | | | | | | | | |
| | (0.13 | ) | | | (0.49 | ) | | | (1.01 | ) | | | (0.83 | ) | | | (1.66 | ) | | | (0.76 | ) | | | (0.14 | ) | | | (0.62 | ) | | | (1.08 | ) | | | (0.89 | ) | | | (1.69 | ) | | | (0.72 | ) |
| | | | | | | | | | | | | | | | | | | | | | | | | | | | | | | | | | | | | | | | | | | | | | |
| | | | | | | | | | | |
| | — | | | | — | | | | — | | | | — | | | | — | | | | — | | | | — | | | | — | | | | — | | | | — | | | | — | | | | — | |
| | | | | | | | | | | | | | | | | | | | | | | | | | | | | | | | | | | | | | | | | | | | | | |
| | | | | | | | | | | |
| $ | 10.49 | | | $ | 10.18 | | | $ | 9.55 | | | $ | 12.16 | | | $ | 11.84 | | | $ | 12.42 | | | $ | 12.34 | | | $ | 11.83 | | | $ | 10.98 | | | $ | 13.97 | | | $ | 13.29 | | | $ | 13.65 | |
| | | | | | | | | | | | | | | | | | | | | | | | | | | | | | | | | | | | | | | | | | | | | | |
| | | | | | | | | | | |
| | 4.31 | (b) | | | 11.83 | | | | (13.06 | ) | | | 9.80 | | | | 9.11 | | | | 17.53 | | | | 5.48 | (b) | | | 13.59 | | | | (13.56 | ) | | | 11.96 | | | | 10.26 | | | | 19.79 | |
| | 473 | | | | 491 | | | | 504 | | | | 621 | | | | 594 | | | | 608 | | | | 1,114 | | | | 1,129 | | | | 1,057 | | | | 1,203 | | | | 1,020 | | | | 946 | |
| | 2.36 | (c) | | | 2.48 | | | | 1.65 | | | | 1.29 | | | | 3.66 | | | | 1.85 | | | | 2.25 | (c) | | | 2.50 | | | | 1.69 | | | | 1.29 | | | | 3.68 | | | | 1.81 | |
| 0.12 | (c) | | | 0.12 | | | | 0.09 | | | | 0.08 | | | | 0.07 | | | | 0.08 | | | | 0.11 | (c) | | | 0.10 | | | | 0.08 | | | | 0.08 | | | | 0.07 | | | | 0.07 | |
| 0.11 | (c) | | | 0.11 | | | | 0.09 | | | | 0.08 | | | | 0.07 | | | | 0.08 | | | | 0.10 | (c) | | | 0.09 | | | | 0.08 | | | | 0.08 | | | | 0.07 | | | | 0.07 | |
| | 6.18 | (b) | | | 21.68 | | | | 19.16 | | | | 22.78 | | | | 22.40 | | | | 10.33 | | | | 8.44 | (b) | | | 22.19 | | | | 18.16 | | | | 15.42 | | | | 16.72 | | | | 5.08 | |
The accompanying notes are an integral part of these financial statements.
129
MoA FUNDS
FINANCIAL HIGHLIGHTS (Continued)
| | | | | | | | | | | | | | | | | | | | | | | | |
| | | MoA Clear Passage 2030 Fund | |
| | | Six Months
Ended
June 30,
2024
(Unaudited) | | | Years Ended December 31, | |
| | | 2023 | | | 2022 | | | 2021 | | | 2020(e) | | | 2019(e) | |
| | | | | | |
Net Asset Value, Beginning of Period | | $ | 12.92 | | | $ | 11.90 | | | $ | 15.25 | | | $ | 14.08 | | | $ | 14.32 | | | $ | 12.36 | |
| | | | | | | | | | | | | | | | | | | | | | | | |
| | | | | | |
INCOME (LOSS) FROM INVESTMENT OPERATIONS | | | | | | | | | | | | | | | | | | | | | | | | |
Net Investment Income (Loss) | | | 0.14 | | | | 0.31 | | | | 0.22 | | | | 0.19 | | | | 0.48 | | | | 0.20 | |
Net Realized and Unrealized Gains (Losses) on Investments, Futures Contracts and Foreign Currency Translations | | | 0.70 | | | | 1.48 | | | | (2.40 | ) | | | 1.94 | | | | 1.10 | | | | 2.47 | |
| | | | | | | | | | | | | | | | | | | | | | | | |
| | | | | | |
Total From Investment Operations | | | 0.84 | | | | 1.79 | | | | (2.18 | ) | | | 2.13 | | | | 1.58 | | | | 2.67 | |
| | | | | | | | | | | | | | | | | | | | | | | | |
| | | | | | |
Less Distributions | | | | | | | | | | | | | | | | | | | | | | | | |
From Net Investment Income | | | (0.14 | ) | | | (0.31 | ) | | | (0.22 | ) | | | (0.26 | ) | | | (0.73 | ) | | | (0.22 | ) |
From Net Realized Gains | | | — | | | | (0.46 | ) | | | (0.95 | ) | | | (0.70 | ) | | | (1.09 | ) | | | (0.49 | ) |
| | | | | | | | | | | | | | | | | | | | | | | | |
| | | | | | |
Total Distributions | | | (0.14 | ) | | | (0.77 | ) | | | (1.17 | ) | | | (0.96 | ) | | | (1.82 | ) | | | (0.71 | ) |
| | | | | | | | | | | | | | | | | | | | | | | | |
| | | | | | |
Net Asset Value, End of Period | | $ | 13.62 | | | $ | 12.92 | | | $ | 11.90 | | | $ | 15.25 | | | $ | 14.08 | | | $ | 14.32 | |
| | | | | | | | | | | | | | | | | | | | | | | | |
| | | | | | |
Total Return (%)(g) | | | 6.52 | (b) | | | 15.25 | | | | (14.14 | ) | | | 15.29 | | | | 11.67 | | | | 21.93 | |
Net Assets, End of Period ($ millions) | | | 1,352 | | | | 1,309 | | | | 1,125 | | | | 1,231 | | | | 981 | | | | 854 | |
Ratio of Net Income (Loss) to Average Net Assets (%) | | | 2.11 | (c) | | | 2.46 | | | | 1.67 | | | | 1.25 | | | | 3.67 | | | | 1.71 | |
Ratio of Expenses to Average Net Assets Before Expense Reimbursement (%)(d) | | | 0.11 | (c) | | | 0.10 | | | | 0.08 | | | | 0.08 | | | | 0.07 | | | | 0.07 | |
Ratio of Expenses to Average Net Assets After Expense Reimbursement (%)(d) | | | 0.10 | (c) | | | 0.09 | | | | 0.08 | | | | 0.08 | | | | 0.07 | | | | 0.07 | |
Portfolio Turnover Rate (%)(a) | | | 8.87 | (b) | | | 19.17 | | | | 15.52 | | | | 13.45 | | | | 12.53 | | | | 4.23 | |
| (a) | Portfolio turnover rate excludes all short-term securities. |
| (d) | Asset Allocation Funds and Target Date Funds exclude expenses of the underlying funds. |
| (e) | On September 25, 2020, the MoA Funds, with the exception of the Catholic Values Index Fund which commenced operations on September 30, 2020, had a 1 for 10 reverse share split. Historical net asset value per share and per share activity have been adjusted to reflect the split on a retroactive basis. |
| (f) | Amount is less than $0.005 per share. |
| (g) | Total return is calculated assuming a purchase of a share on the first day and a sale on the last day of each year or period reported and includes reinvestment of distributions, if any. For variable annuity owners or participants in a group variable annuity, the total return does not reflect the effect of fees and charges associated with your variable annuity contract and does not reflect expenses associated with the separate account such as administrative fees and account charges which, if reflected, would reduce the total returns for all years and periods shown. Past performance is no guarantee of future results. Total returns for periods less than one full year are not annualized. |
| (h) | International Fund excludes the expenses of its ETF investments. |
| (i) | Amount is less than $0.00005 per share. |
| (j) | For the period September 30, 2020 (commencement of operations) through December 31, 2020. |
| (k) | For the period August 3, 2020 (commencement of operations) through December 31, 2020. |
NA = Not Applicable.
The accompanying notes are an integral part of these financial statements.
130
| | | | | | | | | | | | | | | | | | | | | | | | | | | | | | | | | | | | | | | | | | | | | | |
| MoA Clear Passage 2035 Fund | | | MoA Clear Passage 2040 Fund | |
Six Months
Ended
June 30,
2024
(Unaudited) | | | Years Ended December 31, | | | Six Months
Ended
June 30,
2024
(Unaudited) | | | Years Ended December 31, | |
| | 2023 | | | 2022 | | | 2021 | | | 2020(e) | | | 2019(e) | | | 2023 | | | 2022 | | | 2021 | | | 2020(e) | | | 2019(e) | |
| | | | | | | | | | | |
| $ | 13.52 | | | $ | 12.20 | | | $ | 16.00 | | | $ | 14.40 | | | $ | 14.59 | | | $ | 12.43 | | | $ | 13.56 | | | $ | 12.12 | | | $ | 16.15 | | | $ | 14.44 | | | $ | 14.48 | | | $ | 12.23 | |
| | | | | | | | | | | | | | | | | | | | | | | | | | | | | | | | | | | | | | | | | | | | | | |
| | | | | | | | | | | |
| | | | | | | | | | | | | | | | | | | | | | | | | | | | | | | | | | | | | | | | | | | | | | |
| | 0.14 | | | | 0.31 | | | | 0.23 | | | | 0.20 | | | | 0.48 | | | | 0.19 | | | | 0.13 | | | | 0.31 | | | | 0.23 | | | | 0.20 | | | | 0.47 | | | | 0.18 | |
| 0.93 | | | | 1.76 | | | | (2.69 | ) | | | 2.34 | | | | 1.25 | | | | 2.70 | | | | 1.07 | | | | 1.93 | | | | (2.75 | ) | | | 2.64 | | | | 1.37 | | | | 2.74 | |
| | | | | | | | | | | | | | | | | | | | | | | | | | | | | | | | | | | | | | | | | | | | | | |
| | | | | | | | | | | |
| | 1.07 | | | | 2.07 | | | | (2.46 | ) | | | 2.54 | | | | 1.73 | | | | 2.89 | | | | 1.20 | | | | 2.24 | | | | (2.52 | ) | | | 2.84 | | | | 1.84 | | | | 2.92 | |
| | | | | | | | | | | | | | | | | | | | | | | | | | | | | | | | | | | | | | | | | | | | | | |
| | | | | | | | | | | |
| | | | | | | | | | | | | | | | | | | | | | | | | | | | | | | | | | | | | | | | | | | | | | |
| | (0.14 | ) | | | (0.32 | ) | | | (0.24 | ) | | | (0.29 | ) | | | (0.72 | ) | | | (0.22 | ) | | | (0.13 | ) | | | (0.31 | ) | | | (0.24 | ) | | | (0.30 | ) | | | (0.70 | ) | | | (0.21 | ) |
| | — | | | | (0.43 | ) | | | (1.10 | ) | | | (0.65 | ) | | | (1.20 | ) | | | (0.51 | ) | | | — | | | | (0.49 | ) | | | (1.27 | ) | | | (0.83 | ) | | | (1.18 | ) | | | (0.46 | ) |
| | | | | | | | | | | | | | | | | | | | | | | | | | | | | | | | | | | | | | | | | | | | | | |
| | | | | | | | | | | |
| | (0.14 | ) | | | (0.75 | ) | | | (1.34 | ) | | | (0.94 | ) | | | (1.92 | ) | | | (0.73 | ) | | | (0.13 | ) | | | (0.80 | ) | | | (1.51 | ) | | | (1.13 | ) | | | (1.88 | ) | | | (0.67 | ) |
| | | | | | | | | | | | | | | | | | | | | | | | | | | | | | | | | | | | | | | | | | | | | | |
| | | | | | | | | | | |
| $ | 14.45 | | | $ | 13.52 | | | $ | 12.20 | | | $ | 16.00 | | | $ | 14.40 | | | $ | 14.59 | | | $ | 14.63 | | | $ | 13.56 | | | $ | 12.12 | | | $ | 16.15 | | | $ | 14.44 | | | $ | 14.48 | |
| | | | | | | | | | | | | | | | | | | | | | | | | | | | | | | | | | | | | | | | | | | | | | |
| | | | | | | | | | | |
| | 7.92 | (b) | | | 17.26 | | | | (15.20 | ) | | | 17.84 | | | | 12.61 | | | | 23.62 | | | | 8.88 | (b) | | | 18.87 | | | | (15.37 | ) | | | 19.89 | | | | 13.43 | | | | 24.25 | |
| | 1,330 | | | | 1,231 | | | | 1,023 | | | | 1,101 | | | | 846 | | | | 712 | | | | 1,131 | | | | 1,038 | | | | 848 | | | | 925 | | | | 708 | | | | 587 | |
| | 1.98 | (c) | | | 2.44 | | | | 1.70 | | | | 1.25 | | | | 3.67 | | | | 1.64 | | | | 1.89 | (c) | | | 2.40 | | | | 1.69 | | | | 1.22 | | | | 3.59 | | | | 1.59 | |
| | 0.11 | (c) | | | 0.10 | | | | 0.08 | | | | 0.08 | | | | 0.07 | | | | 0.08 | | | | 0.11 | (c) | | | 0.10 | | | | 0.08 | | | | 0.08 | | | | 0.07 | | | | 0.08 | |
| | 0.10 | (c) | | | 0.10 | | | | 0.08 | | | | 0.08 | | | | 0.07 | | | | 0.08 | | | | 0.10 | (c) | | | 0.10 | | | | 0.08 | | | | 0.08 | | | | 0.07 | | | | 0.08 | |
| | 9.53 | (b) | | | 18.50 | | | | 16.15 | | | | 8.93 | | | | 11.53 | | | | 3.33 | | | | 9.93 | (b) | | | 18.97 | | | | 10.97 | | | | 11.55 | | | | 12.53 | | | | 2.38 | |
The accompanying notes are an integral part of these financial statements.
131
MoA FUNDS
FINANCIAL HIGHLIGHTS (Continued)
| | | | | | | | | | | | | | | | | | | | | | | | |
| | | MoA Clear Passage 2045 Fund | |
| | | Six Months
Ended
June 30,
2024
(Unaudited) | | | Years Ended December 31, | |
| | | 2023 | | | 2022 | | | 2021 | | | 2020(e) | | | 2019(e) | |
| | | | | | |
Net Asset Value, Beginning of Period | | $ | 13.37 | | | $ | 11.89 | | | $ | 15.97 | | | $ | 14.28 | | | $ | 14.32 | | | $ | 12.14 | |
| | | | | | | | | | | | | | | | | | | | | | | | |
| | | | | | |
INCOME (LOSS) FROM INVESTMENT OPERATIONS | | | | | | | | | | | | | | | | | | | | | | | | |
Net Investment Income (Loss) | | | 0.13 | | | | 0.30 | | | | 0.22 | | | | 0.19 | | | | 0.45 | | | | 0.18 | |
Net Realized and Unrealized Gains (Losses) on Investments, Futures Contracts and Foreign Currency Translations | | | 1.11 | | | | 1.99 | | | | (2.75 | ) | | | 2.71 | | | | 1.34 | | | | 2.75 | |
| | | | | | | | | | | | | | | | | | | | | | | | |
| | | | | | |
Total From Investment Operations | | | 1.24 | | | | 2.29 | | | | (2.53 | ) | | | 2.90 | | | | 1.79 | | | | 2.93 | |
| | | | | | | | | | | | | | | | | | | | | | | | |
| | | | | | |
Less Distributions | | | | | | | | | | | | | | | | | | | | | | | | |
From Net Investment Income | | | (0.13 | ) | | | (0.31 | ) | | | (0.23 | ) | | | (0.29 | ) | | | (0.68 | ) | | | (0.21 | ) |
From Net Realized Gains | | | — | | | | (0.50 | ) | | | (1.32 | ) | | | (0.92 | ) | | | (1.15 | ) | | | (0.54 | ) |
| | | | | | | | | | | | | | | | | | | | | | | | |
| | | | | | |
Total Distributions | | | (0.13 | ) | | | (0.81 | ) | | | (1.55 | ) | | | (1.21 | ) | | | (1.83 | ) | | | (0.75 | ) |
| | | | | | | | | | | | | | | | | | | | | | | | |
| | | | | | |
Net Asset Value, End of Period | | $ | 14.48 | | | $ | 13.37 | | | $ | 11.89 | | | $ | 15.97 | | | $ | 14.28 | | | $ | 14.32 | |
| | | | | | | | | | | | | | | | | | | | | | | | |
| | | | | | |
Total Return (%)(g) | | | 9.26 | (b) | | | 19.64 | | | | (15.59 | ) | | | 20.57 | | | | 13.31 | | | | 24.54 | |
Net Assets, End of Period ($ millions) | | | 1,167 | | | | 1,069 | | | | 875 | | | | 957 | | | | 733 | | | | 611 | |
Ratio of Net Income (Loss) to Average Net Assets (%) | | | 1.87 | (c) | | | 2.38 | | | | 1.68 | | | | 1.19 | | | | 3.54 | | | | 1.54 | |
Ratio of Expenses to Average Net Assets Before Expense Reimbursement (%)(d) | | | 0.11 | (c) | | | 0.10 | | | | 0.08 | | | | 0.08 | | | | 0.07 | | | | 0.08 | |
Ratio of Expenses to Average Net Assets After Expense Reimbursement (%)(d) | | | 0.11 | (c) | | | 0.10 | | | | 0.08 | | | | 0.08 | | | | 0.07 | | | | 0.08 | |
Portfolio Turnover Rate (%)(a) | | | 8.26 | (b) | | | 14.87 | | | | 13.09 | | | | 11.96 | | | | 10.77 | | | | 2.56 | |
| (a) | Portfolio turnover rate excludes all short-term securities. |
| (d) | Asset Allocation Funds and Target Date Funds exclude expenses of the underlying funds. |
| (e) | On September 25, 2020, the MoA Funds, with the exception of the Catholic Values Index Fund which commenced operations on September 30, 2020, had a 1 for 10 reverse share split. Historical net asset value per share and per share activity have been adjusted to reflect the split on a retroactive basis. |
| (f) | Amount is less than $0.005 per share. |
| (g) | Total return is calculated assuming a purchase of a share on the first day and a sale on the last day of each year or period reported and includes reinvestment of distributions, if any. For variable annuity owners or participants in a group variable annuity, the total return does not reflect the effect of fees and charges associated with your variable annuity contract and does not reflect expenses associated with the separate account such as administrative fees and account charges which, if reflected, would reduce the total returns for all years and periods shown. Past performance is no guarantee of future results. Total returns for periods less than one full year are not annualized. |
| (h) | International Fund excludes the expenses of its ETF investments. |
| (j) | Amount is less than $0.00005 per share. |
| (i) | For the period September 30, 2020 (commencement of operations) through December 31, 2020. |
| (j) | For the period August 3, 2020 (commencement of operations) through December 31, 2020. |
NA = Not Applicable.
The accompanying notes are an integral part of these financial statements.
132
| | | | | | | | | | | | | | | | | | | | | | | | | | | | | | | | | | | | | | | | | | | | | | |
| MoA Clear Passage 2050 Fund | | | MoA Clear Passage 2055 Fund | |
Six Months
Ended
June 30,
2024
(Unaudited) | | | Years Ended December 31, | | | Six Months
Ended
June 30,
2024
(Unaudited) | | | Years Ended December 31, | |
| | 2023 | | | 2022 | | | 2021 | | | 2020(e) | | | 2019(e) | | | 2023 | | | 2022 | | | 2021 | | | 2020(e) | | | 2019(e) | |
| | | | | | | | | | | |
| $ | 17.05 | | | $ | 15.20 | | | $ | 20.31 | | | $ | 17.92 | | | $ | 17.47 | | | $ | 14.64 | | | $ | 13.67 | | | $ | 11.99 | | | $ | 15.99 | | | $ | 13.98 | | | $ | 13.31 | | | $ | 11.02 | |
| | | | | | | | | | | | | | | | | | | | | | | | | | | | | | | | | | | | | | | | | | | | | | |
| | | | | | | | | | | |
| | | | | | | | | | | | | | | | | | | | | | | | | | | | | | | | | | | | | | | | | | | | | | |
| | 0.16 | | | | 0.38 | | | | 0.28 | | | | 0.24 | | | | 0.54 | | | | 0.19 | | | | 0.13 | | | | 0.30 | | | | 0.21 | | | | 0.18 | | | | 0.38 | | | | 0.10 | |
| 1.46 | | | | 2.59 | | | | (3.52 | ) | | | 3.45 | | | | 1.68 | | | | 3.37 | | | | 1.19 | | | | 2.05 | | | | (2.77 | ) | | | 2.74 | | | | 1.41 | | | | 2.56 | |
| | | | | | | | | | | | | | | | | | | | | | | | | | | | | | | | | | | | | | | | | | | | | | |
| | | | | | | | | | | |
| | 1.62 | | | | 2.97 | | | | (3.24 | ) | | | 3.69 | | | | 2.22 | | | | 3.56 | | | | 1.32 | | | | 2.35 | | | | (2.56 | ) | | | 2.92 | | | | 1.79 | | | | 2.66 | |
| | | | | | | | | | | | | | | | | | | | | | | | | | | | | | | | | | | | | | | | | | | | | | |
| | | | | | | | | | | |
| | | | | | | | | | | | | | | | | | | | | | | | | | | | | | | | | | | | | | | | | | | | | | |
| | (0.16 | ) | | | (0.39 | ) | | | (0.29 | ) | | | (0.38 | ) | | | (0.81 | ) | | | (0.23 | ) | | | (0.13 | ) | | | (0.30 | ) | | | (0.23 | ) | | | (0.29 | ) | | | (0.57 | ) | | | (0.12 | ) |
| | — | | | | (0.73 | ) | | | (1.58 | ) | | | (0.92 | ) | | | (0.96 | ) | | | (0.50 | ) | | | — | | | | (0.37 | ) | | | (1.21 | ) | | | (0.62 | ) | | | (0.55 | ) | | | (0.25 | ) |
| | | | | | | | | | | | | | | | | | | | | | | | | | | | | | | | | | | | | | | | | | | | | | |
| | | | | | | | | | | |
| | (0.16 | ) | | | (1.12 | ) | | | (1.87 | ) | | | (1.30 | ) | | | (1.77 | ) | | | (0.73 | ) | | | (0.13 | ) | | | (0.67 | ) | | | (1.44 | ) | | | (0.91 | ) | | | (1.12 | ) | | | (0.37 | ) |
| | | | | | | | | | | | | | | | | | | | | | | | | | | | | | | | | | | | | | | | | | | | | | |
| | | | | | | | | | | |
| $ | 18.51 | | | $ | 17.05 | | | $ | 15.20 | | | $ | 20.31 | | | $ | 17.92 | | | $ | 17.47 | | | $ | 14.86 | | | $ | 13.67 | | | $ | 11.99 | | | $ | 15.99 | | | $ | 13.98 | | | $ | 13.31 | |
| | | | | | | | | | | | | | | | | | | | | | | | | | | | | | | | | | | | | | | | | | | | | | |
| | | | | | | | | | | |
| | 9.49 | (b) | | | 19.94 | | | | (15.66 | ) | | | 20.82 | | | | 13.39 | | | | 24.65 | | | | 9.65 | (b) | | | 19.98 | | | | (15.77 | ) | | | 21.11 | | | | 13.93 | | | | 24.39 | |
| | 913 | | | | 830 | | | | 665 | | | | 717 | | | | 536 | | | | 425 | | | | 510 | | | | 450 | | | | 339 | | | | 330 | | | | 220 | | | | 144 | |
| | 1.81 | (c) | | | 2.36 | | | | 1.66 | | | | 1.18 | | | | 3.56 | | | | 1.53 | | | | 1.79 | (c) | | | 2.38 | | | | 1.64 | | | | 1.16 | | | | 3.66 | | | | 1.58 | |
| | 0.11 | (c) | | | 0.11 | | | | 0.09 | | | | 0.08 | | | | 0.08 | | | | 0.08 | | | | 0.13 | (c) | | | 0.13 | | | | 0.11 | | | | 0.10 | | | | 0.11 | | | | 0.12 | |
| | 0.11 | (c) | | | 0.10 | | | | 0.09 | | | | 0.08 | | | | 0.08 | | | | 0.08 | | | | 0.12 | (c) | | | 0.12 | | | | 0.11 | | | | 0.10 | | | | 0.11 | | | | 0.12 | |
| | 6.39 | (b) | | | 16.86 | | | | 12.91 | | | | 11.57 | | | | 9.80 | | | | 2.11 | | | | 7.20 | (b) | | | 14.85 | | | | 12.88 | | | | 10.49 | | | | 7.28 | | | | 0.57 | |
The accompanying notes are an integral part of these financial statements.
133
MoA FUNDS
FINANCIAL HIGHLIGHTS (Continued)
| | | | | | | | | | | | | | | | | | | | | | | | |
| | | MoA Clear Passage 2060 Fund | |
| | | Six Months
Ended
June 30,
2024
(Unaudited) | | | Years Ended December 31, | |
| | | 2023 | | | 2022 | | | 2021 | | | 2020(e) | | | 2019(e) | |
| | | | | | |
Net Asset Value, Beginning of Period | | $ | 11.68 | | | $ | 10.18 | | | $ | 13.58 | | | $ | 11.87 | | | $ | 11.12 | | | $ | 8.95 | |
| | | | | | | | | | | | | | | | | | | | | | | | |
| | | | | | |
INCOME (LOSS) FROM INVESTMENT OPERATIONS | | | | | | | | | | | | | | | | | | | | | | | | |
Net Investment Income (Loss) | | | 0.11 | | | | 0.25 | | | | 0.18 | | | | 0.16 | | | | 0.28 | | | | 0.08 | |
Net Realized and Unrealized Gains (Losses) on Investments, Futures Contracts and Foreign Currency Translations | | | 1.02 | | | | 1.77 | | | | (2.34 | ) | | | 2.38 | | | | 1.25 | | | | 2.11 | |
| | | | | | | | | | | | | | | | | | | | | | | | |
| | | | | | |
Total From Investment Operations | | | 1.13 | | | | 2.02 | | | | (2.16 | ) | | | 2.54 | | | | 1.53 | | | | 2.19 | |
| | | | | | | | | | | | | | | | | | | | | | | | |
| | | | | | |
Less Distributions | | | | | | | | | | | | | | | | | | | | | | | | |
From Net Investment Income | | | (0.11 | ) | | | (0.25 | ) | | | (0.19 | ) | | | (0.26 | ) | | | (0.42 | ) | | | (0.01 | ) |
From Net Realized Gains | | | — | | | | (0.27 | ) | | | (1.05 | ) | | | (0.57 | ) | | | (0.36 | ) | | | (0.01 | ) |
| | | | | | | | | | | | | | | | | | | | | | | | |
| | | | | | |
Total Distributions | | | (0.11 | ) | | | (0.52 | ) | | | (1.24 | ) | | | (0.83 | ) | | | (0.78 | ) | | | (0.02 | ) |
| | | | | | | | | | | | | | | | | | | | | | | | |
| | | | | | |
Net Asset Value, End of Period | | $ | 12.70 | | | $ | 11.68 | | | $ | 10.18 | | | $ | 13.58 | | | $ | 11.87 | | | $ | 11.12 | |
| | | | | | | | | | | | | | | | | | | | | | | | |
| | | | | | |
Total Return (%)(g) | | | 9.64 | (b) | | | 20.19 | | | | (15.72 | ) | | | 21.60 | | | | 14.08 | | | | 24.53 | |
Net Assets, End of Period ($ millions) | | | 278 | | | | 233 | | | | 155 | | | | 130 | | | | 72 | | | | 30 | |
Ratio of Net Income (Loss) to Average Net Assets (%) | | | 1.78 | (c) | | | 2.39 | | | | 1.62 | | | | 1.25 | | | | 4.14 | | | | 1.95 | |
Ratio of Expenses to Average Net Assets Before Expense Reimbursement (%)(d) | | | 0.15 | (c) | | | 0.17 | | | | 0.17 | | | | 0.16 | | | | 0.22 | | | | 0.51 | |
Ratio of Expenses to Average Net Assets After Expense Reimbursement (%)(d) | | | 0.14 | (c) | | | 0.17 | | | | 0.17 | | | | 0.05 | | | | 0.05 | | | | 0.05 | |
Portfolio Turnover Rate (%)(a) | | | 5.84 | (b) | | | 12.15 | | | | 12.95 | | | | 14.26 | | | | 6.7 | | | | 1.73 | |
| (a) | Portfolio turnover rate excludes all short-term securities. |
| (d) | Asset Allocation Funds and Target Date Funds exclude expenses of the underlying funds. |
| (e) | On September 25, 2020, the MoA Funds, with the exception of the Catholic Values Index Fund which commenced operations on September 30, 2020, had a 1 for 10 reverse share split. Historical net asset value per share and per share activity have been adjusted to reflect the split on a retroactive basis. |
| (f) | Amount is less than $0.005 per share. |
| (g) | Total return is calculated assuming a purchase of a share on the first day and a sale on the last day of each year or period reported and includes reinvestment of distributions, if any. For variable annuity owners or participants in a group variable annuity, the total return does not reflect the effect of fees and charges associated with your variable annuity contract and does not reflect expenses associated with the separate account such as administrative fees and account charges which, if reflected, would reduce the total returns for all years and periods shown. Past performance is no guarantee of future results. Total returns for periods less than one full year are not annualized. |
| (h) | International Fund excludes the expenses of its ETF investments. |
| (i) | Amount is less than $0.00005 per share. |
| (j) | For the period September 30, 2020 (commencement of operations) through December 31, 2020. |
| (k) | For the period August 3, 2020 (commencement of operations) through December 31, 2020. |
NA = Not Applicable.
The accompanying notes are an integral part of these financial statements.
134
| | | | | | | | | | | | | | | | | | | | | | | | | | | | | | | | | | | | | | | | | | |
| MoA Clear Passage 2065 Fund | | | MoA Conservative Allocation Fund | |
Six Months
Ended
June 30,
2024
(Unaudited) | | | Years Ended December 31, | | | Period
Ended
December 31, | | | Six Months
Ended
June 30,
2024
(Unaudited) | | | Years Ended December 31, | |
| | 2023 | | | 2022 | | | 2021 | | | 2020(e)(k) | | | 2023 | | | 2022 | | | 2021 | | | 2020(e) | | | 2019(e) | |
| | | | | | | | | | |
| $ | 11.89 | | | $ | 10.25 | | | $ | 13.20 | | | $ | 11.45 | | | $ | 10.00 | | | $ | 11.16 | | | $ | 10.40 | | | $ | 12.86 | | | $ | 12.67 | | | $ | 12.71 | | | $ | 11.65 | |
| | | | | | | | | | | | | | | | | | | | | | | | | | | | | | | | | | | | | | | | | | |
| | | | | | | | | | |
| | | | | | | | | | | | | | | | | | | | | | | | | | | | | | | | | | | | | | | | | | |
| | 0.11 | | | | 0.26 | | | | 0.18 | | | | 0.16 | | | | 0.22 | | | | 0.15 | | | | 0.25 | | | | 0.19 | | | | 0.18 | | | | 0.48 | | | | 0.24 | |
| 1.06 | | | | 1.81 | | | | (2.26 | ) | | | 2.31 | | | | 1.59 | | | | 0.33 | | | | 0.91 | | | | (1.80 | ) | | | 0.80 | | | | 0.67 | | | | 1.38 | |
| | | | | | | | | | | | | | | | | | | | | | | | | | | | | | | | | | | | | | | | | | |
| | | | | | | | | | |
| | 1.17 | | | | 2.07 | | | | (2.08 | ) | | | 2.47 | | | | 1.81 | | | | 0.48 | | | | 1.16 | | | | (1.61 | ) | | | 0.98 | | | | 1.15 | | | | 1.62 | |
| | | | | | | | | | | | | | | | | | | | | | | | | | | | | | | | | | | | | | | | | | |
| | | | | | | | | | |
| | | | | | | | | | | | | | | | | | | | | | | | | | | | | | | | | | | | | | | | | | |
| | (0.11 | ) | | | (0.26 | ) | | | (0.19 | ) | | | (0.26 | ) | | | (0.24 | ) | | | (0.13 | ) | | | (0.26 | ) | | | (0.19 | ) | | | (0.20 | ) | | | (0.74 | ) | | | (0.26 | ) |
| | — | | | | (0.17 | ) | | | (0.68 | ) | | | (0.46 | ) | | | (0.12 | ) | | | — | | | | (0.14 | ) | | | (0.66 | ) | | | (0.59 | ) | | | (0.45 | ) | | | (0.30 | ) |
| | | | | | | | | | | | | | | | | | | | | | | | | | | | | | | | | | | | | | | | | | |
| | | | | | | | | | |
| | (0.11 | ) | | | (0.43 | ) | | | (0.87 | ) | | | (0.72 | ) | | | (0.36 | ) | | | (0.13 | ) | | | (0.40 | ) | | | (0.85 | ) | | | (0.79 | ) | | | (1.19 | ) | | | (0.56 | ) |
| | | | | | | | | | | | | | | | | | | | | | | | | | | | | | | | | | | | | | | | | | |
| | | | | | | | | | |
| $ | 12.95 | | | $ | 11.89 | | | $ | 10.25 | | | $ | 13.20 | | | $ | 11.45 | | | $ | 11.51 | | | $ | 11.16 | | | $ | 10.40 | | | $ | 12.86 | | | $ | 12.67 | | | $ | 12.71 | |
| | | | | | | | | | | | | | | | | | | | | | | | | | | | | | | | | | | | | | | | | | |
| | | | | | | | | | |
| | 9.86 | (b) | | | 20.50 | | | | (15.54 | ) | | | 21.73 | | | | 18.16 | (b) | | | 4.31 | (b) | | | 11.22 | | | | (12.44 | ) | | | 7.82 | | | | 9.32 | | | | 13.99 | |
| | 95 | | | | 68 | | | | 34 | | | | 17 | | | | 3 | | | | 155 | | | | 158 | | | | 161 | | | | 201 | | | | 188 | | | | 178 | |
| | 1.94 | (c) | | | 2.62 | | | | 1.88 | | | | 1.44 | | | | 3.4 | (b) | | | 2.29 | (c) | | | 2.24 | | | | 1.63 | | | | 1.36 | | | | 3.81 | | | | 2.07 | |
|
0.21 |
(c) | | | 0.43 | | | | 0.63 | | | | 1.15 | | | | 4.61 | (c) | | | 0.09 | (c) | | | 0.13 | | | | 0.08 | | | | 0.06 | | | | 0.06 | | | | 0.05 | |
|
0.04 |
(c) | | | 0.05 | | | | 0.05 | | | | 0.05 | | | | 0.05 | (c) | | | 0.08 | (c) | | | 0.13 | | | | 0.08 | | | | 0.06 | | | | 0.06 | | | | 0.05 | |
| | 5.70 | (b) | | | 17.62 | | | | 16.45 | | | | 28.1 | | | | 10.76 | (b) | | | 11.72 | (b) | | | 12.65 | | | | 10.16 | | | | 16.91 | | | | 10.07 | | | | 9.54 | |
The accompanying notes are an integral part of these financial statements.
135
MoA FUNDS
FINANCIAL HIGHLIGHTS (Continued)
| | | | | | | | | | | | | | | | | | | | | | | | |
| | | MoA Moderate Allocation Fund | |
| | | Six Months
Ended
June 30,
2024
(Unaudited) | | | Years Ended December 31, | |
| | | 2023 | | | 2022 | | | 2021 | | | 2020(e) | | | 2019(e) | |
| | | | | | |
Net Asset Value, Beginning of Period | | $ | 13.17 | | | $ | 12.20 | | | $ | 15.98 | | | $ | 15.14 | | | $ | 15.51 | | | $ | 13.85 | |
| | | | | | | | | | | | | | | | | | | | | | | | |
| | | | | | |
INCOME (LOSS) FROM INVESTMENT OPERATIONS | | | | | | | | | | | | | | | | | | | | | | | | |
Net Investment Income (Loss) | | | 0.14 | | | | 0.30 | | | | 0.24 | | | | 0.22 | | | | 0.58 | | | | 0.29 | |
Net Realized and Unrealized Gains (Losses) on Investments, Futures Contracts and Foreign Currency Translations | | | 0.75 | | | | 1.53 | | | | (2.49 | ) | | | 1.90 | | | | 1.13 | | | | 2.32 | |
| | | | | | | | | | | | | | | | | | | | | | | | |
| | | | | | |
Total From Investment Operations | | | 0.89 | | | | 1.83 | | | | (2.25 | ) | | | 2.12 | | | | 1.71 | | | | 2.61 | |
| | | | | | | | | | | | | | | | | | | | | | | | |
| | | | | | |
Less Distributions | | | | | | | | | | | | | | | | | | | | | | | | |
From Net Investment Income | | | (0.14 | ) | | | (0.30 | ) | | | (0.24 | ) | | | (0.28 | ) | | | (0.89 | ) | | | (0.31 | ) |
From Net Realized Gains | | | — | | | | (0.56 | ) | | | (1.29 | ) | | | (1.00 | ) | | | (1.19 | ) | | | (0.64 | ) |
| | | | | | | | | | | | | | | | | | | | | | | | |
| | | | | | |
Total Distributions | | | (0.14 | ) | | | (0.86 | ) | | | (1.53 | ) | | | (1.28 | ) | | | (2.08 | ) | | | (0.95 | ) |
| | | | | | | | | | | | | | | | | | | | | | | | |
| | | | | | |
Net Asset Value, End of Period | | $ | 13.92 | | | $ | 13.17 | | | $ | 12.20 | | | $ | 15.98 | | | $ | 15.14 | | | $ | 15.51 | |
| | | | | | | | | | | | | | | | | | | | | | | | |
| | | | | | |
Total Return (%)(g) | | | 6.75 | (b) | | | 15.34 | | | | (13.91 | ) | | | 14.19 | | | | 11.67 | | | | 19.15 | |
Net Assets, End of Period ($ millions) | | | 407 | | | | 403 | | | | 393 | | | | 487 | | | | 444 | | | | 433 | |
Ratio of Net Income (Loss) to Average Net Assets (%) | | | 2.06 | (c) | | | 2.25 | | | | 1.71 | | | | 1.34 | | | | 3.69 | | | | 1.91 | |
Ratio of Expenses to Average Net Assets Before Expense Reimbursement (%)(d) | | | 0.07 | (c) | | | 0.07 | | | | 0.04 | | | | 0.03 | | | | 0.03 | | | | 0.03 | |
Ratio of Expenses to Average Net Assets After Expense Reimbursement (%)(d) | | | 0.06 | (c) | | | 0.07 | | | | 0.04 | | | | 0.03 | | | | 0.03 | | | | 0.03 | |
Portfolio Turnover Rate (%)(a) | | | 6.87 | (b) | | | 12.56 | | | | 8.74 | | | | 14.83 | | | | 10.69 | | | | 8.40 | |
| (a) | Portfolio turnover rate excludes all short-term securities. |
| (d) | Asset Allocation Funds and Target Date Funds exclude expenses of the underlying funds. |
| (e) | On September 25, 2020, the MoA Funds, with the exception of the Catholic Values Index Fund which commenced operations on September 30, 2020, had a 1 for 10 reverse share split. Historical net asset value per share and per share activity have been adjusted to reflect the split on a retroactive basis. |
| (f) | Amount is less than $0.005 per share. |
| (g) | Total return is calculated assuming a purchase of a share on the first day and a sale on the last day of each year or period reported and includes reinvestment of distributions, if any. For variable annuity owners or participants in a group variable annuity, the total return does not reflect the effect of fees and charges associated with your variable annuity contract and does not reflect expenses associated with the separate account such as administrative fees and account charges which, if reflected, would reduce the total returns for all years and periods shown. Past performance is no guarantee of future results. Total returns for periods less than one full year are not annualized. |
| (h) | International Fund excludes the expenses of its ETF investments. |
| (i) | Amount is less than $0.00005 per share. |
| (j) | For the period September 30, 2020 (commencement of operations) through December 31, 2020. |
| (k) | For the period August 3, 2020 (commencement of operations) through December 31, 2020. |
NA = Not Applicable.
The accompanying notes are an integral part of these financial statements.
136
| | | | | | | | | | | | | | | | | | | | | | | | |
| MoA Aggressive Allocation Fund | | | |
Six Months
Ended
June 30,
2024
(Unaudited) | | | Years Ended December 31, | | | |
| | 2023 | | | 2022 | | | 2021 | | | 2020(e) | | | 2019(e) | | | |
| | | | | | |
| $ | 14.41 | | | $ | 13.30 | | | $ | 17.86 | | | $ | 16.80 | | | $ | 17.36 | | | $ | 15.30 | | | |
| | | | | | | | | | | | | | | | | | | | | | | | |
| | | | | | |
| | | | | | | | | | | | | | | | | | | | | | | | |
| | 0.14 | | | | 0.32 | | | | 0.26 | | | | 0.23 | | | | 0.59 | | | | 0.29 | | | |
| 0.96 | | | | 1.94 | | | | (3.02 | ) | | | 2.78 | | | | 1.60 | | | | 3.10 | | | |
| | | | | | | | | | | | | | | | | | | | | | | | |
| | | | | | |
| | 1.10 | | | | 2.26 | | | | (2.76 | ) | | | 3.01 | | | | 2.19 | | | | 3.39 | | | |
| | | | | | | | | | | | | | | | | | | | | | | | |
| | | | | | |
| | | | | | | | | | | | | | | | | | | | | | | | |
| | (0.14 | ) | | | (0.32 | ) | | | (0.27 | ) | | | (0.35 | ) | | | (0.92 | ) | | | (0.33 | ) | | |
| | — | | | | (0.83 | ) | | | (1.53 | ) | | | (1.60 | ) | | | (1.83 | ) | | | (1.00 | ) | | |
| | | | | | | | | | | | | | | | | | | | | | | | |
| | | | | | |
| | (0.14 | ) | | | (1.15 | ) | | | (1.80 | ) | | | (1.95 | ) | | | (2.75 | ) | | | (1.33 | ) | | |
| | | | | | | | | | | | | | | | | | | | | | | | |
| | | | | | |
| $ | 15.37 | | | $ | 14.41 | | | $ | 13.30 | | | $ | 17.86 | | | $ | 16.80 | | | $ | 17.36 | | | |
| | | | | | | | | | | | | | | | | | | | | | | | |
| | | | | | |
| | 7.64 | (b) | | | 17.52 | | | | (15.24 | ) | | | 18.21 | | | | 13.72 | | | | 22.74 | | | |
| | 341 | | | | 336 | | | | 313 | | | | 390 | | | | 337 | | | | 320 | | | |
| | 1.86 | (c) | | | 2.21 | | | | 1.66 | | | | 1.22 | | | | 3.50 | | | | 1.69 | | | |
| 0.08 | (c) | | | 0.08 | | | | 0.05 | | | | 0.04 | | | | 0.04 | | | | 0.04 | | | |
| 0.07 | (c) | | | 0.08 | | | | 0.05 | | | | 0.04 | | | | 0.04 | | | | 0.04 | | | |
| | 6.08 | (b) | | | 10.51 | | | | 9.54 | | | | 13.06 | | | | 10.23 | | | | 9.06 | | | |
The accompanying notes are an integral part of these financial statements.
137
MoA FUNDS
FINANCIAL HIGHLIGHTS (Continued)
| | | | | | | | | | | | | | | | | | | | | | | | |
| | | MoA Money Market Fund | |
| | | Six Months
Ended
June 30,
2024
(Unaudited) | | | Years Ended December 31, | |
| | | 2023 | | | 2022 | | | 2021 | | | 2020(e) | | | 2019(e) | |
| | | | | | |
Net Asset Value, Beginning of Period | | $ | 11.858 | | | $ | 11.833 | | | $ | 11.827 | | | $ | 11.852 | | | $ | 12.315 | | | $ | 12.2150 | |
| | | | | | | | | | | | | | | | | | | | | | | | |
| | | | | | |
INCOME (LOSS) FROM INVESTMENT OPERATIONS | | | | | | | | | | | | | | | | | | | | | | | | |
Net Investment Income (Loss) | | | 0.310 | | | | 0.559 | | | | 0.157 | | | | (0.020 | ) | | | 0.185 | | | | 0.3293 | |
Net Realized and Unrealized Gains (Losses) on Investments, Futures Contracts and Foreign Currency Translations | | | (0.005 | ) | | | 0.015 | | | | 0.003 | | | | (0.005 | ) | | | (0.148 | ) | | | (0.0838 | ) |
| | | | | | | | | | | | | | | | | | | | | | | | |
| | | | | | |
Total From Investment Operations | | | 0.305 | | | | 0.574 | | | | 0.160 | | | | (0.025 | ) | | | 0.037 | | | | 0.2455 | |
| | | | | | | | | | | | | | | | | | | | | | | | |
| | | | | | |
Less Distributions | | | | | | | | | | | | | | | | | | | | | | | | |
From Net Investment Income | | | (0.258 | ) | | | (0.549 | ) | | | (0.154 | ) | | | — | | | | (0.499 | ) | | | (0.1457 | ) |
From Net Realized Gains | | | — | | | | — | (l) | | | — | | | | — | | | | (0.001 | ) | | | — | (i) |
Return of Capital | | | — | | | | — | | | | — | | | | — | | | | — | (l) | | | — | |
| | | | | | | | | | | | | | | | | | | | | | | | |
| | | | | | |
Total Distributions | | | (0.258 | ) | | | (0.549 | ) | | | (0.154 | ) | | | — | | | | (0.500 | ) | | | (0.1457 | ) |
| | | | | | | | | | | | | | | | | | | | | | | | |
| | | | | | |
Net Asset Value, End of Period | | $ | 11.905 | | | $ | 11.858 | | | $ | 11.833 | | | $ | 11.827 | | | $ | 11.852 | | | $ | 12.3148 | |
| | | | | | | | | | | | | | | | | | | | | | | | |
| | | | | | |
Total Return (%)(g) | | | 2.60 | (b) | | | 4.99 | | | | 1.31 | | | | (0.17 | ) | | | 0.28 | | | | 2.01 | |
Net Assets, End of Period ($ millions) | | | 517 | | | | 586 | | | | 335 | | | | 173 | | | | 122 | | | | 154 | |
Ratio of Net Income (Loss) to Average Net Assets (%) | | | 5.15 | (c) | | | 4.90 | | | | 1.71 | | | | (0.20 | ) | | | 0.40 | | | | 2.02 | |
Ratio of Expenses to Average Net Assets Before Expense Reimbursement (%) | | | 0.25 | (c) | | | 0.23 | | | | 0.24 | | | | 0.26 | | | | 0.27 | | | | 0.24 | |
Ratio of Expenses to Average Net Assets After Expense Reimbursement (%) | | | 0.24 | (c) | | | 0.23 | | | | 0.24 | | | | 0.26 | | | | 0.27 | | | | 0.24 | |
Portfolio Turnover Rate (%)(a) | | | NA | (b) | | | NA | | | | NA | | | | NA | | | | NA | | | | NA | |
| (a) | Portfolio turnover rate excludes all short-term securities. |
| (d) | Asset Allocation Funds and Target Date Funds exclude expenses of the underlying funds. |
| (e) | On September 25, 2020, the MoA Funds, with the exception of the Catholic Values Index Fund which commenced operations on September 30, 2020, had a 1 for 10 reverse share split. Historical net asset value per share and per share activity have been adjusted to reflect the split on a retroactive basis. |
| (f) | Amount is less than $0.005 per share. |
| (g) | Total return is calculated assuming a purchase of a share on the first day and a sale on the last day of each year or period reported and includes reinvestment of distributions, if any. For variable annuity owners or participants in a group variable annuity, the total return does not reflect the effect of fees and charges associated with your variable annuity contract and does not reflect expenses associated with the separate account such as administrative fees and account charges which, if reflected, would reduce the total returns for all years and periods shown. Past performance is no guarantee of future results. Total returns for periods less than one full year are not annualized. |
| (h) | International Fund excludes the expenses of its ETF investments. |
| (i) | Amount is less than $0.00005 per share. |
| (j) | For the period September 30, 2020 (commencement of operations) through December 31, 2020. |
| (k) | For the period August 3, 2020 (commencement of operations) through December 31, 2020. |
| (l) | Amount is less than $0.0005 per share. |
NA = Not Applicable.
The accompanying notes are an integral part of these financial statements.
138
| | | | | | | | | | | | | | | | | | | | | | | | | | | | | | | | | | | | | | | | | | | | | | |
| MoA Intermediate Bond Fund | | | MoA Core Bond Fund | |
Six Months
Ended
June 30,
2024
(Unaudited) | | | Years Ended December 31, | | | Six Months
Ended
June 30,
2024
(Unaudited) | | | Years Ended December 31, | |
| | 2023 | | | 2022 | | | 2021 | | | 2020(e) | | | 2019(e) | | | 2023 | | | 2022 | | | 2021 | | | 2020(e) | | | 2019(e) | |
| | | | | | | | | | | |
| $ | 9.64 | | | $ | 9.43 | | | $ | 10.36 | | | $ | 10.79 | | | $ | 10.63 | | | $ | 10.24 | | | $ | 12.45 | | | $ | 12.21 | | | $ | 14.32 | | | $ | 15.01 | | | $ | 14.77 | | | $ | 14.07 | |
| | | | | | | | | | | | | | | | | | | | | | | | | | | | | | | | | | | | | | | | | | | | | | |
| | | | | | | | | | | |
| | | | | | | | | | | | | | | | | | | | | | | | | | | | | | | | | | | | | | | | | | | | | | |
| | 0.16 | | | | 0.22 | | | | 0.14 | | | | 0.14 | | | | 0.15 | | | | 0.21 | | | | 0.22 | | | | 0.36 | | | | 0.27 | | | | 0.23 | | | | 0.28 | | | | 0.35 | |
| (0.13 | ) | | | 0.21 | | | | (0.93 | ) | | | (0.36 | ) | | | 0.39 | | | | 0.41 | | | | (0.30 | ) | | | 0.24 | | | | (2.09 | ) | | | (0.60 | ) | | | 0.67 | | | | 0.72 | |
| | | | | | | | | | | | | | | | | | | | | | | | | | | | | | | | | | | | | | | | | | | | | | |
| | | | | | | | | | | |
| | 0.03 | | | | 0.43 | | | | (0.79 | ) | | | (0.22 | ) | | | 0.54 | | | | 0.62 | | | | (0.08 | ) | | | 0.60 | | | | (1.82 | ) | | | (0.37 | ) | | | 0.95 | | | | 1.07 | |
| | | | | | | | | | | | | | | | | | | | | | | | | | | | | | | | | | | | | | | | | | | | | | |
| | | | | | | | | | | |
| | | | | | | | | | | | | | | | | | | | | | | | | | | | | | | | | | | | | | | | | | | | | | |
| | (0.13 | ) | | | (0.22 | ) | | | (0.14 | ) | | | (0.14 | ) | | | (0.38 | ) | | | (0.23 | ) | | | (0.18 | ) | | | (0.36 | ) | | | (0.29 | ) | | | (0.27 | ) | | | (0.70 | ) | | | (0.37 | ) |
| | — | | | | — | | | | — | (f) | | | (0.07 | ) | | | — | (f) | | | — | | | | — | | | | — | | | | — | | | | (0.05 | ) | | | (0.01 | ) | | | — | |
| | — | | | | — | | | | — | | | | — | | | | — | | | | — | | | | — | | | | — | | | | — | | | | — | | | | — | (f) | | | — | |
| | | | | | | | | | | | | | | | | | | | | | | | | | | | | | | | | | | | | | | | | | | | | | |
| | | | | | | | | | | |
| | (0.13 | ) | | | (0.22 | ) | | | (0.14 | ) | | | (0.21 | ) | | | (0.38 | ) | | | (0.23 | ) | | | (0.18 | ) | | | (0.36 | ) | | | (0.29 | ) | | | (0.32 | ) | | | (0.71 | ) | | | (0.37 | ) |
| | | | | | | | | | | | | | | | | | | | | | | | | | | | | | | | | | | | | | | | | | | | | | |
| | | | | | | | | | | |
| $ | 9.54 | | | $ | 9.64 | | | $ | 9.43 | | | $ | 10.36 | | | $ | 10.79 | | | $ | 10.63 | | | $ | 12.19 | | | $ | 12.45 | | | $ | 12.21 | | | $ | 14.32 | | | $ | 15.01 | | | $ | 14.77 | |
| | | | | | | | | | | | | | | | | | | | | | | | | | | | | | | | | | | | | | | | | | | | | | |
| | | | | | | | | | | |
| | 0.37 | (b) | | | 4.62 | | | | (7.66 | ) | | | (2.02 | ) | | | 5.05 | | | | 6.04 | | | | (0.64 | )(b) | | | 5.03 | | | | (12.79 | ) | | | (2.45 | ) | | | 6.40 | | | | 7.65 | |
| | 931 | | | | 950 | | | | 878 | | | | 866 | | | | 829 | | | | 672 | | | | 2,111 | | | | 2,060 | | | | 1,841 | | | | 2,049 | | | | 1,873 | | | | 1,574 | |
| | 3.43 | (c) | | | 2.39 | | | | 1.42 | | | | 1.32 | | | | 1.79 | | | | 2.26 | | | | 3.64 | (c) | | | 2.94 | | | | 2.07 | | | | 1.56 | | | | 2.03 | | | | 2.70 | |
| 0.48 | (c) | | | 0.47 | | | | 0.45 | | | | 0.44 | | | | 0.46 | | | | 0.45 | | | | 0.46 | (c) | | | 0.45 | | | | 0.43 | | | | 0.43 | | | | 0.45 | | | | 0.44 | |
| 0.47 | (c) | | | 0.46 | | | | 0.45 | | | | 0.44 | | | | 0.46 | | | | 0.45 | | | | 0.45 | (c) | | | 0.44 | | | | 0.43 | | | | 0.43 | | | | 0.45 | | | | 0.44 | |
| | 30.54 | (b) | | | 50.30 | | | | 21.07 | | | | 17.57 | | | | 10.72 | | | | 19.47 | | | | 24.96 | (b) | | | 34.81 | | | | 33.44 | | | | 31.53 | | | | 28.98 | | | | 13.36 | |
The accompanying notes are an integral part of these financial statements.
139
MoA FUNDS
NOTES TO FINANCIAL STATEMENTS (Unaudited)
June 30, 2024
The Investment Company is a diversified, open-end management investment company — a type of company commonly known as a “mutual fund.” It is registered under the Investment Company Act of 1940. The Investment Company was formed on February 21, 1986 as a Maryland corporation and offers its shares to various types of investors, including separate accounts of affiliated insurance companies. The Investment Company issues separate series of capital stock, each of which represents a separate Fund (collectively, “the Funds”). The financial statements for each of the Funds are contained within this report.
As of June 30, 2024 there were 28 active funds (collectively the “Funds”), as follows:
| | |
Single Mandate Funds | | Target Date and Asset Allocation Funds |
MoA Equity Index Fund | | MoA Retirement Income Fund |
MoA All America Fund | | MoA Clear Passage 2015 Fund |
MoA Small Cap Value Fund | | MoA Clear Passage 2020 Fund |
MoA Small Cap Growth Fund | | MoA Clear Passage 2025 Fund |
MoA Small Cap Equity Index Fund | | MoA Clear Passage 2030 Fund |
MoA Mid Cap Value Fund | | MoA Clear Passage 2035 Fund |
MoA Mid Cap Equity Index Fund | | MoA Clear Passage 2040 Fund |
MoA International Fund | | MoA Clear Passage 2045 Fund |
MoA Catholic Values Index Fund | | MoA Clear Passage 2050 Fund |
MoA Money Market Fund | | MoA Clear Passage 2055 Fund |
MoA Intermediate Bond Fund | | MoA Clear Passage 2060 Fund |
MoA Core Bond Fund | | MoA Clear Passage 2065 Fund |
| | MoA Conservative Allocation Fund |
| | MoA Moderate Allocation Fund |
| | MoA Aggressive Allocation Fund |
| | MoA Balanced Fund |
Investment Company shares are issued to retail and institutional investors, such as endowments, foundations, corporations, municipalities and other public entities, and trusts. In addition, shares are issued to Mutual of America Life Insurance Company (“Mutual of America Life”) for allocation to its Separate Accounts as a funding medium for variable accumulation annuity contracts, as well as directly issued to one or more of the Investment Company’s Target Date Funds and the MoA Conservative Allocation, MoA Moderate Allocation and MoA Aggressive Allocation Funds (collectively, “Allocation Funds”). The Board of Directors of the Investment Company (the “Board”) has appointed Foreside Fund Services, LLC as principal underwriter for the distribution of the Funds’ shares.
| 2. | SIGNIFICANT ACCOUNTING POLICIES |
The Funds follow investment company accounting and reporting guidance of the Financial Accounting Standards Board (“FASB”) Accounting Codification Topic 946 Financial Services — Investment Companies. The preparation of financial statements in accordance with U.S. generally accepted accounting principles (“GAAP”) requires management to make estimates and assumptions that affect the reported amounts of assets, liabilities, income, expenses and related disclosures. Changes in the economic environment, financial markets and any other parameters used in determining these estimates could cause actual results to differ.
The following is a summary of the significant accounting policies consistently followed by the Investment Company, which are in conformity with GAAP:
Fair Value — The Investment Company values its investments at fair value. Fair value is an estimate of the price the Fund would receive upon selling a security in an orderly arms-length transaction. Investments are categorized based on a three-level valuation hierarchy for measurement and disclosure of fair value. The valuation hierarchy is based upon the transparency of inputs used to measure fair value. These inputs are summarized in the three broad levels listed below:
| | • | | Level 1 — quoted prices in active markets for identical securities. |
| | • | | Level 2 — other significant observable inputs (including yield, quality, coupon rate, maturity, issue type, quoted prices for similar securities, prepayment speeds, trading characteristics, etc.). |
140
MoA FUNDS
NOTES TO FINANCIAL STATEMENTS (Unaudited) (Continued)
June 30, 2024
| 2. | SIGNIFICANT ACCOUNTING POLICIES (CONTINUED) |
| | • | | Level 3 — significant unobservable inputs (including the Fund’s own assumptions in determining the fair value of investments). |
As of June 30, 2024, management determined that the fair value inputs used for all equity securities were considered Level 1, with the exception of two securities in the Small Cap Equity Index Fund and Catholic Values Index Fund (see Note (a) below) which were considered Level 3 and certain securities listed on foreign exchanges which were considered Level 2. Valuation adjustments may be applied to certain securities that were solely traded on a foreign exchange to account for the market movement between the close of the foreign market and the close of the New York Stock Exchange. Securities using these valuation adjustments were considered Level 2. In addition, non-registered securities under Rule 144A of the Securities Act of 1933 were considered Level 2. Fair value inputs for all debt securities and temporary cash investments were considered Level 2, with the exception of one debt security in the Core Bond Fund (see Note (a) below) which was considered as Level 3. The inputs or methodologies used for valuing securities are not necessarily an indication of the risk associated with investing in those securities.
The following is a summary of the inputs used to value the Funds’ investments and other financial instruments as of June 30, 2024:
| | | | | | | | | | | | | | | | |
Fund | | Level 1 — Quoted
Prices | | | Level 2 — Significant
Observable Inputs | | | Level 3 — Significant
Unobservable Inputs | | | Total | |
| | | | |
Investments at Fair Value:* | | | | | | | | | | | | | | | | |
Equity Index Fund | | | | | | | | | | | | | | | | |
Common Stock | | $ | 5,646,199,997 | | | | — | | | | — | | | $ | 5,646,199,997 | |
Short-Term Debt Securities | | | — | | | $ | 4,285,859 | | | | — | | | $ | 4,285,859 | |
Temporary Cash Investment | | | — | | | $ | 2,010,055 | | | | — | | | $ | 2,010,055 | |
| | | | | | | | | | | | | | | | |
| | $ | 5,646,199,997 | | | $ | 6,295,914 | | | | — | | | $ | 5,652,495,911 | |
All America Fund | | | | | | | | | | | | | | | | |
Common Stock | | $ | 303,297,211 | | | | — | | | | — | | | $ | 303,297,211 | |
Short-Term Debt Securities | | | — | | | $ | 1,694,172 | | | | — | | | $ | 1,694,172 | |
Temporary Cash Investment | | | — | | | $ | 2,605,199 | | | | — | | | $ | 2,605,199 | |
| | | | | | | | | | | | | | | | |
| | $ | 303,297,211 | | | $ | 4,299,371 | | | | — | | | $ | 307,596,582 | |
Small Cap Value Fund | | | | | | | | | | | | | | | | |
Common Stock | | $ | 367,163,903 | | | | — | | | | — | | | $ | 367,163,903 | |
Short-Term Debt Securities | | | — | | | $ | 7,475,180 | | | | — | | | $ | 7,475,180 | |
Temporary Cash Investment | | | — | | | $ | 1,392,112 | | | | — | | | $ | 1,392,112 | |
| | | | | | | | | | | | | | | | |
| | $ | 367,163,903 | | | $ | 8,867,292 | | | | — | | | $ | 376,031,195 | |
Small Cap Growth Fund | | | | | | | | | | | | | | | | |
Common Stock | | $ | 389,285,487 | | | | — | | | | — | | | $ | 389,285,487 | |
Short-Term Debt Securities | | | — | | | $ | 3,292,387 | | | | — | | | $ | 3,292,387 | |
Temporary Cash Investment | | | — | | | $ | 1,931,145 | | | | — | | | $ | 1,931,145 | |
| | | | | | | | | | | | | | | | |
| | $ | 389,285,487 | | | $ | 5,223,532 | | | | — | | | $ | 394,509,019 | |
Small Cap Equity Index Fund | | | | | | | | | | | | | | | | |
Common Stock | | $ | 199,306,915 | | | | — | | | | — | (a) | | $ | 199,306,915 | |
Temporary Cash Investment | | | — | | | $ | 188,220 | | | | — | | | $ | 188,220 | |
| | | | | | | | | | | | | | | | |
| | $ | 199,306,915 | | | $ | 188,220 | | | | — | | | $ | 199,495,135 | |
Mid Cap Value Fund | | | | | | | | | | | | | | | | |
Common Stock | | $ | 161,764,366 | | | | — | | | | — | | | $ | 161,764,366 | |
Short-Term Debt Securities | | | — | | | $ | 6,293,870 | | | | — | | | $ | 6,293,870 | |
Temporary Cash Investment | | | — | | | $ | 71,424 | | | | — | | | $ | 71,424 | |
| | | | | | | | | | | | | | | | |
| | $ | 161,764,366 | | | $ | 6,365,294 | | | | — | | | $ | 168,129,660 | |
Mid Cap Equity Index Fund | | | | | | | | | | | | | | | | |
Common Stock | | $ | 1,500,637,881 | | | | — | | | | — | | | $ | 1,500,637,881 | |
Temporary Cash Investment | | | — | | | $ | 1,623,587 | | | | — | | | $ | 1,623,587 | |
| | | | | | | | | | | | | | | | |
| | $ | 1,500,637,881 | | | $ | 1,623,587 | | | | — | | | $ | 1,502,261,468 | |
141
MoA FUNDS
NOTES TO FINANCIAL STATEMENTS (Unaudited) (Continued)
June 30, 2024
| 2. | SIGNIFICANT ACCOUNTING POLICIES (CONTINUED) |
| | | | | | | | | | | | | | | | |
Fund | | Level 1 — Quoted
Prices | | | Level 2 — Significant
Observable Inputs | | | Level 3 — Significant
Unobservable Inputs | | | Total | |
Balanced Fund | | | | | | | | | | | | | | | | |
Common Stock | | $ | 121,975,285 | | | | — | | | | — | | | $ | 121,975,285 | |
U.S. Government Debt | | | — | | | $ | 17,992,728 | | | | — | | | $ | 17,992,728 | |
U.S. Government Agency Residential Mortgage-Backed Obligations | | | — | | | $ | 22,557,850 | | | | — | | | $ | 22,557,850 | |
U.S. Government Agency Non-Mortgage-Backed Obligations | | | — | | | $ | 1,887,050 | | | | — | | | $ | 1,887,050 | |
Long-Term Corporate Debt | | | — | | | $ | 22,194,675 | | | | — | | | $ | 22,194,675 | |
Short-Term Debt Securities | | | — | | | $ | 4,978,769 | | | | — | | | $ | 4,978,769 | |
Commercial Paper | | | — | | | $ | 2,200,000 | | | | — | | | $ | 2,200,000 | |
Temporary Cash Investment | | | — | | | $ | 478,746 | | | | — | | | $ | 478,746 | |
| | | | | | | | | | | | | | | | |
| | $ | 121,975,285 | | | $ | 72,289,818 | | | | — | | | $ | 194,265,103 | |
International Fund | | | | | | | | | | | | | | | | |
Common Stock | | $ | 79,648,968 | | | $ | 1,480,540,830 | | | | — | | | $ | 1,560,189,798 | |
Short-Term Debt Securities | | | — | | | $ | 16,879,406 | | | | — | | | $ | 16,879,406 | |
Temporary Cash Investment | | | — | | | $ | 6,770,472 | | | | — | | | $ | 6,770,472 | |
| | | | | | | | | | | | | | | | |
| | $ | 79,648,968 | | | $ | 1,504,190,708 | | | | — | | | $ | 1,583,839,676 | |
Catholic Values Index Fund | | | | | | | | | | | | | | | | |
Common Stock | | $ | 6,688,363 | | | | — | | | | — | (a) | | $ | 6,688,363 | |
Temporary Cash Investment | | | — | | | $ | 159,280 | | | | — | | | $ | 159,280 | |
| | | | | | | | | | | | | | | | |
| | $ | 6,688,363 | | | $ | 159,280 | | | | — | | | $ | 6,847,643 | |
Retirement Income Fund | | | | | | | | | | | | | | | | |
Common Stock | | $ | 199,052,647 | | | | — | | | | — | | | $ | 199,052,647 | |
Clear Passage 2015 Fund | | | | | | | | | | | | | | | | |
Common Stock | | $ | 109,047,081 | | | | — | | | | — | | | $ | 109,047,081 | |
Clear Passage 2020 Fund | | | | | | | | | | | | | | | | |
Common Stock | | $ | 473,330,673 | | | | — | | | | — | | | $ | 473,330,673 | |
Clear Passage 2025 Fund | | | | | | | | | | | | | | | | |
Common Stock | | $ | 1,114,469,236 | | | | — | | | | — | | | $ | 1,114,469,236 | |
Clear Passage 2030 Fund | | | | | | | | | | | | | | | | |
Common Stock | | $ | 1,352,467,428 | | | | — | | | | — | | | $ | 1,352,467,428 | |
Clear Passage 2035 Fund | | | | | | | | | | | | | | | | |
Common Stock | | $ | 1,330,619,382 | | | | — | | | | — | | | $ | 1,330,619,382 | |
Clear Passage 2040 Fund | | | | | | | | | | | | | | | | |
Common Stock | | $ | 1,131,057,495 | | | | — | | | | — | | | $ | 1,131,057,495 | |
Clear Passage 2045 Fund | | | | | | | | | | | | | | | | |
Common Stock | | $ | 1,167,282,884 | | | | — | | | | — | | | $ | 1,167,282,884 | |
Clear Passage 2050 Fund | | | | | | | | | | | | | | | | |
Common Stock | | $ | 912,940,754 | | | | — | | | | — | | | $ | 912,940,754 | |
Clear Passage 2055 Fund | | | | | | | | | | | | | | | | |
Common Stock | | $ | 510,237,224 | | | | — | | | | — | | | $ | 510,237,224 | |
Clear Passage 2060 Fund | | | | | | | | | | | | | | | | |
Common Stock | | $ | 277,716,275 | | | | — | | | | — | | | $ | 277,716,275 | |
Clear Passage 2065 Fund | | | | | | | | | | | | | | | | |
Common Stock | | $ | 95,363,537 | | | | — | | | | — | | | $ | 95,363,537 | |
Temporary Cash Investment | | | — | | | $ | 161,465 | | | | — | | | $ | 161,465 | |
| | | | | | | | | | | | | | | | |
| | $ | 95,363,537 | | | $ | 161,465 | | | | — | | | $ | 95,525,002 | |
Conservative Allocation Fund | | | | | | | | | | | | | | | | |
Common Stock | | $ | 155,444,641 | | | | — | | | | — | | | $ | 155,444,641 | |
Moderate Allocation Fund | | | | | | | | | | | | | | | | |
Common Stock | | $ | 406,607,053 | | | | — | | | | — | | | $ | 406,607,053 | |
Aggressive Allocation Fund | | | | | | | | | | | | | | | | |
Common Stock | | $ | 340,923,520 | | | | — | | | | — | | | $ | 340,923,520 | |
142
MoA FUNDS
NOTES TO FINANCIAL STATEMENTS (Unaudited) (Continued)
June 30, 2024
| 2. | SIGNIFICANT ACCOUNTING POLICIES (CONTINUED) |
| | | | | | | | | | | | | | | | |
Fund | | Level 1 — Quoted
Prices | | | Level 2 — Significant
Observable Inputs | | | Level 3 — Significant
Unobservable Inputs | | | Total | |
Money Market Fund | | | | | | | | | | | | | | | | |
U.S. Government Debt | | | — | | | $ | 283,706,916 | | | | — | | | $ | 283,706,916 | |
Commercial Paper | | | — | | | $ | 233,782,955 | | | | — | | | $ | 233,782,955 | |
Temporary Cash Investment | | | — | | | $ | 82,783 | | | | — | | | $ | 82,783 | |
| | | | | | | | | | | | | | | | |
| | | — | | | $ | 517,572,654 | | | | — | | | $ | 517,572,654 | |
Intermediate Bond Fund | | | | | | | | | | | | | | | | |
U.S. Government Debt | | | — | | | $ | 504,854,759 | | | | — | | | $ | 504,854,759 | |
U.S. Government Agency Non-Mortgage-Backed Obligations | | | — | | | $ | 20,804,023 | | | | — | | | $ | 20,804,023 | |
Long-Term Corporate Debt | | | — | | | $ | 396,623,943 | | | | — | | | $ | 396,623,943 | |
Short-Term Debt Securities | | | — | | | $ | 320,839 | | | | — | | | $ | 320,839 | |
| | | | | | | | | | | | | | | | |
| | | — | | | $ | 922,603,564 | | | | — | | | $ | 922,603,564 | |
Core Bond Fund | | | | | | | | | | | | | | | | |
U.S. Government Debt | | | — | | | $ | 612,114,052 | | | | — | | | $ | 612,114,052 | |
U.S. Government Agency Residential Mortgage-Backed Obligations | | | — | | | $ | 727,841,662 | | | | — | | | $ | 727,841,662 | |
U.S. Government Agency Non-Mortgage-Backed Obligations | | | — | | | $ | 34,655,275 | | | | — | | | $ | 34,655,275 | |
Long-Term Corporate Debt | | | — | | | $ | 717,605,475 | | | | — | | | $ | 717,605,475 | |
Sovereign Debt | | | — | | | | — | | | $ | 1,408,800 | (a) | | $ | 1,408,800 | |
Commercial Paper | | | — | | | $ | 3,100,000 | | | | — | | | $ | 3,100,000 | |
Temporary Cash Investment | | | — | | | $ | 22,457 | | | | — | | | $ | 22,457 | |
| | | | | | | | | | | | | | | | |
| | | — | | | $ | 2,095,338,921 | | | $ | 1,408,800 | | | $ | 2,096,747,721 | |
| * | See Portfolios of Investments for more details on industry or country classifications, as applicable. |
| (a) | Includes securities fair valued using methods determined in good faith by the Adviser and reviewed by the Investment Company Valuation Committee, in accordance with procedures adopted by the Board of Directors of the Investment Company. |
| | | | | | | | | | | | | | | | | | | | | | | | | | | | | | | | | | | | | | | | |
| | | Fair Value Measurement Using Significant Unobservable
Inputs (Level 3) for the Six Months Ended June 30, 2024 | |
| | | Balance
December 31,
2023(a) | | | Change in
Unrealized
Gains
(Losses) | | | Realized
Gains
(Losses) | | | Accrued
Discounts/
Premiums | | | Transfers
Into
Level 3 | | | Transfers
Out of
Level 3 | | | Purchases/
Payups | | | Sales/
Paydown | | | Balance
June 30,
2024(a) | | | Net Change in
Unrealized
Gains/
(Losses) of
Level 3
Assets Held
as of
June 30, 2024 | |
Small Cap Equity Index Fund — Common Stock | | | — | (b) | | | — | | | | — | | | | — | | | | — | | | | — | | | | — | | | | — | | | | — | (b) | | | — | |
Core Bond Fund — Sovereign Debt | | $ | 1,566,371 | (c) | | $ | 12,992 | | | | — | | | $ | (39,412 | ) | | | — | | | | — | | | | — | | | $ | (131,151 | ) | | $ | 1,408,800 | (c) | | $ | 12,992 | |
Catholic Values Index Fund — Common Stock | | | — | (d) | | | — | | | | — | | | | — | | | | — | | | | — | | | | — | | | | — | | | | — | (d) | | | — | |
| (a) | Includes securities fair valued using methods determined in good faith by the Adviser and reviewed by the Investment Company Valuation Committee, in accordance with procedures adopted by the Board of Directors of the Investment Company. |
| (b) | Level 3 securities, OmniAB, Inc. Cl CR3 and OmniAB, Inc. Cl CR4 - common stocks with $0 fair value. |
| (c) | Level 3 security, Sri Lanka AID, with change in unrealized gain of $12,992, accrued premiums of $(39,412), sales/paydowns of $(131,151) and $1,408,800 fair value. |
| (d) | Level 3 security, Contra ABIOMED, Inc. - contingent value rights with $0 fair value. |
143
MoA FUNDS
NOTES TO FINANCIAL STATEMENTS (Unaudited) (Continued)
June 30, 2024
| 2. | SIGNIFICANT ACCOUNTING POLICIES (CONTINUED) |
Security Valuation — Investment securities are carried at fair value as follows:
The Funds’ investments are valued as of the close of trading on the New York Stock Exchange (“Exchange”) on each day the Exchange is open for trading. The Exchange usually closes at 4:00 pm Eastern Time but sometimes closes earlier. For Funds that invest in securities listed on foreign exchanges, the value of the securities may change on days when the Funds are closed and there is no possibility to purchase or redeem shares of the Funds. Valuation adjustments may be applied to certain securities that were solely traded on a foreign exchange to account for the market movement between the close of the foreign market and the close of the Exchange.
The Board has adopted valuation procedures for security valuation under which the Adviser was designated to perform certain fair valuation responsibilities. The Adviser has established a Valuation Committee responsible for supervising the fair valuation of portfolio securities. The valuation procedures permit the Funds to utilize independent pricing vendor services, quotations from market makers and alternative valuation methods when market quotations are either not readily available or not deemed representative of market value. Assumptions utilized by the valuation committee vary depending on the investment being fair-valued and the technique deemed most appropriate to the nature of the investment and how a market participant would fair value the investment. Such techniques involve utilizing market observable spreads for fixed income securities, discounted cash flow models and weighting of company specific events and circumstances as inputs into fair value estimates. A record of the Valuation Committee’s actions is subject to the Board’s review at its next regularly scheduled quarterly meeting.
Exchange-traded equity securities are valued at the last reported sales price on the principal exchange on which the security is traded. If there is no trading volume for a particular valuation day, the last bid price is used. For equity securities traded in the over-the-counter market, the security is valued at the last sale price, or if no sale, at the latest bid price available.
Short-term debt securities with a maturity of 60 days or less are valued at amortized cost, which approximates fair value for such securities.
Debt securities, including short-term debt securities maturing in excess of 60 days, are typically valued on the basis of prices obtained from an independent pricing source. The pricing source may utilize various pricing methodologies that incorporate both models (which consider factors such as yield, quality, coupon rate, maturity, issue type, quoted prices for similar securities, prepayment speeds and trading characteristics) and dealer-supplied valuations to derive a valuation.
Temporary cash investments are amounts on deposit with financial institutions that are swept daily into an overnight investment and returned the next business day. These short-term temporary cash investments are valued at cost.
When a price is not available from an independent pricing source or when prices may not reflect market value, such as when the price provided by the pricing source is not based on a recent trade, these securities are fair valued using the valuation procedures described above and are considered Level 3 securities.
The Target Date Funds and the Allocation Funds value their investments in the underlying Funds of the Investment Company at their respective net asset values.
Investment Transactions — Investment transactions are accounted for as of the trade date. Realized gains and losses on the sale of securities are computed on the basis of identified cost at the time of sale, determined on the first-in, first-out (“FIFO”) basis.
Futures Contracts — The Equity Index Fund, Mid Cap Equity Index Fund, International Fund and a portion of the All America Fund each maintain portfolios which are subject to equity price risk. In order to remain more fully invested in the equity markets while minimizing transaction costs, the Funds may purchase stock index futures contracts. These
144
MoA FUNDS
NOTES TO FINANCIAL STATEMENTS (Unaudited) (Continued)
June 30, 2024
| 2. | SIGNIFICANT ACCOUNTING POLICIES (CONTINUED) |
purchases of futures contracts allow the Funds to invest available cash to attempt to efficiently and cost effectively keep the Funds fully invested on a daily basis in an attempt to minimize deviation from the performance of the indices.
An initial cash margin deposit (represented by Treasury bills) is made upon entering into a futures contract and serves as collateral for the contract. This initial margin, maintained in a segregated account, is equal to approximately 5%-6% of the contract amount, and does not involve the borrowing of funds to finance the transaction. During the period the futures contract is outstanding, changes in the value of the contract are recognized as unrealized appreciation or depreciation by “marking-to-market” on a daily basis to reflect the market value of the contract at the end of each trading day. The accumulated unrealized appreciation or depreciation on the contract is included in Total Distributable Earnings (Loss) in the Components of Net Assets section of the Statements of Assets and Liabilities. Futures contracts are valued at the settlement price established each day by the exchange on which traded. Depending upon whether unrealized appreciation or depreciation are incurred, variation margin payments are received or made daily. The net change in unrealized appreciation or depreciation of futures contracts is recorded in the Statements of Operations. When the contract is closed, a realized gain or loss from futures transactions is recorded in the Statements of Operations, equal to the net variation margin received or paid over the period the contract was outstanding.
The “Underlying Face Amount at Value” (appearing in the “Footnotes to Portfolios of Investments in Securities”) representing the aggregate of outstanding contractual amounts under futures contracts reflects the extent of a Fund’s exposure to off-balance sheet risk. The use of futures transactions involves the risk of imperfect correlation in the price movements of the contract and the underlying securities. With futures contracts, there is minimal counterparty credit risk to the Fund since futures are exchange traded and the exchange’s clearinghouse, as counterparty to all exchange traded futures, guarantees the futures against default.
The following table presents the financial statement impacts resulting from the Funds’ use of futures contracts at their fair values as of June 30, 2024 and for the six months ended June 30, 2024:
| | | | | | | | | | | | | | | | | | | | | | |
Derivatives not accounted for as hedging instruments | | Risk
Type | | | Locations on Statements of Assets
and Liabilities | | Equity Index
Fund | | | All America
Fund | | | Mid Cap
Equity Index
Fund | | | International
Fund | |
Futures Contracts | | | Equity | | | Total Distributable Earnings (Loss) | | $ | — | | | $ | — | | | $ | — | | | $ | — | |
| | | | | | | | | | | | | | | | | | | | | | |
| | | | | | |
Derivatives not accounted
for as hedging instruments | | Risk
Type | | | Locations on Statements of
Operations | | Equity Index
Fund | | | All America
Fund | | | Mid Cap
Equity Index
Fund | | | International
Fund | |
Futures Contracts | | | Equity | | | Net realized gain (loss) on Futures contracts | | $ | 7,617,738 | | | $ | 278,592 | | | $ | 1,598,743 | | | $ | 2,174,653 | |
| | | | | | | | | | | | | | | | | | | | | | |
Futures Contracts | | | Equity | | | Change in net unrealized appreciation (depreciation) of Futures contracts | | $ | (2,007,303 | ) | | $ | (35,588 | ) | | $ | (609,100 | ) | | $ | (1,031,225 | ) |
| | | | | | | | | | | | | | | | | | | | | | |
During the six months ended June 30, 2024, the Equity Index Fund, All America Fund, Mid Cap Equity Index Fund and International Fund held futures contracts with average notional amounts of $78,349,127, $3,154,362, $16,333,957 and $25,367,454, respectively.
Warrants — A warrant is an option to purchase common stock of an issuer and is issued in conjunction with another security, such as a debt obligation. A warrant specifies the price at which the holder may purchase shares of common stock and usually expires after a period of time. A warrant holder generally may pay cash for the common stock to be purchased or may surrender the principal amount of the related debt security the warrant holder owns equal to the purchase price for the stock.
The common stock underlying a warrant may not increase in value after the date the warrant was issued, or may not increase up to the warrant exercise price. In this case, the warrant generally would have little value and could expire unexercised.
145
MoA FUNDS
NOTES TO FINANCIAL STATEMENTS (Unaudited) (Continued)
June 30, 2024
| 2. | SIGNIFICANT ACCOUNTING POLICIES (CONTINUED) |
Foreign Investment Risk — unaudited. — Foreign markets are subject to the risk of change in currency or exchange rates, economic and political trends in foreign countries, less liquidity, more volatility, more difficulty in enforcing contractual obligations, higher transaction costs and less government supervision and other reporting regulations and requirements than domestic markets. Foreign investment risks are greater in emerging markets than in developed markets. Domestic equities indices could outperform the MSCI EAFE Index for periods of time.
Investment Income — Interest income, accretion of discount and amortization of premium are recorded daily on an accrual basis using the effective interest method. A debt obligation may cease accrual of income and result in a reduction to interest income when the collection of all or a portion of current and past due interest is in doubt. Dividend income is recorded on the ex-dividend date. Non-cash dividends, if any, are recorded at the fair market value of the securities received. Foreign source tax withheld from dividends is recorded as a reduction from dividend income. The Funds may file withholding tax reclaims in certain jurisdictions to recover a portion of amounts previously withheld. These amounts are included in Interest and dividends receivable on the Statements of Assets and Liabilities and in Dividends on the Statements of Operations. At the six months-end June 30, 2024, the International Fund had a withholding tax reclaim receivable amount of $5,121,042.
Foreign Currency Translations — The accounting records of the Funds are maintained in U.S. dollars. Foreign currency amounts are translated into U.S. dollars at the current rate of exchange of such currency against the U.S. dollar to determine the value of investments, assets and liabilities. Purchases and sales of securities, and income and expenses are translated at the prevailing rate of exchange on the respective dates of such transactions.
Reported net realized gains and losses arise from the sales of portfolio securities, sales of foreign currencies, currency gains or losses realized between the trade and settlement dates on securities transactions and the difference between the amounts of dividends, interest and foreign withholding taxes recorded on the Fund’s books and the U.S. dollar equivalent of the amounts actually received or paid. As of December 31, 2023, the effect of changes in foreign exchange rates on the sale of foreign dominated securities was reflected separately in the net realized gain (loss) on foreign currency translations. For the six-months ended June 30, 2024, the effect of changes in foreign exchange rates on the sale of foreign denominated securities is reflected within the net realized gain (loss) on investment securities and is not reflected separately from the fluctuations arising from changes in the market price of securities sold. The effect of changes in foreign currency translations on securities held is reflected within the change in net unrealized appreciation (depreciation) of Investment securities and is not reflected separately from the fluctuations arising from changes in market prices of securities held.
Distributions to Shareholders (“Dividends”) — Distributions to shareholders are recorded on the ex-dividend date and are made at least annually. It is the Investment Company’s policy to make distributions of its net investment income and net realized gains, if any, in accordance with Federal income tax regulations, which may differ from U.S. generally accepted accounting principles. Accordingly, periodic reclassifications (which do not impact the Funds’ net asset values) are made within the Funds’ capital accounts to reflect income and gains available for distribution under Federal income tax regulations.
Federal Income Taxes — Each Fund in the Investment Company intends to continue to comply with the requirements of the Internal Revenue Code applicable to regulated investment companies and to distribute substantially all of its taxable income to shareholders annually. Therefore, no federal income or excise tax provision is required.
GAAP requires the evaluation of tax positions taken in the course of preparing a fund’s tax return to determine whether it is “more-likely-than-not” that tax positions taken in the fund’s tax return will be ultimately sustained, and, if not, a tax liability and expense is recorded.
As of December 31, 2023, management has evaluated the tax positions taken on the Funds’ filed tax returns for all open tax years and has concluded that no tax provision is required in any of the Funds’ financial statements. Generally, the statute of limitations is open for 3 years after the tax returns are filed. Each Fund’s federal, state and local income and federal excise tax returns for tax years for which the applicable statutes of limitations have not expired are subject to examination by the Internal Revenue Service and state departments of revenue.
146
MoA FUNDS
NOTES TO FINANCIAL STATEMENTS (Unaudited) (Continued)
June 30, 2024
| 2. | SIGNIFICANT ACCOUNTING POLICIES (CONTINUED) |
As of December 31, 2023, the following Funds had late-year, and capital loss carry-forwards available to offset net realized capital gains generated after December 31, 2022.
| | | | | | | | | | | | | | | | |
| | | Small Cap
Growth Fund | | | International
Fund | | | Intermediate
Bond Fund | | | Core Bond
Fund | |
Capital loss carry-forward — (short-term) | | $ | (7,227,213 | ) | | $ | (37,921,013 | ) | | $ | (724,220 | ) | | $ | (15,503,618 | ) |
Capital loss carry-forward — (long term) | | $ | — | | | $ | (53,469,467 | ) | | $ | (37,559,543 | ) | | $ | (72,218,470 | ) |
The ability to utilize capital loss carryforwards in the future may be limited under the Internal Revenue Code and related regulations based on the results of future transactions.
The Investment Company has an Investment Advisory Agreement with the Adviser, an indirect wholly-owned subsidiary of Mutual of America Life. For providing investment management services to each of the Funds of the Investment Company, the Adviser receives a fee, calculated as a daily charge of the value of the net assets of each Fund, at the following annual rates:
| | | | |
Fund | | Annual Investment
Management Fee | |
Allocation Funds | | | .00 | % |
Target Date Funds | | | .05 | % |
Equity Index, Mid Cap Equity Index, Small Cap Equity Index Funds | | | .075 | % |
Catholic Values Index and Money Market Funds | | | .15 | % |
Core Bond Fund | | | .39 | % |
All America, Balanced, International Fund (a), Intermediate Bond Funds | | | .40 | % |
Mid Cap Value Fund | | | .55 | % |
Small Cap Value, Small Cap Growth Funds | | | .75 | % |
| (a) | On March 12, 2024, the shareholders of the MoA International Fund approved an amendment to the Fund’s investment advisory agreement that amends the Fund’s management fee to the annual rate of 0.40% of the Fund’s average daily net assets. The change in management fee was effective on May 1, 2024. The Adviser has contractually agreed to waive 0.15% of this fee for the first two years. |
The Allocation and Target Date Funds incur direct investment management expenses of .00% and .05%, respectively. Shareholders in the Allocation and Target Date Funds indirectly bear their pro-rata share of the investment management fees incurred by the underlying funds in which they invest. Certain non-investment management operating expenses that can be attributed only to the Allocation and Target Date Funds are charged directly to those Funds.
The Investment Company and the Adviser have entered into an agreement under which the Adviser agrees to reimburse the direct non-investment management operating expenses of any Allocation or Target Date Fund (each a “Fund of Funds”) that has less than $50 million in average daily net assets for the prior calendar year. This agreement remains in effect through April 30, 2025 and continues into successive 12 month periods ending April 30 unless i) the Fund of Funds has at least $50 million in average daily net assets for the prior calendar year, ii) the Investment Company gives not less than 30 days written notice to the Adviser, or iii) the Adviser gives 45 days advance notice to the Investment Company before the next May 1 of a given year to terminate the agreement. In that case, the agreement will terminate on the next May 1 following the written notice. As of June 30, 2024, the Clear Passage 2065 Fund is the only Fund of Funds that qualifies for this expense limitation. The Investment Company and the Adviser have entered into an additional agreement under which the Adviser agrees to reimburse the non-investment management operating expenses of the Small Cap Equity Index Fund and the Catholic Values Index Fund to the extent that such operating expenses exceed 0.07% of the respective Fund’s net assets. This additional agreement remains in effect through April 30, 2025 and continues into successive 12 month periods ending April 30 unless i) the Investment Company gives not less than 30 days written notice to the Adviser, or ii) the Adviser gives 45 days advance notice to the Investment Company before the next May 1 of a given year to terminate the agreement. In that case, the agreement will terminate on the next May 1 following the written notice.
147
MoA FUNDS
NOTES TO FINANCIAL STATEMENTS (Unaudited) (Continued)
June 30, 2024
The Adviser also serves as an administrator for the Investment Company. On June 15, 2023, the Board of Directors of the Funds approved an Administration Agreement between the Funds and the Adviser. Under the terms of this Agreement, which became effective on July 1, 2023, the Adviser agrees to provide certain Administrative Services or bear the cost of certain affiliates providing such services, in exchange for a fee at an annual rate of 0.03% of each Fund’s average daily net assets. The administrative services provided by the Adviser include, among other items, coordination and supervision of the Funds’ other principal service providers; preparing and submitting reports to various regulatory agencies; compliance-related services; internal legal support; preparing and submitting reports and meeting materials to the Board of Directors; maintaining the Investment Company’s records; providing officers to the Funds; and negotiating and administering contractual arrangements with, and monitoring the performance of, service providers to the Funds. The Adviser has voluntarily agreed to waive 0.008% of this fee. This waiver may be modified or discontinued at any time. The fees to the Adviser from the Administration Agreement, effective July 1, 2023, are disclosed as Administrative expenses on the Statements of Operations. The effect of the waiver of expenses related to the Administrative Services and any non-investment management operating expense reimbursements by the Adviser are included in Fee waiver and expense reimbursement on the Statements of Operations. Amounts by Fund are listed below.
| | | | | | | | | | | | |
Fund | | Expense
Waiver | | | Expense
Reimbursement | | | Total | |
MoA Equity Index Fund | | $ | 217,814 | | | $ | — | | | $ | 217,814 | |
MoA All America Fund | | | 12,060 | | | | — | | | | 12,060 | |
MoA Small Cap Value Fund | | | 15,369 | | | | — | | | | 15,369 | |
MoA Small Cap Growth Fund | | | 15,984 | | | | — | | | | 15,984 | |
MoA Small Cap Equity Index Fund | | | 7,972 | | | | 135,865 | | | | 143,837 | |
MoA Mid Cap Value Fund | | | 6,483 | | | | — | | | | 6,483 | |
MoA Mid Cap Equity Index Fund | | | 60,377 | | | | — | | | | 60,377 | |
MoA Balanced Fund | | | 7,513 | | | | — | | | | 7,513 | |
MoA International Fund | | | 454,045 | | | | — | | | | 454,045 | |
MoA Catholic Values Index Fund | | | 246 | | | | 110,289 | | | | 110,535 | |
MoA Retirement Income Fund | | | 8,068 | | | | — | | | | 8,068 | |
MoA Clear Passage 2015 Fund | | | 4,359 | | | | — | | | | 4,359 | |
MoA Clear Passage 2020 Fund | | | 19,086 | | | | — | | | | 19,086 | |
MoA Clear Passage 2025 Fund | | | 44,649 | | | | — | | | | 44,649 | |
MoA Clear Passage 2030 Fund | | | 53,142 | | | | — | | | | 53,142 | |
MoA Clear Passage 2035 Fund | | | 51,004 | | | | — | | | | 51,004 | |
MoA Clear Passage 2040 Fund | | | 43,292 | | | | — | | | | 43,292 | |
MoA Clear Passage 2045 Fund | | | 44,515 | | | | — | | | | 44,515 | |
MoA Clear Passage 2050 Fund | | | 34,755 | | | | — | | | | 34,755 | |
MoA Clear Passage 2055 Fund | | | 19,185 | | | | — | | | | 19,185 | |
MoA Clear Passage 2060 Fund | | | 10,181 | | | | — | | | | 10,181 | |
MoA Clear Passage 2065 Fund | | | 3,274 | | | | 64,603 | | | | 67,877 | |
MoA Conservative Allocation Fund | | | 6,182 | | | | — | | | | 6,182 | |
MoA Moderate Allocation Fund | | | 16,093 | | | | — | | | | 16,093 | |
MoA Aggressive Allocation Fund | | | 13,491 | | | | — | | | | 13,491 | |
MoA Money Market Fund | | | 21,481 | | | | — | | | | 21,481 | |
MoA Intermediate Bond Fund | | | 36,722 | | | | — | | | | 36,722 | |
MoA Core Bond Fund | | | 82,960 | | | | — | | | | 82,960 | |
| | | | | | | | | | | | |
| | $ | 1,310,302 | | | $ | 310,757 | | | $ | 1,621,059 | |
| | | | | | | | | | | | |
Each Fund may pay a Shareholder Servicing Fee of up to $10 per account or 0.15% of average daily net assets, depending on the terms of the intermediary providing such services. These payments are in addition to the annual transfer agency fees paid by a Fund to the Transfer Agent. For the period ended June 30, 2024 the Funds did not pay any Shareholder Servicing Fees.
148
MoA FUNDS
NOTES TO FINANCIAL STATEMENTS (Unaudited) (Continued)
June 30, 2024
The cost of investment purchases and proceeds from sales of investments, excluding short-term securities and futures contracts, for the six months ended June 30, 2024, were as follows:
| | | | | | | | | | | | | | | | | | | | |
| | | Equity Index
Fund | | | All America
Fund | | | Small Cap
Value Fund | | | Small Cap
Growth Fund | | | Small Cap
Equity Index
Fund | |
Cost of investment purchases | | $ | 224,634,180 | | | $ | 38,304,498 | | | $ | 109,444,034 | | | $ | 102,603,163 | | | $ | 35,591,403 | |
| | | | | | | | | | | | | | | | | | | | |
Proceeds from sales of investments | | $ | (431,789,227 | ) | | $ | (56,146,385 | ) | | $ | (128,346,138 | ) | | $ | (132,243,029 | ) | | $ | (35,906,195 | ) |
| | | | | | | | | | | | | | | | | | | | |
| | | | | |
| | | Mid Cap
Value Fund | | | Mid Cap
Equity Index
Fund | | | Balanced
Fund | | | International
Fund | | | Catholic
Values Index
Fund | |
Cost of investment purchases | | $ | 31,494,240 | | | $ | 213,697,152 | | | $ | 40,724,347 | | | $ | 300,296,738 | | | $ | 958,541 | |
| | | | | | | | | | | | | | | | | | | | |
Proceeds from sales of investments | | $ | (25,483,526 | ) | | $ | (268,688,714 | ) | | $ | (45,940,282 | ) | | $ | (204,269,218 | ) | | $ | (675,499 | ) |
| | | | | | | | | | | | | | | | | | | | |
| | | | | |
| | | Retirement
Income Fund | | | Clear
Passage 2015
Fund | | | Clear
Passage 2020
Fund | | | Clear
Passage 2025
Fund | | | Clear
Passage 2030
Fund | |
Cost of investment purchases | | $ | 20,327,223 | | | $ | 10,971,618 | | | $ | 29,683,335 | | | $ | 94,767,193 | | | $ | 118,491,814 | |
| | | | | | | | | | | | | | | | | | | | |
Proceeds from sales of investments | | $ | (33,383,530 | ) | | $ | (16,404,481 | ) | | $ | (62,158,058 | ) | | $ | (156,464,044 | ) | | $ | (146,124,298 | ) |
| | | | | | | | | | | | | | | | | | | | |
| | | | | |
| | | Clear
Passage 2035
Fund | | | Clear
Passage 2040
Fund | | | Clear
Passage 2045
Fund | | | Clear
Passage 2050
Fund | | | Clear
Passage 2055
Fund | |
Cost of investment purchases | | $ | 135,936,634 | | | $ | 119,286,638 | | | $ | 102,349,334 | | | $ | 67,614,890 | | | $ | 54,399,342 | |
| | | | | | | | | | | | | | | | | | | | |
Proceeds from sales of investments | | $ | (122,004,067 | ) | | $ | (107,959,397 | ) | | $ | (92,387,506 | ) | | $ | (55,816,706 | ) | | $ | (34,681,248 | ) |
| | | | | | | | | | | | | | | | | | | | |
| | | Clear
Passage 2060
Fund | | | Clear
Passage 2065
Fund | | | Conservative
Allocation
Fund | | | Moderate
Allocation
Fund | | | Aggressive
Allocation
Fund | |
Cost of investment purchases | | $ | 38,233,446 | | | $ | 25,592,017 | | | $ | 18,241,038 | | | $ | 27,813,211 | | | $ | 20,627,204 | |
| | | | | | | | | | | | | | | | | | | | |
Proceeds from sales of investments | | $ | (14,941,433 | ) | | $ | (4,676,667 | ) | | $ | (25,582,919 | ) | | $ | (46,718,372 | ) | | $ | (37,152,336 | ) |
| | | | | | | | | | | | | | | | | | | | |
| | | | | |
| | | Intermediate
Bond Fund | | | Core
Bond Fund | | | | | | | | | | |
Cost of investment purchases | | $ | 279,944,964 | | | $ | 617,894,771 | | | | | | | | | | | | | |
| | | | | | | | | | | | | | | | | | | | |
Proceeds from sales of investments | | $ | (283,117,921 | ) | | $ | (513,092,175 | ) | | | | | | | | | | | | |
| | | | | | | | | | | | | | | | | | | | |
The cost of short-term security purchases for the Money Market Fund for the six months ended June 30, 2024, was $2,367,704,959; proceeds from sales for the same period were $2,453,392,156.
149
MoA FUNDS
NOTES TO FINANCIAL STATEMENTS (Unaudited) (Continued)
June 30, 2024
| 4. | INVESTMENTS (CONTINUED) |
The components of net unrealized appreciation (depreciation) of investments for federal income tax purposes and the cost of investments for federal income tax purposes at June 30, 2024 for each of the Funds were as follows:
| | | | | | | | | | | | | | | | | | | | |
| | | Equity Index
Fund | | | All America Fund | | | Small Cap Value
Fund | | | Small Cap
Growth Fund | | | Small Cap Equity
Index Fund | |
Unrealized Appreciation | | $ | 3,040,611,282 | | | $ | 109,449,122 | | | $ | 72,281,599 | | | $ | 78,309,817 | | | $ | 35,268,620 | |
Unrealized Depreciation | | $ | (145,114,672 | ) | | $ | (15,020,753 | ) | | $ | (29,855,479 | ) | | $ | (34,919,488 | ) | | $ | (28,849,228 | ) |
| | | | | | | | | | | | | | | | | | | | |
Net | | $ | 2,895,496,610 | | | $ | 94,428,369 | | | $ | 42,426,120 | | | $ | 43,390,329 | | | $ | 6,419,392 | |
| | | | | | | | | | | | | | | | | | | | |
Tax Cost of Investments | | $ | 2,756,999,301 | | | $ | 213,168,213 | | | $ | 333,605,075 | | | $ | 351,118,690 | | | $ | 193,075,743 | |
| | | | | | | | | | | | | | | | | | | | |
| | | | | |
| | | Mid Cap
Value Fund | | | Mid Cap Equity
Index Fund | | | Balanced
Fund | | | International
Fund | | | Catholic Values
Index Fund | |
Unrealized Appreciation | | $ | 32,618,910 | | | $ | 366,394,626 | | | $ | 54,445,835 | | | $ | 335,505,776 | | | $ | 2,022,649 | |
Unrealized Depreciation | | $ | (6,764,434 | ) | | $ | (106,210,287 | ) | | $ | (6,098,033 | ) | | $ | (135,542,857 | ) | | $ | (258,343 | ) |
| | | | | | | | | | | | | | | | | | | | |
Net | | $ | 25,854,476 | | | $ | 260,184,339 | | | $ | 48,347,802 | | | $ | 199,962,919 | | | $ | 1,764,306 | |
| | | | | | | | | | | | | | | | | | | | |
Tax Cost of Investments | | $ | 142,275,184 | | | $ | 1,242,077,129 | | | $ | 145,917,301 | | | $ | 1,383,876,757 | | | $ | 5,083,337 | |
| | | | | | | | | | | | | | | | | | | | |
| | | | | |
| | | Retirement
Income
Fund | | | Clear Passage
2015
Fund | | | Clear Passage
2020
Fund | | | Clear Passage
2025
Fund | | | Clear Passage
2030
Fund | |
Unrealized Appreciation | | $ | 11,734,694 | | | $ | 5,131,576 | | | $ | 28,848,871 | | | $ | 81,590,521 | | | $ | 119,020,121 | |
Unrealized Depreciation | | $ | (18,436,749 | ) | | $ | (9,491,971 | ) | | $ | (38,761,091 | ) | | $ | (69,757,138 | ) | | $ | (59,584,990 | ) |
| | | | | | | | | | | | | | | | | | | | |
Net | | $ | (6,702,055 | ) | | $ | (4,360,395 | ) | | $ | (9,912,220 | ) | | $ | 11,833,383 | | | $ | 59,435,131 | |
| | | | | | | | | | | | | | | | | | | | |
Tax Cost of Investments | | $ | 205,754,702 | | | $ | 113,407,476 | | | $ | 483,242,893 | | | $ | 1,102,635,853 | | | $ | 1,293,032,297 | |
| | | | | | | | | | | | | | | | | | | | |
| | | | | |
| | | Clear Passage
2035
Fund | | | Clear Passage
2040
Fund | | | Clear Passage
2045
Fund | | | Clear Passage
2050
Fund | | | Clear Passage
2055
Fund | |
Unrealized Appreciation | | $ | 135,061,890 | | | $ | 119,818,349 | | | $ | 131,884,026 | | | $ | 104,791,918 | | | $ | 52,909,055 | |
Unrealized Depreciation | | $ | (47,278,771 | ) | | $ | (32,965,142 | ) | | $ | (30,500,504 | ) | | $ | (22,606,497 | ) | | $ | (11,056,872 | ) |
| | | | | | | | | | | | | | | | | | | | |
Net | | $ | 87,783,119 | | | $ | 86,853,207 | | | $ | 101,383,522 | | | $ | 82,185,421 | | | $ | 41,852,183 | |
| | | | | | | | | | | | | | | | | | | | |
Tax Cost of Investments | | $ | 1,242,836,263 | | | $ | 1,044,204,288 | | | $ | 1,065,899,362 | | | $ | 830,755,333 | | | $ | 468,385,041 | |
| | | | | | | | | | | | | | | | | | | | |
| | | Clear Passage
2060
Fund | | | Clear Passage
2065
Fund | | | Conservative
Allocation Fund | | | Moderate
Allocation Fund | | | Aggressive
Allocation Fund | |
Unrealized Appreciation | | $ | 25,521,520 | | | $ | 10,018,107 | | | $ | 9,836,000 | | | $ | 45,497,214 | | | $ | 42,896,681 | |
Unrealized Depreciation | | $ | (4,712,310 | ) | | $ | (2,131,830 | ) | | $ | (13,029,172 | ) | | $ | (21,741,539 | ) | | $ | (13,361,549 | ) |
| | | | | | | | | | | | | | | | | | | | |
Net | | $ | 20,809,210 | | | $ | 7,886,277 | | | $ | (3,193,172 | ) | | $ | 23,755,675 | | | $ | 29,535,132 | |
| | | | | | | | | | | | | | | | | | | | |
Tax Cost of Investments | | $ | 256,907,065 | | | $ | 87,638,725 | | | $ | 158,637,813 | | | $ | 382,851,378 | | | $ | 311,388,388 | |
| | | | | | | | | | | | | | | | | | | | |
150
MoA FUNDS
NOTES TO FINANCIAL STATEMENTS (Unaudited) (Continued)
June 30, 2024
| 4. | INVESTMENTS (CONTINUED) |
| | | | | | | | | | | | | | | | | | | | |
| | | | | |
| | | Money
Market Fund | | | Intermediate
Bond Fund | | | Core Bond Fund | | | | | | | |
Unrealized Appreciation | | $ | — | | | $ | 1,882,262 | | | $ | 4,058,073 | | | | | | | | | |
Unrealized Depreciation | | $ | (164 | ) | | $ | (29,162,464 | ) | | $ | (164,772,864 | ) | | | | | | | | |
| | | | | | | | | | | | | | | | | | | | |
Net | | $ | (164 | ) | | $ | (27,280,202 | ) | | $ | (160,714,791 | ) | | | | | | | | |
| | | | | | | | | | | | | | | | | | | | |
Tax Cost of Investments | | $ | 517,572,818 | | | $ | 949,883,766 | | | $ | 2,257,462,512 | | | | | | | | | |
| | | | | | | | | | | | | | | | | | | | |
Differences between amounts reflected in the Statements of Assets and Liabilities and those computed for federal income tax purposes arise primarily from federal income tax treatment of wash sales, REITs, PFICs, partnerships, corporate actions and futures contracts.
The Target Date and Allocation Funds are invested in affiliated funds of the Investment Company and receive dividend income and distributions of gains entirely from these affiliated funds. Realized gains and losses result from the disposition of shares of these underlying funds. The Target Date and Allocation Funds also derive unrealized gains and losses entirely from these affiliated funds. Investments in affiliated investment companies during the six months ended June 30, 2024 were as follows:
| | | | | | | | | | | | | | | | | | | | | | | | | | | | |
Affiliated Investment
Company | | Value as of
December 31,
2023 | | | Purchases | | | Realized
Gain
(Loss) on
Investment
Securities | | | Change in
Unrealized
Appreciation
(Depreciation)
of Investment
Securities | | | Sales | | | Value as of
June 30,
2024 | | | Dividends | |
MoA Retirement Income Fund | | | | | | | | | | | | | | | | | | | | | | | | | | | | |
MoA Core Bond Fund | | $ | 68,302,939 | | | $ | 9,495,706 | | | $ | (1,887,119 | ) | | $ | 390,375 | | | $ | (9,652,244 | ) | | $ | 66,649,657 | | | $ | 1,018,812 | |
MoA Equity Index Fund | | | 42,451,039 | | | | 2,618,649 | | | | 1,261,307 | | | | 4,622,228 | | | | (7,387,322 | ) | | | 43,565,901 | | | | 231,855 | |
MoA Intermediate Bond Fund | | | 64,464,284 | | | | 4,444,293 | | | | (1,523,381 | ) | | | 844,913 | | | | (8,729,312 | ) | | | 59,500,797 | | | | 864,098 | |
MoA International Fund | | | 8,572,736 | | | | 2,284,971 | | | | (2,143 | ) | | | 418,537 | | | | (1,371,552 | ) | | | 9,902,549 | | | | 188,272 | |
MoA Mid Cap Equity Index Fund | | | 8,767,604 | | | | 523,582 | | | | (369,169 | ) | | | 854,112 | | | | (1,597,241 | ) | | | 8,178,888 | | | | 46,225 | |
MoA Mid Cap Value Fund | | | 520,207 | | | | 121,692 | | | | 14,211 | | | | (181 | ) | | | (274,309 | ) | | | 381,620 | | | | 2,353 | |
MoA Money Market Fund | | | 14,349,431 | | | | 838,330 | | | | 25,367 | | | | 31,657 | | | | (4,371,550 | ) | | | 10,873,235 | | | | 241,632 | |
| | | | | | | | | | | | | | | | | | | | | | | | | | | | |
Total | | $ | 207,428,240 | | | $ | 20,327,223 | | | $ | (2,480,927 | ) | | $ | 7,161,641 | | | $ | (33,383,530 | ) | | $ | 199,052,647 | | | $ | 2,593,247 | |
| | | | | | | | | | | | | | | | | | | | | | | | | | | | |
| | | | | | | |
MoA Clear Passage 2015 Fund | | | | | | | | | | | | | | | | | | | | | | | | | | | | |
MoA Core Bond Fund | | $ | 35,657,295 | | | $ | 5,924,447 | | | $ | (1,026,989 | ) | | $ | 247,217 | | | $ | (4,063,547 | ) | | $ | 36,738,423 | | | $ | 551,423 | |
MoA Equity Index Fund | | | 25,067,920 | | | | 1,168,789 | | | | 1,418,469 | | | | 2,045,587 | | | | (4,664,619 | ) | | | 25,036,146 | | | | 133,778 | |
MoA Intermediate Bond Fund | | | 31,641,875 | | | | 2,899,466 | | | | (293,334 | ) | | | (24,667 | ) | | | (3,260,127 | ) | | | 30,963,213 | | | | 430,156 | |
MoA International Fund | | | 6,170,016 | | | | 345,888 | | | | 22,965 | | | | 249,212 | | | | (1,265,396 | ) | | | 5,522,685 | | | | 105,457 | |
MoA Mid Cap Equity Index Fund | | | 4,693,370 | | | | 219,044 | | | | (6,453 | ) | | | 260,100 | | | | (460,317 | ) | | | 4,705,744 | | | | 26,699 | |
MoA Mid Cap Value Fund | | | 567,466 | | | | 51,256 | | | | 5,785 | | | | 9,407 | | | | (115,079 | ) | | | 518,835 | | | | 3,171 | |
MoA Money Market Fund | | | 7,743,613 | | | | 362,728 | | | | 17,660 | | | | 13,430 | | | | (2,575,396 | ) | | | 5,562,035 | | | | 122,297 | |
| | | | | | | | | | | | | | | | | | | | | | | | | | | | |
Total | | $ | 111,541,555 | | | $ | 10,971,618 | | | $ | 138,103 | | | $ | 2,800,286 | | | $ | (16,404,481 | ) | | $ | 109,047,081 | | | $ | 1,372,981 | |
| | | | | | | | | | | | | | | | | | | | | | | | | | | | |
| | | | | | | |
MoA Clear Passage 2020 Fund | | | | | | | | | | | | | | | | | | | | | | | | | | | | |
MoA Core Bond Fund | | $ | 161,030,728 | | | $ | 19,381,346 | | | $ | (4,568,589 | ) | | $ | 1,035,725 | | | $ | (17,148,364 | ) | | $ | 159,730,846 | | | $ | 2,426,771 | |
MoA Equity Index Fund | | | 115,016,170 | | | | 2,833,201 | | | | 5,134,683 | | | | 10,778,692 | | | | (15,645,460 | ) | | | 118,117,286 | | | | 629,275 | |
MoA Intermediate Bond Fund | | | 104,894,488 | | | | 4,121,479 | | | | (773,420 | ) | | | (317,243 | ) | | | (10,013,393 | ) | | | 97,911,911 | | | | 1,409,197 | |
MoA International Fund | | | 39,452,711 | | | | 1,306,135 | | | | (160,683 | ) | | | 1,817,895 | | | | (9,037,798 | ) | | | 33,378,260 | | | | 635,375 | |
MoA Mid Cap Equity Index Fund | | | 25,699,695 | | | | 572,562 | | | | 78,443 | | | | 1,311,759 | | | | (2,202,867 | ) | | | 25,459,592 | | | | 143,832 | |
MoA Mid Cap Value Fund | | | 797,118 | | | | 98,645 | | | | 23,535 | | | | (4,522 | ) | | | (476,826 | ) | | | 437,950 | | | | 2,822 | |
MoA Money Market Fund | | | 31,268,227 | | | | 1,056,165 | | | | 39,587 | | | | 83,738 | | | | (6,384,141 | ) | | | 26,063,576 | | | | 577,051 | |
151
MoA FUNDS
NOTES TO FINANCIAL STATEMENTS (Unaudited) (Continued)
June 30, 2024
| 4. | INVESTMENTS (CONTINUED) |
| | | | | | | | | | | | | | | | | | | | | | | | | | | | |
Affiliated Investment
Company | | Value as of
December 31,
2023 | | | Purchases | | | Realized
Gain
(Loss) on
Investment
Securities | | | Change in
Unrealized
Appreciation
(Depreciation)
of Investment
Securities | | | Sales | | | Value as of
June 30,
2024 | | | Dividends | |
| | | | | | |
MoA Clear Passage 2020 Fund (continued) | | | | | | | | | | | | | | | | | | | | | | | | | |
MoA Small Cap Equity Index Fund | | $ | 3,662,734 | | | $ | 118,139 | | | $ | 41,886 | | | $ | (95,313 | ) | | $ | (476,828 | ) | | $ | 3,250,618 | | | $ | 22,317 | |
MoA Small Cap Value Fund | | | 9,615,535 | | | | 195,663 | | | | (58,199 | ) | | | 16 | | | | (772,381 | ) | | | 8,980,634 | | | | 54,401 | |
| | | | | | | | | | | | | | | | | | | | | | | | | | | | |
Total | | $ | 491,437,406 | | | $ | 29,683,335 | | | $ | (242,757 | ) | | $ | 14,610,747 | | | $ | (62,158,058 | ) | | $ | 473,330,673 | | | $ | 5,901,041 | |
| | | | | | | | | | | | | | | | | | | | | | | | | | | | |
| | | | | | | |
MoA Clear Passage 2025 Fund | | | | | | | | | | | | | | | | | | | | | | | | | | | | |
MoA Core Bond Fund | | $ | 349,549,036 | | | $ | 55,593,426 | | | $ | (8,691,660 | ) | | $ | 1,032,158 | | | $ | (36,232,900 | ) | | $ | 361,250,060 | | | $ | 5,385,327 | |
MoA Equity Index Fund | | | 342,798,541 | | | | 11,850,856 | | | | 18,233,703 | | | | 29,403,746 | | | | (55,305,515 | ) | | | 346,981,331 | | | | 1,850,605 | |
MoA Intermediate Bond Fund | | | 169,028,884 | | | | 16,473,491 | | | | (1,953,224 | ) | | | 217,794 | | | | (16,617,887 | ) | | | 167,149,058 | | | | 2,324,925 | |
MoA International Fund | | | 123,493,342 | | | | 5,497,500 | | | | (549,636 | ) | | | 6,174,508 | | | | (22,790,711 | ) | | | 111,825,003 | | | | 2,131,096 | |
MoA Mid Cap Equity Index Fund | | | 58,988,175 | | | | 1,918,901 | | | | (1,432,336 | ) | | | 4,671,659 | | | | (4,963,535 | ) | | | 59,182,864 | | | | 334,659 | |
MoA Mid Cap Value Fund | | | 4,141,068 | | | | 358,356 | | | | 71,716 | | | | 46,133 | | | | (1,079,070 | ) | | | 3,538,203 | | | | 21,715 | |
MoA Money Market Fund | | | 51,775,475 | | | | 1,893,733 | | | | 83,767 | | | | 106,189 | | | | (16,237,213 | ) | | | 37,621,951 | | | | 883,812 | |
MoA Small Cap Equity Index Fund | | | 9,760,204 | | | | 398,001 | | | | 21,133 | | | | (161,753 | ) | | | (1,079,071 | ) | | | 8,938,514 | | | | 61,361 | |
MoA Small Cap Value Fund | | | 19,463,675 | | | | 782,929 | | | | (174,177 | ) | | | 67,967 | | | | (2,158,142 | ) | | | 17,982,252 | | | | 109,648 | |
| | | | | | | | | | | | | | | | | | | | | | | | | | | | |
Total | | $ | 1,128,998,400 | | | $ | 94,767,193 | | | $ | 5,609,286 | | | $ | 41,558,401 | | | $ | (156,464,044 | ) | | $ | 1,114,469,236 | | | $ | 13,103,148 | |
| | | | | | | | | | | | | | | | | | | | | | | | | | | | |
| | | | | | | |
MoA Clear Passage 2030 Fund | | | | | | | | | | | | | | | | | | | | | | | | | | | | |
MoA Core Bond Fund | | $ | 327,183,223 | | | $ | 64,906,245 | | | $ | (5,626,463 | ) | | $ | (1,402,496 | ) | | $ | (26,836,883 | ) | | $ | 358,223,626 | | | $ | 5,085,920 | |
MoA Equity Index Fund | | | 462,321,802 | | | | 21,270,921 | | | | 22,540,053 | | | | 43,033,203 | | | | (59,427,790 | ) | | | 489,738,189 | | | | 2,597,550 | |
MoA Intermediate Bond Fund | | | 151,379,099 | | | | 8,007,493 | | | | (1,373,142 | ) | | | (208,463 | ) | | | (10,501,599 | ) | | | 147,303,388 | | | | 2,091,640 | |
MoA International Fund | | | 169,813,926 | | | | 9,536,734 | | | | 64,675 | | | | 8,759,684 | | | | (25,456,290 | ) | | | 162,718,729 | | | | 3,083,077 | |
MoA Mid Cap Equity Index Fund | | | 81,395,372 | | | | 3,550,856 | | | | (1,537,965 | ) | | | 6,055,925 | | | | (5,309,521 | ) | | | 84,154,667 | | | | 473,825 | |
MoA Mid Cap Value Fund | | | 7,189,094 | | | | 6,145,717 | | | | 207,880 | | | | 22,358 | | | | (1,909,381 | ) | | | 11,655,668 | | | | 70,107 | |
MoA Money Market Fund | | | 56,149,726 | | | | 2,685,209 | | | | 48,996 | | | | 155,343 | | | | (12,864,072 | ) | | | 46,175,202 | | | | 1,071,796 | |
MoA Small Cap Equity Index Fund | | | 16,403,136 | | | | 645,759 | | | | (78,663 | ) | | | (158,674 | ) | | | (954,691 | ) | | | 15,856,867 | | | | 107,954 | |
MoA Small Cap Growth Fund | | | 15,196,974 | | | | 537,804 | | | | (177,149 | ) | | | 650,657 | | | | (954,690 | ) | | | 15,253,596 | | | | — | |
MoA Small Cap Value Fund | | | 22,207,060 | | | | 1,205,076 | | | | (59,392 | ) | | | (55,867 | ) | | | (1,909,381 | ) | | | 21,387,496 | | | | 129,466 | |
| | | | | | | | | | | | | | | | | | | | | | | | | | | | |
Total | | $ | 1,309,239,412 | | | $ | 118,491,814 | | | $ | 14,008,830 | | | $ | 56,851,670 | | | $ | (146,124,298 | ) | | $ | 1,352,467,428 | | | $ | 14,711,335 | |
| | | | | | | | | | | | | | | | | | | | | | | | | | | | |
| | | | | | | |
MoA Clear Passage 2035 Fund | | | | | | | | | | | | | | | | | | | | | | | | | | | | |
MoA Core Bond Fund | | $ | 225,781,686 | | | $ | 60,045,451 | | | $ | (2,982,446 | ) | | $ | (1,748,786 | ) | | $ | (15,529,559 | ) | | $ | 265,566,346 | | | $ | 3,560,872 | |
MoA Equity Index Fund | | | 519,654,103 | | | | 33,432,961 | | | | 26,872,007 | | | | 47,652,534 | | | | (62,262,097 | ) | | | 565,349,508 | | | | 2,989,186 | |
MoA Intermediate Bond Fund | | | 71,848,930 | | | | 9,433,101 | | | | (99,484 | ) | | | (620,897 | ) | | | (4,341,339 | ) | | | 76,220,311 | | | | 1,015,107 | |
MoA International Fund | | | 193,932,543 | | | | 14,799,939 | | | | (268,252 | ) | | | 10,222,519 | | | | (19,853,349 | ) | | | 198,833,400 | | | | 3,754,953 | |
MoA Mid Cap Equity Index Fund | | | 107,961,474 | | | | 6,259,933 | | | | (626,975 | ) | | | 6,666,403 | | | | (9,505,713 | ) | | | 110,755,122 | | | | 621,916 | |
MoA Mid Cap Value Fund | | | 6,301,342 | | | | 5,535,833 | | | | 118,300 | | | | 76,502 | | | | (1,447,114 | ) | | | 10,584,863 | | | | 63,169 | |
MoA Money Market Fund | | | 46,691,984 | | | | 3,199,977 | | | | 18,094 | | | | 154,269 | | | | (6,170,670 | ) | | | 43,893,654 | | | | 990,981 | |
MoA Small Cap Equity Index Fund | | | 20,852,358 | | | | 876,884 | | | | (57,163 | ) | | | (248,833 | ) | | | (723,557 | ) | | | 20,699,689 | | | | 140,550 | |
MoA Small Cap Growth Fund | | | 14,435,564 | | | | 736,333 | | | | (237,305 | ) | | | 691,960 | | | | (723,556 | ) | | | 14,902,996 | | | | — | |
MoA Small Cap Value Fund | | | 23,777,714 | | | | 1,616,222 | | | | (13,366 | ) | | | (119,964 | ) | | | (1,447,113 | ) | | | 23,813,493 | | | | 143,558 | |
| | | | | | | | | | | | | | | | | | | | | | | | | | | | |
Total | | $ | 1,231,237,698 | | | $ | 135,936,634 | | | $ | 22,723,410 | | | $ | 62,725,707 | | | $ | (122,004,067 | ) | | $ | 1,330,619,382 | | | $ | 13,280,292 | |
| | | | | | | | | | | | | | | | | | | | | | | | | | | | |
| | | | | | | |
MoA Clear Passage 2040 Fund | | | | | | | | | | | | | | | | | | | | | | | | | | | | |
MoA Core Bond Fund | | $ | 145,076,502 | | | $ | 21,183,196 | | | $ | (1,150,581 | ) | | $ | (1,887,029 | ) | | $ | (7,696,591 | ) | | $ | 155,525,497 | | | $ | 2,205,682 | |
MoA Equity Index Fund | | | 488,597,615 | | | | 26,151,520 | | | | 27,536,619 | | | | 41,839,603 | | | | (71,635,199 | ) | | | 512,490,158 | | | | 2,722,139 | |
MoA Intermediate Bond Fund | | | 23,713,889 | | | | 33,418,370 | | | | 6,597 | | | | (68,135 | ) | | | (1,589,311 | ) | | | 55,481,410 | | | | 424,581 | |
152
MoA FUNDS
NOTES TO FINANCIAL STATEMENTS (Unaudited) (Continued)
June 30, 2024
| 4. | INVESTMENTS (CONTINUED) |
| | | | | | | | | | | | | | | | | | | | | | | | | | | | |
Affiliated Investment
Company | | Value as of
December 31,
2023 | | | Purchases | | | Realized
Gain
(Loss) on
Investment
Securities | | | Change in
Unrealized
Appreciation
(Depreciation)
of Investment
Securities | | | Sales | | | Value as of
June 30,
2024 | | | Dividends | |
| | | | | | |
MoA Clear Passage 2040 Fund (continued) | | | | | | | | | | | | | | | | | | | | | | | | | |
MoA International Fund | | $ | 184,744,601 | | | $ | 27,823,177 | | | $ | 2,097 | | | $ | 9,274,656 | | | $ | (9,216,973 | ) | | $ | 212,627,558 | | | $ | 3,953,454 | |
MoA Mid Cap Equity Index Fund | | | 101,558,742 | | | | 5,194,905 | | | | 728,126 | | | | 4,960,787 | | | | (7,510,662 | ) | | | 104,931,898 | | | | 588,397 | |
MoA Mid Cap Value Fund | | | 8,462,042 | | | | 1,075,929 | | | | 100,451 | | | | 151,084 | | | | (1,002,369 | ) | | | 8,787,137 | | | | 52,260 | |
MoA Money Market Fund | | | 26,311,342 | | | | 1,602,315 | | | | 4,939 | | | | 101,503 | | | | (1,002,368 | ) | | | 27,017,731 | | | | 578,648 | |
MoA Small Cap Equity Index Fund | | | 22,126,451 | | | | 1,172,621 | | | | 183,722 | | | | (505,415 | ) | | | (1,002,370 | ) | | | 21,975,009 | | | | 148,953 | |
MoA Small Cap Growth Fund | | | 13,262,420 | | | | 511,834 | | | | (1,192,389 | ) | | | 1,695,364 | | | | (3,501,185 | ) | | | 10,776,044 | | | | — | |
MoA Small Cap Value Fund | | | 24,114,743 | | | | 1,152,771 | | | | (68,773 | ) | | | 48,681 | | | | (3,802,369 | ) | | | 21,445,053 | | | | 129,103 | |
| | | | | | | | | | | | | | | | | | | | | | | | | | | | |
Total | | $ | 1,037,968,347 | | | $ | 119,286,638 | | | $ | 26,150,808 | | | $ | 55,611,099 | | | $ | (107,959,397 | ) | | $ | 1,131,057,495 | | | $ | 10,803,217 | |
| | | | | | | | | | | | | | | | | | | | | | | | | | | | |
| | | | | | | |
MoA Clear Passage 2045 Fund | | | | | | | | | | | | | | | | | | | | | | | | | | | | |
MoA Core Bond Fund | | $ | 103,363,845 | | | $ | 12,800,804 | | | $ | (1,113,959 | ) | | $ | (999,506 | ) | | $ | (5,482,173 | ) | | $ | 108,569,011 | | | $ | 1,529,582 | |
MoA Equity Index Fund | | | 513,601,033 | | | | 26,812,253 | | | | 26,673,434 | | | | 46,851,280 | | | | (59,517,404 | ) | | | 554,420,596 | | | | 2,942,046 | |
MoA Intermediate Bond Fund | | | 22,559,850 | | | | 13,232,825 | | | | 1,841 | | | | (173,259 | ) | | | (1,354,905 | ) | | | 34,266,352 | | | | 348,198 | |
MoA International Fund | | | 205,989,584 | | | | 35,856,488 | | | | 1,242,308 | | | | 8,960,586 | | | | (10,430,642 | ) | | | 241,618,324 | | | | 4,497,588 | |
MoA Mid Cap Equity Index Fund | | | 115,504,612 | | | | 5,579,908 | | | | 473,141 | | | | 5,959,390 | | | | (6,969,129 | ) | | | 120,547,922 | | | | 675,779 | |
MoA Mid Cap Value Fund | | | 7,082,559 | | | | 3,073,008 | | | | 112,713 | | | | 97,493 | | | | (1,026,651 | ) | | | 9,339,122 | | | | 55,474 | |
MoA Money Market Fund | | | 29,072,758 | | | | 1,654,864 | | | | 4,094 | | | | 113,231 | | | | (1,026,650 | ) | | | 29,818,297 | | | | 637,329 | |
MoA Small Cap Equity Index Fund | | | 25,362,539 | | | | 1,174,474 | | | | 570,902 | | | | (915,992 | ) | | | (3,026,651 | ) | | | 23,165,272 | | | | 156,939 | |
MoA Small Cap Growth Fund | | | 24,672,346 | | | | 1,017,535 | | | | (77,218 | ) | | | 903,192 | | | | (2,526,650 | ) | | | 23,989,205 | | | | — | |
MoA Small Cap Value Fund | | | 21,547,885 | | | | 1,147,175 | | | | 253,465 | | | | (373,091 | ) | | | (1,026,651 | ) | | | 21,548,783 | | | | 129,641 | |
| | | | | | | | | | | | | | | | | | | | | | | | | | | | |
Total | | $ | 1,068,757,011 | | | $ | 102,349,334 | | | $ | 28,140,721 | | | $ | 60,423,324 | | | $ | (92,387,506 | ) | | $ | 1,167,282,884 | | | $ | 10,972,576 | |
| | | | | | | | | | | | | | | | | | | | | | | | | | | | |
| | | | | | | |
MoA Clear Passage 2050 Fund | | | | | | | | | | | | | | | | | | | | | | | | | | | | |
MoA Core Bond Fund | | $ | 67,946,967 | | | $ | 6,031,708 | | | $ | (666,132 | ) | | $ | (758,329 | ) | | $ | (3,816,600 | ) | | $ | 68,737,614 | | | $ | 1,007,833 | |
MoA Equity Index Fund | | | 398,727,995 | | | | 24,504,108 | | | | 10,691,724 | | | | 47,660,755 | | | | (29,493,162 | ) | | | 452,091,420 | | | | 2,427,188 | |
MoA Intermediate Bond Fund | | | 12,705,013 | | | | 924,735 | | | | 10,303 | | | | (142,124 | ) | | | (714,740 | ) | | | 12,783,187 | | | | 177,414 | |
MoA International Fund | | | 164,771,529 | | | | 23,797,453 | | | | (364,764 | ) | | | 8,737,917 | | | | (8,618,040 | ) | | | 188,324,095 | | | | 3,397,276 | |
MoA Mid Cap Equity Index Fund | | | 97,799,882 | | | | 5,517,199 | | | | 1,032,299 | | | | 4,450,740 | | | | (7,514,305 | ) | | | 101,285,815 | | | | 567,526 | |
MoA Mid Cap Value Fund | | | 12,866,414 | | | | 2,474,608 | | | | 81,607 | | | | 299,572 | | | | (1,270,871 | ) | | | 14,451,330 | | | | 85,914 | |
MoA Money Market Fund | | | 19,149,692 | | | | 1,347,407 | | | | 2,592 | | | | 74,722 | | | | (847,246 | ) | | | 19,727,167 | | | | 421,611 | |
MoA Small Cap Equity Index Fund | | | 21,668,235 | | | | 1,065,233 | | | | 346,776 | | | | (650,300 | ) | | | (1,847,247 | ) | | | 20,582,697 | | | | 139,436 | |
MoA Small Cap Growth Fund | | | 17,551,187 | | | | 925,796 | | | | (16,366 | ) | | | 573,282 | | | | (847,248 | ) | | | 18,186,651 | | | | — | |
MoA Small Cap Value Fund | | | 16,682,343 | | | | 1,026,643 | | | | 150,865 | | | | (241,826 | ) | | | (847,247 | ) | | | 16,770,778 | | | | 100,846 | |
| | | | | | | | | | | | | | | | | | | | | | | | | | | | |
Total | | $ | 829,869,257 | | | $ | 67,614,890 | | | $ | 11,268,904 | | | $ | 60,004,409 | | | $ | (55,816,706 | ) | | $ | 912,940,754 | | | $ | 8,325,044 | |
| | | | | | | | | | | | | | | | | | | | | | | | | | | | |
| | | | | | | |
MoA Clear Passage 2055 Fund | | | | | | | | | | | | | | | | | | | | | | | | | | | | |
MoA Core Bond Fund | | $ | 30,739,770 | | | $ | 3,106,597 | | | $ | (371,155 | ) | | $ | (271,724 | ) | | $ | (1,658,966 | ) | | $ | 31,544,522 | | | $ | 458,864 | |
MoA Equity Index Fund | | | 220,647,932 | | | | 19,638,944 | | | | 6,341,060 | | | | 26,251,841 | | | | (19,492,511 | ) | | | 253,387,266 | | | | 1,349,867 | |
MoA Intermediate Bond Fund | | | 6,586,145 | | | | 3,602,769 | | | | 76 | | | | (52,473 | ) | | | (310,807 | ) | | | 9,825,710 | | | | 101,991 | |
MoA International Fund | | | 92,694,546 | | | | 18,076,076 | | | | 59,935 | | | | 4,635,160 | | | | (4,790,885 | ) | | | 110,674,832 | | | | 2,010,349 | |
MoA Mid Cap Equity Index Fund | | | 53,506,478 | | | | 4,470,629 | | | | (540,619 | ) | | | 3,593,140 | | | | (5,464,040 | ) | | | 55,565,588 | | | | 309,904 | |
MoA Mid Cap Value Fund | | | 6,570,853 | | | | 2,183,617 | | | | 30,759 | | | | 171,570 | | | | (672,011 | ) | | | 8,284,788 | | | | 48,875 | |
MoA Money Market Fund | | | 6,186,564 | | | | 515,925 | | | | 1,058 | | | | 24,245 | | | | (224,003 | ) | | | 6,503,789 | | | | 137,678 | |
MoA Small Cap Equity Index Fund | | | 12,605,492 | | | | 1,222,113 | | | | 124,378 | | | | (305,395 | ) | | | (672,011 | ) | | | 12,974,577 | | | | 87,370 | |
MoA Small Cap Growth Fund | | | 9,714,146 | | | | 756,495 | | | | (407,608 | ) | | | 736,992 | | | | (948,007 | ) | | | 9,852,018 | | | | — | |
MoA Small Cap Value Fund | | | 11,305,523 | | | | 826,177 | | | | 27,867 | | | | (87,426 | ) | | | (448,007 | ) | | | 11,624,134 | | | | 69,682 | |
| | | | | | | | | | | | | | | | | | | | | | | | | | | | |
Total | | $ | 450,557,449 | | | $ | 54,399,342 | | | $ | 5,265,751 | | | $ | 34,695,930 | | | $ | (34,681,248 | ) | | $ | 510,237,224 | | | $ | 4,574,580 | |
| | | | | | | | | | | | | | | | | | | | | | | | | | | | |
153
MoA FUNDS
NOTES TO FINANCIAL STATEMENTS (Unaudited) (Continued)
June 30, 2024
| 4. | INVESTMENTS (CONTINUED) |
| | | | | | | | | | | | | | | | | | | | | | | | | | | | |
Affiliated Investment
Company | | Value as of
December 31,
2023 | | | Purchases | | | Realized
Gain
(Loss) on
Investment
Securities | | | Change in
Unrealized
Appreciation
(Depreciation)
of Investment
Securities | | | Sales | | | Value as of
June 30,
2024 | | | Dividends | |
| | | | | | | |
MoA Clear Passage 2060 Fund | | | | | | | | | | | | | | | | | | | | | | | | | | | | |
MoA Core Bond Fund | | $ | 12,194,896 | | | $ | 1,690,069 | | | $ | (148,098 | ) | | $ | (106,334 | ) | | $ | (509,915 | ) | | $ | 13,120,618 | | | $ | 185,970 | |
MoA Equity Index Fund | | | 111,965,072 | | | | 14,953,484 | | | | 2,383,034 | | | | 14,533,667 | | | | (8,608,863 | ) | | | 135,226,394 | | | | 717,257 | |
MoA Intermediate Bond Fund | | | 2,980,758 | | | | 1,945,642 | | | | 3,688 | | | | (24,214 | ) | | | (622,135 | ) | | | 4,283,739 | | | | 43,241 | |
MoA International Fund | | | 50,407,039 | | | | 12,057,252 | | | | 345,935 | | | | 2,230,779 | | | | (2,025,381 | ) | | | 63,015,624 | | | | 1,137,634 | |
MoA Mid Cap Equity Index Fund | | | 29,704,376 | | | | 3,796,221 | | | | (447,868 | ) | | | 2,139,192 | | | | (1,587,570 | ) | | | 33,604,351 | | | | 186,377 | |
MoA Mid Cap Value Fund | | | 3,692,014 | | | | 928,497 | | | | 14,095 | | | | 99,209 | | | | (271,892 | ) | | | 4,461,923 | | | | 26,035 | |
MoA Money Market Fund | | | 2,375,524 | | | | 355,206 | | | | 426 | | | | 9,600 | | | | (90,630 | ) | | | 2,650,126 | | | | 54,388 | |
MoA Small Cap Equity Index Fund | | | 7,681,181 | | | | 957,796 | | | | 11,216 | | | | (123,201 | ) | | | (271,893 | ) | | | 8,255,099 | | | | 55,335 | |
MoA Small Cap Growth Fund | | | 5,388,373 | | | | 601,641 | | | | (305,546 | ) | | | 497,740 | | | | (681,263 | ) | | | 5,500,945 | | | | — | |
MoA Small Cap Value Fund | | | 6,958,345 | | | | 947,638 | | | | (35,528 | ) | | | (1,108 | ) | | | (271,891 | ) | | | 7,597,456 | | | | 45,177 | |
| | | | | | | | | | | | | | | | | | | | | | | | | | | | |
Total | | $ | 233,347,578 | | | $ | 38,233,446 | | | $ | 1,821,354 | | | $ | 19,255,330 | | | $ | (14,941,433 | ) | | $ | 277,716,275 | | | $ | 2,451,414 | |
| | | | | | | | | | | | | | | | | | | | | | | | | | | | |
| | | | | | | |
MoA Clear Passage 2065 Fund | | | | | | | | | | | | | | | | | | | | | | | | | | | | |
MoA Core Bond Fund | | $ | 2,047,795 | | | $ | 1,290,623 | | | $ | (17,382 | ) | | $ | (21,911 | ) | | $ | (122,140 | ) | | $ | 3,176,985 | | | $ | 36,240 | |
MoA Equity Index Fund | | | 33,119,467 | | | | 11,280,283 | | | | 172,715 | | | | 5,270,499 | | | | (3,128,727 | ) | | | 46,714,237 | | | | 243,602 | |
MoA Intermediate Bond Fund | | | 273,176 | | | | 234,658 | | | | (371 | ) | | | (2,298 | ) | | | (27,229 | ) | | | 477,936 | | | | 5,352 | |
MoA International Fund | | | 15,108,767 | | | | 6,561,040 | | | | (106,922 | ) | | | 908,832 | | | | (608,442 | ) | | | 21,863,275 | | | | 399,818 | |
MoA Mid Cap Equity Index Fund | | | 8,169,571 | | | | 3,112,660 | | | | (39,822 | ) | | | 529,649 | | | | (326,759 | ) | | | 11,445,299 | | | | 60,970 | |
MoA Mid Cap Value Fund | | | 1,738,525 | | | | 768,584 | | | | 5,713 | | | | 50,487 | | | | (91,074 | ) | | | 2,472,235 | | | | 14,200 | |
MoA Money Market Fund | | | 607,387 | | | | 244,976 | | | | 127 | | | | 2,747 | | | | (27,228 | ) | | | 828,009 | | | | 15,671 | |
MoA Small Cap Equity Index Fund | | | 2,346,823 | | | | 706,702 | | | | (30,690 | ) | | | (2,617 | ) | | | (181,690 | ) | | | 2,838,528 | | | | 18,780 | |
MoA Small Cap Growth Fund | | | 2,033,509 | | | | 687,921 | | | | (24,605 | ) | | | 98,211 | | | | (81,690 | ) | | | 2,713,346 | | | | — | |
MoA Small Cap Value Fund | | | 2,221,319 | | | | 704,570 | | | | (16,061 | ) | | | 5,547 | | | | (81,688 | ) | | | 2,833,687 | | | | 16,649 | |
| | | | | | | | | | | | | | | | | | | | | | | | | | | | |
Total | | $ | 67,666,339 | | | $ | 25,592,017 | | | $ | (57,298 | ) | | $ | 6,839,146 | | | $ | (4,676,667 | ) | | $ | 95,363,537 | | | $ | 811,282 | |
| | | | | | | | | | | | | | | | | | | | | | | | | | | | |
| | | | | | | |
MoA Conservative Allocation Fund | | | | | | | | | | | | | | | | | | | | | | | | | | | | |
MoA Core Bond Fund | | $ | 47,309,741 | | | $ | 7,462,214 | | | $ | (875,742 | ) | | $ | (16,683 | ) | | $ | (4,379,199 | ) | | $ | 49,500,331 | | | $ | 688,516 | |
MoA Equity Index Fund | | | 39,834,626 | | | | 1,384,058 | | | | 1,706,130 | | | | 3,768,845 | | | | (5,041,728 | ) | | | 41,651,931 | | | | 221,088 | |
MoA Intermediate Bond Fund | | | 54,700,475 | | | | 2,347,456 | | | | (1,383,876 | ) | | | 754,607 | | | | (14,368,934 | ) | | | 42,049,728 | | | | 725,564 | |
MoA International Fund | | | 8,028,694 | | | | 386,719 | | | | (4,044 | ) | | | 404,755 | | | | (686,823 | ) | | | 8,129,301 | | | | 154,125 | |
MoA Mid Cap Equity Index Fund | | | 8,121,785 | | | | 277,327 | | | | (43,887 | ) | | | 467,287 | | | | (886,821 | ) | | | 7,935,691 | | | | 44,734 | |
MoA Money Market Fund | | | — | | | | 6,383,264 | | | | 343 | | | | 13,466 | | | | (219,414 | ) | | | 6,177,659 | | | | 5,131 | |
| | | | | | | | | | | | | | | | | | | | | | | | | | | | |
Total | | $ | 157,995,321 | | | $ | 18,241,038 | | | $ | (601,076 | ) | | $ | 5,392,277 | | | $ | (25,582,919 | ) | | $ | 155,444,641 | | | $ | 1,839,158 | |
| | | | | | | | | | | | | | | | | | | | | | | | | | | | |
| | | | | | | |
MoA Moderate Allocation Fund | | | | | | | | | | | | | | | | | | | | | | | | | | | | |
MoA Core Bond Fund | | $ | 97,842,315 | | | $ | 8,045,143 | | | $ | (1,368,745 | ) | | $ | (649,090 | ) | | $ | (7,123,725 | ) | | $ | 96,745,898 | | | $ | 1,433,253 | |
MoA Equity Index Fund | | | 141,776,050 | | | | 2,635,684 | | | | 6,519,733 | | | | 13,247,903 | | | | (13,984,024 | ) | | | 150,195,346 | | | | 799,028 | |
MoA Intermediate Bond Fund | | | 59,994,295 | | | | 2,602,105 | | | | (433,762 | ) | | | (175,482 | ) | | | (4,241,483 | ) | | | 57,745,673 | | | | 814,968 | |
MoA International Fund | | | 41,735,768 | | | | 13,485,860 | | | | 573,054 | | | | 1,549,664 | | | | (4,340,641 | ) | | | 53,003,705 | | | | 914,084 | |
MoA Mid Cap Equity Index Fund | | | 61,799,549 | | | | 1,044,419 | | | | (1,459,945 | ) | | | 4,560,907 | | | | (17,028,499 | ) | | | 48,916,431 | | | | 304,300 | |
| | | | | | | | | | | | | | | | | | | | | | | | | | | | |
Total | | $ | 403,147,977 | | | $ | 27,813,211 | | | $ | 3,830,335 | | | $ | 18,533,902 | | | $ | (46,718,372 | ) | | $ | 406,607,053 | | | $ | 4,265,633 | |
| | | | | | | | | | | | | | | | | | | | | | | | | | | | |
| | | | | | | |
MoA Aggressive Allocation Fund | | | | | | | | | | | | | | | | | | | | | | | | | | | | |
MoA Core Bond Fund | | $ | 64,091,831 | | | $ | 4,320,438 | | | $ | (2,437,705 | ) | | $ | 915,909 | | | $ | (11,532,195 | ) | | $ | 55,358,278 | | | $ | 925,330 | |
MoA Equity Index Fund | | | 118,183,358 | | | | 2,379,361 | | | | 5,607,052 | | | | 11,031,612 | | | | (11,662,686 | ) | | | 125,538,697 | | | | 671,747 | |
MoA International Fund | | | 52,278,320 | | | | 11,987,813 | | | | 203,191 | | | | 2,576,144 | | | | (4,101,082 | ) | | | 62,944,386 | | | | 1,175,302 | |
MoA Mid Cap Equity Index Fund | | | 69,691,810 | | | | 1,355,057 | | | | 221,623 | | | | 3,391,796 | | | | (7,404,247 | ) | | | 67,256,039 | | | | 379,275 | |
MoA Small Cap Growth Fund | | | 14,413,790 | | | | 243,946 | | | | (116,629 | ) | | | 555,832 | | | | (1,226,063 | ) | | | 13,870,876 | | | | — | |
MoA Small Cap Value Fund | | | 16,934,354 | | | | 340,589 | | | | (156,830 | ) | | | 63,194 | | | | (1,226,063 | ) | | | 15,955,244 | | | | 96,644 | |
| | | | | | | | | | | | | | | | | | | | | | | | | | | | |
Total | | $ | 335,593,463 | | | $ | 20,627,204 | | | $ | 3,320,702 | | | $ | 18,534,487 | | | $ | (37,152,336 | ) | | $ | 340,923,520 | | | $ | 3,248,298 | |
| | | | | | | | | | | | | | | | | | | | | | | | | | | | |
154
MoA FUNDS
NOTES TO FINANCIAL STATEMENTS (Unaudited) (Continued)
June 30, 2024
The Investment Company has registered an indefinite number of its capital shares pursuant to Rule 24f-2 under the Investment Company Act of 1940. As of June 30, 2024, shares authorized at par value $0.01 per share were allocated into the 28 series of Funds as follows:
| | | | |
| | | Authorized No. of Shares | |
| | | Total Shares
Allocated | |
MoA Equity Index Fund | | | 900,000,000 | |
MoA All America Fund | | | 200,000,000 | |
MoA Small Cap Value Fund | | | 475,000,000 | |
MoA Small Cap Growth Fund | | | 570,000,000 | |
MoA Small Cap Equity Index Fund | | | 200,000,000 | |
MoA Mid Cap Value Fund | | | 100,000,000 | |
MoA Mid Cap Equity Index Fund | | | 1,050,000,000 | |
MoA Balanced Fund | | | 150,000,000 | |
MoA International Fund | | | 1,275,000,000 | |
MoA Catholic Values Index Fund | | | 100,000,000 | |
MoA Retirement Income Fund | | | 270,000,000 | |
MoA Clear Passage 2015 Fund | | | 200,000,000 | |
MoA Clear Passage 2020 Fund | | | 665,000,000 | |
MoA Clear Passage 2025 Fund | | | 1,025,000,000 | |
MoA Clear Passage 2030 Fund | | | 915,000,000 | |
MoA Clear Passage 2035 Fund | | | 845,000,000 | |
MoA Clear Passage 2040 Fund | | | 685,000,000 | |
MoA Clear Passage 2045 Fund | | | 675,000,000 | |
MoA Clear Passage 2050 Fund | | | 470,000,000 | |
MoA Clear Passage 2055 Fund | | | 350,000,000 | |
MoA Clear Passage 2060 Fund | | | 200,000,000 | |
MoA Clear Passage 2065 Fund | | | 100,000,000 | |
MoA Conservative Allocation Fund | | | 215,000,000 | |
MoA Moderate Allocation Fund | | | 370,000,000 | |
MoA Aggressive Allocation Fund | | | 265,000,000 | |
MoA Money Market Fund | | | 5,000,000,000 | |
MoA Intermediate Bond Fund | | | 840,000,000 | |
MoA Core Bond Fund | | | 1,525,000,000 | |
| | | | |
Total | | | 19,635,000,000 | |
| | | | |
| 6. | DISTRIBUTIONS TO SHAREHOLDERS AND INCOME TAX INFORMATION |
Each Fund generally declares dividends at least annually to pay out substantially all of the Fund’s net investment income and net realized short and long term capital gains. All dividends and capital gains distributions are reinvested in additional shares of the distributing Fund, unless a shareholder elects to receive dividends and distributions in cash.
Pursuant to shareholders’ election, substantially all dividend distributions throughout 2023 and 2022 were immediately reinvested into their respective Funds. The tax character of the distributions paid during 2023 and 2022 were as follows:
| | | | | | | | | | | | | | | | | | | | |
| | | Equity Index
Fund | | | All America
Fund | | | Small Cap
Value Fund | | | Small Cap
Growth Fund | | | Small Cap
Equity
Index Fund | |
Ordinary Income (a) | | | | | | | | | | | | | | | | | | | | |
2023 | | $ | 74,340,507 | | | $ | 3,229,269 | | | $ | 6,233,886 | | | $ | — | | | $ | 3,041,639 | |
2022 | | $ | 67,341,484 | | | $ | 3,548,736 | | | $ | 13,532,113 | | | $ | 229 | | | $ | 2,728,310 | |
Long-Term Capital Gains | | | | | | | | | | | | | | | | | | | | |
2023 | | $ | 198,553,132 | | | $ | 24,273,979 | | | $ | 18,658,025 | | | $ | 313,463 | | | $ | 2,702,262 | |
2022 | | $ | 117,807,756 | | | $ | 35,566,602 | | | $ | 28,865,059 | | | $ | 22,756,749 | | | $ | 8,356,762 | |
155
MoA FUNDS
NOTES TO FINANCIAL STATEMENTS (Unaudited) (Continued)
June 30, 2024
| 6. | DISTRIBUTIONS TO SHAREHOLDERS AND INCOME TAX INFORMATION (CONTINUED) |
| | | | | | | | | | | | | | | | | | | | |
| | | Mid Cap
Value Fund | | | Mid Cap
Equity
Index Fund | | | Balanced
Fund | | | International
Fund | | | Catholic
Values
Index Fund | |
Ordinary Income (a) | | | | | | | | | | | | | | | | | | | | |
2023 | | $ | 1,643,172 | | | $ | 23,962,599 | | | $ | 3,840,541 | | | $ | 71,735,676 | | | $ | 67,635 | |
2022 | | $ | 2,430,631 | | | $ | 26,386,156 | | | $ | 3,714,653 | | | $ | 31,936,057 | | | $ | 57,680 | |
Long-Term Capital Gains | | | | | | | | | | | | | | | | | | | | |
2023 | | $ | 2,335,943 | | | $ | 103,819,957 | | | $ | 7,280,078 | | | $ | — | | | $ | 71,915 | |
2022 | | $ | 7,918,703 | | | $ | 187,198,819 | | | $ | 8,563,084 | | | $ | 96,513,276 | | | $ | 43,161 | |
| | | | | |
| | | Retirement
Income
Fund | | | Clear
Passage
2015 Fund | | | Clear
Passage
2020 Fund | | | Clear
Passage
2025 Fund | | | Clear
Passage
2030 Fund | |
Ordinary Income (a) | | | | | | | | | | | | | | | | | | | | |
2023 | | $ | 4,925,605 | | | $ | 2,608,079 | | | $ | 12,236,139 | | | $ | 27,254,324 | | | $ | 29,856,781 | |
2022 | | $ | 3,309,470 | | | $ | 1,904,712 | | | $ | 9,083,352 | | | $ | 18,859,339 | | | $ | 19,500,288 | |
Long-Term Capital Gains | | | | | | | | | | | | | | | | | | | | |
2023 | | $ | 1,508,309 | | | $ | 1,731,061 | | | $ | 10,663,322 | | | $ | 30,144,200 | | | $ | 44,040,437 | |
2022 | | $ | 9,079,034 | | | $ | 234,409 | | | $ | 40,501,958 | | | $ | 77,660,333 | | | $ | 82,200,757 | |
| | | | | |
| | | Clear
Passage
2035 Fund | | | Clear
Passage
2040 Fund | | | Clear
Passage
2045 Fund | | | Clear
Passage
2050 Fund | | | Clear
Passage
2055 Fund | |
Ordinary Income (a) | | | | | | | | | | | | | | | | | | | | |
2023 | | $ | 27,573,276 | | | $ | 22,653,940 | | | $ | 23,182,679 | | | $ | 17,703,503 | | | $ | 9,386,631 | |
2022 | | $ | 17,845,581 | | | $ | 14,924,068 | | | $ | 15,349,927 | | | $ | 11,500,779 | | | $ | 5,582,814 | |
Long-Term Capital Gains | | | | | | | | | | | | | | | | | | | | |
2023 | | $ | 37,463,162 | | | $ | 35,943,857 | | | $ | 38,258,264 | | | $ | 33,837,820 | | | $ | 11,465,643 | |
2022 | | $ | 83,952,773 | | | $ | 80,032,853 | | | $ | 87,153,686 | | | $ | 62,273,858 | | | $ | 30,347,843 | |
| | | | | |
| | | Clear
Passage
2060 Fund | | | Clear
Passage
2065 Fund | | | Conservative
Allocation
Fund | | | Moderate
Allocation
Fund | | | Aggressive
Allocation
Fund | |
Ordinary Income (a) | | | | | | | | | | | | | | | | | | | | |
2023 | | $ | 4,626,021 | | | $ | 1,318,993 | | | $ | 3,632,321 | | | $ | 9,026,965 | | | $ | 7,293,393 | |
2022 | | $ | 2,360,512 | | | $ | 501,122 | | | $ | 2,856,830 | | | $ | 7,285,030 | | | $ | 5,965,212 | |
Long-Term Capital Gains | | | | | | | | | | | | | | | | | | | | |
2023 | | $ | 4,962,136 | | | $ | 857,128 | | | $ | 1,961,071 | | | $ | 16,479,762 | | | $ | 18,588,414 | |
2022 | | $ | 13,975,828 | | | $ | 1,864,391 | | | $ | 9,872,026 | | | $ | 38,348,192 | | | $ | 32,951,326 | |
| | | | | |
| | | Money
Market Fund | | | Intermediate
Bond Fund | | | Core Bond
Fund | | | | | | | |
Ordinary Income (a) | | | | | | | | | | | | | | | | | | | | |
2023 | | $ | 21,370,350 | | | $ | 20,734,790 | | | $ | 56,075,190 | | | | | | | | | |
2022 | | $ | 3,817,537 | | | $ | 12,620,086 | | | $ | 41,632,736 | | | | | | | | | |
Long-Term Capital Gains | | | | | | | | | | | | | | | | | | | | |
2023 | | $ | — | | | $ | — | | | $ | — | | | | | | | | | |
2022 | | $ | — | | | $ | 125,409 | | | $ | — | | | | | | | | | |
Notes:
| (a) | Includes distributions from Fund-level net short-term capital gains. |
156
MoA FUNDS
NOTES TO FINANCIAL STATEMENTS (Unaudited) (Continued)
June 30, 2024
| 6. | DISTRIBUTIONS TO SHAREHOLDERS AND INCOME TAX INFORMATION (CONTINUED) |
Undistributed net income and gains (losses) — As of December 31, 2023, undistributed net income and undistributed accumulated gain (loss) for federal income tax purposes were as follows:
| | | | | | | | | | | | | | | | | | | | |
| | | Equity Index
Fund | | | All America
Fund | | | Small Cap
Value Fund | | | Small Cap
Growth Fund | | | Small Cap
Equity
Index Fund | |
Accumulated undistributed net investment income | | $ | 4,446,289 | | | $ | 3,449 | | | $ | — | | | $ | — | | | $ | 73,260 | |
Accumulated undistributed net realized gain/(loss) on investments and futures contracts | | $ | 52,746,078 | | | $ | 4,736,968 | | | $ | — | | | $ | (7,277,213 | ) | | $ | 1,467,617 | |
Post-October Capital Loss Deferred | | $ | — | | | $ | — | | | $ | (4,642,513 | ) | | $ | (498,267 | ) | | $ | — | |
| | | | | | | | | | | | | | | | | | | | |
Net unrealized appreciation (depreciation) of investments and futures contracts | | $ | 2,396,528,807 | | | $ | 82,851,586 | | | $ | 60,212,577 | | | $ | 46,027,859 | | | $ | 12,770,333 | |
| | | | | | | | | | | | | | | | | | | | |
| | | | | |
| | | Mid Cap
Value Fund | | | Mid Cap
Equity
Index Fund | | | Balanced
Fund | | | International
Fund | | | Catholic
Values
Index Fund | |
Accumulated undistributed net investment income | | $ | 57,403 | | | $ | 1,803,651 | | | $ | 14,986 | | | $ | 6,169,751 | | | $ | 3,580 | |
Accumulated undistributed net realized gain/(loss) on investments and futures contracts | | $ | 2,137,963 | | | $ | 19,151,326 | | | $ | 999,881 | | | $ | (91,390,480 | ) | | $ | 17,946 | |
Post-October Capital Loss Deferred | | $ | — | | | $ | — | | | $ | — | | | $ | (770,403 | ) | | $ | — | |
| | | | | | | | | | | | | | | | | | | | |
Net unrealized appreciation (depreciation) of investments and futures contracts | | $ | 25,479,148 | | | $ | 250,064,168 | | | $ | 40,342,837 | | | $ | 104,550,449 | | | $ | 1,167,526 | |
| | | | | | | | | | | | | | | | | | | | |
| | | | | |
| | | Retirement
Income
Fund | | | Clear
Passage
2015 Fund | | | Clear
Passage
2020 Fund | | | Clear
Passage
2025 Fund | | | Clear Passage
2030 Fund | |
Accumulated undistributed net investment income | | $ | — | | | $ | — | | | $ | 828 | | | $ | 707 | | | $ | — | |
Accumulated undistributed net realized gain/(loss) on investments and futures contracts | | $ | 1,810,696 | | | $ | 1,411,484 | | | $ | 6,791,243 | | | $ | 20,862,303 | | | $ | 27,720,274 | |
Post-October Capital Loss Deferred | | $ | — | | | $ | (733 | ) | | $ | — | | | $ | — | | | $ | — | |
| | | | | | | | | | | | | | | | | | | | |
Net unrealized appreciation (depreciation) of investments and futures contracts | | $ | (13,921,181 | ) | | $ | (7,160,684 | ) | | $ | (24,522,967 | ) | | $ | (29,725,018 | ) | | $ | 2,583,461 | |
| | | | | | | | | | | | | | | | | | | | |
157
MoA FUNDS
NOTES TO FINANCIAL STATEMENTS (Unaudited) (Continued)
June 30, 2024
| 6. | DISTRIBUTIONS TO SHAREHOLDERS AND INCOME TAX INFORMATION (CONTINUED) |
| | | | | | | | | | | | | | | | | | | | |
| | | | | |
| | | Clear
Passage
2035 Fund | | | Clear
Passage
2040 Fund | | | Clear
Passage
2045 Fund | | | Clear
Passage
2050 Fund | | | Clear
Passage
2055 Fund | |
Accumulated undistributed net investment income | | $ | 2,012 | | | $ | — | | | $ | — | | | $ | — | | | $ | — | |
Accumulated undistributed net realized gain/(loss) on investments and futures contracts | | $ | 34,838,732 | | | $ | 31,102,892 | | | $ | 31,846,220 | | | $ | 23,908,542 | | | $ | 12,753,099 | |
Post-October Capital Loss Deferred | | $ | — | | | $ | — | | | $ | — | | | $ | — | | | $ | — | |
| | | | | | | | | | | | | | | | | | | | |
Net unrealized appreciation (depreciation) of investments and futures contracts | | $ | 25,057,411 | | | $ | 31,242,108 | | | $ | 40,960,198 | | | $ | 22,181,012 | | | $ | 7,156,253 | |
| | | | | | | | | | | | | | | | | | | | |
| | | | | |
| | | Clear
Passage
2060 Fund | | | Clear
Passage
2065 Fund | | | Conservative
Allocation
Fund | | | Moderate
Allocation
Fund | | | Aggressive
Allocation
Fund | |
Accumulated undistributed net investment income | | $ | — | | | $ | 2,193 | | | $ | — | | | $ | — | | | $ | — | |
Accumulated undistributed net realized gain/(loss) on investments and futures contracts | | $ | 6,466,466 | | | $ | 1,712,992 | | | $ | 2,288,004 | | | $ | 11,447,281 | | | $ | 10,223,046 | |
Post-October Capital Loss Deferred | | $ | — | | | $ | — | | | $ | — | | | $ | — | | | $ | — | |
| | | | | | | | | | | | | | | | | | | | |
Net unrealized appreciation (depreciation) of investments and futures contracts | | $ | 1,553,880 | | | $ | 1,047,131 | | | $ | 8,637,333 | | | $ | 5,221,773 | | | $ | 11,000,645 | |
| | | | | | | | | | | | | | | | | | | | |
| | | | | |
| | | Money
Market Fund | | | Intermediate
Bond Fund | | | Core Bond
Fund | | | | | | | |
Accumulated undistributed net investment income | | $ | 630,542 | | | $ | 617,654 | | | $ | 946,696 | | | | | | | | | |
Accumulated undistributed net realized gain/(loss) on investments and futures contracts | | $ | — | | | $ | (38,283,763 | ) | | $ | (87,722,088 | ) | | | | | | | | |
Post-October Capital Loss Deferred | | $ | — | | | $ | (3,270,441 | ) | | $ | (2,849,019 | ) | | | | | | | | |
| | | | | | | | | | | | | | | | | | | | |
Net unrealized appreciation (depreciation) of investments and futures contracts | | $ | — | | | $ | (24,707,586 | ) | | $ | (150,349,771 | ) | | | | | | | | |
| | | | | | | | | | | | | | | | | | | | |
The difference between the components of distributable earnings for income tax purposes and the amounts reflected in the statements of assets and liabilities arise primarily from federal income tax treatment of wash sales, REITs, PFICs, partnerships, corporate actions and futures contracts.
Reclassifications: U.S. GAAP requires that certain components of net assets be adjusted to reflect permanent differences between financial and tax reporting. For the year ended December 31, 2023, the Funds reclassified amounts primarily relating to tax treatment of paydowns, REITs, PFICs, prior year post financial statement adjustments. These reclassifications have no effect on net assets or net asset values per share.
158
MoA FUNDS
NOTES TO FINANCIAL STATEMENTS (Unaudited) (Continued)
June 30, 2024
At their meeting on June 11, 2024, the Board of Directors of the MoA Funds approved a plan to convert the MoA Money Market Fund (“MoA MMF”), previously an “institutional prime money market fund,” into a “government money market fund,” as defined under Rule 2a-7 of the Investment Company Act of 1940, as amended. Upon full conversion, the MoA Money Market Fund was renamed the MoA US Government Money Market Fund (“USG MMF”). The conversion occurred on August 23, 2024 after the close of business.
As part of that conversion the MoA MMF shifted from a floating Net Asset Value (“NAV”) to seeking to preserve the NAV at $1.00 per share. The MoA MMF underwent a stock split on August 26, 2024 so that the ending NAV of the MoA MMF was $1.00, prior to full conversion. The exact split ratio was 11.855015:1 on August 23, 2024.
The USG MMF invests at least 99.5% of its assets in short-term obligations of the US Government, repurchase agreements that are fully collateralized by obligations of the US Government and cash. The USG MMF seeks to preserve a $1.00 per share net asset value and will also declare dividends daily and pay them monthly. The investment advisory fee and other expenses of the Fund did not change as a result of the conversion.
159
MoA FUNDS
ADDITIONAL INFORMATION
Quarterly Portfolio Schedules
Included in this Semi-Annual Report are schedules of Investment Company’s Fund portfolio holdings as of June 30, 2024. The Investment Company files complete schedules of Fund portfolio holdings, excluding the Money Market Fund, with the Securities and Exchange Commission (“SEC”) for the first and third quarters of each fiscal year as an exhibit to its reports on Form N-PORT. The Investment Company Fund portfolio holdings are also available for the first and third quarters of the most recent fiscal year through the website, mutualofamerica.com.
The Money Market Fund files its complete schedule of portfolio holdings with the SEC each month on Form N-MFP. The Fund portfolio holdings for the prior six months are also available through the website, mutualofamerica.com.
The Form N-PORT and Form N-MFP are available on the SEC’s website at sec.gov.
Proxy Voting Policies and Procedures
A copy of the Investment Company’s proxy voting policies and procedures can be obtained free of charge by calling 800.914.8716. It is also available on the SEC’s website at sec.gov.
Information regarding how the Investment Company voted proxies relating to portfolio securities during the 12-month period ended June 30, 2023 is available without charge by calling 800.914.8716. It is also available on the SEC website.
Code of Ethics
The Investment Company has adopted a Code of Ethics that complies with Rule 17j-1 of the Investment Company Act of 1940 and with the requirements of the Sarbanes-Oxley Act of 2002. A copy of the Code of Ethics is available free of charge, upon request. To obtain a free copy of the Code of Ethics, please call 212.224.1769 or write to:
Mr. Kyle Medlin
Chief Compliance Officer
MoA Funds Corporation
320 Park Avenue
New York, NY 10022-6839
Renewal of the Funds’ Investment Advisory Agreements
At a meeting held in February 2024, the Board of Directors (the “Board” or the “Directors”) of MoA Funds Corporation (the “Corporation”) approved the continuation of the investment advisory agreements (the “Advisory Agreements”) between Mutual of America Capital Management LLC (“Capital Management”) and the Corporation with respect to each series of the Corporation (each series, a “Fund” and collectively, the “Funds”). That included approval by the Directors who are not “interested persons” (as defined in the Investment Company Act of 1940, as amended (the “1940 Act”)) of the Funds (the “Independent Directors”) voting separately.
The Directors’ determination to approve the continuation of the Advisory Agreements was made on the basis of each Director’s business judgment after an evaluation of all of the information provided to the Directors, including information provided for their consideration at their February 2024 meeting with management and at meetings held in the period leading up to that February 2024 meeting, including portions held outside the presence of management, specifically to review and consider materials related to the proposed continuation of the Advisory Agreements.
The Directors also meet regularly with investment advisory, compliance, operational, and other personnel from Capital Management and regularly review detailed information, presented both orally and in writing, regarding the services performed by Capital Management for the benefit of the Funds, Capital Management’s investment program for each Fund, the performance of each Fund, the fees and expenses of each Fund, and the operations of each Fund. In considering whether to approve the continuation of the Advisory Agreements, each Director took into account information presented to him or her in the past, including over the course of the prior year, to the extent he or she deemed relevant.
160
This summary describes a number, but not necessarily all, of the most important factors considered by the Board and the Independent Directors. Individual Directors may have given different weights to certain factors and assigned various degrees of materiality to information received in connection with the approval process. No single factor was determined to be decisive or controlling. In all their deliberations at the February 2024 meeting, the Independent Directors were advised by independent counsel.
Nature, Extent and Quality of Services. The Directors considered the nature, extent, and quality of the services provided and expected to be provided by Capital Management to each Fund, including the expertise and experience of its investment personnel. In this regard, the Directors considered that Capital Management provides a full investment program for the Funds. In their evaluation of the services provided by Capital Management and the Funds’ contractual relationships with Capital Management, the Directors considered generally the performance record of Capital Management’s portfolio management personnel, including, where applicable, the long-term performance record of the Funds.
The Directors also reviewed reports that compared, among other information, each Fund’s management fee rate and total expense ratio against the management fee rate and total expense ratio of a group of peers maintained by Morningstar, Inc. (“Morningstar”), and each Fund’s performance records for various periods ended December 31, 2023, including the one-year, three-year, five-year (where appliable) and ten-year (where applicable) periods, against the performance records of those funds in each Fund’s Morningstar category and the performance of one or more broad-based indices. Where applicable, the Directors inquired about and considered the factors cited by Capital Management that contributed to the underperformance of a Fund relative to its peer group.
The Directors also considered that Capital Management provides a variety of other services to the Funds in addition to investment advisory services, including certain administrative services (for which Capital Management receives separate compensation). The Directors considered Capital Management’s ongoing efforts to keep the Directors informed about matters relevant to the Funds and their shareholders. The Directors also considered the nature and structure of the Funds’ compliance program. The Directors considered the quality of those non-investment advisory services and determined that their quality appeared to support the continuation of the Funds’ arrangements with Capital Management.
Performance. The Directors evaluated each Fund’s performance history against that of the peer group(s) presented. The Directors noted those Funds that generally had strong performance relative to their peer groups over most or all of the periods presented. The Directors also considered that more than half of the Funds were rated at least four stars by Morningstar, with only two Funds rated two stars as of December 31, 2023. The Directors additionally considered the Funds’ Lipper overall rankings, noting that, as of December 31, 2023, Lipper had rated 12 Funds as Lipper Leaders with a score of 5 (ranking within the top 20 percent of funds in their category) and had rated 12 other Funds as 3 or 4 (each representing the next 20 percent of funds in their category).
In respect of those Funds with relative underperformance over certain periods, including the MoA Small Cap Value Fund, MoA Mid Cap Value Fund, MoA Core Bond Fund, and MoA Intermediate Bond Fund, the Directors considered in each case that Fund’s long-term performance as well as the reasons that Capital Management provided for the relative underperformance, including any information Capital Management provided regarding differences between a Fund’s investment strategies and/or investment positioning (e.g., duration) and that generally of the bulk of its peer group. The Directors noted in this regard that the investment positioning and other explanations provided by Capital Management for relative underperformance were in each case consistent with the relevant Fund’s principal investment strategies and the relevant portfolio management team’s investment approach. The Directors also considered information they had been provided regarding recent process improvements implemented by the portfolio manager of the MoA Small Cap Value Fund and MoA Mid Cap Value Fund and how those efforts might improve the Funds’ performance. The Directors considered that, in 2025, the MoA Clear Passage 2015 Fund was expected to be merged into the MoA Retirement Income Fund. In addition, in respect of those Funds that seek to approximate the performance of an index, the Directors considered the Fund’s level of tracking error and Capital Management’s comments on the level of that tracking error and the explanation of the contributors to that tracking error.
Relative Levels of the Advisory Fees. The Directors also compared the investment advisory fees of the Funds against peer groups determined by Morningstar. The Directors considered that the management fee and total expense ratio comparisons indicated that the overwhelming majority of the Funds’ fees were at or below the median of their peers and in the first or second quartile of the peers presented. The Directors also considered that in the few instances where a Fund had an investment advisory fee above the median or in the third or fourth quartile of the peer group, that the Fund’s advisory fee was within six basis points or fewer of the median of that group. In addition, the Directors
161
considered information from Capital Management regarding the breadth of the peer groups used and the limited number of close peers for certain Funds, such as for the MoA Catholic Values Index Fund.
The Directors considered materials relating to the fees charged by Capital Management to institutional separate accounts for which Capital Management employs investment strategies substantially similar to one or more of the Funds’ investment strategies. The Directors reviewed the management fees that Capital Management charged to its other clients with investment strategies substantially similar to those of a Fund, noting that the level of the Fund’s fees appeared reasonable relative to the fees charged to those other accounts in light of the information they were provided regarding the greater level of services the Funds require and the greater level of risk that Capital Management incurs in sponsoring and managing the Funds relative to separate accounts.
Profitability. The Directors considered Capital Management’s profitability in respect of its investment advisory arrangements with each Fund, noting information provided by Capital Management as to the methods it used, and the assumptions it made, in estimating its profitability on a Fund-by-Fund basis. As part of their considerations, the Directors considered the various other methodologies that could be used to allocate Capital Management’s costs on a Fund-by-Fund basis and how different approaches might lead to different levels of profitability shown for each Fund. The Directors also considered Capital Management’s profitability relative to their understanding of the range of profit margins achieved by other investment advisers in the industry. The Directors noted Capital Management’s confirmation that it remains dedicated to supporting Funds with no or negative profitability and providing those Funds with the same scope and quality of services as provided to the other Funds.
The Directors also considered Capital Management’s pricing philosophy generally, noting that Capital Management seeks to maintain competitive management fees that will support strong relative performance for the Funds over time. The Directors also considered the additional investments made by Capital Management into its operations and staff to better support the Funds from both an operational and investment performance perspective.
Fall-out Benefits. The Directors considered in their evaluation of the proposed renewal of the Advisory Agreements information about both the direct and the indirect benefits to Capital Management from managing the Funds, including, among other things, the ability to offer related retirement products, the scale that the Funds provided in respect of Capital Management and its advisory business generally, the payments or reimbursements that Capital Management (or its affiliates) received from the Funds for certain non-advisory services, and the soft dollar credits that the Funds’ trading activity generate and that can be used to purchase research or other services that benefit Capital Management, potentially reducing Capital Management’s expenses and furthering its overall advisory business.
Economies of Scale. In their evaluation of economies of scale, the Directors considered, among other things, the pricing of the Funds and Capital Management’s reported estimated profitability. They noted also that none of the Funds had breakpoints in its advisory fee schedule. The Directors considered that, generally, Capital Management had investment advisory fees that compared quite favorably to the median of the peers presented, even for those Funds that had not achieved significant scale. The Directors considered that the investment advisory fees were set at a rate that was attractive relative to the rates of many of the Funds’ peers and would appear, as a result, to have the effect of sharing benefits of economies of scale with shareholders even before some of the Funds had achieved significant scale. The Directors noted also that each of the Funds that had attained significant scale had management fees below or near the median of the peers presented. The Directors separately noted also that Capital Management had agreed to continue in place the expense limitation arrangements for a number of the Funds at current levels for an additional one-year period. The Directors also noted Capital Management’s statement that the Funds are priced competitively, but that Capital Management would be willing to consider implementing breakpoints for certain Funds in the future if assets were to grow significantly from their current levels. The Directors concluded that it was not necessary at the present time to implement breakpoints for any of the Funds.
Conclusions. On the basis of these considerations as well as others and in the exercise of their business judgment, the Directors determined that they were satisfied with the nature, extent, and quality of the services provided to each Fund under its Advisory Agreement; that it appeared that the management fees paid by each Fund to Capital Management were generally within the range of management fees paid by the peer groups presented, and generally reasonable in light of the services provided, the quality of the portfolio management teams, and each Fund’s performance history; that the information provided regarding the estimated profitability to Capital Management of its relationships with the Funds generally did not appear excessive or such as to preclude continuation of any Fund’s Advisory Agreement; that the absence of breakpoints in any Fund’s management fee did not render that Fund’s fee unreasonable or inappropriate under the circumstances; and that it would be appropriate to approve each Fund’s Advisory Agreement for an additional one-year period.
162
Liquidity Risk Management Program
In accordance with Rule 22e-4 (the “Liquidity Rule”) under the Investment Company Act of 1940, the Investment Company has adopted a liquidity risk management program (the “Program”) that is designed to assess and manage the liquidity risk of each Fund (the risk that the Fund would be unable to meet requests to redeem shares issued by the Fund without significant dilution of remaining investors’ interests in the Fund). The Liquidity Rule requires each registered open-end investment company (not including money market funds) to adopt and implement a written Program. The Liquidity Rule further requires that the Board of Directors shall be responsible for reviewing, no less frequently than annually, a written report from the Program Administrator that addresses the operation of the Program and its effectiveness of implementation. The Board has appointed a Liquidity Risk Management Committee (“LRMC”) comprised of officers from multiple departments within the Adviser and Mutual of America Life Insurance Company to serve as the Program Administrator. The Program Administrator is responsible for the implementation and ongoing administration of the Program, which includes assessing each Fund’s liquidity risk under both normal and reasonably foreseeable stressed conditions. Under the Program, each of the Fund’s portfolio investments is classified on a daily basis into one of four liquidity categories based on estimations of the number of days an investment is expected to reasonably be converted into cash in current market conditions without significantly changing the investment’s market value.
In February, 2024,, as required by the Program and the Liquidity Rule, the LRMC provided the Board with an annual written report (the “Report”) addressing the operation of the Program and assessing the adequacy and effectiveness of its implementation during the past year (the “Reporting Period”). During the Reporting Period, all of the Funds were primarily invested in highly liquid investments (investments that the Fund anticipates can be converted to cash within three business days or less in current market conditions without significantly changing their market value). Each of the Funds were well above the 50% threshold of assets in highly liquid investments to be designated as a Primarily Highly Liquid Fund. As a result, the Funds were not required to adopt, and have not adopted, a “Highly Liquid Investment Minimum” as defined in the Liquidity Rule. During the Reporting Period, the Funds did not approach the 15% limit imposed by the Liquidity Rule on holdings in illiquid investments (investments that cannot be sold or disposed of in seven days or less in current market conditions without the sale of the investment significantly changing the market value of the investment). The Funds did not experience any issues meeting investor redemptions at any time during the Reporting Period. In the Report, the LRMC stated that it believes the Program has operated adequately and effectively to manage each Fund’s liquidity risk during the Reporting Period in compliance with the statutory requirements of the Liquidity Rule. The LRMC also did not recommend any changes to the Program during the Reporting Period.
163
| ITEM 8. | CHANGE IN AND DISAGREEMENTS WITH ACCOUNTANTS FOR OPEN-END MANAGEMENT INVESTMENT COMPANIES. |
Not applicable.
| ITEM 9. | PROXY DISCLOSURE FOR OPEN-END MANAGEMENT INVESTMENT COMPANIES. |
| | (1) | Special meeting date March 12, 2024. |
| | (3) | Proposal to amend MoA Fund Corporation’s Investment Advisory Agreement to increase the advisory fee for the MoA International Fund. 169,616,053.960 votes cast for, 5,635,931.514 votes against, 446,448.526 abstentions or votes withheld. |
| ITEM 10. | RENUMERATION PAID TO DIRECTORS, OFFICERS, AND OTHERS OF OPEN-END MANAGEMENT INVESTMENT COMPANIES. |
Disclosed as part of the financial statements included in Item 7.
| ITEM 11. | STATEMENT REGARDING BASIS FOR APPROVAL OF INVESTMENT ADVISORY CONTRACT. |
Renewal of the Funds’ Investment Advisory Agreements
At a meeting held in February 2024, the Board of Directors (the “Board” or the “Directors”) of MoA Funds Corporation (the “Corporation”) approved the continuation of the investment advisory agreements (the “Advisory Agreements”) between Mutual of America Capital Management LLC (“Capital Management”) and the Corporation with respect to each series of the Corporation (each series, a “Fund” and collectively, the “Funds”). That included approval by the Directors who are not “interested persons” (as defined in the Investment Company Act of 1940, as amended (the “1940 Act”)) of the Funds (the “Independent Directors”) voting separately.
The Directors’ determination to approve the continuation of the Advisory Agreements was made on the basis of each Director’s business judgment after an evaluation of all of the information provided to the Directors, including information provided for their consideration at their February 2024 meeting with management and at meetings held in the period leading up to that February 2024 meeting, including portions held outside the presence of management, specifically to review and consider materials related to the proposed continuation of the Advisory Agreements.
The Directors also meet regularly with investment advisory, compliance, operational, and other personnel from Capital Management and regularly review detailed information, presented both orally and in writing, regarding the services performed by Capital Management for the benefit of the Funds, Capital Management’s investment program for each Fund, the performance of each Fund, the fees and expenses of each Fund, and the operations of each Fund. In considering whether to approve the continuation of the Advisory Agreements, each Director took into account information presented to him or her in the past, including over the course of the prior year, to the extent he or she deemed relevant.
This summary describes a number, but not necessarily all, of the most important factors considered by the Board and the Independent Directors. Individual Directors may have given different weights to certain factors and assigned various degrees of materiality to information received in connection with the approval process. No single factor was determined to be decisive or controlling. In all their deliberations at the February 2024 meeting, the Independent Directors were advised by independent counsel.
Nature, Extent and Quality of Services. The Directors considered the nature, extent, and quality of the services provided and expected to be provided by Capital Management to each Fund, including the expertise and experience of its investment personnel. In this regard, the Directors considered that Capital Management provides a full investment program for the Funds. In their evaluation of the services provided by Capital Management and the Funds’ contractual relationships with Capital Management, the Directors considered generally the performance record of Capital Management’s portfolio management personnel, including, where applicable, the long-term performance record of the Funds.
The Directors also reviewed reports that compared, among other information, each Fund’s management fee rate and total expense ratio against the management fee rate and total expense ratio of a group of peers maintained by Morningstar, Inc. (“Morningstar”), and each Fund’s performance records for various periods ended December 31, 2023, including the one-year, three-year, five-year (where appliable) and ten-year (where applicable) periods, against the performance records of those funds in each Fund’s Morningstar category and the performance of one or more broad-based indices. Where applicable, the Directors inquired about and considered the factors cited by Capital Management that contributed to the underperformance of a Fund relative to its peer group.
The Directors also considered that Capital Management provides a variety of other services to the Funds in addition to investment advisory services, including certain administrative services (for which Capital Management receives separate compensation). The Directors considered Capital Management’s ongoing efforts to keep the Directors informed about matters relevant to the Funds and their shareholders. The Directors also considered the nature and structure of the Funds’ compliance program. The Directors considered the quality of those non-investment advisory services and determined that their quality appeared to support the continuation of the Funds’ arrangements with Capital Management.
Performance. The Directors evaluated each Fund’s performance history against that of the peer group(s) presented. The Directors noted those Funds that generally had strong performance relative to their peer groups over most or all of the periods presented. The Directors also considered that more than half of the Funds were rated at least four stars by Morningstar, with only two Funds rated two stars as of December 31, 2023. The Directors additionally considered the Funds’ Lipper overall rankings, noting that, as of December 31, 2023, Lipper had rated 12 Funds as Lipper Leaders with a score of 5 (ranking within the top 20 percent of funds in their category) and had rated 12 other Funds as 3 or 4 (each representing the next 20 percent of funds in their category).
In respect of those Funds with relative underperformance over certain periods, including the MoA Small Cap Value Fund, MoA Mid Cap Value Fund, MoA Core Bond Fund, and MoA Intermediate Bond Fund, the Directors considered in each case that Fund’s long-term performance as well as the reasons that Capital Management provided for the relative underperformance, including any information Capital Management provided regarding differences between a Fund’s investment strategies and/or investment positioning (e.g., duration) and that generally of the bulk of its peer group. The Directors noted in this regard that the investment positioning and other explanations provided by Capital Management for relative underperformance were in each case consistent with the relevant Fund’s principal investment strategies and the relevant portfolio management team’s investment approach. The Directors also considered information they had been provided regarding recent process improvements implemented by the portfolio manager of the MoA Small Cap Value Fund and MoA Mid Cap Value Fund and how those efforts might improve the Funds’ performance. The Directors considered that, in 2025, the MoA Clear Passage 2015 Fund was expected to be merged into the MoA Retirement Income Fund. In addition, in respect of those Funds that seek to approximate the performance of an index, the Directors considered the Fund’s level of tracking error and Capital Management’s comments on the level of that tracking error and the explanation of the contributors to that tracking error.
Relative Levels of the Advisory Fees. The Directors also compared the investment advisory fees of the Funds against peer groups determined by Morningstar. The Directors considered that the management fee and total expense ratio comparisons indicated that the overwhelming majority of the Funds’ fees were at or below the median of their peers and in the first or second quartile of the peers presented. The Directors also considered that in the few instances where a Fund had an investment advisory fee above the median or in the third or fourth quartile of the peer group, that the Fund’s advisory fee was within six basis points or fewer of the median of that group. In addition, the Directors
considered information from Capital Management regarding the breadth of the peer groups used and the limited number of close peers for certain Funds, such as for the MoA Catholic Values Index Fund.
The Directors considered materials relating to the fees charged by Capital Management to institutional separate accounts for which Capital Management employs investment strategies substantially similar to one or more of the Funds’ investment strategies. The Directors reviewed the management fees that Capital Management charged to its other clients with investment strategies substantially similar to those of a Fund, noting that the level of the Fund’s fees appeared reasonable relative to the fees charged to those other accounts in light of the information they were provided regarding the greater level of services the Funds require and the greater level of risk that Capital Management incurs in sponsoring and managing the Funds relative to separate accounts.
Profitability. The Directors considered Capital Management’s profitability in respect of its investment advisory arrangements with each Fund, noting information provided by Capital Management as to the methods it used, and the assumptions it made, in estimating its profitability on a Fund-by-Fund basis. As part of their considerations, the Directors considered the various other methodologies that could be used to allocate Capital Management’s costs on a Fund-by-Fund basis and how different approaches might lead to different levels of profitability shown for each Fund. The Directors also considered Capital Management’s profitability relative to their understanding of the range of profit margins achieved by other investment advisers in the industry. The Directors noted Capital Management’s confirmation that it remains dedicated to supporting Funds with no or negative profitability and providing those Funds with the same scope and quality of services as provided to the other Funds.
The Directors also considered Capital Management’s pricing philosophy generally, noting that Capital Management seeks to maintain competitive management fees that will support strong relative performance for the Funds over time. The Directors also considered the additional investments made by Capital Management into its operations and staff to better support the Funds from both an operational and investment performance perspective.
Fall-out Benefits. The Directors considered in their evaluation of the proposed renewal of the Advisory Agreements information about both the direct and the indirect benefits to Capital Management from managing the Funds, including, among other things, the ability to offer related retirement products, the scale that the Funds provided in respect of Capital Management and its advisory business generally, the payments or reimbursements that Capital Management (or its affiliates) received from the Funds for certain non-advisory services, and the soft dollar credits that the Funds’ trading activity generate and that can be used to purchase research or other services that benefit Capital Management, potentially reducing Capital Management’s expenses and furthering its overall advisory business.
Economies of Scale. In their evaluation of economies of scale, the Directors considered, among other things, the pricing of the Funds and Capital Management’s reported estimated profitability. They noted also that none of the Funds had breakpoints in its advisory fee schedule. The Directors considered that, generally, Capital Management had investment advisory fees that compared quite favorably to the median of the peers presented, even for those Funds that had not achieved significant scale. The Directors considered that the investment advisory fees were set at a rate that was attractive relative to the rates of many of the Funds’ peers and would appear, as a result, to have the effect of sharing benefits of economies of scale with shareholders even before some of the Funds had achieved significant scale. The Directors noted also that each of the Funds that had attained significant scale had management fees below or near the median of the peers presented. The Directors separately noted also that Capital Management had agreed to continue in place the expense limitation arrangements for a number of the Funds at current levels for an additional one-year period. The Directors also noted Capital Management’s statement that the Funds are priced competitively, but that Capital Management would be willing to consider implementing breakpoints for certain Funds in the future if assets were to grow significantly from their current levels. The Directors concluded that it was not necessary at the present time to implement breakpoints for any of the Funds.
Conclusions. On the basis of these considerations as well as others and in the exercise of their business judgment, the Directors determined that they were satisfied with the nature, extent, and quality of the services provided to each Fund under its Advisory Agreement; that it appeared that the management fees paid by each Fund to Capital Management were generally within the range of management fees paid by the peer groups presented, and generally reasonable in light of the services provided, the quality of the portfolio management teams, and each Fund’s performance history; that the information provided regarding the estimated profitability to Capital Management of its relationships with the Funds generally did not appear excessive or such as to preclude continuation of any Fund’s Advisory Agreement; that the absence of breakpoints in any Fund’s management fee did not render that Fund’s fee unreasonable or inappropriate under the circumstances; and that it would be appropriate to approve each Fund’s Advisory Agreement for an additional one-year period.
| ITEM 12. | DISCLOSURE OF PROXY VOTING POLICIES AND PROCEDURES FOR CLOSED-END MANAGEMENT INVESTMENT COMPANIES. |
Not applicable.
| ITEM 13. | PORTFOLIO MANAGERS OF CLOSED END MANAGEMENT INVESTMENT COMPANIES. |
Not applicable.
| ITEM 14. | PURCHASES OF EQUITY SECURITIES BY CLOSED-END MANAGEMENT INVESTMENT COMPANY AND AFFILIATED PURCHASERS. |
Not applicable.
| ITEM 15. | SUBMISSION OF MATTERS TO A VOTE OF SECURITY HOLDERS. |
Not applicable.
| ITEM 16. | CONTROLS AND PROCEDURES. |
| | (a) | The registrant’s principal executive officer and principal financial officer have evaluated the registrant’s disclosure controls and procedures within 90 days of this filing and have concluded that the registrant’s disclosure controls and procedures were effective, as of that date, in ensuring that information required to be disclosed by the registrant in this Form N-CSR was recorded, processed, summarized, and reported in a timely and accurate manner. |
| | (b) | The registrant’s principal executive officer and principal financial officer are aware of no changes in the registrant’s internal control over financial reporting that occurred during the period covered by this report that has materially affected, or is likely to materially affect, the registrant’s internal control over financial reporting. |
| ITEM 17. | DISCLOSURE OF SECURITIES LENDING ACTIVITIES FOR CLOSED-END MANAGEMENT INVESTMENT COMPANIES. |
Not applicable.
| ITEM 18. | RECOVERY OF ERRONEOUSLY AWARDED COMPENSATION. |
Not applicable.
Attached hereto:
SIGNATURES
Pursuant to the requirements of the Securities Exchange Act of 1934 and the Investment Company Act of 1940, the registrant has duly caused this report to be signed on its behalf by the undersigned, thereunto duly authorized.
| | |
| | MoA Funds Corporation |
| |
| By: | | /s/ JOSEPH R. GAFFOGLIO |
| | Joseph R. Gaffoglio |
| | Chief Executive Officer and |
| | Principal Executive Officer of |
| | MoA Funds Corporation |
Date: September 5, 2024
Pursuant to the requirements of the Securities Exchange Act of 1934 and the Investment Company Act of 1940, this report has been signed below by the following persons on behalf of the registrant and in the capacities and on the dates indicated.
| | |
| By: | | /s/ JOSEPH R. GAFFOGLIO |
| | Joseph R. Gaffoglio |
| | Chief Executive Officer and |
| | Principal Executive Officer of |
| | MoA Funds Corporation |
Date: September 5, 2024
| | |
| By: | | /s/ AFERDITA GUTIERREZ |
| | Aferdita Gutierrez |
| | Treasurer, Chief Financial Officer and |
| | Principal Financial Officer |
| | MoA Funds Corporation |
Date: September 5, 2024