UNITED STATES
SECURITIES AND EXCHANGE COMMISSION
Washington, D.C. 20549
FORM N-CSR
CERTIFIED SHAREHOLDER REPORT OF REGISTERED
MANAGEMENT
INVESTMENT COMPANIES
Investment Company Act File Number 811-4946
THOMPSON PLUMB FUNDS, INC.
(Exact name of registrant as specified in charter)
918 Deming Way
Madison, Wisconsin 53717
(Address of principal executive offices)--(Zip code)
John W. Thompson
Chief Executive Officer and President
Thompson Plumb Funds, Inc.
918 Deming Way
Madison, Wisconsin 53717
(Name and address of agent for service)
With a copy to:
Fredrick G. Lautz, Esq.
Quarles & Brady LLP
411 East Wisconsin Avenue
Milwaukee, Wisconsin 53202
Registrant's telephone number, including area code: (608) 827-5700
Date of fiscal year end: November 30, 2010
Date of reporting period: May 31, 2010
Form N-CSR is to be used by management investment companies to file reports with the Commission not later than 10 days after the transmission to stockholders of any report that is required to be transmitted to stockholders under Rule 30e-1 under the Investment Company Act of 1940 (17 CFR 270.30e-1). The Commission may use the information provided on Form N-CSR in its regulatory, disclosure review, inspection and policymaking roles.
A registrant is required to disclose the information specified by Form N-CSR, and the Commission will make this information public. A registrant is not required to respond to the collection of information contained in Form N-CSR unless the Form displays a currently valid Office of Management and Budget ("OMB") control number. Please direct comments concerning the accuracy of the information collection burden estimate and any suggestions for reducing the burden to Secretary, Securities and Exchange Commission, 450 Fifth Street, N.W., Washington, DC 20549-0609. The OMB has reviewed this collection of information under the clearance requirements of 44 U.S.C. § 3507.
Item 1. Report to Stockholders.
 |
Semi-Annual Report
May 31, 2010 Thompson Plumb Growth Fund Thompson Plumb MidCap Fund Thompson Plumb Bond Fund Telephone: 1-800-999-0887
www.thompsonplumb.com ___________________________________________ |
THOMPSON PLUMB FUNDS, INC.
SEMI-ANNUAL REPORT TO SHAREHOLDERS
NOTE ON FORWARD-LOOKING STATEMENTS
The matters discussed in this report may constitute forward-looking statements. These include any Advisor or portfolio manager predictions, assessments, analyses or outlooks for individual securities, industries, investment styles, market sectors, interest rates, economic trends and/or markets. These statements involve risks and uncertainties. In addition to the general risks described for each Fund in its current Prospectus, other factors bearing on these reports include the accuracy of the Advisor’s or portfolio manager’s forecasts and predictions, the appropriateness of the investment strategies designed by the Advisor or portfolio manager and the ability of the Advisor or portfolio manager to implement its strategies efficiently and successfully. Any one or more of these factors, as well as other risks affecting the securities markets generally, could cause the actual results of any Fund to differ materially as compared to its benchmarks.
2
THOMPSON PLUMB FUNDS, INC.
SEMI-ANNUAL REPORT TO SHAREHOLDERS
May 31, 2010
CONTENTS
| Page(s) |
| GROWTH FUND | |
| Investment review | 4-6 |
Schedule of investments | 7-8 |
| |
| MIDCAP FUND | |
Investment review | 9-11 |
Schedule of investments | 12-13 |
| |
| BOND FUND | |
Investment review | 14-16 |
Schedule of investments | 17-24 |
| |
| FUND EXPENSE EXAMPLES | 25 |
| |
| FINANCIAL STATEMENTS | |
Statements of assets and liabilities | 26 |
Statements of operations | 27 |
Statements of changes in net assets | 28 |
Notes to financial statements | 29-34 |
Financial highlights | 35-37 |
| |
| ADDITIONAL INFORMATION | 38 |
This report contains information for existing shareholders of Thompson Plumb Funds, Inc. It
does not constitute an offer to sell. This Semi-Annual Report is authorized for distribution to prospective investors
only when preceded or accompanied by a Fund Prospectus, which contains information about
the Funds’ objectives and policies, risks, management, expenses and other information.
A Prospectus can be obtained by calling 1-800-999-0887.
Please read your Prospectus carefully.
3
GROWTH FUND INVESTMENT REVIEW (Unaudited) |
| May 31, 2010 |
Portfolio Managers
James T. Evans, CFA
Jason L. Stephens, CFA
John W. Thompson, CFA
Performance
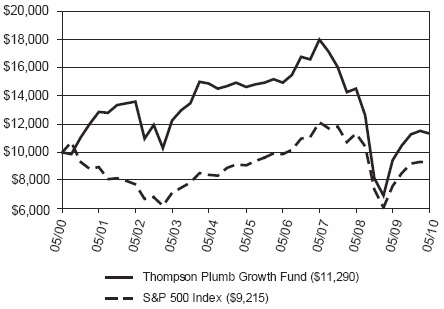
The Growth Fund produced a total return of 0.13% for the six-month period ended May 31, 2010, as compared to its benchmark, the S&P 500 Index, which returned 0.40%.
Comparison of Change in Value of a Hypothetical $10,000 Investment
| Average Annual Total Returns | |
| Through 05/31/10 | |
| 1 Year | | 3 Year | | 5 Year | | 10 Year | |
| Thompson Plumb Growth Fund | 19.49 | % | | -14.41 | % | | -5.00 | % | | 1.22 | % | |
| S&P 500 Index | 20.99 | % | | -8.69 | % | | 0.31 | % | | -0.82 | % | |
Gross Expense Ratio as of 3/31/10 was 1.54%.
Net Expense Ratio – Effective 12/01/09 – 1.40%*
* The Advisor has contractually agreed to waive management fees and/or reimburse expenses incurred by the Growth Fund through March 31, 2011.
Performance data quoted represents past performance; past performance does not guarantee future results. The investment return and principal value of an investment will fluctuate so that an investor’s shares, when redeemed, may be worth more or less than their original cost. Current performance of the Fund may be lower or higher than the performance quoted. Performance data current to the most recent month-end may be obtained by calling 1-800-999-0887 or visiting www.thompsonplumb.com.
Results include the reinvestment of all dividends and capital gains distributions. Investment performance reflects all fee waivers that may be in effect. In the absence of such waivers, total return would be reduced. The performance information reflected in the graph and the table above does not reflect the deduction of taxes that a shareholder would pay on fund distributions or the redemption of fund shares, nor does it imply future performance. The S&P 500 Index is an unmanaged index commonly used to measure the performance of U.S. stocks. You cannot directly invest in an index.
See Notes to Financial Statements.
4
GROWTH FUND INVESTMENT REVIEW (Unaudited) (Continued) |
| May 31, 2010 |
Management Commentary
The modest lag in the Fund’s performance relative to its benchmark during the first half of the fiscal year was attributable to both sector and issue selection, with the Health Care, Energy and Industrials sectors having the largest effect on overall relative performance. This positive impact was partially offset by the decision to overweight the Health Care sector as the sector performed the second worst overall among sectors in the S&P 500 during this period. Health Care had the largest overall positive impact on relative performance because of individual issue selection. Our decision to overweight Health Care stocks was based on a belief that the share prices of Fund holdings in that sector had been unfairly punished during the government health care debate, and that following the passage of a health-care reform bill these holdings would outperform their peers. We were correct about the attractiveness of many of the individual holdings in the Fund relative to other Health Care stocks, but overestimated the size of the bounce that the sector would receive. Going forward, if the sector rotates back into more widespread favor with investors, we feel the Fund is well positioned to take advantage of that change in sentiment.
Industrials and Energy were the two sectors that made the largest negative contribution to the Fund’s performance. Relative underperformance in the Energy sector was attributable to an overweight position that the Fund implemented roughly a month in advance of the Deepwater Horizon oil spill in the Gulf of Mexico. The sector sank after the spill began, dragging the Fund’s holdings in that sector with it. Aside from the individual companies directly involved in the Deepwater Horizon rig, we believe the long-term consequences of the spill will actually be positive for most Energy stocks as any resulting constraint in supply growth stemming from the spill would be likely to increase oil and gas prices. Within the Industrials sector, the Fund’s relative underperformance was largely attributable to issue selection, as the holdings of the Fund, which we view as more defensive, did not keep up with the names that we see as more cyclical within the S&P 500.
Over the remainder of the fiscal year we expect the economy to continue to recover, and have positioned the Fund to take advantage of such a continued recovery if our expectation proves to be correct. We believe a more modest recovery, as opposed to a sharp “V”-shaped bounce, remains the most likely path of future growth. While at the end of the last fiscal year there was no evidence to support a “V” outlook, we are beginning to see some signs that to us signal that growth could occur faster than our more modest expectations. These signs have not been significant enough to change our prediction of which type of recovery is most likely, but they have been enough to bear watching. Most importantly, we believe the odds of a double-dip recession have declined. As a result, we have structured the sector weightings of the Fund and even its individual holdings in a way that we believe would perform well in such a growth environment. As long as we perceive that the fundamental data supporting our investment decisions is continuing to improve and that stocks remain attractively valued, we will maintain a positive outlook for equity market returns.
Opinions expressed are subject to change, are not guaranteed and should not be considered investment advice.
Mutual fund investing involves risk. Principal loss is possible. Investments in smaller companies involve additional risks such as limited liquidity and greater volatility.
Please refer to the Schedule of Investments on page 7 of this report for holdings information. The management commentary above as well as Fund holdings and asset/sector allocations should not be considered a recommendation to buy or sell any security. In addition, please note that Fund holdings and asset/sector allocations are subject to change.
Current and future portfolio holdings are subject to risk.
See Notes to Financial Statements.
5
GROWTH FUND INVESTMENT REVIEW (Unaudited) (Continued) |
| May 31, 2010 |
 | | Top 10 Equity Holdings at 05/31/10 |
| | | % of Fund’s |
| Company | Industry | Net Assets |
| Exxon Mobil Corp. | Oil & Gas Producers | 4.05% |
| Intel Corp. | Technology Hardware & | 2.60% |
| | Equipment | |
| Johnson & Johnson | Pharmaceuticals & | 2.46% |
| | Biotechnology | |
| Microsoft Corp. | Software & Computer | 2.41% |
| | Services | |
| General Electric Co. | General Industrials | 2.24% |
| St. Jude Medical, Inc. | Health Care Equipment & | 2.05% |
| | Services | |
| Bank of America Corp. | Banks | 2.00% |
| QUALCOMM Inc. | Technology Hardware & | 2.00% |
| | Equipment | |
| Hess Corp. | Oil & Gas Producers | 1.98% |
| Amgen Inc. | Pharmaceuticals & | 1.98% |
| | Biotechnology | |
| As of May 31, 2010, 99.9% of the Fund’s net assets were in equity, cash and short-term instruments. |
See Notes to Financial Statements.
6
GROWTH FUND SCHEDULE OF INVESTMENTS (Unaudited) |
| May 31, 2010 |
| Shares | | Value |
| COMMON STOCKS - 99.9% | | | | |
| Consumer Discretionary - 11.2% | | | | |
| Automobiles & Parts - 0.5% | | | | |
| LKQ Corp. (a) | 36,175 | | $ | 666,344 |
| |
| General Retailers - 5.2% | | | | |
| Abercrombie & Fitch Co. Class A | 16,800 | | | 601,944 |
| Bed Bath & Beyond Inc. (a) | 30,200 | | | 1,355,074 |
| Best Buy Co., Inc. | 32,225 | | | 1,361,506 |
| Kohl’s Corp. (a) | 19,450 | | | 987,088 |
| Office Depot, Inc. (a) | 92,250 | | | 535,050 |
| Target Corp. | 36,570 | | | 1,994,162 |
| | | | | 6,834,824 |
| Media - 5.0% | | | | |
| CBS Corp. Class B | 69,695 | | | 1,014,759 |
| Lions Gate | | | | |
| Entertainment Corp. (a) | 148,300 | | | 1,008,440 |
| The Walt Disney Co. | 30,250 | | | 1,010,955 |
| Time Warner Inc. | 44,975 | | | 1,393,775 |
| Viacom Inc. Class B (a) | 60,700 | | | 2,040,127 |
| | | | | 6,468,056 |
| Personal Goods - 0.5% | | | | |
| Hanesbrands, Inc. (a) | 24,775 | | | 675,862 |
| |
| Consumer Staples - 6.8% | | | | |
| Beverages - 1.2% | | | | |
| PepsiCo, Inc. | 25,850 | | | 1,625,707 |
| |
| Food & Drug Retailers - 4.3% | | | | |
| Sysco Corp. | 57,175 | | | 1,704,387 |
| Walgreen Co. | 58,575 | | | 1,876,743 |
| Wal-Mart Stores, Inc. | 39,200 | | | 1,981,952 |
| | | | | 5,563,082 |
| Household Goods & Home | | | | |
| Construction - 1.3% | | | | |
| The Procter & Gamble Co. | 27,375 | | | 1,672,339 |
| |
| Energy - 15.1% | | | | |
| Oil & Gas Producers - 11.3% | | | | |
| Anadarko Petroleum Corp. | 17,400 | | | 910,542 |
| Chevron Corp. | 18,045 | | | 1,332,984 |
| Devon Energy Corp. | 21,145 | | | 1,350,108 |
| Exxon Mobil Corp. | 87,570 | | | 5,294,482 |
| Hess Corp. | 48,750 | | | 2,593,500 |
| Marathon Oil Corp. | 42,775 | | | 1,329,875 |
| Murphy Oil Corp. | 24,950 | | | 1,331,831 |
| Petrohawk Energy Corp. (a) | 35,400 | | | 680,742 |
| | | | | 14,824,064 |
| Oil Equipment, Services & | | | | |
| Distribution - 3.8% | | | | |
| Helmerich & Payne, Inc. | 27,800 | | | 1,047,504 |
| Schlumberger Ltd. | 21,225 | | | 1,191,784 |
| Smith International, Inc. | 31,850 | | | 1,196,286 |
| Weatherford International Ltd. (a) | 109,350 | | | 1,544,022 |
| | | | | 4,979,596 |
| Financials - 15.3% | | | | |
| Banks - 8.9% | | | | |
| Associated Banc-Corp | 149,340 | | | 2,005,636 |
| Bank of America Corp. | 166,200 | | | 2,615,988 |
| First Horizon National Corp. (a) | 104,673 | | | 1,303,179 |
| JPMorgan Chase & Co. | 50,950 | | | 2,016,601 |
| Marshall & Ilsley Corp. | 86,900 | | | 708,235 |
| Northern Trust Corp. | 45,170 | | | 2,295,088 |
| PNC Financial Services Group, Inc. | 10,750 | | | 674,563 |
| | | | | 11,619,290 |
| Financial Services - 5.9% | | | | |
| American Express Co. | 33,800 | | | 1,347,606 |
| Discover Financial Services | 95,590 | | | 1,285,685 |
| Eaton Vance Corp. | 63,000 | | | 1,883,070 |
| State Street Corp. | 57,100 | | | 2,179,507 |
| T. Rowe Price Group Inc. | 19,250 | | | 953,260 |
| | | | | 7,649,128 |
| Insurance - 0.5% | | | | |
| Aflac, Inc. | 15,060 | | | 667,158 |
| |
| Health Care - 16.6% | | | | |
| Health Care Equipment & | | | | |
| Services - 10.1% | | | | |
| Baxter International Inc. | 39,450 | | | 1,665,973 |
| Henry Schein, Inc. (a) | 23,840 | | | 1,344,814 |
| Medco Health | | | | |
| Solutions, Inc. (a) | 35,505 | | | 2,046,863 |
| Medtronic, Inc. | 33,250 | | | 1,302,735 |
| Patterson Cos., Inc. | 34,155 | | | 1,014,745 |
| ResMed Inc. (a) | 15,225 | | | 957,500 |
| St. Jude Medical, Inc. (a) | 71,640 | | | 2,675,038 |
| TomoTherapy Inc. (a) | 51,644 | | | 162,679 |
| Waters Corp. (a) | 9,890 | | | 676,872 |
| Zimmer Holdings, Inc. (a) | 23,395 | | | 1,308,482 |
| | | | | 13,155,701 |
| Health Care Services - 1.0% | | | | |
| McKesson Corp. | 19,375 | | | 1,356,250 |
See Notes to Financial Statements.
7
GROWTH FUND SCHEDULE OF INVESTMENTS (Unaudited) (Continued) |
| May 31, 2010 |
| Shares | | Value |
| COMMON STOCKS (continued) | | | | | |
| Health Care (continued) | | | | | |
| Pharmaceuticals & | | | | | |
| Biotechnology - 5.5% | | | | | |
| Amgen Inc. (a) | | 50,050 | | $ | 2,591,589 |
| Johnson & Johnson | | 55,135 | | | 3,214,370 |
| Novartis AG ADR | | 29,275 | | | 1,317,668 |
| | | | | | 7,123,627 |
| |
| Industrials - 9.3% | | | | | |
| Aerospace & Defense - 1.0% | | | | | |
| Lockheed Martin Corp. | | 16,475 | | | 1,316,682 |
| |
| General Industrials - 3.5% | | | | | |
| General Electric Co. | | 178,975 | | | 2,926,241 |
| 3M Co. | | 20,570 | | | 1,631,407 |
| | | | | | 4,557,648 |
| Industrial Transportation - 1.0% | | | |
| FedEx Corp. | | 16,000 | | | 1,335,840 |
| |
| Support Services - 3.8% | | | | | |
| Cintas Corp. | | 51,350 | | | 1,335,100 |
| EnergySolutions | | 212,050 | | | 1,325,312 |
| Mobile Mini, Inc. (a) | | 41,800 | | | 668,800 |
| W.W. Grainger, Inc. | | 16,095 | | | 1,637,666 |
| | | | | | 4,966,878 |
| |
| Information Technology - 24.8% | | | | | |
| Computer Programs - 2.6% | | | | | |
| Activision Blizzard, Inc. | | 63,985 | | | 687,839 |
| Electronic Arts Inc. (a) | | 116,735 | | | 1,927,295 |
| Take-Two Interactive Software, | | | | | |
| Inc. (a) | | 61,825 | | | 715,315 |
| | | | | | 3,330,449 |
| Electronic & Electrical | | | | | |
| Equipment - 0.5% | | | | | |
| Flextronics International Ltd. (a) | | 99,295 | | | 651,375 |
| |
| Internet Programs & | | | | | |
| Services - 1.7% | | | | | |
| eBay Inc. (a) | | 106,255 | | | 2,274,920 |
| |
| IT Services - 1.5% | | | | | |
| Alliance Data Systems Corp. (a) | | 9,375 | | | 662,437 |
| Visa Inc. Class A | | 17,885 | | | 1,295,947 |
| | | | | | 1,958,384 |
| Software & Computer | | | | | |
| Services - 4.2% | | | | | |
| Adobe Systems Inc. (a) | | 31,425 | | | 1,008,114 |
| Google Inc. Class A (a) | | 2,720 | | | 1,319,690 |
| Microsoft Corp. | | 122,051 | | | 3,148,916 |
| | | | | | 5,476,720 |
| Technology Hardware & | | | | | |
| Equipment - 14.3% | | | | | |
| Altera Corp. | | 71,500 | | | 1,685,255 |
| Broadcom Corp. Class A | | 20,390 | | | 703,863 |
| Cisco Systems, Inc. (a) | | 110,915 | | | 2,568,791 |
| EMC Corp. (a) | | 73,700 | | | 1,372,294 |
| Hewlett-Packard Co. | | 14,450 | | | 664,844 |
| Intel Corp. | | 158,500 | | | 3,395,070 |
| JDS Uniphase Corp. (a) | | 118,610 | | | 1,364,015 |
| Linear Technology Corp. | | 48,320 | | | 1,351,027 |
| Maxim Integrated Products, Inc. | | 74,530 | | | 1,323,653 |
| QUALCOMM Inc. | | 73,530 | | | 2,614,727 |
| Xilinx, Inc. | | 69,375 | | | 1,696,219 |
| | | | | | 18,739,758 |
| |
| Telecommunication Services - 0.8% | | | |
| Mobile Telecommunications - 0.8% | | | |
| Vodafone Group Plc ADR | | 51,995 | | | 1,045,100 |
| |
| TOTAL COMMON STOCKS | | | | | |
| (COST $114,628,067) | | | | | 130,534,782 |
| |
| | Principal | | | |
| | Amount | | | |
| SHORT-TERM INVESTMENTS - 0.0% | | | | | |
| Variable-Rate Demand | | | | | |
| Notes - 0.0% | | | | | |
| American Family Financial | | | | | |
| Services, 0.100% | $ | 804 | | | 804 |
| |
| Total Variable-Rate Demand Notes | | | | | 804 |
| |
| TOTAL SHORT-TERM INVESTMENTS | | | |
| (COST $804) | | | | | 804 |
| |
| TOTAL INVESTMENTS - 99.9% | | | | | |
| (COST $114,628,871) | | | | | 130,535,586 |
| |
| NET OTHER ASSETS AND | | | | | |
| LIABILITIES - 0.1% | | | | | 134,717 |
| |
| NET ASSETS - 100.0% | | | | $ | 130,670,303 |
| | | | | | |
(a) Non-income producing security.
ADR: American Depository Receipt
See Notes to Financial Statements.
8
MIDCAP FUND INVESTMENT REVIEW (Unaudited) |
| May 31, 2010 |
Portfolio Managers
James T. Evans, CFA
Jason L. Stephens, CFA
John W. Thompson, CFA
Performance
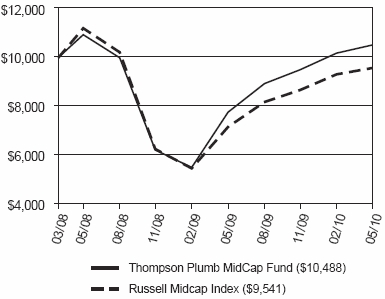
The MidCap Fund produced a total return of 10.89% for the six-month period ended May 31, 2010, as compared to its benchmark, the Russell Midcap Index, which returned 10.41%.
Comparison of Change in Value of a Hypothetical $10,000 Investment
| Average Annual Total Returns |
| Through 05/31/10 |
| | | Since | |
| | | Inception | |
| 1 Year | | (03/31/08) | |
| Thompson Plumb MidCap Fund | 35.40% | | 2.22% | |
| Russell Midcap Index | 33.93% | | -2.14% | |
Gross Expense Ratio as of 3/31/10 was 4.21%.
Net Expense Ratio after reimbursement was 1.30%.*
* The Advisor has contractually agreed to waive management fees and/or reimburse expenses incurred by the MidCap Fund through March 31, 2011.
Performance data quoted represents past performance; past performance does not guarantee future results. The investment return and principal value of an investment will fluctuate so that an investor’s shares, when redeemed, may be worth more or less than their original cost. Current performance of the Fund may be lower or higher than the performance quoted. Performance data current to the most recent month-end may be obtained by calling 1-800-999-0887 or visiting www.thompsonplumb.com.
Results include the reinvestment of all dividends and capital gains distributions. Investment performance reflects all fee waivers that may be in effect. In the absence of such waivers, total return would be reduced. The performance information reflected in the graph and the table above does not reflect the deduction of taxes that a shareholder would pay on fund distributions or the redemption of fund shares, nor does it imply future performance. The Russell Midcap Index measures the performance of the 800 smallest companies in the Russell 1000 Index based on total market capitalization. You cannot directly invest in an index.
See Notes to Financial Statements.
9
MIDCAP FUND INVESTMENT REVIEW (Unaudited) (Continued) |
| May 31, 2010 |
Management Commentary
The MidCap Fund outperformed its benchmark during the first half of the fiscal year as a result of overall sector selection coupled with individual issue selection within the Technology and Consumer Staples sectors. These areas of strength were enough to offset relatively underperforming issue selection within the Industrials sector. The positive relative sector selection mostly came from decisions to underweight the Fund’s Utilities holdings and overweight its Consumer Discretionary holdings relative to the Fund’s benchmark. Within the Technology sector, JDS Uniphase, Akamai Technologies and Heartland Payment Systems stood out, with returns of 55%, 65% and 74%, respectively, during the six-month period, while many other holdings outpaced the benchmark’s average return for that sector as well. The Fund’s performance in the Consumer Staples sector benefited from the acquisition of Bare Escentuals by Japanese firm Shiseido at a healthy premium to its share price prior to the announcement of the acquisition.
On the other hand, the Fund’s relative underperformance in the Industrials sector was attributable to a combination of underperforming individual stocks, such as EnergySolutions and Alliant Techsystems, coupled with a deliberate choice to avoid firms that we view as highly cyclical. With many of the names we view as more aggressive trading at healthy multiples of their prior peak earnings levels (much less of their current earnings levels), we believed that their potential for upside was limited. During the first half of the Fund’s fiscal year, the market disagreed with our viewpoint, causing the lag.
We are encouraged by the level of recent merger and acquisition (M&A) activity involving midcap companies, including some companies that have been held by the MidCap Fund. One of the primary reasons behind our launch of the MidCap Fund was to target midcap stocks that we viewed as offering attractive growth opportunities at reasonable valuations. We hoped that the Fund would provide shareholders with the opportunity to own indirect stakes in faster-growing companies before those companies’ business models had matured or their larger brethren had acquired them.
During the first year and a half of the Fund’s existence, the contracting credit markets and difficult environment for private equity funds made the Fund’s performance more dependent on earnings growth and price-to-earnings expansion of companies in the Fund’s portfolio, and less dependent on M&A activity. Now that it appears that some larger firms as well as many private equity funds have regained enough confidence to consider entering into M&A deals, we believe an extra component of shareholder return may be available to Fund shareholders through the premium typically paid to targets in M&A deals.
The first half of the fiscal year has seen Bare Escentuals, Smith International and Virtual Radiologic enter into deals to be acquired, while Pactiv and Airgas have seen their stock prices jump as rumors about potential deals have swirled. The stocks of all of these companies were held by the Fund at the time the transactions were announced or rumors of them made the news. We are hopeful these deals will be precursors to others in the second half of the fiscal year, and we feel that this is likely to be the case as long as the economy continues to recover.
Opinions expressed are subject to change, are not guaranteed and should not be considered investment advice.
Mutual fund investing involves risk. Principal loss is possible. Midcap companies tend to have limited liquidity and greater volatility than large-capitalization companies.
Please refer to the Schedule of Investments on page 12 of this report for holdings information. The management commentary above as well as Fund holdings and asset/sector allocations should not be considered a recommendation to buy or sell any security. In addition, please note that Fund holdings and asset/sector allocations are subject to change.
Current and future portfolio holdings are subject to risk.
Earnings Growth is a measure of growth in a company’s net income over a specific period, often one year.
Price to earnings (P/E) ratio is a common tool for comparing the prices of different common stocks and is calculated by dividing the current market price of a stock by the earnings per share.
See Notes to Financial Statements.
10
MIDCAP FUND INVESTMENT REVIEW (Unaudited) (Continued) |
| May 31, 2010 |
 | | Top 10 Equity Holdings at 05/31/10 |
| | | | % of Fund’s |
| Company | Industry | Net Assets |
| Investment Technology Group, Inc. | Financial Services | 2.10% |
| | Maxim Integrated Products, Inc. | Technology Hardware | 2.02% |
| | & Equipment | |
| EnergySolutions | Support Services | 2.01% |
| Henry Schein, Inc. | Health Care Equipment | 2.00% |
| | & Services | |
| Murphy Oil Corp. | Oil & Gas Producers | 2.00% |
| Associated Banc-Corp | Banks | 1.99% |
| ResMed Inc. | Health Care Equipment | 1.99% |
| | & Services | |
| Electronic Arts Inc. | Computer Programs | 1.95% |
| JDS Uniphase Corp. | Technology Hardware | 1.93% |
| | & Equipment | |
| Weatherford International Ltd. | Oil Equipment, Services | 1.90% |
| | & Distribution | |
| As of May 31, 2010, 100.0% of the Fund’s net assets were in equity, cash and short-term instruments. |
See Notes to Financial Statements.
11
MIDCAP FUND SCHEDULE OF INVESTMENTS (Unaudited) |
| May 31, 2010 |
| Shares | | Value |
| COMMON STOCKS - 100.0% | | | | |
| Consumer Discretionary - 16.1% | | | | |
| Automobiles & Parts - 1.0% | | | | |
| LKQ Corp. (a) | 7,110 | | $ | 130,966 |
| |
| General Retailers - 5.3% | | | | |
| Abercrombie & Fitch Co. Class A | 5,260 | | | 188,466 |
| Bed Bath & Beyond Inc. (a) | 4,385 | | | 196,755 |
| Jos. A. Bank Clothiers, Inc. (a) | 1,597 | | | 96,906 |
| Nordstrom, Inc. | 3,340 | | | 132,598 |
| Office Depot, Inc. (a) | 11,629 | | | 67,448 |
| | | | | 682,173 |
| Household Products - 1.8% | | | | |
| Jarden Corp. | 4,610 | | | 134,197 |
| The Middleby Corp. (a) | 1,775 | | | 99,950 |
| | | | | 234,147 |
| Media - 2.5% | | | | |
| CBS Corp. Class B | 6,635 | | | 96,606 |
| Lions Gate | | | | |
| �� Entertainment Corp. (a) | 32,321 | | | 219,783 |
| | | | | 316,389 |
| Personal Goods - 3.7% | | | | |
| Coach, Inc. | 5,768 | | | 237,122 |
| Hanesbrands, Inc. (a) | 8,508 | | | 232,098 |
| | | | | 469,220 |
| Travel & Leisure - 1.8% | | | | |
| Darden Restaurants, Inc. | 5,371 | | | 230,416 |
| |
| Consumer Staples - 2.5% | | | | |
| Food Producers - 2.5% | | | | |
| McCormick & Co., Inc. | 5,083 | | | 196,051 |
| The J. M. Smucker Co. | 2,242 | | | 123,803 |
| | | | | 319,854 |
| |
| Energy - 11.8% | | | | |
| Mining - 0.3% | | | | |
| CONSOL Energy Inc. | 900 | | | 32,832 |
| |
Oil & Gas Producers - 7.2% | | | | |
| ATP Oil & Gas Corp. (a) | 4,765 | | | 50,700 |
| Bill Barrett Corp. (a) | 2,065 | | | 67,236 |
| Chesapeake Energy Corp. | 1,475 | | | 32,952 |
| Denbury Resources Inc. (a) | 2,000 | | | 32,900 |
| Forest Oil Corp. (a) | 1,275 | | | 33,966 |
| Murphy Oil Corp. | 4,811 | | | 256,811 |
| Noble Energy, Inc. | 2,563 | | | 152,473 |
| Petrohawk Energy Corp. (a) | 5,175 | | | 99,515 |
| Pioneer Natural Resources Co. | 550 | | | 35,035 |
| Quicksilver Resources Inc. (a) | 2,690 | | | 32,845 |
| Range Resources Corp. | 2,275 | | | 102,261 |
| Swift Energy Co. (a) | 1,120 | | | 30,968 |
| | | | | 927,662 |
| | | | | |
| Oil Equipment, Services & | | | | |
Distribution - 4.3% | | | | |
| Helmerich & Payne, Inc. | 3,690 | | | 139,039 |
| Smith International, Inc. | 4,590 | | | 172,400 |
| Weatherford International Ltd. (a) | 17,320 | | | 244,558 |
| | | | | 555,997 |
| |
| Financials - 18.9% | | | | |
| Banks - 7.1% | | | | |
| Associated Banc-Corp | 19,009 | | | 255,291 |
| First Horizon National Corp. (a) | 17,040 | | | 212,148 |
| Marshall & Ilsley Corp. | 19,981 | | | 162,845 |
| Northern Trust Corp. | 3,730 | | | 189,521 |
| Regions Financial Corp. | 4,250 | | | 32,428 |
| SunTrust Banks, Inc. | 1,175 | | | 31,666 |
| Zions Bancorporation | 1,380 | | | 33,051 |
| | | | | 916,950 |
| Financial Services - 5.7% | | | | |
| Discover Financial Services | 16,244 | | | 218,482 |
| Eaton Vance Corp. | 8,100 | | | 242,109 |
| Investment Technology | | | | |
| Group, Inc. (a) | 15,965 | | | 269,170 |
| | | | | 729,761 |
| Insurance - 6.1% | | | | |
| Cincinnati Financial Corp. | 6,025 | | | 163,820 |
| Genworth Financial Inc. | | | | |
| Class A (a) | 1,835 | | | 28,608 |
| StanCorp Financial Group, Inc. | 3,818 | | | 163,372 |
| Torchmark Corp. | 4,476 | | | 230,648 |
| Unum Group | 8,726 | | | 201,571 |
| | | | | 788,019 |
| |
| Health Care - 11.3% | | | | |
| Health Care Equipment & | | | | |
| Services - 9.5% | | | | |
| Henry Schein, Inc. (a) | 4,564 | | | 257,455 |
Lincare Holdings Inc. (a) | 1,486 | | | 69,575 |
Patterson Cos., Inc. | 7,505 | | | 222,974 |
ResMed Inc. (a) | 4,055 | | | 255,019 |
Virtual Radiologic Corp. (a) | 5,420 | | | 91,490 |
Waters Corp. (a) | 2,939 | | | 201,145 |
Zimmer Holdings, Inc. (a) | 2,275 | | | 127,241 |
| | | | | 1,224,899 |
See Notes to Financial Statements.
12
MIDCAP FUND SCHEDULE OF INVESTMENTS (Unaudited) (Continued) |
| May 31, 2010 |
| Shares | | Value |
| COMMON STOCKS (continued) | | | | | |
| Health Care Services - 1.8% | | | | | |
| McKesson Corp. | | 1,910 | | $ | 133,700 |
| MWI Veterinary Supply, Inc. (a) | | 1,933 | | | 94,736 |
| | | | | | 228,436 |
| |
| Industrials - 9.4% | | | | | |
| Aerospace & Defense - 1.6% | | | | | |
| Alliant Techsystems Inc. (a) | | 3,029 | | | 208,365 |
| |
| Industrial Engineering - 1.2% | | | | | |
| SPX Corp. | | 2,625 | | | 155,138 |
| |
| Support Services - 6.6% | | | | | |
| Cintas Corp. | | 8,895 | | | 231,270 |
| EnergySolutions | | 41,285 | | | 258,031 |
| Mobile Mini, Inc. (a) | | 8,250 | | | 132,000 |
| W.W. Grainger, Inc. | | 2,208 | | | 224,664 |
| | | | | | 845,965 |
| |
| Information Technology - 21.1% | | | | | |
| Computer Programs - 4.7% | | | | | |
| Activision Blizzard, Inc. | | 15,445 | | | 166,034 |
| Electronic Arts Inc. (a) | | 15,160 | | | 250,292 |
| Take-Two Interactive | | | | | |
| Software, Inc. (a) | | 16,060 | | | 185,814 |
| | | | | | 602,140 |
| Electronic & Electrical | | | | | |
| Equipment - 3.5% | | | | | |
| Celestica Inc. (a) | | 6,981 | | | 64,993 |
| Flextronics International Ltd. (a) | | 29,327 | | | 192,385 |
| Molex Inc. Class A | | 10,960 | | | 192,786 |
| | | | | | 450,164 |
| IT Services - 2.0% | | | | | |
| Alliance Data Systems Corp. (a) | | 1,875 | | | 132,487 |
| Fiserv, Inc. (a) | | 2,647 | | | 125,865 |
| | | | | | 258,352 |
| Software & Computer | | | | | |
| Services - 1.0% | | | | | |
| Akamai Technologies, Inc. (a) | | 3,325 | | | 132,069 |
| |
| Technology Hardware & | | | | | |
| Equipment - 9.9% | | | | | |
| Altera Corp. | | 8,300 | | | 195,631 |
| Broadcom Corp. Class A | | 4,000 | | | 138,080 |
| JDS Uniphase Corp. (a) | | 21,561 | | | 247,951 |
| Linear Technology Corp. | | 6,952 | | | 194,378 |
| Maxim Integrated Products, Inc. | | 14,601 | | | 259,314 |
| Xilinx, Inc. | | 9,511 | | | 232,544 |
| | | | | | 1,267,898 |
| Materials - 6.1% | | | | | |
| Chemicals - 2.7% | | | | | |
| Airgas, Inc. | | 2,097 | | | 131,000 |
| International Flavors & | | | | | |
| Fragrances Inc. | | 4,948 | | | 220,186 |
| | | | | | 351,186 |
| General Materials - 1.1% | | | | | |
| Pactiv Corp. (a) | | 4,950 | | | 141,471 |
| |
| Household Materials - 1.3% | | | | | |
| The Scotts Miracle-Gro Co. | | | | | |
| Class A | | 3,646 | | | 161,992 |
| |
| Industrial Materials - 1.0% | | | | | |
| Nalco Holding Co. | | 5,593 | | | 126,737 |
| |
| Utilities - 2.8% | | | | | |
| Electricity - 0.8% | | | | | |
| Pepco Holdings, Inc. | | 5,985 | | | 96,538 |
| |
| Gas, Water & Multiutilities - 2.0% | | | |
| MDU Resources Group, Inc. | | 8,547 | | | 159,829 |
| SCANA Corp. | | 2,689 | | | 97,584 |
| | | | | | 257,413 |
| |
| TOTAL COMMON STOCKS (COST | | | | | |
| $10,890,249) | | | | | 12,843,149 |
| |
| | Principal | | | |
| | Amount | | | |
| SHORT-TERM INVESTMENTS - 0.0% | | | | | |
| Variable-Rate Demand Notes - 0.0% | | | | |
| American Family Financial | | | | | |
| Services, 0.100% | $ | 130 | | | 130 |
| |
| Total Variable-Rate Demand Notes | | | | | 130 |
| |
| TOTAL SHORT-TERM INVESTMENTS | | | |
| (COST $130) | | | | | 130 |
| |
| TOTAL INVESTMENTS - 100.0% | | | | | |
| (COST $10,890,379) | | | | | 12,843,279 |
| |
| NET OTHER ASSETS AND | | | | | |
| LIABILITIES - 0.0% | | | | | 3,539 |
| |
| NET ASSETS - 100.0% | | | | $ | 12,846,818 |
| | | | | | |
(a) Non-income producing security.
See Notes to Financial Statements.
13
BOND FUND INVESTMENT REVIEW (Unaudited) |
| May 31, 2010 |
Portfolio Managers
James T. Evans, CFA
Jason L. Stephens, CFA
John W. Thompson, CFA
Performance
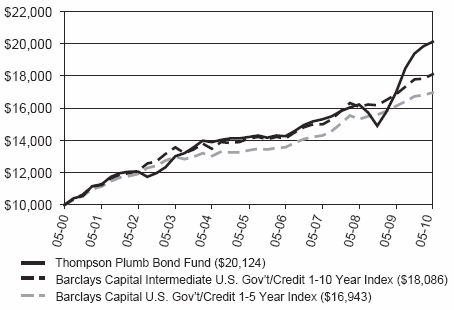
The Bond Fund produced a total return of 3.73% for the six-month period ended May 31, 2010, as compared to its benchmark, the Barclays Capital Intermediate U.S. Government/Credit 1-10 Year Index, which returned 1.65%, and as compared to the Barclays Capital U.S. Government/Credit 1-5 Year Index, which returned 1.18%.
Comparison of Change in Value of a Hypothetical $10,000 Investment
| Average Annual Total Returns |
| Through 05/31/10 |
| 1 Year | | 3 Year | | 5 Year | | 10 Year | |
| Thompson Plumb Bond Fund | 18.19% | | 9.56% | | 7.21% | | 7.24% | |
| Barclays Capital Intermediate U.S. Gov’t/Credit 1-10 Year Index | 7.33% | | 6.50% | | 5.06% | | 6.11% | |
| Barclays Capital U.S. Gov’t/Credit 1-5 Year Index | 5.00% | | 5.85% | | 4.81% | | 5.42% | |
Gross Expense Ratio as of 3/31/10 was 1.20%.
Net Expense Ratio after reimbursement was 0.80%.*
30-Day SEC Yield as of 05/31/10 was 3.10%.
30-Day SEC Yield (without reimbursement) as of 05/31/10 was 2.94%.
* The Advisor has contractually agreed to waive management fees and/or reimburse expenses incurred by the Bond Fund through March 31, 2011.
Performance data quoted represents past performance; past performance does not guarantee future results. The investment return and principal value of an investment will fluctuate so that an investor’s shares, when redeemed, may be worth more or less than their original cost. Current performance of the Fund may be lower or higher than the performance quoted. Performance data current to the most recent month-end may be obtained by calling 1-800-999-0887 or visiting www.thompsonplumb.com.
Results include the reinvestment of all dividends and capital gains distributions. Investment performance reflects all fee waivers that may be in effect. In the absence of such waivers, total return would be reduced. The performance information reflected in the graph and the table above does not reflect the deduction of taxes that a shareholder would pay on fund distributions or the redemption of fund shares, nor does it imply future performance. The Barclays Capital Intermediate U.S. Government/Credit 1-10 Year Index is a market-value-weighted index of all investment-grade bonds with maturities of more than one year and less than 10 years. The Barclays Capital U.S. Government/Credit 1-5 Year Index is a market-value-weighted index of all investment-grade bonds with maturities of more than one year and less than 5 years. You cannot directly invest in an index.
See Notes to Financial Statements.
14
BOND FUND INVESTMENT REVIEW (Unaudited) (Continued) |
| May 31, 2010 |
Management Commentary
The Bond Fund outperformed both its benchmark and the Barclays Capital U.S. Government/Credit 1-5 Year Index over the semi-annual period as a result of the Fund’s larger allocation to corporate bonds. This overweighting helped performance in two ways. First, the average spread between Treasury bonds and corporate bonds at the BBB quality tier narrowed by 31 basis points, which more than overcame the impact of the 5-10 basis point increase in Treasury bond yields during the period. As a result, the average corporate bond in the Fund appreciated in value while the average Treasury or Agency bond in the Fund’s benchmark and in the Barclays Capital U.S. Government/Credit 1-5 Year Index depreciated in value. Secondly, with a higher average yield than both Treasury and Agency bonds, corporate bonds simply spun off more return in the form of interest income than those alternate types of bonds. With more of the Fund allocated to this higher-yielding category, the overall return of the Fund was enhanced relative to the benchmark.
Despite the decrease of 31 basis points in corporate bond spreads during the semi-annual time period, the decline as of mid-April of this year was a much larger 95 basis points. It was after this point that worries about European sovereign debt, efforts by the Chinese government to slow China’s economy, and the Deepwater Horizon oil spill all conspired to create a flight to quality among investors. As a result, corporate bond spreads ended the period at 181 basis points, at the higher end of the historical “normal range” of 100-200 basis points. At these levels we believe owning corporate bonds is still an attractive alternative to owning Treasury or Agency debt, and will likely maintain our current allocation. The steepness of the yield curve is such that we feel it remains attractive to buy corporate debt with maturities of 4-5 years, and with the passage of time “ride” each bond down the maturity curve to a 1-2 year maturity. Thus we expect that the current “barbell” strategy of buying corporate debt with maturities of 4-5 years along with Treasury and Agency debt with maturities of 6 months or less is likely to remain in place for the immediate future.
Opinions expressed are subject to change, are not guaranteed and should not be considered investment advice.
Mutual fund investing involves risk. Principal loss is possible. Investments in debt securities typically decrease in value when interest rates rise. This risk is usually greater for longer-term debt securities. Investments in asset-backed and mortgage-backed securities involve additional risks such as credit risk, prepayment risk, possible illiquidity and default, and increased susceptibility to adverse economic developments.
Please refer to the Schedule of Investments on page 17 of this report for holdings information. The management commentary above as well as Fund holdings should not be considered a recommendation to buy or sell any security. In addition, please note that Fund holdings are subject to change.
Current and future portfolio holdings are subject to risk.
SEC Yield is a standardized yield computed by dividing the net investment income per share earned during the 30-day period prior to quarter-end and was created to allow for fairer comparisons among bond funds.
Basis point is a unit that is equal to 1/100th of 1%, and is used to denote the change in a financial instrument.
Yield is the income earned from a bond, which takes into account the sum of the interest payment, the redemption value at the bond’s maturity, and the initial purchase price of the bond.
See Notes to Financial Statements.
15
BOND FUND INVESTMENT REVIEW (Unaudited) (Continued) |
| May 31, 2010 |
Asset Allocation at 05/31/10
% of Total Investments
| Portfolio Concentration at 05/31/10 |
| (Includes cash and cash equivalents) |
| % of Total Investments |
| Quality |
| U.S. Government and Agency Issues | | 19.3% | |
| AA | | 5.4% | |
| A | | 16.8% | |
| BBB | | 51.2% | |
| BB and Below | | 4.3% | |
| Not Rated | | 0.1% | |
| Short-Term Investments | | 2.7% | |
| Common Stocks | | 0.2% | |
| | 100.0% | |
| | | | |
| Effective Maturity |
| Under 1 year | | 25.2% | |
| 1 to 3 years | | 11.7% | |
| 3 to 5 years | | 46.0% | |
| 5 to 10 years | | 16.1% | |
| Over 10 years | | 0.8% | |
| Common Stocks | | 0.2% | |
| | 100.0% | |
| | | | |
See Notes to Financial Statements.
16
BOND FUND SCHEDULE OF INVESTMENTS (Unaudited) |
| May 31, 2010 |
| | Shares or | | | |
| | Principal | | | |
| | Amount | | Value |
| COMMON STOCKS - 0.2% | | | | | | |
| Financials - 0.2% | | | | | | |
| Financial Services - 0.2% | | | | | | |
| CIT Group, Inc. (a) | | | 17,450 | | $ | 641,985 |
| | | | | | |
| TOTAL COMMON STOCKS | | | | | | |
| (COST $501,587) | | | | | | 641,985 |
| | | | | | |
| BONDS - 95.2% | | | | | | |
| Collateralized Mortgage | | | | | | |
| Obligations - 0.8% | | | | | | |
| General American Railcar II | | | | | | |
| 6.210% due 9/20/2017 | | $ | 2,421,166 | | | 2,475,846 |
| | | | | | |
| Total Collateralized Mortgage | | | | | | |
| Obligations | | | | | | 2,475,846 |
| | | | | | |
| Convertible Bonds - 1.3% | | | | | | |
| Amgen Inc. | | | | | | |
| 0.375% due 2/1/2013 | | | 782,000 | | | 771,248 |
| EMC Corp. | | | | | | |
| 1.750% due 12/1/2013 | | | 1,000,000 | | | 1,276,250 |
| Medtronic, Inc. | | | | | | |
| 1.625% due 4/15/2013 | | | 991,000 | | | 1,004,626 |
| NASDAQ OMX Group, Inc. | | | | | | |
| 2.500% due 8/15/2013 | | | 1,020,000 | | | 977,925 |
| | | | | | |
| Total Convertible Bonds | | | | | | 4,030,049 |
| | | | | | |
| Corporate Bonds - 73.9% | | | | | | |
| Alcoa Inc. | | | | | | |
| 6.000% due 7/15/2013 | | | 200,000 | | | 211,859 |
| American Express | | | | | | |
| 0.428% due 10/4/2010 (b) | | | 400,000 | | | 399,876 |
| 6.650% due 9/15/2015 | | | 90,000 | | | 98,787 |
| 6.900% due 9/15/2015 | | | 277,000 | | | 307,265 |
| American General Finance | | | | | | |
| 6.000% due 10/15/2014 | | | 1,000,000 | | | 852,660 |
| 6.000% due 12/15/2014 | | | 1,000,000 | | | 817,555 |
| 6.900% due 12/15/2017 | | | 1,000,000 | | | 795,000 |
| American Standard Cos., Inc. | | | | | | |
| 5.500% due 4/1/2015 | | | 25,000 | | | 26,721 |
| Amphenol Corp. | | | | | | |
| 4.750% due 11/15/2014 | | | 1,698,000 | | | 1,781,163 |
| Arden Realty LP | | | | | | |
| 5.250% due 3/1/2015 | | | 3,019,000 | | | 3,205,097 |
| Associated Banc-Corp | | | | | | |
| 6.750% due 8/15/2011 | | | 2,622,000 | | | 2,618,106 |
| Axis Capital Holdings | | | | | | |
| 5.750% due 12/1/2014 | | | 2,244,000 | | | 2,383,599 |
| Bank of America Corp. | | | | | | |
| 7.375% due 5/15/2014 | | | 866,000 | | | 956,210 |
| 5.375% due 6/15/2014 | | | 50,000 | | | 51,666 |
| 5.150% due 8/15/2015 | | | 34,000 | | | 34,087 |
| 5.350% due 9/15/2015 | | | 383,000 | | | 389,744 |
| 5.250% due 12/1/2015 | | | 333,000 | | | 333,137 |
| BB&T Corp. | | | | | | |
| 5.200% due 12/23/2015 | | | 769,000 | | | 820,292 |
| Bear Stearns Cos. LLC | | | | | | |
| 3.760% due 3/10/2014 (b) | | | 270,000 | | | 252,428 |
| 3.710% due 4/10/2014 (b) | | | 100,000 | | | 95,614 |
| Berkshire Hathaway | | | | | | |
| 4.200% due 12/15/2010 | | | 1,448,000 | | | 1,474,425 |
| Best Buy Co. | | | | | | |
| 6.750% due 7/15/2013 | | | 570,000 | | | 639,192 |
| Black Hills Corp. | | | | | | |
| 9.000% due 5/15/2014 | | | 2,442,000 | | | 2,838,796 |
| Boston Properties LP | | | | | | |
| 5.625% due 4/15/2015 | | | 331,000 | | | 355,885 |
| Boston Scientific Corp. | | | | | | |
| 5.450% due 6/15/2014 | | | 292,000 | | | 295,996 |
| 4.500% due 1/15/2015 | | | 3,072,000 | | | 2,988,190 |
| 6.250% due 11/15/2015 | | | 2,606,000 | | | 2,712,317 |
| Brinker International | | | | | | |
| 5.750% due 6/1/2014 | | | 5,372,000 | | | 5,591,102 |
| Capital One Bank | | | | | | |
| 6.500% due 6/13/2013 | | | 423,000 | | | 462,395 |
| Caterpillar Inc. | | | | | | |
| 4.300% due 6/1/2010 | | | 1,000,000 | | | 1,000,000 |
| CBS Corp. | | | | | | |
| 8.200% due 5/15/2014 | | | 967,000 | | | 1,131,442 |
| CenterPoint Energy, Inc. | | | | | | |
| 6.850% due 6/1/2015 | | | 192,000 | | | 215,941 |
| CIT Group, Inc. | | | | | | |
| 7.000% due 5/1/2013 | | | 202,759 | | | 195,156 |
| 7.000% due 5/1/2014 | | | 304,143 | | | 285,894 |
| 7.000% due 5/1/2015 | | | 304,143 | | | 280,572 |
| 7.000% due 5/1/2016 | | | 506,906 | | | 460,017 |
| 7.000% due 5/1/2017 | | | 709,672 | | | 640,479 |
| Citigroup, Inc. | | | | | | |
| 5.625% due 8/27/2012 | | | 250,000 | | | 258,498 |
| 5.000% due 9/15/2014 | | | 469,000 | | | 463,717 |
| Commercial Net Lease Realty, Inc. | | | | | | |
| 6.150% due 12/15/2015 | | | 426,000 | | | 438,876 |
See Notes to Financial Statements.
17
BOND FUND SCHEDULE OF INVESTMENTS (Unaudited) (Continued) |
| May 31, 2010 |
| | | Principal | | | |
| | | Amount | | Value |
| BONDS (continued) | | | | | | |
| | Corporate Bonds (continued) | | | | | | |
| CONSOL Energy Inc. | | | | | | |
| 7.875% due 3/1/2012 | | $ | 1,252,000 | | $ | 1,333,380 |
| Continental Corp. | | | | | | |
| 8.375% due 8/15/2012 | | | 150,000 | | | 162,883 |
| Corning Inc. | | | | | | |
| 6.050% due 6/15/2015 | | | 1,000,000 | | | 1,013,307 |
| 6.200% due 3/15/2016 | | | 428,000 | | | 475,190 |
| Countrywide Financial Corp. | | | | | | |
| 6.730% due 4/17/2013 | | | 93,000 | | | 98,344 |
| 6.250% due 5/15/2016 | | | 925,000 | | | 951,232 |
| Coventry Health Care, Inc. | | | | | | |
| 6.300% due 8/15/2014 | | | 2,944,000 | | | 3,119,094 |
| 6.125% due 1/15/2015 | | | 658,000 | | | 662,010 |
| Darden Restaurants | | | | | | |
| 7.125% due 2/1/2016 | | | 75,000 | | | 85,259 |
| Discover Financial Services | | | | | | |
| 0.786% due 6/11/2010 (b) | | | 500,000 | | | 499,898 |
| Dow Chemical Co. | | | | | | |
| 7.600% due 5/15/2014 | | | 1,688,000 | | | 1,933,773 |
| 4.300% due 12/15/2014 | | | 117,000 | | | 118,260 |
| 5.900% due 2/15/2015 | | | 650,000 | | | 700,374 |
| Duquesne Light Holdings Inc. | | | | | | |
| 5.500% due 8/15/2015 | | | 5,820,000 | | | 5,920,430 |
| Fidelity National Financial, Inc. | | | | | | |
| 5.250% due 3/15/2013 | | | 166,000 | | | 168,471 |
| Fifth Third Bancorp | | | | | | |
| 6.250% due 5/1/2013 | | | 1,356,000 | | | 1,464,439 |
| First Tennessee Bank | | | | | | |
| 4.500% due 5/15/2013 | | | 1,780,000 | | | 1,715,502 |
| 4.625% due 5/15/2013 | | | 2,126,000 | | | 2,058,857 |
| 5.050% due 1/15/2015 | | | 2,035,000 | | | 1,976,467 |
| 5.650% due 4/1/2016 | | | 270,000 | | | 259,826 |
| First Union National | | | | | | |
| 7.800% due 8/18/2010 | | | 80,000 | | | 81,061 |
| Fortune Brands, Inc. | | | | | | |
| 4.875% due 12/1/2013 | | | 450,000 | | | 473,455 |
| 6.375% due 6/15/2014 | | | 1,143,000 | | | 1,260,169 |
| 5.375% due 1/15/2016 | | | 54,000 | | | 57,506 |
| GE Capital Franchise Finance | | | | | | |
| 8.750% due 10/15/2010 | | | 208,000 | | | 213,432 |
| General Electric Capital Corp. | | | | | | |
| 4.875% due 10/21/2010 | | | 500,000 | | | 506,929 |
| 4.250% due 12/1/2010 | | | 62,000 | | | 62,882 |
| 6.000% due 10/26/2012 (c) | | | 69,000 | | | 69,834 |
| 5.900% due 5/13/2014 | | | 450,000 | | | 491,645 |
| 5.600% due 7/15/2014 | | | 500,000 | | | 523,845 |
| 4.500% due 5/15/2015 | | | 60,000 | | | 59,933 |
| 5.250% due 6/15/2015 | | | 25,000 | | | 25,881 |
| 5.400% due 6/15/2015 | | | 59,000 | | | 61,463 |
| 5.500% due 8/15/2015 | | | 30,000 | | | 31,449 |
| 5.000% due 4/15/2016 | | | 40,000 | | | 40,236 |
| Genworth Life Insurance Co. | | | | | | |
| 5.875% due 5/3/2013 (e) | | | 1,365,000 | | | 1,422,338 |
| GMAC LLC | | | | | | |
| 7.000% due 10/15/2011 | | | 200,000 | | | 197,053 |
| 7.250% due 8/15/2012 | | | 100,000 | | | 98,011 |
| 7.000% due 11/15/2012 | | | 50,000 | | | 48,145 |
| 7.100% due 1/15/2013 | | | 32,000 | | | 30,988 |
| 6.000% due 7/15/2013 | | | 60,000 | | | 54,942 |
| 0.000% due 6/15/2015 (d) | | | 1,250,000 | | | 796,875 |
| 6.350% due 2/15/2016 (c) | | | 75,000 | | | 65,194 |
| 6.500% due 2/15/2016 (c) | | | 100,000 | | | 87,576 |
| 6.500% due 9/15/2016 (c) | | | 87,000 | | | 75,296 |
| 7.250% due 9/15/2017 | | | 259,000 | | | 228,161 |
| Harley-Davidson | | | | | | |
| 5.250% due 12/15/2012 (e) | | | 1,675,000 | | | 1,752,822 |
| 15.000% due 2/1/2014 | | | 500,000 | | | 658,157 |
| 5.750% due 12/15/2014 (e) | | | 3,800,000 | | | 3,924,199 |
| Hartford Financial Services | | | | | | |
| 3.410% due 6/15/2010 (b) | | | 500,000 | | | 499,565 |
| 7.900% due 6/15/2010 | | | 50,000 | | | 50,115 |
| 5.250% due 10/15/2011 | | | 305,000 | | | 313,636 |
| 4.625% due 7/15/2013 | | | 750,000 | | | 770,200 |
| 5.050% due 7/15/2013 | | | 35,000 | | | 35,248 |
| 4.750% due 3/1/2014 | | | 825,000 | | | 845,569 |
| HCP, Inc. | | | | | | |
| 5.650% due 12/15/2013 | | | 1,368,000 | | | 1,437,564 |
| 6.000% due 3/1/2015 | | | 3,216,000 | | | 3,397,228 |
| 7.072% due 6/8/2015 | | | 531,000 | | | 585,036 |
| Hospitality Properties Trust | | | | | | |
| 6.750% due 2/15/2013 | | | 512,000 | | | 544,038 |
| 7.875% due 8/15/2014 | | | 2,543,000 | | | 2,795,108 |
| 5.125% due 2/15/2015 | | | 1,493,000 | | | 1,460,718 |
| HRPT Properties Trust | | | | | | |
| 5.750% due 11/1/2015 | | | 150,000 | | | 154,560 |
| HSBC Finance Corp. | | | | | | |
| 8.000% due 7/15/2010 | | | 306,000 | | | 308,280 |
| 5.700% due 7/15/2012 | | | 125,000 | | | 130,425 |
| 6.000% due 4/15/2013 | | | 621,000 | | | 661,494 |
| 4.400% due 5/15/2013 | | | 100,000 | | | 99,859 |
| 4.790% due 9/15/2013 (b) | | | 156,000 | | | 151,705 |
| 4.650% due 10/10/2013 (b) | | | 131,000 | | | 125,312 |
| 4.430% due 1/10/2014 (b) | | | 206,000 | | | 202,815 |
See Notes to Financial Statements.
18
BOND FUND SCHEDULE OF INVESTMENTS (Unaudited) (Continued) |
| May 31, 2010 |
| | | | | Principal | | | |
| | | | | | Amount | | Value |
| BONDS (continued) | | | | | | |
| Corporate Bonds (continued) | | | | | | |
| | HSBC Finance Corp. (continued) | | | | | | |
| | | 5.600% due 4/15/2014 | | $ | 75,000 | | $ | 78,550 |
| | | 5.500% due 7/15/2014 | | | 30,000 | | | 30,700 |
| | | 5.500% due 8/15/2014 | | | 45,000 | | | 45,112 |
| | | 6.000% due 8/15/2014 | | | 553,000 | | | 576,406 |
| | | 6.000% due 8/15/2014 | | | 67,000 | | | 69,805 |
| | | 5.800% due 9/15/2014 | | | 153,000 | | | 159,032 |
| | | 5.850% due 9/15/2014 | | | 90,000 | | | 93,682 |
| | | 5.650% due 10/15/2014 | | | 30,000 | | | 30,996 |
| | | 5.750% due 10/15/2014 | | | 274,000 | | | 285,807 |
| | | 5.350% due 11/15/2014 | | | 25,000 | | | 25,688 |
| | | 5.300% due 11/15/2016 | | | 82,000 | | | 80,491 |
| | Ingersoll-Rand | | | | | | |
| | | 9.500% due 4/15/2014 | | | 1,026,000 | | | 1,260,084 |
| | International Bank for | | | | | | |
| | | Reconstruction and | | | | | | |
| | | Development | | | | | | |
| | | 0.000% due 8/15/2010 (d) | | | 79,000 | | | 78,888 |
| | International Lease Finance Corp. | | | | | | |
| | | 5.000% due 6/15/2010 | | | 300,000 | | | 299,789 |
| | ITT Hartford Group | | | | | | |
| | | 7.300% due 11/1/2015 | | | 416,000 | | | 463,159 |
| | Jefferson-Pilot Corp. | | | | | | |
| | | 4.750% due 1/30/2014 | | | 3,739,000 | | | 3,839,344 |
| | John Hancock Life Ins. Co. | | | | | | |
| | | 5.450% due 9/15/2015 | | | 201,000 | | | 212,046 |
| | | 5.450% due 10/15/2015 | | | 29,000 | | | 30,529 |
| | | 5.500% due 11/15/2015 | | | 75,000 | | | 78,975 |
| | | 5.250% due 12/15/2015 | | | 25,000 | | | 26,231 |
| | | 5.500% due 12/15/2015 | | | 25,000 | | | 26,536 |
| | | 5.000% due 4/15/2016 | | | 60,000 | | | 61,769 |
| | Johnson Controls, Inc. | | | | | | |
| | | 5.250% due 1/15/2011 | | | 1,035,000 | | | 1,053,667 |
| | Lexmark International, Inc. | | | | | | |
| | | 5.900% due 6/1/2013 | | | 2,556,000 | | | 2,706,827 |
| | Lincoln National Corp. | | | | | | |
| | | 4.750% due 2/15/2014 | | | 1,638,000 | | | 1,679,980 |
| | Manufacturers & Traders Trust Co. | | | | | | |
| | | 5.585% due 12/28/2020 (b) | | | 1,347,000 | | | 1,257,132 |
| | Marriott International, Inc. | | | | | | |
| | | 5.810% due 11/10/2015 | | | 373,000 | | | 403,402 |
| | Marshall & Ilsley Bank | | | | | | |
| | | 5.350% due 4/1/2011 | | | 1,219,000 | | | 1,230,911 |
| | | 6.375% due 9/1/2011 | | | 2,694,000 | | | 2,729,504 |
| | | 5.300% due 9/8/2011 | | | 757,000 | | | 760,533 |
| | | 5.150% due 2/22/2012 | | | 561,000 | | | 553,264 |
| | | 4.900% due 3/15/2012 | | | 15,000 | | | 14,844 |
| | | 5.500% due 7/15/2012 | | | 10,000 | | | 9,968 |
| | | 5.250% due 9/4/2012 | | | 1,640,000 | | | 1,623,595 |
| | | 5.200% due 2/16/2017 | | | 50,000 | | | 44,614 |
| | Masco Corp. | | | | | | |
| | | 5.875% due 7/15/2012 | | | 1,558,000 | | | 1,612,271 |
| | | 7.125% due 8/15/2013 | | | 2,981,000 | | | 3,142,209 |
| | | 4.800% due 6/15/2015 | | | 500,000 | | | 479,932 |
| | | 6.125% due 10/3/2016 | | | 715,000 | | | 701,276 |
| | Maytag Corp. | | | | | | |
| | | 5.000% due 5/15/2015 | | | 50,000 | | | 50,500 |
| | MBNA Corp. | | | | | | |
| | | 7.500% due 3/15/2012 | | | 100,000 | | | 107,712 |
| | | 6.625% due 6/15/2012 | | | 75,000 | | | 80,071 |
| | | 5.000% due 6/15/2015 | | | 455,000 | | | 459,346 |
| | Merrill Lynch & Co. | | | | | | |
| | | 5.450% due 2/5/2013 | | | 500,000 | | | 521,707 |
| | | 6.150% due 4/25/2013 | | | 455,000 | | | 481,501 |
| | | 0.000% due 8/30/2013 (d) | | | 65,000 | | | 56,832 |
| | | 5.000% due 2/3/2014 | | | 138,000 | | | 139,664 |
| | | 5.450% due 7/15/2014 | | | 1,032,000 | | | 1,063,675 |
| | | 5.000% due 1/15/2015 | | | 143,000 | | | 141,030 |
| | | 5.300% due 9/30/2015 | | | 1,512,000 | | | 1,538,448 |
| | Met Life | | | | | | |
| | | 4.625% due 8/19/2010 (e) | | | 50,000 | | | 50,324 |
| | Montpelier Re Holdings Ltd. | | | | | | |
| | | 6.125% due 8/15/2013 | | | 6,681,000 | | | 6,921,877 |
| | Morgan Stanley | | | | | | |
| | | 4.143% due 6/1/2011 (b) | | | 500,000 | | | 491,050 |
| | | 4.750% due 4/1/2014 | | | 4,268,000 | | | 4,236,895 |
| | | 6.000% due 4/28/2015 | | | 3,440,000 | | | 3,547,417 |
| | | 5.375% due 10/15/2015 | | | 714,000 | | | 704,510 |
| | Nabisco, Inc. | | | | | | |
| | | 7.550% due 6/15/2015 | | | 50,000 | | | 58,587 |
| | National City Corp. | | | | | | |
| | | 0.427% due 6/16/2010 (b) | | | 1,000,000 | | | 999,924 |
| | | 4.900% due 1/15/2015 | | | 1,000,000 | | | 1,068,045 |
| | | 4.250% due 7/1/2018 | | | 200,000 | | | 191,627 |
| | National Rural Utilities | | | | | | |
| | | 7.200% due 10/1/2015 | | | 30,000 | | | 34,616 |
| | NationsBank Corp. | | | | | | |
| | | 0.000% due 8/15/2013 (d) | | | 91,000 | | | 79,512 |
| | | 7.750% due 8/15/2015 | | | 187,000 | | | 209,016 |
| | NiSource Finance Corp. | | | | | | |
| | | 5.400% due 7/15/2014 | | | 215,000 | | | 230,708 |
| | | 10.750% due 3/15/2016 | | | 600,000 | | | 769,543 |
See Notes to Financial Statements.
19
BOND FUND SCHEDULE OF INVESTMENTS (Unaudited) (Continued) |
| May 31, 2010 |
| | | | | Principal | | | |
| | | | | | Amount | | Value |
| BONDS (continued) | | | | | | |
| Corporate Bonds (continued) | | | | | | |
| | Nordstrom, Inc. | | | | | | |
| | | 6.250% due 1/15/2018 | | $ | 1,200,000 | | $ | 1,345,531 |
| | Owens Corning | | | | | | |
| | | 6.500% due 12/1/2016 | | | 840,000 | | | 882,412 |
| | PNC Funding Corp. | | | | | | |
| | | 5.250% due 11/15/2015 | | | 352,000 | | | 375,069 |
| | PPL Energy Supply, LLC | | | | | | |
| | | 6.500% due 5/1/2018 | | | 1,000,000 | | | 1,089,944 |
| | Principal Financial Group | | | | | | |
| | | 7.875% due 5/15/2014 | | | 2,750,000 | | | 3,149,900 |
| | | 4.023% due 4/1/2016 (b) | | | 50,000 | | | 47,075 |
| | Progressive Corp. | | | | | | |
| | | 7.000% due 10/1/2013 | | | 25,000 | | | 27,491 |
| | Protective Life Corp. | | | | | | |
| | | 4.300% due 6/1/2013 | | | 350,000 | | | 354,653 |
| | | 4.875% due 11/1/2014 | | | 820,000 | | | 824,457 |
| | Prudential Financial, Inc. | | | | | | |
| | | 4.750% due 4/1/2014 | | | 5,000 | | | 5,226 |
| | | 5.100% due 9/20/2014 | | | 225,000 | | | 238,508 |
| | | 6.200% due 1/15/2015 | | | 1,100,000 | | | 1,210,374 |
| | | 5.000% due 3/16/2015 | | | 140,000 | | | 143,897 |
| | R.R. Donnelley & Sons Co. | | | | | | |
| | | 4.950% due 4/1/2014 | | | 4,488,000 | | | 4,574,080 |
| | | 5.500% due 5/15/2015 | | | 911,000 | | | 923,954 |
| | Simon Property Group, LP | | | | | | |
| | | 5.300% due 5/30/2013 | | | 1,000,000 | | | 1,072,657 |
| | | 5.750% due 12/1/2015 | | | 1,089,000 | | | 1,184,129 |
| | | 6.100% due 5/1/2016 | | | 1,000,000 | | | 1,096,414 |
| | SLM Corp. | | | | | | |
| | | 5.400% due 10/25/2011 | | | 132,000 | | | 132,345 |
| | | 3.623% due 3/15/2012 (b) | | | 145,000 | | | 131,370 |
| | | 3.643% due 6/15/2012 (b) | | | 106,000 | | | 96,505 |
| | | 3.793% due 6/15/2012 (b) | | | 66,000 | | | 60,568 |
| | | 5.125% due 8/27/2012 | | | 491,000 | | | 481,507 |
| | | 3.793% due 9/15/2012 (b) | | | 65,000 | | | 58,937 |
| | | 3.693% due 12/15/2012 (b) | | | 90,000 | | | 80,592 |
| | | 4.500% due 12/15/2012 | | | 25,000 | | | 23,693 |
| | | 4.500% due 12/15/2012 | | | 87,000 | | | 82,430 |
| | | 5.375% due 1/15/2013 | | | 395,000 | | | 386,319 |
| | | 4.500% due 3/15/2013 | | | 25,000 | | | 23,195 |
| | | 4.700% due 6/15/2013 | | | 10,000 | | | 8,985 |
| | | 4.750% due 6/15/2013 | | | 24,000 | | | 21,596 |
| | | 4.800% due 6/15/2013 | | | 25,000 | | | 23,155 |
| | | 4.593% due 9/15/2013 (b) | | | 91,000 | | | 80,171 |
| | | 5.000% due 10/1/2013 | | | 945,000 | | | 891,630 |
| | | 4.300% due 12/15/2013 | | | 1,000 | | | 920 |
| | | 5.150% due 12/15/2013 | | | 60,000 | | | 56,174 |
| | | 5.250% due 12/15/2013 | | | 30,000 | | | 28,492 |
| | | 4.293% due 1/1/2014 (b) | | | 591,000 | | | 500,807 |
| | | 4.263% due 1/31/2014 (b) | | | 125,000 | | | 102,298 |
| | | 4.700% due 3/15/2014 | | | 25,000 | | | 23,000 |
| | | 4.950% due 3/15/2014 | | | 15,000 | | | 13,829 |
| | | 5.150% due 3/15/2014 | | | 10,000 | | | 9,347 |
| | | 3.763% due 4/1/2014 (b) | | | 1,125,000 | | | 952,616 |
| | | 3.943% due 4/1/2014 (b) | | | 155,000 | | | 128,286 |
| | | 3.843% due 5/1/2014 (b) | | | 500,000 | | | 405,725 |
| | | 5.375% due 5/15/2014 | | | 692,000 | | | 633,524 |
| | | 4.523% due 6/2/2014 (b) | | | 70,000 | | | 58,313 |
| | | 5.100% due 6/15/2014 (c) | | | 20,000 | | | 18,428 |
| | | 5.150% due 6/15/2014 (c) | | | 26,000 | | | 24,000 |
| | | 5.050% due 11/14/2014 | | | 35,000 | | | 30,619 |
| | | 3.893% due 12/15/2014 (b) | | | 444,000 | | | 336,592 |
| | | 6.500% due 12/15/2014 (b) | | | 250,000 | | | 216,238 |
| | | 5.000% due 4/15/2015 | | | 225,000 | | | 195,750 |
| | | 4.093% due 9/15/2015 (b) | | | 90,000 | | | 70,646 |
| | | 5.000% due 9/15/2015 | | | 55,000 | | | 49,029 |
| | | 5.000% due 9/15/2015 | | | 45,000 | | | 40,083 |
| | | 5.000% due 9/15/2015 | | | 25,000 | | | 22,268 |
| | | 4.193% due 12/15/2015 (b) | | | 128,000 | | | 97,763 |
| | | 4.393% due 5/3/2019 (b) | | | 217,000 | | | 153,671 |
| | | 7.000% due 6/15/2021 (c) | | | 79,000 | | | 64,893 |
| | | 5.400% due 4/25/2023 (c) | | | 50,000 | | | 34,543 |
| | StanCorp Financial Group | | | | | | |
| | | 6.875% due 10/1/2012 | | | 505,000 | | | 531,275 |
| | Staples, Inc. | | | | | | |
| | | 9.750% due 1/15/2014 | | | 750,000 | | | 918,500 |
| | Steelcase, Inc. | | | | | | |
| | | 6.500% due 8/15/2011 | | | 2,013,000 | | | 2,046,853 |
| | Sunoco, Inc. | | | | | | |
| | | 4.875% due 10/15/2014 | | | 1,470,000 | | | 1,503,253 |
| | | 9.625% due 4/15/2015 | | | 3,666,000 | | | 4,377,813 |
| | SunTrust Bank | | | | | | |
| | | 5.000% due 9/1/2015 | | | 4,525,000 | | | 4,581,671 |
| | Textron Financial Corp. | | | | | | |
| | | 5.400% due 4/28/2013 | | | 635,000 | | | 656,611 |
| | Time Warner, Inc. | | | | | | |
| | | 6.875% due 5/1/2012 | | | 170,000 | | | 185,262 |
| | Torchmark Corp. | | | | | | |
| | | 7.375% due 8/1/2013 | | | 1,320,000 | | | 1,425,790 |
| | | 6.375% due 6/15/2016 | | | 1,017,000 | | | 1,046,326 |
| | | 7.875% due 5/15/2023 | | | 1,000,000 | | | 1,116,292 |
| | Transamerica Finance Corp. | | | | | | |
| | | 0.000% due 9/1/2012 (d) | | | 100,000 | | | 89,990 |
See Notes to Financial Statements.
20
BOND FUND SCHEDULE OF INVESTMENTS (Unaudited) (Continued) |
| May 31, 2010 |
| | | | | Principal | | | |
| | | | | | Amount | | Value |
| BONDS (continued) | | | | | | |
| Corporate Bonds (continued) | | | | | | |
| | Transatlantic Holdings, Inc. | | | | | | |
| | | 5.750% due 12/14/2015 | | $ | 2,590,000 | | $ | 2,643,199 |
| | Tyco Electronics Group | | | | | | |
| | | 6.000% due 10/1/2012 | | | 395,000 | | | 425,974 |
| | | 5.950% due 1/15/2014 | | | 792,000 | | | 866,758 |
| | UBS PaineWebber Group Inc. | | | | | | |
| | | 7.625% due 2/15/2014 | | | 50,000 | | | 55,533 |
| | UDR, Inc. | | | | | | |
| | | 5.500% due 4/1/2014 | | | 2,386,000 | | | 2,467,644 |
| | | 5.250% due 1/15/2015 | | | 690,000 | | | 708,072 |
| | Unitrin, Inc. | | | | | | |
| | | 4.875% due 11/1/2010 | | | 1,150,000 | | | 1,156,625 |
| | Unum Group | | | | | | |
| | | 7.625% due 3/1/2011 | | | 154,000 | | | 158,975 |
| | | 7.125% due 9/30/2016 | | | 3,200,000 | | | 3,579,984 |
| | UnumProvident Group | | | | | | |
| | | 6.850% due 11/15/2015 (e) | | | 1,900,000 | | | 2,045,567 |
| | Verizon New York | | | | | | |
| | | 6.875% due 4/1/2012 | | | 250,000 | | | 270,539 |
| | Viacom, Inc. | | | | | | |
| | | 5.625% due 8/15/2012 | | | 1,535,000 | | | 1,619,789 |
| | | 6.250% due 4/30/2016 | | | 365,000 | | | 409,737 |
| | Wachovia Bank | | | | | | |
| | | 4.375% due 6/1/2010 | | | 50,000 | | | 50,000 |
| | | 4.800% due 11/1/2014 | | | 1,550,000 | | | 1,615,895 |
| | | 4.875% due 2/1/2015 | | | 500,000 | | | 523,006 |
| | | 5.000% due 8/15/2015 | | | 1,750,000 | | | 1,820,884 |
| | | 5.600% due 3/15/2016 | | | 50,000 | | | 52,678 |
| | | 5.625% due 10/15/2016 | | | 200,000 | | | 212,560 |
| | Wells Fargo & Co. | | | | | | |
| | | 7.550% due 6/21/2010 | | | 89,000 | | | 89,326 |
| | | 4.625% due 8/9/2010 | | | 75,000 | | | 75,502 |
| | | 5.750% due 5/16/2016 | | | 200,000 | | | 215,221 |
| | Westinghouse Credit | | | | | | |
| | | 8.875% due 6/14/2014 | | | 47,000 | | | 54,035 |
| | Wilmington Trust Corp. | | | | | | |
| | | 4.875% due 4/15/2013 | | | 25,000 | | | 24,526 |
| | Wyeth | | | | | | |
| | | 5.500% due 2/1/2014 | | | 1,000,000 | | | 1,111,685 |
| | Wyndham Worldwide | | | | | | |
| | | 9.875% due 5/1/2014 | | | 5,835,000 | | | 6,448,107 |
| | XL Capital | | | | | | |
| | | 6.500% due 1/15/2012 | | | 250,000 | | | 263,837 |
| | | 5.250% due 9/15/2014 | | | 3,678,000 | | | 3,874,424 |
| | Yum! Brands, Inc. | | | | | | |
| | | 6.250% due 4/15/2016 | | | 791,000 | | | 888,087 |
| | Zions Bancorporation | | | | | | |
| | | 5.000% due 11/7/2012 | | | 500,000 | | | 496,571 |
| | | 5.650% due 5/15/2014 | | | 1,700,000 | | | 1,590,471 |
| | | 7.750% due 9/23/2014 | | | 4,313,000 | | | 4,340,970 |
| | | | | | | | | |
| | Total Corporate Bonds | | | | | | 227,968,829 |
| | | | | | | | | |
| Federal Agency Mortgage- | | | | | | |
| | Backed Securities - 0.6% | | | | | | |
| | Fannie Mae | | | | | | |
| | | 6.000% due 10/1/2037, | | | | | | |
| | | Pool #88-8736 | | | 519,958 | | | 557,127 |
| | | 6.000% due 3/1/2038, | | | | | | |
| | | Pool #25-7134 | | | 975,638 | | | 1,045,382 |
| | Ginnie Mae | | | | | | |
| | | 7.000% due 5/15/2033, | | | | | | |
| | | Pool #78-2071 | | | 89,049 | | | 100,437 |
| | | | | | | | | |
| | Total Federal Agency Mortgage- | | | | | | |
| | | Backed Securities | | | | | | 1,702,946 |
| | | | | | | | | |
| United States Government and | | | | | | |
| | Agency Issues - 18.6% | | | | | | |
| | Chattanooga Valley Corp. (TVA) | | | | | | |
| | | 0.000% due 7/1/2010 (d) | | | 305,000 | | | 304,738 |
| | Fannie Mae | | | | | | |
| | | 4.500% due 6/1/2010 | | | 180,000 | | | 180,000 |
| | | 4.625% due 6/1/2010 | | | 215,000 | | | 215,000 |
| | | 3.375% due 6/10/2010 | | | 50,000 | | | 50,038 |
| | | 7.125% due 6/15/2010 | | | 712,000 | | | 713,918 |
| | | 4.625% due 6/16/2010 | | | 25,000 | | | 25,045 |
| | | 4.375% due 6/21/2010 | | | 10,000 | | | 10,022 |
| | | 3.270% due 6/30/2010 | | | 120,000 | | | 120,283 |
| | | 5.125% due 7/6/2010 (c) | | | 330,000 | | | 331,533 |
| | | 3.000% due 7/12/2010 | | | 797,000 | | | 799,502 |
| | | 5.125% due 7/13/2010 (c) | | | 105,000 | | | 105,584 |
| | | 0.000% due 7/15/2010 (d) | | | 41,000 | | | 40,958 |
| | | 4.700% due 7/28/2010 | | | 65,000 | | | 65,447 |
| | | 5.000% due 7/28/2010 (c) | | | 165,000 | | | 166,213 |
| | | 4.750% due 8/2/2010 | | | 60,000 | | | 60,447 |
| | | 0.000% due 8/7/2010 (d) | | | 246,000 | | | 245,626 |
| | | 4.875% due 8/11/2010 | | | 50,000 | | | 50,380 |
| | | 0.000% due 8/12/2010 (d) | | | 35,000 | | | 34,943 |
| | | 3.250% due 8/12/2010 | | | 5,000 | | | 5,030 |
| | | 0.000% due 8/15/2010 (d) | | | 40,000 | | | 39,932 |
| | | 4.250% due 8/15/2010 | | | 671,000 | | | 676,524 |
| | | 4.300% due 8/18/2010 | | | 35,000 | | | 35,297 |
| | | 5.000% due 8/24/2010 | | | 157,000 | | | 158,691 |
See Notes to Financial Statements.
21
BOND FUND SCHEDULE OF INVESTMENTS (Unaudited) (Continued) |
| May 31, 2010 |
| | | | | Principal | | | |
| | | | | | Amount | | Value |
| BONDS (continued) | | | | | | |
| United States Government and | | | | | | |
| | Agency Issues (continued) | | | | | | |
| | | Fannie Mae (continued) | | | | | | |
| | | | 4.375% due 9/13/2010 | | $ | 382,000 | | $ | 386,492 |
| | | | 0.000% due 9/23/2010 (d) | | | 30,000 | | | 29,921 |
| | | | 0.000% due 10/8/2010 (d) | | | 58,000 | | | 57,825 |
| | | | 2.875% due 10/12/2010 | | | 645,000 | | | 651,177 |
| | | | 0.000% due 10/15/2010 (d) | | | 50,000 | | | 49,840 |
| | | | 0.000% due 11/15/2010 (d) | | | 31,000 | | | 30,876 |
| | | | 6.625% due 11/15/2010 | | | 1,160,000 | | | 1,193,922 |
| | | | 4.750% due 12/15/2010 | | | 1,848,000 | | | 1,893,280 |
| | | | 6.080% due 12/15/2010 | | | 80,000 | | | 82,400 |
| | | | 6.250% due 2/1/2011 | | | 495,000 | | | 514,122 |
| | Farmer Mac | | | | | | |
| | | 4.875% due 8/27/2010 | | | 100,000 | | | 101,106 |
| | | 4.625% due 10/12/2010 | | | 2,000 | | | 2,032 |
| | | Federal Farm Credit Banks | | | | | | |
| | | | 0.500% due 6/1/2010 | | | 50,000 | | | 50,000 |
| | | | 2.000% due 6/11/2010 | | | 100,000 | | | 100,046 |
| | | | 3.050% due 6/18/2010 | | | 50,000 | | | 50,066 |
| | | | 5.250% due 6/24/2010 | | | 50,000 | | | 50,160 |
| | | | 2.250% due 7/1/2010 | | | 150,000 | | | 150,251 |
| | | | 4.000% due 7/6/2010 | | | 25,000 | | | 25,091 |
| | | | 5.930% due 7/6/2010 | | | 315,000 | | | 316,740 |
| | | | 4.500% due 7/7/2010 | | | 70,000 | | | 70,298 |
| | | | 5.330% due 8/3/2010 | | | 80,000 | | | 80,700 |
| | | | 4.400% due 8/4/2010 | | | 111,000 | | | 111,807 |
| | | | 1.125% due 8/6/2010 | | | 150,000 | | | 150,264 |
| | | | 4.300% due 8/13/2010 | | | 15,000 | | | 15,122 |
| | | | 5.125% due 8/23/2010 | | | 10,000 | | | 10,109 |
| | | | 4.650% due 8/25/2010 | | | 55,000 | | | 55,565 |
| | | | 4.750% due 8/25/2010 | | | 155,000 | | | 156,629 |
| | | | 4.450% due 8/27/2010 | | | 531,000 | | | 536,334 |
| | | | 6.900% due 9/1/2010 | | | 115,000 | | | 116,847 |
| | | | 3.200% due 9/2/2010 | | | 250,000 | | | 251,772 |
| | | | 2.330% due 9/3/2010 | | | 50,000 | | | 50,267 |
| | | | 1.250% due 9/9/2010 | | | 5,000 | | | 5,014 |
| | | | 5.250% due 9/13/2010 | | | 671,000 | | | 680,221 |
| | | | 6.890% due 9/13/2010 | | | 15,000 | | | 15,284 |
| | | | 5.000% due 9/21/2010 | | | 15,000 | | | 15,218 |
| | | | 4.180% due 9/22/2010 | | | 75,000 | | | 75,910 |
| | | | 4.350% due 9/22/2010 | | | 61,000 | | | 61,772 |
| | | | 4.000% due 9/24/2010 | | | 145,000 | | | 146,709 |
| | | | 1.200% due 9/27/2010 | | | 10,000 | | | 10,031 |
| | | | 4.260% due 9/30/2010 | | | 50,000 | | | 50,664 |
| | | | 4.500% due 10/4/2010 | | | 25,000 | | | 25,363 |
| | | | 6.320% due 10/12/2010 | | | 185,000 | | | 189,088 |
| | | | 4.700% due 10/20/2010 | | | 332,000 | | | 337,710 |
| | | | 4.750% due 11/1/2010 | | | 55,000 | | | 56,029 |
| | | | 5.000% due 11/2/2010 | | | 10,000 | | | 10,199 |
| | | | 4.180% due 11/5/2010 | | | 290,000 | | | 294,853 |
| | | | 6.700% due 11/22/2010 | | | 167,000 | | | 172,095 |
| | | | 3.750% due 12/6/2010 | | | 250,000 | | | 254,308 |
| | | | 5.150% due 12/6/2010 | | | 120,000 | | | 122,948 |
| | | | 6.135% due 12/13/2010 | | | 150,000 | | | 154,587 |
| | | | 4.375% due 12/20/2010 | | | 30,000 | | | 30,654 |
| | | | 6.300% due 12/20/2010 | | | 36,000 | | | 37,176 |
| | | | 6.030% due 12/29/2010 | | | 120,000 | | | 123,879 |
| | | | 0.450% due 1/4/2011 | | | 75,000 | | | 74,996 |
| | | | 5.750% due 1/18/2011 | | | 243,000 | | | 251,112 |
| | | | 5.050% due 2/1/2011 | | | 25,000 | | | 25,758 |
| | Federal Home Loan Banks | | | | | | |
| | | 0.500% due 6/1/2010 | | | 25,000 | | | 25,000 |
| | | 3.000% due 6/11/2010 | | | 2,670,000 | | | 2,672,045 |
| | | 4.250% due 6/11/2010 | | | 695,000 | | | 695,773 |
| | | 5.250% due 6/11/2010 | | | 770,000 | | | 771,070 |
| | | 4.400% due 6/15/2010 | | | 30,000 | | | 30,048 |
| | | 2.750% due 6/18/2010 | | | 200,000 | | | 200,237 |
| | | 4.500% due 6/21/2010 | | | 175,000 | | | 175,414 |
| | | 0.560% due 6/22/2010 | | | 40,000 | | | 40,007 |
| | | 4.500% due 6/22/2010 | | | 20,000 | | | 20,050 |
| | | 5.000% due 6/30/2010 (c) | | | 100,000 | | | 100,381 |
| | | 1.000% due 7/6/2010 | | | 500,000 | | | 500,326 |
| | | 1.000% due 7/7/2010 | | | 50,000 | | | 50,038 |
| | | 4.570% due 7/7/2010 | | | 25,000 | | | 25,108 |
| | | 5.000% due 7/12/2010 (c) | | | 100,000 | | | 100,541 |
| | | 0.500% due 7/13/2010 | | | 15,000 | | | 15,003 |
| | | 1.060% due 7/13/2010 | | | 1,000,000 | | | 1,000,956 |
| | | 4.375% due 7/13/2010 | | | 135,000 | | | 135,650 |
| | | 4.500% due 7/13/2010 | | | 160,000 | | | 160,794 |
| | | 4.320% due 7/14/2010 | | | 50,000 | | | 50,243 |
| | | 3.500% due 7/16/2010 | | | 3,705,000 | | | 3,720,313 |
| | | 0.550% due 7/20/2010 | | | 500,000 | | | 500,210 |
| | | 3.750% due 7/22/2010 | | | 75,000 | | | 75,372 |
| | | 0.550% due 7/28/2010 | | | 440,000 | | | 440,216 |
| | | 1.300% due 7/30/2010 | | | 65,000 | | | 65,100 |
| | | 4.000% due 7/30/2010 | | | 35,000 | | | 35,215 |
| | | 0.550% due 8/4/2010 | | | 50,000 | | | 50,027 |
| | | 1.000% due 8/5/2010 | | | 35,000 | | | 35,047 |
| | | 4.550% due 8/6/2010 | | | 405,000 | | | 408,058 |
| | | 4.516% due 8/10/2010 | | | 210,000 | | | 211,666 |
| | | 4.700% due 8/10/2010 | | | 35,000 | | | 35,289 |
| | | 3.375% due 8/13/2010 | | | 65,000 | | | 65,412 |
| | | 4.125% due 8/13/2010 | | | 865,000 | | | 871,712 |
| | | 4.750% due 8/13/2010 | | | 1,515,000 | | | 1,528,649 |
See Notes to Financial Statements.
22
BOND FUND SCHEDULE OF INVESTMENTS (Unaudited) (Continued) |
| May 31, 2010 |
| | | | | Principal | | | |
| | | | | | Amount | | Value |
| BONDS (continued) | | | | | | |
| United States Government and | | | | | | |
| | Agency Issues (continued) | | | | | | |
| | | Federal Home Loan Banks (continued) | | | | | | |
| | | | 6.875% due 8/13/2010 | | $ | 570,000 | | $ | 577,543 |
| | | | 4.710% due 8/16/2010 | | | 20,000 | | | 20,186 |
| | | | 4.875% due 8/16/2010 | | | 160,000 | | | 161,543 |
| | | | 1.300% due 8/24/2010 | | | 25,000 | | | 25,061 |
| | | | 4.785% due 8/26/2010 | | | 155,000 | | | 156,661 |
| | | | 1.300% due 8/27/2010 | | | 130,000 | | | 130,329 |
| | | | 1.375% due 8/27/2010 | | | 80,000 | | | 80,217 |
| | | | 5.000% due 9/1/2010 | | | 515,000 | | | 521,121 |
| | | | 1.400% due 9/2/2010 | | | 25,000 | | | 25,073 |
| | | | 1.350% due 9/3/2010 | | | 290,000 | | | 290,822 |
| | | | 1.375% due 9/3/2010 | | | 530,000 | | | 531,535 |
| | | | 0.700% due 9/8/2010 | | | 25,000 | | | 25,031 |
| | | | 3.000% due 9/10/2010 | | | 260,000 | | | 261,971 |
| | | | 3.050% due 9/10/2010 | | | 25,000 | | | 25,193 |
| | | | 3.375% due 9/10/2010 | | | 115,000 | | | 115,990 |
| | | | 4.500% due 9/10/2010 | | | 255,000 | | | 257,948 |
| | | | 5.125% due 9/10/2010 | | | 475,000 | | | 481,695 |
| | | | 1.400% due 9/16/2010 | | | 30,000 | | | 30,101 |
| | | | 3.100% due 9/17/2010 | | | 50,000 | | | 50,353 |
| | | | 4.000% due 9/17/2010 | | | 135,000 | | | 136,493 |
| | | | 4.375% due 9/17/2010 | | | 440,000 | | | 445,350 |
| | | | 4.520% due 9/23/2010 | | | 55,000 | | | 55,731 |
| | | | 5.125% due 9/29/2010 | | | 225,000 | | | 228,508 |
| | | | 1.250% due 9/30/2010 | | | 25,000 | | | 25,083 |
| | | | 1.250% due 10/8/2010 | | | 150,000 | | | 150,534 |
| | | | 1.250% due 10/14/2010 | | | 125,000 | | | 125,466 |
| | | | 3.375% due 10/20/2010 | | | 155,000 | | | 156,874 |
| | | | 1.125% due 10/22/2010 | | | 55,000 | | | 55,190 |
| | | | 4.375% due 10/22/2010 | | | 125,000 | | | 126,977 |
| | | | 0.480% due 10/25/2010 | | | 50,000 | | | 50,048 |
| | | | 0.500% due 10/25/2010 | | | 150,000 | | | 150,264 |
| | | | 5.000% due 10/27/2010 | | | 25,000 | | | 25,482 |
| | | | 4.250% due 11/2/2010 | | | 1,025,000 | | | 1,042,152 |
| | | | 1.195% due 11/4/2010 | | | 335,000 | | | 336,329 |
| | | | 3.125% due 11/12/2010 | | | 50,000 | | | 50,635 |
| | | | 4.300% due 11/12/2010 | | | 75,000 | | | 76,346 |
| | | | 1.050% due 11/15/2010 | | | 20,000 | | | 20,044 |
| | | | 4.250% due 11/15/2010 | | | 1,585,000 | | | 1,613,115 |
| | | | 6.625% due 11/15/2010 | | | 655,000 | | | 673,754 |
| | | | 1.000% due 11/18/2010 | | | 160,000 | | | 160,521 |
| | | | 3.000% due 12/10/2010 | | | 115,000 | | | 116,580 |
| | | | 3.500% due 12/10/2010 | | | 185,000 | | | 187,998 |
| | | | 3.875% due 12/10/2010 | | | 105,000 | | | 106,896 |
| | | | 4.750% due 12/10/2010 | | | 515,000 | | | 526,800 |
| | | | 6.100% due 12/13/2010 | | | 70,000 | | | 72,139 |
| | | | 3.200% due 12/17/2010 | | | 45,000 | | | 45,683 |
| | | | 3.625% due 12/17/2010 | | | 135,000 | | | 137,345 |
| | | | 5.210% due 12/29/2010 | | | 70,000 | | | 71,919 |
| | | | 3.150% due 1/3/2011 | | | 50,000 | | | 50,791 |
| | Financing Corp. | | | | | | |
| | | 0.000% due 5/30/2010, | | | | | | |
| | | Series 2 (d) | | | 154,000 | | | 154,000 |
| | | 0.000% due 5/30/2010, | | | | | | |
| | | Series C (d) | | | 59,000 | | | 59,000 |
| | | 0.000% due 6/6/2010, | | | | | | |
| | | Series 12 (d) | | | 29,000 | | | 28,996 |
| | | 0.000% due 6/27/2010, | | | | | | |
| | | Series 13 (d) | | | 148,000 | | | 147,895 |
| | | 0.000% due 8/3/2010, | | | | | | |
| | | Series 6 (d) | | | 43,000 | | | 42,927 |
| | | 0.000% due 8/3/2010, | | | | | | |
| | | Series 7 (d) | | | 41,000 | | | 40,931 |
| | | 0.000% due 8/3/2010, | | | | | | |
| | | Series D (d) | | | 44,000 | | | 43,926 |
| | | 0.000% due 8/8/2010, | | | | | | |
| | | Series 5 (d) | | | 53,000 | | | 52,903 |
| | | 0.000% due 8/8/2010, | | | | | | |
| | | Series 11 (d) | | | 49,000 | | | 48,911 |
| | | 0.000% due 8/8/2010, | | | | | | |
| | | Series A (d) | | | 2,000 | | | 1,996 |
| | | 0.000% due 9/26/2010, | | | | | | |
| | | Series D (d) | | | 131,000 | | | 130,582 |
| | | 0.000% due 10/5/2010, | | | | | | |
| | | Series 16 (d) | | | 416,000 | | | 414,561 |
| | | 0.000% due 10/5/2010, | | | | | | |
| | | Series 17 (d) | | | 207,000 | | | 206,284 |
| | | 0.000% due 10/6/2010, | | | | | | |
| | | Series 4 (d) | | | 38,000 | | | 37,867 |
| | | 0.000% due 10/6/2010, | | | | | | |
| | | Series Gen (d) | | | 153,000 | | | 152,466 |
| | | 0.000% due 11/2/2010, | | | | | | |
| | | Series E (d) | | | 426,000 | | | 424,181 |
| | | 0.000% due 11/11/2010, | | | | | | |
| | | Series 1 (d) | | | 511,000 | | | 508,679 |
| | | 0.000% due 11/30/2010, | | | | | | |
| | | Series 2 (d) | | | 8,000 | | | 7,959 |
| | | 0.000% due 11/30/2010, | | | | | | |
| | | Series 3 (d) | | | 82,000 | | | 81,580 |
| | | 0.000% due 11/30/2010, | | | | | | |
| | | Series 10 (d) | | | 77,000 | | | 76,605 |
| | | 0.000% due 11/30/2010, | | | | | | |
| | | Series C (d) | | | 30,000 | | | 29,846 |
| | | 0.000% due 12/6/2010, | | | | | | |
| | | Series 19 (d) | | | 42,000 | | | 41,779 |
| | | 0.000% due 12/27/2010, | | | | | | |
| | | Series 13 (d) | | | 83,000 | | | 82,512 |
See Notes to Financial Statements.
23
BOND FUND SCHEDULE OF INVESTMENTS (Unaudited) (Continued) |
| May 31, 2010 |
| | | | | Principal | | | |
| | | | | | Amount | | Value |
| BONDS (continued) | | | | | | |
| United States Government and | | | | | | |
| | Agency Issues (continued) | | | | | | |
| | | Freddie Mac | | | | | | |
| | | | 3.340% due 6/9/2010 | | $ | 230,000 | | $ | 230,152 |
| | | | 3.500% due 6/11/2010 | | | 5,000 | | | 5,004 |
| | | | 0.000% due 6/15/2010 (d) | | | 27,000 | | | 26,992 |
| | | | 3.500% due 6/16/2010 | | | 15,000 | | | 15,020 |
| | | | 4.125% due 6/16/2010 (c) | | | 25,000 | | | 25,039 |
| | | | 3.550% due 6/18/2010 | | | 10,000 | | | 10,015 |
| | | | 4.500% due 7/6/2010 | | | 2,437,000 | | | 2,447,079 |
| | | | 4.125% due 7/12/2010 | | | 2,427,000 | | | 2,437,725 |
| | | | 0.000% due 7/15/2010 (d) | | | 245,000 | | | 244,760 |
| | | | 3.250% due 7/16/2010 | | | 1,796,000 | | | 1,802,749 |
| | | | 0.000% due 7/18/2010 (d) | | | 55,000 | | | 54,943 |
| | | | 4.625% due 7/28/2010 | | | 115,000 | | | 115,779 |
| | | | 4.790% due 8/4/2010 | | | 110,000 | | | 110,875 |
| | | | 4.750% due 8/9/2010 | | | 63,000 | | | 63,524 |
| | | | 3.050% due 8/12/2010 | | | 9,000 | | | 9,048 |
| | | | 5.000% due 9/1/2010 | | | 268,000 | | | 271,124 |
| | | | 1.450% due 9/10/2010 | | | 35,000 | | | 35,115 |
| | | | 6.875% due 9/15/2010 | | | 484,000 | | | 493,526 |
| | | | 4.750% due 9/22/2010 | | | 108,000 | | | 109,398 |
| | | | 4.750% due 10/4/2010 | | | 175,000 | | | 177,644 |
| | | | 4.160% due 10/13/2010 | | | 65,000 | | | 65,897 |
| | | | 4.125% due 10/18/2010 | | | 332,000 | | | 336,903 |
| | | | 5.000% due 10/18/2010 | | | 740,000 | | | 752,870 |
| | | | 3.125% due 10/25/2010 | | | 5,000 | | | 5,058 |
| | | | 5.000% due 10/27/2010 (c) | | | 30,000 | | | 30,563 |
| | | | 5.000% due 10/27/2010 (c) | | | 195,000 | | | 198,663 |
| | | | 4.250% due 10/28/2010 | | | 525,000 | | | 533,319 |
| | | | 2.875% due 11/23/2010 | | | 124,000 | | | 125,583 |
| | | | 4.750% due 12/8/2010 | | | 891,000 | | | 911,240 |
| | | | 0.000% due 12/15/2010 (d) | | | 17,000 | | | 16,922 |
| | | | 1.550% due 12/15/2010 | | | 220,000 | | | 221,327 |
| | | | 4.500% due 12/16/2010 | | | 115,000 | | | 117,547 |
| | | | 1.500% due 1/7/2011 | | | 203,000 | | | 204,262 |
| | Government Trust Certificates | | | | | | |
| | | (Israel) | | | | | | |
| | | 0.000% due 10/1/2010 (d) | | | 55,000 | | | 54,798 |
| | | 0.000% due 11/15/2010 (d) | | | 120,000 | | | 119,386 |
| | | Resolution Funding Corp. | | | | | | |
| | | | 0.000% due 7/15/2010 (d) | | | 392,000 | | | 391,717 |
| | | | 0.000% due 10/15/2010 (d) | | | 324,000 | | | 323,251 |
| | Tennessee Valley Authority | | | | | | |
| | | 0.000% due 6/15/2010 (d) | | | 44,000 | | | 43,985 |
| | | 0.000% due 7/15/2010 (d) | | | 25,000 | | | 24,973 |
| | | 0.000% due 10/15/2010 (d) | | | 147,000 | | | 146,491 |
| | | 0.000% due 11/1/2010 (d) | | | 203,000 | | | 202,207 |
| | | 0.000% due 1/15/2011 (d) | | | 54,000 | | | 53,681 |
| | | 5.625% due 1/18/2011 | | | 236,000 | | | 243,940 |
| | | | | | | | | |
| | | Total United States Government | | | | | | |
| | | | and Agency Issues | | | | | | 57,224,660 |
| | | | | | | | | |
| | | TOTAL BONDS | | | | | | |
| | | | (COST $287,018,962) | | | | | | 293,402,330 |
| | | | | | | | | |
| SHORT-TERM INVESTMENTS - 2.8% | | | | | | |
| United States Government and | | | | | | |
| | Agency Issues - 2.6% | | | | | | |
| | Fannie Mae Discount Notes | | | | | | |
| | | 0.218% due 10/1/2010 | | | 100,000 | | | 99,898 |
| | United States Treasury Bills | | | | | | |
| | | 0.142% due 7/1/2010 | | | 6,000,000 | | | 5,999,300 |
| | | 0.132% due 7/8/2010 | | | 2,000,000 | | | 1,999,733 |
| | | | | | | | | |
| | Total United States Government | | | | | | |
| | | and Agency Issues | | | | | | 8,098,931 |
| | | | | | | | | |
| Variable-Rate Demand Notes - 0.2% | | | | | | |
| | American Family Financial | | | | | | |
| | | Services, 0.100% | | | 546,349 | | | 546,349 |
| | | | | | | | | |
| | Total Variable-Rate Demand Notes | | | | | | 546,349 |
| | | | | | | | | |
| | TOTAL SHORT-TERM INVESTMENTS | | | | | | |
| | | (COST $8,645,279) | | | | | | 8,645,280 |
| | | | | | | | | |
| | TOTAL INVESTMENTS - 98.2% | | | | | | |
| | | (COST $296,165,828) | | | | | | 302,689,595 |
| | | | | | | | | |
| | NET OTHER ASSETS AND | | | | | | |
| | | LIABILITIES - 1.8% | | | | | | 5,611,378 |
| | | | | | | | | |
| | NET ASSETS - 100.0% | | | | | $ | 308,300,973 |
| | | | | | | | | |
| (a) | | Non-income producing security. |
| (b) | | Interest rate shown represents the current coupon rate at May 31, 2010. |
| (c) | | Security is a “step-up” bond where the coupon increases or steps up at a predetermined date. |
| (d) | | Zero-coupon security. |
| (e) | | Security is exempt from registration under Rule 144A under the Securities Act of 1933. This security may be resold in transactions that are exempt from registration, normally to qualified institutional buyers. |
See Notes to Financial Statements.
24
FUND EXPENSE EXAMPLES (Unaudited) |
| May 31, 2010 |
Example
A Fund shareholder may incur two types of costs: (1) transaction costs such as redemption fees; and (2) ongoing costs, including management fees and other Fund expenses. This example is intended to help you understand your ongoing costs (in dollars) of investing in a Fund and to compare these costs with the ongoing costs of investing in other mutual funds.
The example is based on an investment of $1,000 invested at the beginning of the period and held for the entire period from December 1, 2009 to May 31, 2010.
Actual Expenses
The first line of the table below under each Fund provides information about actual account values and actual expenses for such Fund. You may use the information in this line, together with the amount you invested, to estimate the expenses that you paid over the period. Simply divide your account value by $1,000 (for example, an $8,600 account value divided by $1,000 = 8.6), then multiply the result by the number in the first line under the heading entitled “Expenses Paid During Period” to estimate the expenses you paid on your account during this period.
Hypothetical Example for Comparison Purposes
The second line of the table below under each Fund provides information about hypothetical account values and hypothetical expenses based on such Fund’s actual expense ratio and an assumed rate of return of 5% per year before expenses, which is not the Fund’s actual return. The hypothetical account values and expenses may not be used to estimate the actual ending account balance or expenses you paid for the period. You may use this information to compare the ongoing costs of investing in each Fund and other funds. To do so, compare the 5% hypothetical example with the 5% hypothetical examples that appear in the shareholder reports of the other funds.
Please note that the expenses shown in the table are meant to highlight your ongoing costs only and do not reflect any transactional costs, such as redemption fees. Therefore, the second line of the table is useful in comparing ongoing costs only, and will not help you determine the relative costs of owning different funds. In addition, if these transactional costs were included, your costs would have been higher.
| | Beginning | | Ending | | Expenses Paid During |
| | Account Value | | Account Value | | Period* |
| | 12/1/09 | | 05/31/10 | | 12/1/09-05/31/10 |
| Thompson Plumb Growth Fund | | | | | | | | | | | | | | | |
| Actual | | | $ | 1,000.00 | | | | $ | 994.42 | | | | $ | 6.86 | |
| Hypothetical (5% return before expenses) | | | $ | 1,000.00 | | | | $ | 1,018.12 | | | | $ | 6.94 | |
| Thompson Plumb MidCap Fund | | | | | | | | | | | | | | | |
| Actual | | | $ | 1,000.00 | | | | $ | 1,102.42 | | | | $ | 6.81 | |
| Hypothetical (5% return before expenses) | | | $ | 1,000.00 | | | | $ | 1,018.52 | | | | $ | 6.54 | |
| Thompson Plumb Bond Fund | | | | | | | | | | | | | | | |
| Actual | | | $ | 1,000.00 | | | | $ | 1,033.31 | | | | $ | 4.06 | |
| Hypothetical (5% return before expenses) | | | $ | 1,000.00 | | | | $ | 1,021.01 | | | | $ | 4.03 | |
| * | Expenses are equal to the annualized expense ratio for each Fund (Growth Fund: 1.38%; MidCap Fund: 1.30%; and Bond Fund: 0.80%), multiplied by the average account value over the period, multiplied by 182/365 (to reflect the one-half year period). For more information, please refer to the Funds’ Prospectus. |
See Notes to Financial Statements.
25
STATEMENTS OF ASSETS AND LIABILITIES (Unaudited) |
| May 31, 2010 (In thousands, except per share amounts) |
| | | GROWTH | | MIDCAP | | BOND |
| | | | FUND | | FUND | | FUND |
| ASSETS | | | | | | | | | | | | | | | | | |
| Total investments in securities, at value (Cost $114,629, $10,890 and | | | | | | | | | | | | | | | | | |
| $296,166, respectively) | | | $ | 130,536 | | | | | $ | 12,843 | | | | | $ | 302,690 | |
| Due from sale of securities | | | | 238 | | | | | | 7 | | | | | | – | |
| Receivable from fund shares sold | | | | 9 | | | | | | 2 | | | | | | 5,872 | |
| Dividends and interest receivable | | | | 271 | | | | | | 12 | | | | | | 3,860 | |
| Due from investment advisor | | | | – | | | | | | 2 | | | | | | – | |
| Prepaid expenses | | | | 28 | | | | | | 17 | | | | | | 35 | |
| Total Assets | | | | 131,082 | | | | | | 12,883 | | | | | | 312,457 | |
| LIABILITIES | | | | | | | | | | | | | | | | | |
| Due on purchase of securities | | | | 55 | | | | | | – | | | | | | 3,005 | |
| Payable for fund shares redeemed | | | | 101 | | | | | | – | | | | | | 976 | |
| Line of credit | | | | 94 | | | | | | 14 | | | | | | – | |
| Accrued expenses payable | | | | 41 | | | | | | 22 | | | | | | 43 | |
| Due to investment advisor | | | | 121 | | | | | | – | | | | | | 132 | |
| Total Liabilities | | | | 412 | | | | | | 36 | | | | | | 4,156 | |
| NET ASSETS | | | $ | 130,670 | | | | | $ | 12,847 | | | | | $ | 308,301 | |
| Net Assets consist of: | | | | | | | | | | | | | | | | | |
| Capital stock ($.001 par value) | | | $ | 238,616 | | | | | $ | 11,043 | | | | | $ | 299,045 | |
| Undistributed net investment income (loss) | | | | (117 | ) | | | | | (4 | ) | | | | | 2,445 | |
| Accumulated net realized gain (loss) on investments | | | | (123,736 | ) | | | | | (145 | ) | | | | | 287 | |
| Net unrealized appreciation on investments | | | | 15,907 | | | | | | 1,953 | | | | | | 6,524 | |
| Net Assets | | | $ | 130,670 | | | | | $ | 12,847 | | | | | $ | 308,301 | |
| Shares of capital stock outstanding (unlimited shares authorized) | | | | 4,834 | | | | | | 1,241 | | | | | | 27,256 | |
| Offering and redemption price/Net asset value per share | | | $ | 27.03 | | | | | $ | 10.35 | | | | | $ | 11.31 | |
| | | | | | | | | | | | | | | | | | |
See Notes to Financial Statements.
26
STATEMENTS OF OPERATIONS (Unaudited) |
| Six-Month Period Ended May 31, 2010 (In thousands) |
| | GROWTH | | MIDCAP | | BOND |
| | FUND | | FUND | | FUND |
| Investment income | | | | | | | | | | | | | | | | | | |
| Dividends(1) | | | $ | 1,003 | | | | | $ | 70 | | | | | | – | | |
| Interest | | | | – | | | | | | – | | | | | $ | 4,943 | | |
| | | | 1,003 | | | | | | 70 | | | | | | 4,943 | | |
| Expenses | | | | | | | | | | | | | | | | | | |
| Investment advisory fees | | | | 665 | | | | | | 59 | | | | | | 639 | | |
| Shareholder servicing costs | | | | 107 | | | | | | 16 | | | | | | 76 | | |
| Administrative and accounting services fees | | | | 63 | | | | | | 15 | | | | | | 71 | | |
| Professional fees | | | | 37 | | | | | | 24 | | | | | | 40 | | |
| Directors fees | | | | 21 | | | | | | 7 | | | | | | 20 | | |
| Custody fees | | | | 17 | | | | | | 7 | | | | | | 21 | | |
| Federal & state registration | | | | 16 | | | | | | 17 | | | | | | 28 | | |
| Other expenses | | | | 54 | | | | | | 6 | | | | | | 67 | | |
| Total expenses | | | | 980 | | | | | | 151 | | | | | | 962 | | |
| Less expenses reimbursed by advisor | | | | – | | | | | | (75 | ) | | | | | (126 | ) | |
| Net expenses | | | | 980 | | | | | | 76 | | | | | | 836 | | |
| Net investment income (loss) | | | | 23 | | | | | | (6 | ) | | | | | 4,107 | | |
| Net realized gain on investments | | | | 7,477 | | | | | | 603 | | | | | | 291 | | |
| Net unrealized appreciation (depreciation) on investments | | | | (6,700 | ) | | | | | 436 | | | | | | 2,895 | | |
| Net gain on investments | | | | 777 | | | | | | 1,039 | | | | | | 3,186 | | |
| Net increase in net assets resulting from operations | | | $ | 800 | | | | | $ | 1,033 | | | | | $ | 7,293 | | |
| | | | | | | | | | | | | | | | | | | |
| (1)Net of foreign withholding taxes | | | $ | 8 | | | | | $ | – | | | | | | – | | |
See Notes to Financial Statements.
27
| STATEMENTS OF CHANGES IN NET ASSETS |
| (In thousands) |
| | | | GROWTH | | MIDCAP | | BOND |
| | | | FUND | | FUND | | FUND |
| | | | Six-Month | | | | | | | | Six-Month | | | | | | | | Six-Month | | | | | | |
| | | | Period Ended | | Year Ended | | Period Ended | | Year Ended | | Period Ended | | Year Ended |
| | | | May 31, 2010 | | November 30, | | May 31, 2010 | | November 30, | | May 31, 2010 | | November 30, |
| | | | | (Unaudited) | | 2009 | | (Unaudited) | | 2009 | | (Unaudited) | | 2009 |
| Operations | | | | | | | | | | | | | | | | | | | | | | | | | | | | | | | | | | | | |
| Net investment income (loss) | | | $ | 23 | | | | | $ | 407 | | | | | $ | (6 | ) | | | | $ | 7 | | | | | $ | 4,107 | | | | | $ | 4,055 | | |
| | Net realized gain (loss) on investments | | | | 7,477 | | | | | | (42,167 | ) | | | | | 603 | | | | | | (407 | ) | | | | | 291 | | | | | | 1,576 | | |
| Net unrealized appreciation (depreciation) | | | | | | | | | | | | | | | | | | | | | | | | | | | | | | | | | | | | |
| | on investments | | | | (6,700 | ) | | | | | 84,205 | | | | | | 436 | | | | | | 2,826 | | | | | | 2,895 | | | | | | 10,019 | | |
| | Net increase in net assets resulting | | | | | | | | | | | | | | | | | | | | | | | | | | | | | | | | | | | | |
| | | from operations | | | | 800 | | | | | | 42,445 | | | | | | 1,033 | | | | | | 2,426 | | | | | | 7,293 | | | | | | 15,650 | | |
| | | | |
| Distributions to Shareholders | | | | | | | | | | | | | | | | | | | | | | | | | | | | | | | | | | | | |
| Distributions from net investment income | | | | (243 | ) | | | | | (1,953 | ) | | | | | (4 | ) | | | | | (19 | ) | | | | | (2,842 | ) | | | | | (3,761 | ) | |
| | Distributions from net realized gains on | | | | | | | | | | | | | | | | | | | | | | | | | | | | | | | | | | | | |
| | | securities transactions | | | | – | | | | | | – | | | | | | (56 | ) | | | | | – | | | | | | (1,011 | ) | | | | | – | | |
| Total distributions to shareholders | | | | (243 | ) | | | | | (1,953 | ) | | | | | (60 | ) | | | | | (19 | ) | | | | | (3,853 | ) | | | | | (3,761 | ) | |
| | | | | | | | | | | | | | | | | | | | | | | | | | | | | | | | | | | | | |
| Fund Share Transactions (See Note 4) | | | | (14,018 | ) | | | | | (30,233 | ) | | | | | 2,236 | | | | | | 4,925 | | | | | | 170,682 | | | | | | 78,328 | | |
| | | | | | | | | | | | | | | | | | | | | | | | | | | | | | | | | | | | | | |
| Total Increase (Decrease) in Net Assets | | | | (13,461 | ) | | | | | 10,259 | | | | | | 3,209 | | | | | | 7,332 | | | | | | 174,122 | | | | | | 90,217 | | |
| | | | | | | | | | | | | | | | | | | | | | | | | | | | | | | | | | | | | | |
| Net Assets | | | | | | | | | | | | | | | | | | | | | | | | | | | | | | | | | | | | |
| Beginning of period | | | | 144,131 | | | | | | 133,872 | | | | | | 9,638 | | | | | | 2,306 | | | | | | 134,179 | | | | | | 43,962 | | |
| | End of period | | | $ | 130,670 | | | | | $ | 144,131 | | | | | $ | 12,847 | | | | | $ | 9,638 | | | | | $ | 308,301 | | | | | $ | 134,179 | | |
| Undistributed net investment income (loss) | | | | | | | | | | | | | | | | | | | | | | | | | | | | | | | | | | | | |
| | included in net assets at end of period | | | $ | (117 | ) | | | | $ | 103 | | | | | $ | (4 | ) | | | | $ | 3 | | | | | $ | 2,445 | | | | | $ | 1,178 | | |
See Notes to Financial Statements.
28
NOTES TO FINANCIAL STATEMENTS (Unaudited) |
| May 31, 2010 |
NOTE 1 - ORGANIZATION
Thompson Plumb Funds, Inc. (the “Company”) is a Wisconsin corporation registered under the Investment Company Act of 1940, as amended (the “1940 Act”), as an open-end, diversified management investment company.
The Company consists of separate mutual funds series (each, a “Fund,” and collectively, the “Funds”): Thompson Plumb Growth Fund (the “Growth Fund”), Thompson Plumb MidCap Fund (the “MidCap Fund”) and Thompson Plumb Bond Fund (the “Bond Fund”). The assets and liabilities of each Fund are segregated and a shareholder’s interest is limited to the Fund in which the shareholder owns shares. The objectives and strategies of each Fund are described in the Funds’ Prospectus.
NOTE 2 - SIGNIFICANT ACCOUNTING POLICIES
The following is a summary of significant accounting policies followed by the Funds in the preparation of their financial statements.
SECURITY VALUATION - Each Fund’s investments are valued at their market prices (generally the last reported sales price on the exchange where the securities are primarily traded or, for Nasdaq-listed securities, at their Nasdaq Official Closing Prices) or, where market quotations are not readily available or are unreliable, at fair value as determined in good faith pursuant to procedures established by the Funds’ Board of Directors (the “Funds’ Board”). Market quotations for the common stocks in which the Funds invest are nearly always readily available; however, market quotations for debt securities are often not readily available. Fair values of debt securities are typically based on valuations published by an independent pricing service, which uses various valuation methodologies such as matrix pricing and other analytical pricing models as well as market transactions and dealer quotations. Debt securities with remaining maturities of 60 days or less are valued at amortized cost basis.
When a security is “fair valued,” consideration is given to the facts and circumstances relevant to the particular situation, including a review of various factors set forth in the Pricing Policies and Procedures adopted by the Funds’ Board, which includes factors such as fundamental analytical data relating to the investment, which may include consideration of yields or prices of securities of comparable quality, coupon rate, maturity and type of issue, nature and duration of any restrictions on disposition of the security and an evaluation of forces that influence the market in which the securities are purchased or sold. Fair value pricing is an inherently subjective process, and no single standard exists for determining fair value. Different funds could reasonably arrive at different values for the same security. No securities in any of the Funds were fair valued as of May 31, 2010.
In accordance with Accounting Standards Codification Topic 820-10, “Fair Value Measurements and Disclosures” (“Topic 820-10”), fair value is defined as the price that the Fund would receive to sell an investment or pay to transfer a liability in an orderly transaction with an independent buyer in the principal market, or in the absence of a principal market the most advantageous market for the investment or liability. Topic 820-10 established a three-tier hierarchy to maximize the use of observable market data and minimize the use of unobservable inputs and to establish classification of fair value measurements for disclosure purposes.
In April 2009, the Financial Accounting Standards Board (“FASB”) updated the accounting standards to provide guidance on estimating the fair value of an asset or liability when the volume and level of activity for the asset or liability have significantly decreased and identifying transactions that are not orderly.
Various inputs are used in determining the value of the Fund’s investments. These inputs are summarized in the three broad levels listed below:
Level 1 – Quoted prices in active markets for identical securities.
Level 2 – Other significant observable inputs (including quoted prices for similar securities, interest rates, prepayment speeds, credit risk, etc.)
Level 3 – Significant unobservable inputs (including the Fund’s own assumptions in determining the fair value of investments).
Inputs may include price information, specific and broad credit data, liquidity statistics, and other factors. The Fund considers observable data to be that market data which is readily available, regularly distributed or updated, reliable and verifiable, not proprietary, and provided by independent sources that are actively involved in the relevant market. The determination of what constitutes “observable” requires significant judgment by the Fund. The categorization of a financial instrument within
29
NOTES TO FINANCIAL STATEMENTS (Unaudited) (Continued) |
| May 31, 2010 |
the hierarchy is based upon the pricing transparency of the instrument and does not necessarily correspond to the Fund’s perceived risk of that instrument. Investments whose values are based on quoted market prices in active markets, and which are therefore classified as level-1 securities, include active listed equities and certain U.S. government obligations.
Investments that trade in markets that are not considered to be active, but are valued based on quoted market prices, dealer quotations or alternative pricing sources supported by observable inputs, are classified as level-2 securities. These include certain U.S. government obligations, most government agency securities, investment-grade corporate bonds, and less liquid listed equities. Level-2 investments include positions that are not traded in active markets.
Investments classified as level-3 securities have significant unobservable inputs, as they trade infrequently or not at all. Level-3 instruments include private-placement and less liquid corporate debt securities. When observable prices are not available for these securities, the Fund uses one or more valuation techniques (e.g., the market approach, the income approach, or the cost approach) for which sufficient and reliable data is available. Within level 3, the use of the market approach generally consists of using comparable market transactions, while the use of the income approach generally consists of using the net present value of estimated future cash flows, adjusted as appropriate for liquidity, credit, market and/or other risk factors. The inputs used by the Fund in estimating the value of level-3 investments include the original transaction price and recent transactions in the same or similar instruments.
The following is a summary of the inputs used to value the Funds’ net assets as of May 31, 2010:
| | Growth Fund |
| Investment Securities: | | Level 1 | | Level 2 | | Level 3 | | Total |
| Common Stocks | | $ | 130,534,782 | | | – | | – | | $ | 130,534,782 |
| Short-term Investments | | | – | | $ | 804 | | – | | | 804 |
| Total | | $ | 130,534,782 | | $ | 804 | | – | | $ | 130,535,586 |
| | | |
| | MidCap Fund |
| Investment Securities: | | Level 1 | | Level 2 | | Level 3 | | Total |
| Common Stocks | | $ | 12,843,149 | | | – | | – | | $ | 12,843,149 |
| Short-term Investments | | | – | | $ | 130 | | – | | | 130 |
| Total | | $ | 12,843,149 | | $ | 130 | | – | | $ | 12,843,279 |
| | | |
| | Bond Fund |
| Investment Securities: | | Level 1 | | Level 2 | | Level 3 | | Total |
| Common Stocks | | $ | 641,985 | | | – | | – | | $ | 641,985 |
| Bonds | | | – | | $ | 293,402,330 | | – | | | 293,402,330 |
| Short-term Investments | | | – | | | 8,645,280 | | – | | | 8,645,280 |
| Total | | $ | 641,985 | | $ | 302,047,610 | | – | | $ | 302,689,595 |
SECURITIES TRANSACTIONS AND INVESTMENT INCOME - Investment securities transactions are accounted for on the trade date. Gains or losses realized on sales of securities are determined by comparing the identified cost of the security lot sold with the net sales proceeds. Discounts/premiums on debt securities purchased are accreted/amortized over the life of the respective securities on the same basis for book and tax purposes. Dividend income is recorded on the ex-dividend date. Interest income is recorded as earned.
SECURITIES PURCHASED ON A WHEN-ISSUED OR DELAYED-DELIVERY BASIS - Each Fund may purchase securities on a when-issued or delayed-delivery basis. When-issued securities are securities purchased with delivery to occur at a later date at a stated price and/or yield, thereby involving the risk that the price and/or yield obtained may be more or less than those available in the market when delivery takes place. At the time a Fund makes a commitment to purchase a security on a when-issued basis, the Fund records the transaction and reflects the value of the security in determining net asset value. Each Fund designates and maintains cash and marketable securities at least equal in value to commitments for when-issued securities.
30
NOTES TO FINANCIAL STATEMENTS (Unaudited) (Continued) |
| May 31, 2010 |
MORTGAGE DOLLAR ROLLS - - The Bond Fund may enter into mortgage dollar roll transactions in which the Fund sells a mortgage-backed security to a counterparty and simultaneously enters into an agreement with the same counterparty to buy back a similar security on a specific future date at a predetermined price. Each mortgage dollar roll is treated as a financing transaction; therefore, any gain or loss is considered unrealized until the roll reaches completion. Risks may arise due to the delayed payment date and the potential inability of counterparties to complete the transaction. Income is generated as consideration for entering into these transactions and is included in interest income on the accompanying financial statements.
VARIABLE-RATE DEMAND NOTES - The Funds invest in short-term variable-rate demand notes, which are unsecured instruments. The Funds may be susceptible to credit risk with respect to these instruments to the extent the issuer defaults on its payment obligation.
PERMANENT BOOK AND TAX DIFFERENCES - Generally accepted accounting principles require that permanent financial reporting and tax differences relating to shareholder distributions be reclassified in the capital accounts.
EXPENSES - Each Fund is charged for those expenses that are directly attributed to it. Expenses that are not readily identifiable to a specific Fund are generally allocated among the Funds in proportion to the relative sizes of the Funds.
USE OF ESTIMATES - The preparation of financial statements in conformity with generally accepted accounting principles requires management to make estimates and assumptions that affect the reported amounts of assets and liabilities and disclosure of contingent assets and liabilities at the date of the financial statements and the reported amounts of revenues and expenses during the reporting period. Actual results could differ from these estimates.
DISTRIBUTIONS TO SHAREHOLDERS - Distributions to shareholders from net investment income and realized gains on securities for the Growth Fund and MidCap Fund normally are declared at least annually. Bond Fund distributions to shareholders from net investment income normally are declared on a quarterly basis, and distributions to shareholders from realized gains on securities normally are declared at least annually. Distributions are recorded on the ex-dividend date.
FEDERAL INCOME TAXES - - No provision has been made for federal income taxes since the Funds have elected to be taxed as regulated investment companies and intend to distribute substantially all income to shareholders and otherwise comply with the provisions of the Internal Revenue Code applicable to regulated investment companies.
DIRECTED BROKERAGE ARRANGEMENTS - The Funds have directed brokerage arrangements with Fidelity Capital Markets, BNY Brokerage and Trade Manage Capital, Inc. Upon purchase and/or sale of the investment securities at best execution, the Funds pay brokerage commissions to Fidelity Capital Markets, BNY Brokerage and Trade Manage Capital, Inc. These commission payments generate non-refundable cumulative credits, which are available to pay certain expenses of the Funds. There were no directed brokerage credits during the six-month period ended May 31, 2010.
LINE OF CREDIT - The Funds have established a line of credit (“LOC”) with U.S. Bank N.A. which expires November 15, 2010 used primarily to finance redemption payments. Each of the individual Fund’s borrowing under the LOC is limited to either 5% of the market value of that Fund’s total assets or any explicit borrowing limits imposed by the Funds’ Board, whatever is less. As of May 31, 2010, the limits established by the Funds’ Board are: Growth Fund - $10,000,000, MidCap Fund - $500,000 and Bond Fund - $4,000,000. The following table shows the average balance, average interest rate and interest expense incurred by the Funds on borrowings under the LOC for the six-month period ended May 31, 2010.
| | Average | | Average | | Interest |
| Fund | | Balance | | Interest Rate | | Expense |
| Growth Fund | | | $ | 265,863 | | | 3.250% | | | $ | 4,373 | |
| MidCap Fund | | | $ | 10,495 | | | 3.250% | | | $ | 173 | |
| Bond Fund | | | $ | 36,258 | | | 3.250% | | | $ | 596 | |
31
NOTES TO FINANCIAL STATEMENTS (Unaudited) (Continued) |
| May 31, 2010 |
GUARANTEES AND INDEMNIFICATIONS - Under the Funds’ organizational documents, each Director, officer, employee or other agent of the Funds (including the Funds’ investment manager) is indemnified, to the extent permitted by the Act, against certain liabilities that may arise out of performance of their duties to the Funds. Additionally, in the normal course of business, the Funds enter into contracts that contain a variety of indemnification clauses. The Funds’ maximum exposure under these arrangements is unknown as this would involve future claims that may be made against the Funds that have not yet occurred. However, the Funds have not had prior claims or losses pursuant to these contracts and believe the risk of loss to be remote.
ACCOUNTING FOR UNCERTAINTY IN INCOME TAXES - The Funds implemented the provisions of the FASB Accounting Standards Codification Topic 740 (“Topic 740”) Accounting for Uncertainty in Income Taxes. This topic prescribes a recognition threshold and measurement attribute for the financial statement recognition and measurement of a tax position taken or expected to be taken in a tax return. It also provides guidance on de-recognition, classification, interest and penalties, accounting in interim periods, disclosure and transition. The implementation of Topic 740 resulted in no material liability for unrecognized tax benefits in the accompanying financial statements. Generally, each of the tax years in the four-year period ended November 30, 2009 remains subject to examination by taxing authorities. The Funds are also not aware of any tax positions for which it is reasonably possible that the total amounts of unrecognized tax benefits will significantly change in the next twelve months.
SUBSEQUENT EVENTS - In May 2009, the FASB updated the accounting standards on the recognition and disclosure of subsequent events. The standard requires the disclosure of the date through which subsequent events were evaluated. This standard was issued and is effective for interim or annual reporting periods ending after June 15, 2009, and applies prospectively. The Funds have evaluated subsequent events through the issuance of the Funds’ financial statements on July 23, 2010 and have determined that such subsequent events do not have an impact on the Funds’ financial statements.
NOTE 3 - INVESTMENT ADVISORY AND ADMINISTRATIVE AND ACCOUNTING SERVICES AGREEMENTS AND OTHER TRANSACTIONS WITH AFFILIATES
The Investment Advisory Agreement pursuant to which Thompson Investment Management, Inc. (“TIM”) is retained by the Funds provides for compensation to TIM (computed daily and paid monthly) at the following annual rates: for the Growth Fund and MidCap Fund - 1.00% of the first $50 million of average daily net assets and 0.90% of average daily net assets in excess of $50 million; and for the Bond Fund - 0.65% of the first $50 million of average daily net assets and 0.60% of average daily net assets in excess of $50 million.
The Advisor is contractually bound to waive management fees and/or reimburse expenses incurred by the Funds through March 31, 2011 so that the annual operating expenses of the Funds do not exceed the following percentages of their respective average daily net assets: Growth Fund-1.40%, MidCap Fund-1.30% and Bond Fund-0.80%. For the six-month period ended May 31, 2010, the Advisor reimbursed expenses incurred by the MidCap Fund and the Bond Fund in the amounts of $75,298 and $125,946, respectively.
Pursuant to an Administrative and Accounting Services Agreement, TIM maintains the Funds’ financial records in accordance with the 1940 Act, prepares all necessary financial statements of the Funds and calculates the net asset value per share of the Funds on a daily basis. As compensation for its services, each Fund pays TIM a fee computed daily and payable monthly at the annual rate of 0.15% of average daily net assets up to $30 million, 0.10% of the next $70 million of average daily net assets and 0.025% of average daily net assets in excess of $100 million, with an annual minimum fee of $30,000 per Fund. The calculations of daily net asset value are subcontracted to U.S. Bancorp Fund Services, resulting in fees paid by TIM for the six-month period ended May 31, 2010 in the amounts of $17,528, $15,000 and $27,465 for the Growth Fund, MidCap Fund and Bond Fund, respectively.
As of May 31, 2010, retirement plan investments by certain employees of the Advisor represent 0.90%, 4.93% and 0.03% of the net assets of the Growth Fund, MidCap Fund and Bond Fund, respectively.
32
NOTES TO FINANCIAL STATEMENTS (Unaudited) (Continued) |
| May 31, 2010 |
NOTE 4 - FUND SHARE TRANSACTIONS
Transactions in shares of the Funds were as follows:
| (In thousands) | | | | | | | | | | | | | | |
| | Six-Month Period Ended | | Year Ended |
| | May 31, 2010 (Unaudited) | | November 30, 2009 |
| | Shares | | Dollars | | Shares | | Dollars |
| Growth Fund | | | | | | | | | | | | | | |
| Shares sold | | 127 | | | $ | 3,609 | | | 584 | | | $ | 12,785 | |
| Shares issued in reinvestment of dividends | | 8 | | | | 232 | | | 92 | | | | 1,864 | |
| Shares issued in reinvestment of realized gains | | – | | | | – | | | – | | | | – | |
| Shares redeemed | | (632 | ) | | | (17,859 | ) | | (2,122 | ) | | | (44,882 | ) |
| Net decrease | | (497 | ) | | $ | (14,018 | ) | | (1,446 | ) | | $ | (30,233 | ) |
| |
| MidCap Fund | | | | | | | | | | | | | | |
| Shares sold | | 273 | | | $ | 2,839 | | | 730 | | | $ | 5,552 | |
| Shares issued in reinvestment of dividends | | - | | | | 4 | | | 2 | | | | 16 | |
| Shares issued in reinvestment of realized gains | | 6 | | | | 56 | | | – | | | | – | |
| Shares redeemed | | (64 | ) | | | (663 | ) | | (79 | ) | | | (643 | ) |
| Net increase | | 215 | | | $ | 2,236 | | | 653 | | | $ | 4,925 | |
| |
| Bond Fund | | | | | | | | | | | | | | |
| Shares sold | | 18,807 | | | $ | 210,777 | | | 9,590 | | | $ | 101,920 | |
| Shares issued in reinvestment of dividends | | 244 | | | | 2,705 | | | 345 | | | | 3,361 | |
| Shares issued in reinvestment of realized gains | | 89 | | | | 982 | | | – | | | | – | |
| Shares redeemed | | (3,909 | ) | | | (43,782 | ) | | (2,667 | ) | | | (26,953 | ) |
| Net increase | | 15,231 | | | $ | 170,682 | | | 7,268 | | | $ | 78,328 | |
| | | | | | | | | | | | | | | |
NOTE 5 - PURCHASE AND SALE OF SECURITIES
Investment transactions for the six-month period ended May 31, 2010 were as follows:
| | Securities other than U.S. | | | | | | |
| | Government and Short-term | | | | | | |
| | Investments | | U.S. Government Securities |
| | Purchases | | Sales | | Purchases | | Sales |
| Growth Fund | | $ | 31,349,286 | | $ | 45,623,072 | | $ | – | | $ | – |
| MidCap Fund | | $ | 4,983,426 | | $ | 2,819,811 | | $ | – | | $ | – |
| Bond Fund | | $ | 129,199,652 | | $ | 1,826,416 | | $ | 75,110,918 | | $ | 32,437,994 |
NOTE 6 - INCOME TAX INFORMATION
At May 31, 2010, the investment cost and aggregate unrealized appreciation and depreciation on investments for federal income tax purposes were as follows:
| | | | | | | | | | | | | | | | Net unrealized |
| | | | | | | Unrealized | | Unrealized | | appreciation |
| | Federal tax cost | | appreciation | | depreciation | | (depreciation) |
| Growth Fund | | | $ | 117,944,258 | | | | $ | 20,611,086 | | | $ | (8,019,758 | ) | | | $ | 12,591,328 | |
| MidCap Fund | | | $ | 11,545,954 | | | | $ | 2,041,390 | | | $ | (744,065 | ) | | | $ | 1,297,325 | |
| Bond Fund | | | $ | 296,165,828 | | | | $ | 7,836,150 | | | $ | (1,312,383 | ) | | | $ | 6,523,767 | |
33
NOTES TO FINANCIAL STATEMENTS (Unaudited) (Continued) |
| May 31, 2010 |
The tax basis of investments for tax and financial reporting purposes differ principally due to wash sales and paydown gains and losses from mortgage securities.
The tax components of distributions paid during the six-month period ended May 31, 2010 (unaudited) are:
| | Ordinary | | Long-term |
| | income | | capital gains |
| | distributions | | distributions |
| Growth Fund | | | $ | 243,395 | | | | $ | – | |
| MidCap Fund | | | $ | 4,192 | | | | $ | 56,071 | |
| Bond Fund | | | $ | 3,441,716 | | | | $ | 411,245 | |
The tax components of distributions paid during the fiscal year ended November 30, 2009, capital loss carryforward as of November 30, 2009 and tax basis post-October losses as of November 30, 2009, which are not being recognized for tax purposes until the first day of the following fiscal year are:
| | Ordinary | | Long-term | | | | | | | | | | |
| | income | | capital gains | | Net capital loss | | Post-October |
| | distributions | | distributions | | carryforward* | | losses |
| Growth Fund | | | $ | 1,952,982 | | | | $ | – | | | | $ | 126,691,453 | | | | $ | 74,237 | |
| MidCap Fund | | | $ | 18,875 | | | | $ | – | | | | $ | – | | | | $ | – | |
| Bond Fund | | | $ | 3,760,610 | | | | $ | – | | | | $ | – | | | | $ | 244 | |
* The Growth Fund has capital losses in the amount of $78,936,169 and $47,755,284 which expire on November 30, 2016 and November 30, 2017, respectively.
NOTE 7 - INDEPENDENT REGISTERED PUBLIC ACCOUNTING FIRM
On January 28, 2010, the Audit Committee of the Board of Directors of the Funds approved the engagement of Cohen Fund Audit Services, Ltd. (“Cohen”) to serve as the Funds’ independent registered public accounting firm for the Funds’ fiscal year ending November 30, 2010.
During the Funds’ fiscal years ended November 30, 2008 and November 30, 2009 and through January 28, 2010, neither the Funds, nor any of the Growth Fund, MidCap Fund or Bond Fund, nor anyone on any of their behalf, consulted with Cohen regarding: (i) the application of accounting principles to a specified transaction, either completed or proposed, or the type of audit opinion that might be rendered on the Funds’ financial statements; or (ii) any matter that was the subject of a disagreement or a reportable event.
The selection of Cohen does not reflect any disagreements with or dissatisfaction by the Funds or the Audit Committee or the Board of Directors with the performance of the Funds’ prior independent registered public accounting firm, PricewaterhouseCoopers, LLP (“PwC”). The January 28, 2010 decision to dismiss PwC, effective as of the completion of the Funds’ audit for the fiscal year ended November 30, 2009, was approved by the Audit Committee of the Board of Directors of the Funds.
PwC’s reports on the Funds’ financial statements for the fiscal years ended November 30, 2008 and November 30, 2009 did not contain any adverse opinion or disclaimer of opinion, nor were such reports qualified or modified as to uncertainty, audit scope, or accounting principles. During the Funds’ fiscal years ended November 30, 2008 and November 30, 2009 and through January 28, 2010: (i) there were no disagreements with PwC on any matter of accounting principles or practices, financial statement disclosure, or auditing scope or procedure, which disagreements, if not resolved to the satisfaction of PwC, would have caused PwC to make reference to the subject matter of the disagreement in connection with its reports on the Funds’ financial statements for such years; and (ii) there were no “reportable events” of the kind described in Item 304(a)(1)(v) of Regulation S-K.
34
The following table presents information relating to a share of capital stock outstanding for the entire period.
| | Six-Month | | | | | | | | | | | | | | | |
| | Period Ended | | | | | | | | | | | | | | | |
| | May 31, 2010 | | Year Ended November 30, |
| | (Unaudited) | | 2009 | | 2008 | | 2007 | | 2006 | | 2005 |
| GROWTH FUND | | | | | | | | | | | | | | | | | | | |
| |
| Net Asset Value, Beginning of Period | | | $27.04 | | | $19.75 | | | $45.86 | | | $49.95 | | | $45.85 | | | $46.03 | |
| Income from Investment Operations | | | | | | | | | | | | | | | | | | | |
| Net investment income | | | 0.01 | | | 0.07 | | | 0.29 | | | 0.36 | | | 0.35 | | | 0.27 | |
| Net realized and unrealized gains (losses) | | | | | | | | | | | | | | | | | | | |
| on investments | | | 0.03 | | | 7.51 | | | (19.59 | ) | | (2.49 | ) | | 5.14 | | | 0.54 | |
| Total from Investment Operations | | | 0.04 | | | 7.58 | | | (19.30 | ) | | (2.13 | ) | | 5.49 | | | 0.81 | |
| Less Distributions | | | | | | | | | | | | | | | | | | | |
| Distributions from net investment income | | | (0.05 | ) | | (0.29 | ) | | (0.41 | ) | | (0.34 | ) | | (0.27 | ) | | (0.44 | ) |
| Distributions from net realized gains | | | – | | | – | | | (6.40 | ) | | (1.62 | ) | | (1.12 | ) | | (0.55 | ) |
| Total Distributions | | | (0.05 | ) | | (0.29 | ) | | (6.81 | ) | | (1.96 | ) | | (1.39 | ) | | (0.99 | ) |
| |
| Net Asset Value, End of Period | | | $27.03 | | | $27.04 | | | $19.75 | | | $45.86 | | | $49.95 | | | $45.85 | |
| |
| Total Return | | | 0.13% | (a) | | 38.88% | | | (49.29% | ) | | (4.52% | ) | | 12.32% | | | 1.76% | |
| |
| Ratios/Supplemental Data | | | | | | | | | | | | | | | | | | | |
| Net assets, end of period (millions) | | | $130.7 | | | $144.1 | | | $133.9 | | | $533.9 | | | $759.0 | | | $1,030.7 | |
| Ratios to average net assets: | | | | | | | | | | | | | | | | | | | |
| Ratio of expenses | | | 1.38% | (b) | | 1.54% | | | 1.27% | | | 1.13% | | | 1.12% | | | 1.08% | |
| Ratio of expenses without reimbursement† | | | 1.38% | (b) | | 1.54% | | | 1.27% | | | 1.13% | | | 1.12% | | | 1.09% | |
| Ratio of net investment income | | | 0.03% | (b) | | 0.32% | | | 0.56% | | | 0.62% | | | 0.63% | | | 0.50% | |
| Ratio of net investment income | | | | | | | | | | | | | | | | | | | |
| without reimbursement† | | | 0.03% | (b) | | 0.32% | | | 0.56% | | | 0.62% | | | 0.63% | | | 0.49% | |
| Portfolio turnover rate | | | 22% | (a) | | 63% | | | 43% | | | 29% | | | 17% | | | 20% | |
| † | Before directed brokerage credits. |
| (a) | Calculated on a non-annualized basis. |
| (b) | Calculated on an annualized basis. |
See Notes to Financial Statements.
35
FINANCIAL HIGHLIGHTS (Continued) |
| |
The following table presents information relating to a share of capital stock outstanding for the entire period.
| | Six-Month | | | | | | March 31, 2008 |
| | Period Ended | | | | | | (inception) |
| | May 31, 2010 | | Year Ended | | through |
| | (Unaudited) | | November 30, 2009 | | November 30, 2008 |
| MIDCAP FUND | | | | | | | | | | | | |
| |
| Net Asset Value, Beginning of Period | | | $9.39 | | | | $6.18 | | | | $10.00 | |
| Income from Investment Operations | | | | | | | | | | | | |
| Net investment income | | | – | | | | 0.01 | | | | 0.04 | |
| Net realized and unrealized gains (losses) | | | | | | | | | | | | |
| on investments | | | 1.01 | | | | 3.25 | | | | (3.86 | ) |
| Total from Investment Operations | | | 1.01 | | | | 3.26 | | | | (3.82 | ) |
| Less Distributions | | | | | | | | | | | | |
| Distributions from net investment income | | | – | | | | (0.05 | ) | | | – | |
| Distributions from net realized gains | | | (0.05 | ) | | | – | | | | – | |
| Total Distributions | | | (0.05 | ) | | | (0.05 | ) | | | – | |
| |
| Net Asset Value, End of Period | | | $10.35 | | | | $9.39 | | | | $6.18 | |
| |
| Total Return | | | 10.89% | (a) | | | 53.04% | | | | (38.20% | )(a) |
| |
| Ratios/Supplemental Data | | | | | | | | | | | | |
| Net assets, end of period (millions) | | | $12.8 | | | | $9.6 | | | | $2.3 | |
| Ratios to average net assets: | | | | | | | | | | | | |
Ratio of expenses | | | 1.30% | (b) | | | 1.30% | | | | 1.30% | (b) |
| Ratio of expenses without reimbursement | | | 2.58% | (b) | | | 4.21% | | | | 8.40% | (b) |
| Ratio of net investment income (loss) | | | (0.11% | )(b) | | | 0.12% | | | | 0.79% | (b) |
| Ratio of net investment loss | | | | | | | | | | | | |
| without reimbursement | | | (1.39% | )(b) | | | (2.79% | ) | | | (6.30% | )(b) |
| Portfolio turnover rate | | | 24% | (a) | | | 61% | | | | 50% | (a) |
(a) Calculated on a non-annualized basis.
(b) Calculated on an annualized basis.
See Notes to Financial Statements.
36
FINANCIAL HIGHLIGHTS (Continued) |
| |
The following table presents information relating to a share of capital stock outstanding for the entire period.
| Six-Month | | | | | | | | | | | | | | | |
| Period Ended | | Year Ended November 30, |
| May 31, 2010 | | | | | | | | | | | | | | | |
| (Unaudited) | | 2009 | | 2008 | | 2007 | | 2006 | | 2005 |
| BOND FUND | | | | | | | | | | | | | | | | | | |
| |
| Net Asset Value, Beginning of Period | | $11.16 | | | $9.24 | | | $10.34 | | | $10.26 | | | $10.21 | | | $10.68 | |
| Income from Investment Operations | | | | | | | | | | | | | | | | | | |
| Net investment income | | 0.17 | | | 0.63 | | | 0.62 | | | 0.48 | | | 0.44 | | | 0.39 | |
| Net realized and unrealized gains (losses) | | | | | | | | | | | | | | | | | | |
| on investments | | 0.24 | | | 2.01 | | | (1.17 | ) | | 0.08 | | | 0.11 | | | (0.36 | ) |
| Total from Investment Operations | | 0.41 | | | 2.64 | | | (0.55 | ) | | 0.56 | | | 0.55 | | | 0.03 | |
| Less Distributions | | | | | | | | | | | | | | | | | | |
| Distributions from net investment income | | (0.18 | ) | | (0.72 | ) | | (0.55 | ) | | (0.48 | ) | | (0.41 | ) | | (0.42 | ) |
| Distributions from net realized gains | | (0.08 | ) | | – | | | – | | | – | | | (0.09 | ) | | (0.08 | ) |
| Total Distributions | | (0.26 | ) | | (0.72 | ) | | (0.55 | ) | | (0.48 | ) | | (0.50 | ) | | (0.50 | ) |
| |
| Net Asset Value, End of Period | | $11.31 | | | $11.16 | | | $9.24 | | | $10.34 | | | $10.26 | | | $10.21 | |
| |
| Total Return | | 3.73% | (a) | | 30.05% | | | (5.63% | ) | | 5.64% | | | 5.64% | | | 0.29% | |
| |
| Ratios/Supplemental Data | | | | | | | | | | | | | | | | | | |
| Net assets, end of period (millions) | | $308.3 | | | $134.2 | | | $44.0 | | | $44.5 | | | $32.5 | | | $30.6 | |
| Ratios to average net assets: | | | | | | | | | | | | | | | | | | |
| Ratio of expenses | | 0.80% | (b) | | 0.75% | | | 0.59% | | | 0.59% | | | 0.72% | | | 0.80% | |
| Ratio of expenses without reimbursement | | 0.92% | (b) | | 1.20% | | | 1.18% | | | 1.24% | | | 1.30% | | | 1.28% | |
| Ratio of net investment income | | 3.91% | (b) | | 6.40% | | | 6.38% | | | 4.92% | | | 4.42% | | | 3.80% | |
| Ratio of net investment income | | | | | | | | | | | | | | | | | | |
| without reimbursement | | 3.79% | (b) | | 5.95% | | | 5.78% | | | 4.26% | | | 3.84% | | | 3.31% | |
| Portfolio turnover rate | | 1% | (a) | | 85% | | | 110% | | | 86% | | | 51% | | | 26% | |
(a) Calculated on a non-annualized basis.
(b) Calculated on an annualized basis.
See Notes to Financial Statements.
37
ADDITIONAL INFORMATION (Unaudited) |
| |
THOMPSON PLUMB FUNDS
DIRECTORS
Donald A. Nichols - Chairman
John W. Feldt
Patricia Lipton
John W. Thompson OFFICERS
John W. Thompson, CFA
President and Chief Executive Officer Jason L. Stephens, CFA
Vice President James T. Evans, CFA
Vice President Penny M. Hubbard
Chief Financial Officer and Treasurer Nedra S. Pierce
Chief Compliance Officer Lesley T. Bailey
Secretary | INVESTMENT ADVISOR
Thompson Investment Management, Inc.
918 Deming Way
Madison, Wisconsin 53717 DISTRIBUTOR
Quasar Distributors, LLC
615 East Michigan Street
Milwaukee, Wisconsin 53202 TRANSFER AGENT
U.S. Bancorp Fund Services, LLC
615 East Michigan Street
Milwaukee, Wisconsin 53202 INDEPENDENT REGISTERED
PUBLIC ACCOUNTING FIRM
Cohen Fund Audit Services, Ltd.
800 Westpoint Parkway
Westlake, Ohio 44145 LEGAL COUNSEL
Quarles & Brady LLP
411 East Wisconsin Avenue
Milwaukee, Wisconsin 53202 |
The Statement of Additional Information contains additional information about the directors and officers of Thompson Plumb Funds, Inc. and is available without charge, upon request, by calling 1-800-999-0887.
Proxy Voting Policy
A description of the policies and procedures that the Funds use to determine how to vote proxies relating to portfolio securities and information regarding how the Funds actually voted proxies during the most recent 12-month period ended June 30 are available without charge, upon request, by calling 1-800-999-0887, through the Funds’ website at www.thompsonplumb.com and on the SEC’s website at www.sec.gov.
Information About Portfolio Securities
The Funds file complete schedules of their portfolio holdings with the Securities and Exchange Commission for the Funds’ first and third quarters of its fiscal year on Form N-Q. The Funds’ Forms N-Q are available on the Securities and Exchange Commission’s website at www.sec.gov. You may also review and copy those documents by visiting the Securities and Exchange Commission’s Public Reference Room in Washington, D.C. Information on the operation of the Public Reference Room may be obtained by calling the Securities and Exchange Commission at 1-800-SEC-0330. The Funds’ Forms N-Q are also available without charge, upon request, by calling 1-800-999-0887.
38
Item 2. Code of Ethics.
Not required in Semi-Annual Reports on Form N-CSR.
Item 3. Audit Committee Financial Expert.
Not required in Semi-Annual Reports on Form N-CSR.
Item 4. Principal Accountant Fees and Services.
Not required in Semi-Annual Reports on Form N-CSR.
Item 5. Audit Committee of Listed Registrants.
Not applicable to this Registrant because it is not a “listed issuer” within the meaning of Rule 10A-3 under the Securities Exchange Act of 1934.
Item 6. Schedule of Investments.
The required Schedules of Investments in securities of unaffiliated issuers is included as part of the Registrant’s Semi-Annual Report to shareholders dated as of May 31, 2010 provided under Item 1 of this Form N-CSR.
Item 7. Disclosure of Proxy Voting Policies and Procedures for Closed-End Management Investment Companies
Not applicable to this Registrant because it is not a closed-end management investment company.
Item 8. Portfolio Managers of Closed-End Management Investment Companies.
Not applicable to this Registrant because it is not a closed-end management investment company.
Item 9. Purchases of Equity Securities by Closed-End Management Investment Companies and Affiliated Purchasers.
Not applicable to this Registrant because it is not a closed-end management investment company.
Item 10. Submission of Matters to a Vote of Securities Holders.
The Registrant has not made any material changes to the procedures by which shareholders may recommend nominees to the Registrant's Board of Directors after the Registrant last provided disclosure in response to the requirements of Item 407(c)(2)(iv) of Regulation S-K or this Item.
2
Item 11. Controls and Procedures.
| | (a) | | Disclosure Controls and Procedures. Based on an evaluation of the Registrant’s disclosure controls and procedures (as defined in Rule 30a-3(c) under the Investment Company Act of 1940) carried out under the supervision and with the participation of the Registrant’s management, including its principal executive and financial officers, within 90 days prior to the filing date of this report on Form N-CSR, the Registrant’s principal executive and financial officers have concluded that the design and operation of the Registrant’s disclosure controls and procedures are effective in providing reasonable assurance that the information required to be disclosed on Form N-CSR is recorded, processed, summarized and reported within the applicable time periods. |
| |
| (b) | | Change in Internal Controls Over Financial Reporting. There were no changes in the Registrant’s internal control over financial reporting (as defined in Rule 30a-3(d) under the Investment Company Act of 1940) that occurred during the Registrant’s second fiscal quarter of the period covered by this Form N-CSR that have materially affected, or are reasonably likely to materially affect, the Registrant’s internal control over financial reporting. |
Item 12. Exhibits
The following exhibits are attached to this Form N-CSR:
| | Exhibit No. | | Description of Exhibit | |
| 12(a)(1) | | The Code of Ethics for the Registrant’s Principal Executive Officer, Principal Financial Officer and Principal Accounting Officer referred to in Item 2 was filed as Exhibit 12(a)(1) to the Registrant’s Certified Shareholder Report on Form N-CSR filed on January 28, 2005, and is incorporated herein by reference |
| | 12(a)(2)-1 | | Certification of Principal Executive Officer Required by Section 302 of the Sarbanes-Oxley Act of 2002 |
| 12(a)(2)-2 | | Certification of Principal Financial Officer Required by Section 302 of the Sarbanes-Oxley Act of 2002 |
| 12(b) | | Certification of Chief Executive Officer and Chief Financial Officer Required by Section 906 of the Sarbanes-Oxley Act of 2002 |
3
SIGNATURES
Pursuant to the requirements of the Securities Exchange Act of 1934 and the Investment Company Act of 1940, the Registrant has duly caused this report to be signed on its behalf by the undersigned, thereunto duly authorized, on this 23rd day of July, 2010.
| | THOMPSON PLUMB FUNDS, INC. |
| | |
| By: | /s/ | John W. Thompson |
| | | John W. Thompson, Chief Executive |
| | | Officer and President |
Pursuant to the requirements of the Securities Exchange Act of 1934 and the Investment Company Act of 1940, this report has been signed below by the following persons on behalf of the Registrant and in the capacities indicated on this 23rd day of July, 2010.
| | By: | /s/ John W. Thompson |
| | | John W. Thompson, Chief Executive |
| | Officer and President (Principal |
| | Executive Officer) |
| |
| By: | /s/ Penny Hubbard |
| | Penny Hubbard, Chief Financial |
| | Officer (Principal Financial Officer) |
4