UNITED STATES
SECURITIES AND EXCHANGE COMMISSION
Washington, D.C. 20549
FORM N-CSR
CERTIFIED SHAREHOLDER REPORT OF REGISTERED
MANAGEMENT
INVESTMENT COMPANIES
Investment Company Act File Number 811-4946
THOMPSON IM FUNDS, INC.
(Exact name of registrant as specified in charter)
918 Deming Way
Madison, Wisconsin 53717
(Address of principal executive offices)--(Zip code)
John W. Thompson
Chief Executive Officer and President
Thompson IM Funds, Inc.
918 Deming Way
Madison, Wisconsin 53717
(Name and address of agent for service)
With a copy to:
Fredrick G. Lautz, Esq.
Quarles & Brady LLP
411 East Wisconsin Avenue
Milwaukee, Wisconsin 53202
Registrant's telephone number, including area code: (608) 827-5700
Date of fiscal year end: November 30, 2013
Date of reporting period: May 31, 2013
Form N-CSR is to be used by management investment companies to file reports with the Commission not later than 10 days after the transmission to stockholders of any report that is required to be transmitted to stockholders under Rule 30e-1 under the Investment Company Act of 1940 (17 CFR 270.30e-1). The Commission may use the information provided on Form N-CSR in its regulatory, disclosure review, inspection and policymaking roles.
A registrant is required to disclose the information specified by Form N-CSR, and the Commission will make this information public. A registrant is not required to respond to the collection of information contained in Form N-CSR unless the Form displays a currently valid Office of Management and Budget ("OMB") control number. Please direct comments concerning the accuracy of the information collection burden estimate and any suggestions for reducing the burden to Secretary, Securities and Exchange Commission, 450 Fifth Street, N.W., Washington, DC 20549-0609. The OMB has reviewed this collection of information under the clearance requirements of 44 U.S.C. § 3507.
Item 1. Report to Stockholders.

THOMPSON IM FUNDS, INC.
SEMI-ANNUAL REPORT TO SHAREHOLDERS
NOTE ON FORWARD-LOOKING STATEMENTS
The matters discussed in this report may constitute forward-looking statements. These include any Advisor or portfolio manager predictions, assessments, analyses or outlooks for individual securities, industries, investment styles, market sectors, interest rates, economic trends and/or markets. These statements involve risks and uncertainties. In addition to the general risks described for each Fund in its current Prospectus, other factors bearing on these reports include the accuracy of the Advisor’s or portfolio manager’s forecasts and predictions, the appropriateness of the investment strategies designed by the Advisor or portfolio manager and the ability of the Advisor or portfolio manager to implement its strategies efficiently and successfully. Any one or more of these factors, as well as other risks affecting the securities markets generally, could cause the actual results of any Fund to differ materially as compared to its benchmarks.
1
THOMPSON IM FUNDS, INC.
SEMI-ANNUAL REPORT TO SHAREHOLDERS
May 31, 2013
CONTENTS
| Page(s) |
| LARGECAP FUND | |
| Investment review | 3-5 |
| Schedule of investments | 6-7 |
| |
| MIDCAP FUND | |
| Investment review | 8-10 |
| Schedule of investments | 11-12 |
| |
| BOND FUND | |
| Investment review | 13-16 |
| Schedule of investments | 17-29 |
| |
| FUND EXPENSE EXAMPLES | 30 |
| |
| FINANCIAL STATEMENTS | |
| Statements of assets and liabilities | 31 |
| Statements of operations | 32 |
| Statements of changes in net assets | 33 |
| Notes to financial statements | 34-39 |
| Financial highlights | 40-42 |
| |
| ADDITIONAL INFORMATION | 43 |
This report contains information for existing shareholders of Thompson IM Funds, Inc. It
does not constitute an offer to sell. This Semi-Annual Report is authorized for distribution to prospective investors
only when preceded or accompanied by a Fund Prospectus, which contains information about
the Funds’ objectives and policies, risks, management, expenses and other information.
A Prospectus can be obtained by calling 1-800-999-0887.
Please read your Prospectus carefully.
2
| LARGECAP FUND INVESTMENT REVIEW (Unaudited) |
| May 31, 2013 |
Portfolio Managers
James T. Evans, CFA
Jason L. Stephens, CFA
John W. Thompson, CFA
Performance
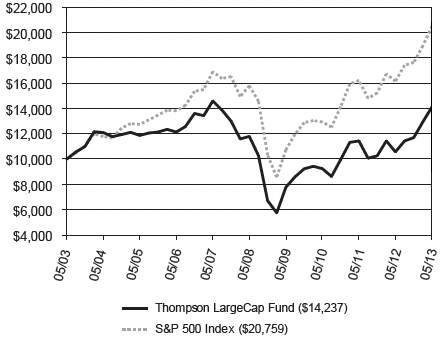
The LargeCap Fund produced a total return of 21.28% for the six-month period ended May 31, 2013, as compared to its benchmark, the S&P 500 Index, which returned 16.43%.
Comparison of Change in Value of a Hypothetical $10,000 Investment
| Average Annual Total Returns |
| Through 05/31/13 |
| | 1 Year | | 3 Year | | 5 Year | | 10 Year | |
| Thompson LargeCap Fund | | 34.47% | | 15.57% | | 3.76% | | 3.60% | |
| S&P 500 Index | | 27.28% | | 16.87% | | 5.43% | | 7.58% | |
Gross Expense Ratio as of 03/31/13 was 1.31%.
Net Expense Ratio after reimbursement was 1.20%.*
* The Advisor has contractually agreed to waive management fees and/or reimburse expenses incurred by the LargeCap Fund through March 31, 2014 so that the annual operating expenses of the Fund do not exceed 1.20% of its average daily net assets.
Performance data quoted represents past performance; past performance does not guarantee future results. The investment return and principal value of an investment will fluctuate so that an investor’s shares, when redeemed, may be worth more or less than their original cost. Current performance of the Fund may be lower or higher than the performance quoted. Performance data current to the most recent month-end may be obtained by calling 1-800-999-0887 or visiting www.thompsonim.com.
Results include the reinvestment of all dividends and capital gains distributions. Investment performance reflects all fee waivers that may be in effect. In the absence of such waivers, total return would be reduced. The performance information reflected in the graph and the table above does not reflect the deduction of taxes that a shareholder would pay on fund distributions or the redemption of fund shares, nor does it imply future performance. The S&P 500 Index is an unmanaged index commonly used to measure the performance of U.S. stocks. You cannot directly invest in an index.
See Notes to Financial Statements.
3
| LARGECAP FUND INVESTMENT REVIEW (Unaudited) (Continued) |
| May 31, 2013 |
Management Commentary
The semi-annual time period proved to be profitable for shareholders, with strong relative and absolute performance. Our pro-cyclical positioning of the portfolio was rewarded with both sector and individual issue attribution contributing to relative returns. Technology and Consumer Discretionary stocks were the best performing areas in the portfolio, but winners were also scattered throughout most of the other areas of the market. Only Energy was materially disappointing, as weakness in natural gas prices hurt several of our holdings in the sector.
More broadly, the semi-annual period contained the start of the fifth year of the current bull market. The S&P 500 is up roughly 164% through May 31, 2013 from the 3/9/2009 bottom, or approaching 26% a year, on average. Mid-sized firms have appreciated at an even faster rate from that point. Despite these returns, many individuals have been selling their equities and reducing their portfolio risk levels over the last few years. With the S&P 500 setting new all time closing highs, it’s natural to ask if the bull market can really continue. After all, a number of traditional metrics the public relies on to gauge the strength of the U.S. economy remain weak as compared to historical levels. These include the unemployment rate, family income growth, and the effectiveness of our political system to solve pressing problems.
It is important to emphasize that we believe stocks ultimately respond to one factor above all others: the profits and cash flow generated by the companies they represent. And on that basis the market appears very healthy. At the last market peak in 2007, the cumulative earnings of all the firms in the S&P 500 totaled roughly $87 per share. In 2012 that number was close to $102, and if consensus estimates for 2013 are correct we will see $110. So earnings are meaningfully higher than they were the last time the market was at these levels. At the same time, we believe that the quality of those earnings is better. In 2007, the Financial sector contributed 27% of S&P 500 earnings, some of which were later “de-booked” as the real estate bubble popped and the financial crisis ensued. It does not appear that today’s earnings are being artificially inflated by a similar effect, suggesting the overall improvement may be even better than the headline numbers imply.
The contradiction between high corporate profits and poor employment statistics can be explained by productivity. Technology has allowed both services companies and manufacturers to increase output while employing fewer people. In this environment, corporate profits and shareholders were able to enjoy financial gains at a much faster pace than individuals. At the end of 2011, corporate after-tax profits stood at 11.7 percent of national income, the highest on record, going back to 1947. We expect the final 2012 statistic should ultimately come in even higher. The oversupply of labor means wages have been low, and in fact inflation-adjusted net wages are less than they were ten years ago. How to improve the status of the individual is a topic beyond the scope of this commentary, but one that our political system will ultimately need to address.
Regardless, we believe we are still finding under-valued securities to purchase and that market valuations are reasonable. The government deficit and potential inflation are longer-term concerns, but we remain optimistic about the near-term future. The market can always experience a temporary pull- back based on short-term concerns, and may do so again despite the strong earnings growth discussed above. But, in our opinion, the increase in the S&P 500 since 2009 is justified, as are potential new market highs that may be set in the future.
Opinions expressed are subject to change, are not guaranteed and should not be considered investment advice.
Mutual fund investing involves risk. Principal loss is possible. Investments in smaller companies involve additional risks such as limited liquidity and greater volatility. Investments in American Depositary Receipts (“ADRs”) are subject to some extent to the risks associated with directly investing in securities of foreign issuers, including the risk of changes in currency exchange rates, expropriation or nationalization of assets, and the impact of political, diplomatic, or social events. Investments in real estate securities may involve greater risk and volatility including greater exposure to economic downturns and changes in real estate values, rents, property taxes, tax, and other laws. A REIT’s share price may decline because of adverse developments affecting the real estate industry.
Please refer to the Schedule of Investments on page 6 of this report for holdings information. The management commentary above as well as Fund holdings and asset/sector allocations should not be considered a recommendation to buy or sell any security. In addition, please note that Fund holdings and asset/sector allocations are subject to change.
Earnings Growth is a measure of growth in a company’s net income over a specific period, often one year. It is not a prediction of the fund’s future returns.
See Notes to Financial Statements.
4
| LARGECAP FUND INVESTMENT REVIEW (Unaudited) (Continued) |
| May 31, 2013 |
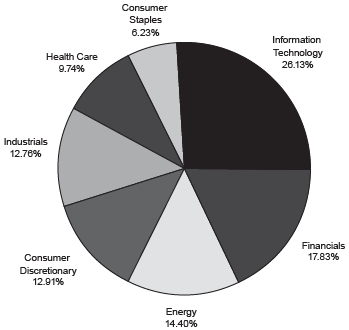
Sector Weightings at 05/31/13
% of Total Investments
| Top 10 Equity Holdings at 05/31/13 |
| | | % of Fund’s |
| Company | Industry | | Net Assets |
| Microsoft Corp. | Software & Computer Services | | 3.34% |
| Exxon Mobil Corp. | Oil & Gas Producers | | 2.70% |
| Bank of America Corp. | Banks | | 2.48% |
| Cisco Systems, Inc. | Technology Hardware & Equipment | | 2.23% |
| JPMorgan Chase & Co. | Banks | | 2.22% |
| Walgreen Co. | Food & Drug Retailers | | 2.12% |
| Express Scripts Holding Co. | Health Care Equipment & Services | | 2.09% |
| JDS Uniphase Corp. | Technology Hardware & Equipment | | 2.05% |
| Citigroup Inc. | Banks | | 1.99% |
| General Electric Co. | General Industrials | | 1.98% |
As of May 31, 2013, 99.9% of the Fund’s net assets were in equity, cash and short-term instruments.
See Notes to Financial Statements.
5
| LARGECAP FUND SCHEDULE OF INVESTMENTS (Unaudited) |
| May 31, 2013 |
| | Shares | | Value |
| COMMON STOCKS - 99.9% | | | | | |
| | | | | | |
| Consumer Discretionary - 12.8% | | | | | |
| Automobiles & Parts - 2.9% | | | | | |
| Harley-Davidson, Inc. | | 15,450 | | $ | 842,643 |
| Johnson Controls, Inc. | | 48,075 | | | 1,796,082 |
| LKQ Corp. (a) | | 24,750 | | | 605,880 |
| | | | | 3,244,605 |
| General Retailers - 4.9% | | | | | |
| Bed Bath & Beyond Inc. (a) | | 16,400 | | | 1,119,300 |
| Best Buy Co., Inc. | | 61,190 | | | 1,685,784 |
| Kohl’s Corp. | | 29,260 | | | 1,504,257 |
| Target Corp. | | 15,960 | | | 1,109,220 |
| | | | | 5,418,561 |
| Household Products - 1.3% | | | | | |
| D.R. Horton, Inc. | | 24,550 | | | 598,038 |
| Jarden Corp. (a) | | 19,185 | | | 893,637 |
| | | | | 1,491,675 |
| Leisure Goods - 0.5% | | | | | |
| Brunswick Corp. | | 16,550 | | | 555,584 |
| |
| Media - 2.4% | | | | | |
| The Walt Disney Co. | | 17,450 | | | 1,100,746 |
| Time Warner Inc. | | 13,200 | | | 770,484 |
| Viacom Inc. Class B | | 11,925 | | | 785,738 |
| | | | | 2,656,968 |
| Personal Goods - 0.8% | | | | | |
| Hanesbrands, Inc. | | 17,850 | | | 890,001 |
| |
| Consumer Staples - 6.2% | | | | | |
| Beverages - 1.1% | | | | | |
| PepsiCo, Inc. | | 15,650 | | | 1,264,050 |
| |
| Food & Drug Retailers - 4.2% | | | | | |
| Sysco Corp. | | 22,445 | | | 758,641 |
| Walgreen Co. | | 49,000 | | | 2,340,240 |
| Wal-Mart Stores, Inc. | | 20,500 | | | 1,534,220 |
| | | | | 4,633,101 |
| Household Goods & | | | | | |
| Home Construction - 0.9% | | | | | |
| The Procter & Gamble Co. | | 12,825 | | | 984,447 |
| |
| Energy - 14.4% | | | | | |
| Oil & Gas Producers - 11.9% | | | | | |
| Anadarko Petroleum Corp. | | 12,992 | | | 1,136,410 |
| Apache Corp. | | 14,750 | | | 1,211,418 |
| Chevron Corp. | | 15,845 | | | 1,944,974 |
| Devon Energy Corp. | | 20,175 | | | 1,146,949 |
| Encana Corp. | | 28,225 | | | 537,122 |
| Exxon Mobil Corp. | | 32,970 | | | 2,982,796 |
| Forest Oil Corp. (a) | | 180,825 | | | 822,754 |
| Goodrich Petroleum Corp. (a) | | 55,025 | | | 691,114 |
| Hess Corp. | | 11,520 | | | 776,563 |
| Noble Energy, Inc. | | 19,350 | | | 1,115,527 |
| Southwestern Energy Co. (a) | | 22,300 | | | 840,487 |
| | | | | | 13,206,114 |
| Oil Equipment, Services & | | | | | |
| Distribution - 2.5% | | | | | |
| Helmerich & Payne, Inc. | | 8,800 | | | 543,312 |
| Schlumberger Ltd. | | 21,944 | | | 1,602,570 |
| Seadrill Ltd. | | 13,715 | | | 555,869 |
| | | | | 2,701,751 |
| Financials - 17.8% | | | | | |
| Banks - 10.5% | | | | | |
| Associated Banc-Corp | | 94,265 | | | 1,452,624 |
| Bank of America Corp. | | 200,350 | | | 2,736,781 |
| Citigroup Inc. | | 42,275 | | | 2,197,877 |
| First Horizon National Corp. | | 106,910 | | | 1,227,327 |
| JPMorgan Chase & Co. | | 44,875 | | | 2,449,726 |
| PNC Financial Services Group, Inc. | | 12,530 | | | 897,649 |
| Zions Bancorporation | | 22,150 | | | 621,308 |
| | | | | 11,583,292 |
| Financial Services - 5.3% | | | | | |
| CIT Group Inc. (a) | | 19,000 | | | 875,520 |
| Discover Financial Services | | 11,620 | | | 550,904 |
| MSCI Inc. (a) | | 43,175 | | | 1,521,487 |
| Northern Trust Corp. | | 19,495 | | | 1,133,634 |
| State Street Corp. | | 27,100 | | | 1,793,478 |
| | | | | | 5,875,023 |
| Insurance - 1.0% | | | | | |
| Aflac, Inc. | | 20,260 | | | 1,128,279 |
| |
| Real Estate Investment | | | | | |
| Trusts - 1.0% | | | | | |
| DiamondRock Hospitality Co. | | 58,100 | | | 552,531 |
| Host Hotels & Resorts Inc. | | 30,825 | | | 548,377 |
| | | | | | 1,100,908 |
| Health Care - 9.7% | | | | | |
| Health Care Equipment & | | | | | |
| Services - 5.8% | | | | | |
| Baxter International Inc. | | 11,460 | | | 805,982 |
| Express Scripts Holding Co. (a) | | 37,125 | | | 2,306,205 |
| Henry Schein, Inc. (a) | | 6,040 | | | 581,592 |
| Hologic, Inc. (a) | | 49,700 | | | 1,031,275 |
| Medtronic, Inc. | | 11,565 | | | 589,931 |
| ResMed Inc. | | 11,275 | | | 541,200 |
| Zimmer Holdings, Inc. | | 7,370 | | | 578,619 |
| | | | | 6,434,804 |
See Notes to Financial Statements.
6
| LARGECAP FUND SCHEDULE OF INVESTMENTS (Unaudited) (Continued) |
| May 31, 2013 |
| | Shares | | Value |
| COMMON STOCKS (continued) | | | | | |
| | | | | | |
| Health Care (continued) | | | | | |
| Health Care Services - 1.3% | | | |
| McKesson Corp. | | 12,375 | | $ | 1,409,017 |
| |
| Pharmaceuticals & | | | | | |
| Biotechnology - 2.6% | | | | | |
| Amgen Inc. | | 7,715 | | | 775,589 |
| Celgene Corp. (a) | | 8,700 | | | 1,075,755 |
| Johnson & Johnson | | 12,635 | | | 1,063,614 |
| | | | | | 2,914,958 |
| Industrials - 12.8% | | | | | |
| Construction & Materials - 1.3% | | | |
| Masco Corp. | | 68,800 | | | 1,446,176 |
| |
| Electrical Equipment - 1.3% | | | |
| Emerson Electric Co. | | 24,250 | | | 1,393,405 |
| |
| General Industrials - 3.5% | | | | | |
| General Electric Co. | | 93,600 | | | 2,182,752 |
| 3M Co. | | 15,345 | | | 1,692,093 |
| | | | | 3,874,845 |
| Industrial Engineering - 4.6% | | | |
| ABB Ltd. ADR | | 86,200 | | | 1,878,298 |
| Illinois Tool Works Inc. | | 17,425 | | | 1,222,015 |
| Ingersoll-Rand PLC (a) | | 10,300 | | | 592,559 |
| Rockwell Automation, Inc. | | 15,675 | | | 1,379,713 |
| | | | | | 5,072,585 |
| Industrial Transportation - 1.2% | | | |
| FedEx Corp. | | 13,975 | | | 1,346,351 |
| |
| Support Services - 0.9% | | | | | |
| Mobile Mini, Inc. (a) | | 28,450 | | | 957,343 |
| |
| Information Technology - 26.2% | | | |
| Computer Programs - 2.8% | | | | | |
| Electronic Arts Inc. (a) | | 87,510 | | | 2,011,855 |
| Take-Two Interactive | | | | | |
| Software, Inc. (a) | | 67,000 | | | 1,114,880 |
| | | | | 3,126,735 |
| Electronic & Electrical | | | | | |
| Equipment - 1.0% | | | | | |
| Maxwell Technologies, Inc. (a) | | 152,450 | | | 1,102,214 |
| |
| Internet Programs & | | | | | |
| Services - 0.7% | | | | | |
| eBay Inc. (a) | | 13,995 | | | 757,130 |
| | | | | |
| IT Services - 1.8% | | | | | |
| Alliance Data Systems Corp. (a) | | 4,700 | | | 832,323 |
| Visa Inc. Class A | | 6,245 | | | 1,112,484 |
| | | | | 1,944,807 |
| Software & Computer | | | | | |
| Services - 5.9% | | | | | |
| Google Inc. Class A (a) | | 1,970 | | | 1,714,708 |
| Microsoft Corp. | | 105,751 | | | 3,688,595 |
| Oracle Corp. | | 32,250 | | | 1,088,760 |
| | | | | | 6,492,063 |
| Technology Hardware & | | | | | |
| Equipment - 14.0% | | | | | |
| Altera Corp. | | 33,575 | | | 1,114,354 |
| Broadcom Corp. Class A | | 40,765 | | | 1,463,871 |
| Cisco Systems, Inc. | | 102,260 | | | 2,462,421 |
| EMC Corp. (a) | | 47,400 | | | 1,173,624 |
| Hewlett-Packard Co. | | 49,900 | | | 1,218,558 |
| Intel Corp. | | 87,225 | | | 2,117,823 |
| JDS Uniphase Corp. (a) | | 166,135 | | | 2,262,759 |
| Linear Technology Corp. | | 22,220 | | | 833,250 |
| Maxim Integrated Products, Inc. | | 24,680 | | | 727,813 |
| Qualcomm, Inc. | | 32,405 | | | 2,057,069 |
| | | | | | 15,431,542 |
| |
| TOTAL COMMON STOCKS | | | | | |
| (COST $91,676,573) | | | | | 110,438,334 |
| |
| SHORT-TERM INVESTMENTS - 0.0% | | | | | |
| | | | | | |
| Money Market Funds - 0.0% | | | | | |
| Fidelity Money Market Portfolio | | | | | |
| Class I, 0.077% (b) | | 145 | | | 145 |
| |
| Total Money Market Funds | | | | | 145 |
| |
| TOTAL SHORT-TERM | | | | | |
| INVESTMENTS (COST $145) | | | | | 145 |
| |
| TOTAL INVESTMENTS - 99.9% | | | | | |
| (COST $91,676,718) | | | | | 110,438,479 |
| |
| NET OTHER ASSETS AND | | | | | |
| LIABILITIES - 0.1% | | | | | 74,459 |
| |
| NET ASSETS - 100.0% | | | | $ | 110,512,938 |
| | (a) | Non-income producing security. |
| (b) | Interest rate shown represents the current coupon rate at May 31, 2013. |
ADR: American Depositary Receipt
PLC: Public Limited Company
See Notes to Financial Statements.
7
| MIDCAP FUND INVESTMENT REVIEW (Unaudited) |
| May 31, 2013 |
Portfolio Managers
James T. Evans, CFA
Jason L. Stephens, CFA
John W. Thompson, CFA
Performance
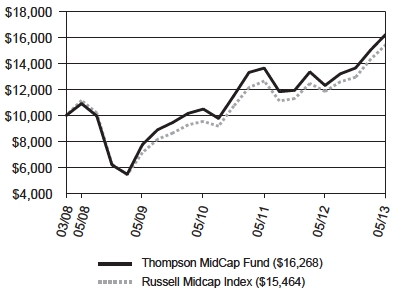
The MidCap Fund produced a total return of 19.13% for the six-month period ended May 31, 2013, as compared to its benchmark, the Russell Midcap Index, which returned 19.49%.
Comparison of Change in Value of a Hypothetical $10,000 Investment
| Average Annual Total Returns |
| Through 05/31/13 |
| | | | | | | | Since | |
| | | | | | | | Inception | |
| | | 1 Year | | 3 Year | | 5 Year | | (03/31/08) | |
| Thompson MidCap Fund | | 32.13% | | 15.76% | | 8.32% | | 9.88% | |
| Russell Midcap Index | | 30.51% | | 17.46% | | 6.75% | | 8.81% | |
Gross Expense Ratio as of 03/31/13 was 1.83%.
Net Expense Ratio after reimbursement was 1.30%.*
* The Advisor has contractually agreed to waive management fees and/or reimburse expenses incurred by the MidCap Fund through March 31, 2014 so that the annual operating expenses of the Fund do not exceed 1.30% of its average daily net assets.
Performance data quoted represents past performance; past performance does not guarantee future results. The investment return and principal value of an investment will fluctuate so that an investor’s shares, when redeemed, may be worth more or less than their original cost. Current performance of the Fund may be lower or higher than the performance quoted. Performance data current to the most recent month-end may be obtained by calling 1-800-999-0887 or visiting www.thompsonim.com.
Results include the reinvestment of all dividends and capital gains distributions. Investment performance reflects all fee waivers that may be in effect. In the absence of such waivers, total return would be reduced. The performance information reflected in the graph and the table above does not reflect the deduction of taxes that a shareholder would pay on fund distributions or the redemption of fund shares, nor does it imply future performance. The Russell Midcap Index measures the performance of the 800 smallest companies in the Russell 1000 Index based on total market capitalization. You cannot directly invest in an index.
See Notes to Financial Statements.
8
| MIDCAP FUND INVESTMENT REVIEW (Unaudited) (Continued) |
| May 31, 2013 |
Management Commentary
The MidCap Fund modestly trailed its benchmark during the semi-annual time period, primarily due to poor stock selection within the Energy sector. Several natural gas companies in the Fund’s portfolio lagged the sector by a wide margin, despite a 12% increase in natural gas spot prices during the period. Natural gas contracts for longer maturities were generally flat-to-up during the time period as well. We were able to partially offset this weakness with strong sector selection, especially in our decisions to underweight Utilities and overweight Industrials. Strong individual stock performance within Technology and Financials also contributed to the Fund’s performance. But in the end the weakness in key Energy holdings was too much to completely overcome.
During the semi-annual time period, we celebrated the five-year anniversary of the MidCap Fund at the end of March. Starting an equity mutual fund the year of the worst financial crisis in almost 80 years was certainly not without its challenges. There is always uncertainty in the marketplace, but the volatility and outright investor fear on display that particular year was stunning. We very much appreciate the support of shareholders who were willing to join the Fund in its infancy amidst such turmoil.
As we’ve noted before, we look for companies that we believe have solid earnings growth potential, trading at reasonable valuation multiples. We maintain a diversified portfolio of securities with the goal of generating competitive returns over the long run. Now that the Fund has reached five years, we have some evidence as to whether or not this goal has been realized. Since inception through the five-year anniversary, the fund outpaced its benchmark. The five-year annual return for the Fund through May 31, 2013 was 8.32%, while the benchmark returned 6.75% for the same period.
We are proud of the Fund’s record during its first five years, and of the process we developed to manage it. We look forward to working together on it for many years to come.
Opinions expressed are subject to change, are not guaranteed and should not be considered investment advice.
Mutual fund investing involves risk. Principal loss is possible. Midcap companies tend to have limited liquidity and greater volatility than large-capitalization companies. Investments in American Depositary Receipts (“ADRs”) are subject to some extent to the risks associated with directly investing in securities of foreign issuers, including the risk of changes in currency exchange rates, expropriation or nationalization of assets, and the impact of political, diplomatic, or social events. Investments in real estate securities may involve greater risk and volatility including greater exposure to economic downturns and changes in real estate values, rents, property taxes, tax, and other laws. A REIT’s share price may decline because of adverse developments affecting the real estate industry.
Please refer to the Schedule of Investments on page 11 of this report for holdings information. The management commentary above as well as Fund holdings and asset/sector allocations should not be considered a recommendation to buy or sell any security. In addition, please note that Fund holdings and asset/sector allocations are subject to change.
Earnings Growth is a measure of growth in a company’s net income over a specific period, often one year. It is not a prediction of the fund’s future returns.
Diversification does not assure a profit nor protect against loss in a declining market.
See Notes to Financial Statements.
9
| MIDCAP FUND INVESTMENT REVIEW (Unaudited) (Continued) |
| May 31, 2013 |
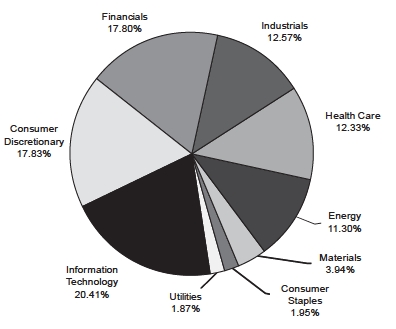
Sector Weightings at 05/31/13
% of Total Investments
| Top 10 Equity Holdings at 05/31/13 |
| | | | % of Fund’s |
| Company | | Industry | | Net Assets |
| First Horizon National Corp. | | Banks | | 2.12% |
| Associated Banc-Corp | | Banks | | 2.09% |
| MSCI Inc. | | Financial Services | | 2.07% |
| JDS Uniphase Corp. | | Technology Hardware & Equipment | | 2.06% |
| Broadcom Corp. Class A | | Technology Hardware & Equipment | | 2.05% |
| Maxwell Technologies, Inc. | | Electronic & Electrical Equipment | | 1.99% |
| Take-Two Interactive Software, Inc. | | Computer Programs | | 1.87% |
| Kohl’s Corp. | | General Retailers | | 1.83% |
| Bed Bath & Beyond Inc. | | General Retailers | | 1.81% |
| Electronic Arts Inc. | | Computer Programs | | 1.80% |
As of May 31, 2013, 99.9% of the Fund’s net assets were in equity, cash and short-term instruments.
See Notes to Financial Statements.
10
| MIDCAP FUND SCHEDULE OF INVESTMENTS (Unaudited) |
| May 31, 2013 |
| | Shares | | Value |
| COMMON STOCKS - 99.9% | | | | | |
| | | | | | |
| Consumer Discretionary - 17.8% | | | | | |
| Automobiles & Parts - 2.8% | | | | | |
| Allison Transmission Holdings, Inc. | | 13,300 | | $ | 316,540 |
| Harley-Davidson, Inc. | | 5,600 | | | 305,424 |
| LKQ Corp. (a) | | 10,070 | | | 246,514 |
| | | | | 868,478 |
| General Retailers - 7.0% | | | | | |
| Bed Bath & Beyond Inc. (a) | | 8,230 | | | 561,697 |
| Best Buy Co., Inc. | | 8,900 | | | 245,195 |
| Jos. A. Bank Clothiers, Inc. (a) | | 9,085 | | | 408,189 |
| Kohl’s Corp. | | 11,045 | | | 567,823 |
| Nordstrom, Inc. | | 6,670 | | | 392,329 |
| | | | | 2,175,233 |
| Household Products - 2.2% | | | | | |
| D.R. Horton, Inc. | | 6,525 | | | 158,949 |
| Jarden Corp. (a) | | 11,537 | | | 537,393 |
| | | | | 696,342 |
| Leisure Goods - 1.0% | | | | | |
| Brunswick Corp. | | 9,400 | | | 315,558 |
| |
| Personal Goods - 3.0% | | | | | |
| Coach, Inc. | | 8,028 | | | 467,711 |
| Hanesbrands, Inc. | | 9,028 | | | 450,136 |
| | | | | 917,847 |
| Travel & Leisure - 1.8% | | | | | |
| Darden Restaurants, Inc. | | 10,531 | | | 545,506 |
| |
| Consumer Staples - 1.9% | | | | | |
| Food Producers - 1.9% | | | | | |
| Ingredion Inc. | | 2,200 | | | 149,864 |
| McCormick & Co., Inc. | | 2,043 | | | 141,130 |
| The J. M. Smucker Co. | | 3,087 | | | 311,664 |
| | | | | 602,658 |
| Energy - 11.3% | | | | | |
| Oil & Gas Producers - 9.0% | | | | | |
| Bill Barrett Corp. (a) | | 13,690 | | | 308,983 |
| Denbury Resources Inc. (a) | | 4,335 | | | 79,547 |
| Encana Corp. | | 8,350 | | | 158,901 |
| Forest Oil Corp. (a) | | 68,200 | | | 310,310 |
| Goodrich Petroleum Corp. (a) | | 26,050 | | | 327,188 |
| Murphy Oil Corp. | | 3,551 | | | 224,849 |
| Noble Energy, Inc. | | 9,136 | | | 526,690 |
| Oasis Petroleum Inc. (a) | | 4,300 | | | 159,788 |
| Range Resources Corp. | | 6,040 | | | 454,087 |
| Swift Energy Co. (a) | | 5,750 | | | 77,970 |
| Ultra Petroleum Corp. (a) | | 7,275 | | | 165,725 |
| | | | | 2,794,038 |
| Oil Equipment, Services & | | | | | |
| Distribution - 2.3% | | | | | |
| Dresser-Rand Group, Inc. (a) | | 3,995 | | | 242,097 |
| Helmerich & Payne, Inc. | | 3,645 | | | 225,042 |
| Seadrill Ltd. | | 5,860 | | | 237,506 |
| | | | | 704,645 |
| Financials - 17.8% | | | | | |
| Banks - 6.1% | | | | | |
| Associated Banc-Corp | | 41,959 | | | 646,588 |
| First Horizon National Corp. | | 57,220 | | | 656,886 |
| Regions Financial Corp. | | 18,485 | | | 168,768 |
| SunTrust Banks, Inc. | | 5,120 | | | 164,301 |
| Zions Bancorporation | | 9,260 | | | 259,743 |
| | | | | 1,896,286 |
| Financial Services - 6.9% | | | | | |
| CIT Group Inc. (a) | | 7,075 | | | 326,016 |
| Discover Financial Services | | 8,129 | | | 385,396 |
| Eaton Vance Corp. | | 5,720 | | | 237,437 |
| MSCI Inc. (a) | | 18,210 | | | 641,720 |
| Northern Trust Corp. | | 9,525 | | | 553,879 |
| | | | | 2,144,448 |
| Insurance - 1.8% | | | | | |
| Cincinnati Financial Corp. | | 4,820 | | | 228,179 |
| Unum Group | | 11,235 | | | 319,973 |
| | | | | 548,152 |
| Real Estate Investment | | | | | |
| Trusts - 3.0% | | | | | |
| DiamondRock Hospitality Co. | | 32,550 | | | 309,551 |
| Host Hotels & Resorts Inc. | | 17,085 | | | 303,942 |
| LaSalle Hotel Properties | | 11,670 | | | 308,088 |
| | | | | 921,581 |
| Health Care - 12.3% | | | | | |
| Health Care Equipment & | | | | | |
| Services - 9.7% | | | | | |
| Hanger, Inc. (a) | | 9,950 | | | 317,505 |
| Henry Schein, Inc. (a) | | 3,169 | | | 305,143 |
| Hologic, Inc. (a) | | 19,325 | | | 400,994 |
| Masimo Corp. (a) | | 7,500 | | | 162,375 |
| MedAssets Inc. (a) | | 25,040 | | | 410,656 |
| Natus Medical Inc. (a) | | 25,025 | | | 352,602 |
| Patterson Cos., Inc. | | 7,580 | | | 296,226 |
| ResMed Inc. | | 9,425 | | | 452,400 |
| Zimmer Holdings, Inc. | | 3,850 | | | 302,264 |
| | | | | 3,000,165 |
| Health Care Services - 1.0% | | | | | |
| McKesson Corp. | | 2,720 | | | 309,699 |
See Notes to Financial Statements.
11
| MIDCAP FUND SCHEDULE OF INVESTMENTS (Unaudited) (Continued) |
| May 31, 2013 |
| | | | Shares | | Value |
| COMMON STOCKS (continued) | | | | |
| | | | | | |
| Health Care (continued) | | | | |
| | Pharmaceuticals & | | | | |
| | Biotechnology - 1.6% | | | | |
| | Exact Sciences Corp. (a) | 29,300 | | $ | 329,332 |
| | Illumina, Inc. (a) | 2,525 | | | 177,558 |
| | | | | | 506,890 |
| Industrials - 12.6% | | | | |
| | Construction & | | | | |
| | Materials - 2.9% | | | | |
| | | Masco Corp. | 22,075 | | | 464,017 |
| | Mueller Water Products, Inc. Class A | 30,900 | | | 235,149 |
| | USG Corp. (a) | 6,650 | | | 181,745 |
| | | | | | 880,911 |
| | | Electrical Equipment - 1.3% | | | | |
| | | Regal-Beloit Corp. | 5,955 | | | 402,022 |
| | |
| | Industrial Engineering - 4.7% | | | | |
| | Ingersoll-Rand PLC (a) | 8,350 | | | 480,375 |
| | Rockwell Automation, Inc. | 5,310 | | | 467,386 |
| | SPX Corp. | 6,350 | | | 501,142 |
| | | | | | 1,448,903 |
| | Industrial Transportation - 1.0% | | | | |
| | Expeditors International of | | | | |
| | Washington, Inc. | 8,025 | | | 313,216 |
| | |
| | Support Services - 2.7% | | | | |
| | Cintas Corp. | 6,600 | | | 301,323 |
| | Mobile Mini, Inc. (a) | 9,420 | | | 316,983 |
| | W.W. Grainger, Inc. | 888 | | | 228,607 |
| | | | | | 846,913 |
| Information Technology - 20.5% | | | | |
| | Computer Programs - 3.7% | | | | |
| | Electronic Arts Inc. (a) | 24,240 | | | 557,278 |
| | Take-Two Interactive | | | | |
| | Software, Inc. (a) | 34,885 | | | 580,486 |
| | | | | | 1,137,764 |
| | Electronic & Electrical | | | | |
| | Equipment - 3.1% | | | | |
| | Celestica Inc. (a) | 18,281 | | | 169,099 |
| | Flextronics International Ltd. (a) | 21,492 | | | 160,330 |
| | Maxwell Technologies, Inc. (a) | 85,225 | | | 616,177 |
| | | | | | 945,606 |
| | Internet Programs & | | | | |
| | Services - 0.8% | | | | |
| | Liquidity Services Inc. (a) | 6,200 | | | 248,062 |
| | |
| | IT Services - 2.1% | | | | |
| | Alliance Data Systems Corp. (a) | 2,290 | | | 405,536 |
| | Fiserv, Inc. (a) | 2,672 | | | 232,892 |
| | | | | | 638,428 |
| | Technology Hardware & | | | | |
| | Equipment - 10.8% | | | | |
| | Altera Corp. | 9,425 | | | 312,816 |
| | Broadcom Corp. Class A | 17,705 | | | 635,787 |
| | Cavium Inc. (a) | 12,150 | | | 398,034 |
| | InvenSense Inc. (a) | 18,500 | | | 238,280 |
| | JDS Uniphase Corp. (a) | 46,856 | | | 638,179 |
| | Linear Technology Corp. | 8,210 | | | 307,875 |
| | Maxim Integrated Products, Inc. | 14,401 | | | 424,685 |
| | Stratasys Ltd. (a) | 2,025 | | | 170,201 |
| | 3D Systems Corp. (a) | 4,600 | | | 223,192 |
| | | | | | 3,349,049 |
| Materials - 3.9% | | | | |
| | Chemicals - 2.9% | | | | |
| | Ecolab Inc. | 5,281 | | | 446,086 |
| | International Flavors & | | | | |
| | Fragrances Inc. | 5,710 | | | 458,456 |
| | | | | | 904,542 |
| | Household Materials - 1.0% | | | | |
| | The Scotts Miracle-Gro Co. Class A | 6,646 | | | 314,156 |
| | | | | |
| Utilities - 1.8% | | | | |
| | Electricity - 0.4% | | | | |
| | Pepco Holdings, Inc. | 6,660 | | | 138,328 |
| | | | | | |
| | Gas, Water & Multiutilities - 1.4% | | | | |
| | MDU Resources Group, Inc. | 8,622 | | | 222,965 |
| | SCANA Corp. | 4,289 | | | 216,337 |
| | | | | | 439,302 |
| | | | | | | |
| | TOTAL COMMON STOCKS | | | | |
| | (COST $25,037,990) | | | | 30,954,728 |
| | |
| SHORT-TERM INVESTMENTS - 0.0% | | | | |
| | | | | |
| Money Market Funds - 0.0% | | | | |
| | Fidelity Money Market Portfolio | | | | |
| | Class I, 0.077% (b) | 637 | | | 637 |
| | | | | | |
| | Total Money Market Funds | | | | 637 |
| | | | | | |
| | TOTAL SHORT-TERM | | | | |
| | INVESTMENTS (COST $637) | | | | 637 |
| | | | | | |
| | TOTAL INVESTMENTS - 99.9% | | | | |
| | (COST $25,038,627) | | | | 30,955,365 |
| | | | | | |
| | NET OTHER ASSETS AND | | | | |
| | LIABILITIES - 0.1% | | | | 16,766 |
| | | | | | |
| | NET ASSETS - 100.0% | | | $ | 30,972,131 |
| | (a) | Non-income producing security. |
| | (b) | Interest rate shown represents the current coupon rate at May 31, 2013. |
PLC: Public Limited Company
See Notes to Financial Statements.
12
| BOND FUND INVESTMENT REVIEW (Unaudited) |
| May 31, 2013 |
Portfolio Managers
James T. Evans, CFA
Jason L. Stephens, CFA
John W. Thompson, CFA
Performance
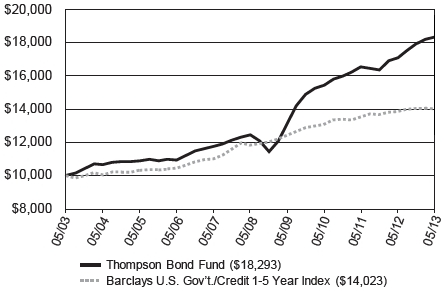
The Bond Fund produced a total return of 2.18% for the six-month period ended May 31, 2013, as compared to its benchmark, the Barclays U.S. Government/Credit 1-5 Year Index, which returned 0.07%.
Comparison of Change in Value of a Hypothetical $10,000 Investment
| Average Annual Total Returns |
| Through 05/31/13 |
| | 1 Year | | 3 Year | | 5 Year | | 10 Year |
| Thompson Bond Fund | | 7.27% | | 5.82% | | 8.01% | | 6.23% |
| Barclays U.S. Gov’t./Credit 1-5 Year Index | | 1.23% | | 2.44% | | 3.51% | | 3.44% |
| Gross Expense Ratio as of 03/31/13 was 0.78%. | 30-Day SEC Yield as of 05/31/13 was 2.06%. |
Performance data quoted represents past performance; past performance does not guarantee future results. The investment return and principal value of an investment will fluctuate so that an investor’s shares, when redeemed, may be worth more or less than their original cost. Current performance of the Fund may be lower or higher than the performance quoted. Performance data current to the most recent month-end may be obtained by calling 1-800-999-0887 or visiting www.thompsonim.com.
Results include the reinvestment of all dividends and capital gains distributions. Investment performance reflects all fee waivers that may be in effect. In the absence of such waivers, total return would be reduced. The performance information reflected in the graph and the table above does not reflect the deduction of taxes that a shareholder would pay on fund distributions or the redemption of fund shares, nor does it imply future performance. The Barclays U.S. Government/Credit 1-5 Year Index is a market-value-weighted index of all investment-grade bonds with maturities of more than one year and less than 5 years. You cannot directly invest in an index.
See Notes to Financial Statements.
13
| BOND FUND INVESTMENT REVIEW (Unaudited) (Continued) |
| May 31, 2013 |
Management Commentary
The Fund’s positive relative return was largely attributable to its significant allocation to corporate bonds. Credit spreads continued to narrow during the first half of the fiscal year. This coupled with the relatively attractive current yields allowed performance to remain competitive in an environment of modestly rising interest rates. Interest-rate risk remains very high in the bond market overall. We cannot predict when or how quickly rates will rise, but believe it would be unrealistic to think that they would move much lower. Hence, we continue to favor taking credit risk for additional yield over extending the portfolio duration. When rates finally do rise, this strategy may change.
We believe the biggest risk to short-term performance of the Fund is that credit spreads widen. There are a few ways in which this risk can manifest itself. First, a general increase in fear regarding economic conditions can drive investors from corporate bonds to U.S. Treasury bonds, depressing corporate bond prices. In the fall of 2011 we experienced this phenomenon, as concerns over the financial solvency of some European countries worried some investors that the economy was at the precipice of another financial crisis. We did not believe this to be the case, and took advantage of some of the attractive values it created. Fear can also widen credit spreads when corporations take on too much debt in the aggregate, or the economy enters a recession. For now, we do not think either of those scenarios is imminent.
The second way credit risk can manifest itself is in the deterioration of an issuer’s fundamentals (or at least the perception of a decline), which is often reflected in a rating downgrade of an individual bond. The price of the bond will likely decline to reflect this weaker outlook. Once this happens, we then must determine whether the event that triggered the downgrade is material enough to warrant the bond’s disposal, or whether we believe the company will still meet its future obligations. If we think there’s real trouble, we generally will sell. If not, we generally will hold. For example, the Fund continues to hold bonds of R.R. Donnelly, an issue that was downgraded to junk in May of 2011. The company used some of its capital to buy back stock, which suggested to the ratings agencies that it was managing its balance sheet more for stockholders than bondholders. We determined at that time that we remained comfortable with the company’s ability to meet its obligations to us because of its large free cash flow, so we continue to hold the bonds.
It is critical to understand how this affects the pattern of shareholder returns. When the price of a bond declines, the net asset value of the fund takes a proportionally direct hit. This impacts performance going backwards, but as long as the bond successfully matures it actually increases the future return of the portfolio. This is because the bond has a higher yield-to-maturity at the new lower price. This is why we focus on the probability of our shareholders being repaid when we buy a bond, rather than on how the market will perceive changes in the bond’s fundamentals. As long as the bond does not default, shareholders should ultimately enjoy the full return of the bond, even if the timing of said returns is uncertain. It is also why we believe the Fund is more attractive to shareholders after spreads have widened than before.
We cannot predict the short-term fluctuations in investor sentiment with respect to credit risk. We simply seek to out-earn other short-term investments through the generation of interest income. When rates do finally rise materially from here, we will likely reduce our exposure to credit risk by reallocating some of the Fund’s portfolio from corporate debt to more intermediate-maturity U.S. Treasury and Agency debt, while still being mindful of the overall duration of the Fund’s portfolio. Until then, changes in investors’ perception of credit risk will likely be more impactful on the Fund’s relative performance than a rise in prevailing interest rates.
See Notes to Financial Statements.
14
| BOND FUND INVESTMENT REVIEW (Unaudited) (Continued) |
| May 31, 2013 |
Opinions expressed are subject to change, are not guaranteed and should not be considered investment advice.
Mutual fund investing involves risk. Principal loss is possible. Investments in debt securities typically decrease in value when interest rates rise. The risk is usually greater for longer-term debt securities. Investments in bonds of foreign issuers involve greater volatility, political and economic risks, and differences in accounting methods. Investment by the Fund in lower-rated and non-rated securities presents a greater risk of loss to principal and interest than higher-rated securities.
Please refer to the Schedule of Investments on page 17 of this report for holdings information. The management commentary above as well as Fund holdings should not be considered a recommendation to buy or sell any security. In addition, please note that Fund holdings are subject to change.
The federal government guarantees interest payments from government securities while dividend payments carry no such guarantee. Government securities, if held to maturity, guarantee the timely payment of principal and interest.
Duration is a commonly used measure of the potential volatility of the price of a debt security, or the aggregate market value of a portfolio of debt securities, prior to maturity. Securities with a longer duration generally have more volatile prices than securities of comparable quality with a shorter duration.
SEC Yield is a standardized yield computed by dividing the net investment income per share earned during the 30-day period prior to quarter-end and was created to allow for fairer comparisons among bond funds.
Yield-to-Maturity is the rate of return anticipated on a bond if it is held until the maturity date, which takes into account the current market price, par value, coupon interest rate and time to maturity.
Yield is the income earned from a bond, which takes into account the sum of the interest payment, the redemption value at the bond’s maturity, and the initial purchase price of the bond.
Free Cash Flow is a measure of financial performance calculated as operating cash flow minus capital expenditures. Free cash flow (FCF) represents the cash that a company is able to generate after laying out the money required to maintain or expand its asset base.
See Notes to Financial Statements.
15
| BOND FUND INVESTMENT REVIEW (Unaudited) (Continued) |
| May 31, 2013 |
| Portfolio Concentration at 05/31/13 |
| (Includes cash and cash equivalents) |
| % Total Investments |
| Quality |
| U.S. Government & Agency Issues | 0.07 | % | |
| AAA | 0.16 | % | |
| AA | 0.47 | % | |
| A | 8.51 | % | |
| BBB | 87.28 | % | |
| BB and Below | 2.06 | % | |
| Not Rated | 1.36 | % | |
| Money Market Funds | 0.09 | % | |
| 100.00 | % | |
| |
| Effective Maturity |
| Under 1 year | 12.44 | % | |
| 1 to 3 years | 29.95 | % | |
| 3 to 5 years | 31.37 | % | |
| 5 to 10 years | 26.24 | % | |
| 100.00 | % | |
| |
| Asset Allocation |
| Corporate Bonds | 88.66 | % | |
| Asset-Backed Securities | 7.27 | % | |
| Taxable Municipal Bonds | 3.13 | % | |
| Convertible Bonds | 0.48 | % | |
| Sovereign Government Bonds | 0.29 | % | |
| Money Market Funds | 0.09 | % | |
| Federal Agency Mortgage-Backed Securities | 0.07 | % | |
| Tax-Exempt Municipal Bonds | 0.01 | % | |
| 100.00 | % | |
| |
See Notes to Financial Statements.
16
| BOND FUND SCHEDULE OF INVESTMENTS (Unaudited) |
| May 31, 2013 |
| | | | Principal | | | |
| | | Amount | | Value |
| BONDS - 98.0% | | | | | |
| | | | | | | |
| Asset-Backed Securities - 7.1% | | | | | |
| | Ameritech Capital Funding Corp. | | | | | |
| | 9.100% due 6/1/2016 | $ | 4,694 | | $ | 5,361 |
| | |
| | AWAS Aviation Capital Ltd. | | | | | |
| | 7.000% due 10/17/2016 (d) | | 42,900,480 | | | 44,938,253 |
| | |
| | Beaver Valley II Funding | | | | | |
| | 9.000% due 6/1/2017 | | 10,000 | | | 10,213 |
| | |
| | Continental Airlines 2009-2 B | | | | | |
| | 9.250% due 5/10/2017 | | 691,193 | | | 777,592 |
| | |
| | Continental Airlines 2010-1 B | | | | | |
| | | 6.000% due 1/12/2019 | | 81,588 | | | 84,851 |
| | |
| | Delta Air Lines 2002-1 G-1 | | | | | |
| | 6.718% due 1/2/2023 | | 4,561 | | | 5,063 |
| | |
| | Delta Air Lines 2007-1 A | | | | | |
| | 6.821% due 8/10/2022 | | 10,573,605 | | | 12,331,996 |
| | |
| | Delta Air Lines 2009-1 B | | | | | |
| | 9.750% due 12/17/2016 | | 578,054 | | | 658,982 |
| | |
| | Doric Nimrod Air Finance | | | | | |
| | Alpha Ltd. 2012-1 B | | | | | |
| | 6.500% due 5/30/2021 (d) | | 17,685,389 | | | 18,384,421 |
| | |
| | Express Pipeline LP | | | | | |
| | 7.390% due 12/31/2017 (d) | | 2,638,000 | | | 2,883,210 |
| | |
| | FPL Energy Caithness | | | | | |
| | Funding Corp. | | | | | |
| | 7.645% due 12/31/2018 (d) | | 2,168,960 | | | 2,326,700 |
| | |
| | General American Railcar 1997-1 | | | | | |
| | 6.690% due 9/20/2016 (d) | | 313,656 | | | 322,548 |
| | |
| | General American Railcar II | | | | | |
| | 6.210% due 9/20/2017 | | 5,614,115 | | | 5,843,063 |
| | |
| | General American Railcar III | | | | | |
| | 7.760% due 8/20/2018 (d) | | 1,107,437 | | | 1,127,743 |
| | |
| | Maritimes & Northeast | | | | | |
| | Pipeline LLC | | | | | |
| | 7.500% due 5/31/2014 (d) | | 28,573,600 | | | 30,052,827 |
| | | | | |
| | Midwest Family Housing LLC | | | | | |
| | 5.168% due 7/1/2016 (d) | | 332,000 | | | 344,311 |
| | |
| | Northwest Airlines 1999-2 A | | | | | |
| | 7.575% due 3/1/2019 | | 185,767 | | | 215,489 |
| | |
| | Northwest Airlines 2001-1 A-1 | | | | | |
| | 7.041% due 4/1/2022 | | 460,353 | | | 512,142 |
| | |
| | Northwest Airlines 2002-1 G-2 | | | | | |
| | 6.264% due 11/20/2021 | | 1,103,940 | | | 1,177,463 |
| | |
| | Northwest Airlines 2007-1 A | | | | | |
| | 7.027% due 11/1/2019 | | 8,208,558 | | | 9,193,584 |
| | |
| | PP&L Montana LLC | | | | | |
| | 8.903% due 7/2/2020 | | 2,920,165 | | | 3,251,721 |
| | |
| | Prologis, Inc. | | | | | |
| | 7.810% due 2/1/2015 | | 2,010,600 | | | 2,089,914 |
| | |
| | World Financial Properties | | | | | |
| | Tower B Corp. | | | | | |
| | 6.910% due 9/1/2013 (d) | | 70,975 | | | 71,320 |
| | |
| | Total Asset-Backed Securities | | | | | 136,608,767 |
| | |
| Convertible Bonds - 0.5% | | | | | |
| | EMC Corp. | | | | | |
| | 1.750% due 12/1/2013 | | 1,000,000 | | | 1,546,250 |
| | |
| | Hospitality Properties Trust | | | | | |
| | 3.800% due 3/15/2027 | | 7,309,000 | | | 7,304,432 |
| | |
| | NASDAQ OMX Group, Inc. | | | | | |
| | 2.500% due 8/15/2013 | | 215,000 | | | 215,269 |
| | |
| | Total Convertible Bonds | | | | | 9,065,951 |
| | |
| Corporate Bonds - 87.0% | | | | | |
| | Abbey National Treasury | | | | | |
| | Services PLC | | | | | |
| | 2.875% due 4/25/2014 | | 8,604,000 | | | 8,762,400 |
| | |
| | Advance Auto Parts, Inc. | | | | | |
| | 5.750% due 5/1/2020 | | 21,826,000 | | | 23,958,138 |
See Notes to Financial Statements.
17
| BOND FUND SCHEDULE OF INVESTMENTS (Unaudited) (Continued) |
| May 31, 2013 |
| Principal | | | |
| Amount | | Value |
| BONDS (continued) | | | | | |
| | | | | | |
| Corporate Bonds (continued) | | | | | |
| Aetna Inc. | | | | | |
| 6.750% due 9/15/2013 | $ | 188,000 | | $ | 191,128 |
| | | | | | |
| Agilent Technologies, Inc. | | | | | |
| 2.500% due 7/15/2013 | | 165,000 | | | 165,356 |
| | | | | | |
| Airgas, Inc. | | | | | |
| 7.125% due 10/1/2018 | | 415,000 | | | 437,551 |
| | | | | | |
| Alcoa Inc. | | | | | |
| 6.000% due 7/15/2013 | | 192,000 | | | 193,122 |
| | | | | | |
| Alltel Corp. | | | | | |
| 6.500% due 11/1/2013 | | 8,000 | | | 8,191 |
| | | | | | |
| Altria Group, Inc. | | | | | |
| 7.000% due 11/4/2013 | | 41,000 | | | 41,921 |
| 8.500% due 11/10/2013 | | 90,000 | | | 93,067 |
| | | | | | |
| AMB Property LP | | | | | |
| 5.900% due 8/15/2013 | | 8,000 | | | 8,078 |
| | | | | | |
| Ameren Corp. | | | | | |
| 8.875% due 5/15/2014 | | 1,210,000 | | | 1,298,232 |
| | | | | | |
| American Express | | | | | |
| 6.650% due 9/15/2015 | | 90,000 | | | 100,450 |
| 6.900% due 9/15/2015 | | 277,000 | | | 311,935 |
| | | | | | |
| American Financial Group, Inc. | | | | | |
| 9.875% due 6/15/2019 | | 1,751,000 | | | 2,349,924 |
| | | | | | |
| American General Finance | | | | | |
| 6.000% due 10/15/2014 | | 1,000,000 | | | 1,019,760 |
| 6.000% due 12/15/2014 | | 1,000,000 | | | 1,027,090 |
| | | | | | |
| American Standard Inc. | | | | | |
| 5.500% due 4/1/2015 | | 25,000 | | | 26,650 |
| | | | | | |
| Amphenol Corp. | | | | | |
| 4.750% due 11/15/2014 | | 1,698,000 | | | 1,796,401 |
| | | | | | |
| Anadarko Petroleum Corp. | | | | | |
| 7.625% due 3/15/2014 | | 988,000 | | | 1,041,523 |
| | | | | | |
| Arden Realty LP | | | | | |
| 5.250% due 3/1/2015 | | 3,040,000 | | | 3,244,048 |
| | | | | | |
| Aspen Insurance Holdings Ltd. | | | | | |
| 6.000% due 8/15/2014 | | 4,669,000 | | | 4,922,405 |
| | | | | | |
| Associated Banc-Corp | | | | | |
| 9.250% due 10/15/2018 | | 387,000 | | | 394,647 |
| | | | | | |
| Associates Corp. N.A. | | | | | |
| 6.950% due 11/1/2018 | | 691,000 | | | 838,694 |
| | | | | | |
| Assurant, Inc. | | | | | |
| 5.625% due 2/15/2014 | | 30,000 | | | 30,963 |
| | | | | | |
| Astoria Financial Corp. | | | | | |
| 5.000% due 6/19/2017 | | 26,873,000 | | | 28,534,047 |
| | | | | | |
| AutoZone, Inc. | | | | | |
| 4.375% due 6/1/2013 | | 155,000 | | | 155,000 |
| | | | | | |
| Avnet, Inc. | | | | | |
| 5.875% due 3/15/2014 | | 15,175,000 | | | 15,710,177 |
| 6.000% due 9/1/2015 | | 225,000 | | | 243,313 |
| 6.625% due 9/15/2016 | | 551,000 | | | 621,946 |
| | | | | | |
| Avon Products, Inc. | | | | | |
| 5.750% due 3/1/2018 | | 5,275,000 | | | 5,828,595 |
| 6.500% due 3/1/2019 | | 24,451,000 | | | 28,047,106 |
| 4.600% due 3/15/2020 | | 500,000 | | | 528,420 |
| | | | | | |
| Axis Capital Holdings | | | | | |
| 5.750% due 12/1/2014 | | 5,622,000 | | | 5,998,348 |
| | | | | | |
| Bank of America Corp. | | | | | |
| 4.750% due 8/15/2013 | | 590,000 | | | 594,742 |
| 4.750% due 8/15/2013 | | 20,000 | | | 20,116 |
| 7.375% due 5/15/2014 | | 926,000 | | | 982,701 |
| 5.375% due 6/15/2014 | | 50,000 | | | 52,242 |
| 5.350% due 9/15/2015 | | 549,000 | | | 591,692 |
| 5.250% due 12/1/2015 | | 333,000 | | | 359,570 |
| 5.625% due 10/14/2016 | | 935,000 | | | 1,053,072 |
| 6.000% due 8/15/2017 | | 115,000 | | | 132,234 |
| 6.050% due 8/15/2017 | | 948,000 | | | 1,072,456 |
| 5.750% due 12/1/2017 | | 555,000 | | | 635,555 |
| 5.350% due 3/15/2018 | | 81,000 | | | 88,933 |
| 5.800% due 2/15/2019 | | 10,000 | | | 11,358 |
| 7.625% due 6/1/2019 | | 730,000 | | | 919,474 |
| 6.400% due 8/15/2019 | | 141,000 | | | 163,210 |
See Notes to Financial Statements.
18
| BOND FUND SCHEDULE OF INVESTMENTS (Unaudited) (Continued) |
| May 31, 2013 |
| Principal | | | |
| Amount | | Value |
| BONDS (continued) | | | | | |
| | | | | | |
| Corporate Bonds (continued) | | | | | |
| Bank of America Corp. (continued) | | | | | |
| 6.750% due 8/15/2019 | $ | 671,000 | | $ | 791,948 |
| 4.625% due 3/30/2020 (b) | | 680,000 | | | 685,814 |
| 5.560% due 11/23/2020 (b) | | 85,000 | | | 85,683 |
| | | | | | |
| Bear Stearns Cos. LLC | | | | | |
| 5.300% due 9/15/2013 | | 20,000 | | | 20,273 |
| 2.920% due 3/10/2014 (a) | | 270,000 | | | 271,296 |
| 2.870% due 4/10/2014 (a) | | 100,000 | | | 100,051 |
| | | | | | |
| Best Buy Co., Inc. | | | | | |
| 7.250% due 7/15/2013 (a) | | 570,000 | | | 572,850 |
| 3.750% due 3/15/2016 | | 17,902,000 | | | 18,125,775 |
| | | | | | |
| Bio-Rad Laboratories, Inc. | | | | | |
| 8.000% due 9/15/2016 | | 21,770,000 | | | 23,016,703 |
| | | | | | |
| Black Hills Corp. | | | | | |
| 9.000% due 5/15/2014 | | 2,452,000 | | | 2,624,214 |
| | | | | | |
| BMC Software, Inc. | | | | | |
| 7.250% due 6/1/2018 | | 26,928,000 | | | 29,158,258 |
| | | | | | |
| Boston Properties LP | | | | | |
| 5.625% due 4/15/2015 | | 331,000 | | | 359,475 |
| | | | | | |
| Boston Scientific Corp. | | | | | |
| 5.450% due 6/15/2014 | | 1,471,000 | | | 1,540,742 |
| 6.250% due 11/15/2015 (a) | | 3,358,000 | | | 3,736,823 |
| | | | | | |
| Brinker International | | | | | |
| 5.750% due 6/1/2014 | | 9,512,000 | | | 9,980,466 |
| | | | | | |
| Brocade Communications | | | | | |
| Systems, Inc. | | | | | |
| 6.875% due 1/15/2020 | | 3,118,000 | | | 3,390,825 |
| | | | | | |
| CA, Inc. | | | | | |
| 6.125% due 12/1/2014 | | 1,614,000 | | | 1,729,704 |
| | | | | | |
| Capital One Financial | | | | | |
| 6.150% due 9/1/2016 | | 300,000 | | | 340,495 |
| | | | | | |
| Carpenter Technology Corp. | | | | | |
| 7.060% due 5/21/2018 | | 500,000 | | | 549,671 |
| 7.030% due 5/22/2018 | | 8,000 | | | 8,785 |
| | | | | | |
| Centel Capital Corp. | | | | | |
| 9.000% due 10/15/2019 | | 10,000 | | | 12,164 |
| | | | | | |
| CenterPoint Energy, Inc. | | | | | |
| 6.850% due 6/1/2015 | | 192,000 | | | 213,579 |
| | | | | | |
| Chesapeake & Potomac | | | | | |
| Telephone Co. | | | | | |
| 7.150% due 5/1/2023 | | 3,949,000 | | | 3,957,723 |
| 7.150% due 5/1/2023 | | 54,000 | | | 54,119 |
| | | | | | |
| Citigroup Funding, Inc. | | | | | |
| 4.250% due 12/15/2018 (b) | | 10,000 | | | 10,122 |
| 4.000% due 8/11/2020 (b) | | 180,000 | | | 184,310 |
| | | | | | |
| Citigroup, Inc. | | | | | |
| 6.500% due 8/19/2013 | | 1,463,000 | | | 1,480,875 |
| 6.000% due 12/13/2013 | | 3,620,000 | | | 3,722,707 |
| 5.125% due 5/5/2014 | | 3,000 | | | 3,118 |
| 5.000% due 9/15/2014 | | 7,085,000 | | | 7,411,363 |
| 6.010% due 1/15/2015 | | 244,000 | | | 262,674 |
| 4.875% due 5/7/2015 | | 115,000 | | | 122,055 |
| 5.500% due 2/15/2017 | | 180,000 | | | 200,040 |
| 6.125% due 11/21/2017 | | 1,269,000 | | | 1,484,474 |
| 6.125% due 5/15/2018 | | 176,000 | | | 207,507 |
| | | | | | |
| Cleveland Electric | | | | | |
| Illuminating Co. | | | | | |
| 5.650% due 12/15/2013 | | 332,000 | | | 340,631 |
| | | | | | |
| Cliffs Natural Resources Inc. | | | | | |
| 3.950% due 1/15/2018 | | 1,200,000 | | | 1,188,174 |
| 5.900% due 3/15/2020 | | 41,774,000 | | | 42,918,566 |
| 4.875% due 4/1/2021 | | 500,000 | | | 480,005 |
| | | | | | |
| CMS Energy Corp. | | | | | |
| 2.750% due 5/15/2014 | | 10,000 | | | 10,170 |
| | | | | | |
| CNA Financial Corp. | | | | | |
| 5.850% due 12/15/2014 | | 1,552,000 | | | 1,658,472 |
| 6.500% due 8/15/2016 | | 1,250,000 | | | 1,426,645 |
| 6.950% due 1/15/2018 | | 605,000 | | | 707,286 |
| | | | | | |
| Commercial Net Lease | | | | | |
| Realty, Inc. | | | | | |
| 6.250% due 6/15/2014 | | 1,060,000 | | | 1,097,004 |
| 6.150% due 12/15/2015 | | 443,000 | | | 498,619 |
See Notes to Financial Statements.
19
| BOND FUND SCHEDULE OF INVESTMENTS (Unaudited) (Continued) |
| May 31, 2013 |
| Principal | | | |
| Amount | | Value |
| BONDS (continued) | | | | | |
| | | | | | |
| Corporate Bonds (continued) | | | | | |
| Commonwealth Edison Co. | | | | | |
| 7.500% due 7/1/2013 | $ | 37,000 | | $ | 37,183 |
| | | | | | |
| Computer Sciences Corp. | | | | | |
| 6.500% due 3/15/2018 | | 19,477,000 | | | 22,502,343 |
| | | | | | |
| Con-way Inc. | | | | | |
| 7.250% due 1/15/2018 | | 13,089,000 | | | 15,212,559 |
| | | | | | |
| Cooperatieve Centrale Raiffeisen- | | | | | |
| Boerenleenbank B.A. | | | | | |
| 2.000% due 1/15/2014 | | 25,000 | | | 25,087 |
| | | | | | |
| Countrywide Financial Corp. | | | | | |
| 5.000% due 5/11/2015 | | 30,000 | | | 29,481 |
| 5.750% due 6/24/2015 (b) | | 560,000 | | | 560,302 |
| 6.500% due 7/28/2015 (b) | | 138,000 | | | 137,662 |
| 6.250% due 5/15/2016 | | 952,000 | | | 1,057,386 |
| 5.250% due 5/27/2020 | | 218,000 | | | 215,503 |
| 6.000% due 8/26/2020 (b) | | 117,000 | | | 116,227 |
| | | | | | |
| Countrywide Home Loans, Inc. | | | | | |
| 6.000% due 1/24/2018 | | 1,077,000 | | | 1,066,876 |
| 5.500% due 5/16/2018 | | 240,000 | | | 237,064 |
| | | | | | |
| Coventry Health Care, Inc. | | | | | |
| 6.300% due 8/15/2014 | | 8,184,000 | | | 8,703,668 |
| 6.125% due 1/15/2015 | | 1,136,000 | | | 1,224,991 |
| 5.950% due 3/15/2017 | | 854,000 | | | 978,605 |
| | | | | | |
| Crane Co. | | | | | |
| 5.500% due 9/15/2013 | | 75,000 | | | 75,869 |
| | | | | | |
| CRH America, Inc. | | | | | |
| 5.300% due 10/15/2013 | | 10,000 | | | 10,167 |
| | | | | | |
| Darden Restaurants | | | | | |
| 7.125% due 2/1/2016 | | 136,000 | | | 153,154 |
| | | | | | |
| Dean Witter Discover & Co. | | | | | |
| 6.750% due 10/15/2013 | | 287,000 | | | 293,458 |
| | | | | | |
| Dell Inc. | | | | | |
| 1.400% due 9/10/2013 | | 5,942,000 | | | 5,946,635 |
| | | | | | |
| Discover Financial Services | | | | | |
| 6.450% due 6/12/2017 | | 590,000 | | | 683,832 |
| 10.250% due 7/15/2019 | | 7,870,000 | | | 10,290,222 |
| | | | | | |
| Domtar Corp. | | | | | |
| 9.500% due 8/1/2016 | | 580,000 | | | 693,105 |
| 10.750% due 6/1/2017 | | 17,379,000 | | | 22,116,672 |
| | | | | | |
| Dow Chemical Co. | | | | | |
| 4.300% due 6/15/2013 | | 35,000 | | | 35,029 |
| 6.850% due 8/15/2013 | | 335,000 | | | 338,892 |
| 5.900% due 2/15/2015 | | 650,000 | | | 705,442 |
| 4.150% due 12/15/2017 | | 65,000 | | | 65,043 |
| 5.000% due 9/15/2020 | | 105,000 | | | 105,311 |
| 5.050% due 9/15/2020 | | 197,000 | | | 197,610 |
| 4.500% due 6/15/2021 | | 25,000 | | | 25,003 |
| | | | | | |
| Duke Energy Corp. | | | | | |
| 5.650% due 6/15/2013 | | 192,000 | | | 192,275 |
| | | | | | |
| Duquesne Light Holdings Inc. | | | | | |
| 5.500% due 8/15/2015 | | 6,799,000 | | | 7,391,478 |
| | | | | | |
| Enbridge Energy Partners, L.P. | | | | | |
| 4.750% due 6/1/2013 | | 25,000 | | | 25,000 |
| | | | | | |
| Endurance Specialty | | | | | |
| Holdings Ltd. | | | | | |
| 6.150% due 10/15/2015 | | 6,158,000 | | | 6,787,908 |
| | | | | | |
| Enel Finance Int’l. N.V. | | | | | |
| 6.250% due 9/15/2017 (d) | | 2,706,000 | | | 3,050,420 |
| 5.125% due 10/7/2019 (d) | | 5,000,000 | | | 5,412,250 |
| 5.125% due 10/7/2019 | | 500,000 | | | 541,225 |
| | | | | | |
| Energy Transfer Partners, L.P. | | | | | |
| 6.000% due 7/1/2013 | | 1,001,000 | | | 1,004,379 |
| 8.500% due 4/15/2014 | | 278,000 | | | 295,952 |
| | | | | | |
| Entergy New Orleans, Inc. | | | | | |
| 5.250% due 8/1/2013 | | 32,000 | | | 32,184 |
| | | | | | |
| Exelon Generation Co., LLC | | | | | |
| 5.350% due 1/15/2014 | | 122,000 | | | 125,463 |
| | | | | | |
| Expedia, Inc. | | | | | |
| 7.456% due 8/15/2018 | | 17,549,000 | | | 20,676,618 |
| | | | | | |
| Fairfax Financial Holdings Ltd. | | | | | |
| 8.250% due 10/1/2015 | | 1,904,000 | | | 2,172,626 |
| 7.375% due 4/15/2018 | | 17,937,000 | | | 20,796,463 |
| 5.800% due 5/15/2021 (d) | | 12,040,000 | | | 12,697,023 |
See Notes to Financial Statements.
20
| BOND FUND SCHEDULE OF INVESTMENTS (Unaudited) (Continued) |
| May 31, 2013 |
| Principal | | | |
| Amount | | Value |
| BONDS (continued) | | | | | |
| | | | | | |
| Corporate Bonds (continued) | | | | | |
| Fidelity National Financial, Inc. | | | | | |
| 6.600% due 5/15/2017 | $ | 15,861,000 | | $ | 17,790,364 |
| | | | | | |
| Fidelity National Information | | | | | |
| Services, Inc. | | | | | |
| 7.875% due 7/15/2020 | | 16,273,000 | | | 18,234,580 |
| | | | | | |
| First Horizon National Corp. | | | | | |
| 5.375% due 12/15/2015 | | 895,000 | | | 977,902 |
| | | | | | |
| First Tennessee Bank | | | | | |
| 5.050% due 1/15/2015 | | 2,757,000 | | | 2,899,959 |
| 5.650% due 4/1/2016 | | 5,247,000 | | | 5,727,930 |
| | | | | | |
| Fortune Brands, Inc. | | | | | |
| 4.875% due 12/1/2013 | | 239,000 | | | 243,575 |
| 5.375% due 1/15/2016 | | 10,000 | | | 10,992 |
| | | | | | |
| Frontier Oil Corp. | | | | | |
| 6.875% due 11/15/2018 | | 1,920,000 | | | 2,083,200 |
| | | | | | |
| GATX Corp. | | | | | |
| 8.750% due 5/15/2014 | | 135,000 | | | 144,902 |
| | | | | | |
| Gazprom OAO Via Gaz | | | | | |
| Capital S.A. | | | | | |
| 8.125% due 7/31/2014 (d) | | 24,896,000 | | | 26,735,814 |
| 4.950% due 5/23/2016 (d) | | 5,000,000 | | | 5,343,200 |
| 9.250% due 4/23/2019 (d) | | 1,500,000 | | | 1,908,750 |
| | | | | | |
| General Electric Capital Corp. | | | | | |
| 4.150% due 6/15/2013 | | 19,000 | | | 19,014 |
| 5.600% due 7/15/2014 | | 500,000 | | | 524,602 |
| 5.250% due 6/15/2015 | | 25,000 | | | 26,879 |
| 5.400% due 6/15/2015 | | 59,000 | | | 63,525 |
| 5.500% due 8/15/2015 | | 30,000 | | | 32,719 |
| 5.450% due 1/15/2016 | | 49,000 | | | 49,174 |
| 5.000% due 4/15/2016 | | 45,000 | | | 49,186 |
| 4.750% due 3/15/2017 | | 395,000 | | | 397,007 |
| 5.000% due 3/15/2018 | | 182,000 | | | 180,645 |
| 5.000% due 3/15/2018 | | 128,000 | | | 127,993 |
| 6.750% due 4/15/2018 | | 373,000 | | | 445,199 |
| 6.300% due 5/15/2018 | | 1,790,000 | | | 2,095,766 |
| 6.000% due 7/15/2018 | | 57,000 | | | 66,289 |
| 6.000% due 7/15/2018 | | 39,000 | | | 45,153 |
| 5.450% due 7/15/2019 | | 50,000 | | | 50,121 |
| 5.500% due 7/15/2019 | | 16,000 | | | 16,038 |
| 6.150% due 7/15/2019 | | 80,000 | | | 78,759 |
| 5.750% due 1/15/2020 | | 110,000 | | | 110,393 |
| | | | | | |
| Genworth Financial Inc. | | | | | |
| 5.750% due 6/15/2014 | | 3,580,000 | | | 3,735,981 |
| 8.625% due 12/15/2016 | | 8,264,000 | | | 9,991,878 |
| 6.515% due 5/22/2018 | | 17,629,000 | | | 20,216,391 |
| 7.700% due 6/15/2020 | | 7,667,000 | | | 9,151,439 |
| 7.200% due 2/15/2021 | | 423,000 | | | 501,568 |
| | | | | | |
| Genworth Global | | | | | |
| Funding Trusts | | | | | |
| 5.500% due 6/15/2013 | | 260,000 | | | 259,998 |
| 5.350% due 7/15/2013 | | 32,000 | | | 32,108 |
| 5.250% due 8/15/2013 | | 33,000 | | | 33,188 |
| 5.000% due 9/15/2013 | | 20,000 | | | 20,148 |
| | | | | | |
| GFI Group Inc. | | | | | |
| 9.625% due 7/19/2018 (a) | | 551,000 | | | 542,735 |
| | | | | | |
| GMAC LLC | | | | | |
| 6.000% due 7/15/2013 | | 60,000 | | | 60,176 |
| 0.000% due 6/15/2015 (c) | | 1,250,000 | | | 1,175,250 |
| 6.350% due 2/15/2016 (b) | | 75,000 | | | 75,408 |
| 6.500% due 2/15/2016 (b) | | 100,000 | | | 100,182 |
| 6.500% due 9/15/2016 (b) | | 87,000 | | | 87,417 |
| 7.250% due 9/15/2017 | | 259,000 | | | 259,078 |
| | | | | | |
| Goldman Sachs Group, Inc. | | | | | |
| 4.750% due 7/15/2013 | | 386,000 | | | 387,779 |
| 5.400% due 4/30/2014 | | 45,000 | | | 46,745 |
| 5.625% due 1/15/2017 | | 565,000 | | | 627,735 |
| 5.950% due 1/18/2018 | | 9,647,000 | | | 11,123,859 |
| | | | | | |
| Great Plains Energy Inc. | | | | | |
| 6.875% due 9/15/2017 | | 30,000 | | | 35,511 |
| | | | | | |
| Harley-Davidson | | | | | |
| 15.000% due 2/1/2014 | | 500,000 | | | 544,063 |
| | | | | | |
| Harsco Corp. | | | | | |
| 5.125% due 9/15/2013 | | 146,000 | | | 147,767 |
| | | | | | |
| Hartford Financial Services | | | | | |
| 4.750% due 3/1/2014 | | 932,000 | | | 956,250 |
See Notes to Financial Statements.
21
| BOND FUND SCHEDULE OF INVESTMENTS (Unaudited) (Continued) |
| May 31, 2013 |
| Principal | | | |
| Amount | | Value |
| BONDS (continued) | | | | | |
| | | | | | |
| Corporate Bonds (continued) | | | | | |
| Hartford Life Insurance Co. | | | | | |
| 5.050% due 7/15/2013 | $ | 35,000 | | $ | 35,116 |
| | | | | | |
| Hasbro, Inc. | | | | | |
| 6.125% due 5/15/2014 | | 1,000,000 | | | 1,050,485 |
| | | | | | |
| HCP, Inc. | | | | | |
| 5.650% due 12/15/2013 | | 1,593,000 | | | 1,635,344 |
| 6.000% due 3/1/2015 | | 5,879,000 | | | 6,379,027 |
| 7.072% due 6/8/2015 | | 703,000 | | | 784,670 |
| | | | | | |
| Hewlett-Packard Co. | | | | | |
| 1.250% due 9/13/2013 | | 2,157,000 | | | 2,159,446 |
| 6.125% due 3/1/2014 | | 656,000 | | | 680,477 |
| 1.550% due 5/30/2014 | | 2,449,000 | | | 2,464,593 |
| 2.600% due 9/15/2017 | | 4,673,000 | | | 4,751,516 |
| 5.500% due 3/1/2018 | | 13,866,000 | | | 15,630,227 |
| | | | | | |
| Horace Mann Educators Corp. | | | | | |
| 6.850% due 4/15/2016 | | 8,370,000 | | | 9,245,109 |
| | | | | | |
| Hospitality Properties Trust | | | | | |
| 7.875% due 8/15/2014 | | 10,953,000 | | | 11,460,737 |
| 5.125% due 2/15/2015 | | 4,594,000 | | | 4,783,048 |
| 6.300% due 6/15/2016 | | 271,000 | | | 298,334 |
| 5.625% due 3/15/2017 | | 2,651,000 | | | 2,917,977 |
| 6.700% due 1/15/2018 | | 1,047,000 | | | 1,189,835 |
| | | | | | |
| Host Hotels & Resorts LP | | | | | |
| 5.875% due 6/15/2019 | | 230,000 | | | 252,960 |
| | | | | | |
| Howard Hughes | | | | | |
| Medical Institute | | | | | |
| 3.450% due 9/1/2014 | | 85,000 | | | 88,146 |
| | | | | | |
| HRPT Properties Trust | | | | | |
| 5.750% due 2/15/2014 | | 1,280,000 | | | 1,290,609 |
| 5.750% due 11/1/2015 | | 3,332,000 | | | 3,538,614 |
| 6.250% due 8/15/2016 | | 3,815,000 | | | 4,122,420 |
| 6.250% due 6/15/2017 | | 1,865,000 | | | 2,028,243 |
| 6.650% due 1/15/2018 | | 21,869,000 | | | 24,231,727 |
| | | | | | |
| HSBC Finance Corp. | | | | | |
| 4.750% due 7/15/2013 | | 347,000 | | | 348,630 |
| 5.350% due 7/15/2013 | | 91,000 | | | 91,421 |
| 5.750% due 7/15/2013 | | 549,000 | | | 551,924 |
| 3.610% due 9/15/2013 (a) | | 366,000 | | | 363,434 |
| 3.810% due 10/10/2013 (a) | | 331,000 | | | 326,793 |
| 1.850% due 12/15/2013 | | 33,000 | | | 33,178 |
| 3.590% due 1/10/2014 (a) | | 335,000 | | | 338,538 |
| 2.500% due 1/15/2014 | | 5,000 | | | 5,033 |
| 2.400% due 2/15/2014 | | 5,000 | | | 5,025 |
| 2.500% due 2/15/2014 | | 690,000 | | | 696,569 |
| 4.950% due 3/15/2014 | | 10,000 | | | 10,279 |
| 2.050% due 4/15/2014 | | 20,000 | | | 20,149 |
| 2.150% due 4/15/2014 | | 25,000 | | | 25,213 |
| 5.600% due 4/15/2014 | | 665,000 | | | 687,153 |
| 1.900% due 6/15/2014 | | 20,000 | | | 20,127 |
| 5.500% due 7/15/2014 | | 30,000 | | | 31,195 |
| 6.000% due 8/15/2014 | | 553,000 | | | 584,666 |
| 6.000% due 8/15/2014 | | 67,000 | | | 70,785 |
| 5.800% due 9/15/2014 | | 153,000 | | | 161,192 |
| 5.850% due 9/15/2014 | | 325,000 | | | 343,771 |
| 5.650% due 10/15/2014 | | 30,000 | | | 31,681 |
| 5.750% due 10/15/2014 | | 274,000 | | | 290,930 |
| 5.350% due 11/15/2014 | | 30,000 | | | 31,623 |
| 5.600% due 2/15/2018 | | 250,000 | | | 280,750 |
| | | | | | |
| HSBC USA Inc. | | | | | |
| 9.500% due 4/15/2014 | | 157,000 | | | 168,239 |
| | | | | | |
| Iberdrola Finance Ireland Ltd. | | | | | |
| 3.800% due 9/11/2014 (d) | | 6,000,000 | | | 6,186,120 |
| 5.000% due 9/11/2019 (d) | | 12,453,000 | | | 13,492,452 |
| | | | | | |
| Ingersoll-Rand | | | | | |
| 9.500% due 4/15/2014 | | 1,281,000 | | | 1,374,911 |
| | | | | | |
| Ingram Micro Inc. | | | | | |
| 5.250% due 9/1/2017 | | 1,000,000 | | | 1,080,773 |
| | | | | | |
| International Game Technology | | | | | |
| 7.500% due 6/15/2019 | | 383,000 | | | 453,354 |
| | | | | | |
| International Paper Co. | | | | | |
| 5.500% due 1/15/2014 | | 50,000 | | | 51,289 |
| 7.400% due 6/15/2014 | | 50,000 | | | 53,120 |
| | | | | | |
| Jabil Circuit, Inc. | | | | | |
| 7.750% due 7/15/2016 | | 6,632,000 | | | 7,626,800 |
| 8.250% due 3/15/2018 | | 9,015,000 | | | 10,908,150 |
| | | | | | |
| Janus Capital Group Inc. | | | | | |
| 6.119% due 4/15/2014 | | 40,000 | | | 40,628 |
See Notes to Financial Statements.
22
| BOND FUND SCHEDULE OF INVESTMENTS (Unaudited) (Continued) |
| May 31, 2013 |
| Principal | | | |
| Amount | | Value |
| BONDS (continued) | | | | | |
| | | | | | |
| Corporate Bonds (continued) | | | | | |
| Jefferson-Pilot Corp. | | | | | |
| 4.750% due 1/30/2014 | $ | 4,063,000 | | $ | 4,170,869 |
| | | | | | |
| John Hancock Life Ins. Co. | | | | | |
| 4.800% due 10/15/2013 | | 5,000 | | | 5,054 |
| 4.750% due 11/15/2013 | | 5,000 | | | 5,065 |
| 5.000% due 12/15/2013 | | 5,000 | | | 5,083 |
| 5.450% due 9/15/2015 | | 201,000 | | | 215,218 |
| 5.450% due 10/15/2015 | | 29,000 | | | 31,194 |
| 5.500% due 11/15/2015 | | 75,000 | | | 80,675 |
| 5.250% due 12/15/2015 | | 25,000 | | | 26,777 |
| 5.500% due 12/15/2015 | | 25,000 | | | 26,929 |
| 5.000% due 4/15/2016 | | 60,000 | | | 64,183 |
| | | | | | |
| JPMorgan Chase & Co. | | | | | |
| 5.250% due 5/15/2018 | | 65,000 | | | 63,753 |
| 5.250% due 3/15/2019 | | 20,000 | | | 19,905 |
| 7.900% due 12/29/2099 (a) | | 8,684,000 | | | 10,138,570 |
| | | | | | |
| Korea Development Bank | | | | | |
| 5.750% due 9/10/2013 | | 30,000 | | | 30,375 |
| 8.000% due 1/23/2014 | | 583,000 | | | 608,116 |
| | | | | | |
| Lexmark International, Inc. | | | | | |
| 6.650% due 6/1/2018 | | 3,370,000 | | | 3,780,618 |
| | | | | | |
| Liberty Property LP | | | | | |
| 5.650% due 8/15/2014 | | 36,000 | | | 37,960 |
| | | | | | |
| Lincoln National Corp. | | | | | |
| 4.750% due 2/15/2014 | | 1,638,000 | | | 1,682,513 |
| | | | | | |
| Macy’s Retail Holdings, Inc. | | | | | |
| 7.625% due 8/15/2013 | | 56,000 | | | 56,693 |
| | | | | | |
| Manufacturers & Traders | | | | | |
| Trust Co. | | | | | |
| 5.585% due 12/28/2020 (a) | | 347,000 | | | 355,597 |
| | | | | | |
| Marriott International, Inc. | | | | | |
| 5.810% due 11/10/2015 | | 373,000 | | | 407,942 |
| | | | | | |
| Masco Corp. | | | | | |
| 7.125% due 8/15/2013 | | 4,402,000 | | | 4,446,020 |
| 4.800% due 6/15/2015 | | 1,475,000 | | | 1,552,107 |
| 6.125% due 10/3/2016 | | 4,502,000 | | | 5,038,737 |
| 5.850% due 3/15/2017 | | 2,899,000 | | | 3,215,278 |
| 6.625% due 4/15/2018 | | 11,640,000 | | | 13,215,649 |
| | | | | | |
| Maxim Integrated | | | | | |
| Products, Inc. | | | | | |
| 3.450% due 6/14/2013 | | 115,000 | | | 115,083 |
| | | | | | |
| Maytag Corp. | | | | | |
| 5.000% due 5/15/2015 | | 50,000 | | | 53,251 |
| | | | | | |
| MBIA Inc. | | | | | |
| 6.400% due 8/15/2022 | | 9,798,000 | | | 9,798,000 |
| | | | | | |
| MBNA Corp. | | | | | |
| 5.000% due 6/15/2015 | | 800,000 | | | 855,382 |
| | | | | | |
| McDonald’s Corp. | | | | | |
| 4.125% due 6/1/2013 | | 49,000 | | | 49,000 |
| | | | | | |
| McKesson Corp. | | | | | |
| 6.500% due 2/15/2014 | | 6,000 | | | 6,246 |
| | | | | | |
| Merrill Lynch & Co. | | | | | |
| 0.000% due 8/30/2013 (c) | | 260,000 | | | 259,226 |
| 5.000% due 2/3/2014 | | 259,000 | | | 266,290 |
| 5.450% due 7/15/2014 | | 1,082,000 | | | 1,132,589 |
| 5.000% due 1/15/2015 | | 343,000 | | | 362,994 |
| 5.300% due 9/30/2015 | | 1,712,000 | | | 1,859,307 |
| 6.050% due 5/16/2016 | | 3,000,000 | | | 3,332,628 |
| 6.400% due 8/28/2017 | | 3,048,000 | | | 3,544,086 |
| 6.875% due 4/25/2018 | | 233,000 | | | 277,547 |
| 6.500% due 7/15/2018 | | 2,668,000 | | | 3,142,482 |
| 6.875% due 11/15/2018 | | 2,316,000 | | | 2,801,698 |
| 8.400% due 11/1/2019 | | 310,000 | | | 378,622 |
| | | | | | |
| Morgan Stanley | | | | | |
| 2.875% due 1/24/2014 | | 301,000 | | | 304,895 |
| 4.750% due 4/1/2014 | | 19,564,000 | | | 20,101,384 |
| 6.000% due 5/13/2014 | | 695,000 | | | 727,904 |
| 6.000% due 4/28/2015 | | 3,753,000 | | | 4,071,352 |
| 4.000% due 7/24/2015 | | 200,000 | | | 210,470 |
| 5.375% due 10/15/2015 | | 1,000,000 | | | 1,088,811 |
| 5.750% due 10/18/2016 | | 2,178,000 | | | 2,442,263 |
| 6.250% due 8/28/2017 | | 2,800,000 | | | 3,230,352 |
| 5.950% due 12/28/2017 | | 2,933,000 | | | 3,366,008 |
| 6.625% due 4/1/2018 | | 10,152,000 | | | 11,948,894 |
| 7.300% due 5/13/2019 | | 4,020,000 | | | 4,925,396 |
| 6.250% due 7/8/2019 (b) | | 139,000 | | | 146,650 |
| 5.625% due 9/23/2019 | | 400,000 | | | 453,073 |
| 5.500% due 1/26/2020 | | 10,000 | | | 11,277 |
| 4.000% due 7/30/2020 (b) | | 8,293,000 | | | 8,291,068 |
See Notes to Financial Statements.
23
| BOND FUND SCHEDULE OF INVESTMENTS (Unaudited) (Continued) |
| May 31, 2013 |
| | | Principal | | |
| | | | Amount | | Value |
| BONDS (continued) | | | | | | |
| | | | | | | |
| Corporate Bonds (continued) | | | | | | |
| Morgan Stanley (continued) | | | | | | |
| 4.000% due 8/19/2020 (b) | | $ | 1,164,000 | | $ | 1,155,615 |
| 4.000% due 9/22/2020 (b) | | | 2,542,000 | | | 2,547,038 |
| 3.500% due 10/15/2020 (b) | | | 340,000 | | | 343,149 |
| |
| Mylan Inc. | | | | | | |
| 7.625% due 7/15/2017 (d) | | | 30,567,000 | | | 33,671,048 |
| 7.875% due 7/15/2020 (d) | | | 3,600,000 | | | 4,183,697 |
| | |
| | Nabisco, Inc. | | | | | | |
| 7.550% due 6/15/2015 | | | 50,000 | | | 56,514 |
| |
| NASDAQ OMX Group, Inc. | | | | | | |
| 4.000% due 1/15/2015 | | | 250,000 | | | 260,520 |
| |
| National City Bank of Indiana | | | | | | |
| 4.250% due 7/1/2018 | | | 200,000 | | | 218,013 |
| |
| National Retail Properties Inc. | | | | | | |
| 6.875% due 10/15/2017 | | | 2,273,000 | | | 2,713,964 |
| |
| National Rural Utilities | | | | | | |
| 4.250% due 8/15/2013 | | | 42,000 | | | 42,247 |
| 7.300% due 11/15/2013 | | | 50,000 | | | 51,281 |
| 7.200% due 10/1/2015 | | | 30,000 | | | 33,413 |
| |
| NationsBank Corp. | | | | | | |
| 0.000% due 8/15/2013 (c) | | | 259,000 | | | 258,292 |
| 7.750% due 8/15/2015 | | | 2,251,000 | | | 2,530,029 |
| |
| Nationwide Building Society | | | | | | |
| 5.250% due 1/15/2014 (d) | | | 1,200,000 | | | 1,228,361 |
| |
| Navigators Group, Inc. | | | | | | |
| 7.000% due 5/1/2016 | | | 14,360,000 | | | 15,941,352 |
| |
| NET Servicos de | | | | | | |
| Comunicacao S.A. | | | | | | |
| 7.500% due 1/27/2020 | | | 26,129,000 | | | 29,003,190 |
| |
| NIPSCO Capital Markets, Inc. | | | | | | |
| 7.860% due 3/27/2017 | | | 38,000 | | | 43,516 |
| |
| NiSource Finance Corp. | | | | | | |
| 5.400% due 7/15/2014 | | | 215,000 | | | 225,424 |
| |
| Noble Energy, Inc. | | | | | | |
| 5.250% due 4/15/2014 | | | 40,000 | | | 41,295 |
| | | | | | | |
| Norfolk Southern Railway Co. | | | | | | |
| Equipment Trust I | | | | | | |
| 6.150% due 4/1/2014 | | | 25,000 | | | 26,115 |
| |
| Northeast Utilities | | | | | | |
| 5.650% due 6/1/2013 | | | 15,000 | | | 15,000 |
| |
| Northern Indiana Public | | | | | | |
| Service Co. | | | | | | |
| 7.590% due 6/12/2017 | | | 182,000 | | | 209,419 |
| |
| Northern Rock Asset | | | | | | |
| Management PLC | | | | | | |
| 5.625% due 6/22/2017 (d) | | | 2,500,000 | | | 2,872,475 |
| |
| NYSE Euronext | | | | | | |
| 4.800% due 6/28/2013 | | | 185,000 | | | 185,533 |
| |
| Odyssey Re Holdings Corp. | | | | | | |
| 7.650% due 11/1/2013 | | | 194,000 | | | 198,968 |
| |
| Ohio Casualty Corp. | | | | | | |
| 7.300% due 6/15/2014 | | | 462,000 | | | 487,467 |
| |
| Owens Corning | | | | | | |
| 6.500% due 12/1/2016 | | | 3,372,000 | | | 3,795,065 |
| |
| Paine Webber Group Inc. | | | | | | |
| 7.625% due 2/15/2014 | | | 50,000 | | | 52,264 |
| |
| Panhandle Eastern Pipe | | | | | | |
| Line Co. LP | | | | | | |
| 6.050% due 8/15/2013 | | | 5,000 | | | 5,048 |
| |
| Petrobras Argentina S.A. | | | | | | |
| 5.875% due 5/15/2017 (d) | | | 13,500,000 | | | 14,580,000 |
| 5.875% due 5/15/2017 | | | 19,444,000 | | | 20,999,520 |
| |
| Petrohawk Energy Corp. | | | | | | |
| 7.875% due 6/1/2015 | | | 208,000 | | | 212,576 |
| 7.250% due 8/15/2018 | | | 41,500,000 | | | 46,116,875 |
| |
| Pitney Bowes Inc. | | | | | | |
| 5.750% due 9/15/2017 | | | 67,000 | | | 74,382 |
| 6.250% due 3/15/2019 | | | 918,000 | | | 1,036,875 |
| 5.250% due 1/15/2037 | | | 42,473,000 | | | 45,066,996 |
See Notes to Financial Statements.
24
| BOND FUND SCHEDULE OF INVESTMENTS (Unaudited) (Continued) |
| May 31, 2013 |
| | | Principal | | | |
| | | | Amount | | Value |
| BONDS (continued) | | | | | | |
| | | | | | | |
| Corporate Bonds (continued) | | | | | | |
| Platinum Underwriters | | | | | | |
| Finance, Inc. | | | | | | |
| 7.500% due 6/1/2017 | | $ | 14,118,000 | | $ | 16,098,431 |
| |
| PNC Funding Corp. | | | | | | |
| 5.250% due 11/15/2015 | | | 352,000 | | | 387,584 |
| | |
| PNM Resources Inc. | | | | | | |
| 9.250% due 5/15/2015 | | | 617,000 | | | 700,295 |
| |
| Potomac Electric Power Co. | | | | | | |
| 4.650% due 4/15/2014 | | | 35,000 | | | 36,150 |
| |
| PPL Energy Supply, LLC | | | | | | |
| 6.300% due 7/15/2013 | | | 60,000 | | | 60,372 |
| 5.400% due 8/15/2014 | | | 15,000 | | | 15,811 |
| 6.500% due 5/1/2018 | | | 1,000,000 | | | 1,179,713 |
| |
| Principal Life Income | | | | | | |
| Funding Trusts | | | | | | |
| 5.000% due 4/15/2014 | | | 30,000 | | | 31,034 |
| 5.000% due 4/15/2014 | | | 40,000 | | | 41,465 |
| 5.000% due 4/15/2014 | | | 5,000 | | | 5,164 |
| 3.858% due 4/1/2016 (a) | | | 50,000 | | | 51,467 |
| |
| Progressive Corp. | | | | | | |
| 7.000% due 10/1/2013 | | | 25,000 | | | 25,521 |
| |
| Prologis, Inc. | | | | | | |
| 7.625% due 8/15/2014 | | | 14,000 | | | 15,170 |
| 6.250% due 3/15/2017 | | | 159,000 | | | 182,426 |
| 7.375% due 10/30/2019 | | | 5,000 | | | 6,211 |
| 6.875% due 3/15/2020 | | | 10,000 | | | 12,059 |
| |
| Protective Life Corp. | | | | | | |
| 4.300% due 6/1/2013 | | | 502,000 | | | 502,000 |
| 4.875% due 11/1/2014 | | | 820,000 | | | 865,298 |
| |
| Protective Life Secured Trusts | | | | | | |
| 5.000% due 6/15/2013 | | | 40,000 | | | 40,023 |
| 4.850% due 10/15/2013 | | | 40,000 | | | 39,995 |
| 4.250% due 3/15/2014 | | | 20,000 | | | 20,311 |
| |
| Provident Cos., Inc. | | | | | | |
| 7.000% due 7/15/2018 | | | 1,057,000 | | | 1,248,229 |
| | | | | | | |
| Prudential Financial, Inc. | | | | | | |
| 4.500% due 7/15/2013 | | | 584,000 | | | 586,645 |
| 4.750% due 4/1/2014 | | | 5,000 | | | 5,168 |
| 5.100% due 9/20/2014 | | | 225,000 | | | 237,405 |
| 6.200% due 1/15/2015 | | | 1,100,000 | | | 1,188,405 |
| 5.000% due 3/16/2015 | | | 140,000 | | | 148,625 |
| |
| Qwest Corp. | | | | | | |
| 3.530% due 6/15/2013 (a) | | | 1,203,000 | | | 1,203,547 |
| |
| R.R. Donnelley & Sons Co. | | | | | | |
| 5.500% due 5/15/2015 | | | 3,314,000 | | | 3,545,980 |
| 8.600% due 8/15/2016 | | | 327,000 | | | 379,320 |
| 6.125% due 1/15/2017 | | | 2,791,000 | | | 2,979,392 |
| |
| Regions Bank / Birmingham AL | | | | | | |
| 7.500% due 5/15/2018 | | | 15,723,000 | | | 19,079,530 |
| |
| Regions Financial Corp. | | | | | | |
| 7.750% due 11/10/2014 | | | 1,170,000 | | | 1,272,586 |
| |
| Retail Property Trust | | | | | | |
| 7.180% due 9/1/2013 (d) | | | 25,000 | | | 25,388 |
| |
| Rio Tinto Finance USA Ltd. | | | | | | |
| 5.875% due 7/15/2013 | | | 33,000 | | | 33,198 |
| |
| RJ Reynolds Tobacco | | | | | | |
| Holdings, Inc. | | | | | | |
| 9.250% due 8/15/2013 | | | 2,849,000 | | | 2,888,407 |
| |
| RPM Int’l., Inc. | | | | | | |
| 6.250% due 12/15/2013 | | | 15,080,000 | | | 15,467,209 |
| |
| Ryder System, Inc. | | | | | | |
| 5.850% due 3/1/2014 | | | 45,000 | | | 46,711 |
| |
| Safeway Inc. | | | | | | |
| 6.250% due 3/15/2014 | | | 2,677,000 | | | 2,782,782 |
| |
| Security Benefit Life Insurance | | | | | | |
| 8.750% due 5/15/2016 (d) | | | 7,000,000 | | | 8,154,006 |
| |
| Seminole Indian | | | | | | |
| Tribe of Florida | | | | | | |
| 8.030% due 10/1/2020 (d) | | | 41,300,000 | | | 45,180,920 |
See Notes to Financial Statements.
25
| BOND FUND SCHEDULE OF INVESTMENTS (Unaudited) (Continued) |
| May 31, 2013 |
| | | Principal | | | |
| | | | Amount | | Value |
| BONDS (continued) | | | | | | |
| | | | | | | |
| Corporate Bonds (continued) | | | | | | |
| Sempra Energy | | | | | | |
| 8.900% due 11/15/2013 | | $ | 20,000 | | $ | 20,729 |
| |
| | Simon Property Group, LP | | | | | | |
| 6.750% due 5/15/2014 | | | 201,000 | | | 209,405 |
| 5.750% due 12/1/2015 | | | 1,089,000 | | | 1,208,795 |
| 6.100% due 5/1/2016 | | | 1,000,000 | | | 1,132,286 |
| |
| SL Green Realty Corp. | | | | | | |
| 5.000% due 8/15/2018 | | | 16,015,000 | | | 17,471,276 |
| |
| SLM Corp. | | | | | | |
| 4.700% due 6/15/2013 | | | 20,000 | | | 19,992 |
| 4.750% due 6/15/2013 | | | 24,000 | | | 23,990 |
| 4.800% due 6/15/2013 | | | 25,000 | | | 24,990 |
| 4.428% due 9/15/2013 (a) | | | 91,000 | | | 90,476 |
| 4.300% due 12/15/2013 | | | 2,000 | | | 1,982 |
| 5.150% due 12/15/2013 | | | 60,000 | | | 59,725 |
| 5.250% due 12/15/2013 | | | 30,000 | | | 29,878 |
| 4.098% due 1/31/2014 (a) | | | 127,000 | | | 128,072 |
| 4.700% due 3/15/2014 | | | 25,000 | | | 24,747 |
| 4.950% due 3/15/2014 | | | 15,000 | | | 14,876 |
| 5.150% due 3/15/2014 | | | 10,000 | | | 9,932 |
| 3.778% due 4/1/2014 (a) | | | 155,000 | | | 154,369 |
| 4.358% due 6/2/2014 (a) | | | 70,000 | | | 69,590 |
| 5.050% due 11/14/2014 | | | 142,000 | | | 147,325 |
| 3.728% due 12/15/2014 (a) | | | 444,000 | | | 444,222 |
| 5.000% due 3/15/2015 (b) | | | 11,000 | | | 10,808 |
| 5.000% due 4/15/2015 | | | 425,000 | | | 442,000 |
| 3.928% due 9/15/2015 (a) | | | 90,000 | | | 91,889 |
| 5.000% due 9/15/2015 | | | 55,000 | | | 53,789 |
| 5.000% due 9/15/2015 | | | 140,000 | | | 136,909 |
| 5.000% due 9/15/2015 | | | 46,000 | | | 44,984 |
| 5.250% due 9/15/2015 | | | 75,000 | | | 73,742 |
| 4.028% due 12/15/2015 (a) | | | 128,000 | | | 126,614 |
| 5.150% due 3/15/2017 | | | 3,085,000 | | | 2,992,450 |
| 4.800% due 6/15/2017 (b) | | | 59,000 | | | 56,209 |
| 5.100% due 6/15/2017 (b) | | | 35,000 | | | 33,714 |
| 4.700% due 12/15/2017 (b) | | | 33,000 | | | 30,907 |
| 5.250% due 3/15/2018 | | | 5,000 | | | 4,761 |
| 5.450% due 3/15/2018 | | | 74,000 | | | 71,035 |
| 5.600% due 3/15/2018 | | | 30,000 | | | 28,983 |
| 5.000% due 6/15/2018 | | | 168,000 | | | 167,999 |
| 5.600% due 6/15/2018 | | | 29,000 | | | 27,857 |
| 6.000% due 6/15/2018 (b) | | | 105,000 | | | 104,931 |
| 8.450% due 6/15/2018 | | | 9,790,000 | | | 10,866,900 |
| 5.200% due 12/15/2018 (b) | | | 30,000 | | | 27,933 |
| 5.450% due 12/15/2018 (b) | | | 46,000 | | | 43,354 |
| 5.250% due 3/15/2019 | | | 42,000 | | | 38,885 |
| 5.500% due 3/15/2019 | | | 800,000 | | | 750,680 |
| 5.500% due 3/15/2019 (b) | | | 375,000 | | | 368,100 |
| 5.900% due 3/15/2019 (b) | | | 30,000 | | | 28,716 |
| 6.000% due 3/15/2019 (b) | | | 110,000 | | | 105,774 |
| 6.000% due 3/15/2019 (b) | | | 61,000 | | | 58,657 |
| 6.200% due 3/15/2019 (b) | | | 44,000 | | | 42,729 |
| 6.250% due 3/15/2019 (b) | | | 20,000 | | | 19,470 |
| 5.190% due 4/24/2019 | | | 731,000 | | | 715,531 |
| 4.228% due 5/3/2019 (a) | | | 217,000 | | | 209,275 |
| 5.000% due 6/15/2019 | | | 158,000 | | | 143,670 |
| 5.000% due 6/15/2019 | | | 48,000 | | | 43,646 |
| 5.150% due 6/15/2019 | | | 11,000 | | | 10,053 |
| 6.000% due 6/15/2019 | | | 25,000 | | | 23,916 |
| 6.000% due 6/15/2019 | | | 94,000 | | | 89,925 |
| 5.500% due 9/15/2019 | | | 5,000 | | | 4,646 |
| 6.000% due 9/15/2019 | | | 43,000 | | | 41,063 |
| 8.000% due 3/25/2020 | | | 20,888,000 | | | 22,741,810 |
| 6.000% due 9/15/2020 (b) | | | 15,000 | | | 14,228 |
| 6.250% due 9/15/2020 (b) | | | 154,000 | | | 148,264 |
| 6.500% due 12/15/2020 (b) | | | 71,000 | | | 71,024 |
| 6.750% due 12/15/2020 (b) | | | 306,000 | | | 302,866 |
| 6.750% due 12/15/2020 (b) | | | 95,000 | | | 94,027 |
| 5.000% due 6/15/2021 (b) | | | 67,000 | | | 66,279 |
| 6.000% due 6/15/2021 | | | 40,000 | | | 37,371 |
| 6.000% due 6/15/2021 | | | 251,000 | | | 234,511 |
| 6.000% due 6/15/2021 | | | 381,000 | | | 357,612 |
| 6.150% due 6/15/2021 | | | 271,000 | | | 257,011 |
| 6.150% due 6/15/2021 | | | 152,000 | | | 144,154 |
| 7.000% due 6/15/2021 (b) | | | 194,000 | | | 194,115 |
| 7.250% due 1/25/2022 | | | 805,000 | | | 847,262 |
| 5.400% due 4/25/2023 (b) | | | 70,000 | | | 62,550 |
| |
| Sonoco Products Co. | | | | | | |
| 6.500% due 11/15/2013 | | | 20,000 | | | 20,500 |
| |
| Spectra Energy Capital LLC | | | | | | |
| 5.500% due 3/1/2014 | | | 37,000 | | | 38,259 |
| |
| Springleaf Finance Corp. | | | | | | |
| 6.900% due 12/15/2017 | | | 1,000,000 | | | 1,036,250 |
| |
| Staples, Inc. | | | | | | |
| 9.750% due 1/15/2014 | | | 1,375,000 | | | 1,449,408 |
| |
| State Bank of India/London | | | | | | |
| 4.125% due 8/1/2017 (d) | | | 8,000,000 | | | 8,224,800 |
See Notes to Financial Statements.
26
| BOND FUND SCHEDULE OF INVESTMENTS (Unaudited) (Continued) |
| May 31, 2013 |
| | | | Principal | | | |
| | | | | Amount | | Value |
| BONDS (continued) | | | | | | |
| | | | | | | | |
| Corporate Bonds (continued) | | | | | | |
| | Steelcase Inc. | | | | | | |
| | 6.375% due 2/15/2021 | | $ | 787,000 | | $ | 856,108 |
| | |
| | Sunoco Logistics Partners | | | | | | |
| | Operations LP | | | | | | |
| | 8.750% due 2/15/2014 | | | 55,000 | | | 57,995 |
| | |
| | Sunoco, Inc. | | | | | | |
| | 4.875% due 10/15/2014 | | | 2,147,000 | | | 2,244,229 |
| | 9.625% due 4/15/2015 | | | 6,466,000 | | | 7,426,453 |
| | |
| | SunTrust Bank | | | | | | |
| | 5.000% due 9/1/2015 | | | 690,000 | | | 742,167 |
| | 5.450% due 12/1/2017 | | | 51,000 | | | 57,999 |
| | |
| | Susa Partnership L.P. | | | | | | |
| | 8.200% due 6/1/2017 | | | 16,000 | | | 19,465 |
| | 7.450% due 7/1/2018 | | | 130,000 | | | 159,527 |
| | |
| | Tech Data Corp. | | | | | | |
| | 3.750% due 9/21/2017 | | | 4,301,000 | | | 4,449,944 |
| | |
| | Telecom Italia | | | | | | |
| | 5.250% due 11/15/2013 | | | 10,101,000 | | | 10,277,767 |
| | 6.175% due 6/18/2014 | | | 1,805,000 | | | 1,884,886 |
| | 6.999% due 6/4/2018 | | | 19,556,000 | | | 22,691,531 |
| | 7.175% due 6/18/2019 | | | 1,053,000 | | | 1,240,829 |
| | |
| | Textron Financial Corp. | | | | | | |
| | 6.200% due 3/15/2015 | | | 14,000 | | | 15,188 |
| | |
| | Torchmark Corp. | | | | | | |
| | 7.375% due 8/1/2013 | | | 1,415,000 | | | 1,429,809 |
| | 6.375% due 6/15/2016 | | | 1,056,000 | | | 1,171,796 |
| | |
| | Transatlantic Holdings, Inc. | | | | | | |
| | 5.750% due 12/14/2015 | | | 2,590,000 | | | 2,850,197 |
| | |
| | 21st Century Insurance Group | | | | | | |
| | 5.900% due 12/15/2013 | | | 363,000 | | | 371,458 |
| | |
| | Tyco Electronics Group | | | | | | |
| | 5.950% due 1/15/2014 | | | 792,000 | | | 817,225 |
| | |
| | UDR, Inc. | | | | | | |
| | 6.050% due 6/1/2013 | | | 35,000 | | | 35,000 |
| | 5.500% due 4/1/2014 | | | 2,411,000 | | | 2,498,242 |
| | 5.250% due 1/15/2015 | | | 690,000 | | | 732,734 |
| | | | | | | | |
| | United Telephone of Florida | | | | | | |
| | 6.875% due 7/15/2013 | | | 46,000 | | | 46,243 |
| | |
| | Unitrin, Inc. | | | | | | |
| | 6.000% due 11/30/2015 | | | 10,185,000 | | | 11,124,108 |
| | 6.000% due 5/15/2017 | | | 8,867,000 | | | 9,715,909 |
| | |
| | Universal Corp. | | | | | | |
| | 5.200% due 10/15/2013 | | | 30,000 | | | 30,386 |
| | |
| | Unum Group | | | | | | |
| | 7.125% due 9/30/2016 | | | 3,200,000 | | | 3,712,074 |
| | |
| | UnumProvident Group | | | | | | |
| | 6.850% due 11/15/2015 (d) | | | 1,900,000 | | | 2,125,999 |
| | |
| | Valero Energy Corp. | | | | | | |
| | 4.750% due 4/1/2014 | | | 15,000 | | | 15,496 |
| | |
| | Veolia Environnement S.A. | | | | | | |
| | 5.250% due 6/3/2013 | | | 40,000 | | | 40,000 |
| | |
| | Wachovia Bank | | | | | | |
| | 4.875% due 2/15/2014 | | | 25,000 | | | 25,741 |
| | 5.000% due 8/15/2015 | | | 1,750,000 | | | 1,901,139 |
| | 5.600% due 3/15/2016 | | | 50,000 | | | 56,025 |
| | 5.625% due 10/15/2016 | | | 200,000 | | | 227,384 |
| | |
| | Warner Chilcott Co. LLC | | | | | | |
| | 7.750% due 9/15/2018 | | | 6,200,000 | | | 6,839,375 |
| | |
| | Weatherford International Ltd. | | | | | | |
| | 4.950% due 10/15/2013 | | | 10,114,000 | | | 10,260,845 |
| | |
| | Weingarten Realty Investors | | | | | | |
| | 4.857% due 1/15/2014 | | | 792,000 | | | 809,993 |
| | |
| | Wells Fargo & Co. | | | | | | |
| | 5.750% due 5/16/2016 | | | 200,000 | | | 226,228 |
| | 7.980% due 3/15/2049 (a) | | | 36,926,000 | | | 43,249,577 |
| | |
| | Western Union Co. | | | | | | |
| | 5.930% due 10/1/2016 | | | 33,095,000 | | | 36,963,475 |
| | |
| | Westinghouse Credit | | | | | | |
| | 8.875% due 6/14/2014 | | | 91,000 | | | 97,711 |
See Notes to Financial Statements.
27
| BOND FUND SCHEDULE OF INVESTMENTS (Unaudited) (Continued) |
| May 31, 2013 |
| | | | Principal | | | |
| | | | | Amount | | Value |
| BONDS (continued) | | | | | | |
| | | | | | | | |
| Corporate Bonds (continued) | | | | | | |
| | Westvaco Corp. | | | | | | |
| | 7.650% due 3/15/2027 | | $ | 7,000 | | $ | 7,902 |
| | |
| | Weyerhaeuser Co. | | | | | | |
| | 6.950% due 8/1/2017 | | | 195,000 | | | 233,765 |
| | |
| | White Mountains | | | | | | |
| | Re Group, Ltd. | | | | | | |
| | | 6.375% due 3/20/2017 (d) | | | 15,135,000 | | | 16,788,014 |
| | |
| | Willamette Industries, Inc. | | | | | | |
| | 7.125% due 7/22/2013 | | | 280,000 | | | 281,215 |
| | |
| | Willis N.A. Inc. | | | | | | |
| | 6.200% due 3/28/2017 | | | 1,801,000 | | | 2,035,865 |
| | |
| | Wyndham Worldwide | | | | | | |
| | 6.000% due 12/1/2016 | | | 2,615,000 | | | 2,941,613 |
| | 5.750% due 2/1/2018 | | | 2,020,000 | | | 2,284,357 |
| | |
| | Wynn Las Vegas LLC | | | | | | |
| | 7.875% due 5/1/2020 | | | 2,422,000 | | | 2,718,695 |
| | 7.750% due 8/15/2020 | | | 38,699,000 | | | 43,633,122 |
| | |
| | Xerox Corp. | | | | | | |
| | 8.250% due 5/15/2014 | | | 9,125,000 | | | 9,745,235 |
| | |
| | XL Capital | | | | | | |
| | 5.250% due 9/15/2014 | | | 4,220,000 | | | 4,443,196 |
| | |
| | Yum! Brands, Inc. | | | | | | |
| | 6.250% due 4/15/2016 | | | 791,000 | | | 895,656 |
| | |
| | Zions Bancorporation | | | | | | |
| | 7.750% due 9/23/2014 | | | 11,330,000 | | | 12,232,638 |
| | 3.500% due 9/15/2015 | | | 4,790,000 | | | 4,800,001 |
| | 2.550% due 11/16/2015 | | | 1,866,000 | | | 1,861,152 |
| | 5.500% due 5/10/2016 | | | 2,943,000 | | | 2,930,130 |
| | 2.750% due 5/16/2016 | | | 10,175,000 | | | 10,247,212 |
| | 4.000% due 6/20/2016 | | | 60,000 | | | 63,411 |
| | 5.000% due 8/1/2016 | | | 3,640,000 | | | 3,662,477 |
| | 5.250% due 11/7/2016 | | | 1,089,000 | | | 1,089,306 |
| | 4.500% due 3/27/2017 | | | 1,125,000 | | | 1,211,584 |
| | |
| | Total Corporate Bonds | | | | | | 1,666,240,580 |
| | | | | | | | |
| Federal Agency Mortgage- | | | | | | |
| | Backed Securities - 0.0% | | | | | | |
| | Fannie Mae | | | | | | |
| | 6.000% due 8/1/2014, | | | | | | |
| | Pool #25-5434F | | | 5,984 | | | 6,092 |
| | 7.000% due 7/1/2015, | | | | | | |
| | Pool #53-5461F | | | 4,275 | | | 4,480 |
| | 8.000% due 9/1/2015, | | | | | | |
| | Pool #53-5460F | | | 10,086 | | | 10,545 |
| | 6.500% due 1/1/2019, | | | | | | |
| | Pool #76-9194F | | | 61,080 | | | 65,666 |
| | 6.000% due 10/1/2037, | | | | | | |
| | Pool #88-8736F | | | 408,573 | | | 440,602 |
| | 6.000% due 3/1/2038, | | | | | | |
| | Pool #25-7134F | | | 276,927 | | | 298,636 |
| | |
| | Freddie Mac | | | | | | |
| | 4.500% due 5/1/2018, | | | | | | |
| | Pool #P1-0032 | | | 46,273 | | | 47,613 |
| | 6.500% due 12/1/2018, | | | | | | |
| | Pool #C9-0241 | | | 40,541 | | | 45,024 |
| | 6.000% due 11/1/2021, | | | | | | |
| | Pool #G1-2449 | | | 78,404 | | | 85,865 |
| | 6.000% due 2/1/2022, | | | | | | |
| | Pool #G1-2758 | | | 126,607 | | | 139,569 |
| | |
| | Ginnie Mae | | | | | | |
| | 5.500% due 6/15/2017, | | | | | | |
| | Pool #58-4476X | | | 2,579 | | | 2,753 |
| | 5.500% due 7/20/2018, | | | | | | |
| | Pool #00-3411M | | | 12,760 | | | 13,647 |
| | 7.000% due 5/15/2033, | | | | | | |
| | Pool #78-2071X | | | 54,082 | | | 65,600 |
| | 5.500% due 6/20/2038, | | | | | | |
| | Pool #00-4163M | | | 59,608 | | | 62,245 |
| | |
| | Total Federal Agency Mortgage- | | | | | | |
| | Backed Securities | | | | | | 1,288,337 |
| | |
| Sovereign Government | | | | | | |
| | Bonds - 0.3% | | | | | | |
| | Export-Import Bank of Korea | | | | | | |
| | 8.125% due 1/21/2014 | | | 5,200,000 | | | 5,425,774 |
| | |
| | Total Sovereign | | | | | | |
| | Government Bonds | | | | | | 5,425,774 |
See Notes to Financial Statements.
28
| BOND FUND SCHEDULE OF INVESTMENTS (Unaudited) (Continued) |
| May 31, 2013 |
| | | | Principal | | | |
| | | | | Amount | | Value |
| BONDS (continued) | | | | | | |
| | | | | | | | |
| Taxable Municipal Bonds - 3.1% | | | | | | |
| | Casino Reinvestment | | | | | | |
| | Development Authority NJ | | | | | | |
| | 5.340% due 6/1/2020 | | $ | 2,915,000 | | $ | 2,944,587 |
| | |
| | City of Detroit MI Water Supply | | | | | | |
| | System Revenue | | | | | | |
| | 3.607% due 7/1/2016 | | | 500,000 | | | 500,650 |
| | |
| | County of Reeves TX Certs. | | | | | | |
| | of Participation | | | | | | |
| | 6.150% due 12/1/2015 | | | 875,000 | | | 913,657 |
| | 6.875% due 12/1/2020 | | | 75,000 | | | 78,323 |
| | 7.700% due 12/1/2021 | | | 1,990,000 | | | 2,113,320 |
| | |
| | | Garza County TX Public | | | | | | |
| | Facility Corp. | | | | | | |
| | 6.200% due 10/1/2020 | | | 20,000 | | | 20,962 |
| | |
| | Lancaster PA Parking Authority | | | | | | |
| | 5.760% due 12/1/2017 | | | 525,000 | | | 559,650 |
| | |
| | LL & P Wind Energy, Inc. WA | | | | | | |
| | 5.983% due 12/1/2022 (d) | | | 6,195,000 | | | 6,310,661 |
| | |
| | Los Angeles CA Community | | | | | | |
| | College District | | | | | | |
| | 4.760% due 8/1/2015 | | | 40,000 | | | 41,662 |
| | | |
| | Puerto Rico Commonwealth | | | | | | |
| | Gov’t. Development Bank | | | | | | |
| | 4.704% due 5/1/2016 | | | 24,080,000 | | | 24,094,448 |
| | 3.875% due 2/1/2017 | | | 8,000,000 | | | 7,782,880 |
| | 4.375% due 2/1/2019 | | | 12,395,000 | | | 12,048,808 |
| | |
| | Willacy County TX Public | | | | | | |
| | Facility Corp | | | | | | |
| | 6.000% due 12/1/2016 | | | 1,330,000 | | | 1,364,819 |
| | |
| | Total Taxable Municipal Bonds | | | | | | 58,774,427 |
| | |
| Tax-Exempt Municipal | | | | | | |
| | Bonds - 0.0% | | | | | | |
| | Philadelphia PA Hospitals & | | | | | | |
| | Higher Education | | | | | | |
| | Facilities Auth. | | | | | | |
| | 4.250% due 7/1/2013 | | | 100,000 | | | 100,281 |
| | | | | | |
| | State of Florida Lottery Revenue | | | | |
| | 4.250% due 7/1/2017 | | | 80,000 | | | 81,033 |
| | |
| | Total Tax-Exempt | | | | | | |
| | Municipal Bonds | | | | | | 181,314 |
| | |
| United States Government & | | | | | | |
| | Agency Issues - 0.0% | | | | | | |
| | Tennessee Valley Authority | | | | | | |
| | 0.000% due 11/1/2013 (c) | | | 15,000 | | | 14,947 |
| | |
| | Total United States Government | | | | |
| | & Agency Issues | | | | | | 14,947 |
| | |
| | TOTAL BONDS | | | | | | |
| | (COST $1,833,821,003) | | | | | | 1,877,600,097 |
| | |
| | | | Shares | | | |
| SHORT-TERM INVESTMENTS - 0.1% | | | | |
| | | | | | | |
| Money Market Funds - 0.1% | | | | | | |
| | Fidelity Money Market Portfolio | | | | |
| | Class I, 0.077% (a) | | | 1,692,860 | | | 1,692,860 |
| | |
| | Total Money Market Funds | | | | | | 1,692,860 |
| | |
| | TOTAL SHORT-TERM INVESTMENTS | | | |
| | (COST $1,692,860) | | | | | | 1,692,860 |
| | |
| | TOTAL INVESTMENTS - 98.1% | | | | |
| | (COST $1,835,513,863) | | | | | | 1,879,292,957 |
| | |
| | NET OTHER ASSETS AND | | | | | | |
| | LIABILITIES - 1.9% | | | | | | 35,430,870 |
| | |
| | NET ASSETS - 100.0% | | | | | $ | 1,914,723,827 |
| | (a) | Interest rate shown represents the current coupon rate at May 31, 2013. |
| | (b) | Security is a “step-up” bond where the coupon increases or steps up at a predetermined date. |
| | (c) | Zero-coupon security. |
| | (d) | Security is exempt from registration under Rule 144A under the Securities Act of 1933. This security may be resold in transactions that are exempt from registration, normally to qualified institutional buyers. |
| | | |
| | PLC: Public Limited Company |
See Notes to Financial Statements.
29
FUND EXPENSE EXAMPLES (Unaudited) |
| May 31, 2013 |
Example
A Fund shareholder may incur two types of costs: (1) transaction costs such as redemption fees; and (2) ongoing costs, including management fees and other Fund expenses. This example is intended to help you understand your ongoing costs (in dollars) of investing in a Fund and to compare these costs with the ongoing costs of investing in other mutual funds.
The example is based on an investment of $1,000 invested at the beginning of the period and held for the entire period from December 1, 2012 to May 31, 2013.
Actual Expenses
The first line of the table below under each Fund provides information about actual account values and actual expenses for such Fund. You may use the information in this line, together with the amount you invested, to estimate the expenses that you paid over the period. Simply divide your account value by $1,000 (for example, an $8,600 account value divided by $1,000 = 8.6), then multiply the result by the number in the first line under the heading entitled “Expenses Paid During Period” to estimate the expenses you paid on your account during this period.
Hypothetical Example for Comparison Purposes
The second line of the table below under each Fund provides information about hypothetical account values and hypothetical expenses based on such Fund’s actual expense ratio and an assumed rate of return of 5% per year before expenses, which is not the Fund’s actual return. The hypothetical account values and expenses may not be used to estimate the actual ending account balance or expenses you paid for the period. You may use this information to compare the ongoing costs of investing in each Fund and other funds. To do so, compare the 5% hypothetical example with the 5% hypothetical examples that appear in the shareholder reports of the other funds.
Please note that the expenses shown in the table are meant to highlight your ongoing costs only and do not reflect any transactional costs, such as redemption fees. Therefore, the second line of the table is useful in comparing ongoing costs only, and will not help you determine the relative costs of owning different funds. In addition, if these transactional costs were included, your costs would have been higher.
| | Beginning | | Ending | | Expenses Paid During |
| | Account Value | | Account Value | | Period* |
| | 12/01/12 | | 05/31/13 | | 12/01/12-05/31/13 |
| Thompson LargeCap Fund | | | | | | | | | | | | | | | |
| Actual | | | $ | 1,000.00 | | | | $ | 1,206.67 | | | | $ | 6.77 | |
| Hypothetical (5% return before expenses) | | | $ | 1,000.00 | | | | $ | 1,018.87 | | | | $ | 6.19 | |
| Thompson MidCap Fund | | | | | | | | | | | | | | | |
| Actual | | | $ | 1,000.00 | | | | $ | 1,184.82 | | | | $ | 7.08 | |
| Hypothetical (5% return before expenses) | | | $ | 1,000.00 | | | | $ | 1,018.52 | | | | $ | 6.54 | |
| Thompson Bond Fund | | | | | | | | | | | | | | | |
| Actual | | | $ | 1,000.00 | | | | $ | 1,018.06 | | | | $ | 3.77 | |
| Hypothetical (5% return before expenses) | | | $ | 1,000.00 | | | | $ | 1,021.26 | | | | $ | 3.78 | |
| * | Expenses are equal to the annualized [net] expense ratio for each Fund (LargeCap Fund: 1.23%; MidCap Fund: 1.30%; and Bond Fund: 0.75%), multiplied by the average account value over the period, multiplied by 182/365 (to reflect the one-half year period). |
| |
| For more information, please refer to the Funds’ Prospectus. |
See Notes to Financial Statements.
30
STATEMENTS OF ASSETS AND LIABILITIES (Unaudited) |
| May 31, 2013 (In thousands, except per share amounts) |
| LARGECAP | | MIDCAP | | BOND |
| FUND | | FUND | | FUND |
| ASSETS | | | | | | | | | | | | | | | | |
| Total investments in securities, at value (Cost $91,677, $25,039 and | | | | | | | | | | | | | | | | |
| $1,835,514, respectively) | | $ | 110,438 | | | | | $ | 30,955 | | | | | $ | 1,879,293 | |
| Due from sale of securities | | | 137 | | | | | | 25 | | | | | | 26,614 | |
| Receivable from fund shares sold | | | 3 | | | | | | – | | | | | | 21,581 | |
| Dividends and interest receivable | | | 193 | | | | | | 28 | | | | | | 27,254 | |
| Prepaid expenses | | | 19 | | | | | | 14 | | | | | | 56 | |
| Total Assets | | | 110,790 | | | | | | 31,022 | | | | | | 1,954,798 | |
| LIABILITIES | | | | | | | | | | | | | | | | |
| Due on purchase of securities | | | – | | | | | | – | | | | | | 17,427 | |
| Payable for fund shares redeemed | | | 61 | | | | | | – | | | | | | 11,098 | |
| Line of credit | | | 46 | | | | | | 9 | | | | | | 10,384 | |
| Accrued expenses payable | | | 71 | | | | | | 20 | | | | | | 88 | |
| Due to Advisor | | | 99 | | | | | | 21 | | | | | | 1,077 | |
| Total Liabilities | | | 277 | | | | | | 50 | | | | | | 40,074 | |
| NET ASSETS | | $ | 110,513 | | | | | $ | 30,972 | | | | | $ | 1,914,724 | |
| Net Assets consist of: | | | | | | | | | | | | | | | | |
| Capital stock ($.001 par value) | | $ | 171,450 | | | | | $ | 24,837 | | | | | $ | 1,854,702 | |
| Undistributed net investment income (loss) | | | 126 | | | | | | (7 | ) | | | | | 14,554 | |
| Accumulated net realized gain (loss) on investments | | | (79,824 | ) | | | | | 226 | | | | | | 1,689 | |
| Net unrealized appreciation on investments | | | 18,761 | | | | | | 5,916 | | | | | | 43,779 | |
| Net Assets | | $ | 110,513 | | | | | $ | 30,972 | | | | | $ | 1,914,724 | |
| Shares of capital stock outstanding (unlimited shares authorized) | | | 2,673 | | | | | | 2,512 | | | | | | 159,702 | |
| Offering and redemption price/Net asset value per share | | $ | 41.34 | | | | | $ | 12.33 | | | | | $ | 11.99 | |
See Notes to Financial Statements.
31
STATEMENTS OF OPERATIONS (Unaudited) |
| Six-Month Period Ended May 31, 2013 (In thousands) |
| | LARGECAP | | MIDCAP | | BOND |
| | FUND | | FUND | | FUND |
| Investment income | | | | | | | | | | | | | | | | | |
| Dividends(1) | | | $ | 909 | | | | | $ | 178 | | | | | $ | – | |
| Interest | | | | – | | | | | | – | | | | | | 33,544 | |
| | | | 909 | | | | | | 178 | | | | | | 33,544 | |
| Expenses | | | | | | | | | | | | | | | | | |
| Investment advisory fees | | | | 494 | | | | | | 138 | | | | | | 4,787 | |
| Shareholder servicing costs | | | | 18 | | | | | | 20 | | | | | | 530 | |
| Administrative & accounting services fees | | | | 58 | | | | | | 21 | | | | | | 244 | |
| Custody fees | | | | 7 | | | | | | 4 | | | | | | 81 | |
| Federal & state registration | | | | 18 | | | | | | 16 | | | | | | 61 | |
| Directors fees | | | | 12 | | | | | | 9 | | | | | | 53 | |
| Professional fees | | | | 19 | | | | | | 18 | | | | | | 34 | |
| Other expenses | | | | 19 | | | | | | 5 | | | | | | 195 | |
| Total expenses | | | | 645 | | | | | | 231 | | | | | | 5,985 | |
| Less expenses reimbursed by Advisor | | | | (4 | ) | | | | | (52 | ) | | | | | – | |
| Net expenses | | | | 641 | | | | | | 179 | | | | | | 5,985 | |
| Net investment income (loss) | | | | 268 | | | | | | (1 | ) | | | | | 27,559 | |
| Net realized gain on investments | | | | 3,584 | | | | | | 579 | | | | | | 2,207 | |
| Net unrealized appreciation on investments | | | | 16,195 | | | | | | 4,254 | | | | | | 2,388 | |
| Net gain on investments | | | | 19,779 | | | | | | 4,833 | | | | | | 4,595 | |
| Net increase in net assets resulting from operations | | | $ | 20,047 | | | | | $ | 4,832 | | | | | $ | 32,154 | |
| | |
| | |
| (1)Net of foreign withholding taxes | | | $ | 2 | | | | | $ | – | | | | | $ | – | |
See Notes to Financial Statements.
32
STATEMENTS OF CHANGES IN NET ASSETS |
| (In thousands) |
| | LARGECAP | | MIDCAP | | BOND |
| | FUND | | FUND | | FUND |
| | Six Month | | | | | | | | Six Month | | | | | | | | Six Month | | | | | | |
| | Period Ended | | Year Ended | | Period Ended | | Year Ended | | Period Ended | | Year Ended |
| | May 31, 2013 | | November 30, | | May 31, 2013 | | November 30, | | May 31, 2013 | | November 30, |
| | (Unaudited) | | 2012 | | (Unaudited) | | 2012 | | (Unaudited) | | 2012 |
| Operations | | | | | | | | | | | | | | | | | | | | | | | | | | | | | | | | | | | | |
| Net investment income (loss) | | | $ | 268 | | | | | $ | 509 | | | | | $ | (1 | ) | | | | $ | (6 | ) | | | | $ | 27,559 | | | | | $ | 35,828 | | |
| Net realized gain on investments | | | | 3,584 | | | | | | 12,001 | | | | | | 579 | | | | | | 2,194 | | | | | | 2,207 | | | | | | 2,478 | | |
| Net unrealized appreciation | | | | | | | | | | | | | | | | | | | | | | | | | | | | | | | | | | | | |
| on investments | | | | 16,195 | | | | | | 756 | | | | | | 4,254 | | | | | | 314 | | | | | | 2,388 | | | | | | 44,436 | | |
| Net increase in net assets resulting | | | | | | | | | | | | | | | | | | | | | | | | | | | | | | | | | | | | |
| from operations | | | | 20,047 | | | | | | 13,266 | | | | | | 4,832 | | | | | | 2,502 | | | | | | 32,154 | | | | | | 82,742 | | |
| Distributions to Shareholders | | | | | | | | | | | | | | | | | | | | | | | | | | | | | | | | | | | | |
| Distributions from net investment income | | | | (538 | ) | | | | | (359 | ) | | | | | – | | | | | | – | | | | | | (24,418 | ) | | | | | (31,675 | ) | |
| Distributions from net realized gains on | | | | | | | | | | | | | | | | | | | | | | | | | | | | | | | | | | | | |
| securities transactions | | | | – | | | | | | – | | | | | | (2,062 | ) | | | | | (1,957 | ) | | | | | (2,354 | ) | | | | | (1,596 | ) | |
| Total distributions to shareholders | | | | (538 | ) | | | | | (359 | ) | | | | | (2,062 | ) | | | | | (1,957 | ) | | | | | (26,772 | ) | | | | | (33,271 | ) | |
| Fund Share Transactions (See Note 4) | | | | (8,606 | ) | | | | | (17,383 | ) | | | | | 3,647 | | | | | | 6,390 | | | | | | 617,059 | | | | | | 586,782 | | |
| Total Increase (Decrease) in Net Assets | | | | 10,903 | | | | | | (4,476 | ) | | | | | 6,417 | | | | | | 6,935 | | | | | | 622,441 | | | | | | 636,253 | | |
| Net Assets | | | | | | | | | | | | | | | | | | | | | | | | | | | | | | | | | | | | |
| Beginning of period | | | | 99,610 | | | | | | 104,086 | | | | | | 24,555 | | | | | | 17,620 | | | | | | 1,292,283 | | | | | | 656,030 | | |
| End of period | | | $ | 110,513 | | | | | $ | 99,610 | | | | | $ | 30,972 | | | | | $ | 24,555 | | | | | $ | 1,914,724 | | | | | $ | 1,292,283 | | |
| Undistributed net investment income (loss) | | | | | | | | | | | | | | | | | | | | | | | | | | | | | | | | | | | | |
| included in net assets at end of period | | | $ | 126 | | | | | $ | 396 | | | | | $ | (7 | ) | | | | $ | (6 | ) | | | | $ | 14,554 | | | | | $ | 10,999 | | |
See Notes to Financial Statements.
33
NOTES TO FINANCIAL STATEMENTS (Unaudited) |
| May 31, 2013 |
NOTE 1 - ORGANIZATION
Thompson IM Funds, Inc. (the “Company”) is a Wisconsin corporation registered under the Investment Company Act of 1940, as amended (the “1940 Act”), as an open-end, diversified management investment company.
The Company consists of separate mutual funds series (each, a “Fund,” and collectively, the “Funds”): Thompson LargeCap Fund (the “LargeCap Fund”), Thompson MidCap Fund (the “MidCap Fund”) and Thompson Bond Fund (the “Bond Fund”). The assets and liabilities of each Fund are segregated and a shareholder’s interest is limited to the Fund in which the shareholder owns shares. The objectives and strategies of each Fund are described in the Funds’ Prospectus.
NOTE 2 - SIGNIFICANT ACCOUNTING POLICIES
The following is a summary of significant accounting policies followed by the Funds in the preparation of their financial statements.
SECURITY VALUATION - Each Fund’s investments are valued at their market prices (generally the last reported sales price on the exchange where the securities are primarily traded or, for Nasdaq-listed securities, at their Nasdaq Official Closing Prices) or, where market quotations are not readily available or are unreliable, at fair value as determined in good faith pursuant to procedures established by the Funds’ Board of Directors (the “Funds’ Board”). Market quotations for the common stocks in which the Funds invest are nearly always readily available; however, market quotations for debt securities are often not readily available. Fair values of debt securities are typically based on valuations published by an independent pricing service, which uses various valuation methodologies such as matrix pricing and other analytical pricing models as well as market transactions and dealer quotations. Debt securities with remaining maturities of 60 days or less are generally valued at amortized cost basis. Exchange-traded options are valued at the last reported sale price on an exchange on which the option is traded. If no sales are reported on a particular day, the mean between the highest bid and lowest asked quotations at the close of the exchanges will be used. Investments in money market mutual funds are generally priced at the ending NAV provided by the service agent of the funds.
When a security is “fair valued,” consideration is given to the facts and circumstances relevant to the particular situation, including a review of various factors set forth in the Pricing Policies and Procedures adopted by the Funds’ Board, which includes factors such as fundamental analytical data relating to the investment, which may include consideration of yields or prices of securities of comparable quality, coupon rate, maturity and type of issue, nature and duration of any restrictions on disposition of the security and an evaluation of forces that influence the market in which the securities are purchased or sold. Fair value pricing is an inherently subjective process, and no single standard exists for determining fair value. Different funds could reasonably arrive at different values for the same security. No securities in any of the Funds were fair valued as of May 31, 2013.
In accordance with generally accepted accounting principles in the United States of America (“GAAP”), fair value is defined as the price that the Fund would receive to sell an investment or pay to transfer a liability in an orderly transaction with an independent buyer in the principal market, or in the absence of a principal market, the most advantageous market for the investment or liability. GAAP established a three-tier hierarchy to maximize the use of observable market data and minimize the use of unobservable inputs and to establish classification of fair value measurements for disclosure purposes.
Various inputs are used in determining the value of each Fund’s investments. These inputs are summarized in the three broad levels listed below:
Level 1 – Quoted prices in active markets for identical securities.
Level 2 – Other significant observable inputs (including quoted prices for similar securities, interest rates, prepayment speeds, credit risk, etc.).
Level 3 – Significant unobservable inputs (including the Fund’s own assumptions in determining the fair value of investments).
Inputs may include price information, specific and broad credit data, liquidity statistics, and other factors. The Fund considers observable data to be that market data which is readily available, regularly distributed or updated, reliable and verifiable, not proprietary, and provided by independent sources that are actively involved in the relevant market. The determination of
34
NOTES TO FINANCIAL STATEMENTS (Unaudited) (Continued) |
| May 31, 2013 |
what constitutes “observable” requires significant judgment by the Fund. The categorization of a financial instrument within the hierarchy is based upon the pricing transparency of the instrument and does not necessarily correspond to the Fund’s perceived risk of that instrument. Investments whose values are based on quoted market prices in active markets, and which are therefore classified as level-1 securities, include active listed equities and certain U.S. government obligations.
Investments that trade in markets that are not considered to be active, but are valued based on quoted market prices, dealer quotations or alternative pricing sources supported by observable inputs, are classified as level-2 securities. These include certain U.S. government obligations, most government agency securities, investment-grade corporate bonds, sovereign government bonds, municipal bonds, and less liquid listed equities. Level-2 investments include positions that are not traded in active markets.
Investments classified as level-3 securities have significant unobservable inputs, as they trade infrequently or not at all. Level-3 instruments include private-placement and less liquid corporate and municipal debt securities. When observable prices are not available for these securities, the Fund uses one or more valuation techniques (e.g., the market approach, the income approach, or the cost approach) for which sufficient and reliable data is available. Within level 3, the use of the market approach generally consists of using comparable market transactions, while the use of the income approach generally consists of using the net present value of estimated future cash flows, adjusted as appropriate for liquidity, credit, market and/or other risk factors. The inputs used by the Fund in estimating the value of level-3 investments include the original transaction price and recent transactions in the same or similar instruments.
The following is a summary of the inputs used to value the Funds’ investments as of May 31, 2013:
| LargeCap Fund |
| Assets | Level 1 | | Level 2 | | Level 3 | | Total |
| Investment Securities: | | | | | | | | | | | |
| Common Stocks | $ | 110,438,334 | | $ | – | | $ | – | | $ | 110,438,334 |
| Short-term securities | | 145 | | | – | | | – | | | 145 |
| Total Assets | $ | 110,438,479 | | $ | – | | $ | – | | $ | 110,438,479 |
| |
| MidCap Fund |
| Assets | Level 1 | | Level 2 | | Level 3 | | Total |
| Investment Securities: | | | | | | | | | | | |
| Common Stocks | $ | 30,954,728 | | $ | – | | $ | – | | $ | 30,954,728 |
| Short-term securities | | 637 | | | – | | | – | | | 637 |
| Total Assets | $ | 30,955,365 | | $ | – | | $ | – | | $ | 30,955,365 |
| |
| Bond Fund |
| Assets | Level 1 | | Level 2 | | Level 3 | | Total |
| Investment Securities: | | | | | | | | | | | |
| Bonds | $ | – | | $ | 1,877,600,097 | | $ | – | | $ | 1,877,600,097 |
| Short-term securities | | 1,692,860 | | | – | | | – | | | 1,692,860 |
| Total Assets | $ | 1,692,860 | | $ | 1,877,600,097 | | $ | – | | $ | 1,879,292,957 |
There were no transfers between level-1 and level-2 securities and the Funds did not invest in any level-3 investments as of and during the six-month period ended May 31, 2013. It is the Funds’ policy to record transfers at the end of the reporting period. Refer to each Fund’s Schedule of Investments for additional information regarding security types and industry classifications.
35
NOTES TO FINANCIAL STATEMENTS (Unaudited) (Continued) |
| May 31, 2013 |
SECURITIES TRANSACTIONS AND INVESTMENT INCOME - Investment securities transactions are accounted for on the trade date. Gains or losses realized on sales of securities are determined by comparing the identified cost of the security lot sold with the net sales proceeds. Discounts/premiums on debt securities purchased are accreted/amortized over the life of the respective securities on the same basis for book and tax purposes. Dividend income is recorded on the ex-dividend date. Interest income is recorded as earned. Income and capital gains on some foreign securities may be subject to foreign withholding taxes, which are accrued as applicable, and have been provided for in accordance with the Funds’ understanding of the applicable country’s tax rules and rates.
OPTIONS - Each Fund may enter into options transactions for hedging purposes and will not use these instruments for speculation. Each Fund may use options to hedge against anticipated declines in the market value of portfolio securities and increases in the market value of securities it intends to purchase and protect against exposure to interest rate changes. Each Fund may also use options to enhance total return or invest in eligible asset classes with greater efficiency and lower cost than is believed to be possible through direct investment. The use of options for hedging purposes involves certain risks and may result in a loss if changes in the value of the option move in a direction different than anticipated, rendering the hedging strategy unsuccessful.
Each Fund may write covered call/put options for which premiums received are recorded as liabilities and are subsequently adjusted to the current fair value of the options written. Premiums received from writing options that expire unexercised are treated as realized gains. Premiums received from writing options which are either exercised or closed are offset against the proceeds received or amount paid on the transaction to determine realized gains or losses.
SECURITIES PURCHASED ON A WHEN-ISSUED OR DELAYED-DELIVERY BASIS - Each Fund may purchase securities on a when-issued or delayed-delivery basis. When-issued securities are securities purchased with delivery to occur at a later date at a stated price and/or yield, thereby involving the risk that the price and/or yield obtained may be more or less than those available in the market when delivery takes place. At the time a Fund makes a commitment to purchase a security on a when-issued basis, the Fund records the transaction and reflects the value of the security in determining net asset value. Each Fund designates and maintains cash and marketable securities at least equal in value to commitments for when-issued securities.
VARIABLE-RATE DEMAND NOTES - The Funds invest in short-term variable-rate demand notes, which are unsecured instruments. The Funds may be susceptible to credit risk with respect to these instruments to the extent the issuer defaults on its payment obligation.
PERMANENT BOOK AND TAX DIFFERENCES - Generally accepted accounting principles require that permanent financial reporting and tax differences relating to shareholder distributions be reclassified in the capital accounts.
EXPENSES - Each Fund is charged for those expenses that are directly attributed to it. Expenses that are not readily identifiable to a specific Fund are generally allocated among the Funds in proportion to the relative sizes of the Funds.
USE OF ESTIMATES - The preparation of financial statements in conformity with GAAP requires management to make estimates and assumptions that affect the reported amounts of assets and liabilities and disclosure of contingent assets and liabilities at the date of the financial statements and the reported amounts of revenues and expenses during the reporting period. Actual results could differ from these estimates.
DISTRIBUTIONS TO SHAREHOLDERS - Distributions to shareholders from net investment income and realized gains on securities for the LargeCap Fund and MidCap Fund normally are declared at least annually. Bond Fund distributions to shareholders from net investment income normally are declared on a quarterly basis, and distributions to shareholders from realized gains on securities normally are declared at least annually. Distributions are recorded on the ex-dividend date.
FEDERAL INCOME TAXES - No provision has been made for federal income taxes since the Funds have elected to be taxed as regulated investment companies and intend to distribute substantially all income to shareholders and otherwise comply with the provisions of the Internal Revenue Code applicable to regulated investment companies.
36
| NOTES TO FINANCIAL STATEMENTS (Unaudited) (Continued) |
| May 31, 2013 |
LINE OF CREDIT - The Funds have established an unsecured line of credit (“LOC”) with U.S. Bank N.A. which expires November 15, 2013 used primarily to finance redemption payments. Each individual Fund’s borrowing under the LOC is limited to either 5% of the value of that Fund’s total assets or any explicit borrowing limits imposed by the Funds’ Board, whatever is less. As of May 31, 2013, the limits established by the Funds’ Board are: LargeCap Fund - $5,250,000, MidCap Fund - $1,200,000 and Bond Fund - $55,000,000. The following table shows the average balance, average interest rate and interest expense incurred by the Funds on borrowings under the LOC for the six-month period ended May 31, 2013.
| | | Average | | Average | | Interest |
| Fund | | | Balance | | Interest Rate | | Expense |
| LargeCap Fund | | | | $ | 146,885 | | | 3.250% | | | $ | 2,413 | |
| MidCap Fund | | | | $ | 15,214 | | | 3.250% | | | $ | 249 | |
| Bond Fund | | | | $ | 1,811,346 | | | 3.250% | | | $ | 29,800 | |
GUARANTEES AND INDEMNIFICATIONS - Under the Funds’ organizational documents, each Director, officer, employee or other agent of the Funds (including the Funds’ investment manager) is indemnified, to the extent permitted by the 1940 Act, against certain liabilities that may arise out of performance of their duties to the Funds. Additionally, in the normal course of business, the Funds enter into contracts that contain a variety of indemnification clauses. The Funds’ maximum exposure under these arrangements is unknown as this would involve future claims that may be made against the Funds that have not yet occurred. However, the Funds have not had prior claims or losses pursuant to these contracts and believe the risk of loss to be remote.
ACCOUNTING FOR UNCERTAINTY IN INCOME TAXES - As of and during the six-month period ended May 31, 2013, the Funds did not have a liability for unrecognized tax benefits in the accompanying financial statements. Also, the Funds recognized no interest or penalties related to unrecognized tax benefits during the same period. The Funds recognize interest and penalties, if any, related to unrecognized tax benefits as income tax expense in the Statements of Operations. Generally, each of the tax years in the four-year period ended November 30, 2012 remains subject to examination by taxing authorities. The Funds are also not aware of any tax positions for which it is reasonably possible that the total amounts of unrecognized tax benefits will significantly change in the next twelve months.
SUBSEQUENT EVENTS - The Funds have evaluated subsequent events through the issuance of the Funds’ financial statements and have determined that such subsequent events do not have an impact on the Funds’ financial statements.
NOTE 3 - INVESTMENT ADVISORY AND ADMINISTRATIVE AND ACCOUNTING SERVICES AGREEMENTS AND OTHER TRANSACTIONS WITH AFFILIATES
The Investment Advisory Agreement pursuant to which Thompson Investment Management, Inc. (“TIM” or “Advisor”) is retained by the Funds provides for compensation to TIM (computed daily and paid monthly) at the following annual rates: for the LargeCap Fund and MidCap Fund - 1.00% of the first $50 million of average daily net assets and 0.90% of average daily net assets in excess of $50 million; and for the Bond Fund - 0.65% of the first $50 million of average daily net assets and 0.60% of average daily net assets in excess of $50 million.
The Advisor is contractually bound to waive management fees and/or reimburse expenses incurred by the LargeCap Fund from March 31, 2013 through March 31, 2014 and the MidCap Fund from December 1, 2012 through March 31, 2014, so that the annual operating expenses of the Funds do not exceed the following percentages of their respective average daily net assets: LargeCap Fund-1.20% and MidCap Fund-1.30%. The Advisor reimbursed expenses incurred by the LargeCap Fund in the amount of $3,568 for the period from March 31, 2013 through May 31, 2013, and the MidCap Fund in the amount of $51,550 for the period from December 1, 2012 through May 31, 2013. The Funds are not obligated to reimburse the Advisor for any fees or expenses waived in previous fiscal years.
37
| NOTES TO FINANCIAL STATEMENTS (Unaudited) (Continued) |
| May 31, 2013 |
Pursuant to an Administrative and Accounting Services Agreement, TIM maintains the Funds’ financial records in accordance with the 1940 Act, prepares all necessary financial statements of the Funds and calculates the net asset value per share of the Funds on a daily basis. As compensation for its services, each Fund pays TIM a fee computed daily and payable monthly at the annual rate of 0.15% of average daily net assets up to $30 million, 0.10% of the next $70 million of average daily net assets and 0.025% of average daily net assets in excess of $100 million, with an annual minimum fee of $30,000 per Fund. The calculations of daily net asset value are subcontracted to U.S. Bancorp Fund Services, resulting in fees paid by TIM for the six-month period ended May 31, 2013 in the amounts of $16,784, $16,431 and $99,633 for the LargeCap Fund, MidCap Fund and Bond Fund, respectively.
The Funds reimburse the Advisor for a portion of amounts paid by the Advisor out of the Advisor’s own resources under various shareholder, account maintenance, networking and other services provided to the Funds by broker-dealers and other intermediaries. The amount reimbursed by the Funds is equal to (1) for those accounts maintained through a shareholder servicing arrangement, an annual rate of no more than 0.10% of the average daily net assets of the omnibus accounts in the Funds for which all broker-dealers and other intermediaries, in the aggregate, are responsible, and (2) for those accounts maintained through a networking arrangement, no more than $6 per year per account in the Funds for which the broker-dealers and other intermediaries are responsible; provided however, in all cases only one of these fees shall be applicable to the assets in an account. This amount has been determined by the Funds’ Board to approximate the transfer agency fees that would otherwise have been payable by the Funds if such broker-dealers and intermediaries did not maintain these accounts. For the six-month period ended May 31, 2013, the amounts reimbursed by the Funds to the Advisor were $13,090, $2,164 and $292,064 for the LargeCap Fund, MidCap Fund and Bond Fund, respectively.
NOTE 4 - FUND SHARE TRANSACTIONS (in thousands)
Transactions in shares of the Funds were as follows:
| | Six-Month Period Ended | | Year Ended |
| | May 31, 2013 (Unaudited) | | November 30, 2012 |
| | Shares | | Dollars | | Shares | | Dollars |
| LargeCap Fund | | | | | | | | | | | | | | | | | | | |
| Shares sold | | | 85 | | | | | $ | 3,236 | | | | | 447 | | | | | $ | 14,978 | | |
| Shares issued in reinvestment of dividends | | | 14 | | | | | | 516 | | | | | 12 | | | | | | 343 | | |
| Shares issued in reinvestment of realized gains | | | – | | | | | | – | | | | | – | | | | | | – | | |
| Shares redeemed | | | (333 | ) | | | | | (12,358 | ) | | | | (1,014 | ) | | | | | (32,704 | ) | |
| Net decrease | | | (234 | ) | | | | $ | (8,606 | ) | | | | (555 | ) | | | | $ | (17,383 | ) | |
| | |
| MidCap Fund | | | | | | | | | | | | | | | | | | | | | | |
| Shares sold | | | 234 | | | | | $ | 2,666 | | | | | 549 | | | | | $ | 6,096 | | |
| Shares issued in reinvestment of dividends | | | – | | | | | | – | | | | | – | | | | | | – | | |
| Shares issued in reinvestment of realized gains | | | 195 | | | | | | 2,058 | | | | | 205 | | | | | | 1,953 | | |
| Shares redeemed | | | (94 | ) | | | | | (1,077 | ) | | | | (157 | ) | | | | | (1,659 | ) | |
| Net increase | | | 335 | | | | | $ | 3,647 | | | | | 597 | | | | | $ | 6,390 | | |
| | |
| Bond Fund | | | | | | | | | | | | | | | | | | | | | | |
| Shares sold | | | 70,752 | | | | | $ | 847,772 | | | | | 69,563 | | | | | $ | 810,480 | | |
| Shares issued in reinvestment of dividends | | | 1,918 | | | | | | 22,805 | | | | | 2,562 | | | | | | 29,525 | | |
| Shares issued in reinvestment of realized gains | | | 188 | | | | | | 2,229 | | | | | 136 | | | | | | 1,521 | | |
| Shares redeemed | | | (21,340 | ) | | | | | (255,747 | ) | | | | (21,964 | ) | | | | | (254,744 | ) | |
| Net increase | | | 51,518 | | | | | $ | 617,059 | | | | | 50,297 | | | | | $ | 586,782 | | |
38
| NOTES TO FINANCIAL STATEMENTS (Unaudited) (Continued) |
| May 31, 2013 |
NOTE 5 - PURCHASE AND SALE OF SECURITIES
Investment transactions for the six-month period ended May 31, 2013 were as follows:
| | Securities other than U.S. | | | | | | | |
| | Government and Short-term | | | | | | | |
| | Investments | | U.S. Government Securities |
| | Purchases | | Sales | | Purchases | | Sales |
| LargeCap Fund | | $ | 10,873,155 | | $ | 19,715,708 | | | $ | – | | | $– |
| MidCap Fund | | $ | 6,631,152 | | $ | 5,044,673 | | | $ | – | | | $– |
| Bond Fund | | $ | 877,088,718 | | $ | 42,398,682 | | | $ | 70,228 | | | $– |
NOTE 6 - INCOME TAX INFORMATION
At May 31, 2013, the investment cost and aggregate unrealized appreciation and depreciation on investments for federal income tax purposes were as follows:
| | | | | | | | | | | | | | | | Net unrealized |
| | | | | | Unrealized | | Unrealized | | appreciation |
| | Federal tax cost | | appreciation | | depreciation | | (depreciation) |
| LargeCap Fund | | $ | 92,356,959 | | | $ | 22,349,117 | | | | $ | (4,267,597 | ) | | | $ | 18,081,520 | |
| MidCap Fund | | $ | 25,300,717 | | | $ | 6,464,683 | | | | $ | (810,035 | ) | | | $ | 5,654,648 | |
| Bond Fund | | $ | 1,835,513,863 | | | $ | 56,065,361 | | | | $ | (12,286,267 | ) | | | $ | 43,779,094 | |
The tax basis of investments for tax and financial reporting purposes differ principally due to wash sales and straddles.
The tax components of distributions paid during the six-month period ended May 31, 2013 (unaudited) are:
| | Ordinary | | Long-term |
| | income | | capital gains |
| | distributions | | distributions |
| LargeCap Fund | | $ | 538,254 | | | $ | – | |
| MidCap Fund | | $ | – | | | $ | 2,062,420 | |
| Bond Fund | | $ | 24,417,662 | | | $ | 2,353,544 | |
The tax components of distributions paid during the fiscal year ended November 30, 2012, capital loss carryforward as of November 30, 2012 and tax basis post-October losses and late-year ordinary losses as of November 30, 2012, which are not being recognized for tax purposes until the first day of the following fiscal year are:
| | Ordinary | | Long-term | | Net capital | | | | | | | | |
| | income | | capital gains | | loss | | Post-October | | Late-year |
| | distributions | | distributions | | carryforward* | | losses | | ordinary losses |
| LargeCap Fund | | $ | 358,796 | | | $ | – | | | $ | 82,544,592 | | | $ | – | | | $ | – | |
| MidCap Fund | | $ | 165,439 | | | $ | 1,791,599 | | | $ | – | | | $ | 3,138 | | | $ | 5,943 | |
| Bond Fund | | $ | 31,793,469 | | | $ | 1,478,148 | | | $ | – | | | $ | 57,021 | | | $ | – | |
| * | The LargeCap Fund has capital losses in the amount of $34,789,309 and $47,755,283 which expire on November 30, 2016 and November 30, 2017, respectively. |
39
The following table presents information relating to a share of capital stock outstanding for the entire period.
| | Six-Month | | | | | | | | | | | | | | | |
| | Period Ended | | | | | | | | | | | | | | | |
| | May 31, 2013 | | Year Ended November 30, |
| | (Unaudited) | | 2012 | | 2011 | | 2010 | | 2009 | | 2008 |
| LARGECAP FUND | | | | | | | | | | | | | | | | | | | |
| | | | | | | | | | | | | | | | | | | | |
| Net Asset Value, Beginning of Period | | | $34.27 | | | $30.07 | | | $29.20 | | | $27.04 | | | $19.75 | | | $45.86 | |
| Income from Investment Operations | | | | | | | | | | | | | | | | | | | | |
| Net investment income | | | 0.10 | | | 0.18 | | | 0.08 | | | 0.01 | | | 0.07 | | | 0.29 | |
| Net realized and unrealized gains (losses) | | | | | | | | | | | | | | | | | | | |
| on investments and options | | | 7.16 | | | 4.13 | | | 0.80 | | | 2.20 | | | 7.51 | | | (19.59 | ) |
| Total from Investment Operations | | | 7.26 | | | 4.31 | | | 0.88 | | | 2.21 | | | 7.58 | | | (19.30 | ) |
| Less Distributions | | | | | | | | | | | | | | | | | | | | | | |
| Distributions from net investment income | | | (0.19 | ) | | (0.11 | ) | | (0.01 | ) | | (0.05 | ) | | (0.29 | ) | | (0.41 | ) |
| Distributions from net realized gains | | | – | | | – | | | – | | | – | | | – | | | (6.40 | ) |
| Total Distributions | | | (0.19 | ) | | (0.11 | ) | | (0.01 | ) | | (0.05 | ) | | (0.29 | ) | | (6.81 | ) |
| | |
| Net Asset Value, End of Period | | | $41.34 | | | $34.27 | | | $30.07 | | | $29.20 | | | $27.04 | | | $19.75 | |
| | |
| Total Return | | | 21.28% | (a) | | 14.37% | | | 3.02% | | | 8.17% | | | 38.88% | | | (49.29% | ) |
| | |
| Ratios/Supplemental Data | | | | | | | | | | | | | | | | | | | | | |
| Net assets, end of period (millions) | | | $110.5 | | | $99.6 | | | $104.1 | | | $125.8 | | | $144.1 | | | $133.9 | |
| Ratios to average net assets: | | | | | | | | | | | | | | | | | | | |
| Ratio of expenses | | | 1.23% | (b) | | 1.31% | | | 1.31% | | | 1.36% | | | 1.54% | | | 1.27% | |
| Ratio of expenses without reimbursement | | | 1.24% | (b) | | 1.31% | | | 1.31% | | | 1.36% | | | 1.54% | | | 1.27% | |
| Ratio of net investment income | | | 0.51% | (b) | | 0.47% | | | 0.24% | | | 0.05% | | | 0.32% | | | 0.56% | |
| Ratio of net investment income | | | | | | | | | | | | | | | | | | | |
| without reimbursement | | | 0.51% | (b) | | 0.47% | | | 0.24% | | | 0.05% | | | 0.32% | | | 0.56% | |
| Portfolio turnover rate | | | 10% | (a) | | 30% | | | 40% | | | 37% | | | 63% | | | 43% | |
| (a) | Calculated on a non-annualized basis. |
| (b) | Calculated on an annualized basis. |
See Notes to Financial Statements.
40
| FINANCIAL HIGHLIGHTS (Continued) |
| |
The following table presents information relating to a share of capital stock outstanding for the entire period.
| | | | | | | | | | | | | | | | | | | March 31, 2008 |
| | Six-Month | | | | | | | | | | | | | | (inception) |
| | Period Ended | | Year Ended November 30, | | through |
| | May 31, 2013 | | | | | | | | | | | | | | November 30, |
| | (Unaudited) | | 2012 | | 2011 | | 2010 | | 2009 | | 2008 |
| MIDCAP FUND | | | | | | | | | | | | | | | | | | | | | | |
| | |
| Net Asset Value, Beginning of Period | | | $11.28 | | | | $11.15 | | | $11.36 | | | $9.39 | | | $6.18 | | | | $10.00 | | |
| Income from Investment Operations | | | | | | | | | | | | | | | | | | | | | | |
| Net investment income | | | – | | | | – | | | – | | | – | | | 0.01 | | | | 0.04 | | |
| Net realized and unrealized gains (losses) | | | | | | | | | | | | | | | | | | | | | | |
| on investments | | | 2.00 | | | | 1.38 | | | 0.44 | | | 2.02 | | | 3.25 | | | | (3.86 | ) | |
| Total from Investment Operations | | | 2.00 | | | | 1.38 | | | 0.44 | | | 2.02 | | | 3.26 | | | | (3.82 | ) | |
| Less Distributions | | | | | | | | | | | | | | | | | | | | | | |
| Distributions from net investment income | | | – | | | | – | | | – | | | – | (c) | | (0.05 | ) | | | – | | |
| Distributions from net realized gains | | | (0.95 | ) | | | (1.25 | ) | | (0.65 | ) | | (0.05 | ) | | – | | | | – | | |
| Total Distributions | | | (0.95 | ) | | | (1.25 | ) | | (0.65 | ) | | (0.05 | ) | | (0.05 | ) | | | – | | |
| | |
| Net Asset Value, End of Period | | | $12.33 | | | | $11.28 | | | $11.15 | | | $11.36 | | | $9.39 | | | | $6.18 | | |
| | |
| Total Return | | | 19.13% | (a) | | | 14.41 | % | | 3.69% | | | 21.71% | | | 53.04% | | | | (38.20% | )(a) | |
| | |
| Ratios/Supplemental Data | | | | | | | | | | | | | | | | | | | | | | |
| Net assets, end of period (millions) | | | $31.0 | | | | $24.6 | | | $17.6 | | | $15.7 | | | $9.6 | | | | $2.3 | | |
| Ratios to average net assets: | | | | | | | | | | | | | | | | | | | | | | |
| Ratio of expenses | | | 1.30% | (b) | | | 1.30% | | | 1.30% | | | 1.30% | | | 1.30% | | | | 1.30% | (b) | |
| Ratio of expenses without reimbursement | | | 1.67% | (b) | | | 1.83% | | | 1.96% | | | 2.34% | | | 4.21% | | | | 8.40% | (b) | |
| Ratio of net investment income (loss) | | | (0.01% | )(b) | | | (0.03% | ) | | (0.19% | ) | | (0.09% | ) | | 0.12% | | | | 0.79% | (b) | |
| Ratio of net investment loss | | | | | | | | | | | | | | | | | | | | | | |
| without reimbursement | | | (0.38% | )(b) | | | (0.56% | ) | | (0.85% | ) | | (1.14% | ) | | (2.79% | ) | | | (6.30% | )(b) | |
| Portfolio turnover rate | | | 18% | (a) | | | 44% | | | 47% | | | 39% | | | 61% | | | | 50% | (a) | |
| (a) | Calculated on a non-annualized basis. |
| (b) | Calculated on an annualized basis. |
| (c) | Less than .005 per share. |
See Notes to Financial Statements.
41
| FINANCIAL HIGHLIGHTS (Continued) |
| |
The following table presents information relating to a share of capital stock outstanding for the entire period.
| | Six-Month | | | | | | | | | | | | | | | |
| | Period Ended | | Year Ended November 30, |
| | May 31, 2013 | | | | | | | | | | | | | | | |
| | (Unaudited) | | 2012 | | 2011 | | 2010 | | 2009 | | 2008 |
| BOND FUND | | | | | | | | | | | | | | | | | | | |
| | |
| Net Asset Value, Beginning of Period | | | $11.95 | | | $11.33 | | | $11.54 | | | $11.16 | | | $9.24 | | | $10.34 | |
| Income from Investment Operations | | | | | | | | | | | | | | | | | | | |
| Net investment income | | | 0.19 | | | 0.41 | | | 0.42 | | | 0.34 | | | 0.63 | | | 0.62 | |
| Net realized and unrealized gains (losses) | | | | | | | | | | | | | | | | | | | |
| on investments | | | 0.07 | (a) | | 0.67 | (a) | | (0.17 | )(a) | | 0.46 | (a) | | 2.01 | | | (1.17 | ) |
| Total from Investment Operations | | | 0.26 | | | 1.08 | | | 0.25 | | | 0.80 | | | 2.64 | | | (0.55 | ) |
| Less Distributions | | | | | | | | | | | | | | | | | | | |
| Distributions from net investment income | | | (0.20 | ) | | (0.43 | ) | | (0.40 | ) | | (0.34 | ) | | (0.72 | ) | | (0.55 | ) |
| Distributions from net realized gains | | | (0.02 | ) | | (0.03 | ) | | (0.06 | ) | | (0.08 | ) | | – | | | – | |
| Total Distributions | | | (0.22 | ) | | (0.46 | ) | | (0.46 | ) | | (0.42 | ) | | (0.72 | ) | | (0.55 | ) |
| | |
| Net Asset Value, End of Period | | | $11.99 | | | $11.95 | | | $11.33 | | | $11.54 | | | $11.16 | | | $9.24 | |
| | |
| Total Return | | | 2.18% | (b) | | 9.70% | | | 2.16% | | | 7.33% | | | 30.05% | | | (5.63% | ) |
| | |
| Ratios/Supplemental Data | | | | | | | | | | | | | | | | | | | |
| Net assets, end of period (millions) | | | $1,914.7 | | | $1,292.3 | | | $656.0 | | | $437.5 | | | $134.2 | | | $44.0 | |
| Ratios to average net assets: | | | | | | | | | | | | | | | | | | | |
| Ratio of expenses | | | 0.75% | (c) | | 0.78% | | | 0.80% | | | 0.80% | | | 0.75% | | | 0.59% | |
| Ratio of expenses without reimbursement | | | 0.75% | (c) | | 0.78% | | | 0.84% | | | 0.87% | | | 1.20% | | | 1.18% | |
| Ratio of net investment income | | | 3.46% | (c) | | 3.90% | | | 3.89% | | | 3.52% | | | 6.40% | | | 6.38% | |
| Ratio of net investment income | | | | | | | | | | | | | | | | | | | |
| without reimbursement | | | 3.46% | (c) | | 3.90% | | | 3.86% | | | 3.44% | | | 5.95% | | | 5.78% | |
| Portfolio turnover rate | | | 18% | (b) | | 16% | | | 14% | | | 10% | | | 85% | | | 110% | |
| (a) | Realized and unrealized gains and losses per share are balancing amounts necessary to reconcile the change in net asset value per share in the period. It does not agree to the aggregate gains and losses in the Statement of Operations due to the fluctuation in share transactions. |
| (b) | Calculated on a non-annualized basis. |
| (c) | Calculated on an annualized basis. |
See Notes to Financial Statements.
42
| ADDITIONAL INFORMATION (Unaudited) |
| |
THOMPSON IM FUNDS
| DIRECTORS | INVESTMENT ADVISOR |
| John W. Feldt - Chairman | Thompson Investment Management, Inc. |
| George E. Austin | 918 Deming Way |
| Patricia Lipton | Madison, Wisconsin 53717 |
| Jason L. Stephens | |
| John W. Thompson | DISTRIBUTOR |
| Quasar Distributors, LLC |
| OFFICERS | 615 East Michigan Street |
| John W. Thompson, CFA | Milwaukee, Wisconsin 53202 |
| President and Chief Executive Officer | |
| Jason L. Stephens, CFA | TRANSFER AGENT |
| Vice President | U.S. Bancorp Fund Services, LLC |
| James T. Evans, CFA | 615 East Michigan Street |
| Vice President | Milwaukee, Wisconsin 53202 |
| Penny M. Hubbard | |
| Chief Financial Officer and Treasurer | INDEPENDENT REGISTERED |
| Nedra S. Pierce | PUBLIC ACCOUNTING FIRM |
| Chief Compliance Officer | Cohen Fund Audit Services, Ltd. |
| Lesley T. Bailey | 1350 Euclid Avenue, Suite 800 |
| Secretary | Cleveland, OH 44115 |
| Sarah M. Baumgartner | |
| Assistant Secretary | LEGAL COUNSEL |
| Quarles & Brady LLP |
| 411 East Wisconsin Avenue |
| Milwaukee, Wisconsin 53202 |
The Statement of Additional Information contains additional information about the directors and officers of Thompson IM Funds, Inc. and is available without charge, upon request, by calling 1-800-999-0887.
Proxy Voting Policy
A description of the policies and procedures that the Funds use to determine how to vote proxies relating to portfolio securities and information regarding how the Funds actually voted proxies during the most recent 12-month period ended June 30 are available without charge, upon request, by calling 1-800-999-0887, through the Funds’ website at www.thompsonim.com and on the SEC’s website at www.sec.gov.
Information About Portfolio Securities
The Funds file complete schedules of their portfolio holdings with the Securities and Exchange Commission for the Funds’ first and third quarters of its fiscal year on Form N-Q. The Funds’ Forms N-Q are available on the Securities and Exchange Commission’s website at www.sec.gov. You may also review and copy those documents by visiting the Securities and Exchange Commission’s Public Reference Room in Washington, D.C. Information on the operation of the Public Reference Room may be obtained by calling the Securities and Exchange Commission at 1-800-SEC-0330. The Funds’ Forms N-Q are also available without charge, upon request, by calling 1-800-999-0887.
43
Item 2. Code of Ethics.
Not required in Semi-Annual Reports on Form N-CSR.
Item 3. Audit Committee Financial Expert.
Not required in Semi-Annual Reports on Form N-CSR.
Item 4. Principal Accountant Fees and Services.
Not required in Semi-Annual Reports on Form N-CSR.
Item 5. Audit Committee of Listed Registrants.
Not applicable to this Registrant because it is not a “listed issuer” within the meaning of Rule 10A-3 under the Securities Exchange Act of 1934.
Item 6. Schedule of Investments.
The required Schedules of Investments in securities of unaffiliated issuers is included as part of the Registrant’s Semi-Annual Report to shareholders dated as of May 31, 2013 provided under Item 1 of this Form N-CSR.
Item 7. Disclosure of Proxy Voting Policies and Procedures for Closed-End Management Investment Companies
Not applicable to this Registrant because it is not a closed-end management investment company.
Item 8. Portfolio Managers of Closed-End Management Investment Companies.
Not applicable to this Registrant because it is not a closed-end management investment company.
Item 9. Purchases of Equity Securities by Closed-End Management Investment Companies and Affiliated Purchasers.
Not applicable to this Registrant because it is not a closed-end management investment company.
Item 10. Submission of Matters to a Vote of Securities Holders.
The Registrant has not made any material changes to the procedures by which shareholders may recommend nominees to the Registrant's Board of Directors after the Registrant last provided disclosure in response to the requirements of Item 407(c)(2)(iv) of Regulation S-K or this Item.
2
Item 11. Controls and Procedures.
| | (a) | | Disclosure Controls and Procedures. Based on an evaluation of the Registrant’s disclosure controls and procedures (as defined in Rule 30a-3(c) under the Investment Company Act of 1940) carried out under the supervision and with the participation of the Registrant’s management, including its principal executive and financial officers, within 90 days prior to the filing date of this report on Form N-CSR, the Registrant’s principal executive and financial officers have concluded that the design and operation of the Registrant’s disclosure controls and procedures are effective in providing reasonable assurance that the information required to be disclosed on Form N-CSR is recorded, processed, summarized and reported within the applicable time periods. |
| |
| (b) | | Change in Internal Controls Over Financial Reporting. There were no changes in the Registrant’s internal control over financial reporting (as defined in Rule 30a-3(d) under the Investment Company Act of 1940) that occurred during the Registrant’s second fiscal quarter of the period covered by this Form N-CSR that have materially affected, or are reasonably likely to materially affect, the Registrant’s internal control over financial reporting. |
Item 12. Exhibits
The following exhibits are attached to this Form N-CSR:
| | Exhibit No. | | Description of Exhibit | |
| 12(a)(1) | | The Code of Ethics for the Registrant’s Principal Executive Officer, Principal Financial Officer and Principal Accounting Officer referred to in Item 2 was filed as Exhibit 12(a)(1) to the Registrant’s Certified Shareholder Report on Form N-CSR filed on January 28, 2005, and is incorporated herein by reference |
| | | |
| 12(a)(2)-1 | | Certification of Principal Executive Officer Required by Section 302 of the Sarbanes-Oxley Act of 2002 |
| | | |
| 12(a)(2)-2 | | Certification of Principal Financial Officer Required by Section 302 of the Sarbanes-Oxley Act of 2002 |
| | | |
| 12(b) | | Certification of Chief Executive Officer and Chief Financial Officer Required by Section 906 of the Sarbanes-Oxley Act of 2002 |
3
SIGNATURES
Pursuant to the requirements of the Securities Exchange Act of 1934 and the Investment Company Act of 1940, the Registrant has duly caused this report to be signed on its behalf by the undersigned, thereunto duly authorized, on this 24th day of July, 2013.
THOMPSON IM FUNDS, INC. |
| | |
| By: | | /s/ John W. Thompson |
| | John W. Thompson, Chief Executive |
| | Officer and President |
Pursuant to the requirements of the Securities Exchange Act of 1934 and the Investment Company Act of 1940, this report has been signed below by the following persons on behalf of the Registrant and in the capacities indicated on this 24th day of July, 2013.
| By: | | /s/ John W. Thompson |
| | John W. Thompson, Chief Executive |
| | Officer and President (Principal |
| | Executive Officer) |
| |
| By: | | /s/ Penny Hubbard |
| | Penny Hubbard, Chief Financial |
| | Officer (Principal Financial Officer) |
4