UNITED STATES
SECURITIES AND EXCHANGE COMMISSION
Washington, D.C. 20549
FORM N-CSR
CERTIFIED SHAREHOLDER REPORT OF REGISTERED
MANAGEMENT
INVESTMENT COMPANIES
Investment Company Act File Number 811-4946
THOMPSON IM FUNDS, INC.
(Exact name of registrant as specified in charter)
918 Deming Way
Madison, Wisconsin 53717
(Address of principal executive offices)--(Zip code)
Jason L. Stephens
Chief Executive Officer
Thompson IM Funds, Inc.
918 Deming Way
Madison, Wisconsin 53717
(Name and address of agent for service)
With a copy to:
Fredrick G. Lautz, Esq.
Quarles & Brady LLP
411 East Wisconsin Avenue
Milwaukee, Wisconsin 53202
Registrant's telephone number, including area code: (608) 827-5700
Date of fiscal year end: November 30, 2015
Date of reporting period: May 31, 2015
Form N-CSR is to be used by management investment companies to file reports with the Commission not later than 10 days after the transmission to stockholders of any report that is required to be transmitted to stockholders under Rule 30e-1 under the Investment Company Act of 1940 (17 CFR 270.30e-1). The Commission may use the information provided on Form N-CSR in its regulatory, disclosure review, inspection and policymaking roles.
A registrant is required to disclose the information specified by Form N-CSR, and the Commission will make this information public. A registrant is not required to respond to the collection of information contained in Form N-CSR unless the Form displays a currently valid Office of Management and Budget ("OMB") control number. Please direct comments concerning the accuracy of the information collection burden estimate and any suggestions for reducing the burden to Secretary, Securities and Exchange Commission, 450 Fifth Street, N.W., Washington, DC 20549-0609. The OMB has reviewed this collection of information under the clearance requirements of 44 U.S.C. § 3507.
Item 1. Report to Stockholders.
THOMPSON IM FUNDS, INC.
SEMI-ANNUAL REPORT TO SHAREHOLDERS
NOTE ON FORWARD-LOOKING STATEMENTS
The matters discussed in this report may constitute forward-looking statements. These include any Advisor or portfolio manager predictions, assessments, analyses or outlooks for individual securities, industries, investment styles, market sectors, interest rates, economic trends and/or markets. These statements involve risks and uncertainties. In addition to the general risks described for each Fund in its current Prospectus, other factors bearing on these reports include the accuracy of the Advisor’s or portfolio manager’s forecasts and predictions, the appropriateness of the investment strategies designed by the Advisor or portfolio manager and the ability of the Advisor or portfolio manager to implement its strategies efficiently and successfully. Any one or more of these factors, as well as other risks affecting the securities markets generally, could cause the actual results of any Fund to differ materially as compared to its benchmarks.
1
THOMPSON IM FUNDS, INC.
SEMI-ANNUAL REPORT TO SHAREHOLDERS
May 31, 2015
CONTENTS
| | Page(s) |
| LARGECAP FUND | |
| Investment review | 3-5 |
| Schedule of investments | 6-8 |
| |
| MIDCAP FUND | |
| Investment review | 9-11 |
| Schedule of investments | 12-14 |
| |
| BOND FUND | |
| Investment review | 15-17 |
| Schedule of investments | 18-27 |
| |
| FUND EXPENSE EXAMPLES | 28 |
| |
| FINANCIAL STATEMENTS | |
| Statements of assets and liabilities | 29 |
| Statements of operations | 30 |
| Statements of changes in net assets | 31 |
| Notes to financial statements | 32-38 |
| Financial highlights | 39-41 |
| |
| ADDITIONAL INFORMATION | 42 |
This report contains information for existing shareholders of Thompson IM Funds, Inc. It
does not constitute an offer to sell. This Semi-Annual Report is authorized for distribution to prospective investors
only when preceded or accompanied by a Fund Prospectus, which contains information about
the Funds’ objectives and policies, risks, management, expenses and other information.
A Prospectus can be obtained by calling 1-800-999-0887.
Please read your Prospectus carefully.
2
| LARGECAP FUND INVESTMENT REVIEW (Unaudited) |
| May 31, 2015 |
Portfolio Managers
James T. Evans, CFA
Jason L. Stephens, CFA
John W. Thompson, CFA
Performance
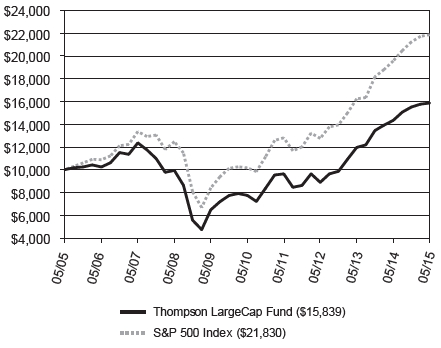
The LargeCap Fund produced a total return of 2.26% for the six-month period ended May 31, 2015, as compared to its benchmark, the S&P 500 Index, which returned 2.97%.
Comparison of Change in Value of a Hypothetical $10,000 Investment
| Average Annual Total Returns |
| Through 05/31/15 |
| | 1 Year | | 3 Year | | 5 Year | | 10 Year | |
| Thompson LargeCap Fund | | 10.65% | | 21.26% | | 15.40% | | 4.71% | |
| S&P 500 Index | | 11.81% | | 19.67% | | 16.54% | | 8.12% | |
Gross Expense Ratio as of 03/31/15 was 1.23%.
Net Expense Ratio after reimbursement as of 03/31/15 was 1.15%.*
| * | The Advisor has contractually agreed to waive management fees and/or reimburse expenses incurred by the LargeCap Fund through March 31, 2016, so that the annual operating expenses of the Fund do not exceed 1.15% of its average daily net assets. |
Performance data quoted represents past performance; past performance does not guarantee future results. The investment return and principal value of an investment will fluctuate so that an investor’s shares, when redeemed, may be worth more or less than their original cost. Current performance of the Fund may be lower or higher than the performance quoted. Performance data current to the most recent month-end may be obtained by calling 1-800-999-0887 or visiting www.thompsonim.com.
Results include the reinvestment of all dividends and capital gains distributions. Investment performance reflects all fee waivers that may be in effect. In the absence of such waivers, total return would be reduced. The performance information reflected in the graph and the table above does not reflect the deduction of taxes that a shareholder would pay on fund distributions or the redemption of fund shares, nor does it imply future performance. The S&P 500 Index is an unmanaged index commonly used to measure the performance of U.S. stocks. You cannot directly invest in an index.
The S&P 500 Index is a product of S&P Dow Jones Indices LLC and has been licensed for use by Thompson Investment Management, Inc. S&P® and S&P 500® are registered trademarks of Standard & Poor’s Financial Services LLC (“S&P”). The Thompson IM Funds are not sponsored, endorsed, sold or promoted by S&P Dow Jones Indices LLC, Dow Jones, S&P or their respective affiliates, and none of S&P Dow Jones Indices LLC, Dow Jones, S&P nor their respective affiliates makes any representation regarding the advisability of investing in such products.
See Notes to Financial Statements.
3
| LARGECAP FUND INVESTMENT REVIEW (Unaudited) (Continued) |
| May 31, 2015 |
Management Commentary
The LargeCap Fund got off to a slow start for the semi-annual period based primarily on weakness within the Health Care and Consumer Discretionary sectors. Performance in both sectors was hurt by a series of poor performers among Fund holdings. The impact of this relative to the Fund’s benchmark was exacerbated by strong performance among stocks the Fund did not own, especially within select industries such as Pharmaceuticals, Health Care Providers and Internet Retailers. In many cases we feel these winners trade at either very high valuation multiples or have lackluster earnings growth, and thus were avoided by the Fund. Although in the short run the performance of stocks can be disconnected from these two factors, as was the case in the semi-annual period, we believe that over longer periods of time earnings growth and valuation are key determinants of performance. We thus remain content with our decision to underweight these holdings.
As we see it, the market appears trapped between the recovering economy and the prospect of higher interest rates. This means some investors are buying stocks based on expectations of higher profits due to economic growth, while others are selling stocks because they anticipate the main alternative, bonds, will be more attractive when rates rise. In addition, higher interest rates mean the discount rate of the market is higher, which all else equal lowers equity prices. On any given day or week one of these two sides appears to have the upper hand, only for the tide to turn again. The resulting choppy market action is a natural phase that occurs as we approach the beginning of a presumptive Federal Reserve rate-hiking cycle. Fortunately, historically this has been a temporary market condition. Once the Fed actually raises rates, equity markets in the past have typically performed well over the subsequent year or two as long as the Fed is only moving from “easy” to “neutral” monetary policy, as we expect will happen. Based on our internal analysis of data compiled by Strategas Research Partners, it’s only later in the cycle, when the Fed is raising rates from “neutral” to “tight” to deliberately slow the economy, when equity markets have typically faltered.
If our assessment of the market is correct, we believe investors will increasingly seek out companies that can grow their earnings without the help of an accommodative Federal Reserve. These are companies that are growing due to their own individual products, opportunities and competitive strengths as opposed to merely trending with the economy. That isn’t to say these companies wouldn’t benefit from a strong economy. Because these companies are on average pro-cyclical in nature, the opposite is actually true. Rather, these are names that can grow even without the help of a broader rising earnings tide lifting the entire market. Overall consensus earnings growth for the S&P 500 is expected to be in the low single digits in 20151. We believe that the Fund, with an expected earnings growth rate of nearly 10%, offers shareholders a collection of strong potential growers. If these growth estimates for the Fund’s holdings relative to the market prove to be correct, they hopefully could translate into stronger-than-market stock price appreciation for shareholders despite the Fund’s holdings having similar valuation levels as the rest of their benchmark.
Opinions expressed are subject to change, are not guaranteed and should not be considered investment advice.
Mutual fund investing involves risk. Principal loss is possible. Investments in smaller companies involve additional risks such as limited liquidity and greater volatility. Investments in American Depositary Receipts (“ADRs”) are subject to some extent to the risks associated with directly investing in securities of foreign issuers, including the risk of changes in currency exchange rates, expropriation or nationalization of assets, and the impact of political, diplomatic, or social events. Investments in real estate securities may involve greater risk and volatility including greater exposure to economic downturns and changes in real estate values, rents, property taxes, tax, and other laws. A REIT’s share price may decline because of adverse developments affecting the real estate industry.
Please refer to the Schedule of Investments on page 6 of this report for holdings information. The management commentary above as well as Fund holdings and asset/sector allocations should not be considered a recommendation to buy or sell any security. In addition, please note that Fund holdings and asset/sector allocations are subject to change.
Discount Rate is the interest rate charged to commercial banks and other depository institutions for loans received from the Federal Reserve Bank’s discount window.
Earnings Growth is a measure of growth in a company’s net income over a specific period, often one year. It is not a prediction of the Fund’s future returns.
____________________
1 Source: Factset Consensus Estimates.
See Notes to Financial Statements.
4
| LARGECAP FUND INVESTMENT REVIEW (Unaudited) (Continued) |
| May 31, 2015 |
Sector Weightings at 05/31/15
% of Total Investments

| Top 10 Equity Holdings at 05/31/15 |
| Company | Industry | % of Fund’s
Net Assets |
| Exxon Mobil Corp. | Oil, Gas & Consumable Fuels | 3.09% |
| Microsoft Corp. | Software | 3.09% |
| Bank of America Corp. | Banks | 2.34% |
| Google Inc. Class A | Internet Software & Services | 2.22% |
| Citigroup Inc. | Banks | 2.12% |
| Chevron Corp. | Oil, Gas & Consumable Fuels | 2.10% |
| General Electric Co. | Industrial Conglomerates | 2.09% |
| Cisco Systems, Inc. | Communications Equipment | 2.09% |
| JPMorgan Chase & Co. | Banks | 2.05% |
| Express Scripts Holding Co. | Health Care Providers & Services | 2.03% |
As of May 31, 2015, 99.8% of the Fund’s net assets were in equity and short-term investments.
See Notes to Financial Statements.
5
| LARGECAP FUND SCHEDULE OF INVESTMENTS (Unaudited) |
| May 31, 2015 |
| | | | | Shares | | Value |
| COMMON STOCKS - 99.8% | | | | | |
| | | | | | |
| Consumer Discretionary - 14.0% | | | | | |
| | Auto Components - 1.6% | | | | | |
| | | Johnson Controls, Inc. | | 39,500 | | $ | 2,054,790 |
| | |
| | Automobiles - 0.9% | | | | | |
| | Harley-Davidson, Inc. | | 22,300 | | | 1,192,827 |
| | |
| | Distributors - 0.8% | | | | | |
| | LKQ Corp. (a) | | 37,275 | | | 1,064,947 |
| | |
| | Household Durables - 1.7% | | | | | |
| | D.R. Horton, Inc. | | 29,025 | | | 758,133 |
| | Jarden Corp. (a) | | 24,990 | | | 1,325,969 |
| | | | | | | 2,084,102 |
| | Leisure Products - 0.6% | | | | | |
| | Brunswick Corp. | | 13,850 | | | 706,904 |
| | |
| | Media - 3.3% | | | | | |
| | The Walt Disney Co. | | 8,575 | | | 946,423 |
| | Time Warner Inc. | | 11,975 | | | 1,011,648 |
| | Viacom Inc. Class B | | 32,725 | | | 2,188,648 |
| | | | | | | 4,146,719 |
| | Multiline Retail - 3.0% | | | | | |
| | Kohl’s Corp. | | 24,235 | | | 1,587,150 |
| | Target Corp. | | 27,310 | | | 2,166,229 |
| | | | | | | 3,753,379 |
| | Specialty Retail - 1.6% | | | | | |
| | Bed Bath & Beyond Inc. (a) | | 21,975 | | | 1,567,257 |
| | Lumber Liquidators Holdings, Inc. (a) | | 22,750 | | | 464,100 |
| | | | | | | 2,031,357 |
| | Textiles, Apparel & Luxury | | | | | |
| | Goods - 0.5% | | | | | |
| | Hanesbrands, Inc. | | 19,600 | | | 624,456 |
| | |
| Consumer Staples - 5.6% | | | | | |
| | Beverages - 0.7% | | | | | |
| | PepsiCo, Inc. | | 9,400 | | | 906,442 |
| | |
| | Food & Staples Retailing - 4.2% | | | | | |
| | CVS Health Corp. | | 11,950 | | | 1,223,441 |
| | Walgreen Boots Alliance, Inc. | | 27,500 | | | 2,360,600 |
| | Wal-Mart Stores, Inc. | | 23,950 | | | 1,778,766 |
| | | | | | | 5,362,807 |
| | Household Products - 0.7% | | | | | |
| | The Procter & Gamble Co. | | 10,550 | | | 827,015 |
| | | | | | | |
| Energy - 12.6% | | | | | |
| | Energy Equipment & | | | | | |
| | Services - 2.1% | | | | | |
| | Helmerich & Payne, Inc. | | 9,500 | | | 693,405 |
| | Schlumberger Ltd. | | 21,369 | | | 1,939,664 |
| | | | | | | 2,633,069 |
| | Oil, Gas & Consumable | | | | | |
| | Fuels - 10.5% | | | | | |
| | Apache Corp. | | 21,075 | | | 1,261,128 |
| | Chevron Corp. | | 25,795 | | | 2,656,885 |
| | Devon Energy Corp. | | 26,150 | | | 1,705,503 |
| | EOG Resources, Inc. | | 13,725 | | | 1,217,270 |
| | Exxon Mobil Corp. | | 45,870 | | | 3,908,124 |
| | Noble Energy, Inc. | | 27,625 | | | 1,209,423 |
| | PetroChina Co. Ltd. ADR | | 11,050 | | | 1,309,314 |
| | | | | | | 13,267,647 |
| Financials - 17.0% | | | | | |
| | Banks - 12.0% | | | | | |
| | Associated Banc-Corp | | 72,215 | | | 1,369,919 |
| | Bank of America Corp. | | 179,450 | | | 2,960,925 |
| | CIT Group Inc. | | 34,550 | | | 1,598,283 |
| | Citigroup Inc. | | 49,650 | | | 2,685,072 |
| | First Horizon National Corp. | | 96,185 | | | 1,419,691 |
| | JPMorgan Chase & Co. | | 39,475 | | | 2,596,666 |
| | PNC Financial Services Group, Inc. | | 11,305 | | | 1,081,775 |
| | SunTrust Banks, Inc. | | 16,750 | | | 714,890 |
| | Zions Bancorporation | | 24,375 | | | 703,950 |
| | | | | | | 15,131,171 |
| | Capital Markets - 2.6% | | | | | |
| | Northern Trust Corp. | | 18,245 | | | 1,360,165 |
| | State Street Corp. | | 25,200 | | | 1,963,836 |
| | | | | | | 3,324,001 |
| | Consumer Finance - 0.5% | | | | | |
| | Discover Financial Services | | 10,620 | | | 618,827 |
| | |
| | Insurance - 1.0% | | | | | |
| | Aflac, Inc. | | 20,360 | | | 1,266,799 |
| | |
| | Real Estate Investment | | | | | |
| | Trusts - 0.9% | | | | | |
| | DiamondRock Hospitality Co. | | 42,475 | | | 559,396 |
| | Host Hotels & Resorts Inc. | | 26,150 | | | 520,908 |
| | | | | | | 1,080,304 |
See Notes to Financial Statements.
6
| LARGECAP FUND SCHEDULE OF INVESTMENTS (Unaudited) (Continued) |
| May 31, 2015 |
| | | | | Shares | | Value |
| COMMON STOCKS (continued) | | | | | |
| | | | | | |
| | Health Care - 12.5% | | | | | |
| | Biotechnology - 4.1% | | | | | |
| | Amgen Inc. | | 7,790 | | $ | 1,217,265 |
| | Celgene Corp. (a) | | 16,650 | | | 1,905,426 |
| | Exact Sciences Corp. (a) | | 78,400 | | | 2,117,584 |
| | | | | | | 5,240,275 |
| | Health Care Equipment | | | | | |
| | & Supplies - 3.0% | | | | | |
| | Baxter Int’l. Inc. | | 17,710 | | | 1,179,663 |
| | Hologic, Inc. (a) | | 39,525 | | | 1,413,809 |
| | ResMed Inc. | | 8,575 | | | 504,382 |
| | Zimmer Holdings, Inc. | | 5,525 | | | 630,347 |
| | | | | | | 3,728,201 |
| | Health Care Providers & | | | | | |
| | Services - 4.4% | | | | | |
| | Express Scripts Holding Co. (a) | | 29,400 | | | 2,561,916 |
| | Hanger, Inc. (a) | | 44,700 | | | 1,027,653 |
| | McKesson Corp. | | 8,260 | | | 1,959,520 |
| | | | | | | 5,549,089 |
| | Pharmaceuticals - 1.0% | | | | | |
| | Johnson & Johnson | | 12,360 | | | 1,237,730 |
| | |
| Industrials - 11.4% | | | | | |
| | Air Freight & Logistics - 1.0% | | | | | |
| | FedEx Corp. | | 7,475 | | | 1,294,819 |
| | |
| | Building Products - 1.6% | | | | | |
| | Masco Corp. | | 75,100 | | | 2,032,957 |
| | |
| | Electrical Equipment - 4.3% | | | | | |
| | ABB Ltd. ADR | | 103,775 | | | 2,266,446 |
| | Emerson Electric Co. | | 25,825 | | | 1,557,506 |
| | Rockwell Automation, Inc. | | 12,525 | | | 1,539,197 |
| | | | | | | 5,363,149 |
| | Industrial Conglomerates - 3.0% | | | | | |
| | General Electric Co. | | 96,850 | | | 2,641,099 |
| | 3M Co. | | 7,570 | | | 1,204,236 |
| | | | | | | 3,845,335 |
| | Machinery - 1.5% | | | | | |
| | Illinois Tool Works Inc. | | 12,975 | | | 1,217,444 |
| | Ingersoll-Rand PLC | | 9,775 | | | 672,325 |
| | | | | | | 1,889,769 |
| Information Technology - 25.4% | | | | | |
| | Communications | | | | | |
| | Equipment - 6.1% | | | | | |
| | Cisco Systems, Inc. | | 89,985 | | | 2,637,460 |
| | JDS Uniphase Corp. (a) | | 195,535 | | | 2,506,759 |
| | Qualcomm, Inc. | | 36,280 | | | 2,527,990 |
| | | | | | | 7,672,209 |
| | Electronic Equipment, | | | | | |
| | Instruments & | | | | | |
| | Components - 1.4% | | | | | |
| | Corning Inc. | | 74,375 | | | 1,555,925 |
| | Maxwell Technologies, Inc. (a) | | 43,697 | | | 222,855 |
| | | | | | | 1,778,780 |
| | Internet Software & | | | | | |
| | Services - 3.1% | | | | | |
| | eBay Inc. (a) | | 18,570 | | | 1,139,455 |
| | Google Inc. Class A (a) | | 5,145 | | | 2,805,671 |
| | | | | | | 3,945,126 |
| | IT Services - 1.8% | | | | | |
| | Alliance Data Systems Corp. (a) | | 3,425 | | | 1,020,753 |
| | Visa Inc. Class A | | 18,280 | | | 1,255,470 |
| | | | | | | 2,276,223 |
| | Semiconductors & | | | | | |
| | Semiconductor | | | | | |
| | Equipment - 6.4% | | | | | |
| | Altera Corp. | | 34,175 | | | 1,669,449 |
| | Broadcom Corp. Class A (a) | | 35,015 | | | 1,990,603 |
| | Intel Corp. | | 35,925 | | | 1,237,976 |
| | Linear Technology Corp. | | 19,570 | | | 936,425 |
| | Maxim Integrated Products, Inc. | | 26,455 | | | 927,777 |
| | NXP Semiconductors N.V. (a) | | 12,100 | | | 1,358,225 |
| | | | | | | 8,120,455 |
| | Software - 4.6% | | | | | |
| | Microsoft Corp. | | 83,251 | | | 3,901,142 |
| | Oracle Corp. | | 44,750 | | | 1,946,177 |
| | | | | | | 5,847,319 |
| | Technology Hardware, Storage | | | | | |
| | & Peripherals - 2.0% | | | | | |
| | EMC Corp. | | 47,475 | | | 1,250,492 |
| | Hewlett-Packard Co. | | 38,025 | | | 1,270,035 |
| | | | | | | 2,520,527 |
| Materials - 1.3% | | | | | |
| | Metals & Mining - 1.3% | | | | | |
| | Freeport-McMoRan Inc. | | 85,825 | | | 1,686,461 |
| | |
| | TOTAL COMMON STOCKS | | | | | |
| | (COST $105,695,340) | | | | | 126,105,987 |
See Notes to Financial Statements.
7
| LARGECAP FUND SCHEDULE OF INVESTMENTS (Unaudited) (Continued) |
| May 31, 2015 |
| | Shares | | Value |
| SHORT-TERM INVESTMENTS - 0.0% | | | | | |
| | | | | | |
| Money Market Funds - 0.0% | | | | | |
| Fidelity Money Market Portfolio | | | | | |
| Class I, 0.097% (b) | | 12,620 | | $ | 12,620 |
| | | | | | |
| Total Money Market Funds | | | | | 12,620 |
| | | | | | |
| TOTAL SHORT-TERM | | | | | |
| INVESTMENTS (COST $12,620) | | | | | 12,620 |
| | | | | | |
| TOTAL INVESTMENTS - 99.8% | | | | | |
| (COST $105,707,960) | | | | | 126,118,607 |
| | | | | | |
| NET OTHER ASSETS AND | | | | | |
| LIABILITIES - 0.2% | | | | | 295,448 |
| | | | | | |
| NET ASSETS - 100.0% | | | | $ | 126,414,055 |
| | (a) | Non-income producing security. |
| (b) | Represents the 7-day yield at May 31, 2015. |
| | |
| | ADR: | American Depositary Receipt |
| | N.V.: | Naamloze Vennootschap is the Dutch term for a public limited liability corporation. |
| | PLC: | Public Limited Company |
The Global Industry Classification Standard (“GICS”) was developed by and is the exclusive property and a service mark of MSCI Inc. (“MSCI”) and Standard & Poor’s Financial Services LLC (“S&P”) and is licensed for use by Thompson Investment Management, Inc. Neither MSCI, S&P, nor any other party involved in making or compiling the GICS or any GICS classifications makes any warranties with respect thereto or the results to be obtained by the use thereof, and no such party shall have any liability whatsoever with respect thereto.
See Notes to Financial Statements.
8
| MIDCAP FUND INVESTMENT REVIEW (Unaudited) |
| May 31, 2015 |
Portfolio Managers
James T. Evans, CFA
Jason L. Stephens, CFA
John W. Thompson, CFA
Performance
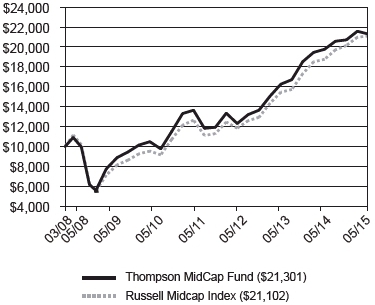
The MidCap Fund produced a total return of 2.84% for the six-month period ended May 31, 2015, as compared to its benchmark, the Russell Midcap Index, which returned 4.74%.
Comparison of Change in Value of a Hypothetical $10,000 Investment
| Average Annual Total Returns |
| Through 05/31/15 |
| | | | | | | Since |
| | | | | | | Inception |
| 1 Year | | 3 Year | | 5 Year | | (03/31/08) |
| Thompson MidCap Fund | 7.75% | | 20.05% | | 15.22% | | 11.13% |
| Russell Midcap Index | 12.47% | | 21.21% | | 17.20% | | 10.98% |
Gross Expense Ratio as of 03/31/15 was 1.54%.
Net Expense Ratio after reimbursement as of 03/31/15 was 1.30%.*
* The Advisor has contractually agreed to waive management fees and/or reimburse expenses incurred by the MidCap Fund through March 31, 2016, so that the annual operating expenses of the Fund do not exceed 1.30% of its average daily net assets.
Performance data quoted represents past performance; past performance does not guarantee future results. The investment return and principal value of an investment will fluctuate so that an investor’s shares, when redeemed, may be worth more or less than their original cost. Current performance of the Fund may be lower or higher than the performance quoted. Performance data current to the most recent month-end may be obtained by calling 1-800-999-0887 or visiting www.thompsonim.com.
Results include the reinvestment of all dividends and capital gains distributions. Investment performance reflects all fee waivers that may be in effect. In the absence of such waivers, total return would be reduced. The performance information reflected in the graph and the table above does not reflect the deduction of taxes that a shareholder would pay on fund distributions or the redemption of fund shares, nor does it imply future performance. The Russell Midcap Index measures the performance of the 800 smallest companies in the Russell 1000 Index based on total market capitalization. You cannot directly invest in an index.
Russell Investment Group is the source and owner of the trademarks, service marks, and copyrights related to the Russell Indexes. Russell® is a trademark of Russell Investment Group.
See Notes to Financial Statements.
9
| MIDCAP FUND INVESTMENT REVIEW (Unaudited) (Continued) |
| May 31, 2015 |
Management Commentary
The semi-annual period was marked by an unexpected decline in oil prices, and its repercussions. The decline caused earnings expectations for many midcap energy companies to drop 50% or more, which was enough to materially lower expected overall index earnings growth to the low single digits1. Many Consumer Discretionary stocks fared poorly after a corresponding increase in consumer spending failed to materialize. Weakness in consumer stocks hurt the Fund the most relative to its benchmark during the semi-annual period. While it’s always disappointing to lag, we do not believe the causes of said performance are likely to persist during the second half of the fiscal year.
Our confidence comes from looking at future expectations for Gross Domestic Product (GDP). While GDP is always of interest, investors are especially sensitive to current economic data as they assess somewhat elevated stock valuations and the likelihood that the Federal Reserve will soon raise rates. Of course, an accelerating economy has historically correlated with growing earnings, which can be good for stock investors. In addition, a sustained pickup in economic activity is usually followed by an increase in inflation, which is a key consideration for the Fed, and could support an interest rate hike.
If GDP is so important, why didn’t both interest rates and the stock market drop precipitously when it was reported that GDP declined -0.2% from the fourth quarter of 2014 to the first quarter of 20152? Why didn’t investors react negatively when multiple employment data points deteriorated in the first quarter of 2015? The answer is that investors understand three of the main reasons for these disappointing trends. First is a seasonal issue. It is important to remember that GDP data is popularly reported quarter-over-quarter and not year-over-year. Historically there is more activity in the fourth quarter than the first quarter due to holiday-influenced consumer purchases. Second, unusually cold weather again skewed results negatively much as it did last year, which affects any quarter-over-quarter number like GDP. Finally, the dramatic decline in oil prices resulted in mass oil industry layoffs and a decline in oil field capital expenditures during the first quarter.
Investors look forward, and as the U.S. is still a net importer of oil, the immediate negative impact of the decline in oil prices should eventually be offset. Companies will either reinvest their gas savings or distribute them to shareholders through dividends or stock buybacks. In the near-term, consumers may pocket their gas savings or pay down debt, but in the long-run consumers’ marginal propensity to spend is high. In other words, we think investors are rationally deducing that the negative data we saw in the first quarter is likely to turn positive as the year progresses. If our reasoning is correct, as time passes the more pro-cyclical allocation within the Fund among Consumer Discretionary and other stocks may benefit shareholders.
Opinions expressed are subject to change, are not guaranteed and should not be considered investment advice.
Mutual fund investing involves risk. Principal loss is possible. Midcap companies tend to have more limited liquidity and greater volatility than large-capitalization companies. Investments in American Depositary Receipts (“ADRs”) are subject to some extent to the risks associated with directly investing in securities of foreign issuers, including the risk of changes in currency exchange rates, expropriation or nationalization of assets, and the impact of political, diplomatic, or social events. Investments in real estate securities may involve greater risk and volatility including greater exposure to economic downturns and changes in real estate values, rents, property taxes, tax, and other laws. A REIT’s share price may decline because of adverse developments affecting the real estate industry.
Please refer to the Schedule of Investments on page 12 of this report for holdings information. The management commentary above as well as Fund holdings and asset/sector allocations should not be considered a recommendation to buy or sell any security. In addition, please note that Fund holdings and asset/sector allocations are subject to change.
Correlation is a statistical measure of how two securities move in relation to each other.
Earnings Growth is a measure of growth in a company’s net income over a specific period, often one year. It is not a prediction of the fund’s future returns.
____________________
| 1 | Source: Factset Consensus Estimates. |
| 2 | Source: US Department of Commerce. |
See Notes to Financial Statements.
10
| MIDCAP FUND INVESTMENT REVIEW (Unaudited) (Continued) |
| May 31, 2015 |
Sector Weightings at 05/31/15
% of Total Investments

| Top 10 Equity Holdings at 05/31/15 |
| | % of Fund’s |
| Company | Industry | Net Assets |
| Broadcom Corp. Class A | Semiconductors & Semiconductor Equipment | 2.46% |
| First Horizon National Corp. | Banks | 2.20% |
| CIT Group Inc. | Banks | 2.07% |
| Jarden Corp. | Household Durables | 2.05% |
| JDS Uniphase Corp. | Communications Equipment | 2.05% |
| Exact Sciences Corp. | Biotechnology | 2.04% |
| Bed Bath & Beyond Inc. | Specialty Retail | 2.04% |
| Hanger, Inc. | Health Care Providers & Services | 2.01% |
| NXP Semiconductors N.V. | Semiconductors & Semiconductor Equipment | 1.98% |
| SPX Corp. | Machinery | 1.96% |
As of May 31, 2015, 100.0% of the Fund’s net assets were in equity and short-term investments.
See Notes to Financial Statements.
11
| MIDCAP FUND SCHEDULE OF INVESTMENTS (Unaudited) |
| May 31, 2015 |
| | | | Shares | | Value |
| COMMON STOCKS - 99.9% | | | | | |
| | | | | | |
| Consumer Discretionary - 19.1% | | | | | |
| Automobiles - 1.3% | | | | | |
| Harley-Davidson, Inc. | | 9,725 | | $ | 520,190 |
| |
| Distributors - 1.5% | | | | | |
| LKQ Corp. (a) | | 21,720 | | | 620,540 |
| |
| Hotels, Restaurants & | | | | | |
| Leisure - 0.9% | | | | | |
| Chuy’s Holdings Inc. (a) | | 14,025 | | | 364,510 |
| |
| Household Durables - 3.6% | | | | | |
| D.R. Horton, Inc. | | 24,675 | | | 644,511 |
| Jarden Corp. (a) | | 16,143 | | | 856,548 |
| | | | | | 1,501,059 |
| Leisure Products - 1.1% | | | | | |
| | Brunswick Corp. | | 9,275 | | | 473,396 |
| |
| Multiline Retail - 2.7% | | | | | |
| Kohl’s Corp. | | 11,035 | | | 722,682 |
| Nordstrom, Inc. | | 5,800 | | | 421,312 |
| | | | | | 1,143,994 |
| Specialty Retail - 4.9% | | | | | |
| Bed Bath & Beyond Inc. (a) | | 11,905 | | | 849,065 |
| Chico’s FAS, Inc. | | 19,725 | | | 327,632 |
| Lumber Liquidators Holdings, Inc. (a) | | 16,400 | | | 334,560 |
| Urban Outfitters, Inc. (a) | | 15,100 | | | 519,138 |
| | | | | | 2,030,395 |
| Textiles, Apparel & | | | | | |
| Luxury Goods - 3.1% | | | | | |
| Coach, Inc. | | 11,055 | | | 391,015 |
| Hanesbrands, Inc. | | 21,660 | | | 690,088 |
| Michael Kors Holdings Ltd. (a) | | 4,925 | | | 229,013 |
| | | | | | 1,310,116 |
| Consumer Staples - 2.8% | | | | | |
| Food & Staples Retailing - 1.2% | | | | | |
| The Fresh Market, Inc. (a) | | 15,400 | | | 488,950 |
| |
| Food Producers - 1.6% | | | | | |
| Ingredion Inc. | | 2,775 | | | 227,467 |
| The J. M. Smucker Co. | | 3,787 | | | 448,949 |
| | | | | | 676,416 |
| Energy - 5.2% | | | | | |
| Energy Equipment & | | | | | |
| Services - 2.4% | | | | | |
| Cameron Int’l. Corp. (a) | | 6,725 | | | 345,194 |
| FMC Technologies, Inc. (a) | | 7,625 | | | 318,649 |
| Helmerich & Payne, Inc. | | 4,785 | | | 349,257 |
| | | | | | 1,013,100 |
| Oil, Gas & Consumable | | | | | |
| Fuels - 2.8% | | | | | |
| Cameco Corp. | | 14,025 | | | 210,235 |
| Denbury Resources Inc. | | 6,910 | | | 50,927 |
| Murphy Oil Corp. | | 5,701 | | | 247,765 |
| Noble Energy, Inc. | | 15,075 | | | 659,983 |
| | | | | | 1,168,910 |
| Financials - 19.8% | | | | | |
| Banks - 9.0% | | | | | |
| Associated Banc-Corp | | 39,805 | | | 755,101 |
| CIT Group Inc. | | 18,680 | | | 864,137 |
| First Horizon National Corp. | | 62,270 | | | 919,105 |
| Regions Financial Corp. | | 22,135 | | | 223,342 |
| SunTrust Banks, Inc. | | 10,495 | | | 447,927 |
| Zions Bancorporation | | 18,110 | | | 523,017 |
| | | | | | 3,732,629 |
| Capital Markets - 3.0% | | | | | |
| Eaton Vance Corp. | | 10,920 | | | 443,352 |
| Northern Trust Corp. | | 10,855 | | | 809,240 |
| | | | | | 1,252,592 |
| Consumer Finance - 1.2% | | | | | |
| Discover Financial Services | | 8,829 | | | 514,466 |
| |
| Insurance - 1.7% | | | | | |
| Cincinnati Financial Corp. | | 6,190 | | | 313,090 |
| Unum Group | | 11,555 | | | 403,963 |
| | | | | | 717,053 |
| Real Estate Investment | | | | | |
| Trusts - 3.6% | | | | | |
| Annaly Capital Management Inc. | | 41,250 | | | 430,650 |
| DiamondRock Hospitality Co. | | 26,450 | | | 348,346 |
| Host Hotels & Resorts Inc. | | 17,835 | | | 355,273 |
| LaSalle Hotel Properties | | 9,520 | | | 347,099 |
| | | | | | 1,481,368 |
| Thrifts & Mortgage | | | | | |
| Finance - 1.3% | | | | | |
| Flagstar Bancorp, Inc. (a) | | 28,325 | | | 530,810 |
See Notes to Financial Statements.
12
| MIDCAP FUND SCHEDULE OF INVESTMENTS (Unaudited) (Continued) |
| May 31, 2015 |
| | | | Shares | | Value |
| COMMON STOCKS (continued) | | | | | |
| | | | | | |
| Health Care - 16.3% | | | | | |
| Biotechnology - 2.5% | | | | | |
| Exact Sciences Corp. (a) | | 31,450 | | $ | 849,464 |
| Myriad Genetics, Inc. (a) | | 5,225 | | | 177,389 |
| | | | | | 1,026,853 |
| Health Care Equipment & | | | | | |
| Supplies - 5.7% | | | | | |
| | Hologic, Inc. (a) | | 19,425 | | | 694,832 |
| Natus Medical Inc. (a) | | 7,725 | | | 301,738 |
| ResMed Inc. | | 11,046 | | | 649,726 |
| Thoratec Corp. (a) | | 7,000 | | | 317,730 |
| Zimmer Holdings, Inc. | | 3,675 | | | 419,281 |
| | | | | | 2,383,307 |
| Health Care Providers & | | | | | |
| Services - 5.2% | | | | | |
| Catamaran Corp. (a) | | 10,775 | | | 644,884 |
| Hanger, Inc. (a) | | 36,525 | | | 839,710 |
| McKesson Corp. | | 1,365 | | | 323,819 |
| Patterson Cos., Inc. | | 7,880 | | | 376,979 |
| | | | | | 2,185,392 |
| Health Care Technology - 1.5% | | | | | |
| MedAssets Inc. (a) | | 29,190 | | | 609,195 |
| |
| Life Sciences Tools & | | | | | |
| Services - 0.4% | | | | | |
| Fluidigm Corp. (a) | | 7,200 | | | 170,208 |
| |
| Pharmaceuticals - 1.0% | | | | | |
| Jazz Pharmaceuticals PLC (a) | | 2,300 | | | 412,505 |
| |
| Industrials - 13.2% | | | | | |
| Air Freight & Logistics - 1.3% | | | | | |
| Expeditors Int’l. of Washington, Inc. | | 11,900 | | | 545,496 |
| |
| Building Products - 2.5% | | | | | |
| Masco Corp. | | 25,225 | | | 682,841 |
| USG Corp. (a) | | 11,775 | | | 339,591 |
| | | | | | 1,022,432 |
| Electrical Equipment - 3.1% | | | | | |
| Regal Beloit Corp. | | 7,405 | | | 578,997 |
| Rockwell Automation, Inc. | | 5,600 | | | 688,184 |
| | | | | | 1,267,181 |
| Machinery - 5.3% | | | | | |
| Allison Transmission Holdings, Inc. | | 13,325 | | | 407,745 |
| Ingersoll-Rand PLC | | 10,000 | | | 687,800 |
| Mueller Water Products, Inc. Class A | | 33,700 | | | 310,714 |
| SPX Corp. | | 11,025 | | | 819,268 |
| | | | | | 2,225,527 |
| Trading Companies & | | | | | |
| Distributors - 1.0% | | | | | |
| W.W. Grainger, Inc. | | 1,788 | | | 429,710 |
| |
| Information Technology - 18.5% | | | | | |
| Communications Equipment - 2.1% | | | |
| JDS Uniphase Corp. (a) | | 66,606 | | | 853,889 |
| |
| Electronic Equipment, | | | | | |
| Instruments & | | | | | |
| Components - 1.0% | | | | | |
| InvenSense Inc. (a) | | 16,875 | | | 238,950 |
| Maxwell Technologies, Inc. (a) | | 37,397 | | | 190,725 |
| | | | | | 429,675 |
| Internet Software & | | | | | |
| Services - 1.0% | | | | | |
| Liquidity Services, Inc. (a) | | 40,675 | | | 403,496 |
| |
| IT Services - 2.3% | | | | | |
| Alliance Data Systems Corp. (a) | | 1,950 | | | 581,158 |
| Fiserv, Inc. (a) | | 4,944 | | | 396,262 |
| | | | | | 977,420 |
| Semiconductors & | | | | | |
| Semiconductor | | | | | |
| Equipment - 9.5% | | | | | |
| Altera Corp. | | 11,225 | | | 548,341 |
| Broadcom Corp. Class A (a) | | 18,030 | | | 1,025,005 |
| Cavium Inc. (a) | | 6,500 | | | 457,405 |
| Linear Technology Corp. | | 9,690 | | | 463,667 |
| Maxim Integrated Products, Inc. | | 18,066 | | | 633,575 |
| NXP Semiconductors N.V. (a) | | 7,350 | | | 825,037 |
| | | | | | 3,953,030 |
| Software - 0.6% | | | | | |
| Take-Two Interactive Software, Inc. (a) | | 9,435 | | | 258,236 |
| |
| Technology Hardware, | | | | | |
| Storage & Peripherals - 2.0% | | | | | |
| Nimble Storage, Inc. (a) | | 12,800 | | | 331,264 |
| Silicon Graphics Int’l. Corp. (a) | | 30,200 | | | 193,884 |
| Stratasys Ltd. (a) | | 3,900 | | | 138,684 |
| 3D Systems Corp. (a) | | 7,550 | | | 165,119 |
| | | | | | 828,951 |
| Materials - 3.7% | | | | | |
| Chemicals - 2.7% | | | | | |
| Ecolab Inc. | | 4,606 | | | 528,078 |
| Int’l. Flavors & Fragrances Inc. | | 5,160 | | | 614,246 |
| | | | | | 1,142,324 |
See Notes to Financial Statements.
13
| MIDCAP FUND SCHEDULE OF INVESTMENTS (Unaudited) (Continued) |
| May 31, 2015 |
| | | | Shares | | Value |
| COMMON STOCKS (continued) | | | | | |
| | | | | | |
| Materials (continued) | | | | | |
| Metals & Mining - 1.0% | | | | | |
| Lundin Mining Corp. (a) | | 43,600 | | $ | 198,816 |
| Stillwater Mining Co. (a) | | 15,200 | | | 220,248 |
| | | | | | 419,064 |
| Utilities - 1.3% | | | | | |
| | Multi-Utilities - 1.3% | | | | | |
| MDU Resources Group, Inc. | | 14,300 | | | 299,442 |
| SCANA Corp. | | 4,850 | | | 257,826 |
| | | | | | 557,268 |
| |
| TOTAL COMMON STOCKS | | | | | |
| (COST $34,606,134) | | | | | 41,641,653 |
| |
| SHORT-TERM INVESTMENTS - 0.1% | | | | | |
| Money Market Funds - 0.1% | | | | | |
| Fidelity Money Market Portfolio | | | | | |
| Class I, 0.097% (b) | | 57,987 | | | 57,987 |
| |
| Total Money Market Funds | | | | | 57,987 |
| | |
| TOTAL SHORT-TERM | | | | | |
| INVESTMENTS (COST $57,987) | | | | | 57,987 |
| |
| TOTAL INVESTMENTS - 100.0% | | | | | |
| (COST $34,664,121) | | | | | 41,699,640 |
| |
| NET OTHER ASSETS AND | | | | | |
| LIABILITIES - 0.0% | | | | | 3,980 |
| | | | | | | |
| NET ASSETS - 100.0% | | | | $ | 41,703,620 |
| | (a) | Non-income producing security. |
| (b) | Represents the 7-day yield at May 31, 2015. |
| |
| | N.V.: | Naamloze Vennootschap is the Dutch term for a public limited liability corporation. |
| | PLC: | Public Limited Company |
The Global Industry Classification Standard (“GICS”) was developed by and is the exclusive property and a service mark of MSCI Inc. (“MSCI”) and Standard & Poor’s Financial Services LLC (“S&P”) and is licensed for use by Thompson Investment Management, Inc. Neither MSCI, S&P, nor any other party involved in making or compiling the GICS or any GICS classifications makes any warranties with respect thereto or the results to be obtained by the use thereof, and no such party shall have any liability whatsoever with respect thereto.
See Notes to Financial Statements.
14
| BOND FUND INVESTMENT REVIEW (Unaudited) |
| May 31, 2015 |
Portfolio Managers
James T. Evans, CFA
Jason L. Stephens, CFA
John W. Thompson, CFA
Performance
The Bond Fund produced a total return of 0.87% for the six-month period ended May 31, 2015, as compared to its benchmark, the Barclays U.S. Government/Credit 1-5 Year Index, which returned 0.78%, and as compared to the Barclays U.S. Credit 1-5 Year Index, which returned 0.99%.
Comparison of Change in Value of a Hypothetical $10,000 Investment

| Average Annual Total Returns |
| Through 05/31/15 |
| 1 Year | | 3 Year | | 5 Year | | 10 Year |
| Thompson Bond Fund | 0.01% | | 3.76% | | 4.30% | | 5.74% |
| Barclays U.S. Gov’t./Credit 1-5 Year Index | 1.42% | | 1.33% | | 2.02% | | 3.41% |
| Barclays U.S. Credit 1-5 Year Index | 1.63% | | 2.53% | | 3.23% | | 4.19% |
| Gross Expense Ratio as of 03/31/15 was 0.72%. | 30-Day SEC Yield as of 5/31/15 was 3.65%. |
Performance data quoted represents past performance; past performance does not guarantee future results. The investment return and principal value of an investment will fluctuate so that an investor’s shares, when redeemed, may be worth more or less than their original cost. Current performance of the Fund may be lower or higher than the performance quoted. Performance data current to the most recent month-end may be obtained by calling 1-800-999-0887 or visiting www.thompsonim.com.
Results include the reinvestment of all dividends and capital gains distributions. Investment performance reflects all fee waivers that may have been in effect. In the absence of such waivers, total return would have been reduced. The performance information reflected in the graph and the table above does not reflect the deduction of taxes that a shareholder would pay on fund distributions or the redemption of fund shares, nor does it imply future performance. The Barclays U.S. Government/Credit 1-5 Year Index is a market-value-weighted index of all investment-grade bonds with maturities of more than one year and less than 5 years. The Barclays U.S. Credit 1-5 Year Index is a market-value-weighted index which includes virtually every major investment-grade rated corporate bond with 1-5 years remaining until maturity that serves as a supplementary benchmark. You cannot directly invest in an index.
Barclays® is a trademark of Barclays Bank PLC.
See Notes to Financial Statements.
15
| BOND FUND INVESTMENT REVIEW (Unaudited) (Continued) |
| May 31, 2015 |
Management Commentary
Though bond investors saw significant fluctuations in interest rates during the first half of fiscal year 2015, those rates ultimately were little changed by the end of May. BBB Corporate spreads were also volatile, and increased approximately 15 basis points during the same period. We expect this volatility to continue as investors reassess their asset allocations in consideration of potential interest rate hikes by the Federal Reserve. In this uncertain environment, we continue to favor corporate bonds with competitive interest rate spreads over Treasury securities.
Our dim view of potential treasury returns is due to their still-historically low yields. The 5-year Treasury, for example, yields a paltry 1.49%. Mathematically, the only way for the returns of a Treasury-dominated portfolio or benchmark to perform much better than this yield going forward is for interest rates to decline. Because we believe the economy is continuing to recover and that hikes in interest rates by the Federal Reserve in the back half of the calendar year are likely, we think rates are unlikely to decline dramatically from here at any time in the near future. If rates actually rise, we’d rather be invested in securities with higher yields than treasuries currently offer.
With a 30-day SEC yield of 3.65% at the end of May, the Fund is not as reliant upon declining interest rates to produce a competitive return. Instead, there are multiple ways in which such a return could be generated, some of which involve rate changes and some of which involve simply holding securities to maturity and collecting their interest payments. This doesn’t mean such a return will necessarily occur, as actual results will vary based on corporate spreads, interest-rate changes and other factors that are impossible to predict. Nevertheless we believe shareholders may benefit by not being entirely dependent upon lower rates to produce positive returns.
As for how we are able to generate a 30-day SEC yield of 3.65% versus a duration of only 2.07 years, the answer comes back to the risk/reward tradeoffs we have discussed in prior commentaries. We take risks we believe shareholders are being fairly compensated to take. Right now we view that as credit risk, which is why the Fund is largely invested in corporate bonds instead of Treasuries, Agencies or mortgage-backed securities. Funds and benchmarks that have a high allocation to those other asset classes are exposing their shareholders to risks that we think they are not adequately being compensated for. This doesn’t mean we will take unlimited credit risk, but rather what we feel is an appropriate amount given the yield being offered. It is this focus on taking or reducing risk in the portfolio relative to available market opportunities that has led to the Fund’s performance over the past decade. Going forward, we plan to maintain the same strategy in an effort to continue rewarding shareholders.
Opinions expressed are subject to change, are not guaranteed and should not be considered investment advice.
Mutual fund investing involves risk. Principal loss is possible. Investments in debt securities typically decrease in value when interest rates rise. The risk is usually greater for longer-term debt securities. Investments in bonds of foreign issuers involve greater volatility, political and economic risks, and differences in accounting methods. Investment by the Fund in lower-rated and non-rated securities presents a greater risk of loss to principal and interest than higher-rated securities.
Please refer to the Schedule of Investments on page 18 of this report for holdings information. The management commentary above as well as Fund holdings should not be considered a recommendation to buy or sell any security. In addition, please note that Fund holdings are subject to change.
The federal government guarantees interest payments from government securities while dividend payments carry no such guarantee. Government securities, if held to maturity, guarantee the timely payment of principal and interest.
SEC Yield is a standardized yield computed by dividing the net investment income per share earned during the 30-day period prior to quarter-end and was created to allow for fairer comparisons among bond funds.
Basis point is a unit that is equal to 1/100th of 1%, and is used to denote the change in a financial instrument.
Duration is a commonly used measure of the potential volatility of the price of a debt security, or the aggregate market value of a portfolio of debt securities, prior to maturity. Securities with a longer duration generally have more volatile prices than securities of comparable quality with a shorter duration.
Spread is the percentage point difference between yields of various classes of bonds compared to treasury bonds.
Yield is the income earned from a bond, which takes into account the sum of the interest payment, the redemption value at the bond’s maturity, and the initial purchase price of the bond.
Credit Ratings are provided by Standard & Poor’s, who assign a rating based on their analysis of the issuer’s credit worthiness. The highest rating given is AAA and the lowest is C.
See Notes to Financial Statements.
16
| BOND FUND INVESTMENT REVIEW (Unaudited) (Continued) |
| May 31, 2015 |
Although the makeup of the Bond Fund’s portfolio is constantly changing, as of May 31, 2015, 85.48% of the Fund’s portfolio was invested in corporate bonds. Due to prevailing market conditions, the composition of the Fund’s portfolio as of that date was consistent with the composition of the Fund’s portfolio over the past 5 years. In addition, as of that date 68.48% of the Fund’s portfolio was invested in bonds rated BBB by Standard & Poor’s, while an additional 15.02% of the Fund’s portfolio was rated below investment grade and 3.31% of the Fund’s portfolio was not rated by Standard & Poor’s. For portfolio information current as of the most recent quarter-end, please call 1-800-999-0887 or visit our website at www.thompsonim.com. Compared to a portfolio that is more evenly allocated between government and corporate bonds, a portfolio that is heavily allocated to corporate bonds may provide higher returns, but is also subject to greater levels of credit and liquidity risk and to greater price fluctuations. A portfolio that is significantly allocated to bonds having lower and below-investment-grade ratings may also be subject to greater levels of credit and liquidity risk and experience greater price fluctuations than a portfolio comprised of higher-rated investment-grade bonds.
| Portfolio Concentration at 05/31/15 |
| (Includes cash and cash equivalents) |
| % Total Investments |
| Quality |
| U.S. Government & Agency Issues | 1.57 | % | |
| AA | 2.76 | % | |
| A | 8.86 | % | |
| BBB | 68.48 | % | |
| BB and Below | 15.02 | % | |
| Not Rated | 3.31 | % | |
| 100.00 | % | |
| |
| Effective Maturity |
| Under 1 year | 22.84 | % | |
| 1 to 3 years | 50.73 | % | |
| 3 to 5 years | 20.18 | % | |
| 5 to 7 years | 5.13 | % | |
| 7 to 10 years | 1.12 | % | |
| 100.00 | % | |
| |
| Asset Allocation |
| Corporate Bonds | 85.48 | % | |
| Asset-Backed Securities | 9.82 | % | |
| Taxable Municipal Bonds | 2.74 | % | |
| U.S. Government & Agency Issues | 1.56 | % | |
| Convertible Bonds | 0.23 | % | |
| Tax-Exempt Municipal Bonds | 0.15 | % | |
| Federal Agency Mortgage-Backed Securities | 0.02 | % | |
| 100.00 | % | |
| |
See Notes to Financial Statements.
17
| BOND FUND SCHEDULE OF INVESTMENTS (Unaudited) |
| May 31, 2015 |
| Principal | | | |
| Amount | | Value |
| BONDS - 97.4% | | | | |
| | | | | |
| Asset-Backed Securities - 9.7% | | | | |
| America West Airlines | | | | |
| 7.930% due 1/2/2019, | | | | |
| Series 1999-1 | 8,756,468 | | $ | 9,719,680 |
| 8.057% due 7/2/2020, | | | | |
| Series 2000-1 | 30,818 | | | 35,286 |
| 7.100% due 4/2/2021, | | | | |
| Series 2001-1 | 5,749,850 | | | 6,353,584 |
| |
| American Airlines | | | | |
| 7.000% due 1/31/2018, | | | | |
| Series 2011-1 B (e) | 19,633,366 | | | 21,105,869 |
| |
| Ameritech Capital Funding Corp. | | | | |
| 9.100% due 6/1/2016 | 3,178 | | | 3,371 |
| |
| AWAS Aviation Capital Ltd. | | | | |
| 7.000% due 10/17/2016 (e) | 36,423,000 | | | 36,969,345 |
| |
| Basketball Properties Ltd. | | | | |
| 6.650% due 3/1/2025 (e) | 5,023,940 | | | 5,476,095 |
| |
| Beaver Valley II Funding | | | | |
| 9.000% due 6/1/2017 | 2,000 | | | 2,160 |
| |
| BellSouth | | | | |
| Telecommunications, LLC | | | | |
| 6.300% due 12/15/2015 | 3,808 | | | 3,857 |
| |
| British Airways PLC | | | | |
| 5.625% due 6/20/2020, | | | | |
| Series 2013-1 (e) | 44,164,513 | | | 46,814,384 |
| 5.625% due 6/20/2020, | | | | |
| Series 2013-1 B (e) | 91,988 | | | 97,508 |
| |
| Bvps II Funding Corp. | | | | |
| 8.890% due 6/1/2017 | 18,000 | | | 18,855 |
| |
| Continental Airlines | | | | |
| 9.000% due 7/8/2016, | | | | |
| Series 2009-1 | 643,266 | | | 689,902 |
| 6.748% due 3/15/2017, | | | | |
| Series 1998-1 B | 108,625 | | | 115,338 |
| 6.648% due 9/15/2017, | | | | |
| Series 1998-1 A | 1,617,642 | | | 1,677,171 |
| 6.900% due 1/2/2018, | | | | |
| Series 1997-4 A | 330,840 | | | 348,606 |
| 6.820% due 5/1/2018, | | | | |
| Series 1998-3 A-1 | 115,466 | | | 123,260 |
| 6.000% due 1/12/2019, | | | | |
| Series 2010-1 B | 2,609,788 | | | 2,766,375 |
| 7.256% due 3/15/2020, | | | | |
| Series 1999-2 A-1 | 36,192 | | | 40,354 |
| 6.250% due 4/11/2020, | | | | |
| Series 2012-1 B | 6,306,600 | | | 6,748,062 |
| 5.500% due 10/29/2020, | | | | |
| Series 2012-2 B | 8,204,047 | | | 8,716,800 |
| |
| Delta Air Lines | | | | |
| 6.750% due 11/23/2015, | | | | |
| Series 2010-2 B (e) | 37,426,000 | | | 38,346,680 |
| 6.375% due 1/2/2016, | | | | |
| Series 2010-1 B (e) | 13,453,000 | | | 13,820,267 |
| 9.750% due 12/17/2016, | | | | |
| Series 2009-1 B | 771,076 | | | 855,894 |
| 6.718% due 1/2/2023, | | | | |
| Series 2002-1 G-1 | 4,074 | | | 4,726 |
| |
| Doric Nimrod Air Alpha | | | | |
| 6.125% due 11/30/2019, | | | | |
| Series 2013-1B (e) | 38,246,513 | | | 40,828,153 |
| 6.125% due 11/30/2019, | | | | |
| Series 2013-1B (e) | 6,231,992 | | | 6,652,651 |
| |
| Doric Nimrod Air | | | | |
| Finance Alpha Ltd. | | | | |
| 6.500% due 5/30/2021, | | | | |
| Series 2012-1 B (e) | 24,240,360 | | | 25,807,354 |
| |
| Express Pipeline LP | | | | |
| 7.390% due 12/31/2017 (e) | 1,486,000 | | | 1,565,228 |
| |
| Federal Express Corp. | | | | |
| 7.020% due 1/15/2016, | | | | |
| Series 1998 | 798,673 | | | 828,623 |
| 7.840% due 1/30/2018, | | | | |
| Series 1996 | 245,973 | | | 270,570 |
| |
| FPL Energy Caithness | | | | |
| Funding Corp. | | | | |
| 7.645% due 12/31/2018 (e) | 1,590,480 | | | 1,717,718 |
| |
| General American Railcar | | | | |
| 6.690% due 9/20/2016, | | | | |
| Series 1997-1 (e) | 123,151 | | | 127,154 |
| 7.760% due 8/20/2018, | | | | |
| Series III (e) | 605,562 | | | 684,285 |
See Notes to Financial Statements.
18
| BOND FUND SCHEDULE OF INVESTMENTS (Unaudited) (Continued) |
| May 31, 2015 |
| Principal | | | |
| Amount | | Value |
| BONDS (continued) | | | | |
| | | | |
| Asset-Backed Securities (continued) | | | |
| Hidden Ridge Facility | | | | |
| 5.650% due 1/1/2022 (e) | 4,327,103 | | $ | 4,573,614 |
| |
| Landmark Leasing LLC | | | | |
| 6.200% due 10/1/2022, | | | | |
| Series 2004A (e) | 240,989 | | | 245,483 |
| |
| Midwest Family Housing LLC | | | | |
| 5.168% due 7/1/2016 (e) | 100,000 | | | 100,362 |
| |
| Northwest Airlines | | | | |
| 7.691% due 4/1/2017, | | | | |
| Series 2001-1 B | 80,732 | | | 88,402 |
| 8.028% due 11/1/2017, | | | | |
| Series 2007-1 B | 98,476 | | | 111,090 |
| 7.575% due 3/1/2019, | | | | |
| Series 1999-2 A | 1,072,530 | | | 1,190,508 |
| 7.150% due 10/1/2019, | | | | |
| Series 2000-1 G (b) | 29,375 | | | 30,990 |
| 7.027% due 11/1/2019, | | | | |
| Series 2007-1 A | 12,282,550 | | | 14,078,259 |
| 6.264% due 11/20/2021, | | | | |
| Series 2002-1 G-2 | 670,998 | | | 713,741 |
| 7.041% due 4/1/2022, | | | | |
| Series 2001-1 A-1 | 389,293 | | | 455,473 |
| |
| United Air Lines | | | | |
| 10.400% due 11/1/2016, | | | | |
| Series 2009-1 | 1,980,292 | | | 2,178,321 |
| |
| US Airways | | | | |
| 8.360% due 1/20/2019, | | | | |
| Series 1999-1A | 95,657 | | | 104,744 |
| 8.000% due 10/1/2019, | | | | |
| Series 2012-1 B | 10,760,198 | | | 12,212,825 |
| |
| Virgin Australia Trust | | | | |
| 5.000% due 10/23/2023, | | | | |
| Series 2013-1A (e) | 250,892 | | | 265,945 |
| |
| Total Asset-Backed Securities | | | | 315,684,922 |
| |
| Convertible Bonds - 0.2% | | | | |
| Hospitality Properties Trust | | | | |
| 3.800% due 3/15/2027 | 7,309,000 | | | 7,309,000 |
| |
| Total Convertible Bonds | | | | 7,309,000 |
| | | | | |
| Corporate Bonds - 84.2% | | | | |
| Air Lease Corp. | | | | |
| 4.500% due 1/15/2016 | 24,160,000 | | | 24,643,200 |
| 5.625% due 4/1/2017 | 34,210,000 | | | 36,519,175 |
| |
| Alcoa Inc. | | | | |
| 5.550% due 2/1/2017 | 118,000 | | | 124,970 |
| 6.750% due 7/15/2018 | 17,376,000 | | | 19,703,845 |
| |
| Aluminum Company | | | | |
| of America | | | | |
| 6.500% due 6/15/2018 | 25,301,000 | | | 28,130,993 |
| |
| Ameriprise Financial, Inc. | | | | |
| 7.518% due 6/1/2066 (b) | 2,329,000 | | | 2,422,160 |
| |
| Astoria Financial Corp. | | | | |
| 5.000% due 6/19/2017 | 57,301,000 | | | 60,491,233 |
| |
| Aviation Capital Group Corp. | | | | |
| 3.875% due 9/27/2016 (e) | 1,639,000 | | | 1,678,103 |
| 4.625% due 1/31/2018 (e) | 1,080,000 | | | 1,126,429 |
| |
| Avnet, Inc. | | | | |
| 6.625% due 9/15/2016 | 551,000 | | | 586,245 |
| |
| Avon Products, Inc. | | | | |
| 5.750% due 3/1/2018 | 9,683,000 | | | 9,537,755 |
| 6.500% due 3/1/2019 | 63,175,000 | | | 62,227,375 |
| 5.350% due 3/15/2020 (b) | 500,000 | | | 452,500 |
| |
| Bank of America Corp. | | | | |
| 2.225% due 11/2/2015 (b) | 70,000 | | | 70,097 |
| 5.250% due 12/1/2015 | 781,000 | | | 799,076 |
| 6.000% due 6/15/2016 | 160,000 | | | 167,596 |
| 1.000% due 10/9/2024 (b) | 35,000,000 | | | 34,720,000 |
| |
| BGC Partners Inc. | | | | |
| 5.375% due 12/9/2019 | 2,875,000 | | | 2,979,219 |
| |
| BioMed Realty, L.P. | | | | |
| 3.850% due 4/15/2016 | 2,373,000 | | | 2,422,805 |
| |
| BMC Software, Inc. | | | | |
| 7.250% due 6/1/2018 | 26,428,000 | | | 25,569,090 |
| |
| Boston Scientific Corp. | | | | |
| 6.250% due 11/15/2015 (b) | 3,359,000 | | | 3,445,340 |
See Notes to Financial Statements.
19
| BOND FUND SCHEDULE OF INVESTMENTS (Unaudited) (Continued) |
| May 31, 2015 |
| Principal | | | |
| Amount | | Value |
| BONDS (continued) | | | | |
| | | | | |
| Corporate Bonds (continued) | | | | |
| Carpenter Technology Corp. | | | | |
| 6.990% due 4/20/2018 | 415,000 | | $ | 449,255 |
| 7.060% due 5/21/2018 | 500,000 | | | 538,346 |
| 7.030% due 5/22/2018 | 8,000 | | | 8,607 |
| |
| Caterpillar Financial | | | | |
| Services Corp. | | | | |
| 1.550% due 6/15/2015 | 101,000 | | | 100,995 |
| |
| Centel Capital Corp. | | | | |
| 9.000% due 10/15/2019 | 10,000 | | | 12,003 |
| |
| CenterPoint Energy, Inc. | | | | |
| 6.850% due 6/1/2015 | 254,000 | | | 254,000 |
| |
| Centrais Eletricas Brasileiras S.A. | | | | |
| 6.875% due 7/30/2019 (e) | 32,373,000 | | | 32,534,865 |
| 6.875% due 7/30/2019 (e) | 1,345,000 | | | 1,351,725 |
| 5.750% due 10/27/2021 (e) | 16,365,000 | | | 15,607,300 |
| |
| Citigroup, Inc. | | | | |
| 0.925% due 10/15/2024 (b) | 35,000,000 | | | 33,776,400 |
| |
| Cliffs Natural Resources Inc. | | | | |
| 5.950% due 1/15/2018 (b) | 6,263,000 | | | 5,229,605 |
| 5.900% due 3/15/2020 | 61,404,000 | | | 34,693,260 |
| |
| CNA Financial Corp. | | | | |
| 6.950% due 1/15/2018 | 605,000 | | | 677,385 |
| |
| Coca-Cola HBC Finance B.V. | | | | |
| 5.500% due 9/17/2015 | 203,000 | | | 205,674 |
| |
| Columbia Property Trust | | | | |
| 5.875% due 4/1/2018 | 130,000 | | | 141,894 |
| |
| Commercial Net Lease | | | | |
| Realty, Inc. | | | | |
| 6.150% due 12/15/2015 | 443,000 | | | 454,834 |
| |
| CommonWealth REIT | | | | |
| 5.875% due 9/15/2020 | 17,777,000 | | | 19,697,645 |
| |
| Computer Sciences Corp. | | | | |
| 6.500% due 3/15/2018 | 18,933,000 | | | 20,938,819 |
| | | | | |
| Continental Resources, Inc. | | | | |
| 7.375% due 10/1/2020 | 6,427,000 | | | 6,748,350 |
| 7.125% due 4/1/2021 | 18,613,000 | | | 19,799,579 |
| |
| Con-way Inc. | | | | |
| 7.250% due 1/15/2018 | 10,589,000 | | | 11,862,963 |
| |
| Copano Energy, LLC | | | | |
| 7.125% due 4/1/2021 | 2,722,000 | | | 2,888,864 |
| |
| Corn Products Int’l., Inc. | | | | |
| 3.200% due 11/1/2015 | 500,000 | | | 504,157 |
| |
| Countrywide Financial Corp. | | | | |
| 6.250% due 5/15/2016 | 2,942,000 | | | 3,074,096 |
| 5.250% due 5/27/2020 | 379,000 | | | 379,029 |
| 6.000% due 8/26/2020 (c) | 140,000 | | | 139,523 |
| |
| Countrywide Home Loans, Inc. | | | | |
| 5.500% due 5/16/2018 | 249,000 | | | 247,959 |
| |
| Darden Restaurants, Inc. | | | | |
| 6.450% due 10/15/2017 (b) | 6,610,000 | | | 7,273,803 |
| |
| Dayton Hudson Corp. | | | | |
| 9.520% due 6/10/2015 | 90,000 | | | 90,113 |
| |
| Denali Borrower LLC / Denali | | | | |
| Finance Corp. | | | | |
| 5.625% due 10/15/2020 (e) | 30,878,000 | | | 32,769,277 |
| |
| Development Bank of Kazakhstan | | | | |
| 6.500% due 6/3/2020 (e) | 5,055,000 | | | 5,343,641 |
| 4.125% due 12/10/2022 (e) | 39,356,000 | | | 35,322,010 |
| |
| Discover Financial Services | | | | |
| 6.450% due 6/12/2017 | 590,000 | | | 645,449 |
| 10.250% due 7/15/2019 | 11,200,000 | | | 13,952,546 |
| |
| Dominion Resources, Inc. | | | | |
| 7.500% due 6/30/2066 (b) | 18,248,000 | | | 18,430,480 |
| |
| Domtar Corp. | | | | |
| 7.125% due 8/15/2015 | 248,000 | | | 250,605 |
| 9.500% due 8/1/2016 | 885,000 | | | 958,443 |
| 10.750% due 6/1/2017 | 33,419,000 | | | 39,070,119 |
See Notes to Financial Statements.
20
| BOND FUND SCHEDULE OF INVESTMENTS (Unaudited) (Continued) |
| May 31, 2015 |
| Principal | | | |
| Amount | | Value |
| BONDS (continued) | | | | |
| | | | | |
| Corporate Bonds (continued) | | | | |
| Dow Chemical Co. | | | | |
| 2.850% due 5/15/2016 | 18,000 | | $ | 17,845 |
| 2.900% due 5/15/2016 | 200,000 | | | 197,906 |
| 2.350% due 8/15/2016 | 20,000 | | | 20,005 |
| |
| Dun & Bradstreet Corp. | | | | |
| 2.875% due 11/15/2015 | 105,000 | | | 106,041 |
| |
| Duquesne Light Holdings Inc. | | | | |
| 5.500% due 8/15/2015 | 6,959,000 | | | 7,031,088 |
| |
| El Paso Corp. | | | | |
| 7.000% due 6/15/2017 | 2,902,000 | | | 3,178,813 |
| |
| Embraer Overseas Ltd. | | | | |
| 6.375% due 1/24/2017 | 10,396,000 | | | 11,066,542 |
| |
| Entergy Corp. | | | | |
| 3.625% due 9/15/2015 | 1,298,000 | | | 1,306,963 |
| |
| Enterprise Products | | | | |
| Operating LLC | | | | |
| 7.000% due 6/1/2067 (b) | 9,613,000 | | | 9,685,098 |
| |
| Everest Reinsurance Holdings Inc. | | | | |
| 6.600% due 5/15/2037 (b) | 8,692,000 | | | 8,681,135 |
| |
| Expedia, Inc. | | | | |
| 7.456% due 8/15/2018 | 4,531,000 | | | 5,210,781 |
| |
| Fairfax Financial Holdings Ltd. | | | | |
| 8.250% due 10/1/2015 | 2,094,000 | | | 2,142,133 |
| 7.375% due 4/15/2018 | 29,666,500 | | | 33,302,901 |
| 5.800% due 5/15/2021 (e) | 12,040,000 | | | 12,992,581 |
| |
| Fidelity National Financial, Inc. | | | | |
| 6.600% due 5/15/2017 | 16,009,000 | | | 17,410,876 |
| |
| Fifth Third Bancorp | | | | |
| 4.900% due 9/30/2019 (b) (d) | 54,690,000 | | | 52,434,037 |
| |
| First Midwest Bancorp, Inc. | | | | |
| 5.875% due 11/22/2016 | 1,175,000 | | | 1,234,199 |
| |
| Fortune Brands, Inc. | | | | |
| 5.375% due 1/15/2016 | 24,000 | | | 24,647 |
| | | | | |
| Frontier Oil Corp. | | | | |
| 6.875% due 11/15/2018 | 27,648,000 | | | 28,598,262 |
| |
| Gazprom OAO Via Gaz | | | | |
| Capital S.A. | | | | |
| 8.146% due 4/11/2018 (e) | 4,500,000 | | | 4,848,750 |
| 9.250% due 4/23/2019 (e) | 30,596,000 | | | 34,564,301 |
| 9.250% due 4/23/2019 (e) | 30,000,000 | | | 33,891,000 |
| |
| GE Capital Trust I | | | | |
| 6.375% due 11/15/2067 (b) | 20,107,000 | | | 21,853,796 |
| |
| General Electric Capital Corp. | | | | |
| 5.000% due 4/15/2016 | 45,000 | | | 46,261 |
| 0.659% due 5/5/2026 (b) | 613,000 | | | 584,035 |
| 6.375% due 11/15/2067 (b) | 51,298,000 | | | 55,914,820 |
| |
| Genworth Financial Inc. | | | | |
| 6.515% due 5/22/2018 | 18,160,000 | | | 19,170,241 |
| 7.700% due 6/15/2020 | 6,293,000 | | | 6,780,707 |
| |
| GFI Group Inc. | | | | |
| 10.375% due 7/19/2018 (b) | 51,953,000 | | | 57,797,712 |
| |
| Globo Comunicacao e | | | | |
| Participacoes S.A. | | | | |
| 5.307% due 5/11/2022 (c) (e) | 10,700,000 | | | 11,154,750 |
| |
| Goldman Sachs Group, Inc. | | | | |
| 1.277% due 2/19/2018 (b) | 5,000,000 | | | 4,986,165 |
| 2.000% due 6/17/2023 (b) | 1,764,000 | | | 1,703,086 |
| |
| Great Plains Energy Inc. | | | | |
| 6.875% due 9/15/2017 | 30,000 | | | 32,748 |
| |
| Harsco Corp. | | | | |
| 5.750% due 5/15/2018 | 23,184,000 | | | 24,053,400 |
| |
| HCP, Inc. | | | | |
| 7.072% due 6/8/2015 | 188,000 | | | 188,163 |
| |
| Hiland Partners, LP | | | | |
| 7.250% due 10/1/2020 (e) | 22,110,000 | | | 24,044,625 |
| |
| Hillshire Brands Co. | | | | |
| 2.750% due 9/15/2015 | 389,000 | | | 391,094 |
See Notes to Financial Statements.
21
| BOND FUND SCHEDULE OF INVESTMENTS (Unaudited) (Continued) |
| May 31, 2015 |
| Principal | | | |
| Amount | | Value |
| BONDS (continued) | | | | |
| | | | | |
| Corporate Bonds (continued) | | | | |
| Horace Mann Educators Corp. | | | | |
| 6.850% due 4/15/2016 | 9,265,000 | | $ | 9,716,048 |
| |
| Hospitality Properties Trust | | | | |
| 6.300% due 6/15/2016 | 1,648,000 | | | 1,689,703 |
| 5.625% due 3/15/2017 | 11,508,000 | | | 12,210,218 |
| 6.700% due 1/15/2018 | 5,007,000 | | | 5,453,785 |
| |
| Host Hotels & Resorts LP | | | | |
| 5.875% due 6/15/2019 | 4,155,000 | | | 4,283,070 |
| 6.000% due 11/1/2020 | 6,584,000 | | | 6,919,073 |
| |
| HRPT Properties Trust | | | | |
| 6.250% due 8/15/2016 | 4,645,000 | | | 4,790,012 |
| 6.250% due 6/15/2017 | 5,678,000 | | | 6,045,440 |
| 6.650% due 1/15/2018 | 33,478,000 | | | 36,127,985 |
| |
| Ingram Micro Inc. | | | | |
| 5.250% due 9/1/2017 | 750,000 | | | 804,774 |
| |
| International Game Technology | | | | |
| 7.500% due 6/15/2019 | 4,888,000 | | | 5,205,720 |
| |
| International Lease Finance Corp. | | | | |
| 6.750% due 9/1/2016 (e) | 14,286,000 | | | 15,107,445 |
| |
| INVISTA Finance LLC | | | | |
| 4.250% due 10/15/2019 (e) | 12,405,000 | | | 12,218,925 |
| |
| ITT Hartford Financial | | | | |
| Services Group, Inc. | | | | |
| 7.300% due 11/1/2015 | 145,000 | | | 148,786 |
| |
| J.C. Penney Corp, Inc. | | | | |
| 6.875% due 10/15/2015 | 3,071,000 | | | 3,132,420 |
| |
| Jabil Circuit, Inc. | | | | |
| 7.750% due 7/15/2016 | 5,069,000 | | | 5,411,157 |
| 8.250% due 3/15/2018 | 71,065,000 | | | 81,813,581 |
| |
| John Hancock Life Ins. Co. | | | | |
| 5.450% due 9/15/2015 | 201,000 | | | 203,586 |
| 5.450% due 10/15/2015 | 29,000 | | | 29,388 |
| 5.500% due 11/15/2015 | 75,000 | | | 75,734 |
| 5.250% due 12/15/2015 | 25,000 | | | 25,582 |
| 5.500% due 12/15/2015 | 25,000 | | | 25,550 |
| 5.000% due 4/15/2016 | 60,000 | | | 61,911 |
| | | | | |
| JPMorgan Chase & Co. | | | | |
| 7.900% due 4/30/2018 (b) (d) | 78,324,000 | | | 83,532,546 |
| 5.250% due 5/15/2018 | 65,000 | | | 65,003 |
| 5.250% due 3/15/2019 | 20,000 | | | 19,774 |
| |
| Kinder Morgan Inc. | | | | |
| 7.000% due 2/1/2018 | 22,258,000 | | | 24,678,936 |
| |
| Lexmark International, Inc. | | | | |
| 6.650% due 6/1/2018 | 4,262,000 | | | 4,720,847 |
| |
| LG&E and KU Energy LLC | | | | |
| 2.125% due 11/15/2015 (e) | 150,000 | | | 150,741 |
| |
| Life Technologies Corp. | | | | |
| 3.500% due 1/15/2016 | 596,000 | | | 605,373 |
| |
| Lincoln National Corp. | | | | |
| 7.000% due 5/17/2066 (b) | 27,985,000 | | | 25,186,500 |
| 6.050% due 4/20/2067 (b) | 20,155,000 | | | 18,492,212 |
| |
| Macy’s Retail Holdings Inc. | | | | |
| 8.125% due 8/15/2035 | 305,000 | | | 309,833 |
| |
| Manufacturers & | | | | |
| Traders Trust Co. | | | | |
| 5.585% due 12/28/2020 (b) | 14,173,000 | | | 14,481,135 |
| 5.629% due 12/1/2021 (b) | 1,002,000 | | | 1,039,575 |
| |
| Marriott Int’l., Inc. | | | | |
| 6.200% due 6/15/2016 | 160,000 | | | 167,678 |
| |
| Masco Corp. | | | | |
| 4.800% due 6/15/2015 | 802,000 | | | 803,079 |
| 6.125% due 10/3/2016 | 8,803,000 | | | 9,353,187 |
| 5.850% due 3/15/2017 | 3,792,000 | | | 4,025,587 |
| 6.625% due 4/15/2018 | 13,741,000 | | | 15,115,100 |
| |
| MBIA Inc. | | | | |
| 6.400% due 8/15/2022 | 78,439,000 | | | 78,439,000 |
| |
| Merrill Lynch & Co. | | | | |
| 6.050% due 5/16/2016 | 4,920,000 | | | 5,133,528 |
| 8.400% due 11/1/2019 | 310,000 | | | 381,664 |
| |
| Midcontinent Express | | | | |
| Pipeline LLC | | | | |
| 6.700% due 9/15/2019 (e) | 14,665,000 | | | 15,856,531 |
See Notes to Financial Statements.
22
| BOND FUND SCHEDULE OF INVESTMENTS (Unaudited) (Continued) |
| May 31, 2015 |
| Principal | | | |
| Amount | | Value |
| BONDS (continued) | | | | |
| | | | | |
| Corporate Bonds (continued) | | | | |
| Morgan Stanley | | | | |
| 6.250% due 7/8/2019 (c) | 201,000 | | $ | 201,003 |
| 1.975% due 4/1/2021 (b) | 130,000 | | | 128,863 |
| 1.975% due 6/9/2023 (b) | 100,000 | | | 102,375 |
| |
| MPT Operating Partnership, L.P. | | | | |
| 6.875% due 5/1/2021 | 45,844,000 | | | 49,110,385 |
| |
| Mylan Inc. | | | | |
| 7.875% due 7/15/2020 (e) | 11,945,000 | | | 12,512,686 |
| |
| National City Bank of Indiana | | | | |
| 4.250% due 7/1/2018 | 200,000 | | | 212,680 |
| |
| National Retail Properties Inc. | | | | |
| �� 6.875% due 10/15/2017 | 1,148,000 | | | 1,277,221 |
| |
| National Rural Utilities | | | | |
| 7.200% due 10/1/2015 | 50,000 | | | 51,135 |
| 7.200% due 10/1/2015 | 80,000 | | | 81,680 |
| |
| Nationwide Building Society | | | | |
| 5.000% due 8/1/2015 (e) | 250,000 | | | 251,592 |
| |
| NCNB Corp. | | | | |
| 10.200% due 7/15/2015 | 329,000 | | | 332,568 |
| |
| NIPSCO Capital Markets, Inc. | | | | |
| 7.860% due 3/27/2017 | 96,000 | | | 104,778 |
| |
| Noble Drilling Corp. | | | | |
| 7.500% due 3/15/2019 | 21,428,000 | | | 23,352,192 |
| |
| Noble Holding Int’l. Ltd. | | | | |
| 3.450% due 8/1/2015 | 502,000 | | | 503,453 |
| 4.900% due 8/1/2020 | 23,359,000 | | | 23,849,282 |
| 4.625% due 3/1/2021 | 14,580,000 | | | 14,492,505 |
| |
| Northern Indiana Public | | | | |
| Service Co. | | | | |
| 7.590% due 6/12/2017 | 182,000 | | | 199,481 |
| |
| Omega Healthcare Investors, Inc. | | | | |
| 6.750% due 10/15/2022 | 17,210,000 | | | 18,048,987 |
| |
| Owens Corning | | | | |
| 6.500% due 12/1/2016 | 217,000 | | | 231,806 |
| | | | | |
| Pemex Project Funding | | | | |
| Master Trust | | | | |
| 9.250% due 3/30/2018 | 20,000 | | | 23,605 |
| |
| Penn Virginia Resource | | | | |
| Partners, L.P. | | | | |
| 6.500% due 5/15/2021 | 14,579,000 | | | 15,570,270 |
| |
| Petrobras Energia S.A. | | | | |
| 5.875% due 5/15/2017 (e) | 13,500,000 | | | 13,770,000 |
| 5.875% due 5/15/2017 (e) | 24,549,000 | | | 25,039,980 |
| |
| Petrobras Int’l. Finance Co. S.A. | | | | |
| 8.375% due 12/10/2018 | 727,000 | | | 806,806 |
| 7.875% due 3/15/2019 | 21,903,200 | | | 23,574,414 |
| 5.750% due 1/20/2020 | 11,320,000 | | | 11,307,548 |
| 5.375% due 1/27/2021 | 1,865,000 | | | 1,819,308 |
| |
| Pitney Bowes Inc. | | | | |
| 4.750% due 1/15/2016 | 167,000 | | | 170,373 |
| 5.250% due 1/15/2037 | 2,821,000 | | | 3,007,364 |
| |
| Plains Exploration & | | | | |
| Production Co. | | | | |
| 6.125% due 6/15/2019 | 12,983,000 | | | 13,761,980 |
| 6.500% due 11/15/2020 | 17,827,000 | | | 18,896,620 |
| 6.625% due 5/1/2021 | 30,335,000 | | | 31,851,750 |
| 6.750% due 2/1/2022 | 14,445,000 | | | 15,383,925 |
| 6.875% due 2/15/2023 | 2,364,000 | | | 2,538,345 |
| |
| Platinum Underwriters Finance, | | | | |
| Inc. | | | | |
| 7.500% due 6/1/2017 | 15,976,000 | | | 17,619,994 |
| |
| Plum Creek Timberlands LP | | | | |
| 5.875% due 11/15/2015 | 50,000 | | | 51,096 |
| |
| PNC Financial Services Group | | | | |
| 6.750% due 8/1/2021 (b) (d) | 34,389,000 | | | 38,300,749 |
| |
| PPF Funding, Inc. | | | | |
| 5.625% due 1/15/2017 (e) | 245,000 | | | 256,902 |
| |
| Principal Life Income | | | | |
| Funding Trusts | | | | |
| 1.855% due 4/1/2016 (b) | 50,000 | | | 49,540 |
See Notes to Financial Statements.
23
| BOND FUND SCHEDULE OF INVESTMENTS (Unaudited) (Continued) |
| May 31, 2015 |
| Principal | | | |
| Amount | | Value |
| BONDS (continued) | | | | |
| | | | | |
| Corporate Bonds (continued) | | | | |
| Prologis, Inc. | | | | |
| 6.875% due 3/15/2020 | 69,000 | | $ | 80,972 |
| |
| Provident Cos., Inc. | | | | |
| 7.000% due 7/15/2018 | 1,057,000 | | | 1,202,036 |
| |
| Reckson Operating | | | | |
| Partnership, L.P. | | | | |
| 6.000% due 3/31/2016 | 1,291,000 | | | 1,342,239 |
| |
| Regency Energy Partners LP | | | | |
| 6.500% due 7/15/2021 | 17,886,000 | | | 19,121,923 |
| |
| Reinsurance Group of | | | | |
| America, Inc. | | | | |
| 6.750% due 12/15/2065 (b) | 33,768,000 | | | 32,164,020 |
| |
| Russian Agricultural Bank OJSC | | | | |
| via RSHB Capital S.A. | | | | |
| 5.298% due 12/27/2017 (e) | 10,000,000 | | | 9,838,600 |
| 5.298% due 12/27/2017 (e) | 2,000,000 | | | 1,967,720 |
| 7.750% due 5/29/2018 (e) | 5,000,000 | | | 5,222,400 |
| |
| Russian Railways via RZD | | | | |
| Capital PLC | | | | |
| 5.739% due 4/3/2017 (e) | 5,745,000 | | | 5,823,994 |
| 5.700% due 4/5/2022 (e) | 28,200,000 | | | 27,354,451 |
| |
| Seagate HDD Cayman | | | | |
| 7.000% due 11/1/2021 | 2,569,000 | | | 2,787,365 |
| |
| Security Benefit Life Insurance | | | | |
| 8.750% due 5/15/2016 (e) | 8,000,000 | | | 8,505,336 |
| |
| Select Income REIT | | | | |
| 2.850% due 2/1/2018 | 17,420,000 | | | 17,664,559 |
| |
| Seminole Indian Tribe of Florida | | | | |
| 8.030% due 10/1/2020 (e) | 33,300,000 | | | 36,130,500 |
| |
| SESI LLC | | | | |
| 6.375% due 5/1/2019 | 30,286,000 | | | 31,118,865 |
| 7.125% due 12/15/2021 | 47,391,000 | | | 50,708,370 |
| |
| Skyway Concession Co. LLC | | | | |
| 0.553% due 6/30/2017 (b) (e) | 67,825,000 | | | 65,315,475 |
| | | | | |
| SL Green Realty Corp. | | | | |
| 5.000% due 8/15/2018 | 16,215,000 | | | 17,414,488 |
| |
| SLM Corp. | | | | |
| 5.500% due 3/15/2019 | 800,000 | | | 779,413 |
| 6.000% due 3/15/2019 (c) | 110,000 | | | 108,034 |
| 6.600% due 3/15/2019 (c) | 375,000 | | | 366,666 |
| 5.190% due 4/24/2019 | 731,000 | | | 729,173 |
| 6.250% due 9/15/2020 (c) | 154,000 | | | 147,953 |
| 6.500% due 12/15/2020 (c) | 71,000 | | | 69,620 |
| 6.750% due 12/15/2020 (c) | 306,000 | | | 302,602 |
| 6.750% due 12/15/2020 (c) | 95,000 | | | 94,624 |
| 6.000% due 6/15/2021 | 251,000 | | | 244,852 |
| 6.150% due 6/15/2021 | 146,000 | | | 140,576 |
| 6.150% due 6/15/2021 | 52,000 | | | 50,790 |
| 7.250% due 1/25/2022 | 520,000 | | | 561,330 |
| |
| Southern Copper Corp. | | | | |
| 6.375% due 7/27/2015 | 120,000 | | | 120,732 |
| |
| Southwestern Energy Co. | | | | |
| 7.500% due 2/1/2018 | 100,000 | | | 112,317 |
| |
| StanCorp Financial Group, Inc. | | | | |
| 6.900% due 6/1/2067 (b) | 39,634,000 | | | 36,859,620 |
| |
| Standard Chartered PLC | | | | |
| 4.000% due 7/12/2022 (b) (e) | 37,273,000 | | | 38,297,038 |
| |
| Stanley Black & Decker Inc. | | | | |
| 5.750% due 12/15/2053 (b) | 2,250,000 | | | 2,446,875 |
| |
| Susa Partnership L.P. | | | | |
| 8.200% due 6/1/2017 | 16,000 | | | 17,966 |
| 7.450% due 7/1/2018 | 130,000 | | | 150,257 |
| |
| Symantec Corp. | | | | |
| 2.750% due 9/15/2015 | 301,000 | | | 302,406 |
| |
| Tech Data Corp. | | | | |
| 3.750% due 9/21/2017 | 4,301,000 | | | 4,446,860 |
| |
| Texas Gas Transmission, LLC | | | | |
| 4.600% due 6/1/2015 | 710,000 | | | 710,000 |
See Notes to Financial Statements.
24
| BOND FUND SCHEDULE OF INVESTMENTS (Unaudited) (Continued) |
| May 31, 2015 |
| Principal | | | |
| | Amount | | Value |
| BONDS (continued) | | | | |
| | | | | |
| Corporate Bonds (continued) | | | | |
| Transocean Inc. | | | | |
| 6.000% due 3/15/2018 | 33,366,000 | | $ | 33,949,905 |
| 7.375% due 4/15/2018 | 4,933,000 | | | 5,154,985 |
| |
| Unitrin, Inc. | | | | |
| 6.000% due 5/15/2017 | 14,877,000 | | | 15,912,290 |
| |
| Wells Fargo & Co. | | | | |
| 7.980% due 3/15/2018 (b) (d) | 68,681,000 | | | 75,549,100 |
| |
| Western Power Distribution | | | | |
| 7.250% due 12/15/2017 (e) | 2,335,000 | | | 2,556,577 |
| |
| Western Union Co. | | | | |
| 5.930% due 10/1/2016 | 29,677,000 | | | 31,378,768 |
| |
| Westvaco Corp. | | | | |
| 7.650% due 3/15/2027 | 256,000 | | | 281,285 |
| 7.500% due 6/15/2027 | 626,000 | | | 663,927 |
| |
| Wyndham Worldwide | | | | |
| 5.750% due 2/1/2018 | 2,046,000 | | | 2,187,053 |
| |
| XL Group PLC | | | | |
| 6.500% due 4/15/2017 (b) (d) | 91,235,000 | | | 78,598,952 |
| |
| ZFS Finance USA Trust II | | | | |
| 6.450% due 12/15/2065 (b) (e) | 5,000,000 | | | 5,175,000 |
| |
| Zions Bancorporation | | | | |
| 4.500% due 3/27/2017 | 1,125,000 | | | 1,177,374 |
| |
| Total Corporate Bonds | | | | 2,747,199,527 |
| |
| Federal Agency Mortgage-Backed | | | | |
| Securities - 0.0% | | | | |
| Fannie Mae | | | | |
| 7.000% due 7/1/2015, | | | | |
| Series 53-5461F | 19 | | | 19 |
| 8.000% due 9/1/2015, | | | | |
| Series 53-5460F | 100 | | | 100 |
| 6.500% due 1/1/2019, | | | | |
| Series 76-9194F | 25,224 | | | 26,419 |
| 6.000% due 10/1/2037, | | | | |
| Series 88-8736F | 159,443 | | | 176,442 |
| 6.000% due 3/1/2038, | | | | |
| Series 25-7134F | 126,550 | | | 139,961 |
| Freddie Mac | | | | |
| 4.500% due 5/1/2018, | | | | |
| Series P1-0032 | 18,313 | | | 18,458 |
| 6.500% due 12/1/2018, | | | | |
| Series C9-0241 | 21,196 | | | 24,353 |
| 6.000% due 11/1/2021, | | | | |
| Series G1-2449 | 37,008 | | | 40,788 |
| 6.000% due 2/1/2022, | | | | |
| Series G1-2758 | 71,799 | | | 79,130 |
| |
| Ginnie Mae | | | | |
| 5.500% due 6/15/2017, | | | | |
| Series 58-4476X | 785 | | | 793 |
| 5.500% due 7/20/2018, | | | | |
| Series 00-3411M | 6,939 | | | 7,237 |
| 7.000% due 5/15/2033, | | | | |
| Series 78-2071X | 37,691 | | | 45,611 |
| 5.500% due 6/20/2038, | | | | |
| Series 00-4163M | 19,906 | | | 21,438 |
| |
| Total Federal Agency Mortgage- | | | | |
| Backed Securities | | | | 580,749 |
| |
| Taxable Municipal Bonds - 2.7% | | | | |
| California Earthquake Authority | | | | |
| 6.169% due 7/1/2016 | 590,000 | | | 599,304 |
| |
| Casino Reinvestment | | | | |
| Development Authority NJ | | | | |
| 5.340% due 6/1/2020 | 9,765,000 | | | 9,964,401 |
| |
| City of Atlantic City NJ | | | | |
| 4.750% due 12/15/2015 | 220,000 | | | 223,445 |
| |
| City of Cleveland OH Airport | | | | |
| System Revenue | | | | |
| 5.239% due 1/1/2017 | 440,000 | | | 446,446 |
| |
| City of Detroit MI Water Supply | | | | |
| System Revenue | | | | |
| 3.607% due 7/1/2016 | 325,000 | | | 326,658 |
| |
| City of Miami FL | | | | |
| 6.750% due 12/1/2018 | 1,310,000 | | | 1,452,738 |
| |
| County of Reeves TX Certs. | | | | |
| of Participation | | | | |
| 4.250% due 12/1/2015 | 10,000 | | | 10,015 |
| 6.150% due 12/1/2015 | 755,000 | | | 760,919 |
See Notes to Financial Statements.
25
| BOND FUND SCHEDULE OF INVESTMENTS (Unaudited) (Continued) |
| May 31, 2015 |
| Principal | | | |
| Amount | | Value |
| BONDS (continued) | | | | |
| | | | | |
| Taxable Municipal Bonds (continued) | | | |
| County of Reeves TX Certs. | | | | |
| of Participation (continued) | | | | |
| 7.000% due 12/1/2015 | 25,000 | | $ | 25,245 |
| 5.000% due 12/1/2016 | 65,000 | | | 66,111 |
| 6.000% due 12/1/2016 | 75,000 | | | 75,990 |
| 5.000% due 12/1/2017 | 45,000 | | | 46,267 |
| 6.250% due 12/1/2017 | 20,000 | | | 20,272 |
| 7.400% due 12/1/2017 | 195,000 | | | 198,744 |
| 5.625% due 12/1/2018 | 125,000 | | | 131,275 |
| 6.500% due 12/1/2018 | 125,000 | | | 126,808 |
| 7.500% due 12/1/2018 | 35,000 | | | 35,676 |
| 6.750% due 12/1/2019 | 625,000 | | | 632,644 |
| 6.125% due 12/1/2020 | 375,000 | | | 401,445 |
| 6.875% due 12/1/2020 | 370,000 | | | 375,132 |
| 6.375% due 12/1/2021 | 45,000 | | | 48,807 |
| 7.000% due 12/1/2021 | 430,000 | | | 436,046 |
| 7.700% due 12/1/2021 | 3,340,000 | | | 3,398,283 |
| |
| Fannin County TX Public | | | | |
| Facility Corp. | | | | |
| 2.950% due 10/1/2015 | 335,000 | | | 336,444 |
| 3.950% due 10/1/2016 | 675,000 | | | 686,178 |
| 4.600% due 10/1/2017 | 740,000 | | | 758,515 |
| 5.200% due 10/1/2019 | 515,000 | | | 533,463 |
| 5.650% due 10/1/2021 | 825,000 | | | 869,253 |
| |
| Garza County TX Public | | | | |
| Facility Corp. | | | | |
| 6.200% due 10/1/2020 | 1,665,000 | | | 1,728,470 |
| |
| Guam Gov’t. | | | | |
| Waterworks Authority | | | | |
| 1.880% due 7/1/2016 | 3,320,000 | | | 3,312,796 |
| 2.516% due 7/1/2017 | 210,000 | | | 209,177 |
| 3.061% due 7/1/2018 | 255,000 | | | 255,592 |
| |
| Kentucky Economic Development | | | | |
| Finance Authority | | | | |
| 7.000% due 12/1/2021 | 270,000 | | | 273,081 |
| |
| Lancaster PA Parking Authority | | | | |
| 5.760% due 12/1/2017 | 510,000 | | | 527,289 |
| |
| LL & P Wind Energy, Inc. WA | | | | |
| 5.733% due 12/1/2017 (e) | 675,000 | | | 681,412 |
| 5.983% due 12/1/2022 (e) | 8,595,000 | | | 8,760,969 |
| | | | |
| Memphis TN Health | | | | |
| Educational & Housing | | | | |
| Facility Board | | | | |
| 4.500% due 3/1/2018 | 200,000 | | | 199,792 |
| |
| New Jersey Economic | | | | |
| Development Authority | | | | |
| 5.000% due 6/15/2017 (e) | 630,000 | | | 636,646 |
| |
| New Jersey Sports & | | | | |
| Exposition Authority | | | | |
| 6.076% due 3/1/2023 | 615,000 | | | 660,707 |
| |
| Pontotoc County OK Educational | | | | |
| Facilities Authority | | | | |
| 4.119% due 9/1/2023 | 360,000 | | | 373,370 |
| |
| Puerto Rico Commonwealth | | | | |
| Gov’t. Development Bank | | | | |
| 4.704% due 5/1/2016 | 24,080,000 | | | 18,451,059 |
| 3.875% due 2/1/2017 | 8,000,000 | | | 4,982,880 |
| 4.375% due 2/1/2019 | 12,395,000 | | | 6,199,979 |
| |
| San Luis AZ Facility | | | | |
| Development Corp. | | | | |
| 4.050% due 5/1/2016 | 1,005,000 | | | 1,007,010 |
| 4.650% due 5/1/2017 | 1,130,000 | | | 1,135,571 |
| 5.050% due 5/1/2018 | 780,000 | | | 788,962 |
| 5.350% due 5/1/2019 | 1,240,000 | | | 1,245,034 |
| 5.600% due 5/1/2020 | 670,000 | | | 681,062 |
| 5.700% due 5/1/2020 | 850,000 | | | 864,552 |
| 5.800% due 5/1/2021 | 1,055,000 | | | 1,073,304 |
| 5.900% due 5/1/2021 | 980,000 | | | 998,326 |
| 6.100% due 5/1/2022 | 1,030,000 | | | 1,043,689 |
| 6.200% due 5/1/2022 | 1,035,000 | | | 1,049,583 |
| |
| Summit County OH Development | | | | |
| Finance Authority | | | | |
| 6.250% due 5/15/2026 | 435,000 | | | 458,929 |
| |
| West Texas Detention | | | | |
| Facility Corp. | | | | |
| 3.800% due 11/1/2016 | 1,000,000 | | | 1,015,530 |
| 4.400% due 11/1/2017 | 1,195,000 | | | 1,227,994 |
| 4.700% due 11/1/2018 | 920,000 | | | 950,544 |
| |
| Willacy County TX Local | | | | |
| Gov’t. Corp. | | | | |
| 7.800% due 12/1/2028 | 1,530,000 | | | 839,037 |
See Notes to Financial Statements.
26
| BOND FUND SCHEDULE OF INVESTMENTS (Unaudited) (Continued) |
| May 31, 2015 |
| Principal | | | |
| Amount | | | |
| or Shares | | Value |
| BONDS (continued) | | | | |
| | | | | |
| Taxable Municipal Bonds (continued) | | | |
| Willacy County TX Public | | | | |
| Facility Corp. | | | | |
| 5.000% due 12/1/2015 | 1,230,000 | | $ | 1,241,734 |
| 6.000% due 12/1/2016 | 1,330,000 | | | 1,377,614 |
| 6.000% due 12/1/2017 | 390,000 | | | 410,046 |
| 5.600% due 12/1/2018 | 420,000 | | | 443,465 |
| |
| Total Taxable Municipal Bonds | | | | 88,091,729 |
| |
| Tax-Exempt Municipal Bonds - 0.1% | | | |
| Casino Reinvestment | | | | |
| Development Authority NJ | | | | |
| 5.250% due 6/1/2019 | 5,000,000 | | | 5,014,750 |
| |
| Total Tax-Exempt | | | | |
| Municipal Bonds | | | | 5,014,750 |
| |
| United States Government & | | | | |
| Agency Issues - 0.5% | | | | |
| U.S. Treasury Bonds | | | | |
| 1.750% due 7/31/2015 | 15,000,000 | | | 15,042,180 |
| |
| Total United States Government | | | | |
| & Agency Issues | | | | 15,042,180 |
| |
| TOTAL BONDS | | | | |
| (COST $3,266,188,056) | | | | 3,178,922,857 |
| |
| SHORT-TERM INVESTMENTS - 1.1% | | | | |
| |
| Money Market Funds - 0.0% | | | | |
| Fidelity Money Market Portfolio | | | | |
| Class I, 0.097% (a) | 330 | | | 330 |
| |
| Total Money Market Funds | | | | 330 |
| | | | | |
| United States Government & | | | | |
| Agency Issues - 1.1% | | | | |
| U.S. Treasury Bills | | | | |
| 0.001% due 7/30/2015 (b) | 35,000,000 | | | 35,000,000 |
| |
| Total United States Government | | | |
| & Agency Issues | | | | 35,000,000 |
| |
| TOTAL SHORT-TERM | | | | |
| INVESTMENTS | | | | |
| (COST $35,000,240) | | | | 35,000,330 |
| |
| TOTAL INVESTMENTS - 98.5% | | | |
| (COST $3,301,188,296) | | | | 3,213,923,187 |
| |
| NET OTHER ASSETS AND | | | | |
| LIABILITIES - 1.5% | | | | 49,792,673 |
| |
| NET ASSETS - 100.0% | | | $ | 3,263,715,860 |
| (a) | Represents the 7-day yield at May 31, 2015. |
|
| (b) | Rate shown represents the current coupon rate at May 31, 2015. |
|
| (c) | Security is a “step-up” bond where the coupon increases or steps up at a predetermined date. |
|
| (d) | Perpetual maturity; date shown represents next contractual call date. |
|
| (e) | Security subject to restrictions on resale under federal securities laws and which therefore may only be resold upon registration under the Securities Act of 1933, as amended, or in transactions exempt from registration, including sales to qualified institutional buyers under Rule 144A of the Securities Act of 1933, as amended. It has been deemed liquid under guidance approved by the Board. |
B.V.: | Besloten Vennootschap is the Dutch term for a private limited liability corporation. |
PLC: | Public Limited Company |
REIT: | Real Estate Investment Trust |
S.A.: | Generally designates corporations in various countries, mostly those employing the civil law. |
See Notes to Financial Statements.
27
FUND EXPENSE EXAMPLES (Unaudited) |
| May 31, 2015 |
Example
A Fund shareholder may incur two types of costs: (1) transaction costs such as redemption fees; and (2) ongoing costs, including management fees and other Fund expenses. This example is intended to help you understand your ongoing costs (in dollars) of investing in a Fund and to compare these costs with the ongoing costs of investing in other mutual funds.
The example is based on an investment of $1,000 invested at the beginning of the period and held for the entire period from December 1, 2014 to May 31, 2015.
Actual Expenses
The first line of the table below under each Fund provides information about actual account values and actual expenses for such Fund. You may use the information in this line, together with the amount you invested, to estimate the expenses that you paid over the period. Simply divide your account value by $1,000 (for example, an $8,600 account value divided by $1,000 = 8.6), then multiply the result by the number in the first line under the heading entitled “Expenses Paid During Period” to estimate the expenses you paid on your account during this period.
Hypothetical Example for Comparison Purposes
The second line of the table below under each Fund provides information about hypothetical account values and hypothetical expenses based on such Fund’s actual expense ratio and an assumed rate of return of 5% per year before expenses, which is not the Fund’s actual return. The hypothetical account values and expenses may not be used to estimate the actual ending account balance or expenses you paid for the period. You may use this information to compare the ongoing costs of investing in each Fund and other funds. To do so, compare the 5% hypothetical example with the 5% hypothetical examples that appear in the shareholder reports of the other funds.
Please note that the expenses shown in the table are meant to highlight your ongoing costs only and do not reflect any transactional costs, such as redemption fees. Therefore, the second line of the table is useful in comparing ongoing costs only, and will not help you determine the relative costs of owning different funds. In addition, if these transactional costs were included, your costs would have been higher.
| Six-Month Period Ended May 31, 2015 | Expense Ratio
for the Period | | Beginning
Account Value
12/01/14 | | Ending
Account Value
05/31/15 | | Expenses Paid During
Period* |
| Thompson LargeCap Fund | | | | | | | |
| Actual | 1.15% | | $1,000.00 | | $1,016.87 | | $5.78 |
| Hypothetical (5% return before expenses) | 1.15% | | $1,000.00 | | $1,019.27 | | $5.79 |
| Thompson MidCap Fund | | | | | | | |
| Actual | 1.30% | | $1,000.00 | | $1,021.92 | | $6.55 |
| Hypothetical (5% return before expenses) | 1.30% | | $1,000.00 | | $1,018.52 | | $6.54 |
| Thompson Bond Fund | | | | | | | |
| Actual | 0.72% | | $1,000.00 | | $1,005.11 | | $3.60 |
| Hypothetical (5% return before expenses) | 0.72% | | $1,000.00 | | $1,021.41 | | $3.63 |
| * | Expenses are equal to the annualized [net] expense ratio for each Fund, multiplied by the average account value over the period, multiplied by 182/365 (to reflect the one-half year period).
|
| For more information, please refer to the Funds’ Prospectus. |
See Notes to Financial Statements.
28
STATEMENTS OF ASSETS AND LIABILITIES (Unaudited) |
May 31, 2015 (In thousands, except per share amounts) |
| LARGECAP | | MIDCAP | | BOND |
| FUND | | FUND | | FUND |
| ASSETS | | | | | | | | | | | | | | | | | |
| Total investments in securities, at value (Cost $105,708, $34,664 and | | | | | | | | | | | | | | | | | |
| $3,301,188 respectively) | | $ | 126,119 | | | | | $ | 41,700 | | | | | $ | 3,213,923 | | |
| Due from sale of securities | | | 157 | | | | | | – | | | | | | 9,766 | | |
| Receivable from fund shares sold | | | 9 | | | | | | – | | | | | | 8,704 | | |
| Dividends and interest receivable | | | 257 | | | | | | 47 | | | | | | 46,341 | | |
| Prepaid expenses | | | 14 | | | | | | 12 | | | | | | 174 | | |
| Total Assets | | | 126,556 | | | | | | 41,759 | | | | | | 3,278,908 | | |
| LIABILITIES | | | | | | | | | | | | | | | | | |
| Due on purchase of securities | | | – | | | | | | – | | | | | | 3,457 | | |
| Payable for fund shares redeemed | | | 9 | | | | | | 2 | | | | | | 9,211 | | |
| Line of credit | | | – | | | | | | – | | | | | | 499 | | |
| Accrued expenses payable | | | 27 | | | | | | 19 | | | | | | 169 | | |
| Due to Advisor | | | 106 | | | | | | 34 | | | | | | 1,856 | | |
| Total Liabilities | | | 142 | | | | | | 55 | | | | | | 15,192 | | |
| NET ASSETS | | $ | 126,414 | | | | | $ | 41,704 | | | | | $ | 3,263,716 | | |
| Net Assets consist of: | | | | | | | | | | | | | | | | | |
| Capital stock ($.001 par value) | | $ | 154,085 | | | | | $ | 33,709 | | | | | $ | 3,325,685 | | |
| Undistributed net investment income (loss) | | | 249 | | | | | | (23 | ) | | | | | 32,839 | | |
| Accumulated net realized gain (loss) on investments | | | (48,331 | ) | | | | | 982 | | | | | | (7,543 | ) | |
| Net unrealized appreciation (depreciation) on investments | | | 20,411 | | | | | | 7,036 | | | | | | (87,265 | ) | |
| Net Assets | | $ | 126,414 | | | | | $ | 41,704 | | | | | $ | 3,263,716 | | |
| Shares of capital stock outstanding (unlimited shares authorized) | | | 2,327 | | | | | | 3,188 | | | | | | 282,518 | | |
| Offering and redemption price/Net asset value per share | | $ | 54.32 | | | | | $ | 13.08 | | | | | $ | 11.55 | | |
See Notes to Financial Statements.
29
STATEMENTS OF OPERATIONS (Unaudited) |
Six-Month Period Ended May 31, 2015 (In thousands) |
| LARGECAP | | MIDCAP | | BOND |
| FUND | | FUND | | FUND |
| Investment income | | | | | | | | | | | | | | | | |
| Dividends | | $ | 1,086 | | | | | $ | 243 | | | | | $ | – | |
| Interest(1) | | | – | | | | | | – | | | | | | 78,912 | |
| | | | 1,086 | | | | | | 243 | | | | | | 78,912 | |
| Expenses | | | | | | | | | | | | | | | | |
| Investment advisory fees | | | 592 | | | | | | 205 | | | | | | 10,201 | |
| Shareholder servicing costs | | | 47 | | | | | | 20 | | | | | | 901 | |
| Administrative & accounting services fees | | | 61 | | | | | | 28 | | | | | | 469 | |
| Custody fees | | | 6 | | | | | | 2 | | | | | | 135 | |
| Directors fees | | | 12 | | | | | | 11 | | | | | | 66 | |
| Federal & state registration | | | 17 | | | | | | 17 | | | | | | 58 | |
| Professional fees | | | 19 | | | | | | 19 | | | | | | 38 | |
| Other expenses | | | 12 | | | | | | 5 | | | | | | 392 | |
| Total expenses | | | 766 | | | | | | 307 | | | | | | 12,260 | |
| Less expenses reimbursed by Advisor | | | (41 | ) | | | | | (41 | ) | | | | | – | |
| Net expenses | | | 725 | | | | | | 266 | | | | | | 12,260 | |
| Net investment income (loss) | | | 361 | | | | | | (23 | ) | | | | | 66,652 | |
| Net realized gain (loss) on investments | | | 3,779 | | | | | | 1,117 | | | | | | (3,676 | ) |
| Net unrealized depreciation on investments | | | (1,346 | ) | | | | | (3 | ) | | | | | (37,673 | ) |
| Net gain (loss) on investments | | | 2,433 | | | | | | 1,114 | | | | | | (41,349 | ) |
| Net increase in net assets resulting from operations | | $ | 2,794 | | | | | $ | 1,091 | | | | | $ | 25,303 | |
| |
| |
| (1)Net of foreign withholding taxes | | $ | – | | | | | $ | – | | | | | $ | 67 | |
See Notes to Financial Statements.
30
STATEMENTS OF CHANGES IN NET ASSETS |
(In thousands) |
| | LARGECAP | | MIDCAP | | BOND |
| | FUND | | FUND | | FUND |
| | Six-Month | | | | Six-Month | | | | | | | | Six-Month | | | | | | |
| | Period Ended | | Year Ended | | Period Ended | | Year Ended | | Period Ended | | Year Ended |
| | May 31, 2015 | | November 30, | | May 31, 2015 | | November 30, | | May 31, 2015 | | November 30, |
| | (Unaudited) | | 2014 | | (Unaudited) | | 2014 | | (Unaudited) | | 2014 |
| Operations | | | | | | | | | | | | | | | | | | | | | | | | | | | | | | | | | | | | |
| Net investment income (loss) | | | $ | 361 | | | | | $ | 672 | | | | | $ | (23 | ) | | | | $ | (9 | ) | | | | $ | 66,652 | | | | | $ | 125,810 | | |
| Net realized gain (loss) | | | | | | | | | | | | | | | | | | | | | | | | | | | | | | | | | | | | |
| on investments | | | | 3,779 | | | | | | 15,743 | | | | | | 1,117 | | | | | | 3,923 | | | | | | (3,676 | ) | | | | | (822 | ) | |
| Net unrealized appreciation | | | | | | | | | | | | | | | | | | | | | | | | | | | | | | | | | | | | |
| (depreciation) on investments | | | | (1,346 | ) | | | | | 1,450 | | | | | | (3 | ) | | | | | 332 | | | | | | (37,673 | ) | | | | | (73,260 | ) | |
| Net increase in net assets resulting | | | | | | | | | | | | | | | | | | | | | | | | | | | | | | | | | | | | |
| from operations | | | | 2,794 | | | | | | 17,865 | | | | | | 1,091 | | | | | | 4,246 | | | | | | 25,303 | | | | | | 51,728 | | |
| Distributions to Shareholders | | | | | | | | | | | | | | | | | | | | | | | | | | | | | | | | | | | | |
| Distributions from net | | | | | | | | | | | | | | | | | | | | | | | | | | | | | | | | | | | | |
| investment income | | | | (676 | ) | | | | | (472 | ) | | | | | – | | | | | | – | | | | | | (71,662 | ) | | | | | (112,531 | ) | |
| Distributions from net realized gains | | | | | | | | | | | | | | | | | | | | | | | | | | | | | | | | | | | | |
| on securities transactions | | | | – | | | | | | – | | | | | | (3,896 | ) | | | | | (3,933 | ) | | | | | – | | | | | | (5,802 | ) | |
| Total distributions to shareholders | | | | (676 | ) | | | | | (472 | ) | | | | | (3,896 | ) | | | | | (3,933 | ) | | | | | (71,662 | ) | | | | | (118,333 | ) | |
| | |
| Fund Share Transactions | | | | | | | | | | | | | | | | | | | | | | | | | | | | | | | | | | | | |
| (See Note 4) | | | | (4,320 | ) | | | | | (13,575 | ) | | | | | 3,202 | | | | | | 3,386 | | | | | | (413,888 | ) | | | | | 1,538,506 | | |
| | |
| Total Increase (Decrease) | | | | | | | | | | | | | | | | | | | | | | | | | | | | | | | | | | | | |
| in Net Assets | | | | (2,202 | ) | | | | | 3,818 | | | | | | 397 | | | | | | 3,699 | | | | | | (460,247 | ) | | | | | 1,471,901 | | |
| | |
| Net Assets | | | | | | | | | | | | | | | | | | | | | | | | | | | | | | | | | | | | |
| Beginning of period | | | | 128,616 | | | | | | 124,798 | | | | | | 41,307 | | | | | | 37,608 | | | | | | 3,723,963 | | | | | | 2,252,062 | | |
| End of period | | | $ | 126,414 | | | | | $ | 128,616 | | | | | $ | 41,704 | | | | | $ | 41,307 | | | | | $ | 3,263,716 | | | | | $ | 3,723,963 | | |
| Undistributed net investment | | | | | | | | | | | | | | | | | | | | | | | | | | | | | | | | | | | | |
| income (loss) included in net assets | | | | | | | | | | | | | | | | | | | | | | | | | | | | | | | | | | | | |
| at end of period | | | $ | 249 | | | | | $ | 564 | | | | | $ | (23 | ) | | | | $ | – | | | | | $ | 32,839 | | | | | $ | 36,424 | | |
See Notes to Financial Statements.
31
NOTES TO FINANCIAL STATEMENTS (Unaudited) |
May 31, 2015 |
NOTE 1 - ORGANIZATION
Thompson IM Funds, Inc. (the “Company”) is a Wisconsin corporation registered under the Investment Company Act of 1940, as amended (the “1940 Act”), as an open-end, diversified management investment company.
The Company consists of separate mutual funds series (each, a “Fund,” and collectively, the “Funds”): Thompson LargeCap Fund (the “LargeCap Fund”), Thompson MidCap Fund (the “MidCap Fund”) and Thompson Bond Fund (the “Bond Fund”). The assets and liabilities of each Fund are segregated and a shareholder’s interest is limited to the Fund in which the shareholder owns shares. The objectives and strategies of each Fund are described in the Funds’ Prospectus.
NOTE 2 - SIGNIFICANT ACCOUNTING POLICIES
The following is a summary of significant accounting policies followed by the Funds in the preparation of their financial statements.
VALUATION POLICY AND PROCEDURES - The Funds’ Board of Directors (the “Funds’ Board”) has adopted methods for valuing securities set forth in the Funds’ Pricing Policies and Procedures, including circumstances in which market quotes are not readily available or deemed to be unreliable, and has delegated authority to the Advisor to apply those methods in making fair value determinations, subject to board oversight. The Advisor has established a valuation committee (the “Committee”). The Committee and other Advisor employees administer, implement, and oversee the fair valuation process and make fair value decisions. The Committee regularly reviews its own fair value decisions, as well as valuations, valuation techniques and services furnished by pricing services, considers circumstances in the markets which may require valuation determinations by the Committee and reviews previous valuation determinations. The Committee reports on its activities and any changes to the fair valuation guidelines to the Funds’ Board.
SECURITY VALUATION - Each Fund’s listed or exchange-traded investments are valued at their market prices (generally the last reported sales price on the exchange where the securities are primarily traded or, for Nasdaq-listed securities, at their Nasdaq Official Closing Prices). Exchange traded options are valued at the last reported sale price on an exchange on which the option is traded. If no sales are reported on a particular day, the mean between the highest bid and lowest asked quotations at the close of the exchanges will be used. Investments in money market mutual funds are generally priced at the ending net asset value provided by the service agent of the funds.
Debt investments are typically valued based on valuations published by an independent pricing service, which uses various valuation methodologies such as matrix pricing and other analytical pricing models as well as market transactions and dealer quotations. Factors considered by pricing services include market characteristics such as benchmark yield curves, option-adjusted spreads, credit spreads and fundamental analytical data relating to the issuer. Debt securities with remaining maturities of 60 days or less are generally valued on an amortized cost basis.
Where market quotations are not readily available or are unreliable, a fair value is determined in good faith pursuant to procedures established by the Funds’ Board. When a security is “fair valued,” consideration is given to the facts and circumstances relevant to the particular situation, including a review of various factors, which includes factors such as fundamental analytical data relating to the investment, which may include consideration of yields or prices of securities of comparable quality, coupon rate, maturity and type of issue, nature and duration of any restrictions on disposition of the security and an evaluation of forces that influence the market in which the securities are purchased or sold. Fair value pricing is an inherently subjective process, and no single standard exists for determining fair value. Different funds could reasonably arrive at different values for the same security. No securities in any of the Funds were fair valued as of May 31, 2015.
VALUATION MEASUREMENTS – In accordance with generally accepted accounting principles in the United States of America (“GAAP”), fair value is defined as the price that the Fund would receive to sell an investment or pay to transfer a liability in an orderly transaction with an independent buyer in the principal market, or in the absence of a principal market the most advantageous market for the investment or liability. GAAP established a three-tier hierarchy to maximize the use of observable market data and minimize the use of unobservable inputs and to establish classification of fair value measurements for disclosure purposes.
32
NOTES TO FINANCIAL STATEMENTS (Unaudited) (Continued) |
May 31, 2015 |
Various inputs are used in determining the value of each Fund’s investments. These inputs are summarized in the three broad levels listed below:
| | Level 1 – Quoted prices in active markets for identical securities.
|
| Level 2 – Other significant observable inputs (including quoted prices for similar securities, interest rates, prepayment speeds, credit risk, etc.).
|
| Level 3 – Significant unobservable inputs (including the Fund’s own assumptions in determining the fair value of investments). |
Inputs may include price information, specific and broad credit data, liquidity statistics, and other factors. The Fund considers observable data to be that market data which is readily available, regularly distributed or updated, reliable and verifiable, not proprietary, and provided by independent sources that are actively involved in the relevant market. The determination of what constitutes “observable” requires significant judgment by the Fund. The categorization of a financial instrument within the hierarchy is based upon the pricing transparency of the instrument and does not necessarily correspond to the Fund’s perceived risk of that instrument. Investments whose values are based on quoted market prices in active markets, and which are therefore classified as level-1 securities, include active listed equities and certain U.S. government obligations.
Investments that trade in markets that are not considered to be active, but are valued based on quoted market prices, dealer quotations or alternative pricing sources supported by observable inputs, are classified as level-2 securities. These include certain U.S. government obligations, most government agency securities, investment-grade corporate bonds, sovereign bonds, municipal bonds, and less liquid listed equities. Level-2 investments include positions that are not traded in active markets.
Investments classified as level-3 securities have significant unobservable inputs, as they trade infrequently or not at all. Level-3 instruments include private-placement and less liquid corporate and municipal debt securities. When observable prices are not available for these securities, the Fund uses one or more valuation techniques (e.g., the market approach, the income approach, or the cost approach) for which sufficient and reliable data is available. Within level 3, the use of the market approach generally consists of using comparable market transactions, while the use of the income approach generally consists of using the net present value of estimated future cash flows, adjusted as appropriate for liquidity, credit, market and/or other risk factors. The inputs used by the Fund in estimating the value of level-3 investments include the original transaction price and recent transactions in the same or similar instruments.
The following is a summary of the inputs used to value the Funds’ investments as of May 31, 2015:
| LargeCap Fund |
| Assets | Level 1 | | Level 2 | | Level 3 | | Total |
| Investment Securities: | | | | | | | | | | | |
| Common stocks | $ | 126,105,987 | | $ | – | | $ | – | | $ | 126,105,987 |
| Short-term investments | | 12,620 | | | – | | | – | | | 12,620 |
| Total Assets | $ | 126,118,607 | | $ | – | | $ | – | | $ | 126,118,607 |
| |
| | MidCap Fund |
| Assets | Level 1 | | Level 2 | | Level 3 | | Total |
| Investment Securities: | | | | | | | | | | | |
| Common stocks | $ | 41,641,653 | | $ | – | | $ | – | | $ | 41,641,653 |
| Short-term investments | | 57,987 | | | – | | | – | | | 57,987 |
| Total Assets | $ | 41,699,640 | | $ | – | | $ | – | | $ | 41,699,640 |
33
| NOTES TO FINANCIAL STATEMENTS (Unaudited) (Continued) |
| May 31, 2015 |
| | Bond Fund |
| Assets | | Level 1 | | Level 2 | | Level 3 | | Total |
| Investment Securities: | | | | | | | | | | | | |
| Bonds | | $ | – | | $ | 3,178,922,857 | | $ | – | | $ | 3,178,922,857 |
| Short-term investments | | | 330 | | | 35,000,000 | | | – | | | 35,000,330 |
| Total Assets | | $ | 330 | | $ | 3,213,922,857 | | $ | – | | $ | 3,213,923,187 |
There were no transfers between level-1 and level-2 securities and the Funds did not invest in any level-3 investments as of and during the six-month period ended May 31, 2015. It is the Funds’ policy to record transfers at the end of the reporting period. Refer to each Fund’s Schedule of Investments for additional information regarding security types and industry classifications.
SECURITIES TRANSACTIONS AND INVESTMENT INCOME - Investment securities transactions are accounted for on the trade date. Gains or losses realized on sales of securities are determined by comparing the identified cost of the security lot sold with the net sales proceeds. Discounts/premiums on debt securities purchased are accreted/amortized over the life of the respective securities on the same basis for book and tax purposes. Dividend income is recorded on the ex-dividend date. Interest income is recorded as earned. Income and capital gains on some foreign securities may be subject to foreign withholding taxes, which are accrued as applicable, and have been provided for in accordance with the Funds’ understanding of the applicable country’s tax rules and rates.
OPTIONS - Each Fund may enter into options transactions for hedging purposes and will not use these instruments for speculation. Each Fund may use options to hedge against anticipated declines in the market value of portfolio securities and increases in the market value of securities it intends to purchase and protect against exposure to interest rate changes. Each Fund may also use options to enhance total return or invest in eligible asset classes with greater efficiency and lower cost than is believed to be possible through direct investment. The use of options for hedging purposes involves certain risks and may result in a loss if changes in the value of the option move in a direction different than anticipated, rendering the hedging strategy unsuccessful.
Each Fund may write covered call/put options for which premiums received are recorded as liabilities and are subsequently adjusted to the current fair value of the options written. Premiums received from writing options that expire unexercised are treated as realized gains. Premiums received from writing options which are either exercised or closed are offset against the proceeds received or amount paid on the transaction to determine realized gains or losses.
SECURITIES PURCHASED ON A WHEN-ISSUED OR DELAYED-DELIVERY BASIS - Each Fund may purchase securities on a when-issued or delayed-delivery basis. When-issued securities are securities purchased with delivery to occur at a later date at a stated price and/or yield, thereby involving the risk that the price and/or yield obtained may be more or less than those available in the market when delivery takes place. At the time a Fund makes a commitment to purchase a security on a when-issued basis, the Fund records the transaction and reflects the value of the security in determining net asset value. Each Fund designates and maintains cash and marketable securities at least equal in value to commitments for when-issued securities.
VARIABLE-RATE DEMAND NOTES - The Funds invest in short-term variable-rate demand notes, which are unsecured instruments. The Funds may be susceptible to credit risk with respect to these instruments to the extent the issuer defaults on its payment obligation.
PERMANENT BOOK AND TAX DIFFERENCES - Generally accepted accounting principles require that permanent financial reporting and tax differences relating to shareholder distributions be reclassified in the capital accounts.
EXPENSES - Each Fund is charged for those expenses that are directly attributed to it. Expenses that are not readily identifiable to a specific Fund are generally allocated among the Funds in proportion to the relative sizes of the Funds.
34
| NOTES TO FINANCIAL STATEMENTS (Unaudited) (Continued) |
| May 31, 2015 |
USE OF ESTIMATES - The preparation of financial statements in conformity with GAAP requires management to make estimates and assumptions that affect the reported amounts of assets and liabilities and disclosure of contingent assets and liabilities at the date of the financial statements and the reported amounts of revenues and expenses during the reporting period. Actual results could differ from these estimates.
DISTRIBUTIONS TO SHAREHOLDERS - Distributions to shareholders from net investment income and realized gains on securities for the LargeCap Fund and MidCap Fund normally are declared at least annually. Bond Fund distributions to shareholders from net investment income normally are declared on a quarterly basis, and distributions to shareholders from realized gains on securities normally are declared at least annually. Distributions are recorded on the ex-dividend date.
FEDERAL INCOME TAXES - No provision has been made for federal income taxes since the Funds have elected to be taxed as regulated investment companies and intend to distribute substantially all income to shareholders and otherwise comply with the provisions of the Internal Revenue Code applicable to regulated investment companies.
LINE OF CREDIT - The Funds have established an unsecured line of credit (“LOC”) with U.S. Bank N.A. which expires November 13, 2015 used primarily to finance redemption payments. Each individual Fund’s borrowing under the LOC is limited to 5% of the value of that Fund’s net assets, 33.33% of the value of the Fund’s investments, or any explicit borrowing limits imposed by the LOC, whatever is less. As of May 31, 2015, the limits established are: LargeCap Fund - $6,500,000, MidCap Fund - $2,000,000 and Bond Fund - $175,000,000. All terms and borrowing limits imposed by the LOC are subject to review and approval by the Funds’ Board. The following table shows the average balance, average interest rate, interest expense, and maximum borrowings incurred by the Funds on the LOC for the six-month period ended May 31, 2015.
| | | | | | | | | | | | | Date of |
| | Average | | Average | | Interest | | Maximum | | Maximum |
| | Balance | | Interest Rate | | Expense | | Borrowing | | Borrowing |
| LargeCap Fund | | $ | 92,011 | | 3.250% | | $ | 1,512 | | $ | 585,000 | | 3/3/2015 |
| MidCap Fund | | $ | 53,670 | | 3.250% | | $ | 882 | | $ | 1,350,000 | | 1/8/2015 |
| Bond Fund | | $ | 3,842,434 | | 3.250% | | $ | 63,133 | | $ | 50,107,000 | | 12/22/2014 |
GUARANTEES AND INDEMNIFICATIONS - Under the Funds’ organizational documents, each Director, officer, employee or other agent of the Funds (including the Funds’ investment advisor) is indemnified, to the extent permitted by the 1940 Act, against certain liabilities that may arise out of performance of their duties to the Funds. Additionally, in the normal course of business, the Funds enter into contracts that contain a variety of indemnification clauses. The Funds’ maximum exposure under these arrangements is unknown as this would involve future claims that may be made against the Funds that have not yet occurred. However, the Funds have not had prior claims or losses pursuant to these contracts and believe the risk of loss to be remote.
ACCOUNTING FOR UNCERTAINTY IN INCOME TAXES - As of and during the six-month period ended May 31, 2015, the Funds did not have a liability for unrecognized tax benefits in the accompanying financial statements. Also, the Funds recognized no interest or penalties related to unrecognized tax benefits during the same period. The Funds recognize interest and penalties, if any, related to unrecognized tax benefits as income tax expense in the Statements of Operations. Generally, each of the tax years in the four-year period ended November 30, 2014 remains subject to examination by taxing authorities. The Funds are also not aware of any tax positions for which it is reasonably possible that the total amounts of unrecognized tax benefits will significantly change in the next twelve months.
SUBSEQUENT EVENTS - The Funds have evaluated subsequent events through the issuance of the Funds’ financial statements and have determined that such subsequent events do not have an impact on the Funds’ financial statements.
35
| NOTES TO FINANCIAL STATEMENTS (Unaudited) (Continued) |
| May 31, 2015 |
NOTE 3 - INVESTMENT ADVISORY AND ADMINISTRATIVE AND ACCOUNTING SERVICES AGREEMENTS AND OTHER TRANSACTIONS WITH AFFILIATES
The Investment Advisory Agreement pursuant to which Thompson Investment Management, Inc. (“TIM” or “Advisor”) is retained by the Funds provides for monthly compensation to TIM computed on average daily net assets at the following annual rates:
| | First | | Over |
| | $50 Million | | $50 Million |
| LargeCap Fund | | 1.00% | | 0.90% |
| MidCap Fund | | 1.00% | | 0.90% |
| Bond Fund | | 0.65% | | 0.60% |
The Advisor is contractually bound to waive management fees and/or reimburse expenses incurred by the Funds through March 31, 2016 so that the annual operating expenses of the Funds do not exceed the following percentages of their respective average daily net assets: LargeCap Fund-1.15%, MidCap Fund-1.30% and Bond Fund-0.80%. For the six-month period ended May 31, 2015, the Advisor reimbursed expenses incurred by the LargeCap Fund and the MidCap Fund in the amounts of $41,258 and $41,300, respectively. The Funds are not obligated to reimburse the Advisor for any fees or expenses waived in previous fiscal years.
Pursuant to an Administrative and Accounting Services Agreement, TIM maintains the Funds’ financial records in accordance with the 1940 Act, prepares all necessary financial statements of the Funds and calculates the net asset value per share of the Funds on a daily basis. As compensation for its services, each Fund pays TIM a fee computed daily and payable monthly at the annual rate of 0.15% of average daily net assets up to $30 million, 0.10% of the next $70 million of average daily net assets and 0.025% of average daily net assets in excess of $100 million, with an annual minimum fee of $30,000 per Fund. The calculations of daily net asset value are subcontracted to U.S. Bancorp Fund Services, resulting in fees paid by TIM for the six-month period ended May 31, 2015 in the following amounts:
| Administrative & |
| Accounting Fees Paid |
| LargeCap Fund | | $ | 18,835 | |
| MidCap Fund | | $ | 17,016 | |
| Bond Fund | | $ | 158,877 | |
The Funds reimburse the Advisor for a portion of amounts paid by the Advisor out of the Advisor’s own resources under various shareholder, account maintenance, networking and other services provided to the Funds by broker-dealers and other intermediaries. The amount reimbursed by the Funds is equal to (1) for those accounts maintained through a shareholder servicing arrangement, an annual rate of no more than 0.10% of the average daily net assets of the omnibus accounts in the Funds for which all broker-dealers and other intermediaries, in the aggregate, are responsible, and (2) for those accounts maintained through a networking arrangement, no more than $6 per year per account in the Funds for which the broker-dealers and other intermediaries are responsible; provided however, in all cases only one of these fees shall be applicable to the assets in an account. This amount has been determined by the Funds’ Board to approximate the transfer agency fees that would otherwise have been payable by the Funds if such broker-dealers and intermediaries did not maintain these accounts. For the six-month period ended May 31, 2015, the amounts reimbursed by the Funds to the Advisor were:
| Intermediary |
| Fees Reimbursed |
| LargeCap Fund | | $ | 13,653 | |
| MidCap Fund | | $ | 2,593 | |
| Bond Fund | | $ | 648,922 | |
As of May 31, 2015, retirement plan investments by certain employees of the Advisor represent 6.22% of the net assets of the MidCap Fund.
36
| NOTES TO FINANCIAL STATEMENTS (Unaudited) (Continued) |
| May 31, 2015 |
NOTE 4 - FUND SHARE TRANSACTIONS (in thousands)
Transactions in shares of the Funds were as follows:
| | Six-Month Period Ended | | Year Ended |
| | May 31, 2015 (Unaudited) | | November 30, 2014 |
| | Shares | | Dollars | | Shares | | Dollars |
| LargeCap Fund | | | | | | | | | | | | | | |
| Shares sold | | 70 | | | $ | 3,780 | | | 113 | | | $ | 5,604 | |
| Shares issued in reinvestment of dividends | | 12 | | | | 652 | | | 10 | | | | 460 | |
| Shares issued in reinvestment of realized gains | | – | | | | – | | | – | | | | – | |
| Shares redeemed | | (163 | ) | | | (8,752 | ) | | (400 | ) | | | (19,639 | ) |
| Net decrease | | (81 | ) | | $ | (4,320 | ) | | (277 | ) | | $ | (13,575 | ) |
| |
| MidCap Fund | | | | | | | | | | | | | | |
| Shares sold | | 168 | | | $ | 2,220 | | | 427 | | | $ | 5,679 | |
| Shares issued in reinvestment of dividends | | – | | | | – | | | – | | | | – | |
| Shares issued in reinvestment of realized gains | | 299 | | | | 3,825 | | | 315 | | | | 3,919 | |
| Shares redeemed | | (221 | ) | | | (2,843 | ) | | (479 | ) | | | (6,212 | ) |
| Net increase | | 246 | | | $ | 3,202 | | | 263 | | | $ | 3,386 | |
| |
| Bond Fund | | | | | | | | | | | | | | |
| Shares sold | | 44,089 | | | $ | 506,295 | | | 196,126 | | | $ | 2,327,553 | |
| Shares issued in reinvestment of dividends | | 5,915 | | | | 67,361 | | | 8,996 | | | | 106,321 | |
| Shares issued in reinvestment of realized gains | | – | | | | – | | | 471 | | | | 5,520 | |
| Shares redeemed | | (86,048 | ) | | | (987,544 | ) | | (76,062 | ) | | | (900,888 | ) |
| Net increase (decrease) | | (36,044 | ) | | $ | (413,888 | ) | | 129,531 | | | $ | 1,538,506 | |
NOTE 5 - PURCHASE AND SALE OF SECURITIES
Investment transactions for the six-month period ended May 31, 2015 were as follows:
| | Securities other than U.S. | | | | | | |
| | Government and Short-term | | | | | | |
| | Investments | | U.S. Government Securities |
| | Purchases | | Sales | | Purchases | | Sales |
| LargeCap Fund | | $ | 5,817,658 | | $ | 10,446,566 | | $ | – | | $ | – |
| MidCap Fund | | $ | 4,407,848 | | $ | 5,136,555 | | $ | – | | $ | – |
| Bond Fund | | $ | 583,944,897 | | $ | 510,188,451 | | $ | 203,143,103 | | $ | 145,067,986 |
NOTE 6 - INCOME TAX INFORMATION
At May 31, 2015, the investment cost and aggregate unrealized appreciation and depreciation on investments for federal income tax purposes were as follows:
| | LargeCap Fund | | MidCap Fund | | Bond Fund |
| Federal tax cost | | $ | 105,933,182 | | | $ | 34,788,847 | | | $ | 3,301,268,877 | |
| Unrealized appreciation | | $ | 24,127,908 | | | $ | 9,491,978 | | | $ | 31,423,277 | |
| Unrealized depreciation | | | (3,942,483 | ) | | | (2,581,185 | ) | | | (118,768,967 | ) |
| Net unrealized appreciation (depreciation) | | $ | 20,185,425 | | | $ | 6,910,793 | | | $ | (87,345,690 | ) |
The tax basis of investments for tax and financial reporting purposes differ principally due to wash sales.
37
| NOTES TO FINANCIAL STATEMENTS (Unaudited) (Continued) |
| May 31, 2015 |
The tax components of distributions paid during the six-month period ended May 31, 2015 and the fiscal year ended November 30, 2014 are as follows:
| | LargeCap Fund | | MidCap Fund | | Bond Fund |
| Six-month period ended May 31, 2015 (Unaudited) | | | | | | | | | | | | | | | |
| Distributions paid from: | | | | | | | | | | | | | | | |
| Ordinary income distributions | | | $ | 675,832 | | | | $ | 429,599 | | | | $ | 71,662,160 | |
| Long-term capital gains distributions | | | | – | | | | | 3,466,117 | | | | | – | |
| Total distributions paid | | | $ | 675,832 | | | | $ | 3,895,716 | | | | $ | 71,662,160 | |
| | |
| Fiscal year ended November 30, 2014 | | | | | | | | | | | | | | | |
| Distributions paid from: | | | | | | | | | | | | | | | |
| Ordinary income distributions | | | $ | 472,077 | | | | $ | 246,171 | | | | $ | 112,531,226 | |
| Long-term capital gains distributions | | | | – | | | | | 3,687,221 | | | | | 5,801,616 | |
| Total distributions paid | | | $ | 472,077 | | | | $ | 3,933,392 | | | | $ | 118,332,842 | |
The tax basis post-October losses as of November 30, 2014 and capital loss carryforward as of November 30, 2014, which are not being recognized for tax purposes until the first day of the following fiscal year, are as follows:
| | LargeCap Fund | | MidCap Fund | | Bond Fund |
| Post-October losses | | | $ | – | | | | $ | – | | | | $ | 1,260,557 | |
| Net capital loss carryforward | | | | | | | | | | | | | | | |
| Subject to expiration | | | | | | | | | | | | | | | |
| November 30, 2016 | | | $ | 4,098,285 | | | | $ | – | | | | $ | – | |
| November 30, 2017 | | | | 47,755,283 | | | | | – | | | | | – | |
| Not subject to expiration | | | | | | | | | | | | | | | |
| Short-term | | | | – | | | | | – | | | | | 1,100,909 | |
| Long-term | | | | – | | | | | – | | | | | – | |
| Total capital loss carryforward | | | $ | 51,853,568 | | | | $ | – | | | | $ | 1,100,909 | |
During the fiscal year ended November 30, 2014, the LargeCap Fund utilized capital loss carryforwards in the amount of $15,660,462.
Under the Regulated Investment Company Modernization Act of 2010 (the “Modernization Act”), capital losses incurred during taxable years after December 22, 2010 are carried forward indefinitely and retain the character of the original loss. Previously, net capital losses were carried forward for eight years and treated as short-term losses. As a transition rule, the Modernization Act requires that post-enactment net capital losses be used before pre-enactment net capital losses.
The following distributions were declared on June 22, 2015, payable to shareholders on June 23, 2015 (Unaudited):
| | LargeCap Fund | | MidCap Fund | | Bond Fund |
| Ordinary income distributions | | | | | | | | | | | | | |
| Amount | | | $ | – | | | | $ | – | | | $ | 33,640,900 |
| Per Share | | | $ | – | | | | $ | – | | | $ | 0.12 |
38
The following table presents information relating to a share of capital stock outstanding for the entire period.
| | Six-Month | | | | | | | | | | | | | | | |
| | Period Ended | | | | | | | | | | | | | | | |
| | May 31, 2015 | | Year Ended November 30, |
| | (Unaudited) | | 2014 | | 2013 | | 2012 | | 2011 | | 2010 |
| LARGECAP FUND | | | | | | | | | | | | | | | | | | | | |
| |
| Net Asset Value, Beginning of Period | | | $53.40 | | | | $46.47 | | | $34.27 | | | $30.07 | | | $29.20 | | | $27.04 | |
| Income from Investment Operations | | | | | | | | | | | | | | | | | | | | |
| Net investment income | | | 0.16 | | | | 0.27 | | | 0.19 | | | 0.18 | | | 0.08 | | | 0.01 | |
| Net realized and unrealized gains | | | | | | | | | | | | | | | | | | | | |
| on investments and options | | | 1.04 | | | | 6.84 | | | 12.20 | | | 4.13 | | | 0.80 | | | 2.20 | |
| Total from Investment Operations | | | 1.20 | | | | 7.11 | | | 12.39 | | | 4.31 | | | 0.88 | | | 2.21 | |
| Less Distributions | | | | | | | | | | | | | | | | | | | | |
| Distributions from net investment income | | | (0.28 | ) | | | (0.18 | ) | | (0.19 | ) | | (0.11 | ) | | (0.01 | ) | | (0.05 | ) |
| Distributions from net realized gains | | | – | | | | – | | | – | | | – | | | – | | | – | |
| Total Distributions | | | (0.28 | ) | | | (0.18 | ) | | (0.19 | ) | | (0.11 | ) | | (0.01 | ) | | (0.05 | ) |
| |
| Net Asset Value, End of Period | | | $54.32 | | | | $53.40 | | | $46.47 | | | $34.27 | | | $30.07 | | | $29.20 | |
| |
| Total Return | | | 2.26% | (a) | | | 15.35% | | | 36.33% | | | 14.37% | | | 3.02% | | | 8.17% | |
| |
| Ratios/Supplemental Data | | | | | | | | | | | | | | | | | | | | |
| Net assets, end of period (millions) | | | $126.4 | | | | $128.6 | | | $124.8 | | | $99.6 | | | $104.1 | | | $125.8 | |
| Ratios to average net assets: | | | | | | | | | | | | | | | | | | | | |
| Ratio of expenses | | | 1.15% | (b) | | | 1.15% | | | 1.21% | | | 1.31% | | | 1.31% | | | 1.36% | |
| Ratio of expenses without reimbursement | | | 1.22% | (b) | | | 1.23% | | | 1.22% | | | 1.31% | | | 1.31% | | | 1.36% | |
| Ratio of net investment income | | | 0.57% | (b) | | | 0.54% | | | 0.46% | | | 0.47% | | | 0.24% | | | 0.05% | |
| Ratio of net investment income | | | | | | | | | | | | | | | | | | | | |
| without reimbursement | | | 0.51% | (b) | | | 0.46% | | | 0.45% | | | 0.47% | | | 0.24% | | | 0.05% | |
| Portfolio turnover rate | | | 5% | (a) | | | 27% | | | 38% | | | 30% | | | 40% | | | 37% | |
| (a) | Calculated on a non-annualized basis. |
| (b) | Calculated on an annualized basis. |
See Notes to Financial Statements.
39
| FINANCIAL HIGHLIGHTS (Continued) |
| |
The following table presents information relating to a share of capital stock outstanding for the entire period.
| | Six-Month | | | | | | | | | | | | | | | |
| | Period Ended | | | | | | | | | | | | | | | |
| | May 31, 2015 | | Year Ended November 30, |
| | (Unaudited) | | 2014 | | 2013 | | 2012 | | 2011 | | 2010 |
| MIDCAP FUND | | | | | | | | | | | | | | | | | | | | |
| |
| Net Asset Value, Beginning of Period | | | $14.04 | | | | $14.04 | | | $11.28 | | | $11.15 | | | $11.36 | | | $9.39 | |
| Income from Investment Operations | | | | | | | | | | | | | | | | | | | | |
| Net investment loss | | | (0.01 | ) | | | – | (a) | | – | (a) | | – | (a) | | – | (a) | | – | (a) |
| Net realized and unrealized gains | | | | | | | | | | | | | | | | | | | | |
| on investments | | | 0.38 | | | | 1.47 | | | 3.71 | | | 1.38 | | | 0.44 | | | 2.02 | |
| Total from Investment Operations | | | 0.37 | | | | 1.47 | | | 3.71 | | | 1.38 | | | 0.44 | | | 2.02 | |
| Less Distributions | | | | | | | | | | | | | | | | | | | | |
| Distributions from net investment income | | | – | | | | – | | | – | | | – | | | – | | | – | (a) |
| Distributions from net realized gains | | | (1.33 | ) | | | (1.47 | ) | | (0.95 | ) | | (1.25 | ) | | (0.65 | ) | | (0.05 | ) |
| Total Distributions | | | (1.33 | ) | | | (1.47 | ) | | (0.95 | ) | | (1.25 | ) | | (0.65 | ) | | (0.05 | ) |
| |
| Net Asset Value, End of Period | | | $13.08 | | | | $14.04 | | | $14.04 | | | $11.28 | | | $11.15 | | | $11.36 | |
| |
| Total Return | | | 2.84% | (b) | | | 11.82% | | | 35.65% | | | 14.41% | | | 3.69% | | | 21.71% | |
| |
| Ratios/Supplemental Data | | | | | | | | | | | | | | | | | | | | |
| Net assets, end of period (millions) | | | $41.7 | | | | $41.3 | | | $37.6 | | | $24.6 | | | $17.6 | | | $15.7 | |
| Ratios to average net assets: | | | | | | | | | | | | | | | | | | | | |
| Ratio of expenses | | | 1.30% | (c) | | | 1.30% | | | 1.30% | | | 1.30% | | | 1.30% | | | 1.30% | |
| Ratio of expenses without reimbursement | | | 1.50% | (c) | | | 1.54% | | | 1.63% | | | 1.83% | | | 1.96% | | | 2.34% | |
| Ratio of net investment loss | | | (0.11% | )(c) | | | (0.02% | ) | | (0.02% | ) | | (0.03% | ) | | (0.19% | ) | | (0.09% | ) |
| Ratio of net investment loss | | | | | | | | | | | | | | | | | | | | |
| without reimbursement | | | (0.32% | )(c) | | | (0.27% | ) | | (0.35% | ) | | (0.56% | ) | | (0.85% | ) | | (1.14% | ) |
| Portfolio turnover rate | | | 11% | (b) | | | 34% | | | 47% | | | 44% | | | 47% | | | 39% | |
| (a) | Less than .005 per share. |
| (b) | Calculated on a non-annualized basis. |
| (c) | Calculated on an annualized basis. |
See Notes to Financial Statements.
40
| FINANCIAL HIGHLIGHTS (Continued) |
| |
The following table presents information relating to a share of capital stock outstanding for the entire period.
| | Six-Month | | | | | | | | | | | | | | | |
| | Period Ended | | | | | | | | | | | | | | | |
| | May 31, 2015 | | Year Ended November 30, |
| | | (Unaudited) | | 2014 | | 2013 | | 2012 | | 2011 | | 2010 |
| BOND FUND | | | | | | | | | | | | | | | | | | | | |
| |
| Net Asset Value, Beginning of Period | | | $11.69 | | | | $11.91 | | | $11.95 | | | $11.33 | | | $11.54 | | | $11.16 | |
| Income from Investment Operations | | | | | | | | | | | | | | | | | | | | |
| Net investment income | | | 0.25 | | | | 0.45 | | | 0.41 | | | 0.41 | | | 0.42 | | | 0.34 | |
| Net realized and unrealized gains (losses) | | | | | | | | | | | | | | | | | | | | |
| on investments | | | (0.15 | ) | | | (0.19 | ) | | (0.03 | ) | | 0.67 | (a) | | (0.17 | )(a) | | 0.46 | (a) |
| Total from Investment Operations | | | 0.10 | | | | 0.26 | | | 0.38 | | | 1.08 | | | 0.25 | | | 0.80 | |
| Less Distributions | | | | | | | | | | | | | | | | | | | | |
| Distributions from net investment income | | | (0.24 | ) | | | (0.45 | ) | | (0.40 | ) | | (0.43 | ) | | (0.40 | ) | | (0.34 | ) |
| Distributions from net realized gains | | | – | | | | (0.03 | ) | | (0.02 | ) | | (0.03 | ) | | (0.06 | ) | | (0.08 | ) |
| Total Distributions | | | (0.24 | ) | | | (0.48 | ) | | (0.42 | ) | | (0.46 | ) | | (0.46 | ) | | (0.42 | ) |
| |
| Net Asset Value, End of Period | | | $11.55 | | | | $11.69 | | | $11.91 | | | $11.95 | | | $11.33 | | | $11.54 | |
| |
| Total Return | | | 0.87%(b) | | | | 2.19% | | | 3.24% | | | 9.70% | | | 2.16% | | | 7.33% | |
| |
| Ratios/Supplemental Data | | | | | | | | | | | | | | | | | | | | |
| Net assets, end of period (millions) | | | $3,263.7 | | | | $3,724.0 | | | $2,252.1 | | | $1,292.3 | | | $656.0 | | | $437.5 | |
| Ratios to average net assets: | | | | | | | | | | | | | | | | | | | | |
| Ratio of expenses | | | 0.72% | (c) | | | 0.72% | | | 0.74% | | | 0.78% | | | 0.80% | | | 0.80% | |
| Ratio of expenses without reimbursement | | | 0.72% | (c) | | | 0.72% | | | 0.74% | | | 0.78% | | | 0.84% | | | 0.87% | |
| Ratio of net investment income | | | 3.93% | (c) | | | 4.04% | | | 3.73% | | | 3.90% | | | 3.89% | | | 3.52% | |
| Ratio of net investment income | | | | | | | | | | | | | | | | | | | | |
| without reimbursement | | | 3.93% | (c) | | | 4.04% | | | 3.73% | | | 3.90% | | | 3.86% | | | 3.44% | |
| Portfolio turnover rate | | | 18% | (b) | | | 21% | | | 33% | | | 16% | | | 14% | | | 10% | |
| (a) | Realized and unrealized gains and losses per share are balancing amounts necessary to reconcile the change in net asset value per share in the period. It does not agree to the aggregate gains and losses in the Statement of Operations due to the fluctuation in share transactions. |
| (b) | Calculated on a non-annualized basis. |
| (c) | Calculated on an annualized basis. |
See Notes to Financial Statements.
41
| ADDITIONAL INFORMATION (Unaudited) |
| |
| THOMPSON IM FUNDS |
| |
DIRECTORS
John W. Feldt - Chairman
George E. Austin
Cornelia Boyle
Patricia Lipton
Jason L. Stephens
John W. Thompson
OFFICERS
Jason L. Stephens, CFA
Chief Executive Officer
John W. Thompson, CFA
President
James T. Evans, CFA
Vice President
Penny M. Hubbard
Chief Financial Officer and Treasurer
Nedra S. Pierce
Chief Compliance Officer
Lesley T. Bailey
Secretary
Sarah M. Baumgartner
Assistant Secretary | INVESTMENT ADVISOR
Thompson Investment Management, Inc.
918 Deming Way
Madison, Wisconsin 53717
DISTRIBUTOR
Quasar Distributors, LLC
615 East Michigan Street
Milwaukee, Wisconsin 53202
TRANSFER AGENT
U.S. Bancorp Fund Services, LLC
615 East Michigan Street
Milwaukee, Wisconsin 53202
INDEPENDENT REGISTERED
PUBLIC ACCOUNTING FIRM
Cohen Fund Audit Services, Ltd.
1350 Euclid Avenue, Suite 800
Cleveland, OH 44115
LEGAL COUNSEL
Quarles & Brady LLP
411 East Wisconsin Avenue
Milwaukee, Wisconsin 53202 |
The Statement of Additional Information contains additional information about the directors and officers of Thompson IM Funds, Inc. and is available without charge, upon request, by calling 1-800-999-0887.
Proxy Voting Policy
A description of the policies and procedures that the Funds use to determine how to vote proxies relating to portfolio securities and information regarding how the Funds actually voted proxies during the most recent 12-month period ended June 30 are available without charge, upon request, by calling 1-800-999-0887, through the Funds’ website at www.thompsonim.com and on the SEC’s website at www.sec.gov.
Information About Portfolio Securities
The Funds file complete schedules of their portfolio holdings with the Securities and Exchange Commission for the Funds’ first and third quarters of its fiscal year on Form N-Q. The Funds’ Forms N-Q are available on the Securities and Exchange Commission’s website at www.sec.gov. You may also review and copy those documents by visiting the Securities and Exchange Commission’s Public Reference Room in Washington, D.C. Information on the operation of the Public Reference Room may be obtained by calling the Securities and Exchange Commission at 1-800-SEC-0330. The Funds’ Forms N-Q are also available without charge, upon request, by calling 1-800-999-0887.
42
Item 2. Code of Ethics.
Not required in Semi-Annual Reports on Form N-CSR.
Item 3. Audit Committee Financial Expert.
Not required in Semi-Annual Reports on Form N-CSR.
Item 4. Principal Accountant Fees and Services.
Not required in Semi-Annual Reports on Form N-CSR.
Item 5. Audit Committee of Listed Registrants.
Not applicable to this Registrant because it is not a “listed issuer” within the meaning of Rule 10A-3 under the Securities Exchange Act of 1934.
Item 6. Investments.
The required Schedules of Investments in securities of unaffiliated issuers is included as part of the Registrant’s Semi-Annual Report to shareholders dated as of May 31, 2015 provided under Item 1 of this Form N-CSR.
Item 7. Disclosure of Proxy Voting Policies and Procedures for Closed-End Management Investment Companies
Not applicable to this Registrant because it is not a closed-end management investment company.
Item 8. Portfolio Managers of Closed-End Management Investment Companies.
Not applicable to this Registrant because it is not a closed-end management investment company.
Item 9. Purchases of Equity Securities by Closed-End Management Investment Companies and Affiliated Purchasers.
Not applicable to this Registrant because it is not a closed-end management investment company.
Item 10. Submission of Matters to a Vote of Securities Holders.
The Registrant has not made any material changes to the procedures by which shareholders may recommend nominees to the Registrant's Board of Directors after the Registrant last provided disclosure in response to the requirements of Item 407(c)(2)(iv) of Regulation S-K or this Item.
2
Item 11. Controls and Procedures.
| | (a) | | Disclosure Controls and Procedures. Based on an evaluation of the Registrant’s disclosure controls and procedures (as defined in Rule 30a-3(c) under the Investment Company Act of 1940) carried out under the supervision and with the participation of the Registrant’s management, including its principal executive and financial officers, within 90 days prior to the filing date of this report on Form N-CSR, the Registrant’s principal executive and financial officers have concluded that the design and operation of the Registrant’s disclosure controls and procedures are effective in providing reasonable assurance that the information required to be disclosed on Form N-CSR is recorded, processed, summarized and reported within the applicable time periods. |
| |
| (b) | | Change in Internal Controls Over Financial Reporting. There were no changes in the Registrant’s internal control over financial reporting (as defined in Rule 30a-3(d) under the Investment Company Act of 1940) that occurred during the Registrant’s second fiscal quarter of the period covered by this Form N-CSR that have materially affected, or are reasonably likely to materially affect, the Registrant’s internal control over financial reporting. |
Item 12. Exhibits
The following exhibits are attached to this Form N-CSR:
| | Exhibit No. | | Description of Exhibit | |
| 12(a)(1) | | The Code of Ethics for the Registrant’s Principal Executive Officer, Principal Financial Officer and Principal Accounting Officer referred to in Item 2 was filed as Exhibit 12(a)(1) to the Registrant’s Certified Shareholder Report on Form N-CSR filed on January 28, 2005, and is incorporated herein by reference |
| | | |
| 12(a)(2)-1 | | Certification of Principal Executive Officer Required by Section 302 of the Sarbanes-Oxley Act of 2002 |
| | | |
| 12(a)(2)-2 | | Certification of Principal Financial Officer Required by Section 302 of the Sarbanes-Oxley Act of 2002 |
| | | |
| 12(b) | | Certification of Chief Executive Officer and Chief Financial Officer Required by Section 906 of the Sarbanes-Oxley Act of 2002 |
3
SIGNATURES
Pursuant to the requirements of the Securities Exchange Act of 1934 and the Investment Company Act of 1940, the Registrant has duly caused this report to be signed on its behalf by the undersigned, thereunto duly authorized, on this 23rd day of July, 2015.
THOMPSON IM FUNDS, INC. |
| | |
| By: | | /s/ Jason L. Stephens |
| | Jason L. Stephens, Chief Executive |
| | Officer |
Pursuant to the requirements of the Securities Exchange Act of 1934 and the Investment Company Act of 1940, this report has been signed below by the following persons on behalf of the Registrant and in the capacities indicated on this 23rd day of July, 2015.
| By: | | /s/ Jason L. Stephens |
| | Jason L. Stephens, Chief Executive |
| | Officer (Principal Executive Officer) |
| |
| By: | | /s/ Penny Hubbard |
| | Penny Hubbard, Chief Financial |
| | Officer (Principal Financial Officer) |
4