UNITED STATES
SECURITIES AND EXCHANGE COMMISSION
Washington, D.C. 20549
FORM N-CSR
CERTIFIED SHAREHOLDER REPORT OF REGISTERED
MANAGEMENT
INVESTMENT COMPANIES
Investment Company Act File Number 811-4946
THOMPSON IM FUNDS, INC.
(Exact name of registrant as specified in charter)
918 Deming Way
Madison, Wisconsin 53717
(Address of principal executive offices)--(Zip code)
Jason L. Stephens
Chief Executive Officer
Thompson IM Funds, Inc.
918 Deming Way
Madison, Wisconsin 53717
(Name and address of agent for service)
With a copy to:
Fredrick G. Lautz, Esq.
Quarles & Brady LLP
411 East Wisconsin Avenue
Milwaukee, Wisconsin 53202
Registrant's telephone number, including area code: (608) 827-5700
Date of fiscal year end: November 30, 2016
Date of reporting period: May 31, 2016
Form N-CSR is to be used by management investment companies to file reports with the Commission not later than 10 days after the transmission to stockholders of any report that is required to be transmitted to stockholders under Rule 30e-1 under the Investment Company Act of 1940 (17 CFR 270.30e-1). The Commission may use the information provided on Form N-CSR in its regulatory, disclosure review, inspection and policymaking roles.
A registrant is required to disclose the information specified by Form N-CSR, and the Commission will make this information public. A registrant is not required to respond to the collection of information contained in Form N-CSR unless the Form displays a currently valid Office of Management and Budget ("OMB") control number. Please direct comments concerning the accuracy of the information collection burden estimate and any suggestions for reducing the burden to Secretary, Securities and Exchange Commission, 450 Fifth Street, N.W., Washington, DC 20549-0609. The OMB has reviewed this collection of information under the clearance requirements of 44 U.S.C. § 3507.
Item 1. Report to Stockholders.
THOMPSON IM FUNDS, INC.
SEMI-ANNUAL REPORT TO SHAREHOLDERS
NOTE ON FORWARD-LOOKING STATEMENTS
The matters discussed in this report may constitute forward-looking statements. These include any Advisor or portfolio manager predictions, assessments, analyses or outlooks for individual securities, industries, investment styles, market sectors, interest rates, economic trends and/or markets. These statements involve risks and uncertainties. In addition to the general risks described for each Fund in its current Prospectus, other factors bearing on these reports include the accuracy of the Advisor’s or portfolio manager’s forecasts and predictions, the appropriateness of the investment strategies designed by the Advisor or portfolio manager and the ability of the Advisor or portfolio manager to implement its strategies efficiently and successfully. Any one or more of these factors, as well as other risks affecting the securities markets generally, could cause the actual results of any Fund to differ materially as compared to its benchmarks.
1
THOMPSON IM FUNDS, INC.
SEMI-ANNUAL REPORT TO SHAREHOLDERS
May 31, 2016
CONTENTS
| Page(s) |
| LARGECAP FUND | |
| Investment review | 3-5 |
| Schedule of investments | 6-8 |
| |
| MIDCAP FUND | |
| Investment review | 9-11 |
| Schedule of investments | 12-14 |
| |
| BOND FUND | |
| Investment review | 15-18 |
| Schedule of investments | 19-26 |
| |
| FUND EXPENSE EXAMPLES | 27 |
| |
| FINANCIAL STATEMENTS | |
| Statements of assets and liabilities | 28 |
| Statements of operations | 29 |
| Statements of changes in net assets | 30 |
| Notes to financial statements | 31-37 |
| Financial highlights | 38-40 |
| |
| ADDITIONAL INFORMATION | 41 |
This report contains information for existing shareholders of Thompson IM Funds, Inc. It
does not constitute an offer to sell. This Semi-Annual Report is authorized for distribution to prospective investors
only when preceded or accompanied by a Fund Prospectus, which contains information about
the Funds’ objectives and policies, risks, management, expenses and other information.
A Prospectus can be obtained by calling 1-800-999-0887.
Please read your Prospectus carefully.
2
| LARGECAP FUND INVESTMENT REVIEW (Unaudited) |
| May 31, 2016 |
| Portfolio Managers |
| | James T. Evans, CFA |
| Jason L. Stephens, CFA |
| John W. Thompson, CFA |
Performance
The LargeCap Fund produced a total return of 0.86% for the six-month period ended May 31, 2016, as compared to its benchmark, the S&P 500 Index, which returned 1.93%.
Comparison of Change in Value of a Hypothetical $10,000 Investment

| Average Annual Total Returns |
| Through 05/31/16 |
| 1 Year | | 3 Year | | 5 Year | | 10 Year | |
| Thompson LargeCap Fund | -5.83% | | 7.68% | | 9.16% | | 3.84% | |
| S&P 500 Index | 1.72% | | 11.06% | | 11.67% | | 7.41% | |
Gross Expense Ratio as of 03/31/16 was 1.22%.
Net Expense Ratio after reimbursement as of 03/31/16 was 1.13%.*
| * | The Advisor has contractually agreed to waive management fees and/or reimburse expenses incurred by the LargeCap Fund through March 31, 2017, so that the annual operating expenses of the Fund do not exceed 1.13% of its average daily net assets. |
Performance data quoted represents past performance; past performance does not guarantee future results. The investment return and principal value of an investment will fluctuate so that an investor’s shares, when redeemed, may be worth more or less than their original cost. Current performance of the Fund may be lower or higher than the performance quoted. Performance data current to the most recent month-end may be obtained by calling 1-800-999-0887 or visiting www.thompsonim.com.
Results include the reinvestment of all dividends and capital gains distributions. Investment performance reflects all fee waivers that may be in effect. In the absence of such waivers, total return would be reduced. The performance information reflected in the graph and the table above does not reflect the deduction of taxes that a shareholder would pay on fund distributions or the redemption of fund shares, nor does it imply future performance. The S&P 500 Index is an unmanaged index commonly used to measure the performance of U.S. stocks. You cannot directly invest in an index.
The S&P 500 Index is a product of S&P Dow Jones Indices LLC and has been licensed for use by Thompson Investment Management, Inc. S&P® and S&P 500® are registered trademarks of Standard & Poor’s Financial Services LLC (“S&P”). The Thompson IM Funds are not sponsored, endorsed, sold or promoted by S&P Dow Jones Indices LLC, Dow Jones, S&P or their respective affiliates, and none of S&P Dow Jones Indices LLC, Dow Jones, S&P nor their respective affiliates makes any representation regarding the advisability of investing in such products.
See Notes to Financial Statements.
3
| LARGECAP FUND INVESTMENT REVIEW (Unaudited) (Continued) |
| May 31, 2016 |
Management Commentary
The performance of the LargeCap Fund during the semi-annual period was largely driven by two competing effects, one negative and one positive. While we are hopeful the first one is temporary, we are encouraged by the second one as it validates a central element of our strategy.
First, on the negative side, the yield on the 10-year Treasury declined from 2.207% at the start of the period to 1.847% by the end. The Fund has an underweight positioning in stocks that tend to benefit from lower interest rates. This was most evident within our sector selection, as the Fund is underweight Telecom, Utilities and Consumer Staples, sectors that widely outperformed the benchmark return. This impact also was apparent through issue selection within Financials, as the Fund’s holdings in bank and lending-related firms lagged the returns of real estate investment trust (REITs) and other industries that typically benefit from lower rates. We remain convinced the long run direction of interest rates should not be permanently down, and thus are wary of owning stocks that in our opinion are very expensive and require further declines in rates to provide attractive returns. We believe less risky opportunities lie elsewhere.
On the positive side, offsetting this interest rate related weakness was solid issue selection, especially within the Materials, Technology, Energy and Industrials sectors. No single name contributed to the Fund’s return in an outsized manner, but a common theme was evident in that the best performing stocks for the Fund within the semi-annual period in many cases had been laggards in prior time periods. A level of patience, and in some cases a willingness to acquire additional shares of the stock even as the price declined, helped shareholders in these stocks.
The outperforming stocks of the semi-annual period for the Fund highlight an important part of our investment strategy. We believe it is important to view each holding on an individual fundamental basis, and not automatically selling a name once it has declined if we feel the source of the underperformance is more temporary in nature. Permanent impairment in contrast generally warrants a sale regardless of prior stock price weakness. While we will not always be right in distinguishing between temporary and permanent problems, we believe the risk/reward profile of continuing to hold such stocks skews in our favor. This is because the stocks already reflect a pessimistic outlook. Assuming we have adequately screened out holdings that have a materially higher bankruptcy/going concern issue, the downside to owning such stocks and being wrong is often more the opportunity cost of not owning a different name rather than a further price decline. The benefit to being right can often vastly outpace the returns available elsewhere.
While we obviously prefer owning companies that never experience these hiccups, ideally increasing in value alongside a steady gain in earnings, the reality is most firms have issues from time to time. As portfolio managers these issues are hard to predict, as often they are fairly minor in nature. Thus it is how we react to them that may create an opportunity for shareholders to benefit. Going back to the market bottom in 2009, many of the Fund’s biggest winners of the past 7 plus years on a relative basis were relative losers at some point after their purchase. If as portfolio managers we make good decisions regarding our holdings, this pattern will hopefully continue into the future as well.
Opinions expressed are subject to change, are not guaranteed and should not be considered investment advice.
Mutual fund investing involves risk. Principal loss is possible. Investments in smaller companies involve additional risks such as limited liquidity and greater volatility. Investments in American Depositary Receipts (“ADRs”) are subject to some extent to the risks associated with directly investing in securities of foreign issuers, including the risk of changes in currency exchange rates, expropriation or nationalization of assets, and the impact of political, diplomatic, or social events. Investments in real estate securities may involve greater risk and volatility including greater exposure to economic downturns and changes in real estate values, rents, property taxes, tax, and other laws. A REIT’s share price may decline because of adverse developments affecting the real estate industry.
Please refer to the Schedule of Investments on page 6 of this report for holdings information. The management commentary above as well as Fund holdings and asset/sector allocations should not be considered a recommendation to buy or sell any security. In addition, please note that Fund holdings and asset/sector allocations are subject to change.
Yield is the income earned from a bond, which takes into account the sum of the interest payment, the redemption value at the bond’s maturity, and the initial purchase price of the bond.
Earnings Growth is a measure of growth in a company’s net income over a specific period, often one year. It is not a prediction of the Fund’s future returns.
See Notes to Financial Statements.
4
| LARGECAP FUND INVESTMENT REVIEW (Unaudited) (Continued) |
| May 31, 2016 |
| Top 10 Equity Holdings at 05/31/16 |
| | % of Fund’s |
| Company | Industry | Net Assets |
| Exxon Mobil Corp. | Oil, Gas & Consumable Fuels | 3.13% |
| Alphabet, Inc. Class A | Internet Software & Services | 2.76% |
| Microsoft Corp. | Software | 2.51% |
| Bank of America Corp. | Banks | 2.33% |
| Viacom Inc. Class B | Media | 2.23% |
| Chevron Corp. | Oil, Gas & Consumable Fuels | 2.21% |
| JPMorgan Chase & Co. | Banks | 2.17% |
| Citigroup Inc. | Banks | 2.14% |
| Cisco Systems, Inc. | Communications Equipment | 2.10% |
| Express Scripts Holding Co. | Health Care Providers & Services | 2.09% |
As of May 31, 2016, 99.7% of the Fund’s net assets were in equity and short-term investments.
See Notes to Financial Statements.
5
| LARGECAP FUND SCHEDULE OF INVESTMENTS (Unaudited) |
| May 31, 2016 |
| | | | | Shares | | Value |
| COMMON STOCKS - 99.7% | | | | | |
| | | | | | |
| Consumer Discretionary - 16.4% | | | | | |
| | Auto Components - 1.6% | | | | | |
| | Johnson Controls, Inc. | | 39,100 | | $ | 1,726,265 |
| | |
| | Automobiles - 1.0% | | | | | |
| | Harley-Davidson, Inc. | | 23,625 | | | 1,095,964 |
| | |
| | Distributors - 1.0% | | | | | |
| | LKQ Corp. (a) | | 33,075 | | | 1,093,790 |
| | |
| | Household Durables - 1.3% | | | | | |
| | D.R. Horton, Inc. | | 21,225 | | | 648,636 |
| | TopBuild Corp. (a) | | 19,602 | | | 708,416 |
| | | | | | | 1,357,052 |
| | Leisure Products - 1.1% | | | | | |
| | Brunswick Corp. | | 23,750 | | | 1,136,912 |
| | |
| | Media - 5.8% | | | | | |
| | CBS Corp. Class B | | 30,375 | | | 1,676,700 |
| | The Walt Disney Co. | | 10,500 | | | 1,041,810 |
| | Time Warner Inc. | | 15,425 | | | 1,167,055 |
| | Viacom Inc. Class B | | 54,125 | | | 2,401,526 |
| | | | | | | 6,287,091 |
| | Multiline Retail - 2.6% | | | | | |
| | Kohl’s Corp. | | 30,035 | | | 1,082,461 |
| | Target Corp. | | 24,910 | | | 1,713,310 |
| | | | | | | 2,795,771 |
| | Specialty Retail - 1.5% | | | | | |
| | Bed Bath & Beyond Inc. | | 26,175 | | | 1,171,331 |
| | Lumber Liquidators Holdings, Inc. (a) | | 36,650 | | | 480,115 |
| | | | | | | 1,651,446 |
| | Textiles, Apparel & Luxury | | | | | |
| | Goods - 0.5% | | | | | |
| | Hanesbrands, Inc. | | 19,200 | | | 519,744 |
| | |
| Consumer Staples - 5.3% | | | | | |
| | Food & Staples Retailing - 3.8% | | | | | |
| | CVS Health Corp. | | 10,475 | | | 1,010,314 |
| | Walgreens Boots Alliance, Inc. | | 26,725 | | | 2,068,515 |
| | Wal-Mart Stores, Inc. | | 14,600 | | | 1,033,388 |
| | | | | | | 4,112,217 |
| | Household Products - 1.5% | | | | | |
| | Kimberly-Clark Corp. | | 5,568 | | | 707,359 |
| | The Procter & Gamble Co. | | 11,850 | | | 960,324 |
| | | | | | | 1,667,683 |
| Energy - 11.9% | | | | | |
| | Energy Equipment & | | | | | |
| | Services - 1.4% | | | | | |
| | Schlumberger Ltd. | | 20,369 | | | 1,554,155 |
| | |
| | Oil, Gas & Consumable | | | | | |
| | Fuels - 10.5% | | | | | |
| | Apache Corp. | | 23,475 | | | 1,341,361 |
| | Chevron Corp. | | 23,595 | | | 2,383,095 |
| | Devon Energy Corp. | | 58,950 | | | 2,127,506 |
| | EOG Resources, Inc. | | 14,825 | | | 1,206,162 |
| | Exxon Mobil Corp. | | 37,895 | | | 3,373,413 |
| | Noble Energy, Inc. | | 24,950 | | | 891,962 |
| | | | | | | 11,323,499 |
| Financials - 17.3% | | | | | |
| | Banks - 12.4% | | | | | |
| | Associated Banc-Corp | | 65,415 | | | 1,222,606 |
| | Bank of America Corp. | | 169,625 | | | 2,508,754 |
| | CIT Group Inc. | | 42,550 | | | 1,457,763 |
| | Citigroup Inc. | | 49,575 | | | 2,308,708 |
| | First Horizon National Corp. | | 86,585 | | | 1,260,678 |
| | JPMorgan Chase & Co. | | 35,850 | | | 2,339,929 |
| | PNC Financial Services Group, Inc. | | 10,305 | | | 924,771 |
| | SunTrust Banks, Inc. | | 15,675 | | | 686,879 |
| | Zions Bancorporation | | 23,875 | | | 668,978 |
| | | | | | | 13,379,066 |
| | Capital Markets - 2.9% | | | | | |
| | Northern Trust Corp. | | 16,235 | | | 1,203,013 |
| | State Street Corp. | | 31,200 | | | 1,967,472 |
| | | | | | | 3,170,485 |
| | Consumer Finance - 0.6% | | | | | |
| | Discover Financial Services | | 10,620 | | | 603,322 |
| | |
| | Insurance - 1.0% | | | | | |
| | Aflac, Inc. | | 15,410 | | | 1,070,379 |
| | |
| | Real Estate Investment | | | | | |
| | Trusts - 0.4% | | | | | |
| | DiamondRock Hospitality Co. | | 45,475 | | | 406,547 |
See Notes to Financial Statements.
6
| LARGECAP FUND SCHEDULE OF INVESTMENTS (Unaudited) (Continued) |
| May 31, 2016 |
| | | | | Shares | | Value |
| COMMON STOCKS (continued) | | | | | |
| | | | | | |
| Health Care - 12.0% | | | | | |
| | Biotechnology - 5.9% | | | | | |
| | AbbVie Inc. | | 22,750 | | $ | 1,431,657 |
| | Amgen Inc. | | 6,990 | | | 1,104,071 |
| | Baxalta Inc. | | 12,160 | | | 549,997 |
| | Celgene Corp. (a) | | 18,075 | | | 1,907,274 |
| | Exact Sciences Corp. (a) | | 208,600 | | | 1,385,104 |
| | | | | | | 6,378,103 |
| | Health Care Equipment & | | | | | |
| | Supplies - 0.5% | | | | | |
| | Zimmer Biomet Holdings, Inc. | | 4,400 | | | 537,284 |
| | |
| | Health Care Providers & | | | | | |
| | Services - 4.6% | | | | | |
| | Express Scripts Holding Co. (a) | | 29,800 | | | 2,251,390 |
| | Hanger, Inc. (a) | | 82,300 | | | 529,189 |
| | McKesson Corp. | | 11,710 | | | 2,144,569 |
| | | | | | | 4,925,148 |
| | Pharmaceuticals - 1.0% | | | | | |
| | Johnson & Johnson | | 9,210 | | | 1,037,875 |
| | |
| Industrials - 11.5% | | | | | |
| | Air Freight & Logistics - 1.3% | | | | | |
| | FedEx Corp. | | 8,800 | | | 1,451,736 |
| | |
| | Airlines - 0.5% | | | | | |
| | Delta Air Lines, Inc. | | 12,975 | | | 563,894 |
| | |
| | Building Products - 1.5% | | | | | |
| | Masco Corp. | | 49,975 | | | 1,631,184 |
| | |
| | Electrical Equipment - 3.0% | | | | | |
| | ABB Ltd. ADR | | 89,475 | | | 1,859,290 |
| | Rockwell Automation, Inc. | | 11,475 | | | 1,331,674 |
| | | | | | | 3,190,964 |
| | Industrial Conglomerates - 2.8% | | | | | |
| | General Electric Co. | | 66,500 | | | 2,010,295 |
| | 3M Co. | | 6,195 | | | 1,042,742 |
| | | | | | | 3,053,037 |
| | Machinery - 1.5% | | | | | |
| | Illinois Tool Works Inc. | | 9,975 | | | 1,057,649 |
| | Ingersoll-Rand PLC | | 7,875 | | | 526,129 |
| | | | | | | 1,583,778 |
| | Trading Companies & | | | | | |
| | Distributors - 0.9% | | | | | |
| | HD Supply Holdings, Inc. (a) | | 26,550 | | | 937,215 |
| | | | | | | |
| Information Technology - 23.8% | | | | | |
| | Communications | | | | | |
| | Equipment - 3.7% | | | | | |
| | Cisco Systems, Inc. | | 77,885 | | | 2,262,559 |
| | Lumentum Holdings Inc. (a) | | 29,807 | | | 755,309 |
| | Viavi Solutions Inc. (a) | | 149,535 | | | 1,021,324 |
| | | | | | | 4,039,192 |
| | Electronic Equipment, | | | | | |
| | Instruments & | | | | | |
| | Components - 1.9% | | | | | |
| | Corning Inc. | | 73,475 | | | 1,534,893 |
| | Maxwell Technologies, Inc. (a) | | 93,997 | | | 501,004 |
| | | | | | | 2,035,897 |
| | Internet Software & | | | | | |
| | Services - 3.2% | | | | | |
| | Alphabet, Inc. Class A (a) | | 3,982 | | | 2,981,921 |
| | eBay Inc. (a) | | 21,070 | | | 515,372 |
| | | | | | | 3,497,293 |
| | IT Services - 3.2% | | | | | |
| | Alliance Data Systems Corp. (a) | | 8,075 | | | 1,794,184 |
| | PayPal Holdings, Inc. (a) | | 30,270 | | | 1,143,903 |
| | Visa Inc. Class A | | 6,625 | | | 522,978 |
| | | | | | | 3,461,065 |
| | Semiconductors & | | | | | |
| | Semiconductor | | | | | |
| | Equipment - 5.6% | | | | | |
| | Intel Corp. | | 31,275 | | | 987,977 |
| | Linear Technology Corp. | | 16,870 | | | 798,288 |
| | Maxim Integrated Products, Inc. | | 21,555 | | | 818,228 |
| | NXP Semiconductors N.V. (a) | | 13,675 | | | 1,292,151 |
| | Qualcomm, Inc. | | 39,980 | | | 2,195,702 |
| | | | | | | 6,092,346 |
| | Software - 4.2% | | | | | |
| | Microsoft Corp. | | 51,201 | | | 2,713,653 |
| | Oracle Corp. | | 44,150 | | | 1,774,830 |
| | | | | | | 4,488,483 |
| | Technology Hardware, Storage | | | | | |
| | & Peripherals - 2.0% | | | | | |
| | EMC Corp. | | 38,675 | | | 1,080,966 |
| | Hewlett Packard Enterprise Co. | | 31,125 | | | 574,879 |
| | HP Inc. | | 38,025 | | | 508,775 |
| | | | | | | 2,164,620 |
| Materials - 1.5% | | | | | |
| | Metals & Mining - 1.5% | | | | | |
| | Freeport-McMoRan Inc. (a) | | 143,625 | | | 1,591,365 |
| | |
| | TOTAL COMMON STOCKS | | | | | |
| | (COST $113,247,603) | | | | | 107,611,867 |
See Notes to Financial Statements.
7
| LARGECAP FUND SCHEDULE OF INVESTMENTS (Unaudited) (Continued) |
| May 31, 2016 |
| Shares | | Value |
| SHORT-TERM INVESTMENTS - 0.0% | | | | |
| | | | | |
| Money Market Funds - 0.0% | | | | |
| Fidelity Money Market Portfolio | | | | |
| Class I, 0.335% (b) | 421 | | $ | 421 |
| | | | | |
| Total Money Market Funds | | | | 421 |
| | | | | |
| TOTAL SHORT-TERM | | | | |
| INVESTMENTS (COST $421) | | | | 421 |
| | | | | |
| TOTAL INVESTMENTS - 99.7% | | | | |
| (COST $113,248,024) | | | | 107,612,288 |
| | | | | |
| NET OTHER ASSETS AND | | | | |
| LIABILITIES - 0.3% | | | | 290,406 |
| | | | | |
| NET ASSETS - 100.0% | | | $ | 107,902,694 |
| | (a) | Non-income producing security. |
| (b) | Represents the 7-day yield at May 31, 2016. |
| |
| | |
| | ADR: | American Depositary Receipt |
| | N.V.: | Naamloze Vennootschap is the Dutch term for a public limited liability corporation. |
| | PLC: | Public Limited Company |
The Global Industry Classification Standard (“GICS”) was developed by and is the exclusive property and a service mark of MSCI Inc. (“MSCI”) and Standard & Poor’s Financial Services LLC (“S&P”) and is licensed for use by Thompson Investment Management, Inc. Neither MSCI, S&P, nor any other party involved in making or compiling the GICS or any GICS classifications makes any warranties with respect thereto or the results to be obtained by the use thereof, and no such party shall have any liability whatsoever with respect thereto.
See Notes to Financial Statements.
8
| MIDCAP FUND INVESTMENT REVIEW (Unaudited) |
| May 31, 2016 |
Portfolio Managers
James T. Evans, CFA
Jason L. Stephens, CFA
Performance
The MidCap Fund produced a total return of 0.64% for the six-month period ended May 31, 2016, as compared to its benchmark, the Russell Midcap Index, which returned 2.21%.
Comparison of Change in Value of a Hypothetical $10,000 Investment

| Average Annual Total Returns |
| Through 05/31/16 |
| | 1 Year | | 3 Year | | 5 Year | | Since
Inception
(03/31/08) | |
| Thompson MidCap Fund | | -7.13% | | 6.74% | | 7.71% | | 8.71% | |
| Russell Midcap Index | | -1.97% | | 10.19% | | 10.33% | | 9.31% | |
Gross Expense Ratio as of 03/31/16 was 1.49%.
Net Expense Ratio after reimbursement as of 03/31/16 was 1.25%.*| * | The Advisor has contractually agreed to waive management fees and/or reimburse expenses incurred by the MidCap Fund through March 31, 2017, so that the annual operating expenses of the Fund do not exceed 1.25% of its average daily net assets. |
Performance data quoted represents past performance; past performance does not guarantee future results. The investment return and principal value of an investment will fluctuate so that an investor’s shares, when redeemed, may be worth more or less than their original cost. Current performance of the Fund may be lower or higher than the performance quoted. Performance data current to the most recent month-end may be obtained by calling 1-800-999-0887 or visiting www.thompsonim.com.
Results include the reinvestment of all dividends and capital gains distributions. Investment performance reflects all fee waivers that may be in effect. In the absence of such waivers, total return would be reduced. The performance information reflected in the graph and the table above does not reflect the deduction of taxes that a shareholder would pay on fund distributions or the redemption of fund shares, nor does it imply future performance. The Russell Midcap Index measures the performance of the 800 smallest companies in the Russell 1000 Index based on total market capitalization. You cannot directly invest in an index.
Russell Investment Group is the source and owner of the trademarks, service marks, and copyrights related to the Russell Indexes. Russell® is a trademark of Russell Investment Group.
See Notes to Financial Statements.
9
| MIDCAP FUND INVESTMENT REVIEW (Unaudited) (Continued) |
| May 31, 2016 |
Management Commentary
The MidCap Fund’s performance lag over this time period was primarily driven by a key characteristic of the portfolio’s current composition.
The Fund is positioned for a rising rate environment. In this scenario, securities that investors use as substitutes for long maturity bonds tend to underperform. However, interest rates generally declined over the last six months, and these bond substitutes therefore performed well. For example, the Fund’s low allocation to the Utility Sector relative to the benchmark hurt its performance, as this sector contains a disproportionate number of bond substitutes relative to the overall market. Also, the portfolio is allocated more heavily to banks within the Financial Sector and has a low weighting in real estate investment trusts (REITs) relative to its benchmark. Banks typically benefit from rising rates, while REITs do not. Again, as interest rates declined over the timeframe described in this report, the portfolio’s positioning within the Financial Sector subtracted from relative performance.
Security selection was strong across most sectors and added to relative performance. It was, however, not strong enough to overcome the impact of declining interest rates on the portfolio. This relationship isn’t just a direct one. To a large degree, short-term interest rate movements appear to have been closely correlated to changes in investor sentiment with respect to the health of the global economy and the ability of companies to grow earnings. An increase in interest rates as signaled by a less accommodative Federal Reserve Open Market Committee would likely reflect positive sentiment on this front and correlate with an increase in investor risk appetite. Because the Fund’s portfolio construction anticipates at least a moderately growing U.S. economy, an increase in interest rates could translate to an appreciation in even those sectors not directly impacted by changes in interest rates. It is an interesting time, to be sure, considering that in most scenarios historically a rise in interest rates has depressed stock prices to some extent.
Though the focus of this commentary has been on macroeconomic trends and their impact on the Fund, we must be clear that the portfolio’s makeup is still primarily driven by bottom-up fundamental analysis. We simply are finding value and growth opportunities in those areas of the market that are currently less loved, like banks, and are increasingly concerned about the downside risk of securities that act like bond substitutes.
Opinions expressed are subject to change, are not guaranteed and should not be considered investment advice.
Mutual fund investing involves risk. Principal loss is possible. Midcap companies tend to have more limited liquidity and greater volatility than large-capitalization companies. Investments in American Depositary Receipts (“ADRs”) are subject to some extent to the risks associated with directly investing in securities of foreign issuers, including the risk of changes in currency exchange rates, expropriation or nationalization of assets, and the impact of political, diplomatic, or social events. Investments in real estate securities may involve greater risk and volatility including greater exposure to economic downturns and changes in real estate values, rents, property taxes, tax, and other laws. A REIT’s share price may decline because of adverse developments affecting the real estate industry.
Please refer to the Schedule of Investments on page 12 of this report for holdings information. The management commentary above as well as Fund holdings and asset/sector allocations should not be considered a recommendation to buy or sell any security. In addition, please note that Fund holdings and asset/sector allocations are subject to change.
Correlation is a statistical measure of the degree to which the movements of two variables (stock/option/convertible prices or returns) are related.
Earnings Growth is a measure of growth in a company’s net income over a specific period, often one year. It is not a prediction of the fund’s future returns.
See Notes to Financial Statements.
10
| MIDCAP FUND INVESTMENT REVIEW (Unaudited) (Continued) |
| May 31, 2016 |
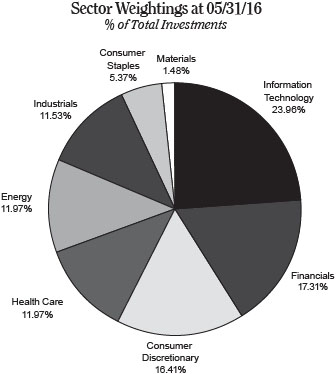
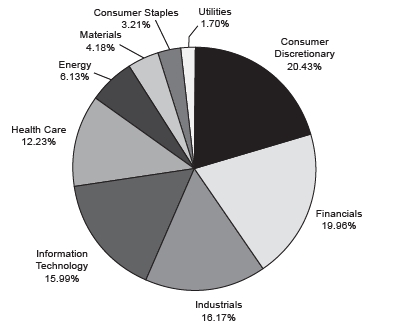
Sector Weightings at 05/31/16
% of Total Investments
| Top 10 Equity Holdings at 05/31/16 |
| Company | Industry | % of Fund’s
Net Assets |
| Alliance Data Systems Corp. | IT Services | 2.23% |
| First Horizon National Corp. | Banks | 2.19% |
| CIT Group Inc. | Banks | 2.07% |
| Northern Trust Corp. | Capital Markets | 1.93% |
| Bed Bath & Beyond Inc. | Specialty Retail | 1.89% |
| Associated Banc-Corp | Banks | 1.83% |
| NXP Semiconductors N.V. | Semiconductors & Semiconductor Equipment | 1.78% |
| Exact Sciences Corp. | Biotechnology | 1.76% |
| Ingersoll-Rand PLC | Machinery | 1.73% |
| Urban Outfitters, Inc. | Specialty Retail | 1.69% |
As of May 31, 2016, 100.0% of the Fund’s net assets were in equity and short-term investments.
See Notes to Financial Statements.
11
| MIDCAP FUND SCHEDULE OF INVESTMENTS (Unaudited) |
| May 31, 2016 |
| Shares | | Value |
| COMMON STOCKS - 99.9% | | | | |
| | | | | |
| Consumer Discretionary - 20.4% | | | | |
| Automobiles - 1.3% | | | | |
| Harley-Davidson, Inc. | 10,500 | | $ | 487,095 |
| |
| Distributors - 1.5% | | | | |
| LKQ Corp. (a) | 17,720 | | | 586,000 |
| |
| Household Durables - 5.0% | | | | |
| D.R. Horton, Inc. | 13,575 | | | 414,852 |
| Newell Brands, Inc. | 8,656 | | | 412,805 |
| PulteGroup Inc. | 21,125 | | | 396,305 |
| Toll Brothers, Inc. (a) | 7,125 | | | 207,694 |
| TopBuild Corp. (a) | 13,250 | | | 478,855 |
| | | | | 1,910,511 |
| Leisure Products - 1.3% | | | | |
| Brunswick Corp. | 10,075 | | | 482,290 |
| |
| Multiline Retail - 1.9% | | | | |
| Kohl’s Corp. | 15,785 | | | 568,891 |
| Nordstrom, Inc. | 4,800 | | | 182,304 |
| | | | | 751,195 |
| Specialty Retail - 4.9% | | | | |
| Bed Bath & Beyond Inc. | 16,330 | | | 730,767 |
| Chico’s FAS, Inc. | 15,325 | | | 166,276 |
| Lumber Liquidators Holdings, Inc. (a) | 27,300 | | | 357,630 |
| Urban Outfitters, Inc. (a) | 22,900 | | | 653,337 |
| | | | | 1,908,010 |
| Textiles, Apparel & | | | | |
| Luxury Goods - 4.5% | | | | |
| Coach, Inc. | 11,555 | | | 455,498 |
| Hanesbrands, Inc. | 21,385 | | | 578,892 |
| Michael Kors Holdings Ltd. (a) | 7,625 | | | 325,740 |
| Skechers U.S.A., Inc. Class A (a) | 12,625 | | | 393,521 |
| | | | | 1,753,651 |
| Consumer Staples - 3.2% | | | | |
| Food Products - 3.2% | | | | |
| Ingredion Inc. | 1,475 | | | 173,180 |
| Inventure Foods, Inc. (a) | 62,375 | | | 467,189 |
| The Hain Celestial Group, Inc. (a) | 6,650 | | | 328,776 |
| The J. M. Smucker Co. | 2,080 | | | 268,632 |
| | | | | 1,237,777 |
| Energy - 6.1% | | | | |
| Energy Equipment & | | | | |
| Services - 1.4% | | | | |
| FMC Technologies, Inc. (a) | 13,125 | | | 357,394 |
| Helmerich & Payne, Inc. | 3,235 | | | 197,820 |
| | | | | 555,214 |
| Oil, Gas & Consumable | | | | |
| Fuels - 4.7% | | | | |
| Cameco Corp. | 14,775 | | | 171,833 |
| Devon Energy Corp. | 11,850 | | | 427,666 |
| Noble Energy, Inc. | 17,375 | | | 621,156 |
| Pioneer Natural Resources Co. | 1,675 | | | 268,536 |
| Southwestern Energy Co. (a) | 23,350 | | | 319,195 |
| | | | | 1,808,386 |
| Financials - 20.0% | | | | |
| Banks - 9.2% | | | | |
| Associated Banc-Corp | 37,805 | | | 706,575 |
| CIT Group Inc. | 23,305 | | | 798,429 |
| First Horizon National Corp. | 57,970 | | | 844,043 |
| Regions Financial Corp. | 22,135 | | | 217,587 |
| SunTrust Banks, Inc. | 10,495 | | | 459,891 |
| Zions Bancorporation | 19,035 | | | 533,361 |
| | | | | 3,559,886 |
| Capital Markets - 3.0% | | | | |
| Eaton Vance Corp. | 11,295 | | | 410,686 |
| Northern Trust Corp. | 10,030 | | | 743,223 |
| | | | | 1,153,909 |
| Consumer Finance - 1.3% | | | | |
| Discover Financial Services | 8,829 | | | 501,575 |
| |
| Insurance - 2.0% | | | | |
| Cincinnati Financial Corp. | 4,215 | | | 291,257 |
| Unum Group | 12,655 | | | 467,223 |
| | | | | 758,480 |
| Real Estate Investment | | | | |
| Trusts - 3.4% | | | | |
| Annaly Capital Management Inc. | 36,375 | | | 384,848 |
| DiamondRock Hospitality Co. | 35,450 | | | 316,923 |
| Host Hotels & Resorts Inc. | 20,435 | | | 314,699 |
| LaSalle Hotel Properties | 11,920 | | | 275,471 |
| | | | | 1,291,941 |
| Thrifts & Mortgage | | | | |
| Finance - 1.1% | | | | |
| Flagstar Bancorp, Inc. (a) | 16,950 | | | 410,868 |
| |
| Health Care - 12.2% | | | | |
| Biotechnology - 2.9% | | | | |
| Exact Sciences Corp. (a) | 102,150 | | | 678,276 |
| MiMedx Group Inc. (a) | 55,475 | | | 436,588 |
| | | | 1,114,864 |
See Notes to Financial Statements.
12
| MIDCAP FUND SCHEDULE OF INVESTMENTS (Unaudited) (Continued) |
| May 31, 2016 |
| Shares | | Value |
| COMMON STOCKS (continued) | | | | |
| | | | | |
| Health Care (continued) | | | | |
| Health Care Equipment & | | | | |
| Supplies - 2.9% | | | | |
| Hologic, Inc. (a) | 7,575 | | $ | 260,656 |
| Natus Medical Inc. (a) | 4,725 | | | 152,759 |
| ResMed Inc. | 5,446 | | | 321,641 |
| Zimmer Biomet Holdings, Inc. | 3,150 | | | 384,647 |
| | | | | 1,119,703 |
| Health Care Providers & | | | | |
| Services - 4.6% | | | | |
| Envision Healthcare Holdings, Inc. (a) | 19,000 | | | 471,390 |
| Hanger, Inc. (a) | 61,269 | | | 393,960 |
| McKesson Corp. | 1,740 | | | 318,664 |
| Patterson Cos., Inc. | 12,480 | | | 609,149 |
| | | | | 1,793,163 |
| Life Sciences Tools & | | | | |
| Services - 0.4% | | | | |
| Fluidigm Corp. (a) | 16,200 | | | 159,408 |
| |
| Pharmaceuticals - 1.4% | | | | |
| Jazz Pharmaceuticals PLC (a) | 3,500 | | | 530,460 |
| |
| Industrials - 16.1% | | | | |
| Air Freight & Logistics - 1.4% | | | | |
| Expeditors Int’l. of Washington, Inc. | 11,500 | | | 558,325 |
| |
| Building Products - 3.1% | | | | |
| A.O. Smith Corp. | 2,500 | | | 205,750 |
| Masco Corp. | 19,925 | | | 650,352 |
| USG Corp. (a) | 12,125 | | | 349,928 |
| | | | | 1,206,030 |
| Electrical Equipment - 3.5% | | | | |
| Plug Power, Inc. (a) | 102,500 | | | 196,800 |
| Regal Beloit Corp. | 9,080 | | | 518,740 |
| Rockwell Automation, Inc. | 5,600 | | | 649,880 |
| | | | | 1,365,420 |
| Machinery - 5.6% | | | | |
| Allison Transmission Holdings, Inc. | 13,375 | | | 375,704 |
| Ingersoll-Rand PLC | 10,000 | | | 668,100 |
| Mueller Water Products, Inc. Class A | 33,700 | | | 371,037 |
| SPX Corp. (a) | 15,750 | | | 260,978 |
| SPX Flow, Inc. (a) | 15,750 | | | 472,027 |
| | | | | 2,147,846 |
| Trading Companies & | | | | |
| Distributors - 2.5% | | | | |
| HD Supply Holdings, Inc. (a) | 16,575 | | | 585,097 |
| W.W. Grainger, Inc. | 1,638 | | | 374,037 |
| | | | | 959,134 |
| Information Technology - 16.0% | | | | |
| Communications Equipment - 1.8% | | | | |
| Lumentum Holdings Inc. (a) | 10,156 | | | 257,353 |
| Viavi Solutions Inc. (a) | 62,281 | | | 425,379 |
| | | | 682,732 |
| Electronic Equipment, | | | | |
| Instruments & | | | | |
| Components - 1.6% | | | | |
| FARO Technologies, Inc. (a) | 5,800 | | | 205,262 |
| InvenSense Inc. (a) | 23,475 | | | 145,076 |
| Maxwell Technologies, Inc. (a) | 50,397 | | | 268,616 |
| | | | | 618,954 |
| Internet Software & | | | | |
| Services - 1.2% | | | | |
| Liquidity Services, Inc. (a) | 70,100 | | | 469,670 |
| |
| IT Services - 3.1% | | | | |
| Alliance Data Systems Corp. (a) | 3,875 | | | 860,986 |
| Fiserv, Inc. (a) | 3,019 | | | 317,991 |
| | | | | 1,178,977 |
| Semiconductors & | | | | |
| Semiconductor | | | | |
| Equipment - 5.2% | | | | |
| Cavium Inc. (a) | 7,650 | | | 380,588 |
| Linear Technology Corp. | 7,590 | | | 359,159 |
| Maxim Integrated Products, Inc. | 15,366 | | | 583,293 |
| NXP Semiconductors N.V. (a) | 7,250 | | | 685,052 |
| | | | | 2,008,092 |
| Software - 0.5% | | | | |
| Take-Two Interactive Software, Inc. (a) | 4,935 | | | 192,021 |
| |
| Technology Hardware, Storage | | | | |
| & Peripherals - 2.6% | | | | |
| CPI Card Group Inc. | 52,000 | | | 216,320 |
| Nimble Storage, Inc. (a) | 25,100 | | | 224,143 |
| Pure Storage, Inc. Class A (a) | 13,650 | | | 160,797 |
| Silicon Graphics Int’l. Corp. (a) | 42,825 | | | 225,260 |
| Stratasys Ltd. (a) | 3,900 | | | 88,998 |
| 3D Systems Corp. (a) | 7,550 | | | 101,095 |
| | | | | 1,016,613 |
| Materials - 4.2% | | | | |
| Chemicals - 2.0% | | | | |
| Ecolab Inc. | 3,156 | | | 370,009 |
| Int’l. Flavors & Fragrances Inc. | 2,960 | | | 381,840 |
| | | | | 751,849 |
| Metals & Mining - 2.2% | | | | |
| Freeport-McMoRan Inc. (a) | 50,550 | | | 560,094 |
| Lundin Mining Corp. (a) | 43,600 | | | 144,752 |
| Stillwater Mining Co. (a) | 15,200 | | | 153,824 |
| | | | | 858,670 |
See Notes to Financial Statements.
13
| MIDCAP FUND SCHEDULE OF INVESTMENTS (Unaudited) (Continued) |
| May 31, 2016 |
| Shares | | Value |
| COMMON STOCKS (continued) | | | | |
| | | | | |
| Utilities - 1.7% | | | | |
| Multi-Utilities - 1.7% | | | | |
| MDU Resources Group, Inc. | 17,300 | | $ | 395,651 |
| SCANA Corp. | 3,750 | | | 262,163 |
| | | | | 657,814 |
| |
| TOTAL COMMON STOCKS | | | | |
| (COST $37,591,837) | | | | 38,546,533 |
| |
| SHORT-TERM INVESTMENTS - 0.1% | | | | |
| Money Market Funds - 0.1% | | | | |
| Fidelity Money Market Portfolio | | | | |
| Class I, 0.335% (b) | 22,394 | | | 22,394 |
| |
| Total Money Market Funds | | | | 22,394 |
| |
| TOTAL SHORT-TERM | | | | |
| INVESTMENTS (COST $22,394) | | | | 22,394 |
| |
| TOTAL INVESTMENTS - 100.0% | | | | |
| (COST $37,614,231) | | | | 38,568,927 |
| |
| NET OTHER ASSETS AND | | | | |
| LIABILITIES - 0.0% | | | | 8,093 |
| |
| NET ASSETS - 100.0% | | | $ | 38,577,020 |
| | (a) | Non-income producing security. |
| (b) | Represents the 7-day yield at May 31, 2016. |
| | |
| | N.V.: | Naamloze Vennootschap is the Dutch term for a public limited liability corporation. |
| | PLC: | Public Limited Company |
The Global Industry Classification Standard (“GICS”) was developed by and is the exclusive property and a service mark of MSCI Inc. (“MSCI”) and Standard & Poor’s Financial Services LLC (“S&P”) and is licensed for use by Thompson Investment Management, Inc. Neither MSCI, S&P, nor any other party involved in making or compiling the GICS or any GICS classifications makes any warranties with respect thereto or the results to be obtained by the use thereof, and no such party shall have any liability whatsoever with respect thereto.
See Notes to Financial Statements.
14
| BOND FUND INVESTMENT REVIEW (Unaudited) |
| May 31, 2016 |
Portfolio Managers
James T. Evans, CFA
Jason L. Stephens, CFA
John W. Thompson, CFA
Performance
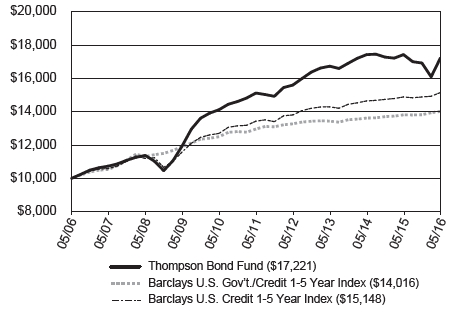
The Bond Fund produced a total return of 1.78% for the six-month period ended May 31, 2016, as compared to its benchmark, the Barclays U.S. Government/Credit 1-5 Year Index, which returned 1.42%, and as compared to the Barclays U.S. Credit 1-5 Year Index, which returned 1.77%.
Comparison of Change in Value of a Hypothetical $10,000 Investment
| Average Annual Total Returns |
| Through 05/31/16 |
| | 1 Year | | 3 Year | | 5 Year | | 10 Year | |
| Thompson Bond Fund | | -1.16% | | 0.97% | | 2.64% | | 5.59% | |
| Barclays U.S. Gov’t./Credit 1-5 Year Index | | 1.49% | | 1.42% | | 1.58% | | 3.43% | |
| Barclays U.S. Credit 1-5 Year Index | | 1.78% | | 1.96% | | 2.44% | | 4.24% | |
Gross Expense Ratio as of 03/31/16 was 0.71%. 30-Day SEC Yield as of 05/31/16 was 4.96%.
Performance data quoted represents past performance; past performance does not guarantee future results. The investment return and principal value of an investment will fluctuate so that an investor’s shares, when redeemed, may be worth more or less than the investor’s original cost. Current performance of the Fund may be lower or higher than the performance quoted. Performance data current to the most recent month-end may be obtained by calling 1-800-999-0887 or visiting www.thompsonim.com.
Results include the reinvestment of all dividends and capital gains distributions. Investment performance reflects all fee waivers that may have been in effect. In the absence of such waivers, total return would have been reduced. The performance information reflected in the graph and the table above does not reflect the deduction of taxes that a shareholder would pay on fund distributions or the redemption of fund shares, nor does it imply future performance. The Barclays U.S. Government/Credit 1-5 Year Index is a market-value-weighted index of all investment-grade bonds with maturities of more than one year and less than 5 years. The Barclays U.S. Credit 1-5 Year Index is a market-value-weighted index which includes virtually every major investment-grade rated corporate bond with 1-5 years remaining until maturity that serves as a supplementary benchmark. You cannot directly invest in an index.
Barclays® is a trademark of Barclays Bank PLC.
See Notes to Financial Statements.
15
| BOND FUND INVESTMENT REVIEW (Unaudited) (Continued) |
| May 31, 2016 |
Management Commentary
The semi-annual period proved to be a volatile one for both bond market participants and shareholders of the Bond Fund. The concerns investors felt in the fourth quarter of 2015 regarding certain energy and commodity-oriented bonds cascaded into a full-blown panic during the first month and a half of the new year. As a result, a subset of the Fund’s holdings in these areas saw their prices fall precipitously on fairly low volume, sending the Fund’s mid-period return down several percentage points. Yet by the end of the semi-annual period, the Fund’s performance was not only positive on an absolute basis, but was ahead of its benchmark. Needless to say, this was a sharp reversal in a mere few months. While we do not desire this level of volatility, we feel that looking into the details should help shareholders better understand the driving factors behind this volatility and to feel more comfortable with our belief that the degree of recent price fluctuations should not be repeated in the rest of the fiscal year.
Coming into the fiscal year, both the market and we thought that oil prices were likely to largely bounce within a $40-60 range for the foreseeable future, with some temporary deviations from this range based on short term supply/demand imbalances. Over the past decade, prices below this range were not sustainable, as the ultimate production costs of global oil dictated that much of the incremental supply brought onto the market was breakeven at best at such levels. Sharp declines in capital expenditures, operating rig counts, and even employment supported the thesis that global production was in the process of gradually adjusting to the reality that $100 oil was not likely to reoccur soon. Investment-grade ratings by S&P and Moody’s for many bonds in the sectors appeared to be based on these assumptions, with some of the Fund’s bonds affirmed in the fourth quarter of calendar 2015 based on oil prices in this range. Our own credit analysis of the Fund’s holdings agreed with this assessment, as we calculated the issuers of our bonds should have the capability to successfully redeem them. The Fund has made a concerted effort to avoid many junk rated energy companies that we believe are unlikely to survive long term under these conditions.
Things changed in January and early February. A combination of a storage capacity problem in the U.S. exacerbated by an unusually warm winter, the lifting of sanctions against Iran, and fears over a hard economic landing for China sent oil prices lower, ultimately bottoming at a closing low of $26.21 per barrel on February 11th. S&P and Moody’s swiftly reversed course, putting the entire sector, including AAA-rated Exxon Mobil, on negative watch. Many names were downgraded as much as two notches. This reaction appears to have been mostly in response to changes in the spot rate of oil, notwithstanding the fact that many larger oil companies tend to hedge their production by using futures contracts, which are typically less volatile. The 12-month out futures contract never closed below $35, and it is unclear how many barrels of production were ultimately sold at the spot-price low. Nevertheless, ratings agencies appear essentially to have assumed those prices would persist for an extended period of time.
Of course, as is often the case, once the market grew concerned about downgrade risk, it ceased to differentiate between high and low-quality energy companies. During the first calendar quarter, the Fund’s total exposure to the Energy sector varied in the mid to upper teens, but it was really a smaller subset of the sector—for the Fund, consisting of just six issuers totaling less than 10% of assets—where the majority of the volatility occurred. Three of the six were downgraded during that calendar quarter, but all of them saw yields generally balloon out to the mid-to-high teens for maturities ranging from 2017 to 2022. On a dollar weighted basis, these yields generally translated into an average price decline of just over 40% from their par value. The volatility occurred despite in some cases the issuer already having enough cash on hand to successfully redeem its debt through at least the issue we own or not having any outstanding debt maturing before 2019 or later, which would allow the company the luxury of time for circumstances to potentially change. Most of these bonds traded lower on light volume. This suggests to us that the significantly lower prices were likely attributable to a handful of sellers that were desperate to sell the bonds and were willing to accept sharply lower prices to accomplish their goals.
The damage in the market was not completely confined to energy bonds, as spreads on 10-year corporate bonds in general at the BBB credit quality tier widened out over 30 basis points beyond the normal 1-2% range typical of non-recessionary time periods. Financial lenders with possible exposure to energy markets saw their spreads widen even more. Equities were not immune either, with the S&P 500 at one point declining over 10% on a year-to-date basis despite what we saw as evidence of an improving economy.
Yet as February turned to March it became apparent that the market had again overreacted to short-term noise. The aforementioned corporate spreads narrowed back down to within a 2% level, and equities rallied back to breakeven. Oil prices rallied to finish May at $49.10 per barrel, actually up nicely over the full semi-annual period from a $41.65 starting point.
See Notes to Financial Statements.
16
| BOND FUND INVESTMENT REVIEW (Unaudited) (Continued) |
| May 31, 2016 |
Many of the same bonds that had gotten hammered during the first two-and-a-half months of the semi-annual period traded up on similarly light volume, as almost no other holders were willing to sell their positions at depressed prices, meaning even a handful of buyers had to pay up if they wanted the bonds.
Ultimately, short-term volatility in market expectations is to be expected. What was unusual is the degree to which asset prices reacted to those expectations, and the extremes to which they varied over such a short period of time. Much as we did not anticipate the magnitude of the weakness in those six bonds, we also did not expect the market to rally back as quickly as it did. It is reasonable to conclude that there must have been forced sellers of these bonds that exacerbated the price reaction, which caused an equally sharp reaction once they had successfully exited their positions and few other sellers remained.
We believe that the volatility experienced in the semi-annual period is not likely to recur soon for several reasons. First, having already downgraded many names in the energy sector to junk there is less S&P and Moody’s could do that would scare investors to the same degree. After all, their presumable fear of repeating mistakes made during the real estate bubble suggests they will be slow to consider upgrading bond ratings despite the rebound in oil prices. This suggests their opinion already reflects fairly conservative assumptions that should prove easier to exceed. Second, the concentration of weakness into only a handful of names has caused us to re-evaluate how we weight issuer concentration within the Fund. We have refined our investment process with respect to how we think about the concentrations of new positions to further delineate among gradients within S&P’s investment-grade rating system. We believe this should translate to less Fund price volatility for shareholders relative to the benchmark.
Despite the rally in prices during the second half of the semi-annual period, we believe the 30-day SEC yield and potential future return opportunity of the Fund remain quite attractive to shareholders. While we have made tweaks to better moderate the Fund’s volatility, our overall strategy remains the same and we are hopeful that it benefits shareholders as it has in the past. We appreciate the trust shareholders have placed in our management team and are working hard to justify their faith.
Opinions expressed are subject to change, are not guaranteed and should not be considered investment advice.
Mutual fund investing involves risk. Principal loss is possible. Investments in debt securities typically decrease in value when interest rates rise. The risk is usually greater for longer-term debt securities. Investments in bonds of foreign issuers involve greater volatility, political and economic risks, and differences in accounting methods. Investment by the Fund in lower-rated and non-rated securities presents a greater risk of loss to principal and interest than higher-rated securities.
Please refer to the Schedule of Investments on page 19 of this report for holdings information. The management commentary above as well as Fund holdings should not be considered a recommendation to buy or sell any security. In addition, please note that Fund holdings are subject to change.
The federal government guarantees interest payments from government securities while dividend payments carry no such guarantee. Government securities, if held to maturity, guarantee the timely payment of principal and interest.
SEC Yield is a standardized yield computed by dividing the net investment income per share earned during the 30-day period prior to quarter-end and was created to allow for fairer comparisons among bond funds.
Basis point is a unit that is equal to 1/100th of 1%, and is used to denote the change in a financial instrument.
Junk bond is a security rated below investment grade having a rating of BBB- or below.
Spread is the percentage point difference between yields of various classes of bonds compared to treasury bonds.
S&P 500 Index is an unmanaged index commonly used to measure the performance of U.S. stocks. You cannot directly invest in an index.
Yield is the income earned from a bond, which takes into account the sum of the interest payment, the redemption value at the bond’s maturity, and the initial purchase price of the bond.
Credit Ratings are provided by Standard & Poor’s, who assign a rating based on their analysis of the issuer’s credit worthiness. The highest rating given is AAA and the lowest is C.
The purpose of Moody’s ratings is to provide investors with a simple system of gradation by which relative creditworthiness of securities may be noted. Gradations of creditworthiness are indicated by rating symbols, with each symbol representing a group in which the credit characteristics are broadly the same. The highest rating assigned by Moody’s is AAA and the lowest is C.
Although the makeup of the Bond Fund’s portfolio is constantly changing, as of May 31, 2016, 81.63% of the Fund’s portfolio was invested in corporate bonds. Due to prevailing market conditions, the composition of the Fund’s portfolio as of that date was consistent with the composition of the Fund’s portfolio over the past 5 years. In addition, as of that date 67.32% of the Fund’s portfolio was invested in bonds rated BBB by Standard & Poor’s, while an additional 16.75% of the Fund’s portfolio was rated below investment grade and 3.37% of the Fund’s portfolio was not rated by Standard & Poor’s. For portfolio information current as of the most recent quarter-end, please call 1-800-999-0887 or visit our website at www.thompsonim.com. Compared to a portfolio that is more evenly allocated between government and corporate bonds, a portfolio that is heavily allocated to corporate bonds may provide higher returns, but is also subject to greater levels of credit and liquidity risk and to greater price fluctuations. A portfolio that is significantly allocated to bonds having lower and below-investment-grade ratings may also be subject to greater levels of credit and liquidity risk and experience greater price fluctuations than a portfolio comprised of higher-rated investment-grade bonds.
See Notes to Financial Statements.
17
| BOND FUND INVESTMENT REVIEW (Unaudited) (Continued) |
| May 31, 2016 |
| Portfolio Concentration at 05/31/16 | |
| (Includes cash and cash equivalents) | |
| % Total Investments | |
| Asset Allocation | |
| | Corporate Bonds | 81.63% | |
| Asset-Backed Securities | 11.17% | |
| Taxable Municipal Bonds | 3.82% | |
| U.S. Government & Agency Issues | 2.61% | |
| Convertible Bonds | 0.44% | |
| | Tax-Exempt Municipal Bonds | 0.33% | |
| | 100.00% | |
| | | |
| Quality | |
| U.S. Government & Agency Issues | 2.61% | |
| AA | 1.39% | |
| A | 8.55% | |
| BBB | 67.32% | |
| BB and Below | 16.75% | |
| Not Rated | 3.37% | |
| Money Market Funds | 0.01% | |
| | 100.00% | |
| | | |
| | |
| Top 10 Bond Holdings at 05/31/16 | |
| % of Fund’s Net Assets | |
| MBIA Inc. | 3.96% | |
| GFI Group Inc. | 3.61% | |
| SESI LLC | 3.59% | |
| Freeport-McMoran Oil & Gas LLC | 3.51% | |
| XL Group PLC | 3.28% | |
| American Airlines Group Inc. | 3.10% | |
| Jabil Circuit, Inc. | 2.96% | |
| Noble Corporation PLC | 2.81% | |
| Kinder Morgan Inc. | 2.78% | |
| MPT Operating Partnership, L.P. | 2.59% | |
See Notes to Financial Statements.
18
| BOND FUND SCHEDULE OF INVESTMENTS (Unaudited) |
| May 31, 2016 |
| | | | Principal | | | |
| | | | | Amount | | Value |
| BONDS - 95.3% | | | | | | |
| | | | | | | |
| Asset-Backed Securities - 10.9% | | | | | | |
| | America West Airlines | | | | | | |
| | 7.930% due 1/2/2019, | | | | | | |
| | Series 1999-1 | | $ | 6,674,563 | | $ | 7,200,185 |
| | 8.057% due 7/2/2020, | | | | | | |
| | Series 2000-1 | | | 25,005 | | | 27,880 |
| | 7.100% due 4/2/2021, | | | | | | |
| | Series 2001-1 | | | 4,858,152 | | | 5,198,223 |
| | |
| | | American Airlines | | | | | | |
| | 7.000% due 1/31/2018, | | | | | | |
| | Series 2011-1 B (e) | | | 23,868,427 | | | 24,882,835 |
| | |
| | Ameritech Capital Funding Corp. | | | | | | |
| | 9.100% due 6/1/2016 | | | 9,680 | | | 9,680 |
| | |
| | Basketball Properties Ltd. | | | | | | |
| | 6.650% due 3/1/2025 (e) | | | 4,649,354 | | | 5,021,303 |
| | |
| | Beaver Valley II Funding | | | | | | |
| | 9.000% due 6/1/2017 | | | 1,000 | | | 1,005 |
| | |
| | British Airways PLC | | | | | | |
| | 5.625% due 6/20/2020, | | | | | | |
| | Series 2013-1 B (e) | | | 35,752,225 | | | 37,182,314 |
| | 5.625% due 6/20/2020, | | | | | | |
| | Series 2013-1 B (e) | | | 74,467 | | | 77,445 |
| | |
| | Bvps II Funding Corp. | | | | | | |
| | 8.890% due 6/1/2017 | | | 5,000 | | | 5,184 |
| | |
| | Continental Airlines | | | | | | |
| | 9.000% due 7/8/2016, | | | | | | |
| | Series 2009-1 | | | 585,847 | | | 593,463 |
| | 6.748% due 3/15/2017, | | | | | | |
| | Series 1998-1 B | | | 107,249 | | | 111,485 |
| | 6.648% due 9/15/2017, | | | | | | |
| | Series 1998-1 A | | | 886,937 | | | 909,643 |
| | 6.900% due 1/2/2018, | | | | | | |
| | Series 1997-4 A | | | 144,932 | | | 147,917 |
| | 6.820% due 5/1/2018, | | | | | | |
| | Series 1998-3 A-1 | | | 67,492 | | | 70,192 |
| | 6.000% due 1/12/2019, | | | | | | |
| | Series 2010-1 B | | | 2,003,654 | | | 2,103,837 |
| | 7.256% due 3/15/2020, | | | | | | |
| | Series 1999-2 A-1 | | | 28,856 | | | 30,948 |
| | 6.250% due 4/11/2020, | | | | | | |
| | Series 2012-1 B | | | 6,966,378 | | | 7,366,944 |
| | 5.500% due 10/29/2020, | | | | | | |
| | Series 2012-2 B | | | 10,380,594 | | | 10,717,964 |
| | | | | | | | | |
| | Delta Air Lines | | | | | | |
| | 9.750% due 12/17/2016, | | | | | | |
| | Series 2009-1 B | | | 913,058 | | | 949,580 |
| | 8.021% due 8/10/2022, | | | | | | |
| | Series 2007-1 B | | | 2,480,632 | | | 2,843,301 |
| | |
| | Doric Nimrod Air Alpha | | | | | | |
| | 6.125% due 11/30/2019, | | | | | | |
| | Series 2013-1B (e) | | | 30,518,135 | | | 30,899,612 |
| | 6.125% due 11/30/2019, | | | | | | |
| | Series 2013-1B (e) | | | 4,972,709 | | | 5,034,868 |
| | |
| | Doric Nimrod Air | | | | | | |
| | Finance Alpha Ltd. | | | | | | |
| | 6.500% due 5/30/2021, | | | | | | |
| | Series 2012-1 B (e) | | | 12,768,484 | | | 13,044,833 |
| | |
| | Express Pipeline LP | | | | | | |
| | 7.390% due 12/31/2017 (e) | | | 840,000 | | | 874,070 |
| | |
| | Federal Express Corp. | | | | | | |
| | 7.840% due 1/30/2018, | | | | | | |
| | Series 1996-B2 | | | 167,766 | | | 179,509 |
| | |
| | FPL Energy Caithness | | | | | | |
| | Funding Corp. | | | | | | |
| | 7.645% due 12/31/2018 (e) | | | 2,682,770 | | | 2,803,494 |
| | |
| | General American Railcar | | | | | | |
| | 6.690% due 9/20/2016, | | | | | | |
| | Series 1997-1 (e) | | | 31,272 | | | 31,538 |
| | |
| | Great River Energy | | | | | | |
| | 5.829% due 7/1/2017 (e) | | | 1,042,882 | | | 1,064,095 |
| | |
| | Hidden Ridge Facility | | | | | | |
| | 5.650% due 1/1/2022 (e) | | | 4,267,240 | | | 4,363,876 |
| | |
| | Landmark Leasing LLC | | | | | | |
| | 6.200% due 10/1/2022, | | | | | | |
| | Series 2004A (e) | | | 349,922 | | | 352,540 |
| | |
| | Latam Airlines Group | | | | | | |
| | 4.500% due 11/15/2023, | | | | | | |
| | Series 2015-1 B (e) | | | 5,836,246 | | | 5,135,897 |
| | 4.200% due 11/15/2027, | | | | | | |
| | Series 2015-1 A (e) | | | 3,832,664 | | | 3,411,071 |
See Notes to Financial Statements.
19
| BOND FUND SCHEDULE OF INVESTMENTS (Unaudited) (Continued) |
| May 31, 2016 |
| | | | Principal | | | |
| | | | | Amount | | Value |
| BONDS (continued) | | | | | | |
| | | | |
| Asset-Backed Securities (continued) | | | |
| | Midwest Family Housing LLC | | | | | | |
| | 5.168% due 7/1/2016 (e) | | $ | 50,847 | | $ | 51,004 |
| | |
| | Northwest Airlines | | | | | | |
| | 8.028% due 11/1/2017, | | | | | | |
| | Series 2007-1 B | | | 92,545 | | | 98,672 |
| | 7.575% due 3/1/2019, | | | | | | |
| | Series 1999-2 A | | | 793,737 | | | 825,487 |
| | 7.150% due 10/1/2019, | | | | | | |
| | Series 2000-1 G (b) | | | 20,372 | | | 21,570 |
| | 7.027% due 11/1/2019, | | | | | | |
| | Series 2007-1 A | | | 11,546,119 | | | 12,851,985 |
| | 6.264% due 11/20/2021, | | | | | | |
| | Series 2002-1 G-2 | | | 578,240 | | | 611,836 |
| | |
| | United Air Lines | | | | | | |
| | | 10.400% due 11/1/2016, | | | | | | |
| | Series 2009-1 | | | 1,328,388 | | | 1,381,524 |
| | 5.375% due 8/15/2021, | | | | | | |
| | Series 2013-1 B | | | 2,155,419 | | | 2,242,282 |
| | |
| | US Airways | | | | | | |
| | 8.360% due 1/20/2019, | | | | | | |
| | Series 1999-1A | | | 65,227 | | | 68,570 |
| | 8.000% due 10/1/2019, | | | | | | |
| | Series 2012-1 B | | | 20,215,102 | | | 22,300,209 |
| | 7.076% due 3/20/2021, | | | | | | |
| | Series 2001-1G | | | 1,017,657 | | | 1,105,430 |
| | |
| | Virgin Australia Trust | | | | | | |
| | 5.000% due 10/23/2023, | | | | | | |
| | Series 2013-1A (e) | | | 204,482 | | | 211,383 |
| | |
| | Total Asset-Backed Securities | | | | | | 214,416,683 |
| | |
| Convertible Bonds - 0.4% | | | | | | |
| | Hospitality Properties Trust | | | | | | |
| | 3.800% due 3/15/2027 | | | 7,309,000 | | | 7,345,545 |
| | |
| | Prospect Capital Corp. | | | | | | |
| | 5.500% due 8/15/2016 | | | 1,075,000 | | | 1,080,375 |
| | |
| | Total Convertible Bonds | | | | | | 8,425,920 |
| | |
| Corporate Bonds - 79.9% | | | | | | |
| | Activision Blizzard, Inc. | | | | | | |
| | 5.625% due 9/15/2021 (e) | | | 5,840,000 | | | 6,132,000 |
| | | | | | | | |
| | Alcoa Inc. | | | | | | |
| | 5.550% due 2/1/2017 | | | 143,000 | | | 146,396 |
| | |
| | Assured Guaranty US | | | | | | |
| | Holdings Inc. | | | | | | |
| | 6.400% due 12/15/2066 (b) | | | 15,242,000 | | | 9,526,250 |
| | |
| | Astoria Financial Corp. | | | | | | |
| | 5.000% due 6/19/2017 | | | 30,696,000 | | | 31,537,132 |
| | |
| | Athene Global Funding | | | | | | |
| | 2.875% due 10/23/2018 (e) | | | 32,217,000 | | | 31,850,274 |
| | |
| | Aviation Capital Group Corp. | | | | | | |
| | 3.875% due 9/27/2016 (e) | | | 1,639,000 | | | 1,647,195 |
| | 4.625% due 1/31/2018 (e) | | | 1,080,000 | | | 1,105,650 |
| | |
| | Avon Products, Inc. | | | | | | |
| | 6.500% due 3/1/2019 | | | 46,803,000 | | | 43,292,775 |
| | 6.350% due 3/15/2020 (b) | | | 500,000 | | | 423,880 |
| | |
| | Bank of America Corp. | | | | | | |
| | 6.000% due 6/15/2016 | | | 160,000 | | | 160,266 |
| | 2.325% due 10/9/2024 (b) | | | 35,000,000 | | | 33,731,250 |
| | |
| | Bank of Oklahoma | | | | | | |
| | 1.316% due 5/15/2017 (b) | | | 50,000 | | | 49,351 |
| | |
| | BGC Partners Inc. | | | | | | |
| | 5.375% due 12/9/2019 | | | 110,000 | | | 114,975 |
| | |
| | BMC Software, Inc. | | | | | | |
| | 7.250% due 6/1/2018 | | | 5,312,000 | | | 4,913,600 |
| | |
| | Cabot Corp. | | | | | | |
| | 2.550% due 1/15/2018 | | | 2,850,000 | | | 2,846,788 |
| | |
| | Carpenter Technology Corp. | | | | | | |
| | 6.990% due 4/20/2018 | | | 2,415,000 | | | 2,550,271 |
| | 7.060% due 5/21/2018 | | | 500,000 | | | 525,846 |
| | 7.030% due 5/22/2018 | | | 8,000 | | | 8,409 |
| | |
| | Centrais Eletricas | | | | | | |
| | Brasileiras S.A. | | | | | | |
| | 6.875% due 7/30/2019 (e) | | | 21,023,000 | | | 20,539,471 |
| | 5.750% due 10/27/2021 (e) | | | 16,365,000 | | | 14,053,444 |
See Notes to Financial Statements.
20
| BOND FUND SCHEDULE OF INVESTMENTS (Unaudited) (Continued) |
| May 31, 2016 |
| | | | | Principal | | | |
| | | | Amount | | Value |
| BONDS (continued) | | | | | | |
| | | | | | | | |
| Corporate Bonds (continued) | | | | | | |
| | Citigroup, Inc. | | | | | | |
| | 2.250% due 10/15/2024 (b) | | $ | 35,000,000 | | $ | 33,965,050 |
| | |
| | Cliffs Natural Resources Inc. | | | | | | |
| | 5.950% due 1/15/2018 (b) | | | 2,761,000 | | | 2,070,750 |
| | 5.900% due 3/15/2020 | | | 22,799,000 | | | 9,575,580 |
| | |
| | Columbia Property Trust | | | | | | |
| | 5.875% due 4/1/2018 | | | 130,000 | | | 137,519 |
| | |
| | Copano Energy, LLC | | | | | | |
| | 7.125% due 4/1/2021 | | | 3,685,000 | | | 3,787,915 |
| | |
| | Countrywide Financial Corp. | | | | | | |
| | 5.250% due 5/27/2020 | | | 379,000 | | | 380,366 |
| | 6.000% due 8/26/2020 (c) | | | 140,000 | | | 138,998 |
| | |
| | Countrywide Home Loans, Inc. | | | | | | |
| | 5.500% due 5/16/2018 | | | 249,000 | | | 247,671 |
| | |
| | Denali Borrower LLC / Denali | | | | | | |
| | Finance Corp. | | | | | | |
| | 5.625% due 10/15/2020 (e) | | | 22,645,000 | | | 23,811,217 |
| | |
| | Development Bank of | | | | | | |
| | Kazakhstan | | | | | | |
| | 6.500% due 6/3/2020 (e) | | | 5,055,000 | | | 5,189,766 |
| | 4.125% due 12/10/2022 (e) | | | 15,035,000 | | | 13,869,788 |
| | |
| | Devon Energy Corp. | | | | | | |
| | 6.300% due 1/15/2019 | | | 5,000,000 | | | 5,279,475 |
| | |
| | Diamond 1 Finance Corp. / | | | | | | |
| | Diamond 2 Finance Corp. | | | | | | |
| | 4.420% due 6/15/2021 (e) (g) | | | 500,000 | | | 509,984 |
| | |
| | Discover Financial Services | | | | | | |
| | 6.450% due 6/12/2017 | | | 1,320,000 | | | 1,377,709 |
| | 10.250% due 7/15/2019 | | | 11,302,000 | | | 13,327,737 |
| | |
| | Domtar Corp. | | | | | | |
| | 9.500% due 8/1/2016 | | | 362,000 | | | 366,309 |
| | 10.750% due 6/1/2017 | | | 9,390,000 | | | 10,056,831 |
| | |
| | El Paso Corp. | | | | | | |
| | 7.000% due 6/15/2017 | | | 3,177,000 | | | 3,316,232 |
| | | | | | | | |
| | Embraer Overseas Ltd. | | | | | | |
| | 6.375% due 1/24/2017 | | | 12,406,000 | | | 12,700,643 |
| | |
| | Enbridge Energy Partners, L.P. | | | | | | |
| | 5.875% due 12/15/2016 | | | 362,000 | | | 369,796 |
| | |
| | Enterprise Products | | | | | | |
| | �� Operating LLC | | | | | | |
| | 7.000% due 6/1/2067 (b) | | | 8,538,000 | | | 6,552,915 |
| | | |
| | Everest Reinsurance | | | | | | |
| | Holdings Inc. | | | | | | |
| | 6.600% due 5/15/2037 (b) | | | 8,692,000 | | | 7,127,440 |
| | |
| | Fairfax Financial Holdings Ltd. | | | | | | |
| | 7.375% due 4/15/2018 | | | 24,226,500 | | | 25,924,996 |
| | |
| | Fidelity National Financial, Inc. | | | | | | |
| | 6.600% due 5/15/2017 | | | 3,160,000 | | | 3,299,508 |
| | |
| | Fifth Third Bancorp | | | | | | |
| | 4.900% due 9/30/2019 (b) (d) | | | 42,312,000 | | | 37,075,890 |
| | |
| | First Midwest Bancorp, Inc. | | | | | | |
| | 5.875% due 11/22/2016 | | | 1,175,000 | | | 1,195,231 |
| | |
| | Freeport-McMoran Oil & | | | | | | |
| | Gas LLC | | | | | | |
| | 6.125% due 6/15/2019 | | | 11,733,000 | | | 11,557,005 |
| | 6.625% due 5/1/2021 | | | 28,585,000 | | | 27,084,287 |
| | |
| | General Electric Capital Corp. | | | | | | |
| | 1.013% due 5/5/2026 (b) | | | 613,000 | | | 570,339 |
| | |
| | Genworth Financial Inc. | | | | | | |
| | 7.700% due 6/15/2020 | | | 2,918,000 | | | 2,567,840 |
| | |
| | GFI Group Inc. | | | | | | |
| | 8.375% due 7/19/2018 (b) | | | 66,699,000 | | | 70,784,314 |
| | |
| | Globo Comunicacao e | | | | | | |
| | Participacoes S.A. | | | | | | |
| | 5.307% due 5/11/2022 (c) (e) | | | 16,990,000 | | | 17,159,900 |
| | |
| | Great Plains Energy Inc. | | | | | | |
| | 6.875% due 9/15/2017 | | | 30,000 | | | 31,457 |
See Notes to Financial Statements.
21
| BOND FUND SCHEDULE OF INVESTMENTS (Unaudited) (Continued) |
| May 31, 2016 |
| | | | | Principal | | | |
| | | | Amount | | Value |
| BONDS (continued) | | | | | | |
| | | | | | | | |
| Corporate Bonds (continued) | | | | | | |
| | Harsco Corp. | | | | | | |
| | 5.750% due 5/15/2018 | | $ | 21,479,000 | | $ | 19,223,705 |
| | |
| | HCP, Inc. | | | | | | |
| | 6.300% due 9/15/2016 | | | 827,000 | | | 838,518 |
| | |
| | Hiland Partners, LP | | | | | | |
| | | 7.250% due 10/1/2020 (e) | | | 23,110,000 | | | 24,116,672 |
| | |
| | Hospitality Properties Trust | | | | | | |
| | 5.625% due 3/15/2017 | | | 11,260,000 | | | 11,553,458 |
| | 6.700% due 1/15/2018 | | | 5,007,000 | | | 5,243,365 |
| | |
| | HRPT Properties Trust | | | | | | |
| | 6.250% due 6/15/2017 | | | 5,773,000 | | | 5,889,372 |
| | 6.650% due 1/15/2018 | | | 33,478,000 | | | 35,015,511 |
| | |
| | International Lease | | | | | | |
| | Finance Corp. | | | | | | |
| | 6.750% due 9/1/2016 (e) | | | 14,286,000 | | | 14,428,860 |
| | |
| | INVISTA Finance LLC | | | | | | |
| | 4.250% due 10/15/2019 (e) | | | 32,365,000 | | | 31,474,962 |
| | |
| | Jabil Circuit, Inc. | | | | | | |
| | 7.750% due 7/15/2016 | | | 4,694,000 | | | 4,723,338 |
| | 8.250% due 3/15/2018 | | | 48,966,000 | | | 53,250,525 |
| | |
| | JPMorgan Chase & Co. | | | | | | |
| | 7.900% due 4/30/2018 (b) (d) | | | 37,491,000 | | | 38,334,547 |
| | |
| | Kinder Morgan Inc. | | | | | | |
| | 7.000% due 2/1/2018 | | | 22,258,000 | | | 23,342,543 |
| | |
| | Kraft Foods Group, Inc. | | | | | | |
| | 6.125% due 8/23/2018 (e) | | | 50,000 | | | 54,833 |
| | |
| | Lexmark International, Inc. | | | | | | |
| | 6.650% due 6/1/2018 | | | 4,134,000 | | | 4,319,827 |
| | |
| | Lincoln National Corp. | | | | | | |
| | 2.985% due 5/17/2066 (b) | | | 25,985,000 | | | 17,813,237 |
| | 6.050% due 4/20/2067 (b) | | | 19,155,000 | | | 12,958,932 |
| | | | | | | | |
| | Manufacturers & Traders | | | | | | |
| | Trust Co. | | | | | | |
| | 1.669% due 12/28/2020 (b) | | | 14,173,000 | | | 13,879,520 |
| | 5.629% due 12/1/2021 (b) | | | 1,002,000 | | | 974,445 |
| | |
| | Masco Corp. | | | | | | |
| | 6.625% due 4/15/2018 | | | 13,741,000 | | | 14,702,870 |
| | |
| | MBIA Inc. | | | | | | |
| | 6.400% due 8/15/2022 | | | 78,492,000 | | | 77,707,080 |
| | |
| | Merrill Lynch & Co. | | | | | | |
| | 6.400% due 8/28/2017 | | | 1,000,000 | | | 1,058,713 |
| | |
| | Midcontinent Express | | | | | | |
| | Pipeline LLC | | | | | | |
| | 6.700% due 9/15/2019 (e) | | | 23,665,000 | | | 22,349,226 |
| | |
| | Morgan Stanley | | | | | | |
| | 3.018% due 4/1/2021 (b) | | | 130,000 | | | 133,575 |
| | 3.018% due 6/9/2023 (b) | | | 100,000 | | | 98,750 |
| | |
| | MPT Operating | | | | | | |
| | Partnership, L.P. | | | | | | |
| | 6.875% due 5/1/2021 | | | 38,813,000 | | | 40,298,374 |
| | 6.375% due 2/15/2022 | | | 10,000,000 | | | 10,476,100 |
| | |
| | Nabors Industries, Inc. | | | | | | |
| | 2.350% due 9/15/2016 (e) | | | 250,000 | | | 250,125 |
| | |
| | National City Bank of | | | | | | |
| | Cleveland OH | | | | | | |
| | 5.800% due 6/7/2017 | | | 705,000 | | | 734,336 |
| | |
| | National Retail Properties Inc. | | | | | | |
| | 6.875% due 10/15/2017 | | | 1,023,000 | | | 1,089,942 |
| | |
| | NationsBank Corp. | | | | | | |
| | 7.800% due 9/15/2016 | | | 770,000 | | | 783,732 |
| | |
| | Navient Corp. | | | | | | |
| | 5.875% due 3/25/2021 | | | 500,000 | | | 470,000 |
| | |
| | Neuberger Berman Group LLC | | | | | | |
| | 5.875% due 3/15/2022 (e) | | | 7,049,000 | | | 7,339,771 |
See Notes to Financial Statements.
22
| BOND FUND SCHEDULE OF INVESTMENTS (Unaudited) (Continued) |
| May 31, 2016 |
| | | | | Principal | | | |
| | | | Amount | | Value |
| BONDS (continued) | | | | | | |
| | | | | | | | |
| | Corporate Bonds (continued) | | | | | | |
| | NIPSCO Capital Markets, Inc. | | | | | | |
| | 7.860% due 3/27/2017 | | $ | 96,000 | | $ | 98,015 |
| | |
| | | Noble Drilling Corp. | | | | | | |
| | | 7.500% due 3/15/2019 | | | 21,234,000 | | | 20,490,810 |
| | |
| | | Noble Holding Int’l. Ltd. | | | | | | |
| | | 4.900% due 8/1/2020 | | | 21,828,000 | | | 17,462,400 |
| | | 4.625% due 3/1/2021 | | | 22,764,000 | | | 17,186,820 |
| | |
| | | Northern Indiana Public | | | | | | |
| | | Service Co. | | | | | | |
| | | 7.590% due 6/12/2017 | | | 182,000 | | | 188,181 |
| | |
| | | Owens Corning | | | | | | |
| | | 6.500% due 12/1/2016 | | | 249,000 | | | 253,103 |
| | |
| | | Pemex Project Funding | | | | | | |
| | | Master Trust | | | | | | |
| | | 9.250% due 3/30/2018 | | | 20,000 | | | 21,730 |
| | |
| | | Pitney Bowes Inc. | | | | | | |
| | | 5.250% due 1/15/2037 | | | 4,359,000 | | | 4,421,656 |
| | |
| | | Plains Exploration & | | | | | | |
| | | Production Co. | | | | | | |
| | | 6.500% due 11/15/2020 | | | 17,327,000 | | | 16,633,920 |
| | | 6.750% due 2/1/2022 | | | 14,470,000 | | | 13,565,625 |
| | |
| | | Pride Int’l., Inc. | | | | | | |
| | | 8.500% due 6/15/2019 | | | 22,476,000 | | | 22,172,574 |
| | |
| | | Regency Energy Partners LP | | | | | | |
| | | 6.500% due 7/15/2021 | | | 45,484,000 | | | 46,802,081 |
| | |
| | | Reinsurance Group of | | | | | | |
| | | America, Inc. | | | | | | |
| | | 3.299% due 12/15/2065 (b) | | | 33,768,000 | | | 23,351,585 |
| | |
| | | Reliance Steel & Aluminum Co. | | | | | | |
| | | 6.200% due 11/15/2016 | | | 1,821,000 | | | 1,853,483 |
| | |
| | | Seagate HDD Cayman | | | | | | |
| | | 7.000% due 11/1/2021 | | | 2,569,000 | | | 2,605,621 |
| | |
| | | Select Income REIT | | | | | | |
| | | 2.850% due 2/1/2018 | | | 21,756,000 | | | 21,851,639 |
| | | | | | | | |
| | | Seminole Indian | | | | | | |
| | | Tribe of Florida | | | | | | |
| | | 8.030% due 10/1/2020 (e) | | | 28,800,000 | | | 30,276,000 |
| | |
| | | SESI LLC | | | | | | |
| | | 6.375% due 5/1/2019 | | | 30,231,000 | | | 28,190,407 |
| | | 7.125% due 12/15/2021 | | | 46,739,000 | | | 42,123,524 |
| | |
| | | SLM Corp. | | | | | | |
| | | 5.500% due 3/15/2019 | | | 800,000 | | | 731,655 |
| | | 6.000% due 3/15/2019 (c) | | | 140,000 | | | 129,554 |
| | | 6.600% due 3/15/2019 (c) | | | 395,000 | | | 371,480 |
| | | 5.190% due 4/24/2019 | | | 529,000 | | | 509,163 |
| | | 8.000% due 3/25/2020 | | | 671,000 | | | 689,453 |
| | | 6.250% due 9/15/2020 (c) | | | 172,000 | | | 151,569 |
| | | 6.500% due 12/15/2020 (c) | | | 71,000 | | | 64,741 |
| | | 6.750% due 12/15/2020 (c) | | | 306,000 | | | 267,640 |
| | | 6.750% due 12/15/2020 (c) | | | 95,000 | | | 83,071 |
| | | 6.000% due 6/15/2021 | | | 20,000 | | | 16,668 |
| | | 6.000% due 6/15/2021 | | | 261,000 | | | 217,243 |
| | | 6.150% due 6/15/2021 | | | 146,000 | | | 122,419 |
| | | 6.150% due 6/15/2021 | | | 52,000 | | | 43,588 |
| | | 7.250% due 1/25/2022 | | | 602,000 | | | 579,425 |
| | |
| | | Southwestern Energy Co. | | | | | | |
| | | 3.300% due 1/23/2018 | | | 4,000,000 | | | 3,860,000 |
| | | 7.500% due 2/1/2018 | | | 4,329,000 | | | 4,350,645 |
| | |
| | | StanCorp Financial Group, Inc. | | | | | | |
| | | 6.900% due 6/1/2067 (b) | | | 39,409,000 | | | 30,739,020 |
| | |
| | | Standard Chartered PLC | | | | | | |
| | | 4.000% due 7/12/2022 (b) (e) | | | 27,573,000 | | | 27,930,870 |
| | |
| | | Tech Data Corp. | | | | | | |
| | | 3.750% due 9/21/2017 | | | 4,226,000 | | | 4,340,415 |
| | |
| | | Transocean Inc. | | | | | | |
| | | 7.375% due 4/15/2018 | | | 3,808,000 | | | 3,708,040 |
| | |
| | | Unitrin, Inc. | | | | | | |
| | | 6.000% due 5/15/2017 | | | 14,676,000 | | | 15,235,112 |
| | |
| | | Viacom Inc. | | | | | | |
| | | 2.500% due 12/15/2016 | | | 344,000 | | | 345,880 |
| | |
| | | Wells Fargo & Co. | | | | | | |
| | | 7.980% due 3/15/2018 (b) (d) | | | 32,006,000 | | | 33,686,315 |
See Notes to Financial Statements.
23
| BOND FUND SCHEDULE OF INVESTMENTS (Unaudited) (Continued) |
| May 31, 2016 |
| Principal | | | |
| Amount | | Value |
| BONDS (continued) | | | | | |
| | | | | | |
| Corporate Bonds (continued) | | | | | |
| Western Power Distribution | | | | | |
| 7.250% due 12/15/2017 (e) | $ | 2,335,000 | | $ | 2,442,095 |
| |
| Westvaco Corp. | | | | | |
| 7.500% due 6/15/2027 | | 711,000 | | | 751,770 |
| |
| White Mountains Insurance | | | | | |
| Group, Ltd. | | | | | |
| 6.375% due 3/20/2017 (e) | | 4,950,000 | | | 5,066,439 |
| |
| Wyndham Worldwide | | | | | |
| 5.750% due 2/1/2018 | | 2,046,000 | | | 2,119,873 |
| |
| XL Group PLC | | | | | |
| 6.500% due 4/15/2017 (b) (d) | | 91,050,000 | | | 64,304,062 |
| |
| ZFS Finance USA Trust II | | | | | |
| 6.450% due 12/15/2065 (b) (e) | | 1,224,000 | | | 1,225,836 |
| |
| Zions Bancorporation | | | | | |
| 4.500% due 3/27/2017 | | 1,161,000 | | | 1,179,002 |
| |
| Total Corporate Bonds | | | | | 1,566,306,662 |
| |
| Federal Agency Mortgage-Backed | | | | | |
| Securities - 0.0% | | | | | |
| Freddie Mac | | | | | |
| 6.500% due 12/1/2018, | | | | | |
| Series C9-0241 | | 13,022 | | | 14,654 |
| |
| Ginnie Mae | | | | | |
| 7.000% due 5/15/2033, | | | | | |
| Series 78-2071X | | 32,001 | | | 38,769 |
| |
| Total Federal Agency Mortgage- | | | | | |
| Backed Securities | | | | | 53,423 |
| |
| Taxable Municipal Bonds - 3.8% | | | | | |
| California Earthquake Authority | | | | | |
| 6.169% due 7/1/2016 | | 308,000 | | | 309,226 |
| |
| Casino Reinvestment | | | | | |
| Development Authority NJ | | | | | |
| 5.340% due 6/1/2020 | | 9,845,000 | | | 10,040,522 |
| |
| City of Cleveland OH Airport | | | | | |
| System Revenue | | | | | |
| 5.239% due 1/1/2017 | | 230,000 | | | 233,636 |
| | | | | | |
| City of Detroit MI Water Supply | | | | | |
| System Revenue | | | | | |
| 3.607% due 7/1/2016 | | 170,000 | | | 170,143 |
| |
| City of Miami FL | | | | | |
| 6.750% due 12/1/2018 | | 1,310,000 | | | 1,407,700 |
| |
| City of Newark NJ | | | | | |
| 5.603% due 4/1/2018 | | 455,000 | | | 473,177 |
| |
| County of Reeves TX Certs. of | | | | | |
| Participation | | | | | |
| 5.000% due 12/1/2016 | | 50,000 | | | 50,212 |
| 6.000% due 12/1/2016 | | 70,000 | | | 70,155 |
| 5.000% due 12/1/2017 | | 45,000 | | | 45,821 |
| 6.250% due 12/1/2017 | | 45,000 | | | 45,102 |
| 7.400% due 12/1/2017 | | 425,000 | | | 426,322 |
| 5.625% due 12/1/2018 | | 125,000 | | | 130,128 |
| 6.500% due 12/1/2018 | | 225,000 | | | 225,531 |
| 7.500% due 12/1/2018 | | 35,000 | | | 35,108 |
| 6.750% due 12/1/2019 | | 1,320,000 | | | 1,323,036 |
| 6.125% due 12/1/2020 | | 680,000 | | | 728,919 |
| 6.875% due 12/1/2020 | | 370,000 | | | 370,751 |
| 6.375% due 12/1/2021 | | 45,000 | | | 48,543 |
| 7.000% due 12/1/2021 | | 500,000 | | | 501,060 |
| 7.700% due 12/1/2021 | | 3,340,000 | | | 3,348,851 |
| |
| District of Columbia Revenue | | | | | |
| 4.713% due 10/1/2016 | | 125,000 | | | 125,190 |
| 5.375% due 10/1/2018 | | 1,455,000 | | | 1,476,316 |
| |
| Eastern Illinois University | | | | | |
| 5.000% due 4/1/2017 | | 405,000 | | | 414,104 |
| 5.250% due 4/1/2018 | | 775,000 | | | 812,533 |
| 5.450% due 4/1/2019 | | 515,000 | | | 552,853 |
| 5.600% due 4/1/2020 | | 585,000 | | | 623,949 |
| 5.700% due 4/1/2021 | | 125,000 | | | 133,344 |
| |
| Fannin County TX Public | | | | | |
| Facility Corp. | | | | | |
| 3.950% due 10/1/2016 | | 675,000 | | | 677,855 |
| 4.600% due 10/1/2017 | | 740,000 | | | 752,846 |
| 5.200% due 10/1/2019 | | 515,000 | | | 534,663 |
| 5.650% due 10/1/2021 | | 825,000 | | | 872,668 |
| |
| Florida State Mid-Bay | | | | | |
| Bridge Authority | | | | | |
| 3.784% due 10/1/2021 | | 5,000,000 | | | 5,124,050 |
See Notes to Financial Statements.
24
| BOND FUND SCHEDULE OF INVESTMENTS (Unaudited) (Continued) |
| May 31, 2016 |
| Principal | | | |
| Amount | | Value |
| BONDS (continued) | | | | | |
| | | | |
| Taxable Municipal Bonds (continued) | | | |
| Garza County TX Public | | | | | |
| Facility Corp. | | | | | |
| 6.200% due 10/1/2020 | $ | 1,960,000 | | $ | 2,056,530 |
| |
| Guam Gov’t. | | | | | |
| Waterworks Authority | | | | | |
| 1.880% due 7/1/2016 | | 3,320,000 | | | 3,320,332 |
| 2.516% due 7/1/2017 | | 210,000 | | | 210,166 |
| 3.061% due 7/1/2018 | | 255,000 | | | 257,152 |
| |
| Kentucky Economic Development | | | | | |
| Finance Authority | | | | | |
| 7.000% due 12/1/2021 | | 270,000 | | | 271,868 |
| |
| Lancaster PA Parking Authority | | | | | |
| 5.760% due 12/1/2017 | | 500,000 | | | 513,135 |
| |
| LL & P Wind Energy, Inc. WA | | | | | |
| 5.733% due 12/1/2017 (e) | | 480,000 | | | 486,091 |
| 5.983% due 12/1/2022 (e) | | 8,595,000 | | | 8,883,190 |
| |
| Memphis TN Health | | | | | |
| Educational & Housing | | | | | |
| Facility Board | | | | | |
| 4.500% due 3/1/2018 | | 115,000 | | | 115,215 |
| |
| New Jersey Economic | | | | | |
| Development Authority | | | | | |
| 5.000% due 6/15/2017 (e) | | 470,000 | | | 474,498 |
| |
| New Jersey Sports & | | | | | |
| Exposition Authority | | | | | |
| 6.076% due 3/1/2023 | | 555,000 | | | 614,474 |
| |
| Pontotoc County OK | | | | | |
| Educational Facilities | | | | | |
| Authority | | | | | |
| 4.119% due 9/1/2023 | | 325,000 | | | 340,688 |
| |
| Public Finance Authority WI | | | | | |
| Student Housing Revenue | | | | | |
| 4.500% due 7/1/2021 | | 1,730,000 | | | 1,727,855 |
| |
| Puerto Rico Commonwealth | | | | | |
| Gov’t. Development Bank | | | | | |
| 4.704% due 5/1/2016 (f) | | 24,080,000 | | | 6,983,200 |
| | | | | | |
| San Luis AZ Facility | | | | | |
| Development Corp. | | | | | |
| 4.650% due 5/1/2017 | | 1,130,000 | | | 1,136,215 |
| 5.050% due 5/1/2018 | | 780,000 | | | 781,997 |
| 5.350% due 5/1/2019 | | 1,240,000 | | | 1,243,869 |
| 5.600% due 5/1/2020 | | 670,000 | | | 671,347 |
| 5.700% due 5/1/2020 | | 850,000 | | | 852,456 |
| 5.800% due 5/1/2021 | | 1,055,000 | | | 1,057,068 |
| 5.900% due 5/1/2021 | | 980,000 | | | 982,773 |
| 6.100% due 5/1/2022 | | 1,030,000 | | | 1,030,649 |
| 6.200% due 5/1/2022 | | 1,035,000 | | | 1,036,563 |
| |
| Summit County OH Development | | | | |
| Finance Authority | | | | | |
| 6.250% due 5/15/2026 | | 665,000 | | | 700,564 |
| |
| West Texas Detention | | | | | |
| Facility Corp. | | | | | |
| 3.800% due 11/1/2016 | | 1,000,000 | | | 1,000,600 |
| 4.400% due 11/1/2017 | | 1,195,000 | | | 1,203,090 |
| 4.700% due 11/1/2018 | | 920,000 | | | 931,675 |
| |
| Willacy County TX Local | | | | | |
| Gov’t. Corp. | | | | | |
| 7.800% due 12/1/2028 | | 1,495,000 | | | 119,600 |
| |
| Willacy County TX Public | | | | | |
| Facility Corp. | | | | | |
| 6.000% due 12/1/2016 | | 1,330,000 | | | 1,348,514 |
| 6.000% due 12/1/2017 | | 390,000 | | | 404,352 |
| 5.600% due 12/1/2018 | | 420,000 | | | 441,231 |
| |
| Total Taxable Municipal Bonds | | | | 73,281,271 |
| |
| Tax-Exempt Municipal Bonds - 0.3% | | | |
| Casino Reinvestment | | | | | |
| Development Authority NJ | | | | |
| 5.250% due 6/1/2019 | | 5,000,000 | | | 5,020,000 |
| |
| Puerto Rico Commonwealth | | | | | |
| 5.500% due 7/1/2018 | | 100,000 | | | 104,483 |
| 5.500% due 7/1/2019 | | 130,000 | | | 136,551 |
| |
| Puerto Rico Electric | | | | | |
| Power Authority | | | | | |
| 5.000% due 7/1/2019 | | 770,000 | | | 779,910 |
See Notes to Financial Statements.
25
| BOND FUND SCHEDULE OF INVESTMENTS (Unaudited) (Continued) |
| May 31, 2016 |
| Principal | | | |
| Amount or | | | |
| Shares | | Value |
| BONDS (continued) | | | | | |
| | | | | | |
| Tax-Exempt Municipal | | | | | |
| Bonds (continued) | | | | | |
| Puerto Rico Highways & | | | | | |
| Transportation Authority | | | | | |
| 4.125% due 7/1/2019 | $ | 120,000 | | $ | 120,865 |
| |
| Puerto Rico Municipal | | | | | |
| Finance Agency | | | | | |
| 5.250% due 8/1/2019 | | 100,000 | | | 102,009 |
| |
| Total Tax-Exempt | | | | | |
| Municipal Bonds | | | | | 6,263,818 |
| |
| TOTAL BONDS (COST | | | | | |
| $2,038,207,840) | | | | | 1,868,747,777 |
| |
| SHORT-TERM INVESTMENTS - 2.6% | | | | | |
| |
| Money Market Funds - 0.0% | | | | | |
| Fidelity Money Market Portfolio | | | | | |
| Class I, 0.335% (a) | | 94,154 | | | 94,154 |
| |
| Total Money Market Funds | | | | | 94,154 |
| |
| United States Government & | | | | | |
| Agency Issues - 2.6% | | | | | |
| U.S. Treasury Bills | | | | | |
| 0.199% due 6/23/2016 (b) | $ | 10,000,000 | | | 9,998,732 |
| 0.160% due 6/30/2016 (b) | | 10,000,000 | | | 9,998,671 |
| 0.156% due 7/7/2016 (b) | | 10,000,000 | | | 9,998,400 |
| 0.198% due 7/14/2016 (b) | | 10,000,000 | | | 9,997,581 |
| 0.196% due 7/21/2016 (b) | | 10,000,000 | | | 9,997,222 |
| |
| Total United States Government | | | | | |
| & Agency Issues | | | | | 49,990,606 |
| |
| TOTAL SHORT-TERM | | | | | |
| INVESTMENTS | | | | | |
| (COST $50,084,760) | | | | | 50,084,760 |
| | | | | | |
| TOTAL INVESTMENTS - 97.9% | | | | | |
| (COST $2,088,292,600) | | | | | 1,918,832,537 |
| |
| NET OTHER ASSETS AND | | | | | |
| LIABILITIES - 2.1% | | | | | 41,504,698 |
| |
| NET ASSETS - 100.0% | | | | $ | 1,960,337,235 |
| (a) | Represents the 7-day yield at May 31, 2016. |
| (b) | Rate shown represents the current coupon rate at May 31, 2016. |
| (c) | Security is a “step-up” bond where the coupon increases or steps up at a predetermined date. |
| (d) | Perpetual maturity; date shown represents next contractual call date. |
| (e) | Security subject to restrictions on resale under federal securities laws and which therefore may only be resold upon registration under the Securities Act of 1933, as amended, or in transactions exempt from registration, including sales to qualified institutional buyers under Rule 144A of the Securities Act of 1933, as amended. It has been deemed liquid under guidance approved by the Board. |
| (f) | The Puerto Rico Commonwealth Government Development Bank security is currently in default. When a bond is in default its scheduled interest and/or principal payments are not currently being paid. |
| (g) | When-issued security. |
| PLC: | Public Limited Company |
| REIT: | Real Estate Investment Trust |
| S.A.: | Generally designates corporations in various countries, mostly those employing the civil law. |
See Notes to Financial Statements.
26
FUND EXPENSE EXAMPLES (Unaudited) |
| May 31, 2016 |
Example
A Fund shareholder may incur two types of costs: (1) transaction costs such as redemption fees; and (2) ongoing costs, including management fees and other Fund expenses. This example is intended to help you understand your ongoing costs (in dollars) of investing in a Fund and to compare these costs with the ongoing costs of investing in other mutual funds.
The example is based on an investment of $1,000 invested at the beginning of the period and held for the entire period from December 01, 2015 to May 31, 2016.
Actual Expenses
The first line of the table below under each Fund provides information about actual account values and actual expenses for such Fund. You may use the information in this line, together with the amount you invested, to estimate the expenses that you paid over the period. Simply divide your account value by $1,000 (for example, an $8,600 account value divided by $1,000 = 8.6), then multiply the result by the number in the first line under the heading entitled “Expenses Paid During Period” to estimate the expenses you paid on your account during this period.
Hypothetical Example for Comparison Purposes
The second line of the table below under each Fund provides information about hypothetical account values and hypothetical expenses based on such Fund’s actual expense ratio and an assumed rate of return of 5% per year before expenses, which is not the Fund’s actual return. The hypothetical account values and expenses may not be used to estimate the actual ending account balance or expenses you paid for the period. You may use this information to compare the ongoing costs of investing in each Fund and other funds. To do so, compare the 5% hypothetical example with the 5% hypothetical examples that appear in the shareholder reports of the other funds.
Please note that the expenses shown in the table are meant to highlight your ongoing costs only and do not reflect any transactional costs, such as redemption fees. Therefore, the second line of the table is useful in comparing ongoing costs only, and will not help you determine the relative costs of owning different funds. In addition, if these transactional costs were included, your costs would have been higher.
| | | | Beginning | | Ending | | |
| | Expense Ratio | | Account Value | | Account Value | | Expenses Paid During |
| Six-Month Period Ended May 31, 2016 | | for the Period | | 12/01/15 | | 05/31/16 | | Period* |
| Thompson LargeCap Fund | | | | | | | | |
| Actual | | 1.13% | | $1,000.00 | | $1,002.95 | | $5.66 |
| Hypothetical (5% return before expenses) | | 1.13% | | $1,000.00 | | $1,019.35 | | $5.70 |
| Thompson MidCap Fund | | | | | | | | |
| Actual | | 1.25% | | $1,000.00 | | $1,000.15 | | $6.25 |
| Hypothetical (5% return before expenses) | | 1.25% | | $1,000.00 | | $1,018.75 | | $6.31 |
| Thompson Bond Fund | | | | | | | | |
| Actual | | 0.72% | | $1,000.00 | | $1,014.20 | | $3.63 |
| Hypothetical (5% return before expenses) | | 0.72% | | $1,000.00 | | $1,021.40 | | $3.64 |
| * | Expenses are equal to the annualized [net] expense ratio for each Fund, multiplied by the average account value over the period, multiplied by 183/366 (to reflect the one-half year period). |
For more information, please refer to the Funds’ Prospectus.
See Notes to Financial Statements.
27
STATEMENTS OF ASSETS AND LIABILITIES (Unaudited) |
May 31, 2016 (In thousands, except per share amounts) |
| LARGECAP | | MIDCAP | | BOND |
| FUND | | FUND | | FUND |
| ASSETS | | | | | | | | | | | | | | |
| Total investments in securities, at value (Cost $113,248, $37,614 and | | | | | | | | | | | | | | |
| $2,088,293 respectively) | | $ | 107,612 | | | | $ | 38,569 | | | | $ | 1,918,833 | |
| Cash | | | – | | | | | – | | | | | 5,780 | |
| Due from sale of securities | | | 487 | | | | | 212 | | | | | 12,946 | |
| Receivable from fund shares sold | | | 2 | | | | | – | | | | | 2,836 | |
| Dividends and interest receivable | | | 230 | | | | | 40 | | | | | 28,015 | |
| Prepaid expenses | | | 14 | | | | | 14 | | | | | 80 | |
| Total Assets | | | 108,345 | | | | | 38,835 | | | | | 1,968,490 | |
| LIABILITIES | | | | | | | | | | | | | | |
| Due on purchase of securities | | | 206 | | | | | 209 | | | | | 1,511 | |
| Payable for fund shares redeemed | | | 9 | | | | | – | | | | | 5,408 | |
| Line of credit | | | 116 | | | | | – | | | | | – | |
| Accrued expenses payable | | | 26 | | | | | 18 | | | | | 122 | |
| Accrued directors expense payable | | | – | | | | | – | | | | | 1 | |
| Due to Advisor | | | 85 | | | | | 31 | | | | | 1,111 | |
| Total Liabilities | | | 442 | | | | | 258 | | | | | 8,153 | |
| NET ASSETS | | $ | 107,903 | | | | $ | 38,577 | | | | $ | 1,960,337 | |
| Net Assets consist of: | | | | | | | | | | | | | | |
| Capital stock ($.001 par value) | | $ | 144,003 | | | | $ | 36,696 | | | | $ | 2,225,179 | |
| Undistributed net investment income | | | 293 | | | | | 7 | | | | | 22,262 | |
| Accumulated net realized gain (loss) on investments | | | (30,757 | ) | | | | 919 | | | | | (117,644 | ) |
| Net unrealized appreciation (depreciation) on investments | | | (5,636 | ) | | | | 955 | | | | | (169,460 | ) |
| Net Assets | | $ | 107,903 | | | | $ | 38,577 | | | | $ | 1,960,337 | |
| Shares of capital stock outstanding (unlimited shares authorized) | | | 2,125 | | | | | 3,482 | | | | | 179,864 | |
| Offering and redemption price/Net asset value per share | | $ | 50.78 | | | | $ | 11.08 | | | | $ | 10.90 | |
See Notes to Financial Statements.
28
STATEMENTS OF OPERATIONS (Unaudited) |
Six-Month Period Ended May 31, 2016 (In thousands) |
| LARGECAP | | MIDCAP | | BOND |
| FUND | | FUND | | FUND |
| Investment income | | | | | | | | | | | | | | | | |
| Dividends | | $ | 988 | | | | | $ | 229 | | | | | $ | – | |
| Interest | | | – | | | | | | – | | | | | | 56,411 | |
| | | | 988 | | | | | | 229 | | | | | | 56,411 | |
| Expenses | | | | | | | | | | | | | | | | |
| Investment advisory fees | | | 490 | | | | | | 177 | | | | | | 6,621 | |
| Shareholder servicing costs | | | 40 | | | | | | 13 | | | | | | 563 | |
| Administrative & accounting services fees | | | 58 | | | | | | 25 | | | | | | 320 | |
| Custody fees | | | 6 | | | | | | 3 | | | | | | 96 | |
| Directors fees | | | 12 | | | | | | 11 | | | | | | 71 | |
| Professional fees | | | 20 | | | | | | 19 | | | | | | 40 | |
| Federal & state registration | | | 16 | | | | | | 17 | | | | | | 35 | |
| Other expenses | | | 10 | | | | | | 5 | | | | | | 217 | |
| Total expenses | | | 652 | | | | | | 270 | | | | | | 7,963 | |
| Less expenses reimbursed by Advisor | | | (69 | ) | | | | | (48 | ) | | | | | – | |
| Net expenses | | | 583 | | | | | | 222 | | | | | | 7,963 | |
| Net investment income | | | 405 | | | | | | 7 | | | | | | 48,448 | |
| Net realized gain (loss) on investments | | | 1,464 | | | | | | 1,045 | | | | | | (96,301 | ) |
| Net unrealized appreciation (depreciation) on investments | | | (1,179 | ) | | | | | (761 | ) | | | | | 59,781 | |
| Net gain (loss) on investments | | | 285 | | | | | | 284 | | | | | | (36,520 | ) |
| Net increase in net assets resulting from operations | | $ | 690 | | | | | $ | 291 | | | | | $ | 11,928 | |
See Notes to Financial Statements.
29
STATEMENTS OF CHANGES IN NET ASSETS |
(In thousands) |
| LARGECAP | | MIDCAP | | BOND |
| FUND | | FUND | | FUND |
| Six-Month | | | | | | | | Six-Month | | | | | | | | Six-Month | | | | | |
| Period Ended | | Year Ended | | Period Ended | | Year Ended | | Period Ended | | Year Ended |
| May 31, 2016 | | November 30, | | May 31, 2016 | | November 30, | | May 31, 2016 | | November 30, |
| (Unaudited) | | 2015 | | (Unaudited) | | 2015 | | (Unaudited) | | 2015 |
| Operations | | | | | | | | | | | | | | | | | | | | | | | | | | | | | | | | | | |
| Net investment income | | $ | 405 | | | | | $ | 773 | | | | | $ | 7 | | | | | $ | 4 | | | | | $ | 48,448 | | | | | $ | 127,750 | |
| Net realized gain (loss) | | | | | | | | | | | | | | | | | | | | | | | | | | | | | | | | | | |
| on investments | | | 1,464 | | | | | | 19,889 | | | | | | 1,045 | | | | | | 3,154 | | | | | | (96,301 | ) | | | | | (13,899 | ) |
| Net unrealized appreciation | | | | | | | | | | | | | | | | | | | | | | | | | | | | | | | | | | |
| (depreciation) on investments | | | (1,179 | ) | | | | | (26,214 | ) | | | | | (761 | ) | | | | | (5,323 | ) | | | | | 59,781 | | | | | | (179,649 | ) |
| Net increase (decrease) in net assets | | | | | | | | | | | | | | | | | | | | | | | | | | | | | | | | | | |
| resulting from operations | | | 690 | | | | | | (5,552 | ) | | | | | 291 | | | | | | (2,165 | ) | | | | | 11,928 | | | | | | (65,798 | ) |
| Distributions to Shareholders | | | | | | | | | | | | | | | | | | | | | | | | | | | | | | | | | | |
| Distributions from net | | | | | | | | | | | | | | | | | | | | | | | | | | | | | | | | | | |
| investment income | | | (773 | ) | | | | | (676 | ) | | | | | (4 | ) | | | | | – | | | | | | (58,581 | ) | | | | | (136,781 | ) |
| Distributions from net realized gains | | | | | | | | | | | | | | | | | | | | | | | | | | | | | | | | | | |
| on securities transactions | | | – | | | | | | – | | | | | | (3,145 | ) | | | | | (3,896 | ) | | | | | – | | | | | | – | |
| Total distributions to shareholders | | | (773 | ) | | | | | (676 | ) | | | | | (3,149 | ) | | | | | (3,896 | ) | | | | | (58,581 | ) | | | | | (136,781 | ) |
| |
| Fund Share Transactions | | | | | | | | | | | | | | | | | | | | | | | | | | | | | | | | | | |
| (See Note 4) | | | (3,926 | ) | | | | | (10,476 | ) | | | | | 3,085 | | | | | | 3,104 | | | | | | (737,492 | ) | | | | | (776,902 | ) |
| |
| Total Increase (Decrease) | | | | | | | | | | | | | | | | | | | | | | | | | | | | | | | | | | |
| in Net Assets | | | (4,009 | ) | | | | | (16,704 | ) | | | | | 227 | | | | | | (2,957 | ) | | | | | (784,145 | ) | | | | | (979,481 | ) |
| |
| Net Assets | | | | | | | | | | | | | | | | | | | | | | | | | | | | | | | | | | |
| Beginning of period | | | 111,912 | | | | | | 128,616 | | | | | | 38,350 | | | | | | 41,307 | | | | | | 2,744,482 | | | | | | 3,723,963 | |
| End of period | | $ | 107,903 | | | | | $ | 111,912 | | | | | $ | 38,577 | | | | | $ | 38,350 | | | | | $ | 1,960,337 | | | | | $ | 2,744,482 | |
| Undistributed net investment | | | | | | | | | | | | | | | | | | | | | | | | | | | | | | | | | | |
| income included in net assets | | | | | | | | | | | | | | | | | | | | | | | | | | | | | | | | | | |
| at end of period | | $ | 293 | | | | | $ | 661 | | | | | $ | 7 | | | | | $ | 4 | | | | | $ | 22,262 | | | | | $ | 30,623 | |
See Notes to Financial Statements.
30
NOTES TO FINANCIAL STATEMENTS (Unaudited) |
May 31, 2016 |
NOTE 1 - ORGANIZATION
Thompson IM Funds, Inc. (the “Company”) is a Wisconsin corporation registered under the Investment Company Act of 1940, as amended (the “1940 Act”), as an open-end, diversified management investment company.
The Company consists of separate mutual funds series (each, a “Fund,” and collectively, the “Funds”): Thompson LargeCap Fund (the “LargeCap Fund”), Thompson MidCap Fund (the “MidCap Fund”) and Thompson Bond Fund (the “Bond Fund”). The assets and liabilities of each Fund are segregated and a shareholder’s interest is limited to the Fund in which the shareholder owns shares. The objectives and strategies of each Fund are described in the Funds’ Prospectus.
NOTE 2 - SIGNIFICANT ACCOUNTING POLICIES
The following is a summary of significant accounting policies followed by the Funds in the preparation of their financial statements. The Funds are investment companies and accordingly follow the investment company accounting and reporting guidance of the Financial Accounting Standards Board (“FASB”) Accounting Codification Topic 946 Financial Services — Investment Companies.
VALUATION POLICY AND PROCEDURES - The Funds’ Board of Directors (the “Funds’ Board”) has adopted methods for valuing securities set forth in the Funds’ Pricing Policies and Procedures, including circumstances in which market quotes are not readily available or deemed to be unreliable, and has delegated authority to the Advisor to apply those methods in making fair value determinations, subject to oversight by the Funds’ Board. The Advisor has established a valuation committee that, along with other Advisor employees, administers, implements, and oversees the fair valuation process and makes fair value decisions. The valuation committee regularly reviews its own fair value decisions, as well as valuations, valuation techniques and services furnished by pricing services; considers circumstances in the markets which may require it to make or adjust valuation determinations; and reviews previous valuation determinations. The valuation committee reports on its activities and any changes to the fair valuation guidelines to the Funds’ Board.
SECURITY VALUATION - Each Fund’s listed or exchange-traded investments are valued at their market prices (generally the last reported sales price on the exchange where the securities are primarily traded or, for Nasdaq-listed securities, at their Nasdaq Official Closing Prices). Exchange traded options are valued at the last reported sale price on an exchange on which the option is traded. If no sales are reported on a particular day, the mean between the highest bid and lowest asked quotations at the close of the exchanges will generally be used. Investments in money market mutual funds are generally priced at the ending net asset value provided by the service agent of the funds.
Debt investments are typically valued based on valuations published by an independent pricing service, which uses various valuation methodologies such as matrix pricing and other analytical pricing models as well as market transactions and dealer quotations. Factors considered by pricing services include market characteristics such as benchmark yield curves, option-adjusted spreads, credit spreads and fundamental analytical data relating to the issuer. Debt securities with remaining maturities of 60 days or less are generally valued on an amortized cost basis.
Where market quotations are not readily available or are unreliable, a fair value is determined in good faith pursuant to procedures established by the Funds’ Board. When a security is “fair valued,” consideration is given to the facts and circumstances relevant to the particular situation, including a review of various factors, which includes factors such as fundamental analytical data relating to the investment, which may include consideration of yields or prices of securities of comparable quality, coupon rate, maturity and type of issue, nature and duration of any restrictions on disposition of the security and an evaluation of forces that influence the market in which the securities are purchased or sold. Fair value pricing is an inherently subjective process, and no single standard exists for determining fair value. Different funds could reasonably arrive at different values for the same security. No securities in any of the Funds were fair valued as of May 31, 2016.
VALUATION MEASUREMENTS – In accordance with generally accepted accounting principles in the United States of America (“GAAP”), fair value is defined as the price that the Fund would receive to sell an investment or pay to transfer a liability in an orderly transaction with an independent buyer in the principal market, or in the absence of a principal market the most advantageous market for the investment or liability. GAAP established a three-tier hierarchy to maximize the use of observable market data and minimize the use of unobservable inputs and to establish classification of fair value measurements for disclosure purposes.
31
NOTES TO FINANCIAL STATEMENTS (Unaudited) (Continued) |
May 31, 2016 |
Various inputs are used in determining the value of each Fund’s investments. These inputs are summarized in the three broad levels listed below:
Level 1 – Quoted prices in active markets for identical securities.
Level 2 – Other significant observable inputs (including quoted prices for similar securities, interest rates, prepayment speeds, credit risk, etc.).
Level 3 – Significant unobservable inputs (including the Fund’s own assumptions in determining the fair value of investments).
Inputs may include price information, specific and broad credit data, liquidity statistics, and other factors. The Fund considers observable data to be that market data which is readily available, regularly distributed or updated, reliable and verifiable, not proprietary, and provided by independent sources that are actively involved in the relevant market. The determination of what constitutes “observable” requires significant judgment by the Fund. The categorization of a financial instrument within the hierarchy is based upon the pricing transparency of the instrument and does not necessarily correspond to the Fund’s perceived risk of that instrument. Investments whose values are based on quoted market prices in active markets, and which are therefore classified as level-1 securities, include active listed equities and certain U.S. government obligations.
Investments that trade in markets that are not considered to be active, but are valued based on quoted market prices, dealer quotations or alternative pricing sources supported by observable inputs, are classified as level-2 securities. These include certain U.S. government obligations, most government agency securities, investment-grade corporate bonds, sovereign bonds, municipal bonds, and less liquid listed equities. Level-2 investments include positions that are not traded in active markets.
Investments classified as level-3 securities have significant unobservable inputs, as they trade infrequently or not at all. Level-3 instruments include private-placement and less liquid corporate and municipal debt securities. When observable prices are not available for these securities, the Fund uses one or more valuation techniques (e.g., the market approach, the income approach, or the cost approach) for which sufficient and reliable data is available. Within level 3, the use of the market approach generally consists of using comparable market transactions, while the use of the income approach generally consists of using the net present value of estimated future cash flows, adjusted as appropriate for liquidity, credit, market and/or other risk factors. The inputs used by the Fund in estimating the value of level-3 investments include the original transaction price and recent transactions in the same or similar instruments.
The following is a summary of the inputs used to value the Funds’ investments as of May 31, 2016:
| LargeCap Fund |
| Assets | Level 1 | | Level 2 | | Level 3 | | Total |
| Investment Securities: | | | | | | | | | | | |
| Common stocks | $ | 107,611,867 | | $ | – | | $ | – | | $ | 107,611,867 |
| Short-term investments | | 421 | | | – | | | – | | | 421 |
| Total Assets | $ | 107,612,288 | | $ | – | | $ | – | | $ | 107,612,288 |
| |
| MidCap Fund |
| Assets | Level 1 | | Level 2 | | Level 3 | | Total |
| Investment Securities: | | | | | | | | | | | |
| Common stocks | $ | 38,546,533 | | $ | – | | $ | – | | $ | 38,546,533 |
| Short-term investments | | 22,394 | | | – | | | – | | | 22,394 |
| Total Assets | $ | 38,568,927 | | $ | – | | $ | – | | $ | 38,568,927 |
32
| NOTES TO FINANCIAL STATEMENTS (Unaudited) (Continued) |
| May 31, 2016 |
| | Bond Fund |
| Assets | | Level 1 | | Level 2 | | Level 3 | | Total |
| Investment Securities: | | | | | | | | | | | | |
| Bonds | | $ | – | | $ | 1,868,747,777 | | $ | – | | $ | 1,868,747,777 |
| Short-term investments | | | 94,154 | | | 49,990,606 | | | – | | | 50,084,760 |
| Total Assets | | $ | 94,154 | | $ | 1,918,738,383 | | $ | – | | $ | 1,918,832,537 |
There were no transfers between level-1 and level-2 securities and the Funds did not invest in any level-3 investments as of and during the six-month period ended May 31, 2016. It is the Funds’ policy to record transfers at the end of the reporting period. Refer to each Fund’s Schedule of Investments for additional information regarding security types and industry classifications.
SECURITIES TRANSACTIONS AND INVESTMENT INCOME - Investment securities transactions are accounted for on the trade date. Gains or losses realized on sales of securities are determined by comparing the identified cost of the security lot sold with the net sales proceeds. Discounts/premiums on debt securities purchased are accreted/amortized over the life of the respective securities on the same basis for book and tax purposes. Dividend income is recorded on the ex-dividend date. Interest income is recorded as earned. Income and capital gains on some foreign securities may be subject to foreign withholding taxes, which are accrued as applicable, and have been provided for in accordance with the Funds’ understanding of the applicable country’s tax rules and rates.
OPTIONS - Each Fund may enter into options transactions for hedging purposes and will not use these instruments for speculation. Each Fund may use options to hedge against anticipated declines in the market value of portfolio securities and increases in the market value of securities it intends to purchase and protect against exposure to interest rate changes. Each Fund may also use options to enhance total return or invest in eligible asset classes with greater efficiency and lower cost than is believed to be possible through direct investment. The use of options for hedging purposes involves certain risks and may result in a loss if changes in the value of the option move in a direction different than anticipated, rendering the hedging strategy unsuccessful.
Each Fund may write covered call/put options for which premiums received are recorded as liabilities and are subsequently adjusted to the current fair value of the options written. Premiums received from writing options that expire unexercised are treated as realized gains. Premiums received from writing options which are either exercised or closed are offset against the proceeds received or amount paid on the transaction to determine realized gains or losses.
SECURITIES PURCHASED ON A WHEN-ISSUED OR DELAYED-DELIVERY BASIS - Each Fund may purchase securities on a when-issued or delayed-delivery basis. When-issued securities are securities purchased with delivery to occur at a later date at a stated price and/or yield, thereby involving the risk that the price and/or yield obtained may be more or less than those available in the market when delivery takes place. At the time a Fund makes a commitment to purchase a security on a when-issued basis, the Fund records the transaction and reflects the value of the security in determining net asset value. Each Fund designates and maintains cash and marketable securities at least equal in value to commitments for when-issued securities.
VARIABLE-RATE DEMAND NOTES - The Funds invest in short-term variable-rate demand notes, which are unsecured instruments. The Funds may be susceptible to credit risk with respect to these instruments to the extent the issuer defaults on its payment obligation.
PERMANENT BOOK AND TAX DIFFERENCES - Generally accepted accounting principles require that permanent financial reporting and tax differences relating to shareholder distributions be reclassified in the capital accounts.
EXPENSES - Each Fund is charged for those expenses that are directly attributed to it. Expenses that are not readily identifiable to a specific Fund are generally allocated among the Funds in proportion to the relative sizes of the Funds.
33
| NOTES TO FINANCIAL STATEMENTS (Unaudited) (Continued) |
| May 31, 2016 |
USE OF ESTIMATES - The preparation of financial statements in conformity with GAAP requires management to make estimates and assumptions that affect the reported amounts of assets and liabilities and disclosure of contingent assets and liabilities at the date of the financial statements and the reported amounts of revenues and expenses during the reporting period. Actual results could differ from these estimates.
DISTRIBUTIONS TO SHAREHOLDERS - Distributions to shareholders from net investment income and realized gains on securities for the LargeCap Fund and MidCap Fund normally are declared at least annually. Bond Fund distributions to shareholders from net investment income normally are declared on a quarterly basis, and distributions to shareholders from realized gains on securities normally are declared at least annually. Distributions are recorded on the ex-dividend date.
FEDERAL INCOME TAXES - No provision has been made for federal income taxes since the Funds have elected to be taxed as regulated investment companies and intend to distribute substantially all income to shareholders and otherwise comply with the provisions of the Internal Revenue Code applicable to regulated investment companies.
LINE OF CREDIT - The Funds have established an unsecured line of credit (“LOC”) with U.S. Bank N.A. which expires November 11, 2016 used primarily to finance redemption payments. Each individual Fund’s borrowing under the LOC is limited to 5% of the value of that Fund’s net assets, 33.33% of the value of the Fund’s investments, or any explicit borrowing limits imposed by the LOC, whatever is less. Interest is charged at the prime rate. As of May 31, 2016, the limits established are: LargeCap Fund - $5,500,000, MidCap Fund - $2,000,000 and Bond Fund - $145,000,000. All terms and borrowing limits imposed by the LOC are subject to review and approval by the Funds’ Board. The following table shows the average balance, average interest rate, interest expense, and maximum borrowings incurred by the Funds on the LOC for the six-month period ended May 31, 2016.
| | | | | | | | | | | | | | | Date of |
| | Average | | Average | | Interest | | Maximum | | Maximum |
| | Balance | | Interest Rate | | Expense | | Borrowing | | Borrowing |
| LargeCap Fund | | $ | 52,710 | | 3.479% | | | $ | 932 | | | $ | 831,000 | | 5/19/2016 |
| MidCap Fund | | $ | 15,984 | | 3.479% | | | $ | 275 | | | $ | 381,000 | | 12/7/2015 |
| Bond Fund | | $ | 409,623 | | 3.479% | | | $ | 7,253 | | | $ | 17,877,000 | | 12/18/15 to |
| | | | | | | | | | | | | | | 12/20/15 |
GUARANTEES AND INDEMNIFICATIONS - Under the Funds’ organizational documents, each Director, officer, employee or other agent of the Funds (including the Funds’ investment advisor) is indemnified, to the extent permitted by the 1940 Act, against certain liabilities that may arise out of performance of their duties to the Funds. Additionally, in the normal course of business, the Funds enter into contracts that contain a variety of indemnification clauses. The Funds’ maximum exposure under these arrangements is unknown as this would involve future claims that may be made against the Funds that have not yet occurred. However, the Funds have not had prior claims or losses pursuant to these contracts and believe the risk of loss to be remote.
ACCOUNTING FOR UNCERTAINTY IN INCOME TAXES - As of and during the six-month period ended May 31, 2016, the Funds did not have a liability for unrecognized tax benefits in the accompanying financial statements. Also, the Funds recognized no interest or penalties related to unrecognized tax benefits during the same period. The Funds recognize interest and penalties, if any, related to unrecognized tax benefits as income tax expense in the Statements of Operations. The Funds are also not aware of any tax positions for which it is reasonably possible that the total amounts of unrecognized tax benefits will significantly change in the next six months.
SUBSEQUENT EVENTS - The Funds have evaluated subsequent events through the issuance of the Funds’ financial statements. See note 6. There were no other subsequent events which were deemed to have an impact on the Funds’ financial statements.
34
| NOTES TO FINANCIAL STATEMENTS (Unaudited) (Continued) |
| May 31, 2016 |
NOTE 3 - INVESTMENT ADVISORY AND ADMINISTRATIVE AND ACCOUNTING SERVICES AGREEMENTS AND OTHER TRANSACTIONS WITH AFFILIATES
The Investment Advisory Agreement pursuant to which Thompson Investment Management, Inc. (“TIM” or “Advisor”) is retained by the Funds provides for monthly compensation to TIM computed on average daily net assets at the following annual rates:
| | First | | Over |
| | $50 Million | | $50 Million |
| LargeCap Fund | | 1.00% | | 0.90% |
| MidCap Fund | | 1.00% | | 0.90% |
| Bond Fund | | 0.65% | | 0.60% |
The Advisor is contractually bound to waive management fees and/or reimburse expenses incurred by the Funds through March 31, 2017 so that the annual operating expenses of the Funds do not exceed the following percentages of their respective average daily net assets: LargeCap Fund - 1.13%, MidCap Fund - 1.25% and Bond Fund - 0.80%. For the six-month period ended May 31, 2016, the Advisor reimbursed expenses incurred by the LargeCap Fund and the MidCap Fund in the amounts of $68,600 and $48,043, respectively. The Funds are not obligated to reimburse the Advisor for any fees or expenses waived in previous fiscal years.
As of May 31, 2016, an affiliated shareholder held 11.26% of the MidCap Fund’s outstanding shares. Transactions by the shareholder may have a material impact on the Fund.
Pursuant to an Administrative and Accounting Services Agreement, TIM maintains the Funds’ financial records in accordance with the 1940 Act, prepares all necessary financial statements of the Funds and calculates the net asset value per share of the Funds on a daily basis. As compensation for its services, each Fund pays TIM a fee computed daily and payable monthly at the annual rate of 0.15% of average daily net assets up to $30 million, 0.10% of the next $70 million of average daily net assets and 0.025% of average daily net assets in excess of $100 million, with an annual minimum fee of $30,000 per Fund. The calculations of daily net asset value are subcontracted to U.S. Bancorp Fund Services, resulting in fees paid by TIM for the six-month period ended May 31, 2016 in the following amounts:
| Administrative & |
| Accounting Fees Paid |
| LargeCap Fund | | $ | 17,970 | |
| MidCap Fund | | $ | 17,500 | |
| Bond Fund | | $ | 117,204 | |
The Funds reimburse the Advisor for a portion of amounts paid by the Advisor out of the Advisor’s own resources under various shareholder, account maintenance, networking and other services provided to the Funds by broker-dealers and other intermediaries. The amount reimbursed by the Funds is equal to (1) for those accounts maintained through a shareholder servicing arrangement, an annual rate of no more than 0.10% of the average daily net assets of the omnibus accounts in the Funds for which all broker-dealers and other intermediaries, in the aggregate, are responsible, and (2) for those accounts maintained through a networking arrangement, no more than $6 per year per account in the Funds for which the broker-dealers and other intermediaries are responsible; provided however, in all cases only one of these fees shall be applicable to the assets in an account. This amount has been determined by the Funds’ Board to approximate (or not to exceed) the transfer agency fees that would otherwise have been payable by the Funds if such broker-dealers and intermediaries did not maintain these accounts. Such amounts are recorded within Shareholder servicing costs on the Fund’s Statement of Operations. For the six-month period ended May 31, 2016, the amounts reimbursed by the Funds to the Advisor were:
| Intermediary |
| Fees Reimbursed |
| LargeCap Fund | | $ | 10,559 | |
| MidCap Fund | | $ | 1,287 | |
| Bond Fund | | $ | 397,070 | |
35
| NOTES TO FINANCIAL STATEMENTS (Unaudited) (Continued) |
| May 31, 2016 |
NOTE 4 - FUND SHARE TRANSACTIONS (in thousands)
Transactions in shares of the Funds were as follows:
| | Six-Month Period Ended | | Year Ended |
| | May 31, 2016 (Unaudited) | | November 30, 2015 |
| | Shares | | Dollars | | Shares | | Dollars |
| LargeCap Fund | | | | | | | | | | | | | | |
| Shares sold | | 63 | | | $ | 2,998 | | | 100 | | | $ | 5,297 | |
| Shares issued in reinvestment of dividends | | 16 | | | | 753 | | | 12 | | | | 652 | |
| Shares issued in reinvestment of realized gains | | – | | | | – | | | – | | | | – | |
| Shares redeemed | | (160 | ) | | | (7,677 | ) | | (314 | ) | | | (16,425 | ) |
| Net decrease | | (81 | ) | | $ | (3,926 | ) | | (202 | ) | | $ | (10,476 | ) |
| |
| MidCap Fund | | | | | | | | | | | | | | |
| Shares sold | | 252 | | | $ | 2,583 | | | 260 | | | $ | 3,369 | |
| Shares issued in reinvestment of dividends | | – | | | | 4 | | | – | | | | – | |
| Shares issued in reinvestment of realized gains | | 296 | | | | 3,078 | | | 299 | | | | 3,825 | |
| Shares redeemed | | (245 | ) | | | (2,580 | ) | | (322 | ) | | | (4,090 | ) |
| Net increase | | 303 | | | $ | 3,085 | | | 237 | | | $ | 3,104 | |
| |
| Bond Fund | | | | | | | | | | | | | | |
| Shares sold | | 12,506 | | | $ | 132,542 | | | 75,715 | | | $ | 860,664 | |
| Shares issued in reinvestment of dividends | | 5,345 | | | | 56,480 | | | 11,396 | | | | 128,763 | |
| Shares issued in reinvestment of realized gains | | – | | | | – | | | – | | | | – | |
| Shares redeemed | | (87,869 | ) | | | (926,514 | ) | | (155,791 | ) | | | (1,766,329 | ) |
| Net decrease | | (70,018 | ) | | $ | (737,492 | ) | | (68,680 | ) | | $ | (776,902 | ) |
NOTE 5 - PURCHASE AND SALE OF SECURITIES
Investment transactions for the six-month period ended May 31, 2016 were as follows:
| | Securities other than U.S. | | | | | | |
| | Government and Short-term | | | | | | |
| | Investments | | U.S. Government Securities |
| | Purchases | | Sales | | Purchases | | Sales |
| LargeCap Fund | | $ | 9,092,507 | | $ | 13,418,475 | | $ | – | | $ | – |
| MidCap Fund | | $ | 5,347,729 | | $ | 5,391,509 | | $ | – | | $ | – |
| Bond Fund | | $ | 58,298,790 | | $ | 712,586,052 | | $ | 326,971,487 | | $ | 152,431,972 |
NOTE 6 - INCOME TAX INFORMATION
At May 31, 2016, the investment cost and aggregate unrealized appreciation and depreciation on investments for federal income tax purposes were as follows:
| | LargeCap Fund | | MidCap Fund | | Bond Fund |
| Federal tax cost | | | $ | 113,337,473 | | | | | $ | 37,734,842 | | | | $ | 2,088,489,790 | |
| Unrealized appreciation | | | $ | 6,353,996 | | | | | $ | 7,275,928 | | | | $ | 7,540,171 | |
| Unrealized depreciation | | | | (12,079,181 | ) | | | | | (6,441,843 | ) | | | | (177,197,424 | ) |
| Net unrealized appreciation (depreciation) | | | $ | (5,725,185 | ) | | | | $ | 834,085 | | | | $ | (169,657,253 | ) |
The tax basis of investments for tax and financial reporting purposes differ principally due to wash sales.
36
| NOTES TO FINANCIAL STATEMENTS (Unaudited) (Continued) |
| May 31, 2016 |
The tax components of distributions paid during the six-month period ended May 31, 2016 and the fiscal year ended November 30, 2015 are as follows:
| | LargeCap Fund | | MidCap Fund | | Bond Fund |
| Six-month period ended May 31, 2016 (Unaudited) | | | | | | | | | | | | | |
| Distributions paid from: | | | | | | | | | | | | | |
| Ordinary income distributions | | | $ | 773,384 | | | | $ | 160,710 | | | $ | 58,580,505 |
| Long-term capital gains distributions | | | | – | | | | | 2,988,206 | | | | – |
| Total distributions paid | | | $ | 773,384 | | | | $ | 3,148,916 | | | $ | 58,580,505 |
| |
| Fiscal year ended November 30, 2015 | | | | | | | | | | | | | |
| Distributions paid from: | | | | | | | | | | | | | |
| Ordinary income distributions | | | $ | 675,832 | | | | $ | 429,599 | | | $ | 136,781,134 |
| Long-term capital gains distributions | | | | – | | | | | 3,466,117 | | | | – |
| Total distributions paid | | | $ | 675,832 | | | | $ | 3,895,716 | | | $ | 136,781,134 |
The tax basis post-October losses as of November 30, 2015 and capital loss carryforward as of November 30, 2015, which are not being recognized for tax purposes until the first day of the following fiscal year, are as follows:
| | LargeCap Fund | | MidCap Fund | | Bond Fund |
| Post-October losses | | | $ | – | | | | $ | – | | | $ | 2,073,821 |
| Net capital loss carryforward | | | | | | | | | | | | | |
| Subject to expiration | | | | | | | | | | | | | |
| November 30, 2017 | | | $ | 32,129,436 | | | | $ | – | | | $ | – |
| Not subject to expiration | | | | | | | | | | | | | |
| Short-term | | | | – | | | | | – | | | | 15,029,290 |
| Long-term | | | | – | | | | | – | | | | 1,401,736 |
| Total capital loss carryforward | | | $ | 32,129,436 | | | | $ | – | | | $ | 16,431,026 |
During the fiscal year ended November 30, 2015, the LargeCap Fund utilized capital loss carryforwards in the amount of $19,724,132.
Under the Regulated Investment Company Modernization Act of 2010 (the “Modernization Act”), capital losses incurred during taxable years after December 22, 2010 are carried forward indefinitely and retain the character of the original loss. Previously, net capital losses were carried forward for eight years and treated as short-term losses. As a transition rule, the Modernization Act requires that post-enactment net capital losses be used before pre-enactment net capital losses.
The following distributions were declared on June 23, 2016, payable to shareholders on June 24, 2016 (Unaudited):
| | LargeCap Fund | | MidCap Fund | | Bond Fund |
| Ordinary income distributions | | | | | | | | | | | | | |
| Amount | | | $ | – | | | | $ | – | | | $ | 21,238,136 |
| Per Share | | | $ | – | | | | $ | – | | | $ | 0.12 |
37
The following table presents information relating to a share of capital stock outstanding for the entire period.
| | Six-Month | | |
| | Period Ended | | |
| | May 31, 2016 | | Year Ended November 30, |
| | (Unaudited) | | 2015 | | 2014 | | 2013 | | 2012 | | 2011 |
| LARGECAP FUND | | | | | | | | | | | | | | | | | | | | |
| |
| Net Asset Value, Beginning of Period | | | $50.72 | | | | $53.40 | | | $46.47 | | | $34.27 | | | $30.07 | | | $29.20 | |
| Income from Investment Operations | | | | | | | | | | | | | | | | | | | | |
| Net investment income | | | 0.19 | | | | 0.35 | | | 0.27 | | | 0.19 | | | 0.18 | | | 0.08 | |
| Net realized and unrealized gains (losses) | | | | | | | | | | | | | | | | | | | | |
| on investments and options | | | 0.22 | | | | (2.75 | ) | | 6.84 | | | 12.20 | | | 4.13 | | | 0.80 | |
| Total from Investment Operations | | | 0.41 | | | | (2.40 | ) | | 7.11 | | | 12.39 | | | 4.31 | | | 0.88 | |
| Less Distributions | | | | | | | | | | | | | | | | | | | | |
| Distributions from net investment income | | | (0.35 | ) | | | (0.28 | ) | | (0.18 | ) | | (0.19 | ) | | (0.11 | ) | | (0.01 | ) |
| Distributions from net realized gains | | | – | | | | – | | | – | | | – | | | – | | | – | |
| Total Distributions | | | (0.35 | ) | | | (0.28 | ) | | (0.18 | ) | | (0.19 | ) | | (0.11 | ) | | (0.01 | ) |
| |
| Net Asset Value, End of Period | | | $50.78 | | | | $50.72 | | | $53.40 | | | $46.47 | | | $34.27 | | | $30.07 | |
| |
| Total Return | | | 0.86% | (a) | | | (4.52% | ) | | 15.35% | | | 36.33% | | | 14.37% | | | 3.02% | |
| |
| Ratios/Supplemental Data | | | | | | | | | | | | | | | | | | | | |
| Net assets, end of period (millions) | | | $107.9 | | | | $111.9 | | | $128.6 | | | $124.8 | | | $99.6 | | | $104.1 | |
| Ratios to average net assets: | | | | | | | | | | | | | | | | | | | | |
| Ratio of expenses | | | 1.13% | (b) | | | 1.15% | | | 1.15% | | | 1.21% | | | 1.31% | | | 1.31% | |
| Ratio of expenses without reimbursement | | | 1.26% | (b) | | | 1.22% | | | 1.23% | | | 1.22% | | | 1.31% | | | 1.31% | |
| Ratio of net investment income | | | 0.78% | (b) | | | 0.64% | | | 0.54% | | | 0.46% | | | 0.47% | | | 0.24% | |
| Ratio of net investment income | | | | | | | | | | | | | | | | | | | | |
| without reimbursement | | | 0.65% | (b) | | | 0.57% | | | 0.46% | | | 0.45% | | | 0.47% | | | 0.24% | |
| Portfolio turnover rate | | | 9% | (a) | | | 45% | | | 27% | | | 38% | | | 30% | | | 40% | |
| (a) | Calculated on a non-annualized basis. |
| (b) | Calculated on an annualized basis. |
See Notes to Financial Statements.
38
| FINANCIAL HIGHLIGHTS (Continued) |
| |
The following table presents information relating to a share of capital stock outstanding for the entire period.
| | Six-Month | | |
| | Period Ended | | |
| | May 31, 2016 | | Year Ended November 30, |
| | (Unaudited) | | 2015 | | 2014 | | 2013 | | 2012 | | 2011 |
| MIDCAP FUND | | | | | | | | | | | | | | | | | |
| |
| Net Asset Value, Beginning of Period | | | $12.07 | | | | $14.04 | | | $14.04 | | | $11.28 | | | $11.15 | | | $11.36 | |
| Income from Investment Operations | | | | | | | | | | | | | | | | | | | | |
| Net investment income (loss) (a) | | | – | | | | – | | | – | | | – | | | – | | | – | |
| Net realized and unrealized gains (losses) | | | | | | | | | | | | | | | | | | | | |
| on investments | | | 0.01 | | | | (0.64 | ) | | 1.47 | | | 3.71 | | | 1.38 | | | 0.44 | |
| Total from Investment Operations | | | 0.01 | | | | (0.64 | ) | | 1.47 | | | 3.71 | | | 1.38 | | | 0.44 | |
| Less Distributions | | | | | | | | | | | | | | | | | | | | |
| Distributions from net investment income | | | – | (a) | | | – | | | – | | | – | | | – | | | – | |
| Distributions from net realized gains | | | (1.00 | ) | | | (1.33 | ) | | (1.47 | ) | | (0.95 | ) | | (1.25 | ) | | (0.65 | ) |
| Total Distributions | | | (1.00 | ) | | | (1.33 | ) | | (1.47 | ) | | (0.95 | ) | | (1.25 | ) | | (0.65 | ) |
| |
| Net Asset Value, End of Period | | | $11.08 | | | | $12.07 | | | $14.04 | | | $14.04 | | | $11.28 | | | $11.15 | |
| |
| Total Return | | | 0.64% | (b) | | | (5.10% | ) | | 11.82% | | | 35.65% | | | 14.41% | | | 3.69% | |
| |
| Ratios/Supplemental Data | | | | | | | | | | | | | | | | | | | | |
| Net assets, end of period (millions) | | | $38.6 | | | | $38.4 | | | $41.3 | | | $37.6 | | | $24.6 | | | $17.6 | |
| Ratios to average net assets: | | | | | | | | | | | | | | | | | | | | |
| Ratio of expenses | | | 1.25% | (c) | | | 1.30% | | | 1.30% | | | 1.30% | | | 1.30% | | | 1.30% | |
| Ratio of expenses without reimbursement | | | 1.52% | (c) | | | 1.49% | | | 1.54% | | | 1.63% | | | 1.83% | | | 1.96% | |
| Ratio of net investment income (loss) | | | 0.04% | (c) | | | 0.01% | | | (0.02% | ) | | (0.02% | ) | | (0.03% | ) | | (0.19% | ) |
| Ratio of net investment loss | | | | | | | | | | | | | | | | | | | | |
| without reimbursement | | | (0.23%) | (c) | | | (0.18% | ) | | (0.27% | ) | | (0.35% | ) | | (0.56% | ) | | (0.85% | ) |
| Portfolio turnover rate | | | 15% | (b) | | | 27% | | | 34% | | | 47% | | | 44% | | | 47% | |
| (a) | Less than .005 per share. |
| (b) | Calculated on a non-annualized basis. |
| (c) | Calculated on an annualized basis. |
See Notes to Financial Statements.
39
| FINANCIAL HIGHLIGHTS (Continued) |
| |
The following table presents information relating to a share of capital stock outstanding for the entire period.
| | Six-Month | | |
| | Period Ended | | |
| | May 31, 2016 | | Year Ended November 30, |
| | (Unaudited) | | 2015 | | 2014 | | 2013 | | 2012 | | 2011 |
| BOND FUND | | | | | | | | | | | | | | | | | | | | |
| |
| Net Asset Value, Beginning of Period | | | $10.98 | | | | $11.69 | | | $11.91 | | | $11.95 | | | $11.33 | | | $11.54 | |
| Income from Investment Operations | | | | | | | | | | | | | | | | | | | | |
| Net investment income | | | 0.27 | | | | 0.49 | | | 0.45 | | | 0.41 | | | 0.41 | | | 0.42 | |
| Net realized and unrealized gains (losses) | | | | | | | | | | | | | | | | | | | | |
| on investments | | | (0.08 | ) | | | (0.72 | ) | | (0.19 | ) | | (0.03 | ) | | 0.67 | (a) | | (0.17 | )(a) |
| Total from Investment Operations | | | 0.19 | | | | (0.23 | ) | | 0.26 | | | 0.38 | | | 1.08 | | | 0.25 | |
| Less Distributions | | | | | | | | | | | | | | | | | | | | |
| Distributions from net investment income | | | (0.27 | ) | | | (0.48 | ) | | (0.45 | ) | | (0.40 | ) | | (0.43 | ) | | (0.40 | ) |
| Distributions from net realized gains | | | – | | | | – | | | (0.03 | ) | | (0.02 | ) | | (0.03 | ) | | (0.06 | ) |
| Total Distributions | | | (0.27 | ) | | | (0.48 | ) | | (0.48 | ) | | (0.42 | ) | | (0.46 | ) | | (0.46 | ) |
| |
| Net Asset Value, End of Period | | | $10.90 | | | | $10.98 | | | $11.69 | | | $11.91 | | | $11.95 | | | $11.33 | |
| |
| Total Return | | | 1.78% | (b) | | | (2.04% | ) | | 2.19% | | | 3.24% | | | 9.70% | | | 2.16% | |
| |
| Ratios/Supplemental Data | | | | | | | | | | | | | | | | | | | | |
| Net assets, end of period (millions) | | | $1,960.3 | | | | $2,744.5 | | | $3,724.0 | | | $2,252.1 | | | $1,292.3 | | | $656.0 | |
| Ratios to average net assets: | | | | | | | | | | | | | | | | | | | | |
| Ratio of expenses | | | 0.72% | (c) | | | 0.71% | | | 0.72% | | | 0.74% | | | 0.78% | | | 0.80% | |
| Ratio of expenses without reimbursement | | | 0.72% | (c) | | | 0.71% | | | 0.72% | | | 0.74% | | | 0.78% | | | 0.84% | |
| Ratio of net investment income | | | 4.40% | (c) | | | 3.98% | | | 4.04% | | | 3.73% | | | 3.90% | | | 3.89% | |
| Ratio of net investment income | | | | | | | | | | | | | | | | | | | | |
| without reimbursement | | | 4.40% | (c) | | | 3.98% | | | 4.04% | | | 3.73% | | | 3.90% | | | 3.86% | |
| Portfolio turnover rate | | | 3% | (b) | | | 29% | | | 21% | | | 33% | | | 16% | | | 14% | |
| (a) | Realized and unrealized gains and losses per share are balancing amounts necessary to reconcile the change in net asset value per share in the period. It does not agree to the aggregate gains and losses in the Statement of Operations due to the fluctuation in share transactions. |
| (b) | Calculated on a non-annualized basis. |
| (c) | Calculated on an annualized basis. |
See Notes to Financial Statements.
40
| ADDITIONAL INFORMATION (Unaudited) |
| |
THOMPSON IM FUNDS, INC.
DIRECTORS
John W. Feldt - Chairman
George E. Austin
Cornelia Boyle
Patricia Lipton
Jason L. Stephens
John W. Thompson
OFFICERS
Jason L. Stephens, CFA
Chief Executive Officer John W. Thompson, CFA
President James T. Evans, CFA
Vice President Penny M. Hubbard
Chief Financial Officer and Treasurer Nedra S. Pierce
Chief Compliance Officer Lesley T. Bailey
Secretary Sarah M. Baumgartner
Assistant Secretary |
INVESTMENT ADVISOR
Thompson Investment Management, Inc.
918 Deming Way
Madison, Wisconsin 53717
DISTRIBUTOR
Quasar Distributors, LLC
615 East Michigan Street
Milwaukee, Wisconsin 53202
TRANSFER AGENT
U.S. Bancorp Fund Services, LLC
615 East Michigan Street
Milwaukee, Wisconsin 53202
INDEPENDENT REGISTERED
PUBLIC ACCOUNTING FIRM
Cohen Fund Audit Services, Ltd.
1350 Euclid Avenue, Suite 800
Cleveland, OH 44115
LEGAL COUNSEL
Quarles & Brady LLP
411 East Wisconsin Avenue
Milwaukee, Wisconsin 53202 |
The Statement of Additional Information contains additional information about the directors and officers of Thompson IM Funds, Inc. and is available without charge, upon request, by calling 1-800-999-0887.
Proxy Voting Policy
A description of the policies and procedures that the Funds use to determine how to vote proxies relating to portfolio securities and information regarding how the Funds actually voted proxies during the most recent 12-month period ended June 30 are available without charge, upon request, by calling 1-800-999-0887, through the Funds’ website at www.thompsonim.com and on the SEC’s website at www.sec.gov.
Information About Portfolio Securities
The Funds file complete schedules of their portfolio holdings with the Securities and Exchange Commission for the Funds’ first and third quarters of its fiscal year on Form N-Q. The Funds’ Forms N-Q are available on the Securities and Exchange Commission’s website at www.sec.gov. You may also review and copy those documents by visiting the Securities and Exchange Commission’s Public Reference Room in Washington, D.C. Information on the operation of the Public Reference Room may be obtained by calling the Securities and Exchange Commission at 1-800-SEC-0330. The Funds’ Forms N-Q are also available without charge, upon request, by calling 1-800-999-0887.
41
Item 2. Code of Ethics.
Not required in Semi-Annual Reports on Form N-CSR.
Item 3. Audit Committee Financial Expert.
Not required in Semi-Annual Reports on Form N-CSR.
Item 4. Principal Accountant Fees and Services.
Not required in Semi-Annual Reports on Form N-CSR.
Item 5. Audit Committee of Listed Registrants.
Not applicable to this Registrant because it is not a “listed issuer” within the meaning of Rule 10A-3 under the Securities Exchange Act of 1934.
Item 6. Investments.
The required Schedules of Investments in securities of unaffiliated issuers is included as part of the Registrant’s Semi-Annual Report to shareholders dated as of May 31, 2016 provided under Item 1 of this Form N-CSR.
Item 7. Disclosure of Proxy Voting Policies and Procedures for Closed-End Management Investment Companies.
Not applicable to this Registrant because it is not a closed-end management investment company.
Item 8. Portfolio Managers of Closed-End Management Investment Companies.
Not applicable to this Registrant because it is not a closed-end management investment company.
Item 9. Purchases of Equity Securities by Closed-End Management Investment Companies and Affiliated Purchasers.
Not applicable to this Registrant because it is not a closed-end management investment company.
Item 10. Submission of Matters to a Vote of Securities Holders.
The Registrant has not made any material changes to the procedures by which shareholders may recommend nominees to the Registrant's Board of Directors after the Registrant last provided disclosure in response to the requirements of Item 407(c)(2)(iv) of Regulation S-K or this Item.
2
Item 11. Controls and Procedures.
| | (a) | | Disclosure Controls and Procedures. Based on an evaluation of the Registrant’s disclosure controls and procedures (as defined in Rule 30a-3(c) under the Investment Company Act of 1940) carried out under the supervision and with the participation of the Registrant’s management, including its principal executive and financial officers, within 90 days prior to the filing date of this report on Form N-CSR, the Registrant’s principal executive and financial officers have concluded that the design and operation of the Registrant’s disclosure controls and procedures are effective in providing reasonable assurance that the information required to be disclosed on Form N-CSR is recorded, processed, summarized and reported within the applicable time periods. |
| |
| (b) | | Change in Internal Controls Over Financial Reporting. There were no changes in the Registrant’s internal control over financial reporting (as defined in Rule 30a-3(d) under the Investment Company Act of 1940) that occurred during the Registrant’s second fiscal quarter of the period covered by this Form N-CSR that have materially affected, or are reasonably likely to materially affect, the Registrant’s internal control over financial reporting. |
Item 12. Exhibits.
The following exhibits are attached to this Form N-CSR:
| Exhibit No. | | Description of Exhibit | |
| | 12(a)(1) | | The Code of Ethics for the Registrant’s Principal Executive Officer, Principal Financial Officer and Principal Accounting Officer referred to in Item 2 was filed as Exhibit 12(a)(1) to the Registrant’s Certified Shareholder Report on Form N-CSR filed on January 28, 2005, and is incorporated herein by reference |
| | | |
| 12(a)(2)-1 | | Certification of Principal Executive Officer Required by Section 302 of the Sarbanes-Oxley Act of 2002 |
| | | |
| 12(a)(2)-2 | | Certification of Principal Financial Officer Required by Section 302 of the Sarbanes-Oxley Act of 2002 |
| | | |
| 12(b) | | Certification of Chief Executive Officer and Chief Financial Officer Required by Section 906 of the Sarbanes-Oxley Act of 2002 |
3
SIGNATURES
Pursuant to the requirements of the Securities Exchange Act of 1934 and the Investment Company Act of 1940, the Registrant has duly caused this report to be signed on its behalf by the undersigned, thereunto duly authorized, on this 27th day of July, 2016.
| THOMPSON IM FUNDS, INC. |
| |
| | By: | /s/ Jason L. Stephens |
| | Jason L. Stephens, Chief Executive |
| | Officer |
Pursuant to the requirements of the Securities Exchange Act of 1934 and the Investment Company Act of 1940, this report has been signed below by the following persons on behalf of the Registrant and in the capacities indicated on this 27th day of July, 2016.
| By: | /s/ Jason L. Stephens |
| | Jason L. Stephens, Chief Executive |
| | | Officer (Principal Executive Officer) |
| |
| By: | /s/ Penny Hubbard |
| | Penny Hubbard, Chief Financial |
| | Officer (Principal Financial Officer) |
4