UNITED STATES
SECURITIES AND EXCHANGE COMMISSION
Washington, D.C. 20549
FORM N-CSR
CERTIFIED SHAREHOLDER REPORT OF REGISTERED
MANAGEMENT
INVESTMENT COMPANIES
Investment Company Act File Number 811-4946
THOMPSON IM FUNDS, INC.
(Exact name of registrant as specified in charter)
918 Deming Way
Madison, Wisconsin 53717
(Address of principal executive offices)--(Zip code)
Jason L. Stephens
Chief Executive Officer
Thompson IM Funds, Inc.
918 Deming Way
Madison, Wisconsin 53717
(Name and address of agent for service)
With a copy to:
Matthew C. Vogel, Esq.
Quarles & Brady LLP
411 East Wisconsin Avenue
Milwaukee, Wisconsin 53202
Registrant's telephone number, including area code: (608) 827-5700
Date of fiscal year end: November 30, 2019
Date of reporting period: May 31, 2019
Form N-CSR is to be used by management investment companies to file reports with the Commission not later than 10 days after the transmission to stockholders of any report that is required to be transmitted to stockholders under Rule 30e-1 under the Investment Company Act of 1940 (17 CFR 270.30e-1). The Commission may use the information provided on Form N-CSR in its regulatory, disclosure review, inspection and policymaking roles.
A registrant is required to disclose the information specified by Form N-CSR, and the Commission will make this information public. A registrant is not required to respond to the collection of information contained in Form N-CSR unless the Form displays a currently valid Office of Management and Budget ("OMB") control number. Please direct comments concerning the accuracy of the information collection burden estimate and any suggestions for reducing the burden to Secretary, Securities and Exchange Commission, 450 Fifth Street, N.W., Washington, DC 20549-0609. The OMB has reviewed this collection of information under the clearance requirements of 44 U.S.C. § 3507.
Item 1. Report to Stockholders.
THOMPSON IM FUNDS, INC.
SEMI-ANNUAL REPORT TO SHAREHOLDERS
NOTE ON FORWARD-LOOKING STATEMENTS
The matters discussed in this report may constitute forward-looking statements. These include any Advisor or portfolio manager predictions, assessments, analyses or outlooks for individual securities, industries, investment styles, market sectors, interest rates, economic trends and/or markets. These statements involve risks and uncertainties. In addition to the general risks described for each Fund in its current Prospectus, other factors bearing on these reports include the accuracy of the Advisor’s or portfolio manager’s forecasts and predictions, the appropriateness of the investment strategies designed by the Advisor or portfolio manager and the ability of the Advisor or portfolio manager to implement its strategies efficiently and successfully. Any one or more of these factors, as well as other risks affecting the securities markets generally, could cause the actual results of any Fund to differ materially as compared to its benchmarks.
THOMPSON IM FUNDS, INC.
SEMI-ANNUAL REPORT TO SHAREHOLDERS
May 31, 2019
CONTENTS
| | Page(s) |
| LargeCap Fund | | |
| Investment review | | 2-4 |
| Schedule of investments | | 5-8 |
| |
| MidCap Fund | | |
| Investment review | | 9-11 |
| Schedule of investments | | 12-16 |
| |
| Bond Fund | | |
| Investment review | | 17-19 |
| Schedule of investments | | 20-35 |
| |
| Fund Expense Examples | | 36 |
| |
| Financial Statements | | |
| Statements of assets and liabilities | | 37 |
| Statements of operations | | 38 |
| Statements of changes in net assets | | 39 |
| Notes to financial statements | | 40-45 |
| Financial highlights | | 46-48 |
| |
| Additional Information | | 49 |
This report contains information for existing shareholders of Thompson IM Funds, Inc. It
does not constitute an offer to sell. This Semi-Annual Report is authorized for distribution to prospective investors
only when preceded or accompanied by a Fund Prospectus, which contains information about
the Funds’ objectives and policies, risks, management, expenses and other information.
A Prospectus can be obtained by calling 1-800-999-0887.
Please read your Prospectus carefully.
1
| LARGECAP FUND INVESTMENT REVIEW(Unaudited) |
| May 31, 2019 |
Portfolio Managers
James T. Evans, CFA
Jason L. Stephens, CFA
Performance
The LargeCap Fund produced a total return of -1.13% for the six-months ended May 31, 2019, as compared to its benchmark, the S&P 500 Index, which returned 0.74%.
| Comparison of Change in Value of a Hypothetical $10,000 Investment |
 |
| Average Annual Total Returns |
| Through 05/31/19 |
| | 1 Year | | 3 Year | | 5 Year | | 10 Year |
| Thompson LargeCap Fund | | -1.03% | | 9.50% | | 6.47% | | 11.70% |
| S&P 500 Index | | 3.78% | | 11.72% | | 9.66% | | 13.95% |
Gross Expense Ratio as of 03/31/19 was 1.21%.
Net Expense Ratio after reimbursement as of 3/31/19 was 1.03%*
| * | The Advisor has contractually agreed to waive management fees and/or reimburse expenses incurred by the LargeCap Fund through March 31, 2020, so that the annual operating expenses of the Fund do not exceed 1.03% of its average daily net assets. Net expense ratios are current as of the most recent Prospectus and are applicable to investors. |
Performance data quoted represents past performance; past performance does not guarantee future results. The investment return and principal value of an investment will fluctuate so that an investor’s shares, when redeemed, may be worth more or less than their original cost. Current performance of the Fund may be lower or higher than the performance quoted. Performance data current to the most recent month-end may be obtained by calling 1-800-999-0887 or visiting www.thompsonim.com.
Results include the reinvestment of all dividends and capital gains distributions. Investment performance reflects all fee waivers that may be in effect. In the absence of such waivers, total return would be reduced. The performance information reflected in the graph and the table above does not reflect the deduction of taxes that a shareholder would pay on fund distributions or the redemption of fund shares, nor does it imply future performance. The S&P 500 Index is an unmanaged index commonly used to measure the performance of U.S. stocks. You cannot directly invest in an index.
The S&P 500 Index is a product of S&P Dow Jones Indices LLC and has been licensed for use by Thompson Investment Management, Inc. S&P®and S&P 500®are registered trademarks of Standard & Poor’s Financial Services LLC (“S&P”). The Thompson IM Funds are not sponsored, endorsed, sold or promoted by S&P Dow Jones Indices LLC, Dow Jones, S&P or their respective affiliates, and none of S&P Dow Jones Indices LLC, Dow Jones, S&P nor their respective affiliates make any representation regarding the advisability of investing in such products.
See Notes to Financial Statements.
2
| LARGECAP FUND INVESTMENT REVIEW(Unaudited) (Continued) |
| May 31, 2019 |
Management Commentary
The Fund’s lag relative to its benchmark over this period was driven to a large degree by changes in investor macroeconomic expectations. The most high-profile indicator of this was the fluctuation in yield on the 10 Year US Treasury note, which moved from 2.99% on November 30 to 2.13% on May 31 – a drop of -0.86%. As interest rates declined significantly, sectors and industries most sensitive to their gyrations reacted accordingly. Banks performed poorly, as investors questioned their ability to expand or even maintain net interest margins. The Real Estate and Utilities sectors performed well, driven by the appeal of their dividend yields relative to bonds. This change in sentiment was likely driven by concerns relating to the potential economic fallout from escalating trade tensions. While a deal between China and the U.S. was largely expected in late April, by mid-May talks had broken down. To compound the worry, late in the month the President threatened incremental tariffs against Mexico unless the country reduced the flow of immigration from Central American countries.
We have no special insight as to the ultimate resolution of the President’s trade negotiations. In many ways the up and down flow of news acts as a Rorschach test on the President himself. To supporters of his trade stance, the benefits of a potential future trade landscape are worth the volatility and economic risks. To critics, the payoff is doubtful, and the dangers of a recession-causing policy mistake are material.
Given this elevated uncertainty, it is understandable that stocks have drifted down from their recent highs. With the market seemingly trapped between “economic boom” and “recession” scenarios, we believe the best option is to not tilt the Fund’s exposure in a way that heavily favors either outcome. We think at this point that committing strongly in one direction or the other risks crossing over the fine line from investing into speculation.
Compounding this is our belief that the valuation risk in many traditional safe haven sectors is elevated. The risk of rotating into overbought securities is that if and when sentiment changes in the opposite direction, a stock’s reaction to the change is that much more dramatic. We would rather take an intermediate view and continue to focus on seeking out earnings growth potential and attractive valuations, while discounting our expectations in accordance with the general level of macroeconomic uncertainty.
Opinions expressed are subject to change, are not guaranteed and should not be considered investment advice.
Mutual fund investing involves risk. Principal loss is possible. Investments in smaller companies involve additional risks such as limited liquidity and greater volatility. Investments in American Depositary Receipts (“ADRs”) are subject to some extent to the risks associated with directly investing in securities of foreign issuers, including the risk of changes in currency exchange rates, expropriation or nationalization of assets, and the impact of political, diplomatic, or social events. Investments in real estate securities may involve greater risk and volatility including greater exposure to economic downturns and changes in real estate values, rents, property taxes, and tax and other laws. A real estate investment trust’s (REIT’s) share price may decline because of adverse developments affecting the real estate industry.
Please refer to the Schedule of Investments on page 5 of this report for holdings information. The management commentary above as well as Fund holdings and asset/sector allocations should not be considered a recommendation to buy or sell any security. In addition, please note that Fund holdings and asset/sector allocations are subject to change.
Dividend Yield is a financial ratio that indicates how much a company pays out in dividends each year relative to its share price.
Net Interest Margin is the ratio of net interest income to invested assets.
Yield is the income earned from a bond, which takes into account the sum of the interest payment, the redemption value at the bond’s maturity, and the initial purchase price of the bond.
Earnings Growth is a measure of growth in a company’s net income over a specific period, often one year. It is not a prediction of the Fund’s future returns.
See Notes to Financial Statements.
3
| LARGECAP FUND INVESTMENT REVIEW(Unaudited) (Continued) |
| May 31, 2019 |
| Sector Weightings at 05/31/19 |
| % of Total Investments |
 |
| Top 10 Equity Holdings at 05/31/19 |
| | % of Fund’s |
| Company | Industry | Net Assets |
| Alphabet, Inc. Class A | Interactive Media & Services | 3.45% |
| Microsoft Corp. | Software | 3.02% |
| Celgene Corp. | Biotechnology | 2.53% |
| Qualcomm Inc. | Semiconductors & Semiconductor Equipment | 2.28% |
| Facebook, Inc. Class A | Interactive Media & Services | 2.25% |
| Pfizer Inc. | Pharmaceuticals | 2.21% |
| Bank of America Corp. | Banks | 2.21% |
| Exact Sciences Corp. | Biotechnology | 2.20% |
| eBay Inc. | Internet & Direct Marketing Retail | 2.15% |
| Citigroup Inc. | Banks | 2.13% |
As of May 31, 2019, 99.8% of the Fund’s net assets were in equity and short-term investments.
See Notes to Financial Statements.
4
| LARGECAP FUND SCHEDULE OF INVESTMENTS(Unaudited) |
| May 31, 2019 |
| | Shares | | Value |
| COMMON STOCKS - 99.8% | | | | $115,926,597 |
| (COST $122,570,472) | | | | |
| | | | | |
| Communication Services - 11.1% | | | | 12,902,457 |
| Entertainment - 3.3% | | | | |
| Activision Blizzard, Inc. | | 26,500 | | 1,149,305 |
| The Walt Disney Co. | | 13,400 | | 1,769,336 |
| Viacom Inc. Class B | | 31,725 | | 920,977 |
| Interactive Media & Services - 5.7% | | | | |
| Alphabet Inc. Class A (a) | | 3,625 | | 4,011,062 |
| Facebook, Inc. Class A (a) | | 14,700 | | 2,608,809 |
| Media - 2.1% | | | | |
| CBS Corp. Class B | | 50,600 | | 2,442,968 |
| | | | | |
| Consumer Discretionary - 10.4% | | | | 12,036,150 |
| Automobiles - 1.0% | | | | |
| Harley-Davidson, Inc. | | 34,400 | | 1,125,568 |
| Distributors - 1.0% | | | | |
| LKQ Corp. (a) | | 45,225 | | 1,160,021 |
| Hotels, Restaurants & Leisure - 0.8% | | | | |
| Starbucks Corp. | | 11,725 | | 891,804 |
| Household Durables - 1.3% | | | | |
| TopBuild Corp. (a) | | 18,752 | | 1,486,471 |
| Internet & Direct Marketing Retail - 2.1% | | | | |
| eBay Inc. | | 69,495 | | 2,496,955 |
| Leisure Products - 0.7% | | | | |
| Brunswick Corp. | | 19,700 | | 817,156 |
| Multiline Retail - 1.0% | | | | |
| Target Corp. | | 14,060 | | 1,131,127 |
| Specialty Retail - 2.5% | | | | |
| Bed Bath & Beyond Inc. | | 79,400 | | 1,007,586 |
| Lumber Liquidators Holdings, Inc. (a) | | 117,775 | | 1,129,462 |
| Party City Holdco Inc. (a) | | 100,000 | | 790,000 |
| | | | | |
| Consumer Staples - 3.2% | | | | 3,702,751 |
| Food & Staples Retailing - 1.9% | | | | |
| Walgreens Boots Alliance, Inc. | | 45,450 | | 2,242,503 |
| Household Products - 1.3% | | | | |
| Kimberly-Clark Corp. | | 11,418 | | 1,460,248 |
| | | | | |
| Energy - 6.4% | | | | 7,434,945 |
| Energy Equipment & Services - 0.7% | | | | |
| Schlumberger Ltd. | | 24,144 | | 837,555 |
See Notes to Financial Statements.
5
| LARGECAP FUND SCHEDULE OF INVESTMENTS(Unaudited) (Continued) |
| May 31, 2019 |
| | Shares | | Value |
| COMMON STOCKS(continued) | | | | |
| | | | |
| Energy(continued) | | | | |
| Oil, Gas & Consumable Fuels - 5.7% | | | | |
| Chevron Corp. | | 9,820 | | $1,118,007 |
| Devon Energy Corp. | | 28,225 | | 710,141 |
| EOG Resources, Inc. | | 9,475 | | 775,813 |
| Exxon Mobil Corp. | | 28,570 | | 2,021,899 |
| Noble Energy, Inc. | | 37,400 | | 800,360 |
| Pioneer Natural Resources Co. | | 8,250 | | 1,171,170 |
| | | | | |
| Financials - 16.1% | | | | 18,749,831 |
| Banks - 9.5% | | | | |
| Bank of America Corp. | | 96,400 | | 2,564,240 |
| CIT Group Inc. | | 30,925 | | 1,470,174 |
| Citigroup Inc. | | 39,830 | | 2,475,434 |
| JPMorgan Chase & Co. | | 22,955 | | 2,432,312 |
| PNC Financial Services Group, Inc. | | 7,345 | | 934,725 |
| SunTrust Banks, Inc. | | 10,450 | | 627,104 |
| Zions Bancorporation, N.A. | | 13,025 | | 560,987 |
| Capital Markets - 4.9% | | | | |
| Northern Trust Corp. | | 18,635 | | 1,593,665 |
| State Street Corp. | | 33,300 | | 1,839,825 |
| The Charles Schwab Corp. | | 28,500 | | 1,185,885 |
| The Goldman Sachs Group, Inc. | | 5,775 | | 1,053,880 |
| Consumer Finance - 0.6% | | | | |
| Discover Financial Services | | 8,820 | | 657,531 |
| Insurance - 1.1% | | | | |
| Fidelity National Financial, Inc. | | 35,125 | | 1,354,069 |
| | | | | |
| Health Care - 21.4% | | | | 24,832,223 |
| Biotechnology - 7.3% | | | | |
| AbbVie Inc. | | 22,125 | | 1,697,209 |
| Amgen Inc. | | 5,475 | | 912,683 |
| Celgene Corp. (a) | | 31,375 | | 2,942,661 |
| Exact Sciences Corp. (a) | | 24,650 | | 2,554,479 |
| MiMedx Group Inc. (a) | | 65,375 | | 297,456 |
| Health Care Equipment & Supplies - 1.0% | | | | |
| Abbott Laboratories | | 15,450 | | 1,176,208 |
| Health Care Providers & Services - 8.9% | | | | |
| Cigna Corp. | | 7,175 | | 1,062,044 |
| CVS Health Corp. | | 41,600 | | 2,178,592 |
| Hanger, Inc. (a) | | 102,074 | | 1,904,701 |
| HCA Healthcare, Inc. | | 9,800 | | 1,185,408 |
| McKesson Corp. | | 18,460 | | 2,254,704 |
| UnitedHealth Group Inc. | | 7,400 | | 1,789,320 |
| Pharmaceuticals - 4.2% | | | | |
| Johnson & Johnson | | 9,185 | | 1,204,613 |
| Merck & Co., Inc. | | 13,900 | | 1,101,019 |
| Pfizer Inc. | | 61,925 | | 2,571,126 |
See Notes to Financial Statements.
6
| LARGECAP FUND SCHEDULE OF INVESTMENTS(Unaudited) (Continued) |
| May 31, 2019 |
| | Shares | | Value |
| COMMON STOCKS(continued) | | | | |
| | | | | |
| Industrials - 8.1% | | | | $9,399,955 |
| Air Freight & Logistics - 1.3% | | | | |
| FedEx Corp. | | 10,175 | | 1,569,799 |
| Airlines - 0.7% | | | | |
| Delta Air Lines, Inc. | | 16,200 | | 834,300 |
| Building Products - 1.6% | | | | |
| Masco Corp. | | 53,775 | | 1,877,823 |
| Electrical Equipment - 0.8% | | | | |
| ABB Ltd. ADR | | 47,975 | | 872,186 |
| Industrial Conglomerates - 1.9% | | | | |
| General Electric Co. | | 233,025 | | 2,199,756 |
| Machinery - 1.0% | | | | |
| Wabtec Corp. | | 18,251 | | 1,138,497 |
| Trading Companies & Distributors - 0.8% | | | | |
| HD Supply Holdings, Inc. (a) | | 21,875 | | 907,594 |
| | | | | |
| Information Technology - 21.6% | | | | 25,136,021 |
| Communications Equipment - 3.5% | | | | |
| Cisco Systems, Inc. | | 45,485 | | 2,366,585 |
| Lumentum Holdings Inc. (a) | | 13,700 | | 554,439 |
| Viavi Solutions Inc. (a) | | 92,735 | | 1,117,457 |
| Electronic Equipment, Instruments & Components - 1.8% | | | | |
| Corning Inc. | | 43,650 | | 1,258,866 |
| II-VI Inc. (a) | | 27,450 | | 862,754 |
| IT Services - 4.4% | | | | |
| Alliance Data Systems Corp. | | 14,175 | | 1,949,062 |
| First Data Corp. Class A (a) | | 65,000 | | 1,652,300 |
| PayPal Holdings, Inc. (a) | | 7,895 | | 866,476 |
| Visa Inc. Class A | | 3,625 | | 584,821 |
| Semiconductors & Semiconductor Equipment - 5.7% | | | | |
| Infineon Technologies A.G. ADR | | 90,950 | | 1,616,182 |
| Intel Corp. | | 22,500 | | 990,900 |
| NXP Semiconductors N.V. | | 16,000 | | 1,410,560 |
| Qualcomm Inc. | | 39,655 | | 2,649,747 |
| Software - 4.7% | | | | |
| Microsoft Corp. | | 28,326 | | 3,503,360 |
| Oracle Corp. | | 39,475 | | 1,997,435 |
| Technology Hardware, Storage & Peripherals - 1.5% | | | | |
| Apple Inc. | | 10,025 | | 1,755,077 |
| | | | | |
| Materials - 1.5% | | | | 1,732,264 |
| Metals & Mining - 1.5% | | | | |
| Freeport-McMoRan Inc. | | 178,400 | | 1,732,264 |
See Notes to Financial Statements.
7
| LARGECAP FUND SCHEDULE OF INVESTMENTS(Unaudited) (Continued) |
| May 31, 2019 |
| | Shares | | Value |
| SHORT-TERM INVESTMENTS - 0.0%^ | | | | $902 |
| (COST $902) | | | | |
| | | | | |
| Money Market Funds - 0.0%^ | | | | 902 |
| First American Gov’t. Obligations Fund Class X, 2.310% (b) | | 902 | | 902 |
| | | | | |
| TOTAL INVESTMENTS - 99.8% (COST $122,571,374) | | | | 115,927,499 |
| | | | | |
| NET OTHER ASSETS AND LIABILITIES - 0.2% | | | | 245,123 |
| | | | | |
| NET ASSETS - 100.0% | | | | $116,172,622 |
| (a) | Non-income producing security. |
| (b) | Represents the 7-day yield at May 31, 2019. |
| ^ | Rounds to 0.0%. |
| Abbreviations: |
| ADR | | American Depositary Receipt |
| A.G. | | Aktiengesellschaft is the German term for a public limited liability corporation. |
| N.V. | | Naamloze Vennootschap is the Dutch term for a public limited liability corporation. |
The Global Industry Classification Standard (“GICS”) was developed by and is the exclusive property and a service mark of MSCI Inc. (“MSCI”) and Standard & Poor’s Financial Services LLC (“S&P”) and is licensed for use by Thompson Investment Management, Inc. Neither MSCI, S&P, nor any other party involved in making or compiling the GICS or any GICS classifications makes any warranties with respect thereto or the results to be obtained by the use thereof, and no such party shall have any liability whatsoever with respect thereto.
The following is a summary of the inputs used to value the Funds’ investments as of May 31, 2019:
| | Level 1 | | Level 2 | | Level 3 | | Total |
| Common stocks | | | | | | | | |
| Communication services | | $12,902,457 | | $– | | $– | | $12,902,457 |
| Consumer discretionary | | 12,036,150 | | – | | – | | 12,036,150 |
| Consumer staples | | 3,702,751 | | – | | – | | 3,702,751 |
| Energy | | 7,434,945 | | – | | – | | 7,434,945 |
| Financials | | 18,749,831 | | – | | – | | 18,749,831 |
| Health care | | 24,832,223 | | – | | – | | 24,832,223 |
| Industrials | | 9,399,955 | | – | | – | | 9,399,955 |
| Information technology | | 25,136,021 | | – | | – | | 25,136,021 |
| Materials | | 1,732,264 | | – | | – | | 1,732,264 |
| Total common stocks | | 115,926,597 | | – | | – | | 115,926,597 |
| Short-term investments | | | | | | | | |
| Money market funds | | 902 | | – | | – | | 902 |
| Total short-term investments | | 902 | | – | | – | | 902 |
| Total investments | | $115,927,499 | | $– | | $– | | $115,927,499 |
The Fund did not invest in any level-3 investments as of and during the six-month period ended May 31, 2019.
For more information on valuation inputs, see financial statement Note 2 - Significant Accounting Policies.
See Notes to Financial Statements.
8
| MIDCAP FUND INVESTMENT REVIEW(Unaudited) |
| May 31, 2019 |
Portfolio Managers
James T. Evans, CFA
Jason L. Stephens, CFA
Performance
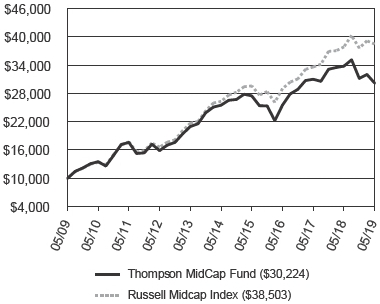
The MidCap Fund produced a total return of -3.17% for the six-months ended May 31, 2019, as compared to its benchmark, the Russell Midcap Index, which returned 2.29%.
| Comparison of Change in Value of a Hypothetical $10,000 Investment |
 |
| Average Annual Total Returns |
| Through 05/31/19 | |
| | 1 Year | | 3 Year | | 5 Year | | 10 Year |
| Thompson MidCap Fund | | | -10.61 | % | | | | 5.77 | % | | | | 3.44 | % | | | | 11.70 | % | |
| Russell Midcap Index | | | 1.59 | % | | | | 9.87 | % | | | | 7.89 | % | | | | 14.43 | % | |
Gross Expense Ratio as of 03/31/19 was 1.42%.
Net Expense Ratio after reimbursement as of 03/31/19 was 1.15%.*
| * | The Advisor has contractually agreed to waive management fees and/or reimburse expenses incurred by the MidCap Fund through March 31, 2020, so that the annual operating expenses of the Fund do not exceed 1.15% of its average daily net assets. Net expense ratios are current as of the most recent Prospectus and are applicable to investors. |
Performance data quoted represents past performance; past performance does not guarantee future results. The investment return and principal value of an investment will fluctuate so that an investor’s shares, when redeemed, may be worth more or less than their original cost. Current performance of the Fund may be lower or higher than the performance quoted. Performance data current to the most recent month-end may be obtained by calling 1-800-999-0887 or visiting www.thompsonim.com.
Results include the reinvestment of all dividends and capital gains distributions. Investment performance reflects all fee waivers that may be in effect. In the absence of such waivers, total return would be reduced. The performance information reflected in the graph and the table above does not reflect the deduction of taxes that a shareholder would pay on fund distributions or the redemption of fund shares, nor does it imply future performance. The Russell Midcap Index measures the performance of the 800 smallest companies in the Russell 1000 Index based on total market capitalization. You cannot directly invest in an index.
FTSE Russell is the source and owner of the trademarks, service marks, and copyrights related to the Russell Indexes. “FTSE®” and “Russell®” are trademarks of the London Stock Exchange Group.
See Notes to Financial Statements.
9
| MIDCAP FUND INVESTMENT REVIEW(Unaudited) (Continued) |
| May 31, 2019 |
Management Commentary
After a poor start in December 2018, the Fund’s performance relative to its benchmark bounced back for the rest of the semi-annual period until May, when the gap significantly widened again in favor of the benchmark. During both poor months, concerns relating to escalating trade tensions rattled investors, sending interest rates lower and investors searching for safe havens. While some of the Fund’s lag can be explained by security-specific issues, much of it is thematic in nature. For the last few years, momentum has been carrying some stocks higher than we believe reasonable and driving others lower than we think justified. The discrepancy has reached extreme levels, with the Russell Growth Index beating the Value index by a cumulative 31.19% since the end of 2016 through the end of the period.
This had been changing, but as sentiment again turned negative in May, investors retreated to strategies that worked well previously over the past two and a half years (favoring growth over value, for example). The question we’ve been asking ourselves repeatedly over that time period is, “Is the growth or safety premium of Company X really worth THAT much more than only slightly worse metrics from Company Y?” Even when taking the potential for operational stumbles into account, we find ourselves questioning valuation discrepancies more and more frequently. The problem we see is that in order for valuations to be close to reasonable for many growth stocks or perceived safe havens, the earnings and interest rate expectations for those stocks must be accurate well into the future. Given the trade and economic concerns mentioned above, we think the accuracy of predictions well into the future are anything but certain.
In aggregate, the Fund portfolio’s estimated earnings growth rate is roughly in line with that of its benchmark. It is our opinion that the Fund’s price/earnings ratio is at a clear discount to the benchmark. This is consistent with the Growth at a Reasonable Price (GARP) strategy we are attempting to employ in the Fund. We believe this strategy provides the opportunity for competitive returns in the future, and over the long run should continue to work toward that end.
Opinions expressed are subject to change, are not guaranteed and should not be considered investment advice.
Mutual fund investing involves risk. Principal loss is possible. Midcap companies tend to have more limited liquidity and greater volatility than large-capitalization companies. Investments in American Depositary Receipts (“ADRs”) are subject to some extent to the risks associated with directly investing in securities of foreign issuers, including the risk of changes in currency exchange rates, expropriation or nationalization of assets, and the impact of political, diplomatic, or social events. Investments in real estate securities may involve greater risk and volatility including greater exposure to economic downturns and changes in real estate values, rents, property taxes, and tax and other laws. A real estate investment trust’s (REIT’s) share price may decline because of adverse developments affecting the real estate industry.
Please refer to the Schedule of Investments on page 12 of this report for holdings information. The management commentary above as well as Fund holdings and asset/sector allocations should not be considered a recommendation to buy or sell any security. In addition, please note that Fund holdings and asset/sector allocations are subject to change.
Price-To-Earnings (P/E) Ratio is a valuation ratio of a company’s current share price compared to its per-share earnings. Divide market value of a share by the earnings per share.
Russell Midcap Growth Index: The Russell Midcap Growth Index measures the performance of those Russell Midcap companies with higher price-to-book ratios and higher forecasted growth values.
The Russell Midcap Value Index measures the performance of those Russell Midcap companies with lower price-to-book ratios and lower forecasted growth values.
Earnings Growth is a measure of growth in a company’s net income over a specific period, often one year. It is not a prediction of the Fund’s future returns.
See Notes to Financial Statements.
10
| MIDCAP FUND INVESTMENT REVIEW(Unaudited) (Continued) |
| May 31, 2019 |
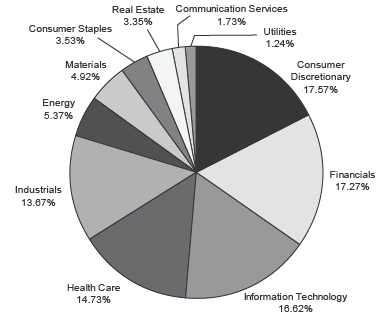
| Sector Weightings at 05/31/19 |
| % of Total Investments |
 |
| Top 10 Equity Holdings at 05/31/19 |
| | % of Fund’s |
| Company | Industry | Net Assets |
| Exact Sciences Corp. | Biotechnology | 2.22% |
| Hanger, Inc. | Health Care Providers & Services | 2.12% |
| CIT Group Inc. | Banks | 2.03% |
| LKQ Corp. | Distributors | 2.02% |
| First Horizon National Corp. | Banks | 2.01% |
| Alliance Data Systems Corp. | IT Services | 1.95% |
| Jazz Pharmaceuticals PLC | Pharmaceuticals | 1.86% |
| Electronics for Imaging, Inc. | Technology Hardware, Storage & Peripherals | 1.85% |
| Newell Brands, Inc. | Household Durables | 1.79% |
| Northern Trust Corp. | Capital Markets | 1.75% |
As of May 31, 2019, 100.0%, of the Fund’s net assets were in equity and short-term investments.
See Notes to Financial Statements.
11
| MIDCAP FUND SCHEDULE OF INVESTMENTS(Unaudited) |
| May 31, 2019 |
| | | | Shares | | Value |
| COMMON STOCKS - 99.8% | | | | | $39,978,004 |
| (COST $38,837,171) | | | | | |
| |
| Communication Services - 1.7% | | | | | 694,818 |
| Entertainment - 1.7% | | | | | |
| Activision Blizzard, Inc. | | 4,500 | | | 195,165 |
| Take-Two Interactive Software, Inc. (a) | | 4,620 | | | 499,653 |
| |
| Consumer Discretionary - 17.6% | | | | | 7,043,341 |
| Automobiles - 0.9% | | | | | |
| Harley-Davidson, Inc. | | 11,325 | | | 370,554 |
| Distributors - 2.0% | | | | | |
| LKQ Corp. (a) | | 31,510 | | | 808,232 |
| Household Durables - 5.7% | | | | | |
| D.R. Horton, Inc. | | 10,515 | | | 449,621 |
| Newell Brands, Inc. | | 53,521 | | | 718,252 |
| PulteGroup Inc. | | 15,010 | | | 465,310 |
| TopBuild Corp. (a) | | 8,040 | | | 637,331 |
| Leisure Products - 1.8% | | | | | |
| Brunswick Corp. | | 10,045 | | | 416,667 |
| Mattel, Inc. (a) | | 31,550 | | | 310,767 |
| Specialty Retail - 5.0% | | | | | |
| Bed Bath & Beyond Inc. | | 30,000 | | | 380,700 |
| Lumber Liquidators Holdings, Inc. (a) | | 58,665 | | | 562,597 |
| Party City Holdco Inc. (a) | | 84,410 | | | 666,839 |
| Urban Outfitters, Inc. (a) | | 17,545 | | | 394,236 |
| Textiles, Apparel & Luxury Goods - 2.2% | | | | | |
| Hanesbrands, Inc. | | 23,315 | | | 346,228 |
| Skechers U.S.A., Inc. Class A (a) | | 18,475 | | | 516,007 |
| |
| Consumer Staples - 3.5% | | | | | 1,414,547 |
| Beverages - 1.2% | | | | | |
| Molson Coors Brewing Co. Class B | | 9,115 | | | 501,143 |
| Food Products - 2.3% | | | | | |
| The Hain Celestial Group, Inc. (a) | | 18,565 | | | 378,540 |
| The J. M. Smucker Co. | | 4,400 | | | 534,864 |
| |
| Energy - 5.4% | | | | | 2,152,276 |
| Energy Equipment & Services - 1.3% | | | | | |
| Helmerich & Payne, Inc. | | 3,510 | | | 171,674 |
| TechnipFMC PLC | | 17,125 | | | 356,200 |
| Oil, Gas & Consumable Fuels - 4.1% | | | | | |
| Cameco Corp. | | 15,200 | | | 153,368 |
| Cheniere Energy, Inc. (a) | | 3,220 | | | 203,440 |
| Devon Energy Corp. | | 10,345 | | | 260,280 |
| Noble Energy, Inc. | | 27,800 | | | 594,920 |
| Pioneer Natural Resources Co. | | 2,905 | | | 412,394 |
See Notes to Financial Statements.
12
| MIDCAP FUND SCHEDULE OF INVESTMENTS(Unaudited) (Continued) |
| May 31, 2019 |
| | | | Shares | | Value |
| COMMON STOCKS(continued) | | | | | |
| |
| Financials - 17.0% | | | | | $6,819,996 |
| Banks - 8.8% | | | | | |
| Associated Banc-Corp | | 34,308 | | | 679,641 |
| CIT Group Inc. | | 17,080 | | | 811,983 |
| First Horizon National Corp. | | 60,145 | | | 806,544 |
| Regions Financial Corp. | | 14,785 | | | 204,477 |
| SunTrust Banks, Inc. | | 6,970 | | | 418,270 |
| Zions Bancorporation, N.A. | | 13,785 | | | 593,720 |
| Capital Markets - 4.0% | | | | | |
| Eaton Vance Corp. | | 12,990 | | | 496,478 |
| Northern Trust Corp. | | 8,180 | | | 699,554 |
| State Street Corp. | | 7,825 | | | 432,331 |
| Consumer Finance - 1.4% | | | | | |
| Discover Financial Services | | 7,329 | | | 546,377 |
| Insurance - 1.8% | | | | | |
| Fidelity National Financial, Inc. | | 11,210 | | | 432,145 |
| Unum Group | | 9,175 | | | 288,921 |
| Thrifts & Mortgage Finance - 1.0% | | | | | |
| Flagstar Bancorp, Inc. | | 13,010 | | | 409,555 |
| |
| Health Care - 14.7% | | | | | 5,903,479 |
| Biotechnology - 2.8% | | | | | |
| Exact Sciences Corp. (a) | | 8,565 | | | 887,591 |
| MiMedx Group Inc. (a) | | 23,635 | | | 107,539 |
| Xencor, Inc. (a) | | 4,100 | | | 126,444 |
| Health Care Providers & Services - 7.1% | | | | | |
| Acadia Healthcare Co., Inc. (a) | | 15,660 | | | 504,565 |
| Hanger, Inc. (a) | | 45,618 | | | 851,232 |
| Henry Schein, Inc. (a) | | 2,180 | | | 140,523 |
| McKesson Corp. | | 2,495 | | | 304,739 |
| Premier, Inc. Class A (a) | | 17,575 | | | 645,881 |
| Tivity Health, Inc. (a) | | 22,460 | | | 411,018 |
| Life Sciences Tools & Services - 2.9% | | | | | |
| Accelerate Diagnostics, Inc. (a) | | 33,700 | | | 637,267 |
| Cambrex Corp. (a) | | 13,575 | | | 540,285 |
| Pharmaceuticals - 1.9% | | | | | |
| Jazz Pharmaceuticals PLC (a) | | 5,945 | | | 746,395 |
| |
| Industrials - 13.7% | | | | | 5,478,830 |
| Building Products - 2.2% | | | | | |
| A.O. Smith Corp. | | 7,850 | | | 317,925 |
| Masco Corp. | | 15,950 | | | 556,974 |
| Commercial Services & Supplies - 1.9% | | | | | |
| Hudson Technologies, Inc. (a) | | 225,325 | | | 360,520 |
| Mobile Mini, Inc. | | 13,020 | | | 399,323 |
| Construction & Engineering - 1.0% | | | | | |
| MasTec, Inc. (a) | | 8,955 | | | 416,318 |
See Notes to Financial Statements.
13
| MIDCAP FUND SCHEDULE OF INVESTMENTS(Unaudited) (Continued) |
| May 31, 2019 |
| | | | Shares | | Value |
| COMMON STOCKS(continued) | | | | | |
| |
| Industrials (continued) | | | | | |
| Electrical Equipment - 0.7% | | | | | |
| Regal Beloit Corp. | | 3,805 | | | $276,624 |
| Machinery - 6.2% | | | | | |
| Ingersoll-Rand PLC | | 3,875 | | | 458,567 |
| Kornit Digital Ltd. (a) | | 11,390 | | | 323,134 |
| Mueller Water Products, Inc. Class A | | 30,525 | | | 282,051 |
| REV Group, Inc. | | 48,025 | | | 532,117 |
| SPX Corp. (a) | | 6,705 | | | 199,407 |
| SPX Flow, Inc. (a) | | 19,065 | | | 680,620 |
| Trading Companies & Distributors - 1.7% | | | | | |
| HD Supply Holdings, Inc. (a) | | 16,275 | | | 675,250 |
| |
| Information Technology - 16.6% | | | | | 6,659,353 |
| Communications Equipment - 2.2% | | | | | |
| Lumentum Holdings Inc. (a) | | 7,200 | | | 291,384 |
| Viavi Solutions Inc. (a) | | 49,571 | | | 597,331 |
| Electronic Equipment, Instruments & Components - 1.2% | | | | | |
| II-VI Inc. (a) | | 15,200 | | | 477,736 |
| IT Services - 3.8% | | | | | |
| Alliance Data Systems Corp. | | 5,695 | | | 783,062 |
| Black Knight, Inc. (a) | | 7,735 | | | 438,497 |
| Fiserv, Inc. (a) | | 3,723 | | | 319,657 |
| Semiconductors & Semiconductor Equipment - 6.1% | | | | | |
| Cypress Semiconductor Corp. | | 35,200 | | | 627,264 |
| Infineon Technologies A.G. ADR | | 31,625 | | | 561,976 |
| Marvell Technology Group Ltd. | | 26,204 | | | 584,349 |
| NXP Semiconductors N.V. | | 7,550 | | | 665,608 |
| Technology Hardware, Storage & Peripherals - 3.3% | | | | | |
| CPI Card Group Inc. (a) | | 150,397 | | | 374,489 |
| Electronics for Imaging, Inc. (a) | | 20,195 | | | 740,147 |
| Pure Storage, Inc. Class A (a) | | 12,475 | | | 197,853 |
| |
| Materials - 4.9% | | | | | 1,970,214 |
| Chemicals - 1.6% | | | | | |
| Ecolab Inc. | | 1,725 | | | 317,555 |
| Int’l. Flavors & Fragrances Inc. | | 2,395 | | | 324,331 |
| Containers & Packaging - 1.6% | | | | | |
| AptarGroup, Inc. | | 1,950 | | | 220,877 |
| Crown Holdings, Inc. (a) | | 7,550 | | | 418,496 |
| Metals & Mining - 1.7% | | | | | |
| Freeport-McMoRan Inc. | | 61,625 | | | 598,379 |
| Lundin Mining Corp. | | 20,400 | | | 90,576 |
See Notes to Financial Statements.
14
| MIDCAP FUND SCHEDULE OF INVESTMENTS(Unaudited) (Continued) |
| May 31, 2019 |
| | | | Shares | | Value |
| COMMON STOCKS(continued) | | | | | | |
| |
| Real Estate - 3.4% | | | | | $1,342,330 | |
| Equity Real Estate Investment - 3.0% | | | | | | |
| DiamondRock Hospitality Co. | | 37,725 | | | 373,855 | |
| Host Hotels & Resorts Inc. | | 21,625 | | | 391,629 | |
| Kimco Realty Corp. | | 23,495 | | | 408,813 | |
| Real Estate Management & Development - 0.4% | | | | | | |
| Realogy Holdings Corp. | | 23,700 | | | 168,033 | |
| |
| Utilities - 1.3% | | | | | 498,820 | |
| Electric Utilities - 0.6% | | | | | | |
| Xcel Energy, Inc. | | 3,685 | | | 211,298 | |
| Multi-Utilities - 0.7% | | | | | | |
| MDU Resources Group, Inc. | | 11,650 | | | 287,522 | |
| |
| SHORT-TERM INVESTMENTS - 0.2% | | | | | 100,000 | |
| (COST $100,000) | | | | | | |
| |
| Money Market Funds - 0.2% | | | | | 100,000 | |
| First American Gov’t. Obligations Fund Class X, 2.310% (b) | | 100,000 | | | 100,000 | |
| |
| TOTAL INVESTMENTS - 100.0% (COST $38,937,171) | | | | | 40,078,004 | |
| |
| NET OTHER ASSETS AND LIABILITIES - 0.0%^ | | | | | (14,645 | ) |
| |
| NET ASSETS - 100.0% | | | | | $40,063,359 | |
| (a) | Non-income producing security. |
| (b) | Represents the 7-day yield at May 31, 2019. |
| ^ | Rounds to 0.0%. |
| Abbreviations: |
| ADR | American Depositary Receipt |
| A.G. | Aktiengesellschaft is the German term for a public limited liability corporation. |
| N.V. | Naamloze Vennootschap is the Dutch term for a public limited liability corporation. |
| PLC | Public Limited Company |
The Global Industry Classification Standard (“GICS”) was developed by and is the exclusive property and a service mark of MSCI Inc. (“MSCI”) and Standard & Poor’s Financial Services LLC (“S&P”) and is licensed for use by Thompson Investment Management, Inc. Neither MSCI, S&P, nor any other party involved in making or compiling the GICS or any GICS classifications makes any warranties with respect thereto or the results to be obtained by the use thereof, and no such party shall have any liability whatsoever with respect thereto.
See Notes to Financial Statements.
15
| MIDCAP FUND SCHEDULE OF INVESTMENTS(Unaudited) (Continued) |
| May 31, 2019 |
The following is a summary of the inputs used to value the Funds’ investments as of May 31, 2019:
| | Level 1 | | Level 2 | | Level 3 | | Total |
| Common stocks | | | | | | | | |
| Communication services | | $694,818 | | $– | | $– | | $694,818 |
| Consumer discretionary | | 7,043,341 | | – | | – | | 7,043,341 |
| Consumer staples | | 1,414,547 | | – | | – | | 1,414,547 |
| Energy | | 2,152,276 | | – | | – | | 2,152,276 |
| Financials | | 6,819,996 | | – | | – | | 6,819,996 |
| Health care | | 5,903,479 | | – | | – | | 5,903,479 |
| Industrials | | 5,478,830 | | – | | – | | 5,478,830 |
| Information technology | | 6,659,353 | | – | | – | | 6,659,353 |
| Materials | | 1,970,214 | | – | | – | | 1,970,214 |
| Real estate | | 1,342,330 | | – | | – | | 1,342,330 |
| Utilities | | 498,820 | | – | | – | | 498,820 |
| Total common stocks | | 39,978,004 | | – | | – | | 39,978,004 |
| Short-term investments | | | | | | | | |
| Money market funds | | 100,000 | | – | | – | | 100,000 |
| Total short-term investments | | 100,000 | | – | | – | | 100,000 |
| Total investments | | $40,078,004 | | $– | | $– | | $40,078,004 |
The Fund did not invest in any level-3 investments as of and during the six-month period ended May 31, 2019.
For more information on valuation inputs, see financial statement Note 2 - Significant Accounting Policies.
See Notes to Financial Statements.
16
| BOND FUND INVESTMENT REVIEW(Unaudited) |
| May 31, 2019 |
Portfolio Managers
James T. Evans, CFA
Jason L. Stephens, CFA
Performance
The Bond Fund produced a total return of 2.36% for the six-months ended May 31, 2019, as compared to its benchmark, the Bloomberg Barclays U.S. Government/Credit 1-5 Year Index, which returned 3.86%, and as compared to the Bloomberg Barclays U.S. Credit 1-5 Year Index, which returned 4.45%.
| Comparison of Change in Value of a Hypothetical $10,000 Investment |
 |
| Average Annual Total Returns |
| Through 05/31/19 |
| | 1 Year | | 3 Year | | 5 Year | | 10 Year |
| Thompson Bond Fund | | 3.07% | | 5.18% | | 2.84% | | 5.31% |
| Bloomberg Barclays U.S. Gov’t./Credit 1-5 Year Index | | 4.53% | | 1.78% | | 1.65% | | 2.19% |
| Bloomberg Barclays U.S. Credit 1-5 Year Index | | 5.08% | | 2.46% | | 2.16% | | 3.47% |
| Gross Expense Ratio as of 03/31/19 was 0.71%. | 30-Day SEC Yield as of 05/31/19 was 3.45%. |
Performance data quoted represents past performance; past performance does not guarantee future results. The investment return and principal value of an investment will fluctuate so that an investor’s shares, when redeemed, may be worth more or less than their original cost. Current performance of the Fund may be lower or higher than the performance quoted. Performance data current to the most recent month-end may be obtained by calling 1-800-999-0887 or visiting www.thompsonim.com.
Results include the reinvestment of all dividends and capital gains distributions. Investment performance reflects all fee waivers that may have been in effect. In the absence of such waivers, total return would have been reduced. The performance information reflected in the graph and the table above does not reflect the deduction of taxes that a shareholder would pay on fund distributions or the redemption of fund shares, nor does it imply future performance. The Bloomberg Barclays U.S. Government/Credit 1-5 Year Index is a market-value-weighted index of all investment-grade bonds with maturities of more than one year and less than 5 years. The Bloomberg Barclays U.S. Credit 1-5 Year Index is a market-value-weighted index which includes virtually every major investment-grade rated corporate bond with 1-5 years remaining until maturity that serves as a supplementary benchmark. You cannot directly invest in an index.
Bloomberg®is a trademark and service mark of Bloomberg Finance L.P. Barclays®is a trademark and service mark of Barclays Bank PLC.
See Notes to Financial Statements.
17
| BOND FUND INVESTMENT REVIEW(Unaudited) (Continued) |
| May 31, 2019 |
Management Commentary
Changes in credit spreads frequently explain the Fund’s relative under and outperformance over short timeframes, but did not during this semi-annual period. In this case, a precipitous decline in yields led to the differential. Yields on the 2 and 5-Year US Treasury dropped 0.87% and 0.90% respectively. The Fund’s end of the period duration of 1.26 years is significantly less than that of its benchmarks, which is 2.67 years for the U.S. Government/Credit 1-5 Year Index and 2.67 years for the U.S. Credit 1-5 Year Index. Consequently, it did not benefit as much from the dramatic interest rate retreat.
While we do not attempt to predict near-term interest rate movements, a dearth of attractive opportunities at the far end of the Fund’s maturity ladder has naturally resulted in fewer purchases of longer-dated securities over the last several quarters. As we have noted before, our goal is to maintain a competitive SEC yield relative to the Fund’s benchmarks. An SEC yield of 3.45% at the end of the period gives us the opportunity to make up the recent lag in the future.
A narrowing of credit spreads has also caused us to retreat to some degree from new purchases of corporate debt for the Fund’s portfolio. The Fund’s exposure to US government debt at the end of the period stands at 15.88%, which is the highest it’s been in many years. If spreads widen (and we expect they eventually will), we’ll look to take advantage. Until then, we’ll seek to remain patient.
We do anticipate that more opportunities to add value will emerge over the next half of the fiscal year. It would be unusual for both interest rates and credit spreads to remain depressed for an extended period of time. It is our opinion that it wouldn’t take much to produce a rebound in either.
Opinions expressed are subject to change, are not guaranteed and should not be considered investment advice.
Mutual fund investing involves risk. Principal loss is possible. Investments in debt securities typically decrease in value when interest rates rise. The risk is usually greater for longer-term debt securities. Investments in bonds of foreign issuers involve greater volatility, political and economic risks, and differences in accounting methods. Investment by the Fund in lower-rated and non-rated securities presents a greater risk of loss to principal and interest than higher-rated securities.
Please refer to the Schedule of Investments on page 20 of this report for holdings information. The management commentary above as well as Fund holdings should not be considered a recommendation to buy or sell any security. In addition, please note that Fund holdings are subject to change.
The federal government guarantees interest payments from government securities while dividend payments carry no such guarantee. Government securities, if held to maturity, guarantee the timely payment of principal and interest.
Duration is a commonly used measure of the potential volatility of the price of a debt security, or the aggregate market value of a portfolio of debt securities, prior to maturity. Securities with a longer duration generally have more volatile prices than securities of comparable quality with a shorter duration.
SEC Yield is a standardized yield computed by dividing the net investment income per share earned during the 30-day period prior to quarter-end and was created to allow for fairer comparisons among bond funds.
Spread is the percentage point difference between yields of various classes of bonds compared to treasury bonds.
Yield is the income earned from a bond, which takes into account the sum of the interest payment, the redemption value at the bond’s maturity, and the initial purchase price of the bond.
Credit Ratings are provided by Standard & Poor’s, who assign a rating based on their analysis of the issuer’s creditworthiness. The highest rating given is AAA and the lowest is C.
The purpose of Moody’s ratings is to provide investors with a simple system of gradation by which relative creditworthiness of securities may be noted. Gradations of creditworthiness are indicated by rating symbols, with each symbol representing a group in which the credit characteristics are broadly the same. The highest rating assigned by Moody’s is AAA and the lowest is C.
Although the makeup of the Bond Fund’s portfolio is constantly changing, as of May 31, 2019, 61.04% of the Fund’s portfolio was invested in corporate bonds. Due to prevailing market conditions, the composition of the Fund’s portfolio as of that date was consistent with the composition of the Fund’s portfolio over the past 5 years. In addition, as of that date 51.29% of the Fund’s portfolio was invested in securities rated BBB by Standard & Poor’s, while an additional 4.25% of the Fund’s portfolio was rated below investment-grade and 21.36% of the Fund’s portfolio was not rated by Standard & Poor’s. For portfolio information current as of the most recent quarter-end, please call 1-800-999-0887 or visit our website at www.thompsonim.com. Compared to a portfolio that is more evenly allocated between government and corporate bonds, a portfolio that is heavily allocated to corporate bonds may provide higher returns but is also subject to greater levels of credit and liquidity risk and to greater price fluctuations. A portfolio that is significantly allocated to bonds having lower and below-investment-grade ratings may also be subject to greater levels of credit and liquidity risk and experience greater price fluctuations than a portfolio comprised of higher-rated investment-grade bonds.
See Notes to Financial Statements.
18
| BOND FUND INVESTMENT REVIEW(Unaudited) (Continued) |
| May 31, 2019 |
| Asset Allocation at 05/31/19 |
| (Includes cash equivalents) |
| % of Total Investments |
| Corporate Bonds | | 61.04% |
| Asset-Backed Securities | | 13.52% |
| U.S. Government & Agency Securities | | 12.49% |
| Commercial Mortgage-Backed Securities | | 3.95% |
| U.S. Government Agency Mortgage-Backed Securities | | 3.39% |
| Taxable Municipal Bonds | | 2.82% |
| Sovereign Bonds | | 1.82% |
| Convertible Bonds | | 0.70% |
| Tax-Exempt Municipal Bonds | | 0.17% |
| Residential Mortgage-Backed Securities | | 0.10% |
| | 100.00% |
| |
| Quality Composition at 05/31/19^ |
| (Includes cash equivalents) |
| % of Total Investments |
| U.S. Government & Agency Issues | | 15.88% |
| AAA | | 0.55% |
| AA | | 0.92% |
| A | | 12.49% |
| BBB | | 63.25% |
| BB and Below | | 6.58% |
| Not Rated | | 0.33% |
| | 100.00% |
| |
^The Bond Fund’s quality composition is calculated using ratings from Standard & Poor’s. If Standard & Poor’s does not rate a holding then Moody’s is used. If Standard & Poor’s and Moody’s do not rate a holding then Fitch is used. For certain securities that are not rated by any of these three agencies, credit ratings from other Nationally Recognized Statistical Credit Rating Organization (NRSRO) agencies may be used. Not rated category includes holdings that are not rated by any NRSRO. All ratings are as of 05/31/19. |
| |
| Top 10 Bond Holdings by Issuer at 05/31/19 |
| % of Fund’s Net Assets |
| Fannie Mae | | 4.10% |
| Ginnie Mae REMIC Trust | | 3.10% |
| Federal Home Loan Banks | | 2.75% |
| XL Group PLC | | 2.18% |
| MBIA Inc. | | 1.98% |
| Barclays PLC | | 1.94% |
| County of Racine WI Anticipation Notes | | 1.68% |
| Freddie Mac | | 1.58% |
| General Electric Co. | | 1.57% |
| Ford Motor Credit Co. LLC | | 1.45% |
See Notes to Financial Statements.
19
| BOND FUND SCHEDULE OF INVESTMENTS(Unaudited) |
| May 31, 2019 |
| | | Rate (%) | | Maturity Date | | Principal Amount | | Value |
| BONDS–97.8% | | | | | | | | $3,665,909,280 |
| (COST $3,700,858,259) | | | | | | | | |
| | | | | | | | | | |
| Asset-Backed Securities–13.4% | | | | | | | | 502,548,589 |
| AASET Trust, Series 2018-1A B (h) | | 5.437 | | 01/16/38 | | 11,731,464 | | 12,025,852 |
| Air Canada, Series 2013-1B (h) | | 5.375 | | 11/15/22 | | 7,393,224 | | 7,586,927 |
| Air Canada, Series 2015-1B (h) | | 3.875 | | 09/15/24 | | 1,848,638 | | 1,849,747 |
| Air Canada, Series 2015-2B (h) | | 5.000 | | 06/15/25 | | 4,400,655 | | 4,542,356 |
| America West Airlines, Series 2001-1 | | 7.100 | | 10/02/22 | | 3,012,397 | | 3,113,824 |
| American Airlines, Series 2013-2 A | | 4.950 | | 07/15/24 | | 330,876 | | 343,449 |
| American Airlines, Series 2014-1 B | | 4.375 | | 04/01/24 | | 124,476 | | 125,896 |
| American Airlines, Series 2015-1 B | | 3.700 | | 11/01/24 | | 2,567,226 | | 2,553,363 |
| American Airlines, Series 2015-2 B | | 4.400 | | 03/22/25 | | 4,823,587 | | 4,901,247 |
| American Airlines, Series 2016-1 B | | 5.250 | | 07/15/25 | | 609,963 | | 639,121 |
| Applebee’s Funding LLC / IHOP Funding LLC, Series 2014-1 A2 (h) | | 4.277 | | 09/05/44 | | 39,558,263 | | 39,726,793 |
| Blackbird Capital Aircraft Lease Securitization Ltd., | | | | | | | | |
| Series 2016-1A A (h) | | 4.213 | | 12/16/41 | | 679,063 | | 698,795 |
| British Airways PLC, Series 2013-1 B (h) | | 5.625 | | 12/20/21 | | 10,515,360 | | 10,645,751 |
| British Airways PLC, Series 2013-1 B (h) | | 5.625 | | 12/20/21 | | 21,902 | | 22,174 |
| Business Jet Securities, LLC, Series 2018-1 A (h) | | 4.335 | | 02/15/33 | | 6,714,464 | | 6,819,604 |
| Business Jet Securities, LLC, Series 2018-1 B (h) | | 6.048 | | 02/15/33 | | 4,056,938 | | 4,209,816 |
| Cajun Global LLC, Series 2017-1A A2 (h) | | 6.500 | | 08/20/47 | | 15,040,000 | | 15,770,493 |
| CAL Funding II Ltd., Series 2012-1A A (h) | | 3.470 | | 10/25/27 | | 954,958 | | 960,883 |
| CAL Funding II Ltd., Series 2013-1A A (h) | | 3.350 | | 03/27/28 | | 2,487,833 | | 2,497,781 |
| CLIF V Holdings LLC, Series 2013-1A (h) | | 2.830 | | 03/18/28 | | 6,866,667 | | 6,843,174 |
| CLIF V Holdings LLC, Series 2013-2A (h) | | 3.220 | | 06/18/28 | | 9,145,260 | | 9,186,691 |
| CLIF V Holdings LLC, Series 2018-1H A (h) | | 6.020 | | 08/19/43 | | 2,523,339 | | 2,636,982 |
| Continental Airlines, Series 1999-2 A-1 | | 7.256 | | 09/15/21 | | 6,472 | | 6,602 |
| Continental Airlines, Series 1999-2 C | | 6.236 | | 09/15/21 | | 82,490 | | 83,727 |
| Continental Airlines, Series 2012-1 B | | 6.250 | | 10/11/21 | | 3,997,997 | | 4,075,558 |
| Continental Airlines, Series 2012-2 B | | 5.500 | | 04/29/22 | | 6,736,339 | | 6,882,518 |
| Cronos Containers Program I Ltd., Series 2013-1A A (h) | | 3.080 | | 04/18/28 | | 4,737,208 | | 4,733,278 |
| Cronos Containers Program I Ltd., Series 2014-1A A (h) | | 3.040 | | 08/18/29 | | 934,579 | | 932,733 |
| DCAL Aviation Finance Ltd., Series 2015-1A A1 (h) | | 4.213 | | 02/15/40 | | 1,729,149 | | 1,752,157 |
| Delta Air Lines, Series 2007-1 B | | 8.021 | | 02/10/24 | | 1,503,784 | | 1,651,455 |
| Domino’s Pizza Master Issuer LLC, Series 2017-1A A2I | | | | | | | | |
| (3 month LIBOR + 1.250%, floor 0.000%) (c)(h) | | 3.830 | | 07/25/47 | | 501,075 | | 500,920 |
| Doric Nimrod Air Alpha, Series 2013-1 B (h) | | 6.125 | | 11/30/21 | | 5,194,218 | | 5,236,810 |
| Doric Nimrod Air Alpha, Series 2013-1 B (h) | | 6.125 | | 11/30/21 | | 768,134 | | 774,433 |
| ECAF I Ltd., Series 2015-1A A2 (h) | | 4.947 | | 06/15/40 | | 7,336,233 | | 7,483,480 |
| ECAF I Ltd., Series 2015-1A B1 (h) | | 5.802 | | 06/15/40 | | 26,698,958 | | 26,750,581 |
| Element Rail Leasing LLC, Series 2014-1A B1 (h) | | 4.406 | | 04/19/44 | | 10,158,750 | | 10,465,071 |
| Element Rail Leasing LLC, Series 2016-1A A1 (h) | | 3.968 | | 03/19/46 | | 14,195,584 | | 14,435,533 |
| EngenCap ABS Trust, Series 2016-1 A (h) | | 3.670 | | 12/21/26 | | 20,446,173 | | 20,364,388 |
| Global Container Assets Ltd., Series 2015-1A A2 (h) | | 3.450 | | 02/05/30 | | 5,168,353 | | 5,175,435 |
| Global SC Finance II SRL (SEACO), Series 2013-1A A (h) | | 2.980 | | 04/17/28 | | 7,050,000 | | 7,015,138 |
| Global SC Finance II SRL (SEACO), Series 2014-1A A1 (h) | | 3.190 | | 07/17/29 | | 4,216,000 | | 4,198,765 |
| Grain Spectrum Funding II LLC (h) | | 3.290 | | 10/10/34 | | 934,278 | | 930,121 |
| Harley Marine Financing LLC, Series 2018-1A A2 (h) | | 5.682 | | 05/15/43 | | 14,550,000 | | 12,407,501 |
| HOA Funding LLC, Series 2014-1A A2 (h) | | 4.846 | | 08/20/44 | | 9,050,000 | | 9,047,557 |
| HP Communities LLC (h) | | 5.320 | | 03/15/23 | | 244,324 | | 253,251 |
| Icon Brand Holdings LLC, Series 2012-1A A (h) | | 4.229 | | 01/25/43 | | 7,947,636 | | 5,807,504 |
See Notes to Financial Statements.
20
| BOND FUND SCHEDULE OF INVESTMENTS(Unaudited) (Continued) |
| May 31, 2019 |
| | | | Rate (%) | | Maturity Date | | Principal Amount | | Value |
| BONDS(continued) | | | | | | | | |
| | | | | | | | | |
| Asset-Backed Securities (continued) | | | | | | | | |
| JOL Air Limited, Series 2019-1 B (h) | | 4.948 | | 04/15/44 | | 1,000,000 | | $999,230 |
| Latam Airlines Group, Series 2015-1 B | | 4.500 | | 08/15/25 | | 3,978,264 | | 3,911,827 |
| Merlin Aviation Holdings D.A.C., Series 2016-1 A (h) | | 4.500 | | 12/15/32 | | 9,466,511 | | 9,734,836 |
| Merlin Aviation Holdings D.A.C., Series 2016-1 B (h) | | 6.500 | | 12/15/32 | | 2,210,808 | | 2,295,282 |
| METAL LLC, Series 2017-1 A (h) | | 4.581 | | 10/15/42 | | 21,179,002 | | 21,206,433 |
| METAL LLC, Series 2017-1 B (h) | | 6.500 | | 10/15/42 | | 25,177,014 | | 25,964,221 |
| Mosaic Solar Loans, LLC, Series 2017-2A C (h) | | 2.000 | | 06/22/43 | | 1,817,377 | | 1,729,307 |
| Northwest Airlines, Series 2000-1 G (d) | | 7.150 | | 04/01/21 | | 3,376 | | 3,333 |
| Northwest Airlines, Series 2002-1 G-2 | | 6.264 | | 05/20/23 | | 751,072 | | 778,111 |
| NP Ferrum LLC, Series 2015-1A B1 (h) | | 4.175 | | 02/19/45 | | 16,917,000 | | 16,789,354 |
| Pioneer Aircraft Finance Ltd., Series 2019-1 B (h)(i) | | 4.948 | | 06/15/44 | | 1,500,000 | | 1,500,000 |
| Prudential Securities Structured Assets, Inc., Series 1998-1 A | | | | | | | | |
| (1 month LIBOR + 0.420%, floor 0.000%) (c)(h) | | 2.901 | | 03/02/25 | | 10,094,500 | | 9,488,830 |
| Sapphire Aviation Finance I Ltd., Series 2018-1A B (h) | | 5.926 | | 03/15/40 | | 2,679,256 | | 2,787,713 |
| SBA Tower Trust, Series 2014-1A C (h) | | 2.898 | | 10/15/44 | | 11,301,000 | | 11,291,361 |
| S-Jets Limited, Series 2017-1 B (h) | | 5.682 | | 08/15/42 | | 13,886,883 | | 14,400,987 |
| Spirit Master Funding, LLC, Series 2014-2A A (h) | | 5.760 | | 03/20/41 | | 16,564,982 | | 17,168,542 |
| Spirit Master Funding, LLC, Series 2014-4A A1 (h) | | 3.501 | | 01/20/45 | | 4,853,256 | | 4,854,088 |
| Spirit Master Funding, LLC, Series 2017-1A B (h) | | 5.490 | | 12/20/47 | | 5,000,000 | | 5,198,133 |
| Sprite Limited, Series 2017-1 B (h) | | 5.750 | | 12/15/37 | | 3,468,703 | | 3,565,408 |
| TAL Advantage V LLC, Series 2013-1A A (h) | | 2.830 | | 02/22/38 | | 3,570,000 | | 3,547,271 |
| TAL Advantage V LLC, Series 2014-1A B (h) | | 4.100 | | 02/22/39 | | 2,659,998 | | 2,672,773 |
| TAL Advantage V LLC, Series 2014-2A A2 (h) | | 3.330 | | 05/20/39 | | 2,172,500 | | 2,181,445 |
| Textainer Marine Containers V Ltd., Series 2017-1A B (h) | | 4.850 | | 05/20/42 | | 3,319,561 | | 3,397,103 |
| Textainer Marine Containers V Ltd., Series 2017-2A B (h) | | 4.750 | | 06/20/42 | | 575,878 | | 587,606 |
| TGIF Funding LLC, Series 2017-1A A2 (h) | | 6.202 | | 04/30/47 | | 28,800,000 | | 27,979,776 |
| United Air Lines, Series 2013-1 B | | 5.375 | | 02/15/23 | | 1,543,732 | | 1,592,468 |
| US Airways, Series 2001-1 G | | 7.076 | | 09/20/22 | | 261,196 | | 271,643 |
| US Airways, Series 2012-1 B | | 8.000 | | 04/01/21 | | 16,374,349 | | 16,579,028 |
| US Airways, Series 2013-1B | | 5.375 | | 05/15/23 | | 1,285,955 | | 1,340,083 |
| Virgin Australia Trust, Series 2013-1 A (h) | | 5.000 | | 04/23/25 | | 65,633 | | 67,162 |
| | | | | | | | | |
| Commercial Mortgage-Backed Securities–3.9% | | | | | | | | 146,719,187 |
| CG-CCRE Commercial Mortgage Trust, Series 2014-FL1 D | | | | | | | | |
| (1 month LIBOR + 2.750%, floor 2.750%) (c)(h) | | 5.190 | | 06/15/31 | | 12,000,000 | | 11,982,272 |
| COMM Mortgage Trust, Series 2012-CR1 D (c)(h) | | 5.498 | | 05/15/45 | | 4,774,000 | | 4,832,564 |
| COMM Mortgage Trust, Series 2012-CR3 E (c)(h) | | 4.911 | | 10/15/45 | | 5,000,000 | | 4,693,320 |
| COMM Mortgage Trust, Series 2012-CR4 B (h) | | 3.703 | | 10/15/45 | | 8,435,000 | | 7,941,226 |
| COMM Mortgage Trust, Series 2013-CR9 D (c)(h) | | 4.397 | | 07/10/45 | | 4,898,000 | | 4,416,521 |
| COMM Mortgage Trust, Series 2013-CR11 D (c)(h) | | 5.286 | | 08/10/50 | | 5,000,000 | | 5,024,865 |
| COMM Mortgage Trust, Series 2014-CC17 D (c)(h) | | 5.015 | | 05/10/47 | | 5,210,000 | | 5,182,887 |
| COMM Mortgage Trust, Series 2014-CR19 D (c)(h) | | 4.895 | | 08/10/47 | | 8,650,000 | | 8,403,563 |
| GS Mortgage Securities Trust, Series 2010-C1 E (h) | | 4.000 | | 08/10/43 | | 17,741,000 | | 17,307,062 |
| GS Mortgage Securities Trust, Series 2012-GC6 D (c)(h) | | 5.840 | | 01/10/45 | | 8,834,852 | | 9,017,648 |
| J.P. Morgan Chase Commercial Mortgage Securities Trust, | | | | | | | | |
| Series 2014-C20 D (c)(h) | | 4.750 | | 07/15/47 | | 5,000,000 | | 4,647,082 |
| JPMBB Commercial Mortgage Securities Trust, | | | | | | | | |
| Series 2013-C12 D (c) | | 4.237 | | 07/15/45 | | 5,000,000 | | 4,923,898 |
See Notes to Financial Statements.
21
| BOND FUND SCHEDULE OF INVESTMENTS(Unaudited) (Continued) |
| May 31, 2019 |
| | | | Rate (%) | | Maturity Date | | Principal Amount | | Value |
| BONDS(continued) | | | | | | | | |
| |
| Commercial Mortgage-Backed Securities (continued) | | | | | | | | |
| JPMBB Commercial Mortgage Securities Trust, | | | | | | | | |
| Series 2014-C22 D (c)(h) | | 4.709 | | 09/15/47 | | 4,966,000 | | $4,434,219 |
| Morgan Stanley Bank of America Merrill Lynch Trust, | | | | | | | | |
| Series 2014-C18 D (h) | | 3.389 | | 10/15/47 | | 5,000,000 | | 4,363,650 |
| Morgan Stanley Bank of America Merrill Lynch Trust, | | | | | | | | |
| Series 2015-C22 D (c)(h) | | 4.377 | | 04/15/48 | | 5,000,000 | | 4,558,003 |
| Morgan Stanley Capital I Trust, Series 2011-C2 B (h) | | 5.200 | | 06/15/44 | | 1,570,000 | | 1,607,930 |
| Morgan Stanley Capital I Trust, Series 2011-C2 D (c)(h) | | 5.668 | | 06/15/44 | | 1,000,000 | | 1,015,086 |
| MSCCG Trust (Morgan Stanley/Citigroup Global), | | | | | | | | |
| Series 2016-SNR D (h) | | 6.550 | | 11/15/34 | | 386,750 | | 389,539 |
| OBP Depositor LLC Trust, Series 2010-OBP A (h) | | 4.646 | | 07/15/45 | | 16,809,000 | | 17,034,647 |
| Palisades Center Trust, Series 2016-PLSD B (h) | | 3.357 | | 04/13/33 | | 4,500,000 | | 4,417,556 |
| Tharaldson Hotel Portfolio Trust, Series 2018-THL D | | | | | | | | |
| (1 month LIBOR + 2.000%, floor 2.100%) (c)(h) | | 4.467 | | 11/11/34 | | 4,900,986 | | 4,909,929 |
| UBS-Barclays Commercial Mortgage Trust, Series 2012-C4 D (c)(h) | | 4.631 | | 12/10/45 | | 5,300,000 | | 5,159,253 |
| Wells Fargo Commercial Mortgage Trust, Series 2014-LC16 D (h) | | 3.938 | | 08/15/50 | | 7,072,000 | | 5,513,580 |
| WFRBS Commercial Mortgage Trust, Series 2011-C4 E (c)(h) | | 5.397 | | 06/15/44 | | 5,000,000 | | 4,942,887 |
| | |
| Convertible Bonds–0.7% | | | | | | | | 25,849,034 |
| Macquarie Infrastructure Corp. | | 2.875 | | 07/15/19 | | 20,927,000 | | 20,844,757 |
| New Mountain Finance Corp. | | 5.000 | | 06/15/19 | | 5,004,000 | | 5,004,277 |
| |
| Corporate Bonds–60.5% | | | | | | | | 2,268,183,614 |
| Acuity Brands Lighting, Inc. | | 6.000 | | 12/15/19 | | 310,000 | | 314,786 |
| AerCap Ireland Capital Ltd. / AerCap Global Aviation Trust | | 4.625 | | 10/30/20 | | 580,000 | | 593,674 |
| AerCap Ireland Capital Ltd. / AerCap Global Aviation Trust | | 4.500 | | 05/15/21 | | 10,151,000 | | 10,425,253 |
| Aircastle Ltd. | | 6.250 | | 12/01/19 | | 16,744,000 | | 17,014,849 |
| Aircastle Ltd. | | 7.625 | | 04/15/20 | | 2,250,000 | | 2,333,031 |
| Aircastle Ltd. | | 5.125 | | 03/15/21 | | 9,562,000 | | 9,874,366 |
| Aircastle Ltd. | | 5.500 | | 02/15/22 | | 8,263,000 | | 8,718,729 |
| Ameriprise Financial, Inc. | | 7.300 | | 06/28/19 | | 4,392,000 | | 4,404,578 |
| Ameris Bancorp (5.750% to 03/15/22, | | | | | | | | |
| then 3 month LIBOR + 3.616%) (c) | | 5.750 | | 03/15/27 | | 5,000,000 | | 5,124,209 |
| AmTrust Financial Services, Inc. | | 6.125 | | 08/15/23 | | 33,034,000 | | 32,085,632 |
| Andeavor LLC | | 5.125 | | 04/01/24 | | 3,380,000 | | 3,469,376 |
| Andeavor Logistics LP / Tesoro Logistics Finance Corp. | | 5.500 | | 10/15/19 | | 5,055,000 | | 5,089,294 |
| Andeavor Logistics LP / Tesoro Logistics Finance Corp. | | 6.250 | | 10/15/22 | | 36,117,000 | | 37,019,925 |
| Arbor Realty Trust, Inc. | | 5.625 | | 05/01/23 | | 12,500,000 | | 12,595,158 |
| Arbor Realty Trust, Inc. (h) | | 5.750 | | 04/01/24 | | 10,000,000 | | 10,123,900 |
| ArcelorMittal | | 5.125 | | 06/01/20 | | 2,805,000 | | 2,860,941 |
| Arconic Inc. | | 6.150 | | 08/15/20 | | 22,281,000 | | 22,893,727 |
| Arconic Inc. | | 5.400 | | 04/15/21 | | 7,202,000 | | 7,377,225 |
| Arrow Electronics, Inc. | | 6.000 | | 04/01/20 | | 3,600,000 | | 3,689,254 |
| Ashtead Capital, Inc. (h) | | 5.625 | | 10/01/24 | | 3,060,000 | | 3,159,450 |
| Associated Banc-Corp | | 2.750 | | 11/15/19 | | 23,439,000 | | 23,434,030 |
| Assured Guaranty US Holdings Inc. (3 month LIBOR + 2.380%) (c) | | 4.991 | | 12/15/66 | | 25,973,000 | | 21,297,860 |
| Astoria Financial Corp. | | 3.500 | | 06/08/20 | | 2,645,000 | | 2,654,206 |
| Australia & New Zealand Banking Group Ltd. | | 2.250 | | 06/13/19 | | 2,746,000 | | 2,745,665 |
| Avery Dennison Corp. | | 5.375 | | 04/15/20 | | 1,401,000 | | 1,426,102 |
See Notes to Financial Statements.
22
| BOND FUND SCHEDULE OF INVESTMENTS(Unaudited) (Continued) |
| May 31, 2019 |
| | | Rate (%) | | Maturity Date | | Principal Amount | | Value |
| BONDS(continued) | | | | | | | | |
| | | | | | | | | |
| Corporate Bonds (continued) | | | | | | | | |
| | Avon Products, Inc. (e) | | 6.600 | | 03/15/20 | | 500,000 | | $510,000 |
| Bank of America Corp. (5.125% to 06/17/19, | | | | | | | | |
| then 3 month LIBOR + 3.387%) (c)(g) | | 5.125 | | 07/01/19 | | 6,753,000 | | 6,723,084 |
| Bank of America Corp. | | 6.750 | | 08/15/19 | | 150,000 | | 151,173 |
| Bank of America Corp. (5.200% to 06/01/23, | | | | | | | | |
| then 3 month LIBOR + 3.135%) (c)(g) | | 5.200 | | 06/01/23 | | 2,500,000 | | 2,525,000 |
| Bank of America Corp. (4.0 times (USISDA10–USISDA02–0.250%), | | | | | | | | |
| floor 0.000%, cap 10.000%) (c) | | 0.000 | | 11/19/30 | | 671,000 | | 448,731 |
| Bank of the Ozarks, Inc. (5.500% to 07/01/21, | | | | | | | | |
| then 3 month LIBOR + 4.425%) (c) | | 5.500 | | 07/01/26 | | 19,475,000 | | 19,846,335 |
| Barclays Bank PLC (d) | | 2.250 | | 09/13/19 | | 15,000,000 | | 14,944,625 |
| Barclays Bank PLC (CPI YOY + 1.000%, floor 0.000%) (c) | | 2.520 | | 03/16/23 | | 4,435,000 | | 4,399,520 |
| Barclays Bank PLC (3 month LIBOR + 0.650%, | | | | | | | | |
| floor 1.650%, cap 6.000%) (c) | | 3.215 | | 02/05/25 | | 15,000,000 | | 14,419,583 |
| Barclays Bank PLC (5.0 times (USISDA30–USISDA05), | | | | | | | | |
| floor 0.000%, cap 10.000%) (c) | | 1.820 | | 04/30/29 | | 2,425,000 | | 2,009,113 |
| Barclays Bank PLC (8.0 times (USISDA30–USISDA05–0.250%), | | | | | | | | |
| floor 0.000%, cap 8.000%) (c) | | 0.096 | | 08/28/29 | | 2,721,000 | | 2,198,568 |
| Barclays PLC | | 2.750 | | 11/08/19 | | 33,992,000 | | 33,943,799 |
| Barclays PLC | | 2.875 | | 06/08/20 | | 636,000 | | 635,447 |
| Barrick (PD) Australia Finance Pty. Ltd. | | 4.950 | | 01/15/20 | | 372,000 | | 377,763 |
| BCB Bancorp, Inc. (5.625% to 08/01/23, | | | | | | | | |
| then 3 month LIBOR + 2.720%) (c)(h) | | 5.625 | | 08/01/28 | | 9,000,000 | | 9,054,657 |
| Becton Dickinson and Co. | | 2.133 | | 06/06/19 | | 5,416,000 | | 5,415,768 |
| Becton Dickinson and Co. | | 2.675 | | 12/15/19 | | 17,131,000 | | 17,122,886 |
| Becton Dickinson and Co. (3 month LIBOR + 1.030%) (c) | | 3.638 | | 06/06/22 | | 25,355,000 | | 25,517,171 |
| Bemis Co., Inc. | | 6.800 | | 08/01/19 | | 1,186,000 | | 1,193,350 |
| BHP Billiton Finance USA Ltd. (6.250% to 10/19/20, then USSW5 | | | | | | | | |
| +4.971% to 10/19/25, +5.221% to 10/19/40, then +5.971%) (c)(h) | | 6.250 | | 10/19/75 | | 7,951,000 | | 8,233,260 |
| Boardwalk Pipelines, LP | | 5.750 | | 09/15/19 | | 2,945,000 | | 2,960,955 |
| BorgWarner, Inc. | | 8.000 | | 10/01/19 | | 4,387,000 | | 4,457,412 |
| Brambles USA, Inc. (h) | | 5.350 | | 04/01/20 | | 1,750,000 | | 1,787,781 |
| Braskem Finance Ltd. (h) | | 5.750 | | 04/15/21 | | 10,000,000 | | 10,325,100 |
| Braskem Finance Ltd. (h) | | 5.750 | | 04/15/21 | | 21,788,000 | | 22,496,328 |
| British Sky Broadcasting Group plc (h) | | 2.625 | | 09/16/19 | | 500,000 | | 499,764 |
| British Sky Broadcasting Group plc (h) | | 2.625 | | 09/16/19 | | 300,000 | | 299,858 |
| Brunswick Corp. (h) | | 4.625 | | 05/15/21 | | 10,828,000 | | 10,829,948 |
| Buckeye Partners, L.P. | | 4.875 | | 02/01/21 | | 572,000 | | 582,687 |
| CA, Inc. | | 5.375 | | 12/01/19 | | 10,443,000 | | 10,567,048 |
| Cadence BanCorp (h) | | 4.875 | | 06/28/19 | | 3,500,000 | | 3,500,217 |
| Capital Funding Bancorp, Inc. (h) | | 6.000 | | 12/01/23 | | 20,000,000 | | 20,683,690 |
| Capital One Bank USA N.A. | | 8.800 | | 07/15/19 | | 8,907,000 | | 8,966,943 |
| Carpenter Technology Corp. | | 5.200 | | 07/15/21 | | 3,665,000 | | 3,751,842 |
| Carpenter Technology Corp. | | 4.450 | | 03/01/23 | | 2,000,000 | | 2,032,659 |
| CBL & Associates LP | | 5.250 | | 12/01/23 | | 7,075,000 | | 4,881,750 |
| CBL & Associates LP | | 4.600 | | 10/15/24 | | 5,889,000 | | 3,798,405 |
| CBQ Finance Ltd. (h) | | 7.500 | | 11/18/19 | | 2,200,000 | | 2,238,500 |
| Citigroup, Inc. (4.0 times (USISDA10–USISDA02–0.250%), | | | | | | | | |
| floor 0.000%, cap 10.000%) (c) | | 0.000 | | 11/19/30 | | 727,000 | | 515,298 |
See Notes to Financial Statements.
23
| BOND FUND SCHEDULE OF INVESTMENTS(Unaudited) (Continued) |
| May 31, 2019 |
| | | Rate (%) | | Maturity Date | | Principal Amount | | Value |
| BONDS(continued) | | | | | | | | |
| | | | | | | | | | |
| Corporate Bonds (continued) | | | | | | | | |
| Citigroup, Inc. (5.0 times (USISDA30–USISDA05), floor 0.000%, | | | | | | | | |
| cap 10.000%) (c) | | 1.585 | | 12/20/33 | | 1,485,000 | | $1,128,452 |
| CNH Industrial Capital LLC | | 3.375 | | 07/15/19 | | 9,966,000 | | 9,953,542 |
| CommonWealth REIT | | 5.875 | | 09/15/20 | | 6,583,000 | | 6,737,663 |
| Compass Bank | | 2.750 | | 09/29/19 | | 2,784,000 | | 2,782,883 |
| ConnectOne Bancorp, Inc. (5.200% to 02/01/23, | | | | | | | | |
| then 3 month LIBOR + 2.840%) (c) | | 5.200 | | 02/01/28 | | 5,080,000 | | 5,148,220 |
| Constellation Brands, Inc. | | 3.875 | | 11/15/19 | | 2,317,000 | | 2,328,064 |
| Continental Resources, Inc. | | 5.000 | | 09/15/22 | | 24,389,000 | | 24,565,888 |
| Controladora Mabe S.A. de C.V. (h) | | 7.875 | | 10/28/19 | | 7,900,000 | | 8,048,125 |
| County Bancorp, Inc. (5.875% to 06/01/23, | | | | | | | | |
| then 3 month LIBOR + 2.884%) (c) | | 5.875 | | 06/01/28 | | 7,500,000 | | 7,683,142 |
| Cowen Inc. (h) | | 7.250 | | 05/06/24 | | 7,000,000 | | 7,103,241 |
| CRB Group, Inc. (h) | | 6.250 | | 06/15/23 | | 5,000,000 | | 5,181,307 |
| Credit Suisse A.G. New York | | 5.400 | | 01/14/20 | | 19,335,000 | | 19,632,237 |
| CVS Health Corp. (3 month LIBOR + 0.630%) (c) | | 3.231 | | 03/09/20 | | 5,000 | | 5,013 |
| Delphi Financial Group, Inc. | | 7.875 | | 01/31/20 | | 3,608,000 | | 3,717,202 |
| Deutsche Bank AG (3 month LIBOR + 0.970%) (c) | | 3.567 | | 07/13/20 | | 2,250,000 | | 2,236,496 |
| Deutsche Bank AG | | 2.950 | | 08/20/20 | | 5,000,000 | | 4,964,281 |
| Deutsche Bank AG (3 month LIBOR + 1.310%) (c) | | 3.830 | | 08/20/20 | | 2,000,000 | | 1,986,539 |
| Deutsche Bank AG | | 3.150 | | 01/22/21 | | 15,250,000 | | 15,062,838 |
| Deutsche Bank AG | | 4.250 | | 02/04/21 | | 175,000 | | 175,627 |
| Deutsche Bank AG | | 4.250 | | 10/14/21 | | 7,057,000 | | 7,103,017 |
| Deutsche Bank AG | | 4.250 | | 10/14/21 | | 313,000 | | 315,041 |
| Discover Bank | | 8.700 | | 11/18/19 | | 2,107,000 | | 2,161,722 |
| Discover Bank | | 7.000 | | 04/15/20 | | 4,912,000 | | 5,084,082 |
| Discover Financial Services | | 10.250 | | 07/15/19 | | 12,519,000 | | 12,621,256 |
| Dominion Gas Holdings, LLC | | 2.500 | | 12/15/19 | | 9,530,000 | | 9,514,053 |
| Drawbridge Special Opportunities Fund L.P. (h) | | 5.000 | | 08/01/21 | | 15,000,000 | | 15,193,246 |
| Eagle Bancorp, Inc. (5.000% to 08/01/21, | | | | | | | | |
| then 3 month LIBOR + 3.850%) (c) | | 5.000 | | 08/01/26 | | 6,474,000 | | 6,537,165 |
| EF Holdco Inc. / EF Cayman Holdings Ltd. (h) | | 5.500 | | 09/01/22 | | 3,500,000 | | 3,578,921 |
| Embraer Overseas Ltd. | | 6.375 | | 01/15/20 | | 13,540,000 | | 13,743,235 |
| Enogex LLC (h) | | 6.250 | | 03/15/20 | | 5,295,000 | | 5,417,859 |
| Ensco PLC | | 8.000 | | 01/31/24 | | 12,306,000 | | 10,090,920 |
| Enstar Group Ltd. | | 4.500 | | 03/10/22 | | 25,056,000 | | 25,620,481 |
| Enterprise Products Operating LLC (3 month LIBOR + 2.7775%) (c) | | 5.404 | | 06/01/67 | | 8,538,000 | | 7,812,270 |
| Enterprise Products Operating LLC | | | | | | | | |
| (5.250% to 08/16/27, then 3 month LIBOR + 3.033%) (c) | | 5.250 | | 08/16/77 | | 6,666,000 | | 6,099,390 |
| Equinix, Inc. | | 5.375 | | 01/01/22 | | 1,525,000 | | 1,561,219 |
| Equinix, Inc. | | 5.375 | | 04/01/23 | | 2,000,000 | | 2,026,900 |
| Everest Reinsurance Holdings Inc. (3 month LIBOR + 2.385%) (c) | | 4.903 | | 05/01/67 | | 24,705,000 | | 22,110,975 |
| Exelon Generation Co., LLC | | 5.200 | | 10/01/19 | | 624,000 | | 628,307 |
| Exelon Generation Co., LLC | | 2.950 | | 01/15/20 | | 8,645,000 | | 8,653,322 |
| Express Scripts, Inc. | | 7.250 | | 06/15/19 | | 927,000 | | 928,192 |
| FedNat Holding Co. (h) | | 7.500 | | 03/15/29 | | 3,000,000 | | 3,000,000 |
| Fidelity Federal Bancorp (6.875% to 10/15/23, | | | | | | | | |
| then 3 month LIBOR + 3.790%) (c)(h) | | 6.875 | | 10/15/28 | | 6,500,000 | | 6,774,789 |
See Notes to Financial Statements.
24
| BOND FUND SCHEDULE OF INVESTMENTS(Unaudited) (Continued) |
| May 31, 2019 |
| | | Rate (%) | | Maturity Date | | Principal Amount | | Value |
| BONDS(continued) | | | | | | | | |
| | |
| Corporate Bonds (continued) | | | | | | | | |
| Fifth Third Bancorp (4.900% to 09/30/19, | | | | | | | | |
| then 3 month LIBOR + 3.129%) (c)(g) | | 4.900 | | 09/30/19 | | 25,010,000 | | $24,884,950 |
| First Niagara Financial Group, Inc. | | 6.750 | | 03/19/20 | | 4,943,000 | | 5,099,424 |
| First Tennessee Bank N.A. | | 2.950 | | 12/01/19 | | 47,302,000 | | 47,328,726 |
| Flagstar Bancorp, Inc. | | 6.125 | | 07/15/21 | | 43,391,000 | | 45,648,767 |
| Flex Ltd. | | 4.625 | | 02/15/20 | | 5,425,000 | | 5,493,237 |
| Flushing Financial Corp. (5.250% to 12/15/21, | | | | | | | | |
| then 3 month LIBOR + 3.440%) (c) | | 5.250 | | 12/15/26 | | 730,000 | | 743,217 |
| FMC Corp. | | 5.200 | | 12/15/19 | | 4,041,000 | | 4,092,685 |
| Ford Motor Credit Co. LLC | | 1.897 | | 08/12/19 | | 15,170,000 | | 15,146,399 |
| Ford Motor Credit Co. LLC | | 2.597 | | 11/04/19 | | 37,480,000 | | 37,442,698 |
| Ford Motor Credit Co. LLC | | 2.681 | | 01/09/20 | | 946,000 | | 944,450 |
| Ford Motor Credit Co. LLC (3 month LIBOR + 1.000%) (c) | | 3.592 | | 01/09/20 | | 486,000 | | 486,645 |
| Ford Motor Credit Co. LLC | | 8.125 | | 01/15/20 | | 500,000 | | 515,123 |
| Fresenius Medical Care US Finance II, Inc. (h) | | 5.625 | | 07/31/19 | | 140,000 | | 140,470 |
| Fresenius Medical Care US Finance II, Inc. (h) | | 5.625 | | 07/31/19 | | 215,000 | | 215,722 |
| FS Investment Corp. | | 4.000 | | 07/15/19 | | 4,427,000 | | 4,428,816 |
| FS Investment Corp. | | 4.250 | | 01/15/20 | | 28,128,000 | | 28,230,027 |
| General Electric Capital Corp. (3 month LIBOR + 1.000%) (c) | | 3.597 | | 04/15/23 | | 10,075,000 | | 9,884,719 |
| General Electric Capital Corp. (3 month LIBOR + 0.380%) (c) | | 2.945 | | 05/05/26 | | 5,148,000 | | 4,620,905 |
| General Electric Co. (5.000% to 01/21/21, | | | | | | | | |
| then 3 month LIBOR + 3.330%) (c)(g) | | 5.000 | | 01/21/21 | | 46,706,000 | | 43,459,933 |
| General Electric Co. / LJ VP Holdings LLC (h) | | 3.800 | | 06/18/19 | | 750,000 | | 750,315 |
| General Motors Financial Co., Inc. | | 3.150 | | 01/15/20 | | 6,918,000 | | 6,928,723 |
| General Motors Financial Co., Inc. | | 2.650 | | 04/13/20 | | 2,997,000 | | 2,994,521 |
| Genworth Financial Inc. | | 7.700 | | 06/15/20 | | 2,918,000 | | 2,919,459 |
| GLP Capital L.P. / GLP Financing II, Inc. | | 4.875 | | 11/01/20 | | 375,000 | | 381,413 |
| Goldman Sachs Group, Inc. (3.000% to 08/31/19, then 4.000%) (d) | | 3.000 | | 08/31/20 | | 15,000,000 | | 14,955,587 |
| Goldman Sachs Group, Inc. (3 month LIBOR + 1.600%) (c) | | 4.125 | | 11/29/23 | | 6,736,000 | | 6,888,234 |
| Hainan Airlines Hong Kong Co., Ltd. (h) | | 3.625 | | 02/07/20 | | 14,737,000 | | 14,756,865 |
| Harley-Davidson Financial Services, Inc. (h) | | 2.400 | | 09/15/19 | | 1,675,000 | | 1,671,737 |
| Harley-Davidson Financial Services, Inc. (h) | | 2.400 | | 09/15/19 | | 225,000 | | 224,562 |
| Harley-Davidson Financial Services, Inc. (h) | | 2.150 | | 02/26/20 | | 11,848,000 | | 11,783,674 |
| Harley-Davidson Financial Services, Inc. (h) | | 2.150 | | 02/26/20 | | 500,000 | | 497,285 |
| HCA Inc. | | 4.250 | | 10/15/19 | | 6,373,000 | | 6,398,150 |
| HCA Inc. | | 6.500 | | 02/15/20 | | 23,403,000 | | 23,957,334 |
| Hewlett Packard Enterprise Co. (h) | | 2.100 | | 10/04/19 | | 250,000 | | 249,494 |
| Hillshire Brands Co. | | 4.100 | | 09/15/20 | | 1,935,000 | | 1,959,901 |
| Holcim US Finance Sarl & Cie S.C.S. (h) | | 6.000 | | 12/30/19 | | 1,650,000 | | 1,674,790 |
| Home BancShares Inc. (5.625% to 04/15/22, | | | | | | | | |
| then 3 month LIBOR + 3.575%) (c) | | 5.625 | | 04/15/27 | | 4,950,000 | | 5,075,353 |
| Hughes Satellite Systems Corp. | | 6.500 | | 06/15/19 | | 9,173,000 | | 9,156,030 |
| Humana Inc. | | 2.625 | | 10/01/19 | | 3,013,000 | | 3,010,992 |
| Husky Energy Inc. | | 7.250 | | 12/15/19 | | 15,381,000 | | 15,734,921 |
| Hyundai Capital Services, Inc. (h) | | 1.625 | | 08/30/19 | | 1,180,000 | | 1,176,752 |
| International Lease Finance Corp. | | 4.625 | | 04/15/21 | | 220,000 | | 226,166 |
| Investar Holding Corp. (6.000% to 03/30/22, | | | | | | | | |
| then 3 month LIBOR +3.945%) (c) | | 6.000 | | 03/30/27 | | 500,000 | | 513,367 |
| INVISTA Finance LLC (h) | | 4.250 | | 10/15/19 | | 32,165,000 | | 32,239,552 |
See Notes to Financial Statements.
25
| BOND FUND SCHEDULE OF INVESTMENTS(Unaudited) (Continued) |
| May 31, 2019 |
| | | Rate (%) | | Maturity Date | | Principal Amount | | Value |
| BONDS(continued) | | | | | | | | |
| | |
| Corporate Bonds (continued) | | | | | | | | |
| IPALCO Enterprises, Inc. | | 3.450 | | 07/15/20 | | 865,000 | | $869,954 |
| Johnson Controls, Inc. | | 5.000 | | 03/30/20 | | 750,000 | | 763,197 |
| JPMorgan Chase & Co. (5.000% to 07/01/19, | | | | | | | | |
| then 3 month LIBOR + 3.320%) (c)(g) | | 5.000 | | 07/01/19 | | 7,500,000 | | 7,471,875 |
| JPMorgan Chase & Co. (3 month LIBOR + 3.470%) (c)(g) | | 6.053 | | 07/30/19 | | 7,903,000 | | 7,895,650 |
| Keysight Technologies, Inc. | | 3.300 | | 10/30/19 | | 22,001,000 | | 22,049,926 |
| Kinder Morgan Inc. | | 3.050 | | 12/01/19 | | 4,666,000 | | 4,670,095 |
| Laclede Group, Inc. | | 2.550 | | 08/15/19 | | 4,695,000 | | 4,680,354 |
| Land O' Lakes, Inc. (h) | | 6.000 | | 11/15/22 | | 6,502,000 | | 6,721,442 |
| Life Technologies Corp. | | 6.000 | | 03/01/20 | | 334,000 | | 341,399 |
| Lincoln National Corp. (3 month LIBOR + 2.3575%) (c) | | 4.883 | | 05/17/66 | | 25,985,000 | | 21,567,550 |
| Lincoln National Corp. (3 month LIBOR + 2.040%) (c) | | 4.632 | | 04/20/67 | | 25,323,000 | | 19,751,940 |
| Lloyds Bank PLC (h) | | 5.800 | | 01/13/20 | | 600,000 | | 610,840 |
| Manufacturers & Traders Trust Co. (1 month LIBOR + 1.215%) (c) | | 3.645 | | 12/28/20 | | 14,173,000 | | 14,177,544 |
| Manufacturers & Traders Trust Co. (3 month LIBOR + 0.640%) (c) | | 3.266 | | 12/01/21 | | 1,007,000 | | 1,006,288 |
| MBIA Inc. | | 6.400 | | 08/15/22 | | 74,877,000 | | 74,221,826 |
| Medallion Financial Corp. (h) | | 8.250 | | 03/22/24 | | 8,000,000 | | 8,036,895 |
| Merrill Lynch & Co. (3 month LIBOR + 0.760%) (c) | | 3.371 | | 09/15/26 | | 3,870,000 | | 3,666,138 |
| Meta Financial Group, Inc. (5.750% to 08/15/21, | | | | | | | | |
| then 3 month LIBOR + 4.630%) (c) | | 5.750 | | 08/15/26 | | 3,200,000 | | 3,260,699 |
| MetLife, Inc. (5.250% to 06/15/20, | | | | | | | | |
| then 3 month LIBOR + 3.575%) (c)(g) | | 5.250 | | 06/15/20 | | 5,490,000 | | 5,538,037 |
| Midcontinent Express Pipeline LLC (h) | | 6.700 | | 09/15/19 | | 22,810,000 | | 22,927,369 |
| Minnwest Corp. (5.875% to 07/15/23, | | | | | | | | |
| then 3 month LIBOR + 2.980%) (c)(h) | | 5.875 | | 07/15/28 | | 6,000,000 | | 6,160,111 |
| Mizuho Bank, Ltd. (h) | | 2.650 | | 09/25/19 | | 4,545,000 | | 4,545,889 |
| MM Finished Lots Holdings, LLC (h) | | 7.250 | | 01/31/24 | | 5,212,455 | | 5,212,455 |
| Molson Coors Brewing Co. | | 2.250 | | 03/15/20 | | 16,406,000 | | 16,345,967 |
| Morgan Stanley (CPI YOY + 2.000%, floor 0.000%, cap 8.000%) (c) | | 3.520 | | 04/01/21 | | 130,000 | | 129,675 |
| Morgan Stanley (CPI YOY + 2.000%, floor 0.000%, cap 8.000%) (c) | | 3.520 | | 06/09/23 | | 100,000 | | 100,750 |
| Motiva Enterprises LLC (h) | | 5.750 | | 01/15/20 | | 6,876,000 | | 6,979,111 |
| MPT Operating Partnership, L.P. / MPT Finance Corp. | | 6.375 | | 03/01/24 | | 24,820,000 | | 25,874,850 |
| Mylan N.V. | | 2.500 | | 06/07/19 | | 6,592,000 | | 6,591,561 |
| NetApp, Inc. | | 2.000 | | 09/27/19 | | 106,000 | | 105,761 |
| NexBank Capital, Inc. (5.500% to 03/15/21, | | | | | | | | |
| then 3 month LIBOR + 4.355%) (c)(h) | | 5.500 | | 03/16/26 | | 14,500,000 | | 14,690,585 |
| Noble Holding Int'l. Ltd. | | 4.625 | | 03/01/21 | | 6,657,000 | | 6,390,720 |
| Northpointe Bank (6.875% to 10/01/23, | | | | | | | | |
| then 3 month LIBOR + 3.765%) (c)(h) | | 6.875 | | 10/01/28 | | 5,000,000 | | 5,214,163 |
| Nutrien Ltd. | | 4.875 | | 03/30/20 | | 4,902,000 | | 4,985,129 |
| NXP B.V. / NXP Funding LLC (h) | | 4.125 | | 06/15/20 | | 12,652,000 | | 12,757,771 |
| NXP B.V. / NXP Funding LLC (h) | | 4.125 | | 06/01/21 | | 15,442,000 | | 15,679,807 |
| Office Properties Income Trust | | 3.600 | | 02/01/20 | | 11,851,000 | | 11,886,819 |
| Office Properties Income Trust | | 4.150 | | 02/01/22 | | 10,919,000 | | 11,035,515 |
| Office Properties Income Trust | | 4.250 | | 05/15/24 | | 13,441,000 | | 13,382,507 |
| Office Properties Income Trust | | 4.500 | | 02/01/25 | | 100,000 | | 97,606 |
| Old Second Bancorp, Inc. (5.750% to 12/31/21, | | | | | | | | |
| then 3 month LIBOR + 3.850%) (c) | | 5.750 | | 12/31/26 | | 1,945,000 | | 2,012,716 |
See Notes to Financial Statements.
26
| BOND FUND SCHEDULE OF INVESTMENTS(Unaudited) (Continued) |
| May 31, 2019 |
| | | Rate (%) | | Maturity Date | | Principal Amount | | Value |
| BONDS(continued) | | | | | | | | |
| | |
| Corporate Bonds (continued) | | | | | | | | |
| Pacific Continental Corp. (5.875% to 06/30/21, | | | | | | | | |
| then 3 month LIBOR + 4.715%) (c) | | 5.875 | | 06/30/26 | | 510,000 | | $520,424 |
| Pearson Funding Four PLC (h) | | 3.750 | | 05/08/22 | | 2,300,000 | | 2,334,658 |
| Pedcor Bancorp (7.250% to 02/15/24, | | | | | | | | |
| then 3 month LIBOR + 4.600%) (c)(h) | | 7.250 | | 02/15/29 | | 3,000,000 | | 3,139,950 |
| Penske Truck Leasing Co., L.P. / PTL Finance Corp. (h) | | 2.500 | | 06/15/19 | | 100,000 | | 99,962 |
| Penske Truck Leasing Co., L.P. / PTL Finance Corp. (h) | | 3.050 | | 01/09/20 | | 5,265,000 | | 5,265,952 |
| Pentair Finance S.A. | | 2.650 | | 12/01/19 | | 6,285,000 | | 6,277,386 |
| Perrigo Finance Unlimited Co. | | 3.500 | | 03/15/21 | | 900,000 | | 895,405 |
| Pershing Road Development Co., LLC | | | | | | | | |
| (3 month LIBOR + 0.400%) (c)(h) | | 3.026 | | 09/15/21 | | 160,000 | | 160,000 |
| Pershing Road Development Co., LLC | | | | | | | | |
| (3 month LIBOR + 0.400%) (c)(h) | | 3.026 | | 09/15/22 | | 2,738,000 | | 2,717,465 |
| Pershing Road Development Co., LLC | | | | | | | | |
| (3 month LIBOR + 0.400%) (c)(h) | | 3.026 | | 09/15/22 | | 1,000,000 | | 992,500 |
| Pershing Road Development Co., LLC | | | | | | | | |
| (3 month LIBOR + 0.400%) (c)(h) | | 3.026 | | 09/15/23 | | 3,841,000 | | 3,792,987 |
| Pershing Road Development Co., LLC | | | | | | | | |
| (3 month LIBOR + 0.400%) (c)(h) | | 3.026 | | 09/15/23 | | 1,705,000 | | 1,683,688 |
| Pershing Road Development Co., LLC | | | | | | | | |
| (3 month LIBOR + 0.400%) (c)(h) | | 3.026 | | 09/15/24 | | 4,799,000 | | 4,727,015 |
| Pershing Road Development Co., LLC | | | | | | | | |
| (3 month LIBOR + 0.400%) (c)(h) | | 3.026 | | 09/15/24 | | 1,815,000 | | 1,787,775 |
| Pershing Road Development Co., LLC | | | | | | | | |
| (3 month LIBOR + 0.400%) (c)(h) | | 3.026 | | 09/15/25 | | 1,530,000 | | 1,499,400 |
| Pershing Road Development Co., LLC | | | | | | | | |
| (3 month LIBOR + 0.400%) (c)(h) | | 3.026 | | 09/15/26 | | 865,000 | | 841,213 |
| Phillips 66 (3 month LIBOR + 0.750%) (c)(h) | | 3.347 | | 04/15/20 | | 18,241,000 | | 18,250,761 |
| Plains All American Pipeline, L.P. / PAA Finance Corp. | | 2.600 | | 12/15/19 | | 4,737,000 | | 4,727,121 |
| Principal Financial Group, Inc. (4.700% to 05/15/20, | | | | | | | | |
| then 3 month LIBOR + 3.044%) (c) | | 4.700 | | 05/15/55 | | 31,600,000 | | 31,017,612 |
| Prospect Capital Corp. | | 4.250 | | 06/15/20 | | 500,000 | | 501,917 |
| Protective Life Corp. | | 7.375 | | 10/15/19 | | 8,073,000 | | 8,208,840 |
| Public Service Co. of Oklahoma | | 5.150 | | 12/01/19 | | 7,200,000 | | 7,285,329 |
| QBE Capital Funding III Ltd. (7.250% to 05/24/21, | | | | | | | | |
| then USSW10 + 4.050%) (c)(h) | | 7.250 | | 05/24/41 | | 1,795,000 | | 1,890,629 |
| Quest Diagnostics Inc. | | 4.750 | | 01/30/20 | | 3,950,000 | | 4,001,913 |
| R. J. Reynolds Tobacco Co. | | 8.125 | | 06/23/19 | | 1,875,000 | | 1,880,756 |
| RBB Bancorp (6.500% to 03/31/21, | | | | | | | | |
| then 3 month LIBOR + 5.160%) (c)(h) | | 6.500 | | 03/31/26 | | 2,000,000 | | 2,047,789 |
| RBB Bancorp (6.180% to 12/01/23, | | | | | | | | |
| then 3 month LIBOR + 3.150%) (c) | | 6.180 | | 12/01/28 | | 5,000,000 | | 5,190,077 |
| ReadyCap Holdings, LLC (h) | | 7.500 | | 02/15/22 | | 26,000,000 | | 27,647,739 |
| Reckson Operating Partnership, L.P. | | 7.750 | | 03/15/20 | | 874,000 | | 906,701 |
| Reinsurance Group of America, Inc. | | 6.450 | | 11/15/19 | | 4,366,000 | | 4,436,225 |
| Reinsurance Group of America, Inc. (3 month LIBOR + 2.665%) (c) | | 5.276 | | 12/15/65 | | 33,029,000 | | 30,386,680 |
| Renasant Corp. (5.000% to 09/01/21, | | | | | | | | |
| then 3 month LIBOR + 3.840%) (c) | | 5.000 | | 09/01/26 | | 4,100,000 | | 4,139,094 |
| RenRe North America Holdings Inc. | | 5.750 | | 03/15/20 | | 3,200,000 | | 3,275,463 |
| Reynolds American Inc. | | 8.125 | | 06/23/19 | | 1,080,000 | | 1,083,316 |
See Notes to Financial Statements.
27
| BOND FUND SCHEDULE OF INVESTMENTS(Unaudited) (Continued) |
| May 31, 2019 |
| | | Rate (%) | | Maturity Date | | Principal Amount | | Value |
| BONDS(continued) | | | | | | | | |
| | |
| Corporate Bonds (continued) | | | | | | | | |
| Rockies Express Pipeline LLC (h) | | 5.625 | | 04/15/20 | | 10,585,000 | | $10,743,457 |
| Royal Bank of Canada (6.100% where | | | | | | | | |
| USISDA10 is greater than or equal to 1.784%) (c) | | 6.100 | | 08/15/19 | | 2,000,000 | | 1,970,000 |
| Royal Bank of Scotland Group PLC | | 6.400 | | 10/21/19 | | 1,385,000 | | 1,403,079 |
| RPM Int'l., Inc. | | 6.125 | | 10/15/19 | | 15,513,000 | | 15,689,618 |
| Ryder System, Inc. | | 2.450 | | 09/03/19 | | 5,250,000 | | 5,244,758 |
| Sabra Health Care L.P. / Sabra Capital Corp. | | 5.500 | | 02/01/21 | | 2,633,000 | | 2,670,389 |
| SAIC, Inc. | | 4.450 | | 12/01/20 | | 13,028,000 | | 13,134,830 |
| Senior Housing Properties Trust | | 6.750 | | 04/15/20 | | 5,012,000 | | 5,074,525 |
| Senior Housing Properties Trust | | 6.750 | | 12/15/21 | | 7,390,000 | | 7,813,023 |
| SESI LLC | | 7.125 | | 12/15/21 | | 38,264,000 | | 28,506,680 |
| Shire Acquisitions Investments Ireland DAC | | 1.900 | | 09/23/19 | | 23,465,000 | | 23,395,142 |
| Silversea Cruise Finance Ltd. (h) | | 7.250 | | 02/01/25 | | 35,256,000 | | 37,767,990 |
| SLM Corp. (d) | | 6.250 | | 09/15/20 | | 172,000 | | 170,126 |
| SLM Corp. (d) | | 6.750 | | 12/15/20 | | 306,000 | | 301,581 |
| SLM Corp. (d) | | 6.750 | | 12/15/20 | | 95,000 | | 93,628 |
| SLM Corp. (d) | | 8.000 | | 12/15/20 | | 71,000 | | 71,252 |
| SLM Corp. | | 6.000 | | 06/15/21 | | 261,000 | | 252,363 |
| SLM Corp. | | 6.150 | | 06/15/21 | | 146,000 | | 141,579 |
| SLM Corp. | | 7.250 | | 01/25/22 | | 602,000 | | 634,821 |
| Smithfield Foods, Inc. (h) | | 2.700 | | 01/31/20 | | 17,859,000 | | 17,809,594 |
| Smithfield Foods, Inc. (h) | | 2.650 | | 10/03/21 | | 6,833,000 | | 6,671,860 |
| Southern California Edison Co. | | 2.900 | | 03/01/21 | | 4,735,000 | | 4,737,194 |
| Southern National Bancorp of Virginia, Inc. | | | | | | | | |
| (5.875% to 01/31/22, then 3 month LIBOR + 3.950%) (c)(h) | | 5.875 | | 01/31/27 | | 2,000,000 | | 2,048,965 |
| Southside Bancshares, Inc. | | | | | | | | |
| (5.500% to 09/30/21, then 3 month LIBOR + 4.297%) (c) | | 5.500 | | 09/30/26 | | 2,035,000 | | 2,068,859 |
| Sprint Spectrum Co. LLC (b)(h) | | 3.360 | | 03/20/23 | | 21,381,875 | | 21,328,420 |
| Standard Chartered PLC (h) | | 2.400 | | 09/08/19 | | 3,700,000 | | 3,693,954 |
| TECO Finance, Inc. | | 5.150 | | 03/15/20 | | 2,800,000 | | 2,851,521 |
| Texas Gas Transmission, LLC (h) | | 4.500 | | 02/01/21 | | 1,000,000 | | 1,020,336 |
| Textron Inc. | | 7.250 | | 10/01/19 | | 2,000,000 | | 2,028,393 |
| TransCanada PipeLines Ltd. (3 month LIBOR + 2.210%) (c) | | 4.728 | | 05/15/67 | | 20,673,000 | | 16,984,317 |
| Trinity Industries, Inc. | | 4.550 | | 10/01/24 | | 5,517,000 | | 5,291,528 |
| United Business Media plc (h) | | 5.750 | | 11/03/20 | | 6,915,000 | | 7,158,248 |
| United Rentals N.A., Inc. | | 4.625 | | 07/15/23 | | 12,607,000 | | 12,827,622 |
| UTB Financial Holding Co. (6.500% to 09/01/23, | | | | | | | | |
| then 3 month LIBOR + 3.620%) (c)(h) | | 6.500 | | 09/01/28 | | 6,000,000 | | 6,237,462 |
| Volkswagen Group of America Finance, LLC (h) | | 2.450 | | 11/20/19 | | 400,000 | | 399,772 |
| Willis North America Inc. | | 7.000 | | 09/29/19 | | 3,299,000 | | 3,339,414 |
| Worthington Industries, Inc. | | 6.500 | | 04/15/20 | | 8,000,000 | | 8,218,473 |
| WT Holdings, Inc. (h) | | 7.000 | | 04/30/23 | | 17,000,000 | | 17,110,500 |
| XL Group PLC (3 month LIBOR + 2.4575%) (c)(g) | | 5.054 | | 07/02/19 | | 84,861,000 | | 81,678,712 |
| ZF North America Capital, Inc. (h) | | 4.000 | | 04/29/20 | | 10,000,000 | | 10,056,951 |
| |
| Residential Mortgage-Backed Securities–0.1% | | | | | | | | 3,523,756 |
| Hawaii Housing Finance & Development Corp. | | 2.600 | | 07/01/37 | | 329,267 | | 328,293 |
| Minnesota Housing Finance Agency | | 2.700 | | 09/01/41 | | 2,068,823 | | 2,017,516 |
| Onslow Bay Mortgage Loan Trust, Series 2015-1 1A8 (c)(h) | | 2.771 | | 11/25/45 | | 1,184,551 | | 1,177,947 |
See Notes to Financial Statements.
28
| BOND FUND SCHEDULE OF INVESTMENTS(Unaudited) (Continued) |
| May 31, 2019 |
| | | | Rate (%) | | Maturity Date | | Principal Amount | | Value |
| BONDS(continued) | | | | | | | | |
| | | | | | | | | |
| Sovereign Bonds–1.8% | | | | | | | | $67,744,824 |
| Banco Latinoamericano de Comercio Exterior, S.A. (h) | | 3.250 | | 05/07/20 | | 12,483,000 | | 12,489,242 |
| Bayerische Landesbank (3 month LIBOR + 1.160% where | | | | | | | | |
| (USISDA30–USISDA02) is greater than -0.250%) (c) | | 3.752 | | 10/02/21 | | 6,000,000 | | 6,088,666 |
| Comision Federal de Electricidad (h) | | 4.875 | | 05/26/21 | | 5,285,000 | | 5,406,608 |
| Petroleos Mexicanos | | 6.000 | | 03/05/20 | | 10,000,000 | | 10,205,000 |
| Petroleos Mexicanos | | 6.375 | | 02/04/21 | | 14,793,000 | | 15,377,323 |
| Petroleos Mexicanos | | 3.500 | | 01/30/23 | | 6,025,000 | | 5,793,640 |
| Petroleos Mexicanos | | 4.875 | | 01/18/24 | | 11,080,000 | | 11,078,892 |
| Syngenta Finance N.V. (h) | | 3.698 | | 04/24/20 | | 1,300,000 | | 1,305,453 |
| | | | | | | | | |
| Taxable Municipal Bonds–2.8% | | | | | | | | 104,938,234 |
| California Statewide Communities Development Authority | | 5.370 | | 06/01/21 | | 425,000 | | 433,802 |
| Casino Reinvestment Development Authority NJ | | 5.340 | | 06/01/20 | | 3,105,000 | | 3,121,550 |
| City of Long Beach CA Pension Obligation | | 5.180 | | 09/01/21 | | 3,180,000 | | 3,294,544 |
| City of Newark NJ | | 3.057 | | 04/01/20 | | 700,000 | | 696,850 |
| Conway Health Facilities Board AR | | 3.500 | | 08/01/19 | | 545,000 | | 545,163 |
| Conway Health Facilities Board AR | | 3.770 | | 08/01/20 | | 905,000 | | 912,312 |
| County of Cuyahoga OH | | 5.000 | | 12/01/19 | | 5,000 | | 5,063 |
| County of Ohio WV Special District Excise Tax Revenue | | 3.500 | | 03/01/20 | | 495,000 | | 495,233 |
| County of Ohio WV Special District Excise Tax Revenue | | 4.000 | | 03/01/20 | | 575,000 | | 579,882 |
| County of Racine WI Anticipation Notes | | 3.050 | | 12/01/20 | | 62,900,000 | | 63,051,589 |
| County of Reeves TX Certs. of Participation | | 6.125 | | 12/01/20 | | 680,000 | | 650,468 |
| County of Reeves TX Certs. of Participation | | 6.375 | | 12/01/21 | | 45,000 | | 41,392 |
| Eastern Illinois University | | 5.600 | | 04/01/20 | | 585,000 | | 585,790 |
| Eastern Illinois University | | 5.700 | | 04/01/21 | | 125,000 | | 125,209 |
| Fannin County TX Public Facility Corp. | | 5.200 | | 10/01/19 | | 515,000 | | 509,469 |
| Fannin County TX Public Facility Corp. | | 5.650 | | 10/01/21 | | 825,000 | | 773,116 |
| Florida State Mid-Bay Bridge Authority | | 3.784 | | 10/01/21 | | 2,800,000 | | 2,820,328 |
| Garza County TX Public Facility Corp. | | 6.200 | | 10/01/20 | | 855,000 | | 816,995 |
| Guam Gov't. Business Privilege Tax Revenue | | 4.383 | | 01/01/22 | | 1,535,000 | | 1,558,716 |
| LL & P Wind Energy, Inc. WA (h) | | 5.983 | | 12/01/22 | | 7,095,000 | | 7,425,627 |
| New Jersey Economic Development Authority | | 3.300 | | 06/15/19 | | 1,000,000 | | 999,930 |
| New Jersey Economic Development Authority | | 3.290 | | 07/01/19 | | 320,000 | | 320,051 |
| New Jersey Sports & Exposition Authority | | 6.076 | | 03/01/23 | | 355,000 | | 384,877 |
| North Texas Tollway Authority | | 8.910 | | 02/01/30 | | 535,000 | | 556,684 |
| Pontotoc County OK Educational Facilities Authority | | 4.119 | | 09/01/23 | | 215,000 | | 220,826 |
| Public Finance Authority WI Student Housing Revenue | | 4.500 | | 07/01/21 | | 1,110,000 | | 1,109,101 |
| San Luis AZ Facility Development Corp. | | 5.600 | | 05/01/20 | | 670,000 | | 660,888 |
| San Luis AZ Facility Development Corp. | | 5.700 | | 05/01/20 | | 850,000 | | 838,440 |
| San Luis AZ Facility Development Corp. | | 5.800 | | 05/01/21 | | 1,055,000 | | 1,006,628 |
| San Luis AZ Facility Development Corp. | | 5.900 | | 05/01/21 | | 980,000 | | 935,057 |
| San Luis AZ Facility Development Corp. | | 6.100 | | 05/01/22 | | 1,030,000 | | 958,796 |
| San Luis AZ Facility Development Corp. | | 6.200 | | 05/01/22 | | 1,035,000 | | 963,440 |
| State of Illinois General Obligation | | 3.650 | | 04/01/20 | | 550,000 | | 551,974 |
| Summit County OH Development Finance Authority | | 6.250 | | 05/15/26 | | 630,000 | | 630,901 |
| Town of Hamden CT General Obligation | | 4.000 | | 08/15/19 | | 680,000 | | 680,959 |
| Town of Oyster Bay NY General Obligation | | 3.800 | | 02/01/20 | | 1,725,000 | | 1,729,571 |
| Town of Oyster Bay NY General Obligation | | 3.950 | | 02/01/21 | | 890,000 | | 897,013 |
See Notes to Financial Statements.
29
| BOND FUND SCHEDULE OF INVESTMENTS(Unaudited) (Continued) |
| May 31, 2019 |
| | | | Rate (%) | | Maturity Date | | Principal Amount | | Value |
| BONDS(continued) | | | | | | | | |
| | | | | | | | | |
| Taxable Municipal Bonds (continued) | | | | | | | | |
| Utah Infrastructure Agency Telecommunications Revenue and | | | | | | | | |
| Refunding | | 3.500 | | 10/15/23 | | 3,050,000 | | $3,050,000 |
| | | | | | | | | |
| Tax-Exempt Municipal Bonds–0.2% | | | | | | | | 6,121,637 |
| Casino Reinvestment Development Authority NJ | | 5.250 | | 06/01/19 | | 5,000,000 | | 5,000,000 |
| Puerto Rico Commonwealth | | 5.500 | | 07/01/19 | | 130,000 | | 130,239 |
| Puerto Rico Electric Power Authority | | 5.000 | | 07/01/19 | | 770,000 | | 771,132 |
| Puerto Rico Highways & Transportation Authority | | 4.125 | | 07/01/19 | | 120,000 | | 120,100 |
| Puerto Rico Municipal Finance Agency | | 5.250 | | 08/01/19 | | 100,000 | | 100,166 |
| | | | | | | | | |
| U.S. Government Agency Mortgage-Backed Securities–3.4% | | | | | | | | 125,927,914 |
| Fannie Mae REMIC, Series 2013-29 Class AI IO | | 2.500 | | 04/25/28 | | 5,632,320 | | 377,770 |
| Fannie Mae REMIC, Series 2013-38 CI IO | | 3.000 | | 04/25/28 | | 15,725,202 | | 1,210,333 |
| Freddie Mac REMIC, Series 4136 Class IH IO | | 3.500 | | 09/15/27 | | 7,770,173 | | 630,557 |
| Freddie Mac REMIC, Series 4238 Class NS IO (-1.0 times 1 month | | | | | | | | |
| LIBOR + 6.700%, floor 0.000%, cap 6.700%) (c) | | 4.260 | | 02/15/42 | | 3,464,897 | | 469,779 |
| Freddie Mac Structured Agency Credit Risk Debt Notes, | | | | | | | | |
| Series 2016-DNA2 M2 (1 month LIBOR + 2.200%, floor 0.000%) (c) | | 4.630 | | 10/25/28 | | 6,831,703 | | 6,859,222 |
| Ginnie Mae, Series 78-2071X | | 7.000 | | 05/15/33 | | 18,740 | | 21,523 |
| Ginnie Mae REMIC Trust, Series 2013-2 AB | | 1.600 | | 12/16/42 | | 993,076 | | 978,340 |
| Ginnie Mae REMIC Trust, Series 2013-30 A | | 1.500 | | 05/16/42 | | 27,218,950 | | 26,163,186 |
| Ginnie Mae REMIC Trust, Series 2013-33 A | | 1.061 | | 07/16/38 | | 43,283,367 | | 41,438,720 |
| Ginnie Mae REMIC Trust, Series 2013-35 A | | 1.618 | | 02/16/40 | | 360,671 | | 349,184 |
| Ginnie Mae REMIC Trust, Series 2013-40 A | | 1.511 | | 10/16/41 | | 11,532,600 | | 11,174,502 |
| Ginnie Mae REMIC Trust, Series 2013-45 AB | | 1.450 | | 04/16/39 | | 1,544,608 | | 1,512,518 |
| Ginnie Mae REMIC Trust, Series 2013-57 A | | 1.350 | | 06/16/37 | | 10,995,751 | | 10,697,339 |
| Ginnie Mae REMIC Trust, Series 2013-125 A | | 1.180 | | 12/16/37 | | 1,740,110 | | 1,693,650 |
| Ginnie Mae REMIC Trust, Series 2015-71 DA (c) | | 2.132 | | 09/16/49 | | 13,879,104 | | 13,594,366 |
| Ginnie Mae REMIC Trust, Series 2018-25 IO (c) | | 0.593 | | 02/16/60 | | 147,462,704 | | 8,756,925 |
| | | | | | | | | |
| U.S. Government & Agency Securities–11.0% | | | | | | | | 414,352,491 |
| Fannie Mae | | 1.000 | | 06/28/19 | | 700,000 | | 699,305 |
| Fannie Mae | | 1.050 | | 06/28/19 | | 95,000 | | 94,909 |
| Fannie Mae | | 1.075 | | 07/11/19 | | 1,659,000 | | 1,656,690 |
| Fannie Mae | | 1.050 | | 07/12/19 | | 1,000,000 | | 998,492 |
| Fannie Mae | | 1.125 | | 07/26/19 | | 610,000 | | 608,870 |
| Fannie Mae | | 1.125 | | 07/26/19 | | 500,000 | | 499,044 |
| Fannie Mae | | 1.250 | | 07/26/19 | | 4,685,000 | | 4,676,593 |
| Fannie Mae | | 1.250 | | 07/26/19 | | 73,000 | | 72,873 |
| Fannie Mae | | 0.875 | | 08/02/19 | | 9,632,000 | | 9,606,826 |
| Fannie Mae | | 1.250 | | 08/23/19 | | 75,000 | | 74,804 |
| Fannie Mae | | 1.250 | | 08/23/19 | | 400,000 | | 398,918 |
| Fannie Mae | | 1.350 | | 08/26/19 | | 835,000 | | 832,869 |
| Fannie Mae | | 1.000 | | 08/28/19 | | 1,680,000 | | 1,674,381 |
| Fannie Mae | | 1.750 | | 09/12/19 | | 10,044,000 | | 10,024,607 |
| Fannie Mae | | 1.125 | | 09/27/19 | | 600,000 | | 597,532 |
| Fannie Mae | | 1.250 | | 09/30/19 | | 677,000 | | 674,632 |
| Fannie Mae (f) | | 0.000 | | 10/09/19 | | 56,985,000 | | 56,483,648 |
| Fannie Mae | | 1.100 | | 10/17/19 | | 1,412,000 | | 1,405,222 |
See Notes to Financial Statements.
30
| BOND FUND SCHEDULE OF INVESTMENTS(Unaudited) (Continued) |
| May 31, 2019 |
| | | | Rate (%) | | Maturity Date | | Principal Amount | | Value |
| BONDS(continued) | | | | | | | | |
| | | | | | | | | |
| U.S. Government & Agency Securities (continued) | | | | | | | | |
| Fannie Mae | | 1.230 | | 10/17/19 | | 28,663,000 | | $28,544,840 |
| Fannie Mae | | 1.000 | | 10/24/19 | | 17,183,000 | | 17,089,316 |
| Fannie Mae | | 1.330 | | 10/24/19 | | 541,000 | | 538,699 |
| Fannie Mae | | 1.200 | | 10/28/19 | | 255,000 | | 253,764 |
| Fannie Mae | | 1.400 | | 10/28/19 | | 4,265,000 | | 4,248,822 |
| Fannie Mae | | 1.250 | | 11/15/19 | | 215,000 | | 213,930 |
| Fannie Mae | | 1.400 | | 11/26/19 | | 89,000 | | 88,602 |
| Fannie Mae | | 1.750 | | 11/26/19 | | 5,846,000 | | 5,828,479 |
| Fannie Mae | | 1.550 | | 12/27/19 | | 870,000 | | 865,891 |
| Fannie Mae | | 1.250 | | 12/30/19 | | 100,000 | | 99,402 |
| Fannie Mae | | 1.300 | | 12/30/19 | | 150,000 | | 149,150 |
| Fannie Mae | | 1.350 | | 12/30/19 | | 100,000 | | 99,429 |
| Fannie Mae | | 1.375 | | 12/30/19 | | 433,000 | | 430,856 |
| Fannie Mae | | 1.580 | | 12/30/19 | | 200,000 | | 199,246 |
| Fannie Mae (2.000% to 06/30/19, then 2.500%) (d) | | 2.000 | | 12/30/19 | | 110,000 | | 109,979 |
| Fannie Mae | | 1.625 | | 01/21/20 | | 1,332,000 | | 1,326,228 |
| Fannie Mae | | 1.650 | | 01/27/20 | | 900,000 | | 896,318 |
| Fannie Mae | | 1.700 | | 01/27/20 | | 1,095,000 | | 1,090,288 |
| Fannie Mae | | 1.500 | | 02/20/20 | | 125,000 | | 124,353 |
| Fannie Mae | | 1.250 | | 02/25/20 | | 102,000 | | 101,337 |
| Fannie Mae | | 1.220 | | 03/30/20 | | 400,000 | | 396,729 |
| Farmer Mac | | 1.640 | | 01/27/20 | | 150,000 | | 149,381 |
| Farmer Mac | | 1.475 | | 04/03/20 | | 180,000 | | 178,834 |
| Federal Farm Credit Banks | | 4.280 | | 06/05/19 | | 285,000 | | 285,030 |
| Federal Farm Credit Banks | | 1.375 | | 06/12/19 | | 1,000,000 | | 999,722 |
| Federal Farm Credit Banks | | 1.180 | | 06/13/19 | | 1,180,000 | | 1,179,606 |
| Federal Farm Credit Banks | | 1.120 | | 06/27/19 | | 20,000,000 | | 19,983,651 |
| Federal Farm Credit Banks | | 1.200 | | 06/27/19 | | 998,000 | | 997,242 |
| Federal Farm Credit Banks | | 1.020 | | 07/12/19 | | 73,000 | | 72,896 |
| Federal Farm Credit Banks | | 1.350 | | 08/02/19 | | 1,959,000 | | 1,956,032 |
| Federal Farm Credit Banks | | 4.375 | | 08/05/19 | | 100,000 | | 100,355 |
| Federal Farm Credit Banks | | 1.400 | | 08/28/19 | | 500,000 | | 498,948 |
| Federal Farm Credit Banks | | 1.200 | | 09/12/19 | | 2,000,000 | | 1,994,590 |
| Federal Farm Credit Banks | | 2.530 | | 09/12/19 | | 100,000 | | 100,072 |
| Federal Farm Credit Banks | | 1.550 | | 09/27/19 | | 215,000 | | 214,521 |
| Federal Farm Credit Banks | | 1.140 | | 10/07/19 | | 771,000 | | 768,193 |
| Federal Farm Credit Banks | | 1.180 | | 10/18/19 | | 168,000 | | 167,359 |
| Federal Farm Credit Banks | | 4.730 | | 10/21/19 | | 980,000 | | 989,190 |
| Federal Farm Credit Banks | | 1.250 | | 10/22/19 | | 1,425,000 | | 1,419,527 |
| Federal Farm Credit Banks | | 1.360 | | 10/28/19 | | 355,000 | | 353,809 |
| Federal Farm Credit Banks | | 1.160 | | 11/01/19 | | 847,000 | | 843,435 |
| Federal Farm Credit Banks | | 1.550 | | 11/15/19 | | 1,050,000 | | 1,046,900 |
| Federal Farm Credit Banks | | 5.150 | | 11/15/19 | | 353,000 | | 357,595 |
| Federal Farm Credit Banks | | 1.100 | | 11/18/19 | | 169,000 | | 168,067 |
| Federal Farm Credit Banks | | 1.600 | | 11/19/19 | | 235,000 | | 234,250 |
| Federal Farm Credit Banks | | 1.300 | | 11/25/19 | | 100,000 | | 99,541 |
| Federal Farm Credit Banks | | 1.240 | | 11/29/19 | | 300,000 | | 298,594 |
| Federal Farm Credit Banks | | 2.390 | | 12/05/19 | | 270,000 | | 270,232 |
See Notes to Financial Statements.
31
| BOND FUND SCHEDULE OF INVESTMENTS(Unaudited) (Continued) |
| May 31, 2019 |
| | | | Rate (%) | | Maturity Date | | Principal Amount | | Value |
| BONDS(continued) | | | | | | | | |
| | | | | | | | | |
| U.S. Government & Agency Securities (continued) | | | | | | | | |
| Federal Farm Credit Banks | | 3.050 | | 12/06/19 | | 231,000 | | $231,973 |
| Federal Farm Credit Banks | | 1.370 | | 12/17/19 | | 214,000 | | 213,039 |
| Federal Farm Credit Banks | | 1.440 | | 12/19/19 | | 500,000 | | 497,597 |
| Federal Farm Credit Banks | | 1.500 | | 12/19/19 | | 233,000 | | 231,959 |
| Federal Farm Credit Banks | | 1.625 | | 01/03/20 | | 100,000 | | 99,665 |
| Federal Farm Credit Banks | | 4.250 | | 01/06/20 | | 286,000 | | 289,402 |
| Federal Farm Credit Banks | | 1.950 | | 01/10/20 | | 504,000 | | 503,210 |
| Federal Farm Credit Banks | | 1.520 | | 01/17/20 | | 1,164,000 | | 1,159,021 |
| Federal Farm Credit Banks | | 4.600 | | 01/29/20 | | 110,000 | | 111,699 |
| Federal Farm Credit Banks | | 1.420 | | 05/18/20 | | 401,000 | | 398,068 |
| Federal Farm Credit Banks | | 1.380 | | 11/02/20 | | 385,000 | | 381,606 |
| Federal Home Loan Banks | | 1.625 | | 06/14/19 | | 385,000 | | 384,915 |
| Federal Home Loan Banks | | 1.160 | | 06/21/19 | | 190,000 | | 189,880 |
| Federal Home Loan Banks | | 4.375 | | 07/01/19 | | 260,000 | | 260,389 |
| Federal Home Loan Banks | | 2.375 | | 07/16/19 | | 745,000 | | 744,946 |
| Federal Home Loan Banks | | 1.375 | | 07/26/19 | | 425,000 | | 424,345 |
| Federal Home Loan Banks | | 0.875 | | 08/05/19 | | 17,560,000 | | 17,512,265 |
| Federal Home Loan Banks | | 5.125 | | 08/15/19 | | 1,280,000 | | 1,286,953 |
| Federal Home Loan Banks | | 1.250 | | 08/22/19 | | 340,000 | | 339,084 |
| Federal Home Loan Banks | | 1.375 | | 09/13/19 | | 1,365,000 | | 1,361,067 |
| Federal Home Loan Banks | | 2.000 | | 09/13/19 | | 720,000 | | 719,064 |
| Federal Home Loan Banks | | 2.375 | | 09/13/19 | | 275,000 | | 274,994 |
| Federal Home Loan Banks | | 4.500 | | 09/13/19 | | 705,000 | | 708,975 |
| Federal Home Loan Banks | | 1.000 | | 09/26/19 | | 13,535,000 | | 13,474,364 |
| Federal Home Loan Banks | | 1.280 | | 09/27/19 | | 105,000 | | 104,626 |
| Federal Home Loan Banks | | 1.350 | | 09/27/19 | | 2,000,000 | | 1,993,062 |
| Federal Home Loan Banks | | 1.500 | | 09/27/19 | | 2,480,000 | | 2,473,170 |
| Federal Home Loan Banks | | 1.500 | | 09/27/19 | | 600,000 | | 598,221 |
| Federal Home Loan Banks | | 1.125 | | 10/03/19 | | 525,000 | | 522,830 |
| Federal Home Loan Banks | | 1.500 | | 10/07/19 | | 695,000 | | 692,776 |
| Federal Home Loan Banks | | 1.125 | | 10/11/19 | | 200,000 | | 199,064 |
| Federal Home Loan Banks | | 1.200 | | 10/11/19 | | 470,000 | | 468,047 |
| Federal Home Loan Banks | | 1.550 | | 10/11/19 | | 385,000 | | 383,786 |
| Federal Home Loan Banks | | 1.340 | | 10/17/19 | | 250,000 | | 249,038 |
| Federal Home Loan Banks | | 2.625 | | 10/18/19 | | 5,000,000 | | 5,004,357 |
| Federal Home Loan Banks | | 1.500 | | 10/21/19 | | 6,340,000 | | 6,317,789 |
| Federal Home Loan Banks | | 1.370 | | 10/24/19 | | 14,706 | | 14,648 |
| Federal Home Loan Banks | | 1.500 | | 10/24/19 | | 100,000 | | 99,657 |
| Federal Home Loan Banks | | 2.750 | | 10/24/19 | | 1,000,000 | | 1,001,197 |
| Federal Home Loan Banks | | 1.190 | | 10/28/19 | | 300,000 | | 298,533 |
| Federal Home Loan Banks | | 1.400 | | 10/29/19 | | 585,000 | | 582,595 |
| Federal Home Loan Banks | | 1.375 | | 11/15/19 | | 10,345,000 | | 10,300,033 |
| Federal Home Loan Banks | | 1.100 | | 11/18/19 | | 500,000 | | 497,030 |
| Federal Home Loan Banks | | 1.250 | | 12/13/19 | | 645,000 | | 641,159 |
| Federal Home Loan Banks | | 2.375 | | 12/13/19 | | 1,400,000 | | 1,400,423 |
| Federal Home Loan Banks | | 4.125 | | 12/13/19 | | 2,045,000 | | 2,064,167 |
| Federal Home Loan Banks | | 2.550 | | 12/19/19 | | 17,470,000 | | 17,483,317 |
| Federal Home Loan Banks | | 1.390 | | 12/26/19 | | 200,000 | | 198,997 |
See Notes to Financial Statements.
32
| BOND FUND SCHEDULE OF INVESTMENTS(Unaudited) (Continued) |
| May 31, 2019 |
| | | | Rate (%) | | Maturity Date | | Principal Amount | | Value |
| BONDS(continued) | | | | | | | | |
| | | | | | | | | | |
| U.S. Government & Agency Securities (continued) | | | | | | | | |
| Federal Home Loan Banks (3 month LIBOR - 0.140%, | | | | | | | | |
| floor 0.000%) (c) | | 2.470 | | 12/26/19 | | 120,000 | | $120,033 |
| Federal Home Loan Banks | | 1.450 | | 12/27/19 | | 200,000 | | 198,982 |
| Federal Home Loan Banks | | 1.500 | | 12/27/19 | | 510,000 | | 507,298 |
| Federal Home Loan Banks | | 2.000 | | 12/27/19 | | 170,000 | | 169,649 |
| Federal Home Loan Banks (d) | | 5.400 | | 12/30/19 | | 1,020,000 | | 1,037,275 |
| Federal Home Loan Banks | | 2.125 | | 02/11/20 | | 3,590,000 | | 3,587,204 |
| Federal Home Loan Banks | | 2.150 | | 02/14/20 | | 150,000 | | 149,890 |
| Federal Home Loan Banks | | 1.700 | | 04/14/20 | | 500,000 | | 497,519 |
| Federal Home Loan Banks | | 2.495 | | 05/28/20 | | 5,000,000 | | 5,001,369 |
| Federal Home Loan Banks (2.000% to 06/29/19, | | | | | | | | |
| 2.250% to 12/29/19, then 2.500%) (d) | | 2.000 | | 06/29/20 | | 100,000 | | 99,987 |
| Federal Home Loan Banks | | 1.240 | | 07/13/20 | | 300,000 | | 297,026 |
| Federal Home Loan Banks | | 1.700 | | 10/19/20 | | 200,000 | | 198,933 |
| Financing Corp. (f) | | 0.000 | | 09/26/19 | | 1,403,000 | | 1,391,693 |
| Freddie Mac (d) | | 2.000 | | 06/07/19 | | 6,852,000 | | 6,851,696 |
| Freddie Mac | | 1.500 | | 07/18/19 | | 500,000 | | 499,407 |
| Freddie Mac | | 1.050 | | 07/26/19 | | 1,000,000 | | 997,908 |
| Freddie Mac | | 1.250 | | 07/26/19 | | 225,000 | | 224,594 |
| Freddie Mac | | 1.500 | | 07/26/19 | | 450,000 | | 449,375 |
| Freddie Mac | | 1.250 | | 08/01/19 | | 118,000 | | 117,791 |
| Freddie Mac | | 1.375 | | 08/15/19 | | 532,000 | | 530,856 |
| Freddie Mac | | 1.300 | | 08/16/19 | | 100,000 | | 99,768 |
| Freddie Mac | | 1.300 | | 08/23/19 | | 1,800,000 | | 1,795,808 |
| Freddie Mac | | 1.300 | | 09/20/19 | | 111,000 | | 110,664 |
| Freddie Mac | | 1.500 | | 09/27/19 | | 100,000 | | 99,734 |
| Freddie Mac | | 1.250 | | 09/30/19 | | 732,000 | | 729,499 |
| Freddie Mac (f) | | 0.000 | | 10/01/19 | | 135,000 | | 133,901 |
| Freddie Mac | | 1.250 | | 10/02/19 | | 20,810,000 | | 20,734,694 |
| Freddie Mac | | 1.500 | | 10/03/19 | | 100,000 | | 99,711 |
| Freddie Mac (d) | | 2.500 | | 10/28/19 | | 100,000 | | 100,020 |
| Freddie Mac | | 1.650 | | 10/30/19 | | 400,000 | | 398,922 |
| Freddie Mac | | 1.350 | | 11/26/19 | | 3,000,000 | | 2,985,381 |
| Freddie Mac | | 1.750 | | 11/27/19 | | 200,000 | | 199,390 |
| Freddie Mac (f) | | 0.000 | | 11/29/19 | | 9,167,000 | | 9,060,585 |
| Freddie Mac | | 1.500 | | 12/26/19 | | 1,800,000 | | 1,791,226 |
| Freddie Mac | | 1.250 | | 12/30/19 | | 328,000 | | 325,991 |
| Freddie Mac | | 1.375 | | 12/30/19 | | 475,000 | | 472,306 |
| Freddie Mac | | 1.500 | | 12/30/19 | | 500,000 | | 497,223 |
| Freddie Mac (2.000% to 06/30/19, then 2.500%) (d) | | 2.000 | | 12/30/19 | | 675,000 | | 674,819 |
| Freddie Mac | | 1.300 | | 02/13/20 | | 5,495,000 | | 5,456,332 |
| Freddie Mac | | 2.000 | | 02/21/20 | | 130,000 | | 129,658 |
| Freddie Mac | | 1.500 | | 02/24/20 | | 247,000 | | 245,524 |
| Freddie Mac | | 1.800 | | 04/13/20 | | 300,000 | | 298,611 |
| Freddie Mac | | 1.350 | | 04/28/20 | | 150,000 | | 148,695 |
| Freddie Mac (2.000% to 11/18/19, then 3.000%) (d) | | 2.000 | | 05/18/20 | | 100,000 | | 99,915 |
| Freddie Mac (2.000% to 06/12/19, 2.250% to 09/12/19, | | | | | | | | |
| 2.500% to 12/12/19, 2.750% to 3/12/20, then 3.000%) (d) | | 2.000 | | 06/12/20 | | 352,000 | | 351,907 |
| Freddie Mac | | 1.500 | | 06/24/20 | | 2,175,000 | | 2,161,992 |
See Notes to Financial Statements.
33
| BOND FUND SCHEDULE OF INVESTMENTS(Unaudited) (Continued) |
| May 31, 2019 |
| | | | | | | | Shares or | | |
| | | Rate (%) | | Maturity Date | | Principal Amount | | Value |
| BONDS(continued) | | | | | | | | |
| | | | | | | | | |
| U.S. Government & Agency Securities (continued) | | | | | | | | |
| Freddie Mac (1.750% to 07/14/19, then 2.250%) (d) | | 1.750 | | 07/14/20 | | 175,000 | | $174,906 |
| Residual Funding Corp. (f) | | 0.000 | | 10/15/19 | | 81,000 | | 80,269 |
| Residual Funding Corp. (f) | | 0.000 | | 10/15/19 | | 13,819,000 | | 13,693,819 |
| Tennessee Valley Authority | | 2.250 | | 03/15/20 | | 550,000 | | 549,633 |
| U.S. Treasury Bonds | | 1.000 | | 08/31/19 | | 10,000,000 | | 9,964,453 |
| U.S. Treasury Bonds | | 1.250 | | 08/31/19 | | 10,000,000 | | 9,970,703 |
| U.S. Treasury Bonds | | 1.000 | | 09/30/19 | | 3,000,000 | | 2,986,172 |
| U.S. Treasury Bonds | | 1.250 | | 10/31/19 | | 10,000,000 | | 9,954,297 |
| U.S. Treasury Bonds | | 1.500 | | 11/30/19 | | 10,000,000 | | 9,957,031 |
| | | | | | | | | |
| SHORT-TERM INVESTMENTS–1.3% | | | | | | | | 49,892,199 |
| (COST $49,885,515) | | | | | | | | |
| | | | | | | | | |
| Money Market Funds–0.0%^ | | | | | | | | 100,000 |
| First American Government Obligations Fund Class X (a) | | 2.310 | | | | 100,000 | | 100,000 |
| | | | | | | | | |
| U.S. Government & Agency Securities–1.3% | | | | | | | | 49,792,199 |
| U.S. Treasury Bills (b) | | 2.278 | | 06/25/19 | | 25,000,000 | | 24,961,333 |
| U.S. Treasury Bills (b) | | 2.296 | | 07/23/19 | | 5,000,000 | | 4,983,280 |
| U.S. Treasury Bills (b) | | 2.303 | | 09/19/19 | | 5,000,000 | | 4,965,519 |
| U.S. Treasury Bills (b) | | 2.327 | | 10/03/19 | | 15,000,000 | | 14,882,067 |
| | | | | | | | | |
| TOTAL INVESTMENTS–99.1% (COST $3,750,743,774) | | | | | | | | 3,715,801,479 |
| | | | | | | | | |
| NET OTHER ASSETS AND LIABILITIES–0.9% | | | | | | | | 33,201,105 |
| | | | | | | | | |
| NET ASSETS–100.0% | | | | | | | | $3,749,002,584 |
| (a) | Rate shown represents the 7-day yield at May 31, 2019. |
| (b) | Rate shown represents the current coupon rate for corporate bonds and the current yield for U.S. Treasury Bills at May 31, 2019. |
| (c) | Variable rate security. Interest rates reset periodically. Interest rate shown reflects the rate in effect at May 31, 2019. For securities based on a published reference rate and spread, the reference rate and spread are indicated in the description above. Certain variable rate securities are not based on a published reference rate and spread but are determined by the issuer or agent and are based on current market conditions. These securities do not indicate a reference rate and spread in their description above. |
| (d) | Security is a “step-up” bond where the coupon increases or steps up at a predetermined date. Securities which do not indicate a future coupon rate in their description above are at their final coupon rate at May 31, 2019. |
| (e) | Rate is subject to adjustment due to credit ratings service downgrades or subsequent upgrades. |
| (f) | Zero-coupon security. |
| (g) | Perpetual maturity; date shown represents next contractual call date. |
| (h) | Security subject to restrictions on resale under federal securities laws and which therefore may only be resold upon registration under the Securities Act of 1933, as amended, or in transactions exempt from registration, including sales to qualified institutional buyers under Rule 144A of the Securities Act of 1933, as amended. It has been deemed liquid under guidance approved by the Board. At May 31, 2019, the aggregate value of these securities was $1,176,670,091, representing 31.4% of net assets. |
| (i) | When-issued security. At May 31, 2019, the aggregate value of these securities was $1,500,000, representing less than 0.04% of net assets. |
| ^ | Rounds to 0.0%. |
See Notes to Financial Statements.
34
| BOND FUND SCHEDULE OF INVESTMENTS(Unaudited) (Continued) |
| May 31, 2019 |
| Abbreviations: |
| CPI YOY | | Consumer Price Index Year-on-Year Growth Rate |
| IO | | Interest Only Security |
| LIBOR | | London Interbank Offered Rate |
| USISDA02 | | 2-Year Dollar ICE Swap Rate |
| USISDA05 | | 5-Year Dollar ICE Swap Rate |
| USISDA10 | | 10-Year Dollar ICE Swap Rate |
| USISDA30 | | 30-Year Dollar ICE Swap Rate |
| USSW5 | | 5-Year Dollar Semi Annual 30/360 Swap Rate |
| USSW10 | | 10-Year Dollar Semi Annual 30/360 Swap Rate |
| | | |
| A.G. | | Aktiengesellschaft is the German term for a public limited liability corporation. |
| B.V. | | Besloten Vennootschap is the Dutch term for a private limited liability corporation. |
| DAC | | Designated Activity Company |
| N.V. | | Naamloze Vennootschap is the Dutch term for a public limited liability corporation. |
| PLC | | Public Limited Company |
| Pty. Ltd. | | Proprietary Limited Company under Australian law. |
| REIT | | Real Estate Investment Trust |
| REMIC | | Real Estate Mortgage Investment Conduit |
| S.A. | | Designates corporations in various countries, mostly those employing civil law. This translates literally as anonymous company. |
| S.A. de C.V. | | Sociedad Anónima de Capital Variable is the term for limited liability companies in Mexico. |
| SARL | | Société à responsabilité limitée is the Luxembourg term for a limited liability corporation. |
| SCS | | Société en commandite simple is the Luxembourg equivalent of a limited partnership. |
| SRL | | Società a responsabilità limitata is the Italian term for a public limited company. |
The following is a summary of the inputs used to value the Funds’ investments as of May 31, 2019:
| | Level 1 | | Level 2 | | Level 3 | | Total |
| Bonds | | | | | | | | |
| Asset-backed securities | | $– | | $502,548,589 | | $– | | $502,548,589 |
| Commercial mortgage-backed securities | | – | | 146,719,187 | | – | | 146,719,187 |
| Convertible bonds | | – | | 25,849,034 | | – | | 25,849,034 |
| Corporate bonds | | – | | 2,268,183,614 | | – | | 2,268,183,614 |
| Residential mortgage-backed securities | | – | | 3,523,756 | | – | | 3,523,756 |
| Sovereign bonds | | – | | 67,744,824 | | – | | 67,744,824 |
| Taxable municipal bonds | | – | | 104,938,234 | | – | | 104,938,234 |
| Tax-exempt municipal bonds | | – | | 6,121,637 | | – | | 6,121,637 |
| U.S. government agency mortgage-backed securities | | – | | 125,927,914 | | – | | 125,927,914 |
| U.S. government & agency securities | | – | | 414,352,491 | | – | | 414,352,491 |
| Total bonds | | – | | 3,665,909,280 | | – | | 3,665,909,280 |
| Short-term investments | | | | | | | | |
| Money market funds | | 100,000 | | – | | – | | 100,000 |
| U.S. government & agency securities | | – | | 49,792,199 | | – | | 49,792,199 |
| Total short-term investments | | 100,000 | | 49,792,199 | | – | | 49,892,199 |
| Total investments | | $100,000 | | $3,715,701,479 | | $– | | $3,715,801,479 |
The Fund did not invest in any level-3 investments as of and during the six-month period ended May 31, 2019.
For more information on valuation inputs, see financial statement Note 2–Significant Accounting Policies.
See Notes to Financial Statements.
35
| FUND EXPENSE EXAMPLES(Unaudited) |
| May 31, 2019 |
Example
A Fund shareholder may incur two types of costs: (1) transaction costs such as redemption fees; and (2) ongoing costs, including management fees and other Fund expenses. This example is intended to help you understand your ongoing costs (in dollars) of investing in a Fund and to compare these costs with the ongoing costs of investing in other mutual funds.
The example is based on an investment of $1,000 invested at the beginning of the period and held for the entire period from December 1, 2018 to May 31, 2019.
Actual Expenses
The first line of the table below under each Fund provides information about actual account values and actual expenses for such Fund. You may use the information in this line, together with the amount you invested, to estimate the expenses that you paid over the period. Simply divide your account value by $1,000 (for example, an $8,600 account value divided by $1,000 = 8.6), then multiply the result by the number in the first line under the heading entitled “Expenses Paid During Period” to estimate the expenses you paid on your account during this period.
Hypothetical Example for Comparison Purposes
The second line of the table below under each Fund provides information about hypothetical account values and hypothetical expenses based on such Fund’s actual expense ratio and an assumed rate of return of 5% per year before expenses, which is not the Fund’s actual return. The hypothetical account values and expenses may not be used to estimate the actual ending account balance or expenses you paid for the period. You may use this information to compare the ongoing costs of investing in each Fund and other funds. To do so, compare the 5% hypothetical example with the 5% hypothetical examples that appear in the shareholder reports of the other funds.
Please note that the expenses shown in the table are meant to highlight your ongoing costs only and do not reflect any transactional costs, such as redemption fees. Therefore, the second line of the table is useful in comparing ongoing costs only, and will not help you determine the relative costs of owning different funds. In addition, if these transactional costs were included, your costs would have been higher.
| | | | | | | Beginning | | Ending | | | | |
| Six-Month Period Ended May 31, 2019 | | | Expense Ratio | | Account Value | | Account Value | | Expenses Paid |
| | | for the Period | | 12/01/18 | | 05/31/19 | | During the Period* |
| LargeCap Fund | | | | | | | | | | | | | | | | | |
| Actual | | | | 1.03% | | | | $1,000.00 | | | | $983.56 | | | | $5.09 | |
| Hypothetical (5% return before expenses) | | | | 1.03% | | | | $1,000.00 | | | | $1,019.86 | | | | $5.19 | |
| MidCap Fund | | | | | | | | | | | | | | | | | |
| Actual | | | | 1.15% | | | | $1,000.00 | | | | $962.57 | | | | $5.63 | |
| Hypothetical (5% return before expenses) | | | | 1.15% | | | | $1,000.00 | | | | $1,019.27 | | | | $5.79 | |
| Bond Fund | | | | | | | | | | | | | | | | | |
| Actual | | | | 0.71% | | | | $1,000.00 | | | | $1,020.06 | | | | $3.58 | |
| Hypothetical (5% return before expenses) | | | | 0.71% | | | | $1,000.00 | | | | $1,021.46 | | | | $3.58 | |
| * | Expenses are equal to the annualized [net] expense ratio for each Fund, multiplied by the average account value over the period, multiplied by 182/365 (to reflect the one-half year period). |
| | For more information, please refer to the Funds’ Prospectus. |
See Notes to Financial Statements.
36
| STATEMENTS OF ASSETS AND LIABILITIES(Unaudited) |
| May 31, 2019 (In thousands, except per share amounts) |
| | LARGECAP | | MIDCAP | | BOND |
| | FUND | | FUND | | FUND |
| | | | | | | |
| Assets | | | | | | | | | | | | | |
| Total investments in securities, at value (a) | | | $115,927 | | | | | $40,078 | | | | $3,715,801 | |
| Cash | | | – | | | | | 122 | | | | 8,739 | |
| Due from sale of securities | | | 190 | | | | | 25 | | | | 2,972 | |
| Receivable from fund shares sold | | | 2 | | | | | – | | | | 8,826 | |
| Dividends and interest receivable (b) | | | 232 | | | | | 52 | | | | 34,598 | |
| Prepaid expenses | | | 13 | | | | | 13 | | | | 124 | |
| Total assets | | | 116,364 | | | | | 40,290 | | | | 3,771,060 | |
| Liabilities | | | | | | | | | | | | | |
| Due on purchase of securities | | | – | | | | | 171 | | | | 16,594 | |
| Payable for fund shares redeemed | | | 33 | | | | | 5 | | | | 3,169 | |
| Line of credit | | | 36 | | | | | – | | | | – | |
| Accrued expenses payable | | | 31 | | | | | 23 | | | | 183 | |
| Accrued directors expense payable | | | 1 | | | | | 1 | | | | 3 | |
| Due to Advisor | | | 90 | | | | | 27 | | | | 2,108 | |
| Total liabilities | | | 191 | | | | | 227 | | | | 22,057 | |
| Net assets | | | $116,173 | | | | | $40,063 | | | | $3,749,003 | |
| Net assets consist of | | | | | | | | | | | | | |
| Capital stock ($.001 par value) | | | $123,049 | | | | | $39,472 | | | | $3,906,791 | |
| Total distributable earnings (accumulated deficit) | | | (6,876 | ) | | | | 591 | | | | (157,788 | ) |
| Net assets | | | $116,173 | | | | | $40,063 | | | | $3,749,003 | |
| Net asset value per share | | | | | | | | | | | | | |
| Shares of capital stock outstanding (unlimited shares | | | | | | | | | | | | | |
| authorized) | | | 1,787 | | | | | 3,696 | | | | 327,034 | |
| Offering and redemption price | | | $65.02 | | (c) | | | $10.84 | | | | $11.46 | |
| | |
| (a) Cost of investments in securities | | | $122,571 | | | | | $38,937 | | | | $3,750,744 | |
| (b) Net of foreign withholding taxes | | | $6 | | | | | $– | | | | $– | |
(c) | Does not recalculate due to rounding. |
See Notes to Financial Statements.
37
| STATEMENTS OF OPERATIONS(Unaudited) |
| Six-Month Period Ended May 31, 2019 (In thousands) |
| | LARGECAP | | MIDCAP | | BOND |
| | FUND | | FUND | | FUND |
| | | | | | | |
| Investment income | | | | | | | | | | | | |
| Interest | | | $1 | | | | $1 | | | | $77,599 | |
| Dividends | | | 1,261 | | | | 311 | | | | – | |
| Less foreign taxes withheld | | | (15 | ) | | | (3 | ) | | | – | |
| Total investment income | | | 1,247 | | | | 309 | | | | 77,599 | |
| Expenses | | | | | | | | | | | | |
| Investment advisory fees | | | 558 | | | | 203 | | | | 11,055 | |
| Shareholder servicing costs | | | 38 | | | | 14 | | | | 825 | |
| Administrative & accounting services fees | | | 60 | | | | 28 | | | | 505 | |
| Custody fees | | | 6 | | | | 5 | | | | 136 | |
| Directors fees | | | 12 | | | | 11 | | | | 72 | |
| Federal & state registration | | | 18 | | | | 17 | | | | 59 | |
| Professional fees | | | 19 | | | | 19 | | | | 42 | |
| Interest expense from line of credit (see note 2) | | | 1 | | | | 2 | | | | 1 | |
| Other expenses | | | 18 | | | | 14 | | | | 293 | |
| Total expenses | | | 730 | | | | 313 | | | | 12,988 | |
| Less expenses reimbursed by Advisor | | | (121 | ) | | | (80 | ) | | | – | |
| Net expenses | | | 609 | | | | 233 | | | | 12,988 | |
| Net investment income | | | 638 | | | | 76 | | | | 64,611 | |
| Realized and unrealized gain (loss) | | | | | | | | | | | | |
| Net realized gain (loss) on investments | | | (311 | ) | | | (451 | ) | | | (867 | ) |
| Net unrealized appreciation (depreciation) on investments | | | (1,939 | ) | | | (1,648 | ) | | | 25,112 | |
| Net realized and unrealized gain (loss) | | | (2,250 | ) | | | (2,099 | ) | | | 24,245 | |
| Increase (Decrease) in net assets | | | | | | | | | | | | |
| resulting from operations | | | ($1,612 | ) | | | ($2,023 | ) | | | $88,856 | |
See Notes to Financial Statements.
38
| STATEMENTS OF CHANGES IN NET ASSETS |
| (In thousands) |
| | LARGECAP | | MIDCAP | | BOND |
| | FUND | | FUND | | FUND |
| |
| | Six-Month | | | | | | Six-Month | | | | | | Six-Month | | | | |
| | Period Ended | | Year Ended | | Period Ended | | Year Ended | | Period Ended | | Year Ended |
| | May 31, 2019 | | November 30, | | May 31, 2019 | | November 30, | | May 31, 2019 | | November 30, |
| | (Unaudited) | | 2018 | | (Unaudited) | | 2018 | | (Unaudited) | | 2018 |
| Operations | | | | | | | | | | | | | | | | | | | | | | | | |
| Net investment income | | | $638 | | | | $1,031 | | | | $76 | | | | $97 | | | | $64,611 | | | | $97,590 | |
| Net realized gain (loss) on investments | | | (311 | ) | | | (9 | ) | | | (451 | ) | | | 2,276 | | | | (867 | ) | | | (24,455 | ) |
| Net unrealized appreciation (depreciation) | | | | | | | | | | | | | | | | | | | | | | | | |
| on investments | | | (1,939 | ) | | | 1,306 | | | | (1,648 | ) | | | (5,204 | ) | | | 25,112 | | | | (10,607 | ) |
| Net increase (decrease) in net assets | | | | | | | | | | | | | | | | | | | | | | | | |
| resulting from operations | | | (1,612 | ) | | | 2,328 | | | | (2,023 | ) | | | (2,831 | ) | | | 88,856 | | | | 62,528 | |
| Distributions to shareholders | | | | | | | | | | | | | | | | | | | | | | | | |
| Total distributions to shareholders | | | (945 | ) | | | (1,071 | ) | | | (2,338 | ) | | | (3,632 | ) | | | (59,874 | ) | | | (88,362 | ) |
| Net decrease in net assets resulting from | | | | | | | | | | | | | | | | | | | | | | | | |
| distributions to shareholders | | | (945 | ) | | | (1,071 | ) | | | (2,338 | ) | | | (3,632 | ) | | | (59,874 | ) | | | (88,362 | ) |
| Fund share transactions | | | | | | | | | | | | | | | | | | | | | | | | |
| Proceeds from shares sold | | | 2,273 | | | | 5,252 | | | | 2,790 | | | | 2,986 | | | | 790,791 | | | | 1,786,706 | |
| Reinvestment of distributions | | | 910 | | | | 1,042 | | | | 2,305 | | | | 3,593 | | | | 55,809 | | | | 83,667 | |
| Cost of shares redeemed | | | (6,170 | ) | | | (14,839 | ) | | | (5,700 | ) | | | (5,939 | ) | | | (781,773 | ) | | | (809,987 | ) |
| Net increase (decrease) in net assets | | | | | | | | | | | | | | | | | | | | | | | | |
| resulting from fund share | | | | | | | | | | | | | | | | | | | | | | | | |
| transactions | | | (2,987 | ) | | | (8,545 | ) | | | (605 | ) | | | 640 | | | | 64,827 | | | | 1,060,386 | |
| Total increase (decrease) in net assets | | | (5,544 | ) | | | (7,288 | ) | | | (4,966 | ) | | | (5,823 | ) | | | 93,809 | | | | 1,034,552 | |
| Net assets | | | | | | | | | | | | | | | | | | | | | | | | |
| Beginning of year | | | 121,717 | | | | 129,005 | | | | 45,029 | | | | 50,852 | | | | 3,655,194 | | | | 2,620,642 | |
| End of period | | | $116,173 | | | | $121,717 | | | | $40,063 | | | | $45,029 | | | | $3,749,003 | | | | $3,655,194 | |
| |
| Share transactions | | | | | | | | | | | | | | | | | | | | | | | | |
| Shares sold | | | 35 | | | | 77 | | | | 250 | | | | 226 | | | | 69,560 | | | | 156,036 | |
| Shares issued in reinvestment | | | | | | | | | | | | | | | | | | | | | | | | |
| of distributions | | | 16 | | | | 16 | | | | 243 | | | | 274 | | | | 4,933 | | | | 7,331 | |
| Shares redeemed | | | (98 | ) | | | (220 | ) | | | (542 | ) | | | (460 | ) | | | (68,789 | ) | | | (70,819 | ) |
| Net increase (decrease) in fund | | | | | | | | | | | | | | | | | | | | | | | | |
| shares outstanding | | | (47 | ) | | | (127 | ) | | | (49 | ) | | | 40 | | | | 5,704 | | | | 92,548 | |
See Notes to Financial Statements.
39
| NOTES TO FINANCIAL STATEMENTS(Unaudited) |
| May 31, 2019 |
NOTE 1 - ORGANIZATION
Thompson IM Funds, Inc. (the “Company”) is a Wisconsin corporation registered under the Investment Company Act of 1940, as amended (the “1940 Act”), as an open-end, diversified management investment company.
The Company consists of separate mutual funds series (each, a “Fund,” and collectively, the “Funds”): Thompson LargeCap Fund (the “LargeCap Fund”), Thompson MidCap Fund (the “MidCap Fund”) and Thompson Bond Fund (the “Bond Fund”). The assets and liabilities of each Fund are segregated and a shareholder’s interest is limited to the Fund in which the shareholder owns shares. The objectives and strategies of each Fund are described in the Funds’ Prospectus.
NOTE 2 - SIGNIFICANT ACCOUNTING POLICIES
The following is a summary of significant accounting policies followed by the Funds in the preparation of their financial statements. The Funds are investment companies and accordingly follow the investment company accounting and reporting guidance of the Financial Accounting Standards Board (“FASB”) Accounting Standards Codification Topic 946 Financial Services — Investment Companies.
VALUATION POLICY AND PROCEDURES - The Funds’ Board of Directors (the “Funds’ Board”) has adopted methods for valuing securities set forth in the Funds’ Pricing Policies and Procedures, including circumstances in which market quotes are not readily available or deemed to be unreliable, and has delegated authority to the Advisor to apply those methods in making fair value determinations, subject to oversight by the Funds’ Board. The Advisor has established a valuation committee that, along with other Advisor employees, administers, implements, and oversees the fair valuation process and makes fair value decisions. The valuation committee regularly reviews its own fair value decisions, as well as valuations, valuation techniques and services furnished by pricing services; considers circumstances in the markets which may require it to make or adjust valuation determinations; and reviews previous valuation determinations. The valuation committee reports on its activities and any changes to the fair valuation guidelines to the Funds’ Board.
VALUATION MEASUREMENTS – In accordance with generally accepted accounting principles in the United States of America (“GAAP”), fair value is defined as the price that the Fund would receive to sell an investment or pay to transfer a liability in an orderly transaction with an independent buyer in the principal market, or in the absence of a principal market the most advantageous market for the investment or liability. GAAP established a three-tier hierarchy to maximize the use of observable market data and minimize the use of unobservable inputs and to establish classification of fair value measurements for disclosure purposes.
Various inputs are used in determining the value of each Fund’s investments. These inputs are summarized in the three broad levels listed below:
Level 1 – Quoted prices in active markets for identical securities.
Level 2 – Other significant observable inputs (including quoted prices for similar securities, interest rates, prepayment speeds, credit risk, etc.).
Level 3 – Significant unobservable inputs (including the Fund’s own assumptions in determining the fair value of investments).
Inputs may include price information, specific and broad credit data, liquidity statistics, and other factors. The Fund considers observable data to be that market data which is readily available, regularly distributed or updated, reliable and verifiable, not proprietary, and provided by independent sources that are actively involved in the relevant market. The determination of what constitutes “observable” requires significant judgment by the Fund. The categorization of a security within the hierarchy is based upon the pricing transparency of the security and does not necessarily correspond to the Fund’s perceived risk of that security. The inputs used to measure fair value may fall into different levels of the fair valuation hierarchy. In such cases, for disclosure purposes, the level in the fair value hierarchy within which the fair value measurement falls in its entirety is determined based on the lowest level that is significant to the fair value measurement in its entirety.
40
| NOTES TO FINANCIAL STATEMENTS(Unaudited) (Continued) |
| May 31, 2019 |
SECURITY VALUATION - Each Fund’s equity securities, including common stocks, ADRs and REITs, are valued at their market prices (generally the last reported sales price on the exchange where the securities are primarily traded or, for Nasdaq-listed securities, at their Nasdaq Official Closing Prices). If no sales are reported on a particular day, the mean between the highest bid and lowest asked quotations at the close of the exchanges will generally be used. To the extent these securities are actively traded, and valuation adjustments are not applied, they are categorized in level 1 of the fair value hierarchy. When adjustments to observable prices are applied or when the market is considered inactive, securities will be categorized in level 2 of the fair value hierarchy.
Investments in money market mutual funds are generally priced at the ending net asset value provided by the service agent of the funds. These securities will be categorized as level 1 securities.
Fixed-income securities such as corporate bonds, asset-backed securities, mortgage-backed securities, U.S. government and agency securities, sovereign bonds, municipal bonds and commercial paper are typically valued based on valuations published by an independent pricing service, which uses various valuation methodologies such as matrix pricing and other analytical pricing models as well as market transactions and dealer quotations. Factors considered by pricing services include market characteristics such as benchmark yield curves, option-adjusted spreads, credit spreads and fundamental analytical data relating to the issuer. Short-term investments in fixed-income securities (those with remaining maturities of 60 days or less) are generally valued on an amortized cost basis. Fixed-income securities will generally be categorized in level 2 of the fair value hierarchy, in instances where lower relative weight is placed on transaction prices, quotations, or similar observable inputs, they are categorized in level 3.
Where market quotations are not readily available or are unreliable, a value is determined in good faith pursuant to procedures established by the Funds’ Board. When determining the value of a security, consideration is given to the facts and circumstances relevant to the particular situation, which includes factors such as fundamental analytical data relating to the investment, which may include consideration of yields or prices of securities of comparable quality, coupon rate, maturity and type of issue, nature and duration of any restrictions on disposition of the security and an evaluation of forces that influence the market in which the securities are purchased or sold. Fair value pricing is an inherently subjective process, and no single standard exists for determining fair value. Different funds could reasonably arrive at different values for the same security.
SECURITIES TRANSACTIONS AND INVESTMENT INCOME - Investment securities transactions are accounted for on the trade date. Dividend income is recorded on the ex-dividend date. Interest income is recorded as earned. Gains or losses realized on sales of securities are determined by comparing the identified cost of the security lot sold with the net sales proceeds. Discounts/premiums on debt securities purchased are accreted/amortized over the life of the respective securities using the effective interest method for both book and tax purposes. Gains and losses on paydowns of asset-backed and mortgage-backed securities are reflected in interest income on the Statement of Operations. Income and capital gains on some foreign securities may be subject to foreign withholding taxes, which are accrued as applicable, and have been provided for in accordance with the Funds’ understanding of the applicable country’s tax rules and rates. The ability of the issuers of the debt securities held by the Funds to meet their obligations may be affected by economic developments in a specific industry, state, or region. Debt obligations may be placed on non-accrual status and related interest income may be reduced by ceasing current accruals and writing off interest receivables when the collection of all or a portion of interest has become doubtful. A debt obligation is removed from non-accrual status when the issuer resumes interest payments or when collectability of interest is reasonably assured.
EXPENSES - Each Fund is charged for those expenses that are directly attributed to it. Expenses that are not readily identifiable to a specific Fund are generally allocated among the Funds in proportion to the relative sizes of the Funds.
SECURITIES PURCHASED ON A WHEN-ISSUED OR DELAYED-DELIVERY BASIS - Each Fund may purchase securities on a when-issued or delayed-delivery basis. When-issued securities are securities purchased with delivery to occur at a later date at a stated price and/or yield, thereby involving the risk that the price and/or yield obtained may be more or less than those available in the market when delivery takes place. At the time a Fund makes a commitment to purchase a security on a when-issued basis, the Fund records the transaction and reflects the value of the security in determining net asset value. Each Fund designates and maintains cash and marketable securities at least equal in value to commitments for when-issued securities.
41
| NOTES TO FINANCIAL STATEMENTS(Unaudited) (Continued) |
| May 31, 2019 |
LINE OF CREDIT - The Funds have established an unsecured line of credit (“LOC”) with U.S. Bank N.A. which expires November 8, 2019, used primarily to finance redemption payments. Each individual Fund’s borrowing under the LOC is limited to 5% of the value of that Fund’s net assets, 33.33% of the value of the Fund’s investments, or any explicit borrowing limits imposed by the LOC, whatever is less. Interest is charged at the prime rate, which was 5.50% as of May 31, 2019. As of May 31, 2019, the limits established are: LargeCap Fund - $6,000,000, MidCap Fund - $2,300,000 and Bond Fund - $145,000,000. All terms and borrowing limits imposed by the LOC are subject to review and approval by the Funds’ Board. The following table shows the average balance, average interest rate, interest expense, and maximum borrowings incurred by the Funds on the LOC for the six-month period ended May 31, 2019.
| | | | Average | | | | | | Date of |
| | Average | | Interest | | Interest | | Maximum | | Maximum |
| | Balance | | Rate | | Expense | | Borrowing | | Borrowing |
| LargeCap Fund | | $26,747 | | 5.44% | | $735 | | $423,000 | | 12/18/18 |
| MidCap Fund | | $66,753 | | 5.48% | | $1,848 | | $1,900,000 | | 12/20/18 |
| Bond Fund | | $61,901 | | 5.25% | | $1,643 | | $11,266,000 | | 12/05/18 |
USE OF ESTIMATES - The preparation of financial statements in conformity with GAAP requires management to make estimates and assumptions that affect the reported amounts of assets and liabilities and disclosure of contingent assets and liabilities at the date of the financial statements and the reported amounts of revenues and expenses during the reporting period. Actual results could differ from these estimates.
GUARANTEES AND INDEMNIFICATIONS - Under the Funds’ organizational documents, each Director, officer, employee or other agent of the Funds (including the Funds’ investment advisor) is indemnified, to the extent permitted by the 1940 Act, against certain liabilities that may arise out of performance of their duties to the Funds. Additionally, in the normal course of business, the Funds enter into contracts that contain a variety of indemnification clauses. The Funds’ maximum exposure under these arrangements is unknown as this would involve future claims that may be made against the Funds that have not yet occurred. However, the Funds have not had prior claims or losses pursuant to these contracts and believe the risk of loss to be remote.
PERMANENT BOOK AND TAX DIFFERENCES - GAAP requires that permanent financial reporting and tax differences relating to shareholder distributions be reclassified in the capital accounts.
DISTRIBUTIONS TO SHAREHOLDERS - Distributions to shareholders from net investment income and realized gains on securities for the LargeCap Fund and MidCap Fund normally are declared at least annually. Bond Fund distributions to shareholders from net investment income normally are declared on a quarterly basis, and distributions to shareholders from realized gains on securities normally are declared at least annually. Distributions are recorded on the ex-dividend date.
FEDERAL INCOME TAXES - No provision has been made for federal income taxes since the Funds have elected to be taxed as regulated investment companies and intend to distribute substantially all income to shareholders and otherwise comply with the provisions of the Internal Revenue Code applicable to regulated investment companies.
ACCOUNTING FOR UNCERTAINTY IN INCOME TAXES - As of and during the six-month ended May 31, 2019, the Funds did not have a liability for unrecognized tax benefits in the accompanying financial statements. Also, the Funds recognized no interest or penalties related to unrecognized tax benefits during the same period. The Funds recognize interest and penalties, if any, related to unrecognized tax benefits as income tax expense in the Statements of Operations. The Funds are also not aware of any tax positions for which it is reasonably possible that the total amounts of unrecognized tax benefits will significantly change in the next twelve months.
SUBSEQUENT EVENTS - The Funds have evaluated subsequent events through the issuance of the Funds’ financial statements. Other than as described in note 5, there were no additional subsequent events which were deemed to have an impact on the Funds’ financial statements.
42
| NOTES TO FINANCIAL STATEMENTS(Unaudited) (Continued) |
| May 31, 2019 |
NOTE 3 - INVESTMENT ADVISORY AND ADMINISTRATIVE AND ACCOUNTING SERVICES AGREEMENTS AND OTHER TRANSACTIONS WITH AFFILIATES
The Investment Advisory Agreement pursuant to which Thompson Investment Management, Inc. (“TIM” or “Advisor”) is retained by the Funds provides for monthly compensation to TIM computed on average daily net assets at the following annual rates:
| | First | | Over |
| | $50 Million | | $50 Million |
| LargeCap Fund | | 1.00% | | 0.90% |
| MidCap Fund | | 1.00% | | 0.90% |
| Bond Fund | | 0.65% | | 0.60% |
The Advisor is contractually bound to waive management fees and/or reimburse expenses incurred by the Funds through March 31, 2020 so that the annual operating expenses of the Funds do not exceed the following percentages of their respective average daily net assets: LargeCap Fund - 1.03%, MidCap Fund - 1.15% and Bond Fund - 0.80%. For the six-month period ended May 31, 2019, the Advisor reimbursed expenses incurred by the LargeCap Fund and the MidCap Fund in the amounts of $120,665 and $80,190, respectively. The Funds are not obligated to reimburse the Advisor for any fees or expenses waived in previous fiscal years.
As of May 31, 2019, affiliated shareholders held 22.36% of the MidCap Fund’s outstanding shares. Transactions by the shareholders may have a material impact on the Fund.
Pursuant to an Administrative and Accounting Services Agreement, TIM maintains the Funds’ financial records in accordance with the 1940 Act, prepares all necessary financial statements of the Funds and calculates the net asset value per share of the Funds on a daily basis. As compensation for its services, each Fund pays TIM a fee computed daily and payable monthly at the annual rate of 0.15% of average daily net assets up to $30 million, 0.10% of the next $70 million of average daily net assets and 0.025% of average daily net assets in excess of $100 million, with an annual minimum fee of $30,000 per Fund. The calculations of daily net asset value are subcontracted to U.S. Bank Global Fund Services, resulting in fees paid by TIM for the six-month period ended May 31, 2019, in the following amounts:
| | Administrative & |
| | Accounting Fees Paid |
| LargeCap Fund | | | $20,461 | |
| MidCap Fund | | | $18,524 | |
| Bond Fund | | | $169,572 | |
The Funds reimburse the Advisor for a portion of amounts paid by the Advisor out of the Advisor’s own resources under various shareholder, account maintenance, networking and other services provided to the Funds by broker-dealers and other intermediaries. The amount reimbursed by the Funds is equal to (1) for those accounts maintained through a shareholder servicing arrangement, an annual rate of no more than 0.10% of the average daily net assets of the omnibus accounts in the Funds for which all broker-dealers and other intermediaries, in the aggregate, are responsible, and (2) for those accounts maintained through a networking arrangement, no more than $6 per year per account in the Funds for which the broker-dealers and other intermediaries are responsible; provided however, in all cases only one of these fees shall be applicable to the assets in an account. This amount has been determined by the Funds’ Board to approximate (or not to exceed) the transfer agency fees that would otherwise have been payable by the Funds if such broker-dealers and intermediaries did not maintain these accounts. Such amounts are recorded within Shareholder servicing costs on each Fund’s Statement of Operations. For the six-month period ended May 31, 2019, the amounts reimbursed by the Funds to the Advisor were:
| | Intermediary |
| | Fees Reimbursed |
| LargeCap Fund | | | $10,481 | |
| MidCap Fund | | | $1,629 | |
| Bond Fund | | | $545,897 | |
43
| NOTES TO FINANCIAL STATEMENTS(Unaudited) (Continued) |
| May 31, 2019 |
NOTE 4 - PURCHASE AND SALE OF SECURITIES
Investment transactions for the six-month period ended May 31, 2019 were as follows:
| | Securities other than U.S. | | | | |
| | Government and Short-term | | | | |
| | Investments | | U.S. Government Securities |
| | Purchases | | Sales | | Purchases | | Sales |
| LargeCap Fund | | $16,093,821 | | $18,981,739 | | $– | | $– |
| MidCap Fund | | $6,750,159 | | $9,671,414 | | $– | | $– |
| Bond Fund | | $419,309,282 | | $496,726,538 | | $701,684,141 | | $302,522,387 |
NOTE 5 – INCOME TAX INFORMATION
At May 31, 2019, the investment cost and aggregate unrealized appreciation and depreciation on investments for federal income tax purposes were as follows:
| | LARGECAP | | MIDCAP | | BOND |
| | FUND | | FUND | | FUND |
| Federal tax cost | | $122,874,186 | | | $39,189,171 | | | $3,750,897,550 | |
| | | | | | | | | | |
| Unrealized appreciation | | $12,443,656 | | | $7,635,976 | | | $23,760,957 | |
| Unrealized depreciation | | (19,390,343 | ) | | (6,747,143 | ) | | (58,857,028 | ) |
| Net unrealized appreciation (depreciation) | | ($6,946,687 | ) | | $888,833 | | | ($35,096,071 | ) |
| | | | | | | |
| At November 30, 2018, the components of distributable earnings (accumulated deficit) on a tax basis were as follows: |
| | | | | | | |
| | LARGECAP | | MIDCAP | | BOND |
| | FUND | | FUND | | FUND |
| Distributable earnings (accumulated deficit) | | | | | | | | | |
| Net unrealized appreciation (depreciation) | | ($4,758,559 | ) | | $2,615,649 | | | ($60,216,740 | ) |
| Distributable ordinary income | | 802,310 | | | 199,651 | | | 22,885,343 | |
| Distributable long-term capital gains | | – | | | 2,136,809 | | | – | |
| Post-October losses | | – | | | – | | | (723,325 | ) |
| Capital loss carryforwards | | (363,087 | ) | | – | | | (148,714,723 | ) |
| Total distributable earnings | | | | | | | | | |
| (accumulated deficit) | | ($4,319,336 | ) | | $4,952,109 | | | ($186,769,445 | ) |
The tax basis of investments for tax and financial reporting purposes differ principally due to wash sales.
The tax basis post-October losses as of November 30, 2018 and capital loss carryforward as of November 30, 2018, which are not being recognized for tax purposes until the first day of the following fiscal year, are as follows:
| | LARGECAP | | MIDCAP | | BOND |
| | FUND | | FUND | | FUND |
| Post-October losses | | | | | | |
| Short-term | | $– | | $– | | $565,218 |
| Long-term | | – | | – | | 158,107 |
| Total Post-October losses | | $– | | $– | | $723,325 |
| Net capital loss carryforward | | | | | | |
| Short-term | | $– | | $– | | $20,433,977 |
| Long-term | | 363,087 | | – | | 128,280,746 |
| Total capital loss carryforward | | $363,087 | | $– | | $148,714,723 |
44
| NOTES TO FINANCIAL STATEMENTS(Unaudited) (Continued) |
| May 31, 2019 |
Capital losses are carried forward indefinitely and are available to offset future net realized gains, to the extent permitted by the Internal Revenue Code.
The tax components of distributions paid during the six-month period ended May 31, 2019 and the fiscal year ended November 30, 2018 are as follows:
| | LARGECAP | | MIDCAP | | BOND |
| | FUND | | FUND | | FUND |
| Six-month period ended May 31, 2019 (Unaudited) | | | | | | |
| Distributions paid from | | | | | | |
| Ordinary income | | $945,393 | | $201,013 | | $59,874,227 |
| Long-term capital gains | | – | | 2,137,435 | | – |
| Total distributions paid | | $945,393 | | $2,338,448 | | $59,874,227 |
| | | | | | | |
| Fiscal year ended November 30, 2018 | | | | | | |
| Distributions paid from | | | | | | |
| Ordinary income | | $878,543 | | $154,749 | | $88,361,797 |
| Long-term capital gains | | 192,000 | | 3,477,629 | | – |
| Total distributions paid | | $1,070,543 | | $3,632,378 | | $88,361,797 |
The following distributions were declared on June 24, 2019, payable to shareholders on June 25, 2019:
| | LARGECAP | | MIDCAP | | BOND |
| | FUND | | FUND | | FUND |
| | | | | | | |
| Ordinary income distributions | | | | | | |
| Amount | | $– | | $– | | $29,317,675 |
| Per share | | $– | | $– | | $0.09 |
45
The following table presents information relating to a share of capital stock outstanding for the entire period.
| LARGECAP FUND | | Six-Month | | | | | | | | | | | | | | | |
| | Period Ended | | |
| | May 31, 2019 | | Year Ended November 30, |
| | (Unaudited) | | 2018 | | 2017 | | 2016 | | 2015 | | 2014 |
| Per share operating performance | | | | | | | | | | | | | | | | | | |
| Net asset value, beginning of period | | $66.36 | | | $65.77 | | | $57.48 | | | $50.72 | | | $53.40 | | | $46.47 | |
| Income from investment operations | | | | | | | | | | | | | | | | | | |
| Net investment income | | 0.37 | | | 0.55 | | | 0.37 | | | 0.47 | | | 0.35 | | | 0.27 | |
| Net realized and unrealized gains (losses) | | | | | | | | | | | | | | | | | | |
| on investments | | (1.19 | ) | | 0.59 | | | 8.38 | | | 6.64 | | | (2.75 | ) | | 6.84 | |
| Total from investment operations | | (0.82 | ) | | 1.14 | | | 8.75 | | | 7.11 | | | (2.40 | ) | | 7.11 | |
| Less distributions | | | | | | | | | | | | | | | | | | |
| Distributions from net investment income | | (0.52 | ) | | (0.45 | ) | | (0.46 | ) | | (0.35 | ) | | (0.28 | ) | | (0.18 | ) |
| Distributions from net realized gains | | – | | | (0.10 | ) | | – | | | – | | | – | | | – | |
| Total distributions | | (0.52 | ) | | (0.55 | ) | | (0.46 | ) | | (0.35 | ) | | (0.28 | ) | | (0.18 | ) |
| Net asset value, end of period | | $65.02 | | | $66.36 | | | $65.77 | | | $57.48 | | | $50.72 | | | $53.40 | |
| Total return | | (1.13% | )(a) | | 1.72% | | | 15.32% | | | 14.16% | | | (4.52% | ) | | 15.35% | |
| Ratios and supplemental data | | | | | | | | | | | | | | | | | | |
| Net assets, end of period (millions) | | $116.2 | | | $121.7 | | | $129.0 | | | $117.5 | | | $111.9 | | | $128.6 | |
| Ratios to average net assets: | | | | | | | | | | | | | | | | | | |
| Ratios of expenses | | 1.03% | (b) | | 1.05% | | | 1.10% | | | 1.13% | | | 1.15% | | | 1.15% | |
| Ratio of expenses without reimbursement | | 1.23% | (b) | | 1.21% | | | 1.22% | | | 1.25% | | | 1.22% | | | 1.23% | |
| Ratio of net investment income | | 1.07% | (b) | | 0.80% | | | 0.59% | | | 0.90% | | | 0.64% | | | 0.54% | |
| Ratio of net investment income | | | | | | | | | | | | | | | | | | |
| without reimbursement | | 0.87% | (b) | | 0.64% | | | 0.47% | | | 0.78% | | | 0.57% | | | 0.46% | |
| Portfolio turnover rate | | 14% | (a) | | 29% | | | 89% | | | 32% | | | 45% | | | 27% | |
(a) Calculated on a non-annualized basis.
(b) Calculated on an annualized basis.
See Notes to Financial Statements.
46
| FINANCIAL HIGHLIGHTS(Continued) |
| |
The following table presents information relating to a share of capital stock outstanding for the entire period.
| MIDCAP FUND | | Six-Month | | | | | | | | | | | | | | | |
| | Period Ended | | | | | | | | | | | | | | | |
| | May 31, 2019 | | Year Ended November 30, |
| | (Unaudited) | | 2018 | | 2017 | | 2016 | | 2015 | | 2014 |
| Per share operating performance | | | | | | | | | | | | | | | | | | |
| Net asset value, beginning of period | | $12.02 | | | $13.73 | | | $12.53 | | | $12.07 | | | $14.04 | | | $14.04 | |
| Income from investment operations | | | | | | | | | | | | | | | | | | |
| Net investment income (loss) | | 0.02 | | | 0.03 | | | 0.01 | | | 0.01 | | | – | (a) | | – | (a) |
| Net realized and unrealized gains (losses) | | | | | | | | | | | | | | | | | | |
| on investments | | (0.50 | ) | | (0.75 | ) | | 1.78 | | | 1.45 | | | (0.64 | ) | | 1.47 | |
| Total from investment operations | | (0.48 | ) | | (0.72 | ) | | 1.79 | | | 1.46 | | | (0.64 | ) | | 1.47 | |
| Less distributions | | | | | | | | | | | | | | | | | | |
| Distributions from net investment income | | (0.03 | ) | | (0.01 | ) | | (0.01 | ) | | – | (a) | | – | | | – | |
| Distributions from net realized gains | | (0.67 | ) | | (0.98 | ) | | (0.58 | ) | | (1.00 | ) | | (1.33 | ) | | (1.47 | ) |
| Total distributions | | (0.70 | ) | | (0.99 | ) | | (0.59 | ) | | (1.00 | ) | | (1.33 | ) | | (1.47 | ) |
| Net asset value, end of period | | $10.84 | | | $12.02 | | | $13.73 | | | $12.53 | | | $12.07 | | | $14.04 | |
| Total return | | (3.17% | )(b) | | (5.85% | ) | | 14.78% | | | 13.82% | | | (5.10% | ) | | 11.82% | |
| Ratios and supplemental data | | | | | | | | | | | | | | | | | | |
| Net assets, end of period (millions) | | $40.1 | | | $45.0 | | | $50.9 | | | $43.8 | | | $38.4 | | | $41.3 | |
| Ratios to average net assets: | | | | | | | | | | | | | | | | | | |
| Ratios of expenses | | 1.15% | (c) | | 1.15% | | | 1.20% | | | 1.25% | | | 1.30% | | | 1.30% | |
| Ratio of expenses without reimbursement | | 1.55% | (c) | | 1.42% | | | 1.44% | | | 1.50% | | | 1.49% | | | 1.54% | |
| Ratio of net investment income (loss) | | 0.37% | (c) | | 0.19% | | | 0.06% | | | 0.06% | | | 0.01% | | | (0.02% | ) |
| Ratio of net investment loss | | | | | | | | | | | | | | | | | | |
| without reimbursement | | (0.03% | )(c) | | (0.08% | ) | | (0.18% | ) | | (0.19% | ) | | (0.18% | ) | | (0.27% | ) |
| Portfolio turnover rate | | 17% | (b) | | 30% | | | 29% | | | 34% | | | 27% | | | 34% | |
(a) Less than .005 per share.
(b) Calculated on a non-annualized basis.
(c) Calculated on an annualized basis.
See Notes to Financial Statements.
47
| FINANCIAL HIGHLIGHTS(Continued) |
| |
The following table presents information relating to a share of capital stock outstanding for the entire period.
| BOND FUND | | Six-Month | | | | | | | | | | | | | | | |
| | Period Ended | | |
| | May 31, 2019 | | Year Ended November 30, |
| | (Unaudited) | | 2018 | | 2017 | | 2016 | | 2015 | | 2014 |
| Per share operating performance | | | | | | | | | | | | | | | | | | |
| Net asset value, beginning of period | | $11.38 | | | $11.45 | | | $11.22 | | | $10.98 | | | $11.69 | | | $11.91 | |
| Income from investment operations | | | | | | | | | | | | | | | | | | |
| Net investment income | | 0.20 | | | 0.36 | | | 0.35 | | | 0.49 | | | 0.49 | | | 0.45 | |
| Net realized and unrealized gains (losses) | | | | | | | | | | | | | | | | | | |
| on investments | | 0.07 | | | (0.09 | ) | | 0.27 | | | 0.26 | | | (0.72 | ) | | (0.19 | ) |
| Total from investment operations | | 0.27 | | | 0.27 | | | 0.62 | | | 0.75 | | | (0.23 | ) | | 0.26 | |
| Less distributions | | | | | | | | | | | | | | | | | | |
| Distributions from net investment income | | (0.19 | ) | | (0.34 | ) | | (0.39 | ) | | (0.51 | ) | | (0.48 | ) | | (0.45 | ) |
| Distributions from net realized gains | | – | | | – | | | – | | | – | | | – | | | (0.03 | ) |
| Total distributions | | (0.19 | ) | | (0.34 | ) | | (0.39 | ) | | (0.51 | ) | | (0.48 | ) | | (0.48 | ) |
| Net asset value, end of period | | $11.46 | | | $11.38 | | | $11.45 | | | $11.22 | | | $10.98 | | | $11.69 | |
| Total return | | 2.36% | (a) | | 2.37% | | | 5.57% | | | 7.05% | | | (2.04% | ) | | 2.19% | |
| Ratios and supplemental data | | | | | | | | | | | | | | | | | | |
| Net assets, end of period (millions) | | $3,749.0 | | | $3,655.2 | | | $2,620.6 | | | $2,020.5 | | | $2,744.5 | | | $3,724.0 | |
| Ratios to average net assets: | | | | | | | | | | | | | | | | | | |
| Ratios of expenses | | 0.71% | (b) | | 0.71% | | | 0.71% | | | 0.72% | | | 0.71% | | | 0.72% | |
| Ratio of net investment income | | 3.51% | (b) | | 3.21% | | | 3.01% | | | 4.16% | | | 3.98% | | | 4.04% | |
| Portfolio turnover rate | | 17% | (a) | | 39% | | | 43% | | | 20% | | | 29% | | | 21% | |
(a) Calculated on a non-annualized basis.
b) Calculated on an annualized basis.
See Notes to Financial Statements.
48
| ADDITIONAL INFORMATION(Unaudited) |
| |
| THOMPSON IM FUNDS, INC. |
| |
| Investment Advisor |
| Thompson Investment Management, Inc. |
| 918 Deming Way |
| Madison, Wisconsin 53717 |
| |
| Distributor |
| Quasar Distributors, LLC |
| 777 East Wisconsin Avenue |
| Milwaukee, Wisconsin 53202 |
| |
| Transfer Agent |
| U.S. Bank Global Fund Services |
| 615 East Michigan Street |
| Milwaukee, Wisconsin 53202 |
| |
| Independent Registered |
| Public Accounting Firm |
| Cohen & Company, Ltd. |
| 342 North Water Street, Suite 830 |
| Milwaukee, Wisconsin 53202 |
| |
| Legal Counsel |
| Quarles & Brady LLP |
| 411 East Wisconsin Avenue |
| Milwaukee, Wisconsin 53202 |
The Statement of Additional Information contains additional information about the directors and officers of Thompson IM Funds, Inc. and is available without charge, upon request, by calling 1-800-999-0887.
Proxy Voting Policy
A description of the policies and procedures that the Funds use to determine how to vote proxies relating to portfolio securities and information regarding how the Funds actually voted proxies during the most recent 12-month period ended June 30 are available without charge, upon request, by calling 1-800-999-0887, through the Funds’ website at www.thompsonim.com and on the SEC’s website at www.sec.gov.
Information About Portfolio Securities
The Funds file complete schedules of their portfolio holdings with the Securities and Exchange Commission for the Funds’ first and third quarters of its fiscal year on Form N-Q. The Funds’ Forms N-Q are available on the Securities and Exchange Commission’s website at www.sec.gov. The Funds’ Forms N-Q are also available without charge, upon request, by calling 1-800-999-0887.
49
Item 2. Code of Ethics.
Not required in Semi-Annual Reports on Form N-CSR.
Item 3. Audit Committee Financial Expert.
Not required in Semi-Annual Reports on Form N-CSR.
Item 4. Principal Accountant Fees and Services.
Not required in Semi-Annual Reports on Form N-CSR.
Item 5. Audit Committee of Listed Registrants.
Not applicable to this Registrant because it is not a “listed issuer” within the meaning of Rule 10A-3 under the Securities Exchange Act of 1934.
Item 6. Investments.
The required Schedules of Investments in securities of unaffiliated issuers is included as part of the Registrant’s Semi-Annual Report to Shareholders dated as of May 31, 2019 provided under Item 1 of this Form N-CSR.
Item 7. Disclosure of Proxy Voting Policies and Procedures for Closed-End Management Investment Companies.
Not applicable to this Registrant because it is not a closed-end management investment company.
Item 8. Portfolio Managers of Closed-End Management Investment Companies.
Not applicable to this Registrant because it is not a closed-end management investment company.
Item 9. Purchases of Equity Securities by Closed-End Management Investment Companies and Affiliated Purchasers.
Not applicable to this Registrant because it is not a closed-end management investment company.
Item 10. Submission of Matters to a Vote of Securities Holders.
The Registrant has not made any material changes to the procedures by which shareholders may recommend nominees to the Registrant's Board of Directors after the Registrant last provided disclosure in response to the requirements of Item 407(c)(2)(iv) of Regulation S-K or this Item.
2
Item 11. Controls and Procedures.
| (a) | Disclosure Controls and Procedures. Based on an evaluation of the Registrant’s disclosure controls and procedures (as defined in Rule 30a-3(c) under the Investment Company Act of 1940) carried out under the supervision and with the participation of the Registrant’s management, including its principal executive and financial officers, within 90 days prior to the filing date of this report on Form N-CSR, the Registrant’s principal executive and financial officers have concluded that the design and operation of the Registrant’s disclosure controls and procedures are effective in providing reasonable assurance that the information required to be disclosed on Form N-CSR is recorded, processed, summarized and reported within the applicable time periods. |
| |
| (b) | Change in Internal Controls Over Financial Reporting. There were no changes in the Registrant’s internal control over financial reporting (as defined in Rule 30a-3(d) under the Investment Company Act of 1940) that occurred during the Registrant’s second fiscal quarter of the period covered by this Form N-CSR that have materially affected, or are reasonably likely to materially affect, the Registrant’s internal control over financial reporting. |
Item 12. Disclosure of Securities Lending Activities for Closed-End Management Investment Companies.
Not applicable to this Registrant because it is not a closed-end management investment company.
Item 13. Exhibits.
The following exhibits are attached to this Form N-CSR:
| | Exhibit No. | | Description of Exhibit |
| | 12(a)(1) | | The Code of Ethics for the Registrant’s Principal Executive Officer, Principal Financial Officer and Principal Accounting Officer referred to in Item 2 was filed as Exhibit 12(a)(1) to the Registrant’s Certified Shareholder Report on Form N-CSR filed on January 28, 2005, and is incorporated herein by reference |
| | 12(a)(2)-1 | | Certification of Principal Executive Officer Required by Section 302 of the Sarbanes-Oxley Act of 2002 |
| | 12(a)(2)-2 | | Certification of Principal Financial Officer Required by Section 302 of the Sarbanes-Oxley Act of 2002 |
| | 12(b) | | Certification of Chief Executive Officer and Chief Financial Officer Required by Section 906 of the Sarbanes-Oxley Act of 2002 |
3
SIGNATURES
Pursuant to the requirements of the Securities Exchange Act of 1934 and the Investment Company Act of 1940, the Registrant has duly caused this report to be signed on its behalf by the undersigned, thereunto duly authorized, on this 31stday of July, 2019.
| THOMPSON IM FUNDS, INC. |
| |
| By: | /s/ Jason L. Stephens | |
| | Jason L. Stephens, Chief Executive |
| | Officer |
Pursuant to the requirements of the Securities Exchange Act of 1934 and the Investment Company Act of 1940, this report has been signed below by the following persons on behalf of the Registrant and in the capacities indicated on this 31stday of July, 2019.
| By: | /s/ Jason L. Stephens | |
| | Jason L. Stephens, Chief Executive |
| | Officer (Principal Executive Officer) |
| |
| By: | /s/ Penny Hubbard | |
| | Penny Hubbard, Chief Financial |
| | Officer (Principal Financial Officer) |
4