UNITED STATES
SECURITIES AND EXCHANGE COMMISSION
Washington, D.C. 20549
FORM N-CSR
CERTIFIED SHAREHOLDER REPORT OF REGISTERED
MANAGEMENT
INVESTMENT COMPANIES
Investment Company Act File Number 811-4946
THOMPSON IM FUNDS, INC.
(Exact name of registrant as specified in charter)
1255 Fourier Drive, Suite 200
Madison, Wisconsin 53717
(Address of principal executive offices)--(Zip code)
Jason L. Stephens
Chief Executive Officer
Thompson IM Funds, Inc.
1255 Fourier Drive, Suite 200
Madison, Wisconsin 53717
(Name and address of agent for service)
With a copy to:
Matthew C. Vogel, Esq.
Quarles & Brady LLP
411 East Wisconsin Avenue
Milwaukee, Wisconsin 53202
Registrant's telephone number, including area code: (608) 827-5700
Date of fiscal year end: November 30, 2021
Date of reporting period: May 31, 2021
Form N-CSR is to be used by management investment companies to file reports with the Commission not later than 10 days after the transmission to stockholders of any report that is required to be transmitted to stockholders under Rule 30e-1 under the Investment Company Act of 1940 (17 CFR 270.30e-1). The Commission may use the information provided on Form N-CSR in its regulatory, disclosure review, inspection and policymaking roles.
A registrant is required to disclose the information specified by Form N-CSR, and the Commission will make this information public. A registrant is not required to respond to the collection of information contained in Form N-CSR unless the Form displays a currently valid Office of Management and Budget ("OMB") control number. Please direct comments concerning the accuracy of the information collection burden estimate and any suggestions for reducing the burden to Secretary, Securities and Exchange Commission, 450 Fifth Street, N.W., Washington, DC 20549-0609. The OMB has reviewed this collection of information under the clearance requirements of 44 U.S.C. § 3507.
Item 1. Reports to Stockholders.
Item 1(a):
THOMPSON IM FUNDS, INC.
SEMI-ANNUAL REPORT TO SHAREHOLDERS
NOTE ON FORWARD-LOOKING STATEMENTS
The matters discussed in this report may constitute forward-looking statements. These include any Advisor or portfolio manager predictions, assessments, analyses or outlooks for individual securities, industries, investment styles, market sectors, interest rates, economic trends and/or markets. These statements involve risks and uncertainties. In addition to the general risks described for each Fund in its current Prospectus, other factors bearing on these reports include the accuracy of the Advisor’s or portfolio manager’s forecasts and predictions, the appropriateness of the investment strategies designed by the Advisor or portfolio manager and the ability of the Advisor or portfolio manager to implement its strategies efficiently and successfully. Any one or more of these factors, as well as other risks affecting the securities markets generally, could cause the actual results of any Fund to differ materially as compared to its benchmarks.
THOMPSON IM FUNDS, INC.
SEMI-ANNUAL REPORT TO SHAREHOLDERS
May 31, 2021
CONTENTS
| | Page(s) |
| LargeCap Fund | | |
| Investment review | | 2-4 |
| Schedule of investments | | 5-8 |
| |
| MidCap Fund | | |
| Investment review | | 9-11 |
| Schedule of investments | | 12-16 |
| |
| Bond Fund | | |
| Investment review | | 17-19 |
| Schedule of investments | | 20-33 |
| |
| Fund Expense Examples | | 34 |
| |
| Financial Statements | | |
| Statements of assets and liabilities | | 35 |
| Statements of operations | | 36 |
| Statements of changes in net assets | | 37 |
| Notes to financial statements | | 38-44 |
| Financial highlights | | 45-47 |
| |
| Additional Information | | 48-49 |
This report contains information for existing shareholders of Thompson IM Funds, Inc. It
does not constitute an offer to sell. This Semi-Annual Report is authorized for distribution to prospective investors
only when preceded or accompanied by a Fund Prospectus, which contains information about
the Funds’ objectives and policies, risks, management, expenses and other information.
A Prospectus can be obtained by calling 1-800-999-0887.
Please read your Prospectus carefully.
1
| LARGECAP FUND INVESTMENT REVIEW (Unaudited) |
| May 31, 2021 |
| Portfolio Managers |
| James T. Evans, CFA |
| Jason L. Stephens, CFA |
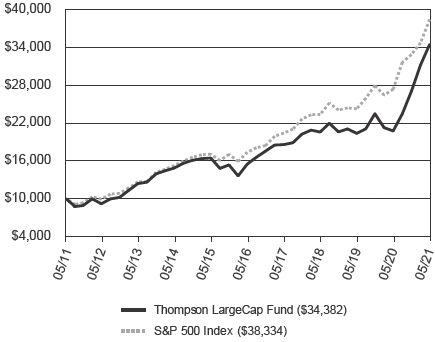
Performance
The LargeCap Fund produced a total return of 27.43% for the six-months ended May 31, 2021, as compared to its benchmark, the S&P 500 Index, which returned 16.95%.
| Comparison of Change in Value of a Hypothetical $10,000 Investment |
| Average Annual Total Returns |
| Through 05/31/21 |
| | 1 Year | | 3 Year | | 5 Year | | 10 Year |
| Thompson LargeCap Fund | | 65.87% | | 18.70% | | 17.28% | | 13.14% |
| S&P 500 Index | | 40.32% | | 18.00% | | 17.16% | | 14.38% |
Gross Expense Ratio as of 03/31/21 was 1.23%.
Net Expense Ratio after reimbursement as of 03/31/21 was 0.99%*
| * | The Advisor has contractually agreed to waive management fees and/or reimburse expenses incurred by the LargeCap Fund through March 31, 2022, so that the annual operating expenses of the Fund do not exceed 0.99% of its average daily net assets. Net expense ratios are current as of the most recent Prospectus and are applicable to investors. |
Performance data quoted represents past performance; past performance does not guarantee future results. The investment return and principal value of an investment will fluctuate so that an investor’s shares, when redeemed, may be worth more or less than their original cost. Current performance of the Fund may be lower or higher than the performance quoted. Performance data current to the most recent month-end may be obtained by calling 1-800-999-0887 or visiting www.thompsonim.com.
Results include the reinvestment of all dividends and capital gains distributions. Investment performance reflects all fee waivers that may be in effect. In the absence of such waivers, total return would be reduced. The performance information reflected in the graph and the table above does not reflect the deduction of taxes that a shareholder would pay on fund distributions or the redemption of fund shares, nor does it imply future performance. The S&P 500 Index is an unmanaged index commonly used to measure the performance of U.S. stocks. You cannot directly invest in an index.
The S&P 500 Index is a product of S&P Dow Jones Indices LLC and has been licensed for use by Thompson Investment Management, Inc. S&P® and S&P 500® are registered trademarks of Standard & Poor’s Financial Services LLC (“S&P”). The Thompson IM Funds are not sponsored, endorsed, sold or promoted by S&P Dow Jones Indices LLC, Dow Jones, S&P or their respective affiliates, and none of S&P Dow Jones Indices LLC, Dow Jones, S&P nor their respective affiliates make any representation regarding the advisability of investing in such products.
See Notes to Financial Statements.
2
| LARGECAP FUND INVESTMENT REVIEW (Unaudited) (Continued) |
| May 31, 2021 |
Management Commentary
We’ve frequently discussed the unusual valuation gap that emerged between Value and Growth stocks over the last several years. The reversal of this trend started in late 2020, and continued through the semi-annual period. Our positioning the portfolio to favor Value stocks has contributed significantly to the competitive risk-adjusted performance over the last 6 months.
It wasn’t just this portfolio tilt toward Value that contributed to performance during this period. The Fund outperformed its benchmark in every sector but one, and surpassed the S&P 500 Value Index’s 21.78% return by 5.65%. It’s also important to remember that the Fund only favors Value presently – it still maintains a significant exposure to Growth stocks. Knowing this, we would not have anticipated beating the S&P 500 Value Index by a relatively wide margin during a time when the Value style was leading the market higher.
Key to understanding the rest of the Fund’s performance during the period– beyond strong security selection – is the average size of the stocks in its portfolio. While solidly a large-cap portfolio overall, the Fund’s weighted average market capitalization is currently somewhat lower than that of its peers. The Fund has less exposure to large and giant companies, and more exposure to medium and small companies, than many of these peers. This composition has helped the Fund’s performance recently, as small- and mid-cap stocks have accelerated their appreciation in anticipation of a reopened economy and likely fiscal stimulus.
While in the near-term the rotation from Growth to Value could pause, we still see a significant valuation gap between the two styles relative to historical valuations, and believe this trend may continue over the intermediate-term. It’s also probable that small-company momentum may slow to some degree. Still, while it’s unlikely that the Fund will achieve the same level of outperformance in the rest of the fiscal year as it did during the semi-annual period, we believe the portfolio’s structure remains compelling. According to current sell-side analyst average earnings estimates, the Fund’s underlying earnings growth potential is similar to that of its benchmark, with an aggregate valuation that is lower1. We have positioned the Fund with the goal of remaining competitive should valuation mean-reversion continue as the economy recovers.
Opinions expressed are subject to change, are not guaranteed and should not be considered investment advice.
Mutual fund investing involves risk. Principal loss is possible. Investments in smaller companies involve additional risks such as limited liquidity and greater volatility. Investments in American Depositary Receipts (“ADRs”) are subject to some extent to the risks associated with directly investing in securities of foreign issuers, including the risk of changes in currency exchange rates, expropriation or nationalization of assets, and the impact of political, diplomatic, or social events. Investments in real estate securities may involve greater risk and volatility including greater exposure to economic downturns and changes in real estate values, rents, property taxes, and tax and other laws. A real estate investment trust’s (REIT’s) share price may decline because of adverse developments affecting the real estate industry.
Please refer to the Schedule of Investments on page 5 of this report for holdings information. The management commentary above as well as Fund holdings and asset/sector allocations should not be considered a recommendation to buy or sell any security. In addition, please note that Fund holdings and asset/sector allocations are subject to change.
The S&P 500 Value Index is a market capitalization weighted index. It consists of stocks within the S&P 500 Index that exhibit strong value characteristics - the ratios of book value, earnings, and sales to price.
Earnings Growth is a measure of growth in a company’s net income over a specific period, often one year. It is not a prediction of the Fund’s future returns.
See Notes to Financial Statements.
3
| LARGECAP FUND INVESTMENT REVIEW (Unaudited) (Continued) |
| May 31, 2021 |
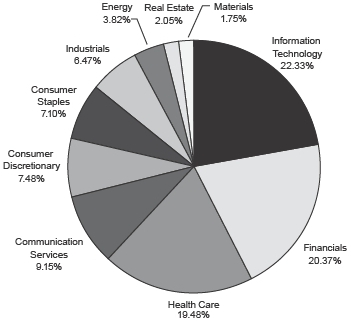
| Sector Weightings at 05/31/21 |
| % of Total Investments |
| Top 10 Equity Holdings at 05/31/21 |
| | % of Fund’s |
| Company | Industry | Net Assets |
| Alphabet, Inc. Class A | Interactive Media & Services | 4.11% |
| Microsoft Corp. | Software | 2.98% |
| General Electric Co. | Industrial Conglomerates | 2.77% |
| Bank of America Corp. | Banks | 2.77% |
| Citigroup, Inc. | Banks | 2.62% |
| JPMorgan Chase & Co. | Banks | 2.35% |
| Alliance Data Systems Corp. | IT Services | 2.21% |
| Facebook, Inc. | Interactive Media & Services | 2.17% |
| Cisco Systems, Inc. | Communications Equipment | 2.15% |
| Walgreens Boots Alliance, Inc. | Food & Staples Retailing | 2.14% |
As of May 31, 2021, 99.8% of the Fund’s net assets were in equity and short-term investments.
See Notes to Financial Statements.
4
| LARGECAP FUND SCHEDULE OF INVESTMENTS (Unaudited) |
| May 31, 2021 |
| | Shares | | Value |
| COMMON STOCKS - 99.8% | | | | $ | 171,082,657 |
| (COST $109,641,730) | | | | | |
| | | | | | |
| Communication Services - 9.1% | | | | | 15,645,629 |
| Interactive Media & Services - 6.3% | | | | | |
| Alphabet, Inc. Class A (a) | | 2,990 | | | 7,046,981 |
| Facebook, Inc. Class A (a) | | 11,325 | | | 3,722,867 |
| Media - 2.8% | | | | | |
| Discovery, Inc. Class A (a) | | 66,450 | | | 2,133,710 |
| ViacomCBS, Inc. Class B | | 64,641 | | | 2,742,071 |
| | | | | | |
| Consumer Discretionary - 7.5% | | | | | 12,800,784 |
| Distributors - 1.8% | | | | | |
| LKQ Corp. (a) | | 59,700 | | | 3,042,312 |
| Hotels, Restaurants & Leisure - 2.3% | | | | | |
| Darden Restaurants, Inc. | | 3,000 | | | 429,690 |
| Las Vegas Sands Corp. (a) | | 38,150 | | | 2,203,162 |
| Starbucks Corp. | | 10,825 | | | 1,232,751 |
| Household Durables - 0.8% | | | | | |
| TopBuild Corp. (a) | | 6,825 | | | 1,351,691 |
| Internet & Direct Marketing Retail - 1.0% | | | | | |
| eBay, Inc. | | 28,995 | | | 1,765,216 |
| Multiline Retail - 1.1% | | | | | |
| Target Corp. | | 8,135 | | | 1,845,994 |
| Specialty Retail - 0.5% | | | | | |
| Bed Bath & Beyond, Inc. (a) | | 33,225 | | | 929,968 |
| | | | | | |
| Consumer Staples - 7.1% | | | | | 12,151,973 |
| Beverages - 0.7% | | | | | |
| MGP Ingredients, Inc. | | 17,500 | | | 1,219,575 |
| Food & Staples Retailing - 3.1% | | | | | |
| Sysco Corp. | | 21,200 | | | 1,717,200 |
| Walgreens Boots Alliance, Inc. | | 69,750 | | | 3,673,034 |
| Food Products - 1.8% | | | | | |
| Kraft Heinz Co/The | | 70,225 | | | 3,061,108 |
| Household Products - 1.5% | | | | | |
| Kimberly-Clark Corp. | | 18,993 | | | 2,481,056 |
| | | | | | |
| Energy - 3.8% | | | | | 6,538,317 |
| Energy Equipment & Services - 0.4% | | | | | |
| Schlumberger Ltd. | | 24,244 | | | 759,565 |
| Oil, Gas & Consumable Fuels - 3.4% | | | | | |
| Chevron Corp. | | 10,820 | | | 1,123,008 |
| Devon Energy Corp. | | 25,425 | | | 675,288 |
| EOG Resources, Inc. | | 9,475 | | | 761,222 |
| Exxon Mobil Corp. | | 29,470 | | | 1,720,163 |
| Pioneer Natural Resources Co. | | 9,850 | | | 1,499,071 |
See Notes to Financial Statements.
5
| LARGECAP FUND SCHEDULE OF INVESTMENTS (Unaudited) (Continued) |
| May 31, 2021 |
| | Shares | | Value |
| COMMON STOCKS (continued) | | | | |
| | | | | |
| Financials - 20.3% | | | | $34,853,533 |
| Banks - 12.1% | | | | |
| Bank of America Corp. | | 111,825 | | 4,740,262 |
| Citigroup, Inc. | | 57,140 | | 4,497,489 |
| Citizens Financial Group, Inc. | | 26,625 | | 1,328,588 |
| JPMorgan Chase & Co. | | 24,520 | | 4,027,165 |
| The PNC Financial Services Group, Inc. | | 7,695 | | 1,498,063 |
| Truist Financial Corp. | | 15,432 | | 953,389 |
| Wells Fargo & Co. | | 54,075 | | 2,526,384 |
| Zions Bancorporation | | 19,550 | | 1,131,554 |
| Capital Markets - 6.3% | | | | |
| Charles Schwab Corp/The | | 38,800 | | 2,865,380 |
| Northern Trust Corp. | | 20,985 | | 2,543,172 |
| State Street Corp. | | 36,800 | | 3,200,864 |
| The Goldman Sachs Group, Inc. | | 5,900 | | 2,194,918 |
| Consumer Finance - 0.9% | | | | |
| Discover Financial Services | | 13,520 | | 1,585,355 |
| Insurance - 1.0% | | | | |
| Fidelity National Financial, Inc. | | 37,475 | | 1,760,950 |
| | | | | |
| Health Care - 19.5% | | | | 33,329,777 |
| Biotechnology - 4.2% | | | | |
| AbbVie, Inc. | | 22,225 | | 2,515,869 |
| Amgen, Inc. | | 6,475 | | 1,540,662 |
| Exact Sciences Corp. (a) | | 22,150 | | 2,448,240 |
| MiMedx Group Inc. (a) | | 57,600 | | 615,744 |
| Health Care Equipment & Supplies - 0.7% | | | | |
| Abbott Laboratories | | 10,175 | | 1,186,914 |
| Health Care Providers & Services - 8.2% | | | | |
| Cigna Corp. | | 8,975 | | 2,323,179 |
| CVS Health Corp. | | 36,975 | | 3,196,119 |
| HCA Healthcare, Inc. | | 10,075 | | 2,164,009 |
| McKesson Corp. | | 16,385 | | 3,152,310 |
| UnitedHealth Group, Inc. | | 7,700 | | 3,171,784 |
| Pharmaceuticals - 6.4% | | | | |
| Bristol-Myers Squibb Co. | | 50,725 | | 3,333,647 |
| Johnson & Johnson | | 10,125 | | 1,713,656 |
| Merck & Co., Inc. | | 21,525 | | 1,633,532 |
| Pfizer, Inc. | | 87,050 | | 3,371,447 |
| Viatris, Inc. | | 63,167 | | 962,665 |
See Notes to Financial Statements.
6
| LARGECAP FUND SCHEDULE OF INVESTMENTS (Unaudited) (Continued) |
| May 31, 2021 |
| | Shares | | Value |
| COMMON STOCKS (continued) | | | | |
| | | | | |
| Industrials - 6.5% | | | | $11,067,666 |
| Aerospace & Defense - 0.9% | | | | |
| General Dynamics Corp. | | 8,175 | | 1,552,514 |
| Air Freight & Logistics - 1.3% | | | | |
| FedEx Corp. | | 6,750 | | 2,124,968 |
| Industrial Conglomerates - 3.4% | | | | |
| 3M Co. | | 5,400 | | 1,096,416 |
| General Electric Co. | | 338,000 | | 4,752,280 |
| Machinery - 0.9% | | | | |
| Wabtec Corp. | | 18,626 | | 1,541,488 |
| | | | | |
| Information Technology - 22.3% | | | | 38,197,930 |
| Communications Equipment - 3.3% | | | | |
| Cisco Systems, Inc. | | 69,810 | | 3,692,949 |
| Lumentum Holdings, Inc. (a) | | 10,125 | | 823,871 |
| Viavi Solutions, Inc. (a) | | 58,735 | | 1,029,625 |
| Electronic Equipment, Instruments & Components - 3.0% | | | | |
| Corning, Inc. | | 46,850 | | 2,044,066 |
| II-VI, Inc. (a) | | 33,050 | | 2,226,578 |
| Keysight Technologies, Inc. (a) | | 6,450 | | 918,351 |
| IT Services - 4.6% | | | | |
| Alliance Data Systems Corp. | | 31,300 | | 3,788,865 |
| Fiserv, Inc. (a) | | 19,149 | | 2,205,965 |
| PayPal Holdings, Inc. (a) | | 4,635 | | 1,205,193 |
| Visa, Inc. Class A | | 3,250 | | 738,725 |
| Semiconductors & Semiconductor Equipment - 4.8% | | | | |
| Infineon Technologies A.G. ADR | | 58,775 | | 2,379,800 |
| NXP Semiconductors NV | | 10,300 | | 2,177,626 |
| Qualcomm, Inc. | | 27,080 | | 3,643,343 |
| Software - 4.7% | | | | |
| Microsoft Corp. | | 20,476 | | 5,112,447 |
| Oracle Corp. | | 37,775 | | 2,974,404 |
| Technology Hardware, Storage & Peripherals - 1.9% | | | | |
| Apple, Inc. | | 25,970 | | 3,236,122 |
| | | | | |
| Materials - 1.7% | | | | 2,992,536 |
| Metals & Mining - 1.7% | | | | |
| Freeport-McMoRan, Inc. | | 70,050 | | 2,992,536 |
| | | | | |
| Real Estate - 2.0% | | | | 3,504,512 |
| Equity Real Estate Investment - 1.3% | | | | |
| Simon Property Group, Inc. | | 17,600 | | 2,261,424 |
| Real Estate Management & Development - 0.7% | | | | |
| Colliers International Group, Inc. | | 11,200 | | 1,243,088 |
See Notes to Financial Statements.
7
| LARGECAP FUND SCHEDULE OF INVESTMENTS (Unaudited) (Continued) |
| May 31, 2021 |
| | Shares | | Value |
| SHORT-TERM INVESTMENTS - 0.0%^ | | | | $364 |
| (COST $364) | | | | |
| | | | | |
| Money Market Funds - 0.0%^ | | | | 364 |
| First American Government Obligations Fund Class X, 0.026% (b) | | 364 | | 364 |
| | | | | |
| TOTAL INVESTMENTS - 99.8% (COST $109,642,094) | | | | 171,083,021 |
| | | | | |
| NET OTHER ASSETS AND LIABILITIES - 0.2% | | | | 284,309 |
| | | | | |
| NET ASSETS - 100.0% | | | | $171,367,330 |
(a) Non-income producing security.
(b) Rate shown represents the current coupon rate at May 31, 2021.
^ Rounds to 0.0%.
Abbreviations:
| ADR | American Depositary Receipt |
| A.G. | Aktiengesellschaft is the German term for a public limited liability corporation. |
| N.V. | Naamloze Vennootschap is the Dutch term for a public limited liability corporation. |
The Global Industry Classification Standard (“GICS”) was developed by and is the exclusive property and a service mark of MSCI Inc. (“MSCI”) and Standard & Poor’s Financial Services LLC (“S&P”) and is licensed for use by Thompson Investment Management, Inc. Neither MSCI, S&P, nor any other party involved in making or compiling the GICS or any GICS classifications makes any warranties with respect thereto or the results to be obtained by the use thereof, and no such party shall have any liability whatsoever with respect thereto.
The following is a summary of the inputs used to value the Funds’ investments as of May 31, 2021:
| | Level 1 | | Level 2 | | Level 3 | | Total |
| Common stocks | | | | | | | | |
| Communication services | | $15,645,629 | | $– | | $– | | $15,645,629 |
| Consumer discretionary | | 12,800,784 | | – | | – | | 12,800,784 |
| Consumer staples | | 12,151,973 | | – | | – | | 12,151,973 |
| Energy | | 6,538,317 | | – | | – | | 6,538,317 |
| Financials | | 34,853,533 | | – | | – | | 34,853,533 |
| Health care | | 33,329,777 | | – | | – | | 33,329,777 |
| Industrials | | 11,067,666 | | – | | – | | 11,067,666 |
| Information technology | | 38,197,930 | | – | | – | | 38,197,930 |
| Materials | | 2,992,536 | | – | | – | | 2,992,536 |
| Real estate | | 3,504,512 | | – | | – | | 3,504,512 |
| Total common stocks | | 171,082,657 | | – | | – | | 171,082,657 |
| Short-term investments | | | | | | | | |
| Money market funds | | 364 | | – | | – | | 364 |
| Total short-term investments | | 364 | | – | | – | | 364 |
| Total investments | | $171,083,021 | | $– | | $– | | $171,083,021 |
The Fund did not invest in any level-3 investments as of and during the six-month period ended May 31, 2021.
For more information on valuation inputs, see financial statement Note 2 - Significant Accounting Policies.
See Notes to Financial Statements.
8
| MIDCAP FUND INVESTMENT REVIEW (Unaudited) |
May 31, 2021 |
Portfolio Managers
James T. Evans, CFA
Jason L. Stephens, CFA
Performance
The MidCap Fund produced a total return of 36.51% for the six-months ended May 31, 2021, as compared to its benchmark, the Russell Midcap Index, which returned 19.93%.
| Comparison of Change in Value of a Hypothetical $10,000 Investment |
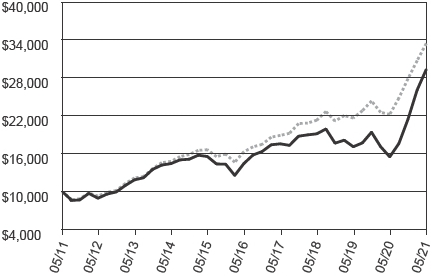
 | Thompson MidCap Fund ($29,352) |
 | Russell Midcap Index ($33,447) |
Average Annual Total Returns |
Through 05/31/21
| | 1 Year | | 3 Year | | 5 Year | | 10 Year |
| Thompson MidCap Fund | | 88.69% | | 15.22% | | 15.16% | | 11.37% |
| Russell Midcap Index | | 50.29% | | 16.15% | | 15.39% | | 12.83% |
Gross Expense Ratio as of 03/31/21 was 1.53%.
Net Expense Ratio after reimbursement as of 03/31/21 was 1.15%.*
*The Advisor has contractually agreed to waive management fees and/or reimburse expenses incurred by the MidCap Fund through March 31, 2022, so that the annual operating expenses of the Fund do not exceed 1.15% of its average daily net assets. Net expense ratios are current as of the most recent Prospectus and are applicable to investors.
Performance data quoted represents past performance; past performance does not guarantee future results. The investment return and principal value of an investment will fluctuate so that an investor’s shares, when redeemed, may be worth more or less than their original cost. Current performance of the Fund may be lower or higher than the performance quoted. Performance data current to the most recent month-end may be obtained by calling 1-800-999-0887 or visiting www.thompsonim.com.
Results include the reinvestment of all dividends and capital gains distributions. Investment performance reflects all fee waivers that may be in effect. In the absence of such waivers, total return would be reduced. The performance information reflected in the graph and the table above does not reflect the deduction of taxes that a shareholder would pay on fund distributions or the redemption of fund shares, nor does it imply future performance. The Russell Midcap Index measures the performance of the 800 smallest companies in the Russell 1000 Index based on total market capitalization. You cannot directly invest in an index.
FTSE Russell is the source and owner of the trademarks, service marks, and copyrights related to the Russell Indexes. “FTSE®” and “Russell®” are trademarks of the London Stock Exchange Group.
See Notes to Financial Statements.
9
| MIDCAP FUND INVESTMENT REVIEW (Unaudited) (Continued) |
| May 31, 2021 |
Management Commentary
We’ve frequently discussed the unusual valuation gap that emerged between Value and Growth stocks over the last several years. The reversal of this trend started in late 2020, and continued through the semi-annual period. Our positioning the portfolio to favor Value stocks has contributed significantly to its competitive risk-adjusted performance over the last 6 months.
There is, however, more to the story. The Fund outperformed in every sector, and didn’t just beat its primary benchmark. It also performed well against the Russell MidCap Value Index’s 26.44% return for the period, besting that index by 10.07%. Though the Fund is tilted toward Value, it still maintains exposure to some Growth stocks. That the Fund outperformed the pure Value version of its benchmark by this wide of a margin during a period when Value significantly outperformed Growth was certainly unexpected. So what explains the rest of the Fund’s competitive performance?
The performance of companies within the portfolio was broadly positive, with the worst-performing stock subtracting a mere -0.21% from the Fund’s overall performance for the period. However, the top contributors to performance added significantly more than the average. These stocks were spread across multiple sectors and industries. The primary thing they have in common is that they were unusually depressed during the market selloff a year ago. As the market bounced over the last 6 months, they had farther to go to recover their losses. In some cases, a little good news allowed them to not only bounce back but reach multi-year highs. Essentially, we saw some of our worst performers from last year come roaring back … and then some.
While in the near-term the rotation from Growth to Value could pause, we still see a significant valuation gap between the two styles relative to historical valuations, and believe this trend will likely continue over the intermediate-term. We also believe that while we now have fewer severely depressed stocks in the portfolio after the Fund’s recent bounce, the portfolio’s valuation in aggregate is compelling. In other words, though we’d be surprised to see the Fund’s recent outperformance repeat itself to the same degree for the second half of the fiscal year, we have positioned the Fund with the goal of remaining competitive should valuation mean-reversion continue amidst a general economic recovery.
Opinions expressed are subject to change, are not guaranteed and should not be considered investment advice.
Mutual fund investing involves risk. Principal loss is possible. Midcap companies tend to have more limited liquidity and greater volatility than large-capitalization companies. Investments in American Depositary Receipts (“ADRs”) are subject to some extent to the risks associated with directly investing in securities of foreign issuers, including the risk of changes in currency exchange rates, expropriation or nationalization of assets, and the impact of political, diplomatic, or social events. Investments in real estate securities may involve greater risk and volatility including greater exposure to economic downturns and changes in real estate values, rents, property taxes, and tax and other laws. A real estate investment trust’s (REIT’s) share price may decline because of adverse developments affecting the real estate industry.
Please refer to the Schedule of Investments on page 12 of this report for holdings information. The management commentary above as well as Fund holdings and asset/sector allocations should not be considered a recommendation to buy or sell any security. In addition, please note that Fund holdings and asset/sector allocations are subject to change.
The Russell Midcap Value Index measures the performance of those Russell Midcap companies with lower price-to-book ratios and lower forecasted growth values.
Earnings Growth is a measure of growth in a company’s net income over a specific period, often one year. It is not a prediction of the Fund’s future returns.
See Notes to Financial Statements.
10
| MIDCAP FUND INVESTMENT REVIEW (Unaudited) (Continued) |
| May 31, 2021 |
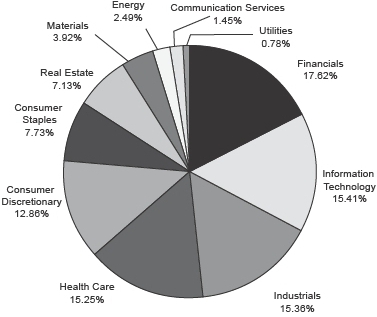
Sector Weightings at 05/31/21 |
| % of Total Investments |
Top 10 Equity Holdings at 05/31/21 |
| | % of Fund’s |
| Company | Industry | Net Assets |
| Alliance Data Systems Corp. | IT Services | 3.37% |
| First Horizon National Corp. | Banks | 2.49% |
| LKQ Corp. | Distributors | 2.27% |
| Walgreens Boots Alliance, Inc. | Food & Staples Retailing | 1.98% |
| Zions Bancorporation | Banks | 1.90% |
| Newell Brands, Inc. | Household Durables | 1.87% |
| Discover Financial Services | Consumer Finance | 1.80% |
| Northern Trust Corp. | Capital Markets | 1.79% |
| Jazz Pharmaceuticals PLC | Pharmaceuticals | 1.71% |
| Associated Banc-Corp | Banks | 1.66% |
As of May 31, 2021, 99.3% of the Fund’s net assets were in equity and short-term investments.
See Notes to Financial Statements.
11
| MIDCAP FUND SCHEDULE OF INVESTMENTS (Unaudited) |
| May 31, 2021 |
| | Shares | | Value |
| COMMON STOCKS - 99.1% | | | | $ | 64,284,855 |
| (COST $38,351,101) | | | | | |
| |
| Communication Services - 1.4% | | | | | 930,696 |
| Entertainment - 0.6% | | | | | |
| Take-Two Interactive Software, Inc. (a) | | 2,150 | | | 398,954 |
| Media - 0.8% | | | | | |
| Discovery, Inc. Class A (a) | | 16,560 | | | 531,742 |
| |
| Consumer Discretionary - 12.8% | | | | | 8,280,452 |
| Distributors - 2.3% | | | | | |
| LKQ Corp. (a) | | 28,950 | | | 1,475,292 |
| Hotels, Restaurants & Leisure - 1.0% | | | | | |
| Noodles & Co. (a) | | 49,332 | | | 635,396 |
| Household Durables - 2.7% | | | | | |
| Newell Brands, Inc. | | 42,226 | | | 1,211,463 |
| TopBuild Corp. (a) | | 2,590 | | | 512,950 |
| Internet & Direct Marketing Retail - 1.2% | | | | | |
| Duluth Holdings, Inc. Class B (a) | | 50,325 | | | 810,233 |
| Leisure Products - 1.2% | | | | | |
| Callaway Golf Co. (a) | | 22,000 | | | 812,240 |
| Specialty Retail - 1.4% | | | | | |
| Bed Bath & Beyond, Inc. (a) | | 10,680 | | | 298,933 |
| Urban Outfitters, Inc. (a) | | 15,520 | | | 607,763 |
| Textiles, Apparel & Luxury Goods - 3.0% | | | | | |
| Hanesbrands, Inc. | | 25,555 | | | 499,345 |
| Levi Strauss & Co. Class A | | 13,700 | | | 366,612 |
| Skechers U.S.A., Inc. Class A (a) | | 22,110 | | | 1,050,225 |
| |
| Consumer Staples - 7.7% | | | | | 4,976,675 |
| Beverages - 2.5% | | | | | |
| MGP Ingredients, Inc. | | 10,794 | | | 752,234 |
| Molson Coors Brewing Co. Class B (a) | | 14,805 | | | 863,427 |
| Food & Staples Retailing - 2.9% | | | | | |
| Performance Food Group Co. (a) | | 11,900 | | | 596,547 |
| Walgreens Boots Alliance, Inc. | | 24,395 | | | 1,284,641 |
| Food Products - 1.4% | | | | | |
| Kraft Heinz Co/The | | 21,100 | | | 919,749 |
| Household Products - 0.9% | | | | | |
| Energizer Holdings, Inc. | | 12,165 | | | 560,077 |
| |
| Energy - 2.5% | | | | | 1,602,853 |
| Energy Equipment & Services - 0.2% | | | | | |
| Helmerich & Payne, Inc. | | 3,510 | | | 99,158 |
| Oil, Gas & Consumable Fuels - 2.3% | | | | | |
| Cameco Corp. | | 15,200 | | | 303,544 |
| Cheniere Energy, Inc. (a) | | 7,145 | | | 606,610 |
| Pioneer Natural Resources Co. | | 3,900 | | | 593,541 |
See Notes to Financial Statements.
12
| MIDCAP FUND SCHEDULE OF INVESTMENTS (Unaudited) (Continued) |
| May 31, 2021 |
| | Shares | | Value |
| COMMON STOCKS (continued) | | | | | |
| |
| Financials - 17.3% | | | | $ | 11,246,642 |
| Banks - 8.9% | | | | | |
| Associated Banc-Corp | | 46,758 | | | 1,074,966 |
| Citizens Financial Group, Inc. | | 16,625 | | | 829,588 |
| First Horizon National Corp. | | 84,605 | | | 1,613,416 |
| Regions Financial Corp. | | 17,585 | | | 411,665 |
| Truist Financial Corp. | | 10,091 | | | 623,422 |
| Zions Bancorporation | | 21,345 | | | 1,235,449 |
| Capital Markets - 3.6% | | | | | |
| Charles Schwab Corp/The | | 5,750 | | | 424,638 |
| Northern Trust Corp. | | 9,580 | | | 1,160,999 |
| State Street Corp. | | 8,625 | | | 750,202 |
| Consumer Finance - 1.8% | | | | | |
| Discover Financial Services | | 9,979 | | | 1,170,138 |
| Insurance - 0.9% | | | | | |
| Fidelity National Financial, Inc. | | 12,140 | | | 570,459 |
| Mortgage Real Estate Investment Trusts (REITs) - 1.0% | | | | | |
| Annaly Capital Management, Inc. | | 70,000 | | | 648,900 |
| Thrifts & Mortgage Finance - 1.1% | | | | | |
| Flagstar Bancorp, Inc. | | 16,000 | | | 732,800 |
| |
| Health Care - 15.1% | | | | | 9,820,472 |
| Biotechnology - 3.3% | | | | | |
| Alexion Pharmaceuticals, Inc. (a) | | 4,100 | | | 723,855 |
| Exact Sciences Corp. (a) | | 5,665 | | | 626,152 |
| MiMedx Group Inc. (a) | | 20,015 | | | 213,960 |
| Neurocrine Biosciences, Inc. (a) | | 4,430 | | | 426,255 |
| Xencor, Inc. (a) | | 3,600 | | | 138,456 |
| Health Care Equipment & Supplies - 0.7% | | | | | |
| Accelerate Diagnostics, Inc. (a) | | 60,900 | | | 462,231 |
| Health Care Providers & Services - 6.3% | | | | | |
| Acadia Healthcare Co., Inc. (a) | | 14,260 | | | 917,774 |
| AMN Healthcare Services, Inc. (a) | | 8,150 | | | 722,905 |
| Hanger, Inc. (a) | | 24,200 | | | 625,086 |
| Henry Schein, Inc. (a) | | 2,730 | | | 207,589 |
| McKesson Corp. | | 1,945 | | | 374,199 |
| Premier, Inc. Class A | | 19,830 | | | 654,390 |
| Universal Health Services, Inc. Class B | | 3,900 | | | 622,557 |
| Pharmaceuticals - 4.8% | | | | | |
| Aerie Pharmaceuticals, Inc. (a) | | 32,405 | | | 527,877 |
| Bausch Health Cos, Inc. (a) | | 25,675 | | | 825,708 |
| Jazz Pharmaceuticals PLC (a) | | 6,220 | | | 1,107,969 |
| Viatris, Inc. | | 42,225 | | | 643,509 |
See Notes to Financial Statements.
13
| MIDCAP FUND SCHEDULE OF INVESTMENTS (Unaudited) (Continued) |
| May 31, 2021 |
| | Shares | | Value |
| COMMON STOCKS (continued) | | | | |
| |
| Industrials - 15.2% | | | | $9,892,139 |
| Building Products - 1.8% | | | | |
| AO Smith Corp. | | 9,880 | | 702,172 |
| Trane Technologies Plc | | 2,650 | | 493,960 |
| Commercial Services & Supplies - 0.9% | | | | |
| Steelcase, Inc. Class A | | 41,875 | | 605,931 |
| Construction & Engineering - 2.8% | | | | |
| MasTec, Inc. (a) | | 8,590 | | 999,275 |
| WillScot Mobile Mini Holdings Corp. (a) | | 27,241 | | 789,989 |
| Electrical Equipment - 0.8% | | | | |
| Regal Beloit Corp. | | 3,405 | | 484,293 |
| Machinery - 8.2% | | | | |
| Evoqua Water Technologies Corp. (a) | | 25,000 | | 778,000 |
| Hillenbrand, Inc. | | 14,750 | | 672,600 |
| Ingersoll Rand, Inc. (a) | | 2,272 | | 112,782 |
| Kornit Digital Ltd. (a) | | 3,015 | | 314,163 |
| Mueller Water Products, Inc. Class A | | 30,225 | | 437,356 |
| Oshkosh Corp. | | 5,910 | | 776,810 |
| REV Group, Inc. | | 39,995 | | 748,706 |
| SPX Corp. (a) | | 4,495 | | 281,522 |
| SPX Flow, Inc. | | 13,845 | | 950,182 |
| WABTEC Corp. | | 3,225 | | 266,901 |
| Trading Companies & Distributors - 0.7% | | | | |
| Hudson Technologies, Inc. (a) | | 169,325 | | 477,497 |
| |
| Information Technology - 15.3% | | | | 9,919,183 |
| Communications Equipment - 1.5% | | | | |
| Lumentum Holdings, Inc. (a) | | 6,275 | | 510,596 |
| Viavi Solutions, Inc. (a) | | 28,771 | | 504,356 |
| Electronic Equipment, Instruments & Components - 2.9% | | | | |
| Corning, Inc. | | 13,200 | | 575,916 |
| II-VI, Inc. (a) | | 11,140 | | 750,502 |
| Keysight Technologies, Inc. (a) | | 3,815 | | 543,180 |
| IT Services - 5.0% | | | | |
| Alliance Data Systems Corp. | | 18,035 | | 2,183,136 |
| Black Knight, Inc. (a) | | 5,890 | | 432,267 |
| Fiserv, Inc. (a) | | 5,243 | | 603,994 |
| Semiconductors & Semiconductor Equipment - 3.5% | | | | |
| Infineon Technologies A.G. ADR | | 15,855 | | 641,969 |
| Marvell Technology, Inc. | | 13,150 | | 635,145 |
| NXP Semiconductors NV | | 4,805 | | 1,015,873 |
| Software - 1.2% | | | | |
| SS&C Technologies Holdings, Inc. | | 10,300 | | 760,861 |
| Technology Hardware, Storage & Peripherals - 1.2% | | | | |
| CPI Card Group, Inc. (a) | | 21,064 | | 397,057 |
| Pure Storage, Inc. Class A (a) | | 19,125 | | 364,331 |
See Notes to Financial Statements.
14
| MIDCAP FUND SCHEDULE OF INVESTMENTS (Unaudited) (Continued) |
| May 31, 2021 |
| | Shares | | Value |
| COMMON STOCKS (continued) | | | | |
| |
| Materials - 3.9% | | | | $2,523,166 |
| Containers & Packaging - 2.0% | | | | |
| Berry Global Group, Inc. (a) | | 10,000 | | 682,100 |
| Crown Holdings, Inc. | | 5,830 | | 601,889 |
| Metals & Mining - 1.9% | | | | |
| Freeport-McMoRan, Inc. | | 24,885 | | 1,063,087 |
| Lundin Mining Corp. | | 16,350 | | 176,090 |
| |
| Real Estate - 7.1% | | | | 4,588,351 |
| Equity Real Estate Investment - 5.3% | | | | |
| Diamondrock Hospitality Co. (a) | | 52,225 | | 505,538 |
| Host Hotels & Resorts, Inc. (a) | | 24,225 | | 415,943 |
| Iron Mountain, Inc. | | 18,635 | | 811,368 |
| Kimco Realty Corp. | | 27,310 | | 581,976 |
| Service Properties Trust (a) | | 28,505 | | 358,023 |
| Simon Property Group, Inc. | | 5,710 | | 733,678 |
| Real Estate Management & Development - 1.8% | | | | |
| Colliers International Group, Inc. | | 7,100 | | 788,029 |
| FirstService Corp. | | 2,425 | | 393,796 |
| |
| Utilities - 0.8% | | | | 504,226 |
| Electric Utilities - 0.2% | | | | |
| Xcel Energy, Inc. | | 2,080 | | 147,430 |
| Multi-Utilities - 0.6% | | | | |
| MDU Resources Group, Inc. | | 10,600 | | 356,796 |
| |
| SHORT-TERM INVESTMENTS - 0.2% | | | | 100,000 |
| (COST $100,000) | | | | |
| |
| Money Market Funds - 0.2% | | | | 100,000 |
| First American Government Obligations Fund Class X, 0.026% (b) | | 100,000 | | 100,000 |
| |
| TOTAL INVESTMENTS - 99.3% (COST $38,451,101) | | | | 64,384,855 |
| |
| NET OTHER ASSETS AND LIABILITIES - 0.7% | | | | 479,871 |
| |
| NET ASSETS - 100.0% | | | | $64,864,726 |
| (a) | Non-income producing security. |
| (b) | Represents the 7-day yield at May 31, 2021. |
| ^ | Rounds to 0.0%. |
| Abbreviations: |
| ADR | American Depositary Receipt |
| A.G. | Aktiengesellschaft is the German term for a public limited liability corporation. |
| N.V. | Naamloze Vennootschap is the Dutch term for a public limited liability corporation. |
| PLC | Public Limited Company |
See Notes to Financial Statements.
15
| MIDCAP FUND SCHEDULE OF INVESTMENTS (Unaudited) (Continued) |
| May 31, 2021 |
The Global Industry Classification Standard (“GICS”) was developed by and is the exclusive property and a service mark of MSCI Inc. (“MSCI”) and Standard & Poor’s Financial Services LLC (“S&P”) and is licensed for use by Thompson Investment Management, Inc. Neither MSCI, S&P, nor any other party involved in making or compiling the GICS or any GICS classifications makes any warranties with respect there to or the results to be obtained by the use thereof, and no such party shall have any liability whatsoever with respect thereto.
The following is a summary of the inputs used to value the Funds’ investments as of May 31, 2021:
| | Level 1 | | Level 2 | | Level 3 | | Total |
| Common stocks | | | | | | | | |
| Communication services | | $930,696 | | $– | | $– | | $930,696 |
| Consumer discretionary | | 8,280,452 | | – | | – | | 8,280,452 |
| Consumer staples | | 4,976,675 | | – | | – | | 4,976,675 |
| Energy | | 1,602,853 | | – | | – | | 1,602,853 |
| Financials | | 11,246,642 | | – | | – | | 11,246,642 |
| Health care | | 9,820,472 | | – | | – | | 9,820,472 |
| Industrials | | 9,892,139 | | – | | – | | 9,892,139 |
| Information technology | | 9,919,183 | | – | | – | | 9,919,183 |
| Materials | | 2,523,166 | | – | | – | | 2,523,166 |
| Real estate | | 4,588,351 | | – | | – | | 4,588,351 |
| Utilities | | 504,226 | | – | | – | | 504,226 |
| Total common stocks | | 64,284,855 | | – | | – | | 64,284,855 |
| Short-term investments | | | | | | | | |
| Money market funds | | 100,000 | | – | | – | | 100,000 |
| Total short-term investments | | 100,000 | | – | | – | | 100,000 |
| Total investments | | $64,384,855 | | $– | | $– | | $64,384,855 |
The Fund did not invest in any level-3 investments as of and during the six-month period ended May 31, 2021
For more information on valuation inputs, see financial statement Note 2 - Significant Accounting Policies.
See Notes to Financial Statements.
16
| BOND FUND INVESTMENT REVIEW (Unaudited) |
| May 31, 2021 |
| Portfolio Managers |
| James T. Evans, CFA |
| Jason L. Stephens, CFA |
Performance
The Bond Fund produced a total return of 6.08% for the six-months ended May 31, 2021, as compared to its benchmark, the Bloomberg Barclays U.S. Government/Credit 1-5 Year Index, which returned 0.08%, and as compared to the Bloomberg Barclays U.S. Credit 1-5 Year Index, which returned 0.51%.
| Comparison of Change in Value of a Hypothetical $10,000 Investment |
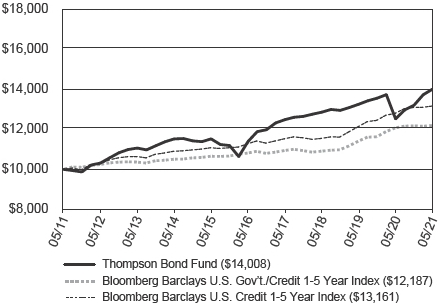
| Average Annual Total Returns |
| Through 05/31/21 |
| | 1 Year | | 3 Year | | 5 Year | | 10 Year |
| Thompson Bond Fund | | 11.85% | | 2.90% | | 4.22% | | 3.43% |
| Bloomberg Barclays U.S. Gov’t./Credit 1-5 Year Index | | 0.97% | | 3.76% | | 2.42% | | 2.00% |
| Bloomberg Barclays U.S. Credit 1-5 Year Index | | 2.84% | | 4.46% | | 3.14% | | 2.79% |
| Gross Expense Ratio as of 03/31/21 was 0.72%. | 30-Day SEC Yield as of 5/31/21 was 3.53%. |
Performance data quoted represents past performance; past performance does not guarantee future results. The investment return and principal value of an investment will fluctuate so that an investor’s shares, when redeemed, may be worth more or less than their original cost. Current performance of the Fund may be lower or higher than the performance quoted. Performance data current to the most recent month-end may be obtained by calling 1-800-999-0887 or visiting www.thompsonim.com.
Results include the reinvestment of all dividends and capital gains distributions. Investment performance reflects all fee waivers that may have been in effect. In the absence of such waivers, total return would have been reduced. The performance information reflected in the graph and the table above does not reflect the deduction of taxes that a shareholder would pay on fund distributions or the redemption of fund shares, nor does it imply future performance. The Bloomberg Barclays U.S. Government/Credit 1-5 Year Index is a market-value-weighted index of all investment-grade bonds with maturities of more than one year and less than 5 years. The Bloomberg Barclays U.S. Credit 1-5 Year Index is a market-value-weighted index which includes virtually every major investment-grade rated corporate bond with 1-5 years remaining until maturity that serves as a supplementary benchmark. You cannot directly invest in an index.
Bloomberg® is a trademark and service mark of Bloomberg Finance L.P. Barclays® is a trademark and service mark of Barclays Bank PLC.
See Notes to Financial Statements.
17
| BOND FUND INVESTMENT REVIEW (Unaudited) (Continued) |
| May 31, 2021 |
Management Commentary
The semi-annual time period was a solid start to the fiscal year for shareholders, as the Fund managed a nice gain relative to its benchmark despite the impact of higher interest rates. Returns were strongest among asset-backed, commercial mortgage, and hybrid holdings. More importantly, the Fund avoided losses on Treasury bonds and corporate bonds with very narrow spreads. Rising rates pushed many of these bonds into a loss for the period, which dragged down the overall return of the Fund’s primary and supplementary benchmarks.
While it is unlikely that the second half of the fiscal year will directly repeat the first half, we believe the Fund is well positioned if rates continue to steadily rise throughout the rest of the period. The 30-day SEC yield of the Fund was 3.53% at the end of May. The income received from this yield might be high enough to help counteract the effects of rising interest rates. There are also holdings held by the Fund as of the end of the period that have not fully recovered from COVID-related impacts. To the degree that a continued rollout of vaccines and fiscal stimulus lead to better economic outcomes, these bonds have the potential to appreciate, possibly even to a complete recovery.
More broadly, we feel this fiscal year could be shaping up as a validation of the Fund’s willingness to freely exchange interest rate and credit risk at different points depending on the reward being offered by the market, with credit risk favored to interest-rate risk over much of the past decade. As the first half of the fiscal year shows, it’s very possible to lose money on Treasury bonds if rates rise on a duration-adjusted basis faster than the pace at which coupon income is earned. For newly issued Treasuries, those coupons have been quite low relative to historical coupons. It has been years since many investors experienced meaningful losses due to rising interest rates. While outside our Fund’s investment category, we feel intermediate-and long-term strategies that rely on significant Treasury weightings are very vulnerable to this risk. The current 30-year Treasury bond has a modified duration of roughly 21.7, suggesting even a 1% rise in interest rates from here would roughly result in losses approaching 22%. Even the current 10-year Treasury bond has a modified duration of over 9. Rather than take that risk for a fairly low reward, it is our opinion that shorter corporate holdings such as those held by the Fund as of the end of the period are a more attractive investment option. While the credit risk is greater, the interest-rate risk is smaller. Measured on a per-unit basis of risk (i.e., the impact that a 100-basis point change in rates or spreads would have), we believe our approach may offer a more attractive risk/reward tradeoff.
Of course, if rates rise fast enough our Fund is exposed to losses from rising rates too. But in that scenario the short duration of the Fund will likely provide a degree of protection relative to some of the Fund’s peers, as a greater percentage of our holdings will likely be maturing than those of funds with longer-maturity strategies. This would allow us to reallocate money to potentially take advantage of higher rates faster than they can. Altogether, this is why we feel the Fund is well positioned for an environment where rates may continue to steadily rise.
Opinions expressed are subject to change, are not guaranteed and should not be considered investment advice.
Mutual fund investing involves risk. Principal loss is possible. Investments in debt securities typically decrease in value when interest rates rise. The risk is usually greater for longer-term debt securities. Investments in bonds of foreign issuers involve greater volatility, political and economic risks, and differences in accounting methods. Investment by the Fund in lower-rated and non-rated securities presents a greater risk of loss to principal and interest than higher-rated securities.
Please refer to the Schedule of Investments on page 20 of this report for holdings information. The management commentary above as well as Fund holdings should not be considered a recommendation to buy or sell any security. In addition, please note that Fund holdings are subject to change.
The federal government guarantees interest payments from government securities while dividend payments carry no such guarantee. Government securities, if held to maturity, guarantee the timely payment of principal and interest.
Basis Point is a unit that is equal to 1/100th of 1%, and is used to denote the change in a financial instrument. The basis point is commonly used for calculating changes in interest rates, equity indexes and the yield of a fixed-income security.
Coupon is the annual interest rate paid on a bond, expressed as a percentage of the face value and paid from issue date until maturity.
Duration is a commonly used measure of the potential volatility of the price of a debt security, or the aggregate market value of a portfolio of debt securities, prior to maturity. Securities with a longer duration generally have more volatile prices than securities of comparable quality with a shorter duration.
SEC Yield is a standardized yield computed by dividing the net investment income per share earned during the 30-day period prior to quarter-end and was created to allow for fairer comparisons among bond funds.
Spread is the percentage point difference between yields of various classes of bonds compared to treasury bonds.
Yield is the income earned from a bond, which takes into account the sum of the interest payment, the redemption value at the bond’s maturity, and the initial purchase price of the bond.
See Notes to Financial Statements.
18
| BOND FUND INVESTMENT REVIEW (Unaudited) (Continued) |
| May 31, 2021 |
Although the makeup of the Bond Fund’s portfolio is constantly changing, as of May 31, 2021, 53.62% of the Fund’s portfolio was invested in corporate bonds. Due to prevailing market conditions, the percentage of corporate bonds held in the Fund’s portfolio over the past 5 years has generally equaled or exceeded the percentage of corporate bonds held in the Fund’s portfolio as of that date. In addition, as of that date 31.09% of the Fund’s portfolio was invested in securities rated BBB by Standard & Poor’s, while an additional 9.34% of the Fund’s portfolio was rated below investment-grade and 44.24% of the Fund’s portfolio was not rated by Standard & Poor’s. Additional information regarding the ratings of securities held in the Fund’s portfolio, including information pertaining to securities that have not been rated by Standard & Poor’s but have been rated by another Nationally Recognized Statistical Credit Rating Organization, is reflected in the quality composition table below. For portfolio information current as of the most recent quarter-end, please call 1-800-999-0887 or visit our website at www.thompsonim. com. Compared to a portfolio that is more evenly allocated between government and corporate bonds, a portfolio that is heavily allocated to corporate bonds may provide higher returns but is also subject to greater levels of credit and liquidity risk and to greater price fluctuations. A portfolio that is significantly allocated to bonds having lower and below-investment-grade ratings may also be subject to greater levels of credit and liquidity risk and experience greater price fluctuations than a portfolio comprised of higher-rated investment-grade bonds.
| Asset Allocation at 05/31/21 |
| (Includes cash equivalents) |
| % of Total Investments |
| Corporate Bonds | | 53.62% |
| Asset-Backed Securities | | 14.72% |
| Commercial Mortgage-Backed Securities | | 13.96% |
| U.S. Government & Agency Securities | | 10.19% |
| U.S. Government Agency Mortgage-Backed Securities | | 4.73% |
| Convertible Bonds | | 2.01% |
| Sovereign Bonds | | 0.47% |
| Taxable Municipal Bonds | | 0.19% |
| Residential Mortgage-Backed Securities | | 0.11% |
| | 100.00% |
| Quality Composition at 05/31/21^ |
| (Includes cash equivalents) |
| % of Total Investments |
| U.S. Government & Agency Issues | | 14.92% |
| AAA | | 1.99% |
| AA | | 3.03% |
| A | | 13.23% |
| BBB | | 50.90% |
| BB and Below | | 13.99% |
| Not Rated | | 1.94% |
| | 100.00% |
| ^ | The Bond Fund’s quality composition is calculated using ratings from Standard & Poor’s. If Standard & Poor’s does not rate a holding then Moody’s is used. If Standard & Poor’s and Moody’s do not rate a holding then Fitch is used. For certain securities that are not rated by any of these three agencies, credit ratings from other Nationally Recognized Statistical Credit Rating Organization (NRSRO) agencies may be used. Not rated category includes holdings that are not rated by any NRSRO. All ratings are as of 05/31/21. |
| Top 10 Bond Holdings by Issuer at 05/31/21 |
| % of Fund’s Net Assets |
| U.S. Treasury Bills | | 9.89% |
| Ginnie Mae REMIC Trust | | 3.47% |
| COMM Mortgage Trust | | 2.50% |
| General Electric Co. | | 1.88% |
| Lincoln National Corp. | | 1.84% |
| Morgan Stanley Bank of America Merrill Lynch Trust | | 1.74% |
| AmTrust Financial Services, Inc. | | 1.57% |
| Arbor Realty Trust, Inc. | | 1.52% |
| WFRBS Commercial Mortgage Trust | | 1.50% |
| JPMBB Commercial Mortgage Securities Trust | | 1.46% |
See Notes to Financial Statements.
19
| BOND FUND SCHEDULE OF INVESTMENTS (Unaudited) |
| May 31, 2021 |
| | | Rate (%) | | Maturity Date | | Principal Amount | | Value |
| BONDS - 89.0% | | | | | | | | $ 2,250,200,785 |
| | (COST $2,334,177,143) | | | | | | | | |
| | | | | | | | | |
| Asset-Backed Securities - 14.5% | | | | | | | | 368,051,726 |
| AASET Trust, Series 2018-2A A (g) | | 4.454 | | 11/18/38 | | 840,147 | | 843,008 |
| Air Canada, Series 2015-1B (g) | | 3.875 | | 09/15/24 | | 1,464,298 | | 1,472,562 |
| American Airlines, Series 2013-2 A | | 4.950 | | 07/15/24 | | 273,608 | | 276,347 |
| American Airlines, Series 2014-1 B | | 4.375 | | 04/01/24 | | 87,028 | | 86,843 |
| American Airlines, Series 2015-1 B | | 3.700 | | 11/01/24 | | 2,282,422 | | 2,229,346 |
| American Airlines, Series 2016-1 B | | 5.250 | | 07/15/25 | | 1,181,195 | | 1,152,566 |
| American Airlines, Series 2017-1 A | | 4.000 | | 08/15/30 | | 402,500 | | 391,054 |
| Aqua Finance Trust, Series 2017-A C (g) | | 8.350 | | 11/15/35 | | 1,750,000 | | 1,828,623 |
| Blackbird Capital Aircraft Lease Securitization Ltd., Series 2016-1A A (g) | | 4.213 | | 12/16/41 | | 2,402,604 | | 2,384,241 |
| Blackbird Capital Aircraft Lease Securitization Ltd., Series 2016-1A B (g) | | 5.682 | | 12/16/41 | | 1,286,501 | | 1,253,719 |
| Burlington Northern and Santa Fe Railway Co. Trust, Series 2002-1 | | 5.943 | | 01/15/23 | | 647 | | 663 |
| Business Jet Securities, LLC, Series 2019-1 B (g) | | 5.193 | | 07/15/34 | | 1,522,637 | | 1,535,009 |
| Cajun Global LLC, Series 2017-1A A2 (g) | | 6.500 | | 08/20/47 | | 20,240,000 | | 20,344,843 |
| Castle Aircraft Securitization Trust, Series 2021-1A B (g) | | 6.656 | | 01/15/46 | | 5,797,726 | | 6,062,970 |
| Cibolo Canyons Special Improvement District (g) | | 4.250 | | 08/20/34 | | 2,520,000 | | 2,167,200 |
| Coinstar Funding, LLC, Series 2017-1A A2 (g) | | 5.216 | | 04/25/47 | | 27,163,200 | | 27,277,307 |
| DCAL Aviation Finance Ltd., Series 2015-1A A1 (g) | | 4.213 | | 02/15/40 | | 1,343,601 | | 1,103,683 |
| Delta Air Lines, Series 2007-1 B | | 8.021 | | 02/10/24 | | 976,218 | | 1,032,619 |
| ECAF I Ltd., Series 2015-1A A2 (g) | | 4.947 | | 06/15/40 | | 10,044,018 | | 9,315,292 |
| ECAF I Ltd., Series 2015-1A B1 (g) | | 5.802 | | 06/15/40 | | 21,086,196 | | 16,605,671 |
| GAIA Aviation Ltd. ( TAILWIND), Series 2019-1 B (g) | | 5.193 | | 12/15/44 | | 3,787,003 | | 3,506,182 |
| Global Container Assets Ltd., Series 2015-1A A2 (g) | | 3.450 | | 02/05/30 | | 1,798,322 | | 1,799,592 |
| Harley Marine Financing LLC, Series 2018-1A A2 (g) | | 5.682 | | 05/15/43 | | 13,567,091 | | 13,093,454 |
| HOA Funding LLC, Series 2014-1A A2 (g) | | 4.846 | | 08/20/44 | | 14,705,000 | | 14,635,151 |
| Horizon Aircraft Finance I Ltd., Series 2018-1 B (g) | | 5.270 | | 12/15/38 | | 2,702,399 | | 2,543,553 |
| Horizon Aircraft Finance II Ltd., Series 2019-1 A (g) | | 3.721 | | 07/15/39 | | 3,965,407 | | 3,979,799 |
| HP Communities LLC (g) | | 5.320 | | 03/15/23 | | 127,252 | | 132,410 |
| Icon Brand Holdings LLC, Series 2012-1A A (g) | | 4.229 | | 01/25/43 | | 7,009,399 | | 2,836,873 |
| JOL Air Limited, Series 2019-1 B (g) | | 4.948 | | 04/15/44 | | 907,397 | | 825,925 |
| KDAC Aviation Finance Ltd., Series 2017-1A A (g) | | 4.212 | | 12/15/42 | | 3,768,806 | | 3,660,929 |
| KDAC Aviation Finance Ltd., Series 2017-1A B (g) | | 5.926 | | 12/15/42 | | 17,132,629 | | 14,610,493 |
| Kestrel Aircraft Funding Ltd., Series 2018-1A A (g) | | 4.250 | | 12/15/38 | | 2,312,620 | | 2,318,599 |
| Kestrel Aircraft Funding Ltd., Series 2018-1A B (g) | | 5.500 | | 12/15/38 | | 2,691,017 | | 2,292,685 |
| Korth Direct Mortgage Inc., Series 19-N008Q (g) | | 5.500 | | 01/25/25 | | 3,300,000 | | 3,248,016 |
| Labrador Aviation Finance Ltd., Series 2016-1A B1 (g) | | 5.682 | | 01/15/42 | | 33,166,314 | | 28,656,231 |
| MACH 1 Cayman Ltd., Series 2019-1 B (g) | | 4.335 | | 10/15/39 | | 4,341,879 | | 4,254,842 |
| MAPS Ltd., Series 2018-1A B (g) | | 5.193 | | 05/15/43 | | 1,918,442 | | 1,859,962 |
| ME Funding, LLC, Series 2019-1 A2 (g) | | 6.448 | | 07/30/49 | | 22,655,000 | | 23,672,210 |
| Merlin Aviation Holdings D.A.C., Series 2016-1 A (g) | | 4.500 | | 12/15/32 | | 7,483,863 | | 7,201,937 |
| Merlin Aviation Holdings D.A.C., Series 2016-1 B (e)(g)(h) | | 6.500 | | 12/15/32 | | 1,554,779 | | 1,325,184 |
| METAL LLC, Series 2017-1 A (g) | | 4.581 | | 10/15/42 | | 16,411,490 | | 12,498,019 |
| METAL LLC, Series 2017-1 B (g) | | 6.500 | | 10/15/42 | | 26,657,035 | | 16,651,797 |
| Mosaic Solar Loans, LLC, Series 2017-2A C (g) | | 2.000 | | 06/22/43 | | 915,396 | | 919,375 |
| Northwest Airlines, Series 2002-1 G-2 | | 6.264 | | 05/20/23 | | 382,287 | | 380,357 |
| Pioneer Aircraft Finance Ltd., Series 2019-1 B (g) | | 4.948 | | 06/15/44 | | 1,419,643 | | 1,373,549 |
| PNMAC GMSR Issuer Trust, Series 2018-GT1 A | | | | | | | | |
| (1 month LIBOR + 2.850%, floor 2.850%) (d)(g) | | 2.942 | | 02/25/23 | | 4,000,000 | | 3,995,606 |
See Notes to Financial Statements.
20
| BOND FUND SCHEDULE OF INVESTMENTS (Unaudited) (Continued) |
| May 31, 2021 |
| | | Rate (%) | | Maturity Date | | Principal Amount | | Value |
| BONDS (continued) | | | | | | | | |
| | | | | | | | | |
| Asset-Backed Securities (continued) | | | | | | | | |
| | Project Silver, Series 2019-1 A (g) | | 3.967 | | 07/15/44 | | 5,447,930 | | $5,457,383 |
| PROP Limited, Series 2017-1 B (g)(i) | | 6.900 | | 03/15/42 | | 4,296,552 | | 2,406,069 |
| Sapphire Aviation Finance I Ltd., Series 2018-1A B (g) | | 5.926 | | 03/15/40 | | 8,617,732 | | 7,536,037 |
| S-Jets Limited, Series 2017-1 A (g) | | 3.967 | | 08/15/42 | | 3,719,359 | | 3,668,703 |
| S-Jets Limited, Series 2017-1 B (g) | | 5.682 | | 08/15/42 | | 12,342,901 | | 11,253,573 |
| SMB Private Education Loan Trust, Series 2014-A C (g) | | 4.500 | | 09/15/45 | | 7,000,000 | | 6,770,000 |
| Solarcity Lmc Series VI LLC, Series 2016-A B (g) | | 6.850 | | 09/20/48 | | 4,858,823 | | 5,025,739 |
| Sprite Limited, Series 2017-1 B (g) | | 5.750 | | 12/15/37 | | 14,177,604 | | 12,500,139 |
| Taco Bell Funding, LLC, Series 2016-1A A2II (g) | | 4.377 | | 05/25/46 | | 1,152,000 | | 1,153,405 |
| TGIF Funding LLC, Series 2017-1A A2 (g) | | 6.202 | | 04/30/47 | | 27,600,000 | | 24,301,524 |
| Thunderbolt Aircraft Lease Ltd., Series 2017-A A (g) | | 4.212 | | 05/17/32 | | 824,726 | | 833,839 |
| Thunderbolt Aircraft Lease Ltd., Series 2017-A B (g) | | 5.750 | | 05/17/32 | | 5,188,403 | | 4,803,956 |
| Thunderbolt Aircraft Lease Ltd., Series 2019-1 B (g) | | 4.750 | | 11/15/39 | | 4,314,678 | | 3,924,878 |
| United Air Lines, Series 2013-1 B | | 5.375 | | 02/15/23 | | 1,113,002 | | 1,119,884 |
| US Airways, Series 2012-2B | | 6.750 | | 12/03/22 | | 1,989,614 | | 1,990,102 |
| US Airways, Series 2013-1B | | 5.375 | | 05/15/23 | | 1,117,683 | | 1,121,869 |
| Willis Engine Structured Trust IV, Series 2018-A A (g) | | 4.750 | | 09/15/43 | | 4,559,883 | | 4,548,330 |
| | | | | | | | | |
| Commercial Mortgage-Backed Securities - 13.8% | | | | | | | | 349,091,064 |
| BBCMS Mortgage Trust, Series 2015-VFM A2 (g) | | 3.375 | | 03/12/36 | | 6,000,000 | | 6,353,518 |
| CD Commercial Mortgage Trust, Series 2016-CD2 A2 | | 3.037 | | 11/10/49 | | 1,107,536 | | 1,112,074 |
| CFCRE Commercial Mortgage Trust, Series 2017-C8 A2 | | 2.982 | | 06/15/50 | | 490,344 | | 496,366 |
| CG-CCRE Commercial Mortgage Trust, Series 2014-FL1 B | | | | | | | | |
| (1 month LIBOR + 1.150%, floor 1.150%) (d)(g) | | 1.251 | | 06/15/31 | | 5,608,848 | | 5,422,355 |
| CG-CCRE Commercial Mortgage Trust, Series 2014-FL1 D | | | | | | | | |
| (1 month LIBOR + 2.750%, floor 2.750%) (d)(g) | | 2.851 | | 06/15/31 | | 12,000,000 | | 5,165,275 |
| Citigroup Commercial Mortgage Trust, Series 2015-GC35 C (d) | | 4.633 | | 11/10/48 | | 7,000,000 | | 6,668,957 |
| Citigroup Commercial Mortgage Trust, Series 2016-GC36 C (d) | | 4.909 | | 02/10/49 | | 5,000,000 | | 5,291,452 |
| Citigroup Commercial Mortgage Trust, Series 2018-B2 A1 | | 2.856 | | 03/10/51 | | 270,718 | | 274,780 |
| COMM Mortgage Trust, Series 2012-CR1 B | | 4.612 | | 05/15/45 | | 5,500,000 | | 5,575,679 |
| COMM Mortgage Trust, Series 2012-CR1 C (d) | | 5.533 | | 05/15/45 | | 1,500,000 | | 1,428,881 |
| COMM Mortgage Trust, Series 2012-CR3 E (d)(g)(i) | | 4.908 | | 10/15/45 | | 5,000,000 | | 2,350,000 |
| COMM Mortgage Trust, Series 2012-CR4 AM | | 3.251 | | 10/15/45 | | 3,000,000 | | 3,059,024 |
| COMM Mortgage Trust, Series 2012-CR4 B (g) | | 3.703 | | 10/15/45 | | 5,606,000 | | 4,947,379 |
| COMM Mortgage Trust, Series 2012-LC4 AM | | 4.063 | | 12/10/44 | | 4,595,715 | | 4,667,868 |
| COMM Mortgage Trust, Series 2012-LC4 B | | 4.934 | | 12/10/44 | | 3,400,000 | | 3,426,675 |
| COMM Mortgage Trust, Series 2012-LC4 C (d) | | 5.718 | | 12/10/44 | | 2,514,188 | | 2,417,526 |
| COMM Mortgage Trust, Series 2013-CR6 A4 | | 3.101 | | 03/10/46 | | 2,865,000 | | 2,951,265 |
| COMM Mortgage Trust, Series 2013-CR9 C (d)(g) | | 4.413 | | 07/10/45 | | 1,500,000 | | 1,351,474 |
| COMM Mortgage Trust, Series 2013-CR9 D (d)(g) | | 4.413 | | 07/10/45 | | 4,898,000 | | 3,015,560 |
| COMM Mortgage Trust, Series 2013-CR11 D (d)(g) | | 5.285 | | 08/10/50 | | 5,000,000 | | 4,687,707 |
| COMM Mortgage Trust, Series 2013-CR12 B | | 4.762 | | 10/10/46 | | 520,000 | | 552,621 |
| COMM Mortgage Trust, Series 2014-CC17 D (d)(g) | | 5.010 | | 05/10/47 | | 5,210,000 | | 4,885,693 |
| COMM Mortgage Trust, Series 2014-CR16 C (d) | | 5.090 | | 04/10/47 | | 5,000,000 | | 5,304,988 |
| COMM Mortgage Trust, Series 2014-UBS4 D (d)(g)(i) | | 4.869 | | 08/10/47 | | 9,740,000 | | 8,559,355 |
| COMM Mortgage Trust, Series 2014-UBS5 | | 4.514 | | 09/10/47 | | 3,270,000 | | 3,538,769 |
| COMM Mortgage Trust, Series 2015-DC1 C (d) | | 4.451 | | 02/10/48 | | 540,000 | | 561,856 |
| Credit Suisse Commercial Mortgage Securities Corp., | | | | | | | | |
| Series 2016-NXSR C (d) | | 4.527 | | 12/15/49 | | 3,000,000 | | 2,665,811 |
See Notes to Financial Statements.
21
| BOND FUND SCHEDULE OF INVESTMENTS (Unaudited) (Continued) |
| May 31, 2021 |
| | | Rate (%) | | Maturity Date | | Principal Amount | | Value |
| BONDS (continued) | | | | | | | | |
| | | | | | | | | |
| Commercial Mortgage-Backed Securities (continued) |
| | Credit Suisse Commercial Mortgage Securities Corp., | | | | | | | | |
| | Series 2019-SKLZ C (1 month LIBOR + 2.750%, floor 2.750%) (d)(g) | | 2.851 | | 01/15/34 | | 2,500,000 | | $2,474,797 |
| CSAIL Commercial Mortgage Trust, Series 2015-C1 C (d) | | 4.405 | | 04/15/50 | | 1,780,000 | | 1,710,458 |
| CSAIL Commercial Mortgage Trust, Series 2015-C2 B (d) | | 4.208 | | 06/15/57 | | 5,000,000 | | 5,229,194 |
| CSAIL Commercial Mortgage Trust, Series 2015-C2 C (d) | | 4.327 | | 06/15/57 | | 3,579,000 | | 3,342,404 |
| CSAIL Commercial Mortgage Trust, Series 2015-C3 B (d) | | 4.266 | | 08/15/48 | | 3,905,000 | | 4,006,850 |
| CSAIL Commercial Mortgage Trust, Series 2015-C3 D (d) | | 3.516 | | 08/15/48 | | 5,795,000 | | 3,189,266 |
| DBUBS Mortgage Trust, Series 2011-LC3A PM1 (g) | | 4.452 | | 05/10/44 | | 7,533,024 | | 7,524,438 |
| GS Mortgage Securities Trust, Series 2012-GCJ7 AS | | 4.085 | | 05/10/45 | | 800,000 | | 817,472 |
| GS Mortgage Securities Trust, Series 2013-GC12 C | | 4.179 | | 06/10/46 | | 4,705,000 | | 4,859,443 |
| GS Mortgage Securities Trust, Series 2014-GC24 B (d) | | 4.648 | | 09/10/47 | | 7,340,000 | | 7,692,189 |
| GS Mortgage Securities Trust, Series 2014-GC24 D (d)(g)(i) | | 4.669 | | 09/10/47 | | 2,955,000 | | 1,777,448 |
| GS Mortgage Securities Trust, Series 2017-GS5 A2 | | 3.218 | | 03/10/50 | | 457,605 | | 460,137 |
| HMH Trust, Series 2017-NSS A (g) | | 3.062 | | 07/05/31 | | 5,850,000 | | 5,853,282 |
| J.P. Morgan Chase Commercial Mortgage Securities Trust, | | | | | | | | |
| Series 2011-C3 B (g) | | 5.013 | | 02/15/46 | | 6,362,401 | | 6,476,996 |
| J.P. Morgan Chase Commercial Mortgage Securities Trust, | | | | | | | | |
| Series 2011-C3 C (g) | | 5.360 | | 02/15/46 | | 4,250,000 | | 3,905,934 |
| J.P. Morgan Chase Commercial Mortgage Securities Trust, | | | | | | | | |
| Series 2012-CBX AS | | 4.271 | | 06/15/45 | | 252,000 | | 259,520 |
| J.P. Morgan Chase Commercial Mortgage Securities Trust, | | | | | | | | |
| Series 2012-CBX B (d) | | 5.019 | | 06/15/45 | | 411,000 | | 418,256 |
| J.P. Morgan Chase Commercial Mortgage Securities Trust, | | | | | | | | |
| Series 2012-LC9 C (d)(g) | | 4.566 | | 12/15/47 | | 3,000,000 | | 3,067,508 |
| J.P. Morgan Chase Commercial Mortgage Securities Trust, | | | | | | | | |
| Series 2013-LC11 B | | 3.499 | | 04/15/46 | | 5,000,000 | | 5,129,359 |
| J.P. Morgan Chase Commercial Mortgage Securities Trust, | | | | | | | | |
| Series 2014-C20 D (d)(g) | | 4.723 | | 07/15/47 | | 5,000,000 | | 4,479,964 |
| JPMBB Commercial Mortgage Securities Trust, Series 2013-C12 C (d) | | 4.235 | | 07/15/45 | | 5,000,000 | | 5,207,562 |
| JPMBB Commercial Mortgage Securities Trust, Series 2013-C14 B (d) | | 4.723 | | 08/15/46 | | 1,310,000 | | 1,350,425 |
| JPMBB Commercial Mortgage Securities Trust, Series 2013-C14 C (d) | | 4.723 | | 08/15/46 | | 5,000,000 | | 4,700,335 |
| JPMBB Commercial Mortgage Securities Trust, Series 2014-C18 C (d) | | 4.960 | | 02/15/47 | | 5,060,000 | | 4,948,454 |
| JPMBB Commercial Mortgage Securities Trust, Series 2014-C22 D (d)(g)(h) | | 4.705 | | 09/15/47 | | 4,966,000 | | 3,658,152 |
| JPMBB Commercial Mortgage Securities Trust, Series 2014-C24 B | | 4.116 | | 11/15/47 | | 10,400,000 | | 10,937,168 |
| JPMBB Commercial Mortgage Securities Trust, Series 2015-C28 C (d) | | 4.288 | | 10/15/48 | | 5,496,426 | | 5,692,589 |
| JPMBB Commercial Mortgage Securities Trust, Series 2015-C32 B | | 4.389 | | 11/15/48 | | 500,000 | | 514,833 |
| Morgan Stanley Bank of America Merrill Lynch Trust, Series 2012-C5 A4 | | 3.176 | | 08/15/45 | | 680,000 | | 692,919 |
| Morgan Stanley Bank of America Merrill Lynch Trust, Series 2013-C7 B | | 3.769 | | 02/15/46 | | 200,000 | | 202,754 |
| Morgan Stanley Bank of America Merrill Lynch Trust, Series 2013-C7 C (d) | | 4.257 | | 02/15/46 | | 7,000,000 | | 6,995,423 |
| Morgan Stanley Bank of America Merrill Lynch Trust, Series 2013-C10 AS (d) | | 4.217 | | 07/15/46 | | 1,478,864 | | 1,557,356 |
| Morgan Stanley Bank of America Merrill Lynch Trust, Series 2013-C10 C (d) | | 4.217 | | 07/15/46 | | 2,750,000 | | 2,398,699 |
| Morgan Stanley Bank of America Merrill Lynch Trust, Series 2013-C11 AS (d) | | 4.496 | | 08/15/46 | | 6,881,000 | | 6,774,158 |
| Morgan Stanley Bank of America Merrill Lynch Trust, Series 2013-C12 C (d) | | 4.921 | | 10/15/46 | | 2,110,000 | | 2,125,351 |
| Morgan Stanley Bank of America Merrill Lynch Trust, Series 2014-C16 C (d) | | 4.926 | | 06/15/47 | | 7,015,936 | | 6,975,330 |
| Morgan Stanley Bank of America Merrill Lynch Trust, Series 2014-C18 D (g) | | 3.389 | | 10/15/47 | | 5,000,000 | | 4,517,613 |
| Morgan Stanley Bank of America Merrill Lynch Trust, Series 2015-C21 C (d) | | 4.279 | | 03/15/48 | | 8,000,000 | | 7,987,274 |
| Morgan Stanley Bank of America Merrill Lynch Trust, Series 2015-C22 D (d)(g) | | 4.355 | | 04/15/48 | | 5,000,000 | | 3,819,670 |
| Morgan Stanley Capital I Trust, Series 2011-C2 D (d)(g) | | 5.420 | | 06/15/44 | | 1,000,000 | | 903,863 |
| Morgan Stanley Capital I Trust, Series 2012-C4 A4 | | 3.244 | | 03/15/45 | | 5,939,709 | | 5,996,361 |
See Notes to Financial Statements.
22
| BOND FUND SCHEDULE OF INVESTMENTS (Unaudited) (Continued) |
| May 31, 2021 |
| | | Rate (%) | | Maturity Date | | Principal Amount | | Value |
| BONDS (continued) | | | | | | | | |
| | | | | | | | | | |
| Commercial Mortgage-Backed Securities (continued) |
| Morgan Stanley Capital I Trust, Series 2012-C4 C (d)(g) | | 5.600 | | 03/15/45 | | 383,000 | | $383,677 |
| Morgan Stanley Capital I Trust, Series 2015-UBS8 C (d) | | 4.735 | | 12/15/48 | | 6,500,000 | | 6,288,822 |
| Morgan Stanley Capital I Trust, Series 2017-HR2 A2 | | 3.345 | | 12/15/50 | | 400,000 | | 412,422 |
| Morgan Stanley Capital I Trust, Series 2019-BPR A | | | | | | | | |
| (1 month LIBOR + 1.400%, floor 1.400%) (d)(g) | | 1.501 | | 05/15/36 | | 7,090,000 | | 6,918,053 |
| Palisades Center Trust, Series 2016-PLSD A (g) | | 2.713 | | 04/13/33 | | 5,000,000 | | 4,619,286 |
| Tharaldson Hotel Portfolio Trust, Series 2018-THL D | | | | | | | | |
| (1 month LIBOR + 2.150%, floor 2.150%) (d)(g) | | 2.256 | | 11/11/34 | | 4,900,986 | | 4,772,165 |
| UBS-Citigroup Commercial Mortgage Trust, Series 2011-C1 B (d)(g) | | 6.282 | | 01/10/45 | | 401,000 | | 406,798 |
| Wells Fargo Commercial Mortgage Trust, Series 2013-LC12 AS (d) | | 4.435 | | 07/15/46 | | 714,000 | | 754,021 |
| Wells Fargo Commercial Mortgage Trust, Series 2013-LC12 B (d) | | 4.435 | | 07/15/46 | | 7,000,000 | | 7,097,434 |
| Wells Fargo Commercial Mortgage Trust, Series 2015-C27 C | | 3.894 | | 02/15/48 | | 6,982,500 | | 7,043,306 |
| Wells Fargo Commercial Mortgage Trust, Series 2015-C31 C (d) | | 4.756 | | 11/15/48 | | 5,000,000 | | 5,283,453 |
| Wells Fargo Commercial Mortgage Trust, Series 2015-LC22 B (d) | | 4.708 | | 09/15/58 | | 800,000 | | 888,160 |
| Wells Fargo Commercial Mortgage Trust, Series 2015-SG1 C (d) | | 4.611 | | 09/15/48 | | 5,000,000 | | 4,663,663 |
| Wells Fargo Commercial Mortgage Trust, Series 2016-C36 C (d) | | 4.325 | | 11/15/59 | | 3,000,000 | | 2,637,414 |
| Wells Fargo Commercial Mortgage Trust, Series 2017-SMP A | | | | | | | | |
| (1 month LIBOR + 0.875%, floor 0.875%) (d)(g) | | 0.976 | | 12/15/34 | | 1,625,000 | | 1,620,910 |
| WFRBS Commercial Mortgage Trust, Series 2012-C10 B | | 3.744 | | 12/15/45 | | 1,645,000 | | 1,580,413 |
| WFRBS Commercial Mortgage Trust, Series 2012-C10 C (d) | | 4.508 | | 12/15/45 | | 7,000,000 | | 5,954,885 |
| WFRBS Commercial Mortgage Trust, Series 2013-C14 B | | 3.841 | | 06/15/46 | | 1,500,000 | | 1,556,002 |
| WFRBS Commercial Mortgage Trust, Series 2013-C14 C (d) | | 4.102 | | 06/15/46 | | 5,000,000 | | 5,039,287 |
| WFRBS Commercial Mortgage Trust, Series 2013-C15 B (d) | | 4.646 | | 08/15/46 | | 3,800,000 | | 3,801,147 |
| WFRBS Commercial Mortgage Trust, Series 2013-C16 C (d) | | 5.171 | | 09/15/46 | | 2,225,000 | | 2,329,424 |
| WFRBS Commercial Mortgage Trust, Series 2014-C19 C | | 4.646 | | 03/15/47 | | 6,000,000 | | 6,267,330 |
| WFRBS Commercial Mortgage Trust, Series 2014-C20 C | | 4.513 | | 05/15/47 | | 4,500,000 | | 4,260,627 |
| WFRBS Commercial Mortgage Trust, Series 2014-C21 C | | 4.234 | | 08/15/47 | | 3,000,000 | | 3,102,179 |
| WFRBS Commercial Mortgage Trust, Series 2014-C21 D (g) | | 3.497 | | 08/15/47 | | 5,000,000 | | 4,046,074 |
| | | | | | | | | |
| Convertible Bonds - 2.0% | | | | | | | | 50,326,801 |
| Colony Capital, Inc. | | 5.000 | | 04/15/23 | | 19,225,000 | | 19,757,673 |
| FedNat Holding Co. (g) | | 5.000 | | 04/19/26 | | 5,000,000 | | 5,000,000 |
| Hope Bancorp Inc. | | 2.000 | | 05/15/38 | | 25,750,000 | | 25,569,128 |
| | | | | | | | | |
| Corporate Bonds - 53.0% | | | | | | | | 1,340,631,204 |
| Adani Abbot Point Terminal Pty. Ltd. (g) | | 4.450 | | 12/15/22 | | 8,570,000 | | 8,356,497 |
| AerCap Ireland Capital DAC / AerCap Global Aviation Trust | | 4.450 | | 12/16/21 | | 4,000,000 | | 4,071,826 |
| AerCap Ireland Capital DAC / AerCap Global Aviation Trust | | 3.950 | | 02/01/22 | | 725,000 | | 738,938 |
| AerCap Ireland Capital DAC / AerCap Global Aviation Trust | | 3.500 | | 05/26/22 | | 300,000 | | 307,806 |
| AerCap Ireland Capital DAC / AerCap Global Aviation Trust | | 4.625 | | 07/01/22 | | 4,050,000 | | 4,223,985 |
| AerCap Ireland Capital DAC / AerCap Global Aviation Trust | | 3.300 | | 01/23/23 | | 1,450,000 | | 1,505,469 |
| Agrium Inc. | | 3.150 | | 10/01/22 | | 389,000 | | 399,102 |
| Air Lease Corp. | | 3.375 | | 06/01/21 | | 1,312,000 | | 1,312,000 |
| Aircastle Ltd. | | 5.500 | | 02/15/22 | | 4,081,000 | | 4,218,022 |
| Amerant Bancorp Inc. | | 5.750 | | 06/30/25 | | 10,000,000 | | 10,355,765 |
| Ameris Bancorp (5.750% to 03/15/22, then 3 month LIBOR + 3.616%) (d) | | 5.750 | | 03/15/27 | | 5,000,000 | | 5,165,667 |
| AmTrust Financial Services, Inc. | | 6.125 | | 08/15/23 | | 39,078,000 | | 39,666,706 |
| Andeavor LLC | | 5.125 | | 04/01/24 | | 3,380,000 | | 3,408,865 |
See Notes to Financial Statements.
23
| BOND FUND SCHEDULE OF INVESTMENTS (Unaudited) (Continued) |
| May 31, 2021 |
| | | Rate (%) | | Maturity Date | | Principal Amount | | Value |
| BONDS (continued) | | | | | | | | |
| | | | | | | | | | |
| Corporate Bonds (continued) | | | | | | | | |
| Arbor Realty Trust, Inc. | | 5.625 | | 05/01/23 | | 16,495,000 | | $16,936,768 |
| Arbor Realty Trust, Inc. (g) | | 5.750 | | 04/01/24 | | 10,000,000 | | 10,368,070 |
| Arbor Realty Trust, Inc. (g) | | 4.750 | | 10/15/24 | | 10,000,000 | | 10,044,815 |
| Arbor Realty Trust, Inc. | | 4.750 | | 10/15/24 | | 1,000,000 | | 1,004,482 |
| Arena Finance II LLC (g) | | 6.750 | | 09/30/25 | | 2,000,000 | | 2,000,000 |
| Aspen Insurance Holdings Ltd. | | 4.650 | | 11/15/23 | | 2,377,000 | | 2,597,726 |
| Assured Guaranty US Holdings Inc. (3 month LIBOR + 2.380%) (d) | | 2.564 | | 12/15/66 | | 31,751,000 | | 25,956,443 |
| Atlantic Union Bankshares Corp. (5.000% to 12/15/21, | | | | | | | | |
| then 3 month LIBOR + 3.175%) (d) | | 5.000 | | 12/15/26 | | 850,000 | | 858,582 |
| Avana Bonhon, LLC (g) | | 6.125 | | 09/15/24 | | 2,884,615 | | 3,002,304 |
| Axos Financial, Inc. (4.875% to 10/01/25, then SOFRRATE + 4.760%) (d) | | 4.875 | | 10/01/30 | | 3,500,000 | | 3,708,876 |
| BAC Capital Trust XIII (Greater of 4.000% or | | | | | | | | |
| 3 month LIBOR + 0.400%, floor 4.000%) (d)(f) | | 4.000 | | 06/14/21 | | 2,600,000 | | 2,588,027 |
| Banc of California, Inc. | | 5.250 | | 04/15/25 | | 5,400,000 | | 5,704,146 |
| Banc of California, Inc. (4.375% to 10/30/25, then SOFRRATE + 4.195%) (d) | | 4.375 | | 10/30/30 | | 9,000,000 | | 9,432,122 |
| Bank of America Corp. (5.200% to 06/01/23, | | | | | | | | |
| then 3 month LIBOR + 3.135%) (d)(f) | | 5.200 | | 06/01/23 | | 2,500,000 | | 2,601,000 |
| Bank of America Corp. (4.0 times (USISDA10 - USISDA02 - 0.250%), | | | | | | | | |
| floor 0.000%, cap 10.000%) (d) | | 4.376 | | 11/19/30 | | 671,000 | | 684,688 |
| Bank of Montreal (4.800% to 08/25/24, then H15T5Y + 2.979%) (d)(f) | | 4.800 | | 08/25/24 | | 6,977,000 | | 7,395,620 |
| Bank of New York Mellon Corp. (3 month LIBOR + 3.420%) (d)(f) | | 3.607 | | 09/20/21 | | 9,989,000 | | 10,028,956 |
| Bank of the Ozarks, Inc. (5.500% to 07/01/21, | | | | | | | | |
| then 3 month LIBOR + 4.425%) (d) | | 5.500 | | 07/01/26 | | 20,479,000 | | 20,522,853 |
| Bay Banks of Virginia, Inc. (5.625% to 10/15/24, | | | | | | | | |
| then SOFRRATE + 4.335%) (d)(g) | | 5.625 | | 10/15/29 | | 3,000,000 | | 3,081,443 |
| BayCom Corp. (5.250% to 09/15/25, then SOFRRATE + 5.210%) (d) | | 5.250 | | 09/15/30 | | 8,455,000 | | 8,997,690 |
| BCB Bancorp, Inc. (5.625% to 08/01/23, | | | | | | | | |
| then 3 month LIBOR + 2.720%) (d)(g) | | 5.625 | | 08/01/28 | | 9,000,000 | | 9,417,582 |
| Becton Dickinson and Co. (3 month LIBOR + 1.030%) (d) | | 1.206 | | 06/06/22 | | 25,355,000 | | 25,577,710 |
| Block Financial LLC | | 5.500 | | 11/01/22 | | 3,493,000 | | 3,644,088 |
| Boeing Co. | | 2.125 | | 03/01/22 | | 628,000 | | 635,145 |
| Boeing Co. | | 2.700 | | 05/01/22 | | 889,000 | | 907,774 |
| Byline Bancorp, Inc. (6.000% to 07/01/25, then SOFRRATE + 5.880%) (d) | | 6.000 | | 07/01/30 | | 12,000,000 | | 13,299,525 |
| Cabot Corp. | | 3.700 | | 07/15/22 | | 702,000 | | 721,439 |
| Capital Funding Bancorp, Inc. (g) | | 6.000 | | 12/01/23 | | 20,000,000 | | 21,362,879 |
| Carrington Holding Co., LLC (g) | | 8.000 | | 01/26/26 | | 12,000,000 | | 12,040,221 |
| CenterState Bank Corp. (5.750% to 06/01/25, | | | | | | | | |
| then SOFRRATE + 5.617%) (d) | | 5.750 | | 06/01/30 | | 690,000 | | 740,052 |
| Charles Schwab Corp. (4.625% to 03/01/22, | | | | | | | | |
| then 3 month LIBOR + 3.315%) (d)(f) | | 4.625 | | 03/01/22 | | 21,618,000 | | 21,905,519 |
| Citigroup, Inc. (4.0 times (USISDA30 - USISDA05), | | | | | | | | |
| floor 0.000%, cap 10.000%) (d) | | 4.452 | | 07/09/28 | | 740,000 | | 719,831 |
| Citigroup, Inc. (4.0 times (USISDA30 - USISDA05), | | | | | | | | |
| floor 0.000%, cap 10.000%) (d) | | 4.636 | | 11/15/28 | | 245,000 | | 230,056 |
| Citigroup, Inc. (4.0 times (USISDA30 - USISDA02), | | | | | | | | |
| floor 0.000%, cap 10.000%) (d) | | 6.680 | | 12/23/29 | | 1,152,000 | | 1,132,272 |
| Citigroup, Inc. (4.0 times (USISDA10 - USISDA02 - 0.250%), | | | | | | | | |
| floor 0.000%, cap 10.000%) (d) | | 4.376 | | 11/19/30 | | 727,000 | | 666,581 |
See Notes to Financial Statements.
24
| BOND FUND SCHEDULE OF INVESTMENTS (Unaudited) (Continued) |
| May 31, 2021 |
| | | Rate (%) | | Maturity Date | | Principal Amount | | Value |
| BONDS (continued) | | | | | | | | |
| | | | | | | | | | |
| Corporate Bonds (continued) | | | | | | | | |
| Citigroup, Inc. (4.35 times (USISDA30 - USISDA05), | | | | | | | | |
| floor 0.000%, cap 10.000%) (d) | | 4.842 | | 07/09/33 | | 1,394,000 | | $1,260,901 |
| Citigroup, Inc. (5.0 times (USISDA30 - USISDA05), | | | | | | | | |
| floor 0.000%, cap 10.000%) (d) | | 6.105 | | 12/20/33 | | 2,863,000 | | 2,614,494 |
| Citigroup, Inc. (3 month LIBOR + 0.550%) (d) | | 0.697 | | 08/25/36 | | 868,000 | | 749,778 |
| Clear Blue Financial Holdings, LLC (g) | | 7.000 | | 04/15/25 | | 5,000,000 | | 4,991,070 |
| CNH Industrial Capital LLC | | 3.875 | | 10/15/21 | | 436,000 | | 441,373 |
| CNH Industrial Capital LLC | | 4.375 | | 04/05/22 | | 100,000 | | 103,322 |
| Congressional Bancshares, Inc. (5.750% to 12/01/24, | | | | | | | | |
| then SOFRRATE + 4.390%) (d)(g) | | 5.750 | | 12/01/29 | | 5,000,000 | | 5,153,975 |
| ConnectOne Bancorp, Inc. (5.200% to 02/01/23, | | | | | | | | |
| then 3 month LIBOR + 2.840%) (d) | | 5.200 | | 02/01/28 | | 6,375,000 | | 6,581,723 |
| ConnectOne Bancorp, Inc. (5.750% to 06/15/25, | | | | | | | | |
| then SOFRRATE + 5.605%) (d) | | 5.750 | | 06/15/30 | | 7,780,000 | | 8,430,901 |
| County Bancorp, Inc. (5.875% to 06/01/23, | | | | | | | | |
| then 3 month LIBOR + 2.884%) (d) | | 5.875 | | 06/01/28 | | 8,250,000 | | 8,644,650 |
| Cowen Inc. (g) | | 7.250 | | 05/06/24 | | 20,000,000 | | 21,555,206 |
| CRB Group, Inc. (g) | | 6.250 | | 06/15/23 | | 5,000,000 | | 5,345,089 |
| Credit Suisse Group Funding Guernsey Ltd. | | 3.800 | | 09/15/22 | | 250,000 | | 260,759 |
| Depository Trust & Clearing Corp. (3 month LIBOR + 3.167%) (d)(f)(g) | | 3.351 | | 06/15/21 | | 1,600,000 | | 1,600,000 |
| Deutsche Bank AG | | 4.250 | | 10/14/21 | | 313,000 | | 317,380 |
| Deutsche Bank AG | | 4.250 | | 10/14/21 | | 7,057,000 | | 7,155,762 |
| Digital Equipment Corp. | | 7.750 | | 04/01/23 | | 551,000 | | 607,807 |
| DXC Technology Co. | | 4.125 | | 04/15/25 | | 1,980,000 | | 2,179,148 |
| Eagle Bancorp, Inc. | | 5.750 | | 09/01/24 | | 1,825,000 | | 1,974,834 |
| Eagle Bancorp, Inc. (5.000% to 08/01/21, | | | | | | | | |
| then 3 month LIBOR + 3.850%) (d) | | 5.000 | | 08/01/26 | | 13,479,000 | | 13,479,367 |
| EF Holdco Inc. / EF Cayman Holdings Ltd. (g) | | 5.500 | | 09/01/22 | | 3,500,000 | | 3,598,986 |
| Enstar Group Ltd. | | 4.500 | | 03/10/22 | | 28,162,000 | | 28,900,802 |
| Enterprise Products Operating LLC (3 month LIBOR + 2.7775%) (d) | | 2.968 | | 06/01/67 | | 8,538,000 | | 7,615,896 |
| Enterprise Products Operating LLC (5.250% to 08/16/27, | | | | | | | | |
| then 3 month LIBOR + 3.033%) (d) | | 5.250 | | 08/16/77 | | 6,666,000 | | 6,852,941 |
| EverBank Financial Corp. (3 month LIBOR + 4.704%) (d) | | 4.888 | | 03/15/26 | | 4,000,000 | | 4,012,501 |
| Everest Reinsurance Holdings Inc. (3 month LIBOR + 2.385%) (d) | | 2.541 | | 05/01/67 | | 17,705,000 | | 16,554,744 |
| F&M Financial Services Corp. (5.950% to 09/15/24, | | | | | | | | |
| then SOFRRATE + 4.840%) (d)(g) | | 5.950 | | 09/15/29 | | 9,000,000 | | 9,536,477 |
| FedNat Holding Co. | | 7.750 | | 03/15/29 | | 17,000,000 | | 17,510,001 |
| Fidelity Federal Bancorp (6.875% to 10/15/23, | | | | | | | | |
| then 3 month LIBOR + 3.790%) (d)(g) | | 6.875 | | 10/15/28 | | 6,500,000 | | 6,860,666 |
| Fidelity Federal Bancorp (6.000% to 11/01/24, | | | | | | | | |
| then SOFRRATE + 4.650%) (d)(g) | | 6.000 | | 11/01/29 | | 7,000,000 | | 7,274,456 |
| Fifth Third Bancorp (3 month LIBOR + 3.129%) (d)(f) | | 3.332 | | 06/28/21 | | 14,997,000 | | 14,922,015 |
| First Financial Bancorp (5.250% to 05/15/25, | | | | | | | | |
| then SOFRRATE + 5.090%) (d) | | 5.250 | | 05/15/30 | | 3,000,000 | | 3,095,653 |
| Flushing Financial Corp. (5.250% to 12/15/21, | | | | | | | | |
| then 3 month LIBOR + 3.440%) (d) | | 5.250 | | 12/15/26 | | 4,030,000 | | 4,079,847 |
| FPL Group, Inc. (3 month LIBOR + 2.0675%) (d) | | 2.269 | | 10/01/66 | | 9,285,000 | | 8,542,200 |
| FS KKR Capital Corp. | | 4.750 | | 05/15/22 | | 9,312,000 | | 9,613,985 |
See Notes to Financial Statements.
25
| BOND FUND SCHEDULE OF INVESTMENTS (Unaudited) (Continued) |
| May 31, 2021 |
| | | Rate (%) | | Maturity Date | | Principal Amount | | Value |
| BONDS (continued) | | | | | | | | |
| | | | | | | | | |
| Corporate Bonds (continued) | | | | | | | | |
| | General Electric Capital Corp. (3 month LIBOR + 0.380%) (d) | | 0.556 | | 05/05/26 | | 5,148,000 | | $5,031,660 |
| General Electric Co. (3 month LIBOR + 3.330%) (d)(f) | | 3.514 | | 09/15/21 | | 44,245,000 | | 42,554,840 |
| Genpact Luxembourg Sarl | | 3.700 | | 04/01/22 | | 730,000 | | 746,201 |
| Government Properties Income Trust | | 4.000 | | 07/15/22 | | 39,000 | | 40,237 |
| Great Southern Bancorp, Inc. (5.250% to 08/15/21, | | | | | | | | |
| then 3 month LIBOR + 4.087%) (d) | | 5.250 | | 08/15/26 | | 6,450,000 | | 6,480,521 |
| Great Southern Bank (5.500% to 06/15/25, then SOFRRATE + 5.325%) (d) | | 5.500 | | 06/15/30 | | 2,000,000 | | 2,178,564 |
| Hallmark Financial Services, Inc. | | 6.250 | | 08/15/29 | | 13,000,000 | | 12,220,000 |
| Hanmi Financial Corp. (5.450% to 03/30/22, | | | | | | | | |
| then 3 month LIBOR + 3.315%) (d) | | 5.450 | | 03/30/27 | | 8,600,000 | | 8,800,789 |
| Hilltop Holdings Inc. (5.750% to 05/15/25, then SOFRRATE + 5.680%) (d) | | 5.750 | | 05/15/30 | | 8,000,000 | | 8,718,347 |
| Home BancShares Inc. (5.625% to 04/15/22, | | | | | | | | |
| then 3 month LIBOR + 3.575%) (d) | | 5.625 | | 04/15/27 | | 6,083,000 | | 6,267,319 |
| Horizon Bancorp, Inc. (5.625% to 07/01/25, then SOFRRATE + 5.490%) (d) | | 5.625 | | 07/01/30 | | 6,000,000 | | 6,396,425 |
| Hospitality Properties Trust | | 4.500 | | 03/15/25 | | 720,000 | | 700,200 |
| Hospitality Properties Trust | | 4.750 | | 10/01/26 | | 3,295,000 | | 3,130,250 |
| Hospitality Properties Trust | | 4.950 | | 02/15/27 | | 1,549,000 | | 1,483,168 |
| Hospitality Properties Trust | | 3.950 | | 01/15/28 | | 1,436,000 | | 1,285,220 |
| Host Hotels & Resorts LP | | 3.750 | | 10/15/23 | | 2,969,000 | | 3,137,153 |
| Howard Bancorp Inc. (6.000% to 12/06/23, | | | | | | | | |
| then 3 month LIBOR + 3.020%) (d)(g) | | 6.000 | | 12/06/28 | | 3,000,000 | | 3,145,750 |
| Hyatt Hotels Corp. (3 month LIBOR + 3.000%) (d) | | 3.191 | | 09/01/22 | | 100,000 | | 100,562 |
| IDEX Corp. | | 4.200 | | 12/15/21 | | 4,990,000 | | 5,046,048 |
| IIP Operating Partnership, LP (g) | | 5.500 | | 05/25/26 | | 3,000,000 | | 3,101,218 |
| International Lease Finance Corp. | | 8.625 | | 01/15/22 | | 728,000 | | 762,984 |
| International Lease Finance Corp. | | 5.875 | | 08/15/22 | | 818,000 | | 868,476 |
| Investar Holding Corp. (6.000% to 03/30/22, | | | | | | | | |
| then 3 month LIBOR +3.945%) (d) | | 6.000 | | 03/30/27 | | 500,000 | | 508,475 |
| Jabil Circuit, Inc. | | 4.700 | | 09/15/22 | | 104,000 | | 109,677 |
| Jefferies Group LLC / Jefferies Group Capital Finance Inc. (4.000% to | | | | | | | | |
| 01/27/22, then 6.000%) (c) | | 4.000 | | 01/27/32 | | 750,000 | | 755,262 |
| Jones Lang LaSalle Inc. | | 4.400 | | 11/15/22 | | 1,008,000 | | 1,053,908 |
| JPMorgan Chase & Co. (3 month LIBOR + 3.320%) (d)(f) | | 3.522 | | 07/01/21 | | 9,552,000 | | 9,517,135 |
| JPMorgan Chase & Co. (3 month LIBOR + 3.470%) (d)(f) | | 3.656 | | 07/30/21 | | 9,030,000 | | 8,984,850 |
| JPMorgan Chase & Co. (3 month LIBOR + 3.800%) (d)(f) | | 3.976 | | 08/01/21 | | 2,000,000 | | 2,002,500 |
| JPMorgan Chase & Co. (4.000% to 04/01/25, then | | | | | | | | |
| SOFRRATE + 2.745%) (d)(f) | | 4.000 | | 04/01/25 | | 5,000,000 | | 5,006,250 |
| Lincoln National Corp. (3 month LIBOR + 2.3575%) (d) | | 2.513 | | 05/17/66 | | 29,378,000 | | 25,470,726 |
| Lincoln National Corp. (3 month LIBOR + 2.040%) (d) | | 2.228 | | 04/20/67 | | 25,384,000 | | 21,068,720 |
| Main Street Capital Corp. | | 4.500 | | 12/01/22 | | 2,923,000 | | 3,055,841 |
| Marathon Petroleum Corp. | | 5.125 | | 04/01/24 | | 36,647,000 | | 36,994,922 |
| Marriott Int'l., Inc. | | 3.125 | | 10/15/21 | | 5,000,000 | | 5,016,058 |
| Marriott Int'l., Inc. | | 2.300 | | 01/15/22 | | 1,800,000 | | 1,816,685 |
| Marriott Int'l., Inc. | | 3.250 | | 09/15/22 | | 130,000 | | 132,696 |
| Marriott Int'l., Inc. | | 2.125 | | 10/03/22 | | 1,824,000 | | 1,855,034 |
| Medallion Financial Corp. (g) | | 8.250 | | 03/22/24 | | 10,000,000 | | 10,000,765 |
| Meridian Corp. (5.375% to 12/30/24, then SOFRRATE + 3.950%) (d) | | 5.375 | | 12/30/29 | | 10,000,000 | | 10,439,362 |
| Merrill Lynch & Co. (3 month LIBOR + 0.760%) (d) | | 0.944 | | 09/15/26 | | 3,870,000 | | 3,865,394 |
See Notes to Financial Statements.
26
| BOND FUND SCHEDULE OF INVESTMENTS (Unaudited) (Continued) |
| May 31, 2021 |
| | | Rate (%) | | Maturity Date | | Principal Amount | | Value |
| BONDS (continued) | | | | | | | | |
| | |
| Corporate Bonds (continued) | | | | | | | | |
| Meta Financial Group, Inc. (5.750% to 08/15/21, | | | | | | | | |
| then 3 month LIBOR + 4.630%) (d) | | 5.750 | | 08/15/26 | | 6,200,000 | | $6,234,052 |
| MetLife, Inc. (3 month LIBOR + 3.575%) (d)(f) | | 3.759 | | 06/15/21 | | 12,677,000 | | 12,677,000 |
| Metropolitan Bank Holding Corp. (6.250% to 03/15/22, then 3 month | | | | | | | | |
| LIBOR + 4.260%) (d)(g) | | 6.250 | | 03/15/27 | | 2,000,000 | | 2,039,886 |
| Midland States Bancorp, Inc. (5.000% to 09/30/24, | | | | | | | | |
| then SOFRRATE + 3.610%) (d) | | 5.000 | | 09/30/29 | | 5,000,000 | | 5,174,103 |
| Mileage Plus Holdings LLC/Mileage Plus Intellectual Property Assets Ltd. (g) | | 6.500 | | 06/20/27 | | 7,000,000 | | 7,662,830 |
| Minnwest Corp. (5.875% to 07/15/23, then 3 month LIBOR + 2.980%) (d)(g) | | 5.875 | | 07/15/28 | | 6,000,000 | | 6,301,788 |
| MM Finished Lots Holdings, LLC (g) | | 7.250 | | 01/31/24 | | 2,151,663 | | 2,194,696 |
| MM Finished Lots Holdings, LLC (g) | | 6.500 | | 11/30/25 | | 4,117,605 | | 4,117,605 |
| Monsanto Co. | | 2.200 | | 07/15/22 | | 2,032,000 | | 2,047,471 |
| Morgan Stanley | | 3.875 | | 10/11/22 | | 400,000 | | 416,233 |
| New York Mortgage Trust, Inc. (g) | | 5.750 | | 04/30/26 | | 5,000,000 | | 5,004,321 |
| Newfield Exploration Co. | | 5.750 | | 01/30/22 | | 9,575,000 | | 9,891,640 |
| Newport Realty Trust, Inc. (g) | | 6.250 | | 12/01/24 | | 10,000,000 | | 10,256,933 |
| Newport Realty Trust, Inc. | | 6.250 | | 12/01/24 | | 1,000,000 | | 1,025,693 |
| NexBank Capital, Inc. (3 month LIBOR + 4.355%) (d)(g) | | 4.539 | | 03/16/26 | | 18,500,000 | | 18,499,940 |
| NexBank Capital, Inc. (6.375% to 09/30/22, | | | | | | | | |
| then 3 month LIBOR + 4.585%) (d)(g) | | 6.375 | | 09/30/27 | | 5,000,000 | | 5,219,084 |
| Nexpoint Real Estate Finance, Inc. | | 5.750 | | 05/01/26 | | 7,000,000 | | 7,097,146 |
| Northpointe Bancshares, Inc. (6.000% to 09/30/24, | | | | | | | | |
| then SOFRRATE + 4.905%) (d)(g) | | 6.000 | | 09/30/29 | | 5,000,000 | | 5,148,812 |
| Northpointe Bank (6.875% to 10/01/23, then 3 month LIBOR + 3.765%) (d)(g) | | 6.875 | | 10/01/28 | | 5,000,000 | | 5,267,374 |
| OceanFirst Financial Corp. (5.250% to 05/15/25, | | | | | | | | |
| then SOFRRATE + 5.095%) (d) | | 5.250 | | 05/15/30 | | 6,000,000 | | 6,197,158 |
| Office Properties Income Trust | | 4.150 | | 02/01/22 | | 12,419,000 | | 12,644,801 |
| Office Properties Income Trust | | 4.250 | | 05/15/24 | | 13,441,000 | | 14,341,458 |
| Office Properties Income Trust | | 4.500 | | 02/01/25 | | 100,000 | | 107,845 |
| Ohio National Financial Services, Inc. (g) | | 5.550 | | 01/24/30 | | 5,000,000 | | 5,591,841 |
| Old Second Bancorp, Inc. (5.750% to 12/31/21, | | | | | | | | |
| then 3 month LIBOR + 3.850%) (d) | | 5.750 | | 12/31/26 | | 1,945,000 | | 1,976,644 |
| OneBeacon U.S. Holdings, Inc. | | 4.600 | | 11/09/22 | | 2,881,000 | | 3,024,683 |
| Opus Bank (5.500% to 07/01/21, then 3 month LIBOR + 4.285%) (d) | | 5.500 | | 07/01/26 | | 500,000 | | 500,790 |
| Orrstown Financial Services, Inc. (6.000% to 12/30/23, | | | | | | | | |
| then 3 month LIBOR + 3.160%) (d) | | 6.000 | | 12/30/28 | | 1,750,000 | | 1,833,507 |
| Pacific Continental Corp. (5.875% to 06/30/21, | | | | | | | | |
| then 3 month LIBOR + 4.715%) (d) | | 5.875 | | 06/30/26 | | 510,000 | | 510,788 |
| Pacific Premier Bancorp, Inc. (5.375% to 06/15/25, | | | | | | | | |
| then SOFRRATE + 5.170%) (d) | | 5.375 | | 06/15/30 | | 5,000,000 | | 5,245,973 |
| Parkway Bancorp, Inc. (6.000% to 03/31/25, | | | | | | | | |
| then 3 month LIBOR + 5.390%) (d)(g) | | 6.000 | | 03/31/30 | | 10,000,000 | | 10,754,576 |
| Pedcor Bancorp (7.250% to 02/15/24, then 3 month LIBOR + 4.600%) (d)(g) | | 7.250 | | 02/15/29 | | 3,000,000 | | 3,144,425 |
| Pershing Road Development Co., LLC (3 month LIBOR + 0.400%) (d)(g) | | 0.591 | | 09/15/21 | | 30,000 | | 30,000 |
| Pershing Road Development Co., LLC (3 month LIBOR + 0.400%) (d)(g) | | 0.591 | | 09/15/22 | | 1,000,000 | | 997,000 |
| Pershing Road Development Co., LLC (3 month LIBOR + 0.400%) (d)(g) | | 0.591 | | 09/15/22 | | 2,738,000 | | 2,729,786 |
| Pershing Road Development Co., LLC (3 month LIBOR + 0.400%) (d)(g) | | 0.591 | | 09/15/23 | | 1,705,000 | | 1,696,475 |
| Pershing Road Development Co., LLC (3 month LIBOR + 0.400%) (d)(g) | | 0.591 | | 09/15/23 | | 3,841,000 | | 3,821,795 |
See Notes to Financial Statements.
27
| BOND FUND SCHEDULE OF INVESTMENTS (Unaudited) (Continued) |
| May 31, 2021 |
| | | Rate (%) | | Maturity Date | | Principal Amount | | Value |
| BONDS (continued) | | | | | | | | |
| | |
| Corporate Bonds (continued) | | | | | | | | |
| Pershing Road Development Co., LLC (3 month LIBOR + 0.400%) (d)(g) | | 0.591 | | 09/15/24 | | 1,815,000 | | $1,796,850 |
| Pershing Road Development Co., LLC (3 month LIBOR + 0.400%) (d)(g) | | 0.591 | | 09/15/24 | | 4,799,000 | | 4,751,010 |
| Pershing Road Development Co., LLC (3 month LIBOR + 0.400%) (d)(g) | | 0.591 | | 09/15/25 | | 1,530,000 | | 1,510,875 |
| Pershing Road Development Co., LLC (3 month LIBOR + 0.400%) (d)(g) | | 0.591 | | 09/15/26 | | 1,415,000 | | 1,392,006 |
| Pinnacle Financial Partners, Inc. (4.125% to 09/15/24, then 3 month | | | | | | | | |
| LIBOR + 2.775%) (d) | | 4.125 | | 09/15/29 | | 5,000,000 | | 5,058,585 |
| Preferred Bank (6.000% to 06/15/21, then 3 month LIBOR + 4.673%) (d) | | 6.000 | | 06/15/26 | | 10,240,000 | | 10,262,746 |
| Principal Financial Group, Inc. (3 month LIBOR + 3.044%) (d) | | 3.200 | | 05/15/55 | | 26,065,000 | | 25,804,350 |
| ProAssurance Corp. | | 5.300 | | 11/15/23 | | 5,001,000 | | 5,386,922 |
| RBB Bancorp (6.180% to 12/01/23, then 3 month LIBOR + 3.150%) (d) | | 6.180 | | 12/01/28 | | 7,000,000 | | 7,354,005 |
| ReadyCap Holdings, LLC (g) | | 7.500 | | 02/15/22 | | 26,000,000 | | 26,425,369 |
| Reinsurance Group of America, Inc. (3 month LIBOR + 2.665%) (d) | | 2.849 | | 12/15/65 | | 33,529,000 | | 32,020,195 |
| Reliant Bancorp Inc. (5.125% to 12/15/24, then SOFRRATE + 3.765%) (d) | | 5.125 | | 12/15/29 | | 10,000,000 | | 10,353,545 |
| Renasant Corp. (5.000% to 09/01/21, then 3 month LIBOR + 3.840%) (d) | | 5.000 | | 09/01/26 | | 4,100,000 | | 4,131,116 |
| Royal Caribbean Cruises Ltd. | | 5.250 | | 11/15/22 | | 100,000 | | 103,281 |
| RPM Int'l., Inc. | | 3.450 | | 11/15/22 | | 371,000 | | 383,530 |
| Sandy Spring Bank (5.625% to 09/30/21, then 3 month LIBOR + 4.409%) (d) | | 5.625 | | 09/30/26 | | 2,500,000 | | 2,525,024 |
| Scripps Networks Interactive, Inc. | | 3.950 | | 06/15/25 | | 491,000 | | 523,963 |
| Signature Bank New York (4.000% to 10/15/25, | | | | | | | | |
| then AMERIBOR RATE + 3.890%) (d) | | 4.000 | | 10/15/30 | | 4,295,000 | | 4,449,774 |
| Silversea Cruise Finance Ltd. (g) | | 7.250 | | 02/01/25 | | 27,906,000 | | 28,922,337 |
| SL Green Operating Partnership LP | | 3.250 | | 10/15/22 | | 752,000 | | 776,319 |
| Southern National Bancorp of Virginia, Inc. (5.875% to 01/31/22, | | | | | | | | |
| then 3 month LIBOR + 3.950%) (d)(g) | | 5.875 | | 01/31/27 | | 2,000,000 | | 2,035,015 |
| Southern National Bancorp of Virginia, Inc. (5.400% to 09/01/25, | | | | | | | | |
| then SOFRRATE + 5.310%) (d) | | 5.400 | | 09/01/30 | | 2,000,000 | | 2,158,311 |
| Southside Bancshares, Inc. (5.500% to 09/30/21, | | | | | | | | |
| then 3 month LIBOR + 4.297%) (d) | | 5.500 | | 09/30/26 | | 2,060,000 | | 2,079,548 |
| Spend Life Wisely Co., Inc. (5.875% to 03/15/22, | | | | | | | | |
| then 3 month LIBOR + 3.742%) (d)(g) | | 5.875 | | 03/15/27 | | 8,500,000 | | 8,701,737 |
| StanCorp Financial Group, Inc. | | 5.000 | | 08/15/22 | | 165,000 | | 173,260 |
| State Street Corp. (3 month LIBOR + 3.597%) (d)(f) | | 3.781 | | 09/15/21 | | 1,703,000 | | 1,704,873 |
| Steel Dynamics, Inc. | | 5.000 | | 12/15/26 | | 1,000,000 | | 1,046,854 |
| Synchrony Bank | | 3.000 | | 06/15/22 | | 1,000,000 | | 1,025,214 |
| Synovus Financial Corp. | | 3.125 | | 11/01/22 | | 260,000 | | 268,065 |
| Texas State Bankshares, Inc. (5.750% to 06/15/24, | | | | | | | | |
| then 3 month LIBOR + 3.550%) (d)(g) | | 5.750 | | 06/15/29 | | 4,000,000 | | 4,112,754 |
| TransCanada PipeLines Ltd. (3 month LIBOR + 2.210%) (d) | | 2.366 | | 05/15/67 | | 24,473,000 | | 20,674,724 |
| TriState Capital Holdings, Inc. (5.750% to 05/15/25, | | | | | | | | |
| then 3 month LIBOR + 5.360%) (d) | | 5.750 | | 05/15/30 | | 10,775,000 | | 11,843,361 |
| Truist Financial Corp. (4.800% to 09/01/24, then H15T5Y + 3.003%) (d)(f) | | 4.800 | | 09/01/24 | | 10,552,000 | | 11,224,690 |
| UTB Financial Holding Co. (6.500% to 09/01/23, | | | | | | | | |
| then 3 month LIBOR + 3.620%) (d)(g) | | 6.500 | | 09/01/28 | | 6,000,000 | | 6,419,210 |
| VeriSign, Inc. | | 4.625 | | 05/01/23 | | 16,443,000 | | 16,465,527 |
| Volunteer State Bancshares, Inc. (5.750% to 11/15/24, | | | | | | | | |
| then SOFRRATE + 4.365%) (d)(g) | | 5.750 | | 11/15/29 | | 9,000,000 | | 9,359,220 |
| WEC Energy Group, Inc. (3 month LIBOR + 2.1125%) (d) | | 2.268 | | 05/15/67 | | 570,000 | | 528,653 |
| Western Gas Partners LP | | 4.500 | | 03/01/28 | | 139,000 | | 146,993 |
| WT Holdings, Inc. (g) | | 7.000 | | 04/30/23 | | 18,000,000 | | 18,790,407 |
See Notes to Financial Statements.
28
| BOND FUND SCHEDULE OF INVESTMENTS (Unaudited) (Continued) |
| May 31, 2021 |
| | | Rate (%) | | Maturity Date | | Principal Amount | | Value |
| BONDS (continued) | | | | | | | | |
| | |
| Residential Mortgage-Backed Securities - 0.1% | | | | | | | | $2,724,472 |
| | Hawaii Housing Finance & Development Corp. | | 2.600 | | 07/01/37 | | 206,571 | | 210,308 |
| Minnesota Housing Finance Agency | | 2.700 | | 09/01/41 | | 1,202,124 | | 1,231,340 |
| Onslow Bay Mortgage Loan Trust, Series 2015-1 2A10 (d)(g) | | 3.108 | | 11/25/45 | | 1,230,596 | | 1,270,775 |
| Sequoia Mortgage Trust, Series 2018-CH1 A11 (g) | | 3.500 | | 02/25/48 | | 12,045 | | 12,049 |
| |
| Sovereign Bonds - 0.5% | | | | | | | | 11,645,363 |
| Antares Holdings LP (g) | | 6.000 | | 08/15/23 | | 4,830,000 | | 5,223,886 |
| Bayerische Landesbank (3 month LIBOR + 1.160% where (USISDA30 - | | | | | | | | |
| USISDA02) is greater than -0.250%) (d) | | 1.362 | | 10/02/21 | | 6,000,000 | | 6,015,173 |
| BOC Aviation Ltd. (g) | | 3.000 | | 05/23/22 | | 400,000 | | 406,304 |
| | |
| Taxable Municipal Bonds - 0.2% | | | | | | | | 4,773,134 |
| California Statewide Communities Development Authority | | 5.370 | | 06/01/21 | | 140,000 | | 140,000 |
| County of Reeves TX Certs. of Participation | | 6.375 | | 12/01/21 | | 38,461 | | 38,630 |
| Florida State Mid-Bay Bridge Authority | | 3.784 | | 10/01/21 | | 760,000 | | 764,547 |
| Guam Gov't. Business Privilege Tax Revenue | | 4.383 | | 01/01/22 | | 530,000 | | 535,763 |
| New Jersey Sports & Exposition Authority | | 6.076 | | 03/01/23 | | 190,000 | | 198,063 |
| Pontotoc County OK Educational Facilities Authority | | 4.119 | | 09/01/23 | | 135,000 | | 139,076 |
| Public Finance Authority WI Student Housing Revenue | | 4.500 | | 07/01/21 | | 400,000 | | 400,286 |
| Summit County OH Development Finance Authority | | 6.250 | | 05/15/26 | | 635,000 | | 637,110 |
| Utah Infrastructure Agency Telecommunications Revenue and Refunding | | 3.500 | | 10/15/23 | | 1,890,000 | | 1,919,659 |
| | |
| U.S. Government & Agency Securities - 0.2% | | | | | | | | 4,709,098 |
| Federal Home Loan Banks | | 1.625 | | 11/19/21 | | 4,675,000 | | 4,709,098 |
| | |
| U.S. Government Agency Mortgage-Backed Securities - 4.7% | | | | | | | | 118,247,923 |
| Fannie Mae Interest Strip, Series 419 C6 (IO) | | 3.500 | | 05/25/44 | | 4,368,062 | | 613,485 |
| Fannie Mae Pool, Series 890163 | | 5.500 | | 03/01/24 | | 130,349 | | 132,512 |
| Fannie Mae REMIC, Series 2010-2 SG (IO) (-1.0 times 1 month LIBOR + | | | | | | | | |
| 6.450%, floor 0.000%, cap 6.450%) (d) | | 6.358 | | 10/25/39 | | 1,696,834 | | 31,222 |
| Fannie Mae REMIC, Series 2010-102 DB | | 4.000 | | 06/25/29 | | 146,948 | | 147,732 |
| Fannie Mae REMIC, Series 2011-3 KA | | 5.000 | | 04/25/40 | | 163,999 | | 173,385 |
| Fannie Mae REMIC, Series 2011-136 ES (IO) (-1.0 times 1 month LIBOR | | | | | | | | |
| + 6.550%, floor 0.000%, cap 6.550%) (d) | | 6.458 | | 02/25/41 | | 2,199,782 | | 218,027 |
| Fannie Mae REMIC, Series 2012-14 DS (IO) (-1.0 times 1 month LIBOR | | | | | | | | |
| + 6.500%, floor 0.000%, cap 6.500%) (d) | | 6.408 | | 03/25/42 | | 8,677,597 | | 2,083,195 |
| Fannie Mae REMIC, Series 2012-14 SH (IO) (-1.0 times 1 month LIBOR | | | | | | | | |
| + 6.550%, floor 0.000%, cap 6.550%) (d) | | 6.458 | | 07/25/40 | | 1,507,241 | | 72,703 |
| Fannie Mae REMIC, Series 2012-114 HS (IO) (-1.0 times 1 month | | | | | | | | |
| LIBOR + 6.150%, floor 0.000%, cap 6.150%) (d) | | 6.058 | | 03/25/40 | | 3,155,851 | | 99,937 |
| Fannie Mae REMIC, Series 2012-122 SA (IO) (-1.0 times 1 month LIBOR | | | | | | | | |
| + 6.200%, floor 0.000%, cap 6.200%) (d) | | 6.108 | | 02/25/40 | | 2,753,830 | | 100,117 |
| Fannie Mae REMIC, Series 2013-7 EI (IO) | | 3.000 | | 10/25/40 | | 7,769,152 | | 501,536 |
| Fannie Mae REMIC, Series 2013-20 CS (IO) (-1.0 times 1 month LIBOR | | | | | | | | |
| + 6.150%, floor 0.000%, cap 6.150%) (d) | | 6.058 | | 03/25/43 | | 2,831,942 | | 375,672 |
| Fannie Mae REMIC, Series 2013-29 Class AI (IO) | | 2.500 | | 04/25/28 | | 3,146,257 | | 166,198 |
| Fannie Mae REMIC, Series 2013-31 IH (IO) | | 3.500 | | 02/25/43 | | 3,334,082 | | 285,401 |
| Fannie Mae REMIC, Series 2013-38 CI (IO) | | 3.000 | | 04/25/28 | | 8,463,377 | | 497,782 |
See Notes to Financial Statements.
29
| BOND FUND SCHEDULE OF INVESTMENTS (Unaudited) (Continued) |
| May 31, 2021 |
| | Rate (%) | | Maturity Date | | Principal Amount | | Value |
| BONDS (continued) | | | | | | | | |
| |
| U.S. Government Agency Mortgage-Backed Securities (continued) | | | | | | | | |
| Fannie Mae REMIC, Series 2013-93 SI (IO) (-1.0 times 1 month LIBOR | | | | | | | | |
| + 5.170%, floor 0.000%, cap 5.170%) (d) | | 5.060 | | 09/25/43 | | 16,104,827 | | $2,119,313 |
| Fannie Mae REMIC, Series 2016-64 CI (IO) | | 3.500 | | 07/25/43 | | 5,093,688 | | 377,360 |
| Fannie Mae REMIC, Series 2019-44 IP (IO) | | 4.000 | | 09/25/46 | | 3,286,522 | | 270,140 |
| Fannie Mae REMIC, Series 2019-74 WA (IO) (d) | | 3.124 | | 07/25/49 | | 3,634,154 | | 471,656 |
| Fannie Mae REMIC, Series 2020-8 WA (IO) (d) | | 6.008 | | 07/25/49 | | 1,933,061 | | 251,113 |
| Fannie Mae REMIC, Series 2020-68 ZC | | 1.000 | | 10/25/50 | | 2,527,922 | | 2,471,197 |
| Fannie Mae REMIC, Series 2020-82 EB | | 1.250 | | 11/25/50 | | 1,506,794 | | 1,432,731 |
| Freddie Mac Multifamily Structured Pass Through Certificates, Series | | | | | | | | |
| K045 X1 (IO) (d) | | 0.435 | | 01/25/25 | | 177,362,968 | | 2,488,527 |
| Freddie Mac Multifamily Structured Pass Through Certificates, Series | | | | | | | | |
| K050 X1 (IO) (d) | | 0.317 | | 08/25/25 | | 177,295,576 | | 2,237,169 |
| Freddie Mac Multifamily Structured Pass Through Certificates, Series | | | | | | | | |
| K056 X1 (IO) (d) | | 1.261 | | 05/25/26 | | 78,894,110 | | 4,201,143 |
| Freddie Mac Multifamily Structured Pass Through Certificates, Series | | | | | | | | |
| K060 X1 (IO) (d) | | 0.071 | | 10/25/26 | | 223,200,298 | | 1,056,050 |
| Freddie Mac REMIC, Series 3848 WL | | 4.000 | | 04/15/40 | | 53,936 | | 54,676 |
| Freddie Mac REMIC, Series 4060 SJ (IO) (-1.0 times 1 month LIBOR + | | | | | | | | |
| 6.650%, floor 0.000%, cap 6.650%) (d) | | 6.549 | | 02/15/41 | | 2,020,306 | | 192,970 |
| Freddie Mac REMIC, Series 4109 AI (IO) | | 3.000 | | 07/15/31 | | 10,701,025 | | 479,097 |
| Freddie Mac REMIC, Series 4116 US (IO) (-1.0 times 1 month LIBOR + | | | | | | | | |
| 4.600%, floor 0.000%, cap 4.600%) (d) | | 4.490 | | 10/15/42 | | 5,528,418 | | 561,339 |
| Freddie Mac REMIC, Series 4136 IH (IO) | | 3.500 | | 09/15/27 | | 4,074,102 | | 242,257 |
| Freddie Mac REMIC, Series 4139 EI (IO) | | 3.000 | | 09/15/31 | | 3,736,912 | | 264,581 |
| Freddie Mac REMIC, Series 4219 AI (IO) | | 3.500 | | 01/15/43 | | 1,833,590 | | 197,154 |
| Freddie Mac REMIC, Series 4238 Class NS (IO) (-1.0 times 1 month | | | | | | | | |
| LIBOR + 6.700%, floor 0.000%, cap 6.700%) (d) | | 6.599 | | 02/15/42 | | 1,619,686 | | 225,508 |
| Freddie Mac REMIC, Series 4267 CI (IO) | | 4.000 | | 05/15/39 | | 383,100 | | 464 |
| Freddie Mac REMIC, Series 4328 DA | | 4.000 | | 01/15/36 | | 825,069 | | 840,306 |
| Freddie Mac REMIC, Series 4335 AL | | 4.250 | | 03/15/40 | | 33,531 | | 33,565 |
| Freddie Mac REMIC, Series 4364 SE (IO) (-1.0 times 1 month LIBOR + | | | | | | | | |
| 6.700%, floor 0.000%, cap 6.700%) (d) | | 6.599 | | 12/15/39 | | 570,133 | | 5,007 |
| Freddie Mac REMIC, Series 4469 HA (c) | | 4.250 | | 02/15/39 | | 1,209,891 | | 1,236,171 |
| Freddie Mac REMIC, Series 4504 (IO) | | 3.500 | | 05/15/42 | | 613,051 | | 13,693 |
| Freddie Mac REMIC, Series 4760 IB (IO) | | 4.000 | | 10/15/42 | | 8,287,278 | | 990,892 |
| Freddie Mac REMIC, Series 4770 HJ | | 4.500 | | 11/15/43 | | 642,897 | | 644,976 |
| Freddie Mac REMIC, Series 5041 JH | | 1.500 | | 11/25/50 | | 1,587,192 | | 1,524,700 |
| Ginnie Mae Pool, Series 78-2071X | | 7.000 | | 05/15/33 | | 11,958 | | 13,943 |
| Ginnie Mae REMIC Trust, Series 2011-32 NA | | 4.000 | | 06/20/40 | | 184,063 | | 187,816 |
| Ginnie Mae REMIC Trust, Series 2012-27 (IO) (d) | | 0.872 | | 04/16/53 | | 33,311,914 | | 637,550 |
| Ginnie Mae REMIC Trust, Series 2013-35 A | | 1.618 | | 02/16/40 | | 136,959 | | 137,845 |
| Ginnie Mae REMIC Trust, Series 2015-81 (IO) (d) | | 0.218 | | 10/16/56 | | 53,483,823 | | 1,010,807 |
| Ginnie Mae REMIC Trust, Series 2016-51 ID (IO) | | 4.000 | | 03/20/43 | | 6,154,415 | | 411,588 |
| Ginnie Mae REMIC Trust, Series 2016-137 (IO) (d) | | 0.720 | | 10/16/56 | | 33,726,007 | | 1,540,162 |
| Ginnie Mae REMIC Trust, Series 2017-24 (IO) (d) | | 0.783 | | 12/16/56 | | 98,455,661 | | 4,536,354 |
| Ginnie Mae REMIC Trust, Series 2017-104 JI (IO) | | 4.000 | | 06/20/44 | | 15,809,370 | | 686,685 |
| Ginnie Mae REMIC Trust, Series 2017-169 (IO) (d) | | 0.602 | | 01/16/60 | | 123,584,093 | | 6,054,335 |
| Ginnie Mae REMIC Trust, Series 2018-25 (IO) (d) | | 0.554 | | 02/16/60 | | 126,106,825 | | 6,009,469 |
| Ginnie Mae REMIC Trust, Series 2019-37 (IO) (d) | | 0.779 | | 11/16/60 | | 23,431,229 | | 1,612,399 |
See Notes to Financial Statements.
30
| BOND FUND SCHEDULE OF INVESTMENTS (Unaudited) (Continued) |
| May 31, 2021 |
| | Rate (%) | | Maturity Date | | Principal Amount | | Value |
| BONDS (continued) | | | | | | | | |
| |
| U.S. Government Agency Mortgage-Backed Securities (continued) | | | | | | | | |
| Ginnie Mae REMIC Trust, Series 2019-59 IM (IO) | | 4.000 | | 12/20/48 | | 446,828 | | $9,384 |
| Ginnie Mae REMIC Trust, Series 2019-59 MI (IO) | | 4.000 | | 05/20/49 | | 459,843 | | 29,815 |
| Ginnie Mae REMIC Trust, Series 2019-63 (IO) (d) | | 0.791 | | 12/16/60 | | 60,758,027 | | 4,065,824 |
| Ginnie Mae REMIC Trust, Series 2019-71 IO (IO) | | 3.500 | | 06/20/49 | | 989,686 | | 69,557 |
| Ginnie Mae REMIC Trust, Series 2019-71 IQ (IO) | | 3.500 | | 06/20/49 | | 907,551 | | 35,098 |
| Ginnie Mae REMIC Trust, Series 2019-78 IQ (IO) | | 4.000 | | 04/20/49 | | 847,486 | | 24,444 |
| Ginnie Mae REMIC Trust, Series 2019-78 QI (IO) | | 4.000 | | 06/20/49 | | 797,834 | | 28,607 |
| Ginnie Mae REMIC Trust, Series 2019-94 (IO) (d) | | 0.949 | | 08/16/61 | | 39,352,168 | | 2,861,406 |
| Ginnie Mae REMIC Trust, Series 2019-118 (IO) (d) | | 0.832 | | 06/16/61 | | 43,624,872 | | 2,787,189 |
| Ginnie Mae REMIC Trust, Series 2019-122 (IO) (d) | | 0.967 | | 07/16/61 | | 52,218,310 | | 3,807,279 |
| Ginnie Mae REMIC Trust, Series 2019-124 (IO) (d) | | 1.024 | | 06/16/61 | | 109,852,855 | | 8,649,340 |
| Ginnie Mae REMIC Trust, Series 2019-136 ES (IO) (-1.0 times 1 month | | | | | | | | |
| LIBOR + 6.050%, floor 0.000%, cap 6.050%) (d) | | 5.951 | | 03/20/48 | | 8,508,543 | | 1,238,960 |
| Ginnie Mae REMIC Trust, Series 2019-139 (IO) (d) | | 0.709 | | 11/16/61 | | 38,638,322 | | 2,377,694 |
| Ginnie Mae REMIC Trust, Series 2020-20 (IO) (d) | | 0.880 | | 05/16/61 | | 33,031,011 | | 2,449,517 |
| Ginnie Mae REMIC Trust, Series 2020-40 (IO) (d) | | 1.163 | | 01/16/62 | | 44,525,399 | | 3,982,427 |
| Ginnie Mae REMIC Trust, Series 2020-44 (IO) (d) | | 1.214 | | 02/16/62 | | 94,076,192 | | 8,768,625 |
| Ginnie Mae REMIC Trust, Series 2020-47 YI (IO) | | 2.500 | | 04/20/50 | | 4,668,514 | | 212,756 |
| Ginnie Mae REMIC Trust, Series 2020-49 (IO) (d) | | 1.119 | | 07/16/62 | | 45,588,679 | | 3,869,690 |
| Ginnie Mae REMIC Trust, Series 2020-58 (IO) (d) | | 1.029 | | 01/16/62 | | 44,421,575 | | 3,543,900 |
| Ginnie Mae REMIC Trust, Series 2020-123 TZ | | 1.000 | | 08/20/50 | | 4,821,699 | | 4,669,951 |
| Ginnie Mae REMIC Trust, Series 2020-134 BZ | | 1.000 | | 09/16/50 | | 3,353,272 | | 3,085,824 |
| Ginnie Mae REMIC Trust, Series 2020-166 BU | | 1.000 | | 11/20/50 | | 998,490 | | 997,742 |
| Ginnie Mae REMIC Trust, Series 2021-16 BU | | 1.000 | | 01/20/51 | | 580,001 | | 579,921 |
| Ginnie Mae REMIC Trust, Series 2021-29 PU | | 1.000 | | 02/20/51 | | 863,000 | | 865,279 |
| Ginnie Mae REMIC Trust, Series 2021-46 BU | | 1.000 | | 03/20/51 | | 498,463 | | 497,542 |
| Ginnie Mae REMIC Trust, Series 2021-46 PU | | 1.000 | | 03/20/51 | | 1,293,853 | | 1,291,935 |
| Ginnie Mae REMIC Trust, Series 2021-66 PU | | 1.000 | | 04/20/51 | | 1,230,512 | | 1,227,542 |
| Ginnie Mae REMIC Trust, Series 2021-89 BU | | 1.000 | | 05/20/51 | | 3,000,000 | | 2,999,063 |
| |
| | | | | | Shares or | | |
| | Rate % | | Maturity Date | | Principal Amount | | Value |
| SHORT-TERM INVESTMENTS - 9.9% | | | | | | | | 250,082,010 |
| (COST $250,068,520) | | | | | | | | |
| |
| Money Market Funds - 0.0%^ | | | | | | | | 100,000 |
| First American Government Obligations Fund Class X (a) | | 0.026 | | | | 100,000 | | 100,000 |
| |
| U.S. Government & Agency Securities - 9.9% | | | | | | | | 249,982,010 |
| U.S. Treasury Bills (b) | | 0.004 | | 06/03/21 | | 20,000,000 | | 19,999,969 |
| U.S. Treasury Bills (b) | | 0.005 | | 06/08/21 | | 5,000,000 | | 4,999,961 |
| U.S. Treasury Bills (b) | | 0.004 | | 07/20/21 | | 10,000,000 | | 9,999,850 |
| U.S. Treasury Bills (b) | | 0.003 | | 07/29/21 | | 10,000,000 | | 9,999,839 |
| U.S. Treasury Bills (b) | | 0.010 | | 08/05/21 | | 10,000,000 | | 9,999,774 |
| U.S. Treasury Bills (b) | | 0.009 | | 08/12/21 | | 10,000,000 | | 9,999,725 |
| U.S. Treasury Bills (b) | | 0.008 | | 08/19/21 | | 10,000,000 | | 9,999,781 |
| U.S. Treasury Bills (b) | | 0.010 | | 08/26/21 | | 20,000,000 | | 19,999,403 |
| U.S. Treasury Bills (b) | | 0.009 | | 09/09/21 | | 5,000,000 | | 4,999,826 |
| U.S. Treasury Bills (b) | | 0.008 | | 09/16/21 | | 5,000,000 | | 4,999,851 |
See Notes to Financial Statements.
31
| BOND FUND SCHEDULE OF INVESTMENTS (Unaudited) (Continued) |
| May 31, 2021 |
| | | | | | Shares or | | |
| | Rate % | | Maturity Date | | Principal Amount | | Value |
| SHORT-TERM INVESTMENTS (continued) | | | | | | | | |
| |
| U.S. Government & Agency Securities (continued) | | | | | | | | |
| U.S. Treasury Bills (b) | | 0.015 | | 09/30/21 | | 5,000,000 | | $4,999,706 |
| U.S. Treasury Bills (b) | | 0.015 | | 10/07/21 | | 20,000,000 | | 19,998,844 |
| U.S. Treasury Bills (b) | | 0.016 | | 11/04/21 | | 40,000,000 | | 39,996,533 |
| U.S. Treasury Bills (b) | | 0.018 | | 11/18/21 | | 20,000,000 | | 19,997,639 |
| U.S. Treasury Bills (b) | | 0.019 | | 12/02/21 | | 30,000,000 | | 29,996,167 |
| U.S. Treasury Bills (b) | | 0.021 | | 12/30/21 | | 30,000,000 | | 29,995,142 |
| TOTAL INVESTMENTS - 98.9% (COST $2,584,245,663) | | | | | | | | 2,500,282,795 |
| |
| NET OTHER ASSETS AND LIABILITIES - 1.1% | | | | | | | | 28,192,984 |
| |
| NET ASSETS - 100.0% | | | | | | | | $2,528,475,779 |
| (a) | Rate shown represents the 7-day yield at May 31, 2021. |
| (b) | Rate shown represents the current yield for U.S. Treasury Bills at May 31, 2021. |
| (c) | Security is a “step-up” bond where the coupon increases or steps up at a predetermined date. Securities which do not indicate a future coupon rate in their description above are at their final coupon rate at May 31, 2021. |
| (d) | Variable rate security. Interest rates reset periodically. Interest rate shown reflects the rate in effect at May 31, 2021. For securities based on a published reference rate and spread, the reference rate and spread are indicated in the description above. Certain variable rate securities are not based on a published reference rate and spread but are determined by the issuer or agent and are based on current market conditions. These securities do not indicate a reference rate and spread in their description above. |
| (e) | Non-income producing security. |
| (f) | Perpetual maturity. Date shown represents next contractual call date. |
| (g) | Security subject to restrictions on resale under federal securities laws and which therefore may only be resold upon registration under the Securities Act of 1933, as amended, or in transactions exempt from registration, including sales to qualified institutional buyers under Rule 144A of the Securities Act of 1933, as amended. At May 31, 2021, the aggregate value of these securities was $864,681,460, representing 34.2% of net assets. |
| (h) | Issuer in default on interest and/or principal repayment. |
| (i) | Illiquid security at May 31, 2021. |
| ^ | Rounds to 0.0%. |
| Abbreviations: |
| AMERIBOR | American Interbank Offered Rate |
| H15T5Y | 5-Year Treasury Constant Maturity Rate |
| IO | Interest Only Security |
| LIBOR | London Interbank Offered Rate |
| SOFRRATE | U.S. Secured Overnight Financing Rate |
| USISDA02 | 2-Year Dollar ICE Swap Rate |
| USISDA05 | 5-Year Dollar ICE Swap Rate |
| USISDA10 | 10-Year Dollar ICE Swap Rate |
| USISDA30 | 30-Year Dollar ICE Swap Rate |
| |
| A.G. | Aktiengesellschaft is the German term for a public limited liability corporation. |
| DAC | Designated Activity Company |
| Pty. Ltd. | Proprietary Limited Company under Australian law. |
| REMIC | Real Estate Mortgage Investment Conduit |
| SRL | Società a responsabilità limitata is the Italian term for a public limited company. |
See Notes to Financial Statements.
32
| BOND FUND SCHEDULE OF INVESTMENTS (Unaudited) (Continued) |
| May 31, 2021 |
The following is a summary of the inputs used to value the Funds’ investments as of May 31, 2021:
| | Level 1 | | Level 2 | | Level 3 | | Total |
| Bonds | | | | | | | | |
| Asset-backed securities | | $– | | $368,051,726 | | $– | | $368,051,726 |
| Commercial mortgage-backed securities | | – | | 349,091,064 | | – | | 349,091,064 |
| Convertible bonds | | – | | 50,326,801 | | – | | 50,326,801 |
| Corporate bonds | | – | | 1,340,631,204 | | – | | 1,340,631,204 |
| Residential mortgage-backed securities | | – | | 2,724,472 | | – | | 2,724,472 |
| Sovereign bonds | | – | | 11,645,363 | | – | | 11,645,363 |
| Taxable municipal bonds | | – | | 4,773,134 | | – | | 4,773,134 |
| U.S. government & agency securities | | – | | 4,709,098 | | – | | 4,709,098 |
| U.S. government agency mortgage-backed securities | | – | | 118,247,923 | | – | | 118,247,923 |
| Total bonds | | – | | 2,250,200,785 | | – | | 2,250,200,785 |
| Short-term investments | | | | | | | | |
| Money market funds | | 100,000 | | – | | – | | 100,000 |
| U.S. government & agency securities | | – | | 249,982,010 | | – | | 249,982,010 |
| Total short-term investments | | 100,000 | | 249,982,010 | | – | | 250,082,010 |
| Total investments | | $100,000 | | $2,500,182,795 | | $– | | $2,500,282,795 |
The Fund did not invest in any level-3 investments during the six-month period ended May 31, 2021.
For more information on valuation inputs, see financial statement Note 2 - Significant Accounting Policies.
See Notes to Financial Statements.
33
| FUND EXPENSE EXAMPLES (Unaudited) |
| May 31, 2021 |
Example
A Fund shareholder may incur two types of costs: (1) transaction costs such as redemption fees; and (2) ongoing costs, including management fees and other Fund expenses. This example is intended to help you understand your ongoing costs (in dollars) of investing in a Fund and to compare these costs with the ongoing costs of investing in other mutual funds.
The example is based on an investment of $1,000 invested at the beginning of the period and held for the entire period from December 1, 2020 to May 31, 2021.
Actual Expenses
The first line of the table below under each Fund provides information about actual account values and actual expenses for such Fund. You may use the information in this line, together with the amount you invested, to estimate the expenses that you paid over the period. Simply divide your account value by $1,000 (for example, an $8,600 account value divided by $1,000 = 8.6), then multiply the result by the number in the first line under the heading entitled “Expenses Paid During Period” to estimate the expenses you paid on your account during this period.
Hypothetical Example for Comparison Purposes
The second line of the table below under each Fund provides information about hypothetical account values and hypothetical expenses based on such Fund’s actual expense ratio and an assumed rate of return of 5% per year before expenses, which is not the Fund’s actual return. The hypothetical account values and expenses may not be used to estimate the actual ending account balance or expenses you paid for the period. You may use this information to compare the ongoing costs of investing in each Fund and other funds. To do so, compare the 5% hypothetical example with the 5% hypothetical examples that appear in the shareholder reports of the other funds.
Please note that the expenses shown in the table are meant to highlight your ongoing costs only and do not reflect any transactional costs, such as redemption fees. Therefore, the second line of the table is useful in comparing ongoing costs only, and will not help you determine the relative costs of owning different funds. In addition, if these transactional costs were included, your costs would have been higher.
| | | | Beginning | | Ending | | |
| | Expense Ratio | | Account Value | | Account Value | | Expenses Paid |
| Six-Month Period Ended May 31, 2021 | | for the Period | | 12/01/20 | | 05/31/21 | | During the Period* |
| LargeCap Fund | | | | | | | | |
| Actual | | 0.99% | | $1,000.00 | | $1,269.36 | | $5.60 |
| Hypothetical (5% return before expenses) | | 0.99% | | $1,000.00 | | $1,020.06 | | $4.99 |
| MidCap Fund | | | | | | | | |
| Actual | | 1.15% | | $1,000.00 | | $1,359.37 | | $6.76 |
| Hypothetical (5% return before expenses) | | 1.15% | | $1,000.00 | | $1,019.27 | | $5.79 |
| Bond Fund | | | | | | | | |
| Actual | | 0.72% | | $1,000.00 | | $1,057.21 | | $3.69 |
| Hypothetical (5% return before expenses) | | 0.72% | | $1,000.00 | | $1,021.41 | | $3.63 |
* Expenses are equal to the annualized [net] expense ratio for each Fund, multiplied by the average account value over the period, multiplied by 182/365 (to reflect the one-half year period).
For more information, please refer to the Funds’ Prospectus.
See Notes to Financial Statements.
34
| STATEMENTS OF ASSETS AND LIABILITIES (Unaudited) |
| May 31, 2021 (In thousands, except per share amounts) |
| | LARGECAP | | MIDCAP | | BOND |
| | FUND | | FUND | | FUND |
| | | | | | | | | | | | |
| Assets | | | | | | | | | | | |
| Total investments in securities, at value (a) | | | $171,083 | | | | $64,385 | | | $2,500,283 | |
| Cash | | | – | | | | 299 | | | 7,937 | |
| Due from sale of securities | | | 198 | | | | 145 | | | 687 | |
| Receivable from fund shares sold | | | 7 | | | | 21 | | | 5,972 | |
| Dividends and interest receivable | | | 248 | | | | 75 | | | 19,282 | |
| Prepaid expenses | | | 15 | | | | 12 | | | 43 | |
| Total Assets | | | 171,551 | | | | 64,937 | | | 2,534,204 | |
| Liabilities | | | | | | | | | | | |
| Due on purchase of securities | | | – | | | | – | | | 2,447 | |
| Payable for fund shares redeemed | | | 2 | | | | 1 | | | 1,753 | |
| Line of credit | | | 29 | | | | – | | | – | |
| Accrued expenses payable | | | 27 | | | | 21 | | | 138 | |
| Accrued directors expense payable | | | 1 | | | | 1 | | | – | |
| Due to Advisor | | | 125 | | | | 49 | | | 1,390 | |
| Total liabilities | | | 184 | | | | 72 | | | 5,728 | |
| Net assets | | | $171,367 | | | | $64,865 | | | $2,528,476 | |
| Net assets consist of | | | | | | | | | | | |
| Capital stock ($.001 par value) | | | $108,555 | | | | $36,448 | | | $2,875,055 | |
| Total distributable earnings (accumulated deficit) | | | 62,812 | | | | 28,417 | | | (346,579 | ) |
| Net Assets | | | $171,367 | | | | $64,865 | | | $2,528,476 | |
| Net asset value per share | | | | | | | | | | | |
| Shares of capital stock outstanding (unlimited | | | | | | | | | | | |
| shares authorized) | | | 1,617 | | | | 3,613 | | | 228,091 | |
| Offering and redemption price | | | $105.98 | | | | $17.96 | (b) | | $11.09 | |
| | | | | | | | | | | | |
| (a) Cost of investments | | | $109,642 | | | | $38,451 | | | $2,584,246 | |
| (b) Does not recalculate due to rounding | | | | | | | | | | | |
See Notes to Financial Statements.
35
STATEMENTS OF OPERATIONS (Unaudited) |
Six-Month Period Ended May 31, 2021 (In thousands) |
| | LARGECAP | | MIDCAP | | BOND |
| | FUND | | FUND | | FUND |
| | | | | | | | | | | | | |
| Investment income | | | | | | | | | | | | |
| Interest | | | $– | | | | $– | | | | $61,959 | |
| Dividends | | | 1,371 | | | | 366 | | | | – | |
| Less foreign taxes withheld | | | (7 | ) | | | (2 | ) | | | – | |
| Total investment income | | | 1,364 | | | | 364 | | | | 61,959 | |
| Expenses | | | | | | | | | | | | |
| Investment advisory fees | | | 738 | | | | 290 | | | | 6,957 | |
| Shareholder servicing costs | | | 37 | | | | 15 | | | | 514 | |
| Administrative & accounting services fees | | | 65 | | | | 37 | | | | 334 | |
| Custody fees | | | 7 | | | | 3 | | | | 93 | |
| Directors fees | | | 15 | | | | 13 | | | | 77 | |
| Federal & state registration | | | 18 | | | | 18 | | | | 57 | |
| Professional fees | | | 20 | | | | 19 | | | | 41 | |
| Interest expense from line of credit (see note 2) | | | 1 | | | | – | | | | – | |
| Other expenses | | | 18 | | | | 14 | | | | 247 | |
| Total expenses | | | 919 | | | | 409 | | | | 8,320 | |
| Less expenses reimbursed by Advisor | | | (134 | ) | | | (70 | ) | | | – | |
| Net expenses | | | 785 | | | | 339 | | | | 8,320 | |
| Net investment income | | | 579 | | | | 25 | | | | 53,639 | |
| Realized and unrealized gain (loss) | | | | | | | | | | | | |
| Net realized gain (loss) on investments | | | 2,178 | | | | 3,683 | | | | (25,503 | ) |
| Net unrealized appreciation (depreciation) on investments | | | 34,993 | | | | 14,206 | | | | 106,361 | |
| Net realized and unrealized gain (loss) | | | 37,171 | | | | 17,889 | | | | 80,858 | |
| Increase (Decrease) in net assets | | | | | | | | | | | | |
| resulting from operations | | | $37,750 | | | $ | 17,914 | | | | $134,497 | |
See Notes to Financial Statements.
36
STATEMENTS OF CHANGES IN NET ASSETS |
(In thousands) |
| | LARGECAP | | MIDCAP | | BOND |
| | FUND | | FUND | | FUND |
| | | | | | | | | | | | | | | | | | | | | | | | | |
| | Six-Month | | | | | | Six-Month | | | | | | Six-Month | | | | |
| | Period Ended | | Year Ended | | Period Ended | | Year Ended | | Period Ended | | Year Ended |
| | May 31, 2021 | | November 30, | | May 31, 2021 | | November 30, | | May 31, 2021 | | November 30, |
| | (Unaudited) | | 2020 | | (Unaudited) | | 2020 | | (Unaudited) | | 2020 |
| Operations | | | | | | | | | | | | | | | | | | | | | | | | |
| Net investment income | | | $579 | | | | $1,302 | | | | $25 | | | | $172 | | | | $53,639 | | | | $128,039 | |
| Net realized gain (loss) on investments | | | 2,178 | | | | (989 | ) | | | 3,683 | | | | (707 | ) | | | (25,503 | ) | | | (110,870 | ) |
| Net unrealized appreciation (depreciation) | | | | | | | | | | | | | | | | | | | | | | | | |
| on investments | | | 34,993 | | | | 19,060 | | | | 14,206 | | | | 6,579 | | | | 106,361 | | | | (168,300 | ) |
| Net increase (decrease) in net assets | | | | | | | | | | | | | | | | | | | | | | | | |
| resulting from operations | | | 37,750 | | | | 19,373 | | | | 17,914 | | | | 6,044 | | | | 134,497 | | | | (151,131 | ) |
| Distributions to shareholders | | | | | | | | | | | | | | | | | | | | | | | | |
| Total distributions to shareholders | | | (1,302 | ) | | | (3,502 | ) | | | (172 | ) | | | (1,306 | ) | | | (58,934 | ) | | | (131,066 | ) |
| Net increase (decrease) in net assets | | | | | | | | | | | | | | | | | | | | | | | | |
| resulting from distributions | | | | | | | | | | | | | | | | | | | | | | | | |
| to shareholders | | | (1,302 | ) | | | (3,502 | ) | | | (172 | ) | | | (1,306 | ) | | | (58,934 | ) | | | (131,066 | ) |
| Fund share transactions | | | | | | | | | | | | | | | | | | | | | | | | |
| Proceeds from shares sold | | | 4,330 | | | | 7,694 | | | | 1,402 | | | | 4,055 | | | | 571,644 | | | | 797,584 | |
| Reinvestment of distributions | | | 1,277 | | | | 3,443 | | | | 170 | | | | 1,292 | | | | 55,259 | | | | 122,456 | |
| Cost of shares redeemed | | | (11,775 | ) | | | (14,787 | ) | | | (5,041 | ) | | | (4,601 | ) | | | (440,519 | ) | | | (2,159,936 | ) |
| Net increase (decrease) in net assets | | | | | | | | | | | | | | | | | | | | | | | | |
| resulting from distributions | | | | | | | | | | | | | | | | | | | | | | | | |
| to shareholders | | | (6,168 | ) | | | (3,650 | ) | | | (3,469 | ) | | | 746 | | | | 186,384 | | | | (1,239,896 | ) |
| Total increase (decrease) in net assets | | | 30,280 | | | | 12,221 | | | | 14,273 | | | | 5,484 | | | | 261,947 | | | | (1,522,093 | ) |
| Net assets | | | | | | | | | | | | | | | | | | | | | | | | |
| Beginning of year | | | 141,087 | | | | 128,866 | | | | 50,592 | | | | 45,108 | | | | 2,266,529 | | | | 3,788,622 | |
| End of period | | | $171,367 | | | | $141,087 | | | | $64,865 | | | | $50,592 | | | | $2,528,476 | | | | $2,266,529 | |
| | | | | | | | | | | | | | | | | | | | | | | | | |
| | | | | | | | | | | | | | | | | | | | | | | | | |
| Share transactions | | | | | | | | | | | | | | | | | | | | | | | | |
| Shares sold | | | 43 | | | | 135 | | | | 84 | | | | 491 | | | | 52,192 | | | | 72,294 | |
| Shares issued in reinvestment of | | | | | | | | | | | | | | | | | | | | | | | | |
| distributions | | | 15 | | | | 46 | | | | 13 | | | | 104 | | | | 5,132 | | | | 11,469 | |
| Shares redeemed | | | (122 | ) | | | (220 | ) | | | (317 | ) | | | (433 | ) | | | (40,527 | ) | | | (201,403 | ) |
| Net increase (decrease) in fund | | | | | | | | | | | | | | | | | | | | | | | | |
| shares outstanding | | | (64 | ) | | | (39 | ) | | | (220 | ) | | | 162 | | | | 16,797 | | | | (117,640 | ) |
See Notes to Financial Statements.
37
| NOTES TO FINANCIAL STATEMENTS (Unaudited) |
| May 31, 2021 |
NOTE 1 - ORGANIZATION
Thompson IM Funds, Inc. (the “Company”) is a Wisconsin corporation registered under the Investment Company Act of 1940, as amended (the “1940 Act”), as an open-end, diversified management investment company.
The Company consists of separate mutual funds series (each, a “Fund,” and collectively, the “Funds”): Thompson LargeCap Fund (the “LargeCap Fund”), Thompson MidCap Fund (the “MidCap Fund”) and Thompson Bond Fund (the “Bond Fund”). The assets and liabilities of each Fund are segregated and a shareholder’s interest is limited to the Fund in which the shareholder owns shares. The objectives and strategies of each Fund are described in the Funds’ Prospectus.
NOTE 2 - SIGNIFICANT ACCOUNTING POLICIES
The following is a summary of significant accounting policies followed by the Funds in the preparation of their financial statements. The Funds are investment companies and accordingly follow the investment company accounting and reporting guidance of the Financial Accounting Standards Board (“FASB”) Accounting Standards Codification Topic 946 Financial Services — Investment Companies.
VALUATION POLICY AND PROCEDURES - The Funds’ Board of Directors (the “Funds’ Board”) has adopted methods for valuing securities set forth in the Funds’ Pricing Policies and Procedures, including circumstances in which market quotes are not readily available or deemed to be unreliable, and has delegated authority to the Advisor to apply those methods in making fair value determinations, subject to oversight by the Funds’ Board. The Advisor has established a valuation committee that, along with other Advisor employees, administers, implements, and oversees the fair valuation process and makes fair value decisions. The valuation committee regularly reviews its own fair value decisions, as well as valuations, valuation techniques and services furnished by pricing services; considers circumstances in the markets which may require it to make or adjust valuation determinations; and reviews previous valuation determinations. The valuation committee reports on its activities and any changes to the fair valuation guidelines to the Funds’ Board.
VALUATION MEASUREMENTS – In accordance with generally accepted accounting principles in the United States of America (“GAAP”), fair value is defined as the price that the Fund would receive to sell an investment or pay to transfer a liability in an orderly transaction with an independent buyer in the principal market, or in the absence of a principal market the most advantageous market for the investment or liability. GAAP established a three-tier hierarchy to maximize the use of observable market data and minimize the use of unobservable inputs and to establish classification of fair value measurements for disclosure purposes.
Various inputs are used in determining the value of each Fund’s investments. These inputs are summarized in the three broad levels listed below:
Level 1 – Quoted prices in active markets for identical securities.
Level 2 – Other significant observable inputs (including quoted prices for similar securities, interest rates, prepayment speeds, credit risk, etc.).
Level 3 – Significant unobservable inputs (including the Fund’s own assumptions in determining the fair value of investments).
Inputs may include price information, specific and broad credit data, liquidity statistics, and other factors. The Fund considers observable data to be that market data which is readily available, regularly distributed or updated, reliable and verifiable, not proprietary, and provided by independent sources that are actively involved in the relevant market. The determination of what constitutes “observable” requires significant judgment by the Fund. The categorization of a security within the hierarchy is based upon the pricing transparency of the security and does not necessarily correspond to the Fund’s perceived risk of that security. The inputs used to measure fair value may fall into different levels of the fair valuation hierarchy. In such cases, for disclosure purposes, the level in the fair value hierarchy within which the fair value measurement falls in its entirety is determined based on the lowest level that is significant to the fair value measurement in its entirety.
38
| NOTES TO FINANCIAL STATEMENTS (Unaudited) (Continued) |
| May 31, 2021 |
SECURITY VALUATION - Each Fund’s equity securities, including common stocks, ADRs, REITs and rights, are valued at their market prices (generally the last reported sales price on the exchange where the securities are primarily traded or, for Nasdaq-listed securities, at their Nasdaq Official Closing Prices). If no sales are reported on a particular day, the mean between the highest bid and lowest asked quotations at the close of the exchanges will generally be used. To the extent these securities are actively traded, and valuation adjustments are not applied, they are categorized in level 1 of the fair value hierarchy. When adjustments to observable prices are applied or when the market is considered inactive, securities will be categorized in level 2 of the fair value hierarchy.
Investments in money market mutual funds are generally priced at the ending net asset value provided by the service agent of the funds. These securities will be categorized as level 1 securities.
Fixed-income securities such as corporate bonds, asset-backed securities, mortgage-backed securities, U.S. government and agency securities, sovereign bonds, municipal bonds and commercial paper are typically valued based on valuations published by an independent pricing service, which uses various valuation methodologies such as matrix pricing and other analytical pricing models as well as market transactions and dealer quotations. Factors considered by pricing services include market characteristics such as benchmark yield curves, option-adjusted spreads, credit spreads and fundamental analytical data relating to the issuer. Short-term investments in fixed-income securities (those with remaining maturities of 60 days or less) are generally valued on an amortized cost basis. Fixed-income securities will generally be categorized in level 2 of the fair value hierarchy, in instances where lower relative weight is placed on transaction prices, quotations, or similar observable inputs, they are categorized in level 3.
Where market quotations are not readily available or are unreliable, a value is determined in good faith pursuant to procedures established by the Funds’ Board. When determining the value of a security, consideration is given to the facts and circumstances relevant to the particular situation, which includes factors such as fundamental analytical data relating to the investment, which may include consideration of yields or prices of securities of comparable quality, coupon rate, maturity and type of issue, nature and duration of any restrictions on disposition of the security and an evaluation of forces that influence the market in which the securities are purchased or sold. Fair value pricing is an inherently subjective process, and no single standard exists for determining fair value. Different funds could reasonably arrive at different values for the same security.
SECURITIES TRANSACTIONS AND INVESTMENT INCOME - Investment securities transactions are accounted for on the trade date. Dividend income is recorded on the ex-dividend date. Interest income is recorded as earned. Gains or losses realized on sales of securities are determined by comparing the identified cost of the security lot sold with the net sales proceeds. Discounts/ premiums on debt securities purchased are accreted/amortized over the life of the respective securities using the effective interest method for both book and tax purposes. Gains and losses on paydowns of asset-backed and mortgage-backed securities are reflected in interest income on the Statements of Operations. Payments received for interest-only or “IO” class mortgage securities are included in interest income. Because no principal will be received at the maturity of an IO, adjustments are made to the cost of the security on a monthly basis until maturity. These adjustments are included in interest income on the Statements of Operations. Income and capital gains on some foreign securities may be subject to foreign withholding taxes, which are accrued as applicable, and have been provided for in accordance with the Funds’ understanding of the applicable country’s tax rules and rates. The ability of the issuers of the debt securities held by the Funds to meet their obligations may be affected by economic developments in a specific industry, state, or region. Debt obligations may be placed on non-accrual status and related interest income may be reduced by ceasing current accruals and writing off interest receivables when the collection of all or a portion of interest has become doubtful. A debt obligation is removed from non-accrual status when the issuer resumes interest payments or when collectability of interest is reasonably assured.
In March 2017, the Financial Accounting Standards Board (“FASB”) issued Accounting Standards Update (“ASU”) No. 2017-08, Receivables-Nonrefundable Fees and Other Costs (Subtopic 310-20): Premium Amortization on Purchased Callable Debt Securities. The amendments in the ASU shorten the amortization period for certain callable debt securities, held at a premium, to be amortized to the earliest call date. The ASU does not require an accounting change for securities held at a discount; which continues to be amortized to estimated maturity. The ASU is effective for fiscal years and interim periods within those fiscal years beginning December 15, 2018. Management has evaluated and adopted ASU 2017-08 and concluded these changes do not have a material impact on the Funds’ financial statements.
39
| NOTES TO FINANCIAL STATEMENTS (Unaudited) (Continued) |
| May 31, 2021 |
EXPENSES - Each Fund is charged for those expenses that are directly attributed to it. Expenses that are not readily identifiable to a specific Fund are generally allocated among the Funds in proportion to the relative sizes of the Funds.
SECURITIES PURCHASED ON A WHEN-ISSUED OR DELAYED-DELIVERY BASIS - Each Fund may purchase securities on a when-issued or delayed-delivery basis. When-issued securities are securities purchased with delivery to occur at a later date at a stated price and/or yield, thereby involving the risk that the price and/or yield obtained may be more or less than those available in the market when delivery takes place. At the time a Fund makes a commitment to purchase a security on a when-issued basis, the Fund records the transaction and reflects the value of the security in determining net asset value. Each Fund designates and maintains cash and marketable securities at least equal in value to commitments for when-issued securities.
LINE OF CREDIT - The Funds have established an unsecured line of credit (“LOC”) with U.S. Bank N.A. which expires November 5, 2021, used primarily to finance redemption payments. Each individual Fund’s borrowing under the LOC is limited to 5% of the value of that Fund’s net assets, 33.33% of the value of the Fund’s investments, or any explicit borrowing limits imposed by the LOC, whatever is less. Interest is charged at the prime rate, which was 3.25% as of May 31, 2021. As of May 31, 2021, the limits established are: LargeCap Fund - $6,000,000, MidCap Fund - $2,000,000 and Bond Fund - $130,000,000. All terms and borrowing limits imposed by the LOC are subject to review and approval by the Funds’ Board. The following table shows the average balance, average interest rate, interest expense, and maximum borrowings incurred by the Funds on the LOC for the six-month period ended May 31, 2021.
| | | | Average | | | | | | Date of |
| | Average | | Interest | | Interest | | Maximum | | Maximum |
| | Balance | | Rate | | Expense | | Borrowing | | Borrowing |
| LargeCap Fund | | $40,637 | | 3.25% | | $668 | | $1,859,000 | | 02/17/2021 |
| MidCap Fund | | $16,698 | | 3.25% | | $274 | | $814,000 | | 05/12/2021 |
| Bond Fund | | $15,110 | | 3.25% | | $248 | | $2,750,000 | | 02/04/2021 |
USE OF ESTIMATES - The preparation of financial statements in conformity with GAAP requires management to make estimates and assumptions that affect the reported amounts of assets and liabilities and disclosure of contingent assets and liabilities at the date of the financial statements and the reported amounts of revenues and expenses during the reporting period. Actual results could differ from these estimates.
GUARANTEES AND INDEMNIFICATIONS - Under the Funds’ organizational documents, each Director, officer, employee or other agent of the Funds (including the Funds’ investment advisor) is indemnified, to the extent permitted by the 1940 Act, against certain liabilities that may arise out of performance of their duties to the Funds. Additionally, in the normal course of business, the Funds enter into contracts that contain a variety of indemnification clauses. The Funds’ maximum exposure under these arrangements is unknown as this would involve future claims that may be made against the Funds that have not yet occurred. However, the Funds have not had prior claims or losses pursuant to these contracts and believe the risk of loss to be remote.
DISTRIBUTIONS TO SHAREHOLDERS - Distributions to shareholders from net investment income and realized gains on securities for the LargeCap Fund and MidCap Fund normally are declared at least annually. Bond Fund distributions to shareholders from net investment income normally are declared on a quarterly basis, and distributions to shareholders from realized gains on securities normally are declared at least annually. Distributions are recorded on the ex-dividend date.
FEDERAL INCOME TAXES - No provision has been made for federal income taxes since the Funds have elected to be taxed as regulated investment companies and intend to distribute substantially all income to shareholders and otherwise comply with the provisions of the Internal Revenue Code applicable to regulated investment companies.
ACCOUNTING FOR UNCERTAINTY IN INCOME TAXES - As of and during the fiscal year ended November 30, 2020, the Funds did not have a liability for unrecognized tax benefits in the accompanying financial statements. Also, the Funds recognized no interest or penalties related to unrecognized tax benefits during the same period. The Funds recognize interest and penalties, if any, related to unrecognized tax benefits as income tax expense in the Statements of Operations. The Funds are also not aware of any tax positions for which it is reasonably possible that the total amounts of unrecognized tax benefits will significantly change in the next twelve months.
40
| NOTES TO FINANCIAL STATEMENTS (Unaudited) (Continued) |
| May 31, 2021 |
SUBSEQUENT EVENTS - The Funds have evaluated subsequent events through the issuance of the Funds’ financial statements. Other than as described in Notes 5, 6 and 7, there were no additional subsequent events which were deemed to have an impact on the Funds’ financial statements.
NOTE 3 - INVESTMENT ADVISORY AND ADMINISTRATIVE AND ACCOUNTING SERVICES AGREEMENTS AND OTHER TRANSACTIONS WITH AFFILIATES
The Investment Advisory Agreement pursuant to which Thompson Investment Management, Inc. (“TIM” or “Advisor”) is retained by the Funds provides for monthly compensation to TIM computed on average daily net assets at the following annual rates:
| | First | | Over |
| | $50 Million | | $50 Million |
| LargeCap Fund | | 1.00% | | 0.90% |
| MidCap Fund | | 1.00% | | 0.90% |
| Bond Fund | | 0.65% | | 0.60% |
The Advisor is contractually bound to waive management fees and/or reimburse expenses incurred by the Funds through March 31, 2022 so that the annual operating expenses of the Funds do not exceed the following percentages of their respective average daily net assets: LargeCap Fund - 0.99%, MidCap Fund - 1.15% and Bond Fund - 0.80%. For the six-month period ended May 31, 2021, the Advisor reimbursed expenses incurred by the LargeCap Fund and the MidCap Fund in the amounts of $134,040 and $70,425, respectively. The Funds are not obligated to reimburse the Advisor for any fees or expenses waived in previous fiscal years.
As of May 31, 2021, an affiliated shareholder held 19.04% of outstanding shares of the MidCap Fund. Transactions by the shareholder may have a material impact on the Fund.
Pursuant to an Administrative and Accounting Services Agreement, TIM maintains the Funds’ financial records in accordance with the 1940 Act, prepares all necessary financial statements of the Funds and calculates the net asset value per share of the Funds on a daily basis. As compensation for its services, each Fund pays TIM a fee computed daily and payable monthly at the annual rate of 0.15% of average daily net assets up to $30 million, 0.10% of the next $70 million of average daily net assets and 0.025% of average daily net assets in excess of $100 million, with an annual minimum fee of $30,000 per Fund. The calculations of daily net asset value and as of May 1, 2021 sub administrative services are subcontracted to U.S. Bank Global Fund Services, resulting in fees paid by TIM for the six-month period ended May 31, 2021, in the following amounts:
| | Administrative & |
| | Accounting Fees Paid |
| LargeCap Fund | | | $30,144 | |
| MidCap Fund | | | $22,531 | |
| Bond Fund | | | $164,380 | |
The Funds reimburse the Advisor for a portion of amounts paid by the Advisor out of the Advisor’s own resources under various shareholder, account maintenance, networking and other services provided to the Funds by broker-dealers and other intermediaries. The amount reimbursed by the Funds is equal to (1) for those accounts maintained through a shareholder servicing arrangement, an annual rate of no more than 0.10% of the average daily net assets of the omnibus accounts in the Funds for which all broker-dealers and other intermediaries, in the aggregate, are responsible, and (2) for those accounts maintained through a networking arrangement, no more than $6 per year per account in the Funds for which the broker-dealers and other intermediaries are responsible; provided however, in all cases only one of these fees shall be applicable to the assets in an account. This amount has been determined by the Funds’ Board to approximate (or not to exceed) the transfer agency
41
| NOTES TO FINANCIAL STATEMENTS (Unaudited) (Continued) |
| May 31, 2021 |
fees that would otherwise have been payable by the Funds if such broker-dealers and intermediaries did not maintain these accounts. Such amounts are recorded within Shareholder servicing costs on each Fund’s Statement of Operations. For the six-month period ended May 31, 2021, the amounts reimbursed by the Funds to the Advisor were:
| | Intermediary |
| | Fees Reimbursed |
| LargeCap Fund | | | $8,882 | |
| MidCap Fund | | | $1,625 | |
| Bond Fund | | | $333,310 | |
NOTE 4 - PURCHASE AND SALE OF SECURITIES
Investment transactions for the six-month period ended May 31, 2021 were as follows:
| | Securities other than U.S. | | | | |
| | Government and Short-term | | | | |
| | Investments | | U.S. Government Securities |
| | Purchases | | Sales | | Purchases | | Sales |
| LargeCap Fund | | $6,192,297 | | $13,081,744 | | $– | | $– |
| MidCap Fund | | $5,396,689 | | $9,460,810 | | $– | | $– |
| Bond Fund | | $419,440,769 | | $319,835,521 | | $434,612,759 | | $337,457,030 |
NOTE 5 – INCOME TAX INFORMATION
At November 30, 2020, the investment cost, aggregate unrealized appreciation and depreciation on investments and other components of distributable earnings for federal income tax purposes were as follows:
| | LARGECAP | | MIDCAP | | BOND |
| | FUND | | FUND | | FUND |
| Federal tax cost | | $114,796,265 | | | $39,186,713 | | | $2,446,178,577 | |
| | | | | | | | | | |
| Unrealized appreciation | | $40,143,429 | | | $15,760,819 | | | $27,165,398 | |
| Unrealized depreciation | | (14,020,442 | ) | | (4,386,015 | ) | | (218,166,863 | ) |
| Net unrealized appreciation (depreciation) | | $26,122,987 | | | $11,374,804 | | | ($191,001,465 | ) |
| Distributable ordinary income | | 1,301,126 | | | 170,601 | | | 26,816,285 | |
| Distributable long-term capital gains | | – | | | – | | | – | |
| Post-October losses | | (311,779 | ) | | – | | | (376,112 | ) |
| Capital loss carryforwards | | (748,278 | ) | | (870,664 | ) | | (257,581,170 | ) |
| Total distributable earnings (accumulated deficit) | | $26,364,056 | | | $10,674,741 | | | ($422,142,462 | ) |
The cost basis of investments for tax and financial reporting purposes differ principally due to wash sales.
Book/tax differences may be temporary or permanent. To the extent these differences are permanent in nature, they are charged to paid-in capital or distributable earnings, in the period that the differences arise. For the fiscal year ended November 30, 2020, a permanent difference attributable to non-deductible Excise Tax paid, has been reclassified within the components of net assets for the Bond Fund: Distributable earnings $2,152, Paid-in capital ($2,152). These reclassifications have no impact on net assets or net asset value per share.
42
| NOTES TO FINANCIAL STATEMENTS (Unaudited) (Continued) |
| May 31, 2021 |
The tax basis post-October losses as of November 30, 2020 and capital loss carryforward as of November 30, 2020, which are not being recognized for tax purposes until the first day of the following fiscal year, are as follows:
| | LARGECAP | | MIDCAP | | BOND |
| | FUND | | FUND | | FUND |
| Post-October losses | | | | | | | | | |
| Short-term | | $28,894 | | | $– | | | $– | |
| Long-term | | (340,673 | ) | | – | | | (376,112 | ) |
| Total Post-October losses | | ($311,779 | ) | | $– | | | ($376,112 | ) |
| Net capital loss carryforward | | | | | | | | | |
| Short-term | | ($748,278 | ) | | ($870,664 | ) | | ($51,620,105 | ) |
| Long-term | | – | | | – | | | (205,961,065 | ) |
| Total capital loss carryforward | | ($748,278 | ) | | ($870,664 | ) | | ($257,581,170 | ) |
Capital losses are carried forward indefinitely and are available to offset future net realized gains, to the extent permitted by the Internal Revenue Code.
The tax components of distributions paid during the six-month period ended May 31, 2021 and the fiscal year ended November 30, 2020 are as follows:
| | LARGECAP | | MIDCAP | | BOND |
| | FUND | | FUND | | FUND |
| Six-month period ended May 31, 2021 | | | | | | |
| Distributions paid from | | | | | | |
| Ordinary income | | $1,302,301 | | $171,632 | | $58,934,436 |
| Long-term capital gains | | – | | – | | – |
| Total distributions paid | | $1,302,301 | | $171,632 | | $58,934,436 |
| |
| Fiscal year ended November 30, 2020 | | | | | | |
| Distributions paid from | | | | | | |
| Ordinary income | | $1,578,138 | | $155,807 | | $131,065,684 |
| Long-term capital gains | | 1,923,289 | | 1,149,402 | | – |
| Total distributions paid | | $3,501,427 | | $1,305,209 | | $131,065,684 |
The following distributions were declared on June 23, 2021, payable to shareholders on June 24, 2021:
| | LARGECAP | | MIDCAP | | BOND |
| | FUND | | FUND | | FUND |
| Ordinary income distributions | | | | | | |
| Amount | | $– | | $– | | $22,957,263 |
| Per share | | $– | | $– | | $0.10 |
| Long-term capital gains distributions | | | | | | |
| Amount | | $– | | $– | | $– |
| Per share | | $– | | $– | | $– |
43
| NOTES TO FINANCIAL STATEMENTS (Unaudited) (Continued) |
| May 31, 2021 |
NOTE 6 – CORONAVIRUS (COVID-19) PANDEMIC
Since March 2020, as a result of issues related to and arising from the COVID-19 coronavirus, markets have experienced very high levels of volatility and generally stressed conditions. Businesses across most sectors have experienced significant challenges to their revenues and business, which could lead to widespread defaults on outstanding corporate debt or make it difficult for businesses to continue as a going concern. Many governments--federal, state, local, and non-United States--have imposed limitations on businesses and intervened in markets in an effort to ensure they continue to function. It is unclear how long these conditions will continue. These current market conditions (as well as market conditions arising from similar pandemics) are likely to amplify the other risks to which the Funds are subject. They also subject each Fund to a variety of unknown risks, including the risk that government actions and intervention in the markets distort which businesses emerge successfully from these conditions and which do not or that they unintentionally exacerbate these conditions.
NOTE 7 – LIBOR DISCONTINUATION RISK
Many financial instruments use or may use a floating rate based on the London Interbank Offered Rate (“LIBOR”) which is the offered rate for short-term Eurodollar deposits between major international banks. On July 27, 2017, the Financial Conduct Authority announced a desire to phase out the use of LIBOR by the end of 2021. There remains uncertainty regarding the future utilization of LIBOR and the nature of any replacement rate. As such, the potential impact of a transition away from LIBOR on the Bond Fund or the financial instruments in which the Bond Fund invests cannot yet be determined. The elimination of LIBOR or changes to other reference rates or any other changes or reforms to the determination or supervision of reference rates could have an adverse impact on the market for, or value of, any securities or payments linked to those reference rates, which may adversely affect the Bond Fund’s performance and/or net asset value. Furthermore, the risks associated with the expected discontinuation of LIBOR and transition may be exacerbated if the work necessary to effect an orderly transition to an alternative reference rate is not completed in a timely manner. Because the usefulness of LIBOR as a benchmark could deteriorate during the transition period, these effects could occur prior to the end of 2021.
44
The following table presents information relating to a share of capital stock outstanding for the entire period.
| LARGECAP FUND | | | | | Year Ended November 30, |
| | Six-Month | | | | | | | | | | | | | | | |
| | Period Ended | | | | | | | | | | | | | | | |
| | May 31, 2021 | | | | | | | | | | | | | | | |
| | (Unaudited) | | 2020 | | 2019 | | 2018 | | 2017 | | 2016 |
| Per share operating performance | | | | | | | | | | | | | | | | | | |
| Net asset value, beginning of period | | $83.93 | | | $74.93 | | | $66.36 | | | $65.77 | | | $57.48 | | | $50.72 | |
| Income from investment operations | | | | | | | | | | | | | | | | | | |
| Net investment income | | 0.37 | | | 0.78 | | | 0.68 | | | 0.55 | | | 0.37 | | | 0.47 | |
| Net realized and unrealized gains (losses) | | | | | | | | | | | | | | | | | | |
| on investments | | 22.46 | | | 10.29 | | | 8.41 | | | 0.59 | | | 8.38 | | | 6.64 | |
| Total from investment operations | | 22.83 | | | 11.07 | | | 9.09 | | | 1.14 | | | 8.75 | | | 7.11 | |
| Less distributions | | | | | | | | | | | | | | | | | | |
| Distributions from net investment income | | (0.78 | ) | | (0.60 | ) | | (0.52 | ) | | (0.45 | ) | | (0.46 | ) | | (0.35 | ) |
| Distributions from net realized gains | | – | | | (1.47 | ) | | – | | | (0.10 | ) | | – | | | – | |
| Total distributions | | (0.78 | ) | | (2.07 | ) | | (0.52 | ) | | (0.55 | ) | | (0.46 | ) | | (0.35 | ) |
| Net asset value, end of period | | $105.98 | | | $83.93 | | | $74.93 | | | $66.36 | | | $65.77 | | | $57.48 | |
| Total return | | 27.43% | (a) | | 15.08% | | | 13.93% | | | 1.72% | | | 15.32% | | | 14.16% | |
| Ratios and supplemental data | | | | | | | | | | | | | | | | | | |
| Net assets, end of period (millions) | | $171.4 | | | $141.1 | | | $128.9 | | | $121.7 | | | $129.0 | | | $117.5 | |
| Ratios to average net assets: | | | | | | | | | | | | | | | | | | |
| Ratios of expenses | | 0.99% | (b) | | 0.99% | | | 1.03% | | | 1.05% | | | 1.10% | | | 1.13% | |
| Ratio of expenses without reimbursement | | 1.16% | (b) | | 1.23% | | | 1.23% | | | 1.21% | | | 1.22% | | | 1.25% | |
| Ratio of net investment income | | 0.73% | (b) | | 1.09% | | | 0.96% | | | 0.80% | | | 0.59% | | | 0.90% | |
| Ratio of net investment income | | | | | | | | | | | | | | | | | | |
| without reimbursement | | 0.56% | (b) | | 0.85% | | | 0.76% | | | 0.64% | | | 0.47% | | | 0.78% | |
| Portfolio turnover rate | | 4% | (a) | | 25% | | | 24% | | | 29% | | | 89% | | | 32% | |
| (a) | Calculated on a non-annualized basis. |
| (b) | Calculated on an annualized basis. |
See Notes to Financial Statements.
45
| FINANCIAL HIGHLIGHTS (Continued) |
| |
The following table presents information relating to a share of capital stock outstanding for the entire period.
| MIDCAP FUND | | Year Ended November 30, |
| | Six-Month | | | | | | | | | | | | | | | | | | | | |
| | Period Ended | | | | | | | | | | | | | | | | | | | | |
| | May 31, 2021 | | | | | | | | | | | | | | | | | | | | |
| | (Unaudited) | | | 2020 | | | | 2019 | | | | 2018 | | | | 2017 | | | | 2016 | |
| Per share operating performance | | | | | | | | | | | | | | | | | | | | | | | | |
| Net asset value, beginning of period | | $ | 13.20 | | | $ | 12.29 | | | $ | 12.02 | | | $ | 13.73 | | | $ | 12.53 | | | $ | 12.07 | |
| Income from investment operations | | | | | | | | | | | | | | | | | | | | | | | | |
| Net investment income | | | 0.02 | | | | 0.04 | | | | 0.04 | | | | 0.03 | | | | 0.01 | | | | 0.01 | |
| Net realized and unrealized gains (losses) | | | | | | | | | | | | | | | | | | | | | | | | |
| on investments | | | 4.79 | | | | 1.23 | | | | 0.93 | | | | (0.75 | ) | | | 1.78 | | | | 1.45 | |
| Total from investment operations | | | 4.81 | | | | 1.27 | | | | 0.97 | | | | (0.72 | ) | | | 1.79 | | | | 1.46 | |
| Less distributions | | | | | | | | | | | | | | | | | | | | | | | | |
| Distributions from net investment income | | | (0.05 | ) | | | (0.04 | ) | | | (0.03 | ) | | | (0.01 | ) | | | (0.01 | ) | | | – | (a) |
| Distributions from net realized gains | | | – | | | | (0.32 | ) | | | (0.67 | ) | | | (0.98 | ) | | | (0.58 | ) | | | (1.00 | ) |
| Total distributions | | | (0.05 | ) | | | (0.36 | ) | | | (0.70 | ) | | | (0.99 | ) | | | (0.59 | ) | | | (1.00 | ) |
| Net asset value, end of period | | $ | 17.96 | | | $ | 13.20 | | | $ | 12.29 | | | $ | 12.02 | | | $ | 13.73 | | | $ | 12.53 | |
| Total return | | | 36.51% | (b) | | | 10.56% | | | | 9.78% | | | | (5.85% | ) | | | 14.78% | | | | 13.82% | |
| Ratios and supplemental data | | | | | | | | | | | | | | | | | | | | | | | | |
| Net assets, end of period (millions) | | $ | 64.9 | | | $ | 50.6 | | | $ | 45.1 | | | $ | 45.0 | | | $ | 50.9 | | | $ | 43.8 | |
| Ratios to average net assets: | | | | | | | | | | | | | | | | | | | | | | | | |
| Ratios of expenses | | | 1.15% | (c) | | | 1.15% | | | | 1.15% | | | | 1.15% | | | | 1.20% | | | | 1.25% | |
| Ratio of expenses without reimbursement | | | 1.39% | (c) | | | 1.53% | | | | 1.53% | | | | 1.42% | | | | 1.44% | | | | 1.50% | |
| Ratio of net investment income | | | 0.08% | (c) | | | 0.42% | | | | 0.37% | | | | 0.19% | | | | 0.06% | | | | 0.06% | |
| Ratio of net investment income (loss) | | | | | | | | | | | | | | | | | | | | | | | | |
| without reimbursement | | | (0.16% | )(c) | | | 0.04% | | | | (0.01% | ) | | | (0.08% | ) | | | (0.18% | ) | | | (0.19% | ) |
| Portfolio turnover rate | | | 9% | (b) | | | 37% | | | | 34% | | | | 30% | | | | 29% | | | | 34% | |
| (a) | Less than .005 per share. |
| (b) | Calculated on a non-annualized basis. |
| (c) | Calculated on an annualized basis. |
See Notes to Financial Statements.
46
| FINANCIAL HIGHLIGHTS (Continued) |
| |
The following table presents information relating to a share of capital stock outstanding for the entire period.
| BOND FUND | | Year Ended November 30, |
| | Six-Month | | | | | | | | | | | | | | | | | | | | |
| | Period Ended | | | | | | | | | | | | | | | | | | | | |
| | May 31, 2021 | | | | | | | | | | | | | | | | | | | | |
| | (Unaudited) | | 2020 | | 2019 | | 2018 | | 2017 | | 2016 |
| Per share operating performance | | | | | | | | | | | | | | | | | | | | | | | | |
| Net asset value, beginning of period | | $ | 10.73 | | | $ | 11.52 | | | $ | 11.38 | | | $ | 11.45 | | | $ | 11.22 | | | $ | 10.98 | |
| Income from investment operations | | | | | | | | | | | | | | | | | | | | | | | | |
| Net investment income | | | 0.25 | | | | 0.52 | | | | 0.40 | | | | 0.36 | | | | 0.35 | | | | 0.49 | |
| Net realized and unrealized gains (losses) | | | | | | | | | | | | | | | | | | | | | | | | |
| on investments | | | 0.39 | | | | (0.83 | ) | | | 0.13 | | | | (0.09 | ) | | | 0.27 | | | | 0.26 | |
| Total from investment operations | | | 0.64 | | | | (0.31 | ) | | | 0.53 | | | | 0.27 | | | | 0.62 | | | | 0.75 | |
| Less distributions | | | | | | | | | | | | | | | | | | | | | | | | |
| Distributions from net investment income | | | (0.28 | ) | | | (0.48 | ) | | | (0.39 | ) | | | (0.34 | ) | | | (0.39 | ) | | | (0.51 | ) |
| Distributions from net realized gains | | | – | | | | – | | | | – | | | | – | | | | – | | | | – | |
| Total distributions | | | (0.28 | ) | | | (0.48 | ) | | | (0.39 | ) | | | (0.34 | ) | | | (0.39 | ) | | | (0.51 | ) |
| Net asset value, end of period | | $ | 11.09 | | | $ | 10.73 | | | $ | 11.52 | | | $ | 11.38 | | | $ | 11.45 | | | $ | 11.22 | |
| Total return | | | 6.08% | (a) | | | (2.60% | ) | | | 4.70% | | | | 2.37% | | | | 5.57% | | | | 7.05% | |
| Ratios and supplemental data | | | | | | | | | | | | | | | | | | | | | | | | |
| Net assets, end of period (millions) | | $ | 2,528.5 | | | $ | 2,266.5 | | | $ | 3,788.6 | | | $ | 3,655.2 | | | $ | 2,620.6 | | | $ | 2,020.5 | |
| Ratios to average net assets: | | | | | | | | | | | | | | | | | | | | | | | | |
| Ratios of expenses | | | 0.72% | (b) | | | 0.72% | | | | 0.71% | | | | 0.71% | | | | 0.71% | | | | 0.72% | |
| Ratio of net investment income | | | 4.63% | (b) | | | 4.27% | | | | 3.49% | | | | 3.21% | | | | 3.01% | | | | 4.16% | |
| Portfolio turnover rate | | | 16% | (a) | | | 38% | | | | 53% | | | | 39% | | | | 43% | | | | 20% | |
| (a) | Calculated on a non-annualized basis. |
| (b) | Calculated on an annualized basis. |
See Notes to Financial Statements.
47
| ADDITIONAL INFORMATION (Unaudited) |
| |
THOMPSON IM FUNDS, INC.
| Investment Advisor |
| Thompson Investment Management, Inc. |
| 1255 Fourier Drive, Suite 200 |
| Madison, Wisconsin 53717 |
| |
| Distributor |
| Quasar Distributors, LLC |
| 111 East Kilbourn Avenue, Suite 2200 |
| Milwaukee, Wisconsin 53202 |
| |
| Transfer Agent |
| U.S. Bank Global Fund Services |
| 615 East Michigan Street |
| Milwaukee, Wisconsin 53202 |
| |
| Independent Registered |
| Public Accounting Firm |
| Cohen & Company, Ltd. |
| 1350 Euclid Avenue, Suite 800 |
| Cleveland, Ohio 44115 |
| |
| Legal Counsel |
| Quarles & Brady LLP |
| 411 East Wisconsin Avenue |
| Milwaukee, Wisconsin 53202 |
The Statement of Additional Information contains additional information about the directors and officers of Thompson IM Funds, Inc. and is available without charge, upon request, by calling 1-800-999-0887.
Proxy Voting Policy
A description of the policies and procedures that the Funds use to determine how to vote proxies relating to portfolio securities and information regarding how the Funds actually voted proxies during the most recent 12-month period ended June 30 are available without charge, upon request, by calling 1-800-999-0887, through the Funds’ website at www.thompsonim.com and on the SEC’s website at www.sec.gov.
Information About Portfolio Securities
The Funds file complete schedules of their portfolio holdings with the Securities and Exchange Commission for the Funds’ first and third quarters of its fiscal year on Form N-PORT. The Funds’ Forms N-PORT are available on the Securities and Exchange Commission’s website at www.sec.gov. The Funds’ Forms N-PORT are also available without charge, upon request, by calling 1-800-999-0887.
48
| ADDITIONAL INFORMATION (Unaudited) (Continued) |
| |
Operation and Effectiveness of the Funds’ Liquidity Risk Management Program:
The Funds have adopted a Liquidity Risk Management Program (the “Program”) under Rule 22e-4 under the Investment Company Act of 1940, as amended (the “Liquidity Rule”), that seeks to assess, manage, and review each Fund’s liquidity risk. The Liquidity Rule requires in part that the Board of Directors of the Funds receive a written report on a no-less-frequently-than-annual basis that addresses the operation of the Program and assesses its adequacy and effectiveness of implementation, including the operation of any highly liquid investment minimum established for a Fund and any material changes to the Program.
The Board of Directors of the Funds has appointed the Valuation Committee of Thompson Investment Management, Inc. as the program administrator for the Program (the “Program Administrator”). At its meeting on February 11, 2021, the Board of Directors of the Funds reviewed the Program Administrator’s written report (the “Report”) relating to the operation of the Program for the period from December 1, 2019, through November 30, 2020 (the “Program Reporting Period”).
The Report addressed the operation of the Program and assessed its adequacy and effectiveness of implementation, including that each Fund continues to primarily hold assets that are highly liquid investments. There were no material changes to the Program during the Program Reporting Period and no liquidity events occurring during the Program Reporting Period, including without limitation the unusually high degree of stress on markets generally and on fixed-income markets in particular as a result of the onset of the COVID-19 pandemic, that affected any of the Funds’ ability to meet redemptions.
Based on this review, the Report concluded that the Program continues to be reasonably designed to effectively assess and manage each Fund’s liquidity risk and the Program has been adequately and effectively implemented with respect to each Fund during the Program Reporting Period, including with respect to each Fund’s ability to meet redemptions under both normal and reasonably foreseeable stressed conditions.
49
Item (b): No notice transmitted to stockholders in reliance on Rule 30e-3 under the Investment Company Act of 1940 contained disclosures specified by paragraph (c)(3) of that rule.
Item 2. Code of Ethics.
Not required in Semi-Annual Reports on Form N-CSR.
Item 3. Audit Committee Financial Expert.
Not required in Semi-Annual Reports on Form N-CSR.
Item 4. Principal Accountant Fees and Services.
Not required in Semi-Annual Reports on Form N-CSR.
Item 5. Audit Committee of Listed Registrants.
Not applicable to this Registrant because it is not a “listed issuer” within the meaning of Rule 10A-3 under the Securities Exchange Act of 1934.
Item 6. Investments.
The required Schedules of Investments in securities of unaffiliated issuers is included as part of the Registrant’s Semi-Annual Report to Shareholders dated as of May 31, 2021 provided under Item 1 of this Form N-CSR.
Item 7. Disclosure of Proxy Voting Policies and Procedures for Closed-End Management Investment Companies.
Not applicable to this Registrant because it is not a closed-end management investment company.
Item 8. Portfolio Managers of Closed-End Management Investment Companies.
Not applicable to this Registrant because it is not a closed-end management investment company.
Item 9. Purchases of Equity Securities by Closed-End Management Investment Companies and Affiliated Purchasers.
Not applicable to this Registrant because it is not a closed-end management investment company.
Item 10. Submission of Matters to a Vote of Securities Holders.
The Registrant has not made any material changes to the procedures by which shareholders may recommend nominees to the Registrant's Board of Directors after the Registrant last provided disclosure in response to the requirements of Item 407(c)(2)(iv) of Regulation S-K or this Item.
2
Item 11. Controls and Procedures.
| (a) | Disclosure Controls and Procedures. Based on an evaluation of the Registrant’s disclosure controls and procedures (as defined in Rule 30a-3(c) under the Investment Company Act of 1940) carried out under the supervision and with the participation of the Registrant’s management, including its principal executive and financial officers, within 90 days prior to the filing date of this report on Form N-CSR, the Registrant’s principal executive and financial officers have concluded that the design and operation of the Registrant’s disclosure controls and procedures are effective in providing reasonable assurance that the information required to be disclosed on Form N-CSR is recorded, processed, summarized and reported within the applicable time periods. |
| | |
| (b) | Change in Internal Controls Over Financial Reporting. There were no changes in the Registrant’s internal control over financial reporting (as defined in Rule 30a-3(d) under the Investment Company Act of 1940) that occurred during the period covered by this Form N-CSR that have materially affected, or are reasonably likely to materially affect, the Registrant’s internal control over financial reporting. |
Item 12. Disclosure of Securities Lending Activities for Closed-End Management Investment Companies.
Not applicable to this Registrant because it is not a closed-end management investment company.
Item 13. Exhibits.
The following exhibits are attached to this Form N-CSR:
3
SIGNATURES
Pursuant to the requirements of the Securities Exchange Act of 1934 and the Investment Company Act of 1940, the Registrant has duly caused this report to be signed on its behalf by the undersigned, thereunto duly authorized, on this 6th day of August, 2021.
| THOMPSON IM FUNDS, INC. |
| |
| By: | /s/ Jason L. Stephens | |
| | Jason L. Stephens, Chief Executive |
| | Officer |
| |
| Pursuant to the requirements of the Securities Exchange Act of 1934 and the Investment Company Act of 1940, this report has been signed below by the following persons on behalf of the Registrant and in the capacities indicated on this 6th day of August, 2021. |
| |
| By: | /s/ Jason L. Stephens | |
| | Jason L. Stephens, Chief Executive |
| | Officer (Principal Executive Officer) |
| |
| By: | /s/ Penny Hubbard | |
| | Penny Hubbard, Chief Financial |
| | Officer (Principal Financial Officer) |
4