UNITED STATES
SECURITIES AND EXCHANGE COMMISSION
Washington, D.C. 20549
FORM N-CSR
CERTIFIED SHAREHOLDER REPORT OF REGISTERED
MANAGEMENT
INVESTMENT COMPANIES
Investment Company Act File Number 811-4946
THOMPSON IM FUNDS, INC.
(Exact name of registrant as specified in charter)
918 Deming Way
Madison, Wisconsin 53717
(Address of principal executive offices)--(Zip code)
Jason L. Stephens
Chief Executive Officer
Thompson IM Funds, Inc.
918 Deming Way
Madison, Wisconsin 53717
(Name and address of agent for service)
With a copy to:
Matthew C. Vogel, Esq.
Quarles & Brady LLP
411 East Wisconsin Avenue
Milwaukee, Wisconsin 53202
Registrant's telephone number, including area code: (608) 827-5700
Date of fiscal year end: November 30, 2018
Date of reporting period: May 31, 2018
Form N-CSR is to be used by management investment companies to file reports with the Commission not later than 10 days after the transmission to stockholders of any report that is required to be transmitted to stockholders under Rule 30e-1 under the Investment Company Act of 1940 (17 CFR 270.30e-1). The Commission may use the information provided on Form N-CSR in its regulatory, disclosure review, inspection and policymaking roles.
A registrant is required to disclose the information specified by Form N-CSR, and the Commission will make this information public. A registrant is not required to respond to the collection of information contained in Form N-CSR unless the Form displays a currently valid Office of Management and Budget ("OMB") control number. Please direct comments concerning the accuracy of the information collection burden estimate and any suggestions for reducing the burden to Secretary, Securities and Exchange Commission, 450 Fifth Street, N.W., Washington, DC 20549-0609. The OMB has reviewed this collection of information under the clearance requirements of 44 U.S.C. § 3507.
Item 1. Report to Stockholders.

THOMPSON IM FUNDS, INC.
SEMI-ANNUAL REPORT TO SHAREHOLDERS
NOTE ON FORWARD-LOOKING STATEMENTS
The matters discussed in this report may constitute forward-looking statements. These include any Advisor or portfolio manager predictions, assessments, analyses or outlooks for individual securities, industries, investment styles, market sectors, interest rates, economic trends and/or markets. These statements involve risks and uncertainties. In addition to the general risks described for each Fund in its current Prospectus, other factors bearing on these reports include the accuracy of the Advisor’s or portfolio manager’s forecasts and predictions, the appropriateness of the investment strategies designed by the Advisor or portfolio manager and the ability of the Advisor or portfolio manager to implement its strategies efficiently and successfully. Any one or more of these factors, as well as other risks affecting the securities markets generally, could cause the actual results of any Fund to differ materially as compared to its benchmarks.
Dear Shareholder:
The directors, officers, and staff of the Funds and Thompson Investment Management, Inc. wish to commend John Feldt on his retirement from his positions with the Funds. John has been an Independent Director of the Funds since their 1987 founding and also served as the Board Chair and the Audit Committee Chair. The Funds have benefited tremendously from his knowledge and perspective for over 30 years. His wisdom and counsel were particularly helpful due to his expertise of the mutual fund industry and he has provided invaluable guidance during his tenure as Board Chair. The directors and management wish to thank him for these contributions.
Opinions expressed are subject to change, are not guaranteed and should not be considered investment advice.
Mutual fund investing involves risk. Principal loss is possible.
1
THOMPSON IM FUNDS, INC.
SEMI-ANNUAL REPORT TO SHAREHOLDERS
May 31, 2018
CONTENTS
| Page(s) |
| Letter to Shareholders | 1 |
| |
| LargeCap Fund | |
| Investment review | 3-5 |
| Schedule of investments | 6-9 |
| |
| MidCap Fund | |
| Investment review | 10-12 |
| Schedule of investments | 13-16 |
| |
| Bond Fund | |
| Investment review | 17-19 |
| Schedule of investments | 20-31 |
| |
| Fund Expense Examples | 32 |
| |
| Financial Statements | |
| Statements of assets and liabilities | 33 |
| Statements of operations | 34 |
| Statements of changes in net assets | 35 |
| Notes to financial statements | 36-42 |
| Financial highlights | 43-45 |
| |
| Additional Information | 46 |
This report contains information for existing shareholders of Thompson IM Funds, Inc. It
does not constitute an offer to sell. This Semi-Annual Report is authorized for distribution to prospective investors
only when preceded or accompanied by a Fund Prospectus, which contains information about
the Funds’ objectives and policies, risks, management, expenses and other information.
A Prospectus can be obtained by calling 1-800-999-0887.
Please read your Prospectus carefully.
2
| LARGECAP FUND INVESTMENT REVIEW (Unaudited) |
| May 31, 2018 |
Portfolio Managers
James T. Evans, CFA
Jason L. Stephens, CFA
Performance
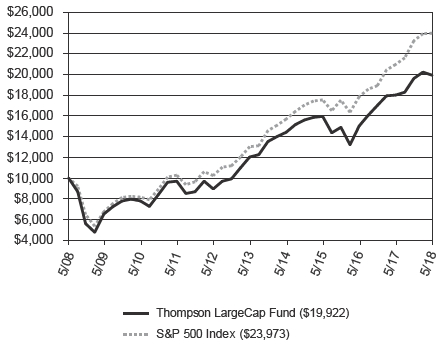
The LargeCap Fund produced a total return of 1.62% for the six-months ended May 31, 2018, as compared to its benchmark, the S&P 500 Index, which returned 3.16%.
| Comparison of Change in Value of a Hypothetical $10,000 Investment |
 |
| Average Annual Total Returns |
| Through 05/31/18 |
| | 1 Year | | 3 Year | | 5 Year | | 10 Year |
| Thompson LargeCap Fund | | 10.67% | | 7.70% | | 10.62% | | 7.14% |
| S&P 500 Index | | 14.38% | | 10.97% | | 12.98% | | 9.14% |
Gross Expense Ratio as of 03/31/18 was 1.22%.
Net Expense Ratio after reimbursement as of 03/31/18 was 1.05%.*
| * | The Advisor has contractually agreed to waive management fees and/or reimburse expenses incurred by the LargeCap Fund through March 31, 2019, so that the annual operating expenses of the Fund do not exceed 1.05% of its average daily net assets. Net expense ratios are current as of the most recent Prospectus and are applicable to investors. |
Performance data quoted represents past performance; past performance does not guarantee future results. The investment return and principal value of an investment will fluctuate so that an investor’s shares, when redeemed, may be worth more or less than their original cost. Current performance of the Fund may be lower or higher than the performance quoted. Performance data current to the most recent month-end may be obtained by calling 1-800-999-0887 or visiting www.thompsonim.com.
Results include the reinvestment of all dividends and capital gains distributions. Investment performance reflects all fee waivers that may be in effect. In the absence of such waivers, total return would be reduced. The performance information reflected in the graph and the table above does not reflect the deduction of taxes that a shareholder would pay on fund distributions or the redemption of fund shares, nor does it imply future performance. The S&P 500 Index is an unmanaged index commonly used to measure the performance of U.S. stocks. You cannot directly invest in an index.
The S&P 500 Index is a product of S&P Dow Jones Indices LLC and has been licensed for use by Thompson Investment Management, Inc. S&P® and S&P 500® are registered trademarks of Standard & Poor’s Financial Services LLC (“S&P”). The Thompson IM Funds are not sponsored, endorsed, sold or promoted by S&P Dow Jones Indices LLC, Dow Jones, S&P or their respective affiliates, and none of S&P Dow Jones Indices LLC, Dow Jones, S&P nor their respective affiliates makes any representation regarding the advisability of investing in such products.
See Notes to Financial Statements.
3
| LARGECAP FUND INVESTMENT REVIEW (Unaudited) (Continued) |
| May 31, 2018 |
Management Commentary
The semi-annual period began with strong performance for stocks in the large-cap universe, as stocks marched steadily upwards based on optimism from the corporate tax cut passed in December 2017. This changed once February hit, as factors such as concerns over higher interest rates, the impact of potential and enacted tariffs upon international trade, and the usual mid-term election jitters began to impact the market. The Fund’s holdings were not immune to this pattern, as they too peaked in late January before selling off the next month.
Of these concerns, we are most worried about the impact of a potential trade war upon the U.S. economy. While these tariffs are being sold politically as a benefit to the U.S. economy, we believe they act like a tax increase on consumers and risk inviting retaliatory tariffs that would hurt U.S. exports. Thus, we are not surprised by the negative reaction in equity markets. While not yet to the point where they endanger the current economic expansion, the danger in our view is that things spiral out of control as politicians are reluctant to back down for fear of appearing “weak”.
Our response to attempt to protect the portfolio for such a risk appears to be different from the path chosen by the majority of investors. While the S&P 500 itself was relatively unchanged from mid-February until the end of the semi-annual period, the performance of select few “favorite” stocks continued unimpeded. Not owning Amazon and Netflix alone cost the Fund roughly 1% in relative performance during the semi-annual period, as investors chose to bid up the stocks of companies perceived to be “immune” to the economic cycle due to their rapid growth. In the case of Netflix, growing negative free cash flow as revenues scale didn’t stop the stock from appreciating 87% during the semi-annual period. However, if economic trading policy gone bad were to lead to a recession, we believe the leaders of the market would be likely to come crashing down despite their perceived immunity, much as similar names did during the two previous recessions associated with the technology bubble and financial crisis.
We claim no special insight into the President’s strategy or end game with regard to trade. What we do know is that the pullback in the market, coupled with the strong improvement in the corporate earnings picture, has put the S&P 500 back into what we feel is reasonable valuation territory. At 15.3 times estimated 2019 consensus earnings, the market is squarely within the 12-16-times earnings range that we view as fairly valued in the long run. That doesn’t mean fear can’t drive the near-term valuation of the market lower as all the political bluster dents investor confidence, but it does mean the risks are fairly balanced at current levels.
This doesn’t mean all equities are equally attractive. If a recession is the ultimate result of a trade war between the United States and its trading partners, we believe the leaders of the market are likely to come crashing down despite their current perceived immunity, much as similar names did during the two previous recessions associated with the technology bubble and financial crisis. Thus, we believe that if an investor is concerned about trade, the better place to invest is in names that already appear to be depressed despite having attractive long-term prospects. We have long positioned the Fund for a rotation out of the old market leadership and into what we believe are more stable and reasonably valued sectors/industries. We are hopeful that many of your holdings will constitute the new market leadership, but are always prepared to switch if something more attractive emerges. We are closely monitoring potential new stocks for the Fund, some of which are currently priced too high in our view. However, if they decline enough as part of a correction they may reach a level that makes them more attractive than the current Fund holdings. If so, we will switch to the more attractive name.
Opinions expressed are subject to change, are not guaranteed and should not be considered investment advice.
Mutual fund investing involves risk. Principal loss is possible. Investments in smaller companies involve additional risks such as limited liquidity and greater volatility. Investments in American Depositary Receipts (“ADRs”) are subject to some extent to the risks associated with directly investing in securities of foreign issuers, including the risk of changes in currency exchange rates, expropriation or nationalization of assets, and the impact of political, diplomatic, or social events. Investments in real estate securities may involve greater risk and volatility including greater exposure to economic downturns and changes in real estate values, rents, property taxes, tax, and other laws. A real estate investment trust’s (REITs) share price may decline because of adverse developments affecting the real estate industry.
Please refer to the Schedule of Investments on page 6 of this report for holdings information. The management commentary above as well as Fund holdings and asset/sector allocations should not be considered a recommendation to buy or sell any security. In addition, please note that Fund holdings and asset/sector allocations are subject to change.
Free Cash Flow is a measure of financial performance calculated as operating cash flow minus capital expenditures. Free cash flow (FCF) represents the cash that a company is able to generate after laying out the money required to maintain or expand its asset base.
Price-To-Earnings (P/E) Ratio is a valuation ratio of a company’s current share price compared to its per-share earnings. Divide market value of a share by the earnings per share.
Earnings Growth is a measure of growth in a company’s net income over a specific period, often one year. It is not a prediction of the Fund’s future returns.
See Notes to Financial Statements.
4
| LARGECAP FUND INVESTMENT REVIEW (Unaudited) (Continued) |
| May 31, 2018 |
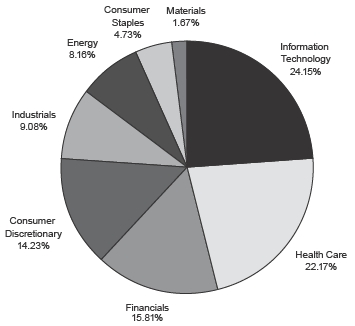
Sector Weightings at 05/31/18 |
| % of Total Investments |
 |
| Top 10 Equity Holdings at 05/31/18 |
| | % of Fund’s |
| Company | Industry | Net Assets |
| Alphabet, Inc. Class A | Internet Software & Services | 3.21% |
| Microsoft Corp. | Software | 2.72% |
| Exxon Mobil Corp. | Oil, Gas & Consumable Fuels | 2.50% |
| General Electric Co. | Industrial Conglomerates | 2.26% |
| Qualcomm, Inc. | Semiconductors & Semiconductor Equipment | 2.25% |
| Bank of America Corp. | Banks | 2.23% |
| Cisco Systems, Inc. | Communications Equipment | 2.11% |
| Exact Sciences Corp. | Biotechnology | 2.10% |
| Hanger, Inc. | Health Care Providers & Services | 2.06% |
| CBS Corp. Class B | Media | 2.04% |
As of May 31, 2018, 99.8% of the Fund’s assets were in equity and short-term investments.
See Notes to Financial Statements.
5
| LARGECAP FUND SCHEDULE OF INVESTMENTS (Unaudited) |
| May 31, 2018 |
| | Shares | | Value |
| COMMON STOCKS - 99.8% | | | | $ | 125,669,338 |
| (COST $129,432,079) | | | | | |
| | | | | | |
| Consumer Discretionary - 14.2% | | | | | 17,889,817 |
| Automobiles - 1.0% | | | | | |
| Harley-Davidson, Inc. | | 29,850 | | | 1,226,238 |
| Distributors - 1.0% | | | | | |
| LKQ Corp. (a) | | 41,175 | | | 1,308,130 |
| Hotels, Restaurants & Leisure - 1.0% | | | | | |
| Starbucks Corp. | | 21,700 | | | 1,229,739 |
| Household Durables - 0.5% | | | | | |
| TopBuild Corp. (a) | | 7,927 | | | 665,472 |
| Leisure Products - 1.0% | | | | | |
| Brunswick Corp. | | 20,300 | | | 1,291,080 |
| Media - 5.4% | | | | | |
| CBS Corp. Class B | | 51,000 | | | 2,568,870 |
| The Walt Disney Co. | | 25,350 | | | 2,521,564 |
| Viacom Inc. Class B | | 61,175 | | | 1,657,843 |
| Multiline Retail - 1.7% | | | | | |
| Target Corp. | | 29,860 | | | 2,176,495 |
| Specialty Retail - 1.6% | | | | | |
| Bed Bath & Beyond Inc. | | 61,375 | | | 1,114,570 |
| Lumber Liquidators Holdings, Inc. (a) | | 39,075 | | | 826,827 |
| Textiles, Apparel & Luxury Goods - 1.0% | | | | | |
| Hanesbrands, Inc. | | 71,475 | | | 1,302,989 |
| | | | | | |
| Consumer Staples - 4.7% | | | | | 5,945,045 |
| Food & Staples Retailing - 2.6% | | | | | |
| Walgreens Boots Alliance, Inc. | | 39,925 | | | 2,490,921 |
| Walmart Inc. | | 9,925 | | | 819,210 |
| Household Products - 2.1% | | | | | |
| Kimberly-Clark Corp. | | 13,793 | | | 1,391,024 |
| The Procter & Gamble Co. | | 17,000 | | | 1,243,890 |
| | | | | | |
| Energy - 8.1% | | | | | 10,253,877 |
| Energy Equipment & Services - 1.3% | | | | | |
| Schlumberger Ltd. | | 24,144 | | | 1,657,968 |
| Oil, Gas & Consumable Fuels - 6.8% | | | | | |
| Anadarko Petroleum Corp. | | 13,022 | | | 908,936 |
| Chevron Corp. | | 9,945 | | | 1,236,164 |
| Devon Energy Corp. | | 31,625 | | | 1,314,651 |
| EOG Resources, Inc. | | 8,100 | | | 954,261 |
| Exxon Mobil Corp. | | 38,820 | | | 3,153,737 |
| Noble Energy, Inc. | | 28,800 | | | 1,028,160 |
See Notes to Financial Statements.
6
| LARGECAP FUND SCHEDULE OF INVESTMENTS (Unaudited) (Continued) |
| May 31, 2018 |
| | Shares | | Value |
| COMMON STOCKS (continued) | | | | | |
| | | | | | |
| Financials - 15.8% | | | | $ | 19,834,002 |
| Banks - 9.6% | | | | | |
| Bank of America Corp. | | 96,625 | | | 2,805,990 |
| CIT Group Inc. | | 32,275 | | | 1,611,491 |
| Citigroup Inc. | | 38,130 | | | 2,542,890 |
| JPMorgan Chase & Co. | | 23,855 | | | 2,552,724 |
| PNC Financial Services Group, Inc. | | 7,345 | | | 1,053,346 |
| SunTrust Banks, Inc. | | 10,850 | | | 732,484 |
| Zions Bancorporation | | 14,525 | | | 796,115 |
| Capital Markets - 4.6% | | | | | |
| Northern Trust Corp. | | 19,085 | | | 1,956,594 |
| State Street Corp. | | 26,450 | | | 2,542,109 |
| The Goldman Sachs Group, Inc. | | 5,550 | | | 1,253,634 |
| Consumer Finance - 0.5% | | | | | |
| Discover Financial Services | | 8,820 | | | 651,445 |
| Insurance - 1.1% | | | | | |
| FNF Group | | 36,125 | | | 1,335,180 |
| | | | | | |
| Health Care - 22.1% | | | | | 27,870,472 |
| Biotechnology - 7.5% | | | | | |
| AbbVie Inc. | | 19,575 | | | 1,936,750 |
| Amgen Inc. | | 9,000 | | | 1,616,580 |
| Celgene Corp. (a) | | 32,275 | | | 2,539,397 |
| Exact Sciences Corp. (a) | | 44,375 | | | 2,642,087 |
| MiMedx Group Inc. (a) | | 89,500 | | | 753,590 |
| Health Care Equipment & Supplies - 2.0% | | | | | |
| Abbott Laboratories | | 21,000 | | | 1,292,130 |
| Zimmer Biomet Holdings, Inc. | | 10,950 | | | 1,221,035 |
| Health Care Providers & Services - 8.6% | | | | | |
| CVS Health Corp. | | 33,850 | | | 2,145,751 |
| Express Scripts Holding Co. (a) | | 31,075 | | | 2,355,796 |
| Hanger, Inc. (a) | | 149,825 | | | 2,594,969 |
| HCA Healthcare, Inc. | | 14,400 | | | 1,485,216 |
| McKesson Corp. | | 16,110 | | | 2,286,653 |
| Pharmaceuticals - 4.0% | | | | | |
| Johnson & Johnson | | 8,985 | | | 1,074,786 |
| Merck & Co., Inc. | | 23,500 | | | 1,398,955 |
| Pfizer Inc. | | 70,325 | | | 2,526,777 |
See Notes to Financial Statements.
7
| LARGECAP FUND SCHEDULE OF INVESTMENTS (Unaudited) (Continued) |
| May 31, 2018 |
| | Shares | | Value |
| COMMON STOCKS (continued) | | | | | |
| | | | | | |
| Industrials - 9.1% | | | | $ | 11,418,494 |
| Air Freight & Logistics - 1.3% | | | | | |
| FedEx Corp. | | 6,675 | | | 1,662,876 |
| Airlines - 0.7% | | | | | |
| Delta Air Lines, Inc. | | 17,000 | | | 918,850 |
| Building Products - 2.9% | | | | | |
| Johnson Controls Int’l. PLC | | 51,941 | | | 1,743,140 |
| Masco Corp. | | 49,975 | | | 1,862,568 |
| Electrical Equipment - 1.0% | | | | | |
| ABB Ltd. ADR | | 54,175 | | | 1,231,940 |
| Industrial Conglomerates - 2.3% | | | | | |
| General Electric Co. | | 202,525 | | | 2,851,552 |
| Trading Companies & Distributors - 0.9% | | | | | |
| HD Supply Holdings, Inc. (a) | | 28,175 | | | 1,147,568 |
| | | | | | |
| Information Technology - 24.1% | | | | | 30,362,454 |
| Communications Equipment - 2.9% | | | | | |
| Cisco Systems, Inc. | | 62,160 | | | 2,654,854 |
| Viavi Solutions Inc. (a) | | 107,735 | | | 1,024,560 |
| Electronic Equipment, Instruments & Components - 1.6% | | | | | |
| Corning Inc. | | 57,925 | | | 1,573,822 |
| Maxwell Technologies, Inc. (a) | | 93,997 | | | 484,085 |
| Internet Software & Services - 5.7% | | | | | |
| Alphabet, Inc. Class A (a) | | 3,675 | | | 4,042,500 |
| eBay Inc. (a) | | 33,070 | | | 1,247,400 |
| Facebook, Inc. Class A (a) | | 9,725 | | | 1,865,060 |
| IT Services - 3.5% | | | | | |
| Alliance Data Systems Corp. | | 9,275 | | | 1,955,355 |
| Black Knight, Inc. (a) | | 15,006 | | | 759,304 |
| PayPal Holdings, Inc. (a) | | 12,270 | | | 1,006,999 |
| Visa Inc. Class A | | 4,875 | | | 637,260 |
| Semiconductors & Semiconductor Equipment - 4.9% | | | | | |
| Infineon Technologies A.G. ADR | | 34,250 | | | 943,759 |
| Intel Corp. | | 26,450 | | | 1,460,040 |
| Maxim Integrated Products, Inc. | | 15,505 | | | 909,368 |
| Qualcomm Inc. | | 48,830 | | | 2,838,000 |
| Software - 4.3% | | | | | |
| Microsoft Corp. | | 34,601 | | | 3,419,963 |
| Oracle Corp. | | 42,475 | | | 1,984,432 |
| Technology Hardware, Storage & Peripherals - 1.2% | | | | | |
| Apple Inc. | | 8,325 | | | 1,555,693 |
| | | | | | |
| Materials - 1.7% | | | | | 2,095,177 |
| Metals & Mining - 1.7% | | | | | |
| Freeport-McMoRan Inc. | | 123,975 | | | 2,095,177 |
See Notes to Financial Statements.
8
| LARGECAP FUND SCHEDULE OF INVESTMENTS (Unaudited) (Continued) |
| May 31, 2018 |
| | Shares | | Value |
| SHORT-TERM INVESTMENTS - 0.0%^ | | | | | $43,717 |
| (COST $43,717) | | | | | |
| | | | | | |
| Money Market Funds - 0.0%^ | | | | | 43,717 |
| Fidelity Inst’l. Government Portfolio Class I, 1.635% (b) | | 43,717 | | | 43,717 |
| | | | | | |
| TOTAL INVESTMENTS - 99.8% (COST $129,475,796) | | | | | 125,713,055 |
| | | | | | |
| NET OTHER ASSETS AND LIABILITIES - 0.2% | | | | | 215,791 |
| | | | | | |
| NET ASSETS - 100.0% | | | | $ | 125,928,846 |
| (a) | Non-income producing security. |
| (b) | Represents the 7-day yield at May 31, 2018. |
| ^ | Rounds to 0.0%. |
| Abbreviations: |
| ADR | American Depositary Receipt |
| A.G. | Aktiengesellschaft is the German term for a public limited liability corporation. |
| PLC | Public Limited Company |
The Global Industry Classification Standard (“GICS”) was developed by and is the exclusive property and a service mark of MSCI Inc. (“MSCI”) and Standard & Poor’s Financial Services LLC (“S&P”) and is licensed for use by Thompson Investment Management, Inc. Neither MSCI, S&P, nor any other party involved in making or compiling the GICS or any GICS classifications makes any warranties with respect thereto or the results to be obtained by the use thereof, and no such party shall have any liability whatsoever with respect thereto.
See Notes to Financial Statements.
9
| MIDCAP FUND INVESTMENT REVIEW (Unaudited) |
| May 31, 2018 |
Portfolio Managers
James T. Evans, CFA
Jason L. Stephens, CFA
Performance
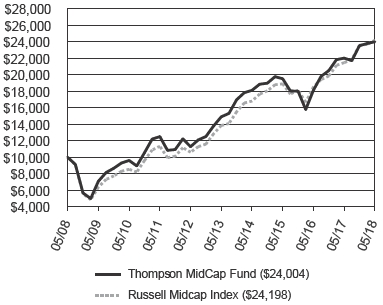
The MidCap Fund produced a total return of 1.98% for the six-months ended May 31, 2018, as compared to its benchmark, the Russell Midcap Index, which returned 2.59%.
| Comparison of Change in Value of a Hypothetical $10,000 Investment |
 |
| Average Annual Total Returns |
| Through 05/31/18 |
| | 1 Year | | 3 Year | | 5 Year | | 10 Year |
| Thompson MidCap Fund | | 8.97% | | 7.13% | | 9.99% | | 9.15% |
| Russell Midcap Index | | 12.67% | | 8.57% | | 11.79% | | 9.24% |
Gross Expense Ratio as of 03/31/18 was 1.44%.
Net Expense Ratio after reimbursement as of 03/31/18 was 1.15%.*
* | The Advisor has contractually agreed to waive management fees and/or reimburse expenses incurred by the MidCap Fund through March 31, 2019, so that the annual operating expenses of the Fund do not exceed 1.15% of its average daily net assets. Net expense ratios are current as of the most recent Prospectus and are applicable to investors. |
Performance data quoted represents past performance; past performance does not guarantee future results. The investment return and principal value of an investment will fluctuate so that an investor’s shares, when redeemed, may be worth more or less than their original cost. Current performance of the Fund may be lower or higher than the performance quoted. Performance data current to the most recent month-end may be obtained by calling 1-800-999-0887 or visiting www.thompsonim.com.
Results include the reinvestment of all dividends and capital gains distributions. Investment performance reflects all fee waivers that may be in effect. In the absence of such waivers, total return would be reduced. The performance information reflected in the graph and the table above does not reflect the deduction of taxes that a shareholder would pay on fund distributions or the redemption of fund shares, nor does it imply future performance. The Russell Midcap Index measures the performance of the 800 smallest companies in the Russell 1000 Index based on total market capitalization. You cannot directly invest in an index.
FTSE Russell is the source and owner of the trademarks, service marks, and copyrights related to the Russell Indexes. “FTSE®” and “Russell®” are trademarks of the London Stock Exchange Group.
See Notes to Financial Statements.
10
| MIDCAP FUND INVESTMENT REVIEW (Unaudited) (Continued) |
| May 31, 2018 |
Management Commentary
As is almost always the case for the Funds, stock selection decisions explain most of the Fund’s performance differential over the last six months relative to its benchmark. Strong selection in the Consumer Staples, Healthcare and Materials sectors was outweighed by poor selection in the Information Technology, Financials and Consumer Discretionary sectors. Dispersion among individual stock contributions to performance was fairly tight, with only five stocks in the entire portfolio adding or subtracting more than 0.5% to total performance. The strongest contributor was Amplify Snack Brands, Inc. – the subject of a January acquisition by The Hershey Company.
March 31, 2018, marked the Thompson MidCap Fund’s 10-year anniversary. Launching in the midst of the financial crisis in 2008 meant that early shareholders had to suffer through a historic -37.35% drop that first year1. In the nine years that followed2, the Fund appreciated 309.02% or 16.94% per year. We appreciate those of you who hung in there during our first year and are pleased that the Fund’s shareholders have been able to participate in the bull market that followed that harrowing early period.
While investor preference has fluctuated greatly over the years, our process has remained consistent. In industry jargon, our strategy is what we would characterize as “GARP” or “Growth at a Reasonable Price.” Essentially, this means that we’re striving to create a portfolio of stocks that in aggregate have the potential to grow earnings at a faster pace than the Fund’s benchmark, while at the same time not overpaying for them. It’s a style that relies on traditional, bottom-up security analysis, and one that we believe gives us the chance to produce competitive long-term returns.
To Fund shareholders, thank you for the opportunity you’ve given us to manage your assets during the Fund’s first decade. We will work hard to give you a reason to celebrate again with us at the Fund’s next milestone.
Opinions expressed are subject to change, are not guaranteed and should not be considered investment advice.
Mutual fund investing involves risk. Principal loss is possible. Midcap companies tend to have more limited liquidity and greater volatility than large-capitalization companies. Investments in American Depositary Receipts (“ADRs”) are subject to some extent to the risks associated with directly investing in securities of foreign issuers, including the risk of changes in currency exchange rates, expropriation or nationalization of assets, and the impact of political, diplomatic, or social events. Investments in real estate securities may involve greater risk and volatility including greater exposure to economic downturns and changes in real estate values, rents, property taxes, tax, and other laws. A real estate investment trust’s (REIT’s) share price may decline because of adverse developments affecting the real estate industry.
Please refer to the Schedule of Investments on page 13 of this report for holdings information. The management commentary above as well as Fund holdings and asset/sector allocations should not be considered a recommendation to buy or sell any security. In addition, please note that Fund holdings and asset/sector allocations are subject to change.
Earnings Growth is a measure of growth in a company’s net income over a specific period, often one year. It is not a prediction of the Fund’s future returns.
| 1 | 03/31/2008 – 03/31/2009, while the Fund’s benchmark returned -40.81% during that same period. |
| 2 | 03/31/2009 – 03/31/2018, while the Fund’s benchmark returned 18.11% during that same period. |
See Notes to Financial Statements.
11
| MIDCAP FUND INVESTMENT REVIEW (Unaudited) (Continued) |
| May 31, 2018 |
| Sector Weightings at 05/31/18 |
| % of Total Investments |
|
| Top 10 Equity Holdings at 05/31/18 |
| | % of Fund’s |
| Company | Industry | Net Assets |
| Hanger, Inc. | Health Care Providers & Services | 3.26% |
| Exact Sciences Corp. | Biotechnology | 2.13% |
| CIT Group Inc. | Banks | 2.09% |
| Alliance Data Systems Corp. | IT Services | 2.05% |
| Associated Banc-Corp | Banks | 2.02% |
| Jazz Pharmaceuticals PLC | Pharmaceuticals | 1.93% |
| Northern Trust Corp. | Capital Markets | 1.89% |
| Hanesbrands, Inc. | Textiles, Apparel & Luxury Goods | 1.81% |
| HD Supply Holdings, Inc. | Trading Companies & Distributors | 1.80% |
| First Horizon National Corp. | Banks | 1.79% |
As of May 31, 2018, 100.0%, of the Fund’s net assets were in equity and short-term investments.
See Notes to Financial Statements.
12
| MIDCAP FUND SCHEDULE OF INVESTMENTS (Unaudited) |
| May 31, 2018 |
| | Shares | | Value |
| COMMON STOCKS - 99.9% | | | | $ | 49,939,908 |
| (COST $41,700,764) | | | | | |
| |
| Consumer Discretionary - 18.9% | | | | | 9,433,616 |
| Automobiles - 1.0% | | | | | |
| Harley-Davidson, Inc. | | 11,875 | | | 487,825 |
| Distributors - 1.6% | | | | | |
| LKQ Corp. (a) | | 24,545 | | | 779,795 |
| Hotels, Restaurants & Leisure - 0.8% | | | | | |
| Extended Stay America, Inc. | | 18,800 | | | 395,740 |
| Household Durables - 4.2% | | | | | |
| D.R. Horton, Inc. | | 10,100 | | | 426,321 |
| Newell Brands, Inc. | | 31,631 | | | 745,859 |
| PulteGroup Inc. | | 15,150 | | | 458,288 |
| TopBuild Corp. (a) | | 5,625 | | | 472,219 |
| Leisure Products - 2.8% | | | | | |
| Brunswick Corp. | | 11,525 | | | 732,990 |
| Mattel, Inc. (a) | | 43,650 | | | 677,448 |
| Multiline Retail - 1.5% | | | | | |
| Kohl’s Corp. | | 11,210 | | | 748,267 |
| Specialty Retail - 3.6% | | | | | |
| Bed Bath & Beyond Inc. | | 41,480 | | | 753,277 |
| Lumber Liquidators Holdings, Inc. (a) | | 23,975 | | | 507,311 |
| Urban Outfitters, Inc. (a) | | 12,475 | | | 518,212 |
| Textiles, Apparel & Luxury Goods - 3.4% | | | | | |
| Hanesbrands, Inc. | | 49,765 | | | 907,216 |
| Skechers U.S.A., Inc. Class A (a) | | 21,425 | | | 622,610 |
| Tapestry, Inc. | | 4,580 | | | 200,238 |
| |
| Consumer Staples - 3.9% | | | | | 1,944,759 |
| Beverages - 1.3% | | | | | |
| Molson Coors Brewing Co. Class B | | 10,225 | | | 630,371 |
| Food Products - 2.6% | | | | | |
| Lamb Weston Holdings, Inc. | | 5,675 | | | 361,781 |
| The Hain Celestial Group, Inc. (a) | | 12,875 | | | 328,570 |
| The J. M. Smucker Co. | | 5,805 | | | 624,037 |
| |
| Energy - 5.7% | | | | | 2,849,410 |
| Energy Equipment & Services - 1.6% | | | | | |
| Helmerich & Payne, Inc. | | 3,685 | | | 244,610 |
| TechnipFMC PLC | | 17,125 | | | 533,444 |
| Oil, Gas & Consumable Fuels - 4.1% | | | | | |
| Cameco Corp. | | 19,750 | | | 204,018 |
| Devon Energy Corp. | | 9,125 | | | 379,326 |
| Noble Energy, Inc. | | 22,050 | | | 787,185 |
| Pioneer Natural Resources Co. | | 1,475 | | | 284,823 |
| Southwestern Energy Co. (a) | | 87,950 | | | 416,004 |
See Notes to Financial Statements.
13
| MIDCAP FUND SCHEDULE OF INVESTMENTS (Unaudited) (Continued) |
| May 31, 2018 |
| | Shares | | Value |
| COMMON STOCKS (continued) | | | | | |
| |
| Financials - 17.2% | | | | $ | 8,595,512 |
| Banks - 9.3% | | | | | |
| Associated Banc-Corp | | 36,543 | | | 1,008,587 |
| CIT Group Inc. | | 20,880 | | | 1,042,538 |
| First Horizon National Corp. | | 48,395 | | | 897,243 |
| Regions Financial Corp. | | 16,035 | | | 292,478 |
| SunTrust Banks, Inc. | | 8,820 | | | 595,438 |
| Zions Bancorporation | | 14,635 | | | 802,144 |
| Capital Markets - 3.5% | | | | | |
| Eaton Vance Corp. | | 9,770 | | | 525,626 |
| Northern Trust Corp. | | 9,230 | | | 946,260 |
| State Street Corp. | | 2,775 | | | 266,705 |
| Consumer Finance - 1.3% | | | | | |
| Discover Financial Services | | 8,779 | | | 648,417 |
| Insurance - 2.0% | | | | | |
| FNF Group | | 17,525 | | | 647,724 |
| Unum Group | | 9,580 | | | 371,800 |
| Thrifts & Mortgage Finance - 1.1% | | | | | |
| Flagstar Bancorp, Inc. (a) | | 15,825 | | | 550,552 |
| |
| Health Care - 18.0% | | | | | 8,987,148 |
| Biotechnology - 4.1% | | | | | |
| Exact Sciences Corp. (a) | | 17,875 | | | 1,064,277 |
| MiMedx Group Inc. (a) | | 88,375 | | | 744,117 |
| Xencor, Inc. (a) | | 5,800 | | | 232,058 |
| Health Care Equipment & Supplies - 2.0% | | | | | |
| Hologic, Inc. (a) | | 10,150 | | | 384,584 |
| Zimmer Biomet Holdings, Inc. | | 5,500 | | | 613,305 |
| Health Care Providers & Services - 8.7% | | | | | |
| Acadia Healthcare Co., Inc. (a) | | 13,675 | | | 549,598 |
| Envision Healthcare Corp. (a) | | 18,955 | | | 812,790 |
| Hanger, Inc. (a) | | 94,044 | | | 1,628,842 |
| Henry Schein, Inc. (a) | | 3,775 | | | 261,230 |
| McKesson Corp. | | 2,390 | | | 339,237 |
| Patterson Cos., Inc. | | 10,980 | | | 229,702 |
| Premier, Inc. Class A (a) | | 16,175 | | | 527,628 |
| Life Sciences Tools & Services - 1.3% | | | | | |
| Accelerate Diagnostics, Inc. (a) | | 31,200 | | | 636,480 |
| Pharmaceuticals - 1.9% | | | | | |
| Jazz Pharmaceuticals PLC (a) | | 5,700 | | | 963,300 |
See Notes to Financial Statements.
14
| MIDCAP FUND SCHEDULE OF INVESTMENTS (Unaudited) (Continued) |
| May 31, 2018 |
| | Shares | | Value |
| COMMON STOCKS (continued) | | | | | |
| |
| Industrials - 11.8% | | | | $ | 5,929,123 |
| Building Products - 3.0% | | | | | |
| A.O. Smith Corp. | | 6,250 | | | 394,188 |
| Masco Corp. | | 19,775 | | | 737,014 |
| USG Corp. (a) | | 9,125 | | | 378,505 |
| Electrical Equipment - 1.1% | | | | | |
| Regal Beloit Corp. | | 7,030 | | | 558,533 |
| Machinery - 5.2% | | | | | |
| Ingersoll-Rand PLC | | 5,725 | | | 501,167 |
| Kornit Digital Ltd. (a) | | 7,500 | | | 128,625 |
| Mueller Water Products, Inc. Class A | | 30,525 | | | 363,553 |
| REV Group, Inc. | | 35,650 | | | 604,624 |
| SPX Corp. (a) | | 7,650 | | | 262,089 |
| SPX Flow, Inc. (a) | | 16,790 | | | 731,540 |
| Trading Companies & Distributors - 2.5% | | | | | |
| HD Supply Holdings, Inc. (a) | | 22,075 | | | 899,115 |
| W.W. Grainger, Inc. | | 1,198 | | | 370,170 |
| |
| Information Technology - 14.9% | | | | | 7,451,958 |
| Communications Equipment - 2.4% | | | | | |
| Lumentum Holdings Inc. (a) | | 7,500 | | | 440,625 |
| Viavi Solutions Inc. (a) | | 78,231 | | | 743,977 |
| Electronic Equipment, Instruments & Components - 1.8% | | | | | |
| FARO Technologies, Inc. (a) | | 4,150 | | | 222,648 |
| II-VI Inc. (a) | | 9,400 | | | 413,130 |
| Maxwell Technologies, Inc. (a) | | 49,997 | | | 257,485 |
| IT Services - 3.8% | | | | | |
| Alliance Data Systems Corp. | | 4,870 | | | 1,026,693 |
| Black Knight, Inc. (a) | | 8,735 | | | 441,991 |
| Fiserv, Inc. (a) | | 6,238 | | | 452,879 |
| Semiconductors & Semiconductor Equipment - 3.2% | | | | | |
| Cavium Inc. (a) | | 7,425 | | | 620,804 |
| Infineon Technologies A.G. ADR | | 18,150 | | | 500,123 |
| Maxim Integrated Products, Inc. | | 8,066 | | | 473,071 |
| Software - 0.6% | | | | | |
| Take-Two Interactive Software, Inc. (a) | | 2,735 | | | 306,539 |
| Technology Hardware, Storage & Peripherals - 3.1% | | | | | |
| CPI Card Group Inc. (a) | | 150,397 | | | 400,056 |
| Electronics for Imaging, Inc. (a) | | 26,450 | | | 884,223 |
| Pure Storage, Inc. Class A (a) | | 12,475 | | | 267,714 |
See Notes to Financial Statements.
15
| MIDCAP FUND SCHEDULE OF INVESTMENTS (Unaudited) (Continued) |
| May 31, 2018 |
| | Shares | | Value |
| COMMON STOCKS (continued) | | | | | |
| |
| Materials - 3.8% | | | | $ | 1,899,662 |
| Chemicals - 1.3% | | | | | |
| Ecolab Inc. | | 2,581 | | | 368,076 |
| Int’l. Flavors & Fragrances Inc. | | 2,410 | | | 294,333 |
| Containers & Packaging - 0.5% | | | | | |
| AptarGroup, Inc. | | 2,650 | | | 244,648 |
| Metals & Mining - 2.0% | | | | | |
| Freeport-McMoRan Inc. | | 49,125 | | | 830,212 |
| Lundin Mining Corp. | | 25,900 | | | 162,393 |
| |
| Real Estate - 4.5% | | | | | 2,273,247 |
| Real Estate Investment Trusts - 3.5% | | | | | |
| DiamondRock Hospitality Co. | | 44,600 | | | 567,758 |
| Host Hotels & Resorts Inc. | | 26,235 | | | 567,463 |
| Kimco Realty Corp. | | 41,950 | | | 648,547 |
| Real Estate Management & Development - 1.0% | | | | | |
| Realogy Holdings Corp. | | 20,575 | | | 489,479 |
| |
| Utilities - 1.2% | | | | | 575,473 |
| Multi-Utilities - 1.2% | | | | | |
| MDU Resources Group, Inc. | | 13,225 | | | 367,655 |
| SCANA Corp. | | 5,725 | | | 207,818 |
| |
| SHORT-TERM INVESTMENTS - 0.1% | | | | | 35,854 |
| (COST $35,854) | | | | | |
| |
| Money Market Funds - 0.1% | | | | | 35,854 |
| Fidelity Inst’l. Government Portfolio Class I, 1.635% (b) | | 35,854 | | | 35,854 |
| |
| TOTAL INVESTMENTS - 100.0% (COST $41,736,618) | | | | | 49,975,762 |
| |
| NET OTHER ASSETS AND LIABILITIES - 0.0%^ | | | | | 24,412 |
| |
| NET ASSETS - 100.0% | | | | $ | 50,000,174 |
| (a) | Non-income producing security. |
| (b) | Represents the 7-day yield at May 31, 2018. |
| ^ | Rounds to 0.0%. |
| Abbreviations: |
| ADR | American Depositary Receipt |
| A.G. | Aktiengesellschaft is the German term for a public limited liability corporation. |
| PLC | Public Limited Company |
The Global Industry Classification Standard (“GICS”) was developed by and is the exclusive property and a service mark of MSCI Inc. (“MSCI”) and Standard & Poor’s Financial Services LLC (“S&P”) and is licensed for use by Thompson Investment Management, Inc. Neither MSCI, S&P, nor any other party involved in making or compiling the GICS or any GICS classifications makes any warranties with respect thereto or the results to be obtained by the use thereof, and no such party shall have any liability whatsoever with respect thereto.
See Notes to Financial Statements.
16
| BOND FUND INVESTMENT REVIEW (Unaudited) |
| May 31, 2018 |
Portfolio Managers
James T. Evans, CFA
Jason L. Stephens, CFA
Performance
The Bond Fund produced a total return of 1.66% for the six-months ended May 31, 2018, as compared to its benchmark, the Bloomberg Barclays U.S. Government/Credit 1-5 Year Index, which returned -0.28%, and as compared to the Bloomberg Barclays U.S. Credit 1-5 Year Index, which returned -0.29%.
| Comparison of Change in Value of a Hypothetical $10,000 Investment |
 |
| Average Annual Total Returns |
| Through 05/31/18 |
| | | 1 Year | | 3 Year | | 5 Year | | 10 Year |
| Thompson Bond Fund | | | 3.00% | | | 3.72% | | 3.05% | | 5.50% |
| Bloomberg Barclays U.S. Gov’t./Credit 1-5 Year Index | | | -0.28% | | | 0.79% | | 1.03% | | 2.26% |
| Bloomberg Barclays U.S. Credit 1-5 Year Index | | | 0.15% | | | 1.38% | | 1.65% | | 3.31% |
| Gross Expense Ratio as of 03/31/18 was 0.71%. | 30-Day SEC Yield as of 05/31/18 was 3.37%. |
Performance data quoted represents past performance; past performance does not guarantee future results. The investment return and principal value of an investment will fluctuate so that an investor’s shares, when redeemed, may be worth more or less than their original cost. Current performance of the Fund may be lower or higher than the performance quoted. Performance data current to the most recent month-end may be obtained by calling 1-800-999-0887 or visiting www.thompsonim.com.
Results include the reinvestment of all dividends and capital gains distributions. Investment performance reflects all fee waivers that may have been in effect. In the absence of such waivers, total return would have been reduced. The performance information reflected in the graph and the table above does not reflect the deduction of taxes that a shareholder would pay on fund distributions or the redemption of fund shares, nor does it imply future performance. The Bloomberg Barclays U.S. Government/Credit 1-5 Year Index is a market-value-weighted index of all investment-grade bonds with maturities of more than one year and less than 5 years. The Bloomberg Barclays U.S. Credit 1-5 Year Index is a market-value-weighted index which includes virtually every major investment-grade rated corporate bond with 1-5 years remaining until maturity that serves as a supplementary benchmark. You cannot directly invest in an index.
Bloomberg® is a trademark and service mark of Bloomberg Finance L.P. Barclays® is a trademark and service mark of Barclays Bank PLC.
See Notes to Financial Statements.
17
| BOND FUND INVESTMENT REVIEW (Unaudited) (Continued) |
| May 31, 2018 |
Management Commentary
It was a challenging period for fixed-income strategies, as evidenced by the negative returns produced by the Fund’s primary and secondary benchmarks. Interest rates rose across all tenors, providing an illustration writ large of the inverse relationship between bond prices and interest rate movements. While this relationship is most keenly felt in longer-maturity issues, shorter duration bond performance was also challenged, as US Treasury yields on maturities ranging from one month out to 7 years increased by between 0.50% and 0.66%. With absolute yields still relatively low, there isn’t much income being generated to offset even modest price declines.
Until prevailing interest rates approach more historically normal levels, we��re likely to employ a cautious approach to interest-rate risk. While credit spreads did expand over the last 6 months, they aren’t yet in our view attractive enough to outweigh this inclination. We’ve therefore continued our gravitation toward shorter-maturity bonds while we wait for opportunities to arise at the longer end of the Fund’s maturity ladder. Consequently, the Fund’s duration was 1.24 years at the end of the semi-annual period – the low end of its historical range. This, along with its SEC yield of 3.37%, contributed greatly to the Fund’s competitive performance during the period.
We have also increased the Funds’ exposure to floating-rate securities over time. The coupons for floating-rate issues periodically fluctuate according to designated interest rate benchmarks like LIBOR (London Interbank Offered Rate). The interest being paid by the issuer to bondholders therefore increases and decreases along with changes to these benchmark rates. In a rising rate environment, floating rate bonds can sometimes mitigate price declines. Over the last three years, we have attempted to opportunistically add these securities to the portfolio in anticipation of rising interest rates, and the benefit of doing so has been realized by the Fund over the last several quarters.
Our strategy remains constant. The environment in which we operate does not. These sometimes-dramatic changes in the Fund’s portfolio characteristics generally do not happen quickly. Rather, they emerge gradually over time as we assess and react to the various risks and opportunities available to us in the market. With a high percentage of the Fund’s portfolio at the end of the period in issues maturing in less than 12 months, we expect that we will have ample flexibility to take advantage of those opportunities as they arise.
Opinions expressed are subject to change, are not guaranteed and should not be considered investment advice.
Mutual fund investing involves risk. Principal loss is possible. Investments in debt securities typically decrease in value when interest rates rise. The risk is usually greater for longer-term debt securities. Investments in bonds of foreign issuers involve greater volatility, political and economic risks, and differences in accounting methods. Investment by the Fund in lower-rated and non-rated securities presents a greater risk of loss to principal and interest than higher-rated securities.
Please refer to the Schedule of Investments on page 20 of this report for holdings information. The management commentary above as well as Fund holdings should not be considered a recommendation to buy or sell any security. In addition, please note that Fund holdings are subject to change.
The federal government guarantees interest payments from government securities while dividend payments carry no such guarantee. Government securities, if held to maturity, guarantee the timely payment of principal and interest.
Duration is a commonly used measure of the potential volatility of the price of a debt security, or the aggregate market value of a portfolio of debt securities, prior to maturity. Securities with a longer duration generally have more volatile prices than securities of comparable quality with a shorter duration.
LIBOR is a benchmark rate that some of the world’s leading banks charge each other for short-term loans. It stands for Intercontinental Exchange London Interbank Offered Rate and serves as the first step to calculating interest rates on various loans throughout the world.
SEC Yield is a standardized yield computed by dividing the net investment income per share earned during the 30-day period prior to quarter-end and was created to allow for fairer comparisons among bond funds.
Spread is the percentage point difference between yields of various classes of bonds compared to treasury bonds.
Yield is the income earned from a bond, which takes into account the sum of the interest payment, the redemption value at the bond’s maturity, and the initial purchase price of the bond.
Credit Ratings are provided by Standard & Poor’s, who assign a rating based on their analysis of the issuer’s creditworthiness. The highest rating given is AAA and the lowest is C.
The purpose of Moody’s ratings is to provide investors with a simple system of gradation by which relative creditworthiness of securities may be noted. Gradations of creditworthiness are indicated by rating symbols, with each symbol representing a group in which the credit characteristics are broadly the same. The highest rating assigned by Moody’s is AAA and the lowest is C.
See Notes to Financial Statements.
18
| BOND FUND INVESTMENT REVIEW (Unaudited) (Continued) |
| May 31, 2018 |
Although the makeup of the Bond Fund’s portfolio is constantly changing, as of May 31, 2018, 74.39% of the Fund’s portfolio was invested in corporate bonds. Due to prevailing market conditions, the composition of the Fund’s portfolio as of that date was consistent with the composition of the Fund’s portfolio over the past 5 years. In addition, as of that date 63.55% of the Fund’s portfolio was invested in securities rated BBB by Standard & Poor’s, while an additional 4.67% of the Fund’s portfolio was rated below investment-grade and 17.59% of the Fund’s portfolio was not rated by Standard & Poor’s. For portfolio information current as of the most recent quarter-end, please call 1-800-999-0887 or visit our website at www.thompsonim.com. Compared to a portfolio that is more evenly allocated between government and corporate bonds, a portfolio that is heavily allocated to corporate bonds may provide higher returns but is also subject to greater levels of credit and liquidity risk and to greater price fluctuations. A portfolio that is significantly allocated to bonds having lower and below-investment-grade ratings may also be subject to greater levels of credit and liquidity risk and experience greater price fluctuations than a portfolio comprised of higher-rated investment-grade bonds.
| Asset Allocation at 05/31/18 |
| (Includes cash equivalents) |
| % of Total Investments |
| Corporate Bonds | 74.39% | |
| Asset-Backed Securities | 12.89% | |
| Taxable Municipal Bonds | 4.26% | |
| Commercial Mortgage-Backed Securities | 3.94% | |
| U.S. Government & Agency Issues | 2.15% | |
| Sovereign Bonds | 1.86% | |
| Tax-Exempt Municipal Bonds | 0.22% | |
| Federal Agency Mortgage-Backed Securities | 0.20% | |
| Residential Mortgage-Backed Securities | 0.09% | |
| 100.00% | |
| | |
| Quality Composition at 05/31/18^ |
| (Includes cash equivalents) |
| % of Total Investments |
| U.S. Government & Agency Issues | 2.36% | |
| AAA | 0.38% | |
| AA | 3.21% | |
| A | 13.35% | |
| BBB | 73.26% | |
| BB and Below | 7.05% | |
| Not Rated | 0.39% | |
| | 100.00% | |
| | | |
^ The Bond Fund’s quality composition is calculated using ratings from Standard & Poor’s. If Standard & Poor’s does not rate a holding then Moody’s is used. If Standard & Poor’s and Moody’s do not rate a holding then Fitch is used. For certain securities that are not rated by any of these three agencies, credit ratings from other Nationally Recognized Statistical Credit Rating Organizations (NRSRO) agencies may be used. Not rated category includes holdings that are not rated by any NRSRO. All ratings are as of 05/31/18. |
| |
| Top 10 Bond Holdings by Issuer at 05/31/18 |
| % of Fund’s Net Assets |
| XL Group PLC | 2.79% | |
| MBIA Inc. | 2.39% | |
| GFI Group Inc. | 2.24% | |
| County of Racine WI | 2.11% | |
| General Electric Co. | 1.91% | |
| Western Union Co. | 1.48% | |
| Lincoln National Corp. | 1.45% | |
| Activision Blizzard, Inc. | 1.43% | |
| Goldman Sachs Group, Inc. | 1.41% | |
| Capital One N.A. | 1.40% | |
See Notes to Financial Statements.
19
| BOND FUND SCHEDULE OF INVESTMENTS (Unaudited) |
| May 31, 2018 |
| | Rate (%) | | Maturity Date | | Principal Amount | | Value |
| BONDS - 99.2% | | | | | | | | $2,953,293,017 |
| (COST $2,993,350,271) | | | | | | | | |
| |
| Asset-Backed Securities - 12.9% | | | | | | | | 385,771,382 |
| Air Canada, Series 2013-1B (h) | | 5.375 | | 11/15/22 | | 8,281,949 | | 8,462,495 |
| Air Canada, Series 2015-2B (h) | | 5.000 | | 06/15/25 | | 4,936,386 | | 5,013,888 |
| Airspeed Ltd., Series 2007-1A G1 (1 month LIBOR + 0.270%, | | | | | | | | |
| floor 0.000%) (c) (h) | | 2.189 | | 06/15/32 | | 2,960,813 | | 2,580,063 |
| America West Airlines, Series 1999-1 | | 7.930 | | 07/02/20 | | 1,727,177 | | 1,778,992 |
| America West Airlines, Series 2000-1 | | 8.057 | | 01/02/22 | | 18,936 | | 20,529 |
| America West Airlines, Series 2001-1 | | 7.100 | | 10/02/22 | | 3,519,521 | | 3,748,290 |
| Applebee’s Funding LLC / IHOP Funding LLC, Series 2014-1 A2 (h) | | 4.277 | | 09/05/44 | | 39,858,705 | | 39,477,345 |
| British Airways PLC, Series 2013-1 B (h) | | 5.625 | | 12/20/21 | | 18,927,649 | | 19,332,700 |
| British Airways PLC, Series 2013-1 B (h) | | 5.625 | | 12/20/21 | | 39,424 | | 40,267 |
| Business Jet Securities, LLC, Series 2018-1 A (h) | | 4.335 | | 02/15/33 | | 8,093,579 | | 8,122,238 |
| Business Jet Securities, LLC, Series 2018-1 B (h) | | 6.048 | | 02/15/33 | | 1,145,509 | | 1,161,919 |
| Cajun Global LLC, Series 2017-1A A2 (h) | | 6.500 | | 08/20/47 | | 9,700,000 | | 9,696,023 |
| CAL Funding II Ltd., Series 2012-1A A (h) | | 3.470 | | 10/25/27 | | 1,234,458 | | 1,225,573 |
| CAL Funding II Ltd., Series 2013-1A A (h) | | 3.350 | | 03/27/28 | | 3,136,833 | | 3,117,473 |
| Castle Aircraft Securitization Trust, Series 2015-1A A (h) | | 4.703 | | 12/15/40 | | 1,079,678 | | 1,078,855 |
| Continental Airlines, Series 1999-2 A-1 | | 7.256 | | 09/15/21 | | 14,571 | | 15,154 |
| Continental Airlines, Series 1999-2 C | | 6.236 | | 09/15/21 | | 473,557 | | 483,028 |
| Continental Airlines, Series 2010-1 B | | 6.000 | | 07/12/20 | | 1,984,744 | | 2,015,805 |
| Continental Airlines, Series 2012-1 B | | 6.250 | | 10/11/21 | | 5,013,748 | | 5,164,160 |
| Continental Airlines, Series 2012-2 B | | 5.500 | | 04/29/22 | | 7,950,808 | | 8,137,652 |
| Delta Air Lines, Series 2007-1 B | | 8.021 | | 02/10/24 | | 1,801,577 | | 1,995,067 |
| Delta Air Lines, Series 2010-1 A | | 6.200 | | 01/02/20 | | 4,028,009 | | 4,042,107 |
| Delta Air Lines, Series 2012-1B (h) | | 6.875 | | 05/07/19 | | 545,537 | | 556,447 |
| Dong Fang Container Finance SPV Ltd., Series 2013-1 A (h) | | 3.960 | | 09/25/28 | | 2,872,054 | | 2,785,186 |
| Dong Fang Container Finance SPV Ltd., Series 2014-1A A2 (h) | | 3.550 | | 11/25/39 | | 363,756 | | 346,558 |
| Doric Nimrod Air Alpha, Series 2013-1 B (h) | | 6.125 | | 11/30/21 | | 13,775,502 | | 14,084,073 |
| Doric Nimrod Air Alpha, Series 2013-1 B (h) | | 6.125 | | 11/30/21 | | 2,244,618 | | 2,294,898 |
| Doric Nimrod Air Finance Alpha Ltd., Series 2012-1 B (h) | | 6.500 | | 05/30/21 | | 4,552,120 | | 4,632,798 |
| ECAF I Ltd., Series 2015-1A A2 (h) | | 4.947 | | 06/15/40 | | 3,864,053 | | 3,902,049 |
| ECAF I Ltd., Series 2015-1A B1 (h) | | 5.802 | | 06/15/40 | | 19,839,185 | | 20,074,581 |
| Element Rail Leasing LLC, Series 2014-1A B1 (h) | | 4.406 | | 04/19/44 | | 10,158,750 | | 10,129,295 |
| Element Rail Leasing LLC, Series 2015-1A B1 (h) | | 4.175 | | 02/19/45 | | 16,917,000 | | 16,380,844 |
| EngenCap ABS Trust, Series 2016-1 A (h) | | 3.670 | | 12/21/26 | | 37,565,160 | | 36,858,935 |
| FPL Energy Caithness Funding Corp. (h) | | 7.645 | | 12/31/18 | | 964,237 | | 973,879 |
| FRS LLC, Series 2013-1A B (h) | | 3.960 | | 04/15/43 | | 1,594,874 | | 1,584,355 |
| Global Container Assets Ltd., Series 2015-1A A1 (h) | | 2.100 | | 02/05/30 | | 1,777,014 | | 1,767,231 |
| Global SC Finance II SRL (SEACO), Series 2014-1A A1 (h) | | 3.190 | | 07/17/29 | | 4,810,000 | | 4,740,129 |
| Harley Marine Financing LLC, Series 2018-1A A2 (h) | | 5.682 | | 05/15/43 | | 5,000,000 | | 5,107,500 |
| HP Communities LLC (h) | | 5.320 | | 03/15/23 | | 297,770 | | 311,000 |
| Icon Brand Holdings LLC, Series 2012-1A A (h) | | 4.229 | | 01/25/43 | | 8,717,099 | | 8,229,299 |
| Landmark Leasing LLC, Series 2004A (h) | | 6.200 | | 10/01/22 | | 265,311 | | 267,131 |
| Latam Airlines Group, Series 2015-1 B | | 4.500 | | 08/15/25 | | 4,592,571 | | 4,445,609 |
| Merlin Aviation Holdings D.A.C., Series 2016-1 A (h) | | 4.500 | | 12/15/32 | | 13,581,485 | | 13,816,243 |
| Merlin Aviation Holdings D.A.C., Series 2016-1 B (h) | | 6.500 | | 12/15/32 | | 1,577,789 | | 1,606,848 |
| METAL LLC, Series 2017-1 A (h) | | 4.581 | | 10/15/42 | | 14,214,871 | | 14,508,318 |
| METAL LLC, Series 2017-1 B (h) | | 6.500 | | 10/15/42 | | 17,057,846 | | 17,754,780 |
See Notes to Financial Statements.
20
| BOND FUND SCHEDULE OF INVESTMENTS (Unaudited) (Continued) |
| May 31, 2018 |
| Rate (%) | | Maturity Date | | Principal Amount | | Value |
| BONDS (continued) | | | | | | | |
| |
| Asset-Backed Securities (continued) | | | | | | | |
| Northwest Airlines, Series 1999-2 A | 7.575 | | 09/01/20 | | 133,577 | | $134,913 |
| Northwest Airlines, Series 2000-1 G (b) | 7.150 | | 04/01/21 | | 9,830 | | 10,051 |
| Northwest Airlines, Series 2002-1 G-2 | 6.264 | | 05/20/23 | | 1,110,613 | | 1,143,932 |
| Prudential Securities Structured Assets, Inc., Series 1998-1 A | | | | | | | |
| (1 month LIBOR + 0.420%, floor 0.000%) (c) (h) | 2.329 | | 03/02/25 | | 10,962,163 | | 10,167,406 |
| Spirit Master Funding, LLC, Series 2014-2A A (h) | 5.760 | | 03/20/41 | | 3,841,412 | | 3,952,313 |
| Spirit Master Funding, LLC, Series 2014-4A A1 (h) | 3.501 | | 01/20/45 | | 4,853,256 | | 4,862,029 |
| Textainer Marine Containers V Ltd., Series 2017-1A B (h) | 4.850 | | 05/20/42 | | 1,714,791 | | 1,713,047 |
| TGIF Funding LLC, Series 2017-1A A2 (h) | 6.202 | | 04/30/47 | | 29,400,000 | | 29,750,742 |
| United Air Lines, Series 2013-1 B | 5.375 | | 02/15/23 | | 1,697,931 | | 1,731,890 |
| US Airways, Series 1999-1 A | 8.360 | | 07/20/20 | | 3,551 | | 3,658 |
| US Airways, Series 2001-1 G | 7.076 | | 09/20/22 | | 456,392 | | 485,487 |
| US Airways, Series 2012-1 B | 8.000 | | 04/01/21 | | 16,980,763 | | 17,829,801 |
| Virgin Australia Trust, Series 2013-1 A (h) | 5.000 | | 04/23/25 | | 116,021 | | 118,504 |
| |
| Commercial Mortgage-Backed Securities - 4.0% | | | | | | | 118,000,527 |
| CG-CCRE Commercial Mortgage Trust, Series 2014-FL1 D | | | | | | | |
| (1 month LIBOR + 2.750%, floor 2.750%) (c) (h) | 4.669 | | 06/15/31 | | 12,000,000 | | 11,921,311 |
| COMM Mortgage Trust, Series 2012-CR3 E (c) (h) | 4.914 | | 10/15/45 | | 5,000,000 | | 4,241,533 |
| COMM Mortgage Trust, Series 2013-CR9 D (c) (h) | 4.404 | | 07/10/45 | | 4,898,000 | | 4,207,543 |
| COMM Mortgage Trust, Series 2014-CC17 D (c) (h) | 4.962 | | 05/10/47 | | 5,210,000 | | 4,625,120 |
| COMM Mortgage Trust, Series 2014-LC17 D (h) | 3.687 | | 10/10/47 | | 5,000,000 | | 3,785,359 |
| GS Mortgage Securities Trust, Series 2010-C1 E (h) | 4.000 | | 08/10/43 | | 17,741,000 | | 16,875,303 |
| J.P. Morgan Chase Commercial Mortgage Securities Trust, | | | | | | | |
| Series 2014-C20 D (c) (h) | 4.724 | | 07/15/47 | | 5,000,000 | | 4,315,273 |
| Morgan Stanley Bank of America Merrill Lynch Trust, | | | | | | | |
| Series 2014-C18 D (h) | 3.389 | | 10/15/47 | | 5,000,000 | | 3,760,753 |
| Morgan Stanley Bank of America Merrill Lynch Trust, | | | | | | | |
| Series 2015-C22 D (c) (h) | 4.382 | | 04/15/48 | | 5,000,000 | | 4,268,282 |
| SCG Trust, Series 2013-SRP1 C (1 month LIBOR + 3.250%, | | | | | | | |
| floor 3.250%) (c) (h) | 5.419 | | 11/15/26 | | 18,940,000 | | 18,776,442 |
| TRU Trust, Series 2016-1 A (1 month LIBOR + 2.250%, | | | | | | | |
| floor 1.750%) (c) (h) | 4.169 | | 11/15/30 | | 9,132,073 | | 9,058,021 |
| TRU Trust, Series 2016-1 B (1 month LIBOR + 3.150%, | | | | | | | |
| floor 2.750%) (c) (h) | 5.069 | | 11/15/30 | | 14,600,000 | | 13,702,189 |
| TRU Trust, Series 2016-1 C (1 month LIBOR + 4.000%, | | | | | | | |
| floor 4.000%) (c) (h) | 5.919 | | 11/15/30 | | 14,575,000 | | 12,641,530 |
| Wells Fargo Commercial Mortgage Trust, Series 2014-LC16 D (h) | 3.938 | | 08/15/50 | | 7,072,000 | | 5,821,868 |
| |
| Corporate Bonds - 74.8% | | | | | | | 2,226,591,488 |
| Actavis Funding SCS | 2.450 | | 06/15/19 | | 6,259,000 | | 6,220,394 |
| Activision Blizzard, Inc. (h) | 6.125 | | 09/15/23 | | 40,869,000 | | 42,538,416 |
| American Tower Corp. | 3.400 | | 02/15/19 | | 2,375,000 | | 2,385,558 |
| Ameriprise Financial, Inc. | 7.300 | | 06/28/19 | | 4,625,000 | | 4,837,166 |
| AmTrust Financial Services, Inc. | 6.125 | | 08/15/23 | | 19,790,000 | | 19,133,153 |
| Anadarko Petroleum Corp. | 8.700 | | 03/15/19 | | 1,495,000 | | 1,559,596 |
| Anadarko Petroleum Corp. | 6.950 | | 06/15/19 | | 2,990,000 | | 3,105,302 |
| Andeavor Logistics LP / Tesoro Logistics Finance Corp. | 6.250 | | 10/15/22 | | 32,365,000 | | 33,740,512 |
| Apache Corp. | 6.900 | | 09/15/18 | | 4,754,000 | | 4,811,125 |
See Notes to Financial Statements.
21
| BOND FUND SCHEDULE OF INVESTMENTS (Unaudited) (Continued) |
| May 31, 2018 |
| Rate (%) | | Maturity Date | | Principal Amount | | Value |
| BONDS (continued) | | | | | | | |
| |
| Corporate Bonds (continued) | | | | | | | |
| Arbor Realty Trust, Inc. (h) | 5.625 | | 05/01/23 | | 12,500,000 | | $12,537,122 |
| ARC Properties Operating Partnership, L.P. | 3.000 | | 02/06/19 | | 3,475,000 | | 3,476,142 |
| Arconic Inc. | 6.150 | | 08/15/20 | | 5,904,000 | | 6,170,270 |
| Arconic Inc. | 5.400 | | 04/15/21 | | 6,922,000 | | 7,103,010 |
| Assured Guaranty US Holdings Inc. (3 month LIBOR + 2.380%) (c) | 4.505 | | 12/15/66 | | 23,364,000 | | 21,962,160 |
| Australia & New Zealand Banking Group Ltd. | 2.250 | | 06/13/19 | | 2,500,000 | | 2,488,778 |
| Avon Products, Inc. (e) | 6.600 | | 03/15/20 | | 500,000 | | 500,000 |
| AXIS Specialty Finance PLC | 2.650 | | 04/01/19 | | 5,797,000 | | 5,787,666 |
| Bank of America Corp. (3 month LIBOR + 3.630%) (c) (g) | 5.989 | | 07/30/18 | | 1,693,000 | | 1,701,465 |
| Bank of America Corp. | 5.490 | | 03/15/19 | | 344,000 | | 350,993 |
| Bank of America Corp. (5.125% to 06/17/19, | | | | | | | |
| then 3 month LIBOR + 3.387%) (c) (g) | 5.125 | | 06/17/19 | | 6,753,000 | | 6,820,530 |
| Bank of America Corp. (5.200% to 06/01/23, | | | | | | | |
| then 3 month LIBOR + 3.135%) (c) (g) | 5.200 | | 06/01/23 | | 2,500,000 | | 2,456,475 |
| Bank of America Corp. (4.0 times (USISDA10 - USISDA02) - | | | | | | | |
| 0.250%, floor 0.000%, cap 10.000%) (c) | 0.272 | | 11/19/30 | | 671,000 | | 390,690 |
| Bank of the Ozarks, Inc. (5.500% to 07/01/21, | | | | | | | |
| then 3 month LIBOR + 4.425%) (c) | 5.500 | | 07/01/26 | | 7,840,000 | | 8,124,436 |
| Barclays Bank PLC (1.750% to 09/13/18, then 2.25%) (d) | 1.750 | | 09/13/19 | | 15,000,000 | | 14,886,907 |
| Barclays Bank PLC (CPI YOY + 1.000%, floor 0.000%) (c) | 3.212 | | 03/16/23 | | 4,435,000 | | 4,412,825 |
| Barclays Bank PLC (3 month LIBOR + 0.650%, | | | | | | | |
| floor 1.650%, cap 6.000%) (c) | 3.013 | | 02/05/25 | | 15,000,000 | | 14,511,082 |
| Barclays Bank PLC (5.0 times (USISDA30 - USISDA05), | | | | | | | |
| floor 0.000%, cap 10.000%) (c) | 0.630 | | 04/30/29 | | 2,425,000 | | 1,805,413 |
| Barclays Bank PLC (8.0 times (USISDA30 - USISDA05) | | | | | | | |
| - 0.250%, floor 0.000%, cap 8.000%) (c) | 0.000 | | 08/28/29 | | 2,721,000 | | 1,929,189 |
| Becton Dickinson and Co. | 2.133 | | 06/06/19 | | 4,510,000 | | 4,472,285 |
| Becton Dickinson and Co. | 2.675 | | 12/15/19 | | 9,660,000 | | 9,608,890 |
| Becton Dickinson and Co. (3 month LIBOR + 1.030%) (c) | 3.055 | | 06/06/22 | | 23,855,000 | | 23,919,356 |
| Best Buy Co., Inc. | 5.000 | | 08/01/18 | | 5,863,000 | | 5,881,432 |
| BGC Partners Inc. | 5.375 | | 12/09/19 | | 110,000 | | 112,687 |
| BHP Billiton Finance USA Ltd. (6.250% to 10/19/20, then USSW5 | | | | | | | |
| +4.971% to 10/19/25, +5.221% to 10/19/40, then +5.971%) (c) (h) | 6.250 | | 10/19/75 | | 7,951,000 | | 8,288,918 |
| Boardwalk Pipelines, LP | 5.750 | | 09/15/19 | | 1,495,000 | | 1,543,440 |
| Braskem Finance Ltd. (h) | 5.750 | | 04/15/21 | | 10,000,000 | | 10,385,000 |
| Broadcom Corp. | 2.700 | | 11/01/18 | | 930,000 | | 930,777 |
| Brunswick Corp. (h) | 4.625 | | 05/15/21 | | 10,828,000 | | 10,843,181 |
| Buckeye Partners, L.P. | 2.650 | | 11/15/18 | | 17,803,000 | | 17,781,003 |
| Buckeye Partners, L.P. | 5.500 | | 08/15/19 | | 1,000,000 | | 1,027,505 |
| Bunge Ltd. Finance Corp. | 8.500 | | 06/15/19 | | 1,833,000 | | 1,931,456 |
| CA, Inc. | 2.875 | | 08/15/18 | | 10,256,000 | | 10,259,204 |
| Cabot Corp. | 7.420 | | 12/11/18 | | 1,000,000 | | 1,020,273 |
| Cadence BanCorp (h) | 4.875 | | 06/28/19 | | 3,500,000 | | 3,522,449 |
| Cameron Int’l. Corp. | 6.375 | | 07/15/18 | | 1,786,000 | | 1,793,358 |
| Campbell Soup Co. | 4.500 | | 02/15/19 | | 14,325,000 | | 14,486,416 |
| Campbell Soup Co. | 8.875 | | 05/01/21 | | 3,750,000 | | 4,255,094 |
| Capital One Bank USA N.A. | 2.150 | | 11/21/18 | | 26,105,000 | | 26,055,341 |
| Capital One Bank USA N.A. | 2.250 | | 02/13/19 | | 1,250,000 | | 1,246,181 |
| Capital One Bank USA N.A. | 8.800 | | 07/15/19 | | 8,907,000 | | 9,437,870 |
See Notes to Financial Statements.
22
| BOND FUND SCHEDULE OF INVESTMENTS (Unaudited) (Continued) |
| May 31, 2018 |
| | Rate (%) | | Maturity Date | | Principal Amount | | Value |
| BONDS (continued) | | | | | | | | |
| | | | | | | | | |
| Corporate Bonds (continued) | | | | | | | | |
| Capital One N.A. (3 month LIBOR + 1.150%) (c) | | 3.471 | | 08/17/18 | | 4,775,000 | | $4,781,505 |
| Catholic Health Initiatives | | 2.600 | | 08/01/18 | | 15,076,000 | | 15,080,751 |
| CBL & Associates LP | | 5.250 | | 12/01/23 | | 7,075,000 | | 6,039,549 |
| CBL & Associates LP | | 4.600 | | 10/15/24 | | 5,889,000 | | 4,775,820 |
| Citigroup, Inc. | | 2.150 | | 07/30/18 | | 230,000 | | 229,922 |
| Citigroup, Inc. | | 2.500 | | 09/26/18 | | 16,951,000 | | 16,950,667 |
| Citizens Bank, N.A. (3 month LIBOR + 0.950%) (c) | | 3.252 | | 03/29/23 | | 10,000,000 | | 10,011,156 |
| Cleveland Electric Illuminating Co. | | 8.875 | | 11/15/18 | | 995,000 | | 1,021,267 |
| Coca-Cola Femsa S.A.B. de C.V. | | 2.375 | | 11/26/18 | | 488,000 | | 487,604 |
| Continental Resources, Inc. | | 5.000 | | 09/15/22 | | 12,387,000 | | 12,574,886 |
| County Bancorp, Inc. (5.875% to 06/01/23, | | | | | | | | |
| then 3 month LIBOR + 2.884%) (c) (h) | | 5.875 | | 06/01/28 | | 7,500,000 | | 7,500,000 |
| CVS Health Corp. | | 2.250 | | 12/05/18 | | 25,196,000 | | 25,150,138 |
| D.R. Horton, Inc. | | 3.750 | | 03/01/19 | | 28,686,000 | | 28,799,025 |
| Delphi Financial Group, Inc. | | 7.875 | | 01/31/20 | | 1,428,000 | | 1,531,827 |
| Depository Trust & Clearing Corp. (4.875% to 06/15/20, | | | | | | | | |
| then 3 month LIBOR + 3.167%) (c) (g) (h) | | 4.875 | | 06/15/20 | | 750,000 | | 753,750 |
| Deutsche Bank AG (3 month LIBOR + 1.450%) (c) | | 3.805 | | 01/18/19 | | 184,000 | | 184,867 |
| Deutsche Bank AG | | 2.500 | | 02/13/19 | | 12,902,000 | | 12,826,853 |
| Deutsche Bank AG | | 2.850 | | 05/10/19 | | 20,586,000 | | 20,397,760 |
| Devon Energy Corp. | | 2.250 | | 12/15/18 | | 80,000 | | 79,589 |
| Devon Energy Corp. | | 6.300 | | 01/15/19 | | 127,000 | | 129,250 |
| Diamond 1 Finance Corp. / Diamond 2 Finance Corp. (h) | | 3.480 | | 06/01/19 | | 2,500,000 | | 2,509,989 |
| Discover Bank | | 2.600 | | 11/13/18 | | 25,819,000 | | 25,812,093 |
| Discover Financial Services | | 10.250 | | 07/15/19 | | 11,309,000 | | 12,118,093 |
| Dominion Resources, Inc. | | 1.875 | | 01/15/19 | | 1,250,000 | | 1,243,026 |
| DPL Inc. | | 6.750 | | 10/01/19 | | 1,106,000 | | 1,146,093 |
| Dr Pepper Snapple Group, Inc. | | 2.600 | | 01/15/19 | | 5,000,000 | | 4,994,155 |
| Drawbridge Special Opportunities Fund L.P. (h) | | 5.000 | | 08/01/21 | | 15,000,000 | | 15,026,096 |
| Eagle Bancorp, Inc. (5.000% to 08/01/21, | | | | | | | | |
| then 3 month LIBOR + 3.850%) (c) | | 5.000 | | 08/01/26 | | 5,624,000 | | 5,692,697 |
| Eaton Corp. | | 6.950 | | 03/20/19 | | 340,000 | | 351,179 |
| Edwards Lifesciences Corp. | | 2.875 | | 10/15/18 | | 19,153,000 | | 19,162,595 |
| El Paso Corp. | | 7.250 | | 06/01/18 | | 4,519,000 | | 4,519,000 |
| Enable Midstream Partners, LP (b) | | 2.400 | | 05/15/19 | | 11,864,000 | | 11,788,019 |
| Enbridge Energy Partners, L.P. | | 9.875 | | 03/01/19 | | 3,010,000 | | 3,163,121 |
| Energy Transfer Partners, L.P. | | 2.500 | | 06/15/18 | | 6,696,000 | | 6,696,150 |
| Energy Transfer Partners, L.P. | | 6.700 | | 07/01/18 | | 2,315,000 | | 2,321,596 |
| Energy Transfer Partners, L.P. | | 9.700 | | 03/15/19 | | 10,549,000 | | 11,103,141 |
| Energy Transfer Partners, L.P. | | 9.000 | | 04/15/19 | | 2,817,000 | | 2,957,095 |
| EnLink Midstream Partners, LP | | 2.700 | | 04/01/19 | | 14,188,000 | | 14,137,005 |
| Ensco PLC | | 8.000 | | 01/31/24 | | 12,306,000 | | 12,275,235 |
| Enterprise Products Operating LLC (3 month LIBOR + 2.7775%) (c) | | 4.784 | | 06/01/67 | | 8,538,000 | | 8,452,620 |
| Enterprise Products Operating LLC (5.250% to 08/16/27, | | | | | | | | |
| then 3 month LIBOR + 3.033%) (c) | | 5.250 | | 08/16/77 | | 6,666,000 | | 6,282,705 |
| Everest Reinsurance Holdings Inc. (3 month LIBOR + 2.385%) (c) | | 4.728 | | 05/01/67 | | 13,386,000 | | 13,252,140 |
| Exxon Mobil Corp. (3 month LIBOR + 0.780%) (c) | | 2.786 | | 03/01/19 | | 400,000 | | 402,310 |
| FedEx Corp. | | 8.000 | | 01/15/19 | | 940,000 | | 970,599 |
See Notes to Financial Statements.
23
| BOND FUND SCHEDULE OF INVESTMENTS (Unaudited) (Continued) |
| May 31, 2018 |
| | Rate (%) | | Maturity Date | | Principal Amount | | Value |
| BONDS (continued) | | | | | | | | |
| | | | | | | | | |
| Corporate Bonds (continued) | | | | | | | | |
| Fifth Third Bancorp (4.900% to 09/30/19, | | | | | | | | |
| then 3 month LIBOR + 3.129%) (c) (g) | | 4.900 | | 09/30/19 | | 40,162,000 | | $40,061,595 |
| Flagstar Bancorp, Inc. | | 6.125 | | 07/15/21 | | 28,956,000 | | 30,578,802 |
| Flex Ltd. | | 4.625 | | 02/15/20 | | 1,750,000 | | 1,786,069 |
| Flushing Financial Corp. (5.250% to 12/15/21, | | | | | | | | |
| then 3 month LIBOR + 3.440%) (c) | | 5.250 | | 12/15/26 | | 730,000 | | 749,687 |
| FMG Resources August 2006 Pty. Ltd. (h) | | 9.750 | | 03/01/22 | | 2,452,762 | | 2,703,128 |
| Ford Motor Credit Co. LLC | | 2.240 | | 06/15/18 | | 17,639,000 | | 17,637,781 |
| Ford Motor Credit Co. LLC | | 2.551 | | 10/05/18 | | 5,280,000 | | 5,280,318 |
| Ford Motor Credit Co. LLC | | 2.375 | | 03/12/19 | | 1,155,000 | | 1,151,551 |
| Ford Motor Credit Co. LLC | | 2.262 | | 03/28/19 | | 5,562,000 | | 5,535,934 |
| Ford Motor Credit Co. LLC | | 2.021 | | 05/03/19 | | 500,000 | | 495,907 |
| GATX Corp. | | 2.375 | | 07/30/18 | | 1,755,000 | | 1,755,018 |
| GATX Corp. | | 2.500 | | 03/15/19 | | 11,908,000 | | 11,895,760 |
| General Electric Capital Corp. | | 6.000 | | 06/15/18 | | 220,000 | | 220,088 |
| General Electric Capital Corp. | | 5.100 | | 02/15/19 | | 522,000 | | 528,269 |
| General Electric Capital Corp. (3 month LIBOR + 1.000%) (c) | | 3.348 | | 04/15/23 | | 5,000,000 | | 5,052,331 |
| General Electric Capital Corp. (3 month LIBOR + 0.380%) (c) | | 2.743 | | 05/05/26 | | 5,148,000 | | 5,000,602 |
| General Electric Co. (5.000% to 01/21/21, | | | | | | | | |
| then 3 month LIBOR + 3.330%) (c) (g) | | 5.000 | | 01/21/21 | | 46,706,000 | | 46,145,528 |
| General Mills, Inc. | | 5.650 | | 02/15/19 | | 1,440,000 | | 1,469,798 |
| General Motors Co. | | 3.500 | | 10/02/18 | | 347,000 | | 347,985 |
| General Motors Financial Co., Inc. | | 6.750 | | 06/01/18 | | 20,651,000 | | 20,651,000 |
| General Motors Financial Co., Inc. | | 2.400 | | 05/09/19 | | 750,000 | | 746,639 |
| Genworth Financial Inc. | | 7.700 | | 06/15/20 | | 2,918,000 | | 2,932,590 |
| GFI Group Inc. (e) | | 8.375 | | 07/19/18 | | 66,639,000 | | 66,652,328 |
| GLP Capital L.P. / GLP Financing II, Inc. | | 4.375 | | 11/01/18 | | 3,280,000 | | 3,288,200 |
| Goldman Sachs Group, Inc. | | 2.900 | | 07/19/18 | | 4,916,000 | | 4,920,129 |
| Goldman Sachs Group, Inc. | | 2.625 | | 01/31/19 | | 25,000,000 | | 25,008,525 |
| Goldman Sachs Group, Inc. (3 month LIBOR + 1.600%) (c) | | 3.919 | | 11/29/23 | | 11,601,000 | | 12,038,710 |
| Hainan Airlines Hong Kong Co., Ltd. (h) | | 3.625 | | 02/07/20 | | 10,000,000 | | 9,947,180 |
| Hartford Financial Services Group, Inc. (8.125% to 06/15/18, | | | | | | | | |
| then 3 month LIBOR + 4.6025%) (c) | | 8.125 | | 06/15/68 | | 18,481,000 | | 18,504,101 |
| HCA Inc. | | 3.750 | | 03/15/19 | | 24,073,000 | | 24,193,365 |
| HCA Inc. | | 6.500 | | 02/15/20 | | 3,027,000 | | 3,163,215 |
| HCP, Inc. | | 3.750 | | 02/01/19 | | 16,491,000 | | 16,548,905 |
| Health Care REIT, Inc. | | 4.125 | | 04/01/19 | | 5,750,000 | | 5,793,486 |
| Hewlett Packard Enterprise Co. (b) | | 2.850 | | 10/05/18 | | 21,805,000 | | 21,825,204 |
| Hughes Satellite Systems Corp. | | 6.500 | | 06/15/19 | | 3,611,000 | | 3,723,844 |
| Huntington National Bank | | 6.600 | | 06/15/18 | | 1,206,000 | | 1,207,470 |
| Huntington National Bank | | 2.000 | | 06/30/18 | | 250,000 | | 249,938 |
| Huntington National Bank | | 2.200 | | 11/06/18 | | 1,000,000 | | 998,871 |
| ING Bank N.V. (4.125% to 11/21/18, | | | | | | | | |
| then USISDA05 + 2.700%) (c) (h) | | 4.125 | | 11/21/23 | | 600,000 | | 602,040 |
| International Lease Finance Corp. | | 6.250 | | 05/15/19 | | 1,545,000 | | 1,592,237 |
| Interstate Power & Light Co. | | 5.875 | | 09/15/18 | | 5,450,000 | | 5,502,578 |
| Interstate Power & Light Co. | | 7.250 | | 10/01/18 | | 2,103,000 | | 2,134,900 |
| INVISTA Finance LLC (h) | | 4.250 | | 10/15/19 | | 32,165,000 | | 32,253,230 |
| IPALCO Enterprises, Inc. | | 3.450 | | 07/15/20 | | 865,000 | | 856,350 |
See Notes to Financial Statements.
24
| BOND FUND SCHEDULE OF INVESTMENTS (Unaudited) (Continued) |
| May 31, 2018 |
| | Rate (%) | | Maturity Date | | Principal Amount | | Value |
| BONDS (continued) | | | | | | | | |
| | | | | | | | | |
| Corporate Bonds (continued) | | | | | | | | |
| Jersey Central Power & Light Co. | | 7.350 | | 02/01/19 | | 500,000 | | $513,500 |
| JPMorgan Chase & Co. (3 month LIBOR + 3.470%) (c) (g) | | 5.829 | | 07/30/18 | | 21,491,000 | | 21,625,319 |
| JPMorgan Chase & Co. (5.000% to 07/01/19, | | | | | | | | |
| then 3 month LIBOR + 3.320%) (c) (g) | | 5.000 | | 07/01/19 | | 15,000,000 | | 15,131,250 |
| Kinder Morgan Energy Partners, L.P. | | 2.650 | | 02/01/19 | | 2,231,000 | | 2,224,432 |
| Kinder Morgan Energy Partners, L.P. | | 9.000 | | 02/01/19 | | 6,109,000 | | 6,348,523 |
| Kraft Heinz Foods Co. (h) | | 6.125 | | 08/23/18 | | 50,000 | | 50,411 |
| Leggett & Platt, Inc. | | 4.400 | | 07/01/18 | | 4,749,000 | | 4,755,721 |
| Lincoln National Corp. (3 month LIBOR + 2.3575%) (c) | | 4.678 | | 05/17/66 | | 25,985,000 | | 24,945,600 |
| Lincoln National Corp. (3 month LIBOR + 2.040%) (c) | | 4.399 | | 04/20/67 | | 19,155,000 | | 18,120,630 |
| Lockheed Martin Corp. | | 1.850 | | 11/23/18 | | 482,000 | | 480,178 |
| Manufacturers & Traders Trust Co. (1 month LIBOR + 1.215%) (c) | | 3.183 | | 12/28/20 | | 14,173,000 | | 14,180,441 |
| Manufacturers & Traders Trust Co. (3 month LIBOR + 0.640%) (c) | | 2.646 | | 12/01/21 | | 1,007,000 | | 1,002,669 |
| MarkWest Energy Partners, L.P. / MarkWest Energy Finance Corp. | | 5.500 | | 02/15/23 | | 1,403,000 | | 1,438,777 |
| Marriott Int’l., Inc. | | 3.000 | | 03/01/19 | | 7,820,000 | | 7,834,531 |
| Marsh & McLennan Cos., Inc. | | 2.550 | | 10/15/18 | | 300,000 | | 299,940 |
| Maxim Integrated Products, Inc. | | 2.500 | | 11/15/18 | | 6,625,000 | | 6,617,822 |
| MBIA Inc. | | 6.400 | | 08/15/22 | | 75,074,000 | | 71,226,457 |
| McKesson Corp. | | 2.284 | | 03/15/19 | | 14,196,000 | | 14,153,716 |
| Medtronic Global Holdings S.C.A. | | 1.700 | | 03/28/19 | | 100,000 | | 99,379 |
| Merrill Lynch & Co. (f) | | 0.000 | | 09/25/18 | | 149,000 | | 147,819 |
| Merrill Lynch & Co. (3 month LIBOR + 0.760%) (c) | | 2.885 | | 09/15/26 | | 3,870,000 | | 3,703,895 |
| Meta Financial Group, Inc. (5.750% to 08/15/21, | | | | | | | | |
| then 3 month LIBOR + 4.630%) (c) | | 5.750 | | 08/15/26 | | 2,525,000 | | 2,581,745 |
| MetLife, Inc. (5.250% to 06/15/20, | | | | | | | | |
| then 3 month LIBOR + 3.575%) (c) (g) | | 5.250 | | 06/15/20 | | 4,440,000 | | 4,517,700 |
| Metropolitan Edison Co. | | 7.700 | | 01/15/19 | | 1,511,000 | | 1,556,966 |
| Midcontinent Express Pipeline LLC (h) | | 6.700 | | 09/15/19 | | 22,665,000 | | 23,288,287 |
| Mission Health System, Inc. | | 1.727 | | 10/01/18 | | 1,015,000 | | 1,010,711 |
| Molson Coors Brewing Co. | | 1.900 | | 03/15/19 | | 1,882,000 | | 1,867,853 |
| Morgan Stanley (CPI YOY + 3.050%) (c) | | 5.262 | | 07/28/18 | | 573,000 | | 573,000 |
| Morgan Stanley | | 2.450 | | 02/01/19 | | 10,000,000 | | 9,981,254 |
| Morgan Stanley (CPI YOY + 2.000%, floor 0.000%, cap 8.000%) (c) | | 4.212 | | 04/01/21 | | 130,000 | | 131,950 |
| Morgan Stanley (CPI YOY + 2.000%, floor 0.000%, cap 8.000%) (c) | | 4.212 | | 06/09/23 | | 100,000 | | 101,731 |
| MPT Operating Partnership, L.P. / MPT Finance Corp. | | 6.375 | | 03/01/24 | | 24,320,000 | | 25,536,000 |
| Mylan Inc. | | 2.550 | | 03/28/19 | | 172,000 | | 171,637 |
| National Bank of Canada | | 2.100 | | 12/14/18 | | 19,613,000 | | 19,584,219 |
| National Fuel Gas Co. | | 8.750 | | 05/01/19 | | 3,890,000 | | 4,090,165 |
| National Rural Utilities Cooperative Finance Corp. | | 6.550 | | 11/01/18 | | 1,760,000 | | 1,788,192 |
| National Rural Utilities Cooperative Finance Corp. | | 10.375 | | 11/01/18 | | 1,100,000 | | 1,134,435 |
| Newell Brands, Inc. | | 2.150 | | 10/15/18 | | 3,455,000 | | 3,445,331 |
| Newell Brands, Inc. | | 2.600 | | 03/29/19 | | 4,843,000 | | 4,828,352 |
| NexBank Capital, Inc. (5.500% to 03/15/21, | | | | | | | | |
| then 3 month LIBOR + 4.355%) (c) (h) | | 5.500 | | 03/16/26 | | 4,500,000 | | 4,567,500 |
| Noble Holding Int’l. Ltd. | | 4.625 | | 03/01/21 | | 6,657,000 | | 6,457,290 |
| Northern Trust Co. | | 6.500 | | 08/15/18 | | 1,250,000 | | 1,260,315 |
| Nutrien Ltd. | | 6.750 | | 01/15/19 | | 3,974,000 | | 4,073,702 |
See Notes to Financial Statements.
25
| BOND FUND SCHEDULE OF INVESTMENTS (Unaudited) (Continued) |
| May 31, 2018 |
| | Rate (%) | | Maturity Date | | Principal Amount | | Value |
| BONDS (continued) | | | | | | | | |
| | | | | | | | | |
| Corporate Bonds (continued) | | | | | | | | |
| NXP B.V. / NXP Funding LLC (h) | | 4.125 | | 06/01/21 | | 1,879,000 | | $1,893,280 |
| ONEOK Partners, L.P. | | 8.625 | | 03/01/19 | | 10,106,000 | | 10,526,862 |
| Oshkosh Corp. | | 5.375 | | 03/01/22 | | 7,746,000 | | 7,954,212 |
| Pacific Continental Corp. (5.875% to 06/30/21, | | | | | | | | |
| then 3 month LIBOR + 4.715%) (c) | | 5.875 | | 06/30/26 | | 500,000 | | 511,181 |
| Panhandle Eastern Pipe Line Co., LP | | 7.000 | | 06/15/18 | | 2,010,000 | | 2,012,547 |
| Pentair Finance S.A. | | 2.900 | | 09/15/18 | | 148,000 | | 148,246 |
| Pershing Road Development Co., LLC | | | | | | | | |
| (3 month LIBOR + 0.400%) (c) (h) | | 2.406 | | 09/15/22 | | 2,738,000 | | 2,655,860 |
| Pershing Road Development Co., LLC | | | | | | | | |
| (3 month LIBOR + 0.400%) (c) (h) | | 2.406 | | 09/15/22 | | 1,000,000 | | 970,000 |
| Pershing Road Development Co., LLC | | | | | | | | |
| (3 month LIBOR + 0.400%) (c) (h) | | 2.406 | | 09/15/23 | | 3,791,000 | | 3,648,838 |
| Pershing Road Development Co., LLC | | | | | | | | |
| (3 month LIBOR + 0.400%) (c) (h) | | 2.406 | | 09/15/23 | | 1,705,000 | | 1,641,063 |
| Pershing Road Development Co., LLC | | | | | | | | |
| (3 month LIBOR + 0.400%) (c) (h) | | 2.406 | | 09/15/24 | | 3,334,000 | | 3,183,970 |
| Pershing Road Development Co., LLC | | | | | | | | |
| (3 month LIBOR + 0.400%) (c) (h) | | 2.406 | | 09/15/24 | | 1,815,000 | | 1,733,325 |
| Pershing Road Development Co., LLC | | | | | | | | |
| (3 month LIBOR + 0.400%) (c) (h) | | 2.406 | | 09/15/25 | | 1,530,000 | | 1,453,500 |
| Petrofac Ltd. (h) | | 3.400 | | 10/10/18 | | 1,090,000 | | 1,082,861 |
| Phillips 66 (3 month LIBOR + 0.750%) (c) (h) | | 3.098 | | 04/15/20 | | 18,241,000 | | 18,252,309 |
| PNC Bank, N.A. | | 1.850 | | 07/20/18 | | 1,107,000 | | 1,106,411 |
| PPL Capital Funding, Inc. | | 1.900 | | 06/01/18 | | 330,000 | | 330,000 |
| Principal Financial Group, Inc. (4.700% to 05/15/20, | | | | | | | | |
| then 3 month LIBOR + 3.044%) (c) | | 4.700 | | 05/15/55 | | 32,000,000 | | 32,000,000 |
| Progress Energy, Inc. | | 7.050 | | 03/15/19 | | 2,185,000 | | 2,256,307 |
| Provident Cos., Inc. | | 7.000 | | 07/15/18 | | 1,468,000 | | 1,475,506 |
| PSEG Power LLC | | 2.450 | | 11/15/18 | | 2,251,000 | | 2,251,408 |
| QVC Inc. | | 3.125 | | 04/01/19 | | 7,140,000 | | 7,137,706 |
| ReadyCap Holdings, LLC (h) | | 7.500 | | 02/15/22 | | 25,500,000 | | 26,022,750 |
| Reed Elsevier Capital Inc. | | 8.625 | | 01/15/19 | | 7,648,000 | | 7,906,112 |
| Regions Bank | | 2.250 | | 09/14/18 | | 21,697,000 | | 21,674,064 |
| Reinsurance Group of America, Inc. (3 month LIBOR + 2.665%) (c) | | 4.790 | | 12/15/65 | | 33,029,000 | | 32,533,565 |
| Renasant Corp. (5.000% to 09/01/21, | | | | | | | | |
| then 3 month LIBOR + 3.840%) (c) | | 5.000 | | 09/01/26 | | 3,450,000 | | 3,498,333 |
| Roper Industries, Inc. | | 2.050 | | 10/01/18 | | 3,858,000 | | 3,853,495 |
| Royal Bank of Canada (6.100% where USISDA10 | | | | | | | | |
| is greater than or equal to 1.784%) (c) | | 6.100 | | 08/15/19 | | 2,000,000 | | 2,022,000 |
| Ryder System, Inc. | | 2.350 | | 02/26/19 | | 775,000 | | 772,806 |
| S&P Global Inc. | | 2.500 | | 08/15/18 | | 1,110,000 | | 1,110,114 |
| Select Income REIT | | 3.600 | | 02/01/20 | | 15,873,000 | | 15,819,159 |
| Select Income REIT | | 4.150 | | 02/01/22 | | 9,473,000 | | 9,481,418 |
| Select Income REIT | | 4.250 | | 05/15/24 | | 2,320,000 | | 2,245,941 |
| Seminole Indian Tribe of Florida (h) | | 7.804 | | 10/01/20 | | 290,000 | | 290,000 |
| Seminole Indian Tribe of Florida (h) | | 8.030 | | 10/01/20 | | 18,600,000 | | 18,600,000 |
| Senior Housing Properties Trust | | 3.250 | | 05/01/19 | | 23,183,000 | | 23,201,059 |
See Notes to Financial Statements.
26
| BOND FUND SCHEDULE OF INVESTMENTS (Unaudited) (Continued) |
| May 31, 2018 |
| | Rate (%) | | Maturity Date | | Principal Amount | | Value |
| BONDS (continued) | | | | | | | | |
| | | | | | | | | |
| Corporate Bonds (continued) | | | | | | | | |
| Senior Housing Properties Trust | | 6.750 | | 04/15/20 | | 4,824,000 | | $5,024,157 |
| SESI LLC | | 7.125 | | 12/15/21 | | 38,264,000 | | 38,981,450 |
| Shire Acquisitions Investments Ireland DAC | | 1.900 | | 09/23/19 | | 9,709,000 | | 9,573,234 |
| SLM Corp. | | 5.190 | | 04/24/19 | | 529,000 | | 527,678 |
| SLM Corp. (b) | | 6.250 | | 09/15/20 | | 172,000 | | 172,056 |
| SLM Corp. (b) | | 6.750 | | 12/15/20 | | 306,000 | | 305,946 |
| SLM Corp. (b) | | 6.750 | | 12/15/20 | | 95,000 | | 95,053 |
| SLM Corp. (b) | | 8.000 | | 12/15/20 | | 71,000 | | 71,078 |
| SLM Corp. | | 6.000 | | 06/15/21 | | 261,000 | | 259,901 |
| SLM Corp. | | 6.150 | | 06/15/21 | | 146,000 | | 146,013 |
| SLM Corp. | | 7.250 | | 01/25/22 | | 602,000 | | 636,615 |
| Southern Co. | | 1.550 | | 07/01/18 | | 257,000 | | 256,843 |
| Southern Co. | | 2.450 | | 09/01/18 | | 517,000 | | 516,667 |
| Spectra Energy Partners, L.P. | | 2.950 | | 09/25/18 | | 1,128,000 | | 1,128,499 |
| Spirit AeroSystems, Inc. | | 5.250 | | 03/15/22 | | 600,000 | | 616,297 |
| Sprint Spectrum Co. LLC (b) (h) | | 3.360 | | 03/20/23 | | 20,659,625 | | 20,504,678 |
| Standard Chartered PLC (h) | | 2.400 | | 09/08/19 | | 10,500,000 | | 10,401,058 |
| Stanley Black & Decker Inc. | | 2.451 | | 11/17/18 | | 2,044,000 | | 2,042,165 |
| Stanley Black & Decker Inc. (5.750% to 12/15/18, | | | | | | | | |
| then 3 month LIBOR + 4.304%) (c) | | 5.750 | | 12/15/53 | | 37,492,000 | | 37,866,920 |
| State Street Bank & Trust Co. | | 5.250 | | 10/15/18 | | 729,000 | | 736,222 |
| Sumitomo Mitsui Banking Corp. | | 2.500 | | 07/19/18 | | 525,000 | | 525,086 |
| Sumitomo Mitsui Banking Corp. | | 1.762 | | 10/19/18 | | 250,000 | | 249,369 |
| Sumitomo Mitsui Banking Corp. (3 month LIBOR + 0.670%) (c) | | 3.025 | | 10/19/18 | | 951,000 | | 953,270 |
| Sumitomo Mitsui Banking Corp. (3 month LIBOR + 0.940%) (c) | | 3.295 | | 01/18/19 | | 600,000 | | 603,260 |
| Synchrony Financial | | 2.600 | | 01/15/19 | | 25,475,000 | | 25,433,830 |
| TECO Finance, Inc. | | 5.150 | | 03/15/20 | | 800,000 | | 826,623 |
| Torchmark Corp. | | 9.250 | | 06/15/19 | | 3,835,000 | | 4,074,326 |
| Total System Services, Inc. | | 2.375 | | 06/01/18 | | 26,423,000 | | 26,423,000 |
| Toyota Motor Credit Corp. (3 month LIBOR + 0.260%, | | | | | | | | |
| floor 0.000%) (c) | | 2.591 | | 01/09/19 | | 340,000 | | 340,635 |
| TransCanada PipeLines Ltd. (3 month LIBOR + 2.210%) (c) | | 4.553 | | 05/15/67 | | 19,398,000 | | 18,355,357 |
| Twenty-First Century Fox America, Inc. | | 6.900 | | 03/01/19 | | 5,728,000 | | 5,905,674 |
| Tyco Electronics Group S.A. | | 2.375 | | 12/17/18 | | 3,573,000 | | 3,569,266 |
| Union Bank, N.A. | | 2.625 | | 09/26/18 | | 612,000 | | 612,001 |
| Union Bank, N.A. | | 2.250 | | 05/06/19 | | 6,940,000 | | 6,913,473 |
| United Utilities PLC | | 4.550 | | 06/19/18 | | 5,585,000 | | 5,589,070 |
| Walgreen Co. | | 5.250 | | 01/15/19 | | 2,510,000 | | 2,547,494 |
| WellPoint, Inc. | | 2.300 | | 07/15/18 | | 795,000 | | 794,778 |
| Wells Fargo & Co. | | 2.150 | | 01/15/19 | | 10,115,000 | | 10,087,327 |
| Western Gas Partners LP | | 2.600 | | 08/15/18 | | 3,435,000 | | 3,433,081 |
| Western Union Co. | | 3.650 | | 08/22/18 | | 25,000 | | 25,070 |
| Western Union Co. (3 month LIBOR + 0.800%) (c) | | 3.129 | | 05/22/19 | | 43,980,000 | | 44,147,391 |
| Westvaco Corp. | | 7.500 | | 06/15/27 | | 142,000 | | 141,989 |
| Worthington Industries, Inc. | | 6.500 | | 04/15/20 | | 500,000 | | 529,117 |
| WT Holdings, Inc. (h) | | 7.000 | | 04/30/23 | | 17,000,000 | | 17,000,000 |
| XL Group PLC (3 month LIBOR + 2.4575%) (c) (g) | | 4.805 | | 07/03/18 | | 85,311,000 | | 82,980,303 |
See Notes to Financial Statements.
27
| BOND FUND SCHEDULE OF INVESTMENTS (Unaudited) (Continued) |
| May 31, 2018 |
| | Rate (%) | | Maturity Date | | Principal Amount | | Value |
| BONDS (continued) | | | | | | | | |
| | | | | | | | | |
| Federal Agency Mortgage-Backed Securities - 0.2% | | | | | | | | $6,084,094 |
| Fannie Mae REMIC, Series 2013-29 Class AI IO | | 2.500 | | 04/25/28 | | 7,119,285 | | 515,420 |
| Freddie Mac, Series C9-0241 | | 6.500 | | 12/01/18 | | 1,525 | | 1,533 |
| Freddie Mac REMIC, Series 4136 Class IH IO | | 3.500 | | 09/15/27 | | 10,389,329 | | 975,929 |
| Freddie Mac REMIC, Series 4238 Class NS IO (-1.0 times | | | | | | | | |
| 1 month LIBOR + 6.700%, floor 0.000%, cap 6.700%) (c) | | 4.781 | | 02/15/42 | | 4,218,138 | | 577,793 |
| Freddie Mac Structured Agency Credit Risk Debt Notes, Series | | | | | | | | |
| 2014-HQ1 M2 (1 month LIBOR + 2.500%, floor 0.000%) (c) | | 4.460 | | 08/25/24 | | 3,966,064 | | 3,988,015 |
| Ginnie Mae, Series 78-2071X | | 7.000 | | 05/15/33 | | 22,288 | | 25,404 |
| | | | | | | | | |
| Residential Mortgage-Backed Securities - 0.1% | | | | | | | | 2,698,452 |
| Hawaii Housing Finance & Development Corp. | | 2.600 | | 07/01/37 | | 378,114 | | 359,484 |
| Minnesota Housing Finance Agency | | 2.700 | | 09/01/41 | | 2,464,302 | | 2,338,968 |
| | | | | | | | | |
| Sovereign Bonds - 1.9% | | | | | | | | 55,620,851 |
| Bayerische Landesbank (3 month LIBOR + 1.160% where | | | | | | | | |
| (USISDA30 - USISDA02) is greater than -0.250%) (c) | | 3.468 | | 10/02/21 | | 6,000,000 | | 6,125,321 |
| Export-Import Bank of Korea | | 2.875 | | 09/17/18 | | 32,185,000 | | 32,188,476 |
| Korea Development Bank | | 2.875 | | 08/22/18 | | 4,967,000 | | 4,968,838 |
| Korea Hydro & Nuclear Power Co., Ltd. (h) | | 2.875 | | 10/02/18 | | 5,000,000 | | 4,995,145 |
| Korea Western Power Co., Ltd. (h) | | 2.875 | | 10/10/18 | | 5,000,000 | | 4,994,232 |
| Petroleos Mexicanos | | 3.500 | | 07/18/18 | | 290,000 | | 290,145 |
| Petroleos Mexicanos | | 8.000 | | 05/03/19 | | 1,991,000 | | 2,058,694 |
| | | | | | | | | |
| Taxable Municipal Bonds - 4.3% | | | | | | | | 127,513,240 |
| Casino Reinvestment Development Authority NJ | | 5.340 | | 06/01/20 | | 5,645,000 | | 5,682,088 |
| City of Berwyn IL General Obligation | | 3.550 | | 12/01/18 | | 480,000 | | 480,043 |
| City of Long Beach CA Pension Obligation | | 5.180 | | 09/01/21 | | 4,130,000 | | 4,277,069 |
| City of Miami FL | | 6.750 | | 12/01/18 | | 530,000 | | 534,855 |
| City of Newark NJ | | 3.057 | | 04/01/20 | | 700,000 | | 690,550 |
| City of Portland OR South Park Blocks Urban Renewal & | | | | | | | | |
| Redevelopment | | 6.031 | | 06/15/18 | | 29,132 | | 29,163 |
| County of Cuyahoga OH | | 5.000 | | 12/01/19 | | 95,000 | | 95,433 |
| County of Ohio WV Special District Excise Tax Revenue | | 4.000 | | 03/01/19 | | 250,000 | | 251,885 |
| County of Ohio WV Special District Excise Tax Revenue | | 3.500 | | 03/01/20 | | 495,000 | | 495,738 |
| County of Ohio WV Special District Excise Tax Revenue | | 4.000 | | 03/01/20 | | 575,000 | | 583,786 |
| County of Racine WI Anticipation Notes | | 3.050 | | 12/01/20 | | 62,900,000 | | 62,918,241 |
| County of Reeves TX Certs. of Participation | | 5.625 | | 12/01/18 | | 94,340 | | 81,575 |
| County of Reeves TX Certs. of Participation | | 6.500 | | 12/01/18 | | 170,074 | | 146,939 |
| County of Reeves TX Certs. of Participation | | 7.500 | | 12/01/18 | | 26,473 | | 22,867 |
| County of Reeves TX Certs. of Participation | | 6.750 | | 12/01/19 | | 1,320,000 | | 736,362 |
| County of Reeves TX Certs. of Participation | | 6.125 | | 12/01/20 | | 680,000 | | 339,871 |
| County of Reeves TX Certs. of Participation | | 6.875 | | 12/01/20 | | 370,000 | | 184,493 |
| County of Reeves TX Certs. of Participation | | 6.375 | | 12/01/21 | | 45,000 | | 20,934 |
| County of Reeves TX Certs. of Participation | | 7.000 | | 12/01/21 | | 500,000 | | 232,305 |
| County of Reeves TX Certs. of Participation | | 7.700 | | 12/01/21 | | 3,340,000 | | 1,603,668 |
| District of Columbia Revenue | | 5.375 | | 10/01/18 | | 1,455,000 | | 1,453,516 |
| Eastern Illinois University | | 5.450 | | 04/01/19 | | 515,000 | | 521,716 |
| Eastern Illinois University | | 5.600 | | 04/01/20 | | 585,000 | | 593,114 |
See Notes to Financial Statements.
28
| BOND FUND SCHEDULE OF INVESTMENTS (Unaudited) (Continued) |
| May 31, 2018 |
| | Rate (%) | | Maturity Date | | Principal Amount | | Value |
| BONDS (continued) | | | | | | | | |
| | | | | | | | | |
| Taxable Municipal Bonds (continued) | | | | | | | | |
| Eastern Illinois University | | 5.700 | | 04/01/21 | | 125,000 | | $126,735 |
| Fannin County TX Public Facility Corp. | | 5.200 | | 10/01/19 | | 515,000 | | 492,314 |
| Fannin County TX Public Facility Corp. | | 5.650 | | 10/01/21 | | 825,000 | | 730,059 |
| Florida State Mid-Bay Bridge Authority | | 3.784 | | 10/01/21 | | 3,625,000 | | 3,616,880 |
| Garza County TX Public Facility Corp. | | 6.200 | | 10/01/20 | | 1,245,000 | | 1,040,758 |
| Guam Gov’t. Business Privilege Tax Revenue | | 4.383 | | 01/01/22 | | 1,535,000 | | 1,522,045 |
| Guam Gov’t. Waterworks Authority | | 3.061 | | 07/01/18 | | 255,000 | | 254,898 |
| LL & P Wind Energy, Inc. WA (h) | | 5.983 | | 12/01/22 | | 8,595,000 | | 8,920,493 |
| New Jersey Economic Development Authority | | 3.300 | | 06/15/19 | | 1,000,000 | | 1,000,490 |
| New Jersey Economic Development Authority | | 3.290 | | 07/01/19 | | 320,000 | | 318,774 |
| New Jersey Sports & Exposition Authority | | 6.076 | | 03/01/23 | | 415,000 | | 450,902 |
| Pontotoc County OK Educational Facilities Authority | | 4.119 | | 09/01/23 | | 250,000 | | 252,532 |
| Public Finance Authority WI Student Housing Revenue | | 4.500 | | 07/01/21 | | 1,425,000 | | 1,406,731 |
| Puerto Rico Commonwealth Gov’t. Development Bank (i) | | 4.704 | | 05/01/16 | | 24,080,000 | | 9,752,400 |
| San Luis AZ Facility Development Corp. | | 5.350 | | 05/01/19 | | 1,240,000 | | 1,192,024 |
| San Luis AZ Facility Development Corp. | | 5.600 | | 05/01/20 | | 670,000 | | 588,669 |
| San Luis AZ Facility Development Corp. | | 5.700 | | 05/01/20 | | 850,000 | | 746,810 |
| San Luis AZ Facility Development Corp. | | 5.800 | | 05/01/21 | | 1,055,000 | | 860,912 |
| San Luis AZ Facility Development Corp. | | 5.900 | | 05/01/21 | | 980,000 | | 799,700 |
| San Luis AZ Facility Development Corp. | | 6.100 | | 05/01/22 | | 1,030,000 | | 798,013 |
| San Luis AZ Facility Development Corp. | | 6.200 | | 05/01/22 | | 1,035,000 | | 801,866 |
| State of Connecticut General Obligation | | 2.300 | | 01/15/19 | | 1,000,000 | | 995,960 |
| State of Illinois Pension Funding | | 4.350 | | 06/01/18 | | 222,000 | | 222,000 |
| Summit County OH Development Finance Authority | | 6.250 | | 05/15/26 | | 630,000 | | 636,180 |
| Town of Hamden CT General Obligation | | 4.000 | | 08/15/19 | | 680,000 | | 685,739 |
| Town of Oyster Bay NY General Obligation | | 3.800 | | 02/01/20 | | 1,725,000 | | 1,725,621 |
| Town of Oyster Bay NY General Obligation | | 3.950 | | 02/01/21 | | 890,000 | | 890,071 |
Utah Infrastructure Agency Telecommunications Revenue and
Refunding | | 3.500 | | 10/15/23 | | 3,500,000 | | 3,417,295 |
| West Texas Detention Facility Corp. | | 4.700 | | 11/01/18 | | 920,000 | | 886,227 |
| Willacy County TX Public Facility Corp. | | 5.600 | | 12/01/18 | | 420,000 | | 403,931 |
| |
| Tax-Exempt Municipal Bonds - 0.2% | | | | | | | | 6,450,426 |
| Casino Reinvestment Development Authority NJ | | 5.250 | | 06/01/19 | | 5,000,000 | | 5,015,650 |
| Puerto Rico Commonwealth | | 5.500 | | 07/01/18 | | 100,000 | | 100,237 |
| Puerto Rico Commonwealth | | 5.500 | | 07/01/19 | | 130,000 | | 133,899 |
| Puerto Rico Electric Power Authority | | 5.000 | | 07/01/19 | | 770,000 | | 777,939 |
| Puerto Rico Highways & Transportation Authority | | 4.125 | | 07/01/19 | | 120,000 | | 120,290 |
| Puerto Rico Municipal Finance Agency | | 5.250 | | 08/01/19 | | 100,000 | | 101,405 |
| Virgin Islands Port Authority | | 5.000 | | 09/01/18 | | 200,000 | | 201,006 |
| |
| U.S. Government & Agency Issues - 0.8% | | | | | | | | 24,562,557 |
| Federal Farm Credit Banks | | 1.400 | | 03/27/19 | | 300,000 | | 298,023 |
| Federal Farm Credit Banks | | 1.030 | | 04/05/19 | | 4,382,000 | | 4,336,690 |
| Federal Farm Credit Banks | | 1.190 | | 04/22/19 | | 245,000 | | 242,605 |
| Federal Home Loan Banks | | 2.250 | | 05/03/19 | | 3,815,000 | | 3,814,470 |
| Freddie Mac | | 1.125 | | 04/15/19 | | 1,000,000 | | 990,301 |
| U.S. Treasury Bonds | | 1.250 | | 04/30/19 | | 10,000,000 | | 9,908,984 |
| U.S. Treasury Bonds | | 1.625 | | 04/30/19 | | 5,000,000 | | 4,971,484 |
See Notes to Financial Statements.
29
| BOND FUND SCHEDULE OF INVESTMENTS (Unaudited) (Continued) |
| May 31, 2018 |
| | | | | | Shares or | | | |
| | Rate(%) | | Maturity Date | | Principal Amount | | Value |
| SHORT-TERM INVESTMENTS - 1.4% | | | | | | | | $39,934,329 | |
| (COST $39,937,271) | | | | | | | | | |
| |
| Money Market Funds - 0.0%^ | | | | | | | | 100,000 | |
| Fidelity Inst’l. Government Portfolio Class I (a) | | 1.635 | | | | 100,000 | | 100,000 | |
| |
| U.S. Government & Agency Issues - 1.4% | | | | | | | | 39,834,329 | |
| U.S. Treasury Bills (b) | | 1.831 | | 08/02/18 | | 10,000,000 | | 9,968,225 | |
| U.S. Treasury Bills (b) | | 1.851 | | 08/09/18 | | 10,000,000 | | 9,964,398 | |
| U.S. Treasury Bills (b) | | 1.874 | | 08/30/18 | | 10,000,000 | | 9,952,750 | |
| U.S. Treasury Bills (b) | | 1.889 | | 09/06/18 | | 10,000,000 | | 9,948,956 | |
| |
| TOTAL INVESTMENTS - 100.6% (COST $3,033,287,542) | | 2,993,227,346 | |
| |
| NET OTHER ASSETS AND LIABILITIES - (0.6%) | | | | | | | | (16,993,367 | ) |
| |
| NET ASSETS - 100.0% | | | | | | | | $2,976,233,979 | |
| (a) | Represents the 7-day yield at May 31, 2018. |
| (b) | Rate shown represents the current coupon rate at May 31, 2018. |
| (c) | Variable rate security. Interest rates reset periodically. Interest rate shown reflects the rate in effect at May 31, 2018. For securities based on a published reference rate and spread, the reference rate and spread are indicated in the description above. Certain variable rate securities are not based on a published reference rate and spread but are determined by the issuer or agent and are based on current market conditions. These securities do not indicate a reference rate and spread in their description above. |
| (d) | Security is a “step-up” bond where the coupon increases or steps up at a predetermined date. |
| (e) | Rate is subject to adjustment due to credit ratings service downgrades or subsequent upgrades. |
| (f) | Zero-coupon security. |
| (g) | Perpetual maturity; date shown represents next contractual call date. |
| (h) | Security subject to restrictions on resale under federal securities laws and which therefore may only be resold upon registration under the Securities Act of 1933, as amended, or in transactions exempt from registration, including sales to qualified institutional buyers under Rule 144A of the Securities Act of 1933, as amended. It has been deemed liquid under guidance approved by the Board. At May 31, 2018, the aggregate value of these securities was $786,145,843, representing 26.4% of net assets. |
| (i) | Security is currently in default. When a bond is in default its scheduled interest and/or principal payments are not currently being paid. |
| ^ | Rounds to 0.0%. |
See Notes to Financial Statements.
30
| BOND FUND SCHEDULE OF INVESTMENTS (Unaudited) (Continued) |
| May 31, 2018 |
| Abbreviations: |
| CPI YOY | Consumer Price Index Year-on-Year Growth Rate |
| IO | Interest Only Security |
| LIBOR | London Interbank Offered Rate |
| USISDA02 | 2-Year Dollar ICE Swap Rate |
| USISDA05 | 5-Year Dollar ICE Swap Rate |
| USISDA10 | 10-Year Dollar ICE Swap Rate |
| USISDA30 | 30-Year Dollar ICE Swap Rate |
| USSW5 | 5-Year Dollar Semi Annual 30/360 Swap Rate |
| |
| A.G. | Aktiengesellschaft is the German term for a public limited liability corporation. |
| B.V. | Besloten Vennootschap is the Dutch term for a private limited liability corporation. |
| DAC | Designated Activity Company |
| N.V. | Naamloze Vennootschap is the Dutch term for a public limited liability corporation. |
| PLC | Public Limited Company |
| REIT | Real Estate Investment Trust |
| REMIC | Real Estate Mortgage Investment Conduit |
| S.A. | Generally designates corporations in various countries, mostly those employing civil law. This translates literally as anonymous company. |
| S.A.B. de C.V. | Sociedad Anónima Bursátil de Capital Variable is the term for publicly traded companies in Mexico. |
| SCA | Société en commandite par actions is the Luxembourg term for a partnership limited by shares. |
| SCS | Société en Commandite Simple is the Luxembourg equivalent of a limited partnership. |
| SRL | Società a Responsabilità Limitata is the Italian term for a public limited company. |
See Notes to Financial Statements.
31
| FUND EXPENSE EXAMPLES (Unaudited) |
| May 31, 2018 |
Example
A Fund shareholder may incur two types of costs: (1) transaction costs such as redemption fees; and (2) ongoing costs, including management fees and other Fund expenses. This example is intended to help you understand your ongoing costs (in dollars) of investing in a Fund and to compare these costs with the ongoing costs of investing in other mutual funds.
The example is based on an investment of $1,000 invested at the beginning of the period and held for the entire period from December 1, 2017 to May 31, 2018.
Actual Expenses
The first line of the table below under each Fund provides information about actual account values and actual expenses for such Fund. You may use the information in this line, together with the amount you invested, to estimate the expenses that you paid over the period. Simply divide your account value by $1,000 (for example, an $8,600 account value divided by $1,000 = 8.6), then multiply the result by the number in the first line under the heading entitled “Expenses Paid During Period” to estimate the expenses you paid on your account during this period.
Hypothetical Example for Comparison Purposes
The second line of the table below under each Fund provides information about hypothetical account values and hypothetical expenses based on such Fund’s actual expense ratio and an assumed rate of return of 5% per year before expenses, which is not the Fund’s actual return. The hypothetical account values and expenses may not be used to estimate the actual ending account balance or expenses you paid for the period. You may use this information to compare the ongoing costs of investing in each Fund and other funds. To do so, compare the 5% hypothetical example with the 5% hypothetical examples that appear in the shareholder reports of the other funds.
Please note that the expenses shown in the table are meant to highlight your ongoing costs only and do not reflect any transactional costs, such as redemption fees. Therefore, the second line of the table is useful in comparing ongoing costs only, and will not help you determine the relative costs of owning different funds. In addition, if these transactional costs were included, your costs would have been higher.
| | | | Beginning | | Ending | | |
| Six-Month Period Ended May 31, 2018 | | Expense Ratio | | Account Value | | Account Value | | Expenses Paid |
| | for the Period | | 12/01/17 | | 05/31/18 | | During the Period* |
| LargeCap Fund | | | | | | | | |
| Actual | | 1.05% | | $1,000.00 | | $1,010.96 | | $5.26 |
| Hypothetical (5% return before expenses) | | 1.05% | | $1,000.00 | | $1,019.76 | | $5.29 |
| MidCap Fund | | | | | | | | |
| Actual | | 1.15% | | $1,000.00 | | $1,014.07 | | $5.77 |
| Hypothetical (5% return before expenses) | | 1.15% | | $1,000.00 | | $1,019.27 | | $5.79 |
| Bond Fund | | | | | | | | |
| Actual | | 0.71% | | $1,000.00 | | $1,013.06 | | $3.56 |
| Hypothetical (5% return before expenses) | | 0.71% | | $1,000.00 | | $1,021.46 | | $3.58 |
| * | Expenses are equal to the annualized [net] expense ratio for each Fund, multiplied by the average account value over the period, multiplied by 182/365 (to reflect the one-half year period). |
| |
| For more information, please refer to the Funds’ Prospectus. |
See Notes to Financial Statements.
32
| STATEMENTS OF ASSETS AND LIABILITIES (Unaudited) |
| May 31, 2018 (In thousands, except per share amounts) |
| | LARGECAP | | MIDCAP | | BOND |
| | FUND | | FUND | | FUND |
| |
| Assets | | | | | | | | | |
| Total investments in securities, at value (Cost $129,476, | | | | | | | | | |
| $41,737 and $3,033,287, respectively) | | $125,713 | | | $49,976 | | | $2,993,227 | |
| Cash | | – | | | – | | | 11,642 | |
| Due from sale of securities | | 409 | | | 119 | | | 1,165 | |
| Receivable from fund shares sold | | 4 | | | – | | | 15,296 | |
| Dividends and interest receivable | | 269 | | | 53 | | | 29,387 | |
| Prepaid expenses | | 17 | | | 15 | | | 86 | |
| Total assets | | 126,412 | | | 50,163 | | | 3,050,803 | |
| Liabilities | | | | | | | | | |
| Due on purchase of securities | | 303 | | | 107 | | | 69,728 | |
| Payable for fund shares redeemed | | 55 | | | – | | | 2,990 | |
| Accrued expenses payable | | 26 | | | 19 | | | 148 | |
| Accrued directors expense payable | | – | | | – | | | 2 | |
| Due to Advisor | | 99 | | | 37 | | | 1,701 | |
| Total liabilities | | 483 | | | 163 | | | 74,569 | |
| Net assets | | $125,929 | | | $50,000 | | | $2,976,234 | |
| Net assets consist of | | | | | | | | | |
| Capital stock ($.001 par value) | | $130,496 | | | $41,254 | | | $3,130,459 | |
| Undistributed net investment income | | 334 | | | 36 | | | 18,440 | |
| Accumulated net realized gain (loss) on investments | | (1,138 | ) | | 471 | | | (132,605 | ) |
| Net unrealized appreciation (depreciation) on investments | | (3,763 | ) | | 8,239 | | | (40,060 | ) |
| Net assets | | $125,929 | | | $50,000 | | | $2,976,234 | |
| Net asset value per share | | | | | | | | | |
| Shares of capital stock outstanding | | | | | | | | | |
| (unlimited shares authorized) | | 1,900 | | | 3,842 | | | 259,245 | |
| Offering and redemption price | | $66.29 | (a) | | $13.02 | (a) | | $11.48 | |
(a) Does not recalculate due to rounding.
See Notes to Financial Statements.
33
| STATEMENTS OF OPERATIONS (Unaudited) |
| Six-Month Period Ended May 31, 2018 (In thousands) |
| | LARGECAP | | MIDCAP | | BOND |
| | FUND | | FUND | | FUND |
| |
| Investment income | | | | | | | | | |
| Interest | | $– | | | $– | | | $51,461 | |
| Dividends | | 1,257 | | | 330 | | | – | |
| Less foreign taxes withheld | | (6 | ) | | (1 | ) | | – | |
| Total investment income | | 1,251 | | | 329 | | | 51,461 | |
| Expenses | | | | | | | | | |
| Investment advisory fees | | 608 | | | 254 | | | 8,160 | |
| Shareholder servicing costs | | 42 | | | 15 | | | 629 | |
| Administrative & accounting services fees | | 61 | | | 33 | | | 384 | |
| Custody fees | | 6 | | | 3 | | | 109 | |
| Directors fees | | 14 | | | 12 | | | 74 | |
| Federal & state registration | | 17 | | | 16 | | | 44 | |
| Professional fees | | 20 | | | 20 | | | 42 | |
| Other expenses | | 11 | | | 5 | | | 225 | |
| Total expenses | | 779 | | | 358 | | | 9,667 | |
| Less expenses reimbursed by Advisor | | (99 | ) | | (65 | ) | | – | |
| Net expenses | | 680 | | | 293 | | | 9,667 | |
| Net investment income | | 571 | | | 36 | | | 41,794 | |
| Realized and unrealized gain (loss) | | | | | | | | | |
| Net realized gain (loss) on investments | | (739 | ) | | 681 | | | (7,283 | ) |
| Net unrealized appreciation (depreciation) on investments | | 2,248 | | | 246 | | | 9,388 | |
| Net realized and unrealized gain (loss) | | 1,509 | | | 927 | | | 2,105 | |
| Increase in net assets resulting from operations | | $2,080 | | | $963 | | | $43,899 | |
See Notes to Financial Statements.
34
| STATEMENTS OF CHANGES IN NET ASSETS |
| (In thousands) |
| | LARGECAP | | MIDCAP | | BOND |
| | FUND | | FUND | | FUND |
| |
| | Six-Month | | | | Six-Month | | | | Six-Month | | |
| | Period Ended | | Year Ended | | Period Ended | | Year Ended | | Period Ended | | Year Ended |
| | May 31, 2018 | | November 30, | | May 31, 2018 | | November 30, | | May 31, 2018 | | November 30, |
| | (Unaudited) | | 2017 | | (Unaudited) | | 2017 | | (Unaudited) | | 2017 |
| Operations | | | | | | | | | | | | | | | | | | |
| Net investment income | | $571 | | | $720 | | | $36 | | | $29 | | | $41,794 | | | $73,657 | |
| Net realized gain (loss) on investments | | (739 | ) | | 23,322 | | | 681 | | | 3,508 | | | (7,283 | ) | | (1,198 | ) |
| Net unrealized appreciation | | | | | | | | | | | | | | | | | | |
| (depreciation) on investments | | 2,248 | | | (6,513 | ) | | 246 | | | 2,967 | | | 9,388 | | | 55,402 | |
| Net increase in net assets resulting | | | | | | | | | | | | | | | | | | |
| from operations | | 2,080 | | | 17,529 | | | 963 | | | 6,504 | | | 43,899 | | | 127,861 | |
| Distributions to shareholders | | | | | | | | | | | | | | | | | | |
| Distributions from net investment income | | (879 | ) | | (930 | ) | | (29 | ) | | (23 | ) | | (37,188 | ) | | (80,820 | ) |
| Distributions from net realized | | | | | | | | | | | | | | | | | | |
| gains on securities transactions | | (192 | ) | | – | | | (3,603 | ) | | (2,027 | ) | | – | | | – | |
| Total distributions to shareholders | | (1,071 | ) | | (930 | ) | | (3,632 | ) | | (2,050 | ) | | (37,188 | ) | | (80,820 | ) |
| Fund share transactions (see note 4) | | (4,085 | ) | | (5,115 | ) | | 1,817 | | | 2,553 | | | 348,881 | | | 553,066 | |
| Total increase (decrease) in net assets | | (3,076 | ) | | 11,484 | | | (852 | ) | | 7,007 | | | 355,592 | | | 600,107 | |
| Net assets | | | | | | | | | | | | | | | | | | |
| Beginning of period | | 129,005 | | | 117,521 | | | 50,852 | | | 43,845 | | | 2,620,642 | | | 2,020,535 | |
| End of period | | $125,929 | | | $129,005 | | | $50,000 | | | $50,852 | | | $2,976,234 | | | $2,620,642 | |
| Undistributed net investment | | | | | | | | | | | | | | | | | | |
| income included in net | | | | | | | | | | | | | | | | | | |
| assets at end of period | | $334 | | | $642 | | | $36 | | | $29 | | | $18,440 | | | $13,338 | |
See Notes to Financial Statements.
35
| NOTES TO FINANCIAL STATEMENTS (Unaudited) |
| May 31, 2018 |
NOTE 1 - ORGANIZATION
Thompson IM Funds, Inc. (the “Company”) is a Wisconsin corporation registered under the Investment Company Act of 1940, as amended (the “1940 Act”), as an open-end, diversified management investment company.
The Company consists of separate mutual funds series (each, a “Fund,” and collectively, the “Funds”): Thompson LargeCap Fund (the “LargeCap Fund”), Thompson MidCap Fund (the “MidCap Fund”) and Thompson Bond Fund (the “Bond Fund”). The assets and liabilities of each Fund are segregated and a shareholder’s interest is limited to the Fund in which the shareholder owns shares. The objectives and strategies of each Fund are described in the Funds’ Prospectus.
NOTE 2 - SIGNIFICANT ACCOUNTING POLICIES
The following is a summary of significant accounting policies followed by the Funds in the preparation of their financial statements. The Funds are investment companies and accordingly follow the investment company accounting and reporting guidance of the Financial Accounting Standards Board (“FASB”) Accounting Standards Codification Topic 946 Financial Services — Investment Companies.
VALUATION POLICY AND PROCEDURES - The Funds’ Board of Directors (the “Funds’ Board”) has adopted methods for valuing securities set forth in the Funds’ Pricing Policies and Procedures, including circumstances in which market quotes are not readily available or deemed to be unreliable, and has delegated authority to the Advisor to apply those methods in making fair value determinations, subject to oversight by the Funds’ Board. The Advisor has established a valuation committee that, along with other Advisor employees, administers, implements, and oversees the fair valuation process and makes fair value decisions. The valuation committee regularly reviews its own fair value decisions, as well as valuations, valuation techniques and services furnished by pricing services; considers circumstances in the markets which may require it to make or adjust valuation determinations; and reviews previous valuation determinations. The valuation committee reports on its activities and any changes to the fair valuation guidelines to the Funds’ Board.
SECURITY VALUATION - Each Fund’s equity securities, including common stocks, ADRs and REITs, are valued at their market prices (generally the last reported sales price on the exchange where the securities are primarily traded or, for Nasdaq-listed securities, at their Nasdaq Official Closing Prices). If no sales are reported on a particular day, the mean between the highest bid and lowest asked quotations at the close of the exchanges will generally be used. Investments in money market mutual funds are generally priced at the ending net asset value provided by the service agent of the funds.
Fixed-income securities such as corporate bonds, asset-backed securities, mortgage-backed securities, U.S. government and agency securities, sovereign bonds and municipal bonds are typically valued based on valuations published by an independent pricing service, which uses various valuation methodologies such as matrix pricing and other analytical pricing models as well as market transactions and dealer quotations. Factors considered by pricing services include market characteristics such as benchmark yield curves, option-adjusted spreads, credit spreads and fundamental analytical data relating to the issuer. Short-term investments in fixed-income securities (those with remaining maturities of 60 days or less) are generally valued on an amortized cost basis.
Where market quotations are not readily available or are unreliable, a value is determined in good faith pursuant to procedures established by the Funds’ Board. When determining the value of a security, consideration is given to the facts and circumstances relevant to the particular situation, which includes factors such as fundamental analytical data relating to the investment, which may include consideration of yields or prices of securities of comparable quality, coupon rate, maturity and type of issue, nature and duration of any restrictions on disposition of the security and an evaluation of forces that influence the market in which the securities are purchased or sold. Fair value pricing is an inherently subjective process, and no single standard exists for determining fair value. Different funds could reasonably arrive at different values for the same security.
VALUATION MEASUREMENTS – In accordance with generally accepted accounting principles in the United States of America (“GAAP”), fair value is defined as the price that the Fund would receive to sell an investment or pay to transfer a liability in an orderly transaction with an independent buyer in the principal market, or in the absence of a principal market the most advantageous market for the investment or liability. GAAP established a three-tier hierarchy to maximize the use of observable market data and minimize the use of unobservable inputs and to establish classification of fair value measurements for disclosure purposes.
36
| NOTES TO FINANCIAL STATEMENTS (Unaudited) (Continued) |
| May 31, 2018 |
Various inputs are used in determining the value of each Fund’s investments. These inputs are summarized in the three broad levels listed below:
Level 1 – Quoted prices in active markets for identical securities.
Level 2 – Other significant observable inputs (including quoted prices for similar securities, interest rates, prepayment speeds, credit risk, etc.).
Level 3 – Significant unobservable inputs (including the Fund’s own assumptions in determining the fair value of investments).
Inputs may include price information, specific and broad credit data, liquidity statistics, and other factors. The Fund considers observable data to be that market data which is readily available, regularly distributed or updated, reliable and verifiable, not proprietary, and provided by independent sources that are actively involved in the relevant market. The determination of what constitutes “observable” requires significant judgment by the Fund. The categorization of a financial instrument within the hierarchy is based upon the pricing transparency of the instrument and does not necessarily correspond to the Fund’s perceived risk of that instrument. Investments whose values are based on quoted market prices in active markets, and which are therefore classified as level-1 securities, include active listed equities and certain U.S. government obligations.
Investments that trade in markets that are not considered to be active, but are valued based on quoted market prices, dealer quotations or alternative pricing sources supported by observable inputs, are classified as level-2 securities. These include certain U.S. government obligations, most government agency securities, investment-grade corporate bonds, asset-backed securities, mortgage-backed securities, sovereign bonds, municipal bonds, and less liquid listed equities. Level-2 investments include positions that are not traded in active markets.
Investments classified as level-3 securities have significant unobservable inputs, as they trade infrequently or not at all. Level-3 instruments include private-placement and less liquid corporate and municipal debt securities. When observable prices are not available for these securities, the Fund uses one or more valuation techniques (e.g., the market approach, the income approach, or the cost approach) for which sufficient and reliable data is available. Within level 3, the use of the market approach generally consists of using comparable market transactions, while the use of the income approach generally consists of using the net present value of estimated future cash flows, adjusted as appropriate for liquidity, credit, market and/or other risk factors. The inputs used by the Fund in estimating the value of level-3 investments include the original transaction price and recent transactions in the same or similar instruments.
The following is a summary of the inputs used to value the Funds’ investments as of May 31, 2018:
| LargeCap Fund |
| | Level 1 | | Level 2 | | Level 3 | | Total |
| Common stocks | | $125,669,338 | | $– | | $– | | $125,669,338 |
| Short-term investments | | 43,717 | | – | | – | | 43,717 |
| Total | | $125,713,055 | | $– | | $– | | $125,713,055 |
| |
| MidCap Fund |
| | Level 1 | | Level 2 | | Level 3 | | Total |
| Common stocks | | $49,939,908 | | $– | | $– | | $49,939,908 |
| Short-term investments | | 35,854 | | – | | – | | 35,854 |
| Total | | $49,975,762 | | $– | | $– | | $49,975,762 |
| |
| Bond Fund |
| | Level 1 | | Level 2 | | Level 3 | | Total |
| Bonds | | $– | | $2,953,293,017 | | $– | | $2,953,293,017 |
| Short-term investments | | 100,000 | | 39,834,329 | | – | | 39,934,329 |
| Total | | $100,000 | | $2,993,127,346 | | $– | | $2,993,227,346 |
37
| NOTES TO FINANCIAL STATEMENTS (Unaudited) (Continued) |
| May 31, 2018 |
There were no transfers between level-1 and level-2 securities and the Funds did not invest in any level-3 investments as of and during the six-month period ended May 31, 2018. It is the Funds’ policy to record transfers at the end of the reporting period. Refer to each Fund’s Schedule of Investments for additional information regarding security types and industry classifications.
SECURITIES TRANSACTIONS AND INVESTMENT INCOME - Investment securities transactions are accounted for on the trade date. Gains or losses realized on sales of securities are determined by comparing the identified cost of the security lot sold with the net sales proceeds. Discounts/premiums on debt securities purchased are accreted/amortized over the life of the respective securities using the effective interest method for both book and tax purposes. Dividend income is recorded on the ex-dividend date. Interest income is recorded as earned. Income and capital gains on some foreign securities may be subject to foreign withholding taxes, which are accrued as applicable, and have been provided for in accordance with the Funds’ understanding of the applicable country’s tax rules and rates. The ability of the issuers of the debt securities held by the Funds to meet their obligations may be affected by economic developments in a specific industry, state, or region. Debt obligations may be placed on non-accrual status and related interest income may be reduced by ceasing current accruals and writing off interest receivables when the collection of all or a portion of interest has become doubtful. A debt obligation is removed from non-accrual status when the issuer resumes interest payments or when collectability of interest is reasonably assured.
EXPENSES - Each Fund is charged for those expenses that are directly attributed to it. Expenses that are not readily identifiable to a specific Fund are generally allocated among the Funds in proportion to the relative sizes of the Funds.
SECURITIES PURCHASED ON A WHEN-ISSUED OR DELAYED-DELIVERY BASIS - Each Fund may purchase securities on a when-issued or delayed-delivery basis. When-issued securities are securities purchased with delivery to occur at a later date at a stated price and/or yield, thereby involving the risk that the price and/or yield obtained may be more or less than those available in the market when delivery takes place. At the time a Fund makes a commitment to purchase a security on a when-issued basis, the Fund records the transaction and reflects the value of the security in determining net asset value. Each Fund designates and maintains cash and marketable securities at least equal in value to commitments for when-issued securities.
LINE OF CREDIT - The Funds have established an unsecured line of credit (“LOC”) with U.S. Bank N.A. which expires November 9, 2018, used primarily to finance redemption payments. Each individual Fund’s borrowing under the LOC is limited to 5% of the value of that Fund’s net assets, 33.33% of the value of the Fund’s investments, or any explicit borrowing limits imposed by the LOC, whatever is less. Interest is charged at the prime rate, which was 4.75% as of May 31, 2018. As of May 31, 2018, the limits established are: LargeCap Fund - $6,000,000, MidCap Fund - $2,300,000 and Bond Fund - $127,000,000. All terms and borrowing limits imposed by the LOC are subject to review and approval by the Funds’ Board. The LOC was drawn upon during the period; however, as of May 31, 2018, there were no borrowings by the Funds outstanding under the LOC. The following table shows the average balance, average interest rate, interest expense, and maximum borrowings incurred by the Funds on the LOC for the six-month period ended May 31, 2018.
| | | | Average | | | | | | Date of |
| | Average | | Interest | | Interest | | Maximum | | Maximum |
| | Balance | | Rate | | Expense | | Borrowing | | Borrowing |
| LargeCap Fund | | $44,648 | | 4.58% | | | $1,033 | | | $673,000 | | 03/27/18 |
| MidCap Fund | | $18,264 | | 4.68% | | | $432 | | | $869,000 | | 03/27/18 |
| Bond Fund | | $109,918 | | 4.75% | | | $2,640 | | | $11,516,000 | | 04/03/18 |
38
| NOTES TO FINANCIAL STATEMENTS (Unaudited) (Continued) |
| May 31, 2018 |
USE OF ESTIMATES - The preparation of financial statements in conformity with GAAP requires management to make estimates and assumptions that affect the reported amounts of assets and liabilities and disclosure of contingent assets and liabilities at the date of the financial statements and the reported amounts of revenues and expenses during the reporting period. Actual results could differ from these estimates.
GUARANTEES AND INDEMNIFICATIONS - Under the Funds’ organizational documents, each Director, officer, employee or other agent of the Funds (including the Funds’ investment advisor) is indemnified, to the extent permitted by the 1940 Act, against certain liabilities that may arise out of performance of their duties to the Funds. Additionally, in the normal course of business, the Funds enter into contracts that contain a variety of indemnification clauses. The Funds’ maximum exposure under these arrangements is unknown as this would involve future claims that may be made against the Funds that have not yet occurred. However, the Funds have not had prior claims or losses pursuant to these contracts and believe the risk of loss to be remote.
PERMANENT BOOK AND TAX DIFFERENCES - Generally accepted accounting principles require that permanent financial reporting and tax differences relating to shareholder distributions be reclassified in the capital accounts.
DISTRIBUTIONS TO SHAREHOLDERS - Distributions to shareholders from net investment income and realized gains on securities for the LargeCap Fund and MidCap Fund normally are declared at least annually. Bond Fund distributions to shareholders from net investment income normally are declared on a quarterly basis, and distributions to shareholders from realized gains on securities normally are declared at least annually. Distributions are recorded on the ex-dividend date.
FEDERAL INCOME TAXES - No provision has been made for federal income taxes since the Funds have elected to be taxed as regulated investment companies and intend to distribute substantially all income to shareholders and otherwise comply with the provisions of the Internal Revenue Code applicable to regulated investment companies.
ACCOUNTING FOR UNCERTAINTY IN INCOME TAXES - As of and during the six-month period ended May 31, 2018, the Funds did not have a liability for unrecognized tax benefits in the accompanying financial statements. Also, the Funds recognized no interest or penalties related to unrecognized tax benefits during the same period. The Funds recognize interest and penalties, if any, related to unrecognized tax benefits as income tax expense in the Statements of Operations. The Funds are also not aware of any tax positions for which it is reasonably possible that the total amounts of unrecognized tax benefits will significantly change in the next twelve months.
SUBSEQUENT EVENTS - The Funds have evaluated subsequent events through the issuance of the Funds’ financial statements. See notes 6. Other than as described in note 6, there were no additional subsequent events which were deemed to have an impact on the Funds’ financial statements.
NOTE 3 - INVESTMENT ADVISORY AND ADMINISTRATIVE AND ACCOUNTING SERVICES AGREEMENTS AND OTHER TRANSACTIONS WITH AFFILIATES
The Investment Advisory Agreement pursuant to which Thompson Investment Management, Inc. (“TIM” or “Advisor”) is retained by the Funds provides for monthly compensation to TIM computed on average daily net assets at the following annual rates:
| | First | | Over |
| | $50 Million | | $50 Million |
| LargeCap Fund | | 1.00% | | 0.90% |
| MidCap Fund | | 1.00% | | 0.90% |
| Bond Fund | | 0.65% | | 0.60% |
39
| NOTES TO FINANCIAL STATEMENTS (Unaudited) (Continued) |
| May 31, 2018 |
The Advisor is contractually bound to waive management fees and/or reimburse expenses incurred by the Funds through March 31, 2019 so that the annual operating expenses of the Funds do not exceed the following percentages of their respective average daily net assets: LargeCap Fund - 1.05%, MidCap Fund - 1.15% and Bond Fund - 0.80%. For the six-month period ended May 31, 2018, the Advisor reimbursed expenses incurred by the LargeCap Fund and the MidCap Fund in the amounts of $98,666 and 65,232, respectively. The Funds are not obligated to reimburse the Advisor for any fees or expenses waived in previous fiscal years.
As of May 31, 2018, an affiliated shareholder held 13.71% of the MidCap Fund’s outstanding shares. Transactions by the shareholder may have a material impact on the Fund.
Pursuant to an Administrative and Accounting Services Agreement, TIM maintains the Funds’ financial records in accordance with the 1940 Act, prepares all necessary financial statements of the Funds and calculates the net asset value per share of the Funds on a daily basis. As compensation for its services, each Fund pays TIM a fee computed daily and payable monthly at the annual rate of 0.15% of average daily net assets up to $30 million, 0.10% of the next $70 million of average daily net assets and 0.025% of average daily net assets in excess of $100 million, with an annual minimum fee of $30,000 per Fund. The calculations of daily net asset value are subcontracted to U.S. Bancorp Fund Services, resulting in fees paid by TIM for the six-month period ended May 31, 2018, in the following amounts:
| | Administrative & |
| | Accounting Fees Paid |
| LargeCap Fund | | | $21,076 | |
| MidCap Fund | | | $18,079 | |
| Bond Fund | | | $138,709 | |
The Funds reimburse the Advisor for a portion of amounts paid by the Advisor out of the Advisor’s own resources under various shareholder, account maintenance, networking and other services provided to the Funds by broker-dealers and other intermediaries. The amount reimbursed by the Funds is equal to (1) for those accounts maintained through a shareholder servicing arrangement, an annual rate of no more than 0.10% of the average daily net assets of the omnibus accounts in the Funds for which all broker-dealers and other intermediaries, in the aggregate, are responsible, and (2) for those accounts maintained through a networking arrangement, no more than $6 per year per account in the Funds for which the broker-dealers and other intermediaries are responsible; provided however, in all cases only one of these fees shall be applicable to the assets in an account. This amount has been determined by the Funds’ Board to approximate (or not to exceed) the transfer agency fees that would otherwise have been payable by the Funds if such broker-dealers and intermediaries did not maintain these accounts. Such amounts are recorded within Shareholder servicing costs on each Fund’s Statement of Operations. For the six-month period ended May 31, 2018, the amounts reimbursed by the Funds to the Advisor were:
| | Intermediary |
| | Fees Reimbursed |
| LargeCap Fund | | | $9,530 | |
| MidCap Fund | | | $1,427 | |
| Bond Fund | | | $339,654 | |
40
| NOTES TO FINANCIAL STATEMENTS (Unaudited) (Continued) |
May 31, 2018 |
NOTE 4 - FUND SHARE TRANSACTIONS (in thousands)
Transactions in shares of the Funds were as follows:
| | Six-Month Period Ended | | |
| | May 31, 2018 | | Year Ended |
| | (Unaudited) | | November 30, 2017 |
| | Shares | | Dollars | | Shares | | Dollars |
| LargeCap Fund | | | | | | | | | | | | |
| Shares sold | | 48 | | | $3,287 | | | 97 | | | $5,894 | |
| Shares issued in reinvestment of distributions | | 16 | | | 1,042 | | | 16 | | | 905 | |
| Shares redeemed | | (125 | ) | | (8,414 | ) | | (196 | ) | | (11,914 | ) |
| Net increase (decrease) | | (61 | ) | | ($4,085 | ) | | (83 | ) | | ($5,115 | ) |
| MidCap Fund | | | | | | | | | | | | |
| Shares sold | | 142 | | | $1,888 | | | 321 | | | $4,078 | |
| Shares issued in reinvestment of distributions | | 274 | | | 3,593 | | | 165 | | | 2,028 | |
| Shares redeemed | | (279 | ) | | (3,664 | ) | | (280 | ) | | (3,553 | ) |
| Net increase (decrease) | | 137 | | | $1,817 | | | 206 | | | $2,553 | |
| Bond Fund | | | | | | | | | | | | |
| Shares sold | | 60,870 | | | $696,678 | | | 102,750 | | | $1,170,581 | |
| Shares issued in reinvestment of distributions | | 3,113 | | | 35,491 | | | 6,699 | | | 75,909 | |
| Shares redeemed | | (33,520 | ) | | (383,288 | ) | | (60,754 | ) | | (693,424 | ) |
| Net increase (decrease) | | 30,463 | | | $348,881 | | | 48,695 | | | $553,066 | |
NOTE 5 - PURCHASE AND SALE OF SECURITIES
Investment transactions for the six-month period ended May 31, 2018 were as follows:
| | Securities other than U.S. | | | | |
| | Government and Short-term | | | | |
| | Investments | | U.S. Government Securities |
| | Purchases | | Sales | | Purchases | | Sales |
| LargeCap Fund | | $20,087,828 | | $24,658,604 | | $– | | $– |
| MidCap Fund | | $6,594,599 | | $8,422,494 | | $– | | $– |
| Bond Fund | | $993,946,940 | | $545,258,099 | | $513,531,084 | | $507,911,506 |
NOTE 6 – INCOME TAX INFORMATION
At May 31, 2018, the investment cost and aggregate unrealized appreciation and depreciation on investments for federal income tax purposes were as follows:
| | LARGECAP | | MIDCAP | | BOND |
| | FUND | | FUND | | FUND |
| Federal tax cost | | $129,498,857 | | | $41,921,253 | | | $3,033,446,543 | |
| | | | | | | | | | |
| Unrealized appreciation | | $10,376,905 | | | $13,415,022 | | | $9,788,454 | |
| Unrealized depreciation | | (14,162,707 | ) | | (5,360,513 | ) | | (50,007,651 | ) |
| Net unrealized appreciation (depreciation) | | ($3,785,802 | ) | | $8,054,509 | | | ($40,219,197 | ) |
41
| NOTES TO FINANCIAL STATEMENTS (Unaudited) (Continued) |
May 31, 2018 |
The tax basis of investments for tax and financial reporting purposes differ principally due to wash sales.
The tax basis post-October losses as of November 30, 2017 and capital loss carryforward as of November 30, 2017, which are not being recognized for tax purposes until the first day of the following fiscal year, are as follows:
| | LARGECAP | | MIDCAP | | BOND |
| | FUND | | FUND | | FUND |
| Post-October losses | | $402,942 | | $– | | $328,320 |
| Net capital loss carryforward | | | | | | |
| Short-term | | $– | | $– | | $17,788,426 |
| Long-term | | – | | – | | 106,594,621 |
| Total capital loss carryforward | | $– | | $– | | $124,383,047 |
During the fiscal year ended November 30, 2017, the LargeCap Fund utilized capital loss carryforwards in the amount of $23,515,595. Capital losses are carried forward indefinitely and are available to offset future net realized gains, to the extent permitted by the Internal Revenue Code.
The tax components of distributions paid during the six-month period ended May 31, 2018 and the fiscal year ended November 30, 2017 are as follows:
| | LARGECAP | | MIDCAP | | BOND |
| | FUND | | FUND | | FUND |
| Six-month period ended May 31, 2018 (Unaudited) | | | | | | |
| Distributions paid from | | | | | | |
| Ordinary income | | $878,543 | | $154,749 | | $37,187,934 |
| Long-term capital gains | | 191,999 | | 3,477,629 | | – |
| Total distributions paid | | $1,070,542 | | $3,632,378 | | $37,187,934 |
| |
| Fiscal year ended November 30, 2017 | | | | | | |
| Distributions paid from | | | | | | |
| Ordinary income | | $929,915 | | $363,026 | | $80,820,288 |
| Long-term capital gains | | – | | 1,687,109 | | – |
| Total distributions paid | | $929,915 | | $2,050,135 | | $80,820,288 |
The following distributions were declared on June 22, 2018, payable to shareholders on June 25, 2018 (Unaudited):
| | LARGECAP | | MIDCAP | | BOND |
| | FUND | | FUND | | FUND |
| | | | | | | |
| Ordinary income distributions | | | | | | |
| Amount | | $– | | $– | | $23,947,240 |
| Per Share | | $– | | $– | | $0.09 |
42
The following table presents information relating to a share of capital stock outstanding for the entire period.
| LARGECAP FUND | | Six-Month | | | | | | | | | | | | | | | |
| | Period Ended | | |
| | May 31, 2018 | | Year Ended November 30, |
| | | (Unaudited) | | 2017 | | 2016 | | 2015 | | 2014 | | 2013 |
| Per share operating performance | | | | | | | | | | | | | | | | | | |
| Net asset value, beginning of period | | $65.77 | | | $57.48 | | | $50.72 | | | $53.40 | | | $46.47 | | | $34.27 | |
| Income from investment operations | | | | | | | | | | | | | | | | | | |
| Net investment income | | 0.30 | | | 0.37 | | | 0.47 | | | 0.35 | | | 0.27 | | | 0.19 | |
| Net realized and unrealized gains (losses) | | | | | | | | | | | | | | | | | | |
| on investments | | 0.77 | | | 8.38 | | | 6.64 | | | (2.75 | ) | | 6.84 | | | 12.20 | |
| Total from investment operations | | 1.07 | | | 8.75 | | | 7.11 | | | (2.40 | ) | | 7.11 | | | 12.39 | |
| Less distributions | | | | | | | | | | | | | | | | | | |
| Distributions from net investment income | | (0.45 | ) | | (0.46 | ) | | (0.35 | ) | | (0.28 | ) | | (0.18 | ) | | (0.19 | ) |
| Distributions from net realized gains | | (0.10 | ) | | – | | | – | | | – | | | – | | | – | |
| Total distributions | | (0.55 | ) | | (0.46 | ) | | (0.35 | ) | | (0.28 | ) | | (0.18 | ) | | (0.19 | ) |
| Net asset value, end of period | | $66.29 | | | $65.77 | | | $57.48 | | | $50.72 | | | $53.40 | | | $46.47 | |
| Total return | | 1.62% | (a) | | 15.32% | | | 14.16% | | | (4.52% | ) | | 15.35% | | | 36.33% | |
| Ratios and supplemental data | | | | | | | | | | | | | | | | | | |
| Net assets, end of period (millions) | | $125.9 | | | $129.0 | | | $117.5 | | | $111.9 | | | $128.6 | | | $124.8 | |
| Ratios to average net assets: | | | | | | | | | | | | | | | | | | |
| Ratios of expenses | | 1.05% | (b) | | 1.10% | | | 1.13% | | | 1.15% | | | 1.15% | | | 1.21% | |
| Ratio of expenses without reimbursement | | 1.20% | (b) | | 1.22% | | | 1.25% | | | 1.22% | | | 1.23% | | | 1.22% | |
| Ratio of net investment income | | 0.88% | (b) | | 0.59% | | | 0.90% | | | 0.64% | | | 0.54% | | | 0.46% | |
| Ratio of net investment income | | | | | | | | | | | | | | | | | | |
| without reimbursement | | 0.73% | (b) | | 0.47% | | | 0.78% | | | 0.57% | | | 0.46% | | | 0.45% | |
| Portfolio turnover rate | | 16% | (a) | | 89% | | | 32% | | | 45% | | | 27% | | | 38% | |
| (a) Calculated on a non-annualized basis. |
| (b) Calculated on an annualized basis. |
See Notes to Financial Statements.
43
| FINANCIAL HIGHLIGHTS (Continued) |
| |
The following table presents information relating to a share of capital stock outstanding for the entire period.
| MIDCAP FUND | | Six-Month | | | | | | | | | | | | | | | |
| | Period Ended | | | | | | | | | | | | | | | |
| | May 31, 2018 | | Year Ended November 30, |
| | (Unaudited) | | 2017 | | 2016 | | 2015 | | 2014 | | 2013 |
| Per share operating performance | | | | | | | | | | | | | | | | | | |
| Net asset value, beginning of period | | $13.73 | | | $12.53 | | | $12.07 | | | $14.04 | | | $14.04 | | | $11.28 | |
| Income from investment operations | | | | | | | | | | | | | | | | | | |
| Net investment income (loss) | | 0.01 | | | 0.01 | | | 0.01 | | | – | (a) | | – | (a) | | – | (a) |
| Net realized and unrealized gains (losses) | | | | | | | | | | | | | | | | | | |
| on investments | | 0.27 | | | 1.78 | | | 1.45 | | | (0.64 | ) | | 1.47 | | | 3.71 | |
| Total from investment operations | | 0.28 | | | 1.79 | | | 1.46 | | | (0.64 | ) | | 1.47 | | | 3.71 | |
| Less distributions | | | | | | | | | | | | | | | | | | |
| Distributions from net investment income | | (0.01 | ) | | (0.01 | ) | | – | (a) | | – | | | – | | | – | |
| Distributions from net realized gains | | (0.98 | ) | | (0.58 | ) | | (1.00 | ) | | (1.33 | ) | | (1.47 | ) | | (0.95 | ) |
| Total distributions | | (0.99 | ) | | (0.59 | ) | | (1.00 | ) | | (1.33 | ) | | (1.47 | ) | | (0.95 | ) |
| Net asset value, end of period | | $13.02 | | | $13.73 | | | $12.53 | | | $12.07 | | | $14.04 | | | $14.04 | |
| Total return | | 1.98% | (b) | | 14.78% | | | 13.82% | | | (5.10% | ) | | 11.82% | | | 35.65% | |
| Ratios and supplemental data | | | | | | | | | | | | | | | | | | |
| Net assets, end of period (millions) | | $50.0 | | | $50.9 | | | $43.8 | | | $38.4 | | | $41.3 | | | $37.6 | |
| Ratios to average net assets: | | | | | | | | | | | | | | | | | | |
| Ratios of expenses | | 1.15% | (c) | | 1.20% | | | 1.25% | | | 1.30% | | | 1.30% | | | 1.30% | |
| Ratio of expenses without reimbursement | | 1.41% | (c) | | 1.44% | | | 1.50% | | | 1.49% | | | 1.54% | | | 1.63% | |
| Ratio of net investment income (loss) | | 0.14% | (c) | | 0.06% | | | 0.06% | | | 0.01% | | | (0.02% | ) | | (0.02% | ) |
| Ratio of net investment loss | | | | | | | | | | | | | | | | | | |
| without reimbursement | | (0.11% | )(c) | | (0.18% | ) | | (0.19% | ) | | (0.18% | ) | | (0.27% | ) | | (0.35% | ) |
| Portfolio turnover rate | | 13% | (b) | | 29% | | | 34% | | | 27% | | | 34% | | | 47% | |
| (a) Less than .005 per share. |
| (b) Calculated on a non-annualized basis. |
| (c) Calculated on an annualized basis. |
See Notes to Financial Statements.
44
| FINANCIAL HIGHLIGHTS (Continued) |
| |
The following table presents information relating to a share of capital stock outstanding for the entire period.
| BOND FUND | | Six-Month | | | | | | | | | | | | | | | |
| | Period Ended | | |
| | May 31, 2018 | | Year Ended November 30, |
| | (Unaudited) | | 2017 | | 2016 | | 2015 | | 2014 | | 2013 |
| Per share operating performance | | | | | | | | | | | | | | | | | | |
| Net asset value, beginning of period | | $11.45 | | | $11.22 | | | $10.98 | | | $11.69 | | | $11.91 | | | $11.95 | |
| Income from investment operations | | | | | | | | | | | | | | | | | | |
| Net investment income | | 0.18 | | | 0.35 | | | 0.49 | | | 0.49 | | | 0.45 | | | 0.41 | |
| Net realized and unrealized gains (losses) | | | | | | | | | | | | | | | | | | |
| on investments | | 0.01 | | | 0.27 | | | 0.26 | | | (0.72 | ) | | (0.19 | ) | | (0.03 | ) |
| Total from investment operations | | 0.19 | | | 0.62 | | | 0.75 | | | (0.23 | ) | | 0.26 | | | 0.38 | |
| Less distributions | | | | | | | | | | | | | | | | | | |
| Distributions from net investment income | | (0.16 | ) | | (0.39 | ) | | (0.51 | ) | | (0.48 | ) | | (0.45 | ) | | (0.40 | ) |
| Distributions from net realized gains | | – | | | – | | | – | | | – | | | (0.03 | ) | | (0.02 | ) |
| Total distributions | | (0.16 | ) | | (0.39 | ) | | (0.51 | ) | | (0.48 | ) | | (0.48 | ) | | (0.42 | ) |
| Net asset value, end of period | | $11.48 | | | $11.45 | | | $11.22 | | | $10.98 | | | $11.69 | | | $11.91 | |
| Total return | | 1.66% | (a) | | 5.57% | | | 7.05% | | | (2.04% | ) | | 2.19% | | | 3.24% | |
| Ratios and supplemental data | | | | | | | | | | | | | | | | | | |
| Net assets, end of period (millions) | | $2,976.2 | | | $2,620.6 | | | $2,020.5 | | | $2,744.5 | | | $3,724.0 | | | $2,252.1 | |
| Ratios to average net assets: | | | | | | | | | | | | | | | | | | |
| Ratios of expenses | | 0.71% | (b) | | 0.71% | | | 0.72% | | | 0.71% | | | 0.72% | | | 0.74% | |
| Ratio of net investment income | | 3.08% | (b) | | 3.01% | | | 4.16% | | | 3.98% | | | 4.04% | | | 3.73% | |
| Portfolio turnover rate | | 26% | (a) | | 43% | | | 20% | | | 29% | | | 21% | | | 33% | |
| (a) Calculated on a non-annualized basis. |
| (b) Calculated on an annualized basis. |
See Notes to Financial Statements.
45
| ADDITIONAL INFORMATION (Unaudited) |
| |
| THOMPSON IM FUNDS, INC. |
| |
| Investment Advisor |
| Thompson Investment Management, Inc. |
| 918 Deming Way |
| Madison, Wisconsin 53717 |
| |
| Distributor |
| Quasar Distributors, LLC |
| 777 East Wisconsin Avenue |
| Milwaukee, Wisconsin 53202 |
| |
| Transfer Agent |
| U.S. Bancorp Fund Services, LLC |
| 615 East Michigan Street |
| Milwaukee, Wisconsin 53202 |
| |
| Independent Registered |
| Public Accounting Firm |
| Cohen & Company, Ltd. |
| 1350 Euclid Avenue, Suite 800 |
| Cleveland, OH 44115 |
| |
| Legal Counsel |
| Quarles & Brady LLP |
| 411 East Wisconsin Avenue |
| Milwaukee, Wisconsin 53202 |
The Statement of Additional Information contains additional information about the directors and officers of Thompson IM Funds, Inc. and is available without charge, upon request, by calling 1-800-999-0887.
Proxy Voting Policy
A description of the policies and procedures that the Funds use to determine how to vote proxies relating to portfolio securities and information regarding how the Funds actually voted proxies during the most recent 12-month period ended June 30 are available without charge, upon request, by calling 1-800-999-0887, through the Funds’ website at www.thompsonim.com and on the SEC’s website at www.sec.gov.
Information About Portfolio Securities
The Funds file complete schedules of their portfolio holdings with the Securities and Exchange Commission for the Funds’ first and third quarters of its fiscal year on Form N-Q. The Funds’ Forms N-Q are available on the Securities and Exchange Commission’s website at www.sec.gov. You may also review and copy those documents by visiting the Securities and Exchange Commission’s Public Reference Room in Washington, D.C. Information on the operation of the Public Reference Room may be obtained by calling the Securities and Exchange Commission at 1-800-SEC-0330. The Funds’ Forms N-Q are also available without charge, upon request, by calling 1-800-999-0887.
46
Item 2. Code of Ethics.
Not required in Semi-Annual Reports on Form N-CSR.
Item 3. Audit Committee Financial Expert.
Not required in Semi-Annual Reports on Form N-CSR.
Item 4. Principal Accountant Fees and Services.
Not required in Semi-Annual Reports on Form N-CSR.
Item 5. Audit Committee of Listed Registrants.
Not applicable to this Registrant because it is not a “listed issuer” within the meaning of Rule 10A-3 under the Securities Exchange Act of 1934.
Item 6. Investments.
The required Schedules of Investments in securities of unaffiliated issuers is included as part of the Registrant’s Semi-Annual Report to Shareholders dated as of May 31, 2018 provided under Item 1 of this Form N-CSR.
Item 7. Disclosure of Proxy Voting Policies and Procedures for Closed-End Management Investment Companies.
Not applicable to this Registrant because it is not a closed-end management investment company.
Item 8. Portfolio Managers of Closed-End Management Investment Companies.
Not applicable to this Registrant because it is not a closed-end management investment company.
Item 9. Purchases of Equity Securities by Closed-End Management Investment Companies and Affiliated Purchasers.
Not applicable to this Registrant because it is not a closed-end management investment company.
Item 10. Submission of Matters to a Vote of Securities Holders.
The Registrant has not made any material changes to the procedures by which shareholders may recommend nominees to the Registrant's Board of Directors after the Registrant last provided disclosure in response to the requirements of Item 407(c)(2)(iv) of Regulation S-K or this Item.
2
Item 11. Controls and Procedures.
| (a) | Disclosure Controls and Procedures. Based on an evaluation of the Registrant’s disclosure controls and procedures (as defined in Rule 30a-3(c) under the Investment Company Act of 1940) carried out under the supervision and with the participation of the Registrant’s management, including its principal executive and financial officers, within 90 days prior to the filing date of this report on Form N-CSR, the Registrant’s principal executive and financial officers have concluded that the design and operation of the Registrant’s disclosure controls and procedures are effective in providing reasonable assurance that the information required to be disclosed on Form N-CSR is recorded, processed, summarized and reported within the applicable time periods. |
| | |
| (b) | Change in Internal Controls Over Financial Reporting. There were no changes in the Registrant’s internal control over financial reporting (as defined in Rule 30a-3(d) under the Investment Company Act of 1940) that occurred during the Registrant’s second fiscal quarter of the period covered by this Form N-CSR that have materially affected, or are reasonably likely to materially affect, the Registrant’s internal control over financial reporting. |
Item 12. Disclosure of Securities Lending Activities for Closed-End Management Investment Companies.
Not applicable to this Registrant because it is not a closed-end management investment company.
Item 13. Exhibits.
The following exhibits are attached to this Form N-CSR:
| | Exhibit No. | | Description of Exhibit | |
| | 12(a)(1) | | The Code of Ethics for the Registrant’s Principal Executive Officer, Principal Financial Officer and Principal Accounting Officer referred to in Item 2 was filed as Exhibit 12(a)(1) to the Registrant’s Certified Shareholder Report on Form N-CSR filed on January 28, 2005, and is incorporated herein by reference |
| | | | |
| | 12(a)(2)-1 | | Certification of Principal Executive Officer Required by Section 302 of the Sarbanes-Oxley Act of 2002 |
| | | | |
| | 12(a)(2)-2 | | Certification of Principal Financial Officer Required by Section 302 of the Sarbanes-Oxley Act of 2002 |
| | | | |
| | 12(b) | | Certification of Chief Executive Officer and Chief Financial Officer Required by Section 906 of the Sarbanes-Oxley Act of 2002 |
3
SIGNATURES
Pursuant to the requirements of the Securities Exchange Act of 1934 and the Investment Company Act of 1940, the Registrant has duly caused this report to be signed on its behalf by the undersigned, thereunto duly authorized, on this 27th day of July, 2018.
| THOMPSON IM FUNDS, INC. |
| |
| By: | /s/ Jason L. Stephens | |
| | Jason L. Stephens, Chief Executive |
| | Officer |
Pursuant to the requirements of the Securities Exchange Act of 1934 and the Investment Company Act of 1940, this report has been signed below by the following persons on behalf of the Registrant and in the capacities indicated on this 27th day of July, 2018.
| By: | /s/ Jason L. Stephens | |
| | Jason L. Stephens, Chief Executive |
| | Officer (Principal Executive Officer) |
| | |
| By: | /s/ Penny Hubbard | |
| | Penny Hubbard, Chief Financial |
| | Officer (Principal Financial Officer) |
4
