UNITED STATES
SECURITIES AND EXCHANGE COMMISSION
Washington, D.C. 20549
FORM N-CSR
CERTIFIED SHAREHOLDER REPORT OF REGISTERED
MANAGEMENT
INVESTMENT COMPANIES
Investment Company Act File Number 811-4946
THOMPSON IM FUNDS, INC.
(Exact name of registrant as specified in charter)
918 Deming Way
Madison, Wisconsin 53717
(Address of principal executive offices)--(Zip code)
Jason L. Stephens
Chief Executive Officer
Thompson IM Funds, Inc.
918 Deming Way
Madison, Wisconsin 53717
(Name and address of agent for service)
With a copy to:
Matthew C. Vogel, Esq.
Quarles & Brady LLP
411 East Wisconsin Avenue
Milwaukee, Wisconsin 53202
Registrant's telephone number, including area code: (608) 827-5700
Date of fiscal year end: November 30, 2017
Date of reporting period: May 31, 2017
Form N-CSR is to be used by management investment companies to file reports with the Commission not later than 10 days after the transmission to stockholders of any report that is required to be transmitted to stockholders under Rule 30e-1 under the Investment Company Act of 1940 (17 CFR 270.30e-1). The Commission may use the information provided on Form N-CSR in its regulatory, disclosure review, inspection and policymaking roles.
A registrant is required to disclose the information specified by Form N-CSR, and the Commission will make this information public. A registrant is not required to respond to the collection of information contained in Form N-CSR unless the Form displays a currently valid Office of Management and Budget ("OMB") control number. Please direct comments concerning the accuracy of the information collection burden estimate and any suggestions for reducing the burden to Secretary, Securities and Exchange Commission, 450 Fifth Street, N.W., Washington, DC 20549-0609. The OMB has reviewed this collection of information under the clearance requirements of 44 U.S.C. § 3507.
Item 1. Report to Stockholders.
THOMPSON IM FUNDS, INC.
SEMI-ANNUAL REPORT TO SHAREHOLDERS
NOTE ON FORWARD-LOOKING STATEMENTS
The matters discussed in this report may constitute forward-looking statements. These include any Advisor or portfolio manager predictions, assessments, analyses or outlooks for individual securities, industries, investment styles, market sectors, interest rates, economic trends and/or markets. These statements involve risks and uncertainties. In addition to the general risks described for each Fund in its current Prospectus, other factors bearing on these reports include the accuracy of the Advisor’s or portfolio manager’s forecasts and predictions, the appropriateness of the investment strategies designed by the Advisor or portfolio manager and the ability of the Advisor or portfolio manager to implement its strategies efficiently and successfully. Any one or more of these factors, as well as other risks affecting the securities markets generally, could cause the actual results of any Fund to differ materially as compared to its benchmarks.
1
THOMPSON IM FUNDS, INC.
SEMI-ANNUAL REPORT TO SHAREHOLDERS
May 31, 2017
CONTENTS
| | Page(s) |
| LARGECAP FUND | | |
| Investment review | | 3-5 |
| Schedule of investments | | 6-8 |
| |
| MIDCAP FUND | | |
| Investment review | | 9-11 |
| Schedule of investments | | 12-14 |
| |
| BOND FUND | | |
| Investment review | | 15-17 |
| Schedule of investments | | 18-29 |
| |
| FUND EXPENSE EXAMPLES | | 30 |
| |
| FINANCIAL STATEMENTS | | |
| Statements of assets and liabilities | | 31 |
| Statements of operations | | 32 |
| Statements of changes in net assets | | 33 |
| Notes to financial statements | | 34-41 |
| Financial highlights | | 42-44 |
| |
| ADDITIONAL INFORMATION | | 45 |
This report contains information for existing shareholders of Thompson IM Funds, Inc. It
does not constitute an offer to sell. This Semi-Annual Report is authorized for distribution to prospective investors
only when preceded or accompanied by a Fund Prospectus, which contains information about
the Funds’ objectives and policies, risks, management, expenses and other information.
A Prospectus can be obtained by calling 1-800-999-0887.
Please read your Prospectus carefully.
2
| LARGECAP FUND INVESTMENT REVIEW (Unaudited) |
| May 31, 2017 |
Portfolio Managers
James T. Evans, CFA
Jason L. Stephens, CFA
Performance
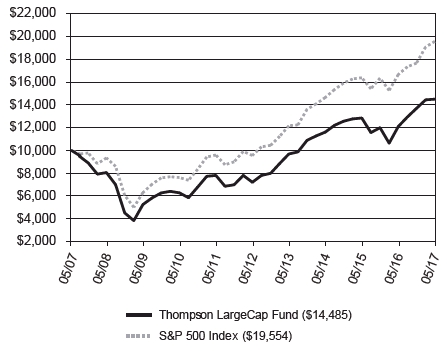
The LargeCap Fund produced a total return of 5.89% for the six-month period ended May 31, 2017, as compared to its benchmark, the S&P 500 Index, which returned 10.81%.
Comparison of Change in Value of a Hypothetical $10,000 Investment
| Average Annual Total Returns |
| Through 05/31/17 |
| | 1 Year | | 3 Year | | 5 Year | | 10 Year |
| Thompson LargeCap Fund | | 19.86 | % | | 7.69 | % | | 15.01 | % | | | 3.77 | % | |
| S&P 500 Index | | 17.47 | % | | 10.14 | % | | 15.42 | % | | | 6.94 | % | |
Gross Expense Ratio as of 03/31/17 was 1.25%.
Net Expense Ratio after reimbursement as of 03/31/17 was 1.10%.*
| * | The Advisor has contractually agreed to waive management fees and/or reimburse expenses incurred by the LargeCap Fund through March 31, 2018, so that the annual operating expenses of the Fund do not exceed 1.10% of its average daily net assets. Net expense ratios are current as of the most recent Prospectus and are applicable to investors. |
Performance data quoted represents past performance; past performance does not guarantee future results. The investment return and principal value of an investment will fluctuate so that an investor’s shares, when redeemed, may be worth more or less than their original cost. Current performance of the Fund may be lower or higher than the performance quoted. Performance data current to the most recent month-end may be obtained by calling 1-800-999-0887 or visiting www.thompsonim.com.
Results include the reinvestment of all dividends and capital gains distributions. Investment performance reflects all fee waivers that may be in effect. In the absence of such waivers, total return would be reduced. The performance information reflected in the graph and the table above does not reflect the deduction of taxes that a shareholder would pay on fund distributions or the redemption of fund shares, nor does it imply future performance. The S&P 500 Index is an unmanaged index commonly used to measure the performance of U.S. stocks. You cannot directly invest in an index.
The S&P 500 Index is a product of S&P Dow Jones Indices LLC and has been licensed for use by Thompson Investment Management, Inc. S&P® and S&P 500® are registered trademarks of Standard & Poor’s Financial Services LLC (“S&P”). The Thompson IM Funds are not sponsored, endorsed, sold or promoted by S&P Dow Jones Indices LLC, Dow Jones, S&P or their respective affiliates, and none of S&P Dow Jones Indices LLC, Dow Jones, S&P nor their respective affiliates makes any representation regarding the advisability of investing in such products.
See Notes to Financial Statements.
3
| LARGECAP FUND INVESTMENT REVIEW (Unaudited) (Continued) |
| May 31, 2017 |
Management Commentary
The Fund finished the prior annual year enjoying a strong bump in absolute and relative performance due to the effects of the “Trump Trade”. Investors anticipated an economic policy of lowering taxes and increased spending from the then newly elected President. It was assumed this would result in an increase in deficit spending and an increase in inflation. The Fund has long held an allocation designed to hopefully outperform its benchmark in a rising interest rate environment, and our holdings reacted as we expected they would as rates rose in November.
Thus the semi-annual period began with the 10-year Treasury yielding 2.382%. While rates managed to climb to around 2.6% twice during the time period, they still finished at a six-month low of 2.204% as the semi-annual period ended. This was despite the Federal Reserve raising short term rates in December and March and a consensus expectation for a future hike in June 2017. Unfortunately, as interest rates declined, the gap between the Fund’s performance and its benchmark widened.
Lower interest rates were not the only reason the Fund lagged during the semi-annual period. Sectors and industries that we expected would benefit from a lower regulatory burden, such as banking and health care, saw their performance slip throughout the time period. Due to a variety of political controversies surrounding the Trump administration, investors appeared to grow more pessimistic about his ability to enact meaningful changes. As a result, the stocks gave up the gains they had experienced in November 2016. In their place, the FANG stocks (Facebook, Apple, Netflix, and Google parent Alphabet) that had dominated index returns in 2015 resumed their market leadership, along with other high flyers such as Tesla. With the exception of Alphabet, we remain underweight the rest of these names due to what we think are extreme valuations and unrealistic growth expectations.
We believe investors are overreacting to news out of Washington, D.C. Our positioning of the Fund was never predicated on a prediction of Trump’s victory in November 2016, but rather a bottom-up view on the growth prospects of the companies we owned relative to their valuations. They were simply far more attractive, in our opinion, than many other stocks that normally benefit from lower interest rates. So while the performance of our holdings certainly benefited from investor enthusiasm over President Trump’s victory, we believe they should have already been benefiting from their own fundamentals. These fundamentals are largely independent of government policy, and we believe should position the companies to continue to boost earnings regardless of what happens in Washington. The evidence to counteract the “Washington controls all” narrative will come as earnings are reported throughout the rest of the year.
The bottom line is that we remain quite optimistic about our holdings and the future potential performance of the Fund. While it can be trying to lag in the meantime, we believe longer-term interest rates cannot remain suppressed forever. As the Fund has demonstrated in the past, our positioning is such that if and when the reversal occurs we believe the benefit to shareholders would be swift and substantial. For now we are staying the course to take advantage of this potential opportunity.
Opinions expressed are subject to change, are not guaranteed and should not be considered investment advice.
Mutual fund investing involves risk. Principal loss is possible. Investments in smaller companies involve additional risks such as limited liquidity and greater volatility. Investments in American Depositary Receipts (“ADRs”) are subject to some extent to the risks associated with directly investing in securities of foreign issuers, including the risk of changes in currency exchange rates, expropriation or nationalization of assets, and the impact of political, diplomatic, or social events. Investments in real estate securities may involve greater risk and volatility including greater exposure to economic downturns and changes in real estate values, rents, property taxes, tax, and other laws. A REIT’s share price may decline because of adverse developments affecting the real estate industry.
Please refer to the Schedule of Investments on page 6 of this report for holdings information. The management commentary above as well as Fund holdings and asset/sector allocations should not be considered a recommendation to buy or sell any security. In addition, please note that Fund holdings and asset/sector allocations are subject to change.
Yield is the income earned from a bond, which takes into account the sum of the interest payment, the redemption value at the bond’s maturity, and the initial purchase price of the bond.
Earnings Growth is a measure of growth in a company’s net income over a specific period, often one year. It is not a prediction of the Fund’s future returns.
See Notes to Financial Statements.
4
| LARGECAP FUND INVESTMENT REVIEW (Unaudited) (Continued) |
| May 31, 2017 |
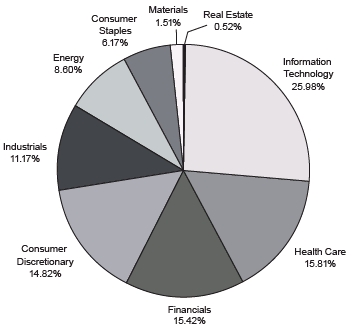
Sector Weightings at 05/31/17
% of Total Investments
| Top 10 Equity Holdings at 05/31/17 |
| | | | % of Fund’s |
| Company | | Industry | | Net Assets |
| Alphabet, Inc. Class A | | Internet Software & Services | | | 3.25 | % | |
| Microsoft Corp. | | Software | | | 2.64 | % | |
| Exxon Mobil Corp. | | Oil, Gas & Consumable Fuels | | | 2.47 | % | |
| Qualcomm, Inc. | | Semiconductors & Semiconductor Equipment | | | 2.18 | % | |
| Bank of America Corp. | | Banks | | | 2.12 | % | |
| McKesson Corp. | | Health Care Providers & Services | | | 2.11 | % | |
| Citigroup Inc. | | Banks | | | 2.08 | % | |
| Cisco Systems, Inc. | | Communications Equipment | | | 2.03 | % | |
| Express Scripts Holding Co. | | Health Care Providers & Services | | | 2.01 | % | |
| Target Corp. | | Multiline Retail | | | 2.01 | % | |
As of May 31, 2017, 100.1% of the Fund’s assets were in equity and short-term investments.
See Notes to Financial Statements.
5
| LARGECAP FUND SCHEDULE OF INVESTMENTS (Unaudited) |
| May 31, 2017 |
| | | | | Shares | | Value |
| COMMON STOCKS - 100.1% | | | | | |
| | | | | | | |
| Consumer Discretionary - 14.9% | | | | | |
| | Automobiles - 1.0% | | | | | |
| | Harley-Davidson, Inc. | | 22,725 | | $ | 1,204,652 |
| | |
| | Distributors - 1.0% | | | | | |
| | LKQ Corp. (a) | | 38,175 | | | 1,202,131 |
| | |
| | Household Durables - 1.3% | | | | | |
| | D.R. Horton, Inc. | | 20,950 | | | 684,856 |
| | TopBuild Corp. (a) | | 16,152 | | | 864,940 |
| | | | | | | 1,549,796 |
| | Leisure Products - 1.0% | | | | | |
| | Brunswick Corp. | | 21,500 | | | 1,188,090 |
| | |
| | Media - 5.2% | | | | | |
| | CBS Corp. Class B | | 29,025 | | | 1,773,718 |
| | The Walt Disney Co. | | 11,775 | | | 1,270,994 |
| | Time Warner Inc. | | 9,325 | | | 927,744 |
| | Viacom Inc. Class B | | 68,475 | | | 2,382,245 |
| | | | | | | 6,354,701 |
| | Multiline Retail - 2.8% | | | | | |
| | Kohl’s Corp. | | 25,710 | | | 988,035 |
| | Target Corp. | | 44,385 | | | 2,447,833 |
| | | | | | | 3,435,868 |
| | Specialty Retail - 2.1% | | | | | |
| | Bed Bath & Beyond Inc. | | 41,575 | | | 1,430,596 |
| | Lumber Liquidators Holdings, Inc. (a) | | 36,775 | | | 1,065,740 |
| | | | | | | 2,496,336 |
| | Textiles, Apparel & Luxury | | | | | |
| | Goods - 0.5% | | | | | |
| | Hanesbrands, Inc. | | 31,425 | | | 648,926 |
| | |
| Consumer Staples - 6.2% | | | | | |
| | Food & Staples Retailing - 4.5% | | | | | |
| | CVS Health Corp. | | 27,675 | | | 2,126,270 |
| | Walgreens Boots Alliance, Inc. | | 28,525 | | | 2,311,095 |
| | Wal-Mart Stores, Inc. | | 12,600 | | | 990,360 |
| | | | | | | 5,427,725 |
| | Household Products - 1.7% | | | | | |
| | Kimberly-Clark Corp. | | 9,268 | | | 1,202,338 |
| | The Procter & Gamble Co. | | 10,200 | | | 898,518 |
| | | | | | | 2,100,856 |
| Energy - 8.6% | | | | | |
| | Energy Equipment & | | | | | |
| | Services - 1.2% | | | | | |
| | Schlumberger Ltd. | | 20,844 | | | 1,450,534 |
| | |
| | Oil, Gas & Consumable | | | | | |
| | Fuels - 7.4% | | | | | |
| | Apache Corp. | | 19,475 | | | 910,651 |
| | Chevron Corp. | | 18,970 | | | 1,963,016 |
| | Devon Energy Corp. | | 40,325 | | | 1,370,244 |
| | EOG Resources, Inc. | | 11,975 | | | 1,081,462 |
| | Exxon Mobil Corp. | | 37,420 | | | 3,012,310 |
| | Noble Energy, Inc. | | 24,725 | | | 709,360 |
| | | | | | | 9,047,043 |
| Financials - 15.5% | | | | | |
| | Banks - 11.0% | | | | | |
| | Associated Banc-Corp | | 50,102 | | | 1,194,933 |
| | Bank of America Corp. | | 115,525 | | | 2,588,915 |
| | CIT Group Inc. | | 34,975 | | | 1,575,624 |
| | Citigroup Inc. | | 41,825 | | | 2,532,085 |
| | First Horizon National Corp. | | 63,335 | | | 1,072,895 |
| | JPMorgan Chase & Co. | | 28,325 | | | 2,326,899 |
| | PNC Financial Services Group, Inc. | | 7,925 | | | 940,698 |
| | SunTrust Banks, Inc. | | 11,300 | | | 603,081 |
| | Zions Bancorporation | | 13,800 | | | 552,966 |
| | | | | | | 13,388,096 |
| | Capital Markets - 3.0% | | | | | |
| | Northern Trust Corp. | | 13,785 | | | 1,205,360 |
| | State Street Corp. | | 29,650 | | | 2,415,289 |
| | | | | | | 3,620,649 |
| | Consumer Finance - 0.4% | | | | | |
| | Discover Financial Services | | 8,770 | | | 514,799 |
| | |
| | Insurance - 1.1% | | | | | |
| | FNF Group | | 30,025 | | | 1,279,365 |
| | |
| Health Care - 15.8% | | | | | |
| | Biotechnology - 7.0% | | | | | |
| | AbbVie Inc. | | 29,725 | | | 1,962,444 |
| | Amgen Inc. | | 9,400 | | | 1,459,256 |
| | Celgene Corp. (a) | | 19,875 | | | 2,273,899 |
| | Exact Sciences Corp. (a) | | 61,575 | | | 2,245,640 |
| | Shire PLC ADR | | 3,602 | | | 622,137 |
| | | | | | | 8,563,376 |
See Notes to Financial Statements.
6
| LARGECAP FUND SCHEDULE OF INVESTMENTS (Unaudited) (Continued) |
| May 31, 2017 |
| | | | | Shares | | Value |
| COMMON STOCKS (continued) | | | | | |
| | | | | | |
| Health Care (continued) | | | | | |
| | Health Care Equipment & | | | | | |
| | Supplies - 1.1% | | | | | |
| | Zimmer Biomet Holdings, Inc. | | 11,200 | | $ | 1,335,152 |
| | |
| | Health Care Providers & | | | | | |
| | Services - 5.6% | | | | | |
| | Express Scripts Holding Co. (a) | | 41,075 | | | 2,454,231 |
| | Hanger, Inc. (a) | | 149,825 | | | 1,860,077 |
| | McKesson Corp. | | 15,760 | | | 2,570,298 |
| | | | | | | 6,884,606 |
| | Pharmaceuticals - 2.1% | | | | | |
| | Johnson & Johnson | | 9,710 | | | 1,245,308 |
| | Pfizer Inc. | | 38,475 | | | 1,256,209 |
| | | | | | | 2,501,517 |
| Industrials - 11.1% | | | | | |
| | Air Freight & Logistics - 1.3% | | | | | |
| | FedEx Corp. | | 7,925 | | | 1,536,182 |
| | |
| | Airlines - 0.8% | | | | | |
| | Delta Air Lines, Inc. | | 20,800 | | | 1,021,904 |
| | |
| | Building Products - 3.0% | | | | | |
| | Johnson Controls Int’l. PLC | | 44,166 | | | 1,844,372 |
| | Masco Corp. | | 50,325 | | | 1,874,606 |
| | | | | | | 3,718,978 |
| | Electrical Equipment - 2.8% | | | | | |
| | ABB Ltd. ADR | | 73,675 | | | 1,851,453 |
| | Rockwell Automation, Inc. | | 9,700 | | | 1,539,584 |
| | | | | | | 3,391,037 |
| | Industrial Conglomerates - 1.9% | | | | | |
| | General Electric Co. | | 85,200 | | | 2,332,776 |
| | |
| | Machinery - 0.5% | | | | | |
| | Ingersoll-Rand PLC | | 6,900 | | | 618,240 |
| | | |
| | Trading Companies & | | | | | |
| | Distributors - 0.8% | | | | | |
| | HD Supply Holdings, Inc. (a) | | 25,000 | | | 1,008,750 |
| | |
| Information Technology - 26.0% | | | | | |
| | Communications | | | | | |
| | Equipment - 3.8% | | | | | |
| | Cisco Systems, Inc. | | 78,660 | | | 2,480,150 |
| | Lumentum Holdings, Inc. (a) | | 18,107 | | | 1,033,004 |
| | Viavi Solutions Inc. (a) | | 101,535 | | | 1,140,238 |
| | | | | | | 4,653,392 |
| | Electronic Equipment, | | | | | |
| | Instruments & | | | | | |
| | Components - 1.8% | | | | | |
| | Corning Inc. | | 55,975 | | | 1,628,873 |
| | Maxwell Technologies, Inc. (a) | | 93,997 | | | 544,243 |
| | | | | | | 2,173,116 |
| | Internet Software & | | | | | |
| | Services - 3.8% | | | | | |
| | Alphabet, Inc. Class A (a) | | 4,020 | | | 3,968,102 |
| | eBay Inc. (a) | | 20,770 | | | 712,411 |
| | | | | | | 4,680,513 |
| | IT Services - 3.4% | | | | | |
| | Alliance Data Systems Corp. | | 8,250 | | | 1,989,322 |
| | PayPal Holdings, Inc. (a) | | 28,770 | | | 1,502,082 |
| | Visa Inc. Class A | | 6,475 | | | 616,614 |
| | | | | | | 4,108,018 |
| | Semiconductors & | | | | | |
| | Semiconductor | | | | | |
| | Equipment - 6.8% | | | | | |
| | Infineon Technologies A.G. ADR | | 50,875 | | | 1,126,881 |
| | Intel Corp. | | 34,775 | | | 1,255,725 |
| | Maxim Integrated Products, Inc. | | 19,655 | | | 939,509 |
| | NXP Semiconductors N.V. (a) | | 20,525 | | | 2,255,697 |
| | Qualcomm, Inc. | | 46,405 | | | 2,657,614 |
| | | | | | | 8,235,426 |
| | Software - 4.3% | | | | | |
| | Microsoft Corp. | | 46,151 | | | 3,223,186 |
| | Oracle Corp. | | 44,475 | | | 2,018,720 |
| | | | | | | 5,241,906 |
| | Technology Hardware, Storage | | | | | |
| | & Peripherals - 2.1% | | | | | |
| | Apple Inc. | | 9,775 | | | 1,493,229 |
| | Hewlett Packard Enterprise Co. | | 27,025 | | | 508,340 |
| | HP Inc. | | 32,225 | | | 604,541 |
| | | | | | | 2,606,110 |
| Materials - 1.5% | | | | | |
| | Metals & Mining - 1.5% | | | | | |
| | Freeport-McMoRan Inc. (a) | | 160,750 | | | 1,847,018 |
| | | | | | |
| Real Estate - 0.5% | | | | | |
| | Real Estate Investment | | | | | |
| | Trusts - 0.5% | | | | | |
| | DiamondRock Hospitality Co. | | 56,950 | | | 631,576 |
| | | |
| | TOTAL COMMON STOCKS | | | | | |
| | (COST $126,504,113) | | | | | 121,999,160 |
See Notes to Financial Statements.
7
| LARGECAP FUND SCHEDULE OF INVESTMENTS (Unaudited) (Continued) |
| May 31, 2017 |
| | | | | Shares | | Value |
| SHORT-TERM INVESTMENTS - 0.0% | | | | | | |
| | | | | | | |
| Money Market Funds - 0.0% | | | | | | |
| | Fidelity Inst’l. Government | | | | | | |
| | Portfolio Class I, 0.652% (b) | | 5,083 | | $ | 5,083 | |
| | | | | | | | |
| | Total Money Market Funds | | | | | 5,083 | |
| | | | | | | | |
| | TOTAL SHORT-TERM | | | | | | |
| | INVESTMENTS (COST $5,083) | | | | | 5,083 | |
| | | | | | | | |
| | TOTAL INVESTMENTS - 100.1% | | | | | | |
| | (COST $126,509,196) | | | | | 122,004,243 | |
| | | | | | | | |
| | NET OTHER ASSETS AND | | | | | | |
| | LIABILITIES - (0.1%) | | | | | (63,335 | ) |
| | | | | | | | |
| | NET ASSETS - 100.0% | | | | $ | 121,940,908 | |
| | (a) | Non-income producing security. |
| (b) | Represents the 7-day yield at May 31, 2017. |
| | ADR: | American Depositary Receipt |
| A.G.: | Aktiengesellschaft is the German term for a public limited liability corporation. |
| N.V.: | Naamloze Vennootschap is the Dutch term for a public limited liability corporation. |
| PLC: | Public Limited Company |
The Global Industry Classification Standard (“GICS”) was developed by and is the exclusive property and a service mark of MSCI Inc. (“MSCI”) and Standard & Poor’s Financial Services LLC (“S&P”) and is licensed for use by Thompson Investment Management, Inc. Neither MSCI, S&P, nor any other party involved in making or compiling the GICS or any GICS classifications makes any warranties with respect thereto or the results to be obtained by the use thereof, and no such party shall have any liability whatsoever with respect thereto.
See Notes to Financial Statements.
8
| MIDCAP FUND INVESTMENT REVIEW (Unaudited) |
| May 31, 2017 |
| Portfolio Managers |
| James T. Evans, CFA |
| Jason L. Stephens, CFA |
Performance
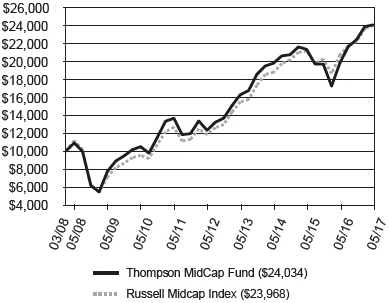
The MidCap Fund produced a total return of 7.43% for the six-month period ended May 31, 2017, as compared to its benchmark, the Russell Midcap Index, which returned 8.14%.
Comparison of Change in Value of a Hypothetical $10,000 Investment
 |
| |
| Average Annual Total Returns |
| Through 05/31/17 |
| | | | | | | | Since |
| | | | | | | | Inception |
| | 1 Year | | 3 Year | | 5 Year | | (03/31/08) |
| Thompson MidCap Fund | | 21.49% | | 6.73% | | 14.31% | | 10.04% |
| Russell Midcap Index | | 15.86% | | 8.50% | | 15.13% | | 10.01% |
Gross Expense Ratio as of 03/31/17 was 1.50%.
Net Expense Ratio after reimbursement as of 03/31/17 was 1.20%.*
| * | The Advisor has contractually agreed to waive management fees and/or reimburse expenses incurred by the MidCap Fund through March 31, 2018, so that the annual operating expenses of the Fund do not exceed 1.20% of its average daily net assets. Net expense ratios are current as of the most recent Prospectus and are applicable to investors. |
Performance data quoted represents past performance; past performance does not guarantee future results. The investment return and principal value of an investment will fluctuate so that an investor’s shares, when redeemed, may be worth more or less than their original cost. Current performance of the Fund may be lower or higher than the performance quoted. Performance data current to the most recent month-end may be obtained by calling 1-800-999-0887 or visiting www.thompsonim.com.
Results include the reinvestment of all dividends and capital gains distributions. Investment performance reflects all fee waivers that may be in effect. In the absence of such waivers, total return would be reduced. The performance information reflected in the graph and the table above does not reflect the deduction of taxes that a shareholder would pay on fund distributions or the redemption of fund shares, nor does it imply future performance. The Russell Midcap Index measures the performance of the 800 smallest companies in the Russell 1000 Index based on total market capitalization. You cannot directly invest in an index.
FTSE Russell is the source and owner of the trademarks, service marks, and copyrights related to the Russell Indexes. “FTSE®” and “Russell®” are trademarks of the London Stock Exchange Group.
See Notes to Financial Statements.
9
| MIDCAP FUND INVESTMENT REVIEW (Unaudited) (Continued) |
| May 31, 2017 |
Management Commentary
There was no individual stock or sector that drove the Fund’s modest lag over the last 6 months. In fact, teasing out a theme that neatly tells the story for the period has proven difficult. The only real standout was Exact Sciences, the outperformance of which was offset by a handful of poor performers whose only clear relation to one another is that they happen to exist in the same portfolio. Sometimes broader sector trends are not reflected well in the movement of the Fund’s biggest contributors, especially with a portfolio invested in medium-sized companies for which the information flow tends to be thinner and trading more volatile than that of their larger-sized brethren. This period provides such an example. The Fund’s most meaningful stock fluctuations were driven by disparate security-specific reasons, often largely disconnected from macro-level themes.
While the reasons behind the Fund’s relative performance differential would require a deep-dive into the stock-specific issues of 10 or more Fund holdings, a discussion of absolute performance trends across sectors is much more straightforward. So far this fiscal year Health Care, Information Technology and Utilities have been the strongest sectors, and Energy the weakest. Health Care stocks really appear to us to have just begun to recover from depressed valuations, while investors looking for growth flooded into the Information Technology Sector. It doesn’t hurt that large-cap tech has been performing really well relative to other sectors, and that’s one rising tide that has floated quite a few boats as investors reconsider buyout valuations for smaller companies. Utilities benefitted from a decline in the 10-year treasury yield. Finally, energy stocks tracked a decline in oil prices.
Looking forward, we expect longer-term interest rates to start to rise again and the economy to continue growing. If we are correct, Utilities stocks (which often act as proxies for long-maturity bonds) will not likely perform as well going forward. We still like the prospect for many Information Technology and Health Care stocks, and have been therefore maintaining our overweight in those sectors relative to the benchmark. We anticipate that banks, which typically benefit both from rising rates and a strong housing market, will restart their stalled recovery, and have also been continuing to overweight that industry.
While it is unusual to have a winner the magnitude of Exact Sciences within a six-month timeframe, it is also unusual to have enough poor performers to largely offset said winner. As both the top positive and negative performers revert to a more “normal” range of outcomes in future time periods, we believe our efforts to find value in almost every sector means the current portfolio composition gives the Fund the opportunity to remain competitive going forward.
Opinions expressed are subject to change, are not guaranteed and should not be considered investment advice.
Mutual fund investing involves risk. Principal loss is possible. Midcap companies tend to have more limited liquidity and greater volatility than large-capitalization companies. Investments in American Depositary Receipts (“ADRs”) are subject to some extent to the risks associated with directly investing in securities of foreign issuers, including the risk of changes in currency exchange rates, expropriation or nationalization of assets, and the impact of political, diplomatic, or social events. Investments in real estate securities may involve greater risk and volatility including greater exposure to economic downturns and changes in real estate values, rents, property taxes, tax, and other laws. A REIT’s share price may decline because of adverse developments affecting the real estate industry.
Please refer to the Schedule of Investments on page 12 of this report for holdings information. The management commentary above as well as Fund holdings and asset/sector allocations should not be considered a recommendation to buy or sell any security. In addition, please note that Fund holdings and asset/sector allocations are subject to change.
See Notes to Financial Statements.
10
| MIDCAP FUND INVESTMENT REVIEW (Unaudited) (Continued) |
| May 31, 2017 |
| Sector Weightings at 05/31/17 |
| % of Total Investments |
| |
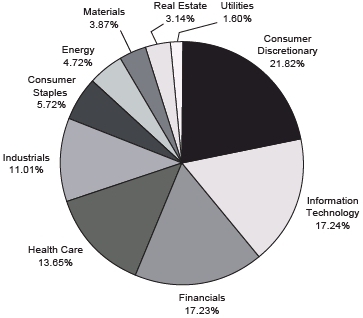 |
| Top 10 Equity Holdings at 05/31/17 |
| | | | % of Fund’s |
| Company | | Industry | | Net Assets |
| Hanger, Inc. | | Health Care Providers & Services | | 2.47% |
| NXP Semiconductors N.V. | | Semiconductors & Semiconductor Equipment | | 2.33% |
| Alliance Data Systems Corp. | | IT Services | | 2.12% |
| CIT Group Inc. | | Banks | | 2.05% |
| Bed Bath & Beyond Inc. | | Specialty Retail | | 1.99% |
| Exact Sciences Corp. | | Biotechnology | | 1.96% |
| Jazz Pharmaceuticals PLC | | Pharmaceuticals | | 1.89% |
| Lumber Liquidators Holdings, Inc. | | Specialty Retail | | 1.86% |
| Northern Trust Corp. | | Capital Markets | | 1.72% |
| Masco Corp. | | Building Products | | 1.65% |
As of May 31, 2017, 100.1% of the Fund’s net assets were in equity and short-term investments.
See Notes to Financial Statements.
11
| MIDCAP FUND SCHEDULE OF INVESTMENTS (Unaudited) |
| May 31, 2017 |
| | | | | Shares | | Value |
| COMMON STOCKS - 99.5% | | | | | |
| | | | | | |
| Consumer Discretionary - 21.8% | | | | | |
| | Automobiles - 1.2% | | | | | |
| | Harley-Davidson, Inc. | | 10,625 | | $ | 563,231 |
| | |
| | Distributors - 1.4% | | | | | |
| | LKQ Corp. (a) | | 20,445 | | | 643,813 |
| | |
| | Hotels, Restaurants & | | | | | |
| | Leisure - 1.0% | | | | | |
| | Extended Stay America, Inc. | | 27,325 | | | 497,315 |
| | |
| | Household Durables - 5.2% | | | | | |
| | D.R. Horton, Inc. | | 15,500 | | | 506,695 |
| | Newell Brands, Inc. | | 10,306 | | | 545,703 |
| | PulteGroup Inc. | | 21,750 | | | 493,072 |
| | Toll Brothers, Inc. | | 7,400 | | | 273,134 |
| | TopBuild Corp. (a) | | 12,125 | | | 649,294 |
| | | | | | | 2,467,898 |
| | Leisure Products - 2.2% | | | | | |
| | Brunswick Corp. | | 10,275 | | | 567,796 |
| | Mattel, Inc. | | 21,475 | | | 491,992 |
| | | | | | | 1,059,788 |
| | Multiline Retail - 1.5% | | | | | |
| | Kohl’s Corp. | | 18,135 | | | 696,928 |
| | |
| | Specialty Retail - 4.7% | | | | | |
| | Bed Bath & Beyond Inc. | | 27,280 | | | 938,705 |
| | Lumber Liquidators Holdings, Inc. (a) | | 30,275 | | | 877,369 |
| | Urban Outfitters, Inc. (a) | | 20,575 | | | 388,250 |
| | | | | | | 2,204,324 |
| | Textiles, Apparel & | | | | | |
| | Luxury Goods - 4.6% | | | | | |
| | Coach, Inc. | | 8,655 | | | 399,948 |
| | Hanesbrands, Inc. | | 36,240 | | | 748,356 |
| | Michael Kors Holdings Ltd. (a) | | 12,625 | | | 418,897 |
| | Skechers U.S.A., Inc. Class A (a) | | 24,300 | | | 620,136 |
| | | | | | | 2,187,337 |
| Consumer Staples - 5.7% | | | | | |
| | Food Products - 5.7% | | | | | |
| | Amplify Snack Brands, Inc. (a) | | 55,925 | | | 511,714 |
| | Inventure Foods, Inc. (a) | | 159,100 | | | 676,175 |
| | Lamb Weston Holdings, Inc. | | 12,225 | | | 567,362 |
| | The Hain Celestial Group, Inc. (a) | | 10,025 | | | 350,173 |
| | The J. M. Smucker Co. | | 4,705 | | | 601,534 |
| | | | | | | 2,706,958 |
| Energy - 4.7% | | | | | |
| | Energy Equipment & | | | | | |
| | Services - 1.2% | | | | | |
| | Helmerich & Payne, Inc. | | 3,410 | | | 179,571 |
| | TechnipFMC PLC (a) | | 13,125 | | | 379,969 |
| | | | | | | 559,540 |
| | Oil, Gas & Consumable | | | | | |
| | Fuels - 3.5% | | | | | |
| | Cameco Corp. | | 19,750 | | | 182,095 |
| | Devon Energy Corp. | | 9,400 | | | 319,412 |
| | Noble Energy, Inc. | | 23,000 | | | 659,870 |
| | Pioneer Natural Resources Co. | | 1,275 | | | 212,747 |
| | Southwestern Energy Co. (a) | | 49,225 | | | 298,304 |
| | | | | | | 1,672,428 |
| Financials - 16.7% | | | | | |
| | Banks - 7.8% | | | | | |
| | Associated Banc-Corp | | 31,343 | | | 747,531 |
| | CIT Group Inc. | | 21,530 | | | 969,926 |
| | First Horizon National Corp. | | 45,070 | | | 763,486 |
| | Regions Financial Corp. | | 15,385 | | | 212,928 |
| | SunTrust Banks, Inc. | | 7,895 | | | 421,356 |
| | Zions Bancorporation | | 14,585 | | | 584,421 |
| | | | | | | 3,699,648 |
| | Capital Markets - 3.3% | | | | | |
| | Eaton Vance Corp. | | 10,720 | | | 499,230 |
| | Northern Trust Corp. | | 9,305 | | | 813,629 |
| | State Street Corp. | | 2,775 | | | 226,052 |
| | | | | | | 1,538,911 |
| | Consumer Finance - 1.2% | | | | | |
| | Discover Financial Services | | 9,704 | | | 569,625 |
| | |
| | Insurance - 2.5% | | | | | |
| | FNF Group | | 17,700 | | | 754,197 |
| | Unum Group | | 9,580 | | | 430,908 |
| | | | | | | 1,185,105 |
| | Mortgage Real Estate | | | | | |
| | Investment Trusts - 0.8% | | | | | |
| | Annaly Capital Management, Inc. | | 32,525 | | | 389,650 |
| | |
| | Thrifts & Mortgage | | | | | |
| | Finance - 1.1% | | | | | |
| | Flagstar Bancorp, Inc. (a) | | 17,325 | | | 500,519 |
| | |
| Health Care - 13.7% | | | | | |
| | Biotechnology - 3.1% | | | | | |
| | Exact Sciences Corp. (a) | | 25,400 | | | 926,338 |
| | MiMedx Group Inc. (a) | | 39,650 | | | 542,412 |
| | | | | | | 1,468,750 |
See Notes to Financial Statements.
12
| MIDCAP FUND SCHEDULE OF INVESTMENTS (Unaudited) (Continued) |
| May 31, 2017 |
| | | | | Shares | | Value |
| COMMON STOCKS (continued) | | | | | |
| | | | | | |
| Health Care (continued) | | | | | |
| | Health Care Equipment & | | | | | |
| | Supplies - 2.3% | | | | | |
| | Hologic, Inc. (a) | | 8,275 | | $ | 358,390 |
| | Natus Medical Inc. (a) | | 3,825 | | | 129,668 |
| | Zimmer Biomet Holdings, Inc. | | 5,200 | | | 619,892 |
| | | | | | | 1,107,950 |
| | Health Care Providers & | | | | | |
| | Services - 6.2% | | | | | |
| | Acadia Healthcare Co., Inc. (a) | | 12,775 | | | 528,118 |
| | Envision Healthcare Corp. (a) | | 8,505 | | | 464,458 |
| | Hanger, Inc. (a) | | 94,044 | | | 1,167,556 |
| | McKesson Corp. | | 2,415 | | | 393,862 |
| | Patterson Cos., Inc. | | 8,130 | | | 359,021 |
| | | | | | | 2,913,015 |
| | Life Sciences Tools & | | | | | |
| | Services - 0.2% | | | | | |
| | Fluidigm Corp. (a) | | 16,200 | | | 73,386 |
| | |
| | Pharmaceuticals - 1.9% | | | | | |
| | Jazz Pharmaceuticals PLC (a) | | 6,125 | | | 891,555 |
| | |
| Industrials - 11.0% | | | | | |
| | Building Products - 3.2% | | | | | |
| | A.O. Smith Corp. | | 6,975 | | | 382,718 |
| | Masco Corp. | | 20,975 | | | 781,319 |
| | USG Corp. (a) | | 12,250 | | | 348,390 |
| | | | | | | 1,512,427 |
| | Electrical Equipment - 2.0% | | | | | |
| | Regal Beloit Corp. | | 5,805 | | | 459,756 |
| | Rockwell Automation, Inc. | | 3,000 | | | 476,160 |
| | | | | | | 935,916 |
| | Machinery - 3.7% | | | | | |
| | Ingersoll-Rand PLC | | 5,275 | | | 472,640 |
| | Mueller Water Products, Inc. Class A | | 31,525 | | | 352,450 |
| | SPX Corp. (a) | | 8,950 | | | 215,606 |
| | SPX Flow, Inc. (a) | | 18,740 | | | 699,564 |
| | | | | | | 1,740,260 |
| | Trading Companies & | | | | | |
| | Distributors - 2.1% | | | | | |
| | HD Supply Holdings, Inc. (a) | | 17,625 | | | 711,169 |
| | W.W. Grainger, Inc. | | 1,788 | | | 308,037 |
| | | | | | | 1,019,206 |
| Information Technology - 17.3% | | | | | |
| | Communications | | | | | |
| | Equipment - 2.2% | | | | | |
| | Lumentum Holdings, Inc. (a) | | 7,956 | | | 453,890 |
| | Viavi Solutions Inc. (a) | | 52,781 | | | 592,731 |
| | | | | | | 1,046,621 |
| | Electronic Equipment, | | | | | |
| | Instruments & | | | | | |
| | Components - 1.1% | | | | | |
| | FARO Technologies, Inc. (a) | | 6,250 | | | 217,188 |
| | Maxwell Technologies, Inc. (a) | | 49,997 | | | 289,483 |
| | | | | | | 506,671 |
| | Internet Software & | | | | | |
| | Services - 0.8% | | | | | |
| | Liquidity Services, Inc. (a) | | 59,575 | | | 369,365 |
| | |
| | IT Services - 3.0% | | | | | |
| | Alliance Data Systems Corp. | | 4,145 | | | 999,484 |
| | Fiserv, Inc. (a) | | 3,194 | | | 400,144 |
| | | | | | | 1,399,628 |
| | Semiconductors & | | | | | |
| | Semiconductor | | | | | |
| | Equipment - 6.5% | | | | | |
| | Cavium Inc. (a) | | 8,825 | | | 643,960 |
| | Infineon Technologies A.G. ADR | | 25,950 | | | 574,792 |
| | Maxim Integrated Products, Inc. | | 15,291 | | | 730,910 |
| | NXP Semiconductors N.V. (a) | | 10,025 | | | 1,101,747 |
| | | | | | | 3,051,409 |
| | Software - 0.6% | | | | | |
| | Take-Two Interactive Software, Inc. (a) | | 3,935 | | | 301,972 |
| | |
| | Technology Hardware, Storage | | | | | |
| | & Peripherals - 3.1% | | | | | |
| | CPI Card Group Inc. | | 243,313 | | | 474,460 |
| | Electronics for Imaging, Inc. (a) | | 10,350 | | | 490,797 |
| | Pure Storage, Inc. Class A (a) | | 19,875 | | | 257,183 |
| | Stratasys Ltd. (a) | | 3,900 | | | 104,910 |
| | 3D Systems Corp. (a) | | 7,250 | | | 148,263 |
| | | | | | | 1,475,613 |
| Materials - 3.9% | | | | | |
| | Chemicals - 1.6% | | | | | |
| | Ecolab Inc. | | 2,581 | | | 342,860 |
| | Int’l. Flavors & Fragrances Inc. | | 2,935 | | | 404,707 |
| | | | | | | 747,567 |
| | Containers & Packaging - 0.5% | | | | | |
| | AptarGroup, Inc. | | 2,650 | | | 225,277 |
See Notes to Financial Statements.
13
| MIDCAP FUND SCHEDULE OF INVESTMENTS (Unaudited) (Continued) |
| May 31, 2017 |
| | | | | Shares | | Value |
| COMMON STOCKS (continued) | | | | | | |
| | | | | | | |
| Materials (continued) | | | | | | |
| | Metals & Mining - 1.8% | | | | | | |
| | Freeport-McMoRan Inc. (a) | | 61,650 | | $ | 708,358 | |
| | Lundin Mining Corp. | | 26,900 | | | 147,428 | |
| | | | | | | 855,786 | |
| Real Estate - 3.1% | | | | | | |
| | Real Estate Investment | | | | | | |
| | Trusts - 1.9% | | | | | | |
| | DiamondRock Hospitality Co. | | 43,300 | | | 480,197 | |
| | Host Hotels & Resorts Inc. | | 24,810 | | | 446,332 | |
| | | | | | | 926,529 | |
| | Real Estate Management & | | | | | | |
| | Development - 1.2% | | | | | | |
| | Realogy Holdings Corp. | | 18,375 | | | 559,702 | |
| | |
| Utilities - 1.6% | | | | | | |
| | Multi-Utilities - 1.6% | | | | | | |
| | MDU Resources Group, Inc. | | 15,625 | | | 425,469 | |
| | SCANA Corp. | | 4,875 | | | 332,475 | |
| | | | | | | 757,944 | |
| | |
| | TOTAL COMMON STOCKS | | | | | | |
| | (COST $40,169,565) | | | | | 47,029,567 | |
| | |
| SHORT-TERM INVESTMENTS - 0.6% | | | | | | |
| | | | | | | |
| Money Market Funds - 0.6% | | | | | | |
| | Fidelity Inst’l. Government | | | | | | |
| | Portfolio Class I, 0.652% (b) | | 263,825 | | | 263,825 | |
| | |
| | Total Money Market Funds | | | | | 263,825 | |
| | |
| | TOTAL SHORT-TERM | | | | | | |
| | INVESTMENTS (COST $263,825) | | | | | 263,825 | |
| | |
| | TOTAL INVESTMENTS - 100.1% | | | | | | |
| | (COST $40,433,390) | | | | | 47,293,392 | |
| | |
| | NET OTHER ASSETS AND | | | | | | |
| | LIABILITIES - (0.1%) | | | | | (43,813 | ) |
| | |
| | NET ASSETS - 100.0% | | | | $ | 47,249,579 | |
| | (a) | Non-income producing security. |
| (b) | Represents the 7-day yield at May 31, 2017. |
| | ADR: | American Depositary Receipt |
| A.G.: | Aktiengesellschaft is the German term for a public limited liability corporation. |
| N.V.: | Naamloze Vennootschap is the Dutch term for a public limited liability corporation. |
| PLC: | Public Limited Company |
The Global Industry Classification Standard (“GICS”) was developed by and is the exclusive property and a service mark of MSCI Inc. (“MSCI”) and Standard & Poor’s Financial Services LLC (“S&P”) and is licensed for use by Thompson Investment Management, Inc. Neither MSCI, S&P, nor any other party involved in making or compiling the GICS or any GICS classifications makes any warranties with respect thereto or the results to be obtained by the use thereof, and no such party shall have any liability whatsoever with respect thereto.
See Notes to Financial Statements.
14
| BOND FUND INVESTMENT REVIEW (Unaudited) |
| May 31, 2017 |
Portfolio Managers
James T. Evans, CFA
Jason L. Stephens, CFA
John W. Thompson, CFA
Performance
The Bond Fund produced a total return of 4.20% for the six-month period ended May 31, 2017, as compared to its benchmark, the Bloomberg Barclays U.S. Government/Credit 1-5 Year Index, which returned 1.30%, and as compared to the Bloomberg Barclays U.S. Credit 1-5 Year Index, which returned 1.91%.
Comparison of Change in Value of a Hypothetical $10,000 Investment
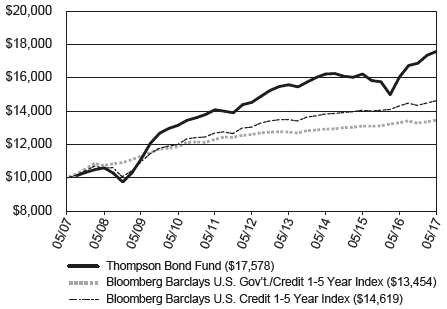
| Average Annual Total Returns |
| Through 05/31/17 |
| | 1 Year | | 3 Year | | 5 Year | | 10 Year |
| Thompson Bond Fund | | 9.60% | | 2.71% | | 3.89% | | 5.80% |
| Bloomberg Barclays U.S. Gov’t./Credit 1-5 Year Index | | 1.16% | | 1.36% | | 1.33% | | 3.01% |
| Bloomberg Barclays U.S. Credit 1-5 Year Index | | 2.22% | | 1.88% | | 2.32% | | 3.87% |
| Gross Expense Ratio as of 03/31/17 was 0.72%. | 30-Day SEC Yield as of 05/31/17 was 2.68%. |
Performance data quoted represents past performance; past performance does not guarantee future results. The investment return and principal value of an investment will fluctuate so that an investor’s shares, when redeemed, may be worth more or less than their original cost. Current performance of the Fund may be lower or higher than the performance quoted. Performance data current to the most recent month-end may be obtained by calling 1-800-999-0887 or visiting www.thompsonim.com.
Results include the reinvestment of all dividends and capital gains distributions. Investment performance reflects all fee waivers that may have been in effect. In the absence of such waivers, total return would have been reduced. The performance information reflected in the graph and the table above does not reflect the deduction of taxes that a shareholder would pay on fund distributions or the redemption of fund shares, nor does it imply future performance. The Bloomberg Barclays U.S. Government/Credit 1-5 Year Index is a market-value-weighted index of all investment-grade bonds with maturities of more than one year and less than 5 years. The Bloomberg Barclays U.S. Credit 1-5 Year Index is a market-value-weighted index which includes virtually every major investment-grade rated corporate bond with 1-5 years remaining until maturity that serves as a supplementary benchmark. You cannot directly invest in an index.
Bloomberg® is a trademark and service mark of Bloomberg Finance L.P. Barclays® is a trademark and service mark of Barclays Bank PLC.
See Notes to Financial Statements.
15
| BOND FUND INVESTMENT REVIEW (Unaudited) (Continued) |
| May 31, 2017 |
Management Commentary
Both corporate spreads and prevailing interest rates declined modestly during the period. Absolute return was buoyed by the absence of material headwinds from these factors. Positive relative performance was driven by the Fund’s relative yield and appreciation among a number of issues in previously unloved sectors and asset classes. While it is unlikely that the Fund’s absolute return will be as attractive over the next 6 months, we do believe the portfolio still has the potential to produce competitive results.
Much of the Fund’s positive relative performance over the last 6 months resulted from decisions made over a year ago. As we have noted many times before, we try to take advantage of the opportunities the market gives us. This often requires waiting for a market overreaction, if not an all-out panic. During these times, one is often able to acquire securities that appear to be priced at a discount to their potential longer-term value. One extreme example of this was the deep discount afforded to financial assets during the financial crisis almost a decade ago. We’ve seen several periods of displeasure in the marketplace since then. Corporate spreads widened significantly in 2011 and 2013, and most recently during the energy panic in 2015 and early 2016. In each case the opportunities were plenty.
While some of the benefit of acquiring assets at a discount can accrue quickly to the purchaser, much of it tends to stretch out over months or years. In hindsight, credit markets entered a period of calm by spring 2016, and new opportunities have been scarcer since then. In the face of narrow credit spreads and rising interest rates we are content to attempt a more conservative tack. Consequently, the Fund’s duration has shrunk to 0.99 years. This was not by design, but is merely a consequence of the lack of attractively priced securities at the long end of the Fund’s maturity ladder. As the yield curve has flattened, it has made more sense to us to buy short. We have learned that something always seems to come along sooner or later to spook investors. Whenever that happens we’ll look to take advantage of opportunities by re-allocating the larger-than-normal accumulation of bonds of 1-year or less maturity within the Fund. In the meantime, we feel the portfolio as it stands is positioned to keep producing a competitive yield while we wait.
Opinions expressed are subject to change, are not guaranteed and should not be considered investment advice.
Mutual fund investing involves risk. Principal loss is possible. Investments in debt securities typically decrease in value when interest rates rise. The risk is usually greater for longer-term debt securities. Investments in bonds of foreign issuers involve greater volatility, political and economic risks, and differences in accounting methods. Investment by the Fund in lower-rated and non-rated securities presents a greater risk of loss to principal and interest than higher-rated securities.
Please refer to the Schedule of Investments on page 18 of this report for holdings information. The management commentary above as well as Fund holdings should not be considered a recommendation to buy or sell any security. In addition, please note that Fund holdings are subject to change.
The federal government guarantees interest payments from government securities while dividend payments carry no such guarantee. Government securities, if held to maturity, guarantee the timely payment of principal and interest.
SEC Yield is a standardized yield computed by dividing the net investment income per share earned during the 30-day period prior to quarter-end and was created to allow for fairer comparisons among bond funds.
Spread is the percentage point difference between yields of various classes of bonds compared to treasury bonds.
Duration is a commonly used measure of the potential volatility of the price of a debt security, or the aggregate market value of a portfolio of debt securities, prior to maturity. Securities with a longer duration generally have more volatile prices than securities of comparable quality with a shorter duration.
Yield is the income earned from a bond, which takes into account the sum of the interest payment, the redemption value at the bond’s maturity, and the initial purchase price of the bond.
Yield Curve is a line that plots the interest rates, at a set point in time, of bonds having equal credit quality but differing maturity dates.
Credit Ratings are provided by Standard & Poor’s, who assign a rating based on their analysis of the issuer’s creditworthiness. The highest rating given is AAA and the lowest is C.
The purpose of Moody’s ratings is to provide investors with a simple system of gradation by which relative creditworthiness of securities may be noted. Gradations of creditworthiness are indicated by rating symbols, with each symbol representing a group in which the credit characteristics are broadly the same. The highest rating assigned by Moody’s is AAA and the lowest is C.
Although the makeup of the Bond Fund’s portfolio is constantly changing, as of May 31, 2017, 80.10% of the Fund’s portfolio was invested in corporate bonds. Due to prevailing market conditions, the composition of the Fund’s portfolio as of that date was consistent with the composition of the Fund’s portfolio over the past 5 years. In addition, as of that date 69.66% of the Fund’s portfolio was invested in securities rated BBB by Standard & Poor’s, while an additional 9.50% of the Fund’s portfolio was rated below investment-grade and 2.84% of the Fund’s portfolio was not rated by Standard & Poor’s. For portfolio information current as of the most recent quarter-end, please call 1-800-999-0887 or visit our website at www.thompsonim.com. Compared to a portfolio that is more evenly allocated between government and corporate bonds, a portfolio that is heavily allocated to corporate bonds may provide higher returns, but is also subject to greater levels of credit and liquidity risk and to greater price fluctuations. A portfolio that is significantly allocated to bonds having lower and below-investment-grade ratings may also be subject to greater levels of credit and liquidity risk and experience greater price fluctuations than a portfolio comprised of higher-rated investment-grade bonds.
See Notes to Financial Statements.
16
| BOND FUND INVESTMENT REVIEW (Unaudited) (Continued) |
| May 31, 2017 |
| Portfolio Concentration at 05/31/17 | |
| (Includes cash and cash equivalents) | |
| % Total Investments | |
| Asset Allocation | |
| Corporate Bonds | | 80.10% | |
| Asset-Backed Securities | | 14.41% | |
| U.S. Government & Agency Issues | | 2.79% | |
| Taxable Municipal Bonds | | 2.45% | |
| Tax-Exempt Municipal Bonds | | 0.25% | |
| | 100.00% | |
| | |
| Quality | |
| U.S. Government & Agency Issues | | 2.79% | |
| AAA | | 0.42% | |
| AA | | 1.85% | |
| A | | 12.94% | |
| BBB | | 69.66% | |
| BB and Below | | 9.50% | |
| Not Rated | | 2.84% | |
| | 100.00% | |
| | | | |
| Top 10 Bond Holdings at 05/31/17 |
| % of Fund’s Net Assets |
| Issuer |
| XL Group PLC | | 2.96% |
| MBIA Inc. | | 2.95% |
| GFI Group Inc. | | 2.78% |
| Ford Motor Credit Co. LLC | | 2.50% |
| U.S. Treasury Bills | | 2.40% |
| Freeport-McMoRan Inc. | | 2.38% |
| SESI LLC | | 2.36% |
| Citigroup, Inc. | | 2.13% |
| Bank of America Corp. | | 2.04% |
| American Airlines Group Inc. | | 2.03% |
See Notes to Financial Statements.
17
| BOND FUND SCHEDULE OF INVESTMENTS (Unaudited) |
| May 31, 2017 |
| | | | | Principal | | | |
| | | | | | Amount | | Value |
| BONDS - 97.9% | | | | | | |
| | | | | | | |
| | Asset-Backed Securities - 14.4% | | | | | | |
| | Air Canada | | | | | | |
| | | 5.375% due 5/15/2021, | | | | | | |
| | | Series 2013-1 B (e) | | $ | 9,254,404 | | $ | 9,647,717 |
| | | 5.000% due 12/15/2023, | | | | | | |
| | | Series 2015-2 B (e) | | | 5,472,118 | | | 5,649,962 |
| | | |
| | | America West Airlines | | | | | | |
| | | | 7.930% due 1/2/2019, | | | | | | |
| | | | Series 1999-1 | | | 4,754,417 | | | 4,992,138 |
| | | | 8.057% due 7/2/2020, | | | | | | |
| | | | Series 2000-1 | | | 19,614 | | | 22,065 |
| | | | 7.100% due 4/2/2021, | | | | | | |
| | | | Series 2001-1 | | | 4,119,827 | | | 4,480,311 |
| | | | |
| | | American Airlines | | | | | | |
| | | | 7.000% due 1/31/2018, | | | | | | |
| | | | Series 2011-1 B (e) | | | 21,140,439 | | | 21,721,801 |
| | | | |
| | | Applebee’s Funding LLC / IHOP | | | | | | |
| | | | Funding LLC (DIN) | | | | | | |
| | | | 4.277% due 9/5/2021, | | | | | | |
| | | | Series 2014-1 (e) | | | 25,059,000 | | | 24,400,875 |
| | | | |
| | | Basketball Properties Ltd. | | | | | | |
| | | | 6.650% due 3/1/2025 (e) | | | 4,249,085 | | | 4,599,634 |
| | | | |
| | | Beaver Valley II Funding | | | | | | |
| | | | 9.000% due 6/1/2017 | | | 240,000 | | | 240,000 |
| | | |
| | | British Airways PLC | | | | | | |
| | | | 5.625% due 6/20/2020, | | | | | | |
| | | | Series 2013-1 B (e) | | | 27,339,937 | | | 28,365,184 |
| | | | 5.625% due 6/20/2020, | | | | | | |
| | | | Series 2013-1 B (e) | | | 56,945 | | | 59,081 |
| | | | |
| | | Bvps II Funding Corp. | | | | | | |
| | | | 8.890% due 6/1/2017 | | | 2,000 | | | 2,000 |
| | | | |
| | | CAL Funding II Ltd. | | | | | | |
| | | | 3.470% due 10/25/2022, | | | | | | |
| | | | Series 2012-1A A (e) | | | 1,513,958 | | | 1,513,797 |
| | | | 3.350% due 3/27/2023, | | | | | | |
| | | | Series 2013-1A A (e) | | | 3,785,833 | | | 3,713,676 |
| | | | |
| | | Castle Aircraft Securitization Trust | | | | | | |
| | | | 4.703% due 12/15/2022, | | | | | | |
| | | | Series 2015-1A (e) | | | 1,501,268 | | | 1,535,603 |
| | | | | | | | | | |
| | | CG-CCRE Commercial | | | | | | |
| | | | Mortgage Trust | | | | | | |
| | | | 3.739% due 6/15/2019, | | | | | | |
| | | | Series 2014-FL1 (b) (e) | | | 12,000,000 | | | 11,771,744 |
| | | |
| | | COBALT CMBS Commercial | | | | | | |
| | | | Mortgage Trust | | | | | | |
| | | | 6.061% due 6/15/2017, | | | | | | |
| | | | Series 2007-C3 (b) | | | 1,632 | | | 1,630 |
| | | | |
| | | Commercial Mortgage Loan | | | | | | |
| | | | Trust | | | | | | |
| | | | 6.335% due 9/10/2017, | | | | | | |
| | | | Series 2008-LS1 (b) | | | 7,921,945 | | | 7,951,634 |
| | | | |
| | | Continental Airlines | | | | | | |
| | | | 6.648% due 9/15/2017, | | | | | | |
| | | | Series 1998-1 A | | | 223,416 | | | 226,209 |
| | | | 6.900% due 1/2/2018, | | | | | | |
| | | | Series 1997-4 A | | | 32,818 | | | 33,265 |
| | | | 6.820% due 5/1/2018, | | | | | | |
| | | | Series 1998-3 A-1 | | | 27,975 | | | 28,534 |
| | | | 6.000% due 1/12/2019, | | | | | | |
| | | | Series 2010-1 B | | | 2,598,843 | | | 2,663,814 |
| | | | 7.256% due 3/15/2020, | | | | | | |
| | | | Series 1999-2 A-1 | | | 20,394 | | | 21,770 |
| | | | 6.250% due 4/11/2020, | | | | | | |
| | | | Series 2012-1 B | | | 5,954,810 | | | 6,297,211 |
| | | | 5.500% due 10/29/2020, | | | | | | |
| | | | Series 2012-2 B | | | 9,165,570 | | | 9,578,020 |
| | | | |
| | | Delta Air Lines | | | | | | |
| | | | 6.875% due 5/7/2019, | | | | | | |
| | | | Series 2012-1B (e) | | | 774,760 | | | 824,151 |
| | | | 8.021% due 8/10/2022, | | | | | | |
| | | | Series 2007-1 B | | | 2,142,031 | | | 2,436,560 |
| | | | |
| | | Dong Fang Container Finance | | | | | | |
| | | | SPV Ltd. | | | | | | |
| | | | 3.960% due 9/25/2023, | | | | | | |
| | | | Series 2013-1 A (e) | | | 3,626,382 | | | 3,508,410 |
| | | | 3.550% due 4/25/2024, | | | | | | |
| | | | Series 2014-1 A (e) | | | 406,725 | | | 377,136 |
| | | | |
| | | Doric Nimrod Air Alpha | | | | | | |
| | | | 6.125% due 11/30/2019, | | | | | | |
| | | | Series 2013-1 B (e) | | | 22,368,776 | | | 23,095,761 |
| | | | 6.125% due 11/30/2019, | | | | | | |
| | | | Series 2013-1 B (e) | | | 3,644,830 | | | 3,763,287 |
See Notes to Financial Statements.
18
| BOND FUND SCHEDULE OF INVESTMENTS (Unaudited) (Continued) |
| May 31, 2017 |
| | | | | | Principal | | | |
| | | | | Amount | | Value |
| BONDS (continued) | | | | | | |
| | | | | | | |
| | Asset-Backed Securities (continued) | | | |
| | Doric Nimrod Air Finance | | | | | | |
| | | Alpha Ltd. | | | | | | |
| | | 6.500% due 5/30/2019, | | | | | | |
| | | Series 2012-1 B (e) | | $ | 8,801,573 | | $ | 9,117,647 |
| | | | |
| | | ECAF I Ltd. | | | | | | |
| | | | 5.802% due 6/15/2022, | | | | | | |
| | | | Series 2015-1A (e) | | | 18,309,700 | | | 18,078,018 |
| | | | |
| | | Element Rail Leasing II LLC | | | | | | |
| | | | 4.175% due 2/19/2045, | | | | | | |
| | | | Series 2015-1A (e) | | | 16,917,000 | | | 16,159,905 |
| | | | |
| | | EngenCap ABS Trust | | | | | | |
| | | | 3.670% due 7/20/2020, | | | | | | |
| | | | Series 2016-1 A (e) | | | 37,000,000 | | | 36,171,200 |
| | | | |
| | | Express Pipeline LP | | | | | | |
| | | | 7.390% due 12/31/2017 (e) | | | 246,000 | | | 254,630 |
| | | | |
| | | Federal Express Corp. | | | | | | |
| | | | 7.840% due 1/30/2018, | | | | | | |
| | | | Series 1996-B2 | | | 86,158 | | | 89,173 |
| | | | |
| | | FPL Energy Caithness | | | | | | |
| | | | Funding Corp. | | | | | | |
| | | | 7.645% due 12/31/2018 (e) | | | 1,856,880 | | | 1,921,871 |
| | | | |
| | | FRS LLC | | | | | | |
| | | | 3.960% due 4/15/2019, | | | | | | |
| | | | Series 2013-1A (e) | | | 1,594,874 | | | 1,601,998 |
| | | | |
| | | GCCFC Commercial | | | | | | |
| | | | Mortgage Trust | | | | | | |
| | | | 5.736% due 8/10/2017, | | | | | | |
| | | | Series 2007-GG11 | | | 786,918 | | | 788,240 |
| | | | |
| | | Global Container Assets Ltd. | | | | | | |
| | | | 2.100% due 2/5/2019, | | | | | | |
| | | | Series 2015-1 A (e) | | | 4,180,937 | | | 4,117,877 |
| | | | |
| | | Global SC Finance II SRL | | | | | | |
| | | | (SEACO) | | | | | | |
| | | | 3.190% due 7/17/2029, | | | | | | |
| | | | Series 2014-1A (e) | | | 2,723,333 | | | 2,700,284 |
| | | | | | | | | | |
| | | Great River Energy | | | | | | |
| | | | 5.829% due 7/1/2017 (e) | | | 516,647 | | | 517,869 |
| | | | |
| | | HP Communities LLC | | | | | | |
| | | | 5.320% due 3/15/2023 (e) | | | 347,823 | | | 369,718 |
| | | | |
| | | Landmark Leasing LLC | | | | | | |
| | | | 6.200% due 10/1/2022, | | | | | | |
| | | | Series 2004A (e) | | | 308,881 | | | 312,212 |
| | | | |
| | | Latam Airlines Group | | | | | | |
| | | | 4.500% due 11/15/2023, | | | | | | |
| | | | Series 2015-1 B | | | 5,207,077 | | | 5,135,480 |
| | | | |
| | | LB Commercial Mortgage Trust | | | | | | |
| | | | 6.295% due 6/15/2017, | | | | | | |
| | | | Series 2007-C3 (b) | | | 979,897 | | | 980,378 |
| | | | |
| | | Northwest Airlines | | | | | | |
| | | | 8.028% due 11/1/2017, | | | | | | |
| | | | Series 2007-1 B | | | 86,867 | | | 88,822 |
| | | | 7.575% due 3/1/2019, | | | | | | |
| | | | Series 1999-2 A | | | 526,214 | | | 547,263 |
| | | | 7.150% due 10/1/2019, | | | | | | |
| | | | Series 2000-1 G (b) | | | 17,903 | | | 18,978 |
| | | | 6.264% due 11/20/2021, | | | | | | |
| | | | Series 2002-1 G-2 | | | 1,183,586 | | | 1,260,519 |
| | | | |
| | | Prudential Securities | | | | | | |
| | | | Structured Assets, Inc. | | | | | | |
| | | | 1.415% due 3/2/2025, | | | | | | |
| | | | Series 1998-1 A (b) (e) | | | 10,754,996 | | | 9,840,822 |
| | | | |
| | | SCG Trust | | | | | | |
| | | | 4.239% due 11/15/2017, | | | | | | |
| | | | Series 2013-SRP1 (b) (e) | | | 11,040,000 | | | 10,745,018 |
| | | | |
| | | TRU Trust | | | | | | |
| | | | 3.239% due 11/15/2019, | | | | | | |
| | | | Series 2016-1 A (b) (e) | | | 9,877,088 | | | 9,912,034 |
| | | | 4.139% due 11/15/2019, | | | | | | |
| | | | Series 2016-1 B (b) (e) | | | 14,600,000 | | | 14,686,106 |
| | | | 4.989% due 11/15/2019, | | | | | | |
| | | | Series 2016-1 C (b) (e) | | | 10,075,000 | | | 10,067,450 |
See Notes to Financial Statements.
19
| BOND FUND SCHEDULE OF INVESTMENTS (Unaudited) (Continued) |
| May 31, 2017 |
| | | | | | Principal | | | |
| | | | | Amount | | Value |
| BONDS (continued) | | | | | | |
| | | | | | | |
| | Asset-Backed Securities (continued) | | | |
| | United Air Lines | | | | | | |
| | | 5.375% due 8/15/2021, | | | | | | |
| | | Series 2013-1 B | | $ | 1,925,328 | | $ | 2,024,001 |
| | | | |
| | | US Airways | | | | | | |
| | | | 8.360% due 1/20/2019, | | | | | | |
| | | | Series 1999-1 A | | | 29,007 | | | 29,007 |
| | | | 8.000% due 10/1/2019, | | | | | | |
| | | | Series 2012-1 B | | | 18,238,554 | | | 19,766,945 |
| | | | 7.076% due 3/20/2021, | | | | | | |
| | | | Series 2001-1 G | | | 712,270 | | | 760,348 |
| | | | |
| | | Virgin Australia Trust | | | | | | |
| | | | 5.000% due 10/23/2023, | | | | | | |
| | | | Series 2013-1 A (e) | | | 163,569 | | | 169,491 |
| | | | |
| | | Wells Fargo Commercial | | | | | | |
| | | | Mortgage Trust | | | | | | |
| | | | 3.938% due 6/15/2024, | | | | | | |
| | | | Series 2014-LC16 (e) | | | 7,072,000 | | | 5,998,225 |
| | | | | | | | | | |
| | | Total Asset-Backed Securities | | | | | | 367,754,509 |
| | | | |
| | Corporate Bonds - 80.3% | | | | | | |
| | Actavis Funding SCS | | | | | | |
| | | 2.350% due 3/12/2018 | | | 4,688,000 | | | 4,708,721 |
| | | | |
| | | Agilent Technologies, Inc. | | | | | | |
| | | | 6.500% due 11/1/2017 | | | 3,479,000 | | | 3,542,168 |
| | | | |
| | | Air Lease Corp. | | | | | | |
| | | | 2.125% due 1/15/2018 | | | 389,000 | | | 389,880 |
| | | | |
| | | Allegion US Holding Co. Inc. | | | | | | |
| | | | 5.750% due 10/1/2021 | | | 11,422,000 | | | 11,884,591 |
| | | | |
| | | American Equity Investment | | | | | | |
| | | | Life Holding Co. | | | | | | |
| | | | 6.625% due 7/15/2021 | | | 24,388,000 | | | 25,302,550 |
| | | | |
| | | American Express Bank, FSB | | | | | | |
| | | | 6.000% due 9/13/2017 | | | 3,000,000 | | | 3,036,990 |
| | | | |
| | | American Express Centurion | | | | | | |
| | | | Bank | | | | | | |
| | | | 5.950% due 6/12/2017 | | | 1,494,000 | | | 1,495,361 |
| | | | | | | | | | |
| | | American Express Co. | | | | | | |
| | | | 6.150% due 8/28/2017 | | | 3,212,000 | | | 3,247,894 |
| | | | |
| | | American Express Credit Corp. | | | | | | |
| | | | 1.125% due 6/5/2017 | | | 20,000,000 | | | 20,000,000 |
| | | | |
| | | American Tower Corp. | | | | | | |
| | | | 4.500% due 1/15/2018 | | | 103,000 | | | 104,661 |
| | | | |
| | | Ameritech Capital Funding | | | | | | |
| | | | Corp. | | | | | | |
| | | | 6.450% due 1/15/2018 | | | 803,000 | | | 824,495 |
| | | | |
| | | Appalachian Power Co. | | | | | | |
| | | | 5.000% due 6/1/2017 | | | 195,000 | | | 195,000 |
| | | | |
| | | Arrow Electronics, Inc. | | | | | | |
| | | | 3.000% due 3/1/2018 | | | 5,733,000 | | | 5,788,834 |
| | | | 6.875% due 6/1/2018 | | | 3,712,000 | | | 3,906,141 |
| | | | |
| | | Assurant, Inc. | | | | | | |
| | | | 2.500% due 3/15/2018 | | | 859,000 | | | 862,981 |
| | | | |
| | | Assured Guaranty US Holdings | | | | | | |
| | | | Inc. | | | | | | |
| | | | 3.511% due 12/15/2066 (b) | | | 14,597,000 | | | 11,969,540 |
| | | | |
| | | Astoria Financial Corp. | | | | | | |
| | | | 5.000% due 6/19/2017 | | | 31,792,000 | | | 31,835,237 |
| | | | |
| | | AT&T Inc. | | | | | | |
| | | | 1.400% due 12/1/2017 | | | 546,000 | | | 545,877 |
| | | | |
| | | Athene Global Funding | | | | | | |
| | | | 2.875% due 10/23/2018 (e) | | | 33,217,000 | | | 33,433,209 |
| | | | |
| | | Autodesk, Inc. | | | | | | |
| | | | 1.950% due 12/15/2017 | | | 6,144,000 | | | 6,148,927 |
| | | | |
| | | AutoNation, Inc. | | | | | | |
| | | | 6.750% due 4/15/2018 | | | 4,313,000 | | | 4,495,595 |
| | | | |
| | | Avon Products, Inc. | | | | | | |
| | | | 6.600% due 3/15/2020 (b) | | | 500,000 | | | 508,750 |
See Notes to Financial Statements.
20
| BOND FUND SCHEDULE OF INVESTMENTS (Unaudited) (Continued) |
| May 31, 2017 |
| | | | | | Principal | | | |
| | | | | Amount | | Value |
| BONDS (continued) | | | | | | |
| | | | | | | | | | |
| | Corporate Bonds (continued) | | | | | | |
| | Bank of America Corp. | | | | | | |
| | | 6.100% due 6/15/2017 | | $ | 1,550,000 | | $ | 1,552,058 |
| | | 6.000% due 9/1/2017 | | | 535,000 | | | 540,954 |
| | | 5.750% due 12/1/2017 | | | 1,400,000 | | | 1,428,805 |
| | | 2.000% due 1/11/2018 | | | 10,000,000 | | | 10,024,780 |
| | | 5.650% due 5/1/2018 | | | 1,992,000 | | | 2,060,804 |
| | | 3.400% due 10/9/2024 (b) | | | 35,000,000 | | | 33,118,750 |
| | | | |
| | | Barclays Bank PLC | | | | | | |
| | | | 1.750% due 2/22/2019 (c) | | | 15,000,000 | | | 14,817,840 |
| | | | |
| | | Barclays PLC | | | | | | |
| | | | 2.000% due 3/16/2018 | | | 6,500,000 | | | 6,507,540 |
| | | | |
| | | BB&T Corp. | | | | | | |
| | | | 4.900% due 6/30/2017 | | | 813,000 | | | 814,786 |
| | | | |
| | | Bear Stearns Cos. LLC | | | | | | |
| | | | 6.400% due 10/2/2017 | | | 2,909,000 | | | 2,956,204 |
| | | | |
| | | Becton Dickinson and Co. | | | | | | |
| | | | 1.800% due 12/15/2017 | | | 723,000 | | | 724,801 |
| | | | 4.900% due 4/15/2018 | | | 3,362,000 | | | 3,449,920 |
| | | | |
| | | BGC Partners Inc. | | | | | | |
| | | | 5.375% due 12/9/2019 | | | 110,000 | | | 116,087 |
| | | | |
| | | Brandywine Operating | | | | | | |
| | | | Partnership, L.P. | | | | | | |
| | | | 4.950% due 4/15/2018 | | | 565,000 | | | 578,781 |
| | | | |
| | | Broadridge Financial Solutions, | | | | | | |
| | | | Inc. | | | | | | |
| | | | 6.125% due 6/1/2017 | | | 4,614,000 | | | 4,614,000 |
| | | | |
| | | Brunswick Corp. | | | | | | |
| | | | 4.625% due 5/15/2021 (e) | | | 375,000 | | | 383,617 |
| | | | |
| | | Bunge Ltd. Finance Corp. | | | | | | |
| | | | 3.200% due 6/15/2017 | | | 2,123,000 | | | 2,124,023 |
| | | | |
| | | Capital One Bank USA N.A. | | | | | | |
| | | | 1.300% due 6/5/2017 | | | 4,736,000 | | | 4,736,000 |
| | | | |
| | | Capital One Financial Corp. | | | | | | |
| | | | 6.750% due 9/15/2017 | | | 7,243,000 | | | 7,347,125 |
| | | | | | | | | | |
| | | Capital One N.A. | | | | | | |
| | | | 1.500% due 9/5/2017 | | | 10,265,000 | | | 10,264,507 |
| | | | 1.650% due 2/5/2018 | | | 7,635,000 | | | 7,633,091 |
| | | | 1.500% due 3/22/2018 | | | 3,650,000 | | | 3,643,189 |
| | | | |
| | | Carpenter Technology Corp. | | | | | | |
| | | | 6.990% due 4/20/2018 | | | 2,415,000 | | | 2,467,005 |
| | | | 7.060% due 5/21/2018 | | | 500,000 | | | 510,171 |
| | | | 7.030% due 5/22/2018 | | | 8,000 | | | 8,158 |
| | | | |
| | | Catholic Health Initiatives | | | | | | |
| | | | 1.600% due 11/1/2017 | | | 21,848,000 | | | 21,839,326 |
| | | | 2.600% due 8/1/2018 | | | 11,456,000 | | | 11,515,525 |
| | | | |
| | | CBS Corp. | | | | | | |
| | | | 1.950% due 7/1/2017 | | | 2,200,000 | | | 2,200,282 |
| | | | |
| | | Celgene Corp. | | | | | | |
| | | | 1.900% due 8/15/2017 | | | 1,000,000 | | | 1,000,914 |
| | | | |
| | | CenterPoint Energy Resources | | | | | | |
| | | | Corp. | | | | | | |
| | | | 6.125% due 11/1/2017 | | | 1,292,000 | | | 1,314,553 |
| | | | |
| | | Citigroup, Inc. | | | | | | |
| | | | 1.550% due 8/14/2017 | | | 3,980,000 | | | 3,981,035 |
| | | | 1.850% due 11/24/2017 | | | 405,000 | | | 405,848 |
| | | | 1.700% due 4/27/2018 | | | 15,276,000 | | | 15,270,012 |
| | | | 3.325% due 10/15/2024 (b) | | | 35,000,000 | | | 34,527,850 |
| | | | |
| | | Citizens Bank, N.A. | | | | | | |
| | | | 1.600% due 12/4/2017 | | | 6,123,000 | | | 6,122,755 |
| | | | |
| | | Cleveland Electric Illuminating | | | | | | |
| | | | Co. | | | | | | |
| | | | 7.880% due 11/1/2017 | | | 582,000 | | | 596,404 |
| | | | |
| | | CNA Financial Corp. | | | | | | |
| | | | 6.950% due 1/15/2018 | | | 5,283,000 | | | 5,447,518 |
| | | | |
| | | Comerica Bank | | | | | | |
| | | | 5.200% due 8/22/2017 | | | 1,100,000 | | | 1,108,337 |
| | | | |
| | | Compass Bank | | | | | | |
| | | | 1.850% due 9/29/2017 | | | 4,505,000 | | | 4,505,410 |
| | | | 6.400% due 10/1/2017 | | | 3,581,000 | | | 3,633,630 |
See Notes to Financial Statements.
21
| BOND FUND SCHEDULE OF INVESTMENTS (Unaudited) (Continued) |
| May 31, 2017 |
| | | | | | Principal | | | |
| | | | | Amount | | Value |
| BONDS (continued) | | | | | | |
| | | | | | | | | | |
| | Corporate Bonds (continued) | | | | | | |
| | Countrywide Financial Corp. | | | | | | |
| | | 6.000% due 11/22/2030 | | $ | 137,000 | | $ | 137,001 |
| | | 6.300% due 4/28/2036 | | | 115,000 | | | 115,238 |
| | | | |
| | | Credit Suisse A.G. New York | | | | | | |
| | | | 1.750% due 1/29/2018 | | | 2,819,000 | | | 2,821,836 |
| | | | 6.000% due 2/15/2018 | | | 26,737,000 | | | 27,504,486 |
| | | | |
| | | D.R. Horton, Inc. | | | | | | |
| | | | 3.625% due 2/15/2018 | | | 1,759,000 | | | 1,775,287 |
| | | | 3.750% due 3/1/2019 | | | 3,550,000 | | | 3,645,665 |
| | | | |
| | | Deutsche Bank AG | | | | | | |
| | | | 6.000% due 9/1/2017 | | | 28,296,000 | | | 28,589,345 |
| | | | 1.875% due 2/13/2018 | | | 12,529,000 | | | 12,527,998 |
| | | | |
| | | Developers Diversified Realty | | | | | | |
| | | | Corp. | | | | | | |
| | | | 4.750% due 4/15/2018 | | | 2,255,000 | | | 2,297,157 |
| | | | |
| | | Discover Financial Services | | | | | | |
| | | | 6.450% due 6/12/2017 | | | 5,598,000 | | | 5,603,447 |
| | | | 10.250% due 7/15/2019 | | | 11,304,000 | | | 12,922,145 |
| | | | |
| | | Domtar Corp. | | | | | | |
| | | | 10.750% due 6/1/2017 | | | 10,334,000 | | | 10,334,000 |
| | | | |
| | | Dun & Bradstreet Corp. | | | | | | |
| | | | 3.500% due 12/1/2017 (b) | | | 8,694,000 | | | 8,759,683 |
| | | | |
| | | eBay Inc. | | | | | | |
| | | | 2.500% due 3/9/2018 | | | 8,308,000 | | | 8,367,917 |
| | | | |
| | | El Paso Corp. | �� | | | | | |
| | | | 7.000% due 6/15/2017 | | | 3,723,000 | | | 3,728,797 |
| | | | |
| | | Ensco PLC | | | | | | |
| | | | 8.000% due 1/31/2024 | | | 12,306,000 | | | 12,121,410 |
| | | | |
| | | Enterprise Products | | | | | | |
| | | | Operating LLC | | | | | | |
| | | | 7.000% due 6/1/2067 (b) | | | 8,538,000 | | | 8,228,498 |
| | | | |
| | | ERP Operating L.P. | | | | | | |
| | | | 5.750% due 6/15/2017 | | | 1,000,000 | | | 1,001,151 |
| | | | | | | | | | |
| | | Everest Reinsurance | | | | | | |
| | | | Holdings Inc. | | | | | | |
| | | | 3.567% due 5/15/2037 (b) | | | 8,692,000 | | | 7,996,640 |
| | | | |
| | | Exelon Corp. | | | | | | |
| | | | 1.550% due 6/9/2017 | | | 801,000 | | | 801,022 |
| | | | |
| | | Exelon Generation Co., LLC | | | | | | |
| | | | 6.200% due 10/1/2017 | | | 6,333,000 | | | 6,423,619 |
| | | | |
| | | Express Scripts Holding Co. | | | | | | |
| | | | 1.250% due 6/2/2017 | | | 3,730,000 | | | 3,730,000 |
| | | | |
| | | Fairfax Financial Holdings Ltd. | | | | | | |
| | | | 7.375% due 4/15/2018 | | | 24,161,500 | | | 25,253,866 |
| | | | |
| | | Fidelity National Information | | | | | | |
| | | | Services, Inc. | | | | | | |
| | | | 1.450% due 6/5/2017 | | | 918,000 | | | 918,000 |
| | | | |
| | | Fifth Third Bancorp | | | | | | |
| | | | 4.900% due 9/30/2019 (b) (d) | | | 40,162,000 | | | 39,961,190 |
| | | | |
| | | FMC Technologies, Inc. | | | | | | |
| | | | 2.000% due 10/1/2017 | | | 16,000 | | | 15,998 |
| | | | |
| | | Ford Motor Credit Co. LLC | | | | | | |
| | | | 3.000% due 6/12/2017 | | | 30,277,000 | | | 30,286,386 |
| | | | 6.625% due 8/15/2017 | | | 1,601,000 | | | 1,616,466 |
| | | | 1.724% due 12/6/2017 | | | 24,513,000 | | | 24,528,468 |
| | | | 5.000% due 5/15/2018 | | | 1,742,000 | | | 1,792,748 |
| | | | 2.240% due 6/15/2018 | | | 5,450,000 | | | 5,466,241 |
| | | | |
| | | Freeport-McMoRan Inc. | | | | | | |
| | | | 6.125% due 6/15/2019 (e) | | | 10,233,000 | | | 10,360,913 |
| | | | 6.500% due 11/15/2020 (e) | | | 16,327,000 | | | 16,899,751 |
| | | | 6.625% due 5/1/2021 (e) | | | 24,585,000 | | | 25,138,162 |
| | | | 6.750% due 2/1/2022 (e) | | | 7,970,000 | | | 8,248,950 |
| | | | |
| | | General Electric Capital Corp. | | | | | | |
| | | | 4.500% due 5/15/2018 | | | 15,000 | | | 15,385 |
| | | | 5.250% due 5/15/2018 | | | 34,000 | | | 35,109 |
| | | | 6.300% due 5/15/2018 | | | 17,000 | | | 17,714 |
| | | | 6.000% due 6/15/2018 | | | 98,000 | | | 102,225 |
| | | | 1.551% due 5/5/2026 (b) | | | 613,000 | | | 600,548 |
See Notes to Financial Statements.
22
| BOND FUND SCHEDULE OF INVESTMENTS (Unaudited) (Continued) |
| May 31, 2017 |
| | | | | Principal | | | |
| | | | Amount | | Value |
| BONDS (continued) | | | | | | |
| | | | | | | |
| Corporate Bonds (continued) | | | | | | |
| | General Motors Financial Co., Inc. | | | | | | |
| | 2.625% due 7/10/2017 | | $ | 11,600,000 | | $ | 11,613,363 |
| | 4.750% due 8/15/2017 | | | 5,212,000 | | | 5,244,627 |
| | 3.000% due 9/25/2017 | | | 439,000 | | | 440,727 |
| | 3.250% due 5/15/2018 | | | 1,283,000 | | | 1,299,812 |
| | |
| | Genworth Financial Inc. | | | | | | |
| | 7.700% due 6/15/2020 | | | 2,918,000 | | | 2,852,345 |
| | |
| | GFI Group Inc. | | | | | | |
| | 8.375% due 7/19/2018 (b) | | | 66,627,000 | | | 70,707,904 |
| | |
| | Goldman Sachs Group, Inc. | | | | | | |
| | 4.000% due 6/15/2017 | | | 48,000 | | | 48,000 |
| | 6.250% due 9/1/2017 | | | 5,397,000 | | | 5,457,301 |
| | 5.950% due 1/18/2018 | | | 2,434,000 | | | 2,497,686 |
| | 6.150% due 4/1/2018 | | | 35,033,000 | | | 36,279,404 |
| | |
| | Great Plains Energy Inc. | | | | | | |
| | 6.875% due 9/15/2017 | | | 475,000 | | | 481,510 |
| | |
| | Hartford Financial Services | | | | | | |
| | Group, Inc. | | | | | | |
| | 6.300% due 3/15/2018 | | | 336,000 | | | 347,603 |
| | |
| | Hewlett Packard Enterprise Co. | | | | | | |
| | 2.450% due 10/5/2017 (c) | | | 757,000 | | | 759,011 |
| | |
| | Highmark Inc. | | | | | | |
| | 4.750% due 5/15/2021 (e) | | | 30,715,000 | | | 31,687,099 |
| | |
| | Highwoods Realty L.P. | | | | | | |
| | 7.500% due 4/15/2018 | | | 1,880,000 | | | 1,968,537 |
| | |
| | Hospitality Properties Trust | | | | | | |
| | 6.700% due 1/15/2018 | | | 5,039,000 | | | 5,065,898 |
| | |
| | HRPT Properties Trust | | | | | | |
| | 6.650% due 1/15/2018 | | | 35,243,000 | | | 35,431,867 |
| | |
| | HSBC USA Inc. | | | | | | |
| | 1.300% due 6/23/2017 | | | 448,000 | | | 448,026 |
| | |
| | Humana Inc. | | | | | | |
| | 7.200% due 6/15/2018 | | | 553,000 | | | 582,103 |
| | | | | | | | | |
| | ING U.S., Inc. | | | | | | |
| | 2.900% due 2/15/2018 (b) | | | 823,000 | | | 829,174 |
| | |
| | Ingram Micro Inc. | | | | | | |
| | 5.250% due 9/1/2017 | | | 210,000 | | | 211,351 |
| | |
| | International Lease Finance | | | | | | |
| | Corp. | | | | | | |
| | 8.875% due 9/1/2017 | | | 4,987,000 | | | 5,060,952 |
| | 3.875% due 4/15/2018 | | | 121,000 | | | 122,966 |
| | |
| | INVISTA Finance LLC | | | | | | |
| | 4.250% due 10/15/2019 (e) | | | 32,365,000 | | | 33,133,669 |
| | |
| | ITC Holdings Corp. | | | | | | |
| | 6.050% due 1/31/2018 (e) | | | 3,746,000 | | | 3,845,220 |
| | |
| | Jabil Circuit, Inc. | | | | | | |
| | 8.250% due 3/15/2018 | | | 39,316,000 | | | 41,085,220 |
| | |
| | Johnson Controls Int’l. plc | | | | | | |
| | 3.750% due 1/15/2018 | | | 60,000 | | | 60,599 |
| | |
| | JPMorgan Chase & Co. | | | | | | |
| | 7.900% due 4/30/2018 (b) (d) | | | 36,491,000 | | | 37,870,360 |
| | |
| | KeyBank N.A. | | | | | | |
| | 5.700% due 11/1/2017 | | | 1,294,000 | | | 1,314,641 |
| | |
| | Kinder Morgan Energy | | | | | | |
| | Partners, L.P. | | | | | | |
| | 5.950% due 2/15/2018 | | | 640,000 | | | 657,699 |
| | |
| | Kinder Morgan Inc. | | | | | | |
| | 7.000% due 2/1/2018 | | | 22,316,000 | | | 23,049,304 |
| | |
| | Koninklijke Ahold Delhaize N.V. | | | | | | |
| | 6.500% due 6/15/2017 | | | 9,285,000 | | | 9,296,690 |
| | |
| | Kraft Heinz Foods Co. | | | | | | |
| | 2.250% due 6/5/2017 | | | 714,000 | | | 714,000 |
| | 1.600% due 6/30/2017 | | | 770,000 | | | 770,050 |
| | 6.125% due 8/23/2018 (e) | | | 50,000 | | | 52,590 |
See Notes to Financial Statements.
23
| BOND FUND SCHEDULE OF INVESTMENTS (Unaudited) (Continued) |
| May 31, 2017 |
| | | | | Principal | | | |
| | | | Amount | | Value |
| BONDS (continued) | | | | | | |
| | | | | | | |
| Corporate Bonds (continued) | | | | | | |
| | Kroger Co. | | | | | | |
| | 7.000% due 5/1/2018 | | $ | 1,240,000 | | $ | 1,300,353 |
| | |
| | Lincoln National Corp. | | | | | | |
| | 3.537% due 5/17/2066 (b) | | | 25,985,000 | | | 24,036,125 |
| | 3.196% due 4/20/2067 (b) | | | 19,155,000 | | | 16,952,175 |
| | |
| | Mack-Cali Realty L.P. | | | | | | |
| | 2.500% due 12/15/2017 | | | 1,489,000 | | | 1,492,694 |
| | |
| | Manufacturers & Traders | | | | | | |
| | Trust Co. | | | | | | |
| | 6.625% due 12/4/2017 | | | 19,665,000 | | | 20,153,420 |
| | 2.259% due 12/28/2020 (b) | | | 14,173,000 | | | 14,180,526 |
| | 1.695% due 12/1/2021 (b) | | | 1,002,000 | | | 984,465 |
| | |
| | Marriott Int’l., Inc. | | | | | | |
| | 6.750% due 5/15/2018 | | | 146,000 | | | 152,805 |
| | |
| | Martin Marietta Materials, Inc. | | | | | | |
| | 6.600% due 4/15/2018 | | | 12,355,000 | | | 12,842,961 |
| | |
| | Masco Corp. | | | | | | |
| | 6.625% due 4/15/2018 | | | 13,953,000 | | | 14,499,944 |
| | |
| | Mattel, Inc. | | | | | | |
| | 1.700% due 3/15/2018 | | | 2,208,000 | | | 2,207,739 |
| | |
| | MBIA Inc. | | | | | | |
| | 6.400% due 8/15/2022 | | | 75,017,000 | | | 75,017,000 |
| | |
| | Medco Health Solutions, Inc. | | | | | | |
| | 7.125% due 3/15/2018 | | | 718,000 | | | 748,152 |
| | |
| | Merrill Lynch & Co. | | | | | | |
| | 6.400% due 8/28/2017 | | | 2,898,000 | | | 2,931,530 |
| | |
| | MetLife, Inc. | | | | | | |
| | 1.903% due 12/15/2017 (c) | | | 1,157,000 | | | 1,159,567 |
| | |
| | Midcontinent Express Pipeline | | | | | | |
| | LLC | | | | | | |
| | 6.700% due 9/15/2019 (e) | | | 22,665,000 | | | 24,166,556 |
| | |
| | Monsanto Co. | | | | | | |
| | 1.150% due 6/30/2017 | | | 486,000 | | | 485,576 |
| | | | | | | | |
| | Morgan Stanley | | | | | | |
| | 6.250% due 8/28/2017 | | | 2,823,000 | | | 2,854,550 |
| | 3.850% due 9/1/2017 | | | 20,000 | | | 19,978 |
| | 1.875% due 1/5/2018 | | | 5,000,000 | | | 5,007,460 |
| | 6.625% due 4/1/2018 | | | 16,633,000 | | | 17,293,297 |
| | 4.738% due 4/1/2021 (b) | | | 130,000 | | | 134,713 |
| | 4.738% due 6/9/2023 (b) | | | 100,000 | | | 100,630 |
| | |
| | MPT Operating Partnership, L.P. | | | | | | |
| | 6.375% due 2/15/2022 | | | 24,682,000 | | | 25,515,017 |
| | |
| | Mylan Inc. | | | | | | |
| | 2.600% due 6/24/2018 | | | 1,000,000 | | | 1,006,950 |
| | |
| | Mylan N.V. | | | | | | |
| | 3.000% due 12/15/2018 | | | 265,000 | | | 268,735 |
| | |
| | National City Bank of | | | | | | |
| | Cleveland OH | | | | | | |
| | 5.800% due 6/7/2017 | | | 4,207,000 | | | 4,208,069 |
| | |
| | National Retail Properties Inc. | | | | | | |
| | 6.875% due 10/15/2017 | | | 1,661,000 | | | 1,691,803 |
| | |
| | NetApp, Inc. | | | | | | |
| | 2.000% due 12/15/2017 | | | 7,708,000 | | | 7,720,657 |
| | |
| | NiSource Finance Corp. | | | | | | |
| | 6.400% due 3/15/2018 | | | 165,000 | | | 170,856 |
| | |
| | Noble Drilling Corp. | | | | | | |
| | 7.500% due 3/15/2019 | | | 19,381,000 | | | 20,253,145 |
| | |
| | Noble Energy, Inc. | | | | | | |
| | 5.625% due 5/1/2021 | | | 25,280,000 | | | 26,006,800 |
| | |
| | Noble Holding Int’l. Ltd. | | | | | | |
| | 4.900% due 8/1/2020 | | | 667,000 | | | 640,320 |
| | 4.625% due 3/1/2021 | | | 7,949,000 | | | 7,154,100 |
| | |
| | Northern Indiana Public | | | | | | |
| | Service Co. | | | | | | |
| | 7.590% due 6/12/2017 | | | 187,000 | | | 187,163 |
| | |
| | Nucor Corp. | | | | | | |
| | 5.750% due 12/1/2017 | | | 2,871,000 | | | 2,927,533 |
See Notes to Financial Statements.
24
| BOND FUND SCHEDULE OF INVESTMENTS (Unaudited) (Continued) |
| May 31, 2017 |
| | | | | Principal | | | |
| | | | Amount | | Value |
| BONDS (continued) | | | | | | |
| | | | | | | |
| Corporate Bonds (continued) | | | | | | |
| | Pacific Gas & Electric Co. | | | | | | |
| | 8.250% due 10/15/2018 | | $ | 7,960,000 | | $ | 8,655,322 |
| | |
| | Packaging Corp. of America | | | | | | |
| | 6.500% due 3/15/2018 | | | 46,000 | | | 47,549 |
| | |
| | PBF Holding Co. LLC / PBF | | | | | | |
| | Finance Corp. | | | | | | |
| | 8.250% due 2/15/2020 | | | 24,822,000 | | | 25,417,728 |
| | |
| | Pemex Project Funding | | | | | | |
| | Master Trust | | | | | | |
| | 5.750% due 3/1/2018 | | | 10,492,000 | | | 10,770,038 |
| | 9.250% due 3/30/2018 (c) | | | 99,000 | | | 104,031 |
| | |
| | Pennsylvania Electric Co. | | | | | | |
| | 6.050% due 9/1/2017 | | | 4,312,000 | | | 4,355,952 |
| | |
| | Pitney Bowes Inc. | | | | | | |
| | 5.750% due 9/15/2017 | | | 2,225,500 | | | 2,253,225 |
| | 5.600% due 3/15/2018 | | | 1,610,000 | | | 1,655,943 |
| | 4.750% due 5/15/2018 | | | 30,000 | | | 30,766 |
| | |
| | Platinum Underwriters | | | | | | |
| | Finance, Inc. | | | | | | |
| | 7.500% due 6/1/2017 | | | 1,740,000 | | | 1,740,000 |
| | |
| | PNC Bank, N.A. | | | | | | |
| | 4.875% due 9/21/2017 | | | 3,499,000 | | | 3,533,101 |
| | 6.000% due 12/7/2017 | | | 2,015,000 | | | 2,058,069 |
| | 6.875% due 4/1/2018 | | | 11,150,000 | | | 11,623,563 |
| | |
| | Protective Life Corp. | | | | | | |
| | 6.400% due 1/15/2018 | | | 848,000 | | | 871,397 |
| | |
| | Regency Energy Partners LP | | | | | | |
| | 6.500% due 7/15/2021 | | | 45,484,000 | | | 46,791,665 |
| | |
| | Regions Bank | | | | | | |
| | 7.500% due 5/15/2018 | | | 2,400,000 | | | 2,526,312 |
| | 2.250% due 9/14/2018 | | | 1,725,000 | | | 1,730,958 |
| | |
| | Reinsurance Group of | | | | | | |
| | America, Inc. | | | | | | |
| | 3.796% due 12/15/2065 (b) | | | 32,993,000 | | | 31,260,867 |
| | | | | | | | |
| | RPM Int’l., Inc. | | | | | | |
| | 6.500% due 2/15/2018 | | | 126,000 | | | 130,309 |
| | |
| | Ryder System, Inc. | | | | | | |
| | 3.500% due 6/1/2017 | | | 535,000 | | | 535,000 |
| | |
| | Seagate HDD Cayman | | | | | | |
| | 3.750% due 11/15/2018 | | | 2,600,000 | | | 2,668,250 |
| | |
| | Select Income REIT | | | | | | |
| | 2.850% due 2/1/2018 | | | 24,891,000 | | | 25,025,660 |
| | |
| | Seminole Indian | | | | | | |
| | Tribe of Florida | | | | | | |
| | 8.030% due 10/1/2020 (e) | | | 23,900,000 | | | 24,378,000 |
| | |
| | SESI LLC | | | | | | |
| | 6.375% due 5/1/2019 | | | 22,231,000 | | | 21,897,535 |
| | 7.125% due 12/15/2021 | | | 38,264,000 | | | 38,168,340 |
| | |
| | SLM Corp. | | | | | | |
| | 5.500% due 3/15/2019 | | | 800,000 | | | 784,506 |
| | 6.000% due 3/15/2019 (c) | | | 140,000 | | | 138,442 |
| | 6.600% due 3/15/2019 (c) | | | 395,000 | | | 394,618 |
| | 5.190% due 4/24/2019 | | | 529,000 | | | 526,355 |
| | 6.250% due 9/15/2020 (c) | | | 172,000 | | | 168,288 |
| | 6.750% due 12/15/2020 (c) | | | 306,000 | | | 302,943 |
| | 6.750% due 12/15/2020 (c) | | | 95,000 | | | 94,051 |
| | 8.000% due 12/15/2020 (c) | | | 71,000 | | | 71,045 |
| | 6.000% due 6/15/2021 | | | 261,000 | | | 250,015 |
| | 6.150% due 6/15/2021 | | | 146,000 | | | 140,453 |
| | 7.250% due 1/25/2022 | | | 602,000 | | | 646,398 |
| | |
| | Smithfield Foods, Inc. | | | | | | |
| | 7.750% due 7/1/2017 | | | 6,565,000 | | | 6,589,590 |
| | |
| | StanCorp Financial Group, Inc. | | | | | | |
| | 6.900% due 6/1/2067 (b) | | | 38,809,000 | | | 35,898,325 |
| | |
| | Standard Chartered PLC | | | | | | |
| | 1.500% due 9/8/2017 (e) | | | 1,300,000 | | | 1,299,073 |
| | 4.000% due 7/12/2022 (b) (e) | | | 27,573,000 | | | 27,630,903 |
| | |
| | State Street Corp. | | | | | | |
| | 4.956% due 3/15/2018 (c) | | | 720,000 | | | 737,927 |
See Notes to Financial Statements.
25
| BOND FUND SCHEDULE OF INVESTMENTS (Unaudited) (Continued) |
| May 31, 2017 |
| | | | | Principal | | | |
| | | | Amount | | Value |
| BONDS (continued) | | | | | | |
| | | | | | | |
| Corporate Bonds (continued) | | | | | | |
| | Symantec Corp. | | | | | | |
| | 2.750% due 6/15/2017 | | $ | 1,608,000 | | $ | 1,608,347 |
| | |
| | Synchrony Financial | | | | | | |
| | 1.875% due 8/15/2017 | | | 492,000 | | | 492,137 |
| | |
| | Tech Data Corp. | | | | | | |
| | 3.750% due 9/21/2017 | | | 6,091,000 | | | 6,121,814 |
| | |
| | TechnipFMC PLC | | | | | | |
| | 2.000% due 10/1/2017 (e) | | | 11,563,000 | | | 11,561,832 |
| | |
| | Total System Services, Inc. | | | | | | |
| | 2.375% due 6/1/2018 | | | 3,693,000 | | | 3,708,396 |
| | |
| | Tyco Electronics Group S.A. | | | | | | |
| | 6.550% due 10/1/2017 | | | 7,851,000 | | | 7,977,990 |
| | |
| | UBS AG, Stamford Branch | | | | | | |
| | 7.375% due 6/15/2017 | | | 342,000 | | | 342,531 |
| | |
| | United Technologies Corp. | | | | | | |
| | 1.800% due 6/1/2017 | | | 380,000 | | | 380,000 |
| | |
| | UPM-Kymmene Oyj | | | | | | |
| | 5.500% due 1/30/2018 (e) | | | 3,000,000 | | | 3,066,354 |
| | |
| | Vulcan Materials Co. | | | | | | |
| | 7.000% due 6/15/2018 | | | 17,765,000 | | | 18,696,028 |
| | |
| | Walgreens Boots Alliance, Inc. | | | | | | |
| | 1.750% due 11/17/2017 | | | 10,065,000 | | | 10,077,269 |
| | |
| | Watson Pharmaceuticals, Inc. | | | | | | |
| | 1.875% due 10/1/2017 | | | 13,528,000 | | | 13,534,980 |
| | |
| | Wells Fargo & Co. | | | | | | |
| | 5.625% due 12/11/2017 | | | 2,016,000 | | | 2,058,782 |
| | 7.980% due 3/15/2018 (b) (d) | | | 36,006,000 | | | 37,392,231 |
| | |
| | Western Power Distribution | | | | | | |
| | 7.250% due 12/15/2017 (e) | | | 2,580,000 | | | 2,649,384 |
| | |
| | Western Union Co. | | | | | | |
| | 2.875% due 12/10/2017 | | | 6,066,000 | | | 6,105,732 |
| | | | | | | | |
| | Westvaco Corp. | | | | | | |
| | 7.500% due 6/15/2027 | | | 427,000 | | | 449,744 |
| | |
| | Wyndham Worldwide Corp. | | | | | | |
| | 5.750% due 2/1/2018 | | | 2,057,000 | | | 2,100,141 |
| | 2.500% due 3/1/2018 | | | 2,042,000 | | | 2,053,429 |
| | |
| | XL Group PLC | | | | | | |
| | 3.616% due 7/4/2017 (b) (d) | | | 85,311,000 | | | 75,286,957 |
| | |
| | Zimmer Biomet Holdings, Inc. | | | | | | |
| | 2.000% due 4/1/2018 | | | 11,312,000 | | | 11,329,262 |
| | |
| | Zoetis Inc. | | | | | | |
| | 1.875% due 2/1/2018 | | | 4,650,000 | | | 4,652,739 |
| | |
| | Total Corporate Bonds | | | | | | 2,044,119,522 |
| | |
| Federal Agency Mortgage-Backed | | | | | | |
| | Securities - 0.0% | | | | | | |
| | Freddie Mac | | | | | | |
| | 6.500% due 12/1/2018, | | | | | | |
| | Series C9-0241 | | | 6,525 | | | 6,695 |
| | |
| | Ginnie Mae | | | | | | |
| | 7.000% due 5/15/2033, | | | | | | |
| | Series 78-2071X | | | 27,002 | | | 31,930 |
| | |
| | Total Federal Agency Mortgage- | | | | | | |
| | Backed Securities | | | | | | 38,625 |
| | |
| Taxable Municipal Bonds - 2.5% | | | | | | |
| | Casino Reinvestment | | | | | | |
| | Development Authority NJ | | | | | | |
| | 5.340% due 6/1/2020 | | | 8,060,000 | | | 8,239,254 |
| | |
| | City of Miami FL | | | | | | |
| | 6.750% due 12/1/2018 | | | 995,000 | | | 1,042,481 |
| | | |
| | City of Newark NJ | | | | | | |
| | 5.603% due 4/1/2018 | | | 240,000 | | | 245,374 |
| | |
| | City of Portland OR South Park | | | | | | |
| | Blocks Urban Renewal & | | | | | | |
| | Redevelopment | | | | | | |
| | 6.031% due 6/15/2018 | | | 56,597 | | | 57,787 |
See Notes to Financial Statements.
26
| BOND FUND SCHEDULE OF INVESTMENTS (Unaudited) (Continued) |
| May 31, 2017 |
| | | | | Principal | | | |
| | | | Amount | | Value |
| BONDS (continued) | | | | | | |
| | | | | | | | |
| Taxable Municipal Bonds (continued) | | | |
| | County of Cuyahoga OH | | | | | | |
| | 5.000% due 12/1/2019 | | $ | 20,000 | | $ | 20,627 |
| | |
| | County of Reeves TX Certs. of | | | | | | |
| | Participation | | | | | | |
| | 5.000% due 12/1/2017 | | | 35,000 | | | 34,264 |
| | 6.250% due 12/1/2017 | | | 37,424 | | | 36,636 |
| | 7.400% due 12/1/2017 | | | 200,000 | | | 195,784 |
| | 5.625% due 12/1/2018 | | | 125,000 | | | 119,440 |
| | 6.500% due 12/1/2018 | | | 225,000 | | | 214,985 |
| | 7.500% due 12/1/2018 | | | 35,000 | | | 33,444 |
| | 6.750% due 12/1/2019 | | | 1,320,000 | | | 1,242,318 |
| | 6.125% due 12/1/2020 | | | 680,000 | | | 625,981 |
| | 6.875% due 12/1/2020 | | | 370,000 | | | 340,585 |
| | 6.375% due 12/1/2021 | | | 45,000 | | | 40,710 |
| | 7.000% due 12/1/2021 | | | 500,000 | | | 452,310 |
| | 7.700% due 12/1/2021 | | | 3,340,000 | | | 3,023,201 |
| | |
| | District of Columbia Revenue | | | | | | |
| | 5.375% due 10/1/2018 | | | 1,455,000 | | | 1,463,468 |
| | |
| | Eastern Illinois University | | | | | | |
| | 5.250% due 4/1/2018 | | | 775,000 | | | 790,461 |
| | 5.450% due 4/1/2019 | | | 515,000 | | | 538,010 |
| | 5.600% due 4/1/2020 | | | 585,000 | | | 609,237 |
| | 5.700% due 4/1/2021 | | | 125,000 | | | 130,180 |
| | |
| | Fannin County TX Public | | | | | | |
| | Facility Corp. | | | | | | |
| | 4.600% due 10/1/2017 | | | 740,000 | | | 709,660 |
| | 5.200% due 10/1/2019 | | | 515,000 | | | 458,360 |
| | 5.650% due 10/1/2021 | | | 825,000 | | | 716,174 |
| | |
| | Florida State Mid-Bay | | | | | | |
| | Bridge Authority | | | | | | |
| | 3.784% due 10/1/2021 | | | 4,325,000 | | | 4,399,952 |
| | |
| | Garza County TX Public | | | | | | |
| | Facility Corp. | | | | | | |
| | 6.200% due 10/1/2020 | | | 1,615,000 | | | 1,429,049 |
| | |
| | Guam Gov’t. Business Privilege | | | | | | |
| | Tax Revenue | | | | | | |
| | 4.383% due 1/1/2022 | | | 1,435,000 | | | 1,434,053 |
| | | | | | | | |
| | Guam Gov’t. Waterworks | | | | | | |
| | Authority | | | | | | |
| | 2.516% due 7/1/2017 | | | 210,000 | | | 209,960 |
| | 3.061% due 7/1/2018 | | | 255,000 | | | 255,592 |
| | |
| | Kentucky Economic | | | | | | |
| | Development Finance | | | | | | |
| | Authority | | | | | | |
| | 7.000% due 12/1/2021 | | | 255,000 | | | 255,436 |
| | |
| | Kentucky Public Transportation | | | | | | |
| | Infrastructure Authority | | | | | | |
| | 3.220% due 7/1/2017 | | | 1,670,000 | | | 1,672,088 |
| | |
| | Lancaster PA Parking Authority | | | | | | |
| | 5.760% due 12/1/2017 | | | 490,000 | | | 500,937 |
| | |
| | LL & P Wind Energy, Inc. WA | | | | | | |
| | 5.733% due 12/1/2017 (e) | | | 180,000 | | | 180,310 |
| | 5.983% due 12/1/2022 (e) | | | 8,595,000 | | | 8,756,500 |
| | |
| | Memphis TN Health | | | | | | |
| | Educational & Housing | | | | | | |
| | Facility Board | | | | | | |
| | 4.500% due 3/1/2018 | | | 35,000 | | | 34,953 |
| | |
| | New Jersey Economic | | | | | | |
| | Development Authority | | | | | | |
| | 5.000% due 6/15/2017 (e) | | | 100,000 | | | 100,041 |
| | |
| | New Jersey Sports & Exposition | | | | | | |
| | Authority | | | | | | |
| | 6.076% due 3/1/2023 | | | 485,000 | | | 531,099 |
| | |
| | Pontotoc County OK | | | | | | |
| | Educational Facilities | | | | | | |
| | Authority | | | | | | |
| | 4.119% due 9/1/2023 | | | 290,000 | | | 300,188 |
| | |
| | Public Finance Authority WI | | | | | | |
| | Student Housing Revenue | | | | | | |
| | 4.500% due 7/1/2021 | | | 1,730,000 | | | 1,717,509 |
| | |
| | Puerto Rico Commonwealth | | | | | | |
| | Gov’t. Development Bank | | | | | | |
| | 4.704% due 12/31/2017 (f) | | | 24,080,000 | | | 8,428,000 |
See Notes to Financial Statements.
27
| BOND FUND SCHEDULE OF INVESTMENTS (Unaudited) (Continued) |
| May 31, 2017 |
| | | | | Principal | | | |
| | | | Amount | | Value |
| BONDS (continued) | | | | | | |
| | | | | | | | |
| Taxable Municipal Bonds (continued) | | | |
| | Rockford IL Park District | | | | | | |
| | 3.000% due 12/15/2017 | | $ | 350,000 | | $ | 350,833 |
| | |
| | San Luis AZ Facility | | | | | | |
| | Development Corp. | | | | | | |
| | 5.050% due 5/1/2018 | | | 780,000 | | | 736,850 |
| | 5.350% due 5/1/2019 | | | 1,240,000 | | | 1,151,985 |
| | 5.600% due 5/1/2020 | | | 670,000 | | | 615,489 |
| | 5.700% due 5/1/2020 | | | 850,000 | | | 780,836 |
| | 5.800% due 5/1/2021 | | | 1,055,000 | | | 942,505 |
| | 5.900% due 5/1/2021 | | | 980,000 | | | 875,493 |
| | 6.100% due 5/1/2022 | | | 1,030,000 | | | 900,436 |
| | 6.200% due 5/1/2022 | | | 1,035,000 | | | 904,787 |
| | |
| | Summit County OH | | | | | | |
| | Development Finance | | | | | | |
| | Authority | | | | | | |
| | 6.250% due 5/15/2026 | | | 630,000 | | | 649,946 |
| | |
| | Village of Tinley Park IL | | | | | | |
| | General Obligation | | | | | | |
| | 3.500% due 12/1/2017 | | | 200,000 | | | 201,518 |
| | |
| | West Texas Detention | | | | | | |
| | Facility Corp. | | | | | | |
| | 4.400% due 11/1/2017 | | | 1,195,000 | | | 1,145,348 |
| | 4.700% due 11/1/2018 | | | 920,000 | | | 821,275 |
| | |
| | Willacy County TX Public | | | | | | |
| | Facility Corp. | | | | | | |
| | 6.000% due 12/1/2017 | | | 390,000 | | | 367,524 |
| | 5.600% due 12/1/2018 | | | 420,000 | | | 376,274 |
| | |
| | Total Taxable Municipal Bonds | | | | 62,407,497 |
| | |
| Tax-Exempt Municipal Bonds - 0.3% | | | | |
| | Casino Reinvestment | | | | | | |
| | Development Authority NJ | | | | |
| | 5.250% due 6/1/2019 | | | 5,000,000 | | | 5,017,750 |
| | | | | | | | |
| | Puerto Rico Commonwealth | | | | | | |
| | 5.500% due 7/1/2018 | | | 100,000 | | | 103,910 |
| | 5.500% due 7/1/2019 | | | 130,000 | | | 138,777 |
| | |
| | Puerto Rico Electric Power | | | | | | |
| | Authority | | | | | | |
| | 5.000% due 7/1/2019 | | | 770,000 | | | 789,489 |
| | |
| | Puerto Rico Highways & | | | | | | |
| | Transportation Authority | | | | | | |
| | 4.125% due 7/1/2019 | | | 120,000 | | | 120,233 |
| | |
| | Puerto Rico Municipal Finance | | | | | | |
| | Agency | | | | | | |
| | 5.250% due 8/1/2019 | | | 100,000 | | | 102,587 |
| | |
| | Virgin Islands Port Authority | | | | | | |
| | 5.000% due 9/1/2018 | | | 200,000 | | | 206,200 |
| | |
| | Total Tax-Exempt | | | | | | |
| | Municipal Bonds | | | | | | 6,478,946 |
| | |
| United States Government & | | | | | | |
| | Agency Issues - 0.4% | | | | | | |
| | U.S. Treasury Bonds | | | | | | |
| | 0.500% due 7/31/2017 | | | 10,000,000 | | | 9,994,510 |
| | |
| | Total United States Government | | | | | | |
| | & Agency Issues | | | | | | 9,994,510 |
| | |
| | TOTAL BONDS (COST | | | | | | |
| | $2,544,393,520) | | | | | | 2,490,793,609 |
See Notes to Financial Statements.
28
| BOND FUND SCHEDULE OF INVESTMENTS (Unaudited) (Continued) |
| May 31, 2017 |
| | | | | Shares or
Principal
Amount | | Value |
| SHORT-TERM INVESTMENTS - 2.4% | | | | | | | |
| | | | | | | | |
| Money Market Funds - 0.0% | | | | | | | |
| | | Fidelity Inst’l. Government | | | | | | | |
| | Portfolio Class I, 0.652% (a) | | | 115,559 | | $ | 115,559 | |
| | |
| | Total Money Market Funds | | | | | | 115,559 | |
| | |
| United States Government & | | | | | | | |
| | Agency Issues - 2.4% | | | | | | | |
| | U.S. Treasury Bills | | | | | | | |
| | 0.603% due 6/1/2017 (b) | | $ | 21,200,000 | | | 21,200,000 | |
| | 0.723% due 7/6/2017 (b) | | | 5,000,000 | | | 4,996,413 | |
| | 0.808% due 7/13/2017 (b) | | | 10,000,000 | | | 9,991,215 | |
| | 0.848% due 7/20/2017 (b) | | | 10,000,000 | | | 9,988,866 | |
| | 0.889% due 8/3/2017 (b) | | | 15,000,000 | | | 14,976,165 | |
| | |
| | Total United States Government | | | | | | | |
| | & Agency Issues | | | | | | 61,152,659 | |
| | |
| | TOTAL SHORT-TERM | | | | | | | |
| | INVESTMENTS | | | | | | | |
| | (COST $61,270,493) | | | | | | 61,268,218 | |
| | |
| | TOTAL INVESTMENTS - 100.3% | | | | | | | |
| | (COST $2,605,664,013) | | | | | | 2,552,061,827 | |
| | |
| | NET OTHER ASSETS AND | | | | | | | |
| | LIABILITIES - (0.3%) | | | | | | (6,679,325 | ) |
| | |
| | NET ASSETS - 100.0% | | | | | $ | 2,545,382,502 | |
| (a) | Represents the 7-day yield at May 31, 2017. |
| (b) | Rate shown represents the current coupon rate at May 31, 2017. |
| (c) | Security is a “step-up” bond where the coupon increases or steps up at a predetermined date. |
| (d) | Perpetual maturity; date shown represents next contractual call date. |
| (e) | Security subject to restrictions on resale under federal securities laws and which therefore may only be resold upon registration under the Securities Act of 1933, as amended, or in transactions exempt from registration, including sales to qualified institutional buyers under Rule 144A of the Securities Act of 1933, as amended. It has been deemed liquid under guidance approved by the Board. |
| (f) | Security is currently in default. When a bond is in default its scheduled interest and/or principal payments are not currently being paid. |
| A.G.: | Aktiengesellschaft is the German term for a public limited liability corporation. |
| FSB | Federal Savings Bank |
| N.V.: | Naamloze Vennootschap is the Dutch term for a public limited liability corporation. |
| OYJ: | Julkinen osakeyhtiö is the Finnish term for a public limited company. |
| PLC: | Public Limited Company |
| REIT: | Real Estate Investment Trust |
| S.A.: | Generally designates corporations in various countries, mostly those employing the civil law. |
| SCS: | Société en commandite simple is the Luxembourg equivalent of a limited partnership. |
| SRL: | Società a Responsabilità Limitata is the Italian term for a public limited company. |
See Notes to Financial Statements.
29
| FUND EXPENSE EXAMPLES (Unaudited) |
| May 31, 2017 |
Example
A Fund shareholder may incur two types of costs: (1) transaction costs such as redemption fees; and (2) ongoing costs, including management fees and other Fund expenses. This example is intended to help you understand your ongoing costs (in dollars) of investing in a Fund and to compare these costs with the ongoing costs of investing in other mutual funds.
The example is based on an investment of $1,000 invested at the beginning of the period and held for the entire period from December 1, 2016 to May 31, 2017.
Actual Expenses
The first line of the table below under each Fund provides information about actual account values and actual expenses for such Fund. You may use the information in this line, together with the amount you invested, to estimate the expenses that you paid over the period. Simply divide your account value by $1,000 (for example, an $8,600 account value divided by $1,000 = 8.6), then multiply the result by the number in the first line under the heading entitled “Expenses Paid During Period” to estimate the expenses you paid on your account during this period.
Hypothetical Example for Comparison Purposes
The second line of the table below under each Fund provides information about hypothetical account values and hypothetical expenses based on such Fund’s actual expense ratio and an assumed rate of return of 5% per year before expenses, which is not the Fund’s actual return. The hypothetical account values and expenses may not be used to estimate the actual ending account balance or expenses you paid for the period. You may use this information to compare the ongoing costs of investing in each Fund and other funds. To do so, compare the 5% hypothetical example with the 5% hypothetical examples that appear in the shareholder reports of the other funds.
Please note that the expenses shown in the table are meant to highlight your ongoing costs only and do not reflect any transactional costs, such as redemption fees. Therefore, the second line of the table is useful in comparing ongoing costs only, and will not help you determine the relative costs of owning different funds. In addition, if these transactional costs were included, your costs would have been higher.
| | | | Beginning | | Ending | | |
| | Expense Ratio | | Account Value | | Account Value | | Expenses Paid During |
| Six-Month Period Ended May 31, 2017 | | for the Period | | 12/01/16 | | 05/31/17 | | Period* |
| Thompson LargeCap Fund | | | | | | | | |
| Actual | | 1.10% | | $1,000.00 | | $1,053.42 | | $5.63 |
| Hypothetical (5% return before expenses) | | 1.10% | | $1,000.00 | | $1,019.52 | | $5.54 |
| Thompson MidCap Fund | | | | | | | | |
| Actual | | 1.20% | | $1,000.00 | | $1,068.32 | | $6.19 |
| Hypothetical (5% return before expenses) | | 1.20% | | $1,000.00 | | $1,019.02 | | $6.04 |
| Thompson Bond Fund | | | | | | | | |
| Actual | | 0.72% | | $1,000.00 | | $1,038.41 | | $3.66 |
| Hypothetical (5% return before expenses) | | 0.72% | | $1,000.00 | | $1,021.41 | | $3.63 |
| * | Expenses are equal to the annualized [net] expense ratio for each Fund, multiplied by the average account value over the period, multiplied by 182/365 (to reflect the one-half year period). |
| |
| For more information, please refer to the Funds’ Prospectus. |
See Notes to Financial Statements.
30
| STATEMENTS OF ASSETS AND LIABILITIES (Unaudited) |
| May 31, 2017 (In thousands, except per share amounts) |
| | LARGECAP | | MIDCAP | | BOND |
| | FUND | | FUND | | FUND |
| ASSETS | | | | | | | | | | | | | | | | | | |
| Total investments in securities, at value (Cost $126,509, $40,433 and | | | | | | | | | | | | | | | | | | |
| $2,605,664 respectively) | | | $ | 122,004 | | | | | $ | 47,293 | | | | | $ | 2,552,062 | | |
| Cash | | | | – | | | | | | – | | | | | | 2,018 | | |
| Due from sale of securities | | | | 158 | | | | | | 40 | | | | | | 4,802 | | |
| Receivable from fund shares sold | | | | 22 | | | | | | 13 | | | | | | 7,847 | | |
| Dividends and interest receivable | | | | 264 | | | | | | 52 | | | | | | 30,870 | | |
| Prepaid expenses | | | | 16 | | | | | | 15 | | | | | | 78 | | |
| Total Assets | | | | 122,464 | | | | | | 47,413 | | | | | | 2,597,677 | | |
| LIABILITIES | | | | | | | | | | | | | | | | | | |
| Due on purchase of securities | | | | – | | | | | | 108 | | | | | | 47,951 | | |
| Payable for fund shares redeemed | | | | 406 | | | | | | 2 | | | | | | 2,862 | | |
| Accrued expenses payable | | | | 19 | | | | | | 15 | | | | | | 77 | | |
| Accrued directors expense payable | | | | – | | | | | | – | | | | | | 2 | | |
| Due to Advisor | | | | 98 | | | | | | 38 | | | | | | 1,402 | | |
| Total Liabilities | | | | 523 | | | | | | 163 | | | | | | 52,294 | | |
| NET ASSETS | | | $ | 121,941 | | | | | $ | 47,250 | | | | | $ | 2,545,383 | | |
| Net Assets consist of: | | | | | | | | | | | | | | | | | | |
| Capital stock ($.001 par value) | | | $ | 138,180 | | | | | $ | 39,080 | | | | | $ | 2,699,428 | | |
| Undistributed net investment income (loss) | | | | 350 | | | | | | (2 | ) | | | | | 19,616 | | |
| Accumulated net realized gain (loss) on investments | | | | (12,084 | ) | | | | | 1,312 | | | | | | (120,059 | ) | |
| Net unrealized appreciation (depreciation) on investments | | | | (4,505 | ) | | | | | 6,860 | | | | | | (53,602 | ) | |
| Net Assets | | | $ | 121,941 | | | | | $ | 47,250 | | | | | $ | 2,545,383 | | |
| Shares of capital stock outstanding (unlimited shares authorized) | | | | 2,019 | | | | | | 3,678 | | | | | | 221,613 | | |
| Offering and redemption price/Net asset value per share | | | $ | 60.39 | (a) | | | | $ | 12.85 | | | | | $ | 11.49 | | |
(a) Does not recalculate due to rounding.
See Notes to Financial Statements.
31
| STATEMENTS OF OPERATIONS (Unaudited) |
| Six-Month Period Ended May 31, 2017 (In thousands) |
| | LARGECAP | | MIDCAP | | BOND |
| | FUND | | FUND | | FUND |
| Investment income | | | | | | | | | | | | | | | | | |
| Dividends (a) | | | $ | 1,093 | | | | | $ | 275 | | | | | $ | – | |
| Interest | | | | – | | | | | | – | | | | | | 46,128 | |
| Total investment income | | | | 1,093 | | | | | | 275 | | | | | | 46,128 | |
| Expenses | | | | | | | | | | | | | | | | | |
| Investment advisory fees | | | | 569 | | | | | | 231 | | | | | | 6,919 | |
| Shareholder servicing costs | | | | 40 | | | | | | 15 | | | | | | 533 | |
| Administrative & accounting services fees | | | | 60 | | | | | | 31 | | | | | | 333 | |
| Custody fees | | | | 7 | | | | | | 4 | | | | | | 98 | |
| Directors fees | | | | 14 | | | | | | 12 | | | | | | 74 | |
| Federal & state registration | | | | 17 | | | | | | 16 | | | | | | 51 | |
| Professional fees | | | | 20 | | | | | | 20 | | | | | | 42 | |
| Other expenses | | | | 12 | | | | | | 5 | | | | | | 213 | |
| Total expenses | | | | 739 | | | | | | 334 | | | | | | 8,263 | |
| Less expenses reimbursed by Advisor | | | | (74 | ) | | | | | (57 | ) | | | | | – | |
| Net expenses | | | | 665 | | | | | | 277 | | | | | | 8,263 | |
| Net investment income (loss) | | | | 428 | | | | | | (2 | ) | | | | | 37,865 | |
| Net realized gain on investments | | | | 11,445 | | | | | | 1,427 | | | | | | 2,875 | |
| Net unrealized appreciation (depreciation) on investments | | | | (5,007 | ) | | | | | 1,834 | | | | | | 51,248 | |
| Net gain on investments | | | | 6,438 | | | | | | 3,261 | | | | | | 54,123 | |
| Net increase in net assets resulting from operations | | | $ | 6,866 | | | | | $ | 3,259 | | | | | $ | 91,988 | |
| | |
| (a) Net of foreign withholding taxes | | | $ | 9 | | | | | $ | 1 | | | | | $ | – | |
See Notes to Financial Statements.
32
| STATEMENTS OF CHANGES IN NET ASSETS |
| (In thousands) |
| | LARGECAP | | MIDCAP | | BOND |
| | FUND | | FUND | | FUND |
| | Six-Month | | | | | | | | Six-Month | | | | | | | | Six-Month | | | | | | |
| | Period Ended | | Year Ended | | Period Ended | | Year Ended | | Period Ended | | Year Ended |
| | May 31, 2017 | | November 30, | | May 31, 2017 | | November 30, | | May 31, 2017 | | November 30, |
| | (Unaudited) | | 2016 | | (Unaudited) | | 2016 | | (Unaudited) | | 2016 |
| Operations | | | | | | | | | | | | | | | | | | | | | | | | | | | | | | | | | | | | |
| Net investment income (loss) | | | $ | 428 | | | | | $ | 964 | | | | | $ | (2 | ) | | | | $ | 23 | | | | | $ | 37,865 | | | | | $ | 86,995 | | |
| Net realized gain (loss) | | | | | | | | | | | | | | | | | | | | | | | | | | | | | | | | | | | | |
| on investments | | | | 11,445 | | | | | | 8,692 | | | | | | 1,427 | | | | | | 2,038 | | | | | | 2,875 | | | | | | (100,179 | ) | |
| Net unrealized appreciation | | | | | | | | | | | | | | | | | | | | | | | | | | | | | | | | | | | | |
| (depreciation) on investments | | | | (5,007 | ) | | | | | 4,959 | | | | | | 1,834 | | | | | | 3,310 | | | | | | 51,248 | | | | | | 124,391 | | |
| Net increase in net assets resulting | | | | | | | | | | | | | | | | | | | | | | | | | | | | | | | | | | | | |
| from operations | | | | 6,866 | | | | | | 14,615 | | | | | | 3,259 | | | | | | 5,371 | | | | | | 91,988 | | | | | | 111,207 | | |
| Distributions to Shareholders | | | | | | | | | | | | | | | | | | | | | | | | | | | | | | | | | | | | |
| Distributions from net | | | | | | | | | | | | | | | | | | | | | | | | | | | | | | | | | | | | |
| investment income | | | | (930 | ) | | | | | (773 | ) | | | | | (23 | ) | | | | | (4 | ) | | | | | (38,056 | ) | | | | | (100,995 | ) | |
| Distributions from net realized gains | | | | | | | | | | | | | | | | | | | | | | | | | | | | | | | | | | | | |
| on securities transactions | | | | – | | | | | | – | | | | | | (2,027 | ) | | | | | (3,145 | ) | | | | | – | | | | | | – | | |
| Total distributions to shareholders | | | | (930 | ) | | | | | (773 | ) | | | | | (2,050 | ) | | | | | (3,149 | ) | | | | | (38,056 | ) | | | | | (100,995 | ) | |
| | |
| Fund Share Transactions | | | | | | | | | | | | | | | | | | | | | | | | | | | | | | | | | | | | |
| (See Note 4) | | | | (1,516 | ) | | | | | (8,233 | ) | | | | | 2,196 | | | | | | 3,273 | | | | | | 470,916 | | | | | | (734,159 | ) | |
| | |
| Total Increase (Decrease) | | | | | | | | | | | | | | | | | | | | | | | | | | | | | | | | | | | | |
| in Net Assets | | | | 4,420 | | | | | | 5,609 | | | | | | 3,405 | | | | | | 5,495 | | | | | | 524,848 | | | | | | (723,947 | ) | |
| | |
| Net Assets | | | | | | | | | | | | | | | | | | | | | | | | | | | | | | | | | | | | |
| Beginning of period | | | | 117,521 | | | | | | 111,912 | | | | | | 43,845 | | | | | | 38,350 | | | | | | 2,020,535 | | | | | | 2,744,482 | | |
| End of period | | | $ | 121,941 | | | | | $ | 117,521 | | | | | $ | 47,250 | | | | | $ | 43,845 | | | | | $ | 2,545,383 | | | | | $ | 2,020,535 | | |
| Undistributed net investment | | | | | | | | | | | | | | | | | | | | | | | | | | | | | | | | | | | | |
| income (loss) included in net | | | | | | | | | | | | | | | | | | | | | | | | | | | | | | | | | | | | |
| assets at end of period | | | $ | 350 | | | | | $ | 852 | | | | | $ | (2 | ) | | | | $ | 23 | | | | | $ | 19,616 | | | | | $ | 19,386 | | |
See Notes to Financial Statements.
33
| NOTES TO FINANCIAL STATEMENTS (Unaudited) |
| May 31, 2017 |
NOTE 1 - ORGANIZATION
Thompson IM Funds, Inc. (the “Company”) is a Wisconsin corporation registered under the Investment Company Act of 1940, as amended (the “1940 Act”), as an open-end, diversified management investment company.
The Company consists of separate mutual funds series (each, a “Fund,” and collectively, the “Funds”): Thompson LargeCap Fund (the “LargeCap Fund”), Thompson MidCap Fund (the “MidCap Fund”) and Thompson Bond Fund (the “Bond Fund”). The assets and liabilities of each Fund are segregated and a shareholder’s interest is limited to the Fund in which the shareholder owns shares. The objectives and strategies of each Fund are described in the Funds’ Prospectus.
NOTE 2 - SIGNIFICANT ACCOUNTING POLICIES
The following is a summary of significant accounting policies followed by the Funds in the preparation of their financial statements. The Funds are investment companies and accordingly follow the investment company accounting and reporting guidance of the Financial Accounting Standards Board (“FASB”) Accounting Standards Codification Topic 946 Financial Services — Investment Companies.
VALUATION POLICY AND PROCEDURES - The Funds’ Board of Directors (the “Funds’ Board”) has adopted methods for valuing securities set forth in the Funds’ Pricing Policies and Procedures, including circumstances in which market quotes are not readily available or deemed to be unreliable, and has delegated authority to the Advisor to apply those methods in making fair value determinations, subject to oversight by the Funds’ Board. The Advisor has established a valuation committee that, along with other Advisor employees, administers, implements, and oversees the fair valuation process and makes fair value decisions. The valuation committee regularly reviews its own fair value decisions, as well as valuations, valuation techniques and services furnished by pricing services; considers circumstances in the markets which may require it to make or adjust valuation determinations; and reviews previous valuation determinations. The valuation committee reports on its activities and any changes to the fair valuation guidelines to the Funds’ Board.
SECURITY VALUATION - Each Fund’s equity securities including common stocks, ADRs and REITs are valued at their market prices (generally the last reported sales price on the exchange where the securities are primarily traded or, for Nasdaq-listed securities, at their Nasdaq Official Closing Prices). Exchange traded options are valued at the last reported sale price on an exchange on which the option is traded. If no sales are reported on a particular day, the mean between the highest bid and lowest asked quotations at the close of the exchanges will generally be used. Investments in money market mutual funds are generally priced at the ending net asset value provided by the service agent of the funds.
Fixed-income securities such as corporate bonds, asset-backed securities, mortgage-backed securities, U.S. government and agency securities, and municipal bonds are typically valued based on valuations published by an independent pricing service, which uses various valuation methodologies such as matrix pricing and other analytical pricing models as well as market transactions and dealer quotations. Factors considered by pricing services include market characteristics such as benchmark yield curves, option-adjusted spreads, credit spreads and fundamental analytical data relating to the issuer. Short-term investments in fixed-income securities (those with remaining maturities of 60 days or less) are generally valued on an amortized cost basis.
Where market quotations are not readily available or are unreliable, a value is determined in good faith pursuant to procedures established by the Funds’ Board. When determining the value of a security, consideration is given to the facts and circumstances relevant to the particular situation, which includes factors such as fundamental analytical data relating to the investment, which may include consideration of yields or prices of securities of comparable quality, coupon rate, maturity and type of issue, nature and duration of any restrictions on disposition of the security and an evaluation of forces that influence the market in which the securities are purchased or sold. Fair value pricing is an inherently subjective process, and no single standard exists for determining fair value. Different funds could reasonably arrive at different values for the same security.
VALUATION MEASUREMENTS – In accordance with generally accepted accounting principles in the United States of America (“GAAP”), fair value is defined as the price that the Fund would receive to sell an investment or pay to transfer a liability in an orderly transaction with an independent buyer in the principal market, or in the absence of a principal market the most advantageous market for the investment or liability. GAAP established a three-tier hierarchy to maximize the use of observable market data and minimize the use of unobservable inputs and to establish classification of fair value measurements for disclosure purposes.
34
| NOTES TO FINANCIAL STATEMENTS (Unaudited) (Continued) |
| May 31, 2017 |
Various inputs are used in determining the value of each Fund’s investments. These inputs are summarized in the three broad levels listed below:
Level 1 – Quoted prices in active markets for identical securities.
Level 2 – Other significant observable inputs (including quoted prices for similar securities, interest rates, prepayment speeds, credit risk, etc.).
Level 3 – Significant unobservable inputs (including the Fund’s own assumptions in determining the fair value of investments).
Inputs may include price information, specific and broad credit data, liquidity statistics, and other factors. The Fund considers observable data to be that market data which is readily available, regularly distributed or updated, reliable and verifiable, not proprietary, and provided by independent sources that are actively involved in the relevant market. The determination of what constitutes “observable” requires significant judgment by the Fund. The categorization of a financial instrument within the hierarchy is based upon the pricing transparency of the instrument and does not necessarily correspond to the Fund’s perceived risk of that instrument. Investments whose values are based on quoted market prices in active markets, and which are therefore classified as level-1 securities, include active listed equities and certain U.S. government obligations.
Investments that trade in markets that are not considered to be active, but are valued based on quoted market prices, dealer quotations or alternative pricing sources supported by observable inputs, are classified as level-2 securities. These include certain U.S. government obligations, most government agency securities, investment-grade corporate bonds, sovereign bonds, municipal bonds, and less liquid listed equities. Level-2 investments include positions that are not traded in active markets.
Investments classified as level-3 securities have significant unobservable inputs, as they trade infrequently or not at all. Level-3 instruments include private-placement and less liquid corporate and municipal debt securities. When observable prices are not available for these securities, the Fund uses one or more valuation techniques (e.g., the market approach, the income approach, or the cost approach) for which sufficient and reliable data is available. Within level 3, the use of the market approach generally consists of using comparable market transactions, while the use of the income approach generally consists of using the net present value of estimated future cash flows, adjusted as appropriate for liquidity, credit, market and/or other risk factors. The inputs used by the Fund in estimating the value of level-3 investments include the original transaction price and recent transactions in the same or similar instruments.
The following is a summary of the inputs used to value the Funds’ investments as of May 31, 2017:
| | LargeCap Fund |
| Assets | | Level 1 | | Level 2 | | Level 3 | | Total |
| Investment Securities: | | | | | | | | | | | | |
| Common stocks | | $ | 121,999,160 | | $ | – | | $ | – | | $ | 121,999,160 |
| Short-term investments | | | 5,083 | | | – | | | – | | | 5,083 |
| Total Assets | | $ | 122,004,243 | | $ | – | | $ | – | | $ | 122,004,243 |
| |
| | MidCap Fund |
| Assets | | Level 1 | | Level 2 | | Level 3 | | | Total |
| Investment Securities: | | | | | | | | | | | | |
| Common stocks | | $ | 47,029,567 | | $ | – | | $ | – | | $ | 47,029,567 |
| Short-term investments | | | 263,825 | | | – | | | – | | | 263,825 |
| Total Assets | | $ | 47,293,392 | | $ | – | | $ | – | | $ | 47,293,392 |
35
| NOTES TO FINANCIAL STATEMENTS (Unaudited) (Continued) |
| May 31, 2017 |
| | Bond Fund |
| Assets | | Level 1 | | Level 2 | | Level 3 | | Total |
| Investment Securities: | | | | | | | | | | | | |
| Bonds | | $ | – | | $ | 2,490,793,609 | | $ | – | | $ | 2,490,793,609 |
| Short-term investments | | | 115,559 | | | 61,152,659 | | | – | | | 61,268,218 |
| Total Assets | | $ | 115,559 | | $ | 2,551,946,268 | | $ | – | | $ | 2,552,061,827 |
There were no transfers between level-1 and level-2 securities and the Funds did not invest in any level-3 investments as of and during the six-month period ended May 31, 2017. It is the Funds’ policy to record transfers at the end of the reporting period. Refer to each Fund’s Schedule of Investments for additional information regarding security types and industry classifications.
SECURITIES TRANSACTIONS AND INVESTMENT INCOME - Investment securities transactions are accounted for on the trade date. Gains or losses realized on sales of securities are determined by comparing the identified cost of the security lot sold with the net sales proceeds. Discounts/premiums on debt securities purchased are accreted/amortized over the life of the respective securities using the effective interest method for both book and tax purposes. Dividend income is recorded on the ex-dividend date. Interest income is recorded as earned. Income and capital gains on some foreign securities may be subject to foreign withholding taxes, which are accrued as applicable, and have been provided for in accordance with the Funds’ understanding of the applicable country’s tax rules and rates. The ability of the issuers of the debt securities held by the Funds to meet their obligations may be affected by economic developments in a specific industry, state, or region. Debt obligations may be placed on non-accrual status and related interest income may be reduced by ceasing current accruals and writing off interest receivables when the collection of all or a portion of interest has become doubtful. A debt obligation is removed from non-accrual status when the issuer resumes interest payments or when collectability of interest is reasonably assured.
OPTIONS - Each Fund may enter into options transactions for hedging purposes and will not use these instruments for speculation. Each Fund may use options to hedge against anticipated declines in the market value of portfolio securities and increases in the market value of securities it intends to purchase and protect against exposure to interest rate changes. Each Fund may also use options to enhance total return or invest in eligible asset classes with greater efficiency and lower cost than is believed to be possible through direct investment. The use of options for hedging purposes involves certain risks and may result in a loss if changes in the value of the option move in a direction different than anticipated, rendering the hedging strategy unsuccessful.
Each Fund may write covered call/put options for which premiums received are recorded as liabilities and are subsequently adjusted to the current fair value of the options written. Premiums received from writing options that expire unexercised are treated as realized gains. Premiums received from writing options which are either exercised or closed are offset against the proceeds received or amount paid on the transaction to determine realized gains or losses.
SECURITIES PURCHASED ON A WHEN-ISSUED OR DELAYED-DELIVERY BASIS - Each Fund may purchase securities on a when-issued or delayed-delivery basis. When-issued securities are securities purchased with delivery to occur at a later date at a stated price and/or yield, thereby involving the risk that the price and/or yield obtained may be more or less than those available in the market when delivery takes place. At the time a Fund makes a commitment to purchase a security on a when-issued basis, the Fund records the transaction and reflects the value of the security in determining net asset value. Each Fund designates and maintains cash and marketable securities at least equal in value to commitments for when-issued securities.
VARIABLE-RATE DEMAND NOTES - The Funds invest in short-term variable-rate demand notes, which are unsecured instruments. The Funds may be susceptible to credit risk with respect to these instruments to the extent the issuer defaults on its payment obligation.
PERMANENT BOOK AND TAX DIFFERENCES - Generally accepted accounting principles require that permanent financial reporting and tax differences relating to shareholder distributions be reclassified in the capital accounts.
EXPENSES - Each Fund is charged for those expenses that are directly attributed to it. Expenses that are not readily identifiable to a specific Fund are generally allocated among the Funds in proportion to the relative sizes of the Funds.
36
| NOTES TO FINANCIAL STATEMENTS (Unaudited) (Continued) |
| May 31, 2017 |
USE OF ESTIMATES - The preparation of financial statements in conformity with GAAP requires management to make estimates and assumptions that affect the reported amounts of assets and liabilities and disclosure of contingent assets and liabilities at the date of the financial statements and the reported amounts of revenues and expenses during the reporting period. Actual results could differ from these estimates.
DISTRIBUTIONS TO SHAREHOLDERS - Distributions to shareholders from net investment income and realized gains on securities for the LargeCap Fund and MidCap Fund normally are declared at least annually. Bond Fund distributions to shareholders from net investment income normally are declared on a quarterly basis, and distributions to shareholders from realized gains on securities normally are declared at least annually. Distributions are recorded on the ex-dividend date.
FEDERAL INCOME TAXES - No provision has been made for federal income taxes since the Funds have elected to be taxed as regulated investment companies and intend to distribute substantially all income to shareholders and otherwise comply with the provisions of the Internal Revenue Code applicable to regulated investment companies.
LINE OF CREDIT - The Funds have established an unsecured line of credit (“LOC”) with U.S. Bank N.A. which expires November 10, 2017, used primarily to finance redemption payments. Each individual Fund’s borrowing under the LOC is limited to 5% of the value of that Fund’s net assets, 33.33% of the value of the Fund’s investments, or any explicit borrowing limits imposed by the LOC, whatever is less. Interest is charged at the prime rate, which was 4.0% as of May 31, 2017. As of May 31, 2017, the limits established are: LargeCap Fund - $5,500,000, MidCap Fund - $2,000,000 and Bond Fund - $97,750,000. All terms and borrowing limits imposed by the LOC are subject to review and approval by the Funds’ Board. The LOC was drawn upon during the period; however, as of May 31, 2017, there were no borrowings by the funds outstanding under the LOC. The following table shows the average balance, average interest rate, interest expense, and maximum borrowings incurred by the Funds on the LOC for the six-month period ended May 31, 2017.
| | | | | | | | | | | | | | | | | | | | Date of |
| | Average | | Average | | Interest | | Maximum | | Maximum |
| | Balance | | Interest Rate | | Expense | | Borrowing | | Borrowing |
| LargeCap Fund | | $ | 40,500 | | | 3.84 | % | | | | $ | 776 | | | | $ | 517,000 | | | 5/24/2017 |
| MidCap Fund | | $ | 39,110 | | | 3.80 | % | | | | $ | 741 | | | | $ | 823,000 | | | 1/26/2017 |
| Bond Fund | | $ | – | | | – | | | | | $ | – | | | | $ | – | | | – |
GUARANTEES AND INDEMNIFICATIONS - Under the Funds’ organizational documents, each Director, officer, employee or other agent of the Funds (including the Funds’ investment advisor) is indemnified, to the extent permitted by the 1940 Act, against certain liabilities that may arise out of performance of their duties to the Funds. Additionally, in the normal course of business, the Funds enter into contracts that contain a variety of indemnification clauses. The Funds’ maximum exposure under these arrangements is unknown as this would involve future claims that may be made against the Funds that have not yet occurred. However, the Funds have not had prior claims or losses pursuant to these contracts and believe the risk of loss to be remote.
ACCOUNTING FOR UNCERTAINTY IN INCOME TAXES - As of and during the six-month period ended May 31, 2017, the Funds did not have a liability for unrecognized tax benefits in the accompanying financial statements. Also, the Funds recognized no interest or penalties related to unrecognized tax benefits during the same period. The Funds recognize interest and penalties, if any, related to unrecognized tax benefits as income tax expense in the Statements of Operations. The Funds are also not aware of any tax positions for which it is reasonably possible that the total amounts of unrecognized tax benefits will significantly change in the next twelve months.
SUBSEQUENT EVENTS - The Funds have evaluated subsequent events through the issuance of the Funds’ financial statements. See note 6. Other than as described in note 6, there were no subsequent events which were deemed to have an impact on the Funds’ financial statements.
37
| NOTES TO FINANCIAL STATEMENTS (Unaudited) (Continued) |
| May 31, 2017 |
NOTE 3 - INVESTMENT ADVISORY AND ADMINISTRATIVE AND ACCOUNTING SERVICES AGREEMENTS AND OTHER TRANSACTIONS WITH AFFILIATES
The Investment Advisory Agreement pursuant to which Thompson Investment Management, Inc. (“TIM” or “Advisor”) is retained by the Funds provides for monthly compensation to TIM computed on average daily net assets at the following annual rates:
| | First | | Over |
| | $50 Million | | $50 Million |
| LargeCap Fund | | | 1.00 | % | | | | 0.90 | % | |
| MidCap Fund | | | 1.00 | % | | | | 0.90 | % | |
| Bond Fund | | | 0.65 | % | | | | 0.60 | % | |
The Advisor is contractually bound to waive management fees and/or reimburse expenses incurred by the Funds through March 31, 2018, so that the annual operating expenses of the Funds do not exceed the following percentages of their respective average daily net assets: LargeCap Fund - 1.10%, MidCap Fund - 1.20% and Bond Fund - 0.80%. For the six-month period ended May 31, 2017, the Advisor reimbursed expenses incurred by the LargeCap Fund and the MidCap Fund in the amounts of $73,696 and $56,673, respectively. The Funds are not obligated to reimburse the Advisor for any fees or expenses waived in previous fiscal years.
As of May 31, 2017, an affiliated shareholder held 11.79% of the MidCap Fund’s outstanding shares. Transactions by the shareholder may have a material impact on the Fund.
Pursuant to an Administrative and Accounting Services Agreement, TIM maintains the Funds’ financial records in accordance with the 1940 Act, prepares all necessary financial statements of the Funds and calculates the net asset value per share of the Funds on a daily basis. As compensation for its services, each Fund pays TIM a fee computed daily and payable monthly at the annual rate of 0.15% of average daily net assets up to $30 million, 0.10% of the next $70 million of average daily net assets and 0.025% of average daily net assets in excess of $100 million, with an annual minimum fee of $30,000 per Fund. The calculations of daily net asset value are subcontracted to U.S. Bancorp Fund Services, resulting in fees paid by TIM for the six-month period ended May 31, 2017, in the following amounts:
| | Administrative & |
| | Accounting Fees Paid |
| LargeCap Fund | | | $ | 19,837 | |
| MidCap Fund | | | $ | 17,686 | |
| Bond Fund | | | $ | 124,547 | |
The Funds reimburse the Advisor for a portion of amounts paid by the Advisor out of the Advisor’s own resources under various shareholder, account maintenance, networking and other services provided to the Funds by broker-dealers and other intermediaries. The amount reimbursed by the Funds is equal to (1) for those accounts maintained through a shareholder servicing arrangement, an annual rate of no more than 0.10% of the average daily net assets of the omnibus accounts in the Funds for which all broker-dealers and other intermediaries, in the aggregate, are responsible, and (2) for those accounts maintained through a networking arrangement, no more than $6 per year per account in the Funds for which the broker-dealers and other intermediaries are responsible; provided however, in all cases only one of these fees shall be applicable to the assets in an account. This amount has been determined by the Funds’ Board to approximate (or not to exceed) the transfer agency fees that would otherwise have been payable by the Funds if such broker-dealers and intermediaries did not maintain these accounts. Such amounts are recorded within Shareholder servicing costs on each Fund’s Statement of Operations. For the six-month period ended May 31, 2017, the amounts reimbursed by the Funds to the Advisor were:
| | Intermediary |
| | Fees Reimbursed |
| LargeCap Fund | | | $ | 10,006 | |
| MidCap Fund | | | $ | 1,727 | |
| Bond Fund | | | $ | 337,324 | |
38
| NOTES TO FINANCIAL STATEMENTS (Unaudited) (Continued) |
| May 31, 2017 |
NOTE 4 - FUND SHARE TRANSACTIONS (in thousands)
Transactions in shares of the Funds were as follows:
| | Six-Month Period Ended | | Year Ended |
| | May 31, 2017 (Unaudited) | | November 30, 2016 |
| | Shares | | Dollars | | Shares | | Dollars |
| LargeCap Fund | | | | | | | | | | | | | | |
| Shares sold | | 63 | | | $ | 3,738 | | | 77 | | | $ | 3,783 | |
| Shares issued in reinvestment of dividends | | 16 | | | | 905 | | | 16 | | | | 753 | |
| Shares issued in reinvestment of realized gains | | – | | | | – | | | – | | | | – | |
| Shares redeemed | | (104 | ) | | | (6,159 | ) | | (255 | ) | | | (12,769 | ) |
| Net decrease | | (25 | ) | | $ | (1,516 | ) | | (162 | ) | | $ | (8,233 | ) |
| |
| MidCap Fund | | | | | | | | | | | | | | |
| Shares sold | | 231 | | | $ | 2,895 | | | 354 | | | $ | 3,786 | |
| Shares issued in reinvestment of dividends | | 2 | | | | 22 | | | – | | | | 4 | |
| Shares issued in reinvestment of realized gains | | 163 | | | | 2,007 | | | 296 | | | | 3,078 | |
| Shares redeemed | | (217 | ) | | | (2,728 | ) | | (330 | ) | | | (3,595 | ) |
| Net increase | | 179 | | | $ | 2,196 | | | 320 | | | $ | 3,273 | |
| |
| Bond Fund | | | | | | | | | | | | | | |
| Shares sold | | 65,711 | | | $ | 745,655 | | | 37,341 | | | $ | 410,292 | |
| Shares issued in reinvestment of dividends | | 3,183 | | | | 35,758 | | | 9,050 | | | | 97,414 | |
| Shares issued in reinvestment of realized gains | | – | | | | – | | | – | | | | – | |
| Shares redeemed | | (27,368 | ) | | | (310,497 | ) | | (116,186 | ) | | | (1,241,865 | ) |
| Net increase (decrease) | | 41,526 | | | $ | 470,916 | | | (69,795 | ) | | $ | (734,159 | ) |
NOTE 5 - PURCHASE AND SALE OF SECURITIES
Investment transactions for the six-month period ended May 31, 2017 were as follows:
| | Securities other than U.S. | | | | | | |
| | Government and Short-term | | | | | | |
| | Investments | | U.S. Government Securities |
| | Purchases | | Sales | | Purchases | | Sales |
| LargeCap Fund | | $ | 46,736,992 | | $ | 48,544,823 | | $ | – | | $ | – |
| MidCap Fund | | $ | 7,142,162 | | $ | 7,141,881 | | $ | – | | $ | – |
| Bond Fund | | $ | 392,570,730 | | $ | 256,248,128 | | $ | 377,947,581 | | $ | 337,904,075 |
39
| NOTES TO FINANCIAL STATEMENTS (Unaudited) (Continued) |
| May 31, 2017 |
NOTE 6 – INCOME TAX INFORMATION
At May 31, 2017, the investment cost and aggregate unrealized appreciation and depreciation on investments for federal income tax purposes were as follows:
| | LargeCap Fund | | MidCap Fund | | Bond Fund |
| Federal tax cost | | | $ | 126,510,710 | | | | | $ | 40,634,519 | | | | $ | 2,605,777,594 | |
| Unrealized appreciation | | | $ | 7,409,733 | | | | | $ | 11,396,490 | | | | $ | 8,992,263 | |
| Unrealized depreciation | | | | (11,916,200 | ) | | | | | (4,737,617 | ) | | | | (62,708,030 | ) |
| Net unrealized appreciation (depreciation) | | | $ | (4,506,467 | ) | | | | $ | 6,658,873 | | | | $ | (53,715,767 | ) |
The tax basis of investments for tax and financial reporting purposes differ principally due to wash sales.
The tax components of distributions paid during the six-month period ended May 31, 2017 and the fiscal year ended November 30, 2016 are as follows:
| | LargeCap Fund | | MidCap Fund | | Bond Fund |
| Six-month period ended May 31, 2017 (Unaudited) | | | | | | | | | | | | | |
| Distributions paid from: | | | | | | | | | | | | | |
| Ordinary income distributions | | | $ | 929,915 | | | | $ | 363,026 | | | $ | 38,056,001 |
| Long-term capital gains distributions | | | | – | | | | | 1,687,109 | | | | – |
| Total distributions paid | | | $ | 929,915 | | | | $ | 2,050,135 | | | $ | 38,056,001 |
| | | | | | | | | | | | | | |
|
| Fiscal year ended November 30, 2016 | | | | | | | | | | | | | |
| Distributions paid from: | | | | | | | | | | | | | |
| Ordinary income distributions | | | $ | 773,384 | | | | $ | 160,710 | | | $ | 100,994,642 |
| Long-term capital gains distributions | | | | – | | | | | 2,988,206 | | | | – |
| Total distributions paid | | | $ | 773,384 | | | | $ | 3,148,916 | | | $ | 100,994,642 |
The tax basis post-October losses as of November 30, 2016 and capital loss carryforward as of November 30, 2016, which are not being recognized for tax purposes until the first day of the following fiscal year, are as follows:
| | LargeCap Fund | | MidCap Fund | | Bond Fund |
| Post-October losses | | | $ | – | | | $ | – | | $ | 202,665 |
| Net capital loss carryforward | | | | | | | | | | | |
| Subject to expiration | | | | | | | | | | | |
| November 30, 2017 | | | $ | 23,515,595 | | | $ | – | | $ | – |
| Not subject to expiration | | | | | | | | | | | |
| Short-term | | | | – | | | | – | | | 17,788,426 |
| Long-term | | | | – | | | | – | | | 104,389,669 |
| Total capital loss carryforward | | | $ | 23,515,595 | | | $ | – | | $ | 122,178,095 |
During the fiscal year ended November 30, 2016, the LargeCap Fund utilized capital loss carryforwards in the amount of $8,613,841.
40
| NOTES TO FINANCIAL STATEMENTS (Unaudited) (Continued) |
| May 31, 2017 |
Under the Regulated Investment Company Modernization Act of 2010 (the “Modernization Act”), capital losses incurred during taxable years after December 22, 2010 are carried forward indefinitely and retain the character of the original loss. Previously, net capital losses were carried forward for eight years and treated as short-term losses. As a transition rule, the Modernization Act requires that post-enactment net capital losses be used before pre-enactment net capital losses.
The following distributions were declared on June 23, 2017, payable to shareholders on June 26, 2017 (Unaudited):
| | LargeCap Fund | | MidCap Fund | | Bond Fund |
| Ordinary income distributions | | | | | | | | | | | | | |
| Amount | | | $ | – | | | | $ | – | | | $ | 20,141,642 |
| Per Share | | | $ | – | | | | $ | – | | | $ | 0.09 |
41
The following table presents information relating to a share of capital stock outstanding for the entire period.
| | Six-Month | | | | | | | | | | | | | | | |
| | Period Ended | | | | | | | | | | | | | | | |
| | May 31, 2017 | | Year Ended November 30, |
| | (Unaudited) | | 2016 | | 2015 | | 2014 | | 2013 | | 2012 |
| LARGECAP FUND | | | | | | | | | | | | | | | | | | | | |
| |
| Net Asset Value, Beginning of Period | | | $57.48 | | | | $50.72 | | | $53.40 | | | $46.47 | | | $34.27 | | | $30.07 | |
| Income from Investment Operations | | | | | | | | | | | | | | | | | | | | |
| Net investment income | | | 0.21 | | | | 0.47 | | | 0.35 | | | 0.27 | | | 0.19 | | | 0.18 | |
| Net realized and unrealized gains (losses) | | | | | | | | | | | | | | | | | | | | |
| on investments | | | 3.16 | | | | 6.64 | | | (2.75 | ) | | 6.84 | | | 12.20 | | | 4.13 | |
| Total from Investment Operations | | | 3.37 | | | | 7.11 | | | (2.40 | ) | | 7.11 | | | 12.39 | | | 4.31 | |
| Less Distributions | | | | | | | | | | | | | | | | | | | | |
| Distributions from net investment income | | | (0.46 | ) | | | (0.35 | ) | | (0.28 | ) | | (0.18 | ) | | (0.19 | ) | | (0.11 | ) |
| Distributions from net realized gains | | | – | | | | – | | | – | | | – | | | – | | | – | |
| Total Distributions | | | (0.46 | ) | | | (0.35 | ) | | (0.28 | ) | | (0.18 | ) | | (0.19 | ) | | (0.11 | ) |
| |
| Net Asset Value, End of Period | | | $60.39 | | | | $57.48 | | | $50.72 | | | $53.40 | | | $46.47 | | | $34.27 | |
| |
| Total Return | | | 5.89% | (a) | | | 14.16% | | | (4.52% | ) | | 15.35% | | | 36.33% | | | 14.37% | |
| |
| Ratios/Supplemental Data | | | | | | | | | | | | | | | | | | | | |
| Net assets, end of period (millions) | | | $121.9 | | | | $117.5 | | | $111.9 | | | $128.6 | | | $124.8 | | | $99.6 | |
| Ratios to average net assets: | | | | | | | | | | | | | | | | | | | | |
| Ratio of expenses | | | 1.10% | (b) | | | 1.13% | | | 1.15% | | | 1.15% | | | 1.21% | | | 1.31% | |
| Ratio of expenses without reimbursement | | | 1.22% | (b) | | | 1.25% | | | 1.22% | | | 1.23% | | | 1.22% | | | 1.31% | |
| Ratio of net investment income | | | 0.71% | (b) | | | 0.90% | | | 0.64% | | | 0.54% | | | 0.46% | | | 0.47% | |
| Ratio of net investment income | | | | | | | | | | | | | | | | | | | | |
| without reimbursement | | | 0.59% | (b) | | | 0.78% | | | 0.57% | | | 0.46% | | | 0.45% | | | 0.47% | |
| Portfolio turnover rate | | | 39% | (a) | | | 32% | | | 45% | | | 27% | | | 38% | | | 30% | |
| (a) | Calculated on a non-annualized basis. |
| (b) | Calculated on an annualized basis. |
See Notes to Financial Statements.
42
| FINANCIAL HIGHLIGHTS (Continued) |
| |
The following table presents information relating to a share of capital stock outstanding for the entire period.
| | Six-Month | | | | | | | | | | | | | | | |
| | Period Ended | | | | | | | | | | | | | | | |
| | May 31, 2017 | | Year Ended November 30, |
| | (Unaudited) | | 2016 | | 2015 | | 2014 | | 2013 | | 2012 |
| MIDCAP FUND | | | | | | | | | | | | | | | | | | | | |
| |
| Net Asset Value, Beginning of Period | | | $12.53 | | | | $12.07 | | | $14.04 | | | $14.04 | | | $11.28 | | | $11.15 | |
| Income from Investment Operations | | | | | | | | | | | | | | | | | | | | |
| Net investment income (loss) | | | – | (a) | | | 0.01 | | | – | (a) | | – | (a) | | – | (a) | | – | (a) |
| Net realized and unrealized gains (losses) | | | | | | | | | | | | | | | | | | | | |
| on investments | | | 0.91 | | | | 1.45 | | | (0.64 | ) | | 1.47 | | | 3.71 | | | 1.38 | |
| Total from Investment Operations | | | 0.91 | | | | 1.46 | | | (0.64 | ) | | 1.47 | | | 3.71 | | | 1.38 | |
| Less Distributions | | | | | | | | | | | | | | | | | | | | |
| Distributions from net investment income | | | (0.01 | ) | | | – | (a) | | – | | | – | | | – | | | – | |
| Distributions from net realized gains | | | (0.58 | ) | | | (1.00 | ) | | (1.33 | ) | | (1.47 | ) | | (0.95 | ) | | (1.25 | ) |
| Total Distributions | | | (0.59 | ) | | | (1.00 | ) | | (1.33 | ) | | (1.47 | ) | | (0.95 | ) | | (1.25 | ) |
| |
| Net Asset Value, End of Period | | | $12.85 | | | | $12.53 | | | $12.07 | | | $14.04 | | | $14.04 | | | $11.28 | |
| |
| Total Return | | | 7.43% | (b) | | | 13.82% | | | (5.10% | ) | | 11.82% | | | 35.65% | | | 14.41% | |
| |
| Ratios/Supplemental Data | | | | | | | | | | | | | | | | | | | | |
| Net assets, end of period (millions) | | | $47.3 | | | | $43.8 | | | $38.4 | | | $41.3 | | | $37.6 | | | $24.6 | |
| Ratios to average net assets: | | | | | | | | | | | | | | | | | | | | |
| Ratio of expenses | | | 1.20% | (c) | | | 1.25% | | | 1.30% | | | 1.30% | | | 1.30% | | | 1.30% | |
| Ratio of expenses without reimbursement | | | 1.44% | (c) | | | 1.50% | | | 1.49% | | | 1.54% | | | 1.63% | | | 1.83% | |
| Ratio of net investment income (loss) | | | (0.01% | )(c) | | | 0.06% | | | 0.01% | | | (0.02% | ) | | (0.02% | ) | | (0.03% | ) |
| Ratio of net investment loss | | | | | | | | | | | | | | | | | | | | |
| without reimbursement | | | (0.26% | )(c) | | | (0.19% | ) | | (0.18% | ) | | (0.27% | ) | | (0.35% | ) | | (0.56% | ) |
| Portfolio turnover rate | | | 16% | (b) | | | 34% | | | 27% | | | 34% | | | 47% | | | 44% | |
| (a) | Less than .005 per share. |
| (b) | Calculated on a non-annualized basis. |
| (c) | Calculated on an annualized basis. |
See Notes to Financial Statements.
43
| FINANCIAL HIGHLIGHTS (Continued) |
| |
The following table presents information relating to a share of capital stock outstanding for the entire period.
| | Six-Month | | | | | | | | | | | | | | | |
| | Period Ended | | | | | | | | | | | | | | | |
| | May 31, 2017 | | Year Ended November 30, |
| | (Unaudited) | | 2016 | | 2015 | | 2014 | | 2013 | | 2012 |
| BOND FUND | | | | | | | | | | | | | | | | | | | | |
| |
| Net Asset Value, Beginning of Period | | | $11.22 | | | | $10.98 | | | $11.69 | | | $11.91 | | | $11.95 | | | $11.33 | |
| Income from Investment Operations | | | | | | | | | | | | | | | | | | | | |
| Net investment income | | | 0.20 | | | | 0.49 | | | 0.49 | | | 0.45 | | | 0.41 | | | 0.41 | |
| Net realized and unrealized gains (losses) | | | | | | | | | | | | | | | | | | | | |
| on investments | | | 0.27 | | | | 0.26 | | | (0.72 | ) | | (0.19 | ) | | (0.03 | ) | | 0.67 | (a) |
| Total from Investment Operations | | | 0.47 | | | | 0.75 | | | (0.23 | ) | | 0.26 | | | 0.38 | | | 1.08 | |
| Less Distributions | | | | | | | | | | | | | | | | | | | | |
| Distributions from net investment income | | | (0.20 | ) | | | (0.51 | ) | | (0.48 | ) | | (0.45 | ) | | (0.40 | ) | | (0.43 | ) |
| Distributions from net realized gains | | | – | | | | – | | | – | | | (0.03 | ) | | (0.02 | ) | | (0.03 | ) |
| Total Distributions | | | (0.20 | ) | | | (0.51 | ) | | (0.48 | ) | | (0.48 | ) | | (0.42 | ) | | (0.46 | ) |
| |
| Net Asset Value, End of Period | | | $11.49 | | | | $11.22 | | | $10.98 | | | $11.69 | | | $11.91 | | | $11.95 | |
| |
| Total Return | | | 4.20% | (b) | | | 7.05% | | | (2.04% | ) | | 2.19% | | | 3.24% | | | 9.70% | |
| |
| Ratios/Supplemental Data | | | | | | | | | | | | | | | | | | | | |
| Net assets, end of period (millions) | | $2,545.4 | | | $2,020.5 | | $2,744.5 | | $3,724.0 | | $2,252.1 | | $1,292.3 | |
| Ratios to average net assets: | | | | | | | | | | | | | | | | | | | | |
| Ratio of expenses | | | 0.72% | (c) | | | 0.72% | | | 0.71% | | | 0.72% | | | 0.74% | | | 0.78% | |
| Ratio of expenses without reimbursement | | | 0.72% | (c) | | | 0.72% | | | 0.71% | | | 0.72% | | | 0.74% | | | 0.78% | |
| Ratio of net investment income | | | 3.29% | (c) | | | 4.16% | | | 3.98% | | | 4.04% | | | 3.73% | | | 3.90% | |
| Ratio of net investment income | | | | | | | | | | | | | | | | | | | | |
| without reimbursement | | | 3.29% | (c) | | | 4.16% | | | 3.98% | | | 4.04% | | | 3.73% | | | 3.90% | |
| Portfolio turnover rate | | | 14% | (b) | | | 20% | | | 29% | | | 21% | | | 33% | | | 16% | |
| (a) | Realized and unrealized gains and losses per share are balancing amounts necessary to reconcile the change in net asset value per share in the period. It does not agree to the aggregate gains and losses in the Statement of Operations due to the fluctuation in share transactions. |
| (b) | Calculated on a non-annualized basis. |
| (c) | Calculated on an annualized basis. |
See Notes to Financial Statements.
44
| ADDITIONAL INFORMATION (Unaudited) |
| |
| THOMPSON IM FUNDS, INC. |
| |
| DIRECTORS | INVESTMENT ADVISOR |
| John W. Feldt - Chairman | Thompson Investment Management, Inc. |
| George E. Austin | 918 Deming Way |
| Cornelia Boyle | Madison, Wisconsin 53717 |
| Patricia Lipton | |
| Jason L. Stephens | DISTRIBUTOR |
| John W. Thompson | Quasar Distributors, LLC |
| | 777 East Wisconsin Avenue |
| OFFICERS | Milwaukee, Wisconsin 53202 |
| Jason L. Stephens, CFA | |
| Chief Executive Officer | |
| | TRANSFER AGENT |
| John W. Thompson, CFA | U.S. Bancorp Fund Services, LLC |
| President | 615 East Michigan Street |
| | Milwaukee, Wisconsin 53202 |
| James T. Evans, CFA | |
| Vice President | |
| INDEPENDENT REGISTERED |
| Penny M. Hubbard | PUBLIC ACCOUNTING FIRM |
| Chief Financial Officer and Treasurer | Cohen & Company, Ltd. |
| | 1350 Euclid Avenue, Suite 800 |
| Nedra S. Pierce | Cleveland, OH 44115 |
| Chief Compliance Officer | |
| |
| Lesley T. Bailey | LEGAL COUNSEL |
| Secretary | Quarles & Brady LLP |
| | 411 East Wisconsin Avenue |
| Sarah M. Baumgartner | Milwaukee, Wisconsin 53202 |
| Assistant Secretary |
The Statement of Additional Information contains additional information about the directors and officers of Thompson IM Funds, Inc. and is available without charge, upon request, by calling 1-800-999-0887.
Proxy Voting Policy
A description of the policies and procedures that the Funds use to determine how to vote proxies relating to portfolio securities and information regarding how the Funds actually voted proxies during the most recent 12-month period ended June 30 are available without charge, upon request, by calling 1-800-999-0887, through the Funds’ website at www.thompsonim.com and on the SEC’s website at www.sec.gov.
Information About Portfolio Securities
The Funds file complete schedules of their portfolio holdings with the Securities and Exchange Commission for the Funds’ first and third quarters of its fiscal year on Form N-Q. The Funds’ Forms N-Q are available on the Securities and Exchange Commission’s website at www.sec.gov. You may also review and copy those documents by visiting the Securities and Exchange Commission’s Public Reference Room in Washington, D.C. Information on the operation of the Public Reference Room may be obtained by calling the Securities and Exchange Commission at 1-800-SEC-0330. The Funds’ Forms N-Q are also available without charge, upon request, by calling 1-800-999-0887.
45
Item 2. Code of Ethics.
Not required in Semi-Annual Reports on Form N-CSR.
Item 3. Audit Committee Financial Expert.
Not required in Semi-Annual Reports on Form N-CSR.
Item 4. Principal Accountant Fees and Services.
Not required in Semi-Annual Reports on Form N-CSR.
Item 5. Audit Committee of Listed Registrants.
Not applicable to this Registrant because it is not a “listed issuer” within the meaning of Rule 10A-3 under the Securities Exchange Act of 1934.
Item 6. Investments.
The required Schedules of Investments in securities of unaffiliated issuers is included as part of the Registrant’s Semi-Annual Report to Shareholders dated as of May 31, 2017 provided under Item 1 of this Form N-CSR.
Item 7. Disclosure of Proxy Voting Policies and Procedures for Closed-End Management Investment Companies.
Not applicable to this Registrant because it is not a closed-end management investment company.
Item 8. Portfolio Managers of Closed-End Management Investment Companies.
Not applicable to this Registrant because it is not a closed-end management investment company.
Item 9. Purchases of Equity Securities by Closed-End Management Investment Companies and Affiliated Purchasers.
Not applicable to this Registrant because it is not a closed-end management investment company.
Item 10. Submission of Matters to a Vote of Securities Holders.
The Registrant has not made any material changes to the procedures by which shareholders may recommend nominees to the Registrant's Board of Directors after the Registrant last provided disclosure in response to the requirements of Item 407(c)(2)(iv) of Regulation S-K or this Item.
2
Item 11. Controls and Procedures.
| | (a) | | Disclosure Controls and Procedures. Based on an evaluation of the Registrant’s disclosure controls and procedures (as defined in Rule 30a-3(c) under the Investment Company Act of 1940) carried out under the supervision and with the participation of the Registrant’s management, including its principal executive and financial officers, within 90 days prior to the filing date of this report on Form N-CSR, the Registrant’s principal executive and financial officers have concluded that the design and operation of the Registrant’s disclosure controls and procedures are effective in providing reasonable assurance that the information required to be disclosed on Form N-CSR is recorded, processed, summarized and reported within the applicable time periods. |
| |
| (b) | | Change in Internal Controls Over Financial Reporting. There were no changes in the Registrant’s internal control over financial reporting (as defined in Rule 30a-3(d) under the Investment Company Act of 1940) that occurred during the Registrant’s second fiscal quarter of the period covered by this Form N-CSR that have materially affected, or are reasonably likely to materially affect, the Registrant’s internal control over financial reporting. |
Item 12. Exhibits.
The following exhibits are attached to this Form N-CSR:
| Exhibit No. | | Description of Exhibit | |
| | 12(a)(1) | | The Code of Ethics for the Registrant’s Principal Executive Officer, Principal Financial Officer and Principal Accounting Officer referred to in Item 2 was filed as Exhibit 12(a)(1) to the Registrant’s Certified Shareholder Report on Form N-CSR filed on January 28, 2005, and is incorporated herein by reference |
| | | |
| 12(a)(2)-1 | | Certification of Principal Executive Officer Required by Section 302 of the Sarbanes-Oxley Act of 2002 |
| | | |
| 12(a)(2)-2 | | Certification of Principal Financial Officer Required by Section 302 of the Sarbanes-Oxley Act of 2002 |
| | | |
| 12(b) | | Certification of Chief Executive Officer and Chief Financial Officer Required by Section 906 of the Sarbanes-Oxley Act of 2002 |
3
SIGNATURES
Pursuant to the requirements of the Securities Exchange Act of 1934 and the Investment Company Act of 1940, the Registrant has duly caused this report to be signed on its behalf by the undersigned, thereunto duly authorized, on this 28th day of July, 2017.
| THOMPSON IM FUNDS, INC. |
| |
| | By: | /s/ Jason L. Stephens |
| | Jason L. Stephens, Chief Executive |
| | Officer |
Pursuant to the requirements of the Securities Exchange Act of 1934 and the Investment Company Act of 1940, this report has been signed below by the following persons on behalf of the Registrant and in the capacities indicated on this 28th day of July, 2017.
| By: | /s/ Jason L. Stephens |
| | Jason L. Stephens, Chief Executive |
| | | Officer (Principal Executive Officer) |
| |
| By: | /s/ Penny Hubbard |
| | Penny Hubbard, Chief Financial |
| | Officer (Principal Financial Officer) |
4