UNITED STATES
SECURITIES AND EXCHANGE COMMISSION
Washington, D.C. 20549
FORM N-CSR
CERTIFIED SHAREHOLDER REPORT OF REGISTERED
MANAGEMENT
INVESTMENT COMPANIES
Investment Company Act File Number 811-4946
THOMPSON IM FUNDS, INC.
(Exact name of registrant as specified in charter)
918 Deming Way
Madison, Wisconsin 53717
(Address of principal executive offices)--(Zip code)
Jason L. Stephens
Chief Executive Officer
Thompson IM Funds, Inc.
918 Deming Way
Madison, Wisconsin 53717
(Name and address of agent for service)
With a copy to:
Fredrick G. Lautz, Esq.
Quarles & Brady LLP
411 East Wisconsin Avenue
Milwaukee, Wisconsin 53202
Registrant's telephone number, including area code: (608) 827-5700
Date of fiscal year end: November 30, 2015
Date of reporting period: November 30, 2015
Form N-CSR is to be used by management investment companies to file reports with the Commission not later than 10 days after the transmission to stockholders of any report that is required to be transmitted to stockholders under Rule 30e-1 under the Investment Company Act of 1940 (17 CFR 270.30e-1). The Commission may use the information provided on Form N-CSR in its regulatory, disclosure review, inspection and policymaking roles.
A registrant is required to disclose the information specified by Form N-CSR, and the Commission will make this information public. A registrant is not required to respond to the collection of information contained in Form N-CSR unless the Form displays a currently valid Office of Management and Budget ("OMB") control number. Please direct comments concerning the accuracy of the information collection burden estimate and any suggestions for reducing the burden to Secretary, Securities and Exchange Commission, 450 Fifth Street, N.W., Washington, DC 20549-0609. The OMB has reviewed this collection of information under the clearance requirements of 44 U.S.C. § 3507.
Item 1. Report to Stockholders.
THOMPSON IM FUNDS, INC.
ANNUAL REPORT TO SHAREHOLDERS
NOTE ON FORWARD-LOOKING STATEMENTS
The matters discussed in this report may constitute forward-looking statements. These include any Advisor or portfolio manager predictions, assessments, analyses or outlooks for individual securities, industries, investment styles, market sectors, interest rates, economic trends and/or markets. These statements involve risks and uncertainties. In addition to the general risks described for each Fund in its current Prospectus, other factors bearing on these reports include the accuracy of the Advisor’s or portfolio manager’s forecasts and predictions, the appropriateness of the investment strategies designed by the Advisor or portfolio manager and the ability of the Advisor or portfolio manager to implement its strategies efficiently and successfully. Any one or more of these factors, as well as other risks affecting the securities markets generally, could cause the actual results of any Fund to differ materially as compared to its benchmarks.
1
THOMPSON IM FUNDS, INC.
ANNUAL REPORT TO SHAREHOLDERS
November 30, 2015
CONTENTS
| Page(s) |
| LARGECAP FUND | |
| Investment review | 3-5 |
| Schedule of investments | 6-8 |
| |
| MIDCAP FUND | |
| Investment review | 9-11 |
| Schedule of investments | 12-14 |
| |
| BOND FUND | |
| Investment review | 15-17 |
| Schedule of investments | 18-27 |
| |
| FUND EXPENSE EXAMPLES | 28 |
| |
| FINANCIAL STATEMENTS | |
| Statements of assets and liabilities | 29 |
| Statements of operations | 30 |
| Statements of changes in net assets | 31 |
| Notes to financial statements | 32-39 |
| Financial highlights | 40-42 |
| |
| REPORT OF INDEPENDENT REGISTERED PUBLIC ACCOUNTING FIRM | 43 |
| |
| DIRECTORS AND OFFICERS | 44-45 |
| |
| ADDITIONAL INFORMATION | 46-49 |
This report contains information for existing shareholders of Thompson IM Funds, Inc. It
does not constitute an offer to sell. This Annual Report is authorized for distribution to prospective investors
only when preceded or accompanied by a Fund Prospectus, which contains information about
the Funds’ objectives and policies, risks, management, expenses and other information.
A Prospectus can be obtained by calling 1-800-999-0887.
Please read your Prospectus carefully.
2
| LARGECAP FUND INVESTMENT REVIEW (Unaudited) |
| November 30, 2015 |
Portfolio Managers
James T. Evans, CFA
Jason L. Stephens, CFA
John W. Thompson, CFA
Performance
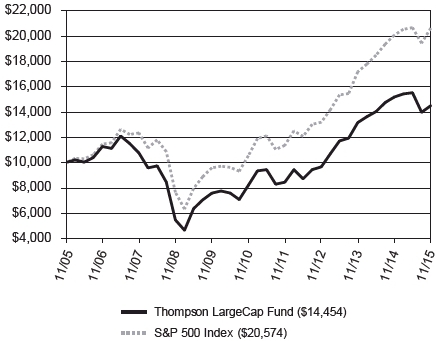
The LargeCap Fund produced a total return of -4.52% for the fiscal year ended November 30, 2015, as compared to its benchmark, the S&P 500 Index, which returned 2.75%.
Comparison of Change in Value of a Hypothetical $10,000 Investment
| Average Annual Total Returns |
| Through 11/30/15 |
| 1 Year | 3 Year | 5 Year | 10 Year |
| Thompson LargeCap Fund | -4.52% | 14.51% | 12.09% | 3.75% |
| S&P 500 Index | 2.75% | 16.09% | 14.40% | 7.48% |
Gross Expense Ratio as of 03/31/15 was 1.23%.
Net Expense Ratio after reimbursement as of 12/1/15 was 1.13%.*
| * | The Advisor has contractually agreed to waive management fees and/or reimburse expenses incurred by the LargeCap Fund through March 31, 2017, so that the annual operating expenses of the Fund do not exceed 1.13% of its average daily net assets. |
Performance data quoted represents past performance; past performance does not guarantee future results. The investment return and principal value of an investment will fluctuate so that an investor’s shares, when redeemed, may be worth more or less than their original cost. Current performance of the Fund may be lower or higher than the performance quoted. Performance data current to the most recent month-end may be obtained by calling 1-800-999-0887 or visiting www.thompsonim.com.
Results include the reinvestment of all dividends and capital gains distributions. Investment performance reflects all fee waivers that may be in effect. In the absence of such waivers, total return would be reduced. The performance information reflected in the graph and the table above does not reflect the deduction of taxes that a shareholder would pay on fund distributions or the redemption of fund shares, nor does it imply future performance. The S&P 500 Index is an unmanaged index commonly used to measure the performance of U.S. stocks. You cannot directly invest in an index.
The S&P 500 Index is a product of S&P Dow Jones Indices LLC and has been licensed for use by Thompson Investment Management, Inc. S&P® and S&P 500® are registered trademarks of Standard & Poor’s Financial Services LLC (“S&P”). The Thompson IM Funds are not sponsored, endorsed, sold or promoted by S&P Dow Jones Indices LLC, Dow Jones, S&P or their respective affiliates, and none of S&P Dow Jones Indices LLC, Dow Jones, S&P nor their respective affiliates makes any representation regarding the advisability of investing in such products.
See Notes to Financial Statements.
3
| LARGECAP FUND INVESTMENT REVIEW (Unaudited) (Continued) |
| November 30, 2015 |
Management Commentary
The fiscal year was a difficult one for the LargeCap Fund. A combination of falling energy costs, a strong U.S. dollar, concerns about economic growth in China and the prospect of a Federal Reserve about to raise interest rates all acted to depress both earnings growth and equity returns of various sectors. While weakness was widespread, our security selection in the Consumer Discretionary sector in particular stands out as a shortcoming this year. Given the fall in energy costs, we expected the resulting windfall to consumers would result in a better consumer spending environment. Instead, they chose to save. In the long run it should actually be a positive for the country for consumers to be saving more and repairing their balance sheets, but in the short run it tends to create a drag on stock performance. A number of the decisions we made in managing the Fund this year were based on an anticipated rise in consumer spending that never materialized, and the Fund’s relative underperformance was in part driven by consumers’ decisions to save rather than spend.
In addition, this year has been notable for the concentrated nature of returns within the market. Although not to the same degree as during the technology bubble of the late 1990’s, the recent performance of the market has been concentrated in a fairly narrow slice of companies. The average return of the top 10 largest companies in the S&P 500 index by market capitalization was roughly 20.5% during the fiscal year, a huge spread over the benchmark’s total return of 2.75%. As measured on a calendar year basis, this is easily the biggest gap between the top 10 largest companies in the index and everyone else since 19991. This means the weighted-average performance of the entire rest of the index was even worse than the benchmark’s total return. In fact, the equally weighted version of the S&P 500 underperformed the market capitalization weighted version of the index by 4.26% during the fiscal year, a gap which would seem to correspond with lower relative returns for actively managed funds like ours.
The implication of this is that shareholders may have a nice investment opportunity before them. Much like after the technology bubble, we believe shareholders can benefit from owning stocks that trade at reasonable valuations yet have solid earnings growth. Many companies fitting this description have not participated strongly in the performance of the index this year, and we have attempted to construct a portfolio that is largely comprised of stocks that fit this description. Those that have are generally what we view as very expensive high flyers which, in our opinion, are vulnerable to a correction. We expect the payoff to this strategy may not occur until later in 2016 because the market needs to move past the worries surrounding the first hike in rates by the Federal Reserve. But once the Fed finally acts we are hopeful shareholders can capitalize on the opportunity before them.
Opinions expressed are subject to change, are not guaranteed and should not be considered investment advice.
Mutual fund investing involves risk. Principal loss is possible. Investments in smaller companies involve additional risks such as limited liquidity and greater volatility. Investments in American Depositary Receipts (“ADRs”) are subject to some extent to the risks associated with directly investing in securities of foreign issuers, including the risk of changes in currency exchange rates, expropriation or nationalization of assets, and the impact of political, diplomatic, or social events. Investments in real estate securities may involve greater risk and volatility including greater exposure to economic downturns and changes in real estate values, rents, property taxes, tax, and other laws. A REIT’s share price may decline because of adverse developments affecting the real estate industry.
Please refer to the Schedule of Investments on page 6 of this report for holdings information. The management commentary above as well as Fund holdings and asset/sector allocations should not be considered a recommendation to buy or sell any security. In addition, please note that Fund holdings and asset/sector allocations are subject to change.
Earnings Growth is a measure of growth in a company’s net income over a specific period, often one year. It is not a prediction of the Fund’s future returns.
____________________
1 Strategas Research Partners
See Notes to Financial Statements.
4
| LARGECAP FUND INVESTMENT REVIEW (Unaudited) (Continued) |
| November 30, 2015 |
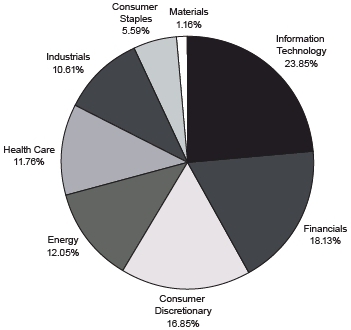
Sector Weightings at 11/30/15
% of Total Investments
| Top 10 Equity Holdings at 11/30/15 |
| | % of Fund’s |
| Company | Industry | Net Assets |
| Exxon Mobil Corp. | Oil, Gas & Consumable Fuels | 3.46% |
| Alphabet, Inc. Class A | Internet Software & Services | 3.05% |
| Microsoft Corp. | Software | 3.02% |
| Bank of America Corp. | Banks | 2.68% |
| Chevron Corp. | Oil, Gas & Consumable Fuels | 2.47% |
| Citigroup Inc. | Banks | 2.34% |
| Viacom Inc. Class B | Media | 2.33% |
| JPMorgan Chase & Co. | Banks | 2.26% |
| General Electric Co. | Industrial Conglomerates | 2.00% |
| Express Scripts Holding Co. | Health Care Providers & Services | 1.98% |
As of November 30, 2015, 99.8% of the Fund’s net assets were in equity and short-term investments.
See Notes to Financial Statements.
5
| LARGECAP FUND SCHEDULE OF INVESTMENTS |
| November 30, 2015 |
| | | | | Shares | | Value |
| COMMON STOCKS - 99.8% | | | | | |
| | | | | | |
| Consumer Discretionary - 16.8% | | | | | |
| | Auto Components - 1.6% | | | | | |
| | Johnson Controls, Inc. | | 39,900 | | $ | 1,835,400 |
| | |
| | Automobiles - 1.0% | | | | | |
| | Harley-Davidson, Inc. | | 22,950 | | | 1,122,714 |
| | |
| | Distributors - 0.9% | | | | | |
| | LKQ Corp. (a) | | 34,875 | | | 1,028,464 |
| | |
| | Household Durables - 2.2% | | | | | |
| | D.R. Horton, Inc. | | 23,225 | | | 750,400 |
| | Jarden Corp. (a) | | 23,690 | | | 1,105,849 |
| | TopBuild Corp. (a) | | 20,302 | | | 618,399 |
| | | | | | | 2,474,648 |
| | Leisure Products - 0.5% | | | | | |
| | Brunswick Corp. | | 11,250 | | | 592,088 |
| | |
| | Media - 5.5% | | | | | |
| | CBS Corp. Class B | | 30,675 | | | 1,548,474 |
| | The Walt Disney Co. | | 7,750 | | | 879,393 |
| | Time Warner Inc. | | 15,225 | | | 1,065,446 |
| | Viacom Inc. Class B | | 52,325 | | | 2,605,262 |
| | | | | | | 6,098,575 |
| | Multiline Retail - 2.9% | | | | | |
| | Kohl’s Corp. | | 30,585 | | | 1,441,471 |
| | Target Corp. | | 24,810 | | | 1,798,725 |
| | | | | | | 3,240,196 |
| | Specialty Retail - 1.7% | | | | | |
| | Bed Bath & Beyond Inc. (a) | | 23,675 | | | 1,290,761 |
| | Lumber Liquidators Holdings, Inc. (a) | | 36,650 | | | 572,473 |
| | | | | | | 1,863,234 |
| | Textiles, Apparel & Luxury | | | | | |
| | Goods - 0.5% | | | | | |
| | Hanesbrands, Inc. | | 18,200 | | | 558,194 |
| | |
| Consumer Staples - 5.6% | | | | | |
| | Food & Staples Retailing - 3.9% | | | | | |
| | CVS Health Corp. | | 10,825 | | | 1,018,524 |
| | Walgreens Boots Alliance, Inc. | | 21,550 | | | 1,810,846 |
| | Wal-Mart Stores, Inc. | | 25,250 | | | 1,485,710 |
| | | | | | | 4,315,080 |
| | Household Products - 1.7% | | | | | |
| | Kimberly-Clark Corp. | | 6,875 | | | 819,156 |
| | The Procter & Gamble Co. | | 14,750 | | | 1,103,890 |
| | | | | | | 1,923,046 |
| Energy - 12.1% | | | | | |
| | Energy Equipment & | | | | | |
| | Services - 1.5% | | | | | |
| | Schlumberger Ltd. | | 21,369 | | | 1,648,618 |
| | |
| | Oil, Gas & Consumable | | | | | |
| | Fuels - 10.6% | | | | | |
| | Apache Corp. | | 21,075 | | | 1,036,469 |
| | Chevron Corp. | | 30,245 | | | 2,761,973 |
| | Devon Energy Corp. | | 26,150 | | | 1,203,161 |
| | EOG Resources, Inc. | | 13,725 | | | 1,145,077 |
| | Exxon Mobil Corp. | | 47,470 | | | 3,876,400 |
| | Noble Energy, Inc. | | 27,350 | | | 1,002,925 |
| | PetroChina Co. Ltd. ADR | | 11,050 | | | 786,871 |
| | | | | | | 11,812,876 |
| Financials - 18.1% | | | | | |
| | Banks - 13.4% | | | | | |
| | Associated Banc-Corp | | 68,715 | | | 1,409,345 |
| | Bank of America Corp. | | 171,850 | | | 2,995,345 |
| | CIT Group Inc. | | 34,550 | | | 1,484,268 |
| | Citigroup Inc. | | 48,400 | | | 2,617,956 |
| | First Horizon National Corp. | | 93,485 | | | 1,390,122 |
| | JPMorgan Chase & Co. | | 37,875 | | | 2,525,505 |
| | PNC Financial Services Group, Inc. | | 11,305 | | | 1,079,741 |
| | SunTrust Banks, Inc. | | 16,550 | | | 718,601 |
| | Zions Bancorporation | | 24,375 | | | 730,275 |
| | | | | | | 14,951,158 |
| | Capital Markets - 2.8% | | | | | |
| | Northern Trust Corp. | | 17,910 | | | 1,342,175 |
| | State Street Corp. | | 24,100 | | | 1,749,178 |
| | | | | | | 3,091,353 |
| | Consumer Finance - 0.5% | | | | | |
| | Discover Financial Services | | 10,620 | | | 602,791 |
| | |
| | Insurance - 1.0% | | | | | |
| | Aflac, Inc. | | 17,135 | | | 1,117,887 |
| | |
| | Real Estate Investment | | | | | |
| | Trusts - 0.4% | | | | | |
| | DiamondRock Hospitality Co. | | 42,475 | | | 472,747 |
See Notes to Financial Statements.
6
| LARGECAP FUND SCHEDULE OF INVESTMENTS (Continued) |
| November 30, 2015 |
| | | | | Shares | | Value |
| COMMON STOCKS (continued) | | | | | |
| | | | | | |
| Health Care - 11.7% | | | | | |
| | Biotechnology - 5.1% | | | | | |
| | AbbVie Inc. | | 18,500 | | $ | 1,075,775 |
| | Amgen Inc. | | 7,190 | | | 1,158,309 |
| | Baxalta Inc. | | 15,360 | | | 528,077 |
| | Celgene Corp. (a) | | 13,600 | | | 1,488,520 |
| | Exact Sciences Corp. (a) | | 157,600 | | | 1,432,584 |
| | | | | | | 5,683,265 |
| | Health Care Equipment & | | | | | |
| | Supplies - 1.4% | | | | | |
| | Hologic, Inc. (a) | | 13,875 | | | 559,856 |
| | ResMed Inc. | | 8,575 | | | 510,813 |
| | Zimmer Biomet Holdings, Inc. | | 5,425 | | | 547,979 |
| | | | | | | 1,618,648 |
| | Health Care Providers & | | | | | |
| | Services - 4.2% | | | | | |
| | Express Scripts Holding Co. (a) | | 25,950 | | | 2,218,206 |
| | Hanger, Inc. (a) | | 44,700 | | | 695,979 |
| | McKesson Corp. | | 9,560 | | | 1,810,186 |
| | | | | | | 4,724,371 |
| | Pharmaceuticals - 1.0% | | | | | |
| | Johnson & Johnson | | 10,960 | | | 1,109,590 |
| | |
| Industrials - 10.5% | | | | | |
| | Air Freight & Logistics - 1.0% | | | | | |
| | FedEx Corp. | | 7,400 | | | 1,173,196 |
| | |
| | Building Products - 1.5% | | | | | |
| | Masco Corp. | | 56,275 | | | 1,683,185 |
| | |
| | Electrical Equipment - 2.9% | | | | | |
| | ABB Ltd. ADR | | 103,775 | | | 1,953,045 |
| | Rockwell Automation, Inc. | | 12,525 | | | 1,333,161 |
| | | | | | | 3,286,206 |
| | Industrial Conglomerates - 3.0% | | | | | |
| | General Electric Co. | | 74,725 | | | 2,237,266 |
| | 3M Co. | | 7,120 | | | 1,114,850 |
| | | | | | | 3,352,116 |
| | Machinery - 1.6% | | | | | |
| | Illinois Tool Works Inc. | | 12,575 | | | 1,181,798 |
| | Ingersoll-Rand PLC | | 9,775 | | | 573,499 |
| | | | | | | 1,755,297 |
| | Trading Companies & | | | | | |
| | Distributors - 0.5% | | | | | |
| | HD Supply Holdings, Inc. (a) | | 18,900 | | | 597,807 |
| | | | | | | |
| Information Technology - 23.8% | | | | | |
| | Communications | | | | | |
| | Equipment - 5.4% | | | | | |
| | Cisco Systems, Inc. | | 81,235 | | | 2,213,654 |
| | Lumentum Holdings Inc. (a) | | 39,107 | | | 782,140 |
| | Qualcomm, Inc. | | 36,480 | | | 1,779,859 |
| | Viavi Solutions Inc. (a) | | 195,535 | | | 1,243,603 |
| | | | | | | 6,019,256 |
| | Electronic Equipment, | | | | | |
| | Instruments & | | | | | |
| | Components - 1.9% | | | | | |
| | Corning Inc. | | 77,875 | | | 1,458,599 |
| | Maxwell Technologies, Inc. (a) | | 95,697 | | | 675,621 |
| | | | | | | 2,134,220 |
| | Internet Software & | | | | | |
| | Services - 3.5% | | | | | |
| | Alphabet, Inc. Class A (a) | | 4,475 | | | 3,413,754 |
| | eBay Inc. (a) | | 18,570 | | | 549,486 |
| | | | | | | 3,963,240 |
| | IT Services - 2.8% | | | | | |
| | Alliance Data Systems Corp. (a) | | 3,875 | | | 1,111,544 |
| | PayPal Holdings, Inc. (a) | | 34,570 | | | 1,218,938 |
| | Visa Inc. Class A | | 10,550 | | | 833,556 |
| | | | | | | 3,164,038 |
| | Semiconductors & | | | | | |
| | Semiconductor | | | | | |
| | Equipment - 3.6% | | | | | |
| | Intel Corp. | | 35,125 | | | 1,221,296 |
| | Linear Technology Corp. | | 19,570 | | | 894,740 |
| | Maxim Integrated Products, Inc. | | 21,655 | | | 839,564 |
| | NXP Semiconductors N.V. (a) | | 11,400 | | | 1,065,444 |
| | | | | | | 4,021,044 |
| | Software - 4.6% | | | | | |
| | Microsoft Corp. | | 62,251 | | | 3,383,342 |
| | Oracle Corp. | | 44,750 | | | 1,743,907 |
| | | | | | | 5,127,249 |
| | Technology Hardware, Storage | | | | | |
| | & Peripherals - 2.0% | | | | | |
| | EMC Corp. | | 46,175 | | | 1,170,075 |
| | Hewlett Packard Enterprise Co. | | 38,025 | | | 565,052 |
| | HP Inc. | | 38,025 | | | 476,834 |
| | | | | | | 2,211,961 |
| Materials - 1.2% | | | | | |
| | Metals & Mining - 1.2% | | | | | |
| | Freeport-McMoRan Inc. | | 158,625 | | | 1,297,552 |
| | |
| | TOTAL COMMON STOCKS | | | | | |
| | (COST $116,128,204) | | | | | 111,671,310 |
See Notes to Financial Statements.
7
| LARGECAP FUND SCHEDULE OF INVESTMENTS (Continued) |
| November 30, 2015 |
| Shares | | Value |
| SHORT-TERM INVESTMENTS - 0.0% | | | | |
| Money Market Funds - 0.0% | | | | |
| Fidelity Money Market Portfolio | | | | |
| Class I, 0.125% (b) | 11,998 | | $ | 11,998 |
| | | | | |
| Total Money Market Funds | | | | 11,998 |
| | | | | |
| TOTAL SHORT-TERM | | | | |
| INVESTMENTS (COST $11,998) | | | | 11,998 |
| | | | | |
| TOTAL INVESTMENTS - 99.8% | | | | |
| (COST $116,140,202) | | | | 111,683,308 |
| | | | | |
| NET OTHER ASSETS AND | | | | |
| LIABILITIES - 0.2% | | | | 228,742 |
| | | | | |
| NET ASSETS - 100.0% | | | $ | 111,912,050 |
| | (a) | Non-income producing security. |
| (b) | Represents the 7-day yield at November 30, 2015. |
| | ADR: | American Depositary Receipt |
| N.V.: | Naamloze Vennootschap is the Dutch term for a public limited liability corporation. |
| PLC: | Public Limited Company |
The Global Industry Classification Standard (“GICS”) was developed by and is the exclusive property and a service mark of MSCI Inc. (“MSCI”) and Standard & Poor’s Financial Services LLC (“S&P”) and is licensed for use by Thompson Investment Management, Inc. Neither MSCI, S&P, nor any other party involved in making or compiling the GICS or any GICS classifications makes any warranties with respect thereto or the results to be obtained by the use thereof, and no such party shall have any liability whatsoever with respect thereto.
See Notes to Financial Statements.
8
| MIDCAP FUND INVESTMENT REVIEW (Unaudited) |
| November 30, 2015 |
Portfolio Managers
James T. Evans, CFA
Jason L. Stephens, CFA
John W. Thompson, CFA
Performance
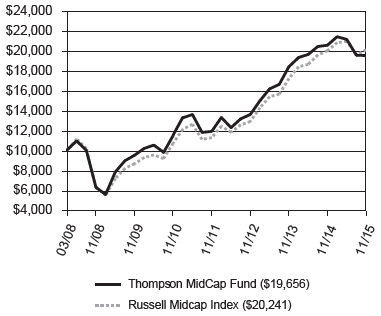
The MidCap Fund produced a total return of -5.10% for the fiscal year ended November 30, 2015, as compared to its benchmark, the Russell Midcap Index, which returned 0.46%.
Comparison of Change in Value of a Hypothetical $10,000 Investment
| Average Annual Total Returns |
| Through 11/30/15 |
| | | | | | Since |
| | | | | | Inception |
| | 1 Year | | 3 Year | 5 Year | (03/31/08) |
| Thompson MidCap Fund | | -5.10% | | 12.91% | 11.30% | 9.21% |
| Russell Midcap Index | | 0.46% | | 16.08% | 13.56% | 9.63% |
Gross Expense Ratio as of 03/31/15 was 1.54%.
Net Expense Ratio after reimbursement as of 12/1/15 was 1.25%.*
* The Advisor has contractually agreed to waive management fees and/or reimburse expenses incurred by the MidCap Fund through March 31, 2017, so that the annual operating expenses of the Fund do not exceed 1.25% of its average daily net assets.
Performance data quoted represents past performance; past performance does not guarantee future results. The investment return and principal value of an investment will fluctuate so that an investor’s shares, when redeemed, may be worth more or less than their original cost. Current performance of the Fund may be lower or higher than the performance quoted. Performance data current to the most recent month-end may be obtained by calling 1-800-999-0887 or visiting www.thompsonim.com.
Results include the reinvestment of all dividends and capital gains distributions. Investment performance reflects all fee waivers that may be in effect. In the absence of such waivers, total return would be reduced. The performance information reflected in the graph and the table above does not reflect the deduction of taxes that a shareholder would pay on fund distributions or the redemption of fund shares, nor does it imply future performance. The Russell Midcap Index measures the performance of the 800 smallest companies in the Russell 1000 Index based on total market capitalization. You cannot directly invest in an index.
Russell Investment Group is the source and owner of the trademarks, service marks, and copyrights related to the Russell Indexes. Russell® is a trademark of Russell Investment Group.
See Notes to Financial Statements.
9
| MIDCAP FUND INVESTMENT REVIEW (Unaudited) (Continued) |
| November 30, 2015 |
Management Commentary
The performance lag in the MidCap Fund during the fiscal year was driven by poor stock selection in the Consumer Discretionary, Health Care and Industrials sectors. Within these sectors, the Fund contained a handful of securities that performed especially badly. Usually, the Fund has enough “home runs” to offset the biggest laggards, but this proved not to be the case over the last twelve months.
As it has historically, we anticipate that stock selection will again be the primary driver of performance in the next fiscal year. When a stock experiences a dramatic decline, we must determine whether to sell the position, hold it, or buy more shares to bring it back to our initial target weighting. Our decision is typically driven by an analysis of the underlying fundamentals, the company’s potential for earnings growth, and the stock’s valuation relative to those of stocks in the company’s industry and the broader market. In the case of most of the largest “losers” from the last fiscal year, we believe the market has significantly overreacted to transient issues. If we are correct, these poor performers could become performance leaders going forward.
Our view for the coming year is possibly more positive than that held by the market in general. We anticipate that many of the issues that hindered positive momentum in the market this year will either moderate or will contribute less to investor anxiety (declining commodity prices, rising interest rates, etc.). Regardless, we will continue to focus on that which has supported the long-term competitive track record of the Fund: strong fundamental analysis.
Opinions expressed are subject to change, are not guaranteed and should not be considered investment advice.
Mutual fund investing involves risk. Principal loss is possible. Midcap companies tend to have more limited liquidity and greater volatility than large-capitalization companies. Investments in American Depositary Receipts (“ADRs”) are subject to some extent to the risks associated with directly investing in securities of foreign issuers, including the risk of changes in currency exchange rates, expropriation or nationalization of assets, and the impact of political, diplomatic, or social events. Investments in real estate securities may involve greater risk and volatility including greater exposure to economic downturns and changes in real estate values, rents, property taxes, tax, and other laws. A REIT’s share price may decline because of adverse developments affecting the real estate industry.
Please refer to the Schedule of Investments on page 12 of this report for holdings information. The management commentary above as well as Fund holdings and asset/sector allocations should not be considered a recommendation to buy or sell any security. In addition, please note that Fund holdings and asset/sector allocations are subject to change.
Earnings Growth is a measure of growth in a company’s net income over a specific period, often one year. It is not a prediction of the fund’s future returns.
See Notes to Financial Statements.
10
| MIDCAP FUND INVESTMENT REVIEW (Unaudited) (Continued) |
| November 30, 2015 |
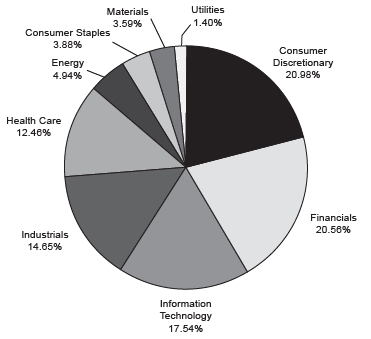
Sector Weightings at 11/30/15
% of Total Investments
| Top 10 Equity Holdings at 11/30/15 |
| | % of Fund’s |
| Company | Industry | Net Assets |
| First Horizon National Corp. | Banks | 2.32% |
| Kohl’s Corp. | Multiline Retail | 2.11% |
| CIT Group Inc. | Banks | 2.09% |
| Northern Trust Corp. | Capital Markets | 2.09% |
| Associated Banc-Corp | Banks | 2.06% |
| Bed Bath & Beyond Inc. | Specialty Retail | 1.89% |
| Exact Sciences Corp. | Biotechnology | 1.89% |
| MedAssets Inc. | Health Care Technology | 1.83% |
| Jarden Corp. | Household Durables | 1.82% |
| Maxim Integrated Products, Inc. | Semiconductors & Semiconductor Equipment | 1.76% |
As of November 30, 2015, 100.0% of the Fund’s net assets were in equity and short-term investments.
See Notes to Financial Statements.
11
| MIDCAP FUND SCHEDULE OF INVESTMENTS |
| November 30, 2015 |
| | | Shares | | Value |
| COMMON STOCKS - 100.0% | | | | |
| | | | | |
| Consumer Discretionary - 21.0% | | | | |
| | | Automobiles - 1.2% | | | | |
| | Harley-Davidson, Inc. | 9,725 | | $ | 475,747 |
| | |
| | Distributors - 1.5% | | | | |
| | LKQ Corp. (a) | 20,020 | | | 590,390 |
| | |
| | Household Durables - 5.7% | | | | |
| | D.R. Horton, Inc. | 15,375 | | | 496,766 |
| | Jarden Corp. (a) | 14,943 | | | 697,539 |
| | PulteGroup Inc. | 18,800 | | | 366,224 |
| | Toll Brothers, Inc. (a) | 5,250 | | | 195,195 |
| | TopBuild Corp. (a) | 13,850 | | | 421,871 |
| | | | | | 2,177,595 |
| | Leisure Products - 1.1% | | | | |
| | Brunswick Corp. | 8,275 | | | 435,513 |
| | |
| | Multiline Retail - 2.7% | | | | |
| | Kohl’s Corp. | 17,135 | | | 807,573 |
| | Nordstrom, Inc. | 3,800 | | | 213,978 |
| | | | | | 1,021,551 |
| | Specialty Retail - 4.8% | | | | |
| | Bed Bath & Beyond Inc. (a) | 13,305 | | | 725,389 |
| | Chico’s FAS, Inc. | 19,725 | | | 236,700 |
| | Lumber Liquidators Holdings, Inc. (a) | 27,300 | | | 426,426 |
| | Urban Outfitters, Inc. (a) | 19,500 | | | 436,800 |
| | | | | | 1,825,315 |
| | Textiles, Apparel & | | | | |
| | Luxury Goods - 4.0% | | | | |
| | Coach, Inc. | 11,555 | | | 367,102 |
| | Hanesbrands, Inc. | 21,160 | | | 648,977 |
| | Michael Kors Holdings Ltd. (a) | 7,125 | | | 306,517 |
| | Skechers U.S.A., Inc. Class A (a) | 6,525 | | | 197,055 |
| | | | | | 1,519,651 |
| Consumer Staples - 3.9% | | | | |
| | Food & Staples Retailing - 1.3% | | | | |
| | The Fresh Market, Inc. (a) | 20,050 | | | 480,799 |
| | |
| | Food Producers - 2.6% | | | | |
| | Ingredion Inc. | 2,000 | | | 197,140 |
| | Inventure Foods, Inc. (a) | 57,825 | | | 437,157 |
| | The J. M. Smucker Co. | 3,087 | | | 374,114 |
| | | | | | 1,008,411 |
| Energy - 4.9% | | | | |
| | Energy Equipment & | | | | |
| | Services - 1.7% | | | | |
| | FMC Technologies, Inc. (a) | 10,925 | | | 371,668 |
| | Helmerich & Payne, Inc. | 4,785 | | | 278,726 |
| | | | | | 650,394 |
| | Oil, Gas & Consumable | | | | |
| | Fuels - 3.2% | | | | |
| | Cameco Corp. | 14,025 | | | 171,386 |
| | Denbury Resources Inc. (a) | 6,910 | | | 25,567 |
| | Murphy Oil Corp. | 5,701 | | | 162,935 |
| | Noble Energy, Inc. | 17,475 | | | 640,808 |
| | Pioneer Natural Resources Co. | 1,675 | | | 242,456 |
| | | | | | 1,243,152 |
| Financials - 20.7% | | | | |
| | Banks - 9.7% | | | | |
| | Associated Banc-Corp | 38,605 | | | 791,789 |
| | CIT Group Inc. | 18,680 | | | 802,493 |
| | First Horizon National Corp. | 59,770 | | | 888,780 |
| | Regions Financial Corp. | 22,135 | | | 224,449 |
| | SunTrust Banks, Inc. | 10,495 | | | 455,693 |
| | Zions Bancorporation | 18,110 | | | 542,576 |
| | | | | | 3,705,780 |
| | Capital Markets - 3.1% | | | | |
| | Eaton Vance Corp. | 10,920 | | | 392,246 |
| | Northern Trust Corp. | 10,680 | | | 800,359 |
| | | | | | 1,192,605 |
| | Consumer Finance - 1.3% | | | | |
| | Discover Financial Services | 8,829 | | | 501,134 |
| | |
| | Insurance - 2.0% | | | | |
| | Cincinnati Financial Corp. | 5,315 | | | 324,800 |
| | Unum Group | 11,555 | | | 423,837 |
| | | | | | 748,637 |
| | Real Estate Investment | | | | |
| | Trusts - 3.3% | | | | |
| | Annaly Capital Management Inc. | 41,250 | | | 395,175 |
| | DiamondRock Hospitality Co. | 26,450 | | | 294,388 |
| | Host Hotels & Resorts Inc. | 17,835 | | | 296,061 |
| | LaSalle Hotel Properties | 9,520 | | | 268,559 |
| | | | | | 1,254,183 |
| | Thrifts & Mortgage | | | | |
| | Finance - 1.3% | | | | |
| | Flagstar Bancorp, Inc. (a) | 19,625 | | | 481,990 |
See Notes to Financial Statements.
12
| MIDCAP FUND SCHEDULE OF INVESTMENTS (Continued) |
| November 30, 2015 |
| | | | Shares | | Value |
| COMMON STOCKS (continued) | | | | |
| | | | | |
| Health Care - 12.5% | | | | |
| | Biotechnology - 2.4% | | | | |
| | Exact Sciences Corp. (a) | 79,650 | | $ | 724,018 |
| | Myriad Genetics, Inc. (a) | 4,575 | | | 199,013 |
| | | | | | 923,031 |
| | Health Care Equipment & | | | | |
| | Supplies - 3.5% | | | | |
| | Hologic, Inc. (a) | 7,350 | | | 296,572 |
| | Natus Medical Inc. (a) | 4,225 | | | 206,096 |
| | ResMed Inc. | 8,046 | | | 479,300 |
| | Zimmer Biomet Holdings, Inc. | 3,675 | | | 371,212 |
| | | | | | 1,353,180 |
| | Health Care Providers & | | | | |
| | Services - 3.2% | | | | |
| | Hanger, Inc. (a) | 37,525 | | | 584,264 |
| | McKesson Corp. | 1,440 | | | 272,664 |
| | Patterson Cos., Inc. | 7,780 | | | 354,535 |
| | | | | | 1,211,463 |
| | | Health Care Technology - 1.8% | | | | |
| | MedAssets Inc. (a) | 23,340 | | | 703,234 |
| | |
| | Life Sciences Tools & | | | | |
| | Services - 0.5% | | | | |
| | Fluidigm Corp. (a) | 16,200 | | | 184,194 |
| | |
| | Pharmaceuticals - 1.1% | | | | |
| | Jazz Pharmaceuticals PLC (a) | 2,750 | | | 403,122 |
| | |
| Industrials - 14.5% | | | | |
| | Air Freight & Logistics - 1.3% | | | | |
| | Expeditors Int’l. of Washington, Inc. | 10,400 | | | 504,816 |
| | |
| | Building Products - 2.9% | | | | |
| | A.O. Smith Corp. | 2,500 | | | 199,400 |
| | Masco Corp. | 21,425 | | | 640,822 |
| | USG Corp. (a) | 12,025 | | | 289,562 |
| | | | | | 1,129,784 |
| | Electrical Equipment - 3.4% | | | | |
| | Plug Power, Inc. (a) | 102,500 | | | 225,500 |
| | Regal Beloit Corp. | 7,605 | | | 490,218 |
| | Rockwell Automation, Inc. | 5,600 | | | 596,064 |
| | | | | | 1,311,782 |
| | Machinery - 4.9% | | | | |
| | Allison Transmission Holdings, Inc. | 13,575 | | | 379,557 |
| | Ingersoll-Rand PLC | 10,000 | | | 586,700 |
| | Mueller Water Products, Inc. Class A | 33,700 | | | 314,084 |
| | SPX Corp. (a) | 13,750 | | | 151,800 |
| | SPX Flow, Inc. (a) | 13,750 | | | 462,000 |
| | | | | | 1,894,141 |
| | Trading Companies & | | | | |
| | Distributors - 2.0% | | | | |
| | HD Supply Holdings, Inc. (a) | 12,900 | | | 408,027 |
| | W.W. Grainger, Inc. | 1,838 | | | 368,593 |
| | | | | | 776,620 |
| Information Technology - 17.5% | | | | |
| | Communications Equipment - 2.0% | | | | |
| | Lumentum Holdings Inc. (a) | 14,456 | | | 289,120 |
| | Viavi Solutions Inc. (a) | 72,281 | | | 459,707 |
| | | | | | 748,827 |
| | Electronic Equipment, | | | | |
| | Instruments & | | | | |
| | Components - 1.9% | | | | |
| | FARO Technologies, Inc. (a) | 5,300 | | | 159,477 |
| | InvenSense Inc. (a) | 18,875 | | | 218,761 |
| | Maxwell Technologies, Inc. (a) | 50,397 | | | 355,803 |
| | | | | | 734,041 |
| | Internet Software & | | | | |
| | Services - 0.8% | | | | |
| | Liquidity Services, Inc. (a) | 46,775 | | | 319,005 |
| | |
| | IT Services - 2.8% | | | | |
| | Alliance Data Systems Corp. (a) | 2,200 | | | 631,070 |
| | Fiserv, Inc. (a) | 4,719 | | | 454,157 |
| | | | | | 1,085,227 |
| | Semiconductors & | | | | |
| | Semiconductor | | | | |
| | Equipment - 6.2% | | | | |
| | Altera Corp. | 4,300 | | | 227,040 |
| | Cavium Inc. (a) | 5,750 | | | 385,882 |
| | Linear Technology Corp. | 9,690 | | | 443,027 |
| | Maxim Integrated Products, Inc. | 17,366 | | | 673,280 |
| | NXP Semiconductors N.V. (a) | 7,050 | | | 658,893 |
| | | | | | 2,388,122 |
| | Software - 2.4% | | | | |
| | Solera Holdings Inc. | 10,750 | | | 577,705 |
| | Take-Two Interactive Software, Inc. (a) | 9,435 | | | 333,716 |
| | | | | | 911,421 |
| | Technology Hardware, | | | | |
| | Storage & Peripherals - 1.4% | | | | |
| | Nimble Storage, Inc. (a) | 12,800 | | | 134,016 |
| | Silicon Graphics Int’l. Corp. (a) | 40,375 | | | 236,598 |
| | Stratasys Ltd. (a) | 3,900 | | | 97,500 |
| | 3D Systems Corp. (a) | 7,550 | | | 68,856 |
| | | | | | 536,970 |
| Materials - 3.6% | | | | |
| | Chemicals - 2.0% | | | | |
| | Ecolab Inc. | 3,156 | | | 376,069 |
| | Int’l. Flavors & Fragrances Inc. | 3,310 | | | 397,233 |
| | | | | | 773,302 |
See Notes to Financial Statements.
13
| MIDCAP FUND SCHEDULE OF INVESTMENTS (Continued) |
| November 30, 2015 |
| | | | Shares | | Value |
| COMMON STOCKS (continued) | | | | |
| | | | | |
| Materials (continued) | | | | |
| | Metals & Mining - 1.6% | | | | |
| | Freeport-McMoRan Inc. | 41,650 | | $ | 340,697 |
| | Lundin Mining Corp. (a) | 43,600 | | | 119,900 |
| | Stillwater Mining Co. (a) | 15,200 | | | 142,272 |
| | | | | | 602,869 |
| Utilities - 1.4% | | | | |
| | Multi-Utilities - 1.4% | | | | |
| | MDU Resources Group, Inc. | 14,300 | | | 249,106 |
| | SCANA Corp. | 4,850 | | | 286,829 |
| | | | | | 535,935 |
| | |
| | TOTAL COMMON STOCKS | | | | |
| | | (COST $36,628,071) | | | | 38,343,933 |
| | |
| SHORT-TERM INVESTMENTS - 0.0% | | | | |
| Money Market Funds - 0.0% | | | | |
| | Fidelity Money Market Portfolio | | | | |
| | Class I, 0.125% (b) | 638 | | | 638 |
| | |
| | Total Money Market Funds | | | | 638 |
| | |
| | TOTAL SHORT-TERM | | | | |
| | INVESTMENTS (COST $638) | | | | 638 |
| | |
| | TOTAL INVESTMENTS - 100.0% | | | | |
| | (COST $36,628,709) | | | | 38,344,571 |
| | |
| | NET OTHER ASSETS AND | | | | |
| | LIABILITIES - 0.0% | | | | 5,173 |
| | |
| | NET ASSETS - 100.0% | | | $ | 38,349,744 |
| | (a) | Non-income producing security. |
| (b) | Represents the 7-day yield at November 30, 2015. |
| | N.V.: | Naamloze Vennootschap is the Dutch term for a public limited liability corporation. |
| | PLC: | Public Limited Company |
The Global Industry Classification Standard (“GICS”) was developed by and is the exclusive property and a service mark of MSCI Inc. (“MSCI”) and Standard & Poor’s Financial Services LLC (“S&P”) and is licensed for use by Thompson Investment Management, Inc. Neither MSCI, S&P, nor any other party involved in making or compiling the GICS or any GICS classifications makes any warranties with respect thereto or the results to be obtained by the use thereof, and no such party shall have any liability whatsoever with respect thereto.
See Notes to Financial Statements.
14
| BOND FUND INVESTMENT REVIEW (Unaudited) |
| November 30, 2015 |
Portfolio Managers
James T. Evans, CFA
Jason L. Stephens, CFA
John W. Thompson, CFA
Performance
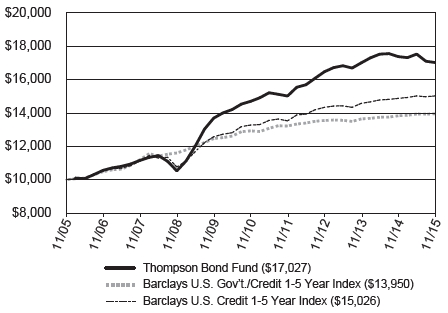
The Bond Fund produced a total return of -2.04% for the fiscal year ended November 30, 2015, as compared to its benchmark, the Barclays U.S. Government/Credit 1-5 Year Index, which returned 0.84%, and as compared to the Barclays U.S. Credit 1-5 Year Index, which returned 0.99%.
Comparison of Change in Value of a Hypothetical $10,000 Investment
| Average Annual Total Returns |
| Through 11/30/15 |
| 1 Year | 3 Year | 5 Year | 10 Year |
| Thompson Bond Fund | -2.04% | 1.10% | 2.98% | 5.47% |
| Barclays U.S. Gov't./Credit 1-5 Year Index | 0.84% | 0.97% | 1.53% | 3.39% |
| Barclays U.S. Credit 1-5 Year Index | 0.99% | 1.57% | 2.51% | 4.16% |
Gross Expense Ratio as of 03/31/15 was 0.72%. 30-Day SEC Yield as of 11/30/15 was 4.98%.
Performance data quoted represents past performance; past performance does not guarantee future results. The investment return and principal value of an investment will fluctuate so that an investor’s shares, when redeemed, may be worth more or less than the investor’s original cost. Current performance of the Fund may be lower or higher than the performance quoted. Performance data current to the most recent month-end may be obtained by calling 1-800-999-0887 or visiting www.thompsonim.com.
Results include the reinvestment of all dividends and capital gains distributions. Investment performance reflects all fee waivers that may have been in effect. In the absence of such waivers, total return would have been reduced. The performance information reflected in the graph and the table above does not reflect the deduction of taxes that a shareholder would pay on fund distributions or the redemption of fund shares, nor does it imply future performance. The Barclays U.S. Government/Credit 1-5 Year Index is a market-value-weighted index of all investment-grade bonds with maturities of more than one year and less than 5 years. The Barclays U.S. Credit 1-5 Year Index is a market-value-weighted index which includes virtually every major investment-grade rated corporate bond with 1-5 years remaining until maturity that serves as a supplementary benchmark. You cannot directly invest in an index.
Barclays® is a trademark of Barclays Bank PLC.
See Notes to Financial Statements.
15
| BOND FUND INVESTMENT REVIEW (Unaudited) (Continued) |
| November 30, 2015 |
Management Commentary
The fiscal year marked the most difficult time period for the Bond Fund since the 2008 Financial Crisis. Much as we were then, we are disappointed with the return this year but realize the strategy we employ is designed to work over longer time periods and doesn’t always pay off on an annual basis. While the overall returns for this year and for 2008 were similar, the path the Fund took while achieving the two results has both parallels and key differences. Comparing the two years can give shareholders a sense of the Fund's risks while providing insight into how we are positioning the Fund as we move into the next fiscal year.
In 2008, corporate bond spreads on BBB-rated debt rose above the historically normal 1-2% range as the economy entered a period of economic distress. Roughly 100 basis points of widening occurred during the first three quarters of that year, with another 200 basis points occurring once the panic brought on by the failure of Lehman Brothers caused a liquidity freeze during its fourth quarter. The spreads on some investment-grade bonds, especially those issued by financial firms, ballooned out well beyond historical averages and reached 1200 points or more. The Fund did not feel the full impact of this shift as a significant portion of the Fund was then invested in Treasury and mortgage bonds, because at the time these types of bonds offered a competitive nominal yield that we felt adequately compensated investors for holding them. Coupled with several purchases at what turned out to be extremely attractive prices that fall, the overall impact of the spread widening was painful but not disastrous for shareholders over that year. Nevertheless, the overall volatility caused by that market was much greater than the final year end result would imply. The payoff occurred in 2009 and beyond as the income and appreciation that was built into the portfolio by the end of that year accrued to shareholders with the passage of time.
In the most recent fiscal year a similar phenomenon has occurred. Corporate bond spreads at the BBB level have widened about 50 basis points to the high end of the historically normal 1-2% range. However, some bonds in the energy and commodity sectors widened far more, especially since the summer when worries over China’s impact on global growth began to dominate headlines. Much like 2008, the Fund’s overall allocation to the problem areas of the market in 2015 remained contained, but was still significant enough to meaningfully lower performance for the fiscal year. Liquidity remained much better than in 2008, but around the end of each quarter we’ve noticed a pattern of bonds trading lower on lighter volume as some investors desperately try to get their holdings off their books by the next holdings reporting date. The Fund has been able to scoop up several highly attractive bargains during these time periods, but has also been subject to additional volatility when some of its existing holdings have been subjected to this type of selling pressure.
We are hopeful that the final parallel to 2008 also comes to pass and that 2016 and beyond are years of strong performance for shareholders of the Fund. As we did coming out of 2008, we feel the portfolio includes many holdings that have been unfairly punished because they belong to a sector of the market that contains bad actors. For example, there will undoubtedly be junk-rated shale drillers that are too levered to withstand the current downtrend in energy prices. This in our view does not mean all energy and commodity companies are in trouble any more than the failure of a few investment companies signaled that all bonds issued by the financial-sector companies were to be avoided. A central element of active management is the ability to take advantage of these dislocations through analysis of individual securities. As before, this process doesn’t always reward shareholders with the types of returns they hope for on a year to year basis. But over time it has largely proven to be a successful strategy for the Fund. Since 2008 the Fund has outperformed its Morningstar category in 21 out of 27 calendar quarters. We cannot guarantee that is repeatable, but we would be thrilled if a similar streak were ahead of us based on the opportunities we see available today.
The Fund’s Morningstar Category is Short-Term Bond. Each Morningstar Category Average reflects a universe of funds with similar portfolio statistics and compositions.
As of November 30, 2015, the standardized performance for the Morningstar Category Average Return for Short Term Bond Funds is as follows: 1-Year 0.15%, 5-Year 1.46% and 10-Year 2.94%.
Opinions expressed are subject to change, are not guaranteed and should not be considered investment advice.
Mutual fund investing involves risk. Principal loss is possible. Investments in debt securities typically decrease in value when interest rates rise. The risk is usually greater for longer-term debt securities. Investments in bonds of foreign issuers involve greater volatility, political and economic risks, and differences in accounting methods. Investment by the Fund in lower-rated and non-rated securities presents a greater risk of loss to principal and interest than higher-rated securities.
Please refer to the Schedule of Investments on page 18 of this report for holdings information. The management commentary above as well as Fund holdings should not be considered a recommendation to buy or sell any security. In addition, please note that Fund holdings are subject to change.
The federal government guarantees interest payments from government securities while dividend payments carry no such guarantee. Government securities, if held to maturity, guarantee the timely payment of principal and interest.
See Notes to Financial Statements.
16
| BOND FUND INVESTMENT REVIEW (Unaudited) (Continued) |
| November 30, 2015 |
SEC Yield is a standardized yield computed by dividing the net investment income per share earned during the 30-day period prior to quarter-end and was created to allow for fairer comparisons among bond funds.
Basis point is a unit that is equal to 1/100th of 1%, and is used to denote the change in a financial instrument.
Spread is the percentage point difference between yields of various classes of bonds compared to treasury bonds.
Yield is the income earned from a bond, which takes into account the sum of the interest payment, the redemption value at the bond’s maturity, and the initial purchase price of the bond.
Credit Ratings are provided by Standard & Poor’s, who assign a rating based on their analysis of the issuer’s credit worthiness. The highest rating given is AAA and the lowest is C.
Although the makeup of the Bond Fund’s portfolio is constantly changing, as of November 30, 2015, 85.55% of the Fund’s portfolio was invested in corporate bonds. Due to prevailing market conditions, the composition of the Fund’s portfolio as of that date was consistent with the composition of the Fund’s portfolio over the past 5 years. In addition, as of that date 70.59% of the Fund’s portfolio was invested in bonds rated BBB by Standard & Poor’s, while an additional 11.83% of the Fund’s portfolio was rated below investment grade and 2.79% of the Fund’s portfolio was not rated by Standard & Poor’s. For portfolio information current as of the most recent quarter-end, please call 1-800-999-0887 or visit our website at www.thompsonim.com. Compared to a portfolio that is more evenly allocated between government and corporate bonds, a portfolio that is heavily allocated to corporate bonds may provide higher returns, but is also subject to greater levels of credit and liquidity risk and to greater price fluctuations. A portfolio that is significantly allocated to bonds having lower and below-investment-grade ratings may also be subject to greater levels of credit and liquidity risk and experience greater price fluctuations than a portfolio comprised of higher-rated investment-grade bonds.
| Portfolio Concentration at 11/30/15 | |
| (Includes cash and cash equivalents) | |
| | % Total Investments | |
| Asset Allocation | |
| Corporate Bonds | 85.55 | % | |
| Asset-Backed Securities | 9.27 | % | |
| Taxable Municipal Bonds | 3.28 | % | |
| U.S. Government & Agency Issues | 1.22 | % | |
| Convertible Bonds | 0.31 | % | |
| Tax-Exempt Municipal Bonds | 0.23 | % | |
| Money Market Funds | 0.12 | % | |
| Federal Agency Mortgage-Backed Securities | 0.02 | % | |
| | 100.00 | % | |
| | | |
| Quality | |
| U.S. Government & Agency Issues | 1.24 | % | |
| AA | 3.47 | % | |
| A | 9.96 | % | |
| BBB | 70.59 | % | |
| BB and Below | 11.83 | % | |
| Not Rated | 2.79 | % | |
| Money Market Funds | 0.12 | % | |
| | 100.00 | % | |
| | | |
| | |
| Top 10 Bond Holdings at 11/30/15 | |
| % of Fund’s Net Assets | |
| MBIA Inc. | 3.01 | % | |
| Jabil Circuit, Inc. | 2.96 | % | |
| JPMorgan Chase & Co. | 2.94 | % | |
| SESI LLC | 2.71 | % | |
| GFI Group Inc. | 2.63 | % | |
| XL Group PLC | 2.59 | % | |
| Skyway Concession Co. LLC | 2.44 | % | |
| American Airlines Group Inc. | 2.39 | % | |
| Noble Corporation PLC | 2.38 | % | |
| Wells Fargo & Co. | 2.33 | % | |
| | | | | |
See Notes to Financial Statements.
17
| BOND FUND SCHEDULE OF INVESTMENTS |
| November 30, 2015 |
| Principal | | | |
| Amount | | Value |
| BONDS - 97.8% | | | | | |
| | | | | | |
| Asset-Backed Securities - 9.2% | | | | | |
| America West Airlines | | | | | |
| 7.930% due 1/2/2019, | | | | | |
| Series 1999-1 | $ | 7,944,717 | | $ | 8,520,710 |
| 8.057% due 7/2/2020, | | | | | |
| Series 2000-1 | | 26,048 | | | 29,239 |
| 7.100% due 4/2/2021, | | | | | |
| Series 2001-1 | | 5,280,991 | | | 5,624,255 |
| | | | | | |
| American Airlines | | | | | |
| 7.000% due 1/31/2018, | | | | | |
| Series 2011-1 B (e) | | 25,243,507 | | | 26,631,900 |
| | | | | | |
| Ameritech Capital Funding Corp. | | | | | |
| 9.100% due 6/1/2016 | | 9,680 | | | 9,993 |
| | | | | | |
| AWAS Aviation Capital Ltd. | | | | | |
| 7.000% due 10/17/2016 (e) | | 13,654,813 | | | 13,671,881 |
| | | | | | |
| Basketball Properties Ltd. | | | | | |
| 6.650% due 3/1/2025 (e) | | 4,839,752 | | | 5,226,932 |
| | | | | | |
| Beaver Valley II Funding | | | | | |
| 9.000% due 6/1/2017 | | 1,000 | | | 1,070 |
| | | | | | |
| BellSouth | | | | | |
| Telecommunications, LLC | | | | | |
| 6.300% due 12/15/2015 | | 2,492 | | | 2,495 |
| | | | | | |
| British Airways PLC | | | | | |
| 5.625% due 6/20/2020, | | | | | |
| Series 2013-1 B (e) | | 39,958,369 | | | 41,556,703 |
| 5.625% due 6/20/2020, | | | | | |
| Series 2013-1 B (e) | | 83,228 | | | 86,557 |
| | | | | | |
| Bvps II Funding Corp. | | | | | |
| 8.890% due 6/1/2017 | | 11,000 | | | 11,475 |
| | | | | | |
| Continental Airlines | | | | | |
| 9.000% due 7/8/2016, | | | | | |
| Series 2009-1 | | 614,556 | | | 640,675 |
| 6.748% due 3/15/2017, | | | | | |
| Series 1998-1 B | | 108,625 | | | 112,492 |
| 6.648% due 9/15/2017, | | | | | |
| Series 1998-1 A | | 1,615,583 | | | 1,660,012 |
| 6.900% due 1/2/2018, | | | | | |
| Series 1997-4 A | | 313,364 | | | 323,329 |
| 6.820% due 5/1/2018, | | | | | |
| Series 1998-3 A-1 | | 115,466 | | | 121,817 |
| 6.000% due 1/12/2019, | | | | | |
| Series 2010-1 B | | 2,359,868 | | | 2,471,962 |
| 7.256% due 3/15/2020, | | | | | |
| Series 1999-2 A-1 | | 35,460 | | | 38,430 |
| 6.250% due 4/11/2020, | | | | | |
| Series 2012-1 B | | 7,398,986 | | | 7,768,936 |
| 5.500% due 10/29/2020, | | | | | |
| Series 2012-2 B | | 10,988,197 | | | 11,317,843 |
| |
| Delta Air Lines | | | | | |
| 6.375% due 1/2/2016, | | | | | |
| Series 2010-1 B (e) | | 28,000 | | | 28,105 |
| 9.750% due 12/17/2016, | | | | | |
| Series 2009-1 B | | 965,768 | | | 1,028,542 |
| 8.021% due 8/10/2022, | | | | | |
| Series 2007-1 B | | 2,632,068 | | | 2,947,916 |
| 6.718% due 1/2/2023, | | | | | |
| Series 2002-1 G-1 | | 4,074 | | | 4,645 |
| |
| Doric Nimrod Air Alpha | | | | | |
| 6.125% due 11/30/2019, | | | | | |
| Series 2013-1B (e) | | 34,433,560 | | | 35,036,148 |
| 6.125% due 11/30/2019, | | | | | |
| Series 2013-1B (e) | | 5,610,699 | | | 5,708,886 |
| |
| Doric Nimrod Air | | | | | |
| Finance Alpha Ltd. | | | | | |
| 6.500% due 5/30/2021, | | | | | |
| Series 2012-1 B (e) | | 18,603,075 | | | 18,828,098 |
| |
| Express Pipeline LP | | | | | |
| 7.390% due 12/31/2017 (e) | | 1,172,000 | | | 1,223,302 |
| |
| Federal Express Corp. | | | | | |
| 7.020% due 1/15/2016, | | | | | |
| Series 1998 | | 798,165 | | | 806,147 |
| 7.840% due 1/30/2018, | | | | | |
| Series 1996 | | 245,973 | | | 262,576 |
| 6.845% due 1/15/2019, | | | | | |
| Series 1998 | | 1,481,107 | | | 1,603,298 |
| |
| FPL Energy Caithness | | | | | |
| Funding Corp. | | | | | |
| 7.645% due 12/31/2018 (e) | | 3,447,385 | | | 3,619,754 |
See Notes to Financial Statements.
18
| BOND FUND SCHEDULE OF INVESTMENTS (continued) |
| November 30, 2015 |
| Principal | | | |
| Amount | | Value |
| BONDS (continued) | | | | | |
| | | | | | |
| Asset-Backed Securities (continued) | | | |
| General American Railcar | | | | | |
| 6.690% due 9/20/2016, | | | | | |
| Series 1997-1 (e) | $ | 77,540 | | $ | 79,439 |
| 7.760% due 8/20/2018, | | | | | |
| Series III (e) | | 486,780 | | | 550,061 |
| |
| Hidden Ridge Facility | | | | | |
| 5.650% due 1/1/2022 (e) | | 4,327,103 | | | 4,497,522 |
| |
| Landmark Leasing LLC | | | | | |
| 6.200% due 10/1/2022, | | | | | |
| Series 2004A (e) | | 228,984 | | | 233,097 |
| |
| Latam Airlines Group | | | | | |
| 4.500% due 11/15/2023, | | | | | |
| Series 2015-1 B (e) | | 5,000,000 | | | 4,616,510 |
| |
| Midwest Family Housing LLC | | | | | |
| 5.168% due 7/1/2016 (e) | | 100,000 | | | 99,995 |
| |
| Northwest Airlines | | | | | |
| 7.691% due 4/1/2017, | | | | | |
| Series 2001-1 B | | 77,663 | | | 82,322 |
| 8.028% due 11/1/2017, | | | | | |
| Series 2007-1 B | | 95,495 | | | 103,727 |
| 7.575% due 3/1/2019, | | | | | |
| Series 1999-2 A | | 1,034,081 | | | 1,127,148 |
| 7.150% due 10/1/2019, | | | | | |
| Series 2000-1 G (b) | | 23,005 | | | 24,155 |
| 7.027% due 11/1/2019, | | | | | |
| Series 2007-1 A | | 11,907,911 | | | 13,292,444 |
| 6.264% due 11/20/2021, | | | | | |
| Series 2002-1 G-2 | | 645,823 | | | 673,658 |
| |
| United Air Lines | | | | | |
| 10.400% due 11/1/2016, | | | | | |
| Series 2009-1 | | 1,659,051 | | | 1,767,884 |
| 5.375% due 8/15/2021, | | | | | |
| Series 2013-1 B | | 2,270,457 | | | 2,344,247 |
| |
| US Airways | | | | | |
| 8.360% due 1/20/2019, | | | | | |
| Series 1999-1A | | 78,679 | | | 83,793 |
| 8.000% due 10/1/2019, | | | | | |
| Series 2012-1 B | | 21,237,066 | | | 23,466,957 |
| 7.076% due 3/20/2021, | | | | | |
| Series 2001-1G | | 1,097,884 | | | 1,182,970 |
| | | | | | |
| Virgin Australia Trust | | | | | |
| 5.000% due 10/23/2023, | | | | | |
| Series 2013-1A (e) | | 224,115 | | | 231,959 |
| |
| Total Asset-Backed Securities | | | | | 251,384,011 |
| |
| Convertible Bonds - 0.3% | | | | | |
| Hospitality Properties Trust | | | | | |
| 3.800% due 3/15/2027 | | 7,309,000 | | | 7,309,000 |
| |
| Prospect Capital Corp. | | | | | |
| 5.500% due 8/15/2016 | | 1,075,000 | | | 1,086,422 |
| |
| Total Convertible Bonds | | | | | 8,395,422 |
| |
| Corporate Bonds - 84.5% | | | | | |
| ACMP Finance Corp. | | | | | |
| 4.875% due 5/15/2023 | | 1,350,000 | | | 1,187,874 |
| |
| Aegon N.V. | | | | | |
| 4.625% due 12/1/2015 | | 508,000 | | | 508,000 |
| |
| Air Lease Corp. | | | | | |
| 4.500% due 1/15/2016 | | 12,985,000 | | | 13,025,643 |
| 5.625% due 4/1/2017 | | 34,210,000 | | | 35,663,925 |
| |
| Alcoa Inc. | | | | | |
| 5.550% due 2/1/2017 | | 143,000 | | | 147,487 |
| 6.750% due 7/15/2018 | | 17,376,000 | | | 18,689,973 |
| 5.720% due 2/23/2019 | | 1,400,000 | | | 1,471,470 |
| |
| Allied World Assurance Co. | | | | | |
| Holdings Ltd. | | | | | |
| 7.500% due 8/1/2016 | | 142,000 | | | 147,666 |
| |
| Aluminum Company of America | | | | | |
| 6.500% due 6/15/2018 | | 26,507,000 | | | 28,627,560 |
| |
| Ameriprise Financial, Inc. | | | | | |
| 7.518% due 6/1/2066 (b) | | 2,329,000 | | | 2,288,475 |
| |
| Assured Guaranty US | | | | | |
| Holdings Inc. | | | | | |
| 6.400% due 12/15/2066 (b) | | 15,242,000 | | | 11,126,660 |
| |
| Astoria Financial Corp. | | | | | |
| 5.000% due 6/19/2017 | | 57,301,000 | | | 59,525,081 |
See Notes to Financial Statements.
19
| BOND FUND SCHEDULE OF INVESTMENTS (continued) |
| November 30, 2015 |
| Principal | | | |
| Amount | | Value |
| BONDS (continued) | | | | | |
| | | | | | |
| Corporate Bonds (continued) | | | | | |
| Athene Global Funding | | | | | |
| 2.875% due 10/23/2018 (e) | $ | 32,217,000 | | $ | 31,747,212 |
| |
| Aviation Capital Group Corp. | | | | | |
| 3.875% due 9/27/2016 (e) | | 1,639,000 | | | 1,658,176 |
| 4.625% due 1/31/2018 (e) | | 1,080,000 | | | 1,109,700 |
| |
| Avnet, Inc. | | | | | |
| 6.625% due 9/15/2016 | | 587,000 | | | 610,034 |
| |
| Avon Products, Inc. | | | | | |
| 5.750% due 3/1/2018 | | 2,830,000 | | | 2,405,500 |
| 6.500% due 3/1/2019 | | 62,403,000 | | | 49,298,370 |
| 6.350% due 3/15/2020 (b) | | 500,000 | | | 368,800 |
| |
| Bank of America Corp. | | | | | |
| 6.000% due 6/15/2016 | | 160,000 | | | 164,045 |
| 5.750% due 8/15/2016 | | 550,000 | | | 567,234 |
| 1.371% due 10/9/2024 (b) | | 35,000,000 | | | 34,518,750 |
| |
| Bank of New York Mellon Corp. | | | | | |
| 4.950% due 6/20/2020 (b) (d) | | 3,000,000 | | | 2,973,750 |
| |
| BB&T Corp. | | | | | |
| 5.200% due 12/23/2015 | | 525,000 | | | 526,293 |
| |
| BGC Partners Inc. | | | | | |
| 5.375% due 12/9/2019 | | 375,000 | | | 391,285 |
| |
| BioMed Realty, L.P. | | | | | |
| 3.850% due 4/15/2016 | | 2,438,000 | | | 2,454,951 |
| |
| BMC Software, Inc. | | | | | |
| 7.250% due 6/1/2018 | | 7,312,000 | | | 6,690,480 |
| |
| Carpenter Technology Corp. | | | | | |
| 6.990% due 4/20/2018 | | 2,415,000 | | | 2,603,829 |
| 7.060% due 5/21/2018 | | 500,000 | | | 537,001 |
| 7.030% due 5/22/2018 | | 8,000 | | | 8,587 |
| |
| Centel Capital Corp. | | | | | |
| 9.000% due 10/15/2019 | | 10,000 | | | 11,523 |
| |
| Centrais Eletricas | | | | | |
| Brasileiras S.A. | | | | | |
| 6.875% due 7/30/2019 (e) | | 32,373,000 | | | 30,592,485 |
| 6.875% due 7/30/2019 (e) | | 1,345,000 | | | 1,271,025 |
| 5.750% due 10/27/2021 (e) | | 16,365,000 | | | 13,664,775 |
| | | | | | |
| Chesapeake Midstream | | | | | |
| Partners, L.P. | | | | | |
| 6.125% due 7/15/2022 | | 3,408,000 | | | 3,399,412 |
| |
| Citigroup, Inc. | | | | | |
| 1.296% due 10/15/2024 (b) | | 35,000,000 | | | 33,837,300 |
| |
| Cliffs Natural Resources Inc. | | | | | |
| 5.950% due 1/15/2018 (b) | | 6,263,000 | | | 2,740,063 |
| 5.900% due 3/15/2020 | | 61,404,000 | | | 15,965,040 |
| |
| CNA Financial Corp. | | | | | |
| 6.950% due 1/15/2018 | | 480,000 | | | 525,073 |
| |
| Columbia Property Trust | | | | | |
| 5.875% due 4/1/2018 | | 130,000 | | | 139,149 |
| |
| Commercial Net Lease | | | | | |
| Realty, Inc. | | | | | |
| 6.150% due 12/15/2015 | | 328,000 | | | 328,502 |
| |
| Computer Sciences Corp. | | | | | |
| 6.500% due 3/15/2018 | | 15,524,000 | | | 16,937,786 |
| |
| Continental Resources, Inc. | | | | | |
| 7.375% due 10/1/2020 | | 6,427,000 | | | 6,587,675 |
| 7.125% due 4/1/2021 | | 22,154,000 | | | 23,048,711 |
| |
| Con-way Inc. | | | | | |
| 7.250% due 1/15/2018 | | 3,389,000 | | | 3,422,802 |
| |
| Copano Energy, LLC | | | | | |
| 7.125% due 4/1/2021 | | 5,685,000 | | | 5,839,177 |
| |
| Countrywide Financial Corp. | | | | | |
| 6.250% due 5/15/2016 | | 3,688,000 | | | 3,768,767 |
| 5.250% due 5/27/2020 | | 379,000 | | | 374,392 |
| 6.000% due 8/26/2020 (c) | | 140,000 | | | 139,903 |
| |
| Countrywide Home Loans, Inc. | | | | | |
| 5.500% due 5/16/2018 | | 249,000 | | | 249,000 |
| |
| Denali Borrower LLC / Denali | | | | | |
| Finance Corp. | | | | | |
| 5.625% due 10/15/2020 (e) | | 50,645,000 | | | 53,687,752 |
See Notes to Financial Statements.
20
| BOND FUND SCHEDULE OF INVESTMENTS (continued) |
| November 30, 2015 |
| Principal | | | |
| Amount | | Value |
| BONDS (continued) | | | | | |
| | | | | | |
| Corporate Bonds (continued) | | | | | |
| Development Bank of | | | | | |
| Kazakhstan | | | | | |
| 6.500% due 6/3/2020 (e) | $ | 5,055,000 | | $ | 5,224,343 |
| 4.125% due 12/10/2022 (e) | | 39,356,000 | | | 35,228,894 |
| |
| Discover Financial Services | | | | | |
| 6.450% due 6/12/2017 | | 590,000 | | | 628,233 |
| 10.250% due 7/15/2019 | | 11,247,000 | | | 13,591,685 |
| |
| Dominion Resources, Inc. | | | | | |
| 7.500% due 6/30/2066 (b) | | 18,248,000 | | | 15,855,687 |
| |
| Domtar Corp. | | | | | |
| 9.500% due 8/1/2016 | | 362,000 | | | 382,049 |
| 10.750% due 6/1/2017 | | 9,338,000 | | | 10,471,577 |
| |
| Dow Chemical Co. | | | | | |
| 2.350% due 8/15/2016 | | 20,000 | | | 19,989 |
| |
| El Paso Corp. | | | | | |
| 7.000% due 6/15/2017 | | 3,177,000 | | | 3,312,213 |
| |
| Embraer Overseas Ltd. | | | | | |
| 6.375% due 1/24/2017 | | 12,406,000 | | | 12,840,210 |
| |
| Enbridge Energy Partners, L.P. | | | | | |
| 5.875% due 12/15/2016 | | 362,000 | | | 373,694 |
| |
| Enterprise Products | | | | | |
| Operating LLC | | | | | |
| 7.000% due 6/1/2067 (b) | | 9,613,000 | | | 8,555,570 |
| |
| Everest Reinsurance Holdings Inc. | | | | | |
| 6.600% due 5/15/2037 (b) | | 8,692,000 | | | 7,909,720 |
| |
| Expedia, Inc. | | | | | |
| 7.456% due 8/15/2018 | | 154,000 | | | 173,415 |
| |
| Fairfax Financial Holdings Ltd. | | | | | |
| 7.375% due 4/15/2018 | | 29,666,500 | | | 32,537,861 |
| 5.800% due 5/15/2021 (e) | | 12,040,000 | | | 12,834,893 |
| |
| Fidelity National Financial, Inc. | | | | | |
| 6.600% due 5/15/2017 | | 15,989,000 | | | 16,949,891 |
| |
| Fifth Third Bancorp | | | | | |
| 4.900% due 9/30/2019 (b) (d) | | 53,227,000 | | | 50,232,981 |
| | | | | | |
| First Horizon National Corp. | | | | | |
| 5.375% due 12/15/2015 | | 1,185,000 | | | 1,186,751 |
| |
| First Midwest Bancorp, Inc. | | | | | |
| 5.875% due 11/22/2016 | | 1,175,000 | | | 1,213,735 |
| |
| Freeport-McMoran Oil & Gas LLC | | | | | |
| 6.125% due 6/15/2019 | | 12,983,000 | | | 11,165,380 |
| 6.625% due 5/1/2021 | | 30,335,000 | | | 24,571,350 |
| |
| General Electric Capital Corp. | | | | | |
| 0.714% due 5/5/2026 (b) | | 613,000 | | | 571,553 |
| |
| Genworth Financial Inc. | | | | | |
| 7.700% due 6/15/2020 | | 2,918,000 | | | 2,874,230 |
| |
| GFI Group Inc. | | | | | |
| 8.625% due 7/19/2018 (b) | | 66,699,000 | | | 72,201,668 |
| |
| Globo Comunicacao e | | | | | |
| Participacoes S.A. | | | | | |
| 5.307% due 5/11/2022 (c) (e) | | 16,990,000 | | | 17,151,405 |
| |
| Goldman Sachs Group, Inc. | | | | | |
| 1.367% due 2/19/2018 (b) | | 5,000,000 | | | 4,987,245 |
| 1.834% due 6/17/2023 (b) | | 1,764,000 | | | 1,703,112 |
| |
| Great Plains Energy Inc. | | | | | |
| 6.875% due 9/15/2017 | | 30,000 | | | 32,056 |
| |
| Harsco Corp. | | | | | |
| 5.750% due 5/15/2018 | | 23,184,000 | | | 21,619,080 |
| |
| HCP, Inc. | | | | | |
| 6.300% due 9/15/2016 | | 827,000 | | | 856,837 |
| |
| Hiland Partners, LP | | | | | |
| 7.250% due 10/1/2020 (e) | | 23,110,000 | | | 23,803,300 |
| |
| Horace Mann Educators Corp. | | | | | |
| 6.850% due 4/15/2016 | | 9,564,000 | | | 9,759,632 |
| |
| Hospitality Properties Trust | | | | | |
| 6.300% due 6/15/2016 | | 1,873,000 | | | 1,880,320 |
| 5.625% due 3/15/2017 | | 11,508,000 | | | 11,937,939 |
| 6.700% due 1/15/2018 | | 5,007,000 | | | 5,320,393 |
See Notes to Financial Statements.
21
| BOND FUND SCHEDULE OF INVESTMENTS (continued) |
| November 30, 2015 |
| Principal | | | |
| Amount | | Value |
| BONDS (continued) | | | | | |
| | | | | | |
| Corporate Bonds (continued) | | | | | |
| HRPT Properties Trust | | | | | |
| 6.250% due 8/15/2016 | $ | 4,645,000 | | $ | 4,683,763 |
| 6.250% due 6/15/2017 | | 5,773,000 | | | 5,986,185 |
| 6.650% due 1/15/2018 | | 33,478,000 | | | 35,583,498 |
| |
| Ingram Micro Inc. | | | | | |
| 5.250% due 9/1/2017 | | 550,000 | | | 579,428 |
| |
| International Lease | | | | | |
| Finance Corp. | | | | | |
| 6.750% due 9/1/2016 (e) | | 14,286,000 | | | 14,803,868 |
| |
| INVISTA Finance LLC | | | | | |
| 4.250% due 10/15/2019 (e) | | 32,365,000 | | | 31,636,788 |
| |
| Jabil Circuit, Inc. | | | | | |
| 7.750% due 7/15/2016 | | 5,069,000 | | | 5,227,406 |
| 8.250% due 3/15/2018 | | 68,065,000 | | | 75,892,475 |
| |
| John Hancock Life Ins. Co. | | | | | |
| 5.250% due 12/15/2015 | | 25,000 | | | 25,035 |
| 5.500% due 12/15/2015 | | 25,000 | | | 25,004 |
| 5.000% due 4/15/2016 | | 60,000 | | | 60,906 |
| |
| JPMorgan Chase & Co. | | | | | |
| 7.900% due 4/30/2018 (b) (d) | | 78,324,000 | | | 80,673,720 |
| |
| Kinder Morgan Inc. | | | | | |
| 7.000% due 2/1/2018 | | 22,258,000 | | | 23,944,288 |
| |
| Leggett & Platt, Inc. | | | | | |
| 4.400% due 7/1/2018 | | 5,145,000 | | | 5,359,840 |
| |
| Lexmark International, Inc. | | | | | |
| 6.650% due 6/1/2018 | | 4,262,000 | | | 4,613,615 |
| |
| Lincoln National Corp. | | | | | |
| 7.000% due 5/17/2066 (b) | | 25,985,000 | | | 21,437,625 |
| 6.050% due 4/20/2067 (b) | | 19,155,000 | | | 15,707,100 |
| |
| Magellan Midstream Partners, L.P. | | | | | |
| 5.650% due 10/15/2016 | | 717,000 | | | 740,780 |
| |
| Manufacturers & Traders | | | | | |
| Trust Co. | | | | | |
| 5.585% due 12/28/2020 (b) | | 14,173,000 | | | 14,069,381 |
| 5.629% due 12/1/2021 (b) | | 1,002,000 | | | 994,485 |
| | | | | | |
| Masco Corp. | | | | | |
| 6.125% due 10/3/2016 | | 13,815,000 | | | 14,315,103 |
| 5.850% due 3/15/2017 | | 3,792,000 | | | 3,962,640 |
| 6.625% due 4/15/2018 | | 13,741,000 | | | 14,874,633 |
| |
| Mattel, Inc. | | | | | |
| 2.500% due 11/1/2016 | | 77,000 | | | 77,870 |
| |
| MBIA Inc. | | | | | |
| 6.400% due 8/15/2022 | | 83,545,000 | | | 82,709,550 |
| |
| Merrill Lynch & Co. | | | | | |
| 6.050% due 5/16/2016 | | 6,595,000 | | | 6,740,967 |
| 8.400% due 11/1/2019 | | 310,000 | | | 371,650 |
| |
| MetLife, Inc. | | | | | |
| 5.250% due 6/15/2020 (b) (d) | | 4,000,000 | | | 4,025,000 |
| |
| Midcontinent Express | | | | | |
| Pipeline LLC | | | | | |
| 6.700% due 9/15/2019 (e) | | 17,665,000 | | | 17,046,725 |
| |
| Morgan Stanley | | | | | |
| 2.195% due 4/1/2021 (b) | | 130,000 | | | 134,225 |
| 2.195% due 6/9/2023 (b) | | 100,000 | | | 102,500 |
| |
| MPT Operating Partnership, L.P. | | | | | |
| 6.875% due 5/1/2021 | | 50,963,000 | | | 53,128,928 |
| 6.375% due 2/15/2022 | | 10,000,000 | | | 10,400,000 |
| |
| National City Bank of Indiana | | | | | |
| 4.250% due 7/1/2018 | | 200,000 | | | 210,326 |
| |
| National Retail Properties Inc. | | | | | |
| 6.875% due 10/15/2017 | | 1,023,000 | | | 1,109,672 |
| |
| NationsBank Corp. | | | | | |
| 7.800% due 9/15/2016 | | 991,000 | | | 1,040,121 |
| |
| Navient Corp. | | | | | |
| 5.500% due 1/15/2019 | | 200,000 | | | 192,400 |
| 5.875% due 3/25/2021 | | 500,000 | | | 457,500 |
| |
| NIPSCO Capital Markets, Inc. | | | | | |
| 7.860% due 3/27/2017 | | 96,000 | | | 102,179 |
See Notes to Financial Statements.
22
| BOND FUND SCHEDULE OF INVESTMENTS (continued) |
| November 30, 2015 |
| Principal | | | |
| Amount | | Value |
| BONDS (continued) | | | | | |
| |
| Corporate Bonds (continued) | | | | | |
| Noble Drilling Corp. | | | | | |
| 7.500% due 3/15/2019 | $ | 21,428,000 | | $ | 21,765,491 |
| |
| Noble Holding Int’l. Ltd. | | | | | |
| 3.050% due 3/1/2016 | | 2,000,000 | | | 2,008,068 |
| 4.900% due 8/1/2020 | | 24,209,000 | | | 20,942,286 |
| 4.625% due 3/1/2021 | | 24,799,000 | | | 20,546,046 |
| |
| Northern Indiana Public | | | | | |
| Service Co. | | | | | |
| 7.590% due 6/12/2017 | | 182,000 | | | 194,739 |
| |
| Owens Corning | | | | | |
| 6.500% due 12/1/2016 | | 249,000 | | | 260,680 |
| |
| Pemex Project Funding | | | | | |
| Master Trust | | | | | |
| 9.250% due 3/30/2018 | | 20,000 | | | 22,477 |
| |
| Petrobras Energia S.A. | | | | | |
| 5.875% due 5/15/2017 (e) | | 13,500,000 | | | 13,159,800 |
| 5.875% due 5/15/2017 (e) | | 24,549,000 | | | 23,930,365 |
| |
| Petrobras Int’l. Finance Co. S.A. | | | | | |
| 8.375% due 12/10/2018 | | 727,000 | | | 714,059 |
| 7.875% due 3/15/2019 | | 21,903,200 | | | 20,337,121 |
| 5.750% due 1/20/2020 | | 11,320,000 | | | 9,434,654 |
| 5.375% due 1/27/2021 | | 1,865,000 | | | 1,486,778 |
| |
| PetroLogistics LP / | | | | | |
| PetroLogistics Finance Corp. | | | | | |
| 6.250% due 4/1/2020 | | 629,000 | | | 656,299 |
| |
| Pitney Bowes Inc. | | | | | |
| 5.250% due 1/15/2037 | | 4,079,000 | | | 4,078,621 |
| |
| Plains Exploration & | | | | | |
| Production Co. | | | | | |
| 6.500% due 11/15/2020 | | 17,827,000 | | | 14,261,600 |
| 6.750% due 2/1/2022 | | 14,470,000 | | | 11,720,700 |
| 6.875% due 2/15/2023 | | 2,364,000 | | | 1,914,840 |
| |
| Platinum Underwriters | | | | | |
| Finance, Inc. | | | | | |
| 7.500% due 6/1/2017 | | 15,976,000 | | | 17,057,831 |
| | | | | | |
| PNC Financial Services Group | | | | | |
| 6.750% due 8/1/2021 (b) (d) | | 34,389,000 | | | 37,389,096 |
| |
| Pride Int’l., Inc. | | | | | |
| 8.500% due 6/15/2019 | | 12,527,000 | | | 12,862,097 |
| |
| Principal Life Income | | | | | |
| Funding Trusts | | | | | |
| 2.075% due 4/1/2016 (b) | | 50,000 | | | 50,000 |
| |
| Provident Cos., Inc. | | | | | |
| 7.000% due 7/15/2018 | | 1,057,000 | | | 1,177,027 |
| |
| Reckson Operating | | | | | |
| Partnership, L.P. | | | | | |
| 6.000% due 3/31/2016 | | 1,301,000 | | | 1,318,241 |
| |
| Regency Energy Partners LP | | | | | |
| 6.500% due 7/15/2021 | | 45,484,000 | | | 46,848,520 |
| |
| Reinsurance Group of | | | | | |
| America, Inc. | | | | | |
| 6.750% due 12/15/2065 (b) | | 33,768,000 | | | 28,069,650 |
| |
| Seagate HDD Cayman | | | | | |
| 7.000% due 11/1/2021 | | 2,569,000 | | | 2,687,816 |
| |
| Security Benefit Life Insurance | | | | | |
| 8.750% due 5/15/2016 (e) | | 8,000,000 | | | 8,236,848 |
| |
| Select Income REIT | | | | | |
| 2.850% due 2/1/2018 | | 25,175,000 | | | 25,192,849 |
| |
| Seminole Indian Tribe of Florida | | | | | |
| 8.030% due 10/1/2020 (e) | | 28,800,000 | | | 30,348,000 |
| |
| SESI LLC | | | | | |
| 6.375% due 5/1/2019 | | 30,286,000 | | | 29,453,135 |
| 7.125% due 12/15/2021 | | 47,274,000 | | | 44,792,115 |
| |
| Skyway Concession Co. LLC | | | | | |
| 0.607% due 6/30/2017 (b) (e) | | 68,550,000 | | | 67,093,313 |
| |
| SL Green Realty Corp. | | | | | |
| 5.000% due 8/15/2018 | | 7,015,000 | | | 7,420,656 |
See Notes to Financial Statements.
23
| BOND FUND SCHEDULE OF INVESTMENTS (continued) |
| November 30, 2015 |
| Principal | | | |
| Amount | | Value |
| BONDS (continued) | | | | | |
| | | | | | |
| Corporate Bonds (continued) | | | | | |
| SLM Corp. | | | | | |
| 5.100% due 6/15/2017 (c) | $ | 16,000 | | $ | 15,462 |
| 5.000% due 6/15/2018 | | 98,000 | | | 94,335 |
| 5.500% due 3/15/2019 | | 800,000 | | | 716,266 |
| 6.000% due 3/15/2019 (c) | | 140,000 | | | 127,070 |
| 6.600% due 3/15/2019 (c) | | 395,000 | | | 365,779 |
| 5.190% due 4/24/2019 | | 529,000 | | | 493,293 |
| 8.000% due 3/25/2020 | | 671,000 | | | 681,065 |
| 6.250% due 9/15/2020 (c) | | 172,000 | | | 148,313 |
| 6.500% due 12/15/2020 (c) | | 71,000 | | | 64,541 |
| 6.750% due 12/15/2020 (c) | | 306,000 | | | 268,806 |
| 6.750% due 12/15/2020 (c) | | 95,000 | | | 83,778 |
| 6.000% due 6/15/2021 | | 20,000 | | | 16,661 |
| 6.000% due 6/15/2021 | | 261,000 | | | 217,747 |
| 6.150% due 6/15/2021 | | 146,000 | | | 123,376 |
| 6.150% due 6/15/2021 | | 52,000 | | | 43,942 |
| 7.250% due 1/25/2022 | | 602,000 | | | 571,900 |
| |
| Southwestern Energy Co. | | | | | |
| 7.500% due 2/1/2018 | | 329,000 | | | 322,629 |
| |
| StanCorp Financial Group, Inc. | | | | | |
| 6.900% due 6/1/2067 (b) | | 39,634,000 | | | 33,887,070 |
| |
| Standard Chartered PLC | | | | | |
| 4.000% due 7/12/2022 (b) (e) | | 37,273,000 | | | 37,646,587 |
| |
| Stanley Black & Decker Inc. | | | | | |
| 5.750% due 12/15/2053 (b) | | 1,050,000 | | | 1,119,300 |
| |
| State Street Corp. | | | | | |
| 5.250% due 9/15/2020 (b) (d) | | 2,000,000 | | | 2,009,900 |
| |
| Susa Partnership L.P. | | | | | |
| 8.200% due 6/1/2017 | | 16,000 | | | 17,416 |
| 7.450% due 7/1/2018 | | 130,000 | | | 147,355 |
| |
| Tech Data Corp. | | | | | |
| 3.750% due 9/21/2017 | | 4,226,000 | | | 4,286,419 |
| |
| Transocean Inc. | | | | | |
| 6.000% due 3/15/2018 | | 22,778,000 | | | 21,752,990 |
| 7.375% due 4/15/2018 | | 3,808,000 | | | 3,674,720 |
| | | | | | |
| Twenty-First Century Fox | | | | | |
| America, Inc. | | | | | |
| 8.000% due 10/17/2016 | | 800,000 | | | 848,096 |
| |
| Unitrin, Inc. | | | | | |
| 6.000% due 5/15/2017 | | 14,577,000 | | | 15,262,323 |
| |
| Vale Overseas Ltd. | | | | | |
| 6.250% due 1/11/2016 | | 100,000 | | | 100,000 |
| |
| Viacom Inc. | | | | | |
| 2.500% due 12/15/2016 | | 344,000 | | | 347,636 |
| |
| Wells Fargo & Co. | | | | | |
| 7.980% due 3/15/2018 (b) (d) | 60,897,000 | | | 63,941,850 |
| |
| Western Power Distribution | | | | | |
| 7.250% due 12/15/2017 (e) | 2,335,000 | | | 2,504,867 |
| |
| Westvaco Corp. | | | | | |
| 7.500% due 6/15/2027 | | 711,000 | | | 749,508 |
| |
| Wyndham Worldwide | | | | | |
| 5.750% due 2/1/2018 | | 2,046,000 | | | 2,148,732 |
| |
| XL Group PLC | | | | | |
| 6.500% due 4/15/2017 (b) (d) | 91,235,000 | | | 71,163,300 |
| |
| ZFS Finance USA Trust II | | | | | |
| 6.450% due 12/15/2065 (b) (e) | 4,150,000 | | | 4,201,875 |
| |
| Zions Bancorporation | | | | | |
| 4.500% due 3/27/2017 | | 1,125,000 | | | 1,150,307 |
| 3.600% due 6/30/2018 | | 205,000 | | | 203,657 |
| |
| Total Corporate Bonds | | | | | 2,319,530,882 |
| |
| Federal Agency Mortgage-Backed | | | | |
| Securities - 0.0% | | | | | |
| Fannie Mae | | | | | |
| 6.500% due 1/1/2019, | | | | | |
| Series 76-9194F | | 20,957 | | | 21,805 |
| 6.000% due 10/1/2037, | | | | | |
| Series 88-8736F | | 131,862 | | | 144,976 |
| 6.000% due 3/1/2038, | | | | | |
| Series 25-7134F | | 109,320 | | | 120,698 |
See Notes to Financial Statements.
24
| BOND FUND SCHEDULE OF INVESTMENTS (Continued) |
| November 30, 2015 |
| Principal | | | |
| Amount | | Value |
| BONDS (continued) | | | | | |
| | | | | | |
| Federal Agency Mortgage-Backed | | | | |
| Securities (continued) | | | | | |
| Freddie Mac | | | | | |
| 4.500% due 5/1/2018, | | | | | |
| Series P1-0032 | $ | 13,568 | | $ | 13,902 |
| 6.500% due 12/1/2018, | | | | | |
| Series C9-0241 | | 16,380 | | | 18,675 |
| 6.000% due 11/1/2021, | | | | | |
| Series G1-2449 | | 30,569 | | | 33,160 |
| 6.000% due 2/1/2022, | | | | | |
| Series G1-2758 | | 59,982 | | | 64,932 |
| |
| Ginnie Mae | | | | | |
| 5.500% due 6/15/2017, | | | | | |
| Series 58-4476X | | 520 | | | 523 |
| 5.500% due 7/20/2018, | | | | | |
| Series 00-3411M | | 5,519 | | | 5,710 |
| 7.000% due 5/15/2033, | | | | | |
| Series 78-2071X | | 34,467 | | | 40,846 |
| 5.500% due 6/20/2038, | | | | | |
| Series 00-4163M | | 14,660 | | | 15,606 |
| |
| Total Federal Agency Mortgage- | | | | |
| Backed Securities | | | | | 480,833 |
| |
| Taxable Municipal Bonds - 3.3% | | | | |
| California Earthquake | | | | | |
| Authority | | | | | |
| 6.169% due 7/1/2016 | | 308,000 | | | 316,279 |
| |
| Casino Reinvestment | | | | | |
| Development Authority NJ | | | | |
| 5.340% due 6/1/2020 | | 9,845,000 | | | 9,999,173 |
| |
| City of Atlantic City NJ | | | | | |
| 4.750% due 12/15/2015 | | 220,000 | | | 220,251 |
| |
| City of Cleveland OH Airport | | | | | |
| System Revenue | | | | | |
| 5.239% due 1/1/2017 | | 440,000 | | | 446,002 |
| |
| City of Detroit MI Water Supply | | | | |
| System Revenue | | | | | |
| 3.607% due 7/1/2016 | | 170,000 | | | 170,865 |
| |
| City of Miami FL | | | | | |
| 6.750% due 12/1/2018 | | 1,310,000 | | | 1,426,367 |
| |
| City of Newark NJ | | | | | |
| 5.603% due 4/1/2018 | | 655,000 | | | 678,226 |
| | | | | | |
| County of Reeves TX Certs. of | | | | | |
| Participation | | | | | |
| 4.250% due 12/1/2015 | | 5,000 | | | 5,000 |
| 6.150% due 12/1/2015 | | 280,000 | | | 280,000 |
| 7.000% due 12/1/2015 | | 10,000 | | | 10,000 |
| 5.000% due 12/1/2016 | | 65,000 | | | 65,721 |
| 6.000% due 12/1/2016 | | 75,000 | | | 75,168 |
| 5.000% due 12/1/2017 | | 45,000 | | | 45,940 |
| 6.250% due 12/1/2017 | | 45,000 | | | 45,093 |
| 7.400% due 12/1/2017 | | 480,000 | | | 481,411 |
| 5.625% due 12/1/2018 | | 125,000 | | | 130,341 |
| 6.500% due 12/1/2018 | | 225,000 | | | 225,504 |
| 7.500% due 12/1/2018 | | 35,000 | | | 35,105 |
| 6.750% due 12/1/2019 | | 1,320,000 | | | 1,322,930 |
| 6.125% due 12/1/2020 | | 680,000 | | | 724,023 |
| 6.875% due 12/1/2020 | | 370,000 | | | 370,533 |
| 6.375% due 12/1/2021 | | 45,000 | | | 47,787 |
| 7.000% due 12/1/2021 | | 500,000 | | | 500,775 |
| 7.700% due 12/1/2021 | | 3,340,000 | | | 3,349,051 |
| |
| District of Columbia Revenue | | | | | |
| 4.713% due 10/1/2016 | | 125,000 | | | 125,540 |
| 5.375% due 10/1/2018 | | 1,455,000 | | | 1,465,301 |
| |
| Eastern Illinois University | | | | | |
| 5.000% due 4/1/2017 | | 405,000 | | | 417,377 |
| 5.250% due 4/1/2018 | | 775,000 | | | 815,680 |
| 5.450% due 4/1/2019 | | 515,000 | | | 551,616 |
| 5.600% due 4/1/2020 | | 585,000 | | | 622,867 |
| 5.700% due 4/1/2021 | | 125,000 | | | 132,834 |
| |
| Fannin County TX Public | | | | | |
| Facility Corp. | | | | | |
| 3.950% due 10/1/2016 | | 675,000 | | | 682,452 |
| 4.600% due 10/1/2017 | | 740,000 | | | 752,025 |
| 5.200% due 10/1/2019 | | 515,000 | | | 528,931 |
| 5.650% due 10/1/2021 | | 825,000 | | | 864,526 |
| |
| Florida State Mid-Bay | | | | | |
| Bridge Authority | | | | | |
| 3.784% due 10/1/2021 | | 5,000,000 | | | 5,045,750 |
| |
| Garza County TX Public | | | | | |
| Facility Corp. | | | | | |
| 6.200% due 10/1/2020 | | 1,960,000 | | | 2,051,826 |
See Notes to Financial Statements.
25
| BOND FUND SCHEDULE OF INVESTMENTS (Continued) |
| November 30, 2015 |
| Principal | | | |
| Amount | | Value |
| BONDS (continued) | | | | | |
| | | | | | |
| Taxable Municipal Bonds (continued) | | | |
| Guam Gov’t. | | | | | |
| Waterworks Authority | | | | | |
| 1.880% due 7/1/2016 | $ | 3,320,000 | | $ | 3,319,402 |
| 2.516% due 7/1/2017 | | 210,000 | | | 208,891 |
| 3.061% due 7/1/2018 | | 255,000 | | | 255,128 |
| |
| Kentucky Economic Development | | | | | |
| Finance Authority | | | | | |
| 7.000% due 12/1/2021 | | 270,000 | | | 273,116 |
| |
| Lancaster PA Parking Authority | | | | | |
| 5.760% due 12/1/2017 | | 510,000 | | | 523,408 |
| |
| LL & P Wind Energy, Inc. WA | | | | | |
| 5.733% due 12/1/2017 (e) | | 675,000 | | | 680,906 |
| 5.983% due 12/1/2022 (e) | | 8,595,000 | | | 8,745,241 |
| |
| Memphis TN Health | | | | | |
| Educational & Housing | | | | | |
| Facility Board | | | | | |
| 4.500% due 3/1/2018 | | 160,000 | | | 159,886 |
| |
| New Jersey Economic | | | | | |
| Development Authority | | | | | |
| 5.000% due 6/15/2017 (e) | | 530,000 | | | 536,980 |
| |
| New Jersey Sports & Exposition | | | | | |
| Authority | | | | | |
| 6.076% due 3/1/2023 | | 615,000 | | | 659,969 |
| |
| Pontotoc County OK | | | | | |
| Educational Facilities | | | | | |
| Authority | | | | | |
| 4.119% due 9/1/2023 | | 325,000 | | | 336,967 |
| |
| Public Finance Authority WI | | | | | |
| Student Housing Revenue | | | | | |
| 4.500% due 7/1/2021 | | 1,730,000 | | | 1,720,277 |
| |
| Puerto Rico Commonwealth | | | | | |
| Gov’t. Development Bank | | | | | |
| 4.704% due 5/1/2016 | | 24,080,000 | | | 12,101,404 |
| 3.875% due 2/1/2017 | | 8,000,000 | | | 2,980,400 |
| 4.375% due 2/1/2019 | | 12,395,000 | | | 3,533,319 |
| | | | | | |
| San Luis AZ Facility | | | | | |
| Development Corp. | | | | | |
| 4.050% due 5/1/2016 | | 1,005,000 | | | 1,006,196 |
| 4.650% due 5/1/2017 | | 1,130,000 | | | 1,130,768 |
| 5.050% due 5/1/2018 | | 780,000 | | | 784,345 |
| 5.350% due 5/1/2019 | | 1,240,000 | | | 1,250,317 |
| 5.600% due 5/1/2020 | | 670,000 | | | 677,015 |
| 5.700% due 5/1/2020 | | 850,000 | | | 860,990 |
| 5.800% due 5/1/2021 | | 1,055,000 | | | 1,066,879 |
| 5.900% due 5/1/2021 | | 980,000 | | | 993,985 |
| 6.100% due 5/1/2022 | | 1,030,000 | | | 1,041,557 |
| 6.200% due 5/1/2022 | | 1,035,000 | | | 1,045,671 |
| |
| Summit County OH Development | | | | |
| Finance Authority | | | | | |
| 6.250% due 5/15/2026 | | 665,000 | | | 695,730 |
| |
| West Texas Detention | | | | | |
| Facility Corp. | | | | | |
| 3.800% due 11/1/2016 | | 1,000,000 | | | 1,012,330 |
| 4.400% due 11/1/2017 | | 1,195,000 | | | 1,220,191 |
| 4.700% due 11/1/2018 | | 920,000 | | | 946,496 |
| |
| Willacy County TX Local | | | | | |
| Gov’t. Corp. | | | | | |
| 7.800% due 12/1/2028 | | 1,530,000 | | | 612,535 |
| |
| Willacy County TX Public | | | | | |
| Facility Corp. | | | | | |
| 5.000% due 12/1/2015 | | 1,230,000 | | | 1,230,000 |
| 6.000% due 12/1/2016 | | 1,330,000 | | | 1,365,218 |
| 6.000% due 12/1/2017 | | 390,000 | | | 405,783 |
| 5.600% due 12/1/2018 | | 420,000 | | | 440,395 |
| |
| Total Taxable Municipal Bonds | | | | 88,849,965 |
| |
| Tax-Exempt Municipal | | | | | |
| Bonds - 0.2% | | | | | |
| Casino Reinvestment | | | | | |
| Development Authority NJ | | | | |
| 5.250% due 6/1/2019 | | 5,000,000 | | | 5,015,950 |
| |
| Puerto Rico Commonwealth | | | | | |
| 5.500% due 7/1/2018 | | 100,000 | | | 105,138 |
| 5.500% due 7/1/2019 | | 100,000 | | | 105,292 |
See Notes to Financial Statements.
26
| BOND FUND SCHEDULE OF INVESTMENTS (Continued) |
| November 30, 2015 |
| Principal | | | |
| Amount | | Value |
| BONDS (continued) | | | | | |
| | | | | | |
| Tax-Exempt Municipal | | | | | |
| Bonds (continued) | | | | | |
| Puerto Rico Electric | | | | | |
| Power Authority | | | | | |
| 5.000% due 7/1/2019 | $ | 770,000 | | $ | 777,284 |
| |
| Puerto Rico Highways & | | | | | |
| Transportation Authority | | | | | |
| 4.125% due 7/1/2019 | | 120,000 | | | 119,306 |
| |
| Puerto Rico Municipal | | | | | |
| Finance Agency | | | | | |
| 5.250% due 8/1/2019 | | 100,000 | | | 100,621 |
| |
| Total Tax-Exempt | | | | | |
| Municipal Bonds | | | | | 6,223,591 |
| |
| United States Government & | | | | | |
| Agency Issues - 0.3% | | | | | |
| U.S. Treasury Bonds | | | | | |
| 2.125% due 12/31/2015 | | 8,000,000 | | | 8,011,872 |
| |
| Total United States Government | | | | |
| & Agency Issues | | | | | 8,011,872 |
| |
| TOTAL BONDS (COST | | | | | |
| $2,912,117,452) | | | | | 2,682,876,576 |
| |
| Shares or | | | |
| Principal | | | |
| Amount | | | |
| SHORT-TERM INVESTMENTS - 1.0% | | | | |
| |
| Money Market Funds - 0.1% | | | | | |
| Fidelity Money Market Portfolio | | | | |
| Class I, 0.125% (a) | | 3,209,318 | | | 3,209,318 |
| |
| Total Money Market Funds | | | | | 3,209,318 |
| | | | | | |
| United States Government & | | | | | |
| Agency Issues - 0.9% | | | | | |
| U.S. Treasury Bills | | | | | |
| 0.012% due 12/10/2015 (b) | | 15,000,000 | | | 14,999,951 |
| 0.042% due 1/7/2016 (b) | | 10,000,000 | | | 9,999,558 |
| |
| Total United States Government | | | | | |
| & Agency Issues | | | | | 24,999,509 |
| |
| TOTAL SHORT-TERM | | | | | |
| INVESTMENTS | | | | | |
| (COST $28,208,827) | | | | | 28,208,827 |
| |
| TOTAL INVESTMENTS - 98.8% | | | | | |
| (COST $2,940,326,279) | | | | | 2,711,085,403 |
| |
| NET OTHER ASSETS AND | | | | | |
| LIABILITIES - 1.2% | | | | | 33,396,927 |
| |
| NET ASSETS - 100.0% | | | | $ | 2,744,482,330 |
| (a) | | Represents the 7-day yield at November 30, 2015. |
| (b) | | Rate shown represents the current coupon rate at November 30, 2015. |
| (c) | | Security is a “step-up” bond where the coupon increases or steps up at a predetermined date. |
| (d) | | Perpetual maturity; date shown represents next contractual call date. |
| (e) | | Security subject to restrictions on resale under federal securities laws and which therefore may only be resold upon registration under the Securities Act of 1933, as amended, or in transactions exempt from registration, including sales to qualified institutional buyers under Rule 144A of the Securities Act of 1933, as amended. It has been deemed liquid under guidance approved by the Board. |
| N.V.: | | Naamloze Vennootschap is the Dutch term for a public limited liability corporation. |
| PLC: | | Public Limited Company |
| REIT: | | Real Estate Investment Trust |
| S.A.: | | Generally designates corporations in various countries, mostly those employing the civil law. |
See Notes to Financial Statements.
27
| FUND EXPENSE EXAMPLES (Unaudited) |
| November 30, 2015 |
Example
A Fund shareholder may incur two types of costs: (1) transaction costs such as redemption fees; and (2) ongoing costs, including management fees and other Fund expenses. This example is intended to help you understand your ongoing costs (in dollars) of investing in a Fund and to compare these costs with the ongoing costs of investing in other mutual funds.
The example is based on an investment of $1,000 invested at the beginning of the period and held for the entire period from June 1, 2015 to November 30, 2015.
Actual Expenses
The first line of the table below under each Fund provides information about actual account values and actual expenses for such Fund. You may use the information in this line, together with the amount you invested, to estimate the expenses that you paid over the period. Simply divide your account value by $1,000 (for example, an $8,600 account value divided by $1,000 = 8.6), then multiply the result by the number in the first line under the heading entitled “Expenses Paid During Period” to estimate the expenses you paid on your account during this period.
Hypothetical Example for Comparison Purposes
The second line of the table below under each Fund provides information about hypothetical account values and hypothetical expenses based on such Fund’s actual expense ratio and an assumed rate of return of 5% per year before expenses, which is not the Fund’s actual return. The hypothetical account values and expenses may not be used to estimate the actual ending account balance or expenses you paid for the period. You may use this information to compare the ongoing costs of investing in each Fund and other funds. To do so, compare the 5% hypothetical example with the 5% hypothetical examples that appear in the shareholder reports of the other funds.
Please note that the expenses shown in the table are meant to highlight your ongoing costs only and do not reflect any transactional costs, such as redemption fees. Therefore, the second line of the table is useful in comparing ongoing costs only, and will not help you determine the relative costs of owning different funds. In addition, if these transactional costs were included, your costs would have been higher.
| | | | | Beginning | | Ending | | | | | |
| | | Expense Ratio | | Account Value | | Account Value | | Expenses Paid During |
| Six-Month Period Ended November 30, 2015 | | for the Period | | 06/01/15 | | 11/30/15 | | Period* |
| Thompson LargeCap Fund | | | | | | | | | | | | | | | | | |
| Actual | | 1.15% | | | $ | 1,000.00 | | | | $ | 927.93 | | | | $ | 5.56 | |
| Hypothetical (5% return before expenses) | | 1.15% | | | $ | 1,000.00 | | | | $ | 1,019.23 | | | | $ | 5.82 | |
| Thompson MidCap Fund | | | | | | | | | | | | | | | | | |
| Actual | | 1.30% | | | $ | 1,000.00 | | | | $ | 916.28 | | | | $ | 6.24 | |
| Hypothetical (5% return before expenses) | | 1.30% | | | $ | 1,000.00 | | | | $ | 1,018.48 | | | | $ | 6.58 | |
| Thompson Bond Fund | | | | | | | | | | | | | | | | | |
| Actual | | 0.71% | | | $ | 1,000.00 | | | | $ | 967.54 | | | | $ | 3.50 | |
| Hypothetical (5% return before expenses) | | 0.71% | | | $ | 1,000.00 | | | | $ | 1,021.44 | | | | $ | 3.60 | |
| * | Expenses are equal to the annualized [net] expense ratio for each Fund, multiplied by the average account value over the period, multiplied by 183/365 (to reflect the one-half year period). |
| |
| For more information, please refer to the Funds’ Prospectus. |
See Notes to Financial Statements.
28
| STATEMENTS OF ASSETS AND LIABILITIES |
| November 30, 2015 (In thousands, except per share amounts) |
| | LARGECAP | | MIDCAP | | BOND |
| | FUND | | FUND | | FUND |
| ASSETS | | | | | | | | | | | | | | | |
| Total investments in securities, at value (Cost $116,140, $36,629 and | | | | | | | | | | | | | | | |
| $2,940,326 respectively) | | | $ | 111,683 | | | | $ | 38,345 | | | | $ | 2,711,085 | |
| Cash | | | | – | | | | | – | | | | | 12,222 | |
| Due from sale of securities | | | | 196 | | | | | 42 | | | | | – | |
| Receivable from fund shares sold | | | | 3 | | | | | – | | | | | 3,046 | |
| Dividends and interest receivable | | | | 231 | | | | | 42 | | | | | 40,170 | |
| Prepaid expenses | | | | 7 | | | | | 4 | | | | | 122 | |
| Total Assets | | | | 112,120 | | | | | 38,433 | | | | | 2,766,645 | |
| LIABILITIES | | | | | | | | | | | | | | | |
| Due on purchase of securities | | | | 21 | | | | | 20 | | | | | 2,212 | |
| Payable for fund shares redeemed | | | | 63 | | | | | – | | | | | 18,488 | |
| Line of credit | | | | – | | | | | 8 | | | | | – | |
| Accrued expenses payable | | | | 29 | | | | | 24 | | | | | 89 | |
| Accrued directors expense payable | | | | – | | | | | – | | | | | 3 | |
| Due to Advisor | | | | 95 | | | | | 31 | | | | | 1,371 | |
| Total Liabilities | | | | 208 | | | | | 83 | | | | | 22,163 | |
| NET ASSETS | | | $ | 111,912 | | | | $ | 38,350 | | | | $ | 2,744,482 | |
| Net Assets consist of: | | | | | | | | | | | | | | | |
| Capital stock ($.001 par value) | | | $ | 147,929 | | | | $ | 33,611 | | | | $ | 2,962,671 | |
| Undistributed net investment income | | | | 661 | | | | | 4 | | | | | 30,623 | |
| Accumulated net realized gain (loss) on investments | | | | (32,221 | ) | | | | 3,019 | | | | | (19,571 | ) |
| Net unrealized appreciation (depreciation) on investments | | | | (4,457 | ) | | | | 1,716 | | | | | (229,241 | ) |
| Net Assets | | | $ | 111,912 | | | | $ | 38,350 | | | | $ | 2,744,482 | |
| Shares of capital stock outstanding (unlimited shares authorized) | | | | 2,206 | | | | | 3,179 | | | | | 249,882 | |
| Offering and redemption price/Net asset value per share | | | $ | 50.72 | (a) | | | $ | 12.07 | (a) | | | $ | 10.98 | |
(a) Does not recalculate due to rounding.
See Notes to Financial Statements.
29
| STATEMENTS OF OPERATIONS |
| Year Ended November 30, 2015 (In thousands) |
| | LARGECAP | | MIDCAP | | BOND |
| | FUND | | FUND | | FUND |
| Investment income(a) | | | | | | | | | | | | | | | |
| Dividends | | | $ | 2,166 | | | | $ | 526 | | | | $ | – | |
| Interest | | | | – | | | | | – | | | | | 150,706 | |
| | | | 2,166 | | | | | 526 | | | | | 150,706 | |
| Expenses | | | | | | | | | | | | | | | |
| Investment advisory fees | | | | 1,140 | | | | | 402 | | | | | 19,300 | |
| Shareholder servicing costs | | | | 87 | | | | | 36 | | | | | 1,453 | |
| Administrative & accounting services fees | | | | 120 | | | | | 55 | | | | | 893 | |
| Custody fees | | | | 12 | | | | | 5 | | | | | 258 | |
| Directors fees | | | | 27 | | | | | 24 | | | | | 143 | |
| Federal & state registration | | | | 33 | | | | | 32 | | | | | 98 | |
| Professional fees | | | | 37 | | | | | 36 | | | | | 77 | |
| Other expenses | | | | 23 | | | | | 10 | | | | | 734 | |
| Total expenses | | | | 1,479 | | | | | 600 | | | | | 22,956 | |
| Less expenses reimbursed by Advisor | | | | (86 | ) | | | | (78 | ) | | | | – | |
| Net expenses | | | | 1,393 | | | | | 522 | | | | | 22,956 | |
| Net investment income | | | | 773 | | | | | 4 | | | | | 127,750 | |
| Net realized gain (loss) on investments | | | | 19,889 | | | | | 3,154 | | | | | (13,899 | ) |
| Net unrealized depreciation on investments | | | | (26,214 | ) | | | | (5,323 | ) | | | | (179,649 | ) |
| Net loss on investments | | | | (6,325 | ) | | | | (2,169 | ) | | | | (193,548 | ) |
| Net decrease in net assets resulting from operations | | | $ | (5,552 | ) | | | $ | (2,165 | ) | | | $ | (65,798 | ) |
| | | | | | | | | | | | | | | | |
| | | | | | | | | | | | | | | | |
| (a)Net of foreign withholding taxes | | | $ | 3 | | | | $ | 1 | | | | $ | 67 | |
See Notes to Financial Statements.
30
| STATEMENTS OF CHANGES IN NET ASSETS |
| (In thousands) |
| | LARGECAP | | MIDCAP | | BOND |
| | FUND | | FUND | | FUND |
| | Year Ended | | Year Ended | | Year Ended | | Year Ended | | Year Ended | | Year Ended |
| | November 30, | | November 30, | | November 30, | | November 30, | | November 30, | | November 30, |
| | 2015 | | 2014 | | 2015 | | 2014 | | 2015 | | 2014 |
| Operations | | | | | | | | | | | | | | | | | | | | | | | | | | | | | | |
| Net investment income (loss) | | | $ | 773 | | | | $ | 672 | | | | $ | 4 | | | | $ | (9 | ) | | | $ | 127,750 | | | | $ | 125,810 | |
| Net realized gain (loss) | | | | | | | | | | | | | | | | | | | | | | | | | | | | | | |
| on investments | | | | 19,889 | | | | | 15,743 | | | | | 3,154 | | | | | 3,923 | | | | | (13,899 | ) | | | | (822 | ) |
| Net unrealized appreciation | | | | | | | | | | | | | | | | | | | | | | | | | | | | | | |
| (depreciation) on investments | | | | (26,214 | ) | | | | 1,450 | | | | | (5,323 | ) | | | | 332 | | | | | (179,649 | ) | | | | (73,260 | ) |
| Net increase (decrease) in net assets | | | | | | | | | | | | | | | | | | | | | | | | | | | | | | |
| resulting from operations | | | | (5,552 | ) | | | | 17,865 | | | | | (2,165 | ) | | | | 4,246 | | | | | (65,798 | ) | | | | 51,728 | |
| Distributions to Shareholders | | | | | | | | | | | | | | | | | | | | | | | | | | | | | | |
| Distributions from net | | | | | | | | | | | | | | | | | | | | | | | | | | | | | | |
| investment income | | | | (676 | ) | | | | (472 | ) | | | | – | | | | | – | | | | | (136,781 | ) | | | | (112,531 | ) |
| Distributions from net realized gains | | | | | | | | | | | | | | | | | | | | | | | | | | | | | | |
| on securities transactions | | | | – | | | | | – | | | | | (3,896 | ) | | | | (3,933 | ) | | | | – | | | | | (5,802 | ) |
| Total distributions to shareholders | | | | (676 | ) | | | | (472 | ) | | | | (3,896 | ) | | | | (3,933 | ) | | | | (136,781 | ) | | | | (118,333 | ) |
| |
| Fund Share Transactions | | | | | | | | | | | | | | | | | | | | | | | | | | | | | | |
| (See Note 4) | | | | (10,476 | ) | | | | (13,575 | ) | | | | 3,104 | | | | | 3,386 | | | | | (776,902 | ) | | | | 1,538,506 | |
| |
| Total Increase (Decrease) | | | | | | | | | | | | | | | | | | | | | | | | | | | | | | |
| in Net Assets | | | | (16,704 | ) | | | | 3,818 | | | | | (2,957 | ) | | | | 3,699 | | | | | (979,481 | ) | | | | 1,471,901 | |
| |
| Net Assets | | | | | | | | | | | | | | | | | | | | | | | | | | | | | | |
| Beginning of period | | | | 128,616 | | | | | 124,798 | | | | | 41,307 | | | | | 37,608 | | | | | 3,723,963 | | | | | 2,252,062 | |
| End of period | | | $ | 111,912 | | | | $ | 128,616 | | | | $ | 38,350 | | | | $ | 41,307 | | | | $ | 2,744,482 | | | | $ | 3,723,963 | |
| Undistributed net investment | | | | | | | | | | | | | | | | | | | | | | | | | | | | | | |
| income included in net assets | | | | | | | | | | | | | | | | | | | | | | | | | | | | | | |
| at end of period | | | $ | 661 | | | | $ | 564 | | | | $ | 4 | | | | $ | – | | | | $ | 30,623 | | | | $ | 36,424 | |
See Notes to Financial Statements.
31
| NOTES TO FINANCIAL STATEMENTS |
| November 30, 2015 |
NOTE 1 - ORGANIZATION
Thompson IM Funds, Inc. (the “Company”) is a Wisconsin corporation registered under the Investment Company Act of 1940, as amended (the “1940 Act”), as an open-end, diversified management investment company.
The Company consists of separate mutual funds series (each, a “Fund,” and collectively, the “Funds”): Thompson LargeCap Fund (the “LargeCap Fund”), Thompson MidCap Fund (the “MidCap Fund”) and Thompson Bond Fund (the “Bond Fund”). The assets and liabilities of each Fund are segregated and a shareholder’s interest is limited to the Fund in which the shareholder owns shares. The objectives and strategies of each Fund are described in the Funds’ Prospectus.
NOTE 2 - SIGNIFICANT ACCOUNTING POLICIES
The following is a summary of significant accounting policies followed by the Funds in the preparation of their financial statements. The Funds are investment companies and accordingly follow the investment company accounting and reporting guidance of the Financial Accounting Standards Board (“FASB”) Accounting Codification Topic 946 Financial Services — Investment Companies.
VALUATION POLICY AND PROCEDURES - The Funds’ Board of Directors (the “Funds’ Board”) has adopted methods for valuing securities set forth in the Funds’ Pricing Policies and Procedures, including circumstances in which market quotes are not readily available or deemed to be unreliable, and has delegated authority to the Advisor to apply those methods in making fair value determinations, subject to board oversight. The Advisor has established a valuation committee (the “Committee”). The Committee and other Advisor employees administer, implement, and oversee the fair valuation process and make fair value decisions. The Committee regularly reviews its own fair value decisions, as well as valuations, valuation techniques and services furnished by pricing services, considers circumstances in the markets which may require valuation determinations by the Committee and reviews previous valuation determinations. The Committee reports on its activities and any changes to the fair valuation guidelines to the Funds’ Board.
SECURITY VALUATION - Each Fund’s listed or exchange-traded investments are valued at their market prices (generally the last reported sales price on the exchange where the securities are primarily traded or, for Nasdaq-listed securities, at their Nasdaq Official Closing Prices). Exchange traded options are valued at the last reported sale price on an exchange on which the option is traded. If no sales are reported on a particular day, the mean between the highest bid and lowest asked quotations at the close of the exchanges will generally be used. Investments in money market mutual funds are generally priced at the ending net asset value provided by the service agent of the funds.
Debt investments are typically valued based on valuations published by an independent pricing service, which uses various valuation methodologies such as matrix pricing and other analytical pricing models as well as market transactions and dealer quotations. Factors considered by pricing services include market characteristics such as benchmark yield curves, option-adjusted spreads, credit spreads and fundamental analytical data relating to the issuer. Debt securities with remaining maturities of 60 days or less are generally valued on an amortized cost basis.
Where market quotations are not readily available or are unreliable, a fair value is determined in good faith pursuant to procedures established by the Funds’ Board. When a security is “fair valued,” consideration is given to the facts and circumstances relevant to the particular situation, including a review of various factors, which includes factors such as fundamental analytical data relating to the investment, which may include consideration of yields or prices of securities of comparable quality, coupon rate, maturity and type of issue, nature and duration of any restrictions on disposition of the security and an evaluation of forces that influence the market in which the securities are purchased or sold. Fair value pricing is an inherently subjective process, and no single standard exists for determining fair value. Different funds could reasonably arrive at different values for the same security. No securities in any of the Funds were fair valued as of November 30, 2015.
VALUATION MEASUREMENTS – In accordance with generally accepted accounting principles in the United States of America (“GAAP”), fair value is defined as the price that the Fund would receive to sell an investment or pay to transfer a liability in an orderly transaction with an independent buyer in the principal market, or in the absence of a principal market the most advantageous market for the investment or liability. GAAP established a three-tier hierarchy to maximize the use of observable market data and minimize the use of unobservable inputs and to establish classification of fair value measurements for disclosure purposes.
32
| NOTES TO FINANCIAL STATEMENTS (Continued) |
| November 30, 2015 |
Various inputs are used in determining the value of each Fund’s investments. These inputs are summarized in the three broad levels listed below:
Level 1 – Quoted prices in active markets for identical securities.
Level 2 – Other significant observable inputs (including quoted prices for similar securities, interest rates, prepayment speeds, credit risk, etc.).
Level 3 – Significant unobservable inputs (including the Fund’s own assumptions in determining the fair value of investments).
Inputs may include price information, specific and broad credit data, liquidity statistics, and other factors. The Fund considers observable data to be that market data which is readily available, regularly distributed or updated, reliable and verifiable, not proprietary, and provided by independent sources that are actively involved in the relevant market. The determination of what constitutes “observable” requires significant judgment by the Fund. The categorization of a financial instrument within the hierarchy is based upon the pricing transparency of the instrument and does not necessarily correspond to the Fund’s perceived risk of that instrument. Investments whose values are based on quoted market prices in active markets, and which are therefore classified as level-1 securities, include active listed equities and certain U.S. government obligations.
Investments that trade in markets that are not considered to be active, but are valued based on quoted market prices, dealer quotations or alternative pricing sources supported by observable inputs, are classified as level-2 securities. These include certain U.S. government obligations, most government agency securities, investment-grade corporate bonds, sovereign bonds, municipal bonds, and less liquid listed equities. Level-2 investments include positions that are not traded in active markets.
Investments classified as level-3 securities have significant unobservable inputs, as they trade infrequently or not at all. Level-3 instruments include private-placement and less liquid corporate and municipal debt securities. When observable prices are not available for these securities, the Fund uses one or more valuation techniques (e.g., the market approach, the income approach, or the cost approach) for which sufficient and reliable data is available. Within level 3, the use of the market approach generally consists of using comparable market transactions, while the use of the income approach generally consists of using the net present value of estimated future cash flows, adjusted as appropriate for liquidity, credit, market and/or other risk factors. The inputs used by the Fund in estimating the value of level-3 investments include the original transaction price and recent transactions in the same or similar instruments.
The following is a summary of the inputs used to value the Funds’ investments as of November 30, 2015:
| | LargeCap Fund |
| Assets | | Level 1 | | Level 2 | | Level 3 | | Total |
| Investment Securities: | | | | | | | | | | | | |
| Common stocks | | $ | 111,671,310 | | $ | – | | $ | – | | $ | 111,671,310 |
| Short-term investments | | | 11,998 | | | – | | | – | | | 11,998 |
| Total Assets | | $ | 111,683,308 | | $ | – | | $ | – | | $ | 111,683,308 |
| |
| | | MidCap Fund |
| Assets | | Level 1 | | Level 2 | | Level 3 | | Total |
| Investment Securities: | | | | | | | | | | | | |
| Common stocks | | $ | 38,343,933 | | $ | – | | $ | – | | $ | 38,343,933 |
| Short-term investments | | | 638 | | | – | | | – | | | 638 |
| Total Assets | | $ | 38,344,571 | | $ | – | | $ | – | | $ | 38,344,571 |
33
| NOTES TO FINANCIAL STATEMENTS (Continued) |
| November 30, 2015 |
| | Bond Fund |
| Assets | | Level 1 | | Level 2 | | Level 3 | | Total |
| Investment Securities: | | | | | | | | | | | | |
| Bonds | | $ | – | | $ | 2,682,876,576 | | $ | – | | $ | 2,682,876,576 |
| Short-term investments | | | 3,209,318 | | | 24,999,509 | | | – | | | 28,208,827 |
| Total Assets | | $ | 3,209,318 | | $ | 2,707,876,085 | | $ | – | | $ | 2,711,085,403 |
There were no transfers between level-1 and level-2 securities and the Funds did not invest in any level-3 investments as of and during the fiscal year ended November 30, 2015. It is the Funds’ policy to record transfers at the end of the reporting period. Refer to each Fund’s Schedule of Investments for additional information regarding security types and industry classifications.
SECURITIES TRANSACTIONS AND INVESTMENT INCOME - Investment securities transactions are accounted for on the trade date. Gains or losses realized on sales of securities are determined by comparing the identified cost of the security lot sold with the net sales proceeds. Discounts/premiums on debt securities purchased are accreted/amortized over the life of the respective securities on the same basis for book and tax purposes. Dividend income is recorded on the ex-dividend date. Interest income is recorded as earned. Income and capital gains on some foreign securities may be subject to foreign withholding taxes, which are accrued as applicable, and have been provided for in accordance with the Funds’ understanding of the applicable country’s tax rules and rates.
OPTIONS - Each Fund may enter into options transactions for hedging purposes and will not use these instruments for speculation. Each Fund may use options to hedge against anticipated declines in the market value of portfolio securities and increases in the market value of securities it intends to purchase and protect against exposure to interest rate changes. Each Fund may also use options to enhance total return or invest in eligible asset classes with greater efficiency and lower cost than is believed to be possible through direct investment. The use of options for hedging purposes involves certain risks and may result in a loss if changes in the value of the option move in a direction different than anticipated, rendering the hedging strategy unsuccessful.
Each Fund may write covered call/put options for which premiums received are recorded as liabilities and are subsequently adjusted to the current fair value of the options written. Premiums received from writing options that expire unexercised are treated as realized gains. Premiums received from writing options which are either exercised or closed are offset against the proceeds received or amount paid on the transaction to determine realized gains or losses.
SECURITIES PURCHASED ON A WHEN-ISSUED OR DELAYED-DELIVERY BASIS - Each Fund may purchase securities on a when-issued or delayed-delivery basis. When-issued securities are securities purchased with delivery to occur at a later date at a stated price and/or yield, thereby involving the risk that the price and/or yield obtained may be more or less than those available in the market when delivery takes place. At the time a Fund makes a commitment to purchase a security on a when-issued basis, the Fund records the transaction and reflects the value of the security in determining net asset value. Each Fund designates and maintains cash and marketable securities at least equal in value to commitments for when-issued securities.
VARIABLE-RATE DEMAND NOTES - The Funds invest in short-term variable-rate demand notes, which are unsecured instruments. The Funds may be susceptible to credit risk with respect to these instruments to the extent the issuer defaults on its payment obligation.
PERMANENT BOOK AND TAX DIFFERENCES - Generally accepted accounting principles require that permanent financial reporting and tax differences relating to shareholder distributions be reclassified in the capital accounts.
EXPENSES - Each Fund is charged for those expenses that are directly attributed to it. Expenses that are not readily identifiable to a specific Fund are generally allocated among the Funds in proportion to the relative sizes of the Funds.
34
| NOTES TO FINANCIAL STATEMENTS (Continued) |
| November 30, 2015 |
USE OF ESTIMATES - The preparation of financial statements in conformity with GAAP requires management to make estimates and assumptions that affect the reported amounts of assets and liabilities and disclosure of contingent assets and liabilities at the date of the financial statements and the reported amounts of revenues and expenses during the reporting period. Actual results could differ from these estimates.
DISTRIBUTIONS TO SHAREHOLDERS - Distributions to shareholders from net investment income and realized gains on securities for the LargeCap Fund and MidCap Fund normally are declared at least annually. Bond Fund distributions to shareholders from net investment income normally are declared on a quarterly basis, and distributions to shareholders from realized gains on securities normally are declared at least annually. Distributions are recorded on the ex-dividend date.
FEDERAL INCOME TAXES - No provision has been made for federal income taxes since the Funds have elected to be taxed as regulated investment companies and intend to distribute substantially all income to shareholders and otherwise comply with the provisions of the Internal Revenue Code applicable to regulated investment companies.
LINE OF CREDIT - The Funds have established an unsecured line of credit (“LOC”) with U.S. Bank N.A. which expires November 11, 2016 used primarily to finance redemption payments. Each individual Fund’s borrowing under the LOC is limited to 5% of the value of that Fund’s net assets, 33.33% of the value of the Fund’s investments, or any explicit borrowing limits imposed by the LOC, whatever is less. Interest is charged at the prime rate. As of November 30, 2015, the limits established are: LargeCap Fund - $5,500,000, MidCap Fund - $2,000,000 and Bond Fund - $145,000,000. All terms and borrowing limits imposed by the LOC are subject to review and approval by the Funds’ Board. The following table shows the average balance, average interest rate, interest expense, and maximum borrowings incurred by the Funds on the LOC for the fiscal year ended November 30, 2015.
| | | | | | | | | | | | Date of |
| Average | | Average | | Interest | | Maximum | | Maximum |
| Balance | | Interest Rate | | Expense | | Borrowing | | Borrowing |
| LargeCap Fund | $ | 89,118 | | 3.250% | | $ | 2,937 | | $ | 667,000 | | 6/22/2015 |
| MidCap Fund | $ | 34,904 | | 3.250% | | $ | 1,150 | | $ | 1,350,000 | | 1/8/2015 |
| Bond Fund | $ | 2,574,058 | | 3.250% | | $ | 84,819 | | $ | 50,107,000 | | 12/22/2014 |
GUARANTEES AND INDEMNIFICATIONS - Under the Funds’ organizational documents, each Director, officer, employee or other agent of the Funds (including the Funds’ investment advisor) is indemnified, to the extent permitted by the 1940 Act, against certain liabilities that may arise out of performance of their duties to the Funds. Additionally, in the normal course of business, the Funds enter into contracts that contain a variety of indemnification clauses. The Funds’ maximum exposure under these arrangements is unknown as this would involve future claims that may be made against the Funds that have not yet occurred. However, the Funds have not had prior claims or losses pursuant to these contracts and believe the risk of loss to be remote.
ACCOUNTING FOR UNCERTAINTY IN INCOME TAXES - As of and during the fiscal year ended November 30, 2015, the Funds did not have a liability for unrecognized tax benefits in the accompanying financial statements. Also, the Funds recognized no interest or penalties related to unrecognized tax benefits during the same period. The Funds recognize interest and penalties, if any, related to unrecognized tax benefits as income tax expense in the Statements of Operations. The Funds are also not aware of any tax positions for which it is reasonably possible that the total amounts of unrecognized tax benefits will significantly change in the next twelve months.
SUBSEQUENT EVENTS - The Funds have evaluated subsequent events through the issuance of the Funds’ financial statements. See note 6. There were no other subsequent events which were deemed to have an impact on the Funds’ financial statements.
35
| NOTES TO FINANCIAL STATEMENTS (Continued) |
| November 30, 2015 |
NOTE 3 - INVESTMENT ADVISORY AND ADMINISTRATIVE AND ACCOUNTING SERVICES AGREEMENTS AND OTHER TRANSACTIONS WITH AFFILIATES
The Investment Advisory Agreement pursuant to which Thompson Investment Management, Inc. (“TIM” or “Advisor”) is retained by the Funds provides for monthly compensation to TIM computed on average daily net assets at the following annual rates:
| | First | | Over |
| | $50 Million | | $50 Million |
| LargeCap Fund | | 1.00% | | 0.90% |
| MidCap Fund | | 1.00% | | 0.90% |
| Bond Fund | | 0.65% | | 0.60% |
The Advisor is contractually bound to waive management fees and/or reimburse expenses incurred by the Funds through March 31, 2017 so that the annual operating expenses of the Funds do not exceed the following percentages of their respective average daily net assets: LargeCap Fund - 1.13%, MidCap Fund - 1.25% and Bond Fund - 0.80%. Prior to December 1, 2015, the applicable expense limitation percentages were LargeCap Fund - 1.15% and MidCap Fund - 1.30%. For the fiscal year ended November 30, 2015, the Advisor reimbursed expenses incurred by the LargeCap Fund and the MidCap Fund in the amounts of $85,942 and $77,706, respectively. The Funds are not obligated to reimburse the Advisor for any fees or expenses waived in previous fiscal years.
Pursuant to an Administrative and Accounting Services Agreement, TIM maintains the Funds’ financial records in accordance with the 1940 Act, prepares all necessary financial statements of the Funds and calculates the net asset value per share of the Funds on a daily basis. As compensation for its services, each Fund pays TIM a fee computed daily and payable monthly at the annual rate of 0.15% of average daily net assets up to $30 million, 0.10% of the next $70 million of average daily net assets and 0.025% of average daily net assets in excess of $100 million, with an annual minimum fee of $30,000 per Fund. The calculations of daily net asset value are subcontracted to U.S. Bancorp Fund Services, resulting in fees paid by TIM for the fiscal year ended November 30, 2015 in the following amounts:
| | Administrative & |
| | Accounting Fees Paid |
| LargeCap Fund | | | $ | 37,234 | |
| MidCap Fund | | | $ | 34,274 | |
| Bond Fund | | | $ | 302,476 | |
The Funds reimburse the Advisor for a portion of amounts paid by the Advisor out of the Advisor’s own resources under various shareholder, account maintenance, networking and other services provided to the Funds by broker-dealers and other intermediaries. The amount reimbursed by the Funds is equal to (1) for those accounts maintained through a shareholder servicing arrangement, an annual rate of no more than 0.10% of the average daily net assets of the omnibus accounts in the Funds for which all broker-dealers and other intermediaries, in the aggregate, are responsible, and (2) for those accounts maintained through a networking arrangement, no more than $6 per year per account in the Funds for which the broker-dealers and other intermediaries are responsible; provided however, in all cases only one of these fees shall be applicable to the assets in an account. This amount has been determined by the Funds’ Board to approximate the transfer agency fees that would otherwise have been payable by the Funds if such broker-dealers and intermediaries did not maintain these accounts. Such amounts are recorded within Shareholder servicing costs on the Fund’s Statement of Operations. For the fiscal year ended November 30, 2015, the amounts reimbursed by the Funds to the Advisor were:
| Intermediary |
| Fees Reimbursed |
| LargeCap Fund | | $ | 22,947 | |
| MidCap Fund | | $ | 3,911 | |
| Bond Fund | | $ | 988,673 | |
36
| NOTES TO FINANCIAL STATEMENTS (Continued) |
| November 30, 2015 |
NOTE 4 - FUND SHARE TRANSACTIONS (in thousands)
Transactions in shares of the Funds were as follows:
| Year Ended | | Year Ended |
| November 30, 2015 | | November 30, 2014 |
| Shares | | Dollars | | Shares | | Dollars |
| LargeCap Fund | | | | | | | | | | | | | |
| Shares sold | 100 | | | $ | 5,297 | | | 113 | | | $ | 5,604 | |
| Shares issued in reinvestment of dividends | 12 | | | | 652 | | | 10 | | | | 460 | |
| Shares issued in reinvestment of realized gains | – | | | | – | | | – | | | | – | |
| Shares redeemed | (314 | ) | | | (16,425 | ) | | (400 | ) | | | (19,639 | ) |
| Net decrease | (202 | ) | | $ | (10,476 | ) | | (277 | ) | | $ | (13,575 | ) |
| |
| MidCap Fund | | | | | | | | | | | | | |
| Shares sold | 260 | | | $ | 3,369 | | | 427 | | | $ | 5,679 | |
| Shares issued in reinvestment of dividends | – | | | | – | | | – | | | | – | |
| Shares issued in reinvestment of realized gains | 299 | | | | 3,825 | | | 315 | | | | 3,919 | |
| Shares redeemed | (322 | ) | | | (4,090 | ) | | (479 | ) | | | (6,212 | ) |
| Net increase | 237 | | | $ | 3,104 | | | 263 | | | $ | 3,386 | |
| |
| Bond Fund | | | | | | | | | | | | | |
| Shares sold | 75,715 | | | $ | 860,664 | | | 196,126 | | | $ | 2,327,553 | |
| Shares issued in reinvestment of dividends | 11,396 | | | | 128,763 | | | 8,996 | | | | 106,321 | |
| Shares issued in reinvestment of realized gains | – | | | | – | | | 471 | | | | 5,520 | |
| Shares redeemed | (155,791 | ) | | | (1,766,329 | ) | | (76,062 | ) | | | (900,888 | ) |
| Net increase (decrease) | (68,680 | ) | | $ | (776,902 | ) | | 129,531 | | | $ | 1,538,506 | |
NOTE 5 - PURCHASE AND SALE OF SECURITIES
Investment transactions for the fiscal year ended November 30, 2015 were as follows:
| | Securities other than U.S. | | | | | | |
| | Government and Short-term | | | | | | |
| | Investments | | U.S. Government Securities |
| | Purchases | | Sales | | Purchases | | Sales |
| LargeCap Fund | | $ | 54,174,004 | | $ | 64,457,836 | | $ | – | | $ | – |
| MidCap Fund | | $ | 10,792,367 | | $ | 11,536,353 | | $ | – | | $ | – |
| Bond Fund | | $ | 907,011,614 | | $ | 959,314,813 | | $ | 454,271,499 | | $ | 304,094,999 |
37
| NOTES TO FINANCIAL STATEMENTS (Continued) |
| November 30, 2015 |
NOTE 6 - INCOME TAX INFORMATION
At November 30, 2015, the investment cost and aggregate unrealized appreciation and depreciation on investments for federal income tax purposes were as follows:
| LargeCap Fund | | MidCap Fund | | Bond Fund |
| Federal tax cost | | $ | 116,231,404 | | | | | $ | 36,751,763 | | | | $ | 2,941,430,097 | |
| Unrealized appreciation | | $ | 6,265,148 | | | | | $ | 7,368,766 | | | | $ | 13,867,106 | |
| Unrealized depreciation | | | (10,813,244 | ) | | | | | (5,775,958 | ) | | | | (244,211,800 | ) |
| Net unrealized appreciation (depreciation) | | $ | (4,548,096 | ) | | | | $ | 1,592,808 | | | | $ | (230,344,694 | ) |
| |
| Distributable ordinary income | | $ | 660,820 | | | | | $ | 159,206 | | | | $ | 30,661,001 | |
| Distributable long-term capital gains | | | – | | | | | | 2,986,294 | | | | | – | |
| Total distributable earnings | | $ | 660,820 | | | | | $ | 3,145,500 | | | | $ | 30,661,001 | |
The tax basis of investments for tax and financial reporting purposes differ principally due to wash sales and discount accretion of debt securities.
The tax components of distributions paid during the fiscal years ended November 30, 2015 and November 30, 2014 are as follows:
| | LargeCap Fund | | MidCap Fund | | Bond Fund |
| Fiscal year ended November 30, 2015 | | | | | | | | | | | | | | | |
| Distributions paid from: | | | | | | | | | | | | | | | |
| Ordinary income distributions | | | $ | 675,832 | | | | $ | 429,599 | | | | $ | 136,781,134 | |
| Long-term capital gains distributions | | | | – | | | | | 3,466,117 | | | | | – | |
| Total distributions paid | | | $ | 675,832 | | | | $ | 3,895,716 | | | | $ | 136,781,134 | |
| | |
| Fiscal year ended November 30, 2014 | | | | | | | | | | | | | | | |
| Distributions paid from: | | | | | | | | | | | | | | | |
| Ordinary income distributions | | | $ | 472,077 | | | | $ | 246,171 | | | | $ | 112,531,226 | |
| Long-term capital gains distributions | | | | – | | | | | 3,687,221 | | | | | 5,801,616 | |
| Total distributions paid | | | $ | 472,077 | | | | $ | 3,933,392 | | | | $ | 118,332,842 | |
The tax basis post-October losses as of November 30, 2015 and capital loss carryforward as of November 30, 2015, which are not being recognized for tax purposes until the first day of the following fiscal year, are as follows:
| | LargeCap Fund | | MidCap Fund | | Bond Fund |
| Post-October losses | | | $ | – | | | | $ | – | | | $ | 2,073,821 |
| Net capital loss carryforward | | | | | | | | | | | | | |
| Subject to expiration | | | | | | | | | | | | | |
| November 30, 2017 | | | $ | 32,129,436 | | | | $ | – | | | $ | – |
| Not subject to expiration | | | | | | | | | | | | | |
| Short-term | | | | – | | | | | – | | | | 15,029,290 |
| Long-term | | | | – | | | | | – | | | | 1,401,736 |
| Total capital loss carryforward | | | $ | 32,129,436 | | | | $ | – | | | $ | 16,431,026 |
During the fiscal year ended November 30, 2015, the LargeCap Fund utilized capital loss carryforwards in the amount of $19,724,132.
38
| NOTES TO FINANCIAL STATEMENTS (Continued) |
| November 30, 2015 |
Under the Regulated Investment Company Modernization Act of 2010 (the “Modernization Act”), capital losses incurred during taxable years after December 22, 2010 are carried forward indefinitely and retain the character of the original loss. Previously, net capital losses were carried forward for eight years and treated as short-term losses. As a transition rule, the Modernization Act requires that post-enactment net capital losses be used before pre-enactment net capital losses.
The following distributions were declared on December 17, 2015, payable to shareholders on December 18, 2015:
| | LargeCap Fund | | MidCap Fund | | Bond Fund |
| Ordinary income distributions | | | | | | | | | | | | | |
| Amount | | | $ | 773,384 | | | | $ | 160,710 | | | $ | 37,149,976 |
| Per Share | | | $ | 0.35 | | | | $ | 0.05 | | | $ | 0.16 |
| Long-term capital gains distributions | | | | | | | | | | | | | |
| Amount | | | $ | – | | | | $ | 2,988,206 | | | $ | – |
| Per Share | | | $ | – | | | | $ | 0.95 | | | $ | – |
39
The following table presents information relating to a share of capital stock outstanding for the entire period.
| | Year Ended November 30, |
| | 2015 | | 2014 | | 2013 | | 2012 | | 2011 |
| LARGECAP FUND | | | | | | | | | | | | | | | |
| |
| Net Asset Value, Beginning of Period | | $53.40 | | | $46.47 | | | $34.27 | | | $30.07 | | | $29.20 | |
| Income from Investment Operations | | | | | | | | | | | | | | | |
| Net investment income | | 0.35 | | | 0.27 | | | 0.19 | | | 0.18 | | | 0.08 | |
| Net realized and unrealized gains (losses) | | | | | | | | | | | | | | | |
| on investments and options | | (2.75 | ) | | 6.84 | | | 12.20 | | | 4.13 | | | 0.80 | |
| Total from Investment Operations | | (2.40 | ) | | 7.11 | | | 12.39 | | | 4.31 | | | 0.88 | |
| Less Distributions | | | | | | | | | | | | | | | |
| Distributions from net investment income | | (0.28 | ) | | (0.18 | ) | | (0.19 | ) | | (0.11 | ) | | (0.01 | ) |
| Distributions from net realized gains | | – | | | – | | | – | | | – | | | – | |
| Total Distributions | | (0.28 | ) | | (0.18 | ) | | (0.19 | ) | | (0.11 | ) | | (0.01 | ) |
| |
| Net Asset Value, End of Period | | $50.72 | | | $53.40 | | | $46.47 | | | $34.27 | | | $30.07 | |
| |
| Total Return | | (4.52% | ) | | 15.35% | | | 36.33% | | | 14.37% | | | 3.02% | |
| |
| Ratios/Supplemental Data | | | | | | | | | | | | | | | |
| Net assets, end of period (millions) | | $111.9 | | | $128.6 | | | $124.8 | | | $99.6 | | | $104.1 | |
| Ratios to average net assets: | | | | | | | | | | | | | | | |
| Ratio of expenses | | 1.15% | | | 1.15% | | | 1.21% | | | 1.31% | | | 1.31% | |
| Ratio of expenses without reimbursement | | 1.22% | | | 1.23% | | | 1.22% | | | 1.31% | | | 1.31% | |
| Ratio of net investment income | | 0.64% | | | 0.54% | | | 0.46% | | | 0.47% | | | 0.24% | |
| Ratio of net investment income | | | | | | | | | | | | | | | |
| without reimbursement | | 0.57% | | | 0.46% | | | 0.45% | | | 0.47% | | | 0.24% | |
| Portfolio turnover rate | | 45% | | | 27% | | | 38% | | | 30% | | | 40% | |
See Notes to Financial Statements.
40
| FINANCIAL HIGHLIGHTS (Continued) |
| |
The following table presents information relating to a share of capital stock outstanding for the entire period.
| | Year Ended November 30, |
| | 2015 | | 2014 | | 2013 | | 2012 | | 2011 |
| MIDCAP FUND | | | | | | | | | | | | | | | |
| |
| Net Asset Value, Beginning of Period | | $14.04 | | | $14.04 | | | $11.28 | | | $11.15 | | | $11.36 | |
| Income from Investment Operations | | | | | | | | | | | | | | | |
| Net investment income (loss) (a) | | – | | | – | | | – | | | – | | | – | |
| Net realized and unrealized gains (losses) | | | | | | | | | | | | | | | |
| on investments | | (0.64 | ) | | 1.47 | | | 3.71 | | | 1.38 | | | 0.44 | |
| Total from Investment Operations | | (0.64 | ) | | 1.47 | | | 3.71 | | | 1.38 | | | 0.44 | |
| Less Distributions | | | | | | | | | | | | | | | |
| Distributions from net investment income | | – | | | – | | | – | | | – | | | – | |
| Distributions from net realized gains | | (1.33 | ) | | (1.47 | ) | | (0.95 | ) | | (1.25 | ) | | (0.65 | ) |
| Total Distributions | | (1.33 | ) | | (1.47 | ) | | (0.95 | ) | | (1.25 | ) | | (0.65 | ) |
| |
| Net Asset Value, End of Period | | $12.07 | | | $14.04 | | | $14.04 | | | $11.28 | | | $11.15 | |
| |
| Total Return | | (5.10% | ) | | 11.82% | | | 35.65% | | | 14.41% | | | 3.69% | |
| |
| Ratios/Supplemental Data | | | | | | | | | | | | | | | |
| Net assets, end of period (millions) | | $38.4 | | | $41.3 | | | $37.6 | | | $24.6 | | | $17.6 | |
| Ratios to average net assets: | | | | | | | | | | | | | | | |
| Ratio of expenses | | 1.30% | | | 1.30% | | | 1.30% | | | 1.30% | | | 1.30% | |
| Ratio of expenses without reimbursement | | 1.49% | | | 1.54% | | | 1.63% | | | 1.83% | | | 1.96% | |
| Ratio of net investment income (loss) | | 0.01% | | | (0.02% | ) | | (0.02% | ) | | (0.03% | ) | | (0.19% | ) |
| Ratio of net investment loss | | | | | | | | | | | | | | | |
| without reimbursement | | (0.18% | ) | | (0.27% | ) | | (0.35% | ) | | (0.56% | ) | | (0.85% | ) |
| Portfolio turnover rate | | 27% | | | 34% | | | 47% | | | 44% | | | 47% | |
(a) Less than .005 per share.
See Notes to Financial Statements.
41
| FINANCIAL HIGHLIGHTS (Continued) |
| |
The following table presents information relating to a share of capital stock outstanding for the entire period.
| | Year Ended November 30, |
| | 2015 | | 2014 | | 2013 | | 2012 | | 2011 |
| BOND FUND | | | | | | | | | | | | | | | |
| |
| Net Asset Value, Beginning of Period | | $11.69 | | | $11.91 | | | $11.95 | | | $11.33 | | | $11.54 | |
| Income from Investment Operations | | | | | | | | | | | | | | | |
| Net investment income | | 0.49 | | | 0.45 | | | 0.41 | | | 0.41 | | | 0.42 | |
| Net realized and unrealized gains (losses) | | | | | | | | | | | | | | | |
| on investments | | (0.72 | ) | | (0.19 | ) | | (0.03 | ) | | 0.67 | (a) | | (0.17 | )(a) |
| Total from Investment Operations | | (0.23 | ) | | 0.26 | | | 0.38 | | | 1.08 | | | 0.25 | |
| Less Distributions | | | | | | | | | | | | | | | |
| Distributions from net investment income | | (0.48 | ) | | (0.45 | ) | | (0.40 | ) | | (0.43 | ) | | (0.40 | ) |
| Distributions from net realized gains | | – | | | (0.03 | ) | | (0.02 | ) | | (0.03 | ) | | (0.06 | ) |
| Total Distributions | | (0.48 | ) | | (0.48 | ) | | (0.42 | ) | | (0.46 | ) | | (0.46 | ) |
| |
| Net Asset Value, End of Period | | $10.98 | | | $11.69 | | | $11.91 | | | $11.95 | | | $11.33 | |
| |
| Total Return | | (2.04% | ) | | 2.19% | | | 3.24% | | | 9.70% | | | 2.16% | |
| |
| Ratios/Supplemental Data | | | | | | | | | | | | | | | |
| Net assets, end of period (millions) | | $2,744.5 | | | $3,724.0 | | | $2,252.1 | | | $1,292.3 | | | $656.0 | |
| Ratios to average net assets: | | | | | | | | | | | | | | | |
| Ratio of expenses | | 0.71% | | | 0.72% | | | 0.74% | | | 0.78% | | | 0.80% | |
| Ratio of expenses without reimbursement | | 0.71% | | | 0.72% | | | 0.74% | | | 0.78% | | | 0.84% | |
| Ratio of net investment income | | 3.98% | | | 4.04% | | | 3.73% | | | 3.90% | | | 3.89% | |
| Ratio of net investment income | | | | | | | | | | | | | | | |
| without reimbursement | | 3.98% | | | 4.04% | | | 3.73% | | | 3.90% | | | 3.86% | |
| Portfolio turnover rate | | 29% | | | 21% | | | 33% | | | 16% | | | 14% | |
| (a) | Realized and unrealized gains and losses per share are balancing amounts necessary to reconcile the change in net asset value per share in the period. It does not agree to the aggregate gains and losses in the Statement of Operations due to the fluctuation in share transactions. |
See Notes to Financial Statements.
42
REPORT OF INDEPENDENT REGISTERED PUBLIC ACCOUNTING FIRM
To the Shareholders and Board of Directors of
Thompson IM Funds, Inc.
We have audited the accompanying statements of assets and liabilities, including the schedules of investments, of Thompson IM Funds, Inc., comprising Thompson LargeCap Fund, Thompson MidCap Fund, and Thompson Bond Fund (the “Funds”) as of November 30, 2015, and the related statements of operations for the year then ended, the statements of changes in net assets for each of the two years in the period then ended, and the financial highlights for each of the five years in the period then ended. These financial statements and financial highlights are the responsibility of the Funds’ management. Our responsibility is to express an opinion on these financial statements and financial highlights based on our audits.
We conducted our audits in accordance with the standards of the Public Company Accounting Oversight Board (United States). Those standards require that we plan and perform the audit to obtain reasonable assurance about whether the financial statements and financial highlights are free of material misstatement. An audit includes examining, on a test basis, evidence supporting the amounts and disclosures in the financial statements. Our procedures included confirmation of securities owned as of November 30, 2015, by correspondence with the custodian and brokers. An audit also includes assessing the accounting principles used and significant estimates made by management, as well as evaluating the overall financial statement presentation. We believe that our audits provide a reasonable basis for our opinion.
In our opinion, the financial statements and financial highlights referred to above present fairly, in all material respects, the financial position of each of the Funds constituting Thompson IM Funds, Inc. as of November 30, 2015, the results of their operations for the year then ended, the changes in their net assets for each of the two years in the period then ended, and the financial highlights for each of the five years in the period then ended, in conformity with accounting principles generally accepted in the United States of America.
 COHEN FUND AUDIT SERVICES, LTD.
Cleveland, Ohio
January 20, 201643
| DIRECTORS AND OFFICERS (Unaudited) |
| (Information as of 12/31/15) |
| | Position(s) | | | | | | |
| | Held with | | | | Number of | | Other |
| | Thompson IM | | | | Thompson IM | | Directorships |
| | Funds, Inc. and | | Principal Occupation(s) | | Funds Overseen | | Held |
| Name and Age | | Length of Time Served(1) | | During Past Five Years | | by Director | | by Director |
Independent Directors: | | | | | | | | |
| | | | | | | | | |
John W. Feldt
Birth date: 5/2/42 | | Chairman since
July 2012 Director since 1987 | | ●Currently retired ●Senior Vice President of Finance of the University of Wisconsin Foundation from 1984 to 2006 ●Former Vice President of Finance for the University of Wisconsin Foundation
| | 3 | | Baird Funds,
Inc.
(12 funds) |
George E. Austin
Birth date: 9/15/52 | | Director since 2011 | | ●President of AVA Civic Enterprises Inc. (consulting firm), since January 2011 ●Director of W. Jerome Frautschi Foundation Inc. (private foundation), since December 2012; President from 1998 to December 2012 ●Director of the Home Savings Bank since 1998 ●Director of Overture Development Corporation (support organization for Overture Center Foundation), since 2001; President from 2001 to 2009
| | 3 | | None |
Cornelia Boyle
Birth date: 9/23/53 | | Director since 2015 | | ●Currently retired ●Director of North Track Funds, Inc. (investment company) from 2003 to 2009 ●Trustee of Ziegler Exchange Traded Trust (investment company) from 2005 to 2009 ●Executive Vice President and Chief Operations Officer, AIG Sun America Retirement Markets, Inc. (distribution and marketing company for variable annuity and retirement products) from 2000 to 2003 ●Executive Vice President, Fidelity Investments from 1996 to 2000 | | 3 | | None |
Patricia Lipton
Birth date: 12/9/42 | | Director since 2007 | | ●Currently retired ●Executive Director, State of Wisconsin Investment Board (“SWIB”) from 1989 to 2004 ●Assistant Executive Director, SWIB from 1982 to 1989 ●Former Director, State Tax Policy Bureau of the Wisconsin Department of Revenue
| | 3 | | None |
44
| DIRECTORS AND OFFICERS (Unaudited) (Continued) |
| (Information as of 12/31/15) |
| | Position(s) | | | | | | |
| | Held with | | | | Number of | | Other |
| | Thompson IM | | | | Thompson IM | | Directorships |
| | Funds, Inc. and | | Principal Occupation(s) | | Funds Overseen | | Held |
| Name and Age | | Length of Time Served(1) | | During Past Five Years | | by Director | | by Director |
Interested Directors and Officers: | | | | | | | | |
| | | | | | | | | |
John W. Thompson(2)
Birth date: 7/26/43 | | Director since 1987 President since 2009 Chief Executive Officer from 2005 to 2015
| | ●President of Thompson Investment Management, Inc. (“TIM”) since 2004; Chairman since 2015 ●President of Thompson Plumb & Associates, Inc. (“TPA”) (investment advisor) from 1984 to 2003 ●A Chartered Financial Analyst
| | 3 | | None |
Jason L. Stephens(2)
Birth date: 10/15/74 | | Director since 2011 Chief Executive Officer since 2015 Vice President from 2009 to 2015
| | ●Chief Executive Officer of TIM since 2015; Chief Operating Officer of TIM from 2009 to 2015 ●Corporate Secretary of TIM since 2004 ●Portfolio Manager of TIM since 2007 ●A Chartered Financial Analyst
| | 3 | | None |
James T. Evans
Birth date: 6/6/75 | | Vice President since 2009 | | ●Chief Investment Officer of TIM since 2009 ●Portfolio Manager of TIM since 2008 ●Managing Director of Nakoma Capital Management, from 2000 to 2005 ●A Chartered Financial Analyst
| | N/A | | N/A |
Penny M. Hubbard
Birth date: 6/2/61 | | Chief Financial Officer and Treasurer since 2005 | | ●Vice President of TIM since 2004 ●Assistant Vice President - Client Services of TPA and various other capacities 1984-2004
| | N/A | | N/A |
Nedra S. Pierce
Birth date: 10/2/61 | | Chief Compliance
Officer since 2006 | | ●Chief Compliance Officer of TIM since 2006 ●Director of Business Development of TIM from 2004 to 2006 and since June 2010 ●Director of Business Development of TPA from 1998 to 2003
| | N/A | | N/A |
Lesley T. Bailey
Birth date: 9/30/78 | | Secretary since 2010 | | ●Fund Accounting and Administration at TIM since 2004 ●Fund Accounting and Administration at TPA from 2001 to 2004
| | N/A | | N/A |
Sarah M. Baumgartner
Birth date: 2/21/84 | | Assistant Secretary
since 2012 | | ●Fund Accounting and Administration at TIM since 2007 | | N/A | | N/A |
The address of each Director and officer as it relates to the Company’s business is 918 Deming Way, Madison WI 53717.
(1) Officers of the Investment Company serve one-year terms, subject to annual reappointment by the Board of Directors. Directors of the Investment Company serve a term of indefinite length until their resignation or removal, and stand for re-election by shareholders as and when required under the 1940 Act.
(2) John W. Thompson and Jason L. Stephens are “interested persons” of the Investment Company by virtue of their position with the Investment Company and TIM.
45
| ADDITIONAL INFORMATION (Unaudited) |
| |
THOMPSON IM FUNDS, INC.
INVESTMENT ADVISOR
Thompson Investment Management, Inc.
918 Deming Way
Madison, Wisconsin 53717
DISTRIBUTOR
Quasar Distributors, LLC
615 East Michigan Street
Milwaukee, Wisconsin 53202
TRANSFER AGENT
U.S. Bancorp Fund Services, LLC
615 East Michigan Street
Milwaukee, Wisconsin 53202
INDEPENDENT REGISTERED
PUBLIC ACCOUNTING FIRM
Cohen Fund Audit Services, Ltd.
1350 Euclid Avenue, Suite 800
Cleveland, OH 44115
LEGAL COUNSEL
Quarles & Brady LLP
411 East Wisconsin Avenue
Milwaukee, Wisconsin 53202
The Statement of Additional Information contains additional information about the directors and officers of Thompson IM Funds, Inc. and is available without charge, upon request, by calling 1-800-999-0887.
Proxy Voting Policy
A description of the policies and procedures that the Funds use to determine how to vote proxies relating to portfolio securities and information regarding how the Funds actually voted proxies during the most recent 12-month period ended June 30 are available without charge, upon request, by calling 1-800-999-0887, through the Funds’ website at www.thompsonim.com and on the SEC’s website at www.sec.gov.
Information About Portfolio Securities
The Funds file complete schedules of their portfolio holdings with the Securities and Exchange Commission for the Funds’ first and third quarters of its fiscal year on Form N-Q. The Funds’ Forms N-Q are available on the Securities and Exchange Commission’s website at www.sec.gov. You may also review and copy those documents by visiting the Securities and Exchange Commission’s Public Reference Room in Washington, D.C. Information on the operation of the Public Reference Room may be obtained by calling the Securities and Exchange Commission at 1-800-SEC-0330. The Funds’ Forms N-Q are also available without charge, upon request, by calling 1-800-999-0887.
46
| ADDITIONAL INFORMATION (Unaudited) (Continued) |
| |
Board Approval of Investment Advisory Agreement
The Investment Company Act of 1940 (the “Act”) requires that the Investment Advisory Agreement (the “Agreement”) for Thompson IM Funds, Inc. (the “Funds”) be approved annually by a vote of a majority of the Board of Directors, including a majority of the Directors who are not parties to the Agreement or “interested persons” of the Funds as that term is defined in the Act (the “Independent Directors”). At its meeting on November 19, 2015, the Board of Directors of the Funds, including all of the Independent Directors, voted unanimously to renew the existing Agreement between the Funds and Thompson Investment Management, Inc. (the “Advisor”) for each of the LargeCap Fund, the MidCap Fund and the Bond Fund (each of these series of the Funds is sometimes referred to as a “Fund” in this section).
The Board’s approval was based on its consideration and evaluation of a variety of factors, including: (1) the nature, extent, and quality of the services provided by the Advisor; (2) the performance of each of the Funds in comparison to its benchmark index and to a peer group of mutual funds; (3) the management fees and total operating expenses of each Fund, including comparative information with respect to a peer group of mutual funds and with fees charged by the Advisor to other clients whose assets are managed under similar objectives and strategies; (4) the extent to which economies of scale may be realized as a Fund grows; and (5) whether fee levels reflect any potential economies of scale for the benefit of shareholders. The Board generally viewed these factors in their totality, with no single factor serving as the principal reason for determining whether to renew the Agreement and with individual Board members giving different weight to different factors.
In connection with the renewal process, both the Independent Directors as well as the full Board met separately in person on November 19, 2015, and the full Board met by telephone on November 5, 2015, to consider information relevant to the renewal process. The Independent Directors and the full Board are referred to collectively as the “Board” in this section.
To facilitate evaluation of the Agreement, the Board received and reviewed information prepared or compiled by the Advisor as well as an independent analysis of each Fund’s performance, expenses, and profitability prepared by Broadridge, a leading independent provider of data for independent directors of investment companies for purposes of their review of investment advisory agreements. Information reviewed included a memorandum from Fund counsel discussing the fiduciary duty of Directors under Section 15(c) of the Act; an executive summary and memorandum from Fund management providing its recommendation for renewal of the Agreement; the Advisor’s analysis of profitability of the Agreement to the Advisor and the profitability of related service contracts with the Advisor; a separate profitability comparison prepared by Broadridge; a detailed statistical report from Broadridge comparing each Fund’s respective performance and expenses with both a comparison “group” and a comparison “universe” and expanded universe of other funds; information regarding the composition of and fees charged for standardized investment products offered to separately managed account clients of the Advisor; the Advisor’s Form ADV, which, among other things, showed fees charged by the Advisor to manage the investments of other clients with objectives and programs similar to the Funds; the Agreement and other service agreements with the Advisor; and background information on the Funds’ portfolio managers and reports from the Funds’ Chief Compliance Officer. In addition, the Board had received and considered detailed information on the Funds’ investment performance and expenses at each of its quarterly meetings during the year as well as in-person reports from the Fund’s portfolio managers and reports from the Funds’ Chief Compliance Officer. Throughout the review and approval process, the Independent Directors were represented by independent legal counsel.
The Board considered the nature, extent, and quality of services provided by the Advisor, including services required to be provided under the Agreement, services required to be provided under other agreements with the Advisor and with affiliates of the Advisor, and additional services provided by the Advisor that were not required under any of those agreements. The Board considered the background and experience of the Funds’ portfolio managers, other advisory personnel, compliance personnel, and other support personnel. It noted that in addition to considering these factors at this meeting, it had also considered many of these factors during the course of its quarterly meetings over the past year as well as at its November 5 special telephonic meeting. The Board noted that, in addition to investment management and broker-selection services, the Advisor prepares compliance and other materials for each of the Board’s meetings; provides office space, equipment, information technology and administrative services necessary for operation of the Funds; and performs regular compliance and risk analysis functions for the Funds. The Board believed that the nature, extent, and quality of services provided by the Advisor were comparable to those provided by advisors to comparable funds and that such services were adequate for the Funds’ needs.
In reviewing the investment performance of each of the Funds, the Board reviewed the one-, two-, three-, four-, five- and ten-year performances of the Bond Fund and LargeCap Fund and the one-, two-, three-, four-, and five-year and life-of-fund performances of the MidCap Fund (which commenced operations on March 31, 2008).
47
| ADDITIONAL INFORMATION (Unaudited) (Continued) |
| |
The Board noted that the Bond Fund ranked in the top 20 percent of its comparison group and its comparison universe over each period other than the one-year period, for which it ranked in the bottom 20 percent of its comparison group and its comparison universe. The Board further noted that the Bond Fund had outperformed its benchmark index as well as the Barclays Credit 1-5 Year Index and the Morningstar Short-Term Bond category for the three-, five-, and ten-year periods.
The Board observed that the investment performance for the LargeCap Fund was particularly strong relative to its Broadridge performance group during the three-, four-, and five-year periods, during which time it ranked in the top 20 percent. The Board further observed that the Fund ranked in the top 40 percent of funds in its performance group and performance universe over the two-year period as well as among the top half of funds in its performance group for the one-year period and top half of funds in its performance universe for the one-, four-, and five-year periods. The Board also noted that the LargeCap Fund had outperformed its benchmark over the three-year period and the Morningstar Large Blend category over the one-, three-, and five-year periods. While the Fund ranked among the bottom 20 percent of funds over the ten-year period, the Board noted that a consistent team of portfolio managers for the Fund had been in place during the past five years of more favorable performance.
The performance of the MidCap Fund ranked in the top 20 percent of its performance universe and top 40 percent of its performance group for the since-inception period, as well as in the top 40 percent of both its performance group and performance universe for the three-year period. The Board noted that the Fund had not performed as well over various other measured periods, including ranking in the bottom 20 percent and 40 percent of its performance group and performance universe, respectively, over the one-year period. The Board observed that the Fund had outperformed its benchmark for the since-inception period and the Morningstar Mid-Cap Blend category for the three-year and five-year periods.
The Board discussed with management of the Advisor the reasons behind the recent underperformance of the Bond Fund and MidCap Fund and was satisfied with the Advisor’s plan of action for those Funds going forward.
After considering the performances of the Bond Fund, LargeCap Fund and MidCap Fund, the Board determined that relative to the performances of comparable funds and to each Fund’s benchmark index, the performance of each Fund was within an acceptable range.
In reviewing the cost of services provided to the Funds and profits realized by the Advisor from these relationships, the Board compared information relating to the various management fees charged to separately managed accounts of the Advisor that have relatively analogous investment objectives as those of a Fund. Among the information reviewed by the Board was information relating to standardized investment products offered to separately managed account clients of the Advisor. The Board determined that these standardized products in most instances had investment objectives and styles that were sufficiently different from the investment objectives and styles of any of the Funds so as to make the comparison inapt. With respect to those standardized products available to separately managed account clients of the Advisor that the Board determined to be sufficiently similar in investment objective and strategy to a Fund to be relevant for comparative purposes, the Board determined that in light of the significantly different level of services and resources required for the management of these products and the Funds, the management fees charged by the Advisor with respect to each of the Funds were reasonable relative to the management fees charged by the Advisor with respect to the relevant standardized separately managed account product.
The Board noted that the Bond Fund’s contractual management fee was the highest of its Broadridge comparison group and that its actual management fee was the highest of both its comparison group and comparison universe. The Board also noted, however, that the Fund’s total expense ratio was among the lowest 40 percent of both its Broadridge comparison group and comparison universe, which the Board determined was reasonable.
The information provided by Broadridge indicated that the advisory fees of the LargeCap Fund were one of the highest in both the Fund’s Broadridge comparison group and its comparison universe. The Board, however, observed that the Advisor was proposing to institute a more substantial fee waiver that would lower the ceiling on the maximum total expense ratio that the Fund could incur from 1.15 percent to 1.13 percent of average daily net assets of the Fund, which would place the Fund’s total expense ratio in the third quintile of its expanded comparison universe. The Board also noted that the Fund’s non-management expenses were near the median of its comparison universe (although well above the median of the Fund’s comparison group). After taking into account all of these considerations, the Board determined that the management fee and total expense ratio of the LargeCap Fund were reasonable.
The Board noted that the MidCap Fund’s management fee, after waiver of a portion thereof by the Advisor, ranked in the fourth quintile of management fees of funds in the MidCap Fund’s Broadridge comparison group while ranking near the median of its comparison universe. The Board noted that the non-management expense ratio of the Fund continued to be relatively high as compared to the Fund’s Broadridge comparison group and comparison universe, but that with the growth in assets across all of the Funds this ratio was comparing more favorably than several years ago. The Board further observed that, given the relatively low level of assets in the Fund, the opportunity existed for non-management expenses to decline as the MidCap Fund grows in assets, thereby having a decreasing impact on the Fund’s total expenses. The Board observed that the actual total expense ratio of the Fund was just above the
48
| ADDITIONAL INFORMATION (Unaudited) (Continued) |
| |
median actual total expense ratio for funds in the Fund’s comparison group while falling in the top 80 percent for funds in the Fund’s comparison universe. The Board considered that the Advisor was proposing to institute a more substantial fee waiver for the Fund, which would have the effect of capping the maximum total expense ratio that the Fund could incur at 1.25 percent (whereas the cap had previously been set at 1.30 percent). This cap would have the effect of placing the Fund’s actual total expense ratio in the top 60 percent of funds in the Fund’s comparison expanded universe, which the Board believed was reasonable.
With regard to profitability, the Board noted that the Advisor’s pre-tax profitability, before accounting for marketing fees borne by the Advisor, ranked below the median of firms included in the Broadridge analysis, though it ranked high relative to these firms on a post-marketing basis. The Board observed that all of the investment advisors for which profitability information was publicly available and that were included in the Broadridge comparison were publicly traded entities having markedly different marketing strategies from that of the Advisor. The Board also observed that the Advisor’s profitability has tended to fluctuate from year-to-year rather than being consistently high and that the decline in assets of the Bond Fund was likely to decrease profitability during the next year. The Board determined that the operating margins of the Advisor were reasonable and, after reviewing information provided by Broadridge and reviewing the Advisor’s own analysis, the Board concluded that the cost of services provided by the Advisor and its affiliates to the Funds and the profits realized with respect thereto were reasonable.
The Board also considered whether economies of scale might be realized as the Funds’ assets increase. It noted that the Agreement provides for a fee breakpoint at $50 million of assets. This breakpoint is equal to ten basis points for the LargeCap Fund and MidCap Fund and five basis points for the Bond Fund. The Board considered that an increase in assets could provide economies of scale in the Funds’ operations. However, it noted that the level of assets of the LargeCap Fund presented no opportunity for such economies. The Board noted that the MidCap Fund continued to lack scale in comparison to other funds having similar investment objectives. Therefore the Board concluded that the MidCap Fund was unlikely to realize material economies of scale until its assets grew significantly. The Board noted that the significant growth in assets of the Bond Fund had recently stabilized and reversed to some degree, and the Board determined that the Bond Fund had not yet reached a point where the Fund was realizing any material economies of scale notwithstanding this growth.
49
Item 2. Code of Ethics.
As of the end of the period covered by this report on Form N-CSR, the Registrant has adopted a Code of Ethics (as defined in Item 2(b) of Form N-CSR) that applies to the Registrant’s principal executive officer, principal financial officer and principal accounting officer. The Registrant’s Code of Ethics (as defined in Item 2(b) of Form N-CSR) and any amendments or waivers thereto are available on the Registrant’s website at www.thompsonim.com.
Item 3. Audit Committee Financial Expert.
The Registrant’s Board of Directors has determined that the Registrant has at least one audit committee financial expert serving on its audit committee. John Feldt, a director of the Registrant since 1987, has been determined to be an audit committee financial expert and is “independent” within the meaning of Item 3(a)(2) of Form N-CSR. Mr. Feldt, currently retired, was the Senior Vice President-Finance for the University of Wisconsin Foundation from 1984 through 2006. In such capacity, he oversaw the investment and accounting functions for the Foundation. These duties required Mr. Feldt to supervise the Foundation’s controller and approve the Foundation’s accounting and audit information.
Item 4. Principal Accountant Fees and Services.
The following table sets forth information as to the fees billed to the Registrant for each of the last two fiscal years for audit-related, tax and other services and products provided by Cohen Fund Audit Services, Ltd., the Registrant’s principal accountant.
| Fiscal Year Ended November 30, |
| 2014 | | 2015 |
| Audit Fees(1) | | $ | 36,000.00 | | | | $ | 38,500.00 | |
| Audit-Related Fees(2) | | $ | 0.00 | | | | $ | 0.00 | |
| Tax Fees(3) | | $ | 9,000.00 | | | | $ | 9,000.00 | |
| All Other Fees(4) | | $ | 0.00 | | | | $ | 0.00 | |
| TOTAL | | $ | 45,000.00 | | | | $ | 47,500.00 | |
___________________
| (1) | This category relates to professional services rendered by the principal accountant for the audit of the Registrant's annual financial statements or services that are normally provided by the accountant in connection with statutory and regulatory filings or engagements for those fiscal years. |
| | |
| (2) | This category relates to assurance and related services by the principal accountant that are reasonably related to the performance of the audit of the Registrant's financial statements and are not reported under "Audit Fees" above. |
| |
| (3) | This category relates to professional services rendered by the principal accountant for tax compliance, tax advice and tax planning. For 2014 and 2015, the tax services provided by the Registrant’s principal accountant specifically related to the preparation of the Registrant’s federal and state income and excise tax returns and a review of the Registrant’s distributions of capital gains and dividend and interest income. |
| |
| (4) | This category relates to products and services provided by the principal accountant other than those reported under "Audit Fees," "Audit-Related Fees," and "Tax Fees" above. |
2
Cohen Fund Audit Services, Ltd. did not bill any amounts over the last two fiscal years for services or products provided to Thompson Investment Management, Inc., the Registrant's investment advisor, or any entity controlling, controlled by or under common control with such advisor that provides ongoing services for the Registrant.
The audit committee of the Registrant’s Board of Directors has not adopted any pre-approval policies and procedures (as described in paragraph (c)(7) of Rule 2-01 of Regulation S-X) regarding the provision of audit or non-audit services to the Registrant.
No services described in paragraphs (b)-(d) of this Item were approved by the audit committee pursuant to paragraph (c)(7)(i)(C) of Rule 2-01 of Regulation S-X.
Item 5. Audit Committee of Listed Registrants.
Not applicable to this Registrant because it is not a “listed issuer” within the meaning of Rule 10A-3 under the Securities Exchange Act of 1934.
Item 6. Investments.
The required Schedules of Investments in securities of unaffiliated issuers is included as part of the Registrant’s Annual Report to shareholders dated as of November 30, 2015 provided under Item 1 of this Form N-CSR.
Item 7. Disclosure of Proxy Voting Policies and Procedures for Closed-End Management Investment Companies.
Not applicable to this Registrant because it is not a closed-end management investment company.
Item 8. Portfolio Managers of Closed-End Management Investment Companies.
Not applicable to this Registrant because it is not a closed-end management investment company.
Item 9. Purchases of Equity Securities by Closed-End Management Investment Companies and Affiliated Purchasers.
Not applicable to this Registrant because it is not a closed-end management investment company.
Item 10. Submission of Matters to a Vote of Securities Holders.
The Registrant has not made any material changes to the procedures by which shareholders may recommend nominees to the Registrant's Board of Directors after the Registrant last provided disclosure in response to the requirements of Item 407(c)(2)(iv) of Regulation S-K or this Item.
3
Item 11. Controls and Procedures.
| (a) | Disclosure Controls and Procedures. Based on an evaluation of the Registrant’s disclosure controls and procedures (as defined in Rule 30a-3(c) under the Investment Company Act of 1940) carried out under the supervision and with the participation of the Registrant’s management, including its principal executive and financial officers, within 90 days prior to the filing date of this report on Form N-CSR, the Registrant’s principal executive and financial officers have concluded that the design and operation of the Registrant’s disclosure controls and procedures are effective in providing reasonable assurance that the information required to be disclosed on Form N-CSR is recorded, processed, summarized and reported within the applicable time periods. |
| | | |
| (b) | Change in Internal Controls Over Financial Reporting. There were no changes in the Registrant’s internal control over financial reporting (as defined in Rule 30a-3(d) under the Investment Company Act of 1940) that occurred during the Registrant’s second fiscal quarter of the period covered by this Form N-CSR that have materially affected, or are reasonably likely to materially affect, the Registrant’s internal control over financial reporting. |
Item 12. Exhibits.
The following exhibits are attached to this Form N-CSR:
| | Exhibit No. | | Description of Exhibit | |
| 12(a)(1) | | The Code of Ethics for the Registrant’s Principal Executive Officer, Principal Financial Officer and Principal Accounting Officer referred to in Item 2 was filed as Exhibit 12(a)(1) to the Registrant’s Certified Shareholder Report on Form N-CSR filed on January 28, 2005, and is incorporated herein by reference |
| | | |
| 12(a)(2)-1 | | Certification of Principal Executive Officer Required by Section 302 of the Sarbanes-Oxley Act of 2002 |
| | | |
| 12(a)(2)-2 | | Certification of Principal Financial Officer Required by Section 302 of the Sarbanes-Oxley Act of 2002 |
| | | |
| 12(b) | | Certification of Chief Executive Officer and Chief Financial Officer Required by Section 906 of the Sarbanes-Oxley Act of 2002 |
4
SIGNATURES
Pursuant to the requirements of the Securities Exchange Act of 1934 and the Investment Company Act of 1940, the Registrant has duly caused this report to be signed on its behalf by the undersigned, thereunto duly authorized, on this 20th day of January, 2016.
| THOMPSON IM FUNDS, INC. |
| |
| By: | /s/ Jason L. Stephens | |
| Jason L. Stephens, Chief Executive |
| Officer |
Pursuant to the requirements of the Securities Exchange Act of 1934 and the Investment Company Act of 1940, this report has been signed below by the following persons on behalf of the Registrant and in the capacities indicated on this 20th day of January, 2016.
| By: | /s/ Jason L. Stephens | |
| Jason L. Stephens, Chief Executive |
| Officer (Principal Executive Officer) |
| |
| By: | /s/ Penny Hubbard | |
| Penny Hubbard, Chief Financial |
| Officer (Principal Financial Officer) |
5