Item 1: Report to Shareholders| Maryland Tax-Free Bond Fund | February 28, 2005 |
The views and opinions in this report were current as of February 28, 2005. They are not guarantees of performance or investment results and should not be taken as investment advice. Investment decisions reflect a variety of factors, and the managers reserve the right to change their views about individual stocks, sectors, and the markets at any time. As a result, the views expressed should not be relied upon as a forecast of the fund’s future investment intent. The report is certified under the Sarbanes-Oxley Act of 2002, which requires mutual funds and other public companies to affirm that, to the best of their knowledge, the information in their financial reports is fairly and accurately stated in all material respects.
REPORTS ON THE WEB
Sign up for our E-mail Program, and you can begin to receive updated fund reports and prospectuses online rather than through the mail. Log in to your account at troweprice.com for more information.
Fellow Shareholders
Tax-free bonds generally produced positive returns and outperformed their taxable bond counterparts for the year ended February 28, 2005. Most of the municipal market’s gains occurred in the last six months—a period characterized by rising short-term interest rates, steady economic growth, elevated oil prices, and an unexpected decline in long-term interest rates. For the past 6- and 12-month periods, long-term securities outperformed short-term while high-yield municipals produced better results than investment-grade muni issues. The Maryland Tax-Free Funds generated modest returns that were largely in line with the national averages.
MARKET ENVIRONMENT
Twelve months ago, at the beginning of our fiscal year, the economy was growing vigorously, and the Federal Reserve prepared to unwind—at a “measured” pace—the accommodative monetary policy that had prevailed for almost three years. From June 30, 2004, through the end of February 2005—and despite a brief period of uncertainty about the economic outlook related to geopolitical concerns, rising oil prices, and a tight presidential race—the central bank raised the federal funds target rate in quarter-point increments from 1.00% to 2.50%, a three-year high.
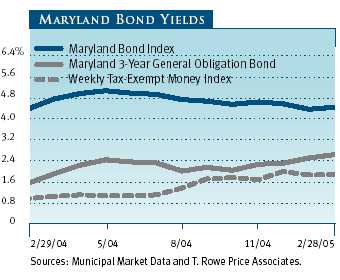
As shown in the graph, municipal money market yields rose steadily for most of the year. Long- term rates, on the other hand, declined after peaking in the spring of 2004—the opposite of what one would expect when the Fed is raising short-term rates. The result was that longer-term municipal securities outperformed short- and intermediate-term bonds in the last six months and for our entire fiscal year.
MUNICIPAL MARKET NEWSNew municipal supply totaled $360 billion in 2004, approximately 6% below the previous year’s record. While new issuance was high from a historical perspective, the increased participation of property and casualty insurance companies and other nontraditional buyers of municipal securities easily absorbed supply, which reduced downward pressure on municipal bond prices. Many states have recovered nicely from the 2001 recession as higher-than-anticipated revenues, spending cuts, and fee increases have improved many states’ finances and reduced the need to borrow.
Local governments and school districts are also participating in the states’ recovery in that they are receiving more in assistance and transfers. The rise in housing prices over the last three years also benefited local governments since it resulted in increased property tax receipts, which are localities’ primary revenue source. Broadly speaking, the outlook for public finance is brighter, though escalating pension and benefit costs may hinder further improvement.
MARYLAND MARKET NEWS
Maryland has a long record of fiscal stability and strong demographics, and its economy continued to fare quite well versus the national averages. The state’s unemployment rate stood at 4.0% at the end of 2004, significantly lower than the 5.5% national average, and Maryland’s per capita personal income was 118% of the national average, according to latest available data, making it one of the wealthiest states in the nation. In 2004, Maryland municipalities issued $6.1 billion of debt, $500 million less than in 2003. The consistently top-flight fiscal stewardship sustained the state’s position in the highest credit rating category from each of the major rating agencies: Aaa, AAA, and AAA from Moody’s Investors Service, Standard & Poor’s, and Fitch Ratings, respectively, and rate the state’s outlook as stable.
Expenditures from the General Fund continued to be managed conservatively. Fiscal year 2004 ended with a General Fund surplus (excess of sources over uses) of $305 million and an ending unreserved General Fund balance of $640 million, or 4% of General Fund revenues. Through January, fiscal 2005 financial performance is ahead of the state’s budget forecast. We expect Maryland to end fiscal 2005 with another surplus.
Although Governor Ehrlich has balanced the fiscal 2006 budget, Maryland continues to be challenged by a structural budget gap due to rising human service and educational funding costs, which may require the use of some one-time solutions.PERFORMANCE AND PORTFOLIO STRATEGIES
Maryland Tax-Free Money Fund
The Maryland Tax-Free Money Fund generated a 0.54% return for the six-month period ended February 28, 2005, marginally outperforming the Lipper Other States Tax-Exempt Money Market Funds Average. For the 12-month period, your fund’s 0.80% gain was also slightly ahead of the Lipper peer group. In both periods, our focus on very short-term securities, which allowed us to reinvest proceeds from maturing issues at higher yields, benefited our relative performance.
| Periods Ended 2/28/05 | 6 Months | 12 Months |
| Maryland Tax-Free Money Fund | 0.54% | 0.80% |
| Lipper Other States Tax-Exempt | | |
| Money Market Funds Average | 0.51 | 0.75 |
A tightening of monetary conditions by the Federal Reserve has been good news for money fund investors. The string of successive fed funds rate increases has pushed money fund yields substantially higher. The fund’s seven-day simple dividend yield nearly doubled over the past six months, rising to 1.37% at the end of the reporting period from 0.72% on August 31, 2004. If the Fed continues to raise short-term rates, money fund yields should continue to improve.
| PORTFOLIO CHARACTERISTICS |
| Periods Ended | 8/31/04 | 2/28/05 |
| Price Per Share | $1.00 | $1.00 |
| Dividends Per Share | | |
| For 6 months | 0.003 | 0.005 |
| For 12 months | 0.005 | 0.008 |
| Dividend Yield (7-Day Simple) * | 0.72% | 1.37% |
| Weighted Average Maturity (days) | 30 | 30 |
| | | |
| * Dividends earned for the last seven days of each period are |
| annualized and divided by the fund’s net asset value at the |
| end of the period. | | |
| Note: A money fund’s yield more closely reflects its current |
| earnings than the total return. | | |
Since our August report, the money markets have absorbed four Federal Reserve interest rate increases and the market continues to price in expectations for further hikes in short-term rates. One-year Libor—a taxable money fund benchmark rate—has moved 131 basis points higher since August to 3.57% from 2.26% . Municipal rates, which generally move in tandem with taxable rates, rose in a similar fashion. Variable-rate debt with maturities out to seven days increased an average of 60 basis points in yield since August. Longer-dated yields moved even higher, pricing in the risk of further Fed moves. Six-month municipal note yields rose 80 basis points since August to 2.15%, and one-year note yields climbed 78 basis points to 2.35% .
| PORTFOLIO DIVERSIFICATION |
| Percent of | Percent of |
| Net Assets | Net Assets |
| Periods Ended | 8/31/04 | 2/28/05 |
| General Obligation – Local | 19.8% | 20.6% |
| Life Care/Nursing Home Revenue | 12.0 | 16.9 |
| Educational Revenue | 14.2 | 16.5 |
| Housing Finance Revenue | 20.4 | 12.6 |
| Hospital Revenue | 10.4 | 10.8 |
| General Obligation – State | 2.1 | 4.5 |
| Dedicated Tax Revenue | 2.7 | 2.1 |
| Prerefunded Bonds | 0.3 | 1.1 |
| Lease Revenue | 0.0 | 1.0 |
| Industrial and Pollution | | |
| Control Revenue | 0.7 | 0.7 |
| All Other Sectors | 17.2 | 13.6 |
| Other Assets Less Liabilities | 0.2 | -0.4 |
| Total | 100.0% | 100.0% |
| | | |
| Historical weightings reflect current industry/sector classifications. |
With rates increasing, we maintained a short weighted average maturity (WAM). At the end of the fund’s fiscal year, the portfolio’s WAM was 30 days, unchanged from six months earlier. Our investment focus continues to be on high-quality, short-maturity issues with an emphasis on variable-rate debt and commercial paper. However, during the past six months, we extended the fund’s maturity on a limited basis when we felt we could exploit a temporary yield advantage. In general, a shorter WAM benefits shareholders in a rising rate environment because assets can be reinvested more quickly at successively higher rates.
With economic recovery appearing firmly entrenched and fears of deflation long since forgotten, the market anticipates the Fed will continue to raise rates through the balance of the year. With this in mind, we intend to continue our current strategy, managing the fund with a short weighted average maturity and concentrating on exploiting temporary yield advantages in short-term securities. Following this strategy, we expect the fund’s yield to rise gradually for the remainder of this current cycle of Fed tightening.
Maryland Short-Term Tax-Free Bond Fund
The Maryland Short-Term Tax-Free Bond Fund returned -0.17% and -0.30% for the 6- and 12-month periods ended February 28, 2005, respectively. The portfolio’s results trailed the Lipper Short Municipal Debt Funds Average for both periods. Although the past 12 months have been a difficult period for short-term municipals and your fund—reflecting the low interest rate environment—our 5- and 10-year results are modestly ahead of the benchmark Lipper average (see the fund’s annualized returns tables after the letter). Additionally, our comparison to the Lipper peer group suffered in part because we are a single-state fund in a peer group that can invest nationally.
| Periods Ended 2/28/05 | 6 Months | 12 Months |
| Maryland Short-Term | | |
| Tax-Free Bond Fund | -0.17% | -0.30% |
| Lipper Short Municipal Debt | | |
| Funds Average | 0.23 | 0.24 |
| PORTFOLIO CHARACTERISTICS |
| Periods Ended | 8/31/04 | 2/28/05 |
| Price Per Share | $5.22 | $5.16 |
| Dividends Per Share | | |
| For 6 months | 0.05 | 0.05 |
| For 12 months | 0.11 | 0.10 |
| 30-Day Dividend Yield * | 1.95% | 2.03% |
| 30-Day Standardized | | |
| Yield to Maturity | 1.59 | 2.13 |
| Weighted Average | | |
| Maturity (years) | 2.2 | 2.2 |
| Weighted Average Effective | | |
| Duration (years) | 2.0 | 2.0 |
| | | |
| * Dividends earned for the last 30 days of each period indicated |
| are annualized and divided by the fund’s net asset value at the |
| end of the period. | | |
The fund generated $0.05 and $0.10 of dividend income over the past six and 12 months, respectively. However, the share price loss, due to the steadily rising interest rates, more than offset the income. The portfolio’s 30-day dividend yield, 2.03%, was marginally higher than at the end of the reporting period six months ago, although the 30-day standardized yield to maturity rose substantially to 2.13%.
Short-term and short-intermediate term bonds were the worst-performing areas of the municipal market for the past 12 months, as they were most affected by the rise in short-term rates and expectations for future rate increases. For example, three-year, high-grade Maryland general obligation bonds yielded 1.6% last February, which didn’t provide much of a yield cushion for a rising rate environment. Those yields are up roughly 100 basis points over the year and should provide more of a cushion if bond prices continue falling.
| PORTFOLIO DIVERSIFICATION |
| | Percent of | Percent of |
| | Net Assets | Net Assets |
| Periods Ended | 8/31/04 | 2/28/05 |
| General Obligation – Local | 29.1% | 31.3% |
| General Obligation – State | 15.9 | 12.0 |
| Hospital Revenue | 12.3 | 10.5 |
| Solid Waste Revenue | 7.9 | 10.1 |
| Prerefunded Bonds | 6.8 | 8.5 |
| Educational Revenue | 5.2 | 6.0 |
| Lease Revenue | 4.4 | 4.9 |
| Ground Transportation Revenue | 3.3 | 3.6 |
| Electric Revenue | 3.0 | 3.3 |
| Dedicated Tax Revenue | 3.9 | 1.9 |
| All Other Sectors | 7.1 | 6.7 |
| Other Assets Less Liabilities | 1.1 | 1.2 |
| Total | 100.0% | 100.0% |
| | | |
| Historical weightings reflect current industry/sector classifications. |
Approximately half the portfolio is invested in securities with maturities of two years or less. Another 29% matures in two to four years, and the balance (21% of assets) has maturities between four and six years. This posturing reflects our belief that interest rates will continue to rise and should allow us to opportunistically reinvest the proceeds from maturing securities in issues with higher yields. Over the course of fiscal 2005, we shifted the portfolio from a neutral duration posture to a more defensive position that was shorter than our benchmark at the end of the year.
Our sector allocation was little changed over the past six months. We added to solid waste holdings, which offer a bit more yield, and reduced our allocation to state general obligations. Hospital revenue holdings also declined since August, and we have more hospital investments maturing this summer with no uptick in supply expected.
Looking ahead, we think short-term rates will continue to move higher. However, we expect your fund to generate better returns in the coming year than it did for the past 12 months because the fixed income markets have already factored in the prospect of several more fed funds increases, and interest rates are significantly higher today than a year ago. The higher yield component should help offset any potential deterioration in bond values. In the near term, we intend to maintain a defensive posture. As always, we will rely on our credit analysts to find and add lower-rated, higher-yielding securities that can enhance returns over time.
Maryland Tax-Free Bond Fund
The Maryland Tax-Free Bond Fund returned 2.01% for the past six months and its fiscal year. Your fund’s 6- and 12-month results were better than the Lipper peer group’s 1.78% and 1.91% returns, respectively. The portfolio’s long-term returns, as shown in the annualized performance tables after the letter, are also well ahead of the Lipper average for Maryland municipal debt funds.
| Periods Ended 2/28/05 | 6 Months | 12 Months |
| Maryland Tax-Free Bond Fund | 2.01% | 2.01% |
| Lipper Maryland Municipal | | |
| Debt Funds Average | 1.78 | 1.91 |
Long-term interest rates spiked higher last spring and have trended steadily lower since then. However, we are pleased to report that dividend income—$0.47 for the past 12 months—was identical to the dividends paid over the 12-month periods ended six months and one year ago. Although we endured a difficult first half of our fiscal year, when the share price decline almost completely offset income, we made every effort to maintain the portfolio’s dividend stream without compromising our credit standards. At the end of the reporting period, the fund’s 30-day dividend yield was 4.38%, modestly higher than 4.25% at the end of February 2004. This was in part due to the fund’s expense ratio, which has remained well below the Lipper peer group average and aided our relative performance.
For the past six months, we concentrated our new investments in longer-maturity securities because we (correctly) believed that the municipal yield curve was too steep by historical standards and would likely flatten. We took advantage of the higher yields available on the long end and increased our long-maturity holdings over the period. Overall, duration and average maturity were little changed because we kept a portion of the portfolio in the short-and intermediate-term areas of the curve to offset the higher risk of the longer holdings. For the period, our best returns were in our longer-maturity holdings.
| PORTFOLIO CHARACTERISTICS |
| Periods Ended | 8/31/04 | 2/28/05 |
| Price Per Share | $10.79 | $10.77 |
| Dividends Per Share | | |
| For 6 months | 0.24 | 0.23 |
| For 12 months | 0.47 | 0.47 |
| 30-Day Dividend Yield * | 4.40% | 4.38% |
| 30-Day Standardized | | |
| Yield to Maturity | 3.51 | 3.38 |
| Weighted Average | | |
| Maturity (years) | 14.3 | 14.2 |
| Weighted Average | | |
| Effective Duration (years) | 5.1 | 5.0 |
| | | |
| * Dividends earned for the last 30 days of each period indicated |
| are annualized and divided by the fund’s net asset value at the |
| end of the period. | | |
We utilized our proprietary research to focus our new investments in higher-yielding credits because, in our view, an improving economy should help this sector sustain its recovery. However, because new issuance in this credit range was limited, we added only selectively to this sector. Among our new additions was a small position in bonds backed by the Hyatt in Cambridge. This project has improved greatly from a rocky start several years ago. We will continue to look for similar higher-yielding securities that meet our stringent credit requirements. (Please refer to our portfolio of investments for a complete listing of the fund’s holdings and the amount each represents of the portfolio.)
We targeted a conservative interest rate posture as we braced for higher rates, but over the past six months we made only modest sector allocation adjustments. While we took profits in the hospital sector and state general obligations, we gradually increased our weight in education revenue holdings and maintained broad diversification. During this reporting period, yield curve position had a greater impact on the portfolio than sector allocation. For the past six months, our short positions lagged while our increase in long holdings served the portfolio well.
| PORTFOLIO DIVERSIFICATION |
| | Percent of | Percent of |
| | Net Assets | Net Assets |
| Periods Ended | 8/31/04 | 2/28/05 |
| Hospital Revenue | 19.2% | 17.8% |
| Educational Revenue | 8.7 | 10.9 |
| Prerefunded Bonds | 8.9 | 10.1 |
| General Obligation – Local | 8.5 | 9.0 |
| Housing Finance Revenue | 7.4 | 6.4 |
| Escrowed to Maturity | 4.7 | 5.4 |
| Ground Transportation Revenue | 5.2 | 5.0 |
| Solid Waste Revenue | 5.0 | 4.9 |
| General Obligation – State | 7.3 | 4.7 |
| Water and Sewer Revenue | 4.0 | 3.9 |
| All Other Sectors | 20.2 | 20.6 |
| Other Assets Less Liabilities | 0.9 | 1.3 |
| Total | 100.0% | 100.0% |
| | | |
| Historical weightings reflect current industry/sector classifications. |
OUTLOOK
While heightened energy prices may dampen consumer spending, strong fundamentals support our outlook for sustained economic expansion. Because the Fed remains committed to removing monetary policy accommodation, interest rates along the yield curve are more likely to rise than fall, suggesting a more challenging bond market environment in the period ahead.
Although it may be time for renewed caution regarding fixed-income investments, we believe several factors are likely to temper a broad increase in interest rates. First, the current cyclical increase in inflation may be modest compared with previous inflationary periods, as forces that encourage price increases—such as dollar weakness and a tighter labor market—may be offset to some degree by forces that tend to restrain inflation, including productivity gains and intense global price competition. Second, reduced supply in a higher interest rate environment should lead to less refinancing issuance, less borrowing, and generally better fiscal conditions. Third, the greater transparency of the Federal Open Market Committee process, as evidenced by the earlier publication of Fed meeting minutes, may lessen the prospect for a surprise rate hike by the central bank and should help mitigate any overreaction to new economic data. Finally, given that the municipal yield curve remains somewhat steep, we believe that bonds with longer maturities still offer value to investors.
Respectfully submitted,

Joseph K. Lynagh
Chairman of the Investment Advisory Committee
Maryland Tax-Free Money Fund

Charles B. Hill
Chairman of the Investment Advisory Committee
Maryland Short-Term Tax-Free Bond Fund

Hugh D. McGuirk
Chairman of the Investment Advisory Committee
Maryland Tax-Free Bond Fund
March 16, 2005
Each committee chairman has day-to-day responsibility for managing the portfolio and works with committee members in developing and executing each fund’s investment programs.
RISKS OF FIXED-INCOME INVESTINGBonds are subject to interest rate risk (the decline in bond prices that usually accompanies a rise in interest rates) and credit risk (the chance that any fund holding could have its credit rating downgraded, or that a bond issuer will default by failing to make timely payments of interest or principal), potentially reducing the fund’s income level and share price. The Maryland Tax-Free Funds are less diversified than those investing nationally.
The money fund seeks to maintain a stable net asset value and provide an appropriate place for money between investments or during uncertain market conditions. An investment in the fund is not insured or guaranteed by the FDIC or any other government agency. Although the fund seeks to preserve the value of your investment at $1.00 per share, it is possible to lose money by investing in the fund.
GLOSSARY
Average maturity: The weighted average of the stated maturity dates of the portfolio’s securities. In general, the longer the average maturity, the greater the fund’s sensitivity to interest rate changes. A shorter average maturity usually means less interest rate sensitivity and therefore a less volatile portfolio.
Basis point: One one-hundredth of one percentage point, or 0.01% .
Duration: The average time (expressed in years) it takes investors to receive the present value of the future cash flows on their investment. It is used to measure the sensitivity of bond prices to interest rate changes (the shorter the duration, the less the bond’s price will rise or fall in value when interest rates change). Duration is affected by maturity, the coupon, and the time interval between payments. Other things being equal, a bond with a higher coupon will have a shorter duration, while zero-coupon bonds have the longest.
Federal funds rate: The interest rate charged on overnight loans of reserves by one financial institution to another in the United States. The Federal Reserve sets a target federal funds rate to affect the direction of interest rates.
Investment grade: High-quality bonds as measured by one of the major credit rating agencies. For example, Standard & Poor’s designates the bonds in its top four categories (AAA to BBB) as investment grade.
Lipper averages: The averages of available mutual fund performance returns for specified time periods in defined categories by Lipper.
Yield curve: A graph depicting the relationship between yields and maturity dates for a set of similar securities. These curves are in constant flux. One of the key activities in managing any fixed-income portfolio is to study the trends reflected by yield curves.
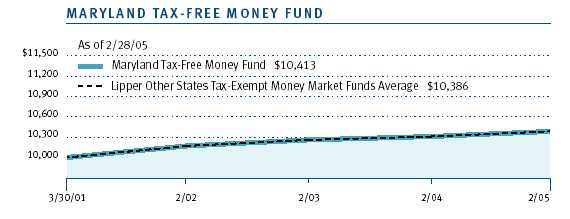
This chart shows the value of a hypothetical $10,000 investment in the fund over the past 10 fiscal year periods or since inception (for funds lacking 10-year records). The result is compared with benchmarks, which may include a broad-based market index and a peer group average or index. Market indexes do not include expenses, which are deducted from fund returns as well as mutual fund averages and indexes.
| AVERAGE ANNUAL COMPOUND TOTAL RETURN |
This table shows how the fund and its benchmarks would have performed each year if their actual (or cumulative) returns for the periods shown had been earned at a constant rate.
| | | Since |
| | | Inception |
| Periods Ended 2/28/05 | 1 Year | 3/30/01 |
| Maryland Tax-Free Money Fund | 0.80% | 1.04% |
| Lipper Other States Tax-Exempt Money Market Funds Average | 0.75 | 0.97 |
| | | |
| Returns do not reflect taxes that the shareholder may pay on fund distributions or the redemption of fund |
| shares. Past performance cannot guarantee future results. | | |
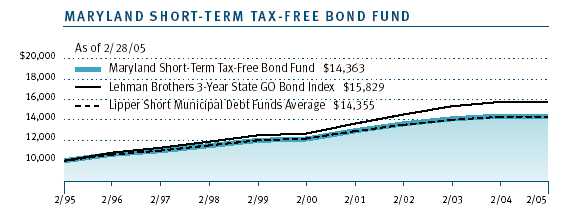
This chart shows the value of a hypothetical $10,000 investment in the fund over the past 10 fiscal year periods or since inception (for funds lacking 10-year records). The result is compared with benchmarks, which may include a broad-based market index and a peer group average or index. Market indexes do not include expenses, which are deducted from fund returns as well as mutual fund averages and indexes.
| AVERAGE ANNUAL COMPOUND TOTAL RETURN |
This table shows how the fund and its benchmarks would have performed each year if their actual (or cumulative) returns for the periods shown had been earned at a constant rate.
| Periods Ended 2/28/05 | 1 Year | 5 Years | 10 Years |
| Maryland Short-Term Tax-Free Bond Fund | -0.30% | 3.40% | 3.69% |
| Lehman Brothers 3-Year State GO Bond Index | 0.17 | 4.53 | 4.70 |
| Lipper Short Municipal Debt Funds Average | 0.24 | 3.34 | 3.68 |
| |
| Returns do not reflect taxes that the shareholder may pay on fund distributions or the redemption of fund |
| shares. Past performance cannot guarantee future results. |
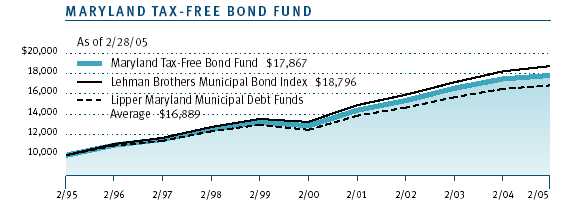
This chart shows the value of a hypothetical $10,000 investment in the fund over the past 10 fiscal year periods or since inception (for funds lacking 10-year records). The result is compared with benchmarks, which may include a broad-based market index and a peer group average or index. Market indexes do not include expenses, which are deducted from fund returns as well as mutual fund averages and indexes.
| AVERAGE ANNUAL COMPOUND TOTAL RETURN |
This table shows how the fund and its benchmarks would have performed each year if their actual (or cumulative) returns for the periods shown had been earned at a constant rate.
| Periods Ended 2/28/05 | 1 Year | 5 Years | 10 Years |
| Maryland Tax-Free Bond Fund | 2.01% | 6.73% | 5.98% |
| Lehman Brothers Municipal Bond Index | 2.96 | 7.18 | 6.51 |
| Lipper Maryland Municipal Debt Funds Average | 1.91 | 6.01 | 5.37 |
| | | | |
| Returns do not reflect taxes that the shareholder may pay on fund distributions or the redemption of |
| fund shares. Past performance cannot guarantee future results. | | |
As a mutual fund shareholder, you may incur two types of costs: (1) transaction costs such as redemption fees or sales loads and (2) ongoing costs, including management fees, distribution and service (12b-1) fees, and other fund expenses. The following example is intended to help you understand your ongoing costs (in dollars) of investing in the fund and to compare these costs with the ongoing costs of investing in other mutual funds. The example is based on an investment of $1,000 invested at the beginning of the most recent six-month period and held for the entire period.
Actual Expenses
The first line of the following table (“Actual”) provides information about actual account values and actual expenses. You may use the information in this line, together with your account balance, to estimate the expenses that you paid over the period. Simply divide your account value by $1,000 (for example, an $8,600 account value divided by $1,000 = 8.6), then multiply the result by the number in the first line under the heading “Expenses Paid During Period” to estimate the expenses you paid on your account during this period.
Hypothetical Example for Comparison Purposes
The information on the second line of the table (“Hypothetical”) is based on hypothetical account values and expenses derived from the fund’s actual expense ratio and an assumed 5% per year rate of return before expenses (not the fund’s actual return). You may compare the ongoing costs of investing in the fund with other funds by contrasting this 5% hypothetical example and the 5% hypothetical examples that appear in the shareholder reports of the other funds. The hypothetical account values and expenses may not be used to estimate the actual ending account balance or expenses you paid for the period.
Note: T. Rowe Price charges an annual small-account maintenance fee of $10, generally for accounts with less than $2,000 ($500 for UGMA/UTMA). The fee is waived for any investor whose T. Rowe Price mutual fund accounts total $25,000 or more, accounts employing automatic investing, and IRAs and other retirement plan accounts that utilize a prototype plan sponsored by T. Rowe Price (although a separate custodial or administrative fee may apply to such accounts). This fee is not included in the accompanying table. If you are subject to the fee, keep it in mind when you are estimating the ongoing expenses of investing in the fund and when comparing the expenses of this fund with other funds.
You should also be aware that the expenses shown in the table highlight only your ongoing costs and do not reflect any transaction costs, such as redemption fees or sales loads. Therefore, the second line of the table is useful in comparing ongoing costs only and will not help you determine the relative total costs of owning different funds. To the extent a fund charges transaction costs, however, the total cost of owning that fund is higher.
| T. ROWE PRICE MARYLAND TAX-FREE MONEY FUND |
| | Beginning | Ending | Expenses Paid |
| | Account Value | Account Value | During Period* |
| | 9/1/04 | 2/28/05 | 9/1/04 to 2/28/05 |
| |
| Actual | $1,000.00 | $1,005.40 | $2.73 |
| Hypothetical (assumes 5% | | | |
| return before expenses) | $1,000.00 | $1,022.07 | $2.76 |
| |
| * Expenses are equal to the fund’s annualized expense ratio for the six-month period (0.55%), multiplied |
| by the average account value over the period, multiplied by the number of days in the most recent |
| fiscal half year (181) divided by the days in the year (365) to reflect the half-year period. |
| T. ROWE PRICE MARYLAND SHORT-TERM TAX-FREE BOND FUND |
| | Beginning | Ending | Expenses Paid |
| | Account Value | Account Value | During Period* |
| | 9/1/04 | 2/28/05 | 9/1/04 to 2/28/05 |
| |
| Actual | $1,000.00 | $998.30 | $2.68 |
| Hypothetical (assumes 5% | | | |
| return before expenses) | $1,000.00 | $1,022.12 | $2.71 |
| |
| * Expenses are equal to the fund’s annualized expense ratio for the six-month period (0.54%), multiplied |
| by the average account value over the period, multiplied by the number of days in the most recent |
| fiscal half year (181) divided by the days in the year (365) to reflect the half-year period. |
| T. ROWE PRICE MARYLAND TAX-FREE BOND FUND |
| | Beginning | Ending | Expenses Paid |
| | Account Value | Account Value | During Period* |
| | 9/1/04 | 2/28/05 | 9/1/04 to 2/28/05 |
| |
| Actual | $1,000.00 | $1,020.10 | $2.40 |
| Hypothetical (assumes 5% | | | |
| return before expenses) | $1,000.00 | $1,022.41 | $2.41 |
| |
| * Expenses are equal to the fund’s annualized expense ratio for the six-month period (0.48%), multiplied |
| by the average account value over the period, multiplied by the number of days in the most recent |
| fiscal half year (181) divided by the days in the year (365) to reflect the half-year period. |
| | 7-Day | | | | | |
| | Simple | | | | Since | Inception |
| Periods Ended 12/31/04 | Yield | 1 Year | 5 Years | 10 Years | Inception | Date |
| |
| Maryland Tax-Free | | | | | | |
| Money Fund | 1.30% | 0.67% | – | – | 1.03% | 3/30/01 |
| Lipper Other States Tax- | | | | | | |
| Exempt Money Market | | | | | | |
| Funds Average | – | 0.61 | – | – | 0.96 | – |
| Maryland Short-Term | | | | | | |
| Tax-Free Bond Fund | – | 0.88 | 3.58% | 3.93% | – | – |
| Lipper Short Municipal | | | | | | |
| Debt Funds Average | – | 1.02 | 3.45 | 3.86 | – | – |
| Lehman Brothers 3-Year | | | | | | |
| State GO Bond Index | – | 1.93 | 4.73 | 4.92 | – | – |
| Maryland Tax-Free | | | | | | |
| Bond Fund | – | 3.51 | 6.81 | 6.50 | – | – |
| Lipper Maryland Municipal | | | | | | |
| Debt Funds Average | – | 3.32 | 6.02 | 5.92 | – | – |
| Lehman Brothers Municipal | | | | | | |
| Bond Index | – | 4.48 | 7.20 | 7.06 | – | – |
| | | | | | | |
| Current performance may be higher or lower than the quoted past performance, which cannot |
| guarantee future results. Share price, principal value, and return will vary, and you may have |
| a gain or loss when you sell your shares. For the most recent month-end performance infor- |
| mation, please visit our Web site (troweprice.com) or contact a T. Rowe Price representative |
| at 1-800-225-5132. | | | | | | |
| This table provides returns net of all expenses through the most recent calendar quarter-end rather than |
| through the end of the funds’ fiscal periods. Average annual total returns include changes in principal value, |
| reinvested dividends, and capital gain distributions. Returns do not reflect taxes that the shareholder may |
| pay on fund distributions or the redemption of fund shares. A money fund’s yield more closely represents |
| its current earnings than the total return. | | | | | |
| FINANCIAL HIGHLIGHTS | | | | For a share outstanding throughout each period |
| |
| | | Year | | | | | | | | |
| | | Ended | | | | | | | | |
| | | 2/28/05** | | 2/29/04 | | 2/28/03 | | 2/28/02 | | 2/28/01 |
| NET ASSET VALUE | | | | | | | | | | |
| Beginning of period | $ | 11.05 | $ | 10.94 | $ | 10.64 | $ | 10.48 | $ | 9.87 |
| |
| Investment activities | | | | | | | | | | |
| Net investment income (loss) | | 0.47 | | 0.47 | | 0.50 | | 0.52 | | 0.53 |
| Net realized and | | | | | | | | | | |
| unrealized gain (loss) | | (0.26) | | 0.12 | | 0.32 | | 0.15 | | 0.61 |
| Total from | | | | | | | | | | |
| investment activities | | 0.21 | | 0.59 | | 0.82 | | 0.67 | | 1.14 |
| |
| Distributions | | | | | | | | | | |
| Net investment income | | (0.47) | | (0.47) | | (0.50) | | (0.51) | | (0.53) |
| Net realized gain | | (0.02) | | (0.01) | | (0.02) | | – | | – |
| Total distributions | | (0.49) | | (0.48) | | (0.52) | | (0.51) | | (0.53) |
| |
| NET ASSET VALUE | | | | | | | | | | |
| End of period | $ | 10.77 | $ | 11.05 | $ | 10.94 | $ | 10.64 | $ | 10.48 |
| |
| |
| Ratios/Supplemental Data | | | | | | | | | | |
| Total return^ | | 2.01% | | 5.57% | | 7.87% | | 6.56% | | 11.87% |
| Ratio of total expenses to | | | | | | | | | | |
| average net assets | | 0.48% | | 0.48% | | 0.49% | | 0.49% | | 0.49% |
| Ratio of net investment | | | | | | | | | | |
| income (loss) to average | | | | | | | | | | |
| net assets | | 4.40% | | 4.38% | | 4.62% | | 4.87% | | 5.24% |
| Portfolio turnover rate | | 21.2% | | 33.0% | | 19.4% | | 18.5% | | 19.3% |
| Net assets, end of period | | | | | | | | | | |
| (in millions) | $ | 1,293 | $ | 1,329 | $ | 1,348 | $ | 1,229 | $ | 1,110 |
| ^ | Total return reflects the rate that an investor would have earned on an investment in the fund during each period, |
| | assuming reinvestment of all distributions. |
| ** | Per share amounts calculated using average shares outstanding method. |
| |
| The accompanying notes are an integral part of these financial statements. |
| PORTFOLIO OF INVESTMENTS (1) | | |
| | $ Par | Value |
| (Amounts in 000s) | | |
| | | |
| MARYLAND 93.8% | | |
| Annapolis IDRB, Park Place Project, 5.35%, 7/1/34 | 2,850 | 2,829 |
| Anne Arundel County, GO | | |
| 5.00%, 3/1/07 | 3,300 | 3,454 |
| 5.00%, 3/1/16 | 1,000 | 1,083 |
| 5.125%, 7/1/28 | 1,200 | 1,279 |
| 5.125%, 7/1/29 | 2,000 | 2,126 |
| 6.30%, 8/1/16 (Prerefunded 8/1/05†) | 775 | 796 |
| 6.30%, 8/1/19 (Prerefunded 8/1/05†) | 725 | 745 |
| 6.30%, 8/1/20 (Prerefunded 8/1/05†) | 705 | 724 |
| 6.30%, 8/1/21 (Prerefunded 8/1/05†) | 790 | 811 |
| 6.30%, 8/1/22 (Prerefunded 8/1/05†) | 450 | 462 |
| 6.30%, 8/1/24 (Prerefunded 8/1/05†) | 720 | 740 |
| Anne Arundel County | | |
| Farmington Village, 6.25%, 6/1/25 | 4,129 | 4,214 |
| National Business Park Project, 7.375%, 7/1/28 | | |
| (Prerefunded 7/1/10†) | 6,500 | 7,928 |
| Anne Arundel County PCR, Baltimore Gas & Electric Company | | |
| 6.00%, 4/1/24 | 1,425 | 1,469 |
| Baltimore City, GO | | |
| Zero Coupon, 10/15/06 (FGIC Insured) | 3,100 | 2,880 |
| 7.00%, 10/15/08 (MBIA Insured) | 5,190 | 5,919 |
| 7.50%, 10/15/09 (FGIC Insured) | 2,635 | 3,135 |
| Consolidated Public Improvement | | |
| Zero Coupon, 10/15/08 (FGIC Insured) | 1,785 | 1,469 |
| Zero Coupon, 10/15/09 (FGIC Insured) | 2,170 | 1,680 |
| Zero Coupon, 10/15/11 (FGIC Insured) | 3,525 | 2,409 |
| Muni Auction Rate (Currently 1.98%) (FSA Insured) | 2,300 | 2,300 |
| 7.00%, 10/15/07 (MBIA Insured) | 500 | 554 |
| Baltimore City | | |
| COP, 5.25%, 4/1/06 (MBIA Insured) | 2,000 | 2,059 |
| Board of Ed. Administration, COP | | |
| 5.00%, 4/1/14 (MBIA Insured) | 3,635 | 3,940 |
| 5.00%, 4/1/16 (MBIA Insured) | 3,825 | 4,136 |
| Parking | | |
| 5.25%, 7/1/21 (FGIC Insured) | 2,050 | 2,323 |
| 6.00%, 7/1/14 (FGIC Insured) | 5,155 | 6,070 |
| 6.00%, 7/1/15 (FGIC Insured) | 5,460 | 6,520 |
| 6.00%, 7/1/16 (FGIC Insured) | 5,785 | 6,931 |
| 6.00%, 7/1/17 (FGIC Insured) | 6,135 | 7,394 |
| 6.00%, 7/1/18 (FGIC Insured) | 6,505 | 7,825 |
| Waste Water | | |
| 5.60%, 7/1/13 (MBIA Insured) | 7,100 | 8,093 |
| 5.625%, 7/1/30 (Prerefunded 7/1/10†) (FSA Insured) | 5,000 | 5,612 |
| Water | | |
| 5.00%, 7/1/24 (FGIC Insured) | 3,095 | 3,277 |
| 5.125%, 7/1/42 (FGIC Insured) | 3,835 | 3,990 |
| 5.60%, 7/1/13 (MBIA Insured) | 12,200 | 13,906 |
| 5.65%, 7/1/20 (MBIA Insured) | 2,000 | 2,318 |
| 5.80%, 7/1/15 (Prerefunded 7/1/12†) (FGIC Insured) | 3,350 | 3,864 |
| 6.00%, 7/1/15 (FGIC Insured) | 6,250 | 7,259 |
| 6.00%, 7/1/16 (Prerefunded 7/1/10†) (FSA Insured) | 1,230 | 1,403 |
| 6.00%, 7/1/19 (Prerefunded 7/1/10†) (FSA Insured) | 650 | 741 |
| 6.00%, 7/1/20 (Prerefunded 7/1/10†) (FSA Insured) | 990 | 1,129 |
| 6.00%, 7/1/21 (Prerefunded 7/1/10†) (FSA Insured) | 1,650 | 1,882 |
| Baltimore City Port Fac. PCR, DuPont de Nemours, 6.50%, 10/1/11 | 10,900 | 11,750 |
| Baltimore County, GO, Pension | | |
| 5.125%, 8/1/14 | 4,300 | 4,638 |
| 5.125%, 8/1/15 | 4,195 | 4,522 |
| Baltimore County, Quail Ridge Apartments | | |
| Multi-Family Housing, VRDN (Currently 1.86%) | 2,700 | 2,700 |
| Baltimore County Economic Dev., Maryvale Preparatory School | | |
| 6.50%, 5/1/11 | 600 | 579 |
| Baltimore County Mortgage, North Brooke Apartments | | |
| Multi-Family Housing, 6.35%, 1/20/21 (GNMA Guaranteed) | 3,000 | 3,064 |
| Calvert County PCR, Baltimore Gas & Electric, 5.55%, 7/15/14 | 5,650 | 5,770 |
| Carroll County, GO | | |
| 5.625%, 10/1/20 | 1,900 | 2,041 |
| Commissioners Public Improvement | | |
| 5.50%, 12/1/16 (Prerefunded 12/1/09†) | 1,130 | 1,264 |
| 5.50%, 12/1/18 (Prerefunded 12/1/09†) | 1,000 | 1,118 |
| 5.50%, 12/1/19 (Prerefunded 12/1/09†) | 1,000 | 1,119 |
| Consolidated Public Improvement, 5.00%, 11/1/08 | 1,465 | 1,575 |
| Charles County | | |
| Holly Station, Multi-Family Housing, 6.45%, 5/1/26 | | |
| (FHA Guaranteed) | 1,780 | 1,820 |
| New Forest Apartments, Multi-Family Housing, 6.10%, 11/1/28 | | |
| (FHA Guaranteed) | 5,000 | 5,192 |
| Damascus Gardens Dev. Corp., 7.375%, 8/15/17 | | |
| (Escrowed to Maturity) | 3,065 | 3,746 |
| Frederick County, GO | | |
| 5.00%, 12/1/09 | 1,000 | 1,087 |
| 5.00%, 12/1/10 | 2,855 | 3,132 |
| 5.00%, 12/1/12 | 2,895 | 3,146 |
| 5.25%, 7/1/13 | 2,080 | 2,321 |
| 5.25%, 7/1/16 | 2,000 | 2,239 |
| Public Fac. | | |
| 5.25%, 7/1/15 | 925 | 1,015 |
| 5.25%, 12/1/20 | 1,990 | 2,181 |
| 5.75%, 7/1/19 | 6,430 | 7,176 |
| Frederick County, Urbana Community Auth., 5.95%, 7/1/30 | 2,900 | 2,911 |
| Gaithersburg Hosp. Fac., 6.50%, 9/1/12 | | |
| (Escrowed to Maturity) (FSA Insured) | 5,000 | 5,787 |
| Harford County Economic Dev., Battelle Memorial Institute | | |
| 5.25%, 4/1/34 | 8,625 | 9,023 |
| Howard County, GO, COP, 8.15%, 2/15/20 | 455 | 637 |
| Hyattsville | | |
| Univ. Town Center | | |
| 5.00%, 7/1/17 | 1,676 | 1,688 |
| 5.60%, 7/1/24 | 1,750 | 1,760 |
| 5.75%, 7/1/34 | 3,550 | 3,573 |
| Maryland, GO | | |
| State & Local Fac. | | |
| 5.125%, 8/1/05 | 4,000 | 4,049 |
| 5.25%, 3/1/06 | 3,830 | 3,940 |
| 5.25%, 7/15/13 | 18,900 | 20,585 |
| 5.25%, 7/15/14 | 10,045 | 11,004 |
| 5.50%, 3/1/10 | 10,000 | 11,142 |
| Maryland, State & Local Fac., 5.75%, 8/1/15 | | |
| (Prerefunded 8/10/10†) ++ | 20,590 | 23,458 |
| Maryland CDA | | |
| Multi-Family Housing | | |
| 5.70%, 7/1/17 # | 2,875 | 3,010 |
| 5.85%, 7/1/27 # | 7,000 | 7,246 |
| 5.875%, 7/1/16 | 2,530 | 2,635 |
| 6.20%, 7/1/23 # | 3,885 | 4,109 |
| Single Family Housing | | |
| 4.80%, 4/1/13 | 1,050 | 1,097 |
| 5.00%, 9/1/29 # | 5,020 | 5,249 |
| 5.25%, 9/1/19 # | 545 | 567 |
| 5.40%, 4/1/11 | 1,000 | 1,024 |
| 5.50%, 9/1/22 # | 4,230 | 4,437 |
| 5.60%, 9/1/28 # | 3,000 | 3,104 |
| 5.80%, 9/1/32 # | 2,240 | 2,264 |
| 5.85%, 9/1/21 # | 5,000 | 5,250 |
| 5.875%, 9/1/25 # | 5,000 | 5,174 |
| 5.95%, 4/1/16 | 845 | 877 |
| 5.95%, 9/1/29 # | 9,080 | 9,243 |
| Maryland DOT | | |
| 5.00%, 12/15/06 | 2,020 | 2,108 |
| 5.50%, 2/1/17 | 75 | 87 |
| Maryland Economic Dev. Corp. | | |
| Anne Arundel County Golf Course, 8.25%, 6/1/28 | 4,050 | 3,961 |
| Associated Jewish Charities, 5.67%, 7/15/29 | 16,645 | 17,339 |
| Aviation Administration | | |
| 5.375%, 6/1/20 (FSA Insured) # | 5,040 | 5,445 |
| 5.375%, 6/1/21 (FSA Insured) # | 5,000 | 5,384 |
| 5.375%, 6/1/22 (FSA Insured) # | 5,000 | 5,373 |
| 5.50%, 6/1/13 (FSA Insured) # | 1,150 | 1,282 |
| Chesapeake Hyatt, 7.625%, 12/1/22 | 2,000 | 2,117 |
| Morgan State Univ. Student Housing | | |
| 6.00%, 7/1/22 | 2,250 | 2,411 |
| 6.00%, 7/1/34 | 9,580 | 10,126 |
| Univ. Village at Sheppard Pratt, 6.00%, 7/1/33 (ACA Insured) | 4,000 | 4,314 |
| Waste Management, 2.30%, 4/1/16 (Tender 4/1/06) # | 5,700 | 5,634 |
| Maryland Energy Fin. Administration | | |
| Baltimore Wastewater | | |
| 6.30%, 12/1/10 # | 6,145 | 6,476 |
| 6.45%, 12/1/16 # | 2,600 | 2,723 |
| Maryland HHEFA | | |
| 6.625%, 7/1/08 (Escrowed to Maturity) | 1,150 | 1,227 |
| Adventist Healthcare | | |
| 5.75%, 1/1/15 | 700 | 775 |
| 5.75%, 1/1/25 | 4,350 | 4,577 |
| Board of Child Care | | |
| 5.375%, 7/1/32 | 1,475 | 1,548 |
| 5.625%, 7/1/20 | 1,000 | 1,093 |
| 5.625%, 7/1/22 | 500 | 540 |
| Bradford Oaks Nursing & Rehabilitation Center | | |
| 6.375%, 1/1/19 | 1,500 | 1,502 |
| 6.375%, 1/1/27 | 2,740 | 2,669 |
| Calvert Memorial Hosp. | | |
| 5.50%, 7/1/36 | 4,200 | 4,409 |
| 5.50%, 7/1/39 | 1,200 | 1,254 |
| Carroll Hosp. Center | | |
| 5.80%, 7/1/32 | 5,055 | 5,293 |
| 6.00%, 7/1/16 | 670 | 738 |
| 6.00%, 7/1/17 | 300 | 329 |
| 6.00%, 7/1/21 | 1,100 | 1,189 |
| 6.00%, 7/1/26 | 4,740 | 5,050 |
| 6.00%, 7/1/37 | 14,750 | 15,630 |
| Catholic Health Initiatives | | |
| 6.00%, 12/1/20 | 835 | 935 |
| 6.00%, 12/1/20 (Escrowed to Maturity) | 2,565 | 2,925 |
| 6.00%, 12/1/24 (Escrowed to Maturity) | 1,000 | 1,140 |
| Civista Medical Center, 5.00%, 7/1/37 (RAA Insured) | 4,750 | 4,838 |
| Collington Episcopal Lifecare | | |
| 6.75%, 4/1/20 | 995 | 810 |
| 6.75%, 4/1/23 | 5,800 | 4,723 |
| Doctor's Community Hosp. | | |
| �� 5.50%, 7/1/24 | 9,965 | 9,967 |
| 5.75%, 7/1/13 | 3,490 | 3,506 |
| Frederick Memorial Hosp. | | |
| 5.00%, 7/1/23 (FGIC Insured) | 4,000 | 4,022 |
| 5.125%, 7/1/35 | 3,940 | 4,032 |
| Good Samaritan Hosp. | | |
| 5.60%, 7/1/06 (Escrowed to Maturity) | 1,545 | 1,608 |
| 5.60%, 7/1/07 (Escrowed to Maturity) | 1,875 | 2,001 |
| 5.75%, 7/1/13 (Escrowed to Maturity) | 2,480 | 2,823 |
| 5.75%, 7/1/13 (Escrowed to Maturity) (AMBAC Insured) | 1,520 | 1,730 |
| Goucher College | | |
| 5.00%, 7/1/16 | 540 | 577 |
| 5.125%, 7/1/34 | 6,200 | 6,371 |
| Helix Health | | |
| 5.00%, 7/1/27 (Escrowed to Maturity) (AMBAC Insured) | 7,870 | 8,458 |
| 5.125%, 7/1/10 (Escrowed to Maturity) (AMBAC Insured) | 2,485 | 2,728 |
| Howard County General, 5.50%, 7/1/21 (Escrowed to Maturity) | 5,000 | 5,292 |
| Johns Hopkins Hosp. | | |
| Zero Coupon, 7/1/19 | 9,460 | 4,742 |
| 5.00%, 8/1/06 | 2,000 | 2,066 |
| 5.50%, 5/15/38 | 10,590 | 11,456 |
| Johns Hopkins Hosp. Medical Institute Parking Fac. | | |
| 5.00%, 7/1/38 (AMBAC Insured) | 5,700 | 5,947 |
| 5.375%, 7/1/20 (AMBAC Insured) | 5,550 | 5,835 |
| 5.50%, 7/1/26 (AMBAC Insured) | 3,220 | 3,386 |
| Johns Hopkins Univ. | | |
| 5.00%, 7/1/32 | 500 | 517 |
| 5.00%, 7/1/33 | 14,660 | 15,258 |
| 5.00%, 7/1/38 | 11,775 | 12,247 |
| 5.00%, 7/1/41 | 400 | 409 |
| 5.125%, 7/1/20 | 6,660 | 7,113 |
| 5.25%, 7/1/15 | 1,500 | 1,635 |
| 5.25%, 7/1/16 | 9,615 | 10,462 |
| 5.25%, 7/1/17 | 3,100 | 3,373 |
| 6.00%, 7/1/07 | 1,065 | 1,146 |
| 6.00%, 7/1/39 (Prerefunded 7/1/09†) | 19,150 | 21,681 |
| Kaiser Permanente, 5.375%, 7/1/15 | 2,365 | 2,528 |
| Kennedy Krieger Institute, 5.50%, 7/1/33 | 6,000 | 6,145 |
| Lifebridge Health | | |
| 5.125%, 7/1/34 | 2,175 | 2,235 |
| 5.25%, 7/1/20 | 625 | 667 |
| Loyola College, 5.375%, 10/1/26 (MBIA Insured) | 6,570 | 6,928 |
| Maryland Institute College of Art | | |
| 5.50%, 6/1/32 | 5,550 | 5,806 |
| 5.625%, 6/1/36 | 3,570 | 3,754 |
| Mercy Medical Center | | |
| 5.625%, 7/1/31 | 22,185 | 22,850 |
| 5.75%, 7/1/26 (FSA Insured) | 1,500 | 1,582 |
| 6.50%, 7/1/13 (FSA Insured) | 2,155 | 2,516 |
| Mercy Ridge Retirement Community | | |
| 5.00%, 4/1/08 | 3,700 | 3,764 |
| 6.00%, 4/1/28 | 1,675 | 1,731 |
| 6.00%, 4/1/35 | 3,660 | 3,785 |
| Sheppard & Enoch Pratt Foundation | | |
| Muni Auction Rate (Currently 2.05%) (RAA Insured) | 10,730 | 10,730 |
| 5.25%, 7/1/35 | 10,000 | 10,363 |
| Suburban Hosp. | | |
| 5.00%, 7/1/05 | 750 | 757 |
| 5.00%, 7/1/07 | 2,400 | 2,516 |
| Univ. of Maryland Medical System | | |
| 5.00%, 7/1/12 | 500 | 531 |
| 5.25%, 7/1/34 | 2,055 | 2,113 |
| 6.00%, 7/1/22 | 3,000 | 3,296 |
| 6.00%, 7/1/32 | 7,960 | 8,647 |
| 6.50%, 7/1/26 | 1,700 | 1,890 |
| 6.50%, 7/1/31 | 4,420 | 4,906 |
| 6.625%, 7/1/20 | 6,165 | 6,907 |
| 6.75%, 7/1/30 | 15,535 | 17,457 |
| 7.00%, 7/1/22 (FGIC Insured) | 2,090 | 2,750 |
| Upper Chesapeake Health | | |
| 5.125%, 1/1/38 (FSA Insured) | 2,000 | 2,073 |
| 5.375%, 1/1/28 (FSA Insured) | 2,250 | 2,387 |
| Maryland Ind. Dev. Fin. Auth. | | |
| American Center For Physics, 5.00%, 12/15/12 | 2,000 | 2,166 |
| Bon Secours Health System, 5.929%, 8/26/22 (FSA Insured) | 15,000 | 17,738 |
| National Aquarium in Baltimore, 5.50%, 11/1/17 | 1,430 | 1,580 |
| Trinity Health Corp., 5.60%, 12/1/09 | 2,780 | 3,058 |
| Maryland National Capital Park & Planning Commission, GO | | |
| Prince Georges County, Muni Auction Rate (Currently 1.95%) | 1,485 | 1,485 |
| Maryland Stadium Auth., 5.875%, 12/15/11 (AMBAC Insured) | 2,025 | 2,072 |
| Maryland Transportation Auth. | | |
| 5.25%, 3/1/21 (AMBAC Insured) | 4,735 | 5,160 |
| 6.80%, 7/1/16 (Escrowed to Maturity) | 20,820 | 24,465 |
| Baltimore-Washington Int'l Airport | | |
| VRDN (Currently 1.84%) # | 2,200 | 2,200 |
| 5.25%, 3/1/11 (AMBAC Insured) # | 6,475 | 7,042 |
| 5.25%, 3/1/13 (AMBAC Insured) # | 7,180 | 7,813 |
| 5.25%, 3/1/14 (AMBAC Insured) # | 6,375 | 6,895 |
| 5.25%, 3/1/27 (AMBAC Insured) # | 10,000 | 10,557 |
| 5.50%, 3/1/16 (AMBAC Insured) # | 8,540 | 9,337 |
| Baltimore-Washington Int'l Airport Parking | | |
| 5.25%, 3/1/20 (AMBAC Insured) | 4,500 | 4,927 |
| 5.50%, 3/1/19 (AMBAC Insured) # | 8,170 | 8,888 |
| Capital Appreciation | | |
| Zero Coupon, 7/1/07 (FGIC Insured) | 8,500 | 7,981 |
| Zero Coupon, 7/1/08 (FGIC Insured) | 2,000 | 1,811 |
| Zero Coupon, 7/1/09 (FGIC Insured) | 10,410 | 9,074 |
| Maryland Water Quality Fin. Admin. | | |
| Zero Coupon, 9/1/07 | 1,125 | 1,051 |
| 6.00%, 9/1/15 | 1,600 | 1,605 |
| Montgomery County, GO | | |
| 5.00%, 2/1/19 | 5,000 | 5,397 |
| 5.00%, 2/1/21 | 1,185 | 1,263 |
| 5.25%, 10/1/19 | 5,710 | 6,280 |
| Consolidated Public Improvement | | |
| 5.375%, 5/1/16 (Prerefunded 5/1/07†) | 4,000 | 4,310 |
| 5.50%, 1/1/14 (Prerefunded 1/1/10†) | 5,795 | 6,488 |
| 6.00%, 1/1/20 (Prerefunded 1/1/10†) | 6,500 | 7,422 |
| Montgomery County | | |
| 6.125%, 10/1/22 (Prerefunded 10/1/06†) | 2,260 | 2,429 |
| Consolidated Public Improvement | | |
| 5.375%, 5/1/09 (Prerefunded 5/1/07†) | 2,850 | 3,071 |
| 5.375%, 5/1/10 (Prerefunded 5/1/07†) | 2,700 | 2,909 |
| 5.50%, 4/1/14 (Prerefunded 4/1/06†) | 2,500 | 2,631 |
| Montgomery County Economic Dev. | | |
| Trinity Health Corp. | | |
| 5.25%, 12/1/31 | 2,275 | 2,360 |
| 5.50%, 12/1/16 | 3,450 | 3,764 |
| Montgomery County Housing Opportunities Commission | | |
| Metropolitan Project, 6.25%, 7/1/25 | 5,500 | 5,636 |
| Multi-Family Housing, 6.10%, 7/1/30 | 4,620 | 4,843 |
| Montgomery County PCR, Potomac Electric Power | | |
| 5.375%, 2/15/24 | 4,110 | 4,155 |
| Morgan State Univ., 6.05%, 7/1/15 (MBIA Insured) | 1,100 | 1,284 |
| Northeast Maryland Waste Disposal Auth. | | |
| Montgomery County Resources Fac. | | |
| 5.50%, 4/1/12 (AMBAC Insured) # | 3,000 | 3,311 |
| 5.50%, 4/1/15 (AMBAC Insured) # | 5,000 | 5,460 |
| 5.50%, 4/1/16 (AMBAC Insured) # | 16,000 | 17,483 |
| 5.90%, 7/1/05 # | 1,010 | 1,020 |
| 6.00%, 7/1/06 # | 1,115 | 1,155 |
| 6.00%, 7/1/07 # | 1,050 | 1,107 |
| 6.00%, 7/1/08 # | 10,000 | 10,729 |
| Northeast Maryland Waste Disposal Auth. IDRB | | |
| Waste Management | | |
| 4.75%, 1/1/12 # | 1,620 | 1,652 |
| 5.00%, 1/1/12 # | 6,545 | 6,746 |
| Prince Georges County, GO | | |
| 5.25%, 12/1/19 (FGIC Insured) | 2,720 | 3,013 |
| Consolidated Public Improvement | | |
| 5.00%, 10/1/07 | 3,690 | 3,908 |
| 5.50%, 5/15/11 (FSA Insured) | 500 | 563 |
| Prince Georges County | | |
| Solid Waste | | |
| 5.00%, 6/15/09 (MBIA Insured) | 4,105 | 4,441 |
| 5.00%, 6/15/10 (MBIA Insured) | 4,170 | 4,553 |
| Prince Georges County Hosp., Dimensions Health Corp. | | |
| 5.375%, 7/1/14 | 2,685 | 2,394 |
| Prince Georges County Housing Auth. | | |
| Single Family Housing | | |
| 6.15%, 8/1/19 # | 60 | 64 |
| 6.20%, 2/1/32 # | 70 | 73 |
| Prince Georges County PCR | | |
| Potomac Electric Power | | |
| 5.75%, 3/15/10 | 8,150 | 9,107 |
| 6.375%, 1/15/23 | 7,175 | 7,248 |
| Queen Annes County, GO, School & Public Fac. | | |
| 5.25%, 1/15/15 (FGIC Insured) | 2,040 | 2,245 |
| St. Mary's County, GO | | |
| 5.50%, 10/1/13 (Prerefunded 10/1/09†) | 1,680 | 1,875 |
| 6.00%, 10/1/15 (Prerefunded 10/1/09†) | 1,875 | 2,133 |
| 6.00%, 10/1/16 (Prerefunded 10/1/09†) | 1,980 | 2,252 |
| 6.00%, 10/1/17 (Prerefunded 10/1/09†) | 1,095 | 1,245 |
| 6.00%, 10/1/18 (Prerefunded 10/1/09†) | 2,115 | 2,406 |
| 6.00%, 10/1/19 (Prerefunded 10/1/09†) | 2,345 | 2,667 |
| Univ. of Maryland | | |
| Auxiliary Fac. & Tuition | | |
| 5.00%, 4/1/09 | 4,220 | 4,556 |
| 5.00%, 4/1/11 | 10,110 | 11,086 |
| 5.00%, 4/1/19 | 3,080 | 3,305 |
| 5.00%, 4/1/20 | 5,330 | 5,642 |
| 5.00%, 4/1/21 | 5,000 | 5,293 |
| 5.00%, 4/1/21 (MBIA Insured) | 8,270 | 8,922 |
| 5.125%, 4/1/21 | 3,850 | 4,142 |
| 5.25%, 10/1/12 | 3,005 | 3,310 |
| 5.25%, 10/1/13 | 4,770 | 5,254 |
| 5.375%, 10/1/16 | 3,960 | 4,385 |
| 5.60%, 4/1/11 (Prerefunded 4/1/06†) | 3,155 | 3,293 |
| 5.75%, 4/1/17 (Prerefunded 4/1/06†) | 4,400 | 4,599 |
| 5.75%, 10/1/20 | 6,555 | 7,374 |
| Washington County, GO, Public Improvement | | |
| 5.00%, 1/1/23 (FSA Insured) | 200 | 214 |
| Washington Suburban Sanitary Dist., GO | | |
| VRDN (Currently 1.87%) | 3,000 | 3,000 |
| 5.25%, 6/1/18 | 1,060 | 1,162 |
| 5.25%, 6/1/19 | 1,120 | 1,224 |
| Westminster, Carroll Lutheran Village, 6.25%, 5/1/34 | 4,000 | 4,175 |
| Worcester County, GO | | |
| 5.00%, 3/1/11 | 3,305 | 3,632 |
| 5.00%, 3/1/12 | 3,475 | 3,835 |
| 5.00%, 3/1/13 | 2,290 | 2,538 |
| 5.00%, 3/1/14 | 3,030 | 3,364 |
| 5.00%, 3/1/15 | 1,180 | 1,309 |
| Total Maryland (Cost $1,137,131) | | 1,213,303 |
| |
| DISTRICT OF COLUMBIA 0.7% | | |
| Washington Metropolitan Area Transit Auth. | | |
| 5.00%, 7/1/10 (MBIA Insured) | 1,050 | 1,148 |
| 5.00%, 7/1/12 (MBIA Insured) | 7,000 | 7,722 |
| Total District of Columbia (Cost $8,812) | | 8,870 |
| |
| PUERTO RICO 3.9% | | |
| Children's Trust Fund, Tobacco Settlement | | |
| 6.00%, 7/1/26 (Prerefunded 7/1/10†) | 2,500 | 2,841 |
| Puerto Rico Commonwealth | | |
| 5.375%, 7/1/21 (Prerefunded 7/1/07†) (MBIA Insured) | 3,000 | 3,233 |
| GO | | |
| 5.50%, 7/1/14 (FGIC Insured) | 4,000 | 4,598 |
| Public Improvement, 6.25%, 7/1/12 (MBIA Insured) | 1,750 | 2,069 |
| Puerto Rico Highway & Transportation Auth. | | |
| 5.00%, 7/1/19 (FGIC Insured) | 1,615 | 1,750 |
| 5.50%, 7/1/15 (FSA Insured) | 5,000 | 5,767 |
| 5.50%, 7/1/18 | 2,000 | 2,095 |
| 5.875%, 7/1/21 (MBIA Insured) | 3,020 | 3,409 |
| Puerto Rico Housing Fin. Auth., 5.00%, 12/1/20 | 4,235 | 4,478 |
| Puerto Rico Infrastructure Fin. Auth., 5.375%, 10/1/24 | | |
| (Escrowed to Maturity) | 5,000 | 5,516 |
| Puerto Rico Municipal Fin. Agency, GO | | |
| 5.50%, 8/1/07 (FSA Insured) | 2,000 | 2,134 |
| 6.00%, 7/1/12 (FSA Insured) | 5,000 | 5,838 |
| Puerto Rico Public Buildings Auth., GO, 5.50%, 7/1/24 | 2,750 | 3,019 |
| Puerto Rico Public Fin. Corp., 5.25%, 8/1/29 | | |
| (Tender 2/1/12) (MBIA Insured) | 4,000 | 4,417 |
| Total Puerto Rico (Cost $46,754) | | 51,164 |
| |
| U. S. VIRGIN ISLANDS 0.3% | | |
| Virgin Islands PFA | | |
| Hovensa Refinery | | |
| 5.875%, 7/1/22 # | 2,000 | 2,124 |
| 6.125%, 7/1/22 # | 1,000 | 1,074 |
| Total U. S. Virgin Islands (Cost $3,000) | | 3,198 |
| |
| FUTURES CONTRACTS 0.0% | | |
| Variation margin receivable (payable) on open futures contracts (2) | | 26 |
| Total Futures Contracts | | 26 |
| Total Investments in Securities | | |
| 98.7% of Net Assets (Cost $1,195,697) | $ | 1,276,561 |
| (1) | Denominated in U.S. dollars unless other- | | |
| | wise noted | FHA | Federal Housing Authority |
| # | Interest subject to alternative minimum tax | FSA | Financial Security Assurance Inc. |
| ++ | All or a portion of this security is pledged | GNMA | Government National Mortgage Association |
| | to cover margin requirements on futures | GO | General Obligation |
| | contracts at February 28, 2005. | HHEFA | Health & Higher Educational Facility |
| † | Used in determining portfolio maturity | | Authority |
| ACA | American Capital Access Financial Guaranty | IDRB | Industrial Development Revenue Bond |
| | Corp. | MBIA | MBIA Insurance Corp. |
| AMBAC | AMBAC Assurance Corp. | PCR | Pollution Control Revenue |
| CDA | Community Development Administration | PFA | Public Finance Authority |
| COP | Certificates of Participation | RAA | Radian Asset Assurance Inc. |
| DOT | Department of Transportation | VRDN | Variable-Rate Demand Note rate shown is |
| FGIC | Financial Guaranty Insurance Company | | effective rate at period-end |
| (2) Open Futures Contracts at February 28, 2005 were as follows: | | |
| ($ 000s) | | | | | |
| | | | Contract | | Unrealized |
| | Expiration | | Value | | Gain (Loss) |
| Short, 50 U.S. Treasury ten year contracts, | | | | | |
| $100 par of 5.75% Maryland State & Local | | | | | |
| Fac. Bonds pledged as initial margin | 3/05 | $ | (5,544) | $ | 69 |
| Net payments (receipts) of variation | | | | | |
| margin to date | | | | | (43) |
| Variation margin receivable (payable) | | | | | |
| on open futures contracts | | | | $ | 26 |
The accompanying notes are an integral part of these financial statements.
| STATEMENT OF ASSETS AND LIABILITIES | | | |
| (In thousands except shares and per share amounts) | | | |
| Assets | | | |
| Investments in securities, at value (cost $1,195,697) | | $ | 1,276,561 |
| Interest receivable | | | 15,664 |
| Receivable for investment securities sold | | | 5,100 |
| Receivable for shares sold | | | 1,378 |
| Other assets | | | 508 |
| Total assets | | | 1,299,211 |
| |
| Liabilities | | | |
| Investment management fees payable | | | 410 |
| Payable for investment securities purchased | | | 2,303 |
| Payable for shares redeemed | | | 1,476 |
| Due to affiliates | | | 37 |
| Other liabilities | | | 1,555 |
| Total liabilities | | | 5,781 |
| |
| NET ASSETS | | $ | 1,293,430 |
| Net Assets Consist of: | | | |
| Undistributed net investment income (loss) | | $ | 1,565 |
| Undistributed net realized gain (loss) | | | (3,759) |
| Net unrealized gain (loss) | | | 80,907 |
| Paid-in-capital applicable to 120,103,031 no par | | | |
| value shares of beneficial interest outstanding; | | | |
| unlimited number of shares authorized | | | 1,214,717 |
| |
| NET ASSETS | | $ | 1,293,430 |
| |
| NET ASSET VALUE PER SHARE | | $ | 10.77 |
The accompanying notes are an integral part of these financial statements.
| STATEMENT OF OPERATIONS | | |
| ($ 000s) | | |
| | | Year |
| | | Ended |
| | | 2/28/05 |
| Investment Income (Loss) | | |
| Interest income | $ | 62,129 |
| Expenses | | |
| Investment management | | 5,270 |
| Shareholder servicing | | 556 |
| Custody and accounting | | 190 |
| Prospectus and shareholder reports | | 68 |
| Legal and audit | | 16 |
| Trustees | | 7 |
| Registration | | 5 |
| Proxy and annual meeting | | 1 |
| Miscellaneous | | 11 |
| Total expenses | | 6,124 |
| Expenses paid indirectly | | (1) |
| Net expenses | | 6,123 |
| Net investment income (loss) | | 56,006 |
| |
| Realized and Unrealized Gain (Loss) | | |
| Net realized gain (loss) | | |
| Securities | | (1,721) |
| Futures | | (770) |
| Written options | | 66 |
| Net realized gain (loss) | | (2,425) |
| Change in net unrealized gain (loss) | | |
| Securities | | (29,928) |
| Futures | | 141 |
| Change in net unrealized gain (loss) | | (29,787) |
| Net realized and unrealized gain (loss) | | (32,212) |
| |
| INCREASE (DECREASE) IN NET | | |
| ASSETS FROM OPERATIONS | $ | 23,794 |
The accompanying notes are an integral part of these financial statements.
| STATEMENT OF CHANGES IN NET ASSETS | | | | |
| ($ 000s) | | | | | | |
| | | | | Year | | |
| | | | | Ended | | |
| | | | | 2/28/05 | | 2/29/04 |
| |
| Increase (Decrease) in Net Assets | | | | | |
| Operations | | | | | | |
| Net investment income (loss) | | | $ | 56,006 | $ | 58,215 |
| Net realized gain (loss) | | | (2,425) | | 3,083 |
| Change in net unrealized gain (loss) | | (29,787) | | 10,315 |
| Increase (decrease) in net assets from operations | 23,794 | | 71,613 |
| |
| Distributions to shareholders | | | | | | |
| Net investment income | | | | (55,743) | | (57,950) |
| Net realized gain | | | | (2,411) | | (1,233) |
| Decrease in net assets from distributions | | | (58,154) | | (59,183) |
| |
| Capital share transactions * | | | | | | |
| Shares sold | | | | 176,188 | | 162,006 |
| Distributions reinvested | | | | 40,169 | | 40,606 |
| Shares redeemed | | | | (217,304) | | (234,199) |
| Increase (decrease) in net assets from capital | | | | |
| share transactions | | | | (947) | | (31,587) |
| |
| Net Assets | | | | | | |
| Increase (decrease) during period | | | (35,307) | | (19,157) |
| Beginning of period | | | | 1,328,737 | | 1,347,894 |
| |
| End of period | | | $ | 1,293,430 | $ | 1,328,737 |
| (Including undistributed net investment income of | | | | |
| $1,565 at 2/28/05 and $1,427 at 2/29/04) | | | | | |
| |
| *Share information | | | | | | |
| Shares sold | | | | 16,350 | | 14,869 |
| Distributions reinvested | | | | 3,737 | | 3,729 |
| Shares redeemed | | | | (20,265) | | (21,547) |
| Increase (decrease) in shares outstanding | | | (178) | | (2,949) |
The accompanying notes are an integral part of these financial statements.
| NOTES TO FINANCIAL STATEMENTS |
NOTE 1 - SIGNIFICANT ACCOUNTING POLICIES
T. Rowe Price State Tax-Free Income Trust (the trust) is registered under the Investment Company Act of 1940 (the 1940 Act). The Maryland Tax-Free Bond Fund (the fund), a nondiversified, open-end management investment company, is one portfolio established by the trust. The fund commenced operations on March 31, 1987. The fund seeks to provide, consistent with prudent portfolio management, the highest level of income exempt from federal and Maryland state and local income taxes by investing primarily in investment-grade Maryland municipal bonds.
The accompanying financial statements were prepared in accordance with accounting principles generally accepted in the United States of America, which require the use of estimates made by fund management.
Valuation The fund values its investments and computes its net asset value per share at the close of the New York Stock Exchange (NYSE), normally 4 p.m. ET, each day that the NYSE is open for business. Debt securities are generally traded in the over-the-counter market. Securities are valued at prices furnished by dealers who make markets in such securities or by an independent pricing service, which considers yield or price of bonds of comparable quality, coupon, maturity, and type, as well as prices quoted by dealers who make markets in such securities.
Options on futures contracts are valued at the last sale price. Financial futures contracts are valued at closing settlement prices.
Other investments, including restricted securities, and those for which the above valuation procedures are inappropriate or are deemed not to reflect fair value are stated at fair value as determined in good faith by the T. Rowe Price Valuation Committee, established by the fund’s Board of Trustees.
Credits The fund earns credits on temporarily uninvested cash balances at the custodian that reduce the fund’s custody charges. Custody expense in the accompanying financial statements is presented before reduction for credits, which are reflected as expenses paid indirectly.
Investment Transactions, Investment Income, and Distributions Income and expenses are recorded on the accrual basis. Premiums and discounts on debt securities are amortized for financial reporting purposes. Investment transactions are accounted for on the trade date. Realized gains and losses are reported on the identified cost basis. Payments (“variation margin”) made or received to settle the daily fluctuations in the value of futures contracts are recorded as unrealized gains or losses until the contracts are closed. Unsettled variation margin on futures contracts is included in investments in securities, and unrealized gains and losses on futures contracts are included in the change in net unrealized gain or loss in the accompanying financial statements. Distributions to shareholders are recorded on the ex-dividend date. Income distributions are declared on a daily basis and paid monthly. Capital gain distributions, if any, are declared and paid by the fund, typically on an annual basis.
Other In the normal course of business, the fund enters into contracts that provide general indemnifications. The fund’s maximum exposure under these arrangements is dependent on claims that may be made against the fund in the future and, therefore, cannot be estimated; however, based on experience, the risk of material loss from such claims is considered remote.
NOTE 2 - INVESTMENT TRANSACTIONS
Consistent with its investment objective, the fund engages in the following practices to manage exposure to certain risks or enhance performance. The investment objective, policies, program, and risk factors of the fund are described more fully in the fund’s prospectus and Statement of Additional Information.
Futures Contracts During the year ended February 28, 2005, the fund was a party to futures contracts, which provide for the future sale by one party and purchase by another of a specified amount of a specific financial instrument at an agreed upon price, date, time, and place. Risks arise from possible illiquidity of the futures market and from movements in security values and interest rates.
Options Call and put options on futures contracts give the holder the right to purchase or sell, respectively, a particular futures contract at a specified price on a certain date. Risks arise from possible illiquidity of the options market and from movements in underlying futures prices. Transactions in options written and related premiums received during the year ended February 28, 2005, were as follows:
| | Number of | | |
| | Contracts | | Premiums |
| Outstanding at beginning of period | – | $ | – |
| Written | 450 | | 309,000 |
| Closed | (450) | | (309,000) |
| |
| Outstanding at end of period | – | $ | – |
Other Purchases and sales of portfolio securities, other than short-term securities, aggregated $265,130,000 and $286,248,000, respectively, for the year ended February 28, 2005.
NOTE 3 - FEDERAL INCOME TAXES
No provision for federal income taxes is required since the fund intends to continue to qualify as a regulated investment company under Subchapter M of the Internal Revenue Code and distribute to shareholders all of its income and gains. Federal income tax regulations differ from generally accepted accounting principles; therefore, distributions determined in accordance with tax regulations may differ significantly in amount or character from net investment income and realized gains for financial reporting purposes. Financial reporting records are adjusted for permanent book/tax differences to reflect tax character. Financial records are not adjusted for temporary differences.
Distributions during the year ended February 28, 2005 were characterized as follows for tax purposes:
| Tax-exempt income | $ 55,743,000 |
| Long-term capital gain | 2,411,000 |
| Total distributions | $ 58,154,000 |
At February 28, 2005, the tax-basis components of net assets were as follows:
| Unrealized appreciation | $ 84,495,000 |
| Unrealized depreciation | (4,290,000) |
| Net unrealized appreciation (depreciation) | 80,205,000 |
| Undistributed tax-exempt income | 59,000 |
| Capital loss carryforwards | (1,551,000) |
| Paid-in capital | 1,214,717,000 |
| |
| Net assets | $1,293,430,000 |
Federal income tax regulations require the fund to defer recognition of capital losses realized on certain covered option and futures transactions; accordingly, $2,139,000 of realized losses reflected in the accompanying financial statements have not been recognized for tax purposes as of February 28, 2005. For federal income tax purposes, market discount is recognized as income at the time of sale in the amount of the lesser of gain or scheduled amortization. Accordingly, at February 28, 2005, amortization of $1,506,000 that has been recognized as income for financial reporting purposes is treated as unrealized appreciation for tax purposes. The fund intends to retain realized gains to the extent of available capital loss carryforwards for federal income tax purposes. As of February 28, 2005, the fund had $1,551,000 of capital loss carryforwards that expire in fiscal 2013.
For the year ended February 28, 2005, the fund recorded the following permanent reclassifications to reflect tax character. Reclassifications to paid-in capital relate primarily to a tax practice that treats a portion of the proceeds from each redemption of capital shares as a distribution of taxable net investment income and/or realized capital gain. Results of operations and net assets were not affected by these reclassifications.
| Undistributed net investment income | $ | (125,000) |
| Undistributed net realized gain | | 107,000 |
| Paid-in capital | | 18,000 |
At February 28, 2005, the cost of investments for federal income tax purposes was $1,196,399,000.
NOTE 4- RELATED PARTY TRANSACTIONS
The fund is managed by T. Rowe Price Associates, Inc. (the manager or Price Associates), a wholly owned subsidiary of T. Rowe Price Group, Inc. The investment management agreement between the fund and the manager provides for an annual investment management fee, which is computed daily and paid monthly. The fee consists of an individual fund fee, equal to 0.10% of the fund’s average daily net assets, and the fund’s pro-rata share of a group fee. The group fee is calculated based on the combined net assets of certain mutual funds sponsored by Price Associates (the group) applied to a graduated fee schedule, with rates ranging from 0.48% for the first $1 billion of assets to 0.295% for assets in excess of $120 billion. The fund’s portion of the group fee is determined by the ratio of its average daily net assets to those of the group. At February 28, 2005, the effective annual group fee rate was 0.31% .
In addition, the fund has entered into service agreements with Price Associates and a wholly owned subsidiary of Price Associates (collectively, Price). Price Associates computes the daily share price and maintains the financial records of the fund. T. Rowe Price Services, Inc., provides shareholder and administrative services in its capacity as the fund’s transfer and dividend disbursing agent. For the year ended February 28, 2005, expenses incurred pursuant to these service agreements were $84,000 for Price Associates and $374,000 for T. Rowe Price Services. The total amount payable at period end pursuant to these service agreements is reflected as due to affiliates in the accompanying financial statements.
| REPORT OF INDEPENDENT REGISTERED PUBLIC ACCOUNTING FIRM |
To the Board of Directors of T. Rowe Price State Tax-Free Income Trust and Shareholders of T. Rowe Price Maryland Tax-Free Bond Fund
In our opinion, the accompanying statement of assets and liabilities, including the portfolio of investments, and the related statements of operations and of changes in net assets and the financial highlights present fairly, in all material respects, the financial position of T. Rowe Price Maryland Tax-Free Bond Fund (one of the portfolios comprising T. Rowe Price State Tax-Free Income Trust, hereafter referred to as the “Fund”) at February 28, 2005, the results of its operations for the year then ended, the changes in its net assets for each of the two years in the period then ended and the financial highlights for each of the five years in the period then ended, in conformity with accounting principles generally accepted in the United States of America. These financial statements and financial highlights (hereafter referred to as “financial statements”) are the responsibility of the Fund’s management; our responsibility is to express an opinion on these financial statements based on our audits. We conducted our audits of these financial statements in accordance with the auditing standards of the Public Company Accounting Oversight Board (United States). Those standards require that we plan and perform the audit to obtain reasonable assurance about whether the financial statements are free of material misstatement. An audit includes examining, on a test basis, evidence supporting the amounts and disclosures in the financial statements, assessing the accounting principles used and significant estimates made by management, and evaluating the overall financial statement presentation. We believe that our audits, which included confirmation of securities at February 28, 2005 by correspondence with the custodian and brokers, provide a reasonable basis for our opinion.
PricewaterhouseCoopers LLP
Baltimore, Maryland
April 11, 2005
| TAX INFORMATION (UNAUDITED) FOR THE TAX YEAR ENDED 2/28/05 |
We are providing this information as required by the Internal Revenue Code. The amounts shown may differ from those elsewhere in this report because of differences between tax and financial reporting requirements.
The fund’s distributions to shareholders included:
• $2,411,000 from long-term capital gains, subject to the 15% rate gains category,
• $55,558,000 which qualified as exempt-interest dividends.
| INFORMATION ON PROXY VOTING POLICIES, PROCEDURES, AND RECORDS |
A description of the policies and procedures used by T. Rowe Price funds and portfolios to determine how to vote proxies relating to portfolio securities is available in each fund’s Statement of Additional Information, which you may request by calling 1-800-225-5132 or by accessing the SEC’s Web site, www.sec.gov. The description of our proxy voting policies and procedures is also available on our Web site, www.troweprice.com. To access it, click on the words “Company Info” at the top of our homepage for individual investors. Then, in the window that appears, click on the “Proxy Voting Policy” navigation button in the top left corner.
Each fund’s most recent annual proxy voting record is available on our Web site and through the SEC’s Web site. To access it through our Web site, follow the directions above, then click on the words “Proxy Voting Record” at the bottom of the Proxy Voting Policy page.
| HOW TO OBTAIN QUARTERLY PORTFOLIO HOLDINGS |
The fund files a complete schedule of portfolio holdings with the Securities and Exchange Commission for the first and third quarters of each fiscal year on Form N-Q. The fund’s Form N-Q is available electronically on the SEC’s Web site (www.sec.gov); hard copies may be reviewed and copied at the SEC’s Public Reference Room, 450 Fifth St. N.W., Washington, DC 20549. For more information on the Public Reference Room, call 1-800-SEC-0330.
| ABOUT THE FUND’S TRUSTEES AND OFFICERS |
Your fund is governed by a Board of Trustees that meets regularly to review investments, performance, expenses, and other business matters, and is responsible for protecting the interests of shareholders. The majority of the fund’s trustees are independent of T. Rowe Price Associates, Inc. (T. Rowe Price); “inside” trustees are officers of T. Rowe Price. The Board of Trustees elects the fund’s officers, who are listed in the final table. The business address of each trustee and officer is 100 East Pratt Street, Baltimore, MD 21202. The Statement of Additional Information includes additional information about the fund trustees and is available without charge by calling a T. Rowe Price representative at 1-800-225-5132.
| Independent Trustees | |
| |
| Name | |
| (Year of Birth) | Principal Occupation(s) During Past 5 Years and |
| Year Elected* | Directorships of Other Public Companies |
| |
| Anthony W. Deering | Chairman, Exeter Capital, LLC, a private investment firm (2004 to pre- |
| (1945) | sent); Director, Chairman of the Board, and Chief Executive Officer, |
| 1986 | The Rouse Company, real estate developers (1997 to 2004); Director, |
| | Mercantile Bank (4/03 to present) |
| |
| Donald W. Dick, Jr. | Principal, EuroCapital Advisors, LLC, an acquisition and management |
| (1943) | advisory firm; Chairman, President, and Chief Executive Officer, |
| 2001 | The Haven Group, a custom manufacturer of modular homes (1/04 |
| | to present) |
| |
| David K. Fagin | Chairman and President, Nye Corporation (6/88 to present); Director, |
| (1938) | Canyon Resources Corporation, Golden Star Resources Ltd. (5/00 to |
| 2001 | present), and Pacific Rim Mining Corporation (2/02 to present) |
| |
| Karen N. Horn | Managing Director and President, Global Private Client Services, Marsh |
| (1943) | Inc. (1999 to 2003); Managing Director and Head of International |
| 2003 | Private Banking, Bankers Trust (1996 to 1999); Director, Eli Lilly and |
| | Company and Georgia Pacific (5/04 to present) |
| |
| F. Pierce Linaweaver | President, F. Pierce Linaweaver & Associates, Inc., consulting environ- |
| (1934) | mental and civil engineers |
| 1986 | |
| |
| John G. Schreiber | Owner/President, Centaur Capital Partners, Inc., a real estate investment |
| (1946) | company; Partner, Blackstone Real Estate Advisors, L.P.; Director, AMLI |
| 1992 | Residential Properties Trust and The Rouse Company, real estate |
| | developers |
| |
| * Each independent trustee oversees 112 T. Rowe Price portfolios and serves until retirement, resignation, or |
| election of a successor. | |
| Inside Trustees | |
| |
| Name | |
| (Year of Birth) | |
| Year Elected* | |
| [Number of T. Rowe Price | Principal Occupation(s) During Past 5 Years and |
| Portfolios Overseen] | Directorships of Other Public Companies |
| |
| Mary J. Miller, CFA | Director and Vice President, T. Rowe Price; Vice President, T. Rowe |
| (1955) | Price Group, Inc.; President, State Tax-Free Income Trust |
| 2004 | |
| [38] | |
| |
| James S. Riepe | Director and Vice President, T. Rowe Price; Vice Chairman of the Board, |
| (1943) | Director, and Vice President, T. Rowe Price Group, Inc.; Chairman of the |
| 1986 | Board and Director, T. Rowe Price Global Asset Management Limited, |
| [112] | T. Rowe Price Global Investment Services Limited, T. Rowe Price |
| | Investment Services, Inc., T. Rowe Price Retirement Plan Services, Inc., |
| | and T. Rowe Price Services, Inc.; Chairman of the Board, Director, |
| | President, and Trust Officer, T. Rowe Price Trust Company; Director, |
| | T. Rowe Price International, Inc.; Chairman of the Board, State Tax- |
| | Free Income Trust |
| |
| * Each inside trustee serves until retirement, resignation, or election of a successor. |
| Officers | |
| |
| Name (Year of Birth) | |
| Title and Fund(s) Served | Principal Occupation(s) |
| |
| Stephen V. Booth, CPA (1961) | Vice President, T. Rowe Price, T. Rowe Price |
| Vice President, State Tax-Free Income Trust | Group, Inc., and T. Rowe Price Trust Company |
| |
| Linda A. Brisson (1959) | Vice President, T. Rowe Price and T. Rowe Price |
| Vice President, State Tax-Free Income Trust | Group, Inc. |
| |
| Steven G. Brooks, CFA (1954) | Vice President, T. Rowe Price and T. Rowe Price |
| Vice President, State Tax-Free Income Trust | Group, Inc. |
| |
| Joseph A. Carrier, CPA (1960) | Vice President, T. Rowe Price, T. Rowe Price |
| Treasurer, State Tax-Free Income Trust | Group, Inc., T. Rowe Price Investment Services, |
| | Inc., and T. Rowe Price Trust Company |
| | |
| Jonathan M. Chirunga (1966) | Vice President, T. Rowe Price; formerly Municipal |
| Vice President, State Tax-Free Income Trust | Credit Analyst/Associate Director, Standard & |
| | Poor’s Rating Services (to 2001) |
| |
| Maria H. Condez (1962) | Assistant Vice President, T. Rowe Price |
| Assistant Vice President, State Tax-Free | |
| Income Trust | |
| |
| G. Richard Dent (1960) | Vice President, T. Rowe Price and T. Rowe Price |
| Vice President, State Tax-Free Income Trust | Group, Inc.; formerly Deputy General Counsel, |
| | ACA Financial Guaranty Corporation (to 2001) |
| |
| Roger L. Fiery III, CPA (1959) | Vice President, T. Rowe Price, T. Rowe Price |
| Vice President, State Tax-Free Income Trust | Group, Inc., T. Rowe Price International, Inc., |
| | and T. Rowe Price Trust Company |
| |
| John R. Gilner (1961) | Chief Compliance Officer and Vice President, |
| Chief Compliance Officer, State Tax-Free | T. Rowe Price; Vice President, T. Rowe Price |
| Income Trust | Group, Inc., and T. Rowe Price Investment |
| | Services, Inc. |
| |
| Gregory S. Golczewski (1966) | Vice President, T. Rowe Price and T. Rowe Price |
| Vice President, State Tax-Free Income Trust | Trust Company |
| |
| Charles B. Hill, CFA (1961) | Vice President, T. Rowe Price and T. Rowe Price |
| Executive Vice President, State Tax-Free | Group, Inc. |
| Income Trust | |
| |
| Henry H. Hopkins (1942) | Director and Vice President, T. Rowe Price |
| Vice President, State Tax-Free Income Trust | Investment Services, Inc., T. Rowe Price Services, |
| | Inc., and T. Rowe Price Trust Company; Vice |
| | President, T. Rowe Price, T. Rowe Price Group, |
| | Inc., T. Rowe Price International, Inc., and |
| | T. Rowe Price Retirement Plan Services, Inc. |
| |
| T. Dylan Jones (1971) | Assistant Vice President, T. Rowe Price |
| Assistant Vice President, State Tax-Free | |
| Income Trust | |
| |
| Philip J. Kligman, CFA (1974) | Assistant Vice President, T. Rowe Price |
| Assistant Vice President, State Tax-Free | |
| Income Trust | |
| | |
| Marcy M. Lash (1963) | Vice President, T. Rowe Price and T. Rowe Price |
| Vice President, State Tax-Free Income Trust | Group, Inc. |
| |
| Alan D. Levenson, Ph.D. (1958) | Vice President, T. Rowe Price and T. Rowe Price |
| Vice President, State Tax-Free Income Trust | Group, Inc. |
| |
| Patricia B. Lippert (1953) | Assistant Vice President, T. Rowe Price and |
| Secretary, State Tax-Free Income Trust | T. Rowe Price Investment Services, Inc. |
| |
| Joseph K. Lynagh, CFA (1958) | Vice President, T. Rowe Price and T. Rowe Price |
| Executive Vice President, State Tax-Free | Group, Inc. |
| Income Trust | |
| |
| Konstantine B. Mallas (1963) | Vice President, T. Rowe Price and T. Rowe Price |
| Executive Vice President, State Tax-Free | Group, Inc. |
| Income Trust | |
| |
| James M. McDonald (1949) | Vice President, T. Rowe Price, T. Rowe Price |
| Vice President, State Tax-Free Income Trust | Group, Inc., and T. Rowe Price Trust Company |
| |
| Hugh D. McGuirk, CFA (1960) | Vice President, T. Rowe Price and T. Rowe Price |
| Executive Vice President, State Tax-Free | Group, Inc. |
| Income Trust | |
| |
| Timothy G. Taylor, CFA (1975) | Assistant Vice President, T. Rowe Price |
| Assistant Vice President, State Tax-Free | |
| Income Trust | |
| |
| Julie L. Waples (1970) | Vice President, T. Rowe Price |
| Vice President, State Tax-Free Income Trust | |
| |
| Edward A. Wiese, CFA (1959) | Vice President, T. Rowe Price, T. Rowe Price |
| Vice President, State Tax-Free Income Trust | Group, Inc., and T. Rowe Price Trust Company; |
| | Chief Investment Officer, Director, and Vice |
| | President, T. Rowe Price Savings Bank |
| |
| Unless otherwise noted, officers have been employees of T. Rowe Price or T. Rowe Price International for at least |
| five years. | |
Item 2. Code of Ethics.
The registrant has adopted a code of ethics, as defined in Item 2 of Form N-CSR, applicable to its principal executive officer, principal financial officer, principal accounting officer or controller, or persons performing similar functions. A copy of this code of ethics is filed as an exhibit to this Form N-CSR. No substantive amendments were approved or waivers were granted to this code of ethics during the period covered by this report.
Item 3. Audit Committee Financial Expert.
The registrant’s Board of Directors/Trustees has determined that Mr. David K. Fagin qualifies as an audit committee financial expert, as defined in Item 3 of Form N-CSR. Mr. Fagin is considered independent for purposes of Item 3 of Form N-CSR.
Item 4. Principal Accountant Fees and Services.
(a) – (d) Aggregate fees billed to the registrant for the last two fiscal years for professional services rendered by the registrant’s principal accountant were as follows:
| | 2005 | 2004 |
| Audit Fees | $8,081 | $10,480 |
| Audit-Related Fees | 919 | 907 |
| Tax Fees | 2,353 | 2,921 |
| All Other Fees | - | 124 |
Audit fees include amounts related to the audit of the registrant’s annual financial statements and services normally provided by the accountant in connection with statutory and regulatory filings. Audit-related fees include amounts reasonably related to the performance of the audit of the registrant’s financial statements, specifically the issuance of a report on internal controls. Tax fees include amounts related to tax compliance, tax planning, and tax advice. Other fees include the registrant’s pro-rata share of amounts for agreed-upon procedures in conjunction with service contract approvals by the registrant’s Board of Directors/Trustees.
(e)(1) The registrant’s audit committee has adopted a policy whereby audit and non-audit services performed by the registrant’s principal accountant for the registrant, its investment adviser, and any entity controlling, controlled by, or under common control with the investment adviser that provides ongoing services to the registrant require pre-approval in advance at regularly scheduled audit committee meetings. If such a service is required between regularly scheduled audit committee meetings, pre-approval may be authorized by one audit committee member with ratification at the next scheduled audit committee meeting. Waiver of pre-approval for audit or non-audit services requiring fees of a de minimis amount is not permitted.
(2) No services included in (b) – (d) above were approved pursuant to paragraph (c)(7)(i)(C) of Rule 2-01 of Regulation S-X.
(f) Less than 50 percent of the hours expended on the principal accountant’s engagement to audit the registrant’s financial statements for the most recent fiscal year were attributed to work performed by persons other than the principal accountant’s full-time, permanent employees.
(g) The aggregate fees billed for the most recent fiscal year and the preceding fiscal year by the registrant’s principal accountant for non-audit services rendered to the registrant, its investment adviser, and any entity controlling, controlled by, or under common control with the investment adviser that provides ongoing services to the registrant were $903,000 and $821,000, respectively, and were less than the aggregate fees billed for those same periods by the registrant’s principal accountant for audit services rendered to the T. Rowe Price Funds.
(h) All non-audit services rendered in (g) above were pre-approved by the registrant’s audit committee. Accordingly, these services were considered by the registrant’s audit committee in maintaining the principal accountant’s independence.Item 5. Audit Committee of Listed Registrants.
Not applicable.
Item 6. Schedule of Investments.
Not applicable. The complete schedule of investments is included in Item 1 of this Form N-CSR.
Item 7. Disclosure of Proxy Voting Policies and Procedures for Closed-End Management Investment Companies.
Not applicable.
Item 8. Portfolio Managers of Closed-End Management Investment Companies.
Not applicable.
Item 9. Purchases of Equity Securities by Closed-End Management Investment Company and Affiliated Purchasers.
Not applicable.
Item 10. Submission of Matters to a Vote of Security Holders.
Not applicable.
Item 11. Controls and Procedures.
(a) The registrant’s principal executive officer and principal financial officer have evaluated the registrant’s disclosure controls and procedures within 90 days of this filing and have concluded that the registrant’s disclosure controls and procedures were effective, as of that date, in ensuring that information required to be disclosed by the registrant in this Form N-CSR was recorded, processed, summarized, and reported timely.
(b) The registrant’s principal executive officer and principal financial officer are aware of no change in the registrant’s internal control over financial reporting that occurred during the registrant’s second fiscal quarter covered by this report that has materially affected, or is reasonably likely to materially affect, the registrant’s internal control over financial reporting.
Item 12. Exhibits.
(a)(1) The registrant’s code of ethics pursuant to Item 2 of Form N-CSR is attached.
(2) Separate certifications by the registrant's principal executive officer and principal financial officer, pursuant to Section 302 of the Sarbanes-Oxley Act of 2002 and required by Rule 30a-2(a) under the Investment Company Act of 1940, are attached.
(3) Written solicitation to repurchase securities issued by closed-end companies: not applicable.
(b) A certification by the registrant's principal executive officer and principal financial officer, pursuant to Section 906 of the Sarbanes-Oxley Act of 2002 and required by Rule 30a-2(b) under the Investment Company Act of 1940, is attached.SIGNATURES
Pursuant to the requirements of the Securities Exchange Act of 1934 and the Investment Company Act of 1940, the registrant has duly caused this report to be signed on its behalf by the undersigned, thereunto duly authorized.
T. Rowe Price State Tax-Free Income Trust
| By | /s/ James S. Riepe |
| | James S. Riepe |
| | Principal Executive Officer |
| |
| Date | April 15, 2005 |
Pursuant to the requirements of the Securities Exchange Act of 1934 and the Investment Company Act of 1940, this report has been signed below by the following persons on behalf of the registrant and in the capacities and on the dates indicated.
| By | /s/ James S. Riepe |
| | James S. Riepe |
| | Principal Executive Officer |
| |
| Date | April 15, 2005 |
| |
| |
| |
| By | /s/ Joseph A. Carrier |
| | Joseph A. Carrier |
| | Principal Financial Officer |
| |
| Date | April 15, 2005 |