Item 1: Report to Shareholders| Georgia Tax-Free Bond Fund | February 28, 2005 |
The views and opinions in this report were current as of February 28, 2005. They are not guarantees of performance or investment results and should not be taken as investment advice. Investment decisions reflect a variety of factors, and the managers reserve the right to change their views about individual stocks, sectors, and the markets at any time. As a result, the views expressed should not be relied upon as a forecast of the fund’s future investment intent. The report is certified under the Sarbanes-Oxley Act of 2002, which requires mutual funds and other public companies to affirm that, to the best of their knowledge, the information in their financial reports is fairly and accurately stated in all material respects.
REPORTS ON THE WEB
Sign up for our E-mail Program, and you can begin to receive updated fund reports and prospectuses online rather than through the mail. Log in to your account at troweprice.com for more information.
Fellow Shareholders
Tax-free bonds produced generally positive returns and outperformed their taxable bond counterparts in the one-year period ended February 28, 2005. Most of the municipal market’s gains occurred in the last six months—a period characterized by rising short-term interest rates, steady economic growth, elevated oil prices, and an unexpected decline in long-term interest rates. In both periods, long-term and high-yield municipals fared better than short-term and investment-grade municipal securities, respectively. In line with the national trends, your fund generated modest gains for the year, with the bulk of returns earned in the past six months.
ECONOMY AND INTEREST RATES
Twelve months ago, at the beginning of our fiscal year, the economy was growing vigorously, and the Federal Reserve prepared to begin unwinding at a “measured” pace the accommodative monetary policy that had prevailed for almost three years. From June 30, 2004, through the end of February 2005—and despite a brief period of uncertainty about the economic outlook related to geopolitical concerns, rising oil prices, and a tight presidential race—the central bank gradually lifted the federal funds target rate from 1.00% to 2.50%, a three-year high.
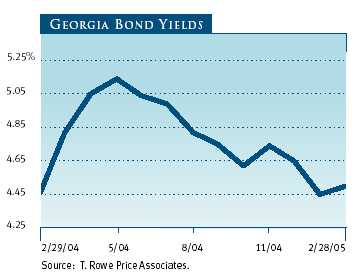
As shown in the graph, Georgia municipal yields declined after peaking in the spring of 2004—the opposite of what one would expect when the Fed is raising short-term rates. The result was that longer-term municipal securities outperformed short- and intermediate-term bonds in the last six months and for our entire fiscal year.
Nationally, new municipal supply in 2004 totaled $359 billion, approximately 6.5% below the previous year’s record $384 billion (according to The Bond BuyerThe Bond Buyer). While still high from a historical perspective, the increased participation of property and casualty insurance companies and other nontraditional buyers of municipal securities easily absorbed supply, which reduced downward pressure on municipal bond prices. Many states have recovered nicely from the 2001 recession as higher-than-anticipated revenues, spending cuts, and fee increases have improved their finances and reduced the need to borrow.
Local governments and school districts are also participating in the states’ recovery in that they are receiving more in assistance and transfers. The rise in housing prices over the last three years also benefited local governments since rising property assessments resulted in increased property tax receipts, which are localities’ primary revenue source. Broadly speaking, the outlook for public finance is brighter, though escalating pension and benefit costs may hinder further improvement.
GEORGIA MARKET NEWS
Georgia’s economic recovery remains strong. The state’s 4.4% unemployment rate compares favorably with the national rate of 5.4%. It remains the dominant transportation center in the region, anchored by Hartsfield-Jackson Atlanta International Airport, which perennially ranks as the busiest or second busiest airport in the world. Georgia’s moderate cost of living and academic research centers provided by its colleges and universities serve to attract a highly skilled labor force.
The state’s unaudited financial statements at the end of fiscal 2004 suggest that the state’s general fund closed with a $1.0 billion surplus before transfers, and the balance of $66.6 million in its unreserved general fund represents about 0.4% of expenditures. Offsetting this shallow balance going into fiscal 2005, the state had a revenue shortfall reserve of $260.6 million and a reserve for midyear adjustments of $142 million. The governor maintained the state’s conservative fiscal management, cutting spending by 5% despite strong revenue growth. The state’s fiscal 2005 receipts through February show growth of 8.1% over a year ago, due primarily to stronger collections of sales and individual and corporate income taxes.
Georgia’s credit rating remains solid. Moody’s Investors Service rates the state Aaa, while Standard & Poor’s and Fitch both rate it AAA, and both Standard & Poor’s and Moody’s maintain stable outlooks on the credit. Georgia’s debt is modest at $861 per capita. Georgia municipalities issued nearly $8 billion in debt in calendar year 2004—12th highest among all states—but the state is not expected to issue a large amount of debt in calendar year 2005.
PERFORMANCE AND PORTFOLIO STRATEGY
The Georgia Tax-Free Bond Fund returned 2.14% during the second half of its fiscal year, reflecting $0.23 per share in dividends and a $0.01 increase in share price. Returns for the full year were only slightly higher due to the weak first six months. We are pleased to report that the fund outpaced its Lipper peer group average for both periods, as shown in the table.
| PERFORMANCE COMPARISON |
| Periods Ended 2/28/05 | 6 Months | 12 Months |
| Georgia Tax-Free | | |
| Bond Fund | 2.14% | 2.28% |
| Lipper Georgia Municipal Debt | | |
| Funds Average | 1.85 | 1.58 |
The fund benefited from our decision to concentrate new investment primarily in longer-maturity bonds. We thought that the municipal yield curve was too steep by historical standards and would likely flatten, and we wanted to take advantage of the increase in yield available on the long end. As it happened, the yield curve did flatten as short-term rates rose and longer-term yields declined, and our best returns were in longer-maturity holdings. This strategy meant that the weighted average maturity of the portfolio lengthened a little, to 14.6 years from 13.2 years at the end of August. With yields holding near their lows and most long bonds trading to their call—rather than maturity—dates, overall duration and yields were little changed.
| PORTFOLIO CHARACTERISTICS |
| Periods Ended | 8/31/04 | 2/28/05 |
| Price Per Share | $11.28 | $11.29 |
| Dividends Per Share | | |
| For 6 months | 0.23 | 0.23 |
| For 12 months | 0.46 | 0.46 |
| 30-Day Dividend Yield * | 4.11% | 4.03% |
| 30-Day Standardized | | |
| Yield to Maturity | 3.26 | 3.15 |
| Weighted Average Maturity (years) | 13.2 | 14.6 |
| Weighted Average Effective | | |
| Duration (years) | 5.3 | 5.3 |
| | |
| * Dividends earned for the last 30 days of each period indicated are annualized and divided by the |
| fund’s net asset value at the end of the period. |
We targeted a conservative interest rate posture for much of the period. While we focused most new investment in long maturities, we offset this with a slightly higher level of cash and other short-maturity holdings to avoid increasing the portfolio’s overall interest rate sensitivity. This “barbell” structure worked well as the yield curve flattened.
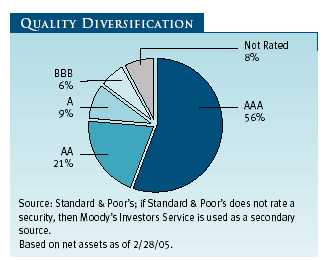
Large insured (AAA) issues for the Atlanta area dominated new issuance in Georgia. Our proprietary research helped us capture some extra yield with a small investment in Augusta Airport (BBB) bonds. In general, the lower-rated bonds were an excellent source of incremental return as the economy recovered. We will continue to search for lower-rated credits with a good long-term fundamental story, but we will add carefully going forward, as the improving economy has tightened the yield spread, reducing the attractiveness of lower-rated securities.
We kept the portfolio diversified across the state, with a bias toward strong local general obligation and essential service bonds. Overall, our sector allocations did not change significantly. Local GOs were down modestly over the past six months, offset by an increase in water and sewer revenue bonds.
| PORTFOLIO DIVERSIFICATION |
| Percent of | Percent of |
| Net Assets | Net Assets |
| Periods Ended | 8/31/04 | 2/28/05 |
| Water and Sewer Revenue | 22.4% | 25.5% |
| Prerefunded Bonds | 14.9 | 13.2 |
| General Obligation – Local | 13.7 | 10.9 |
| Hospital Revenue | 10.0 | 8.0 |
| Air and Sea Transportation Revenue | 4.2 | 7.5 |
| Educational Revenue | 5.9 | 6.3 |
| Electric Revenue | 5.9 | 5.5 |
| Escrowed to Maturity | 3.9 | 3.6 |
| Housing Finance Revenue | 3.9 | 3.6 |
| Life Care/Nursing Home Revenue | 3.5 | 3.4 |
| All Other Sectors | 11.7 | 11.3 |
| Other Assets Less Liabilities | 0.0 | 1.2 |
| Total | 100.0% | 100.0% |
| | | |
| Historical weightings reflect current industry/sector classifications. |
OUTLOOK
While higher energy prices may dampen consumer spending, strong fundamentals support our outlook for sustained economic expansion. Because the Fed remains committed to removing monetary policy accommodation, interest rates along the yield curve are more likely to rise than fall, suggesting a more challenging bond market environment ahead.
Although it may be time for renewed caution regarding fixed-income investments, we believe several factors are likely to temper a broad increase in interest rates. First, the current cyclical increase in inflation may be modest compared with previous inflationary periods, as forces that encourage price increases—such as dollar weakness and a tighter labor market—may be offset to some degree by forces that tend to restrain inflation, including productivity gains and intense global price competition. Second, reduced supply in a higher interest rate environment should lead to less refinancing issuance, less borrowing, and generally better fiscal conditions. Third, the greater transparency of the Federal Open Market Committee process, as evidenced by the earlier publication of Fed meeting minutes, may lessen the prospect for a surprise rate hike by the central bank and should help mitigate any overreaction to new economic data. Finally, given that the municipal yield curve remains som ewhat steep, we believe that bonds with longer maturities still offer value to investors.
Thank you for your continued confidence in T. Rowe Price.
Respectfully submitted,

Hugh D. McGuirkChairman of the Investment Advisory CommitteeMarch 21, 2005
The committee chairman has day-to-day responsibility for managing the portfolio and works with committee members in developing and executing the fund’s investment program.
RISKS OF INVESTING
As with all mutual funds, the share price can fall because of weakness in the markets, a particular industry, or specific holdings. Yield and share price will vary with interest rate changes. Investors should note that if interest rates rise significantly from current levels, the fund’s share price will decline and may even turn negative in the short term. There is also a chance that some of the fund’s holdings may have their credit rating downgraded or may default. The fund is less diversified than one investing nationally.
GLOSSARY
Average maturity: The weighted average of the stated maturity dates of the portfolio’s securities. In general, the longer the average maturity, the greater the fund’s sensitivity to interest rate changes. A shorter average maturity usually means less interest rate sensitivity and therefore a less volatile portfolio.
Basis point: One one-hundredth of one percentage point, or 0.01% .
Duration: The average time (expressed in years) it takes investors to receive the present value of the future cash flows on their investment. It is used to measure the sensitivity of bond prices to interest rate changes (the shorter the duration, the less the bond’s price will rise or fall in value when interest rates change). Duration is affected by maturity, the coupon, and the time interval between payments. Other things being equal, a bond with a higher coupon will have a shorter duration, while zero-coupon bonds have the longest.
Federal funds rate: The interest rate charged on overnight loans of reserves by one financial institution to another in the United States. The Federal Reserve sets a target federal funds rate to affect the direction of interest rates.
Investment grade: High-quality bonds as measured by one of the major credit rating agencies. For example, Standard & Poor’s designates the bonds in its top four categories (AAA to BBB) as investment grade.
Lipper averages: The averages of available mutual fund performance returns for specified time periods in defined categories as tracked by Lipper Inc.
Yield curve: A graph depicting the relationship between yields and maturity dates for a set of similar securities. These curves are in constant flux. One of the key activities in managing any fixed-income portfolio is to study trends reflected by comparative yield curves.
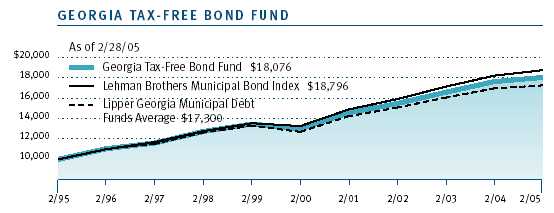
This chart shows the value of a hypothetical $10,000 investment in the fund over the past 10 fiscal year periods or since inception (for funds lacking 10-year records). The result is compared with benchmarks, which may include a broad-based market index and a peer group average or index. Market indexes do not include expenses, which are deducted from fund returns as well as mutual fund averages and indexes.
| AVERAGE ANNUAL COMPOUND TOTAL RETURN |
This table shows how the fund and its benchmarks would have performed each year if their actual (or cumulative) returns for the periods shown had been earned at a constant rate.
| Periods Ended 2/28/05 | 1 Year | 5 Years | 10 Years |
| | | | |
| Georgia Tax-Free Bond Fund | 2.28% | 6.78% | 6.10% |
| Lehman Brothers Municipal Bond Index | 2.96 | 7.18 | 6.51 |
| Lipper Georgia Municipal Debt Funds Average | 1.58 | 6.26 | 5.62 |
| | | | |
| Average annual total return figures include changes in principal value, reinvested dividends, and capital |
| gain distributions. Returns do not reflect taxes that the shareholder may pay on fund distributions or |
| the redemption of fund shares. Past performance cannot guarantee future results. When assessing |
| performance, shareholders should consider both short- and long-term returns. | |
As a mutual fund shareholder, you may incur two types of costs: (1) transaction costs such as redemption fees or sales loads and (2) ongoing costs, including management fees, distribution and service (12b-1) fees, and other fund expenses. The following example is intended to help you understand your ongoing costs (in dollars) of investing in the fund and to compare these costs with the ongoing costs of investing in other mutual funds. The example is based on an investment of $1,000 invested at the beginning of the most recent six-month period and held for the entire period.
Actual Expenses
The first line of the following table (“Actual”) provides information about actual account values and actual expenses. You may use the information in this line, together with your account balance, to estimate the expenses that you paid over the period. Simply divide your account value by $1,000 (for example, an $8,600 account value divided by $1,000 = 8.6), then multiply the result by the number in the first line under the heading “Expenses Paid During Period” to estimate the expenses you paid on your account during this period.
Hypothetical Example for Comparison Purposes
The information on the second line of the table (“Hypothetical”) is based on hypothetical account values and expenses derived from the fund’s actual expense ratio and an assumed 5% per year rate of return before expenses (not the fund’s actual return). You may compare the ongoing costs of investing in the fund with other funds by contrasting this 5% hypothetical example and the 5% hypothetical examples that appear in the shareholder reports of the other funds. The hypothetical account values and expenses may not be used to estimate the actual ending account balance or expenses you paid for the period.
Note: T. Rowe Price charges an annual small-account maintenance fee of $10, generally for accounts with less than $2,000 ($500 for UGMA/UTMA). The fee is waived for any investor whose T. Rowe Price mutual fund accounts total $25,000 or more, accounts employing automatic investing, and IRAs and other retirement plan accounts that utilize a prototype plan sponsored by T. Rowe Price (although a separate custodial or administrative fee may apply to such accounts). This fee is not included in the accompanying table. If you are subject to the fee, keep it in mind when you are estimating the ongoing expenses of investing in the fund and when comparing the expenses of this fund with other funds.
You should also be aware that the expenses shown in the table highlight only your ongoing costs and do not reflect any transaction costs, such as redemption fees or sales loads. Therefore, the second line of the table is useful in comparing ongoing costs only and will not help you determine the relative total costs of owning different funds. To the extent a fund charges transaction costs, however, the total cost of owning that fund is higher.
| T. ROWE PRICE GEORGIA TAX-FREE BOND FUND |
| |
| | Beginning | Ending | Expenses Paid |
| | Account Value | Account Value | During Period* |
| | 9/1/04 | 2/28/05 | 9/1/04 to 2/28/05 |
| Actual | $1,000.00 | $1,021.40 | $3.21 |
| Hypothetical (assumes 5% | | | |
| return before expenses) | 1,000.00 | 1,021.62 | 3.21 |
| * Expenses are equal to the fund’s annualized expense ratio for the six-month period (0.64%), multi- |
| plied by the average account value over the period, multiplied by the number of days in the most |
| recent fiscal half year (181) divided by the days in the year (365) to reflect the half-year period. |
| | | | |
| QUARTER-END RETURNS |
| |
| Periods Ended 12/31/04 | 1 Year | 5 Years | 10 Years |
| Georgia Tax-Free Bond Fund | 4.00% | 6.83% | 6.69% |
| Lehman Brothers Municipal Bond Index | 4.48 | 7.20 | 7.06 |
| Lipper Georgia Municipal Debt | | | |
| Funds Average | 3.01 | 6.29 | 6.21 |
| |
| Current performance may be higher or lower than the quoted past performance, which |
| cannot guarantee future results. Share price, principal value, and return will vary, and you |
| may have a gain or loss when you sell your shares. For the most recent month-end perfor- |
| mance information, please visit our Web site (troweprice.com) or contact a T. Rowe Price |
| representative at 1-800-225-5132. | | | |
| | | | |
| This table provides returns net of all expenses through the most recent calendar quarter-end rather than |
| through the end of the fund’s fiscal period. Average annual total returns include changes in principal |
| value, reinvested dividends, and capital gain distributions. Investment return and principal value will |
| vary, and shares may be worth more or less at redemption than at original purchase. Returns do not |
| reflect taxes that the shareholder may pay on fund distributions or the redemption of fund shares. Past |
| performance cannot guarantee future results. When assessing performance, investors should consider |
| both short- and long-term returns. | | | |
| | | | | | | | | | | |
| FINANCIAL HIGHLIGHTS | For a share outstanding throughout each period |
| | | | | | | | | | | |
| | | Year | | | | | | | | |
| | | Ended | | | | | | | | |
| | | 2/28/05** | | 2/29/04 | | 2/28/03 | | 2/28/02 | | 2/28/01 |
| NET ASSET VALUE | | | | | | | | | | |
| Beginning of period | $ | 11.50 | $ | 11.27 | $ | 10.99 | $ | 10.83 | $ | 10.15 |
| Investment activities | | | | | | | | | | |
| Net investment income (loss) | | 0.46 | | 0.46 | | 0.49 | | 0.51* | | 0.52* |
| Net realized and | | | | | | | | | | |
| unrealized gain (loss) | | (0.21) | | 0.23 | | 0.28 | | 0.16 | | 0.68 |
| Total from | | | | | | | | | | |
| investment activities | | 0.25 | | 0.69 | | 0.77 | | 0.67 | | 1.20 |
| Distributions | | | | | | | | | | |
| Net investment income | | (0.46) | | (0.46) | | (0.49) | | (0.51) | | (0.52) |
| NET ASSET VALUE | | | | | | | | | | |
| End of period | $ | 11.29 | $ | 11.50 | $ | 11.27 | $ | 10.99 | $ | 10.83 |
| Ratios/Supplemental Data | | | | | | | | | | |
| Total return^ | | 2.28% | | 6.30% | | 7.15% | | 6.29%* | | 12.08%* |
| Ratio of total expenses to | | | | | | | | | | |
| average net assets | | 0.64% | | 0.65% | | 0.65% | | 0.65%* | | 0.65%* |
| Ratio of net investment | | | | | | | | | | |
| income (loss) to average | | | | | | | | | | |
| net assets | | 4.11% | | 4.13% | | 4.39% | | 4.65%* | | 4.93%* |
| Portfolio turnover rate | | 25.3% | | 29.2% | | 24.8% | | 32.1% | | 33.9% |
| Net assets, end of period | | | | | | | | | | |
| (in thousands) | $ | 96,539 | $ | 91,714 | $ | 86,622 | $ | 77,807 | $ | 69,874 |
| | |
| ^ | Total return reflects the rate that an investor would have earned on an investment in the fund during each period, |
| | assuming reinvestment of all distributions. |
| * | Excludes expenses in excess of a 0.65% contractual expense limitation in effect through 2/28/03. |
| ** Per share amounts calculated using average shares outstanding method. |
| |
| The accompanying notes are an integral part of these financial statements. |
| | | |
| PORTFOLIO OF INVESTMENTS (1) | $ Par | Value |
| (Amounts in 000s) | | |
| | | |
| GEORGIA 94.3% | | |
| Albany-Dougherty County Hosp. Auth., Phoebe Putney | | |
| Memorial Hosp., VRDN (Currently 1.82%) (AMBAC Insured) | 200 | 200 |
| Americus & Sumter County Hosp. Auth., Magnolia Manor | | |
| 6.25%, 5/15/19 | 1,000 | 1,003 |
| Assoc. County Commoners Leasing Program, Jackson County | | |
| COP, 5.25%, 4/1/24 (XLCA Insured) | 1,000 | 1,089 |
| Athens - Clarke County Residential Care Fac. | | |
| Wesley Woods of Athens, 6.375%, 10/1/27 | 600 | 529 |
| Atlanta & Fulton County Recreation Auth., GO, 5.75%, 12/1/18 | | |
| (AMBAC Insured) | 1,500 | 1,695 |
| Atlanta Airport | | |
| Zero Coupon, 1/1/10 (MBIA Insured) # | 1,355 | 1,057 |
| 5.00%, 1/1/07 (FGIC Insured) # | 500 | 520 |
| 5.00%, 1/1/30 (FSA Insured) | 1,500 | 1,556 |
| 5.00%, 1/1/34 (FSA Insured) | 1,000 | 1,035 |
| 5.50%, 1/1/26 (Prerefunded 1/1/10†) (FGIC Insured) | 1,000 | 1,119 |
| 5.60%, 1/1/30 (Prerefunded 1/1/10†) (FGIC Insured) | 1,895 | 2,128 |
| 6.25%, 1/1/14 (FGIC Insured) # | 1,000 | 1,125 |
| Atlanta Water & Sewer | | |
| VRDN (Currently 1.85%) (FSA Insured) | 350 | 350 |
| 5.00%, 11/1/34 (FSA Insured) | 1,000 | 1,041 |
| Augusta Airport, 5.45%, 1/1/31 # | 900 | 903 |
| Augusta Water & Sewer | | |
| 5.00%, 10/1/27 (FSA Insured) | 1,000 | 1,040 |
| 5.25%, 10/1/34 (FSA Insured) | 1,000 | 1,076 |
| 5.25%, 10/1/39 (FSA Insured) | 1,500 | 1,605 |
| Chatham County Hosp. Auth. | | |
| Memorial Univ. Medical Center | | |
| 5.75%, 1/1/29 | 1,000 | 1,073 |
| 6.125%, 1/1/24 | 1,230 | 1,341 |
| Cherokee County Water & Sewer Auth., 5.50%, 8/1/23 | | |
| (MBIA Insured) | 1,000 | 1,160 |
| Clayton County Water Auth. | | |
| 5.00%, 5/1/20 | 1,000 | 1,077 |
| 6.25%, 5/1/16 (Prerefunded 5/1/10†) | 1,000 | 1,158 |
| Cobb County Dev. Auth., Waste Management, 2.10%, 4/1/33 | | |
| (Tender 4/1/05) # | 1,000 | 999 |
| Cobb County Hosp. Auth., Wellstar Health System, 5.25%, 4/1/23 | | |
| (AMBAC Insured) | 1,000 | 1,092 |
| Cobb-Marietta Water Auth., 5.25%, 11/1/21 | 1,000 | 1,097 |
| Columbia County, Courthouse/Detention Center, GO | | |
| 5.625%, 2/1/20 | 1,250 | 1,357 |
| Columbia County Water & Sewer | | |
| 5.00%, 6/1/24 (FSA Insured) | 1,000 | 1,058 |
| 6.25%, 6/1/18 (Prerefunded 6/1/10†) (FGIC Insured) | 1,000 | 1,151 |
| Columbus Water & Sewer, 5.00%, 5/1/25 (MBIA Insured) | 1,000 | 1,054 |
| Coweta County Residential Care Fac. for the Elderly | | |
| Wesley Woods of Newnan-Peachtree City, 8.25%, 10/1/26 | 500 | 519 |
| Crisp County Dev. Auth., Int'l Paper, 6.20%, 2/1/20 # | 1,000 | 1,074 |
| DeKalb County Hosp. Auth., DeKalb Regional Healthcare System | | |
| 5.00%, 9/1/11 (FSA Insured) | 1,000 | 1,090 |
| DeKalb County Water & Sewer, 5.125%, 10/1/31 | 1,000 | 1,040 |
| DeKalb Private Hosp. Auth., Egleston Childrens Hosp. | | |
| VRDN (Currently 1.86%) | 300 | 300 |
| Fayette County Public Fac. Auth. | | |
| 6.00%, 6/1/30 (Prerefunded 6/1/10†) | 270 | 310 |
| 6.25%, 6/1/20 (Prerefunded 6/1/10†) | 500 | 580 |
| Fayette County School Dist., GO, STEP, 0.00%, 3/1/25 | | |
| (FSA Insured) | 750 | 562 |
| Forsyth County | | |
| 6.00%, 3/1/16 (Prerefunded 3/1/10†) | 1,250 | 1,430 |
| Forsyth County, GO | | |
| 5.25%, 3/1/19 | 760 | 838 |
| Forsyth County School Dist., 6.00%, 2/1/16 | | |
| (Prerefunded 2/1/10†) | 1,250 | 1,439 |
| Forsyth County Water & Sewer Auth. | | |
| 5.00%, 4/1/21 | 1,060 | 1,125 |
| 5.00%, 4/1/32 | 1,000 | 1,036 |
| 6.25%, 4/1/20 (Prerefunded 4/1/10†) | 1,000 | 1,154 |
| Fulton County Dev. Auth., Georgia Tech Foundation | | |
| 5.00%, 11/1/21 | 1,000 | 1,063 |
| Fulton County Residential Care Fac. for the Elderly | | |
| Canterbury Court | | |
| 6.125%, 2/15/26 | 750 | 756 |
| 6.30%, 10/1/24 (Prerefunded 10/1/09†) | 500 | 574 |
| Fulton County Water & Sewer Auth. | | |
| 5.00%, 1/1/35 (FGIC Insured) | 1,000 | 1,038 |
| 6.25%, 1/1/09 (FGIC Insured) | 1,000 | 1,118 |
| Gainesville Water & Sewer, 6.00%, 11/15/12 (FGIC Insured) | 1,000 | 1,150 |
| Georgia Housing & Fin. Auth. | | |
| Single Family Housing | | |
| 5.65%, 12/1/21 # | 1,000 | 1,052 |
| 5.75%, 12/1/31 # | 870 | 901 |
| 5.80%, 12/1/21 # | 670 | 702 |
| 5.80%, 12/1/26 # | 370 | 387 |
| 6.05%, 12/1/16 # | 405 | 420 |
| Georgia Private Colleges & Univ. Auth. | | |
| Emory Univ. | | |
| 5.50%, 11/1/20 | 500 | 554 |
| 5.50%, 11/1/25 | 1,975 | 2,148 |
| 5.50%, 11/1/33 | 1,500 | 1,638 |
| VRDN (Currently 1.82%) | 700 | 700 |
| Glynn County Water & Sewer, 5.00%, 4/1/23 (AMBAC Insured) | 1,000 | 1,058 |
| Griffin Combined Public Utility, 5.125%, 1/1/27 (AMBAC Insured) | 1,000 | 1,061 |
| Gwinnett County School Dist., GO, 5.00%, 2/1/07 | 500 | 523 |
| Gwinnett County Water & Sewer Auth., GO, 5.25%, 8/1/24 | 1,000 | 1,082 |
| Hall County & Gainsville Hosp. Auth., Northeast Health System | | |
| 5.50%, 5/15/31 | 1,500 | 1,551 |
| Henry County Hosp. Auth., Henry Medical Center, GO | | |
| 5.00%, 7/1/25 (MBIA Insured) | 1,000 | 1,058 |
| Henry County Water & Sewer Auth. | | |
| 5.00%, 2/1/07 (MBIA Insured) | 1,000 | 1,044 |
| 5.125%, 2/1/20 (MBIA Insured) | 1,000 | 1,083 |
| 5.625%, 2/1/30 (FGIC Insured) | 1,000 | 1,098 |
| Macon Water & Sewer Auth., 5.00%, 10/1/21 | 1,000 | 1,063 |
| Macon-Bibb County Urban Dev. Auth., GO, 5.50%, 10/1/22 | 1,000 | 1,113 |
| Medical Center Hosp. Auth., Columbus Regional | | |
| Healthcare System, 5.50%, 8/1/25 (MBIA Insured) | 1,000 | 1,089 |
| Metropolitan Atlanta Rapid Transit Auth., 7.00%, 7/1/11 | | |
| (Escrowed to Maturity) (MBIA Insured) | 635 | 753 |
| Metropolitan Atlanta Rapid Transit Auth., 7.00%, 7/1/11 | | |
| (Escrowed to Maturity) ++ | 2,050 | 2,413 |
| Milledgeville & Baldwin County Dev. Auth. | | |
| Georgia College & State Univ. Foundation, 6.00%, 9/1/33 | 1,000 | 1,073 |
| Municipal Electric Auth. of Georgia | | |
| 6.50%, 1/1/12 | 440 | 503 |
| 6.50%, 1/1/12 (Escrowed to Maturity) | 80 | 93 |
| 6.50%, 1/1/17 (MBIA Insured) | 205 | 247 |
| 6.60%, 1/1/18 | 860 | 1,037 |
| 6.60%, 1/1/18 (Escrowed to Maturity) | 175 | 217 |
| 7.25%, 1/1/24 (AMBAC Insured) | 1,000 | 1,372 |
| Newton County Hosp. Auth., GO, 6.00%, 2/1/20 (AMBAC Insured) | 1,000 | 1,123 |
| Paulding County School Dist., GO, 6.00%, 2/1/13 (MBIA Insured) | 1,000 | 1,166 |
| Paulding County Water & Sewer, 6.00%, 12/1/13 (MBIA Insured) | 1,000 | 1,148 |
| Rockdale County Dev. Auth., Pratt Industries USA | | |
| 7.40%, 1/1/16 # | 365 | 377 |
| Roswell, 5.50%, 2/1/14 (Prerefunded 2/1/09†) | 1,000 | 1,106 |
| Savannah, Savannah Airport Commission, 5.25%, 1/1/17 | | |
| (FSA Insured) | 1,000 | 1,083 |
| Savannah Economic Dev. Auth. | | |
| Marshes of Skidaway, 7.40%, 1/1/24 | 420 | 438 |
| Savannah College of Art & Design, 6.80%, 10/1/19 | | |
| (Prerefunded 10/1/09†) | 500 | 581 |
| Savannah Economic Dev. Auth. IDRB, Waste Management | | |
| 5.50%, 7/1/16 # | 1,500 | 1,574 |
| Univ. of Georgia Athletic Assoc., Athens - Clarke County | | |
| VRDN (Currently 1.80%) | 2,500 | 2,500 |
| Total Georgia (Cost $85,363) | | 91,013 |
| |
| PUERTO RICO 4.5% | | |
| Puerto Rico Electric Power Auth., 5.00%, 7/1/08 | 2,000 | 2,126 |
| Puerto Rico Public Buildings Auth., GO, 5.50%, 7/1/24 | 1,000 | 1,098 |
| Puerto Rico Public Fin. Corp., 5.25%, 8/1/29 (Tender 2/1/12) | | |
| (MBIA Insured) | 1,000 | 1,104 |
| Total Puerto Rico (Cost $4,206) | | 4,328 |
| |
| FUTURES CONTRACTS 0.0% | | |
| Variation margin receivable (payable) on open futures contracts (2) | | 5 |
| Total Futures Contracts | | 5 |
| | | |
| Total Investments in Securities | | |
| 98.8% of Net Assets (Cost $89,569) | $ | 95,346 |
| | |
| (1) | Denominated in U.S. dollars unless other- |
| | wise noted |
| # | Interest subject to alternative minimum tax |
| ++ | All or a portion of this security is pledged to |
| | cover margin requirements on futures con- |
| | tracts at February 28, 2005. |
| † | Used in determining portfolio maturity |
| AMBAC | AMBAC Assurance Corp. |
| COP | Certificates of Participation |
| FGIC | Financial Guaranty Insurance Company |
| FSA | Financial Security Assurance Inc. |
| GO | General Obligation |
| IDRB | Industrial Development Revenue Bond |
| MBIA | MBIA Insurance Corp. |
| STEP | Stepped coupon bond for which the |
| | coupon rate of interest will adjust on speci- |
| | fied future date(s) |
| VRDN | Variable-Rate Demand Note; rate shown is |
| | effective rate at period-end |
| XLCA | XL Capital Assurance Inc. |
| | | | | | |
| (2) Open Futures Contracts at February 28, 2005 were as follows: | | |
| ($ 000s) | | | | | |
| | | | Contract | | Unrealized |
| | Expiration | | Value | | Gain (Loss) |
| Short, 10 U.S. Treasury ten year | | | | | |
| notes contracts, $20 par of 7.00% | | | | | |
| Metropolitan Atlanta Rapid Transit | | | | | |
| Auth. pledged as initial margin | 3/05 | $ | (1,109) | $ | 14 |
| Net payments (receipts) of variation | | | | | |
| margin to date | | | | | (9) |
| Variation margin receivable (payable) | | | | | |
| on open futures contracts | | | | $ | 5 |
The accompanying notes are an integral part of these financial statements.
| STATEMENT OF ASSETS AND LIABILITIES | | |
| (In thousands except shares and per share amounts) | | |
| | | |
| Assets | | |
| Investments in securities, at value (cost $89,569) | $ | 95,346 |
| Interest receivable | | 1,102 |
| Receivable for investment securities sold | | 1,137 |
| Receivable for shares sold | | 61 |
| Other assets | | 5 |
| Total assets | | 97,651 |
| |
| Liabilities | | |
| Investment management fees payable | | 31 |
| Payable for investment securities purchased | | 900 |
| Payable for shares redeemed | | 10 |
| Due to affiliates | | 8 |
| Other liabilities | | 163 |
| Total liabilities | | 1,112 |
| |
| NET ASSETS | $ | 96,539 |
| Net Assets Consist of: | | |
| Undistributed net investment income (loss) | $ | 42 |
| Undistributed net realized gain (loss) | | (564) |
| Net unrealized gain (loss) | | 5,786 |
| Paid-in-capital applicable to 8,550,084 no par | | |
| value shares of beneficial interest outstanding; | | |
| unlimited number of shares authorized | | 91,275 |
| |
| NET ASSETS | $ | 96,539 |
| |
| NET ASSET VALUE PER SHARE | $ | 11.29 |
The accompanying notes are an integral part of these financial statements.
| STATEMENT OF OPERATIONS | | |
| ($ 000s) | | |
| | | Year |
| | | Ended |
| | | 2/28/05 |
| Investment Income (Loss) | | |
| Interest income | $ | 4,356 |
| Expenses | | |
| Investment management | | 380 |
| Custody and accounting | | 100 |
| Shareholder servicing | | 55 |
| Prospectus and shareholder reports | | 20 |
| Legal and audit | | 14 |
| Directors | | 5 |
| Registration | | 4 |
| Miscellaneous | | 6 |
| Reductions/repayments pursuant to expense limitation | | |
| Investment Management fees (waived) repaid | | 4 |
| Total expenses | | 588 |
| Expenses paid indirectly | | (2) |
| Net expenses | | 586 |
| Net investment income (loss) | | 3,770 |
| |
| Realized and Unrealized Gain (Loss) | | |
| Net realized gain (loss) | | |
| Securities | | (108) |
| Futures | | (25) |
| Written options | | 9 |
| Net realized gain (loss) | | (124) |
| Change in net unrealized gain (loss) | | |
| Securities | | (1,579) |
| Futures | | 14 |
| Change in net unrealized gain (loss) | | (1,565) |
| Net realized and unrealized gain (loss) | | (1,689) |
| |
| INCREASE (DECREASE) IN NET | | |
| ASSETS FROM OPERATIONS | $ | 2,081 |
The accompanying notes are an integral part of these financial statements.
| STATEMENT OF CHANGES IN NET ASSETS | | | | |
| ($ 000s) | | | | |
| | | Year | | |
| | | Ended | | |
| | | 2/28/05 | | 2/29/04 |
| Increase (Decrease) in Net Assets | | | | |
| Operations | | | | |
| Net investment income (loss) | $ | 3,770 | $ | 3,620 |
| Net realized gain (loss) | | (124) | | 536 |
| Change in net unrealized gain (loss) | | (1,565) | | 1,205 |
| Increase (decrease) in net assets from operations | | 2,081 | | 5,361 |
| Distributions to shareholders | | | | |
| Net investment income | | (3,763) | | (3,612) |
| Capital share transactions * | | | | |
| Shares sold | | 17,139 | | 21,300 |
| Distributions reinvested | | 2,584 | | 2,538 |
| Shares redeemed | | (13,216) | | (20,495) |
| Increase (decrease) in net assets from capital | | | | |
| share transactions | | 6,507 | | 3,343 |
| Net Assets | | | | |
| Increase (decrease) during period | | 4,825 | | 5,092 |
| Beginning of period | | 91,714 | | 86,622 |
| End of period | $ | 96,539 | $ | 91,714 |
| (Including undistributed net investment income of $42 | | | | |
| at 2/28/05 and $36 at 2/29/04) | | | | |
| *Share information | | | | |
| Shares sold | | 1,521 | | 1,882 |
| Distributions reinvested | | 230 | | 225 |
| Shares redeemed | | (1,178) | | (1,819) |
| Increase (decrease) in shares outstanding | | 573 | | 288 |
The accompanying notes are an integral part of these financial statements.
| NOTES TO FINANCIAL STATEMENTS |
NOTE 1 - SIGNIFICANT ACCOUNTING POLICIES
T. Rowe Price State Tax-Free Income Trust, Inc. (the trust) is registered under the Investment Company Act of 1940 (the 1940 Act). The Georgia Tax-Free Bond Fund (the fund), a nondiversified, open-end management investment company, is one portfolio established by the trust. The fund commenced operations on March 31, 1993. The fund seeks to provide, consistent with prudent portfolio management, the highest level of income exempt from federal and Georgia state income taxes by investing primarily in investment-grade Georgia municipal bonds.
The accompanying financial statements were prepared in accordance with accounting principles generally accepted in the United States of America, which require the use of estimates made by fund management.
Valuation The fund values its investments and computes its net asset value per share at the close of the New York Stock Exchange (NYSE), normally 4 p.m. ET, each day that the NYSE is open for business. Debt securities are generally traded in the over-the-counter market. Securities are valued at prices furnished by dealers who make markets in such securities or by an independent pricing service, which considers yield or price of bonds of comparable quality, coupon, maturity, and type, as well as prices quoted by dealers who make markets in such securities.
Options on futures contracts are valued at the last sale price. Financial futures contracts are valued at closing settlement prices.
Other investments, including restricted securities, and those for which the above valuation procedures are inappropriate or are deemed not to reflect fair value are stated at fair value as determined in good faith by the T. Rowe Price Valuation Committee, established by the fund’s Board of Trustees.
Credits The fund earns credits on temporarily uninvested cash balances at the custodian that reduce the fund’s custody charges. Custody expense in the accompanying financial statements is presented before reduction for credits, which are reflected as expenses paid indirectly.
Investment Transactions, Investment Income, and Distributions Income and expenses are recorded on the accrual basis. Premiums and discounts on debt securities are amortized for financial reporting purposes. Investment transactions are accounted for on the trade date. Realized gains and losses are reported on the identified cost basis. Payments (“variation margin”) made or received to settle the daily fluctuations in the value of futures contracts are recorded as unrealized gains or losses until the contracts are closed. Unsettled variation margin on futures contracts is included in investments in securities, and unrealized gains and losses on futures contracts are included in the change in net unrealized gain or loss in the accompanying financial statements. Distributions to shareholders are recorded on the ex-dividend date. Income distributions are declared on a daily basis and paid monthly. Capital gain distrib utions, if any, are declared and paid by the fund, typically on an annual basis.
Other In the normal course of business, the fund enters into contracts that provide general indemnifications. The fund’s maximum exposure under these arrangements is dependent on claims that may be made against the fund in the future and, therefore, cannot be estimated; however, based on experience, the risk of material loss from such claims is considered remote.
NOTE 2 - INVESTMENT TRANSACTIONS
Consistent with its investment objective, the fund engages in the following practices to manage exposure to certain risks or enhance performance. The investment objective, policies, program, and risk factors of the fund are described more fully in the fund’s prospectus and Statement of Additional Information.
Futures Contracts During the year ended February 28, 2005, the fund was a party to futures contracts, which provide for the future sale by one party and purchase by another of a specified amount of a specific financial instrument at an agreed upon price, date, time, and place. Risks arise from possible illiquidity of the futures market and from movements in security values and interest rates.
Options Call and put options on futures contracts give the holder the right to purchase or sell, respectively, a particular futures contract at a specified price on a certain date. Risks arise from possible illiquidity of the options market and from movements in underlying futures prices. Transactions in options written and related premiums received during the year ended February 28, 2005, were as follows:
| | Number of | | |
| | Contracts | | Premiums |
| Outstanding at beginning of period | – | $ | – |
| Written | 60 | | 41,000 |
| Closed | (60) | | (41,000) |
| Outstanding at end of period | – | $ | – |
Other Purchases and sales of portfolio securities, other than short-term securities, aggregated $26,318,000 and $22,504,000, respectively, for the year ended February 28, 2005.
NOTE 3 - FEDERAL INCOME TAXES
No provision for federal income taxes is required since the fund intends to continue to qualify as a regulated investment company under Subchapter M of the Internal Revenue Code and distribute to shareholders all of its income and gains. Federal income tax regulations differ from generally accepted accounting principles; therefore, distributions determined in accordance with tax regulations may differ significantly in amount or character from net investment income and realized gains for financial reporting purposes. Financial reporting records are adjusted for permanent book/tax differences to reflect tax character. Financial records are not adjusted for temporary differences.
Distributions during the year ended February 28, 2005, totaled $3,763,000 and were characterized as tax-exempt income for tax purposes. At February 28, 2005, the tax-basis components of net assets were as follows:
| Unrealized appreciation | $ | 5,905,000 |
| Unrealized depreciation | | (440,000) |
| Net unrealized appreciation (depreciation) | | 5,465,000 |
| Undistributed tax-exempt income | | 4,000 |
| Capital loss carryforwards | | (205,000) |
| Paid-in capital | | 91,275,000 |
| Net assets | $ | 96,539,000 |
Federal income tax regulations require the fund to defer recognition of capital losses realized on certain covered option and futures transactions; accordingly, $345,000 of realized losses reflected in the accompanying financial statements have not been recognized for tax purposes as of February 28, 2005. The fund intends to retain realized gains to the extent of available capital loss carryforwards for federal income tax purposes. During the fiscal year ended February 28, 2005, the fund utilized $6,000 of capital loss carryforwards. As of February 28, 2005, the fund had $187,000 of capital loss carryforwards that expire in fiscal 2009, and $18,000 that expire fiscal 2010.
For the year ended February 28, 2005, the fund recorded the following permanent reclassifications to reflect tax character. Reclassifications between income and gain relate primarily to differences between book / tax amortization policies. Results of operations and net assets were not affected by these reclassifications.
| Undistributed net investment income | $ | (1,000) |
| Undistributed net realized gain | | 1,000 |
At February 28, 2005, the cost of investments for federal income tax purposes was $89,890,000.
NOTE 4 - RELATED PARTY TRANSACTIONS
The fund is managed by T. Rowe Price Associates, Inc. (the manager or Price Associates), a wholly owned subsidiary of T. Rowe Price Group, Inc. The investment management agreement between the fund and the manager provides for an annual investment management fee, which is computed daily and paid monthly. The fee consists of an individual fund fee, equal to 0.10% of the fund’s average daily net assets, and the fund’s pro-rata share of a group fee. The group fee is calculated based on the combined net assets of certain mutual funds sponsored by Price Associates (the group) applied to a graduated fee schedule, with rates ranging from 0.48% for the first $1 billion of assets to 0.295% for assets in excess of $120 billion. The fund’s portion of the group fee is determined by the ratio of its average daily net assets to those of the group. At February 28, 2005, the effective annual group fee rate was 0.31% .
The fund is also subject to a contractual expense limitation through February 28, 2003. During the limitation period, the manager is required to waive its management fee and reimburse the fund for any expenses, excluding interest, taxes, brokerage commissions, and extraordinary expenses, that would otherwise cause the fund’s ratio of total expenses to average net assets (expense ratio) to exceed its expense limitation of 0.65% . Through February 28, 2005, the fund is required to repay the manager for expenses previously reimbursed and management fees waived to the extent its net assets have grown or expenses have declined sufficiently to allow repayment without causing the fund’s expense ratio to exceed its expense limitation. Pursuant to this agreement, at February 28, 2005, there were no amounts subject to repayment by the fund.
In addition, the fund has entered into service agreements with Price Associates and a wholly owned subsidiary of Price Associates (collectively, Price). Price Associates computes the daily share price and maintains the financial records of the fund. T. Rowe Price Services, Inc., provides shareholder and administrative services in its capacity as the fund’s transfer and dividend disbursing agent. For the year ended February 28, 2005, expenses incurred pursuant to these service agreements were $64,000 for Price Associates and $41,000 for T. Rowe Price Services. The total amount payable at period end pursuant to these service agreements is reflected as due to affiliates in the accompanying financial statements.
| REPORT OF INDEPENDENT REGISTERED PUBLIC ACCOUNTING FIRM |
To the Board of Directors of T. Rowe Price State Tax-Free Income Trust and Shareholders of T. Rowe Price Georgia Tax-Free Bond Fund
In our opinion, the accompanying statement of assets and liabilities, including the portfolio of investments, and the related statements of operations and of changes in net assets and the financial highlights present fairly, in all material respects, the financial position of T. Rowe Price Georgia Tax-Free Bond Fund (one of the portfolios comprising T. Rowe Price State Tax-Free Income Trust, hereafter referred to as the “Fund”) at February 28, 2005, the results of its operations for the year then ended, the changes in its net assets for each of the two years in the period then ended and the financial highlights for each of the five years in the period then ended, in conformity with accounting principles generally accepted in the United States of America. These financial statements and financial highlights (hereafter referred to as “financial statements”) are the responsibility of the Fund’s management; our responsibility is to express an opinion on these financial s tatements based on our audits. We conducted our audits of these financial statements in accordance with the auditing standards of the Public Company Accounting Oversight Board (United States). Those standards require that we plan and perform the audit to obtain reasonable assurance about whether the financial statements are free of material misstatement. An audit includes examining, on a test basis, evidence supporting the amounts and disclosures in the financial statements, assessing the accounting principles used and significant estimates made by management, and evaluating the overall financial statement presentation. We believe that our audits, which included confirmation of securities at February 28, 2005, by correspondence with the custodian and brokers, provide a reasonable basis for our opinion.
| PricewaterhouseCoopers LLP |
| Baltimore, Maryland |
| April 11, 2005 |
| |
| TAX INFORMATION (UNAUDITED) FOR THE TAX YEAR ENDED 2/28/05 |
We are providing this information as required by the Internal Revenue Code. The amounts shown may differ from those elsewhere in this report because of differences between tax and financial reporting requirements.
The fund’s distributions to shareholders included $3,737,000 which qualified as exempt-interest dividends.
| INFORMATION ON PROXY VOTING POLICIES, PROCEDURES, AND RECORDS |
A description of the policies and procedures used by T. Rowe Price funds and portfolios to determine how to vote proxies relating to portfolio securities is available in each fund’s Statement of Additional Information, which you may request by calling 1-800-225-5132 or by accessing the SEC’s Web site, www.sec.gov. The description of our proxy voting policies and procedures is also available on our Web site, www.troweprice.com. To access it, click on the words “Company Info” at the top of our homepage for individual investors. Then, in the window that appears, click on the “Proxy Voting Policy” navigation button in the top left corner.
Each fund’s most recent annual proxy voting record is available on our Web site and through the SEC’s Web site. To access it through our Web site, follow the directions above, then click on the words “Proxy Voting Record” at the bottom of the Proxy Voting Policy page.
| HOW TO OBTAIN QUARTERLY PORTFOLIO HOLDINGS |
The fund files a complete schedule of portfolio holdings with the Securities and Exchange Commission for the first and third quarters of each fiscal year on Form N-Q. The fund’s Form N-Q is available electronically on the SEC’s Web site (www.sec.gov); hard copies may be reviewed and copied at the SEC’s Public Reference Room, 450 Fifth St. N.W., Washington, DC 20549. For more information on the Public Reference Room, call 1-800-SEC-0330.
| ABOUT THE FUND’S TRUSTEES AND OFFICERS |
Your fund is governed by a Board of Trustees that meets regularly to review investments, performance, expenses, and other business matters, and is responsible for protecting the interests of shareholders. The majority of the fund’s trustees are independent of T. Rowe Price Associates, Inc. (T. Rowe Price); “inside” trustees are officers of T. Rowe Price. The Board of Trustees elects the fund’s officers, who are listed in the final table. The business address of each trustee and officer is 100 East Pratt Street, Baltimore, MD 21202. The Statement of Additional Information includes additional information about the fund trustees and is available without charge by calling a T. Rowe Price representative at 1-800-225-5132.
| Independent Trustees | |
| |
| Name | |
| (Year of Birth) | Principal Occupation(s) During Past 5 Years and |
| Year Elected* | Directorships of Other Public Companies |
| |
| Anthony W. Deering | Chairman, Exeter Capital, LLC, a private investment firm (2004 to pre- |
| (1945) | sent); Director, Chairman of the Board, and Chief Executive Officer, |
| 1986 | The Rouse Company, real estate developers (1997 to 2004); Director, |
| | Mercantile Bank (4/03 to present) |
| |
| Donald W. Dick, Jr. | Principal, EuroCapital Advisors, LLC, an acquisition and management |
| (1943) | advisory firm; Chairman, President, and Chief Executive Officer, |
| 2001 | The Haven Group, a custom manufacturer of modular homes |
| | (1/04 to present) |
| |
| David K. Fagin | Chairman and President, Nye Corporation (6/88 to present); Director, |
| (1938) | Canyon Resources Corporation, Golden Star Resources Ltd. (5/00 to |
| 2001 | present), and Pacific Rim Mining Corporation (2/02 to present) |
| |
| Karen N. Horn | Managing Director and President, Global Private Client Services, |
| (1943) | Marsh Inc. (1999 to 2003); Managing Director and Head of |
| 2003 | International Private Banking, Bankers Trust (1996 to 1999); |
| | Director, Eli Lilly and Company and Georgia Pacific (5/04 to present) |
| |
| F. Pierce Linaweaver | President, F. Pierce Linaweaver & Associates, Inc., consulting environ- |
| (1934) | mental and civil engineers |
| 1986 | |
| |
| John G. Schreiber | Owner/President, Centaur Capital Partners, Inc., a real estate invest- |
| (1946) | ment company; Partner, Blackstone Real Estate Advisors, L.P.; |
| 1992 | Director, AMLI Residential Properties Trust and The Rouse Company, |
| | real estate developers |
| |
| * Each independent trustee oversees 112 T. Rowe Price portfolios and serves until retirement, resignation, or elec- |
| tion of a successor. | |
| | |
| Inside Trustees | |
| |
| Name | |
| (Year of Birth) | |
| Year Elected* | |
| [Number of T. Rowe Price | Principal Occupation(s) During Past 5 Years and |
| Portfolios Overseen] | Directorships of Other Public Companies |
| |
| Mary J. Miller, CFA | Director and Vice President, T. Rowe Price; Vice President, T. Rowe |
| (1955) | Price Group, Inc.; President, State Tax-Free Income Trust |
| 2004 | |
| [38] | |
| |
| James S. Riepe | Director and Vice President, T. Rowe Price; Vice Chairman of the |
| (1943) | Board, Director, and Vice President, T. Rowe Price Group, Inc.; |
| 1986 | Chairman of the Board and Director, T. Rowe Price Global Asset |
| [112] | Management Limited, T. Rowe Price Global Investment Services |
| | Limited, T. Rowe Price Investment Services, Inc., T. Rowe Price |
| | Retirement Plan Services, Inc., and T. Rowe Price Services, Inc.; |
| | Chairman of the Board, Director, President, and Trust Officer, |
| | T. Rowe Price Trust Company; Director, T. Rowe Price International, |
| | Inc.; Chairman of the Board, State Tax-Free Income Trust |
| |
| *Each inside trustee serves until retirement, resignation, or election of a successor. |
| | |
| Officers | |
| |
| Name (Year of Birth) | |
| Title and Fund(s) Served | Principal Occupation(s) |
| |
| Stephen V. Booth, CPA (1961) | Vice President, T. Rowe Price, T. Rowe Price |
| Vice President, State Tax-Free Income Trust | Group, Inc., and T. Rowe Price Trust Company |
| |
| Linda A. Brisson (1959) | Vice President, T. Rowe Price and T. Rowe Price |
| Vice President, State Tax-Free Income Trust | Group, Inc. |
| |
| Steven G. Brooks, CFA (1954) | Vice President, T. Rowe Price and T. Rowe Price |
| Vice President, State Tax-Free Income Trust | Group, Inc. |
| |
| Joseph A. Carrier, CPA (1960) | Vice President, T. Rowe Price, T. Rowe Price |
| Treasurer, State Tax-Free Income Trust | Group, Inc., T. Rowe Price Investment Services, |
| | Inc., and T. Rowe Price Trust Company |
| |
| Jonathan M. Chirunga (1966) | Vice President, T. Rowe Price; formerly |
| Vice President, State Tax-Free Income Trust | Municipal Credit Analyst/Associate Director, |
| | Standard & Poor’s Rating Services (to 2001) |
| | |
| Maria H. Condez (1962) | Assistant Vice President, T. Rowe Price |
| Assistant Vice President, State Tax-Free | |
| Income Trust | |
| |
| G. Richard Dent (1960) | Vice President, T. Rowe Price and T. Rowe Price |
| Vice President, State Tax-Free Income Trust | Group, Inc.; formerly Deputy General Counsel, |
| | ACA Financial Guaranty Corporation (to 2001) |
| |
| Roger L. Fiery III, CPA (1959) | Vice President, T. Rowe Price, T. Rowe Price |
| Vice President, State Tax-Free Income Trust | Group, Inc., T. Rowe Price International, Inc., |
| | and T. Rowe Price Trust Company |
| |
| John R. Gilner (1961) | Chief Compliance Officer and Vice President, |
| Chief Compliance Officer, State Tax-Free | T. Rowe Price; Vice President, T. Rowe Price |
| Income Trust | Group, Inc., and T. Rowe Price Investment |
| | Services, Inc. |
| |
| Gregory S. Golczewski (1966) | Vice President, T. Rowe Price and T. Rowe Price |
| Vice President, State Tax-Free Income Trust | Trust Company |
| |
| Charles B. Hill, CFA (1961) | Vice President, T. Rowe Price and T. Rowe Price |
| Executive Vice President, State Tax-Free | Group, Inc. |
| Income Trust | |
| |
| Henry H. Hopkins (1942) | Director and Vice President, T. Rowe Price |
| Vice President, State Tax-Free Income Trust | Investment Services, Inc., T. Rowe Price |
| | Services, Inc., and T. Rowe Price Trust |
| | Company; Vice President, T. Rowe Price, |
| | T. Rowe Price Group, Inc., T. Rowe Price |
| | International, Inc., and T. Rowe Price |
| | Retirement Plan Services, Inc. |
| |
| T. Dylan Jones (1971) | Assistant Vice President, T. Rowe Price |
| Assistant Vice President, State Tax-Free | |
| Income Trust | |
| |
| Philip J. Kligman, CFA (1974) | Assistant Vice President, T. Rowe Price |
| Assistant Vice President, State Tax-Free | |
| Income Trust | |
| |
| Marcy M. Lash (1963) | Vice President, T. Rowe Price and T. Rowe Price |
| Vice President, State Tax-Free Income Trust | Group, Inc. |
| | |
| Alan D. Levenson, Ph.D. (1958) | Vice President, T. Rowe Price and T. Rowe Price |
| Vice President, State Tax-Free Income Trust | Group, Inc. |
| |
| Patricia B. Lippert (1953) | Assistant Vice President, T. Rowe Price and |
| Secretary, State Tax-Free Income Trust | T. Rowe Price Investment Services, Inc. |
| |
| Joseph K. Lynagh, CFA (1958) | Vice President, T. Rowe Price and T. Rowe Price |
| Executive Vice President, State Tax-Free | Group, Inc. |
| Income Trust | |
| |
| Konstantine B. Mallas (1963) | Vice President, T. Rowe Price and T. Rowe Price |
| Executive Vice President, State Tax-Free | Group, Inc. |
| Income Trust | |
| |
| James M. McDonald (1949) | Vice President, T. Rowe Price, T. Rowe Price |
| Vice President, State Tax-Free Income Trust | Group, Inc., and T. Rowe Price Trust Company |
| |
| Hugh D. McGuirk, CFA (1960) | Vice President, T. Rowe Price and T. Rowe Price |
| Executive Vice President, State Tax-Free | Group, Inc. |
| Income Trust | |
| |
| Timothy G. Taylor, CFA (1975) | Assistant Vice President, T. Rowe Price |
| Assistant Vice President, State Tax-Free | |
| Income Trust | |
| |
| Julie L. Waples (1970) | Vice President, T. Rowe Price |
| Vice President, State Tax-Free Income Trust | |
| |
| Edward A. Wiese, CFA (1959) | Vice President, T. Rowe Price, T. Rowe Price |
| Vice President, State Tax-Free Income Trust | Group, Inc., and T. Rowe Price Trust Company; |
| | Chief Investment Officer, Director, and Vice |
| | President, T. Rowe Price Savings Bank |
| |
| Unless otherwise noted, officers have been employees of T. Rowe Price or T. Rowe Price International for at least |
| five years. | |
Item 2. Code of Ethics.
The registrant has adopted a code of ethics, as defined in Item 2 of Form N-CSR, applicable to its principal executive officer, principal financial officer, principal accounting officer or controller, or persons performing similar functions. A copy of this code of ethics is filed as an exhibit to this Form N-CSR. No substantive amendments were approved or waivers were granted to this code of ethics during the period covered by this report.
Item 3. Audit Committee Financial Expert.
The registrant’s Board of Directors/Trustees has determined that Mr. David K. Fagin qualifies as an audit committee financial expert, as defined in Item 3 of Form N-CSR. Mr. Fagin is considered independent for purposes of Item 3 of Form N-CSR.
Item 4. Principal Accountant Fees and Services.
(a) – (d) Aggregate fees billed to the registrant for the last two fiscal years for professional services rendered by the registrant’s principal accountant were as follows:
| | 2005 | 2004 |
| Audit Fees | $6,860 | $7,993 |
| Audit-Related Fees | 781 | 682 |
| Tax Fees | 1,997 | 2,228 |
| All Other Fees | - | 124 |
Audit fees include amounts related to the audit of the registrant’s annual financial statements and services normally provided by the accountant in connection with statutory and regulatory filings. Audit-related fees include amounts reasonably related to the performance of the audit of the registrant’s financial statements, specifically the issuance of a report on internal controls. Tax fees include amounts related to tax compliance, tax planning, and tax advice. Other fees include the registrant’s pro-rata share of amounts for agreed-upon procedures in conjunction with service contract approvals by the registrant’s Board of Directors/Trustees.
(e)(1) The registrant’s audit committee has adopted a policy whereby audit and non-audit services performed by the registrant’s principal accountant for the registrant, its investment adviser, and any entity controlling, controlled by, or under common control with the investment adviser that provides ongoing services to the registrant require pre-approval in advance at regularly scheduled audit committee meetings. If such a service is required between regularly scheduled audit committee meetings, pre-approval may be authorized by one audit committee member with ratification at the next scheduled audit committee meeting. Waiver of pre-approval for audit or non-audit services requiring fees of a de minimis amount is not permitted.
(2) No services included in (b) – (d) above were approved pursuant to paragraph (c)(7)(i)(C) of Rule 2-01 of Regulation S-X.
(f) Less than 50 percent of the hours expended on the principal accountant’s engagement to audit the registrant’s financial statements for the most recent fiscal year were attributed to work performed by persons other than the principal accountant’s full-time, permanent employees.
(g) The aggregate fees billed for the most recent fiscal year and the preceding fiscal year by the registrant’s principal accountant for non-audit services rendered to the registrant, its investment adviser, and any entity controlling, controlled by, or under common control with the investment adviser that provides ongoing services to the registrant were $903,000 and $821,000, respectively, and were less than the aggregate fees billed for those same periods by the registrant’s principal accountant for audit services rendered to the T. Rowe Price Funds.
(h) All non-audit services rendered in (g) above were pre-approved by the registrant’s audit committee. Accordingly, these services were considered by the registrant’s audit committee in maintaining the principal accountant’s independence.Item 5. Audit Committee of Listed Registrants.
Not applicable.
Item 6. Schedule of Investments.
Not applicable. The complete schedule of investments is included in Item 1 of this Form N-CSR.
Item 7. Disclosure of Proxy Voting Policies and Procedures for Closed-End Management Investment Companies.
Not applicable.
Item 8. Portfolio Managers of Closed-End Management Investment Companies.
Not applicable.
Item 9. Purchases of Equity Securities by Closed-End Management Investment Company and Affiliated Purchasers.
Not applicable.
Item 10. Submission of Matters to a Vote of Security Holders.
Not applicable.
Item 11. Controls and Procedures.
(a) The registrant’s principal executive officer and principal financial officer have evaluated the registrant’s disclosure controls and procedures within 90 days of this filing and have concluded that the registrant’s disclosure controls and procedures were effective, as of that date, in ensuring that information required to be disclosed by the registrant in this Form N-CSR was recorded, processed, summarized, and reported timely.
(b) The registrant’s principal executive officer and principal financial officer are aware of no change in the registrant’s internal control over financial reporting that occurred during the registrant’s second fiscal quarter covered by this report that has materially affected, or is reasonably likely to materially affect, the registrant’s internal control over financial reporting.
Item 12. Exhibits.
(a)(1) The registrant’s code of ethics pursuant to Item 2 of Form N-CSR is attached.
(2) Separate certifications by the registrant's principal executive officer and principal financial officer, pursuant to Section 302 of the Sarbanes-Oxley Act of 2002 and required by Rule 30a-2(a) under the Investment Company Act of 1940, are attached.
(3) Written solicitation to repurchase securities issued by closed-end companies: not applicable.
(b) A certification by the registrant's principal executive officer and principal financial officer, pursuant to Section 906 of the Sarbanes-Oxley Act of 2002 and required by Rule 30a-2(b) under the Investment Company Act of 1940, is attached.SIGNATURES
Pursuant to the requirements of the Securities Exchange Act of 1934 and the Investment Company Act of 1940, the registrant has duly caused this report to be signed on its behalf by the undersigned, thereunto duly authorized.
T. Rowe Price State Tax-Free Income Trust
| By | /s/ James S. Riepe |
| | James S. Riepe |
| | Principal Executive Officer |
| |
| Date | April 15, 2005 |
Pursuant to the requirements of the Securities Exchange Act of 1934 and the Investment Company Act of 1940, this report has been signed below by the following persons on behalf of the registrant and in the capacities and on the dates indicated.
| By | /s/ James S. Riepe |
| | James S. Riepe |
| | Principal Executive Officer |
| |
| Date | April 15, 2005 |
| |
| |
| |
| By | /s/ Joseph A. Carrier |
| | Joseph A. Carrier |
| | Principal Financial Officer |
| |
| Date | April 15, 2005 |