Item 1: Report to Shareholders| Maryland Short-Term Tax-Free Bond Fund | February 28, 2006 |
The views and opinions in this report were current as of February 28, 2006. They are not guarantees of performance or investment results and should not be taken as investment advice. Investment decisions reflect a variety of factors, and the managers reserve the right to change their views about individual stocks, sectors, and the markets at any time. As a result, the views expressed should not be relied upon as a forecast of the fund’s future investment intent. The report is certified under the Sarbanes-Oxley Act of 2002, which requires mutual funds and other public companies to affirm that, to the best of their knowledge, the information in their financial reports is fairly and accurately stated in all material respects.
REPORTS ON THE WEB
Sign up for our E-mail Program, and you can begin to receive updated fund reports and prospectuses online rather than through the mail. Log in to your account at troweprice.com for more information.
Fellow ShareholdersBonds in general produced modest returns over the last year, although tax-free bonds surpassed their taxable counterparts in both the 6- and 12-month periods ended February 28, 2006. In the last six months, bond yields rose across all maturities as the Federal Reserve raised short-term interest rates to a level not seen in more than four years. The central bank has now lifted the federal funds target rate 14 times in the last 20 months. Long-term and lower-quality municipal securities turned in the best performance during the funds’ fiscal year. The Maryland Tax-Free Funds produced positive returns that reflected the challenging interest rate environment.
MARKET ENVIRONMENT
Despite some weakness in the fourth quarter of 2005, the U.S. economy was generally healthy over the last 12 months. Job growth was steady, unemployment slipped below 5%, and the red-hot housing market began to cool. Inflation increased partly because of rising energy costs, though recent declines in oil, natural gas, and gasoline prices from their post-Hurricane Katrina peaks have helped ease fears of a significant acceleration of inflation throughout the economy.
Nevertheless, central bank officials acknowledged that rising employment and capacity utilization trends and a renewed increase in energy costs have the potential to push inflation higher. In response, the Federal Reserve—now led by Ben Bernanke following Alan Greenspan’s retirement at the end of January—raised the federal funds target rate from 3.50% to 4.50% in four quarter-point increments during the second half of our fiscal year.
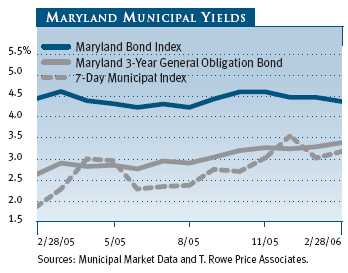
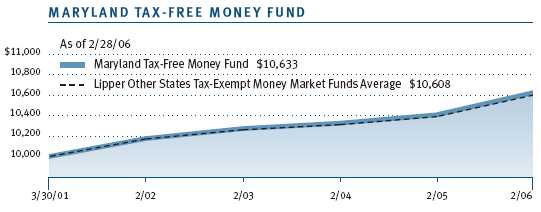
As shown in the graph, Maryland municipal money market and the three-year general obligation bond yields rose significantly over the past 12 months, while the yield on the longer-term Maryland Bond Index narrowly declined. The taxable bond market experienced similar trends, but municipal bonds outperformed their taxable counterparts both before and after tax. For example, in the 6- and 12-month periods ended February 28, the Lehman Brothers Municipal Bond Index returned 0.99% and 3.87%, respectively, versus -0.11% and 2.74% for the taxable Lehman Brothers U.S. Aggregate Index.
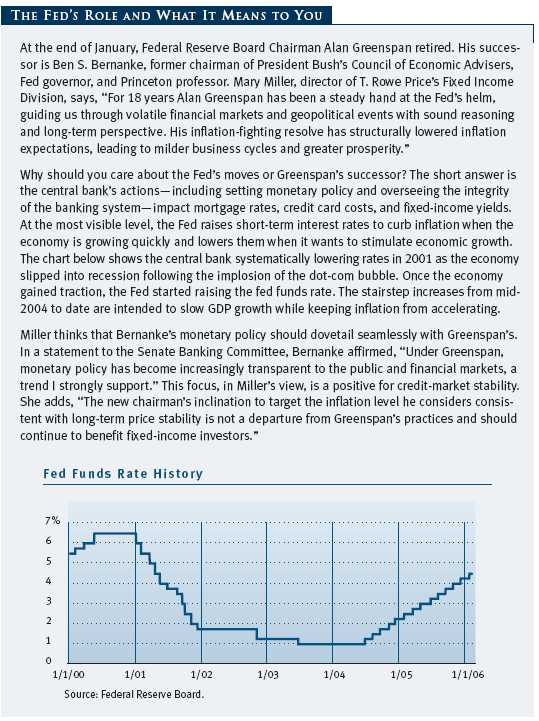
In recent months, there have been growing signs that the end of the Fed’s tightening program may be in sight. According to the minutes and the post-meeting statement for the Fed’s mid-December monetary policy meeting, central bank officials no longer consider monetary policy to be “accommodative,” and they believe that the number of additional interest rate increases “probably would not be large.” In addition, the Treasury yield curve was inverted for most of the last two months, as 10-year yields slipped below two-year yields. Such inversions—which are rare because long-term rates are usually higher than short-term rates to compensate investors for lending money for longer periods—sometimes precede a period of slower economic growth. The municipal yield curve maintained a positive slope but continued to flatten, with only a one-percentage-point difference between municipal money market yields and 30-year municipal bond yields at the end of our reporting period.
MUNICIPAL MARKET NEWS
New municipal borrowing in 2005 totaled a record of more than $400 billion. Nearly half of new issuance was refunding debt, as issuers refinanced older, high-coupon debt to lower their overall interest costs. Despite heavy issuance, demand for tax-free securities remained strong, thanks greatly to institutional investors, hedge funds, and various non-traditional buyers of municipals. Credit quality in the municipal market remains good, as state governments are flush with cash due to better-than-expected tax collections stemming from a strong economy. Given higher interest rates, reduced refunding activity, and stronger state tax revenues, municipal issuance in 2006 seems likely to be less robust.
Lower-quality municipal securities outperformed investment-grade issues in the last six months, as yield-hungry investors sought more speculative investments. Airline bonds did well as major carriers have been taking steps to stabilize their cost structures, though the sector is susceptible to higher fuel costs. Tobacco bonds—which are backed by payments from tobacco companies to the states through the Master Settlement Agreement (MSA)—also performed well, helped by the federal government’s failed bid to reinstate a $280 billion penalty against the tobacco industry and the Illinois Supreme Court’s overturning of an unfavorable ruling against cigarette maker Altria. In the investment-grade sector, BBB and A rated hospital bonds performed extremely well as investors sought their yield advantage. Housing-related bonds also did well as prepayment activity diminished amid rising interest rates.
MARYLAND MARKET NEWS
Maryland’s economy continued to fare well compared with other states. The state’s unemployment rate was 3.6% in January 2006, much better than the national unemployment rate of 4.7%. However, employment growth, which was strongest in the educational and health sciences sectors, was 1.3% between January 2005 and January 2006, compared to 2.0% growth for the nation. Maryland continued to demonstrate strong income levels, ranking fourth among the states in per capita personal income; personal income growth was also strong versus the national averages.
For the fiscal year ended June 30, 2005, Maryland’s general fund earned a budgetary surplus of $377 million or 3%, substantially outperforming the prior year. All major sources of revenue (personal and corporate income taxes and sales and use taxes) showed healthy increases indicating the broad nature of Maryland’s participation in the recovering national economy. As of June 30, 2005, the undesignated general fund surplus balance and state reserve fund stood at $938 million, a healthy 8% of general fund revenues.
For the six months ended December 31, 2005, the first half of fiscal 2006, general fund revenues are running 6% ahead of the same period one year ago, and another healthy surplus year is expected. Maryland is currently working on its fiscal 2007 budget and is contemplating a 5% increase in general fund revenues. While the governor has proposed higher expenditure growth and effectively spending down prior-year surpluses, a solid reserve position will be maintained. By allowing expenditure growth in excess of revenue growth, a budget gap of $1 billion is possible in fiscal 2009 and will need to be addressed. In comparison with other states, Maryland’s reserve position has always been strong, and we take comfort in the state’s long history of responsible stewardship. Maryland’s general obligation bonds are rated Aaa, AAA, and AAA by Moody’s Investors Service, Standard & Poor’s, and Fitch Rating Service, respectively, and each of the rating agencies carries a stable outlook.
PERFORMANCE AND PORTFOLIO STRATEGIESMaryland Tax-Free Money Fund
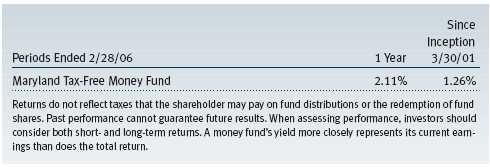
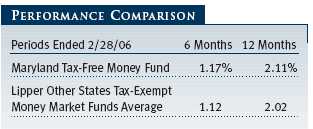
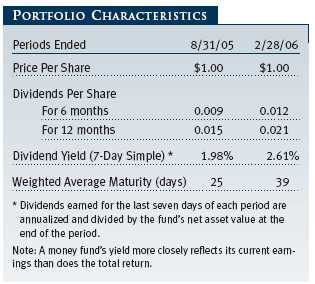
The Maryland Tax-Free Money Fund outperformed its peers during the 6- and 12-month periods ended February 28, 2006, with returns of 1.17% and 2.11%, respectively, versus the Lipper average of 1.12% and 2.02%. Money fund investors benefited from rising yields in response to continued tightening by the Federal Reserve. Since our August report, the fund’s seven-day simple yield has moved up 63 basis points (0.63%) to 2.61%. Fund yields should continue rising until the Fed signals a clear end to this round of monetary tightening.
The steady drumbeat of rate increases by the Federal Reserve has created an environment in which money market yields have become increasingly competitive versus the rest of the fixed-income market. As the Fed continues to push short rates higher and the yield curve continues to flatten, money market rates have begun to approach, and in some cases exceed, those available to investors in intermediate-term securities. This development has not been lost on municipal money market investors who have pushed total industry assets to record levels.
The move toward higher rates has affected the money market portion of the yield curve most significantly. Twelve months ago, the fed funds rate stood at 2.50% and the one-year Libor (a short-term taxable benchmark) was quoted at 3.53%. Municipal overnight yields were 1.79%, and one-year notes traded at 2.35%. Today, with the fed funds rate at 4.50% and one-year Libor quoted at 5.15%, municipal overnight rates are yielding 2.97% and one-year notes 3.40%. These rate increases translate into higher yields for money market fund investors.
As interest rates have moved higher, it has been to our advantage to manage the fund with a weighted average maturity (WAM) substantially shorter than normal. Over the past six-month period, the fund’s WAM averaged 37 days. Importantly, the municipal money market curve has not experienced the same flattening as the taxable money market; the spread from overnight to one year remained fairly constant at around 38 basis points. Relative to our peer group, we maintained a lower allocation to the overnight (variable-rate) portion of our curve, investing instead in somewhat longer-dated maturities.
With demand for municipal money market securities growing, the relative attractiveness of municipal yields compared with taxable alternatives continues to recede to more normal levels. In 2002 and 2003, municipal yields were 90% to 100% of the yields on comparable taxable investments. However, over the past year, this percentage has declined to about 75%, and we expect to see it fall a bit further, to a more typical level near 72%.
With the forward market pricing in at least two more quarter-point rate increases by the Federal Reserve, we continue to maintain the defensive posture that has served us well over the past year. Some early signs of slowing in the housing market suggest that the Fed’s monetary restraint may finally be having an impact. We will remain attuned for further signs of economic slowing, which could indicate the end of—or at least a pause in—rate hikes is at hand.
Maryland Short-Term Tax-Free Bond Fund
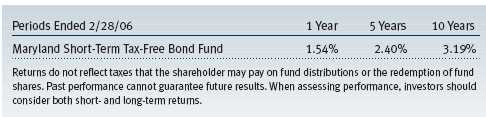
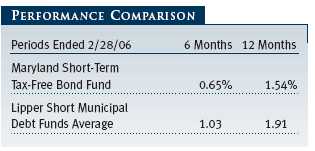
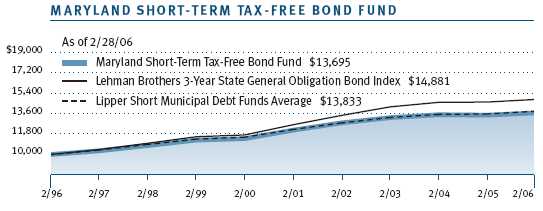
The Maryland Short-Term Tax-Free Bond Fund returned 0.65% and 1.54% for the 6- and 12-month periods ended February 28, 2006, respectively. The portfolio’s results trailed the Lipper Short Municipal Debt Funds Average by 38 basis points (a basis point equals 0.01%) for the past six months and a similar amount for the year. Unlike money market funds, which were able to quickly take advantage of higher short-term rates, and long-term funds, which also performed well because long-term rates actually fell, short-term municipal securities bore the brunt of the Fed’s tightening and performed poorly in the face of rising short-term municipal yields.

Over the last six months, the front end of the yield curve remained under pressure as the Federal Reserve increased the federal funds rate in four quarter-point increments to 4.50%. Short-term municipal yields moved higher in sympathy although not as much as similar-maturity taxable bonds. Higher interest rates helped the fund’s income offset principal losses, which led to modestly positive returns for the 6- and 12-month periods. Unfortunately, the portfolio’s results fell short of our peer group. In fact, the Lipper Short Municipal Debt Funds Average’s return was similar to the national average for tax-exempt money funds, which highlights how focused on very short-term securities many other short-term bond funds had become during this period of rising short-term rates.
Our strategy over the past six months was similar to that in the prior reporting period. We generally kept the portfolio’s duration—a measure of interest rate sensitivity—shorter than its benchmark and held a considerable amount of variable-rate, money market-type investments, which constituted approximately one-third of the portfolio at the end of the reporting period. Another aspect of our strategy was to increase the portfolio’s distributed yield. This involved selling bonds with losses and reinvesting the proceeds at higher rates to increase the income paid out to shareholders. Over the past six months, the fund’s 30-day dividend yield is up about 30 basis points, while the SEC’s standardized yield, or yield to maturity, rose by 40 basis points.

Moving forward, we believe there is considerably more value in the short-term portion of the municipal yield curve than there has been for the past few years. The Fed has increased the fed funds rate from 1% to 4.5%, and short-term municipal rates have moved up accordingly. Most market participants believe the Fed is near the end of its tightening cycle. The Treasury yield curve is inverted, and the municipal curve has flattened to roughly 100 basis points. In our view, these conditions make short-term municipals considerably more favorable than they have been over the past year.
Maryland Tax-Free Bond Fund
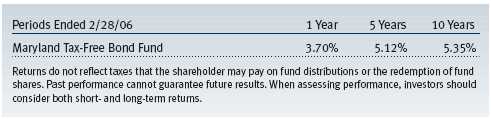
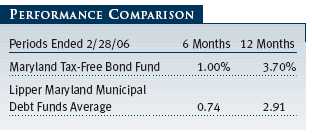
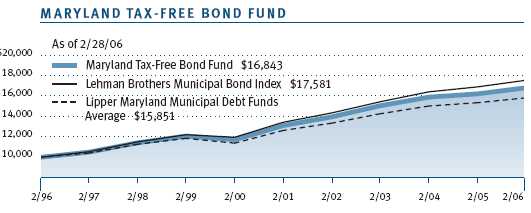
The Maryland Tax-Free Bond Fund delivered surprisingly good returns for a year in which the Federal Reserve raised short-term rates two full percentage points—usually a negative for bonds. Your fund’s 6- and 12-month returns of 1.00% and 3.70%, respectively, surpassed the Lipper peer group’s corresponding average returns of 0.74% and 2.91%.
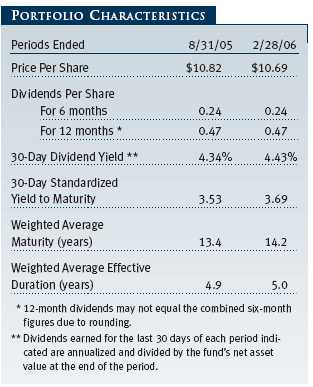
The fund’s net asset value at the end of February was $10.69, down $0.13 over the past 12 months, while the income distribution for the period was $0.47 per share. We were able to keep the income payout the same as in the prior year, which nudged the fund’s 30-day dividend yield up to 4.43% at the end of the reporting period. Our positive absolute and relative results reflected some structural decisions, the solid performance of lower-rated credits, the surge in debt refunding that occurred in 2005, and finally the important positive tailwind we get from our low expenses, especially in a low-return environment. With yields still comparatively low from a historical perspective, low expenses are an important and sustainable advantage for the fund that allows us to pass through more income to you as a shareholder.
Since our midyear shareholder letter, dated August 31, 2005, we focused our new cash flow and reinvestment proceeds on bonds maturing in 20 years or more. Rather than “ladder” the portfolio (similar allocations in short-, intermediate-, and long-term holdings), we structured the portfolio like a “barbell” by emphasizing short- and long-term securities at the expense of intermediate-term issues. This strategy worked in our favor, because intermediate-term bonds lagged, as the municipal yield curve continued to flatten, and longer-term bonds provided excellent relative returns. Although we pared back some of our intermediate-term holdings during the period, our remaining positions underperformed longer-maturity holdings. As a result of this activity, the fund’s average maturity lengthened to 14.2 years from 13.4 years six months ago.
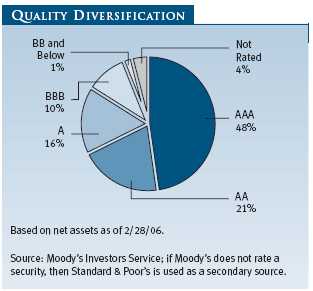
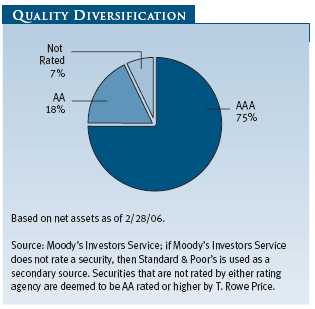
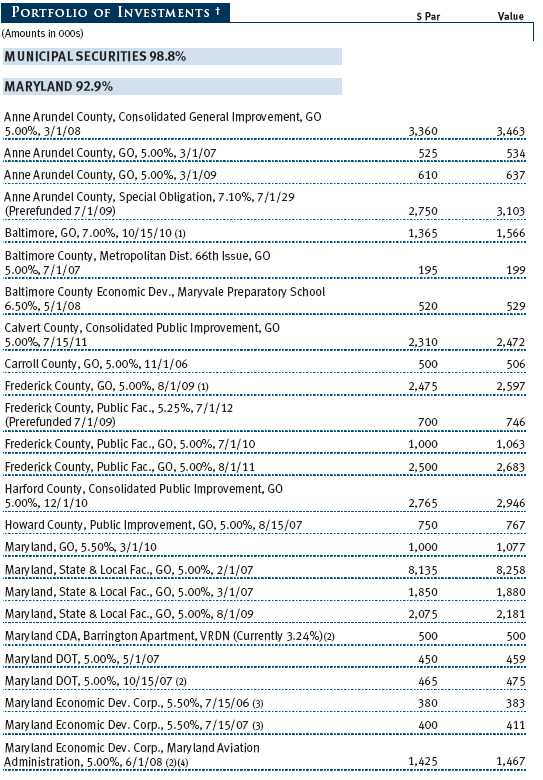
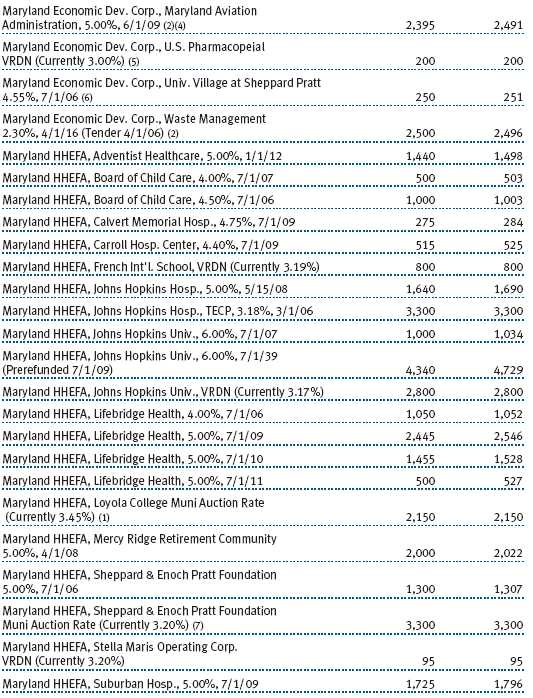
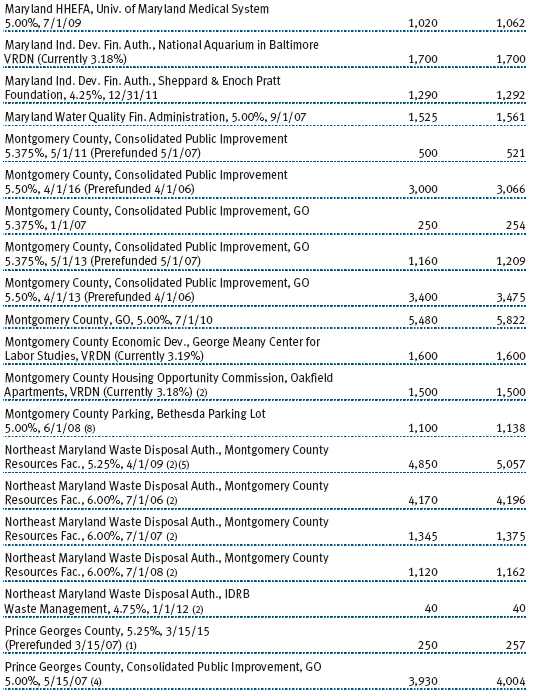
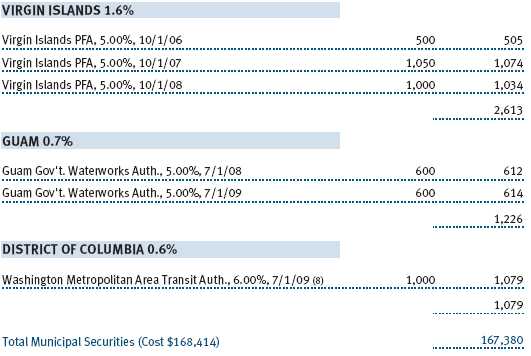
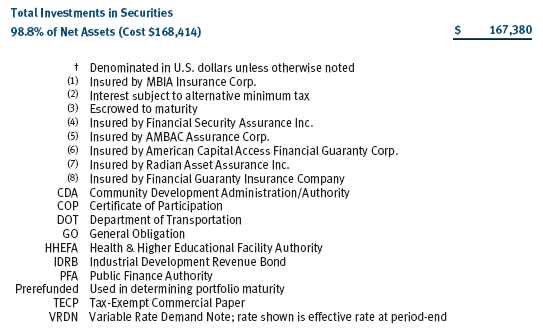
The portfolio’s overall credit quality remained very high, and 86% of the portfolio is invested in credits rated A or higher. When opportunities arose, however, we purchased some lower-quality, investment-grade bonds and several below investment-grade credits, to capture their yield advantage over insured and higher-quality issues. Notable recent additions include bonds issued by Loyola College (A rated) and the Maryland Institute College of Art (rated BBB+). These higher-yielding credits performed well as spreads tightened and the fundamentals of the underlying projects improved. We also added senior and subordinate bonds (rated AAA and BB+, respectively) issued by Baltimore to finance the construction of the Baltimore Convention Center Hotel next to Camden Yards. Most of these holdings have long maturities, but their additional yield helps offset the higher volatility, and we believe these are excellent long-term portfolio additions. In contrast, some of our highest-quality portfolio holdings—notably five- and seven-year bonds—were among the laggards for the period. (Please see the portfolio of investments for a complete listing of the fund’s holdings and the amount each represents in the portfolio.)
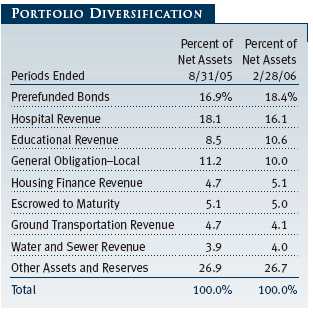
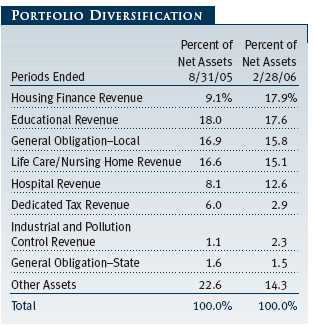
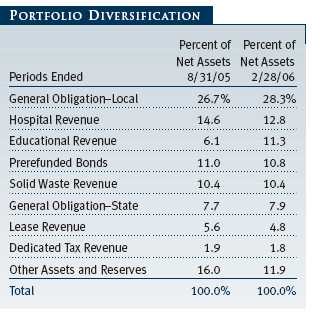
The portfolio benefited from the heavy refinancing activity in 2005, and several of our holdings were refunded and appreciated nicely over the past six months. For example, an approximately 3% stake in hospital credits—including a sizable position in the University of Maryland Medical System—was refunded to an early call date this fall. Though we added several positions in the hospital sector and some prerefunded holdings matured, the net effect of this activity raised our prerefunded bonds exposure to 18.4% from 16.9%, and lowered our hospital weighting to 16.1% from 18.1% at the conclusion of our reporting period.
OUTLOOK
Despite the approaching end of the Federal Reserve’s tightening cycle, the taxable and municipal bond markets do not appear poised to rally after a year of moderate returns in 2005. In fact, given the strong U.S. economy and the current level of interest rates, bond yields may climb modestly. In general, we believe 2006 will be a transition year as interest rates settle into some higher ranges and yield spreads widen for those taking more risk. The good news for municipal investors will be higher tax-free income, especially from shorter-term bonds. Inflation will be a key driver of interest rates as we wait to see whether the rise in energy prices feeds through into core inflation, which has remained notably restrained to date.
We see good value in municipal bonds, which offer yields only slightly below taxable Treasury bond yields even after providing good relative returns this past year. This makes them an especially appealing option for those in higher tax brackets. We will continue to use our proprietary research to uncover the best credit opportunities in order to invest in attractive income-producing investments that we believe will perform well.Respectfully submitted,

Joseph K. Lynagh
Chairman of the Investment Advisory Committee
Maryland Tax-Free Money Fund

Charles B. Hill
Chairman of the Investment Advisory Committee
Maryland Short-Term Tax-Free Bond Fund

Hugh D. McGuirk
Chairman of the Investment Advisory Committee
Maryland Tax-Free Bond Fund
March 22, 2006
Each committee chairman has day-to-day responsibility for managing the portfolio and works with committee members in developing and executing each fund’s investment programs.
RISKS OF FIXED-INCOME INVESTINGBonds are subject to interest rate risk (the decline in bond prices that usually accompanies a rise in interest rates) and credit risk (the chance that any fund holding could have its credit rating downgraded, or that a bond issuer will default by failing to make timely payments of interest or principal), potentially reducing the fund’s income level and share price. The Maryland Tax-Free Funds are less diversified than those investing nationally.
The money fund seeks to maintain a stable net asset value and provide an appropriate place for money between investments or during uncertain market conditions. An investment in the fund is not insured or guaranteed by the FDIC or any other government agency. Although the fund seeks to preserve the value of your investment at $1.00 per share, it is possible to lose money by investing in the fund.
GLOSSARY
Appropriation-backed bonds: Long-term obligations sold under a variety of financial arrangements—primarily lease-purchase and contractual service agreements used to finance capital projects. Debt service on such obligations is appropriated by the state legislature annually, but the legislature has no legal obligation to continue to make such appropriations.
Average maturity: The weighted average of the stated maturity dates of the portfolio’s securities. In general, the longer the average maturity, the greater the fund’s sensitivity to interest rate changes. A shorter average maturity usually means less interest rate sensitivity and therefore a less volatile portfolio.
Basis point: One one-hundredth of one percentage point, or 0.01%.
Duration: A measure of a bond fund’s sensitivity to changes in interest rates. For example, a fund with a duration of 5.0 years would fall about 5% in price in response to a one-percentage-point rise in interest rates, and vice versa.
Federal funds rate: The interest rate charged on overnight loans of reserves by one financial institution to another in the United States. The Federal Reserve sets a target federal funds rate to affect the direction of interest rates.
General obligation debt: A government’s strongest pledge that obligates its full faith and credit, including, if necessary, its ability to raise taxes.
Investment grade: High-quality bonds as measured by one of the major credit rating agencies. For example, Standard & Poor’s designates the bonds in its top four categories (AAA to BBB) as investment grade.
Lehman Brothers Municipal Bond Index: A broadly diversified index of tax-exempt bonds.
Lehman Brothers U.S. Aggregate Index: A broadly diversified index of investment-grade corporate, government, and mortgage securities.
Lipper averages: The averages of available mutual fund performance returns for specified time periods in defined categories by Lipper.Prerefunded bond: A bond that originally may have been issued as a general obligation or revenue bond but that is now secured by an escrow fund consisting entirely of direct U.S. government obligations that are sufficient for paying the bondholders.
Yield curve: A graph depicting the relationship between yields and maturity dates for a set of similar securities. These curves are in constant flux. One of the key activities in managing any fixed-income portfolio is to study the trends reflected by yield curves.
This chart shows the value of a hypothetical $10,000 investment in the fund over the past 10 fiscal year periods or since inception (for funds lacking 10-year records). The result is compared with benchmarks, which may include a broad-based market index and a peer group average or index. Market indexes do not include expenses, which are deducted from fund returns as well as mutual fund averages and indexes.
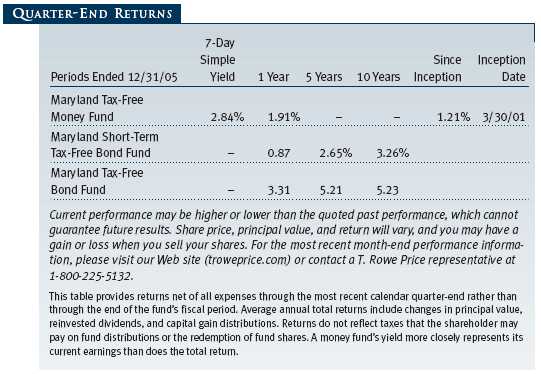
| AVERAGE ANNUAL COMPOUND TOTAL RETURN |
This table shows how the fund would have performed each year if its actual (or cumulative) returns for the periods shown had been earned at a constant rate.
This chart shows the value of a hypothetical $10,000 investment in the fund over the past 10 fiscal year periods or since inception (for funds lacking 10-year records). The result is compared with benchmarks, which may include a broad-based market index and a peer group average or index. Market indexes do not include expenses, which are deducted from fund returns as well as mutual fund averages and indexes.
| AVERAGE ANNUAL COMPOUND TOTAL RETURN |
This table shows how the fund would have performed each year if its actual (or cumulative) returns for the periods shown had been earned at a constant rate.
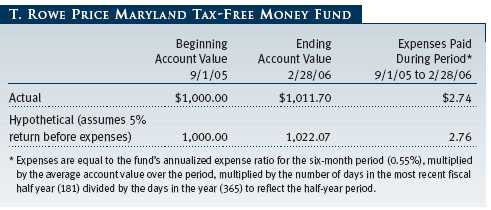
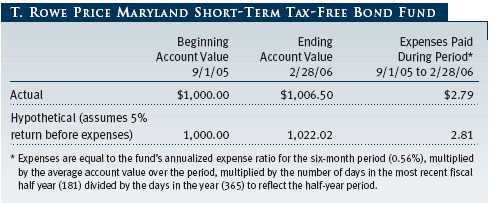
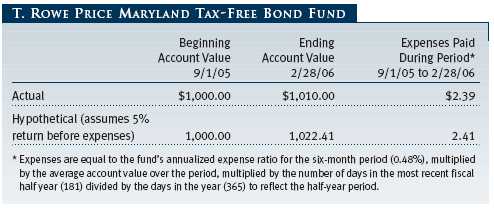
As a mutual fund shareholder, you may incur two types of costs: (1) transaction costs, such as redemption fees or sales loads, and (2) ongoing costs, including management fees, distribution and service (12b-1) fees, and other fund expenses. The following example is intended to help you understand your ongoing costs (in dollars) of investing in the fund and to compare these costs with the ongoing costs of investing in other mutual funds. The example is based on an investment of $1,000 invested at the beginning of the most recent six-month period and held for the entire period.
Actual Expenses
The first line of the following table (“Actual”) provides information about actual account values and actual expenses. You may use the information in this line, together with your account balance, to estimate the expenses that you paid over the period. Simply divide your account value by $1,000 (for example, an $8,600 account value divided by $1,000 = 8.6), then multiply the result by the number in the first line under the heading “Expenses Paid During Period” to estimate the expenses you paid on your account during this period.
Hypothetical Example for Comparison Purposes
The information on the second line of the table (“Hypothetical”) is based on hypothetical account values and expenses derived from the fund’s actual expense ratio and an assumed 5% per year rate of return before expenses (not the fund’s actual return). You may compare the ongoing costs of investing in the fund with other funds by contrasting this 5% hypothetical example and the 5% hypothetical examples that appear in the shareholder reports of the other funds. The hypothetical account values and expenses may not be used to estimate the actual ending account balance or expenses you paid for the period.
Note: T. Rowe Price charges an annual small-account maintenance fee of $10, generally for accounts with less than $2,000 ($500 for UGMA/UTMA). The fee is waived for any investor whose T. Rowe Price mutual fund accounts total $25,000 or more, accounts employing automatic investing, and IRAs and other retirement plan accounts that utilize a prototype plan sponsored by T. Rowe Price (although a separate custodial or administrative fee may apply to such accounts). This fee is not included in the accompanying table. If you are subject to the fee, keep it in mind when you are estimating the ongoing expenses of investing in the fund and when comparing the expenses of this fund with other funds.
You should also be aware that the expenses shown in the table highlight only your ongoing costs and do not reflect any transaction costs, such as redemption fees or sales loads. Therefore, the second line of the table is useful in comparing ongoing costs only and will not help you determine the relative total costs of owning different funds. To the extent a fund charges transaction costs, however, the total cost of owning that fund is higher.
The accompanying notes are an integral part of these financial statements.

The accompanying notes are an integral part of these financial statements.

The accompanying notes are an integral part of these financial statements.
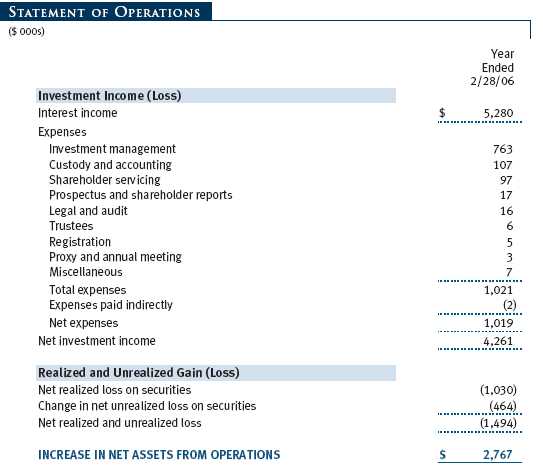
The accompanying notes are an integral part of these financial statements.
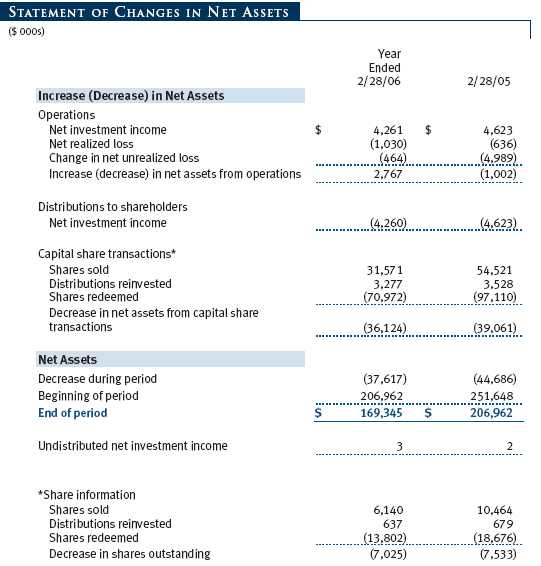
The accompanying notes are an integral part of these financial statements.
| NOTES TO FINANCIAL STATEMENTS |
NOTE 1 - SIGNIFICANT ACCOUNTING POLICIEST. Rowe Price State Tax-Free Income Trust (the trust) is registered under the Investment Company Act of 1940 (the 1940 Act). The Maryland Short-Term Tax-Free Bond Fund (the fund), a nondiversified, open-end management investment company, is one portfolio established by the trust. The fund commenced operations on January 29, 1993. The fund seeks to provide the highest level of income exempt from federal and Maryland state and local income taxes consistent with modest fluctuation in principal value.
The accompanying financial statements were prepared in accordance with accounting principles generally accepted in the United States of America, which require the use of estimates made by fund management. Fund management believes that estimates and security valuations are appropriate; however, actual results may differ from those estimates, and the security valuations reflected in the financial statements may differ from the value the fund ultimately realizes upon sale of the securities.
Valuation The fund values its investments and computes its net asset value per share at the close of the New York Stock Exchange (NYSE), normally 4 p.m. ET, each day that the NYSE is open for business. Debt securities are generally traded in the over-the-counter market. Securities are valued at prices furnished by dealers who make markets in such securities or by an independent pricing service, which considers yield or price of bonds of comparable quality, coupon, maturity, and type, as well as prices quoted by dealers who make markets in such securities.
Other investments, including restricted securities, and those for which the above valuation procedures are inappropriate or are deemed not to reflect fair value are stated at fair value as determined in good faith by the T. Rowe Price Valuation Committee, established by the fund’s Board of Trustees.
Credits The fund earns credits on temporarily uninvested cash balances at the custodian that reduce the fund’s custody charges. Custody expense in the accompanying financial statements is presented before reduction for credits, which are reflected as expenses paid indirectly.
Investment Transactions, Investment Income, and Distributions Income and expenses are recorded on the accrual basis. Premiums and discounts on debt securities are amortized for financial reporting purposes. Investment transactions are accounted for on the trade date.
Realized gains and losses are reported on the identified cost basis. Distributions to shareholders are recorded on the ex-dividend date. Income distributions are declared on a daily basis and paid monthly. Capital gain distributions, if any, are declared and paid by the fund, typically on an annual basis.
NOTE 2 - INVESTMENT TRANSACTIONS
Purchases and sales of portfolio securities, other than short-term securities, aggregated $76,078,000 and $119,632,000, respectively, for the year ended February 28, 2006.
NOTE 3 - FEDERAL INCOME TAXES
No provision for federal income taxes is required since the fund intends to continue to qualify as a regulated investment company under Subchapter M of the Internal Revenue Code and distribute to shareholders all of its income and gains. Federal income tax regulations differ from generally accepted accounting principles; therefore, distributions determined in accordance with tax regulations may differ significantly in amount or character from net investment income and realized gains for financial reporting purposes. Financial reporting records are adjusted for permanent book/tax differences to reflect tax character. Financial records are not adjusted for temporary differences.
Distributions during the year ended February 28, 2006, totaled $4,260,000 and were characterized as tax-exempt income for tax purposes. At February 28, 2006, the tax-basis components of net assets were as follows:
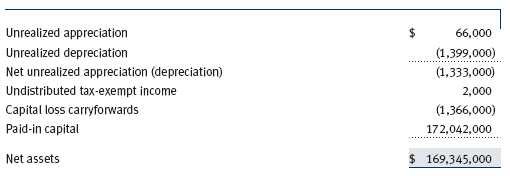
The fund intends to retain realized gains to the extent of available capital loss carryforwards for federal income tax purposes. As of February 28, 2006, the fund had $537,000 of capital loss carryforwards that expire in fiscal 2013 and $829,000 that expire in fiscal 2014.
At February 28, 2006, the cost of investments for federal income tax purposes was $168,713,000.
NOTE 4 - RELATED PARTY TRANSACTIONS
The fund is managed by T. Rowe Price Associates, Inc. (the manager or Price Associates), a wholly owned subsidiary of T. Rowe Price Group, Inc. The investment management agreement between the fund and the manager provides for an annual investment management fee, which is computed daily and paid monthly. The fee consists of an individual fund fee, equal to 0.10% of the fund’s average daily net assets, and a group fee. The group fee rate is calculated based on the combined net assets of certain mutual funds sponsored by Price Associates (the group) applied to a graduated fee schedule, with rates ranging from 0.48% for the first $1 billion of assets to 0.29% for assets in excess of $160 billion. Prior to May 1, 2005, the maximum group fee rate in the graduated fee schedule had been 0.295% for assets in excess of $120 billion. The fund’s group fee is determined by applying the group fee rate to the fund’s average daily net assets. At February 28, 2006, the effective annual gr oup fee rate was 0.31%.
In addition, the fund has entered into service agreements with Price Associates and a wholly owned subsidiary of Price Associates (collectively, Price). Price Associates computes the daily share price and provides certain other administrative services to the fund. T. Rowe Price Services, Inc., provides shareholder and administrative services in its capacity as the fund’s transfer and dividend disbursing agent. For the year ended February 28, 2006, expenses incurred pursuant to these service agreements were $65,000 for Price Associates and $64,000 for T. Rowe Price Services. The total amount payable at period end pursuant to these service agreements is reflected as Due to Affiliates in the accompanying financial statements.
| REPORT OF INDEPENDENT REGISTERED PUBLIC ACCOUNTING FIRM |
To the Board of Trustees of T. Rowe Price State Tax-Free Income Trust and Shareholders of T. Rowe Price Maryland Short-Term Tax-Free Bond FundIn our opinion, the accompanying statement of assets and liabilities, including the portfolio of investments, and the related statements of operations and of changes in net assets and the financial highlights present fairly, in all material respects, the financial position of T. Rowe Price Maryland Short-Term Tax-Free Bond Fund (one of the portfolios comprising T. Rowe Price State Tax-Free Income Trust, hereafter referred to as the “Fund”) at February 28, 2006, the results of its operations for the year then ended, the changes in its net assets for each of the two years in the period then ended and the financial highlights for each of the five years in the period then ended, in conformity with accounting principles generally accepted in the United States of America. These financial statements and financial highlights (hereafter referred to as “financial statements”) are the responsibility of the Fund’s management; our responsibility is to express an opinion on the se financial statements based on our audits. We conducted our audits of these financial statements in accordance with the standards of the Public Company Accounting Oversight Board (United States). Those standards require that we plan and perform the audit to obtain reasonable assurance about whether the financial statements are free of material misstatement. An audit includes examining, on a test basis, evidence supporting the amounts and disclosures in the financial statements, assessing the accounting principles used and significant estimates made by management, and evaluating the overall financial statement presentation. We believe that our audits, which included confirmation of securities at February 28, 2006 by correspondence with the custodian, provide a reasonable basis for our opinion.
PricewaterhouseCoopers LLP
Baltimore, Maryland
April 10, 2006
| TAX INFORMATION (2>UNAUDITED) FOR THE TAX YEAR ENDED 2/28/06 |
We are providing this information as required by the Internal Revenue Code. The amounts shown may differ from those elsewhere in this report because of differences between tax and financial reporting requirements.
The fund’s distributions to shareholders included $4,269,000 which qualified as exempt-interest dividends.
| INFORMATION ON PROXY VOTING POLICIES, PROCEDURES, AND RECORDS |
A description of the policies and procedures used by T. Rowe Price funds and portfolios to determine how to vote proxies relating to portfolio securities is available in each fund’s Statement of Additional Information, which you may request by calling 1-800-225-5132 or by accessing the SEC’s Web site, www.sec.gov. The description of our proxy voting policies and procedures is also available on our Web site, www.troweprice.com. To access it, click on the words “Company Info” at the top of our homepage for individual investors. Then, in the window that appears, click on the “Proxy Voting Policy” navigation button in the top left corner.
Each fund’s most recent annual proxy voting record is available on our Web site and through the SEC’s Web site. To access it through our Web site, follow the directions above, then click on the words “Proxy Voting Record” at the bottom of the Proxy Voting Policy page.
| HOW TO OBTAIN QUARTERLY PORTFOLIO HOLDINGS |
The fund files a complete schedule of portfolio holdings with the Securities and Exchange Commission for the first and third quarters of each fiscal year on Form N-Q. The fund’s Form N-Q is available electronically on the SEC’s Web site (www.sec.gov); hard copies may be reviewed and copied at the SEC’s Public Reference Room, 450 Fifth St. N.W., Washington, DC 20549. For more information on the Public Reference Room, call 1-800-SEC-0330.
| ABOUT THE FUND’S TRUSTEES AND OFFICERS |
Your fund is governed by a Board of Trustees that meets regularly to review performance, investment programs, compliance matters, advisory fees and expenses, service providers, and other business matters, and is responsible for protecting the interests of shareholders. At least 75% of the fund’s trustees are independent of T. Rowe Price Associates, Inc. (T. Rowe Price); “inside” trustees are officers of T. Rowe Price. The Board of Trustees elects the fund’s officers, who are listed in the final table. The business address of each trustee and officer is 100 East Pratt Street, Baltimore, MD 21202. The Statement of Additional Information includes additional information about the fund trustees and is available without charge by calling a T. Rowe Price representative at 1-800-225-5132.
| Independent Trustees | |
| |
| Name | |
| (Year of Birth) | |
| Year Elected * | |
| [Number of T. Rowe Price | Principal Occupation(s) During Past 5 Years and Directorships of |
| Portfolios Overseen] | Other Public Companies |
| |
| Anthony W. Deering | Chairman, Exeter Capital, LLC, a private investment firm (2004 to pres- |
| (1945) | ent); Director, Vornado Real Estate Investment Trust (3/04 to present); |
| 1986 | Director, Mercantile Bankshares (4/03 to present); Member, Advisory |
| [113] | Board, Deutsche Bank North America (2004 to present); Director, |
| | Chairman of the Board, and Chief Executive Officer, The Rouse |
| | Company, real estate developers (1997 to 2004) |
| |
| Donald W. Dick, Jr. | Principal, EuroCapital Advisors, LLC, an acquisition and manage- |
| (1943) | ment advisory firm; Chairman, President, and Chief Executive Officer, |
| 2001 | The Haven Group, a custom manufacturer of modular homes (1/04 |
| [113] | to present) |
| |
| David K. Fagin | Chairman and President, Nye Corporation (6/88 to present); Director, |
| (1938) | Canyon Resources Corp. and Golden Star Resources Ltd. (5/92 to |
| 2001 | present), and Pacific Rim Mining Corp. (2/02 to present) |
| [113] | |
| |
| Karen N. Horn | Managing Director and President, Global Private Client Services, Marsh |
| (1943) | Inc. (1999 to 2003); Managing Director and Head of International |
| 2003 | Private Banking, Bankers Trust (1996 to 1999); Director, Georgia |
| [113] | Pacific, Eli Lilly and Company, and Simon Property Group |
| |
| Theo C. Rodgers | President, A&R Development Corporation |
| (1941) | |
| 2005 | |
| [97] | |
| John G. Schreiber | Owner/President, Centaur Capital Partners, Inc., a real estate investment |
| (1946) | company; Partner, Blackstone Real Estate Advisors, L.P.; Director, AMLI |
| 1992 | Residential Properties Trust |
| [113] | |
| |
| * Each independent trustee serves until retirement, resignation, or election of a successor. |
| |
| |
| Inside Trustees | |
| |
| Name | |
| (Year of Birth) | |
| Year Elected * | |
| [Number of T. Rowe Price | Principal Occupation(s) During Past 5 Years and Directorships of |
| Portfolios Overseen] | Other Public Companies |
| |
| Mary J. Miller | Director and Vice President, T. Rowe Price; Vice President, T. Rowe |
| (1955) | Price Group, Inc.; President, State Tax-Free Income Trust |
| 2004 | |
| [37] | |
| |
| James S. Riepe | Chairman of the Board and Director, T. Rowe Price Investment Services, |
| (1943) | Inc.; Director, T. Rowe Price Group, Inc.; Chairman of the Board, all funds |
| 1986 | |
| [113] | |
| |
| *Each inside trustee serves until retirement, resignation, or election of a successor. |
| Officers | |
| |
| Name (Year of Birth) | |
| Title and Fund(s) Served | Principal Occupation(s) |
| |
| Steven G. Brooks, CFA (1954) | Vice President, T. Rowe Price and T. Rowe Price |
| Vice President, State Tax-Free Income Trust | Group, Inc. |
| Joseph A. Carrier, CPA (1960) | Vice President, T. Rowe Price, T. Rowe Price |
| Treasurer, State Tax-Free Income Trust | Group, Inc., T. Rowe Price Investment Services, |
| | Inc., and T. Rowe Price Trust Company |
| |
| Jonathan M. Chirunga (1966) | Vice President, T. Rowe Price |
| Vice President, State Tax-Free Income Trust | |
| |
| M. Helena Condez (1962) | Assistant Vice President, T. Rowe Price |
| Assistant Vice President, State Tax-Free | |
| Income Trust | |
| |
| G. Richard Dent (1960) | Vice President, T. Rowe Price and T. Rowe Price |
| Vice President, State Tax-Free Income Trust | Group, Inc. |
| |
| Roger L. Fiery III, CPA (1959) | Vice President, T. Rowe Price, T. Rowe Price |
| Vice President, State Tax-Free Income Trust | Group, Inc., T. Rowe Price International, Inc., |
| | and T. Rowe Price Trust Company |
| |
| John R. Gilner (1961) | Chief Compliance Officer and Vice President, |
| Chief Compliance Officer, State Tax-Free | T. Rowe Price; Vice President, T. Rowe Price Group, |
| Income Trust | Inc., and T. Rowe Price Investment Services, Inc. |
| |
| Gregory S. Golczewski (1966) | Vice President, T. Rowe Price and T. Rowe Price |
| Vice President, State Tax-Free Income Trust | Trust Company |
| |
| Charles B. Hill, CFA (1961) | Vice President, T. Rowe Price and T. Rowe Price |
| Executive Vice President, State Tax-Free | Group, Inc. |
| Income Trust | |
| |
| Henry H. Hopkins (1942) | Director and Vice President, T. Rowe Price |
| Vice President, State Tax-Free Income Trust | Investment Services, Inc., T. Rowe Price |
| | Services, Inc., and T. Rowe Price Trust |
| | Company; Vice President, T. Rowe Price, |
| | T. Rowe Price Group, Inc., T. Rowe Price |
| | International, Inc., and T. Rowe Price |
| | Retirement Plan Services, Inc. |
| |
| T. Dylan Jones (1971) | Assistant Vice President, T. Rowe Price |
| Assistant Vice President, State Tax-Free | |
| Income Trust | |
| Philip J. Kligman, CFA (1974) | Assistant Vice President, T. Rowe Price |
| Assistant Vice President, State Tax-Free | |
| Income Trust | |
| |
| Marcy M. Lash (1963) | Vice President, T. Rowe Price and T. Rowe Price |
| Vice President, State Tax-Free Income Trust | Group, Inc. |
| |
| Alan D. Levenson, Ph.D. (1958) | Vice President, T. Rowe Price and T. Rowe Price |
| Vice President, State Tax-Free Income Trust | Group, Inc. |
| |
| Patricia B. Lippert (1953) | Assistant Vice President, T. Rowe Price and |
| Secretary, State Tax-Free Income Trust | T. Rowe Price Investment Services, Inc. |
| |
| Joseph K. Lynagh, CFA (1958) | Vice President, T. Rowe Price and T. Rowe Price |
| Executive Vice President, State Tax-Free | Group, Inc. |
| Income Trust | |
| |
| Konstantine B. Mallas (1963) | Vice President, T. Rowe Price and T. Rowe Price |
| Executive Vice President, State Tax-Free | Group, Inc. |
| Income Trust | |
| |
| James M. McDonald (1949) | Vice President, T. Rowe Price, T. Rowe Price |
| Vice President, State Tax-Free Income Trust | Group, Inc., and T. Rowe Price Trust Company |
| |
| Hugh D. McGuirk, CFA (1960) | Vice President, T. Rowe Price and T. Rowe Price |
| Executive Vice President, State Tax-Free | Group, Inc. |
| Income Trust | |
| |
| Linda A. Murphy (1959) | Vice President, T. Rowe Price and T. Rowe Price |
| Vice President, State Tax-Free Income Trust | Group, Inc. |
| |
| Timothy G. Taylor, CFA (1975) | Assistant Vice President, T. Rowe Price |
| Assistant Vice President, State Tax-Free | |
| Income Trust | |
| |
| Julie L. Waples (1970) | Vice President, T. Rowe Price |
| Vice President, State Tax-Free Income Trust | |
| |
| Unless otherwise noted, officers have been employees of T. Rowe Price or T. Rowe Price International for at |
| least five years. | |
Item 2. Code of Ethics.The registrant has adopted a code of ethics, as defined in Item 2 of Form N-CSR, applicable to its principal executive officer, principal financial officer, principal accounting officer or controller, or persons performing similar functions. A copy of this code of ethics is filed as an exhibit to this Form N-CSR. No substantive amendments were approved or waivers were granted to this code of ethics during the period covered by this report.
Item 3. Audit Committee Financial Expert.
The registrant’s Board of Directors/Trustees has determined that Mr. Donald W. Dick Jr. qualifies as an audit committee financial expert, as defined in Item 3 of Form N-CSR. Mr. Dick is considered independent for purposes of Item 3 of Form N-CSR.
Item 4. Principal Accountant Fees and Services.
(a) – (d) Aggregate fees billed to the registrant for the last two fiscal years for professional services rendered by the registrant’s principal accountant were as follows:
| | 2006 | 2005 |
| Audit Fees | $7,824 | $7,082 |
| Audit-Related Fees | 637 | 808 |
| Tax Fees | 2,226 | 2,062 |
| All Other Fees | 419 | - |
Audit fees include amounts related to the audit of the registrant’s annual financial statements and services normally provided by the accountant in connection with statutory and regulatory filings. Audit-related fees include amounts reasonably related to the performance of the audit of the registrant’s financial statements and specifically include the issuance of a report on internal controls. Tax fees include amounts related to services for tax compliance, tax planning, and tax advice. The nature of these services specifically includes the review of distribution calculations and the preparation of Federal, state, and excise tax returns. All other fees include the registrant’s pro-rata share of amounts for agreed-upon procedures in conjunction with service contract approvals by the registrant’s Board of Directors/Trustees.
(e)(1) The registrant’s audit committee has adopted a policy whereby audit and non-audit services performed by the registrant’s principal accountant for the registrant, its investment adviser, and any entity controlling, controlled by, or under common control with the investment adviser that provides ongoing services to the registrant require pre-approval in advance at regularly scheduled audit committee meetings. If such a service is required between regularly scheduled audit committee meetings, pre-approval may be authorized by one audit committee member with ratification at the next scheduled audit committee meeting. Waiver of pre-approval for audit or non-audit services requiring fees of a de minimis amount is not permitted.
(2) No services included in (b) – (d) above were approved pursuant to paragraph (c)(7)(i)(C) of Rule 2-01 of Regulation S-X.
(f) Less than 50 percent of the hours expended on the principal accountant’s engagement to audit the registrant’s financial statements for the most recent fiscal year were attributed to work performed by persons other than the principal accountant’s full-time, permanent employees.
(g) The aggregate fees billed for the most recent fiscal year and the preceding fiscal year by the registrant’s principal accountant for non-audit services rendered to the registrant, its investment adviser, and any entity controlling, controlled by, or under common control with the investment adviser that provides ongoing services to the registrant were $1,008,000 and $903,000, respectively, and were less than the aggregate fees billed for those same periods by the registrant’s principal accountant for audit services rendered to the T. Rowe Price Funds.
(h) All non-audit services rendered in (g) above were pre-approved by the registrant’s audit committee. Accordingly, these services were considered by the registrant’s audit committee in maintaining the principal accountant’s independence.Item 5. Audit Committee of Listed Registrants.
Not applicable.
Item 6. Schedule of Investments.
Not applicable. The complete schedule of investments is included in Item 1 of this Form N-CSR.
Item 7. Disclosure of Proxy Voting Policies and Procedures for Closed-End Management Investment Companies.
Not applicable.
Item 8. Portfolio Managers of Closed-End Management Investment Companies.
Not applicable.
Item 9. Purchases of Equity Securities by Closed-End Management Investment Company and Affiliated Purchasers.
Not applicable.
Item 10. Submission of Matters to a Vote of Security Holders.
Not applicable.
Item 11. Controls and Procedures.
(a) The registrant’s principal executive officer and principal financial officer have evaluated the registrant’s disclosure controls and procedures within 90 days of this filing and have concluded that the registrant’s disclosure controls and procedures were effective, as of that date, in ensuring that information required to be disclosed by the registrant in this Form N-CSR was recorded, processed, summarized, and reported timely.
(b) The registrant’s principal executive officer and principal financial officer are aware of no change in the registrant’s internal control over financial reporting that occurred during the registrant’s second fiscal quarter covered by this report that has materially affected, or is reasonably likely to materially affect, the registrant’s internal control over financial reporting.
Item 12. Exhibits.
(a)(1) The registrant’s code of ethics pursuant to Item 2 of Form N-CSR is attached.
(2) Separate certifications by the registrant's principal executive officer and principal financial officer, pursuant to Section 302 of the Sarbanes-Oxley Act of 2002 and required by Rule 30a-2(a) under the Investment Company Act of 1940, are attached.
(3) Written solicitation to repurchase securities issued by closed-end companies: not applicable.
(b) A certification by the registrant's principal executive officer and principal financial officer, pursuant to Section 906 of the Sarbanes-Oxley Act of 2002 and required by Rule 30a-2(b) under the Investment Company Act of 1940, is attached.
| | |
SIGNATURES |
| |
| | Pursuant to the requirements of the Securities Exchange Act of 1934 and the Investment |
| Company Act of 1940, the registrant has duly caused this report to be signed on its behalf by the |
| undersigned, thereunto duly authorized. |
| |
| T. Rowe Price State Tax-Free Income Trust |
| |
| By | /s/ James S. Riepe |
| | James S. Riepe |
| | Principal Executive Officer |
| |
| Date | April 13, 2006 |
| |
| |
| | Pursuant to the requirements of the Securities Exchange Act of 1934 and the Investment |
| Company Act of 1940, this report has been signed below by the following persons on behalf of |
| the registrant and in the capacities and on the dates indicated. |
| |
| |
| By | /s/ James S. Riepe |
| | James S. Riepe |
| | Principal Executive Officer |
| |
| Date | April 13, 2006 |
| |
| |
| |
| By | /s/ Joseph A. Carrier |
| | Joseph A. Carrier |
| | Principal Financial Officer |
| |
| Date | April 13, 2006 |