Item 1: Report to Shareholders| New York Tax-Free Bond Fund | February 28, 2007 |
The views and opinions in this report were current as of February 28, 2007. They are not guarantees of performance or investment results and should not be taken as investment advice. Investment decisions reflect a variety of factors, and the managers reserve the right to change their views about individual stocks, sectors, and the markets at any time. As a result, the views expressed should not be relied upon as a forecast of the fund’s future investment intent. The report is certified under the Sarbanes-Oxley Act, which requires mutual funds and other public companies to affirm that, to the best of their knowledge, the information in their financial reports is fairly and accurately stated in all material respects.
REPORTS ON THE WEB
Sign up for our E-mail Program, and you can begin to receive updated fund reports and prospectuses online rather than through the mail. Log in to your account at troweprice.com for more information.
Fellow ShareholdersBonds produced moderate returns in the one-year period ended February 28, 2007, helped by price appreciation stemming from a six-month decline in longer-term interest rates. Believing that moderating economic growth would allow inflation pressures to ease, the Federal Reserve left the fed funds target rate unchanged at 5.25%, the level reached last June. Investors seeking higher yields and returns helped long-term bonds outpace short-term issues and lower-quality municipals outperform higher-quality issues. In this environment, the New York Tax-Free Money Fund and the New York Tax-Free Bond Fund enjoyed solid returns that compared favorably with their benchmarks.
HIGHLIGHTS
• Tax-free bonds produced moderate returns, helped by price appreciation stemming from a six-month decline in longer-term interest rates.
• The New York Tax-Free Money and Tax-Free Bond Funds outpaced their respective Lipper benchmarks for the 6- and 12-month periods ended February 28, 2007.
• Yield spreads between U.S. Treasuries and comparable municipal issues are at historically narrow levels, and both funds are positioning themselves to take advantage of the eventual widening of these spreads.
• We anticipate a more vigorous economy by the end of 2007, little or no Fed easing this year, and a bond market with interest rates remaining in a fairly limited range.
MARKET ENVIRONMENT
Economic growth moderated during 2006, thanks in part to a significantly cooler housing market, softer manufacturing activity, and elevated energy costs. According to the most recent economic data, the nation’s gross domestic product (GDP) slowed to an annualized rate of 2.2% in the fourth quarter of 2006 compared with a very robust 5.6% in the first quarter.
The overall rate of inflation eased somewhat as oil and gas prices declined from their peaks last summer, but “core” inflation, which excludes food and energy prices, has remained slightly above the comfort zone of Federal Reserve officials. Despite leaving the fed funds target rate unchanged after a two-year period of regular increases, Fed officials are vigilantly watching prices and labor costs and have left open the possibility of additional rate increases if inflation pressures do not wane as they expect.
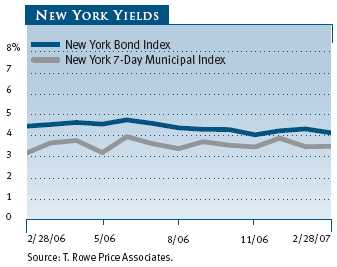
As shown in the graph, New York municipal money market and bond yields declined slightly from their peaks in June 2006. In the general municipal market, short- and intermediate-term rates edged higher, but long-term rates declined, resulting in the outperformance of long-term securities and a continued flattening of the municipal yield curve. At the end of February, yields of the highest-quality municipal securities with maturities of 10 years or less were practically the same regardless of maturity, and the difference between tax-free money market yields and tax-free 30-year bond yields decreased to approximately 40 basis points (100 basis points equal one percentage point)—an extraordinary and historically narrow gap.
In the taxable bond market, the Treasury yield curve remained inverted, as short-term rates were fairly steady while intermediate- and long-term interest rates, which were already lower than short-term rates, declined in the last six months. The resulting price appreciation helped taxable securities outperform their tax-free counterparts—a reversal of the pattern of recent years. In the six-month period ended February 28, 2007, the Lehman Brothers U.S. Aggregate Index returned 3.66% compared with 2.89% for the Lehman Brothers Municipal Bond Index. For the 12-month period, the taxable index generated a 5.54% return compared with a 4.96% return for the municipal index.
MUNICIPAL MARKET NEWS
New municipal issuance in 2006 amounted to more than $383 billion, the second highest yearly total and slightly less than the record $408 billion in 2005, according to The Bond Buyer. Fourth-quarter supply was much stronger than expected, as municipalities took advantage of falling long-term interest rates in the last six months of 2006. Issuance remained strong in the first two months of 2007. Despite the dropping rates, demand for tax-free securities from traditional investors (such as mutual funds and individual investors) and from nontraditional investors (including hedge funds and foreign buyers) has been supportive. Credit conditions have remained favorable, and the fiscal health of municipalities is still very encouraging. If the economy cools significantly, the credit cycle could be approaching a near-term peak.
Long-term municipals outperformed shorter-term issues in the last six months as well as during our fiscal year. Despite the diminishing yield advantage provided by high-yield over investment-grade securities, high-yield securities maintained their performance advantage, as investors seeking higher returns continued to embrace risk. However, as lower-quality bond valuations reached more expensive levels, the magnitude of their outperformance has been dwindling.
Tobacco bonds, backed by payments from tobacco companies to the states through the Master Settlement Agreement (MSA), continued to perform well. The sector has been driven recently by mostly favorable court rulings and credit rating agency outlooks, but, in recent months, tobacco bonds’ performance advantage has been diminishing. Housing finance revenue bonds also performed very well for most of the period, as this higher-yielding sector benefited from generally low interest rate volatility. Hospital revenue bonds continued their winning streak, but their extended valuations make us cautious. On the other hand, prerefunded bonds lagged, as investors seeking higher yields favored higher-risk, lower-quality securities.
NEW YORK MARKET NEWS
New York’s economic expansion is expected to moderate, and its future rate of growth may lag the nation’s. The state continues to benefit from job growth in the greater New York City region. New York expects to close fiscal year 2007 with a general fund surplus of approximately $1.5 billion. Newly elected governor Eliot Spitzer presented his 2008 budget that called for $53.3 billion in general fund spending and $120.6 in spending from all funds. Growing nondiscretionary expenses, such as Medicaid, public employee retirement and health care, and debt service, are putting pressure on the state budget. Since New York’s highest court ordered the state to provide $1.9 billion in additional annual funding to New York City schools, concerns about this case’s impact on the state budget have eased because the figure is less than those in earlier court rulings. Nevertheless, the state’s structural budget imbalances, which occur when projected revenues do not cover projected expenses, remain large for future years.
New York’s net tax-supported debt load remains high at $49.5 billion, according to Moody’s Investors Service. New York’s debt per capita ($2,569) and debt as a percentage of personal income (6.7%) measures are the fifth highest in the country. The majority of the state’s tax-supported debt is “appropriation backed,” meaning that debt service must be appropriated annually, but the state legislature has no legal obligation to make such appropriations. Voters must approve the state’s direct debt, and the state government resorted to using appropriation-backed debt as “back-door borrowing” to avoid seeking voter approval. New York’s credit ratings have not changed in the past year. The state’s general obligation debt is rated Aa3 by Moody’s Investors Service, AA by Standard & Poor’s, and AA- by Fitch Ratings.
In 2006, New York City benefited from large Wall Street bonuses, strong tourism, and a healthy real estate market. The city’s unemployment level declined to 4.9%, its lowest level in at least 30 years. The national slowdown in housing is expected to eventually affect New York City, but the city’s practice of phasing in property tax assessments over five years should be a stabilizing factor. The city expects to end its 2007 fiscal year with a surplus of about $3.9 billion, some of which will be used to provide tax cuts in the fiscal 2008 budget. City budget planners continue to use conservative revenue estimates, and future budget imbalances remain large. Following an upgrade from S&P in May 2006, New York City remains at its highest ratings in history, rated A1 by Moody’s, AA- by S&P, and A+ by Fitch Ratings.
PORTFOLIO STRATEGIES

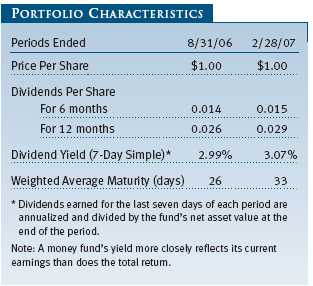
Your fund returned 1.51% for the last six months and 2.98% for the one-year period ended February 28, 2007, surpassing its Lipper benchmark for both periods, as shown in the table. Since our last report in August 2006, the money market curves we monitor have remained flat to slightly inverted. While an unchanged fed funds rate of 5.25% anchored the front end of the yield curve, changing perceptions regarding the direction and likelihood of the Federal Reserve’s next move alternately moved the longer money market rates above and below the Fed’s target rate. As a result, money market investors generally favored the more stable—and higher—yields found in the yield curve’s front end.
Taxable money market rates moved within a narrow band for the last six months. One- to three-month Libor rates averaged between 5.32% and 5.35% . The longer, one-year Libor moved somewhat more, beginning the period yielding 5.39%, moving as high as 5.46%, and closing at 5.23% at the end of February. The inverted Libor curve along with pricing in the fed funds futures curve suggests that the market currently believes the Federal Reserve is nearing a cut in interest rates.
The New York municipal money market curve has remained remarkably flat. For the past six months, the yield difference between seven-day variable rates and one-year note rates has been between one and three basis points. Overnight and seven-day variable rates averaged 3.55% during the past six months. One-year note levels, which started the period at 3.55%, traded as high as 3.65% and ended February at 3.60%. Demand for higher-quality New York securities has pushed some issues three to seven basis points below national levels.
The seeming disconnect between the one-year municipal rate and the one-year Libor (and indeed the rest of the municipal yield curve) is more the result of technical forces at work in the municipal money market than a differing outlook for rates. As mentioned in previous reports, continuing growth of the tender option bond (a derivative) market is generating large amounts of new, cheaply priced variable rate supply. This supply dynamic is pushing yields in the front end of the curve higher while at the same time reducing demand for longer-dated maturities in our curve’s 6- to 12-month portion. As a result, municipal money market rates are trending cheaper for the near term and exhibiting less volatility—a plus for tax-sensitive investors.
Our strategy has remained generally defensive throughout the period. We believe the Fed will remain on hold in the near term in recognition of persistent labor force strength and inflation rates somewhat above Fed targets. Our Fed view, along with a flat municipal yield curve, has caused us to keep our maturities relatively short and to seek the higher yields available in the front end of our curve. We expect to heavily weight our variable rate positions, but we also expect to see some opportunities to extend maturities between mid-March and mid-May, when tax-related selling affects our market.
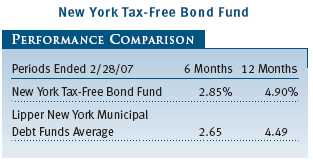
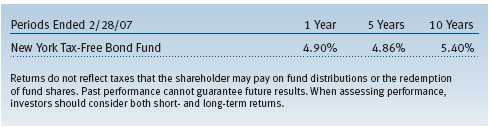
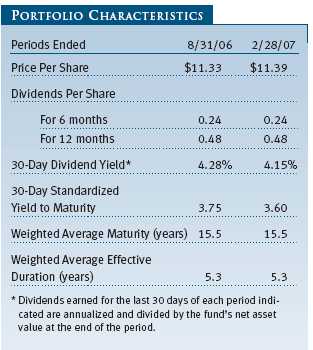
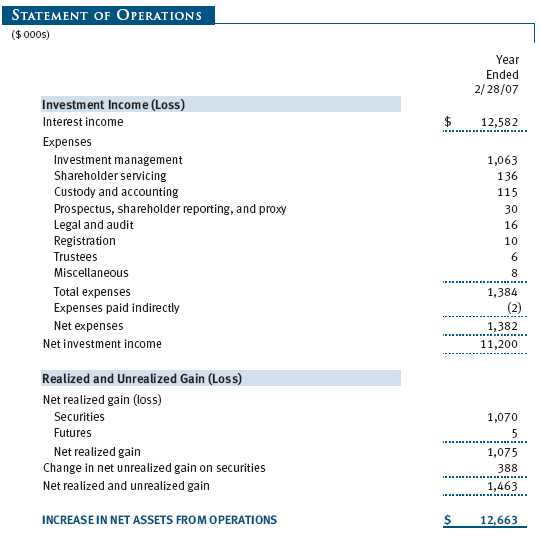
Your fund returned 2.85% for the last six months and 4.90% for the one-year period ended February 28, 2007, outpacing the six-month return of 2.65% and the one-year return of 4.49% for its Lipper peer group average. Returns reflect a dividend of $0.24 per share and the gain of $0.06 per share for the past six months.
The fund’s long-term record relative to its competitors remains generally favorable. Based on cumulative total return, Lipper ranked the New York Tax-Free Bond Fund 27 out of 99, 29 out of 99, 26 out of 88, and 13 out of 64 funds for the 1-, 3-, 5-, and 10-year periods ended February 28, 2007, respectively. Returns will vary for other periods. Past performance cannot guarantee future results.
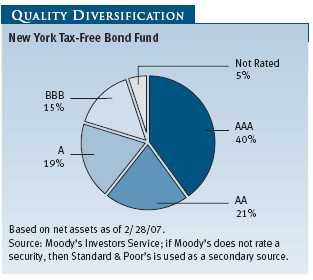
Since our August 2006 report to shareholders, the fund’s structure changed little, reflecting the Fed’s decision to hold rates steady. We extended the fund’s weighted average maturity to 15.5 years, a slight increase from six months ago and a reflection of our preference for longer maturities. However, the fund’s effective duration, a measure of interest rate sensitivity, remained unchanged at 5.3 years, reflecting our preference for a more neutral interest rate posture. The fund’s weighted average quality remained high, but we opportunistically increased the exposure to lower-rated credits. Less than half of the fund’s holdings carried AAA ratings, but 80% were rated A or better.
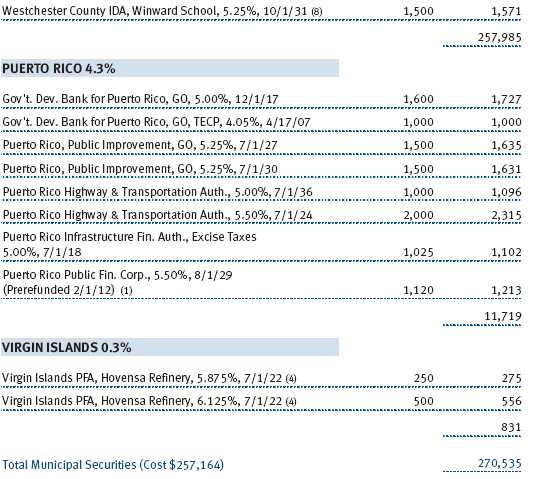
The fund’s lower-rated credits performed well thanks to the strong demand for incremental yield that helped to reduce the spreads on lower-rated issues. The fund’s holdings that were rated A or lower were strong performers, particularly various New York City Liberty Development bonds and uninsured Puerto Rico debt. With returns on the far end of the yield curve generating the best results during this period, our longer duration holdings of noncallable and zero-coupon bonds fared well. Although the fund’s permitted exposure to below investment-grade bonds has increased to 10% of total assets, we have maintained the exposure closer to 5%. We are concerned that this cycle’s spread tightening may have peaked and the demand for risk premiums will increase, driving yields higher and bond prices lower.
Most of the fund’s underperforming holdings were shorter-term securities. On a total return basis, maturities of less than 10 years—primarily prerefunded bonds and those with fairly short calls—were the worst contributors during the period. We remained underweight relative to the benchmark in this maturity range, and we carried an overweight in bonds maturing in 20 years or longer.
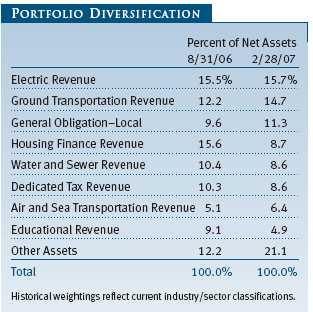
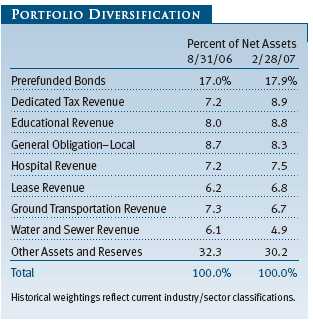
We did not make any changes in our larger sector categories, which reflects our steady credit outlook. We increased our holdings in the dedicated tax revenue sector, adding New York Transitional Finance Authority and Puerto Rico-related debt. The prerefunded sector slightly increased as a result of positions that were refunded since our last report.
For most of the reporting period, the fund’s duration was slightly shorter than or equal to the fund’s benchmark. Based on our current outlook that the Fed will keep its target rate unchanged for the remainder of the year and given the continued solid demand for tax-exempt securities, we expect to keep our duration very close to the benchmark’s. We will continue to look to enhance returns with opportunistic trading on yield curve positioning and to use our in-depth credit research capability to identify undervalued credits.
OUTLOOK
The national economy appears to be in the middle of a “soft landing”—a period of below-average growth during an economic expansion that reduces inflation pressures but does not result in a recession. Some recent economic data have been weaker than expected. The cooling of the housing market, despite some tentative signs of stabilizing, as well as fallout from the growing number of defaults in subprime mortgages may continue to ripple through the economy and into the bond market.
At present, we anticipate a more vigorous economy by the end of 2007, little or no Fed easing this year, and a bond market with interest rates remaining in a fairly limited range. Although the Fed could raise rates again should cost and price pressures continue to mount, central bank officials currently believe that the 5.25% fed funds rate will allow core inflation to ease gradually yet maintain a sustainable rate of economic growth. Given the recent signs of a slowing economy, it is quite possible that the central bank may soon adopt the view that the risks of inflation and the risks of economic weakness are balanced.
Conditions in the municipal bond market look favorable. The municipal yield curve’s positive slope (that is, the longest maturities still have higher yields than shorter maturities) will help to support municipal bonds at current levels. Demand for municipals is likely to remain steady, even though issuance in 2007 could be robust as municipalities continue to tap the credit markets to meet their ongoing needs, including funding for their employees’ retirement benefits. While we are increasingly favoring high-quality securities over high-yield issues because of current valuations and the potential for increased risk aversion, we continue to identify some tactical opportunities in lower-quality credits where valuations justify the additional credit risk. As always, we will continue to rely upon our proprietary research to uncover the best credit opportunities and selectively invest in attractive income-producing investments.
Over the past several years, municipal bonds have outperformed their taxable counterparts on an absolute basis, reaching valuations one might consider rich. However, we still believe that municipal bonds may be on a long-term trend of improving valuations, which, in a broader, historical context, may still appear attractive. Thus, municipals may continue to be an appealing alternative for investors in higher tax brackets, as their after-tax yields are likely to be greater than those of comparable Treasuries or other taxable securities.Respectfully submitted,

Joseph K. Lynagh
Chairman of the Investment Advisory Committee
New York Tax-Free Money Fund

Konstantine B. Mallas
Chairman of the Investment Advisory Committee
New York Tax-Free Bond Fund
March 20, 2007
The committee chairmen have day-to-day responsibility for managing the portfolios and work with committee members in developing and executing the funds’ investment program.
RISKS OF FIXED-INCOME INVESTINGSince money market funds are managed to maintain a constant $1.00 share price, there should be little risk of principal loss. However, there is no assurance the fund will avoid principal losses if fund holdings default or are downgraded, or if interest rates rise sharply in an unusually short period. In addition, the fund’s yield will vary; it is not fixed for a specific period like the yield on a bank certificate of deposit. An investment in the fund is not insured or guaranteed by the Federal Deposit Insurance Corporation (FDIC) or any other government agency. Although a money market fund seeks to preserve the value of your investment at $1.00 per share, it is possible to lose money by investing in it. Bonds are subject to interest rate risk (the decline in bond prices that usually accompanies a rise in interest rates) and credit risk (the chance that any fund holding could have its credit rating downgraded or that a bond issuer will default by failing to make timely payments of interest or principal), potentially reducing the fund’s income level and share price. Some income may be subject to state and local taxes and the federal alternative minimum tax.
GLOSSARY
Appropriation-backed bonds: Long-term obligations sold under a variety of financial arrangements—primarily lease/purchase and contractual service agreements used to finance capital projects. Debt service on such obligations is appropriated annually by the state, although the state has no legal obligation to continue to make such appropriations.
Average maturity: For a bond fund, the average of the stated maturity dates of the portfolio’s securities. In general, the longer the average maturity, the greater the fund’s sensitivity to interest rate changes, which means greater price fluctuation. A shorter average maturity usually means a less sensitive and, consequently, less volatile portfolio.
Basis points: One hundred basis points equal one percentage point.
Duration: A measure of a bond fund’s sensitivity to changes in interest rates. For example, a fund with a duration of six years would fall about 6% in price in response to a one-percentage-point rise in interest rates, and vice versa.
Fed funds target rate: An overnight lending rate set by the Federal Reserve and used by banks to meet reserve requirements. Banks also use the fed funds rate as a benchmark for their prime lending rates.
General obligation debt: A government’s strongest pledge that obligates its full faith and credit, including, if necessary, its ability to raise taxes.
Lehman Brothers Municipal Bond Index: An unmanaged index that includes investment-grade, tax-exempt, and fixed-rate bonds with long-term maturities selected from issues larger than $50 million.
Lehman Brothers U.S. Aggregate Index: An unmanaged index made up of the Lehman Brothers Government/Corporate Bond Index, Mortgage-Backed Securities Index, and Asset-Backed Securities Index, including securities of investment-grade quality or better, with at least one year to maturity, and an outstanding par value of at least $100 million.Libor: The London Interbank Offered Rate is a benchmark for short-term taxable rates.
Lipper averages: The averages of available mutual fund performance returns for specified time periods in defined categories as tracked by Lipper Inc.
Prerefunded bond: A bond that originally may have been issued as a general obligation or revenue bond but that is now secured by an escrow fund consisting entirely of direct U.S. government obligations that are sufficient for paying the bondholders.
Tender Option Bond: Obligations that grant the bondholder the right to require the issuer or a specified third party acting as agent for the issuer to purchase the bonds, usually at par, at a specified time or times prior to maturity or upon the occurrence of certain events or conditions.
Yield curve: A graphic depiction of the relationship among the yields for similar bonds with different maturities. A yield curve is positive when short-term yields are lower than long-term yields and negative when short-term yields are higher than long-term yields.
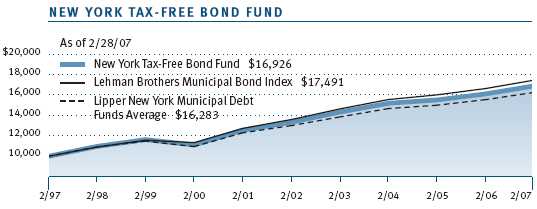
This chart shows the value of a hypothetical $10,000 investment in the fund over the past 10 fiscal year periods or since inception (for funds lacking 10-year records). The result is compared with benchmarks, which may include a broad-based market index and a peer group average or index. Market indexes do not include expenses, which are deducted from fund returns as well as mutual fund averages and indexes.

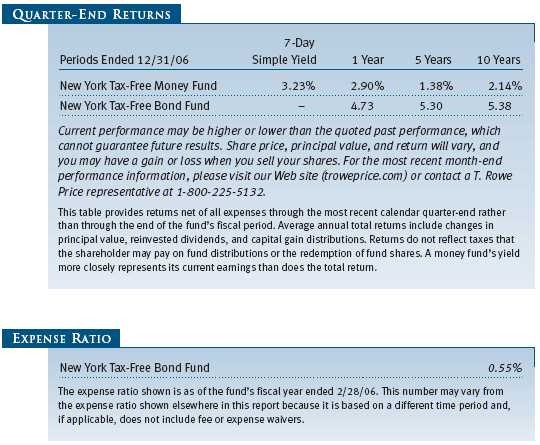
| AVERAGE ANNUAL COMPOUND TOTAL RETURN |
This table shows how the fund would have performed each year if its actual (or cumulative) returns for the periods shown had been earned at a constant rate.
This chart shows the value of a hypothetical $10,000 investment in the fund over the past 10 fiscal year periods or since inception (for funds lacking 10-year records). The result is compared with benchmarks, which may include a broad-based market index and a peer group average or index. Market indexes do not include expenses, which are deducted from fund returns as well as mutual fund averages and indexes.
| AVERAGE ANNUAL COMPOUND TOTAL RETURN |
This table shows how the fund would have performed each year if its actual (or cumulative) returns for the periods shown had been earned at a constant rate.
As a mutual fund shareholder, you may incur two types of costs: (1) transaction costs, such as redemption fees or sales loads, and (2) ongoing costs, including management fees, distribution and service (12b-1) fees, and other fund expenses. The following example is intended to help you understand your ongoing costs (in dollars) of investing in the fund and to compare these costs with the ongoing costs of investing in other mutual funds. The example is based on an investment of $1,000 invested at the beginning of the most recent six-month period and held for the entire period.
Actual Expenses
The first line of the following table (“Actual”) provides information about actual account values and expenses based on the fund’s actual returns. You may use the information in this line, together with your account balance, to estimate the expenses that you paid over the period. Simply divide your account value by $1,000 (for example, an $8,600 account value divided by $1,000 = 8.6), then multiply the result by the number in the first line under the heading “Expenses Paid During Period” to estimate the expenses you paid on your account during this period.
Hypothetical Example for Comparison Purposes
The information on the second line of the table (“Hypothetical”) is based on hypothetical account values and expenses derived from the fund’s actual expense ratio and an assumed 5% per year rate of return before expenses (not the fund’s actual return). You may compare the ongoing costs of investing in the fund with other funds by contrasting this 5% hypothetical example and the 5% hypothetical examples that appear in the shareholder reports of the other funds. The hypothetical account values and expenses may not be used to estimate the actual ending account balance or expenses you paid for the period.
Note: T. Rowe Price charges an annual small-account maintenance fee of $10, generally for accounts with less than $2,000 ($500 for UGMA/UTMA). The fee is waived for any investor whose T. Rowe Price mutual fund accounts total $25,000 or more, accounts employing automatic investing, and IRAs and other retirement plan accounts that utilize a prototype plan sponsored by T. Rowe Price (although a separate custodial or administrative fee may apply to such accounts). This fee is not included in the accompanying table. If you are subject to the fee, keep it in mind when you are estimating the ongoing expenses of investing in the fund and when comparing the expenses of this fund with other funds.
You should also be aware that the expenses shown in the table highlight only your ongoing costs and do not reflect any transaction costs, such as redemption fees or sales loads. Therefore, the second line of the table is useful in comparing ongoing costs only and will not help you determine the relative total costs of owning different funds. To the extent a fund charges transaction costs, however, the total cost of owning that fund is higher.

The accompanying notes are an integral part of these financial statements.

The accompanying notes are an integral part of these financial statements.
The accompanying notes are an integral part of these financial statements.
The accompanying notes are an integral part of these financial statements.
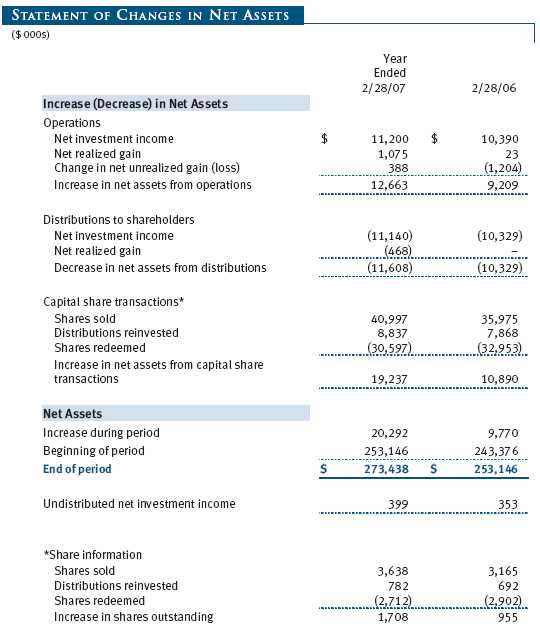
The accompanying notes are an integral part of these financial statements.
| NOTES TO FINANCIAL STATEMENTS |
NOTE 1 - SIGNIFICANT ACCOUNTING POLICIES
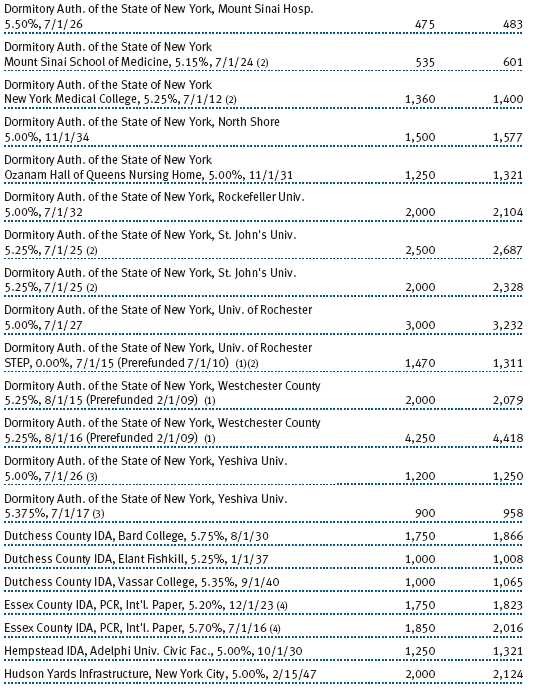
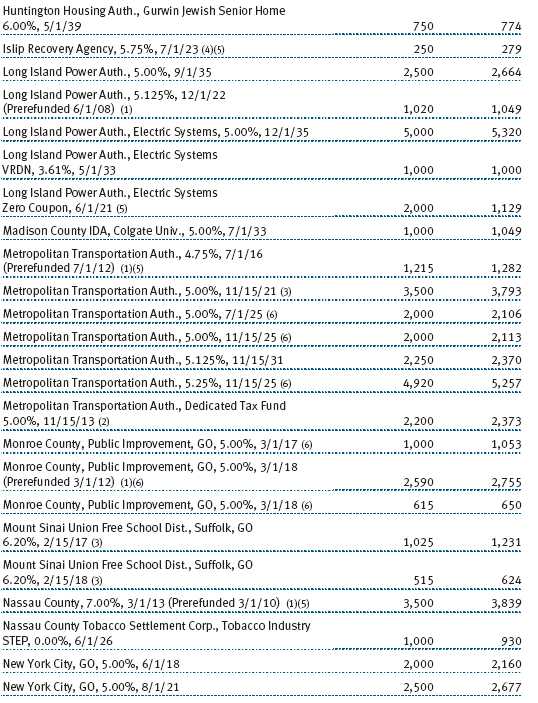
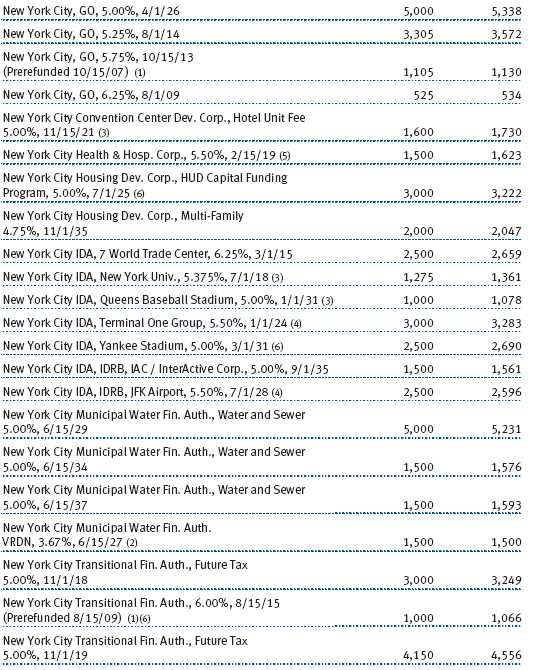
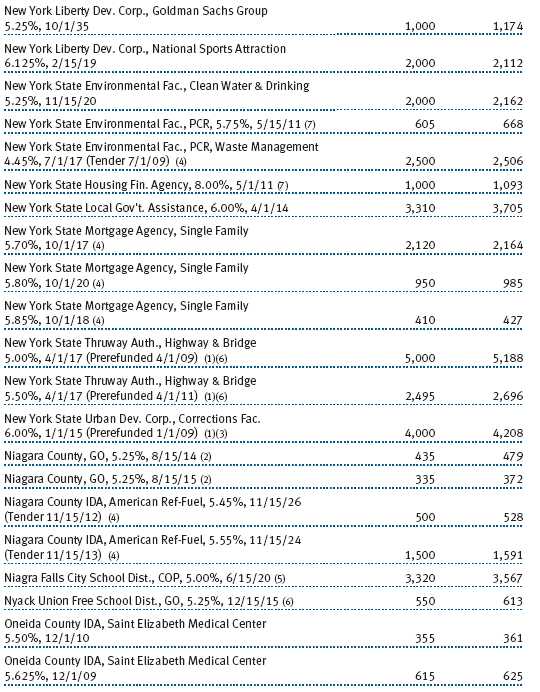
T. Rowe Price State Tax-Free Income Trust (the trust), is registered under the Investment Company Act of 1940 (the 1940 Act). The New York Tax-Free Bond Fund (the fund), a nondiversified, open-end management investment company, is one portfolio established by the trust. The fund commenced operations on August 28, 1986. The fund seeks to provide, consistent with prudent portfolio management, the highest level of income exempt from federal, New York state, and New York City income taxes by investing primarily in investment-grade New York municipal bonds.
The accompanying financial statements were prepared in accordance with accounting principles generally accepted in the United States of America, which require the use of estimates made by fund management. Fund management believes that estimates and security valuations are appropriate; however, actual results may differ from those estimates, and the security valuations reflected in the financial statements may differ from the value the fund ultimately realizes upon sale of the securities.
Valuation The fund values its investments and computes its net asset value per share at the close of the New York Stock Exchange (NYSE), normally 4 p.m. ET, each day that the NYSE is open for business. Debt securities are generally traded in the over-the-counter market. Securities with original maturities of one year or more are valued at prices furnished by dealers who make markets in such securities or by an independent pricing service, which considers yield or price of bonds of comparable quality, coupon, maturity, and type, as well as prices quoted by dealers who make markets in such securities. Securities with original maturities of less than one year are valued at amortized cost in local currency, which approximates fair value when combined with accrued interest.
Financial futures contracts are valued at closing settlement prices.
Other investments, including restricted securities, and those for which the above valuation procedures are inappropriate or are deemed not to reflect fair value are stated at fair value as determined in good faith by the T. Rowe Price Valuation Committee, established by the fund’s Board of Trustees.
Credits The fund earns credits on temporarily uninvested cash balances at the custodian that reduce the fund’s custody charges. Custody expense in the accompanying financial statements is presented before reduction for credits, which are reflected as expenses paid indirectly.
Investment Transactions, Investment Income, and Distributions Income and expenses are recorded on the accrual basis. Premiums and discounts on debt securities are amortized for financial reporting purposes. Investment transactions are accounted for on the trade date. Realized gains and losses are reported on the identified cost basis. Payments (“variation margin”) made or received to settle the daily fluctuations in the value of futures contracts are recorded as unrealized gains or losses until the contracts are closed. Distributions to shareholders are recorded on the ex-dividend date. Income distributions are declared on a daily basis and paid monthly. Capital gain distributions, if any, are declared and paid by the fund, typically on an annual basis.
New Accounting Pronouncements In June 2006, the Financial Accounting Standards Board (“FASB”) issued FASB Interpretation No. 48 (“FIN 48”), Accounting for Uncertainty in Income Taxes, a clarification of FASB Statement No. 109, Accounting for Income Taxes. FIN 48 establishes financial reporting rules regarding recognition and measurement of tax positions taken or expected to be taken on a tax return. Management is evaluating the anticipated impact, if any, that FIN 48 will have on the fund upon adoption, which, pursuant to a delay granted by the U.S. Securities and Exchange Commission, is expected to be on the last business day of the fund’s semi-annual period, August 31, 2007.
In September 2006, the FASB released the Statement of Financial Accounting Standard No. 157 (“FAS 157”), Fair Value Measurements. FAS 157 clarifies the definition of fair value and establishes the framework for measuring fair value, as well as proper disclosure of this methodology in the financial statements. It will be effective for the fund’s fiscal year beginning March 1, 2008. Management is evaluating the effects of FAS 157; however, it is not expected to have a material impact on the fund’s net assets or results of operations.
NOTE 2 - INVESTMENT TRANSACTIONS
Consistent with its investment objective, the fund engages in the following practices to manage exposure to certain risks or to enhance performance. The investment objective, policies, program, and risk factors of the fund are described more fully in the fund’s prospectus and Statement of Additional Information.
Futures Contracts During the year ended February 28, 2007, the fund was a party to futures contracts, which provide for the future sale by one party and purchase by another of a specified amount of a specific financial instrument at an agreed upon price, date, time, and place. Risks arise from possible illiquidity of the futures market and from movements in security values and/or interest rates.
Other Purchases and sales of portfolio securities, other than short-term securities, aggregated $85,279,000 and $67,709,000, respectively, for the year ended February 28, 2007.
NOTE 3 - FEDERAL INCOME TAXES
No provision for federal income taxes is required since the fund intends to continue to qualify as a regulated investment company under Subchapter M of the Internal Revenue Code and distribute to shareholders all of its income and gains. Federal income tax regulations differ from generally accepted accounting principles; therefore, distributions determined in accordance with tax regulations may differ significantly in amount or character from net investment income and realized gains for financial reporting purposes. Financial reporting records are adjusted for permanent book/tax differences to reflect tax character. Financial records are not adjusted for temporary differences.
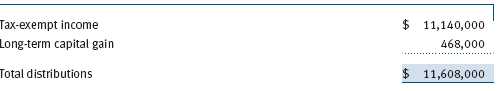
Distributions during the year ended February 28, 2007, were characterized as follows for tax purposes:
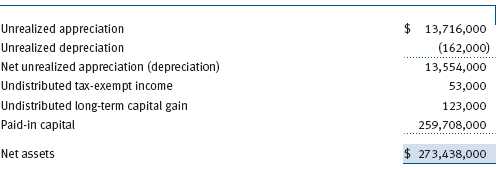
At February 28, 2007, the tax-basis components of net assets were as follows:
For federal income tax purposes, market discount is recognized as income at the time of sale in the amount of the lesser of gain or scheduled amortization. Accordingly, at February 28, 2007, amortization of $345,000 that has been recognized as income for financial reporting purposes is treated as unrealized appreciation for tax purposes.
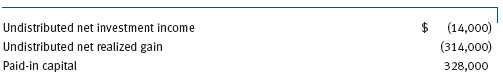
For the year ended February 28, 2007, the fund recorded the following permanent reclassifications to reflect tax character. Reclassifications to paid-in capital relate primarily to a tax practice that treats a portion of the proceeds from each redemption of capital shares as a distribution of taxable net investment income and/or realized capital gain. Results of operations and net assets were not affected by these reclassifications.
At February 28, 2007, the cost of investments for federal income tax purposes was $256,981,000.
NOTE 4 - RELATED PARTY TRANSACTIONS
The fund is managed by T. Rowe Price Associates, Inc. (the manager or Price Associates), a wholly owned subsidiary of T. Rowe Price Group, Inc. The investment management agreement between the fund and the manager provides for an annual investment management fee, which is computed daily and paid monthly. The fee consists of an individual fund fee, equal to 0.10% of the fund’s average daily net assets, and a group fee. The group fee rate is calculated based on the combined net assets of certain mutual funds sponsored by Price Associates (the group) applied to a graduated fee schedule, with rates ranging from 0.48% for the first $1 billion of assets to 0.29% for assets in excess of $160 billion. The fund’s group fee is determined by applying the group fee rate to the fund’s average daily net assets. At February 28, 2007, the effective annual group fee rate was 0.31%.
In addition, the fund has entered into service agreements with Price Associates and a wholly owned subsidiary of Price Associates (collectively, Price). Price Associates computes the daily share price and provides certain other administrative services to the fund. T. Rowe Price Services, Inc., provides shareholder and administrative services in its capacity as the fund’s transfer and dividend disbursing agent. For the year ended February 28, 2007, expenses incurred pursuant to these service agreements were $72,000 for Price Associates and $101,000 for T. Rowe Price Services. The total amount payable at period-end pursuant to these service agreements is reflected as Due to Affiliates in the accompanying financial statements.
| REPORT OF INDEPENDENT REGISTERED PUBLIC ACCOUNTING FIRM |
To the Board of Trustees of T. Rowe Price State Tax-Free Income Trust and Shareholders of T. Rowe Price New York Tax-Free Bond Fund
In our opinion, the accompanying statement of assets and liabilities, including the portfolio of investments, and the related statements of operations and of changes in net assets and the financial highlights present fairly, in all material respects, the financial position of T. Rowe Price New York Tax-Free Bond Fund (one of the portfolios comprising T. Rowe Price State Tax-Free Income Trust, hereafter referred to as the “Fund”) at February 28, 2007, the results of its operations for the year then ended, the changes in its net assets for each of the two years in the period then ended and the financial highlights for each of the five years in the period then ended, in conformity with accounting principles generally accepted in the United States of America. These financial statements and financial highlights (hereafter referred to as “financial statements”) are the responsibility of the Fund’s management; our responsibility is to express an opinion on these financial statements based on our audits. We conducted our audits of these financial statements in accordance with the standards of the Public Company Accounting Oversight Board (United States). Those standards require that we plan and perform the audit to obtain reasonable assurance about whether the financial statements are free of material misstatement. An audit includes examining, on a test basis, evidence supporting the amounts and disclosures in the financial statements, assessing the accounting principles used and significant estimates made by management, and evaluating the overall financial statement presentation. We believe that our audits, which included confirmation of securities at February 28, 2007 by correspondence with the custodian, provide a reasonable basis for our opinion.
PricewaterhouseCoopers LLP
Baltimore, Maryland
April 11, 2007
| TAX INFORMATION (UNAUDITED) FOR THE TAX YEAR ENDED 2/28/07 |
We are providing this information as required by the Internal Revenue Code. The amounts shown may differ from those elsewhere in this report because of differences between tax and financial reporting requirements.
The fund’s distributions to shareholders included:
• $110,000 from short-term capital gains.
• $671,000 from long-term capital gains, which was subject to the 15% rate gains category.
• $11,093,000 which qualified as exempt-interest dividends.
| INFORMATION ON PROXY VOTING POLICIES, PROCEDURES, AND RECORDS |
A description of the policies and procedures used by T. Rowe Price funds and portfolios to determine how to vote proxies relating to portfolio securities is available in each fund’s Statement of Additional Information, which you may request by calling 1-800-225-5132 or by accessing the SEC’s Web site, www.sec.gov. The description of our proxy voting policies and procedures is also available on our Web site, www.troweprice.com. To access it, click on the words “Company Info” at the top of our homepage for individual investors. Then, in the window that appears, click on the “Proxy Voting Policy” navigation button in the top left corner.
Each fund’s most recent annual proxy voting record is available on our Web site and through the SEC’s Web site. To access it through our Web site, follow the directions above, then click on the words “Proxy Voting Record” at the bottom of the Proxy Voting Policy page.
| HOW TO OBTAIN QUARTERLY PORTFOLIO HOLDINGS |
The fund files a complete schedule of portfolio holdings with the Securities and Exchange Commission for the first and third quarters of each fiscal year on Form N-Q. The fund’s Form N-Q is available electronically on the SEC’s Web site (www.sec.gov); hard copies may be reviewed and copied at the SEC’s Public Reference Room, 450 Fifth St. N.W., Washington, DC 20549. For more information on the Public Reference Room, call 1-800-SEC-0330.
| ABOUT THE FUND’S TRUSTEES AND OFFICERS |
Your fund is governed by a Board of Trustees that meets regularly to review a wide variety of matters affecting the fund, including performance, investment programs, compliance matters, advisory fees and expenses, service providers, and other business affairs. The Board of Trustees elects the fund’s officers, who are listed in the final table. At least 75% of Board members are independent of T. Rowe Price Associates, Inc. (T. Rowe Price), and T. Rowe Price International, Inc. (T. Rowe Price International); “inside” or “interested” trustees are employees or officers of T. Rowe Price. The business address of each trustee and officer is 100 East Pratt Street, Baltimore, Maryland 21202. The Statement of Additional Information includes additional information about the fund trustees and is available without charge by calling a T. Rowe Price representative at 1-800-225-5132.
| Independent Trustees | |
| |
| Name | |
| (Year of Birth) | Principal Occupation(s) During Past 5 Years |
| Year Elected* | and Directorships of Other Public Companies |
| |
| Jeremiah E. Casey | Director, Allfirst Financial Inc. (previously First Maryland Bankcorp) |
| (1940) | (1983 to 2002); Director, National Life Insurance (2001 to 2005); |
| 2006 | Director, The Rouse Company, real estate developers (1990 to 2004) |
| |
| Anthony W. Deering | Chairman, Exeter Capital, LLC, a private investment firm (2004 to |
| (1945) | present); Director, Vornado Real Estate Investment Trust (3/04 to |
| 1986 | present); Director, Mercantile Bankshares (4/03 to present); Member, |
| | Advisory Board, Deutsche Bank North America (2004 to present); |
| | Director, Chairman of the Board, and Chief Executive Officer, The Rouse |
| | Company, real estate developers (1997 to 2004) |
| |
| Donald W. Dick, Jr. | Principal, EuroCapital Advisors, LLC, an acquisition and management |
| (1943) | advisory firm; Chairman, The Haven Group, a custom manufacturer of |
| 2001 | modular homes (1/04 to present) |
| |
| David K. Fagin | Chairman and President, Nye Corporation (6/88 to present); Director, |
| (1938) | Canyon Resources Corp. (5/00 to present); Director, Golden Star |
| 2001 | Resources Ltd. (5/92 to present); Director, Pacific Rim Mining Corp. |
| | (2/02 to present) |
| |
| Karen N. Horn | Director, Federal National Mortgage Association (9/06 to present); |
| (1943) | Managing Director and President, Global Private Client Services, Marsh |
| 2003 | Inc. (1999 to 2003); Managing Director and Head of International |
| | Private Banking, Bankers Trust (1996 to 1999); Director, Georgia Pacific |
| | (5/04 to 12/05), Eli Lilly and Company, and Simon Property Group |
| Theo C. Rodgers | President, A&R Development Corporation (1977 to present) |
| (1941) | |
| 2005 | |
| |
| John G. Schreiber | Owner/President, Centaur Capital Partners, Inc., a real estate invest- |
| (1946) | ment company; Partner, Blackstone Real Estate Advisors, L.P. |
| 1992 | |
| |
| * Each independent trustee oversees 118 T. Rowe Price portfolios and serves until retirement, resignation, |
| or election of a successor. | |
| Inside Trustees | |
| |
| Name | |
| (Year of Birth) | |
| Year Elected* | |
| [Number of T. Rowe Price | Principal Occupation(s) During Past 5 Years and |
| Portfolios Overseen] | Directorships of Other Public Companies |
| |
| Edward C. Bernard | Director and Vice President, T. Rowe Price and T. Rowe Price Group, |
| (1956) | Inc.; Chairman of the Board, Director, and President, T. Rowe Price |
| 2006 | Investment Services, Inc.; Chairman of the Board and Director, T. Rowe |
| [118] | Price Retirement Plan Services, Inc., T. Rowe Price Services, Inc., and |
| | T. Rowe Price Savings Bank; Director, T. Rowe Price Global Asset |
| | Management Limited, T. Rowe Price Global Investment Services Limited, |
| | and T. Rowe Price International, Inc.; Chief Executive Officer, Chairman of |
| | the Board, Director, and President, T. Rowe Price Trust Company; |
| | Chairman of the Board, all funds |
| |
| Mary J. Miller, CFA | Director, T. Rowe Price Trust Company; Director and Vice President, |
| (1955) | T. Rowe Price; Vice President, T. Rowe Price Group, Inc.; President, State |
| 2004 | Tax-Free Income Trust |
| [37] | |
| |
| * Each inside trustee serves until retirement, resignation, or election of a successor. |
| Officers | |
| |
| Officers | |
| Name (Year of Birth) | |
| Title and Fund(s) Served | Principal Occupation(s) |
| |
| Steven G. Brooks, CFA (1954) | Vice President, T. Rowe Price and T. Rowe Price |
| Vice President, State Tax-Free Income Trust | Group, Inc. |
| |
| Joseph A. Carrier, CPA (1960) | Vice President, T. Rowe Price, T. Rowe Price |
| Treasurer, State Tax-Free Income Trust | Group, Inc., T. Rowe Price Investment Services, |
| | Inc., and T. Rowe Price Trust Company |
| |
| Jonathan M. Chirunga (1966) | Vice President, T. Rowe Price |
| Vice President, State Tax-Free Income Trust | |
| |
| M. Helena Condez (1962) | Assistant Vice President, T. Rowe Price |
| Assistant Vice President, State Tax-Free Income Trust | |
| |
| G. Richard Dent (1960) | Vice President, T. Rowe Price and T. Rowe Price |
| Vice President, State Tax-Free Income Trust | Group, Inc. |
| |
| Roger L. Fiery III, CPA (1959) | Vice President, T. Rowe Price, T. Rowe Price |
| Vice President, State Tax-Free Income Trust | Group, Inc., T. Rowe Price International, Inc., |
| | and T. Rowe Price Trust Company |
| |
| John R. Gilner (1961) | Chief Compliance Officer and Vice President, |
| Chief Compliance Officer, State Tax-Free Income Trust | T. Rowe Price; Vice President, T. Rowe Price Group, |
| | Inc., and T. Rowe Price Investment Services, Inc. |
| |
| Gregory S. Golczewski (1966) | Vice President, T. Rowe Price and T. Rowe Price |
| Vice President, State Tax-Free Income Trust | Trust Company |
| |
| Charles B. Hill, CFA (1961) | Vice President, T. Rowe Price and T. Rowe Price |
| Executive Vice President, State Tax-Free Income Trust | Group, Inc. |
| |
| Henry H. Hopkins (1942) | Director and Vice President, T. Rowe Price |
| Vice President, State Tax-Free Income Trust | Investment Services, Inc., T. Rowe Price Services, |
| | Inc., and T. Rowe Price Trust Company; Vice |
| | President, T. Rowe Price, T. Rowe Price Group, |
| | Inc., T. Rowe Price International, Inc., and |
| | T. Rowe Price Retirement Plan Services, Inc. |
| |
| T. Dylan Jones (1971) | Assistant Vice President, T. Rowe Price |
| Assistant Vice President, State Tax-Free Income Trust | |
| Philip J. Kligman, CFA (1974) | Assistant Vice President, T. Rowe Price |
| Assistant Vice President, State Tax-Free Income Trust | |
| |
| Marcy M. Lash (1963) | Vice President, T. Rowe Price and T. Rowe Price |
| Vice President, State Tax-Free Income Trust | Group, Inc. |
| |
| Alan D. Levenson, Ph.D. (1958) | Vice President, T. Rowe Price and T. Rowe Price |
| Vice President, State Tax-Free Income Trust | Group, Inc. |
| |
| Patricia B. Lippert (1953) | Assistant Vice President, T. Rowe Price and |
| Secretary, State Tax-Free Income Trust | T. Rowe Price Investment Services, Inc. |
| |
| Joseph K. Lynagh, CFA (1958) | Vice President, T. Rowe Price and T. Rowe Price |
| Executive Vice President, State Tax-Free Income Trust | Group, Inc. |
| |
| Konstantine B. Mallas (1963) | Vice President, T. Rowe Price and T. Rowe Price |
| Executive Vice President, State Tax-Free Income Trust | Group, Inc. |
| |
| James M. McDonald (1949) | Vice President, T. Rowe Price, T. Rowe Price |
| Vice President, State Tax-Free Income Trust | Group, Inc., and T. Rowe Price Trust Company |
| |
| Hugh D. McGuirk, CFA (1960) | Vice President, T. Rowe Price and T. Rowe Price |
| Executive Vice President, State Tax-Free Income Trust | Group, Inc. |
| |
| Linda A. Murphy (1959) | Vice President, T. Rowe Price and T. Rowe Price |
| Vice President, State Tax-Free Income Trust | Group, Inc. |
| |
| Timothy G. Taylor, CFA (1975) | Vice President, T. Rowe Price |
| Assistant Vice President, State Tax-Free Income Trust | |
| |
| Julie L. Waples (1970) | Vice President, T. Rowe Price |
| Vice President, State Tax-Free Income Trust | |
| |
| Unless otherwise noted, officers have been employees of T. Rowe Price or T. Rowe Price International for at least |
| five years. | |
Item 2. Code of Ethics.
The registrant has adopted a code of ethics, as defined in Item 2 of Form N-CSR, applicable to its principal executive officer, principal financial officer, principal accounting officer or controller, or persons performing similar functions. A copy of this code of ethics is filed as an exhibit to this Form N-CSR. No substantive amendments were approved or waivers were granted to this code of ethics during the period covered by this report.
Item 3. Audit Committee Financial Expert.
The registrant’s Board of Directors/Trustees has determined that Mr. Donald W. Dick Jr. qualifies as an audit committee financial expert, as defined in Item 3 of Form N-CSR. Mr. Dick is considered independent for purposes of Item 3 of Form N-CSR.
Item 4. Principal Accountant Fees and Services.
(a) – (d) Aggregate fees billed to the registrant for the last two fiscal years for professional services rendered by the registrant’s principal accountant were as follows:
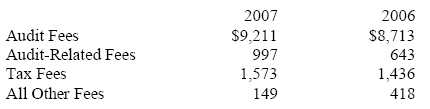
Audit fees include amounts related to the audit of the registrant’s annual financial statements and services normally provided by the accountant in connection with statutory and regulatory filings. Audit-related fees include amounts reasonably related to the performance of the audit of the registrant’s financial statements and specifically include the issuance of a report on internal controls and, if applicable, agreed-upon procedures related to fund acquisitions. Tax fees include amounts related to services for tax compliance, tax planning, and tax advice. The nature of these services specifically includes the review of distribution calculations and the preparation of Federal, state, and excise tax returns. Reclassification from tax fees to audit fees of fiscal 2006 amounts related to the auditing of tax disclosures within the registrant’s annual financial statements has been made in order to conform to fiscal 2007 presentation. All other fees include the registrant’s pro-rata share of amounts for agreed-upon procedures in conjunction with service contract approvals by the registrant’s Board of Directors/Trustees.
(e)(1) The registrant’s audit committee has adopted a policy whereby audit and non-audit services performed by the registrant’s principal accountant for the registrant, its investment adviser, and any entity controlling, controlled by, or under common control with the investment adviser that provides ongoing services to the registrant require pre-approval in advance at regularly scheduled audit committee meetings. If such a service is required between regularly scheduled audit committee meetings, pre-approval may be authorized by one audit committee member with ratification at the next scheduled audit committee meeting. Waiver of pre-approval for audit or non-audit services requiring fees of a de minimis amount is not permitted.
(2) No services included in (b) – (d) above were approved pursuant to paragraph (c)(7)(i)(C) of Rule 2-01 of Regulation S-X.
(f) Less than 50 percent of the hours expended on the principal accountant’s engagement to audit the registrant’s financial statements for the most recent fiscal year were attributed to work performed by persons other than the principal accountant’s full-time, permanent employees.
(g) The aggregate fees billed for the most recent fiscal year and the preceding fiscal year by the registrant’s principal accountant for non-audit services rendered to the registrant, its investment adviser, and any entity controlling, controlled by, or under common control with the investment adviser that provides ongoing services to the registrant were $1,263,000 and $883,000, respectively, and were less than the aggregate fees billed for those same periods by the registrant’s principal accountant for audit services rendered to the T. Rowe Price Funds. Preceding fiscal year amount reflects the reclassification of tax fees described in (a) – (d) above.
(h) All non-audit services rendered in (g) above were pre-approved by the registrant’s audit committee. Accordingly, these services were considered by the registrant’s audit committee in maintaining the principal accountant’s independence.Item 5. Audit Committee of Listed Registrants.
Not applicable.
Item 6. Schedule of Investments.
Not applicable. The complete schedule of investments is included in Item 1 of this Form N-CSR.
Item 7. Disclosure of Proxy Voting Policies and Procedures for Closed-End Management Investment Companies.
Not applicable.
Item 8. Portfolio Managers of Closed-End Management Investment Companies.
Not applicable.
Item 9. Purchases of Equity Securities by Closed-End Management Investment Company and Affiliated Purchasers.
Not applicable.
Item 10. Submission of Matters to a Vote of Security Holders.
Not applicable.
Item 11. Controls and Procedures.
(a) The registrant’s principal executive officer and principal financial officer have evaluated the registrant’s disclosure controls and procedures within 90 days of this filing and have concluded that the registrant’s disclosure controls and procedures were effective, as of that date, in ensuring that information required to be disclosed by the registrant in this Form N-CSR was recorded, processed, summarized, and reported timely.
(b) The registrant’s principal executive officer and principal financial officer are aware of no change in the registrant’s internal control over financial reporting that occurred during the registrant’s second fiscal quarter covered by this report that has materially affected, or is reasonably likely to materially affect, the registrant’s internal control over financial reporting.
Item 12. Exhibits.
(a)(1) The registrant’s code of ethics pursuant to Item 2 of Form N-CSR is attached.
(2) Separate certifications by the registrant's principal executive officer and principal financial officer, pursuant to Section 302 of the Sarbanes-Oxley Act of 2002 and required by Rule 30a-2(a) under the Investment Company Act of 1940, are attached.
(3) Written solicitation to repurchase securities issued by closed-end companies: not applicable.
(b) A certification by the registrant's principal executive officer and principal financial officer, pursuant to Section 906 of the Sarbanes-Oxley Act of 2002 and required by Rule 30a-2(b) under the Investment Company Act of 1940, is attached.
| | |
SIGNATURES |
| |
| | Pursuant to the requirements of the Securities Exchange Act of 1934 and the Investment |
| Company Act of 1940, the registrant has duly caused this report to be signed on its behalf by the |
| undersigned, thereunto duly authorized. |
| |
| T. Rowe Price State Tax-Free Income Trust |
| |
| |
| By | /s/ Edward C. Bernard |
| | Edward C. Bernard |
| | Principal Executive Officer |
| |
| Date | April 16, 2007 |
| |
| |
| | Pursuant to the requirements of the Securities Exchange Act of 1934 and the Investment |
| Company Act of 1940, this report has been signed below by the following persons on behalf of |
| the registrant and in the capacities and on the dates indicated. |
| |
| |
| By | /s/ Edward C. Bernard |
| | Edward C. Bernard |
| | Principal Executive Officer |
| |
| Date | April 16, 2007 |
| |
| |
| |
| By | /s/ Joseph A. Carrier |
| | Joseph A. Carrier |
| | Principal Financial Officer |
| |
| Date | April 16, 2007 |