UNITED STATES
SECURITIES AND EXCHANGE COMMISSION
Washington, D.C. 20549
FORM N-CSR
CERTIFIED SHAREHOLDER REPORT OF REGISTERED
MANAGEMENT INVESTMENT COMPANIES
Investment Company Act File Number: 811-4521
| T. Rowe Price State Tax-Free Income Trust |
|
| (Exact name of registrant as specified in charter) |
| |
| 100 East Pratt Street, Baltimore, MD 21202 |
|
| (Address of principal executive offices) |
| |
| David Oestreicher |
| 100 East Pratt Street, Baltimore, MD 21202 |
|
| (Name and address of agent for service) |
Registrant’s telephone number, including area code: (410) 345-2000
Date of fiscal year end: February 29
Date of reporting period: February 29, 2012
Item 1. Report to Shareholders
| New Jersey Tax-Free Bond Fund | February 29, 2012 |
The views and opinions in this report were current as of February 29, 2012. They are not guarantees of performance or investment results and should not be taken as investment advice. Investment decisions reflect a variety of factors, and the managers reserve the right to change their views about individual stocks, sectors, and the markets at any time. As a result, the views expressed should not be relied upon as a forecast of the fund’s future investment intent. The report is certified under the Sarbanes-Oxley Act, which requires mutual funds and other public companies to affirm that, to the best of their knowledge, the information in their financial reports is fairly and accurately stated in all material respects.REPORTS ON THE WEB
Sign up for our E-mail Program, and you can begin to receive updated fund reports and prospectuses online rather than through the mail. Log in to your account at troweprice.com for more information.
Manager’s Letter
Fellow Shareholders
Tax-free municipal bonds produced excellent returns in the 6- and 12-month periods ended February 29, 2012. In the second half of the funds’ fiscal year, municipals rallied with U.S. Treasuries—led by long-term bonds—as year-over-year issuance declined and as last year’s fears of widespread defaults subsided, despite the largest municipal bankruptcy in U.S. history in Jefferson County, Alabama. The T. Rowe Price New Jersey Tax-Free Bond Fund advanced strongly over the past 12 months but trailed its Lipper peer group average due to its more conservative positioning.
MARKET ENVIRONMENT
The U.S. economy strengthened in the fourth quarter of 2011 and grew moderately in the early months of 2012, defying expectations that the ongoing sovereign debt crisis in Europe would weigh heavily on the domestic economic recovery. The labor market recovery has been firming with nonfarm payrolls increasing 245,000 on average in the three months through February and the national unemployment rate dipping to 8.3%, the lowest level since early 2009. Corporate profit growth remains healthy, and manufacturing activity has been increasing moderately. The housing market is still weak, however, and the Federal Reserve remains cautious about the durability of the economy.
To support the recovery with low long-term interest rates, the Fed initiated a “maturity extension program” in September 2011 through which it would purchase $400 billion in longer-term Treasuries and sell issues maturing in three years or less through June 2012. Also, after the Fed’s monetary policy meeting in January, central bank officials projected that short-term rates will remain low at least until late 2014—versus previous expectations of low rates lasting through mid-2013—and expressed a willingness to provide additional stimulus if the economic outlook deteriorates.
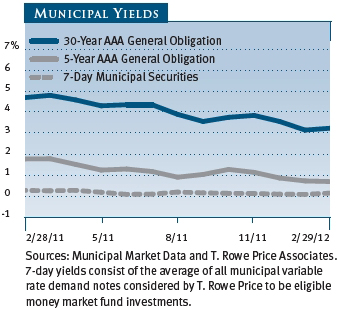
The municipal yield curve flattened over the last year, with long-term yields falling significantly while shorter-term yields continued to grind their way closer to 0%. Nevertheless, with municipal yields comparable with or higher than Treasury yields, tax-free securities are an attractive alternative for fixed income investors. As of February 29, 2012, the 3.23% yield offered by a 30-year tax-free municipal bond rated AAA was about 104% of the 3.09% pretax yield offered by a 30-year Treasury. An investor in the 28% federal tax bracket would need to invest in a taxable bond yielding about 4.49% in order to receive the same after-tax income. (To calculate a municipal bond’s taxable-equivalent yield, divide the municipal bond’s yield by the quantity of 1.00 minus your federal tax bracket expressed as a decimal—in this case, 1.00 – 0.28, or 0.72.)
MUNICIPAL MARKET NEWS
Municipal issuance in 2011 totaled only $295 billion, according to The Bond Buyer—the lowest level seen in a decade. Contributing factors include the absence of the Build America Bond program and a pervasive sentiment toward fiscal austerity, which could keep issuance somewhat subdued in 2012. While the $43 billion in year-to-date long-term issuance is higher than at this point in 2011, much of it reflects municipalities refinancing their debts to take advantage of low long-term interest rates rather than net new issuance. Issuance may stay on the low side of estimates as state and local governments have been conservative about adding to indebtedness, despite prevailing low yields.
Demand for municipal securities in early 2011 was weak but picked up as the year progressed. Municipal bond fund cash flows, which were negative in the first half of 2011, turned positive in the second half as risk-averse investors realized that municipals were still a high-quality asset class. In recent months, cash flows have been strong.
Many states continue to face fiscal difficulties and have been forced to raise taxes and fees and cut spending to close budget deficits. We believe many states deserve high credit ratings, and we do not see a near-term threat to their ability to continue servicing their outstanding debts. However, we have longer-term concerns about potentially onerous future pension obligations and other retirement benefits.
Municipal bond performance in the last six months and throughout the fund’s fiscal year was generally driven by investors’ search for higher yields in a low interest rate environment. In both periods, long- and intermediate-term bonds outperformed short-term securities, while lower-quality investment-grade issues, especially A rated bonds, outpaced higher-grade municipals. Among revenue bonds, tobacco and health care were two of the top-performing segments. We continue to underweight tobacco bonds because of declining long-term tobacco consumption trends, and while we are overweight health care in most portfolios, we are very selective in this sector, particularly hospitals, as the implementation of health care reform may put pressure on already thin hospital profit margins. Prerefunded bonds, which are backed by U.S. Treasuries, produced mild gains in both periods due to their high-quality and short-term characteristics.
NEW JERSEY MARKET NEWS
New Jersey benefits from a diverse economy and high personal wealth. Based on 2010 per capita personal income at 128% of the national average, New Jersey is the country’s third-richest state. Its economic recovery has recently followed the national trend, but job recovery has been sluggish. Going forward, New Jersey’s economy is expected to track or lag that of the nation.
New Jersey’s significant long-term liabilities continue to pressure the state’s fiscal stability. According to Moody’s 2011 State Debt Medians, New Jersey remains among the most heavily indebted states as measured by debt per capita ($3,940) and debt as a percentage of personal income (7.9%). Most of the state’s debt is appropriation-backed, meaning that debt service can only be paid if the state legislature annually sets aside the funds to do so. New Jersey also faces significant future liabilities for pension and other post-employment benefits (OPEB) and has repeatedly underfunded its annual required contribution for pensions.
New Jersey’s general obligation (GO) debt is rated Aa3 by Moody’s Investors Service, AA- by Standard & Poor’s, and AA- by Fitch. Both Moody’s and Fitch lowered their ratings in 2011 due to the state’s significant pension and OPEB liabilities, high debt level, and heavy tax burden. These factors have limited the state’s financial flexibility and created a persistent structural imbalance.
All three agencies have assigned stable outlooks, reflecting recent progress in improving New Jersey’s fiscal condition. Audited results for the year ended June 30, 2011, show that a 3% decline in spending more than offset a 1% revenue decline. New Jersey ended the year with an unrestricted fund balance of $864 million, or just under 3% of its general fund revenue. For the first six months of fiscal year 2012, revenues were tracking relatively close to expectations. Although New Jersey has taken steps toward pension reform, the state’s pension plan is still underfunded. The governor recently presented a $32 billion budget for 2013, a 3.7% increase over last year’s spending.
PORTFOLIO PERFORMANCE AND STRATEGY REVIEW
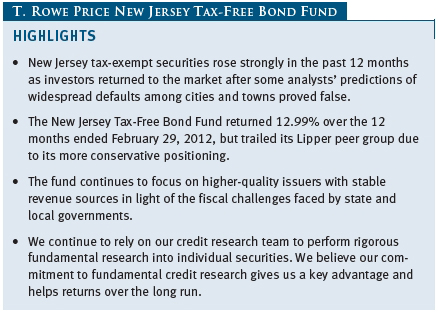
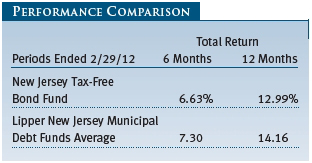
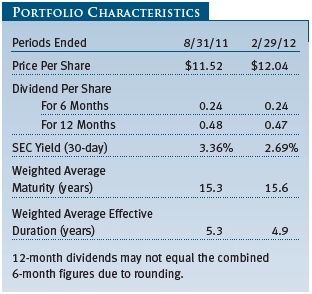
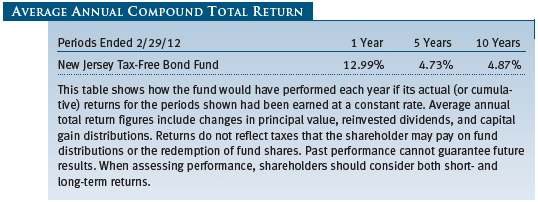
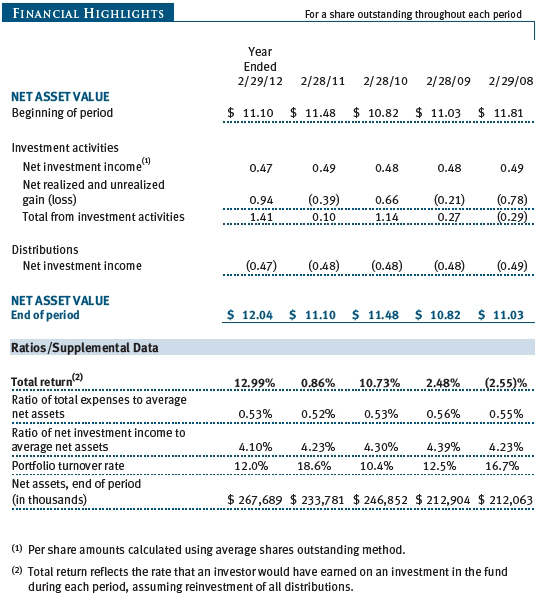
The New Jersey Tax-Free Bond Fund returned 6.63% for the six months and 12.99% for the 12 months ended February 29, 2012. The gains reflect the municipal bond market’s strong comeback in 2011 after some analysts’ predictions of widespread defaults proved false. However, returns in both periods trailed that of the Lipper peer group average due to the fund’s more conservative positioning.
Since our last report at the end of August, we reduced the fund’s cash holdings and overweight allocation to bonds with maturities of less than two years, which were hurting performance. Because we remain cautious of the very low yields intermediate-term bonds offer, our new purchases were focused on bonds in the 20-year range, where we found yields more compelling given the steep yield curve. The fund continues to be overweight in longer-dated bonds relative to the benchmark, but some of our peers had significantly greater exposure to long bonds and benefited more from their strong performance in the period. The fund’s duration—a measure of its sensitivity to interest rates—stayed fairly close to neutral versus the benchmark but shorter relative to the peer group. The fund’s weighted average maturity remained largely unchanged from our last report at 15.6 years.
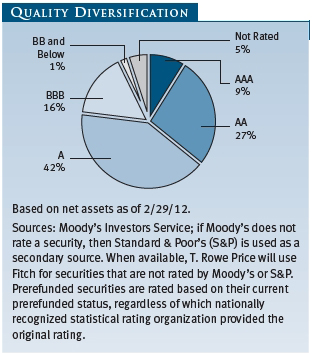
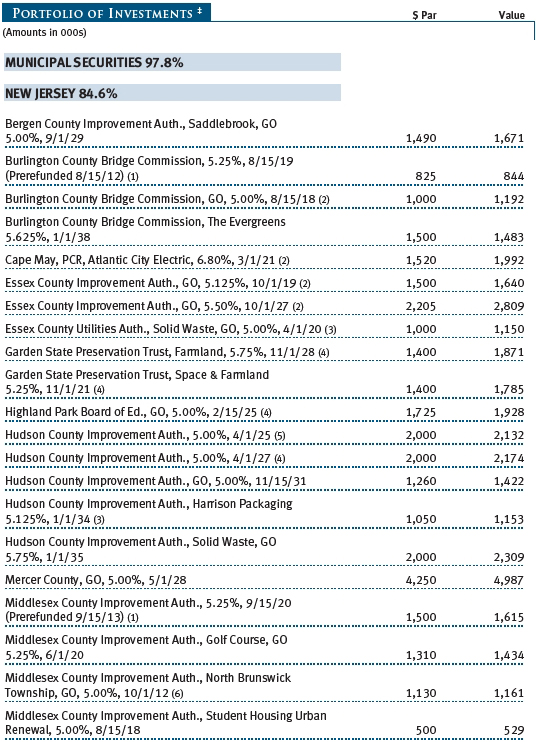
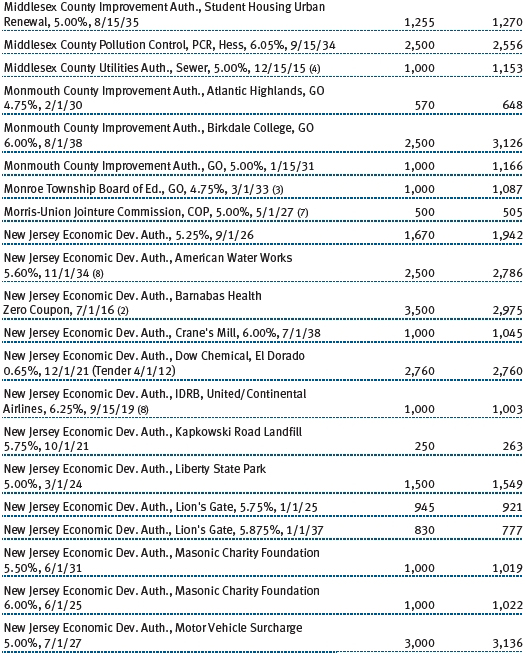
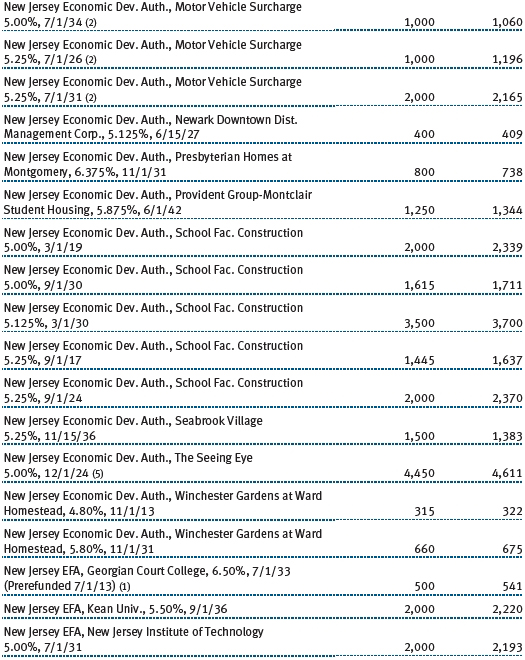
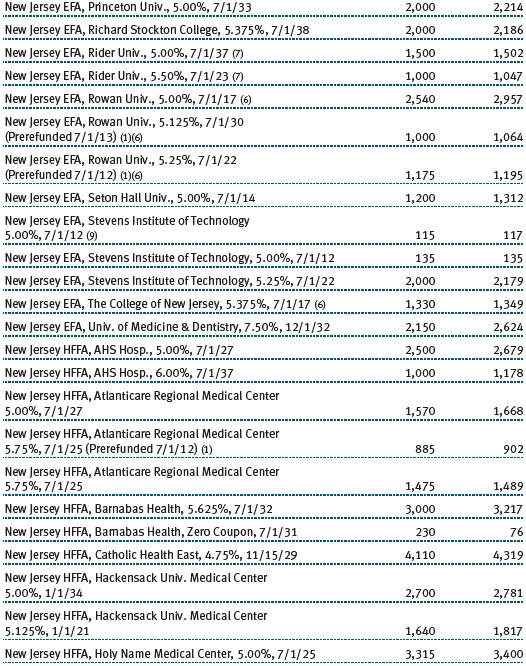
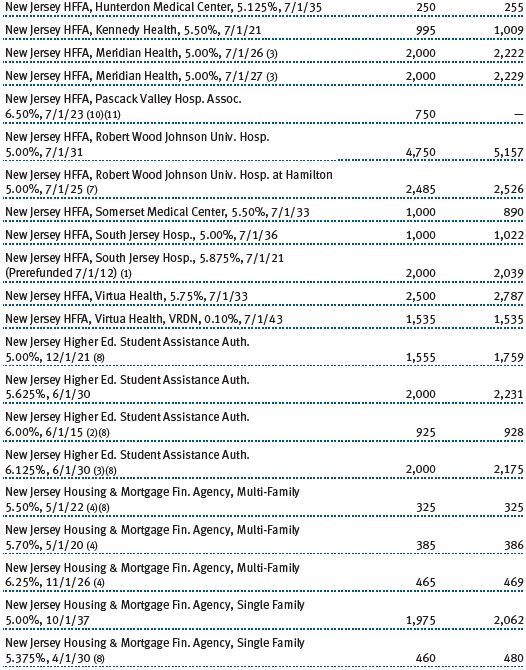
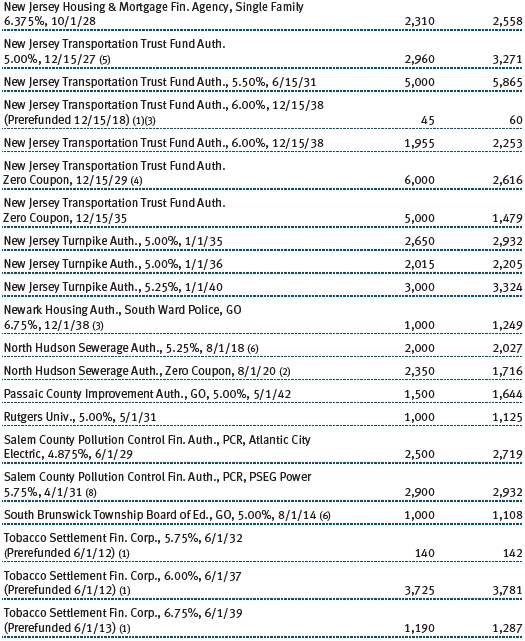
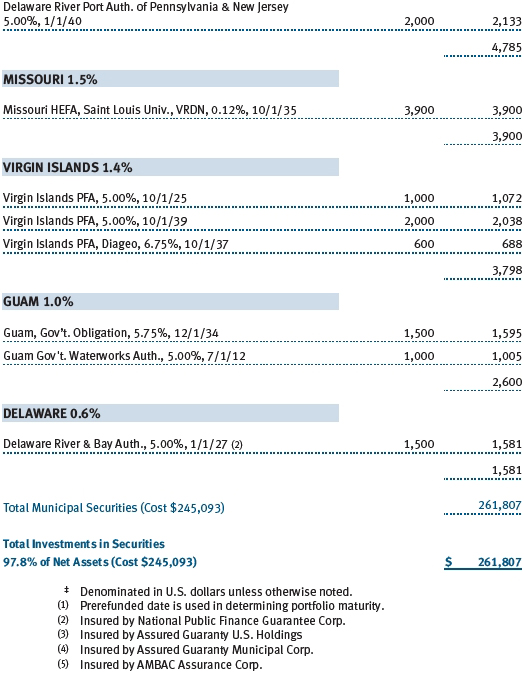
New issuance of New Jersey tax-exempt bonds in the past year was scarce, particularly in the 30-year range. Constrained supply limited us from extending the fund’s weighted average maturity. We increased our investments in bonds backed by the state, purchasing bonds issued through the NJ Transportation Trust Fund Authority as the state’s outlook improved in line with the U.S. economy. Our direct guarantor exposure to the state of New Jersey, however, remains underweight compared with our peer group. The fund’s quality diversification stayed largely unchanged: Our greatest exposure is in the A range, which increased 4% since the end of August. Our conservative posture relative to the peer group was another reason for underperformance, given that lower-quality credits fared best over the period. (Please refer to the fund’s portfolio of investments for a complete list of our holdings and the amount each represents in the portfolio.)
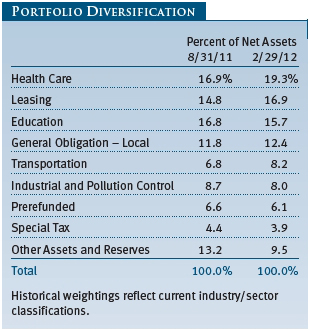
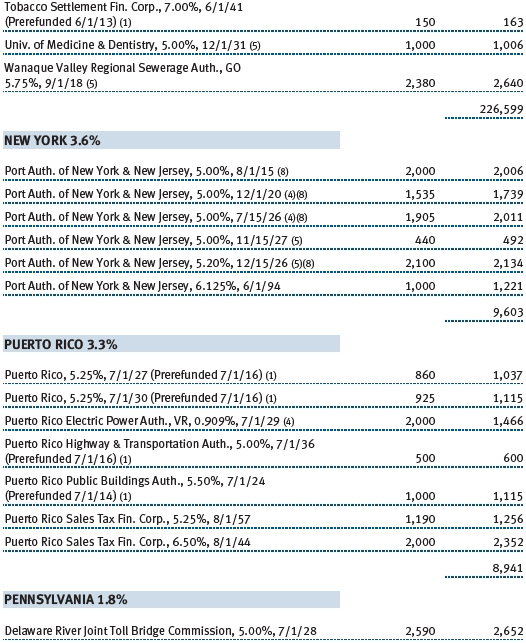
Health care remained the fund’s largest sector. We increased our positions in health care issuers, which fortunately ranked among the period’s top performers. There were no significant changes in sector holdings, and we continue to prefer revenue bonds over GOs. Among significant sales, we reduced our positions in Puerto Rico due to concerns about continued issuance and rising debt loads and trimmed our exposure to life-care—largely retirement and assisted living issuers—due to long-term credit concerns in specific bonds. The fund no longer holds tobacco bonds backed by the Master Settlement Agreement (MSA), reflecting our outlook for weaker-than-expected tobacco consumption. However, the tobacco sector enjoyed tremendous outperformance as buyers sought yield, and our relative performance suffered accordingly. We expect tobacco bonds to stay volatile and remain negative on the overall sector.
Holdings that performed the best over the 12-month period were bonds with long durations—particularly zero-coupon bonds as well as bonds with longer maturities. Lower-quality and BBB rated bonds, including the hospital and life-care sectors, outpaced their higher-quality counterparts. Bonds contributing the least to performance were high-quality positions, such as prerefunded bonds with maturities shorter than three years.
OUTLOOK
While we are pleased with the tremendous performance of municipal bonds over the last year, we believe that returns in 2012 will moderate, as the credit and economic environment for municipalities is likely to remain challenging. Modest economic growth and improving income and sales tax revenues are providing some support for state and local governments. However, tax revenues remain below previous peaks, and cutbacks in state support and downward pressure on property tax revenues could keep local municipal issuers vulnerable. If the economy slides back into a recession—which we are not currently predicting—municipalities will face even tougher challenges.
State and local government liabilities, such as pension benefits and health care costs, are a growing long-term concern. Maintaining balanced budgets and addressing these long-term concerns require careful and dedicated work by state and local officials. These efforts will need to continue—with or without additional federal government assistance.
We continue to believe that the municipal bond market is a high-quality market, with good opportunities for long-term investors. While we are comforted somewhat by Federal Reserve assurances that interest rate hikes are not imminent and by the demonstrated ability of states to balance their budgets in tough times, we are mindful that municipal yields are at or near historical lows and that there is the potential for losses if rates start to rise in response to stronger economic growth or inflation. With rates at such low levels, we are guarded in our interest rate outlook and careful with any investment shift that might increase our portfolio’s interest rate sensitivity.
We believe T. Rowe Price’s strong credit research capabilities have been and will remain an asset for our investors. We continue to conduct our own thorough research and assign our own independent credit ratings before making investment decisions. As always, we are on the lookout for attractively valued bonds issued by municipalities with good fundamentals—an investment strategy that has served our investors well in the past.
Respectfully submitted,

Konstantine B. Mallas
Chairman of the Investment Advisory Committee
March 12, 2012
The committee chairman has day-to-day responsibility for managing the portfolio and works with committee members in developing and executing the fund’s investment program.
RISKS OF FIXED INCOME INVESTING
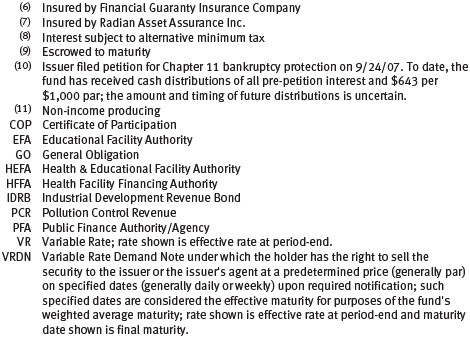
Bonds are subject to interest rate risk (the decline in bond prices that usually accompanies a rise in interest rates) and credit risk (the chance that any fund holding could have its credit rating downgraded or that a bond issuer will default by failing to make timely payments of interest or principal), potentially reducing the fund’s income level and share price. The New Jersey Tax-Free Bond Fund is less diversified than one investing nationally. Some income may be subject to state and local taxes and the federal alternative minimum tax.
GLOSSARY
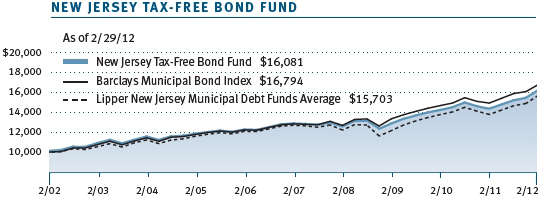
Barclays Municipal Bond Index: A broadly diversified index of tax-exempt bonds.
Duration: A measure of a bond fund’s sensitivity to changes in interest rates. For example, a fund with a duration of five years would fall about 5% in price in response to a one-percentage-point rise in interest rates, and vice versa.
Federal funds rate: The interest rate charged on overnight loans of reserves by one financial institution to another in the United States. The Federal Reserve sets a target federal funds rate to affect the direction of interest rates.
General obligation debt: A government’s strongest pledge that obligates its full faith and credit, including, if necessary, its ability to raise taxes.
Lipper averages: The averages of available mutual fund performance returns for specified time periods in categories defined by Lipper.
Prerefunded bond: A bond that originally may have been issued as a general obligation or revenue bond but that is now secured by an escrow fund consisting entirely of direct U.S. government obligations that are sufficient for paying the bondholders.
SEC yield (30-day): A method of calculating a fund’s yield that assumes all portfolio securities are held until maturity. The Securities and Exchange Commission (SEC) requires all bond funds to calculate this yield. Yield will vary and is not guaranteed.
Weighted average maturity: A measure of a fund’s interest rate sensitivity. In general, the longer the average maturity, the greater the fund’s sensitivity to interest rate changes. The weighted average maturity may take into account the interest rate readjustment dates for certain securities. Money funds must maintain a weighted average maturity of less than 60 days.
Yield curve: A graphic depiction of the relationship between yields and maturity dates for a set of similar securities. Securities with longer maturities usually have a higher yield. If short-term securities offer a higher yield, then the curve is said to be “inverted.” If short- and long-term bonds are offering equivalent yields, then the curve is said to be “flat.”
Performance and Expenses
This chart shows the value of a hypothetical $10,000 investment in the fund over the past 10 fiscal year periods or since inception (for funds lacking 10-year records). The result is compared with benchmarks, which may include a broad-based market index and a peer group average or index. Market indexes do not include expenses, which are deducted from fund returns as well as mutual fund averages and indexes.
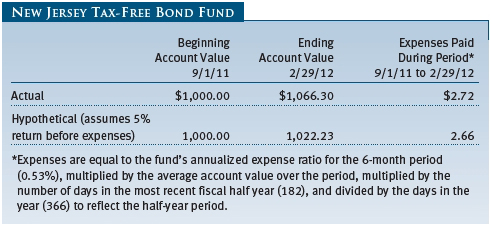
As a mutual fund shareholder, you may incur two types of costs: (1) transaction costs, such as redemption fees or sales loads, and (2) ongoing costs, including management fees, distribution and service (12b-1) fees, and other fund expenses. The following example is intended to help you understand your ongoing costs (in dollars) of investing in the fund and to compare these costs with the ongoing costs of investing in other mutual funds. The example is based on an investment of $1,000 invested at the beginning of the most recent six-month period and held for the entire period.
Actual Expenses
The first line of the following table (“Actual”) provides information about actual account values and expenses based on the fund’s actual returns. You may use the information on this line, together with your account balance, to estimate the expenses that you paid over the period. Simply divide your account value by $1,000 (for example, an $8,600 account value divided by $1,000 = 8.6), then multiply the result by the number on the first line under the heading “Expenses Paid During Period” to estimate the expenses you paid on your account during this period.
Hypothetical Example for Comparison Purposes
The information on the second line of the table (“Hypothetical”) is based on hypothetical account values and expenses derived from the fund’s actual expense ratio and an assumed 5% per year rate of return before expenses (not the fund’s actual return). You may compare the ongoing costs of investing in the fund with other funds by contrasting this 5% hypothetical example and the 5% hypothetical examples that appear in the shareholder reports of the other funds. The hypothetical account values and expenses may not be used to estimate the actual ending account balance or expenses you paid for the period.
Note: T. Rowe Price charges an annual account service fee of $20, generally for accounts with less than $10,000. The fee is waived for any investor whose T. Rowe Price mutual fund accounts total $50,000 or more; accounts electing to receive electronic delivery of account statements, transaction confirmations, prospectuses, and shareholder reports; or accounts of an investor who is a T. Rowe Price Preferred Services, Personal Services, or Enhanced Personal Services client (enrollment in these programs generally requires T. Rowe Price assets of at least $100,000). This fee is not included in the accompanying table. If you are subject to the fee, keep it in mind when you are estimating the ongoing expenses of investing in the fund and when comparing the expenses of this fund with other funds.
You should also be aware that the expenses shown in the table highlight only your ongoing costs and do not reflect any transaction costs, such as redemption fees or sales loads. Therefore, the second line of the table is useful in comparing ongoing costs only and will not help you determine the relative total costs of owning different funds. To the extent a fund charges transaction costs, however, the total cost of owning that fund is higher.
The accompanying notes are an integral part of these financial statements.
The accompanying notes are an integral part of these financial statements.
The accompanying notes are an integral part of these financial statements.
The accompanying notes are an integral part of these financial statements.
The accompanying notes are an integral part of these financial statements.
| Notes to Financial Statements |
T. Rowe Price State Tax-Free Income Trust (the trust), is registered under the Investment Company Act of 1940 (the 1940 Act). The New Jersey Tax-Free Bond Fund (the fund), a nondiversified, open-end management investment company, is one portfolio established by the trust. The fund commenced operations on April 30, 1991. The fund seeks to provide, consistent with prudent portfolio management, the highest level of income exempt from federal and New Jersey state income taxes by investing primarily in investment-grade New Jersey municipal bonds.
NOTE 1 - SIGNIFICANT ACCOUNTING POLICIES
Basis of Preparation The accompanying financial statements were prepared in accordance with accounting principles generally accepted in the United States of America (GAAP), which require the use of estimates made by management. Management believes that estimates and valuations are appropriate; however, actual results may differ from those estimates, and the valuations reflected in the accompanying financial statements may differ from the value ultimately realized upon sale or maturity.
Investment Transactions, Investment Income, and Distributions Income and expenses are recorded on the accrual basis. Premiums and discounts on debt securities are amortized for financial reporting purposes. Income tax-related interest and penalties, if incurred, would be recorded as income tax expense. Investment transactions are accounted for on the trade date. Realized gains and losses are reported on the identified cost basis. Distributions to shareholders are recorded on the ex-dividend date. Income distributions are declared daily and paid monthly. Capital gain distributions, if any, are generally declared and paid by the fund annually.
Credits The fund earns credits on temporarily uninvested cash balances held at the custodian, which reduce the fund’s custody charges. Custody expense in the accompanying financial statements is presented before reduction for credits.
New Accounting Pronouncements In December 2011, the Financial Accounting Standards Board issued amended guidance to enhance disclosure for offsetting assets and liabilities. The guidance is effective for fiscal years and interim periods beginning on or after January 1, 2013; adoption will have no effect on the fund’s net assets or results of operations.
NOTE 2 - VALUATION
The fund’s financial instruments are reported at fair value as defined by GAAP. The fund determines the values of its assets and liabilities and computes its net asset value per share at the close of the New York Stock Exchange (NYSE), normally 4 p.m. ET, each day that the NYSE is open for business.
Valuation Methods Debt securities are generally traded in the over-the-counter (OTC) market. Securities with remaining maturities of one year or more at the time of acquisition are valued at prices furnished by dealers who make markets in such securities or by an independent pricing service, which considers the yield or price of bonds of comparable quality, coupon, maturity, and type, as well as prices quoted by dealers who make markets in such securities. Securities with remaining maturities of less than one year at the time of acquisition generally use amortized cost in local currency to approximate fair value. However, if amortized cost is deemed not to reflect fair value or the fund holds a significant amount of such securities with remaining maturities of more than 60 days, the securities are valued at prices furnished by dealers who make markets in such securities or by an independent pricing service.
Other investments, including restricted securities and private placements, and those financial instruments for which the above valuation procedures are inappropriate or are deemed not to reflect fair value, are stated at fair value as determined in good faith by the T. Rowe Price Valuation Committee, established by the fund’s Board of Trustees (the Board). Subject to oversight by the Board, the Valuation Committee develops pricing-related policies and procedures and approves all fair-value determinations. The Valuation Committee regularly makes good faith judgments, using a wide variety of sources and information, to establish and adjust valuations of certain securities as events occur and circumstances warrant. For instance, in determining the fair value of private-equity instruments, the Valuation Committee considers a variety of factors, including the company’s business prospects, its financial performance, strategic events impacting the company, relevant valuations of similar companies, new rounds of financing, and any negotiated transactions of significant size between other investors in the company. Because any fair-value determination involves a significant amount of judgment, there is a degree of subjectivity inherent in such pricing decisions.
Valuation Inputs Various inputs are used to determine the value of the fund’s financial instruments. These inputs are summarized in the three broad levels listed below:
Level 1 – quoted prices in active markets for identical financial instruments
Level 2 – observable inputs other than Level 1 quoted prices (including, but not limited to, quoted prices for similar financial instruments, interest rates, prepayment speeds, and credit risk)
Level 3 – unobservable inputs
Observable inputs are those based on market data obtained from sources independent of the fund, and unobservable inputs reflect the fund’s own assumptions based on the best information available. The input levels are not necessarily an indication of the risk or liquidity associated with financial instruments at that level. On February 29, 2012, all of the fund’s financial instruments were classified as Level 2, based on the inputs used to determine their values.
NOTE 3 - OTHER INVESTMENT TRANSACTIONS
Purchases and sales of portfolio securities other than short-term securities aggregated $38,266,000 and $28,129,000, respectively, for the year ended February 29, 2012.
NOTE 4 - FEDERAL INCOME TAXES
No provision for federal income taxes is required since the fund intends to continue to qualify as a regulated investment company under Subchapter M of the Internal Revenue Code and distribute to shareholders all of its income and gains. Distributions determined in accordance with federal income tax regulations may differ in amount or character from net investment income and realized gains for financial reporting purposes. Financial reporting records are adjusted for permanent book/tax differences to reflect tax character but are not adjusted for temporary differences.
The fund files U.S. federal, state, and local tax returns as required. The fund’s tax returns are subject to examination by the relevant tax authorities until expiration of the applicable statute of limitations, which is generally three years after the filing of the tax return but which can be extended to six years in certain circumstances. Tax returns for open years have incorporated no uncertain tax positions that require a provision for income taxes.
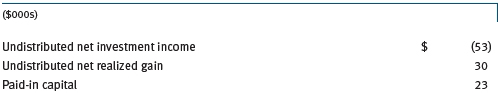
Reclassifications to paid-in capital relate primarily to a tax practice that treats a portion of the proceeds from each redemption of capital shares as a distribution of taxable net investment income and/or realized capital gain. Reclassifications between income and gain relate primarily to differences between book/tax amortization policies. For the year ended February 29, 2012, the following reclassifications were recorded to reflect tax character (there was no impact on results of operations or net assets):
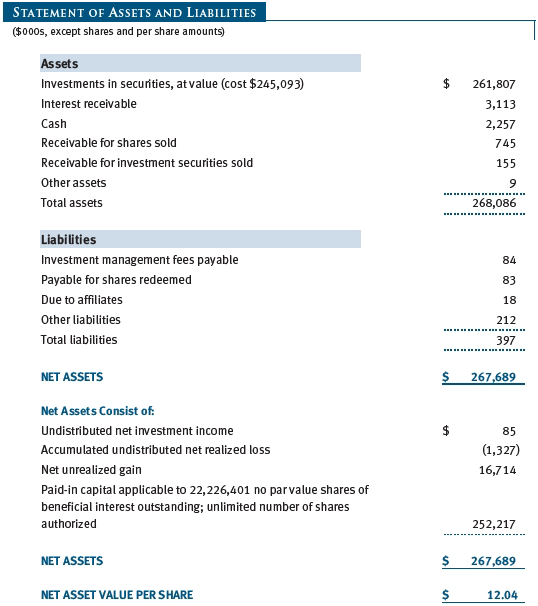
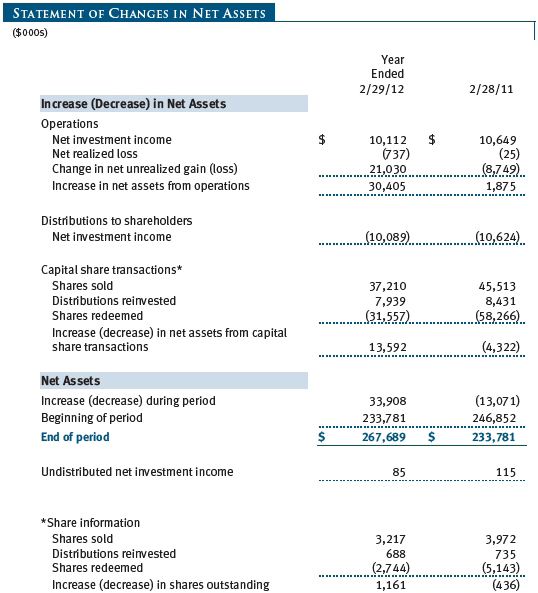
Distributions during the years ended February 29, 2012 and February 28, 2011, totaled $10,089,000 and $10,624,000, respectively, and were characterized as tax-exempt income for tax purposes. At February 29, 2012, the tax-basis cost of investments and components of net assets were as follows: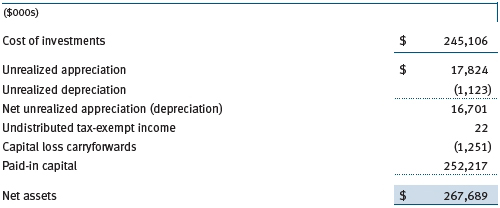
As a result of the Regulated Investment Company Modernization Act of 2010, net capital losses realized on or after March 1, 2011 (effective date) may be carried forward indefinitely to offset future realized capital gains; however, post-effective losses must be used before pre-effective capital loss carryforwards with expiration dates. Accordingly, it is possible that all or a portion of the fund’s pre-effective capital loss carryforwards could expire unused. The fund intends to retain realized gains to the extent of available capital loss carryforwards. The fund’s available capital loss carryforwards as of February 29, 2012, expire as follows: $93,000 in fiscal 2016, $413,000 in fiscal 2017; $745,000 have no expiration.
NOTE 5 - RELATED PARTY TRANSACTIONS
The fund is managed by T. Rowe Price Associates, Inc. (Price Associates), a wholly owned subsidiary of T. Rowe Price Group, Inc. (Price Group). The investment management agreement between the fund and Price Associates provides for an annual investment management fee, which is computed daily and paid monthly. The fee consists of an individual fund fee, equal to 0.10% of the fund’s average daily net assets, and a group fee. The group fee rate is calculated based on the combined net assets of certain mutual funds sponsored by Price Associates (the group) applied to a graduated fee schedule, with rates ranging from 0.48% for the first $1 billion of assets to 0.28% for assets in excess of $300 billion. The fund’s group fee is determined by applying the group fee rate to the fund’s average daily net assets. At February 29, 2012, the effective annual group fee rate was 0.30%.
In addition, the fund has entered into service agreements with Price Associates and a wholly owned subsidiary of Price Associates (collectively, Price). Price Associates computes the daily share price and provides certain other administrative services to the fund. T. Rowe Price Services, Inc., provides shareholder and administrative services in its capacity as the fund’s transfer and dividend disbursing agent. For the year ended February 29, 2012, expenses incurred pursuant to these service agreements were $96,000 for Price Associates and $62,000 for T. Rowe Price Services, Inc. The total amount payable at period-end pursuant to these service agreements is reflected as Due to Affiliates in the accompanying financial statements.
| Report of Independent Registered Public Accounting Firm |
To the Board of Trustees of T. Rowe Price State Tax-Free Income Trust and
Shareholders of New Jersey Tax-Free Bond Fund
In our opinion, the accompanying statement of assets and liabilities, including the portfolio of investments, and the related statements of operations and of changes in net assets and the financial highlights present fairly, in all material respects, the financial position of New Jersey Tax-Free Bond Fund (one of the portfolios comprising T. Rowe Price State Tax-Free Income Trust, hereafter referred to as the “Fund”) at February 29, 2012, and the results of its operations, the changes in its net assets and the financial highlights for each of the periods indicated therein, in conformity with accounting principles generally accepted in the United States of America. These financial statements and financial highlights (hereafter referred to as “financial statements”) are the responsibility of the Fund’s management; our responsibility is to express an opinion on these financial statements based on our audits. We conducted our audits of these financial statements in accordance with the standards of the Public Company Accounting Oversight Board (United States). Those standards require that we plan and perform the audit to obtain reasonable assurance about whether the financial statements are free of material misstatement. An audit includes examining, on a test basis, evidence supporting the amounts and disclosures in the financial statements, assessing the accounting principles used and significant estimates made by management, and evaluating the overall financial statement presentation. We believe that our audits, which included confirmation of securities at February 29, 2012 by correspondence with the custodian, provide a reasonable basis for our opinion.
PricewaterhouseCoopers LLP
Baltimore, Maryland
April 13, 2012
| Tax Information (Unaudited) for the Tax Year Ended 2/29/12 |
We are providing this information as required by the Internal Revenue Code. The amounts shown may differ from those elsewhere in this report because of differences between tax and financial reporting requirements.
The fund’s distributions to shareholders included $23,000 from short-term capital gains.
The fund’s distributions to shareholders included $10,089,000 which qualified as exempt-interest dividends.
| Information on Proxy Voting Policies, Procedures, and Records |
A description of the policies and procedures used by T. Rowe Price funds and portfolios to determine how to vote proxies relating to portfolio securities is available in each fund’s Statement of Additional Information, which you may request by calling 1-800-225-5132 or by accessing the SEC’s website, sec.gov. The description of our proxy voting policies and procedures is also available on our website, troweprice.com. To access it, click on the words “Our Company” at the top of our corporate homepage. Then, when the next page appears, click on the words “Proxy Voting Policies” on the left side of the page.
Each fund’s most recent annual proxy voting record is available on our website and through the SEC’s website. To access it through our website, follow the directions above, then click on the words “Proxy Voting Records” on the right side of the Proxy Voting Policies page.
| How to Obtain Quarterly Portfolio Holdings |
The fund files a complete schedule of portfolio holdings with the Securities and Exchange Commission for the first and third quarters of each fiscal year on Form N-Q. The fund’s Form N-Q is available electronically on the SEC’s website (sec.gov); hard copies may be reviewed and copied at the SEC’s Public Reference Room, 450 Fifth St. N.W., Washington, DC 20549. For more information on the Public Reference Room, call 1-800-SEC-0330.
| About the Fund’s Trustees and Officers |
Your fund is overseen by a Board of Trustees (Board) that meets regularly to review a wide variety of matters affecting the fund, including performance, investment programs, compliance matters, advisory fees and expenses, service providers, and other business affairs. The Board elects the fund’s officers, who are listed in the final table. At least 75% of the Board’s members are independent of T. Rowe Price Associates, Inc. (T. Rowe Price), and its affiliates; “inside” or “interested” trustees are employees or officers of T. Rowe Price. The business address of each trustee and officer is 100 East Pratt Street, Baltimore, Maryland 21202. The Statement of Additional Information includes additional information about the fund trustees and is available without charge by calling a T. Rowe Price representative at 1-800-638-5660.
Independent Trustees | | |
| | | |
| Name | | |
| (Year of Birth) | | Principal Occupation(s) and Directorships of Public Companies and |
| Year Elected* | | Other Investment Companies During the Past Five Years |
| | |
| William R. Brody | | President and Trustee, Salk Institute for Biological Studies (2009 |
| (1944) | | to present); Director, Novartis, Inc. (2009 to present); Director, IBM |
| 2009 | | (2007 to present); President and Trustee, Johns Hopkins University |
| | (1996 to 2009); Chairman of Executive Committee and Trustee, |
| | Johns Hopkins Health System (1996 to 2009) |
| | |
| Jeremiah E. Casey | | Retired |
| (1940) | | |
| 2006 | | |
| | |
| Anthony W. Deering | | Chairman, Exeter Capital, LLC, a private investment firm (2004 |
| (1945) | | to present); Director, Under Armour (2008 to present); Director, |
| 1986 | | Vornado Real Estate Investment Trust (2004 to present); Director, |
| | Mercantile Bankshares (2002 to 2007); Director and Member of the |
| | Advisory Board, Deutsche Bank North America (2004 to present) |
| | |
| Donald W. Dick, Jr. | | Principal, EuroCapital Partners, LLC, an acquisition and management |
| (1943) | | advisory firm (1995 to present) |
| 2001 | | |
| | |
| Karen N. Horn | | Senior Managing Director, Brock Capital Group, an advisory and |
| (1943) | | investment banking firm (2004 to present); Director, Eli Lilly and |
| 2003 | | Company (1987 to present); Director, Simon Property Group (2004 |
| | to present); Director, Norfolk Southern (2008 to present); Director, |
| | Fannie Mae (2006 to 2008) |
| | |
| Theo C. Rodgers | | President, A&R Development Corporation (1977 to present) |
| (1941) | | |
| 2005 | | |
| | |
| John G. Schreiber | | Owner/President, Centaur Capital Partners, Inc., a real estate |
| (1946) | | investment company (1991 to present); Cofounder and Partner, |
| 1992 | | Blackstone Real Estate Advisors, L.P. (1992 to present); Director, |
| | General Growth Properties, Inc. (2010 to present) |
| | |
| Mark R. Tercek | | President and Chief Executive Officer, The Nature Conservancy (2008 |
| (1957) | | to present); Managing Director, The Goldman Sachs Group, Inc. |
| 2009 | | (1984 to 2008) |
| | |
| *Each independent trustee oversees 136 T. Rowe Price portfolios and serves until retirement, resignation, or election of a successor. |
| | | |
Inside Trustees | | |
| | | |
| Name | | |
| (Year of Birth) | | |
| Year Elected* | | |
| [Number of T. Rowe Price | | Principal Occupation(s) and Directorships of Public Companies and |
| Portfolios Overseen] | | Other Investment Companies During the Past Five Years |
| | | |
| Edward C. Bernard | | Director and Vice President, T. Rowe Price; Vice Chairman of the |
| (1956) | | Board, Director, and Vice President, T. Rowe Price Group, Inc.; |
| 2006 | | Chairman of the Board, Director, and President, T. Rowe Price |
| [136] | | Investment Services, Inc.; Chairman of the Board and Director, |
| | T. Rowe Price Retirement Plan Services, Inc., T. Rowe Price Savings |
| | Bank, and T. Rowe Price Services, Inc.; Chairman of the Board, Chief |
| | Executive Officer, and Director, T. Rowe Price International; Chief |
| | Executive Officer, Chairman of the Board, Director, and President, |
| | T. Rowe Price Trust Company |
| | |
| Michael C. Gitlin | | Director of Fixed Income, T. Rowe Price (2009 to present); Global |
| (1970) | | Head of Trading, T. Rowe Price (2007 to 2009); Vice President, Price |
| 2010 | | Hong Kong, Price Singapore, T. Rowe Price, T. Rowe Price Group, Inc., |
| [46] | | and T. Rowe Price International; formerly Head of U.S. Equity Sales, |
| | Citigroup Global Markets (2005 to 2007) |
| | | |
*Each inside trustee serves until retirement, resignation, or election of a successor. |
| Officers | | |
| |
| Name (Year of Birth) | | |
| Position Held With State Tax-Free Income Trust | | Principal Occupation(s) |
| | | |
| R. Lee Arnold, Jr., CFA, CPA (1970) | | Vice President, T. Rowe Price and T. Rowe Price |
| Vice President | | Group, Inc. |
| | | |
| M. Helena Condez (1962) | | Vice President, T. Rowe Price |
| Vice President | | |
| | | |
| Patricia S. Deford (1957) | | Vice President, T. Rowe Price and T. Rowe Price |
| Vice President | | Group, Inc. |
| | | |
| G. Richard Dent (1960) | | Vice President, T. Rowe Price and T. Rowe Price |
| Vice President | | Group, Inc. |
| | | |
| Charles E. Emrich (1961) | | Vice President, T. Rowe Price and T. Rowe Price |
| Vice President | | Group, Inc. |
| | | |
| Roger L. Fiery III, CPA (1959) | | Vice President, Price Hong Kong, Price |
| Vice President | | Singapore, T. Rowe Price, T. Rowe Price Group, |
| | Inc., T. Rowe Price International, and T. Rowe |
| | Price Trust Company |
| | | |
| Kathryn A. Floyd, CFA (1982) | | Vice President, T. Rowe Price and T. Rowe Price |
| Vice President | | Group, Inc. |
| | | |
| John R. Gilner (1961) | | Chief Compliance Officer and Vice President, |
| Chief Compliance Officer | | T. Rowe Price; Vice President, T. Rowe Price |
| | Group, Inc., and T. Rowe Price Investment |
| | Services, Inc. |
| | | |
| Gregory S. Golczewski (1966) | | Vice President, T. Rowe Price and T. Rowe Price |
| Vice President | | Trust Company |
| | | |
| Charles B. Hill, CFA (1961) | | Vice President, T. Rowe Price and T. Rowe Price |
| Executive Vice President | | Group, Inc. |
| | | |
| Gregory K. Hinkle, CPA (1958) | | Vice President, T. Rowe Price, T. Rowe Price |
| Treasurer | | Group, Inc., and T. Rowe Price Trust Company; |
| | formerly Partner, PricewaterhouseCoopers LLP |
| | (to 2007) |
| | | |
| Marcy M. Lash (1963) | | Vice President, T. Rowe Price and T. Rowe Price |
| Vice President | | Group, Inc. |
| | | |
| Alan D. Levenson, Ph.D. (1958) | | Vice President, T. Rowe Price and T. Rowe Price |
| Vice President | | Group, Inc. |
| | | |
| Patricia B. Lippert (1953) | | Assistant Vice President, T. Rowe Price and |
| Secretary | | T. Rowe Price Investment Services, Inc. |
| | |
| Joseph K. Lynagh, CFA (1958) | | Vice President, T. Rowe Price, T. Rowe Price |
| Executive Vice President | | Group, Inc., and T. Rowe Price Trust Company |
| | | |
| Konstantine B. Mallas (1963) | | Vice President, T. Rowe Price and T. Rowe Price |
| Executive Vice President | | Group, Inc. |
| | | |
| Hugh D. McGuirk, CFA (1960) | | Vice President, T. Rowe Price and T. Rowe Price |
| President | | Group, Inc. |
| | | |
| Linda A. Murphy (1959) | | Vice President, T. Rowe Price and T. Rowe Price |
| Vice President | | Group, Inc. |
| | | |
| David Oestreicher (1967) | | Director and Vice President, T. Rowe Price |
| Vice President | | Investment Services, Inc., T. Rowe Price |
| | Retirement Plan Services, Inc., T. Rowe Price |
| | Services, Inc., and T. Rowe Price Trust Company; |
| | Vice President, Price Hong Kong, Price |
| | Singapore, T. Rowe Price, T. Rowe Price Group, |
| | Inc., and T. Rowe Price International |
| | | |
| Deborah D. Seidel (1962) | | Vice President, T. Rowe Price, T. Rowe Price |
| Vice President | | Group, Inc., and T. Rowe Price Investment |
| | Services, Inc.; Assistant Treasurer and Vice |
| | President, T. Rowe Price Services, Inc.; Assistant |
| | Treasurer, T. Rowe Price Retirement Plan |
| | Services, Inc. |
| | | |
| Michael K. Sewell (1970) | | Assistant Vice President, T. Rowe Price |
| Assistant Vice President | | |
| | | |
| Chen Shao (1980) | | Assistant Vice President, T. Rowe Price |
| Assistant Vice President | | |
| | | |
| Timothy G. Taylor, CFA (1975) | | Vice President, T. Rowe Price and T. Rowe Price |
| Vice President | | Group, Inc. |
| | | |
| Julie L. Waples (1970) | | Vice President, T. Rowe Price |
| Vice President | | |
| | |
Unless otherwise noted, officers have been employees of T. Rowe Price or T. Rowe Price International for at least 5 years. |
Item 2. Code of Ethics.
The registrant has adopted a code of ethics, as defined in Item 2 of Form N-CSR, applicable to its principal executive officer, principal financial officer, principal accounting officer or controller, or persons performing similar functions. A copy of this code of ethics is filed as an exhibit to this Form N-CSR. No substantive amendments were approved or waivers were granted to this code of ethics during the period covered by this report.
Item 3. Audit Committee Financial Expert.
The registrant’s Board of Directors/Trustees has determined that Mr. Anthony W. Deering qualifies as an audit committee financial expert, as defined in Item 3 of Form N-CSR. Mr. Deering is considered independent for purposes of Item 3 of Form N-CSR.
Item 4. Principal Accountant Fees and Services.
(a) – (d) Aggregate fees billed to the registrant for the last two fiscal years for professional services rendered by the registrant’s principal accountant were as follows:
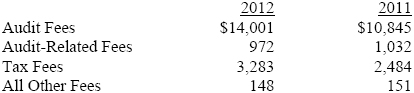
Audit fees include amounts related to the audit of the registrant’s annual financial statements and services normally provided by the accountant in connection with statutory and regulatory filings. Audit-related fees include amounts reasonably related to the performance of the audit of the registrant’s financial statements and specifically include the issuance of a report on internal controls and, if applicable, agreed-upon procedures related to fund acquisitions. Tax fees include amounts related to services for tax compliance, tax planning, and tax advice. The nature of these services specifically includes the review of distribution calculations and the preparation of Federal, state, and excise tax returns. All other fees include the registrant’s pro-rata share of amounts for agreed-upon procedures in conjunction with service contract approvals by the registrant’s Board of Directors/Trustees.
(e)(1) The registrant’s audit committee has adopted a policy whereby audit and non-audit services performed by the registrant’s principal accountant for the registrant, its investment adviser, and any entity controlling, controlled by, or under common control with the investment adviser that provides ongoing services to the registrant require pre-approval in advance at regularly scheduled audit committee meetings. If such a service is required between regularly scheduled audit committee meetings, pre-approval may be authorized by one audit committee member with ratification at the next scheduled audit committee meeting. Waiver of pre-approval for audit or non-audit services requiring fees of a de minimis amount is not permitted.
(2) No services included in (b) – (d) above were approved pursuant to paragraph (c)(7)(i)(C) of Rule 2-01 of Regulation S-X.
(f) Less than 50 percent of the hours expended on the principal accountant’s engagement to audit the registrant’s financial statements for the most recent fiscal year were attributed to work performed by persons other than the principal accountant’s full-time, permanent employees.
(g) The aggregate fees billed for the most recent fiscal year and the preceding fiscal year by the registrant’s principal accountant for non-audit services rendered to the registrant, its investment adviser, and any entity controlling, controlled by, or under common control with the investment adviser that provides ongoing services to the registrant were $1,704,000 and $1,583,000, respectively.
(h) All non-audit services rendered in (g) above were pre-approved by the registrant’s audit committee. Accordingly, these services were considered by the registrant’s audit committee in maintaining the principal accountant’s independence.
Item 5. Audit Committee of Listed Registrants.
Not applicable.
Item 6. Investments.
(a) Not applicable. The complete schedule of investments is included in Item 1 of this Form N-CSR.
(b) Not applicable.
Item 7. Disclosure of Proxy Voting Policies and Procedures for Closed-End Management Investment Companies.
Not applicable.
Item 8. Portfolio Managers of Closed-End Management Investment Companies.
Not applicable.
Item 9. Purchases of Equity Securities by Closed-End Management Investment Company and Affiliated Purchasers.
Not applicable.
Item 10. Submission of Matters to a Vote of Security Holders.
Not applicable.
Item 11. Controls and Procedures.
(a) The registrant’s principal executive officer and principal financial officer have evaluated the registrant’s disclosure controls and procedures within 90 days of this filing and have concluded that the registrant’s disclosure controls and procedures were effective, as of that date, in ensuring that information required to be disclosed by the registrant in this Form N-CSR was recorded, processed, summarized, and reported timely.
(b) The registrant’s principal executive officer and principal financial officer are aware of no change in the registrant’s internal control over financial reporting that occurred during the registrant’s second fiscal quarter covered by this report that has materially affected, or is reasonably likely to materially affect, the registrant’s internal control over financial reporting.
Item 12. Exhibits.
(a)(1) The registrant’s code of ethics pursuant to Item 2 of Form N-CSR is attached.
(2) Separate certifications by the registrant's principal executive officer and principal financial officer, pursuant to Section 302 of the Sarbanes-Oxley Act of 2002 and required by Rule 30a-2(a) under the Investment Company Act of 1940, are attached.
(3) Written solicitation to repurchase securities issued by closed-end companies: not applicable.
(b) A certification by the registrant's principal executive officer and principal financial officer, pursuant to Section 906 of the Sarbanes-Oxley Act of 2002 and required by Rule 30a-2(b) under the Investment Company Act of 1940, is attached.
SIGNATURES
Pursuant to the requirements of the Securities Exchange Act of 1934 and the Investment Company Act of 1940, the registrant has duly caused this report to be signed on its behalf by the undersigned, thereunto duly authorized.
T. Rowe Price State Tax-Free Income Trust
| By | /s/ Edward C. Bernard |
| | Edward C. Bernard |
| | Principal Executive Officer |
| | |
| Date April 13, 2012 | | |
Pursuant to the requirements of the Securities Exchange Act of 1934 and the Investment Company Act of 1940, this report has been signed below by the following persons on behalf of the registrant and in the capacities and on the dates indicated.
| By | /s/ Edward C. Bernard |
| | Edward C. Bernard |
| | Principal Executive Officer |
| | |
| Date April 13, 2012 | | |
| | |
| | |
| By | /s/ Gregory K. Hinkle |
| | Gregory K. Hinkle |
| | Principal Financial Officer |
| | |
| Date April 13, 2012 | | |