UNITED STATES
SECURITIES AND EXCHANGE COMMISSION
Washington, D.C. 20549
FORM N-CSR
CERTIFIED SHAREHOLDER REPORT OF REGISTERED
MANAGEMENT INVESTMENT COMPANIES
Investment Company Act File Number: 811-4521
| T. Rowe Price State Tax-Free Income Trust |
|
| (Exact name of registrant as specified in charter) |
| |
| 100 East Pratt Street, Baltimore, MD 21202 |
|
| (Address of principal executive offices) |
| |
| David Oestreicher |
| 100 East Pratt Street, Baltimore, MD 21202 |
|
| (Name and address of agent for service) |
Registrant’s telephone number, including area code: (410) 345-2000
Date of fiscal year end: February 29
Date of reporting period: February 29, 2012
Item 1. Report to Shareholders
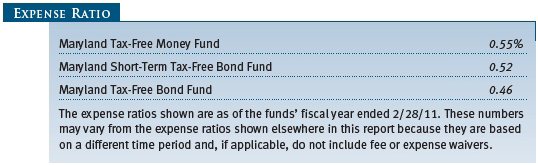
| Maryland Tax-Free Money Fund | February 29, 2012 |
The views and opinions in this report were current as of February 29, 2012. They are not guarantees of performance or investment results and should not be taken as investment advice. Investment decisions reflect a variety of factors, and the managers reserve the right to change their views about individual stocks, sectors, and the markets at any time. As a result, the views expressed should not be relied upon as a forecast of the fund’s future investment intent. The report is certified under the Sarbanes-Oxley Act, which requires mutual funds and other public companies to affirm that, to the best of their knowledge, the information in their financial reports is fairly and accurately stated in all material respects.
REPORTS ON THE WEB
Sign up for our E-mail Program, and you can begin to receive updated fund reports and prospectuses online rather than through the mail. Log in to your account at troweprice.com for more information.
Manager’s Letter
Fellow Shareholders
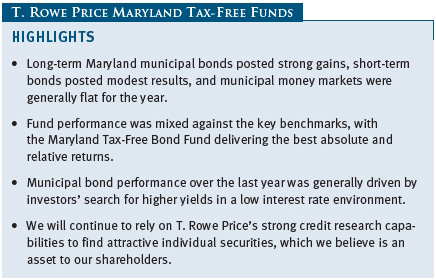
Tax-free Maryland municipal bonds produced generally good returns in the 6- and 12-month periods ended February 29, 2012. In the second half of the funds’ fiscal year, munis rallied along with U.S. Treasuries—led by long-term bonds—as year-over-year issuance declined and last year’s fears of widespread defaults continued to subside, despite the largest municipal bankruptcy in U.S. history in Jefferson County, Alabama. Meanwhile, muni money market rates were flat, reflecting the 0% interest rate policy implemented by the Federal Reserve. The T. Rowe Price Maryland Tax-Free Funds mostly performed in line with their benchmarks over the last year.
MARKET ENVIRONMENT
The U.S. economy strengthened in the fourth quarter of 2011 and grew moderately in the early months of 2012, defying expectations that the ongoing sovereign debt crisis in Europe would weigh heavily on the domestic economic recovery. The labor market recovery has been firming, with nonfarm payrolls increasing 245,000 on average in the three months through February and the national unemployment rate dipping to 8.3%, the lowest level since early 2009. Corporate profit growth remains healthy, and manufacturing activity has been increasing moderately. The housing market is still weak, however, and the Federal Reserve remains cautious about the durability of the economy.
To support the recovery with low long-term interest rates, the Fed initiated a “maturity extension program” in September 2011 through which it would purchase $400 billion in longer-term Treasuries and sell issues maturing in three years or less through June 2012. Also, after the Fed’s monetary policy meeting in January, central bank officials projected that short-term rates will remain low at least until late 2014—versus previous expectations of low rates lasting through mid-2013—and expressed a willingness to provide additional stimulus if the economic outlook deteriorates.
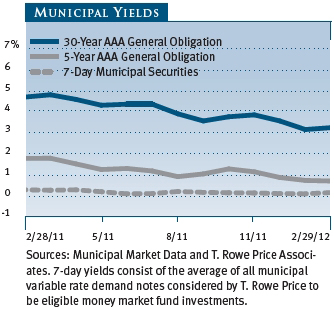
The municipal yield curve flattened over the last year, with long-term yields falling significantly while shorter-term yields continued to grind their way closer to 0%. Nevertheless, with municipal yields comparable to or higher than Treasury yields, tax-free securities are an attractive alternative for fixed income investors. As of February 29, 2012, the 3.23% yield offered by a 30-year tax-free municipal bond rated AAA was about 104% of the 3.09% pretax yield offered by a 30-year Treasury. An investor in the 28% federal tax bracket would need to invest in a taxable bond yielding about 4.49% in order to receive the same after-tax income. (To calculate a municipal bond’s taxable-equivalent yield, divide the municipal bond’s yield by the quantity of 1.00 minus your federal tax bracket expressed as a decimal—in this case, 1.00 – 0.28, or 0.72.)
MUNICIPAL MARKET NEWS
Municipal issuance in 2011 totaled only $295 billion, according to The Bond Buyer—the lowest level seen in a decade. Contributing factors include the absence of the Build America Bond program and a pervasive sentiment toward fiscal austerity, which could keep issuance somewhat subdued in 2012. While the $43 billion in year-to-date long-term issuance is higher than it was at this point in 2011, much of it reflects municipalities refinancing their debts to take advantage of low long-term interest rates, rather than net new issuance. Issuance may stay on the low side of estimates as state and local governments have been conservative about adding to indebtedness, despite prevailing low yields.
Demand for municipal securities in early 2011 was weak but picked up as the year progressed. Municipal bond fund cash flows, which were negative in the first half of 2011, turned positive in the second half as risk-averse investors realized that municipals were still a high-quality asset class. In recent months, cash flows have been strong.
Many states continue to face fiscal difficulties and have been forced to raise taxes and fees and cut spending to close budget deficits. We believe many states deserve high credit ratings, and we do not see a near-term threat to their ability to continue servicing their outstanding debts. However, we have longer-term concerns about potentially onerous future pension obligations and other retirement benefits.
Municipal bond performance in the last six months and throughout the fund’s fiscal year was generally driven by investors’ search for higher yields in a low interest rate environment. In both periods, long- and intermediate-term bonds outperformed short-term securities, while lower-quality investment-grade issues, especially A rated bonds, outpaced higher-grade munis. Among revenue bonds, tobacco and health care were two of the top-performing segments. We continue to underweight tobacco bonds because of declining long-term tobacco consumption trends, and while we are overweight to health care in most portfolios, we are very selective in this sector, particularly hospitals, as the implementation of health care reform may put pressure on already thin hospital profit margins. Prerefunded bonds, which are backed by U.S. Treasuries, produced modest gains in both periods due to their high-quality and short-term characteristics.
MARYLAND MARKET NEWS
Maryland’s economic profile remains strong compared with other states. Marylanders are relatively prosperous—per capita personal income represented 123% of the national average in 2010, ranking it fourth in the nation. The state’s unemployment rate was 6.5% as of January 31, 2012 (the latest available data), well below the 8.3% national unemployment rate at that time. Maryland’s employment base grew by 1.0% over the past year, consistent with the national average.
While Maryland’s economic and demographic trends have been relatively good, its finances have not been immune to the national recession. General fund revenues dropped almost 9% during the recession, but they have started to climb. In the latest fiscal year, ended June 30, 2011, Maryland’s general fund receipts were 6.4% ahead of where they were in the prior year, producing a surplus of $90 million.
The state has always maintained a good cushion in its rainy day fund—on June 30, 2011, Maryland’s reserve fund held $629 million, representing a solid 4.8% of general fund revenues. The state has balanced its budget for 2012, and officials expect its reserve fund to hold $682 million at the end of fiscal 2012. Through the seven months ended January 31, 2012, general fund receipts are running 5.9% ahead of the same period one year ago. Work has begun on how to solve an estimated $1.2 billion budget gap for fiscal 2013. Governor Martin O’Malley has proposed a 3% increase in the budget for fiscal year 2013, and legislators are currently working on modifying and finalizing this budget.
Maryland’s debt load is above the national average. According to Moody’s 2011 State Debt Medians, the state’s debt burden is in the upper third when measured by debt per capita and only modestly better when measured on a debt-to-personal income basis. Debt service as a percentage of the budget is, nonetheless, very manageable at 3.5% in fiscal 2011. However, as of June 30, 2011, Maryland’s Retirement and Pension System was only funded at 64% on an actuarial basis. Maryland faces fairly heavy unfunded liabilities for its pension and benefits plans, at $19 billion and $10 billion, respectively. Various modifications to benefits under these programs have been proposed to reduce liabilities and improve funding.
Maryland has a long history of responsible stewardship and prudent financial management. The state’s general obligation (GO) bonds are rated Aaa, AAA, and AAA by Moody’s Investors Service, Standard & Poor’s, and Fitch, respectively. While S&P and Fitch maintain stable outlooks, Moody’s revised its outlook on Maryland to negative at the beginning of August 2011 in conjunction with a similar move on the outlook for the United States. In Moody’s opinion, Maryland has above-average economic sensitivity and dependence on federal employment and procurement.
PERFORMANCE AND PORTFOLIO STRATEGY REVIEW
Maryland Tax-Free Money Fund
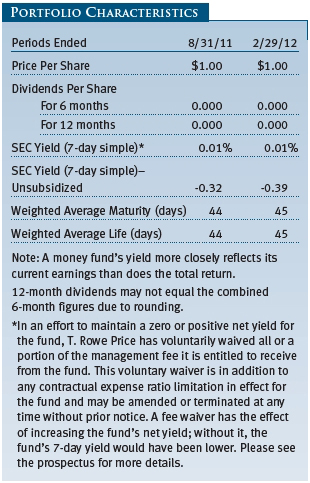
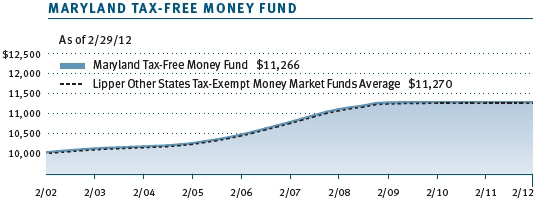
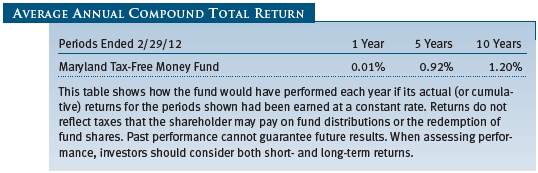
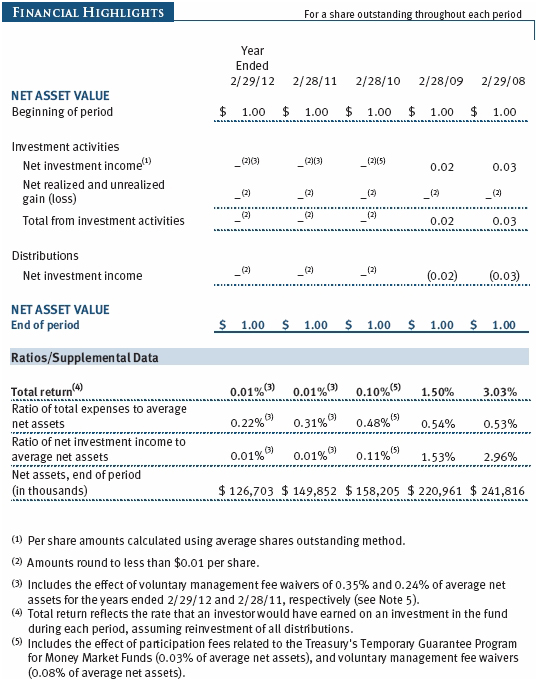
Your fund generated a 0.01% return for the 6- and 12-month periods ended February 29, 2012. These results were in line with the Lipper Other States Tax-Exempt Money Market Funds Average. All money market rates continue to be closely tied to the Federal Reserve’s fed funds target rate of 0.00% to 0.25%. The Maryland Tax-Free Money Fund has performed in line with its competitors over the longer term.

With the Federal Reserve’s 0% interest rate policy now in place for more than three years, and showing no signs of abating, rates and income in the municipal money market offer minimal returns for investors. One aspect of Fed policy has been to induce investors to shift assets away from the lower-risk returns of money funds and toward higher-risk alternatives. As a result, money fund assets are down significantly from their 2008 peaks.
Municipal money rates continued to compress around 0.00%. Overall, rates across the money market curve were lower compared with those when we penned our last report six months ago. Overnight rates averaged 0.08% during the last six months compared with 0.12% in the prior period, while seven-day rates averaged 0.11% compared with 0.17%. Six-month and one-year note yields pushed lower, both down about five basis points (0.05%). The six-month note ended the reporting period at 0.16%, while the one-year yield was 0.20%.
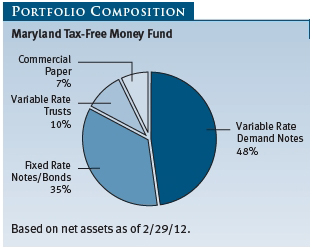
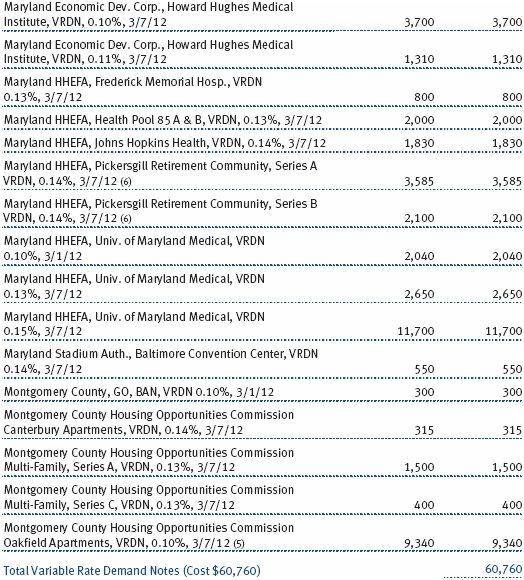
One interesting sidebar within the municipal money markets has been the growing popularity of tax-exempt municipal variable rate demand notes (VRDNs) within taxable money funds. The Securities and Exchange Commission requires money funds to maintain significant overnight and seven-day liquidity, and VRDNs nicely perform that function. Moreover, for quite some time, yields on tax-exempt VRDNs were comparable with taxable yields. These attributes created significant demand for VRDNs and have contributed to pushing yields lower.
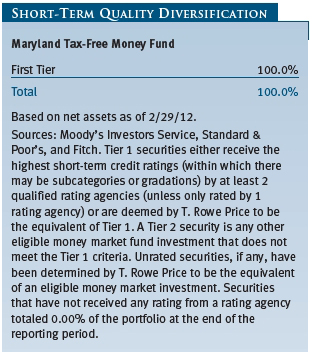
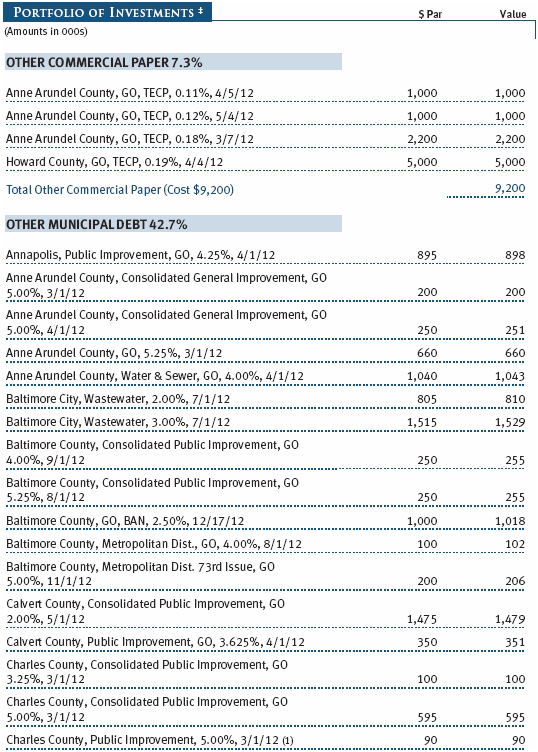
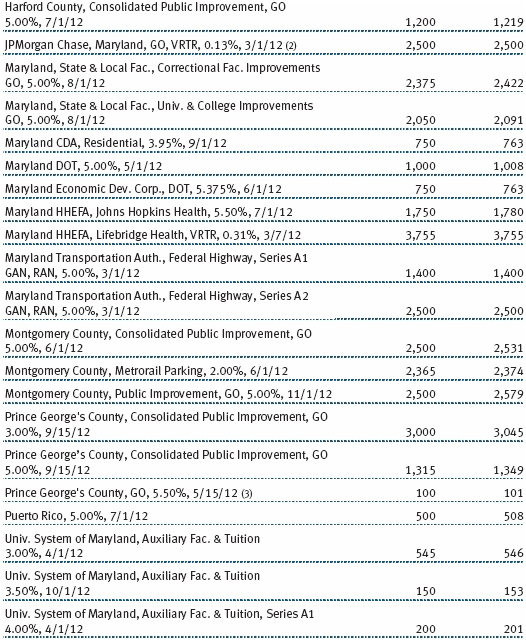
Credit quality remains a key focus in the management of your fund, both with respect to municipal issuers as well as to the banks that figure prominently in providing forms of credit and liquidity support to so many municipal issues. The State of Maryland fortunately remains a high-quality issuer, unlike some of its peers. Our largest positions are in county general obligation bonds as well as high-quality hospital bonds. Housing bonds guaranteed by Fannie Mae and Freddie Mac also make up a significant portion of our holdings. Ratings downgrade concerns for banks such as Bank of America and Citibank have caused us to look for credit and liquidity enhancement elsewhere. Bank of Montreal and Wells Fargo are among our preferred bank liquidity providers.
Recent headlines have suggested that regulators may be considering further changes to rules governing money funds. We continue to monitor such a possibility but are unclear as to the benefits of some proposals. Despite low rates, a challenging credit environment, and the potential for increased regulation, we continue to focus on managing the fund with an emphasis on quality and principal stability.
Maryland Short-Term Tax-Free Bond Fund
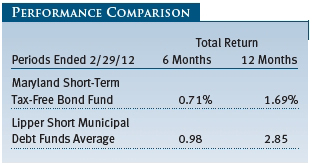
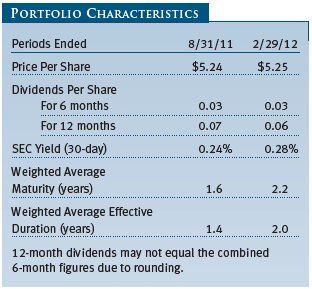
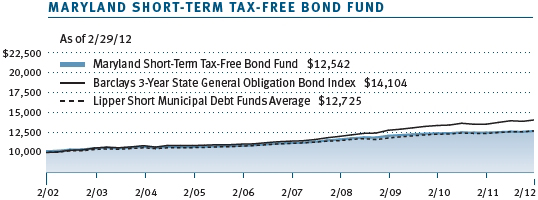
The fund returned 0.71% and 1.69% over the 6- and 12-month periods ended February 29, 2012, respectively. As shown in the Performance Comparison table, the Maryland Short-Term Tax-Free Bond Fund trailed the Lipper Short Municipal Debt Funds Average, which measures the performance of competing funds, in both periods. The fund’s net asset value gained $0.03 over the last year to $5.25, and dividends per share contributed $0.06 to the fund’s total return. In the second half of our fiscal year, dividends per share remained stable, contributing $0.03 to performance.
There were two primary reasons for our underperformance over the last 12 months. First, the portfolio’s average maturity and duration were shorter than that of our peer group and the benchmark. As we entered the fourth quarter of 2011, we decided the fund was holding too much in cash and bonds maturing within two years. In the higher-rated categories that we favor (the A and higher tiers), cash and short-term securities yield less than 50 basis points (0.50%). Very high-quality bonds maturing in less than one year were yielding less than 20 basis points. This defensive position would benefit performance only if interest rates were to move higher. However, after the Federal Open Market Committee (FOMC) said that it would leave the federal funds rate unchanged until mid-2013, it extended that time frame through the end of 2014, prompting us to rethink our prospects for these assets.
The second reason for our underperformance is that we manage a Maryland-only fund within a peer group of national funds. The fund’s focus is on generating triple-tax-exempt income for Maryland residents. Extending our duration (a measure of the fund’s sensitivity to interest rate changes) to a little longer than neutral should generate middle-of-the-pack performance. Although Maryland is a high-quality state with a AAA rating, a longer-than-neutral strategy increases risk should interest rates move higher. Since August 2011, we extended almost 30% of the fund from less than two-year holdings into bonds with two- to four-year maturities, which lengthened the portfolio’s duration to 2.0 years from 1.4 years. We intend to keep the fund’s duration at two years or slightly longer, which is modestly longer than that of the benchmark, for the foreseeable future.
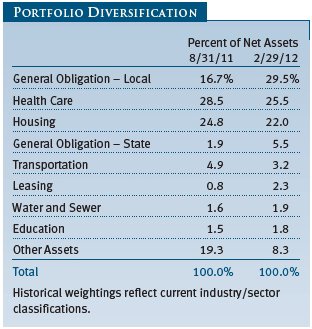
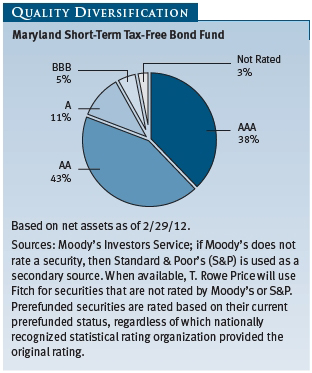
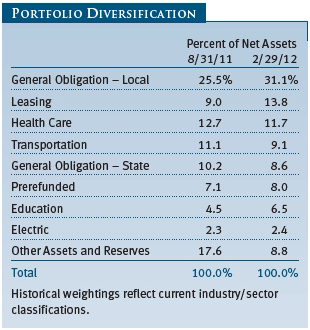
Although we have extended the fund’s weighted average maturity and effective duration, we did not sacrifice the portfolio’s high average credit quality. AAA rated bonds accounted for 38% of assets at the end of the reporting period, while our allocation to A and AA rated issues widened by five percentage points to 54%. In aggregate, investment-grade holdings represent 97% of the portfolio, which is unchanged from six months ago. Given the lack of supply in Maryland away from the larger general obligation issues, the bulk of our additions in the past six months were to leasing and local general obligation bonds.
Looking ahead, our plan is to stay ahead of our reinvestment needs and not allow the combination of cash and short-term bonds to build up as bonds mature and “roll” down the yield curve (a graphic depiction of the relationship between yields and maturities for a set of similar securities). We have extended the portfolio’s maturity and duration because of the steepness of the curve (the substantial difference between short- and long-term interest rates). There are two components to bond total returns—yield to maturity and price appreciation. For example, as a five-year bond rolls down the yield curve and essentially becomes a four-year bond, its price will increase because the yield on the four-year bond is less than on a five-year bond. In the current environment, this appreciation can significantly increase the bond’s total return.
This strategy works as long as the yield curve stays steep and the FOMC keeps the federal funds rate anchored near 0%. While we take comfort in the Fed’s statement that it will keep the rate low through 2014, we understand that the central bank can change its policy at any time. Indeed, the Fed would like nothing better than to be wrong because the economy is growing faster than anticipated. However, we do not view that as likely in the next six months.
We believe the Maryland Short-Term Tax-Free Bond Fund continues to be an attractive investment relative to a low-yielding money market fund. Our unwavering focus is on providing tax-exempt income for Maryland residents while allowing only a moderate fluctuation of principal.
Maryland Tax-Free Bond Fund
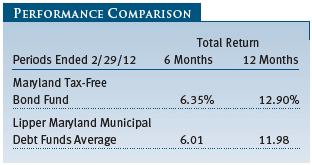
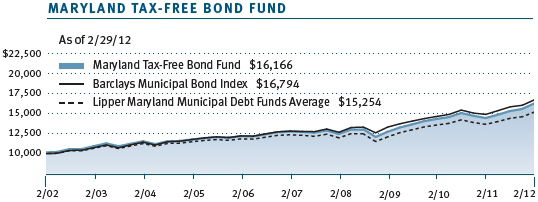
The Maryland municipal market and your fund continued its bounce back from early 2011 market travails and posted positive returns for the second half and full year. The Maryland Tax-Free Bond Fund returned 6.35% and 12.90% for the 6- and 12-month periods ended February 29, 2012, respectively. Both results were well in excess of our Lipper peer group average. The fund’s net asset value was $10.93 at the end of February, up $0.83 over the past 12 months. Dividends per share contributed $0.44 to the fund’s annual total return.
We are pleased to report that your fund continued to compare favorably relative to its competitors over the longer term. Based on cumulative total return, Lipper ranked the Maryland Tax-Free Bond Fund 9 of 35, 11 of 34, 2 of 30, and 3 of 23 funds in the Maryland municipal debt funds universe for the 1-, 3-, 5-, and 10-year periods ended February 29, 2012, respectively. Past performance cannot guarantee future results.
As shown in the Portfolio Characteristics table, the portfolio generated dividends of $0.22 in each of the six-month periods that made up the fund’s fiscal year. However, falling interest rates reduced the fund’s 30-day SEC yield to 2.86% at the end of the reporting period from 3.62% six months ago. Our emphasis on longer-maturity securities, sector strategy, and low fees were important contributors to the fund’s total return and our positive relative results. While maintaining exposure to higher-yielding securities, we are focusing new investment on more defensively structured bonds.

Your fund benefited nicely from its curve and interest rate positioning over the past year. While we were not looking for the aggressive drop in rates that the market provided, we believed at the outset that long-term bonds represented the best value in the market. As a result, we maintained a weighting well above the benchmark’s in 20-year and longer bonds, which provided an extra boost for the portfolio as 30-year municipal rates fell nearly 1.5% over the past year. Although we continue to believe that longer-term issues are more attractive on a relative basis, long-term rates were hovering near all-time lows at the end of the period. While we recognize that economic challenges may persist for several years, which could suppress long-term interest rates for the foreseeable future, yields are vulnerable at these low levels. We have, therefore, focused net new investment in the portfolio a bit more across the curve than before, and we are emphasizing more defensive long bonds in order to reduce the portfolio’s sensitivity to interest rates.
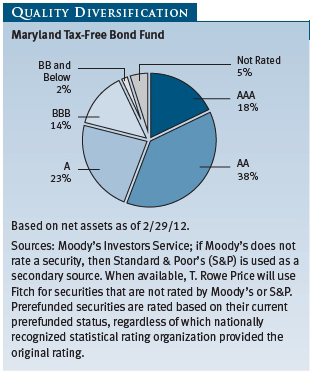
In terms of quality, we kept our portfolio positioned with our biggest emphasis on securities rated AA and lower. While this moderately higher-quality emphasis partly reflected the available supply during the reporting period, it mostly represented our search for higher-quality issuers that should bear up well if the economy continues to muddle along. One of our more significant moves was to halve our exposure to Puerto Rico and other U.S. territory bonds (all bonds with interest exempt in Maryland), as prolonged deficits and the economic downturn challenged these credits especially. As a consequence, our allocation of securities rated A and lower fell to 44% at the end of the period from 48% in August, which has slightly reduced the portfolio’s yield.
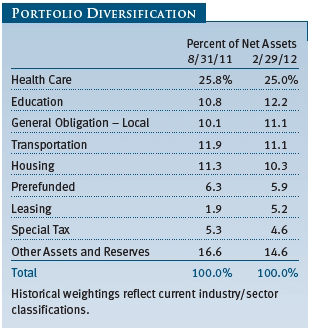
Health care remains our largest and most important sector of the portfolio at 25%, and many of our best contributors came from this segment. While there are financial pressures on health care issuers, hospital bonds, with their premium yields, continue to generate excellent returns for municipal investors. Our allocation to health care will likely remain substantial, and we expect it to continue providing favorable long-term returns for the fund.
The flip side of the market’s strong recent performance is that reinvestment continues to challenge us. Yields are at or near all-time lows across the curve. Yields for issues maturing within the next several years are barely positive. The additional yield offered by lower-quality issues, while still reasonably attractive by historical standards, has compressed significantly in recent months. Meanwhile, issuers continue to retire older, higher-yielding debt. While this boosts their credit position, which benefits prices and investors, it also hampers our efforts to try to preserve income for our shareholders.
The resilience of the muni market continues to impress us. A year ago, negative publicity and subsequent negative cash flows increased yields sharply in Maryland and across the country. Municipal issuers have adjusted significantly to today’s economic reality. While we have favored higher-quality issuers recently, we still see good value in select lower-rated opportunities. In these economic times, our fundamental research, at the foundation of our investment process, has never been more important.
OUTLOOK
While we are pleased with the tremendous performance of municipal bonds over the last year, we believe that returns in 2012 will moderate as the credit and economic environment for municipalities is likely to remain challenging. Modest economic growth and improving income and sales tax revenues are providing some support for state and local governments. However, tax revenues remain below previous peaks, and cutbacks in state support and persisting downward pressure on property tax revenues could keep local municipal issuers vulnerable. If the economy slides back into a recession—which we are not currently predicting—municipalities will face even tougher challenges.
State and local government liabilities such as pension benefits and health care costs are a growing long-term concern. Maintaining balanced budgets and addressing these long-term issues require careful and dedicated work by state and local officials. These efforts will need to continue—with or without additional federal government assistance.
We continue to believe that municipals represent a high-quality market with good opportunities for long-term investors. While we are comforted somewhat by Federal Reserve assurances that interest rate hikes are not imminent and by the demonstrated ability of states to balance their budgets in tough times, we are mindful that municipal yields are at or near historic lows and that there is the potential for losses if rates start to rise in response to stronger economic growth or inflation. With rates at such low levels, we are guarded in our interest rate outlook and careful with any investment shift that might increase our portfolios’ interest rate sensitivity.
We believe T. Rowe Price’s strong credit research capabilities have been and will remain an asset for our investors. We continue to conduct our own thorough research and assign our own independent credit ratings before making investment decisions. As always, we are on the lookout for attractively valued bonds issued by municipalities with good fundamentals—an investment strategy that has served our investors well in the past.
Thank you for investing with T. Rowe Price.
Respectfully submitted,

Joseph K. Lynagh
Chairman of the Investment Advisory Committee
Maryland Tax-Free Money Fund

Charles B. Hill
Chairman of the Investment Advisory Committee
Maryland Short-Term Tax-Free Bond Fund

Hugh D. McGuirk
Chairman of the Investment Advisory Committee
Maryland Tax-Free Bond Fund
March 16, 2012
The committee chairmen have day-to-day responsibility for managing the portfolios and work with committee members in developing and executing the funds’ investment programs.
RISKS OF FIXED INCOME INVESTING
Bonds are subject to interest rate risk (the decline in bond prices that usually accompanies a rise in interest rates) and credit risk (the chance that any fund holding could have its credit rating downgraded or that a bond issuer will default by failing to make timely payments of interest or principal), potentially reducing the fund’s income level and share price. The Maryland Tax-Free Funds are less diversified than those investing nationally. Some income may be subject to state and local taxes and the federal alternative minimum tax.
The money fund seeks to maintain a stable net asset value and provide an appropriate place for money between investments or during uncertain market conditions. An investment in the fund is not insured or guaranteed by the FDIC or any other government agency. Although the fund seeks to preserve the value of your investment at $1.00 per share, it is possible to lose money by investing in the fund.
GLOSSARY
Barclays 3-Year State General Obligation Bond Index: A broadly diversified index of state-issued general obligation tax-exempt bonds with maturities between two and four years.
Barclays Municipal Bond Index: A broadly diversified index of tax-exempt bonds.
Basis point: One one-hundredth of one percentage point, or 0.01%.
Duration: A measure of a bond fund’s sensitivity to changes in interest rates. For example, a fund with a duration of five years would fall about 5% in price in response to a one-percentage-point rise in interest rates, and vice versa.
Federal funds rate: The interest rate charged on overnight loans of reserves by one financial institution to another in the United States. The Federal Reserve sets a target federal funds rate to affect the direction of interest rates.
General obligation debt: A government’s strongest pledge that obligates its full faith and credit, including, if necessary, its ability to raise taxes.
Investment grade: High-quality bonds as measured by one of the major credit rating agencies. For example, Standard & Poor’s designates the bonds in its top four categories (AAA to BBB) as investment grade.
Lipper averages: The averages of available mutual fund performance returns for specified time periods in categories defined by Lipper.
Prerefunded bond: A bond that originally may have been issued as a general obligation or revenue bond but that is now secured by an escrow fund consisting entirely of direct U.S. government obligations that are sufficient for paying the bondholders.
Revenue (or revenue-backed) bond: A bond issued to fund specific projects, such as airports, bridges, hospitals, and toll roads, where a portion of the revenue generated is used to service the interest payments on the bond.
SEC yield (7-day unsubsidized simple): A method of calculating a money fund’s yield by annualizing the fund’s net investment income for the last seven days of each period divided by the fund’s net asset value at the end of the period. Yield will vary and is not guaranteed.
SEC yield (30-day): A method of calculating a fund’s yield that assumes all portfolio securities are held until maturity. Yield will vary and is not guaranteed.
Weighted average life: A measure of a fund’s credit quality risk. In general, the longer the average life, the greater the fund’s credit quality risk. The average life is the dollar-weighted average maturity of a portfolio’s individual securities without taking into account interest rate readjustment dates. Money funds must maintain a weighted average life of less than 120 days.
Weighted average maturity: A measure of a fund’s interest rate sensitivity. In general, the longer the average maturity, the greater the fund’s sensitivity to interest rate changes. The weighted average maturity may take into account the interest rate readjustment dates for certain securities. Money funds must maintain a weighted average maturity of less than 60 days.
Yield curve: A graphic depiction of the relationship between yields and maturity dates for a set of similar securities such as Treasuries or municipal securities. Securities with longer maturities usually a have higher yield. If short-term securities offer a higher yield, then the curve is said to be “inverted.” If short- and long-term bonds are offering equivalent yields, then the curve is said to be “flat.”
Performance and Expenses
This chart shows the value of a hypothetical $10,000 investment in the fund over the past 10 fiscal year periods or since inception (for funds lacking 10-year records). The result is compared with benchmarks, which may include a broad-based market index and a peer group average or index. Market indexes do not include expenses, which are deducted from fund returns as well as mutual fund averages and indexes.
This chart shows the value of a hypothetical $10,000 investment in the fund over the past 10 fiscal year periods or since inception (for funds lacking 10-year records). The result is compared with benchmarks, which may include a broad-based market index and a peer group average or index. Market indexes do not include expenses, which are deducted from fund returns as well as mutual fund averages and indexes.

This chart shows the value of a hypothetical $10,000 investment in the fund over the past 10 fiscal year periods or since inception (for funds lacking 10-year records). The result is compared with benchmarks, which may include a broad-based market index and a peer group average or index. Market indexes do not include expenses, which are deducted from fund returns as well as mutual fund averages and indexes.

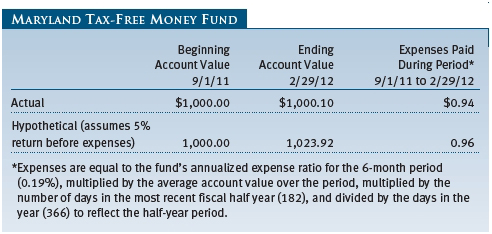
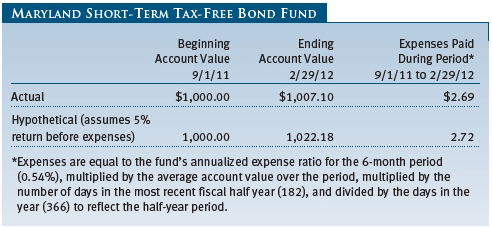
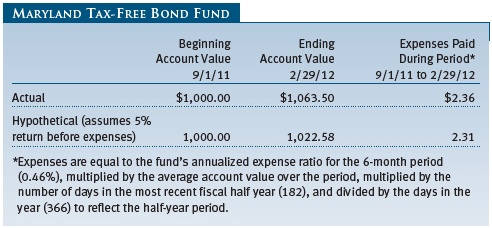
As a mutual fund shareholder, you may incur two types of costs: (1) transaction costs, such as redemption fees or sales loads, and (2) ongoing costs, including management fees, distribution and service (12b-1) fees, and other fund expenses. The following example is intended to help you understand your ongoing costs (in dollars) of investing in the fund and to compare these costs with the ongoing costs of investing in other mutual funds. The example is based on an investment of $1,000 invested at the beginning of the most recent six-month period and held for the entire period.
Actual Expenses
The first line of the following table (“Actual”) provides information about actual account values and expenses based on the fund’s actual returns. You may use the information on this line, together with your account balance, to estimate the expenses that you paid over the period. Simply divide your account value by $1,000 (for example, an $8,600 account value divided by $1,000 = 8.6), then multiply the result by the number on the first line under the heading “Expenses Paid During Period” to estimate the expenses you paid on your account during this period.
Hypothetical Example for Comparison Purposes
The information on the second line of the table (“Hypothetical”) is based on hypothetical account values and expenses derived from the fund’s actual expense ratio and an assumed 5% per year rate of return before expenses (not the fund’s actual return). You may compare the ongoing costs of investing in the fund with other funds by contrasting this 5% hypothetical example and the 5% hypothetical examples that appear in the shareholder reports of the other funds. The hypothetical account values and expenses may not be used to estimate the actual ending account balance or expenses you paid for the period.
Note: T. Rowe Price charges an annual account service fee of $20, generally for accounts with less than $10,000. The fee is waived for any investor whose T. Rowe Price mutual fund accounts total $50,000 or more; accounts electing to receive electronic delivery of account statements, transaction confirmations, prospectuses, and shareholder reports; or accounts of an investor who is a T. Rowe Price Preferred Services, Personal Services, or Enhanced Personal Services client (enrollment in these programs generally requires T. Rowe Price assets of at least $100,000). This fee is not included in the accompanying table. If you are subject to the fee, keep it in mind when you are estimating the ongoing expenses of investing in the fund and when comparing the expenses of this fund with other funds.
You should also be aware that the expenses shown in the table highlight only your ongoing costs and do not reflect any transaction costs, such as redemption fees or sales loads. Therefore, the second line of the table is useful in comparing ongoing costs only and will not help you determine the relative total costs of owning different funds. To the extent a fund charges transaction costs, however, the total cost of owning that fund is higher.

The accompanying notes are an integral part of these financial statements.

The accompanying notes are an integral part of these financial statements.
The accompanying notes are an integral part of these financial statements.
The accompanying notes are an integral part of these financial statements.
The accompanying notes are an integral part of these financial statements.
| Notes to Financial Statements |
T. Rowe Price State Tax-Free Income Trust (the trust), is registered under the Investment Company Act of 1940 (the 1940 Act). The Maryland Tax-Free Money Fund (the fund), a nondiversified, open-end management investment company, is one portfolio established by the trust. The fund commenced operations on March 30, 2001. The fund seeks to provide preservation of capital, liquidity, and, consistent with these objectives, the highest level of income exempt from federal and Maryland state and local income taxes.
NOTE 1 - SIGNIFICANT ACCOUNTING POLICIES
Basis of Preparation The accompanying financial statements were prepared in accordance with accounting principles generally accepted in the United States of America, which require the use of estimates made by management. Management believes that estimates and valuations are appropriate; however, actual results may differ from those estimates, and the valuations reflected in the accompanying financial statements may differ from the value ultimately realized upon sale or maturity.
Investment Transactions, Investment Income, and Distributions Income and expenses are recorded on the accrual basis. Premiums and discounts on debt securities are amortized for financial reporting purposes. Income tax-related interest and penalties, if incurred, would be recorded as income tax expense. Investment transactions are accounted for on the trade date. Realized gains and losses are reported on the identified cost basis. Distributions to shareholders are recorded on the ex-dividend date. Income distributions are declared daily and paid monthly.
Credits The fund earns credits on temporarily uninvested cash balances held at the custodian, which reduce the fund’s custody charges. Custody expense in the accompanying financial statements is presented before reduction for credits.
New Accounting Pronouncements In December 2011, the Financial Accounting Standards Board issued amended guidance to enhance disclosure for offsetting assets and liabilities. The guidance is effective for fiscal years and interim periods beginning on or after January 1, 2013; adoption will have no effect on the fund’s net assets or results of operations.
NOTE 2 - VALUATION
The fund values its investments and computes its net asset value per share each day that the New York Stock Exchange is open for business. In accordance with Rule 2a-7 under the 1940 Act, securities are valued at amortized cost, which approximates fair value. Securities for which amortized cost is deemed not to reflect fair value are stated at fair value as determined in good faith by the T. Rowe Price Valuation Committee, established by the fund’s Board of Trustees.
Various inputs are used to determine the value of the fund’s financial instruments. These inputs are summarized in the three broad levels listed below:
Level 1 – quoted prices in active markets for identical financial instruments
Level 2 – observable inputs other than Level 1 quoted prices (including, but not limited to, quoted prices for similar financial instruments, interest rates, prepayment speeds, and credit risk)
Level 3 – unobservable inputs
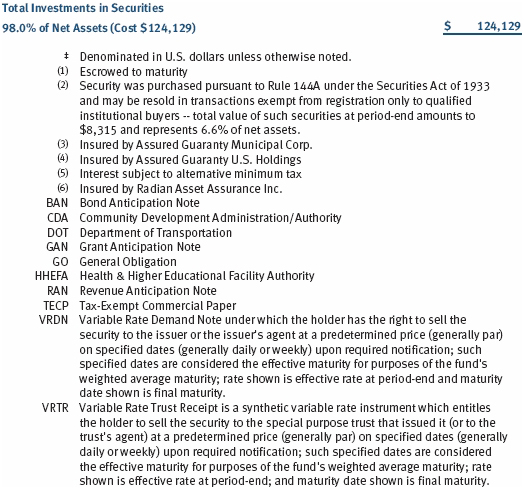
Observable inputs are those based on market data obtained from sources independent of the fund, and unobservable inputs reflect the fund’s own assumptions based on the best information available. The input levels are not necessarily an indication of the risk or liquidity associated with financial instruments at that level. For example, securities held by a money market fund are generally high quality and liquid; however, they are reflected as Level 2 because the inputs used to determine fair value are not quoted prices in an active market. On February 29, 2012, all of the fund’s financial instruments were classified as Level 2, based on the inputs used to determine their values.
NOTE 3 - OTHER INVESTMENT TRANSACTIONS
Consistent with its investment objective, the fund engages in the following practices to manage exposure to certain risks and/or to enhance performance. The investment objective, policies, program, and risk factors of the fund are described more fully in the fund’s prospectus and Statement of Additional Information.
Restricted Securities The fund may invest in securities that are subject to legal or contractual restrictions on resale. Prompt sale of such securities at an acceptable price may be difficult and may involve substantial delays and additional costs.
NOTE 4 - FEDERAL INCOME TAXES
No provision for federal income taxes is required since the fund intends to continue to qualify as a regulated investment company under Subchapter M of the Internal Revenue Code and distribute to shareholders all of its income and gains. Distributions determined in accordance with federal income tax regulations may differ in amount or character from net investment income and realized gains for financial reporting purposes. Financial reporting records are adjusted for permanent book/tax differences to reflect tax character but are not adjusted for temporary differences.
The fund files U.S. federal, state, and local tax returns as required. The fund’s tax returns are subject to examination by the relevant tax authorities until expiration of the applicable statute of limitations, which is generally three years after the filing of the tax return but which can be extended to six years in certain circumstances. Tax returns for open years have incorporated no uncertain tax positions that require a provision for income taxes.
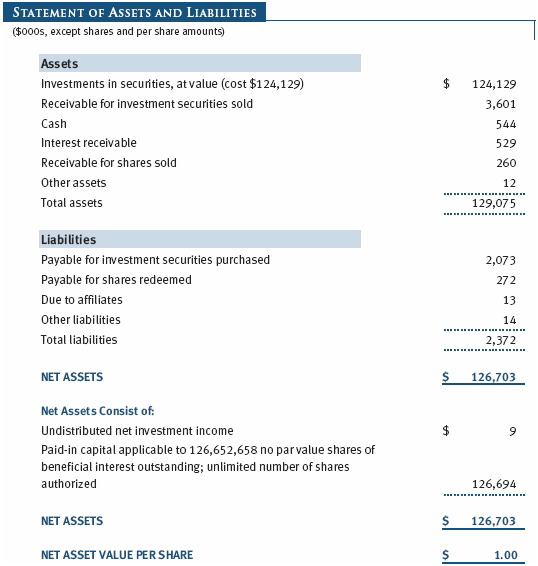
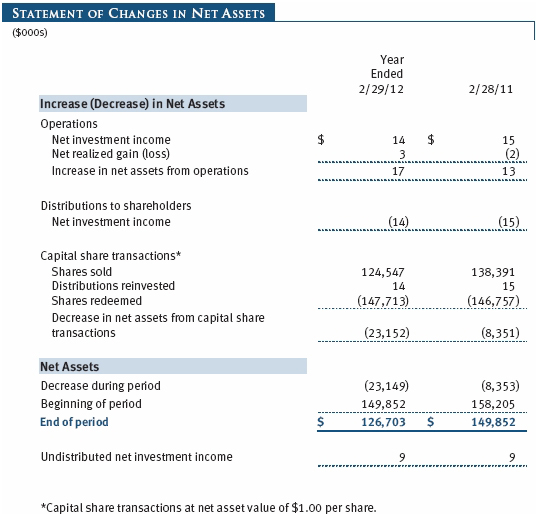
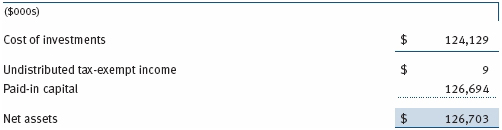
Distributions during the years ended February 29, 2012 and February 28, 2011, totaled $14,000 and $15,000, respectively, and were characterized as tax-exempt income for tax purposes. At February 29, 2012, the tax-basis cost of investments and components of net assets were as follows:
During the year ended February 29, 2012, the fund utilized $3,000 of capital loss carryforwards.
NOTE 5 - RELATED PARTY TRANSACTIONS
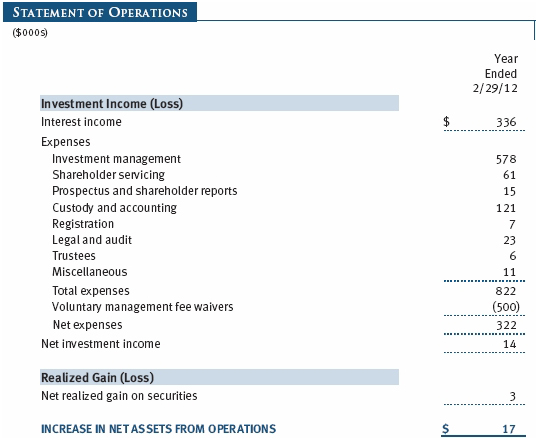
The fund is managed by T. Rowe Price Associates, Inc. (Price Associates), a wholly owned subsidiary of T. Rowe Price Group, Inc. (Price Group). The investment management agreement between the fund and Price Associates provides for an annual investment management fee, which is computed daily and paid monthly. The fee consists of an individual fund fee, equal to 0.10% of the fund’s average daily net assets, and a group fee. The group fee rate is calculated based on the combined net assets of certain mutual funds sponsored by Price Associates (the group) applied to a graduated fee schedule, with rates ranging from 0.48% for the first $1 billion of assets to 0.28% for assets in excess of $300 billion. The fund’s group fee is determined by applying the group fee rate to the fund’s average daily net assets. At February 29, 2012, the effective annual group fee rate was 0.30%.
Price Associates may voluntarily waive all or a portion of its management fee to the extent necessary for the fund to maintain a zero or positive net yield (voluntary waiver). Any amounts waived under this voluntary agreement are not subject to repayment by the fund. Price Associates may amend or terminate this voluntary arrangement at any time without prior notice. For the year ended February 29, 2012, management fees waived totaled $500,000.
In addition, the fund has entered into service agreements with Price Associates and a wholly owned subsidiary of Price Associates (collectively, Price). Price Associates computes the daily share price and provides certain other administrative services to the fund. T. Rowe Price Services, Inc., provides shareholder and administrative services in its capacity as the fund’s transfer and dividend disbursing agent. For the year ended February 29, 2012, expenses incurred pursuant to these service agreements were $94,000 for Price Associates and $44,000 for T. Rowe Price Services, Inc. The total amount payable at period-end pursuant to these service agreements is reflected as Due to Affiliates in the accompanying financial statements.
As of February 29, 2012, T. Rowe Price Group, Inc., and/or its wholly owned subsidiaries owned 8,867,644 shares of the fund, representing 7% of the fund’s net assets.
| Report of Independent Registered Public Accounting Firm |
To the Board of Trustees of T. Rowe Price State Tax-Free Income Trust and
Shareholders of Maryland Tax-Free Money Fund
In our opinion, the accompanying statement of assets and liabilities, including the portfolio of investments, and the related statements of operations and of changes in net assets and the financial highlights present fairly, in all material respects, the financial position of Maryland Tax-Free Money Fund (one of the portfolios comprising T. Rowe Price State Tax-Free Income Trust, hereafter referred to as the “Fund”) at February 29, 2012, and the results of its operations, the changes in its net assets and the financial highlights for each of the periods indicated therein, in conformity with accounting principles generally accepted in the United States of America. These financial statements and financial highlights (hereafter referred to as “financial statements”) are the responsibility of the Fund’s management; our responsibility is to express an opinion on these financial statements based on our audits. We conducted our audits of these financial statements in accordance with the standards of the Public Company Accounting Oversight Board (United States). Those standards require that we plan and perform the audit to obtain reasonable assurance about whether the financial statements are free of material misstatement. An audit includes examining, on a test basis, evidence supporting the amounts and disclosures in the financial statements, assessing the accounting principles used and significant estimates made by management, and evaluating the overall financial statement presentation. We believe that our audits, which included confirmation of securities at February 29, 2012 by correspondence with the custodian and brokers, provide a reasonable basis for our opinion.
PricewaterhouseCoopers LLP
Baltimore, Maryland
April 13, 2012
| Tax Information (Unaudited) for the Tax Year Ended 2/29/12 |
We are providing this information as required by the Internal Revenue Code. The amounts shown may differ from those elsewhere in this report because of differences between tax and financial reporting requirements.
The fund’s distributions to shareholders included $14,000 which qualified as exempt-interest dividends.
| Information on Proxy Voting Policies, Procedures, and Records |
A description of the policies and procedures used by T. Rowe Price funds and portfolios to determine how to vote proxies relating to portfolio securities is available in each fund’s Statement of Additional Information, which you may request by calling 1-800-225-5132 or by accessing the SEC’s website, sec.gov. The description of our proxy voting policies and procedures is also available on our website, troweprice.com. To access it, click on the words “Our Company” at the top of our corporate homepage. Then, when the next page appears, click on the words “Proxy Voting Policies” on the left side of the page.
Each fund’s most recent annual proxy voting record is available on our website and through the SEC’s website. To access it through our website, follow the directions above, then click on the words “Proxy Voting Records” on the right side of the Proxy Voting Policies page.
| How to Obtain Quarterly Portfolio Holdings |
The fund files a complete schedule of portfolio holdings with the Securities and Exchange Commission for the first and third quarters of each fiscal year on Form N-Q. The fund’s Form N-Q is available electronically on the SEC’s website (sec.gov); hard copies may be reviewed and copied at the SEC’s Public Reference Room, 450 Fifth St. N.W., Washington, DC 20549. For more information on the Public Reference Room, call 1-800-SEC-0330.
| About the Fund’s Trustees and Officers |
Your fund is overseen by a Board of Trustees (Board) that meets regularly to review a wide variety of matters affecting the fund, including performance, investment programs, compliance matters, advisory fees and expenses, service providers, and other business affairs. The Board elects the fund’s officers, who are listed in the final table. At least 75% of the Board’s members are independent of T. Rowe Price Associates, Inc. (T. Rowe Price), and its affiliates; “inside” or “interested” trustees are employees or officers of T. Rowe Price. The business address of each trustee and officer is 100 East Pratt Street, Baltimore, Maryland 21202. The Statement of Additional Information includes additional information about the fund trustees and is available without charge by calling a T. Rowe Price representative at 1-800-638-5660.
Independent Trustees
| Name | | |
| (Year of Birth) | | Principal Occupation(s) and Directorships of Public Companies and |
| Year Elected* | | Other Investment Companies During the Past Five Years |
| | | |
| William R. Brody | | President and Trustee, Salk Institute for Biological Studies (2009 |
| (1944) | | to present); Director, Novartis, Inc. (2009 to present); Director, |
| 2009 | | IBM (2007 to present); President and Trustee, Johns Hopkins |
| | University (1996 to 2009); Chairman of Executive Committee and |
| | Trustee, Johns Hopkins Health System (1996 to 2009) |
| | | |
| Jeremiah E. Casey | | Retired |
| (1940) | | |
| 2006 | | |
| | | |
| Anthony W. Deering | | Chairman, Exeter Capital, LLC, a private investment firm (2004 |
| (1945) | | to present); Director, Under Armour (2008 to present); Director, |
| 1986 | | Vornado Real Estate Investment Trust (2004 to present); Director, |
| | Mercantile Bankshares (2002 to 2007); Director and Member of the |
| | Advisory Board, Deutsche Bank North America (2004 to present) |
| | | |
| Donald W. Dick, Jr. | | Principal, EuroCapital Partners, LLC, an acquisition and management |
| (1943) | | advisory firm (1995 to present) |
| 2001 | | |
| | | |
| Karen N. Horn | | Senior Managing Director, Brock Capital Group, an advisory and |
| (1943) | | investment banking firm (2004 to present); Director, Eli Lilly and |
| 2003 | | Company (1987 to present); Director, Simon Property Group (2004 |
| | to present); Director, Norfolk Southern (2008 to present); Director, |
| | Fannie Mae (2006 to 2008) |
| | | |
| Theo C. Rodgers | | President, A&R Development Corporation (1977 to present) |
| (1941) | | |
| 2005 | | |
| John G. Schreiber | | Owner/President, Centaur Capital Partners, Inc., a real estate |
| (1946) | | investment company (1991 to present); Cofounder and Partner, |
| 1992 | | Blackstone Real Estate Advisors, L.P. (1992 to present); Director, |
| | General Growth Properties, Inc. (2010 to present) |
| | | |
| Mark R. Tercek | | President and Chief Executive Officer, The Nature Conservancy |
| (1957) | | (2008 to present); Managing Director, The Goldman Sachs |
| 2009 | | Group, Inc. (1984 to 2008) |
| |
| *Each independent trustee oversees 136 T. Rowe Price portfolios and serves until retirement, resignation, or election of a |
| successor. |
Inside Trustees
| Name | | |
| (Year of Birth) | | |
| Year Elected* | | |
| [Number of T. Rowe Price | | Principal Occupation(s) and Directorships of Public Companies and |
| Portfolios Overseen] | | Other Investment Companies During the Past Five Years |
| |
| Edward C. Bernard | | Director and Vice President, T. Rowe Price; Vice Chairman of the |
| (1956) | | Board, Director, and Vice President, T. Rowe Price Group, Inc.; |
| 2006 | | Chairman of the Board, Director, and President, T. Rowe Price |
| [136] | | Investment Services, Inc.; Chairman of the Board and Director, |
| | | T. Rowe Price Retirement Plan Services, Inc., T. Rowe Price Savings |
| | Bank, and T. Rowe Price Services, Inc.; Chairman of the Board, |
| | Chief Executive Officer, and Director, T. Rowe Price International; |
| | Chief Executive Officer, Chairman of the Board, Director, and |
| | President, T. Rowe Price Trust Company |
| |
| Michael C. Gitlin | | Director of Fixed Income, T. Rowe Price (2009 to present); Global |
| (1970) | | Head of Trading, T. Rowe Price (2007 to 2009); Vice President, Price |
| 2010 | | Hong Kong, Price Singapore, T. Rowe Price, T. Rowe Price Group, Inc., |
| [46] | | and T. Rowe Price International; formerly Head of U.S. Equity Sales, |
| | Citigroup Global Markets (2005 to 2007) |
| |
| *Each inside trustee serves until retirement, resignation, or election of a successor. |
Officers
| Name (Year of Birth) | | |
| Position Held With State Tax-Free Income Trust | | Principal Occupation(s) |
| | | |
| R. Lee Arnold, Jr., CFA, CPA (1970) | | Vice President, T. Rowe Price and T. Rowe Price |
| Vice President | | Group, Inc. |
| | | |
| M. Helena Condez (1962) | | Vice President, T. Rowe Price |
| Vice President | | |
| | | |
| Patricia S. Deford (1957) | | Vice President, T. Rowe Price and T. Rowe Price |
| Vice President | | Group, Inc. |
| | | |
| G. Richard Dent (1960) | | Vice President, T. Rowe Price and T. Rowe Price |
| Vice President | | Group, Inc. |
| | | |
| Charles E. Emrich (1961) | | Vice President, T. Rowe Price and T. Rowe Price |
| Vice President | | Group, Inc. |
| | | |
| Roger L. Fiery III, CPA (1959) | | Vice President, Price Hong Kong, Price |
| Vice President | | Singapore, T. Rowe Price, T. Rowe Price Group, |
| | | Inc., T. Rowe Price International, and T. Rowe |
| | Price Trust Company |
| | | |
| Kathryn A. Floyd, CFA (1982) | | Vice President, T. Rowe Price and T. Rowe Price |
| Vice President | | Group, Inc. |
| | | |
| John R. Gilner (1961) | | Chief Compliance Officer and Vice President, |
| Chief Compliance Officer | | T. Rowe Price; Vice President, T. Rowe Price |
| | Group, Inc., and T. Rowe Price Investment |
| | Services, Inc. |
| | | |
| Gregory S. Golczewski (1966) | | Vice President, T. Rowe Price and T. Rowe Price |
| Vice President | | Trust Company |
| | | |
| Charles B. Hill, CFA (1961) | | Vice President, T. Rowe Price and T. Rowe Price |
| Executive Vice President | | Group, Inc. |
| | | |
| Gregory K. Hinkle, CPA (1958) | | Vice President, T. Rowe Price, T. Rowe Price |
| Treasurer | | Group, Inc., and T. Rowe Price Trust Company; |
| | formerly Partner, PricewaterhouseCoopers LLP |
| | (to 2007) |
| | | |
| Marcy M. Lash (1963) | | Vice President, T. Rowe Price and T. Rowe Price |
| Vice President | | Group, Inc. |
| | | |
| Alan D. Levenson, Ph.D. (1958) | | Vice President, T. Rowe Price and T. Rowe Price |
| Vice President | | Group, Inc. |
| Patricia B. Lippert (1953) | | Assistant Vice President, T. Rowe Price and |
| Secretary | | T. Rowe Price Investment Services, Inc. |
| | | |
| Joseph K. Lynagh, CFA (1958) | | Vice President, T. Rowe Price, T. Rowe Price |
| Executive Vice President | | Group, Inc., and T. Rowe Price Trust Company |
| | | |
| Konstantine B. Mallas (1963) | | Vice President, T. Rowe Price and T. Rowe Price |
| Executive Vice President | | Group, Inc. |
| | | |
| Hugh D. McGuirk, CFA (1960) | | Vice President, T. Rowe Price and T. Rowe Price |
| President | | Group, Inc. |
| | | |
| Linda A. Murphy (1959) | | Vice President, T. Rowe Price and T. Rowe Price |
| Vice President | | Group, Inc. |
| | | |
| David Oestreicher (1967) | | Director and Vice President, T. Rowe Price |
| Vice President | | Investment Services, Inc., T. Rowe Price |
| | | Retirement Plan Services, Inc., T. Rowe |
| | Price Services, Inc., and T. Rowe Price Trust |
| | Company; Vice President, Price Hong Kong, |
| | Price Singapore, T. Rowe Price, T. Rowe Price |
| | Group, Inc., and T. Rowe Price International |
| | | |
| Deborah D. Seidel (1962) | | Vice President, T. Rowe Price, T. Rowe Price |
| Vice President | | Group, Inc., and T. Rowe Price Investment |
| | Services, Inc.; Assistant Treasurer and Vice |
| | President, T. Rowe Price Services, Inc.; |
| | Assistant Treasurer, T. Rowe Price Retirement |
| | Plan Services, Inc. |
| | | |
| Michael K. Sewell (1970) | | Assistant Vice President, T. Rowe Price |
| Assistant Vice President | | |
| | | |
| Chen Shao (1980) | | Assistant Vice President, T. Rowe Price |
| Assistant Vice President | | |
| | | |
| Timothy G. Taylor, CFA (1975) | | Vice President, T. Rowe Price and T. Rowe Price |
| Vice President | | Group, Inc. |
| | | |
| Julie L. Waples (1970) | | Vice President, T. Rowe Price |
| Vice President | | |
| |
| Unless otherwise noted, officers have been employees of T. Rowe Price or T. Rowe Price International for at least 5 years. |
Item 2. Code of Ethics.
The registrant has adopted a code of ethics, as defined in Item 2 of Form N-CSR, applicable to its principal executive officer, principal financial officer, principal accounting officer or controller, or persons performing similar functions. A copy of this code of ethics is filed as an exhibit to this Form N-CSR. No substantive amendments were approved or waivers were granted to this code of ethics during the period covered by this report.
Item 3. Audit Committee Financial Expert.
The registrant’s Board of Directors/Trustees has determined that Mr. Anthony W. Deering qualifies as an audit committee financial expert, as defined in Item 3 of Form N-CSR. Mr. Deering is considered independent for purposes of Item 3 of Form N-CSR.
Item 4. Principal Accountant Fees and Services.
(a) – (d) Aggregate fees billed to the registrant for the last two fiscal years for professional services rendered by the registrant’s principal accountant were as follows:
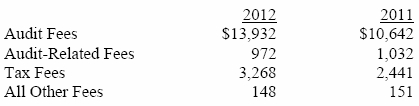
Audit fees include amounts related to the audit of the registrant’s annual financial statements and services normally provided by the accountant in connection with statutory and regulatory filings. Audit-related fees include amounts reasonably related to the performance of the audit of the registrant’s financial statements and specifically include the issuance of a report on internal controls and, if applicable, agreed-upon procedures related to fund acquisitions. Tax fees include amounts related to services for tax compliance, tax planning, and tax advice. The nature of these services specifically includes the review of distribution calculations and the preparation of Federal, state, and excise tax returns. All other fees include the registrant’s pro-rata share of amounts for agreed-upon procedures in conjunction with service contract approvals by the registrant’s Board of Directors/Trustees.
(e)(1) The registrant’s audit committee has adopted a policy whereby audit and non-audit services performed by the registrant’s principal accountant for the registrant, its investment adviser, and any entity controlling, controlled by, or under common control with the investment adviser that provides ongoing services to the registrant require pre-approval in advance at regularly scheduled audit committee meetings. If such a service is required between regularly scheduled audit committee meetings, pre-approval may be authorized by one audit committee member with ratification at the next scheduled audit committee meeting. Waiver of pre-approval for audit or non-audit services requiring fees of a de minimis amount is not permitted.
(2) No services included in (b) – (d) above were approved pursuant to paragraph (c)(7)(i)(C) of Rule 2-01 of Regulation S-X.
(f) Less than 50 percent of the hours expended on the principal accountant’s engagement to audit the registrant’s financial statements for the most recent fiscal year were attributed to work performed by persons other than the principal accountant’s full-time, permanent employees.
(g) The aggregate fees billed for the most recent fiscal year and the preceding fiscal year by the registrant’s principal accountant for non-audit services rendered to the registrant, its investment adviser, and any entity controlling, controlled by, or under common control with the investment adviser that provides ongoing services to the registrant were $1,704,000 and $1,583,000, respectively.
(h) All non-audit services rendered in (g) above were pre-approved by the registrant’s audit committee. Accordingly, these services were considered by the registrant’s audit committee in maintaining the principal accountant’s independence.
Item 5. Audit Committee of Listed Registrants.
Not applicable.
Item 6. Investments.
(a) Not applicable. The complete schedule of investments is included in Item 1 of this Form N-CSR.
(b) Not applicable.
Item 7. Disclosure of Proxy Voting Policies and Procedures for Closed-End Management Investment Companies.
Not applicable.
Item 8. Portfolio Managers of Closed-End Management Investment Companies.
Not applicable.
Item 9. Purchases of Equity Securities by Closed-End Management Investment Company and Affiliated Purchasers.
Not applicable.
Item 10. Submission of Matters to a Vote of Security Holders.
Not applicable.
Item 11. Controls and Procedures.
(a) The registrant’s principal executive officer and principal financial officer have evaluated the registrant’s disclosure controls and procedures within 90 days of this filing and have concluded that the registrant’s disclosure controls and procedures were effective, as of that date, in ensuring that information required to be disclosed by the registrant in this Form N-CSR was recorded, processed, summarized, and reported timely.
(b) The registrant’s principal executive officer and principal financial officer are aware of no change in the registrant’s internal control over financial reporting that occurred during the registrant’s second fiscal quarter covered by this report that has materially affected, or is reasonably likely to materially affect, the registrant’s internal control over financial reporting.
Item 12. Exhibits.
(a)(1) The registrant’s code of ethics pursuant to Item 2 of Form N-CSR is attached.
(2) Separate certifications by the registrant's principal executive officer and principal financial officer, pursuant to Section 302 of the Sarbanes-Oxley Act of 2002 and required by Rule 30a-2(a) under the Investment Company Act of 1940, are attached.
(3) Written solicitation to repurchase securities issued by closed-end companies: not applicable.
(b) A certification by the registrant's principal executive officer and principal financial officer, pursuant to Section 906 of the Sarbanes-Oxley Act of 2002 and required by Rule 30a-2(b) under the Investment Company Act of 1940, is attached.
SIGNATURES
Pursuant to the requirements of the Securities Exchange Act of 1934 and the Investment Company Act of 1940, the registrant has duly caused this report to be signed on its behalf by the undersigned, thereunto duly authorized.
T. Rowe Price State Tax-Free Income Trust
| By | /s/ Edward C. Bernard |
| | Edward C. Bernard |
| | Principal Executive Officer |
| | |
| Date April 13, 2012 | | |
Pursuant to the requirements of the Securities Exchange Act of 1934 and the Investment Company Act of 1940, this report has been signed below by the following persons on behalf of the registrant and in the capacities and on the dates indicated.
| By | /s/ Edward C. Bernard |
| | Edward C. Bernard |
| | Principal Executive Officer |
| | |
| Date April 13, 2012 | | |
| | |
| | |
| By | /s/ Gregory K. Hinkle |
| | Gregory K. Hinkle |
| | Principal Financial Officer |
| | |
| Date April 13, 2012 | | |