UNITED STATES
SECURITIES AND EXCHANGE COMMISSION
Washington, D.C. 20549
FORM N-CSR
CERTIFIED SHAREHOLDER REPORT OF REGISTERED
MANAGEMENT INVESTMENT COMPANIES
Investment Company Act File Number: 811-04521
| T. Rowe Price State Tax-Free Income Trust |
|
| (Exact name of registrant as specified in charter) |
| |
| 100 East Pratt Street, Baltimore, MD 21202 |
|
| (Address of principal executive offices) |
| |
| David Oestreicher |
| 100 East Pratt Street, Baltimore, MD 21202 |
|
| (Name and address of agent for service) |
Registrant’s telephone number, including area code: (410) 345-2000
Date of fiscal year end: February 28
Date of reporting period: February 28, 2015
Item 1. Report to Shareholders
| Maryland Tax-Free Bond Fund | February 28, 2015 |
The views and opinions in this report were current as of February 28, 2015. They are not guarantees of performance or investment results and should not be taken as investment advice. Investment decisions reflect a variety of factors, and the managers reserve the right to change their views about individual stocks, sectors, and the markets at any time. As a result, the views expressed should not be relied upon as a forecast of the fund’s future investment intent. The report is certified under the Sarbanes-Oxley Act, which requires mutual funds and other public companies to affirm that, to the best of their knowledge, the information in their financial reports is fairly and accurately stated in all material respects.
REPORTS ON THE WEB
Sign up for our E-mail Program, and you can begin to receive updated fund reports and prospectuses online rather than through the mail. Log in to your account at troweprice.com for more information.
Manager’s Letter
Fellow Shareholders
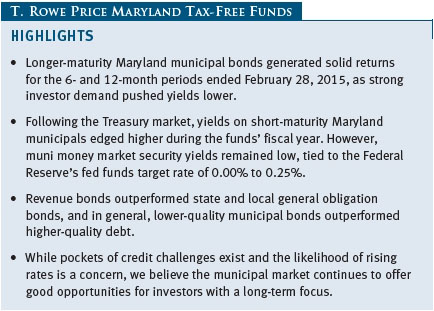
Longer-term Maryland municipal bond prices rallied in the 12 months ended February 28, 2015, amid strong investor demand and a flattening yield curve. The Federal Reserve ended its asset purchase program in October 2014 on the back of improvements in the labor market and other aspects of the economy, and investors have shifted their focus to the timing of the Fed’s first rate hike. Yields on shorter-term U.S. Treasury securities climbed as investors anticipated the Fed’s policy tightening—possibly beginning as early as mid-2015—while longer-term Treasury yields defied market expectations and moved lower. Tax-free and taxable money market rates remained close to 0.00%. Lower-quality, longer-maturity revenue bonds outperformed higher-quality, short-maturity issues and general obligation (GO) debt, as investors continued to seek attractive yields in the ongoing low-rate environment. By primarily focusing on revenue bonds, the T. Rowe Price Maryland Tax-Free Funds generally performed in line with or better than their benchmarks in the fiscal year.
ECONOMY AND INTEREST RATES
Data on the U.S. labor market and other aspects of the economy continued to improve during the reporting period, as the unemployment rate dropped to 5.5% as of February 2015 from 6.7% 12 months earlier. The federal government’s latest available estimate of gross domestic product growth for the fourth quarter of 2014 showed that the economy expanded at a respectable 2.2% annual rate. Although this represented a slowdown from the 5.0% third-quarter 2014 growth pace, it was still far stronger than the 2.1% contraction in the first quarter of last year, which most economists attributed to severe winter weather. Inflation trends, meanwhile, remained benign. Plummeting oil prices in the second half of 2014 led to falling inflation rates—the consumer price index (CPI) declined 0.1% in the 12 months through January 2015, marking the first negative 12-month CPI reading since October 2009. However, core CPI, which excludes food and energy, rose 1.6% in the 12 months through January.
The Federal Reserve ended its large-scale asset purchases in October 2014, and investors’ attention since then has focused on when the central bank will make the initial increase in short-term lending rates. In her semiannual testimony before Congress in February, Fed Chair Janet Yellen said that the central bank will begin to evaluate an initial interest rate hike on a “meeting-by-meeting basis,” with policymakers basing their decision on the latest available economic data. While below-target inflation and global economic weakness could delay the Fed’s plans, central bank officials have repeatedly expressed their intent to begin tightening policy around midyear. However, we expect rate increases to occur at a measured pace and not necessarily at regular intervals. Absent a spike in Treasury yields, investor demand for tax-free income should continue to support municipal debt prices.
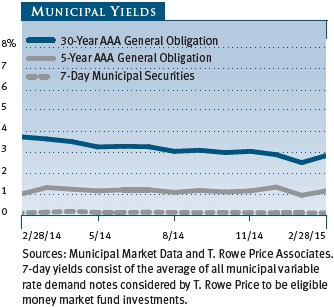
The difference between short- and long-term yields for both Treasuries and municipal debt decreased over the 12-month reporting period, flattening the yield curve for both asset classes amid benign inflation trends. In Treasuries, shorter-term yields climbed considerably, while yields on longer-term securities decreased even more significantly. For example, the yield on the 30-year Treasury “long bond” fell by 98 basis points in the reporting period. (One basis point equals 0.01 percentage points.) Municipal yields followed a similar pattern as yields climbed for shorter-term debt even as they decreased for long-maturity bonds. Money market yields remained anchored close to 0.00%. At the end of the reporting period, intermediate- and long-term municipal debt yielded more than comparable-maturity Treasuries, making them attractive as an alternative for taxable fixed income investors.

As an illustration of their relative attractiveness, on February 28, 2015, the 2.90% yield offered by a 30-year tax-free general obligation bond rated AAA was about 112% of the 2.60% pretax yield offered by a 30-year Treasury bond. Including the 3.8% net investment income tax that took effect in 2013 as part of the Affordable Care Act, the top marginal federal tax rate currently stands at 43.4%. An investor in this tax bracket would need to invest in a taxable bond yielding about 5.12% to receive the same after-tax income as that generated by the municipal bond. (To calculate a municipal bond’s taxable-equivalent yield, divide the yield by the quantity of 1.00 minus your federal tax bracket expressed as a decimal—in this case, 1.00 – 0.434, or 0.566.)
MUNICIPAL MARKET NEWS
Demand outstripped supply in the municipal bond market for much of 2014 and provided a strong technical backdrop that helped support bond prices. Toward the end of the year, supply picked up as municipalities took advantage of declining interest rates that made refinancing more attractive. In 2014, total municipal bond issuance exceeded $330 billion, according to The Bond Buyer, which was approximately the same as full-year 2013 issuance. In the first two months of 2015, the volume of supply picked up significantly from comparable periods in previous years, with refundings rising significantly and new-money bonds seeing small increases. Inflows into the asset class were robust, with high yield and intermediate-term portfolios experiencing the most demand. The broad municipal bond market posted positive returns in every month in 2014 as well as in January 2015. However, that streak ended in February 2015, when elevated supply and a sell-off in Treasuries led to the first monthly loss for municipals since December 2013.
Municipal bond issuer fundamentals remain generally sound, as austerity-minded state and local government leaders have been conservative about adding to indebtedness since the financial crisis. According to data compiled by the Pew Charitable Trusts, total tax revenue collected by the 50 U.S. states has recovered from its steep decline following the financial crisis. However, while some states and localities have fared quite well, other states, such as Illinois, New Jersey, and Pennsylvania, are more challenged; Puerto Rico, a U.S. territory, is extremely challenged.
Many states and cities, for example, are grappling with underfunded pensions and other post-employment benefit (OPEB) obligations. In contrast with the past, where the market has typically overlooked this long-term risk, we believe pension risks will become increasingly priced into the market over time. Part of our thinking is based on new reporting rules from the Governmental Accounting Standards Board that will bring more transparency to states’ funding gaps in the coming year. State and local municipalities will be required to report net liabilities directly on their balance sheets on a mark-to-market basis beginning in fiscal year 2015, as opposed to smoothing the value of plan assets over multiple years and relegating the number to financial statement footnotes.
Detroit and Puerto Rico are two municipal borrowers that have generated materially negative headlines at times over the last two years, but this had only a muted impact on the broad muni market in the reporting period. Market participants seemed to recognize that situations such as these are unique and that municipal bond market fundamentals were strong overall. In the case of Detroit, the U.S. Bankruptcy Court accepted in November 2014 the city’s plan to emerge from bankruptcy. The plan calls for 74% and 34% recovery rates for Detroit’s unlimited tax and limited tax GO debt holders, respectively, while retiree pension benefits remain largely intact. Although Detroit GO debt only represents a small portion of the municipal bond market, we have longer-term concerns about the precedent of pension beneficiaries receiving more favorable treatment than bondholders in a bankruptcy. This reinforces our strong preference for single-project revenue bonds that are secured by specified revenue-generating assets or dedicated taxes and are more insulated from pension funding risks.
Meanwhile, Puerto Rico continued to struggle with its finances, and the territory’s economic outlook deteriorated. In June 2014, the territory enacted the Puerto Rico Corporations Debt Enforcement & Recovery Act (Recovery Act), which would have allowed Puerto Rico’s public corporations, including electric utility PREPA, to restructure their debt. However, at the end of the reporting period, a federal judge struck down the Recovery Act as unconstitutional and ruled that Puerto Rico’s public corporations may not use the Recovery Act to restructure their debt. As Puerto Rico’s governmental issuers are not eligible to restructure their debts under Chapter 9 of the federal bankruptcy code, any negotiated settlement with creditors promises to be a chaotic process. Moody’s has since downgraded the commonwealth’s GO bonds to Caa1 from B2, with a negative outlook for all of Puerto Rico’s governmental and public corporation debt. The commonwealth is appealing the ruling, with arguments to be heard in May. We are closely following developments as growing uncertainty and increasing pressure on the commonwealth’s GO debt could send ripples across the broader municipal market. We continue to have no direct exposure to Puerto Rico in the Maryland Tax-Free Funds. Events such as Detroit’s bankruptcy and the ongoing developments in Puerto Rico highlight the need for diligent credit research and careful bond selection.
In terms of sector performance, revenue bonds handily outperformed local and state GOs during the reporting period. We continue to favor bonds backed by a dedicated revenue stream over GOs, with a preference for higher-yielding health care and transportation bonds. Among revenue bonds, the hospital and industrial revenue segments were among the best-performing areas, as investors favored higher-yielding issues. Revenue debt in the special tax and leasing sectors also generated healthy returns but trailed the revenue-bond leaders. In general, lower-quality municipal bonds outperformed higher-quality debt as higher yields attracted investors in the ongoing low-rate environment. Longer-maturity bonds also outperformed as the yield curve flattened over the reporting period.
MARYLAND MARKET NEWS
Maryland’s economic profile remains strong compared with other states. Marylanders are relatively prosperous—per capita personal income was 120% of the national average in 2013 (all data are the latest available), ranking it fifth. The state’s unemployment rate was 5.5% as of December 2014, better than the 5.6% national unemployment rate at that time and an improvement from an unemployment rate of 6.1% in December 2013. However, Maryland’s employment base grew at a pace that was below the national average.
Maryland’s finances appear to be plateauing. General fund revenues dropped 9% during the last recession and recovered in fiscal years 2011 and 2012, but they have shown lackluster growth in 2013 and 2014. In the latest audited fiscal year, ended June 30, 2014, Maryland’s general fund receipts were 3% ahead of where they were in the prior fiscal year, but they underperformed original budget expectations. Expense pressures led to a general fund deficit of $220 million (1%) in fiscal 2014. The state has always maintained a good cushion in its rainy day fund—on June 30, 2014, Maryland’s reserve fund held $773 million, representing a solid 5.1% of general fund revenues. The state balanced its budget for fiscal 2015 and the budget was delivered on time. Maryland’s rainy day fund is estimated to grow to $790 million as of June 30, 2015.
Maryland’s debt load is above the national average. According to Moody’s 2014 State Debt Medians, the state’s debt burden, at $10.6 billion, is in the upper third of all states when measured by debt per capita and only modestly better when measured on a debt-to-personal income basis. Debt service as a percentage of the budget remained manageable at 6.0% in fiscal 2014. However, as of June 30, 2014, Maryland’s State Employees Retirement and Pension System was only funded at 62% on an actuarial basis, while the Teachers’ Plan was 71% funded.
Maryland’s practice of not fully funding its actuarially calculated retirement contributions has led to a rise in its unfunded pension liability. As a result, Maryland faces fairly heavy unfunded liabilities for its pension plans, at $19 billion. Various modifications to benefits under these programs have been proposed to reduce liabilities and improve funding, and some have been recently adopted. We are closely monitoring these developments. Liabilities for retiree health programs were also high at $9.0 billion as of June 30, 2014.
Aside from these unfunded pension and OPEB liabilities, Maryland has a long history of responsible stewardship and prudent financial management. The state’s GO bonds are rated Aaa by Moody’s Investors Service and AAA by Standard & Poor’s and Fitch. All three rating agencies maintain stable outlooks.
PERFORMANCE AND PORTFOLIO STRATEGY REVIEW
Maryland Tax-Free Money Fund
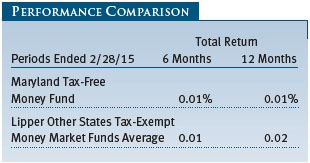
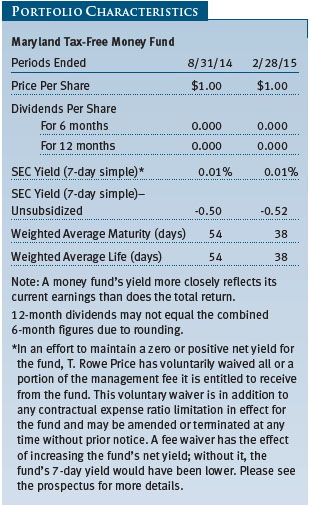
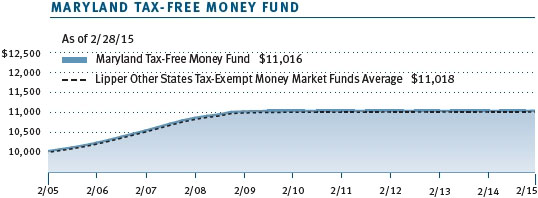
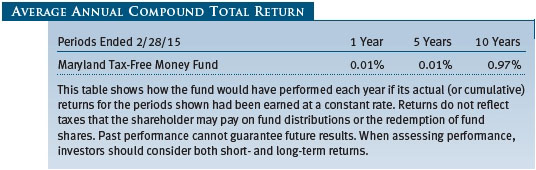
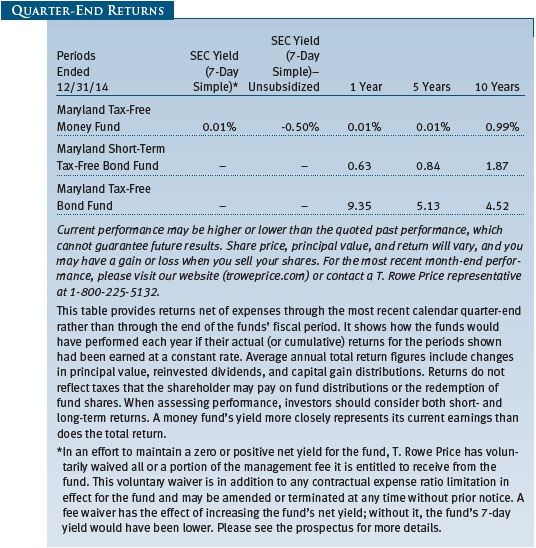
Your fund generated a 0.01% return for the 12-month period ended February 28, 2015. Our performance slightly trailed the return for the Lipper Other States Tax-Exempt Money Market Funds Average. All money market rates continue to be closely tied to the Federal Reserve’s fed funds target rate of 0.00% to 0.25%. The Maryland Tax-Free Money Fund has performed in line with its competitors over the longer term.
Persistently low rates continue to suppress income for investors in the Maryland Tax-Free Money Fund. However, for the first time in more than six years, the possibility of higher rates looms on the investment horizon. The Fed, which has maintained a zero rate stance since the 2008 financial crisis, seems inclined to begin tightening monetary policy sometime in 2015. Most market observers feel that the U.S. economy is now strong enough for the Fed to lift rates this summer despite the absence of inflation.
Municipal money markets have yet to price in this sentiment. Over the past six months, the slope of the Maryland municipal money market yield curve steepened as overnight and seven-day yields moved lower by two to three basis points to 0.02% (100 basis points equal 1.00%), while the yield on one-year paper moved slightly higher by four basis points to 0.16%. Persistently strong demand for high-quality, short-dated Maryland investments explain much of this move. As expectations for a Fed liftoff build, we expect one-year yields to move much higher than current offerings. However, yields on shorter-term investments (one to three months) are likely to only react to an imminent rate hike.
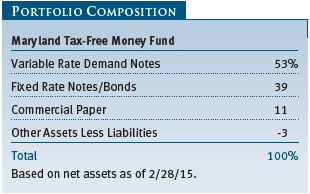
The low interest rates over the last few years continue to contribute to a supply/demand imbalance as issuers chose to borrow for longer periods to lock in currently favorable financing costs, leading to less issuance to offset maturing debt. We have discussed this concern in prior letters, and at this time, we see no signs of abatement. Net new issuance of variable rate discount notes (VRDNs) has been negative since 2008. For example, in 2014, net new VRDN issuance was down nearly 9% after dropping 14% in 2013 and 13% in 2012. With these reductions in supply, investors have been left to be price-takers, and VRDN yields range from 0.01% to 0.03%. With the Fed poised to raise interest rates later this year, some investors seem inclined to take a wait-and-see approach, buying VRDNs and commercial paper with less than three-month maturities and anchoring the front end of the yield curve. However, long-maturity yields are drifting slightly higher.
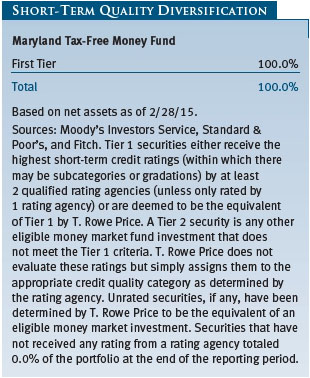
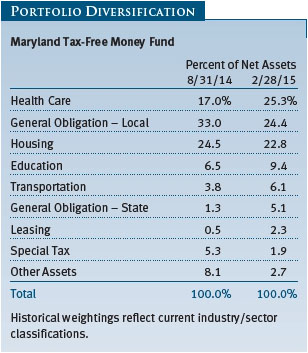
Credit quality in Maryland continues to be quite strong relative to other states. Continuing our policy of only investing in the most highly rated credit, we have significant exposures to the health care (mostly hospitals), state and local general obligation, and housing revenue sectors. Some of our prominent positions in the portfolio include the State of Maryland General Obligations, Maryland Community Development Administration, and the Howard Hughes Medical Institute. Many of our VRDN issues continue to rely on higher-quality banks for credit enhancement, including Toronto Dominion Bank and Wells Fargo, while the Federal National Mortgage Association (Fannie Mae) and the Federal Home Loan Mortgage Corporation back many of our housing bonds. (Please refer to the fund’s portfolio of investments for a complete list of holdings and the amount each represents in the portfolio.)
With a Fed rate liftoff on the investment horizon, we are less inclined to invest in longer-maturity issuance, which we believe does not reflect our current interest rate expectations. As such, the fund’s weighted average maturity will move shorter until we believe the yield curve correctly prices in near-term rate increases. As always, we remain committed to managing a high-quality, diversified portfolio focused on liquidity and stability of principal, which we deem to be of the utmost importance to our shareholders.
Finally, as we discussed in our last shareholder letter, the Securities and Exchange Commission rule changes affecting money market funds are expected to become effective in October 2016. T. Rowe Price is currently reviewing these rule changes and their ramifications for shareholders. For most shareholders, there will be minimal or no change to their investments. We intend to offer a full range of investing solutions for all of our shareholders, and we will write more on this very important topic as the situation unfolds.
Maryland Short-Term Tax-Free Bond Fund
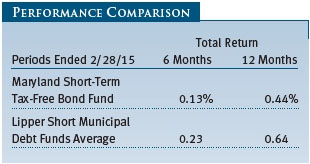
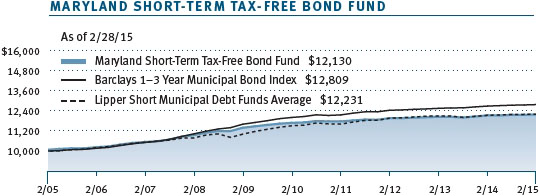
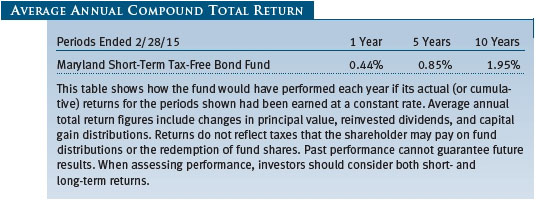
The Maryland Short-Term Tax-Free Bond Fund returned 0.44% for the 12-month period ended February 28, 2015, slightly underperforming the Lipper Short Municipal Debt Funds Average of similarly managed funds. The fund’s net asset value ended the 12-month period one penny lower at $5.23. Dividend income of $0.03 per share for the fiscal year was also a penny lower than in the 12-month period ended February 28, 2014, reflecting the falling interest rate environment.
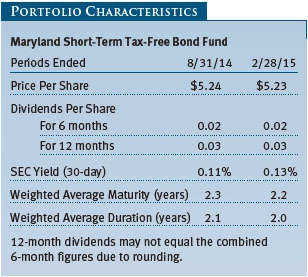
Our investment strategy changed slightly in the past six months. In general, we prefer to target higher-yielding revenue sectors versus GO bonds, and we target a neutral interest rate posture for your fund. Over time, we have learned to adapt and adjust this general strategy for this portfolio, as the periodic supply constraints in the short-maturity Maryland market limit our flexibility somewhat. Over the past six months, we decreased the portfolio’s interest rate sensitivity due to the prospect of rising interest rates later this year. The portfolio’s duration (a measure of interest rate sensitivity) and its weighted average maturity were both down slightly from six months ago. In addition, while we added a bit more to the health care sector, our greatest sector emphasis remained on the higher-quality general obligation sector.
Over the last six months, we began shifting our exposure to the yield curve into more of a “barbell” strategy that overweights short- and long-maturity securities and underweights intermediate-term debt. We chose to hold more short-term debt maturing within one year in order to offset the fund’s exposure to bonds in the seven-year part of the curve. We believe the difference in yield between one-year and seven-year bonds is very large, indicating that there is still value in this part of the curve. If the Fed begins to raise the overnight lending rate sometime this summer, we believe the difference in yields could collapse. Further, we also view this trade as a bit of insurance if unforeseen events cause the Treasury yield curve to flatten with long rates falling as a result of overseas monetary policy or economic weakness. We experienced a bit of this over the last six months. Despite having modest out-of-benchmark exposure to the longer end of the yield curve, more than 50% of the fund will be maturing in the next two years. We would welcome a higher interest rate environment to make new investments.
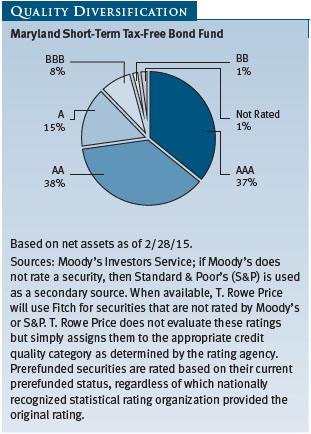
We have maintained a zero allocation to bonds issued by the Commonwealth of Puerto Rico, which are triple-tax-free for Marylanders but too risky, in our view. We have limited opportunities to buy other lower-rated, high-yielding Maryland tax-exempt debt given the state’s high credit rating. Investment-grade issues represented 98% of the portfolio at the end of the period.
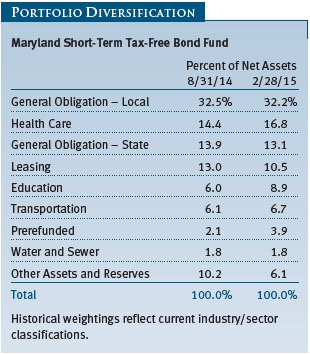
We added to our holdings in the health care and education segments over the past six months as supply allowed. We funded the shift by reducing our stake in state-issued GOs and leasing bonds. We are always looking for ways to diversify away from the state. In the last six months, most of our purchases were in the hospital sector. We added to the University of Maryland Medical Center, MedStar Health, LifeBridge Health, Western Maryland Health System, Anne Arundel Health System, and Greater Baltimore Medical Center. (Please refer to the fund’s portfolio of investments for a complete list of holdings and the amount each represents in the portfolio.)
Short-term returns have suffered relative to other parts of the municipal market as the yield curve flattened, with short-term yields moving slightly higher while long-term yields declined. In an effort to keep a steady level of tax-free income for our shareholders, we will continue to invest in higher-income opportunities as they present themselves. Our goal is to drive returns by investing in sectors that offer incremental yield, and we think we will have better opportunities moving forward.
Looking ahead, we expect periods of considerable yield volatility on short-term bonds. We believe that the Fed will increase the fed funds rate later this year and that yields on short-term bonds will move higher. However, we hesitate to get overly bearish on short-term bonds because we don’t think we are at the beginning of a protracted move to a materially higher federal funds rate. We are sure the Fed wants the overnight rate higher than it is today, but not high enough to significantly do damage to the bond market and, more importantly, the economy.
Maryland Tax-Free Bond Fund
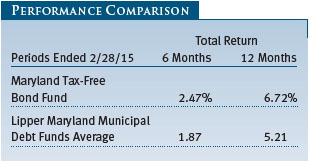
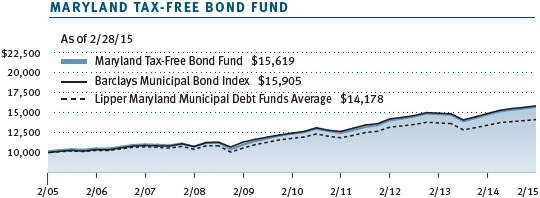
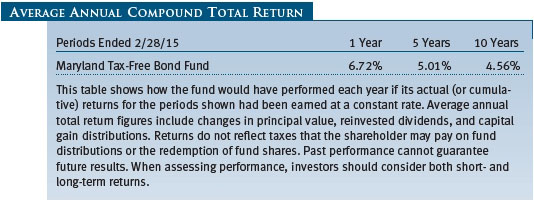
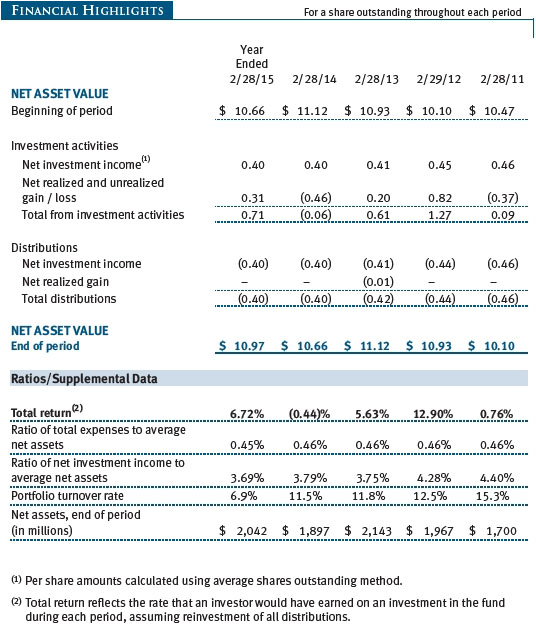
The Maryland Tax-Free Bond Fund returned 6.72% in its fiscal year ended February 28, 2015, with a gain of 2.47% in the last six months—both results outperformed the Lipper peer group average. Our strong performance versus the benchmark stemmed from yield curve positioning, sector allocation decisions, an emphasis on revenue bonds, and the fund’s below-average fees. In addition, our zero exposure to any Puerto Rico bonds enhanced our relative returns as Puerto Rico bond prices churned lower during the past year. Our conservative interest rate positioning slightly detracted from relative returns over the past 12 months.
Longer term, your fund continued to compare very favorably with its competitors. Lipper ranked the Maryland Tax-Free Bond Fund first in its peer group for the 3-, 5-, and 10-year periods ended February 28, 2015. (Based on cumulative total return, Lipper ranked the Maryland Tax-Free Bond Fund 7 of 31, 1 of 30, 1 of 29, and 1 of 20 funds in the Maryland municipal debt funds universe for the 1-, 3-, 5-, and 10-year periods ended February 28, 2015, respectively. Past performance cannot guarantee future results.)
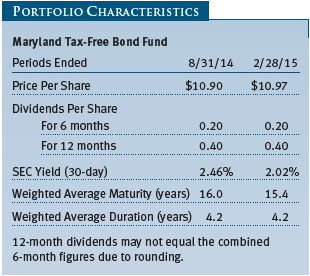
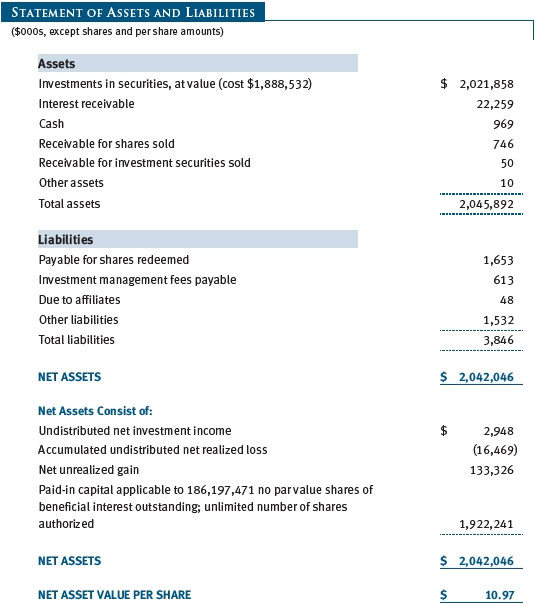
The fund’s net asset value was $10.97 at the end of the reporting period, gaining $0.31 over the past 12 months. Dividends per share contributed $0.40 to the fund’s annual total return, which was unchanged compared with the prior 12-month period. Despite broader credit concerns focused on problems with Detroit and Puerto Rico, the fund benefited from falling long-term interest rates.
In the current market environment, and given the shape of the yield curve, we believe there is still value in longer-maturity debt. Lower rates and the flattening of the yield curve to date have injected a bit more caution into our investment strategy, however, and we have tempered our enthusiasm for the longest-term bonds and shifted our investment emphasis closer to the 15- to 20-year maturities. We trimmed the fund’s weighted average maturity to 15.4 years from 16.0 years, while our duration was unchanged from six months ago.
Late in the reporting period, we made several notable additions in the 15- to 20-year area, including purchases of MedStar Health and Western Maryland Health System. Many of our long-maturity holdings were our best performers over the past 12 months. Although our moderately more conservative positioning has recently detracted a bit from the fund’s relative performance as interest rates have declined, we expect that upward pressure on longer-term rates will resume in the not-too-distant future. (Please refer to the fund’s portfolio of investments for a complete list of holdings and the amount each represents in the portfolio.)
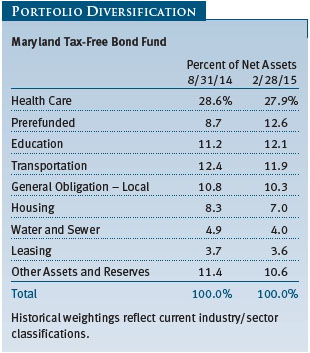
In terms of sector positioning, we continued to focus on revenue sectors with a heavy emphasis on health care (mostly hospitals), which has benefited the portfolio over the past year. Health care bonds typically offer higher-than-average yields. Maryland has many well-run hospitals, and its unique reimbursement environment improves the risk/reward potential in this sector. A number of hospital holdings were among our top performers for the past year. Our preference for revenue sectors stems from the relative security of specific claims on revenues versus the generic pledges of taxing power associated with general obligations.
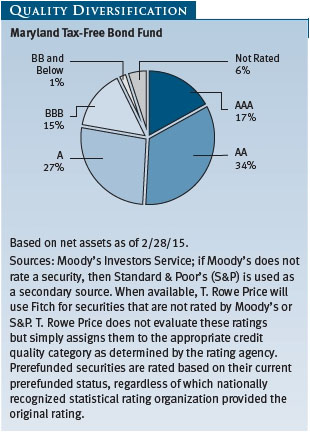
Our quality mix was little changed over the past six-month period. We favor A rated bonds for the premium yield this sector generally offers. Although we added several A rated holdings to the portfolio, maturities and calls unfortunately removed a few of our seasoned holdings from this quality segment. On the higher-quality side, our position in prerefunded holdings grew nearly four percentage points to 12.6% of the portfolio, as overall low rates allowed issuers to advance fund or refinance a few of our seasoned holdings.
In contrast with the previous six-month period, our zero exposure to Puerto Rico boosted relative returns. Given the dim prospects for investors gaining a full return of their investment in Puerto Rico bonds, we expect to continue avoiding all Puerto Rico holdings for the foreseeable future. We will continue to evaluate Puerto Rico’s ability to repair its fiscal situation. As always, we will focus on the Maryland municipal market’s best long-term prospects, led by T. Rowe Price’s strong credit research capabilities and our fundamentals-driven investment process.
OUTLOOK
We believe that the municipal bond market remains a high-quality market that offers good opportunities for long-term investors seeking tax-free income. While fundamentals are sound overall and technical support should persist, there could be hurdles in 2015. In particular, with the Fed preparing to tighten monetary policy, we are mindful that rising rates would likely weaken the appetite for bonds with higher interest rate risk.
In addition, while we believe that many states deserve high credit ratings and will be able to continue servicing their debts, we have some longer-term concerns about significant funding shortfalls for pensions and OPEB obligations in some jurisdictions. These funding gaps stem from investment losses during the financial crisis, insufficient plan contributions, and unrealistic return projections. Although few large plans are at risk of insolvency in the near term, the magnitude of unfunded liabilities is becoming more conspicuous in a few states.
History has shown that when negative headlines spark a broad muni sell-off, cheap valuations tend to be short-lived. Investors quickly return to take advantage of more attractive taxable-equivalent yields and the opportunity to purchase high-quality securities at a discount. We believe this resilience will endure, but it is critical to possess the fundamental research prowess to avoid the deteriorating credits at the center of any storm. Ultimately, we believe T. Rowe Price’s independent credit research is our greatest strength and will remain an asset for our investors as we navigate the current market environment.
As always, we focus on finding attractively valued bonds issued by municipalities with good long-term fundamentals—an investment strategy that we believe will continue to serve our investors well.
Thank you for investing with T. Rowe Price.
Respectfully submitted,

Joseph K. Lynagh
Chairman of the Investment Advisory Committee
Maryland Tax-Free Money Fund

Charles B. Hill
Chairman of the Investment Advisory Committee
Maryland Short-Term Tax-Free Bond Fund

Hugh D. McGuirk
Chairman of the Investment Advisory Committee
Maryland Tax-Free Bond Fund
March 13, 2015
The committee chairmen have day-to-day responsibility for managing the portfolios and work with committee members in developing and executing the funds’ investment programs.
RISKS OF FIXED INCOME INVESTING
Bonds are subject to interest rate risk (the decline in bond prices that usually accompanies a rise in interest rates) and credit risk (the chance that any fund holding could have its credit rating downgraded or that a bond issuer will default by failing to make timely payments of interest or principal), potentially reducing the fund’s income level and share price. The Maryland Tax-Free Funds are less diversified than those investing nationally. Some income may be subject to state and local taxes and the federal alternative minimum tax.
The money fund seeks to maintain a stable net asset value and provide an appropriate place for money between investments or during uncertain market conditions. An investment in the fund is not insured or guaranteed by the FDIC or any other government agency. Although the fund seeks to preserve the value of your investment at $1.00 per share, it is possible to lose money by investing in the fund.
GLOSSARY
Barclays 1–3 Year Municipal Bond Index: A broadly diversified index of state-issued general obligation tax-exempt bonds with maturities of one to three years.
Barclays Municipal Bond Index: A broadly diversified index of tax-exempt bonds.
Basis point: One one-hundredth of one percentage point, or 0.01%.
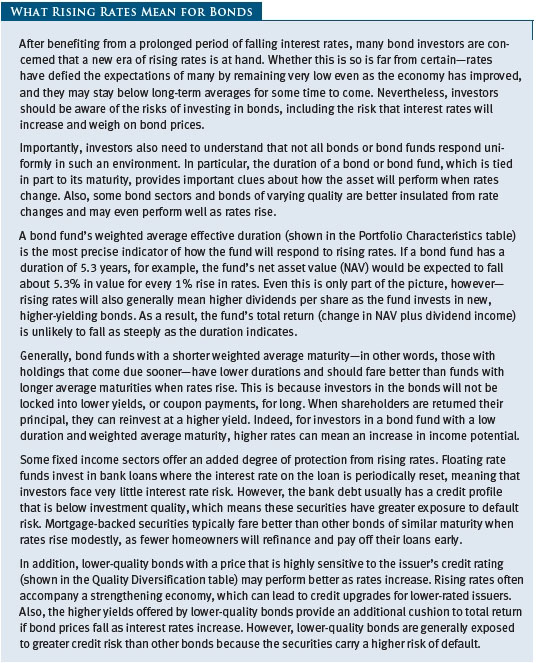
Duration: A measure of a bond fund’s sensitivity to changes in interest rates. For example, a fund with a duration of five years would fall about 5% in price in response to a one-percentage-point rise in interest rates, and vice versa.
Federal funds rate: The interest rate charged on overnight loans of reserves by one financial institution to another in the United States. The Federal Reserve sets a target federal funds rate to affect the direction of interest rates.
General obligation debt: A government’s strongest pledge that obligates its full faith and credit, including, if necessary, its ability to raise taxes.
Investment grade: High-quality bonds as measured by one of the major credit rating agencies. For example, Standard & Poor’s designates the bonds in its top four categories (AAA to BBB) as investment grade.
Lipper averages: The averages of available mutual fund performance returns for specified time periods in categories defined by Lipper.
Other post-employment benefits liability (OPEB): Benefits paid to an employee after retirement, such as premiums for life and health insurance.
Prerefunded bond: A bond that originally may have been issued as a general obligation or revenue bond but that is now secured by an escrow fund consisting entirely of direct U.S. government obligations that are sufficient for paying the bondholders.
Revenue bonds: Bonds issued to fund specific projects, such as airports, bridges, hospitals, and toll roads, where a portion of the revenue generated is used to service the interest payments on the bond.
SEC yield (7-day simple): A method of calculating a money fund’s yield by annualizing the fund’s net investment income for the last seven days of each period divided by the fund’s net asset value at the end of the period. Yield will vary and is not guaranteed.
SEC yield (30-day): A method of calculating a fund’s yield that assumes all portfolio securities are held until maturity. Yield will vary and is not guaranteed.
Variable rate demand note (VRDN): Generally, a debt security that requires the issuer to redeem at the holder’s discretion on a specified date or dates prior to maturity. Upon redemption, the issuer pays par to the holder who loses future coupon payments that might otherwise be due. VRDNs might be especially attractive at times of rising rates, to protect against interest rate risk by redeeming at par value and reinvesting proceeds in a new bond.
Weighted average life: In general, the longer the average life, the greater the fund’s credit quality risk. The average life is the dollar-weighted average maturity of a portfolio’s individual securities without taking into account interest rate readjustment dates. Money funds must maintain a weighted average life of less than 120 days.
Weighted average maturity: In general, the longer the average maturity, the greater the fund’s sensitivity to interest rate changes. The weighted average maturity may take into account the interest rate readjustment dates for certain securities. Money funds must maintain a weighted average maturity of less than 60 days.
Yield curve: A graphic depiction of the relationship between yields and maturity dates for a set of similar securities such as Treasuries or municipal securities. Securities with longer maturities usually a have higher yield. If short-term securities offer a higher yield, then the curve is said to be “inverted.” If short- and long-term bonds are offering equivalent yields, then the curve is said to be “flat.”
Performance and Expenses
This chart shows the value of a hypothetical $10,000 investment in the fund over the past 10 fiscal year periods or since inception (for funds lacking 10-year records). The result is compared with benchmarks, which may include a broad-based market index and a peer group average or index. Market indexes do not include expenses, which are deducted from fund returns as well as mutual fund averages and indexes.
This chart shows the value of a hypothetical $10,000 investment in the fund over the past 10 fiscal year periods or since inception (for funds lacking 10-year records). The result is compared with benchmarks, which may include a broad-based market index and a peer group average or index. Market indexes do not include expenses, which are deducted from fund returns as well as mutual fund averages and indexes.
This chart shows the value of a hypothetical $10,000 investment in the fund over the past 10 fiscal year periods or since inception (for funds lacking 10-year records). The result is compared with benchmarks, which may include a broad-based market index and a peer group average or index. Market indexes do not include expenses, which are deducted from fund returns as well as mutual fund averages and indexes.
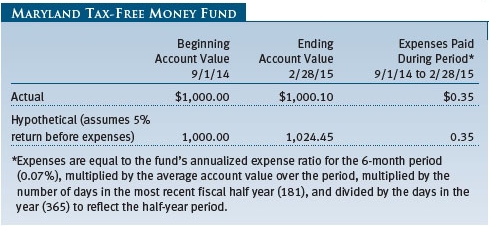
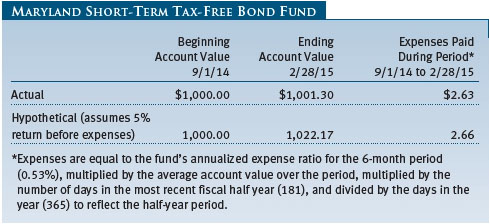
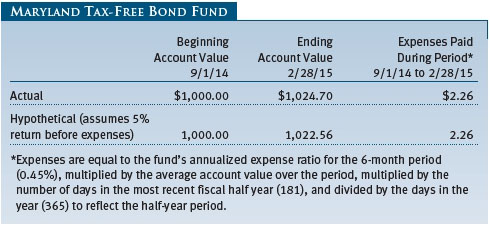
As a mutual fund shareholder, you may incur two types of costs: (1) transaction costs, such as redemption fees or sales loads, and (2) ongoing costs, including management fees, distribution and service (12b-1) fees, and other fund expenses. The following example is intended to help you understand your ongoing costs (in dollars) of investing in the fund and to compare these costs with the ongoing costs of investing in other mutual funds. The example is based on an investment of $1,000 invested at the beginning of the most recent six-month period and held for the entire period.
Actual Expenses
The first line of the following table (Actual) provides information about actual account values and expenses based on the fund’s actual returns. You may use the information on this line, together with your account balance, to estimate the expenses that you paid over the period. Simply divide your account value by $1,000 (for example, an $8,600 account value divided by $1,000 = 8.6), then multiply the result by the number on the first line under the heading “Expenses Paid During Period” to estimate the expenses you paid on your account during this period.
Hypothetical Example for Comparison Purposes
The information on the second line of the table (Hypothetical) is based on hypothetical account values and expenses derived from the fund’s actual expense ratio and an assumed 5% per year rate of return before expenses (not the fund’s actual return). You may compare the ongoing costs of investing in the fund with other funds by contrasting this 5% hypothetical example and the 5% hypothetical examples that appear in the shareholder reports of the other funds. The hypothetical account values and expenses may not be used to estimate the actual ending account balance or expenses you paid for the period.
Note: T. Rowe Price charges an annual account service fee of $20, generally for accounts with less than $10,000. The fee is waived for any investor whose T. Rowe Price mutual fund accounts total $50,000 or more; accounts electing to receive electronic delivery of account statements, transaction confirmations, prospectuses, and shareholder reports; or accounts of an investor who is a T. Rowe Price Preferred Services, Personal Services, or Enhanced Personal Services client (enrollment in these programs generally requires T. Rowe Price assets of at least $100,000). This fee is not included in the accompanying table. If you are subject to the fee, keep it in mind when you are estimating the ongoing expenses of investing in the fund and when comparing the expenses of this fund with other funds.
You should also be aware that the expenses shown in the table highlight only your ongoing costs and do not reflect any transaction costs, such as redemption fees or sales loads. Therefore, the second line of the table is useful in comparing ongoing costs only and will not help you determine the relative total costs of owning different funds. To the extent a fund charges transaction costs, however, the total cost of owning that fund is higher.
The accompanying notes are an integral part of these financial statements.

The accompanying notes are an integral part of these financial statements.
The accompanying notes are an integral part of these financial statements.
The accompanying notes are an integral part of these financial statements.
The accompanying notes are an integral part of these financial statements.
| Notes to Financial Statements |
T. Rowe Price State Tax-Free Income Trust (the trust), is registered under the Investment Company Act of 1940 (the 1940 Act). The Maryland Tax-Free Bond Fund (the fund) is a nondiversified, open-end management investment company established by the trust. The fund commenced operations on March 31, 1987. The fund seeks to provide, consistent with prudent portfolio management, the highest level of income exempt from federal and Maryland state and local income taxes by investing primarily in investment-grade Maryland municipal bonds.
NOTE 1 - SIGNIFICANT ACCOUNTING POLICIES
Basis of Preparation The fund is an investment company and follows accounting and reporting guidance in the Financial Accounting Standards Board (FASB) Accounting Standards Codification Topic 946 (ASC 946). The accompanying financial statements were prepared in accordance with accounting principles generally accepted in the United States of America (GAAP), including but not limited to ASC 946. GAAP requires the use of estimates made by management. Management believes that estimates and valuations are appropriate; however, actual results may differ from those estimates, and the valuations reflected in the accompanying financial statements may differ from the value ultimately realized upon sale or maturity.
Investment Transactions, Investment Income, and Distributions Income and expenses are recorded on the accrual basis. Premiums and discounts on debt securities are amortized for financial reporting purposes. Income tax-related interest and penalties, if incurred, would be recorded as income tax expense. Investment transactions are accounted for on the trade date. Realized gains and losses are reported on the identified cost basis. Distributions to shareholders are recorded on the ex-dividend date. Income distributions are declared daily and paid monthly. Capital gain distributions, if any, are generally declared and paid by the fund annually.
New Accounting Guidance In June 2014, FASB issued Accounting Standards Update (ASU) No. 2014-11, Transfers and Servicing (Topic 860), Repurchase-to-Maturity Transactions, Repurchase Financings, and Disclosures. The ASU changes the accounting for certain repurchase agreements and expands disclosure requirements related to repurchase agreements, securities lending, repurchase-to-maturity and similar transactions. The ASU is effective for interim and annual reporting periods beginning after December 15, 2014. Adoption will have no effect on the fund’s net assets or results of operations.
NOTE 2 - VALUATION
The fund’s financial instruments are valued and its net asset value (NAV) per share is computed at the close of the New York Stock Exchange (NYSE), normally 4 p.m. ET, each day the NYSE is open for business.
Fair Value The fund’s financial instruments are reported at fair value, which GAAP defines as the price that would be received to sell an asset or paid to transfer a liability in an orderly transaction between market participants at the measurement date. The T. Rowe Price Valuation Committee (the Valuation Committee) has been established by the fund’s Board of Trustees (the Board) to ensure that financial instruments are appropriately priced at fair value in accordance with GAAP and the 1940 Act. Subject to oversight by the Board, the Valuation Committee develops and oversees pricing-related policies and procedures and approves all fair value determinations. Specifically, the Valuation Committee establishes procedures to value securities; determines pricing techniques, sources, and persons eligible to effect fair value pricing actions; oversees the selection, services, and performance of pricing vendors; oversees valuation-related business continuity practices; and provides guidance on internal controls and valuation-related matters. The Valuation Committee reports to the Board; is chaired by the fund’s treasurer; and has representation from legal, portfolio management and trading, operations, and risk management.
Various valuation techniques and inputs are used to determine the fair value of financial instruments. GAAP establishes the following fair value hierarchy that categorizes the inputs used to measure fair value:
Level 1 – quoted prices (unadjusted) in active markets for identical financial instruments that the fund can access at the reporting date
Level 2 – inputs other than Level 1 quoted prices that are observable, either directly or indirectly (including, but not limited to, quoted prices for similar financial instruments in active markets, quoted prices for identical or similar financial instruments in inactive markets, interest rates and yield curves, implied volatilities, and credit spreads)
Level 3 – unobservable inputs
Observable inputs are developed using market data, such as publicly available information about actual events or transactions, and reflect the assumptions that market participants would use to price the financial instrument. Unobservable inputs are those for which market data are not available and are developed using the best information available about the assumptions that market participants would use to price the financial instrument. GAAP requires valuation techniques to maximize the use of relevant observable inputs and minimize the use of unobservable inputs. When multiple inputs are used to derive fair value, the financial instrument is assigned to the level within the fair value hierarchy based on the lowest-level input that is significant to the fair value of the financial instrument. Input levels are not necessarily an indication of the risk or liquidity associated with financial instruments at that level but rather the degree of judgment used in determining those values.
Valuation Techniques Debt securities generally are traded in the over-the-counter (OTC) market. Securities with remaining maturities of one year or more at the time of acquisition are valued at prices furnished by dealers who make markets in such securities or by an independent pricing service, which considers the yield or price of bonds of comparable quality, coupon, maturity, and type, as well as prices quoted by dealers who make markets in such securities. Securities with remaining maturities of less than one year at the time of acquisition generally use amortized cost in local currency to approximate fair value. However, if amortized cost is deemed not to reflect fair value or the fund holds a significant amount of such securities with remaining maturities of more than 60 days, the securities are valued at prices furnished by dealers who make markets in such securities or by an independent pricing service. Generally, debt securities are categorized in Level 2 of the fair value hierarchy; however, to the extent the valuations include significant unobservable inputs, the securities would be categorized in Level 3.
Assets and liabilities other than financial instruments, including short-term receivables and payables, are carried at cost, or estimated realizable value, if less, which approximates fair value.
Thinly traded financial instruments and those for which the above valuation procedures are inappropriate or are deemed not to reflect fair value are stated at fair value as determined in good faith by the Valuation Committee. The objective of any fair value pricing determination is to arrive at a price that could reasonably be expected from a current sale. Financial instruments fair valued by the Valuation Committee are primarily private placements, restricted securities, warrants, rights, and other securities that are not publicly traded.
Subject to oversight by the Board, the Valuation Committee regularly makes good faith judgments to establish and adjust the fair valuations of certain securities as events occur and circumstances warrant. For instance, in determining the fair value of troubled or thinly traded debt instruments, the Valuation Committee considers a variety of factors, which may include, but are not limited to, the issuer’s business prospects, its financial standing and performance, recent investment transactions in the issuer, strategic events affecting the company, market liquidity for the issuer, and general economic conditions and events. In consultation with the investment and pricing teams, the Valuation Committee will determine an appropriate valuation technique based on available information, which may include both observable and unobservable inputs. The Valuation Committee typically will afford greatest weight to actual prices in arm’s length transactions, to the extent they represent orderly transactions between market participants; transaction information can be reliably obtained; and prices are deemed representative of fair value. However, the Valuation Committee may also consider other valuation methods such as a discount or premium from market value of a similar, freely traded security of the same issuer; discounted cash flows; yield to maturity; or some combination. Fair value determinations are reviewed on a regular basis and updated as information becomes available, including actual purchase and sale transactions of the issue. Because any fair value determination involves a significant amount of judgment, there is a degree of subjectivity inherent in such pricing decisions, and fair value prices determined by the Valuation Committee could differ from those of other market participants. Depending on the relative significance of unobservable inputs, including the valuation technique(s) used, fair valued securities may be categorized in Level 2 or 3 of the fair value hierarchy.
Valuation Inputs On February 28, 2015, all of the fund’s financial instruments were classified as Level 2, based on the inputs used to determine their fair values. There were no material transfers between Levels 1 and 2 during the year ended February 28, 2015.
NOTE 3 - OTHER INVESTMENT TRANSACTIONS
Consistent with its investment objective, the fund engages in the following practices to manage exposure to certain risks and/or to enhance performance. The investment objective, policies, program, and risk factors of the fund are described more fully in the fund’s prospectus and Statement of Additional Information.
Restricted Securities The fund may invest in securities that are subject to legal or contractual restrictions on resale. Prompt sale of such securities at an acceptable price may be difficult and may involve substantial delays and additional costs.
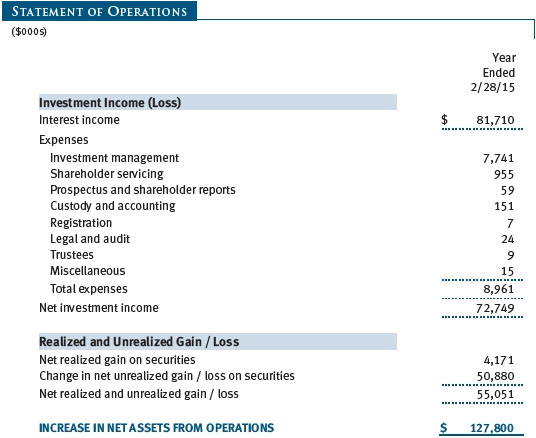
Other Purchases and sales of portfolio securities other than short-term securities aggregated $253,055,000 and $134,477,000, respectively, for the year ended February 28, 2015.
NOTE 4 - FEDERAL INCOME TAXES
No provision for federal income taxes is required since the fund intends to continue to qualify as a regulated investment company under Subchapter M of the Internal Revenue Code and distribute to shareholders all of its income and gains. Distributions determined in accordance with federal income tax regulations may differ in amount or character from net investment income and realized gains for financial reporting purposes. Financial reporting records are adjusted for permanent book/tax differences to reflect tax character but are not adjusted for temporary differences.
The fund files U.S. federal, state, and local tax returns as required. The fund’s tax returns are subject to examination by the relevant tax authorities until expiration of the applicable statute of limitations, which is generally three years after the filing of the tax return but which can be extended to six years in certain circumstances. Tax returns for open years have incorporated no uncertain tax positions that require a provision for income taxes.
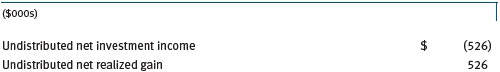
Reclassifications between income and gain relate primarily to the character of market discount at time of sale. For the year ended February 28, 2015, the following reclassifications were recorded to reflect tax character (there was no impact on results of operations or net assets):
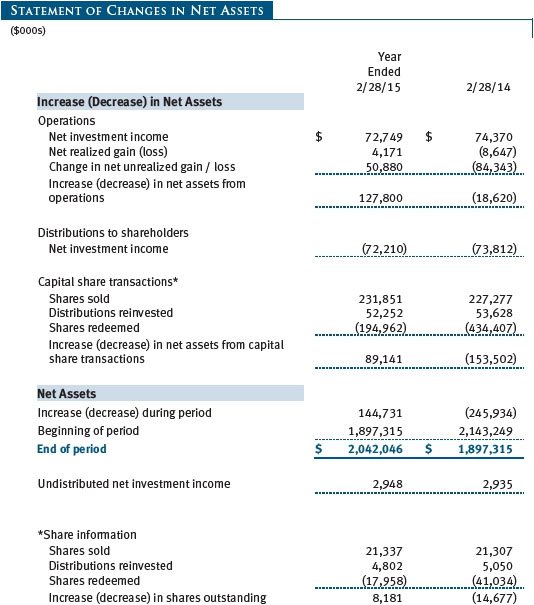
Distributions during the years ended February 28, 2015 and February 28, 2014, totaled $72,210,000 and $73,812,000, respectively, and were characterized as tax-exempt income for tax purposes. At February 28, 2015, the tax-basis cost of investments and components of net assets were as follows:
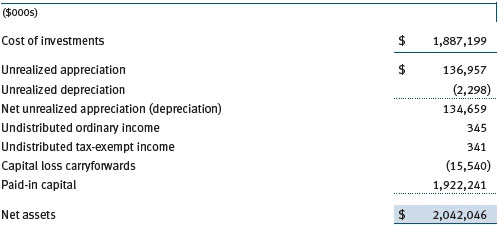
The difference between book-basis and tax-basis net unrealized appreciation (depreciation) is attributable to the recognition of market discount amortization for tax purposes. The fund intends to retain realized gains to the extent of available capital loss carryforwards. Because the fund is required to use capital loss carryforwards that do not expire before those with expiration dates, all or a portion of its capital loss carryforwards subject to expiration could ultimately go unused. During the year ended February 28, 2015, the fund utilized $4,251,000 of capital loss carryforwards. The fund’s available capital loss carryforwards as of February 28, 2015, expire as follows: $8,553,000 in fiscal 2017 and $2,637,000 in fiscal 2019; $4,350,000 have no expiration.
NOTE 5 - RELATED PARTY TRANSACTIONS
The fund is managed by T. Rowe Price Associates, Inc. (Price Associates), a wholly owned subsidiary of T. Rowe Price Group, Inc. (Price Group). The investment management agreement between the fund and Price Associates provides for an annual investment management fee, which is computed daily and paid monthly. The fee consists of an individual fund fee, equal to 0.10% of the fund’s average daily net assets, and a group fee. The group fee rate is calculated based on the combined net assets of certain mutual funds sponsored by Price Associates (the group) applied to a graduated fee schedule, with rates ranging from 0.48% for the first $1 billion of assets to 0.275% for assets in excess of $400 billion. The fund’s group fee is determined by applying the group fee rate to the fund’s average daily net assets. At February 28, 2015, the effective annual group fee rate was 0.29%.
In addition, the fund has entered into service agreements with Price Associates and a wholly owned subsidiary of Price Associates (collectively, Price). Price Associates computes the daily share price and provides certain other administrative services to the fund. T. Rowe Price Services, Inc., provides shareholder and administrative services in its capacity as the fund’s transfer and dividend-disbursing agent. For the year ended February 28, 2015, expenses incurred pursuant to these service agreements were $95,000 for Price Associates and $392,000 for T. Rowe Price Services, Inc. The total amount payable at period-end pursuant to these service agreements is reflected as Due to Affiliates in the accompanying financial statements.
| Report of Independent Registered Public Accounting Firm |
To the Board of Trustees of T. Rowe Price State Tax-Free Income Trust and
Shareholders of Maryland Tax-Free Bond Fund
In our opinion, the accompanying statement of assets and liabilities, including the portfolio of investments, and the related statements of operations and of changes in net assets and the financial highlights present fairly, in all material respects, the financial position of the Maryland Tax-Free Bond Fund (one of the portfolios comprising T. Rowe Price State Tax-Free Income Trust, hereafter referred to as the “Fund”) at February 28, 2015, the results of its operations, the changes in its net assets and the financial highlights for each of the periods indicated therein, in conformity with accounting principles generally accepted in the United States of America. These financial statements and financial highlights (hereafter referred to as “financial statements”) are the responsibility of the Fund’s management. Our responsibility is to express an opinion on these financial statements based on our audits. We conducted our audits of these financial statements in accordance with the standards of the Public Company Accounting Oversight Board (United States). Those standards require that we plan and perform the audit to obtain reasonable assurance about whether the financial statements are free of material misstatement. An audit includes examining, on a test basis, evidence supporting the amounts and disclosures in the financial statements, assessing the accounting principles used and significant estimates made by management, and evaluating the overall financial statement presentation. We believe that our audits, which included confirmation of securities at February 28, 2015 by correspondence with the custodian, provide a reasonable basis for our opinion.
PricewaterhouseCoopers LLP
Baltimore, Maryland
April 15, 2015
| Tax Information (Unaudited) for the Tax Year Ended 2/28/15 |
We are providing this information as required by the Internal Revenue Code. The amounts shown may differ from those elsewhere in this report because of differences between tax and financial reporting requirements.
The fund’s distributions to shareholders included $71,904,000 which qualified as exempt-interest dividends.
| Information on Proxy Voting Policies, Procedures, and Records |
A description of the policies and procedures used by T. Rowe Price funds and portfolios to determine how to vote proxies relating to portfolio securities is available in each fund’s Statement of Additional Information. You may request this document by calling 1-800-225-5132 or by accessing the SEC’s website, sec.gov.
The description of our proxy voting policies and procedures is also available on our website, troweprice.com. To access it, click on the words “Social Responsibility” at the top of our corporate homepage. Next, click on the words “Conducting Business Responsibly” on the left side of the page that appears. Finally, click on the words “Proxy Voting Policies” on the left side of the page that appears.
Each fund’s most recent annual proxy voting record is available on our website and through the SEC’s website. To access it through our website, follow the above directions to reach the “Conducting Business Responsibly” page. Click on the words “Proxy Voting Records” on the left side of that page, and then click on the “View Proxy Voting Records” link at the bottom of the page that appears.
| How to Obtain Quarterly Portfolio Holdings |
The fund files a complete schedule of portfolio holdings with the Securities and Exchange Commission for the first and third quarters of each fiscal year on Form N-Q. The fund’s Form N-Q is available electronically on the SEC’s website (sec.gov); hard copies may be reviewed and copied at the SEC’s Public Reference Room, 100 F St. N.E., Washington, DC 20549. For more information on the Public Reference Room, call 1-800-SEC-0330.
| About the Fund’s Trustees and Officers |
Your fund is overseen by a Board of Trustees (Board) that meets regularly to review a wide variety of matters affecting or potentially affecting the fund, including performance, investment programs, compliance matters, advisory fees and expenses, service providers, and business and regulatory affairs. The Board elects the fund’s officers, who are listed in the final table. At least 75% of the Board’s members are independent of T. Rowe Price Associates, Inc. (T. Rowe Price), and its affiliates; “inside” or “interested” trustees are employees or officers of T. Rowe Price. The business address of each trustee and officer is 100 East Pratt Street, Baltimore, Maryland 21202. The Statement of Additional Information includes additional information about the fund trustees and is available without charge by calling a T. Rowe Price representative at 1-800-638-5660.
Independent Trustees
| Name | | |
| (Year of Birth) | | |
| Year Elected* | | |
| [Number of T. Rowe Price | | Principal Occupation(s) and Directorships of Public Companies and |
| Portfolios Overseen] | | Other Investment Companies During the Past Five Years |
| | | |
| William R. Brody, M.D., Ph.D. | | President and Trustee, Salk Institute for Biological Studies (2009 to |
| (1944) | | present); Director, BioMed Realty Trust (2013 to present); Director, |
| 2009 | | Novartis, Inc. (2009 to 2014); Director, IBM (2007 to present) |
| [165] | | |
| | | |
| Anthony W. Deering | | Chairman, Exeter Capital, LLC, a private investment firm (2004 to |
| (1945) | | present); Director, Brixmor Real Estate Investment Trust (2012 to |
| 1986 | | present); Director and Advisory Board Member, Deutsche Bank |
| [165] | | North America (2004 to present); Director, Under Armour (2008 |
| | to present); Director, Vornado Real Estate Investment Trust (2004 |
| | to 2012) |
| | | |
| Donald W. Dick, Jr. | | Principal, EuroCapital Partners, LLC, an acquisition and management |
| (1943) | | advisory firm (1995 to present) |
| 2001 | | |
| [165] | | |
| | | |
| Bruce W. Duncan | | President, Chief Executive Officer, and Director, First Industrial Realty |
| (1951) | | Trust, an owner and operator of industrial properties (2009 to |
| 2013 | | present); Chairman of the Board (2005 to present) and Director (1999 |
| [165] | | to present), Starwood Hotels & Resorts, a hotel and leisure company |
| | | |
| Robert J. Gerrard, Jr. | | Chairman of Compensation Committee and Director, Syniverse |
| (1952) | | Holdings, Inc., a provider of wireless voice and data services for |
| 2013 | | telecommunications companies (2008 to 2011); Advisory Board |
| [165] | | Member, Pipeline Crisis/Winning Strategies, a collaborative working |
| | to improve opportunities for young African Americans (1997 |
| | to present) |
| | | |
| Karen N. Horn | | Limited Partner and Senior Managing Director, Brock Capital |
| (1943) | | Group, an advisory and investment banking firm (2004 to present); |
| 2003 | | Director, Eli Lilly and Company (1987 to present); Director, Simon |
| [165] | | Property Group (2004 to present); Director, Norfolk Southern (2008 |
| | to present) |
| | | |
| Paul F. McBride | | Former Company Officer and Senior Vice President, Human |
| (1956) | | Resources and Corporate Initiatives, Black & Decker Corporation |
| 2013 | | (2004 to 2010) |
| [165] | | |
| | | |
| Cecilia E. Rouse, Ph.D. | | Dean, Woodrow Wilson School (2012 to present); Professor and |
| (1963) | | Researcher, Princeton University (1992 to present); Director, MDRC, |
| 2013 | | a nonprofit education and social policy research organization |
| [165] | | (2011 to present); Member, National Academy of Education (2010 |
| | to present); Research Associate, National Bureau of Economic |
| | Research’s Labor Studies Program (2011 to present); Member, |
| | President’s Council of Economic Advisers (2009 to 2011); Chair |
| | of Committee on the Status of Minority Groups in the Economic |
| | Profession, American Economic Association (2012 to present) |
| | | |
| John G. Schreiber | | Owner/President, Centaur Capital Partners, Inc., a real estate |
| (1946) | | investment company (1991 to present); Cofounder and Partner, |
| 1992 | | Blackstone Real Estate Advisors, L.P. (1992 to present); Director, |
| [165] | | General Growth Properties, Inc. (2010 to 2013); Director, Blackstone |
| | Mortgage Trust, a real estate financial company (2012 to present); |
| | Director and Chairman of the Board, Brixmor Property Group, Inc. |
| | (2013 to present); Director, Hilton Worldwide (2013 to present); |
| | | Director, Hudson Pacific Properties (2014 to present) |
| | | |
| Mark R. Tercek | | President and Chief Executive Officer, The Nature Conservancy (2008 |
| (1957) | | to present) |
| 2009 | | |
| [165] | | |
| |
| *Each independent trustee serves until retirement, resignation, or election of a successor. |
Inside Trustees
| Name | | |
| (Year of Birth) | | |
| Year Elected* | | |
| [Number of T. Rowe Price | | Principal Occupation(s) and Directorships of Public Companies and |
| Portfolios Overseen] | | Other Investment Companies During the Past Five Years |
| | | |
| Edward C. Bernard | | Director and Vice President, T. Rowe Price; Vice Chairman of the |
| (1956) | | Board, Director, and Vice President, T. Rowe Price Group, Inc.; |
| 2006 | | Chairman of the Board, Director, and President, T. Rowe Price |
| [165] | | Investment Services, Inc.; Chairman of the Board and Director, |
| | T. Rowe Price Retirement Plan Services, Inc., and T. Rowe Price |
| | Services, Inc.; Chairman of the Board, Chief Executive Officer, |
| | Director, and President, T. Rowe Price International and T. Rowe |
| | Price Trust Company; Chairman of the Board, all funds |
| | | |
| Edward A. Wiese, CFA | | Director and Vice President, T. Rowe Price Trust Company; Vice |
| (1959) | | President, T. Rowe Price, T. Rowe Price Group, Inc., and T. Rowe Price |
| 2015 | | International; Vice President, State Tax-Free Income Trust |
| [54] | | |
| |
| *Each inside trustee serves until retirement, resignation, or election of a successor. |
Officers
| Name (Year of Birth) | | |
| Position Held With State Tax-Free Income Trust | | Principal Occupation(s) |
| | | |
| Austin Applegate (1974) | | Vice President, T. Rowe Price and T. Rowe Price |
| Vice President | | Group, Inc.; formerly, Senior Municipal Credit |
| | Research Analyst, Barclays (to 2011) |
| | | |
| R. Lee Arnold, Jr., CFA, CPA (1970) | | Vice President, T. Rowe Price and T. Rowe Price |
| Vice President | | Group, Inc. |
| | | |
| Darrell N. Braman (1963) | | Vice President, Price Hong Kong, Price |
| Vice President | | Singapore, T. Rowe Price, T. Rowe Price Group, |
| | Inc., T. Rowe Price International, T. Rowe Price |
| | Investment Services, Inc., and T. Rowe Price |
| | Services, Inc. |
| | | |
| M. Helena Condez (1962) | | Vice President, T. Rowe Price and T. Rowe Price |
| Vice President | | Group, Inc. |
| | | |
| G. Richard Dent (1960) | | Vice President, T. Rowe Price and T. Rowe Price |
| Vice President | | Group, Inc. |
| | | |
| Charles E. Emrich (1961) | | Vice President, T. Rowe Price and T. Rowe Price |
| Vice President | | Group, Inc. |
| | | |
| Sarah J. Engle (1979) | | Vice President, T. Rowe Price and T. Rowe Price |
| Vice President | | Group, Inc.; formerly, Program Examiner and |
| | Policy Analyst, Office of Management & Budget |
| | (to 2012); Analyst, Moody’s Investor Service |
| | (to 2010) |
| | | |
| John R. Gilner (1961) | | Chief Compliance Officer and Vice President, |
| Chief Compliance Officer | | T. Rowe Price; Vice President, T. Rowe Price |
| | Group, Inc., and T. Rowe Price Investment |
| | | Services, Inc. |
| | | |
| Charles B. Hill, CFA (1961) | | Vice President, T. Rowe Price and T. Rowe Price |
| Executive Vice President | | Group, Inc. |
| | | |
| Gregory K. Hinkle, CPA (1958) | | Vice President, T. Rowe Price, T. Rowe Price |
| Treasurer | | Group, Inc., and T. Rowe Price Trust Company |
| | | |
| Dylan Jones, CFA (1971) | | Vice President, T. Rowe Price and T. Rowe Price |
| Vice President | | Group, Inc. |
| | | |
| Marcy M. Lash (1963) | | Vice President, T. Rowe Price and T. Rowe Price |
| Vice President | | Group, Inc. |
| | | |
| Alan D. Levenson, Ph.D. (1958) | | Vice President, T. Rowe Price and T. Rowe Price |
| Vice President | | Group, Inc. |
| | | |
| Patricia B. Lippert (1953) | | Assistant Vice President, T. Rowe Price and |
| Secretary | | T. Rowe Price Investment Services, Inc. |
| | | |
| Joseph K. Lynagh, CFA (1958) | | Vice President, T. Rowe Price, T. Rowe Price |
| Executive Vice President | | Group, Inc., and T. Rowe Price Trust Company |
| | | |
| Konstantine B. Mallas (1963) | | Vice President, T. Rowe Price and T. Rowe Price |
| Executive Vice President | | Group, Inc. |
| | | |
| Hugh D. McGuirk, CFA (1960) | | Vice President, T. Rowe Price and T. Rowe Price |
| President | | Group, Inc. |
| | | |
| James M. Murphy, CFA (1967) | | Vice President, T. Rowe Price and T. Rowe Price |
| Vice President | | Group, Inc. |
| | | |
| Linda A. Murphy (1959) | | Vice President, T. Rowe Price and T. Rowe Price |
| Vice President | | Group, Inc. |
| | | |
| Alexander S. Obaza (1981) | | Vice President, T. Rowe Price, T. Rowe Price |
| Vice President | | Group, Inc., and T. Rowe Price Trust Company |
| | | |
| David Oestreicher (1967) | | Director, Vice President, and Secretary, T. Rowe |
| Vice President | | Price Investment Services, Inc., T. Rowe Price |
| | Retirement Plan Services, Inc., T. Rowe Price |
| | Services, Inc., and T. Rowe Price Trust Company; |
| | Chief Legal Officer, Vice President, and |
| | Secretary, T. Rowe Price Group, Inc.; Vice |
| | President and Secretary, T. Rowe Price and |
| | T. Rowe Price International; Vice President, |
| | Price Hong Kong and Price Singapore |
| | | |
| John W. Ratzesberger (1975) | | Vice President, T. Rowe Price and T. Rowe Price |
| Vice President | | Group, Inc.; formerly, North American Head of |
| | Listed Derivatives Operation, Morgan Stanley |
| | (to 2013) |
| | | |
| Deborah D. Seidel (1962) | | Vice President, T. Rowe Price, T. Rowe Price |
| Vice President | | Group, Inc., T. Rowe Price Investment Services, |
| | Inc., and T. Rowe Price Services, Inc. |
| | | |
| Chen Shao (1980) | | Assistant Vice President, T. Rowe Price |
| Assistant Vice President | | |
| | | |
| Douglas D. Spratley, CFA (1969) | | Vice President, T. Rowe Price and T. Rowe Price |
| Vice President | | Group, Inc. |
| | | |
| Timothy G. Taylor, CFA (1975) | | Vice President, T. Rowe Price and T. Rowe Price |
| Vice President | | Group, Inc. |
| | | |
| Jeffrey T. Zoller (1970) | | Vice President, T. Rowe Price and T. Rowe Price |
| Vice President | | Trust Company |
| |
| Unless otherwise noted, officers have been employees of T. Rowe Price or T. Rowe Price International for at least 5 years. |
Item 2. Code of Ethics.
The registrant has adopted a code of ethics, as defined in Item 2 of Form N-CSR, applicable to its principal executive officer, principal financial officer, principal accounting officer or controller, or persons performing similar functions. A copy of this code of ethics is filed as an exhibit to this Form N-CSR. No substantive amendments were approved or waivers were granted to this code of ethics during the period covered by this report.
Item 3. Audit Committee Financial Expert.
The registrant’s Board of Directors/Trustees has determined that Mr. Bruce W. Duncan qualifies as an audit committee financial expert, as defined in Item 3 of Form N-CSR. Mr. Duncan is considered independent for purposes of Item 3 of Form N-CSR.
Item 4. Principal Accountant Fees and Services.
(a) – (d) Aggregate fees billed for the last two fiscal years for professional services rendered to, or on behalf of, the registrant by the registrant’s principal accountant were as follows:
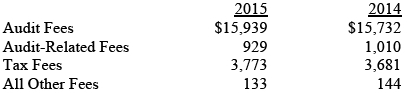
Audit fees include amounts related to the audit of the registrant’s annual financial statements and services normally provided by the accountant in connection with statutory and regulatory filings. Audit-related fees include amounts reasonably related to the performance of the audit of the registrant’s financial statements and specifically include the issuance of a report on internal controls and, if applicable, agreed-upon procedures related to fund acquisitions. Tax fees include amounts related to services for tax compliance, tax planning, and tax advice. The nature of these services specifically includes the review of distribution calculations and the preparation of Federal, state, and excise tax returns. All other fees include the registrant’s pro-rata share of amounts for agreed-upon procedures in conjunction with service contract approvals by the registrant’s Board of Directors/Trustees.
(e)(1) The registrant’s audit committee has adopted a policy whereby audit and non-audit services performed by the registrant’s principal accountant for the registrant, its investment adviser, and any entity controlling, controlled by, or under common control with the investment adviser that provides ongoing services to the registrant require pre-approval in advance at regularly scheduled audit committee meetings. If such a service is required between regularly scheduled audit committee meetings, pre-approval may be authorized by one audit committee member with ratification at the next scheduled audit committee meeting. Waiver of pre-approval for audit or non-audit services requiring fees of a de minimis amount is not permitted.
(2) No services included in (b) – (d) above were approved pursuant to paragraph (c)(7)(i)(C) of Rule 2-01 of Regulation S-X.
(f) Less than 50 percent of the hours expended on the principal accountant’s engagement to audit the registrant’s financial statements for the most recent fiscal year were attributed to work performed by persons other than the principal accountant’s full-time, permanent employees.
(g) The aggregate fees billed for the most recent fiscal year and the preceding fiscal year by the registrant’s principal accountant for non-audit services rendered to the registrant, its investment adviser, and any entity controlling, controlled by, or under common control with the investment adviser that provides ongoing services to the registrant were $2,042,000 and $1,862,000, respectively.
(h) All non-audit services rendered in (g) above were pre-approved by the registrant’s audit committee. Accordingly, these services were considered by the registrant’s audit committee in maintaining the principal accountant’s independence.
Item 5. Audit Committee of Listed Registrants.
Not applicable.
Item 6. Investments.
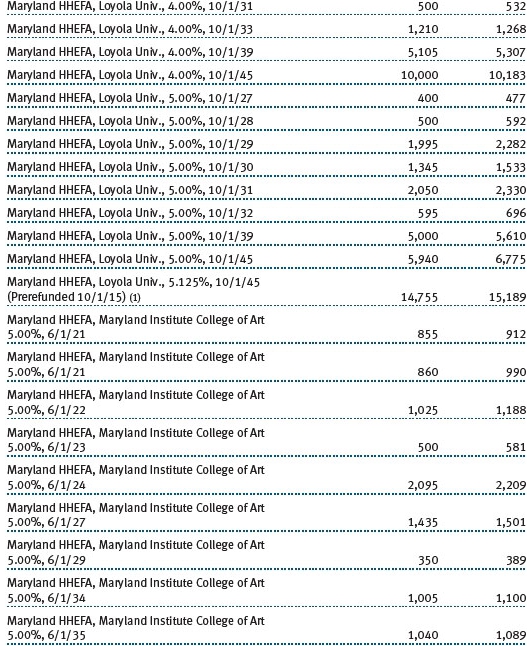
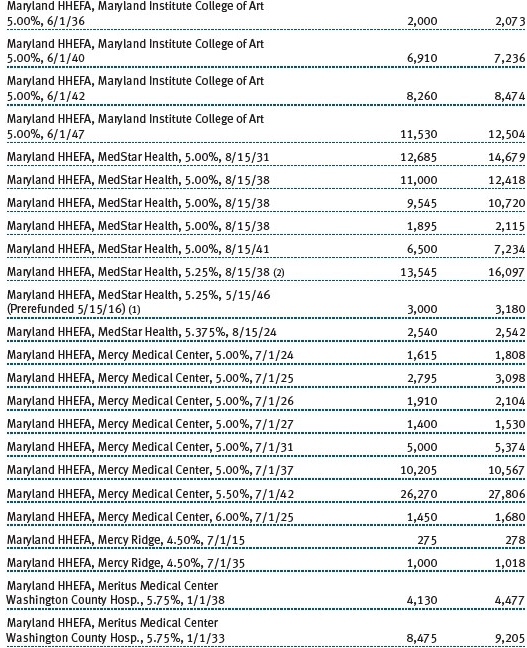
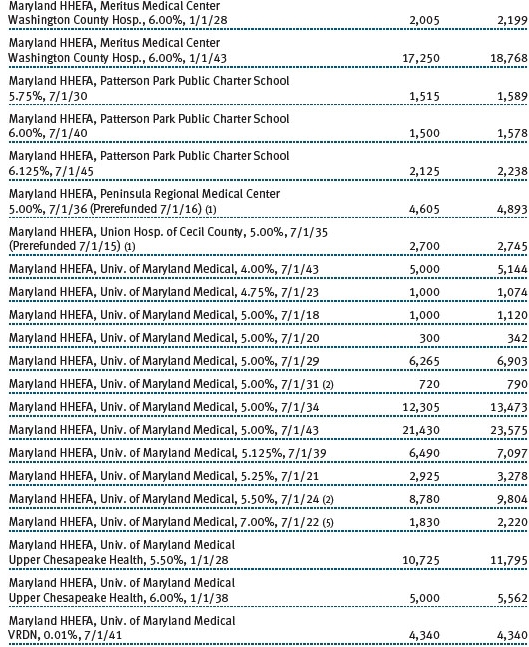
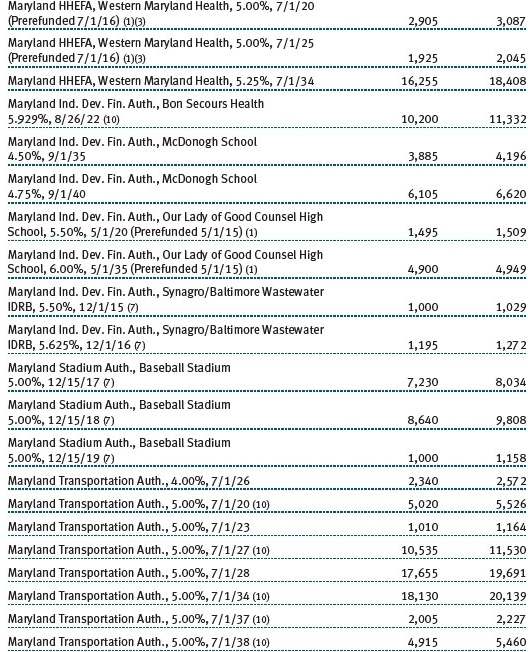
(a) Not applicable. The complete schedule of investments is included in Item 1 of this Form N-CSR.
(b) Not applicable.
Item 7. Disclosure of Proxy Voting Policies and Procedures for Closed-End Management Investment Companies.
Not applicable.
Item 8. Portfolio Managers of Closed-End Management Investment Companies.
Not applicable.
Item 9. Purchases of Equity Securities by Closed-End Management Investment Company and Affiliated Purchasers.
Not applicable.
Item 10. Submission of Matters to a Vote of Security Holders.
Not applicable.
Item 11. Controls and Procedures.
(a) The registrant’s principal executive officer and principal financial officer have evaluated the registrant’s disclosure controls and procedures within 90 days of this filing and have concluded that the registrant’s disclosure controls and procedures were effective, as of that date, in ensuring that information required to be disclosed by the registrant in this Form N-CSR was recorded, processed, summarized, and reported timely.
(b) The registrant’s principal executive officer and principal financial officer are aware of no change in the registrant’s internal control over financial reporting that occurred during the registrant’s second fiscal quarter covered by this report that has materially affected, or is reasonably likely to materially affect, the registrant’s internal control over financial reporting.
Item 12. Exhibits.
(a)(1) The registrant’s code of ethics pursuant to Item 2 of Form N-CSR is attached.
(2) Separate certifications by the registrant's principal executive officer and principal financial officer, pursuant to Section 302 of the Sarbanes-Oxley Act of 2002 and required by Rule 30a-2(a) under the Investment Company Act of 1940, are attached.
(3) Written solicitation to repurchase securities issued by closed-end companies: not applicable.
(b) A certification by the registrant's principal executive officer and principal financial officer, pursuant to Section 906 of the Sarbanes-Oxley Act of 2002 and required by Rule 30a-2(b) under the Investment Company Act of 1940, is attached.
SIGNATURES
Pursuant to the requirements of the Securities Exchange Act of 1934 and the Investment Company Act of 1940, the registrant has duly caused this report to be signed on its behalf by the undersigned, thereunto duly authorized.
T. Rowe Price State Tax-Free Income Trust
| By | /s/ Edward C. Bernard |
| | Edward C. Bernard |
| | Principal Executive Officer |
| | |
| Date April 17, 2015 | | |
Pursuant to the requirements of the Securities Exchange Act of 1934 and the Investment Company Act of 1940, this report has been signed below by the following persons on behalf of the registrant and in the capacities and on the dates indicated.
| By | /s/ Edward C. Bernard |
| | Edward C. Bernard |
| | Principal Executive Officer |
| | |
| Date April 17, 2015 | | |
| | |
| | |
| By | /s/ Gregory K. Hinkle |
| | Gregory K. Hinkle |
| | Principal Financial Officer |
| | |
| Date April 17, 2015 | | |