UNITED STATES
SECURITIES AND EXCHANGE COMMISSION
Washington, D.C. 20549
FORM N-CSR
CERTIFIED SHAREHOLDER REPORT OF REGISTERED
MANAGEMENT INVESTMENT COMPANIES
Investment Company Act file number 811-4707
Fidelity Advisor Series II
(Exact name of registrant as specified in charter)
82 Devonshire St., Boston, Massachusetts 02109
(Address of principal executive offices) (Zip code)
Scott C. Goebel, Secretary
82 Devonshire St.
Boston, Massachusetts 02109
(Name and address of agent for service)
Registrant's telephone number, including area code: 617-563-7000
Date of fiscal year end: | August 31 |
| |
Date of reporting period: | February 29, 2012 |
Item 1. Reports to Stockholders
(Fidelity Investment logo)(registered trademark)
Fidelity Advisor®
Intermediate Bond
Fund - Class A, Class T, Class B
and Class C
Semiannual Report
February 29, 2012
(Fidelity Cover Art)
Contents
Shareholder Expense Example | (Click Here) | An example of shareholder expenses. |
Investment Changes | (Click Here) | A summary of major shifts in the fund's investments over the past six months. |
Investments | (Click Here) | A complete list of the fund's investments with their market values. |
Financial Statements | (Click Here) | Statements of assets and liabilities, operations, and changes in net assets, as well as financial highlights. |
Notes | (Click Here) | Notes to the financial statements. |
Board Approval of Investment Advisory Contracts and Management Fees | (Click Here) | |
To view a fund's proxy voting guidelines and proxy voting record for the 12-month period ended June 30, visit http://www.fidelity.com/proxyvotingresults or visit the Securities and Exchange Commission's (SEC) web site at http://www.sec.gov. You may also call 1-877-208-0098 to request a free copy of the proxy voting guidelines.
Standard & Poor's, S&P and S&P 500 are registered service marks of The McGraw-Hill Companies, Inc. and have been licensed for use by Fidelity Distributors Corporation.
Other third party marks appearing herein are the property of their respective owners.
All other marks appearing herein are registered or unregistered trademarks or service marks of FMR LLC or an affiliated company.
This report and the financial statements contained herein are submitted for the general information of the shareholders of the fund. This report is not authorized for distribution to prospective investors in the fund unless preceded or accompanied by an effective prospectus.
A fund files its complete schedule of portfolio holdings with the SEC for the first and third quarters of each fiscal year on Form N-Q. Forms N-Q are available on the SEC's web site at http://www.sec.gov. A fund's Forms N-Q may be reviewed and copied at the SEC's Public Reference Room in Washington, DC. Information regarding the operation of the SEC's Public Reference Room may be obtained by calling 1-800-SEC-0330. For a complete list of a fund's portfolio holdings, view the most recent holdings listing, semiannual report, or annual report on Fidelity's web site at http://www.fidelity.com, http://www.advisor.fidelity.com, or http://www.401k.com, as applicable.
NOT FDIC INSURED • MAY LOSE VALUE • NO BANK GUARANTEE
Neither the fund nor Fidelity Distributors Corporation is a bank.
Semiannual Report
Shareholder Expense Example
As a shareholder of the Fund, you incur two types of costs: (1) transaction costs, including sales charges (loads) on purchase payments or redemption proceeds, and (2) ongoing costs, including management fees, distribution and/or service (12b-1) fees and other Fund expenses. This Example is intended to help you understand your ongoing costs (in dollars) of investing in the Fund and to compare these costs with the ongoing costs of investing in other mutual funds.
The Example is based on an investment of $1,000 invested at the beginning of the period and held for the entire period (September 1, 2011 to February 29, 2012).
Actual Expenses
The first line of the accompanying table for each class of the Fund provides information about actual account values and actual expenses. You may use the information in this line, together with the amount you invested, to estimate the expenses that you paid over the period. Simply divide your account value by $1,000.00 (for example, an $8,600 account value divided by $1,000.00 = 8.6), then multiply the result by the number in the first line for a class of the Fund under the heading entitled "Expenses Paid During Period" to estimate the expenses you paid on your account during this period. In addition, the Fund, as a shareholder in the underlying Fidelity Central Funds, will indirectly bear its pro-rata share of the fees and expenses incurred by the underlying Fidelity Central Funds. These fees and expenses are not included in the Fund's annualized expense ratio used to calculate the expense estimate in the table below.
Hypothetical Example for Comparison Purposes
The second line of the accompanying table for each class of the Fund provides information about hypothetical account values and hypothetical expenses based on a Class' actual expense ratio and an assumed rate of return of 5% per year before expenses, which is not the Class' actual return. The hypothetical account values and expenses may not be used to estimate the actual ending account balance or expenses you paid for the period. You may use this information to compare the ongoing costs of investing in the Fund and other funds. To do so, compare this 5% hypothetical example with the 5% hypothetical examples that appear in the shareholder reports of the other funds. In addition, the Fund, as a shareholder in the underlying Fidelity Central Funds, will indirectly bear its pro-rata share of the fees and expenses incurred by the underlying Fidelity Central Funds. These fees and expenses are not included in the Fund's annualized expense ratio used to calculate the expense estimate in the table below.
Please note that the expenses shown in the table are meant to highlight your ongoing costs only and do not reflect any transaction costs. Therefore, the second line of the table is useful in comparing ongoing costs only, and will not help you determine the relative total costs of owning different funds. In addition, if these transactional costs were included, your costs would have been higher.
Semiannual Report
Shareholder Expense Example - continued
| Annualized
Expense Ratio | Beginning
Account Value
September 1, 2011 | Ending
Account Value
February 29, 2012 | Expenses Paid
During Period *
September 1, 2011 to
February 29, 2012 |
Class A | .84% | | | |
Actual | | $ 1,000.00 | $ 1,016.70 | $ 4.21 |
HypotheticalA | | $ 1,000.00 | $ 1,020.69 | $ 4.22 |
Class T | .81% | | | |
Actual | | $ 1,000.00 | $ 1,017.80 | $ 4.06 |
HypotheticalA | | $ 1,000.00 | $ 1,020.84 | $ 4.07 |
Class B | 1.57% | | | |
Actual | | $ 1,000.00 | $ 1,014.00 | $ 7.86 |
HypotheticalA | | $ 1,000.00 | $ 1,017.06 | $ 7.87 |
Class C | 1.58% | | | |
Actual | | $ 1,000.00 | $ 1,013.90 | $ 7.91 |
HypotheticalA | | $ 1,000.00 | $ 1,017.01 | $ 7.92 |
Institutional Class | .59% | | | |
Actual | | $ 1,000.00 | $ 1,017.90 | $ 2.96 |
HypotheticalA | | $ 1,000.00 | $ 1,021.93 | $ 2.97 |
A 5% return per year before expenses
* Expenses are equal to each Class' annualized expense ratio, multiplied by the average account value over the period, multiplied by 182/366 (to reflect the one-half year period). The fees and expenses of the underlying Fidelity Central Funds in which the Fund invests are not included in the Fund's annualized expense ratio.
Semiannual Report
Investment Changes (Unaudited)
Quality Diversification (% of fund's net assets) |
As of February 29, 2012 | As of August 31, 2011 |
 | U.S. Government
and U.S. Government Agency Obligations† 46.2% | | | U.S. Government
and U.S. Government Agency Obligations† 45.5% | |
 | AAA 14.0% | | | AAA 14.0% | |
 | AA 7.1% | | | AA 7.6% | |
 | A 9.3% | | | A 10.2% | |
 | BBB 19.2% | | | BBB 17.5% | |
 | BB and Below 2.3% | | | BB and Below 3.1% | |
 | Not Rated 0.2% | | | Not Rated 0.3% | |
 | Short-Term
Investments and
Net Other Assets 1.7% | | | Short-Term
Investments and
Net Other Assets 1.8% | |

We have used ratings from Moody's Investors Service, Inc. Where Moody's® ratings are not available, we have used S&P® ratings. All ratings are as of the date indicated and do not reflect subsequent changes. Securities rated BB or below were rated investment grade at the time of acquisition. The information in the above table is based on the combined investments of the Fund and its pro-rata share of the investments of Fidelity's fixed-income central funds. |
Weighted Average Maturity as of February 29, 2012 |
| | 6 months ago |
Years | 4.6 | 4.6 |
This is a weighted average of all the maturities of the securities held in a fund. Weighted Average Maturity (WAM) can be used as a measure of sensitivity to interest rate changes and market changes. Generally, the longer the maturity, the greater the sensitivity to such changes. WAM is based on the dollar-weighted average length of time until principal payments must be paid. Depending on the types of securities held in a fund, certain maturity shortening devices (e.g., demand features, interest rate resets, and call options) may be taken into account when calculating the WAM. |
Duration as of February 29, 2012 |
| | 6 months ago |
Years | 3.9 | 3.8 |
Duration estimates how much a bond fund's price will change with a change in comparable interest rates. If rates rise 1%, for example, a fund with a 5-year duration is likely to lose about 5% of its value. Other factors also can influence a bond fund's performance and share price. Accordingly, a bond fund's actual performance may differ from this example. Duration takes into account any call or put option embedded in the bonds. |
Asset Allocation (% of fund's net assets) |
As of February 29, 2012 * | As of August 31, 2011 ** |
| Corporate Bonds 35.2% | | | Corporate Bonds 35.4% | |
| U.S. Government
and U.S. Government
Agency Obligations† 46.2% | | | U.S. Government
and U.S. Government
Agency Obligations† 45.5% | |
| Asset-Backed
Securities 9.0% | | | Asset-Backed
Securities 8.2% | |
| CMOs and Other Mortgage Related Securities 6.2% | | | CMOs and Other Mortgage Related Securities 7.5% | |
| Municipal Bonds 0.4% | | | Municipal Bonds 0.4% | |
| Other Investments 1.3% | | | Other Investments 1.2% | |
| Short-Term
Investments and
Net Other Assets 1.7% | | | Short-Term
Investments and
Net Other Assets 1.8% | |
* Foreign investments | 9.3% | | ** Foreign investments | 9.4% | |

* Futures and Swaps | 0.0% | | ** Futures and Swaps | 0.0% | |
† Includes NCUA Guaranteed Notes. |
The information in the above table is based on the combined investments of the Fund and its pro-rata share of the investments of Fidelity's fixed-income central funds. A holdings listing for the Fund, which presents direct holdings as well as the pro-rata share of any securities and other investments held indirectly through its investments in underlying non-money market Fidelity Central Funds is available at advisor.fidelity.com. |
Semiannual Report
Showing Percentage of Net Assets
Nonconvertible Bonds - 34.5% |
| Principal Amount | | Value |
CONSUMER DISCRETIONARY - 3.1% |
Auto Components - 0.2% |
DaimlerChrysler NA Holding Corp. 6.5% 11/15/13 | | $ 1,121,000 | | $ 1,223,297 |
Automobiles - 0.3% |
Daimler Finance North America LLC 1.95% 3/28/14 (c) | | 790,000 | | 796,391 |
Volkswagen International Finance NV 1.875% 4/1/14 (c) | | 1,180,000 | | 1,192,831 |
| | 1,989,222 |
Diversified Consumer Services - 0.1% |
Yale University 2.9% 10/15/14 | | 530,000 | | 562,669 |
Media - 1.9% |
Comcast Corp.: | | | | |
4.95% 6/15/16 | | 326,000 | | 368,491 |
5.15% 3/1/20 | | 693,000 | | 812,046 |
5.7% 5/15/18 | | 42,000 | | 49,609 |
COX Communications, Inc. 4.625% 6/1/13 | | 674,000 | | 706,475 |
Discovery Communications LLC: | | | | |
3.7% 6/1/15 | | 875,000 | | 937,977 |
5.05% 6/1/20 | | 322,000 | | 369,070 |
NBCUniversal Media LLC: | | | | |
3.65% 4/30/15 | | 66,000 | | 70,801 |
5.15% 4/30/20 | | 1,000,000 | | 1,155,921 |
News America, Inc.: | | | | |
5.3% 12/15/14 | | 132,000 | | 146,544 |
6.9% 3/1/19 | | 750,000 | | 912,016 |
Time Warner Cable, Inc.: | | | | |
5.4% 7/2/12 | | 425,000 | | 431,509 |
5.85% 5/1/17 | | 996,000 | | 1,172,133 |
6.2% 7/1/13 | | 404,000 | | 432,625 |
6.75% 7/1/18 | | 1,141,000 | | 1,402,506 |
Time Warner, Inc.: | | | | |
3.15% 7/15/15 | | 24,000 | | 25,490 |
4.875% 3/15/20 | | 731,000 | | 821,974 |
5.875% 11/15/16 | | 685,000 | | 810,028 |
Viacom, Inc.: | | | | |
3.5% 4/1/17 | | 455,000 | | 488,397 |
6.125% 10/5/17 | | 679,000 | | 809,551 |
| | 11,923,163 |
Multiline Retail - 0.2% |
Target Corp. 3.875% 7/15/20 | | 1,000,000 | | 1,103,063 |
Nonconvertible Bonds - continued |
| Principal Amount | | Value |
CONSUMER DISCRETIONARY - continued |
Specialty Retail - 0.4% |
Home Depot, Inc. 4.4% 4/1/21 | | $ 610,000 | | $ 699,227 |
Lowe's Companies, Inc. 4.625% 4/15/20 | | 750,000 | | 845,144 |
Staples, Inc. 7.375% 10/1/12 | | 1,352,000 | | 1,402,362 |
| | 2,946,733 |
TOTAL CONSUMER DISCRETIONARY | | 19,748,147 |
CONSUMER STAPLES - 2.1% |
Beverages - 1.0% |
Anheuser-Busch InBev Worldwide, Inc.: | | | | |
1.5% 7/14/14 | | 551,000 | | 559,719 |
2.5% 3/26/13 | | 1,453,000 | | 1,482,994 |
5.375% 11/15/14 | | 111,000 | | 124,189 |
FBG Finance Ltd. 5.125% 6/15/15 (c) | | 510,000 | | 562,560 |
Fortune Brands, Inc.: | | | | |
5.375% 1/15/16 | | 466,000 | | 517,327 |
6.375% 6/15/14 | | 272,000 | | 300,277 |
PepsiCo, Inc. 7.9% 11/1/18 | | 815,000 | | 1,111,882 |
SABMiller Holdings, Inc. 2.45% 1/15/17 (c) | | 1,280,000 | | 1,305,229 |
The Coca-Cola Co. 3.15% 11/15/20 | | 80,000 | | 85,128 |
| | 6,049,305 |
Food & Staples Retailing - 0.2% |
CVS Caremark Corp. 4.125% 5/15/21 | | 620,000 | | 681,890 |
Wal-Mart Stores, Inc. 2.25% 7/8/15 | | 820,000 | | 858,072 |
| | 1,539,962 |
Food Products - 0.3% |
Cargill, Inc. 6% 11/27/17 (c) | | 106,000 | | 125,543 |
General Mills, Inc. 5.2% 3/17/15 | | 650,000 | | 727,053 |
Kraft Foods, Inc.: | | | | |
5.375% 2/10/20 | | 660,000 | | 769,328 |
6.5% 8/11/17 | | 140,000 | | 169,932 |
6.75% 2/19/14 | | 82,000 | | 90,920 |
| | 1,882,776 |
Tobacco - 0.6% |
Altria Group, Inc.: | | | | |
8.5% 11/10/13 | | 30,000 | | 33,712 |
9.7% 11/10/18 | | 1,342,000 | | 1,826,804 |
Nonconvertible Bonds - continued |
| Principal Amount | | Value |
CONSUMER STAPLES - continued |
Tobacco - continued |
Philip Morris International, Inc. 4.5% 3/26/20 | | $ 1,000,000 | | $ 1,131,028 |
Reynolds American, Inc. 6.75% 6/15/17 | | 513,000 | | 611,139 |
| | 3,602,683 |
TOTAL CONSUMER STAPLES | | 13,074,726 |
ENERGY - 4.4% |
Energy Equipment & Services - 0.7% |
DCP Midstream LLC 5.35% 3/15/20 (c) | | 633,000 | | 698,902 |
El Paso Pipeline Partners Operating Co. LLC 6.5% 4/1/20 | | 768,000 | | 855,523 |
Halliburton Co. 6.15% 9/15/19 | | 425,000 | | 515,212 |
Noble Holding International Ltd.: | | | | |
2.5% 3/15/17 | | 262,000 | | 264,568 |
3.45% 8/1/15 | | 58,000 | | 60,661 |
Transocean, Inc. 5.05% 12/15/16 | | 417,000 | | 456,280 |
Weatherford International Ltd.: | | | | |
4.95% 10/15/13 | | 303,000 | | 318,915 |
5.15% 3/15/13 | | 1,469,000 | | 1,519,722 |
| | 4,689,783 |
Oil, Gas & Consumable Fuels - 3.7% |
Anadarko Petroleum Corp.: | | | | |
5.95% 9/15/16 | | 45,000 | | 52,104 |
6.375% 9/15/17 | | 555,000 | | 666,274 |
BG Energy Capital PLC 2.875% 10/15/16 (c) | | 620,000 | | 643,164 |
Canadian Natural Resources Ltd. 5.15% 2/1/13 | | 781,000 | | 812,748 |
Cenovus Energy, Inc. 5.7% 10/15/19 | | 650,000 | | 782,784 |
Duke Capital LLC 6.25% 2/15/13 | | 151,000 | | 158,439 |
Duke Energy Field Services 5.375% 10/15/15 (c) | | 212,000 | | 229,931 |
El Paso Natural Gas Co. 5.95% 4/15/17 | | 21,000 | | 23,313 |
Enbridge Energy Partners LP 4.2% 9/15/21 | | 615,000 | | 656,247 |
Encana Holdings Finance Corp. 5.8% 5/1/14 | | 502,000 | | 544,689 |
Enterprise Products Operating LP: | | | | |
4.05% 2/15/22 | | 610,000 | | 646,859 |
4.6% 8/1/12 | | 706,000 | | 717,153 |
5.6% 10/15/14 | | 339,000 | | 373,526 |
5.65% 4/1/13 | | 105,000 | | 110,181 |
EQT Corp. 4.875% 11/15/21 | | 276,000 | | 282,274 |
Gulf South Pipeline Co. LP 5.75% 8/15/12 (c) | | 671,000 | | 682,250 |
Gulfstream Natural Gas System LLC 6.95% 6/1/16 (c) | | 20,000 | | 23,146 |
Nonconvertible Bonds - continued |
| Principal Amount | | Value |
ENERGY - continued |
Oil, Gas & Consumable Fuels - continued |
Marathon Petroleum Corp. 3.5% 3/1/16 | | $ 875,000 | | $ 907,279 |
Midcontinent Express Pipeline LLC 5.45% 9/15/14 (c) | | 877,000 | | 908,319 |
Nexen, Inc.: | | | | |
5.2% 3/10/15 | | 158,000 | | 171,518 |
6.2% 7/30/19 | | 55,000 | | 65,315 |
NGPL PipeCo LLC 6.514% 12/15/12 (c) | | 397,000 | | 383,377 |
Petro-Canada 6.05% 5/15/18 | | 326,000 | | 394,683 |
Petrobras International Finance Co. Ltd.: | | | | |
2.875% 2/6/15 | | 630,000 | | 644,049 |
5.75% 1/20/20 | | 816,000 | | 897,600 |
7.875% 3/15/19 | | 647,000 | | 795,810 |
Petroleos Mexicanos: | | | | |
4.875% 1/24/22 (c) | | 700,000 | | 731,500 |
6% 3/5/20 | | 59,000 | | 67,113 |
Plains All American Pipeline LP/PAA Finance Corp.: | | | | |
3.95% 9/15/15 | | 375,000 | | 398,232 |
4.25% 9/1/12 | | 1,045,000 | | 1,060,337 |
5.75% 1/15/20 | | 962,000 | | 1,114,528 |
Ras Laffan Liquefied Natural Gas Co. Ltd. III: | | | | |
4.5% 9/30/12 (c) | | 329,000 | | 333,935 |
5.832% 9/30/16 (c) | | 209,466 | | 225,176 |
Rockies Express Pipeline LLC 6.25% 7/15/13 (c) | | 473,000 | | 482,460 |
Southeast Supply Header LLC 4.85% 8/15/14 (c) | | 862,000 | | 914,560 |
Spectra Energy Capital, LLC 5.65% 3/1/20 | | 28,000 | | 31,994 |
Suncor Energy, Inc. 6.1% 6/1/18 | | 944,000 | | 1,151,828 |
Texas Eastern Transmission LP 6% 9/15/17 (c) | | 1,096,000 | | 1,270,068 |
TransCapitalInvest Ltd. 5.67% 3/5/14 (c) | | 489,000 | | 517,118 |
Transcontinental Gas Pipe Line Corp. 6.4% 4/15/16 | | 394,000 | | 458,322 |
Western Gas Partners LP 5.375% 6/1/21 | | 600,000 | | 640,218 |
XTO Energy, Inc.: | | | | |
4.9% 2/1/14 | | 777,000 | | 837,305 |
5% 1/31/15 | | 264,000 | | 295,330 |
5.65% 4/1/16 | | 181,000 | | 213,612 |
| | 23,316,668 |
TOTAL ENERGY | | 28,006,451 |
FINANCIALS - 16.6% |
Capital Markets - 2.0% |
Bear Stearns Companies, Inc. 5.3% 10/30/15 | | 374,000 | | 414,913 |
Nonconvertible Bonds - continued |
| Principal Amount | | Value |
FINANCIALS - continued |
Capital Markets - continued |
BlackRock, Inc. 4.25% 5/24/21 | | $ 650,000 | | $ 704,579 |
Goldman Sachs Group, Inc.: | | | | |
3.7% 8/1/15 | | 712,000 | | 726,199 |
5.25% 7/27/21 | | 750,000 | | 751,005 |
5.95% 1/18/18 | | 1,693,000 | | 1,829,889 |
6.15% 4/1/18 | | 402,000 | | 435,731 |
Lazard Group LLC: | | | | |
6.85% 6/15/17 | | 669,000 | | 727,275 |
7.125% 5/15/15 | | 239,000 | | 257,606 |
Merrill Lynch & Co., Inc.: | | | | |
6.4% 8/28/17 | | 40,000 | | 42,123 |
6.875% 4/25/18 | | 726,000 | | 790,263 |
Morgan Stanley: | | | | |
4.1% 1/26/15 | | 1,320,000 | | 1,322,167 |
4.75% 4/1/14 | | 138,000 | | 139,621 |
5.45% 1/9/17 | | 200,000 | | 205,790 |
5.625% 9/23/19 | | 112,000 | | 111,955 |
5.75% 1/25/21 | | 647,000 | | 641,151 |
5.95% 12/28/17 | | 383,000 | | 397,765 |
6% 4/28/15 | | 130,000 | | 136,949 |
7.3% 5/13/19 | | 603,000 | | 650,674 |
Royal Bank of Scotland PLC 4.875% 8/25/14 (c) | | 1,200,000 | | 1,237,849 |
The Bank of New York Mellon Corp. 2.4% 1/17/17 | | 1,250,000 | | 1,284,125 |
| | 12,807,629 |
Commercial Banks - 4.8% |
ANZ Banking Group Ltd. 2.125% 1/10/14 (c) | | 740,000 | | 745,002 |
Bank of Montreal 2.5% 1/11/17 | | 640,000 | | 653,164 |
Barclays Bank PLC 2.375% 1/13/14 | | 1,680,000 | | 1,682,223 |
BNP Paribas 2.125% 12/21/12 | | 380,000 | | 381,047 |
Comerica, Inc. 3% 9/16/15 | | 2,000 | | 2,071 |
Commonwealth Bank of Australia 2.9% 9/17/14 (c) | | 3,000,000 | | 3,136,767 |
Credit Suisse New York Branch 6% 2/15/18 | | 1,605,000 | | 1,690,648 |
Danske Bank A/S 3.875% 4/14/16 (c) | | 910,000 | | 893,128 |
DBS Bank Ltd. (Singapore) 0.7176% 5/16/17 (c)(f) | | 846,000 | | 841,770 |
Fifth Third Bancorp: | | | | |
3.625% 1/25/16 | | 361,000 | | 381,422 |
4.5% 6/1/18 | | 63,000 | | 65,277 |
8.25% 3/1/38 | | 68,000 | | 87,098 |
Fifth Third Bank 4.75% 2/1/15 | | 308,000 | | 324,923 |
Fifth Third Capital Trust IV 6.5% 4/15/67 (f) | | 7,000 | | 6,948 |
Nonconvertible Bonds - continued |
| Principal Amount | | Value |
FINANCIALS - continued |
Commercial Banks - continued |
First Niagara Financial Group, Inc. 6.75% 3/19/20 | | $ 625,000 | | $ 680,226 |
HBOS PLC 6.75% 5/21/18 (c) | | 509,000 | | 457,383 |
HSBC Holdings PLC 5.1% 4/5/21 | | 610,000 | | 667,422 |
Huntington Bancshares, Inc. 7% 12/15/20 | | 180,000 | | 203,518 |
ING Bank NV 2.65% 1/14/13 (c) | | 1,310,000 | | 1,312,227 |
JPMorgan Chase Bank 6% 10/1/17 | | 1,762,000 | | 1,977,323 |
KeyBank NA 5.8% 7/1/14 | | 801,000 | | 866,834 |
KeyCorp. 5.1% 3/24/21 | | 622,000 | | 675,935 |
Marshall & Ilsley Bank: | | | | |
5% 1/17/17 | | 778,000 | | 830,778 |
5.25% 9/4/12 | | 6,000 | | 6,128 |
PNC Funding Corp. 3.625% 2/8/15 | | 717,000 | | 766,225 |
Rabobank (Netherlands) NV 1.85% 1/10/14 | | 1,998,000 | | 2,012,829 |
Regions Bank 7.5% 5/15/18 | | 250,000 | | 272,500 |
Regions Financial Corp.: | | | | |
0.7438% 6/26/12 (f) | | 31,000 | | 30,974 |
5.75% 6/15/15 | | 4,000 | | 4,088 |
7.75% 11/10/14 | | 20,000 | | 21,354 |
SunTrust Banks, Inc. 3.6% 4/15/16 | | 525,000 | | 544,254 |
Svenska Handelsbanken AB 2.875% 9/14/12 (c) | | 2,245,000 | | 2,269,861 |
The Toronto Dominion Bank 2.375% 10/19/16 | | 1,230,000 | | 1,268,297 |
UnionBanCal Corp. 5.25% 12/16/13 | | 115,000 | | 119,142 |
Wachovia Bank NA 4.875% 2/1/15 | | 283,000 | | 306,117 |
Wachovia Corp. 5.625% 10/15/16 | | 590,000 | | 663,188 |
Wells Fargo & Co.: | | | | |
1.25% 2/13/15 | | 2,229,000 | | 2,224,640 |
3.676% 6/15/16 | | 620,000 | | 664,464 |
Westpac Banking Corp. 1.85% 12/9/13 | | 687,000 | | 693,851 |
| | 30,431,046 |
Consumer Finance - 2.1% |
American Express Credit Corp. 2.75% 9/15/15 | | 2,160,000 | | 2,247,283 |
American Honda Finance Corp. 2.375% 3/18/13 (c) | | 300,000 | | 305,351 |
Capital One Financial Corp.: | | | | |
2.125% 7/15/14 | | 1,309,000 | | 1,312,410 |
3.15% 7/15/16 | | 605,000 | | 618,071 |
7.375% 5/23/14 | | 232,000 | | 258,194 |
Discover Financial Services: | | | | |
6.45% 6/12/17 | | 399,000 | | 438,007 |
10.25% 7/15/19 | | 54,000 | | 68,855 |
Nonconvertible Bonds - continued |
| Principal Amount | | Value |
FINANCIALS - continued |
Consumer Finance - continued |
General Electric Capital Corp.: | | | | |
2.1% 1/7/14 | | $ 177,000 | | $ 180,535 |
2.15% 1/9/15 | | 936,000 | | 960,310 |
2.25% 11/9/15 | | 886,000 | | 911,352 |
2.9% 1/9/17 | | 640,000 | | 668,510 |
2.95% 5/9/16 | | 255,000 | | 266,726 |
3.35% 10/17/16 | | 610,000 | | 650,804 |
3.5% 6/29/15 | | 1,263,000 | | 1,345,766 |
5.4% 9/20/13 | | 887,000 | | 946,258 |
6.375% 11/15/67 (f) | | 1,275,000 | | 1,294,125 |
HSBC USA, Inc. 2.375% 2/13/15 | | 511,000 | | 518,226 |
| | 12,990,783 |
Diversified Financial Services - 3.1% |
Bank of America Corp: | | | | |
4.5% 4/1/15 | | 1,230,000 | | 1,248,718 |
5.75% 12/1/17 | | 1,150,000 | | 1,204,025 |
5.875% 1/5/21 | | 980,000 | | 1,031,187 |
BB&T Corp. 2.05% 4/28/14 | | 750,000 | | 765,256 |
BP Capital Markets PLC: | | | | |
2.248% 11/1/16 | | 620,000 | | 641,000 |
3.125% 10/1/15 | | 60,000 | | 64,249 |
3.2% 3/11/16 | | 610,000 | | 651,950 |
Capital One Capital V 10.25% 8/15/39 | | 140,000 | | 145,950 |
Citigroup, Inc.: | | | | |
3.953% 6/15/16 | | 610,000 | | 630,624 |
4.75% 5/19/15 | | 1,605,000 | | 1,700,862 |
5.125% 5/5/14 | | 239,000 | | 252,086 |
6.125% 5/15/18 | | 38,000 | | 42,451 |
6.5% 8/19/13 | | 2,950,000 | | 3,126,059 |
Deutsche Bank AG London Branch 2.375% 1/11/13 | | 1,320,000 | | 1,330,545 |
JPMorgan Chase & Co.: | | | | |
3.15% 7/5/16 | | 600,000 | | 617,854 |
3.4% 6/24/15 | | 2,482,000 | | 2,611,352 |
4.5% 1/24/22 | | 640,000 | | 679,811 |
5.4% 1/6/42 | | 266,000 | | 286,931 |
TECO Finance, Inc.: | | | | |
4% 3/15/16 | | 171,000 | | 180,958 |
5.15% 3/15/20 | | 252,000 | | 283,110 |
Nonconvertible Bonds - continued |
| Principal Amount | | Value |
FINANCIALS - continued |
Diversified Financial Services - continued |
USAA Capital Corp. 3.5% 7/17/14 (c) | | $ 932,000 | | $ 976,744 |
Whirlpool Corp. 8% 5/1/12 | | 710,000 | | 717,523 |
ZFS Finance USA Trust IV 5.875% 5/9/62 (c)(f) | | 527,000 | | 513,825 |
| | 19,703,070 |
Insurance - 2.0% |
American International Group, Inc. 4.25% 9/15/14 | | 970,000 | | 1,004,063 |
Aon Corp.: | | | | |
3.5% 9/30/15 | | 911,000 | | 952,454 |
5% 9/30/20 | | 600,000 | | 671,733 |
Assurant, Inc. 5.625% 2/15/14 | | 332,000 | | 351,560 |
Axis Capital Holdings Ltd. 5.75% 12/1/14 | | 84,000 | | 89,340 |
Great-West Life & Annuity Insurance Co. 7.153% 5/16/46 (c)(f) | | 259,000 | | 257,058 |
Hartford Financial Services Group, Inc. 5.375% 3/15/17 | | 18,000 | | 18,724 |
Liberty Mutual Group, Inc.: | | | | |
5% 6/1/21 (c) | | 599,000 | | 597,595 |
6.5% 3/15/35 (c) | | 104,000 | | 109,174 |
Marsh & McLennan Companies, Inc. 4.8% 7/15/21 | | 361,000 | | 402,379 |
MetLife, Inc.: | | | | |
2.375% 2/6/14 | | 876,000 | | 899,668 |
5% 6/15/15 | | 175,000 | | 193,816 |
Metropolitan Life Global Funding I 2.5% 9/29/15 (c) | | 750,000 | | 770,202 |
Monumental Global Funding III 5.5% 4/22/13 (c) | | 382,000 | | 398,174 |
New York Life Global Funding 2.25% 12/14/12 (c) | | 650,000 | | 658,506 |
Northwestern Mutual Life Insurance Co. 6.063% 3/30/40 (c) | | 48,000 | | 59,224 |
Pacific Life Global Funding 5.15% 4/15/13 (c) | | 1,218,000 | | 1,274,381 |
Pacific LifeCorp 6% 2/10/20 (c) | | 51,000 | | 55,765 |
Prudential Financial, Inc.: | | | | |
3.625% 9/17/12 | | 643,000 | | 652,654 |
4.5% 11/15/20 | | 700,000 | | 744,973 |
5.15% 1/15/13 | | 73,000 | | 75,695 |
5.4% 6/13/35 | | 68,000 | | 69,864 |
QBE Insurance Group Ltd. 5.647% 7/1/23 (c)(f) | | 29,000 | | 26,222 |
Symetra Financial Corp. 6.125% 4/1/16 (c) | | 892,000 | | 912,962 |
Unum Group: | | | | |
5.625% 9/15/20 | | 370,000 | | 392,986 |
7.125% 9/30/16 | | 704,000 | | 805,380 |
| | 12,444,552 |
Nonconvertible Bonds - continued |
| Principal Amount | | Value |
FINANCIALS - continued |
Real Estate Investment Trusts - 0.7% |
Alexandria Real Estate Equities, Inc. 4.6% 4/1/22 | | $ 189,000 | | $ 191,217 |
AvalonBay Communities, Inc. 4.95% 3/15/13 | | 55,000 | | 56,841 |
BRE Properties, Inc. 5.5% 3/15/17 | | 61,000 | | 66,809 |
Camden Property Trust: | | | | |
5.375% 12/15/13 | | 326,000 | | 339,573 |
5.875% 11/30/12 | | 102,000 | | 104,479 |
Developers Diversified Realty Corp.: | | | | |
4.75% 4/15/18 | | 290,000 | | 297,688 |
5.375% 10/15/12 | | 225,000 | | 227,167 |
7.5% 4/1/17 | | 389,000 | | 437,219 |
Duke Realty LP: | | | | |
4.625% 5/15/13 | | 122,000 | | 125,977 |
5.875% 8/15/12 | | 86,000 | | 87,372 |
Equity One, Inc.: | | | | |
6% 9/15/17 | | 131,000 | | 140,706 |
6.25% 12/15/14 | | 62,000 | | 66,983 |
6.25% 1/15/17 | | 74,000 | | 80,190 |
Federal Realty Investment Trust: | | | | |
5.4% 12/1/13 | | 85,000 | | 89,761 |
5.9% 4/1/20 | | 5,000 | | 5,638 |
6% 7/15/12 | | 509,000 | | 517,015 |
6.2% 1/15/17 | | 94,000 | | 106,363 |
HRPT Properties Trust: | | | | |
5.75% 11/1/15 | | 211,000 | | 220,634 |
6.25% 6/15/17 | | 186,000 | | 198,677 |
6.65% 1/15/18 | | 95,000 | | 102,262 |
UDR, Inc. 5.5% 4/1/14 | | 1,107,000 | | 1,163,291 |
Washington (REIT) 5.25% 1/15/14 | | 30,000 | | 31,445 |
| | 4,657,307 |
Real Estate Management & Development - 1.9% |
AMB Property LP 5.9% 8/15/13 | | 389,000 | | 400,914 |
BioMed Realty LP: | | | | |
3.85% 4/15/16 | | 1,000,000 | | 1,029,027 |
6.125% 4/15/20 | | 6,000 | | 6,734 |
Brandywine Operating Partnership LP: | | | | |
5.7% 5/1/17 | | 369,000 | | 383,607 |
5.75% 4/1/12 | | 371,000 | | 371,715 |
Colonial Properties Trust 6.875% 8/15/12 | | 107,000 | | 108,574 |
Duke Realty LP: | | | | |
5.4% 8/15/14 | | 498,000 | | 531,530 |
Nonconvertible Bonds - continued |
| Principal Amount | | Value |
FINANCIALS - continued |
Real Estate Management & Development - continued |
Duke Realty LP: - continued | | | | |
6.25% 5/15/13 | | $ 1,166,000 | | $ 1,226,353 |
6.75% 3/15/20 | | 35,000 | | 40,689 |
8.25% 8/15/19 | | 7,000 | | 8,704 |
ERP Operating LP: | | | | |
4.625% 12/15/21 | | 630,000 | | 674,802 |
4.75% 7/15/20 | | 446,000 | | 478,372 |
5.375% 8/1/16 | | 240,000 | | 267,421 |
5.5% 10/1/12 | | 384,000 | | 394,029 |
5.75% 6/15/17 | | 1,003,000 | | 1,140,785 |
Liberty Property LP: | | | | |
4.75% 10/1/20 | | 455,000 | | 470,163 |
5.125% 3/2/15 | | 170,000 | | 180,273 |
5.5% 12/15/16 | | 260,000 | | 284,813 |
6.625% 10/1/17 | | 582,000 | | 666,298 |
Mack-Cali Realty LP 7.75% 8/15/19 | | 64,000 | | 78,023 |
Post Apartment Homes LP 6.3% 6/1/13 | | 571,000 | | 593,354 |
Prime Property Funding, Inc.: | | | | |
5.125% 6/1/15 (c) | | 189,000 | | 192,385 |
5.35% 4/15/12 (c) | | 101,000 | | 101,169 |
5.5% 1/15/14 (c) | | 144,000 | | 147,393 |
5.7% 4/15/17 (c) | | 295,000 | | 302,565 |
Regency Centers LP: | | | | |
4.95% 4/15/14 | | 92,000 | | 96,409 |
5.25% 8/1/15 | | 322,000 | | 346,708 |
5.875% 6/15/17 | | 160,000 | | 178,795 |
Simon Property Group LP: | | | | |
2.8% 1/30/17 | | 142,000 | | 147,664 |
4.2% 2/1/15 | | 234,000 | | 249,565 |
5.3% 5/30/13 | | 12,000 | | 12,488 |
Tanger Properties LP: | | | | |
6.125% 6/1/20 | | 606,000 | | 690,067 |
6.15% 11/15/15 | | 115,000 | | 128,908 |
| | 11,930,296 |
TOTAL FINANCIALS | | 104,964,683 |
Nonconvertible Bonds - continued |
| Principal Amount | | Value |
HEALTH CARE - 1.2% |
Biotechnology - 0.1% |
Amgen, Inc. 5.85% 6/1/17 | | $ 446,000 | | $ 525,588 |
Celgene Corp. 2.45% 10/15/15 | | 56,000 | | 57,528 |
| | 583,116 |
Health Care Equipment & Supplies - 0.1% |
Medtronic, Inc. 4.45% 3/15/20 | | 670,000 | | 765,486 |
Health Care Providers & Services - 0.8% |
Coventry Health Care, Inc.: | | | | |
5.95% 3/15/17 | | 264,000 | | 299,408 |
6.3% 8/15/14 | | 546,000 | | 597,602 |
Express Scripts, Inc.: | | | | |
3.125% 5/15/16 | | 555,000 | | 573,827 |
5.25% 6/15/12 | | 505,000 | | 511,071 |
6.25% 6/15/14 | | 299,000 | | 329,253 |
Medco Health Solutions, Inc. 2.75% 9/15/15 | | 1,108,000 | | 1,122,239 |
UnitedHealth Group, Inc. 3.875% 10/15/20 | | 759,000 | | 825,211 |
WellPoint, Inc. 4.35% 8/15/20 | | 760,000 | | 831,217 |
| | 5,089,828 |
Pharmaceuticals - 0.2% |
Merck & Co., Inc. 5% 6/30/19 | | 348,000 | | 416,807 |
Teva Pharmaceutical Finance II BV/Teva Pharmaceutical Finance III LLC 3% 6/15/15 | | 1,000,000 | | 1,060,395 |
Watson Pharmaceuticals, Inc. 5% 8/15/14 | | 66,000 | | 70,470 |
| | 1,547,672 |
TOTAL HEALTH CARE | | 7,986,102 |
INDUSTRIALS - 0.4% |
Aerospace & Defense - 0.0% |
BAE Systems Holdings, Inc. 4.95% 6/1/14 (c) | | 53,000 | | 55,926 |
Airlines - 0.2% |
Continental Airlines, Inc.: | | | | |
6.648% 3/15/19 | | 452,323 | | 474,940 |
6.795% 2/2/20 | | 20,196 | | 20,347 |
6.9% 7/2/19 | | 119,701 | | 127,481 |
U.S. Airways pass-thru trust certificates: | | | | |
6.85% 1/30/18 | | 248,089 | | 250,570 |
8.36% 1/20/19 | | 200,700 | | 203,710 |
| | 1,077,048 |
Nonconvertible Bonds - continued |
| Principal Amount | | Value |
INDUSTRIALS - continued |
Industrial Conglomerates - 0.1% |
Covidien International Finance SA 6% 10/15/17 | | $ 442,000 | | $ 535,336 |
Road & Rail - 0.1% |
Burlington Northern Santa Fe LLC 3.45% 9/15/21 | | 600,000 | | 622,672 |
TOTAL INDUSTRIALS | | 2,290,982 |
INFORMATION TECHNOLOGY - 0.9% |
Computers & Peripherals - 0.1% |
Hewlett-Packard Co. 2.625% 12/9/14 | | 630,000 | | 653,240 |
Electronic Equipment & Components - 0.3% |
Tyco Electronics Group SA: | | | | |
5.95% 1/15/14 | | 526,000 | | 564,248 |
6% 10/1/12 | | 673,000 | | 693,582 |
6.55% 10/1/17 | | 356,000 | | 420,557 |
| | 1,678,387 |
Office Electronics - 0.3% |
Xerox Corp. 4.25% 2/15/15 | | 2,064,000 | | 2,198,082 |
Software - 0.2% |
Oracle Corp. 3.875% 7/15/20 | | 1,000,000 | | 1,120,692 |
TOTAL INFORMATION TECHNOLOGY | | 5,650,401 |
MATERIALS - 1.1% |
Chemicals - 0.4% |
Dow Chemical Co.: | | | | |
4.125% 11/15/21 | | 594,000 | | 631,943 |
4.25% 11/15/20 | | 321,000 | | 343,597 |
4.85% 8/15/12 | | 1,481,000 | | 1,507,208 |
7.6% 5/15/14 | | 80,000 | | 90,921 |
| | 2,573,669 |
Construction Materials - 0.1% |
CRH America, Inc. 6% 9/30/16 | | 319,000 | | 347,867 |
Metals & Mining - 0.6% |
Anglo American Capital PLC: | | | | |
2.15% 9/27/13 (c) | | 1,000,000 | | 997,691 |
9.375% 4/8/14 (c) | | 459,000 | | 527,981 |
9.375% 4/8/19 (c) | | 630,000 | | 815,507 |
ArcelorMittal SA 3.75% 3/1/16 | | 166,000 | | 166,537 |
Nonconvertible Bonds - continued |
| Principal Amount | | Value |
MATERIALS - continued |
Metals & Mining - continued |
Corporacion Nacional del Cobre de Chile (Codelco): | | | | |
3.875% 11/3/21 (c) | | $ 630,000 | | $ 645,561 |
6.375% 11/30/12 (c) | | 302,000 | | 312,204 |
Vale Overseas Ltd. 6.25% 1/23/17 | | 403,000 | | 465,395 |
| | 3,930,876 |
TOTAL MATERIALS | | 6,852,412 |
TELECOMMUNICATION SERVICES - 2.0% |
Diversified Telecommunication Services - 1.4% |
AT&T Broadband Corp. 8.375% 3/15/13 | | 390,000 | | 420,491 |
AT&T, Inc.: | | | | |
2.5% 8/15/15 | | 562,000 | | 587,199 |
6.7% 11/15/13 | | 177,000 | | 194,693 |
CenturyLink, Inc. 6.15% 9/15/19 | | 592,000 | | 621,730 |
Deutsche Telekom International Financial BV: | | | | |
3.125% 4/11/16 (c) | | 923,000 | | 956,580 |
5.25% 7/22/13 | | 370,000 | | 389,399 |
France Telecom SA 2.125% 9/16/15 | | 220,000 | | 223,812 |
Qwest Corp. 3.7963% 6/15/13 (f) | | 1,080,000 | | 1,098,900 |
SBC Communications, Inc. 5.1% 9/15/14 | | 950,000 | | 1,050,730 |
Telefonica Emisiones SAU: | | | | |
3.729% 4/27/15 | | 1,278,000 | | 1,283,990 |
6.421% 6/20/16 | | 234,000 | | 252,084 |
Verizon Communications, Inc.: | | | | |
2% 11/1/16 | | 1,279,000 | | 1,307,527 |
3% 4/1/16 | | 621,000 | | 662,686 |
| | 9,049,821 |
Wireless Telecommunication Services - 0.6% |
America Movil SAB de CV: | | | | |
2.375% 9/8/16 | | 646,000 | | 659,704 |
3.625% 3/30/15 | | 600,000 | | 633,000 |
DIRECTV Holdings LLC/DIRECTV Financing, Inc.: | | | | |
4.75% 10/1/14 | | 1,360,000 | | 1,481,882 |
5.875% 10/1/19 | | 34,000 | | 39,548 |
Nonconvertible Bonds - continued |
| Principal Amount | | Value |
TELECOMMUNICATION SERVICES - continued |
Wireless Telecommunication Services - continued |
Vodafone Group PLC: | | | | |
4.15% 6/10/14 | | $ 346,000 | | $ 370,728 |
5% 12/16/13 | | 398,000 | | 427,114 |
| | 3,611,976 |
TOTAL TELECOMMUNICATION SERVICES | | 12,661,797 |
UTILITIES - 2.7% |
Electric Utilities - 1.6% |
Ameren Illinois Co. 6.125% 11/15/17 | | 62,000 | | 70,258 |
AmerenUE 6.4% 6/15/17 | | 519,000 | | 624,968 |
Cleveland Electric Illuminating Co. 5.65% 12/15/13 | | 714,000 | | 763,800 |
Commonwealth Edison Co. 4% 8/1/20 | | 600,000 | | 654,473 |
Duquesne Light Holdings, Inc. 6.4% 9/15/20 (c) | | 48,000 | | 51,820 |
Edison International 3.75% 9/15/17 | | 431,000 | | 458,147 |
EDP Finance BV: | | | | |
4.9% 10/1/19 (c) | | 200,000 | | 157,740 |
5.375% 11/2/12 (c) | | 1,001,000 | | 999,499 |
Exelon Corp. 4.9% 6/15/15 | | 415,000 | | 452,049 |
FirstEnergy Corp. 7.375% 11/15/31 | | 55,000 | | 70,067 |
FirstEnergy Solutions Corp.: | | | | |
4.8% 2/15/15 | | 160,000 | | 172,899 |
6.05% 8/15/21 | | 655,000 | | 746,405 |
LG&E and KU Energy LLC: | | | | |
2.125% 11/15/15 | | 479,000 | | 477,422 |
3.75% 11/15/20 | | 2,000 | | 2,032 |
Nevada Power Co.: | | | | |
6.5% 5/15/18 | | 1,562,000 | | 1,909,184 |
6.5% 8/1/18 | | 273,000 | | 334,143 |
Pacific Gas & Electric Co. 3.25% 9/15/21 | | 95,000 | | 97,982 |
Pennsylvania Electric Co. 6.05% 9/1/17 | | 115,000 | | 132,177 |
Pepco Holdings, Inc. 2.7% 10/1/15 | | 456,000 | | 461,934 |
Progress Energy, Inc. 4.4% 1/15/21 | | 732,000 | | 804,560 |
Sierra Pacific Power Co. 5.45% 9/1/13 | | 270,000 | | 286,465 |
Tampa Electric Co. 5.4% 5/15/21 | | 238,000 | | 278,768 |
Wisconsin Electric Power Co. 2.95% 9/15/21 | | 110,000 | | 112,473 |
| | 10,119,265 |
Gas Utilities - 0.0% |
Southern Natural Gas Co. / Southern Natural Issuing Corp. 4.4% 6/15/21 | | 188,000 | | 193,922 |
Nonconvertible Bonds - continued |
| Principal Amount | | Value |
UTILITIES - continued |
Independent Power Producers & Energy Traders - 0.4% |
Duke Capital LLC 5.668% 8/15/14 | | $ 357,000 | | $ 386,916 |
Exelon Generation Co. LLC 5.35% 1/15/14 | | 231,000 | | 248,361 |
PPL Energy Supply LLC 6.3% 7/15/13 | | 1,500,000 | | 1,591,341 |
PSEG Power LLC 2.75% 9/15/16 | | 148,000 | | 150,388 |
| | 2,377,006 |
Multi-Utilities - 0.7% |
Consolidated Edison Co. of New York, Inc. 4.45% 6/15/20 | | 680,000 | | 774,157 |
Dominion Resources, Inc.: | | | | |
2.8793% 9/30/66 (f) | | 651,000 | | 554,154 |
7.5% 6/30/66 (f) | | 567,000 | | 599,603 |
MidAmerican Energy Holdings, Co. 5.875% 10/1/12 | | 495,000 | | 509,014 |
National Grid PLC 6.3% 8/1/16 | | 248,000 | | 287,952 |
NiSource Finance Corp.: | | | | |
5.25% 9/15/17 | | 402,000 | | 447,494 |
5.4% 7/15/14 | | 234,000 | | 255,140 |
5.45% 9/15/20 | | 43,000 | | 48,524 |
6.4% 3/15/18 | | 230,000 | | 271,686 |
Wisconsin Energy Corp. 6.25% 5/15/67 (f) | | 454,000 | | 465,350 |
| | 4,213,074 |
TOTAL UTILITIES | | 16,903,267 |
TOTAL NONCONVERTIBLE BONDS (Cost $202,294,890) |
218,138,968
|
U.S. Government and Government Agency Obligations - 39.7% |
|
U.S. Government Agency Obligations - 2.6% |
Fannie Mae: | | | | |
0.375% 3/16/15 | | 584,000 | | 580,980 |
0.625% 10/30/14 | | 233,000 | | 233,689 |
0.75% 12/19/14 | | 833,000 | | 839,131 |
0.875% 8/28/14 | | 4,614,000 | | 4,668,459 |
Freddie Mac: | | | | |
0.5% 4/17/15 | | 402,000 | | 400,794 |
0.625% 12/29/14 | | 201,000 | | 201,518 |
0.75% 11/25/14 | | 248,000 | | 249,559 |
1% 7/30/14 | | 2,698,000 | | 2,733,257 |
U.S. Government and Government Agency Obligations - continued |
| Principal Amount | | Value |
U.S. Government Agency Obligations - continued |
Freddie Mac: - continued | | | | |
1% 8/27/14 | | $ 2,210,000 | | $ 2,238,894 |
1.75% 9/10/15 | | 4,207,000 | | 4,374,279 |
TOTAL U.S. GOVERNMENT AGENCY OBLIGATIONS | | 16,520,560 |
U.S. Treasury Obligations - 37.0% |
U.S. Treasury Notes: | | | | |
0.875% 11/30/16 | | 16,269,000 | | 16,312,210 |
0.875% 2/28/17 | | 26,845,000 | | 26,849,188 |
1% 9/30/16 | | 7,613,000 | | 7,687,349 |
1.375% 2/28/19 | | 37,064,000 | | 37,011,888 |
1.75% 7/31/15 | | 26,929,000 | | 28,041,922 |
1.875% 6/30/15 | | 4,339,000 | | 4,534,255 |
1.875% 9/30/17 | | 12,226,000 | | 12,781,904 |
3% 9/30/16 | | 11,517,000 | | 12,667,802 |
3.125% 1/31/17 | | 8,719,000 | | 9,667,191 |
3.125% 5/15/21 (d) | | 41,171,000 | | 45,696,594 |
3.625% 2/15/20 | | 21,040,000 | | 24,278,182 |
4.25% 8/15/15 | | 7,619,000 | | 8,585,066 |
TOTAL U.S. TREASURY OBLIGATIONS | | 234,113,551 |
Other Government Related - 0.1% |
National Credit Union Administration Guaranteed Notes Master Trust 1.4% 6/12/15 (NCUA Guaranteed) | | 850,000 | | 866,992 |
TOTAL U.S. GOVERNMENT AND GOVERNMENT AGENCY OBLIGATIONS (Cost $241,217,466) |
251,501,103
|
U.S. Government Agency - Mortgage Securities - 5.9% |
|
Fannie Mae - 4.8% |
1.925% 12/1/34 (f) | | 44,195 | | 46,028 |
1.926% 2/1/33 (f) | | 43,740 | | 45,802 |
1.93% 10/1/33 (f) | | 48,342 | | 50,296 |
1.952% 3/1/35 (f) | | 37,099 | | 39,031 |
1.964% 10/1/33 (f) | | 21,609 | | 22,700 |
2.036% 7/1/35 (f) | | 20,511 | | 21,541 |
2.05% 3/1/35 (f) | | 7,263 | | 7,509 |
2.115% 10/1/35 (f) | | 67,908 | | 71,086 |
U.S. Government Agency - Mortgage Securities - continued |
| Principal Amount | | Value |
Fannie Mae - continued |
2.301% 7/1/34 (f) | | $ 25,356 | | $ 26,878 |
2.303% 6/1/36 (f) | | 34,637 | | 36,744 |
2.424% 10/1/33 (f) | | 51,335 | | 54,288 |
2.445% 7/1/35 (f) | | 151,940 | | 160,327 |
2.448% 3/1/35 (f) | | 24,307 | | 25,435 |
2.471% 12/1/33 (f) | | 1,400,187 | | 1,466,433 |
2.487% 11/1/36 (f) | | 272,866 | | 290,773 |
2.537% 7/1/35 (f) | | 241,792 | | 256,960 |
2.597% 4/1/35 (f) | | 857,801 | | 914,647 |
2.632% 5/1/35 (f) | | 98,659 | | 104,189 |
2.635% 7/1/37 (f) | | 78,939 | | 84,120 |
3% 7/1/21 to 11/1/21 | | 9,705,819 | | 10,154,887 |
3.188% 1/1/40 (f) | | 500,002 | | 519,133 |
3.471% 3/1/40 (f) | | 377,897 | | 391,449 |
3.5% 12/1/25 | | 10,677,935 | | 11,203,708 |
3.539% 12/1/39 (f) | | 141,149 | | 146,753 |
3.613% 3/1/40 (f) | | 534,618 | | 558,019 |
4% 8/1/18 | | 572,792 | | 606,217 |
4.5% 8/1/18 to 3/1/35 | | 1,075,012 | | 1,149,817 |
6% 5/1/16 to 4/1/17 | | 183,420 | | 195,301 |
6.5% 12/1/13 to 11/1/17 | | 524,439 | | 562,143 |
7% 5/1/12 to 6/1/33 | | 809,860 | | 925,863 |
7.5% 8/1/17 to 3/1/28 | | 227,288 | | 266,710 |
8.5% 5/1/21 to 9/1/25 | | 41,385 | | 48,189 |
9.5% 2/1/25 | | 4,055 | | 4,362 |
10.5% 8/1/20 | | 10,838 | | 12,804 |
12.5% 12/1/13 to 4/1/15 | | 4,158 | | 4,605 |
TOTAL FANNIE MAE | | 30,474,747 |
Freddie Mac - 1.1% |
2.084% 4/1/35 (f) | | 384,814 | | 407,123 |
2.468% 1/1/35 (f) | | 81,471 | | 84,824 |
2.943% 3/1/33 (f) | | 7,859 | | 8,360 |
3% 8/1/21 | | 1,380,739 | | 1,446,396 |
3.149% 10/1/35 (f) | | 51,229 | | 54,583 |
3.56% 4/1/40 (f) | | 330,136 | | 343,583 |
3.565% 4/1/40 (f) | | 288,804 | | 299,748 |
3.618% 2/1/40 (f) | | 700,766 | | 726,983 |
4.5% 8/1/18 | | 1,153,407 | | 1,231,000 |
5% 3/1/19 | | 1,803,620 | | 1,939,386 |
U.S. Government Agency - Mortgage Securities - continued |
| Principal Amount | | Value |
Freddie Mac - continued |
8.5% 9/1/24 to 8/1/27 | | $ 46,584 | | $ 55,904 |
11.5% 10/1/15 | | 1,828 | | 1,971 |
TOTAL FREDDIE MAC | | 6,599,861 |
Ginnie Mae - 0.0% |
7% 7/15/28 to 11/15/28 | | 162,682 | | 187,165 |
7.5% 2/15/28 to 10/15/28 | | 4,256 | | 5,002 |
8% 6/15/24 | | 203 | | 238 |
8.5% 10/15/21 | | 35,769 | | 41,857 |
11% 7/20/19 to 8/20/19 | | 2,795 | | 3,317 |
TOTAL GINNIE MAE | | 237,579 |
TOTAL U.S. GOVERNMENT AGENCY - MORTGAGE SECURITIES (Cost $36,209,504) |
37,312,187
|
Asset-Backed Securities - 9.0% |
|
Accredited Mortgage Loan Trust Series 2005-1 Class M1, 0.714% 4/25/35 (f) | | 102,912 | | 55,594 |
ACE Securities Corp. Home Equity Loan Trust: | | | | |
Series 2004-HE1 Class M2, 1.894% 3/25/34 (f) | | 56,455 | | 39,570 |
Series 2005-HE2 Class M2, 0.694% 4/25/35 (f) | | 12,197 | | 11,842 |
Advanta Business Card Master Trust: | | | | |
Series 2006-C1 Class C1, 0.6758% 10/20/14 (f) | | 62,000 | | 620 |
Series 2007-D1 Class D, 1.5863% 1/22/13 (c)(f) | | 1,065,000 | | 15,975 |
Ally Auto Receivables Trust: | | | | |
Series 2009 B Class A3, 1.98% 10/15/13 (c) | | 556,235 | | 558,719 |
Series 2009-A: | | | | |
Class A3, 2.33% 6/17/13 (c) | | 92,278 | | 92,658 |
Class A4, 3% 10/15/15 (c) | | 280,000 | | 285,117 |
Series 2010-1 Class A4, 2.3% 12/15/14 | | 1,120,000 | | 1,146,238 |
Series 2010-4 Class A4, 1.35% 12/15/15 | | 570,000 | | 575,960 |
Series 2010-5 Class A4, 1.75% 3/15/16 | | 240,000 | | 244,772 |
Series 2011-1 Class A4, 2.23% 3/15/16 | | 1,090,000 | | 1,124,281 |
Series 2011-2 Class A3, 1.18% 4/15/15 | | 600,000 | | 603,962 |
Series 2011-3 Class A3, 0.97% 8/17/15 | | 770,000 | | 772,875 |
Series 2011-4 Class A2, 0.65% 3/17/14 | | 240,000 | | 240,084 |
Series 2012-1 Class A2, 0.71% 9/15/14 | | 900,000 | | 901,738 |
Ally Master Owner Trust: | | | | |
Series 2010-3 Class A, 2.88% 4/15/15 (c) | | 320,000 | | 326,361 |
Asset-Backed Securities - continued |
| Principal Amount | | Value |
Ally Master Owner Trust: - continued | | | | |
Series 2011-1 Class A2, 2.15% 1/15/16 | | $ 2,260,000 | | $ 2,301,510 |
Series 2011-3 Class A2, 1.81% 5/15/16 | | 1,240,000 | | 1,256,409 |
Series 2011-5 Class A1, 0.8985% 6/15/15 (f) | | 1,240,000 | | 1,242,447 |
Series 2012-1 Class A2, 0.7% 2/15/17 | | 1,260,000 | | 1,260,769 |
AmeriCredit Automobile Receivables Trust: | | | | |
Series 2010-4 Class A3, 1.27% 4/8/15 | | 870,000 | | 867,296 |
Series 2011-1 Class A3, 1.39% 9/8/15 | | 450,000 | | 453,530 |
Series 2011-2 Class A3, 1.61% 10/8/15 | | 910,000 | | 920,367 |
Series 2011-3 Class A3, 1.17% 1/8/16 | | 330,000 | | 331,941 |
Series 2011-4 Class A/S, 0.92% 3/9/15 | | 910,000 | | 911,473 |
Series 2011-5 Class A2, 1.19% 8/8/15 | | 300,000 | | 301,232 |
Ameriquest Mortgage Securities, Inc. pass-thru certificates: | | | | |
Series 2003-10 Class M1, 0.944% 12/25/33 (f) | | 9,466 | | 7,446 |
Series 2004-R2 Class M3, 0.794% 4/25/34 (f) | | 15,238 | | 4,772 |
Series 2005-R2 Class M1, 0.694% 4/25/35 (f) | | 176,341 | | 153,105 |
Argent Securities, Inc. pass-thru certificates: | | | | |
Series 2003-W7 Class A2, 1.0563% 3/25/34 (f) | | 4,092 | | 2,949 |
Series 2004-W11 Class M2, 0.944% 11/25/34 (f) | | 63,962 | | 45,494 |
Series 2004-W7 Class M1, 0.794% 5/25/34 (f) | | 185,706 | | 132,946 |
Series 2006-W4 Class A2C, 0.404% 5/25/36 (f) | | 150,889 | | 36,893 |
Asset Backed Securities Corp. Home Equity Loan Trust: | | | | |
Series 2004-HE2 Class M1, 1.069% 4/25/34 (f) | | 216,483 | | 146,742 |
Series 2006-HE2 Class M1, 0.614% 3/25/36 (f) | | 15,125 | | 119 |
Avis Budget Rental Car Funding (AESOP) LLC Series 2009-1A Class A, 9.31% 10/20/13 (c) | | 1,140,000 | | 1,175,617 |
Axon Financial Funding Ltd. Series 2007-1 Class A1, 1.181% 4/4/17 (b)(c)(f) | | 842,000 | | 0 |
Bank of America Auto Trust: | | | | |
Series 2009-1A Class A4, 3.52% 6/15/16 (c) | | 500,000 | | 507,323 |
Series 2009-2A Class A3, 2.13% 9/15/13 (c) | | 44,001 | | 44,078 |
Series 2009-3A Class A3, 1.67% 12/15/13 (c) | | 239,394 | | 239,938 |
Series 2010-2 Class A3, 1.31% 7/15/14 | | 703,157 | | 705,570 |
Bear Stearns Asset Backed Securities I Trust Series 2005-HE2 Class M2, 1.369% 2/25/35 (f) | | 427,000 | | 240,699 |
BMW Vehicle Lease Trust: | | | | |
Series 2010-1 Class A3, 0.82% 4/15/13 | | 817,118 | | 817,982 |
Series 2011-1 Class A3, 1.06% 2/20/14 | | 880,000 | | 883,612 |
Brazos Higher Education Authority, Inc. Series 2006-2 Class A9, 0.5838% 12/25/24 (f) | | 119,539 | | 105,385 |
Capital Auto Receivables Asset Trust Series 2007-1 Class C, 5.38% 11/15/12 | | 72,000 | | 72,402 |
Asset-Backed Securities - continued |
| Principal Amount | | Value |
Capital One Multi-Asset Execution Trust Series 2008-A3 Class A3, 5.05% 2/15/16 | | $ 400,000 | | $ 420,095 |
Capital Trust Ltd. Series 2004-1: | | | | |
Class A2, 0.6955% 7/20/39 (c)(f) | | 31,572 | | 23,521 |
Class B, 0.9955% 7/20/39 (c)(f) | | 30,070 | | 12,329 |
Class C, 1.3455% 7/20/39 (c)(f) | | 38,684 | | 870 |
Carrington Mortgage Loan Trust Series 2007-RFC1 Class A3, 0.384% 12/25/36 (f) | | 205,465 | | 64,992 |
Chase Issuance Trust Series 2011-A2 Class A2, 0.3385% 5/15/15 (f) | | 2,300,000 | | 2,301,143 |
Chrysler Financial Auto Securitization Trust Series 2010-A Class A3, 0.91% 8/8/13 | | 700,000 | | 700,778 |
Citibank Credit Card Issuance Trust: | | | | |
Series 2008-A5 Class A5, 4.85% 4/22/15 | | 700,000 | | 734,539 |
Series 2009-A5 Class A5, 2.25% 12/23/14 | | 2,070,000 | | 2,100,090 |
Citibank Omni Master Trust Series 2009-A8 Class A8, 2.3485% 5/16/16 (c)(f) | | 1,000,000 | | 1,004,122 |
CitiFinancial Auto Issuance Trust Series 2009-1 Class A3, 2.59% 10/15/13 (c) | | 626,851 | | 630,402 |
Countrywide Asset-Backed Certificates Trust: | | | | |
Series 2007-11 Class 2A1, 0.304% 6/25/47 (f) | | 1,469 | | 1,452 |
Series 2007-4 Class A1A, 0.3963% 9/25/37 (f) | | 34,013 | | 33,154 |
Countrywide Home Loan Trust Series 2006-13 Class N, 7% 8/25/37 (c) | | 37,648 | | 0 |
Countrywide Home Loans, Inc.: | | | | |
Series 2003-BC1 Class B1, 5.5436% 3/25/32 (MGIC Investment Corp. Insured) (f) | | 36,015 | | 6,162 |
Series 2004-3 Class M4, 1.214% 4/25/34 (f) | | 18,137 | | 7,991 |
Series 2004-4 Class M2, 1.039% 6/25/34 (f) | | 50,135 | | 22,673 |
Series 2005-3 Class MV1, 0.664% 8/25/35 (f) | | 18,669 | | 18,411 |
Discover Card Master Trust Series 2012-A1 Class A1, 0.81% 8/15/17 | | 1,410,000 | | 1,409,859 |
Fannie Mae subordinate REMIC pass-thru certificates Series 2004-T5 Class AB3, 0.7513% 5/28/35 (f) | | 4,436 | | 2,847 |
Fieldstone Mortgage Investment Corp. Series 2004-3 Class M5, 2.419% 8/25/34 (f) | | 33,155 | | 19,323 |
Ford Credit Auto Lease Trust: | | | | |
Series 2010-B Class A3, 0.91% 7/15/13 (c) | | 930,000 | | 930,864 |
Series 2011-A Class A3, 1.03% 7/15/14 | | 1,080,000 | | 1,085,124 |
Ford Credit Auto Owner Trust: | | | | |
Series 2009-B Class A3, 2.79% 8/15/13 | | 120,872 | | 121,338 |
Series 2009-C Class A4, 4.43% 11/15/14 | | 520,000 | | 539,409 |
Series 2009-D Class A4, 2.98% 8/15/14 | | 690,000 | | 704,377 |
Series 2009-E Class A3, 1.51% 1/15/14 | | 276,019 | | 276,971 |
Asset-Backed Securities - continued |
| Principal Amount | | Value |
Ford Credit Auto Owner Trust: - continued | | | | |
Series 2010-B: | | | | |
Class A3, 0.98% 10/15/14 | | $ 507,866 | | $ 509,436 |
Class A4, 1.58% 9/15/15 | | 1,360,000 | | 1,381,495 |
Series 2011-B Class A4, 1.35% 12/15/16 | | 510,000 | | 515,897 |
Ford Credit Automobile Lease Trust Series 2012-A Class A3, 0.85% 1/15/15 | | 400,000 | | 399,960 |
Ford Credit Floorplan Master Owner Trust: | | | | |
Series 2010-5 Class A1, 1.5% 9/15/15 | | 640,000 | | 646,203 |
Series 2012-2 Class A, 1.92% 1/15/19 | | 1,310,000 | | 1,310,124 |
Fremont Home Loan Trust: | | | | |
Series 2005-A: | | | | |
Class M3, 0.734% 1/25/35 (f) | | 81,136 | | 25,601 |
Class M4, 0.924% 1/25/35 (f) | | 41,438 | | 9,393 |
Series 2006-D Class M1, 0.474% 11/25/36 (f) | | 8,492 | | 34 |
GCO Education Loan Funding Master Trust II Series 2007-1A Class C1L, 0.8706% 2/25/47 (c)(f) | | 335,000 | | 117,250 |
GCO Slims Trust Series 2006-1A, 5.72% 3/1/22 (c) | | 145,579 | | 133,933 |
GE Business Loan Trust: | | | | |
Series 2003-1 Class A, 0.6785% 4/15/31 (c)(f) | | 24,355 | | 22,771 |
Series 2006-2A: | | | | |
Class A, 0.4285% 11/15/34 (c)(f) | | 226,861 | | 187,728 |
Class B, 0.5285% 11/15/34 (c)(f) | | 82,313 | | 53,092 |
Class C, 0.6285% 11/15/34 (c)(f) | | 135,849 | | 67,245 |
Class D, 0.9985% 11/15/34 (c)(f) | | 51,529 | | 11,336 |
GE Capital Credit Card Master Note Trust Series 2012-1 Class A, 1.03% 1/15/18 | | 1,190,000 | | 1,189,881 |
Goal Capital Funding Trust Series 2007-1 Class C1, 0.9738% 6/25/42 (f) | | 67,714 | | 51,700 |
GSAMP Trust Series 2004-AR1 Class B4, 5% 6/25/34 (c)(f) | | 54,683 | | 15,981 |
Guggenheim Structured Real Estate Funding Ltd. Series 2006-3: | | | | |
Class B, 0.644% 9/25/46 (c)(f) | | 3,434 | | 3,433 |
Class C, 0.794% 9/25/46 (c)(f) | | 174,018 | | 88,749 |
Home Equity Asset Trust: | | | | |
Series 2003-2 Class M1, 1.564% 8/25/33 (f) | | 48,998 | | 33,344 |
Series 2003-3 Class M1, 1.534% 8/25/33 (f) | | 59,799 | | 43,141 |
Series 2003-5 Class A2, 0.944% 12/25/33 (f) | | 2,817 | | 2,052 |
Series 2005-5 Class 2A2, 0.494% 11/25/35 (f) | | 592 | | 591 |
Series 2006-1 Class 2A3, 0.469% 4/25/36 (f) | | 36,823 | | 36,516 |
Honda Auto Receivables Owner Trust: | | | | |
Series 2010-1 Class A4, 1.98% 5/23/16 | | 260,000 | | 263,667 |
Asset-Backed Securities - continued |
| Principal Amount | | Value |
Honda Auto Receivables Owner Trust: - continued | | | | |
Series 2010-2 Class A4, 1.93% 8/18/16 | | $ 1,670,000 | | $ 1,696,352 |
Series 2011-1 Class A4, 1.8% 4/17/17 | | 330,000 | | 336,813 |
Series 2011-2 Class A4, 1.55% 8/18/17 | | 820,000 | | 833,703 |
HSI Asset Securitization Corp. Trust Series 2007-HE1 Class 2A3, 0.434% 1/25/37 (f) | | 141,116 | | 41,108 |
Hyundai Auto Lease Securitization Trust Series 2011-A Class A3, 1.02% 8/15/14 (c) | | 660,000 | | 660,603 |
Hyundai Auto Receivables Trust Series 2009-A Class A3, 2.03% 8/15/13 | | 98,493 | | 98,833 |
John Deere Owner Trust: | | | | |
Series 2009-B Class A-3, 1.57% 10/15/13 | | 139,063 | | 139,221 |
Series 2011-A Class A4, 1.96% 4/16/18 | | 260,000 | | 266,360 |
JPMorgan Mortgage Acquisition Trust: | | | | |
Series 2006-NC2 Class M2, 0.544% 7/25/36 (f) | | 25,000 | | 478 |
Series 2007-CH1 Class AV4, 0.374% 11/25/36 (f) | | 176,698 | | 146,141 |
Keycorp Student Loan Trust: | | | | |
Series 1999-A Class A2, 0.9038% 12/27/29 (f) | | 50,645 | | 44,474 |
Series 2006-A Class 2C, 1.7238% 3/27/42 (f) | | 392,000 | | 105,087 |
Long Beach Mortgage Loan Trust Series 2004-2 Class M2, 1.324% 6/25/34 (f) | | 9,594 | | 5,697 |
Marriott Vacation Club Owner Trust Series 2006-2A: | | | | |
Class B, 5.442% 10/20/28 (c) | | 1,811 | | 1,837 |
Class C, 5.691% 10/20/28 (c) | | 905 | | 914 |
Class D, 6.01% 10/20/28 (c) | | 9,732 | | 9,786 |
MASTR Asset Backed Securities Trust Series 2007-HE1 Class M1, 0.544% 5/25/37 (f) | | 89,453 | | 1,547 |
Mercedes-Benz Auto Lease Trust: | | | | |
Series 2011-1A Class A3 1.18% 11/15/13 (c) | | 1,250,000 | | 1,254,255 |
Series 2011-B Class A3, 1.07% 1/15/14 (c) | | 670,000 | | 670,701 |
Mercedes-Benz Auto Receivables Trust Series 2011-1 Class A3, 0.85% 3/16/15 | | 730,000 | | 732,510 |
Meritage Mortgage Loan Trust Series 2004-1 Class M1, 0.994% 7/25/34 (f) | | 21,191 | | 13,131 |
Merrill Lynch Mortgage Investors Trust: | | | | |
Series 2003-OPT1 Class M1, 1.219% 7/25/34 (f) | | 70,377 | | 47,193 |
Series 2006-FM1 Class A2B, 0.354% 4/25/37 (f) | | 155,280 | | 115,338 |
Series 2006-OPT1 Class A1A, 0.504% 6/25/35 (f) | | 312,305 | | 233,503 |
Morgan Stanley ABS Capital I Trust: | | | | |
Series 2004-HE6 Class A2, 0.584% 8/25/34 (f) | | 4,895 | | 3,757 |
Series 2004-NC8 Class M6, 1.494% 9/25/34 (f) | | 87,133 | | 49,632 |
Series 2005-NC1 Class M1, 0.684% 1/25/35 (f) | | 45,571 | | 28,778 |
Series 2005-NC2 Class B1, 1.414% 3/25/35 (f) | | 47,458 | | 6,010 |
Asset-Backed Securities - continued |
| Principal Amount | | Value |
Morgan Stanley ABS Capital I Trust: - continued | | | | |
Series 2007-HE2 Class M1, 0.494% 1/25/37 (f) | | $ 16,460 | | $ 48 |
National Collegiate Student Loan Trust: | | | | |
Series 2004-2 Class AIO, 9.75% 10/27/14 (h) | | 614,000 | | 41,445 |
Series 2006-4 Class D, 1.344% 5/25/32 (f) | | 300,000 | | 639 |
Series 2007-1 Class AIO, 7.27% 4/25/12 (h) | | 2,308,000 | | 36,928 |
Series 2007-2 Class AIO, 6.7% 7/25/12 (h) | | 1,656,899 | | 36,754 |
New Century Home Equity Loan Trust Series 2005-4 Class M2, 0.754% 9/25/35 (f) | | 162,650 | | 69,167 |
Nissan Auto Lease Trust: | | | | |
Series 2010-B Class A4, 1.27% 10/15/16 | | 290,000 | | 291,902 |
Series 2011-A Class A3, 1.04% 8/15/14 | | 910,000 | | 915,100 |
Series 2011-B Class A3, 0.92% 2/16/15 | | 460,000 | | 459,809 |
Nissan Auto Receivables Owner Trust Series 2011-A Class A3, 1.18% 2/16/15 | | 510,000 | | 514,325 |
Ocala Funding LLC: | | | | |
Series 2005-1A Class A, 1.7455% 3/20/10 (b)(c)(f) | | 64,000 | | 0 |
Series 2006-1A Class A, 1.6455% 3/20/11 (b)(c)(f) | | 134,000 | | 0 |
Option One Mortgage Loan Trust: | | | | |
Series 2007-5 Class 2A1, 0.334% 5/25/37 (f) | | 542 | | 538 |
Series 2007-6 Class 2A1, 0.304% 7/25/37 (f) | | 2,713 | | 2,671 |
Park Place Securities, Inc.: | | | | |
Series 2004-WCW1: | | | | |
Class M3, 1.494% 9/25/34 (f) | | 60,741 | | 25,612 |
Class M4, 1.694% 9/25/34 (f) | | 77,891 | | 17,021 |
Series 2005-WCH1 Class M4, 1.074% 1/25/36 (f) | | 126,217 | | 56,226 |
Salomon Brothers Mortgage Securities VII, Inc. Series 2003-HE1 Class A, 1.044% 4/25/33 (f) | | 582 | | 471 |
Santander Drive Auto Receivables Trust Series 2011-4 Class A2, 1.37% 3/16/15 | | 640,000 | | 640,592 |
Santander Drive Automobile Receivables Trust Series 2012-1 Class A2, 1.25% 4/15/15 | | 570,000 | | 570,993 |
Saxon Asset Securities Trust Series 2004-1 Class M1, 1.039% 3/25/35 (f) | | 151,975 | | 92,707 |
Sierra Receivables Funding Co. Series 2007-1A Class A2, 0.4309% 3/20/19 (FGIC Insured) (c)(f) | | 62,825 | | 60,164 |
SLM Private Credit Student Loan Trust Series 2004-A Class C, 1.4963% 6/15/33 (f) | | 145,000 | | 65,786 |
Specialty Underwriting & Residential Finance Trust Series 2006-AB2 Class N1, 5.75% 6/25/37 (c) | | 81,826 | | 0 |
Structured Asset Investment Loan Trust Series 2004-8 Class M5, 1.969% 9/25/34 (f) | | 7,425 | | 2,377 |
SVO VOI Mortgage Corp. Series 2006-AA Class A, 5.28% 2/20/24 (c) | | 71,658 | | 73,995 |
Asset-Backed Securities - continued |
| Principal Amount | | Value |
Terwin Mortgage Trust Series 2003-4HE Class A1, 1.104% 9/25/34 (f) | | $ 2,472 | | $ 1,835 |
Toyota Auto Receivables Owner Trust Series 2010-B Class M3, 1.04% 2/18/14 | | 302,389 | | 303,238 |
Trapeza CDO XII Ltd./Trapeza CDO XII, Inc. Series 2007-12A Class B, 1.1425% 4/6/42 (c)(f) | | 311,067 | | 9,332 |
USAA Auto Owner Trust: | | | | |
Series 2009-1 Class A4, 4.77% 9/15/14 | | 388,702 | | 395,426 |
Series 2009-2 Class A3, 1.54% 2/18/14 | | 193,682 | | 194,109 |
Volkswagen Auto Lease Trust Series 2010-A: | | | | |
Class A3, 0.99% 11/20/13 | | 1,410,000 | | 1,413,091 |
Class A4, 1.18% 10/20/15 | | 200,000 | | 200,862 |
WaMu Asset Holdings Corp. Series 2006-8 Class N1, 6.048% 10/25/46 (c) | | 75,976 | | 0 |
Wells Fargo Home Equity Trust Series 2004-3 Class A, 4.5% 11/27/34 (c) | | 646 | | 0 |
Whinstone Capital Management Ltd. Series 1A Class B3, 2.3601% 10/25/44 (c)(f) | | 203,978 | | 108,108 |
World Omni Automobile Lease Securitization Trust Series 2011-A, Class A3, 1.49% 10/15/14 | | 510,000 | | 514,011 |
TOTAL ASSET-BACKED SECURITIES (Cost $56,660,972) |
57,118,845
|
Collateralized Mortgage Obligations - 1.6% |
|
Private Sponsor - 1.0% |
Arran Residential Mortgages Funding PLC floater Series 2011-1A Class A1C, 1.6931% 11/19/47 (c)(f) | | 813,683 | | 814,422 |
Cobalt CMBS Commercial Mortgage Trust Series 2007-C2 Class B, 5.617% 4/15/47 (f) | | 241,000 | | 53,020 |
COMM pass-thru certificates floater Series 2001-J2A Class A2F, 0.7475% 7/16/34 (c)(f) | | 2,334 | | 2,333 |
Credit Suisse Mortgage Capital Certificates: | | | | |
floater Series 2011-7R Class A1, 1.494% 8/27/47 (c)(f) | | 482,969 | | 473,897 |
sequential payer Series 2010-16 Class A1, 3% 6/25/50 (c) | | 353,495 | | 341,123 |
Granite Master Issuer PLC floater: | | | | |
Series 2005-4 Class C2, 1.3455% 12/20/54 (f) | | 25,291 | | 15,376 |
Series 2006-1A Class C2, 1.4455% 12/20/54 (c)(f) | | 578,000 | | 352,580 |
Series 2006-2 Class C1, 1.1855% 12/20/54 (f) | | 463,000 | | 282,430 |
Series 2006-3 Class C2, 0.7455% 12/20/54 (f) | | 128,000 | | 78,080 |
Collateralized Mortgage Obligations - continued |
| Principal Amount | | Value |
Private Sponsor - continued |
Granite Master Issuer PLC floater: - continued | | | | |
Series 2006-4: | | | | |
Class B1, 0.4255% 12/20/54 (f) | | $ 521,000 | | $ 438,682 |
Class C1, 1.0055% 12/20/54 (f) | | 319,000 | | 194,590 |
Class M1, 0.5855% 12/20/54 (f) | | 137,000 | | 104,463 |
Series 2007-1: | | | | |
Class 1C1, 0.8455% 12/20/54 (f) | | 258,000 | | 157,380 |
Class 1M1, 0.5455% 12/20/54 (f) | | 172,000 | | 131,150 |
Class 2C1, 1.2055% 12/20/54 (f) | | 117,000 | | 71,370 |
Class 2M1, 0.7455% 12/20/54 (f) | | 222,000 | | 169,275 |
Series 2007-2 Class 2C1, 0.676% 12/17/54 (f) | | 308,000 | | 187,880 |
Granite Mortgages Series 2003-2 Class 1A3, 1.0612% 7/20/43 (f) | | 308,878 | | 299,179 |
Granite Mortgages PLC floater: | | | | |
Series 2003-3 Class 1C, 3.0112% 1/20/44 (f) | | 36,767 | | 26,392 |
Series 2004-1 Class 2A1, 0.8832% 3/20/44 (f) | | 517,788 | | 497,853 |
JPMorgan Chase Commercial Mortgage Securities Trust Series 2007-CB18 Class A3, 5.447% 6/12/47 (f) | | 367,136 | | 386,605 |
MASTR Adjustable Rate Mortgages Trust Series 2007-3 Class 22A2, 0.454% 5/25/47 (f) | | 70,362 | | 41,358 |
Merrill Lynch Alternative Note Asset Trust floater Series 2007-OAR1 Class A1, 0.414% 2/25/37 (f) | | 139,145 | | 93,518 |
RESI Finance LP/RESI Finance DE Corp. floater Series 2003-B: | | | | |
Class B5, 2.6048% 7/10/35 (c)(f) | | 156,078 | | 126,781 |
Class B6, 3.1048% 7/10/35 (c)(f) | | 259,651 | | 206,643 |
Residential Funding Securities Corp. floater Series 2003-RP2 Class A1, 0.694% 6/25/33 (c)(f) | | 28,633 | | 26,605 |
Santander Drive Auto Receivables Trust sequential payer Series 2011-3 Class A2, 1.11% 8/15/14 | | 590,000 | | 590,094 |
Sequoia Mortgage Trust floater Series 2004-6 Class A3B, 1.668% 7/20/34 (f) | | 4,073 | | 2,935 |
TBW Mortgage-Backed pass-thru certificates floater Series 2006-4 Class A3, 0.4763% 9/25/36 (f) | | 280,140 | | 213,660 |
TOTAL PRIVATE SPONSOR | | 6,379,674 |
U.S. Government Agency - 0.6% |
Fannie Mae Guaranteed Mtg. pass-thru certificates Series 2010-123 Class DL, 3.5% 11/25/25 | | 446,842 | | 466,048 |
Fannie Mae subordinate REMIC pass-thru certificates: | | | | |
planned amortization class Series 2002-9 Class PC, 6% 3/25/17 | | 46,700 | | 50,251 |
Collateralized Mortgage Obligations - continued |
| Principal Amount | | Value |
U.S. Government Agency - continued |
Fannie Mae subordinate REMIC pass-thru certificates: - continued | | | | |
sequential payer: | | | | |
Series 2002-56 Class MC, 5.5% 9/25/17 | | $ 160,145 | | $ 171,736 |
Series 2004-86 Class KC, 4.5% 5/25/19 | | 104,659 | | 108,297 |
Series 2010-143 Class B, 3.5% 12/25/25 | | 697,689 | | 730,891 |
Freddie Mac Multi-Class pass-thru certificates: | | | | |
floater Series 3346 Class FA, 0.4785% 2/15/19 (f) | | 645,425 | | 646,332 |
planned amortization class: | | | | |
Series 2356 Class GD, 6% 9/15/16 | | 164,972 | | 177,019 |
Series 2363 Class PF, 6% 9/15/16 | | 208,267 | | 221,362 |
Series 3777 Class AC, 3.5% 12/15/25 | | 1,239,839 | | 1,297,986 |
TOTAL U.S. GOVERNMENT AGENCY | | 3,869,922 |
TOTAL COLLATERALIZED MORTGAGE OBLIGATIONS (Cost $8,172,445) |
10,249,596
|
Commercial Mortgage Securities - 5.2% |
|
Asset Securitization Corp. Series 1997-D5: | | | | |
Class A2, 7.0826% 2/14/43 (f) | | 159,000 | | 160,785 |
Class A3, 7.1326% 2/14/43 (f) | | 172,000 | | 175,100 |
Class A6, 7.4526% 2/14/43 (f) | | 253,000 | | 257,865 |
Class PS1, 1.4363% 2/14/43 (f)(h) | | 578,169 | | 6,372 |
Banc of America Commercial Mortgage Trust: | | | | |
sequential payer: | | | | |
Series 2006-2 Class AAB, 5.9028% 5/10/45 (f) | | 211,146 | | 225,292 |
Series 2006-5 Class A3, 5.39% 9/10/47 | | 301,000 | | 318,018 |
Series 2006-6 Class A3, 5.369% 10/10/45 | | 432,000 | | 460,803 |
Series 2007-4 Class A3, 5.9813% 2/10/51 (f) | | 215,000 | | 228,391 |
Series 2006-6 Class E, 5.619% 10/10/45 (c) | | 125,000 | | 25,325 |
Series 2007-3 Class A3, 5.8426% 6/10/49 (f) | | 361,000 | | 378,384 |
Banc of America Commercial Mortgage, Inc.: | | | | |
sequential payer Series 2004-2: | | | | |
Class A3, 4.05% 11/10/38 | | 29,639 | | 30,077 |
Class A4, 4.153% 11/10/38 | | 274,000 | | 284,617 |
Series 2001-3 Class H, 6.562% 4/11/37 (c) | | 121,000 | | 121,323 |
Series 2001-PB1: | | | | |
Class J, 7.166% 5/11/35 (c) | | 20,174 | | 20,181 |
Class K, 6.15% 5/11/35 (c) | | 100,000 | | 97,412 |
Commercial Mortgage Securities - continued |
| Principal Amount | | Value |
Banc of America Large Loan, Inc. floater: | | | | |
Series 2005-MIB1: | | | | |
Class C, 0.5585% 3/15/22 (c)(f) | | $ 93,000 | | $ 90,210 |
Class D, 0.6085% 3/15/22 (c)(f) | | 94,000 | | 91,180 |
Class E, 0.6485% 3/15/22 (c)(f) | | 78,000 | | 75,660 |
Class F, 0.7185% 3/15/22 (c)(f) | | 70,189 | | 67,381 |
Class G, 0.7785% 3/15/22 (c)(f) | | 45,493 | | 42,763 |
Series 2006-BIX1: | | | | |
Class D, 0.4585% 10/15/19 (c)(f) | | 155,576 | | 149,353 |
Class E, 0.4885% 10/15/19 (c)(f) | | 157,000 | | 149,150 |
Class F, 0.5585% 10/15/19 (c)(f) | | 360,653 | | 339,014 |
Class G, 0.5785% 10/15/19 (c)(f) | | 144,054 | | 128,208 |
Bayview Commercial Asset Trust: | | | | |
floater: | | | | |
Series 2003-2 Class M1, 1.094% 12/25/33 (c)(f) | | 7,490 | | 5,305 |
Series 2004-1: | | | | |
Class A, 0.604% 4/25/34 (c)(f) | | 107,576 | | 86,599 |
Class B, 2.144% 4/25/34 (c)(f) | | 14,763 | | 8,536 |
Class M1, 0.804% 4/25/34 (c)(f) | | 11,962 | | 8,326 |
Class M2, 1.444% 4/25/34 (c)(f) | | 11,074 | | 7,676 |
Series 2005-2A: | | | | |
Class A1, 0.554% 8/25/35 (c)(f) | | 156,305 | | 102,038 |
Class M1, 0.674% 8/25/35 (c)(f) | | 9,210 | | 4,740 |
Class M2, 0.724% 8/25/35 (c)(f) | | 15,191 | | 6,917 |
Class M3, 0.744% 8/25/35 (c)(f) | | 8,405 | | 3,345 |
Series 2005-3A: | | | | |
Class A2, 0.644% 11/25/35 (c)(f) | | 68,419 | | 45,199 |
Class M1, 0.684% 11/25/35 (c)(f) | | 8,037 | | 4,609 |
Class M2, 0.734% 11/25/35 (c)(f) | | 10,203 | | 5,622 |
Class M3, 0.754% 11/25/35 (c)(f) | | 9,132 | | 4,820 |
Class M4, 0.844% 11/25/35 (c)(f) | | 11,377 | | 5,495 |
Series 2005-4A: | | | | |
Class A2, 0.634% 1/25/36 (c)(f) | | 152,637 | | 94,622 |
Class B1, 1.644% 1/25/36 (c)(f) | | 13,191 | | 1,750 |
Class M1, 0.694% 1/25/36 (c)(f) | | 49,238 | | 21,249 |
Class M2, 0.714% 1/25/36 (c)(f) | | 14,772 | | 5,734 |
Class M3, 0.744% 1/25/36 (c)(f) | | 21,572 | | 7,546 |
Class M4, 0.854% 1/25/36 (c)(f) | | 11,931 | | 3,707 |
Class M5, 0.894% 1/25/36 (c)(f) | | 11,931 | | 3,229 |
Class M6, 0.944% 1/25/36 (c)(f) | | 12,672 | | 2,450 |
Series 2006-1: | | | | |
Class A2, 0.604% 4/25/36 (c)(f) | | 23,867 | | 16,509 |
Class M1, 0.624% 4/25/36 (c)(f) | | 8,536 | | 4,827 |
Commercial Mortgage Securities - continued |
| Principal Amount | | Value |
Bayview Commercial Asset Trust: - continued | | | | |
floater: | | | | |
Series 2006-1: | | | | |
Class M2, 0.644% 4/25/36 (c)(f) | | $ 9,019 | | $ 4,751 |
Class M3, 0.664% 4/25/36 (c)(f) | | 7,760 | | 3,819 |
Class M4, 0.764% 4/25/36 (c)(f) | | 4,398 | | 1,978 |
Class M5, 0.804% 4/25/36 (c)(f) | | 4,268 | | 1,708 |
Class M6, 0.884% 4/25/36 (c)(f) | | 8,511 | | 3,236 |
Series 2006-2A: | | | | |
Class A1, 0.474% 7/25/36 (c)(f) | | 366,360 | | 231,956 |
Class A2, 0.524% 7/25/36 (c)(f) | | 21,047 | | 12,628 |
Class B1, 1.114% 7/25/36 (c)(f) | | 7,880 | | 930 |
Class B3, 2.944% 7/25/36 (c)(f) | | 11,906 | | 485 |
Class M1, 0.554% 7/25/36 (c)(f) | | 22,083 | | 8,848 |
Class M2, 0.574% 7/25/36 (c)(f) | | 15,580 | | 5,618 |
Class M3, 0.594% 7/25/36 (c)(f) | | 12,924 | | 4,202 |
Class M4, 0.664% 7/25/36 (c)(f) | | 8,727 | | 2,513 |
Class M5, 0.714% 7/25/36 (c)(f) | | 10,726 | | 2,658 |
Class M6, 0.784% 7/25/36 (c)(f) | | 16,004 | | 2,571 |
Series 2006-3A: | | | | |
Class B1, 1.044% 10/25/36 (c)(f) | | 15,354 | | 307 |
Class M4, 0.674% 10/25/36 (c)(f) | | 17,128 | | 1,683 |
Class M5, 0.724% 10/25/36 (c)(f) | | 20,504 | | 1,493 |
Class M6, 0.804% 10/25/36 (c)(f) | | 40,182 | | 1,860 |
Series 2006-4A: | | | | |
Class A1, 0.474% 12/25/36 (c)(f) | | 89,753 | | 59,377 |
Class A2, 0.514% 12/25/36 (c)(f) | | 377,350 | | 192,449 |
Class B1, 0.944% 12/25/36 (c)(f) | | 13,874 | | 1,296 |
Class B2, 1.494% 12/25/36 (c)(f) | | 14,275 | | 852 |
Class B3, 2.694% 12/25/36 (c)(f) | | 8,501 | | 175 |
Class M1, 0.534% 12/25/36 (c)(f) | | 28,933 | | 11,026 |
Class M2, 0.554% 12/25/36 (c)(f) | | 19,486 | | 6,554 |
Class M3, 0.584% 12/25/36 (c)(f) | | 19,486 | | 5,683 |
Class M4, 0.644% 12/25/36 (c)(f) | | 23,029 | | 5,338 |
Class M5, 0.684% 12/25/36 (c)(f) | | 21,848 | | 3,605 |
Class M6, 0.764% 12/25/36 (c)(f) | | 19,486 | | 2,379 |
Series 2007-1: | | | | |
Class A2, 0.514% 3/25/37 (c)(f) | | 99,558 | | 47,788 |
Class B1, 0.914% 3/25/37 (c)(f) | | 31,723 | | 2,288 |
Class B2, 1.394% 3/25/37 (c)(f) | | 20,288 | | 873 |
Class M1, 0.514% 3/25/37 (c)(f) | | 27,862 | | 9,095 |
Class M2, 0.534% 3/25/37 (c)(f) | | 20,900 | | 5,419 |
Class M3, 0.564% 3/25/37 (c)(f) | | 18,806 | | 3,764 |
Commercial Mortgage Securities - continued |
| Principal Amount | | Value |
Bayview Commercial Asset Trust: - continued | | | | |
floater: | | | | |
Series 2007-1: | | | | |
Class M4, 0.614% 3/25/37 (c)(f) | | $ 14,926 | | $ 2,209 |
Class M5, 0.664% 3/25/37 (c)(f) | | 23,675 | | 2,983 |
Class M6, 0.744% 3/25/37 (c)(f) | | 32,731 | | 3,376 |
Series 2007-2A: | | | | |
Class A1, 0.514% 7/25/37 (c)(f) | | 92,696 | | 47,796 |
Class A2, 0.564% 7/25/37 (c)(f) | | 86,663 | | 30,332 |
Class B1, 1.844% 7/25/37 (c)(f) | | 26,525 | | 1,009 |
Class B2, 2.494% 7/25/37 (c)(f) | | 8,695 | | 460 |
Class M1, 0.614% 7/25/37 (c)(f) | | 30,432 | | 4,610 |
Class M2, 0.654% 7/25/37 (c)(f) | | 16,441 | | 1,813 |
Class M3, 0.734% 7/25/37 (c)(f) | | 16,585 | | 1,454 |
Class M4, 0.894% 7/25/37 (c)(f) | | 33,806 | | 2,639 |
Class M5, 0.994% 7/25/37 (c)(f) | | 29,784 | | 1,947 |
Class M6, 1.244% 7/25/37 (c)(f) | | 37,229 | | 1,941 |
Series 2007-3: | | | | |
Class A2, 0.534% 7/25/37 (c)(f) | | 91,423 | | 39,112 |
Class B1, 1.194% 7/25/37 (c)(f) | | 22,494 | | 1,876 |
Class B2, 1.844% 7/25/37 (c)(f) | | 56,505 | | 3,010 |
Class B3, 4.244% 7/25/37 (c)(f) | | 6,902 | | 156 |
Class M1, 0.554% 7/25/37 (c)(f) | | 20,280 | | 6,694 |
Class M2, 0.584% 7/25/37 (c)(f) | | 21,759 | | 5,906 |
Class M3, 0.614% 7/25/37 (c)(f) | | 33,567 | | 7,387 |
Class M4, 0.744% 7/25/37 (c)(f) | | 53,112 | | 9,371 |
Class M5, 0.844% 7/25/37 (c)(f) | | 27,608 | | 3,679 |
Class M6, 1.044% 7/25/37 (c)(f) | | 20,913 | | 2,283 |
Series 2007-4A: | | | | |
Class B1, 2.794% 9/25/37 (c)(f) | | 22,785 | | 820 |
Class M1, 1.194% 9/25/37 (c)(f) | | 34,890 | | 3,057 |
Class M2, 1.294% 9/25/37 (c)(f) | | 34,890 | | 2,119 |
Class M4, 1.844% 9/25/37 (c)(f) | | 87,978 | | 3,800 |
Class M5, 1.994% 9/25/37 (c)(f) | | 87,978 | | 2,805 |
Class M6, 2.194% 9/25/37 (c)(f) | | 88,055 | | 1,806 |
Series 2004-1, Class IO, 1.25% 4/25/34 (c)(h) | | 404,008 | | 14,746 |
Series 2007-5A, Class IO, 4.1484% 10/25/37 (c)(f)(h) | | 1,000,248 | | 94,623 |
Bear Stearns Commercial Mortgage Securities Trust: | | | | |
floater: | | | | |
Series 2006-BBA7: | | | | |
Class H, 0.8985% 3/15/19 (c)(f) | | 47,525 | | 45,645 |
Class J, 1.0985% 3/15/19 (c)(f) | | 46,405 | | 39,920 |
Commercial Mortgage Securities - continued |
| Principal Amount | | Value |
Bear Stearns Commercial Mortgage Securities Trust: - continued | | | | |
floater: | | | | |
Series 2007-BBA8: | | | | |
Class D, 0.4985% 3/15/22 (c)(f) | | $ 76,569 | | $ 65,697 |
Class E, 0.5485% 3/15/22 (c)(f) | | 394,020 | | 334,134 |
Class F, 0.5985% 3/15/22 (c)(f) | | 241,475 | | 199,944 |
Class G, 0.6485% 3/15/22 (c)(f) | | 62,931 | | 51,478 |
Class H, 0.7985% 3/15/22 (c)(f) | | 76,569 | | 61,103 |
Class J, 0.9485% 3/15/22 (c)(f) | | 76,569 | | 59,572 |
sequential payer: | | | | |
Series 2003-PWR2 Class A3, 4.834% 5/11/39 | | 11,409 | | 11,425 |
Series 2004-PWR3 Class A3, 4.487% 2/11/41 | | 63,555 | | 64,794 |
Series 2006-PW14 Class X2, 0.8632% 12/11/38 (c)(f)(h) | | 2,274,310 | | 27,057 |
Series 2006-T24 Class X2, 0.6237% 10/12/41 (c)(f)(h) | | 427,756 | | 3,189 |
Series 2007-PW18 Class X2, 0.4796% 6/11/50 (c)(f)(h) | | 15,203,103 | | 170,199 |
Series 2007-T28 Class X2, 0.3272% 9/11/42 (c)(f)(h) | | 8,179,766 | | 53,537 |
C-BASS Trust floater Series 2006-SC1 Class A, 0.514% 5/25/36 (c)(f) | | 83,294 | | 68,684 |
CDC Commercial Mortgage Trust Series 2002-FX1: | | | | |
Class G, 6.625% 5/15/35 (c) | | 254,000 | | 264,882 |
Class XCL, 1.5913% 5/15/35 (c)(f)(h) | | 887,674 | | 20,772 |
Citigroup Commercial Mortgage Trust: | | | | |
floater Series 2006-FL2: | | | | |
Class G, 0.5835% 8/15/21 (c)(f) | | 23,352 | | 22,257 |
Class H, 0.6235% 8/15/21 (c)(f) | | 40,527 | | 37,873 |
Series 2006-C5 Class AMP2, 5.5005% 10/15/49 (c) | | 319,954 | | 304,967 |
Series 2008-C7 Class A2B, 6.2764% 12/10/49 (f) | | 203,577 | | 209,525 |
Citigroup/Deutsche Bank Commercial Mortgage Trust Series 2007-CD4: | | | | |
Class A3, 5.293% 12/11/49 | | 210,000 | | 224,452 |
Class C, 5.476% 12/11/49 | | 407,000 | | 116,608 |
Cobalt CMBS Commercial Mortgage Trust: | | | | |
sequential payer Series 2007-C3 Class A3, 6.0104% 5/15/46 (f) | | 216,000 | | 231,789 |
Series 2006-C1 Class B, 5.359% 8/15/48 | | 648,000 | | 38,880 |
Commercial Mortgage Securities - continued |
| Principal Amount | | Value |
COMM pass-thru certificates: | | | | |
floater: | | | | |
Series 2005-F10A: | | | | |
Class G, 0.7985% 4/15/17 (c)(f) | | $ 8,877 | | $ 8,552 |
Class H, 0.8685% 4/15/17 (c)(f) | | 19,555 | | 16,885 |
Class J, 1.0985% 4/15/17 (c)(f) | | 14,996 | | 10,497 |
Series 2005-FL11: | | | | |
Class C, 0.5485% 11/15/17 (c)(f) | | 164,947 | | 151,751 |
Class D, 0.5885% 11/15/17 (c)(f) | | 8,646 | | 7,868 |
Class E, 0.6385% 11/15/17 (c)(f) | | 30,262 | | 27,236 |
Class F, 0.6985% 11/15/17 (c)(f) | | 21,193 | | 18,862 |
Class G, 0.7485% 11/15/17 (c)(f) | | 14,690 | | 12,927 |
Series 2006-FL12 Class AJ, 0.3785% 12/15/20 (c)(f) | | 308,000 | | 276,112 |
sequential payer: | | | | |
Series 2006-C8 Class A3, 5.31% 12/10/46 | | 615,000 | | 639,740 |
Series 2006-CN2A: | | | | |
Class A2FX, 5.449% 2/5/19 (c) | | 365,000 | | 354,953 |
Class AJFX, 5.478% 2/5/19 (c) | | 380,000 | | 377,682 |
Series 2006-C8 Class XP, 0.6566% 12/10/46 (f)(h) | | 2,095,136 | | 18,433 |
Commercial Mortgage pass-thru certificates: | | | | |
sequential payer Series 2005-C6 Class A2, 4.999% 6/10/44 (f) | | 1,542 | | 1,548 |
Series 2004-LB4A Class A5, 4.84% 10/15/37 | | 1,690,000 | | 1,796,404 |
Credit Suisse Commercial Mortgage Trust: | | | | |
sequential payer: | | | | |
Series 2007-C2 Class A3, 5.542% 1/15/49 (f) | | 432,000 | | 470,347 |
Series 2007-C3: | | | | |
Class A2, 5.9018% 6/15/39 (f) | | 281,512 | | 282,355 |
Class A4, 5.9018% 6/15/39 (f) | | 130,000 | | 141,723 |
Series 2006-C5 Class ASP, 0.8652% 12/15/39 (f)(h) | | 1,400,562 | | 16,832 |
Credit Suisse First Boston Mortgage Capital Certificates floater Series 2007-TF2A Class B, 0.5985% 4/15/22 (c)(f) | | 771,000 | | 572,476 |
Credit Suisse First Boston Mortgage Securities Corp.: | | | | |
sequential payer Series 2004-C1: | | | | |
Class A3, 4.321% 1/15/37 | | 11,139 | | 11,191 |
Class A4, 4.75% 1/15/37 | | 101,000 | | 106,412 |
Series 2001-CK6 Class AX, 1.1089% 8/15/36 (f)(h) | | 84,129 | | 215 |
Series 2001-CKN5 Class AX, 1.9203% 9/15/34 (c)(f)(h) | | 339,217 | | 560 |
Series 2003-C4 Class A4, 5.137% 8/15/36 | | 560,000 | | 584,228 |
Commercial Mortgage Securities - continued |
| Principal Amount | | Value |
Credit Suisse Mortgage Capital Certificates: | | | | |
floater Series 2007-TFL1: | | | | |
Class B, 0.3985% 2/15/22 (c)(f) | | $ 82,000 | | $ 73,603 |
Class C: | | | | |
0.4185% 2/15/22 (c)(f) | | 212,546 | | 188,613 |
0.5185% 2/15/22 (c)(f) | | 75,912 | | 66,590 |
Class F, 0.5685% 2/15/22 (c)(f) | | 151,805 | | 131,615 |
Series 2007-C1: | | | | |
Class ASP, 0.5721% 2/15/40 (f)(h) | | 3,373,706 | | 24,945 |
Class B, 5.487% 2/15/40 (c)(f) | | 330,000 | | 49,500 |
First Union National Bank-Bank of America Commercial Mortgage Trust Series 2001-C1 Class G, 6.936% 3/15/33 (c) | | 142,000 | | 143,295 |
GE Capital Commercial Mortgage Corp.: | | | | |
sequential payer Series 2007-C1 Class A4, 5.543% 12/10/49 | | 1,136,000 | | 1,229,944 |
Series 2001-1 Class X1, 1.5729% 5/15/33 (c)(f)(h) | | 246,606 | | 2,192 |
Series 2007-C1 Class XP, 0.3493% 12/10/49 (f)(h) | | 3,017,912 | | 13,297 |
GMAC Commercial Mortgage Securities, Inc.: | | | | |
sequential payer Series 2003-C2 Class A2, 5.6355% 5/10/40 (f) | | 290,000 | | 306,443 |
Series 2005-C1 Class X2, 0.7314% 5/10/43 (f)(h) | | 748,891 | | 1,283 |
Greenwich Capital Commercial Funding Corp.: | | | | |
floater Series 2006-FL4 Class B, 0.4525% 11/5/21 (c)(f) | | 81,000 | | 78,678 |
sequential payer Series 2007-GG11 Class A2, 5.597% 12/10/49 | | 432,000 | | 444,838 |
Series 2007-GG11 Class A1, 0.4565% 12/10/49 (c)(f)(h) | | 4,582,587 | | 28,440 |
GS Mortgage Securities Corp. II: | | | | |
floater: | | | | |
Series 2006-FL8A: | | | | |
Class E, 0.6325% 6/6/20 (c)(f) | | 49,233 | | 46,955 |
Class F, 0.7025% 6/6/20 (c)(f) | | 95,176 | | 89,850 |
Series 2007-EOP: | | | | |
Class A1, 1.1031% 3/6/20 (c)(f) | | 852,092 | | 845,701 |
Class C, 2.1455% 3/6/20 (c)(f) | | 236,000 | | 229,675 |
Class D, 2.3636% 3/6/20 (c)(f) | | 467,000 | | 452,616 |
Class F, 2.8433% 3/6/20 (c)(f) | | 19,000 | | 18,244 |
Class G, 3.0177% 3/6/20 (c)(f) | | 10,000 | | 9,552 |
Class H, 3.5846% 3/6/20 (c)(f) | | 7,000 | | 6,693 |
Class J, 4.4568% 3/6/20 (c)(f) | | 11,000 | | 10,590 |
sequential payer Series 2005-GG4 Class A3, 4.607% 7/10/39 | | 420,000 | | 420,660 |
Series 2005-GG4 Class XP, 0.8961% 7/10/39 (c)(f)(h) | | 3,286,754 | | 7,113 |
Commercial Mortgage Securities - continued |
| Principal Amount | | Value |
GS Mortgage Securities Trust: | | | | |
sequential payer: | | | | |
Series 2006-GG8 Class A2, 5.479% 11/10/39 | | $ 163,182 | | $ 164,176 |
Series 2007-GG10 Class A2, 5.778% 8/10/45 | | 70,814 | | 72,107 |
Series 2012-GC6 Class A1, 1.282% 1/10/45 | | 230,000 | | 230,500 |
JPMorgan Chase Commercial Mortgage Securities Corp.: | | | | |
floater Series 2011-CCHP Class A, 2.6% 7/15/28 (c)(f) | | 1,200,000 | | 1,199,893 |
sequential payer Series 2003-C1 Class A2, 4.985% 1/12/37 | | 480,000 | | 492,625 |
Series 2003-CB7 Class A4, 4.879% 1/12/38 (f) | | 236,504 | | 248,780 |
JPMorgan Chase Commercial Mortgage Securities Trust: | | | | |
floater Series 2006-FLA2: | | | | |
Class B, 0.4185% 11/15/18 (c)(f) | | 118,573 | | 110,273 |
Class C, 0.4585% 11/15/18 (c)(f) | | 84,204 | | 75,783 |
Class D, 0.4785% 11/15/18 (c)(f) | | 25,878 | | 22,773 |
Class E, 0.5285% 11/15/18 (c)(f) | | 37,813 | | 32,519 |
Class F, 0.5785% 11/15/18 (c)(f) | | 56,500 | | 48,025 |
Class G, 0.6085% 11/15/18 (c)(f) | | 49,114 | | 40,273 |
Class H, 0.7485% 11/15/18 (c)(f) | | 37,822 | | 29,501 |
sequential payer: | | | | |
Series 2006-LDP9 Class A2, 5.134% 5/15/47 (f) | | 82,371 | | 86,245 |
Series 2007-LD11 Class A2, 5.9895% 6/15/49 (f) | | 533,904 | | 538,476 |
Series 2007-LDPX: | | | | |
Class A2 S, 5.305% 1/15/49 | | 1,293,476 | | 1,293,746 |
Class A3, 5.42% 1/15/49 | | 594,000 | | 664,649 |
Series 2005-CB13 Class E, 5.5259% 1/12/43 (c)(f) | | 109,000 | | 5,563 |
Series 2006-CB17 Class A3, 5.45% 12/12/43 | | 57,109 | | 58,961 |
Series 2007-CB19: | | | | |
Class B, 5.9303% 2/12/49 (f) | | 18,000 | | 6,703 |
Class C, 5.9303% 2/12/49 (f) | | 48,000 | | 14,044 |
Class D, 5.9303% 2/12/49 (f) | | 51,000 | | 7,077 |
Series 2007-LDP10 Class ES, 5.7445% 1/15/49 (c)(f) | | 112,000 | | 5,863 |
JPMorgan Commercial Mortgage Finance Corp. Series 2000-C9 Class G, 6.25% 10/15/32 (c) | | 5,561 | | 5,572 |
LB Commercial Conduit Mortgage Trust Series 1998-C1 Class D, 6.98% 2/18/30 | | 30,708 | | 31,223 |
LB-UBS Commercial Mortgage Trust: | | | | |
sequential payer: | | | | |
Series 2006-C1 Class A2, 5.084% 2/15/31 | | 29,379 | | 29,684 |
Series 2006-C7 Class A2, 5.3% 11/15/38 | | 129,971 | | 130,125 |
Series 2007-C1 Class A4, 5.424% 2/15/40 | | 28,000 | | 31,614 |
Series 2007-C2 Class A3, 5.43% 2/15/40 | | 104,000 | | 115,566 |
Commercial Mortgage Securities - continued |
| Principal Amount | | Value |
LB-UBS Commercial Mortgage Trust: - continued | | | | |
Series 2005-C3 Class XCP, 0.9042% 7/15/40 (f)(h) | | $ 491,215 | | $ 1,031 |
Series 2006-C6 Class XCP, 0.8617% 9/15/39 (f)(h) | | 920,913 | | 9,857 |
Series 2007-C1 Class XCP, 0.6167% 2/15/40 (f)(h) | | 344,025 | | 2,914 |
Series 2007-C7 Class XCP, 0.431% 9/15/45 (f)(h) | | 15,785,489 | | 114,618 |
Lehman Brothers Floating Rate Commercial Mortgage Trust floater Series 2006-LLFA: | | | | |
Class D, 0.4785% 9/15/21 (c)(f) | | 69,510 | | 62,223 |
Class E, 0.5385% 9/15/21 (c)(f) | | 249,861 | | 216,172 |
Class F, 0.5885% 9/15/21 (c)(f) | | 97,418 | | 81,360 |
Class G, 0.6085% 9/15/21 (c)(f) | | 192,585 | | 155,064 |
Class H, 0.6485% 9/15/21 (c)(f) | | 49,497 | | 37,873 |
Merrill Lynch Mortgage Trust: | | | | |
Series 2005-CKI1 Class A3, 5.3913% 11/12/37 (f) | | 146,567 | | 147,935 |
Series 2005-LC1 Class F, 5.5568% 1/12/44 (c)(f) | | 188,000 | | 105,002 |
Merrill Lynch-CFC Commercial Mortgage Trust: | | | | |
floater Series 2006-4 Class A2FL, 0.4158% 12/12/49 (f) | | 32,746 | | 32,737 |
sequential payer: | | | | |
Series 2006-1 Class A3, 5.6568% 2/12/39 (f) | | 230,000 | | 233,716 |
Series 2006-4 Class ASB, 5.133% 12/12/49 (f) | | 177,970 | | 188,940 |
Series 2007-5: | | | | |
Class A3, 5.364% 8/12/48 | | 84,000 | | 86,141 |
Class A4, 5.378% 8/12/48 | | 9,000 | | 9,731 |
Class B, 5.479% 8/12/48 | | 648,000 | | 162,000 |
Series 2006-3 Class ASB, 5.382% 7/12/46 (f) | | 846,508 | | 890,824 |
Series 2006-4 Class XP, 0.8109% 12/12/49 (f)(h) | | 3,222,242 | | 53,763 |
Series 2007-6 Class B, 5.635% 3/12/51 (f) | | 216,000 | | 67,470 |
Series 2007-7 Class B, 5.9345% 6/12/50 (f) | | 19,000 | | 1,602 |
Morgan Stanley Capital I Trust: | | | | |
floater: | | | | |
Series 2006-XLF Class C, 1.449% 7/15/19 (c)(f) | | 40,774 | | 23,649 |
Series 2007-XLFA: | | | | |
Class C, 0.409% 10/15/20 (c)(f) | | 124,000 | | 112,329 |
Class D, 0.439% 10/15/20 (c)(f) | | 76,067 | | 68,527 |
Class E, 0.499% 10/15/20 (c)(f) | | 95,138 | | 80,951 |
Class F, 0.549% 10/15/20 (c)(f) | | 57,094 | | 43,442 |
Class G, 0.589% 10/15/20 (c)(f) | | 70,577 | | 51,583 |
Class H, 0.679% 10/15/20 (c)(f) | | 44,426 | | 25,806 |
Class J, 0.829% 10/15/20 (c)(f) | | 25,989 | | 10,808 |
Class MHRO, 0.939% 10/15/20 (c)(f) | | 69,447 | | 58,335 |
Class NHRO, 1.139% 10/15/20 (c)(f) | | 105,124 | | 86,202 |
Commercial Mortgage Securities - continued |
| Principal Amount | | Value |
Morgan Stanley Capital I Trust: - continued | | | | |
sequential payer: | | | | |
Series 2003-IQ4 Class A2, 4.07% 5/15/40 | | $ 199,287 | | $ 204,200 |
Series 2005-IQ9 Class A3, 4.54% 7/15/56 | | 222,752 | | 227,001 |
Series 2007-IQ13 Class A1, 5.05% 3/15/44 | | 1,520 | | 1,519 |
Series 2006-HQ10 Class X2, 0.6911% 11/12/41 (c)(f)(h) | | 1,101,604 | | 4,509 |
Series 2006-HQ8 Class A3, 5.6512% 3/12/44 (f) | | 71,390 | | 71,778 |
Series 2006-T23 Class A3, 5.986% 8/12/41 (f) | | 110,000 | | 114,905 |
Morgan Stanley Dean Witter Capital I Trust sequential payer Series 2003-T11 Class A4, 5.15% 6/13/41 | | 247,621 | | 257,053 |
Providence Place Group Ltd. Partnership sequential payer Series 2000-C1 Class A1, 7.75% 7/20/16 (c) | | 121,232 | | 126,506 |
Structured Asset Securities Corp. Series 1997-LLI Class D, 7.15% 10/12/34 | | 10,226 | | 10,241 |
Wachovia Bank Commercial Mortgage Trust: | | | | |
floater: | | | | |
Series 2006-WL7A: | | | | |
Class A1, 0.3751% 9/15/21 (c)(f) | | 536,741 | | 517,018 |
Class E, 0.5696% 9/15/21 (c)(f) | | 201,847 | | 158,097 |
Class F, 0.6296% 9/15/21 (c)(f) | | 214,060 | | 161,242 |
Class G, 0.6496% 9/15/21 (c)(f) | | 202,788 | | 146,667 |
Class J, 0.8896% 9/15/21 (c)(f) | | 45,086 | | 20,435 |
Series 2007-WHL8: | | | | |
Class AP1, 0.9485% 6/15/20 (c)(f) | | 16,443 | | 14,798 |
Class AP2, 1.0485% 6/15/20 (c)(f) | | 26,799 | | 23,583 |
Class F, 0.7285% 6/15/20 (c)(f) | | 526,588 | | 342,282 |
Class LXR1, 0.9485% 6/15/20 (c)(f) | | 26,316 | | 21,316 |
sequential payer: | | | | |
Series 2006-C29 Class A3, 5.313% 11/15/48 | | 574,000 | | 591,444 |
Series 2007-C30: | | | | |
Class A3, 5.246% 12/15/43 | | 69,387 | | 70,991 |
Class A4, 5.305% 12/15/43 | | 64,000 | | 68,014 |
Class A5, 5.342% 12/15/43 | | 231,000 | | 251,619 |
Series 2007-C32: | | | | |
Class A2, 5.9237% 6/15/49 (f) | | 221,992 | | 230,076 |
Class A3, 5.9287% 6/15/49 (f) | | 367,000 | | 404,029 |
Series 2005-C22 Class F, 5.5336% 12/15/44 (c)(f) | | 360,000 | | 87,040 |
Series 2007-C30: | | | | |
Class C, 5.483% 12/15/43 (f) | | 648,000 | | 255,892 |
Class XP, 0.6327% 12/15/43 (c)(f)(h) | | 1,932,136 | | 18,877 |
Series 2007-C31 Class C, 5.8735% 4/15/47 (f) | | 59,000 | | 12,048 |
Commercial Mortgage Securities - continued |
| Principal Amount | | Value |
Wachovia Bank Commercial Mortgage Trust: - continued | | | | |
Series 2007-C31A Class A2, 5.421% 4/15/47 | | $ 662,261 | | $ 688,106 |
Wachovia Bank Commercial Mortgage Trust pass-thru certificates sequential payer Series 2007-C33 Class A5, 6.0964% 2/15/51 (f) | | 143,000 | | 157,894 |
TOTAL COMMERCIAL MORTGAGE SECURITIES (Cost $27,808,779) |
33,169,959
|
Municipal Securities - 0.4% |
|
California Gen. Oblig. 5.25% 4/1/14 | | 1,500,000 | | 1,602,240 |
Illinois Gen. Oblig.: | | | | |
Series 2010, 3.321% 1/1/13 | | 920,000 | | 938,041 |
Series 2011, 5.877% 3/1/19 | | 75,000 | | 83,048 |
TOTAL MUNICIPAL SECURITIES (Cost $2,498,541) |
2,623,329
|
Foreign Government and Government Agency Obligations - 1.2% |
|
Brazilian Federative Republic 4.875% 1/22/21 | | 500,000 | | 565,000 |
Chilean Republic 3.25% 9/14/21 | | 224,000 | | 229,712 |
Hydro-Quebec 2% 6/30/16 | | 2,500,000 | | 2,576,240 |
New Brunswick Province 2.75% 6/15/18 | | 1,300,000 | | 1,367,288 |
Ontario Province 2.3% 5/10/16 | | 2,820,000 | | 2,925,366 |
TOTAL FOREIGN GOVERNMENT AND GOVERNMENT AGENCY OBLIGATIONS (Cost $7,457,943) |
7,663,606
|
Supranational Obligations - 0.0% |
|
Corporacion Andina de Fomento 5.2% 5/21/13
(Cost $35,619) | | 37,000 | |
38,408
|
Bank Notes - 0.4% |
|
National City Bank, Cleveland 0.6269% 3/1/13 (f) | | 1,729,000 | | 1,730,193 |
Wachovia Bank NA 6% 11/15/17 | | 570,000 | | 655,588 |
TOTAL BANK NOTES (Cost $2,286,046) | 2,385,781 |
Fixed-Income Funds - 0.8% |
| Shares | | Value |
Fidelity Specialized High Income Central Fund (g)
(Cost $4,804,391) | 48,063 | | $ 4,991,856 |
Money Market Funds - 0.7% |
| | | |
Fidelity Cash Central Fund, 0.12% (a)
(Cost $4,489,158) | 4,489,158 | |
4,489,158
|
TOTAL INVESTMENT PORTFOLIO - 99.4% (Cost $593,935,754) | | 629,682,796 |
NET OTHER ASSETS (LIABILITIES) - 0.6% | | 3,553,177 |
NET ASSETS - 100% | $ 633,235,973 |
Swap Agreements |
| Expiration Date | | Notional Amount | | |
Credit Default Swaps |
Receive monthly notional amount multiplied by .82% and pay UBS upon credit event of Morgan Stanley ABS Capital I, Inc., par value of the notional amount of Morgan Stanley ABS Capital I, Inc. Series 2004-NC6 Class M3, 5.6413% 7/25/34 (Rating-Ca) (e) | August 2034 | | $ 72,782 | | (56,298) |
Receive monthly notional amount multiplied by 2.5% and pay Credit Suisse First Boston upon credit event of Ameriquest Mortgage Securities, Inc., par value of the notional amount of Ameriquest Mortgage Securities, Inc. Series 2004-R11 Class M9, 8.03% 11/25/34 (Rating-C) (e) | Dec. 2034 | | 248,360 | | (238,614) |
Receive monthly notional amount multiplied by 2.61% and pay Goldman Sachs upon credit event of Fremont Home Loan Trust, par value of the notional amount of Fremont Home Loan Trust Series 2004-A Class B3, 7.0413% 1/25/34 (Rating-C) (e) | Feb. 2034 | | 806 | | (753) |
Swap Agreements - continued |
| Expiration Date | | Notional Amount | | Value |
Credit Default Swaps - continued |
Receive monthly notional amount multiplied by 3.05% and pay Merrill Lynch upon credit event of Morgan Stanley ABS Capital I, Inc., par value of the notional amount of Morgan Stanley ABS Capital I, Inc. Series 2004-NC8, Class B3, 7.2913% 9/25/34 (Rating-Ca) (e) | Oct. 2034 | | $ 85,210 | | $ (71,782) |
Receive monthly notional amount multiplied by 3.35% and pay Morgan Stanley, Inc. upon credit event of Morgan Stanley ABS Capital I, Inc., par value of the notional amount of Morgan Stanley ABS Capital I, Inc. Series 2004-HE7, Class B3, 9.01% 8/25/34 (Rating-C) (e) | Sept. 2034 | | 70,670 | | (61,616) |
| | $ 477,828 | | $ (429,063) |
Legend |
(a) Affiliated fund that is available only to investment companies and other accounts managed by Fidelity Investments. The rate quoted is the annualized seven-day yield of the fund at period end. A complete unaudited listing of the fund's holdings as of its most recent quarter end is available upon request. In addition, each Fidelity Central Fund's financial statements are available on the SEC's website or upon request. |
(b) Non-income producing - Security is in default. |
(c) Security exempt from registration under Rule 144A of the Securities Act of 1933. These securities may be resold in transactions exempt from registration, normally to qualified institutional buyers. At the end of the period, the value of these securities amounted to $61,242,696 or 9.7% of net assets. |
(d) Security or a portion of the security has been segregated as collateral for open swap agreements. At the period end, the value of securities pledged amounted to $110,992. |
(e) Represents a credit default swap contract in which the Fund has sold protection on the underlying reference entity. The value of each credit default swap and the credit rating can be measures of the current payment/performance risk. For the underlying reference entity, ratings disclosed are from Moody's Investors Service, Inc. Where Moody's ratings are not available, S&P ratings are disclosed and are indicated as such. All ratings are as of the report date and do not reflect subsequent changes. Where a credit rating is not disclosed, the value is used as the measure of the payment/performance risk. |
(f) Coupon rates for floating and adjustable rate securities reflect the rates in effect at period end. |
(g) Affiliated fund that is available only to investment companies and other accounts managed by Fidelity Investments. A complete unaudited schedule of portfolio holdings for each Fidelity Central Fund is filed with the SEC for the first and third quarters of each fiscal year on Form N-Q and is available upon request or at the SEC's web site at www.sec.gov. An unaudited holdings listing for the Fund, which presents direct holdings as well as the pro rata share of securities and other investments held indirectly through its investment in underlying non-money market Fidelity Central Funds, is available at advisor.fidelity.com. In addition, each Fidelity Central Fund's financial statements are available on the SEC's web site or upon request. |
(h) Security represents right to receive monthly interest payments on an underlying pool of mortgages or assets. Principal shown is the outstanding par amount of the pool as of the end of the period. |
Affiliated Central Funds |
Information regarding fiscal year to date income earned by the Fund from investments in Fidelity Central Funds is as follows: |
Fund | Income earned |
Fidelity Cash Central Fund | $ 1,870 |
Fidelity Specialized High Income Central Fund | 158,540 |
Total | $ 160,410 |
Additional information regarding the Fund's fiscal year to date purchases and sales, including the ownership percentage, of the non Money Market Central Funds is as follows: |
Fund | Value,
beginning of
period | Purchases | Sales
Proceeds | Value,
end of
period | % ownership,
end of
period |
Fidelity Specialized High Income Central Fund | $ 5,890,796 | $ 158,540 | $ 1,300,150 | $ 4,991,856 | 1.1% |
Other Information |
The following is a summary of the inputs used, as of February 29, 2012, involving the Fund's assets and liabilities carried at fair value. The inputs or methodology used for valuing securities may not be an indication of the risk associated with investing in those securities. For more information on valuation inputs, and their aggregation into the levels used in the tables below, please refer to the Security Valuation section in the accompanying Notes to Financial Statements. |
Valuation Inputs at Reporting Date: |
Description | Total | Level 1 | Level 2 | Level 3 |
Investments in Securities: | | | | |
Corporate Bonds | $ 218,138,968 | $ - | $ 218,138,968 | $ - |
U.S. Government and Government Agency Obligations | 251,501,103 | - | 251,501,103 | - |
U.S. Government Agency - Mortgage Securities | 37,312,187 | - | 37,312,187 | - |
Asset-Backed Securities | 57,118,845 | - | 55,292,971 | 1,825,874 |
Collateralized Mortgage Obligations | 10,249,596 | - | 9,863,152 | 386,444 |
Commercial Mortgage Securities | 33,169,959 | - | 30,312,155 | 2,857,804 |
Municipal Securities | 2,623,329 | - | 2,623,329 | - |
Foreign Government and Government Agency Obligations | 7,663,606 | - | 7,663,606 | - |
Supranational Obligations | 38,408 | - | 38,408 | - |
Bank Notes | 2,385,781 | - | 2,385,781 | - |
Fixed-Income Funds | 4,991,856 | 4,991,856 | - | - |
Money Market Funds | 4,489,158 | 4,489,158 | - | - |
Total Investments in Securities: | $ 629,682,796 | $ 9,481,014 | $ 615,131,660 | $ 5,070,122 |
Derivative Instruments: | | | | |
Liabilities | | | | |
Swap Agreements | $ (429,063) | $ - | $ - | $ (429,063) |
The following is a reconciliation of Investments in Securities and Derivative Instruments for which Level 3 inputs were used in determining value: |
Investments in Securities: | |
Beginning Balance | $ 6,731,716 |
Total Realized Gain (Loss) | 118,750 |
Total Unrealized Gain (Loss) | (426,378) |
Cost of Purchases | 1,384 |
Proceeds of Sales | (1,212,984) |
Amortization/Accretion | 48,687 |
Transfers in to Level 3 | 1,781,183 |
Transfers out of Level 3 | (1,972,236) |
Ending Balance | $ 5,070,122 |
The change in unrealized gain (loss) for the period attributable to Level 3 securities held at February 29, 2012 | $ (372,458) |
Derivative Instruments: | |
Swap Agreements | |
Beginning Balance | $ (374,228) |
Total Unrealized Gain (Loss) | (54,835) |
Transfers in to Level 3 | - |
Transfers out of Level 3 | - |
Ending Balance | $ (429,063) |
Realized gain (loss) on Swap Agreements for the period | $ 6,578 |
The change in unrealized gain (loss) for the period attributable to Level 3 Swap Agreements held at February 29, 2012 | $ (54,835) |
The information used in the above reconciliations represents fiscal year to date activity for any Investments in Securities and Derivative Instruments identified as using Level 3 inputs at either the beginning or the end of the current fiscal period. Transfers in or out of Level 3 represent the beginning value of any Security or Instrument where a change in the pricing level occurred from the beginning to the end of the period. The cost of purchases and the proceeds of sales may include securities received or delivered through corporate actions or exchanges. Realized and unrealized gains (losses) disclosed in the reconciliations are included in Net Gain (Loss) on the Fund's Statement of Operations. |
Value of Derivative Instruments |
The following table is a summary of the Fund's value of derivative instruments by risk exposure as of February 29, 2012. For additional information on derivative instruments, please refer to the Derivative Instruments section in the accompanying Notes to Financial Statements. |
Risk Exposure /
Derivative Type | Value |
| Asset | Liability |
Credit Risk | | |
Swap Agreements (a) | $ - | $ (429,063) |
(a) Value is disclosed on the Statement of Assets and Liabilities in the Swap agreements, at value line-items. |
See accompanying notes which are an integral part of the financial statements.
Semiannual Report
Statement of Assets and Liabilities
| February 29, 2012 (Unaudited) |
| | |
Assets | | |
Investment in securities, at value - See accompanying schedule: Unaffiliated issuers (cost $584,642,205) | $ 620,201,782 | |
Fidelity Central Funds (cost $9,293,549) | 9,481,014 | |
Total Investments (cost $593,935,754) | | $ 629,682,796 |
Cash | | 18,161 |
Receivable for investments sold | | 2,219,076 |
Receivable for swap agreements | | 1,247 |
Receivable for fund shares sold | | 850,329 |
Interest receivable | | 3,830,354 |
Distributions receivable from Fidelity Central Funds | | 563 |
Prepaid expenses | | 883 |
Other receivables | | 404,301 |
Total assets | | 637,007,710 |
| | |
Liabilities | | |
Payable for investments purchased | $ 399,951 | |
Payable for fund shares redeemed | 1,887,229 | |
Distributions payable | 162,302 | |
Swap agreements, at value | 429,063 | |
Accrued management fee | 167,027 | |
Distribution and service plan fees payable | 156,281 | |
Other affiliated payables | 111,609 | |
Other payables and accrued expenses | 458,275 | |
Total liabilities | | 3,771,737 |
| | |
Net Assets | | $ 633,235,973 |
Net Assets consist of: | | |
Paid in capital | | $ 643,415,153 |
Undistributed net investment income | | 4,149,584 |
Accumulated undistributed net realized gain (loss) on investments | | (49,643,962) |
Net unrealized appreciation (depreciation) on investments and assets and liabilities in foreign currencies | | 35,315,198 |
Net Assets | | $ 633,235,973 |
See accompanying notes which are an integral part of the financial statements.
Semiannual Report
Financial Statements - continued
Statement of Assets and Liabilities - continued
| February 29, 2012 (Unaudited) |
| | |
Calculation of Maximum Offering Price Class A:
Net Asset Value and redemption price per share ($194,586,929 ÷ 16,913,811 shares) | | $ 11.50 |
| | |
Maximum offering price per share (100/97.25 of $11.50) | | $ 11.83 |
Class T:
Net Asset Value and redemption price per share ($269,477,378 ÷ 23,409,935 shares) | | $ 11.51 |
| | |
Maximum offering price per share (100/97.25 of $11.51) | | $ 11.84 |
Class B:
Net Asset Value and offering price per share ($5,996,550 ÷ 521,825 shares)A | | $ 11.49 |
Class C:
Net Asset Value and offering price per share ($65,469,656 ÷ 5,702,970 shares)A | | $ 11.48 |
Institutional Class:
Net Asset Value, offering price and redemption price per share ($97,705,460 ÷ 8,470,878 shares) | | $ 11.53 |
A Redemption price per share is equal to net asset value less any applicable contingent deferred sales charge.
See accompanying notes which are an integral part of the financial statements.
Semiannual Report
Statement of Operations
| Six months ended February 29, 2012 (Unaudited) |
| | |
Investment Income | | |
Dividends | | $ 5,285 |
Interest | | 11,091,058 |
Income from Fidelity Central Funds | | 160,410 |
Total income | | 11,256,753 |
| | |
Expenses | | |
Management fee | $ 998,670 | |
Transfer agent fees | 551,889 | |
Distribution and service plan fees | 934,798 | |
Accounting and security lending fees | 123,483 | |
Custodian fees and expenses | 16,261 | |
Independent trustees' compensation | 1,224 | |
Registration fees | 54,587 | |
Audit | 57,254 | |
Legal | 1,246 | |
Miscellaneous | 2,567 | |
Total expenses before reductions | 2,741,979 | |
Expense reductions | (59) | 2,741,920 |
Net investment income (loss) | | 8,514,833 |
Realized and Unrealized Gain (Loss) Net realized gain (loss) on: | | |
Investment securities: | | |
Unaffiliated issuers | 4,829,585 | |
Fidelity Central Funds | 18,829 | |
Swap agreements | 6,578 | |
Total net realized gain (loss) | | 4,854,992 |
Change in net unrealized appreciation (depreciation) on: Investment securities | (2,367,986) | |
Swap agreements | (54,835) | |
Total change in net unrealized appreciation (depreciation) | | (2,422,821) |
Net gain (loss) | | 2,432,171 |
Net increase (decrease) in net assets resulting from operations | | $ 10,947,004 |
See accompanying notes which are an integral part of the financial statements.
Semiannual Report
Financial Statements - continued
Statement of Changes in Net Assets
| Six months ended
February 29, 2012
(Unaudited) | Year ended
August 31,
2011 |
Increase (Decrease) in Net Assets | | |
Operations | | |
Net investment income (loss) | $ 8,514,833 | $ 19,519,052 |
Net realized gain (loss) | 4,854,992 | 16,567,374 |
Change in net unrealized appreciation (depreciation) | (2,422,821) | (9,619,670) |
Net increase (decrease) in net assets resulting
from operations | 10,947,004 | 26,466,756 |
Distributions to shareholders from net investment income | (7,617,845) | (18,348,879) |
Distributions to shareholders from net realized gain | - | (937,926) |
Total distributions | (7,617,845) | (19,286,805) |
Share transactions - net increase (decrease) | 8,213,613 | (96,763,897) |
Total increase (decrease) in net assets | 11,542,772 | (89,583,946) |
| | |
Net Assets | | |
Beginning of period | 621,693,201 | 711,277,147 |
End of period (including undistributed net investment income of $4,149,584 and undistributed net investment income of $3,252,596, respectively) | $ 633,235,973 | $ 621,693,201 |
See accompanying notes which are an integral part of the financial statements.
Semiannual Report
Financial Highlights - Class A
| Six months ended February 29, 2012 | Years ended August 31, |
| (Unaudited) | 2011 | 2010 | 2009 | 2008 | 2007 |
Selected Per-Share Data | | | | | |
Net asset value, beginning of period | $ 11.45 | $ 11.28 | $ 10.48 | $ 10.31 | $ 10.64 | $ 10.78 |
Income from Investment Operations | | | | | | |
Net investment income (loss) E | .156 | .344 | .416 | .435 | .457 | .487 |
Net realized and unrealized gain (loss) | .034 | .163 | .793 | .149 | (.319) | (.167) |
Total from investment operations | .190 | .507 | 1.209 | .584 | .138 | .320 |
Distributions from net investment income | (.140) | (.322) | (.372) | (.414) | (.468) | (.460) |
Distributions from net realized gain | - | (.015) | (.037) | - | - | - |
Total distributions | (.140) | (.337) | (.409) | (.414) | (.468) | (.460) |
Net asset value, end of period | $ 11.50 | $ 11.45 | $ 11.28 | $ 10.48 | $ 10.31 | $ 10.64 |
Total Return B, C, D | 1.67% | 4.59% | 11.77% | 6.05% | 1.28% | 2.99% |
Ratios to Average Net Assets F, H | | | | | | |
Expenses before reductions | .84% A | .83% | .85% | .87% | .85% | .79% |
Expenses net of fee waivers, if any | .84% A | .83% | .85% | .87% | .85% | .79% |
Expenses net of all reductions | .84% A | .83% | .85% | .87% | .85% | .78% |
Net investment income (loss) | 2.75% A | 3.06% | 3.84% | 4.45% | 4.32% | 4.52% |
Supplemental Data | | | | | | |
Net assets, end of period (000 omitted) | $ 194,587 | $ 187,442 | $ 211,123 | $ 195,407 | $ 216,683 | $ 255,591 |
Portfolio turnover rate G | 119% A | 108% I | 107% I | 73% I | 81% | 89% I |
A Annualized
B Total returns for periods of less than one year are not annualized.
C Total returns would have been lower if certain expenses had not been reduced during the applicable periods shown.
D Total returns do not include the effect of the sales charges.
E Calculated based on average shares outstanding during the period.
F Fees and expenses of any underlying Fidelity Central Funds are not included in the Fund's expense ratio. The Fund indirectly bears its proportionate share of the expenses of any underlying Fidelity Central Funds.
G Amount does not include the portfolio activity of any underlying Fidelity Central Funds.
H Expense ratios reflect operating expenses of the class. Expenses before reductions do not reflect amounts reimbursed by the investment adviser or reductions from brokerage service arrangements or reductions from other expense offset arrangements and do not represent the amount paid by the class during periods when reimbursements or reductions occur. Expenses net of fee waivers reflect expenses after reimbursement by the investment adviser but prior to reductions from brokerage service arrangements or other expense offset arrangements. Expenses net of all reductions represent the net expenses paid by the class.
I The portfolio turnover rate excludes liquidations and redemptions executed in-kind from Affiliated Central Funds.
See accompanying notes which are an integral part of the financial statements.
Semiannual Report
Financial Highlights - Class T
| Six months ended February 29, 2012 | Years ended August 31, |
| (Unaudited) | 2011 | 2010 | 2009 | 2008 | 2007 |
Selected Per-Share Data | | | | | |
Net asset value, beginning of period | $ 11.45 | $ 11.29 | $ 10.48 | $ 10.32 | $ 10.64 | $ 10.79 |
Income from Investment Operations | | | | | | |
Net investment income (loss) E | .158 | .348 | .420 | .440 | .462 | .484 |
Net realized and unrealized gain (loss) | .044 | .153 | .803 | .139 | (.310) | (.178) |
Total from investment operations | .202 | .501 | 1.223 | .579 | .152 | .306 |
Distributions from net investment income | (.142) | (.326) | (.376) | (.419) | (.472) | (.456) |
Distributions from net realized gain | - | (.015) | (.037) | - | - | - |
Total distributions | (.142) | (.341) | (.413) | (.419) | (.472) | (.456) |
Net asset value, end of period | $ 11.51 | $ 11.45 | $ 11.29 | $ 10.48 | $ 10.32 | $ 10.64 |
Total Return B, C, D | 1.78% | 4.53% | 11.90% | 6.00% | 1.41% | 2.85% |
Ratios to Average Net Assets F, H | | | | | | |
Expenses before reductions | .81% A | .80% | .81% | .82% | .82% | .82% |
Expenses net of fee waivers, if any | .81% A | .80% | .81% | .82% | .82% | .82% |
Expenses net of all reductions | .81% A | .80% | .81% | .82% | .82% | .82% |
Net investment income (loss) | 2.78% A | 3.09% | 3.87% | 4.50% | 4.35% | 4.48% |
Supplemental Data | | | | | | |
Net assets, end of period (000 omitted) | $ 269,477 | $ 274,215 | $ 314,110 | $ 290,428 | $ 344,229 | $ 503,737 |
Portfolio turnover rate G | 119% A | 108% I | 107% I | 73% I | 81% | 89% I |
A Annualized
B Total returns for periods of less than one year are not annualized.
C Total returns would have been lower if certain expenses had not been reduced during the applicable periods shown.
D Total returns do not include the effect of the sales charges.
E Calculated based on average shares outstanding during the period.
F Fees and expenses of any underlying Fidelity Central Funds are not included in the Fund's expense ratio. The Fund indirectly bears its proportionate share of the expenses of any underlying Fidelity Central Funds.
G Amount does not include the portfolio activity of any underlying Fidelity Central Funds.
H Expense ratios reflect operating expenses of the class. Expenses before reductions do not reflect amounts reimbursed by the investment adviser or reductions from brokerage service arrangements or reductions from other expense offset arrangements and do not represent the amount paid by the class during periods when reimbursements or reductions occur. Expenses net of fee waivers reflect expenses after reimbursement by the investment adviser but prior to reductions from brokerage service arrangements or other expense offset arrangements. Expenses net of all reductions represent the net expenses paid by the class.
I The portfolio turnover rate excludes liquidations and redemptions executed in-kind from Affiliated Central Funds.
See accompanying notes which are an integral part of the financial statements.
Semiannual Report
Financial Highlights - Class B
| Six months ended February 29, 2012 | Years ended August 31, |
| (Unaudited) | 2011 | 2010 | 2009 | 2008 | 2007 |
Selected Per-Share Data | | | | | |
Net asset value, beginning of period | $ 11.43 | $ 11.27 | $ 10.47 | $ 10.30 | $ 10.63 | $ 10.77 |
Income from Investment Operations | | | | | | |
Net investment income (loss) E | .115 | .264 | .339 | .369 | .385 | .409 |
Net realized and unrealized gain (loss) | .044 | .154 | .794 | .150 | (.318) | (.169) |
Total from investment operations | .159 | .418 | 1.133 | .519 | .067 | .240 |
Distributions from net investment income | (.099) | (.243) | (.296) | (.349) | (.397) | (.380) |
Distributions from net realized gain | - | (.015) | (.037) | - | - | - |
Total distributions | (.099) | (.258) | (.333) | (.349) | (.397) | (.380) |
Net asset value, end of period | $ 11.49 | $ 11.43 | $ 11.27 | $ 10.47 | $ 10.30 | $ 10.63 |
Total Return B, C, D | 1.40% | 3.77% | 11.00% | 5.35% | .60% | 2.24% |
Ratios to Average Net Assets F, H | | | | | | |
Expenses before reductions | 1.57% A | 1.55% | 1.55% | 1.54% | 1.53% | 1.52% |
Expenses net of fee waivers, if any | 1.57% A | 1.55% | 1.55% | 1.54% | 1.53% | 1.52% |
Expenses net of all reductions | 1.57% A | 1.55% | 1.55% | 1.54% | 1.53% | 1.52% |
Net investment income (loss) | 2.02% A | 2.35% | 3.13% | 3.78% | 3.64% | 3.78% |
Supplemental Data | | | | | | |
Net assets, end of period (000 omitted) | $ 5,997 | $ 7,018 | $ 10,941 | $ 11,753 | $ 15,141 | $ 22,609 |
Portfolio turnover rate G | 119% A | 108% I | 107% I | 73% I | 81% | 89% I |
A Annualized
B Total returns for periods of less than one year are not annualized.
C Total returns would have been lower if certain expenses had not been reduced during the applicable periods shown.
D Total returns do not include the effect of the contingent deferred sales charge.
E Calculated based on average shares outstanding during the period.
F Fees and expenses of any underlying Fidelity Central Funds are not included in the Fund's expense ratio. The Fund indirectly bears its proportionate share of the expenses of any underlying Fidelity Central Funds.
G Amount does not include the portfolio activity of any underlying Fidelity Central Funds.
H Expense ratios reflect operating expenses of the class. Expenses before reductions do not reflect amounts reimbursed by the investment adviser or reductions from brokerage service arrangements or reductions from other expense offset arrangements and do not represent the amount paid by the class during periods when reimbursements or reductions occur. Expenses net of fee waivers reflect expenses after reimbursement by the investment adviser but prior to reductions from brokerage service arrangements or other expense offset arrangements. Expenses net of all reductions represent the net expenses paid by the class.
I The portfolio turnover rate excludes liquidations and redemptions executed in-kind from Affiliated Central Funds.
See accompanying notes which are an integral part of the financial statements.
Semiannual Report
Financial Highlights - Class C
| Six months ended February 29, 2012 | Years ended August 31, |
| (Unaudited) | 2011 | 2010 | 2009 | 2008 | 2007 |
Selected Per-Share Data | | | | | |
Net asset value, beginning of period | $ 11.42 | $ 11.26 | $ 10.46 | $ 10.29 | $ 10.62 | $ 10.76 |
Income from Investment Operations | | | | | | |
Net investment income (loss) E | .114 | .262 | .338 | .364 | .378 | .400 |
Net realized and unrealized gain (loss) | .044 | .154 | .794 | .150 | (.317) | (.167) |
Total from investment operations | .158 | .416 | 1.132 | .514 | .061 | .233 |
Distributions from net investment income | (.098) | (.241) | (.295) | (.344) | (.391) | (.373) |
Distributions from net realized gain | - | (.015) | (.037) | - | - | - |
Total distributions | (.098) | (.256) | (.332) | (.344) | (.391) | (.373) |
Net asset value, end of period | $ 11.48 | $ 11.42 | $ 11.26 | $ 10.46 | $ 10.29 | $ 10.62 |
Total Return B, C, D | 1.39% | 3.76% | 11.00% | 5.31% | .54% | 2.18% |
Ratios to Average Net Assets F, H | | | | | | |
Expenses before reductions | 1.58% A | 1.56% | 1.56% | 1.59% | 1.59% | 1.59% |
Expenses net of fee waivers, if any | 1.58% A | 1.56% | 1.56% | 1.59% | 1.59% | 1.59% |
Expenses net of all reductions | 1.58% A | 1.56% | 1.56% | 1.59% | 1.59% | 1.58% |
Net investment income (loss) | 2.00% A | 2.33% | 3.12% | 3.73% | 3.58% | 3.72% |
Supplemental Data | | | | | | |
Net assets, end of period (000 omitted) | $ 65,470 | $ 63,435 | $ 80,043 | $ 63,750 | $ 52,529 | $ 58,693 |
Portfolio turnover rate G | 119% A | 108% I | 107% I | 73% I | 81% | 89% I |
A Annualized
B Total returns for periods of less than one year are not annualized.
C Total returns would have been lower if certain expenses had not been reduced during the applicable periods shown.
D Total returns do not include the effect of the contingent deferred sales charge.
E Calculated based on average shares outstanding during the period.
F Fees and expenses of any underlying Fidelity Central Funds are not included in the Fund's expense ratio. The Fund indirectly bears its proportionate share of the expenses of any underlying Fidelity Central Funds.
G Amount does not include the portfolio activity of any underlying Fidelity Central Funds.
H Expense ratios reflect operating expenses of the class. Expenses before reductions do not reflect amounts reimbursed by the investment adviser or reductions from brokerage service arrangements or reductions from other expense offset arrangements and do not represent the amount paid by the class during periods when reimbursements or reductions occur. Expenses net of fee waivers reflect expenses after reimbursement by the investment adviser but prior to reductions from brokerage service arrangements or other expense offset arrangements. Expenses net of all reductions represent the net expenses paid by the class.
I The portfolio turnover rate excludes liquidations and redemptions executed in-kind from Affiliated Central Funds.
See accompanying notes which are an integral part of the financial statements.
Semiannual Report
Financial Highlights - Institutional Class
| Six months ended February 29, 2012 | Years ended August 31, |
| (Unaudited) | 2011 | 2010 | 2009 | 2008 | 2007 |
Selected Per-Share Data | | | | | |
Net asset value, beginning of period | $ 11.48 | $ 11.31 | $ 10.50 | $ 10.34 | $ 10.66 | $ 10.80 |
Income from Investment Operations | | | | | | |
Net investment income (loss) D | .171 | .373 | .447 | .468 | .494 | .513 |
Net realized and unrealized gain (loss) | .033 | .163 | .802 | .139 | (.311) | (.169) |
Total from investment operations | .204 | .536 | 1.249 | .607 | .183 | .344 |
Distributions from net investment income | (.154) | (.351) | (.402) | (.447) | (.503) | (.484) |
Distributions from net realized gain | - | (.015) | (.037) | - | - | - |
Total distributions | (.154) | (.366) | (.439) | (.447) | (.503) | (.484) |
Net asset value, end of period | $ 11.53 | $ 11.48 | $ 11.31 | $ 10.50 | $ 10.34 | $ 10.66 |
Total Return B, C | 1.79% | 4.85% | 12.15% | 6.30% | 1.71% | 3.22% |
Ratios to Average Net Assets E, G | | | | | | |
Expenses before reductions | .59% A | .58% | .57% | .54% | .53% | .55% |
Expenses net of fee waivers, if any | .59% A | .58% | .57% | .54% | .53% | .55% |
Expenses net of all reductions | .59% A | .58% | .57% | .54% | .53% | .55% |
Net investment income (loss) | 3.00% A | 3.32% | 4.11% | 4.78% | 4.64% | 4.75% |
Supplemental Data | | | | | | |
Net assets, end of period (000 omitted) | $ 97,705 | $ 89,583 | $ 95,061 | $ 78,372 | $ 362,708 | $ 715,292 |
Portfolio turnover rate F | 119% A | 108% H | 107% H | 73% H | 81% | 89% H |
A Annualized
B Total returns for periods of less than one year are not annualized.
C Total returns would have been lower if certain expenses had not been reduced during the applicable periods shown.
D Calculated based on average shares outstanding during the period.
E Fees and expenses of any underlying Fidelity Central Funds are not included in the Fund's expense ratio. The Fund indirectly bears its proportionate share of the expenses of any underlying Fidelity Central Funds.
F Amount does not include the portfolio activity of any underlying Fidelity Central Funds.
G Expense ratios reflect operating expenses of the class. Expenses before reductions do not reflect amounts reimbursed by the investment adviser or reductions from brokerage service arrangements or reductions from other expense offset arrangements and do not represent the amount paid by the class during periods when reimbursements or reductions occur. Expenses net of fee waivers reflect expenses after reimbursement by the investment adviser but prior to reductions from brokerage service arrangements or other expense offset arrangements. Expenses net of all reductions represent the net expenses paid by the class.
H The portfolio turnover rate excludes liquidations and redemptions executed in-kind from Affiliated Central Funds.
See accompanying notes which are an integral part of the financial statements.
Semiannual Report
Notes to Financial Statements
For the period ended February 29, 2012 (Unaudited)
1. Organization.
Fidelity Advisor® Intermediate Bond Fund (the Fund) is a fund of Fidelity Advisor Series II (the Trust) and is authorized to issue an unlimited number of shares. The Trust is registered under the Investment Company Act of 1940, as amended (the 1940 Act), as an open-end management investment company organized as a Massachusetts business trust. The Fund offers Class A, Class T, Class C and Institutional Class shares, each of which, along with Class B shares, has equal rights as to assets and voting privileges. Effective after the close of business on September 1, 2010, Class B shares were closed to new accounts and additional purchases, except for exchanges and reinvestments. Each class has exclusive voting rights with respect to matters that affect that class. Class B shares will automatically convert to Class A shares after a holding period of four years from the initial date of purchase. Investment income, realized and unrealized capital gains and losses, the common expenses of the Fund, and certain fund-level expense reductions, if any, are allocated on a pro-rata basis to each class based on the relative net assets of each class to the total net assets of the Fund. Each class differs with respect to transfer agent and distribution and service plan fees incurred. Certain expense reductions may also differ by class.
2. Investments in Fidelity Central Funds.
The Fund invests in Fidelity Central Funds, which are open-end investment companies available only to other investment companies and accounts managed by Fidelity Management & Research Company (FMR) and its affiliates. The Fund's Schedule of Investments lists each of the Fidelity Central Funds held as of period end, if any, as an investment of the Fund, but does not include the underlying holdings of each Fidelity Central Fund. As an Investing Fund, the Fund indirectly bears its proportionate share of the expenses of the underlying Fidelity Central Funds.
Based on their investment objective, each Fidelity Central Fund may invest or participate in various investment vehicles or strategies that are similar to those of the Fund. These strategies are consistent with the investment objectives of the Fund and may involve certain economic risks which may cause a decline in value of each of the Fidelity Central Funds and thus a decline in the value of the Fund. The Money Market Central Funds seek preservation of capital and current income and are managed by Fidelity Investments Money Management, Inc. (FIMM), an affiliate of FMR. The following summarizes the Fund's investment in each Fidelity Central Fund.
Semiannual Report
2. Investments in Fidelity Central Funds - continued
Fidelity Central Fund | Investment Manager | Investment Objective | Investment Practices |
Fidelity Specialized High Income Central Fund | FMR Co., Inc. (FMRC) | Seeks a high level of current income by normally investing in income-producing debt securities, with an emphasis on lower-quality debt securities. | Delayed Delivery & When Issued Securities Loans & Direct Debt Instruments Repurchase Agreements Restricted Securities |
An unaudited holdings listing for the Fund, which presents direct holdings as well as the pro-rata share of any securities and other investments held indirectly through its investment in underlying non-money market Fidelity Central Funds, is available at advisor.fidelity.com. A complete unaudited list of holdings for each Fidelity Central Fund is available upon request or at the Securities and Exchange Commission (the SEC) web site at www.sec.gov. In addition, the financial statements of the Fidelity Central Funds which contain the significant accounting policies (including security valuation policies) of those funds are available on the SEC web site or upon request.
3. Significant Accounting Policies.
The financial statements have been prepared in conformity with accounting principles generally accepted in the United States of America (GAAP), which require management to make certain estimates and assumptions at the date of the financial statements. Actual results could differ from those estimates. Subsequent events, if any, through the date that the financial statements were issued have been evaluated in the preparation of the financial statements. The following summarizes the significant accounting policies of the Fund:
Security Valuation. Investments are valued as of 4:00 p.m. Eastern time on the last calendar day of the period. The Fund uses independent pricing services approved by the Board of Trustees to value its investments. When current market prices or quotations are not readily available or reliable, valuations may be determined in good faith in accordance with procedures adopted by the Board of Trustees. Factors used in determining value may include market or security specific events, changes in interest rates and credit quality. The frequency with which these procedures are used cannot be predicted and they may be utilized to a significant extent. The value used for net asset value (NAV) calculation under these procedures may differ from published prices for the same securities.
Semiannual Report
Notes to Financial Statements (Unaudited) - continued
3. Significant Accounting Policies - continued
Security Valuation - continued
The Fund categorizes the inputs to valuation techniques used to value its investments into a disclosure hierarchy consisting of three levels as shown below:
Level 1 - quoted prices in active markets for identical investments
Level 2 - other significant observable inputs (including quoted prices for similar investments, interest rates, prepayment speeds, etc.)
Level 3 - unobservable inputs (including the Fund's own assumptions based on the best information available)
Changes in valuation techniques may result in transfers in or out of an assigned level within the disclosure hierarchy. The aggregate value of investments by input level, as of February 29, 2012 for the Fund's investments, as well as a roll forward of Level 3 securities, is included at the end of the Fund's Schedule of Investments. Valuation techniques used to value the Fund's investments by major category are as follows:
Debt securities, including restricted securities, are valued based on evaluated prices received from independent pricing services or from dealers who make markets in such securities. For corporate bonds, bank notes, foreign government and government agency obligations, municipal securities, supranational obligations and U.S. government and government agency obligations, pricing services utilize matrix pricing which considers yield or price of bonds of comparable quality, coupon, maturity and type as well as dealer supplied prices and are generally categorized as Level 2 in the hierarchy. For asset backed securities, collateralized mortgage obligations, commercial mortgage securities and U.S. government agency mortgage securities, pricing services utilize matrix pricing which considers prepayment speed assumptions, attributes of the collateral, yield or price of bonds of comparable quality, coupon, maturity and type as well as dealer supplied prices and, accordingly, such securities are generally categorized as Level 2 in the hierarchy. Swaps are marked-to-market daily based on valuations from independent pricing services or dealer-supplied valuations and changes in value are recorded as unrealized appreciation (depreciation). Pricing services utilize matrix pricing which considers comparisons to interest rate curves, credit spread curves, default possibilities and recovery rates and, as a result, swaps are generally categorized as Level 2 in the hierarchy. When independent prices are unavailable or unreliable, debt securities and swaps may be valued utilizing pricing matrices which consider similar factors that would be used by independent pricing services. These are generally categorized as Level 2 in the hierarchy but may be Level 3 depending on the circumstances.
Semiannual Report
3. Significant Accounting Policies - continued
Security Valuation - continued
Investments in open-end mutual funds, including the Fidelity Central Funds, are valued at their closing net asset value each business day and are categorized as Level 1 in the hierarchy.
New Accounting Pronouncements. In May 2011, the Financial Accounting Standards Board issued Accounting Standard Update No. 2011-04, Fair Value Measurement (Topic 820) - Amendments to Achieve Common Fair Value Measurement and Disclosure Requirements in U.S. GAAP and IFRSs. The update is effective during interim and annual periods beginning after December 15, 2011 and will result in additional disclosure for transfers between levels as well as expanded disclosure for securities categorized as Level 3 under the fair value hierarchy.
In December 2011, the Financial Accounting Standards Board issued Accounting Standard Update No. 2011-11, Disclosures about Offsetting Assets and Liabilities. The update creates new disclosure requirements requiring entities to disclose both gross and net information for derivatives and other financial instruments that are either offset in the Statement of Assets and Liabilities or subject to an enforceable master netting arrangement or similar agreement. The disclosure requirements are effective for interim and annual reporting periods beginning on or after January 1, 2013. Management is currently evaluating the impact of the update's adoption on the Fund's financial statement disclosures.
Investment Transactions and Income. For financial reporting purposes, the Fund's investment holdings and NAV include trades executed through the end of the last business day of the period. The NAV per share for processing shareholder transactions is calculated as of the close of business of the New York Stock Exchange (NYSE), normally 4:00 p.m. Eastern time and includes trades executed through the end of the prior business day. Gains and losses on securities sold are determined on the basis of identified cost and may include proceeds received from litigation. Dividend income is recorded on the ex-dividend date. Interest income and distributions from the Fidelity Central Funds are accrued as earned. Interest income includes coupon interest and amortization of premium and accretion of discount on debt securities. The principal amount on inflation-indexed securities is periodically adjusted to the rate of inflation and interest is accrued based on the principal amount. The adjustments to principal due to inflation are reflected as increases or decreases to interest income even though principal is not received until maturity. Debt obligations may be placed on non-accrual status and related interest income may be reduced by ceasing current accruals and writing off interest receivables when the collection of all or a portion of interest has become doubtful based on consistently applied procedures. A debt obligation is removed from non-accrual status when the issuer resumes interest payments or when collectability of interest is reasonably assured.
Semiannual Report
Notes to Financial Statements (Unaudited) - continued
3. Significant Accounting Policies - continued
Expenses. Expenses directly attributable to a fund are charged to that fund. Expenses attributable to more than one fund are allocated among the respective funds on the basis of relative net assets or other appropriate methods. Expense estimates are accrued in the period to which they relate and adjustments are made when actual amounts are known.
Income Tax Information and Distributions to Shareholders. Each year, the Fund intends to qualify as a regulated investment company under Subchapter M of the Internal Revenue Code, including distributing substantially all of its taxable income and realized gains. As a result, no provision for income taxes is required. The Fund files a U.S. federal tax return, in addition to state and local tax returns as required. A fund's federal income tax returns are subject to examination by the Internal Revenue Service (IRS) for a period of three fiscal years after they are filed. State and local tax returns may be subject to examination for an additional fiscal year depending on the jurisdiction.
Dividends are declared and recorded daily and paid monthly from net investment income. Distributions from realized gains, if any, are declared and recorded on the ex-dividend date. Income dividends and capital gain distributions are declared separately for each class. Income and capital gain distributions are determined in accordance with income tax regulations, which may differ from GAAP.
Capital accounts within the financial statements are adjusted for permanent book-tax differences. These adjustments have no impact on net assets or the results of operations. Temporary book-tax differences will reverse in a subsequent period.
Book-tax differences are primarily due to swap agreements, market discount, partnerships (including allocations from Fidelity Central Funds), deferred trustees compensation, capital loss carryforwards and losses deferred due to wash sales.
The federal tax cost of investment securities and unrealized appreciation (depreciation) as of period end were as follows:
Gross unrealized appreciation | $ 26,489,345 |
Gross unrealized depreciation | (2,677,381) |
Net unrealized appreciation (depreciation) on securities and other investments | $ 23,811,964 |
| |
Tax cost | $ 605,870,832 |
Capital loss carryforwards are only available to offset future capital gains of the Fund to the extent provided by regulations and may be limited. Under the Regulated Investment Company Modernization Act of 2010 (the Act), the Fund is permitted to carry forward
Semiannual Report
3. Significant Accounting Policies - continued
Income Tax Information and Distributions to Shareholders - continued
capital losses incurred in taxable years beginning after December 22, 2010 for an unlimited period and such capital losses are required to be used prior to any losses that expire. At August 31, 2011 capital loss carryforwards were as follows:
Fiscal year of expiration | |
2016 | $ (3,445,754) |
2017 | (13,593,034) |
2018 | (18,759,952) |
Total capital loss carryforward | $ (35,798,740) |
4. Operating Policies.
Restricted Securities. The Fund may invest in securities that are subject to legal or contractual restrictions on resale. These securities generally may be resold in transactions exempt from registration or to the public if the securities are registered. Disposal of these securities may involve time-consuming negotiations and expense, and prompt sale at an acceptable price may be difficult. Information regarding restricted securities is included at the end of the Fund's Schedule of Investments.
5. Derivative Instruments.
Risk Exposures and the Use of Derivative Instruments. The Fund used derivative instruments (derivatives), including swap agreements, in order to meet its investment objectives. The strategy is to use derivatives to increase returns, to gain exposure to certain types of assets and to manage exposure to certain risks as defined below. The success of any strategy involving derivatives depends on analysis of numerous economic factors, and if the strategies for investment do not work as intended, the Fund may not achieve its objectives.
The Fund's use of derivatives increased or decreased its exposure to the following risk:
Credit Risk | Credit risk relates to the ability of the issuer of a financial instrument to make further principal or interest payments on an obligation or commitment that it has to the Fund. |
The Fund is also exposed to additional risks from investing in derivatives, such as liquidity risk and counterparty credit risk. Liquidity risk is the risk that the Fund will be unable to close out the derivative in the open market in a timely manner. Counterparty credit risk is the risk that the counterparty will not be able to fulfill its obligation to the Fund. Derivative counterparty credit risk is managed through formal evaluation of the creditworthiness of all potential counterparties. On certain over-the-counter (OTC)
Semiannual Report
Notes to Financial Statements (Unaudited) - continued
5. Derivative Instruments - continued
Risk Exposures and the Use of Derivative Instruments - continued
derivatives such as swap agreements, the Fund attempts to reduce its exposure to counterparty credit risk by entering into an International Swaps and Derivatives Association (ISDA) Master Agreement on a bilateral basis with each of its counterparties. The ISDA Master Agreement gives the Fund the right to terminate all transactions traded under such agreement if there is a certain deterioration in the credit quality of the counterparty. The ISDA Master Agreement gives each party the right, upon an event of default by the other party or a termination of the agreement, to close out all transactions traded under such agreement and to net amounts owed under each transaction to one net payable by one party to the other. To mitigate counterparty credit risk on OTC derivatives, the Fund receives collateral in the form of cash or securities once the Fund's net unrealized appreciation on outstanding derivative contracts under an ISDA Master Agreement exceeds certain applicable thresholds, subject to certain minimum transfer provisions. The collateral received is held in segregated accounts with the Fund's custodian bank in accordance with the collateral agreements entered into between the Fund, the counterparty and the Fund's custodian bank. The Fund could experience delays and costs in gaining access to the collateral even though it is held by the Fund's custodian bank. The Fund's maximum risk of loss from counterparty credit risk related to OTC derivatives is generally the aggregate unrealized appreciation and unpaid counterparty payments in excess of any collateral pledged by the counterparty to the Fund. The Fund may be required to pledge collateral for the benefit of the counterparties on OTC derivatives in an amount not less than the counterparty's unrealized appreciation on outstanding derivative contracts, subject to certain minimum transfer provisions, and any such pledged collateral is identified in the Schedule of Investments. Derivatives involve, to varying degrees, risk of loss in excess of the amounts recognized in the Statement of Assets and Liabilities.
Net Realized Gain (Loss) and Change in Net Unrealized Appreciation (Depreciation) on Derivatives. The table below, which reflects the impacts of derivatives on the financial performance of the Fund, summarizes the net realized gain (loss) and change in net unrealized appreciation (depreciation) for derivatives during the period.
Risk Exposure / Derivative Type | Net Realized Gain (Loss) | Change in Net Unrealized Appreciation (Depreciation) |
Credit Risk | | |
Swap Agreements (a) | 6,578 | (54,835) |
(a) A summary of the value of derivatives by risk exposure as of period end, is included at the end of the Schedule of Investments and is representative of activity for the period.
Semiannual Report
5. Derivative Instruments - continued
Swap Agreements. A swap agreement (swap) is a contract between two parties to exchange future cash flows at periodic intervals based on a notional principal amount.
Details of swaps open at period end are included in the Schedule of Investments under the caption "Swap Agreements." Swaps are marked-to-market daily and changes in value are recorded as unrealized appreciation or (depreciation) and reflected in the Statement of Assets and Liabilities. Any upfront premiums paid or received upon entering a swap to compensate for differences between stated terms of the agreement and prevailing market conditions (e.g. credit spreads, interest rates or other factors) are recorded as realized gain or (loss) ratably over the term of the swap. Payments are exchanged at specified intervals, accrued daily commencing with the effective date of the contract and recorded as realized gain or (loss). Realized gain or (loss) is also recorded in the event of an early termination of a swap. The net realized gain (loss) and change in net unrealized appreciation (depreciation) on swaps during the period is included in the Statement of Operations.
Credit Default Swaps. Credit default swaps enable the Fund to buy or sell protection on a debt security or a basket of securities against a defined credit event. Under the terms of a credit default swap the buyer of protection (buyer) receives credit protection in exchange for making periodic payments to the seller of protection (seller) based on a fixed percentage applied to a notional principal amount. In return for these payments, the seller acts as a guarantor of the creditworthiness of a reference obligation. The Fund enters into credit default swaps as a seller to gain credit exposure to an issuer and/or as a buyer to provide a measure of protection against defaults of an issuer. The issuer may be either a single issuer or a "basket" of issuers. Periodic payments are made over the life of the contract provided that no credit event occurs.
For credit default swaps on most corporate and sovereign issuers, credit events include bankruptcy, failure to pay, obligation acceleration or repudiation/moratorium. For credit default swaps on corporate or sovereign issuers, the obligation that may be put to the seller is not limited to the specific reference obligation described in the Schedule of Investments. For credit default swaps on asset-backed securities, a credit event may be triggered by events such as failure to pay principal, maturity extension, rating downgrade or write-down. For credit default swaps on asset-backed securities, the reference obligation described represents the security that may be put to the seller.
As a seller, if an underlying credit event occurs, the Fund will either pay the buyer an amount equal to the notional amount of the swap and take delivery of the reference obligation or underlying securities comprising an index or pay a net settlement amount of cash equal to the notional amount of the swap less the recovery value of the reference obligation or underlying securities comprising an index.
Semiannual Report
Notes to Financial Statements (Unaudited) - continued
5. Derivative Instruments - continued
Credit Default Swaps - continued
As a buyer, if an underlying credit event occurs, the Fund will either receive from the seller an amount equal to the notional amount of the swap and deliver the reference obligation or underlying securities comprising an index or receive a net settlement amount of cash equal to the notional amount of the swap less the recovery value of the reference obligation or underlying securities comprising an index.
Typically, the value of each credit default swap and credit rating disclosed for each reference obligation in the Schedule of Investments, where the Fund is the seller, can be used as measures of the current payment/performance risk of the swap. As the value of the swap changes as a positive or negative percentage of the total notional amount, the payment/performance risk may decrease or increase, respectively. In addition to these measures, FMR monitors a variety of factors including cash flow assumptions, market activity and market sentiment as part of its ongoing process of assessing payment/performance risk.
The notional amount of credit default swaps is included in the Schedule of Investments and approximates the maximum potential amount of future payments that the Fund could be required to make if the Fund is the seller and a credit event were to occur. The total notional amount of all credit default swaps open at period end where the Fund is the seller amounted to $477,828 representing 0.08% of net assets.
6. Purchases and Sales of Investments.
Purchases and sales of securities (including the Fixed-Income Central Funds), other than short-term securities and U.S. government securities, aggregated $55,619,071 and $55,053,513, respectively.
7. Fees and Other Transactions with Affiliates.
Management Fee. FMR and its affiliates provide the Fund with investment management related services for which the Fund pays a monthly management fee. The management fee is the sum of an individual fund fee rate that is based on an annual rate of .20% of the Fund's average net assets and an annualized group fee rate that averaged .12% during the period. The group fee rate is based upon the average net assets of all the mutual funds advised by FMR. The group fee rate decreases as assets under management increase and increases as assets under management decrease. For the period, the total annualized management fee rate was .32% of the Fund's average net assets.
Semiannual Report
7. Fees and Other Transactions with Affiliates - continued
Distribution and Service Plan Fees. In accordance with Rule 12b-1 of the 1940 Act, the Fund has adopted separate Distribution and Service Plans for each class of shares. Certain classes pay Fidelity Distributors Corporation (FDC), an affiliate of FMR, separate Distribution and Service Fees, each of which is based on an annual percentage of each class' average net assets. In addition, FDC may pay financial intermediaries for selling shares of the Fund and providing shareholder support services. For the period, the Distribution and Service Fee rates, total fees and amounts retained by FDC were as follows:
| Distribution
Fee | Service
Fee | Total Fees | Retained
by FDC |
Class A | -% | .25% | $ 237,847 | $ 9,389 |
Class T | -% | .25% | 344,405 | 2,092 |
Class B | .65% | .25% | 30,221 | 21,875 |
Class C | .75% | .25% | 322,325 | 42,335 |
| | | $ 934,798 | $ 75,691 |
Sales Load. FDC may receive a front-end sales charge of up to 2.75% for selling Class A shares and Class T shares, some of which is paid to financial intermediaries for selling shares of the Fund. Depending on the holding period, FDC may receive contingent deferred sales charges levied on Class A, Class T, Class B, and Class C redemptions. The deferred sales charges range from 3.00% to 1.00% for Class B, 1.00% for Class C, .75% or .50% for certain purchases of Class A shares and .25% for certain purchases of Class T shares.
For the period, sales charge amounts retained by FDC were as follows:
| Retained
by FDC |
Class A | $ 9,965 |
Class T | 3,046 |
Class B* | 4,143 |
Class C* | 4,307 |
| $ 21,461 |
* When Class B and Class C shares are initially sold, FDC pays commissions from its own resources to financial intermediaries through which the sales are made.
Transfer Agent Fees. Fidelity Investments Institutional Operations Company, Inc. (FIIOC), an affiliate of FMR, is the transfer, dividend disbursing and shareholder servicing agent for each class of the Fund. FIIOC receives account fees and asset-based fees that vary according to the account size and type of account of the shareholders of the
Semiannual Report
Notes to Financial Statements (Unaudited) - continued
7. Fees and Other Transactions with Affiliates - continued
Transfer Agent Fees - continued
respective classes of the Fund. FIIOC pays for typesetting, printing and mailing of shareholder reports, except proxy statements. For the period, transfer agent fees for each class were as follows:
| Amount | % of
Average
Net Assets* |
Class A | $ 176,640 | .19 |
Class T | 220,030 | .16 |
Class B | 8,821 | .26 |
Class C | 57,019 | .18 |
Institutional Class | 89,379 | .19 |
| $ 551,889 | |
* Annualized
Accounting and Security Lending Fees. Fidelity Service Company, Inc. (FSC), an affiliate of FMR, maintains the Fund's accounting records. The accounting fee is based on the level of average net assets for each month. Under a separate contract, FSC administers the security lending program. The security lending fee is based on the number and duration of lending transactions.
8. Committed Line of Credit.
The Fund participates with other funds managed by FMR or an affiliate in a $4.0 billion credit facility (the "line of credit") to be utilized for temporary or emergency purposes to fund shareholder redemptions or for other short-term liquidity purposes. The Fund has agreed to pay commitment fees on its pro-rata portion of the line of credit, which amounted to $868 and is reflected in Miscellaneous expenses on the Statement of Operations. During the period, there were no borrowings on this line of credit.
9. Security Lending.
The Fund lends portfolio securities from time to time in order to earn additional income. On the settlement date of the loan, the Fund receives collateral (in the form of U.S. Treasury obligations, letters of credit and/or cash) against the loaned securities and maintains collateral in an amount not less than 100% of the market value of the loaned securities during the period of the loan. The market value of the loaned securities is determined at the close of business of the Fund and any additional required collateral is delivered to the Fund on the next business day. If the borrower defaults on its obligation
Semiannual Report
9. Security Lending - continued
to return the securities loaned because of insolvency or other reasons, a fund could experience delays and costs in recovering the securities loaned or in gaining access to the collateral. Any cash collateral received is maintained at the Fund's custodian and/or invested in cash equivalents. At period end, there were no security loans outstanding. Security lending income represents the income earned on investing cash collateral, less rebates paid to borrowers, plus any premium payments received for lending certain types of securities. Security lending income is presented in the Statement of Operations as a component of interest income. Total security lending income during the period amounted to $4,320.
10. Expense Reductions.
Through arrangements with the Fund's custodian, credits realized as a result of uninvested cash balances were used to reduce the Fund's expenses. During the period, these credits reduced the Fund's custody expenses by $59.
11. Distributions to Shareholders.
Distributions to shareholders of each class were as follows:
| Six months ended
February 29,
2012 | Year ended
August 31,
2011 |
From net investment income | | |
Class A | $ 2,335,322 | $ 5,532,975 |
Class T | 3,407,882 | 8,298,201 |
Class B | 58,056 | 185,526 |
Class C | 554,012 | 1,454,482 |
Institutional Class | 1,262,573 | 2,877,695 |
Total | $ 7,617,845 | $ 18,348,879 |
From net realized gain | | |
Class A | $ - | $ 277,121 |
Class T | - | 415,972 |
Class B | - | 14,010 |
Class C | - | 104,258 |
Institutional Class | - | 126,565 |
Total | $ - | $ 937,926 |
Semiannual Report
Notes to Financial Statements (Unaudited) - continued
12. Share Transactions.
Transactions for each class of shares were as follows:
| Shares | Dollars |
| Six months ended
February 29,
2012 | Year ended
August 31,
2011 | Six months ended
February 29,
2012 | Year ended
August 31,
2011 |
Class A | | | | |
Shares sold | 2,828,710 | 4,404,009 | $ 32,336,932 | $ 49,603,576 |
Reinvestment of distributions | 167,601 | 419,543 | 1,916,987 | 4,719,208 |
Shares redeemed | (2,456,678) | (7,163,345) | (28,081,744) | (80,194,309) |
Net increase (decrease) | 539,633 | (2,339,793) | $ 6,172,175 | $ (25,871,525) |
Class T | | | | |
Shares sold | 4,271,993 | 6,304,457 | $ 48,788,914 | $ 70,986,556 |
Reinvestment of distributions | 282,658 | 733,623 | 3,235,047 | 8,253,801 |
Shares redeemed | (5,085,472) | (10,924,752) | (58,239,992) | (122,319,193) |
Net increase (decrease) | (530,821) | (3,886,672) | $ (6,216,031) | $ (43,078,836) |
Class B | | | | |
Shares sold | 70,732 | 130,207 | $ 804,997 | $ 1,474,556 |
Reinvestment of distributions | 4,540 | 16,164 | 51,863 | 181,551 |
Shares redeemed | (167,206) | (503,441) | (1,907,438) | (5,638,256) |
Net increase (decrease) | (91,934) | (357,070) | $ (1,050,578) | $ (3,982,149) |
Class C | | | | |
Shares sold | 885,192 | 1,492,562 | $ 10,085,010 | $ 16,820,363 |
Reinvestment of distributions | 39,611 | 110,942 | 452,134 | 1,245,103 |
Shares redeemed | (775,040) | (3,159,856) | (8,833,856) | (35,300,044) |
Net increase (decrease) | 149,763 | (1,556,352) | $ 1,703,288 | $ (17,234,578) |
Institutional Class | | | | |
Shares sold | 1,360,471 | 2,701,789 | $ 15,578,002 | $ 30,352,013 |
Reinvestment of distributions | 99,137 | 239,277 | 1,136,875 | 2,696,942 |
Shares redeemed | (794,516) | (3,540,888) | (9,110,118) | (39,645,764) |
Net increase (decrease) | 665,092 | (599,822) | $ 7,604,759 | $ (6,596,809) |
13. Other.
The Fund's organizational documents provide former and current trustees and officers with a limited indemnification against liabilities arising in connection with the performance of their duties to the Fund. In the normal course of business, the Fund may also enter into contracts that provide general indemnifications. The Fund's maximum exposure under these arrangements is unknown as this would be dependent on future claims that may be made against the Fund. The risk of material loss from such claims is considered remote.
Semiannual Report
14. Credit Risk.
The Fund invests a portion of its assets in structured securities of issuers backed by residential mortgage loans, credit card receivables and automotive loans. The value and related income of these securities is sensitive to changes in economic conditions, including delinquencies and/or defaults.
Semiannual Report
Board Approval of Investment Advisory Contracts and Management Fees
Fidelity Advisor Intermediate Bond Fund
Each year, the Board of Trustees, including the Independent Trustees (together, the Board), votes on the renewal of the management contract and sub-advisory agreements (together, the Advisory Contracts) for the fund. The Board, assisted by the advice of fund counsel and Independent Trustees' counsel, requests and considers a broad range of information relevant to the renewal of the Advisory Contracts throughout the year.
The Board meets regularly and considers at each of its meetings factors that are relevant to its annual consideration of the renewal of the fund's Advisory Contracts, including the services and support provided to the fund and its shareholders. The Board has established three standing committees, Operations, Audit, and Nominating and Governance, each composed of Independent Trustees with varying backgrounds, to which the Board has assigned specific subject matter responsibilities in order to enhance effective decision-making by the Board. The Operations Committee, of which all of the Independent Trustees are members, meets regularly throughout the year and, among other matters, considers matters specifically related to the annual consideration of the renewal of the fund's Advisory Contracts. The Board, acting directly and through its Committees, requests and receives information concerning the annual consideration of the renewal of the fund's Advisory Contracts. The Board also meets as needed to consider matters specifically related to the Board's annual consideration of the renewal of Advisory Contracts. Members of the Board may also meet with trustees of other Fidelity funds through ad hoc joint committees to discuss certain matters relevant to the Fidelity funds.
At its September 2011 meeting, the Board of Trustees, including the Independent Trustees, unanimously determined to renew the fund's Advisory Contracts. In reaching its determination, the Board considered all factors it believed relevant, including (i) the nature, extent, and quality of the services to be provided to the fund and its shareholders (including the investment performance of the fund); (ii) the competitiveness of the fund's management fee and total expense ratio; (iii) the total costs of the services to be provided by and the profits to be realized by Fidelity from its relationship with the fund; (iv) the extent to which economies of scale would be realized as the fund grows; and (v) whether fee levels reflect these economies of scale, if any, for the benefit of fund shareholders.
In considering whether to renew the Advisory Contracts for the fund, the Board reached a determination, with the assistance of fund counsel and Independent Trustees' counsel and through the exercise of its business judgment, that the renewal of the Advisory Contracts is in the best interests of the fund and its shareholders and that the compensation payable under the Advisory Contracts is fair and reasonable. The Board's decision to renew the Advisory Contracts was not based on any single factor, but rather was based on a comprehensive consideration of all the information provided to the Board at its meetings throughout the year. The Board, in reaching its determination to renew the Advisory Contracts, is aware that shareholders in the fund have a broad range of investment choices available to them, including a wide choice among mutual funds offered by Fidelity's competitors, and that the fund's shareholders, who have the opportunity to review and weigh the disclosure provided by the fund in its prospectus and other public disclosures, have chosen to invest in this fund, managed by Fidelity.
Semiannual Report
Nature, Extent, and Quality of Services Provided. The Board considered the staffing within the investment adviser, FMR, and the sub-advisers (together, the Investment Advisers), including the backgrounds of the fund's investment personnel and the fund's investment objective and discipline. The Independent Trustees also had discussions with senior management of Fidelity's investment operations and investment groups. The Board considered the structure of the portfolio manager compensation program and whether this structure provides appropriate incentives to act in the best interests of the fund.
Resources Dedicated to Investment Management and Support Services. The Board reviewed the general qualifications and capabilities of the Investment Advisers' investment staff, including its size, education, experience, and resources, as well as the Investment Advisers' approach to recruiting, managing, and compensating investment personnel. The Board also noted that FMR has devoted increased resources to non-U.S. offices. The Board noted that Fidelity's analysts have extensive resources, tools and capabilities which allow them to conduct sophisticated quantitative and fundamental analysis, as well as credit analysis of issuers, counterparties and enhancers. The Board also believes that Fidelity's investment professionals have sufficient access to global information and data so as to provide competitive investment results over time, and that those professionals also have access to sophisticated tools which permit them to assess portfolio construction and risk and performance attribution characteristics continuously, as well as to transmit new information and research conclusions rapidly around the world. Additionally, in its deliberations, the Board considered the Investment Advisers' trading capabilities and resources which are an integral part of the investment management process.
Shareholder and Administrative Services. The Board considered (i) the nature, extent, quality, and cost of advisory, administrative, and shareholder services performed by the Investment Advisers and their affiliates under the Advisory Contracts and under separate agreements covering transfer agency, pricing and bookkeeping, and securities lending services for the fund; (ii) the nature and extent of the investment adviser's supervision of third party service providers, principally custodians and subcustodians; and (iii) the resources devoted to, and the record of compliance with, the fund's compliance policies and procedures.
The Board noted that the growth of fund assets over time across the complex allows Fidelity to reinvest in the development of services designed to enhance the value or convenience of the Fidelity funds as investment vehicles. These services include 24-hour access to account information and market information through telephone representatives and over the Internet, investor education materials and asset allocation tools, and the expanded availability of Fidelity Investor Centers, with 35 new branches opening since 2010.
Semiannual Report
Board Approval of Investment Advisory Contracts and
Management Fees - continued
Investment in a Large Fund Family. The Board considered the benefits to shareholders of investing in a Fidelity fund, including the benefits of investing in a fund that is part of a large family of funds offering a variety of investment disciplines and providing a large variety of mutual fund investor services. The Board noted that Fidelity had taken, or had made recommendations that resulted in the Fidelity funds taking, a number of actions over the previous year that benefited particular funds, including (i) continuing to dedicate additional resources to investment research and support of the senior management team that oversees asset management; (ii) rationalizing product lines through the mergers of six funds into other funds; (iii) continuing to migrate the Freedom Funds to dedicated lower cost underlying funds; (iv) obtaining shareholder approval to broaden the investment strategies for Fidelity Consumer Finance Portfolio, Fidelity Emerging Asia Fund, and Fidelity Environment and Alternative Energy Portfolio; (v) contractually agreeing to reduce the management fees and impose other expense limitations on Spartan 500 Index Fund and U.S. Bond Index Fund in connection with launching new institutional classes of these funds; (vi) changing the name, primary and supplemental benchmarks, and investment policies of Fidelity Global Strategies Fund to support the fund's flexible investment mandate and global orientation; and (vii) reducing the transfer agency account fee rates on certain accounts.
Investment Performance. The Board considered whether the fund has operated in accordance with its investment objective, as well as its record of compliance with its investment restrictions. It also reviewed the fund's absolute investment performance for each class, as well as the fund's relative investment performance for each class measured over multiple periods against (i) a broad-based securities market index, and (ii) a peer group of mutual funds deemed appropriate by Fidelity and reviewed by the Board. The following charts considered by the Board show, over the one-, three-, and five-year periods ended December 31, 2010, the cumulative total returns of Institutional Class (Class I) and Class C of the fund, the cumulative total returns of a broad-based securities market index ("benchmark"), and a range of cumulative total returns of a peer group of mutual funds identified by Lipper Inc. as having an investment objective similar to that of the fund. The returns of Institutional Class (Class I) and Class C show the performance of the highest and lowest performing classes, respectively (based on five-year performance). The box within each chart shows the 25th percentile return (bottom of box) and the 75th percentile return (top of box) of the peer group. Returns shown above the box are in the first quartile and returns shown below the box are in the fourth quartile. The percentage beaten numbers noted below each chart correspond to the percentile box and represent the percentage of funds in the peer group whose performance was equal to or lower than that of the class indicated.
Semiannual Report
Fidelity Advisor Intermediate Bond Fund

The Board reviewed the fund's relative investment performance against its peer group and noted that the performance of Institutional Class (Class I) of the fund was in the first quartile for the one-year period and the second quartile for the three- and five-year periods. The Board also noted that the investment performance of Institutional Class (Class I) of the fund compared favorably to its benchmark for the one- and three-year periods, although the fund's five-year cumulative total return was lower than its benchmark. The Board considered that the variations in performance among the fund's classes reflect the variations in class expenses, which result in lower performance for higher expense classes. The Board also reviewed the fund's performance since inception as well as performance in the current year.
Based on its review, the Board concluded that the nature, extent, and quality of services provided to the fund under the Advisory Contracts should benefit the fund's shareholders.
Competitiveness of Management Fee and Total Expense Ratio. The Board considered the fund's management fee and total expense ratio compared to "mapped groups" of competitive funds and classes. Fidelity creates "mapped groups" by combining similar Lipper investment objective categories that have comparable management fee characteristics. Combining Lipper investment objective categories aids the Board's management fee and total expense ratio comparisons by broadening the competitive group used for comparison and by reducing the number of universes to which various Fidelity funds are compared.
Semiannual Report
Board Approval of Investment Advisory Contracts and
Management Fees - continued
Management Fee. The Board considered two proprietary management fee comparisons for the 12-month periods shown in the chart below. The group of Lipper funds used by the Board for management fee comparisons is referred to below as the "Total Mapped Group" and, for the reasons explained above, is broader than the Lipper peer group used by the Board for performance comparisons. The Total Mapped Group comparison focuses on a fund's standing relative to the total universe of comparable funds available to investors in terms of gross management fees before expense reimbursements or caps. "TMG %" represents the percentage of funds in the Total Mapped Group that had management fees that were lower than the fund's. For example, a TMG % of 12% means that 88% of the funds in the Total Mapped Group had higher management fees than the fund. The "Asset-Size Peer Group" (ASPG) comparison focuses on a fund's standing relative to non-Fidelity funds similar in size to the fund within the Total Mapped Group. The ASPG represents at least 15% of the funds in the Total Mapped Group with comparable asset size and management fee characteristics, subject to a minimum of 50 funds (or all funds in the Total Mapped Group if fewer than 50). Additional information, such as the ASPG quartile in which the fund's management fee ranked, is also included in the chart and considered by the Board.
Fidelity Advisor Intermediate Bond Fund
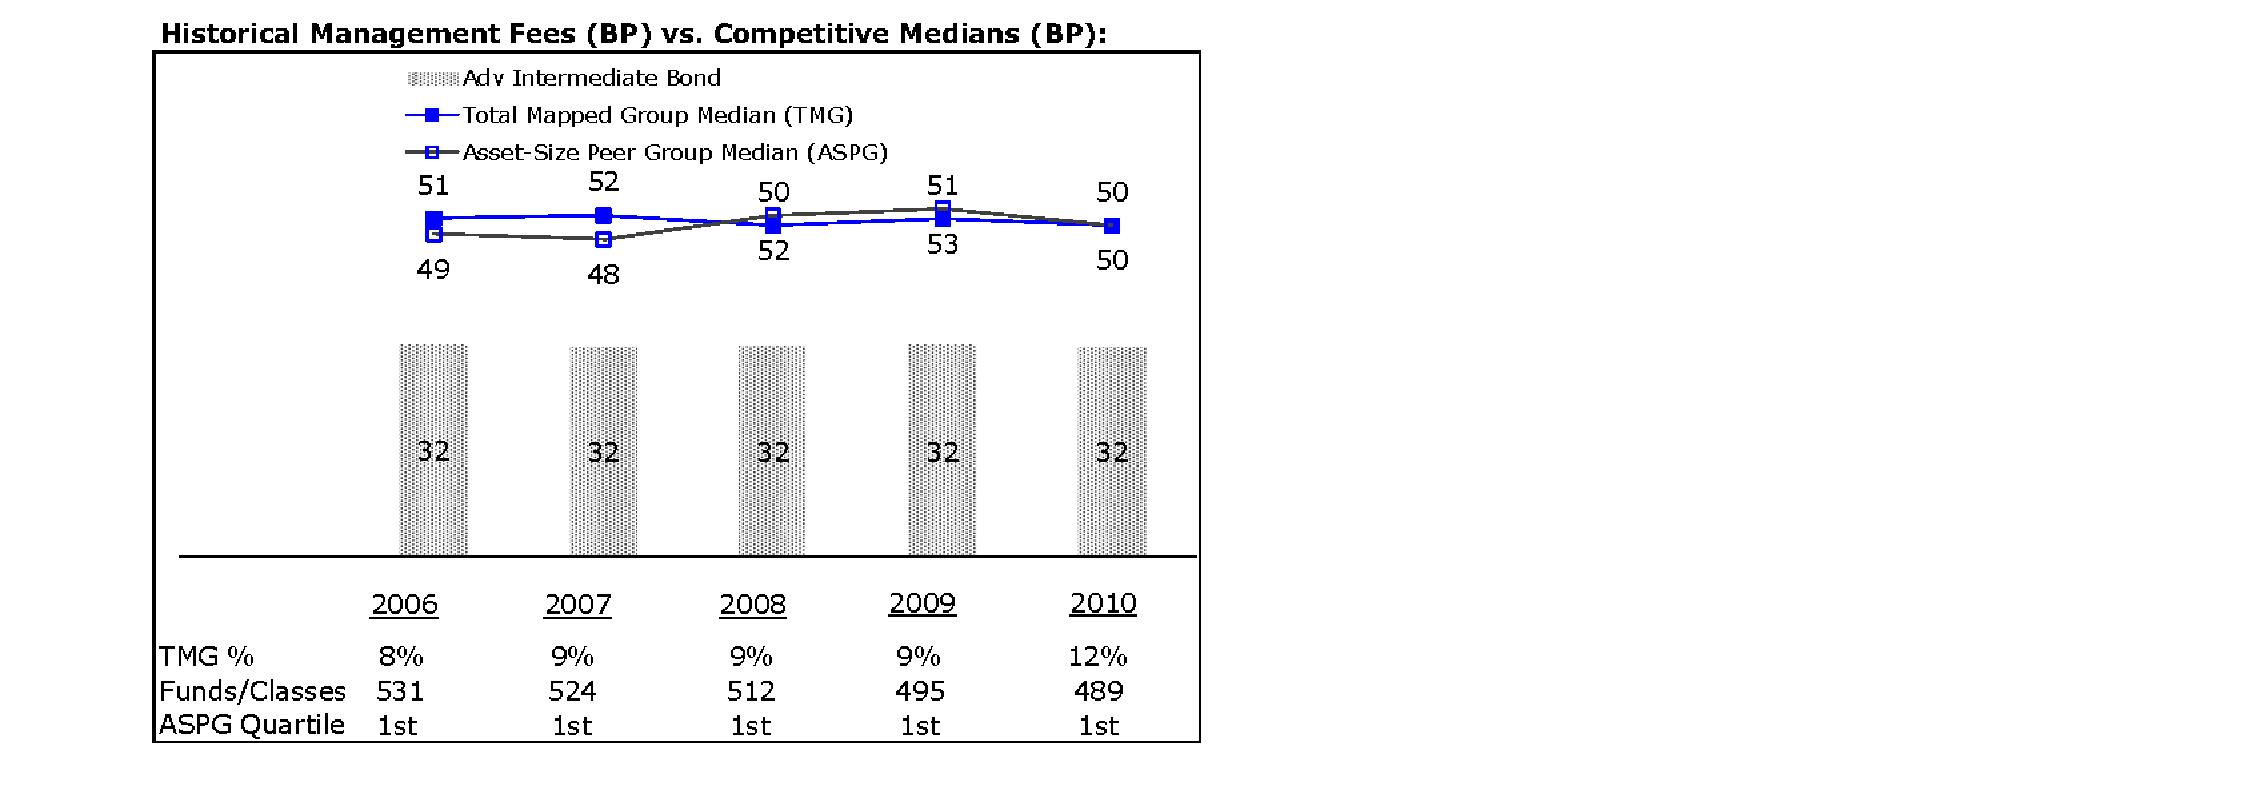
The Board noted that the fund's management fee ranked below the median of its Total Mapped Group and below the median of its ASPG for 2010.
Semiannual Report
Based on its review, the Board concluded that the fund's management fee is fair and reasonable in light of the services that the fund receives and the other factors considered.
Total Expense Ratio. In its review of each class's total expense ratio, the Board considered the fund's management fee as well as other fund or class expenses, as applicable, such as transfer agent fees, pricing and bookkeeping fees, fund-paid 12b-1 fees, and custodial, legal, and audit fees. The Board also noted the effects of any waivers and reimbursements on fees and expenses. As part of its review, the Board also considered the current and historical total expense ratios of each class of the fund compared to competitive fund median expenses. Each class of the fund is compared to those funds and classes in the Total Mapped Group (used by the Board for management fee comparisons) that have a similar sales load structure.
The Board noted that the total expense ratio of each class ranked below its competitive median for 2010.
Fees Charged to Other Fidelity Clients. The Board also considered Fidelity fee structures and other information with respect to clients of FMR and its affiliates, such as other mutual funds advised or subadvised by FMR or its affiliates, pension plan clients, and other institutional clients. In March 2010, the Board created an ad hoc joint committee with the board of other Fidelity funds (the Committee) to review and compare Fidelity's institutional investment advisory business with its business of providing services to the Fidelity funds, including the differences in services provided, fees charged, and costs incurred, as well as competition in their respective marketplaces.
Based on its review of total expense ratios and fees charged to other Fidelity clients, the Board concluded that the total expense ratio of each class of the fund was reasonable in light of the services that the fund and its shareholders receive and the other factors considered, including the findings of the Committee.
Costs of the Services and Profitability. The Board considered the revenues earned and the expenses incurred by Fidelity in conducting the business of developing, marketing, distributing, managing, administering and servicing the fund and its shareholders. The Board also considered the level of Fidelity's profits in respect of all the Fidelity funds.
On an annual basis, FMR presents to the Board Fidelity's profitability for the fund. Fidelity calculates the profitability for each fund, as well as aggregate profitability for groups of Fidelity funds and all Fidelity funds, using a series of detailed revenue and cost allocation methodologies which originate with the books and records of Fidelity on which Fidelity's audited financial statements are based. The Audit Committee of the Board reviews any significant changes from the prior year's methodologies.
Semiannual Report
Board Approval of Investment Advisory Contracts and
Management Fees - continued
PricewaterhouseCoopers LLP (PwC), independent registered public accounting firm and auditor to Fidelity and certain Fidelity funds, has been engaged annually by the Board as part of the Board's assessment of Fidelity's profitability analysis. PwC's engagement includes the review and assessment of Fidelity's methodologies used in determining the revenues and expenses attributable to Fidelity's mutual fund business, and completion of agreed-upon procedures surrounding the mathematical accuracy of fund profitability and its conformity to allocation methodologies. After considering PwC's reports issued under the engagement and information provided by Fidelity, the Board concluded that while other allocation methods may also be reasonable, Fidelity's profitability methodologies are reasonable in all material respects.
The Board also reviewed Fidelity's non-fund businesses and fall-out benefits related to the mutual fund business as well as cases where Fidelity's affiliates may benefit from or be related to the fund's business.
The Board considered the costs of the services provided by and the profits realized by Fidelity in connection with the operation of the fund and was satisfied that the profitability was not excessive in the circumstances.
Economies of Scale. The Board considered whether there have been economies of scale in respect of the management of the Fidelity funds, whether the Fidelity funds (including the fund) have appropriately benefited from any such economies of scale, and whether there is potential for realization of any further economies of scale. The Board considered the extent to which the fund will benefit from economies of scale through increased services to the fund, through waivers or reimbursements, or through fee or expense reductions. The Board also noted that in 2009, it and the board of other Fidelity funds created an ad hoc committee (the Economies of Scale Committee) to analyze whether FMR attains economies of scale in respect of the management and servicing of the Fidelity funds, whether the Fidelity funds have appropriately benefited from such economies of scale, and whether there is potential for realization of any further economies of scale.
The Board recognized that the fund's management contract incorporates a "group fee" structure, which provides for lower group fee rates as total fund assets under FMR's management increase, and for higher group fee rates as total fund assets under FMR's management decrease. FMR calculates the group fee rates based on a tiered asset "breakpoint" schedule that varies based on asset class. The Board considered that the group fee is designed to deliver the benefits of economies of scale to fund shareholders when total Fidelity fund assets increase, even if assets of any particular fund are unchanged or have declined, because some portion of Fidelity's costs are attributable to services provided to all Fidelity funds, and all funds benefit if those costs can be allocated among more assets. The Board concluded that, given the group fee structure, fund shareholders will benefit from lower management fees as assets under FMR's management increase at the fund complex level, regardless of whether Fidelity achieves any such economies of scale.
Semiannual Report
The Board concluded, taking into account the analysis of the Economies of Scale Committee, that any potential economies of scale are being appropriately shared between fund shareholders and Fidelity.
Additional Information Requested by the Board. In order to develop fully the factual basis for consideration of the Fidelity funds' Advisory Contracts, the Board requested and received additional information on certain topics, including: (i) Fidelity's fund profitability methodology, profitability trends for certain funds, and the impact of certain factors on fund profitability results; (ii) portfolio manager changes that have occurred during the past year and the amount of the investment that each portfolio manager has made in the Fidelity fund(s) that he or she manages; (iii) Fidelity's compensation structure for portfolio managers, research analysts, and other key personnel, including its effects on fund profitability, the rationale for the compensation structure, and the extent to which current market conditions have affected retention and recruitment; (iv) the compensation paid to fund sub-advisers on behalf of the Fidelity funds; (v) Fidelity's fee structures and rationale for recommending different fees among different categories of funds and classes, as well as Fidelity's voluntary waiver of its fees to maintain minimum yields for certain money market funds and classes; (vi) the reasons why certain expenses affect various funds and classes differently; (vii) Fidelity's transfer agent fees, expenses, and services and how the benefits of decreased costs and new efficiencies can be shared across all of the Fidelity funds; (viii) the reasons for and consequences of changes to certain product lines compared to competitors; (ix) the allocation of and historical trends in Fidelity's realization of fall-out benefits; and (x) explanations regarding the relative total expense ratios of certain funds and classes, total expense competitive trends, and actions that might be taken by FMR to reduce total expense ratios for certain funds and classes or to achieve further economies of scale.
Based on its evaluation of all of the conclusions noted above, and after considering all factors it believed relevant, the Board ultimately concluded that the advisory fee structures are fair and reasonable, and that the fund's Advisory Contracts should be renewed.
Semiannual Report
Investment Adviser
Fidelity Management & Research Company
Boston, MA
Investment Sub-Advisers
Fidelity Investments Money
Management, Inc.
Fidelity Management & Research
(U.K.) Inc.
Fidelity Management & Research
(Hong Kong) Limited
Fidelity Management & Research
(Japan) Inc.
General Distributor
Fidelity Distributors Corporation
Boston, MA
Transfer and Service Agents
Fidelity Investments Institutional Operations Company, Inc.
Boston, MA
Fidelity Service Company, Inc.
Boston, MA
Custodian
The Bank of New York Mellon
New York, NY
LTB-USAN-0412
1.784888.109
(Fidelity Investment logo)(registered trademark)
(Fidelity Investment logo)(registered trademark)
Fidelity Advisor®
Intermediate Bond
Fund - Institutional Class
Semiannual Report
February 29, 2012
(Fidelity Cover Art)
Contents
Shareholder Expense Example | (Click Here) | An example of shareholder expenses. |
Investment Changes | (Click Here) | A summary of major shifts in the fund's investments over the past six months. |
Investments | (Click Here) | A complete list of the fund's investments with their market values. |
Financial Statements | (Click Here) | Statements of assets and liabilities, operations, and changes in net assets, as well as financial highlights. |
Notes | (Click Here) | Notes to the financial statements. |
Board Approval of Investment Advisory Contracts and Management Fees | (Click Here) | |
To view a fund's proxy voting guidelines and proxy voting record for the 12-month period ended June 30, visit http://www.fidelity.com/proxyvotingresults or visit the Securities and Exchange Commission's (SEC) web site at http://www.sec.gov. You may also call 1-877-208-0098 to request a free copy of the proxy voting guidelines.
Standard & Poor's, S&P and S&P 500 are registered service marks of The McGraw-Hill Companies, Inc. and have been licensed for use by Fidelity Distributors Corporation.
Other third party marks appearing herein are the property of their respective owners.
All other marks appearing herein are registered or unregistered trademarks or service marks of FMR LLC or an affiliated company.
This report and the financial statements contained herein are submitted for the general information of the shareholders of the fund. This report is not authorized for distribution to prospective investors in the fund unless preceded or accompanied by an effective prospectus.
A fund files its complete schedule of portfolio holdings with the SEC for the first and third quarters of each fiscal year on Form N-Q. Forms N-Q are available on the SEC's web site at http://www.sec.gov. A fund's Forms N-Q may be reviewed and copied at the SEC's Public Reference Room in Washington, DC. Information regarding the operation of the SEC's Public Reference Room may be obtained by calling 1-800-SEC-0330. For a complete list of a fund's portfolio holdings, view the most recent holdings listing, semiannual report, or annual report on Fidelity's web site at http://www.fidelity.com, http://www.advisor.fidelity.com, or http://www.401k.com, as applicable.
NOT FDIC INSURED • MAY LOSE VALUE • NO BANK GUARANTEE
Neither the fund nor Fidelity Distributors Corporation is a bank.
Semiannual Report
Shareholder Expense Example
As a shareholder of the Fund, you incur two types of costs: (1) transaction costs, including sales charges (loads) on purchase payments or redemption proceeds, and (2) ongoing costs, including management fees, distribution and/or service (12b-1) fees and other Fund expenses. This Example is intended to help you understand your ongoing costs (in dollars) of investing in the Fund and to compare these costs with the ongoing costs of investing in other mutual funds.
The Example is based on an investment of $1,000 invested at the beginning of the period and held for the entire period (September 1, 2011 to February 29, 2012).
Actual Expenses
The first line of the accompanying table for each class of the Fund provides information about actual account values and actual expenses. You may use the information in this line, together with the amount you invested, to estimate the expenses that you paid over the period. Simply divide your account value by $1,000.00 (for example, an $8,600 account value divided by $1,000.00 = 8.6), then multiply the result by the number in the first line for a class of the Fund under the heading entitled "Expenses Paid During Period" to estimate the expenses you paid on your account during this period. In addition, the Fund, as a shareholder in the underlying Fidelity Central Funds, will indirectly bear its pro-rata share of the fees and expenses incurred by the underlying Fidelity Central Funds. These fees and expenses are not included in the Fund's annualized expense ratio used to calculate the expense estimate in the table below.
Hypothetical Example for Comparison Purposes
The second line of the accompanying table for each class of the Fund provides information about hypothetical account values and hypothetical expenses based on a Class' actual expense ratio and an assumed rate of return of 5% per year before expenses, which is not the Class' actual return. The hypothetical account values and expenses may not be used to estimate the actual ending account balance or expenses you paid for the period. You may use this information to compare the ongoing costs of investing in the Fund and other funds. To do so, compare this 5% hypothetical example with the 5% hypothetical examples that appear in the shareholder reports of the other funds. In addition, the Fund, as a shareholder in the underlying Fidelity Central Funds, will indirectly bear its pro-rata share of the fees and expenses incurred by the underlying Fidelity Central Funds. These fees and expenses are not included in the Fund's annualized expense ratio used to calculate the expense estimate in the table below.
Please note that the expenses shown in the table are meant to highlight your ongoing costs only and do not reflect any transaction costs. Therefore, the second line of the table is useful in comparing ongoing costs only, and will not help you determine the relative total costs of owning different funds. In addition, if these transactional costs were included, your costs would have been higher.
Semiannual Report
Shareholder Expense Example - continued
| Annualized
Expense Ratio | Beginning
Account Value
September 1, 2011 | Ending
Account Value
February 29, 2012 | Expenses Paid
During Period *
September 1, 2011 to
February 29, 2012 |
Class A | .84% | | | |
Actual | | $ 1,000.00 | $ 1,016.70 | $ 4.21 |
HypotheticalA | | $ 1,000.00 | $ 1,020.69 | $ 4.22 |
Class T | .81% | | | |
Actual | | $ 1,000.00 | $ 1,017.80 | $ 4.06 |
HypotheticalA | | $ 1,000.00 | $ 1,020.84 | $ 4.07 |
Class B | 1.57% | | | |
Actual | | $ 1,000.00 | $ 1,014.00 | $ 7.86 |
HypotheticalA | | $ 1,000.00 | $ 1,017.06 | $ 7.87 |
Class C | 1.58% | | | |
Actual | | $ 1,000.00 | $ 1,013.90 | $ 7.91 |
HypotheticalA | | $ 1,000.00 | $ 1,017.01 | $ 7.92 |
Institutional Class | .59% | | | |
Actual | | $ 1,000.00 | $ 1,017.90 | $ 2.96 |
HypotheticalA | | $ 1,000.00 | $ 1,021.93 | $ 2.97 |
A 5% return per year before expenses
* Expenses are equal to each Class' annualized expense ratio, multiplied by the average account value over the period, multiplied by 182/366 (to reflect the one-half year period). The fees and expenses of the underlying Fidelity Central Funds in which the Fund invests are not included in the Fund's annualized expense ratio.
Semiannual Report
Investment Changes (Unaudited)
Quality Diversification (% of fund's net assets) |
As of February 29, 2012 | As of August 31, 2011 |
| U.S. Government
and U.S. Government Agency Obligations† 46.2% | | | U.S. Government
and U.S. Government Agency Obligations† 45.5% | |
| AAA 14.0% | | | AAA 14.0% | |
| AA 7.1% | | | AA 7.6% | |
| A 9.3% | | | A 10.2% | |
| BBB 19.2% | | | BBB 17.5% | |
| BB and Below 2.3% | | | BB and Below 3.1% | |
| Not Rated 0.2% | | | Not Rated 0.3% | |
| Short-Term
Investments and
Net Other Assets 1.7% | | | Short-Term
Investments and
Net Other Assets 1.8% | |

We have used ratings from Moody's Investors Service, Inc. Where Moody's® ratings are not available, we have used S&P® ratings. All ratings are as of the date indicated and do not reflect subsequent changes. Securities rated BB or below were rated investment grade at the time of acquisition. The information in the above table is based on the combined investments of the Fund and its pro-rata share of the investments of Fidelity's fixed-income central funds. |
Weighted Average Maturity as of February 29, 2012 |
| | 6 months ago |
Years | 4.6 | 4.6 |
This is a weighted average of all the maturities of the securities held in a fund. Weighted Average Maturity (WAM) can be used as a measure of sensitivity to interest rate changes and market changes. Generally, the longer the maturity, the greater the sensitivity to such changes. WAM is based on the dollar-weighted average length of time until principal payments must be paid. Depending on the types of securities held in a fund, certain maturity shortening devices (e.g., demand features, interest rate resets, and call options) may be taken into account when calculating the WAM. |
Duration as of February 29, 2012 |
| | 6 months ago |
Years | 3.9 | 3.8 |
Duration estimates how much a bond fund's price will change with a change in comparable interest rates. If rates rise 1%, for example, a fund with a 5-year duration is likely to lose about 5% of its value. Other factors also can influence a bond fund's performance and share price. Accordingly, a bond fund's actual performance may differ from this example. Duration takes into account any call or put option embedded in the bonds. |
Asset Allocation (% of fund's net assets) |
As of February 29, 2012 * | As of August 31, 2011 ** |
| Corporate Bonds 35.2% | | | Corporate Bonds 35.4% | |
| U.S. Government
and U.S. Government
Agency Obligations† 46.2% | | | U.S. Government
and U.S. Government
Agency Obligations† 45.5% | |
| Asset-Backed
Securities 9.0% | | | Asset-Backed
Securities 8.2% | |
| CMOs and Other Mortgage Related Securities 6.2% | | | CMOs and Other Mortgage Related Securities 7.5% | |
| Municipal Bonds 0.4% | | | Municipal Bonds 0.4% | |
| Other Investments 1.3% | | | Other Investments 1.2% | |
| Short-Term
Investments and
Net Other Assets 1.7% | | | Short-Term
Investments and
Net Other Assets 1.8% | |
* Foreign investments | 9.3% | | ** Foreign investments | 9.4% | |

* Futures and Swaps | 0.0% | | ** Futures and Swaps | 0.0% | |
† Includes NCUA Guaranteed Notes. |
The information in the above table is based on the combined investments of the Fund and its pro-rata share of the investments of Fidelity's fixed-income central funds. A holdings listing for the Fund, which presents direct holdings as well as the pro-rata share of any securities and other investments held indirectly through its investments in underlying non-money market Fidelity Central Funds is available at advisor.fidelity.com. |
Semiannual Report
Showing Percentage of Net Assets
Nonconvertible Bonds - 34.5% |
| Principal Amount | | Value |
CONSUMER DISCRETIONARY - 3.1% |
Auto Components - 0.2% |
DaimlerChrysler NA Holding Corp. 6.5% 11/15/13 | | $ 1,121,000 | | $ 1,223,297 |
Automobiles - 0.3% |
Daimler Finance North America LLC 1.95% 3/28/14 (c) | | 790,000 | | 796,391 |
Volkswagen International Finance NV 1.875% 4/1/14 (c) | | 1,180,000 | | 1,192,831 |
| | 1,989,222 |
Diversified Consumer Services - 0.1% |
Yale University 2.9% 10/15/14 | | 530,000 | | 562,669 |
Media - 1.9% |
Comcast Corp.: | | | | |
4.95% 6/15/16 | | 326,000 | | 368,491 |
5.15% 3/1/20 | | 693,000 | | 812,046 |
5.7% 5/15/18 | | 42,000 | | 49,609 |
COX Communications, Inc. 4.625% 6/1/13 | | 674,000 | | 706,475 |
Discovery Communications LLC: | | | | |
3.7% 6/1/15 | | 875,000 | | 937,977 |
5.05% 6/1/20 | | 322,000 | | 369,070 |
NBCUniversal Media LLC: | | | | |
3.65% 4/30/15 | | 66,000 | | 70,801 |
5.15% 4/30/20 | | 1,000,000 | | 1,155,921 |
News America, Inc.: | | | | |
5.3% 12/15/14 | | 132,000 | | 146,544 |
6.9% 3/1/19 | | 750,000 | | 912,016 |
Time Warner Cable, Inc.: | | | | |
5.4% 7/2/12 | | 425,000 | | 431,509 |
5.85% 5/1/17 | | 996,000 | | 1,172,133 |
6.2% 7/1/13 | | 404,000 | | 432,625 |
6.75% 7/1/18 | | 1,141,000 | | 1,402,506 |
Time Warner, Inc.: | | | | |
3.15% 7/15/15 | | 24,000 | | 25,490 |
4.875% 3/15/20 | | 731,000 | | 821,974 |
5.875% 11/15/16 | | 685,000 | | 810,028 |
Viacom, Inc.: | | | | |
3.5% 4/1/17 | | 455,000 | | 488,397 |
6.125% 10/5/17 | | 679,000 | | 809,551 |
| | 11,923,163 |
Multiline Retail - 0.2% |
Target Corp. 3.875% 7/15/20 | | 1,000,000 | | 1,103,063 |
Nonconvertible Bonds - continued |
| Principal Amount | | Value |
CONSUMER DISCRETIONARY - continued |
Specialty Retail - 0.4% |
Home Depot, Inc. 4.4% 4/1/21 | | $ 610,000 | | $ 699,227 |
Lowe's Companies, Inc. 4.625% 4/15/20 | | 750,000 | | 845,144 |
Staples, Inc. 7.375% 10/1/12 | | 1,352,000 | | 1,402,362 |
| | 2,946,733 |
TOTAL CONSUMER DISCRETIONARY | | 19,748,147 |
CONSUMER STAPLES - 2.1% |
Beverages - 1.0% |
Anheuser-Busch InBev Worldwide, Inc.: | | | | |
1.5% 7/14/14 | | 551,000 | | 559,719 |
2.5% 3/26/13 | | 1,453,000 | | 1,482,994 |
5.375% 11/15/14 | | 111,000 | | 124,189 |
FBG Finance Ltd. 5.125% 6/15/15 (c) | | 510,000 | | 562,560 |
Fortune Brands, Inc.: | | | | |
5.375% 1/15/16 | | 466,000 | | 517,327 |
6.375% 6/15/14 | | 272,000 | | 300,277 |
PepsiCo, Inc. 7.9% 11/1/18 | | 815,000 | | 1,111,882 |
SABMiller Holdings, Inc. 2.45% 1/15/17 (c) | | 1,280,000 | | 1,305,229 |
The Coca-Cola Co. 3.15% 11/15/20 | | 80,000 | | 85,128 |
| | 6,049,305 |
Food & Staples Retailing - 0.2% |
CVS Caremark Corp. 4.125% 5/15/21 | | 620,000 | | 681,890 |
Wal-Mart Stores, Inc. 2.25% 7/8/15 | | 820,000 | | 858,072 |
| | 1,539,962 |
Food Products - 0.3% |
Cargill, Inc. 6% 11/27/17 (c) | | 106,000 | | 125,543 |
General Mills, Inc. 5.2% 3/17/15 | | 650,000 | | 727,053 |
Kraft Foods, Inc.: | | | | |
5.375% 2/10/20 | | 660,000 | | 769,328 |
6.5% 8/11/17 | | 140,000 | | 169,932 |
6.75% 2/19/14 | | 82,000 | | 90,920 |
| | 1,882,776 |
Tobacco - 0.6% |
Altria Group, Inc.: | | | | |
8.5% 11/10/13 | | 30,000 | | 33,712 |
9.7% 11/10/18 | | 1,342,000 | | 1,826,804 |
Nonconvertible Bonds - continued |
| Principal Amount | | Value |
CONSUMER STAPLES - continued |
Tobacco - continued |
Philip Morris International, Inc. 4.5% 3/26/20 | | $ 1,000,000 | | $ 1,131,028 |
Reynolds American, Inc. 6.75% 6/15/17 | | 513,000 | | 611,139 |
| | 3,602,683 |
TOTAL CONSUMER STAPLES | | 13,074,726 |
ENERGY - 4.4% |
Energy Equipment & Services - 0.7% |
DCP Midstream LLC 5.35% 3/15/20 (c) | | 633,000 | | 698,902 |
El Paso Pipeline Partners Operating Co. LLC 6.5% 4/1/20 | | 768,000 | | 855,523 |
Halliburton Co. 6.15% 9/15/19 | | 425,000 | | 515,212 |
Noble Holding International Ltd.: | | | | |
2.5% 3/15/17 | | 262,000 | | 264,568 |
3.45% 8/1/15 | | 58,000 | | 60,661 |
Transocean, Inc. 5.05% 12/15/16 | | 417,000 | | 456,280 |
Weatherford International Ltd.: | | | | |
4.95% 10/15/13 | | 303,000 | | 318,915 |
5.15% 3/15/13 | | 1,469,000 | | 1,519,722 |
| | 4,689,783 |
Oil, Gas & Consumable Fuels - 3.7% |
Anadarko Petroleum Corp.: | | | | |
5.95% 9/15/16 | | 45,000 | | 52,104 |
6.375% 9/15/17 | | 555,000 | | 666,274 |
BG Energy Capital PLC 2.875% 10/15/16 (c) | | 620,000 | | 643,164 |
Canadian Natural Resources Ltd. 5.15% 2/1/13 | | 781,000 | | 812,748 |
Cenovus Energy, Inc. 5.7% 10/15/19 | | 650,000 | | 782,784 |
Duke Capital LLC 6.25% 2/15/13 | | 151,000 | | 158,439 |
Duke Energy Field Services 5.375% 10/15/15 (c) | | 212,000 | | 229,931 |
El Paso Natural Gas Co. 5.95% 4/15/17 | | 21,000 | | 23,313 |
Enbridge Energy Partners LP 4.2% 9/15/21 | | 615,000 | | 656,247 |
Encana Holdings Finance Corp. 5.8% 5/1/14 | | 502,000 | | 544,689 |
Enterprise Products Operating LP: | | | | |
4.05% 2/15/22 | | 610,000 | | 646,859 |
4.6% 8/1/12 | | 706,000 | | 717,153 |
5.6% 10/15/14 | | 339,000 | | 373,526 |
5.65% 4/1/13 | | 105,000 | | 110,181 |
EQT Corp. 4.875% 11/15/21 | | 276,000 | | 282,274 |
Gulf South Pipeline Co. LP 5.75% 8/15/12 (c) | | 671,000 | | 682,250 |
Gulfstream Natural Gas System LLC 6.95% 6/1/16 (c) | | 20,000 | | 23,146 |
Nonconvertible Bonds - continued |
| Principal Amount | | Value |
ENERGY - continued |
Oil, Gas & Consumable Fuels - continued |
Marathon Petroleum Corp. 3.5% 3/1/16 | | $ 875,000 | | $ 907,279 |
Midcontinent Express Pipeline LLC 5.45% 9/15/14 (c) | | 877,000 | | 908,319 |
Nexen, Inc.: | | | | |
5.2% 3/10/15 | | 158,000 | | 171,518 |
6.2% 7/30/19 | | 55,000 | | 65,315 |
NGPL PipeCo LLC 6.514% 12/15/12 (c) | | 397,000 | | 383,377 |
Petro-Canada 6.05% 5/15/18 | | 326,000 | | 394,683 |
Petrobras International Finance Co. Ltd.: | | | | |
2.875% 2/6/15 | | 630,000 | | 644,049 |
5.75% 1/20/20 | | 816,000 | | 897,600 |
7.875% 3/15/19 | | 647,000 | | 795,810 |
Petroleos Mexicanos: | | | | |
4.875% 1/24/22 (c) | | 700,000 | | 731,500 |
6% 3/5/20 | | 59,000 | | 67,113 |
Plains All American Pipeline LP/PAA Finance Corp.: | | | | |
3.95% 9/15/15 | | 375,000 | | 398,232 |
4.25% 9/1/12 | | 1,045,000 | | 1,060,337 |
5.75% 1/15/20 | | 962,000 | | 1,114,528 |
Ras Laffan Liquefied Natural Gas Co. Ltd. III: | | | | |
4.5% 9/30/12 (c) | | 329,000 | | 333,935 |
5.832% 9/30/16 (c) | | 209,466 | | 225,176 |
Rockies Express Pipeline LLC 6.25% 7/15/13 (c) | | 473,000 | | 482,460 |
Southeast Supply Header LLC 4.85% 8/15/14 (c) | | 862,000 | | 914,560 |
Spectra Energy Capital, LLC 5.65% 3/1/20 | | 28,000 | | 31,994 |
Suncor Energy, Inc. 6.1% 6/1/18 | | 944,000 | | 1,151,828 |
Texas Eastern Transmission LP 6% 9/15/17 (c) | | 1,096,000 | | 1,270,068 |
TransCapitalInvest Ltd. 5.67% 3/5/14 (c) | | 489,000 | | 517,118 |
Transcontinental Gas Pipe Line Corp. 6.4% 4/15/16 | | 394,000 | | 458,322 |
Western Gas Partners LP 5.375% 6/1/21 | | 600,000 | | 640,218 |
XTO Energy, Inc.: | | | | |
4.9% 2/1/14 | | 777,000 | | 837,305 |
5% 1/31/15 | | 264,000 | | 295,330 |
5.65% 4/1/16 | | 181,000 | | 213,612 |
| | 23,316,668 |
TOTAL ENERGY | | 28,006,451 |
FINANCIALS - 16.6% |
Capital Markets - 2.0% |
Bear Stearns Companies, Inc. 5.3% 10/30/15 | | 374,000 | | 414,913 |
Nonconvertible Bonds - continued |
| Principal Amount | | Value |
FINANCIALS - continued |
Capital Markets - continued |
BlackRock, Inc. 4.25% 5/24/21 | | $ 650,000 | | $ 704,579 |
Goldman Sachs Group, Inc.: | | | | |
3.7% 8/1/15 | | 712,000 | | 726,199 |
5.25% 7/27/21 | | 750,000 | | 751,005 |
5.95% 1/18/18 | | 1,693,000 | | 1,829,889 |
6.15% 4/1/18 | | 402,000 | | 435,731 |
Lazard Group LLC: | | | | |
6.85% 6/15/17 | | 669,000 | | 727,275 |
7.125% 5/15/15 | | 239,000 | | 257,606 |
Merrill Lynch & Co., Inc.: | | | | |
6.4% 8/28/17 | | 40,000 | | 42,123 |
6.875% 4/25/18 | | 726,000 | | 790,263 |
Morgan Stanley: | | | | |
4.1% 1/26/15 | | 1,320,000 | | 1,322,167 |
4.75% 4/1/14 | | 138,000 | | 139,621 |
5.45% 1/9/17 | | 200,000 | | 205,790 |
5.625% 9/23/19 | | 112,000 | | 111,955 |
5.75% 1/25/21 | | 647,000 | | 641,151 |
5.95% 12/28/17 | | 383,000 | | 397,765 |
6% 4/28/15 | | 130,000 | | 136,949 |
7.3% 5/13/19 | | 603,000 | | 650,674 |
Royal Bank of Scotland PLC 4.875% 8/25/14 (c) | | 1,200,000 | | 1,237,849 |
The Bank of New York Mellon Corp. 2.4% 1/17/17 | | 1,250,000 | | 1,284,125 |
| | 12,807,629 |
Commercial Banks - 4.8% |
ANZ Banking Group Ltd. 2.125% 1/10/14 (c) | | 740,000 | | 745,002 |
Bank of Montreal 2.5% 1/11/17 | | 640,000 | | 653,164 |
Barclays Bank PLC 2.375% 1/13/14 | | 1,680,000 | | 1,682,223 |
BNP Paribas 2.125% 12/21/12 | | 380,000 | | 381,047 |
Comerica, Inc. 3% 9/16/15 | | 2,000 | | 2,071 |
Commonwealth Bank of Australia 2.9% 9/17/14 (c) | | 3,000,000 | | 3,136,767 |
Credit Suisse New York Branch 6% 2/15/18 | | 1,605,000 | | 1,690,648 |
Danske Bank A/S 3.875% 4/14/16 (c) | | 910,000 | | 893,128 |
DBS Bank Ltd. (Singapore) 0.7176% 5/16/17 (c)(f) | | 846,000 | | 841,770 |
Fifth Third Bancorp: | | | | |
3.625% 1/25/16 | | 361,000 | | 381,422 |
4.5% 6/1/18 | | 63,000 | | 65,277 |
8.25% 3/1/38 | | 68,000 | | 87,098 |
Fifth Third Bank 4.75% 2/1/15 | | 308,000 | | 324,923 |
Fifth Third Capital Trust IV 6.5% 4/15/67 (f) | | 7,000 | | 6,948 |
Nonconvertible Bonds - continued |
| Principal Amount | | Value |
FINANCIALS - continued |
Commercial Banks - continued |
First Niagara Financial Group, Inc. 6.75% 3/19/20 | | $ 625,000 | | $ 680,226 |
HBOS PLC 6.75% 5/21/18 (c) | | 509,000 | | 457,383 |
HSBC Holdings PLC 5.1% 4/5/21 | | 610,000 | | 667,422 |
Huntington Bancshares, Inc. 7% 12/15/20 | | 180,000 | | 203,518 |
ING Bank NV 2.65% 1/14/13 (c) | | 1,310,000 | | 1,312,227 |
JPMorgan Chase Bank 6% 10/1/17 | | 1,762,000 | | 1,977,323 |
KeyBank NA 5.8% 7/1/14 | | 801,000 | | 866,834 |
KeyCorp. 5.1% 3/24/21 | | 622,000 | | 675,935 |
Marshall & Ilsley Bank: | | | | |
5% 1/17/17 | | 778,000 | | 830,778 |
5.25% 9/4/12 | | 6,000 | | 6,128 |
PNC Funding Corp. 3.625% 2/8/15 | | 717,000 | | 766,225 |
Rabobank (Netherlands) NV 1.85% 1/10/14 | | 1,998,000 | | 2,012,829 |
Regions Bank 7.5% 5/15/18 | | 250,000 | | 272,500 |
Regions Financial Corp.: | | | | |
0.7438% 6/26/12 (f) | | 31,000 | | 30,974 |
5.75% 6/15/15 | | 4,000 | | 4,088 |
7.75% 11/10/14 | | 20,000 | | 21,354 |
SunTrust Banks, Inc. 3.6% 4/15/16 | | 525,000 | | 544,254 |
Svenska Handelsbanken AB 2.875% 9/14/12 (c) | | 2,245,000 | | 2,269,861 |
The Toronto Dominion Bank 2.375% 10/19/16 | | 1,230,000 | | 1,268,297 |
UnionBanCal Corp. 5.25% 12/16/13 | | 115,000 | | 119,142 |
Wachovia Bank NA 4.875% 2/1/15 | | 283,000 | | 306,117 |
Wachovia Corp. 5.625% 10/15/16 | | 590,000 | | 663,188 |
Wells Fargo & Co.: | | | | |
1.25% 2/13/15 | | 2,229,000 | | 2,224,640 |
3.676% 6/15/16 | | 620,000 | | 664,464 |
Westpac Banking Corp. 1.85% 12/9/13 | | 687,000 | | 693,851 |
| | 30,431,046 |
Consumer Finance - 2.1% |
American Express Credit Corp. 2.75% 9/15/15 | | 2,160,000 | | 2,247,283 |
American Honda Finance Corp. 2.375% 3/18/13 (c) | | 300,000 | | 305,351 |
Capital One Financial Corp.: | | | | |
2.125% 7/15/14 | | 1,309,000 | | 1,312,410 |
3.15% 7/15/16 | | 605,000 | | 618,071 |
7.375% 5/23/14 | | 232,000 | | 258,194 |
Discover Financial Services: | | | | |
6.45% 6/12/17 | | 399,000 | | 438,007 |
10.25% 7/15/19 | | 54,000 | | 68,855 |
Nonconvertible Bonds - continued |
| Principal Amount | | Value |
FINANCIALS - continued |
Consumer Finance - continued |
General Electric Capital Corp.: | | | | |
2.1% 1/7/14 | | $ 177,000 | | $ 180,535 |
2.15% 1/9/15 | | 936,000 | | 960,310 |
2.25% 11/9/15 | | 886,000 | | 911,352 |
2.9% 1/9/17 | | 640,000 | | 668,510 |
2.95% 5/9/16 | | 255,000 | | 266,726 |
3.35% 10/17/16 | | 610,000 | | 650,804 |
3.5% 6/29/15 | | 1,263,000 | | 1,345,766 |
5.4% 9/20/13 | | 887,000 | | 946,258 |
6.375% 11/15/67 (f) | | 1,275,000 | | 1,294,125 |
HSBC USA, Inc. 2.375% 2/13/15 | | 511,000 | | 518,226 |
| | 12,990,783 |
Diversified Financial Services - 3.1% |
Bank of America Corp: | | | | |
4.5% 4/1/15 | | 1,230,000 | | 1,248,718 |
5.75% 12/1/17 | | 1,150,000 | | 1,204,025 |
5.875% 1/5/21 | | 980,000 | | 1,031,187 |
BB&T Corp. 2.05% 4/28/14 | | 750,000 | | 765,256 |
BP Capital Markets PLC: | | | | |
2.248% 11/1/16 | | 620,000 | | 641,000 |
3.125% 10/1/15 | | 60,000 | | 64,249 |
3.2% 3/11/16 | | 610,000 | | 651,950 |
Capital One Capital V 10.25% 8/15/39 | | 140,000 | | 145,950 |
Citigroup, Inc.: | | | | |
3.953% 6/15/16 | | 610,000 | | 630,624 |
4.75% 5/19/15 | | 1,605,000 | | 1,700,862 |
5.125% 5/5/14 | | 239,000 | | 252,086 |
6.125% 5/15/18 | | 38,000 | | 42,451 |
6.5% 8/19/13 | | 2,950,000 | | 3,126,059 |
Deutsche Bank AG London Branch 2.375% 1/11/13 | | 1,320,000 | | 1,330,545 |
JPMorgan Chase & Co.: | | | | |
3.15% 7/5/16 | | 600,000 | | 617,854 |
3.4% 6/24/15 | | 2,482,000 | | 2,611,352 |
4.5% 1/24/22 | | 640,000 | | 679,811 |
5.4% 1/6/42 | | 266,000 | | 286,931 |
TECO Finance, Inc.: | | | | |
4% 3/15/16 | | 171,000 | | 180,958 |
5.15% 3/15/20 | | 252,000 | | 283,110 |
Nonconvertible Bonds - continued |
| Principal Amount | | Value |
FINANCIALS - continued |
Diversified Financial Services - continued |
USAA Capital Corp. 3.5% 7/17/14 (c) | | $ 932,000 | | $ 976,744 |
Whirlpool Corp. 8% 5/1/12 | | 710,000 | | 717,523 |
ZFS Finance USA Trust IV 5.875% 5/9/62 (c)(f) | | 527,000 | | 513,825 |
| | 19,703,070 |
Insurance - 2.0% |
American International Group, Inc. 4.25% 9/15/14 | | 970,000 | | 1,004,063 |
Aon Corp.: | | | | |
3.5% 9/30/15 | | 911,000 | | 952,454 |
5% 9/30/20 | | 600,000 | | 671,733 |
Assurant, Inc. 5.625% 2/15/14 | | 332,000 | | 351,560 |
Axis Capital Holdings Ltd. 5.75% 12/1/14 | | 84,000 | | 89,340 |
Great-West Life & Annuity Insurance Co. 7.153% 5/16/46 (c)(f) | | 259,000 | | 257,058 |
Hartford Financial Services Group, Inc. 5.375% 3/15/17 | | 18,000 | | 18,724 |
Liberty Mutual Group, Inc.: | | | | |
5% 6/1/21 (c) | | 599,000 | | 597,595 |
6.5% 3/15/35 (c) | | 104,000 | | 109,174 |
Marsh & McLennan Companies, Inc. 4.8% 7/15/21 | | 361,000 | | 402,379 |
MetLife, Inc.: | | | | |
2.375% 2/6/14 | | 876,000 | | 899,668 |
5% 6/15/15 | | 175,000 | | 193,816 |
Metropolitan Life Global Funding I 2.5% 9/29/15 (c) | | 750,000 | | 770,202 |
Monumental Global Funding III 5.5% 4/22/13 (c) | | 382,000 | | 398,174 |
New York Life Global Funding 2.25% 12/14/12 (c) | | 650,000 | | 658,506 |
Northwestern Mutual Life Insurance Co. 6.063% 3/30/40 (c) | | 48,000 | | 59,224 |
Pacific Life Global Funding 5.15% 4/15/13 (c) | | 1,218,000 | | 1,274,381 |
Pacific LifeCorp 6% 2/10/20 (c) | | 51,000 | | 55,765 |
Prudential Financial, Inc.: | | | | |
3.625% 9/17/12 | | 643,000 | | 652,654 |
4.5% 11/15/20 | | 700,000 | | 744,973 |
5.15% 1/15/13 | | 73,000 | | 75,695 |
5.4% 6/13/35 | | 68,000 | | 69,864 |
QBE Insurance Group Ltd. 5.647% 7/1/23 (c)(f) | | 29,000 | | 26,222 |
Symetra Financial Corp. 6.125% 4/1/16 (c) | | 892,000 | | 912,962 |
Unum Group: | | | | |
5.625% 9/15/20 | | 370,000 | | 392,986 |
7.125% 9/30/16 | | 704,000 | | 805,380 |
| | 12,444,552 |
Nonconvertible Bonds - continued |
| Principal Amount | | Value |
FINANCIALS - continued |
Real Estate Investment Trusts - 0.7% |
Alexandria Real Estate Equities, Inc. 4.6% 4/1/22 | | $ 189,000 | | $ 191,217 |
AvalonBay Communities, Inc. 4.95% 3/15/13 | | 55,000 | | 56,841 |
BRE Properties, Inc. 5.5% 3/15/17 | | 61,000 | | 66,809 |
Camden Property Trust: | | | | |
5.375% 12/15/13 | | 326,000 | | 339,573 |
5.875% 11/30/12 | | 102,000 | | 104,479 |
Developers Diversified Realty Corp.: | | | | |
4.75% 4/15/18 | | 290,000 | | 297,688 |
5.375% 10/15/12 | | 225,000 | | 227,167 |
7.5% 4/1/17 | | 389,000 | | 437,219 |
Duke Realty LP: | | | | |
4.625% 5/15/13 | | 122,000 | | 125,977 |
5.875% 8/15/12 | | 86,000 | | 87,372 |
Equity One, Inc.: | | | | |
6% 9/15/17 | | 131,000 | | 140,706 |
6.25% 12/15/14 | | 62,000 | | 66,983 |
6.25% 1/15/17 | | 74,000 | | 80,190 |
Federal Realty Investment Trust: | | | | |
5.4% 12/1/13 | | 85,000 | | 89,761 |
5.9% 4/1/20 | | 5,000 | | 5,638 |
6% 7/15/12 | | 509,000 | | 517,015 |
6.2% 1/15/17 | | 94,000 | | 106,363 |
HRPT Properties Trust: | | | | |
5.75% 11/1/15 | | 211,000 | | 220,634 |
6.25% 6/15/17 | | 186,000 | | 198,677 |
6.65% 1/15/18 | | 95,000 | | 102,262 |
UDR, Inc. 5.5% 4/1/14 | | 1,107,000 | | 1,163,291 |
Washington (REIT) 5.25% 1/15/14 | | 30,000 | | 31,445 |
| | 4,657,307 |
Real Estate Management & Development - 1.9% |
AMB Property LP 5.9% 8/15/13 | | 389,000 | | 400,914 |
BioMed Realty LP: | | | | |
3.85% 4/15/16 | | 1,000,000 | | 1,029,027 |
6.125% 4/15/20 | | 6,000 | | 6,734 |
Brandywine Operating Partnership LP: | | | | |
5.7% 5/1/17 | | 369,000 | | 383,607 |
5.75% 4/1/12 | | 371,000 | | 371,715 |
Colonial Properties Trust 6.875% 8/15/12 | | 107,000 | | 108,574 |
Duke Realty LP: | | | | |
5.4% 8/15/14 | | 498,000 | | 531,530 |
Nonconvertible Bonds - continued |
| Principal Amount | | Value |
FINANCIALS - continued |
Real Estate Management & Development - continued |
Duke Realty LP: - continued | | | | |
6.25% 5/15/13 | | $ 1,166,000 | | $ 1,226,353 |
6.75% 3/15/20 | | 35,000 | | 40,689 |
8.25% 8/15/19 | | 7,000 | | 8,704 |
ERP Operating LP: | | | | |
4.625% 12/15/21 | | 630,000 | | 674,802 |
4.75% 7/15/20 | | 446,000 | | 478,372 |
5.375% 8/1/16 | | 240,000 | | 267,421 |
5.5% 10/1/12 | | 384,000 | | 394,029 |
5.75% 6/15/17 | | 1,003,000 | | 1,140,785 |
Liberty Property LP: | | | | |
4.75% 10/1/20 | | 455,000 | | 470,163 |
5.125% 3/2/15 | | 170,000 | | 180,273 |
5.5% 12/15/16 | | 260,000 | | 284,813 |
6.625% 10/1/17 | | 582,000 | | 666,298 |
Mack-Cali Realty LP 7.75% 8/15/19 | | 64,000 | | 78,023 |
Post Apartment Homes LP 6.3% 6/1/13 | | 571,000 | | 593,354 |
Prime Property Funding, Inc.: | | | | |
5.125% 6/1/15 (c) | | 189,000 | | 192,385 |
5.35% 4/15/12 (c) | | 101,000 | | 101,169 |
5.5% 1/15/14 (c) | | 144,000 | | 147,393 |
5.7% 4/15/17 (c) | | 295,000 | | 302,565 |
Regency Centers LP: | | | | |
4.95% 4/15/14 | | 92,000 | | 96,409 |
5.25% 8/1/15 | | 322,000 | | 346,708 |
5.875% 6/15/17 | | 160,000 | | 178,795 |
Simon Property Group LP: | | | | |
2.8% 1/30/17 | | 142,000 | | 147,664 |
4.2% 2/1/15 | | 234,000 | | 249,565 |
5.3% 5/30/13 | | 12,000 | | 12,488 |
Tanger Properties LP: | | | | |
6.125% 6/1/20 | | 606,000 | | 690,067 |
6.15% 11/15/15 | | 115,000 | | 128,908 |
| | 11,930,296 |
TOTAL FINANCIALS | | 104,964,683 |
Nonconvertible Bonds - continued |
| Principal Amount | | Value |
HEALTH CARE - 1.2% |
Biotechnology - 0.1% |
Amgen, Inc. 5.85% 6/1/17 | | $ 446,000 | | $ 525,588 |
Celgene Corp. 2.45% 10/15/15 | | 56,000 | | 57,528 |
| | 583,116 |
Health Care Equipment & Supplies - 0.1% |
Medtronic, Inc. 4.45% 3/15/20 | | 670,000 | | 765,486 |
Health Care Providers & Services - 0.8% |
Coventry Health Care, Inc.: | | | | |
5.95% 3/15/17 | | 264,000 | | 299,408 |
6.3% 8/15/14 | | 546,000 | | 597,602 |
Express Scripts, Inc.: | | | | |
3.125% 5/15/16 | | 555,000 | | 573,827 |
5.25% 6/15/12 | | 505,000 | | 511,071 |
6.25% 6/15/14 | | 299,000 | | 329,253 |
Medco Health Solutions, Inc. 2.75% 9/15/15 | | 1,108,000 | | 1,122,239 |
UnitedHealth Group, Inc. 3.875% 10/15/20 | | 759,000 | | 825,211 |
WellPoint, Inc. 4.35% 8/15/20 | | 760,000 | | 831,217 |
| | 5,089,828 |
Pharmaceuticals - 0.2% |
Merck & Co., Inc. 5% 6/30/19 | | 348,000 | | 416,807 |
Teva Pharmaceutical Finance II BV/Teva Pharmaceutical Finance III LLC 3% 6/15/15 | | 1,000,000 | | 1,060,395 |
Watson Pharmaceuticals, Inc. 5% 8/15/14 | | 66,000 | | 70,470 |
| | 1,547,672 |
TOTAL HEALTH CARE | | 7,986,102 |
INDUSTRIALS - 0.4% |
Aerospace & Defense - 0.0% |
BAE Systems Holdings, Inc. 4.95% 6/1/14 (c) | | 53,000 | | 55,926 |
Airlines - 0.2% |
Continental Airlines, Inc.: | | | | |
6.648% 3/15/19 | | 452,323 | | 474,940 |
6.795% 2/2/20 | | 20,196 | | 20,347 |
6.9% 7/2/19 | | 119,701 | | 127,481 |
U.S. Airways pass-thru trust certificates: | | | | |
6.85% 1/30/18 | | 248,089 | | 250,570 |
8.36% 1/20/19 | | 200,700 | | 203,710 |
| | 1,077,048 |
Nonconvertible Bonds - continued |
| Principal Amount | | Value |
INDUSTRIALS - continued |
Industrial Conglomerates - 0.1% |
Covidien International Finance SA 6% 10/15/17 | | $ 442,000 | | $ 535,336 |
Road & Rail - 0.1% |
Burlington Northern Santa Fe LLC 3.45% 9/15/21 | | 600,000 | | 622,672 |
TOTAL INDUSTRIALS | | 2,290,982 |
INFORMATION TECHNOLOGY - 0.9% |
Computers & Peripherals - 0.1% |
Hewlett-Packard Co. 2.625% 12/9/14 | | 630,000 | | 653,240 |
Electronic Equipment & Components - 0.3% |
Tyco Electronics Group SA: | | | | |
5.95% 1/15/14 | | 526,000 | | 564,248 |
6% 10/1/12 | | 673,000 | | 693,582 |
6.55% 10/1/17 | | 356,000 | | 420,557 |
| | 1,678,387 |
Office Electronics - 0.3% |
Xerox Corp. 4.25% 2/15/15 | | 2,064,000 | | 2,198,082 |
Software - 0.2% |
Oracle Corp. 3.875% 7/15/20 | | 1,000,000 | | 1,120,692 |
TOTAL INFORMATION TECHNOLOGY | | 5,650,401 |
MATERIALS - 1.1% |
Chemicals - 0.4% |
Dow Chemical Co.: | | | | |
4.125% 11/15/21 | | 594,000 | | 631,943 |
4.25% 11/15/20 | | 321,000 | | 343,597 |
4.85% 8/15/12 | | 1,481,000 | | 1,507,208 |
7.6% 5/15/14 | | 80,000 | | 90,921 |
| | 2,573,669 |
Construction Materials - 0.1% |
CRH America, Inc. 6% 9/30/16 | | 319,000 | | 347,867 |
Metals & Mining - 0.6% |
Anglo American Capital PLC: | | | | |
2.15% 9/27/13 (c) | | 1,000,000 | | 997,691 |
9.375% 4/8/14 (c) | | 459,000 | | 527,981 |
9.375% 4/8/19 (c) | | 630,000 | | 815,507 |
ArcelorMittal SA 3.75% 3/1/16 | | 166,000 | | 166,537 |
Nonconvertible Bonds - continued |
| Principal Amount | | Value |
MATERIALS - continued |
Metals & Mining - continued |
Corporacion Nacional del Cobre de Chile (Codelco): | | | | |
3.875% 11/3/21 (c) | | $ 630,000 | | $ 645,561 |
6.375% 11/30/12 (c) | | 302,000 | | 312,204 |
Vale Overseas Ltd. 6.25% 1/23/17 | | 403,000 | | 465,395 |
| | 3,930,876 |
TOTAL MATERIALS | | 6,852,412 |
TELECOMMUNICATION SERVICES - 2.0% |
Diversified Telecommunication Services - 1.4% |
AT&T Broadband Corp. 8.375% 3/15/13 | | 390,000 | | 420,491 |
AT&T, Inc.: | | | | |
2.5% 8/15/15 | | 562,000 | | 587,199 |
6.7% 11/15/13 | | 177,000 | | 194,693 |
CenturyLink, Inc. 6.15% 9/15/19 | | 592,000 | | 621,730 |
Deutsche Telekom International Financial BV: | | | | |
3.125% 4/11/16 (c) | | 923,000 | | 956,580 |
5.25% 7/22/13 | | 370,000 | | 389,399 |
France Telecom SA 2.125% 9/16/15 | | 220,000 | | 223,812 |
Qwest Corp. 3.7963% 6/15/13 (f) | | 1,080,000 | | 1,098,900 |
SBC Communications, Inc. 5.1% 9/15/14 | | 950,000 | | 1,050,730 |
Telefonica Emisiones SAU: | | | | |
3.729% 4/27/15 | | 1,278,000 | | 1,283,990 |
6.421% 6/20/16 | | 234,000 | | 252,084 |
Verizon Communications, Inc.: | | | | |
2% 11/1/16 | | 1,279,000 | | 1,307,527 |
3% 4/1/16 | | 621,000 | | 662,686 |
| | 9,049,821 |
Wireless Telecommunication Services - 0.6% |
America Movil SAB de CV: | | | | |
2.375% 9/8/16 | | 646,000 | | 659,704 |
3.625% 3/30/15 | | 600,000 | | 633,000 |
DIRECTV Holdings LLC/DIRECTV Financing, Inc.: | | | | |
4.75% 10/1/14 | | 1,360,000 | | 1,481,882 |
5.875% 10/1/19 | | 34,000 | | 39,548 |
Nonconvertible Bonds - continued |
| Principal Amount | | Value |
TELECOMMUNICATION SERVICES - continued |
Wireless Telecommunication Services - continued |
Vodafone Group PLC: | | | | |
4.15% 6/10/14 | | $ 346,000 | | $ 370,728 |
5% 12/16/13 | | 398,000 | | 427,114 |
| | 3,611,976 |
TOTAL TELECOMMUNICATION SERVICES | | 12,661,797 |
UTILITIES - 2.7% |
Electric Utilities - 1.6% |
Ameren Illinois Co. 6.125% 11/15/17 | | 62,000 | | 70,258 |
AmerenUE 6.4% 6/15/17 | | 519,000 | | 624,968 |
Cleveland Electric Illuminating Co. 5.65% 12/15/13 | | 714,000 | | 763,800 |
Commonwealth Edison Co. 4% 8/1/20 | | 600,000 | | 654,473 |
Duquesne Light Holdings, Inc. 6.4% 9/15/20 (c) | | 48,000 | | 51,820 |
Edison International 3.75% 9/15/17 | | 431,000 | | 458,147 |
EDP Finance BV: | | | | |
4.9% 10/1/19 (c) | | 200,000 | | 157,740 |
5.375% 11/2/12 (c) | | 1,001,000 | | 999,499 |
Exelon Corp. 4.9% 6/15/15 | | 415,000 | | 452,049 |
FirstEnergy Corp. 7.375% 11/15/31 | | 55,000 | | 70,067 |
FirstEnergy Solutions Corp.: | | | | |
4.8% 2/15/15 | | 160,000 | | 172,899 |
6.05% 8/15/21 | | 655,000 | | 746,405 |
LG&E and KU Energy LLC: | | | | |
2.125% 11/15/15 | | 479,000 | | 477,422 |
3.75% 11/15/20 | | 2,000 | | 2,032 |
Nevada Power Co.: | | | | |
6.5% 5/15/18 | | 1,562,000 | | 1,909,184 |
6.5% 8/1/18 | | 273,000 | | 334,143 |
Pacific Gas & Electric Co. 3.25% 9/15/21 | | 95,000 | | 97,982 |
Pennsylvania Electric Co. 6.05% 9/1/17 | | 115,000 | | 132,177 |
Pepco Holdings, Inc. 2.7% 10/1/15 | | 456,000 | | 461,934 |
Progress Energy, Inc. 4.4% 1/15/21 | | 732,000 | | 804,560 |
Sierra Pacific Power Co. 5.45% 9/1/13 | | 270,000 | | 286,465 |
Tampa Electric Co. 5.4% 5/15/21 | | 238,000 | | 278,768 |
Wisconsin Electric Power Co. 2.95% 9/15/21 | | 110,000 | | 112,473 |
| | 10,119,265 |
Gas Utilities - 0.0% |
Southern Natural Gas Co. / Southern Natural Issuing Corp. 4.4% 6/15/21 | | 188,000 | | 193,922 |
Nonconvertible Bonds - continued |
| Principal Amount | | Value |
UTILITIES - continued |
Independent Power Producers & Energy Traders - 0.4% |
Duke Capital LLC 5.668% 8/15/14 | | $ 357,000 | | $ 386,916 |
Exelon Generation Co. LLC 5.35% 1/15/14 | | 231,000 | | 248,361 |
PPL Energy Supply LLC 6.3% 7/15/13 | | 1,500,000 | | 1,591,341 |
PSEG Power LLC 2.75% 9/15/16 | | 148,000 | | 150,388 |
| | 2,377,006 |
Multi-Utilities - 0.7% |
Consolidated Edison Co. of New York, Inc. 4.45% 6/15/20 | | 680,000 | | 774,157 |
Dominion Resources, Inc.: | | | | |
2.8793% 9/30/66 (f) | | 651,000 | | 554,154 |
7.5% 6/30/66 (f) | | 567,000 | | 599,603 |
MidAmerican Energy Holdings, Co. 5.875% 10/1/12 | | 495,000 | | 509,014 |
National Grid PLC 6.3% 8/1/16 | | 248,000 | | 287,952 |
NiSource Finance Corp.: | | | | |
5.25% 9/15/17 | | 402,000 | | 447,494 |
5.4% 7/15/14 | | 234,000 | | 255,140 |
5.45% 9/15/20 | | 43,000 | | 48,524 |
6.4% 3/15/18 | | 230,000 | | 271,686 |
Wisconsin Energy Corp. 6.25% 5/15/67 (f) | | 454,000 | | 465,350 |
| | 4,213,074 |
TOTAL UTILITIES | | 16,903,267 |
TOTAL NONCONVERTIBLE BONDS (Cost $202,294,890) |
218,138,968
|
U.S. Government and Government Agency Obligations - 39.7% |
|
U.S. Government Agency Obligations - 2.6% |
Fannie Mae: | | | | |
0.375% 3/16/15 | | 584,000 | | 580,980 |
0.625% 10/30/14 | | 233,000 | | 233,689 |
0.75% 12/19/14 | | 833,000 | | 839,131 |
0.875% 8/28/14 | | 4,614,000 | | 4,668,459 |
Freddie Mac: | | | | |
0.5% 4/17/15 | | 402,000 | | 400,794 |
0.625% 12/29/14 | | 201,000 | | 201,518 |
0.75% 11/25/14 | | 248,000 | | 249,559 |
1% 7/30/14 | | 2,698,000 | | 2,733,257 |
U.S. Government and Government Agency Obligations - continued |
| Principal Amount | | Value |
U.S. Government Agency Obligations - continued |
Freddie Mac: - continued | | | | |
1% 8/27/14 | | $ 2,210,000 | | $ 2,238,894 |
1.75% 9/10/15 | | 4,207,000 | | 4,374,279 |
TOTAL U.S. GOVERNMENT AGENCY OBLIGATIONS | | 16,520,560 |
U.S. Treasury Obligations - 37.0% |
U.S. Treasury Notes: | | | | |
0.875% 11/30/16 | | 16,269,000 | | 16,312,210 |
0.875% 2/28/17 | | 26,845,000 | | 26,849,188 |
1% 9/30/16 | | 7,613,000 | | 7,687,349 |
1.375% 2/28/19 | | 37,064,000 | | 37,011,888 |
1.75% 7/31/15 | | 26,929,000 | | 28,041,922 |
1.875% 6/30/15 | | 4,339,000 | | 4,534,255 |
1.875% 9/30/17 | | 12,226,000 | | 12,781,904 |
3% 9/30/16 | | 11,517,000 | | 12,667,802 |
3.125% 1/31/17 | | 8,719,000 | | 9,667,191 |
3.125% 5/15/21 (d) | | 41,171,000 | | 45,696,594 |
3.625% 2/15/20 | | 21,040,000 | | 24,278,182 |
4.25% 8/15/15 | | 7,619,000 | | 8,585,066 |
TOTAL U.S. TREASURY OBLIGATIONS | | 234,113,551 |
Other Government Related - 0.1% |
National Credit Union Administration Guaranteed Notes Master Trust 1.4% 6/12/15 (NCUA Guaranteed) | | 850,000 | | 866,992 |
TOTAL U.S. GOVERNMENT AND GOVERNMENT AGENCY OBLIGATIONS (Cost $241,217,466) |
251,501,103
|
U.S. Government Agency - Mortgage Securities - 5.9% |
|
Fannie Mae - 4.8% |
1.925% 12/1/34 (f) | | 44,195 | | 46,028 |
1.926% 2/1/33 (f) | | 43,740 | | 45,802 |
1.93% 10/1/33 (f) | | 48,342 | | 50,296 |
1.952% 3/1/35 (f) | | 37,099 | | 39,031 |
1.964% 10/1/33 (f) | | 21,609 | | 22,700 |
2.036% 7/1/35 (f) | | 20,511 | | 21,541 |
2.05% 3/1/35 (f) | | 7,263 | | 7,509 |
2.115% 10/1/35 (f) | | 67,908 | | 71,086 |
U.S. Government Agency - Mortgage Securities - continued |
| Principal Amount | | Value |
Fannie Mae - continued |
2.301% 7/1/34 (f) | | $ 25,356 | | $ 26,878 |
2.303% 6/1/36 (f) | | 34,637 | | 36,744 |
2.424% 10/1/33 (f) | | 51,335 | | 54,288 |
2.445% 7/1/35 (f) | | 151,940 | | 160,327 |
2.448% 3/1/35 (f) | | 24,307 | | 25,435 |
2.471% 12/1/33 (f) | | 1,400,187 | | 1,466,433 |
2.487% 11/1/36 (f) | | 272,866 | | 290,773 |
2.537% 7/1/35 (f) | | 241,792 | | 256,960 |
2.597% 4/1/35 (f) | | 857,801 | | 914,647 |
2.632% 5/1/35 (f) | | 98,659 | | 104,189 |
2.635% 7/1/37 (f) | | 78,939 | | 84,120 |
3% 7/1/21 to 11/1/21 | | 9,705,819 | | 10,154,887 |
3.188% 1/1/40 (f) | | 500,002 | | 519,133 |
3.471% 3/1/40 (f) | | 377,897 | | 391,449 |
3.5% 12/1/25 | | 10,677,935 | | 11,203,708 |
3.539% 12/1/39 (f) | | 141,149 | | 146,753 |
3.613% 3/1/40 (f) | | 534,618 | | 558,019 |
4% 8/1/18 | | 572,792 | | 606,217 |
4.5% 8/1/18 to 3/1/35 | | 1,075,012 | | 1,149,817 |
6% 5/1/16 to 4/1/17 | | 183,420 | | 195,301 |
6.5% 12/1/13 to 11/1/17 | | 524,439 | | 562,143 |
7% 5/1/12 to 6/1/33 | | 809,860 | | 925,863 |
7.5% 8/1/17 to 3/1/28 | | 227,288 | | 266,710 |
8.5% 5/1/21 to 9/1/25 | | 41,385 | | 48,189 |
9.5% 2/1/25 | | 4,055 | | 4,362 |
10.5% 8/1/20 | | 10,838 | | 12,804 |
12.5% 12/1/13 to 4/1/15 | | 4,158 | | 4,605 |
TOTAL FANNIE MAE | | 30,474,747 |
Freddie Mac - 1.1% |
2.084% 4/1/35 (f) | | 384,814 | | 407,123 |
2.468% 1/1/35 (f) | | 81,471 | | 84,824 |
2.943% 3/1/33 (f) | | 7,859 | | 8,360 |
3% 8/1/21 | | 1,380,739 | | 1,446,396 |
3.149% 10/1/35 (f) | | 51,229 | | 54,583 |
3.56% 4/1/40 (f) | | 330,136 | | 343,583 |
3.565% 4/1/40 (f) | | 288,804 | | 299,748 |
3.618% 2/1/40 (f) | | 700,766 | | 726,983 |
4.5% 8/1/18 | | 1,153,407 | | 1,231,000 |
5% 3/1/19 | | 1,803,620 | | 1,939,386 |
U.S. Government Agency - Mortgage Securities - continued |
| Principal Amount | | Value |
Freddie Mac - continued |
8.5% 9/1/24 to 8/1/27 | | $ 46,584 | | $ 55,904 |
11.5% 10/1/15 | | 1,828 | | 1,971 |
TOTAL FREDDIE MAC | | 6,599,861 |
Ginnie Mae - 0.0% |
7% 7/15/28 to 11/15/28 | | 162,682 | | 187,165 |
7.5% 2/15/28 to 10/15/28 | | 4,256 | | 5,002 |
8% 6/15/24 | | 203 | | 238 |
8.5% 10/15/21 | | 35,769 | | 41,857 |
11% 7/20/19 to 8/20/19 | | 2,795 | | 3,317 |
TOTAL GINNIE MAE | | 237,579 |
TOTAL U.S. GOVERNMENT AGENCY - MORTGAGE SECURITIES (Cost $36,209,504) |
37,312,187
|
Asset-Backed Securities - 9.0% |
|
Accredited Mortgage Loan Trust Series 2005-1 Class M1, 0.714% 4/25/35 (f) | | 102,912 | | 55,594 |
ACE Securities Corp. Home Equity Loan Trust: | | | | |
Series 2004-HE1 Class M2, 1.894% 3/25/34 (f) | | 56,455 | | 39,570 |
Series 2005-HE2 Class M2, 0.694% 4/25/35 (f) | | 12,197 | | 11,842 |
Advanta Business Card Master Trust: | | | | |
Series 2006-C1 Class C1, 0.6758% 10/20/14 (f) | | 62,000 | | 620 |
Series 2007-D1 Class D, 1.5863% 1/22/13 (c)(f) | | 1,065,000 | | 15,975 |
Ally Auto Receivables Trust: | | | | |
Series 2009 B Class A3, 1.98% 10/15/13 (c) | | 556,235 | | 558,719 |
Series 2009-A: | | | | |
Class A3, 2.33% 6/17/13 (c) | | 92,278 | | 92,658 |
Class A4, 3% 10/15/15 (c) | | 280,000 | | 285,117 |
Series 2010-1 Class A4, 2.3% 12/15/14 | | 1,120,000 | | 1,146,238 |
Series 2010-4 Class A4, 1.35% 12/15/15 | | 570,000 | | 575,960 |
Series 2010-5 Class A4, 1.75% 3/15/16 | | 240,000 | | 244,772 |
Series 2011-1 Class A4, 2.23% 3/15/16 | | 1,090,000 | | 1,124,281 |
Series 2011-2 Class A3, 1.18% 4/15/15 | | 600,000 | | 603,962 |
Series 2011-3 Class A3, 0.97% 8/17/15 | | 770,000 | | 772,875 |
Series 2011-4 Class A2, 0.65% 3/17/14 | | 240,000 | | 240,084 |
Series 2012-1 Class A2, 0.71% 9/15/14 | | 900,000 | | 901,738 |
Ally Master Owner Trust: | | | | |
Series 2010-3 Class A, 2.88% 4/15/15 (c) | | 320,000 | | 326,361 |
Asset-Backed Securities - continued |
| Principal Amount | | Value |
Ally Master Owner Trust: - continued | | | | |
Series 2011-1 Class A2, 2.15% 1/15/16 | | $ 2,260,000 | | $ 2,301,510 |
Series 2011-3 Class A2, 1.81% 5/15/16 | | 1,240,000 | | 1,256,409 |
Series 2011-5 Class A1, 0.8985% 6/15/15 (f) | | 1,240,000 | | 1,242,447 |
Series 2012-1 Class A2, 0.7% 2/15/17 | | 1,260,000 | | 1,260,769 |
AmeriCredit Automobile Receivables Trust: | | | | |
Series 2010-4 Class A3, 1.27% 4/8/15 | | 870,000 | | 867,296 |
Series 2011-1 Class A3, 1.39% 9/8/15 | | 450,000 | | 453,530 |
Series 2011-2 Class A3, 1.61% 10/8/15 | | 910,000 | | 920,367 |
Series 2011-3 Class A3, 1.17% 1/8/16 | | 330,000 | | 331,941 |
Series 2011-4 Class A/S, 0.92% 3/9/15 | | 910,000 | | 911,473 |
Series 2011-5 Class A2, 1.19% 8/8/15 | | 300,000 | | 301,232 |
Ameriquest Mortgage Securities, Inc. pass-thru certificates: | | | | |
Series 2003-10 Class M1, 0.944% 12/25/33 (f) | | 9,466 | | 7,446 |
Series 2004-R2 Class M3, 0.794% 4/25/34 (f) | | 15,238 | | 4,772 |
Series 2005-R2 Class M1, 0.694% 4/25/35 (f) | | 176,341 | | 153,105 |
Argent Securities, Inc. pass-thru certificates: | | | | |
Series 2003-W7 Class A2, 1.0563% 3/25/34 (f) | | 4,092 | | 2,949 |
Series 2004-W11 Class M2, 0.944% 11/25/34 (f) | | 63,962 | | 45,494 |
Series 2004-W7 Class M1, 0.794% 5/25/34 (f) | | 185,706 | | 132,946 |
Series 2006-W4 Class A2C, 0.404% 5/25/36 (f) | | 150,889 | | 36,893 |
Asset Backed Securities Corp. Home Equity Loan Trust: | | | | |
Series 2004-HE2 Class M1, 1.069% 4/25/34 (f) | | 216,483 | | 146,742 |
Series 2006-HE2 Class M1, 0.614% 3/25/36 (f) | | 15,125 | | 119 |
Avis Budget Rental Car Funding (AESOP) LLC Series 2009-1A Class A, 9.31% 10/20/13 (c) | | 1,140,000 | | 1,175,617 |
Axon Financial Funding Ltd. Series 2007-1 Class A1, 1.181% 4/4/17 (b)(c)(f) | | 842,000 | | 0 |
Bank of America Auto Trust: | | | | |
Series 2009-1A Class A4, 3.52% 6/15/16 (c) | | 500,000 | | 507,323 |
Series 2009-2A Class A3, 2.13% 9/15/13 (c) | | 44,001 | | 44,078 |
Series 2009-3A Class A3, 1.67% 12/15/13 (c) | | 239,394 | | 239,938 |
Series 2010-2 Class A3, 1.31% 7/15/14 | | 703,157 | | 705,570 |
Bear Stearns Asset Backed Securities I Trust Series 2005-HE2 Class M2, 1.369% 2/25/35 (f) | | 427,000 | | 240,699 |
BMW Vehicle Lease Trust: | | | | |
Series 2010-1 Class A3, 0.82% 4/15/13 | | 817,118 | | 817,982 |
Series 2011-1 Class A3, 1.06% 2/20/14 | | 880,000 | | 883,612 |
Brazos Higher Education Authority, Inc. Series 2006-2 Class A9, 0.5838% 12/25/24 (f) | | 119,539 | | 105,385 |
Capital Auto Receivables Asset Trust Series 2007-1 Class C, 5.38% 11/15/12 | | 72,000 | | 72,402 |
Asset-Backed Securities - continued |
| Principal Amount | | Value |
Capital One Multi-Asset Execution Trust Series 2008-A3 Class A3, 5.05% 2/15/16 | | $ 400,000 | | $ 420,095 |
Capital Trust Ltd. Series 2004-1: | | | | |
Class A2, 0.6955% 7/20/39 (c)(f) | | 31,572 | | 23,521 |
Class B, 0.9955% 7/20/39 (c)(f) | | 30,070 | | 12,329 |
Class C, 1.3455% 7/20/39 (c)(f) | | 38,684 | | 870 |
Carrington Mortgage Loan Trust Series 2007-RFC1 Class A3, 0.384% 12/25/36 (f) | | 205,465 | | 64,992 |
Chase Issuance Trust Series 2011-A2 Class A2, 0.3385% 5/15/15 (f) | | 2,300,000 | | 2,301,143 |
Chrysler Financial Auto Securitization Trust Series 2010-A Class A3, 0.91% 8/8/13 | | 700,000 | | 700,778 |
Citibank Credit Card Issuance Trust: | | | | |
Series 2008-A5 Class A5, 4.85% 4/22/15 | | 700,000 | | 734,539 |
Series 2009-A5 Class A5, 2.25% 12/23/14 | | 2,070,000 | | 2,100,090 |
Citibank Omni Master Trust Series 2009-A8 Class A8, 2.3485% 5/16/16 (c)(f) | | 1,000,000 | | 1,004,122 |
CitiFinancial Auto Issuance Trust Series 2009-1 Class A3, 2.59% 10/15/13 (c) | | 626,851 | | 630,402 |
Countrywide Asset-Backed Certificates Trust: | | | | |
Series 2007-11 Class 2A1, 0.304% 6/25/47 (f) | | 1,469 | | 1,452 |
Series 2007-4 Class A1A, 0.3963% 9/25/37 (f) | | 34,013 | | 33,154 |
Countrywide Home Loan Trust Series 2006-13 Class N, 7% 8/25/37 (c) | | 37,648 | | 0 |
Countrywide Home Loans, Inc.: | | | | |
Series 2003-BC1 Class B1, 5.5436% 3/25/32 (MGIC Investment Corp. Insured) (f) | | 36,015 | | 6,162 |
Series 2004-3 Class M4, 1.214% 4/25/34 (f) | | 18,137 | | 7,991 |
Series 2004-4 Class M2, 1.039% 6/25/34 (f) | | 50,135 | | 22,673 |
Series 2005-3 Class MV1, 0.664% 8/25/35 (f) | | 18,669 | | 18,411 |
Discover Card Master Trust Series 2012-A1 Class A1, 0.81% 8/15/17 | | 1,410,000 | | 1,409,859 |
Fannie Mae subordinate REMIC pass-thru certificates Series 2004-T5 Class AB3, 0.7513% 5/28/35 (f) | | 4,436 | | 2,847 |
Fieldstone Mortgage Investment Corp. Series 2004-3 Class M5, 2.419% 8/25/34 (f) | | 33,155 | | 19,323 |
Ford Credit Auto Lease Trust: | | | | |
Series 2010-B Class A3, 0.91% 7/15/13 (c) | | 930,000 | | 930,864 |
Series 2011-A Class A3, 1.03% 7/15/14 | | 1,080,000 | | 1,085,124 |
Ford Credit Auto Owner Trust: | | | | |
Series 2009-B Class A3, 2.79% 8/15/13 | | 120,872 | | 121,338 |
Series 2009-C Class A4, 4.43% 11/15/14 | | 520,000 | | 539,409 |
Series 2009-D Class A4, 2.98% 8/15/14 | | 690,000 | | 704,377 |
Series 2009-E Class A3, 1.51% 1/15/14 | | 276,019 | | 276,971 |
Asset-Backed Securities - continued |
| Principal Amount | | Value |
Ford Credit Auto Owner Trust: - continued | | | | |
Series 2010-B: | | | | |
Class A3, 0.98% 10/15/14 | | $ 507,866 | | $ 509,436 |
Class A4, 1.58% 9/15/15 | | 1,360,000 | | 1,381,495 |
Series 2011-B Class A4, 1.35% 12/15/16 | | 510,000 | | 515,897 |
Ford Credit Automobile Lease Trust Series 2012-A Class A3, 0.85% 1/15/15 | | 400,000 | | 399,960 |
Ford Credit Floorplan Master Owner Trust: | | | | |
Series 2010-5 Class A1, 1.5% 9/15/15 | | 640,000 | | 646,203 |
Series 2012-2 Class A, 1.92% 1/15/19 | | 1,310,000 | | 1,310,124 |
Fremont Home Loan Trust: | | | | |
Series 2005-A: | | | | |
Class M3, 0.734% 1/25/35 (f) | | 81,136 | | 25,601 |
Class M4, 0.924% 1/25/35 (f) | | 41,438 | | 9,393 |
Series 2006-D Class M1, 0.474% 11/25/36 (f) | | 8,492 | | 34 |
GCO Education Loan Funding Master Trust II Series 2007-1A Class C1L, 0.8706% 2/25/47 (c)(f) | | 335,000 | | 117,250 |
GCO Slims Trust Series 2006-1A, 5.72% 3/1/22 (c) | | 145,579 | | 133,933 |
GE Business Loan Trust: | | | | |
Series 2003-1 Class A, 0.6785% 4/15/31 (c)(f) | | 24,355 | | 22,771 |
Series 2006-2A: | | | | |
Class A, 0.4285% 11/15/34 (c)(f) | | 226,861 | | 187,728 |
Class B, 0.5285% 11/15/34 (c)(f) | | 82,313 | | 53,092 |
Class C, 0.6285% 11/15/34 (c)(f) | | 135,849 | | 67,245 |
Class D, 0.9985% 11/15/34 (c)(f) | | 51,529 | | 11,336 |
GE Capital Credit Card Master Note Trust Series 2012-1 Class A, 1.03% 1/15/18 | | 1,190,000 | | 1,189,881 |
Goal Capital Funding Trust Series 2007-1 Class C1, 0.9738% 6/25/42 (f) | | 67,714 | | 51,700 |
GSAMP Trust Series 2004-AR1 Class B4, 5% 6/25/34 (c)(f) | | 54,683 | | 15,981 |
Guggenheim Structured Real Estate Funding Ltd. Series 2006-3: | | | | |
Class B, 0.644% 9/25/46 (c)(f) | | 3,434 | | 3,433 |
Class C, 0.794% 9/25/46 (c)(f) | | 174,018 | | 88,749 |
Home Equity Asset Trust: | | | | |
Series 2003-2 Class M1, 1.564% 8/25/33 (f) | | 48,998 | | 33,344 |
Series 2003-3 Class M1, 1.534% 8/25/33 (f) | | 59,799 | | 43,141 |
Series 2003-5 Class A2, 0.944% 12/25/33 (f) | | 2,817 | | 2,052 |
Series 2005-5 Class 2A2, 0.494% 11/25/35 (f) | | 592 | | 591 |
Series 2006-1 Class 2A3, 0.469% 4/25/36 (f) | | 36,823 | | 36,516 |
Honda Auto Receivables Owner Trust: | | | | |
Series 2010-1 Class A4, 1.98% 5/23/16 | | 260,000 | | 263,667 |
Asset-Backed Securities - continued |
| Principal Amount | | Value |
Honda Auto Receivables Owner Trust: - continued | | | | |
Series 2010-2 Class A4, 1.93% 8/18/16 | | $ 1,670,000 | | $ 1,696,352 |
Series 2011-1 Class A4, 1.8% 4/17/17 | | 330,000 | | 336,813 |
Series 2011-2 Class A4, 1.55% 8/18/17 | | 820,000 | | 833,703 |
HSI Asset Securitization Corp. Trust Series 2007-HE1 Class 2A3, 0.434% 1/25/37 (f) | | 141,116 | | 41,108 |
Hyundai Auto Lease Securitization Trust Series 2011-A Class A3, 1.02% 8/15/14 (c) | | 660,000 | | 660,603 |
Hyundai Auto Receivables Trust Series 2009-A Class A3, 2.03% 8/15/13 | | 98,493 | | 98,833 |
John Deere Owner Trust: | | | | |
Series 2009-B Class A-3, 1.57% 10/15/13 | | 139,063 | | 139,221 |
Series 2011-A Class A4, 1.96% 4/16/18 | | 260,000 | | 266,360 |
JPMorgan Mortgage Acquisition Trust: | | | | |
Series 2006-NC2 Class M2, 0.544% 7/25/36 (f) | | 25,000 | | 478 |
Series 2007-CH1 Class AV4, 0.374% 11/25/36 (f) | | 176,698 | | 146,141 |
Keycorp Student Loan Trust: | | | | |
Series 1999-A Class A2, 0.9038% 12/27/29 (f) | | 50,645 | | 44,474 |
Series 2006-A Class 2C, 1.7238% 3/27/42 (f) | | 392,000 | | 105,087 |
Long Beach Mortgage Loan Trust Series 2004-2 Class M2, 1.324% 6/25/34 (f) | | 9,594 | | 5,697 |
Marriott Vacation Club Owner Trust Series 2006-2A: | | | | |
Class B, 5.442% 10/20/28 (c) | | 1,811 | | 1,837 |
Class C, 5.691% 10/20/28 (c) | | 905 | | 914 |
Class D, 6.01% 10/20/28 (c) | | 9,732 | | 9,786 |
MASTR Asset Backed Securities Trust Series 2007-HE1 Class M1, 0.544% 5/25/37 (f) | | 89,453 | | 1,547 |
Mercedes-Benz Auto Lease Trust: | | | | |
Series 2011-1A Class A3 1.18% 11/15/13 (c) | | 1,250,000 | | 1,254,255 |
Series 2011-B Class A3, 1.07% 1/15/14 (c) | | 670,000 | | 670,701 |
Mercedes-Benz Auto Receivables Trust Series 2011-1 Class A3, 0.85% 3/16/15 | | 730,000 | | 732,510 |
Meritage Mortgage Loan Trust Series 2004-1 Class M1, 0.994% 7/25/34 (f) | | 21,191 | | 13,131 |
Merrill Lynch Mortgage Investors Trust: | | | | |
Series 2003-OPT1 Class M1, 1.219% 7/25/34 (f) | | 70,377 | | 47,193 |
Series 2006-FM1 Class A2B, 0.354% 4/25/37 (f) | | 155,280 | | 115,338 |
Series 2006-OPT1 Class A1A, 0.504% 6/25/35 (f) | | 312,305 | | 233,503 |
Morgan Stanley ABS Capital I Trust: | | | | |
Series 2004-HE6 Class A2, 0.584% 8/25/34 (f) | | 4,895 | | 3,757 |
Series 2004-NC8 Class M6, 1.494% 9/25/34 (f) | | 87,133 | | 49,632 |
Series 2005-NC1 Class M1, 0.684% 1/25/35 (f) | | 45,571 | | 28,778 |
Series 2005-NC2 Class B1, 1.414% 3/25/35 (f) | | 47,458 | | 6,010 |
Asset-Backed Securities - continued |
| Principal Amount | | Value |
Morgan Stanley ABS Capital I Trust: - continued | | | | |
Series 2007-HE2 Class M1, 0.494% 1/25/37 (f) | | $ 16,460 | | $ 48 |
National Collegiate Student Loan Trust: | | | | |
Series 2004-2 Class AIO, 9.75% 10/27/14 (h) | | 614,000 | | 41,445 |
Series 2006-4 Class D, 1.344% 5/25/32 (f) | | 300,000 | | 639 |
Series 2007-1 Class AIO, 7.27% 4/25/12 (h) | | 2,308,000 | | 36,928 |
Series 2007-2 Class AIO, 6.7% 7/25/12 (h) | | 1,656,899 | | 36,754 |
New Century Home Equity Loan Trust Series 2005-4 Class M2, 0.754% 9/25/35 (f) | | 162,650 | | 69,167 |
Nissan Auto Lease Trust: | | | | |
Series 2010-B Class A4, 1.27% 10/15/16 | | 290,000 | | 291,902 |
Series 2011-A Class A3, 1.04% 8/15/14 | | 910,000 | | 915,100 |
Series 2011-B Class A3, 0.92% 2/16/15 | | 460,000 | | 459,809 |
Nissan Auto Receivables Owner Trust Series 2011-A Class A3, 1.18% 2/16/15 | | 510,000 | | 514,325 |
Ocala Funding LLC: | | | | |
Series 2005-1A Class A, 1.7455% 3/20/10 (b)(c)(f) | | 64,000 | | 0 |
Series 2006-1A Class A, 1.6455% 3/20/11 (b)(c)(f) | | 134,000 | | 0 |
Option One Mortgage Loan Trust: | | | | |
Series 2007-5 Class 2A1, 0.334% 5/25/37 (f) | | 542 | | 538 |
Series 2007-6 Class 2A1, 0.304% 7/25/37 (f) | | 2,713 | | 2,671 |
Park Place Securities, Inc.: | | | | |
Series 2004-WCW1: | | | | |
Class M3, 1.494% 9/25/34 (f) | | 60,741 | | 25,612 |
Class M4, 1.694% 9/25/34 (f) | | 77,891 | | 17,021 |
Series 2005-WCH1 Class M4, 1.074% 1/25/36 (f) | | 126,217 | | 56,226 |
Salomon Brothers Mortgage Securities VII, Inc. Series 2003-HE1 Class A, 1.044% 4/25/33 (f) | | 582 | | 471 |
Santander Drive Auto Receivables Trust Series 2011-4 Class A2, 1.37% 3/16/15 | | 640,000 | | 640,592 |
Santander Drive Automobile Receivables Trust Series 2012-1 Class A2, 1.25% 4/15/15 | | 570,000 | | 570,993 |
Saxon Asset Securities Trust Series 2004-1 Class M1, 1.039% 3/25/35 (f) | | 151,975 | | 92,707 |
Sierra Receivables Funding Co. Series 2007-1A Class A2, 0.4309% 3/20/19 (FGIC Insured) (c)(f) | | 62,825 | | 60,164 |
SLM Private Credit Student Loan Trust Series 2004-A Class C, 1.4963% 6/15/33 (f) | | 145,000 | | 65,786 |
Specialty Underwriting & Residential Finance Trust Series 2006-AB2 Class N1, 5.75% 6/25/37 (c) | | 81,826 | | 0 |
Structured Asset Investment Loan Trust Series 2004-8 Class M5, 1.969% 9/25/34 (f) | | 7,425 | | 2,377 |
SVO VOI Mortgage Corp. Series 2006-AA Class A, 5.28% 2/20/24 (c) | | 71,658 | | 73,995 |
Asset-Backed Securities - continued |
| Principal Amount | | Value |
Terwin Mortgage Trust Series 2003-4HE Class A1, 1.104% 9/25/34 (f) | | $ 2,472 | | $ 1,835 |
Toyota Auto Receivables Owner Trust Series 2010-B Class M3, 1.04% 2/18/14 | | 302,389 | | 303,238 |
Trapeza CDO XII Ltd./Trapeza CDO XII, Inc. Series 2007-12A Class B, 1.1425% 4/6/42 (c)(f) | | 311,067 | | 9,332 |
USAA Auto Owner Trust: | | | | |
Series 2009-1 Class A4, 4.77% 9/15/14 | | 388,702 | | 395,426 |
Series 2009-2 Class A3, 1.54% 2/18/14 | | 193,682 | | 194,109 |
Volkswagen Auto Lease Trust Series 2010-A: | | | | |
Class A3, 0.99% 11/20/13 | | 1,410,000 | | 1,413,091 |
Class A4, 1.18% 10/20/15 | | 200,000 | | 200,862 |
WaMu Asset Holdings Corp. Series 2006-8 Class N1, 6.048% 10/25/46 (c) | | 75,976 | | 0 |
Wells Fargo Home Equity Trust Series 2004-3 Class A, 4.5% 11/27/34 (c) | | 646 | | 0 |
Whinstone Capital Management Ltd. Series 1A Class B3, 2.3601% 10/25/44 (c)(f) | | 203,978 | | 108,108 |
World Omni Automobile Lease Securitization Trust Series 2011-A, Class A3, 1.49% 10/15/14 | | 510,000 | | 514,011 |
TOTAL ASSET-BACKED SECURITIES (Cost $56,660,972) |
57,118,845
|
Collateralized Mortgage Obligations - 1.6% |
|
Private Sponsor - 1.0% |
Arran Residential Mortgages Funding PLC floater Series 2011-1A Class A1C, 1.6931% 11/19/47 (c)(f) | | 813,683 | | 814,422 |
Cobalt CMBS Commercial Mortgage Trust Series 2007-C2 Class B, 5.617% 4/15/47 (f) | | 241,000 | | 53,020 |
COMM pass-thru certificates floater Series 2001-J2A Class A2F, 0.7475% 7/16/34 (c)(f) | | 2,334 | | 2,333 |
Credit Suisse Mortgage Capital Certificates: | | | | |
floater Series 2011-7R Class A1, 1.494% 8/27/47 (c)(f) | | 482,969 | | 473,897 |
sequential payer Series 2010-16 Class A1, 3% 6/25/50 (c) | | 353,495 | | 341,123 |
Granite Master Issuer PLC floater: | | | | |
Series 2005-4 Class C2, 1.3455% 12/20/54 (f) | | 25,291 | | 15,376 |
Series 2006-1A Class C2, 1.4455% 12/20/54 (c)(f) | | 578,000 | | 352,580 |
Series 2006-2 Class C1, 1.1855% 12/20/54 (f) | | 463,000 | | 282,430 |
Series 2006-3 Class C2, 0.7455% 12/20/54 (f) | | 128,000 | | 78,080 |
Collateralized Mortgage Obligations - continued |
| Principal Amount | | Value |
Private Sponsor - continued |
Granite Master Issuer PLC floater: - continued | | | | |
Series 2006-4: | | | | |
Class B1, 0.4255% 12/20/54 (f) | | $ 521,000 | | $ 438,682 |
Class C1, 1.0055% 12/20/54 (f) | | 319,000 | | 194,590 |
Class M1, 0.5855% 12/20/54 (f) | | 137,000 | | 104,463 |
Series 2007-1: | | | | |
Class 1C1, 0.8455% 12/20/54 (f) | | 258,000 | | 157,380 |
Class 1M1, 0.5455% 12/20/54 (f) | | 172,000 | | 131,150 |
Class 2C1, 1.2055% 12/20/54 (f) | | 117,000 | | 71,370 |
Class 2M1, 0.7455% 12/20/54 (f) | | 222,000 | | 169,275 |
Series 2007-2 Class 2C1, 0.676% 12/17/54 (f) | | 308,000 | | 187,880 |
Granite Mortgages Series 2003-2 Class 1A3, 1.0612% 7/20/43 (f) | | 308,878 | | 299,179 |
Granite Mortgages PLC floater: | | | | |
Series 2003-3 Class 1C, 3.0112% 1/20/44 (f) | | 36,767 | | 26,392 |
Series 2004-1 Class 2A1, 0.8832% 3/20/44 (f) | | 517,788 | | 497,853 |
JPMorgan Chase Commercial Mortgage Securities Trust Series 2007-CB18 Class A3, 5.447% 6/12/47 (f) | | 367,136 | | 386,605 |
MASTR Adjustable Rate Mortgages Trust Series 2007-3 Class 22A2, 0.454% 5/25/47 (f) | | 70,362 | | 41,358 |
Merrill Lynch Alternative Note Asset Trust floater Series 2007-OAR1 Class A1, 0.414% 2/25/37 (f) | | 139,145 | | 93,518 |
RESI Finance LP/RESI Finance DE Corp. floater Series 2003-B: | | | | |
Class B5, 2.6048% 7/10/35 (c)(f) | | 156,078 | | 126,781 |
Class B6, 3.1048% 7/10/35 (c)(f) | | 259,651 | | 206,643 |
Residential Funding Securities Corp. floater Series 2003-RP2 Class A1, 0.694% 6/25/33 (c)(f) | | 28,633 | | 26,605 |
Santander Drive Auto Receivables Trust sequential payer Series 2011-3 Class A2, 1.11% 8/15/14 | | 590,000 | | 590,094 |
Sequoia Mortgage Trust floater Series 2004-6 Class A3B, 1.668% 7/20/34 (f) | | 4,073 | | 2,935 |
TBW Mortgage-Backed pass-thru certificates floater Series 2006-4 Class A3, 0.4763% 9/25/36 (f) | | 280,140 | | 213,660 |
TOTAL PRIVATE SPONSOR | | 6,379,674 |
U.S. Government Agency - 0.6% |
Fannie Mae Guaranteed Mtg. pass-thru certificates Series 2010-123 Class DL, 3.5% 11/25/25 | | 446,842 | | 466,048 |
Fannie Mae subordinate REMIC pass-thru certificates: | | | | |
planned amortization class Series 2002-9 Class PC, 6% 3/25/17 | | 46,700 | | 50,251 |
Collateralized Mortgage Obligations - continued |
| Principal Amount | | Value |
U.S. Government Agency - continued |
Fannie Mae subordinate REMIC pass-thru certificates: - continued | | | | |
sequential payer: | | | | |
Series 2002-56 Class MC, 5.5% 9/25/17 | | $ 160,145 | | $ 171,736 |
Series 2004-86 Class KC, 4.5% 5/25/19 | | 104,659 | | 108,297 |
Series 2010-143 Class B, 3.5% 12/25/25 | | 697,689 | | 730,891 |
Freddie Mac Multi-Class pass-thru certificates: | | | | |
floater Series 3346 Class FA, 0.4785% 2/15/19 (f) | | 645,425 | | 646,332 |
planned amortization class: | | | | |
Series 2356 Class GD, 6% 9/15/16 | | 164,972 | | 177,019 |
Series 2363 Class PF, 6% 9/15/16 | | 208,267 | | 221,362 |
Series 3777 Class AC, 3.5% 12/15/25 | | 1,239,839 | | 1,297,986 |
TOTAL U.S. GOVERNMENT AGENCY | | 3,869,922 |
TOTAL COLLATERALIZED MORTGAGE OBLIGATIONS (Cost $8,172,445) |
10,249,596
|
Commercial Mortgage Securities - 5.2% |
|
Asset Securitization Corp. Series 1997-D5: | | | | |
Class A2, 7.0826% 2/14/43 (f) | | 159,000 | | 160,785 |
Class A3, 7.1326% 2/14/43 (f) | | 172,000 | | 175,100 |
Class A6, 7.4526% 2/14/43 (f) | | 253,000 | | 257,865 |
Class PS1, 1.4363% 2/14/43 (f)(h) | | 578,169 | | 6,372 |
Banc of America Commercial Mortgage Trust: | | | | |
sequential payer: | | | | |
Series 2006-2 Class AAB, 5.9028% 5/10/45 (f) | | 211,146 | | 225,292 |
Series 2006-5 Class A3, 5.39% 9/10/47 | | 301,000 | | 318,018 |
Series 2006-6 Class A3, 5.369% 10/10/45 | | 432,000 | | 460,803 |
Series 2007-4 Class A3, 5.9813% 2/10/51 (f) | | 215,000 | | 228,391 |
Series 2006-6 Class E, 5.619% 10/10/45 (c) | | 125,000 | | 25,325 |
Series 2007-3 Class A3, 5.8426% 6/10/49 (f) | | 361,000 | | 378,384 |
Banc of America Commercial Mortgage, Inc.: | | | | |
sequential payer Series 2004-2: | | | | |
Class A3, 4.05% 11/10/38 | | 29,639 | | 30,077 |
Class A4, 4.153% 11/10/38 | | 274,000 | | 284,617 |
Series 2001-3 Class H, 6.562% 4/11/37 (c) | | 121,000 | | 121,323 |
Series 2001-PB1: | | | | |
Class J, 7.166% 5/11/35 (c) | | 20,174 | | 20,181 |
Class K, 6.15% 5/11/35 (c) | | 100,000 | | 97,412 |
Commercial Mortgage Securities - continued |
| Principal Amount | | Value |
Banc of America Large Loan, Inc. floater: | | | | |
Series 2005-MIB1: | | | | |
Class C, 0.5585% 3/15/22 (c)(f) | | $ 93,000 | | $ 90,210 |
Class D, 0.6085% 3/15/22 (c)(f) | | 94,000 | | 91,180 |
Class E, 0.6485% 3/15/22 (c)(f) | | 78,000 | | 75,660 |
Class F, 0.7185% 3/15/22 (c)(f) | | 70,189 | | 67,381 |
Class G, 0.7785% 3/15/22 (c)(f) | | 45,493 | | 42,763 |
Series 2006-BIX1: | | | | |
Class D, 0.4585% 10/15/19 (c)(f) | | 155,576 | | 149,353 |
Class E, 0.4885% 10/15/19 (c)(f) | | 157,000 | | 149,150 |
Class F, 0.5585% 10/15/19 (c)(f) | | 360,653 | | 339,014 |
Class G, 0.5785% 10/15/19 (c)(f) | | 144,054 | | 128,208 |
Bayview Commercial Asset Trust: | | | | |
floater: | | | | |
Series 2003-2 Class M1, 1.094% 12/25/33 (c)(f) | | 7,490 | | 5,305 |
Series 2004-1: | | | | |
Class A, 0.604% 4/25/34 (c)(f) | | 107,576 | | 86,599 |
Class B, 2.144% 4/25/34 (c)(f) | | 14,763 | | 8,536 |
Class M1, 0.804% 4/25/34 (c)(f) | | 11,962 | | 8,326 |
Class M2, 1.444% 4/25/34 (c)(f) | | 11,074 | | 7,676 |
Series 2005-2A: | | | | |
Class A1, 0.554% 8/25/35 (c)(f) | | 156,305 | | 102,038 |
Class M1, 0.674% 8/25/35 (c)(f) | | 9,210 | | 4,740 |
Class M2, 0.724% 8/25/35 (c)(f) | | 15,191 | | 6,917 |
Class M3, 0.744% 8/25/35 (c)(f) | | 8,405 | | 3,345 |
Series 2005-3A: | | | | |
Class A2, 0.644% 11/25/35 (c)(f) | | 68,419 | | 45,199 |
Class M1, 0.684% 11/25/35 (c)(f) | | 8,037 | | 4,609 |
Class M2, 0.734% 11/25/35 (c)(f) | | 10,203 | | 5,622 |
Class M3, 0.754% 11/25/35 (c)(f) | | 9,132 | | 4,820 |
Class M4, 0.844% 11/25/35 (c)(f) | | 11,377 | | 5,495 |
Series 2005-4A: | | | | |
Class A2, 0.634% 1/25/36 (c)(f) | | 152,637 | | 94,622 |
Class B1, 1.644% 1/25/36 (c)(f) | | 13,191 | | 1,750 |
Class M1, 0.694% 1/25/36 (c)(f) | | 49,238 | | 21,249 |
Class M2, 0.714% 1/25/36 (c)(f) | | 14,772 | | 5,734 |
Class M3, 0.744% 1/25/36 (c)(f) | | 21,572 | | 7,546 |
Class M4, 0.854% 1/25/36 (c)(f) | | 11,931 | | 3,707 |
Class M5, 0.894% 1/25/36 (c)(f) | | 11,931 | | 3,229 |
Class M6, 0.944% 1/25/36 (c)(f) | | 12,672 | | 2,450 |
Series 2006-1: | | | | |
Class A2, 0.604% 4/25/36 (c)(f) | | 23,867 | | 16,509 |
Class M1, 0.624% 4/25/36 (c)(f) | | 8,536 | | 4,827 |
Commercial Mortgage Securities - continued |
| Principal Amount | | Value |
Bayview Commercial Asset Trust: - continued | | | | |
floater: | | | | |
Series 2006-1: | | | | |
Class M2, 0.644% 4/25/36 (c)(f) | | $ 9,019 | | $ 4,751 |
Class M3, 0.664% 4/25/36 (c)(f) | | 7,760 | | 3,819 |
Class M4, 0.764% 4/25/36 (c)(f) | | 4,398 | | 1,978 |
Class M5, 0.804% 4/25/36 (c)(f) | | 4,268 | | 1,708 |
Class M6, 0.884% 4/25/36 (c)(f) | | 8,511 | | 3,236 |
Series 2006-2A: | | | | |
Class A1, 0.474% 7/25/36 (c)(f) | | 366,360 | | 231,956 |
Class A2, 0.524% 7/25/36 (c)(f) | | 21,047 | | 12,628 |
Class B1, 1.114% 7/25/36 (c)(f) | | 7,880 | | 930 |
Class B3, 2.944% 7/25/36 (c)(f) | | 11,906 | | 485 |
Class M1, 0.554% 7/25/36 (c)(f) | | 22,083 | | 8,848 |
Class M2, 0.574% 7/25/36 (c)(f) | | 15,580 | | 5,618 |
Class M3, 0.594% 7/25/36 (c)(f) | | 12,924 | | 4,202 |
Class M4, 0.664% 7/25/36 (c)(f) | | 8,727 | | 2,513 |
Class M5, 0.714% 7/25/36 (c)(f) | | 10,726 | | 2,658 |
Class M6, 0.784% 7/25/36 (c)(f) | | 16,004 | | 2,571 |
Series 2006-3A: | | | | |
Class B1, 1.044% 10/25/36 (c)(f) | | 15,354 | | 307 |
Class M4, 0.674% 10/25/36 (c)(f) | | 17,128 | | 1,683 |
Class M5, 0.724% 10/25/36 (c)(f) | | 20,504 | | 1,493 |
Class M6, 0.804% 10/25/36 (c)(f) | | 40,182 | | 1,860 |
Series 2006-4A: | | | | |
Class A1, 0.474% 12/25/36 (c)(f) | | 89,753 | | 59,377 |
Class A2, 0.514% 12/25/36 (c)(f) | | 377,350 | | 192,449 |
Class B1, 0.944% 12/25/36 (c)(f) | | 13,874 | | 1,296 |
Class B2, 1.494% 12/25/36 (c)(f) | | 14,275 | | 852 |
Class B3, 2.694% 12/25/36 (c)(f) | | 8,501 | | 175 |
Class M1, 0.534% 12/25/36 (c)(f) | | 28,933 | | 11,026 |
Class M2, 0.554% 12/25/36 (c)(f) | | 19,486 | | 6,554 |
Class M3, 0.584% 12/25/36 (c)(f) | | 19,486 | | 5,683 |
Class M4, 0.644% 12/25/36 (c)(f) | | 23,029 | | 5,338 |
Class M5, 0.684% 12/25/36 (c)(f) | | 21,848 | | 3,605 |
Class M6, 0.764% 12/25/36 (c)(f) | | 19,486 | | 2,379 |
Series 2007-1: | | | | |
Class A2, 0.514% 3/25/37 (c)(f) | | 99,558 | | 47,788 |
Class B1, 0.914% 3/25/37 (c)(f) | | 31,723 | | 2,288 |
Class B2, 1.394% 3/25/37 (c)(f) | | 20,288 | | 873 |
Class M1, 0.514% 3/25/37 (c)(f) | | 27,862 | | 9,095 |
Class M2, 0.534% 3/25/37 (c)(f) | | 20,900 | | 5,419 |
Class M3, 0.564% 3/25/37 (c)(f) | | 18,806 | | 3,764 |
Commercial Mortgage Securities - continued |
| Principal Amount | | Value |
Bayview Commercial Asset Trust: - continued | | | | |
floater: | | | | |
Series 2007-1: | | | | |
Class M4, 0.614% 3/25/37 (c)(f) | | $ 14,926 | | $ 2,209 |
Class M5, 0.664% 3/25/37 (c)(f) | | 23,675 | | 2,983 |
Class M6, 0.744% 3/25/37 (c)(f) | | 32,731 | | 3,376 |
Series 2007-2A: | | | | |
Class A1, 0.514% 7/25/37 (c)(f) | | 92,696 | | 47,796 |
Class A2, 0.564% 7/25/37 (c)(f) | | 86,663 | | 30,332 |
Class B1, 1.844% 7/25/37 (c)(f) | | 26,525 | | 1,009 |
Class B2, 2.494% 7/25/37 (c)(f) | | 8,695 | | 460 |
Class M1, 0.614% 7/25/37 (c)(f) | | 30,432 | | 4,610 |
Class M2, 0.654% 7/25/37 (c)(f) | | 16,441 | | 1,813 |
Class M3, 0.734% 7/25/37 (c)(f) | | 16,585 | | 1,454 |
Class M4, 0.894% 7/25/37 (c)(f) | | 33,806 | | 2,639 |
Class M5, 0.994% 7/25/37 (c)(f) | | 29,784 | | 1,947 |
Class M6, 1.244% 7/25/37 (c)(f) | | 37,229 | | 1,941 |
Series 2007-3: | | | | |
Class A2, 0.534% 7/25/37 (c)(f) | | 91,423 | | 39,112 |
Class B1, 1.194% 7/25/37 (c)(f) | | 22,494 | | 1,876 |
Class B2, 1.844% 7/25/37 (c)(f) | | 56,505 | | 3,010 |
Class B3, 4.244% 7/25/37 (c)(f) | | 6,902 | | 156 |
Class M1, 0.554% 7/25/37 (c)(f) | | 20,280 | | 6,694 |
Class M2, 0.584% 7/25/37 (c)(f) | | 21,759 | | 5,906 |
Class M3, 0.614% 7/25/37 (c)(f) | | 33,567 | | 7,387 |
Class M4, 0.744% 7/25/37 (c)(f) | | 53,112 | | 9,371 |
Class M5, 0.844% 7/25/37 (c)(f) | | 27,608 | | 3,679 |
Class M6, 1.044% 7/25/37 (c)(f) | | 20,913 | | 2,283 |
Series 2007-4A: | | | | |
Class B1, 2.794% 9/25/37 (c)(f) | | 22,785 | | 820 |
Class M1, 1.194% 9/25/37 (c)(f) | | 34,890 | | 3,057 |
Class M2, 1.294% 9/25/37 (c)(f) | | 34,890 | | 2,119 |
Class M4, 1.844% 9/25/37 (c)(f) | | 87,978 | | 3,800 |
Class M5, 1.994% 9/25/37 (c)(f) | | 87,978 | | 2,805 |
Class M6, 2.194% 9/25/37 (c)(f) | | 88,055 | | 1,806 |
Series 2004-1, Class IO, 1.25% 4/25/34 (c)(h) | | 404,008 | | 14,746 |
Series 2007-5A, Class IO, 4.1484% 10/25/37 (c)(f)(h) | | 1,000,248 | | 94,623 |
Bear Stearns Commercial Mortgage Securities Trust: | | | | |
floater: | | | | |
Series 2006-BBA7: | | | | |
Class H, 0.8985% 3/15/19 (c)(f) | | 47,525 | | 45,645 |
Class J, 1.0985% 3/15/19 (c)(f) | | 46,405 | | 39,920 |
Commercial Mortgage Securities - continued |
| Principal Amount | | Value |
Bear Stearns Commercial Mortgage Securities Trust: - continued | | | | |
floater: | | | | |
Series 2007-BBA8: | | | | |
Class D, 0.4985% 3/15/22 (c)(f) | | $ 76,569 | | $ 65,697 |
Class E, 0.5485% 3/15/22 (c)(f) | | 394,020 | | 334,134 |
Class F, 0.5985% 3/15/22 (c)(f) | | 241,475 | | 199,944 |
Class G, 0.6485% 3/15/22 (c)(f) | | 62,931 | | 51,478 |
Class H, 0.7985% 3/15/22 (c)(f) | | 76,569 | | 61,103 |
Class J, 0.9485% 3/15/22 (c)(f) | | 76,569 | | 59,572 |
sequential payer: | | | | |
Series 2003-PWR2 Class A3, 4.834% 5/11/39 | | 11,409 | | 11,425 |
Series 2004-PWR3 Class A3, 4.487% 2/11/41 | | 63,555 | | 64,794 |
Series 2006-PW14 Class X2, 0.8632% 12/11/38 (c)(f)(h) | | 2,274,310 | | 27,057 |
Series 2006-T24 Class X2, 0.6237% 10/12/41 (c)(f)(h) | | 427,756 | | 3,189 |
Series 2007-PW18 Class X2, 0.4796% 6/11/50 (c)(f)(h) | | 15,203,103 | | 170,199 |
Series 2007-T28 Class X2, 0.3272% 9/11/42 (c)(f)(h) | | 8,179,766 | | 53,537 |
C-BASS Trust floater Series 2006-SC1 Class A, 0.514% 5/25/36 (c)(f) | | 83,294 | | 68,684 |
CDC Commercial Mortgage Trust Series 2002-FX1: | | | | |
Class G, 6.625% 5/15/35 (c) | | 254,000 | | 264,882 |
Class XCL, 1.5913% 5/15/35 (c)(f)(h) | | 887,674 | | 20,772 |
Citigroup Commercial Mortgage Trust: | | | | |
floater Series 2006-FL2: | | | | |
Class G, 0.5835% 8/15/21 (c)(f) | | 23,352 | | 22,257 |
Class H, 0.6235% 8/15/21 (c)(f) | | 40,527 | | 37,873 |
Series 2006-C5 Class AMP2, 5.5005% 10/15/49 (c) | | 319,954 | | 304,967 |
Series 2008-C7 Class A2B, 6.2764% 12/10/49 (f) | | 203,577 | | 209,525 |
Citigroup/Deutsche Bank Commercial Mortgage Trust Series 2007-CD4: | | | | |
Class A3, 5.293% 12/11/49 | | 210,000 | | 224,452 |
Class C, 5.476% 12/11/49 | | 407,000 | | 116,608 |
Cobalt CMBS Commercial Mortgage Trust: | | | | |
sequential payer Series 2007-C3 Class A3, 6.0104% 5/15/46 (f) | | 216,000 | | 231,789 |
Series 2006-C1 Class B, 5.359% 8/15/48 | | 648,000 | | 38,880 |
Commercial Mortgage Securities - continued |
| Principal Amount | | Value |
COMM pass-thru certificates: | | | | |
floater: | | | | |
Series 2005-F10A: | | | | |
Class G, 0.7985% 4/15/17 (c)(f) | | $ 8,877 | | $ 8,552 |
Class H, 0.8685% 4/15/17 (c)(f) | | 19,555 | | 16,885 |
Class J, 1.0985% 4/15/17 (c)(f) | | 14,996 | | 10,497 |
Series 2005-FL11: | | | | |
Class C, 0.5485% 11/15/17 (c)(f) | | 164,947 | | 151,751 |
Class D, 0.5885% 11/15/17 (c)(f) | | 8,646 | | 7,868 |
Class E, 0.6385% 11/15/17 (c)(f) | | 30,262 | | 27,236 |
Class F, 0.6985% 11/15/17 (c)(f) | | 21,193 | | 18,862 |
Class G, 0.7485% 11/15/17 (c)(f) | | 14,690 | | 12,927 |
Series 2006-FL12 Class AJ, 0.3785% 12/15/20 (c)(f) | | 308,000 | | 276,112 |
sequential payer: | | | | |
Series 2006-C8 Class A3, 5.31% 12/10/46 | | 615,000 | | 639,740 |
Series 2006-CN2A: | | | | |
Class A2FX, 5.449% 2/5/19 (c) | | 365,000 | | 354,953 |
Class AJFX, 5.478% 2/5/19 (c) | | 380,000 | | 377,682 |
Series 2006-C8 Class XP, 0.6566% 12/10/46 (f)(h) | | 2,095,136 | | 18,433 |
Commercial Mortgage pass-thru certificates: | | | | |
sequential payer Series 2005-C6 Class A2, 4.999% 6/10/44 (f) | | 1,542 | | 1,548 |
Series 2004-LB4A Class A5, 4.84% 10/15/37 | | 1,690,000 | | 1,796,404 |
Credit Suisse Commercial Mortgage Trust: | | | | |
sequential payer: | | | | |
Series 2007-C2 Class A3, 5.542% 1/15/49 (f) | | 432,000 | | 470,347 |
Series 2007-C3: | | | | |
Class A2, 5.9018% 6/15/39 (f) | | 281,512 | | 282,355 |
Class A4, 5.9018% 6/15/39 (f) | | 130,000 | | 141,723 |
Series 2006-C5 Class ASP, 0.8652% 12/15/39 (f)(h) | | 1,400,562 | | 16,832 |
Credit Suisse First Boston Mortgage Capital Certificates floater Series 2007-TF2A Class B, 0.5985% 4/15/22 (c)(f) | | 771,000 | | 572,476 |
Credit Suisse First Boston Mortgage Securities Corp.: | | | | |
sequential payer Series 2004-C1: | | | | |
Class A3, 4.321% 1/15/37 | | 11,139 | | 11,191 |
Class A4, 4.75% 1/15/37 | | 101,000 | | 106,412 |
Series 2001-CK6 Class AX, 1.1089% 8/15/36 (f)(h) | | 84,129 | | 215 |
Series 2001-CKN5 Class AX, 1.9203% 9/15/34 (c)(f)(h) | | 339,217 | | 560 |
Series 2003-C4 Class A4, 5.137% 8/15/36 | | 560,000 | | 584,228 |
Commercial Mortgage Securities - continued |
| Principal Amount | | Value |
Credit Suisse Mortgage Capital Certificates: | | | | |
floater Series 2007-TFL1: | | | | |
Class B, 0.3985% 2/15/22 (c)(f) | | $ 82,000 | | $ 73,603 |
Class C: | | | | |
0.4185% 2/15/22 (c)(f) | | 212,546 | | 188,613 |
0.5185% 2/15/22 (c)(f) | | 75,912 | | 66,590 |
Class F, 0.5685% 2/15/22 (c)(f) | | 151,805 | | 131,615 |
Series 2007-C1: | | | | |
Class ASP, 0.5721% 2/15/40 (f)(h) | | 3,373,706 | | 24,945 |
Class B, 5.487% 2/15/40 (c)(f) | | 330,000 | | 49,500 |
First Union National Bank-Bank of America Commercial Mortgage Trust Series 2001-C1 Class G, 6.936% 3/15/33 (c) | | 142,000 | | 143,295 |
GE Capital Commercial Mortgage Corp.: | | | | |
sequential payer Series 2007-C1 Class A4, 5.543% 12/10/49 | | 1,136,000 | | 1,229,944 |
Series 2001-1 Class X1, 1.5729% 5/15/33 (c)(f)(h) | | 246,606 | | 2,192 |
Series 2007-C1 Class XP, 0.3493% 12/10/49 (f)(h) | | 3,017,912 | | 13,297 |
GMAC Commercial Mortgage Securities, Inc.: | | | | |
sequential payer Series 2003-C2 Class A2, 5.6355% 5/10/40 (f) | | 290,000 | | 306,443 |
Series 2005-C1 Class X2, 0.7314% 5/10/43 (f)(h) | | 748,891 | | 1,283 |
Greenwich Capital Commercial Funding Corp.: | | | | |
floater Series 2006-FL4 Class B, 0.4525% 11/5/21 (c)(f) | | 81,000 | | 78,678 |
sequential payer Series 2007-GG11 Class A2, 5.597% 12/10/49 | | 432,000 | | 444,838 |
Series 2007-GG11 Class A1, 0.4565% 12/10/49 (c)(f)(h) | | 4,582,587 | | 28,440 |
GS Mortgage Securities Corp. II: | | | | |
floater: | | | | |
Series 2006-FL8A: | | | | |
Class E, 0.6325% 6/6/20 (c)(f) | | 49,233 | | 46,955 |
Class F, 0.7025% 6/6/20 (c)(f) | | 95,176 | | 89,850 |
Series 2007-EOP: | | | | |
Class A1, 1.1031% 3/6/20 (c)(f) | | 852,092 | | 845,701 |
Class C, 2.1455% 3/6/20 (c)(f) | | 236,000 | | 229,675 |
Class D, 2.3636% 3/6/20 (c)(f) | | 467,000 | | 452,616 |
Class F, 2.8433% 3/6/20 (c)(f) | | 19,000 | | 18,244 |
Class G, 3.0177% 3/6/20 (c)(f) | | 10,000 | | 9,552 |
Class H, 3.5846% 3/6/20 (c)(f) | | 7,000 | | 6,693 |
Class J, 4.4568% 3/6/20 (c)(f) | | 11,000 | | 10,590 |
sequential payer Series 2005-GG4 Class A3, 4.607% 7/10/39 | | 420,000 | | 420,660 |
Series 2005-GG4 Class XP, 0.8961% 7/10/39 (c)(f)(h) | | 3,286,754 | | 7,113 |
Commercial Mortgage Securities - continued |
| Principal Amount | | Value |
GS Mortgage Securities Trust: | | | | |
sequential payer: | | | | |
Series 2006-GG8 Class A2, 5.479% 11/10/39 | | $ 163,182 | | $ 164,176 |
Series 2007-GG10 Class A2, 5.778% 8/10/45 | | 70,814 | | 72,107 |
Series 2012-GC6 Class A1, 1.282% 1/10/45 | | 230,000 | | 230,500 |
JPMorgan Chase Commercial Mortgage Securities Corp.: | | | | |
floater Series 2011-CCHP Class A, 2.6% 7/15/28 (c)(f) | | 1,200,000 | | 1,199,893 |
sequential payer Series 2003-C1 Class A2, 4.985% 1/12/37 | | 480,000 | | 492,625 |
Series 2003-CB7 Class A4, 4.879% 1/12/38 (f) | | 236,504 | | 248,780 |
JPMorgan Chase Commercial Mortgage Securities Trust: | | | | |
floater Series 2006-FLA2: | | | | |
Class B, 0.4185% 11/15/18 (c)(f) | | 118,573 | | 110,273 |
Class C, 0.4585% 11/15/18 (c)(f) | | 84,204 | | 75,783 |
Class D, 0.4785% 11/15/18 (c)(f) | | 25,878 | | 22,773 |
Class E, 0.5285% 11/15/18 (c)(f) | | 37,813 | | 32,519 |
Class F, 0.5785% 11/15/18 (c)(f) | | 56,500 | | 48,025 |
Class G, 0.6085% 11/15/18 (c)(f) | | 49,114 | | 40,273 |
Class H, 0.7485% 11/15/18 (c)(f) | | 37,822 | | 29,501 |
sequential payer: | | | | |
Series 2006-LDP9 Class A2, 5.134% 5/15/47 (f) | | 82,371 | | 86,245 |
Series 2007-LD11 Class A2, 5.9895% 6/15/49 (f) | | 533,904 | | 538,476 |
Series 2007-LDPX: | | | | |
Class A2 S, 5.305% 1/15/49 | | 1,293,476 | | 1,293,746 |
Class A3, 5.42% 1/15/49 | | 594,000 | | 664,649 |
Series 2005-CB13 Class E, 5.5259% 1/12/43 (c)(f) | | 109,000 | | 5,563 |
Series 2006-CB17 Class A3, 5.45% 12/12/43 | | 57,109 | | 58,961 |
Series 2007-CB19: | | | | |
Class B, 5.9303% 2/12/49 (f) | | 18,000 | | 6,703 |
Class C, 5.9303% 2/12/49 (f) | | 48,000 | | 14,044 |
Class D, 5.9303% 2/12/49 (f) | | 51,000 | | 7,077 |
Series 2007-LDP10 Class ES, 5.7445% 1/15/49 (c)(f) | | 112,000 | | 5,863 |
JPMorgan Commercial Mortgage Finance Corp. Series 2000-C9 Class G, 6.25% 10/15/32 (c) | | 5,561 | | 5,572 |
LB Commercial Conduit Mortgage Trust Series 1998-C1 Class D, 6.98% 2/18/30 | | 30,708 | | 31,223 |
LB-UBS Commercial Mortgage Trust: | | | | |
sequential payer: | | | | |
Series 2006-C1 Class A2, 5.084% 2/15/31 | | 29,379 | | 29,684 |
Series 2006-C7 Class A2, 5.3% 11/15/38 | | 129,971 | | 130,125 |
Series 2007-C1 Class A4, 5.424% 2/15/40 | | 28,000 | | 31,614 |
Series 2007-C2 Class A3, 5.43% 2/15/40 | | 104,000 | | 115,566 |
Commercial Mortgage Securities - continued |
| Principal Amount | | Value |
LB-UBS Commercial Mortgage Trust: - continued | | | | |
Series 2005-C3 Class XCP, 0.9042% 7/15/40 (f)(h) | | $ 491,215 | | $ 1,031 |
Series 2006-C6 Class XCP, 0.8617% 9/15/39 (f)(h) | | 920,913 | | 9,857 |
Series 2007-C1 Class XCP, 0.6167% 2/15/40 (f)(h) | | 344,025 | | 2,914 |
Series 2007-C7 Class XCP, 0.431% 9/15/45 (f)(h) | | 15,785,489 | | 114,618 |
Lehman Brothers Floating Rate Commercial Mortgage Trust floater Series 2006-LLFA: | | | | |
Class D, 0.4785% 9/15/21 (c)(f) | | 69,510 | | 62,223 |
Class E, 0.5385% 9/15/21 (c)(f) | | 249,861 | | 216,172 |
Class F, 0.5885% 9/15/21 (c)(f) | | 97,418 | | 81,360 |
Class G, 0.6085% 9/15/21 (c)(f) | | 192,585 | | 155,064 |
Class H, 0.6485% 9/15/21 (c)(f) | | 49,497 | | 37,873 |
Merrill Lynch Mortgage Trust: | | | | |
Series 2005-CKI1 Class A3, 5.3913% 11/12/37 (f) | | 146,567 | | 147,935 |
Series 2005-LC1 Class F, 5.5568% 1/12/44 (c)(f) | | 188,000 | | 105,002 |
Merrill Lynch-CFC Commercial Mortgage Trust: | | | | |
floater Series 2006-4 Class A2FL, 0.4158% 12/12/49 (f) | | 32,746 | | 32,737 |
sequential payer: | | | | |
Series 2006-1 Class A3, 5.6568% 2/12/39 (f) | | 230,000 | | 233,716 |
Series 2006-4 Class ASB, 5.133% 12/12/49 (f) | | 177,970 | | 188,940 |
Series 2007-5: | | | | |
Class A3, 5.364% 8/12/48 | | 84,000 | | 86,141 |
Class A4, 5.378% 8/12/48 | | 9,000 | | 9,731 |
Class B, 5.479% 8/12/48 | | 648,000 | | 162,000 |
Series 2006-3 Class ASB, 5.382% 7/12/46 (f) | | 846,508 | | 890,824 |
Series 2006-4 Class XP, 0.8109% 12/12/49 (f)(h) | | 3,222,242 | | 53,763 |
Series 2007-6 Class B, 5.635% 3/12/51 (f) | | 216,000 | | 67,470 |
Series 2007-7 Class B, 5.9345% 6/12/50 (f) | | 19,000 | | 1,602 |
Morgan Stanley Capital I Trust: | | | | |
floater: | | | | |
Series 2006-XLF Class C, 1.449% 7/15/19 (c)(f) | | 40,774 | | 23,649 |
Series 2007-XLFA: | | | | |
Class C, 0.409% 10/15/20 (c)(f) | | 124,000 | | 112,329 |
Class D, 0.439% 10/15/20 (c)(f) | | 76,067 | | 68,527 |
Class E, 0.499% 10/15/20 (c)(f) | | 95,138 | | 80,951 |
Class F, 0.549% 10/15/20 (c)(f) | | 57,094 | | 43,442 |
Class G, 0.589% 10/15/20 (c)(f) | | 70,577 | | 51,583 |
Class H, 0.679% 10/15/20 (c)(f) | | 44,426 | | 25,806 |
Class J, 0.829% 10/15/20 (c)(f) | | 25,989 | | 10,808 |
Class MHRO, 0.939% 10/15/20 (c)(f) | | 69,447 | | 58,335 |
Class NHRO, 1.139% 10/15/20 (c)(f) | | 105,124 | | 86,202 |
Commercial Mortgage Securities - continued |
| Principal Amount | | Value |
Morgan Stanley Capital I Trust: - continued | | | | |
sequential payer: | | | | |
Series 2003-IQ4 Class A2, 4.07% 5/15/40 | | $ 199,287 | | $ 204,200 |
Series 2005-IQ9 Class A3, 4.54% 7/15/56 | | 222,752 | | 227,001 |
Series 2007-IQ13 Class A1, 5.05% 3/15/44 | | 1,520 | | 1,519 |
Series 2006-HQ10 Class X2, 0.6911% 11/12/41 (c)(f)(h) | | 1,101,604 | | 4,509 |
Series 2006-HQ8 Class A3, 5.6512% 3/12/44 (f) | | 71,390 | | 71,778 |
Series 2006-T23 Class A3, 5.986% 8/12/41 (f) | | 110,000 | | 114,905 |
Morgan Stanley Dean Witter Capital I Trust sequential payer Series 2003-T11 Class A4, 5.15% 6/13/41 | | 247,621 | | 257,053 |
Providence Place Group Ltd. Partnership sequential payer Series 2000-C1 Class A1, 7.75% 7/20/16 (c) | | 121,232 | | 126,506 |
Structured Asset Securities Corp. Series 1997-LLI Class D, 7.15% 10/12/34 | | 10,226 | | 10,241 |
Wachovia Bank Commercial Mortgage Trust: | | | | |
floater: | | | | |
Series 2006-WL7A: | | | | |
Class A1, 0.3751% 9/15/21 (c)(f) | | 536,741 | | 517,018 |
Class E, 0.5696% 9/15/21 (c)(f) | | 201,847 | | 158,097 |
Class F, 0.6296% 9/15/21 (c)(f) | | 214,060 | | 161,242 |
Class G, 0.6496% 9/15/21 (c)(f) | | 202,788 | | 146,667 |
Class J, 0.8896% 9/15/21 (c)(f) | | 45,086 | | 20,435 |
Series 2007-WHL8: | | | | |
Class AP1, 0.9485% 6/15/20 (c)(f) | | 16,443 | | 14,798 |
Class AP2, 1.0485% 6/15/20 (c)(f) | | 26,799 | | 23,583 |
Class F, 0.7285% 6/15/20 (c)(f) | | 526,588 | | 342,282 |
Class LXR1, 0.9485% 6/15/20 (c)(f) | | 26,316 | | 21,316 |
sequential payer: | | | | |
Series 2006-C29 Class A3, 5.313% 11/15/48 | | 574,000 | | 591,444 |
Series 2007-C30: | | | | |
Class A3, 5.246% 12/15/43 | | 69,387 | | 70,991 |
Class A4, 5.305% 12/15/43 | | 64,000 | | 68,014 |
Class A5, 5.342% 12/15/43 | | 231,000 | | 251,619 |
Series 2007-C32: | | | | |
Class A2, 5.9237% 6/15/49 (f) | | 221,992 | | 230,076 |
Class A3, 5.9287% 6/15/49 (f) | | 367,000 | | 404,029 |
Series 2005-C22 Class F, 5.5336% 12/15/44 (c)(f) | | 360,000 | | 87,040 |
Series 2007-C30: | | | | |
Class C, 5.483% 12/15/43 (f) | | 648,000 | | 255,892 |
Class XP, 0.6327% 12/15/43 (c)(f)(h) | | 1,932,136 | | 18,877 |
Series 2007-C31 Class C, 5.8735% 4/15/47 (f) | | 59,000 | | 12,048 |
Commercial Mortgage Securities - continued |
| Principal Amount | | Value |
Wachovia Bank Commercial Mortgage Trust: - continued | | | | |
Series 2007-C31A Class A2, 5.421% 4/15/47 | | $ 662,261 | | $ 688,106 |
Wachovia Bank Commercial Mortgage Trust pass-thru certificates sequential payer Series 2007-C33 Class A5, 6.0964% 2/15/51 (f) | | 143,000 | | 157,894 |
TOTAL COMMERCIAL MORTGAGE SECURITIES (Cost $27,808,779) |
33,169,959
|
Municipal Securities - 0.4% |
|
California Gen. Oblig. 5.25% 4/1/14 | | 1,500,000 | | 1,602,240 |
Illinois Gen. Oblig.: | | | | |
Series 2010, 3.321% 1/1/13 | | 920,000 | | 938,041 |
Series 2011, 5.877% 3/1/19 | | 75,000 | | 83,048 |
TOTAL MUNICIPAL SECURITIES (Cost $2,498,541) |
2,623,329
|
Foreign Government and Government Agency Obligations - 1.2% |
|
Brazilian Federative Republic 4.875% 1/22/21 | | 500,000 | | 565,000 |
Chilean Republic 3.25% 9/14/21 | | 224,000 | | 229,712 |
Hydro-Quebec 2% 6/30/16 | | 2,500,000 | | 2,576,240 |
New Brunswick Province 2.75% 6/15/18 | | 1,300,000 | | 1,367,288 |
Ontario Province 2.3% 5/10/16 | | 2,820,000 | | 2,925,366 |
TOTAL FOREIGN GOVERNMENT AND GOVERNMENT AGENCY OBLIGATIONS (Cost $7,457,943) |
7,663,606
|
Supranational Obligations - 0.0% |
|
Corporacion Andina de Fomento 5.2% 5/21/13
(Cost $35,619) | | 37,000 | |
38,408
|
Bank Notes - 0.4% |
|
National City Bank, Cleveland 0.6269% 3/1/13 (f) | | 1,729,000 | | 1,730,193 |
Wachovia Bank NA 6% 11/15/17 | | 570,000 | | 655,588 |
TOTAL BANK NOTES (Cost $2,286,046) | 2,385,781 |
Fixed-Income Funds - 0.8% |
| Shares | | Value |
Fidelity Specialized High Income Central Fund (g)
(Cost $4,804,391) | 48,063 | | $ 4,991,856 |
Money Market Funds - 0.7% |
| | | |
Fidelity Cash Central Fund, 0.12% (a)
(Cost $4,489,158) | 4,489,158 | |
4,489,158
|
TOTAL INVESTMENT PORTFOLIO - 99.4% (Cost $593,935,754) | | 629,682,796 |
NET OTHER ASSETS (LIABILITIES) - 0.6% | | 3,553,177 |
NET ASSETS - 100% | $ 633,235,973 |
Swap Agreements |
| Expiration Date | | Notional Amount | | |
Credit Default Swaps |
Receive monthly notional amount multiplied by .82% and pay UBS upon credit event of Morgan Stanley ABS Capital I, Inc., par value of the notional amount of Morgan Stanley ABS Capital I, Inc. Series 2004-NC6 Class M3, 5.6413% 7/25/34 (Rating-Ca) (e) | August 2034 | | $ 72,782 | | (56,298) |
Receive monthly notional amount multiplied by 2.5% and pay Credit Suisse First Boston upon credit event of Ameriquest Mortgage Securities, Inc., par value of the notional amount of Ameriquest Mortgage Securities, Inc. Series 2004-R11 Class M9, 8.03% 11/25/34 (Rating-C) (e) | Dec. 2034 | | 248,360 | | (238,614) |
Receive monthly notional amount multiplied by 2.61% and pay Goldman Sachs upon credit event of Fremont Home Loan Trust, par value of the notional amount of Fremont Home Loan Trust Series 2004-A Class B3, 7.0413% 1/25/34 (Rating-C) (e) | Feb. 2034 | | 806 | | (753) |
Swap Agreements - continued |
| Expiration Date | | Notional Amount | | Value |
Credit Default Swaps - continued |
Receive monthly notional amount multiplied by 3.05% and pay Merrill Lynch upon credit event of Morgan Stanley ABS Capital I, Inc., par value of the notional amount of Morgan Stanley ABS Capital I, Inc. Series 2004-NC8, Class B3, 7.2913% 9/25/34 (Rating-Ca) (e) | Oct. 2034 | | $ 85,210 | | $ (71,782) |
Receive monthly notional amount multiplied by 3.35% and pay Morgan Stanley, Inc. upon credit event of Morgan Stanley ABS Capital I, Inc., par value of the notional amount of Morgan Stanley ABS Capital I, Inc. Series 2004-HE7, Class B3, 9.01% 8/25/34 (Rating-C) (e) | Sept. 2034 | | 70,670 | | (61,616) |
| | $ 477,828 | | $ (429,063) |
Legend |
(a) Affiliated fund that is available only to investment companies and other accounts managed by Fidelity Investments. The rate quoted is the annualized seven-day yield of the fund at period end. A complete unaudited listing of the fund's holdings as of its most recent quarter end is available upon request. In addition, each Fidelity Central Fund's financial statements are available on the SEC's website or upon request. |
(b) Non-income producing - Security is in default. |
(c) Security exempt from registration under Rule 144A of the Securities Act of 1933. These securities may be resold in transactions exempt from registration, normally to qualified institutional buyers. At the end of the period, the value of these securities amounted to $61,242,696 or 9.7% of net assets. |
(d) Security or a portion of the security has been segregated as collateral for open swap agreements. At the period end, the value of securities pledged amounted to $110,992. |
(e) Represents a credit default swap contract in which the Fund has sold protection on the underlying reference entity. The value of each credit default swap and the credit rating can be measures of the current payment/performance risk. For the underlying reference entity, ratings disclosed are from Moody's Investors Service, Inc. Where Moody's ratings are not available, S&P ratings are disclosed and are indicated as such. All ratings are as of the report date and do not reflect subsequent changes. Where a credit rating is not disclosed, the value is used as the measure of the payment/performance risk. |
(f) Coupon rates for floating and adjustable rate securities reflect the rates in effect at period end. |
(g) Affiliated fund that is available only to investment companies and other accounts managed by Fidelity Investments. A complete unaudited schedule of portfolio holdings for each Fidelity Central Fund is filed with the SEC for the first and third quarters of each fiscal year on Form N-Q and is available upon request or at the SEC's web site at www.sec.gov. An unaudited holdings listing for the Fund, which presents direct holdings as well as the pro rata share of securities and other investments held indirectly through its investment in underlying non-money market Fidelity Central Funds, is available at advisor.fidelity.com. In addition, each Fidelity Central Fund's financial statements are available on the SEC's web site or upon request. |
(h) Security represents right to receive monthly interest payments on an underlying pool of mortgages or assets. Principal shown is the outstanding par amount of the pool as of the end of the period. |
Affiliated Central Funds |
Information regarding fiscal year to date income earned by the Fund from investments in Fidelity Central Funds is as follows: |
Fund | Income earned |
Fidelity Cash Central Fund | $ 1,870 |
Fidelity Specialized High Income Central Fund | 158,540 |
Total | $ 160,410 |
Additional information regarding the Fund's fiscal year to date purchases and sales, including the ownership percentage, of the non Money Market Central Funds is as follows: |
Fund | Value,
beginning of
period | Purchases | Sales
Proceeds | Value,
end of
period | % ownership,
end of
period |
Fidelity Specialized High Income Central Fund | $ 5,890,796 | $ 158,540 | $ 1,300,150 | $ 4,991,856 | 1.1% |
Other Information |
The following is a summary of the inputs used, as of February 29, 2012, involving the Fund's assets and liabilities carried at fair value. The inputs or methodology used for valuing securities may not be an indication of the risk associated with investing in those securities. For more information on valuation inputs, and their aggregation into the levels used in the tables below, please refer to the Security Valuation section in the accompanying Notes to Financial Statements. |
Valuation Inputs at Reporting Date: |
Description | Total | Level 1 | Level 2 | Level 3 |
Investments in Securities: | | | | |
Corporate Bonds | $ 218,138,968 | $ - | $ 218,138,968 | $ - |
U.S. Government and Government Agency Obligations | 251,501,103 | - | 251,501,103 | - |
U.S. Government Agency - Mortgage Securities | 37,312,187 | - | 37,312,187 | - |
Asset-Backed Securities | 57,118,845 | - | 55,292,971 | 1,825,874 |
Collateralized Mortgage Obligations | 10,249,596 | - | 9,863,152 | 386,444 |
Commercial Mortgage Securities | 33,169,959 | - | 30,312,155 | 2,857,804 |
Municipal Securities | 2,623,329 | - | 2,623,329 | - |
Foreign Government and Government Agency Obligations | 7,663,606 | - | 7,663,606 | - |
Supranational Obligations | 38,408 | - | 38,408 | - |
Bank Notes | 2,385,781 | - | 2,385,781 | - |
Fixed-Income Funds | 4,991,856 | 4,991,856 | - | - |
Money Market Funds | 4,489,158 | 4,489,158 | - | - |
Total Investments in Securities: | $ 629,682,796 | $ 9,481,014 | $ 615,131,660 | $ 5,070,122 |
Derivative Instruments: | | | | |
Liabilities | | | | |
Swap Agreements | $ (429,063) | $ - | $ - | $ (429,063) |
The following is a reconciliation of Investments in Securities and Derivative Instruments for which Level 3 inputs were used in determining value: |
Investments in Securities: | |
Beginning Balance | $ 6,731,716 |
Total Realized Gain (Loss) | 118,750 |
Total Unrealized Gain (Loss) | (426,378) |
Cost of Purchases | 1,384 |
Proceeds of Sales | (1,212,984) |
Amortization/Accretion | 48,687 |
Transfers in to Level 3 | 1,781,183 |
Transfers out of Level 3 | (1,972,236) |
Ending Balance | $ 5,070,122 |
The change in unrealized gain (loss) for the period attributable to Level 3 securities held at February 29, 2012 | $ (372,458) |
Derivative Instruments: | |
Swap Agreements | |
Beginning Balance | $ (374,228) |
Total Unrealized Gain (Loss) | (54,835) |
Transfers in to Level 3 | - |
Transfers out of Level 3 | - |
Ending Balance | $ (429,063) |
Realized gain (loss) on Swap Agreements for the period | $ 6,578 |
The change in unrealized gain (loss) for the period attributable to Level 3 Swap Agreements held at February 29, 2012 | $ (54,835) |
The information used in the above reconciliations represents fiscal year to date activity for any Investments in Securities and Derivative Instruments identified as using Level 3 inputs at either the beginning or the end of the current fiscal period. Transfers in or out of Level 3 represent the beginning value of any Security or Instrument where a change in the pricing level occurred from the beginning to the end of the period. The cost of purchases and the proceeds of sales may include securities received or delivered through corporate actions or exchanges. Realized and unrealized gains (losses) disclosed in the reconciliations are included in Net Gain (Loss) on the Fund's Statement of Operations. |
Value of Derivative Instruments |
The following table is a summary of the Fund's value of derivative instruments by risk exposure as of February 29, 2012. For additional information on derivative instruments, please refer to the Derivative Instruments section in the accompanying Notes to Financial Statements. |
Risk Exposure /
Derivative Type | Value |
| Asset | Liability |
Credit Risk | | |
Swap Agreements (a) | $ - | $ (429,063) |
(a) Value is disclosed on the Statement of Assets and Liabilities in the Swap agreements, at value line-items. |
See accompanying notes which are an integral part of the financial statements.
Semiannual Report
Statement of Assets and Liabilities
| February 29, 2012 (Unaudited) |
| | |
Assets | | |
Investment in securities, at value - See accompanying schedule: Unaffiliated issuers (cost $584,642,205) | $ 620,201,782 | |
Fidelity Central Funds (cost $9,293,549) | 9,481,014 | |
Total Investments (cost $593,935,754) | | $ 629,682,796 |
Cash | | 18,161 |
Receivable for investments sold | | 2,219,076 |
Receivable for swap agreements | | 1,247 |
Receivable for fund shares sold | | 850,329 |
Interest receivable | | 3,830,354 |
Distributions receivable from Fidelity Central Funds | | 563 |
Prepaid expenses | | 883 |
Other receivables | | 404,301 |
Total assets | | 637,007,710 |
| | |
Liabilities | | |
Payable for investments purchased | $ 399,951 | |
Payable for fund shares redeemed | 1,887,229 | |
Distributions payable | 162,302 | |
Swap agreements, at value | 429,063 | |
Accrued management fee | 167,027 | |
Distribution and service plan fees payable | 156,281 | |
Other affiliated payables | 111,609 | |
Other payables and accrued expenses | 458,275 | |
Total liabilities | | 3,771,737 |
| | |
Net Assets | | $ 633,235,973 |
Net Assets consist of: | | |
Paid in capital | | $ 643,415,153 |
Undistributed net investment income | | 4,149,584 |
Accumulated undistributed net realized gain (loss) on investments | | (49,643,962) |
Net unrealized appreciation (depreciation) on investments and assets and liabilities in foreign currencies | | 35,315,198 |
Net Assets | | $ 633,235,973 |
See accompanying notes which are an integral part of the financial statements.
Semiannual Report
Financial Statements - continued
Statement of Assets and Liabilities - continued
| February 29, 2012 (Unaudited) |
| | |
Calculation of Maximum Offering Price Class A:
Net Asset Value and redemption price per share ($194,586,929 ÷ 16,913,811 shares) | | $ 11.50 |
| | |
Maximum offering price per share (100/97.25 of $11.50) | | $ 11.83 |
Class T:
Net Asset Value and redemption price per share ($269,477,378 ÷ 23,409,935 shares) | | $ 11.51 |
| | |
Maximum offering price per share (100/97.25 of $11.51) | | $ 11.84 |
Class B:
Net Asset Value and offering price per share ($5,996,550 ÷ 521,825 shares)A | | $ 11.49 |
Class C:
Net Asset Value and offering price per share ($65,469,656 ÷ 5,702,970 shares)A | | $ 11.48 |
Institutional Class:
Net Asset Value, offering price and redemption price per share ($97,705,460 ÷ 8,470,878 shares) | | $ 11.53 |
A Redemption price per share is equal to net asset value less any applicable contingent deferred sales charge.
See accompanying notes which are an integral part of the financial statements.
Semiannual Report
Statement of Operations
| Six months ended February 29, 2012 (Unaudited) |
| | |
Investment Income | | |
Dividends | | $ 5,285 |
Interest | | 11,091,058 |
Income from Fidelity Central Funds | | 160,410 |
Total income | | 11,256,753 |
| | |
Expenses | | |
Management fee | $ 998,670 | |
Transfer agent fees | 551,889 | |
Distribution and service plan fees | 934,798 | |
Accounting and security lending fees | 123,483 | |
Custodian fees and expenses | 16,261 | |
Independent trustees' compensation | 1,224 | |
Registration fees | 54,587 | |
Audit | 57,254 | |
Legal | 1,246 | |
Miscellaneous | 2,567 | |
Total expenses before reductions | 2,741,979 | |
Expense reductions | (59) | 2,741,920 |
Net investment income (loss) | | 8,514,833 |
Realized and Unrealized Gain (Loss) Net realized gain (loss) on: | | |
Investment securities: | | |
Unaffiliated issuers | 4,829,585 | |
Fidelity Central Funds | 18,829 | |
Swap agreements | 6,578 | |
Total net realized gain (loss) | | 4,854,992 |
Change in net unrealized appreciation (depreciation) on: Investment securities | (2,367,986) | |
Swap agreements | (54,835) | |
Total change in net unrealized appreciation (depreciation) | | (2,422,821) |
Net gain (loss) | | 2,432,171 |
Net increase (decrease) in net assets resulting from operations | | $ 10,947,004 |
See accompanying notes which are an integral part of the financial statements.
Semiannual Report
Financial Statements - continued
Statement of Changes in Net Assets
| Six months ended
February 29, 2012
(Unaudited) | Year ended
August 31,
2011 |
Increase (Decrease) in Net Assets | | |
Operations | | |
Net investment income (loss) | $ 8,514,833 | $ 19,519,052 |
Net realized gain (loss) | 4,854,992 | 16,567,374 |
Change in net unrealized appreciation (depreciation) | (2,422,821) | (9,619,670) |
Net increase (decrease) in net assets resulting
from operations | 10,947,004 | 26,466,756 |
Distributions to shareholders from net investment income | (7,617,845) | (18,348,879) |
Distributions to shareholders from net realized gain | - | (937,926) |
Total distributions | (7,617,845) | (19,286,805) |
Share transactions - net increase (decrease) | 8,213,613 | (96,763,897) |
Total increase (decrease) in net assets | 11,542,772 | (89,583,946) |
| | |
Net Assets | | |
Beginning of period | 621,693,201 | 711,277,147 |
End of period (including undistributed net investment income of $4,149,584 and undistributed net investment income of $3,252,596, respectively) | $ 633,235,973 | $ 621,693,201 |
See accompanying notes which are an integral part of the financial statements.
Semiannual Report
Financial Highlights - Class A
| Six months ended February 29, 2012 | Years ended August 31, |
| (Unaudited) | 2011 | 2010 | 2009 | 2008 | 2007 |
Selected Per-Share Data | | | | | |
Net asset value, beginning of period | $ 11.45 | $ 11.28 | $ 10.48 | $ 10.31 | $ 10.64 | $ 10.78 |
Income from Investment Operations | | | | | | |
Net investment income (loss) E | .156 | .344 | .416 | .435 | .457 | .487 |
Net realized and unrealized gain (loss) | .034 | .163 | .793 | .149 | (.319) | (.167) |
Total from investment operations | .190 | .507 | 1.209 | .584 | .138 | .320 |
Distributions from net investment income | (.140) | (.322) | (.372) | (.414) | (.468) | (.460) |
Distributions from net realized gain | - | (.015) | (.037) | - | - | - |
Total distributions | (.140) | (.337) | (.409) | (.414) | (.468) | (.460) |
Net asset value, end of period | $ 11.50 | $ 11.45 | $ 11.28 | $ 10.48 | $ 10.31 | $ 10.64 |
Total Return B, C, D | 1.67% | 4.59% | 11.77% | 6.05% | 1.28% | 2.99% |
Ratios to Average Net Assets F, H | | | | | | |
Expenses before reductions | .84% A | .83% | .85% | .87% | .85% | .79% |
Expenses net of fee waivers, if any | .84% A | .83% | .85% | .87% | .85% | .79% |
Expenses net of all reductions | .84% A | .83% | .85% | .87% | .85% | .78% |
Net investment income (loss) | 2.75% A | 3.06% | 3.84% | 4.45% | 4.32% | 4.52% |
Supplemental Data | | | | | | |
Net assets, end of period (000 omitted) | $ 194,587 | $ 187,442 | $ 211,123 | $ 195,407 | $ 216,683 | $ 255,591 |
Portfolio turnover rate G | 119% A | 108% I | 107% I | 73% I | 81% | 89% I |
A Annualized
B Total returns for periods of less than one year are not annualized.
C Total returns would have been lower if certain expenses had not been reduced during the applicable periods shown.
D Total returns do not include the effect of the sales charges.
E Calculated based on average shares outstanding during the period.
F Fees and expenses of any underlying Fidelity Central Funds are not included in the Fund's expense ratio. The Fund indirectly bears its proportionate share of the expenses of any underlying Fidelity Central Funds.
G Amount does not include the portfolio activity of any underlying Fidelity Central Funds.
H Expense ratios reflect operating expenses of the class. Expenses before reductions do not reflect amounts reimbursed by the investment adviser or reductions from brokerage service arrangements or reductions from other expense offset arrangements and do not represent the amount paid by the class during periods when reimbursements or reductions occur. Expenses net of fee waivers reflect expenses after reimbursement by the investment adviser but prior to reductions from brokerage service arrangements or other expense offset arrangements. Expenses net of all reductions represent the net expenses paid by the class.
I The portfolio turnover rate excludes liquidations and redemptions executed in-kind from Affiliated Central Funds.
See accompanying notes which are an integral part of the financial statements.
Semiannual Report
Financial Highlights - Class T
| Six months ended February 29, 2012 | Years ended August 31, |
| (Unaudited) | 2011 | 2010 | 2009 | 2008 | 2007 |
Selected Per-Share Data | | | | | |
Net asset value, beginning of period | $ 11.45 | $ 11.29 | $ 10.48 | $ 10.32 | $ 10.64 | $ 10.79 |
Income from Investment Operations | | | | | | |
Net investment income (loss) E | .158 | .348 | .420 | .440 | .462 | .484 |
Net realized and unrealized gain (loss) | .044 | .153 | .803 | .139 | (.310) | (.178) |
Total from investment operations | .202 | .501 | 1.223 | .579 | .152 | .306 |
Distributions from net investment income | (.142) | (.326) | (.376) | (.419) | (.472) | (.456) |
Distributions from net realized gain | - | (.015) | (.037) | - | - | - |
Total distributions | (.142) | (.341) | (.413) | (.419) | (.472) | (.456) |
Net asset value, end of period | $ 11.51 | $ 11.45 | $ 11.29 | $ 10.48 | $ 10.32 | $ 10.64 |
Total Return B, C, D | 1.78% | 4.53% | 11.90% | 6.00% | 1.41% | 2.85% |
Ratios to Average Net Assets F, H | | | | | | |
Expenses before reductions | .81% A | .80% | .81% | .82% | .82% | .82% |
Expenses net of fee waivers, if any | .81% A | .80% | .81% | .82% | .82% | .82% |
Expenses net of all reductions | .81% A | .80% | .81% | .82% | .82% | .82% |
Net investment income (loss) | 2.78% A | 3.09% | 3.87% | 4.50% | 4.35% | 4.48% |
Supplemental Data | | | | | | |
Net assets, end of period (000 omitted) | $ 269,477 | $ 274,215 | $ 314,110 | $ 290,428 | $ 344,229 | $ 503,737 |
Portfolio turnover rate G | 119% A | 108% I | 107% I | 73% I | 81% | 89% I |
A Annualized
B Total returns for periods of less than one year are not annualized.
C Total returns would have been lower if certain expenses had not been reduced during the applicable periods shown.
D Total returns do not include the effect of the sales charges.
E Calculated based on average shares outstanding during the period.
F Fees and expenses of any underlying Fidelity Central Funds are not included in the Fund's expense ratio. The Fund indirectly bears its proportionate share of the expenses of any underlying Fidelity Central Funds.
G Amount does not include the portfolio activity of any underlying Fidelity Central Funds.
H Expense ratios reflect operating expenses of the class. Expenses before reductions do not reflect amounts reimbursed by the investment adviser or reductions from brokerage service arrangements or reductions from other expense offset arrangements and do not represent the amount paid by the class during periods when reimbursements or reductions occur. Expenses net of fee waivers reflect expenses after reimbursement by the investment adviser but prior to reductions from brokerage service arrangements or other expense offset arrangements. Expenses net of all reductions represent the net expenses paid by the class.
I The portfolio turnover rate excludes liquidations and redemptions executed in-kind from Affiliated Central Funds.
See accompanying notes which are an integral part of the financial statements.
Semiannual Report
Financial Highlights - Class B
| Six months ended February 29, 2012 | Years ended August 31, |
| (Unaudited) | 2011 | 2010 | 2009 | 2008 | 2007 |
Selected Per-Share Data | | | | | |
Net asset value, beginning of period | $ 11.43 | $ 11.27 | $ 10.47 | $ 10.30 | $ 10.63 | $ 10.77 |
Income from Investment Operations | | | | | | |
Net investment income (loss) E | .115 | .264 | .339 | .369 | .385 | .409 |
Net realized and unrealized gain (loss) | .044 | .154 | .794 | .150 | (.318) | (.169) |
Total from investment operations | .159 | .418 | 1.133 | .519 | .067 | .240 |
Distributions from net investment income | (.099) | (.243) | (.296) | (.349) | (.397) | (.380) |
Distributions from net realized gain | - | (.015) | (.037) | - | - | - |
Total distributions | (.099) | (.258) | (.333) | (.349) | (.397) | (.380) |
Net asset value, end of period | $ 11.49 | $ 11.43 | $ 11.27 | $ 10.47 | $ 10.30 | $ 10.63 |
Total Return B, C, D | 1.40% | 3.77% | 11.00% | 5.35% | .60% | 2.24% |
Ratios to Average Net Assets F, H | | | | | | |
Expenses before reductions | 1.57% A | 1.55% | 1.55% | 1.54% | 1.53% | 1.52% |
Expenses net of fee waivers, if any | 1.57% A | 1.55% | 1.55% | 1.54% | 1.53% | 1.52% |
Expenses net of all reductions | 1.57% A | 1.55% | 1.55% | 1.54% | 1.53% | 1.52% |
Net investment income (loss) | 2.02% A | 2.35% | 3.13% | 3.78% | 3.64% | 3.78% |
Supplemental Data | | | | | | |
Net assets, end of period (000 omitted) | $ 5,997 | $ 7,018 | $ 10,941 | $ 11,753 | $ 15,141 | $ 22,609 |
Portfolio turnover rate G | 119% A | 108% I | 107% I | 73% I | 81% | 89% I |
A Annualized
B Total returns for periods of less than one year are not annualized.
C Total returns would have been lower if certain expenses had not been reduced during the applicable periods shown.
D Total returns do not include the effect of the contingent deferred sales charge.
E Calculated based on average shares outstanding during the period.
F Fees and expenses of any underlying Fidelity Central Funds are not included in the Fund's expense ratio. The Fund indirectly bears its proportionate share of the expenses of any underlying Fidelity Central Funds.
G Amount does not include the portfolio activity of any underlying Fidelity Central Funds.
H Expense ratios reflect operating expenses of the class. Expenses before reductions do not reflect amounts reimbursed by the investment adviser or reductions from brokerage service arrangements or reductions from other expense offset arrangements and do not represent the amount paid by the class during periods when reimbursements or reductions occur. Expenses net of fee waivers reflect expenses after reimbursement by the investment adviser but prior to reductions from brokerage service arrangements or other expense offset arrangements. Expenses net of all reductions represent the net expenses paid by the class.
I The portfolio turnover rate excludes liquidations and redemptions executed in-kind from Affiliated Central Funds.
See accompanying notes which are an integral part of the financial statements.
Semiannual Report
Financial Highlights - Class C
| Six months ended February 29, 2012 | Years ended August 31, |
| (Unaudited) | 2011 | 2010 | 2009 | 2008 | 2007 |
Selected Per-Share Data | | | | | |
Net asset value, beginning of period | $ 11.42 | $ 11.26 | $ 10.46 | $ 10.29 | $ 10.62 | $ 10.76 |
Income from Investment Operations | | | | | | |
Net investment income (loss) E | .114 | .262 | .338 | .364 | .378 | .400 |
Net realized and unrealized gain (loss) | .044 | .154 | .794 | .150 | (.317) | (.167) |
Total from investment operations | .158 | .416 | 1.132 | .514 | .061 | .233 |
Distributions from net investment income | (.098) | (.241) | (.295) | (.344) | (.391) | (.373) |
Distributions from net realized gain | - | (.015) | (.037) | - | - | - |
Total distributions | (.098) | (.256) | (.332) | (.344) | (.391) | (.373) |
Net asset value, end of period | $ 11.48 | $ 11.42 | $ 11.26 | $ 10.46 | $ 10.29 | $ 10.62 |
Total Return B, C, D | 1.39% | 3.76% | 11.00% | 5.31% | .54% | 2.18% |
Ratios to Average Net Assets F, H | | | | | | |
Expenses before reductions | 1.58% A | 1.56% | 1.56% | 1.59% | 1.59% | 1.59% |
Expenses net of fee waivers, if any | 1.58% A | 1.56% | 1.56% | 1.59% | 1.59% | 1.59% |
Expenses net of all reductions | 1.58% A | 1.56% | 1.56% | 1.59% | 1.59% | 1.58% |
Net investment income (loss) | 2.00% A | 2.33% | 3.12% | 3.73% | 3.58% | 3.72% |
Supplemental Data | | | | | | |
Net assets, end of period (000 omitted) | $ 65,470 | $ 63,435 | $ 80,043 | $ 63,750 | $ 52,529 | $ 58,693 |
Portfolio turnover rate G | 119% A | 108% I | 107% I | 73% I | 81% | 89% I |
A Annualized
B Total returns for periods of less than one year are not annualized.
C Total returns would have been lower if certain expenses had not been reduced during the applicable periods shown.
D Total returns do not include the effect of the contingent deferred sales charge.
E Calculated based on average shares outstanding during the period.
F Fees and expenses of any underlying Fidelity Central Funds are not included in the Fund's expense ratio. The Fund indirectly bears its proportionate share of the expenses of any underlying Fidelity Central Funds.
G Amount does not include the portfolio activity of any underlying Fidelity Central Funds.
H Expense ratios reflect operating expenses of the class. Expenses before reductions do not reflect amounts reimbursed by the investment adviser or reductions from brokerage service arrangements or reductions from other expense offset arrangements and do not represent the amount paid by the class during periods when reimbursements or reductions occur. Expenses net of fee waivers reflect expenses after reimbursement by the investment adviser but prior to reductions from brokerage service arrangements or other expense offset arrangements. Expenses net of all reductions represent the net expenses paid by the class.
I The portfolio turnover rate excludes liquidations and redemptions executed in-kind from Affiliated Central Funds.
See accompanying notes which are an integral part of the financial statements.
Semiannual Report
Financial Highlights - Institutional Class
| Six months ended February 29, 2012 | Years ended August 31, |
| (Unaudited) | 2011 | 2010 | 2009 | 2008 | 2007 |
Selected Per-Share Data | | | | | |
Net asset value, beginning of period | $ 11.48 | $ 11.31 | $ 10.50 | $ 10.34 | $ 10.66 | $ 10.80 |
Income from Investment Operations | | | | | | |
Net investment income (loss) D | .171 | .373 | .447 | .468 | .494 | .513 |
Net realized and unrealized gain (loss) | .033 | .163 | .802 | .139 | (.311) | (.169) |
Total from investment operations | .204 | .536 | 1.249 | .607 | .183 | .344 |
Distributions from net investment income | (.154) | (.351) | (.402) | (.447) | (.503) | (.484) |
Distributions from net realized gain | - | (.015) | (.037) | - | - | - |
Total distributions | (.154) | (.366) | (.439) | (.447) | (.503) | (.484) |
Net asset value, end of period | $ 11.53 | $ 11.48 | $ 11.31 | $ 10.50 | $ 10.34 | $ 10.66 |
Total Return B, C | 1.79% | 4.85% | 12.15% | 6.30% | 1.71% | 3.22% |
Ratios to Average Net Assets E, G | | | | | | |
Expenses before reductions | .59% A | .58% | .57% | .54% | .53% | .55% |
Expenses net of fee waivers, if any | .59% A | .58% | .57% | .54% | .53% | .55% |
Expenses net of all reductions | .59% A | .58% | .57% | .54% | .53% | .55% |
Net investment income (loss) | 3.00% A | 3.32% | 4.11% | 4.78% | 4.64% | 4.75% |
Supplemental Data | | | | | | |
Net assets, end of period (000 omitted) | $ 97,705 | $ 89,583 | $ 95,061 | $ 78,372 | $ 362,708 | $ 715,292 |
Portfolio turnover rate F | 119% A | 108% H | 107% H | 73% H | 81% | 89% H |
A Annualized
B Total returns for periods of less than one year are not annualized.
C Total returns would have been lower if certain expenses had not been reduced during the applicable periods shown.
D Calculated based on average shares outstanding during the period.
E Fees and expenses of any underlying Fidelity Central Funds are not included in the Fund's expense ratio. The Fund indirectly bears its proportionate share of the expenses of any underlying Fidelity Central Funds.
F Amount does not include the portfolio activity of any underlying Fidelity Central Funds.
G Expense ratios reflect operating expenses of the class. Expenses before reductions do not reflect amounts reimbursed by the investment adviser or reductions from brokerage service arrangements or reductions from other expense offset arrangements and do not represent the amount paid by the class during periods when reimbursements or reductions occur. Expenses net of fee waivers reflect expenses after reimbursement by the investment adviser but prior to reductions from brokerage service arrangements or other expense offset arrangements. Expenses net of all reductions represent the net expenses paid by the class.
H The portfolio turnover rate excludes liquidations and redemptions executed in-kind from Affiliated Central Funds.
See accompanying notes which are an integral part of the financial statements.
Semiannual Report
Notes to Financial Statements
For the period ended February 29, 2012 (Unaudited)
1. Organization.
Fidelity Advisor® Intermediate Bond Fund (the Fund) is a fund of Fidelity Advisor Series II (the Trust) and is authorized to issue an unlimited number of shares. The Trust is registered under the Investment Company Act of 1940, as amended (the 1940 Act), as an open-end management investment company organized as a Massachusetts business trust. The Fund offers Class A, Class T, Class C and Institutional Class shares, each of which, along with Class B shares, has equal rights as to assets and voting privileges. Effective after the close of business on September 1, 2010, Class B shares were closed to new accounts and additional purchases, except for exchanges and reinvestments. Each class has exclusive voting rights with respect to matters that affect that class. Class B shares will automatically convert to Class A shares after a holding period of four years from the initial date of purchase. Investment income, realized and unrealized capital gains and losses, the common expenses of the Fund, and certain fund-level expense reductions, if any, are allocated on a pro-rata basis to each class based on the relative net assets of each class to the total net assets of the Fund. Each class differs with respect to transfer agent and distribution and service plan fees incurred. Certain expense reductions may also differ by class.
2. Investments in Fidelity Central Funds.
The Fund invests in Fidelity Central Funds, which are open-end investment companies available only to other investment companies and accounts managed by Fidelity Management & Research Company (FMR) and its affiliates. The Fund's Schedule of Investments lists each of the Fidelity Central Funds held as of period end, if any, as an investment of the Fund, but does not include the underlying holdings of each Fidelity Central Fund. As an Investing Fund, the Fund indirectly bears its proportionate share of the expenses of the underlying Fidelity Central Funds.
Based on their investment objective, each Fidelity Central Fund may invest or participate in various investment vehicles or strategies that are similar to those of the Fund. These strategies are consistent with the investment objectives of the Fund and may involve certain economic risks which may cause a decline in value of each of the Fidelity Central Funds and thus a decline in the value of the Fund. The Money Market Central Funds seek preservation of capital and current income and are managed by Fidelity Investments Money Management, Inc. (FIMM), an affiliate of FMR. The following summarizes the Fund's investment in each Fidelity Central Fund.
Semiannual Report
2. Investments in Fidelity Central Funds - continued
Fidelity Central Fund | Investment Manager | Investment Objective | Investment Practices |
Fidelity Specialized High Income Central Fund | FMR Co., Inc. (FMRC) | Seeks a high level of current income by normally investing in income-producing debt securities, with an emphasis on lower-quality debt securities. | Delayed Delivery & When Issued Securities Loans & Direct Debt Instruments Repurchase Agreements Restricted Securities |
An unaudited holdings listing for the Fund, which presents direct holdings as well as the pro-rata share of any securities and other investments held indirectly through its investment in underlying non-money market Fidelity Central Funds, is available at advisor.fidelity.com. A complete unaudited list of holdings for each Fidelity Central Fund is available upon request or at the Securities and Exchange Commission (the SEC) web site at www.sec.gov. In addition, the financial statements of the Fidelity Central Funds which contain the significant accounting policies (including security valuation policies) of those funds are available on the SEC web site or upon request.
3. Significant Accounting Policies.
The financial statements have been prepared in conformity with accounting principles generally accepted in the United States of America (GAAP), which require management to make certain estimates and assumptions at the date of the financial statements. Actual results could differ from those estimates. Subsequent events, if any, through the date that the financial statements were issued have been evaluated in the preparation of the financial statements. The following summarizes the significant accounting policies of the Fund:
Security Valuation. Investments are valued as of 4:00 p.m. Eastern time on the last calendar day of the period. The Fund uses independent pricing services approved by the Board of Trustees to value its investments. When current market prices or quotations are not readily available or reliable, valuations may be determined in good faith in accordance with procedures adopted by the Board of Trustees. Factors used in determining value may include market or security specific events, changes in interest rates and credit quality. The frequency with which these procedures are used cannot be predicted and they may be utilized to a significant extent. The value used for net asset value (NAV) calculation under these procedures may differ from published prices for the same securities.
Semiannual Report
Notes to Financial Statements (Unaudited) - continued
3. Significant Accounting Policies - continued
Security Valuation - continued
The Fund categorizes the inputs to valuation techniques used to value its investments into a disclosure hierarchy consisting of three levels as shown below:
Level 1 - quoted prices in active markets for identical investments
Level 2 - other significant observable inputs (including quoted prices for similar investments, interest rates, prepayment speeds, etc.)
Level 3 - unobservable inputs (including the Fund's own assumptions based on the best information available)
Changes in valuation techniques may result in transfers in or out of an assigned level within the disclosure hierarchy. The aggregate value of investments by input level, as of February 29, 2012 for the Fund's investments, as well as a roll forward of Level 3 securities, is included at the end of the Fund's Schedule of Investments. Valuation techniques used to value the Fund's investments by major category are as follows:
Debt securities, including restricted securities, are valued based on evaluated prices received from independent pricing services or from dealers who make markets in such securities. For corporate bonds, bank notes, foreign government and government agency obligations, municipal securities, supranational obligations and U.S. government and government agency obligations, pricing services utilize matrix pricing which considers yield or price of bonds of comparable quality, coupon, maturity and type as well as dealer supplied prices and are generally categorized as Level 2 in the hierarchy. For asset backed securities, collateralized mortgage obligations, commercial mortgage securities and U.S. government agency mortgage securities, pricing services utilize matrix pricing which considers prepayment speed assumptions, attributes of the collateral, yield or price of bonds of comparable quality, coupon, maturity and type as well as dealer supplied prices and, accordingly, such securities are generally categorized as Level 2 in the hierarchy. Swaps are marked-to-market daily based on valuations from independent pricing services or dealer-supplied valuations and changes in value are recorded as unrealized appreciation (depreciation). Pricing services utilize matrix pricing which considers comparisons to interest rate curves, credit spread curves, default possibilities and recovery rates and, as a result, swaps are generally categorized as Level 2 in the hierarchy. When independent prices are unavailable or unreliable, debt securities and swaps may be valued utilizing pricing matrices which consider similar factors that would be used by independent pricing services. These are generally categorized as Level 2 in the hierarchy but may be Level 3 depending on the circumstances.
Semiannual Report
3. Significant Accounting Policies - continued
Security Valuation - continued
Investments in open-end mutual funds, including the Fidelity Central Funds, are valued at their closing net asset value each business day and are categorized as Level 1 in the hierarchy.
New Accounting Pronouncements. In May 2011, the Financial Accounting Standards Board issued Accounting Standard Update No. 2011-04, Fair Value Measurement (Topic 820) - Amendments to Achieve Common Fair Value Measurement and Disclosure Requirements in U.S. GAAP and IFRSs. The update is effective during interim and annual periods beginning after December 15, 2011 and will result in additional disclosure for transfers between levels as well as expanded disclosure for securities categorized as Level 3 under the fair value hierarchy.
In December 2011, the Financial Accounting Standards Board issued Accounting Standard Update No. 2011-11, Disclosures about Offsetting Assets and Liabilities. The update creates new disclosure requirements requiring entities to disclose both gross and net information for derivatives and other financial instruments that are either offset in the Statement of Assets and Liabilities or subject to an enforceable master netting arrangement or similar agreement. The disclosure requirements are effective for interim and annual reporting periods beginning on or after January 1, 2013. Management is currently evaluating the impact of the update's adoption on the Fund's financial statement disclosures.
Investment Transactions and Income. For financial reporting purposes, the Fund's investment holdings and NAV include trades executed through the end of the last business day of the period. The NAV per share for processing shareholder transactions is calculated as of the close of business of the New York Stock Exchange (NYSE), normally 4:00 p.m. Eastern time and includes trades executed through the end of the prior business day. Gains and losses on securities sold are determined on the basis of identified cost and may include proceeds received from litigation. Dividend income is recorded on the ex-dividend date. Interest income and distributions from the Fidelity Central Funds are accrued as earned. Interest income includes coupon interest and amortization of premium and accretion of discount on debt securities. The principal amount on inflation-indexed securities is periodically adjusted to the rate of inflation and interest is accrued based on the principal amount. The adjustments to principal due to inflation are reflected as increases or decreases to interest income even though principal is not received until maturity. Debt obligations may be placed on non-accrual status and related interest income may be reduced by ceasing current accruals and writing off interest receivables when the collection of all or a portion of interest has become doubtful based on consistently applied procedures. A debt obligation is removed from non-accrual status when the issuer resumes interest payments or when collectability of interest is reasonably assured.
Semiannual Report
Notes to Financial Statements (Unaudited) - continued
3. Significant Accounting Policies - continued
Expenses. Expenses directly attributable to a fund are charged to that fund. Expenses attributable to more than one fund are allocated among the respective funds on the basis of relative net assets or other appropriate methods. Expense estimates are accrued in the period to which they relate and adjustments are made when actual amounts are known.
Income Tax Information and Distributions to Shareholders. Each year, the Fund intends to qualify as a regulated investment company under Subchapter M of the Internal Revenue Code, including distributing substantially all of its taxable income and realized gains. As a result, no provision for income taxes is required. The Fund files a U.S. federal tax return, in addition to state and local tax returns as required. A fund's federal income tax returns are subject to examination by the Internal Revenue Service (IRS) for a period of three fiscal years after they are filed. State and local tax returns may be subject to examination for an additional fiscal year depending on the jurisdiction.
Dividends are declared and recorded daily and paid monthly from net investment income. Distributions from realized gains, if any, are declared and recorded on the ex-dividend date. Income dividends and capital gain distributions are declared separately for each class. Income and capital gain distributions are determined in accordance with income tax regulations, which may differ from GAAP.
Capital accounts within the financial statements are adjusted for permanent book-tax differences. These adjustments have no impact on net assets or the results of operations. Temporary book-tax differences will reverse in a subsequent period.
Book-tax differences are primarily due to swap agreements, market discount, partnerships (including allocations from Fidelity Central Funds), deferred trustees compensation, capital loss carryforwards and losses deferred due to wash sales.
The federal tax cost of investment securities and unrealized appreciation (depreciation) as of period end were as follows:
Gross unrealized appreciation | $ 26,489,345 |
Gross unrealized depreciation | (2,677,381) |
Net unrealized appreciation (depreciation) on securities and other investments | $ 23,811,964 |
| |
Tax cost | $ 605,870,832 |
Capital loss carryforwards are only available to offset future capital gains of the Fund to the extent provided by regulations and may be limited. Under the Regulated Investment Company Modernization Act of 2010 (the Act), the Fund is permitted to carry forward
Semiannual Report
3. Significant Accounting Policies - continued
Income Tax Information and Distributions to Shareholders - continued
capital losses incurred in taxable years beginning after December 22, 2010 for an unlimited period and such capital losses are required to be used prior to any losses that expire. At August 31, 2011 capital loss carryforwards were as follows:
Fiscal year of expiration | |
2016 | $ (3,445,754) |
2017 | (13,593,034) |
2018 | (18,759,952) |
Total capital loss carryforward | $ (35,798,740) |
4. Operating Policies.
Restricted Securities. The Fund may invest in securities that are subject to legal or contractual restrictions on resale. These securities generally may be resold in transactions exempt from registration or to the public if the securities are registered. Disposal of these securities may involve time-consuming negotiations and expense, and prompt sale at an acceptable price may be difficult. Information regarding restricted securities is included at the end of the Fund's Schedule of Investments.
5. Derivative Instruments.
Risk Exposures and the Use of Derivative Instruments. The Fund used derivative instruments (derivatives), including swap agreements, in order to meet its investment objectives. The strategy is to use derivatives to increase returns, to gain exposure to certain types of assets and to manage exposure to certain risks as defined below. The success of any strategy involving derivatives depends on analysis of numerous economic factors, and if the strategies for investment do not work as intended, the Fund may not achieve its objectives.
The Fund's use of derivatives increased or decreased its exposure to the following risk:
Credit Risk | Credit risk relates to the ability of the issuer of a financial instrument to make further principal or interest payments on an obligation or commitment that it has to the Fund. |
The Fund is also exposed to additional risks from investing in derivatives, such as liquidity risk and counterparty credit risk. Liquidity risk is the risk that the Fund will be unable to close out the derivative in the open market in a timely manner. Counterparty credit risk is the risk that the counterparty will not be able to fulfill its obligation to the Fund. Derivative counterparty credit risk is managed through formal evaluation of the creditworthiness of all potential counterparties. On certain over-the-counter (OTC)
Semiannual Report
Notes to Financial Statements (Unaudited) - continued
5. Derivative Instruments - continued
Risk Exposures and the Use of Derivative Instruments - continued
derivatives such as swap agreements, the Fund attempts to reduce its exposure to counterparty credit risk by entering into an International Swaps and Derivatives Association (ISDA) Master Agreement on a bilateral basis with each of its counterparties. The ISDA Master Agreement gives the Fund the right to terminate all transactions traded under such agreement if there is a certain deterioration in the credit quality of the counterparty. The ISDA Master Agreement gives each party the right, upon an event of default by the other party or a termination of the agreement, to close out all transactions traded under such agreement and to net amounts owed under each transaction to one net payable by one party to the other. To mitigate counterparty credit risk on OTC derivatives, the Fund receives collateral in the form of cash or securities once the Fund's net unrealized appreciation on outstanding derivative contracts under an ISDA Master Agreement exceeds certain applicable thresholds, subject to certain minimum transfer provisions. The collateral received is held in segregated accounts with the Fund's custodian bank in accordance with the collateral agreements entered into between the Fund, the counterparty and the Fund's custodian bank. The Fund could experience delays and costs in gaining access to the collateral even though it is held by the Fund's custodian bank. The Fund's maximum risk of loss from counterparty credit risk related to OTC derivatives is generally the aggregate unrealized appreciation and unpaid counterparty payments in excess of any collateral pledged by the counterparty to the Fund. The Fund may be required to pledge collateral for the benefit of the counterparties on OTC derivatives in an amount not less than the counterparty's unrealized appreciation on outstanding derivative contracts, subject to certain minimum transfer provisions, and any such pledged collateral is identified in the Schedule of Investments. Derivatives involve, to varying degrees, risk of loss in excess of the amounts recognized in the Statement of Assets and Liabilities.
Net Realized Gain (Loss) and Change in Net Unrealized Appreciation (Depreciation) on Derivatives. The table below, which reflects the impacts of derivatives on the financial performance of the Fund, summarizes the net realized gain (loss) and change in net unrealized appreciation (depreciation) for derivatives during the period.
Risk Exposure / Derivative Type | Net Realized Gain (Loss) | Change in Net Unrealized Appreciation (Depreciation) |
Credit Risk | | |
Swap Agreements (a) | 6,578 | (54,835) |
(a) A summary of the value of derivatives by risk exposure as of period end, is included at the end of the Schedule of Investments and is representative of activity for the period.
Semiannual Report
5. Derivative Instruments - continued
Swap Agreements. A swap agreement (swap) is a contract between two parties to exchange future cash flows at periodic intervals based on a notional principal amount.
Details of swaps open at period end are included in the Schedule of Investments under the caption "Swap Agreements." Swaps are marked-to-market daily and changes in value are recorded as unrealized appreciation or (depreciation) and reflected in the Statement of Assets and Liabilities. Any upfront premiums paid or received upon entering a swap to compensate for differences between stated terms of the agreement and prevailing market conditions (e.g. credit spreads, interest rates or other factors) are recorded as realized gain or (loss) ratably over the term of the swap. Payments are exchanged at specified intervals, accrued daily commencing with the effective date of the contract and recorded as realized gain or (loss). Realized gain or (loss) is also recorded in the event of an early termination of a swap. The net realized gain (loss) and change in net unrealized appreciation (depreciation) on swaps during the period is included in the Statement of Operations.
Credit Default Swaps. Credit default swaps enable the Fund to buy or sell protection on a debt security or a basket of securities against a defined credit event. Under the terms of a credit default swap the buyer of protection (buyer) receives credit protection in exchange for making periodic payments to the seller of protection (seller) based on a fixed percentage applied to a notional principal amount. In return for these payments, the seller acts as a guarantor of the creditworthiness of a reference obligation. The Fund enters into credit default swaps as a seller to gain credit exposure to an issuer and/or as a buyer to provide a measure of protection against defaults of an issuer. The issuer may be either a single issuer or a "basket" of issuers. Periodic payments are made over the life of the contract provided that no credit event occurs.
For credit default swaps on most corporate and sovereign issuers, credit events include bankruptcy, failure to pay, obligation acceleration or repudiation/moratorium. For credit default swaps on corporate or sovereign issuers, the obligation that may be put to the seller is not limited to the specific reference obligation described in the Schedule of Investments. For credit default swaps on asset-backed securities, a credit event may be triggered by events such as failure to pay principal, maturity extension, rating downgrade or write-down. For credit default swaps on asset-backed securities, the reference obligation described represents the security that may be put to the seller.
As a seller, if an underlying credit event occurs, the Fund will either pay the buyer an amount equal to the notional amount of the swap and take delivery of the reference obligation or underlying securities comprising an index or pay a net settlement amount of cash equal to the notional amount of the swap less the recovery value of the reference obligation or underlying securities comprising an index.
Semiannual Report
Notes to Financial Statements (Unaudited) - continued
5. Derivative Instruments - continued
Credit Default Swaps - continued
As a buyer, if an underlying credit event occurs, the Fund will either receive from the seller an amount equal to the notional amount of the swap and deliver the reference obligation or underlying securities comprising an index or receive a net settlement amount of cash equal to the notional amount of the swap less the recovery value of the reference obligation or underlying securities comprising an index.
Typically, the value of each credit default swap and credit rating disclosed for each reference obligation in the Schedule of Investments, where the Fund is the seller, can be used as measures of the current payment/performance risk of the swap. As the value of the swap changes as a positive or negative percentage of the total notional amount, the payment/performance risk may decrease or increase, respectively. In addition to these measures, FMR monitors a variety of factors including cash flow assumptions, market activity and market sentiment as part of its ongoing process of assessing payment/performance risk.
The notional amount of credit default swaps is included in the Schedule of Investments and approximates the maximum potential amount of future payments that the Fund could be required to make if the Fund is the seller and a credit event were to occur. The total notional amount of all credit default swaps open at period end where the Fund is the seller amounted to $477,828 representing 0.08% of net assets.
6. Purchases and Sales of Investments.
Purchases and sales of securities (including the Fixed-Income Central Funds), other than short-term securities and U.S. government securities, aggregated $55,619,071 and $55,053,513, respectively.
7. Fees and Other Transactions with Affiliates.
Management Fee. FMR and its affiliates provide the Fund with investment management related services for which the Fund pays a monthly management fee. The management fee is the sum of an individual fund fee rate that is based on an annual rate of .20% of the Fund's average net assets and an annualized group fee rate that averaged .12% during the period. The group fee rate is based upon the average net assets of all the mutual funds advised by FMR. The group fee rate decreases as assets under management increase and increases as assets under management decrease. For the period, the total annualized management fee rate was .32% of the Fund's average net assets.
Semiannual Report
7. Fees and Other Transactions with Affiliates - continued
Distribution and Service Plan Fees. In accordance with Rule 12b-1 of the 1940 Act, the Fund has adopted separate Distribution and Service Plans for each class of shares. Certain classes pay Fidelity Distributors Corporation (FDC), an affiliate of FMR, separate Distribution and Service Fees, each of which is based on an annual percentage of each class' average net assets. In addition, FDC may pay financial intermediaries for selling shares of the Fund and providing shareholder support services. For the period, the Distribution and Service Fee rates, total fees and amounts retained by FDC were as follows:
| Distribution
Fee | Service
Fee | Total Fees | Retained
by FDC |
Class A | -% | .25% | $ 237,847 | $ 9,389 |
Class T | -% | .25% | 344,405 | 2,092 |
Class B | .65% | .25% | 30,221 | 21,875 |
Class C | .75% | .25% | 322,325 | 42,335 |
| | | $ 934,798 | $ 75,691 |
Sales Load. FDC may receive a front-end sales charge of up to 2.75% for selling Class A shares and Class T shares, some of which is paid to financial intermediaries for selling shares of the Fund. Depending on the holding period, FDC may receive contingent deferred sales charges levied on Class A, Class T, Class B, and Class C redemptions. The deferred sales charges range from 3.00% to 1.00% for Class B, 1.00% for Class C, .75% or .50% for certain purchases of Class A shares and .25% for certain purchases of Class T shares.
For the period, sales charge amounts retained by FDC were as follows:
| Retained
by FDC |
Class A | $ 9,965 |
Class T | 3,046 |
Class B* | 4,143 |
Class C* | 4,307 |
| $ 21,461 |
* When Class B and Class C shares are initially sold, FDC pays commissions from its own resources to financial intermediaries through which the sales are made.
Transfer Agent Fees. Fidelity Investments Institutional Operations Company, Inc. (FIIOC), an affiliate of FMR, is the transfer, dividend disbursing and shareholder servicing agent for each class of the Fund. FIIOC receives account fees and asset-based fees that vary according to the account size and type of account of the shareholders of the
Semiannual Report
Notes to Financial Statements (Unaudited) - continued
7. Fees and Other Transactions with Affiliates - continued
Transfer Agent Fees - continued
respective classes of the Fund. FIIOC pays for typesetting, printing and mailing of shareholder reports, except proxy statements. For the period, transfer agent fees for each class were as follows:
| Amount | % of
Average
Net Assets* |
Class A | $ 176,640 | .19 |
Class T | 220,030 | .16 |
Class B | 8,821 | .26 |
Class C | 57,019 | .18 |
Institutional Class | 89,379 | .19 |
| $ 551,889 | |
* Annualized
Accounting and Security Lending Fees. Fidelity Service Company, Inc. (FSC), an affiliate of FMR, maintains the Fund's accounting records. The accounting fee is based on the level of average net assets for each month. Under a separate contract, FSC administers the security lending program. The security lending fee is based on the number and duration of lending transactions.
8. Committed Line of Credit.
The Fund participates with other funds managed by FMR or an affiliate in a $4.0 billion credit facility (the "line of credit") to be utilized for temporary or emergency purposes to fund shareholder redemptions or for other short-term liquidity purposes. The Fund has agreed to pay commitment fees on its pro-rata portion of the line of credit, which amounted to $868 and is reflected in Miscellaneous expenses on the Statement of Operations. During the period, there were no borrowings on this line of credit.
9. Security Lending.
The Fund lends portfolio securities from time to time in order to earn additional income. On the settlement date of the loan, the Fund receives collateral (in the form of U.S. Treasury obligations, letters of credit and/or cash) against the loaned securities and maintains collateral in an amount not less than 100% of the market value of the loaned securities during the period of the loan. The market value of the loaned securities is determined at the close of business of the Fund and any additional required collateral is delivered to the Fund on the next business day. If the borrower defaults on its obligation
Semiannual Report
9. Security Lending - continued
to return the securities loaned because of insolvency or other reasons, a fund could experience delays and costs in recovering the securities loaned or in gaining access to the collateral. Any cash collateral received is maintained at the Fund's custodian and/or invested in cash equivalents. At period end, there were no security loans outstanding. Security lending income represents the income earned on investing cash collateral, less rebates paid to borrowers, plus any premium payments received for lending certain types of securities. Security lending income is presented in the Statement of Operations as a component of interest income. Total security lending income during the period amounted to $4,320.
10. Expense Reductions.
Through arrangements with the Fund's custodian, credits realized as a result of uninvested cash balances were used to reduce the Fund's expenses. During the period, these credits reduced the Fund's custody expenses by $59.
11. Distributions to Shareholders.
Distributions to shareholders of each class were as follows:
| Six months ended
February 29,
2012 | Year ended
August 31,
2011 |
From net investment income | | |
Class A | $ 2,335,322 | $ 5,532,975 |
Class T | 3,407,882 | 8,298,201 |
Class B | 58,056 | 185,526 |
Class C | 554,012 | 1,454,482 |
Institutional Class | 1,262,573 | 2,877,695 |
Total | $ 7,617,845 | $ 18,348,879 |
From net realized gain | | |
Class A | $ - | $ 277,121 |
Class T | - | 415,972 |
Class B | - | 14,010 |
Class C | - | 104,258 |
Institutional Class | - | 126,565 |
Total | $ - | $ 937,926 |
Semiannual Report
Notes to Financial Statements (Unaudited) - continued
12. Share Transactions.
Transactions for each class of shares were as follows:
| Shares | Dollars |
| Six months ended
February 29,
2012 | Year ended
August 31,
2011 | Six months ended
February 29,
2012 | Year ended
August 31,
2011 |
Class A | | | | |
Shares sold | 2,828,710 | 4,404,009 | $ 32,336,932 | $ 49,603,576 |
Reinvestment of distributions | 167,601 | 419,543 | 1,916,987 | 4,719,208 |
Shares redeemed | (2,456,678) | (7,163,345) | (28,081,744) | (80,194,309) |
Net increase (decrease) | 539,633 | (2,339,793) | $ 6,172,175 | $ (25,871,525) |
Class T | | | | |
Shares sold | 4,271,993 | 6,304,457 | $ 48,788,914 | $ 70,986,556 |
Reinvestment of distributions | 282,658 | 733,623 | 3,235,047 | 8,253,801 |
Shares redeemed | (5,085,472) | (10,924,752) | (58,239,992) | (122,319,193) |
Net increase (decrease) | (530,821) | (3,886,672) | $ (6,216,031) | $ (43,078,836) |
Class B | | | | |
Shares sold | 70,732 | 130,207 | $ 804,997 | $ 1,474,556 |
Reinvestment of distributions | 4,540 | 16,164 | 51,863 | 181,551 |
Shares redeemed | (167,206) | (503,441) | (1,907,438) | (5,638,256) |
Net increase (decrease) | (91,934) | (357,070) | $ (1,050,578) | $ (3,982,149) |
Class C | | | | |
Shares sold | 885,192 | 1,492,562 | $ 10,085,010 | $ 16,820,363 |
Reinvestment of distributions | 39,611 | 110,942 | 452,134 | 1,245,103 |
Shares redeemed | (775,040) | (3,159,856) | (8,833,856) | (35,300,044) |
Net increase (decrease) | 149,763 | (1,556,352) | $ 1,703,288 | $ (17,234,578) |
Institutional Class | | | | |
Shares sold | 1,360,471 | 2,701,789 | $ 15,578,002 | $ 30,352,013 |
Reinvestment of distributions | 99,137 | 239,277 | 1,136,875 | 2,696,942 |
Shares redeemed | (794,516) | (3,540,888) | (9,110,118) | (39,645,764) |
Net increase (decrease) | 665,092 | (599,822) | $ 7,604,759 | $ (6,596,809) |
13. Other.
The Fund's organizational documents provide former and current trustees and officers with a limited indemnification against liabilities arising in connection with the performance of their duties to the Fund. In the normal course of business, the Fund may also enter into contracts that provide general indemnifications. The Fund's maximum exposure under these arrangements is unknown as this would be dependent on future claims that may be made against the Fund. The risk of material loss from such claims is considered remote.
Semiannual Report
14. Credit Risk.
The Fund invests a portion of its assets in structured securities of issuers backed by residential mortgage loans, credit card receivables and automotive loans. The value and related income of these securities is sensitive to changes in economic conditions, including delinquencies and/or defaults.
Semiannual Report
Board Approval of Investment Advisory Contracts and Management Fees
Fidelity Advisor Intermediate Bond Fund
Each year, the Board of Trustees, including the Independent Trustees (together, the Board), votes on the renewal of the management contract and sub-advisory agreements (together, the Advisory Contracts) for the fund. The Board, assisted by the advice of fund counsel and Independent Trustees' counsel, requests and considers a broad range of information relevant to the renewal of the Advisory Contracts throughout the year.
The Board meets regularly and considers at each of its meetings factors that are relevant to its annual consideration of the renewal of the fund's Advisory Contracts, including the services and support provided to the fund and its shareholders. The Board has established three standing committees, Operations, Audit, and Nominating and Governance, each composed of Independent Trustees with varying backgrounds, to which the Board has assigned specific subject matter responsibilities in order to enhance effective decision-making by the Board. The Operations Committee, of which all of the Independent Trustees are members, meets regularly throughout the year and, among other matters, considers matters specifically related to the annual consideration of the renewal of the fund's Advisory Contracts. The Board, acting directly and through its Committees, requests and receives information concerning the annual consideration of the renewal of the fund's Advisory Contracts. The Board also meets as needed to consider matters specifically related to the Board's annual consideration of the renewal of Advisory Contracts. Members of the Board may also meet with trustees of other Fidelity funds through ad hoc joint committees to discuss certain matters relevant to the Fidelity funds.
At its September 2011 meeting, the Board of Trustees, including the Independent Trustees, unanimously determined to renew the fund's Advisory Contracts. In reaching its determination, the Board considered all factors it believed relevant, including (i) the nature, extent, and quality of the services to be provided to the fund and its shareholders (including the investment performance of the fund); (ii) the competitiveness of the fund's management fee and total expense ratio; (iii) the total costs of the services to be provided by and the profits to be realized by Fidelity from its relationship with the fund; (iv) the extent to which economies of scale would be realized as the fund grows; and (v) whether fee levels reflect these economies of scale, if any, for the benefit of fund shareholders.
In considering whether to renew the Advisory Contracts for the fund, the Board reached a determination, with the assistance of fund counsel and Independent Trustees' counsel and through the exercise of its business judgment, that the renewal of the Advisory Contracts is in the best interests of the fund and its shareholders and that the compensation payable under the Advisory Contracts is fair and reasonable. The Board's decision to renew the Advisory Contracts was not based on any single factor, but rather was based on a comprehensive consideration of all the information provided to the Board at its meetings throughout the year. The Board, in reaching its determination to renew the Advisory Contracts, is aware that shareholders in the fund have a broad range of investment choices available to them, including a wide choice among mutual funds offered by Fidelity's competitors, and that the fund's shareholders, who have the opportunity to review and weigh the disclosure provided by the fund in its prospectus and other public disclosures, have chosen to invest in this fund, managed by Fidelity.
Semiannual Report
Nature, Extent, and Quality of Services Provided. The Board considered the staffing within the investment adviser, FMR, and the sub-advisers (together, the Investment Advisers), including the backgrounds of the fund's investment personnel and the fund's investment objective and discipline. The Independent Trustees also had discussions with senior management of Fidelity's investment operations and investment groups. The Board considered the structure of the portfolio manager compensation program and whether this structure provides appropriate incentives to act in the best interests of the fund.
Resources Dedicated to Investment Management and Support Services. The Board reviewed the general qualifications and capabilities of the Investment Advisers' investment staff, including its size, education, experience, and resources, as well as the Investment Advisers' approach to recruiting, managing, and compensating investment personnel. The Board also noted that FMR has devoted increased resources to non-U.S. offices. The Board noted that Fidelity's analysts have extensive resources, tools and capabilities which allow them to conduct sophisticated quantitative and fundamental analysis, as well as credit analysis of issuers, counterparties and enhancers. The Board also believes that Fidelity's investment professionals have sufficient access to global information and data so as to provide competitive investment results over time, and that those professionals also have access to sophisticated tools which permit them to assess portfolio construction and risk and performance attribution characteristics continuously, as well as to transmit new information and research conclusions rapidly around the world. Additionally, in its deliberations, the Board considered the Investment Advisers' trading capabilities and resources which are an integral part of the investment management process.
Shareholder and Administrative Services. The Board considered (i) the nature, extent, quality, and cost of advisory, administrative, and shareholder services performed by the Investment Advisers and their affiliates under the Advisory Contracts and under separate agreements covering transfer agency, pricing and bookkeeping, and securities lending services for the fund; (ii) the nature and extent of the investment adviser's supervision of third party service providers, principally custodians and subcustodians; and (iii) the resources devoted to, and the record of compliance with, the fund's compliance policies and procedures.
The Board noted that the growth of fund assets over time across the complex allows Fidelity to reinvest in the development of services designed to enhance the value or convenience of the Fidelity funds as investment vehicles. These services include 24-hour access to account information and market information through telephone representatives and over the Internet, investor education materials and asset allocation tools, and the expanded availability of Fidelity Investor Centers, with 35 new branches opening since 2010.
Semiannual Report
Board Approval of Investment Advisory Contracts and
Management Fees - continued
Investment in a Large Fund Family. The Board considered the benefits to shareholders of investing in a Fidelity fund, including the benefits of investing in a fund that is part of a large family of funds offering a variety of investment disciplines and providing a large variety of mutual fund investor services. The Board noted that Fidelity had taken, or had made recommendations that resulted in the Fidelity funds taking, a number of actions over the previous year that benefited particular funds, including (i) continuing to dedicate additional resources to investment research and support of the senior management team that oversees asset management; (ii) rationalizing product lines through the mergers of six funds into other funds; (iii) continuing to migrate the Freedom Funds to dedicated lower cost underlying funds; (iv) obtaining shareholder approval to broaden the investment strategies for Fidelity Consumer Finance Portfolio, Fidelity Emerging Asia Fund, and Fidelity Environment and Alternative Energy Portfolio; (v) contractually agreeing to reduce the management fees and impose other expense limitations on Spartan 500 Index Fund and U.S. Bond Index Fund in connection with launching new institutional classes of these funds; (vi) changing the name, primary and supplemental benchmarks, and investment policies of Fidelity Global Strategies Fund to support the fund's flexible investment mandate and global orientation; and (vii) reducing the transfer agency account fee rates on certain accounts.
Investment Performance. The Board considered whether the fund has operated in accordance with its investment objective, as well as its record of compliance with its investment restrictions. It also reviewed the fund's absolute investment performance for each class, as well as the fund's relative investment performance for each class measured over multiple periods against (i) a broad-based securities market index, and (ii) a peer group of mutual funds deemed appropriate by Fidelity and reviewed by the Board. The following charts considered by the Board show, over the one-, three-, and five-year periods ended December 31, 2010, the cumulative total returns of Institutional Class (Class I) and Class C of the fund, the cumulative total returns of a broad-based securities market index ("benchmark"), and a range of cumulative total returns of a peer group of mutual funds identified by Lipper Inc. as having an investment objective similar to that of the fund. The returns of Institutional Class (Class I) and Class C show the performance of the highest and lowest performing classes, respectively (based on five-year performance). The box within each chart shows the 25th percentile return (bottom of box) and the 75th percentile return (top of box) of the peer group. Returns shown above the box are in the first quartile and returns shown below the box are in the fourth quartile. The percentage beaten numbers noted below each chart correspond to the percentile box and represent the percentage of funds in the peer group whose performance was equal to or lower than that of the class indicated.
Semiannual Report
Fidelity Advisor Intermediate Bond Fund
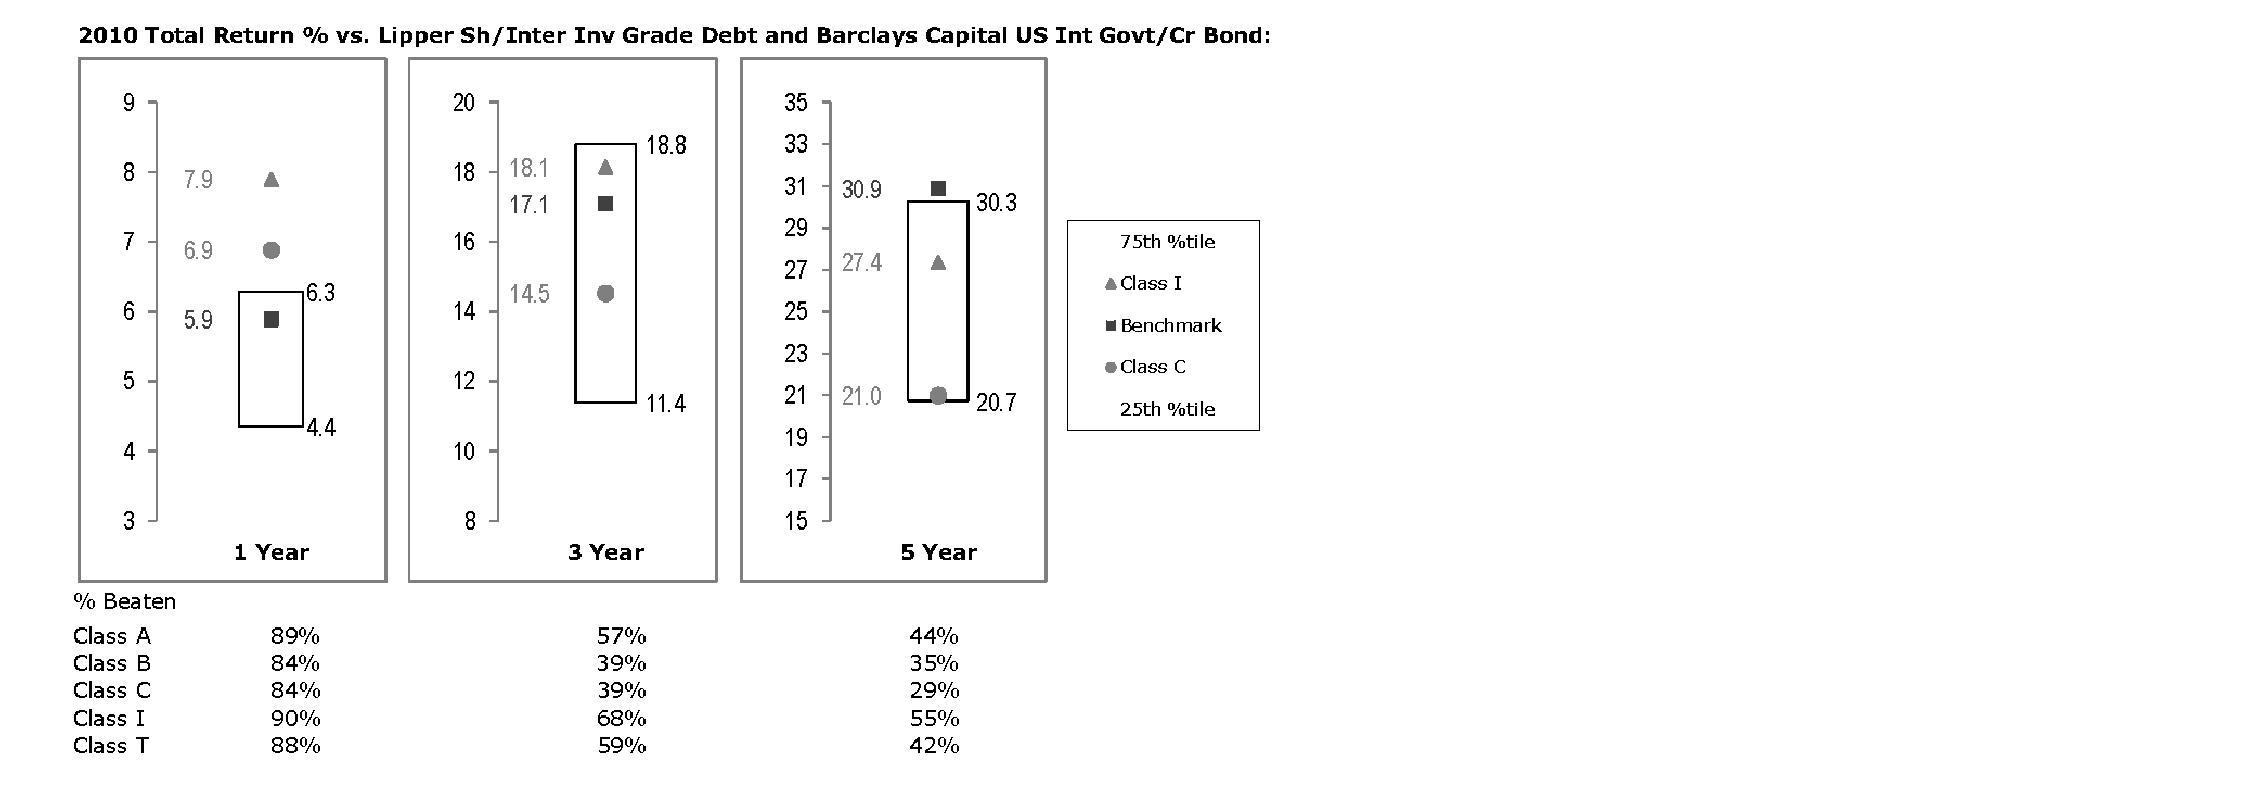
The Board reviewed the fund's relative investment performance against its peer group and noted that the performance of Institutional Class (Class I) of the fund was in the first quartile for the one-year period and the second quartile for the three- and five-year periods. The Board also noted that the investment performance of Institutional Class (Class I) of the fund compared favorably to its benchmark for the one- and three-year periods, although the fund's five-year cumulative total return was lower than its benchmark. The Board considered that the variations in performance among the fund's classes reflect the variations in class expenses, which result in lower performance for higher expense classes. The Board also reviewed the fund's performance since inception as well as performance in the current year.
Based on its review, the Board concluded that the nature, extent, and quality of services provided to the fund under the Advisory Contracts should benefit the fund's shareholders.
Competitiveness of Management Fee and Total Expense Ratio. The Board considered the fund's management fee and total expense ratio compared to "mapped groups" of competitive funds and classes. Fidelity creates "mapped groups" by combining similar Lipper investment objective categories that have comparable management fee characteristics. Combining Lipper investment objective categories aids the Board's management fee and total expense ratio comparisons by broadening the competitive group used for comparison and by reducing the number of universes to which various Fidelity funds are compared.
Semiannual Report
Board Approval of Investment Advisory Contracts and
Management Fees - continued
Management Fee. The Board considered two proprietary management fee comparisons for the 12-month periods shown in the chart below. The group of Lipper funds used by the Board for management fee comparisons is referred to below as the "Total Mapped Group" and, for the reasons explained above, is broader than the Lipper peer group used by the Board for performance comparisons. The Total Mapped Group comparison focuses on a fund's standing relative to the total universe of comparable funds available to investors in terms of gross management fees before expense reimbursements or caps. "TMG %" represents the percentage of funds in the Total Mapped Group that had management fees that were lower than the fund's. For example, a TMG % of 12% means that 88% of the funds in the Total Mapped Group had higher management fees than the fund. The "Asset-Size Peer Group" (ASPG) comparison focuses on a fund's standing relative to non-Fidelity funds similar in size to the fund within the Total Mapped Group. The ASPG represents at least 15% of the funds in the Total Mapped Group with comparable asset size and management fee characteristics, subject to a minimum of 50 funds (or all funds in the Total Mapped Group if fewer than 50). Additional information, such as the ASPG quartile in which the fund's management fee ranked, is also included in the chart and considered by the Board.
Fidelity Advisor Intermediate Bond Fund

The Board noted that the fund's management fee ranked below the median of its Total Mapped Group and below the median of its ASPG for 2010.
Semiannual Report
Based on its review, the Board concluded that the fund's management fee is fair and reasonable in light of the services that the fund receives and the other factors considered.
Total Expense Ratio. In its review of each class's total expense ratio, the Board considered the fund's management fee as well as other fund or class expenses, as applicable, such as transfer agent fees, pricing and bookkeeping fees, fund-paid 12b-1 fees, and custodial, legal, and audit fees. The Board also noted the effects of any waivers and reimbursements on fees and expenses. As part of its review, the Board also considered the current and historical total expense ratios of each class of the fund compared to competitive fund median expenses. Each class of the fund is compared to those funds and classes in the Total Mapped Group (used by the Board for management fee comparisons) that have a similar sales load structure.
The Board noted that the total expense ratio of each class ranked below its competitive median for 2010.
Fees Charged to Other Fidelity Clients. The Board also considered Fidelity fee structures and other information with respect to clients of FMR and its affiliates, such as other mutual funds advised or subadvised by FMR or its affiliates, pension plan clients, and other institutional clients. In March 2010, the Board created an ad hoc joint committee with the board of other Fidelity funds (the Committee) to review and compare Fidelity's institutional investment advisory business with its business of providing services to the Fidelity funds, including the differences in services provided, fees charged, and costs incurred, as well as competition in their respective marketplaces.
Based on its review of total expense ratios and fees charged to other Fidelity clients, the Board concluded that the total expense ratio of each class of the fund was reasonable in light of the services that the fund and its shareholders receive and the other factors considered, including the findings of the Committee.
Costs of the Services and Profitability. The Board considered the revenues earned and the expenses incurred by Fidelity in conducting the business of developing, marketing, distributing, managing, administering and servicing the fund and its shareholders. The Board also considered the level of Fidelity's profits in respect of all the Fidelity funds.
On an annual basis, FMR presents to the Board Fidelity's profitability for the fund. Fidelity calculates the profitability for each fund, as well as aggregate profitability for groups of Fidelity funds and all Fidelity funds, using a series of detailed revenue and cost allocation methodologies which originate with the books and records of Fidelity on which Fidelity's audited financial statements are based. The Audit Committee of the Board reviews any significant changes from the prior year's methodologies.
Semiannual Report
Board Approval of Investment Advisory Contracts and
Management Fees - continued
PricewaterhouseCoopers LLP (PwC), independent registered public accounting firm and auditor to Fidelity and certain Fidelity funds, has been engaged annually by the Board as part of the Board's assessment of Fidelity's profitability analysis. PwC's engagement includes the review and assessment of Fidelity's methodologies used in determining the revenues and expenses attributable to Fidelity's mutual fund business, and completion of agreed-upon procedures surrounding the mathematical accuracy of fund profitability and its conformity to allocation methodologies. After considering PwC's reports issued under the engagement and information provided by Fidelity, the Board concluded that while other allocation methods may also be reasonable, Fidelity's profitability methodologies are reasonable in all material respects.
The Board also reviewed Fidelity's non-fund businesses and fall-out benefits related to the mutual fund business as well as cases where Fidelity's affiliates may benefit from or be related to the fund's business.
The Board considered the costs of the services provided by and the profits realized by Fidelity in connection with the operation of the fund and was satisfied that the profitability was not excessive in the circumstances.
Economies of Scale. The Board considered whether there have been economies of scale in respect of the management of the Fidelity funds, whether the Fidelity funds (including the fund) have appropriately benefited from any such economies of scale, and whether there is potential for realization of any further economies of scale. The Board considered the extent to which the fund will benefit from economies of scale through increased services to the fund, through waivers or reimbursements, or through fee or expense reductions. The Board also noted that in 2009, it and the board of other Fidelity funds created an ad hoc committee (the Economies of Scale Committee) to analyze whether FMR attains economies of scale in respect of the management and servicing of the Fidelity funds, whether the Fidelity funds have appropriately benefited from such economies of scale, and whether there is potential for realization of any further economies of scale.
The Board recognized that the fund's management contract incorporates a "group fee" structure, which provides for lower group fee rates as total fund assets under FMR's management increase, and for higher group fee rates as total fund assets under FMR's management decrease. FMR calculates the group fee rates based on a tiered asset "breakpoint" schedule that varies based on asset class. The Board considered that the group fee is designed to deliver the benefits of economies of scale to fund shareholders when total Fidelity fund assets increase, even if assets of any particular fund are unchanged or have declined, because some portion of Fidelity's costs are attributable to services provided to all Fidelity funds, and all funds benefit if those costs can be allocated among more assets. The Board concluded that, given the group fee structure, fund shareholders will benefit from lower management fees as assets under FMR's management increase at the fund complex level, regardless of whether Fidelity achieves any such economies of scale.
Semiannual Report
The Board concluded, taking into account the analysis of the Economies of Scale Committee, that any potential economies of scale are being appropriately shared between fund shareholders and Fidelity.
Additional Information Requested by the Board. In order to develop fully the factual basis for consideration of the Fidelity funds' Advisory Contracts, the Board requested and received additional information on certain topics, including: (i) Fidelity's fund profitability methodology, profitability trends for certain funds, and the impact of certain factors on fund profitability results; (ii) portfolio manager changes that have occurred during the past year and the amount of the investment that each portfolio manager has made in the Fidelity fund(s) that he or she manages; (iii) Fidelity's compensation structure for portfolio managers, research analysts, and other key personnel, including its effects on fund profitability, the rationale for the compensation structure, and the extent to which current market conditions have affected retention and recruitment; (iv) the compensation paid to fund sub-advisers on behalf of the Fidelity funds; (v) Fidelity's fee structures and rationale for recommending different fees among different categories of funds and classes, as well as Fidelity's voluntary waiver of its fees to maintain minimum yields for certain money market funds and classes; (vi) the reasons why certain expenses affect various funds and classes differently; (vii) Fidelity's transfer agent fees, expenses, and services and how the benefits of decreased costs and new efficiencies can be shared across all of the Fidelity funds; (viii) the reasons for and consequences of changes to certain product lines compared to competitors; (ix) the allocation of and historical trends in Fidelity's realization of fall-out benefits; and (x) explanations regarding the relative total expense ratios of certain funds and classes, total expense competitive trends, and actions that might be taken by FMR to reduce total expense ratios for certain funds and classes or to achieve further economies of scale.
Based on its evaluation of all of the conclusions noted above, and after considering all factors it believed relevant, the Board ultimately concluded that the advisory fee structures are fair and reasonable, and that the fund's Advisory Contracts should be renewed.
Semiannual Report
Investment Adviser
Fidelity Management & Research Company
Boston, MA
Investment Sub-Advisers
Fidelity Investments Money
Management, Inc.
Fidelity Management & Research
(U.K.) Inc.
Fidelity Management & Research
(Hong Kong) Limited
Fidelity Management & Research
(Japan) Inc.
General Distributor
Fidelity Distributors Corporation
Boston, MA
Transfer and Service Agents
Fidelity Investments Institutional Operations Company, Inc.
Boston, MA
Fidelity Service Company, Inc.
Boston, MA
Custodian
The Bank of New York Mellon
New York, NY
LTBI-USAN-0412
1.784889.109
(Fidelity Investment logo)(registered trademark)
(Fidelity Investment logo)(registered trademark)
Fidelity Advisor®
Mortgage Securities
Fund - Class A, Class T, Class B
and Class C
Semiannual Report
February 29, 2012
(Fidelity Cover Art)
Contents
Shareholder Expense Example | (Click Here) | An example of shareholder expenses. |
Investment Changes | (Click Here) | A summary of major shifts in the fund's investments over the past six months. |
Investments | (Click Here) | A complete list of the fund's investments with their market values. |
Financial Statements | (Click Here) | Statements of assets and liabilities, operations, and changes in net assets, as well as financial highlights. |
Notes | (Click Here) | Notes to the financial statements. |
Board Approval of Investment Advisory Contracts and Management Fees | (Click Here) | |
To view a fund's proxy voting guidelines and proxy voting record for the 12-month period ended June 30, visit http://www.fidelity.com/proxyvotingresults or visit the Securities and Exchange Commission's (SEC) web site at http://www.sec.gov. You may also call 1-877-208-0098 to request a free copy of the proxy voting guidelines.
Standard & Poor's, S&P and S&P 500 are registered service marks of The McGraw-Hill Companies, Inc. and have been licensed for use by Fidelity Distributors Corporation.
Other third party marks appearing herein are the property of their respective owners.
All other marks appearing herein are registered or unregistered trademarks or service marks of FMR LLC or an affiliated company.
This report and the financial statements contained herein are submitted for the general information of the shareholders of the fund. This report is not authorized for distribution to prospective investors in the fund unless preceded or accompanied by an effective prospectus.
A fund files its complete schedule of portfolio holdings with the SEC for the first and third quarters of each fiscal year on Form N-Q. Forms N-Q are available on the SEC's web site at http://www.sec.gov. A fund's Forms N-Q may be reviewed and copied at the SEC's Public Reference Room in Washington, DC. Information regarding the operation of the SEC's Public Reference Room may be obtained by calling 1-800-SEC-0330. For a complete list of a fund's portfolio holdings, view the most recent holdings listing, semiannual report, or annual report on Fidelity's web site at http://www.fidelity.com, http://www.advisor.fidelity.com, or http://www.401k.com, as applicable.
NOT FDIC INSURED • MAY LOSE VALUE • NO BANK GUARANTEE
Neither the fund nor Fidelity Distributors Corporation is a bank.
Semiannual Report
Shareholder Expense Example
As a shareholder of the Fund, you incur two types of costs: (1) transaction costs, including sales charges (loads) on purchase payments or redemption proceeds, and (2) ongoing costs, including management fees, distribution and/or service (12b-1) fees and other Fund expenses. This Example is intended to help you understand your ongoing costs (in dollars) of investing in the Fund and to compare these costs with the ongoing costs of investing in other mutual funds.
The Example is based on an investment of $1,000 invested at the beginning of the period and held for the entire period (September 1, 2011 to February 29, 2012).
Actual Expenses
The first line of the accompanying table for each class of the Fund provides information about actual account values and actual expenses. You may use the information in this line, together with the amount you invested, to estimate the expenses that you paid over the period. Simply divide your account value by $1,000.00 (for example, an $8,600 account value divided by $1,000.00 = 8.6), then multiply the result by the number in the first line for a class of the Fund under the heading entitled "Expenses Paid During Period" to estimate the expenses you paid on your account during this period.
Hypothetical Example for Comparison Purposes
The second line of the accompanying table for each class of the Fund provides information about hypothetical account values and hypothetical expenses based on a Class' actual expense ratio and an assumed rate of return of 5% per year before expenses, which is not the Class' actual return. The hypothetical account values and expenses may not be used to estimate the actual ending account balance or expenses you paid for the period. You may use this information to compare the ongoing costs of investing in the Fund and other funds. To do so, compare this 5% hypothetical example with the 5% hypothetical examples that appear in the shareholder reports of the other funds.
Please note that the expenses shown in the table are meant to highlight your ongoing costs only and do not reflect any transaction costs. Therefore, the second line of the table is useful in comparing ongoing costs only, and will not help you determine the relative total costs of owning different funds. In addition, if these transactional costs were included, your costs would have been higher.
Semiannual Report
Shareholder Expense Example - continued
| Annualized Expense Ratio | Beginning
Account Value
September 1, 2011 | Ending
Account Value
February 29, 2012 | Expenses Paid
During Period*
September 1, 2011 to
February 29, 2012 |
Class A | .82% | | | |
Actual | | $ 1,000.00 | $ 1,018.50 | $ 4.12 |
Hypothetical A | | $ 1,000.00 | $ 1,020.79 | $ 4.12 |
Class T | .79% | | | |
Actual | | $ 1,000.00 | $ 1,018.60 | $ 3.96 |
Hypothetical A | | $ 1,000.00 | $ 1,020.93 | $ 3.97 |
Class B | 1.51% | | | |
Actual | | $ 1,000.00 | $ 1,015.00 | $ 7.57 |
Hypothetical A | | $ 1,000.00 | $ 1,017.35 | $ 7.57 |
Class C | 1.54% | | | |
Actual | | $ 1,000.00 | $ 1,014.90 | $ 7.71 |
Hypothetical A | | $ 1,000.00 | $ 1,017.21 | $ 7.72 |
Fidelity Mortgage Securities Fund | .45% | | | |
Actual | | $ 1,000.00 | $ 1,020.30 | $ 2.26 |
Hypothetical A | | $ 1,000.00 | $ 1,022.63 | $ 2.26 |
Institutional Class | .51% | | | |
Actual | | $ 1,000.00 | $ 1,020.10 | $ 2.56 |
Hypothetical A | | $ 1,000.00 | $ 1,022.33 | $ 2.56 |
A 5% return per year before expenses
* Expenses are equal to each Class' annualized expense ratio, multiplied by the average account value over the period, multiplied by 182/366 (to reflect the one-half year period).
Semiannual Report
Investment Changes (Unaudited)
Coupon Distribution as of February 29, 2012 |
| % of fund's investments | % of fund's investments
6 months ago |
Less than 0.01% | 0.4 | 0.4 |
0.01 - 0.99% | 7.3 | 6.7 |
1 - 1.99% | 1.0 | 0.7 |
2 - 2.99% | 1.3 | 0.7 |
3 - 3.99% | 7.0 | 4.5 |
4 - 4.99% | 37.4 | 41.1 |
5 - 5.99% | 31.5 | 32.4 |
6 - 6.99% | 8.1 | 8.2 |
7% and over | 2.7 | 2.6 |
Coupon distribution shows the range of stated interest rates on the fund's investments, excluding short-term investments. |
Weighted Average Maturity as of February 29, 2012 |
| | 6 months ago |
Years | 3.8 | 4.1 |
This is a weighted average of all the maturities of the securities held in a fund. Weighted Average Maturity (WAM) can be used as a measure of sensitivity to interest rate changes and market changes. Generally, the longer the maturity, the greater the sensitivity to such changes. WAM is based on the dollar-weighted average length of time until principal payments must be paid. Depending on the types of securities held in a fund, certain maturity shortening devices (e.g., demand features, interest rate resets, and call options) may be taken into account when calculating the WAM. |
Duration as of February 29, 2012 |
| | 6 months ago |
Years | 2.4 | 2.9 |
Duration estimates how much a bond fund's price will change with a change in comparable interest rates. If rates rise 1%, for example, a fund with a 5-year duration is likely to lose about 5% of its value. Other factors also can influence a bond fund's performance and share price. Accordingly, a bond fund's actual performance may differ from this example. Duration takes into account any call or put option embedded in the bonds. |
Asset Allocation (% of fund's net assets) |
As of February 29, 2012* | As of August 31, 2011** |
 | Mortgage
Securities 100.0% | | | Mortgage
Securities 114.5% | |
 | CMOs and
Other Mortgage
Related Securities 18.8% | | | CMOs and
Other Mortgage
Related Securities 20.5% | |
 | Asset-Backed
Securities 3.8% | |  | Asset-Backed
Securities 3.5% | |
 | Short-Term
Investments and
Net Other Assets† (22.6)% | |  | Short-Term
Investments and
Net Other Assets† (38.5)% | |
* Foreign investments | 1.7% | | ** Foreign investments | 2.1% | |
* Futures and Swaps | (2.3)% | | ** Futures and Swaps | (4.0)% | |

† Short-Term Investments and Net Other Assets are not included in the pie chart.
Semiannual Report
Showing Percentage of Net Assets
U.S. Government Agency - Mortgage Securities - 100.0% |
| Principal Amount (000s) | | Value (000s) |
Fannie Mae - 54.2% |
2.303% 6/1/36 (e) | | $ 50 | | $ 53 |
2.322% 1/1/35 (e) | | 354 | | 377 |
2.336% 5/1/36 (e) | | 268 | | 278 |
2.393% 9/1/36 (e) | | 169 | | 180 |
2.424% 10/1/33 (e) | | 77 | | 81 |
2.435% 4/1/36 (e) | | 229 | | 243 |
2.438% 8/1/35 (e) | | 469 | | 500 |
2.448% 3/1/35 (e) | | 49 | | 51 |
2.487% 11/1/36 (e) | | 71 | | 75 |
2.537% 7/1/35 (e) | | 101 | | 108 |
2.609% 5/1/36 (e) | | 95 | | 101 |
2.625% 10/1/36 (e) | | 172 | | 183 |
2.71% 9/1/36 (e) | | 104 | | 111 |
3% 3/1/27 (c) | | 2,000 | | 2,076 |
3% 3/1/27 (c) | | 6,000 | | 6,227 |
3% 3/1/27 (c) | | 7,600 | | 7,887 |
3% 3/1/27 (c) | | 6,000 | | 6,227 |
3.377% 9/1/41 (e) | | 363 | | 381 |
3.471% 3/1/40 (e) | | 817 | | 846 |
3.5% 12/1/25 to 9/1/26 | | 1,682 | | 1,771 |
3.5% 3/1/42 (c) | | 11,000 | | 11,370 |
3.5% 3/1/42 (c) | | 7,100 | | 7,339 |
3.5% 3/1/42 (c) | | 8,400 | | 8,682 |
3.5% 3/1/42 (c) | | 4,000 | | 4,134 |
4% 10/1/25 to 11/1/41 | | 73,940 | | 78,313 |
4% 3/1/42 (c) | | 20,700 | | 21,786 |
4% 3/1/42 (c) | | 6,000 | | 6,315 |
4.168% 6/1/36 (e) | | 825 | | 869 |
4.5% 5/1/18 to 11/1/41 | | 69,092 | | 74,294 |
4.5% 3/1/42 (c) | | 12,600 | | 13,429 |
4.5% 3/1/42 (c) | | 3,000 | | 3,197 |
5% 9/1/17 to 6/1/40 | | 39,275 | | 42,587 |
5% 3/1/42 (c) | | 14,500 | | 15,660 |
5% 3/1/42 (c) | | 25,600 | | 27,647 |
5% 3/1/42 (c) | | 9,000 | | 9,720 |
5.003% 7/1/35 (e) | | 12 | | 13 |
5.08% 7/1/35 (e) | | 109 | | 117 |
5.5% 2/1/18 to 9/1/38 | | 64,357 | | 70,230 |
5.5% 3/1/42 (c) | | 4,000 | | 4,358 |
5.5% 3/1/42 (c) | | 29,000 | | 31,597 |
5.718% 3/1/36 (e) | | 561 | | 592 |
5.99% 9/1/36 (e) | | 219 | | 235 |
U.S. Government Agency - Mortgage Securities - continued |
| Principal Amount (000s) | | Value (000s) |
Fannie Mae - continued |
6% 3/1/17 to 2/1/38 | | $ 8,380 | | $ 9,194 |
6% 3/1/42 (c) | | 1,000 | | 1,100 |
6.021% 8/1/46 (e) | | 107 | | 117 |
6.039% 9/1/36 (e) | | 202 | | 215 |
6.24% 9/1/37 (e) | | 22 | | 23 |
6.313% 4/1/37 (e) | | 236 | | 254 |
6.499% 12/1/36 (e) | | 195 | | 212 |
6.5% 12/1/12 to 5/1/38 | | 5,368 | | 6,024 |
6.555% 12/1/36 (e) | | 107 | | 115 |
6.824% 9/1/37 (e) | | 89 | | 95 |
7% 12/1/15 to 5/1/30 | | 2,316 | | 2,641 |
7.431% 9/1/37 (e) | | 30 | | 32 |
7.5% 8/1/22 to 9/1/32 | | 1,252 | | 1,469 |
8% 12/1/29 to 3/1/37 | | 75 | | 89 |
8.5% 1/1/16 to 7/1/31 | | 171 | | 202 |
9% 10/1/30 | | 274 | | 338 |
9.5% 7/1/16 to 8/1/22 | | 39 | | 44 |
12.5% 8/1/15 to 3/1/16 | | 10 | | 11 |
12.75% 2/1/15 | | 2 | | 3 |
13.5% 9/1/14 | | 1 | | 2 |
| | 482,420 |
Freddie Mac - 24.9% |
1.915% 3/1/35 (e) | | 217 | | 225 |
2.095% 5/1/37 (e) | | 112 | | 116 |
2.292% 11/1/35 (e) | | 431 | | 455 |
2.481% 5/1/34 (e) | | 16 | | 17 |
2.638% 4/1/37 (e) | | 162 | | 173 |
2.639% 6/1/37 (e) | | 364 | | 387 |
2.711% 6/1/33 (e) | | 1,113 | | 1,186 |
2.795% 7/1/36 (e) | | 176 | | 188 |
3.149% 10/1/35 (e) | | 73 | | 78 |
3.586% 6/1/37 (e) | | 911 | | 961 |
4% 9/1/41 | | 938 | | 990 |
4% 10/1/41 | | 1,893 | | 2,018 |
4% 3/1/42 (c) | | 23,000 | | 24,127 |
4.5% 7/1/25 to 10/1/41 | | 47,804 | | 51,292 |
4.5% 3/1/42 (c) | | 28,300 | | 30,062 |
5% 7/1/33 to 9/1/40 | | 35,750 | | 38,789 |
5.138% 4/1/35 (e) | | 78 | | 81 |
5.5% 10/1/17 to 1/1/40 (d) | | 32,055 | | 34,835 |
5.847% 6/1/37 (e) | | 56 | | 58 |
U.S. Government Agency - Mortgage Securities - continued |
| Principal Amount (000s) | | Value (000s) |
Freddie Mac - continued |
6% 4/1/14 to 6/1/39 | | $ 10,400 | | $ 11,400 |
6.011% 4/1/37 (e) | | 81 | | 86 |
6.05% 3/1/36 (e) | | 744 | | 793 |
6.058% 10/1/36 (e) | | 53 | | 57 |
6.333% 6/1/37 (e) | | 38 | | 40 |
6.421% 12/1/36 (e) | | 614 | | 651 |
6.5% 2/1/13 to 9/1/39 | | 11,879 | | 13,259 |
6.662% 8/1/37 (e) | | 186 | | 195 |
7% 6/1/21 to 9/1/36 | | 3,176 | | 3,635 |
7.03% 6/1/36 (e) | | 32 | | 34 |
7.07% 2/1/37 (e) | | 55 | | 60 |
7.22% 4/1/37 (e) | | 9 | | 9 |
7.5% 4/1/12 to 7/1/34 | | 4,801 | | 5,529 |
8% 11/1/16 to 1/1/37 | | 67 | | 79 |
8.5% 6/1/16 to 9/1/20 | | 12 | | 13 |
9% 9/1/16 to 5/1/21 | | 92 | | 103 |
10% 1/1/16 to 5/1/19 | | 18 | | 20 |
10.5% 2/1/16 | | 1 | | 1 |
12.5% 2/1/14 to 12/1/14 | | 3 | | 3 |
13% 12/1/13 to 6/1/15 | | 11 | | 11 |
| | 222,016 |
Ginnie Mae - 20.9% |
3.5% 10/15/41 to 2/15/42 | | 9,799 | | 10,288 |
3.5% 3/1/42 (c) | | 7,500 | | 7,862 |
4% 9/15/25 to 11/15/41 | | 20,791 | | 22,473 |
4% 3/1/42 (c) | | 2,300 | | 2,477 |
4.5% 8/15/33 to 5/20/41 | | 56,311 | | 61,877 |
4.5% 3/1/42 (c) | | 700 | | 763 |
4.751% 12/20/60 (i) | | 13,639 | | 15,227 |
4.814% 1/20/61 (i) | | 308 | | 346 |
5% 9/20/33 to 9/15/40 | | 34,669 | | 38,576 |
5% 3/1/42 (c) | | 9,000 | | 9,941 |
5.5% 10/15/33 to 9/15/39 | | 5,832 | | 6,503 |
6% 1/15/36 to 9/20/38 | | 5,476 | | 6,159 |
6.5% 10/15/34 to 7/15/36 | | 290 | | 334 |
7% 2/15/24 to 4/20/32 | | 1,975 | | 2,273 |
7.5% 12/15/16 to 4/15/32 | | 667 | | 776 |
8% 6/15/21 to 12/15/25 | | 305 | | 358 |
8.5% 8/15/16 to 10/15/28 | | 347 | | 407 |
U.S. Government Agency - Mortgage Securities - continued |
| Principal Amount (000s) | | Value (000s) |
Ginnie Mae - continued |
9% 11/20/17 | | $ 1 | | $ 1 |
10.5% 12/20/15 to 2/20/18 | | 10 | | 12 |
| | 186,653 |
TOTAL U.S. GOVERNMENT AGENCY - MORTGAGE SECURITIES (Cost $869,441) | 891,089 |
Asset-Backed Securities - 3.8% |
|
ACE Securities Corp. Home Equity Loan Trust Series 2005-HE7 Class A2C, 0.494% 11/25/35 (e) | | 645 | | 641 |
Aesop Funding II LLC Series 2005-4A Class A3, 0.5255% 7/20/12 (AMBAC Insured) (b)(e) | | 2,917 | | 2,905 |
AmeriCredit Automobile Receivables Trust Series 2007-CM Class A4B, 0.3425% 4/7/14 (National Public Finance Guarantee Corp. Insured) (e) | | 2,007 | | 1,995 |
Avis Budget Rental Car Funding (AESOP) LLC: | | | | |
Series 2007-2A Class A, 0.3855% 8/20/13 (AMBAC Insured) (b)(e) | | 4,930 | | 4,902 |
Series 2009-1A Class A, 9.31% 10/20/13 (b) | | 2,805 | | 2,893 |
Countrywide Asset-Backed Certificates Trust: | | | | |
Series 2007-11 Class 2A1, 0.304% 6/25/47 (e) | | 248 | | 245 |
Series 2007-4 Class A1A, 0.3963% 9/25/37 (e) | | 784 | | 764 |
Series 2007-5 Class 2A1, 0.344% 9/25/47 (e) | | 249 | | 248 |
Countrywide Home Loans, Inc. Series 2005-2 Class M2, 0.949% 7/25/35 (e) | | 1,984 | | 1,966 |
GSAMP Trust: | | | | |
Series 2004-AR1 Class B4, 5% 6/25/34 (b)(e) | | 82 | | 24 |
Series 2004-AR2 Class B1, 3.094% 8/25/34 (e) | | 796 | | 62 |
GSR Mortgage Loan Trust Series 2005-HE4 Class A2C, 0.614% 7/25/45 (e) | | 4,930 | | 4,924 |
Morgan Stanley ABS Capital I Trust Series 2005-3 Class A3, 0.624% 8/25/35 (e) | | 1,179 | | 1,174 |
National Collegiate Student Loan Trust: | | | | |
Series 2004-2 Class AIO, 9.75% 10/27/14 (f) | | 2,045 | | 138 |
Series 2007-1 Class AIO, 7.27% 4/25/12 (f) | | 9,200 | | 147 |
Series 2007-2 Class AIO, 6.7% 7/25/12 (f) | | 6,385 | | 142 |
Ocala Funding LLC Series 2006-1A Class A, 1.6455% 3/20/11 (a)(b)(e) | | 2,100 | | 0 |
Option One Mortgage Loan Trust: | | | | |
Series 2007-5 Class 2A1, 0.334% 5/25/37 (e) | | 928 | | 922 |
Series 2007-6 Class 2A1, 0.304% 7/25/37 (e) | | 68 | | 67 |
Asset-Backed Securities - continued |
| Principal Amount (000s) | | Value (000s) |
Rental Car Finance Corp. Series 2007-1A Class A, 0.384% 7/25/13 (FGIC Insured) (b)(e) | | $ 8,333 | | $ 8,279 |
Structured Asset Securities Corp. Series 2005-NC2 Class M3, 0.674% 5/25/35 (e) | | 1,995 | | 1,119 |
WaMu Asset Holdings Corp.: | | | | |
Series 2006-5 Class N1, 5.926% 7/25/46 (b) | | 1,148 | | 0 |
Series 2006-7 Class N1, 5.926% 9/25/46 (b) | | 912 | | 0 |
Series 2006-8 Class N1, 6.048% 10/25/46 (b) | | 1,160 | | 0 |
TOTAL ASSET-BACKED SECURITIES (Cost $39,574) |
33,557
|
Collateralized Mortgage Obligations - 14.9% |
|
Private Sponsor - 4.0% |
Arkle Master Issuer PLC floater Series 2010-1A Class 2A, 1.6451% 5/17/60 (b)(e) | | 3,032 | | 3,033 |
Arran Residential Mortgages Funding PLC floater Series 2011-1A Class A1C, 1.6931% 11/19/47 (b)(e) | | 1,177 | | 1,178 |
Banc of America Funding Trust sequential payer Series 2009-R1 Class A1, 5.0298% 5/20/36 (e) | | 173 | | 174 |
Banc of America Mortgage Securities, Inc. planned amortization class Series 2005-3 Class 1A20, 5.5% 4/25/35 | | 3,006 | | 2,996 |
BCAP LLC Trust sequential payer Series 2010-RR12 Class 3A5, 5% 8/26/37 (b) | | 429 | | 429 |
Citigroup Mortgage Loan Trust Series 2010-7 Class 9A1, 4.5% 10/25/37 (b) | | 4,601 | | 4,666 |
Credit Suisse Mortgage Capital Certificates: | | | | |
floater Series 2011-7R Class A1, 1.494% 8/27/47 (b)(e) | | 2,337 | | 2,293 |
sequential payer Series 2010-16 Class A1, 3% 6/25/50 (b) | | 486 | | 469 |
CSMC floater Series 2011-1R Class A1, 1.244% 2/27/47 (b)(e) | | 3,459 | | 3,403 |
First Horizon Mortgage pass-thru Trust Series 2004-AR5 Class 2A1, 2.631% 10/25/34 (e) | | 934 | | 860 |
Gracechurch Mortgage Financing PLC floater Series 2007-1A Class 3A1, 0.5731% 11/20/56 (b)(e) | | 4,156 | | 4,150 |
Granite Mortgages Series 2003-2 Class 1A3, 1.0612% 7/20/43 (e) | | 447 | | 433 |
Granite Mortgages PLC floater: | | | | |
Series 2003-3 Class 1A3, 0.9612% 1/20/44 (e) | | 173 | | 168 |
Series 2004-1 Class 2A1, 0.8832% 3/20/44 (e) | | 5,398 | | 5,190 |
Collateralized Mortgage Obligations - continued |
| Principal Amount (000s) | | Value (000s) |
Private Sponsor - continued |
Granite Mortgages PLC floater: - continued | | | | |
Series 2004-3 Class 2A1, 0.8432% 9/20/44 (e) | | $ 211 | | $ 203 |
Holmes Master Issuer PLC floater Series 2007-2A Class 4A, 0.667% 7/15/20 (e) | | 1,650 | | 1,645 |
Luminent Mortgage Trust floater Series 2006-1 Class A1, 0.484% 4/25/36 (e) | | 2,088 | | 1,087 |
MASTR Adjustable Rate Mortgages Trust Series 2007-3 Class 22A2, 0.454% 5/25/47 (e) | | 579 | | 340 |
Merrill Lynch Alternative Note Asset Trust floater Series 2007-OAR1 Class A1, 0.414% 2/25/37 (e) | | 2,773 | | 1,863 |
Structured Asset Securities Corp.: | | | | |
Series 2003-15A Class 4A, 5.3281% 4/25/33 (e) | | 488 | | 451 |
Series 2004-21XS Class 2A3, 4.32% 12/25/34 | | 83 | | 83 |
Wells Fargo Mortgage Backed Securities Trust Series 2005-AR2 Class 1A2, 2.67% 3/25/35 (e) | | 414 | | 133 |
TOTAL PRIVATE SPONSOR | | 35,247 |
U.S. Government Agency - 10.9% |
Fannie Mae Series 2011-67 Class AI, 4% 7/25/26 (f) | | 807 | | 86 |
Fannie Mae Guaranteed Mtg. pass-thru certificates: | | | | |
planned amortization class Series 1994-23: | | | | |
Class PX, 6% 8/25/23 | | 1,233 | | 1,283 |
Class PZ, 6% 2/25/24 | | 3,216 | | 3,813 |
Series 1993-165 Class SH, 19.0927% 9/25/23 (e)(h) | | 84 | | 112 |
Series 2003-39 Class IA, 5.5% 10/25/22 (e)(f) | | 471 | | 31 |
Series 2009-16 Class SA, 6.006% 3/25/24 (e)(f)(h) | | 1,763 | | 164 |
Series 2010-109 Class IM, 5.5% 9/25/40 (f) | | 7,315 | | 1,107 |
Series 2010-23: | | | | |
Class AI, 5% 12/25/18 (f) | | 1,308 | | 107 |
Class HI, 4.5% 10/25/18 (f) | | 883 | | 82 |
Series 2010-29 Class LI, 4.5% 6/25/19 (f) | | 2,572 | | 235 |
Series 2010-97 Class CI, 4.5% 8/25/25 (f) | | 1,714 | | 149 |
Series 2011-83 Class DI, 6% 9/25/26 (f) | | 1,293 | | 165 |
Fannie Mae Stripped Mortgage-Backed Securities: | | | | |
sequential payer Series 377 Class 1, 10/1/36 (g) | | 1,560 | | 1,461 |
Series 339 Class 29, 5.5% 7/1/18 (f) | | 746 | | 68 |
Series 348 Class 14, 6.5% 8/1/34 (f) | | 473 | | 85 |
Series 351: | | | | |
Class 12, 5.5% 4/1/34 (f) | | 357 | | 52 |
Class 13, 6% 3/1/34 (f) | | 441 | | 80 |
Collateralized Mortgage Obligations - continued |
| Principal Amount (000s) | | Value (000s) |
U.S. Government Agency - continued |
Fannie Mae Stripped Mortgage-Backed Securities: - continued | | | | |
Series 359 Class 19, 6% 7/1/35 (f) | | $ 416 | | $ 68 |
Series 384 Class 6, 5% 7/25/37 (f) | | 1,776 | | 231 |
Fannie Mae subordinate REMIC pass-thru certificates: | | | | |
floater Series 2007-57 Class FA, 0.474% 6/25/37 (e) | | 4,743 | | 4,724 |
planned amortization class: | | | | |
Series 1999-17 Class PG, 6% 4/25/29 | | 2,169 | | 2,400 |
Series 1999-32 Class PL, 6% 7/25/29 | | 1,680 | | 1,866 |
Series 1999-33 Class PK, 6% 7/25/29 | | 1,013 | | 1,123 |
Series 2001-52 Class YZ, 6.5% 10/25/31 | | 110 | | 127 |
Series 2005-39 Class TE, 5% 5/25/35 | | 1,120 | | 1,327 |
Series 2005-73 Class SA, 16.9156% 8/25/35 (e)(h) | | 461 | | 558 |
Series 2006-105 Class MD, 5.5% 6/25/35 | | 1,145 | | 1,291 |
sequential payer: | | | | |
Series 2001-20 Class Z, 6% 5/25/31 | | 1,934 | | 2,139 |
Series 2001-31 Class ZC, 6.5% 7/25/31 | | 708 | | 794 |
Series 2002-16 Class ZD, 6.5% 4/25/32 | | 318 | | 356 |
Series 2002-74 Class SV, 7.306% 11/25/32 (e)(f) | | 475 | | 93 |
Series 2002-79 Class Z, 5.5% 11/25/22 | | 1,034 | | 1,134 |
Series 2003-80 Class CG, 6% 4/25/30 | | 201 | | 205 |
Series 2003-21 Class SK, 7.856% 3/25/33 (e)(f)(h) | | 315 | | 66 |
Series 2003-35 Class TQ, 7.256% 5/25/18 (e)(f)(h) | | 252 | | 34 |
Series 2003-42 Class SJ, 6.806% 11/25/22 (e)(f)(h) | | 239 | | 17 |
Series 2003-48 Class HI, 5% 11/25/17 (f) | | 683 | | 37 |
Series 2005-104 Class NI, 6.456% 3/25/35 (e)(f)(h) | | 3,755 | | 596 |
Series 2006-4 Class IT, 6% 10/25/35 (f) | | 87 | | 6 |
Series 2007-57 Class SA, 39.156% 6/25/37 (e)(h) | | 1,420 | | 2,420 |
Series 2007-66: | | | | |
Class FB, 0.644% 7/25/37 (e) | | 2,137 | | 2,131 |
Class SB, 38.136% 7/25/37 (e)(h) | | 394 | | 697 |
Series 2009-114 Class AI, 5% 12/25/23 (f) | | 1,498 | | 124 |
Series 2009-76 Class MI, 5.5% 9/25/24 (f) | | 950 | | 122 |
Series 2009-85 Class IB, 4.5% 8/25/24 (f) | | 482 | | 41 |
Series 2009-93 Class IC, 4.5% 9/25/24 (f) | | 854 | | 69 |
Series 2010-12 Class AI, 5% 12/25/18 (f) | | 2,695 | | 297 |
Series 2010-135 Class LS, 5.806% 12/25/40 (e)(f)(h) | | 2,132 | | 310 |
Series 2010-139 Class NI, 4.5% 2/25/40 (f) | | 1,913 | | 272 |
Series 2010-96 Class DI, 4% 5/25/23 (f) | | 1,321 | | 56 |
Collateralized Mortgage Obligations - continued |
| Principal Amount (000s) | | Value (000s) |
U.S. Government Agency - continued |
Freddie Mac: | | | | |
floater Series 3318 Class GY, 0% 5/15/37 (e) | | $ 37 | | $ 37 |
floater planned amortization Series 3988 Class PF, 0.6485% 1/15/40 (e) | | 3,069 | | 3,066 |
planned amortization class: | | | | |
Series 2095 Class PE, 6% 11/15/28 | | 2,056 | | 2,281 |
Series 2104 Class PG, 6% 12/15/28 | | 646 | | 714 |
Series 2162 Class PH, 6% 6/15/29 | | 223 | | 247 |
Series 70 Class C, 9% 9/15/20 | | 46 | | 52 |
sequential payer Series 2114 Class ZM, 6% 1/15/29 | | 304 | | 336 |
Freddie Mac Manufactured Housing participation certificates guaranteed planned amortization class Series 2043 Class CJ, 6.5% 4/15/28 | | 737 | | 825 |
Freddie Mac Multi-Class pass-thru certificates: | | | | |
floater: | | | | |
Series 3129 Class MF, 0% 7/15/34 (e) | | 7 | | 7 |
Series 3222 Class HF, 0% 9/15/36 (e) | | 102 | | 99 |
planned amortization class: | | | | |
Series 2121 Class MG, 6% 2/15/29 | | 857 | | 948 |
Series 2154 Class PT, 6% 5/15/29 | | 1,309 | | 1,448 |
Series 2520 Class BE, 6% 11/15/32 | | 1,205 | | 1,334 |
Series 2585 Class KS, 7.3515% 3/15/23 (e)(f)(h) | | 152 | | 24 |
Series 2590 Class YR, 5.5% 9/15/32 (f) | | 46 | | 4 |
Series 2802 Class OB, 6% 5/15/34 | | 3,375 | | 3,924 |
Series 2810 Class PD, 6% 6/15/33 | | 1,357 | | 1,416 |
Series 3741 Class YU, 3.5% 11/15/22 | | 2,150 | | 2,262 |
Series 3786 Class HP, 4.5% 3/15/38 | | 3,064 | | 3,302 |
Series 3806 Class UP, 4.5% 2/15/41 | | 2,324 | | 2,519 |
Series 3832 Class PE, 5% 3/15/41 | | 960 | | 1,074 |
sequential payer: | | | | |
Series 2135 Class JE, 6% 3/15/29 | | 972 | | 1,076 |
Series 2274 Class ZM, 6.5% 1/15/31 | | 391 | | 441 |
Series 2281 Class ZB, 6% 3/15/30 | | 377 | | 416 |
Series 2357 Class ZB, 6.5% 9/15/31 | | 842 | | 943 |
Series 2502 Class ZC, 6% 9/15/32 | | 1,162 | | 1,295 |
Series 2575 Class ID, 5.5% 8/15/22 (f) | | 22 | | 1 |
Series 2817 Class SD, 6.8015% 7/15/30 (e)(f)(h) | | 330 | | 23 |
Series 3097 Class IA, 5.5% 3/15/33 (f) | | 1,214 | | 110 |
Series 1658 Class GZ, 7% 1/15/24 | | 1,154 | | 1,286 |
Series 2587 Class IM, 6.5% 3/15/33 (f) | | 590 | | 110 |
Series 2844: | | | | |
Class SC, 45.1848% 8/15/24 (e)(h) | | 43 | | 83 |
Collateralized Mortgage Obligations - continued |
| Principal Amount (000s) | | Value (000s) |
U.S. Government Agency - continued |
Freddie Mac Multi-Class pass-thru certificates: - continued | | | | |
Series 2844: | | | | |
Class SD, 83.2195% 8/15/24 (e)(h) | | $ 63 | | $ 150 |
Series 3772 Class BI, 4.5% 10/15/18 (f) | | 1,750 | | 135 |
Ginnie Mae guaranteed REMIC pass-thru certificates: | | | | |
floater: | | | | |
Series 2010-H17 Class FA, 0.5755% 7/20/60 (e)(i) | | 419 | | 411 |
Series 2010-H18 Class AF, 0.5703% 9/20/60 (e)(i) | | 445 | | 436 |
Series 2010-H19 Class FG, 0.5455% 8/20/60 (e)(i) | | 566 | | 556 |
Series 2011-H03 Class FA, 0.7455% 1/20/61 (e)(i) | | 10,218 | | 10,150 |
Series 2011-H05 Class FA, 0.7455% 12/20/60 (e)(i) | | 1,525 | | 1,515 |
Series 2011-H07 Class FA, 0.7455% 2/20/61 (e)(i) | | 3,076 | | 3,024 |
Series 2011-H12 Class FA, 0.7355% 2/20/61 (e)(i) | | 3,726 | | 3,662 |
Series 2011-H13 Class FA, 0.7455% 4/20/61 (e)(i) | | 242 | | 241 |
Series 2011-H14: | | | | |
Class FB, 0.7455% 5/20/61 (e)(i) | | 1,713 | | 1,692 |
Class FC, 0.7455% 5/20/61 (e)(i) | | 1,746 | | 1,725 |
Series 2011-H17 Class FA, 0.7755% 6/20/61 (e)(i) | | 2,189 | | 2,179 |
planned amortization class Series 2011-79 Class PO, 6/20/40 (g) | | 3,034 | | 2,566 |
sequential payer Series 2002-42 Class ZA, 6% 6/20/32 | | 987 | | 1,109 |
Series 2004-32 Class GS, 6.2525% 5/16/34 (e)(f)(h) | | 774 | | 161 |
Series 2010-91 Class PO, 7/20/40 (g) | | 1,017 | | 898 |
Government National Mortgage Association planned amortization class Series 2011-136 Class WI, 4.5% 5/20/40 (f) | | 924 | | 185 |
TOTAL U.S. GOVERNMENT AGENCY | | 97,309 |
TOTAL COLLATERALIZED MORTGAGE OBLIGATIONS (Cost $129,427) | 132,556 |
Commercial Mortgage Securities - 3.9% |
|
Asset Securitization Corp. Series 1997-D5: | | | | |
Class A6, 7.4526% 2/14/43 (e) | | 4,300 | | 4,383 |
Class PS1, 1.4363% 2/14/43 (e)(f) | | 9,301 | | 103 |
Banc of America Commercial Mortgage, Inc. sequential payer Series 2004-4 Class A5, 4.576% 7/10/42 | | 304 | | 311 |
Commercial Mortgage Securities - continued |
| Principal Amount (000s) | | Value (000s) |
Bayview Commercial Asset Trust floater: | | | | |
Series 2006-4A Class B2, 1.494% 12/25/36 (b)(e) | | $ 74 | | $ 4 |
Series 2007-3: | | | | |
Class M1, 0.554% 7/25/37 (b)(e) | | 68 | | 23 |
Class M2, 0.584% 7/25/37 (b)(e) | | 71 | | 19 |
Class M3, 0.614% 7/25/37 (b)(e) | | 116 | | 25 |
CDC Commercial Mortgage Trust Series 2002-FX1 Class XCL, 1.5913% 5/15/35 (b)(e)(f) | | 6,520 | | 153 |
Citigroup/Deutsche Bank Commercial Mortgage Trust sequential payer Series 2007-CD4 Class A4, 5.322% 12/11/49 | | 5,110 | | 5,608 |
Credit Suisse Commercial Mortgage Trust sequential payer Series 2007-C3 Class A2, 5.9018% 6/15/39 (e) | | 685 | | 687 |
GS Mortgage Securities Corp. II sequential payer Series 2005-GG4 Class A3, 4.607% 7/10/39 | | 560 | | 561 |
JPMorgan Chase Commercial Mortgage Securities Corp. floater Series 2011-CCHP Class A, 2.6% 7/15/28 (b)(e) | | 9,075 | | 9,074 |
JPMorgan Chase Commercial Mortgage Securities Trust sequential payer: | | | | |
Series 2007-LD11 Class A4, 6.0045% 6/15/49 (e) | | 4,140 | | 4,571 |
Series 2007-LDPX Class A2 S, 5.305% 1/15/49 | | 4,309 | | 4,310 |
LB-UBS Commercial Mortgage Trust: | | | | |
sequential payer Series 2007-C6 Class A2, 5.845% 7/15/40 | | 499 | | 507 |
Series 2007-C1 Class XCP, 0.6167% 2/15/40 (e)(f) | | 9,316 | | 79 |
Merrill Lynch-CFC Commercial Mortgage Trust sequential payer Series 2007-6 Class A4, 5.485% 3/12/51 (e) | | 175 | | 190 |
Wachovia Bank Commercial Mortgage Trust: | | | | |
floater Series 2006-WL7A Class A1, 0.3751% 9/15/21 (b)(e) | | 2,314 | | 2,229 |
Series 2007-C31A Class A2, 5.421% 4/15/47 | | 769 | | 799 |
Wachovia Bank Commercial Mortgage Trust pass-thru certificates sequential payer Series 2007-C33 Class A4, 6.0964% 2/15/51 (e) | | 1,470 | | 1,621 |
TOTAL COMMERCIAL MORTGAGE SECURITIES (Cost $34,956) | 35,257 |
Cash Equivalents - 4.1% |
| Maturity Amount (000s) | | Value (000s) |
Investments in repurchase agreements in a joint trading account at 0.14%, dated 2/29/12 due 3/1/12 (Collateralized by U.S. Government Obligations) #
(Cost $36,334) | $ 36,334 | | $ 36,334 |
TOTAL INVESTMENT PORTFOLIO - 126.7% (Cost $1,109,732) | | 1,128,793 |
NET OTHER ASSETS (LIABILITIES) - (26.7)% | | (238,093) |
NET ASSETS - 100% | $ 890,700 |
TBA Sale Commitments |
| Principal Amount (000s) | | |
Fannie Mae |
3.5% 3/1/42 | $ (1,000) | | (1,034) |
4.5% 3/1/27 | (5,000) | | (5,350) |
4.5% 3/1/42 | (4,400) | | (4,689) |
5% 3/1/42 | (9,000) | | (9,720) |
5% 3/1/42 | (9,000) | | (9,720) |
5.5% 3/1/42 | (2,000) | | (2,179) |
5.5% 3/1/42 | (8,000) | | (8,716) |
TOTAL FANNIE MAE | | (41,408) |
Ginnie Mae |
4% 3/1/42 | (2,500) | | (2,692) |
5% 3/1/42 | (17,200) | | (18,998) |
TOTAL GINNIE MAE | | (21,690) |
TOTAL TBA SALE COMMITMENTS (Proceeds $63,145) | $ (63,098) |
Swap Agreements |
| Expiration Date | | Notional Amount (000s) | | Value (000s) |
Interest Rate Swaps |
Receive quarterly a floating rate based on 3-month LIBOR and pay semi-annually a fixed rate equal to 0.9975% with JPMorgan Chase, Inc. | Feb. 2017 | | $ 18,000 | | $ 86 |
Receive quarterly a floating rate based on 3-month LIBOR and pay semi-annually a fixed rate equal to 3.75125% with Credit Suisse First Boston | August 2041 | | 2,900 | | (586) |
| | $ 20,900 | | $ (500) |
Legend |
(a) Non-income producing - Security is in default. |
(b) Security exempt from registration under Rule 144A of the Securities Act of 1933. These securities may be resold in transactions exempt from registration, normally to qualified institutional buyers. At the end of the period, the value of these securities amounted to $50,151,000 or 5.6% of net assets. |
(c) Security or a portion of the security purchased on a delayed delivery or when-issued basis. |
(d) Security or a portion of the security has been segregated as collateral for open swap agreements. At the period end, the value of securities pledged amounted to $673,000. |
(e) Coupon rates for floating and adjustable rate securities reflect the rates in effect at period end. |
(f) Security represents right to receive monthly interest payments on an underlying pool of mortgages or assets. Principal shown is the outstanding par amount of the pool as of the end of the period. |
(g) Principal Only Strips represent the right to receive the monthly principal payments on an underlying pool of mortgage loans. |
(h) Coupon is inversely indexed to a floating interest rate multiplied by a specified factor. The price may be considerably more volatile than the price of a comparable fixed rate security. |
(i) Represents an investment in an underlying pool of reverse mortgages which typically do not require regular principal and interest payments as repayment is deferred until a maturity event. |
# Additional information on each counterparty to the repurchase agreement is as follows: |
Repurchase Agreement / Counterparty | Value
(Amounts in thousands) |
$36,334,000 due 3/01/12 at 0.14% |
Citibank NA | $ 6,368 |
Credit Suisse Securities (USA) LLC | 26,782 |
Merrill Lynch, Pierce, Fenner & Smith, Inc. | 3,184 |
| $ 36,334 |
Other Information |
The following is a summary of the inputs used, as of February 29, 2012, involving the Fund's assets and liabilities carried at fair value. The inputs or methodology used for valuing securities may not be an indication of the risk associated with investing in those securities. For more information on valuation inputs, and their aggregation into the levels used in the tables below, please refer to the Security Valuation section in the accompanying Notes to Financial Statements. |
Valuation Inputs at Reporting Date: |
Description
(Amounts in thousands) | Total | Level 1 | Level 2 | Level 3 |
Investments in Securities: | | | | |
U.S. Government Agency - Mortgage Securities | $ 891,089 | $ - | $ 891,089 | $ - |
Asset-Backed Securities | 33,557 | - | 33,471 | 86 |
Collateralized Mortgage Obligations | 132,556 | - | 132,423 | 133 |
Commercial Mortgage Securities | 35,257 | - | 35,186 | 71 |
Cash Equivalents | 36,334 | - | 36,334 | - |
Total Investments in Securities: | $ 1,128,793 | $ - | $ 1,128,503 | $ 290 |
Derivative Instruments: | | | | |
Assets | | | | |
Swap Agreements | $ 86 | $ - | $ 86 | $ - |
Liabilities | | | | |
Swap Agreements | $ (586) | $ - | $ (586) | $ - |
Total Derivative Instruments: | $ (500) | $ - | $ (500) | $ - |
Other Financial Instruments: | | | | |
TBA Sale Commitments | $ (63,098) | $ - | $ (63,098) | $ - |
The following is a reconciliation of Investments in Securities for which Level 3 inputs were used in determining value: |
(Amounts in thousands) | |
Investments in Securities: | |
Beginning Balance | $ 184 |
Total Realized Gain (Loss) | (404) |
Total Unrealized Gain (Loss) | 415 |
Cost of Purchases | - |
Proceeds of Sales | (39) |
Amortization/Accretion | (41) |
Transfers in to Level 3 | 175 |
Transfers out of Level 3 | - |
Ending Balance | $ 290 |
The change in unrealized gain (loss) for the period attributable to Level 3 securities held at February 29, 2012 | $ 11 |
The information used in the above reconciliation represents fiscal year to date activity for any Investments in Securities identified as using Level 3 inputs at either the beginning or the end of the current fiscal period. Transfers in or out of Level 3 represent the beginning value of any Security or Instrument where a change in the pricing level occurred from the beginning to the end of the period. The cost of purchases and the proceeds of sales may include securities received or delivered through corporate actions or exchanges. Realized and unrealized gains (losses) disclosed in the reconciliation are included in Net Gain (Loss) on the Fund's Statement of Operations. |
Value of Derivative Instruments |
The following table is a summary of the Fund's value of derivative instruments by risk exposure as of February 29, 2012. For additional information on derivative instruments, please refer to the Derivative Instruments section in the accompanying Notes to Financial Statements. |
Risk Exposure /
Derivative Type | Value
(Amounts in thousands) |
| Asset | Liability |
Interest Rate Risk | | |
Swap Agreements (a) | $ 86 | $ (586) |
Total Value of Derivatives | $ 86 | $ (586) |
(a) Value is disclosed on the Statement of Assets and Liabilities in the Swap agreements, at value line-items. |
See accompanying notes which are an integral part of the financial statements.
Semiannual Report
Statement of Assets and Liabilities
Amounts in thousands (except per-share amounts) | February 29, 2012 (Unaudited) |
| | |
Assets | | |
Investment in securities, at value (including repurchase agreements of $36,334) - See accompanying schedule: Unaffiliated issuers (cost $1,109,732) | | $ 1,128,793 |
Cash | | 74 |
Receivable for investments sold, regular delivery | | 13,845 |
Receivable for TBA sale commitments | | 63,145 |
Receivable for fund shares sold | | 10,930 |
Interest receivable | | 3,292 |
Swap agreements, at value | | 86 |
Other receivables | | 116 |
Total assets | | 1,220,281 |
| | |
Liabilities | | |
TBA sale commitments, at value | $ 63,098 | |
Payable for investments purchased on a delayed delivery basis | 264,306 | |
Payable for fund shares redeemed | 879 | |
Distributions payable | 219 | |
Swap agreements, at value | 586 | |
Accrued management fee | 232 | |
Distribution and service plan fees payable | 38 | |
Other affiliated payables | 109 | |
Other payables and accrued expenses | 114 | |
Total liabilities | | 329,581 |
| | |
Net Assets | | $ 890,700 |
Net Assets consist of: | | |
Paid in capital | | $ 961,846 |
Distributions in excess of net investment income | | (7,410) |
Accumulated undistributed net realized gain (loss) on investments | | (82,344) |
Net unrealized appreciation (depreciation) on investments | | 18,608 |
Net Assets | | $ 890,700 |
See accompanying notes which are an integral part of the financial statements.
Semiannual Report
Statement of Assets and Liabilities - continued
Amounts in thousands (except per-share amounts) | February 29, 2012 (Unaudited) |
| | |
Calculation of Maximum Offering Price
Class A:
Net Asset Value and redemption price per share ($58,492 ÷ 5,226.9 shares) | | $ 11.19 |
| | |
Maximum offering price per share (100/96.00 of $11.19) | | $ 11.66 |
Class T:
Net Asset Value and redemption price per share ($36,308 ÷ 3,238.3 shares) | | $ 11.21 |
| | |
Maximum offering price per share (100/96.00 of $11.21) | | $ 11.68 |
Class B:
Net Asset Value and offering price per share ($4,265 ÷ 381.1 shares)A | | $ 11.19 |
| | |
Class C:
Net Asset Value and offering price per share ($18,205 ÷ 1,629.2 shares)A | | $ 11.17 |
| | |
| | |
Fidelity Mortgage Securities Fund:
Net Asset Value, offering price and redemption price per share ($763,511 ÷ 68,067.9 shares) | | $ 11.22 |
| | |
Institutional Class:
Net Asset Value, offering price and redemption price per share ($9,919 ÷ 887.2 shares) | | $ 11.18 |
A Redemption price per share is equal to net asset value less any applicable contingent deferred sales charge.
See accompanying notes which are an integral part of the financial statements.
Semiannual Report
Financial Statements - continued
Statement of Operations
Amounts in thousands | Six months ended February 29, 2012 (Unaudited) |
| | |
Investment Income | | |
Interest | | $ 15,556 |
| | |
Expenses | | |
Management fee | $ 1,396 | |
Transfer agent fees | 501 | |
Distribution and service plan fees | 222 | |
Fund wide operations fee | 145 | |
Independent trustees' compensation | 1 | |
Miscellaneous | 1 | |
Total expenses | | 2,266 |
Net investment income (loss) | | 13,290 |
Realized and Unrealized Gain (Loss) Net realized gain (loss) on: | | |
Investment securities: | | |
Unaffiliated issuers | 12,843 | |
Futures contracts | 4 | |
Swap agreements | (1,236) | |
Total net realized gain (loss) | | 11,611 |
Change in net unrealized appreciation (depreciation) on: Investment securities | (7,469) | |
Swap agreements | 422 | |
Delayed delivery commitments | (340) | |
Total change in net unrealized appreciation (depreciation) | | (7,387) |
Net gain (loss) | | 4,224 |
Net increase (decrease) in net assets resulting from operations | | $ 17,514 |
See accompanying notes which are an integral part of the financial statements.
Semiannual Report
Statement of Changes in Net Assets
Amounts in thousands | Six months ended February 29, 2012
(Unaudited) | Year ended
August 31,
2011 |
Increase (Decrease) in Net Assets | | |
Operations | | |
Net investment income (loss) | $ 13,290 | $ 29,651 |
Net realized gain (loss) | 11,611 | 10,993 |
Change in net unrealized appreciation (depreciation) | (7,387) | 6,942 |
Net increase (decrease) in net assets resulting
from operations | 17,514 | 47,586 |
Distributions to shareholders from net investment income | (13,511) | (30,093) |
Share transactions - net increase (decrease) | (687) | (96,103) |
Total increase (decrease) in net assets | 3,316 | (78,610) |
| | |
Net Assets | | |
Beginning of period | 887,384 | 965,994 |
End of period (including distributions in excess of net investment income of $7,410 and distributions in excess of net investment income of $7,189, respectively) | $ 890,700 | $ 887,384 |
See accompanying notes which are an integral part of the financial statements.
Semiannual Report
Financial Highlights - Class A
| Six months ended February 29, 2012 | Years ended August 31, |
| (Unaudited) | 2011 | 2010 | 2009 | 2008 | 2007 |
Selected Per-Share Data | | | | | | |
Net asset value, beginning of period | $ 11.14 | $ 10.91 | $ 10.38 | $ 10.09 | $ 10.57 | $ 10.97 |
Income from Investment Operations | | | | | | |
Net investment income (loss) E | .151 | .323 | .357 | .464 | .467 | .521 |
Net realized and unrealized gain (loss) | .053 | .235 | .602 | .283 | (.461) | (.401) |
Total from investment operations | .204 | .558 | .959 | .747 | .006 | .120 |
Distributions from net investment income | (.154) | (.328) | (.429) | (.457) | (.486) | (.520) |
Net asset value, end of period | $ 11.19 | $ 11.14 | $ 10.91 | $ 10.38 | $ 10.09 | $ 10.57 |
Total Return B, C, D | 1.85% | 5.22% | 9.44% | 7.63% | .06% | 1.04% |
Ratios to Average Net Assets F, H | | | | | |
Expenses before reductions | .82% A | .82% | .83% | .84% | .85% | .79% |
Expenses net of fee waivers, if any | .82% A | .82% | .83% | .84% | .85% | .79% |
Expenses net of all reductions | .82% A | .82% | .83% | .84% | .85% | .78% |
Net investment income (loss) | 2.73% A | 2.96% | 3.36% | 4.59% | 4.52% | 4.77% |
Supplemental Data | | | | | | |
Net assets, end of period (in millions) | $ 58 | $ 59 | $ 61 | $ 47 | $ 39 | $ 54 |
Portfolio turnover rate G | 496% A | 490% | 527% | 476% | 397% | 409% |
A Annualized
B Total returns for periods of less than one year are not annualized.
C Total returns would have been lower if certain expenses had not been reduced during the applicable periods shown.
D Total returns do not include the effect of the sales charges.
E Calculated based on average shares outstanding during the period.
F Fees and expenses of any underlying Fidelity Central Funds are not included in the Fund's expense ratio. The Fund indirectly bears its proportionate share of the expenses of any underlying Fidelity Central Funds.
G Amount does not include the portfolio activity of any underlying Fidelity Central Funds.
H Expense ratios reflect operating expenses of the class. Expenses before reductions do not reflect amounts reimbursed by the investment adviser or reductions from expense offset arrangements and do not represent the amount paid by the class during periods when reimbursements or reductions occur. Expenses net of fee waivers reflect expenses after reimbursement by the investment adviser but prior to reductions from expense offset arrangements. Expenses net of all reductions represent the net expenses paid by the class.
See accompanying notes which are an integral part of the financial statements.
Semiannual Report
Financial Highlights - Class T
| Six months ended February 29, 2012 | Years ended August 31, |
| (Unaudited) | 2011 | 2010 | 2009 | 2008 | 2007 |
Selected Per-Share Data | | | | | | |
Net asset value, beginning of period | $ 11.16 | $ 10.93 | $ 10.40 | $ 10.11 | $ 10.59 | $ 10.99 |
Income from Investment Operations | | | | | | |
Net investment income (loss) E | .153 | .326 | .360 | .466 | .470 | .519 |
Net realized and unrealized gain (loss) | .053 | .235 | .602 | .282 | (.462) | (.403) |
Total from investment operations | .206 | .561 | .962 | .748 | .008 | .116 |
Distributions from net investment income | (.156) | (.331) | (.432) | (.458) | (.488) | (.516) |
Net asset value, end of period | $ 11.21 | $ 11.16 | $ 10.93 | $ 10.40 | $ 10.11 | $ 10.59 |
Total Return B, C, D | 1.86% | 5.24% | 9.44% | 7.62% | .07% | 1.01% |
Ratios to Average Net Assets F, H | | | | | |
Expenses before reductions | .79% A | .79% | .81% | .83% | .83% | .82% |
Expenses net of fee waivers, if any | .79% A | .79% | .81% | .83% | .83% | .82% |
Expenses net of all reductions | .79% A | .79% | .81% | .83% | .83% | .82% |
Net investment income (loss) | 2.76% A | 2.99% | 3.39% | 4.60% | 4.53% | 4.73% |
Supplemental Data | | | | | | |
Net assets, end of period (in millions) | $ 36 | $ 37 | $ 41 | $ 40 | $ 41 | $ 68 |
Portfolio turnover rate G | 496% A | 490% | 527% | 476% | 397% | 409% |
A Annualized
B Total returns for periods of less than one year are not annualized.
C Total returns would have been lower if certain expenses had not been reduced during the applicable periods shown.
D Total returns do not include the effect of the sales charges.
E Calculated based on average shares outstanding during the period.
F Fees and expenses of any underlying Fidelity Central Funds are not included in the Fund's expense ratio. The Fund indirectly bears its proportionate share of the expenses of any underlying Fidelity Central Funds.
G Amount does not include the portfolio activity of any underlying Fidelity Central Funds.
H Expense ratios reflect operating expenses of the class. Expenses before reductions do not reflect amounts reimbursed by the investment adviser or reductions from expense offset arrangements and do not represent the amount paid by the class during periods when reimbursements or reductions occur. Expenses net of fee waivers reflect expenses after reimbursement by the investment adviser but prior to reductions from expense offset arrangements. Expenses net of all reductions represent the net expenses paid by the class.
See accompanying notes which are an integral part of the financial statements.
Semiannual Report
Financial Highlights - Class B
| Six months ended February 29, 2012 | Years ended August 31, |
| (Unaudited) | 2011 | 2010 | 2009 | 2008 | 2007 |
Selected Per-Share Data | | | | | | |
Net asset value, beginning of period | $ 11.14 | $ 10.91 | $ 10.38 | $ 10.09 | $ 10.57 | $ 10.97 |
Income from Investment Operations | | | | | | |
Net investment income (loss) E | .113 | .248 | .286 | .398 | .400 | .443 |
Net realized and unrealized gain (loss) | .053 | .235 | .602 | .283 | (.461) | (.401) |
Total from investment operations | .166 | .483 | .888 | .681 | (.061) | .042 |
Distributions from net investment income | (.116) | (.253) | (.358) | (.391) | (.419) | (.442) |
Net asset value, end of period | $ 11.19 | $ 11.14 | $ 10.91 | $ 10.38 | $ 10.09 | $ 10.57 |
Total Return B, C, D | 1.50% | 4.51% | 8.71% | 6.93% | (.58)% | .32% |
Ratios to Average Net Assets F, H | | | | | |
Expenses before reductions | 1.51% A | 1.50% | 1.50% | 1.50% | 1.50% | 1.50% |
Expenses net of fee waivers, if any | 1.51% A | 1.50% | 1.50% | 1.50% | 1.50% | 1.50% |
Expenses net of all reductions | 1.51% A | 1.50% | 1.50% | 1.50% | 1.50% | 1.50% |
Net investment income (loss) | 2.04% A | 2.27% | 2.69% | 3.93% | 3.86% | 4.05% |
Supplemental Data | | | | | | |
Net assets, end of period (in millions) | $ 4 | $ 5 | $ 7 | $ 19 | $ 32 | $ 50 |
Portfolio turnover rate G | 496% A | 490% | 527% | 476% | 397% | 409% |
A Annualized
B Total returns for periods of less than one year are not annualized.
C Total returns would have been lower if certain expenses had not been reduced during the applicable periods shown.
D Total returns do not include the effect of the contingent deferred sales charge.
E Calculated based on average shares outstanding during the period.
F Fees and expenses of any underlying Fidelity Central Funds are not included in the Fund's expense ratio. The Fund indirectly bears its proportionate share of the expenses of any underlying Fidelity Central Funds.
G Amount does not include the portfolio activity of any underlying Fidelity Central Funds.
H Expense ratios reflect operating expenses of the class. Expenses before reductions do not reflect amounts reimbursed by the investment adviser or reductions from expense offset arrangements and do not represent the amount paid by the class during periods when reimbursements or reductions occur. Expenses net of fee waivers reflect expenses after reimbursement by the investment adviser but prior to reductions from expense offset arrangements. Expenses net of all reductions represent the net expenses paid by the class.
See accompanying notes which are an integral part of the financial statements.
Semiannual Report
Financial Highlights - Class C
| Six months ended February 29, 2012 | Years ended August 31, |
| (Unaudited) | 2011 | 2010 | 2009 | 2008 | 2007 |
Selected Per-Share Data | | | | | | |
Net asset value, beginning of period | $ 11.12 | $ 10.90 | $ 10.37 | $ 10.08 | $ 10.56 | $ 10.96 |
Income from Investment Operations | | | | | | |
Net investment income (loss) E | .111 | .244 | .282 | .390 | .389 | .434 |
Net realized and unrealized gain (loss) | .054 | .226 | .603 | .284 | (.459) | (.401) |
Total from investment operations | .165 | .470 | .885 | .674 | (.070) | .033 |
Distributions from net investment income | (.115) | (.250) | (.355) | (.384) | (.410) | (.433) |
Net asset value, end of period | $ 11.17 | $ 11.12 | $ 10.90 | $ 10.37 | $ 10.08 | $ 10.56 |
Total Return B, C, D | 1.49% | 4.39% | 8.69% | 6.86% | (.68)% | .25% |
Ratios to Average Net Assets F, H | | | | | |
Expenses before reductions | 1.54% A | 1.53% | 1.53% | 1.57% | 1.60% | 1.58% |
Expenses net of fee waivers, if any | 1.54% A | 1.53% | 1.53% | 1.57% | 1.60% | 1.58% |
Expenses net of all reductions | 1.54% A | 1.53% | 1.53% | 1.57% | 1.60% | 1.58% |
Net investment income (loss) | 2.01% A | 2.24% | 2.66% | 3.86% | 3.77% | 3.97% |
Supplemental Data | | | | | | |
Net assets, end of period (in millions) | $ 18 | $ 15 | $ 18 | $ 18 | $ 15 | $ 23 |
Portfolio turnover rate G | 496% A | 490% | 527% | 476% | 397% | 409% |
A Annualized
B Total returns for periods of less than one year are not annualized.
C Total returns would have been lower if certain expenses had not been reduced during the applicable periods shown.
D Total returns do not include the effect of the contingent deferred sales charge.
E Calculated based on average shares outstanding during the period.
F Fees and expenses of any underlying Fidelity Central Funds are not included in the Fund's expense ratio. The Fund indirectly bears its proportionate share of the expenses of any underlying Fidelity Central Funds.
G Amount does not include the portfolio activity of any underlying Fidelity Central Funds.
H Expense ratios reflect operating expenses of the class. Expenses before reductions do not reflect amounts reimbursed by the investment adviser or reductions from expense offset arrangements and do not represent the amount paid by the class during periods when reimbursements or reductions occur. Expenses net of fee waivers reflect expenses after reimbursement by the investment adviser but prior to reductions from expense offset arrangements. Expenses net of all reductions represent the net expenses paid by the class.
See accompanying notes which are an integral part of the financial statements.
Semiannual Report
Financial Highlights - Fidelity Mortgage Securities Fund
| Six months ended February 29, 2012 | Years ended August 31, |
| (Unaudited) | 2011 | 2010 | 2009 | 2008 | 2007 |
Selected Per-Share Data | | | | | | |
Net asset value, beginning of period | $ 11.17 | $ 10.94 | $ 10.41 | $ 10.11 | $ 10.59 | $ 10.99 |
Income from Investment Operations | | | | | | |
Net investment income (loss) D | .172 | .364 | .399 | .505 | .509 | .559 |
Net realized and unrealized gain (loss) | .053 | .234 | .601 | .292 | (.462) | (.403) |
Total from investment operations | .225 | .598 | 1.000 | .797 | .047 | .156 |
Distributions from net investment income | (.175) | (.368) | (.470) | (.497) | (.527) | (.556) |
Net asset value, end of period | $ 11.22 | $ 11.17 | $ 10.94 | $ 10.41 | $ 10.11 | $ 10.59 |
Total Return B, C | 2.03% | 5.59% | 9.83% | 8.14% | .46% | 1.38% |
Ratios to Average Net Assets E, G | | | | | |
Expenses before reductions | .45% A | .45% | .45% | .45% | .45% | .45% |
Expenses net of fee waivers, if any | .45% A | .45% | .45% | .45% | .45% | .45% |
Expenses net of all reductions | .45% A | .45% | .45% | .45% | .45% | .45% |
Net investment income (loss) | 3.10% A | 3.33% | 3.74% | 4.99% | 4.91% | 5.10% |
Supplemental Data | | | | | | |
Net assets, end of period (in millions) | $ 764 | $ 765 | $ 829 | $ 838 | $ 1,049 | $ 1,446 |
Portfolio turnover rate F | 496% A | 490% | 527% | 476% | 397% | 409% |
A Annualized
B Total returns for periods of less than one year are not annualized.
C Total returns would have been lower if certain expenses had not been reduced during the applicable periods shown.
D Calculated based on average shares outstanding during the period.
E Fees and expenses of any underlying Fidelity Central Funds are not included in the Fund's expense ratio. The Fund indirectly bears its proportionate share of the expenses of any underlying Fidelity Central Funds.
F Amount does not include the portfolio activity of any underlying Fidelity Central Funds.
G Expense ratios reflect operating expenses of the class. Expenses before reductions do not reflect amounts reimbursed by the investment adviser or reductions from expense offset arrangements and do not represent the amount paid by the class during periods when reimbursements or reductions occur. Expenses net of fee waivers reflect expenses after reimbursement by the investment adviser but prior to reductions from expense offset arrangements. Expenses net of all reductions represent the net expenses paid by the class.
See accompanying notes which are an integral part of the financial statements.
Semiannual Report
Financial Highlights - Institutional Class
| Six months ended February 29, 2012 | Years ended August 31, |
| (Unaudited) | 2011 | 2010 | 2009 | 2008 | 2007 |
Selected Per-Share Data | | | | | | |
Net asset value, beginning of period | $ 11.13 | $ 10.90 | $ 10.37 | $ 10.08 | $ 10.56 | $ 10.97 |
Income from Investment Operations | | | | | | |
Net investment income (loss) D | .168 | .354 | .391 | .496 | .499 | .548 |
Net realized and unrealized gain (loss) | .054 | .235 | .603 | .284 | (.461) | (.411) |
Total from investment operations | .222 | .589 | .994 | .780 | .038 | .137 |
Distributions from net investment income | (.172) | (.359) | (.464) | (.490) | (.518) | (.547) |
Net asset value, end of period | $ 11.18 | $ 11.13 | $ 10.90 | $ 10.37 | $ 10.08 | $ 10.56 |
Total Return B, C | 2.01% | 5.53% | 9.80% | 7.98% | .37% | 1.20% |
Ratios to Average Net Assets E, G | | | | | |
Expenses before reductions | .51% A | .53% | .50% | .52% | .54% | .53% |
Expenses net of fee waivers, if any | .51% A | .53% | .50% | .52% | .54% | .53% |
Expenses net of all reductions | .51% A | .53% | .50% | .52% | .54% | .53% |
Net investment income (loss) | 3.04% A | 3.24% | 3.69% | 4.92% | 4.83% | 5.02% |
Supplemental Data | | | | | | |
Net assets, end of period (in millions) | $ 10 | $ 7 | $ 10 | $ 10 | $ 7 | $ 10 |
Portfolio turnover rate F | 496% A | 490% | 527% | 476% | 397% | 409% |
A Annualized
B Total returns for periods of less than one year are not annualized.
C Total returns would have been lower if certain expenses had not been reduced during the applicable periods shown.
D Calculated based on average shares outstanding during the period.
E Fees and expenses of any underlying Fidelity Central Funds are not included in the Fund's expense ratio. The Fund indirectly bears its proportionate share of the expenses of any underlying Fidelity Central Funds.
F Amount does not include the portfolio activity of any underlying Fidelity Central Funds.
G Expense ratios reflect operating expenses of the class. Expenses before reductions do not reflect amounts reimbursed by the investment adviser or reductions from expense offset arrangements and do not represent the amount paid by the class during periods when reimbursements or reductions occur. Expenses net of fee waivers reflect expenses after reimbursement by the investment adviser but prior to reductions from expense offset arrangements. Expenses net of all reductions represent the net expenses paid by the class.
See accompanying notes which are an integral part of the financial statements.
Semiannual Report
Notes to Financial Statements
For the period ended February 29, 2012 (Unaudited)
(Amounts in thousands except percentages)
1. Organization.
Fidelity Advisor Mortgage Securities Fund (the Fund) is a fund of Fidelity Advisor Series II (the Trust) and is authorized to issue an unlimited number of shares. The Trust is registered under the Investment Company Act of 1940, as amended (the 1940 Act), as an open-end management investment company organized as a Massachusetts business trust. The Fund offers Class A, Class T, Class C, Fidelity Mortgage Securities Fund and Institutional Class shares, each of which, along with Class B shares, has equal rights as to assets and voting privileges. Effective after the close of business on September 1, 2010, Class B shares were closed to new accounts and additional purchases, except for exchanges and reinvestments. Each class has exclusive voting rights with respect to matters that affect that class. Class B shares will automatically convert to Class A shares after a holding period of seven years from the initial date of purchase. Investment income, realized and unrealized capital gains and losses, the common expenses of the Fund, and certain fund-level expense reductions, if any, are allocated on a pro-rata basis to each class based on the relative net assets of each class to the total net assets of the Fund. Each class differs with respect to transfer agent and distribution and service plan fees incurred. Certain expense reductions may also differ by class.
2. Significant Accounting Policies.
The financial statements have been prepared in conformity with accounting principles generally accepted in the United States of America (GAAP), which require management to make certain estimates and assumptions at the date of the financial statements. Actual results could differ from those estimates. Subsequent events, if any, through the date that the financial statements were issued have been evaluated in the preparation of the financial statements. The following summarizes the significant accounting policies of the Fund:
Security Valuation. Investments are valued as of 4:00 p.m. Eastern time on the last calendar day of the period. The Fund uses independent pricing services approved by the Board of Trustees to value its investments. When current market prices or quotations are not readily available or reliable, valuations may be determined in good faith in accordance with procedures adopted by the Board of Trustees. Factors used in determining value may include market or security specific events, changes in interest rates and credit quality. The frequency with which these procedures are used cannot be predicted and they may be utilized to a significant extent. The value used for net asset value (NAV) calculation under these procedures may differ from published prices for the same securities.
Semiannual Report
Notes to Financial Statements (Unaudited) - continued
(Amounts in thousands except percentages)
2. Significant Accounting Policies - continued
Security Valuation - continued
The Fund categorizes the inputs to valuation techniques used to value its investments into a disclosure hierarchy consisting of three levels as shown below:
Level 1 - quoted prices in active markets for identical investments
Level 2 - other significant observable inputs (including quoted prices for similar investments, interest rates, prepayment speeds, etc.)
Level 3 - unobservable inputs (including the Fund's own assumptions based on the best information available)
Changes in valuation techniques may result in transfers in or out of an assigned level within the disclosure hierarchy. The aggregate value of investments by input level, as of February 29, 2012 for the Fund's investments, as well as a roll forward of Level 3 securities, is included at the end of the Fund's Schedule of Investments. Valuation techniques used to value the Fund's investments by major category are as follows:
Debt securities, including restricted securities, are valued based on evaluated prices received from independent pricing services or from dealers who make markets in such securities. For asset backed securities, collateralized mortgage obligations, commercial mortgage securities and U.S. government agency mortgage securities, pricing services utilize matrix pricing which considers prepayment speed assumptions, attributes of the collateral, yield or price of bonds of comparable quality, coupon, maturity and type as well as dealer supplied prices and, accordingly, such securities are generally categorized as Level 2 in the hierarchy. Dealers which make markets in asset backed securities, collateralized mortgage obligations and commercial mortgage securities may also consider such factors as the structure of the issue, cash flow assumptions, the value of underlying assets as well as any guarantees. Swaps are marked-to-market daily based on valuations from independent pricing services or dealer-supplied valuations and changes in value are recorded as unrealized appreciation (depreciation). Pricing services utilize matrix pricing which considers comparisons to interest rate curves, credit spread curves, default possibilities and recovery rates and, as a result, swaps are generally categorized as Level 2 in the hierarchy. When independent prices are unavailable or unreliable, debt securities and swaps may be valued utilizing pricing matrices which consider similar factors that would be used by independent pricing services. These are generally categorized as Level 2 in the hierarchy but may be Level 3 depending on the circumstances.
Short-term securities with remaining maturities of sixty days or less may be valued at amortized cost, which approximates fair value, and are categorized as Level 2 in the hierarchy.
Semiannual Report
2. Significant Accounting Policies - continued
New Accounting Pronouncements. In May 2011, the Financial Accounting Standards Board issued Accounting Standard Update No. 2011-04, Fair Value Measurement (Topic 820) - Amendments to Achieve Common Fair Value Measurement and Disclosure Requirements in U.S. GAAP and IFRSs. The update is effective during interim and annual periods beginning after December 15, 2011 and will result in additional disclosure for transfers between levels as well as expanded disclosure for securities categorized as Level 3 under the fair value hierarchy.
In December 2011, the Financial Accounting Standards Board issued Accounting Standard Update No. 2011-11, Disclosures about Offsetting Assets and Liabilities. The update creates new disclosure requirements requiring entities to disclose both gross and net information for derivatives and other financial instruments that are either offset in the Statement of Assets and Liabilities or subject to an enforceable master netting arrangement or similar agreement. The disclosure requirements are effective for interim and annual reporting periods beginning on or after January 1, 2013. Management is currently evaluating the impact of the update's adoption on the Fund's financial statement disclosures.
Investment Transactions and Income. For financial reporting purposes, the Fund's investment holdings and NAV include trades executed through the end of the last business day of the period. The NAV per share for processing shareholder transactions is calculated as of the close of business of the New York Stock Exchange (NYSE), normally 4:00 p.m. Eastern time and includes trades executed through the end of the prior business day. Gains and losses on securities sold are determined on the basis of identified cost. Interest income is accrued as earned. Interest income includes coupon interest and amortization of premium and accretion of discount on debt securities. Debt obligations may be placed on non-accrual status and related interest income may be reduced by ceasing current accruals and writing off interest receivables when the collection of all or a portion of interest has become doubtful based on consistently applied procedures. A debt obligation is removed from non-accrual status when the issuer resumes interest payments or when collectability of interest is reasonably assured.
Expenses. Expenses directly attributable to a fund are charged to that fund. Expenses attributable to more than one fund are allocated among the respective funds on the basis of relative net assets or other appropriate methods. Expense estimates are accrued in the period to which they relate and adjustments are made when actual amounts are known.
Income Tax Information and Distributions to Shareholders. Each year, the Fund intends to qualify as a regulated investment company under Subchapter M of the Internal Revenue Code, including distributing substantially all of its taxable income and realized gains. As a result, no provision for income taxes is required. The Fund files a U.S.
Semiannual Report
Notes to Financial Statements (Unaudited) - continued
(Amounts in thousands except percentages)
2. Significant Accounting Policies - continued
Income Tax Information and Distributions to Shareholders - continued
federal tax return, in addition to state and local tax returns as required. A fund's federal income tax returns are subject to examination by the Internal Revenue Service (IRS) for a period of three fiscal years after they are filed. State and local tax returns may be subject to examination for an additional fiscal year depending on the jurisdiction.
Dividends are declared and recorded daily and paid monthly from net investment income. Distributions from realized gains, if any, are declared and recorded on the ex-dividend date. Income dividends and capital gain distributions are declared separately for each class. Income and capital gain distributions are determined in accordance with income tax regulations, which may differ from GAAP.
Capital accounts within the financial statements are adjusted for permanent book-tax differences. These adjustments have no impact on net assets or the results of operations. Temporary book-tax differences will reverse in a subsequent period.
Book-tax differences are primarily due to futures transactions, swap agreements, prior period premium and discount on debt securities, market discount, deferred trustees compensation, financing transactions, capital loss carryforwards and losses deferred due to wash sales and excise tax regulations.
The federal tax cost of investment securities and unrealized appreciation (depreciation) as of period end were as follows:
Gross unrealized appreciation | $ 29,452 |
Gross unrealized depreciation | (10,393) |
Net unrealized appreciation (depreciation) on securities and other investments | $ 19,059 |
| |
Tax cost | $ 1,109,734 |
Capital loss carryforwards are only available to offset future capital gains of the Fund to the extent provided by regulations and may be limited. Under the Regulated Investment Company Modernization Act of 2010 (the Act), the Fund is permitted to carry forward capital losses incurred in taxable years beginning after December 22, 2010 for an unlimited period and such capital losses are required to be used prior to any losses that expire. At August 31, 2011, capital loss carryforwards were as follows:
Fiscal year of expiration | |
2016 | $ (5,307) |
2017 | (84,825) |
Total capital loss carryforward | $ (90,132) |
Semiannual Report
3. Operating Policies.
Repurchase Agreements. FMR has received an Exemptive Order from the Securities and Exchange Commission (the SEC) which permits the Fund and other affiliated entities of FMR to transfer uninvested cash balances into joint trading accounts which are then invested in repurchase agreements. The Fund may also invest directly with institutions in repurchase agreements. Repurchase agreements are collateralized by government or non-government securities. Upon settlement date, collateral is held in segregated accounts with custodian banks and may be obtained in the event of a default of the counterparty. The Fund monitors, on a daily basis, the value of the collateral to ensure it is at least equal to the principal amount of the repurchase agreement (including accrued interest). In the event of a default by the counterparty, realization of the collateral proceeds could be delayed, during which time the value of the collateral may decline.
Delayed Delivery Transactions and When-Issued Securities. During the period, the Fund transacted in securities on a delayed delivery or when-issued basis. Payment and delivery may take place after the customary settlement period for that security. The price of the underlying securities and the date when the securities will be delivered and paid for are fixed at the time the transaction is negotiated. During the time a delayed delivery sell is outstanding, the contract is marked-to-market daily and equivalent deliverable securities are held for the transaction. The securities purchased on a delayed delivery or when-issued basis are identified as such in the Fund's Schedule of Investments. The Fund may receive compensation for interest forgone in the purchase of a delayed delivery or when-issued security. With respect to purchase commitments, the Fund identifies securities as segregated in its records with a value at least equal to the amount of the commitment. Losses may arise due to changes in the value of the underlying securities or if the counterparty does not perform under the contract's terms, or if the issuer does not issue the securities due to political, economic, or other factors.
To-Be-Announced (TBA) Securities and Mortgage Dollar Rolls. During the period, the Fund transacted in TBA securities that involved buying or selling mortgage-backed securities (MBS) on a forward commitment basis. A TBA transaction typically does not designate the actual security to be delivered and only includes an approximate principal amount however; delivered securities must meet specified terms defined by industry guidelines, including issuer, rate and current principal amount outstanding on underlying mortgage pools. The Fund may enter into a TBA transaction with the intent to take possession of or deliver the underlying MBS, or the Fund may elect to extend the settlement by entering into either a mortgage or reverse mortgage dollar roll. Mortgage dollar rolls are transactions where a fund sells MBS and simultaneously agrees to repurchase MBS on a later date at a lower price and with the same counterparty. Reverse mortgage
Semiannual Report
Notes to Financial Statements (Unaudited) - continued
(Amounts in thousands except percentages)
3. Operating Policies - continued
To-Be-Announced (TBA) Securities and Mortgage Dollar Rolls - continued
dollar rolls involve the purchase and simultaneous agreement to sell MBS on a later date at a lower price. Transactions in mortgage dollar rolls and reverse mortgage dollar rolls are accounted for as purchases and sales and may result in an increase to the Fund's portfolio turnover rate.
Purchases and sales of TBA securities involve risks similar to those discussed above for delayed delivery and when-issued securities. Also, if the counterparty in a dollar roll or a reverse dollar roll transaction files for bankruptcy or becomes insolvent, the Fund's right to repurchase or sell securities may be limited. Additionally, when a fund sells TBA securities without already owning or having the right to obtain the deliverable securities (an uncovered forward commitment to sell), it incurs a risk of loss because it could have to purchase the securities at a price that is higher than the price at which it sold them. A fund may be unable to purchase the deliverable securities if the corresponding market is illiquid.
TBA securities subject to a forward commitment to sell at period end are included at the end of the Fund's Schedule of Investments under the caption "TBA Sale Commitments." The proceeds and value of these commitments are reflected in the Fund's Statement of Assets and Liabilities.
Restricted Securities. The Fund may invest in securities that are subject to legal or contractual restrictions on resale. These securities generally may be resold in transactions exempt from registration or to the public if the securities are registered. Disposal of these securities may involve time-consuming negotiations and expense, and prompt sale at an acceptable price may be difficult. Information regarding restricted securities is included at the end of the Fund's Schedule of Investments.
4. Derivative Instruments.
Risk Exposures and the Use of Derivative Instruments. The Fund used derivative instruments (derivatives), including futures contracts and swap agreements, in order to meet its investment objectives. The strategy is to use derivatives to increase returns, to gain exposure to certain types of assets and to manage exposure to certain risks as defined below. The success of any strategy involving derivatives depends on analysis of numerous economic factors, and if the strategies for investment do not work as intended, the Fund may not achieve its objectives.
Semiannual Report
4. Derivative Instruments - continued
Risk Exposures and the Use of Derivative Instruments - continued
The Fund's use of derivatives increased or decreased its exposure to the following risk:
Interest Rate Risk | Interest rate risk relates to the fluctuations in the value of interest-bearing securities due to changes in the prevailing levels of market interest rates. |
The Fund is also exposed to additional risks from investing in derivatives, such as liquidity risk and counterparty credit risk. Liquidity risk is the risk that the Fund will be unable to close out the derivative in the open market in a timely manner. Counterparty credit risk is the risk that the counterparty will not be able to fulfill its obligation to the Fund. Derivative counterparty credit risk is managed through formal evaluation of the creditworthiness of all potential counterparties. On certain over-the-counter (OTC) derivatives such as swap agreements, the Fund attempts to reduce its exposure to counterparty credit risk by entering into an International Swaps and Derivatives Association (ISDA) Master Agreement on a bilateral basis with each of its counterparties. The ISDA Master Agreement gives the Fund the right to terminate all transactions traded under such agreement if there is a certain deterioration in the credit quality of the counterparty. The ISDA Master Agreement gives each party the right, upon an event of default by the other party or a termination of the agreement, to close out all transactions traded under such agreement and to net amounts owed under each transaction to one net payable by one party to the other. To mitigate counterparty credit risk on OTC derivatives, the Fund receives collateral in the form of cash or securities once the Fund's net unrealized appreciation on outstanding derivative contracts under an ISDA Master Agreement exceeds certain applicable thresholds, subject to certain minimum transfer provisions. The collateral received is held in segregated accounts with the Fund's custodian bank in accordance with the collateral agreements entered into between the Fund, the counterparty and the Fund's custodian bank. The Fund could experience delays and costs in gaining access to the collateral even though it is held by the Fund's custodian bank. The Fund's maximum risk of loss from counterparty credit risk related to OTC derivatives is generally the aggregate unrealized appreciation and unpaid counterparty payments in excess of any collateral pledged by the counterparty to the Fund. The Fund may be required to pledge collateral for the benefit of the counterparties on OTC derivatives in an amount not less than the counterparty's unrealized appreciation on outstanding derivative contracts, subject to certain minimum transfer provisions, and any such pledged collateral is identified in the Schedule of Investments. Futures contracts are not covered by the ISDA Master Agreement, however, counterparty credit risk related to exchange-traded futures contracts is minimal because of the protection provided by the exchange on which they trade. Derivatives involve, to varying degrees, risk of loss in excess of the amounts recognized in the Statement of Assets and Liabilities.
Semiannual Report
Notes to Financial Statements (Unaudited) - continued
(Amounts in thousands except percentages)
4. Derivative Instruments - continued
Net Realized Gain (Loss) and Change in Net Unrealized Appreciation (Depreciation) on Derivatives. The table below, which reflects the impacts of derivatives on the financial performance of the Fund, summarizes the net realized gain (loss) and change in net unrealized appreciation (depreciation) for derivatives during the period.
Risk Exposure / Derivative Type | Net Realized
Gain (Loss) | Change in Net Unrealized
Appreciation (Depreciation) |
Interest Rate Risk | | |
Futures Contracts | $ 4 | $ - |
Swap Agreements | (1,236) | 422 |
Totals (a) | $ (1,232) | $ 422 |
(a) A summary of the value of derivatives by risk exposure as of period end, if any, is included at the end of the Schedule of Investments and is representative of activity for the period.
Futures Contracts. A futures contract is an agreement between two parties to buy or sell a specified underlying instrument for a fixed price at a specified future date. The Fund used futures contracts to manage its exposure to the fluctuations in interest rates.
Upon entering into a futures contract, a fund is required to deposit either cash or securities (initial margin) with a clearing broker in an amount equal to a certain percentage of the face value of the contract. Futures contracts are marked-to-market daily and subsequent payments (variation margin) are made or received by a fund depending on the daily fluctuations in the value of the futures contracts and are recorded as unrealized appreciation or (depreciation). This receivable and/or payable is included in daily variation margin on futures contracts in the Statement of Assets and Liabilities. Realized gain or (loss) is recorded upon the expiration or closing of a futures contract. The net realized gain (loss) and change in net unrealized appreciation (depreciation) on futures contracts during the period is included in the Statement of Operations.
The underlying face amount at value of open futures contracts at period end, if any, is shown in the Schedule of Investments under the caption "Futures Contracts."
Swap Agreements. A swap agreement (swap) is a contract between two parties to exchange future cash flows at periodic intervals based on a notional principal amount.
Details of swaps open at period end are included in the Schedule of Investments under the caption "Swap Agreements." Swaps are marked-to-market daily and changes in value are recorded as unrealized appreciation or (depreciation) and reflected in the Statement of Assets and Liabilities. Any upfront premiums paid or received upon entering a swap to compensate for differences between stated terms of the agreement and prevailing market conditions (e.g. credit spreads, interest rates or other factors) are recorded as realized gain or (loss) ratably over the term of the swap. Payments are exchanged at specified intervals, accrued daily commencing with the effective date of the contract and recorded as realized
Semiannual Report
4. Derivative Instruments - continued
Swap Agreements - continued
gain or (loss). Realized gain or (loss) is also recorded in the event of an early termination of a swap. The net realized gain (loss) and change in net unrealized appreciation (depreciation) on swaps during the period is included in the Statement of Operations.
Interest Rate Swaps. Interest rate swaps are agreements between counterparties to exchange cash flows, one based on a fixed rate, and the other on a floating rate. The Fund entered into interest rate swaps to manage its exposure to interest rate changes. Changes in interest rates can have an effect on both the value of bond holdings as well as the amount of interest income earned. In general, the value of bonds can fall when interest rates rise and can rise when interest rates fall.
5. Purchases and Sales of Investments.
Purchases and sales of securities, other than short-term securities and U.S. government securities, aggregated $45,047 and $52,466, respectively.
6. Fees and Other Transactions with Affiliates.
Management Fee. FMR and its affiliates provide the Fund with investment management related services for which the Fund pays a monthly management fee. The management fee is the sum of an individual fund fee rate that is based on an annual rate of .20% of the Fund's average net assets and an annualized group fee rate that averaged .12% during the period. The group fee rate is based upon the average net assets of all the mutual funds advised by FMR. The group fee rate decreases as assets under management increase and increases as assets under management decrease. For the period, the total annualized management fee rate was .32% of the Fund's average net assets.
Distribution and Service Plan Fees. In accordance with Rule 12b-1 of the 1940 Act, the Fund has adopted separate Distribution and Service Plans for each class of shares. Certain classes pay Fidelity Distributors Corporation (FDC), an affiliate of FMR, separate Distribution and Service Fees, each of which is based on an annual percentage of each class' average net assets. In addition, FDC may pay financial intermediaries for selling shares of the Fund and providing shareholder support services. For the period, the Distribution and Service Fee rates, total fees and amounts retained by FDC were as follows:
| Distribution
Fee | Service
Fee | Total
Fees | Retained
by FDC |
Class A | -% | .25% | $ 74 | $ 3 |
Class T | -% | .25% | 46 | -* |
Class B | .65% | .25% | 21 | 15 |
Class C | .75% | .25% | 81 | 10 |
| | | $ 222 | $ 28 |
* Amount represents two hundred eighty-one dollars.
Semiannual Report
Notes to Financial Statements (Unaudited) - continued
(Amounts in thousands except percentages)
6. Fees and Other Transactions with Affiliates - continued
Sales Load. FDC may receive a front-end sales charge of up to 4.00% for selling Class A shares and Class T shares, some of which is paid to financial intermediaries for selling shares of the Fund. Depending on the holding period, FDC may receive contingent deferred sales charges levied on Class A, Class T, Class B, and Class C redemptions. The deferred sales charges range from 5.00% to 1.00% for Class B, 1.00% for Class C, .75% for certain purchases of Class A shares and .25% for certain purchases of Class T shares.
For the period, sales charge amounts retained by FDC were as follows:
| Retained
by FDC |
Class A | $ 6 |
Class T | 2 |
Class B* | 6 |
Class C* | 1 |
| $ 15 |
* When Class B and Class C shares are initially sold, FDC pays commissions from its own resources to financial intermediaries through which the sales are made.
Transfer Agent Fees. Fidelity Investments Institutional Operations Company, Inc. (FIIOC), an affiliate of FMR, is the transfer, dividend disbursing and shareholder servicing agent for each class of the Fund. FIIOC receives account fees and asset-based fees that vary according to the account size and type of account of the shareholders of each respective class of the Fund, with the exception of Fidelity Mortgage Securities Fund. FIIOC receives an asset-based fee of .10% of Fidelity Mortgage Securities Fund's average net assets. FIIOC pays for typesetting, printing and mailing of shareholder reports, except proxy statements. For the period, transfer agent fees for each class were as follows:
| Amount | % of
Average
Net Assets* |
Class A | $ 63 | .21 |
Class T | 33 | .18 |
Class B | 6 | .25 |
Class C | 15 | .18 |
Fidelity Mortgage Securities Fund | 378 | .10 |
Institutional Class | 6 | .15 |
| $ 501 | |
* Annualized
Semiannual Report
6. Fees and Other Transactions with Affiliates - continued
Fund Wide Operations Fee. Pursuant to the Fund Wide Operations and Expense Agreement (FWOE), FMR has agreed to provide for fund level expenses (which do not include transfer agent, Rule 12b-1 fees, compensation of the independent Trustees, interest (including commitment fees), taxes or extraordinary expenses, if any) in return for a FWOE fee equal to .35% less the total amount of the management fee. The FWOE paid by the Fund is reduced by an amount equal to the fees and expenses paid to the independent Trustees. For the period, the FWOE fee was equivalent to an annualized rate of .03% of average net assets.
7. Committed Line of Credit.
The Fund participates with other funds managed by FMR or an affiliate in a $4.0 billion credit facility (the "line of credit") to be utilized for temporary or emergency purposes to fund shareholder redemptions or for other short-term liquidity purposes. The Fund has agreed to pay commitment fees on its pro-rata portion of the line of credit, which amounted to $1 and is reflected in Miscellaneous expenses on the Statement of Operations. During the period, there were no borrowings on this line of credit.
8. Distributions to Shareholders.
Distributions to shareholders of each class were as follows:
| Six months ended February 29,
2012 | Year ended
August 31,
2011 |
From net investment income | | |
Class A | $ 821 | $ 1,718 |
Class T | 511 | 1,137 |
Class B | 48 | 133 |
Class C | 168 | 380 |
Fidelity Mortgage Securities Fund | 11,837 | 26,484 |
Institutional Class | 126 | 241 |
Total | $ 13,511 | $ 30,093 |
Semiannual Report
Notes to Financial Statements (Unaudited) - continued
(Amounts in thousands except percentages)
9. Share Transactions.
Transactions for each class of shares were as follows:
| Shares | Dollars |
| Six months ended February 29, 2012 | Year ended
August 31, 2011 | Six months ended February 29, 2012 | Year ended
August 31, 2011 |
Class A | | | | |
Shares sold | 843 | 1,347 | $ 9,403 | $ 14,756 |
Reinvestment of distributions | 60 | 129 | 674 | 1,402 |
Shares redeemed | (965) | (1,794) | (10,749) | (19,528) |
Net increase (decrease) | (62) | (318) | $ (672) | $ (3,370) |
Class T | | | | |
Shares sold | 275 | 574 | $ 3,075 | $ 6,276 |
Reinvestment of distributions | 42 | 92 | 466 | 1,004 |
Shares redeemed | (378) | (1,136) | (4,223) | (12,380) |
Net increase (decrease) | (61) | (470) | $ (682) | $ (5,100) |
Class B | | | | |
Shares sold | 7 | 32 | $ 84 | $ 360 |
Reinvestment of distributions | 3 | 8 | 28 | 83 |
Shares redeemed | (66) | (263) | (738) | (2,865) |
Net increase (decrease) | (56) | (223) | $ (626) | $ (2,422) |
Class C | | | | |
Shares sold | 419 | 226 | $ 4,667 | $ 2,470 |
Reinvestment of distributions | 10 | 25 | 116 | 275 |
Shares redeemed | (177) | (526) | (1,975) | (5,730) |
Net increase (decrease) | 252 | (275) | $ 2,808 | $ (2,985) |
Fidelity Mortgage Securities Fund | | | | |
Shares sold | 4,615 | 8,371 | $ 51,615 | $ 91,409 |
Reinvestment of distributions | 961 | 2,193 | 10,731 | 23,971 |
Shares redeemed | (6,008) | (17,842) | (67,100) | (194,555) |
Net increase (decrease) | (432) | (7,278) | $ (4,754) | $ (79,175) |
Institutional Class | | | | |
Shares sold | 387 | 226 | $ 4,319 | $ 2,471 |
Reinvestment of distributions | 10 | 20 | 108 | 214 |
Shares redeemed | (107) | (530) | (1,188) | (5,736) |
Net increase (decrease) | 290 | (284) | $ 3,239 | $ (3,051) |
Semiannual Report
10. Other.
The Fund's organizational documents provide former and current trustees and officers with a limited indemnification against liabilities arising in connection with the performance of their duties to the Fund. In the normal course of business, the Fund may also enter into contracts that provide general indemnifications. The Fund's maximum exposure under these arrangements is unknown as this would be dependent on future claims that may be made against the Fund. The risk of material loss from such claims is considered remote.
11. Credit Risk.
The Fund invests a portion of its assets in structured securities of issuers backed by residential mortgage loans, credit card receivables and automotive loans. The value and related income of these securities is sensitive to changes in economic conditions, including delinquencies and/or defaults.
Semiannual Report
Board Approval of Investment Advisory Contracts and Management Fees
Fidelity Advisor Mortgage Securities Fund
Each year, the Board of Trustees, including the Independent Trustees (together, the Board), votes on the renewal of the management contract and sub-advisory agreements (together, the Advisory Contracts) for the fund. The Board, assisted by the advice of fund counsel and Independent Trustees' counsel, requests and considers a broad range of information relevant to the renewal of the Advisory Contracts throughout the year.
The Board meets regularly and considers at each of its meetings factors that are relevant to its annual consideration of the renewal of the fund's Advisory Contracts, including the services and support provided to the fund and its shareholders. The Board has established three standing committees, Operations, Audit, and Nominating and Governance, each composed of Independent Trustees with varying backgrounds, to which the Board has assigned specific subject matter responsibilities in order to enhance effective decision-making by the Board. The Operations Committee, of which all of the Independent Trustees are members, meets regularly throughout the year and, among other matters, considers matters specifically related to the annual consideration of the renewal of the fund's Advisory Contracts. The Board, acting directly and through its Committees, requests and receives information concerning the annual consideration of the renewal of the fund's Advisory Contracts. The Board also meets as needed to consider matters specifically related to the Board's annual consideration of the renewal of Advisory Contracts. Members of the Board may also meet with trustees of other Fidelity funds through ad hoc joint committees to discuss certain matters relevant to the Fidelity funds.
At its September 2011 meeting, the Board of Trustees, including the Independent Trustees, unanimously determined to renew the fund's Advisory Contracts. In reaching its determination, the Board considered all factors it believed relevant, including (i) the nature, extent, and quality of the services to be provided to the fund and its shareholders (including the investment performance of the fund); (ii) the competitiveness of the fund's management fee and total expense ratio; (iii) the total costs of the services to be provided by and the profits to be realized by Fidelity from its relationship with the fund; (iv) the extent to which economies of scale would be realized as the fund grows; and (v) whether fee levels reflect these economies of scale, if any, for the benefit of fund shareholders.
In considering whether to renew the Advisory Contracts for the fund, the Board reached a determination, with the assistance of fund counsel and Independent Trustees' counsel and through the exercise of its business judgment, that the renewal of the Advisory Contracts is in the best interests of the fund and its shareholders and that the compensation payable under the Advisory Contracts is fair and reasonable. The Board's decision to renew the Advisory Contracts was not based on any single factor, but rather was based on a comprehensive consideration of all the information provided to the Board at its meetings throughout the year. The Board, in reaching its determination to renew the Advisory Contracts, is aware that shareholders in the fund have a broad range of investment choices available to them, including a wide choice among mutual funds offered by Fidelity's competitors, and that the fund's shareholders, who have the opportunity to review and weigh the disclosure provided by the fund in its prospectus and other public disclosures, have chosen to invest in this fund, managed by Fidelity.
Semiannual Report
Nature, Extent, and Quality of Services Provided. The Board considered the staffing within the investment adviser, FMR, and the sub-advisers (together, the Investment Advisers), including the backgrounds of the fund's investment personnel and the fund's investment objective and discipline. The Independent Trustees also had discussions with senior management of Fidelity's investment operations and investment groups. The Board considered the structure of the portfolio manager compensation program and whether this structure provides appropriate incentives to act in the best interests of the fund.
Resources Dedicated to Investment Management and Support Services. The Board reviewed the general qualifications and capabilities of the Investment Advisers' investment staff, including its size, education, experience, and resources, as well as the Investment Advisers' approach to recruiting, managing, and compensating investment personnel. The Board also noted that FMR has devoted increased resources to non-U.S. offices. The Board noted that Fidelity's analysts have extensive resources, tools and capabilities which allow them to conduct sophisticated quantitative and fundamental analysis, as well as credit analysis of issuers, counterparties and enhancers. The Board also believes that Fidelity's investment professionals have sufficient access to global information and data so as to provide competitive investment results over time, and that those professionals also have access to sophisticated tools which permit them to assess portfolio construction and risk and performance attribution characteristics continuously, as well as to transmit new information and research conclusions rapidly around the world. Additionally, in its deliberations, the Board considered the Investment Advisers' trading capabilities and resources which are an integral part of the investment management process.
Shareholder and Administrative Services. The Board considered (i) the nature, extent, quality, and cost of advisory, administrative, and shareholder services performed by the Investment Advisers and their affiliates under the Advisory Contracts and under separate agreements covering transfer agency, pricing and bookkeeping, and securities lending services for the fund; (ii) the nature and extent of the investment adviser's supervision of third party service providers, principally custodians and subcustodians; and (iii) the resources devoted to, and the record of compliance with, the fund's compliance policies and procedures.
The Board noted that the growth of fund assets over time across the complex allows Fidelity to reinvest in the development of services designed to enhance the value or convenience of the Fidelity funds as investment vehicles. These services include 24-hour access to account information and market information through telephone representatives and over the Internet, investor education materials and asset allocation tools, and the expanded availability of Fidelity Investor Centers, with 35 new branches opening since 2010.
Semiannual Report
Board Approval of Investment Advisory Contracts and
Management Fees - continued
Investment in a Large Fund Family. The Board considered the benefits to shareholders of investing in a Fidelity fund, including the benefits of investing in a fund that is part of a large family of funds offering a variety of investment disciplines and providing a large variety of mutual fund investor services. The Board noted that Fidelity had taken, or had made recommendations that resulted in the Fidelity funds taking, a number of actions over the previous year that benefited particular funds, including (i) continuing to dedicate additional resources to investment research and support of the senior management team that oversees asset management; (ii) rationalizing product lines through the mergers of six funds into other funds; (iii) continuing to migrate the Freedom Funds to dedicated lower cost underlying funds; (iv) obtaining shareholder approval to broaden the investment strategies for Fidelity Consumer Finance Portfolio, Fidelity Emerging Asia Fund, and Fidelity Environment and Alternative Energy Portfolio; (v) contractually agreeing to reduce the management fees and impose other expense limitations on Spartan 500 Index Fund and U.S. Bond Index Fund in connection with launching new institutional classes of these funds; (vi) changing the name, primary and supplemental benchmarks, and investment policies of Fidelity Global Strategies Fund to support the fund's flexible investment mandate and global orientation; and (vii) reducing the transfer agency account fee rates on certain accounts.
Investment Performance. The Board considered whether the fund has operated in accordance with its investment objective, as well as its record of compliance with its investment restrictions. It also reviewed the fund's absolute investment performance for each class, as well as the fund's relative investment performance for each class measured over multiple periods against (i) a broad-based securities market index, and (ii) a peer group of mutual funds deemed appropriate by Fidelity and reviewed by the Board. The following charts considered by the Board show, over the one-, three-, and five-year periods ended December 31, 2010, the cumulative total returns of the retail class and Class C of the fund, the cumulative total returns of a broad-based securities market index ("benchmark"), and a range of cumulative total returns of a peer group of mutual funds identified by Lipper Inc. as having an investment objective similar to that of the fund. The returns of the retail class and Class C show the performance of the highest and lowest performing classes, respectively (based on five-year performance). The box within each chart shows the 25th percentile return (bottom of box) and the 75th percentile return (top of box) of the peer group. Returns shown above the box are in the first quartile and returns shown below the box are in the fourth quartile. The percentage beaten numbers noted below each chart correspond to the percentile box and represent the percentage of funds in the peer group whose performance was equal to or lower than that of the class indicated.
Semiannual Report
Fidelity Advisor Mortgage Securities Fund

The Board reviewed the fund's relative investment performance against its peer group and noted that the performance of the retail class of the fund was in the second quartile for the one- and three-year periods and the third quartile for the five-year period. The Board also noted that the investment performance of the fund was lower than its benchmark for the three- and five-year periods, although the one-year total return of the retail class compared favorably to its benchmark. The Board considered that the variations in performance among the fund's classes reflect the variations in class expenses, which result in lower performance for higher expense classes. The Board also reviewed the fund's performance since inception as well as performance in the current year.
Based on its review, the Board concluded that the nature, extent, and quality of services provided to the fund under the Advisory Contracts should benefit the fund's shareholders.
Competitiveness of Management Fee and Total Expense Ratio. The Board considered the fund's management fee and total expense ratio compared to "mapped groups" of competitive funds and classes. Fidelity creates "mapped groups" by combining similar Lipper investment objective categories that have comparable management fee characteristics. Combining Lipper investment objective categories aids the Board's management fee and total expense ratio comparisons by broadening the competitive group used for comparison and by reducing the number of universes to which various Fidelity funds are compared.
Semiannual Report
Board Approval of Investment Advisory Contracts and
Management Fees - continued
Management Fee. The Board considered two proprietary management fee comparisons for the 12-month periods shown in the chart below. The group of Lipper funds used by the Board for management fee comparisons is referred to below as the "Total Mapped Group" and, for the reasons explained above, is broader than the Lipper peer group used by the Board for performance comparisons. The Total Mapped Group comparison focuses on a fund's standing relative to the total universe of comparable funds available to investors in terms of gross management fees before expense reimbursements or caps. "TMG %" represents the percentage of funds in the Total Mapped Group that had management fees that were lower than the fund's. For example, a TMG % of 12% means that 88% of the funds in the Total Mapped Group had higher management fees than the fund. The "Asset-Size Peer Group" (ASPG) comparison focuses on a fund's standing relative to non-Fidelity funds similar in size to the fund within the Total Mapped Group. The ASPG represents at least 15% of the funds in the Total Mapped Group with comparable asset size and management fee characteristics, subject to a minimum of 50 funds (or all funds in the Total Mapped Group if fewer than 50). Additional information, such as the ASPG quartile in which the fund's management fee ranked, is also included in the chart and considered by the Board.
Fidelity Advisor Mortgage Securities Fund
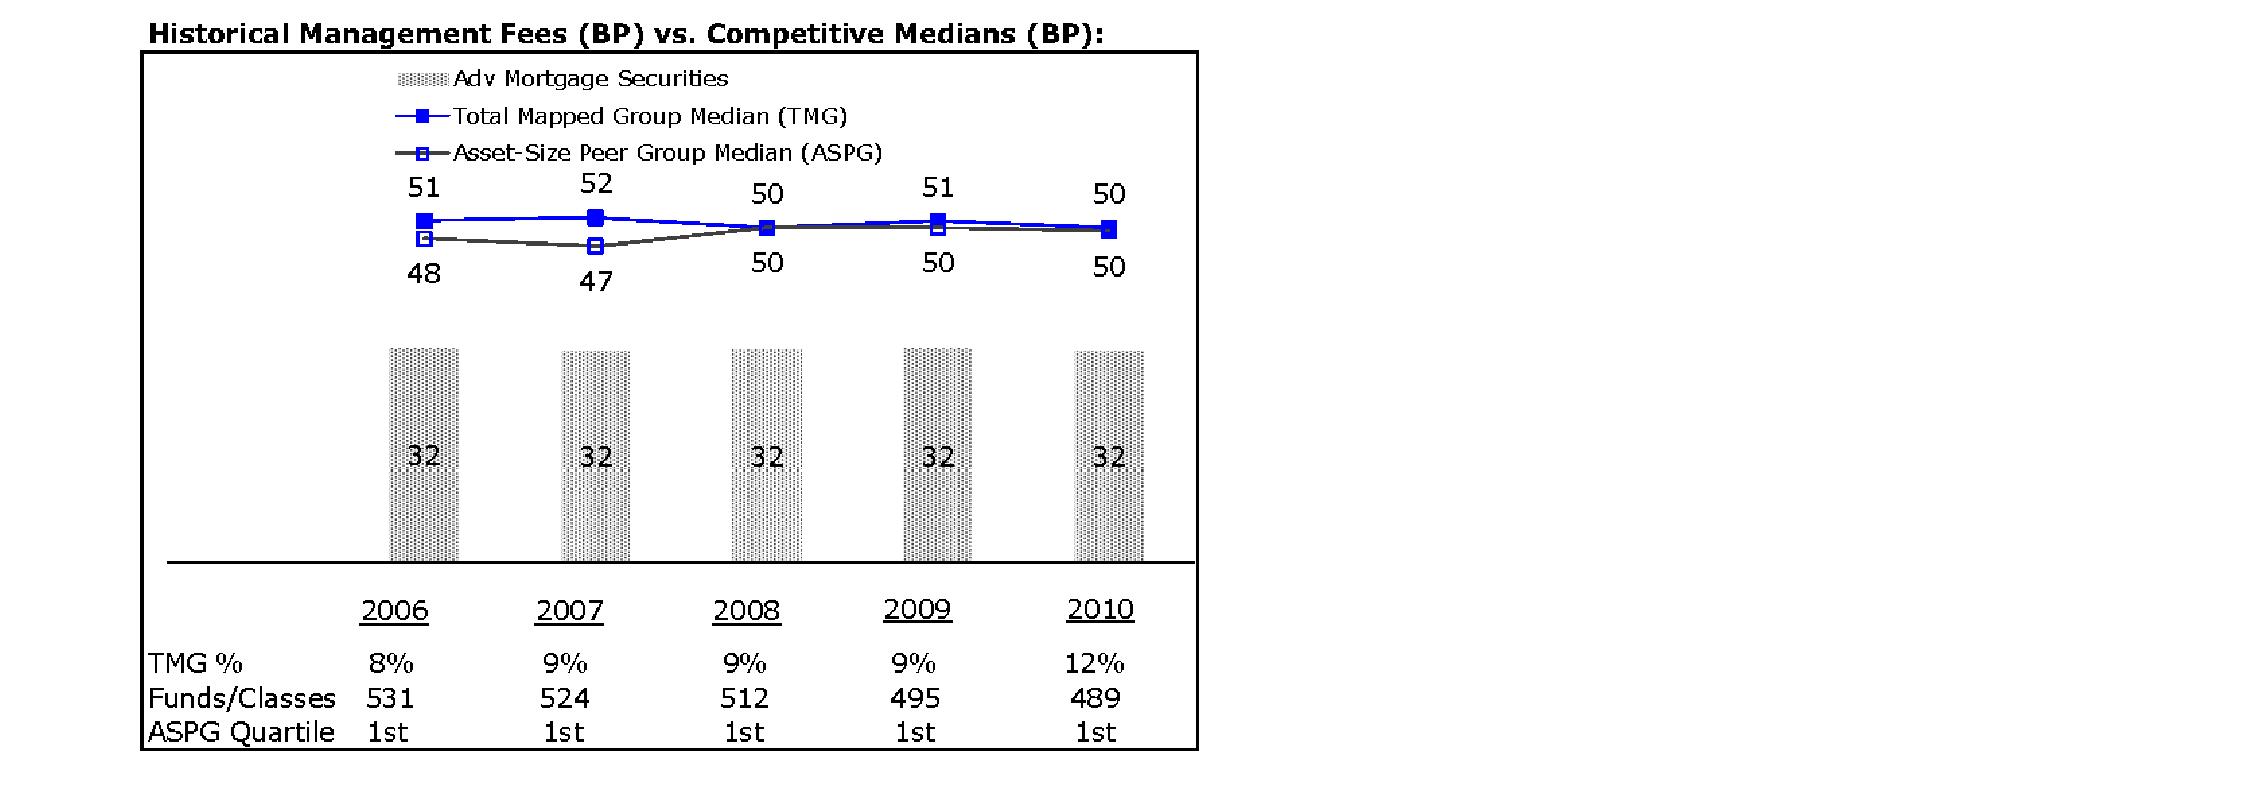
The Board noted that the fund's management fee ranked below the median of its Total Mapped Group and below the median of its ASPG for 2010.
Based on its review, the Board concluded that the fund's management fee is fair and reasonable in light of the services that the fund receives and the other factors considered.
Semiannual Report
Total Expense Ratio. In its review of each class's total expense ratio, the Board considered the fund's management fee as well as other fund or class expenses, as applicable, such as transfer agent fees, pricing and bookkeeping fees, fund-paid 12b-1 fees, and custodial, legal, and audit fees. The Board also noted the effects of any waivers and reimbursements on fees and expenses. As part of its review, the Board also considered the current and historical total expense ratios of each class of the fund compared to competitive fund median expenses. Each class of the fund is compared to those funds and classes in the Total Mapped Group (used by the Board for management fee comparisons) that have a similar sales load structure.
The Board also considered that the current contractual arrangements for the fund (i) have the effect of setting the total "fund-level" expenses (including, among certain other expenses, the management fee) for each class at 35 basis points, (ii) limit the "class-level" transfer agent fee for the retail class to 10 basis points, and (iii) limit the total expenses for the retail class to 45 basis points. The fees and expenses payable under these contractual arrangements may not be increased without the approval of the Board and the shareholders of the applicable class. The fund's Advisor classes are subject to different "class-level" expenses (transfer agent fees and 12b-1 fees).
The Board noted that the total expense ratio of each class ranked below its competitive median for 2010.
The Board recognized that the fund's management contract incorporates a "group fee" structure, which provides for lower group fee rates as total fund assets under FMR's management increase, and for higher group fee rates as total fund assets under FMR's management decrease. FMR calculates the group fee rates based on a tiered asset "breakpoint" schedule that varies based on asset class. The Board noted, however, that because the current contractual arrangements set the total "fund-level" expenses for each class at 35 basis points, increases or decreases in the management fee due to changes in the group fee rate will not impact the total expense ratio.
Fees Charged to Other Fidelity Clients. The Board also considered Fidelity fee structures and other information with respect to clients of FMR and its affiliates, such as other mutual funds advised or subadvised by FMR or its affiliates, pension plan clients, and other institutional clients. In March 2010, the Board created an ad hoc joint committee with the board of other Fidelity funds (the Committee) to review and compare Fidelity's institutional investment advisory business with its business of providing services to the Fidelity funds, including the differences in services provided, fees charged, and costs incurred, as well as competition in their respective marketplaces.
Based on its review of total expense ratios and fees charged to other Fidelity clients, the Board concluded that the total expense ratio of each class of the fund was reasonable in light of the services that the fund and its shareholders receive and the other factors considered, including the findings of the Committee.
Semiannual Report
Board Approval of Investment Advisory Contracts and
Management Fees - continued
Costs of the Services and Profitability. The Board considered the revenues earned and the expenses incurred by Fidelity in conducting the business of developing, marketing, distributing, managing, administering and servicing the fund and its shareholders. The Board also considered the level of Fidelity's profits in respect of all the Fidelity funds.
On an annual basis, FMR presents to the Board Fidelity's profitability for the fund. Fidelity calculates the profitability for each fund, as well as aggregate profitability for groups of Fidelity funds and all Fidelity funds, using a series of detailed revenue and cost allocation methodologies which originate with the books and records of Fidelity on which Fidelity's audited financial statements are based. The Audit Committee of the Board reviews any significant changes from the prior year's methodologies.
PricewaterhouseCoopers LLP (PwC), independent registered public accounting firm and auditor to Fidelity and certain Fidelity funds, has been engaged annually by the Board as part of the Board's assessment of Fidelity's profitability analysis. PwC's engagement includes the review and assessment of Fidelity's methodologies used in determining the revenues and expenses attributable to Fidelity's mutual fund business, and completion of agreed-upon procedures surrounding the mathematical accuracy of fund profitability and its conformity to allocation methodologies. After considering PwC's reports issued under the engagement and information provided by Fidelity, the Board concluded that while other allocation methods may also be reasonable, Fidelity's profitability methodologies are reasonable in all material respects.
The Board also reviewed Fidelity's non-fund businesses and fall-out benefits related to the mutual fund business as well as cases where Fidelity's affiliates may benefit from or be related to the fund's business.
The Board considered the costs of the services provided by and the profits realized by Fidelity in connection with the operation of the fund and was satisfied that the profitability was not excessive in the circumstances.
Economies of Scale. The Board considered whether there have been economies of scale in respect of the management of the Fidelity funds, whether the Fidelity funds (including the fund) have appropriately benefited from any such economies of scale, and whether there is potential for realization of any further economies of scale. The Board considered the extent to which the fund will benefit from economies of scale through increased services to the fund, through waivers or reimbursements, or through fee or expense reductions. The Board also noted that in 2009, it and the board of other Fidelity funds created an ad hoc committee (the Economies of Scale Committee) to analyze whether FMR attains economies of scale in respect of the management and servicing of the Fidelity funds, whether the Fidelity funds have appropriately benefited from such economies of scale, and whether there is potential for realization of any further economies of scale.
Semiannual Report
The Board concluded, taking into account the analysis of the Economies of Scale Committee, that any potential economies of scale are being appropriately shared between fund shareholders and Fidelity.
Additional Information Requested by the Board. In order to develop fully the factual basis for consideration of the Fidelity funds' Advisory Contracts, the Board requested and received additional information on certain topics, including: (i) Fidelity's fund profitability methodology, profitability trends for certain funds, and the impact of certain factors on fund profitability results; (ii) portfolio manager changes that have occurred during the past year and the amount of the investment that each portfolio manager has made in the Fidelity fund(s) that he or she manages; (iii) Fidelity's compensation structure for portfolio managers, research analysts, and other key personnel, including its effects on fund profitability, the rationale for the compensation structure, and the extent to which current market conditions have affected retention and recruitment; (iv) the compensation paid to fund sub-advisers on behalf of the Fidelity funds; (v) Fidelity's fee structures and rationale for recommending different fees among different categories of funds and classes, as well as Fidelity's voluntary waiver of its fees to maintain minimum yields for certain money market funds and classes; (vi) the reasons why certain expenses affect various funds and classes differently; (vii) Fidelity's transfer agent fees, expenses, and services and how the benefits of decreased costs and new efficiencies can be shared across all of the Fidelity funds; (viii) the reasons for and consequences of changes to certain product lines compared to competitors; (ix) the allocation of and historical trends in Fidelity's realization of fall-out benefits; and (x) explanations regarding the relative total expense ratios of certain funds and classes, total expense competitive trends, and actions that might be taken by FMR to reduce total expense ratios for certain funds and classes or to achieve further economies of scale.
Based on its evaluation of all of the conclusions noted above, and after considering all factors it believed relevant, the Board ultimately concluded that the advisory fee structures are fair and reasonable, and that the fund's Advisory Contracts should be renewed.
Semiannual Report
Investment Adviser
Fidelity Management & Research Company
Boston, MA
Investment Sub-Advisers
Fidelity Investments Money Management, Inc.
Fidelity Management & Research
(U.K.) Inc.
Fidelity Management & Research
(Hong Kong) Limited
Fidelity Management & Research
(Japan), Inc.
General Distributor
Fidelity Distributors Corporation
Boston, MA
Transfer and Service Agents
Fidelity Investments Institutional Operations Company, Inc.
Boston, MA
Fidelity Service Company, Inc.
Boston, MA
Custodian
The Bank of New York Mellon
New York, NY
AMOR-USAN-0412
1.784898.109
(Fidelity Investment logo)(registered trademark)
(Fidelity Investment logo)(registered trademark)
Fidelity Advisor®
Mortgage Securities
Fund - Institutional Class
Semiannual Report
February 29, 2012
(Fidelity Cover Art)
Contents
Shareholder Expense Example | (Click Here) | An example of shareholder expenses. |
Investment Changes | (Click Here) | A summary of major shifts in the fund's investments over the past six months. |
Investments | (Click Here) | A complete list of the fund's investments with their market values. |
Financial Statements | (Click Here) | Statements of assets and liabilities, operations, and changes in net assets, as well as financial highlights. |
Notes | (Click Here) | Notes to the financial statements. |
Board Approval of Investment Advisory Contracts and Management Fees | (Click Here) | |
To view a fund's proxy voting guidelines and proxy voting record for the 12-month period ended June 30, visit http://www.fidelity.com/proxyvotingresults or visit the Securities and Exchange Commission's (SEC) web site at http://www.sec.gov. You may also call 1-877-208-0098 to request a free copy of the proxy voting guidelines.
Standard & Poor's, S&P and S&P 500 are registered service marks of The McGraw-Hill Companies, Inc. and have been licensed for use by Fidelity Distributors Corporation.
Other third party marks appearing herein are the property of their respective owners.
All other marks appearing herein are registered or unregistered trademarks or service marks of FMR LLC or an affiliated company.
This report and the financial statements contained herein are submitted for the general information of the shareholders of the fund. This report is not authorized for distribution to prospective investors in the fund unless preceded or accompanied by an effective prospectus.
A fund files its complete schedule of portfolio holdings with the SEC for the first and third quarters of each fiscal year on Form N-Q. Forms N-Q are available on the SEC's web site at http://www.sec.gov. A fund's Forms N-Q may be reviewed and copied at the SEC's Public Reference Room in Washington, DC. Information regarding the operation of the SEC's Public Reference Room may be obtained by calling 1-800-SEC-0330. For a complete list of a fund's portfolio holdings, view the most recent holdings listing, semiannual report, or annual report on Fidelity's web site at http://www.fidelity.com, http://www.advisor.fidelity.com, or http://www.401k.com, as applicable.
NOT FDIC INSURED • MAY LOSE VALUE • NO BANK GUARANTEE
Neither the fund nor Fidelity Distributors Corporation is a bank.
Semiannual Report
Shareholder Expense Example
As a shareholder of the Fund, you incur two types of costs: (1) transaction costs, including sales charges (loads) on purchase payments or redemption proceeds, and (2) ongoing costs, including management fees, distribution and/or service (12b-1) fees and other Fund expenses. This Example is intended to help you understand your ongoing costs (in dollars) of investing in the Fund and to compare these costs with the ongoing costs of investing in other mutual funds.
The Example is based on an investment of $1,000 invested at the beginning of the period and held for the entire period (September 1, 2011 to February 29, 2012).
Actual Expenses
The first line of the accompanying table for each class of the Fund provides information about actual account values and actual expenses. You may use the information in this line, together with the amount you invested, to estimate the expenses that you paid over the period. Simply divide your account value by $1,000.00 (for example, an $8,600 account value divided by $1,000.00 = 8.6), then multiply the result by the number in the first line for a class of the Fund under the heading entitled "Expenses Paid During Period" to estimate the expenses you paid on your account during this period.
Hypothetical Example for Comparison Purposes
The second line of the accompanying table for each class of the Fund provides information about hypothetical account values and hypothetical expenses based on a Class' actual expense ratio and an assumed rate of return of 5% per year before expenses, which is not the Class' actual return. The hypothetical account values and expenses may not be used to estimate the actual ending account balance or expenses you paid for the period. You may use this information to compare the ongoing costs of investing in the Fund and other funds. To do so, compare this 5% hypothetical example with the 5% hypothetical examples that appear in the shareholder reports of the other funds.
Please note that the expenses shown in the table are meant to highlight your ongoing costs only and do not reflect any transaction costs. Therefore, the second line of the table is useful in comparing ongoing costs only, and will not help you determine the relative total costs of owning different funds. In addition, if these transactional costs were included, your costs would have been higher.
Semiannual Report
Shareholder Expense Example - continued
| Annualized Expense Ratio | Beginning
Account Value
September 1, 2011 | Ending
Account Value
February 29, 2012 | Expenses Paid
During Period*
September 1, 2011 to
February 29, 2012 |
Class A | .82% | | | |
Actual | | $ 1,000.00 | $ 1,018.50 | $ 4.12 |
Hypothetical A | | $ 1,000.00 | $ 1,020.79 | $ 4.12 |
Class T | .79% | | | |
Actual | | $ 1,000.00 | $ 1,018.60 | $ 3.96 |
Hypothetical A | | $ 1,000.00 | $ 1,020.93 | $ 3.97 |
Class B | 1.51% | | | |
Actual | | $ 1,000.00 | $ 1,015.00 | $ 7.57 |
Hypothetical A | | $ 1,000.00 | $ 1,017.35 | $ 7.57 |
Class C | 1.54% | | | |
Actual | | $ 1,000.00 | $ 1,014.90 | $ 7.71 |
Hypothetical A | | $ 1,000.00 | $ 1,017.21 | $ 7.72 |
Fidelity Mortgage Securities Fund | .45% | | | |
Actual | | $ 1,000.00 | $ 1,020.30 | $ 2.26 |
Hypothetical A | | $ 1,000.00 | $ 1,022.63 | $ 2.26 |
Institutional Class | .51% | | | |
Actual | | $ 1,000.00 | $ 1,020.10 | $ 2.56 |
Hypothetical A | | $ 1,000.00 | $ 1,022.33 | $ 2.56 |
A 5% return per year before expenses
* Expenses are equal to each Class' annualized expense ratio, multiplied by the average account value over the period, multiplied by 182/366 (to reflect the one-half year period).
Semiannual Report
Investment Changes (Unaudited)
Coupon Distribution as of February 29, 2012 |
| % of fund's investments | % of fund's investments
6 months ago |
Less than 0.01% | 0.4 | 0.4 |
0.01 - 0.99% | 7.3 | 6.7 |
1 - 1.99% | 1.0 | 0.7 |
2 - 2.99% | 1.3 | 0.7 |
3 - 3.99% | 7.0 | 4.5 |
4 - 4.99% | 37.4 | 41.1 |
5 - 5.99% | 31.5 | 32.4 |
6 - 6.99% | 8.1 | 8.2 |
7% and over | 2.7 | 2.6 |
Coupon distribution shows the range of stated interest rates on the fund's investments, excluding short-term investments. |
Weighted Average Maturity as of February 29, 2012 |
| | 6 months ago |
Years | 3.8 | 4.1 |
This is a weighted average of all the maturities of the securities held in a fund. Weighted Average Maturity (WAM) can be used as a measure of sensitivity to interest rate changes and market changes. Generally, the longer the maturity, the greater the sensitivity to such changes. WAM is based on the dollar-weighted average length of time until principal payments must be paid. Depending on the types of securities held in a fund, certain maturity shortening devices (e.g., demand features, interest rate resets, and call options) may be taken into account when calculating the WAM. |
Duration as of February 29, 2012 |
| | 6 months ago |
Years | 2.4 | 2.9 |
Duration estimates how much a bond fund's price will change with a change in comparable interest rates. If rates rise 1%, for example, a fund with a 5-year duration is likely to lose about 5% of its value. Other factors also can influence a bond fund's performance and share price. Accordingly, a bond fund's actual performance may differ from this example. Duration takes into account any call or put option embedded in the bonds. |
Asset Allocation (% of fund's net assets) |
As of February 29, 2012* | As of August 31, 2011** |
| Mortgage
Securities 100.0% | | | Mortgage
Securities 114.5% | |
| CMOs and
Other Mortgage
Related Securities 18.8% | | | CMOs and
Other Mortgage
Related Securities 20.5% | |
| Asset-Backed
Securities 3.8% | | | Asset-Backed
Securities 3.5% | |
| Short-Term
Investments and
Net Other Assets† (22.6)% | | | Short-Term
Investments and
Net Other Assets† (38.5)% | |
* Foreign investments | 1.7% | | ** Foreign investments | 2.1% | |
* Futures and Swaps | (2.3)% | | ** Futures and Swaps | (4.0)% | |

† Short-Term Investments and Net Other Assets are not included in the pie chart.
Semiannual Report
Showing Percentage of Net Assets
U.S. Government Agency - Mortgage Securities - 100.0% |
| Principal Amount (000s) | | Value (000s) |
Fannie Mae - 54.2% |
2.303% 6/1/36 (e) | | $ 50 | | $ 53 |
2.322% 1/1/35 (e) | | 354 | | 377 |
2.336% 5/1/36 (e) | | 268 | | 278 |
2.393% 9/1/36 (e) | | 169 | | 180 |
2.424% 10/1/33 (e) | | 77 | | 81 |
2.435% 4/1/36 (e) | | 229 | | 243 |
2.438% 8/1/35 (e) | | 469 | | 500 |
2.448% 3/1/35 (e) | | 49 | | 51 |
2.487% 11/1/36 (e) | | 71 | | 75 |
2.537% 7/1/35 (e) | | 101 | | 108 |
2.609% 5/1/36 (e) | | 95 | | 101 |
2.625% 10/1/36 (e) | | 172 | | 183 |
2.71% 9/1/36 (e) | | 104 | | 111 |
3% 3/1/27 (c) | | 2,000 | | 2,076 |
3% 3/1/27 (c) | | 6,000 | | 6,227 |
3% 3/1/27 (c) | | 7,600 | | 7,887 |
3% 3/1/27 (c) | | 6,000 | | 6,227 |
3.377% 9/1/41 (e) | | 363 | | 381 |
3.471% 3/1/40 (e) | | 817 | | 846 |
3.5% 12/1/25 to 9/1/26 | | 1,682 | | 1,771 |
3.5% 3/1/42 (c) | | 11,000 | | 11,370 |
3.5% 3/1/42 (c) | | 7,100 | | 7,339 |
3.5% 3/1/42 (c) | | 8,400 | | 8,682 |
3.5% 3/1/42 (c) | | 4,000 | | 4,134 |
4% 10/1/25 to 11/1/41 | | 73,940 | | 78,313 |
4% 3/1/42 (c) | | 20,700 | | 21,786 |
4% 3/1/42 (c) | | 6,000 | | 6,315 |
4.168% 6/1/36 (e) | | 825 | | 869 |
4.5% 5/1/18 to 11/1/41 | | 69,092 | | 74,294 |
4.5% 3/1/42 (c) | | 12,600 | | 13,429 |
4.5% 3/1/42 (c) | | 3,000 | | 3,197 |
5% 9/1/17 to 6/1/40 | | 39,275 | | 42,587 |
5% 3/1/42 (c) | | 14,500 | | 15,660 |
5% 3/1/42 (c) | | 25,600 | | 27,647 |
5% 3/1/42 (c) | | 9,000 | | 9,720 |
5.003% 7/1/35 (e) | | 12 | | 13 |
5.08% 7/1/35 (e) | | 109 | | 117 |
5.5% 2/1/18 to 9/1/38 | | 64,357 | | 70,230 |
5.5% 3/1/42 (c) | | 4,000 | | 4,358 |
5.5% 3/1/42 (c) | | 29,000 | | 31,597 |
5.718% 3/1/36 (e) | | 561 | | 592 |
5.99% 9/1/36 (e) | | 219 | | 235 |
U.S. Government Agency - Mortgage Securities - continued |
| Principal Amount (000s) | | Value (000s) |
Fannie Mae - continued |
6% 3/1/17 to 2/1/38 | | $ 8,380 | | $ 9,194 |
6% 3/1/42 (c) | | 1,000 | | 1,100 |
6.021% 8/1/46 (e) | | 107 | | 117 |
6.039% 9/1/36 (e) | | 202 | | 215 |
6.24% 9/1/37 (e) | | 22 | | 23 |
6.313% 4/1/37 (e) | | 236 | | 254 |
6.499% 12/1/36 (e) | | 195 | | 212 |
6.5% 12/1/12 to 5/1/38 | | 5,368 | | 6,024 |
6.555% 12/1/36 (e) | | 107 | | 115 |
6.824% 9/1/37 (e) | | 89 | | 95 |
7% 12/1/15 to 5/1/30 | | 2,316 | | 2,641 |
7.431% 9/1/37 (e) | | 30 | | 32 |
7.5% 8/1/22 to 9/1/32 | | 1,252 | | 1,469 |
8% 12/1/29 to 3/1/37 | | 75 | | 89 |
8.5% 1/1/16 to 7/1/31 | | 171 | | 202 |
9% 10/1/30 | | 274 | | 338 |
9.5% 7/1/16 to 8/1/22 | | 39 | | 44 |
12.5% 8/1/15 to 3/1/16 | | 10 | | 11 |
12.75% 2/1/15 | | 2 | | 3 |
13.5% 9/1/14 | | 1 | | 2 |
| | 482,420 |
Freddie Mac - 24.9% |
1.915% 3/1/35 (e) | | 217 | | 225 |
2.095% 5/1/37 (e) | | 112 | | 116 |
2.292% 11/1/35 (e) | | 431 | | 455 |
2.481% 5/1/34 (e) | | 16 | | 17 |
2.638% 4/1/37 (e) | | 162 | | 173 |
2.639% 6/1/37 (e) | | 364 | | 387 |
2.711% 6/1/33 (e) | | 1,113 | | 1,186 |
2.795% 7/1/36 (e) | | 176 | | 188 |
3.149% 10/1/35 (e) | | 73 | | 78 |
3.586% 6/1/37 (e) | | 911 | | 961 |
4% 9/1/41 | | 938 | | 990 |
4% 10/1/41 | | 1,893 | | 2,018 |
4% 3/1/42 (c) | | 23,000 | | 24,127 |
4.5% 7/1/25 to 10/1/41 | | 47,804 | | 51,292 |
4.5% 3/1/42 (c) | | 28,300 | | 30,062 |
5% 7/1/33 to 9/1/40 | | 35,750 | | 38,789 |
5.138% 4/1/35 (e) | | 78 | | 81 |
5.5% 10/1/17 to 1/1/40 (d) | | 32,055 | | 34,835 |
5.847% 6/1/37 (e) | | 56 | | 58 |
U.S. Government Agency - Mortgage Securities - continued |
| Principal Amount (000s) | | Value (000s) |
Freddie Mac - continued |
6% 4/1/14 to 6/1/39 | | $ 10,400 | | $ 11,400 |
6.011% 4/1/37 (e) | | 81 | | 86 |
6.05% 3/1/36 (e) | | 744 | | 793 |
6.058% 10/1/36 (e) | | 53 | | 57 |
6.333% 6/1/37 (e) | | 38 | | 40 |
6.421% 12/1/36 (e) | | 614 | | 651 |
6.5% 2/1/13 to 9/1/39 | | 11,879 | | 13,259 |
6.662% 8/1/37 (e) | | 186 | | 195 |
7% 6/1/21 to 9/1/36 | | 3,176 | | 3,635 |
7.03% 6/1/36 (e) | | 32 | | 34 |
7.07% 2/1/37 (e) | | 55 | | 60 |
7.22% 4/1/37 (e) | | 9 | | 9 |
7.5% 4/1/12 to 7/1/34 | | 4,801 | | 5,529 |
8% 11/1/16 to 1/1/37 | | 67 | | 79 |
8.5% 6/1/16 to 9/1/20 | | 12 | | 13 |
9% 9/1/16 to 5/1/21 | | 92 | | 103 |
10% 1/1/16 to 5/1/19 | | 18 | | 20 |
10.5% 2/1/16 | | 1 | | 1 |
12.5% 2/1/14 to 12/1/14 | | 3 | | 3 |
13% 12/1/13 to 6/1/15 | | 11 | | 11 |
| | 222,016 |
Ginnie Mae - 20.9% |
3.5% 10/15/41 to 2/15/42 | | 9,799 | | 10,288 |
3.5% 3/1/42 (c) | | 7,500 | | 7,862 |
4% 9/15/25 to 11/15/41 | | 20,791 | | 22,473 |
4% 3/1/42 (c) | | 2,300 | | 2,477 |
4.5% 8/15/33 to 5/20/41 | | 56,311 | | 61,877 |
4.5% 3/1/42 (c) | | 700 | | 763 |
4.751% 12/20/60 (i) | | 13,639 | | 15,227 |
4.814% 1/20/61 (i) | | 308 | | 346 |
5% 9/20/33 to 9/15/40 | | 34,669 | | 38,576 |
5% 3/1/42 (c) | | 9,000 | | 9,941 |
5.5% 10/15/33 to 9/15/39 | | 5,832 | | 6,503 |
6% 1/15/36 to 9/20/38 | | 5,476 | | 6,159 |
6.5% 10/15/34 to 7/15/36 | | 290 | | 334 |
7% 2/15/24 to 4/20/32 | | 1,975 | | 2,273 |
7.5% 12/15/16 to 4/15/32 | | 667 | | 776 |
8% 6/15/21 to 12/15/25 | | 305 | | 358 |
8.5% 8/15/16 to 10/15/28 | | 347 | | 407 |
U.S. Government Agency - Mortgage Securities - continued |
| Principal Amount (000s) | | Value (000s) |
Ginnie Mae - continued |
9% 11/20/17 | | $ 1 | | $ 1 |
10.5% 12/20/15 to 2/20/18 | | 10 | | 12 |
| | 186,653 |
TOTAL U.S. GOVERNMENT AGENCY - MORTGAGE SECURITIES (Cost $869,441) | 891,089 |
Asset-Backed Securities - 3.8% |
|
ACE Securities Corp. Home Equity Loan Trust Series 2005-HE7 Class A2C, 0.494% 11/25/35 (e) | | 645 | | 641 |
Aesop Funding II LLC Series 2005-4A Class A3, 0.5255% 7/20/12 (AMBAC Insured) (b)(e) | | 2,917 | | 2,905 |
AmeriCredit Automobile Receivables Trust Series 2007-CM Class A4B, 0.3425% 4/7/14 (National Public Finance Guarantee Corp. Insured) (e) | | 2,007 | | 1,995 |
Avis Budget Rental Car Funding (AESOP) LLC: | | | | |
Series 2007-2A Class A, 0.3855% 8/20/13 (AMBAC Insured) (b)(e) | | 4,930 | | 4,902 |
Series 2009-1A Class A, 9.31% 10/20/13 (b) | | 2,805 | | 2,893 |
Countrywide Asset-Backed Certificates Trust: | | | | |
Series 2007-11 Class 2A1, 0.304% 6/25/47 (e) | | 248 | | 245 |
Series 2007-4 Class A1A, 0.3963% 9/25/37 (e) | | 784 | | 764 |
Series 2007-5 Class 2A1, 0.344% 9/25/47 (e) | | 249 | | 248 |
Countrywide Home Loans, Inc. Series 2005-2 Class M2, 0.949% 7/25/35 (e) | | 1,984 | | 1,966 |
GSAMP Trust: | | | | |
Series 2004-AR1 Class B4, 5% 6/25/34 (b)(e) | | 82 | | 24 |
Series 2004-AR2 Class B1, 3.094% 8/25/34 (e) | | 796 | | 62 |
GSR Mortgage Loan Trust Series 2005-HE4 Class A2C, 0.614% 7/25/45 (e) | | 4,930 | | 4,924 |
Morgan Stanley ABS Capital I Trust Series 2005-3 Class A3, 0.624% 8/25/35 (e) | | 1,179 | | 1,174 |
National Collegiate Student Loan Trust: | | | | |
Series 2004-2 Class AIO, 9.75% 10/27/14 (f) | | 2,045 | | 138 |
Series 2007-1 Class AIO, 7.27% 4/25/12 (f) | | 9,200 | | 147 |
Series 2007-2 Class AIO, 6.7% 7/25/12 (f) | | 6,385 | | 142 |
Ocala Funding LLC Series 2006-1A Class A, 1.6455% 3/20/11 (a)(b)(e) | | 2,100 | | 0 |
Option One Mortgage Loan Trust: | | | | |
Series 2007-5 Class 2A1, 0.334% 5/25/37 (e) | | 928 | | 922 |
Series 2007-6 Class 2A1, 0.304% 7/25/37 (e) | | 68 | | 67 |
Asset-Backed Securities - continued |
| Principal Amount (000s) | | Value (000s) |
Rental Car Finance Corp. Series 2007-1A Class A, 0.384% 7/25/13 (FGIC Insured) (b)(e) | | $ 8,333 | | $ 8,279 |
Structured Asset Securities Corp. Series 2005-NC2 Class M3, 0.674% 5/25/35 (e) | | 1,995 | | 1,119 |
WaMu Asset Holdings Corp.: | | | | |
Series 2006-5 Class N1, 5.926% 7/25/46 (b) | | 1,148 | | 0 |
Series 2006-7 Class N1, 5.926% 9/25/46 (b) | | 912 | | 0 |
Series 2006-8 Class N1, 6.048% 10/25/46 (b) | | 1,160 | | 0 |
TOTAL ASSET-BACKED SECURITIES (Cost $39,574) |
33,557
|
Collateralized Mortgage Obligations - 14.9% |
|
Private Sponsor - 4.0% |
Arkle Master Issuer PLC floater Series 2010-1A Class 2A, 1.6451% 5/17/60 (b)(e) | | 3,032 | | 3,033 |
Arran Residential Mortgages Funding PLC floater Series 2011-1A Class A1C, 1.6931% 11/19/47 (b)(e) | | 1,177 | | 1,178 |
Banc of America Funding Trust sequential payer Series 2009-R1 Class A1, 5.0298% 5/20/36 (e) | | 173 | | 174 |
Banc of America Mortgage Securities, Inc. planned amortization class Series 2005-3 Class 1A20, 5.5% 4/25/35 | | 3,006 | | 2,996 |
BCAP LLC Trust sequential payer Series 2010-RR12 Class 3A5, 5% 8/26/37 (b) | | 429 | | 429 |
Citigroup Mortgage Loan Trust Series 2010-7 Class 9A1, 4.5% 10/25/37 (b) | | 4,601 | | 4,666 |
Credit Suisse Mortgage Capital Certificates: | | | | |
floater Series 2011-7R Class A1, 1.494% 8/27/47 (b)(e) | | 2,337 | | 2,293 |
sequential payer Series 2010-16 Class A1, 3% 6/25/50 (b) | | 486 | | 469 |
CSMC floater Series 2011-1R Class A1, 1.244% 2/27/47 (b)(e) | | 3,459 | | 3,403 |
First Horizon Mortgage pass-thru Trust Series 2004-AR5 Class 2A1, 2.631% 10/25/34 (e) | | 934 | | 860 |
Gracechurch Mortgage Financing PLC floater Series 2007-1A Class 3A1, 0.5731% 11/20/56 (b)(e) | | 4,156 | | 4,150 |
Granite Mortgages Series 2003-2 Class 1A3, 1.0612% 7/20/43 (e) | | 447 | | 433 |
Granite Mortgages PLC floater: | | | | |
Series 2003-3 Class 1A3, 0.9612% 1/20/44 (e) | | 173 | | 168 |
Series 2004-1 Class 2A1, 0.8832% 3/20/44 (e) | | 5,398 | | 5,190 |
Collateralized Mortgage Obligations - continued |
| Principal Amount (000s) | | Value (000s) |
Private Sponsor - continued |
Granite Mortgages PLC floater: - continued | | | | |
Series 2004-3 Class 2A1, 0.8432% 9/20/44 (e) | | $ 211 | | $ 203 |
Holmes Master Issuer PLC floater Series 2007-2A Class 4A, 0.667% 7/15/20 (e) | | 1,650 | | 1,645 |
Luminent Mortgage Trust floater Series 2006-1 Class A1, 0.484% 4/25/36 (e) | | 2,088 | | 1,087 |
MASTR Adjustable Rate Mortgages Trust Series 2007-3 Class 22A2, 0.454% 5/25/47 (e) | | 579 | | 340 |
Merrill Lynch Alternative Note Asset Trust floater Series 2007-OAR1 Class A1, 0.414% 2/25/37 (e) | | 2,773 | | 1,863 |
Structured Asset Securities Corp.: | | | | |
Series 2003-15A Class 4A, 5.3281% 4/25/33 (e) | | 488 | | 451 |
Series 2004-21XS Class 2A3, 4.32% 12/25/34 | | 83 | | 83 |
Wells Fargo Mortgage Backed Securities Trust Series 2005-AR2 Class 1A2, 2.67% 3/25/35 (e) | | 414 | | 133 |
TOTAL PRIVATE SPONSOR | | 35,247 |
U.S. Government Agency - 10.9% |
Fannie Mae Series 2011-67 Class AI, 4% 7/25/26 (f) | | 807 | | 86 |
Fannie Mae Guaranteed Mtg. pass-thru certificates: | | | | |
planned amortization class Series 1994-23: | | | | |
Class PX, 6% 8/25/23 | | 1,233 | | 1,283 |
Class PZ, 6% 2/25/24 | | 3,216 | | 3,813 |
Series 1993-165 Class SH, 19.0927% 9/25/23 (e)(h) | | 84 | | 112 |
Series 2003-39 Class IA, 5.5% 10/25/22 (e)(f) | | 471 | | 31 |
Series 2009-16 Class SA, 6.006% 3/25/24 (e)(f)(h) | | 1,763 | | 164 |
Series 2010-109 Class IM, 5.5% 9/25/40 (f) | | 7,315 | | 1,107 |
Series 2010-23: | | | | |
Class AI, 5% 12/25/18 (f) | | 1,308 | | 107 |
Class HI, 4.5% 10/25/18 (f) | | 883 | | 82 |
Series 2010-29 Class LI, 4.5% 6/25/19 (f) | | 2,572 | | 235 |
Series 2010-97 Class CI, 4.5% 8/25/25 (f) | | 1,714 | | 149 |
Series 2011-83 Class DI, 6% 9/25/26 (f) | | 1,293 | | 165 |
Fannie Mae Stripped Mortgage-Backed Securities: | | | | |
sequential payer Series 377 Class 1, 10/1/36 (g) | | 1,560 | | 1,461 |
Series 339 Class 29, 5.5% 7/1/18 (f) | | 746 | | 68 |
Series 348 Class 14, 6.5% 8/1/34 (f) | | 473 | | 85 |
Series 351: | | | | |
Class 12, 5.5% 4/1/34 (f) | | 357 | | 52 |
Class 13, 6% 3/1/34 (f) | | 441 | | 80 |
Collateralized Mortgage Obligations - continued |
| Principal Amount (000s) | | Value (000s) |
U.S. Government Agency - continued |
Fannie Mae Stripped Mortgage-Backed Securities: - continued | | | | |
Series 359 Class 19, 6% 7/1/35 (f) | | $ 416 | | $ 68 |
Series 384 Class 6, 5% 7/25/37 (f) | | 1,776 | | 231 |
Fannie Mae subordinate REMIC pass-thru certificates: | | | | |
floater Series 2007-57 Class FA, 0.474% 6/25/37 (e) | | 4,743 | | 4,724 |
planned amortization class: | | | | |
Series 1999-17 Class PG, 6% 4/25/29 | | 2,169 | | 2,400 |
Series 1999-32 Class PL, 6% 7/25/29 | | 1,680 | | 1,866 |
Series 1999-33 Class PK, 6% 7/25/29 | | 1,013 | | 1,123 |
Series 2001-52 Class YZ, 6.5% 10/25/31 | | 110 | | 127 |
Series 2005-39 Class TE, 5% 5/25/35 | | 1,120 | | 1,327 |
Series 2005-73 Class SA, 16.9156% 8/25/35 (e)(h) | | 461 | | 558 |
Series 2006-105 Class MD, 5.5% 6/25/35 | | 1,145 | | 1,291 |
sequential payer: | | | | |
Series 2001-20 Class Z, 6% 5/25/31 | | 1,934 | | 2,139 |
Series 2001-31 Class ZC, 6.5% 7/25/31 | | 708 | | 794 |
Series 2002-16 Class ZD, 6.5% 4/25/32 | | 318 | | 356 |
Series 2002-74 Class SV, 7.306% 11/25/32 (e)(f) | | 475 | | 93 |
Series 2002-79 Class Z, 5.5% 11/25/22 | | 1,034 | | 1,134 |
Series 2003-80 Class CG, 6% 4/25/30 | | 201 | | 205 |
Series 2003-21 Class SK, 7.856% 3/25/33 (e)(f)(h) | | 315 | | 66 |
Series 2003-35 Class TQ, 7.256% 5/25/18 (e)(f)(h) | | 252 | | 34 |
Series 2003-42 Class SJ, 6.806% 11/25/22 (e)(f)(h) | | 239 | | 17 |
Series 2003-48 Class HI, 5% 11/25/17 (f) | | 683 | | 37 |
Series 2005-104 Class NI, 6.456% 3/25/35 (e)(f)(h) | | 3,755 | | 596 |
Series 2006-4 Class IT, 6% 10/25/35 (f) | | 87 | | 6 |
Series 2007-57 Class SA, 39.156% 6/25/37 (e)(h) | | 1,420 | | 2,420 |
Series 2007-66: | | | | |
Class FB, 0.644% 7/25/37 (e) | | 2,137 | | 2,131 |
Class SB, 38.136% 7/25/37 (e)(h) | | 394 | | 697 |
Series 2009-114 Class AI, 5% 12/25/23 (f) | | 1,498 | | 124 |
Series 2009-76 Class MI, 5.5% 9/25/24 (f) | | 950 | | 122 |
Series 2009-85 Class IB, 4.5% 8/25/24 (f) | | 482 | | 41 |
Series 2009-93 Class IC, 4.5% 9/25/24 (f) | | 854 | | 69 |
Series 2010-12 Class AI, 5% 12/25/18 (f) | | 2,695 | | 297 |
Series 2010-135 Class LS, 5.806% 12/25/40 (e)(f)(h) | | 2,132 | | 310 |
Series 2010-139 Class NI, 4.5% 2/25/40 (f) | | 1,913 | | 272 |
Series 2010-96 Class DI, 4% 5/25/23 (f) | | 1,321 | | 56 |
Collateralized Mortgage Obligations - continued |
| Principal Amount (000s) | | Value (000s) |
U.S. Government Agency - continued |
Freddie Mac: | | | | |
floater Series 3318 Class GY, 0% 5/15/37 (e) | | $ 37 | | $ 37 |
floater planned amortization Series 3988 Class PF, 0.6485% 1/15/40 (e) | | 3,069 | | 3,066 |
planned amortization class: | | | | |
Series 2095 Class PE, 6% 11/15/28 | | 2,056 | | 2,281 |
Series 2104 Class PG, 6% 12/15/28 | | 646 | | 714 |
Series 2162 Class PH, 6% 6/15/29 | | 223 | | 247 |
Series 70 Class C, 9% 9/15/20 | | 46 | | 52 |
sequential payer Series 2114 Class ZM, 6% 1/15/29 | | 304 | | 336 |
Freddie Mac Manufactured Housing participation certificates guaranteed planned amortization class Series 2043 Class CJ, 6.5% 4/15/28 | | 737 | | 825 |
Freddie Mac Multi-Class pass-thru certificates: | | | | |
floater: | | | | |
Series 3129 Class MF, 0% 7/15/34 (e) | | 7 | | 7 |
Series 3222 Class HF, 0% 9/15/36 (e) | | 102 | | 99 |
planned amortization class: | | | | |
Series 2121 Class MG, 6% 2/15/29 | | 857 | | 948 |
Series 2154 Class PT, 6% 5/15/29 | | 1,309 | | 1,448 |
Series 2520 Class BE, 6% 11/15/32 | | 1,205 | | 1,334 |
Series 2585 Class KS, 7.3515% 3/15/23 (e)(f)(h) | | 152 | | 24 |
Series 2590 Class YR, 5.5% 9/15/32 (f) | | 46 | | 4 |
Series 2802 Class OB, 6% 5/15/34 | | 3,375 | | 3,924 |
Series 2810 Class PD, 6% 6/15/33 | | 1,357 | | 1,416 |
Series 3741 Class YU, 3.5% 11/15/22 | | 2,150 | | 2,262 |
Series 3786 Class HP, 4.5% 3/15/38 | | 3,064 | | 3,302 |
Series 3806 Class UP, 4.5% 2/15/41 | | 2,324 | | 2,519 |
Series 3832 Class PE, 5% 3/15/41 | | 960 | | 1,074 |
sequential payer: | | | | |
Series 2135 Class JE, 6% 3/15/29 | | 972 | | 1,076 |
Series 2274 Class ZM, 6.5% 1/15/31 | | 391 | | 441 |
Series 2281 Class ZB, 6% 3/15/30 | | 377 | | 416 |
Series 2357 Class ZB, 6.5% 9/15/31 | | 842 | | 943 |
Series 2502 Class ZC, 6% 9/15/32 | | 1,162 | | 1,295 |
Series 2575 Class ID, 5.5% 8/15/22 (f) | | 22 | | 1 |
Series 2817 Class SD, 6.8015% 7/15/30 (e)(f)(h) | | 330 | | 23 |
Series 3097 Class IA, 5.5% 3/15/33 (f) | | 1,214 | | 110 |
Series 1658 Class GZ, 7% 1/15/24 | | 1,154 | | 1,286 |
Series 2587 Class IM, 6.5% 3/15/33 (f) | | 590 | | 110 |
Series 2844: | | | | |
Class SC, 45.1848% 8/15/24 (e)(h) | | 43 | | 83 |
Collateralized Mortgage Obligations - continued |
| Principal Amount (000s) | | Value (000s) |
U.S. Government Agency - continued |
Freddie Mac Multi-Class pass-thru certificates: - continued | | | | |
Series 2844: | | | | |
Class SD, 83.2195% 8/15/24 (e)(h) | | $ 63 | | $ 150 |
Series 3772 Class BI, 4.5% 10/15/18 (f) | | 1,750 | | 135 |
Ginnie Mae guaranteed REMIC pass-thru certificates: | | | | |
floater: | | | | |
Series 2010-H17 Class FA, 0.5755% 7/20/60 (e)(i) | | 419 | | 411 |
Series 2010-H18 Class AF, 0.5703% 9/20/60 (e)(i) | | 445 | | 436 |
Series 2010-H19 Class FG, 0.5455% 8/20/60 (e)(i) | | 566 | | 556 |
Series 2011-H03 Class FA, 0.7455% 1/20/61 (e)(i) | | 10,218 | | 10,150 |
Series 2011-H05 Class FA, 0.7455% 12/20/60 (e)(i) | | 1,525 | | 1,515 |
Series 2011-H07 Class FA, 0.7455% 2/20/61 (e)(i) | | 3,076 | | 3,024 |
Series 2011-H12 Class FA, 0.7355% 2/20/61 (e)(i) | | 3,726 | | 3,662 |
Series 2011-H13 Class FA, 0.7455% 4/20/61 (e)(i) | | 242 | | 241 |
Series 2011-H14: | | | | |
Class FB, 0.7455% 5/20/61 (e)(i) | | 1,713 | | 1,692 |
Class FC, 0.7455% 5/20/61 (e)(i) | | 1,746 | | 1,725 |
Series 2011-H17 Class FA, 0.7755% 6/20/61 (e)(i) | | 2,189 | | 2,179 |
planned amortization class Series 2011-79 Class PO, 6/20/40 (g) | | 3,034 | | 2,566 |
sequential payer Series 2002-42 Class ZA, 6% 6/20/32 | | 987 | | 1,109 |
Series 2004-32 Class GS, 6.2525% 5/16/34 (e)(f)(h) | | 774 | | 161 |
Series 2010-91 Class PO, 7/20/40 (g) | | 1,017 | | 898 |
Government National Mortgage Association planned amortization class Series 2011-136 Class WI, 4.5% 5/20/40 (f) | | 924 | | 185 |
TOTAL U.S. GOVERNMENT AGENCY | | 97,309 |
TOTAL COLLATERALIZED MORTGAGE OBLIGATIONS (Cost $129,427) | 132,556 |
Commercial Mortgage Securities - 3.9% |
|
Asset Securitization Corp. Series 1997-D5: | | | | |
Class A6, 7.4526% 2/14/43 (e) | | 4,300 | | 4,383 |
Class PS1, 1.4363% 2/14/43 (e)(f) | | 9,301 | | 103 |
Banc of America Commercial Mortgage, Inc. sequential payer Series 2004-4 Class A5, 4.576% 7/10/42 | | 304 | | 311 |
Commercial Mortgage Securities - continued |
| Principal Amount (000s) | | Value (000s) |
Bayview Commercial Asset Trust floater: | | | | |
Series 2006-4A Class B2, 1.494% 12/25/36 (b)(e) | | $ 74 | | $ 4 |
Series 2007-3: | | | | |
Class M1, 0.554% 7/25/37 (b)(e) | | 68 | | 23 |
Class M2, 0.584% 7/25/37 (b)(e) | | 71 | | 19 |
Class M3, 0.614% 7/25/37 (b)(e) | | 116 | | 25 |
CDC Commercial Mortgage Trust Series 2002-FX1 Class XCL, 1.5913% 5/15/35 (b)(e)(f) | | 6,520 | | 153 |
Citigroup/Deutsche Bank Commercial Mortgage Trust sequential payer Series 2007-CD4 Class A4, 5.322% 12/11/49 | | 5,110 | | 5,608 |
Credit Suisse Commercial Mortgage Trust sequential payer Series 2007-C3 Class A2, 5.9018% 6/15/39 (e) | | 685 | | 687 |
GS Mortgage Securities Corp. II sequential payer Series 2005-GG4 Class A3, 4.607% 7/10/39 | | 560 | | 561 |
JPMorgan Chase Commercial Mortgage Securities Corp. floater Series 2011-CCHP Class A, 2.6% 7/15/28 (b)(e) | | 9,075 | | 9,074 |
JPMorgan Chase Commercial Mortgage Securities Trust sequential payer: | | | | |
Series 2007-LD11 Class A4, 6.0045% 6/15/49 (e) | | 4,140 | | 4,571 |
Series 2007-LDPX Class A2 S, 5.305% 1/15/49 | | 4,309 | | 4,310 |
LB-UBS Commercial Mortgage Trust: | | | | |
sequential payer Series 2007-C6 Class A2, 5.845% 7/15/40 | | 499 | | 507 |
Series 2007-C1 Class XCP, 0.6167% 2/15/40 (e)(f) | | 9,316 | | 79 |
Merrill Lynch-CFC Commercial Mortgage Trust sequential payer Series 2007-6 Class A4, 5.485% 3/12/51 (e) | | 175 | | 190 |
Wachovia Bank Commercial Mortgage Trust: | | | | |
floater Series 2006-WL7A Class A1, 0.3751% 9/15/21 (b)(e) | | 2,314 | | 2,229 |
Series 2007-C31A Class A2, 5.421% 4/15/47 | | 769 | | 799 |
Wachovia Bank Commercial Mortgage Trust pass-thru certificates sequential payer Series 2007-C33 Class A4, 6.0964% 2/15/51 (e) | | 1,470 | | 1,621 |
TOTAL COMMERCIAL MORTGAGE SECURITIES (Cost $34,956) | 35,257 |
Cash Equivalents - 4.1% |
| Maturity Amount (000s) | | Value (000s) |
Investments in repurchase agreements in a joint trading account at 0.14%, dated 2/29/12 due 3/1/12 (Collateralized by U.S. Government Obligations) #
(Cost $36,334) | $ 36,334 | | $ 36,334 |
TOTAL INVESTMENT PORTFOLIO - 126.7% (Cost $1,109,732) | | 1,128,793 |
NET OTHER ASSETS (LIABILITIES) - (26.7)% | | (238,093) |
NET ASSETS - 100% | $ 890,700 |
TBA Sale Commitments |
| Principal Amount (000s) | | |
Fannie Mae |
3.5% 3/1/42 | $ (1,000) | | (1,034) |
4.5% 3/1/27 | (5,000) | | (5,350) |
4.5% 3/1/42 | (4,400) | | (4,689) |
5% 3/1/42 | (9,000) | | (9,720) |
5% 3/1/42 | (9,000) | | (9,720) |
5.5% 3/1/42 | (2,000) | | (2,179) |
5.5% 3/1/42 | (8,000) | | (8,716) |
TOTAL FANNIE MAE | | (41,408) |
Ginnie Mae |
4% 3/1/42 | (2,500) | | (2,692) |
5% 3/1/42 | (17,200) | | (18,998) |
TOTAL GINNIE MAE | | (21,690) |
TOTAL TBA SALE COMMITMENTS (Proceeds $63,145) | $ (63,098) |
Swap Agreements |
| Expiration Date | | Notional Amount (000s) | | Value (000s) |
Interest Rate Swaps |
Receive quarterly a floating rate based on 3-month LIBOR and pay semi-annually a fixed rate equal to 0.9975% with JPMorgan Chase, Inc. | Feb. 2017 | | $ 18,000 | | $ 86 |
Receive quarterly a floating rate based on 3-month LIBOR and pay semi-annually a fixed rate equal to 3.75125% with Credit Suisse First Boston | August 2041 | | 2,900 | | (586) |
| | $ 20,900 | | $ (500) |
Legend |
(a) Non-income producing - Security is in default. |
(b) Security exempt from registration under Rule 144A of the Securities Act of 1933. These securities may be resold in transactions exempt from registration, normally to qualified institutional buyers. At the end of the period, the value of these securities amounted to $50,151,000 or 5.6% of net assets. |
(c) Security or a portion of the security purchased on a delayed delivery or when-issued basis. |
(d) Security or a portion of the security has been segregated as collateral for open swap agreements. At the period end, the value of securities pledged amounted to $673,000. |
(e) Coupon rates for floating and adjustable rate securities reflect the rates in effect at period end. |
(f) Security represents right to receive monthly interest payments on an underlying pool of mortgages or assets. Principal shown is the outstanding par amount of the pool as of the end of the period. |
(g) Principal Only Strips represent the right to receive the monthly principal payments on an underlying pool of mortgage loans. |
(h) Coupon is inversely indexed to a floating interest rate multiplied by a specified factor. The price may be considerably more volatile than the price of a comparable fixed rate security. |
(i) Represents an investment in an underlying pool of reverse mortgages which typically do not require regular principal and interest payments as repayment is deferred until a maturity event. |
# Additional information on each counterparty to the repurchase agreement is as follows: |
Repurchase Agreement / Counterparty | Value
(Amounts in thousands) |
$36,334,000 due 3/01/12 at 0.14% |
Citibank NA | $ 6,368 |
Credit Suisse Securities (USA) LLC | 26,782 |
Merrill Lynch, Pierce, Fenner & Smith, Inc. | 3,184 |
| $ 36,334 |
Other Information |
The following is a summary of the inputs used, as of February 29, 2012, involving the Fund's assets and liabilities carried at fair value. The inputs or methodology used for valuing securities may not be an indication of the risk associated with investing in those securities. For more information on valuation inputs, and their aggregation into the levels used in the tables below, please refer to the Security Valuation section in the accompanying Notes to Financial Statements. |
Valuation Inputs at Reporting Date: |
Description
(Amounts in thousands) | Total | Level 1 | Level 2 | Level 3 |
Investments in Securities: | | | | |
U.S. Government Agency - Mortgage Securities | $ 891,089 | $ - | $ 891,089 | $ - |
Asset-Backed Securities | 33,557 | - | 33,471 | 86 |
Collateralized Mortgage Obligations | 132,556 | - | 132,423 | 133 |
Commercial Mortgage Securities | 35,257 | - | 35,186 | 71 |
Cash Equivalents | 36,334 | - | 36,334 | - |
Total Investments in Securities: | $ 1,128,793 | $ - | $ 1,128,503 | $ 290 |
Derivative Instruments: | | | | |
Assets | | | | |
Swap Agreements | $ 86 | $ - | $ 86 | $ - |
Liabilities | | | | |
Swap Agreements | $ (586) | $ - | $ (586) | $ - |
Total Derivative Instruments: | $ (500) | $ - | $ (500) | $ - |
Other Financial Instruments: | | | | |
TBA Sale Commitments | $ (63,098) | $ - | $ (63,098) | $ - |
The following is a reconciliation of Investments in Securities for which Level 3 inputs were used in determining value: |
(Amounts in thousands) | |
Investments in Securities: | |
Beginning Balance | $ 184 |
Total Realized Gain (Loss) | (404) |
Total Unrealized Gain (Loss) | 415 |
Cost of Purchases | - |
Proceeds of Sales | (39) |
Amortization/Accretion | (41) |
Transfers in to Level 3 | 175 |
Transfers out of Level 3 | - |
Ending Balance | $ 290 |
The change in unrealized gain (loss) for the period attributable to Level 3 securities held at February 29, 2012 | $ 11 |
The information used in the above reconciliation represents fiscal year to date activity for any Investments in Securities identified as using Level 3 inputs at either the beginning or the end of the current fiscal period. Transfers in or out of Level 3 represent the beginning value of any Security or Instrument where a change in the pricing level occurred from the beginning to the end of the period. The cost of purchases and the proceeds of sales may include securities received or delivered through corporate actions or exchanges. Realized and unrealized gains (losses) disclosed in the reconciliation are included in Net Gain (Loss) on the Fund's Statement of Operations. |
Value of Derivative Instruments |
The following table is a summary of the Fund's value of derivative instruments by risk exposure as of February 29, 2012. For additional information on derivative instruments, please refer to the Derivative Instruments section in the accompanying Notes to Financial Statements. |
Risk Exposure /
Derivative Type | Value
(Amounts in thousands) |
| Asset | Liability |
Interest Rate Risk | | |
Swap Agreements (a) | $ 86 | $ (586) |
Total Value of Derivatives | $ 86 | $ (586) |
(a) Value is disclosed on the Statement of Assets and Liabilities in the Swap agreements, at value line-items. |
See accompanying notes which are an integral part of the financial statements.
Semiannual Report
Statement of Assets and Liabilities
Amounts in thousands (except per-share amounts) | February 29, 2012 (Unaudited) |
| | |
Assets | | |
Investment in securities, at value (including repurchase agreements of $36,334) - See accompanying schedule: Unaffiliated issuers (cost $1,109,732) | | $ 1,128,793 |
Cash | | 74 |
Receivable for investments sold, regular delivery | | 13,845 |
Receivable for TBA sale commitments | | 63,145 |
Receivable for fund shares sold | | 10,930 |
Interest receivable | | 3,292 |
Swap agreements, at value | | 86 |
Other receivables | | 116 |
Total assets | | 1,220,281 |
| | |
Liabilities | | |
TBA sale commitments, at value | $ 63,098 | |
Payable for investments purchased on a delayed delivery basis | 264,306 | |
Payable for fund shares redeemed | 879 | |
Distributions payable | 219 | |
Swap agreements, at value | 586 | |
Accrued management fee | 232 | |
Distribution and service plan fees payable | 38 | |
Other affiliated payables | 109 | |
Other payables and accrued expenses | 114 | |
Total liabilities | | 329,581 |
| | |
Net Assets | | $ 890,700 |
Net Assets consist of: | | |
Paid in capital | | $ 961,846 |
Distributions in excess of net investment income | | (7,410) |
Accumulated undistributed net realized gain (loss) on investments | | (82,344) |
Net unrealized appreciation (depreciation) on investments | | 18,608 |
Net Assets | | $ 890,700 |
See accompanying notes which are an integral part of the financial statements.
Semiannual Report
Statement of Assets and Liabilities - continued
Amounts in thousands (except per-share amounts) | February 29, 2012 (Unaudited) |
| | |
Calculation of Maximum Offering Price
Class A:
Net Asset Value and redemption price per share ($58,492 ÷ 5,226.9 shares) | | $ 11.19 |
| | |
Maximum offering price per share (100/96.00 of $11.19) | | $ 11.66 |
Class T:
Net Asset Value and redemption price per share ($36,308 ÷ 3,238.3 shares) | | $ 11.21 |
| | |
Maximum offering price per share (100/96.00 of $11.21) | | $ 11.68 |
Class B:
Net Asset Value and offering price per share ($4,265 ÷ 381.1 shares)A | | $ 11.19 |
| | |
Class C:
Net Asset Value and offering price per share ($18,205 ÷ 1,629.2 shares)A | | $ 11.17 |
| | |
| | |
Fidelity Mortgage Securities Fund:
Net Asset Value, offering price and redemption price per share ($763,511 ÷ 68,067.9 shares) | | $ 11.22 |
| | |
Institutional Class:
Net Asset Value, offering price and redemption price per share ($9,919 ÷ 887.2 shares) | | $ 11.18 |
A Redemption price per share is equal to net asset value less any applicable contingent deferred sales charge.
See accompanying notes which are an integral part of the financial statements.
Semiannual Report
Financial Statements - continued
Statement of Operations
Amounts in thousands | Six months ended February 29, 2012 (Unaudited) |
| | |
Investment Income | | |
Interest | | $ 15,556 |
| | |
Expenses | | |
Management fee | $ 1,396 | |
Transfer agent fees | 501 | |
Distribution and service plan fees | 222 | |
Fund wide operations fee | 145 | |
Independent trustees' compensation | 1 | |
Miscellaneous | 1 | |
Total expenses | | 2,266 |
Net investment income (loss) | | 13,290 |
Realized and Unrealized Gain (Loss) Net realized gain (loss) on: | | |
Investment securities: | | |
Unaffiliated issuers | 12,843 | |
Futures contracts | 4 | |
Swap agreements | (1,236) | |
Total net realized gain (loss) | | 11,611 |
Change in net unrealized appreciation (depreciation) on: Investment securities | (7,469) | |
Swap agreements | 422 | |
Delayed delivery commitments | (340) | |
Total change in net unrealized appreciation (depreciation) | | (7,387) |
Net gain (loss) | | 4,224 |
Net increase (decrease) in net assets resulting from operations | | $ 17,514 |
See accompanying notes which are an integral part of the financial statements.
Semiannual Report
Statement of Changes in Net Assets
Amounts in thousands | Six months ended February 29, 2012
(Unaudited) | Year ended
August 31,
2011 |
Increase (Decrease) in Net Assets | | |
Operations | | |
Net investment income (loss) | $ 13,290 | $ 29,651 |
Net realized gain (loss) | 11,611 | 10,993 |
Change in net unrealized appreciation (depreciation) | (7,387) | 6,942 |
Net increase (decrease) in net assets resulting
from operations | 17,514 | 47,586 |
Distributions to shareholders from net investment income | (13,511) | (30,093) |
Share transactions - net increase (decrease) | (687) | (96,103) |
Total increase (decrease) in net assets | 3,316 | (78,610) |
| | |
Net Assets | | |
Beginning of period | 887,384 | 965,994 |
End of period (including distributions in excess of net investment income of $7,410 and distributions in excess of net investment income of $7,189, respectively) | $ 890,700 | $ 887,384 |
See accompanying notes which are an integral part of the financial statements.
Semiannual Report
Financial Highlights - Class A
| Six months ended February 29, 2012 | Years ended August 31, |
| (Unaudited) | 2011 | 2010 | 2009 | 2008 | 2007 |
Selected Per-Share Data | | | | | | |
Net asset value, beginning of period | $ 11.14 | $ 10.91 | $ 10.38 | $ 10.09 | $ 10.57 | $ 10.97 |
Income from Investment Operations | | | | | | |
Net investment income (loss) E | .151 | .323 | .357 | .464 | .467 | .521 |
Net realized and unrealized gain (loss) | .053 | .235 | .602 | .283 | (.461) | (.401) |
Total from investment operations | .204 | .558 | .959 | .747 | .006 | .120 |
Distributions from net investment income | (.154) | (.328) | (.429) | (.457) | (.486) | (.520) |
Net asset value, end of period | $ 11.19 | $ 11.14 | $ 10.91 | $ 10.38 | $ 10.09 | $ 10.57 |
Total Return B, C, D | 1.85% | 5.22% | 9.44% | 7.63% | .06% | 1.04% |
Ratios to Average Net Assets F, H | | | | | |
Expenses before reductions | .82% A | .82% | .83% | .84% | .85% | .79% |
Expenses net of fee waivers, if any | .82% A | .82% | .83% | .84% | .85% | .79% |
Expenses net of all reductions | .82% A | .82% | .83% | .84% | .85% | .78% |
Net investment income (loss) | 2.73% A | 2.96% | 3.36% | 4.59% | 4.52% | 4.77% |
Supplemental Data | | | | | | |
Net assets, end of period (in millions) | $ 58 | $ 59 | $ 61 | $ 47 | $ 39 | $ 54 |
Portfolio turnover rate G | 496% A | 490% | 527% | 476% | 397% | 409% |
A Annualized
B Total returns for periods of less than one year are not annualized.
C Total returns would have been lower if certain expenses had not been reduced during the applicable periods shown.
D Total returns do not include the effect of the sales charges.
E Calculated based on average shares outstanding during the period.
F Fees and expenses of any underlying Fidelity Central Funds are not included in the Fund's expense ratio. The Fund indirectly bears its proportionate share of the expenses of any underlying Fidelity Central Funds.
G Amount does not include the portfolio activity of any underlying Fidelity Central Funds.
H Expense ratios reflect operating expenses of the class. Expenses before reductions do not reflect amounts reimbursed by the investment adviser or reductions from expense offset arrangements and do not represent the amount paid by the class during periods when reimbursements or reductions occur. Expenses net of fee waivers reflect expenses after reimbursement by the investment adviser but prior to reductions from expense offset arrangements. Expenses net of all reductions represent the net expenses paid by the class.
See accompanying notes which are an integral part of the financial statements.
Semiannual Report
Financial Highlights - Class T
| Six months ended February 29, 2012 | Years ended August 31, |
| (Unaudited) | 2011 | 2010 | 2009 | 2008 | 2007 |
Selected Per-Share Data | | | | | | |
Net asset value, beginning of period | $ 11.16 | $ 10.93 | $ 10.40 | $ 10.11 | $ 10.59 | $ 10.99 |
Income from Investment Operations | | | | | | |
Net investment income (loss) E | .153 | .326 | .360 | .466 | .470 | .519 |
Net realized and unrealized gain (loss) | .053 | .235 | .602 | .282 | (.462) | (.403) |
Total from investment operations | .206 | .561 | .962 | .748 | .008 | .116 |
Distributions from net investment income | (.156) | (.331) | (.432) | (.458) | (.488) | (.516) |
Net asset value, end of period | $ 11.21 | $ 11.16 | $ 10.93 | $ 10.40 | $ 10.11 | $ 10.59 |
Total Return B, C, D | 1.86% | 5.24% | 9.44% | 7.62% | .07% | 1.01% |
Ratios to Average Net Assets F, H | | | | | |
Expenses before reductions | .79% A | .79% | .81% | .83% | .83% | .82% |
Expenses net of fee waivers, if any | .79% A | .79% | .81% | .83% | .83% | .82% |
Expenses net of all reductions | .79% A | .79% | .81% | .83% | .83% | .82% |
Net investment income (loss) | 2.76% A | 2.99% | 3.39% | 4.60% | 4.53% | 4.73% |
Supplemental Data | | | | | | |
Net assets, end of period (in millions) | $ 36 | $ 37 | $ 41 | $ 40 | $ 41 | $ 68 |
Portfolio turnover rate G | 496% A | 490% | 527% | 476% | 397% | 409% |
A Annualized
B Total returns for periods of less than one year are not annualized.
C Total returns would have been lower if certain expenses had not been reduced during the applicable periods shown.
D Total returns do not include the effect of the sales charges.
E Calculated based on average shares outstanding during the period.
F Fees and expenses of any underlying Fidelity Central Funds are not included in the Fund's expense ratio. The Fund indirectly bears its proportionate share of the expenses of any underlying Fidelity Central Funds.
G Amount does not include the portfolio activity of any underlying Fidelity Central Funds.
H Expense ratios reflect operating expenses of the class. Expenses before reductions do not reflect amounts reimbursed by the investment adviser or reductions from expense offset arrangements and do not represent the amount paid by the class during periods when reimbursements or reductions occur. Expenses net of fee waivers reflect expenses after reimbursement by the investment adviser but prior to reductions from expense offset arrangements. Expenses net of all reductions represent the net expenses paid by the class.
See accompanying notes which are an integral part of the financial statements.
Semiannual Report
Financial Highlights - Class B
| Six months ended February 29, 2012 | Years ended August 31, |
| (Unaudited) | 2011 | 2010 | 2009 | 2008 | 2007 |
Selected Per-Share Data | | | | | | |
Net asset value, beginning of period | $ 11.14 | $ 10.91 | $ 10.38 | $ 10.09 | $ 10.57 | $ 10.97 |
Income from Investment Operations | | | | | | |
Net investment income (loss) E | .113 | .248 | .286 | .398 | .400 | .443 |
Net realized and unrealized gain (loss) | .053 | .235 | .602 | .283 | (.461) | (.401) |
Total from investment operations | .166 | .483 | .888 | .681 | (.061) | .042 |
Distributions from net investment income | (.116) | (.253) | (.358) | (.391) | (.419) | (.442) |
Net asset value, end of period | $ 11.19 | $ 11.14 | $ 10.91 | $ 10.38 | $ 10.09 | $ 10.57 |
Total Return B, C, D | 1.50% | 4.51% | 8.71% | 6.93% | (.58)% | .32% |
Ratios to Average Net Assets F, H | | | | | |
Expenses before reductions | 1.51% A | 1.50% | 1.50% | 1.50% | 1.50% | 1.50% |
Expenses net of fee waivers, if any | 1.51% A | 1.50% | 1.50% | 1.50% | 1.50% | 1.50% |
Expenses net of all reductions | 1.51% A | 1.50% | 1.50% | 1.50% | 1.50% | 1.50% |
Net investment income (loss) | 2.04% A | 2.27% | 2.69% | 3.93% | 3.86% | 4.05% |
Supplemental Data | | | | | | |
Net assets, end of period (in millions) | $ 4 | $ 5 | $ 7 | $ 19 | $ 32 | $ 50 |
Portfolio turnover rate G | 496% A | 490% | 527% | 476% | 397% | 409% |
A Annualized
B Total returns for periods of less than one year are not annualized.
C Total returns would have been lower if certain expenses had not been reduced during the applicable periods shown.
D Total returns do not include the effect of the contingent deferred sales charge.
E Calculated based on average shares outstanding during the period.
F Fees and expenses of any underlying Fidelity Central Funds are not included in the Fund's expense ratio. The Fund indirectly bears its proportionate share of the expenses of any underlying Fidelity Central Funds.
G Amount does not include the portfolio activity of any underlying Fidelity Central Funds.
H Expense ratios reflect operating expenses of the class. Expenses before reductions do not reflect amounts reimbursed by the investment adviser or reductions from expense offset arrangements and do not represent the amount paid by the class during periods when reimbursements or reductions occur. Expenses net of fee waivers reflect expenses after reimbursement by the investment adviser but prior to reductions from expense offset arrangements. Expenses net of all reductions represent the net expenses paid by the class.
See accompanying notes which are an integral part of the financial statements.
Semiannual Report
Financial Highlights - Class C
| Six months ended February 29, 2012 | Years ended August 31, |
| (Unaudited) | 2011 | 2010 | 2009 | 2008 | 2007 |
Selected Per-Share Data | | | | | | |
Net asset value, beginning of period | $ 11.12 | $ 10.90 | $ 10.37 | $ 10.08 | $ 10.56 | $ 10.96 |
Income from Investment Operations | | | | | | |
Net investment income (loss) E | .111 | .244 | .282 | .390 | .389 | .434 |
Net realized and unrealized gain (loss) | .054 | .226 | .603 | .284 | (.459) | (.401) |
Total from investment operations | .165 | .470 | .885 | .674 | (.070) | .033 |
Distributions from net investment income | (.115) | (.250) | (.355) | (.384) | (.410) | (.433) |
Net asset value, end of period | $ 11.17 | $ 11.12 | $ 10.90 | $ 10.37 | $ 10.08 | $ 10.56 |
Total Return B, C, D | 1.49% | 4.39% | 8.69% | 6.86% | (.68)% | .25% |
Ratios to Average Net Assets F, H | | | | | |
Expenses before reductions | 1.54% A | 1.53% | 1.53% | 1.57% | 1.60% | 1.58% |
Expenses net of fee waivers, if any | 1.54% A | 1.53% | 1.53% | 1.57% | 1.60% | 1.58% |
Expenses net of all reductions | 1.54% A | 1.53% | 1.53% | 1.57% | 1.60% | 1.58% |
Net investment income (loss) | 2.01% A | 2.24% | 2.66% | 3.86% | 3.77% | 3.97% |
Supplemental Data | | | | | | |
Net assets, end of period (in millions) | $ 18 | $ 15 | $ 18 | $ 18 | $ 15 | $ 23 |
Portfolio turnover rate G | 496% A | 490% | 527% | 476% | 397% | 409% |
A Annualized
B Total returns for periods of less than one year are not annualized.
C Total returns would have been lower if certain expenses had not been reduced during the applicable periods shown.
D Total returns do not include the effect of the contingent deferred sales charge.
E Calculated based on average shares outstanding during the period.
F Fees and expenses of any underlying Fidelity Central Funds are not included in the Fund's expense ratio. The Fund indirectly bears its proportionate share of the expenses of any underlying Fidelity Central Funds.
G Amount does not include the portfolio activity of any underlying Fidelity Central Funds.
H Expense ratios reflect operating expenses of the class. Expenses before reductions do not reflect amounts reimbursed by the investment adviser or reductions from expense offset arrangements and do not represent the amount paid by the class during periods when reimbursements or reductions occur. Expenses net of fee waivers reflect expenses after reimbursement by the investment adviser but prior to reductions from expense offset arrangements. Expenses net of all reductions represent the net expenses paid by the class.
See accompanying notes which are an integral part of the financial statements.
Semiannual Report
Financial Highlights - Fidelity Mortgage Securities Fund
| Six months ended February 29, 2012 | Years ended August 31, |
| (Unaudited) | 2011 | 2010 | 2009 | 2008 | 2007 |
Selected Per-Share Data | | | | | | |
Net asset value, beginning of period | $ 11.17 | $ 10.94 | $ 10.41 | $ 10.11 | $ 10.59 | $ 10.99 |
Income from Investment Operations | | | | | | |
Net investment income (loss) D | .172 | .364 | .399 | .505 | .509 | .559 |
Net realized and unrealized gain (loss) | .053 | .234 | .601 | .292 | (.462) | (.403) |
Total from investment operations | .225 | .598 | 1.000 | .797 | .047 | .156 |
Distributions from net investment income | (.175) | (.368) | (.470) | (.497) | (.527) | (.556) |
Net asset value, end of period | $ 11.22 | $ 11.17 | $ 10.94 | $ 10.41 | $ 10.11 | $ 10.59 |
Total Return B, C | 2.03% | 5.59% | 9.83% | 8.14% | .46% | 1.38% |
Ratios to Average Net Assets E, G | | | | | |
Expenses before reductions | .45% A | .45% | .45% | .45% | .45% | .45% |
Expenses net of fee waivers, if any | .45% A | .45% | .45% | .45% | .45% | .45% |
Expenses net of all reductions | .45% A | .45% | .45% | .45% | .45% | .45% |
Net investment income (loss) | 3.10% A | 3.33% | 3.74% | 4.99% | 4.91% | 5.10% |
Supplemental Data | | | | | | |
Net assets, end of period (in millions) | $ 764 | $ 765 | $ 829 | $ 838 | $ 1,049 | $ 1,446 |
Portfolio turnover rate F | 496% A | 490% | 527% | 476% | 397% | 409% |
A Annualized
B Total returns for periods of less than one year are not annualized.
C Total returns would have been lower if certain expenses had not been reduced during the applicable periods shown.
D Calculated based on average shares outstanding during the period.
E Fees and expenses of any underlying Fidelity Central Funds are not included in the Fund's expense ratio. The Fund indirectly bears its proportionate share of the expenses of any underlying Fidelity Central Funds.
F Amount does not include the portfolio activity of any underlying Fidelity Central Funds.
G Expense ratios reflect operating expenses of the class. Expenses before reductions do not reflect amounts reimbursed by the investment adviser or reductions from expense offset arrangements and do not represent the amount paid by the class during periods when reimbursements or reductions occur. Expenses net of fee waivers reflect expenses after reimbursement by the investment adviser but prior to reductions from expense offset arrangements. Expenses net of all reductions represent the net expenses paid by the class.
See accompanying notes which are an integral part of the financial statements.
Semiannual Report
Financial Highlights - Institutional Class
| Six months ended February 29, 2012 | Years ended August 31, |
| (Unaudited) | 2011 | 2010 | 2009 | 2008 | 2007 |
Selected Per-Share Data | | | | | | |
Net asset value, beginning of period | $ 11.13 | $ 10.90 | $ 10.37 | $ 10.08 | $ 10.56 | $ 10.97 |
Income from Investment Operations | | | | | | |
Net investment income (loss) D | .168 | .354 | .391 | .496 | .499 | .548 |
Net realized and unrealized gain (loss) | .054 | .235 | .603 | .284 | (.461) | (.411) |
Total from investment operations | .222 | .589 | .994 | .780 | .038 | .137 |
Distributions from net investment income | (.172) | (.359) | (.464) | (.490) | (.518) | (.547) |
Net asset value, end of period | $ 11.18 | $ 11.13 | $ 10.90 | $ 10.37 | $ 10.08 | $ 10.56 |
Total Return B, C | 2.01% | 5.53% | 9.80% | 7.98% | .37% | 1.20% |
Ratios to Average Net Assets E, G | | | | | |
Expenses before reductions | .51% A | .53% | .50% | .52% | .54% | .53% |
Expenses net of fee waivers, if any | .51% A | .53% | .50% | .52% | .54% | .53% |
Expenses net of all reductions | .51% A | .53% | .50% | .52% | .54% | .53% |
Net investment income (loss) | 3.04% A | 3.24% | 3.69% | 4.92% | 4.83% | 5.02% |
Supplemental Data | | | | | | |
Net assets, end of period (in millions) | $ 10 | $ 7 | $ 10 | $ 10 | $ 7 | $ 10 |
Portfolio turnover rate F | 496% A | 490% | 527% | 476% | 397% | 409% |
A Annualized
B Total returns for periods of less than one year are not annualized.
C Total returns would have been lower if certain expenses had not been reduced during the applicable periods shown.
D Calculated based on average shares outstanding during the period.
E Fees and expenses of any underlying Fidelity Central Funds are not included in the Fund's expense ratio. The Fund indirectly bears its proportionate share of the expenses of any underlying Fidelity Central Funds.
F Amount does not include the portfolio activity of any underlying Fidelity Central Funds.
G Expense ratios reflect operating expenses of the class. Expenses before reductions do not reflect amounts reimbursed by the investment adviser or reductions from expense offset arrangements and do not represent the amount paid by the class during periods when reimbursements or reductions occur. Expenses net of fee waivers reflect expenses after reimbursement by the investment adviser but prior to reductions from expense offset arrangements. Expenses net of all reductions represent the net expenses paid by the class.
See accompanying notes which are an integral part of the financial statements.
Semiannual Report
Notes to Financial Statements
For the period ended February 29, 2012 (Unaudited)
(Amounts in thousands except percentages)
1. Organization.
Fidelity Advisor Mortgage Securities Fund (the Fund) is a fund of Fidelity Advisor Series II (the Trust) and is authorized to issue an unlimited number of shares. The Trust is registered under the Investment Company Act of 1940, as amended (the 1940 Act), as an open-end management investment company organized as a Massachusetts business trust. The Fund offers Class A, Class T, Class C, Fidelity Mortgage Securities Fund and Institutional Class shares, each of which, along with Class B shares, has equal rights as to assets and voting privileges. Effective after the close of business on September 1, 2010, Class B shares were closed to new accounts and additional purchases, except for exchanges and reinvestments. Each class has exclusive voting rights with respect to matters that affect that class. Class B shares will automatically convert to Class A shares after a holding period of seven years from the initial date of purchase. Investment income, realized and unrealized capital gains and losses, the common expenses of the Fund, and certain fund-level expense reductions, if any, are allocated on a pro-rata basis to each class based on the relative net assets of each class to the total net assets of the Fund. Each class differs with respect to transfer agent and distribution and service plan fees incurred. Certain expense reductions may also differ by class.
2. Significant Accounting Policies.
The financial statements have been prepared in conformity with accounting principles generally accepted in the United States of America (GAAP), which require management to make certain estimates and assumptions at the date of the financial statements. Actual results could differ from those estimates. Subsequent events, if any, through the date that the financial statements were issued have been evaluated in the preparation of the financial statements. The following summarizes the significant accounting policies of the Fund:
Security Valuation. Investments are valued as of 4:00 p.m. Eastern time on the last calendar day of the period. The Fund uses independent pricing services approved by the Board of Trustees to value its investments. When current market prices or quotations are not readily available or reliable, valuations may be determined in good faith in accordance with procedures adopted by the Board of Trustees. Factors used in determining value may include market or security specific events, changes in interest rates and credit quality. The frequency with which these procedures are used cannot be predicted and they may be utilized to a significant extent. The value used for net asset value (NAV) calculation under these procedures may differ from published prices for the same securities.
Semiannual Report
Notes to Financial Statements (Unaudited) - continued
(Amounts in thousands except percentages)
2. Significant Accounting Policies - continued
Security Valuation - continued
The Fund categorizes the inputs to valuation techniques used to value its investments into a disclosure hierarchy consisting of three levels as shown below:
Level 1 - quoted prices in active markets for identical investments
Level 2 - other significant observable inputs (including quoted prices for similar investments, interest rates, prepayment speeds, etc.)
Level 3 - unobservable inputs (including the Fund's own assumptions based on the best information available)
Changes in valuation techniques may result in transfers in or out of an assigned level within the disclosure hierarchy. The aggregate value of investments by input level, as of February 29, 2012 for the Fund's investments, as well as a roll forward of Level 3 securities, is included at the end of the Fund's Schedule of Investments. Valuation techniques used to value the Fund's investments by major category are as follows:
Debt securities, including restricted securities, are valued based on evaluated prices received from independent pricing services or from dealers who make markets in such securities. For asset backed securities, collateralized mortgage obligations, commercial mortgage securities and U.S. government agency mortgage securities, pricing services utilize matrix pricing which considers prepayment speed assumptions, attributes of the collateral, yield or price of bonds of comparable quality, coupon, maturity and type as well as dealer supplied prices and, accordingly, such securities are generally categorized as Level 2 in the hierarchy. Dealers which make markets in asset backed securities, collateralized mortgage obligations and commercial mortgage securities may also consider such factors as the structure of the issue, cash flow assumptions, the value of underlying assets as well as any guarantees. Swaps are marked-to-market daily based on valuations from independent pricing services or dealer-supplied valuations and changes in value are recorded as unrealized appreciation (depreciation). Pricing services utilize matrix pricing which considers comparisons to interest rate curves, credit spread curves, default possibilities and recovery rates and, as a result, swaps are generally categorized as Level 2 in the hierarchy. When independent prices are unavailable or unreliable, debt securities and swaps may be valued utilizing pricing matrices which consider similar factors that would be used by independent pricing services. These are generally categorized as Level 2 in the hierarchy but may be Level 3 depending on the circumstances.
Short-term securities with remaining maturities of sixty days or less may be valued at amortized cost, which approximates fair value, and are categorized as Level 2 in the hierarchy.
Semiannual Report
2. Significant Accounting Policies - continued
New Accounting Pronouncements. In May 2011, the Financial Accounting Standards Board issued Accounting Standard Update No. 2011-04, Fair Value Measurement (Topic 820) - Amendments to Achieve Common Fair Value Measurement and Disclosure Requirements in U.S. GAAP and IFRSs. The update is effective during interim and annual periods beginning after December 15, 2011 and will result in additional disclosure for transfers between levels as well as expanded disclosure for securities categorized as Level 3 under the fair value hierarchy.
In December 2011, the Financial Accounting Standards Board issued Accounting Standard Update No. 2011-11, Disclosures about Offsetting Assets and Liabilities. The update creates new disclosure requirements requiring entities to disclose both gross and net information for derivatives and other financial instruments that are either offset in the Statement of Assets and Liabilities or subject to an enforceable master netting arrangement or similar agreement. The disclosure requirements are effective for interim and annual reporting periods beginning on or after January 1, 2013. Management is currently evaluating the impact of the update's adoption on the Fund's financial statement disclosures.
Investment Transactions and Income. For financial reporting purposes, the Fund's investment holdings and NAV include trades executed through the end of the last business day of the period. The NAV per share for processing shareholder transactions is calculated as of the close of business of the New York Stock Exchange (NYSE), normally 4:00 p.m. Eastern time and includes trades executed through the end of the prior business day. Gains and losses on securities sold are determined on the basis of identified cost. Interest income is accrued as earned. Interest income includes coupon interest and amortization of premium and accretion of discount on debt securities. Debt obligations may be placed on non-accrual status and related interest income may be reduced by ceasing current accruals and writing off interest receivables when the collection of all or a portion of interest has become doubtful based on consistently applied procedures. A debt obligation is removed from non-accrual status when the issuer resumes interest payments or when collectability of interest is reasonably assured.
Expenses. Expenses directly attributable to a fund are charged to that fund. Expenses attributable to more than one fund are allocated among the respective funds on the basis of relative net assets or other appropriate methods. Expense estimates are accrued in the period to which they relate and adjustments are made when actual amounts are known.
Income Tax Information and Distributions to Shareholders. Each year, the Fund intends to qualify as a regulated investment company under Subchapter M of the Internal Revenue Code, including distributing substantially all of its taxable income and realized gains. As a result, no provision for income taxes is required. The Fund files a U.S.
Semiannual Report
Notes to Financial Statements (Unaudited) - continued
(Amounts in thousands except percentages)
2. Significant Accounting Policies - continued
Income Tax Information and Distributions to Shareholders - continued
federal tax return, in addition to state and local tax returns as required. A fund's federal income tax returns are subject to examination by the Internal Revenue Service (IRS) for a period of three fiscal years after they are filed. State and local tax returns may be subject to examination for an additional fiscal year depending on the jurisdiction.
Dividends are declared and recorded daily and paid monthly from net investment income. Distributions from realized gains, if any, are declared and recorded on the ex-dividend date. Income dividends and capital gain distributions are declared separately for each class. Income and capital gain distributions are determined in accordance with income tax regulations, which may differ from GAAP.
Capital accounts within the financial statements are adjusted for permanent book-tax differences. These adjustments have no impact on net assets or the results of operations. Temporary book-tax differences will reverse in a subsequent period.
Book-tax differences are primarily due to futures transactions, swap agreements, prior period premium and discount on debt securities, market discount, deferred trustees compensation, financing transactions, capital loss carryforwards and losses deferred due to wash sales and excise tax regulations.
The federal tax cost of investment securities and unrealized appreciation (depreciation) as of period end were as follows:
Gross unrealized appreciation | $ 29,452 |
Gross unrealized depreciation | (10,393) |
Net unrealized appreciation (depreciation) on securities and other investments | $ 19,059 |
| |
Tax cost | $ 1,109,734 |
Capital loss carryforwards are only available to offset future capital gains of the Fund to the extent provided by regulations and may be limited. Under the Regulated Investment Company Modernization Act of 2010 (the Act), the Fund is permitted to carry forward capital losses incurred in taxable years beginning after December 22, 2010 for an unlimited period and such capital losses are required to be used prior to any losses that expire. At August 31, 2011, capital loss carryforwards were as follows:
Fiscal year of expiration | |
2016 | $ (5,307) |
2017 | (84,825) |
Total capital loss carryforward | $ (90,132) |
Semiannual Report
3. Operating Policies.
Repurchase Agreements. FMR has received an Exemptive Order from the Securities and Exchange Commission (the SEC) which permits the Fund and other affiliated entities of FMR to transfer uninvested cash balances into joint trading accounts which are then invested in repurchase agreements. The Fund may also invest directly with institutions in repurchase agreements. Repurchase agreements are collateralized by government or non-government securities. Upon settlement date, collateral is held in segregated accounts with custodian banks and may be obtained in the event of a default of the counterparty. The Fund monitors, on a daily basis, the value of the collateral to ensure it is at least equal to the principal amount of the repurchase agreement (including accrued interest). In the event of a default by the counterparty, realization of the collateral proceeds could be delayed, during which time the value of the collateral may decline.
Delayed Delivery Transactions and When-Issued Securities. During the period, the Fund transacted in securities on a delayed delivery or when-issued basis. Payment and delivery may take place after the customary settlement period for that security. The price of the underlying securities and the date when the securities will be delivered and paid for are fixed at the time the transaction is negotiated. During the time a delayed delivery sell is outstanding, the contract is marked-to-market daily and equivalent deliverable securities are held for the transaction. The securities purchased on a delayed delivery or when-issued basis are identified as such in the Fund's Schedule of Investments. The Fund may receive compensation for interest forgone in the purchase of a delayed delivery or when-issued security. With respect to purchase commitments, the Fund identifies securities as segregated in its records with a value at least equal to the amount of the commitment. Losses may arise due to changes in the value of the underlying securities or if the counterparty does not perform under the contract's terms, or if the issuer does not issue the securities due to political, economic, or other factors.
To-Be-Announced (TBA) Securities and Mortgage Dollar Rolls. During the period, the Fund transacted in TBA securities that involved buying or selling mortgage-backed securities (MBS) on a forward commitment basis. A TBA transaction typically does not designate the actual security to be delivered and only includes an approximate principal amount however; delivered securities must meet specified terms defined by industry guidelines, including issuer, rate and current principal amount outstanding on underlying mortgage pools. The Fund may enter into a TBA transaction with the intent to take possession of or deliver the underlying MBS, or the Fund may elect to extend the settlement by entering into either a mortgage or reverse mortgage dollar roll. Mortgage dollar rolls are transactions where a fund sells MBS and simultaneously agrees to repurchase MBS on a later date at a lower price and with the same counterparty. Reverse mortgage
Semiannual Report
Notes to Financial Statements (Unaudited) - continued
(Amounts in thousands except percentages)
3. Operating Policies - continued
To-Be-Announced (TBA) Securities and Mortgage Dollar Rolls - continued
dollar rolls involve the purchase and simultaneous agreement to sell MBS on a later date at a lower price. Transactions in mortgage dollar rolls and reverse mortgage dollar rolls are accounted for as purchases and sales and may result in an increase to the Fund's portfolio turnover rate.
Purchases and sales of TBA securities involve risks similar to those discussed above for delayed delivery and when-issued securities. Also, if the counterparty in a dollar roll or a reverse dollar roll transaction files for bankruptcy or becomes insolvent, the Fund's right to repurchase or sell securities may be limited. Additionally, when a fund sells TBA securities without already owning or having the right to obtain the deliverable securities (an uncovered forward commitment to sell), it incurs a risk of loss because it could have to purchase the securities at a price that is higher than the price at which it sold them. A fund may be unable to purchase the deliverable securities if the corresponding market is illiquid.
TBA securities subject to a forward commitment to sell at period end are included at the end of the Fund's Schedule of Investments under the caption "TBA Sale Commitments." The proceeds and value of these commitments are reflected in the Fund's Statement of Assets and Liabilities.
Restricted Securities. The Fund may invest in securities that are subject to legal or contractual restrictions on resale. These securities generally may be resold in transactions exempt from registration or to the public if the securities are registered. Disposal of these securities may involve time-consuming negotiations and expense, and prompt sale at an acceptable price may be difficult. Information regarding restricted securities is included at the end of the Fund's Schedule of Investments.
4. Derivative Instruments.
Risk Exposures and the Use of Derivative Instruments. The Fund used derivative instruments (derivatives), including futures contracts and swap agreements, in order to meet its investment objectives. The strategy is to use derivatives to increase returns, to gain exposure to certain types of assets and to manage exposure to certain risks as defined below. The success of any strategy involving derivatives depends on analysis of numerous economic factors, and if the strategies for investment do not work as intended, the Fund may not achieve its objectives.
Semiannual Report
4. Derivative Instruments - continued
Risk Exposures and the Use of Derivative Instruments - continued
The Fund's use of derivatives increased or decreased its exposure to the following risk:
Interest Rate Risk | Interest rate risk relates to the fluctuations in the value of interest-bearing securities due to changes in the prevailing levels of market interest rates. |
The Fund is also exposed to additional risks from investing in derivatives, such as liquidity risk and counterparty credit risk. Liquidity risk is the risk that the Fund will be unable to close out the derivative in the open market in a timely manner. Counterparty credit risk is the risk that the counterparty will not be able to fulfill its obligation to the Fund. Derivative counterparty credit risk is managed through formal evaluation of the creditworthiness of all potential counterparties. On certain over-the-counter (OTC) derivatives such as swap agreements, the Fund attempts to reduce its exposure to counterparty credit risk by entering into an International Swaps and Derivatives Association (ISDA) Master Agreement on a bilateral basis with each of its counterparties. The ISDA Master Agreement gives the Fund the right to terminate all transactions traded under such agreement if there is a certain deterioration in the credit quality of the counterparty. The ISDA Master Agreement gives each party the right, upon an event of default by the other party or a termination of the agreement, to close out all transactions traded under such agreement and to net amounts owed under each transaction to one net payable by one party to the other. To mitigate counterparty credit risk on OTC derivatives, the Fund receives collateral in the form of cash or securities once the Fund's net unrealized appreciation on outstanding derivative contracts under an ISDA Master Agreement exceeds certain applicable thresholds, subject to certain minimum transfer provisions. The collateral received is held in segregated accounts with the Fund's custodian bank in accordance with the collateral agreements entered into between the Fund, the counterparty and the Fund's custodian bank. The Fund could experience delays and costs in gaining access to the collateral even though it is held by the Fund's custodian bank. The Fund's maximum risk of loss from counterparty credit risk related to OTC derivatives is generally the aggregate unrealized appreciation and unpaid counterparty payments in excess of any collateral pledged by the counterparty to the Fund. The Fund may be required to pledge collateral for the benefit of the counterparties on OTC derivatives in an amount not less than the counterparty's unrealized appreciation on outstanding derivative contracts, subject to certain minimum transfer provisions, and any such pledged collateral is identified in the Schedule of Investments. Futures contracts are not covered by the ISDA Master Agreement, however, counterparty credit risk related to exchange-traded futures contracts is minimal because of the protection provided by the exchange on which they trade. Derivatives involve, to varying degrees, risk of loss in excess of the amounts recognized in the Statement of Assets and Liabilities.
Semiannual Report
Notes to Financial Statements (Unaudited) - continued
(Amounts in thousands except percentages)
4. Derivative Instruments - continued
Net Realized Gain (Loss) and Change in Net Unrealized Appreciation (Depreciation) on Derivatives. The table below, which reflects the impacts of derivatives on the financial performance of the Fund, summarizes the net realized gain (loss) and change in net unrealized appreciation (depreciation) for derivatives during the period.
Risk Exposure / Derivative Type | Net Realized
Gain (Loss) | Change in Net Unrealized
Appreciation (Depreciation) |
Interest Rate Risk | | |
Futures Contracts | $ 4 | $ - |
Swap Agreements | (1,236) | 422 |
Totals (a) | $ (1,232) | $ 422 |
(a) A summary of the value of derivatives by risk exposure as of period end, if any, is included at the end of the Schedule of Investments and is representative of activity for the period.
Futures Contracts. A futures contract is an agreement between two parties to buy or sell a specified underlying instrument for a fixed price at a specified future date. The Fund used futures contracts to manage its exposure to the fluctuations in interest rates.
Upon entering into a futures contract, a fund is required to deposit either cash or securities (initial margin) with a clearing broker in an amount equal to a certain percentage of the face value of the contract. Futures contracts are marked-to-market daily and subsequent payments (variation margin) are made or received by a fund depending on the daily fluctuations in the value of the futures contracts and are recorded as unrealized appreciation or (depreciation). This receivable and/or payable is included in daily variation margin on futures contracts in the Statement of Assets and Liabilities. Realized gain or (loss) is recorded upon the expiration or closing of a futures contract. The net realized gain (loss) and change in net unrealized appreciation (depreciation) on futures contracts during the period is included in the Statement of Operations.
The underlying face amount at value of open futures contracts at period end, if any, is shown in the Schedule of Investments under the caption "Futures Contracts."
Swap Agreements. A swap agreement (swap) is a contract between two parties to exchange future cash flows at periodic intervals based on a notional principal amount.
Details of swaps open at period end are included in the Schedule of Investments under the caption "Swap Agreements." Swaps are marked-to-market daily and changes in value are recorded as unrealized appreciation or (depreciation) and reflected in the Statement of Assets and Liabilities. Any upfront premiums paid or received upon entering a swap to compensate for differences between stated terms of the agreement and prevailing market conditions (e.g. credit spreads, interest rates or other factors) are recorded as realized gain or (loss) ratably over the term of the swap. Payments are exchanged at specified intervals, accrued daily commencing with the effective date of the contract and recorded as realized
Semiannual Report
4. Derivative Instruments - continued
Swap Agreements - continued
gain or (loss). Realized gain or (loss) is also recorded in the event of an early termination of a swap. The net realized gain (loss) and change in net unrealized appreciation (depreciation) on swaps during the period is included in the Statement of Operations.
Interest Rate Swaps. Interest rate swaps are agreements between counterparties to exchange cash flows, one based on a fixed rate, and the other on a floating rate. The Fund entered into interest rate swaps to manage its exposure to interest rate changes. Changes in interest rates can have an effect on both the value of bond holdings as well as the amount of interest income earned. In general, the value of bonds can fall when interest rates rise and can rise when interest rates fall.
5. Purchases and Sales of Investments.
Purchases and sales of securities, other than short-term securities and U.S. government securities, aggregated $45,047 and $52,466, respectively.
6. Fees and Other Transactions with Affiliates.
Management Fee. FMR and its affiliates provide the Fund with investment management related services for which the Fund pays a monthly management fee. The management fee is the sum of an individual fund fee rate that is based on an annual rate of .20% of the Fund's average net assets and an annualized group fee rate that averaged .12% during the period. The group fee rate is based upon the average net assets of all the mutual funds advised by FMR. The group fee rate decreases as assets under management increase and increases as assets under management decrease. For the period, the total annualized management fee rate was .32% of the Fund's average net assets.
Distribution and Service Plan Fees. In accordance with Rule 12b-1 of the 1940 Act, the Fund has adopted separate Distribution and Service Plans for each class of shares. Certain classes pay Fidelity Distributors Corporation (FDC), an affiliate of FMR, separate Distribution and Service Fees, each of which is based on an annual percentage of each class' average net assets. In addition, FDC may pay financial intermediaries for selling shares of the Fund and providing shareholder support services. For the period, the Distribution and Service Fee rates, total fees and amounts retained by FDC were as follows:
| Distribution
Fee | Service
Fee | Total
Fees | Retained
by FDC |
Class A | -% | .25% | $ 74 | $ 3 |
Class T | -% | .25% | 46 | -* |
Class B | .65% | .25% | 21 | 15 |
Class C | .75% | .25% | 81 | 10 |
| | | $ 222 | $ 28 |
* Amount represents two hundred eighty-one dollars.
Semiannual Report
Notes to Financial Statements (Unaudited) - continued
(Amounts in thousands except percentages)
6. Fees and Other Transactions with Affiliates - continued
Sales Load. FDC may receive a front-end sales charge of up to 4.00% for selling Class A shares and Class T shares, some of which is paid to financial intermediaries for selling shares of the Fund. Depending on the holding period, FDC may receive contingent deferred sales charges levied on Class A, Class T, Class B, and Class C redemptions. The deferred sales charges range from 5.00% to 1.00% for Class B, 1.00% for Class C, .75% for certain purchases of Class A shares and .25% for certain purchases of Class T shares.
For the period, sales charge amounts retained by FDC were as follows:
| Retained
by FDC |
Class A | $ 6 |
Class T | 2 |
Class B* | 6 |
Class C* | 1 |
| $ 15 |
* When Class B and Class C shares are initially sold, FDC pays commissions from its own resources to financial intermediaries through which the sales are made.
Transfer Agent Fees. Fidelity Investments Institutional Operations Company, Inc. (FIIOC), an affiliate of FMR, is the transfer, dividend disbursing and shareholder servicing agent for each class of the Fund. FIIOC receives account fees and asset-based fees that vary according to the account size and type of account of the shareholders of each respective class of the Fund, with the exception of Fidelity Mortgage Securities Fund. FIIOC receives an asset-based fee of .10% of Fidelity Mortgage Securities Fund's average net assets. FIIOC pays for typesetting, printing and mailing of shareholder reports, except proxy statements. For the period, transfer agent fees for each class were as follows:
| Amount | % of
Average
Net Assets* |
Class A | $ 63 | .21 |
Class T | 33 | .18 |
Class B | 6 | .25 |
Class C | 15 | .18 |
Fidelity Mortgage Securities Fund | 378 | .10 |
Institutional Class | 6 | .15 |
| $ 501 | |
* Annualized
Semiannual Report
6. Fees and Other Transactions with Affiliates - continued
Fund Wide Operations Fee. Pursuant to the Fund Wide Operations and Expense Agreement (FWOE), FMR has agreed to provide for fund level expenses (which do not include transfer agent, Rule 12b-1 fees, compensation of the independent Trustees, interest (including commitment fees), taxes or extraordinary expenses, if any) in return for a FWOE fee equal to .35% less the total amount of the management fee. The FWOE paid by the Fund is reduced by an amount equal to the fees and expenses paid to the independent Trustees. For the period, the FWOE fee was equivalent to an annualized rate of .03% of average net assets.
7. Committed Line of Credit.
The Fund participates with other funds managed by FMR or an affiliate in a $4.0 billion credit facility (the "line of credit") to be utilized for temporary or emergency purposes to fund shareholder redemptions or for other short-term liquidity purposes. The Fund has agreed to pay commitment fees on its pro-rata portion of the line of credit, which amounted to $1 and is reflected in Miscellaneous expenses on the Statement of Operations. During the period, there were no borrowings on this line of credit.
8. Distributions to Shareholders.
Distributions to shareholders of each class were as follows:
| Six months ended February 29,
2012 | Year ended
August 31,
2011 |
From net investment income | | |
Class A | $ 821 | $ 1,718 |
Class T | 511 | 1,137 |
Class B | 48 | 133 |
Class C | 168 | 380 |
Fidelity Mortgage Securities Fund | 11,837 | 26,484 |
Institutional Class | 126 | 241 |
Total | $ 13,511 | $ 30,093 |
Semiannual Report
Notes to Financial Statements (Unaudited) - continued
(Amounts in thousands except percentages)
9. Share Transactions.
Transactions for each class of shares were as follows:
| Shares | Dollars |
| Six months ended February 29, 2012 | Year ended
August 31, 2011 | Six months ended February 29, 2012 | Year ended
August 31, 2011 |
Class A | | | | |
Shares sold | 843 | 1,347 | $ 9,403 | $ 14,756 |
Reinvestment of distributions | 60 | 129 | 674 | 1,402 |
Shares redeemed | (965) | (1,794) | (10,749) | (19,528) |
Net increase (decrease) | (62) | (318) | $ (672) | $ (3,370) |
Class T | | | | |
Shares sold | 275 | 574 | $ 3,075 | $ 6,276 |
Reinvestment of distributions | 42 | 92 | 466 | 1,004 |
Shares redeemed | (378) | (1,136) | (4,223) | (12,380) |
Net increase (decrease) | (61) | (470) | $ (682) | $ (5,100) |
Class B | | | | |
Shares sold | 7 | 32 | $ 84 | $ 360 |
Reinvestment of distributions | 3 | 8 | 28 | 83 |
Shares redeemed | (66) | (263) | (738) | (2,865) |
Net increase (decrease) | (56) | (223) | $ (626) | $ (2,422) |
Class C | | | | |
Shares sold | 419 | 226 | $ 4,667 | $ 2,470 |
Reinvestment of distributions | 10 | 25 | 116 | 275 |
Shares redeemed | (177) | (526) | (1,975) | (5,730) |
Net increase (decrease) | 252 | (275) | $ 2,808 | $ (2,985) |
Fidelity Mortgage Securities Fund | | | | |
Shares sold | 4,615 | 8,371 | $ 51,615 | $ 91,409 |
Reinvestment of distributions | 961 | 2,193 | 10,731 | 23,971 |
Shares redeemed | (6,008) | (17,842) | (67,100) | (194,555) |
Net increase (decrease) | (432) | (7,278) | $ (4,754) | $ (79,175) |
Institutional Class | | | | |
Shares sold | 387 | 226 | $ 4,319 | $ 2,471 |
Reinvestment of distributions | 10 | 20 | 108 | 214 |
Shares redeemed | (107) | (530) | (1,188) | (5,736) |
Net increase (decrease) | 290 | (284) | $ 3,239 | $ (3,051) |
Semiannual Report
10. Other.
The Fund's organizational documents provide former and current trustees and officers with a limited indemnification against liabilities arising in connection with the performance of their duties to the Fund. In the normal course of business, the Fund may also enter into contracts that provide general indemnifications. The Fund's maximum exposure under these arrangements is unknown as this would be dependent on future claims that may be made against the Fund. The risk of material loss from such claims is considered remote.
11. Credit Risk.
The Fund invests a portion of its assets in structured securities of issuers backed by residential mortgage loans, credit card receivables and automotive loans. The value and related income of these securities is sensitive to changes in economic conditions, including delinquencies and/or defaults.
Semiannual Report
Board Approval of Investment Advisory Contracts and Management Fees
Fidelity Advisor Mortgage Securities Fund
Each year, the Board of Trustees, including the Independent Trustees (together, the Board), votes on the renewal of the management contract and sub-advisory agreements (together, the Advisory Contracts) for the fund. The Board, assisted by the advice of fund counsel and Independent Trustees' counsel, requests and considers a broad range of information relevant to the renewal of the Advisory Contracts throughout the year.
The Board meets regularly and considers at each of its meetings factors that are relevant to its annual consideration of the renewal of the fund's Advisory Contracts, including the services and support provided to the fund and its shareholders. The Board has established three standing committees, Operations, Audit, and Nominating and Governance, each composed of Independent Trustees with varying backgrounds, to which the Board has assigned specific subject matter responsibilities in order to enhance effective decision-making by the Board. The Operations Committee, of which all of the Independent Trustees are members, meets regularly throughout the year and, among other matters, considers matters specifically related to the annual consideration of the renewal of the fund's Advisory Contracts. The Board, acting directly and through its Committees, requests and receives information concerning the annual consideration of the renewal of the fund's Advisory Contracts. The Board also meets as needed to consider matters specifically related to the Board's annual consideration of the renewal of Advisory Contracts. Members of the Board may also meet with trustees of other Fidelity funds through ad hoc joint committees to discuss certain matters relevant to the Fidelity funds.
At its September 2011 meeting, the Board of Trustees, including the Independent Trustees, unanimously determined to renew the fund's Advisory Contracts. In reaching its determination, the Board considered all factors it believed relevant, including (i) the nature, extent, and quality of the services to be provided to the fund and its shareholders (including the investment performance of the fund); (ii) the competitiveness of the fund's management fee and total expense ratio; (iii) the total costs of the services to be provided by and the profits to be realized by Fidelity from its relationship with the fund; (iv) the extent to which economies of scale would be realized as the fund grows; and (v) whether fee levels reflect these economies of scale, if any, for the benefit of fund shareholders.
In considering whether to renew the Advisory Contracts for the fund, the Board reached a determination, with the assistance of fund counsel and Independent Trustees' counsel and through the exercise of its business judgment, that the renewal of the Advisory Contracts is in the best interests of the fund and its shareholders and that the compensation payable under the Advisory Contracts is fair and reasonable. The Board's decision to renew the Advisory Contracts was not based on any single factor, but rather was based on a comprehensive consideration of all the information provided to the Board at its meetings throughout the year. The Board, in reaching its determination to renew the Advisory Contracts, is aware that shareholders in the fund have a broad range of investment choices available to them, including a wide choice among mutual funds offered by Fidelity's competitors, and that the fund's shareholders, who have the opportunity to review and weigh the disclosure provided by the fund in its prospectus and other public disclosures, have chosen to invest in this fund, managed by Fidelity.
Semiannual Report
Nature, Extent, and Quality of Services Provided. The Board considered the staffing within the investment adviser, FMR, and the sub-advisers (together, the Investment Advisers), including the backgrounds of the fund's investment personnel and the fund's investment objective and discipline. The Independent Trustees also had discussions with senior management of Fidelity's investment operations and investment groups. The Board considered the structure of the portfolio manager compensation program and whether this structure provides appropriate incentives to act in the best interests of the fund.
Resources Dedicated to Investment Management and Support Services. The Board reviewed the general qualifications and capabilities of the Investment Advisers' investment staff, including its size, education, experience, and resources, as well as the Investment Advisers' approach to recruiting, managing, and compensating investment personnel. The Board also noted that FMR has devoted increased resources to non-U.S. offices. The Board noted that Fidelity's analysts have extensive resources, tools and capabilities which allow them to conduct sophisticated quantitative and fundamental analysis, as well as credit analysis of issuers, counterparties and enhancers. The Board also believes that Fidelity's investment professionals have sufficient access to global information and data so as to provide competitive investment results over time, and that those professionals also have access to sophisticated tools which permit them to assess portfolio construction and risk and performance attribution characteristics continuously, as well as to transmit new information and research conclusions rapidly around the world. Additionally, in its deliberations, the Board considered the Investment Advisers' trading capabilities and resources which are an integral part of the investment management process.
Shareholder and Administrative Services. The Board considered (i) the nature, extent, quality, and cost of advisory, administrative, and shareholder services performed by the Investment Advisers and their affiliates under the Advisory Contracts and under separate agreements covering transfer agency, pricing and bookkeeping, and securities lending services for the fund; (ii) the nature and extent of the investment adviser's supervision of third party service providers, principally custodians and subcustodians; and (iii) the resources devoted to, and the record of compliance with, the fund's compliance policies and procedures.
The Board noted that the growth of fund assets over time across the complex allows Fidelity to reinvest in the development of services designed to enhance the value or convenience of the Fidelity funds as investment vehicles. These services include 24-hour access to account information and market information through telephone representatives and over the Internet, investor education materials and asset allocation tools, and the expanded availability of Fidelity Investor Centers, with 35 new branches opening since 2010.
Semiannual Report
Board Approval of Investment Advisory Contracts and
Management Fees - continued
Investment in a Large Fund Family. The Board considered the benefits to shareholders of investing in a Fidelity fund, including the benefits of investing in a fund that is part of a large family of funds offering a variety of investment disciplines and providing a large variety of mutual fund investor services. The Board noted that Fidelity had taken, or had made recommendations that resulted in the Fidelity funds taking, a number of actions over the previous year that benefited particular funds, including (i) continuing to dedicate additional resources to investment research and support of the senior management team that oversees asset management; (ii) rationalizing product lines through the mergers of six funds into other funds; (iii) continuing to migrate the Freedom Funds to dedicated lower cost underlying funds; (iv) obtaining shareholder approval to broaden the investment strategies for Fidelity Consumer Finance Portfolio, Fidelity Emerging Asia Fund, and Fidelity Environment and Alternative Energy Portfolio; (v) contractually agreeing to reduce the management fees and impose other expense limitations on Spartan 500 Index Fund and U.S. Bond Index Fund in connection with launching new institutional classes of these funds; (vi) changing the name, primary and supplemental benchmarks, and investment policies of Fidelity Global Strategies Fund to support the fund's flexible investment mandate and global orientation; and (vii) reducing the transfer agency account fee rates on certain accounts.
Investment Performance. The Board considered whether the fund has operated in accordance with its investment objective, as well as its record of compliance with its investment restrictions. It also reviewed the fund's absolute investment performance for each class, as well as the fund's relative investment performance for each class measured over multiple periods against (i) a broad-based securities market index, and (ii) a peer group of mutual funds deemed appropriate by Fidelity and reviewed by the Board. The following charts considered by the Board show, over the one-, three-, and five-year periods ended December 31, 2010, the cumulative total returns of the retail class and Class C of the fund, the cumulative total returns of a broad-based securities market index ("benchmark"), and a range of cumulative total returns of a peer group of mutual funds identified by Lipper Inc. as having an investment objective similar to that of the fund. The returns of the retail class and Class C show the performance of the highest and lowest performing classes, respectively (based on five-year performance). The box within each chart shows the 25th percentile return (bottom of box) and the 75th percentile return (top of box) of the peer group. Returns shown above the box are in the first quartile and returns shown below the box are in the fourth quartile. The percentage beaten numbers noted below each chart correspond to the percentile box and represent the percentage of funds in the peer group whose performance was equal to or lower than that of the class indicated.
Semiannual Report
Fidelity Advisor Mortgage Securities Fund
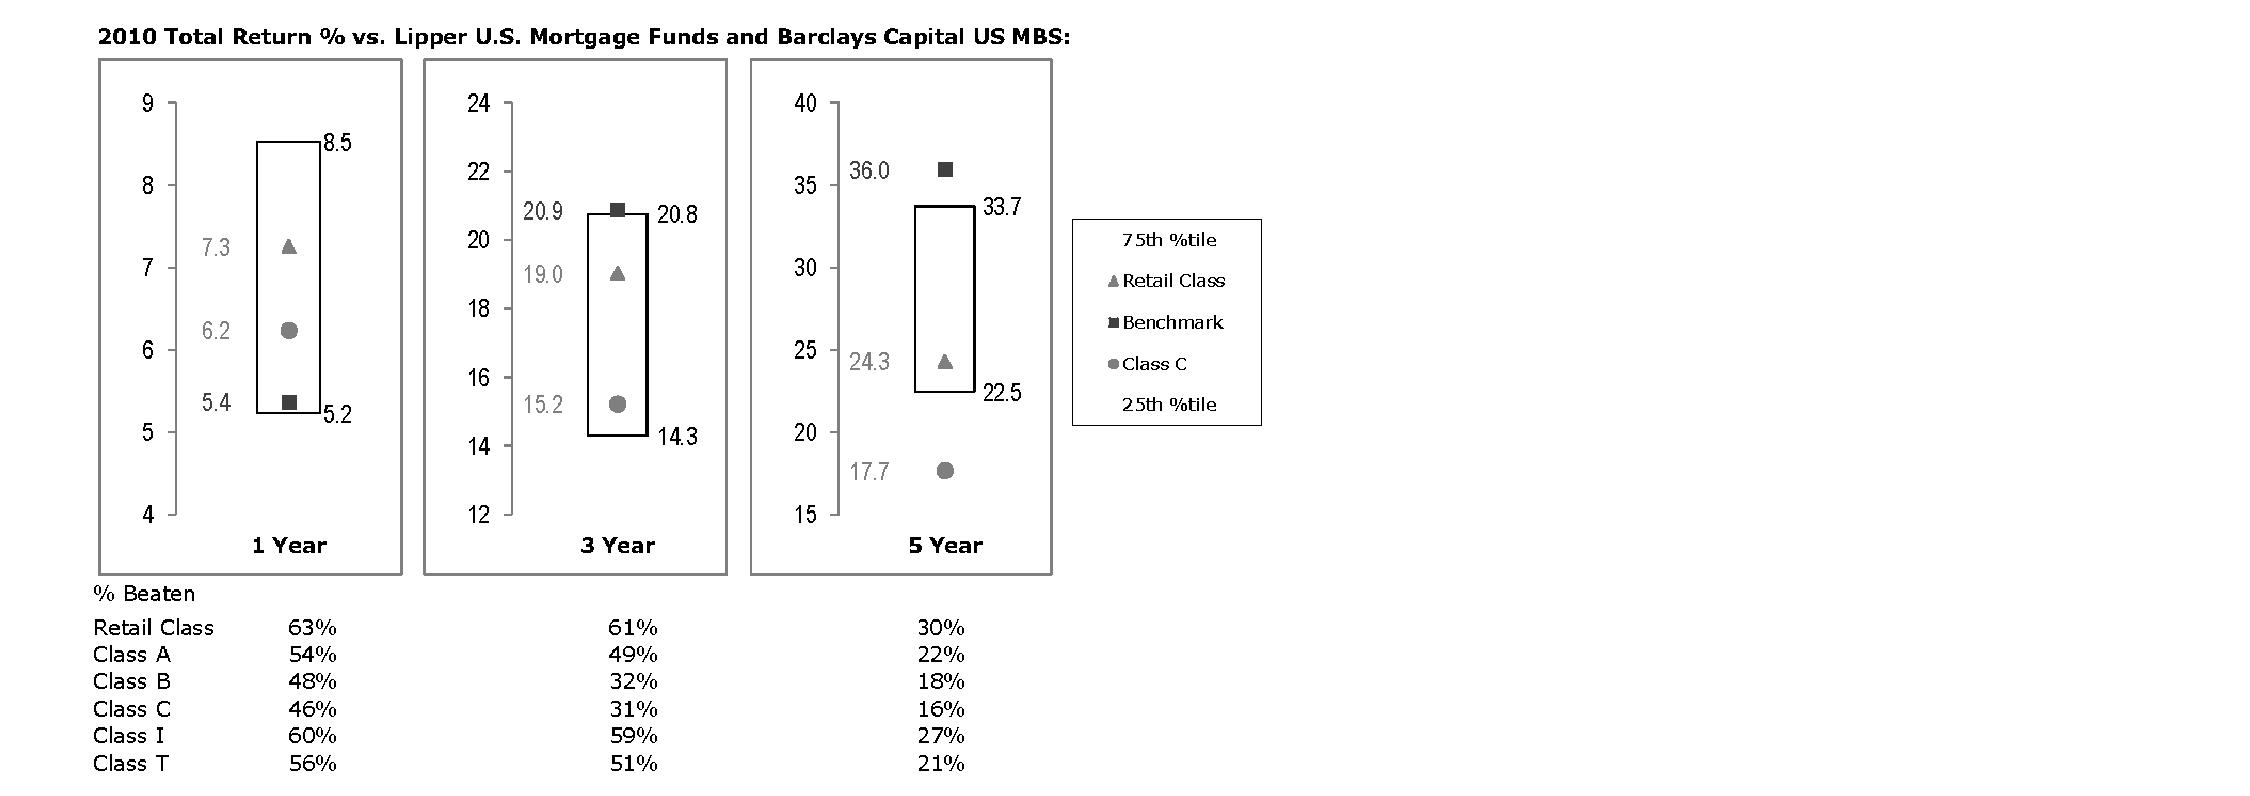
The Board reviewed the fund's relative investment performance against its peer group and noted that the performance of the retail class of the fund was in the second quartile for the one- and three-year periods and the third quartile for the five-year period. The Board also noted that the investment performance of the fund was lower than its benchmark for the three- and five-year periods, although the one-year total return of the retail class compared favorably to its benchmark. The Board considered that the variations in performance among the fund's classes reflect the variations in class expenses, which result in lower performance for higher expense classes. The Board also reviewed the fund's performance since inception as well as performance in the current year.
Based on its review, the Board concluded that the nature, extent, and quality of services provided to the fund under the Advisory Contracts should benefit the fund's shareholders.
Competitiveness of Management Fee and Total Expense Ratio. The Board considered the fund's management fee and total expense ratio compared to "mapped groups" of competitive funds and classes. Fidelity creates "mapped groups" by combining similar Lipper investment objective categories that have comparable management fee characteristics. Combining Lipper investment objective categories aids the Board's management fee and total expense ratio comparisons by broadening the competitive group used for comparison and by reducing the number of universes to which various Fidelity funds are compared.
Semiannual Report
Board Approval of Investment Advisory Contracts and
Management Fees - continued
Management Fee. The Board considered two proprietary management fee comparisons for the 12-month periods shown in the chart below. The group of Lipper funds used by the Board for management fee comparisons is referred to below as the "Total Mapped Group" and, for the reasons explained above, is broader than the Lipper peer group used by the Board for performance comparisons. The Total Mapped Group comparison focuses on a fund's standing relative to the total universe of comparable funds available to investors in terms of gross management fees before expense reimbursements or caps. "TMG %" represents the percentage of funds in the Total Mapped Group that had management fees that were lower than the fund's. For example, a TMG % of 12% means that 88% of the funds in the Total Mapped Group had higher management fees than the fund. The "Asset-Size Peer Group" (ASPG) comparison focuses on a fund's standing relative to non-Fidelity funds similar in size to the fund within the Total Mapped Group. The ASPG represents at least 15% of the funds in the Total Mapped Group with comparable asset size and management fee characteristics, subject to a minimum of 50 funds (or all funds in the Total Mapped Group if fewer than 50). Additional information, such as the ASPG quartile in which the fund's management fee ranked, is also included in the chart and considered by the Board.
Fidelity Advisor Mortgage Securities Fund

The Board noted that the fund's management fee ranked below the median of its Total Mapped Group and below the median of its ASPG for 2010.
Based on its review, the Board concluded that the fund's management fee is fair and reasonable in light of the services that the fund receives and the other factors considered.
Semiannual Report
Total Expense Ratio. In its review of each class's total expense ratio, the Board considered the fund's management fee as well as other fund or class expenses, as applicable, such as transfer agent fees, pricing and bookkeeping fees, fund-paid 12b-1 fees, and custodial, legal, and audit fees. The Board also noted the effects of any waivers and reimbursements on fees and expenses. As part of its review, the Board also considered the current and historical total expense ratios of each class of the fund compared to competitive fund median expenses. Each class of the fund is compared to those funds and classes in the Total Mapped Group (used by the Board for management fee comparisons) that have a similar sales load structure.
The Board also considered that the current contractual arrangements for the fund (i) have the effect of setting the total "fund-level" expenses (including, among certain other expenses, the management fee) for each class at 35 basis points, (ii) limit the "class-level" transfer agent fee for the retail class to 10 basis points, and (iii) limit the total expenses for the retail class to 45 basis points. The fees and expenses payable under these contractual arrangements may not be increased without the approval of the Board and the shareholders of the applicable class. The fund's Advisor classes are subject to different "class-level" expenses (transfer agent fees and 12b-1 fees).
The Board noted that the total expense ratio of each class ranked below its competitive median for 2010.
The Board recognized that the fund's management contract incorporates a "group fee" structure, which provides for lower group fee rates as total fund assets under FMR's management increase, and for higher group fee rates as total fund assets under FMR's management decrease. FMR calculates the group fee rates based on a tiered asset "breakpoint" schedule that varies based on asset class. The Board noted, however, that because the current contractual arrangements set the total "fund-level" expenses for each class at 35 basis points, increases or decreases in the management fee due to changes in the group fee rate will not impact the total expense ratio.
Fees Charged to Other Fidelity Clients. The Board also considered Fidelity fee structures and other information with respect to clients of FMR and its affiliates, such as other mutual funds advised or subadvised by FMR or its affiliates, pension plan clients, and other institutional clients. In March 2010, the Board created an ad hoc joint committee with the board of other Fidelity funds (the Committee) to review and compare Fidelity's institutional investment advisory business with its business of providing services to the Fidelity funds, including the differences in services provided, fees charged, and costs incurred, as well as competition in their respective marketplaces.
Based on its review of total expense ratios and fees charged to other Fidelity clients, the Board concluded that the total expense ratio of each class of the fund was reasonable in light of the services that the fund and its shareholders receive and the other factors considered, including the findings of the Committee.
Semiannual Report
Board Approval of Investment Advisory Contracts and
Management Fees - continued
Costs of the Services and Profitability. The Board considered the revenues earned and the expenses incurred by Fidelity in conducting the business of developing, marketing, distributing, managing, administering and servicing the fund and its shareholders. The Board also considered the level of Fidelity's profits in respect of all the Fidelity funds.
On an annual basis, FMR presents to the Board Fidelity's profitability for the fund. Fidelity calculates the profitability for each fund, as well as aggregate profitability for groups of Fidelity funds and all Fidelity funds, using a series of detailed revenue and cost allocation methodologies which originate with the books and records of Fidelity on which Fidelity's audited financial statements are based. The Audit Committee of the Board reviews any significant changes from the prior year's methodologies.
PricewaterhouseCoopers LLP (PwC), independent registered public accounting firm and auditor to Fidelity and certain Fidelity funds, has been engaged annually by the Board as part of the Board's assessment of Fidelity's profitability analysis. PwC's engagement includes the review and assessment of Fidelity's methodologies used in determining the revenues and expenses attributable to Fidelity's mutual fund business, and completion of agreed-upon procedures surrounding the mathematical accuracy of fund profitability and its conformity to allocation methodologies. After considering PwC's reports issued under the engagement and information provided by Fidelity, the Board concluded that while other allocation methods may also be reasonable, Fidelity's profitability methodologies are reasonable in all material respects.
The Board also reviewed Fidelity's non-fund businesses and fall-out benefits related to the mutual fund business as well as cases where Fidelity's affiliates may benefit from or be related to the fund's business.
The Board considered the costs of the services provided by and the profits realized by Fidelity in connection with the operation of the fund and was satisfied that the profitability was not excessive in the circumstances.
Economies of Scale. The Board considered whether there have been economies of scale in respect of the management of the Fidelity funds, whether the Fidelity funds (including the fund) have appropriately benefited from any such economies of scale, and whether there is potential for realization of any further economies of scale. The Board considered the extent to which the fund will benefit from economies of scale through increased services to the fund, through waivers or reimbursements, or through fee or expense reductions. The Board also noted that in 2009, it and the board of other Fidelity funds created an ad hoc committee (the Economies of Scale Committee) to analyze whether FMR attains economies of scale in respect of the management and servicing of the Fidelity funds, whether the Fidelity funds have appropriately benefited from such economies of scale, and whether there is potential for realization of any further economies of scale.
Semiannual Report
The Board concluded, taking into account the analysis of the Economies of Scale Committee, that any potential economies of scale are being appropriately shared between fund shareholders and Fidelity.
Additional Information Requested by the Board. In order to develop fully the factual basis for consideration of the Fidelity funds' Advisory Contracts, the Board requested and received additional information on certain topics, including: (i) Fidelity's fund profitability methodology, profitability trends for certain funds, and the impact of certain factors on fund profitability results; (ii) portfolio manager changes that have occurred during the past year and the amount of the investment that each portfolio manager has made in the Fidelity fund(s) that he or she manages; (iii) Fidelity's compensation structure for portfolio managers, research analysts, and other key personnel, including its effects on fund profitability, the rationale for the compensation structure, and the extent to which current market conditions have affected retention and recruitment; (iv) the compensation paid to fund sub-advisers on behalf of the Fidelity funds; (v) Fidelity's fee structures and rationale for recommending different fees among different categories of funds and classes, as well as Fidelity's voluntary waiver of its fees to maintain minimum yields for certain money market funds and classes; (vi) the reasons why certain expenses affect various funds and classes differently; (vii) Fidelity's transfer agent fees, expenses, and services and how the benefits of decreased costs and new efficiencies can be shared across all of the Fidelity funds; (viii) the reasons for and consequences of changes to certain product lines compared to competitors; (ix) the allocation of and historical trends in Fidelity's realization of fall-out benefits; and (x) explanations regarding the relative total expense ratios of certain funds and classes, total expense competitive trends, and actions that might be taken by FMR to reduce total expense ratios for certain funds and classes or to achieve further economies of scale.
Based on its evaluation of all of the conclusions noted above, and after considering all factors it believed relevant, the Board ultimately concluded that the advisory fee structures are fair and reasonable, and that the fund's Advisory Contracts should be renewed.
Semiannual Report
Investment Adviser
Fidelity Management & Research Company
Boston, MA
Investment Sub-Advisers
Fidelity Investments Money Management, Inc.
Fidelity Management & Research
(U.K.) Inc.
Fidelity Management & Research
(Hong Kong) Limited
Fidelity Management & Research
(Japan), Inc.
General Distributor
Fidelity Distributors Corporation
Boston, MA
Transfer and Service Agents
Fidelity Investments Institutional Operations Company, Inc.
Boston, MA
Fidelity Service Company, Inc.
Boston, MA
Custodian
The Bank of New York Mellon
New York, NY
AMORI-USAN-0412
1.784899.109
(Fidelity Investment logo)(registered trademark)
Fidelity®
Mortgage Securities
Fund
(A Class of Fidelity Advisor® Mortgage
Securities Fund)
Semiannual Report
February 29, 2012
(Fidelity Cover Art)
Contents
Shareholder Expense Example | (Click Here) | An example of shareholder expenses. |
Investment Changes | (Click Here) | A summary of major shifts in the fund's investments over the past six months. |
Investments | (Click Here) | A complete list of the fund's investments with their market values. |
Financial Statements | (Click Here) | Statements of assets and liabilities, operations, and changes in net assets, as well as financial highlights. |
Notes | (Click Here) | Notes to the financial statements. |
Board Approval of Investment Advisory Contracts and Management Fees | (Click Here) | |
To view a fund's proxy voting guidelines and proxy voting record for the 12-month period ended June 30, visit http://www.fidelity.com/proxyvotingresults or visit the Securities and Exchange Commission's (SEC) web site at http://www.sec.gov. You may also call 1-800-544-8544 to request a free copy of the proxy voting guidelines.
Standard & Poor's, S&P and S&P 500 are registered service marks of The McGraw-Hill Companies, Inc. and have been licensed for use by Fidelity Distributors Corporation.
Other third party marks appearing herein are the property of their respective owners.
All other marks appearing herein are registered or unregistered trademarks or service marks of FMR LLC or an affiliated company.
This report and the financial statements contained herein are submitted for the general information of the shareholders of the fund. This report is not authorized for distribution to prospective investors in the fund unless preceded or accompanied by an effective prospectus.
A fund files its complete schedule of portfolio holdings with the SEC for the first and third quarters of each fiscal year on Form N-Q. Forms N-Q are available on the SEC's web site at http://www.sec.gov. A fund's Forms N-Q may be reviewed and copied at the SEC's Public Reference Room in Washington, DC. Information regarding the operation of the SEC's Public Reference Room may be obtained by calling 1-800-SEC-0330. For a complete list of a fund's portfolio holdings, view the most recent holdings listing, semiannual report, or annual report on Fidelity's web site at http://www.fidelity.com, http://www.advisor.fidelity.com, or http://www.401k.com, as applicable.
NOT FDIC INSURED • MAY LOSE VALUE • NO BANK GUARANTEE
Neither the fund nor Fidelity Distributors Corporation is a bank.
Semiannual Report
Shareholder Expense Example
As a shareholder of the Fund, you incur two types of costs: (1) transaction costs, including sales charges (loads) on purchase payments or redemption proceeds, and (2) ongoing costs, including management fees, distribution and/or service (12b-1) fees and other Fund expenses. This Example is intended to help you understand your ongoing costs (in dollars) of investing in the Fund and to compare these costs with the ongoing costs of investing in other mutual funds.
The Example is based on an investment of $1,000 invested at the beginning of the period and held for the entire period (September 1, 2011 to February 29, 2012).
Actual Expenses
The first line of the accompanying table for each class of the Fund provides information about actual account values and actual expenses. You may use the information in this line, together with the amount you invested, to estimate the expenses that you paid over the period. Simply divide your account value by $1,000.00 (for example, an $8,600 account value divided by $1,000.00 = 8.6), then multiply the result by the number in the first line for a class of the Fund under the heading entitled "Expenses Paid During Period" to estimate the expenses you paid on your account during this period.
Hypothetical Example for Comparison Purposes
The second line of the accompanying table for each class of the Fund provides information about hypothetical account values and hypothetical expenses based on a Class' actual expense ratio and an assumed rate of return of 5% per year before expenses, which is not the Class' actual return. The hypothetical account values and expenses may not be used to estimate the actual ending account balance or expenses you paid for the period. You may use this information to compare the ongoing costs of investing in the Fund and other funds. To do so, compare this 5% hypothetical example with the 5% hypothetical examples that appear in the shareholder reports of the other funds.
Please note that the expenses shown in the table are meant to highlight your ongoing costs only and do not reflect any transaction costs. Therefore, the second line of the table is useful in comparing ongoing costs only, and will not help you determine the relative total costs of owning different funds. In addition, if these transactional costs were included, your costs would have been higher.
Semiannual Report
Shareholder Expense Example - continued
| Annualized Expense Ratio | Beginning
Account Value
September 1, 2011 | Ending
Account Value
February 29, 2012 | Expenses Paid
During Period*
September 1, 2011 to
February 29, 2012 |
Class A | .82% | | | |
Actual | | $ 1,000.00 | $ 1,018.50 | $ 4.12 |
Hypothetical A | | $ 1,000.00 | $ 1,020.79 | $ 4.12 |
Class T | .79% | | | |
Actual | | $ 1,000.00 | $ 1,018.60 | $ 3.96 |
Hypothetical A | | $ 1,000.00 | $ 1,020.93 | $ 3.97 |
Class B | 1.51% | | | |
Actual | | $ 1,000.00 | $ 1,015.00 | $ 7.57 |
Hypothetical A | | $ 1,000.00 | $ 1,017.35 | $ 7.57 |
Class C | 1.54% | | | |
Actual | | $ 1,000.00 | $ 1,014.90 | $ 7.71 |
Hypothetical A | | $ 1,000.00 | $ 1,017.21 | $ 7.72 |
Fidelity Mortgage Securities Fund | .45% | | | |
Actual | | $ 1,000.00 | $ 1,020.30 | $ 2.26 |
Hypothetical A | | $ 1,000.00 | $ 1,022.63 | $ 2.26 |
Institutional Class | .51% | | | |
Actual | | $ 1,000.00 | $ 1,020.10 | $ 2.56 |
Hypothetical A | | $ 1,000.00 | $ 1,022.33 | $ 2.56 |
A 5% return per year before expenses
* Expenses are equal to each Class' annualized expense ratio, multiplied by the average account value over the period, multiplied by 182/366 (to reflect the one-half year period).
Semiannual Report
Investment Changes (Unaudited)
Coupon Distribution as of February 29, 2012 |
| % of fund's investments | % of fund's investments
6 months ago |
Less than 0.01% | 0.4 | 0.4 |
0.01 - 0.99% | 7.3 | 6.7 |
1 - 1.99% | 1.0 | 0.7 |
2 - 2.99% | 1.3 | 0.7 |
3 - 3.99% | 7.0 | 4.5 |
4 - 4.99% | 37.4 | 41.1 |
5 - 5.99% | 31.5 | 32.4 |
6 - 6.99% | 8.1 | 8.2 |
7% and over | 2.7 | 2.6 |
Coupon distribution shows the range of stated interest rates on the fund's investments, excluding short-term investments. |
Weighted Average Maturity as of February 29, 2012 |
| | 6 months ago |
Years | 3.8 | 4.1 |
This is a weighted average of all the maturities of the securities held in a fund. Weighted Average Maturity (WAM) can be used as a measure of sensitivity to interest rate changes and market changes. Generally, the longer the maturity, the greater the sensitivity to such changes. WAM is based on the dollar-weighted average length of time until principal payments must be paid. Depending on the types of securities held in a fund, certain maturity shortening devices (e.g., demand features, interest rate resets, and call options) may be taken into account when calculating the WAM. |
Duration as of February 29, 2012 |
| | 6 months ago |
Years | 2.4 | 2.9 |
Duration estimates how much a bond fund's price will change with a change in comparable interest rates. If rates rise 1%, for example, a fund with a 5-year duration is likely to lose about 5% of its value. Other factors also can influence a bond fund's performance and share price. Accordingly, a bond fund's actual performance may differ from this example. Duration takes into account any call or put option embedded in the bonds. |
Asset Allocation (% of fund's net assets) |
As of February 29, 2012* | As of August 31, 2011** |
| Mortgage
Securities 100.0% | | | Mortgage
Securities 114.5% | |
| CMOs and
Other Mortgage
Related Securities 18.8% | | | CMOs and
Other Mortgage
Related Securities 20.5% | |
| Asset-Backed
Securities 3.8% | | | Asset-Backed
Securities 3.5% | |
| Short-Term
Investments and
Net Other Assets† (22.6)% | | | Short-Term
Investments and
Net Other Assets† (38.5)% | |
* Foreign investments | 1.7% | | ** Foreign investments | 2.1% | |
* Futures and Swaps | (2.3)% | | ** Futures and Swaps | (4.0)% | |

† Short-Term Investments and Net Other Assets are not included in the pie chart.
Semiannual Report
Showing Percentage of Net Assets
U.S. Government Agency - Mortgage Securities - 100.0% |
| Principal Amount (000s) | | Value (000s) |
Fannie Mae - 54.2% |
2.303% 6/1/36 (e) | | $ 50 | | $ 53 |
2.322% 1/1/35 (e) | | 354 | | 377 |
2.336% 5/1/36 (e) | | 268 | | 278 |
2.393% 9/1/36 (e) | | 169 | | 180 |
2.424% 10/1/33 (e) | | 77 | | 81 |
2.435% 4/1/36 (e) | | 229 | | 243 |
2.438% 8/1/35 (e) | | 469 | | 500 |
2.448% 3/1/35 (e) | | 49 | | 51 |
2.487% 11/1/36 (e) | | 71 | | 75 |
2.537% 7/1/35 (e) | | 101 | | 108 |
2.609% 5/1/36 (e) | | 95 | | 101 |
2.625% 10/1/36 (e) | | 172 | | 183 |
2.71% 9/1/36 (e) | | 104 | | 111 |
3% 3/1/27 (c) | | 2,000 | | 2,076 |
3% 3/1/27 (c) | | 6,000 | | 6,227 |
3% 3/1/27 (c) | | 7,600 | | 7,887 |
3% 3/1/27 (c) | | 6,000 | | 6,227 |
3.377% 9/1/41 (e) | | 363 | | 381 |
3.471% 3/1/40 (e) | | 817 | | 846 |
3.5% 12/1/25 to 9/1/26 | | 1,682 | | 1,771 |
3.5% 3/1/42 (c) | | 11,000 | | 11,370 |
3.5% 3/1/42 (c) | | 7,100 | | 7,339 |
3.5% 3/1/42 (c) | | 8,400 | | 8,682 |
3.5% 3/1/42 (c) | | 4,000 | | 4,134 |
4% 10/1/25 to 11/1/41 | | 73,940 | | 78,313 |
4% 3/1/42 (c) | | 20,700 | | 21,786 |
4% 3/1/42 (c) | | 6,000 | | 6,315 |
4.168% 6/1/36 (e) | | 825 | | 869 |
4.5% 5/1/18 to 11/1/41 | | 69,092 | | 74,294 |
4.5% 3/1/42 (c) | | 12,600 | | 13,429 |
4.5% 3/1/42 (c) | | 3,000 | | 3,197 |
5% 9/1/17 to 6/1/40 | | 39,275 | | 42,587 |
5% 3/1/42 (c) | | 14,500 | | 15,660 |
5% 3/1/42 (c) | | 25,600 | | 27,647 |
5% 3/1/42 (c) | | 9,000 | | 9,720 |
5.003% 7/1/35 (e) | | 12 | | 13 |
5.08% 7/1/35 (e) | | 109 | | 117 |
5.5% 2/1/18 to 9/1/38 | | 64,357 | | 70,230 |
5.5% 3/1/42 (c) | | 4,000 | | 4,358 |
5.5% 3/1/42 (c) | | 29,000 | | 31,597 |
5.718% 3/1/36 (e) | | 561 | | 592 |
5.99% 9/1/36 (e) | | 219 | | 235 |
U.S. Government Agency - Mortgage Securities - continued |
| Principal Amount (000s) | | Value (000s) |
Fannie Mae - continued |
6% 3/1/17 to 2/1/38 | | $ 8,380 | | $ 9,194 |
6% 3/1/42 (c) | | 1,000 | | 1,100 |
6.021% 8/1/46 (e) | | 107 | | 117 |
6.039% 9/1/36 (e) | | 202 | | 215 |
6.24% 9/1/37 (e) | | 22 | | 23 |
6.313% 4/1/37 (e) | | 236 | | 254 |
6.499% 12/1/36 (e) | | 195 | | 212 |
6.5% 12/1/12 to 5/1/38 | | 5,368 | | 6,024 |
6.555% 12/1/36 (e) | | 107 | | 115 |
6.824% 9/1/37 (e) | | 89 | | 95 |
7% 12/1/15 to 5/1/30 | | 2,316 | | 2,641 |
7.431% 9/1/37 (e) | | 30 | | 32 |
7.5% 8/1/22 to 9/1/32 | | 1,252 | | 1,469 |
8% 12/1/29 to 3/1/37 | | 75 | | 89 |
8.5% 1/1/16 to 7/1/31 | | 171 | | 202 |
9% 10/1/30 | | 274 | | 338 |
9.5% 7/1/16 to 8/1/22 | | 39 | | 44 |
12.5% 8/1/15 to 3/1/16 | | 10 | | 11 |
12.75% 2/1/15 | | 2 | | 3 |
13.5% 9/1/14 | | 1 | | 2 |
| | 482,420 |
Freddie Mac - 24.9% |
1.915% 3/1/35 (e) | | 217 | | 225 |
2.095% 5/1/37 (e) | | 112 | | 116 |
2.292% 11/1/35 (e) | | 431 | | 455 |
2.481% 5/1/34 (e) | | 16 | | 17 |
2.638% 4/1/37 (e) | | 162 | | 173 |
2.639% 6/1/37 (e) | | 364 | | 387 |
2.711% 6/1/33 (e) | | 1,113 | | 1,186 |
2.795% 7/1/36 (e) | | 176 | | 188 |
3.149% 10/1/35 (e) | | 73 | | 78 |
3.586% 6/1/37 (e) | | 911 | | 961 |
4% 9/1/41 | | 938 | | 990 |
4% 10/1/41 | | 1,893 | | 2,018 |
4% 3/1/42 (c) | | 23,000 | | 24,127 |
4.5% 7/1/25 to 10/1/41 | | 47,804 | | 51,292 |
4.5% 3/1/42 (c) | | 28,300 | | 30,062 |
5% 7/1/33 to 9/1/40 | | 35,750 | | 38,789 |
5.138% 4/1/35 (e) | | 78 | | 81 |
5.5% 10/1/17 to 1/1/40 (d) | | 32,055 | | 34,835 |
5.847% 6/1/37 (e) | | 56 | | 58 |
U.S. Government Agency - Mortgage Securities - continued |
| Principal Amount (000s) | | Value (000s) |
Freddie Mac - continued |
6% 4/1/14 to 6/1/39 | | $ 10,400 | | $ 11,400 |
6.011% 4/1/37 (e) | | 81 | | 86 |
6.05% 3/1/36 (e) | | 744 | | 793 |
6.058% 10/1/36 (e) | | 53 | | 57 |
6.333% 6/1/37 (e) | | 38 | | 40 |
6.421% 12/1/36 (e) | | 614 | | 651 |
6.5% 2/1/13 to 9/1/39 | | 11,879 | | 13,259 |
6.662% 8/1/37 (e) | | 186 | | 195 |
7% 6/1/21 to 9/1/36 | | 3,176 | | 3,635 |
7.03% 6/1/36 (e) | | 32 | | 34 |
7.07% 2/1/37 (e) | | 55 | | 60 |
7.22% 4/1/37 (e) | | 9 | | 9 |
7.5% 4/1/12 to 7/1/34 | | 4,801 | | 5,529 |
8% 11/1/16 to 1/1/37 | | 67 | | 79 |
8.5% 6/1/16 to 9/1/20 | | 12 | | 13 |
9% 9/1/16 to 5/1/21 | | 92 | | 103 |
10% 1/1/16 to 5/1/19 | | 18 | | 20 |
10.5% 2/1/16 | | 1 | | 1 |
12.5% 2/1/14 to 12/1/14 | | 3 | | 3 |
13% 12/1/13 to 6/1/15 | | 11 | | 11 |
| | 222,016 |
Ginnie Mae - 20.9% |
3.5% 10/15/41 to 2/15/42 | | 9,799 | | 10,288 |
3.5% 3/1/42 (c) | | 7,500 | | 7,862 |
4% 9/15/25 to 11/15/41 | | 20,791 | | 22,473 |
4% 3/1/42 (c) | | 2,300 | | 2,477 |
4.5% 8/15/33 to 5/20/41 | | 56,311 | | 61,877 |
4.5% 3/1/42 (c) | | 700 | | 763 |
4.751% 12/20/60 (i) | | 13,639 | | 15,227 |
4.814% 1/20/61 (i) | | 308 | | 346 |
5% 9/20/33 to 9/15/40 | | 34,669 | | 38,576 |
5% 3/1/42 (c) | | 9,000 | | 9,941 |
5.5% 10/15/33 to 9/15/39 | | 5,832 | | 6,503 |
6% 1/15/36 to 9/20/38 | | 5,476 | | 6,159 |
6.5% 10/15/34 to 7/15/36 | | 290 | | 334 |
7% 2/15/24 to 4/20/32 | | 1,975 | | 2,273 |
7.5% 12/15/16 to 4/15/32 | | 667 | | 776 |
8% 6/15/21 to 12/15/25 | | 305 | | 358 |
8.5% 8/15/16 to 10/15/28 | | 347 | | 407 |
U.S. Government Agency - Mortgage Securities - continued |
| Principal Amount (000s) | | Value (000s) |
Ginnie Mae - continued |
9% 11/20/17 | | $ 1 | | $ 1 |
10.5% 12/20/15 to 2/20/18 | | 10 | | 12 |
| | 186,653 |
TOTAL U.S. GOVERNMENT AGENCY - MORTGAGE SECURITIES (Cost $869,441) | 891,089 |
Asset-Backed Securities - 3.8% |
|
ACE Securities Corp. Home Equity Loan Trust Series 2005-HE7 Class A2C, 0.494% 11/25/35 (e) | | 645 | | 641 |
Aesop Funding II LLC Series 2005-4A Class A3, 0.5255% 7/20/12 (AMBAC Insured) (b)(e) | | 2,917 | | 2,905 |
AmeriCredit Automobile Receivables Trust Series 2007-CM Class A4B, 0.3425% 4/7/14 (National Public Finance Guarantee Corp. Insured) (e) | | 2,007 | | 1,995 |
Avis Budget Rental Car Funding (AESOP) LLC: | | | | |
Series 2007-2A Class A, 0.3855% 8/20/13 (AMBAC Insured) (b)(e) | | 4,930 | | 4,902 |
Series 2009-1A Class A, 9.31% 10/20/13 (b) | | 2,805 | | 2,893 |
Countrywide Asset-Backed Certificates Trust: | | | | |
Series 2007-11 Class 2A1, 0.304% 6/25/47 (e) | | 248 | | 245 |
Series 2007-4 Class A1A, 0.3963% 9/25/37 (e) | | 784 | | 764 |
Series 2007-5 Class 2A1, 0.344% 9/25/47 (e) | | 249 | | 248 |
Countrywide Home Loans, Inc. Series 2005-2 Class M2, 0.949% 7/25/35 (e) | | 1,984 | | 1,966 |
GSAMP Trust: | | | | |
Series 2004-AR1 Class B4, 5% 6/25/34 (b)(e) | | 82 | | 24 |
Series 2004-AR2 Class B1, 3.094% 8/25/34 (e) | | 796 | | 62 |
GSR Mortgage Loan Trust Series 2005-HE4 Class A2C, 0.614% 7/25/45 (e) | | 4,930 | | 4,924 |
Morgan Stanley ABS Capital I Trust Series 2005-3 Class A3, 0.624% 8/25/35 (e) | | 1,179 | | 1,174 |
National Collegiate Student Loan Trust: | | | | |
Series 2004-2 Class AIO, 9.75% 10/27/14 (f) | | 2,045 | | 138 |
Series 2007-1 Class AIO, 7.27% 4/25/12 (f) | | 9,200 | | 147 |
Series 2007-2 Class AIO, 6.7% 7/25/12 (f) | | 6,385 | | 142 |
Ocala Funding LLC Series 2006-1A Class A, 1.6455% 3/20/11 (a)(b)(e) | | 2,100 | | 0 |
Option One Mortgage Loan Trust: | | | | |
Series 2007-5 Class 2A1, 0.334% 5/25/37 (e) | | 928 | | 922 |
Series 2007-6 Class 2A1, 0.304% 7/25/37 (e) | | 68 | | 67 |
Asset-Backed Securities - continued |
| Principal Amount (000s) | | Value (000s) |
Rental Car Finance Corp. Series 2007-1A Class A, 0.384% 7/25/13 (FGIC Insured) (b)(e) | | $ 8,333 | | $ 8,279 |
Structured Asset Securities Corp. Series 2005-NC2 Class M3, 0.674% 5/25/35 (e) | | 1,995 | | 1,119 |
WaMu Asset Holdings Corp.: | | | | |
Series 2006-5 Class N1, 5.926% 7/25/46 (b) | | 1,148 | | 0 |
Series 2006-7 Class N1, 5.926% 9/25/46 (b) | | 912 | | 0 |
Series 2006-8 Class N1, 6.048% 10/25/46 (b) | | 1,160 | | 0 |
TOTAL ASSET-BACKED SECURITIES (Cost $39,574) |
33,557
|
Collateralized Mortgage Obligations - 14.9% |
|
Private Sponsor - 4.0% |
Arkle Master Issuer PLC floater Series 2010-1A Class 2A, 1.6451% 5/17/60 (b)(e) | | 3,032 | | 3,033 |
Arran Residential Mortgages Funding PLC floater Series 2011-1A Class A1C, 1.6931% 11/19/47 (b)(e) | | 1,177 | | 1,178 |
Banc of America Funding Trust sequential payer Series 2009-R1 Class A1, 5.0298% 5/20/36 (e) | | 173 | | 174 |
Banc of America Mortgage Securities, Inc. planned amortization class Series 2005-3 Class 1A20, 5.5% 4/25/35 | | 3,006 | | 2,996 |
BCAP LLC Trust sequential payer Series 2010-RR12 Class 3A5, 5% 8/26/37 (b) | | 429 | | 429 |
Citigroup Mortgage Loan Trust Series 2010-7 Class 9A1, 4.5% 10/25/37 (b) | | 4,601 | | 4,666 |
Credit Suisse Mortgage Capital Certificates: | | | | |
floater Series 2011-7R Class A1, 1.494% 8/27/47 (b)(e) | | 2,337 | | 2,293 |
sequential payer Series 2010-16 Class A1, 3% 6/25/50 (b) | | 486 | | 469 |
CSMC floater Series 2011-1R Class A1, 1.244% 2/27/47 (b)(e) | | 3,459 | | 3,403 |
First Horizon Mortgage pass-thru Trust Series 2004-AR5 Class 2A1, 2.631% 10/25/34 (e) | | 934 | | 860 |
Gracechurch Mortgage Financing PLC floater Series 2007-1A Class 3A1, 0.5731% 11/20/56 (b)(e) | | 4,156 | | 4,150 |
Granite Mortgages Series 2003-2 Class 1A3, 1.0612% 7/20/43 (e) | | 447 | | 433 |
Granite Mortgages PLC floater: | | | | |
Series 2003-3 Class 1A3, 0.9612% 1/20/44 (e) | | 173 | | 168 |
Series 2004-1 Class 2A1, 0.8832% 3/20/44 (e) | | 5,398 | | 5,190 |
Collateralized Mortgage Obligations - continued |
| Principal Amount (000s) | | Value (000s) |
Private Sponsor - continued |
Granite Mortgages PLC floater: - continued | | | | |
Series 2004-3 Class 2A1, 0.8432% 9/20/44 (e) | | $ 211 | | $ 203 |
Holmes Master Issuer PLC floater Series 2007-2A Class 4A, 0.667% 7/15/20 (e) | | 1,650 | | 1,645 |
Luminent Mortgage Trust floater Series 2006-1 Class A1, 0.484% 4/25/36 (e) | | 2,088 | | 1,087 |
MASTR Adjustable Rate Mortgages Trust Series 2007-3 Class 22A2, 0.454% 5/25/47 (e) | | 579 | | 340 |
Merrill Lynch Alternative Note Asset Trust floater Series 2007-OAR1 Class A1, 0.414% 2/25/37 (e) | | 2,773 | | 1,863 |
Structured Asset Securities Corp.: | | | | |
Series 2003-15A Class 4A, 5.3281% 4/25/33 (e) | | 488 | | 451 |
Series 2004-21XS Class 2A3, 4.32% 12/25/34 | | 83 | | 83 |
Wells Fargo Mortgage Backed Securities Trust Series 2005-AR2 Class 1A2, 2.67% 3/25/35 (e) | | 414 | | 133 |
TOTAL PRIVATE SPONSOR | | 35,247 |
U.S. Government Agency - 10.9% |
Fannie Mae Series 2011-67 Class AI, 4% 7/25/26 (f) | | 807 | | 86 |
Fannie Mae Guaranteed Mtg. pass-thru certificates: | | | | |
planned amortization class Series 1994-23: | | | | |
Class PX, 6% 8/25/23 | | 1,233 | | 1,283 |
Class PZ, 6% 2/25/24 | | 3,216 | | 3,813 |
Series 1993-165 Class SH, 19.0927% 9/25/23 (e)(h) | | 84 | | 112 |
Series 2003-39 Class IA, 5.5% 10/25/22 (e)(f) | | 471 | | 31 |
Series 2009-16 Class SA, 6.006% 3/25/24 (e)(f)(h) | | 1,763 | | 164 |
Series 2010-109 Class IM, 5.5% 9/25/40 (f) | | 7,315 | | 1,107 |
Series 2010-23: | | | | |
Class AI, 5% 12/25/18 (f) | | 1,308 | | 107 |
Class HI, 4.5% 10/25/18 (f) | | 883 | | 82 |
Series 2010-29 Class LI, 4.5% 6/25/19 (f) | | 2,572 | | 235 |
Series 2010-97 Class CI, 4.5% 8/25/25 (f) | | 1,714 | | 149 |
Series 2011-83 Class DI, 6% 9/25/26 (f) | | 1,293 | | 165 |
Fannie Mae Stripped Mortgage-Backed Securities: | | | | |
sequential payer Series 377 Class 1, 10/1/36 (g) | | 1,560 | | 1,461 |
Series 339 Class 29, 5.5% 7/1/18 (f) | | 746 | | 68 |
Series 348 Class 14, 6.5% 8/1/34 (f) | | 473 | | 85 |
Series 351: | | | | |
Class 12, 5.5% 4/1/34 (f) | | 357 | | 52 |
Class 13, 6% 3/1/34 (f) | | 441 | | 80 |
Collateralized Mortgage Obligations - continued |
| Principal Amount (000s) | | Value (000s) |
U.S. Government Agency - continued |
Fannie Mae Stripped Mortgage-Backed Securities: - continued | | | | |
Series 359 Class 19, 6% 7/1/35 (f) | | $ 416 | | $ 68 |
Series 384 Class 6, 5% 7/25/37 (f) | | 1,776 | | 231 |
Fannie Mae subordinate REMIC pass-thru certificates: | | | | |
floater Series 2007-57 Class FA, 0.474% 6/25/37 (e) | | 4,743 | | 4,724 |
planned amortization class: | | | | |
Series 1999-17 Class PG, 6% 4/25/29 | | 2,169 | | 2,400 |
Series 1999-32 Class PL, 6% 7/25/29 | | 1,680 | | 1,866 |
Series 1999-33 Class PK, 6% 7/25/29 | | 1,013 | | 1,123 |
Series 2001-52 Class YZ, 6.5% 10/25/31 | | 110 | | 127 |
Series 2005-39 Class TE, 5% 5/25/35 | | 1,120 | | 1,327 |
Series 2005-73 Class SA, 16.9156% 8/25/35 (e)(h) | | 461 | | 558 |
Series 2006-105 Class MD, 5.5% 6/25/35 | | 1,145 | | 1,291 |
sequential payer: | | | | |
Series 2001-20 Class Z, 6% 5/25/31 | | 1,934 | | 2,139 |
Series 2001-31 Class ZC, 6.5% 7/25/31 | | 708 | | 794 |
Series 2002-16 Class ZD, 6.5% 4/25/32 | | 318 | | 356 |
Series 2002-74 Class SV, 7.306% 11/25/32 (e)(f) | | 475 | | 93 |
Series 2002-79 Class Z, 5.5% 11/25/22 | | 1,034 | | 1,134 |
Series 2003-80 Class CG, 6% 4/25/30 | | 201 | | 205 |
Series 2003-21 Class SK, 7.856% 3/25/33 (e)(f)(h) | | 315 | | 66 |
Series 2003-35 Class TQ, 7.256% 5/25/18 (e)(f)(h) | | 252 | | 34 |
Series 2003-42 Class SJ, 6.806% 11/25/22 (e)(f)(h) | | 239 | | 17 |
Series 2003-48 Class HI, 5% 11/25/17 (f) | | 683 | | 37 |
Series 2005-104 Class NI, 6.456% 3/25/35 (e)(f)(h) | | 3,755 | | 596 |
Series 2006-4 Class IT, 6% 10/25/35 (f) | | 87 | | 6 |
Series 2007-57 Class SA, 39.156% 6/25/37 (e)(h) | | 1,420 | | 2,420 |
Series 2007-66: | | | | |
Class FB, 0.644% 7/25/37 (e) | | 2,137 | | 2,131 |
Class SB, 38.136% 7/25/37 (e)(h) | | 394 | | 697 |
Series 2009-114 Class AI, 5% 12/25/23 (f) | | 1,498 | | 124 |
Series 2009-76 Class MI, 5.5% 9/25/24 (f) | | 950 | | 122 |
Series 2009-85 Class IB, 4.5% 8/25/24 (f) | | 482 | | 41 |
Series 2009-93 Class IC, 4.5% 9/25/24 (f) | | 854 | | 69 |
Series 2010-12 Class AI, 5% 12/25/18 (f) | | 2,695 | | 297 |
Series 2010-135 Class LS, 5.806% 12/25/40 (e)(f)(h) | | 2,132 | | 310 |
Series 2010-139 Class NI, 4.5% 2/25/40 (f) | | 1,913 | | 272 |
Series 2010-96 Class DI, 4% 5/25/23 (f) | | 1,321 | | 56 |
Collateralized Mortgage Obligations - continued |
| Principal Amount (000s) | | Value (000s) |
U.S. Government Agency - continued |
Freddie Mac: | | | | |
floater Series 3318 Class GY, 0% 5/15/37 (e) | | $ 37 | | $ 37 |
floater planned amortization Series 3988 Class PF, 0.6485% 1/15/40 (e) | | 3,069 | | 3,066 |
planned amortization class: | | | | |
Series 2095 Class PE, 6% 11/15/28 | | 2,056 | | 2,281 |
Series 2104 Class PG, 6% 12/15/28 | | 646 | | 714 |
Series 2162 Class PH, 6% 6/15/29 | | 223 | | 247 |
Series 70 Class C, 9% 9/15/20 | | 46 | | 52 |
sequential payer Series 2114 Class ZM, 6% 1/15/29 | | 304 | | 336 |
Freddie Mac Manufactured Housing participation certificates guaranteed planned amortization class Series 2043 Class CJ, 6.5% 4/15/28 | | 737 | | 825 |
Freddie Mac Multi-Class pass-thru certificates: | | | | |
floater: | | | | |
Series 3129 Class MF, 0% 7/15/34 (e) | | 7 | | 7 |
Series 3222 Class HF, 0% 9/15/36 (e) | | 102 | | 99 |
planned amortization class: | | | | |
Series 2121 Class MG, 6% 2/15/29 | | 857 | | 948 |
Series 2154 Class PT, 6% 5/15/29 | | 1,309 | | 1,448 |
Series 2520 Class BE, 6% 11/15/32 | | 1,205 | | 1,334 |
Series 2585 Class KS, 7.3515% 3/15/23 (e)(f)(h) | | 152 | | 24 |
Series 2590 Class YR, 5.5% 9/15/32 (f) | | 46 | | 4 |
Series 2802 Class OB, 6% 5/15/34 | | 3,375 | | 3,924 |
Series 2810 Class PD, 6% 6/15/33 | | 1,357 | | 1,416 |
Series 3741 Class YU, 3.5% 11/15/22 | | 2,150 | | 2,262 |
Series 3786 Class HP, 4.5% 3/15/38 | | 3,064 | | 3,302 |
Series 3806 Class UP, 4.5% 2/15/41 | | 2,324 | | 2,519 |
Series 3832 Class PE, 5% 3/15/41 | | 960 | | 1,074 |
sequential payer: | | | | |
Series 2135 Class JE, 6% 3/15/29 | | 972 | | 1,076 |
Series 2274 Class ZM, 6.5% 1/15/31 | | 391 | | 441 |
Series 2281 Class ZB, 6% 3/15/30 | | 377 | | 416 |
Series 2357 Class ZB, 6.5% 9/15/31 | | 842 | | 943 |
Series 2502 Class ZC, 6% 9/15/32 | | 1,162 | | 1,295 |
Series 2575 Class ID, 5.5% 8/15/22 (f) | | 22 | | 1 |
Series 2817 Class SD, 6.8015% 7/15/30 (e)(f)(h) | | 330 | | 23 |
Series 3097 Class IA, 5.5% 3/15/33 (f) | | 1,214 | | 110 |
Series 1658 Class GZ, 7% 1/15/24 | | 1,154 | | 1,286 |
Series 2587 Class IM, 6.5% 3/15/33 (f) | | 590 | | 110 |
Series 2844: | | | | |
Class SC, 45.1848% 8/15/24 (e)(h) | | 43 | | 83 |
Collateralized Mortgage Obligations - continued |
| Principal Amount (000s) | | Value (000s) |
U.S. Government Agency - continued |
Freddie Mac Multi-Class pass-thru certificates: - continued | | | | |
Series 2844: | | | | |
Class SD, 83.2195% 8/15/24 (e)(h) | | $ 63 | | $ 150 |
Series 3772 Class BI, 4.5% 10/15/18 (f) | | 1,750 | | 135 |
Ginnie Mae guaranteed REMIC pass-thru certificates: | | | | |
floater: | | | | |
Series 2010-H17 Class FA, 0.5755% 7/20/60 (e)(i) | | 419 | | 411 |
Series 2010-H18 Class AF, 0.5703% 9/20/60 (e)(i) | | 445 | | 436 |
Series 2010-H19 Class FG, 0.5455% 8/20/60 (e)(i) | | 566 | | 556 |
Series 2011-H03 Class FA, 0.7455% 1/20/61 (e)(i) | | 10,218 | | 10,150 |
Series 2011-H05 Class FA, 0.7455% 12/20/60 (e)(i) | | 1,525 | | 1,515 |
Series 2011-H07 Class FA, 0.7455% 2/20/61 (e)(i) | | 3,076 | | 3,024 |
Series 2011-H12 Class FA, 0.7355% 2/20/61 (e)(i) | | 3,726 | | 3,662 |
Series 2011-H13 Class FA, 0.7455% 4/20/61 (e)(i) | | 242 | | 241 |
Series 2011-H14: | | | | |
Class FB, 0.7455% 5/20/61 (e)(i) | | 1,713 | | 1,692 |
Class FC, 0.7455% 5/20/61 (e)(i) | | 1,746 | | 1,725 |
Series 2011-H17 Class FA, 0.7755% 6/20/61 (e)(i) | | 2,189 | | 2,179 |
planned amortization class Series 2011-79 Class PO, 6/20/40 (g) | | 3,034 | | 2,566 |
sequential payer Series 2002-42 Class ZA, 6% 6/20/32 | | 987 | | 1,109 |
Series 2004-32 Class GS, 6.2525% 5/16/34 (e)(f)(h) | | 774 | | 161 |
Series 2010-91 Class PO, 7/20/40 (g) | | 1,017 | | 898 |
Government National Mortgage Association planned amortization class Series 2011-136 Class WI, 4.5% 5/20/40 (f) | | 924 | | 185 |
TOTAL U.S. GOVERNMENT AGENCY | | 97,309 |
TOTAL COLLATERALIZED MORTGAGE OBLIGATIONS (Cost $129,427) | 132,556 |
Commercial Mortgage Securities - 3.9% |
|
Asset Securitization Corp. Series 1997-D5: | | | | |
Class A6, 7.4526% 2/14/43 (e) | | 4,300 | | 4,383 |
Class PS1, 1.4363% 2/14/43 (e)(f) | | 9,301 | | 103 |
Banc of America Commercial Mortgage, Inc. sequential payer Series 2004-4 Class A5, 4.576% 7/10/42 | | 304 | | 311 |
Commercial Mortgage Securities - continued |
| Principal Amount (000s) | | Value (000s) |
Bayview Commercial Asset Trust floater: | | | | |
Series 2006-4A Class B2, 1.494% 12/25/36 (b)(e) | | $ 74 | | $ 4 |
Series 2007-3: | | | | |
Class M1, 0.554% 7/25/37 (b)(e) | | 68 | | 23 |
Class M2, 0.584% 7/25/37 (b)(e) | | 71 | | 19 |
Class M3, 0.614% 7/25/37 (b)(e) | | 116 | | 25 |
CDC Commercial Mortgage Trust Series 2002-FX1 Class XCL, 1.5913% 5/15/35 (b)(e)(f) | | 6,520 | | 153 |
Citigroup/Deutsche Bank Commercial Mortgage Trust sequential payer Series 2007-CD4 Class A4, 5.322% 12/11/49 | | 5,110 | | 5,608 |
Credit Suisse Commercial Mortgage Trust sequential payer Series 2007-C3 Class A2, 5.9018% 6/15/39 (e) | | 685 | | 687 |
GS Mortgage Securities Corp. II sequential payer Series 2005-GG4 Class A3, 4.607% 7/10/39 | | 560 | | 561 |
JPMorgan Chase Commercial Mortgage Securities Corp. floater Series 2011-CCHP Class A, 2.6% 7/15/28 (b)(e) | | 9,075 | | 9,074 |
JPMorgan Chase Commercial Mortgage Securities Trust sequential payer: | | | | |
Series 2007-LD11 Class A4, 6.0045% 6/15/49 (e) | | 4,140 | | 4,571 |
Series 2007-LDPX Class A2 S, 5.305% 1/15/49 | | 4,309 | | 4,310 |
LB-UBS Commercial Mortgage Trust: | | | | |
sequential payer Series 2007-C6 Class A2, 5.845% 7/15/40 | | 499 | | 507 |
Series 2007-C1 Class XCP, 0.6167% 2/15/40 (e)(f) | | 9,316 | | 79 |
Merrill Lynch-CFC Commercial Mortgage Trust sequential payer Series 2007-6 Class A4, 5.485% 3/12/51 (e) | | 175 | | 190 |
Wachovia Bank Commercial Mortgage Trust: | | | | |
floater Series 2006-WL7A Class A1, 0.3751% 9/15/21 (b)(e) | | 2,314 | | 2,229 |
Series 2007-C31A Class A2, 5.421% 4/15/47 | | 769 | | 799 |
Wachovia Bank Commercial Mortgage Trust pass-thru certificates sequential payer Series 2007-C33 Class A4, 6.0964% 2/15/51 (e) | | 1,470 | | 1,621 |
TOTAL COMMERCIAL MORTGAGE SECURITIES (Cost $34,956) | 35,257 |
Cash Equivalents - 4.1% |
| Maturity Amount (000s) | | Value (000s) |
Investments in repurchase agreements in a joint trading account at 0.14%, dated 2/29/12 due 3/1/12 (Collateralized by U.S. Government Obligations) #
(Cost $36,334) | $ 36,334 | | $ 36,334 |
TOTAL INVESTMENT PORTFOLIO - 126.7% (Cost $1,109,732) | | 1,128,793 |
NET OTHER ASSETS (LIABILITIES) - (26.7)% | | (238,093) |
NET ASSETS - 100% | $ 890,700 |
TBA Sale Commitments |
| Principal Amount (000s) | | |
Fannie Mae |
3.5% 3/1/42 | $ (1,000) | | (1,034) |
4.5% 3/1/27 | (5,000) | | (5,350) |
4.5% 3/1/42 | (4,400) | | (4,689) |
5% 3/1/42 | (9,000) | | (9,720) |
5% 3/1/42 | (9,000) | | (9,720) |
5.5% 3/1/42 | (2,000) | | (2,179) |
5.5% 3/1/42 | (8,000) | | (8,716) |
TOTAL FANNIE MAE | | (41,408) |
Ginnie Mae |
4% 3/1/42 | (2,500) | | (2,692) |
5% 3/1/42 | (17,200) | | (18,998) |
TOTAL GINNIE MAE | | (21,690) |
TOTAL TBA SALE COMMITMENTS (Proceeds $63,145) | $ (63,098) |
Swap Agreements |
| Expiration Date | | Notional Amount (000s) | | Value (000s) |
Interest Rate Swaps |
Receive quarterly a floating rate based on 3-month LIBOR and pay semi-annually a fixed rate equal to 0.9975% with JPMorgan Chase, Inc. | Feb. 2017 | | $ 18,000 | | $ 86 |
Receive quarterly a floating rate based on 3-month LIBOR and pay semi-annually a fixed rate equal to 3.75125% with Credit Suisse First Boston | August 2041 | | 2,900 | | (586) |
| | $ 20,900 | | $ (500) |
Legend |
(a) Non-income producing - Security is in default. |
(b) Security exempt from registration under Rule 144A of the Securities Act of 1933. These securities may be resold in transactions exempt from registration, normally to qualified institutional buyers. At the end of the period, the value of these securities amounted to $50,151,000 or 5.6% of net assets. |
(c) Security or a portion of the security purchased on a delayed delivery or when-issued basis. |
(d) Security or a portion of the security has been segregated as collateral for open swap agreements. At the period end, the value of securities pledged amounted to $673,000. |
(e) Coupon rates for floating and adjustable rate securities reflect the rates in effect at period end. |
(f) Security represents right to receive monthly interest payments on an underlying pool of mortgages or assets. Principal shown is the outstanding par amount of the pool as of the end of the period. |
(g) Principal Only Strips represent the right to receive the monthly principal payments on an underlying pool of mortgage loans. |
(h) Coupon is inversely indexed to a floating interest rate multiplied by a specified factor. The price may be considerably more volatile than the price of a comparable fixed rate security. |
(i) Represents an investment in an underlying pool of reverse mortgages which typically do not require regular principal and interest payments as repayment is deferred until a maturity event. |
# Additional information on each counterparty to the repurchase agreement is as follows: |
Repurchase Agreement / Counterparty | Value
(Amounts in thousands) |
$36,334,000 due 3/01/12 at 0.14% |
Citibank NA | $ 6,368 |
Credit Suisse Securities (USA) LLC | 26,782 |
Merrill Lynch, Pierce, Fenner & Smith, Inc. | 3,184 |
| $ 36,334 |
Other Information |
The following is a summary of the inputs used, as of February 29, 2012, involving the Fund's assets and liabilities carried at fair value. The inputs or methodology used for valuing securities may not be an indication of the risk associated with investing in those securities. For more information on valuation inputs, and their aggregation into the levels used in the tables below, please refer to the Security Valuation section in the accompanying Notes to Financial Statements. |
Valuation Inputs at Reporting Date: |
Description
(Amounts in thousands) | Total | Level 1 | Level 2 | Level 3 |
Investments in Securities: | | | | |
U.S. Government Agency - Mortgage Securities | $ 891,089 | $ - | $ 891,089 | $ - |
Asset-Backed Securities | 33,557 | - | 33,471 | 86 |
Collateralized Mortgage Obligations | 132,556 | - | 132,423 | 133 |
Commercial Mortgage Securities | 35,257 | - | 35,186 | 71 |
Cash Equivalents | 36,334 | - | 36,334 | - |
Total Investments in Securities: | $ 1,128,793 | $ - | $ 1,128,503 | $ 290 |
Derivative Instruments: | | | | |
Assets | | | | |
Swap Agreements | $ 86 | $ - | $ 86 | $ - |
Liabilities | | | | |
Swap Agreements | $ (586) | $ - | $ (586) | $ - |
Total Derivative Instruments: | $ (500) | $ - | $ (500) | $ - |
Other Financial Instruments: | | | | |
TBA Sale Commitments | $ (63,098) | $ - | $ (63,098) | $ - |
The following is a reconciliation of Investments in Securities for which Level 3 inputs were used in determining value: |
(Amounts in thousands) | |
Investments in Securities: | |
Beginning Balance | $ 184 |
Total Realized Gain (Loss) | (404) |
Total Unrealized Gain (Loss) | 415 |
Cost of Purchases | - |
Proceeds of Sales | (39) |
Amortization/Accretion | (41) |
Transfers in to Level 3 | 175 |
Transfers out of Level 3 | - |
Ending Balance | $ 290 |
The change in unrealized gain (loss) for the period attributable to Level 3 securities held at February 29, 2012 | $ 11 |
The information used in the above reconciliation represents fiscal year to date activity for any Investments in Securities identified as using Level 3 inputs at either the beginning or the end of the current fiscal period. Transfers in or out of Level 3 represent the beginning value of any Security or Instrument where a change in the pricing level occurred from the beginning to the end of the period. The cost of purchases and the proceeds of sales may include securities received or delivered through corporate actions or exchanges. Realized and unrealized gains (losses) disclosed in the reconciliation are included in Net Gain (Loss) on the Fund's Statement of Operations. |
Value of Derivative Instruments |
The following table is a summary of the Fund's value of derivative instruments by risk exposure as of February 29, 2012. For additional information on derivative instruments, please refer to the Derivative Instruments section in the accompanying Notes to Financial Statements. |
Risk Exposure /
Derivative Type | Value
(Amounts in thousands) |
| Asset | Liability |
Interest Rate Risk | | |
Swap Agreements (a) | $ 86 | $ (586) |
Total Value of Derivatives | $ 86 | $ (586) |
(a) Value is disclosed on the Statement of Assets and Liabilities in the Swap agreements, at value line-items. |
See accompanying notes which are an integral part of the financial statements.
Semiannual Report
Statement of Assets and Liabilities
Amounts in thousands (except per-share amounts) | February 29, 2012 (Unaudited) |
| | |
Assets | | |
Investment in securities, at value (including repurchase agreements of $36,334) - See accompanying schedule: Unaffiliated issuers (cost $1,109,732) | | $ 1,128,793 |
Cash | | 74 |
Receivable for investments sold, regular delivery | | 13,845 |
Receivable for TBA sale commitments | | 63,145 |
Receivable for fund shares sold | | 10,930 |
Interest receivable | | 3,292 |
Swap agreements, at value | | 86 |
Other receivables | | 116 |
Total assets | | 1,220,281 |
| | |
Liabilities | | |
TBA sale commitments, at value | $ 63,098 | |
Payable for investments purchased on a delayed delivery basis | 264,306 | |
Payable for fund shares redeemed | 879 | |
Distributions payable | 219 | |
Swap agreements, at value | 586 | |
Accrued management fee | 232 | |
Distribution and service plan fees payable | 38 | |
Other affiliated payables | 109 | |
Other payables and accrued expenses | 114 | |
Total liabilities | | 329,581 |
| | |
Net Assets | | $ 890,700 |
Net Assets consist of: | | |
Paid in capital | | $ 961,846 |
Distributions in excess of net investment income | | (7,410) |
Accumulated undistributed net realized gain (loss) on investments | | (82,344) |
Net unrealized appreciation (depreciation) on investments | | 18,608 |
Net Assets | | $ 890,700 |
See accompanying notes which are an integral part of the financial statements.
Semiannual Report
Statement of Assets and Liabilities - continued
Amounts in thousands (except per-share amounts) | February 29, 2012 (Unaudited) |
| | |
Calculation of Maximum Offering Price
Class A:
Net Asset Value and redemption price per share ($58,492 ÷ 5,226.9 shares) | | $ 11.19 |
| | |
Maximum offering price per share (100/96.00 of $11.19) | | $ 11.66 |
Class T:
Net Asset Value and redemption price per share ($36,308 ÷ 3,238.3 shares) | | $ 11.21 |
| | |
Maximum offering price per share (100/96.00 of $11.21) | | $ 11.68 |
Class B:
Net Asset Value and offering price per share ($4,265 ÷ 381.1 shares)A | | $ 11.19 |
| | |
Class C:
Net Asset Value and offering price per share ($18,205 ÷ 1,629.2 shares)A | | $ 11.17 |
| | |
| | |
Fidelity Mortgage Securities Fund:
Net Asset Value, offering price and redemption price per share ($763,511 ÷ 68,067.9 shares) | | $ 11.22 |
| | |
Institutional Class:
Net Asset Value, offering price and redemption price per share ($9,919 ÷ 887.2 shares) | | $ 11.18 |
A Redemption price per share is equal to net asset value less any applicable contingent deferred sales charge.
See accompanying notes which are an integral part of the financial statements.
Semiannual Report
Financial Statements - continued
Statement of Operations
Amounts in thousands | Six months ended February 29, 2012 (Unaudited) |
| | |
Investment Income | | |
Interest | | $ 15,556 |
| | |
Expenses | | |
Management fee | $ 1,396 | |
Transfer agent fees | 501 | |
Distribution and service plan fees | 222 | |
Fund wide operations fee | 145 | |
Independent trustees' compensation | 1 | |
Miscellaneous | 1 | |
Total expenses | | 2,266 |
Net investment income (loss) | | 13,290 |
Realized and Unrealized Gain (Loss) Net realized gain (loss) on: | | |
Investment securities: | | |
Unaffiliated issuers | 12,843 | |
Futures contracts | 4 | |
Swap agreements | (1,236) | |
Total net realized gain (loss) | | 11,611 |
Change in net unrealized appreciation (depreciation) on: Investment securities | (7,469) | |
Swap agreements | 422 | |
Delayed delivery commitments | (340) | |
Total change in net unrealized appreciation (depreciation) | | (7,387) |
Net gain (loss) | | 4,224 |
Net increase (decrease) in net assets resulting from operations | | $ 17,514 |
See accompanying notes which are an integral part of the financial statements.
Semiannual Report
Statement of Changes in Net Assets
Amounts in thousands | Six months ended February 29, 2012
(Unaudited) | Year ended
August 31,
2011 |
Increase (Decrease) in Net Assets | | |
Operations | | |
Net investment income (loss) | $ 13,290 | $ 29,651 |
Net realized gain (loss) | 11,611 | 10,993 |
Change in net unrealized appreciation (depreciation) | (7,387) | 6,942 |
Net increase (decrease) in net assets resulting
from operations | 17,514 | 47,586 |
Distributions to shareholders from net investment income | (13,511) | (30,093) |
Share transactions - net increase (decrease) | (687) | (96,103) |
Total increase (decrease) in net assets | 3,316 | (78,610) |
| | |
Net Assets | | |
Beginning of period | 887,384 | 965,994 |
End of period (including distributions in excess of net investment income of $7,410 and distributions in excess of net investment income of $7,189, respectively) | $ 890,700 | $ 887,384 |
See accompanying notes which are an integral part of the financial statements.
Semiannual Report
Financial Highlights - Class A
| Six months ended February 29, 2012 | Years ended August 31, |
| (Unaudited) | 2011 | 2010 | 2009 | 2008 | 2007 |
Selected Per-Share Data | | | | | | |
Net asset value, beginning of period | $ 11.14 | $ 10.91 | $ 10.38 | $ 10.09 | $ 10.57 | $ 10.97 |
Income from Investment Operations | | | | | | |
Net investment income (loss) E | .151 | .323 | .357 | .464 | .467 | .521 |
Net realized and unrealized gain (loss) | .053 | .235 | .602 | .283 | (.461) | (.401) |
Total from investment operations | .204 | .558 | .959 | .747 | .006 | .120 |
Distributions from net investment income | (.154) | (.328) | (.429) | (.457) | (.486) | (.520) |
Net asset value, end of period | $ 11.19 | $ 11.14 | $ 10.91 | $ 10.38 | $ 10.09 | $ 10.57 |
Total Return B, C, D | 1.85% | 5.22% | 9.44% | 7.63% | .06% | 1.04% |
Ratios to Average Net Assets F, H | | | | | |
Expenses before reductions | .82% A | .82% | .83% | .84% | .85% | .79% |
Expenses net of fee waivers, if any | .82% A | .82% | .83% | .84% | .85% | .79% |
Expenses net of all reductions | .82% A | .82% | .83% | .84% | .85% | .78% |
Net investment income (loss) | 2.73% A | 2.96% | 3.36% | 4.59% | 4.52% | 4.77% |
Supplemental Data | | | | | | |
Net assets, end of period (in millions) | $ 58 | $ 59 | $ 61 | $ 47 | $ 39 | $ 54 |
Portfolio turnover rate G | 496% A | 490% | 527% | 476% | 397% | 409% |
A Annualized
B Total returns for periods of less than one year are not annualized.
C Total returns would have been lower if certain expenses had not been reduced during the applicable periods shown.
D Total returns do not include the effect of the sales charges.
E Calculated based on average shares outstanding during the period.
F Fees and expenses of any underlying Fidelity Central Funds are not included in the Fund's expense ratio. The Fund indirectly bears its proportionate share of the expenses of any underlying Fidelity Central Funds.
G Amount does not include the portfolio activity of any underlying Fidelity Central Funds.
H Expense ratios reflect operating expenses of the class. Expenses before reductions do not reflect amounts reimbursed by the investment adviser or reductions from expense offset arrangements and do not represent the amount paid by the class during periods when reimbursements or reductions occur. Expenses net of fee waivers reflect expenses after reimbursement by the investment adviser but prior to reductions from expense offset arrangements. Expenses net of all reductions represent the net expenses paid by the class.
See accompanying notes which are an integral part of the financial statements.
Semiannual Report
Financial Highlights - Class T
| Six months ended February 29, 2012 | Years ended August 31, |
| (Unaudited) | 2011 | 2010 | 2009 | 2008 | 2007 |
Selected Per-Share Data | | | | | | |
Net asset value, beginning of period | $ 11.16 | $ 10.93 | $ 10.40 | $ 10.11 | $ 10.59 | $ 10.99 |
Income from Investment Operations | | | | | | |
Net investment income (loss) E | .153 | .326 | .360 | .466 | .470 | .519 |
Net realized and unrealized gain (loss) | .053 | .235 | .602 | .282 | (.462) | (.403) |
Total from investment operations | .206 | .561 | .962 | .748 | .008 | .116 |
Distributions from net investment income | (.156) | (.331) | (.432) | (.458) | (.488) | (.516) |
Net asset value, end of period | $ 11.21 | $ 11.16 | $ 10.93 | $ 10.40 | $ 10.11 | $ 10.59 |
Total Return B, C, D | 1.86% | 5.24% | 9.44% | 7.62% | .07% | 1.01% |
Ratios to Average Net Assets F, H | | | | | |
Expenses before reductions | .79% A | .79% | .81% | .83% | .83% | .82% |
Expenses net of fee waivers, if any | .79% A | .79% | .81% | .83% | .83% | .82% |
Expenses net of all reductions | .79% A | .79% | .81% | .83% | .83% | .82% |
Net investment income (loss) | 2.76% A | 2.99% | 3.39% | 4.60% | 4.53% | 4.73% |
Supplemental Data | | | | | | |
Net assets, end of period (in millions) | $ 36 | $ 37 | $ 41 | $ 40 | $ 41 | $ 68 |
Portfolio turnover rate G | 496% A | 490% | 527% | 476% | 397% | 409% |
A Annualized
B Total returns for periods of less than one year are not annualized.
C Total returns would have been lower if certain expenses had not been reduced during the applicable periods shown.
D Total returns do not include the effect of the sales charges.
E Calculated based on average shares outstanding during the period.
F Fees and expenses of any underlying Fidelity Central Funds are not included in the Fund's expense ratio. The Fund indirectly bears its proportionate share of the expenses of any underlying Fidelity Central Funds.
G Amount does not include the portfolio activity of any underlying Fidelity Central Funds.
H Expense ratios reflect operating expenses of the class. Expenses before reductions do not reflect amounts reimbursed by the investment adviser or reductions from expense offset arrangements and do not represent the amount paid by the class during periods when reimbursements or reductions occur. Expenses net of fee waivers reflect expenses after reimbursement by the investment adviser but prior to reductions from expense offset arrangements. Expenses net of all reductions represent the net expenses paid by the class.
See accompanying notes which are an integral part of the financial statements.
Semiannual Report
Financial Highlights - Class B
| Six months ended February 29, 2012 | Years ended August 31, |
| (Unaudited) | 2011 | 2010 | 2009 | 2008 | 2007 |
Selected Per-Share Data | | | | | | |
Net asset value, beginning of period | $ 11.14 | $ 10.91 | $ 10.38 | $ 10.09 | $ 10.57 | $ 10.97 |
Income from Investment Operations | | | | | | |
Net investment income (loss) E | .113 | .248 | .286 | .398 | .400 | .443 |
Net realized and unrealized gain (loss) | .053 | .235 | .602 | .283 | (.461) | (.401) |
Total from investment operations | .166 | .483 | .888 | .681 | (.061) | .042 |
Distributions from net investment income | (.116) | (.253) | (.358) | (.391) | (.419) | (.442) |
Net asset value, end of period | $ 11.19 | $ 11.14 | $ 10.91 | $ 10.38 | $ 10.09 | $ 10.57 |
Total Return B, C, D | 1.50% | 4.51% | 8.71% | 6.93% | (.58)% | .32% |
Ratios to Average Net Assets F, H | | | | | |
Expenses before reductions | 1.51% A | 1.50% | 1.50% | 1.50% | 1.50% | 1.50% |
Expenses net of fee waivers, if any | 1.51% A | 1.50% | 1.50% | 1.50% | 1.50% | 1.50% |
Expenses net of all reductions | 1.51% A | 1.50% | 1.50% | 1.50% | 1.50% | 1.50% |
Net investment income (loss) | 2.04% A | 2.27% | 2.69% | 3.93% | 3.86% | 4.05% |
Supplemental Data | | | | | | |
Net assets, end of period (in millions) | $ 4 | $ 5 | $ 7 | $ 19 | $ 32 | $ 50 |
Portfolio turnover rate G | 496% A | 490% | 527% | 476% | 397% | 409% |
A Annualized
B Total returns for periods of less than one year are not annualized.
C Total returns would have been lower if certain expenses had not been reduced during the applicable periods shown.
D Total returns do not include the effect of the contingent deferred sales charge.
E Calculated based on average shares outstanding during the period.
F Fees and expenses of any underlying Fidelity Central Funds are not included in the Fund's expense ratio. The Fund indirectly bears its proportionate share of the expenses of any underlying Fidelity Central Funds.
G Amount does not include the portfolio activity of any underlying Fidelity Central Funds.
H Expense ratios reflect operating expenses of the class. Expenses before reductions do not reflect amounts reimbursed by the investment adviser or reductions from expense offset arrangements and do not represent the amount paid by the class during periods when reimbursements or reductions occur. Expenses net of fee waivers reflect expenses after reimbursement by the investment adviser but prior to reductions from expense offset arrangements. Expenses net of all reductions represent the net expenses paid by the class.
See accompanying notes which are an integral part of the financial statements.
Semiannual Report
Financial Highlights - Class C
| Six months ended February 29, 2012 | Years ended August 31, |
| (Unaudited) | 2011 | 2010 | 2009 | 2008 | 2007 |
Selected Per-Share Data | | | | | | |
Net asset value, beginning of period | $ 11.12 | $ 10.90 | $ 10.37 | $ 10.08 | $ 10.56 | $ 10.96 |
Income from Investment Operations | | | | | | |
Net investment income (loss) E | .111 | .244 | .282 | .390 | .389 | .434 |
Net realized and unrealized gain (loss) | .054 | .226 | .603 | .284 | (.459) | (.401) |
Total from investment operations | .165 | .470 | .885 | .674 | (.070) | .033 |
Distributions from net investment income | (.115) | (.250) | (.355) | (.384) | (.410) | (.433) |
Net asset value, end of period | $ 11.17 | $ 11.12 | $ 10.90 | $ 10.37 | $ 10.08 | $ 10.56 |
Total Return B, C, D | 1.49% | 4.39% | 8.69% | 6.86% | (.68)% | .25% |
Ratios to Average Net Assets F, H | | | | | |
Expenses before reductions | 1.54% A | 1.53% | 1.53% | 1.57% | 1.60% | 1.58% |
Expenses net of fee waivers, if any | 1.54% A | 1.53% | 1.53% | 1.57% | 1.60% | 1.58% |
Expenses net of all reductions | 1.54% A | 1.53% | 1.53% | 1.57% | 1.60% | 1.58% |
Net investment income (loss) | 2.01% A | 2.24% | 2.66% | 3.86% | 3.77% | 3.97% |
Supplemental Data | | | | | | |
Net assets, end of period (in millions) | $ 18 | $ 15 | $ 18 | $ 18 | $ 15 | $ 23 |
Portfolio turnover rate G | 496% A | 490% | 527% | 476% | 397% | 409% |
A Annualized
B Total returns for periods of less than one year are not annualized.
C Total returns would have been lower if certain expenses had not been reduced during the applicable periods shown.
D Total returns do not include the effect of the contingent deferred sales charge.
E Calculated based on average shares outstanding during the period.
F Fees and expenses of any underlying Fidelity Central Funds are not included in the Fund's expense ratio. The Fund indirectly bears its proportionate share of the expenses of any underlying Fidelity Central Funds.
G Amount does not include the portfolio activity of any underlying Fidelity Central Funds.
H Expense ratios reflect operating expenses of the class. Expenses before reductions do not reflect amounts reimbursed by the investment adviser or reductions from expense offset arrangements and do not represent the amount paid by the class during periods when reimbursements or reductions occur. Expenses net of fee waivers reflect expenses after reimbursement by the investment adviser but prior to reductions from expense offset arrangements. Expenses net of all reductions represent the net expenses paid by the class.
See accompanying notes which are an integral part of the financial statements.
Semiannual Report
Financial Highlights - Fidelity Mortgage Securities Fund
| Six months ended February 29, 2012 | Years ended August 31, |
| (Unaudited) | 2011 | 2010 | 2009 | 2008 | 2007 |
Selected Per-Share Data | | | | | | |
Net asset value, beginning of period | $ 11.17 | $ 10.94 | $ 10.41 | $ 10.11 | $ 10.59 | $ 10.99 |
Income from Investment Operations | | | | | | |
Net investment income (loss) D | .172 | .364 | .399 | .505 | .509 | .559 |
Net realized and unrealized gain (loss) | .053 | .234 | .601 | .292 | (.462) | (.403) |
Total from investment operations | .225 | .598 | 1.000 | .797 | .047 | .156 |
Distributions from net investment income | (.175) | (.368) | (.470) | (.497) | (.527) | (.556) |
Net asset value, end of period | $ 11.22 | $ 11.17 | $ 10.94 | $ 10.41 | $ 10.11 | $ 10.59 |
Total Return B, C | 2.03% | 5.59% | 9.83% | 8.14% | .46% | 1.38% |
Ratios to Average Net Assets E, G | | | | | |
Expenses before reductions | .45% A | .45% | .45% | .45% | .45% | .45% |
Expenses net of fee waivers, if any | .45% A | .45% | .45% | .45% | .45% | .45% |
Expenses net of all reductions | .45% A | .45% | .45% | .45% | .45% | .45% |
Net investment income (loss) | 3.10% A | 3.33% | 3.74% | 4.99% | 4.91% | 5.10% |
Supplemental Data | | | | | | |
Net assets, end of period (in millions) | $ 764 | $ 765 | $ 829 | $ 838 | $ 1,049 | $ 1,446 |
Portfolio turnover rate F | 496% A | 490% | 527% | 476% | 397% | 409% |
A Annualized
B Total returns for periods of less than one year are not annualized.
C Total returns would have been lower if certain expenses had not been reduced during the applicable periods shown.
D Calculated based on average shares outstanding during the period.
E Fees and expenses of any underlying Fidelity Central Funds are not included in the Fund's expense ratio. The Fund indirectly bears its proportionate share of the expenses of any underlying Fidelity Central Funds.
F Amount does not include the portfolio activity of any underlying Fidelity Central Funds.
G Expense ratios reflect operating expenses of the class. Expenses before reductions do not reflect amounts reimbursed by the investment adviser or reductions from expense offset arrangements and do not represent the amount paid by the class during periods when reimbursements or reductions occur. Expenses net of fee waivers reflect expenses after reimbursement by the investment adviser but prior to reductions from expense offset arrangements. Expenses net of all reductions represent the net expenses paid by the class.
See accompanying notes which are an integral part of the financial statements.
Semiannual Report
Financial Highlights - Institutional Class
| Six months ended February 29, 2012 | Years ended August 31, |
| (Unaudited) | 2011 | 2010 | 2009 | 2008 | 2007 |
Selected Per-Share Data | | | | | | |
Net asset value, beginning of period | $ 11.13 | $ 10.90 | $ 10.37 | $ 10.08 | $ 10.56 | $ 10.97 |
Income from Investment Operations | | | | | | |
Net investment income (loss) D | .168 | .354 | .391 | .496 | .499 | .548 |
Net realized and unrealized gain (loss) | .054 | .235 | .603 | .284 | (.461) | (.411) |
Total from investment operations | .222 | .589 | .994 | .780 | .038 | .137 |
Distributions from net investment income | (.172) | (.359) | (.464) | (.490) | (.518) | (.547) |
Net asset value, end of period | $ 11.18 | $ 11.13 | $ 10.90 | $ 10.37 | $ 10.08 | $ 10.56 |
Total Return B, C | 2.01% | 5.53% | 9.80% | 7.98% | .37% | 1.20% |
Ratios to Average Net Assets E, G | | | | | |
Expenses before reductions | .51% A | .53% | .50% | .52% | .54% | .53% |
Expenses net of fee waivers, if any | .51% A | .53% | .50% | .52% | .54% | .53% |
Expenses net of all reductions | .51% A | .53% | .50% | .52% | .54% | .53% |
Net investment income (loss) | 3.04% A | 3.24% | 3.69% | 4.92% | 4.83% | 5.02% |
Supplemental Data | | | | | | |
Net assets, end of period (in millions) | $ 10 | $ 7 | $ 10 | $ 10 | $ 7 | $ 10 |
Portfolio turnover rate F | 496% A | 490% | 527% | 476% | 397% | 409% |
A Annualized
B Total returns for periods of less than one year are not annualized.
C Total returns would have been lower if certain expenses had not been reduced during the applicable periods shown.
D Calculated based on average shares outstanding during the period.
E Fees and expenses of any underlying Fidelity Central Funds are not included in the Fund's expense ratio. The Fund indirectly bears its proportionate share of the expenses of any underlying Fidelity Central Funds.
F Amount does not include the portfolio activity of any underlying Fidelity Central Funds.
G Expense ratios reflect operating expenses of the class. Expenses before reductions do not reflect amounts reimbursed by the investment adviser or reductions from expense offset arrangements and do not represent the amount paid by the class during periods when reimbursements or reductions occur. Expenses net of fee waivers reflect expenses after reimbursement by the investment adviser but prior to reductions from expense offset arrangements. Expenses net of all reductions represent the net expenses paid by the class.
See accompanying notes which are an integral part of the financial statements.
Semiannual Report
Notes to Financial Statements
For the period ended February 29, 2012 (Unaudited)
(Amounts in thousands except percentages)
1. Organization.
Fidelity Advisor Mortgage Securities Fund (the Fund) is a fund of Fidelity Advisor Series II (the Trust) and is authorized to issue an unlimited number of shares. The Trust is registered under the Investment Company Act of 1940, as amended (the 1940 Act), as an open-end management investment company organized as a Massachusetts business trust. The Fund offers Class A, Class T, Class C, Fidelity Mortgage Securities Fund and Institutional Class shares, each of which, along with Class B shares, has equal rights as to assets and voting privileges. Effective after the close of business on September 1, 2010, Class B shares were closed to new accounts and additional purchases, except for exchanges and reinvestments. Each class has exclusive voting rights with respect to matters that affect that class. Class B shares will automatically convert to Class A shares after a holding period of seven years from the initial date of purchase. Investment income, realized and unrealized capital gains and losses, the common expenses of the Fund, and certain fund-level expense reductions, if any, are allocated on a pro-rata basis to each class based on the relative net assets of each class to the total net assets of the Fund. Each class differs with respect to transfer agent and distribution and service plan fees incurred. Certain expense reductions may also differ by class.
2. Significant Accounting Policies.
The financial statements have been prepared in conformity with accounting principles generally accepted in the United States of America (GAAP), which require management to make certain estimates and assumptions at the date of the financial statements. Actual results could differ from those estimates. Subsequent events, if any, through the date that the financial statements were issued have been evaluated in the preparation of the financial statements. The following summarizes the significant accounting policies of the Fund:
Security Valuation. Investments are valued as of 4:00 p.m. Eastern time on the last calendar day of the period. The Fund uses independent pricing services approved by the Board of Trustees to value its investments. When current market prices or quotations are not readily available or reliable, valuations may be determined in good faith in accordance with procedures adopted by the Board of Trustees. Factors used in determining value may include market or security specific events, changes in interest rates and credit quality. The frequency with which these procedures are used cannot be predicted and they may be utilized to a significant extent. The value used for net asset value (NAV) calculation under these procedures may differ from published prices for the same securities.
Semiannual Report
Notes to Financial Statements (Unaudited) - continued
(Amounts in thousands except percentages)
2. Significant Accounting Policies - continued
Security Valuation - continued
The Fund categorizes the inputs to valuation techniques used to value its investments into a disclosure hierarchy consisting of three levels as shown below:
Level 1 - quoted prices in active markets for identical investments
Level 2 - other significant observable inputs (including quoted prices for similar investments, interest rates, prepayment speeds, etc.)
Level 3 - unobservable inputs (including the Fund's own assumptions based on the best information available)
Changes in valuation techniques may result in transfers in or out of an assigned level within the disclosure hierarchy. The aggregate value of investments by input level, as of February 29, 2012 for the Fund's investments, as well as a roll forward of Level 3 securities, is included at the end of the Fund's Schedule of Investments. Valuation techniques used to value the Fund's investments by major category are as follows:
Debt securities, including restricted securities, are valued based on evaluated prices received from independent pricing services or from dealers who make markets in such securities. For asset backed securities, collateralized mortgage obligations, commercial mortgage securities and U.S. government agency mortgage securities, pricing services utilize matrix pricing which considers prepayment speed assumptions, attributes of the collateral, yield or price of bonds of comparable quality, coupon, maturity and type as well as dealer supplied prices and, accordingly, such securities are generally categorized as Level 2 in the hierarchy. Dealers which make markets in asset backed securities, collateralized mortgage obligations and commercial mortgage securities may also consider such factors as the structure of the issue, cash flow assumptions, the value of underlying assets as well as any guarantees. Swaps are marked-to-market daily based on valuations from independent pricing services or dealer-supplied valuations and changes in value are recorded as unrealized appreciation (depreciation). Pricing services utilize matrix pricing which considers comparisons to interest rate curves, credit spread curves, default possibilities and recovery rates and, as a result, swaps are generally categorized as Level 2 in the hierarchy. When independent prices are unavailable or unreliable, debt securities and swaps may be valued utilizing pricing matrices which consider similar factors that would be used by independent pricing services. These are generally categorized as Level 2 in the hierarchy but may be Level 3 depending on the circumstances.
Short-term securities with remaining maturities of sixty days or less may be valued at amortized cost, which approximates fair value, and are categorized as Level 2 in the hierarchy.
Semiannual Report
2. Significant Accounting Policies - continued
New Accounting Pronouncements. In May 2011, the Financial Accounting Standards Board issued Accounting Standard Update No. 2011-04, Fair Value Measurement (Topic 820) - Amendments to Achieve Common Fair Value Measurement and Disclosure Requirements in U.S. GAAP and IFRSs. The update is effective during interim and annual periods beginning after December 15, 2011 and will result in additional disclosure for transfers between levels as well as expanded disclosure for securities categorized as Level 3 under the fair value hierarchy.
In December 2011, the Financial Accounting Standards Board issued Accounting Standard Update No. 2011-11, Disclosures about Offsetting Assets and Liabilities. The update creates new disclosure requirements requiring entities to disclose both gross and net information for derivatives and other financial instruments that are either offset in the Statement of Assets and Liabilities or subject to an enforceable master netting arrangement or similar agreement. The disclosure requirements are effective for interim and annual reporting periods beginning on or after January 1, 2013. Management is currently evaluating the impact of the update's adoption on the Fund's financial statement disclosures.
Investment Transactions and Income. For financial reporting purposes, the Fund's investment holdings and NAV include trades executed through the end of the last business day of the period. The NAV per share for processing shareholder transactions is calculated as of the close of business of the New York Stock Exchange (NYSE), normally 4:00 p.m. Eastern time and includes trades executed through the end of the prior business day. Gains and losses on securities sold are determined on the basis of identified cost. Interest income is accrued as earned. Interest income includes coupon interest and amortization of premium and accretion of discount on debt securities. Debt obligations may be placed on non-accrual status and related interest income may be reduced by ceasing current accruals and writing off interest receivables when the collection of all or a portion of interest has become doubtful based on consistently applied procedures. A debt obligation is removed from non-accrual status when the issuer resumes interest payments or when collectability of interest is reasonably assured.
Expenses. Expenses directly attributable to a fund are charged to that fund. Expenses attributable to more than one fund are allocated among the respective funds on the basis of relative net assets or other appropriate methods. Expense estimates are accrued in the period to which they relate and adjustments are made when actual amounts are known.
Income Tax Information and Distributions to Shareholders. Each year, the Fund intends to qualify as a regulated investment company under Subchapter M of the Internal Revenue Code, including distributing substantially all of its taxable income and realized gains. As a result, no provision for income taxes is required. The Fund files a U.S.
Semiannual Report
Notes to Financial Statements (Unaudited) - continued
(Amounts in thousands except percentages)
2. Significant Accounting Policies - continued
Income Tax Information and Distributions to Shareholders - continued
federal tax return, in addition to state and local tax returns as required. A fund's federal income tax returns are subject to examination by the Internal Revenue Service (IRS) for a period of three fiscal years after they are filed. State and local tax returns may be subject to examination for an additional fiscal year depending on the jurisdiction.
Dividends are declared and recorded daily and paid monthly from net investment income. Distributions from realized gains, if any, are declared and recorded on the ex-dividend date. Income dividends and capital gain distributions are declared separately for each class. Income and capital gain distributions are determined in accordance with income tax regulations, which may differ from GAAP.
Capital accounts within the financial statements are adjusted for permanent book-tax differences. These adjustments have no impact on net assets or the results of operations. Temporary book-tax differences will reverse in a subsequent period.
Book-tax differences are primarily due to futures transactions, swap agreements, prior period premium and discount on debt securities, market discount, deferred trustees compensation, financing transactions, capital loss carryforwards and losses deferred due to wash sales and excise tax regulations.
The federal tax cost of investment securities and unrealized appreciation (depreciation) as of period end were as follows:
Gross unrealized appreciation | $ 29,452 |
Gross unrealized depreciation | (10,393) |
Net unrealized appreciation (depreciation) on securities and other investments | $ 19,059 |
| |
Tax cost | $ 1,109,734 |
Capital loss carryforwards are only available to offset future capital gains of the Fund to the extent provided by regulations and may be limited. Under the Regulated Investment Company Modernization Act of 2010 (the Act), the Fund is permitted to carry forward capital losses incurred in taxable years beginning after December 22, 2010 for an unlimited period and such capital losses are required to be used prior to any losses that expire. At August 31, 2011, capital loss carryforwards were as follows:
Fiscal year of expiration | |
2016 | $ (5,307) |
2017 | (84,825) |
Total capital loss carryforward | $ (90,132) |
Semiannual Report
3. Operating Policies.
Repurchase Agreements. FMR has received an Exemptive Order from the Securities and Exchange Commission (the SEC) which permits the Fund and other affiliated entities of FMR to transfer uninvested cash balances into joint trading accounts which are then invested in repurchase agreements. The Fund may also invest directly with institutions in repurchase agreements. Repurchase agreements are collateralized by government or non-government securities. Upon settlement date, collateral is held in segregated accounts with custodian banks and may be obtained in the event of a default of the counterparty. The Fund monitors, on a daily basis, the value of the collateral to ensure it is at least equal to the principal amount of the repurchase agreement (including accrued interest). In the event of a default by the counterparty, realization of the collateral proceeds could be delayed, during which time the value of the collateral may decline.
Delayed Delivery Transactions and When-Issued Securities. During the period, the Fund transacted in securities on a delayed delivery or when-issued basis. Payment and delivery may take place after the customary settlement period for that security. The price of the underlying securities and the date when the securities will be delivered and paid for are fixed at the time the transaction is negotiated. During the time a delayed delivery sell is outstanding, the contract is marked-to-market daily and equivalent deliverable securities are held for the transaction. The securities purchased on a delayed delivery or when-issued basis are identified as such in the Fund's Schedule of Investments. The Fund may receive compensation for interest forgone in the purchase of a delayed delivery or when-issued security. With respect to purchase commitments, the Fund identifies securities as segregated in its records with a value at least equal to the amount of the commitment. Losses may arise due to changes in the value of the underlying securities or if the counterparty does not perform under the contract's terms, or if the issuer does not issue the securities due to political, economic, or other factors.
To-Be-Announced (TBA) Securities and Mortgage Dollar Rolls. During the period, the Fund transacted in TBA securities that involved buying or selling mortgage-backed securities (MBS) on a forward commitment basis. A TBA transaction typically does not designate the actual security to be delivered and only includes an approximate principal amount however; delivered securities must meet specified terms defined by industry guidelines, including issuer, rate and current principal amount outstanding on underlying mortgage pools. The Fund may enter into a TBA transaction with the intent to take possession of or deliver the underlying MBS, or the Fund may elect to extend the settlement by entering into either a mortgage or reverse mortgage dollar roll. Mortgage dollar rolls are transactions where a fund sells MBS and simultaneously agrees to repurchase MBS on a later date at a lower price and with the same counterparty. Reverse mortgage
Semiannual Report
Notes to Financial Statements (Unaudited) - continued
(Amounts in thousands except percentages)
3. Operating Policies - continued
To-Be-Announced (TBA) Securities and Mortgage Dollar Rolls - continued
dollar rolls involve the purchase and simultaneous agreement to sell MBS on a later date at a lower price. Transactions in mortgage dollar rolls and reverse mortgage dollar rolls are accounted for as purchases and sales and may result in an increase to the Fund's portfolio turnover rate.
Purchases and sales of TBA securities involve risks similar to those discussed above for delayed delivery and when-issued securities. Also, if the counterparty in a dollar roll or a reverse dollar roll transaction files for bankruptcy or becomes insolvent, the Fund's right to repurchase or sell securities may be limited. Additionally, when a fund sells TBA securities without already owning or having the right to obtain the deliverable securities (an uncovered forward commitment to sell), it incurs a risk of loss because it could have to purchase the securities at a price that is higher than the price at which it sold them. A fund may be unable to purchase the deliverable securities if the corresponding market is illiquid.
TBA securities subject to a forward commitment to sell at period end are included at the end of the Fund's Schedule of Investments under the caption "TBA Sale Commitments." The proceeds and value of these commitments are reflected in the Fund's Statement of Assets and Liabilities.
Restricted Securities. The Fund may invest in securities that are subject to legal or contractual restrictions on resale. These securities generally may be resold in transactions exempt from registration or to the public if the securities are registered. Disposal of these securities may involve time-consuming negotiations and expense, and prompt sale at an acceptable price may be difficult. Information regarding restricted securities is included at the end of the Fund's Schedule of Investments.
4. Derivative Instruments.
Risk Exposures and the Use of Derivative Instruments. The Fund used derivative instruments (derivatives), including futures contracts and swap agreements, in order to meet its investment objectives. The strategy is to use derivatives to increase returns, to gain exposure to certain types of assets and to manage exposure to certain risks as defined below. The success of any strategy involving derivatives depends on analysis of numerous economic factors, and if the strategies for investment do not work as intended, the Fund may not achieve its objectives.
Semiannual Report
4. Derivative Instruments - continued
Risk Exposures and the Use of Derivative Instruments - continued
The Fund's use of derivatives increased or decreased its exposure to the following risk:
Interest Rate Risk | Interest rate risk relates to the fluctuations in the value of interest-bearing securities due to changes in the prevailing levels of market interest rates. |
The Fund is also exposed to additional risks from investing in derivatives, such as liquidity risk and counterparty credit risk. Liquidity risk is the risk that the Fund will be unable to close out the derivative in the open market in a timely manner. Counterparty credit risk is the risk that the counterparty will not be able to fulfill its obligation to the Fund. Derivative counterparty credit risk is managed through formal evaluation of the creditworthiness of all potential counterparties. On certain over-the-counter (OTC) derivatives such as swap agreements, the Fund attempts to reduce its exposure to counterparty credit risk by entering into an International Swaps and Derivatives Association (ISDA) Master Agreement on a bilateral basis with each of its counterparties. The ISDA Master Agreement gives the Fund the right to terminate all transactions traded under such agreement if there is a certain deterioration in the credit quality of the counterparty. The ISDA Master Agreement gives each party the right, upon an event of default by the other party or a termination of the agreement, to close out all transactions traded under such agreement and to net amounts owed under each transaction to one net payable by one party to the other. To mitigate counterparty credit risk on OTC derivatives, the Fund receives collateral in the form of cash or securities once the Fund's net unrealized appreciation on outstanding derivative contracts under an ISDA Master Agreement exceeds certain applicable thresholds, subject to certain minimum transfer provisions. The collateral received is held in segregated accounts with the Fund's custodian bank in accordance with the collateral agreements entered into between the Fund, the counterparty and the Fund's custodian bank. The Fund could experience delays and costs in gaining access to the collateral even though it is held by the Fund's custodian bank. The Fund's maximum risk of loss from counterparty credit risk related to OTC derivatives is generally the aggregate unrealized appreciation and unpaid counterparty payments in excess of any collateral pledged by the counterparty to the Fund. The Fund may be required to pledge collateral for the benefit of the counterparties on OTC derivatives in an amount not less than the counterparty's unrealized appreciation on outstanding derivative contracts, subject to certain minimum transfer provisions, and any such pledged collateral is identified in the Schedule of Investments. Futures contracts are not covered by the ISDA Master Agreement, however, counterparty credit risk related to exchange-traded futures contracts is minimal because of the protection provided by the exchange on which they trade. Derivatives involve, to varying degrees, risk of loss in excess of the amounts recognized in the Statement of Assets and Liabilities.
Semiannual Report
Notes to Financial Statements (Unaudited) - continued
(Amounts in thousands except percentages)
4. Derivative Instruments - continued
Net Realized Gain (Loss) and Change in Net Unrealized Appreciation (Depreciation) on Derivatives. The table below, which reflects the impacts of derivatives on the financial performance of the Fund, summarizes the net realized gain (loss) and change in net unrealized appreciation (depreciation) for derivatives during the period.
Risk Exposure / Derivative Type | Net Realized
Gain (Loss) | Change in Net Unrealized
Appreciation (Depreciation) |
Interest Rate Risk | | |
Futures Contracts | $ 4 | $ - |
Swap Agreements | (1,236) | 422 |
Totals (a) | $ (1,232) | $ 422 |
(a) A summary of the value of derivatives by risk exposure as of period end, if any, is included at the end of the Schedule of Investments and is representative of activity for the period.
Futures Contracts. A futures contract is an agreement between two parties to buy or sell a specified underlying instrument for a fixed price at a specified future date. The Fund used futures contracts to manage its exposure to the fluctuations in interest rates.
Upon entering into a futures contract, a fund is required to deposit either cash or securities (initial margin) with a clearing broker in an amount equal to a certain percentage of the face value of the contract. Futures contracts are marked-to-market daily and subsequent payments (variation margin) are made or received by a fund depending on the daily fluctuations in the value of the futures contracts and are recorded as unrealized appreciation or (depreciation). This receivable and/or payable is included in daily variation margin on futures contracts in the Statement of Assets and Liabilities. Realized gain or (loss) is recorded upon the expiration or closing of a futures contract. The net realized gain (loss) and change in net unrealized appreciation (depreciation) on futures contracts during the period is included in the Statement of Operations.
The underlying face amount at value of open futures contracts at period end, if any, is shown in the Schedule of Investments under the caption "Futures Contracts."
Swap Agreements. A swap agreement (swap) is a contract between two parties to exchange future cash flows at periodic intervals based on a notional principal amount.
Details of swaps open at period end are included in the Schedule of Investments under the caption "Swap Agreements." Swaps are marked-to-market daily and changes in value are recorded as unrealized appreciation or (depreciation) and reflected in the Statement of Assets and Liabilities. Any upfront premiums paid or received upon entering a swap to compensate for differences between stated terms of the agreement and prevailing market conditions (e.g. credit spreads, interest rates or other factors) are recorded as realized gain or (loss) ratably over the term of the swap. Payments are exchanged at specified intervals, accrued daily commencing with the effective date of the contract and recorded as realized
Semiannual Report
4. Derivative Instruments - continued
Swap Agreements - continued
gain or (loss). Realized gain or (loss) is also recorded in the event of an early termination of a swap. The net realized gain (loss) and change in net unrealized appreciation (depreciation) on swaps during the period is included in the Statement of Operations.
Interest Rate Swaps. Interest rate swaps are agreements between counterparties to exchange cash flows, one based on a fixed rate, and the other on a floating rate. The Fund entered into interest rate swaps to manage its exposure to interest rate changes. Changes in interest rates can have an effect on both the value of bond holdings as well as the amount of interest income earned. In general, the value of bonds can fall when interest rates rise and can rise when interest rates fall.
5. Purchases and Sales of Investments.
Purchases and sales of securities, other than short-term securities and U.S. government securities, aggregated $45,047 and $52,466, respectively.
6. Fees and Other Transactions with Affiliates.
Management Fee. FMR and its affiliates provide the Fund with investment management related services for which the Fund pays a monthly management fee. The management fee is the sum of an individual fund fee rate that is based on an annual rate of .20% of the Fund's average net assets and an annualized group fee rate that averaged .12% during the period. The group fee rate is based upon the average net assets of all the mutual funds advised by FMR. The group fee rate decreases as assets under management increase and increases as assets under management decrease. For the period, the total annualized management fee rate was .32% of the Fund's average net assets.
Distribution and Service Plan Fees. In accordance with Rule 12b-1 of the 1940 Act, the Fund has adopted separate Distribution and Service Plans for each class of shares. Certain classes pay Fidelity Distributors Corporation (FDC), an affiliate of FMR, separate Distribution and Service Fees, each of which is based on an annual percentage of each class' average net assets. In addition, FDC may pay financial intermediaries for selling shares of the Fund and providing shareholder support services. For the period, the Distribution and Service Fee rates, total fees and amounts retained by FDC were as follows:
| Distribution
Fee | Service
Fee | Total
Fees | Retained
by FDC |
Class A | -% | .25% | $ 74 | $ 3 |
Class T | -% | .25% | 46 | -* |
Class B | .65% | .25% | 21 | 15 |
Class C | .75% | .25% | 81 | 10 |
| | | $ 222 | $ 28 |
* Amount represents two hundred eighty-one dollars.
Semiannual Report
Notes to Financial Statements (Unaudited) - continued
(Amounts in thousands except percentages)
6. Fees and Other Transactions with Affiliates - continued
Sales Load. FDC may receive a front-end sales charge of up to 4.00% for selling Class A shares and Class T shares, some of which is paid to financial intermediaries for selling shares of the Fund. Depending on the holding period, FDC may receive contingent deferred sales charges levied on Class A, Class T, Class B, and Class C redemptions. The deferred sales charges range from 5.00% to 1.00% for Class B, 1.00% for Class C, .75% for certain purchases of Class A shares and .25% for certain purchases of Class T shares.
For the period, sales charge amounts retained by FDC were as follows:
| Retained
by FDC |
Class A | $ 6 |
Class T | 2 |
Class B* | 6 |
Class C* | 1 |
| $ 15 |
* When Class B and Class C shares are initially sold, FDC pays commissions from its own resources to financial intermediaries through which the sales are made.
Transfer Agent Fees. Fidelity Investments Institutional Operations Company, Inc. (FIIOC), an affiliate of FMR, is the transfer, dividend disbursing and shareholder servicing agent for each class of the Fund. FIIOC receives account fees and asset-based fees that vary according to the account size and type of account of the shareholders of each respective class of the Fund, with the exception of Fidelity Mortgage Securities Fund. FIIOC receives an asset-based fee of .10% of Fidelity Mortgage Securities Fund's average net assets. FIIOC pays for typesetting, printing and mailing of shareholder reports, except proxy statements. For the period, transfer agent fees for each class were as follows:
| Amount | % of
Average
Net Assets* |
Class A | $ 63 | .21 |
Class T | 33 | .18 |
Class B | 6 | .25 |
Class C | 15 | .18 |
Fidelity Mortgage Securities Fund | 378 | .10 |
Institutional Class | 6 | .15 |
| $ 501 | |
* Annualized
Semiannual Report
6. Fees and Other Transactions with Affiliates - continued
Fund Wide Operations Fee. Pursuant to the Fund Wide Operations and Expense Agreement (FWOE), FMR has agreed to provide for fund level expenses (which do not include transfer agent, Rule 12b-1 fees, compensation of the independent Trustees, interest (including commitment fees), taxes or extraordinary expenses, if any) in return for a FWOE fee equal to .35% less the total amount of the management fee. The FWOE paid by the Fund is reduced by an amount equal to the fees and expenses paid to the independent Trustees. For the period, the FWOE fee was equivalent to an annualized rate of .03% of average net assets.
7. Committed Line of Credit.
The Fund participates with other funds managed by FMR or an affiliate in a $4.0 billion credit facility (the "line of credit") to be utilized for temporary or emergency purposes to fund shareholder redemptions or for other short-term liquidity purposes. The Fund has agreed to pay commitment fees on its pro-rata portion of the line of credit, which amounted to $1 and is reflected in Miscellaneous expenses on the Statement of Operations. During the period, there were no borrowings on this line of credit.
8. Distributions to Shareholders.
Distributions to shareholders of each class were as follows:
| Six months ended February 29,
2012 | Year ended
August 31,
2011 |
From net investment income | | |
Class A | $ 821 | $ 1,718 |
Class T | 511 | 1,137 |
Class B | 48 | 133 |
Class C | 168 | 380 |
Fidelity Mortgage Securities Fund | 11,837 | 26,484 |
Institutional Class | 126 | 241 |
Total | $ 13,511 | $ 30,093 |
Semiannual Report
Notes to Financial Statements (Unaudited) - continued
(Amounts in thousands except percentages)
9. Share Transactions.
Transactions for each class of shares were as follows:
| Shares | Dollars |
| Six months ended February 29, 2012 | Year ended
August 31, 2011 | Six months ended February 29, 2012 | Year ended
August 31, 2011 |
Class A | | | | |
Shares sold | 843 | 1,347 | $ 9,403 | $ 14,756 |
Reinvestment of distributions | 60 | 129 | 674 | 1,402 |
Shares redeemed | (965) | (1,794) | (10,749) | (19,528) |
Net increase (decrease) | (62) | (318) | $ (672) | $ (3,370) |
Class T | | | | |
Shares sold | 275 | 574 | $ 3,075 | $ 6,276 |
Reinvestment of distributions | 42 | 92 | 466 | 1,004 |
Shares redeemed | (378) | (1,136) | (4,223) | (12,380) |
Net increase (decrease) | (61) | (470) | $ (682) | $ (5,100) |
Class B | | | | |
Shares sold | 7 | 32 | $ 84 | $ 360 |
Reinvestment of distributions | 3 | 8 | 28 | 83 |
Shares redeemed | (66) | (263) | (738) | (2,865) |
Net increase (decrease) | (56) | (223) | $ (626) | $ (2,422) |
Class C | | | | |
Shares sold | 419 | 226 | $ 4,667 | $ 2,470 |
Reinvestment of distributions | 10 | 25 | 116 | 275 |
Shares redeemed | (177) | (526) | (1,975) | (5,730) |
Net increase (decrease) | 252 | (275) | $ 2,808 | $ (2,985) |
Fidelity Mortgage Securities Fund | | | | |
Shares sold | 4,615 | 8,371 | $ 51,615 | $ 91,409 |
Reinvestment of distributions | 961 | 2,193 | 10,731 | 23,971 |
Shares redeemed | (6,008) | (17,842) | (67,100) | (194,555) |
Net increase (decrease) | (432) | (7,278) | $ (4,754) | $ (79,175) |
Institutional Class | | | | |
Shares sold | 387 | 226 | $ 4,319 | $ 2,471 |
Reinvestment of distributions | 10 | 20 | 108 | 214 |
Shares redeemed | (107) | (530) | (1,188) | (5,736) |
Net increase (decrease) | 290 | (284) | $ 3,239 | $ (3,051) |
Semiannual Report
10. Other.
The Fund's organizational documents provide former and current trustees and officers with a limited indemnification against liabilities arising in connection with the performance of their duties to the Fund. In the normal course of business, the Fund may also enter into contracts that provide general indemnifications. The Fund's maximum exposure under these arrangements is unknown as this would be dependent on future claims that may be made against the Fund. The risk of material loss from such claims is considered remote.
11. Credit Risk.
The Fund invests a portion of its assets in structured securities of issuers backed by residential mortgage loans, credit card receivables and automotive loans. The value and related income of these securities is sensitive to changes in economic conditions, including delinquencies and/or defaults.
Semiannual Report
Board Approval of Investment Advisory Contracts and Management Fees
Fidelity Advisor Mortgage Securities Fund
Each year, the Board of Trustees, including the Independent Trustees (together, the Board), votes on the renewal of the management contract and sub-advisory agreements (together, the Advisory Contracts) for the fund. The Board, assisted by the advice of fund counsel and Independent Trustees' counsel, requests and considers a broad range of information relevant to the renewal of the Advisory Contracts throughout the year.
The Board meets regularly and considers at each of its meetings factors that are relevant to its annual consideration of the renewal of the fund's Advisory Contracts, including the services and support provided to the fund and its shareholders. The Board has established three standing committees, Operations, Audit, and Nominating and Governance, each composed of Independent Trustees with varying backgrounds, to which the Board has assigned specific subject matter responsibilities in order to enhance effective decision-making by the Board. The Operations Committee, of which all of the Independent Trustees are members, meets regularly throughout the year and, among other matters, considers matters specifically related to the annual consideration of the renewal of the fund's Advisory Contracts. The Board, acting directly and through its Committees, requests and receives information concerning the annual consideration of the renewal of the fund's Advisory Contracts. The Board also meets as needed to consider matters specifically related to the Board's annual consideration of the renewal of Advisory Contracts. Members of the Board may also meet with trustees of other Fidelity funds through ad hoc joint committees to discuss certain matters relevant to the Fidelity funds.
At its September 2011 meeting, the Board of Trustees, including the Independent Trustees, unanimously determined to renew the fund's Advisory Contracts. In reaching its determination, the Board considered all factors it believed relevant, including (i) the nature, extent, and quality of the services to be provided to the fund and its shareholders (including the investment performance of the fund); (ii) the competitiveness of the fund's management fee and total expense ratio; (iii) the total costs of the services to be provided by and the profits to be realized by Fidelity from its relationship with the fund; (iv) the extent to which economies of scale would be realized as the fund grows; and (v) whether fee levels reflect these economies of scale, if any, for the benefit of fund shareholders.
In considering whether to renew the Advisory Contracts for the fund, the Board reached a determination, with the assistance of fund counsel and Independent Trustees' counsel and through the exercise of its business judgment, that the renewal of the Advisory Contracts is in the best interests of the fund and its shareholders and that the compensation payable under the Advisory Contracts is fair and reasonable. The Board's decision to renew the Advisory Contracts was not based on any single factor, but rather was based on a comprehensive consideration of all the information provided to the Board at its meetings throughout the year. The Board, in reaching its determination to renew the Advisory Contracts, is aware that shareholders in the fund have a broad range of investment choices available to them, including a wide choice among mutual funds offered by Fidelity's competitors, and that the fund's shareholders, who have the opportunity to review and weigh the disclosure provided by the fund in its prospectus and other public disclosures, have chosen to invest in this fund, managed by Fidelity.
Semiannual Report
Nature, Extent, and Quality of Services Provided. The Board considered the staffing within the investment adviser, FMR, and the sub-advisers (together, the Investment Advisers), including the backgrounds of the fund's investment personnel and the fund's investment objective and discipline. The Independent Trustees also had discussions with senior management of Fidelity's investment operations and investment groups. The Board considered the structure of the portfolio manager compensation program and whether this structure provides appropriate incentives to act in the best interests of the fund.
Resources Dedicated to Investment Management and Support Services. The Board reviewed the general qualifications and capabilities of the Investment Advisers' investment staff, including its size, education, experience, and resources, as well as the Investment Advisers' approach to recruiting, managing, and compensating investment personnel. The Board also noted that FMR has devoted increased resources to non-U.S. offices. The Board noted that Fidelity's analysts have extensive resources, tools and capabilities which allow them to conduct sophisticated quantitative and fundamental analysis, as well as credit analysis of issuers, counterparties and enhancers. The Board also believes that Fidelity's investment professionals have sufficient access to global information and data so as to provide competitive investment results over time, and that those professionals also have access to sophisticated tools which permit them to assess portfolio construction and risk and performance attribution characteristics continuously, as well as to transmit new information and research conclusions rapidly around the world. Additionally, in its deliberations, the Board considered the Investment Advisers' trading capabilities and resources which are an integral part of the investment management process.
Shareholder and Administrative Services. The Board considered (i) the nature, extent, quality, and cost of advisory, administrative, and shareholder services performed by the Investment Advisers and their affiliates under the Advisory Contracts and under separate agreements covering transfer agency, pricing and bookkeeping, and securities lending services for the fund; (ii) the nature and extent of the investment adviser's supervision of third party service providers, principally custodians and subcustodians; and (iii) the resources devoted to, and the record of compliance with, the fund's compliance policies and procedures.
The Board noted that the growth of fund assets over time across the complex allows Fidelity to reinvest in the development of services designed to enhance the value or convenience of the Fidelity funds as investment vehicles. These services include 24-hour access to account information and market information through telephone representatives and over the Internet, investor education materials and asset allocation tools, and the expanded availability of Fidelity Investor Centers, with 35 new branches opening since 2010.
Semiannual Report
Board Approval of Investment Advisory Contracts and
Management Fees - continued
Investment in a Large Fund Family. The Board considered the benefits to shareholders of investing in a Fidelity fund, including the benefits of investing in a fund that is part of a large family of funds offering a variety of investment disciplines and providing a large variety of mutual fund investor services. The Board noted that Fidelity had taken, or had made recommendations that resulted in the Fidelity funds taking, a number of actions over the previous year that benefited particular funds, including (i) continuing to dedicate additional resources to investment research and support of the senior management team that oversees asset management; (ii) rationalizing product lines through the mergers of six funds into other funds; (iii) continuing to migrate the Freedom Funds to dedicated lower cost underlying funds; (iv) obtaining shareholder approval to broaden the investment strategies for Fidelity Consumer Finance Portfolio, Fidelity Emerging Asia Fund, and Fidelity Environment and Alternative Energy Portfolio; (v) contractually agreeing to reduce the management fees and impose other expense limitations on Spartan 500 Index Fund and U.S. Bond Index Fund in connection with launching new institutional classes of these funds; (vi) changing the name, primary and supplemental benchmarks, and investment policies of Fidelity Global Strategies Fund to support the fund's flexible investment mandate and global orientation; and (vii) reducing the transfer agency account fee rates on certain accounts.
Investment Performance. The Board considered whether the fund has operated in accordance with its investment objective, as well as its record of compliance with its investment restrictions. It also reviewed the fund's absolute investment performance for each class, as well as the fund's relative investment performance for each class measured over multiple periods against (i) a broad-based securities market index, and (ii) a peer group of mutual funds deemed appropriate by Fidelity and reviewed by the Board. The following charts considered by the Board show, over the one-, three-, and five-year periods ended December 31, 2010, the cumulative total returns of the retail class and Class C of the fund, the cumulative total returns of a broad-based securities market index ("benchmark"), and a range of cumulative total returns of a peer group of mutual funds identified by Lipper Inc. as having an investment objective similar to that of the fund. The returns of the retail class and Class C show the performance of the highest and lowest performing classes, respectively (based on five-year performance). The box within each chart shows the 25th percentile return (bottom of box) and the 75th percentile return (top of box) of the peer group. Returns shown above the box are in the first quartile and returns shown below the box are in the fourth quartile. The percentage beaten numbers noted below each chart correspond to the percentile box and represent the percentage of funds in the peer group whose performance was equal to or lower than that of the class indicated.
Semiannual Report
Fidelity Advisor Mortgage Securities Fund

The Board reviewed the fund's relative investment performance against its peer group and noted that the performance of the retail class of the fund was in the second quartile for the one- and three-year periods and the third quartile for the five-year period. The Board also noted that the investment performance of the fund was lower than its benchmark for the three- and five-year periods, although the one-year total return of the retail class compared favorably to its benchmark. The Board considered that the variations in performance among the fund's classes reflect the variations in class expenses, which result in lower performance for higher expense classes. The Board also reviewed the fund's performance since inception as well as performance in the current year.
Based on its review, the Board concluded that the nature, extent, and quality of services provided to the fund under the Advisory Contracts should benefit the fund's shareholders.
Competitiveness of Management Fee and Total Expense Ratio. The Board considered the fund's management fee and total expense ratio compared to "mapped groups" of competitive funds and classes. Fidelity creates "mapped groups" by combining similar Lipper investment objective categories that have comparable management fee characteristics. Combining Lipper investment objective categories aids the Board's management fee and total expense ratio comparisons by broadening the competitive group used for comparison and by reducing the number of universes to which various Fidelity funds are compared.
Semiannual Report
Board Approval of Investment Advisory Contracts and
Management Fees - continued
Management Fee. The Board considered two proprietary management fee comparisons for the 12-month periods shown in the chart below. The group of Lipper funds used by the Board for management fee comparisons is referred to below as the "Total Mapped Group" and, for the reasons explained above, is broader than the Lipper peer group used by the Board for performance comparisons. The Total Mapped Group comparison focuses on a fund's standing relative to the total universe of comparable funds available to investors in terms of gross management fees before expense reimbursements or caps. "TMG %" represents the percentage of funds in the Total Mapped Group that had management fees that were lower than the fund's. For example, a TMG % of 12% means that 88% of the funds in the Total Mapped Group had higher management fees than the fund. The "Asset-Size Peer Group" (ASPG) comparison focuses on a fund's standing relative to non-Fidelity funds similar in size to the fund within the Total Mapped Group. The ASPG represents at least 15% of the funds in the Total Mapped Group with comparable asset size and management fee characteristics, subject to a minimum of 50 funds (or all funds in the Total Mapped Group if fewer than 50). Additional information, such as the ASPG quartile in which the fund's management fee ranked, is also included in the chart and considered by the Board.
Fidelity Advisor Mortgage Securities Fund

The Board noted that the fund's management fee ranked below the median of its Total Mapped Group and below the median of its ASPG for 2010.
Based on its review, the Board concluded that the fund's management fee is fair and reasonable in light of the services that the fund receives and the other factors considered.
Semiannual Report
Total Expense Ratio. In its review of each class's total expense ratio, the Board considered the fund's management fee as well as other fund or class expenses, as applicable, such as transfer agent fees, pricing and bookkeeping fees, fund-paid 12b-1 fees, and custodial, legal, and audit fees. The Board also noted the effects of any waivers and reimbursements on fees and expenses. As part of its review, the Board also considered the current and historical total expense ratios of each class of the fund compared to competitive fund median expenses. Each class of the fund is compared to those funds and classes in the Total Mapped Group (used by the Board for management fee comparisons) that have a similar sales load structure.
The Board also considered that the current contractual arrangements for the fund (i) have the effect of setting the total "fund-level" expenses (including, among certain other expenses, the management fee) for each class at 35 basis points, (ii) limit the "class-level" transfer agent fee for the retail class to 10 basis points, and (iii) limit the total expenses for the retail class to 45 basis points. The fees and expenses payable under these contractual arrangements may not be increased without the approval of the Board and the shareholders of the applicable class. The fund's Advisor classes are subject to different "class-level" expenses (transfer agent fees and 12b-1 fees).
The Board noted that the total expense ratio of each class ranked below its competitive median for 2010.
The Board recognized that the fund's management contract incorporates a "group fee" structure, which provides for lower group fee rates as total fund assets under FMR's management increase, and for higher group fee rates as total fund assets under FMR's management decrease. FMR calculates the group fee rates based on a tiered asset "breakpoint" schedule that varies based on asset class. The Board noted, however, that because the current contractual arrangements set the total "fund-level" expenses for each class at 35 basis points, increases or decreases in the management fee due to changes in the group fee rate will not impact the total expense ratio.
Fees Charged to Other Fidelity Clients. The Board also considered Fidelity fee structures and other information with respect to clients of FMR and its affiliates, such as other mutual funds advised or subadvised by FMR or its affiliates, pension plan clients, and other institutional clients. In March 2010, the Board created an ad hoc joint committee with the board of other Fidelity funds (the Committee) to review and compare Fidelity's institutional investment advisory business with its business of providing services to the Fidelity funds, including the differences in services provided, fees charged, and costs incurred, as well as competition in their respective marketplaces.
Based on its review of total expense ratios and fees charged to other Fidelity clients, the Board concluded that the total expense ratio of each class of the fund was reasonable in light of the services that the fund and its shareholders receive and the other factors considered, including the findings of the Committee.
Semiannual Report
Board Approval of Investment Advisory Contracts and
Management Fees - continued
Costs of the Services and Profitability. The Board considered the revenues earned and the expenses incurred by Fidelity in conducting the business of developing, marketing, distributing, managing, administering and servicing the fund and its shareholders. The Board also considered the level of Fidelity's profits in respect of all the Fidelity funds.
On an annual basis, FMR presents to the Board Fidelity's profitability for the fund. Fidelity calculates the profitability for each fund, as well as aggregate profitability for groups of Fidelity funds and all Fidelity funds, using a series of detailed revenue and cost allocation methodologies which originate with the books and records of Fidelity on which Fidelity's audited financial statements are based. The Audit Committee of the Board reviews any significant changes from the prior year's methodologies.
PricewaterhouseCoopers LLP (PwC), independent registered public accounting firm and auditor to Fidelity and certain Fidelity funds, has been engaged annually by the Board as part of the Board's assessment of Fidelity's profitability analysis. PwC's engagement includes the review and assessment of Fidelity's methodologies used in determining the revenues and expenses attributable to Fidelity's mutual fund business, and completion of agreed-upon procedures surrounding the mathematical accuracy of fund profitability and its conformity to allocation methodologies. After considering PwC's reports issued under the engagement and information provided by Fidelity, the Board concluded that while other allocation methods may also be reasonable, Fidelity's profitability methodologies are reasonable in all material respects.
The Board also reviewed Fidelity's non-fund businesses and fall-out benefits related to the mutual fund business as well as cases where Fidelity's affiliates may benefit from or be related to the fund's business.
The Board considered the costs of the services provided by and the profits realized by Fidelity in connection with the operation of the fund and was satisfied that the profitability was not excessive in the circumstances.
Economies of Scale. The Board considered whether there have been economies of scale in respect of the management of the Fidelity funds, whether the Fidelity funds (including the fund) have appropriately benefited from any such economies of scale, and whether there is potential for realization of any further economies of scale. The Board considered the extent to which the fund will benefit from economies of scale through increased services to the fund, through waivers or reimbursements, or through fee or expense reductions. The Board also noted that in 2009, it and the board of other Fidelity funds created an ad hoc committee (the Economies of Scale Committee) to analyze whether FMR attains economies of scale in respect of the management and servicing of the Fidelity funds, whether the Fidelity funds have appropriately benefited from such economies of scale, and whether there is potential for realization of any further economies of scale.
Semiannual Report
The Board concluded, taking into account the analysis of the Economies of Scale Committee, that any potential economies of scale are being appropriately shared between fund shareholders and Fidelity.
Additional Information Requested by the Board. In order to develop fully the factual basis for consideration of the Fidelity funds' Advisory Contracts, the Board requested and received additional information on certain topics, including: (i) Fidelity's fund profitability methodology, profitability trends for certain funds, and the impact of certain factors on fund profitability results; (ii) portfolio manager changes that have occurred during the past year and the amount of the investment that each portfolio manager has made in the Fidelity fund(s) that he or she manages; (iii) Fidelity's compensation structure for portfolio managers, research analysts, and other key personnel, including its effects on fund profitability, the rationale for the compensation structure, and the extent to which current market conditions have affected retention and recruitment; (iv) the compensation paid to fund sub-advisers on behalf of the Fidelity funds; (v) Fidelity's fee structures and rationale for recommending different fees among different categories of funds and classes, as well as Fidelity's voluntary waiver of its fees to maintain minimum yields for certain money market funds and classes; (vi) the reasons why certain expenses affect various funds and classes differently; (vii) Fidelity's transfer agent fees, expenses, and services and how the benefits of decreased costs and new efficiencies can be shared across all of the Fidelity funds; (viii) the reasons for and consequences of changes to certain product lines compared to competitors; (ix) the allocation of and historical trends in Fidelity's realization of fall-out benefits; and (x) explanations regarding the relative total expense ratios of certain funds and classes, total expense competitive trends, and actions that might be taken by FMR to reduce total expense ratios for certain funds and classes or to achieve further economies of scale.
Based on its evaluation of all of the conclusions noted above, and after considering all factors it believed relevant, the Board ultimately concluded that the advisory fee structures are fair and reasonable, and that the fund's Advisory Contracts should be renewed.
Semiannual Report
Managing Your Investments
Fidelity offers several ways to conveniently manage your personal investments via your telephone or PC. You can access your account information, conduct trades and research your investments 24 hours a day.
By Phone
Fidelity Automated Service Telephone provides a single toll-free number to access account balances, positions, quotes and trading. It's easy to navigate the service, and on your first call, the system will help you create a personal identification number (PIN) for security.
(phone graphic)Fidelity Automated
Service Telephone (FAST®)
1-800-544-5555
Press
1 For mutual fund and brokerage trading.
2 For quotes.*
3 For account balances and holdings.
4 To review orders and mutual
fund activity.
5 To change your PIN.
*0 To speak to a Fidelity representative.
By PC
Fidelity's web site on the Internet provides a wide range of information, including daily financial news, fund performance, interactive planning tools and news about Fidelity products and services.
(computer graphic)Fidelity's Web Site
www.fidelity.com
* When you call the quotes line, please remember that a fund's yield and return will vary and, except for money market funds, share price will also vary. This means that you may have a gain or loss when you sell your shares. There is no assurance that money market funds will be able to maintain a stable $1 share price; an investment in a money market fund is not insured or guaranteed by the U.S. government. Total returns are historical and include changes in share price, reinvestment of dividends and capital gains distributions, and the effects of any sales charges.
Semiannual Report
To Visit Fidelity
For directions and hours,
please call 1-800-544-9797.
Arizona
7001 West Ray Road
Chandler, AZ
15445 N. Scottsdale Road
Scottsdale, AZ
17550 North 75th Avenue
Glendale, AZ
5330 E. Broadway Blvd
Tucson, AZ
California
815 East Birch Street
Brea, CA
1411 Chapin Avenue
Burlingame, CA
851 East Hamilton Avenue
Campbell, CA
601 Larkspur Landing Circle
Larkspur, CA
2000 Avenue of the Stars
Los Angeles, CA
27101 Puerta Real
Mission Viejo, CA
73575 El Paseo
Palm Desert, CA
251 University Avenue
Palo Alto, CA
123 South Lake Avenue
Pasadena, CA
16656 Bernardo Ctr. Drive
Rancho Bernardo, CA
1220 Roseville Parkway
Roseville, CA
1740 Arden Way
Sacramento, CA
7676 Hazard Center Drive
San Diego, CA
11943 El Camino Real
San Diego, CA
8 Montgomery Street
San Francisco, CA
3793 State Street
Santa Barbara, CA
1200 Wilshire Boulevard
Santa Monica, CA
398 West El Camino Real
Sunnyvale, CA
111 South Westlake Blvd
Thousand Oaks, CA
21701 Hawthorne Boulevard
Torrance, CA
2001 North Main Street
Walnut Creek, CA
6326 Canoga Avenue
Woodland Hills, CA
2211 Michelson Drive
Irvine, CA
Colorado
281 East Flatiron Circle
Broomfield, CO
1625 Broadway
Denver, CO
9185 Westview Road
Lone Tree, CO
Connecticut
48 West Putnam Avenue
Greenwich, CT
265 Church Street
New Haven, CT
300 Atlantic Street
Stamford, CT
29 South Main Street
West Hartford, CT
1261 Post Road
Fairfield, CT
Delaware
400 Delaware Avenue
Wilmington, DE
Florida
175 East Altamonte Drive
Altamonte Springs, FL
1400 Glades Road
Boca Raton, FL
121 Alhambra Plaza
Coral Gables, FL
2948 N. Federal Highway
Ft. Lauderdale, FL
4671 Town Center Parkway
Jacksonville, FL
8880 Tamiami Trail, North
Naples, FL
230 Royal Palm Way
Palm Beach, FL
3501 PGA Boulevard
Palm Beach Gardens, FL
3550 Tamiami Trail, South
Sarasota, FL
1502 N. Westshore Blvd.
Tampa, FL
2465 State Road 7
Wellington, FL
Georgia
3242 Peachtree Road
Atlanta, GA
1000 Abernathy Road
Atlanta, GA
Illinois
One North LaSalle Street
Chicago, IL
401 North Michigan Avenue
Chicago, IL
One Skokie Valley Road
Highland Park, IL
1415 West 22nd Street
Oak Brook, IL
15105 S LaGrange Road
Orland Park, IL
1572 East Golf Road
Schaumburg, IL
1823 Freedom Drive
Naperville, IL
Indiana
8480 Keystone Crossing
Indianapolis, IN
Kansas
5400 College Boulevard
Overland Park, KS
Maine
Three Canal Plaza
Portland, ME
Maryland
7315 Wisconsin Avenue
Bethesda, MD
610 York Road
Towson, MD
Massachusetts
801 Boylston Street
Boston, MA
155 Congress Street
Boston, MA
300 Granite Street
Braintree, MA
44 Mall Road
Burlington, MA
238 Main Street
Cambridge, MA
200 Endicott Street
Danvers, MA
Fidelity Brokerage Services, Inc., 100 Summer St., Boston, MA 02110 Member NYSE/SIPC
Semiannual Report
405 Cochituate Road
Framingham, MA
551 Boston Turnpike
Shrewsbury, MA
Michigan
500 E. Eisenhower Pkwy.
Ann Arbor, MI
280 N. Old Woodward Ave.
Birmingham, MI
30200 Northwestern Hwy.
Farmington Hills, MI
43420 Grand River Avenue
Novi, MI
3480 28th Street
Grand Rapids, MI
2425 S. Linden Road STE E
Flint, MI
Minnesota
7740 France Avenue South
Edina, MN
8342 3rd Street North
Oakdale, MN
Missouri
1524 South Lindbergh Blvd.
St. Louis, MO
Nevada
2225 Village Walk Drive
Henderson, NV
New Jersey
501 Route 73 South
Marlton, NJ
150 Essex Street
Millburn, NJ
35 Morris Street
Morristown, NJ
396 Route 17, North
Paramus, NJ
3518 Route 1 North
Princeton, NJ
530 Broad Street
Shrewsbury, NJ
New Mexico
2261 Q Street NE
Albuquerque, NM
New York
1130 Franklin Avenue
Garden City, NY
37 West Jericho Turnpike
Huntington Station, NY
1271 Avenue of the Americas
New York, NY
980 Madison Avenue
New York, NY
61 Broadway
New York, NY
350 Park Avenue
New York, NY
200 Fifth Avenue
New York, NY
733 Third Avenue
New York, NY
2070 Broadway
New York, NY
1075 Northern Blvd.
Roslyn, NY
799 Central Park Avenue
Scarsdale, NY
3349 Monroe Avenue
Rochester, NY
North Carolina
4611 Sharon Road
Charlotte, NC
7011 Fayetteville Road
Durham, NC
Ohio
3805 Edwards Road
Cincinnati, OH
1324 Polaris Parkway
Columbus, OH
1800 Crocker Road
Westlake, OH
28699 Chagrin Boulevard
Woodmere Village, OH
Oregon
7493 SW Bridgeport Road
Tigard, OR
Pennsylvania
600 West DeKalb Pike
King of Prussia, PA
1735 Market Street
Philadelphia, PA
12001 Perry Highway
Wexford, PA
Rhode Island
10 Memorial Boulevard
Providence, RI
Tennessee
3018 Peoples Street
Johnson City, TN
7628 West Farmington Blvd.
Germantown, TN
2035 Mallory Lane
Franklin, TN
Texas
10000 Research Boulevard
Austin, TX
4001 Northwest Parkway
Dallas, TX
12532 Memorial Drive
Houston, TX
2701 Drexel Drive
Houston, TX
6560 Fannin Street
Houston, TX
1701 Lake Robbins Drive
The Woodlands, TX
6500 N. MacArthur Blvd.
Irving, TX
6005 West Park Boulevard
Plano, TX
1576 East Southlake Blvd.
Southlake, TX
15600 Southwest Freeway
Sugar Land, TX
139 N. Loop 1604 East
San Antonio, TX
Utah
279 West South Temple
Salt Lake City, UT
Virginia
1861 International Drive
McLean, VA
11957 Democracy Drive
Reston, VA
Washington
10500 NE 8th Street
Bellevue, WA
1518 6th Avenue
Seattle, WA
304 Strander Blvd
Tukwila, WA
Washington, DC
1900 K Street, N.W.
Washington, DC
Wisconsin
16020 West Bluemound Road
Brookfield, WI
Semiannual Report
Investment Adviser
Fidelity Management & Research Company
Boston, MA
Investment Sub-Advisers
Fidelity Investments Money Management, Inc.
Fidelity Management & Research
(U.K.) Inc.
Fidelity Management & Research
(Hong Kong) Limited
Fidelity Management & Research
(Japan), Inc.
General Distributor
Fidelity Distributors Corporation
Boston, MA
Transfer and Service Agents
Fidelity Investments Institutional
Operations Company, Inc.
Boston, MA
Fidelity Service Company, Inc.
Boston, MA
Custodian
The Bank of New York Mellon
New York, NY
The Fidelity Telephone Connection
Mutual Fund 24-Hour Service
Exchanges/Redemptions
and Account Assistance 1-800-544-6666
Product Information 1-800-544-6666
Retirement Accounts 1-800-544-4774
(8 a.m. - 9 p.m.)
TDD Service 1-800-544-0118
for the deaf and hearing impaired
(9 a.m. - 9 p.m. Eastern time)
Fidelity Automated Service
Telephone (FAST®) 1-800-544-5555
Automated line for quickest service
MOR-USAN-0412
1.784900.109
(Fidelity Investment logo)(registered trademark)
Corporate Headquarters
82 Devonshire St., Boston, MA 02109
www.fidelity.com
(Fidelity Investment logo)(registered trademark)
Fidelity Advisor®
Short Fixed-Income
Fund - Class A, Class T, Class B and Class C
Semiannual Report
February 29, 2012
(Fidelity Cover Art)
Contents
Shareholder Expense Example | (Click Here) | An example of shareholder expenses. |
Investment Changes | (Click Here) | A summary of major shifts in the fund's investments over the past six months. |
Investments | (Click Here) | A complete list of the fund's investments with their market values. |
Financial Statements | (Click Here) | Statements of assets and liabilities, operations, and changes in net assets,
as well as financial highlights. |
Notes | (Click Here) | Notes to the financial statements. |
Report of Independent Registered Public Accounting Firm | (Click Here) | |
Board Approval of Investment Advisory Contracts and Management Fees | (Click Here) | |
To view a fund's proxy voting guidelines and proxy voting record for the 12-month period ended June 30, visit http://www.fidelity.com/proxyvotingresults or visit the Securities and Exchange Commission's (SEC) web site at http://www.sec.gov. You may also call 1-877-208-0098 to request a free copy of the proxy voting guidelines.
Standard & Poor's, S&P and S&P 500 are registered service marks of The McGraw-Hill Companies, Inc. and have been licensed for use by Fidelity Distributors Corporation.
Other third party marks appearing herein are the property of their respective owners.
All other marks appearing herein are registered or unregistered trademarks or service marks of FMR LLC or an affiliated company.
This report and the financial statements contained herein are submitted for the general information of the shareholders of the fund. This report is not authorized for distribution to prospective investors in the fund unless preceded or accompanied by an effective prospectus.
A fund files its complete schedule of portfolio holdings with the SEC for the first and third quarters of each fiscal year on Form N-Q. Forms N-Q are available on the SEC's web site at http://www.sec.gov. A fund's Forms N-Q may be reviewed and copied at the SEC's Public Reference Room in Washington, DC. Information regarding the operation of the SEC's Public Reference Room may be obtained by calling 1-800-SEC-0330. For a complete list of a fund's portfolio holdings, view the most recent holdings listing, semiannual report, or annual report on Fidelity's web site at http://www.fidelity.com, http://www.advisor.fidelity.com, or http://www.401k.com, as applicable.
NOT FDIC INSURED • MAY LOSE VALUE • NO BANK GUARANTEE
Neither the fund nor Fidelity Distributors Corporation is a bank.
Semiannual Report
Shareholder Expense Example
As a shareholder of the Fund, you incur two types of costs: (1) transaction costs, including sales charges (loads) on purchase payments or redemption proceeds, and (2) ongoing costs, including management fees, distribution and/or service (12b-1) fees and other Fund expenses. This Example is intended to help you understand your ongoing costs (in dollars) of investing in the Fund and to compare these costs with the ongoing costs of investing in other mutual funds.
The Example is based on an investment of $1,000 invested at the beginning of the period and held for the entire period (September 1, 2011 to February 29, 2012).
Actual Expenses
The first line of the accompanying table for each class of the Fund provides information about actual account values and actual expenses. You may use the information in this line, together with the amount you invested, to estimate the expenses that you paid over the period. Simply divide your account value by $1,000.00 (for example, an $8,600 account value divided by $1,000.00 = 8.6), then multiply the result by the number in the first line for a class of the Fund under the heading entitled "Expenses Paid During Period" to estimate the expenses you paid on your account during this period. In addition, the Fund, as a shareholder in the underlying Fidelity Central Funds, will indirectly bear its pro-rata share of the fees and expenses incurred by the underlying Fidelity Central Funds. These fees and expenses are not included in the Fund's annualized expense ratio used to calculate the expense estimate in the table below.
Hypothetical Example for Comparison Purposes
The second line of the accompanying table for each class of the Fund provides information about hypothetical account values and hypothetical expenses based on a Class' actual expense ratio and an assumed rate of return of 5% per year before expenses, which is not the Class' actual return. The hypothetical account values and expenses may not be used to estimate the actual ending account balance or expenses you paid for the period. You may use this information to compare the ongoing costs of investing in the Fund and other funds. To do so, compare this 5% hypothetical example with the 5% hypothetical examples that appear in the shareholder reports of the other funds. In addition, the Fund, as a shareholder in the underlying Fidelity Central Funds, will indirectly bear its pro-rata share of the fees and expenses incurred by the underlying Fidelity Central Funds. These fees and expenses are not included in the Fund's annualized expense ratio used to calculate the expense estimate in the table below.
Please note that the expenses shown in the table are meant to highlight your ongoing costs only and do not reflect any transaction costs. Therefore, the second line of the table is useful in comparing ongoing costs only, and will not help you determine the relative total costs of owning different funds. In addition, if these transactional costs were included, your costs would have been higher.
Semiannual Report
| Annualized Expense Ratio | Beginning
Account Value
September 1, 2011 | Ending
Account Value
February 29, 2012 | Expenses Paid
During Period*
September 1, 2011 to February 29, 2012 |
Class A | .70% | | | |
Actual | | $ 1,000.00 | $ 1,005.00 | $ 3.49 |
HypotheticalA | | $ 1,000.00 | $ 1,021.38 | $ 3.52 |
Class T | .71% | | | |
Actual | | $ 1,000.00 | $ 1,006.00 | $ 3.54 |
HypotheticalA | | $ 1,000.00 | $ 1,021.33 | $ 3.57 |
Class B | 1.52% | | | |
Actual | | $ 1,000.00 | $ 1,002.00 | $ 7.57 |
HypotheticalA | | $ 1,000.00 | $ 1,017.30 | $ 7.62 |
Class C | 1.55% | | | |
Actual | | $ 1,000.00 | $ 1,000.70 | $ 7.71 |
HypotheticalA | | $ 1,000.00 | $ 1,017.16 | $ 7.77 |
Institutional Class | .53% | | | |
Actual | | $ 1,000.00 | $ 1,006.90 | $ 2.64 |
HypotheticalA | | $ 1,000.00 | $ 1,022.23 | $ 2.66 |
A 5% return per year before expenses
* Expenses are equal to each Class' annualized expense ratio, multiplied by the average account value over the period, multiplied by 182/366 (to reflect the one-half year period).
Semiannual Report
Investment Changes (Unaudited)
Quality Diversification (% of fund's net assets) |
As of February 29, 2012 | As of August 31, 2011 |
| U.S. Government
and U.S. Government Agency Obligations† 48.4% | | | U.S. Government
and U.S. Government Agency Obligations††54.6% | |
| AAA 17.7% | | | AAA 14.8% | |
| AA 9.7% | | | AA 9.4% | |
| A 10.4% | | | A 9.2% | |
| BBB 11.4% | |  | BBB 8.7% | |
| BB and Below 0.8% | | | BB and Below 1.0% | |
| Not Rated 0.9% | | | Not Rated 0.5% | |
| Short-Term
Investments and
Net Other Assets 0.7% | | | Short-Term
Investments and
Net Other Assets 1.8% | |

We have used ratings from Moody's Investors Service, Inc. Where Moody's® ratings are not available, we have used S&P® ratings. All ratings are as of the date indicated and do not reflect subsequent changes. |
Weighted Average Maturity as of February 29, 2012 |
| | 6 months ago |
Years | 2.3 | 2.3 |
This is a weighted average of all the maturities of the securities held in a fund. Weighted Average Maturity (WAM) can be used as a measure of sensitivity to interest rate changes and market changes. Generally, the longer the maturity, the greater the sensitivity to such changes. WAM is based on the dollar-weighted average length of time until principal payments must be paid. Depending on the types of securities held in a fund, certain maturity shortening devices (e.g., demand features, interest rate resets, and call options) may be taken into account when calculating the WAM. |
Duration as of February 29, 2012 |
| | 6 months ago |
Years | 1.9 | 1.8 |
Duration estimates how much a bond fund's price will change with a change in comparable interest rates. If rates rise 1%, for example, a fund with a 5-year duration is likely to lose about 5% of its value. Other factors also can influence a bond fund's performance and share price. Accordingly, a bond fund's actual performance may differ from this example. Duration takes into account any call or put option embedded in the bonds. |
Asset Allocation (% of fund's net assets) |
As of February 29, 2012 * | As of August 31, 2011 ** |
| Corporate Bonds 31.5% | | | Corporate Bonds 27.9% | |
| U.S. Government
and U.S. Government Agency Obligations† 48.4% | | | U.S. Government
and U.S. Government Agency Obligations†† 54.6% | |
| Asset-Backed
Securities 12.1% | | | Asset-Backed
Securities 9.6% | |
| CMOs and Other Mortgage Related Securities 6.2% | | | CMOs and Other Mortgage Related Securities 5.1% | |
| Municipal Bonds 0.7% | | | Municipal Bonds 0.7% | |
| Other Investments 0.4% | | | Other Investments 0.3% | |
| Short-Term
Investments and
Net Other Assets 0.7% | | | Short-Term
Investments and
Net Other Assets 1.8% | |
* Foreign investments | 11.1% | | ** Foreign investments | 8.7% | |

* Futures and Swaps | 1.5% | | ** Futures and Swaps | 0.0% | |
† Includes NCUA Guaranteed Note. |
†† Includes FDIC Guaranteed Corporate Securities and NCUA Guaranteed Notes. |
Semiannual Report
Investments February 29, 2012
Showing Percentage of Net Assets
Nonconvertible Bonds - 31.5% |
| Principal Amount | | Value |
CONSUMER DISCRETIONARY - 2.1% |
Auto Components - 0.1% |
DaimlerChrysler NA Holding Corp. 6.5% 11/15/13 | | $ 1,149,000 | | $ 1,253,852 |
Automobiles - 0.6% |
Daimler Finance North America LLC: | | | | |
1.875% 9/15/14 (d) | | 1,270,000 | | 1,279,623 |
1.95% 3/28/14 (d) | | 3,076,000 | | 3,100,885 |
2.3% 1/9/15 (d) | | 1,330,000 | | 1,352,872 |
Volkswagen International Finance NV 1.875% 4/1/14 (d) | | 2,300,000 | | 2,325,010 |
| | 8,058,390 |
Diversified Consumer Services - 0.1% |
Yale University 2.9% 10/15/14 | | 970,000 | | 1,029,791 |
Media - 1.1% |
COX Communications, Inc. 7.125% 10/1/12 | | 3,434,000 | | 3,563,427 |
NBCUniversal Media LLC: | | | | |
2.875% 4/1/16 | | 1,200,000 | | 1,251,770 |
3.65% 4/30/15 | | 1,310,000 | | 1,405,283 |
News America, Inc. 5.3% 12/15/14 | | 2,007,000 | | 2,228,135 |
Time Warner Cable, Inc. 5.4% 7/2/12 | | 2,542,000 | | 2,580,931 |
Time Warner, Inc. 3.15% 7/15/15 | | 1,923,000 | | 2,042,353 |
Viacom, Inc. 1.25% 2/27/15 | | 1,634,000 | | 1,636,477 |
| | 14,708,376 |
Specialty Retail - 0.1% |
Staples, Inc. 7.375% 10/1/12 | | 1,224,000 | | 1,269,594 |
Textiles, Apparel & Luxury Goods - 0.1% |
VF Corp. 1.2426% 8/23/13 (g) | | 763,000 | | 762,909 |
TOTAL CONSUMER DISCRETIONARY | | 27,082,912 |
CONSUMER STAPLES - 1.8% |
Beverages - 0.7% |
Anheuser-Busch InBev Worldwide, Inc.: | | | | |
1.5% 7/14/14 | | 1,611,000 | | 1,636,492 |
2.5% 3/26/13 | | 2,054,000 | | 2,096,401 |
Coca-Cola Enterprises, Inc. 1.125% 11/12/13 | | 1,269,000 | | 1,274,806 |
FBG Finance Ltd. 5.125% 6/15/15 (d) | | 1,054,000 | | 1,162,624 |
SABMiller Holdings, Inc. 2.45% 1/15/17 (d) | | 2,660,000 | | 2,712,429 |
| | 8,882,752 |
Food & Staples Retailing - 0.1% |
Wal-Mart Stores, Inc. 2.25% 7/8/15 | | 1,607,000 | | 1,681,611 |
Nonconvertible Bonds - continued |
| Principal Amount | | Value |
CONSUMER STAPLES - continued |
Food Products - 0.5% |
Cargill, Inc. 5.2% 1/22/13 (d) | | $ 500,000 | | $ 519,417 |
General Mills, Inc. 1.55% 5/16/14 | | 1,200,000 | | 1,219,532 |
Kraft Foods, Inc.: | | | | |
1.4565% 7/10/13 (g) | | 2,330,000 | | 2,341,890 |
2.625% 5/8/13 | | 2,575,000 | | 2,628,583 |
| | 6,709,422 |
Household Products - 0.2% |
Procter & Gamble Co. 0.7% 8/15/14 | | 2,540,000 | | 2,549,716 |
Tobacco - 0.3% |
Altria Group, Inc.: | | | | |
4.125% 9/11/15 | | 2,300,000 | | 2,521,143 |
8.5% 11/10/13 | | 1,000,000 | | 1,123,738 |
| | 3,644,881 |
TOTAL CONSUMER STAPLES | | 23,468,382 |
ENERGY - 1.9% |
Oil, Gas & Consumable Fuels - 1.9% |
BG Energy Capital PLC 2.875% 10/15/16 (d) | | 1,350,000 | | 1,400,439 |
Canadian Natural Resources Ltd. 1.45% 11/14/14 | | 2,453,000 | | 2,498,596 |
Cenovus Energy, Inc. 4.5% 9/15/14 | | 2,105,000 | | 2,279,744 |
Enterprise Products Operating LP: | | | | |
4.6% 8/1/12 | | 1,896,000 | | 1,925,951 |
5.65% 4/1/13 | | 1,227,000 | | 1,287,539 |
Gazstream SA 5.625% 7/22/13 (d) | | 417,588 | | 430,116 |
Marathon Petroleum Corp. 3.5% 3/1/16 | | 1,703,000 | | 1,765,824 |
NGPL PipeCo LLC 6.514% 12/15/12 (d) | | 699,000 | | 675,015 |
Petrobras International Finance Co. Ltd.: | | | | |
2.875% 2/6/15 | | 1,320,000 | | 1,349,436 |
3.875% 1/27/16 | | 1,151,000 | | 1,200,566 |
Plains All American Pipeline LP/PAA Finance Corp. 4.25% 9/1/12 | | 1,800,000 | | 1,826,419 |
Ras Laffan Liquefied Natural Gas Co. Ltd. III 4.5% 9/30/12 (d) | | 704,000 | | 714,560 |
Rockies Express Pipeline LLC 6.25% 7/15/13 (d) | | 1,922,000 | | 1,960,440 |
Southeast Supply Header LLC 4.85% 8/15/14 (d) | | 1,835,000 | | 1,946,889 |
Spectra Energy Partners, LP 2.95% 6/15/16 | | 313,000 | | 318,648 |
Total Capital Canada Ltd. 1.625% 1/28/14 | | 1,210,000 | | 1,235,647 |
Nonconvertible Bonds - continued |
| Principal Amount | | Value |
ENERGY - continued |
Oil, Gas & Consumable Fuels - continued |
TransCanada PipeLines Ltd. 0.875% 3/2/15 | | $ 460,000 | | $ 458,741 |
XTO Energy, Inc. 4.9% 2/1/14 | | 1,559,000 | | 1,679,999 |
| | 24,954,569 |
FINANCIALS - 18.2% |
Capital Markets - 2.0% |
Goldman Sachs Group, Inc.: | | | | |
3.7% 8/1/15 | | 2,000,000 | | 2,039,886 |
5.25% 10/15/13 | | 5,117,000 | | 5,358,348 |
HSBC Bank PLC 3.1% 5/24/16 (d) | | 1,210,000 | | 1,237,861 |
JPMorgan Chase & Co. 1.3611% 1/24/14 (g) | | 2,500,000 | | 2,510,480 |
Merrill Lynch & Co., Inc. 5.45% 7/15/14 | | 950,000 | | 988,281 |
Morgan Stanley: | | | | |
2.875% 1/24/14 | | 1,200,000 | | 1,191,786 |
2.875% 7/28/14 | | 1,406,000 | | 1,395,478 |
6% 5/13/14 | | 2,690,000 | | 2,818,714 |
Royal Bank of Scotland PLC 4.875% 8/25/14 (d) | | 2,400,000 | | 2,475,698 |
State Street Corp. 4.3% 5/30/14 | | 1,110,000 | | 1,187,183 |
The Bank of New York Mellon Corp. 1.7% 11/24/14 | | 3,150,000 | | 3,201,408 |
UBS AG Stamford Branch 2.25% 1/28/14 | | 2,500,000 | | 2,499,928 |
| | 26,905,051 |
Commercial Banks - 6.9% |
ANZ Banking Group Ltd. 2.125% 1/10/14 (d) | | 1,210,000 | | 1,218,178 |
Bank of England 0.5% 3/6/15 (d) | | 1,812,000 | | 1,804,727 |
Bank of Montreal 2.125% 6/28/13 | | 2,670,000 | | 2,724,225 |
Bank of Nova Scotia 1.85% 1/12/15 | | 4,200,000 | | 4,288,444 |
Bank of Tokyo-Mitsubishi UFJ Ltd. 2.6% 1/22/13 (d) | | 1,928,000 | | 1,953,517 |
Barclays Bank PLC: | | | | |
2.375% 1/13/14 | | 3,080,000 | | 3,084,075 |
2.5% 1/23/13 | | 577,000 | | 581,974 |
BNP Paribas 2.125% 12/21/12 | | 2,030,000 | | 2,035,595 |
Canadian Imperial Bank of Commerce 1.45% 9/13/13 | | 2,094,000 | | 2,121,856 |
Commonwealth Bank of Australia: | | | | |
1.227% 8/7/13 (d)(g) | | 1,000,000 | | 1,000,073 |
1.2892% 3/17/14 (d)(g) | | 440,000 | | 436,313 |
2.125% 3/17/14 (d) | | 1,210,000 | | 1,216,582 |
Credit Suisse New York Branch: | | | | |
1.527% 1/14/14 (g) | | 1,400,000 | | 1,387,984 |
2.2% 1/14/14 | | 3,082,000 | | 3,107,165 |
Danske Bank A/S 1.617% 4/14/14 (d)(g) | | 1,800,000 | | 1,762,031 |
Nonconvertible Bonds - continued |
| Principal Amount | | Value |
FINANCIALS - continued |
Commercial Banks - continued |
DBS Bank Ltd. (Singapore) 0.7176% 5/16/17 (d)(g) | | $ 147,614 | | $ 146,876 |
Fifth Third Bancorp 3.625% 1/25/16 | | 673,000 | | 711,072 |
ING Bank NV 2.65% 1/14/13 (d) | | 2,540,000 | | 2,544,318 |
KeyBank NA 5.8% 7/1/14 | | 2,087,000 | | 2,258,531 |
Nordea Bank AB 1.75% 10/4/13 (d) | | 1,830,000 | | 1,822,878 |
PNC Funding Corp.: | | | | |
3% 5/19/14 | | 1,700,000 | | 1,766,353 |
3.625% 2/8/15 | | 1,445,000 | | 1,544,205 |
Rabobank (Netherlands) NV 1.85% 1/10/14 | | 6,185,000 | | 6,230,905 |
Regions Financial Corp. 4.875% 4/26/13 | | 1,300,000 | | 1,319,500 |
Royal Bank of Canada: | | | | |
0.867% 4/17/14 (g) | | 1,400,000 | | 1,403,674 |
1.125% 1/15/14 | | 1,720,000 | | 1,730,270 |
1.45% 10/30/14 | | 1,165,000 | | 1,184,186 |
Royal Bank of Scotland PLC 1.5% 3/30/12 (d) | | 3,080,000 | | 3,081,737 |
Santander U.S. Debt SA Unipersonal 2.485% 1/18/13 (d) | | 2,370,000 | | 2,332,130 |
Sumitomo Mitsui Banking Corp.: | | | | |
1.9% 1/12/15 (d) | | 1,600,000 | | 1,615,726 |
1.95% 1/14/14 (d) | | 2,400,000 | | 2,421,156 |
SunTrust Banks, Inc. 3.6% 4/15/16 | | 1,025,000 | | 1,062,591 |
Svenska Handelsbanken AB 2.875% 9/14/12 (d) | | 4,282,000 | | 4,329,419 |
The Toronto Dominion Bank: | | | | |
0.9969% 11/1/13 (g) | | 1,400,000 | | 1,410,730 |
1.375% 7/14/14 | | 3,000,000 | | 3,051,450 |
U.S. Bancorp: | | | | |
1.375% 9/13/13 | | 1,038,000 | | 1,048,574 |
4.2% 5/15/14 | | 1,770,000 | | 1,898,583 |
Union Bank NA 2.125% 12/16/13 | | 3,642,000 | | 3,699,139 |
Wachovia Bank NA 0.9171% 11/3/14 (g) | | 1,820,000 | | 1,758,033 |
Wells Fargo & Co.: | | | | |
3.625% 4/15/15 | | 2,400,000 | | 2,572,006 |
4.375% 1/31/13 | | 5,106,000 | | 5,284,899 |
Westpac Banking Corp.: | | | | |
1.3093% 3/31/14 (d)(g) | | 1,300,000 | | 1,280,102 |
1.85% 12/9/13 | | 1,889,000 | | 1,907,839 |
2.1% 8/2/13 | | 581,000 | | 588,433 |
| | 90,728,054 |
Consumer Finance - 3.4% |
American Express Credit Corp. 2.75% 9/15/15 | | 3,500,000 | | 3,641,432 |
Nonconvertible Bonds - continued |
| Principal Amount | | Value |
FINANCIALS - continued |
Consumer Finance - continued |
American Honda Finance Corp.: | | | | |
1.45% 2/27/15 (d) | | $ 1,310,000 | | $ 1,313,887 |
2.375% 3/18/13 (d) | | 550,000 | | 559,809 |
Capital One Financial Corp.: | | | | |
2.125% 7/15/14 | | 2,639,000 | | 2,645,875 |
7.375% 5/23/14 | | 2,500,000 | | 2,782,263 |
Caterpillar Financial Services Corp.: | | | | |
1.375% 5/20/14 | | 2,050,000 | | 2,081,125 |
2% 4/5/13 | | 979,000 | | 994,085 |
2.75% 6/24/15 | | 701,000 | | 740,564 |
General Electric Capital Corp.: | | | | |
2.1% 1/7/14 | | 1,553,000 | | 1,584,012 |
2.15% 1/9/15 | | 10,668,000 | | 10,945,069 |
2.25% 11/9/15 | | 1,650,000 | | 1,697,213 |
5.4% 9/20/13 | | 6,698,000 | | 7,145,473 |
HSBC Finance Corp. 5.9% 6/19/12 | | 1,200,000 | | 1,217,105 |
HSBC USA, Inc. 2.375% 2/13/15 | | 1,063,000 | | 1,078,031 |
John Deere Capital Corp.: | | | | |
0.981% 10/4/13 (g) | | 1,350,000 | | 1,360,086 |
1.875% 6/17/13 | | 2,143,000 | | 2,180,614 |
Toyota Motor Credit Corp. 0.9521% 1/17/14 (g) | | 2,000,000 | | 2,005,738 |
| | 43,972,381 |
Diversified Financial Services - 3.9% |
Bank of America Corp.: | | | | |
2.1305% 7/11/14 (g) | | 2,780,000 | | 2,682,617 |
3.7% 9/1/15 | | 960,000 | | 959,084 |
4.9% 5/1/13 | | 3,690,000 | | 3,791,800 |
BB&T Corp. 2.05% 4/28/14 | | 2,710,000 | | 2,765,124 |
BP Capital Markets PLC: | | | | |
1.14% 3/11/14 (g) | | 2,210,000 | | 2,221,415 |
1.7% 12/5/14 | | 1,320,000 | | 1,352,208 |
2.248% 11/1/16 | | 1,320,000 | | 1,364,710 |
Citigroup, Inc.: | | | | |
1.511% 4/1/14 (g) | | 500,000 | | 490,755 |
2.0265% 1/13/14 (g) | | 3,558,000 | | 3,525,110 |
2.51% 8/13/13 (g) | | 650,000 | | 650,059 |
2.65% 3/2/15 | | 3,350,000 | | 3,351,136 |
5.125% 5/5/14 | | 1,628,000 | | 1,717,140 |
6.375% 8/12/14 | | 2,900,000 | | 3,145,932 |
6.5% 8/19/13 | | 1,733,000 | | 1,836,427 |
Nonconvertible Bonds - continued |
| Principal Amount | | Value |
FINANCIALS - continued |
Diversified Financial Services - continued |
Deutsche Bank AG London Branch 2.375% 1/11/13 | | $ 5,240,000 | | $ 5,281,862 |
Export Development Canada 1.5% 5/15/14 | | 800,000 | | 818,476 |
JPMorgan Chase & Co.: | | | | |
3.4% 6/24/15 | | 2,005,000 | | 2,109,493 |
3.7% 1/20/15 | | 5,780,000 | | 6,136,770 |
MassMutual Global Funding II: | | | | |
0.9515% 1/14/14 (d)(g) | | 1,742,000 | | 1,741,930 |
3.625% 7/16/12 (d) | | 800,000 | | 808,664 |
MetLife Institutional Funding II 1.481% 4/4/14 (d)(g) | | 1,000,000 | | 999,619 |
OAO Industry & Construction Bank 5.01% 9/29/15 (Issued by Or-ICB SA for OAO Industry & Construction Bank) (g) | | 270,000 | | 263,925 |
USAA Capital Corp. 3.5% 7/17/14 (d) | | 1,798,000 | | 1,884,320 |
Whirlpool Corp. 8% 5/1/12 | | 1,396,000 | | 1,410,792 |
| | 51,309,368 |
Insurance - 1.5% |
American International Group, Inc. 4.25% 9/15/14 | | 2,270,000 | | 2,349,713 |
Berkshire Hathaway, Inc.: | | | | |
1.2026% 8/15/14 (g) | | 1,400,000 | | 1,417,555 |
2.125% 2/11/13 | | 2,570,000 | | 2,612,999 |
Metropolitan Life Global Funding I: | | | | |
2% 1/9/15 (d) | | 4,359,000 | | 4,405,070 |
2.5% 9/29/15 (d) | | 1,000,000 | | 1,026,936 |
New York Life Global Funding: | | | | |
2.25% 12/14/12 (d) | | 1,200,000 | | 1,215,703 |
5.25% 10/16/12 (d) | | 2,280,000 | | 2,348,454 |
Pricoa Global Funding I 5.45% 6/11/14 (d) | | 1,150,000 | | 1,235,243 |
Prudential Financial, Inc.: | | | | |
2.75% 1/14/13 | | 530,000 | | 538,447 |
3.625% 9/17/12 | | 1,850,000 | | 1,877,776 |
5.15% 1/15/13 | | 672,000 | | 696,807 |
| | 19,724,703 |
Real Estate Investment Trusts - 0.2% |
AvalonBay Communities, Inc. 6.125% 11/1/12 | | 621,000 | | 638,662 |
Equity One, Inc.: | | | | |
5.375% 10/15/15 | | 144,000 | | 152,237 |
6.25% 12/15/14 | | 1,200,000 | | 1,296,436 |
| | 2,087,335 |
Nonconvertible Bonds - continued |
| Principal Amount | | Value |
FINANCIALS - continued |
Real Estate Management & Development - 0.3% |
Liberty Property LP 6.375% 8/15/12 | | $ 1,358,000 | | $ 1,380,840 |
Simon Property Group LP: | | | | |
4.2% 2/1/15 | | 484,000 | | 516,194 |
Simon Property Group LP: - continued | | | | |
5.3% 5/30/13 | | 1,511,000 | | 1,572,458 |
Tanger Properties LP 6.15% 11/15/15 | | 404,000 | | 452,858 |
| | 3,922,350 |
TOTAL FINANCIALS | | 238,649,242 |
HEALTH CARE - 0.7% |
Biotechnology - 0.1% |
Amgen, Inc. 1.875% 11/15/14 | | 1,300,000 | | 1,330,122 |
Health Care Providers & Services - 0.3% |
Aristotle Holding, Inc. 2.1% 2/12/15 (d) | | 1,970,000 | | 1,985,801 |
Express Scripts, Inc. 5.25% 6/15/12 | | 1,783,000 | | 1,804,433 |
| | 3,790,234 |
Pharmaceuticals - 0.3% |
Sanofi SA: | | | | |
1.2% 9/30/14 | | 920,000 | | 935,208 |
2.625% 3/29/16 | | 1,263,000 | | 1,327,942 |
Teva Pharmaceutical Finance III BV 1.7% 3/21/14 | | 1,210,000 | | 1,232,012 |
Teva Pharmaceutical Finance IV LLC 1.7% 11/10/14 | | 1,300,000 | | 1,326,748 |
| | 4,821,910 |
TOTAL HEALTH CARE | | 9,942,266 |
INDUSTRIALS - 0.3% |
Aerospace & Defense - 0.1% |
BAE Systems Holdings, Inc. 4.95% 6/1/14 (d) | | 1,500,000 | | 1,582,806 |
Airlines - 0.1% |
Iberbond 2004 PLC 4.826% 12/24/17 (j) | | 1,178,078 | | 1,136,845 |
Industrial Conglomerates - 0.1% |
Covidien International Finance SA 1.875% 6/15/13 | | 1,330,000 | | 1,347,265 |
TOTAL INDUSTRIALS | | 4,066,916 |
Nonconvertible Bonds - continued |
| Principal Amount | | Value |
INFORMATION TECHNOLOGY - 0.9% |
Computers & Peripherals - 0.2% |
Hewlett-Packard Co.: | | | | |
1.25% 9/13/13 | | $ 1,216,000 | | 1,220,379 |
2.625% 12/9/14 | | 1,330,000 | | 1,379,062 |
| | 2,599,441 |
Electronic Equipment & Components - 0.1% |
Tyco Electronics Group SA 1.6% 2/3/15 | | 678,000 | | 680,345 |
IT Services - 0.2% |
IBM Corp. 1.95% 7/22/16 | | 1,621,000 | | 1,676,096 |
The Western Union Co. 1.1139% 3/7/13 (g) | | 1,220,000 | | 1,223,406 |
| | 2,899,502 |
Office Electronics - 0.4% |
Xerox Corp. 1.3176% 5/16/14 (g) | | 5,738,000 | | 5,656,566 |
TOTAL INFORMATION TECHNOLOGY | | 11,835,854 |
MATERIALS - 1.0% |
Chemicals - 0.4% |
Dow Chemical Co. 4.85% 8/15/12 | | 4,852,000 | | 4,937,861 |
Metals & Mining - 0.6% |
Anglo American Capital PLC 2.15% 9/27/13 (d) | | 2,400,000 | | 2,394,458 |
BHP Billiton Financial (USA) Ltd.: | | | | |
1% 2/24/15 | | 1,310,000 | | 1,314,290 |
1.125% 11/21/14 | | 1,970,000 | | 1,987,610 |
Corporacion Nacional del Cobre de Chile (Codelco) 6.375% 11/30/12 (d) | | 700,000 | | 723,652 |
Rio Tinto Finance Ltd. (United States) 8.95% 5/1/14 | | 1,413,000 | | 1,649,567 |
| | 8,069,577 |
TOTAL MATERIALS | | 13,007,438 |
TELECOMMUNICATION SERVICES - 2.1% |
Diversified Telecommunication Services - 1.6% |
AT&T Broadband Corp. 8.375% 3/15/13 | | 750,000 | | 808,636 |
AT&T, Inc.: | | | | |
2.5% 8/15/15 | | 2,320,000 | | 2,424,024 |
2.95% 5/15/16 | | 1,200,000 | | 1,274,389 |
4.95% 1/15/13 | | 2,327,000 | | 2,414,309 |
6.7% 11/15/13 | | 470,000 | | 516,983 |
Nonconvertible Bonds - continued |
| Principal Amount | | Value |
TELECOMMUNICATION SERVICES - continued |
Diversified Telecommunication Services - continued |
Deutsche Telekom International Financial BV 3.125% 4/11/16 (d) | | $ 1,209,000 | | 1,252,985 |
Qwest Corp. 3.7963% 6/15/13 (g) | | 3,110,000 | | 3,164,425 |
Telefonica Emisiones SAU 2.582% 4/26/13 | | 3,300,000 | | 3,299,244 |
Verizon Communications, Inc.: | | | | |
1.95% 3/28/14 | | 2,420,000 | | 2,484,338 |
2% 11/1/16 | | 2,727,000 | | 2,787,823 |
| | 20,427,156 |
Wireless Telecommunication Services - 0.5% |
America Movil SAB de CV 2.375% 9/8/16 | | 1,532,000 | | 1,564,498 |
DIRECTV Holdings LLC/DIRECTV Financing, Inc. 4.75% 10/1/14 | | 2,496,000 | | 2,719,689 |
Verizon Wireless Capital LLC 5.55% 2/1/14 | | 2,380,000 | | 2,588,555 |
| | 6,872,742 |
TOTAL TELECOMMUNICATION SERVICES | | 27,299,898 |
UTILITIES - 2.5% |
Electric Utilities - 1.3% |
Alabama Power Co. 4.85% 12/15/12 | | 560,000 | | 578,623 |
Commonwealth Edison Co. 1.625% 1/15/14 | | 2,440,000 | | 2,479,333 |
EDP Finance BV 5.375% 11/2/12 (d) | | 2,500,000 | | 2,496,250 |
Entergy Louisiana LLC 1.875% 12/15/14 | | 748,000 | | 759,325 |
FirstEnergy Solutions Corp. 4.8% 2/15/15 | | 2,340,000 | | 2,528,651 |
LG&E and KU Energy LLC 2.125% 11/15/15 | | 831,000 | | 828,262 |
Niagara Mohawk Power Corp. 3.553% 10/1/14 (d) | | 2,675,000 | | 2,840,882 |
Pacific Gas & Electric Co. 6.25% 12/1/13 | | 1,278,000 | | 1,400,337 |
Pepco Holdings, Inc. 2.7% 10/1/15 | | 1,098,000 | | 1,112,289 |
Progress Energy, Inc. 6.05% 3/15/14 | | 1,532,000 | | 1,688,512 |
Southern Co. 4.15% 5/15/14 | | 412,000 | | 441,017 |
| | 17,153,481 |
Independent Power Producers & Energy Traders - 0.2% |
PSEG Power LLC 2.5% 4/15/13 | | 2,910,000 | | 2,964,568 |
Multi-Utilities - 1.0% |
Dominion Resources, Inc.: | | | | |
1.8% 3/15/14 | | 451,000 | | 461,422 |
1.95% 8/15/16 | | 848,000 | | 865,374 |
2.25% 9/1/15 | | 1,300,000 | | 1,341,180 |
2.8793% 9/30/66 (g) | | 1,336,000 | | 1,137,250 |
Nonconvertible Bonds - continued |
| Principal Amount | | Value |
UTILITIES - continued |
Multi-Utilities - continued |
Dominion Resources, Inc.: - continued | | | | |
6.25% 6/30/12 | | $ 1,300,000 | | 1,323,361 |
DTE Energy Co. 1.2272% 6/3/13 (g) | | 2,039,000 | | 2,045,523 |
NiSource Finance Corp. 6.15% 3/1/13 | | 1,790,000 | | 1,884,763 |
PG&E Corp. 5.75% 4/1/14 | | 590,000 | | 644,761 |
Sempra Energy: | | | | |
1.3063% 3/15/14 (g) | | 500,000 | | 499,359 |
2% 3/15/14 | | 2,435,000 | | 2,486,176 |
| | 12,689,169 |
TOTAL UTILITIES | | 32,807,218 |
TOTAL NONCONVERTIBLE BONDS (Cost $406,031,200) |
413,114,695
|
U.S. Government and Government Agency Obligations - 41.7% |
|
U.S. Government Agency Obligations - 12.4% |
Fannie Mae: | | | | |
0.375% 3/16/15 | | 11,801,000 | | 11,739,965 |
0.625% 10/30/14 | | 1,692,000 | | 1,697,007 |
0.75% 12/18/13 | | 292,000 | | 294,068 |
0.75% 12/19/14 | | 12,067,000 | | 12,155,813 |
0.875% 8/28/14 | | 44,140,000 | | 44,660,984 |
4.625% 10/15/13 | | 5,789,000 | | 6,189,668 |
Freddie Mac: | | | | |
0.375% 10/30/13 | | 20,736,000 | | 20,785,870 |
0.5% 4/17/15 | | 5,455,000 | | 5,438,630 |
0.625% 12/29/14 | | 11,379,000 | | 11,408,324 |
0.75% 11/25/14 | | 11,173,000 | | 11,243,245 |
1% 7/30/14 | | 14,662,000 | | 14,853,603 |
1% 8/27/14 | | 21,508,000 | | 21,789,196 |
TOTAL U.S. GOVERNMENT AGENCY OBLIGATIONS | | 162,256,373 |
U.S. Treasury Obligations - 29.2% |
U.S. Treasury Notes: | | | | |
0.25% 11/30/13 (e) | | 9,121,000 | | 9,115,299 |
0.25% 9/15/14 | | 20,647,000 | | 20,576,016 |
0.25% 1/15/15 | | 5,000,000 | | 4,977,735 |
U.S. Government and Government Agency Obligations - continued |
| Principal Amount | | Value |
U.S. Treasury Obligations - continued |
U.S. Treasury Notes: - continued | | | | |
0.375% 6/30/13 | | $ 21,558,000 | | $ 21,594,217 |
0.375% 11/15/14 | | 27,628,000 | | 27,608,578 |
0.5% 8/15/14 | | 81,749,000 | | 82,004,466 |
0.625% 7/15/14 | | 164,565,000 | | 165,593,522 |
0.75% 6/15/14 | | 4,304,000 | | 4,343,679 |
1.375% 11/30/15 | | 14,117,000 | | 14,520,662 |
1.75% 7/31/15 | | 18,150,000 | | 18,900,103 |
2.375% 9/30/14 | | 3,667,000 | | 3,853,790 |
2.375% 10/31/14 | | 9,988,000 | | 10,507,686 |
TOTAL U.S. TREASURY OBLIGATIONS | | 383,595,753 |
Other Government Related - 0.1% |
National Credit Union Administration Guaranteed Notes Master Trust 1.4% 6/12/15 (NCUA Guaranteed) | | 1,700,000 | | 1,733,983 |
TOTAL U.S. GOVERNMENT AND GOVERNMENT AGENCY OBLIGATIONS (Cost $544,642,300) |
547,586,109
|
U.S. Government Agency - Mortgage Securities - 4.4% |
|
Fannie Mae - 3.5% |
1.93% 10/1/33 (g) | | 56,399 | | 58,679 |
1.952% 3/1/35 (g) | | 49,686 | | 52,274 |
2.115% 10/1/35 (g) | | 81,070 | | 84,864 |
2.271% 5/1/33 (g) | | 16,468 | | 17,476 |
2.343% 7/1/35 (g) | | 563,772 | | 598,020 |
2.368% 11/1/34 (g) | | 307,245 | | 324,600 |
2.397% 5/1/35 (g) | | 582,563 | | 609,341 |
2.414% 10/1/35 (g) | | 733,512 | | 779,790 |
2.424% 10/1/33 (g) | | 89,835 | | 95,004 |
2.427% 12/1/34 (g) | | 340,383 | | 357,518 |
2.437% 11/1/36 (g) | | 105,200 | | 111,330 |
2.438% 8/1/35 (g) | | 408,029 | | 434,806 |
2.445% 7/1/35 (g) | | 1,946,647 | | 2,054,102 |
2.448% 3/1/35 (g) | | 29,246 | | 30,604 |
2.471% 12/1/33 (g) | | 349,687 | | 366,231 |
2.481% 2/1/35 (g) | | 687,524 | | 730,246 |
2.487% 11/1/36 (g) | | 694,189 | | 739,745 |
2.537% 7/1/35 (g) | | 225,930 | | 240,103 |
U.S. Government Agency - Mortgage Securities - continued |
| Principal Amount | | Value |
Fannie Mae - continued |
2.575% 10/1/41 (g) | | $ 1,111,530 | | $ 1,151,864 |
2.597% 4/1/35 (g) | | 219,728 | | 234,289 |
2.697% 9/1/41 (g) | | 1,306,823 | | 1,357,545 |
2.739% 8/1/41 (g) | | 1,621,661 | | 1,680,177 |
2.863% 10/1/35 (g) | | 145,100 | | 152,645 |
3% 7/1/21 to 11/1/21 | | 20,201,077 | | 21,137,146 |
3.021% 8/1/41 (g) | | 474,853 | | 494,934 |
3.188% 1/1/40 (g) | | 962,967 | | 999,812 |
3.471% 3/1/40 (g) | | 740,556 | | 767,113 |
3.539% 12/1/39 (g) | | 250,931 | | 260,895 |
3.613% 3/1/40 (g) | | 1,035,823 | | 1,081,162 |
4.5% 8/1/18 to 7/1/20 | | 5,645,530 | | 6,043,061 |
5.5% 11/1/17 to 6/1/19 | | 2,375,892 | | 2,588,187 |
6.5% 4/1/13 to 6/1/16 | | 443,742 | | 462,006 |
7% 1/1/16 to 11/1/18 | | 61,597 | | 66,280 |
7.5% 5/1/12 to 10/1/14 | | 6,623 | | 7,008 |
TOTAL FANNIE MAE | | 46,168,857 |
Freddie Mac - 0.9% |
2.375% 4/1/35 (g) | | 678,557 | | 717,554 |
2.415% 11/1/35 (g) | | 378,345 | | 399,721 |
2.468% 1/1/35 (g) | | 103,320 | | 107,572 |
2.557% 6/1/37 (g) | | 390,650 | | 416,286 |
2.61% 8/1/34 (g) | | 163,959 | | 174,425 |
2.704% 8/1/36 (g) | | 220,370 | | 234,665 |
2.985% 8/1/41 (g) | | 981,975 | | 1,024,166 |
3% 8/1/21 | | 2,852,951 | | 2,988,614 |
3.08% 9/1/41 (g) | | 587,188 | | 613,003 |
3.56% 4/1/40 (g) | | 644,552 | | 670,804 |
3.565% 4/1/40 (g) | | 561,564 | | 582,842 |
4.5% 8/1/18 to 11/1/18 | | 3,234,443 | | 3,453,624 |
8.5% 5/1/26 to 7/1/28 | | 78,831 | | 94,448 |
12% 11/1/19 | | 1,726 | | 1,868 |
TOTAL FREDDIE MAC | | 11,479,592 |
Ginnie Mae - 0.0% |
7% 1/15/25 to 6/15/32 | | 362,210 | | 416,872 |
TOTAL U.S. GOVERNMENT AGENCY - MORTGAGE SECURITIES (Cost $56,650,760) |
58,065,321
|
Asset-Backed Securities - 12.1% |
| Principal Amount | | Value |
Accredited Mortgage Loan Trust: | | | | |
Series 2003-3 Class A1, 4.46% 1/25/34 (AMBAC Insured) | | $ 427,544 | | $ 352,859 |
Series 2005-1 Class M1, 0.714% 4/25/35 (g) | | 152,751 | | 82,517 |
ACE Securities Corp. Home Equity Loan Trust Series 2005-HE2 Class M2, 0.694% 4/25/35 (g) | | 13,581 | | 13,185 |
Advanta Business Card Master Trust Series 2006-C1 Class C1, 0.6758% 10/20/14 (g) | | 61,000 | | 610 |
Ally Auto Receivables Trust: | | | | |
Series 2009 B Class A3, 1.98% 10/15/13 (d) | | 1,022,270 | | 1,026,835 |
Series 2009-A Class A4, 3% 10/15/15 (d) | | 2,000,000 | | 2,036,547 |
Series 2010-1 Class A4, 2.3% 12/15/14 | | 2,170,000 | | 2,220,835 |
Series 2010-4 Class A3, 0.91% 11/17/14 | | 1,680,000 | | 1,684,077 |
Series 2010-5 Class A3, 1.11% 1/15/15 | | 1,480,000 | | 1,486,190 |
Series 2011-1 Class A3, 1.38% 1/15/15 | | 1,390,000 | | 1,401,613 |
Series 2011-2 Class A3, 1.18% 4/15/15 | | 1,200,000 | | 1,207,924 |
Series 2011-3 Class A3, 0.97% 8/17/15 | | 1,550,000 | | 1,555,788 |
Series 2011-4 Class A2, 0.65% 3/17/14 | | 480,000 | | 480,169 |
Series 2012-1 Class A2, 0.71% 9/15/14 | | 1,900,000 | | 1,903,670 |
Ally Master Owner Trust: | | | | |
Series 2010-3 Class A, 2.88% 4/15/15 (d) | | 510,000 | | 520,138 |
Series 2011-1 Class A2, 2.15% 1/15/16 | | 4,370,000 | | 4,450,265 |
Series 2011-3 Class A2, 1.81% 5/15/16 | | 3,460,000 | | 3,505,788 |
Series 2011-5 Class A1, 0.8985% 6/15/15 (g) | | 2,720,000 | | 2,725,367 |
Series 2012-1 Class A2, 0.7% 2/15/17 | | 2,630,000 | | 2,631,604 |
AmeriCredit Automobile Receivables Trust: | | | | |
Series 2007-CM Class A4B, 0.3425% 4/7/14 (National Public Finance Guarantee Corp. Insured) (g) | | 1,204,405 | | 1,196,707 |
Series 2010-4 Class A3, 1.27% 4/8/15 | | 1,510,000 | | 1,505,308 |
Series 2011-1 Class A3, 1.39% 9/8/15 | | 850,000 | | 856,667 |
Series 2011-2 Class A3, 1.61% 10/8/15 | | 1,800,000 | | 1,820,507 |
Series 2011-3 Class A3, 1.17% 1/8/16 | | 650,000 | | 653,822 |
Series 2011-4 Class A/S, 0.92% 3/9/15 | | 1,860,000 | | 1,863,010 |
Series 2011-5 Class A2, 1.19% 8/8/15 | | 640,000 | | 642,629 |
Series 2012-1 Class A2, 0.91% 10/8/15 | | 1,000,000 | | 1,000,660 |
Ameriquest Mortgage Securities, Inc. pass-thru certificates: | | | | |
Series 2004-R2 Class M3, 0.794% 4/25/34 (g) | | 16,966 | | 5,313 |
Series 2005-R2 Class M1, 0.694% 4/25/35 (g) | | 262,030 | | 227,504 |
Argent Securities, Inc. pass-thru certificates: | | | | |
Series 2003-W7 Class A2, 1.0563% 3/25/34 (g) | | 82,560 | | 59,490 |
Asset-Backed Securities - continued |
| Principal Amount | | Value |
Argent Securities, Inc. pass-thru certificates: - continued | | | | |
Series 2006-W4 Class A2C, 0.404% 5/25/36 (g) | | $ 168,000 | | $ 41,077 |
Avis Budget Rental Car Funding (AESOP) LLC Series 2009-1A Class A, 9.31% 10/20/13 (d) | | 2,000,000 | | 2,062,485 |
Axon Financial Funding Ltd. Series 2007-1 Class A1, 1.181% 4/4/17 (b)(d)(g) | | 432,000 | | 0 |
Bank of America Auto Trust: | | | | |
Series 2009-1A: | | | | |
Class A3, 2.67% 7/15/13 (d) | | 46,893 | | 46,938 |
Class A4, 3.52% 6/15/16 (d) | | 1,100,000 | | 1,116,111 |
Series 2009-3A Class A3, 1.67% 12/15/13 (d) | | 435,261 | | 436,252 |
Series 2010-2 Class A3, 1.31% 7/15/14 | | 1,375,742 | | 1,380,463 |
BMW Vehicle Lease Trust: | | | | |
Series 2010-1 Class A3, 0.82% 4/15/13 | | 1,416,918 | | 1,418,416 |
Series 2011-1 Class A3, 1.06% 2/20/14 | | 1,760,000 | | 1,767,224 |
BMW Vehicle Owner Trust Series 2011-A: | | | | |
Class A2, 0.63% 2/25/14 | | 1,610,000 | | 1,610,835 |
Class A3, 0.76% 8/25/15 | | 1,150,000 | | 1,152,116 |
Brazos Higher Education Authority, Inc. Series 2006-2 Class A9, 0.5838% 12/25/24 (g) | | 177,712 | | 156,671 |
Capital Auto Receivables Asset Trust Series 2007-1 Class B, 5.15% 9/17/12 | | 36,236 | | 36,305 |
Capital One Multi-Asset Execution Trust Series 2008-A3 Class A3, 5.05% 2/15/16 | | 700,000 | | 735,166 |
Capital Trust Ltd. Series 2004-1: | | | | |
Class A2, 0.6955% 7/20/39 (d)(g) | | 425,658 | | 317,116 |
Class B, 0.9955% 7/20/39 (d)(g) | | 373,480 | | 153,127 |
Class C, 1.3455% 7/20/39 (d)(g) | | 478,070 | | 10,757 |
Carrington Mortgage Loan Trust Series 2007-RFC1 Class A3, 0.384% 12/25/36 (g) | | 228,766 | | 72,362 |
Chase Issuance Trust: | | | | |
Series 2007-A17 Class A, 5.12% 10/15/14 | | 3,730,000 | | 3,841,043 |
Series 2011-A1 Class A1, 0.4385% 3/16/15 (g) | | 2,850,000 | | 2,854,211 |
Series 2011-A2 Class A2, 0.3385% 5/15/15 (g) | | 4,610,000 | | 4,612,291 |
Series 2011-A3 Class A3, 0.3685% 12/15/15 (g) | | 5,000,000 | | 5,000,055 |
Chrysler Financial Auto Securitization Trust Series 2010-A Class A3, 0.91% 8/8/13 | | 1,220,000 | | 1,221,356 |
Citibank Credit Card Issuance Trust: | | | | |
Series 2008-A5 Class A5, 4.85% 4/22/15 | | 4,260,000 | | 4,470,196 |
Series 2009-A5 Class A5, 2.25% 12/23/14 | | 5,870,000 | | 5,955,327 |
Citibank Omni Master Trust Series 2009-A8 Class A8, 2.3485% 5/16/16 (d)(g) | | 2,000,000 | | 2,008,244 |
Countrywide Home Loan Trust Series 2006-13 Class N, 7% 8/25/37 (d) | | 41,917 | | 0 |
Asset-Backed Securities - continued |
| Principal Amount | | Value |
Countrywide Home Loans, Inc.: | | | | |
Series 2003-BC1 Class B1, 5.5436% 3/25/32 (MGIC Investment Corp. Insured) (g) | | $ 31,876 | | $ 5,454 |
Series 2004-2 Class 3A4, 0.744% 7/25/34 (g) | | 62,430 | | 48,905 |
Series 2004-3 Class M4, 1.214% 4/25/34 (g) | | 20,061 | | 8,839 |
Series 2004-4 Class M2, 1.039% 6/25/34 (g) | | 74,616 | | 33,744 |
Series 2005-3 Class MV1, 0.664% 8/25/35 (g) | | 27,782 | | 27,398 |
Discover Card Master Trust: | | | | |
Series 2011-A2 Class A2, 0.4585% 11/16/15 (g) | | 2,160,000 | | 2,164,243 |
Series 2012-A1 Class A1, 0.81% 8/15/17 | | 2,920,000 | | 2,919,708 |
Fannie Mae subordinate REMIC pass-thru certificates Series 2004-T5: | | | | |
Class AB1, 0.8077% 5/28/35 (g) | | 159,655 | | 117,456 |
Class AB3, 0.7513% 5/28/35 (g) | | 67,441 | | 43,285 |
Fieldstone Mortgage Investment Corp. Series 2004-3 Class M5, 2.419% 8/25/34 (g) | | 36,914 | | 21,514 |
First Franklin Mortgage Loan Trust Series 2005-FF9 Class A3, 0.524% 10/25/35 (g) | | 203,095 | | 189,359 |
Ford Credit Auto Lease Trust: | | | | |
Series 2011-B Class A3, 1.05% 10/15/14 | | 2,080,000 | | 2,083,896 |
Series 2010-B Class A3, 0.91% 7/15/13 (d) | | 1,610,000 | | 1,611,496 |
Series 2011-A Class A3, 1.03% 7/15/14 | | 2,190,000 | | 2,200,391 |
Ford Credit Auto Owner Trust: | | | | |
Series 2009-C Class A4, 4.43% 11/15/14 | | 1,000,000 | | 1,037,325 |
Series 2009-E Class A3, 1.51% 1/15/14 | | 512,607 | | 514,375 |
Series 2010-B Class A3, 0.98% 10/15/14 | | 991,157 | | 994,222 |
Series 2011-B Class A3, 0.84% 6/15/15 | | 1,000,000 | | 1,003,295 |
Ford Credit Automobile Lease Trust Series 2012-A Class A3, 0.85% 1/15/15 | | 820,000 | | 819,918 |
Ford Credit Automobile Owner Trust Series 2012-A Class A2, 0.62% 9/15/14 | | 1,320,000 | | 1,320,825 |
Ford Credit Floorplan Master Owner Trust: | | | | |
Series 2010-1 Class A, 1.8985% 12/15/14 (d)(g) | | 1,290,000 | | 1,304,624 |
Series 2010-5 Class A1, 1.5% 9/15/15 | | 1,110,000 | | 1,120,758 |
Series 2012-1 Class A, 0.857% 1/15/16 (g) | | 4,000,000 | | 4,009,040 |
Fremont Home Loan Trust: | | | | |
Series 2004-D: | | | | |
Class M4, 1.669% 11/25/34 (g) | | 104,293 | | 10,289 |
Class M5, 1.744% 11/25/34 (g) | | 66,415 | | 3,444 |
Series 2005-A: | | | | |
Class M3, 0.734% 1/25/35 (g) | | 120,398 | | 37,990 |
Class M4, 0.924% 1/25/35 (g) | | 46,138 | | 10,458 |
Asset-Backed Securities - continued |
| Principal Amount | | Value |
GCO Education Loan Funding Master Trust II Series 2007-1A Class C1L, 0.8706% 2/25/47 (d)(g) | | $ 298,000 | | $ 104,300 |
GCO Slims Trust Series 2006-1A, 5.72% 3/1/22 (d) | | 445,650 | | 409,998 |
GE Business Loan Trust Series 2003-1 Class A, 0.6785% 4/15/31 (d)(g) | | 27,118 | | 25,354 |
GE Capital Credit Card Master Note Trust Series 2012-1 Class A, 1.03% 1/15/18 | | 2,450,000 | | 2,449,755 |
Guggenheim Structured Real Estate Funding Ltd. Series 2006-3: | | | | |
Class B, 0.644% 9/25/46 (d)(g) | | 36,026 | | 36,012 |
Class C, 0.794% 9/25/46 (d)(g) | | 1,943,752 | | 991,314 |
Home Equity Asset Trust: | | | | |
Series 2003-3 Class M1, 1.534% 8/25/33 (g) | | 88,540 | | 63,876 |
Series 2003-5 Class A2, 0.944% 12/25/33 (g) | | 44,160 | | 32,169 |
Series 2004-1 Class M2, 1.944% 6/25/34 (g) | | 81,330 | | 55,750 |
Series 2005-5 Class 2A2, 0.494% 11/25/35 (g) | | 878 | | 877 |
Series 2006-1 Class 2A3, 0.469% 4/25/36 (g) | | 40,637 | | 40,298 |
Honda Auto Receivables Owner Trust Series 2011-3 Class A2, 0.67% 4/21/14 | | 1,600,000 | | 1,601,730 |
Honda Auto Receivables Owner Trust: | | | | |
Series 2010-1 Class A4, 1.98% 5/23/16 | | 510,000 | | 517,193 |
Series 2010-2 Class A3, 1.34% 3/18/14 | | 948,737 | | 953,189 |
Series 2010-3 Class A3, 0.7% 4/21/14 | | 2,450,000 | | 2,452,547 |
Series 2011-1 Class A4, 1.8% 4/17/17 | | 640,000 | | 653,214 |
Series 2011-2 Class A3, 0.94% 3/18/15 | | 1,560,000 | | 1,566,744 |
Honda Automobile Receivables Owner Trust Series 2009-3 Class A3, 2.31% 5/15/13 | | 138,907 | | 139,356 |
HSI Asset Securitization Corp. Trust Series 2007-HE1 Class 2A3, 0.434% 1/25/37 (g) | | 157,118 | | 45,769 |
Hyundai Auto Lease Securitization Trust Series 2011-A Class A3, 1.02% 8/15/14 (d) | | 1,350,000 | | 1,351,233 |
Hyundai Auto Receivables Trust: | | | | |
Series 2009-A Class A4, 3.15% 3/15/16 | | 210,000 | | 215,978 |
Series 2011-A Class A3, 1.16% 4/15/15 | | 810,000 | | 815,561 |
Series 2011-C Class A2, 0.62% 7/15/14 | | 1,610,000 | | 1,610,546 |
John Deere Owner Trust: | | | | |
Seires 2011-A Class A3, 1.29% 1/15/16 | | 1,710,000 | | 1,724,599 |
Series 2009-B Class A-3, 1.57% 10/15/13 | | 252,321 | | 252,606 |
JPMorgan Mortgage Acquisition Trust Series 2007-CH1 Class AV4, 0.374% 11/25/36 (g) | | 157,766 | | 130,483 |
Keycorp Student Loan Trust Series 1999-A Class A2, 0.9038% 12/27/29 (g) | | 75,275 | | 66,102 |
Long Beach Mortgage Loan Trust Series 2004-2 Class M2, 1.324% 6/25/34 (g) | | 10,682 | | 6,343 |
Asset-Backed Securities - continued |
| Principal Amount | | Value |
Marriott Vacation Club Owner Trust: | | | | |
Series 2005-2 Class A, 5.25% 10/20/27 (d) | | $ 179,875 | | $ 181,888 |
Series 2006-1A: | | | | |
Class B, 5.827% 4/20/28 (d) | | 66,533 | | 67,871 |
Class C, 6.125% 4/20/28 (d) | | 66,533 | | 67,577 |
MASTR Asset Backed Securities Trust Series 2007-HE1 Class M1, 0.544% 5/25/37 (g) | | 99,598 | | 1,722 |
Mercedes-Benz Auto Lease Trust: | | | | |
Series 2011-1A Class A3 1.18% 11/15/13 (d) | | 2,420,000 | | 2,428,238 |
Series 2011-B Class A3, 1.07% 1/15/14 (d) | | 1,410,000 | | 1,411,476 |
Mercedes-Benz Auto Receivables Trust: | | | | |
Series 2009-1 Class A3, 1.67% 1/15/14 | | 376,181 | | 378,200 |
Series 2011-1 Class A3, 0.85% 3/16/15 | | 1,460,000 | | 1,465,019 |
Merrill Lynch Mortgage Investors Trust: | | | | |
Series 2006-FM1 Class A2B, 0.354% 4/25/37 (g) | | 172,890 | | 128,418 |
Series 2006-OPT1 Class A1A, 0.504% 6/25/35 (g) | | 183,505 | | 137,202 |
Morgan Stanley ABS Capital I Trust: | | | | |
Series 2004-HE6 Class A2, 0.584% 8/25/34 (g) | | 138,792 | | 106,531 |
Series 2004-NC8 Class M6, 1.494% 9/25/34 (g) | | 77,120 | | 43,929 |
Series 2005-NC1 Class M1, 0.684% 1/25/35 (g) | | 50,738 | | 32,041 |
Series 2005-NC2 Class B1, 1.414% 3/25/35 (g) | | 52,840 | | 6,691 |
National Collegiate Student Loan Trust Series 2004-2 Class AIO, 9.75% 10/27/14 (i) | | 942,500 | | 63,619 |
Nissan Auto Lease Trust: | | | | |
Series 2010-B: | | | | |
Class A3, 1.12% 12/15/13 | | 1,710,000 | | 1,715,756 |
Class A4, 1.27% 10/15/16 | | 560,000 | | 563,672 |
Series 2011-A Class A3, 1.04% 8/15/14 | | 1,840,000 | | 1,850,312 |
Series 2011-B Class A3, 0.92% 2/16/15 | | 930,000 | | 929,613 |
Nissan Auto Receivables Owner Trust: | | | | |
Series 2011-A Class A3, 1.18% 2/16/15 | | 1,020,000 | | 1,028,650 |
Series 2011-B Class A3, 0.95% 2/16/16 | | 950,000 | | 952,349 |
Northstar Education Finance, Inc., Delaware Series 2005-1 Class A5, 1.1747% 10/30/45 (g) | | 1,093,614 | | 1,016,514 |
Ocala Funding LLC: | | | | |
Series 2005-1A Class A, 1.7455% 3/20/10 (b)(d)(g) | | 71,000 | | 0 |
Series 2006-1A Class A, 1.6455% 3/20/11 (b)(d)(g) | | 149,000 | | 0 |
Park Place Securities, Inc.: | | | | |
Series 2004-WCW1: | | | | |
Class M3, 1.494% 9/25/34 (g) | | 797,630 | | 336,331 |
Class M4, 1.694% 9/25/34 (g) | | 1,086,724 | | 237,468 |
Series 2005-WCH1 Class M4, 1.074% 1/25/36 (g) | | 187,294 | | 83,434 |
Asset-Backed Securities - continued |
| Principal Amount | | Value |
Salomon Brothers Mortgage Securities VII, Inc. Series 2003-HE1 Class A, 1.044% 4/25/33 (g) | | $ 648 | | $ 525 |
Santander Drive Auto Receivables Trust: | | | | |
Series 2010-2 Class A2, 0.95% 8/15/13 | | 762,600 | | 762,767 |
Series 2010-3 Class A2, 0.93% 6/17/13 | | 279,031 | | 279,077 |
Series 2011-1, Class A2, 0.94% 2/18/14 | | 1,183,967 | | 1,183,623 |
Series 2011-4 Class A2, 1.37% 3/16/15 | | 1,400,000 | | 1,401,295 |
Santander Drive Automobile Receivables Trust Series 2012-1 Class A2, 1.25% 4/15/15 | | 1,190,000 | | 1,192,072 |
Saxon Asset Securities Trust Series 2004-1 Class M1, 1.039% 3/25/35 (g) | | 168,939 | | 103,055 |
Sierra Receivables Funding Co. Series 2007-1A Class A2, 0.4309% 3/20/19 (FGIC Insured) (d)(g) | | 55,686 | | 53,327 |
SLM Private Credit Student Loan Trust: | | | | |
Series 2004 B Class A2, 0.7463% 6/15/21 (g) | | 1,474,377 | | 1,413,600 |
Series 2004-A: | | | | |
Class B, 1.1263% 6/15/33 (g) | | 364,397 | | 226,588 |
Class C, 1.4963% 6/15/33 (g) | | 1,181,000 | | 535,819 |
Series 2004-B Class C, 1.4163% 9/15/33 (g) | | 1,900,000 | | 885,649 |
Structured Asset Investment Loan Trust Series 2004-8 Class M5, 1.969% 9/25/34 (g) | | 8,267 | | 2,647 |
Terwin Mortgage Trust Series 2003-4HE Class A1, 1.104% 9/25/34 (g) | | 86,903 | | 64,505 |
Toyota Auto Receivables Owner Trust Series 2010-B Class M3, 1.04% 2/18/14 | | 590,027 | | 591,683 |
USAA Auto Owner Trust Series 2009-2 Class A3, 1.54% 2/18/14 | | 355,786 | | 356,569 |
Volkswagen Auto Lease Trust: | | | | |
Series 2010-A: | | | | |
Class A3, 0.99% 11/20/13 | | 2,450,000 | | 2,455,371 |
Class A4, 1.18% 10/20/15 | | 900,000 | | 903,879 |
Series 2011-A Class A2, 1% 2/20/14 | | 930,000 | | 928,378 |
Volkswagen Auto Loan Enhanced Trust Series 2011-1 Class A3, 1.22% 6/22/15 | | 2,840,000 | | 2,862,780 |
Volkswagen Automobile Loan Enhanced Trust Series 2012-1 Series A2, 0.61% 10/20/14 | | 1,280,000 | | 1,281,173 |
Wachovia Auto Owner Trust Series 2008-A Class A4B, 1.3955% 3/20/14 (g) | | 521,310 | | 522,629 |
WaMu Asset Holdings Corp. Series 2006-8 Class N1, 6.048% 10/25/46 (d) | | 112,639 | | 0 |
Wells Fargo Home Equity Trust Series 2004-3 Class A, 4.5% 11/27/34 (d) | | 961 | | 0 |
Asset-Backed Securities - continued |
| Principal Amount | | Value |
Whinstone Capital Management Ltd. Series 1A Class B3, 2.3601% 10/25/44 (d)(g) | | $ 1,390,735 | | $ 737,089 |
World Omni Automobile Lease Securitization Trust Series 2011-A, Class A3, 1.49% 10/15/14 | | 1,020,000 | | 1,028,023 |
TOTAL ASSET-BACKED SECURITIES (Cost $163,800,959) |
158,575,533
|
Collateralized Mortgage Obligations - 4.2% |
|
Private Sponsor - 1.9% |
Arkle Master Issuer PLC floater Series 2010-1A Class 2A, 1.6451% 5/17/60 (d)(g) | | 1,500,000 | | 1,500,286 |
Arran Residential Mortgages Funding PLC floater Series 2011-1A Class A1C, 1.6931% 11/19/47 (d)(g) | | 1,612,836 | | 1,614,301 |
Banc of America Funding Trust sequential payer Series 2009-R1 Class A1, 5.0298% 5/20/36 (g) | | 241,477 | | 243,068 |
Credit Suisse Mortgage Capital Certificates: | | | | |
floater Series 2011-7R Class A1, 1.494% 8/27/47 (d)(g) | | 965,939 | | 947,794 |
sequential payer Series 2010-16 Class A1, 3% 6/25/50 (d) | | 618,617 | | 596,965 |
Gracechurch Mortgage Financing PLC floater: | | | | |
Series 2006-1 Class A6, 0.5931% 11/20/56 (d)(g) | | 1,616,864 | | 1,608,888 |
Series 2007-1A Class 3A1, 0.5731% 11/20/56 (d)(g) | | 2,971,591 | | 2,966,765 |
Granite Master Issuer PLC floater: | | | | |
Series 2006-1A Class C2, 1.4455% 12/20/54 (d)(g) | | 762,000 | | 464,820 |
Series 2006-2 Class C1, 1.1855% 12/20/54 (g) | | 3,254,000 | | 1,984,940 |
Series 2006-3 Class C2, 0.7455% 12/20/54 (g) | | 142,000 | | 86,620 |
Series 2006-4: | | | | |
Class B1, 0.4255% 12/20/54 (g) | | 381,000 | | 320,802 |
Class C1, 1.0055% 12/20/54 (g) | | 233,000 | | 142,130 |
Class M1, 0.5855% 12/20/54 (g) | | 100,000 | | 76,250 |
Series 2007-1: | | | | |
Class 1C1, 0.8455% 12/20/54 (g) | | 235,000 | | 143,350 |
Class 1M1, 0.5455% 12/20/54 (g) | | 153,000 | | 116,663 |
Class 2C1, 1.2055% 12/20/54 (g) | | 107,000 | | 65,270 |
Class 2M1, 0.7455% 12/20/54 (g) | | 196,000 | | 149,450 |
Series 2007-2 Class 2C1, 0.676% 12/17/54 (g) | | 272,000 | | 165,920 |
Granite Mortgages Series 2003-2 Class 1A3, 1.0612% 7/20/43 (g) | | 613,146 | | 593,893 |
Collateralized Mortgage Obligations - continued |
| Principal Amount | | Value |
Private Sponsor - continued |
Granite Mortgages PLC floater: | | | | |
Series 2003-3: | | | | |
Class 1A3, 0.9612% 1/20/44 (g) | | $ 260,582 | | $ 252,243 |
Class 1C, 3.0112% 1/20/44 (g) | | 54,183 | | 38,893 |
Series 2004-1 Class 2A1, 0.8832% 3/20/44 (g) | | 1,778,113 | | 1,709,656 |
Series 2004-3 Class 2A1, 0.8432% 9/20/44 (g) | | 365,609 | | 350,985 |
Holmes Master Issuer PLC floater: | | | | |
Series 2007-2A Class 4A, 0.667% 7/15/20 (g) | | 2,480,000 | | 2,472,835 |
Series 2012-1A Class A1, 0.4485% 1/15/13 (d)(g) | | 2,120,000 | | 2,121,672 |
MASTR Adjustable Rate Mortgages Trust Series 2007-3 Class 22A2, 0.454% 5/25/47 (g) | | 104,758 | | 61,575 |
Merrill Lynch Alternative Note Asset Trust floater Series 2007-OAR1 Class A1, 0.414% 2/25/37 (g) | | 155,542 | | 104,539 |
Morgan Stanley Reremic Trust Series 2010-R3 Class 3A, 0.5163% 6/26/36 (d)(g) | | 890,394 | | 884,051 |
Permanent Master Issuer PLC floater Series 2010-1A Class 1A, 1.717% 7/15/42 (d)(g) | | 1,000,000 | | 999,045 |
RESI Finance LP/RESI Finance DE Corp. floater Series 2003-B Class B5, 2.6048% 7/10/35 (d)(g) | | 81,002 | | 65,797 |
Residential Funding Securities Corp. floater Series 2003-RP2 Class A1, 0.694% 6/25/33 (d)(g) | | 20,076 | | 18,653 |
Santander Drive Auto Receivables Trust sequential payer Series 2011-3 Class A2, 1.11% 8/15/14 | | 1,200,000 | | 1,200,192 |
Sequoia Mortgage Trust floater Series 2004-6 Class A3B, 1.668% 7/20/34 (g) | | 4,535 | | 3,268 |
Structured Asset Securities Corp. Series 2004-21XS Class 2A3, 4.32% 12/25/34 | | 113,163 | | 112,645 |
TBW Mortgage-Backed pass-thru certificates floater Series 2006-4 Class A3, 0.4763% 9/25/36 (g) | | 415,454 | | 316,862 |
TOTAL PRIVATE SPONSOR | | 24,501,086 |
U.S. Government Agency - 2.3% |
Fannie Mae Guaranteed Mtg. pass-thru certificates: | | | | |
planned amortization class Series 1993-187 Class L, 6.5% 7/25/23 | | 87,069 | | 87,942 |
sequential payer Series 2009-31 Class A, 4% 2/25/24 | | 481,982 | | 502,031 |
Series 2010-123 Class DL, 3.5% 11/25/25 | | 766,015 | | 798,939 |
Fannie Mae subordinate REMIC pass-thru certificates: | | | | |
floater Series 2008-76 Class EF, 0.744% 9/25/23 (g) | | 322,357 | | 323,487 |
floater planned amortization Series 2005-90 Class FC, 0.494% 10/25/35 (g) | | 1,059,410 | | 1,057,998 |
Collateralized Mortgage Obligations - continued |
| Principal Amount | | Value |
U.S. Government Agency - continued |
Fannie Mae subordinate REMIC pass-thru certificates: - continued | | | | |
planned amortization class Series 2006-54 Class PE, 6% 2/25/33 | | $ 612,219 | | $ 650,791 |
sequential payer: | | | | |
Series 2001-40 Class Z, 6% 8/25/31 | | 444,466 | | 493,124 |
Series 2003-76 Class BA, 4.5% 3/25/18 | | 778,009 | | 812,400 |
Series 2010-135 Class DE, 2.25% 4/25/24 | | 1,726,446 | | 1,745,842 |
Series 2011-16 Class FB, 0.394% 3/25/31 (g) | | 2,948,587 | | 2,947,296 |
Series 2010-143 Class B, 3.5% 12/25/25 | | 1,204,501 | | 1,261,821 |
Series 2011-23 Class AB, 2.75% 6/25/20 | | 965,229 | | 999,734 |
Federal Home Loan Mortgage Corp. floater sequential payer Series 3943 Class EF 0.4985% 2/15/26 (g) | | 1,678,350 | | 1,676,379 |
Freddie Mac Multi-Class pass-thru certificates: | | | | |
floater Series 3346 Class FA, 0.4785% 2/15/19 (g) | | 4,025,479 | | 4,031,140 |
floater planned amortization Series 3117 Class JF, 0.5485% 2/15/36 (g) | | 1,191,940 | | 1,193,021 |
floater sequential payer Series 3387 Class DF, 0.4285% 10/15/17 (g) | | 1,317,056 | | 1,317,257 |
planned amortization class: | | | | |
Series 2535 Class PC, 6% 9/15/32 | | 420,534 | | 444,400 |
Series 2866 Class XE, 4% 12/15/18 | | 919,804 | | 953,759 |
Series 2901 Class UM, 4.5% 1/15/30 | | 605,314 | | 610,381 |
Series 3792 Class DF, 0.6485% 11/15/40 (g) | | 2,726,757 | | 2,734,025 |
sequential payer: | | | | |
Series 2609 Class UJ, 6% 2/15/17 | | 54,249 | | 54,273 |
Series 2635 Class DG, 4.5% 1/15/18 | | 840,765 | | 870,386 |
Series 2970 Class YA, 5% 9/15/18 | | 11,957 | | 11,941 |
Series 3560 Class LA, 2% 8/15/14 | | 474,163 | | 476,555 |
Series 3573 Class LC, 1.85% 8/15/14 | | 894,116 | | 900,297 |
Series 3659 Class EJ 3% 6/15/18 | | 2,291,395 | | 2,363,297 |
Series 3696 Class AE, 1.2% 7/15/15 | | 1,112,316 | | 1,112,909 |
TOTAL U.S. GOVERNMENT AGENCY | | 30,431,425 |
TOTAL COLLATERALIZED MORTGAGE OBLIGATIONS (Cost $53,958,184) |
54,932,511
|
Commercial Mortgage Securities - 4.3% |
| Principal Amount | | Value |
Asset Securitization Corp. Series 1997-D5 Class PS1, 1.4363% 2/14/43 (g)(i) | | $ 2,442,397 | | $ 26,918 |
Banc of America Commercial Mortgage, Inc. Series 2005-4 Class XP, 0.3486% 7/10/45 (g)(i) | | 9,377,512 | | 13,288 |
Banc of America Large Loan, Inc. floater: | | | | |
Series 2005-MIB1: | | | | |
Class F, 0.7185% 3/15/22 (d)(g) | | 78,149 | | 75,023 |
Class G, 0.7785% 3/15/22 (d)(g) | | 320,652 | | 301,413 |
Class H, 1.0285% 3/15/22 (d)(g) | | 500,000 | | 465,000 |
Series 2006-BIX1: | | | | |
Class F, 0.5585% 10/15/19 (d)(g) | | 201,139 | | 189,071 |
Class G, 0.5785% 10/15/19 (d)(g) | | 137,009 | | 121,938 |
Bayview Commercial Asset Trust: | | | | |
floater: | | | | |
Series 2003-2 Class M1, 1.094% 12/25/33 (d)(g) | | 8,340 | | 5,906 |
Series 2004-1: | | | | |
Class A, 0.604% 4/25/34 (d)(g) | | 397,114 | | 319,677 |
Class B, 2.144% 4/25/34 (d)(g) | | 48,109 | | 27,819 |
Class M1, 0.804% 4/25/34 (d)(g) | | 27,856 | | 19,390 |
Class M2, 1.444% 4/25/34 (d)(g) | | 26,869 | | 18,622 |
Series 2005-2A: | | | | |
Class A1, 0.554% 8/25/35 (d)(g) | | 138,208 | | 90,224 |
Class M1, 0.674% 8/25/35 (d)(g) | | 10,255 | | 5,277 |
Class M2, 0.724% 8/25/35 (d)(g) | | 16,913 | | 7,702 |
Class M3, 0.744% 8/25/35 (d)(g) | | 9,358 | | 3,725 |
Series 2005-3A: | | | | |
Class A2, 0.644% 11/25/35 (d)(g) | | 49,047 | | 32,402 |
Class M1, 0.684% 11/25/35 (d)(g) | | 8,948 | | 5,131 |
Class M2, 0.734% 11/25/35 (d)(g) | | 11,360 | | 6,259 |
Class M3, 0.754% 11/25/35 (d)(g) | | 10,167 | | 5,366 |
Class M4, 0.844% 11/25/35 (d)(g) | | 12,667 | | 6,118 |
Series 2005-4A: | | | | |
Class A2, 0.634% 1/25/36 (d)(g) | | 849,021 | | 526,318 |
Class B1, 1.644% 1/25/36 (d)(g) | | 57,128 | | 7,578 |
Class M1, 0.694% 1/25/36 (d)(g) | | 267,032 | | 115,241 |
Class M2, 0.714% 1/25/36 (d)(g) | | 101,331 | | 39,332 |
Class M3, 0.744% 1/25/36 (d)(g) | | 108,903 | | 38,096 |
Class M4, 0.854% 1/25/36 (d)(g) | | 55,726 | | 17,315 |
Class M5, 0.894% 1/25/36 (d)(g) | | 55,726 | | 15,080 |
Class M6, 0.944% 1/25/36 (d)(g) | | 56,551 | | 10,932 |
Series 2006-1: | | | | |
Class A2, 0.604% 4/25/36 (d)(g) | | 26,574 | | 18,381 |
Class M1, 0.624% 4/25/36 (d)(g) | | 9,504 | | 5,374 |
Commercial Mortgage Securities - continued |
| Principal Amount | | Value |
Bayview Commercial Asset Trust: - continued | | | | |
floater: | | | | |
Series 2006-1: | | | | |
Class M2, 0.644% 4/25/36 (d)(g) | | $ 10,042 | | $ 5,290 |
Class M3, 0.664% 4/25/36 (d)(g) | | 8,640 | | 4,253 |
Class M4, 0.764% 4/25/36 (d)(g) | | 4,896 | | 2,202 |
Class M5, 0.804% 4/25/36 (d)(g) | | 4,752 | | 1,902 |
Class M6, 0.884% 4/25/36 (d)(g) | | 9,476 | | 3,603 |
Series 2006-2A: | | | | |
Class A1, 0.474% 7/25/36 (d)(g) | | 259,565 | | 164,340 |
Class A2, 0.524% 7/25/36 (d)(g) | | 23,434 | | 14,060 |
Class B1, 1.114% 7/25/36 (d)(g) | | 8,774 | | 1,035 |
Class B3, 2.944% 7/25/36 (d)(g) | | 13,256 | | 540 |
Class M1, 0.554% 7/25/36 (d)(g) | | 24,587 | | 9,851 |
Class M2, 0.574% 7/25/36 (d)(g) | | 17,347 | | 6,256 |
Class M3, 0.594% 7/25/36 (d)(g) | | 14,389 | | 4,678 |
Class M4, 0.664% 7/25/36 (d)(g) | | 9,716 | | 2,798 |
Class M5, 0.714% 7/25/36 (d)(g) | | 11,943 | | 2,960 |
Class M6, 0.784% 7/25/36 (d)(g) | | 17,818 | | 2,863 |
Series 2006-3A: | | | | |
Class B1, 1.044% 10/25/36 (d)(g) | | 17,096 | | 341 |
Class M4, 0.674% 10/25/36 (d)(g) | | 19,070 | | 1,874 |
Class M5, 0.724% 10/25/36 (d)(g) | | 22,830 | | 1,662 |
Class M6, 0.804% 10/25/36 (d)(g) | | 44,739 | | 2,071 |
Series 2006-4A: | | | | |
Class A1, 0.474% 12/25/36 (d)(g) | | 80,895 | | 53,517 |
Class A2, 0.514% 12/25/36 (d)(g) | | 366,687 | | 187,010 |
Class B1, 0.944% 12/25/36 (d)(g) | | 12,818 | | 1,197 |
Class B2, 1.494% 12/25/36 (d)(g) | | 13,264 | | 792 |
Class B3, 2.694% 12/25/36 (d)(g) | | 7,863 | | 162 |
Class M1, 0.534% 12/25/36 (d)(g) | | 25,981 | | 9,901 |
Class M2, 0.554% 12/25/36 (d)(g) | | 17,714 | | 5,958 |
Class M3, 0.584% 12/25/36 (d)(g) | | 17,714 | | 5,167 |
Class M4, 0.644% 12/25/36 (d)(g) | | 21,257 | | 4,927 |
Class M5, 0.684% 12/25/36 (d)(g) | | 19,486 | | 3,216 |
Class M6, 0.764% 12/25/36 (d)(g) | | 17,714 | | 2,163 |
Series 2007-1: | | | | |
Class A2, 0.514% 3/25/37 (d)(g) | | 402,662 | | 193,278 |
Class B1, 0.914% 3/25/37 (d)(g) | | 128,564 | | 9,273 |
Class B2, 1.394% 3/25/37 (d)(g) | | 83,390 | | 3,589 |
Class M1, 0.514% 3/25/37 (d)(g) | | 110,105 | | 35,940 |
Class M2, 0.534% 3/25/37 (d)(g) | | 83,359 | | 21,615 |
Class M3, 0.564% 3/25/37 (d)(g) | | 72,394 | | 14,491 |
Class M4, 0.614% 3/25/37 (d)(g) | | 54,606 | | 8,083 |
Class M5, 0.664% 3/25/37 (d)(g) | | 91,283 | | 11,502 |
Commercial Mortgage Securities - continued |
| Principal Amount | | Value |
Bayview Commercial Asset Trust: - continued | | | | |
floater: | | | | |
Series 2007-1: | | | | |
Class M6, 0.744% 3/25/37 (d)(g) | | $ 125,885 | | $ 12,986 |
Series 2007-2A: | | | | |
Class A1, 0.514% 7/25/37 (d)(g) | | 66,815 | | 34,451 |
Class A2, 0.564% 7/25/37 (d)(g) | | 62,579 | | 21,903 |
Class B1, 1.844% 7/25/37 (d)(g) | | 19,608 | | 746 |
Class B2, 2.494% 7/25/37 (d)(g) | | 6,305 | | 334 |
Class M1, 0.614% 7/25/37 (d)(g) | | 22,304 | | 3,379 |
Class M2, 0.654% 7/25/37 (d)(g) | | 12,516 | | 1,380 |
Class M3, 0.734% 7/25/37 (d)(g) | | 12,676 | | 1,111 |
Class M4, 0.894% 7/25/37 (d)(g) | | 24,406 | | 1,905 |
Class M5, 0.994% 7/25/37 (d)(g) | | 21,582 | | 1,411 |
Class M6, 1.244% 7/25/37 (d)(g) | | 27,390 | | 1,428 |
Series 2007-3: | | | | |
Class A2, 0.534% 7/25/37 (d)(g) | | 101,790 | | 43,547 |
Class B1, 1.194% 7/25/37 (d)(g) | | 87,598 | | 7,307 |
Class B2, 1.844% 7/25/37 (d)(g) | | 224,232 | | 11,945 |
Class B3, 4.244% 7/25/37 (d)(g) | | 27,085 | | 612 |
Class M1, 0.554% 7/25/37 (d)(g) | | 76,901 | | 25,383 |
Class M2, 0.584% 7/25/37 (d)(g) | | 80,851 | | 21,944 |
Class M3, 0.614% 7/25/37 (d)(g) | | 130,872 | | 28,799 |
Class M4, 0.744% 7/25/37 (d)(g) | | 206,954 | | 36,514 |
Class M5, 0.844% 7/25/37 (d)(g) | | 103,167 | | 13,749 |
Class M6, 1.044% 7/25/37 (d)(g) | | 80,569 | | 8,794 |
Series 2007-4A: | | | | |
Class A2, 0.794% 9/25/37 (d)(g) | | 854,985 | | 213,746 |
Class B1, 2.794% 9/25/37 (d)(g) | | 89,902 | | 3,234 |
Class M1, 1.194% 9/25/37 (d)(g) | | 132,484 | | 11,609 |
Class M2, 1.294% 9/25/37 (d)(g) | | 132,484 | | 8,044 |
Class M4, 1.844% 9/25/37 (d)(g) | | 349,137 | | 15,080 |
Class M5, 1.994% 9/25/37 (d)(g) | | 349,137 | | 11,131 |
Class M6, 2.194% 9/25/37 (d)(g) | | 349,223 | | 7,163 |
Series 2004-1, Class IO, 1.25% 4/25/34 (d)(i) | | 3,028,722 | | 110,548 |
Series 2006-2A Class IO, 3.1745% 7/25/36 (c)(d)(i) | | 8,827,640 | | 290,412 |
Bear Stearns Commercial Mortgage Securities Trust: | | | | |
floater: | | | | |
Series 2006-BBA7: | | | | |
Class H, 0.8985% 3/15/19 (d)(g) | | 52,914 | | 50,821 |
Class J, 1.0985% 3/15/19 (d)(g) | | 51,667 | | 44,446 |
Series 2007-BBA8: | | | | |
Class D, 0.4985% 3/15/22 (d)(g) | | 52,963 | | 45,443 |
Class E, 0.5485% 3/15/22 (d)(g) | | 275,033 | | 233,231 |
Class F, 0.5985% 3/15/22 (d)(g) | | 168,653 | | 139,647 |
Commercial Mortgage Securities - continued |
| Principal Amount | | Value |
Bear Stearns Commercial Mortgage Securities Trust: - continued | | | | |
floater: | | | | |
Series 2007-BBA8: | | | | |
Class G, 0.6485% 3/15/22 (d)(g) | | $ 43,346 | | $ 35,458 |
Class H, 0.7985% 3/15/22 (d)(g) | | 52,963 | | 42,265 |
Class J, 0.9485% 3/15/22 (d)(g) | | 52,963 | | 41,206 |
Series 2004-PWR6 Class X2, 0.848% 11/11/41 (g)(i) | | 4,145,469 | | 23,675 |
Series 2005-PWR9 Class X2, 0.5336% 9/11/42 (d)(g)(i) | | 26,814,187 | | 166,087 |
C-BASS Trust floater Series 2006-SC1 Class A, 0.514% 5/25/36 (d)(g) | | 92,740 | | 76,473 |
CDC Commercial Mortgage Trust Series 2002-FX1 Class XCL, 1.5913% 5/15/35 (d)(g)(i) | | 8,921,862 | | 208,780 |
Citigroup Commercial Mortgage Trust floater Series 2006-FL2: | | | | |
Class G, 0.5835% 8/15/21 (d)(g) | | 26,524 | | 25,280 |
Class H, 0.6235% 8/15/21 (d)(g) | | 45,122 | | 42,168 |
Citigroup/Deutsche Bank Commercial Mortgage Trust Series 2006-CD3 Class X3, 0.6703% 10/15/48 (g)(i) | | 43,934,058 | | 360,655 |
Cobalt CMBS Commercial Mortgage Trust sequential payer Series 2007-C2 Class A2, 5.334% 4/15/47 | | 882,936 | | 890,214 |
COMM pass-thru certificates: | | | | |
floater: | | | | |
Series 2005-F10A: | | | | |
Class G, 0.7985% 4/15/17 (d)(g) | | 9,883 | | 9,522 |
Class H, 0.8685% 4/15/17 (d)(g) | | 21,773 | | 18,800 |
Class J, 1.0985% 4/15/17 (d)(g) | | 16,697 | | 11,688 |
Series 2005-FL11: | | | | |
Class F, 0.6985% 11/15/17 (d)(g) | | 23,597 | | 21,001 |
Class G, 0.7485% 11/15/17 (d)(g) | | 16,356 | | 14,393 |
Series 2006-CN2A Class A2FL, 0.4825% 2/5/19 (d)(g) | | 310,000 | | 293,221 |
sequential payer Series 2006-CN2A Class A2FX, 5.449% 2/5/19 (d) | | 1,375,000 | | 1,337,153 |
Series 2005-LP5 Class XP, 0.4391% 5/10/43 (g)(i) | | 5,873,922 | | 2,203 |
Series 2006-CN2A Class E, 5.7556% 2/5/19 (d)(g) | | 630,000 | | 597,747 |
Commercial Mortgage pass-thru certificates: | | | | |
Series 2004-LB4A Class A5, 4.84% 10/15/37 | | 3,510,000 | | 3,730,993 |
Series 2011-STRT Class A, 2.555% 12/10/24 (d) | | 1,170,000 | | 1,173,413 |
Credit Suisse Commercial Mortgage Trust: | | | | |
sequential payer Series 2007-C3 Class A2, 5.9018% 6/15/39 (g) | | 554,446 | | 556,106 |
Series 2006-C5 Class ASP, 0.8652% 12/15/39 (g)(i) | | 33,856,114 | | 406,883 |
Commercial Mortgage Securities - continued |
| Principal Amount | | Value |
Credit Suisse First Boston Mortgage Securities Corp.: | | | | |
Series 2001-CK6 Class AX, 1.1089% 8/15/36 (g)(i) | | $ 2,226,326 | | $ 5,677 |
Series 2003-C4 Class A4, 5.137% 8/15/36 | | 1,140,000 | | 1,189,321 |
Series 2005-C1 Class ASP, 0.5114% 2/15/38 (d)(g)(i) | | 10,138,085 | | 193 |
Series 2005-C2 Class ASP, 0.7388% 4/15/37 (d)(g)(i) | | 8,868,679 | | 9,853 |
Credit Suisse Mortgage Capital Certificates floater Series 2007-TFL1: | | | | |
Class C: | | | | |
0.4185% 2/15/22 (d)(g) | | 236,650 | | 210,003 |
0.5185% 2/15/22 (d)(g) | | 84,521 | | 74,142 |
Class F, 0.5685% 2/15/22 (d)(g) | | 169,020 | | 146,540 |
DBUBS 2011 LC3 Series 2011-LC3A Class A1, 2.238% 8/10/44 | | 424,908 | | 434,297 |
GE Capital Commercial Mortgage Corp. Series 2001-1 Class X1, 1.5729% 5/15/33 (d)(g)(i) | | 1,141,488 | | 10,148 |
GMAC Commercial Mortgage Securities, Inc.: | | | | |
sequential payer Series 2003-C2: | | | | |
Class A1, 4.576% 5/10/40 | | 790,820 | | 811,757 |
Class A2, 5.6355% 5/10/40 (g) | | 590,000 | | 623,453 |
Series 2004-C2 Class A4, 5.301% 8/10/38 | | 1,200,000 | | 1,296,493 |
Greenwich Capital Commercial Funding Corp.: | | | | |
floater Series 2006-FL4 Class B, 0.4525% 11/5/21 (d)(g) | | 1,170,000 | | 1,136,464 |
sequential payer Series 2005-GG3 Class A2, 4.305% 8/10/42 (g) | | 705,802 | | 705,672 |
Series 2007-GG11 Class A1, 0.4565% 12/10/49 (d)(g)(i) | | 80,112,209 | | 497,176 |
GS Mortgage Securities Corp. II: | | | | |
floater: | | | | |
Series 2006-FL8A Class F, 0.7025% 6/6/20 (d)(g) | | 105,970 | | 100,040 |
Series 2007-EOP: | | | | |
Class A1, 1.1031% 3/6/20 (d)(g) | | 2,307,411 | | 2,290,106 |
Class C, 2.1455% 3/6/20 (d)(g) | | 720,000 | | 700,704 |
Class D, 2.3636% 3/6/20 (d)(g) | | 215,000 | | 208,378 |
Class E, 2.6688% 3/6/20 (d)(g) | | 360,000 | | 347,112 |
Class F, 2.8433% 3/6/20 (d)(g) | | 180,000 | | 172,836 |
Class G, 3.0177% 3/6/20 (d)(g) | | 90,000 | | 85,968 |
Class H, 3.5846% 3/6/20 (d)(g) | | 150,000 | | 143,430 |
Class J, 4.4568% 3/6/20 (d)(g) | | 215,000 | | 206,981 |
sequential payer: | | | | |
Series 2005-GG4 Class A3, 4.607% 7/10/39 | | 710,000 | | 711,116 |
Commercial Mortgage Securities - continued |
| Principal Amount | | Value |
GS Mortgage Securities Corp. II: - continued | | | | |
sequential payer Series 2004-GG2 Class A6, 5.396% 8/10/38 (g) | | $ 1,340,000 | | $ 1,447,271 |
Series 2006-GG6 Class A2, 5.506% 4/10/38 | | 363,207 | | 369,098 |
GS Mortgage Securities Trust: | | | | |
sequential payer Series 2006-GG8 Class A2, 5.479% 11/10/39 | | 1,279,426 | | 1,287,216 |
Series 2011-GC5 Class A1, 1.468% 8/10/44 (g) | | 1,047,720 | | 1,051,638 |
Series 2012-GC6 Class A1, 1.282% 1/10/45 | | 480,000 | | 481,043 |
JPMorgan Chase Commercial Mortgage Securities Corp.: | | | | |
floater Series 2011-CCHP Class A, 2.6% 7/15/28 (d)(g) | | 3,430,000 | | 3,429,695 |
sequential payer Series 2003-C1 Class A2, 4.985% 1/12/37 | | 980,000 | | 1,005,777 |
Series 2003-CB7 Class A4, 4.879% 1/12/38 (g) | | 473,009 | | 497,560 |
Series 2006-LDP7 Class A2, 6.0508% 4/15/45 (g) | | 33,019 | | 33,130 |
JPMorgan Chase Commercial Mortgage Securities Trust: | | | | |
floater Series 2006-FLA2: | | | | |
Class D, 0.4785% 11/15/18 (d)(g) | | 19,246 | | 16,936 |
Class E, 0.5285% 11/15/18 (d)(g) | | 27,273 | | 23,454 |
Class F, 0.5785% 11/15/18 (d)(g) | | 40,905 | | 34,769 |
Class G, 0.6085% 11/15/18 (d)(g) | | 35,550 | | 29,151 |
Class H, 0.7485% 11/15/18 (d)(g) | | 27,279 | | 21,277 |
sequential payer: | | | | |
Series 2005-LDP5 Class A2, 5.198% 12/15/44 | | 1,090,000 | | 1,100,133 |
Series 2007-LD11 Class A2, 5.9895% 6/15/49 (g) | | 1,077,516 | | 1,086,742 |
Series 2007-LDPX Class A2 S, 5.305% 1/15/49 | | 390,954 | | 391,036 |
LB-UBS Commercial Mortgage Trust: | | | | |
sequential payer: | | | | |
Series 2003-C3 Class A4, 4.166% 5/15/32 | | 440,000 | | 452,908 |
Series 2006-C1 Class A2, 5.084% 2/15/31 | | 944,925 | | 954,731 |
Series 2007-C6 Class A2, 5.845% 7/15/40 | | 681,118 | | 692,374 |
Series 2004-C8, 4.799% 12/15/29 | | 1,240,000 | | 1,324,279 |
Series 2005-C7 Class XCP, 0.3371% 11/15/40 (g)(i) | | 48,698,284 | | 77,966 |
Series 2006-C1 Class XCP, 0.5146% 2/15/41 (g)(i) | | 35,503,479 | | 128,913 |
Series 2006-C6 Class XCP, 0.8617% 9/15/39 (g)(i) | | 17,983,510 | | 192,495 |
Series 2007-C1 Class XCP, 0.6167% 2/15/40 (g)(i) | | 6,713,062 | | 56,860 |
Series 2007-C2 Class XCP, 0.6911% 2/15/40 (g)(i) | | 35,599,956 | | 355,893 |
Lehman Brothers Floating Rate Commercial Mortgage Trust floater Series 2006-LLFA: | | | | |
Class F, 0.5885% 9/15/21 (d)(g) | | 145,070 | | 121,158 |
Class G, 0.6085% 9/15/21 (d)(g) | | 286,588 | | 230,752 |
Class H, 0.6485% 9/15/21 (d)(g) | | 73,934 | | 56,572 |
Commercial Mortgage Securities - continued |
| Principal Amount | | Value |
Merrill Lynch Mortgage Trust: | | | | |
sequential payer Series 2005-MKB2 Class A2, 4.806% 9/12/42 | | $ 117,242 | | $ 117,446 |
Series 2005-MCP1 Class XP, 0.8267% 6/12/43 (g)(i) | | 7,848,810 | | 68,999 |
Series 2005-MKB2 Class XP, 0.4028% 9/12/42 (g)(i) | | 3,586,854 | | 10,689 |
Merrill Lynch-CFC Commercial Mortgage Trust: | | | | |
sequential payer Series 2007-9 Class A2, 5.59% 9/12/49 | | 769,747 | | 778,930 |
Series 2006-4 Class XP, 0.8109% 12/12/49 (g)(i) | | 13,440,465 | | 224,254 |
Morgan Stanley Capital I Trust: | | | | |
floater: | | | | |
Series 2006-XLF Class C, 1.449% 7/15/19 (d)(g) | | 45,397 | | 26,330 |
Series 2007-XLFA: | | | | |
Class D, 0.439% 10/15/20 (d)(g) | | 84,694 | | 76,299 |
Class E, 0.499% 10/15/20 (d)(g) | | 105,926 | | 90,130 |
Class F, 0.549% 10/15/20 (d)(g) | | 63,569 | | 48,368 |
Class G, 0.589% 10/15/20 (d)(g) | | 78,581 | | 57,433 |
Class H, 0.679% 10/15/20 (d)(g) | | 49,464 | | 28,733 |
Class J, 0.829% 10/15/20 (d)(g) | | 28,936 | | 12,034 |
Class MHRO, 0.939% 10/15/20 (d)(g) | | 21,668 | | 18,201 |
Class NHRO, 1.139% 10/15/20 (d)(g) | | 31,646 | | 25,950 |
sequential payer: | | | | |
Series 2003-IQ4 Class A2, 4.07% 5/15/40 | | 398,575 | | 408,400 |
Series 2007-IQ14 Class A2, 5.61% 4/15/49 | | 1,890,909 | | 1,947,076 |
Series 2005-HQ5 Class X2, 0.3921% 1/14/42 (g)(i) | | 8,731,786 | | 23,890 |
Series 2005-TOP17 Class X2, 0.8024% 12/13/41 (g)(i) | | 6,316,817 | | 36,050 |
Series 2011-C3 Class A1, 2.178% 7/15/49 | | 2,407,946 | | 2,448,513 |
Morgan Stanley Dean Witter Capital I Trust sequential payer Series 2003-T11 Class A4, 5.15% 6/13/41 | | 505,147 | | 524,388 |
Wachovia Bank Commercial Mortgage Trust: | | | | |
floater: | | | | |
Series 2006-WL7A: | | | | |
Class A1, 0.3751% 9/15/21 (d)(g) | | 1,832,587 | | 1,765,247 |
Class E, 0.5696% 9/15/21 (d)(g) | | 176,861 | | 138,527 |
Class F, 0.6296% 9/15/21 (d)(g) | | 238,334 | | 179,526 |
Class G, 0.6496% 9/15/21 (d)(g) | | 225,785 | | 163,300 |
Class J, 0.8896% 9/15/21 (d)(g) | | 50,198 | | 22,752 |
Series 2007-WHL8: | | | | |
Class AP1, 0.9485% 6/15/20 (d)(g) | | 11,855 | | 10,669 |
Class AP2, 1.0485% 6/15/20 (d)(g) | | 19,414 | | 17,084 |
Class F, 0.7285% 6/15/20 (d)(g) | | 376,985 | | 245,040 |
Series 2003-C9 Class A4, 5.012% 12/15/35 | | 1,490,000 | | 1,576,539 |
Commercial Mortgage Securities - continued |
| Principal Amount | | Value |
Wachovia Bank Commercial Mortgage Trust: - continued | | | | |
Series 2005-C18 Class XP, 0.488% 4/15/42 (d)(g)(i) | | $ 11,626,167 | | $ 8,069 |
Series 2006-C23 Class X, 0.2568% 1/15/45 (d)(g)(i) | | 202,200,881 | | 301,684 |
Series 2007-C30 Class XP, 0.6327% 12/15/43 (d)(g)(i) | | 35,983,383 | | 351,558 |
Series 2007-C31A Class A2, 5.421% 4/15/47 | | 767,337 | | 797,284 |
WaMu Commercial Mortgage Securities Trust sequential payer Series 2005-C1A Class AJ, 5.19% 5/25/36 (d) | | 116,486 | | 116,391 |
TOTAL COMMERCIAL MORTGAGE SECURITIES (Cost $60,798,268) |
56,628,313
|
Municipal Securities - 0.7% |
|
Illinois Gen. Oblig. Series 2010, 3.321% 1/1/13 | | 1,780,000 | | 1,814,906 |
Indiana Fin. Auth.'s Econ. Dev. Bonds (Republic Svcs., Inc. Proj.) Series A, 0.85%, tender 6/1/12 (g)(h) | | 600,000 | | 600,000 |
Kentucky Econ. Dev. Fin. Auth. Solid Waste Disp. Rev. Bonds (Republic Svcs., Inc. Proj.) Series A, 0.85%, tender 6/1/12 (g)(h) | | 1,500,000 | | 1,500,000 |
Louisville/Jefferson County Metropolitan Govt. Poll. Cont. Rev. Bonds (Louisville Gas and Electronic Co. Proj.): | | | | |
Series 2003 A, 1.9%, tender 4/2/12 (g) | | 600,000 | | 600,570 |
Series 2007 B, 1.9%, tender 6/1/12 (g) | | 600,000 | | 601,806 |
New York State Energy Research & Dev. Auth. Facilities Rev. Bonds (Consolidated Edison Co. of New York, Inc. Proj.) Series 2010 A, 1.45%, tender 11/1/12 (g)(h) | | 2,300,000 | | 2,313,524 |
Ohio Solid Waste Rev. Bonds (Republic Svcs., Inc. Proj.) 0.7%, tender 6/1/12 (g) | | 900,000 | | 900,000 |
Pennsylvania Econ. Dev. Fing. Auth. Solid Waste Disp. Rev. Bonds (Republic Svcs., Inc. Proj.) Series 2010 A, 0.85%, tender 4/2/12 (g)(h) | | 700,000 | | 700,000 |
TOTAL MUNICIPAL SECURITIES (Cost $8,978,880) |
9,030,806
|
Foreign Government and Government Agency Obligations - 0.4% |
| Principal Amount | | Value |
Ontario Province 1.375% 1/27/14 | | $ 3,750,000 | | $ 3,809,573 |
United Mexican States 6.625% 3/3/15 | | 1,300,000 | | 1,483,950 |
TOTAL FOREIGN GOVERNMENT AND GOVERNMENT AGENCY OBLIGATIONS (Cost $5,211,946) |
5,293,523
|
Commercial Paper - 0.3% |
|
Vodafone Group PLC yankee: | | | | |
1% 6/11/12 | | 1,500,000 | | 1,497,258 |
1% 6/11/12 | | 1,500,000 | | 1,497,258 |
Weatherford International Ltd. yankee 0.82% 5/14/12 | | 1,000,000 | | 998,896 |
TOTAL COMMERCIAL PAPER (Cost $3,989,708) | 3,993,412 |
Money Market Funds - 0.4% |
| Shares | | |
Fidelity Cash Central Fund, 0.12% (a)
(Cost $4,845,587) | 4,845,587 | |
4,845,587
|
TOTAL INVESTMENT PORTFOLIO - 100.0% (Cost $1,308,907,792) | 1,312,065,810 |
NET OTHER ASSETS (LIABILITIES) - 0.0% | | 22,882 |
NET ASSETS - 100% | $ 1,312,088,692 |
Futures Contracts |
| Expiration Date | | Underlying Face Amount at Value | | Unrealized Appreciation/
(Depreciation) |
Purchased |
Eurodollar Contracts |
20 Eurodollar 90 Day Index Contracts | June 2012 | | $ 19,977,500 | | $ 4,199 |
Swap Agreements |
| Expiration Date | | Notional Amount | | Value |
Credit Default Swaps |
Receive monthly notional amount multiplied by .82% and pay UBS upon credit event of Morgan Stanley ABS Capital I, Inc., par value of the notional amount of Morgan Stanley ABS Capital I, Inc. Series 2004-NC6 Class M3, 5.6413% 7/25/34 (Rating-Ca) (f) | August 2034 | | $ 64,419 | | $ (49,828) |
Receive monthly notional amount multiplied by 2.61% and pay Goldman Sachs upon credit event of Fremont Home Loan Trust, par value of the notional amount of Fremont Home Loan Trust Series 2004-A Class B3, 7.0413% 1/25/34 (Rating-C) (f) | Feb. 2034 | | 1,009 | | (942) |
Receive monthly notional amount multiplied by 3.05% and pay Merrill Lynch upon credit event of Morgan Stanley ABS Capital I, Inc., par value of the notional amount of Morgan Stanley ABS Capital I, Inc. Series 2004-NC8, Class B3, 7.2913% 9/25/34 (Rating-Ca) (f) | Oct. 2034 | | 85,210 | | (71,783) |
Receive monthly notional amount multiplied by 3.35% and pay Morgan Stanley, Inc. upon credit event of Morgan Stanley ABS Capital I, Inc., par value of the notional amount of Morgan Stanley ABS Capital I, Inc. Series 2004-HE7, Class B3, 9.01% 8/25/34 (Rating-C) (f) | Sept. 2034 | | 62,549 | | (54,535) |
| | $ 213,187 | | $ (177,088) |
Legend |
(a) Affiliated fund that is available only to investment companies and other accounts managed by Fidelity Investments. The rate quoted is the annualized seven-day yield of the fund at period end. A complete unaudited listing of the fund's holdings as of its most recent quarter end is available upon request. In addition, each Fidelity Central Fund's financial statements, which are not covered by the Fund's Report of Independent Registered Public Accounting Firm, are available on the SEC's website or upon request. |
(b) Non-income producing - Security is in default. |
(c) Security initially issued at one coupon which converts to a higher coupon at a specified date. The rate shown is the rate at period end. |
(d) Security exempt from registration under Rule 144A of the Securities Act of 1933. These securities may be resold in transactions exempt from registration, normally to qualified institutional buyers. At the end of the period, the value of these securities amounted to $140,271,565 or 10.7% of net assets. |
(e) Security or a portion of the security was pledged to cover margin requirements for futures contracts. At the period end, the value of securities pledged amounted to $9,994. |
(f) Represents a credit default swap contract in which the Fund has sold protection on the underlying reference entity. The value of each credit default swap and the credit rating can be measures of the current payment/performance risk. For the underlying reference entity, ratings disclosed are from Moody's Investors Service, Inc. Where Moody's ratings are not available, S&P ratings are disclosed and are indicated as such. All ratings are as of the report date and do not reflect subsequent changes. Where a credit rating is not disclosed, the value is used as the measure of the payment/performance risk. |
(g) Coupon rates for floating and adjustable rate securities reflect the rates in effect at period end. |
(h) Private activity obligations whose interest is subject to the federal alternative minimum tax for individuals. |
(i) Security represents right to receive monthly interest payments on an underlying pool of mortgages or assets. Principal shown is the outstanding par amount of the pool as of the end of the period. |
(j) Restricted securities - Investment in securities not registered under the Securities Act of 1933 (excluding 144A issues). At the end of the period, the value of restricted securities (excluding 144A issues) amounted to $1,136,845 or 0.1% of net assets. |
Additional information on each restricted holding is as follows: |
Security | Acquisition Date | Acquisition Cost |
Iberbond 2004 PLC 4.826% 12/24/17 | 11/30/05 | $ 1,142,771 |
Affiliated Central Funds |
Information regarding fiscal year to date income earned by the Fund from investments in Fidelity Central Funds is as follows: |
Fund | Income earned |
Fidelity Cash Central Fund | $ 1,596 |
Other Information |
The following is a summary of the inputs used, as of February 29, 2012, involving the Fund's assets and liabilities carried at fair value. The inputs or methodology used for valuing securities may not be an indication of the risk associated with investing in those securities. For more information on valuation inputs, and their aggregation into the levels used in the tables below, please refer to the Security Valuation section in the accompanying Notes to Financial Statements. |
Valuation Inputs at Reporting Date: |
Description | Total | Level 1 | Level 2 | Level 3 |
Investments in Securities: | | | | |
Corporate Bonds | $ 413,114,695 | $ - | $ 411,977,850 | $ 1,136,845 |
U.S. Government and Government Agency Obligations | 547,586,109 | - | 547,586,109 | - |
U.S. Government Agency - Mortgage Securities | 58,065,321 | - | 58,065,321 | - |
Asset-Backed Securities | 158,575,533 | - | 155,072,944 | 3,502,589 |
Collateralized Mortgage Obligations | 54,932,511 | - | 54,866,714 | 65,797 |
Commercial Mortgage Securities | 56,628,313 | - | 53,949,592 | 2,678,721 |
Municipal Securities | 9,030,806 | - | 9,030,806 | - |
Foreign Government and Government Agency Obligations | 5,293,523 | - | 5,293,523 | - |
Commercial Paper | 3,993,412 | - | 3,993,412 | - |
Money Market Funds | 4,845,587 | 4,845,587 | - | - |
Total Investments in Securities: | $ 1,312,065,810 | $ 4,845,587 | $ 1,299,836,271 | $ 7,383,952 |
Derivative Instruments: | | | | |
Assets | | | | |
Futures Contracts | $ 4,199 | $ 4,199 | $ - | $ - |
Liabilities | | | | |
Swap Agreements | $ (177,088) | $ - | $ - | $ (177,088) |
Total Derivative Instruments: | $ (172,889) | $ 4,199 | $ - | $ (177,088) |
The following is a reconciliation of Investments in Securities and Derivative Instruments for which Level 3 inputs were used in determining value: |
Investments in Securities: | |
Beginning Balance | $ 13,922,827 |
Total Realized Gain (Loss) | (2,263,407) |
Total Unrealized Gain (Loss) | 2,792,408 |
Cost of Purchases | - |
Proceeds of Sales | (2,338,000) |
Amortization/Accretion | (4,314) |
Transfers in to Level 3 | 1,387,940 |
Transfers out of Level 3 | (6,113,502) |
Ending Balance | $ 7,383,952 |
The change in unrealized gain (loss) for the period attributable to Level 3 securities held at February 29, 2012 | $ 565,793 |
Derivative Instruments: | |
Swap Agreements | |
Beginning Balance | $ (121,041) |
Total Unrealized Gain (Loss) | (56,047) |
Transfers in to Level 3 | - |
Transfers out of Level 3 | - |
Ending Balance | $ (177,088) |
Realized gain (loss) on Swap Agreements for the period | $ 3,635 |
The change in unrealized gain (loss) for the period attributable to Level 3 Swap Agreements held at February 29, 2012 | $ (56,047) |
The information used in the above reconciliation represents fiscal year to date activity for any Investments in Securities and Derivative Instruments identified as using Level 3 inputs at either the beginning or the end of the current fiscal period. Transfers in or out of Level 3 represent the beginning value of any Security or Instrument where a change in the pricing level occurred from the beginning to the end of the period. The cost of purchases and the proceeds of sales may include securities received or delivered through corporate actions or exchanges. Realized and unrealized gains (losses) disclosed in the reconciliation are included in Net Gain (Loss) on the Fund's Statement of Operations. |
Value of Derivative Instruments |
The following table is a summary of the Fund's value of derivative instruments by risk exposure as of February 29, 2012. For additional information on derivative instruments, please refer to the Derivative Instruments section in the accompanying Notes to Financial Statements. |
Risk Exposure /
Derivative Type | Value |
| Asset | Liability |
Credit Risk | | |
Swap Agreements (a) | $ - | $ (177,088) |
Interest Rate Risk | | |
Futures Contracts (b) | 4,199 | - |
Total Value of Derivatives | $ 4,199 | $ (177,088) |
(a) Value is disclosed on the Statement of Assets and Liabilities in the Swap agreements, at value line-items. |
(b) Reflects cumulative appreciation/(depreciation) on futures contracts as disclosed on the Schedule of Investments. Only the period end variation margin is separately disclosed on the Statement of Assets and Liabilities. |
Other Information |
Distribution of investments by country of issue, as a percentage of total net assets, is as follows: (Unaudited) |
United States of America | 88.9% |
United Kingdom | 3.2% |
Canada | 2.2% |
Netherlands | 1.2% |
Australia | 1.0% |
Others (Individually Less Than 1%) | 3.5% |
| 100.0% |
See accompanying notes which are an integral part of the financial statements.
Semiannual Report
Statement of Assets and Liabilities
| February 29, 2012 |
| | |
Assets | | |
Investment in securities, at value - See accompanying schedule: Unaffiliated issuers (cost $1,304,062,205) | $ 1,307,220,223 | |
Fidelity Central Funds (cost $4,845,587) | 4,845,587 | |
Total Investments (cost $1,308,907,792) | | $ 1,312,065,810 |
Cash | | 42,101 |
Receivable for investments sold | | 6,417,666 |
Receivable for swap agreements | | 628 |
Receivable for fund shares sold | | 2,390,432 |
Interest receivable | | 4,598,151 |
Distributions receivable from Fidelity Central Funds | | 922 |
Receivable for daily variation margin on futures contracts | | 1,250 |
Prepaid expenses | | 1,837 |
Total assets | | 1,325,518,797 |
| | |
Liabilities | | |
Payable for investments purchased | $ 4,584,231 | |
Payable for fund shares redeemed | 7,780,307 | |
Distributions payable | 102,806 | |
Swap agreements, at value | 177,088 | |
Accrued management fee | 346,942 | |
Distribution and service plan fees payable | 156,724 | |
Other affiliated payables | 209,326 | |
Other payables and accrued expenses | 72,681 | |
Total liabilities | | 13,430,105 |
| | |
Net Assets | | $ 1,312,088,692 |
Net Assets consist of: | | |
Paid in capital | | $ 1,355,998,540 |
Undistributed net investment income | | 68,503 |
Accumulated undistributed net realized gain (loss) on investments | | (46,963,481) |
Net unrealized appreciation (depreciation) on investments and assets and liabilities in foreign currencies | | 2,985,130 |
Net Assets | | $ 1,312,088,692 |
See accompanying notes which are an integral part of the financial statements.
Semiannual Report
Statement of Assets and Liabilities - continued
| February 29, 2012 |
| | |
Calculation of Maximum Offering Price
Class A:
Net Asset Value and redemption price per share
($219,926,870 ÷ 23,693,118 shares) | | $ 9.28 |
| | |
Maximum offering price per share (100/98.50 of $9.28) | | $ 9.42 |
Class T:
Net Asset Value and redemption price per share ($152,190,512 ÷ 16,381,885 shares) | | $ 9.29 |
| | |
Maximum offering price per share (100/98.50 of $9.29) | | $ 9.43 |
Class B:
Net Asset Value and offering price per share ($9,058,085 ÷ 974,179 shares)A | | $ 9.30 |
| | |
Class C:
Net Asset Value and offering price per share ($122,092,620 ÷ 13,136,971 shares)A | | $ 9.29 |
| | |
Institutional Class:
Net Asset Value, offering price and redemption price per share ($808,820,605 ÷ 87,062,137 shares) | | $ 9.29 |
A Redemption price per share is equal to net asset value less any applicable contingent deferred sales charge.
See accompanying notes which are an integral part of the financial statements.
Semiannual Report
Financial Statements - continued
Statement of Operations
| Six months ended February 29, 2012 |
| | |
Investment Income | | |
Interest | | $ 11,514,183 |
Income from Fidelity Central Funds | | 1,596 |
Total income | | 11,515,779 |
| | |
Expenses | | |
Management fee | $ 2,093,658 | |
Transfer agent fees | 1,048,291 | |
Distribution and service plan fees | 980,273 | |
Accounting fees and expenses | 227,686 | |
Custodian fees and expenses | 18,145 | |
Independent trustees' compensation | 2,464 | |
Registration fees | 59,587 | |
Audit | 88,962 | |
Legal | 2,217 | |
Miscellaneous | 5,223 | |
Total expenses before reductions | 4,526,506 | |
Expense reductions | (1,999) | 4,524,507 |
Net investment income (loss) | | 6,991,272 |
Realized and Unrealized Gain (Loss) Net realized gain (loss) on: | | |
Investment securities: | | |
Unaffiliated issuers | 1,349,918 | |
Swap agreements | 3,635 | |
Total net realized gain (loss) | | 1,353,553 |
Change in net unrealized appreciation (depreciation) on: Investment securities | (739,186) | |
Futures contracts | 4,199 | |
Swap agreements | (56,047) | |
Total change in net unrealized appreciation (depreciation) | | (791,034) |
Net gain (loss) | | 562,519 |
Net increase (decrease) in net assets resulting from operations | | $ 7,553,791 |
See accompanying notes which are an integral part of the financial statements.
Semiannual Report
Statement of Changes in Net Assets
| Six months ended February 29,
2012 | Year ended
August 31,
2011 |
Increase (Decrease) in Net Assets | | |
Operations | | |
Net investment income (loss) | $ 6,991,272 | $ 17,712,935 |
Net realized gain (loss) | 1,353,553 | 10,408,684 |
Change in net unrealized appreciation (depreciation) | (791,034) | (2,530,497) |
Net increase (decrease) in net assets resulting
from operations | 7,553,791 | 25,591,122 |
Distributions to shareholders from net investment income | (8,040,807) | (17,998,623) |
Share transactions - net increase (decrease) | 36,995,181 | 32,684,771 |
Total increase (decrease) in net assets | 36,508,165 | 40,277,270 |
| | |
Net Assets | | |
Beginning of period | 1,275,580,527 | 1,235,303,257 |
End of period (including undistributed net investment income of $68,503 and undistributed net investment income of $1,118,038, respectively) | $ 1,312,088,692 | $ 1,275,580,527 |
See accompanying notes which are an integral part of the financial statements.
Semiannual Report
Financial Highlights - Class A
| Six months ended
February 29, | Years ended August 31, |
| 2012 | 2011 | 2010 | 2009 | 2008 | 2007 |
Selected Per-Share Data | | | | | |
Net asset value, beginning of period | $ 9.29 | $ 9.23 | $ 8.96 | $ 8.94 | $ 9.25 | $ 9.39 |
Income from Investment Operations | | | | | | |
Net investment income (loss) E | .048 | .134 | .189 | .237 | .364 | .414 |
Net realized and unrealized gain (loss) | (.002) H | .062 | .273 | .007 | (.315) | (.154) |
Total from investment operations | .046 | .196 | .462 | .244 | .049 | .260 |
Distributions from net investment income | (.056) | (.136) | (.192) | (.224) | (.359) | (.400) |
Net asset value, end of period | $ 9.28 | $ 9.29 | $ 9.23 | $ 8.96 | $ 8.94 | $ 9.25 |
Total Return B,C,D | .50% | 2.14% | 5.21% | 2.81% | .51% | 2.79% |
Ratios to Average Net Assets F,I | | | | | |
Expenses before reductions | .70% A | .70% | .71% | .74% | .78% | .78% |
Expenses net of fee waivers, if any | .70% A | .70% | .71% | .74% | .78% | .78% |
Expenses net of all reductions | .70% A | .70% | .71% | .74% | .78% | .77% |
Net investment income (loss) | 1.05% A | 1.44% | 2.07% | 2.70% | 3.98% | 4.41% |
Supplemental Data | | | | | |
Net assets, end of period (000 omitted) | $ 219,927 | $ 250,546 | $ 254,410 | $ 265,959 | $ 342,015 | $ 412,412 |
Portfolio turnover rate G | 69% A | 204% | 217% | 318% J | 94% | 91% J |
A Annualized
B Total returns for periods of less than one year are not annualized.
C Total returns would have been lower if certain expenses had not been reduced during the applicable periods shown.
D Total returns do not include the effect of the sales charges.
E Calculated based on average shares outstanding during the period.
F Fees and expenses of any underlying Fidelity Central Funds are not included in the Fund's expense ratio. The Fund indirectly bears its proportionate share of the expenses of any underlying Fidelity Central Funds.
G Amount does not include the portfolio activity of any underlying Fidelity Central Funds.
H The amount shown for a share outstanding does not correspond with the aggregate net gain (loss) on investments for the period due to the timing of sales and repurchases of shares in relation to fluctuating market values of the investments of the Fund.
I Expense ratios reflect operating expenses of the class. Expenses before reductions do not reflect amounts reimbursed by the investment adviser or reductions from brokerage service arrangements or reductions from other expense offset arrangements and do not represent the amount paid by the class during periods when reimbursements or reductions occur. Expenses net of fee waivers reflect expenses after reimbursement by the investment adviser but prior to reductions from brokerage service arrangements or other expense offset arrangements. Expenses net of all reductions represent the net expenses paid by the class.
J The portfolio turnover rate excludes liquidations and/or redemptions executed in-kind from Affiliated Central Funds.
See accompanying notes which are an integral part of the financial statements.
Semiannual Report
Financial Highlights - Class T
| Six months ended
February 29, | Years ended August 31, |
| 2012 | 2011 | 2010 | 2009 | 2008 | 2007 |
Selected Per-Share Data | | | | | |
Net asset value, beginning of period | $ 9.29 | $ 9.24 | $ 8.97 | $ 8.94 | $ 9.26 | $ 9.40 |
Income from Investment Operations | | | | | | |
Net investment income (loss) E | .048 | .134 | .189 | .237 | .368 | .417 |
Net realized and unrealized gain (loss) | .008 | .052 | .273 | .016 | (.327) | (.154) |
Total from investment operations | .056 | .186 | .462 | .253 | .041 | .263 |
Distributions from net investment income | (.056) | (.136) | (.192) | (.223) | (.361) | (.403) |
Net asset value, end of period | $ 9.29 | $ 9.29 | $ 9.24 | $ 8.97 | $ 8.94 | $ 9.26 |
Total Return B,C,D | .60% | 2.03% | 5.20% | 2.91% | .43% | 2.82% |
Ratios to Average Net Assets F,H | | | | | |
Expenses before reductions | .71% A | .70% | .71% | .75% | .76% | .75% |
Expenses net of fee waivers, if any | .71% A | .70% | .71% | .75% | .76% | .75% |
Expenses net of all reductions | .71% A | .70% | .71% | .75% | .76% | .75% |
Net investment income (loss) | 1.05% A | 1.44% | 2.08% | 2.70% | 4.01% | 4.44% |
Supplemental Data | | | | | | |
Net assets, end of period (000 omitted) | $ 152,191 | $ 163,217 | $ 189,230 | $ 253,439 | $ 334,850 | $ 516,227 |
Portfolio turnover rate G | 69% A | 204% | 217% | 318% I | 94% | 91% I |
A Annualized
B Total returns for periods of less than one year are not annualized.
C Total returns would have been lower if certain expenses had not been reduced during the applicable periods shown.
D Total returns do not include the effect of the sales charges.
E Calculated based on average shares outstanding during the period.
F Fees and expenses of any underlying Fidelity Central Funds are not included in the Fund's expense ratio. The Fund indirectly bears its proportionate share of the expenses of any underlying Fidelity Central Funds.
G Amount does not include the portfolio activity of any underlying Fidelity Central Funds.
H Expense ratios reflect operating expenses of the class. Expenses before reductions do not reflect amounts reimbursed by the investment adviser or reductions from brokerage service arrangements or reductions from other expense offset arrangements and do not represent the amount paid by the class during periods when reimbursements or reductions occur. Expenses net of fee waivers reflect expenses after reimbursement by the investment adviser but prior to reductions from brokerage service arrangements or other expense offset arrangements. Expenses net of all reductions represent the net expenses paid by the class.
I The portfolio turnover rate excludes liquidations and/or redemptions executed in-kind from Affiliated Central Funds.
See accompanying notes which are an integral part of the financial statements.
Semiannual Report
Financial Highlights - Class B
| Six months ended
February 29, | Years ended August 31, |
| 2012 | 2011 | 2010 | 2009 | 2008 | 2007 |
Selected Per-Share Data | | | | | |
Net asset value, beginning of period | $ 9.30 | $ 9.24 | $ 8.97 | $ 8.95 | $ 9.27 | $ 9.41 |
Income from Investment Operations | | | | | | |
Net investment income (loss) E | .011 | .059 | .115 | .167 | .295 | .344 |
Net realized and unrealized gain (loss) | .007 | .062 | .273 | .007 | (.326) | (.155) |
Total from investment operations | .018 | .121 | .388 | .174 | (.031) | .189 |
Distributions from net investment income | (.018) | (.061) | (.118) | (.154) | (.289) | (.329) |
Net asset value, end of period | $ 9.30 | $ 9.30 | $ 9.24 | $ 8.97 | $ 8.95 | $ 9.27 |
Total Return B,C,D | .20% | 1.31% | 4.35% | 2.00% | (.36)% | 2.01% |
Ratios to Average Net Assets F,H | | | | | |
Expenses before reductions | 1.52% A | 1.52% | 1.52% | 1.54% | 1.55% | 1.54% |
Expenses net of fee waivers, if any | 1.52% A | 1.52% | 1.52% | 1.54% | 1.55% | 1.54% |
Expenses net of all reductions | 1.52% A | 1.52% | 1.52% | 1.54% | 1.55% | 1.53% |
Net investment income (loss) | .24% A | .63% | 1.26% | 1.91% | 3.22% | 3.65% |
Supplemental Data | | | | | | |
Net assets, end of period (000 omitted) | $ 9,058 | $ 9,337 | $ 12,587 | $ 12,579 | $ 11,617 | $ 19,895 |
Portfolio turnover rate G | 69% A | 204% | 217% | 318% I | 94% | 91% I |
A Annualized
B Total returns for periods of less than one year are not annualized.
C Total returns would have been lower if certain expenses had not been reduced during the applicable periods shown.
D Total returns do not include the effect of the contingent deferred sales charge.
E Calculated based on average shares outstanding during the period.
F Fees and expenses of any underlying Fidelity Central Funds are not included in the Fund's expense ratio. The Fund indirectly bears its proportionate share of the expenses of any underlying Fidelity Central Funds.
G Amount does not include the portfolio activity of any underlying Fidelity Central Funds.
H Expense ratios reflect operating expenses of the class. Expenses before reductions do not reflect amounts reimbursed by the investment adviser or reductions from brokerage service arrangements or reductions from other expense offset arrangements and do not represent the amount paid by the class during periods when reimbursements or reductions occur. Expenses net of fee waivers reflect expenses after reimbursement by the investment adviser but prior to reductions from brokerage service arrangements or other expense offset arrangements. Expenses net of all reductions represent the net expenses paid by the class.
I The portfolio turnover rate excludes liquidations and/or redemptions executed in-kind from Affiliated Central Funds.
See accompanying notes which are an integral part of the financial statements.
Semiannual Report
Financial Highlights - Class C
| Six months ended
February 29, | Years ended August 31, |
| 2012 | 2011 | 2010 | 2009 | 2008 | 2007 |
Selected Per-Share Data | | | | | |
Net asset value, beginning of period | $ 9.30 | $ 9.24 | $ 8.97 | $ 8.95 | $ 9.26 | $ 9.40 |
Income from Investment Operations | | | | | | |
Net investment income (loss) E | .009 | .056 | .113 | .164 | .291 | .340 |
Net realized and unrealized gain (loss) | (.002) H | .062 | .273 | .006 | (.315) | (.155) |
Total from investment operations | .007 | .118 | .386 | .170 | (.024) | .185 |
Distributions from net investment income | (.017) | (.058) | (.116) | (.150) | (.286) | (.325) |
Net asset value, end of period | $ 9.29 | $ 9.30 | $ 9.24 | $ 8.97 | $ 8.95 | $ 9.26 |
Total Return B,C,D | .07% | 1.29% | 4.33% | 1.95% | (.29)% | 1.98% |
Ratios to Average Net Assets F,H | | | | | |
Expenses before reductions | 1.55% A | 1.54% | 1.54% | 1.57% | 1.58% | 1.57% |
Expenses net of fee waivers, if any | 1.55% A | 1.54% | 1.54% | 1.57% | 1.58% | 1.57% |
Expenses net of all reductions | 1.55% A | 1.54% | 1.54% | 1.57% | 1.58% | 1.57% |
Net investment income (loss) | .20% A | .61% | 1.24% | 1.87% | 3.18% | 3.62% |
Supplemental Data | | | | | | |
Net assets, end of period (000 omitted) | $ 122,093 | $ 132,589 | $ 131,947 | $ 103,378 | $ 97,150 | $ 129,105 |
Portfolio turnover rate G | 69% A | 204% | 217% | 318% I | 94% | 91% I |
A Annualized
B Total returns for periods of less than one year are not annualized.
C Total returns would have been lower if certain expenses had not been reduced during the applicable periods shown.
D Total returns do not include the effect of the contingent deferred sales charge.
E Calculated based on average shares outstanding during the period.
F Fees and expenses of any underlying Fidelity Central Funds are not included in the Fund's expense ratio. The Fund indirectly bears its proportionate share of the expenses of any underlying Fidelity Central Funds.
G Amount does not include the portfolio activity of any underlying Fidelity Central Funds.
H Expense ratios reflect operating expenses of the class. Expenses before reductions do not reflect amounts reimbursed by the investment adviser or reductions from brokerage service arrangements or reductions from other expense offset arrangements and do not represent the amount paid by the class during periods when reimbursements or reductions occur. Expenses net of fee waivers reflect expenses after reimbursement by the investment adviser but prior to reductions from brokerage service arrangements or other expense offset arrangements. Expenses net of all reductions represent the net expenses paid by the class.
I The portfolio turnover rate excludes liquidations and/or redemptions executed in-kind from Affiliated Central Funds.
See accompanying notes which are an integral part of the financial statements.
Semiannual Report
Financial Highlights - Institutional Class
| Six months ended
February 29, | Years ended August 31, |
| 2012 | 2011 | 2010 | 2009 | 2008 | 2007 |
Selected Per-Share Data | | | | | |
Net asset value, beginning of period | $ 9.29 | $ 9.24 | $ 8.97 | $ 8.94 | $ 9.26 | $ 9.40 |
Income from Investment Operations | | | | | | |
Net investment income (loss) D | .056 | .150 | .205 | .255 | .385 | .435 |
Net realized and unrealized gain (loss) | .008 | .052 | .273 | .016 | (.324) | (.154) |
Total from investment operations | .064 | .202 | .478 | .271 | .061 | .281 |
Distributions from net investment income | (.064) | (.152) | (.208) | (.241) | (.381) | (.421) |
Net asset value, end of period | $ 9.29 | $ 9.29 | $ 9.24 | $ 8.97 | $ 8.94 | $ 9.26 |
Total Return B,C | .69% | 2.21% | 5.38% | 3.12% | .65% | 3.02% |
Ratios to Average Net Assets E,G | | | | | |
Expenses before reductions | .53% A | .53% | .53% | .54% | .54% | .55% |
Expenses net of fee waivers, if any | .53% A | .53% | .53% | .54% | .54% | .55% |
Expenses net of all reductions | .53% A | .53% | .53% | .54% | .54% | .55% |
Net investment income (loss) | 1.22% A | 1.62% | 2.25% | 2.90% | 4.23% | 4.64% |
Supplemental Data | | | | | | |
Net assets, end of period (000 omitted) | $ 808,821 | $ 719,891 | $ 647,129 | $ 618,098 | $ 589,076 | $ 361,894 |
Portfolio turnover rate F | 69% A | 204% | 217% | 318% H | 94% | 91% H |
A Annualized
B Total returns for periods of less than one year are not annualized.
C Total returns would have been lower if certain expenses had not been reduced during the applicable periods shown.
D Calculated based on average shares outstanding during the period.
E Fees and expenses of any underlying Fidelity Central Funds are not included in the Fund's expense ratio. The Fund indirectly bears its proportionate share of the expenses of any underlying Fidelity Central Funds.
F Amount does not include the portfolio activity of any underlying Fidelity Central Funds.
G Expense ratios reflect operating expenses of the class. Expenses before reductions do not reflect amounts reimbursed by the investment adviser or reductions from brokerage service arrangements or reductions from other expense offset arrangements and do not represent the amount paid by the class during periods when reimbursements or reductions occur. Expenses net of fee waivers reflect expenses after reimbursement by the investment adviser but prior to reductions from brokerage service arrangements or other expense offset arrangements. Expenses net of all reductions represent the net expenses paid by the class.
H The portfolio turnover rate excludes liquidations and/or redemptions executed in-kind from Affiliated Central Funds.
See accompanying notes which are an integral part of the financial statements.
Semiannual Report
Notes to Financial Statements
For the period ended February 29, 2012
1. Organization.
Fidelity Advisor Short Fixed-Income Fund (the Fund) is a fund of Fidelity Advisor Series II (the Trust) and is authorized to issue an unlimited number of shares. The Trust is registered under the Investment Company Act of 1940, as amended (the 1940 Act), as an open-end management investment company organized as a Massachusetts business trust. The Fund offers Class A, Class T, Class C and Institutional Class shares, each of which, along with Class B shares, has equal rights as to assets and voting privileges. Effective after the close of business on September 1, 2010, Class B shares were closed to new accounts and additional purchases, except for exchanges and reinvestments. Each class has exclusive voting rights with respect to matters that affect that class. Class B shares will automatically convert to Class A shares after a holding period of four years from the initial date of purchase. Investment income, realized and unrealized capital gains and losses, the common expenses of the Fund, and certain fund-level expense reductions, if any, are allocated on a pro-rata basis to each class based on the relative net assets of each class to the total net assets of the Fund. Each class differs with respect to transfer agent and distribution and service plan fees incurred. Certain expense reductions may also differ by class.
2. Investments in Fidelity Central Funds.
The Fund may invests in Fidelity Central Funds, which are open-end investment companies available only to other investment companies and accounts managed by FMR and its affiliates. The Fund's Schedule of Investments lists each of the Fidelity Central Funds held as of period end, if any, as an investment of the Fund, but does not include the underlying holdings of each Fidelity Central Fund. As an Investing Fund, the Fund indirectly bears its proportionate share of the expenses of the underlying Fidelity Central Funds.
The Money Market Central Funds seek preservation of capital and current income and are managed by Fidelity Investments Money Management, Inc. (FIMM), an affiliate of FMR.
A complete unaudited list of holdings for each Fidelity Central Fund is available upon request or at the Securities and Exchange Commission (the SEC) web site at www.sec.gov. In addition, the financial statements of the Fidelity Central Funds, which are not covered by the Fund's Report of Independent Registered Public Accounting Firm, are available on the SEC web site or upon request.
Semiannual Report
3. Significant Accounting Policies.
The financial statements have been prepared in conformity with accounting principles generally accepted in the United States of America (GAAP), which require management to make certain estimates and assumptions at the date of the financial statements. Actual results could differ from those estimates. Subsequent events, if any, through the date that the financial statements were issued have been evaluated in the preparation of the financial statements. The following summarizes the significant accounting policies of the Fund:
Security Valuation. Investments are valued as of 4:00 p.m. Eastern time on the last calendar day of the period. The Fund uses independent pricing services approved by the Board of Trustees to value its investments. When current market prices or quotations are not readily available or reliable, valuations may be determined in good faith in accordance with procedures adopted by the Board of Trustees. Factors used in determining value may include market or security specific events, changes in interest rates and credit quality. The frequency with which these procedures are used cannot be predicted and they may be utilized to a significant extent. The value used for net asset value (NAV) calculation under these procedures may differ from published prices for the same securities.
The Fund categorizes the inputs to valuation techniques used to value its investments into a disclosure hierarchy consisting of three levels as shown below:
Level 1 - quoted prices in active markets for identical investments
Level 2 - other significant observable inputs (including quoted prices for similar investments, interest rates, prepayment speeds, etc.)
Level 3 - unobservable inputs (including the Fund's own assumptions based on the best information available)
Changes in valuation techniques may result in transfers in or out of an assigned level within the disclosure hierarchy. The aggregate value of investments by input level, as of February 29, 2012 for the Fund's investments, as well as a roll forward of Level 3 securities, is included at the end of the Fund's Schedule of Investments. Valuation techniques used to value the Fund's investments by major category are as follows:
Debt securities, including restricted securities, are valued based on evaluated prices received from independent pricing services or from dealers who make markets in such securities. For corporate bonds, foreign government and government agency obligations, municipal securities, U.S. government and government agency obligations and commercial paper, pricing services utilize matrix pricing which considers yield or price of bonds of comparable quality, coupon, maturity and type as well as dealer supplied prices and
Semiannual Report
Notes to Financial Statements - continued
3. Significant Accounting Policies - continued
Security Valuation - continued
are generally categorized as Level 2 in the hierarchy. For asset backed securities, collateralized mortgage obligations, commercial mortgage securities and U.S. government agency mortgage securities, pricing services utilize matrix pricing which considers prepayment speed assumptions, attributes of the collateral, yield or price of bonds of comparable quality, coupon, maturity and type as well as dealer supplied prices and, accordingly, such securities are generally categorized as Level 2 in the hierarchy. Swaps are marked-to-market daily based on valuations from independent pricing services or dealer-supplied valuations and changes in value are recorded as unrealized appreciation (depreciation). Pricing services utilize matrix pricing which considers comparisons to interest rate curves, credit spread curves, default possibilities and recovery rates and, as a result, swaps are generally categorized as Level 2 in the hierarchy. When independent prices are unavailable or unreliable, debt securities and swaps may be valued utilizing pricing matrices which consider similar factors that would be used by independent pricing services. These are generally categorized as Level 2 in the hierarchy but may be Level 3 depending on the circumstances.
Futures contracts are valued at the settlement price established each day by the board of trade or exchange on which they are traded and are categorized as Level 1 in the hierarchy. Investments in open-end mutual funds, including the Fidelity Central Funds, are valued at their closing net asset value each business day and are categorized as Level 1 in the hierarchy. Short-term securities with remaining maturities of sixty days or less may be valued at amortized cost, which approximates fair value, and are categorized as Level 2 in the hierarchy.
New Accounting Pronouncements. In May 2011, the Financial Accounting Standards Board issued Accounting Standard Update No. 2011-04, Fair Value Measurement (Topic 820) - Amendments to Achieve Common Fair Value Measurement and Disclosure Requirements in U.S. GAAP and IFRSs. The update is effective during interim and annual periods beginning after December 15, 2011 and will result in additional disclosure for transfers between levels as well as expanded disclosure for securities categorized as Level 3 under the fair value hierarchy.
In December 2011, the Financial Accounting Standards Board issued Accounting Standard Update No. 2011-11, Disclosures about Offsetting Assets and Liabilities. The update creates new disclosure requirements requiring entities to disclose both gross and net information for derivatives and other financial instruments that are either offset in the Statement of Assets and Liabilities or subject to an enforceable master netting arrangement or similar agreement. The disclosure requirements are effective for interim and annual reporting periods beginning on or after January 1, 2013. Management is currently evaluating the impact of the update's adoption on the Fund's financial statement disclosures.
Semiannual Report
3. Significant Accounting Policies - continued
Investment Transactions and Income. For financial reporting purposes, the Fund's investment holdings and NAV include trades executed through the end of the last business day of the period. The NAV per share for processing shareholder transactions is calculated as of the close of business of the New York Stock Exchange (NYSE), normally 4:00 p.m. Eastern time and includes trades executed through the end of the prior business day. Gains and losses on securities sold are determined on the basis of identified cost and may include proceeds received from litigation. Interest income and distributions from the Fidelity Central Funds are accrued as earned. Interest income includes coupon interest and amortization of premium and accretion of discount on debt securities. The principal amount on inflation-indexed securities is periodically adjusted to the rate of inflation and interest is accrued based on the principal amount. The adjustments to principal due to inflation are reflected as increases or decreases to interest income even though principal is not received until maturity. Debt obligations may be placed on non-accrual status and related interest income may be reduced by ceasing current accruals and writing off interest receivables when the collection of all or a portion of interest has become doubtful based on consistently applied procedures. A debt obligation is removed from non-accrual status when the issuer resumes interest payments or when collectability of interest is reasonably assured.
Expenses. Expenses directly attributable to a fund are charged to that fund. Expenses attributable to more than one fund are allocated among the respective funds on the basis of relative net assets or other appropriate methods. Expense estimates are accrued in the period to which they relate and adjustments are made when actual amounts are known.
Income Tax Information and Distributions to Shareholders. Each year, the Fund intends to qualify as a regulated investment company under Subchapter M of the Internal Revenue Code, including distributing substantially all of its taxable income and realized gains. As a result, no provision for income taxes is required. The Fund files a U.S. federal tax return, in addition to state and local tax returns as required. A fund's federal income tax returns are subject to examination by the Internal Revenue Service (IRS) for a period of three fiscal years after they are filed. State and local tax returns may be subject to examination for an additional fiscal year depending on the jurisdiction.
Dividends are declared and recorded daily and paid monthly from net investment income. Distributions from realized gains, if any, are declared and recorded on the ex-dividend date. Income dividends and capital gain distributions are declared separately for each class. Income and capital gain distributions are determined in accordance with income tax regulations, which may differ from GAAP.
Capital accounts within the financial statements are adjusted for permanent book-tax differences. These adjustments have no impact on net assets or the results of operations. Temporary book-tax differences will reverse in a subsequent period.
Semiannual Report
Notes to Financial Statements - continued
3. Significant Accounting Policies - continued
Income Tax Information and Distributions to Shareholders - continued
Book-tax differences are primarily due to swap agreements, market discount, deferred trustees compensation, capital loss carryforwards and losses deferred due to wash sales.
The federal tax cost of investment securities and unrealized appreciation (depreciation) as of period end were as follows:
Gross unrealized appreciation | $ 17,503,655 |
Gross unrealized depreciation | (13,841,663) |
Net unrealized appreciation (depreciation) on securities and other investments | $ 3,661,992 |
| |
Tax cost | $ 1,308,403,818 |
Capital loss carryforwards are only available to offset future capital gains of the Fund to the extent provided by regulations and may be limited. Under the Regulated Investment Company Modernization Act of 2010 (the Act), the Fund is permitted to carry forward capital losses incurred in taxable years beginning after December 22, 2010 for an unlimited period and such capital losses are required to be used prior to any losses that expire. At August 31, 2011, capital loss carryforwards were as follows:
Fiscal year of expiration | |
2014 | $ (666,090) |
2015 | (1,110,250) |
2016 | (1,361,959) |
2017 | (28,600,668) |
2018 | (16,553,917) |
Total capital loss carryforward | $ (48,292,884) |
4. Operating Policies.
Restricted Securities. The Fund may invest in securities that are subject to legal or contractual restrictions on resale. These securities generally may be resold in transactions exempt from registration or to the public if the securities are registered. Disposal of these securities may involve time-consuming negotiations and expense, and prompt sale at an acceptable price may be difficult. Information regarding restricted securities is included at the end of the Fund's Schedule of Investments.
Semiannual Report
5. Derivative Instruments.
Risk Exposures and the Use of Derivative Instruments. The Fund used derivative instruments (derivatives), including futures contracts and swap agreements, in order to meet its investment objectives. The strategy is to use derivatives to increase returns, to gain exposure to certain types of assets and to manage exposure to certain risks as defined below. The success of any strategy involving derivatives depends on analysis of numerous economic factors, and if the strategies for investment do not work as intended, the Fund may not achieve its objectives.
The Fund's use of derivatives increased or decreased its exposure to the following risks:
Credit Risk | Credit risk relates to the ability of the issuer of a financial instrument to make further principal or interest payments on an obligation or commitment that it has to the Fund. |
Interest Rate Risk | Interest rate risk relates to the fluctuations in the value of interest-bearing securities due to changes in the prevailing levels of market interest rates. |
The Fund is also exposed to additional risks from investing in derivatives, such as liquidity risk and counterparty credit risk. Liquidity risk is the risk that the Fund will be unable to close out the derivative in the open market in a timely manner. Counterparty credit risk is the risk that the counterparty will not be able to fulfill its obligation to the Fund. Derivative counterparty credit risk is managed through formal evaluation of the creditworthiness of all potential counterparties. On certain over-the-counter (OTC) derivatives such as swap agreements, the Fund attempts to reduce its exposure to counterparty credit risk by entering into an International Swaps and Derivatives Association (ISDA) Master Agreement on a bilateral basis with each of its counterparties. The ISDA Master Agreement gives the Fund the right to terminate all transactions traded under such agreement if there is a certain deterioration in the credit quality of the counterparty. The ISDA Master Agreement gives each party the right, upon an event of default by the other party or a termination of the agreement, to close out all transactions traded under such agreement and to net amounts owed under each transaction to one net payable by one party to the other. To mitigate counterparty credit risk on OTC derivatives, the Fund receives collateral in the form of cash or securities once the Fund's net unrealized appreciation on outstanding derivative contracts under an ISDA Master Agreement exceeds certain applicable thresholds, subject to certain minimum transfer provisions. The collateral received is held in segregated accounts with the Fund's custodian bank in accordance with the collateral agreements entered into between the Fund, the counterparty and the Fund's custodian bank. The Fund could experience delays and costs in gaining access to the collateral even though it is held by the Fund's custodian bank. The Fund's maximum risk of loss from counterparty credit risk related to OTC derivatives is generally the aggregate unrealized appreciation and unpaid counterparty payments in excess of any collateral pledged by the counterparty to the Fund.
Semiannual Report
Notes to Financial Statements - continued
5. Derivative Instruments - continued
Risk Exposures and the Use of Derivative Instruments - continued
Futures contracts are not covered by the ISDA Master Agreement, however, counterparty credit risk related to exchange-traded futures contracts is minimal because of the protection provided by the exchange on which they trade. Derivatives involve, to varying degrees, risk of loss in excess of the amounts recognized in the Statement of Assets and Liabilities.
Net Realized Gain (Loss) and Change in Net Unrealized Appreciation (Depreciation) on Derivatives. The table below, which reflects the impacts of derivatives on the financial performance of the Fund, summarizes the net realized gain (loss) and change in net unrealized appreciation (depreciation) for derivatives during the period.
Risk Exposure / Derivative Type | Net Realized Gain (Loss) | Change in Net Unrealized Appreciation (Depreciation) |
Credit Risk | | |
Swap Agreements | $ 3,635 | $ (56,047) |
Interest Rate Risk | | |
Futures Contracts | - | 4,199 |
Totals (a)(b) | $ 3,635 | $ (51,848) |
(a) A summary of the value of derivatives by risk exposure as of period end, is included at the end of the Schedule of Investments and is representative of activity for the period.
(b) Total derivatives change in net unrealized appreciation (depreciation) included in the Statement of Operations is comprised of $4,199 for futures contracts and $(56,047) for swap agreements.
Futures Contracts. A futures contract is an agreement between two parties to buy or sell a specified underlying instrument for a fixed price at a specified future date. The Fund used futures contracts to manage its exposure to the bond market, and to fluctuations in interest rates.
Upon entering into a futures contract, a fund is required to deposit either cash or securities (initial margin) with a clearing broker in an amount equal to a certain percentage of the face value of the contract. Futures contracts are marked-to-market daily and subsequent payments are made or received by a fund depending on the daily fluctuations in the value of the futures contracts and are recorded as unrealized appreciation or (depreciation). This receivable and/or payable is included in daily variation margin on futures contracts in the Statement of Assets and Liabilities. Realized gain or (loss) is recorded upon the expiration or closing of a futures contract. The net realized gain (loss) and change in net unrealized appreciation (depreciation) on futures contracts during the period is included in the Statement of Operations.
Semiannual Report
5. Derivative Instruments - continued
Futures Contracts - continued
The underlying face amount at value of open futures contracts at period end is shown in the Schedule of Investments under the caption "Futures Contracts." This amount reflects each contract's exposure to the underlying instrument at period end. Securities deposited to meet initial margin requirements are identified in the Schedule of Investments.
Swap Agreements. A swap agreement (swap) is a contract between two parties to exchange future cash flows at periodic intervals based on a notional principal amount.
Details of swaps open at period end are included in the Schedule of Investments under the caption "Swap Agreements." Swaps are marked-to-market daily and changes in value are recorded as unrealized appreciation or (depreciation) and reflected in the Statement of Assets and Liabilities. Any upfront premiums paid or received upon entering a swap to compensate for differences between stated terms of the agreement and prevailing market conditions (e.g. credit spreads, interest rates or other factors) are recorded as realized gain or (loss) ratably over the term of the swap. Payments are exchanged at specified intervals, accrued daily commencing with the effective date of the contract and recorded as realized gain or (loss). Realized gain or (loss) is also recorded in the event of an early termination of a swap. The net realized gain (loss) and change in net unrealized appreciation (depreciation) on swaps during the period is included in the Statement of Operations.
Credit Default Swaps. Credit default swaps enable the Fund to buy or sell protection on a debt security or a basket of securities against a defined credit event. Under the terms of a credit default swap the buyer of protection (buyer) receives credit protection in exchange for making periodic payments to the seller of protection (seller) based on a fixed percentage applied to a notional principal amount. In return for these payments, the seller acts as a guarantor of the creditworthiness of a reference obligation. The Fund enters into credit default swaps as a seller to gain credit exposure to an issuer and/or as a buyer to provide a measure of protection against defaults of an issuer. The issuer may be either a single issuer or a "basket" of issuers. Periodic payments are made over the life of the contract provided that no credit event occurs.
For credit default swaps on most corporate and sovereign issuers, credit events include bankruptcy, failure to pay, obligation acceleration or repudiation/moratorium. For credit default swaps on corporate or sovereign issuers, the obligation that may be put to the seller is not limited to the specific reference obligation described in the Schedule of Investments. For credit default swaps on asset-backed securities, a credit event may be triggered by events such as failure to pay principal, maturity extension, rating downgrade or write-down. For credit default swaps on asset-backed securities, the reference obligation described represents the security that may be put to the seller.
Semiannual Report
Notes to Financial Statements - continued
5. Derivative Instruments - continued
Credit Default Swaps - continued
As a seller, if an underlying credit event occurs, the Fund will either pay the buyer an amount equal to the notional amount of the swap and take delivery of the reference obligation or underlying securities comprising an index or pay a net settlement amount of cash equal to the notional amount of the swap less the recovery value of the reference obligation or underlying securities comprising an index.
As a buyer, if an underlying credit event occurs, the Fund will either receive from the seller an amount equal to the notional amount of the swap and deliver the reference obligation or underlying securities comprising an index or receive a net settlement amount of cash equal to the notional amount of the swap less the recovery value of the reference obligation or underlying securities comprising an index.
Typically, the value of each credit default swap and credit rating disclosed for each reference obligation in the Schedule of Investments, where the Fund is the seller, can be used as measures of the current payment/performance risk of the swap. As the value of the swap changes as a positive or negative percentage of the total notional amount, the payment/performance risk may decrease or increase, respectively. In addition to these measures, FMR monitors a variety of factors including cash flow assumptions, market activity and market sentiment as part of its ongoing process of assessing payment/performance risk.
The notional amount of credit default swaps is included in the Schedule of Investments and approximates the maximum potential amount of future payments that the Fund could be required to make if the Fund is the seller and a credit event were to occur. The total notional amount of all credit default swaps open at period end where the Fund is the seller amounted to $213,187 representing 0.02% of net assets.
6. Purchases and Sales of Investments.
Purchases and sales of securities, other than short-term securities and U.S. government securities, aggregated $215,794,690 and $108,661,244, respectively.
7. Fees and Other Transactions with Affiliates.
Management Fee. FMR and its affiliates provide the Fund with investment management related services for which the Fund pays a monthly management fee. The management fee is the sum of an individual fund fee rate that is based on an annual rate of .20% of the Fund's average net assets and an annualized group fee rate that averaged .12% during the period. The group fee rate is based upon the average net assets of all the mutual funds advised by FMR. The group fee rate decreases as assets under management increase and increases as assets under management decrease. For the period, the total annualized management fee rate was .32% of the Fund's average net assets.
Semiannual Report
7. Fees and Other Transactions with Affiliates - continued
Distribution and Service Plan Fees. In accordance with Rule 12b-1 of the 1940 Act, the Fund has adopted separate Distribution and Service Plans for each class of shares. Certain classes pay Fidelity Distributors Corporation (FDC), an affiliate of FMR, separate Distribution and Service Fees, each of which is based on an annual percentage of each class' average net assets. In addition, FDC may pay financial intermediaries for selling shares of the Fund and providing shareholder support services. For the period, the Distribution and Service Fee rates, total fees and amounts retained by FDC were as follows:
| Distribution
Fee | Service
Fee | Total Fees | Retained
by FDC |
Class A | -% | .15% | $ 171,793 | $ 5,274 |
Class T | -% | .15% | 119,079 | 1,322 |
Class B | .65% | .25% | 43,512 | 31,456 |
Class C | .75% | .25% | 645,889 | 92,061 |
| | | $ 980,273 | $ 130,113 |
Sales Load. FDC may receive a front-end sales charge of up to 1.50% for selling Class A and Class T shares, some of which is paid to financial intermediaries for selling shares of the Fund. Depending on the holding period, FDC may receive a contingent deferred sales charges levied on Class A, Class T, Class B and Class C redemptions. The deferred sales charges range from 3.00% to 1.00% for Class B, 1.00% for Class C, .75% or .50% for certain purchases of Class A shares and .25% for certain purchases of Class T shares.
For the period, sales charge amounts retained by FDC were as follows:
| Retained
by FDC |
Class A | $ 18,366 |
Class T | 5,512 |
Class B* | 6,564 |
Class C* | 9,636 |
| $ 40,078 |
* When Class B and Class C shares are initially sold, FDC pays commissions from its own resources to financial intermediaries through which the sales are made.
Semiannual Report
Notes to Financial Statements - continued
7. Fees and Other Transactions with Affiliates - continued
Transfer Agent Fees. Fidelity Investments Institutional Operations Company, Inc. (FIIOC), an affiliate of FMR, is the transfer, dividend disbursing and shareholder servicing agent for each class of the Fund. FIIOC receives account fees and asset-based fees that vary according to the account size and type of account of the shareholders of the respective classes of the Fund. FIIOC pays for typesetting, printing and mailing of shareholder reports, except proxy statements. For the period, transfer agent fees for each class were as follows:
| Amount | % of
Average
Net Assets* |
Class A | $ 195,108 | .17 |
Class T | 139,065 | .18 |
Class B | 11,173 | .23 |
Class C | 105,023 | .16 |
Institutional Class | 597,922 | .15 |
| $ 1,048,291 | |
* Annualized
Accounting Fees. Fidelity Service Company, Inc. (FSC), an affiliate of FMR, maintains the Fund's accounting records. The fee is based on the level of average net assets for each month.
8. Committed Line of Credit.
The Fund participates with other funds managed by FMR or an affiliate in a $4.0 billion credit facility (the "line of credit") to be utilized for temporary or emergency purposes to fund shareholder redemptions or for other short-term liquidity purposes. The Fund has agreed to pay commitment fees on its pro-rata portion of the line of credit, which amounted to $1,811 and is reflected in Miscellaneous expenses on the Statement of Operations. During the period, there were no borrowings on this line of credit.
9. Expense Reductions.
Through arrangements with the Fund's custodian, credits realized as a result of uninvested cash balances were used to reduce the Fund's expenses. During the period, these credits reduced the Fund's expenses by $1,999.
Semiannual Report
10. Distributions to Shareholders.
Distributions to shareholders of each class were as follows:
| Six months ended
February 29, 2012 | Year ended
August 31, 2011 |
From net investment income | | |
Class A | $ 1,381,558 | $ 3,589,797 |
Class T | 954,719 | 2,571,175 |
Class B | 18,953 | 68,023 |
Class C | 233,547 | 778,830 |
Institutional Class | 5,452,030 | 10,990,798 |
Total | $ 8,040,807 | $ 17,998,623 |
11. Share Transactions.
Transactions for each class of shares were as follows:
| Shares | Dollars |
| Six months ended February 29,
2012 | Year ended
August 31,
2011 | Six months ended
February 29,
2012 | Year ended
August 31,
2011 |
Class A | | | | |
Shares sold | 5,581,749 | 12,640,586 | $ 51,663,992 | $ 116,964,068 |
Reinvestment of distributions | 125,043 | 326,685 | 1,157,466 | 3,020,597 |
Shares redeemed | (8,992,414) | (13,556,554) | (83,204,618) | (125,303,809) |
Net increase (decrease) | (3,285,622) | (589,283) | $ (30,383,160) | $ (5,319,144) |
Class T | | | | |
Shares sold | 2,442,795 | 5,179,009 | $ 22,608,483 | $ 47,931,812 |
Reinvestment of distributions | 91,303 | 245,526 | 845,769 | 2,271,746 |
Shares redeemed | (3,712,584) | (8,352,254) | (34,393,208) | (77,237,420) |
Net increase (decrease) | (1,178,486) | (2,927,719) | $ (10,938,956) | $ (27,033,862) |
Class B | | | | |
Shares sold | 227,192 | 401,646 | $ 2,104,782 | $ 3,725,761 |
Reinvestment of distributions | 1,706 | 5,898 | 15,815 | 54,610 |
Shares redeemed | (258,443) | (765,462) | (2,396,318) | (7,079,431) |
Net increase (decrease) | (29,545) | (357,918) | $ (275,721) | $ (3,299,060) |
Class C | | | | |
Shares sold | 2,071,600 | 6,716,368 | $ 19,201,570 | $ 62,282,145 |
Reinvestment of distributions | 19,674 | 62,961 | 182,239 | 582,567 |
Shares redeemed | (3,213,887) | (6,800,176) | (29,781,558) | (62,900,715) |
Net increase (decrease) | (1,122,613) | (20,847) | $ (10,397,749) | $ (36,003) |
Institutional Class | | | | |
Shares sold | 26,135,518 | 26,140,873 | $ 242,026,308 | $ 241,890,765 |
Reinvestment of distributions | 558,173 | 1,118,484 | 5,170,979 | 10,350,571 |
Shares redeemed | (17,084,122) | (19,871,997) | (158,206,520) | (183,868,496) |
Net increase (decrease) | 9,609,569 | 7,387,360 | $ 88,990,767 | $ 68,372,840 |
Semiannual Report
Notes to Financial Statements - continued
12. Other.
The Fund's organizational documents provide former and current trustees and officers with a limited indemnification against liabilities arising in connection with the performance of their duties to the Fund. In the normal course of business, the Fund may also enter into contracts that provide general indemnifications. The Fund's maximum exposure under these arrangements is unknown as this would be dependent on future claims that may be made against the Fund. The risk of material loss from such claims is considered remote.
13. Credit Risk.
The Fund invests a portion of its assets in structured securities of issuers backed by residential mortgage loans, credit card receivables and automotive loans. The value and related income of these securities is sensitive to changes in economic conditions, including delinquencies and/or defaults.
Semiannual Report
To the Trustees of Fidelity Advisor Series II and Shareholders of Fidelity Advisor Short Fixed-Income Fund:
We have audited the accompanying statement of assets and liabilities of Fidelity Advisor Short Fixed-Income Fund (the Fund), a fund of Fidelity Advisor Series II, including the schedule of investments, as of February 29, 2012, and the related statement of operations for the six months then ended, the statements of changes in net assets for the six months ended February 29, 2012 and for the year ended August 31, 2011, and the financial highlights for the six months ended February 29, 2012 and for each of the five years in the period ended August 31, 2011. These financial statements and financial highlights are the responsibility of the Fund's management. Our responsibility is to express an opinion on these financial statements and financial highlights based on our audits.
We conducted our audits in accordance with the standards of the Public Company Accounting Oversight Board (United States). Those standards require that we plan and perform the audit to obtain reasonable assurance about whether the financial statements and financial highlights are free of material misstatement. The Fund is not required to have, nor were we engaged to perform, an audit of its internal control over financial reporting. Our audits included consideration of internal control over financial reporting as a basis for designing audit procedures that are appropriate in the circumstances, but not for the purpose of expressing an opinion on the effectiveness of the Fund's internal control over financial reporting. Accordingly, we express no such opinion. An audit also includes examining, on a test basis, evidence supporting the amounts and disclosures in the financial statements, assessing the accounting principles used and significant estimates made by management, as well as evaluating the overall financial statement presentation. Our procedures included confirmation of securities owned as of February 29, 2012, by correspondence with the custodians and brokers; where replies were not received from brokers, we performed other auditing procedures. We believe that our audits provide a reasonable basis for our opinion.
In our opinion, the financial statements and financial highlights referred to above present fairly, in all material respects, the financial position of Fidelity Advisor Short Fixed-Income Fund as of February 29, 2012, the results of its operations for the six months then ended, the changes in its net assets for the six months ended February 29, 2012 and for the year ended August 31, 2011, and the financial highlights for the six months ended February 29, 2012 and for each of the five years in the period ended August 31, 2011, in conformity with accounting principles generally accepted in the United States of America.
/s/ Deloitte & Touche LLP
DELOITTE & TOUCHE LLP
Boston, Massachusetts
April 17, 2012
Semiannual Report
Board Approval of Investment Advisory Contracts and Management Fees
Fidelity Advisor Short Fixed-Income Fund
Each year, the Board of Trustees, including the Independent Trustees (together, the Board), votes on the renewal of the management contract and sub-advisory agreements (together, the Advisory Contracts) for the fund. The Board, assisted by the advice of fund counsel and Independent Trustees' counsel, requests and considers a broad range of information relevant to the renewal of the Advisory Contracts throughout the year.
The Board meets regularly and considers at each of its meetings factors that are relevant to its annual consideration of the renewal of the fund's Advisory Contracts, including the services and support provided to the fund and its shareholders. The Board has established three standing committees, Operations, Audit, and Nominating and Governance, each composed of Independent Trustees with varying backgrounds, to which the Board has assigned specific subject matter responsibilities in order to enhance effective decision-making by the Board. The Operations Committee, of which all of the Independent Trustees are members, meets regularly throughout the year and, among other matters, considers matters specifically related to the annual consideration of the renewal of the fund's Advisory Contracts. The Board, acting directly and through its Committees, requests and receives information concerning the annual consideration of the renewal of the fund's Advisory Contracts. The Board also meets as needed to consider matters specifically related to the Board's annual consideration of the renewal of Advisory Contracts. Members of the Board may also meet with trustees of other Fidelity funds through ad hoc joint committees to discuss certain matters relevant to the Fidelity funds.
At its September 2011 meeting, the Board of Trustees, including the Independent Trustees, unanimously determined to renew the fund's Advisory Contracts. In reaching its determination, the Board considered all factors it believed relevant, including (i) the nature, extent, and quality of the services to be provided to the fund and its shareholders (including the investment performance of the fund); (ii) the competitiveness of the fund's management fee and total expense ratio; (iii) the total costs of the services to be provided by and the profits to be realized by Fidelity from its relationship with the fund; (iv) the extent to which economies of scale would be realized as the fund grows; and (v) whether fee levels reflect these economies of scale, if any, for the benefit of fund shareholders.
In considering whether to renew the Advisory Contracts for the fund, the Board reached a determination, with the assistance of fund counsel and Independent Trustees' counsel and through the exercise of its business judgment, that the renewal of the Advisory Contracts is in the best interests of the fund and its shareholders and that the compensation payable under the Advisory Contracts is fair and reasonable. The Board's decision to renew the Advisory Contracts was not based on any single factor, but rather was based on a comprehensive consideration of all the information provided to the Board at its meetings throughout the year. The Board, in reaching its determination to renew the Advisory Contracts, is aware that shareholders in the fund have a broad range of investment choices available to them, including a wide choice among mutual funds offered by Fidelity's competitors, and that the fund's shareholders, who have the opportunity to review and weigh the disclosure provided by the fund in its prospectus and other public disclosures, have chosen to invest in this fund, managed by Fidelity.
Semiannual Report
Nature, Extent, and Quality of Services Provided. The Board considered the staffing within the investment adviser, FMR, and the sub-advisers (together, the Investment Advisers), including the backgrounds of the fund's investment personnel and the fund's investment objective and discipline. The Independent Trustees also had discussions with senior management of Fidelity's investment operations and investment groups. The Board considered the structure of the portfolio manager compensation program and whether this structure provides appropriate incentives to act in the best interests of the fund.
Resources Dedicated to Investment Management and Support Services. The Board reviewed the general qualifications and capabilities of the Investment Advisers' investment staff, including its size, education, experience, and resources, as well as the Investment Advisers' approach to recruiting, managing, and compensating investment personnel. The Board also noted that FMR has devoted increased resources to non-U.S. offices. The Board noted that Fidelity's analysts have extensive resources, tools and capabilities which allow them to conduct sophisticated quantitative and fundamental analysis, as well as credit analysis of issuers, counterparties and enhancers. The Board also believes that Fidelity's investment professionals have sufficient access to global information and data so as to provide competitive investment results over time, and that those professionals also have access to sophisticated tools which permit them to assess portfolio construction and risk and performance attribution characteristics continuously, as well as to transmit new information and research conclusions rapidly around the world. Additionally, in its deliberations, the Board considered the Investment Advisers' trading capabilities and resources which are an integral part of the investment management process.
Shareholder and Administrative Services. The Board considered (i) the nature, extent, quality, and cost of advisory, administrative, and shareholder services performed by the Investment Advisers and their affiliates under the Advisory Contracts and under separate agreements covering transfer agency, pricing and bookkeeping, and securities lending services for the fund; (ii) the nature and extent of the investment adviser's supervision of third party service providers, principally custodians and subcustodians; and (iii) the resources devoted to, and the record of compliance with, the fund's compliance policies and procedures.
The Board noted that the growth of fund assets over time across the complex allows Fidelity to reinvest in the development of services designed to enhance the value or convenience of the Fidelity funds as investment vehicles. These services include 24-hour access to account information and market information through telephone representatives and over the Internet, investor education materials and asset allocation tools, and the expanded availability of Fidelity Investor Centers, with 35 new branches opening since 2010.
Semiannual Report
Board Approval of Investment Advisory Contracts and
Management Fees - continued
Investment in a Large Fund Family. The Board considered the benefits to shareholders of investing in a Fidelity fund, including the benefits of investing in a fund that is part of a large family of funds offering a variety of investment disciplines and providing a large variety of mutual fund investor services. The Board noted that Fidelity had taken, or had made recommendations that resulted in the Fidelity funds taking, a number of actions over the previous year that benefited particular funds, including (i) continuing to dedicate additional resources to investment research and support of the senior management team that oversees asset management; (ii) rationalizing product lines through the mergers of six funds into other funds; (iii) continuing to migrate the Freedom Funds to dedicated lower cost underlying funds; (iv) obtaining shareholder approval to broaden the investment strategies for Fidelity Consumer Finance Portfolio, Fidelity Emerging Asia Fund, and Fidelity Environment and Alternative Energy Portfolio; (v) contractually agreeing to reduce the management fees and impose other expense limitations on Spartan 500 Index Fund and U.S. Bond Index Fund in connection with launching new institutional classes of these funds; (vi) changing the name, primary and supplemental benchmarks, and investment policies of Fidelity Global Strategies Fund to support the fund's flexible investment mandate and global orientation; and (vii) reducing the transfer agency account fee rates on certain accounts.
Investment Performance. The Board considered whether the fund has operated in accordance with its investment objective, as well as its record of compliance with its investment restrictions. It also reviewed the fund's absolute investment performance for each class, as well as the fund's relative investment performance for each class measured over multiple periods against (i) a broad-based securities market index, and (ii) a peer group of mutual funds deemed appropriate by Fidelity and reviewed by the Board. The following charts considered by the Board show, over the one-, three-, and five-year periods ended December 31, 2010, the cumulative total returns of Institutional Class (Class I) and Class C of the fund, the cumulative total returns of a broad-based securities market index ("benchmark"), and a range of cumulative total returns of a peer group of mutual funds identified by Lipper Inc. as having an investment objective similar to that of the fund. The returns of Institutional Class (Class I) and Class C show the performance of the highest and lowest performing classes, respectively (based on five-year performance). The box within each chart shows the 25th percentile return (bottom of box) and the 75th percentile return (top of box) of the peer group. Returns shown above the box are in the first quartile and returns shown below the box are in the fourth quartile. The percentage beaten numbers noted below each chart correspond to the percentile box and represent the percentage of funds in the peer group whose performance was equal to or lower than that of the class indicated.
Semiannual Report
Fidelity Advisor Short Fixed-Income Fund

The Board reviewed the fund's relative investment performance against its peer group and noted that the performance of Institutional Class (Class I) of the fund was in the second quartile for the one-year period and the third quartile for the three- and five-year periods. The Board also noted that the investment performance of the fund was lower than its benchmark for the three- and five-year periods, although the one-year total return of Institutional Class (Class I) compared favorably to its benchmark. The Board considered that the variations in performance among the fund's classes reflect the variations in class expenses, which result in lower performance for higher expense classes. The Board also reviewed the fund's performance since inception as well as performance in the current year.
Based on its review, the Board concluded that the nature, extent, and quality of services provided to the fund under the Advisory Contracts should benefit the fund's shareholders.
Competitiveness of Management Fee and Total Expense Ratio. The Board considered the fund's management fee and total expense ratio compared to "mapped groups" of competitive funds and classes. Fidelity creates "mapped groups" by combining similar Lipper investment objective categories that have comparable management fee characteristics. Combining Lipper investment objective categories aids the Board's management fee and total expense ratio comparisons by broadening the competitive group used for comparison and by reducing the number of universes to which various Fidelity funds are compared.
Semiannual Report
Board Approval of Investment Advisory Contracts and
Management Fees - continued
Management Fee. The Board considered two proprietary management fee comparisons for the 12-month periods shown in the chart below. The group of Lipper funds used by the Board for management fee comparisons is referred to below as the "Total Mapped Group" and, for the reasons explained above, is broader than the Lipper peer group used by the Board for performance comparisons. The Total Mapped Group comparison focuses on a fund's standing relative to the total universe of comparable funds available to investors in terms of gross management fees before expense reimbursements or caps. "TMG %" represents the percentage of funds in the Total Mapped Group that had management fees that were lower than the fund's. For example, a TMG % of 28% means that 82% of the funds in the Total Mapped Group had higher management fees than the fund. The "Asset-Size Peer Group" (ASPG) comparison focuses on a fund's standing relative to non-Fidelity funds similar in size to the fund within the Total Mapped Group. The ASPG represents at least 15% of the funds in the Total Mapped Group with comparable asset size and management fee characteristics, subject to a minimum of 50 funds (or all funds in the Total Mapped Group if fewer than 50). Additional information, such as the ASPG quartile in which the fund's management fee ranked, is also included in the chart and considered by the Board.
Fidelity Advisor Short Fixed-Income Fund
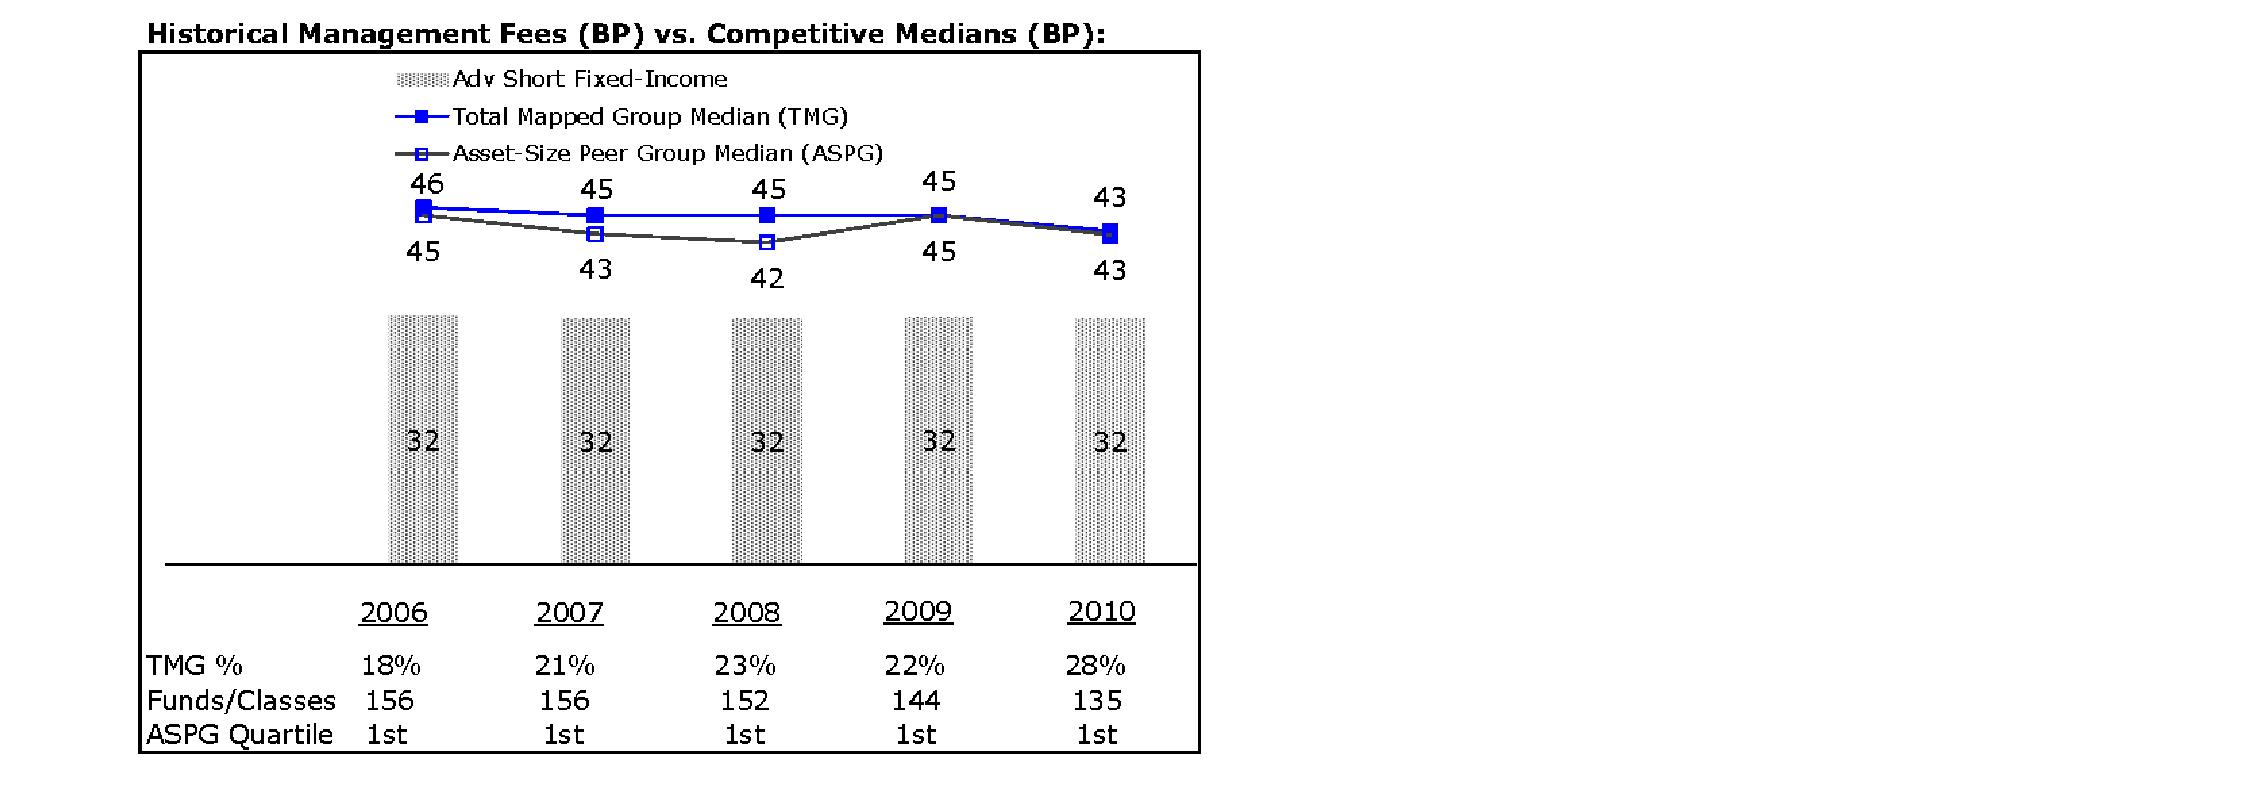
The Board noted that the fund's management fee ranked below the median of its Total Mapped Group and below the median of its ASPG for 2010.
Based on its review, the Board concluded that the fund's management fee is fair and reasonable in light of the services that the fund receives and the other factors considered.
Semiannual Report
Total Expense Ratio. In its review of each class's total expense ratio, the Board considered the fund's management fee as well as other fund or class expenses, as applicable, such as transfer agent fees, pricing and bookkeeping fees, fund-paid 12b-1 fees, and custodial, legal, and audit fees. The Board also noted the effects of any waivers and reimbursements on fees and expenses. As part of its review, the Board also considered the current and historical total expense ratios of each class of the fund compared to competitive fund median expenses. Each class of the fund is compared to those funds and classes in the Total Mapped Group (used by the Board for management fee comparisons) that have a similar sales load structure.
The Board noted that the total expense ratio of each of Class A, Class T, and Class B ranked below its competitive median for 2010 and the total expense ratio of each of Class C and Institutional Class ranked above its competitive median for 2010. The Board considered that various factors, including 12b-1 fees and relatively higher other expenses in the case of small fund size, can affect total expense ratios. The Board noted that the funds and classes in the Total Mapped Group that have a similar sales load structure to Class C have a range of 12b-1 fees, and, when compared to a subset of funds with the same 12b-1 fee, Class C ranked below the median for 2010. The Board also noted that Institutional Class has a significantly lower investment minimum than certain funds and classes in the Total Mapped Group that have a similar sales load or 12b-1 fee structure and that, when compared to funds with the same or lower investment minimum, Institutional Class ranked below the median for 2010. The Board noted that the fund offers multiple classes, each of which has a different sales load and 12b-1 fee structure, and that the multiple structures are intended to offer a range of pricing options for the intermediary market. The Board also noted that the total expense ratios of the classes vary primarily by the level of their 12b-1 fees, although differences in transfer agent fees may also cause expenses to vary from class to class.
Fees Charged to Other Fidelity Clients. The Board also considered Fidelity fee structures and other information with respect to clients of FMR and its affiliates, such as other mutual funds advised or subadvised by FMR or its affiliates, pension plan clients, and other institutional clients. In March 2010, the Board created an ad hoc joint committee with the board of other Fidelity funds (the Committee) to review and compare Fidelity's institutional investment advisory business with its business of providing services to the Fidelity funds, including the differences in services provided, fees charged, and costs incurred, as well as competition in their respective marketplaces.
Based on its review of total expense ratios and fees charged to other Fidelity clients, the Board concluded that the total expense ratio of each class of the fund was reasonable, although in some cases above the median of the universe presented for comparison, in light of the services that the fund and its shareholders receive and the other factors considered, including the findings of the Committee.
Semiannual Report
Board Approval of Investment Advisory Contracts and
Management Fees - continued
Costs of the Services and Profitability. The Board considered the revenues earned and the expenses incurred by Fidelity in conducting the business of developing, marketing, distributing, managing, administering and servicing the fund and its shareholders. The Board also considered the level of Fidelity's profits in respect of all the Fidelity funds.
On an annual basis, FMR presents to the Board Fidelity's profitability for the fund. Fidelity calculates the profitability for each fund, as well as aggregate profitability for groups of Fidelity funds and all Fidelity funds, using a series of detailed revenue and cost allocation methodologies which originate with the books and records of Fidelity on which Fidelity's audited financial statements are based. The Audit Committee of the Board reviews any significant changes from the prior year's methodologies.
PricewaterhouseCoopers LLP (PwC), independent registered public accounting firm and auditor to Fidelity and certain Fidelity funds, has been engaged annually by the Board as part of the Board's assessment of Fidelity's profitability analysis. PwC's engagement includes the review and assessment of Fidelity's methodologies used in determining the revenues and expenses attributable to Fidelity's mutual fund business, and completion of agreed-upon procedures surrounding the mathematical accuracy of fund profitability and its conformity to allocation methodologies. After considering PwC's reports issued under the engagement and information provided by Fidelity, the Board concluded that while other allocation methods may also be reasonable, Fidelity's profitability methodologies are reasonable in all material respects.
The Board also reviewed Fidelity's non-fund businesses and fall-out benefits related to the mutual fund business as well as cases where Fidelity's affiliates may benefit from or be related to the fund's business.
The Board considered the costs of the services provided by and the profits realized by Fidelity in connection with the operation of the fund and was satisfied that the profitability was not excessive in the circumstances.
Economies of Scale. The Board considered whether there have been economies of scale in respect of the management of the Fidelity funds, whether the Fidelity funds (including the fund) have appropriately benefited from any such economies of scale, and whether there is potential for realization of any further economies of scale. The Board considered the extent to which the fund will benefit from economies of scale through increased services to the fund, through waivers or reimbursements, or through fee or expense reductions. The Board also noted that in 2009, it and the board of other Fidelity funds created an ad hoc committee (the Economies of Scale Committee) to analyze whether FMR attains economies of scale in respect of the management and servicing of the Fidelity funds, whether the Fidelity funds have appropriately benefited from such economies of scale, and whether there is potential for realization of any further economies of scale.
Semiannual Report
The Board recognized that the fund's management contract incorporates a "group fee" structure, which provides for lower group fee rates as total fund assets under FMR's management increase, and for higher group fee rates as total fund assets under FMR's management decrease. FMR calculates the group fee rates based on a tiered asset "breakpoint" schedule that varies based on asset class. The Board considered that the group fee is designed to deliver the benefits of economies of scale to fund shareholders when total Fidelity fund assets increase, even if assets of any particular fund are unchanged or have declined, because some portion of Fidelity's costs are attributable to services provided to all Fidelity funds, and all funds benefit if those costs can be allocated among more assets. The Board concluded that, given the group fee structure, fund shareholders will benefit from lower management fees as assets under FMR's management increase at the fund complex level, regardless of whether Fidelity achieves any such economies of scale.
The Board concluded, taking into account the analysis of the Economies of Scale Committee, that any potential economies of scale are being appropriately shared between fund shareholders and Fidelity.
Additional Information Requested by the Board. In order to develop fully the factual basis for consideration of the Fidelity funds' Advisory Contracts, the Board requested and received additional information on certain topics, including: (i) Fidelity's fund profitability methodology, profitability trends for certain funds, and the impact of certain factors on fund profitability results; (ii) portfolio manager changes that have occurred during the past year and the amount of the investment that each portfolio manager has made in the Fidelity fund(s) that he or she manages; (iii) Fidelity's compensation structure for portfolio managers, research analysts, and other key personnel, including its effects on fund profitability, the rationale for the compensation structure, and the extent to which current market conditions have affected retention and recruitment; (iv) the compensation paid to fund sub-advisers on behalf of the Fidelity funds; (v) Fidelity's fee structures and rationale for recommending different fees among different categories of funds and classes, as well as Fidelity's voluntary waiver of its fees to maintain minimum yields for certain money market funds and classes; (vi) the reasons why certain expenses affect various funds and classes differently; (vii) Fidelity's transfer agent fees, expenses, and services and how the benefits of decreased costs and new efficiencies can be shared across all of the Fidelity funds; (viii) the reasons for and consequences of changes to certain product lines compared to competitors; (ix) the allocation of and historical trends in Fidelity's realization of fall-out benefits; and (x) explanations regarding the relative total expense ratios of certain funds and classes, total expense competitive trends, and actions that might be taken by FMR to reduce total expense ratios for certain funds and classes or to achieve further economies of scale.
Semiannual Report
Board Approval of Investment Advisory Contracts and
Management Fees - continued
Based on its evaluation of all of the conclusions noted above, and after considering all factors it believed relevant, the Board ultimately concluded that the advisory fee structures are fair and reasonable, and that the fund's Advisory Contracts should be renewed.
Semiannual Report
Investment Adviser
Fidelity Management & Research Company
Boston, MA
Investment Sub-Advisers
Fidelity Investments Money
Management, Inc.
Fidelity Management & Research
(U.K.) Inc.
Fidelity Management & Research
(Hong Kong) Limited
Fidelity Management & Research
(Japan) Inc.
General Distributor
Fidelity Distributors Corporation
Boston, MA
Transfer and Service Agents
Fidelity Investments Institutional
Operations Company, Inc.
Boston, MA
Fidelity Service Company, Inc.
Boston, MA
Custodian
The Bank of New York Mellon
New York, NY
SFI-USAN-0412
1.784905.109
(Fidelity Investment logo)(registered trademark)
(Fidelity Investment logo)(registered trademark)
Fidelity Advisor®
Short Fixed-Income
Fund - Institutional Class
Semiannual Report
February 29, 2012
(Fidelity Cover Art)
Contents
Shareholder Expense Example | (Click Here) | An example of shareholder expenses. |
Investment Changes | (Click Here) | A summary of major shifts in the fund's investments over the past six months. |
Investments | (Click Here) | A complete list of the fund's investments with their market values. |
Financial Statements | (Click Here) | Statements of assets and liabilities, operations, and changes in net assets,
as well as financial highlights. |
Notes | (Click Here) | Notes to the financial statements. |
Report of Independent Registered Public Accounting Firm | (Click Here) | |
Board Approval of Investment Advisory Contracts and Management Fees | (Click Here) | |
To view a fund's proxy voting guidelines and proxy voting record for the 12-month period ended June 30, visit http://www.fidelity.com/proxyvotingresults or visit the Securities and Exchange Commission's (SEC) web site at http://www.sec.gov. You may also call 1-877-208-0098 to request a free copy of the proxy voting guidelines.
Standard & Poor's, S&P and S&P 500 are registered service marks of The McGraw-Hill Companies, Inc. and have been licensed for use by Fidelity Distributors Corporation.
Other third party marks appearing herein are the property of their respective owners.
All other marks appearing herein are registered or unregistered trademarks or service marks of FMR LLC or an affiliated company.
This report and the financial statements contained herein are submitted for the general information of the shareholders of the fund. This report is not authorized for distribution to prospective investors in the fund unless preceded or accompanied by an effective prospectus.
A fund files its complete schedule of portfolio holdings with the SEC for the first and third quarters of each fiscal year on Form N-Q. Forms N-Q are available on the SEC's web site at http://www.sec.gov. A fund's Forms N-Q may be reviewed and copied at the SEC's Public Reference Room in Washington, DC. Information regarding the operation of the SEC's Public Reference Room may be obtained by calling 1-800-SEC-0330. For a complete list of a fund's portfolio holdings, view the most recent holdings listing, semiannual report, or annual report on Fidelity's web site at http://www.fidelity.com, http://www.advisor.fidelity.com, or http://www.401k.com, as applicable.
NOT FDIC INSURED • MAY LOSE VALUE • NO BANK GUARANTEE
Neither the fund nor Fidelity Distributors Corporation is a bank.
Semiannual Report
Shareholder Expense Example
As a shareholder of the Fund, you incur two types of costs: (1) transaction costs, including sales charges (loads) on purchase payments or redemption proceeds, and (2) ongoing costs, including management fees, distribution and/or service (12b-1) fees and other Fund expenses. This Example is intended to help you understand your ongoing costs (in dollars) of investing in the Fund and to compare these costs with the ongoing costs of investing in other mutual funds.
The Example is based on an investment of $1,000 invested at the beginning of the period and held for the entire period (September 1, 2011 to February 29, 2012).
Actual Expenses
The first line of the accompanying table for each class of the Fund provides information about actual account values and actual expenses. You may use the information in this line, together with the amount you invested, to estimate the expenses that you paid over the period. Simply divide your account value by $1,000.00 (for example, an $8,600 account value divided by $1,000.00 = 8.6), then multiply the result by the number in the first line for a class of the Fund under the heading entitled "Expenses Paid During Period" to estimate the expenses you paid on your account during this period. In addition, the Fund, as a shareholder in the underlying Fidelity Central Funds, will indirectly bear its pro-rata share of the fees and expenses incurred by the underlying Fidelity Central Funds. These fees and expenses are not included in the Fund's annualized expense ratio used to calculate the expense estimate in the table below.
Hypothetical Example for Comparison Purposes
The second line of the accompanying table for each class of the Fund provides information about hypothetical account values and hypothetical expenses based on a Class' actual expense ratio and an assumed rate of return of 5% per year before expenses, which is not the Class' actual return. The hypothetical account values and expenses may not be used to estimate the actual ending account balance or expenses you paid for the period. You may use this information to compare the ongoing costs of investing in the Fund and other funds. To do so, compare this 5% hypothetical example with the 5% hypothetical examples that appear in the shareholder reports of the other funds. In addition, the Fund, as a shareholder in the underlying Fidelity Central Funds, will indirectly bear its pro-rata share of the fees and expenses incurred by the underlying Fidelity Central Funds. These fees and expenses are not included in the Fund's annualized expense ratio used to calculate the expense estimate in the table below.
Please note that the expenses shown in the table are meant to highlight your ongoing costs only and do not reflect any transaction costs. Therefore, the second line of the table is useful in comparing ongoing costs only, and will not help you determine the relative total costs of owning different funds. In addition, if these transactional costs were included, your costs would have been higher.
Semiannual Report
| Annualized Expense Ratio | Beginning
Account Value
September 1, 2011 | Ending
Account Value
February 29, 2012 | Expenses Paid
During Period*
September 1, 2011 to February 29, 2012 |
Class A | .70% | | | |
Actual | | $ 1,000.00 | $ 1,005.00 | $ 3.49 |
HypotheticalA | | $ 1,000.00 | $ 1,021.38 | $ 3.52 |
Class T | .71% | | | |
Actual | | $ 1,000.00 | $ 1,006.00 | $ 3.54 |
HypotheticalA | | $ 1,000.00 | $ 1,021.33 | $ 3.57 |
Class B | 1.52% | | | |
Actual | | $ 1,000.00 | $ 1,002.00 | $ 7.57 |
HypotheticalA | | $ 1,000.00 | $ 1,017.30 | $ 7.62 |
Class C | 1.55% | | | |
Actual | | $ 1,000.00 | $ 1,000.70 | $ 7.71 |
HypotheticalA | | $ 1,000.00 | $ 1,017.16 | $ 7.77 |
Institutional Class | .53% | | | |
Actual | | $ 1,000.00 | $ 1,006.90 | $ 2.64 |
HypotheticalA | | $ 1,000.00 | $ 1,022.23 | $ 2.66 |
A 5% return per year before expenses
* Expenses are equal to each Class' annualized expense ratio, multiplied by the average account value over the period, multiplied by 182/366 (to reflect the one-half year period).
Semiannual Report
Investment Changes (Unaudited)
Quality Diversification (% of fund's net assets) |
As of February 29, 2012 | As of August 31, 2011 |
| U.S. Government
and U.S. Government Agency Obligations† 48.4% | | | U.S. Government
and U.S. Government Agency Obligations††54.6% | |
| AAA 17.7% | | | AAA 14.8% | |
| AA 9.7% | | | AA 9.4% | |
| A 10.4% | | | A 9.2% | |
| BBB 11.4% | | | BBB 8.7% | |
| BB and Below 0.8% | | | BB and Below 1.0% | |
| Not Rated 0.9% | | | Not Rated 0.5% | |
| Short-Term
Investments and
Net Other Assets 0.7% | | | Short-Term
Investments and
Net Other Assets 1.8% | |

We have used ratings from Moody's Investors Service, Inc. Where Moody's® ratings are not available, we have used S&P® ratings. All ratings are as of the date indicated and do not reflect subsequent changes. |
Weighted Average Maturity as of February 29, 2012 |
| | 6 months ago |
Years | 2.3 | 2.3 |
This is a weighted average of all the maturities of the securities held in a fund. Weighted Average Maturity (WAM) can be used as a measure of sensitivity to interest rate changes and market changes. Generally, the longer the maturity, the greater the sensitivity to such changes. WAM is based on the dollar-weighted average length of time until principal payments must be paid. Depending on the types of securities held in a fund, certain maturity shortening devices (e.g., demand features, interest rate resets, and call options) may be taken into account when calculating the WAM. |
Duration as of February 29, 2012 |
| | 6 months ago |
Years | 1.9 | 1.8 |
Duration estimates how much a bond fund's price will change with a change in comparable interest rates. If rates rise 1%, for example, a fund with a 5-year duration is likely to lose about 5% of its value. Other factors also can influence a bond fund's performance and share price. Accordingly, a bond fund's actual performance may differ from this example. Duration takes into account any call or put option embedded in the bonds. |
Asset Allocation (% of fund's net assets) |
As of February 29, 2012 * | As of August 31, 2011 ** |
| Corporate Bonds 31.5% | | | Corporate Bonds 27.9% | |
| U.S. Government
and U.S. Government Agency Obligations† 48.4% | | | U.S. Government
and U.S. Government Agency Obligations†† 54.6% | |
| Asset-Backed
Securities 12.1% | | | Asset-Backed
Securities 9.6% | |
| CMOs and Other Mortgage Related Securities 6.2% | | | CMOs and Other Mortgage Related Securities 5.1% | |
| Municipal Bonds 0.7% | | | Municipal Bonds 0.7% | |
| Other Investments 0.4% | | | Other Investments 0.3% | |
| Short-Term
Investments and
Net Other Assets 0.7% | | | Short-Term
Investments and
Net Other Assets 1.8% | |
* Foreign investments | 11.1% | | ** Foreign investments | 8.7% | |

* Futures and Swaps | 1.5% | | ** Futures and Swaps | 0.0% | |
† Includes NCUA Guaranteed Note. |
†† Includes FDIC Guaranteed Corporate Securities and NCUA Guaranteed Notes. |
Semiannual Report
Investments February 29, 2012
Showing Percentage of Net Assets
Nonconvertible Bonds - 31.5% |
| Principal Amount | | Value |
CONSUMER DISCRETIONARY - 2.1% |
Auto Components - 0.1% |
DaimlerChrysler NA Holding Corp. 6.5% 11/15/13 | | $ 1,149,000 | | $ 1,253,852 |
Automobiles - 0.6% |
Daimler Finance North America LLC: | | | | |
1.875% 9/15/14 (d) | | 1,270,000 | | 1,279,623 |
1.95% 3/28/14 (d) | | 3,076,000 | | 3,100,885 |
2.3% 1/9/15 (d) | | 1,330,000 | | 1,352,872 |
Volkswagen International Finance NV 1.875% 4/1/14 (d) | | 2,300,000 | | 2,325,010 |
| | 8,058,390 |
Diversified Consumer Services - 0.1% |
Yale University 2.9% 10/15/14 | | 970,000 | | 1,029,791 |
Media - 1.1% |
COX Communications, Inc. 7.125% 10/1/12 | | 3,434,000 | | 3,563,427 |
NBCUniversal Media LLC: | | | | |
2.875% 4/1/16 | | 1,200,000 | | 1,251,770 |
3.65% 4/30/15 | | 1,310,000 | | 1,405,283 |
News America, Inc. 5.3% 12/15/14 | | 2,007,000 | | 2,228,135 |
Time Warner Cable, Inc. 5.4% 7/2/12 | | 2,542,000 | | 2,580,931 |
Time Warner, Inc. 3.15% 7/15/15 | | 1,923,000 | | 2,042,353 |
Viacom, Inc. 1.25% 2/27/15 | | 1,634,000 | | 1,636,477 |
| | 14,708,376 |
Specialty Retail - 0.1% |
Staples, Inc. 7.375% 10/1/12 | | 1,224,000 | | 1,269,594 |
Textiles, Apparel & Luxury Goods - 0.1% |
VF Corp. 1.2426% 8/23/13 (g) | | 763,000 | | 762,909 |
TOTAL CONSUMER DISCRETIONARY | | 27,082,912 |
CONSUMER STAPLES - 1.8% |
Beverages - 0.7% |
Anheuser-Busch InBev Worldwide, Inc.: | | | | |
1.5% 7/14/14 | | 1,611,000 | | 1,636,492 |
2.5% 3/26/13 | | 2,054,000 | | 2,096,401 |
Coca-Cola Enterprises, Inc. 1.125% 11/12/13 | | 1,269,000 | | 1,274,806 |
FBG Finance Ltd. 5.125% 6/15/15 (d) | | 1,054,000 | | 1,162,624 |
SABMiller Holdings, Inc. 2.45% 1/15/17 (d) | | 2,660,000 | | 2,712,429 |
| | 8,882,752 |
Food & Staples Retailing - 0.1% |
Wal-Mart Stores, Inc. 2.25% 7/8/15 | | 1,607,000 | | 1,681,611 |
Nonconvertible Bonds - continued |
| Principal Amount | | Value |
CONSUMER STAPLES - continued |
Food Products - 0.5% |
Cargill, Inc. 5.2% 1/22/13 (d) | | $ 500,000 | | $ 519,417 |
General Mills, Inc. 1.55% 5/16/14 | | 1,200,000 | | 1,219,532 |
Kraft Foods, Inc.: | | | | |
1.4565% 7/10/13 (g) | | 2,330,000 | | 2,341,890 |
2.625% 5/8/13 | | 2,575,000 | | 2,628,583 |
| | 6,709,422 |
Household Products - 0.2% |
Procter & Gamble Co. 0.7% 8/15/14 | | 2,540,000 | | 2,549,716 |
Tobacco - 0.3% |
Altria Group, Inc.: | | | | |
4.125% 9/11/15 | | 2,300,000 | | 2,521,143 |
8.5% 11/10/13 | | 1,000,000 | | 1,123,738 |
| | 3,644,881 |
TOTAL CONSUMER STAPLES | | 23,468,382 |
ENERGY - 1.9% |
Oil, Gas & Consumable Fuels - 1.9% |
BG Energy Capital PLC 2.875% 10/15/16 (d) | | 1,350,000 | | 1,400,439 |
Canadian Natural Resources Ltd. 1.45% 11/14/14 | | 2,453,000 | | 2,498,596 |
Cenovus Energy, Inc. 4.5% 9/15/14 | | 2,105,000 | | 2,279,744 |
Enterprise Products Operating LP: | | | | |
4.6% 8/1/12 | | 1,896,000 | | 1,925,951 |
5.65% 4/1/13 | | 1,227,000 | | 1,287,539 |
Gazstream SA 5.625% 7/22/13 (d) | | 417,588 | | 430,116 |
Marathon Petroleum Corp. 3.5% 3/1/16 | | 1,703,000 | | 1,765,824 |
NGPL PipeCo LLC 6.514% 12/15/12 (d) | | 699,000 | | 675,015 |
Petrobras International Finance Co. Ltd.: | | | | |
2.875% 2/6/15 | | 1,320,000 | | 1,349,436 |
3.875% 1/27/16 | | 1,151,000 | | 1,200,566 |
Plains All American Pipeline LP/PAA Finance Corp. 4.25% 9/1/12 | | 1,800,000 | | 1,826,419 |
Ras Laffan Liquefied Natural Gas Co. Ltd. III 4.5% 9/30/12 (d) | | 704,000 | | 714,560 |
Rockies Express Pipeline LLC 6.25% 7/15/13 (d) | | 1,922,000 | | 1,960,440 |
Southeast Supply Header LLC 4.85% 8/15/14 (d) | | 1,835,000 | | 1,946,889 |
Spectra Energy Partners, LP 2.95% 6/15/16 | | 313,000 | | 318,648 |
Total Capital Canada Ltd. 1.625% 1/28/14 | | 1,210,000 | | 1,235,647 |
Nonconvertible Bonds - continued |
| Principal Amount | | Value |
ENERGY - continued |
Oil, Gas & Consumable Fuels - continued |
TransCanada PipeLines Ltd. 0.875% 3/2/15 | | $ 460,000 | | $ 458,741 |
XTO Energy, Inc. 4.9% 2/1/14 | | 1,559,000 | | 1,679,999 |
| | 24,954,569 |
FINANCIALS - 18.2% |
Capital Markets - 2.0% |
Goldman Sachs Group, Inc.: | | | | |
3.7% 8/1/15 | | 2,000,000 | | 2,039,886 |
5.25% 10/15/13 | | 5,117,000 | | 5,358,348 |
HSBC Bank PLC 3.1% 5/24/16 (d) | | 1,210,000 | | 1,237,861 |
JPMorgan Chase & Co. 1.3611% 1/24/14 (g) | | 2,500,000 | | 2,510,480 |
Merrill Lynch & Co., Inc. 5.45% 7/15/14 | | 950,000 | | 988,281 |
Morgan Stanley: | | | | |
2.875% 1/24/14 | | 1,200,000 | | 1,191,786 |
2.875% 7/28/14 | | 1,406,000 | | 1,395,478 |
6% 5/13/14 | | 2,690,000 | | 2,818,714 |
Royal Bank of Scotland PLC 4.875% 8/25/14 (d) | | 2,400,000 | | 2,475,698 |
State Street Corp. 4.3% 5/30/14 | | 1,110,000 | | 1,187,183 |
The Bank of New York Mellon Corp. 1.7% 11/24/14 | | 3,150,000 | | 3,201,408 |
UBS AG Stamford Branch 2.25% 1/28/14 | | 2,500,000 | | 2,499,928 |
| | 26,905,051 |
Commercial Banks - 6.9% |
ANZ Banking Group Ltd. 2.125% 1/10/14 (d) | | 1,210,000 | | 1,218,178 |
Bank of England 0.5% 3/6/15 (d) | | 1,812,000 | | 1,804,727 |
Bank of Montreal 2.125% 6/28/13 | | 2,670,000 | | 2,724,225 |
Bank of Nova Scotia 1.85% 1/12/15 | | 4,200,000 | | 4,288,444 |
Bank of Tokyo-Mitsubishi UFJ Ltd. 2.6% 1/22/13 (d) | | 1,928,000 | | 1,953,517 |
Barclays Bank PLC: | | | | |
2.375% 1/13/14 | | 3,080,000 | | 3,084,075 |
2.5% 1/23/13 | | 577,000 | | 581,974 |
BNP Paribas 2.125% 12/21/12 | | 2,030,000 | | 2,035,595 |
Canadian Imperial Bank of Commerce 1.45% 9/13/13 | | 2,094,000 | | 2,121,856 |
Commonwealth Bank of Australia: | | | | |
1.227% 8/7/13 (d)(g) | | 1,000,000 | | 1,000,073 |
1.2892% 3/17/14 (d)(g) | | 440,000 | | 436,313 |
2.125% 3/17/14 (d) | | 1,210,000 | | 1,216,582 |
Credit Suisse New York Branch: | | | | |
1.527% 1/14/14 (g) | | 1,400,000 | | 1,387,984 |
2.2% 1/14/14 | | 3,082,000 | | 3,107,165 |
Danske Bank A/S 1.617% 4/14/14 (d)(g) | | 1,800,000 | | 1,762,031 |
Nonconvertible Bonds - continued |
| Principal Amount | | Value |
FINANCIALS - continued |
Commercial Banks - continued |
DBS Bank Ltd. (Singapore) 0.7176% 5/16/17 (d)(g) | | $ 147,614 | | $ 146,876 |
Fifth Third Bancorp 3.625% 1/25/16 | | 673,000 | | 711,072 |
ING Bank NV 2.65% 1/14/13 (d) | | 2,540,000 | | 2,544,318 |
KeyBank NA 5.8% 7/1/14 | | 2,087,000 | | 2,258,531 |
Nordea Bank AB 1.75% 10/4/13 (d) | | 1,830,000 | | 1,822,878 |
PNC Funding Corp.: | | | | |
3% 5/19/14 | | 1,700,000 | | 1,766,353 |
3.625% 2/8/15 | | 1,445,000 | | 1,544,205 |
Rabobank (Netherlands) NV 1.85% 1/10/14 | | 6,185,000 | | 6,230,905 |
Regions Financial Corp. 4.875% 4/26/13 | | 1,300,000 | | 1,319,500 |
Royal Bank of Canada: | | | | |
0.867% 4/17/14 (g) | | 1,400,000 | | 1,403,674 |
1.125% 1/15/14 | | 1,720,000 | | 1,730,270 |
1.45% 10/30/14 | | 1,165,000 | | 1,184,186 |
Royal Bank of Scotland PLC 1.5% 3/30/12 (d) | | 3,080,000 | | 3,081,737 |
Santander U.S. Debt SA Unipersonal 2.485% 1/18/13 (d) | | 2,370,000 | | 2,332,130 |
Sumitomo Mitsui Banking Corp.: | | | | |
1.9% 1/12/15 (d) | | 1,600,000 | | 1,615,726 |
1.95% 1/14/14 (d) | | 2,400,000 | | 2,421,156 |
SunTrust Banks, Inc. 3.6% 4/15/16 | | 1,025,000 | | 1,062,591 |
Svenska Handelsbanken AB 2.875% 9/14/12 (d) | | 4,282,000 | | 4,329,419 |
The Toronto Dominion Bank: | | | | |
0.9969% 11/1/13 (g) | | 1,400,000 | | 1,410,730 |
1.375% 7/14/14 | | 3,000,000 | | 3,051,450 |
U.S. Bancorp: | | | | |
1.375% 9/13/13 | | 1,038,000 | | 1,048,574 |
4.2% 5/15/14 | | 1,770,000 | | 1,898,583 |
Union Bank NA 2.125% 12/16/13 | | 3,642,000 | | 3,699,139 |
Wachovia Bank NA 0.9171% 11/3/14 (g) | | 1,820,000 | | 1,758,033 |
Wells Fargo & Co.: | | | | |
3.625% 4/15/15 | | 2,400,000 | | 2,572,006 |
4.375% 1/31/13 | | 5,106,000 | | 5,284,899 |
Westpac Banking Corp.: | | | | |
1.3093% 3/31/14 (d)(g) | | 1,300,000 | | 1,280,102 |
1.85% 12/9/13 | | 1,889,000 | | 1,907,839 |
2.1% 8/2/13 | | 581,000 | | 588,433 |
| | 90,728,054 |
Consumer Finance - 3.4% |
American Express Credit Corp. 2.75% 9/15/15 | | 3,500,000 | | 3,641,432 |
Nonconvertible Bonds - continued |
| Principal Amount | | Value |
FINANCIALS - continued |
Consumer Finance - continued |
American Honda Finance Corp.: | | | | |
1.45% 2/27/15 (d) | | $ 1,310,000 | | $ 1,313,887 |
2.375% 3/18/13 (d) | | 550,000 | | 559,809 |
Capital One Financial Corp.: | | | | |
2.125% 7/15/14 | | 2,639,000 | | 2,645,875 |
7.375% 5/23/14 | | 2,500,000 | | 2,782,263 |
Caterpillar Financial Services Corp.: | | | | |
1.375% 5/20/14 | | 2,050,000 | | 2,081,125 |
2% 4/5/13 | | 979,000 | | 994,085 |
2.75% 6/24/15 | | 701,000 | | 740,564 |
General Electric Capital Corp.: | | | | |
2.1% 1/7/14 | | 1,553,000 | | 1,584,012 |
2.15% 1/9/15 | | 10,668,000 | | 10,945,069 |
2.25% 11/9/15 | | 1,650,000 | | 1,697,213 |
5.4% 9/20/13 | | 6,698,000 | | 7,145,473 |
HSBC Finance Corp. 5.9% 6/19/12 | | 1,200,000 | | 1,217,105 |
HSBC USA, Inc. 2.375% 2/13/15 | | 1,063,000 | | 1,078,031 |
John Deere Capital Corp.: | | | | |
0.981% 10/4/13 (g) | | 1,350,000 | | 1,360,086 |
1.875% 6/17/13 | | 2,143,000 | | 2,180,614 |
Toyota Motor Credit Corp. 0.9521% 1/17/14 (g) | | 2,000,000 | | 2,005,738 |
| | 43,972,381 |
Diversified Financial Services - 3.9% |
Bank of America Corp.: | | | | |
2.1305% 7/11/14 (g) | | 2,780,000 | | 2,682,617 |
3.7% 9/1/15 | | 960,000 | | 959,084 |
4.9% 5/1/13 | | 3,690,000 | | 3,791,800 |
BB&T Corp. 2.05% 4/28/14 | | 2,710,000 | | 2,765,124 |
BP Capital Markets PLC: | | | | |
1.14% 3/11/14 (g) | | 2,210,000 | | 2,221,415 |
1.7% 12/5/14 | | 1,320,000 | | 1,352,208 |
2.248% 11/1/16 | | 1,320,000 | | 1,364,710 |
Citigroup, Inc.: | | | | |
1.511% 4/1/14 (g) | | 500,000 | | 490,755 |
2.0265% 1/13/14 (g) | | 3,558,000 | | 3,525,110 |
2.51% 8/13/13 (g) | | 650,000 | | 650,059 |
2.65% 3/2/15 | | 3,350,000 | | 3,351,136 |
5.125% 5/5/14 | | 1,628,000 | | 1,717,140 |
6.375% 8/12/14 | | 2,900,000 | | 3,145,932 |
6.5% 8/19/13 | | 1,733,000 | | 1,836,427 |
Nonconvertible Bonds - continued |
| Principal Amount | | Value |
FINANCIALS - continued |
Diversified Financial Services - continued |
Deutsche Bank AG London Branch 2.375% 1/11/13 | | $ 5,240,000 | | $ 5,281,862 |
Export Development Canada 1.5% 5/15/14 | | 800,000 | | 818,476 |
JPMorgan Chase & Co.: | | | | |
3.4% 6/24/15 | | 2,005,000 | | 2,109,493 |
3.7% 1/20/15 | | 5,780,000 | | 6,136,770 |
MassMutual Global Funding II: | | | | |
0.9515% 1/14/14 (d)(g) | | 1,742,000 | | 1,741,930 |
3.625% 7/16/12 (d) | | 800,000 | | 808,664 |
MetLife Institutional Funding II 1.481% 4/4/14 (d)(g) | | 1,000,000 | | 999,619 |
OAO Industry & Construction Bank 5.01% 9/29/15 (Issued by Or-ICB SA for OAO Industry & Construction Bank) (g) | | 270,000 | | 263,925 |
USAA Capital Corp. 3.5% 7/17/14 (d) | | 1,798,000 | | 1,884,320 |
Whirlpool Corp. 8% 5/1/12 | | 1,396,000 | | 1,410,792 |
| | 51,309,368 |
Insurance - 1.5% |
American International Group, Inc. 4.25% 9/15/14 | | 2,270,000 | | 2,349,713 |
Berkshire Hathaway, Inc.: | | | | |
1.2026% 8/15/14 (g) | | 1,400,000 | | 1,417,555 |
2.125% 2/11/13 | | 2,570,000 | | 2,612,999 |
Metropolitan Life Global Funding I: | | | | |
2% 1/9/15 (d) | | 4,359,000 | | 4,405,070 |
2.5% 9/29/15 (d) | | 1,000,000 | | 1,026,936 |
New York Life Global Funding: | | | | |
2.25% 12/14/12 (d) | | 1,200,000 | | 1,215,703 |
5.25% 10/16/12 (d) | | 2,280,000 | | 2,348,454 |
Pricoa Global Funding I 5.45% 6/11/14 (d) | | 1,150,000 | | 1,235,243 |
Prudential Financial, Inc.: | | | | |
2.75% 1/14/13 | | 530,000 | | 538,447 |
3.625% 9/17/12 | | 1,850,000 | | 1,877,776 |
5.15% 1/15/13 | | 672,000 | | 696,807 |
| | 19,724,703 |
Real Estate Investment Trusts - 0.2% |
AvalonBay Communities, Inc. 6.125% 11/1/12 | | 621,000 | | 638,662 |
Equity One, Inc.: | | | | |
5.375% 10/15/15 | | 144,000 | | 152,237 |
6.25% 12/15/14 | | 1,200,000 | | 1,296,436 |
| | 2,087,335 |
Nonconvertible Bonds - continued |
| Principal Amount | | Value |
FINANCIALS - continued |
Real Estate Management & Development - 0.3% |
Liberty Property LP 6.375% 8/15/12 | | $ 1,358,000 | | $ 1,380,840 |
Simon Property Group LP: | | | | |
4.2% 2/1/15 | | 484,000 | | 516,194 |
Simon Property Group LP: - continued | | | | |
5.3% 5/30/13 | | 1,511,000 | | 1,572,458 |
Tanger Properties LP 6.15% 11/15/15 | | 404,000 | | 452,858 |
| | 3,922,350 |
TOTAL FINANCIALS | | 238,649,242 |
HEALTH CARE - 0.7% |
Biotechnology - 0.1% |
Amgen, Inc. 1.875% 11/15/14 | | 1,300,000 | | 1,330,122 |
Health Care Providers & Services - 0.3% |
Aristotle Holding, Inc. 2.1% 2/12/15 (d) | | 1,970,000 | | 1,985,801 |
Express Scripts, Inc. 5.25% 6/15/12 | | 1,783,000 | | 1,804,433 |
| | 3,790,234 |
Pharmaceuticals - 0.3% |
Sanofi SA: | | | | |
1.2% 9/30/14 | | 920,000 | | 935,208 |
2.625% 3/29/16 | | 1,263,000 | | 1,327,942 |
Teva Pharmaceutical Finance III BV 1.7% 3/21/14 | | 1,210,000 | | 1,232,012 |
Teva Pharmaceutical Finance IV LLC 1.7% 11/10/14 | | 1,300,000 | | 1,326,748 |
| | 4,821,910 |
TOTAL HEALTH CARE | | 9,942,266 |
INDUSTRIALS - 0.3% |
Aerospace & Defense - 0.1% |
BAE Systems Holdings, Inc. 4.95% 6/1/14 (d) | | 1,500,000 | | 1,582,806 |
Airlines - 0.1% |
Iberbond 2004 PLC 4.826% 12/24/17 (j) | | 1,178,078 | | 1,136,845 |
Industrial Conglomerates - 0.1% |
Covidien International Finance SA 1.875% 6/15/13 | | 1,330,000 | | 1,347,265 |
TOTAL INDUSTRIALS | | 4,066,916 |
Nonconvertible Bonds - continued |
| Principal Amount | | Value |
INFORMATION TECHNOLOGY - 0.9% |
Computers & Peripherals - 0.2% |
Hewlett-Packard Co.: | | | | |
1.25% 9/13/13 | | $ 1,216,000 | | 1,220,379 |
2.625% 12/9/14 | | 1,330,000 | | 1,379,062 |
| | 2,599,441 |
Electronic Equipment & Components - 0.1% |
Tyco Electronics Group SA 1.6% 2/3/15 | | 678,000 | | 680,345 |
IT Services - 0.2% |
IBM Corp. 1.95% 7/22/16 | | 1,621,000 | | 1,676,096 |
The Western Union Co. 1.1139% 3/7/13 (g) | | 1,220,000 | | 1,223,406 |
| | 2,899,502 |
Office Electronics - 0.4% |
Xerox Corp. 1.3176% 5/16/14 (g) | | 5,738,000 | | 5,656,566 |
TOTAL INFORMATION TECHNOLOGY | | 11,835,854 |
MATERIALS - 1.0% |
Chemicals - 0.4% |
Dow Chemical Co. 4.85% 8/15/12 | | 4,852,000 | | 4,937,861 |
Metals & Mining - 0.6% |
Anglo American Capital PLC 2.15% 9/27/13 (d) | | 2,400,000 | | 2,394,458 |
BHP Billiton Financial (USA) Ltd.: | | | | |
1% 2/24/15 | | 1,310,000 | | 1,314,290 |
1.125% 11/21/14 | | 1,970,000 | | 1,987,610 |
Corporacion Nacional del Cobre de Chile (Codelco) 6.375% 11/30/12 (d) | | 700,000 | | 723,652 |
Rio Tinto Finance Ltd. (United States) 8.95% 5/1/14 | | 1,413,000 | | 1,649,567 |
| | 8,069,577 |
TOTAL MATERIALS | | 13,007,438 |
TELECOMMUNICATION SERVICES - 2.1% |
Diversified Telecommunication Services - 1.6% |
AT&T Broadband Corp. 8.375% 3/15/13 | | 750,000 | | 808,636 |
AT&T, Inc.: | | | | |
2.5% 8/15/15 | | 2,320,000 | | 2,424,024 |
2.95% 5/15/16 | | 1,200,000 | | 1,274,389 |
4.95% 1/15/13 | | 2,327,000 | | 2,414,309 |
6.7% 11/15/13 | | 470,000 | | 516,983 |
Nonconvertible Bonds - continued |
| Principal Amount | | Value |
TELECOMMUNICATION SERVICES - continued |
Diversified Telecommunication Services - continued |
Deutsche Telekom International Financial BV 3.125% 4/11/16 (d) | | $ 1,209,000 | | 1,252,985 |
Qwest Corp. 3.7963% 6/15/13 (g) | | 3,110,000 | | 3,164,425 |
Telefonica Emisiones SAU 2.582% 4/26/13 | | 3,300,000 | | 3,299,244 |
Verizon Communications, Inc.: | | | | |
1.95% 3/28/14 | | 2,420,000 | | 2,484,338 |
2% 11/1/16 | | 2,727,000 | | 2,787,823 |
| | 20,427,156 |
Wireless Telecommunication Services - 0.5% |
America Movil SAB de CV 2.375% 9/8/16 | | 1,532,000 | | 1,564,498 |
DIRECTV Holdings LLC/DIRECTV Financing, Inc. 4.75% 10/1/14 | | 2,496,000 | | 2,719,689 |
Verizon Wireless Capital LLC 5.55% 2/1/14 | | 2,380,000 | | 2,588,555 |
| | 6,872,742 |
TOTAL TELECOMMUNICATION SERVICES | | 27,299,898 |
UTILITIES - 2.5% |
Electric Utilities - 1.3% |
Alabama Power Co. 4.85% 12/15/12 | | 560,000 | | 578,623 |
Commonwealth Edison Co. 1.625% 1/15/14 | | 2,440,000 | | 2,479,333 |
EDP Finance BV 5.375% 11/2/12 (d) | | 2,500,000 | | 2,496,250 |
Entergy Louisiana LLC 1.875% 12/15/14 | | 748,000 | | 759,325 |
FirstEnergy Solutions Corp. 4.8% 2/15/15 | | 2,340,000 | | 2,528,651 |
LG&E and KU Energy LLC 2.125% 11/15/15 | | 831,000 | | 828,262 |
Niagara Mohawk Power Corp. 3.553% 10/1/14 (d) | | 2,675,000 | | 2,840,882 |
Pacific Gas & Electric Co. 6.25% 12/1/13 | | 1,278,000 | | 1,400,337 |
Pepco Holdings, Inc. 2.7% 10/1/15 | | 1,098,000 | | 1,112,289 |
Progress Energy, Inc. 6.05% 3/15/14 | | 1,532,000 | | 1,688,512 |
Southern Co. 4.15% 5/15/14 | | 412,000 | | 441,017 |
| | 17,153,481 |
Independent Power Producers & Energy Traders - 0.2% |
PSEG Power LLC 2.5% 4/15/13 | | 2,910,000 | | 2,964,568 |
Multi-Utilities - 1.0% |
Dominion Resources, Inc.: | | | | |
1.8% 3/15/14 | | 451,000 | | 461,422 |
1.95% 8/15/16 | | 848,000 | | 865,374 |
2.25% 9/1/15 | | 1,300,000 | | 1,341,180 |
2.8793% 9/30/66 (g) | | 1,336,000 | | 1,137,250 |
Nonconvertible Bonds - continued |
| Principal Amount | | Value |
UTILITIES - continued |
Multi-Utilities - continued |
Dominion Resources, Inc.: - continued | | | | |
6.25% 6/30/12 | | $ 1,300,000 | | 1,323,361 |
DTE Energy Co. 1.2272% 6/3/13 (g) | | 2,039,000 | | 2,045,523 |
NiSource Finance Corp. 6.15% 3/1/13 | | 1,790,000 | | 1,884,763 |
PG&E Corp. 5.75% 4/1/14 | | 590,000 | | 644,761 |
Sempra Energy: | | | | |
1.3063% 3/15/14 (g) | | 500,000 | | 499,359 |
2% 3/15/14 | | 2,435,000 | | 2,486,176 |
| | 12,689,169 |
TOTAL UTILITIES | | 32,807,218 |
TOTAL NONCONVERTIBLE BONDS (Cost $406,031,200) |
413,114,695
|
U.S. Government and Government Agency Obligations - 41.7% |
|
U.S. Government Agency Obligations - 12.4% |
Fannie Mae: | | | | |
0.375% 3/16/15 | | 11,801,000 | | 11,739,965 |
0.625% 10/30/14 | | 1,692,000 | | 1,697,007 |
0.75% 12/18/13 | | 292,000 | | 294,068 |
0.75% 12/19/14 | | 12,067,000 | | 12,155,813 |
0.875% 8/28/14 | | 44,140,000 | | 44,660,984 |
4.625% 10/15/13 | | 5,789,000 | | 6,189,668 |
Freddie Mac: | | | | |
0.375% 10/30/13 | | 20,736,000 | | 20,785,870 |
0.5% 4/17/15 | | 5,455,000 | | 5,438,630 |
0.625% 12/29/14 | | 11,379,000 | | 11,408,324 |
0.75% 11/25/14 | | 11,173,000 | | 11,243,245 |
1% 7/30/14 | | 14,662,000 | | 14,853,603 |
1% 8/27/14 | | 21,508,000 | | 21,789,196 |
TOTAL U.S. GOVERNMENT AGENCY OBLIGATIONS | | 162,256,373 |
U.S. Treasury Obligations - 29.2% |
U.S. Treasury Notes: | | | | |
0.25% 11/30/13 (e) | | 9,121,000 | | 9,115,299 |
0.25% 9/15/14 | | 20,647,000 | | 20,576,016 |
0.25% 1/15/15 | | 5,000,000 | | 4,977,735 |
U.S. Government and Government Agency Obligations - continued |
| Principal Amount | | Value |
U.S. Treasury Obligations - continued |
U.S. Treasury Notes: - continued | | | | |
0.375% 6/30/13 | | $ 21,558,000 | | $ 21,594,217 |
0.375% 11/15/14 | | 27,628,000 | | 27,608,578 |
0.5% 8/15/14 | | 81,749,000 | | 82,004,466 |
0.625% 7/15/14 | | 164,565,000 | | 165,593,522 |
0.75% 6/15/14 | | 4,304,000 | | 4,343,679 |
1.375% 11/30/15 | | 14,117,000 | | 14,520,662 |
1.75% 7/31/15 | | 18,150,000 | | 18,900,103 |
2.375% 9/30/14 | | 3,667,000 | | 3,853,790 |
2.375% 10/31/14 | | 9,988,000 | | 10,507,686 |
TOTAL U.S. TREASURY OBLIGATIONS | | 383,595,753 |
Other Government Related - 0.1% |
National Credit Union Administration Guaranteed Notes Master Trust 1.4% 6/12/15 (NCUA Guaranteed) | | 1,700,000 | | 1,733,983 |
TOTAL U.S. GOVERNMENT AND GOVERNMENT AGENCY OBLIGATIONS (Cost $544,642,300) |
547,586,109
|
U.S. Government Agency - Mortgage Securities - 4.4% |
|
Fannie Mae - 3.5% |
1.93% 10/1/33 (g) | | 56,399 | | 58,679 |
1.952% 3/1/35 (g) | | 49,686 | | 52,274 |
2.115% 10/1/35 (g) | | 81,070 | | 84,864 |
2.271% 5/1/33 (g) | | 16,468 | | 17,476 |
2.343% 7/1/35 (g) | | 563,772 | | 598,020 |
2.368% 11/1/34 (g) | | 307,245 | | 324,600 |
2.397% 5/1/35 (g) | | 582,563 | | 609,341 |
2.414% 10/1/35 (g) | | 733,512 | | 779,790 |
2.424% 10/1/33 (g) | | 89,835 | | 95,004 |
2.427% 12/1/34 (g) | | 340,383 | | 357,518 |
2.437% 11/1/36 (g) | | 105,200 | | 111,330 |
2.438% 8/1/35 (g) | | 408,029 | | 434,806 |
2.445% 7/1/35 (g) | | 1,946,647 | | 2,054,102 |
2.448% 3/1/35 (g) | | 29,246 | | 30,604 |
2.471% 12/1/33 (g) | | 349,687 | | 366,231 |
2.481% 2/1/35 (g) | | 687,524 | | 730,246 |
2.487% 11/1/36 (g) | | 694,189 | | 739,745 |
2.537% 7/1/35 (g) | | 225,930 | | 240,103 |
U.S. Government Agency - Mortgage Securities - continued |
| Principal Amount | | Value |
Fannie Mae - continued |
2.575% 10/1/41 (g) | | $ 1,111,530 | | $ 1,151,864 |
2.597% 4/1/35 (g) | | 219,728 | | 234,289 |
2.697% 9/1/41 (g) | | 1,306,823 | | 1,357,545 |
2.739% 8/1/41 (g) | | 1,621,661 | | 1,680,177 |
2.863% 10/1/35 (g) | | 145,100 | | 152,645 |
3% 7/1/21 to 11/1/21 | | 20,201,077 | | 21,137,146 |
3.021% 8/1/41 (g) | | 474,853 | | 494,934 |
3.188% 1/1/40 (g) | | 962,967 | | 999,812 |
3.471% 3/1/40 (g) | | 740,556 | | 767,113 |
3.539% 12/1/39 (g) | | 250,931 | | 260,895 |
3.613% 3/1/40 (g) | | 1,035,823 | | 1,081,162 |
4.5% 8/1/18 to 7/1/20 | | 5,645,530 | | 6,043,061 |
5.5% 11/1/17 to 6/1/19 | | 2,375,892 | | 2,588,187 |
6.5% 4/1/13 to 6/1/16 | | 443,742 | | 462,006 |
7% 1/1/16 to 11/1/18 | | 61,597 | | 66,280 |
7.5% 5/1/12 to 10/1/14 | | 6,623 | | 7,008 |
TOTAL FANNIE MAE | | 46,168,857 |
Freddie Mac - 0.9% |
2.375% 4/1/35 (g) | | 678,557 | | 717,554 |
2.415% 11/1/35 (g) | | 378,345 | | 399,721 |
2.468% 1/1/35 (g) | | 103,320 | | 107,572 |
2.557% 6/1/37 (g) | | 390,650 | | 416,286 |
2.61% 8/1/34 (g) | | 163,959 | | 174,425 |
2.704% 8/1/36 (g) | | 220,370 | | 234,665 |
2.985% 8/1/41 (g) | | 981,975 | | 1,024,166 |
3% 8/1/21 | | 2,852,951 | | 2,988,614 |
3.08% 9/1/41 (g) | | 587,188 | | 613,003 |
3.56% 4/1/40 (g) | | 644,552 | | 670,804 |
3.565% 4/1/40 (g) | | 561,564 | | 582,842 |
4.5% 8/1/18 to 11/1/18 | | 3,234,443 | | 3,453,624 |
8.5% 5/1/26 to 7/1/28 | | 78,831 | | 94,448 |
12% 11/1/19 | | 1,726 | | 1,868 |
TOTAL FREDDIE MAC | | 11,479,592 |
Ginnie Mae - 0.0% |
7% 1/15/25 to 6/15/32 | | 362,210 | | 416,872 |
TOTAL U.S. GOVERNMENT AGENCY - MORTGAGE SECURITIES (Cost $56,650,760) |
58,065,321
|
Asset-Backed Securities - 12.1% |
| Principal Amount | | Value |
Accredited Mortgage Loan Trust: | | | | |
Series 2003-3 Class A1, 4.46% 1/25/34 (AMBAC Insured) | | $ 427,544 | | $ 352,859 |
Series 2005-1 Class M1, 0.714% 4/25/35 (g) | | 152,751 | | 82,517 |
ACE Securities Corp. Home Equity Loan Trust Series 2005-HE2 Class M2, 0.694% 4/25/35 (g) | | 13,581 | | 13,185 |
Advanta Business Card Master Trust Series 2006-C1 Class C1, 0.6758% 10/20/14 (g) | | 61,000 | | 610 |
Ally Auto Receivables Trust: | | | | |
Series 2009 B Class A3, 1.98% 10/15/13 (d) | | 1,022,270 | | 1,026,835 |
Series 2009-A Class A4, 3% 10/15/15 (d) | | 2,000,000 | | 2,036,547 |
Series 2010-1 Class A4, 2.3% 12/15/14 | | 2,170,000 | | 2,220,835 |
Series 2010-4 Class A3, 0.91% 11/17/14 | | 1,680,000 | | 1,684,077 |
Series 2010-5 Class A3, 1.11% 1/15/15 | | 1,480,000 | | 1,486,190 |
Series 2011-1 Class A3, 1.38% 1/15/15 | | 1,390,000 | | 1,401,613 |
Series 2011-2 Class A3, 1.18% 4/15/15 | | 1,200,000 | | 1,207,924 |
Series 2011-3 Class A3, 0.97% 8/17/15 | | 1,550,000 | | 1,555,788 |
Series 2011-4 Class A2, 0.65% 3/17/14 | | 480,000 | | 480,169 |
Series 2012-1 Class A2, 0.71% 9/15/14 | | 1,900,000 | | 1,903,670 |
Ally Master Owner Trust: | | | | |
Series 2010-3 Class A, 2.88% 4/15/15 (d) | | 510,000 | | 520,138 |
Series 2011-1 Class A2, 2.15% 1/15/16 | | 4,370,000 | | 4,450,265 |
Series 2011-3 Class A2, 1.81% 5/15/16 | | 3,460,000 | | 3,505,788 |
Series 2011-5 Class A1, 0.8985% 6/15/15 (g) | | 2,720,000 | | 2,725,367 |
Series 2012-1 Class A2, 0.7% 2/15/17 | | 2,630,000 | | 2,631,604 |
AmeriCredit Automobile Receivables Trust: | | | | |
Series 2007-CM Class A4B, 0.3425% 4/7/14 (National Public Finance Guarantee Corp. Insured) (g) | | 1,204,405 | | 1,196,707 |
Series 2010-4 Class A3, 1.27% 4/8/15 | | 1,510,000 | | 1,505,308 |
Series 2011-1 Class A3, 1.39% 9/8/15 | | 850,000 | | 856,667 |
Series 2011-2 Class A3, 1.61% 10/8/15 | | 1,800,000 | | 1,820,507 |
Series 2011-3 Class A3, 1.17% 1/8/16 | | 650,000 | | 653,822 |
Series 2011-4 Class A/S, 0.92% 3/9/15 | | 1,860,000 | | 1,863,010 |
Series 2011-5 Class A2, 1.19% 8/8/15 | | 640,000 | | 642,629 |
Series 2012-1 Class A2, 0.91% 10/8/15 | | 1,000,000 | | 1,000,660 |
Ameriquest Mortgage Securities, Inc. pass-thru certificates: | | | | |
Series 2004-R2 Class M3, 0.794% 4/25/34 (g) | | 16,966 | | 5,313 |
Series 2005-R2 Class M1, 0.694% 4/25/35 (g) | | 262,030 | | 227,504 |
Argent Securities, Inc. pass-thru certificates: | | | | |
Series 2003-W7 Class A2, 1.0563% 3/25/34 (g) | | 82,560 | | 59,490 |
Asset-Backed Securities - continued |
| Principal Amount | | Value |
Argent Securities, Inc. pass-thru certificates: - continued | | | | |
Series 2006-W4 Class A2C, 0.404% 5/25/36 (g) | | $ 168,000 | | $ 41,077 |
Avis Budget Rental Car Funding (AESOP) LLC Series 2009-1A Class A, 9.31% 10/20/13 (d) | | 2,000,000 | | 2,062,485 |
Axon Financial Funding Ltd. Series 2007-1 Class A1, 1.181% 4/4/17 (b)(d)(g) | | 432,000 | | 0 |
Bank of America Auto Trust: | | | | |
Series 2009-1A: | | | | |
Class A3, 2.67% 7/15/13 (d) | | 46,893 | | 46,938 |
Class A4, 3.52% 6/15/16 (d) | | 1,100,000 | | 1,116,111 |
Series 2009-3A Class A3, 1.67% 12/15/13 (d) | | 435,261 | | 436,252 |
Series 2010-2 Class A3, 1.31% 7/15/14 | | 1,375,742 | | 1,380,463 |
BMW Vehicle Lease Trust: | | | | |
Series 2010-1 Class A3, 0.82% 4/15/13 | | 1,416,918 | | 1,418,416 |
Series 2011-1 Class A3, 1.06% 2/20/14 | | 1,760,000 | | 1,767,224 |
BMW Vehicle Owner Trust Series 2011-A: | | | | |
Class A2, 0.63% 2/25/14 | | 1,610,000 | | 1,610,835 |
Class A3, 0.76% 8/25/15 | | 1,150,000 | | 1,152,116 |
Brazos Higher Education Authority, Inc. Series 2006-2 Class A9, 0.5838% 12/25/24 (g) | | 177,712 | | 156,671 |
Capital Auto Receivables Asset Trust Series 2007-1 Class B, 5.15% 9/17/12 | | 36,236 | | 36,305 |
Capital One Multi-Asset Execution Trust Series 2008-A3 Class A3, 5.05% 2/15/16 | | 700,000 | | 735,166 |
Capital Trust Ltd. Series 2004-1: | | | | |
Class A2, 0.6955% 7/20/39 (d)(g) | | 425,658 | | 317,116 |
Class B, 0.9955% 7/20/39 (d)(g) | | 373,480 | | 153,127 |
Class C, 1.3455% 7/20/39 (d)(g) | | 478,070 | | 10,757 |
Carrington Mortgage Loan Trust Series 2007-RFC1 Class A3, 0.384% 12/25/36 (g) | | 228,766 | | 72,362 |
Chase Issuance Trust: | | | | |
Series 2007-A17 Class A, 5.12% 10/15/14 | | 3,730,000 | | 3,841,043 |
Series 2011-A1 Class A1, 0.4385% 3/16/15 (g) | | 2,850,000 | | 2,854,211 |
Series 2011-A2 Class A2, 0.3385% 5/15/15 (g) | | 4,610,000 | | 4,612,291 |
Series 2011-A3 Class A3, 0.3685% 12/15/15 (g) | | 5,000,000 | | 5,000,055 |
Chrysler Financial Auto Securitization Trust Series 2010-A Class A3, 0.91% 8/8/13 | | 1,220,000 | | 1,221,356 |
Citibank Credit Card Issuance Trust: | | | | |
Series 2008-A5 Class A5, 4.85% 4/22/15 | | 4,260,000 | | 4,470,196 |
Series 2009-A5 Class A5, 2.25% 12/23/14 | | 5,870,000 | | 5,955,327 |
Citibank Omni Master Trust Series 2009-A8 Class A8, 2.3485% 5/16/16 (d)(g) | | 2,000,000 | | 2,008,244 |
Countrywide Home Loan Trust Series 2006-13 Class N, 7% 8/25/37 (d) | | 41,917 | | 0 |
Asset-Backed Securities - continued |
| Principal Amount | | Value |
Countrywide Home Loans, Inc.: | | | | |
Series 2003-BC1 Class B1, 5.5436% 3/25/32 (MGIC Investment Corp. Insured) (g) | | $ 31,876 | | $ 5,454 |
Series 2004-2 Class 3A4, 0.744% 7/25/34 (g) | | 62,430 | | 48,905 |
Series 2004-3 Class M4, 1.214% 4/25/34 (g) | | 20,061 | | 8,839 |
Series 2004-4 Class M2, 1.039% 6/25/34 (g) | | 74,616 | | 33,744 |
Series 2005-3 Class MV1, 0.664% 8/25/35 (g) | | 27,782 | | 27,398 |
Discover Card Master Trust: | | | | |
Series 2011-A2 Class A2, 0.4585% 11/16/15 (g) | | 2,160,000 | | 2,164,243 |
Series 2012-A1 Class A1, 0.81% 8/15/17 | | 2,920,000 | | 2,919,708 |
Fannie Mae subordinate REMIC pass-thru certificates Series 2004-T5: | | | | |
Class AB1, 0.8077% 5/28/35 (g) | | 159,655 | | 117,456 |
Class AB3, 0.7513% 5/28/35 (g) | | 67,441 | | 43,285 |
Fieldstone Mortgage Investment Corp. Series 2004-3 Class M5, 2.419% 8/25/34 (g) | | 36,914 | | 21,514 |
First Franklin Mortgage Loan Trust Series 2005-FF9 Class A3, 0.524% 10/25/35 (g) | | 203,095 | | 189,359 |
Ford Credit Auto Lease Trust: | | | | |
Series 2011-B Class A3, 1.05% 10/15/14 | | 2,080,000 | | 2,083,896 |
Series 2010-B Class A3, 0.91% 7/15/13 (d) | | 1,610,000 | | 1,611,496 |
Series 2011-A Class A3, 1.03% 7/15/14 | | 2,190,000 | | 2,200,391 |
Ford Credit Auto Owner Trust: | | | | |
Series 2009-C Class A4, 4.43% 11/15/14 | | 1,000,000 | | 1,037,325 |
Series 2009-E Class A3, 1.51% 1/15/14 | | 512,607 | | 514,375 |
Series 2010-B Class A3, 0.98% 10/15/14 | | 991,157 | | 994,222 |
Series 2011-B Class A3, 0.84% 6/15/15 | | 1,000,000 | | 1,003,295 |
Ford Credit Automobile Lease Trust Series 2012-A Class A3, 0.85% 1/15/15 | | 820,000 | | 819,918 |
Ford Credit Automobile Owner Trust Series 2012-A Class A2, 0.62% 9/15/14 | | 1,320,000 | | 1,320,825 |
Ford Credit Floorplan Master Owner Trust: | | | | |
Series 2010-1 Class A, 1.8985% 12/15/14 (d)(g) | | 1,290,000 | | 1,304,624 |
Series 2010-5 Class A1, 1.5% 9/15/15 | | 1,110,000 | | 1,120,758 |
Series 2012-1 Class A, 0.857% 1/15/16 (g) | | 4,000,000 | | 4,009,040 |
Fremont Home Loan Trust: | | | | |
Series 2004-D: | | | | |
Class M4, 1.669% 11/25/34 (g) | | 104,293 | | 10,289 |
Class M5, 1.744% 11/25/34 (g) | | 66,415 | | 3,444 |
Series 2005-A: | | | | |
Class M3, 0.734% 1/25/35 (g) | | 120,398 | | 37,990 |
Class M4, 0.924% 1/25/35 (g) | | 46,138 | | 10,458 |
Asset-Backed Securities - continued |
| Principal Amount | | Value |
GCO Education Loan Funding Master Trust II Series 2007-1A Class C1L, 0.8706% 2/25/47 (d)(g) | | $ 298,000 | | $ 104,300 |
GCO Slims Trust Series 2006-1A, 5.72% 3/1/22 (d) | | 445,650 | | 409,998 |
GE Business Loan Trust Series 2003-1 Class A, 0.6785% 4/15/31 (d)(g) | | 27,118 | | 25,354 |
GE Capital Credit Card Master Note Trust Series 2012-1 Class A, 1.03% 1/15/18 | | 2,450,000 | | 2,449,755 |
Guggenheim Structured Real Estate Funding Ltd. Series 2006-3: | | | | |
Class B, 0.644% 9/25/46 (d)(g) | | 36,026 | | 36,012 |
Class C, 0.794% 9/25/46 (d)(g) | | 1,943,752 | | 991,314 |
Home Equity Asset Trust: | | | | |
Series 2003-3 Class M1, 1.534% 8/25/33 (g) | | 88,540 | | 63,876 |
Series 2003-5 Class A2, 0.944% 12/25/33 (g) | | 44,160 | | 32,169 |
Series 2004-1 Class M2, 1.944% 6/25/34 (g) | | 81,330 | | 55,750 |
Series 2005-5 Class 2A2, 0.494% 11/25/35 (g) | | 878 | | 877 |
Series 2006-1 Class 2A3, 0.469% 4/25/36 (g) | | 40,637 | | 40,298 |
Honda Auto Receivables Owner Trust Series 2011-3 Class A2, 0.67% 4/21/14 | | 1,600,000 | | 1,601,730 |
Honda Auto Receivables Owner Trust: | | | | |
Series 2010-1 Class A4, 1.98% 5/23/16 | | 510,000 | | 517,193 |
Series 2010-2 Class A3, 1.34% 3/18/14 | | 948,737 | | 953,189 |
Series 2010-3 Class A3, 0.7% 4/21/14 | | 2,450,000 | | 2,452,547 |
Series 2011-1 Class A4, 1.8% 4/17/17 | | 640,000 | | 653,214 |
Series 2011-2 Class A3, 0.94% 3/18/15 | | 1,560,000 | | 1,566,744 |
Honda Automobile Receivables Owner Trust Series 2009-3 Class A3, 2.31% 5/15/13 | | 138,907 | | 139,356 |
HSI Asset Securitization Corp. Trust Series 2007-HE1 Class 2A3, 0.434% 1/25/37 (g) | | 157,118 | | 45,769 |
Hyundai Auto Lease Securitization Trust Series 2011-A Class A3, 1.02% 8/15/14 (d) | | 1,350,000 | | 1,351,233 |
Hyundai Auto Receivables Trust: | | | | |
Series 2009-A Class A4, 3.15% 3/15/16 | | 210,000 | | 215,978 |
Series 2011-A Class A3, 1.16% 4/15/15 | | 810,000 | | 815,561 |
Series 2011-C Class A2, 0.62% 7/15/14 | | 1,610,000 | | 1,610,546 |
John Deere Owner Trust: | | | | |
Seires 2011-A Class A3, 1.29% 1/15/16 | | 1,710,000 | | 1,724,599 |
Series 2009-B Class A-3, 1.57% 10/15/13 | | 252,321 | | 252,606 |
JPMorgan Mortgage Acquisition Trust Series 2007-CH1 Class AV4, 0.374% 11/25/36 (g) | | 157,766 | | 130,483 |
Keycorp Student Loan Trust Series 1999-A Class A2, 0.9038% 12/27/29 (g) | | 75,275 | | 66,102 |
Long Beach Mortgage Loan Trust Series 2004-2 Class M2, 1.324% 6/25/34 (g) | | 10,682 | | 6,343 |
Asset-Backed Securities - continued |
| Principal Amount | | Value |
Marriott Vacation Club Owner Trust: | | | | |
Series 2005-2 Class A, 5.25% 10/20/27 (d) | | $ 179,875 | | $ 181,888 |
Series 2006-1A: | | | | |
Class B, 5.827% 4/20/28 (d) | | 66,533 | | 67,871 |
Class C, 6.125% 4/20/28 (d) | | 66,533 | | 67,577 |
MASTR Asset Backed Securities Trust Series 2007-HE1 Class M1, 0.544% 5/25/37 (g) | | 99,598 | | 1,722 |
Mercedes-Benz Auto Lease Trust: | | | | |
Series 2011-1A Class A3 1.18% 11/15/13 (d) | | 2,420,000 | | 2,428,238 |
Series 2011-B Class A3, 1.07% 1/15/14 (d) | | 1,410,000 | | 1,411,476 |
Mercedes-Benz Auto Receivables Trust: | | | | |
Series 2009-1 Class A3, 1.67% 1/15/14 | | 376,181 | | 378,200 |
Series 2011-1 Class A3, 0.85% 3/16/15 | | 1,460,000 | | 1,465,019 |
Merrill Lynch Mortgage Investors Trust: | | | | |
Series 2006-FM1 Class A2B, 0.354% 4/25/37 (g) | | 172,890 | | 128,418 |
Series 2006-OPT1 Class A1A, 0.504% 6/25/35 (g) | | 183,505 | | 137,202 |
Morgan Stanley ABS Capital I Trust: | | | | |
Series 2004-HE6 Class A2, 0.584% 8/25/34 (g) | | 138,792 | | 106,531 |
Series 2004-NC8 Class M6, 1.494% 9/25/34 (g) | | 77,120 | | 43,929 |
Series 2005-NC1 Class M1, 0.684% 1/25/35 (g) | | 50,738 | | 32,041 |
Series 2005-NC2 Class B1, 1.414% 3/25/35 (g) | | 52,840 | | 6,691 |
National Collegiate Student Loan Trust Series 2004-2 Class AIO, 9.75% 10/27/14 (i) | | 942,500 | | 63,619 |
Nissan Auto Lease Trust: | | | | |
Series 2010-B: | | | | |
Class A3, 1.12% 12/15/13 | | 1,710,000 | | 1,715,756 |
Class A4, 1.27% 10/15/16 | | 560,000 | | 563,672 |
Series 2011-A Class A3, 1.04% 8/15/14 | | 1,840,000 | | 1,850,312 |
Series 2011-B Class A3, 0.92% 2/16/15 | | 930,000 | | 929,613 |
Nissan Auto Receivables Owner Trust: | | | | |
Series 2011-A Class A3, 1.18% 2/16/15 | | 1,020,000 | | 1,028,650 |
Series 2011-B Class A3, 0.95% 2/16/16 | | 950,000 | | 952,349 |
Northstar Education Finance, Inc., Delaware Series 2005-1 Class A5, 1.1747% 10/30/45 (g) | | 1,093,614 | | 1,016,514 |
Ocala Funding LLC: | | | | |
Series 2005-1A Class A, 1.7455% 3/20/10 (b)(d)(g) | | 71,000 | | 0 |
Series 2006-1A Class A, 1.6455% 3/20/11 (b)(d)(g) | | 149,000 | | 0 |
Park Place Securities, Inc.: | | | | |
Series 2004-WCW1: | | | | |
Class M3, 1.494% 9/25/34 (g) | | 797,630 | | 336,331 |
Class M4, 1.694% 9/25/34 (g) | | 1,086,724 | | 237,468 |
Series 2005-WCH1 Class M4, 1.074% 1/25/36 (g) | | 187,294 | | 83,434 |
Asset-Backed Securities - continued |
| Principal Amount | | Value |
Salomon Brothers Mortgage Securities VII, Inc. Series 2003-HE1 Class A, 1.044% 4/25/33 (g) | | $ 648 | | $ 525 |
Santander Drive Auto Receivables Trust: | | | | |
Series 2010-2 Class A2, 0.95% 8/15/13 | | 762,600 | | 762,767 |
Series 2010-3 Class A2, 0.93% 6/17/13 | | 279,031 | | 279,077 |
Series 2011-1, Class A2, 0.94% 2/18/14 | | 1,183,967 | | 1,183,623 |
Series 2011-4 Class A2, 1.37% 3/16/15 | | 1,400,000 | | 1,401,295 |
Santander Drive Automobile Receivables Trust Series 2012-1 Class A2, 1.25% 4/15/15 | | 1,190,000 | | 1,192,072 |
Saxon Asset Securities Trust Series 2004-1 Class M1, 1.039% 3/25/35 (g) | | 168,939 | | 103,055 |
Sierra Receivables Funding Co. Series 2007-1A Class A2, 0.4309% 3/20/19 (FGIC Insured) (d)(g) | | 55,686 | | 53,327 |
SLM Private Credit Student Loan Trust: | | | | |
Series 2004 B Class A2, 0.7463% 6/15/21 (g) | | 1,474,377 | | 1,413,600 |
Series 2004-A: | | | | |
Class B, 1.1263% 6/15/33 (g) | | 364,397 | | 226,588 |
Class C, 1.4963% 6/15/33 (g) | | 1,181,000 | | 535,819 |
Series 2004-B Class C, 1.4163% 9/15/33 (g) | | 1,900,000 | | 885,649 |
Structured Asset Investment Loan Trust Series 2004-8 Class M5, 1.969% 9/25/34 (g) | | 8,267 | | 2,647 |
Terwin Mortgage Trust Series 2003-4HE Class A1, 1.104% 9/25/34 (g) | | 86,903 | | 64,505 |
Toyota Auto Receivables Owner Trust Series 2010-B Class M3, 1.04% 2/18/14 | | 590,027 | | 591,683 |
USAA Auto Owner Trust Series 2009-2 Class A3, 1.54% 2/18/14 | | 355,786 | | 356,569 |
Volkswagen Auto Lease Trust: | | | | |
Series 2010-A: | | | | |
Class A3, 0.99% 11/20/13 | | 2,450,000 | | 2,455,371 |
Class A4, 1.18% 10/20/15 | | 900,000 | | 903,879 |
Series 2011-A Class A2, 1% 2/20/14 | | 930,000 | | 928,378 |
Volkswagen Auto Loan Enhanced Trust Series 2011-1 Class A3, 1.22% 6/22/15 | | 2,840,000 | | 2,862,780 |
Volkswagen Automobile Loan Enhanced Trust Series 2012-1 Series A2, 0.61% 10/20/14 | | 1,280,000 | | 1,281,173 |
Wachovia Auto Owner Trust Series 2008-A Class A4B, 1.3955% 3/20/14 (g) | | 521,310 | | 522,629 |
WaMu Asset Holdings Corp. Series 2006-8 Class N1, 6.048% 10/25/46 (d) | | 112,639 | | 0 |
Wells Fargo Home Equity Trust Series 2004-3 Class A, 4.5% 11/27/34 (d) | | 961 | | 0 |
Asset-Backed Securities - continued |
| Principal Amount | | Value |
Whinstone Capital Management Ltd. Series 1A Class B3, 2.3601% 10/25/44 (d)(g) | | $ 1,390,735 | | $ 737,089 |
World Omni Automobile Lease Securitization Trust Series 2011-A, Class A3, 1.49% 10/15/14 | | 1,020,000 | | 1,028,023 |
TOTAL ASSET-BACKED SECURITIES (Cost $163,800,959) |
158,575,533
|
Collateralized Mortgage Obligations - 4.2% |
|
Private Sponsor - 1.9% |
Arkle Master Issuer PLC floater Series 2010-1A Class 2A, 1.6451% 5/17/60 (d)(g) | | 1,500,000 | | 1,500,286 |
Arran Residential Mortgages Funding PLC floater Series 2011-1A Class A1C, 1.6931% 11/19/47 (d)(g) | | 1,612,836 | | 1,614,301 |
Banc of America Funding Trust sequential payer Series 2009-R1 Class A1, 5.0298% 5/20/36 (g) | | 241,477 | | 243,068 |
Credit Suisse Mortgage Capital Certificates: | | | | |
floater Series 2011-7R Class A1, 1.494% 8/27/47 (d)(g) | | 965,939 | | 947,794 |
sequential payer Series 2010-16 Class A1, 3% 6/25/50 (d) | | 618,617 | | 596,965 |
Gracechurch Mortgage Financing PLC floater: | | | | |
Series 2006-1 Class A6, 0.5931% 11/20/56 (d)(g) | | 1,616,864 | | 1,608,888 |
Series 2007-1A Class 3A1, 0.5731% 11/20/56 (d)(g) | | 2,971,591 | | 2,966,765 |
Granite Master Issuer PLC floater: | | | | |
Series 2006-1A Class C2, 1.4455% 12/20/54 (d)(g) | | 762,000 | | 464,820 |
Series 2006-2 Class C1, 1.1855% 12/20/54 (g) | | 3,254,000 | | 1,984,940 |
Series 2006-3 Class C2, 0.7455% 12/20/54 (g) | | 142,000 | | 86,620 |
Series 2006-4: | | | | |
Class B1, 0.4255% 12/20/54 (g) | | 381,000 | | 320,802 |
Class C1, 1.0055% 12/20/54 (g) | | 233,000 | | 142,130 |
Class M1, 0.5855% 12/20/54 (g) | | 100,000 | | 76,250 |
Series 2007-1: | | | | |
Class 1C1, 0.8455% 12/20/54 (g) | | 235,000 | | 143,350 |
Class 1M1, 0.5455% 12/20/54 (g) | | 153,000 | | 116,663 |
Class 2C1, 1.2055% 12/20/54 (g) | | 107,000 | | 65,270 |
Class 2M1, 0.7455% 12/20/54 (g) | | 196,000 | | 149,450 |
Series 2007-2 Class 2C1, 0.676% 12/17/54 (g) | | 272,000 | | 165,920 |
Granite Mortgages Series 2003-2 Class 1A3, 1.0612% 7/20/43 (g) | | 613,146 | | 593,893 |
Collateralized Mortgage Obligations - continued |
| Principal Amount | | Value |
Private Sponsor - continued |
Granite Mortgages PLC floater: | | | | |
Series 2003-3: | | | | |
Class 1A3, 0.9612% 1/20/44 (g) | | $ 260,582 | | $ 252,243 |
Class 1C, 3.0112% 1/20/44 (g) | | 54,183 | | 38,893 |
Series 2004-1 Class 2A1, 0.8832% 3/20/44 (g) | | 1,778,113 | | 1,709,656 |
Series 2004-3 Class 2A1, 0.8432% 9/20/44 (g) | | 365,609 | | 350,985 |
Holmes Master Issuer PLC floater: | | | | |
Series 2007-2A Class 4A, 0.667% 7/15/20 (g) | | 2,480,000 | | 2,472,835 |
Series 2012-1A Class A1, 0.4485% 1/15/13 (d)(g) | | 2,120,000 | | 2,121,672 |
MASTR Adjustable Rate Mortgages Trust Series 2007-3 Class 22A2, 0.454% 5/25/47 (g) | | 104,758 | | 61,575 |
Merrill Lynch Alternative Note Asset Trust floater Series 2007-OAR1 Class A1, 0.414% 2/25/37 (g) | | 155,542 | | 104,539 |
Morgan Stanley Reremic Trust Series 2010-R3 Class 3A, 0.5163% 6/26/36 (d)(g) | | 890,394 | | 884,051 |
Permanent Master Issuer PLC floater Series 2010-1A Class 1A, 1.717% 7/15/42 (d)(g) | | 1,000,000 | | 999,045 |
RESI Finance LP/RESI Finance DE Corp. floater Series 2003-B Class B5, 2.6048% 7/10/35 (d)(g) | | 81,002 | | 65,797 |
Residential Funding Securities Corp. floater Series 2003-RP2 Class A1, 0.694% 6/25/33 (d)(g) | | 20,076 | | 18,653 |
Santander Drive Auto Receivables Trust sequential payer Series 2011-3 Class A2, 1.11% 8/15/14 | | 1,200,000 | | 1,200,192 |
Sequoia Mortgage Trust floater Series 2004-6 Class A3B, 1.668% 7/20/34 (g) | | 4,535 | | 3,268 |
Structured Asset Securities Corp. Series 2004-21XS Class 2A3, 4.32% 12/25/34 | | 113,163 | | 112,645 |
TBW Mortgage-Backed pass-thru certificates floater Series 2006-4 Class A3, 0.4763% 9/25/36 (g) | | 415,454 | | 316,862 |
TOTAL PRIVATE SPONSOR | | 24,501,086 |
U.S. Government Agency - 2.3% |
Fannie Mae Guaranteed Mtg. pass-thru certificates: | | | | |
planned amortization class Series 1993-187 Class L, 6.5% 7/25/23 | | 87,069 | | 87,942 |
sequential payer Series 2009-31 Class A, 4% 2/25/24 | | 481,982 | | 502,031 |
Series 2010-123 Class DL, 3.5% 11/25/25 | | 766,015 | | 798,939 |
Fannie Mae subordinate REMIC pass-thru certificates: | | | | |
floater Series 2008-76 Class EF, 0.744% 9/25/23 (g) | | 322,357 | | 323,487 |
floater planned amortization Series 2005-90 Class FC, 0.494% 10/25/35 (g) | | 1,059,410 | | 1,057,998 |
Collateralized Mortgage Obligations - continued |
| Principal Amount | | Value |
U.S. Government Agency - continued |
Fannie Mae subordinate REMIC pass-thru certificates: - continued | | | | |
planned amortization class Series 2006-54 Class PE, 6% 2/25/33 | | $ 612,219 | | $ 650,791 |
sequential payer: | | | | |
Series 2001-40 Class Z, 6% 8/25/31 | | 444,466 | | 493,124 |
Series 2003-76 Class BA, 4.5% 3/25/18 | | 778,009 | | 812,400 |
Series 2010-135 Class DE, 2.25% 4/25/24 | | 1,726,446 | | 1,745,842 |
Series 2011-16 Class FB, 0.394% 3/25/31 (g) | | 2,948,587 | | 2,947,296 |
Series 2010-143 Class B, 3.5% 12/25/25 | | 1,204,501 | | 1,261,821 |
Series 2011-23 Class AB, 2.75% 6/25/20 | | 965,229 | | 999,734 |
Federal Home Loan Mortgage Corp. floater sequential payer Series 3943 Class EF 0.4985% 2/15/26 (g) | | 1,678,350 | | 1,676,379 |
Freddie Mac Multi-Class pass-thru certificates: | | | | |
floater Series 3346 Class FA, 0.4785% 2/15/19 (g) | | 4,025,479 | | 4,031,140 |
floater planned amortization Series 3117 Class JF, 0.5485% 2/15/36 (g) | | 1,191,940 | | 1,193,021 |
floater sequential payer Series 3387 Class DF, 0.4285% 10/15/17 (g) | | 1,317,056 | | 1,317,257 |
planned amortization class: | | | | |
Series 2535 Class PC, 6% 9/15/32 | | 420,534 | | 444,400 |
Series 2866 Class XE, 4% 12/15/18 | | 919,804 | | 953,759 |
Series 2901 Class UM, 4.5% 1/15/30 | | 605,314 | | 610,381 |
Series 3792 Class DF, 0.6485% 11/15/40 (g) | | 2,726,757 | | 2,734,025 |
sequential payer: | | | | |
Series 2609 Class UJ, 6% 2/15/17 | | 54,249 | | 54,273 |
Series 2635 Class DG, 4.5% 1/15/18 | | 840,765 | | 870,386 |
Series 2970 Class YA, 5% 9/15/18 | | 11,957 | | 11,941 |
Series 3560 Class LA, 2% 8/15/14 | | 474,163 | | 476,555 |
Series 3573 Class LC, 1.85% 8/15/14 | | 894,116 | | 900,297 |
Series 3659 Class EJ 3% 6/15/18 | | 2,291,395 | | 2,363,297 |
Series 3696 Class AE, 1.2% 7/15/15 | | 1,112,316 | | 1,112,909 |
TOTAL U.S. GOVERNMENT AGENCY | | 30,431,425 |
TOTAL COLLATERALIZED MORTGAGE OBLIGATIONS (Cost $53,958,184) |
54,932,511
|
Commercial Mortgage Securities - 4.3% |
| Principal Amount | | Value |
Asset Securitization Corp. Series 1997-D5 Class PS1, 1.4363% 2/14/43 (g)(i) | | $ 2,442,397 | | $ 26,918 |
Banc of America Commercial Mortgage, Inc. Series 2005-4 Class XP, 0.3486% 7/10/45 (g)(i) | | 9,377,512 | | 13,288 |
Banc of America Large Loan, Inc. floater: | | | | |
Series 2005-MIB1: | | | | |
Class F, 0.7185% 3/15/22 (d)(g) | | 78,149 | | 75,023 |
Class G, 0.7785% 3/15/22 (d)(g) | | 320,652 | | 301,413 |
Class H, 1.0285% 3/15/22 (d)(g) | | 500,000 | | 465,000 |
Series 2006-BIX1: | | | | |
Class F, 0.5585% 10/15/19 (d)(g) | | 201,139 | | 189,071 |
Class G, 0.5785% 10/15/19 (d)(g) | | 137,009 | | 121,938 |
Bayview Commercial Asset Trust: | | | | |
floater: | | | | |
Series 2003-2 Class M1, 1.094% 12/25/33 (d)(g) | | 8,340 | | 5,906 |
Series 2004-1: | | | | |
Class A, 0.604% 4/25/34 (d)(g) | | 397,114 | | 319,677 |
Class B, 2.144% 4/25/34 (d)(g) | | 48,109 | | 27,819 |
Class M1, 0.804% 4/25/34 (d)(g) | | 27,856 | | 19,390 |
Class M2, 1.444% 4/25/34 (d)(g) | | 26,869 | | 18,622 |
Series 2005-2A: | | | | |
Class A1, 0.554% 8/25/35 (d)(g) | | 138,208 | | 90,224 |
Class M1, 0.674% 8/25/35 (d)(g) | | 10,255 | | 5,277 |
Class M2, 0.724% 8/25/35 (d)(g) | | 16,913 | | 7,702 |
Class M3, 0.744% 8/25/35 (d)(g) | | 9,358 | | 3,725 |
Series 2005-3A: | | | | |
Class A2, 0.644% 11/25/35 (d)(g) | | 49,047 | | 32,402 |
Class M1, 0.684% 11/25/35 (d)(g) | | 8,948 | | 5,131 |
Class M2, 0.734% 11/25/35 (d)(g) | | 11,360 | | 6,259 |
Class M3, 0.754% 11/25/35 (d)(g) | | 10,167 | | 5,366 |
Class M4, 0.844% 11/25/35 (d)(g) | | 12,667 | | 6,118 |
Series 2005-4A: | | | | |
Class A2, 0.634% 1/25/36 (d)(g) | | 849,021 | | 526,318 |
Class B1, 1.644% 1/25/36 (d)(g) | | 57,128 | | 7,578 |
Class M1, 0.694% 1/25/36 (d)(g) | | 267,032 | | 115,241 |
Class M2, 0.714% 1/25/36 (d)(g) | | 101,331 | | 39,332 |
Class M3, 0.744% 1/25/36 (d)(g) | | 108,903 | | 38,096 |
Class M4, 0.854% 1/25/36 (d)(g) | | 55,726 | | 17,315 |
Class M5, 0.894% 1/25/36 (d)(g) | | 55,726 | | 15,080 |
Class M6, 0.944% 1/25/36 (d)(g) | | 56,551 | | 10,932 |
Series 2006-1: | | | | |
Class A2, 0.604% 4/25/36 (d)(g) | | 26,574 | | 18,381 |
Class M1, 0.624% 4/25/36 (d)(g) | | 9,504 | | 5,374 |
Commercial Mortgage Securities - continued |
| Principal Amount | | Value |
Bayview Commercial Asset Trust: - continued | | | | |
floater: | | | | |
Series 2006-1: | | | | |
Class M2, 0.644% 4/25/36 (d)(g) | | $ 10,042 | | $ 5,290 |
Class M3, 0.664% 4/25/36 (d)(g) | | 8,640 | | 4,253 |
Class M4, 0.764% 4/25/36 (d)(g) | | 4,896 | | 2,202 |
Class M5, 0.804% 4/25/36 (d)(g) | | 4,752 | | 1,902 |
Class M6, 0.884% 4/25/36 (d)(g) | | 9,476 | | 3,603 |
Series 2006-2A: | | | | |
Class A1, 0.474% 7/25/36 (d)(g) | | 259,565 | | 164,340 |
Class A2, 0.524% 7/25/36 (d)(g) | | 23,434 | | 14,060 |
Class B1, 1.114% 7/25/36 (d)(g) | | 8,774 | | 1,035 |
Class B3, 2.944% 7/25/36 (d)(g) | | 13,256 | | 540 |
Class M1, 0.554% 7/25/36 (d)(g) | | 24,587 | | 9,851 |
Class M2, 0.574% 7/25/36 (d)(g) | | 17,347 | | 6,256 |
Class M3, 0.594% 7/25/36 (d)(g) | | 14,389 | | 4,678 |
Class M4, 0.664% 7/25/36 (d)(g) | | 9,716 | | 2,798 |
Class M5, 0.714% 7/25/36 (d)(g) | | 11,943 | | 2,960 |
Class M6, 0.784% 7/25/36 (d)(g) | | 17,818 | | 2,863 |
Series 2006-3A: | | | | |
Class B1, 1.044% 10/25/36 (d)(g) | | 17,096 | | 341 |
Class M4, 0.674% 10/25/36 (d)(g) | | 19,070 | | 1,874 |
Class M5, 0.724% 10/25/36 (d)(g) | | 22,830 | | 1,662 |
Class M6, 0.804% 10/25/36 (d)(g) | | 44,739 | | 2,071 |
Series 2006-4A: | | | | |
Class A1, 0.474% 12/25/36 (d)(g) | | 80,895 | | 53,517 |
Class A2, 0.514% 12/25/36 (d)(g) | | 366,687 | | 187,010 |
Class B1, 0.944% 12/25/36 (d)(g) | | 12,818 | | 1,197 |
Class B2, 1.494% 12/25/36 (d)(g) | | 13,264 | | 792 |
Class B3, 2.694% 12/25/36 (d)(g) | | 7,863 | | 162 |
Class M1, 0.534% 12/25/36 (d)(g) | | 25,981 | | 9,901 |
Class M2, 0.554% 12/25/36 (d)(g) | | 17,714 | | 5,958 |
Class M3, 0.584% 12/25/36 (d)(g) | | 17,714 | | 5,167 |
Class M4, 0.644% 12/25/36 (d)(g) | | 21,257 | | 4,927 |
Class M5, 0.684% 12/25/36 (d)(g) | | 19,486 | | 3,216 |
Class M6, 0.764% 12/25/36 (d)(g) | | 17,714 | | 2,163 |
Series 2007-1: | | | | |
Class A2, 0.514% 3/25/37 (d)(g) | | 402,662 | | 193,278 |
Class B1, 0.914% 3/25/37 (d)(g) | | 128,564 | | 9,273 |
Class B2, 1.394% 3/25/37 (d)(g) | | 83,390 | | 3,589 |
Class M1, 0.514% 3/25/37 (d)(g) | | 110,105 | | 35,940 |
Class M2, 0.534% 3/25/37 (d)(g) | | 83,359 | | 21,615 |
Class M3, 0.564% 3/25/37 (d)(g) | | 72,394 | | 14,491 |
Class M4, 0.614% 3/25/37 (d)(g) | | 54,606 | | 8,083 |
Class M5, 0.664% 3/25/37 (d)(g) | | 91,283 | | 11,502 |
Commercial Mortgage Securities - continued |
| Principal Amount | | Value |
Bayview Commercial Asset Trust: - continued | | | | |
floater: | | | | |
Series 2007-1: | | | | |
Class M6, 0.744% 3/25/37 (d)(g) | | $ 125,885 | | $ 12,986 |
Series 2007-2A: | | | | |
Class A1, 0.514% 7/25/37 (d)(g) | | 66,815 | | 34,451 |
Class A2, 0.564% 7/25/37 (d)(g) | | 62,579 | | 21,903 |
Class B1, 1.844% 7/25/37 (d)(g) | | 19,608 | | 746 |
Class B2, 2.494% 7/25/37 (d)(g) | | 6,305 | | 334 |
Class M1, 0.614% 7/25/37 (d)(g) | | 22,304 | | 3,379 |
Class M2, 0.654% 7/25/37 (d)(g) | | 12,516 | | 1,380 |
Class M3, 0.734% 7/25/37 (d)(g) | | 12,676 | | 1,111 |
Class M4, 0.894% 7/25/37 (d)(g) | | 24,406 | | 1,905 |
Class M5, 0.994% 7/25/37 (d)(g) | | 21,582 | | 1,411 |
Class M6, 1.244% 7/25/37 (d)(g) | | 27,390 | | 1,428 |
Series 2007-3: | | | | |
Class A2, 0.534% 7/25/37 (d)(g) | | 101,790 | | 43,547 |
Class B1, 1.194% 7/25/37 (d)(g) | | 87,598 | | 7,307 |
Class B2, 1.844% 7/25/37 (d)(g) | | 224,232 | | 11,945 |
Class B3, 4.244% 7/25/37 (d)(g) | | 27,085 | | 612 |
Class M1, 0.554% 7/25/37 (d)(g) | | 76,901 | | 25,383 |
Class M2, 0.584% 7/25/37 (d)(g) | | 80,851 | | 21,944 |
Class M3, 0.614% 7/25/37 (d)(g) | | 130,872 | | 28,799 |
Class M4, 0.744% 7/25/37 (d)(g) | | 206,954 | | 36,514 |
Class M5, 0.844% 7/25/37 (d)(g) | | 103,167 | | 13,749 |
Class M6, 1.044% 7/25/37 (d)(g) | | 80,569 | | 8,794 |
Series 2007-4A: | | | | |
Class A2, 0.794% 9/25/37 (d)(g) | | 854,985 | | 213,746 |
Class B1, 2.794% 9/25/37 (d)(g) | | 89,902 | | 3,234 |
Class M1, 1.194% 9/25/37 (d)(g) | | 132,484 | | 11,609 |
Class M2, 1.294% 9/25/37 (d)(g) | | 132,484 | | 8,044 |
Class M4, 1.844% 9/25/37 (d)(g) | | 349,137 | | 15,080 |
Class M5, 1.994% 9/25/37 (d)(g) | | 349,137 | | 11,131 |
Class M6, 2.194% 9/25/37 (d)(g) | | 349,223 | | 7,163 |
Series 2004-1, Class IO, 1.25% 4/25/34 (d)(i) | | 3,028,722 | | 110,548 |
Series 2006-2A Class IO, 3.1745% 7/25/36 (c)(d)(i) | | 8,827,640 | | 290,412 |
Bear Stearns Commercial Mortgage Securities Trust: | | | | |
floater: | | | | |
Series 2006-BBA7: | | | | |
Class H, 0.8985% 3/15/19 (d)(g) | | 52,914 | | 50,821 |
Class J, 1.0985% 3/15/19 (d)(g) | | 51,667 | | 44,446 |
Series 2007-BBA8: | | | | |
Class D, 0.4985% 3/15/22 (d)(g) | | 52,963 | | 45,443 |
Class E, 0.5485% 3/15/22 (d)(g) | | 275,033 | | 233,231 |
Class F, 0.5985% 3/15/22 (d)(g) | | 168,653 | | 139,647 |
Commercial Mortgage Securities - continued |
| Principal Amount | | Value |
Bear Stearns Commercial Mortgage Securities Trust: - continued | | | | |
floater: | | | | |
Series 2007-BBA8: | | | | |
Class G, 0.6485% 3/15/22 (d)(g) | | $ 43,346 | | $ 35,458 |
Class H, 0.7985% 3/15/22 (d)(g) | | 52,963 | | 42,265 |
Class J, 0.9485% 3/15/22 (d)(g) | | 52,963 | | 41,206 |
Series 2004-PWR6 Class X2, 0.848% 11/11/41 (g)(i) | | 4,145,469 | | 23,675 |
Series 2005-PWR9 Class X2, 0.5336% 9/11/42 (d)(g)(i) | | 26,814,187 | | 166,087 |
C-BASS Trust floater Series 2006-SC1 Class A, 0.514% 5/25/36 (d)(g) | | 92,740 | | 76,473 |
CDC Commercial Mortgage Trust Series 2002-FX1 Class XCL, 1.5913% 5/15/35 (d)(g)(i) | | 8,921,862 | | 208,780 |
Citigroup Commercial Mortgage Trust floater Series 2006-FL2: | | | | |
Class G, 0.5835% 8/15/21 (d)(g) | | 26,524 | | 25,280 |
Class H, 0.6235% 8/15/21 (d)(g) | | 45,122 | | 42,168 |
Citigroup/Deutsche Bank Commercial Mortgage Trust Series 2006-CD3 Class X3, 0.6703% 10/15/48 (g)(i) | | 43,934,058 | | 360,655 |
Cobalt CMBS Commercial Mortgage Trust sequential payer Series 2007-C2 Class A2, 5.334% 4/15/47 | | 882,936 | | 890,214 |
COMM pass-thru certificates: | | | | |
floater: | | | | |
Series 2005-F10A: | | | | |
Class G, 0.7985% 4/15/17 (d)(g) | | 9,883 | | 9,522 |
Class H, 0.8685% 4/15/17 (d)(g) | | 21,773 | | 18,800 |
Class J, 1.0985% 4/15/17 (d)(g) | | 16,697 | | 11,688 |
Series 2005-FL11: | | | | |
Class F, 0.6985% 11/15/17 (d)(g) | | 23,597 | | 21,001 |
Class G, 0.7485% 11/15/17 (d)(g) | | 16,356 | | 14,393 |
Series 2006-CN2A Class A2FL, 0.4825% 2/5/19 (d)(g) | | 310,000 | | 293,221 |
sequential payer Series 2006-CN2A Class A2FX, 5.449% 2/5/19 (d) | | 1,375,000 | | 1,337,153 |
Series 2005-LP5 Class XP, 0.4391% 5/10/43 (g)(i) | | 5,873,922 | | 2,203 |
Series 2006-CN2A Class E, 5.7556% 2/5/19 (d)(g) | | 630,000 | | 597,747 |
Commercial Mortgage pass-thru certificates: | | | | |
Series 2004-LB4A Class A5, 4.84% 10/15/37 | | 3,510,000 | | 3,730,993 |
Series 2011-STRT Class A, 2.555% 12/10/24 (d) | | 1,170,000 | | 1,173,413 |
Credit Suisse Commercial Mortgage Trust: | | | | |
sequential payer Series 2007-C3 Class A2, 5.9018% 6/15/39 (g) | | 554,446 | | 556,106 |
Series 2006-C5 Class ASP, 0.8652% 12/15/39 (g)(i) | | 33,856,114 | | 406,883 |
Commercial Mortgage Securities - continued |
| Principal Amount | | Value |
Credit Suisse First Boston Mortgage Securities Corp.: | | | | |
Series 2001-CK6 Class AX, 1.1089% 8/15/36 (g)(i) | | $ 2,226,326 | | $ 5,677 |
Series 2003-C4 Class A4, 5.137% 8/15/36 | | 1,140,000 | | 1,189,321 |
Series 2005-C1 Class ASP, 0.5114% 2/15/38 (d)(g)(i) | | 10,138,085 | | 193 |
Series 2005-C2 Class ASP, 0.7388% 4/15/37 (d)(g)(i) | | 8,868,679 | | 9,853 |
Credit Suisse Mortgage Capital Certificates floater Series 2007-TFL1: | | | | |
Class C: | | | | |
0.4185% 2/15/22 (d)(g) | | 236,650 | | 210,003 |
0.5185% 2/15/22 (d)(g) | | 84,521 | | 74,142 |
Class F, 0.5685% 2/15/22 (d)(g) | | 169,020 | | 146,540 |
DBUBS 2011 LC3 Series 2011-LC3A Class A1, 2.238% 8/10/44 | | 424,908 | | 434,297 |
GE Capital Commercial Mortgage Corp. Series 2001-1 Class X1, 1.5729% 5/15/33 (d)(g)(i) | | 1,141,488 | | 10,148 |
GMAC Commercial Mortgage Securities, Inc.: | | | | |
sequential payer Series 2003-C2: | | | | |
Class A1, 4.576% 5/10/40 | | 790,820 | | 811,757 |
Class A2, 5.6355% 5/10/40 (g) | | 590,000 | | 623,453 |
Series 2004-C2 Class A4, 5.301% 8/10/38 | | 1,200,000 | | 1,296,493 |
Greenwich Capital Commercial Funding Corp.: | | | | |
floater Series 2006-FL4 Class B, 0.4525% 11/5/21 (d)(g) | | 1,170,000 | | 1,136,464 |
sequential payer Series 2005-GG3 Class A2, 4.305% 8/10/42 (g) | | 705,802 | | 705,672 |
Series 2007-GG11 Class A1, 0.4565% 12/10/49 (d)(g)(i) | | 80,112,209 | | 497,176 |
GS Mortgage Securities Corp. II: | | | | |
floater: | | | | |
Series 2006-FL8A Class F, 0.7025% 6/6/20 (d)(g) | | 105,970 | | 100,040 |
Series 2007-EOP: | | | | |
Class A1, 1.1031% 3/6/20 (d)(g) | | 2,307,411 | | 2,290,106 |
Class C, 2.1455% 3/6/20 (d)(g) | | 720,000 | | 700,704 |
Class D, 2.3636% 3/6/20 (d)(g) | | 215,000 | | 208,378 |
Class E, 2.6688% 3/6/20 (d)(g) | | 360,000 | | 347,112 |
Class F, 2.8433% 3/6/20 (d)(g) | | 180,000 | | 172,836 |
Class G, 3.0177% 3/6/20 (d)(g) | | 90,000 | | 85,968 |
Class H, 3.5846% 3/6/20 (d)(g) | | 150,000 | | 143,430 |
Class J, 4.4568% 3/6/20 (d)(g) | | 215,000 | | 206,981 |
sequential payer: | | | | |
Series 2005-GG4 Class A3, 4.607% 7/10/39 | | 710,000 | | 711,116 |
Commercial Mortgage Securities - continued |
| Principal Amount | | Value |
GS Mortgage Securities Corp. II: - continued | | | | |
sequential payer Series 2004-GG2 Class A6, 5.396% 8/10/38 (g) | | $ 1,340,000 | | $ 1,447,271 |
Series 2006-GG6 Class A2, 5.506% 4/10/38 | | 363,207 | | 369,098 |
GS Mortgage Securities Trust: | | | | |
sequential payer Series 2006-GG8 Class A2, 5.479% 11/10/39 | | 1,279,426 | | 1,287,216 |
Series 2011-GC5 Class A1, 1.468% 8/10/44 (g) | | 1,047,720 | | 1,051,638 |
Series 2012-GC6 Class A1, 1.282% 1/10/45 | | 480,000 | | 481,043 |
JPMorgan Chase Commercial Mortgage Securities Corp.: | | | | |
floater Series 2011-CCHP Class A, 2.6% 7/15/28 (d)(g) | | 3,430,000 | | 3,429,695 |
sequential payer Series 2003-C1 Class A2, 4.985% 1/12/37 | | 980,000 | | 1,005,777 |
Series 2003-CB7 Class A4, 4.879% 1/12/38 (g) | | 473,009 | | 497,560 |
Series 2006-LDP7 Class A2, 6.0508% 4/15/45 (g) | | 33,019 | | 33,130 |
JPMorgan Chase Commercial Mortgage Securities Trust: | | | | |
floater Series 2006-FLA2: | | | | |
Class D, 0.4785% 11/15/18 (d)(g) | | 19,246 | | 16,936 |
Class E, 0.5285% 11/15/18 (d)(g) | | 27,273 | | 23,454 |
Class F, 0.5785% 11/15/18 (d)(g) | | 40,905 | | 34,769 |
Class G, 0.6085% 11/15/18 (d)(g) | | 35,550 | | 29,151 |
Class H, 0.7485% 11/15/18 (d)(g) | | 27,279 | | 21,277 |
sequential payer: | | | | |
Series 2005-LDP5 Class A2, 5.198% 12/15/44 | | 1,090,000 | | 1,100,133 |
Series 2007-LD11 Class A2, 5.9895% 6/15/49 (g) | | 1,077,516 | | 1,086,742 |
Series 2007-LDPX Class A2 S, 5.305% 1/15/49 | | 390,954 | | 391,036 |
LB-UBS Commercial Mortgage Trust: | | | | |
sequential payer: | | | | |
Series 2003-C3 Class A4, 4.166% 5/15/32 | | 440,000 | | 452,908 |
Series 2006-C1 Class A2, 5.084% 2/15/31 | | 944,925 | | 954,731 |
Series 2007-C6 Class A2, 5.845% 7/15/40 | | 681,118 | | 692,374 |
Series 2004-C8, 4.799% 12/15/29 | | 1,240,000 | | 1,324,279 |
Series 2005-C7 Class XCP, 0.3371% 11/15/40 (g)(i) | | 48,698,284 | | 77,966 |
Series 2006-C1 Class XCP, 0.5146% 2/15/41 (g)(i) | | 35,503,479 | | 128,913 |
Series 2006-C6 Class XCP, 0.8617% 9/15/39 (g)(i) | | 17,983,510 | | 192,495 |
Series 2007-C1 Class XCP, 0.6167% 2/15/40 (g)(i) | | 6,713,062 | | 56,860 |
Series 2007-C2 Class XCP, 0.6911% 2/15/40 (g)(i) | | 35,599,956 | | 355,893 |
Lehman Brothers Floating Rate Commercial Mortgage Trust floater Series 2006-LLFA: | | | | |
Class F, 0.5885% 9/15/21 (d)(g) | | 145,070 | | 121,158 |
Class G, 0.6085% 9/15/21 (d)(g) | | 286,588 | | 230,752 |
Class H, 0.6485% 9/15/21 (d)(g) | | 73,934 | | 56,572 |
Commercial Mortgage Securities - continued |
| Principal Amount | | Value |
Merrill Lynch Mortgage Trust: | | | | |
sequential payer Series 2005-MKB2 Class A2, 4.806% 9/12/42 | | $ 117,242 | | $ 117,446 |
Series 2005-MCP1 Class XP, 0.8267% 6/12/43 (g)(i) | | 7,848,810 | | 68,999 |
Series 2005-MKB2 Class XP, 0.4028% 9/12/42 (g)(i) | | 3,586,854 | | 10,689 |
Merrill Lynch-CFC Commercial Mortgage Trust: | | | | |
sequential payer Series 2007-9 Class A2, 5.59% 9/12/49 | | 769,747 | | 778,930 |
Series 2006-4 Class XP, 0.8109% 12/12/49 (g)(i) | | 13,440,465 | | 224,254 |
Morgan Stanley Capital I Trust: | | | | |
floater: | | | | |
Series 2006-XLF Class C, 1.449% 7/15/19 (d)(g) | | 45,397 | | 26,330 |
Series 2007-XLFA: | | | | |
Class D, 0.439% 10/15/20 (d)(g) | | 84,694 | | 76,299 |
Class E, 0.499% 10/15/20 (d)(g) | | 105,926 | | 90,130 |
Class F, 0.549% 10/15/20 (d)(g) | | 63,569 | | 48,368 |
Class G, 0.589% 10/15/20 (d)(g) | | 78,581 | | 57,433 |
Class H, 0.679% 10/15/20 (d)(g) | | 49,464 | | 28,733 |
Class J, 0.829% 10/15/20 (d)(g) | | 28,936 | | 12,034 |
Class MHRO, 0.939% 10/15/20 (d)(g) | | 21,668 | | 18,201 |
Class NHRO, 1.139% 10/15/20 (d)(g) | | 31,646 | | 25,950 |
sequential payer: | | | | |
Series 2003-IQ4 Class A2, 4.07% 5/15/40 | | 398,575 | | 408,400 |
Series 2007-IQ14 Class A2, 5.61% 4/15/49 | | 1,890,909 | | 1,947,076 |
Series 2005-HQ5 Class X2, 0.3921% 1/14/42 (g)(i) | | 8,731,786 | | 23,890 |
Series 2005-TOP17 Class X2, 0.8024% 12/13/41 (g)(i) | | 6,316,817 | | 36,050 |
Series 2011-C3 Class A1, 2.178% 7/15/49 | | 2,407,946 | | 2,448,513 |
Morgan Stanley Dean Witter Capital I Trust sequential payer Series 2003-T11 Class A4, 5.15% 6/13/41 | | 505,147 | | 524,388 |
Wachovia Bank Commercial Mortgage Trust: | | | | |
floater: | | | | |
Series 2006-WL7A: | | | | |
Class A1, 0.3751% 9/15/21 (d)(g) | | 1,832,587 | | 1,765,247 |
Class E, 0.5696% 9/15/21 (d)(g) | | 176,861 | | 138,527 |
Class F, 0.6296% 9/15/21 (d)(g) | | 238,334 | | 179,526 |
Class G, 0.6496% 9/15/21 (d)(g) | | 225,785 | | 163,300 |
Class J, 0.8896% 9/15/21 (d)(g) | | 50,198 | | 22,752 |
Series 2007-WHL8: | | | | |
Class AP1, 0.9485% 6/15/20 (d)(g) | | 11,855 | | 10,669 |
Class AP2, 1.0485% 6/15/20 (d)(g) | | 19,414 | | 17,084 |
Class F, 0.7285% 6/15/20 (d)(g) | | 376,985 | | 245,040 |
Series 2003-C9 Class A4, 5.012% 12/15/35 | | 1,490,000 | | 1,576,539 |
Commercial Mortgage Securities - continued |
| Principal Amount | | Value |
Wachovia Bank Commercial Mortgage Trust: - continued | | | | |
Series 2005-C18 Class XP, 0.488% 4/15/42 (d)(g)(i) | | $ 11,626,167 | | $ 8,069 |
Series 2006-C23 Class X, 0.2568% 1/15/45 (d)(g)(i) | | 202,200,881 | | 301,684 |
Series 2007-C30 Class XP, 0.6327% 12/15/43 (d)(g)(i) | | 35,983,383 | | 351,558 |
Series 2007-C31A Class A2, 5.421% 4/15/47 | | 767,337 | | 797,284 |
WaMu Commercial Mortgage Securities Trust sequential payer Series 2005-C1A Class AJ, 5.19% 5/25/36 (d) | | 116,486 | | 116,391 |
TOTAL COMMERCIAL MORTGAGE SECURITIES (Cost $60,798,268) |
56,628,313
|
Municipal Securities - 0.7% |
|
Illinois Gen. Oblig. Series 2010, 3.321% 1/1/13 | | 1,780,000 | | 1,814,906 |
Indiana Fin. Auth.'s Econ. Dev. Bonds (Republic Svcs., Inc. Proj.) Series A, 0.85%, tender 6/1/12 (g)(h) | | 600,000 | | 600,000 |
Kentucky Econ. Dev. Fin. Auth. Solid Waste Disp. Rev. Bonds (Republic Svcs., Inc. Proj.) Series A, 0.85%, tender 6/1/12 (g)(h) | | 1,500,000 | | 1,500,000 |
Louisville/Jefferson County Metropolitan Govt. Poll. Cont. Rev. Bonds (Louisville Gas and Electronic Co. Proj.): | | | | |
Series 2003 A, 1.9%, tender 4/2/12 (g) | | 600,000 | | 600,570 |
Series 2007 B, 1.9%, tender 6/1/12 (g) | | 600,000 | | 601,806 |
New York State Energy Research & Dev. Auth. Facilities Rev. Bonds (Consolidated Edison Co. of New York, Inc. Proj.) Series 2010 A, 1.45%, tender 11/1/12 (g)(h) | | 2,300,000 | | 2,313,524 |
Ohio Solid Waste Rev. Bonds (Republic Svcs., Inc. Proj.) 0.7%, tender 6/1/12 (g) | | 900,000 | | 900,000 |
Pennsylvania Econ. Dev. Fing. Auth. Solid Waste Disp. Rev. Bonds (Republic Svcs., Inc. Proj.) Series 2010 A, 0.85%, tender 4/2/12 (g)(h) | | 700,000 | | 700,000 |
TOTAL MUNICIPAL SECURITIES (Cost $8,978,880) |
9,030,806
|
Foreign Government and Government Agency Obligations - 0.4% |
| Principal Amount | | Value |
Ontario Province 1.375% 1/27/14 | | $ 3,750,000 | | $ 3,809,573 |
United Mexican States 6.625% 3/3/15 | | 1,300,000 | | 1,483,950 |
TOTAL FOREIGN GOVERNMENT AND GOVERNMENT AGENCY OBLIGATIONS (Cost $5,211,946) |
5,293,523
|
Commercial Paper - 0.3% |
|
Vodafone Group PLC yankee: | | | | |
1% 6/11/12 | | 1,500,000 | | 1,497,258 |
1% 6/11/12 | | 1,500,000 | | 1,497,258 |
Weatherford International Ltd. yankee 0.82% 5/14/12 | | 1,000,000 | | 998,896 |
TOTAL COMMERCIAL PAPER (Cost $3,989,708) | 3,993,412 |
Money Market Funds - 0.4% |
| Shares | | |
Fidelity Cash Central Fund, 0.12% (a)
(Cost $4,845,587) | 4,845,587 | |
4,845,587
|
TOTAL INVESTMENT PORTFOLIO - 100.0% (Cost $1,308,907,792) | 1,312,065,810 |
NET OTHER ASSETS (LIABILITIES) - 0.0% | | 22,882 |
NET ASSETS - 100% | $ 1,312,088,692 |
Futures Contracts |
| Expiration Date | | Underlying Face Amount at Value | | Unrealized Appreciation/
(Depreciation) |
Purchased |
Eurodollar Contracts |
20 Eurodollar 90 Day Index Contracts | June 2012 | | $ 19,977,500 | | $ 4,199 |
Swap Agreements |
| Expiration Date | | Notional Amount | | Value |
Credit Default Swaps |
Receive monthly notional amount multiplied by .82% and pay UBS upon credit event of Morgan Stanley ABS Capital I, Inc., par value of the notional amount of Morgan Stanley ABS Capital I, Inc. Series 2004-NC6 Class M3, 5.6413% 7/25/34 (Rating-Ca) (f) | August 2034 | | $ 64,419 | | $ (49,828) |
Receive monthly notional amount multiplied by 2.61% and pay Goldman Sachs upon credit event of Fremont Home Loan Trust, par value of the notional amount of Fremont Home Loan Trust Series 2004-A Class B3, 7.0413% 1/25/34 (Rating-C) (f) | Feb. 2034 | | 1,009 | | (942) |
Receive monthly notional amount multiplied by 3.05% and pay Merrill Lynch upon credit event of Morgan Stanley ABS Capital I, Inc., par value of the notional amount of Morgan Stanley ABS Capital I, Inc. Series 2004-NC8, Class B3, 7.2913% 9/25/34 (Rating-Ca) (f) | Oct. 2034 | | 85,210 | | (71,783) |
Receive monthly notional amount multiplied by 3.35% and pay Morgan Stanley, Inc. upon credit event of Morgan Stanley ABS Capital I, Inc., par value of the notional amount of Morgan Stanley ABS Capital I, Inc. Series 2004-HE7, Class B3, 9.01% 8/25/34 (Rating-C) (f) | Sept. 2034 | | 62,549 | | (54,535) |
| | $ 213,187 | | $ (177,088) |
Legend |
(a) Affiliated fund that is available only to investment companies and other accounts managed by Fidelity Investments. The rate quoted is the annualized seven-day yield of the fund at period end. A complete unaudited listing of the fund's holdings as of its most recent quarter end is available upon request. In addition, each Fidelity Central Fund's financial statements, which are not covered by the Fund's Report of Independent Registered Public Accounting Firm, are available on the SEC's website or upon request. |
(b) Non-income producing - Security is in default. |
(c) Security initially issued at one coupon which converts to a higher coupon at a specified date. The rate shown is the rate at period end. |
(d) Security exempt from registration under Rule 144A of the Securities Act of 1933. These securities may be resold in transactions exempt from registration, normally to qualified institutional buyers. At the end of the period, the value of these securities amounted to $140,271,565 or 10.7% of net assets. |
(e) Security or a portion of the security was pledged to cover margin requirements for futures contracts. At the period end, the value of securities pledged amounted to $9,994. |
(f) Represents a credit default swap contract in which the Fund has sold protection on the underlying reference entity. The value of each credit default swap and the credit rating can be measures of the current payment/performance risk. For the underlying reference entity, ratings disclosed are from Moody's Investors Service, Inc. Where Moody's ratings are not available, S&P ratings are disclosed and are indicated as such. All ratings are as of the report date and do not reflect subsequent changes. Where a credit rating is not disclosed, the value is used as the measure of the payment/performance risk. |
(g) Coupon rates for floating and adjustable rate securities reflect the rates in effect at period end. |
(h) Private activity obligations whose interest is subject to the federal alternative minimum tax for individuals. |
(i) Security represents right to receive monthly interest payments on an underlying pool of mortgages or assets. Principal shown is the outstanding par amount of the pool as of the end of the period. |
(j) Restricted securities - Investment in securities not registered under the Securities Act of 1933 (excluding 144A issues). At the end of the period, the value of restricted securities (excluding 144A issues) amounted to $1,136,845 or 0.1% of net assets. |
Additional information on each restricted holding is as follows: |
Security | Acquisition Date | Acquisition Cost |
Iberbond 2004 PLC 4.826% 12/24/17 | 11/30/05 | $ 1,142,771 |
Affiliated Central Funds |
Information regarding fiscal year to date income earned by the Fund from investments in Fidelity Central Funds is as follows: |
Fund | Income earned |
Fidelity Cash Central Fund | $ 1,596 |
Other Information |
The following is a summary of the inputs used, as of February 29, 2012, involving the Fund's assets and liabilities carried at fair value. The inputs or methodology used for valuing securities may not be an indication of the risk associated with investing in those securities. For more information on valuation inputs, and their aggregation into the levels used in the tables below, please refer to the Security Valuation section in the accompanying Notes to Financial Statements. |
Valuation Inputs at Reporting Date: |
Description | Total | Level 1 | Level 2 | Level 3 |
Investments in Securities: | | | | |
Corporate Bonds | $ 413,114,695 | $ - | $ 411,977,850 | $ 1,136,845 |
U.S. Government and Government Agency Obligations | 547,586,109 | - | 547,586,109 | - |
U.S. Government Agency - Mortgage Securities | 58,065,321 | - | 58,065,321 | - |
Asset-Backed Securities | 158,575,533 | - | 155,072,944 | 3,502,589 |
Collateralized Mortgage Obligations | 54,932,511 | - | 54,866,714 | 65,797 |
Commercial Mortgage Securities | 56,628,313 | - | 53,949,592 | 2,678,721 |
Municipal Securities | 9,030,806 | - | 9,030,806 | - |
Foreign Government and Government Agency Obligations | 5,293,523 | - | 5,293,523 | - |
Commercial Paper | 3,993,412 | - | 3,993,412 | - |
Money Market Funds | 4,845,587 | 4,845,587 | - | - |
Total Investments in Securities: | $ 1,312,065,810 | $ 4,845,587 | $ 1,299,836,271 | $ 7,383,952 |
Derivative Instruments: | | | | |
Assets | | | | |
Futures Contracts | $ 4,199 | $ 4,199 | $ - | $ - |
Liabilities | | | | |
Swap Agreements | $ (177,088) | $ - | $ - | $ (177,088) |
Total Derivative Instruments: | $ (172,889) | $ 4,199 | $ - | $ (177,088) |
The following is a reconciliation of Investments in Securities and Derivative Instruments for which Level 3 inputs were used in determining value: |
Investments in Securities: | |
Beginning Balance | $ 13,922,827 |
Total Realized Gain (Loss) | (2,263,407) |
Total Unrealized Gain (Loss) | 2,792,408 |
Cost of Purchases | - |
Proceeds of Sales | (2,338,000) |
Amortization/Accretion | (4,314) |
Transfers in to Level 3 | 1,387,940 |
Transfers out of Level 3 | (6,113,502) |
Ending Balance | $ 7,383,952 |
The change in unrealized gain (loss) for the period attributable to Level 3 securities held at February 29, 2012 | $ 565,793 |
Derivative Instruments: | |
Swap Agreements | |
Beginning Balance | $ (121,041) |
Total Unrealized Gain (Loss) | (56,047) |
Transfers in to Level 3 | - |
Transfers out of Level 3 | - |
Ending Balance | $ (177,088) |
Realized gain (loss) on Swap Agreements for the period | $ 3,635 |
The change in unrealized gain (loss) for the period attributable to Level 3 Swap Agreements held at February 29, 2012 | $ (56,047) |
The information used in the above reconciliation represents fiscal year to date activity for any Investments in Securities and Derivative Instruments identified as using Level 3 inputs at either the beginning or the end of the current fiscal period. Transfers in or out of Level 3 represent the beginning value of any Security or Instrument where a change in the pricing level occurred from the beginning to the end of the period. The cost of purchases and the proceeds of sales may include securities received or delivered through corporate actions or exchanges. Realized and unrealized gains (losses) disclosed in the reconciliation are included in Net Gain (Loss) on the Fund's Statement of Operations. |
Value of Derivative Instruments |
The following table is a summary of the Fund's value of derivative instruments by risk exposure as of February 29, 2012. For additional information on derivative instruments, please refer to the Derivative Instruments section in the accompanying Notes to Financial Statements. |
Risk Exposure /
Derivative Type | Value |
| Asset | Liability |
Credit Risk | | |
Swap Agreements (a) | $ - | $ (177,088) |
Interest Rate Risk | | |
Futures Contracts (b) | 4,199 | - |
Total Value of Derivatives | $ 4,199 | $ (177,088) |
(a) Value is disclosed on the Statement of Assets and Liabilities in the Swap agreements, at value line-items. |
(b) Reflects cumulative appreciation/(depreciation) on futures contracts as disclosed on the Schedule of Investments. Only the period end variation margin is separately disclosed on the Statement of Assets and Liabilities. |
Other Information |
Distribution of investments by country of issue, as a percentage of total net assets, is as follows: (Unaudited) |
United States of America | 88.9% |
United Kingdom | 3.2% |
Canada | 2.2% |
Netherlands | 1.2% |
Australia | 1.0% |
Others (Individually Less Than 1%) | 3.5% |
| 100.0% |
See accompanying notes which are an integral part of the financial statements.
Semiannual Report
Statement of Assets and Liabilities
| February 29, 2012 |
| | |
Assets | | |
Investment in securities, at value - See accompanying schedule: Unaffiliated issuers (cost $1,304,062,205) | $ 1,307,220,223 | |
Fidelity Central Funds (cost $4,845,587) | 4,845,587 | |
Total Investments (cost $1,308,907,792) | | $ 1,312,065,810 |
Cash | | 42,101 |
Receivable for investments sold | | 6,417,666 |
Receivable for swap agreements | | 628 |
Receivable for fund shares sold | | 2,390,432 |
Interest receivable | | 4,598,151 |
Distributions receivable from Fidelity Central Funds | | 922 |
Receivable for daily variation margin on futures contracts | | 1,250 |
Prepaid expenses | | 1,837 |
Total assets | | 1,325,518,797 |
| | |
Liabilities | | |
Payable for investments purchased | $ 4,584,231 | |
Payable for fund shares redeemed | 7,780,307 | |
Distributions payable | 102,806 | |
Swap agreements, at value | 177,088 | |
Accrued management fee | 346,942 | |
Distribution and service plan fees payable | 156,724 | |
Other affiliated payables | 209,326 | |
Other payables and accrued expenses | 72,681 | |
Total liabilities | | 13,430,105 |
| | |
Net Assets | | $ 1,312,088,692 |
Net Assets consist of: | | |
Paid in capital | | $ 1,355,998,540 |
Undistributed net investment income | | 68,503 |
Accumulated undistributed net realized gain (loss) on investments | | (46,963,481) |
Net unrealized appreciation (depreciation) on investments and assets and liabilities in foreign currencies | | 2,985,130 |
Net Assets | | $ 1,312,088,692 |
See accompanying notes which are an integral part of the financial statements.
Semiannual Report
Statement of Assets and Liabilities - continued
| February 29, 2012 |
| | |
Calculation of Maximum Offering Price
Class A:
Net Asset Value and redemption price per share
($219,926,870 ÷ 23,693,118 shares) | | $ 9.28 |
| | |
Maximum offering price per share (100/98.50 of $9.28) | | $ 9.42 |
Class T:
Net Asset Value and redemption price per share ($152,190,512 ÷ 16,381,885 shares) | | $ 9.29 |
| | |
Maximum offering price per share (100/98.50 of $9.29) | | $ 9.43 |
Class B:
Net Asset Value and offering price per share ($9,058,085 ÷ 974,179 shares)A | | $ 9.30 |
| | |
Class C:
Net Asset Value and offering price per share ($122,092,620 ÷ 13,136,971 shares)A | | $ 9.29 |
| | |
Institutional Class:
Net Asset Value, offering price and redemption price per share ($808,820,605 ÷ 87,062,137 shares) | | $ 9.29 |
A Redemption price per share is equal to net asset value less any applicable contingent deferred sales charge.
See accompanying notes which are an integral part of the financial statements.
Semiannual Report
Financial Statements - continued
Statement of Operations
| Six months ended February 29, 2012 |
| | |
Investment Income | | |
Interest | | $ 11,514,183 |
Income from Fidelity Central Funds | | 1,596 |
Total income | | 11,515,779 |
| | |
Expenses | | |
Management fee | $ 2,093,658 | |
Transfer agent fees | 1,048,291 | |
Distribution and service plan fees | 980,273 | |
Accounting fees and expenses | 227,686 | |
Custodian fees and expenses | 18,145 | |
Independent trustees' compensation | 2,464 | |
Registration fees | 59,587 | |
Audit | 88,962 | |
Legal | 2,217 | |
Miscellaneous | 5,223 | |
Total expenses before reductions | 4,526,506 | |
Expense reductions | (1,999) | 4,524,507 |
Net investment income (loss) | | 6,991,272 |
Realized and Unrealized Gain (Loss) Net realized gain (loss) on: | | |
Investment securities: | | |
Unaffiliated issuers | 1,349,918 | |
Swap agreements | 3,635 | |
Total net realized gain (loss) | | 1,353,553 |
Change in net unrealized appreciation (depreciation) on: Investment securities | (739,186) | |
Futures contracts | 4,199 | |
Swap agreements | (56,047) | |
Total change in net unrealized appreciation (depreciation) | | (791,034) |
Net gain (loss) | | 562,519 |
Net increase (decrease) in net assets resulting from operations | | $ 7,553,791 |
See accompanying notes which are an integral part of the financial statements.
Semiannual Report
Statement of Changes in Net Assets
| Six months ended February 29,
2012 | Year ended
August 31,
2011 |
Increase (Decrease) in Net Assets | | |
Operations | | |
Net investment income (loss) | $ 6,991,272 | $ 17,712,935 |
Net realized gain (loss) | 1,353,553 | 10,408,684 |
Change in net unrealized appreciation (depreciation) | (791,034) | (2,530,497) |
Net increase (decrease) in net assets resulting
from operations | 7,553,791 | 25,591,122 |
Distributions to shareholders from net investment income | (8,040,807) | (17,998,623) |
Share transactions - net increase (decrease) | 36,995,181 | 32,684,771 |
Total increase (decrease) in net assets | 36,508,165 | 40,277,270 |
| | |
Net Assets | | |
Beginning of period | 1,275,580,527 | 1,235,303,257 |
End of period (including undistributed net investment income of $68,503 and undistributed net investment income of $1,118,038, respectively) | $ 1,312,088,692 | $ 1,275,580,527 |
See accompanying notes which are an integral part of the financial statements.
Semiannual Report
Financial Highlights - Class A
| Six months ended
February 29, | Years ended August 31, |
| 2012 | 2011 | 2010 | 2009 | 2008 | 2007 |
Selected Per-Share Data | | | | | |
Net asset value, beginning of period | $ 9.29 | $ 9.23 | $ 8.96 | $ 8.94 | $ 9.25 | $ 9.39 |
Income from Investment Operations | | | | | | |
Net investment income (loss) E | .048 | .134 | .189 | .237 | .364 | .414 |
Net realized and unrealized gain (loss) | (.002) H | .062 | .273 | .007 | (.315) | (.154) |
Total from investment operations | .046 | .196 | .462 | .244 | .049 | .260 |
Distributions from net investment income | (.056) | (.136) | (.192) | (.224) | (.359) | (.400) |
Net asset value, end of period | $ 9.28 | $ 9.29 | $ 9.23 | $ 8.96 | $ 8.94 | $ 9.25 |
Total Return B,C,D | .50% | 2.14% | 5.21% | 2.81% | .51% | 2.79% |
Ratios to Average Net Assets F,I | | | | | |
Expenses before reductions | .70% A | .70% | .71% | .74% | .78% | .78% |
Expenses net of fee waivers, if any | .70% A | .70% | .71% | .74% | .78% | .78% |
Expenses net of all reductions | .70% A | .70% | .71% | .74% | .78% | .77% |
Net investment income (loss) | 1.05% A | 1.44% | 2.07% | 2.70% | 3.98% | 4.41% |
Supplemental Data | | | | | |
Net assets, end of period (000 omitted) | $ 219,927 | $ 250,546 | $ 254,410 | $ 265,959 | $ 342,015 | $ 412,412 |
Portfolio turnover rate G | 69% A | 204% | 217% | 318% J | 94% | 91% J |
A Annualized
B Total returns for periods of less than one year are not annualized.
C Total returns would have been lower if certain expenses had not been reduced during the applicable periods shown.
D Total returns do not include the effect of the sales charges.
E Calculated based on average shares outstanding during the period.
F Fees and expenses of any underlying Fidelity Central Funds are not included in the Fund's expense ratio. The Fund indirectly bears its proportionate share of the expenses of any underlying Fidelity Central Funds.
G Amount does not include the portfolio activity of any underlying Fidelity Central Funds.
H The amount shown for a share outstanding does not correspond with the aggregate net gain (loss) on investments for the period due to the timing of sales and repurchases of shares in relation to fluctuating market values of the investments of the Fund.
I Expense ratios reflect operating expenses of the class. Expenses before reductions do not reflect amounts reimbursed by the investment adviser or reductions from brokerage service arrangements or reductions from other expense offset arrangements and do not represent the amount paid by the class during periods when reimbursements or reductions occur. Expenses net of fee waivers reflect expenses after reimbursement by the investment adviser but prior to reductions from brokerage service arrangements or other expense offset arrangements. Expenses net of all reductions represent the net expenses paid by the class.
J The portfolio turnover rate excludes liquidations and/or redemptions executed in-kind from Affiliated Central Funds.
See accompanying notes which are an integral part of the financial statements.
Semiannual Report
Financial Highlights - Class T
| Six months ended
February 29, | Years ended August 31, |
| 2012 | 2011 | 2010 | 2009 | 2008 | 2007 |
Selected Per-Share Data | | | | | |
Net asset value, beginning of period | $ 9.29 | $ 9.24 | $ 8.97 | $ 8.94 | $ 9.26 | $ 9.40 |
Income from Investment Operations | | | | | | |
Net investment income (loss) E | .048 | .134 | .189 | .237 | .368 | .417 |
Net realized and unrealized gain (loss) | .008 | .052 | .273 | .016 | (.327) | (.154) |
Total from investment operations | .056 | .186 | .462 | .253 | .041 | .263 |
Distributions from net investment income | (.056) | (.136) | (.192) | (.223) | (.361) | (.403) |
Net asset value, end of period | $ 9.29 | $ 9.29 | $ 9.24 | $ 8.97 | $ 8.94 | $ 9.26 |
Total Return B,C,D | .60% | 2.03% | 5.20% | 2.91% | .43% | 2.82% |
Ratios to Average Net Assets F,H | | | | | |
Expenses before reductions | .71% A | .70% | .71% | .75% | .76% | .75% |
Expenses net of fee waivers, if any | .71% A | .70% | .71% | .75% | .76% | .75% |
Expenses net of all reductions | .71% A | .70% | .71% | .75% | .76% | .75% |
Net investment income (loss) | 1.05% A | 1.44% | 2.08% | 2.70% | 4.01% | 4.44% |
Supplemental Data | | | | | | |
Net assets, end of period (000 omitted) | $ 152,191 | $ 163,217 | $ 189,230 | $ 253,439 | $ 334,850 | $ 516,227 |
Portfolio turnover rate G | 69% A | 204% | 217% | 318% I | 94% | 91% I |
A Annualized
B Total returns for periods of less than one year are not annualized.
C Total returns would have been lower if certain expenses had not been reduced during the applicable periods shown.
D Total returns do not include the effect of the sales charges.
E Calculated based on average shares outstanding during the period.
F Fees and expenses of any underlying Fidelity Central Funds are not included in the Fund's expense ratio. The Fund indirectly bears its proportionate share of the expenses of any underlying Fidelity Central Funds.
G Amount does not include the portfolio activity of any underlying Fidelity Central Funds.
H Expense ratios reflect operating expenses of the class. Expenses before reductions do not reflect amounts reimbursed by the investment adviser or reductions from brokerage service arrangements or reductions from other expense offset arrangements and do not represent the amount paid by the class during periods when reimbursements or reductions occur. Expenses net of fee waivers reflect expenses after reimbursement by the investment adviser but prior to reductions from brokerage service arrangements or other expense offset arrangements. Expenses net of all reductions represent the net expenses paid by the class.
I The portfolio turnover rate excludes liquidations and/or redemptions executed in-kind from Affiliated Central Funds.
See accompanying notes which are an integral part of the financial statements.
Semiannual Report
Financial Highlights - Class B
| Six months ended
February 29, | Years ended August 31, |
| 2012 | 2011 | 2010 | 2009 | 2008 | 2007 |
Selected Per-Share Data | | | | | |
Net asset value, beginning of period | $ 9.30 | $ 9.24 | $ 8.97 | $ 8.95 | $ 9.27 | $ 9.41 |
Income from Investment Operations | | | | | | |
Net investment income (loss) E | .011 | .059 | .115 | .167 | .295 | .344 |
Net realized and unrealized gain (loss) | .007 | .062 | .273 | .007 | (.326) | (.155) |
Total from investment operations | .018 | .121 | .388 | .174 | (.031) | .189 |
Distributions from net investment income | (.018) | (.061) | (.118) | (.154) | (.289) | (.329) |
Net asset value, end of period | $ 9.30 | $ 9.30 | $ 9.24 | $ 8.97 | $ 8.95 | $ 9.27 |
Total Return B,C,D | .20% | 1.31% | 4.35% | 2.00% | (.36)% | 2.01% |
Ratios to Average Net Assets F,H | | | | | |
Expenses before reductions | 1.52% A | 1.52% | 1.52% | 1.54% | 1.55% | 1.54% |
Expenses net of fee waivers, if any | 1.52% A | 1.52% | 1.52% | 1.54% | 1.55% | 1.54% |
Expenses net of all reductions | 1.52% A | 1.52% | 1.52% | 1.54% | 1.55% | 1.53% |
Net investment income (loss) | .24% A | .63% | 1.26% | 1.91% | 3.22% | 3.65% |
Supplemental Data | | | | | | |
Net assets, end of period (000 omitted) | $ 9,058 | $ 9,337 | $ 12,587 | $ 12,579 | $ 11,617 | $ 19,895 |
Portfolio turnover rate G | 69% A | 204% | 217% | 318% I | 94% | 91% I |
A Annualized
B Total returns for periods of less than one year are not annualized.
C Total returns would have been lower if certain expenses had not been reduced during the applicable periods shown.
D Total returns do not include the effect of the contingent deferred sales charge.
E Calculated based on average shares outstanding during the period.
F Fees and expenses of any underlying Fidelity Central Funds are not included in the Fund's expense ratio. The Fund indirectly bears its proportionate share of the expenses of any underlying Fidelity Central Funds.
G Amount does not include the portfolio activity of any underlying Fidelity Central Funds.
H Expense ratios reflect operating expenses of the class. Expenses before reductions do not reflect amounts reimbursed by the investment adviser or reductions from brokerage service arrangements or reductions from other expense offset arrangements and do not represent the amount paid by the class during periods when reimbursements or reductions occur. Expenses net of fee waivers reflect expenses after reimbursement by the investment adviser but prior to reductions from brokerage service arrangements or other expense offset arrangements. Expenses net of all reductions represent the net expenses paid by the class.
I The portfolio turnover rate excludes liquidations and/or redemptions executed in-kind from Affiliated Central Funds.
See accompanying notes which are an integral part of the financial statements.
Semiannual Report
Financial Highlights - Class C
| Six months ended
February 29, | Years ended August 31, |
| 2012 | 2011 | 2010 | 2009 | 2008 | 2007 |
Selected Per-Share Data | | | | | |
Net asset value, beginning of period | $ 9.30 | $ 9.24 | $ 8.97 | $ 8.95 | $ 9.26 | $ 9.40 |
Income from Investment Operations | | | | | | |
Net investment income (loss) E | .009 | .056 | .113 | .164 | .291 | .340 |
Net realized and unrealized gain (loss) | (.002) H | .062 | .273 | .006 | (.315) | (.155) |
Total from investment operations | .007 | .118 | .386 | .170 | (.024) | .185 |
Distributions from net investment income | (.017) | (.058) | (.116) | (.150) | (.286) | (.325) |
Net asset value, end of period | $ 9.29 | $ 9.30 | $ 9.24 | $ 8.97 | $ 8.95 | $ 9.26 |
Total Return B,C,D | .07% | 1.29% | 4.33% | 1.95% | (.29)% | 1.98% |
Ratios to Average Net Assets F,H | | | | | |
Expenses before reductions | 1.55% A | 1.54% | 1.54% | 1.57% | 1.58% | 1.57% |
Expenses net of fee waivers, if any | 1.55% A | 1.54% | 1.54% | 1.57% | 1.58% | 1.57% |
Expenses net of all reductions | 1.55% A | 1.54% | 1.54% | 1.57% | 1.58% | 1.57% |
Net investment income (loss) | .20% A | .61% | 1.24% | 1.87% | 3.18% | 3.62% |
Supplemental Data | | | | | | |
Net assets, end of period (000 omitted) | $ 122,093 | $ 132,589 | $ 131,947 | $ 103,378 | $ 97,150 | $ 129,105 |
Portfolio turnover rate G | 69% A | 204% | 217% | 318% I | 94% | 91% I |
A Annualized
B Total returns for periods of less than one year are not annualized.
C Total returns would have been lower if certain expenses had not been reduced during the applicable periods shown.
D Total returns do not include the effect of the contingent deferred sales charge.
E Calculated based on average shares outstanding during the period.
F Fees and expenses of any underlying Fidelity Central Funds are not included in the Fund's expense ratio. The Fund indirectly bears its proportionate share of the expenses of any underlying Fidelity Central Funds.
G Amount does not include the portfolio activity of any underlying Fidelity Central Funds.
H Expense ratios reflect operating expenses of the class. Expenses before reductions do not reflect amounts reimbursed by the investment adviser or reductions from brokerage service arrangements or reductions from other expense offset arrangements and do not represent the amount paid by the class during periods when reimbursements or reductions occur. Expenses net of fee waivers reflect expenses after reimbursement by the investment adviser but prior to reductions from brokerage service arrangements or other expense offset arrangements. Expenses net of all reductions represent the net expenses paid by the class.
I The portfolio turnover rate excludes liquidations and/or redemptions executed in-kind from Affiliated Central Funds.
See accompanying notes which are an integral part of the financial statements.
Semiannual Report
Financial Highlights - Institutional Class
| Six months ended
February 29, | Years ended August 31, |
| 2012 | 2011 | 2010 | 2009 | 2008 | 2007 |
Selected Per-Share Data | | | | | |
Net asset value, beginning of period | $ 9.29 | $ 9.24 | $ 8.97 | $ 8.94 | $ 9.26 | $ 9.40 |
Income from Investment Operations | | | | | | |
Net investment income (loss) D | .056 | .150 | .205 | .255 | .385 | .435 |
Net realized and unrealized gain (loss) | .008 | .052 | .273 | .016 | (.324) | (.154) |
Total from investment operations | .064 | .202 | .478 | .271 | .061 | .281 |
Distributions from net investment income | (.064) | (.152) | (.208) | (.241) | (.381) | (.421) |
Net asset value, end of period | $ 9.29 | $ 9.29 | $ 9.24 | $ 8.97 | $ 8.94 | $ 9.26 |
Total Return B,C | .69% | 2.21% | 5.38% | 3.12% | .65% | 3.02% |
Ratios to Average Net Assets E,G | | | | | |
Expenses before reductions | .53% A | .53% | .53% | .54% | .54% | .55% |
Expenses net of fee waivers, if any | .53% A | .53% | .53% | .54% | .54% | .55% |
Expenses net of all reductions | .53% A | .53% | .53% | .54% | .54% | .55% |
Net investment income (loss) | 1.22% A | 1.62% | 2.25% | 2.90% | 4.23% | 4.64% |
Supplemental Data | | | | | | |
Net assets, end of period (000 omitted) | $ 808,821 | $ 719,891 | $ 647,129 | $ 618,098 | $ 589,076 | $ 361,894 |
Portfolio turnover rate F | 69% A | 204% | 217% | 318% H | 94% | 91% H |
A Annualized
B Total returns for periods of less than one year are not annualized.
C Total returns would have been lower if certain expenses had not been reduced during the applicable periods shown.
D Calculated based on average shares outstanding during the period.
E Fees and expenses of any underlying Fidelity Central Funds are not included in the Fund's expense ratio. The Fund indirectly bears its proportionate share of the expenses of any underlying Fidelity Central Funds.
F Amount does not include the portfolio activity of any underlying Fidelity Central Funds.
G Expense ratios reflect operating expenses of the class. Expenses before reductions do not reflect amounts reimbursed by the investment adviser or reductions from brokerage service arrangements or reductions from other expense offset arrangements and do not represent the amount paid by the class during periods when reimbursements or reductions occur. Expenses net of fee waivers reflect expenses after reimbursement by the investment adviser but prior to reductions from brokerage service arrangements or other expense offset arrangements. Expenses net of all reductions represent the net expenses paid by the class.
H The portfolio turnover rate excludes liquidations and/or redemptions executed in-kind from Affiliated Central Funds.
See accompanying notes which are an integral part of the financial statements.
Semiannual Report
Notes to Financial Statements
For the period ended February 29, 2012
1. Organization.
Fidelity Advisor Short Fixed-Income Fund (the Fund) is a fund of Fidelity Advisor Series II (the Trust) and is authorized to issue an unlimited number of shares. The Trust is registered under the Investment Company Act of 1940, as amended (the 1940 Act), as an open-end management investment company organized as a Massachusetts business trust. The Fund offers Class A, Class T, Class C and Institutional Class shares, each of which, along with Class B shares, has equal rights as to assets and voting privileges. Effective after the close of business on September 1, 2010, Class B shares were closed to new accounts and additional purchases, except for exchanges and reinvestments. Each class has exclusive voting rights with respect to matters that affect that class. Class B shares will automatically convert to Class A shares after a holding period of four years from the initial date of purchase. Investment income, realized and unrealized capital gains and losses, the common expenses of the Fund, and certain fund-level expense reductions, if any, are allocated on a pro-rata basis to each class based on the relative net assets of each class to the total net assets of the Fund. Each class differs with respect to transfer agent and distribution and service plan fees incurred. Certain expense reductions may also differ by class.
2. Investments in Fidelity Central Funds.
The Fund may invests in Fidelity Central Funds, which are open-end investment companies available only to other investment companies and accounts managed by FMR and its affiliates. The Fund's Schedule of Investments lists each of the Fidelity Central Funds held as of period end, if any, as an investment of the Fund, but does not include the underlying holdings of each Fidelity Central Fund. As an Investing Fund, the Fund indirectly bears its proportionate share of the expenses of the underlying Fidelity Central Funds.
The Money Market Central Funds seek preservation of capital and current income and are managed by Fidelity Investments Money Management, Inc. (FIMM), an affiliate of FMR.
A complete unaudited list of holdings for each Fidelity Central Fund is available upon request or at the Securities and Exchange Commission (the SEC) web site at www.sec.gov. In addition, the financial statements of the Fidelity Central Funds, which are not covered by the Fund's Report of Independent Registered Public Accounting Firm, are available on the SEC web site or upon request.
Semiannual Report
3. Significant Accounting Policies.
The financial statements have been prepared in conformity with accounting principles generally accepted in the United States of America (GAAP), which require management to make certain estimates and assumptions at the date of the financial statements. Actual results could differ from those estimates. Subsequent events, if any, through the date that the financial statements were issued have been evaluated in the preparation of the financial statements. The following summarizes the significant accounting policies of the Fund:
Security Valuation. Investments are valued as of 4:00 p.m. Eastern time on the last calendar day of the period. The Fund uses independent pricing services approved by the Board of Trustees to value its investments. When current market prices or quotations are not readily available or reliable, valuations may be determined in good faith in accordance with procedures adopted by the Board of Trustees. Factors used in determining value may include market or security specific events, changes in interest rates and credit quality. The frequency with which these procedures are used cannot be predicted and they may be utilized to a significant extent. The value used for net asset value (NAV) calculation under these procedures may differ from published prices for the same securities.
The Fund categorizes the inputs to valuation techniques used to value its investments into a disclosure hierarchy consisting of three levels as shown below:
Level 1 - quoted prices in active markets for identical investments
Level 2 - other significant observable inputs (including quoted prices for similar investments, interest rates, prepayment speeds, etc.)
Level 3 - unobservable inputs (including the Fund's own assumptions based on the best information available)
Changes in valuation techniques may result in transfers in or out of an assigned level within the disclosure hierarchy. The aggregate value of investments by input level, as of February 29, 2012 for the Fund's investments, as well as a roll forward of Level 3 securities, is included at the end of the Fund's Schedule of Investments. Valuation techniques used to value the Fund's investments by major category are as follows:
Debt securities, including restricted securities, are valued based on evaluated prices received from independent pricing services or from dealers who make markets in such securities. For corporate bonds, foreign government and government agency obligations, municipal securities, U.S. government and government agency obligations and commercial paper, pricing services utilize matrix pricing which considers yield or price of bonds of comparable quality, coupon, maturity and type as well as dealer supplied prices and
Semiannual Report
Notes to Financial Statements - continued
3. Significant Accounting Policies - continued
Security Valuation - continued
are generally categorized as Level 2 in the hierarchy. For asset backed securities, collateralized mortgage obligations, commercial mortgage securities and U.S. government agency mortgage securities, pricing services utilize matrix pricing which considers prepayment speed assumptions, attributes of the collateral, yield or price of bonds of comparable quality, coupon, maturity and type as well as dealer supplied prices and, accordingly, such securities are generally categorized as Level 2 in the hierarchy. Swaps are marked-to-market daily based on valuations from independent pricing services or dealer-supplied valuations and changes in value are recorded as unrealized appreciation (depreciation). Pricing services utilize matrix pricing which considers comparisons to interest rate curves, credit spread curves, default possibilities and recovery rates and, as a result, swaps are generally categorized as Level 2 in the hierarchy. When independent prices are unavailable or unreliable, debt securities and swaps may be valued utilizing pricing matrices which consider similar factors that would be used by independent pricing services. These are generally categorized as Level 2 in the hierarchy but may be Level 3 depending on the circumstances.
Futures contracts are valued at the settlement price established each day by the board of trade or exchange on which they are traded and are categorized as Level 1 in the hierarchy. Investments in open-end mutual funds, including the Fidelity Central Funds, are valued at their closing net asset value each business day and are categorized as Level 1 in the hierarchy. Short-term securities with remaining maturities of sixty days or less may be valued at amortized cost, which approximates fair value, and are categorized as Level 2 in the hierarchy.
New Accounting Pronouncements. In May 2011, the Financial Accounting Standards Board issued Accounting Standard Update No. 2011-04, Fair Value Measurement (Topic 820) - Amendments to Achieve Common Fair Value Measurement and Disclosure Requirements in U.S. GAAP and IFRSs. The update is effective during interim and annual periods beginning after December 15, 2011 and will result in additional disclosure for transfers between levels as well as expanded disclosure for securities categorized as Level 3 under the fair value hierarchy.
In December 2011, the Financial Accounting Standards Board issued Accounting Standard Update No. 2011-11, Disclosures about Offsetting Assets and Liabilities. The update creates new disclosure requirements requiring entities to disclose both gross and net information for derivatives and other financial instruments that are either offset in the Statement of Assets and Liabilities or subject to an enforceable master netting arrangement or similar agreement. The disclosure requirements are effective for interim and annual reporting periods beginning on or after January 1, 2013. Management is currently evaluating the impact of the update's adoption on the Fund's financial statement disclosures.
Semiannual Report
3. Significant Accounting Policies - continued
Investment Transactions and Income. For financial reporting purposes, the Fund's investment holdings and NAV include trades executed through the end of the last business day of the period. The NAV per share for processing shareholder transactions is calculated as of the close of business of the New York Stock Exchange (NYSE), normally 4:00 p.m. Eastern time and includes trades executed through the end of the prior business day. Gains and losses on securities sold are determined on the basis of identified cost and may include proceeds received from litigation. Interest income and distributions from the Fidelity Central Funds are accrued as earned. Interest income includes coupon interest and amortization of premium and accretion of discount on debt securities. The principal amount on inflation-indexed securities is periodically adjusted to the rate of inflation and interest is accrued based on the principal amount. The adjustments to principal due to inflation are reflected as increases or decreases to interest income even though principal is not received until maturity. Debt obligations may be placed on non-accrual status and related interest income may be reduced by ceasing current accruals and writing off interest receivables when the collection of all or a portion of interest has become doubtful based on consistently applied procedures. A debt obligation is removed from non-accrual status when the issuer resumes interest payments or when collectability of interest is reasonably assured.
Expenses. Expenses directly attributable to a fund are charged to that fund. Expenses attributable to more than one fund are allocated among the respective funds on the basis of relative net assets or other appropriate methods. Expense estimates are accrued in the period to which they relate and adjustments are made when actual amounts are known.
Income Tax Information and Distributions to Shareholders. Each year, the Fund intends to qualify as a regulated investment company under Subchapter M of the Internal Revenue Code, including distributing substantially all of its taxable income and realized gains. As a result, no provision for income taxes is required. The Fund files a U.S. federal tax return, in addition to state and local tax returns as required. A fund's federal income tax returns are subject to examination by the Internal Revenue Service (IRS) for a period of three fiscal years after they are filed. State and local tax returns may be subject to examination for an additional fiscal year depending on the jurisdiction.
Dividends are declared and recorded daily and paid monthly from net investment income. Distributions from realized gains, if any, are declared and recorded on the ex-dividend date. Income dividends and capital gain distributions are declared separately for each class. Income and capital gain distributions are determined in accordance with income tax regulations, which may differ from GAAP.
Capital accounts within the financial statements are adjusted for permanent book-tax differences. These adjustments have no impact on net assets or the results of operations. Temporary book-tax differences will reverse in a subsequent period.
Semiannual Report
Notes to Financial Statements - continued
3. Significant Accounting Policies - continued
Income Tax Information and Distributions to Shareholders - continued
Book-tax differences are primarily due to swap agreements, market discount, deferred trustees compensation, capital loss carryforwards and losses deferred due to wash sales.
The federal tax cost of investment securities and unrealized appreciation (depreciation) as of period end were as follows:
Gross unrealized appreciation | $ 17,503,655 |
Gross unrealized depreciation | (13,841,663) |
Net unrealized appreciation (depreciation) on securities and other investments | $ 3,661,992 |
| |
Tax cost | $ 1,308,403,818 |
Capital loss carryforwards are only available to offset future capital gains of the Fund to the extent provided by regulations and may be limited. Under the Regulated Investment Company Modernization Act of 2010 (the Act), the Fund is permitted to carry forward capital losses incurred in taxable years beginning after December 22, 2010 for an unlimited period and such capital losses are required to be used prior to any losses that expire. At August 31, 2011, capital loss carryforwards were as follows:
Fiscal year of expiration | |
2014 | $ (666,090) |
2015 | (1,110,250) |
2016 | (1,361,959) |
2017 | (28,600,668) |
2018 | (16,553,917) |
Total capital loss carryforward | $ (48,292,884) |
4. Operating Policies.
Restricted Securities. The Fund may invest in securities that are subject to legal or contractual restrictions on resale. These securities generally may be resold in transactions exempt from registration or to the public if the securities are registered. Disposal of these securities may involve time-consuming negotiations and expense, and prompt sale at an acceptable price may be difficult. Information regarding restricted securities is included at the end of the Fund's Schedule of Investments.
Semiannual Report
5. Derivative Instruments.
Risk Exposures and the Use of Derivative Instruments. The Fund used derivative instruments (derivatives), including futures contracts and swap agreements, in order to meet its investment objectives. The strategy is to use derivatives to increase returns, to gain exposure to certain types of assets and to manage exposure to certain risks as defined below. The success of any strategy involving derivatives depends on analysis of numerous economic factors, and if the strategies for investment do not work as intended, the Fund may not achieve its objectives.
The Fund's use of derivatives increased or decreased its exposure to the following risks:
Credit Risk | Credit risk relates to the ability of the issuer of a financial instrument to make further principal or interest payments on an obligation or commitment that it has to the Fund. |
Interest Rate Risk | Interest rate risk relates to the fluctuations in the value of interest-bearing securities due to changes in the prevailing levels of market interest rates. |
The Fund is also exposed to additional risks from investing in derivatives, such as liquidity risk and counterparty credit risk. Liquidity risk is the risk that the Fund will be unable to close out the derivative in the open market in a timely manner. Counterparty credit risk is the risk that the counterparty will not be able to fulfill its obligation to the Fund. Derivative counterparty credit risk is managed through formal evaluation of the creditworthiness of all potential counterparties. On certain over-the-counter (OTC) derivatives such as swap agreements, the Fund attempts to reduce its exposure to counterparty credit risk by entering into an International Swaps and Derivatives Association (ISDA) Master Agreement on a bilateral basis with each of its counterparties. The ISDA Master Agreement gives the Fund the right to terminate all transactions traded under such agreement if there is a certain deterioration in the credit quality of the counterparty. The ISDA Master Agreement gives each party the right, upon an event of default by the other party or a termination of the agreement, to close out all transactions traded under such agreement and to net amounts owed under each transaction to one net payable by one party to the other. To mitigate counterparty credit risk on OTC derivatives, the Fund receives collateral in the form of cash or securities once the Fund's net unrealized appreciation on outstanding derivative contracts under an ISDA Master Agreement exceeds certain applicable thresholds, subject to certain minimum transfer provisions. The collateral received is held in segregated accounts with the Fund's custodian bank in accordance with the collateral agreements entered into between the Fund, the counterparty and the Fund's custodian bank. The Fund could experience delays and costs in gaining access to the collateral even though it is held by the Fund's custodian bank. The Fund's maximum risk of loss from counterparty credit risk related to OTC derivatives is generally the aggregate unrealized appreciation and unpaid counterparty payments in excess of any collateral pledged by the counterparty to the Fund.
Semiannual Report
Notes to Financial Statements - continued
5. Derivative Instruments - continued
Risk Exposures and the Use of Derivative Instruments - continued
Futures contracts are not covered by the ISDA Master Agreement, however, counterparty credit risk related to exchange-traded futures contracts is minimal because of the protection provided by the exchange on which they trade. Derivatives involve, to varying degrees, risk of loss in excess of the amounts recognized in the Statement of Assets and Liabilities.
Net Realized Gain (Loss) and Change in Net Unrealized Appreciation (Depreciation) on Derivatives. The table below, which reflects the impacts of derivatives on the financial performance of the Fund, summarizes the net realized gain (loss) and change in net unrealized appreciation (depreciation) for derivatives during the period.
Risk Exposure / Derivative Type | Net Realized Gain (Loss) | Change in Net Unrealized Appreciation (Depreciation) |
Credit Risk | | |
Swap Agreements | $ 3,635 | $ (56,047) |
Interest Rate Risk | | |
Futures Contracts | - | 4,199 |
Totals (a)(b) | $ 3,635 | $ (51,848) |
(a) A summary of the value of derivatives by risk exposure as of period end, is included at the end of the Schedule of Investments and is representative of activity for the period.
(b) Total derivatives change in net unrealized appreciation (depreciation) included in the Statement of Operations is comprised of $4,199 for futures contracts and $(56,047) for swap agreements.
Futures Contracts. A futures contract is an agreement between two parties to buy or sell a specified underlying instrument for a fixed price at a specified future date. The Fund used futures contracts to manage its exposure to the bond market, and to fluctuations in interest rates.
Upon entering into a futures contract, a fund is required to deposit either cash or securities (initial margin) with a clearing broker in an amount equal to a certain percentage of the face value of the contract. Futures contracts are marked-to-market daily and subsequent payments are made or received by a fund depending on the daily fluctuations in the value of the futures contracts and are recorded as unrealized appreciation or (depreciation). This receivable and/or payable is included in daily variation margin on futures contracts in the Statement of Assets and Liabilities. Realized gain or (loss) is recorded upon the expiration or closing of a futures contract. The net realized gain (loss) and change in net unrealized appreciation (depreciation) on futures contracts during the period is included in the Statement of Operations.
Semiannual Report
5. Derivative Instruments - continued
Futures Contracts - continued
The underlying face amount at value of open futures contracts at period end is shown in the Schedule of Investments under the caption "Futures Contracts." This amount reflects each contract's exposure to the underlying instrument at period end. Securities deposited to meet initial margin requirements are identified in the Schedule of Investments.
Swap Agreements. A swap agreement (swap) is a contract between two parties to exchange future cash flows at periodic intervals based on a notional principal amount.
Details of swaps open at period end are included in the Schedule of Investments under the caption "Swap Agreements." Swaps are marked-to-market daily and changes in value are recorded as unrealized appreciation or (depreciation) and reflected in the Statement of Assets and Liabilities. Any upfront premiums paid or received upon entering a swap to compensate for differences between stated terms of the agreement and prevailing market conditions (e.g. credit spreads, interest rates or other factors) are recorded as realized gain or (loss) ratably over the term of the swap. Payments are exchanged at specified intervals, accrued daily commencing with the effective date of the contract and recorded as realized gain or (loss). Realized gain or (loss) is also recorded in the event of an early termination of a swap. The net realized gain (loss) and change in net unrealized appreciation (depreciation) on swaps during the period is included in the Statement of Operations.
Credit Default Swaps. Credit default swaps enable the Fund to buy or sell protection on a debt security or a basket of securities against a defined credit event. Under the terms of a credit default swap the buyer of protection (buyer) receives credit protection in exchange for making periodic payments to the seller of protection (seller) based on a fixed percentage applied to a notional principal amount. In return for these payments, the seller acts as a guarantor of the creditworthiness of a reference obligation. The Fund enters into credit default swaps as a seller to gain credit exposure to an issuer and/or as a buyer to provide a measure of protection against defaults of an issuer. The issuer may be either a single issuer or a "basket" of issuers. Periodic payments are made over the life of the contract provided that no credit event occurs.
For credit default swaps on most corporate and sovereign issuers, credit events include bankruptcy, failure to pay, obligation acceleration or repudiation/moratorium. For credit default swaps on corporate or sovereign issuers, the obligation that may be put to the seller is not limited to the specific reference obligation described in the Schedule of Investments. For credit default swaps on asset-backed securities, a credit event may be triggered by events such as failure to pay principal, maturity extension, rating downgrade or write-down. For credit default swaps on asset-backed securities, the reference obligation described represents the security that may be put to the seller.
Semiannual Report
Notes to Financial Statements - continued
5. Derivative Instruments - continued
Credit Default Swaps - continued
As a seller, if an underlying credit event occurs, the Fund will either pay the buyer an amount equal to the notional amount of the swap and take delivery of the reference obligation or underlying securities comprising an index or pay a net settlement amount of cash equal to the notional amount of the swap less the recovery value of the reference obligation or underlying securities comprising an index.
As a buyer, if an underlying credit event occurs, the Fund will either receive from the seller an amount equal to the notional amount of the swap and deliver the reference obligation or underlying securities comprising an index or receive a net settlement amount of cash equal to the notional amount of the swap less the recovery value of the reference obligation or underlying securities comprising an index.
Typically, the value of each credit default swap and credit rating disclosed for each reference obligation in the Schedule of Investments, where the Fund is the seller, can be used as measures of the current payment/performance risk of the swap. As the value of the swap changes as a positive or negative percentage of the total notional amount, the payment/performance risk may decrease or increase, respectively. In addition to these measures, FMR monitors a variety of factors including cash flow assumptions, market activity and market sentiment as part of its ongoing process of assessing payment/performance risk.
The notional amount of credit default swaps is included in the Schedule of Investments and approximates the maximum potential amount of future payments that the Fund could be required to make if the Fund is the seller and a credit event were to occur. The total notional amount of all credit default swaps open at period end where the Fund is the seller amounted to $213,187 representing 0.02% of net assets.
6. Purchases and Sales of Investments.
Purchases and sales of securities, other than short-term securities and U.S. government securities, aggregated $215,794,690 and $108,661,244, respectively.
7. Fees and Other Transactions with Affiliates.
Management Fee. FMR and its affiliates provide the Fund with investment management related services for which the Fund pays a monthly management fee. The management fee is the sum of an individual fund fee rate that is based on an annual rate of .20% of the Fund's average net assets and an annualized group fee rate that averaged .12% during the period. The group fee rate is based upon the average net assets of all the mutual funds advised by FMR. The group fee rate decreases as assets under management increase and increases as assets under management decrease. For the period, the total annualized management fee rate was .32% of the Fund's average net assets.
Semiannual Report
7. Fees and Other Transactions with Affiliates - continued
Distribution and Service Plan Fees. In accordance with Rule 12b-1 of the 1940 Act, the Fund has adopted separate Distribution and Service Plans for each class of shares. Certain classes pay Fidelity Distributors Corporation (FDC), an affiliate of FMR, separate Distribution and Service Fees, each of which is based on an annual percentage of each class' average net assets. In addition, FDC may pay financial intermediaries for selling shares of the Fund and providing shareholder support services. For the period, the Distribution and Service Fee rates, total fees and amounts retained by FDC were as follows:
| Distribution
Fee | Service
Fee | Total Fees | Retained
by FDC |
Class A | -% | .15% | $ 171,793 | $ 5,274 |
Class T | -% | .15% | 119,079 | 1,322 |
Class B | .65% | .25% | 43,512 | 31,456 |
Class C | .75% | .25% | 645,889 | 92,061 |
| | | $ 980,273 | $ 130,113 |
Sales Load. FDC may receive a front-end sales charge of up to 1.50% for selling Class A and Class T shares, some of which is paid to financial intermediaries for selling shares of the Fund. Depending on the holding period, FDC may receive a contingent deferred sales charges levied on Class A, Class T, Class B and Class C redemptions. The deferred sales charges range from 3.00% to 1.00% for Class B, 1.00% for Class C, .75% or .50% for certain purchases of Class A shares and .25% for certain purchases of Class T shares.
For the period, sales charge amounts retained by FDC were as follows:
| Retained
by FDC |
Class A | $ 18,366 |
Class T | 5,512 |
Class B* | 6,564 |
Class C* | 9,636 |
| $ 40,078 |
* When Class B and Class C shares are initially sold, FDC pays commissions from its own resources to financial intermediaries through which the sales are made.
Semiannual Report
Notes to Financial Statements - continued
7. Fees and Other Transactions with Affiliates - continued
Transfer Agent Fees. Fidelity Investments Institutional Operations Company, Inc. (FIIOC), an affiliate of FMR, is the transfer, dividend disbursing and shareholder servicing agent for each class of the Fund. FIIOC receives account fees and asset-based fees that vary according to the account size and type of account of the shareholders of the respective classes of the Fund. FIIOC pays for typesetting, printing and mailing of shareholder reports, except proxy statements. For the period, transfer agent fees for each class were as follows:
| Amount | % of
Average
Net Assets* |
Class A | $ 195,108 | .17 |
Class T | 139,065 | .18 |
Class B | 11,173 | .23 |
Class C | 105,023 | .16 |
Institutional Class | 597,922 | .15 |
| $ 1,048,291 | |
* Annualized
Accounting Fees. Fidelity Service Company, Inc. (FSC), an affiliate of FMR, maintains the Fund's accounting records. The fee is based on the level of average net assets for each month.
8. Committed Line of Credit.
The Fund participates with other funds managed by FMR or an affiliate in a $4.0 billion credit facility (the "line of credit") to be utilized for temporary or emergency purposes to fund shareholder redemptions or for other short-term liquidity purposes. The Fund has agreed to pay commitment fees on its pro-rata portion of the line of credit, which amounted to $1,811 and is reflected in Miscellaneous expenses on the Statement of Operations. During the period, there were no borrowings on this line of credit.
9. Expense Reductions.
Through arrangements with the Fund's custodian, credits realized as a result of uninvested cash balances were used to reduce the Fund's expenses. During the period, these credits reduced the Fund's expenses by $1,999.
Semiannual Report
10. Distributions to Shareholders.
Distributions to shareholders of each class were as follows:
| Six months ended
February 29, 2012 | Year ended
August 31, 2011 |
From net investment income | | |
Class A | $ 1,381,558 | $ 3,589,797 |
Class T | 954,719 | 2,571,175 |
Class B | 18,953 | 68,023 |
Class C | 233,547 | 778,830 |
Institutional Class | 5,452,030 | 10,990,798 |
Total | $ 8,040,807 | $ 17,998,623 |
11. Share Transactions.
Transactions for each class of shares were as follows:
| Shares | Dollars |
| Six months ended February 29,
2012 | Year ended
August 31,
2011 | Six months ended
February 29,
2012 | Year ended
August 31,
2011 |
Class A | | | | |
Shares sold | 5,581,749 | 12,640,586 | $ 51,663,992 | $ 116,964,068 |
Reinvestment of distributions | 125,043 | 326,685 | 1,157,466 | 3,020,597 |
Shares redeemed | (8,992,414) | (13,556,554) | (83,204,618) | (125,303,809) |
Net increase (decrease) | (3,285,622) | (589,283) | $ (30,383,160) | $ (5,319,144) |
Class T | | | | |
Shares sold | 2,442,795 | 5,179,009 | $ 22,608,483 | $ 47,931,812 |
Reinvestment of distributions | 91,303 | 245,526 | 845,769 | 2,271,746 |
Shares redeemed | (3,712,584) | (8,352,254) | (34,393,208) | (77,237,420) |
Net increase (decrease) | (1,178,486) | (2,927,719) | $ (10,938,956) | $ (27,033,862) |
Class B | | | | |
Shares sold | 227,192 | 401,646 | $ 2,104,782 | $ 3,725,761 |
Reinvestment of distributions | 1,706 | 5,898 | 15,815 | 54,610 |
Shares redeemed | (258,443) | (765,462) | (2,396,318) | (7,079,431) |
Net increase (decrease) | (29,545) | (357,918) | $ (275,721) | $ (3,299,060) |
Class C | | | | |
Shares sold | 2,071,600 | 6,716,368 | $ 19,201,570 | $ 62,282,145 |
Reinvestment of distributions | 19,674 | 62,961 | 182,239 | 582,567 |
Shares redeemed | (3,213,887) | (6,800,176) | (29,781,558) | (62,900,715) |
Net increase (decrease) | (1,122,613) | (20,847) | $ (10,397,749) | $ (36,003) |
Institutional Class | | | | |
Shares sold | 26,135,518 | 26,140,873 | $ 242,026,308 | $ 241,890,765 |
Reinvestment of distributions | 558,173 | 1,118,484 | 5,170,979 | 10,350,571 |
Shares redeemed | (17,084,122) | (19,871,997) | (158,206,520) | (183,868,496) |
Net increase (decrease) | 9,609,569 | 7,387,360 | $ 88,990,767 | $ 68,372,840 |
Semiannual Report
Notes to Financial Statements - continued
12. Other.
The Fund's organizational documents provide former and current trustees and officers with a limited indemnification against liabilities arising in connection with the performance of their duties to the Fund. In the normal course of business, the Fund may also enter into contracts that provide general indemnifications. The Fund's maximum exposure under these arrangements is unknown as this would be dependent on future claims that may be made against the Fund. The risk of material loss from such claims is considered remote.
13. Credit Risk.
The Fund invests a portion of its assets in structured securities of issuers backed by residential mortgage loans, credit card receivables and automotive loans. The value and related income of these securities is sensitive to changes in economic conditions, including delinquencies and/or defaults.
Semiannual Report
To the Trustees of Fidelity Advisor Series II and Shareholders of Fidelity Advisor Short Fixed-Income Fund:
We have audited the accompanying statement of assets and liabilities of Fidelity Advisor Short Fixed-Income Fund (the Fund), a fund of Fidelity Advisor Series II, including the schedule of investments, as of February 29, 2012, and the related statement of operations for the six months then ended, the statements of changes in net assets for the six months ended February 29, 2012 and for the year ended August 31, 2011, and the financial highlights for the six months ended February 29, 2012 and for each of the five years in the period ended August 31, 2011. These financial statements and financial highlights are the responsibility of the Fund's management. Our responsibility is to express an opinion on these financial statements and financial highlights based on our audits.
We conducted our audits in accordance with the standards of the Public Company Accounting Oversight Board (United States). Those standards require that we plan and perform the audit to obtain reasonable assurance about whether the financial statements and financial highlights are free of material misstatement. The Fund is not required to have, nor were we engaged to perform, an audit of its internal control over financial reporting. Our audits included consideration of internal control over financial reporting as a basis for designing audit procedures that are appropriate in the circumstances, but not for the purpose of expressing an opinion on the effectiveness of the Fund's internal control over financial reporting. Accordingly, we express no such opinion. An audit also includes examining, on a test basis, evidence supporting the amounts and disclosures in the financial statements, assessing the accounting principles used and significant estimates made by management, as well as evaluating the overall financial statement presentation. Our procedures included confirmation of securities owned as of February 29, 2012, by correspondence with the custodians and brokers; where replies were not received from brokers, we performed other auditing procedures. We believe that our audits provide a reasonable basis for our opinion.
In our opinion, the financial statements and financial highlights referred to above present fairly, in all material respects, the financial position of Fidelity Advisor Short Fixed-Income Fund as of February 29, 2012, the results of its operations for the six months then ended, the changes in its net assets for the six months ended February 29, 2012 and for the year ended August 31, 2011, and the financial highlights for the six months ended February 29, 2012 and for each of the five years in the period ended August 31, 2011, in conformity with accounting principles generally accepted in the United States of America.
/s/ Deloitte & Touche LLP
DELOITTE & TOUCHE LLP
Boston, Massachusetts
April 17, 2012
Semiannual Report
Board Approval of Investment Advisory Contracts and Management Fees
Fidelity Advisor Short Fixed-Income Fund
Each year, the Board of Trustees, including the Independent Trustees (together, the Board), votes on the renewal of the management contract and sub-advisory agreements (together, the Advisory Contracts) for the fund. The Board, assisted by the advice of fund counsel and Independent Trustees' counsel, requests and considers a broad range of information relevant to the renewal of the Advisory Contracts throughout the year.
The Board meets regularly and considers at each of its meetings factors that are relevant to its annual consideration of the renewal of the fund's Advisory Contracts, including the services and support provided to the fund and its shareholders. The Board has established three standing committees, Operations, Audit, and Nominating and Governance, each composed of Independent Trustees with varying backgrounds, to which the Board has assigned specific subject matter responsibilities in order to enhance effective decision-making by the Board. The Operations Committee, of which all of the Independent Trustees are members, meets regularly throughout the year and, among other matters, considers matters specifically related to the annual consideration of the renewal of the fund's Advisory Contracts. The Board, acting directly and through its Committees, requests and receives information concerning the annual consideration of the renewal of the fund's Advisory Contracts. The Board also meets as needed to consider matters specifically related to the Board's annual consideration of the renewal of Advisory Contracts. Members of the Board may also meet with trustees of other Fidelity funds through ad hoc joint committees to discuss certain matters relevant to the Fidelity funds.
At its September 2011 meeting, the Board of Trustees, including the Independent Trustees, unanimously determined to renew the fund's Advisory Contracts. In reaching its determination, the Board considered all factors it believed relevant, including (i) the nature, extent, and quality of the services to be provided to the fund and its shareholders (including the investment performance of the fund); (ii) the competitiveness of the fund's management fee and total expense ratio; (iii) the total costs of the services to be provided by and the profits to be realized by Fidelity from its relationship with the fund; (iv) the extent to which economies of scale would be realized as the fund grows; and (v) whether fee levels reflect these economies of scale, if any, for the benefit of fund shareholders.
In considering whether to renew the Advisory Contracts for the fund, the Board reached a determination, with the assistance of fund counsel and Independent Trustees' counsel and through the exercise of its business judgment, that the renewal of the Advisory Contracts is in the best interests of the fund and its shareholders and that the compensation payable under the Advisory Contracts is fair and reasonable. The Board's decision to renew the Advisory Contracts was not based on any single factor, but rather was based on a comprehensive consideration of all the information provided to the Board at its meetings throughout the year. The Board, in reaching its determination to renew the Advisory Contracts, is aware that shareholders in the fund have a broad range of investment choices available to them, including a wide choice among mutual funds offered by Fidelity's competitors, and that the fund's shareholders, who have the opportunity to review and weigh the disclosure provided by the fund in its prospectus and other public disclosures, have chosen to invest in this fund, managed by Fidelity.
Semiannual Report
Nature, Extent, and Quality of Services Provided. The Board considered the staffing within the investment adviser, FMR, and the sub-advisers (together, the Investment Advisers), including the backgrounds of the fund's investment personnel and the fund's investment objective and discipline. The Independent Trustees also had discussions with senior management of Fidelity's investment operations and investment groups. The Board considered the structure of the portfolio manager compensation program and whether this structure provides appropriate incentives to act in the best interests of the fund.
Resources Dedicated to Investment Management and Support Services. The Board reviewed the general qualifications and capabilities of the Investment Advisers' investment staff, including its size, education, experience, and resources, as well as the Investment Advisers' approach to recruiting, managing, and compensating investment personnel. The Board also noted that FMR has devoted increased resources to non-U.S. offices. The Board noted that Fidelity's analysts have extensive resources, tools and capabilities which allow them to conduct sophisticated quantitative and fundamental analysis, as well as credit analysis of issuers, counterparties and enhancers. The Board also believes that Fidelity's investment professionals have sufficient access to global information and data so as to provide competitive investment results over time, and that those professionals also have access to sophisticated tools which permit them to assess portfolio construction and risk and performance attribution characteristics continuously, as well as to transmit new information and research conclusions rapidly around the world. Additionally, in its deliberations, the Board considered the Investment Advisers' trading capabilities and resources which are an integral part of the investment management process.
Shareholder and Administrative Services. The Board considered (i) the nature, extent, quality, and cost of advisory, administrative, and shareholder services performed by the Investment Advisers and their affiliates under the Advisory Contracts and under separate agreements covering transfer agency, pricing and bookkeeping, and securities lending services for the fund; (ii) the nature and extent of the investment adviser's supervision of third party service providers, principally custodians and subcustodians; and (iii) the resources devoted to, and the record of compliance with, the fund's compliance policies and procedures.
The Board noted that the growth of fund assets over time across the complex allows Fidelity to reinvest in the development of services designed to enhance the value or convenience of the Fidelity funds as investment vehicles. These services include 24-hour access to account information and market information through telephone representatives and over the Internet, investor education materials and asset allocation tools, and the expanded availability of Fidelity Investor Centers, with 35 new branches opening since 2010.
Semiannual Report
Board Approval of Investment Advisory Contracts and
Management Fees - continued
Investment in a Large Fund Family. The Board considered the benefits to shareholders of investing in a Fidelity fund, including the benefits of investing in a fund that is part of a large family of funds offering a variety of investment disciplines and providing a large variety of mutual fund investor services. The Board noted that Fidelity had taken, or had made recommendations that resulted in the Fidelity funds taking, a number of actions over the previous year that benefited particular funds, including (i) continuing to dedicate additional resources to investment research and support of the senior management team that oversees asset management; (ii) rationalizing product lines through the mergers of six funds into other funds; (iii) continuing to migrate the Freedom Funds to dedicated lower cost underlying funds; (iv) obtaining shareholder approval to broaden the investment strategies for Fidelity Consumer Finance Portfolio, Fidelity Emerging Asia Fund, and Fidelity Environment and Alternative Energy Portfolio; (v) contractually agreeing to reduce the management fees and impose other expense limitations on Spartan 500 Index Fund and U.S. Bond Index Fund in connection with launching new institutional classes of these funds; (vi) changing the name, primary and supplemental benchmarks, and investment policies of Fidelity Global Strategies Fund to support the fund's flexible investment mandate and global orientation; and (vii) reducing the transfer agency account fee rates on certain accounts.
Investment Performance. The Board considered whether the fund has operated in accordance with its investment objective, as well as its record of compliance with its investment restrictions. It also reviewed the fund's absolute investment performance for each class, as well as the fund's relative investment performance for each class measured over multiple periods against (i) a broad-based securities market index, and (ii) a peer group of mutual funds deemed appropriate by Fidelity and reviewed by the Board. The following charts considered by the Board show, over the one-, three-, and five-year periods ended December 31, 2010, the cumulative total returns of Institutional Class (Class I) and Class C of the fund, the cumulative total returns of a broad-based securities market index ("benchmark"), and a range of cumulative total returns of a peer group of mutual funds identified by Lipper Inc. as having an investment objective similar to that of the fund. The returns of Institutional Class (Class I) and Class C show the performance of the highest and lowest performing classes, respectively (based on five-year performance). The box within each chart shows the 25th percentile return (bottom of box) and the 75th percentile return (top of box) of the peer group. Returns shown above the box are in the first quartile and returns shown below the box are in the fourth quartile. The percentage beaten numbers noted below each chart correspond to the percentile box and represent the percentage of funds in the peer group whose performance was equal to or lower than that of the class indicated.
Semiannual Report
Fidelity Advisor Short Fixed-Income Fund
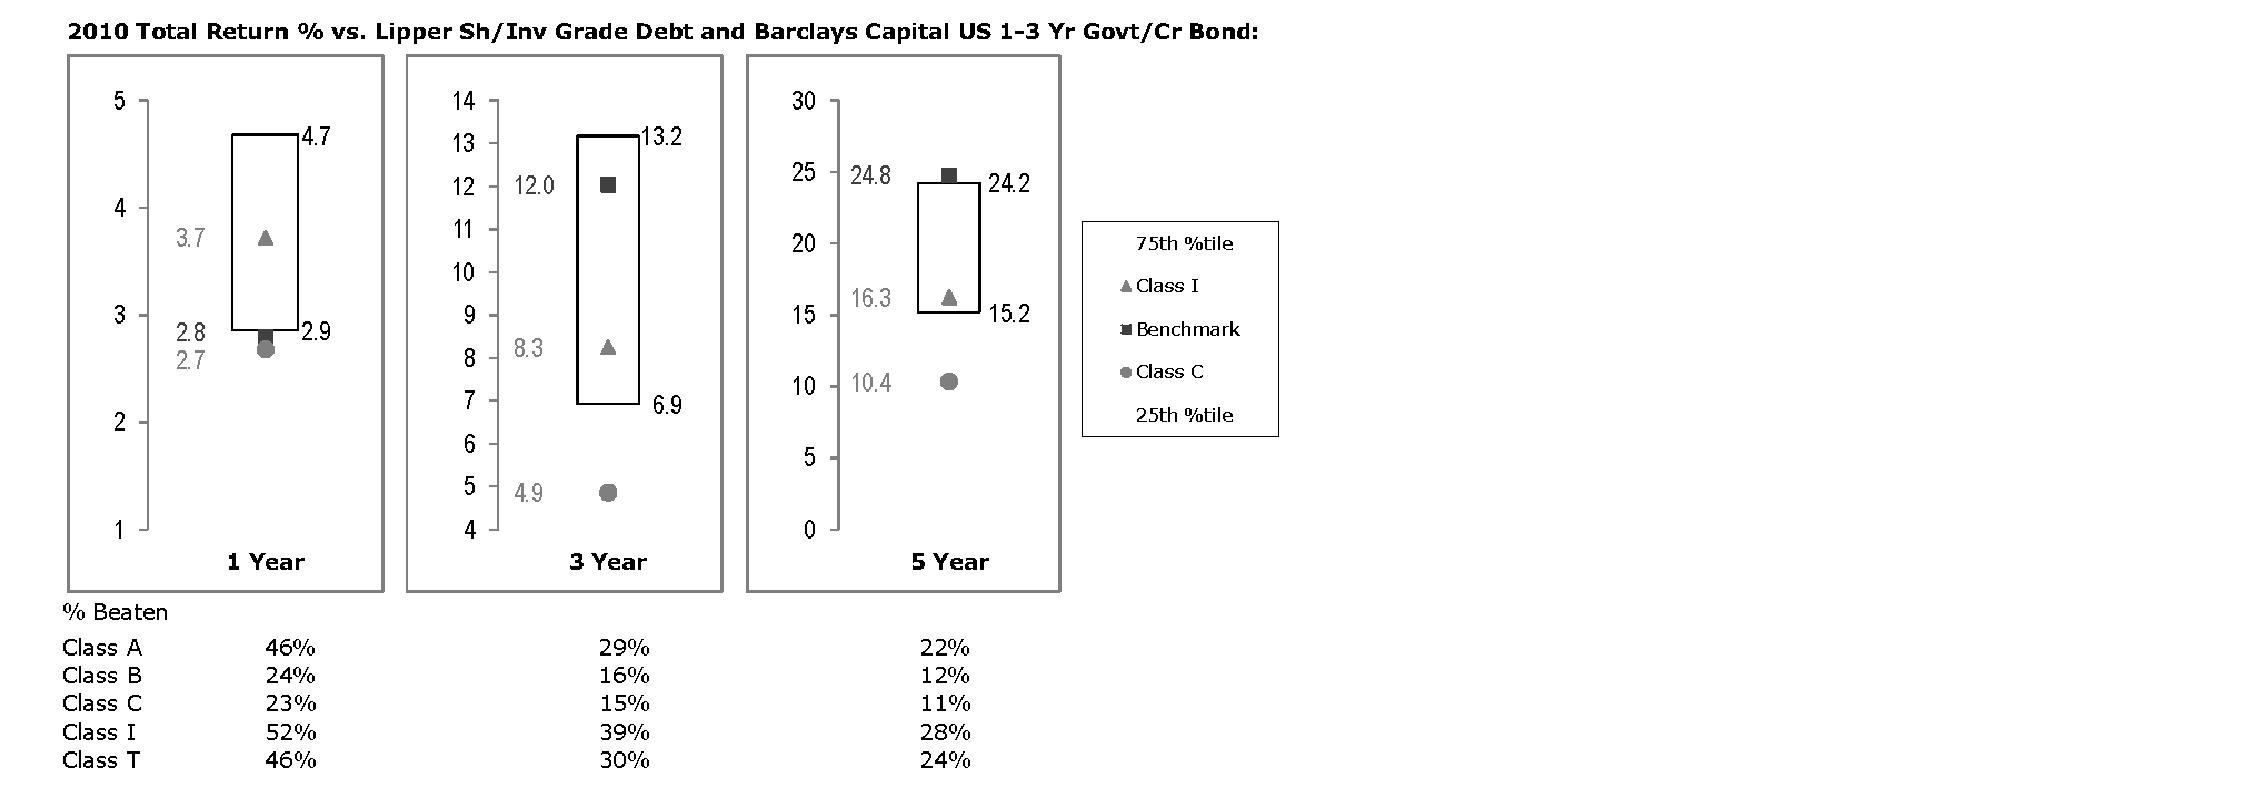
The Board reviewed the fund's relative investment performance against its peer group and noted that the performance of Institutional Class (Class I) of the fund was in the second quartile for the one-year period and the third quartile for the three- and five-year periods. The Board also noted that the investment performance of the fund was lower than its benchmark for the three- and five-year periods, although the one-year total return of Institutional Class (Class I) compared favorably to its benchmark. The Board considered that the variations in performance among the fund's classes reflect the variations in class expenses, which result in lower performance for higher expense classes. The Board also reviewed the fund's performance since inception as well as performance in the current year.
Based on its review, the Board concluded that the nature, extent, and quality of services provided to the fund under the Advisory Contracts should benefit the fund's shareholders.
Competitiveness of Management Fee and Total Expense Ratio. The Board considered the fund's management fee and total expense ratio compared to "mapped groups" of competitive funds and classes. Fidelity creates "mapped groups" by combining similar Lipper investment objective categories that have comparable management fee characteristics. Combining Lipper investment objective categories aids the Board's management fee and total expense ratio comparisons by broadening the competitive group used for comparison and by reducing the number of universes to which various Fidelity funds are compared.
Semiannual Report
Board Approval of Investment Advisory Contracts and
Management Fees - continued
Management Fee. The Board considered two proprietary management fee comparisons for the 12-month periods shown in the chart below. The group of Lipper funds used by the Board for management fee comparisons is referred to below as the "Total Mapped Group" and, for the reasons explained above, is broader than the Lipper peer group used by the Board for performance comparisons. The Total Mapped Group comparison focuses on a fund's standing relative to the total universe of comparable funds available to investors in terms of gross management fees before expense reimbursements or caps. "TMG %" represents the percentage of funds in the Total Mapped Group that had management fees that were lower than the fund's. For example, a TMG % of 28% means that 82% of the funds in the Total Mapped Group had higher management fees than the fund. The "Asset-Size Peer Group" (ASPG) comparison focuses on a fund's standing relative to non-Fidelity funds similar in size to the fund within the Total Mapped Group. The ASPG represents at least 15% of the funds in the Total Mapped Group with comparable asset size and management fee characteristics, subject to a minimum of 50 funds (or all funds in the Total Mapped Group if fewer than 50). Additional information, such as the ASPG quartile in which the fund's management fee ranked, is also included in the chart and considered by the Board.
Fidelity Advisor Short Fixed-Income Fund

The Board noted that the fund's management fee ranked below the median of its Total Mapped Group and below the median of its ASPG for 2010.
Based on its review, the Board concluded that the fund's management fee is fair and reasonable in light of the services that the fund receives and the other factors considered.
Semiannual Report
Total Expense Ratio. In its review of each class's total expense ratio, the Board considered the fund's management fee as well as other fund or class expenses, as applicable, such as transfer agent fees, pricing and bookkeeping fees, fund-paid 12b-1 fees, and custodial, legal, and audit fees. The Board also noted the effects of any waivers and reimbursements on fees and expenses. As part of its review, the Board also considered the current and historical total expense ratios of each class of the fund compared to competitive fund median expenses. Each class of the fund is compared to those funds and classes in the Total Mapped Group (used by the Board for management fee comparisons) that have a similar sales load structure.
The Board noted that the total expense ratio of each of Class A, Class T, and Class B ranked below its competitive median for 2010 and the total expense ratio of each of Class C and Institutional Class ranked above its competitive median for 2010. The Board considered that various factors, including 12b-1 fees and relatively higher other expenses in the case of small fund size, can affect total expense ratios. The Board noted that the funds and classes in the Total Mapped Group that have a similar sales load structure to Class C have a range of 12b-1 fees, and, when compared to a subset of funds with the same 12b-1 fee, Class C ranked below the median for 2010. The Board also noted that Institutional Class has a significantly lower investment minimum than certain funds and classes in the Total Mapped Group that have a similar sales load or 12b-1 fee structure and that, when compared to funds with the same or lower investment minimum, Institutional Class ranked below the median for 2010. The Board noted that the fund offers multiple classes, each of which has a different sales load and 12b-1 fee structure, and that the multiple structures are intended to offer a range of pricing options for the intermediary market. The Board also noted that the total expense ratios of the classes vary primarily by the level of their 12b-1 fees, although differences in transfer agent fees may also cause expenses to vary from class to class.
Fees Charged to Other Fidelity Clients. The Board also considered Fidelity fee structures and other information with respect to clients of FMR and its affiliates, such as other mutual funds advised or subadvised by FMR or its affiliates, pension plan clients, and other institutional clients. In March 2010, the Board created an ad hoc joint committee with the board of other Fidelity funds (the Committee) to review and compare Fidelity's institutional investment advisory business with its business of providing services to the Fidelity funds, including the differences in services provided, fees charged, and costs incurred, as well as competition in their respective marketplaces.
Based on its review of total expense ratios and fees charged to other Fidelity clients, the Board concluded that the total expense ratio of each class of the fund was reasonable, although in some cases above the median of the universe presented for comparison, in light of the services that the fund and its shareholders receive and the other factors considered, including the findings of the Committee.
Semiannual Report
Board Approval of Investment Advisory Contracts and
Management Fees - continued
Costs of the Services and Profitability. The Board considered the revenues earned and the expenses incurred by Fidelity in conducting the business of developing, marketing, distributing, managing, administering and servicing the fund and its shareholders. The Board also considered the level of Fidelity's profits in respect of all the Fidelity funds.
On an annual basis, FMR presents to the Board Fidelity's profitability for the fund. Fidelity calculates the profitability for each fund, as well as aggregate profitability for groups of Fidelity funds and all Fidelity funds, using a series of detailed revenue and cost allocation methodologies which originate with the books and records of Fidelity on which Fidelity's audited financial statements are based. The Audit Committee of the Board reviews any significant changes from the prior year's methodologies.
PricewaterhouseCoopers LLP (PwC), independent registered public accounting firm and auditor to Fidelity and certain Fidelity funds, has been engaged annually by the Board as part of the Board's assessment of Fidelity's profitability analysis. PwC's engagement includes the review and assessment of Fidelity's methodologies used in determining the revenues and expenses attributable to Fidelity's mutual fund business, and completion of agreed-upon procedures surrounding the mathematical accuracy of fund profitability and its conformity to allocation methodologies. After considering PwC's reports issued under the engagement and information provided by Fidelity, the Board concluded that while other allocation methods may also be reasonable, Fidelity's profitability methodologies are reasonable in all material respects.
The Board also reviewed Fidelity's non-fund businesses and fall-out benefits related to the mutual fund business as well as cases where Fidelity's affiliates may benefit from or be related to the fund's business.
The Board considered the costs of the services provided by and the profits realized by Fidelity in connection with the operation of the fund and was satisfied that the profitability was not excessive in the circumstances.
Economies of Scale. The Board considered whether there have been economies of scale in respect of the management of the Fidelity funds, whether the Fidelity funds (including the fund) have appropriately benefited from any such economies of scale, and whether there is potential for realization of any further economies of scale. The Board considered the extent to which the fund will benefit from economies of scale through increased services to the fund, through waivers or reimbursements, or through fee or expense reductions. The Board also noted that in 2009, it and the board of other Fidelity funds created an ad hoc committee (the Economies of Scale Committee) to analyze whether FMR attains economies of scale in respect of the management and servicing of the Fidelity funds, whether the Fidelity funds have appropriately benefited from such economies of scale, and whether there is potential for realization of any further economies of scale.
Semiannual Report
The Board recognized that the fund's management contract incorporates a "group fee" structure, which provides for lower group fee rates as total fund assets under FMR's management increase, and for higher group fee rates as total fund assets under FMR's management decrease. FMR calculates the group fee rates based on a tiered asset "breakpoint" schedule that varies based on asset class. The Board considered that the group fee is designed to deliver the benefits of economies of scale to fund shareholders when total Fidelity fund assets increase, even if assets of any particular fund are unchanged or have declined, because some portion of Fidelity's costs are attributable to services provided to all Fidelity funds, and all funds benefit if those costs can be allocated among more assets. The Board concluded that, given the group fee structure, fund shareholders will benefit from lower management fees as assets under FMR's management increase at the fund complex level, regardless of whether Fidelity achieves any such economies of scale.
The Board concluded, taking into account the analysis of the Economies of Scale Committee, that any potential economies of scale are being appropriately shared between fund shareholders and Fidelity.
Additional Information Requested by the Board. In order to develop fully the factual basis for consideration of the Fidelity funds' Advisory Contracts, the Board requested and received additional information on certain topics, including: (i) Fidelity's fund profitability methodology, profitability trends for certain funds, and the impact of certain factors on fund profitability results; (ii) portfolio manager changes that have occurred during the past year and the amount of the investment that each portfolio manager has made in the Fidelity fund(s) that he or she manages; (iii) Fidelity's compensation structure for portfolio managers, research analysts, and other key personnel, including its effects on fund profitability, the rationale for the compensation structure, and the extent to which current market conditions have affected retention and recruitment; (iv) the compensation paid to fund sub-advisers on behalf of the Fidelity funds; (v) Fidelity's fee structures and rationale for recommending different fees among different categories of funds and classes, as well as Fidelity's voluntary waiver of its fees to maintain minimum yields for certain money market funds and classes; (vi) the reasons why certain expenses affect various funds and classes differently; (vii) Fidelity's transfer agent fees, expenses, and services and how the benefits of decreased costs and new efficiencies can be shared across all of the Fidelity funds; (viii) the reasons for and consequences of changes to certain product lines compared to competitors; (ix) the allocation of and historical trends in Fidelity's realization of fall-out benefits; and (x) explanations regarding the relative total expense ratios of certain funds and classes, total expense competitive trends, and actions that might be taken by FMR to reduce total expense ratios for certain funds and classes or to achieve further economies of scale.
Semiannual Report
Board Approval of Investment Advisory Contracts and
Management Fees - continued
Based on its evaluation of all of the conclusions noted above, and after considering all factors it believed relevant, the Board ultimately concluded that the advisory fee structures are fair and reasonable, and that the fund's Advisory Contracts should be renewed.
Semiannual Report
Investment Adviser
Fidelity Management & Research Company
Boston, MA
Investment Sub-Advisers
Fidelity Investments Money
Management, Inc.
Fidelity Management & Research
(Hong Kong) Limited
Fidelity Management & Research
(U.K.) Inc.
Fidelity Management & Research
(Japan) Inc.
General Distributor
Fidelity Distributors Corporation
Boston, MA
Transfer and Service Agents
Fidelity Investments Institutional
Operations Company, Inc.
Boston, MA
Fidelity Service Company, Inc.
Boston, MA
Custodian
The Bank of New York Mellon
New York, NY
SFII-USAN-0412
1.784906.109
(Fidelity Investment logo)(registered trademark)
Item 2. Code of Ethics
Not applicable.
Item 3. Audit Committee Financial Expert
Not applicable.
Item 4. Principal Accountant Fees and Services
Not applicable.
Item 5. Audit Committee of Listed Registrants
Not applicable.
Item 6. Investments
(a) Not applicable.
(b) Not applicable
Item 7. Disclosure of Proxy Voting Policies and Procedures for Closed-End Management Investment Companies
Not applicable.
Item 8. Portfolio Managers of Closed-End Management Investment Companies
Not applicable.
Item 9. Purchase of Equity Securities by Closed-End Management Investment Company and Affiliated Purchasers
Not applicable.
Item 10. Submission of Matters to a Vote of Security Holders
There were no material changes to the procedures by which shareholders may recommend nominees to the Fidelity Advisor Series II's Board of Trustees.
Item 11. Controls and Procedures
(a)(i) The President and Treasurer and the Chief Financial Officer have concluded that the Fidelity Advisor Series II's (the "Trust") disclosure controls and procedures (as defined in Rule 30a-3(c) under the Investment Company Act) provide reasonable assurances that material information relating to the Trust is made known to them by the appropriate persons, based on their evaluation of these controls and procedures as of a date within 90 days of the filing date of this report.
(a)(ii) There was no change in the Trust's internal control over financial reporting (as defined in Rule 30a-3(d) under the Investment Company Act) that occurred during the second fiscal quarter of the period covered by this report that has materially affected, or is reasonably likely to materially affect, the Trust's internal control over financial reporting.
Item 12. Exhibits
(a) | (1) | Not applicable. |
(a) | (2) | Certification pursuant to Rule 30a-2(a) under the Investment Company Act of 1940 (17 CFR 270.30a-2(a)) is filed and attached hereto as Exhibit 99.CERT. |
(a) | (3) | Not applicable. |
(b) | | Certification pursuant to Rule 30a-2(b) under the Investment Company Act of 1940 (17 CFR 270.30a-2(b)) is furnished and attached hereto as Exhibit 99.906CERT. |
SIGNATURES
Pursuant to the requirements of the Securities Exchange Act of 1934 and the Investment Company Act of 1940, the registrant has duly caused this report to be signed on its behalf by the undersigned, thereunto duly authorized.
Fidelity Advisor Series II
By: | /s/John R. Hebble |
| John R. Hebble |
| President and Treasurer |
| |
Date: | April 20, 2012 |
Pursuant to the requirements of the Securities Exchange Act of 1934 and the Investment Company Act of 1940, this report has been signed below by the following persons on behalf of the registrant and in the capacities and on the dates indicated.
By: | /s/John R. Hebble |
| John R. Hebble |
| President and Treasurer |
| |
Date: | April 20, 2012 |
By: | /s/Christine Reynolds |
| Christine Reynolds |
| Chief Financial Officer |
| |
Date: | April 20, 2012 |