UNITED STATES
SECURITIES AND EXCHANGE COMMISSION
Washington, D.C. 20549
FORM N-CSR
CERTIFIED SHAREHOLDER REPORT OF REGISTERED
MANAGEMENT INVESTMENT COMPANIES
Investment Company Act file number 811-4707
Fidelity Advisor Series II
(Exact name of registrant as specified in charter)
82 Devonshire St., Boston, Massachusetts 02109
(Address of principal executive offices) (Zip code)
Eric D. Roiter, Secretary
82 Devonshire St.
Boston, Massachusetts 02109
(Name and address of agent for service)
Registrant's telephone number, including area code: 617-563-7000
Date of fiscal year end: | October 31 |
| |
Date of reporting period: | April 30, 2006 |
Item 1. Reports to Stockholders

| | Fidelity® Advisor
Government Investment
Fund - Class A, Class T, Class B
and Class C
|
| | Semiannual Report
April 30, 2006
|

| Contents | | | | |
| |
| |
| Chairman’s Message | | 3 | | Ned Johnson’s message to |
| | | | | shareholders. |
| Shareholder Expense | | 4 | | An example of shareholder expenses. |
| Example | | | | |
| Investment Changes | | 6 | | A summary of major shifts in the |
| | | | | fund’s investments over the past six |
| | | | | months. |
| Investments | | 7 | | A complete list of the fund’s |
| | | | | investments with their market |
| | | | | values. |
| Financial Statements | | 18 | | Statements of assets and liabilities, |
| | | | | operations, and changes in net |
| | | | | assets, as well as financial highlights. |
| Notes | | 27 | | Notes to the financial statements. |
| Board Approval of | | 36 | | |
| Investment Advisory | | | | |
| Contracts and Management | | | | |
| Fees | | | | |
To view a fund’s proxy voting guidelines and proxy voting record for the 12 month period ended
June 30, visit www.fidelity.com/proxyvotingresults or visit the Securities and Exchange Commis
sion’s (SEC) web site at www.sec.gov. You may also call 1-877-208-0098 to request a free copy of
the proxy voting guidelines.
Standard & Poor’s, S&P and S&P 500 are registered service marks of The McGraw Hill Companies,
Inc. and have been licensed for use by Fidelity Distributors Corporation.
Other third party marks appearing herein are the property of their respective owners.
All other marks appearing herein are registered or unregistered trademarks or service marks
of FMR Corp. or an affiliated company.
|
| | This report and the financial statements contained herein are submitted for the general information
of the shareholders of the fund. This report is not authorized for distribution to prospective investors
in the fund unless preceded or accompanied by an effective prospectus.
A fund files its complete schedule of portfolio holdings with the SEC for the first and third
quarters of each fiscal year on Form N Q. Forms N Q are available on the SEC’s web site at
http://www.sec.gov. A fund’s Forms N Q may be reviewed and copied at the SEC’s Public
Reference Room in Washington, DC. Information regarding the operation of the SEC’s Public
Reference Room may be obtained by calling 1-800-SEC-0330. For a complete list of a fund’s port
folio holdings, view the most recent quarterly holdings report, semiannual report, or annual
report on Fidelity’s web site at http://www.advisor.fidelity.com.
NOT FDIC INSURED · MAY LOSE VALUE · NO BANK GUARANTEE
Neither the fund nor Fidelity Distributors Corporation is a bank.
|
Chairman’s Message
(photograph of Edward C. Johnson 3d)
Dear Shareholder:
Although many securities markets made gains in early 2006, there is only one certainty when it comes to investing: There is no sure thing. There are, however, a number of time tested, fundamental investment principles that can put the historical odds in your favor.
One of the basic tenets is to invest for the long term. Over time, riding out the markets’ inevitable ups and downs has proven much more effective than selling into panic or chasing the hottest trend. Even missing only a few of the markets’ best days can significantly diminish investor returns. Patience also affords the benefits of compounding of earning interest on additional income or reinvested dividends and capital gains. There are tax advantages and cost benefits to consider as well. The more you sell, the more taxes you pay, and the more you trade, the higher the costs. While staying the course doesn’t eliminate risk, it can considerably lessen the effect of short term declines.
You can further manage your investing risk through diversification. And today, more than ever, geographic diversification should be taken into account. Studies indicate that asset allocation is the single most important determinant of a portfolio’s long term success. The right mix of stocks, bonds and cash aligned to your particular risk tolerance and investment objective is very important. Age appropriate rebalancing is also an essential aspect of asset allocation. For younger investors, an emphasis on equities which historically have been the best performing asset class over time is encouraged. As investors near their specific goal, such as retirement or sending a child to college, consideration may be given to replacing volatile assets (e.g. common stocks) with more stable fixed investments (bonds or savings plans).
A third investment principle investing regularly can help lower the average cost of your purchases. Investing a certain amount of money each month or quarter helps ensure you won’t pay for all your shares at market highs. This strategy known as dollar cost averaging also reduces unconstructive “emotion” from investing, helping shareholders avoid selling weak performers just prior to an upswing, or chasing a hot performer just before a correction.
We invite you to contact us via the Internet, through our Investor Centers or over the phone. It is our privilege to provide you the information you need to make the investments that are right for you.
Sincerely,
/s/ Edward C. Johnson 3d
Edward C. Johnson 3d
3 Semiannual Report
Shareholder Expense Example
As a shareholder of the Fund, you incur two types of costs: (1) transaction costs, including sales charges (loads) on purchase payments or redemption proceeds, and (2) ongoing costs, including management fees, distribution and/or service (12b 1) fees and other Fund expenses. This Example is intended to help you understand your ongoing costs (in dollars) of investing in the Fund and to compare these costs with the ongoing costs of investing in other mutual funds.
The Example is based on an investment of $1,000 invested at the beginning of the period and held for the entire period (November 1, 2005 to April 30, 2006).
The first line of the table below for each class of the Fund provides information about actual account values and actual expenses. You may use the information in this line, together with the amount you invested, to estimate the expenses that you paid over the period. Simply divide your account value by $1,000.00 (for example, an $8,600 account value divided by $1,000.00 = 8.6), then multiply the result by the number in the first line for a class of the Fund under the heading entitled “Expenses Paid During Period” to estimate the expenses you paid on your account during this period.
Hypothetical Example for Comparison Purposes
The second line of the table below for each class of the Fund provides information about hypothetical account values and hypothetical expenses based on a Class’ actual expense ratio and an assumed rate of return of 5% per year before expenses, which is not the Class’ actual return. The hypothetical account values and expenses may not be used to estimate the actual ending account balance or expenses you paid for the period. You may use this information to compare the ongoing costs of investing in the Fund and other funds. To do so, compare this 5% hypothetical example with the 5% hypothetical examples that appear in the shareholder reports of the other funds.
Please note that the expenses shown in the table are meant to highlight your ongoing costs only and do not reflect any transaction costs. Therefore, the second line of the table is useful in comparing ongoing costs only, and will not help you determine the relative total costs of owning different funds. In addition, if these transactional costs were included, your costs would have been higher.
| | | | | | | | | | | Expenses Paid |
| | | Beginning | | | | Ending | | During Period* |
| | | Account Value | | | | Account Value | | November 1, 2005 |
| | | November 1, 2005 | | | | April 30, 2006 | | to April 30, 2006 |
| Class A | | | | | | | | | | | | |
| Actual | | | | $ 1,000.00 | | | | $ 1,001.50 | | | | $ 3.87 |
| HypotheticalA | | | | $ 1,000.00 | | | | $ 1,020.93 | | | | $ 3.91 |
| Class T | | | | | | | | | | | | |
| Actual | | | | $ 1,000.00 | | | | $ 1,001.10 | | | | $ 4.22 |
| HypotheticalA | | | | $ 1,000.00 | | | | $ 1,020.58 | | | | $ 4.26 |
| Class B | | | | | | | | | | | | |
| Actual | | | | $ 1,000.00 | | | | $ 997.70 | | | | $ 7.63 |
| HypotheticalA | | | | $ 1,000.00 | | | | $ 1,017.16 | | | | $ 7.70 |
Semiannual Report 4
| | | | | | | | | | | Expenses Paid |
| | | Beginning | | | | Ending | | During Period* |
| | | Account Value | | | | Account Value | | November 1, 2005 |
| | | November 1, 2005 | | | | April 30, 2006 | | to April 30, 2006 |
| Class C | | | | | | | | | | | | |
| Actual | | | | $ 1,000.00 | | | | $ 997.40 | | | | $ 7.92 |
| HypotheticalA | | | | $ 1,000.00 | | | | $ 1,016.86 | | | | $ 8.00 |
| Institutional Class | | | | | | | | | | | | |
| Actual | | | | $ 1,000.00 | | | | $ 1,002.50 | | | | $ 2.88 |
| HypotheticalA | | | | $ 1,000.00 | | | | $ 1,021.92 | | | | $ 2.91 |
A 5% return per year before expenses | | | | | | | | |
* Expenses are equal to each Class’ annualized expense ratio (shown in the table below); multiplied by the average account value over the period, multiplied by 181/365 (to reflect the one half year period).
| | | Annualized |
| | | Expense Ratio |
| Class A | | 78% |
| Class T | | 85% |
| Class B | | 1.54% |
| Class C | | 1.60% |
| Institutional Class | | 58% |
5 Semiannual Report
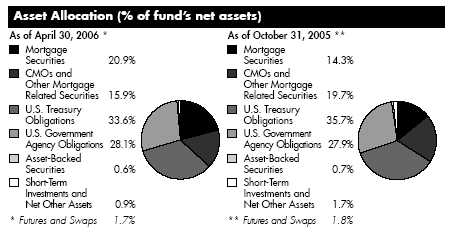
| Investment Changes | | | | |
| |
| |
| Coupon Distribution as of April 30, 2006 | | | | |
| | | % of fund’s | | % of fund’s investments |
| | | investments | | 6 months ago |
| Zero coupon bonds | | 1.4 | | 0.1 |
| Less than 1% | | 2.5 | | 1.3 |
| 1 – 1.99% | | 2.9 | | 2.7 |
| 2 – 2.99% | | 3.9 | | 2.5 |
| 3 – 3.99% | | 6.5 | | 21.6 |
| 4 – 4.99% | | 39.5 | | 25.1 |
| 5 – 5.99% | | 22.9 | | 16.4 |
| 6 – 6.99% | | 16.8 | | 19.1 |
| 7% and over | | 3.3 | | 5.8 |
Coupon distribution shows the range of stated interest rates on the fund’s investments, excluding short term investments.
| Average Years to Maturity as of April 30, 2006 | | |
| | | | | 6 months ago |
| Years | | 6.5 | | 6.4 |
Average years to maturity is based on the average time remaining until principal payments are expected from each of the fund’s bonds, weighted by dollar amount.
| Duration as of April 30, 2006 | | | | |
| | | | | | | 6 months ago |
| Years | | | | 4.2 | | 4.2 |
Duration shows how much a bond fund’s price fluctuates with changes in comparable interest rates. If rates rise 1%, for example, a fund with a five year duration is likely to lose about 5% of its value. Other factors also can influence a bond fund’s performance and share price. Accordingly, a bond fund’s actual performance may differ from this example.
Semiannual Report 6
| Investments April 30, 2006 (Unaudited) |
| Showing Percentage of Net Assets | | | | |
| |
| U.S. Government and Government Agency Obligations 61.7% | | | | |
| | | Principal | | Value (Note 1) |
| | | Amount | | |
| U.S. Government Agency Obligations 28.1% | | | | |
| Fannie Mae: | | | | |
| 3.25% 8/15/08 | | $ 4,812,000 | | $ 4,617,509 |
| 3.25% 2/15/09 | | 610,000 | | 580,063 |
| 4% 9/2/08 | | 1,755,000 | | 1,707,106 |
| 4.25% 5/15/09 | | 21,500,000 | | 20,971,745 |
| 4.5% 10/15/08 | | 57,372,000 | | 56,522,435 |
| 4.625% 1/15/08 | | 36,500,000 | | 36,190,079 |
| 4.75% 12/15/10 | | 21,605,000 | | 21,149,934 |
| 6% 5/15/08 | | 2,718,000 | | 2,763,054 |
| 6.25% 2/1/11 | | 24,260,000 | | 25,074,627 |
| 6.625% 9/15/09 | | 1,620,000 | | 1,691,810 |
| Federal Home Loan Bank 5.8% 9/2/08 | | 9,965,000 | | 10,075,801 |
| Freddie Mac: | | | | |
| 4.75% 1/19/16 | | 22,800,000 | | 21,708,427 |
| 5% 1/30/14 | | 25,000,000 | | 24,219,425 |
| 5.125% 4/18/08 | | 6,000,000 | | 5,998,125 |
| 5.875% 3/21/11 | | 6,960,000 | | 7,080,902 |
| Guaranteed Trade Trust Certificates (assets of Trust guaranteed | | | | |
| by U.S. Government through Export-Import Bank) | | | | |
| Series 1994 A, 7.39% 6/26/06 | | 375,000 | | 379,564 |
| Israeli State (guaranteed by U.S. Government through Agency | | | | |
| for International Development): | | | | |
| 6.6% 2/15/08 | | 6,974,709 | | 7,057,876 |
| 6.8% 2/15/12 | | 5,000,000 | | 5,282,980 |
| Overseas Private Investment Corp. U.S. Government | | | | |
| guaranteed participation certificates: | | | | |
| 6.77% 11/15/13 | | 1,013,461 | | 1,059,066 |
| 6.99% 5/21/16 | | 3,787,500 | | 4,041,073 |
| Private Export Funding Corp.: | | | | |
| secured: | | | | |
| 5.66% 9/15/11 (a) | | 2,610,000 | | 2,646,235 |
| 5.685% 5/15/12 | | 3,845,000 | | 3,912,511 |
| 6.67% 9/15/09 | | 1,380,000 | | 1,444,705 |
| 4.974% 8/15/13 | | 2,850,000 | | 2,783,108 |
| Small Business Administration guaranteed development | | | | |
| participation certificates Series 2002-20K Class 1, 5.08% | | | | |
| 11/1/22 | | 4,950,201 | | 4,824,434 |
| Tennessee Valley Authority 5.375% 4/1/56 | | 3,000,000 | | 2,841,489 |
| U.S. Department of Housing and Urban Development | | | | |
| Government guaranteed participation certificates Series | | | | |
| 1999 A: | | | | |
| 5.75% 8/1/06 | | 2,100,000 | | 2,103,043 |
See accompanying notes which are an integral part of the financial statements.
7 Semiannual Report
| Investments (Unaudited) continued | | |
| |
| |
| U.S. Government and Government Agency Obligations continued | | | | |
| | | Principal | | Value (Note 1) |
| | | Amount | | |
| U.S. Government Agency Obligations continued | | | | |
| U.S. Department of Housing and Urban Development | | | | |
| Government guaranteed participation certificates Series | | | | |
| 1999-A: – continued | | | | |
| 5.96% 8/1/09 | | $ 1,800,000 | | $ 1,813,469 |
| U.S. Trade Trust Certificates (assets of Trust guaranteed by | | | | |
| U.S. Government through Export-Import Bank) 8.17% | | | | |
| 1/15/07 | | 60,000 | | 60,660 |
| |
| TOTAL U.S. GOVERNMENT AGENCY OBLIGATIONS | | | | 280,601,255 |
| U.S. Treasury Inflation Protected Obligations 9.2% | | | | |
| U.S. Treasury Inflation-Indexed Notes: | | | | |
| 0.875% 4/15/10 | | 25,904,866 | | 24,630,593 |
| 1.875% 7/15/15 | | 30,337,659 | | 29,120,256 |
| 2.375% 4/15/11 | | 38,038,380 | | 38,237,500 |
| |
| TOTAL U.S. TREASURY INFLATION PROTECTED OBLIGATIONS | | | | 91,988,349 |
| U.S. Treasury Obligations – 24.4% | | | | |
| U.S. Treasury Bonds: | | | | |
| 6.125% 8/15/29 | | 45,052,000 | | 49,969,020 |
| 6.25% 8/15/23 | | 1,500,000 | | 1,657,734 |
| 8% 11/15/21 | | 4,794,000 | | 6,154,298 |
| 12% 8/15/13 | | 10,000,000 | | 11,526,950 |
| U.S. Treasury Notes: | | | | |
| 3.5% 8/15/09 | | 3,229,000 | | 3,093,534 |
| 3.75% 5/15/08 | | 21,726,000 | | 21,257,544 |
| 4.125% 8/15/10 | | 12,000,000 | | 11,639,064 |
| 4.25% 8/15/13 | | 11,670,000 | | 11,132,538 |
| 4.25% 11/15/13 | | 37,610,000 | | 35,800,019 |
| 4.75% 5/15/14 | | 73,050,000 | | 71,688,852 |
| 5.625% 5/15/08 | | 19,400,000 | | 19,676,605 |
| |
| TOTAL U.S. TREASURY OBLIGATIONS | | | | 243,596,158 |
| |
| TOTAL U.S. GOVERNMENT AND GOVERNMENT AGENCY | | | | |
| OBLIGATIONS | | | | |
| (Cost $630,272,158) | | | | 616,185,762 |
See accompanying notes which are an integral part of the financial statements.
Semiannual Report 8
| U.S. Government Agency Mortgage Securities 20.9% | | | | | | | | |
| | | | | Principal | | Value (Note 1) |
| | | | | Amount | | | | |
| Fannie Mae – 17.8% | | | | | | | | |
| 3.734% 1/1/35 (c) | | | | $ 168,030 | | | | $ 165,043 |
| 3.749% 12/1/34 (c) | | | | 140,405 | | | | 138,028 |
| 3.752% 10/1/33 (c) | | | | 115,520 | | | | 112,704 |
| 3.782% 12/1/34 (c) | | | | 28,159 | | | | 27,722 |
| 3.792% 6/1/34 (c) | | | | 522,073 | | | | 504,803 |
| 3.824% 6/1/33 (c) | | | | 80,483 | | | | 78,950 |
| 3.829% 1/1/35 (c) | | | | 106,554 | | | | 104,849 |
| 3.847% 1/1/35 (c) | | | | 311,514 | | | | 306,331 |
| 3.854% 10/1/33 (c) | | | | 3,405,088 | | | | 3,333,582 |
| 3.869% 1/1/35 (c) | | | | 197,596 | | | | 194,541 |
| 3.879% 6/1/33 (c) | | | | 453,483 | | | | 445,026 |
| 3.902% 10/1/34 (c) | | | | 126,443 | | | | 124,674 |
| 3.913% 5/1/34 (c) | | | | 37,401 | | | | 37,397 |
| 3.917% 12/1/34 (c) | | | | 95,206 | | | | 93,763 |
| 3.947% 11/1/34 (c) | | | | 209,559 | | | | 206,647 |
| 3.957% 1/1/35 (c) | | | | 137,773 | | | | 135,762 |
| 3.96% 5/1/33 (c) | | | | 40,180 | | | | 39,535 |
| 3.972% 12/1/34 (c) | | | | 106,306 | | | | 104,810 |
| 3.978% 12/1/34 (c) | | | | 131,908 | | | | 130,060 |
| 3.983% 12/1/34 (c) | | | | 705,231 | | | | 695,364 |
| 3.988% 1/1/35 (c) | | | | 89,005 | | | | 87,727 |
| 4% 5/1/18 to 9/1/18 | | | | 3,988,999 | | | | 3,730,375 |
| 4.003% 12/1/34 (c) | | | | 69,328 | | | | 68,363 |
| 4.006% 2/1/35 (c) | | | | 94,825 | | | | 93,451 |
| 4.013% 1/1/35 (c) | | | | 195,978 | | | | 193,237 |
| 4.021% 2/1/35 (c) | | | | 86,215 | | | | 85,057 |
| 4.042% 12/1/34 (c) | | | | 191,070 | | | | 188,519 |
| 4.048% 10/1/18 (c) | | | | 103,243 | | | | 101,318 |
| 4.05% 1/1/35 (c) | | | | 61,471 | | | | 60,591 |
| 4.051% 1/1/35 (c) | | | | 89,400 | | | | 88,206 |
| 4.066% 4/1/33 (c) | | | | 39,471 | | | | 38,947 |
| 4.067% 1/1/35 (c) | | | | 180,613 | | | | 178,171 |
| 4.081% 5/1/33 (c) | | 10,864,957 | | | | 10,699,701 |
| 4.09% 2/1/35 (c) | | | | 76,275 | | | | 75,205 |
| 4.091% 2/1/35 (c) | | | | 184,777 | | | | 182,253 |
| 4.092% 2/1/35 (c) | | | | 73,104 | | | | 72,155 |
| 4.106% 2/1/35 (c) | | | | 340,694 | | | | 336,456 |
| 4.109% 1/1/35 (c) | | | | 197,748 | | | | 195,132 |
| 4.113% 11/1/34 (c) | | | | 154,880 | | | | 152,991 |
| 4.115% 2/1/35 (c) | | | | 218,359 | | | | 215,442 |
| 4.121% 1/1/35 (c) | | | | 186,487 | | | | 184,097 |
| 4.122% 1/1/35 (c) | | | | 342,566 | | | | 338,298 |
See accompanying notes which are an integral part of the financial statements.
| Investments (Unaudited) continued | | | | | | |
| |
| |
| U.S. Government Agency Mortgage Securities continued | | | | | | | | |
| | | | | Principal | | Value (Note 1) |
| | | | | Amount | | |
| Fannie Mae – continued | | | | | | | | |
| 4.144% 1/1/35 (c) | | | | $ 292,826 | | | | $ 290,141 |
| 4.153% 2/1/35 (c) | | | | 183,535 | | | | 181,191 |
| 4.166% 11/1/34 (c) | | | | 49,159 | | | | 48,627 |
| 4.176% 1/1/35 (c) | | | | 161,949 | | | | 159,986 |
| 4.178% 1/1/35 (c) | | | | 341,696 | | | | 337,897 |
| 4.178% 1/1/35 (c) | | | | 224,809 | | | | 218,604 |
| 4.188% 10/1/34 (c) | | | | 286,301 | | | | 284,090 |
| 4.22% 3/1/34 (c) | | | | 103,645 | | | | 101,532 |
| 4.223% 1/1/35 (c) | | | | 105,321 | | | | 104,118 |
| 4.248% 1/1/34 (c) | | | | 350,187 | | | | 343,926 |
| 4.25% 2/1/35 (c) | | | | 127,804 | | | | 124,348 |
| 4.267% 2/1/35 (c) | | | | 65,916 | | | | 65,216 |
| 4.27% 10/1/34 (c) | | | | 61,910 | | | | 61,340 |
| 4.28% 8/1/33 (c) | | | | 234,317 | | | | 231,494 |
| 4.283% 3/1/35 (c) | | | | 113,921 | | | | 112,559 |
| 4.287% 7/1/34 (c) | | | | 81,531 | | | | 81,278 |
| 4.294% 3/1/33 (c) | | | | 156,128 | | | | 154,438 |
| 4.299% 5/1/35 (c) | | | | 157,647 | | | | 156,013 |
| 4.304% 12/1/34 (c) | | | | 73,146 | | | | 72,385 |
| 4.315% 10/1/33 (c) | | | | 59,389 | | | | 58,520 |
| 4.316% 3/1/33 (c) | | | | 55,427 | | | | 53,928 |
| 4.339% 9/1/34 (c) | | | | 166,614 | | | | 165,086 |
| 4.345% 6/1/33 (c) | | | | 79,858 | | | | 78,979 |
| 4.354% 9/1/34 (c) | | | | 433,732 | | | | 432,396 |
| 4.356% 1/1/35 (c) | | | | 126,536 | | | | 123,394 |
| 4.357% 4/1/35 (c) | | | | 77,059 | | | | 76,184 |
| 4.392% 1/1/35 (c) | | | | 144,879 | | | | 143,491 |
| 4.395% 5/1/35 (c) | | | | 357,621 | | | | 353,673 |
| 4.402% 10/1/34 (c) | | | | 701,438 | | | | 686,736 |
| 4.434% 10/1/34 (c) | | | | 550,103 | | | | 545,857 |
| 4.436% 4/1/34 (c) | | | | 183,079 | | | | 181,052 |
| 4.438% 3/1/35 (c) | | | | 147,674 | | | | 144,104 |
| 4.465% 8/1/34 (c) | | | | 342,326 | | | | 336,983 |
| 4.474% 5/1/35 (c) | | | | 76,371 | | | | 75,623 |
| 4.481% 1/1/35 (c) | | | | 164,463 | | | | 163,208 |
| 4.5% 2/1/18 to 9/1/33 | | | | 15,684,978 | | | | 14,690,070 |
| 4.504% 8/1/34 (c) | | | | 812,506 | | | | 810,646 |
| 4.512% 10/1/35 (c) | | | | 91,797 | | | | 90,674 |
| 4.526% 2/1/35 (c) | | | | 2,148,259 | | | | 2,118,893 |
| 4.54% 2/1/35 (c) | | | | 719,493 | | | | 714,061 |
| 4.541% 7/1/34 (c) | | | | 184,284 | | | | 184,521 |
| 4.543% 2/1/35 (c) | | | | 74,418 | | | | 73,870 |
See accompanying notes which are an integral part of the financial statements.
| U.S. Government Agency Mortgage Securities continued | | | | | | |
| | | | | Principal | | Value (Note 1) |
| | | | | Amount | | |
| Fannie Mae – continued | | | | | | | | |
| 4.545% 7/1/35 (c) | | | | $ 442,119 | | | | $ 437,707 |
| 4.546% 2/1/35 (c) | | | | 112,472 | | | | 111,605 |
| 4.555% 1/1/35 (c) | | | | 274,947 | | | | 272,978 |
| 4.559% 9/1/34 (c) | | | | 496,272 | | | | 493,106 |
| 4.582% 9/1/34 (c) | | | | 2,496,820 | | | | 2,454,124 |
| 4.584% 8/1/34 (c) | | | | 176,877 | | | | 176,958 |
| 4.584% 7/1/35 (c) | | | | 536,471 | | | | 531,460 |
| 4.587% 2/1/35 (c) | | | | 576,868 | | | | 565,302 |
| 4.618% 7/1/34 (c) | | | | 5,157,737 | | | | 5,130,349 |
| 4.629% 9/1/34 (c) | | | | 52,408 | | | | 52,478 |
| 4.633% 3/1/35 (c) | | | | 66,752 | | | | 66,311 |
| 4.641% 1/1/33 (c) | | | | 89,849 | | | | 89,301 |
| 4.677% 3/1/35 (c) | | | | 916,644 | | | | 911,291 |
| 4.705% 10/1/32 (c) | | | | 30,838 | | | | 30,765 |
| 4.726% 7/1/34 (c) | | | | 326,449 | | | | 321,986 |
| 4.728% 1/1/35 (c) | | | | 625,634 | | | | 622,725 |
| 4.731% 2/1/33 (c) | | | | 27,729 | | | | 27,592 |
| 4.74% 10/1/34 (c) | | | | 516,821 | | | | 509,668 |
| 4.746% 1/1/35 (c) | | | | 30,039 | | | | 29,887 |
| 4.747% 10/1/32 (c) | | | | 36,130 | | | | 35,949 |
| 4.798% 12/1/32 (c) | | | | 157,608 | | | | 157,029 |
| 4.798% 12/1/34 (c) | | | | 122,294 | | | | 120,665 |
| 4.812% 6/1/35 (c) | | | | 638,584 | | | | 634,759 |
| 4.815% 2/1/33 (c) | | | | 194,987 | | | | 194,225 |
| 4.815% 5/1/33 (c) | | | | 10,604 | | | | 10,567 |
| 4.83% 8/1/34 (c) | | | | 139,718 | | | | 139,471 |
| 4.844% 11/1/34 (c) | | | | 398,820 | | | | 393,963 |
| 4.861% 8/1/34 (c) | | | | 7,255,793 | | | | 7,177,938 |
| 4.887% 10/1/35 (c) | | | | 363,756 | | | | 359,696 |
| 4.969% 12/1/32 (c) | | | | 14,105 | | | | 14,078 |
| 4.984% 11/1/32 (c) | | | | 96,673 | | | | 96,516 |
| 5% 9/1/33 to 11/1/35 | | | | 29,243,071 | | | | 27,713,110 |
| 5% 2/1/35 (c) | | | | 59,079 | | | | 58,968 |
| 5.042% 7/1/34 (c) | | | | 76,490 | | | | 75,952 |
| 5.063% 11/1/34 (c) | | | | 28,526 | | | | 28,494 |
| 5.103% 9/1/34 (c) | | | | 150,430 | | | | 149,514 |
| 5.104% 5/1/35 (c) | | | | 821,944 | | | | 821,139 |
| 5.115% 1/1/34 (c) | | | | 135,550 | | | | 135,784 |
| 5.172% 5/1/35 (c) | | | | 504,095 | | | | 500,697 |
| 5.177% 5/1/35 (c) | | | | 1,393,620 | | | | 1,383,893 |
| 5.197% 8/1/33 (c) | | | | 189,224 | | | | 188,552 |
| 5.197% 6/1/35 (c) | | | | 569,834 | | | | 570,022 |
See accompanying notes which are an integral part of the financial statements.
11 Semiannual Report
| Investments (Unaudited) continued | | | | | | |
| |
| |
| U.S. Government Agency Mortgage Securities continued | | | | | | |
| | | | | Principal | | Value (Note 1) |
| | | | | Amount | | |
| Fannie Mae – continued | | | | | | | | |
| 5.231% 3/1/35 (c) | | | | $ 80,454 | | | | $ 80,108 |
| 5.318% 7/1/35 (c) | | | | 85,261 | | | | 85,387 |
| 5.343% 12/1/34 (c) | | | | 212,374 | | | | 212,008 |
| 5.5% 3/1/13 to 7/1/33 | | | | 37,395,763 | | | | 36,908,147 |
| 5.5% 5/1/36 (b) | | | | 163,304 | | | | 158,606 |
| 5.505% 2/1/36 (c) | | | | 2,400,459 | | | | 2,392,057 |
| 5.636% 1/1/36 (c) | | | | 669,705 | | | | 669,933 |
| 6% 1/1/18 to 2/1/34 | | | | 17,303,160 | | | | 17,263,774 |
| 6.5% 12/1/24 to 3/1/35 | | | | 12,931,145 | | | | 13,190,624 |
| 7% 4/1/26 to 7/1/32 | | | | 2,490,992 | | | | 2,567,102 |
| 7.5% 3/1/28 to 4/1/29 | | | | 30,737 | | | | 32,101 |
| 8.5% 9/1/16 to 1/1/17 | | | | 19,936 | | | | 21,201 |
| 9% 11/1/11 to 5/1/14 | | | | 207,765 | | | | 209,228 |
| 9.5% 5/1/07 to 5/1/20 | | | | 142,418 | | | | 153,036 |
| 11.5% 6/15/19 | | | | 44,093 | | | | 49,523 |
| 12.5% 8/1/15 | | | | 1,588 | | | | 1,814 |
| | | | | | | | | 177,567,638 |
| Freddie Mac – 2.8% | | | | | | | | |
| 4.05% 12/1/34 (c) | | | | 134,445 | | | | 132,195 |
| 4.106% 12/1/34 (c) | | | | 183,223 | | | | 180,343 |
| 4.152% 1/1/35 (c) | | | | 506,636 | | | | 498,910 |
| 4.263% 3/1/35 (c) | | | | 164,158 | | | | 161,832 |
| 4.294% 5/1/35 (c) | | | | 293,931 | | | | 290,019 |
| 4.304% 12/1/34 (c) | | | | 159,722 | | | | 155,225 |
| 4.353% 2/1/35 (c) | | | | 337,823 | | | | 333,394 |
| 4.443% 3/1/35 (c) | | | | 160,811 | | | | 156,350 |
| 4.462% 6/1/35 (c) | | | | 250,019 | | | | 246,526 |
| 4.482% 3/1/35 (c) | | | | 169,353 | | | | 165,005 |
| 4.484% 3/1/35 (c) | | | | 1,190,688 | | | | 1,170,625 |
| 4.768% 10/1/32 (c) | | | | 25,641 | | | | 25,457 |
| 4.869% 3/1/33 (c) | | | | 70,028 | | | | 69,637 |
| 5.007% 4/1/35 (c) | | | | 890,056 | | | | 885,659 |
| 5.338% 6/1/35 (c) | | | | 626,539 | | | | 622,968 |
| 5.405% 8/1/33 (c) | | | | 80,286 | | | | 80,430 |
| 5.5% 2/1/36 | | | | 9,949,618 | | | | 9,668,442 |
| 5.571% 1/1/36 (c) | | | | 1,177,993 | | | | 1,172,268 |
| 5.588% 4/1/32 (c) | | | | 35,154 | | | | 35,424 |
| 6% 9/1/16 to 11/1/33 | | | | 10,320,456 | | | | 10,332,326 |
| 6.5% 3/1/35 | | | | 719,158 | | | | 731,427 |
| 7.5% 3/1/15 to 3/1/16 | | | | 500,475 | | | | 515,963 |
| 8.5% 2/1/10 | | | | 11,867 | | | | 12,135 |
See accompanying notes which are an integral part of the financial statements.
| U.S. Government Agency Mortgage Securities continued | | | | | | |
| | | | | Principal | | Value (Note 1) |
| | | | | Amount | | |
| Freddie Mac – continued | | | | | | | | |
| 9% 10/1/08 to 10/1/20 | | | | $ 40,351 | | | | $ 42,202 |
| 9.5% 5/1/21 to 7/1/21 | | | | 58,472 | | | | 63,863 |
| 11% 7/1/13 to 5/1/14 | | | | 99,777 | | | | 109,851 |
| 12.5% 2/1/10 to 6/1/19 | | | | 22,620 | | | | 24,727 |
| | | | | | | | | 27,883,203 |
| Government National Mortgage Association – 0.3% | | | | | | | | |
| 6.5% 6/20/34 | | | | 2,442,923 | | | | 2,490,047 |
| 7.5% 9/15/06 to 8/15/29 | | | | 43,840 | | | | 44,328 |
| 8% 12/15/23 | | | | 368,585 | | | | 387,821 |
| 9% 12/15/09 | | | | 1,184 | | | | 1,184 |
| 10.5% 12/15/17 to 1/20/18 | | | | 42,100 | | | | 47,406 |
| 13.5% 7/15/11 | | | | 9,621 | | | | 10,914 |
| | | | | | | | | 2,981,700 |
| |
| TOTAL U.S. GOVERNMENT AGENCY MORTGAGE SECURITIES | | | | | | | | |
| (Cost $211,699,702) | | | | | | | | 208,432,541 |
| |
| Asset Backed Securities 0.6% | | | | | | | | |
| |
| Fannie Mae Grantor Trust Series 2005-T4 Class A1C, | | | | | | | | |
| 5.1094% 9/25/35 (c) | | | | | | | | |
| (Cost $6,360,000) | | | | 6,360,000 | | | | 6,371,152 |
| |
| Collateralized Mortgage Obligations 15.7% | | | | | | | | |
| |
| U.S. Government Agency 15.7% | | | | | | | | |
| Fannie Mae: | | | | | | | | |
| floater Series 2003-25 Class CF, 5.3094% 3/25/17 (c) | | | | 2,535,143 | | | | 2,544,574 |
| planned amortization class: | | | | | | | | |
| Series 1992-168 Class KB, 7% 10/25/22 | | | | 2,035,238 | | | | 2,103,554 |
| Series 1993-160 Class PK, 6.5% 11/25/22 | | | | 28,933 | | | | 28,841 |
| Series 1993-187 Class L, 6.5% 7/25/23 | | | | 929,631 | | | | 946,671 |
| Series 1994-27 Class PJ, 6.5% 6/25/23 | | | | 540,318 | | | | 542,115 |
| Series 2003-39 Class PV, 5.5% 9/25/22 | | | | 1,845,000 | | | | 1,826,619 |
| Series 2006-37 Class OW, 5/25/36 (d) | | | | 960,000 | | | | 672,298 |
| Fannie Mae guaranteed REMIC pass thru certificates: | | | | | | | | |
| floater: | | | | | | | | |
| Series 2001-38 Class QF, 5.9394% 8/25/31 (c) | | | | 1,069,639 | | | | 1,097,971 |
| Series 2002-49 Class FB, 5.51% 11/18/31 (c) | | | | 1,502,780 | | | | 1,518,107 |
| Series 2002-60 Class FV, 5.9594% 4/25/32 (c) | | | | 310,128 | | | | 320,839 |
| Series 2002-68 Class FH, 5.41% 10/18/32 (c) | | | | 1,258,190 | | | | 1,276,758 |
See accompanying notes which are an integral part of the financial statements.
13 Semiannual Report
| Investments (Unaudited) continued | | | | | | |
| |
| |
| Collateralized Mortgage Obligations continued | | | | | | | | |
| | | | | Principal | | Value (Note 1) |
| | | | | Amount | | | | |
| U.S. Government Agency continued | | | | | | | | |
| Fannie Mae guaranteed REMIC pass thru certificates: - | | | | | | |
| continued | | | | | | | | |
| floater: | | | | | | | | |
| Series 2002-75 Class FA, 5.9594% 11/25/32 (c) | | | | $ 635,294 | | | | $ 657,565 |
| Series 2003-122 Class FL, 5.3094% 7/25/29 (c) | | | | 527,319 | | | | 529,053 |
| Series 2003-131 Class FM, 5.3594% 12/25/29 (c) | | | | 398,554 | | | | 400,166 |
| Series 2003-15 Class WF, 5.3094% 8/25/17 (c) | | | | 652,653 | | | | 655,545 |
| Series 2004-31 Class F, 5.2594% 6/25/30 (c) | | | | 964,053 | | | | 966,051 |
| Series 2004-33 Class FW, 5.3594% 8/25/25 (c) | | | | 904,611 | | | | 908,059 |
| Series 2004-54 Class FE, 6.1094% 2/25/33 (c) | | | | 522,097 | | | | 526,529 |
| planned amortization class: | | | | | | | | |
| Series 2001-30 Class PL, 7% 2/25/31 | | | | 508,125 | | | | 508,995 |
| Series 2002-18 Class PC, 5.5% 4/25/17 | | | | 1,170,000 | | | | 1,162,316 |
| Series 2003-113 Class PJ, 3.5% 2/25/13 | | | | 1,750,000 | | | | 1,702,395 |
| Series 2003-67 Class GL, 3% 1/25/25 | | | | 4,746,391 | | | | 4,603,168 |
| Series 2003-73 Class GA, 3.5% 5/25/31 | | | | 4,907,141 | | | | 4,547,199 |
| Series 2003-91 Class HA, 4.5% 11/25/16 | | | | 1,465,000 | | | | 1,425,085 |
| Series 2004-21 Class QE, 4.5% 11/25/32 | | | | 1,500,000 | | | | 1,372,769 |
| Series 2006-12 Class BO, 10/25/35 (d) | | | | 4,474,291 | | | | 3,227,038 |
| sequential pay: | | | | | | | | |
| Series 2001-46 Class ZG, 6% 9/25/31 | | | | 7,933,242 | | | | 7,844,371 |
| Series 2002-79 Class Z, 5.5% 11/25/22 | | | | 3,592,819 | | | | 3,493,168 |
| Series 2004-3 Class BA, 4% 7/25/17 | | | | 104,980 | | | | 100,236 |
| Series 2004-86 Class KC, 4.5% 5/25/19 | | | | 534,448 | | | | 514,467 |
| Series 2004-91 Class AH, 4.5% 5/25/29 | | | | 1,041,997 | | | | 1,011,866 |
| Series 2005-41 Class WY, 5.5% 5/25/25 | | | | 2,630,000 | | | | 2,503,702 |
| Series 2005-55 Class LY, 5.5% 7/25/25 | | | | 2,580,000 | | | | 2,460,272 |
| 7/25/34 (b)(d) | | | | 1,005,000 | | | | 743,543 |
| Freddie Mac: | | | | | | | | |
| planned amortization class: | | | | | | | | |
| Series 2512 Class PG, 5.5% 10/15/22 | | | | 2,000,000 | | | | 1,916,116 |
| Series 3145 Class GO, 4/15/36 (d) | | | | 1,662,755 | | | | 1,149,869 |
| sequential pay: | | | | | | | | |
| Series 2114 Class ZM, 6% 1/15/29 | | | | 415,237 | | | | 418,172 |
| Series 2343 Class VD, 7% 8/15/16 | | | | 2,638,032 | | | | 2,643,839 |
| Series 2361 Class KB, 6.25% 1/15/28 | | | | 1,436,856 | | | | 1,437,600 |
| Series 3151 Class PO, 8/15/35 (b)(d) | | | | 1,790,000 | | | | 1,232,583 |
| Freddie Mac Manufactured Housing participation certificates | | | | | | | | |
| guaranteed planned amortization class Series 1681 Class | | | | | | | | |
| PJ, 7% 12/15/23 | | | | 4,000,000 | | | | 4,099,386 |
See accompanying notes which are an integral part of the financial statements.
| Collateralized Mortgage Obligations continued | | | | |
| | | Principal | | Value (Note 1) |
| | | Amount | | |
| U.S. Government Agency continued | | | | |
| Freddie Mac Multi-class participation certificates guaranteed: | | |
| floater: | | | | |
| Series 2406: | | | | |
| Class FP, 5.89% 1/15/32 (c) | | $ 1,180,576 | | $ 1,211,297 |
| Class PF, 5.89% 12/15/31 (c) | | 1,080,000 | | 1,113,133 |
| Series 2410 Class PF, 5.89% 2/15/32 (c) | | 2,365,630 | | 2,436,619 |
| Series 2530 Class FE, 5.51% 2/15/32 (c) | | 862,693 | | 875,947 |
| Series 2553 Class FB, 5.41% 3/15/29 (c) | | 2,975,000 | | 2,995,468 |
| Series 2577 Class FW, 5.41% 1/15/30 (c) | | 2,074,564 | | 2,090,115 |
| Series 2625 Class FJ, 5.21% 7/15/17 (c) | | 1,539,840 | | 1,542,054 |
| Series 2861 Class GF, 5.21% 1/15/21 (c) | | 547,661 | | 548,168 |
| Series 2994 Class FB, 5.06% 6/15/20 (c) | | 750,261 | | 748,304 |
| Series 3008 Class SM, 21.2552% 7/15/35 (c) | | 441,441 | | 477,653 |
| planned amortization class: | | | | |
| Seires 2625 Class QX, 2.25% 3/15/22 | | 184,321 | | 179,370 |
| Series 1141 Class G, 9% 9/15/21 | | 134,965 | | 134,740 |
| Series 1671 Class G, 6.5% 8/15/23 | | 3,327,821 | | 3,333,385 |
| Series 1727 Class H, 6.5% 8/15/23 | | 689,102 | | 690,727 |
| Series 2006-15 Class OP, 3/25/36 (d) | | 1,153,011 | | 795,522 |
| Series 2389 Class DA, 5.81% 11/15/30 (c) | | 2,168,433 | | 2,181,510 |
| Series 2543 CLass PM, 5.5% 8/15/18 | | 669,106 | | 668,758 |
| Series 2587 Class UP, 4% 8/15/25 | | 3,347,643 | | 3,322,227 |
| Series 2622 Class PE, 4.5% 5/15/18 | | 2,640,000 | | 2,434,738 |
| Series 2628 Class OE, 4.5% 6/15/18 | | 1,600,000 | | 1,492,070 |
| Series 2640: | | | | |
| Class GE, 4.5% 7/15/18 | | 3,660,000 | | 3,410,407 |
| Class GR, 3% 3/15/10 | | 534,803 | | 532,523 |
| Class QG, 2% 4/15/22 | | 243,395 | | 236,075 |
| Series 2660 Class ML, 3.5% 7/15/22 | | 10,000,000 | | 9,757,217 |
| Series 2676 Class QA, 3% 8/15/16 | | 601,009 | | 597,671 |
| Series 2683 Class UH, 3% 3/15/19 | | 1,783,383 | | 1,765,392 |
| Series 2752 Class PW, 4% 4/15/22 | | 3,270,000 | | 3,199,286 |
| Series 2755 Class LC, 4% 6/15/27 | | 1,655,000 | | 1,575,198 |
| Series 2802 Class OB, 6% 5/15/34 | | 1,325,000 | | 1,314,479 |
| Series 2810 Class PD, 6% 6/15/33 | | 995,000 | | 981,503 |
| Series 2828 Class JA, 4.5% 1/15/10 | | 984,393 | | 979,195 |
| Series 3077 Class TO, 4/15/35 (d) | | 2,521,230 | | 1,752,658 |
| Series 3102 Class OH, 1/15/36 (d) | | 1,120,000 | | 800,800 |
| Series 3121 Class KO, 3/15/36 (d) | | 1,009,408 | | 745,650 |
| Series 3122 Class OP, 3/15/36 (d) | | 1,946,429 | | 1,334,665 |
See accompanying notes which are an integral part of the financial statements.
15 Semiannual Report
| Investments (Unaudited) continued | | |
| |
| |
| Collateralized Mortgage Obligations continued | | | | |
| | | Principal | | Value (Note 1) |
| | | Amount | | |
| U.S. Government Agency continued | | | | |
| Freddie Mac Multi-class participation certificates guaranteed: | | | | |
| – continued | | | | |
| planned amortization class: | | | | |
| Series 3123 Class LO, 3/15/36 (d) | | $ 1,835,672 | | $ 1,262,025 |
| sequential pay: | | | | |
| Series 2448 Class VH, 6.5% 5/15/18 | | 1,495,749 | | 1,498,639 |
| Series 2492 Class A, 5.25% 5/15/29 | | 1,274,526 | | 1,271,678 |
| Series 2546 Class MJ, 5.5% 3/15/23 | | 2,861,239 | | 2,742,766 |
| Series 2587 Class AD, 4.71% 3/15/33 | | 5,784,746 | | 4,887,765 |
| Series 2601 Class TB, 5.5% 4/15/23 | | 869,000 | | 832,577 |
| Series 2617 Class GW, 3.5% 6/15/16 | | 2,129,239 | | 2,065,407 |
| Series 2675 Class CB, 4% 5/15/16 | | 2,644,007 | | 2,544,766 |
| Series 2677 Class HG, 3% 8/15/12 | | 2,699,280 | | 2,637,392 |
| Series 2683 Class JA, 4% 10/15/16 | | 2,688,107 | | 2,581,214 |
| Series 2750 Class ZT, 5% 2/15/34 | | 958,185 | | 808,792 |
| Series 2773 Class HC, 4.5% 4/15/19 | | 703,518 | | 636,954 |
| Series 2809 Class UA, 4% 12/15/14 | | 706,852 | | 689,846 |
| Series 3007 Class EW, 5.5% 7/15/25 | | 1,135,000 | | 1,088,680 |
| Series 2769 Class BU, 5% 3/15/34 | | 867,446 | | 820,407 |
| Series 2877 Class JC, 5% 10/15/34 | | 1,552,028 | | 1,508,544 |
| target amortization class Series 2156 Class TC, 6.25% | | | | |
| 5/15/29 | | 3,410,427 | | 3,453,751 |
| TOTAL COLLATERALIZED MORTGAGE OBLIGATIONS | | | | |
| (Cost $160,150,251) | | | | 157,225,197 |
| |
| Commercial Mortgage Securities 0.2% | | | | |
| |
| Freddie Mac Multi-class participation certificates guaranteed | | | | |
| floater Series 2448 Class FT, 5.91% 3/15/32 (c) | | | | |
| (Cost $1,574,250) | | 1,544,608 | | 1,591,519 |
See accompanying notes which are an integral part of the financial statements.
| Cash Equivalents 0.4% | | | | | | | | |
| | | | | Maturity | | Value (Note 1) |
| | | | | Amount | | | | |
| |
| Investments in repurchase agreements (Collateralized by U.S. | | | | | | | | |
| Government Obligations), in a joint trading account at | | | | | | | | |
| 4.78%, dated 4/28/06 due 5/1/06 | | | | | | | | |
| (Cost $3,673,000) | | | | $ 3,674,463 | | | | $ 3,673,000 |
| |
| |
| TOTAL INVESTMENT PORTFOLIO – 99.5% | | | | | | | | |
| (Cost $1,013,729,361) | | | | | | | | 993,479,171 |
| |
| NET OTHER ASSETS – 0.5% | | | | | | | | 4,576,006 |
| |
| NET ASSETS 100% | | | | | | | | $ 998,055,177 |
| |
| |
| Swap Agreements | | | | | | | | |
| | | Expiration | | Notional | | | | Value |
| | | Date | | Amount | | | | |
| |
| Interest Rate Swaps | | | | | | | | |
| Receive quarterly a fixed rate equal to | | | | | | | | |
| 4.508% and pay quarterly a floating rate | | | | | | | | |
| based on 3-month LIBOR with Lehman | | | | | | | | |
| Brothers, Inc. | | August 2010 | | $ 8,000,000 | | | | $ (255,680) |
| Receive semi-annually a fixed rate equal to | | | | | | | | |
| 4.708% and pay quarterly a floating rate | | | | | | | | |
| based on 3-month LIBOR with Lehman | | | | | | | | |
| Brothers, Inc. | | Oct. 2010 | | 9,000,000 | | | | (236,610) |
| |
| | | | | $ 17,000,000 | | | | $ (492,290) |
Legend
(a) Security exempt from registration under
Rule 144A of the Securities Act of 1933.
These securities may be resold in
transactions exempt from registration,
normally to qualified institutional buyers.
At the period end, the value of these
securities amounted to $2,646,235 or
0.3% of net assets.
(b) Security or a portion of the security
purchased on a delayed delivery or
when-issued basis.
|
(c) The coupon rate shown on floating or
adjustable rate securities represents the
rate at period end.
(d) Principal Only Strips represent the right
to receive the monthly principal
payments on an underlying pool of
mortgage loans.
|
Income Tax Information
At October 31, 2005, the fund had a capital loss carryforward of approximately $1,882,000 all of which will expire on October 31, 2013.
See accompanying notes which are an integral part of the financial statements.
17 Semiannual Report
| Financial Statements | | | | | | |
| |
| Statement of Assets and Liabilities | | | | | | |
| | | | | April 30, 2006 (Unaudited) |
| |
| Assets | | | | | | |
| Investment in securities, at value (including repurchase | | | | | | |
| agreements of $3,673,000) See accompanying | | | | | | |
| schedule: | | | | | | |
| Unaffiliated issuers (cost $1,013,729,361) | | | | | | $ 993,479,171 |
| Cash | | | | | | 264 |
| Receivable for investments sold | | | | | | 136,368 |
| Receivable for fund shares sold | | | | | | 2,162,410 |
| Interest receivable | | | | | | 9,401,628 |
| Prepaid expenses | | | | | | 2,568 |
| Total assets | | | | | | 1,005,182,409 |
| |
| Liabilities | | | | | | |
| Payable for investments purchased | | | | | | |
| Regular delivery | | | | $ 1,842,437 | | |
| Delayed delivery | | | | 2,134,984 | | |
| Payable for fund shares redeemed | | | | 1,856,881 | | |
| Distributions payable | | | | 148,347 | | |
| Swap agreements, at value | | | | 492,290 | | |
| Accrued management fee | | | | 264,309 | | |
| Distribution fees payable | | | | 151,222 | | |
| Other affiliated payables | | | | 196,651 | | |
| Other payables and accrued expenses | | | | 40,111 | | |
| Total liabilities | | | | | | 7,127,232 |
| |
| Net Assets | | | | | | $ 998,055,177 |
| Net Assets consist of: | | | | | | |
| Paid in capital | | | | | | $1,025,771,786 |
| Undistributed net investment income | | | | | | 855,542 |
| Accumulated undistributed net realized gain (loss) on | | | | | | |
| investments | | | | | | (7,829,671) |
| Net unrealized appreciation (depreciation) on | | | | | | |
| investments | | | | | | (20,742,480) |
| Net Assets | | | | | | $ 998,055,177 |
See accompanying notes which are an integral part of the financial statements.
| Statement of Assets and Liabilities continued | | | | |
| | | | | April 30, 2006 (Unaudited) |
| |
| Calculation of Maximum Offering Price | | | | | | |
| Class A: | | | | | | |
| Net Asset Value and redemption price per share | | | | | | |
| ($103,414,354 ÷ 10,607,252 shares) | | | | | | $ 9.75 |
| Maximum offering price per share (100/95.25 of $9.75) | | . | | | | $ 10.24 |
| Class T: | | | | | | |
| Net Asset Value and redemption price per share | | | | | | |
| ($210,585,457 ÷ 21,615,410 shares) | | | | | | $ 9.74 |
| Maximum offering price per share (100/96.50 of $9.74) | | . | | | | $ 10.09 |
| Class B: | | | | | | |
| Net Asset Value and offering price per share | | | | | | |
| ($70,277,405 ÷ 7,221,183 shares)A | | | | | | $ 9.73 |
| Class C: | | | | | | |
| Net Asset Value and offering price per share | | | | | | |
| ($47,346,588 ÷ 4,861,047 shares)A | | | | | | $ 9.74 |
| Institutional Class: | | | | | | |
| Net Asset Value, offering price and redemption price per | | | | |
| share ($566,431,373 ÷ 58,435,475 shares) | | | | | | $ 9.69 |
| |
| A Redemption price per share is equal to net asset value less any applicable contingent deferred sales charge. | | | | |
See accompanying notes which are an integral part of the financial statements.
19 Semiannual Report
| Financial Statements continued | | | | |
| |
| |
| Statement of Operations | | | | | | |
| | | Six months ended April 30, 2006 (Unaudited) |
| |
| Investment Income | | | | | | |
| Interest | | | | | | $ 21,950,072 |
| |
| Expenses | | | | | | |
| Management fee | | | | $ 1,558,282 | | |
| Transfer agent fees | | | | 991,153 | | |
| Distribution fees | | | | 977,531 | | |
| Accounting and security lending fees | | | | 185,030 | | |
| Independent trustees’ compensation | | | | 1,939 | | |
| Custodian fees and expenses | | | | 23,587 | | |
| Registration fees | | | | 52,109 | | |
| Audit | | | | 29,770 | | |
| Legal | | | | 1,523 | | |
| Miscellaneous | | | | 21,831 | | |
| Total expenses before reductions | | | | 3,842,755 | | |
| Expense reductions | | | | (3,792) | | 3,838,963 |
| |
| Net investment income | | | | | | 18,111,109 |
| Realized and Unrealized Gain (Loss) | | | | | | |
| Net realized gain (loss) on: | | | | | | |
| Investment securities: | | | | | | |
| Unaffiliated issuers | | | | (5,164,924) | | |
| Swap agreements | | | | 27,559 | | |
| Total net realized gain (loss) | | | | | | (5,137,365) |
| Change in net unrealized appreciation (depreciation) on: | | | | | | |
| Investment securities | | | | (11,557,221) | | |
| Swap agreements | | | | (276,788) | | |
| Total change in net unrealized appreciation | | | | | | |
| (depreciation) | | | | | | (11,834,009) |
| Net gain (loss) | | | | | | (16,971,374) |
| Net increase (decrease) in net assets resulting from | | | | | | |
| operations | | | | | | $ 1,139,735 |
See accompanying notes which are an integral part of the financial statements.
| Statement of Changes in Net Assets | | | | | | | | |
| | | Six months ended | | | | Year ended |
| | | April 30, 2006 | | | | October 31, |
| | | (Unaudited) | | | | 2005 |
| Increase (Decrease) in Net Assets | | | | | | | | |
| Operations | | | | | | | | |
| Net investment income | | | | $ 18,111,109 | | | | $ 26,477,498 |
| Net realized gain (loss) | | | | (5,137,365) | | | | (2,327,529) |
| Change in net unrealized appreciation (depreciation) . | | | | (11,834,009) | | | | (19,424,731) |
| Net increase (decrease) in net assets resulting | | | | | | | | |
| from operations | | | | 1,139,735 | | | | 4,725,238 |
| Distributions to shareholders from net investment income . | | | | (19,163,139) | | | | (24,292,986) |
| Distributions to shareholders from net realized gain | | | | — | | | | (1,496,540) |
| Total distributions | | | | (19,163,139) | | | | (25,789,526) |
| Share transactions - net increase (decrease) | | | | 88,666,576 | | | | 197,654,113 |
| Total increase (decrease) in net assets | | | | 70,643,172 | | | | 176,589,825 |
| |
| Net Assets | | | | | | | | |
| Beginning of period | | | | 927,412,005 | | | | 750,822,180 |
| End of period (including undistributed net investment | | | | | | | | |
| income of $855,542 and undistributed net invest- | | | | | | | | |
| ment income of $1,907,572, respectively) | | | | $ 998,055,177 | | | | $ 927,412,005 |
See accompanying notes which are an integral part of the financial statements.
21 Semiannual Report
| Financial Highlights Class A | | | | | | | | | | |
| | | Six months ended | | | | | | | | | | | | |
| | | April 30, 2006 | | Years ended October 31, |
| | | (Unaudited) | | 2005 | | 2004 | | 2003 | | 2002 | | | | 2001 |
| Selected Per Share Data | | | | | | | | | | | | | | |
| Net asset value, | | | | | | | | | | | | | | | | |
| beginning of | | | | | | | | | | | | | | | | |
| period | | | | $ 9.93 | | $ 10.17 | | $ 10.12 | | $ 10.33 | | $ 10.14 | | | | $ 9.42 |
| Income from | | | | | | | | | | | | | | | | |
| Investment | | | | | | | | | | | | | | | | |
| Operations | | | | | | | | | | | | | | | | |
| Net investment | | | | | | | | | | | | | | | | |
| incomeE | | | | .185 | | .333 | | .319 | | .360 | | .410G | | | | .546 |
| Net realized and | | | | | | | | | | | | | | | | |
| unrealized gain | | | | | | | | | | | | | | | | |
| (loss) | | | | (.169) | | (.248) | | .151 | | (.144) | | .205G | | | | .730 |
| Total from investment | | | | | | | | | | | | | | | | |
| operations | | | | .016 | | .085 | | .470 | | .216 | | .615 | | | | 1.276 |
| Distributions from | | | | | | | | | | | | | | | | |
| net investment | | | | | | | | | | | | | | | | |
| income | | | | (.196) | | (.305) | | (.320) | | (.356) | | (.425) | | | | (.556) |
| Distributions from | | | | | | | | | | | | | | | | |
| net realized gain | | | | | | (.020) | | (.100) | | (.070) | | — | | | | — |
| Total distributions | | | | (.196) | | (.325) | | (.420) | | (.426) | | (.425) | | | | (.556) |
| Net asset value, end | | | | | | | | | | | | | | | | |
| of period | | | | $ 9.75 | | $ 9.93 | | $ 10.17 | | $ 10.12 | | $ 10.33 | | | | $ 10.14 |
| Total ReturnB,C,D | | | | .15% | | .84% | | 4.76% | | 2.11% | | 6.31% | | | | 13.95% |
| Ratios to Average Net AssetsF | | | | | | | | | | | | | | | | |
| Expenses before | | | | | | | | | | | | | | | | |
| reductions | | | | .78%A | | .84% | | .88% | | .83% | | .83% | | | | .87% |
| Expenses net of fee | | | | | | | | | | | | | | | | |
| waivers, if any | | | | .78%A | | .84% | | .88% | | .83% | | .83% | | | | .87% |
| Expenses net of | | | | | | | | | | | | | | | | |
| all reductions | | | | .78%A | | .84% | | .88% | | .83% | | .83% | | | | .86% |
| Net investment | | | | | | | | | | | | | | | | |
| income | | | | 3.78%A | | 3.31% | | 3.17% | | 3.50% | | 4.11%G | | | | 5.61% |
| Supplemental Data | | | | | | | | | | | | | | | | |
| Net assets, | | | | | | | | | | | | | | | | |
| end of period | | | | | | | | | | | | | | | | |
| (000 omitted) . | | | | $103,414 | | $ 84,685 | | $ 70,407 | | $ 69,011 | | $ 68,973 | | | | $ 43,205 |
| Portfolio turnover | | | | | | | | | | | | | | | | |
| rate | | | | 155%A | | 160% | | 133% | | 262% | | 251% | | | | 260% |
A Annualized
B Total returns for periods of less than one year are not annualized.
C Total returns would have been lower had certain expenses not been reduced during the periods shown.
D Total returns do not include the effect of the sales charges.
E Calculated based on average shares outstanding during the period.
F Expense ratios reflect operating expenses of the class. Expenses before reductions do not reflect amounts reimbursed by the investment adviser or
expense offset arrangements and do not represent the amount paid by the class during periods when reimbursements or reductions occur. Ex
penses net of fee waivers reflect expenses after reimbursement by the investment adviser but prior to reductions from expense offset arrange
ments. Expenses net of all reductions represent the net expenses paid by the class.
G Effective November 1, 2001, the fund adopted the provisions of the AICPA Audit and Accounting Guide for Investment Companies and began
amortizing premium and discount on all debt securities. Per share data and ratios for periods prior to adoption have not been restated to reflect
this change.
|
See accompanying notes which are an integral part of the financial statements.
| Financial Highlights Class T | | | | | | | | | | |
| | | Six months ended | | | | | | | | | | | | |
| | | April 30, 2006 | | Years ended October 31, |
| | | (Unaudited) | | 2005 | | 2004 | | 2003 | | 2002 | | | | 2001 |
| Selected Per Share Data | | | | | | | | | | | | | | | | |
| Net asset value, | | | | | | | | | | | | | | | | |
| beginning of | | | | | | | | | | | | | | | | |
| period | | | | $ 9.92 | | $ 10.16 | | $ 10.11 | | $ 10.32 | | $ 10.13 | | | | $ 9.41 |
| Income from | | | | | | | | | | | | | | | | |
| Investment | | | | | | | | | | | | | | | | |
| Operations | | | | | | | | | | | | | | | | |
| Net investment | | | | | | | | | | | | | | | | |
| incomeE | | | | 182 | | .325 | | .311 | | .350 | | .398G | | | | .535 |
| Net realized and | | | | | | | | | | | | | | | | |
| unrealized gain | | | | | | | | | | | | | | | | |
| (loss) | | | | (.170) | | (.248) | | .150 | | (.144) | | .206G | | | | .731 |
| Total from investment | | | | | | | | | | | | | | | | |
| operations | | | | .012 | | .077 | | .461 | | .206 | | .604 | | | | 1.266 |
| Distributions from | | | | | | | | | | | | | | | | |
| net investment | | | | | | | | | | | | | | | | |
| income | | | | (.192) | | (.297) | | (.311) | | (.346) | | (.414) | | | | (.546) |
| Distributions from | | | | | | | | | | | | | | | | |
| net realized gain | | | | | | (.020) | | (.100) | | (.070) | | — | | | | — |
| Total distributions | | | | (.192) | | (.317) | | (.411) | | (.416) | | (.414) | | | | (.546) |
| Net asset value, end | | | | | | | | | | | | | | | | |
| of period | | | | $ 9.74 | | $ 9.92 | | $ 10.16 | | $ 10.11 | | $ 10.32 | | | | $ 10.13 |
| Total ReturnB,C,D | | | | 11% | | .76% | | 4.67% | | 2.01% | | 6.19% | | | | 13.86% |
| Ratios to Average Net AssetsF | | | | | | | | | | | | | | | | |
| Expenses before | | | | | | | | | | | | | | | | |
| reductions | | | | .85%A | | .92% | | .97% | | .93% | | .94% | | | | .96% |
| Expenses net of fee | | | | | | | | | | | | | | | | |
| waivers, if any | | | | .85%A | | .92% | | .97% | | .93% | | .94% | | | | .96% |
| Expenses net of | | | | | | | | | | | | | | | | |
| all reductions | | | | .85%A | | .92% | | .97% | | .93% | | .94% | | | | .96% |
| Net investment | | | | | | | | | | | | | | | | |
| income | | | | 3.72%A | | 3.23% | | 3.08% | | 3.39% | | 4.00%G | | | | 5.52% |
| Supplemental Data | | | | | | | | | | | | | | | | |
| Net assets, | | | | | | | | | | | | | | | | |
| end of period | | | | | | | | | | | | | | | | |
| (000 omitted) . | | | | $210,585 | | $243,819 | | $259,149 | | $304,517 | | $366,209 | | | | $293,105 |
| Portfolio turnover | | | | | | | | | | | | | | | | |
| rate | | | | 155%A | | 160% | | 133% | | 262% | | 251% | | | | 260% |
A Annualized
B Total returns for periods of less than one year are not annualized.
C Total returns would have been lower had certain expenses not been reduced during the periods shown.
D Total returns do not include the effect of the sales charges.
E Calculated based on average shares outstanding during the period.
F Expense ratios reflect operating expenses of the class. Expenses before reductions do not reflect amounts reimbursed by the investment adviser or
expense offset arrangements and do not represent the amount paid by the class during periods when reimbursements or reductions occur. Ex
penses net of fee waivers reflect expenses after reimbursement by the investment adviser but prior to reductions from expense offset arrange
ments. Expenses net of all reductions represent the net expenses paid by the class.
G Effective November 1, 2001, the fund adopted the provisions of the AICPA Audit and Accounting Guide for Investment Companies and began
amortizing premium and discount on all debt securities. Per share data and ratios for periods prior to adoption have not been restated to reflect
this change.
|
See accompanying notes which are an integral part of the financial statements.
23 Semiannual Report
| Financial Highlights Class B | | | | | | | | | | |
| | | Six months ended | | | | | | | | | | | | |
| | | April 30, 2006 | | Years ended October 31, |
| | | (Unaudited) | | 2005 | | 2004 | | 2003 | | 2002 | | | | 2001 |
| Selected Per Share Data | | | | | | | | | | | | | | |
| Net asset value, | | | | | | | | | | | | | | | | |
| beginning of | | | | | | | | | | | | | | | | |
| period | | | | $ 9.91 | | $ 10.15 | | $ 10.10 | | $ 10.31 | | $ 10.12 | | | | $ 9.41 |
| Income from | | | | | | | | | | | | | | | | |
| Investment | | | | | | | | | | | | | | | | |
| Operations | | | | | | | | | | | | | | | | |
| Net investment | | | | | | | | | | | | | | | | |
| incomeE | | | | .148 | | .257 | | .242 | | .282 | | .335G | | | | .474 |
| Net realized and | | | | | | | | | | | | | | | | |
| unrealized gain | | | | | | | | | | | | | | | | |
| (loss) | | | | (.170) | | (.248) | | .151 | | (.144) | | .205G | | | | .720 |
| Total from investment | | | | | | | | | | | | | | | | |
| operations | | | | (.022) | | .009 | | .393 | | .138 | | .540 | | | | 1.194 |
| Distributions from | | | | | | | | | | | | | | | | |
| net investment | | | | | | | | | | | | | | | | |
| income | | | | (.158) | | (.229) | | (.243) | | (.278) | | (.350) | | | | (.484) |
| Distributions from | | | | | | | | | | | | | | | | |
| net realized gain | | | | | | (.020) | | (.100) | | (.070) | | — | | | | — |
| Total distributions | | | | (.158) | | (.249) | | (.343) | | (.348) | | (.350) | | | | (.484) |
| Net asset value, end | | | | | | | | | | | | | | | | |
| of period | | | | $ 9.73 | | $ 9.91 | | $ 10.15 | | $ 10.10 | | $ 10.31 | | | | $ 10.12 |
| Total ReturnB,C,D | | | | (.23)% | | .08% | | 3.97% | | 1.34% | | 5.52% | | | | 13.03% |
| Ratios to Average Net AssetsF | | | | | | | | | �� | | | | | | | |
| Expenses before | | | | | | | | | | | | | | | | |
| reductions | | | | 1.54%A | | 1.61% | | 1.65% | | 1.59% | | 1.58% | | | | 1.60% |
| Expenses net of fee | | | | | | | | | | | | | | | | |
| waivers, if any . | | | | 1.54%A | | 1.60% | | 1.65% | | 1.59% | | 1.58% | | | | 1.60% |
| Expenses net of | | | | | | | | | | | | | | | | |
| all reductions . | | | | 1.54%A | | 1.60% | | 1.65% | | 1.59% | | 1.58% | | | | 1.60% |
| Net investment | | | | | | | | | | | | | | | | |
| income | | | | 3.02%A | | 2.55% | | 2.40% | | 2.74% | | 3.36%G | | | | 4.88% |
| Supplemental Data | | | | | | | | | | | | | | | | |
| Net assets, | | | | | | | | | | | | | | | | |
| end of period | | | | | | | | | | | | | | | | |
| (000 omitted) . | | | | $70,277 | | $94,149 | | $127,576 | | $176,855 | | $158,864 | | | | $158,864 |
| Portfolio turnover | | | | | | | | | | | | | | | | |
| rate | | | | 155%A | | 160% | | 133% | | 262% | | 251% | | | | 260% |
A Annualized
B Total returns for periods of less than one year are not annualized.
C Total returns would have been lower had certain expenses not been reduced during the periods shown.
D Total returns do not include the effect of the contingent deferred sales charge.
E Calculated based on average shares outstanding during the period.
F Expense ratios reflect operating expenses of the class. Expenses before reductions do not reflect amounts reimbursed by the investment adviser or
expense offset arrangements and do not represent the amount paid by the class during periods when reimbursements or reductions occur. Ex
penses net of fee waivers reflect expenses after reimbursement by the investment adviser but prior to reductions from expense offset arrange
ments. Expenses net of all reductions represent the net expenses paid by the class.
G Effective November 1, 2001, the fund adopted the provisions of the AICPA Audit and Accounting Guide for Investment Companies and began
amortizing premium and discount on all debt securities. Per share data and ratios for periods prior to adoption have not been restated to reflect
this change.
|
See accompanying notes which are an integral part of the financial statements.
| Financial Highlights Class C | | | | | | | | | | |
| | | Six months ended | | | | | | | | | | | | |
| | | April 30, 2006 | | Years ended October 31, |
| | | (Unaudited) | | 2005 | | 2004 | | 2003 | | 2002 | | | | 2001 |
| Selected Per Share Data | | | | | | | | | | | | | | | | |
| Net asset value, | | | | | | | | | | | | | | | | |
| beginning of | | | | | | | | | | | | | | | | |
| period | | | | $ 9.92 | | $ 10.16 | | $ 10.11 | | $ 10.32 | | $ 10.13 | | | | $ 9.41 |
| Income from | | | | | | | | | | | | | | | | |
| Investment | | | | | | | | | | | | | | | | |
| Operations | | | | | | | | | | | | | | | | |
| Net investment | | | | | | | | | | | | | | | | |
| incomeE | | | | .145 | | .250 | | .238 | | .275 | | .327G | | | | .468 |
| Net realized and | | | | | | | | | | | | | | | | |
| unrealized gain | | | | | | | | | | | | | | | | |
| (loss) | | | | (.170) | | (.247) | | .150 | | (.144) | | .205G | | | | .729 |
| Total from investment | | | | | | | | | | | | | | | | |
| operations | | | | (.025) | | .003 | | .388 | | .131 | | .532 | | | | 1.197 |
| Distributions from | | | | | | | | | | | | | | | | |
| net investment | | | | | | | | | | | | | | | | |
| income | | | | (.155) | | (.223) | | (.238) | | (.271) | | (.342) | | | | (.477) |
| Distributions from | | | | | | | | | | | | | | | | |
| net realized gain | | | | — | | (.020) | | (.100) | | (.070) | | — | | | | — |
| Total distributions | | | | (.155) | | (.243) | | (.338) | | (.341) | | (.342) | | | | (.477) |
| Net asset value, end | | | | | | | | | | | | | | | | |
| of period | | | | $ 9.74 | | $ 9.92 | | $ 10.16 | | $ 10.11 | | $ 10.32 | | | | $ 10.13 |
| Total ReturnB,C,D | | | | (.26)% | | .02% | | 3.92% | | 1.27% | | 5.44% | | | | 13.05% |
| Ratios to Average Net AssetsF | | | | | | | | | | | | | | | | |
| Expenses before | | | | | | | | | | | | | | | | |
| reductions | | | | 1.60%A | | 1.66% | | 1.69% | | 1.66% | | 1.66% | | | | 1.67% |
| Expenses net of fee | | | | | | | | | | | | | | | | |
| waivers, if any . | | | | 1.60%A | | 1.66% | | 1.69% | | 1.66% | | 1.66% | | | | 1.67% |
| Expenses net of | | | | | | | | | | | | | | | | |
| all reductions . | | | | 1.60%A | | 1.66% | | 1.69% | | 1.66% | | 1.66% | | | | 1.67% |
| Net investment | | | | | | | | | | | | | | | | |
| income | | | | 2.96%A | | 2.49% | | 2.36% | | 2.66% | | 3.29%G | | | | 4.81% |
| Supplemental Data | | | | | | | | | | | | | | | | |
| Net assets, | | | | | | | | | | | | | | | | |
| end of period | | | | | | | | | | | | | | | | |
| (000 omitted) . | | | | $ 47,347 | | $ 53,488 | | $ 62,133 | | $ 80,620 | | $ 103,002 | | | | $ 87,214 |
| Portfolio turnover | | | | | | | | | | | | | | | | |
| rate | | | | 155%A | | 160% | | 133% | | 262% | | 251% | | | | 260% |
A Annualized
B Total returns for periods of less than one year are not annualized.
C Total returns would have been lower had certain expenses not been reduced during the periods shown.
D Total returns do not include the effect of the contingent deferred sales charge.
E Calculated based on average shares outstanding during the period.
F Expense ratios reflect operating expenses of the class. Expenses before reductions do not reflect amounts reimbursed by the investment adviser or
expense offset arrangements and do not represent the amount paid by the class during periods when reimbursements or reductions occur. Ex
penses net of fee waivers reflect expenses after reimbursement by the investment adviser but prior to reductions from expense offset arrange
ments. Expenses net of all reductions represent the net expenses paid by the class.
G Effective November 1, 2001, the fund adopted the provisions of the AICPA Audit and Accounting Guide for Investment Companies and began
amortizing premium and discount on all debt securities. Per share data and ratios for periods prior to adoption have not been restated to reflect
this change.
|
See accompanying notes which are an integral part of the financial statements.
25 Semiannual Report
| Financial Highlights Institutional Class | | | | | | | | |
| | | Six months ended | | | | | | | | | | | | |
| | | April 30, 2006 | | Years ended October 31, |
| | | (Unaudited) | | 2005 | | 2004 | | 2003 | | 2002 | | | | 2001 |
| Selected Per Share Data | | | | | | | | | | | | | | | | |
| Net asset value, | | | | | | | | | | | | | | | | |
| beginning of | | | | | | | | | | | | | | | | |
| period | | | | $ 9.87 | | $ 10.12 | | $ 10.07 | | $ 10.28 | | $ 10.09 | | | | $ 9.38 |
| Income from | | | | | | | | | | | | | | | | |
| Investment | | | | | | | | | | | | | | | | |
| Operations | | | | | | | | | | | | | | | | |
| Net investment | | | | | | | | | | | | | | | | |
| incomeD | | | | .194 | | .351 | | .333 | | .370 | | .422F | | | | .560 |
| Net realized and | | | | | | | | | | | | | | | | |
| unrealized gain | | | | | | | | | | | | | | | | |
| (loss) | | | | (.169) | | (.257) | | .155 | | (.138) | | .207F | | | | .723 |
| Total from investment | | | | | | | | | | | | | | | | |
| operations | | | | .025 | | .094 | | .488 | | .232 | | .629 | | | | 1.283 |
| Distributions from | | | | | | | | | | | | | | | | |
| net investment | | | | | | | | | | | | | | | | |
| income | | | | (.205) | | (.324) | | (.338) | | (.372) | | (.439) | | | | (.573) |
| Distributions from | | | | | | | | | | | | | | | | |
| net realized gain | | | | — | | (.020) | | (.100) | | (.070) | | — | | | | — |
| Total distributions | | | | (.205) | | (.344) | | (.438) | | (.442) | | (.439) | | | | (.573) |
| Net asset value, end | | | | | | | | | | | | | | | | |
| of period | | | | $ 9.69 | | $ 9.87 | | $ 10.12 | | $ 10.07 | | $ 10.28 | | | | $ 10.09 |
| Total ReturnB,C | | | | .25% | | .94% | | 4.98% | | 2.28% | | 6.49% | | | | 14.11% |
| Ratios to Average Net AssetsE | | | | | | | | | | | | | | | | |
| Expenses before | | | | | | | | | | | | | | | | |
| reductions | | | | .58%A | | .64% | | .69% | | .68% | | .69% | | | | .69% |
| Expenses net of fee | | | | | | | | | | | | | | | | |
| waivers, if any | | | | .58%A | | .64% | | .69% | | .68% | | .69% | | | | .69% |
| Expenses net of | | | | | | | | | | | | | | | | |
| all reductions | | | | .58%A | | .64% | | .69% | | .68% | | .69% | | | | .69% |
| Net investment | | | | | | | | | | | | | | | | |
| income | | | | 3.98%A | | 3.51% | | 3.35% | | 3.64% | | 4.26%F | | | | 5.79% |
| Supplemental Data | | | | | | | | | | | | | | | | |
| Net assets, | | | | | | | | | | | | | | | | |
| end of period | | | | | | | | | | | | | | | | |
| (000 omitted) . | | | | $ 566,431 | | $ 451,272 | | $ 231,557 | | $ 96,356 | | $ 50,953 | | | | $ 27,782 |
| Portfolio turnover | | | | | | | | | | | | | | | | |
| rate | | | | 155%A | | 160% | | 133% | | 262% | | 251% | | | | 260% |
A Annualized
B Total returns for periods of less than one year are not annualized.
C Total returns would have been lower had certain expenses not been reduced during the periods shown.
D Calculated based on average shares outstanding during the period.
E Expense ratios reflect operating expenses of the class. Expenses before reductions do not reflect amounts reimbursed by the investment adviser or
expense offset arrangements and do not represent the amount paid by the class during periods when reimbursements or reductions occur. Ex
penses net of fee waivers reflect expenses after reimbursement by the investment adviser but prior to reductions from expense offset arrange
ments. Expenses net of all reductions represent the net expenses paid by the class.
F Effective November 1, 2001, the fund adopted the provisions of the AICPA Audit and Accounting Guide for Investment Companies and began
amortizing premium and discount on all debt securities. Per share data and ratios for periods prior to adoption have not been restated to reflect
this change.
|
See accompanying notes which are an integral part of the financial statements.
Notes to Financial Statements
For the period ended April 30, 2006 (Unaudited)
1. Significant Accounting Policies.
Fidelity Advisor Government Investment Fund (the fund) is a fund of Fidelity Advisor Series II (the trust) and is authorized to issue an unlimited number of shares. The trust is registered under the Investment Company Act of 1940, as amended (the 1940 Act), as an open end management investment company organized as a Massachusetts business trust.
The fund offers Class A, Class T, Class B, Class C, and Institutional Class shares, each of which has equal rights as to assets and voting privileges. Each class has exclusive voting rights with respect to matters that affect that class. Class B shares will automatically convert to Class A shares after a holding period of seven years from the initial date of purchase. Investment income, realized and unrealized capital gains and losses, the common expenses of the fund, and certain fund level expense reductions, if any, are allocated on a pro rata basis to each class based on the relative net assets of each class to the total net assets of the fund. Each class differs with respect to transfer agent and distribution and service plan fees incurred. Certain expense reductions also differ by class.
The financial statements have been prepared in conformity with accounting principles generally accepted in the United States of America, which require management to make certain estimates and assumptions at the date of the financial statements. The following summarizes the significant accounting policies of the fund:
Security Valuation. Investments are valued and net asset value per share is calculated (NAV calculation) as of the close of business of the New York Stock Exchange, normally 4:00 p.m. Eastern time. Wherever possible, the fund uses independent pricing services approved by the Board of Trustees to value its investments. Debt securities, including restricted securities, for which quotes are readily available, are valued by independent pricing services or by dealers who make markets in such securities. Pricing services consider yield or price of bonds of comparable quality, coupon, maturity and type as well as dealer supplied prices. When current market prices or quotations are not readily available or do not accurately reflect fair value, valuations may be determined in accor dance with procedures adopted by the Board of Trustees. The frequency of when fair value pricing is used is unpredictable. The value of securities used for NAV calculation under fair value pricing may differ from published prices for the same securities. Investments in open end mutual funds are valued at their closing net asset value each business day. Short term securities with remaining maturities of sixty days or less for which quotations are not readily available are valued at amortized cost, which approxi mates value.
27 Semiannual Report
| Notes to Financial Statements (Unaudited) continued |
1. Significant Accounting Policies continued |
Investment Transactions and Income. Security transactions are accounted for as of trade date. Gains and losses on securities sold are determined on the basis of identified cost. Interest income is accrued as earned. Interest income includes coupon interest and amortization of premium and accretion of discount on debt securities. Inflation indexed bonds are fixed income securities whose principal value is periodically adjusted to the rate of inflation. Interest is accrued based on the principal value, which is adjusted for inflation. Any increase in the principal amount of an inflation indexed bond is recorded as interest income, even though principal is not received until maturity.
Expenses. Most expenses of the trust can be directly attributed to a fund. Expenses which cannot be directly attributed are apportioned among each fund in the trust.
Income Tax Information and Distributions to Shareholders. Each year, the fund intends to qualify as a regulated investment company by distributing all of its taxable income and realized gains under Subchapter M of the Internal Revenue Code. As a result, no provision for income taxes is required in the accompanying financial statements.
Dividends are declared daily and paid monthly from net investment income. Distribu tions from realized gains, if any, are recorded on the ex dividend date. Income dividends and capital gain distributions are declared separately for each class. Income and capital gain distributions are determined in accordance with income tax regulations, which may differ from generally accepted accounting principles.
Capital accounts within the financial statements are adjusted for permanent book tax differences. These adjustments have no impact on net assets or the results of operations. Temporary book tax differences will reverse in a subsequent period.
Book tax differences are primarily due to prior period premium and discount on debt securities, market discount, deferred trustees compensation, financing transactions, and losses deferred due to wash sales.
The federal tax cost of investments and unrealized appreciation (depreciation) as of period end were as follows:
| Unrealized appreciation | | | | $ 1,581,752 |
| Unrealized depreciation | | | | (21,813,578) |
| Net unrealized appreciation (depreciation) | | | | $ (20,231,826) |
| Cost for federal income tax purposes | | | | $ 1,013,710,997 |
Repurchase Agreements. Fidelity Management & Research Company (FMR) has received an Exemptive Order from the Securities and Exchange Commission (the SEC) which permits the fund and other affiliated entities of FMR to transfer uninvested cash balances into joint trading accounts which are then invested in repurchase agreements. The fund may also invest directly with institutions in repurchase agreements. Repur chase agreements are collateralized by government or non government securities. Upon settlement date, collateral is held in segregated accounts with custodian banks and may be obtained in the event of a default of the counterparty. The fund monitors, on a daily basis, the value of the collateral to ensure it is at least equal to the principal amount of the repurchase agreement (including accrued interest). In the event of a default by the counterparty, realization of the collateral proceeds could be delayed, during which time the value of the collateral may decline.
Delayed Delivery Transactions and When Issued Securities. The fund may purchase or sell securities on a delayed delivery or when issued basis. Payment and delivery may take place after the customary settlement period for that security. The price of the underlying securities and the date when the securities will be delivered and paid for are fixed at the time the transaction is negotiated. During the time a delayed delivery sell is outstanding, the contract is marked to market daily and equivalent deliverable securities are held for the transaction. The value of the securities purchased on a delayed delivery or when issued basis are identified as such in the fund’s Schedule of Investments. The fund may receive compensation for interest forgone in the purchase of a delayed delivery or when issued security. With respect to purchase commitments, the fund identifies securities as segregated in its records with a value at least equal to the amount of the commitment. Losses may arise due to changes in the value of the underly ing securities or if the counterparty does not perform under the contract’s terms, or if the issuer does not issue the securities due to political, economic, or other factors.
Restricted Securities. The fund may invest in securities that are subject to legal or contractual restrictions on resale. These securities generally may be resold in transac tions exempt from registration or to the public if the securities are registered. Disposal of these securities may involve time consuming negotiations and expense, and prompt sale at an acceptable price may be difficult. Information regarding restricted securities is included at the end of the fund’s Schedule of Investments.
Swap Agreements. The fund may invest in swaps for the purpose of managing its exposure to interest rate, credit or market risk. Interest rate swaps are agreements to exchange cash flows periodically based on a notional principal amount, for example, the exchange of fixed rate interest payments for floating rate interest payments. Periodic payments received or made by the fund are recorded in the accompanying Statement of Operations as realized gains or losses, respectively. The primary risk associated with interest rate swaps is that unfavorable changes in the fluctuation of interest rates could adversely impact a fund.
29 Semiannual Report
| Notes to Financial Statements (Unaudited) continued |
2. Operating Policies continued | | |
Swap Agreements continued | | |
Swaps are marked to market daily based on dealer supplied valuations and changes in value are recorded as unrealized appreciation (depreciation). Gains or losses are realized upon early termination of the swap agreement. Collateral, in the form of cash or securities, may be required to be held in segregated accounts with a fund’s custodian in compliance with swap contracts. Risks may exceed amounts recognized on the State ment of Assets and Liabilities. These risks include changes in the returns of the underly ing instruments, failure of the counterparties to perform under the contracts’ terms and the possible lack of liquidity with respect to the swap agreements. Details of swap agreements open at period end are included in the fund’s Schedule of Investments under the caption “Swap Agreements.”
Mortgage Dollar Rolls. To earn additional income, the fund may employ trading strategies which involve the sale and simultaneous agreement to repurchase similar securities (“mortgage dollar rolls”) or the purchase and simultaneous agreement to sell similar securities (“reverse mortgage dollar rolls”). The securities traded are mortgage securities and bear the same interest rate but may be collateralized by different pools of mortgages. During the period between the sale and repurchase in a mortgage dollar roll transaction, a fund will not be entitled to receive interest and principal payments on the securities sold but will invest the proceeds of the sale in other securities which may enhance the yield and total return. In addition, the difference between the sale price and the future purchase price is recorded as an adjustment to investment income. During the period between the purchase and subsequent sale in a reverse mortgage dollar roll transaction a fund is entitled to interest and principal payments on the securities purchased. The price differential between the purchase and sale is recorded as an adjustment to investment income. Losses may arise due to changes in the value of the securities or if the counterparty does not perform under the terms of the agreement. If the counterparty files for bankruptcy or becomes insolvent, a fund’s right to repurchase or sell securities may be limited.
3. Fees and Other Transactions with Affiliates.
Management Fee. FMR and its affiliates provide the fund with investment manage ment related services for which the fund pays a monthly management fee. The manage ment fee is the sum of an individual fund fee rate that is based on an annual rate of .20% of the fund’s average net assets and a group fee rate that averaged .12% during the period. The group fee rate is based upon the average net assets of all the mutual funds advised by FMR. The group fee rate decreases as assets under management increase and increases as assets under management decrease. For the period, the total annualized management fee rate was .32% of the fund’s average net assets.
3. Fees and Other Transactions with Affiliates continued
Distribution and Service Plan. In accordance with Rule 12b 1 of the 1940 Act, the fund has adopted separate Distribution and Service Plans for each class of shares. Certain classes pay Fidelity Distributors Corporation (FDC), an affiliate of FMR, separate Distribution and Service Fees, each of which is based on an annual percentage of each class’ average net assets. In addition, FDC may pay financial intermediaries for selling shares of the fund and providing shareholder support services. For the period, the Distribution and Service Fee rates and the total amounts paid to and retained by FDC were as follows:
| | | Distribution | | Service | | | | Paid to | | | | Retained |
| | | Fee | | Fee | | | | FDC | | | | by FDC |
| Class A | | 0% | | .15% | | | | $ 69,808 | | | | $ 1,622 |
| Class T | | 0% | | .25% | | | | 283,317 | | | | 3,056 |
| Class B | | .65% | | .25% | | | | 370,922 | | | | 268,726 |
| Class C | | .75% | | .25% | | | | 253,484 | | | | 18,062 |
| | | | | | | | | $ 977,531 | | | | $ 291,466 |
Sales Load. FDC receives a front end sales charge of up to 4.75% for selling Class A shares, and 3.50% for selling Class T shares, some of which is paid to financial intermedi aries for selling shares of the fund. FDC receives the proceeds of contingent deferred sales charges levied on Class A, Class T, Class B, and Class C redemptions. These charges depend on the holding period. The deferred sales charges range from 5% to 1% for Class B, 1% for Class C,.75% to .50% for certain purchases of Class A shares (.25% prior to February 24, 2006) and .25% for certain purchases of Class T shares.
| For the period, sales charge amounts retained by FDC were as follows: | | |
| |
| | | | | Retained |
| | | | | by FDC |
| Class A | | | | $ 10,959 |
| Class T | | | | 5,692 |
| Class B* | | | | 114,358 |
| Class C* | | | | 1,416 |
| | | | | $ 132,425 |
| * | When Class B and Class C shares are initially sold, FDC pays commissions from its own resources to financial intermediaries through which the sales are made. |
| |
31 Semiannual Report
| Notes to Financial Statements (Unaudited) continued |
| 3. Fees and Other Transactions with Affiliates continued |
Transfer Agent Fees. Fidelity Investments Institutional Operations Company, Inc. (FIIOC), an affiliate of FMR, is the transfer, dividend disbursing and shareholder servic ing agent for each class of the fund. FIIOC receives account fees and asset based fees that vary according to the account size and type of account of the shareholders of the respective classes of the fund. FIIOC pays for typesetting, printing and mailing of share holder reports, except proxy statements. For the period the total transfer agent fees paid by each class to FIIOC, were as follows:
| | | | | | | % of |
| | | | | | | Average |
| | | | | Amount | | Net Assets |
| Class A | | | | $ 111,624 | | .24* |
| Class T | | | | 230,386 | | .20* |
| Class B | | | | 101,361 | | .25* |
| Class C | | | | 52,031 | | .21* |
| Institutional Class | | | | 495,751 | | .19* |
| | | | | $ 991,153 | | |
| * Annualized | | | | | | |
Accounting and Security Lending Fees. Fidelity Service Company, Inc. (FSC), an affiliate of FMR, maintains the fund’s accounting records. The accounting fee is based on the level of average net assets for the month. Under a separate contract, FSC administers the security lending program. The security lending fee is based on the number and duration of lending transactions.
4. Committed Line of Credit.
|
The fund participates with other funds managed by FMR in a $4.2 billion credit facility (the “line of credit”) to be utilized for temporary or emergency purposes to fund share holder redemptions or for other short term liquidity purposes. The fund has agreed to pay commitment fees on its pro rata portion of the line of credit, which amounts to $938 and is reflected in Miscellaneous Expense on the Statement of Operations. During the period, there were no borrowings on this line of credit.
The fund lends portfolio securities from time to time in order to earn additional income. On the settlement date of the loan, the fund receives collateral (in the form of U.S. Treasury obligations, letters of credit and/or cash) against the loaned securities and maintains collateral in an amount not less than 100% of the market value of the loaned securities during the period of the loan. The market value of the loaned securities is determined at the close of business of the fund and any additional required collateral is delivered to the fund on the next business day. If the borrower defaults on its obligation to return the securities loaned because of insolvency or other reasons, a fund could experience delays and costs in recovering the securities loaned or in gaining access to the collateral. Any cash collateral received is invested in cash equivalents. At period end there were no security loans outstanding. Security lending income represents the income earned on investing cash collateral, less fees and expenses associated with the loan, plus any premium payments that may be received on the loan of certain types of securities. Security lending income is presented in the Statement of Operations as a component of interest income. Net income from lending portfolio securities during the period amounted to $3,108.
Through arrangements with the fund’s custodian and each class’ transfer agent, credits realized as a result of uninvested cash balances were used to reduce the fund’s expenses. During the period, these credits reduced the fund’s custody expenses by $300. During the period, credits reduced each class’ transfer agent expense as noted in the table below.
| | | | | Transfer Agent |
| | | | | expense reduction |
| Class A | | | | $ 2,404 |
| Institutional Class | | | | 1,088 |
| | | | | $ 3,492 |
| |
| 7. Other. | | | | |
The fund’s organizational documents provide former and current trustees and officers with a limited indemnification against liabilities arising in connection with the performance of their duties to the fund. In the normal course of business, the fund may also enter into contracts that provide general indemnifications. The fund’s maximum exposure under these arrangements is unknown as this would be dependent on future claims that may be made against the fund. The risk of material loss from such claims is considered remote.
At the end of the period, the Fidelity Advisor Freedom Funds were the owners of record, in the aggregate, of approximately 26% of the total outstanding shares of the fund.
33 Semiannual Report
| Notes to Financial Statements (Unaudited) continued |
8. Distributions to Shareholders. | | |
Distributions to shareholders of each class were as follows: | | |
| | | | | | | Six months ended | | Year ended |
| | | | | | | April 30, 2006 | | October 31, 2005 |
| From net investment income | | | | | | | | | | | | | | |
| Class A | | | | | | $ 1,835,863 | | | | | | $ 2,224,216 |
| Class T | | | | | | 4,421,364 | | | | | | 7,397,091 |
| Class B | | | | | | 1,336,162 | | | | | | 2,471,404 |
| Class C | | | | | | 800,836 | | | | | | 1,237,969 |
| Institutional Class | | | | | | 10,768,914 | | | | | | 10,962,306 |
| Total | | | | | | $ 19,163,139 | | | | | | $ 24,292,986 |
| From net realized gain | | | | | | | | | | | | |
| Class A | | | | | | $ — | | | | | | $ 139,625 |
| Class T | | | | | | — | | | | | | 507,903 |
| Class B | | | | | | — | | | | | | 244,101 |
| Class C | | | | | | — | | | | | | 116,835 |
| Institutional Class | | | | | | — | | | | | | 488,076 |
| Total | | | | | | $ — | | | | | | $ 1,496,540 |
| |
| 9. Share Transactions. | | | | | | | | | | | | | | |
| |
Transactions for each class of shares were as follows:
| | | | | | | | | | |
| | | Shares | | | | Dollars |
| | | Six months ended | | Year ended | | | | Six months ended | | | | Year ended |
| | | April 30, 2006 | | October 31, 2005 | | | | April 30, 2006 | | | | October 31, 2005 |
| Class A | | | | | | | | | | | | | | | | |
| Shares sold | | 3,677,760 | | | | 4,113,241 | | | | | | $ 36,304,592 | | | | $ 41,451,899 |
| Reinvestment of | | | | | | | | | | | | | | | | |
| distributions | | 168,138 | | | | 208,122 | | | | | | 1,662,722 | | | | 2,095,808 |
| Shares redeemed | | (1,768,253) | | | | (2,714,775) | | | | | | (17,483,934) | | | | (27,351,893) |
| Net increase (decrease) . | | 2,077,645 | | | | 1,606,588 | | | | | | $ 20,483,380 | | | | $ 16,195,814 |
| Class T | | | | | | | | | | | | | | | | |
| Shares sold | | 2,508,256 | | | | 8,129,709 | | | | | | $ 24,818,800 | | | | $ 81,837,721 |
| Reinvestment of | | | | | | | | | | | | | | | | |
| distributions | | 423,534 | | | | 741,353 | | | | | | 4,187,082 | | | | 7,462,032 |
| Shares redeemed | | (5,890,796) | | | | (9,793,832) | | | | | | (58,291,393) | | | | (98,641,967) |
| Net increase (decrease) . | | (2,959,006) | | | | (922,770) | | | | | | $ (29,285,511) | | | | $ (9,342,214) |
| Class B | | | | | | | | | | | | | | | | |
| Shares sold | | 141,351 | | | | 963,812 | | | | | | $ 1,396,504 | | | | $ 9,708,714 |
| Reinvestment of | | | | | | | | | | | | | | | | |
| distributions | | 107,499 | | | | 210,668 | | | | | | 1,062,239 | | | | 2,118,016 |
| Shares redeemed | | (2,526,792) | | | | (4,240,223) | | | | | | (24,978,538) | | | | (42,659,299) |
| Net increase (decrease) . | | (2,277,942) | | | | (3,065,743) | | | | | | $ (22,519,795) | | | | $ (30,832,569) |
| |
| |
| |
| Semiannual Report | | | | 34 | | | | | | | | | | |
| 9. Share Transactions - continued | | | | | | | | |
| | | Shares | | Dollars |
| | | Six months ended | | Year ended | | Six months ended | | Year ended |
| | | April 30, 2006 | | October 31, 2005 | | April 30, 2006 | | October 31, 2005 |
| Class C | | | | | | | | | | | | |
| Shares sold | | 370,747 | | 986,075 | | | | $ 3,665,233 | | | | $ 9,938,801 |
| Reinvestment of | | | | | | | | | | | | |
| distributions | | 50,595 | | 83,491 | | | | 500,304 | | | | 840,019 |
| Shares redeemed | | (952,694) | | (1,791,952) | | | | (9,425,436) | | | | (18,050,113) |
| Net increase (decrease) . | | (531,352) | | (722,386) | | | | $ (5,259,899) | | | | $ (7,271,293) |
| Institutional Class | | | | | | | | | | | | |
| Shares sold | | 15,016,014 | | 24,879,267 | | | | $ 147,813,311 | | | | $ 249,564,976 |
| Reinvestment of | | | | | | | | | | | | |
| distributions | | 1,030,044 | | 1,044,484 | | | | 10,121,188 | | | | 10,458,786 |
| Shares redeemed | | (3,318,909) | | (3,106,436) | | | | (32,686,098) | | | | (31,119,387) |
| Net increase (decrease) . | | 12,727,149 | | 22,817,315 | | | | $ 125,248,401 | | | | $ 228,904,375 |
| |
| 10. Proposed Reorganization. | | | | | | | | |
On April 20, 2006, the Board of Trustees of Fidelity Advisor Government Investment Fund (the fund) approved an Agreement and Plan of Reorganization (“Agreement”) between the fund and Fidelity Government Income Fund (“Reorganization”). The Agreement provides for the transfer of all of the assets of the fund to Fidelity Government Income Fund in exchange solely for the number of shares of Class A, Class T, Class B, Class C and Institutional Class (the Advisor Classes) of Fidelity Government Income Fund having the same relative net asset value as the outstanding shares of Class A, Class T, Class B, Class C and Institutional Class of the fund as of the close of business of the New York Stock Exchange on the day that the Reorganization is effective and the assumption by Fidelity Government Income Fund of all of the liabilities of the fund. The Advisor Classes of Fidelity Government Income Fund are being created for purposes of the Reorganization and will not commence operations until the date of the Reorganization. The Reorganization can be consummated only if, among other things, it is approved by the vote of a majority (as defined by the 1940 Act) of outstanding voting securities of the fund. A Special Meeting of Shareholders (“Meeting”) of the fund will be held on September 20, 2006, to vote on the Agreement. A detailed description of the proposed transactions and voting information will be sent to shareholders of the fund in July, 2006. If the Agreement is approved at the Meeting, the Reorganization is expected to become effective on or about October 27, 2006. The Reorganization is expected to qualify as a tax free transaction with no gain or loss recognized by the funds or their shareholders.
35 Semiannual Report
Board Approval of Investment Advisory Contracts and Management Fees
Advisor Government Investment Fund
On January 19, 2006, the Board of Trustees, including the Independent Trustees (together, the Board), voted to approve a general research services agreement (the Agreement) between FMR, FMR Co., Inc. (FMRC), Fidelity Investments Money Manage ment, Inc. (FIMM), and Fidelity Research & Analysis Company (FRAC) (together, the Investment Advisers) for the fund, effective January 20, 2006, pursuant to which FRAC may provide general research and investment advisory support services to FMRC and FIMM. The Board considered that it has approved previously various sub advisory agreements for the fund with affiliates of FMR that allow FMR to obtain research, non discretionary advice, or discretionary portfolio management at no additional expense to the fund. The Board, assisted by the advice of fund counsel and independent Trustees’ counsel, considered a broad range of information and determined that it would be beneficial for the fund to access the research and investment advisory support services supplied by FRAC at no additional expense to the fund.
The Board reached this determination in part because the new arrangement will involve no changes in (i) the contractual terms of and fees payable under the fund’s manage ment contract or sub advisory agreements; (ii) the investment process or strategies employed in the management of the fund’s assets; (iii) the nature or level of services provided under the fund’s management contract or sub advisory agreements; (iv) the day to day management of the fund or the persons primarily responsible for such man agement; or (v) the ultimate control or beneficial ownership of FMR, FMRC, or FIMM. The Board also considered that the establishment of the Agreement would not necessi tate prior shareholder approval of the Agreement or result in an assignment and termination of the fund’s management contract or sub advisory agreements under the Investment Company Act of 1940.
Because the Board was approving an arrangement with FRAC under which the fund will not bear any additional management fees or expenses and under which the fund’s portfolio manager would not change, it did not consider the fund’s investment perfor mance, competitiveness of management fee and total expenses, costs of services and profitability, or economies of scale to be significant factors in its decision.
In connection with its future renewal of the fund’s management contract and sub advisory agreements, the Board will consider: (i) the nature, extent, and quality of services provided to the fund, including shareholder and administrative services and investment performance; (ii) the competitiveness of the fund’s management fee and total expenses; (iii) the costs of the services and profitability, including the revenues earned and the expenses incurred by Fidelity in conducting the business of developing, marketing, distributing, managing, administering, and servicing the fund and its shareholders; and (iv) whether there have been economies of scale in respect of the management of the Fidelity funds, whether the Fidelity funds (including the fund) have
appropriately benefited from any such economies of scale, and whether there is potential for realization of any further economies.
Based on its evaluation of all of the conclusions noted above, and after considering all material factors, the Board ultimately concluded that the fund’s Agreement is fair and reasonable, and that the fund’s Agreement should be approved.
37 Semiannual Report
39 Semiannual Report
41 Semiannual Report
43 Semiannual Report
Investment Adviser
Fidelity Management & Research Company
Boston, MA
Investment Sub Advisers
Fidelity Investments Money
Management, Inc.
Fidelity Research & Analysis Company
(formerly Fidelity Research &
Management Company (Far East) Inc.)
Fidelity International
Investment Advisors
Fidelity International
Investment Advisors (U.K.) Limited
General Distributor
Fidelity Distributors Corporation
Boston, MA
Transfer and Service Agents
Fidelity Investments Institutional
Operations Company, Inc.
Boston, MA
Fidelity Service Company, Inc.
Boston, MA
Custodian
The Bank of New York
New York, NY
|
AGOV USAN-0606
1.784882.103
|


Fidelity® Advisor
Government Investment
Fund - Institutional Class
|
Semiannual Report
April 30, 2006
|

| Contents | | | | |
| |
| |
| Chairman’s Message | | 3 | | Ned Johnson’s message to |
| | | | | shareholders. |
| Shareholder Expense | | 4 | | An example of shareholder expenses. |
| Example | | | | |
| Investment Changes | | 6 | | A summary of major shifts in the |
| | | | | fund’s investments over the past six |
| | | | | months. |
| Investments | | 7 | | A complete list of the fund’s |
| | | | | investments with their market |
| | | | | values. |
| Financial Statements | | 18 | | Statements of assets and liabilities, |
| | | | | operations, and changes in net |
| | | | | assets, as well as financial highlights. |
| Notes | | 27 | | Notes to the financial statements. |
| Board Approval of | | 36 | | |
| Investment Advisory | | | | |
| Contracts and Management | | | | |
| Fees | | | | |
To view a fund’s proxy voting guidelines and proxy voting record for the 12 month period ended
June 30, visit www.fidelity.com/proxyvotingresults or visit the Securities and Exchange Commis
sion’s (SEC) web site at www.sec.gov. You may also call 1-877-208-0098 to request a free copy of
the proxy voting guidelines.
Standard & Poor’s, S&P and S&P 500 are registered service marks of The McGraw Hill Companies,
Inc. and have been licensed for use by Fidelity Distributors Corporation.
Other third party marks appearing herein are the property of their respective owners.
All other marks appearing herein are registered or unregistered trademarks or service marks
of FMR Corp. or an affiliated company.
|
| | This report and the financial statements contained herein are submitted for the general information
of the shareholders of the fund. This report is not authorized for distribution to prospective investors
in the fund unless preceded or accompanied by an effective prospectus.
A fund files its complete schedule of portfolio holdings with the SEC for the first and third
quarters of each fiscal year on Form N Q. Forms N Q are available on the SEC’s web site at
http://www.sec.gov. A fund’s Forms N Q may be reviewed and copied at the SEC’s Public Refer
ence Room in Washington, DC. Information regarding the operation of the SEC’s Public Reference
Room may be obtained by calling 1-800-SEC-0330. For a complete list of a fund’s portfolio
holdings, view the most recent quarterly holdings report, semiannual report, or annual report
on Fidelity’s web site at http://www.advisor.fidelity.com.
NOT FDIC INSURED · MAY LOSE VALUE · NO BANK GUARANTEE
Neither the fund nor Fidelity Distributors Corporation is a bank.
|
Chairman’s Message
(photograph of Edward C. Johnson 3d)
Dear Shareholder:
Although many securities markets made gains in early 2006, there is only one certainty when it comes to investing: There is no sure thing. There are, however, a number of time tested, fundamental investment principles that can put the historical odds in your favor.
One of the basic tenets is to invest for the long term. Over time, riding out the markets’ inevitable ups and downs has proven much more effective than selling into panic or chasing the hottest trend. Even missing only a few of the markets’ best days can significantly diminish investor returns. Patience also affords the benefits of compounding of earning interest on additional income or reinvested dividends and capital gains. There are tax advantages and cost benefits to consider as well. The more you sell, the more taxes you pay, and the more you trade, the higher the costs. While staying the course doesn’t eliminate risk, it can considerably lessen the effect of short term declines.
You can further manage your investing risk through diversification. And today, more than ever, geographic diversification should be taken into account. Studies indicate that asset allocation is the single most important determinant of a portfolio’s long term success. The right mix of stocks, bonds and cash aligned to your particular risk tolerance and investment objective is very important. Age appropriate rebalancing is also an essential aspect of asset allocation. For younger investors, an emphasis on equities which historically have been the best performing asset class over time is encouraged. As investors near their specific goal, such as retirement or sending a child to college, consideration may be given to replacing volatile assets (e.g. common stocks) with more stable fixed investments (bonds or savings plans).
A third investment principle investing regularly can help lower the average cost of your purchases. Investing a certain amount of money each month or quarter helps ensure you won’t pay for all your shares at market highs. This strategy known as dollar cost averaging also reduces unconstructive “emotion” from investing, helping shareholders avoid selling weak performers just prior to an upswing, or chasing a hot performer just before a correction.
We invite you to contact us via the Internet, through our Investor Centers or over the phone. It is our privilege to provide you the information you need to make the investments that are right for you.
Sincerely,
/s/ Edward C. Johnson 3d
Edward C. Johnson 3d
3 Semiannual Report
Shareholder Expense Example
As a shareholder of the Fund, you incur two types of costs: (1) transaction costs, including sales charges (loads) on purchase payments or redemption proceeds, and (2) ongoing costs, including management fees, distribution and/or service (12b 1) fees and other Fund expenses. This Example is intended to help you understand your ongoing costs (in dollars) of investing in the Fund and to compare these costs with the ongoing costs of investing in other mutual funds.
The Example is based on an investment of $1,000 invested at the beginning of the period and held for the entire period (November 1, 2005 to April 30, 2006).
The first line of the table below for each class of the Fund provides information about actual account values and actual expenses. You may use the information in this line, together with the amount you invested, to estimate the expenses that you paid over the period. Simply divide your account value by $1,000.00 (for example, an $8,600 account value divided by $1,000.00 = 8.6), then multiply the result by the number in the first line for a class of the Fund under the heading entitled “Expenses Paid During Period” to estimate the expenses you paid on your account during this period.
Hypothetical Example for Comparison Purposes
The second line of the table below for each class of the Fund provides information about hypothetical account values and hypothetical expenses based on a Class’ actual expense ratio and an assumed rate of return of 5% per year before expenses, which is not the Class’ actual return. The hypothetical account values and expenses may not be used to estimate the actual ending account balance or expenses you paid for the period. You may use this information to compare the ongoing costs of investing in the Fund and other funds. To do so, compare this 5% hypothetical example with the 5% hypothetical examples that appear in the shareholder reports of the other funds.
Please note that the expenses shown in the table are meant to highlight your ongoing costs only and do not reflect any transaction costs. Therefore, the second line of the table is useful in comparing ongoing costs only, and will not help you determine the relative total costs of owning different funds. In addition, if these transactional costs were included, your costs would have been higher.
| | | | | | | | | | | Expenses Paid |
| | | Beginning | | | | Ending | | During Period* |
| | | Account Value | | | | Account Value | | November 1, 2005 |
| | | November 1, 2005 | | | | April 30, 2006 | | to April 30, 2006 |
| Class A | | | | | | | | | | | | |
| Actual | | | | $ 1,000.00 | | | | $ 1,001.50 | | | | $ 3.87 |
| HypotheticalA | | | | $ 1,000.00 | | | | $ 1,020.93 | | | | $ 3.91 |
| Class T | | | | | | | | | | | | |
| Actual | | | | $ 1,000.00 | | | | $ 1,001.10 | | | | $ 4.22 |
| HypotheticalA | | | | $ 1,000.00 | | | | $ 1,020.58 | | | | $ 4.26 |
| Class B | | | | | | | | | | | | |
| Actual | | | | $ 1,000.00 | | | | $ 997.70 | | | | $ 7.63 |
| HypotheticalA | | | | $ 1,000.00 | | | | $ 1,017.16 | | | | $ 7.70 |
Semiannual Report 4
| | | | | | | | | | | Expenses Paid |
| | | Beginning | | | | Ending | | During Period* |
| | | Account Value | | | | Account Value | | November 1, 2005 |
| | | November 1, 2005 | | | | April 30, 2006 | | to April 30, 2006 |
| Class C | | | | | | | | | | | | |
| Actual | | | | $ 1,000.00 | | | | $ 997.40 | | | | $ 7.92 |
| HypotheticalA | | | | $ 1,000.00 | | | | $ 1,016.86 | | | | $ 8.00 |
| Institutional Class | | | | | | | | | | | | |
| Actual | | | | $ 1,000.00 | | | | $ 1,002.50 | | | | $ 2.88 |
| HypotheticalA | | | | $ 1,000.00 | | | | $ 1,021.92 | | | | $ 2.91 |
A 5% return per year before expenses | | | | | | | | |
* Expenses are equal to each Class’ annualized expense ratio (shown in the table below); multiplied by the average account value over the period, multiplied by 181/365 (to reflect the one half year period).
| | | Annualized |
| | | Expense Ratio |
| Class A | | 78% |
| Class T | | 85% |
| Class B | | 1.54% |
| Class C | | 1.60% |
| Institutional Class | | 58% |
5 Semiannual Report
| Investment Changes | | | | |
| |
| |
| Coupon Distribution as of April 30, 2006 | | | | |
| | | % of fund’s | | % of fund’s investments |
| | | investments | | 6 months ago |
| Zero coupon bonds | | 1.4 | | 0.1 |
| Less than 1% | | 2.5 | | 1.3 |
| 1 – 1.99% | | 2.9 | | 2.7 |
| 2 – 2.99% | | 3.9 | | 2.5 |
| 3 – 3.99% | | 6.5 | | 21.6 |
| 4 – 4.99% | | 39.5 | | 25.1 |
| 5 – 5.99% | | 22.9 | | 16.4 |
| 6 – 6.99% | | 16.8 | | 19.1 |
| 7% and over | | 3.3 | | 5.8 |
Coupon distribution shows the range of stated interest rates on the fund’s investments, excluding short term investments.
| Average Years to Maturity as of April 30, 2006 | | |
| | | | | 6 months ago |
| Years | | 6.5 | | 6.4 |
Average years to maturity is based on the average time remaining until principal payments are expected from each of the fund’s bonds, weighted by dollar amount.
| Duration as of April 30, 2006 | | | | |
| | | | | | | 6 months ago |
| Years | | | | 4.2 | | 4.2 |
Duration shows how much a bond fund’s price fluctuates with changes in comparable interest rates. If rates rise 1%, for example, a fund with a five year duration is likely to lose about 5% of its value. Other factors also can influence a bond fund’s performance and share price. Accordingly, a bond fund’s actual performance may differ from this example.

Semiannual Report 6
| Investments April 30, 2006 (Unaudited) |
| Showing Percentage of Net Assets | | | | |
| |
| U.S. Government and Government Agency Obligations 61.7% | | | | |
| | | Principal | | Value (Note 1) |
| | | Amount | | |
| U.S. Government Agency Obligations 28.1% | | | | |
| Fannie Mae: | | | | |
| 3.25% 8/15/08 | | $ 4,812,000 | | $ 4,617,509 |
| 3.25% 2/15/09 | | 610,000 | | 580,063 |
| 4% 9/2/08 | | 1,755,000 | | 1,707,106 |
| 4.25% 5/15/09 | | 21,500,000 | | 20,971,745 |
| 4.5% 10/15/08 | | 57,372,000 | | 56,522,435 |
| 4.625% 1/15/08 | | 36,500,000 | | 36,190,079 |
| 4.75% 12/15/10 | | 21,605,000 | | 21,149,934 |
| 6% 5/15/08 | | 2,718,000 | | 2,763,054 |
| 6.25% 2/1/11 | | 24,260,000 | | 25,074,627 |
| 6.625% 9/15/09 | | 1,620,000 | | 1,691,810 |
| Federal Home Loan Bank 5.8% 9/2/08 | | 9,965,000 | | 10,075,801 |
| Freddie Mac: | | | | |
| 4.75% 1/19/16 | | 22,800,000 | | 21,708,427 |
| 5% 1/30/14 | | 25,000,000 | | 24,219,425 |
| 5.125% 4/18/08 | | 6,000,000 | | 5,998,125 |
| 5.875% 3/21/11 | | 6,960,000 | | 7,080,902 |
| Guaranteed Trade Trust Certificates (assets of Trust guaranteed | | | | |
| by U.S. Government through Export-Import Bank) | | | | |
| Series 1994 A, 7.39% 6/26/06 | | 375,000 | | 379,564 |
| Israeli State (guaranteed by U.S. Government through Agency | | | | |
| for International Development): | | | | |
| 6.6% 2/15/08 | | 6,974,709 | | 7,057,876 |
| 6.8% 2/15/12 | | 5,000,000 | | 5,282,980 |
| Overseas Private Investment Corp. U.S. Government | | | | |
| guaranteed participation certificates: | | | | |
| 6.77% 11/15/13 | | 1,013,461 | | 1,059,066 |
| 6.99% 5/21/16 | | 3,787,500 | | 4,041,073 |
| Private Export Funding Corp.: | | | | |
| secured: | | | | |
| 5.66% 9/15/11 (a) | | 2,610,000 | | 2,646,235 |
| 5.685% 5/15/12 | | 3,845,000 | | 3,912,511 |
| 6.67% 9/15/09 | | 1,380,000 | | 1,444,705 |
| 4.974% 8/15/13 | | 2,850,000 | | 2,783,108 |
| Small Business Administration guaranteed development | | | | |
| participation certificates Series 2002-20K Class 1, 5.08% | | | | |
| 11/1/22 | | 4,950,201 | | 4,824,434 |
| Tennessee Valley Authority 5.375% 4/1/56 | | 3,000,000 | | 2,841,489 |
| U.S. Department of Housing and Urban Development | | | | |
| Government guaranteed participation certificates Series | | | | |
| 1999 A: | | | | |
| 5.75% 8/1/06 | | 2,100,000 | | 2,103,043 |
See accompanying notes which are an integral part of the financial statements.
7 Semiannual Report
| Investments (Unaudited) continued | | |
| |
| |
| U.S. Government and Government Agency Obligations continued | | | | |
| | | Principal | | Value (Note 1) |
| | | Amount | | |
| U.S. Government Agency Obligations continued | | | | |
| U.S. Department of Housing and Urban Development | | | | |
| Government guaranteed participation certificates Series | | | | |
| 1999-A: – continued | | | | |
| 5.96% 8/1/09 | | $ 1,800,000 | | $ 1,813,469 |
| U.S. Trade Trust Certificates (assets of Trust guaranteed by | | | | |
| U.S. Government through Export-Import Bank) 8.17% | | | | |
| 1/15/07 | | 60,000 | | 60,660 |
| |
| TOTAL U.S. GOVERNMENT AGENCY OBLIGATIONS | | | | 280,601,255 |
| U.S. Treasury Inflation Protected Obligations 9.2% | | | | |
| U.S. Treasury Inflation-Indexed Notes: | | | | |
| 0.875% 4/15/10 | | 25,904,866 | | 24,630,593 |
| 1.875% 7/15/15 | | 30,337,659 | | 29,120,256 |
| 2.375% 4/15/11 | | 38,038,380 | | 38,237,500 |
| |
| TOTAL U.S. TREASURY INFLATION PROTECTED OBLIGATIONS | | | | 91,988,349 |
| U.S. Treasury Obligations – 24.4% | | | | |
| U.S. Treasury Bonds: | | | | |
| 6.125% 8/15/29 | | 45,052,000 | | 49,969,020 |
| 6.25% 8/15/23 | | 1,500,000 | | 1,657,734 |
| 8% 11/15/21 | | 4,794,000 | | 6,154,298 |
| 12% 8/15/13 | | 10,000,000 | | 11,526,950 |
| U.S. Treasury Notes: | | | | |
| 3.5% 8/15/09 | | 3,229,000 | | 3,093,534 |
| 3.75% 5/15/08 | | 21,726,000 | | 21,257,544 |
| 4.125% 8/15/10 | | 12,000,000 | | 11,639,064 |
| 4.25% 8/15/13 | | 11,670,000 | | 11,132,538 |
| 4.25% 11/15/13 | | 37,610,000 | | 35,800,019 |
| 4.75% 5/15/14 | | 73,050,000 | | 71,688,852 |
| 5.625% 5/15/08 | | 19,400,000 | | 19,676,605 |
| |
| TOTAL U.S. TREASURY OBLIGATIONS | | | | 243,596,158 |
| |
| TOTAL U.S. GOVERNMENT AND GOVERNMENT AGENCY | | | | |
| OBLIGATIONS | | | | |
| (Cost $630,272,158) | | | | 616,185,762 |
See accompanying notes which are an integral part of the financial statements.
Semiannual Report 8
| U.S. Government Agency Mortgage Securities 20.9% | | | | | | | | |
| | | | | Principal | | Value (Note 1) |
| | | | | Amount | | |
| Fannie Mae – 17.8% | | | | | | | | |
| 3.734% 1/1/35 (c) | | | | $ 168,030 | | | | $ 165,043 |
| 3.749% 12/1/34 (c) | | | | 140,405 | | | | 138,028 |
| 3.752% 10/1/33 (c) | | | | 115,520 | | | | 112,704 |
| 3.782% 12/1/34 (c) | | | | 28,159 | | | | 27,722 |
| 3.792% 6/1/34 (c) | | | | 522,073 | | | | 504,803 |
| 3.824% 6/1/33 (c) | | | | 80,483 | | | | 78,950 |
| 3.829% 1/1/35 (c) | | | | 106,554 | | | | 104,849 |
| 3.847% 1/1/35 (c) | | | | 311,514 | | | | 306,331 |
| 3.854% 10/1/33 (c) | | | | 3,405,088 | | | | 3,333,582 |
| 3.869% 1/1/35 (c) | | | | 197,596 | | | | 194,541 |
| 3.879% 6/1/33 (c) | | | | 453,483 | | | | 445,026 |
| 3.902% 10/1/34 (c) | | | | 126,443 | | | | 124,674 |
| 3.913% 5/1/34 (c) | | | | 37,401 | | | | 37,397 |
| 3.917% 12/1/34 (c) | | | | 95,206 | | | | 93,763 |
| 3.947% 11/1/34 (c) | | | | 209,559 | | | | 206,647 |
| 3.957% 1/1/35 (c) | | | | 137,773 | | | | 135,762 |
| 3.96% 5/1/33 (c) | | | | 40,180 | | | | 39,535 |
| 3.972% 12/1/34 (c) | | | | 106,306 | | | | 104,810 |
| 3.978% 12/1/34 (c) | | | | 131,908 | | | | 130,060 |
| 3.983% 12/1/34 (c) | | | | 705,231 | | | | 695,364 |
| 3.988% 1/1/35 (c) | | | | 89,005 | | | | 87,727 |
| 4% 5/1/18 to 9/1/18 | | | | 3,988,999 | | | | 3,730,375 |
| 4.003% 12/1/34 (c) | | | | 69,328 | | | | 68,363 |
| 4.006% 2/1/35 (c) | | | | 94,825 | | | | 93,451 |
| 4.013% 1/1/35 (c) | | | | 195,978 | | | | 193,237 |
| 4.021% 2/1/35 (c) | | | | 86,215 | | | | 85,057 |
| 4.042% 12/1/34 (c) | | | | 191,070 | | | | 188,519 |
| 4.048% 10/1/18 (c) | | | | 103,243 | | | | 101,318 |
| 4.05% 1/1/35 (c) | | | | 61,471 | | | | 60,591 |
| 4.051% 1/1/35 (c) | | | | 89,400 | | | | 88,206 |
| 4.066% 4/1/33 (c) | | | | 39,471 | | | | 38,947 |
| 4.067% 1/1/35 (c) | | | | 180,613 | | | | 178,171 |
| 4.081% 5/1/33 (c) | | | | 10,864,957 | | | | 10,699,701 |
| 4.09% 2/1/35 (c) | | | | 76,275 | | | | 75,205 |
| 4.091% 2/1/35 (c) | | | | 184,777 | | | | 182,253 |
| 4.092% 2/1/35 (c) | | | | 73,104 | | | | 72,155 |
| 4.106% 2/1/35 (c) | | | | 340,694 | | | | 336,456 |
| 4.109% 1/1/35 (c) | | | | 197,748 | | | | 195,132 |
| 4.113% 11/1/34 (c) | | | | 154,880 | | | | 152,991 |
| 4.115% 2/1/35 (c) | | | | 218,359 | | | | 215,442 |
| 4.121% 1/1/35 (c) | | | | 186,487 | | | | 184,097 |
| 4.122% 1/1/35 (c) | | | | 342,566 | | | | 338,298 |
See accompanying notes which are an integral part of the financial statements.
| Investments (Unaudited) continued | | | | | | |
| |
| |
| U.S. Government Agency Mortgage Securities continued | | | | | | |
| | | | | Principal | | Value (Note 1) |
| | | | | Amount | | |
| Fannie Mae – continued | | | | | | | | |
| 4.144% 1/1/35 (c) | | | | $ 292,826 | | | | $ 290,141 |
| 4.153% 2/1/35 (c) | | | | 183,535 | | | | 181,191 |
| 4.166% 11/1/34 (c) | | | | 49,159 | | | | 48,627 |
| 4.176% 1/1/35 (c) | | | | 161,949 | | | | 159,986 |
| 4.178% 1/1/35 (c) | | | | 341,696 | | | | 337,897 |
| 4.178% 1/1/35 (c) | | | | 224,809 | | | | 218,604 |
| 4.188% 10/1/34 (c) | | | | 286,301 | | | | 284,090 |
| 4.22% 3/1/34 (c) | | | | 103,645 | | | | 101,532 |
| 4.223% 1/1/35 (c) | | | | 105,321 | | | | 104,118 |
| 4.248% 1/1/34 (c) | | | | 350,187 | | | | 343,926 |
| 4.25% 2/1/35 (c) | | | | 127,804 | | | | 124,348 |
| 4.267% 2/1/35 (c) | | | | 65,916 | | | | 65,216 |
| 4.27% 10/1/34 (c) | | | | 61,910 | | | | 61,340 |
| 4.28% 8/1/33 (c) | | | | 234,317 | | | | 231,494 |
| 4.283% 3/1/35 (c) | | | | 113,921 | | | | 112,559 |
| 4.287% 7/1/34 (c) | | | | 81,531 | | | | 81,278 |
| 4.294% 3/1/33 (c) | | | | 156,128 | | | | 154,438 |
| 4.299% 5/1/35 (c) | | | | 157,647 | | | | 156,013 |
| 4.304% 12/1/34 (c) | | | | 73,146 | | | | 72,385 |
| 4.315% 10/1/33 (c) | | | | 59,389 | | | | 58,520 |
| 4.316% 3/1/33 (c) | | | | 55,427 | | | | 53,928 |
| 4.339% 9/1/34 (c) | | | | 166,614 | | | | 165,086 |
| 4.345% 6/1/33 (c) | | | | 79,858 | | | | 78,979 |
| 4.354% 9/1/34 (c) | | | | 433,732 | | | | 432,396 |
| 4.356% 1/1/35 (c) | | | | 126,536 | | | | 123,394 |
| 4.357% 4/1/35 (c)�� | | | | 77,059 | | | | 76,184 |
| 4.392% 1/1/35 (c) | | | | 144,879 | | | | 143,491 |
| 4.395% 5/1/35 (c) | | | | 357,621 | | | | 353,673 |
| 4.402% 10/1/34 (c) | | | | 701,438 | | | | 686,736 |
| 4.434% 10/1/34 (c) | | | | 550,103 | | | | 545,857 |
| 4.436% 4/1/34 (c) | | | | 183,079 | | | | 181,052 |
| 4.438% 3/1/35 (c) | | | | 147,674 | | | | 144,104 |
| 4.465% 8/1/34 (c) | | | | 342,326 | | | | 336,983 |
| 4.474% 5/1/35 (c) | | | | 76,371 | | | | 75,623 |
| 4.481% 1/1/35 (c) | | | | 164,463 | | | | 163,208 |
| 4.5% 2/1/18 to 9/1/33 | | | | 15,684,978 | | | | 14,690,070 |
| 4.504% 8/1/34 (c) | | | | 812,506 | | | | 810,646 |
| 4.512% 10/1/35 (c) | | | | 91,797 | | | | 90,674 |
| 4.526% 2/1/35 (c) | | | | 2,148,259 | | | | 2,118,893 |
| 4.54% 2/1/35 (c) | | | | 719,493 | | | | 714,061 |
| 4.541% 7/1/34 (c) | | | | 184,284 | | | | 184,521 |
| 4.543% 2/1/35 (c) | | | | 74,418 | | | | 73,870 |
See accompanying notes which are an integral part of the financial statements.
| U.S. Government Agency Mortgage Securities continued | | | | | | |
| | | | | Principal | | Value (Note 1) |
| | | | | Amount | | |
| Fannie Mae – continued | | | | | | | | |
| 4.545% 7/1/35 (c) | | | | $ 442,119 | | | | $ 437,707 |
| 4.546% 2/1/35 (c) | | | | 112,472 | | | | 111,605 |
| 4.555% 1/1/35 (c) | | | | 274,947 | | | | 272,978 |
| 4.559% 9/1/34 (c) | | | | 496,272 | | | | 493,106 |
| 4.582% 9/1/34 (c) | | | | 2,496,820 | | | | 2,454,124 |
| 4.584% 8/1/34 (c) | | | | 176,877 | | | | 176,958 |
| 4.584% 7/1/35 (c) | | | | 536,471 | | | | 531,460 |
| 4.587% 2/1/35 (c) | | | | 576,868 | | | | 565,302 |
| 4.618% 7/1/34 (c) | | | | 5,157,737 | | | | 5,130,349 |
| 4.629% 9/1/34 (c) | | | | 52,408 | | | | 52,478 |
| 4.633% 3/1/35 (c) | | | | 66,752 | | | | 66,311 |
| 4.641% 1/1/33 (c) | | | | 89,849 | | | | 89,301 |
| 4.677% 3/1/35 (c) | | | | 916,644 | | | | 911,291 |
| 4.705% 10/1/32 (c) | | | | 30,838 | | | | 30,765 |
| 4.726% 7/1/34 (c) | | | | 326,449 | | | | 321,986 |
| 4.728% 1/1/35 (c) | | | | 625,634 | | | | 622,725 |
| 4.731% 2/1/33 (c) | | | | 27,729 | | | | 27,592 |
| 4.74% 10/1/34 (c) | | | | 516,821 | | | | 509,668 |
| 4.746% 1/1/35 (c) | | | | 30,039 | | | | 29,887 |
| 4.747% 10/1/32 (c) | | | | 36,130 | | | | 35,949 |
| 4.798% 12/1/32 (c) | | | | 157,608 | | | | 157,029 |
| 4.798% 12/1/34 (c) | | | | 122,294 | | | | 120,665 |
| 4.812% 6/1/35 (c) | | | | 638,584 | | | | 634,759 |
| 4.815% 2/1/33 (c) | | | | 194,987 | | | | 194,225 |
| 4.815% 5/1/33 (c) | | | | 10,604 | | | | 10,567 |
| 4.83% 8/1/34 (c) | | | | 139,718 | | | | 139,471 |
| 4.844% 11/1/34 (c) | | | | 398,820 | | | | 393,963 |
| 4.861% 8/1/34 (c) | | | | 7,255,793 | | | | 7,177,938 |
| 4.887% 10/1/35 (c) | | | | 363,756 | | | | 359,696 |
| 4.969% 12/1/32 (c) | | | | 14,105 | | | | 14,078 |
| 4.984% 11/1/32 (c) | | | | 96,673 | | | | 96,516 |
| 5% 9/1/33 to 11/1/35 | | | | 29,243,071 | | | | 27,713,110 |
| 5% 2/1/35 (c) | | | | 59,079 | | | | 58,968 |
| 5.042% 7/1/34 (c) | | | | 76,490 | | | | 75,952 |
| 5.063% 11/1/34 (c) | | | | 28,526 | | | | 28,494 |
| 5.103% 9/1/34 (c) | | | | 150,430 | | | | 149,514 |
| 5.104% 5/1/35 (c) | | | | 821,944 | | | | 821,139 |
| 5.115% 1/1/34 (c) | | | | 135,550 | | | | 135,784 |
| 5.172% 5/1/35 (c) | | | | 504,095 | | | | 500,697 |
| 5.177% 5/1/35 (c) | | | | 1,393,620 | | | | 1,383,893 |
| 5.197% 8/1/33 (c) | | | | 189,224 | | | | 188,552 |
| 5.197% 6/1/35 (c) | | | | 569,834 | | | | 570,022 |
See accompanying notes which are an integral part of the financial statements.
11 Semiannual Report
| Investments (Unaudited) continued | | | | | | |
| |
| |
| U.S. Government Agency Mortgage Securities continued | | | | | | |
| | | | | Principal | | Value (Note 1) |
| | | | | Amount | | |
| Fannie Mae – continued | | | | | | | | |
| 5.231% 3/1/35 (c) | | | | $ 80,454 | | | | $ 80,108 |
| 5.318% 7/1/35 (c) | | | | 85,261 | | | | 85,387 |
| 5.343% 12/1/34 (c) | | | | 212,374 | | | | 212,008 |
| 5.5% 3/1/13 to 7/1/33 | | | | 37,395,763 | | | | 36,908,147 |
| 5.5% 5/1/36 (b) | | | | 163,304 | | | | 158,606 |
| 5.505% 2/1/36 (c) | | | | 2,400,459 | | | | 2,392,057 |
| 5.636% 1/1/36 (c) | | | | 669,705 | | | | 669,933 |
| 6% 1/1/18 to 2/1/34 | | | | 17,303,160 | | | | 17,263,774 |
| 6.5% 12/1/24 to 3/1/35 | | | | 12,931,145 | | | | 13,190,624 |
| 7% 4/1/26 to 7/1/32 | | | | 2,490,992 | | | | 2,567,102 |
| 7.5% 3/1/28 to 4/1/29 | | | | 30,737 | | | | 32,101 |
| 8.5% 9/1/16 to 1/1/17 | | | | 19,936 | | | | 21,201 |
| 9% 11/1/11 to 5/1/14 | | | | 207,765 | | | | 209,228 |
| 9.5% 5/1/07 to 5/1/20 | | | | 142,418 | | | | 153,036 |
| 11.5% 6/15/19 | | | | 44,093 | | | | 49,523 |
| 12.5% 8/1/15 | | | | 1,588 | | | | 1,814 |
| | | | | | | | | 177,567,638 |
| Freddie Mac – 2.8% | | | | | | | | |
| 4.05% 12/1/34 (c) | | | | 134,445 | | | | 132,195 |
| 4.106% 12/1/34 (c) | | | | 183,223 | | | | 180,343 |
| 4.152% 1/1/35 (c) | | | | 506,636 | | | | 498,910 |
| 4.263% 3/1/35 (c) | | | | 164,158 | | | | 161,832 |
| 4.294% 5/1/35 (c) | | | | 293,931 | | | | 290,019 |
| 4.304% 12/1/34 (c) | | | | 159,722 | | | | 155,225 |
| 4.353% 2/1/35 (c) | | | | 337,823 | | | | 333,394 |
| 4.443% 3/1/35 (c) | | | | 160,811 | | | | 156,350 |
| 4.462% 6/1/35 (c) | | | | 250,019 | | | | 246,526 |
| 4.482% 3/1/35 (c) | | | | 169,353 | | | | 165,005 |
| 4.484% 3/1/35 (c) | | | | 1,190,688 | | | | 1,170,625 |
| 4.768% 10/1/32 (c) | | | | 25,641 | | | | 25,457 |
| 4.869% 3/1/33 (c) | | | | 70,028 | | | | 69,637 |
| 5.007% 4/1/35 (c) | | | | 890,056 | | | | 885,659 |
| 5.338% 6/1/35 (c) | | | | 626,539 | | | | 622,968 |
| 5.405% 8/1/33 (c) | | | | 80,286 | | | | 80,430 |
| 5.5% 2/1/36 | | | | 9,949,618 | | | | 9,668,442 |
| 5.571% 1/1/36 (c) | | | | 1,177,993 | | | | 1,172,268 |
| 5.588% 4/1/32 (c) | | | | 35,154 | | | | 35,424 |
| 6% 9/1/16 to 11/1/33 | | | | 10,320,456 | | | | 10,332,326 |
| 6.5% 3/1/35 | | | | 719,158 | | | | 731,427 |
| 7.5% 3/1/15 to 3/1/16 | | | | 500,475 | | | | 515,963 |
| 8.5% 2/1/10 | | | | 11,867 | | | | 12,135 |
See accompanying notes which are an integral part of the financial statements.
| U.S. Government Agency Mortgage Securities continued | | | | | | |
| | | | | Principal | | Value (Note 1) |
| | | | | Amount | | |
| Freddie Mac – continued | | | | | | | | |
| 9% 10/1/08 to 10/1/20 | | | | $ 40,351 | | | | $ 42,202 |
| 9.5% 5/1/21 to 7/1/21 | | | | 58,472 | | | | 63,863 |
| 11% 7/1/13 to 5/1/14 | | | | 99,777 | | | | 109,851 |
| 12.5% 2/1/10 to 6/1/19 | | | | 22,620 | | | | 24,727 |
| | | | | | | | | 27,883,203 |
| Government National Mortgage Association – 0.3% | | | | | | |
| 6.5% 6/20/34 | | | | 2,442,923 | | | | 2,490,047 |
| 7.5% 9/15/06 to 8/15/29 | | | | 43,840 | | | | 44,328 |
| 8% 12/15/23 | | | | 368,585 | | | | 387,821 |
| 9% 12/15/09 | | | | 1,184 | | | | 1,184 |
| 10.5% 12/15/17 to 1/20/18 | | | | 42,100 | | | | 47,406 |
| 13.5% 7/15/11 | | | | 9,621 | | | | 10,914 |
| | | | | | | | | 2,981,700 |
| |
| TOTAL U.S. GOVERNMENT AGENCY MORTGAGE SECURITIES | | | | |
| (Cost $211,699,702) | | | | | | 208,432,541 |
| |
| Asset Backed Securities | | 0.6% | | | | | | |
| |
| Fannie Mae Grantor Trust Series 2005-T4 Class A1C, | | | | | | |
| 5.1094% 9/25/35 (c) | | | | | | | | |
| (Cost $6,360,000) | | | | 6,360,000 | | | | 6,371,152 |
| |
| Collateralized Mortgage Obligations 15.7% | | | | | | |
| |
| U.S. Government Agency 15.7% | | | | | | |
| Fannie Mae: | | | | | | | | |
| floater Series 2003-25 Class CF, 5.3094% 3/25/17 (c) | | 2,535,143 | | | | 2,544,574 |
| planned amortization class: | | | | | | | | |
| Series 1992-168 Class KB, 7% 10/25/22 | | 2,035,238 | | | | 2,103,554 |
| Series 1993-160 Class PK, 6.5% 11/25/22 | | 28,933 | | | | 28,841 |
| Series 1993-187 Class L, 6.5% 7/25/23 | | 929,631 | | | | 946,671 |
| Series 1994-27 Class PJ, 6.5% 6/25/23 | | 540,318 | | | | 542,115 |
| Series 2003-39 Class PV, 5.5% 9/25/22 | | 1,845,000 | | | | 1,826,619 |
| Series 2006-37 Class OW, 5/25/36 (d) | | 960,000 | | | | 672,298 |
| Fannie Mae guaranteed REMIC pass thru certificates: | | | | | | |
| floater: | | | | | | | | |
| Series 2001-38 Class QF, 5.9394% 8/25/31 (c) | | 1,069,639 | | | | 1,097,971 |
| Series 2002-49 Class FB, 5.51% 11/18/31 (c) | | 1,502,780 | | | | 1,518,107 |
| Series 2002-60 Class FV, 5.9594% 4/25/32 (c) | | 310,128 | | | | 320,839 |
| Series 2002-68 Class FH, 5.41% 10/18/32 (c) | | 1,258,190 | | | | 1,276,758 |
See accompanying notes which are an integral part of the financial statements.
13 Semiannual Report
| Investments (Unaudited) continued | | | | | | |
| |
| |
| Collateralized Mortgage Obligations continued | | | | | | | | |
| | | | | Principal | | Value (Note 1) |
| | | | | Amount | | |
| U.S. Government Agency continued | | | | | | | | |
| Fannie Mae guaranteed REMIC pass thru certificates: - | | | | | | | | |
| continued | | | | | | | | |
| floater: | | | | | | | | |
| Series 2002-75 Class FA, 5.9594% 11/25/32 (c) | | | | $ 635,294 | | | | $ 657,565 |
| Series 2003-122 Class FL, 5.3094% 7/25/29 (c) | | | | 527,319 | | | | 529,053 |
| Series 2003-131 Class FM, 5.3594% 12/25/29 (c) | | | | 398,554 | | | | 400,166 |
| Series 2003-15 Class WF, 5.3094% 8/25/17 (c) | | | | 652,653 | | | | 655,545 |
| Series 2004-31 Class F, 5.2594% 6/25/30 (c) | | | | 964,053 | | | | 966,051 |
| Series 2004-33 Class FW, 5.3594% 8/25/25 (c) | | | | 904,611 | | | | 908,059 |
| Series 2004-54 Class FE, 6.1094% 2/25/33 (c) | | | | 522,097 | | | | 526,529 |
| planned amortization class: | | | | | | | | |
| Series 2001-30 Class PL, 7% 2/25/31 | | | | 508,125 | | | | 508,995 |
| Series 2002-18 Class PC, 5.5% 4/25/17 | | | | 1,170,000 | | | | 1,162,316 |
| Series 2003-113 Class PJ, 3.5% 2/25/13 | | | | 1,750,000 | | | | 1,702,395 |
| Series 2003-67 Class GL, 3% 1/25/25 | | | | 4,746,391 | | | | 4,603,168 |
| Series 2003-73 Class GA, 3.5% 5/25/31 | | | | 4,907,141 | | | | 4,547,199 |
| Series 2003-91 Class HA, 4.5% 11/25/16 | | | | 1,465,000 | | | | 1,425,085 |
| Series 2004-21 Class QE, 4.5% 11/25/32 | | | | 1,500,000 | | | | 1,372,769 |
| Series 2006-12 Class BO, 10/25/35 (d) | | | | 4,474,291 | | | | 3,227,038 |
| sequential pay: | | | | | | | | |
| Series 2001-46 Class ZG, 6% 9/25/31 | | | | 7,933,242 | | | | 7,844,371 |
| Series 2002-79 Class Z, 5.5% 11/25/22 | | | | 3,592,819 | | | | 3,493,168 |
| Series 2004-3 Class BA, 4% 7/25/17 | | | | 104,980 | | | | 100,236 |
| Series 2004-86 Class KC, 4.5% 5/25/19 | | | | 534,448 | | | | 514,467 |
| Series 2004-91 Class AH, 4.5% 5/25/29 | | | | 1,041,997 | | | | 1,011,866 |
| Series 2005-41 Class WY, 5.5% 5/25/25 | | | | 2,630,000 | | | | 2,503,702 |
| Series 2005-55 Class LY, 5.5% 7/25/25 | | | | 2,580,000 | | | | 2,460,272 |
| 7/25/34 (b)(d) | | | | 1,005,000 | | | | 743,543 |
| Freddie Mac: | | | | | | | | |
| planned amortization class: | | | | | | | | |
| Series 2512 Class PG, 5.5% 10/15/22 | | | | 2,000,000 | | | | 1,916,116 |
| Series 3145 Class GO, 4/15/36 (d) | | | | 1,662,755 | | | | 1,149,869 |
| sequential pay: | | | | | | | | |
| Series 2114 Class ZM, 6% 1/15/29 | | | | 415,237 | | | | 418,172 |
| Series 2343 Class VD, 7% 8/15/16 | | | | 2,638,032 | | | | 2,643,839 |
| Series 2361 Class KB, 6.25% 1/15/28 | | | | 1,436,856 | | | | 1,437,600 |
| Series 3151 Class PO, 8/15/35 (b)(d) | | | | 1,790,000 | | | | 1,232,583 |
| Freddie Mac Manufactured Housing participation certificates | | | | | | | | |
| guaranteed planned amortization class Series 1681 Class | | | | | | | | |
| PJ, 7% 12/15/23 | | | | 4,000,000 | | | | 4,099,386 |
See accompanying notes which are an integral part of the financial statements.
| Collateralized Mortgage Obligations continued | | | | |
| | | Principal | | Value (Note 1) |
| | | Amount | | |
| U.S. Government Agency continued | | | | |
| Freddie Mac Multi-class participation certificates guaranteed: | | | | |
| floater: | | | | |
| Series 2406: | | | | |
| Class FP, 5.89% 1/15/32 (c) | | $ 1,180,576 | | $ 1,211,297 |
| Class PF, 5.89% 12/15/31 (c) | | 1,080,000 | | 1,113,133 |
| Series 2410 Class PF, 5.89% 2/15/32 (c) | | 2,365,630 | | 2,436,619 |
| Series 2530 Class FE, 5.51% 2/15/32 (c) | | 862,693 | | 875,947 |
| Series 2553 Class FB, 5.41% 3/15/29 (c) | | 2,975,000 | | 2,995,468 |
| Series 2577 Class FW, 5.41% 1/15/30 (c) | | 2,074,564 | | 2,090,115 |
| Series 2625 Class FJ, 5.21% 7/15/17 (c) | | 1,539,840 | | 1,542,054 |
| Series 2861 Class GF, 5.21% 1/15/21 (c) | | 547,661 | | 548,168 |
| Series 2994 Class FB, 5.06% 6/15/20 (c) | | 750,261 | | 748,304 |
| Series 3008 Class SM, 21.2552% 7/15/35 (c) | | 441,441 | | 477,653 |
| planned amortization class: | | | | |
| Seires 2625 Class QX, 2.25% 3/15/22 | | 184,321 | | 179,370 |
| Series 1141 Class G, 9% 9/15/21 | | 134,965 | | 134,740 |
| Series 1671 Class G, 6.5% 8/15/23 | | 3,327,821 | | 3,333,385 |
| Series 1727 Class H, 6.5% 8/15/23 | | 689,102 | | 690,727 |
| Series 2006-15 Class OP, 3/25/36 (d) | | 1,153,011 | | 795,522 |
| Series 2389 Class DA, 5.81% 11/15/30 (c) | | 2,168,433 | | 2,181,510 |
| Series 2543 CLass PM, 5.5% 8/15/18 | | 669,106 | | 668,758 |
| Series 2587 Class UP, 4% 8/15/25 | | 3,347,643 | | 3,322,227 |
| Series 2622 Class PE, 4.5% 5/15/18 | | 2,640,000 | | 2,434,738 |
| Series 2628 Class OE, 4.5% 6/15/18 | | 1,600,000 | | 1,492,070 |
| Series 2640: | | | | |
| Class GE, 4.5% 7/15/18 | | 3,660,000 | | 3,410,407 |
| Class GR, 3% 3/15/10 | | 534,803 | | 532,523 |
| Class QG, 2% 4/15/22 | | 243,395 | | 236,075 |
| Series 2660 Class ML, 3.5% 7/15/22 | | 10,000,000 | | 9,757,217 |
| Series 2676 Class QA, 3% 8/15/16 | | 601,009 | | 597,671 |
| Series 2683 Class UH, 3% 3/15/19 | | 1,783,383 | | 1,765,392 |
| Series 2752 Class PW, 4% 4/15/22 | | 3,270,000 | | 3,199,286 |
| Series 2755 Class LC, 4% 6/15/27 | | 1,655,000 | | 1,575,198 |
| Series 2802 Class OB, 6% 5/15/34 | | 1,325,000 | | 1,314,479 |
| Series 2810 Class PD, 6% 6/15/33 | | 995,000 | | 981,503 |
| Series 2828 Class JA, 4.5% 1/15/10 | | 984,393 | | 979,195 |
| Series 3077 Class TO, 4/15/35 (d) | | 2,521,230 | | 1,752,658 |
| Series 3102 Class OH, 1/15/36 (d) | | 1,120,000 | | 800,800 |
| Series 3121 Class KO, 3/15/36 (d) | | 1,009,408 | | 745,650 |
| Series 3122 Class OP, 3/15/36 (d) | | 1,946,429 | | 1,334,665 |
See accompanying notes which are an integral part of the financial statements.
15 Semiannual Report
| Investments (Unaudited) continued | | |
| |
| |
| Collateralized Mortgage Obligations continued | | | | |
| | | Principal | | Value (Note 1) |
| | | Amount | | |
| U.S. Government Agency continued | | | | |
| Freddie Mac Multi-class participation certificates guaranteed: | | | | |
| – continued | | | | |
| planned amortization class: | | | | |
| Series 3123 Class LO, 3/15/36 (d) | | $ 1,835,672 | | $ 1,262,025 |
| sequential pay: | | | | |
| Series 2448 Class VH, 6.5% 5/15/18 | | 1,495,749 | | 1,498,639 |
| Series 2492 Class A, 5.25% 5/15/29 | | 1,274,526 | | 1,271,678 |
| Series 2546 Class MJ, 5.5% 3/15/23 | | 2,861,239 | | 2,742,766 |
| Series 2587 Class AD, 4.71% 3/15/33 | | 5,784,746 | | 4,887,765 |
| Series 2601 Class TB, 5.5% 4/15/23 | | 869,000 | | 832,577 |
| Series 2617 Class GW, 3.5% 6/15/16 | | 2,129,239 | | 2,065,407 |
| Series 2675 Class CB, 4% 5/15/16 | | 2,644,007 | | 2,544,766 |
| Series 2677 Class HG, 3% 8/15/12 | | 2,699,280 | | 2,637,392 |
| Series 2683 Class JA, 4% 10/15/16 | | 2,688,107 | | 2,581,214 |
| Series 2750 Class ZT, 5% 2/15/34 | | 958,185 | | 808,792 |
| Series 2773 Class HC, 4.5% 4/15/19 | | 703,518 | | 636,954 |
| Series 2809 Class UA, 4% 12/15/14 | | 706,852 | | 689,846 |
| Series 3007 Class EW, 5.5% 7/15/25 | | 1,135,000 | | 1,088,680 |
| Series 2769 Class BU, 5% 3/15/34 | | 867,446 | | 820,407 |
| Series 2877 Class JC, 5% 10/15/34 | | 1,552,028 | | 1,508,544 |
| target amortization class Series 2156 Class TC, 6.25% | | | | |
| 5/15/29 | | 3,410,427 | | 3,453,751 |
| TOTAL COLLATERALIZED MORTGAGE OBLIGATIONS | | | | |
| (Cost $160,150,251) | | | | 157,225,197 |
| |
| Commercial Mortgage Securities 0.2% | | | | |
| |
| Freddie Mac Multi-class participation certificates guaranteed | | | | |
| floater Series 2448 Class FT, 5.91% 3/15/32 (c) | | | | |
| (Cost $1,574,250) | | 1,544,608 | | 1,591,519 |
See accompanying notes which are an integral part of the financial statements.
| Cash Equivalents 0.4% | | | | | | | | |
| | | | | Maturity | | Value (Note 1) |
| | | | | Amount | | |
| |
| Investments in repurchase agreements (Collateralized by U.S. | | | | | | | | |
| Government Obligations), in a joint trading account at | | | | | | | | |
| 4.78%, dated 4/28/06 due 5/1/06 | | | | | | | | |
| (Cost $3,673,000) | | | | $ 3,674,463 | | | | $ 3,673,000 |
| |
| |
| TOTAL INVESTMENT PORTFOLIO – 99.5% | | | | | | | | |
| (Cost $1,013,729,361) | | | | | | | | 993,479,171 |
| |
| NET OTHER ASSETS – 0.5% | | | | | | | | 4,576,006 |
| |
| NET ASSETS 100% | | | | | | | | $ 998,055,177 |
| |
| |
| Swap Agreements | | | | | | | | |
| | | Expiration | | Notional | | | | Value |
| | | Date | | Amount | | | | |
| |
| Interest Rate Swaps | | | | | | | | |
| Receive quarterly a fixed rate equal to | | | | | | | | |
| 4.508% and pay quarterly a floating rate | | | | | | | | |
| based on 3-month LIBOR with Lehman | | | | | | | | |
| Brothers, Inc. | | August 2010 | | $ 8,000,000 | | | | $ (255,680) |
| Receive semi-annually a fixed rate equal to | | | | | | | | |
| 4.708% and pay quarterly a floating rate | | | | | | | | |
| based on 3-month LIBOR with Lehman | | | | | | | | |
| Brothers, Inc. | | Oct. 2010 | | 9,000,000 | | | | (236,610) |
| |
| | | | | $ 17,000,000 | | | | $ (492,290) |
Legend
(a) Security exempt from registration under
Rule 144A of the Securities Act of 1933.
These securities may be resold in
transactions exempt from registration,
normally to qualified institutional buyers.
At the period end, the value of these
securities amounted to $2,646,235 or
0.3% of net assets.
(b) Security or a portion of the security
purchased on a delayed delivery or
when-issued basis.
|
(c) The coupon rate shown on floating or
adjustable rate securities represents the
rate at period end.
(d) Principal Only Strips represent the right
to receive the monthly principal
payments on an underlying pool of
mortgage loans.
|
Income Tax Information
At October 31, 2005, the fund had a capital loss carryforward of approximately $1,882,000 all of which will expire on October 31, 2013.
See accompanying notes which are an integral part of the financial statements.
17 Semiannual Report
| Financial Statements | | | | | | |
| |
| Statement of Assets and Liabilities | | | | | | |
| | | | | April 30, 2006 (Unaudited) |
| |
| Assets | | | | | | |
| Investment in securities, at value (including repurchase | | | | | | |
| agreements of $3,673,000) See accompanying | | | | | | |
| schedule: | | | | | | |
| Unaffiliated issuers (cost $1,013,729,361) | | | | | | $ 993,479,171 |
| Cash | | | | | | 264 |
| Receivable for investments sold | | | | | | 136,368 |
| Receivable for fund shares sold | | | | | | 2,162,410 |
| Interest receivable | | | | | | 9,401,628 |
| Prepaid expenses | | | | | | 2,568 |
| Total assets | | | | | | 1,005,182,409 |
| |
| Liabilities | | | | | | |
| Payable for investments purchased | | | | | | |
| Regular delivery | | | | $ 1,842,437 | | |
| Delayed delivery | | | | 2,134,984 | | |
| Payable for fund shares redeemed | | | | 1,856,881 | | |
| Distributions payable | | | | 148,347 | | |
| Swap agreements, at value | | | | 492,290 | | |
| Accrued management fee | | | | 264,309 | | |
| Distribution fees payable | | | | 151,222 | | |
| Other affiliated payables | | | | 196,651 | | |
| Other payables and accrued expenses | | | | 40,111 | | |
| Total liabilities | | | | | | 7,127,232 |
| |
| Net Assets | | | | | | $ 998,055,177 |
| Net Assets consist of: | | | | | | |
| Paid in capital | | | | | | $1,025,771,786 |
| Undistributed net investment income | | | | | | 855,542 |
| Accumulated undistributed net realized gain (loss) on | | | | | | |
| investments | | | | | | (7,829,671) |
| Net unrealized appreciation (depreciation) on | | | | | | |
| investments | | | | | | (20,742,480) |
| Net Assets | | | | | | $ 998,055,177 |
See accompanying notes which are an integral part of the financial statements.
| Statement of Assets and Liabilities continued | | | | |
| | | | | April 30, 2006 (Unaudited) |
| |
| Calculation of Maximum Offering Price | | | | | | |
| Class A: | | | | | | |
| Net Asset Value and redemption price per share | | | | | | |
| ($103,414,354 ÷ 10,607,252 shares) | | | | | | $ 9.75 |
| Maximum offering price per share (100/95.25 of $9.75) | | | | | | $ 10.24 |
| Class T: | | | | | | |
| Net Asset Value and redemption price per share | | | | | | |
| ($210,585,457 ÷ 21,615,410 shares) | | | | | | $ 9.74 |
| Maximum offering price per share (100/96.50 of $9.74) | | | | | | $ 10.09 |
| Class B: | | | | | | |
| Net Asset Value and offering price per share | | | | | | |
| ($70,277,405 ÷ 7,221,183 shares)A | | | | | | $ 9.73 |
| Class C: | | | | | | |
| Net Asset Value and offering price per share | | | | | | |
| ($47,346,588 ÷ 4,861,047 shares)A | | | | | | $ 9.74 |
| Institutional Class: | | | | | | |
| Net Asset Value, offering price and redemption price per | | | | | | |
| share ($566,431,373 ÷ 58,435,475 shares) | | | | | | $ 9.69 |
| |
| A Redemption price per share is equal to net asset value less any applicable contingent deferred sales charge. | | | | |
See accompanying notes which are an integral part of the financial statements.
19 Semiannual Report
| Financial Statements continued | | | | |
| |
| |
| Statement of Operations | | | | | | |
| | | Six months ended April 30, 2006 (Unaudited) |
| |
| Investment Income | | | | | | |
| Interest | | | | | | $ 21,950,072 |
| |
| Expenses | | | | | | |
| Management fee | | | | $ 1,558,282 | | |
| Transfer agent fees | | | | 991,153 | | |
| Distribution fees | | | | 977,531 | | |
| Accounting and security lending fees | | | | 185,030 | | |
| Independent trustees’ compensation | | | | 1,939 | | |
| Custodian fees and expenses | | | | 23,587 | | |
| Registration fees | | | | 52,109 | | |
| Audit | | | | 29,770 | | |
| Legal | | | | 1,523 | | |
| Miscellaneous | | | | 21,831 | | |
| Total expenses before reductions | | | | 3,842,755 | | |
| Expense reductions | | | | (3,792) | | 3,838,963 |
| |
| Net investment income | | | | | | 18,111,109 |
| Realized and Unrealized Gain (Loss) | | | | | | |
| Net realized gain (loss) on: | | | | | | |
| Investment securities: | | | | | | |
| Unaffiliated issuers | | | | (5,164,924) | | |
| Swap agreements | | | | 27,559 | | |
| Total net realized gain (loss) | | | | | | (5,137,365) |
| Change in net unrealized appreciation (depreciation) on: | | | | | | |
| Investment securities | | | | (11,557,221) | | |
| Swap agreements | | | | (276,788) | | |
| Total change in net unrealized appreciation | | | | | | |
| (depreciation) | | | | | | (11,834,009) |
| Net gain (loss) | | | | | | (16,971,374) |
| Net increase (decrease) in net assets resulting from | | | | | | |
| operations | | | | | | $ 1,139,735 |
See accompanying notes which are an integral part of the financial statements.
| Statement of Changes in Net Assets | | | | | | | | |
| | | | | Six months ended | | | | Year ended |
| | | | | April 30, 2006 | | | | October 31, |
| | | | | (Unaudited) | | | | 2005 |
| Increase (Decrease) in Net Assets | | | | | | | | |
| Operations | | | | | | | | |
| Net investment income | | | | $ 18,111,109 | | | | $ 26,477,498 |
| Net realized gain (loss) | | | | (5,137,365) | | | | (2,327,529) |
| Change in net unrealized appreciation (depreciation) | | | | (11,834,009) | | | | (19,424,731) |
| Net increase (decrease) in net assets resulting | | | | | | | | |
| from operations | | | | 1,139,735 | | | | 4,725,238 |
| Distributions to shareholders from net investment income | | | | (19,163,139) | | | | (24,292,986) |
| Distributions to shareholders from net realized gain | | | | — | | | | (1,496,540) |
| Total distributions | | | | (19,163,139) | | | | (25,789,526) |
| Share transactions - net increase (decrease) | | | | 88,666,576 | | | | 197,654,113 |
| Total increase (decrease) in net assets | | | | 70,643,172 | | | | 176,589,825 |
| |
| Net Assets | | | | | | | | |
| Beginning of period | | | | 927,412,005 | | | | 750,822,180 |
| End of period (including undistributed net investment | | | | | | | | |
| income of $855,542 and undistributed net invest- | | | | | | | | |
| ment income of $1,907,572, respectively) | | | | $ 998,055,177 | | | | $ 927,412,005 |
See accompanying notes which are an integral part of the financial statements.
21 Semiannual Report
| Financial Highlights Class A | | | | | | | | | | |
| | | Six months ended | | | | | | | | | | | | |
| | | April 30, 2006 | | Years ended October 31, |
| | | (Unaudited) | | 2005 | | 2004 | | 2003 | | 2002 | | | | 2001 |
| Selected Per Share Data | | | | | | | | | | | | | | | | |
| Net asset value, | | | | | | | | | | | | | | | | |
| beginning of | | | | | | | | | | | | | | | | |
| period | | | | $ 9.93 | | $ 10.17 | | $ 10.12 | | $ 10.33 | | $ 10.14 | | | | $ 9.42 |
| Income from | | | | | | | | | | | | | | | | |
| Investment | | | | | | | | | | | | | | | | |
| Operations | | | | | | | | | | | | | | | | |
| Net investment | | | | | | | | | | | | | | | | |
| incomeE | | | | .185 | | .333 | | .319 | | .360 | | .410G | | | | .546 |
| Net realized and | | | | | | | | | | | | | | | | |
| unrealized gain | | | | | | | | | | | | | | | | |
| (loss) | | | | (.169) | | (.248) | | .151 | | (.144) | | .205G | | | | .730 |
| Total from investment | | | | | | | | | | | | | | | | |
| operations | | | | .016 | | .085 | | .470 | | .216 | | .615 | | | | 1.276 |
| Distributions from | | | | | | | | | | | | | | | | |
| net investment | | | | | | | | | | | | | | | | |
| income | | | | (.196) | | (.305) | | (.320) | | (.356) | | (.425) | | | | (.556) |
| Distributions from | | | | | | | | | | | | | | | | |
| net realized gain | | | | — | | (.020) | | (.100) | | (.070) | | — | | | | — |
| Total distributions | | | | (.196) | | (.325) | | (.420) | | (.426) | | (.425) | | | | (.556) |
| Net asset value, end | | | | | | | | | | | | | | | | |
| of period | | | | $ 9.75 | | $ 9.93 | | $ 10.17 | | $ 10.12 | | $ 10.33 | | | | $ 10.14 |
| Total ReturnB,C,D | | | | .15% | | .84% | | 4.76% | | 2.11% | | 6.31% | | | | 13.95% |
| Ratios to Average Net AssetsF | | | | | | | | | | | | | | | | |
| Expenses before | | | | | | | | | | | | | | | | |
| reductions | | | | .78%A | | .84% | | .88% | | .83% | | .83% | | | | .87% |
| Expenses net of fee | | | | | | | | | | | | | | | | |
| waivers, if any | | | | .78%A | | .84% | | .88% | | .83% | | .83% | | | | .87% |
| Expenses net of | | | | | | | | | | | | | | | | |
| all reductions | | | | .78%A | | .84% | | .88% | | .83% | | .83% | | | | .86% |
| Net investment | | | | | | | | | | | | | | | | |
| income | | | | 3.78%A | | 3.31% | | 3.17% | | 3.50% | | 4.11%G | | | | 5.61% |
| Supplemental Data | | | | | | | | | | | | | | | | |
| Net assets, | | | | | | | | | | | | | | | | |
| end of period | | | | | | | | | | | | | | | | |
| (000 omitted) | | | | $103,414 | | $84,685 | | $70,407 | | $69,011 | | $68,973 | | | | $43,205 |
| Portfolio turnover | | | | | | | | | | | | | | | | |
| rate | | | | 155%A | | 160% | | 133% | | 262% | | 251% | | | | 260% |
A Annualized
B Total returns for periods of less than one year are not annualized.
C Total returns would have been lower had certain expenses not been reduced during the periods shown.
D Total returns do not include the effect of the sales charges.
E Calculated based on average shares outstanding during the period.
F Expense ratios reflect operating expenses of the class. Expenses before reductions do not reflect amounts reimbursed by the investment adviser or
expense offset arrangements and do not represent the amount paid by the class during periods when reimbursements or reductions occur. Ex
penses net of fee waivers reflect expenses after reimbursement by the investment adviser but prior to reductions from expense offset arrange
ments. Expenses net of all reductions represent the net expenses paid by the class.
G Effective November 1, 2001, the fund adopted the provisions of the AICPA Audit and Accounting Guide for Investment Companies and began
amortizing premium and discount on all debt securities. Per share data and ratios for periods prior to adoption have not been restated to reflect
this change.
|
See accompanying notes which are an integral part of the financial statements.
| Financial Highlights Class T | | | | | | | | | | |
| | | Six months ended | | | | | | | | | | | | |
| | | April 30, 2006 | | Years ended October 31, |
| | | (Unaudited) | | 2005 | | 2004 | | 2003 | | 2002 | | | | 2001 |
| Selected Per Share Data | | | | | | | | | | | | | | | | |
| Net asset value, | | | | | | | | | | | | | | | | |
| beginning of | | | | | | | | | | | | | | | | |
| period | | | | $ 9.92 | | $ 10.16 | | $ 10.11 | | $ 10.32 | | $ 10.13 | | | | $ 9.41 |
| Income from | | | | | | | | | | | | | | | | |
| Investment | | | | | | | | | | | | | | | | |
| Operations | | | | | | | | | | | | | | | | |
| Net investment | | | | | | | | | | | | | | | | |
| incomeE | | | | .182 | | .325 | | .311 | | .350 | | .398G | | | | .535 |
| Net realized and | | | | | | | | | | | | | | | | |
| unrealized gain | | | | | | | | | | | | | | | | |
| (loss) | | | | (.170) | | (.248) | | .150 | | (.144) | | .206G | | | | .731 |
| Total from investment | | | | | | | | | | | | | | | | |
| operations | | | | .012 | | .077 | | .461 | | .206 | | .604 | | | | 1.266 |
| Distributions from | | | | | | | | | | | | | | | | |
| net investment | | | | | | | | | | | | | | | | |
| income | | | | (.192) | | (.297) | | (.311) | | (.346) | | (.414) | | | | (.546) |
| Distributions from | | | | | | | | | | | | | | | | |
| net realized gain | | | | — | | (.020) | | (.100) | | (.070) | | — | | | | — |
| Total distributions | | | | (.192) | | (.317) | | (.411) | | (.416) | | (.414) | | | | (.546) |
| Net asset value, end | | | | | | | | | | | | | | | | |
| of period | | | | $ 9.74 | | $ 9.92 | | $ 10.16 | | $ 10.11 | | $ 10.32 | | | | $ 10.13 |
| Total ReturnB,C,D | | | | .11% | | .76% | | 4.67% | | 2.01% | | 6.19% | | | | 13.86% |
| Ratios to Average Net AssetsF | | | | | | | | | | | | | | | | |
| Expenses before | | | | | | | | | | | | | | | | |
| reductions | | | | 85%A | | .92% | | .97% | | .93% | | .94% | | | | .96% |
| Expenses net of fee | | | | | | | | | | | | | | | | |
| waivers, if any | | | | 85%A | | .92% | | .97% | | .93% | | .94% | | | | .96% |
| Expenses net of | | | | | | | | | | | | | | | | |
| all reductions | | | | 85%A | | .92% | | .97% | | .93% | | .94% | | | | .96% |
| Net investment | | | | | | | | | | | | | | | | |
| income | | | | 3.72%A | | 3.23% | | 3.08% | | 3.39% | | 4.00%G | | | | 5.52% |
| Supplemental Data | | | | | | | | | | | | | | | | |
| Net assets, | | | | | | | | | | | | | | | | |
| end of period | | | | | | | | | | | | | | | | |
| (000 omitted) . | | | | $210,585 | | $243,819 | | $259,149 | | $304,517 | | $366,209 | | | | $293,105 |
| Portfolio turnover | | | | | | | | | | | | | | | | |
| rate | | | | 155%A | | 160% | | 133% | | 262% | | 251% | | | | 260% |
A Annualized
B Total returns for periods of less than one year are not annualized.
C Total returns would have been lower had certain expenses not been reduced during the periods shown.
D Total returns do not include the effect of the sales charges.
E Calculated based on average shares outstanding during the period.
F Expense ratios reflect operating expenses of the class. Expenses before reductions do not reflect amounts reimbursed by the investment adviser or
expense offset arrangements and do not represent the amount paid by the class during periods when reimbursements or reductions occur. Ex
penses net of fee waivers reflect expenses after reimbursement by the investment adviser but prior to reductions from expense offset arrange
ments. Expenses net of all reductions represent the net expenses paid by the class.
G Effective November 1, 2001, the fund adopted the provisions of the AICPA Audit and Accounting Guide for Investment Companies and began
amortizing premium and discount on all debt securities. Per share data and ratios for periods prior to adoption have not been restated to reflect
this change.
|
See accompanying notes which are an integral part of the financial statements.
23 Semiannual Report
| Financial Highlights Class B | | | | | | | | | | |
| | | Six months ended | | | | | | | | | | | | |
| | | April 30, 2006 | | Years ended October 31, |
| | | (Unaudited) | | 2005 | | 2004 | | 2003 | | 2002 | | | | 2001 |
| Selected Per Share Data | | | | | | | | | | | | | | | | |
| Net asset value, | | | | | | | | | | | | | | | | |
| beginning of | | | | | | | | | | | | | | | | |
| period | | | | $ 9.91 | | $ 10.15 | | $ 10.10 | | $ 10.31 | | $ 10.12 | | | | $ 9.41 |
| Income from | | | | | | | | | | | | | | | | |
| Investment | | | | | | | | | | | | | | | | |
| Operations | | | | | | | | | | | | | | | | |
| Net investment | | | | | | | | | | | | | | | | |
| incomeE | | | | .148 | | .257 | | .242 | | .282 | | .335G | | | | .474 |
| Net realized and | | | | | | | | | | | | | | | | |
| unrealized gain | | | | | | | | | | | | | | | | |
| (loss) | | | | (.170) | | (.248) | | .151 | | (.144) | | .205G | | | | .720 |
| Total from investment | | | | | | | | | | | | | | | | |
| operations | | | | (.022) | | .009 | | .393 | | .138 | | .540 | | | | 1.194 |
| Distributions from | | | | | | | | | | | | | | | | |
| net investment | | | | | | | | | | | | | | | | |
| income | | | | (.158) | | (.229) | | (.243) | | (.278) | | (.350) | | | | (.484) |
| Distributions from | | | | | | | | | | | | | | | | |
| net realized gain | | | | — | | (.020) | | (.100) | | (.070) | | — | | | | — |
| Total distributions | | | | (.158) | | (.249) | | (.343) | | (.348) | | (.350) | | | | (.484) |
| Net asset value, end | | | | | | | | | | | | | | | | |
| of period | | | | $ 9.73 | | $ 9.91 | | $ 10.15 | | $ 10.10 | | $ 10.31 | | | | $ 10.12 |
| Total ReturnB,C,D | | | | (.23)% | | .08% | | 3.97% | | 1.34% | | 5.52% | | | | 13.03% |
| Ratios to Average Net AssetsF | | | | | | | | | | | | | | | | |
| Expenses before | | | | | | | | | | | | | | | | |
| reductions | | | | 1.54%A | | 1.61% | | 1.65% | | 1.59% | | 1.58% | | | | 1.60% |
| Expenses net of fee | | | | | | | | | | | | | | | | |
| waivers, if any | | | | 1.54%A | | 1.60% | | 1.65% | | 1.59% | | 1.58% | | | | 1.60% |
| Expenses net of | | | | | | | | | | | | | | | | |
| all reductions | | | | 1.54%A | | 1.60% | | 1.65% | | 1.59% | | 1.58% | | | | 1.60% |
| Net investment | | | | | | | | | | | | | | | | |
| income | | | | 3.02%A | | 2.55% | | 2.40% | | 2.74% | | 3.36%G | | | | 4.88% |
| Supplemental Data | | | | | | | | | | | | | | | | |
| Net assets, | | | | | | | | | | | | | | | | |
| end of period | | | | | | | | | | | | | | | | |
| (000 omitted) | | | | $70,277 | | $94,149 | | $127,576 | | $176,855 | | $230,244 | | | | $158,864 |
| Portfolio turnover | | | | | | | | | | | | | | | | |
| rate | | | | 155%A | | 160% | | 133% | | 262% | | 251% | | | | 260% |
A Annualized
B Total returns for periods of less than one year are not annualized.
C Total returns would have been lower had certain expenses not been reduced during the periods shown.
D Total returns do not include the effect of the contingent deferred sales charge.
E Calculated based on average shares outstanding during the period.
F Expense ratios reflect operating expenses of the class. Expenses before reductions do not reflect amounts reimbursed by the investment adviser or
expense offset arrangements and do not represent the amount paid by the class during periods when reimbursements or reductions occur. Ex
penses net of fee waivers reflect expenses after reimbursement by the investment adviser but prior to reductions from expense offset arrange
ments. Expenses net of all reductions represent the net expenses paid by the class.
G Effective November 1, 2001, the fund adopted the provisions of the AICPA Audit and Accounting Guide for Investment Companies and began
amortizing premium and discount on all debt securities. Per share data and ratios for periods prior to adoption have not been restated to reflect
this change.
|
See accompanying notes which are an integral part of the financial statements.
| Financial Highlights Class C | | | | | | | | | | |
| | | Six months ended | | | | | | | | | | | | |
| | | April 30, 2006 | | Years ended October 31, |
| | | (Unaudited) | | 2005 | | 2004 | | 2003 | | 2002 | | | | 2001 |
| Selected Per Share Data | | | | | | | | | | | | | | | | |
| Net asset value, | | | | | | | | | | | | | | | | |
| beginning of | | | | | | | | | | | | | | | | |
| period | | | | $ 9.92 | | $ 10.16 | | $ 10.11 | | $ 10.32 | | $ 10.13 | | | | $ 9.41 |
| Income from | | | | | | | | | | | | | | | | |
| Investment | | | | | | | | | | | | | | | | |
| Operations | | | | | | | | | | | | | | | | |
| Net investment | | | | | | | | | | | | | | | | |
| incomeE | | | | .145 | | .250 | | .238 | | .275 | | .327G | | | | .468 |
| Net realized and | | | | | | | | | | | | | | | | |
| unrealized gain | | | | | | | | | | | | | | | | |
| (loss) | | | | (.170) | | (.247) | | .150 | | (.144) | | .205G | | | | .729 |
| Total from investment | | | | | | | | | | | | | | | | |
| operations | | | | (.025) | | .003 | | .388 | | .131 | | .532 | | | | 1.197 |
| Distributions from | | | | | | | | | | | | | | | | |
| net investment | | | | | | | | | | | | | | | | |
| income | | | | (.155) | | (.223) | | (.238) | | (.271) | | (.342) | | | | (.477) |
| Distributions from | | | | | | | | | | | | | | | | |
| net realized gain | | | | — | | (.020) | | (.100) | | (.070) | | — | | | | — |
| Total distributions | | | | (.155) | | (.243) | | (.338) | | (.341) | | (.342) | | | | (.477) |
| Net asset value, end | | | | | | | | | | | | | | | | |
| of period | | | | $ 9.74 | | $ 9.92 | | $ 10.16 | | $ 10.11 | | $ 10.32 | | | | $ 10.13 |
| Total ReturnB,C,D | | | | (.26)% | | .02% | | 3.92% | | 1.27% | | 5.44% | | | | 13.05% |
| Ratios to Average Net AssetsF | | | | | | | | | | | | | | | | |
| Expenses before | | | | | | | | | | | | | | | | |
| reductions | | | | 1.60%A | | 1.66% | | 1.69% | | 1.66% | | 1.66% | | | | 1.67% |
| Expenses net of fee | | | | | | | | | | | | | | | | |
| waivers, if any | | | | 1.60%A | | 1.66% | | 1.69% | | 1.66% | | 1.66% | | | | 1.67% |
| Expenses net of | | | | | | | | | | | | | | | | |
| all reductions | | | | 1.60%A | | 1.66% | | 1.69% | | 1.66% | | 1.66% | | | | 1.67% |
| Net investment | | | | | | | | | | | | | | | | |
| income | | | | 2.96%A | | 2.49% | | 2.36% | | 2.66% | | 3.29%G | | | | 4.81% |
| Supplemental Data | | | | | | | | | | | | | | | | |
| Net assets, | | | | | | | | | | | | | | | | |
| end of period | | | | | | | | | | | | | | | �� | |
| (000 omitted) . | | | | $47,347 | | $53,488 | | $62,133 | | $80,620 | | $103,002 | | | | $87,214 |
| Portfolio turnover | | | | | | | | | | | | | | | | |
| rate | | | | 155%A | | 160% | | 133% | | 262% | | 251% | | | | 260% |
A Annualized
B Total returns for periods of less than one year are not annualized.
C Total returns would have been lower had certain expenses not been reduced during the periods shown.
D Total returns do not include the effect of the contingent deferred sales charge.
E Calculated based on average shares outstanding during the period.
F Expense ratios reflect operating expenses of the class. Expenses before reductions do not reflect amounts reimbursed by the investment adviser or
expense offset arrangements and do not represent the amount paid by the class during periods when reimbursements or reductions occur. Ex
penses net of fee waivers reflect expenses after reimbursement by the investment adviser but prior to reductions from expense offset arrange
ments. Expenses net of all reductions represent the net expenses paid by the class.
G Effective November 1, 2001, the fund adopted the provisions of the AICPA Audit and Accounting Guide for Investment Companies and began
amortizing premium and discount on all debt securities. Per share data and ratios for periods prior to adoption have not been restated to reflect
this change.
|
See accompanying notes which are an integral part of the financial statements.
25 Semiannual Report
| Financial Highlights Institutional Class | | | | | | | | |
| | | Six months ended | | | | | | | | | | | | |
| | | April 30, 2006 | | Years ended October 31, |
| | | (Unaudited) | | 2005 | | 2004 | | 2003 | | 2002 | | | | 2001 |
| Selected Per Share Data | | | | | | | | | | | | | | | | |
| Net asset value, | | | | | | | | | | | | | | | | |
| beginning of | | | | | | | | | | | | | | | | |
| period | | | | $ 9.87 | | $ 10.12 | | $ 10.07 | | $ 10.28 | | $ 10.09 | | | | $ 9.38 |
| Income from | | | | | | | | | | | | | | | | |
| Investment | | | | | | | | | | | | | | | | |
| Operations | | | | | | | | | | | | | | | | |
| Net investment | | | | | | | | | | | | | | | | |
| incomeD | | | | .194 | | .351 | | .333 | | .370 | | .422F | | | | .560 |
| Net realized and | | | | | | | | | | | | | | | | |
| unrealized gain | | | | | | | | | | | | | | | | |
| (loss) | | | | (.169) | | (.257) | | .155 | | (.138) | | .207F | | | | .723 |
| Total from investment | | | | | | | | | | | | | | | | |
| operations | | | | .025 | | .094 | | .488 | | .232 | | .629 | | | | 1.283 |
| Distributions from | | | | | | | | | | | | | | | | |
| net investment | | | | | | | | | | | | | | | | |
| income | | | | (.205) | | (.324) | | (.338) | | (.372) | | (.439) | | | | (.573) |
| Distributions from | | | | | | | | | | | | | | | | |
| net realized gain | | | | — | | (.020) | | (.100) | | (.070) | | — | | | | — |
| Total distributions | | | | (.205) | | (.344) | | (.438) | | (.442) | | (.439) | | | | (.573) |
| Net asset value, end | | | | | | | | | | | | | | | | |
| of period | | | | $ 9.69 | | $ 9.87 | | $ 10.12 | | $ 10.07 | | $ 10.28 | | | | $ 10.09 |
| Total ReturnB,C | | | | .25% | | .94% | | 4.98% | | 2.28% | | 6.49% | | | | 14.11% |
| Ratios to Average Net AssetsE | | | | | | | | | | | | | | | | |
| Expenses before | | | | | | | | | | | | | | | | |
| reductions | | | | .58%A | | .64% | | .69% | | .68% | | .69% | | | | .69% |
| Expenses net of fee | | | | | | | | | | | | | | | | |
| waivers, if any | | | | .58%A | | .64% | | .69% | | .68% | | .69% | | | | .69% |
| Expenses net of | | | | | | | | | | | | | | | | |
| all reductions | | | | .58%A | | .64% | | .69% | | .68% | | .69% | | | | .69% |
| Net investment | | | | | | | | | | | | | | | | |
| income | | | | 3.98%A | | 3.51% | | 3.35% | | 3.64% | | 4.26%F | | | | 5.79% |
| Supplemental Data | | | | | | | | | | | | | | | | |
| Net assets, | | | | | | | | | | | | | | | | |
| end of period | | | | | | | | | | | | | | | | |
| (000 omitted) | | | | $566,431 | | $451,272 | | $231,557 | | $96,356 | | $50,953 | | | | $27,782 |
| Portfolio turnover | | | | | | | | | | | | | | | | |
| rate | | | | 155%A | | 160% | | 133% | | 262% | | 251% | | | | 260% |
A Annualized
B Total returns for periods of less than one year are not annualized.
C Total returns would have been lower had certain expenses not been reduced during the periods shown.
D Calculated based on average shares outstanding during the period.
E Expense ratios reflect operating expenses of the class. Expenses before reductions do not reflect amounts reimbursed by the investment adviser or
expense offset arrangements and do not represent the amount paid by the class during periods when reimbursements or reductions occur. Ex
penses net of fee waivers reflect expenses after reimbursement by the investment adviser but prior to reductions from expense offset arrange
ments. Expenses net of all reductions represent the net expenses paid by the class.
F Effective November 1, 2001, the fund adopted the provisions of the AICPA Audit and Accounting Guide for Investment Companies and began
amortizing premium and discount on all debt securities. Per share data and ratios for periods prior to adoption have not been restated to reflect
this change.
|
See accompanying notes which are an integral part of the financial statements.
Notes to Financial Statements
For the period ended April 30, 2006 (Unaudited)
1. Significant Accounting Policies.
Fidelity Advisor Government Investment Fund (the fund) is a fund of Fidelity Advisor Series II (the trust) and is authorized to issue an unlimited number of shares. The trust is registered under the Investment Company Act of 1940, as amended (the 1940 Act), as an open end management investment company organized as a Massachusetts business trust.
The fund offers Class A, Class T, Class B, Class C, and Institutional Class shares, each of which has equal rights as to assets and voting privileges. Each class has exclusive voting rights with respect to matters that affect that class. Class B shares will automatically convert to Class A shares after a holding period of seven years from the initial date of purchase. Investment income, realized and unrealized capital gains and losses, the common expenses of the fund, and certain fund level expense reductions, if any, are allocated on a pro rata basis to each class based on the relative net assets of each class to the total net assets of the fund. Each class differs with respect to transfer agent and distribution and service plan fees incurred. Certain expense reductions also differ by class.
The financial statements have been prepared in conformity with accounting principles generally accepted in the United States of America, which require management to make certain estimates and assumptions at the date of the financial statements. The following summarizes the significant accounting policies of the fund:
Security Valuation. Investments are valued and net asset value per share is calculated (NAV calculation) as of the close of business of the New York Stock Exchange, normally 4:00 p.m. Eastern time. Wherever possible, the fund uses independent pricing services approved by the Board of Trustees to value its investments. Debt securities, including restricted securities, for which quotes are readily available, are valued by independent pricing services or by dealers who make markets in such securities. Pricing services consider yield or price of bonds of comparable quality, coupon, maturity and type as well as dealer supplied prices. When current market prices or quotations are not readily available or do not accurately reflect fair value, valuations may be determined in accor dance with procedures adopted by the Board of Trustees. The frequency of when fair value pricing is used is unpredictable. The value of securities used for NAV calculation under fair value pricing may differ from published prices for the same securities. Investments in open end mutual funds are valued at their closing net asset value each business day. Short term securities with remaining maturities of sixty days or less for which quotations are not readily available are valued at amortized cost, which approxi mates value.
27 Semiannual Report
| Notes to Financial Statements (Unaudited) continued |
1. Significant Accounting Policies continued |
Investment Transactions and Income. Security transactions are accounted for as of trade date. Gains and losses on securities sold are determined on the basis of identified cost. Interest income is accrued as earned. Interest income includes coupon interest and amortization of premium and accretion of discount on debt securities. Inflation indexed bonds are fixed income securities whose principal value is periodically adjusted to the rate of inflation. Interest is accrued based on the principal value, which is adjusted for inflation. Any increase in the principal amount of an inflation indexed bond is recorded as interest income, even though principal is not received until maturity.
Expenses. Most expenses of the trust can be directly attributed to a fund. Expenses which cannot be directly attributed are apportioned among each fund in the trust.
Income Tax Information and Distributions to Shareholders. Each year, the fund intends to qualify as a regulated investment company by distributing all of its taxable income and realized gains under Subchapter M of the Internal Revenue Code. As a result, no provision for income taxes is required in the accompanying financial statements.
Dividends are declared daily and paid monthly from net investment income. Distribu tions from realized gains, if any, are recorded on the ex dividend date. Income dividends and capital gain distributions are declared separately for each class. Income and capital gain distributions are determined in accordance with income tax regulations, which may differ from generally accepted accounting principles.
Capital accounts within the financial statements are adjusted for permanent book tax differences. These adjustments have no impact on net assets or the results of operations. Temporary book tax differences will reverse in a subsequent period.
Book tax differences are primarily due to prior period premium and discount on debt securities, market discount, deferred trustees compensation, financing transactions, and losses deferred due to wash sales.
The federal tax cost of investments and unrealized appreciation (depreciation) as of period end were as follows:
| Unrealized appreciation | | | | $ 1,581,752 |
| Unrealized depreciation | | | | (21,813,578) |
| Net unrealized appreciation (depreciation) | | | | $ (20,231,826) |
| Cost for federal income tax purposes | | | | $ 1,013,710,997 |
Repurchase Agreements. Fidelity Management & Research Company (FMR) has received an Exemptive Order from the Securities and Exchange Commission (the SEC) which permits the fund and other affiliated entities of FMR to transfer uninvested cash balances into joint trading accounts which are then invested in repurchase agreements. The fund may also invest directly with institutions in repurchase agreements. Repur chase agreements are collateralized by government or non government securities. Upon settlement date, collateral is held in segregated accounts with custodian banks and may be obtained in the event of a default of the counterparty. The fund monitors, on a daily basis, the value of the collateral to ensure it is at least equal to the principal amount of the repurchase agreement (including accrued interest). In the event of a default by the counterparty, realization of the collateral proceeds could be delayed, during which time the value of the collateral may decline.
Delayed Delivery Transactions and When Issued Securities. The fund may purchase or sell securities on a delayed delivery or when issued basis. Payment and delivery may take place after the customary settlement period for that security. The price of the underlying securities and the date when the securities will be delivered and paid for are fixed at the time the transaction is negotiated. During the time a delayed delivery sell is outstanding, the contract is marked to market daily and equivalent deliverable securities are held for the transaction. The value of the securities purchased on a delayed delivery or when issued basis are identified as such in the fund’s Schedule of Investments. The fund may receive compensation for interest forgone in the purchase of a delayed delivery or when issued security. With respect to purchase commitments, the fund identifies securities as segregated in its records with a value at least equal to the amount of the commitment. Losses may arise due to changes in the value of the underly ing securities or if the counterparty does not perform under the contract’s terms, or if the issuer does not issue the securities due to political, economic, or other factors.
Restricted Securities. The fund may invest in securities that are subject to legal or contractual restrictions on resale. These securities generally may be resold in transac tions exempt from registration or to the public if the securities are registered. Disposal of these securities may involve time consuming negotiations and expense, and prompt sale at an acceptable price may be difficult. Information regarding restricted securities is included at the end of the fund’s Schedule of Investments.
Swap Agreements. The fund may invest in swaps for the purpose of managing its exposure to interest rate, credit or market risk. Interest rate swaps are agreements to exchange cash flows periodically based on a notional principal amount, for example, the exchange of fixed rate interest payments for floating rate interest payments. Periodic payments received or made by the fund are recorded in the accompanying Statement of Operations as realized gains or losses, respectively. The primary risk associated with interest rate swaps is that unfavorable changes in the fluctuation of interest rates could adversely impact a fund.
29 Semiannual Report
| Notes to Financial Statements (Unaudited) continued |
2. Operating Policies continued | | |
Swap Agreements continued | | |
Swaps are marked to market daily based on dealer supplied valuations and changes in value are recorded as unrealized appreciation (depreciation). Gains or losses are realized upon early termination of the swap agreement. Collateral, in the form of cash or securities, may be required to be held in segregated accounts with a fund’s custodian in compliance with swap contracts. Risks may exceed amounts recognized on the State ment of Assets and Liabilities. These risks include changes in the returns of the underly ing instruments, failure of the counterparties to perform under the contracts’ terms and the possible lack of liquidity with respect to the swap agreements. Details of swap agreements open at period end are included in the fund’s Schedule of Investments under the caption “Swap Agreements.”
Mortgage Dollar Rolls. To earn additional income, the fund may employ trading strategies which involve the sale and simultaneous agreement to repurchase similar securities (“mortgage dollar rolls”) or the purchase and simultaneous agreement to sell similar securities (“reverse mortgage dollar rolls”). The securities traded are mortgage securities and bear the same interest rate but may be collateralized by different pools of mortgages. During the period between the sale and repurchase in a mortgage dollar roll transaction, a fund will not be entitled to receive interest and principal payments on the securities sold but will invest the proceeds of the sale in other securities which may enhance the yield and total return. In addition, the difference between the sale price and the future purchase price is recorded as an adjustment to investment income. During the period between the purchase and subsequent sale in a reverse mortgage dollar roll transaction a fund is entitled to interest and principal payments on the securities purchased. The price differential between the purchase and sale is recorded as an adjustment to investment income. Losses may arise due to changes in the value of the securities or if the counterparty does not perform under the terms of the agreement. If the counterparty files for bankruptcy or becomes insolvent, a fund’s right to repurchase or sell securities may be limited.
3. Fees and Other Transactions with Affiliates.
Management Fee. FMR and its affiliates provide the fund with investment manage ment related services for which the fund pays a monthly management fee. The manage ment fee is the sum of an individual fund fee rate that is based on an annual rate of .20% of the fund’s average net assets and a group fee rate that averaged .12% during the period. The group fee rate is based upon the average net assets of all the mutual funds advised by FMR. The group fee rate decreases as assets under management increase and increases as assets under management decrease. For the period, the total annualized management fee rate was .32% of the fund’s average net assets.
3. Fees and Other Transactions with Affiliates continued
Distribution and Service Plan. In accordance with Rule 12b 1 of the 1940 Act, the fund has adopted separate Distribution and Service Plans for each class of shares. Certain classes pay Fidelity Distributors Corporation (FDC), an affiliate of FMR, separate Distribution and Service Fees, each of which is based on an annual percentage of each class’ average net assets. In addition, FDC may pay financial intermediaries for selling shares of the fund and providing shareholder support services. For the period, the Distribution and Service Fee rates and the total amounts paid to and retained by FDC were as follows:
| | | Distribution | | Service | | | | Paid to | | | | Retained |
| | | Fee | | Fee | | | | FDC | | | | by FDC |
| Class A | | 0% | | .15% | | | | $ 69,808 | | | | $ 1,622 |
| Class T | | 0% | | .25% | | | | 283,317 | | | | 3,056 |
| Class B | | .65% | | .25% | | | | 370,922 | | | | 268,726 |
| Class C | | .75% | | .25% | | | | 253,484 | | | | 18,062 |
| | | | | | | | | $ 977,531 | | | | $ 291,466 |
Sales Load. FDC receives a front end sales charge of up to 4.75% for selling Class A shares, and 3.50% for selling Class T shares, some of which is paid to financial intermedi aries for selling shares of the fund. FDC receives the proceeds of contingent deferred sales charges levied on Class A, Class T, Class B, and Class C redemptions. These charges depend on the holding period. The deferred sales charges range from 5% to 1% for Class B, 1% for Class C,.75% to .50% for certain purchases of Class A shares (.25% prior to February 24, 2006) and .25% for certain purchases of Class T shares.
| For the period, sales charge amounts retained by FDC were as follows: | | |
| |
| | | | | Retained |
| | | | | by FDC |
| Class A | | | | $ 10,959 |
| Class T | | | | 5,692 |
| Class B* | | | | 114,358 |
| Class C* | | | | 1,416 |
| | | | | $ 132,425 |
| * | When Class B and Class C shares are initially sold, FDC pays commissions from its own resources to financial intermediaries through which the sales are made. |
| |
31 Semiannual Report
| Notes to Financial Statements (Unaudited) continued |
3. Fees and Other Transactions with Affiliates continued |
Transfer Agent Fees. Fidelity Investments Institutional Operations Company, Inc. (FIIOC), an affiliate of FMR, is the transfer, dividend disbursing and shareholder servic ing agent for each class of the fund. FIIOC receives account fees and asset based fees that vary according to the account size and type of account of the shareholders of the respective classes of the fund. FIIOC pays for typesetting, printing and mailing of share holder reports, except proxy statements. For the period the total transfer agent fees paid by each class to FIIOC, were as follows:
| | | | | | | % of |
| | | | | | | Average |
| | | | | Amount | | Net Assets |
| Class A | | | | $ 111,624 | | .24* |
| Class T | | | | 230,386 | | .20* |
| Class B | | | | 101,361 | | .25* |
| Class C | | | | 52,031 | | .21* |
| Institutional Class | | | | 495,751 | | .19* |
| | | | | $ 991,153 | | |
| * Annualized | | | | | | |
Accounting and Security Lending Fees. Fidelity Service Company, Inc. (FSC), an affiliate of FMR, maintains the fund’s accounting records. The accounting fee is based on the level of average net assets for the month. Under a separate contract, FSC administers the security lending program. The security lending fee is based on the number and duration of lending transactions.
4. Committed Line of Credit.
|
The fund participates with other funds managed by FMR in a $4.2 billion credit facility (the “line of credit”) to be utilized for temporary or emergency purposes to fund share holder redemptions or for other short term liquidity purposes. The fund has agreed to pay commitment fees on its pro rata portion of the line of credit, which amounts to $938 and is reflected in Miscellaneous Expense on the Statement of Operations. During the period, there were no borrowings on this line of credit.
The fund lends portfolio securities from time to time in order to earn additional income. On the settlement date of the loan, the fund receives collateral (in the form of U.S. Treasury obligations, letters of credit and/or cash) against the loaned securities and maintains collateral in an amount not less than 100% of the market value of the loaned securities during the period of the loan. The market value of the loaned securities is determined at the close of business of the fund and any additional required collateral is delivered to the fund on the next business day. If the borrower defaults on its obligation to return the securities loaned because of insolvency or other reasons, a fund could experience delays and costs in recovering the securities loaned or in gaining access to the collateral. Any cash collateral received is invested in cash equivalents. At period end there were no security loans outstanding. Security lending income represents the income earned on investing cash collateral, less fees and expenses associated with the loan, plus any premium payments that may be received on the loan of certain types of securities. Security lending income is presented in the Statement of Operations as a component of interest income. Net income from lending portfolio securities during the period amounted to $3,108.
Through arrangements with the fund’s custodian and each class’ transfer agent, credits realized as a result of uninvested cash balances were used to reduce the fund’s expenses. During the period, these credits reduced the fund’s custody expenses by $300. During the period, credits reduced each class’ transfer agent expense as noted in the table below.
| | | | | Transfer Agent |
| | | | | expense reduction |
| Class A | | | | $ 2,404 |
| Institutional Class | | | | 1,088 |
| | | | | $ 3,492 |
| |
| 7. Other. | | | | |
The fund’s organizational documents provide former and current trustees and officers with a limited indemnification against liabilities arising in connection with the performance of their duties to the fund. In the normal course of business, the fund may also enter into contracts that provide general indemnifications. The fund’s maximum exposure under these arrangements is unknown as this would be dependent on future claims that may be made against the fund. The risk of material loss from such claims is considered remote.
At the end of the period, the Fidelity Advisor Freedom Funds were the owners of record, in the aggregate, of approximately 26% of the total outstanding shares of the fund.
33 Semiannual Report
| Notes to Financial Statements (Unaudited) continued |
8. Distributions to Shareholders. | | |
Distributions to shareholders of each class were as follows: | | |
| | | | | | | Six months ended | | | | Year ended |
| | | | | | | April 30, 2006 | | | | October 31, 2005 |
| From net investment income | | | | | | | | | | | | | | |
| Class A | | | | | | $ 1,835,863 | | | | | | $ 2,224,216 |
| Class T | | | | | | 4,421,364 | | | | | | 7,397,091 |
| Class B | | | | | | 1,336,162 | | | | | | 2,471,404 |
| Class C | | | | | | 800,836 | | | | | | 1,237,969 |
| Institutional Class | | | | | | 10,768,914 | | | | | | 10,962,306 |
| Total | | | | | | $ 19,163,139 | | | | | | 24,292,986 |
| From net realized gain | | | | | | | | | | | | |
| Class A | | | | | | $ — | | | | | | $ 139,625 |
| Class T | | | | | | — | | | | | | 507,903 |
| Class B | | | | | | — | | | | | | 244,101 |
| Class C | | | | | | — | | | | | | 116,835 |
| Institutional Class | | | | | | — | | | | | | 488,076 |
| Total | | | | | | $ — | | | | | | $ 1,496,540 |
| |
| 9. Share Transactions. | | | | | | | | | | | | | | |
| |
Transactions for each class of shares were as follows:
| | | | | | | | | | |
| | | Shares | | | | Dollars |
| | | Six months ended | | Year ended | | | | Six months ended | | | | Year ended |
| | | April 30, 2006 | | October 31, 2005 | | | | April 30, 2006 | | | | October 31, 2005 |
| Class A | | | | | | | | | | | | | | | | |
| Shares sold | | 3,677,760 | | | | 4,113,241 | | | | | | $ 36,304,592 | | | | $ 41,451,899 |
| Reinvestment of | | | | | | | | | | | | | | | | |
| distributions | | 168,138 | | | | 208,122 | | | | | | 1,662,722 | | | | 2,095,808 |
| Shares redeemed | | (1,768,253) | | | | (2,714,775) | | | | | | (17,483,934) | | | | (27,351,893) |
| Net increase (decrease) | | 2,077,645 | | | | 1,606,588 | | | | | | $ 20,483,380 | | | | $ 16,195,814 |
| Class T | | | | | | | | | | | | | | | | |
| Shares sold | | 2,508,256 | | | | 8,129,709 | | | | | | $ 24,818,800 | | | | $ 81,837,721 |
| Reinvestment of | | | | | | | | | | | | | | | | |
| distributions | | 423,534 | | | | 741,353 | | | | | | 4,187,082 | | | | 7,462,032 |
| Shares redeemed | | (5,890,796) | | | | (9,793,832) | | | | | | (58,291,393) | | | | (98,641,967) |
| Net increase (decrease) | | (2,959,006) | | | | (922,770) | | | | | | $ (29,285,511) | | | | $ (9,342,214) |
| Class B | | | | | | | | | | | | | | | | |
| Shares sold | | 141,351 | | | | 963,812 | | | | | | $ 1,396,504 | | | | $ 9,708,714 |
| Reinvestment of | | | | | | | | | | | | | | | | |
| distributions | | 107,499 | | | | 210,668 | | | | | | 1,062,239 | | | | 2,118,016 |
| Shares redeemed | | (2,526,792) | | | | (4,240,223) | | | | | | (24,978,538) | | | | (42,659,299) |
| Net increase (decrease) | | (2,277,942) | | | | (3,065,743) | | | | | | $ (22,519,795) | | | | $ (30,832,569) |
| |
| |
| |
| Semiannual Report | | | | 34 | | | | | | | | | | |
| 9. Share Transactions - continued | | | | | | | | |
| | | Shares | | | | Dollars |
| | | Six months ended | | Year ended | | | | Six months ended | | | | Year ended |
| | | April 30, 2006 | | October 31, 2005 | | | | April 30, 2006 | | | | October 31, 2005 |
| Class C | | | | | | | | | | | | |
| Shares sold | | 370,747 | | 986,075 | | | | $ 3,665,233 | | | | $ 9,938,801 |
| Reinvestment of | | | | | | | | | | | | |
| distributions | | 50,595 | | 83,491 | | | | 500,304 | | | | 840,019 |
| Shares redeemed | | (952,694) | | (1,791,952) | | | | (9,425,436) | | | | (18,050,113) |
| Net increase (decrease) . | | (531,352) | | (722,386) | | | | $ (5,259,899) | | | | $ (7,271,293) |
| Institutional Class | | | | | | | | | | | | |
| Shares sold | | 15,016,014 | | 24,879,267 | | | | $ 147,813,311 | | | | $ 249,564,976 |
| Reinvestment of | | | | | | | | | | | | |
| distributions | | 1,030,044 | | 1,044,484 | | | | 10,121,188 | | | | 10,458,786 |
| Shares redeemed | | (3,318,909) | | (3,106,436) | | | | (32,686,098) | | | | (31,119,387) |
| Net increase (decrease) . | | 12,727,149 | | 22,817,315 | | | | $ 125,248,401 | | | | $ 228,904,375 |
| |
| 10. Proposed Reorganization. | | | | | | | | |
On April 20, 2006, the Board of Trustees of Fidelity Advisor Government Investment Fund (the fund) approved an Agreement and Plan of Reorganization (“Agreement”) between the fund and Fidelity Government Income Fund (“Reorganization”). The Agreement provides for the transfer of all of the assets of the fund to Fidelity Government Income Fund in exchange solely for the number of shares of Class A, Class T, Class B, Class C and Institutional Class (the Advisor Classes) of Fidelity Government Income Fund having the same relative net asset value as the outstanding shares of Class A, Class T, Class B, Class C and Institutional Class of the fund as of the close of business of the New York Stock Exchange on the day that the Reorganization is effective and the assumption by Fidelity Government Income Fund of all of the liabilities of the fund. The Advisor Classes of Fidelity Government Income Fund are being created for purposes of the Reorganization and will not commence operations until the date of the Reorganization. The Reorganization can be consummated only if, among other things, it is approved by the vote of a majority (as defined by the 1940 Act) of outstanding voting securities of the fund. A Special Meeting of Shareholders (“Meeting”) of the fund will be held on September 20, 2006, to vote on the Agreement. A detailed description of the proposed transactions and voting information will be sent to shareholders of the fund in July, 2006. If the Agreement is approved at the Meeting, the Reorganization is expected to become effective on or about October 27, 2006. The Reorganization is expected to qualify as a tax free transaction with no gain or loss recognized by the funds or their shareholders.
35 Semiannual Report
Board Approval of Investment Advisory Contracts and Management Fees
Advisor Government Investment Fund
On January 19, 2006, the Board of Trustees, including the Independent Trustees (together, the Board), voted to approve a general research services agreement (the Agreement) between FMR, FMR Co., Inc. (FMRC), Fidelity Investments Money Manage ment, Inc. (FIMM), and Fidelity Research & Analysis Company (FRAC) (together, the Investment Advisers) for the fund, effective January 20, 2006, pursuant to which FRAC may provide general research and investment advisory support services to FMRC and FIMM. The Board considered that it has approved previously various sub advisory agreements for the fund with affiliates of FMR that allow FMR to obtain research, non discretionary advice, or discretionary portfolio management at no additional expense to the fund. The Board, assisted by the advice of fund counsel and independent Trustees’ counsel, considered a broad range of information and determined that it would be beneficial for the fund to access the research and investment advisory support services supplied by FRAC at no additional expense to the fund.
The Board reached this determination in part because the new arrangement will involve no changes in (i) the contractual terms of and fees payable under the fund’s manage ment contract or sub advisory agreements; (ii) the investment process or strategies employed in the management of the fund’s assets; (iii) the nature or level of services provided under the fund’s management contract or sub advisory agreements; (iv) the day to day management of the fund or the persons primarily responsible for such man agement; or (v) the ultimate control or beneficial ownership of FMR, FMRC, or FIMM. The Board also considered that the establishment of the Agreement would not necessi tate prior shareholder approval of the Agreement or result in an assignment and termination of the fund’s management contract or sub advisory agreements under the Investment Company Act of 1940.
Because the Board was approving an arrangement with FRAC under which the fund will not bear any additional management fees or expenses and under which the fund’s portfolio manager would not change, it did not consider the fund’s investment perfor mance, competitiveness of management fee and total expenses, costs of services and profitability, or economies of scale to be significant factors in its decision.
In connection with its future renewal of the fund’s management contract and sub advisory agreements, the Board will consider: (i) the nature, extent, and quality of services provided to the fund, including shareholder and administrative services and investment performance; (ii) the competitiveness of the fund’s management fee and total expenses; (iii) the costs of the services and profitability, including the revenues earned and the expenses incurred by Fidelity in conducting the business of developing, marketing, distributing, managing, administering, and servicing the fund and its shareholders; and (iv) whether there have been economies of scale in respect of the management of the Fidelity funds, whether the Fidelity funds (including the fund) have
appropriately benefited from any such economies of scale, and whether there is potential for realization of any further economies.
Based on its evaluation of all of the conclusions noted above, and after considering all material factors, the Board ultimately concluded that the fund’s Agreement is fair and reasonable, and that the fund’s Agreement should be approved.
37 Semiannual Report
Investment Adviser
Fidelity Management & Research Company
Boston, MA
Investment Sub Advisers
Fidelity Investments Money
Management, Inc.
Fidelity Research & Analysis Company
(formerly Fidelity Research &
Management Company (Far East) Inc.)
Fidelity International
Investment Advisors
Fidelity International
Investment Advisors (U.K.) Limited
General Distributor
Fidelity Distributors Corporation
Boston, MA
Transfer and Service Agents
Fidelity Investments Institutional
Operations Company, Inc.
Boston, MA
Fidelity Service Company, Inc.
Boston, MA
Custodian
The Bank of New York
New York, NY
|
AGOVI-USAN-0606
1.784883.103
|

Item 2. Code of Ethics
Not applicable.
Item 3. Audit Committee Financial Expert
Not applicable.
Item 4. Principal Accountant Fees and Services
Not applicable.
Item 5. Audit Committee of Listed Registrants
Not applicable.
Item 6. Schedule of Investments
Not applicable.
Item 7. Disclosure of Proxy Voting Policies and Procedures for Closed-End Management Investment Companies
Not applicable.
Item 8. Portfolio Managers of Closed-End Management Investment Companies
Not applicable.
Item 9. Purchase of Equity Securities by Closed-End Management Investment Company and Affiliated Purchasers
Not applicable.
Item 10. Submission of Matters to a Vote of Security Holders
There were no material changes to the procedures by which shareholders may recommend nominees to the Fidelity Advisor Series II: Fidelity Advisor Government Investment Fund's Board of Trustees.
Item 11. Controls and Procedures
(a)(i) The President and Treasurer and the Chief Financial Officer have concluded that the Fidelity Advisor Series II: Fidelity Advisor Government Investment Fund's (the "Fund") disclosure controls and procedures (as defined in Rule 30a-3(c) under the Investment Company Act) provide reasonable assurances that material information relating to the Fund is made known to them by the appropriate persons, based on their evaluation of these controls and procedures as of a date within 90 days of the filing date of this report.
(a)(ii) There was no change in the Fund's internal control over financial reporting (as defined in Rule 30a-3(d) under the Investment Company Act) that occurred during the second fiscal quarter of the period covered by this report that has materially affected, or is reasonably likely to materially affect, the Fund's internal control over financial reporting.
Item 12. Exhibits
(a) | (1) | Not applicable. |
(a) | (2) | Certification pursuant to Rule 30a-2(a) under the Investment Company Act of 1940 (17 CFR 270.30a-2(a)) is filed and attached hereto as Exhibit 99.CERT. |
(a) | (3) | Not applicable. |
(b) | | Certification pursuant to Rule 30a-2(b) under the Investment Company Act of 1940 (17 CFR 270.30a-2(b)) is furnished and attached hereto as Exhibit 99.906CERT. |
SIGNATURES
Pursuant to the requirements of the Securities Exchange Act of 1934 and the Investment Company Act of 1940, the registrant has duly caused this report to be signed on its behalf by the undersigned, thereunto duly authorized.
Fidelity Advisor Series II
By: | /s/Christine Reynolds |
| Christine Reynolds |
| President and Treasurer |
| |
Date: | June 16, 2006 |
Pursuant to the requirements of the Securities Exchange Act of 1934 and the Investment Company Act of 1940, this report has been signed below by the following persons on behalf of the registrant and in the capacities and on the dates indicated.
By: | /s/Christine Reynolds |
| Christine Reynolds |
| President and Treasurer |
| |
Date: | June 16, 2006 |
By: | /s/Paul M. Murphy |
| Paul M. Murphy |
| Chief Financial Officer |
| |
Date: | June 16, 2006 |