UNITED STATES
SECURITIES AND EXCHANGE COMMISSION
Washington, D.C. 20549
FORM N-CSR
CERTIFIED SHAREHOLDER REPORT OF REGISTERED
MANAGEMENT INVESTMENT COMPANIES
Investment Company Act file number 811-4707
Fidelity Advisor Series II
(Exact name of registrant as specified in charter)
82 Devonshire St., Boston, Massachusetts 02109
(Address of principal executive offices) (Zip code)
Eric D. Roiter, Secretary
82 Devonshire St.
Boston, Massachusetts 02109
(Name and address of agent for service)
Registrant's telephone number, including area code: 617-563-7000
Date of fiscal year end: | October 31 |
Date of reporting period: | April 30, 2006 |
Item 1. Reports to Stockholders
| Fidelity® Advisor High Income Advantage Fund - Class A, Class T, Class B and Class C |
| Semiannual Report April 30, 2006 |

| Contents | ||||
| Chairman’s Message | 3 | Ned Johnson’s message to shareholders. | ||
| Shareholder Expense | 4 | An example of shareholder expenses. | ||
| Example | ||||
| Investment Changes | 6 | A summary of major shifts in the fund’s | ||
| investments over the past six months. | ||||
| Investments | 8 | A complete list of the fund’s investments | ||
| with their market values. | ||||
| Financial Statements | 22 | Statements of assets and liabilities, | ||
| operations, and changes in net assets, | ||||
| as well as financial highlights. | ||||
| Notes | 31 | Notes to the financial statements. | ||
| Board Approval of | 40 | |||
| Investment Advisory | ||||
| Contracts and | ||||
| Management Fees | ||||
| To view a fund’s proxy voting guidelines and proxy voting record for the 12 month period ended June 30, visit www.fidelity.com/proxyvotingresults or visit the Securities and Exchange Commis sion’s (SEC) web site at www.sec.gov. You may also call 1-877-208-0098 to request a free copy of the proxy voting guidelines. Standard & Poor’s, S&P and S&P 500 are registered service marks of The McGraw Hill Companies, Inc. and have been licensed for use by Fidelity Distributors Corporation. Other third party marks appearing herein are the property of their respective owners. All other marks appearing herein are registered or unregistered trademarks or service marks of FMR Corp. or an affiliated company. |
| This report and the financial statements contained herein are submitted for the general information of the shareholders of the fund. This report is not authorized for distribution to prospective investors in the fund unless preceded or accompanied by an effective prospectus. A fund files its complete schedule of portfolio holdings with the SEC for the first and third quarters of each fiscal year on Form N Q. Forms N Q are available on the SEC’s web site at http://www.sec.gov. A fund’s Forms N Q may be reviewed and copied at the SEC’s Public Refer ence Room in Washington, DC. Information regarding the operation of the SEC’s Public Reference Room may be obtained by calling 1-800-SEC-0330. For a complete list of a fund’s portfolio hold ings, view the most recent quarterly holdings report, semiannual report, or annual report on Fidelity’s web site at http://www.advisor.fidelity.com. NOT FDIC INSURED · MAY LOSE VALUE · NO BANK GUARANTEE Neither the fund nor Fidelity Distributors Corporation is a bank. |
| Semiannual Report |
| 2 |
Chairman’s Message
(photograph of Edward C. Johnson 3d)
Dear Shareholder:
Although many securities markets made gains in early 2006, there is only one certainty when it comes to investing: There is no sure thing. There are, however, a number of time tested, fundamental investment principles that can put the historical odds in your favor.
One of the basic tenets is to invest for the long term. Over time, riding out the markets’ inevitable ups and downs has proven much more effective than selling into panic or chasing the hottest trend. Even missing only a few of the markets’ best days can significantly diminish investor returns. Patience also affords the benefits of compounding of earning interest on additional income or reinvested dividends and capital gains. There are tax advantages and cost benefits to consider as well. The more you sell, the more taxes you pay, and the more you trade, the higher the costs. While staying the course doesn’t eliminate risk, it can considerably lessen the effect of short term declines.
You can further manage your investing risk through diversification. And today, more than ever, geographic diversification should be taken into account. Studies indicate that asset allocation is the single most important determinant of a portfolio’s long term success. The right mix of stocks, bonds and cash aligned to your particular risk tolerance and investment objective is very important. Age appropriate rebalancing is also an essential aspect of asset allocation. For younger investors, an emphasis on equities which historically have been the best performing asset class over time is encouraged. As investors near their specific goal, such as retirement or sending a child to college, consideration may be given to replacing volatile assets (e.g. common stocks) with more stable fixed investments (bonds or savings plans).
A third investment principle investing regularly can help lower the average cost of your purchases. Investing a certain amount of money each month or quarter helps ensure you won’t pay for all your shares at market highs. This strategy known as dollar cost averaging also reduces unconstructive “emotion” from investing, helping shareholders avoid selling weak performers just prior to an upswing, or chasing a hot performer just before a correction.
We invite you to contact us via the Internet, through our Investor Centers or over the phone. It is our privilege to provide you the information you need to make the investments that are right for you.
Sincerely,
/s/ Edward C. Johnson 3d
Edward C. Johnson 3d
3 Semiannual Report
Shareholder Expense Example
As a shareholder of the Fund, you incur two types of costs: (1) transaction costs, including sales charges (loads) on purchase payments or redemption proceeds, and (2) ongoing costs, including management fees, distribution and/or service (12b 1) fees and other Fund expenses. This Example is intended to help you understand your ongoing costs (in dollars) of investing in the Fund and to compare these costs with the ongoing costs of investing in other mutual funds.
The Example is based on an investment of $1,000 invested at the beginning of the period and held for the entire period (November 1, 2005 to April 30, 2006).
| Actual Expenses |
The first line of the table below for each class of the Fund provides information about actual account values and actual expenses. You may use the information in this line, together with the amount you invested, to estimate the expenses that you paid over the period. Simply divide your account value by $1,000.00 (for example, an $8,600 account value divided by $1,000.00 = 8.6), then multiply the result by the number in the first line for a class of the Fund under the heading entitled “Expenses Paid During Period” to estimate the expenses you paid on your account during this period.
Hypothetical Example for Comparison Purposes
The second line of the table below for each class of the Fund provides information about hypothetical account values and hypothetical expenses based on a Class’ actual expense ratio and an assumed rate of return of 5% per year before expenses, which is not the Class’ actual return. The hypothetical account values and expenses may not be used to estimate the actual ending account balance or expenses you paid for the period. You may use this information to compare the ongoing costs of investing in the Fund and other funds. To do so, compare this 5% hypothetical example with the 5% hypothetical examples that appear in the shareholder reports of the other funds.
Please note that the expenses shown in the table are meant to highlight your ongoing costs only and do not reflect any transaction costs. Therefore, the second line of the table is useful in comparing ongoing costs only, and will not help you determine the relative total costs of owning different funds. In addition, if these transactional costs were included, your costs would have been higher.
| Expenses Paid | ||||||||||||
| Beginning | Ending | During Period* | ||||||||||
| Account Value | Account Value | November 1, 2005 | ||||||||||
| November 1, 2005 | April 30, 2006 | to April 30, 2006 | ||||||||||
| Class A | ||||||||||||
| Actual | $ 1,000.00 | $ 1,094.00 | $ 5.14 | |||||||||
| HypotheticalA | $ 1,000.00 | $ 1,019.89 | $ 4.96 | |||||||||
| Class T | ||||||||||||
| Actual | $ 1,000.00 | $ 1,094.40 | $ 5.50 | |||||||||
| HypotheticalA | $ 1,000.00 | $ 1,019.54 | $ 5.31 | |||||||||
| Class B | ||||||||||||
| Actual | $ 1,000.00 | $ 1,090.30 | $ 9.07 | |||||||||
| HypotheticalA | $ 1,000.00 | $ 1,016.12 | $ 8.75 | |||||||||
| Semiannual Report | 4 | |||||||||||
| Expenses Paid | ||||||||||||
| Beginning | Ending | During Period* | ||||||||||
| Account Value | Account Value | November 1, 2005 | ||||||||||
| November 1, 2005 | April 30, 2006 | to April 30, 2006 | ||||||||||
| Class C | ||||||||||||
| Actual | $ 1,000.00 | $ 1,089.60 | $ 9.43 | |||||||||
| HypotheticalA | $ 1,000.00 | $ 1,015.77 | $ 9.10 | |||||||||
| Institutional Class | ||||||||||||
| Actual | $ 1,000.00 | $ 1,095.00 | $ 4.26 | |||||||||
| HypotheticalA | $ 1,000.00 | $ 1,020.73 | $ 4.11 | |||||||||
| A 5% return per year before expenses | ||||||||||||
* Expenses are equal to each Class’ annualized expense ratio (shown in the table below); multiplied by the average account value over the period, multiplied by 181/365 (to reflect the one half year period).
| Annualized | ||
| Expense Ratio | ||
| Class A | .99% | |
| Class T | 1.06% | |
| Class B | 1.75% | |
| Class C | 1.82% | |
| Institutional Class | .82% |
5 Semiannual Report
| Investment Changes | ||||
| Top Five Holdings as of April 30, 2006 | ||||
| (by issuer, excluding cash equivalents) | % of fund’s | % of fund’s net assets | ||
| net assets | 6 months ago | |||
| El Paso Corp. | 5.2 | 2.7 | ||
| Revlon, Inc. | 4.5 | 4.5 | ||
| Six Flags, Inc. | 4.4 | 4.8 | ||
| Tenet Healthcare Corp. | 3.9 | 3.0 | ||
| Levi Strauss & Co. | 3.2 | 3.5 | ||
| 21.2 | ||||
| Top Five Market Sectors as of April 30, 2006 | ||||
| % of fund’s | % of fund’s net assets | |||
| net assets | 6 months ago | |||
| Energy | 9.5 | 10.4 | ||
| Telecommunications | 8.8 | 13.0 | ||
| Healthcare | 8.1 | 7.1 | ||
| Technology | 6.3 | 4.8 | ||
| Consumer Products | 5.2 | 5.0 | ||
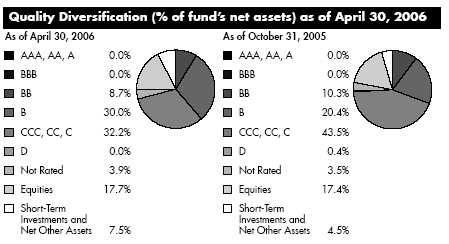
We have used ratings from Moody’s® Investors Services, Inc. Where Moody’s ratings are not available, we have used S&P® ratings.
Semiannual Report 6
7 Semiannual Report
| Investments April 30, 2006 (Unaudited) | ||||||||||
| Showing Percentage of Net Assets | ||||||||||
| Corporate Bonds 72.9% | ||||||||||
| Principal | Value (Note 1) | |||||||||
| Amount (000s) | (000s) | |||||||||
| Convertible Bonds 1.0% | ||||||||||
| Cable TV 0.6% | ||||||||||
| Charter Communications, Inc. 5.875% 11/16/09 (e) | $ 22,580 | $ 16,709 | ||||||||
| Telecommunications – 0.4% | ||||||||||
| ICO North America, Inc. 7.5% 8/15/09 (g) | 8,175 | 10,301 | ||||||||
| TOTAL CONVERTIBLE BONDS | 27,010 | |||||||||
| Nonconvertible Bonds – 71.9% | ||||||||||
| Aerospace – 0.5% | ||||||||||
| Bombardier, Inc. 7.45% 5/1/34 (e) | 8,650 | 7,807 | ||||||||
| L-3 Communications Corp. 5.875% 1/15/15 | 1,225 | 1,148 | ||||||||
| Orbimage Holdings, Inc. 14.2% 7/1/12 (e)(f) | 3,710 | 4,044 | ||||||||
| 12,999 | ||||||||||
| Air Transportation – 4.0% | ||||||||||
| American Airlines, Inc. pass thru trust certificates: | ||||||||||
| 6.817% 5/23/11 | 13,320 | 12,954 | ||||||||
| 6.977% 11/23/22 | 729 | 693 | ||||||||
| 7.377% 5/23/19 | 13,843 | 12,736 | ||||||||
| 7.8% 4/1/08 | 9,740 | 9,643 | ||||||||
| 10.18% 1/2/13 | 5,055 | 4,903 | ||||||||
| Delta Air Lines, Inc.: | ||||||||||
| 7.9% 12/15/09 (h) | 31,370 | 8,078 | ||||||||
| 8% 12/15/07 (e)(h) | 7,900 | 1,896 | ||||||||
| 8.3% 12/15/29 (h) | 99,585 | 25,773 | ||||||||
| 9.5% 11/18/08 (e)(h) | 2,065 | 2,003 | ||||||||
| 10% 8/15/08 (h) | 41,705 | 10,376 | ||||||||
| Delta Air Lines, Inc. pass thru trust certificates 7.779% | ||||||||||
| 1/2/12 | 1,674 | 1,532 | ||||||||
| Northwest Airlines Corp. 10% 2/1/09 (h) | 1,524 | 625 | ||||||||
| Northwest Airlines, Inc.: | ||||||||||
| 7.875% 3/15/08 (h) | 11,925 | 5,068 | ||||||||
| 8.7% 3/15/07 (h) | 1,630 | 701 | ||||||||
| 9.875% 3/15/07 (h) | 6,255 | 2,721 | ||||||||
| 10.5% 4/1/09 (h) | 8,139 | 2,686 | ||||||||
| Northwest Airlines, Inc. pass thru trust certificates | ||||||||||
| 9.179% 10/1/11 | 1,753 | 438 | ||||||||
| 102,826 | ||||||||||
| Automotive 4.0% | ||||||||||
| Accuride Corp. 8.5% 2/1/15 | 4,780 | 4,720 | ||||||||
| Altra Industrial Motion, Inc. 9% 12/1/11 | 2,460 | 2,460 | ||||||||
| American Tire Distributors, Inc. 10.75% 4/1/13 | 6,930 | 6,480 | ||||||||
See accompanying notes which are an integral part of the financial statements. | ||||||||||
| Semiannual Report | 8 | |||||||||
| Corporate Bonds continued | ||||||||||
| Principal | Value (Note 1) | |||||||||
| Amount (000s) | (000s) | |||||||||
| Nonconvertible Bonds continued | ||||||||||
| Automotive continued | ||||||||||
| Delco Remy International, Inc. 9.375% 4/15/12 | $ 1,480 | $ 703 | ||||||||
| General Motors Acceptance Corp.: | ||||||||||
| 5.85% 1/14/09 | 8,675 | 8,156 | ||||||||
| 6.75% 12/1/14 | 30,390 | 27,655 | ||||||||
| 6.875% 9/15/11 | 4,335 | 4,053 | ||||||||
| General Motors Corp. 8.375% 7/15/33 | 38,140 | 28,414 | ||||||||
| IdleAire Technologies Corp. 0% 12/15/12 unit (c)(e) | 16,350 | 12,263 | ||||||||
| Tenneco, Inc. 8.625% 11/15/14 | 2,870 | 2,899 | ||||||||
| Visteon Corp. 8.25% 8/1/10 | 7,200 | 6,336 | ||||||||
| 104,139 | ||||||||||
| Broadcasting – 0.1% | ||||||||||
| Paxson Communications Corp. 11.3183% | ||||||||||
| 1/15/13 (e)(f) | 3,255 | 3,288 | ||||||||
| Building Materials – 1.6% | ||||||||||
| Goodman Global Holdings, Inc. 7.875% 12/15/12 | 13,870 | 13,870 | ||||||||
| Interface, Inc. 9.5% 2/1/14 | 320 | 328 | ||||||||
| MAXX Corp. 9.75% 6/15/12 | 13,888 | 11,840 | ||||||||
| NTK Holdings, Inc. 0% 3/1/14 (c) | 17,240 | 13,102 | ||||||||
| U.S. Concrete, Inc. 8.375% 4/1/14 | 2,940 | 3,028 | ||||||||
| 42,168 | ||||||||||
| Cable TV 3.6% | ||||||||||
| Cablevision Systems Corp. 8% 4/15/12 | 21,940 | 21,995 | ||||||||
| CCH I LLC / CCH I Capital Corp. 11% 10/1/15 | 65,809 | 57,501 | ||||||||
| Charter Communications Holding II LLC/Charter | ||||||||||
| Communications Holdings II Capital Corp. 10.25% | ||||||||||
| 9/15/10 (e) | 6,495 | 6,544 | ||||||||
| Charter Communications Operating LLC/Charter | ||||||||||
| Communications Operating Capital Corp. 8% | ||||||||||
| 4/30/12 (e) | 6,475 | 6,475 | ||||||||
| 92,515 | ||||||||||
| Capital Goods 1.5% | ||||||||||
| Hawk Corp. 8.75% 11/1/14 | 2,770 | 2,784 | ||||||||
| Invensys PLC 9.875% 3/15/11 (e) | 7,590 | 8,007 | ||||||||
| Park-Ohio Industries, Inc. 8.375% 11/15/14 | 20,525 | 19,345 | ||||||||
| Sensus Metering Systems, Inc. 8.625% 12/15/13 | 4,555 | 4,430 | ||||||||
| Thermadyne Holdings Corp. 9.25% 2/1/14 | 5,710 | 5,139 | ||||||||
| 39,705 | ||||||||||
| See accompanying notes which are an integral part of the financial statements. | ||||||||||
| 9 | Semiannual Report | |||||||||
| Investments (Unaudited) continued | ||||||||||
| Corporate Bonds continued | ||||||||||
| Principal | Value (Note 1) | |||||||||
| Amount (000s) | (000s) | |||||||||
| Nonconvertible Bonds continued | ||||||||||
| Chemicals – 3.8% | ||||||||||
| Crystal US Holding 3 LLC/Crystal US Sub 3 Corp.: | ||||||||||
| Series A, 0% 10/1/14 (c) | $ 7,785 | $ 6,277 | ||||||||
| Series B, 0% 10/1/14 (c) | 15,211 | 11,903 | ||||||||
| Equistar Chemicals LP/Equistar Funding Corp. 10.625% | ||||||||||
| 5/1/11 | 5,920 | 6,453 | ||||||||
| Hexion US Finance Corp. / Hexion Nova Scotia Finance | ||||||||||
| ULC 9.8183% 7/15/10 (f) | 4,990 | 5,090 | ||||||||
| Huntsman LLC 11.625% 10/15/10 | 5,972 | 6,808 | ||||||||
| Nell AF Sarl 8.375% 8/15/15 (e) | 3,990 | 3,950 | ||||||||
| PAHC Holdings Corp. 15% 2/1/10 pay in-kind | 3,610 | 3,682 | ||||||||
| Phibro Animal Health Corp. 13% 12/1/07 unit | 3,404 | 3,506 | ||||||||
| Resolution Performance Products LLC/RPP Capital Corp. | ||||||||||
| 13.5% 11/15/10 | 28,415 | 30,511 | ||||||||
| Rhodia SA 8.875% 6/1/11 | 11,901 | 12,288 | ||||||||
| Rockwood Specialties Group, Inc. 7.5% 11/15/14 | 950 | 950 | ||||||||
| Tronox Worldwide LLC / Tronox Worldwide Finance | ||||||||||
| Corp. 9.5% 12/1/12 (e) | 5,110 | 5,378 | ||||||||
| 96,796 | ||||||||||
| Consumer Products – 0.5% | ||||||||||
| NPI Merger Corp. 10.75% 4/15/14 (e) | 1,880 | 1,939 | ||||||||
| Revlon Consumer Products Corp. 9.5% 4/1/11 | 12,120 | 11,847 | ||||||||
| 13,786 | ||||||||||
| Containers – 2.1% | ||||||||||
| Anchor Glass Container Corp. 11% 2/15/13 (h) | 6,050 | 5,294 | ||||||||
| Constar International, Inc. 11% 12/1/12 | 3,315 | 2,519 | ||||||||
| Graham Packaging Co. LP/ GPC Capital Corp. 9.875% | ||||||||||
| 10/15/14 | 14,530 | 14,821 | ||||||||
| Huntsman Packaging Corp. 13% 6/1/10 (h) | 13,795 | 6,346 | ||||||||
| Owens-Brockway Glass Container, Inc.: | ||||||||||
| 6.75% 12/1/14 | 4,410 | 4,234 | ||||||||
| 8.25% 5/15/13 | 8,535 | 8,748 | ||||||||
| Pliant Corp.: | ||||||||||
| 11.125% 9/1/09 (h) | 1,210 | 1,186 | ||||||||
| 13% 6/1/10 (h) | 7,975 | 3,669 | ||||||||
| Solo Cup Co. 8.5% 2/15/14 | 7,000 | 6,598 | ||||||||
| 53,415 | ||||||||||
| See accompanying notes which are an integral part of the financial statements. | ||||||||||
| Semiannual Report | 10 | |||||||||
| Corporate Bonds continued | ||||||||||
| Principal | Value (Note 1) | |||||||||
| Amount (000s) | (000s) | |||||||||
| Nonconvertible Bonds continued | ||||||||||
| Diversified Financial Services – 0.3% | ||||||||||
| Cardtronics, Inc. 9.25% 8/15/13 (e) | $ 2,840 | $ 2,812 | ||||||||
| Triad Acquisition Corp. 11.125% 5/1/13 | 4,170 | 4,170 | ||||||||
| 6,982 | ||||||||||
| Diversified Media – 0.1% | ||||||||||
| Affinion Group, Inc. 11.5% 10/15/15 (e) | 1,570 | 1,609 | ||||||||
| Electric Utilities – 1.1% | ||||||||||
| Mirant Americas Generation LLC: | ||||||||||
| 8.5% 10/1/21 | 6,645 | 6,695 | ||||||||
| 9.125% 5/1/31 | 9,625 | 10,106 | ||||||||
| Mirant North America LLC/Mirant North America | ||||||||||
| Finance Corp. 7.375% 12/31/13 (e) | 3,880 | 3,895 | ||||||||
| NRG Energy, Inc. 7.375% 2/1/16 | 6,500 | 6,541 | ||||||||
| 27,237 | ||||||||||
| Energy – 7.9% | ||||||||||
| Aventine Renewable Energy Holdings, Inc. 10.91% | ||||||||||
| 12/15/11 (e)(f) | 15,780 | 16,569 | ||||||||
| Chaparral Energy, Inc. 8.5% 12/1/15 (e) | 4,490 | 4,670 | ||||||||
| El Paso Corp.: | ||||||||||
| 6.5% 6/1/08 (e) | 10,390 | 10,401 | ||||||||
| 6.95% 6/1/28 (e) | 15,800 | 14,457 | ||||||||
| 7% 5/15/11 | 38,000 | 37,763 | ||||||||
| 7.75% 6/15/10 (e) | 42,465 | 43,687 | ||||||||
| 7.75% 1/15/32 (e) | 1,970 | 1,975 | ||||||||
| 7.875% 6/15/12 | 12,620 | 13,062 | ||||||||
| El Paso Energy Corp. 7.375% 12/15/12 | 22,275 | 22,498 | ||||||||
| El Paso Production Holding Co. 7.75% 6/1/13 | 8,155 | 8,440 | ||||||||
| Hanover Compressor Co.: | ||||||||||
| 7.5% 4/15/13 | 990 | 1,000 | ||||||||
| 9% 6/1/14 | 1,105 | 1,188 | ||||||||
| Inergy LP/Inergy Finance Corp. 8.25% 3/1/16 (e) | 3,260 | 3,325 | ||||||||
| Mariner Energy, Inc. 7.5% 4/15/13 (e) | 5,850 | 5,792 | ||||||||
| Ocean Rig Norway AS 8.375% 7/1/13 (e) | 2,190 | 2,310 | ||||||||
| Pogo Producing Co.: | ||||||||||
| 6.625% 3/15/15 | 6,505 | 6,294 | ||||||||
| 6.875% 10/1/17 | 6,485 | 6,307 | ||||||||
| Venoco, Inc. 8.75% 12/15/11 | 3,670 | 3,633 | ||||||||
| 203,371 | ||||||||||
| Entertainment/Film 0.0% | ||||||||||
| Livent, Inc. yankee 9.375% 10/15/04 (h) | 11,100 | 333 | ||||||||
See accompanying notes which are an integral part of the financial statements.
11 Semiannual Report
| Investments (Unaudited) continued | ||||||||||
| Corporate Bonds continued | ||||||||||
| Principal | Value (Note 1) | |||||||||
| Amount (000s) | (000s) | |||||||||
| Nonconvertible Bonds continued | ||||||||||
| Environmental – 1.9% | ||||||||||
| Allied Waste North America, Inc.: | ||||||||||
| 7.25% 3/15/15 | $ 27,340 | $ 27,818 | ||||||||
| 7.375% 4/15/14 | 21,790 | 21,518 | ||||||||
| 49,336 | ||||||||||
| Food and Drug Retail – 2.8% | ||||||||||
| Ahold Finance USA, Inc. 8.25% 7/15/10 | 39,237 | 41,444 | ||||||||
| Albertsons, Inc. 8% 5/1/31 | 13,110 | 12,358 | ||||||||
| AmeriQual Group LLC/AmeriQual Finance Corp. 9% | ||||||||||
| 4/1/12 (e) | 3,000 | 3,120 | ||||||||
| Doane Pet Care Co. 10.625% 11/15/15 | 2,770 | 3,379 | ||||||||
| Nutritional Sourcing Corp. 10.125% 8/1/09 | 7,424 | 5,494 | ||||||||
| Pathmark Stores, Inc. 8.75% 2/1/12 | 7,300 | 7,191 | ||||||||
| 72,986 | ||||||||||
| Food/Beverage/Tobacco – 1.0% | ||||||||||
| Pierre Foods, Inc. 9.875% 7/15/12 | 2,240 | 2,318 | ||||||||
| Swift & Co.: | ||||||||||
| 10.125% 10/1/09 | 5,405 | 5,540 | ||||||||
| 12.5% 1/1/10 | 16,705 | 16,705 | ||||||||
| UAP Holding Corp. 0% 7/15/12 (c) | 880 | 792 | ||||||||
| 25,355 | ||||||||||
| Gaming – 0.5% | ||||||||||
| San Pasqual Casino Development Group, Inc. 8% | ||||||||||
| 9/15/13 (e) | 1,660 | 1,656 | ||||||||
| Virgin River Casino Corp./RBG LLC/B&BB, Inc.: | ||||||||||
| 0% 1/15/13 (c) | 2,990 | 2,033 | ||||||||
| 9% 1/15/12 | 1,760 | 1,795 | ||||||||
| Wynn Las Vegas LLC/Wynn Las Vegas Capital Corp. | ||||||||||
| 6.625% 12/1/14 | 6,680 | 6,480 | ||||||||
| 11,964 | ||||||||||
| Healthcare 5.8% | ||||||||||
| Accellent, Inc. 10.5% 12/1/13 | 6,160 | 6,637 | ||||||||
| AMR HoldCo, Inc./EmCare HoldCo, Inc. 10% 2/15/15 | 4,260 | 4,526 | ||||||||
| CRC Health Group, Inc. 10.75% 2/1/16 (e) | 3,340 | 3,432 | ||||||||
| DaVita, Inc. 7.25% 3/15/15 | 7,400 | 7,382 | ||||||||
| IASIS Healthcare LLC/IASIS Capital Corp. 8.75% | ||||||||||
| 6/15/14 | 10,770 | 10,824 | ||||||||
| Lifecare Holdings, Inc. 9.25% 8/15/13 (e) | 6,590 | 4,168 | ||||||||
| Multiplan, Inc. 10.375% 4/15/16 (e) | 3,660 | 3,719 | ||||||||
| See accompanying notes which are an integral part of the financial statements. | ||||||||||
| Semiannual Report | 12 | |||||||||
| Corporate Bonds continued | ||||||||||
| Principal | Value (Note 1) | |||||||||
| Amount (000s) | (000s) | |||||||||
| Nonconvertible Bonds continued | ||||||||||
| Healthcare continued | ||||||||||
| Team Finance LLC / Health Finance Corp. 11.25% | ||||||||||
| 12/1/13 (e) | $ 9,190 | $ 9,489 | ||||||||
| Tenet Healthcare Corp.: | ||||||||||
| 6.375% 12/1/11 | 11,625 | 10,782 | ||||||||
| 6.5% 6/1/12 | 24,700 | 22,539 | ||||||||
| 7.375% 2/1/13 | 49,340 | 46,380 | ||||||||
| 9.25% 2/1/15 (e) | 11,960 | 12,199 | ||||||||
| 9.875% 7/1/14 | 6,675 | 6,942 | ||||||||
| 149,019 | ||||||||||
| Homebuilding/Real Estate – 0.3% | ||||||||||
| Kimball Hill, Inc. 10.5% 12/15/12 (e) | 3,250 | 3,193 | ||||||||
| Technical Olympic USA, Inc. 10.375% 7/1/12 | 4,614 | 4,683 | ||||||||
| 7,876 | ||||||||||
| Insurance – 1.6% | ||||||||||
| Provident Companies, Inc.: | ||||||||||
| 7% 7/15/18 | 3,650 | 3,668 | ||||||||
| 7.25% 3/15/28 | 17,830 | 17,269 | ||||||||
| UnumProvident Corp.: | ||||||||||
| 6.75% 12/15/28 | 11,350 | 10,612 | ||||||||
| 7.375% 6/15/32 | 9,190 | 9,012 | ||||||||
| 40,561 | ||||||||||
| Leisure – 4.3% | ||||||||||
| Festival Fun Parks LLC 10.875% 4/15/14 (e) | 2,470 | 2,485 | ||||||||
| Six Flags, Inc.: | ||||||||||
| 9.625% 6/1/14 | 67,995 | 68,845 | ||||||||
| 9.75% 4/15/13 | 40,010 | 40,610 | ||||||||
| 111,940 | ||||||||||
| Paper 1.6% | ||||||||||
| Bowater Canada Finance Corp. 7.95% 11/15/11 | 10,000 | 10,000 | ||||||||
| Bowater, Inc. 6.5% 6/15/13 | 9,755 | 9,097 | ||||||||
| Georgia-Pacific Corp. 7.7% 6/15/15 | 10,645 | 10,645 | ||||||||
| Jefferson Smurfit Corp. U.S.: | ||||||||||
| 7.5% 6/1/13 | 6,960 | 6,508 | ||||||||
| 8.25% 10/1/12 | 5,000 | 4,838 | ||||||||
| 41,088 | ||||||||||
| See accompanying notes which are an integral part of the financial statements. | ||||||||||
| 13 | Semiannual Report | |||||||||
| Investments (Unaudited) continued | ||||||||||
| Corporate Bonds continued | ||||||||||
| Principal | Value (Note 1) | |||||||||
| Amount (000s) | (000s) | |||||||||
| Nonconvertible Bonds continued | ||||||||||
| Publishing/Printing – 0.7% | ||||||||||
| CBD Media Holdings LLC/CBD Holdings Finance, Inc. | ||||||||||
| 9.25% 7/15/12 | $ 6,140 | $ 6,247 | ||||||||
| Vertis, Inc. 10.875% 6/15/09 | 13,265 | 12,668 | ||||||||
| 18,915 | ||||||||||
| Restaurants 0.8% | ||||||||||
| The Restaurant Co. 10% 10/1/13 | 14,920 | 14,025 | ||||||||
| Uno Restaurant Corp. 10% 2/15/11 (e) | 8,670 | 6,979 | ||||||||
| 21,004 | ||||||||||
| Services – 1.7% | ||||||||||
| Ashtead Holdings PLC 8.625% 8/1/15 (e) | 2,500 | 2,588 | ||||||||
| Cornell Companies, Inc. 10.75% 7/1/12 | 7,345 | 7,712 | ||||||||
| FTI Consulting, Inc. 7.625% 6/15/13 | 1,510 | 1,570 | ||||||||
| Hertz Corp. 10.5% 1/1/16 (e) | 6,990 | 7,689 | ||||||||
| Hydrochem Industrial Services, Inc. 9.25% 2/15/13 (e) . | 5,150 | 5,111 | ||||||||
| Language Line, Inc. 11.125% 6/15/12 | 4,610 | 4,299 | ||||||||
| Muzak LLC/Muzak Finance Corp. 10% 2/15/09 | 12,200 | 10,614 | ||||||||
| Neff Rent LLC/Neff Finance Corp. 11.25% 6/15/12 (e) | 4,350 | 4,807 | ||||||||
| 44,390 | ||||||||||
| Shipping – 0.4% | ||||||||||
| Ship Finance International Ltd. 8.5% 12/15/13 | 11,965 | 11,247 | ||||||||
| Steels – 0.5% | ||||||||||
| Edgen Acquisition Corp. 9.875% 2/1/11 | 5,980 | 5,965 | ||||||||
| RathGibson, Inc. 11.25% 2/15/14 (e) | 6,190 | 6,654 | ||||||||
| 12,619 | ||||||||||
| Super Retail – 1.0% | ||||||||||
| Intcomex, Inc. 11.75% 1/15/11 (e) | 6,260 | 6,197 | ||||||||
| NBC Acquisition Corp. 0% 3/15/13 (c) | 12,830 | 9,109 | ||||||||
| The Bon-Ton Department Stores, Inc. 10.25% | ||||||||||
| 3/15/14 (e) | 10,220 | 9,760 | ||||||||
| 25,066 | ||||||||||
| Technology – 5.9% | ||||||||||
| Activant Solutions, Inc. 9.5% 5/1/16 (e) | 2,310 | 2,342 | ||||||||
| Amkor Technology, Inc.: | ||||||||||
| 7.125% 3/15/11 | 7,505 | 7,130 | ||||||||
| 7.75% 5/15/13 | 16,490 | 15,707 | ||||||||
| 10.5% 5/1/09 | 26,175 | 26,633 | ||||||||
| Avago Technologies Finance Ltd.: | ||||||||||
| 10.125% 12/1/13 (e) | 19,280 | 20,871 | ||||||||
| See accompanying notes which are an integral part of the financial statements. | ||||||||||
| Semiannual Report | 14 | |||||||||
| Corporate Bonds continued | ||||||||||
| Principal | Value (Note 1) | |||||||||
| Amount (000s) | (000s) | |||||||||
| Nonconvertible Bonds continued | ||||||||||
| Technology – continued | ||||||||||
| Avago Technologies Finance Ltd.: – continued | ||||||||||
| 11.875% 12/1/15 (e) | $ 10,280 | $ 11,282 | ||||||||
| Danka Business Systems PLC 11% 6/15/10 | 6,205 | 5,212 | ||||||||
| Freescale Semiconductor, Inc. 7.125% 7/15/14 | 4,460 | 4,572 | ||||||||
| MagnaChip Semiconductor SA/MagnaChip | ||||||||||
| Semiconductor Finance Co.: | ||||||||||
| 6.875% 12/15/11 | 2,465 | 2,366 | ||||||||
| 8.16% 12/15/11 (f) | 3,840 | 3,859 | ||||||||
| New ASAT Finance Ltd. 9.25% 2/1/11 | 9,425 | 8,082 | ||||||||
| SERENA Software, Inc. 10.375% 3/15/16 (e) | 1,450 | 1,537 | ||||||||
| Solectron Global Finance Ltd. 8% 3/15/16 (e) | 2,190 | 2,223 | ||||||||
| SS&C Technologies, Inc. 11.75% 12/1/13 (e) | 9,920 | 10,614 | ||||||||
| SunGard Data Systems, Inc. 10.25% 8/15/15 (e) | 15,470 | 16,553 | ||||||||
| Viasystems, Inc. 10.5% 1/15/11 | 12,680 | 12,617 | ||||||||
| 151,600 | ||||||||||
| Telecommunications – 6.8% | ||||||||||
| Centennial Cellular Operating Co./Centennial | ||||||||||
| Communications Corp. 10.125% 6/15/13 | 5,000 | 5,463 | ||||||||
| Centennial Communications Corp./Centennial Cellular | ||||||||||
| Operating Co. LLC/Centennial Puerto Rico Operations | ||||||||||
| Corp. 8.125% 2/1/14 | 6,680 | 6,864 | ||||||||
| Cincinnati Bell, Inc. 8.375% 1/15/14 | 3,095 | 3,165 | ||||||||
| Eschelon Operating Co. 8.375% 3/15/10 | 2,522 | 2,415 | ||||||||
| Intelsat Ltd.: | ||||||||||
| 6.5% 11/1/13 | 18,795 | 14,754 | ||||||||
| 7.625% 4/15/12 | 19,730 | 16,869 | ||||||||
| Level 3 Financing, Inc. 12.25% 3/15/13 (e) | 6,100 | 6,527 | ||||||||
| Nordic Telephone Co. Holdings Aps 8.875% 5/1/16 (e) | 3,430 | 3,567 | ||||||||
| Qwest Capital Funding, Inc.: | ||||||||||
| 7% 8/3/09 | 22,120 | 22,203 | ||||||||
| 7.25% 2/15/11 | 4,000 | 4,015 | ||||||||
| 7.625% 8/3/21 | 3,210 | 3,186 | ||||||||
| 7.75% 2/15/31 | 29,425 | 30,087 | ||||||||
| Qwest Communications International, Inc. 7.5% | ||||||||||
| 2/15/14 | 14,000 | 14,280 | ||||||||
| Rogers Communications, Inc.: | ||||||||||
| 6.375% 3/1/14 | 12,190 | 11,885 | ||||||||
| 7.5% 3/15/15 | 7,260 | 7,596 | ||||||||
| Rural Cellular Corp. 9.75% 1/15/10 | 4,825 | 4,958 | ||||||||
| See accompanying notes which are an integral part of the financial statements. | ||||||||||
| 15 | Semiannual Report | |||||||||
| Investments (Unaudited) continued | ||||||||||
| Corporate Bonds continued | ||||||||||
| Principal | Value (Note 1) | |||||||||
| Amount (000s) | (000s) | |||||||||
| Nonconvertible Bonds continued | ||||||||||
| Telecommunications – continued | ||||||||||
| U.S. West Capital Funding, Inc. 6.375% 7/15/08 | $ 5,000 | $ 4,950 | ||||||||
| U.S. West Communications 6.875% 9/15/33 | 15,000 | 13,950 | ||||||||
| 176,734 | ||||||||||
| Textiles & Apparel – 3.2% | ||||||||||
| Levi Strauss & Co.: | ||||||||||
| 8.875% 4/1/16 (e) | 6,510 | 6,510 | ||||||||
| 9.75% 1/15/15 | 22,090 | 23,250 | ||||||||
| 12.25% 12/15/12 | 46,975 | 53,317 | ||||||||
| 83,077 | ||||||||||
| TOTAL NONCONVERTIBLE BONDS | 1,855,946 | |||||||||
| TOTAL CORPORATE BONDS | ||||||||||
| (Cost $1,875,776) | 1,882,956 | |||||||||
| Common Stocks 16.9% | ||||||||||
| Shares | ||||||||||
| Cable TV 0.4% | ||||||||||
| NTL, Inc. (a) | 361,330 | 9,929 | ||||||||
| NTL, Inc. warrants 1/13/11 (a) | 3 | 0 | ||||||||
| Pegasus Communications Corp. warrants 1/1/07 (a)(g) | 6,509 | 0 | ||||||||
| 9,929 | ||||||||||
| Chemicals – 0.1% | ||||||||||
| Huntsman Corp. (g) | 96,480 | 1,896 | ||||||||
| Consumer Products – 4.5% | ||||||||||
| Revlon, Inc. Class A (sub. vtg.) (a)(d) | 35,592,996 | 115,669 | ||||||||
| Containers – 0.8% | ||||||||||
| Owens Illinois, Inc. (a) | 1,143,900 | 20,910 | ||||||||
| Trivest 1992 Special Fund Ltd. (a)(g) | 3,037,732 | 15 | ||||||||
| 20,925 | ||||||||||
| Electric Utilities – 1.9% | ||||||||||
| AES Corp. (a) | 2,192,509 | 37,207 | ||||||||
| Mirant Corp. (a) | 523,570 | 12,859 | ||||||||
| 50,066 | ||||||||||
| Energy – 1.0% | ||||||||||
| Chesapeake Energy Corp. | 800,000 | 25,344 | ||||||||
| See accompanying notes which are an integral part of the financial statements. | ||||||||||
| Semiannual Report | 16 | |||||||||
| Common Stocks continued | ||||||
| Shares | Value (Note 1) | |||||
| (000s) | ||||||
| Food and Drug Retail – 0.7% | ||||||
| Pathmark Stores, Inc. (a) | 1,818,878 | $ 18,825 | ||||
| Pathmark Stores, Inc. warrants 9/19/10 (a) | 747,828 | 232 | ||||
| 19,057 | ||||||
| Healthcare 2.3% | ||||||
| DaVita, Inc. (a) | 1,056,946 | 59,464 | ||||
| Metals/Mining – 1.5% | ||||||
| Haynes International, Inc. (a)(d) | 1,140,617 | 37,640 | ||||
| Paper 0.7% | ||||||
| Temple-Inland, Inc. | 365,678 | 16,982 | ||||
| Shipping – 1.2% | ||||||
| Teekay Shipping Corp. | 793,800 | 30,537 | ||||
| Technology – 0.4% | ||||||
| STATS ChipPAC Ltd. sponsored ADR (a) | 261,000 | 2,221 | ||||
| Viasystems Group, Inc. (a)(g) | 1,026,780 | 8,728 | ||||
| 10,949 | ||||||
| Telecommunications – 1.4% | ||||||
| Choice One Communications, Inc. (a)(g) | 571,711 | 2,430 | ||||
| ICO Global Communications Holdings Ltd.: | ||||||
| warrants 5/16/06 (a) | 7,290 | 0 | ||||
| Class A (a) | 43,772 | 241 | ||||
| McLeodUSA, Inc. (a) | 4,914,174 | 34,399 | ||||
| 37,070 | ||||||
| Textiles & Apparel – 0.0% | ||||||
| Arena Brands Holding Corp. Class B (g) | 42,253 | 631 | ||||
| Pillowtex Corp. (a) | 490,256 | 1 | ||||
| 632 | ||||||
| TOTAL COMMON STOCKS | ||||||
| (Cost $321,234) | 436,160 | |||||
| Preferred Stocks 0.8% | ||||||
| Convertible Preferred Stocks 0.6% | ||||||
| Energy – 0.4% | ||||||
| El Paso Corp. 4.99% (e) | 10,000 | 11,493 | ||||
| Leisure – 0.2% | ||||||
| Six Flags, Inc. 7.25% PIERS | 200,000 | 4,582 | ||||
| TOTAL CONVERTIBLE PREFERRED STOCKS | 16,075 | |||||
| See accompanying notes which are an integral part of the financial statements. | ||||||
| 17 | Semiannual Report | |||||
| Investments (Unaudited) continued | ||||||||
| Preferred Stocks continued | ||||||||
| Shares | Value (Note 1) | |||||||
| (000s) | ||||||||
| Nonconvertible Preferred Stocks 0.2% | ||||||||
| Broadcasting – 0.2% | ||||||||
| Spanish Broadcasting System, Inc. Class B, 10.75% | 3,671 | $ 4,038 | ||||||
| TOTAL PREFERRED STOCKS | ||||||||
| (Cost $18,032) | 20,113 | |||||||
| Floating Rate Loans 1.9% | ||||||||
| Principal | ||||||||
| Amount (000s) | ||||||||
| Building Materials – 1.2% | ||||||||
| Masonite International Corp. term loan: | ||||||||
| 7.106% 4/5/13 (f) | $ 2,590 | 2,567 | ||||||
| 11.3619% 4/6/15 (f) | 29,788 | 28,299 | ||||||
| 30,866 | ||||||||
| Cable TV 0.1% | ||||||||
| Wide Open West Finance LLC Tranche 2, term loan | ||||||||
| 10.04% 4/28/14 (f) | 1,770 | 1,783 | ||||||
| Consumer Products – 0.2% | ||||||||
| Amscan Holdings, Inc. Tranche 2, term loan 9.77% | ||||||||
| 12/23/13 (f) | 4,550 | 4,584 | ||||||
| Energy – 0.2% | ||||||||
| Coffeyville Resources LLC Tranche 2, term loan 11.75% | ||||||||
| 7/8/13 (f) | 6,510 | 6,673 | ||||||
| Telecommunications – 0.2% | ||||||||
| Choice One Communications, Inc. Tranche C, term loan | ||||||||
| 9.9794% 11/30/10 (f) | 5,348 | 5,334 | ||||||
| TOTAL FLOATING RATE LOANS | ||||||||
| (Cost $47,594) | 49,240 | |||||||
| Money Market Funds 4.6% | ||||||||
| Shares | ||||||||
| Fidelity Cash Central Fund, 4.8% (b) | ||||||||
| (Cost $119,798) | 119,798,054 | 119,798 | ||||||
| See accompanying notes which are an integral part of the financial statements. | ||||||||
| Semiannual Report | 18 | |||||||
| Cash Equivalents 0.2% | ||||||||||
| Maturity | Value (Note 1) | |||||||||
| Amount (000s) | (000s) | |||||||||
| Investments in repurchase agreements (Collateralized by U.S. | ||||||||||
| Treasury Obligations, in a joint trading account at 4.69%, | ||||||||||
| dated 4/28/06 due 5/1/06) | ||||||||||
| (Cost $4,588) | $ 4,590 | $ 4,588 | ||||||||
| TOTAL INVESTMENT PORTFOLIO 97.3% | ||||||||||
| (Cost $2,387,022) | 2,512,855 | |||||||||
| NET OTHER ASSETS – 2.7% | 69,771 | |||||||||
| NET ASSETS 100% | $ 2,582,626 | |||||||||
| Security Type Abbreviations | ||||
| PIERS | - | Preferred Income Equity | ||
| Redeemable Securities | ||||
| Legend (a) Non-income producing (b) Affiliated fund that is available only to investment companies and other accounts managed by Fidelity Investments. The rate quoted is the annualized seven-day yield of the fund at period end. A complete unaudited listing of the fund’s holdings as of its most recent quarter end is available upon request. (c) Security initially issued in zero coupon form which converts to coupon form at a specified rate and date. The rate shown is the rate at period end. (d) Affiliated company (e) Security exempt from registration under Rule 144A of the Securities Act of 1933. These securities may be resold in transactions exempt from registration, normally to qualified institutional buyers. At the period end, the value of these securities amounted to $378,570,000 or 14.7% of net assets. |
| (f) The coupon rate shown on floating or adjustable rate securities represents the rate at period end. (g) Restricted securities – Investment in securities not registered under the Securities Act of 1933 (excluding 144A issues). At the end of the period, the value of restricted securities (excluding 144A issues) amounted to $24,001,000 or 0.9% of net assets. |
See accompanying notes which are an integral part of the financial statements.
19 Semiannual Report
Investments (Unaudited) continued
| Additional information on each holding is as follows: | ||||||
| Acquisition | Acquisition | |||||
| Security | Date | Cost (000s) | ||||
| Arena Brands | ||||||
| Holding Corp. | 6/18/97 - | |||||
| Class B | 7/13/98 | $ 1,538 | ||||
| Choice One | ||||||
| Communications, | ||||||
| Inc. | 11/18/04 | $ 2,390 | ||||
| Huntsman Corp. | 4/30/03 | $ 690 | ||||
| ICO North | ||||||
| America, Inc. | ||||||
| 7.5% 8/15/09 | 8/12/05 | $ 8,175 | ||||
| Pegasus | ||||||
| Communications | ||||||
| Corp. warrants | ||||||
| 1/1/07 | 10/17/97 | $ 635 | ||||
| Trivest 1992 | ||||||
| Special Fund Ltd. | 7/30/92 | $ — | ||||
| Viasystems | ||||||
| Group, Inc. | 2/13/04 | $ 20,664 | ||||
| (h) Non-income producing - Issuer is in default. |
Affiliated Central Funds
Information regarding fiscal year to date income earned by the fund from the affiliated Central funds is as follows:
| Fund | Income earned | |||
| (Amounts in thousands) | ||||
| Fidelity Cash Central Fund | $ 1,861 | |||
| Fidelity Securities Lending Cash Central Fund | 7 | |||
| Total | $ 1,868 | |||
See accompanying notes which are an integral part of the financial statements.
Semiannual Report 20
Other Affiliated Issuers
An affiliated company is a company in which the fund has ownership of at least 5% of the voting securities. Fiscal year to date transactions with companies which are or were affiliates are as follows:
| Value, | Purchases | Sales | Dividend | Value, end of | ||||||||||||||||
| Affiliate | beginning of | Proceeds | Income | period | ||||||||||||||||
| (Amounts in thousands) | period | |||||||||||||||||||
| Haynes International, | ||||||||||||||||||||
| Inc. | $ 25,094 | $ — | $ — | $ — | $ 37,640 | |||||||||||||||
| Revlon, Inc. Class A | ||||||||||||||||||||
| (sub. vtg.) | 103,517 | 10,422 | 10,515 | — | 115,669 | |||||||||||||||
| TOTALS | $ 128,611 | $ 10,422 | $ 10,515 | $ — | $ 153,309 | |||||||||||||||
Income Tax Information
At October 31, 2005, the fund had a capital loss carryforward of approximately $955,951,000 of which $477,033,000 and $478,918,000 will expire on October 31, 2009 and 2010, respectively.
See accompanying notes which are an integral part of the financial statements.
21 Semiannual Report
| Financial Statements | ||||||
| Statement of Assets and Liabilities | ||||||
| Amounts in thousands (except per share amounts) | April 30, 2006 (Unaudited) | |||||
| Assets | ||||||
| Investment in securities, at value (including repurchase | ||||||
| agreements of $4,588) See accompanying | ||||||
| schedule: | ||||||
| Unaffiliated issuers (cost $2,182,258) | $ 2,239,748 | |||||
| Affiliated Central Funds (cost $119,798) | 119,798 | |||||
| Other affiliated issuers (cost $84,966) | 153,309 | |||||
| Total Investments (cost $2,387,022) | $ 2,512,855 | |||||
| Cash | 1 | |||||
| Receivable for investments sold | 44,489 | |||||
| Receivable for fund shares sold | 6,295 | |||||
| Dividends receivable | 91 | |||||
| Interest receivable | 45,117 | |||||
| Prepaid expenses | 7 | |||||
| Receivable from investment adviser for expense | ||||||
| reductions | 3 | |||||
| Other affiliated receivables | 40 | |||||
| Other receivables | 1 | |||||
| Total assets | 2,608,899 | |||||
| Liabilities | ||||||
| Payable for investments purchased | $ 15,158 | |||||
| Payable for fund shares redeemed | 6,252 | |||||
| Distributions payable | 2,416 | |||||
| Accrued management fee | 1,209 | |||||
| Distribution fees payable | 652 | |||||
| Other affiliated payables | 545 | |||||
| Other payables and accrued expenses | 41 | |||||
| Total liabilities | 26,273 | |||||
| Net Assets | $ 2,582,626 | |||||
| Net Assets consist of: | ||||||
| Paid in capital | $ 3,399,652 | |||||
| Undistributed net investment income | 29,357 | |||||
| Accumulated undistributed net realized gain (loss) on | ||||||
| investments | (972,216) | |||||
| Net unrealized appreciation (depreciation) on | ||||||
| investments | 125,833 | |||||
| Net Assets | $ 2,582,626 | |||||
See accompanying notes which are an integral part of the financial statements.
Semiannual Report 22
| Statement of Assets and Liabilities continued | ||||
Amounts in thousands (except per share amounts) | April 30, 2006 (Unaudited) | |||
| Calculation of Maximum Offering Price | ||||
| Class A: | ||||
| Net Asset Value and redemption price per share | ||||
| ($520,160 ÷ 51,433 shares) | $ 10.11 | |||
| Maximum offering price per share (100/95.25 of $10.11) | $ 10.61 | |||
| Class T: | ||||
| Net Asset Value and redemption price per share | ||||
| ($1,067,809 ÷ 105,249 shares) | $ 10.15 | |||
| Maximum offering price per share (100/96.50 of $10.15) | $ 10.52 | |||
| Class B: | ||||
| Net Asset Value and offering price per share ($267,877 | ||||
| ÷ 26,598 shares)A | $ 10.07 | |||
| Class C: | ||||
| Net Asset Value and offering price per share ($198,426 | ||||
| ÷ 19,640 shares)A | $ 10.10 | |||
| Institutional Class: | ||||
| Net Asset Value, offering price and redemption price per | ||||
| share ($528,354 ÷ 54,129 shares) | $ 9.76 | |||
| A Redemption price per share is equal to net asset value less any applicable contingent deferred sales charge. | ||||
See accompanying notes which are an integral part of the financial statements.
23 Semiannual Report
| Financial Statements continued | ||||||
| Statement of Operations | ||||||
| Amounts in thousands | Six months ended April 30, 2006 (Unaudited) | |||||
| Investment Income | ||||||
| Dividends | $ 1,212 | |||||
| Interest | 90,428 | |||||
| Income from affiliated Central Funds | 1,868 | |||||
| Total income | 93,508 | |||||
| Expenses | ||||||
| Management fee | $ 6,902 | |||||
| Transfer agent fees | 2,300 | |||||
| Distribution fees | 3,933 | |||||
| Accounting and security lending fees | 416 | |||||
| Independent trustees’ compensation | 5 | |||||
| Appreciation in deferred trustee compensation account | 3 | |||||
| Custodian fees and expenses | 21 | |||||
| Registration fees | 80 | |||||
| Audit | 37 | |||||
| Legal | 8 | |||||
| Miscellaneous | 62 | |||||
| Total expenses before reductions | 13,767 | |||||
| Expense reductions | (31) | 13,736 | ||||
| Net investment income | 79,772 | |||||
| Realized and Unrealized Gain (Loss) | ||||||
| Net realized gain (loss) on: | ||||||
| Investment securities: | ||||||
| Unaffiliated issuers | (12,568) | |||||
| Other affiliated issuers | 4,510 | |||||
| Total net realized gain (loss) | (8,058) | |||||
| Change in net unrealized appreciation (depreciation) on | ||||||
| investment securities | 144,107 | |||||
| Net gain (loss) | 136,049 | |||||
| Net increase (decrease) in net assets resulting from | ||||||
| operations | $ 215,821 | |||||
See accompanying notes which are an integral part of the financial statements.
| Semiannual Report |
| 24 |
| Statement of Changes in Net Assets | ||||||||
| Six months ended | Year ended | |||||||
| April 30, 2006 | October 31, | |||||||
| Amounts in thousands | (Unaudited) | 2005 | ||||||
| Increase (Decrease) in Net Assets | ||||||||
| Operations | ||||||||
| Net investment income | $ 79,772 | $ 167,624 | ||||||
| Net realized gain (loss) | (8,058) | 192,519 | ||||||
| Change in net unrealized appreciation (depreciation) . | 144,107 | (155,940) | ||||||
| Net increase (decrease) in net assets resulting | ||||||||
| from operations | 215,821 | 204,203 | ||||||
| Distributions to shareholders from net investment income . | (83,275) | (213,900) | ||||||
| Distributions to shareholders from net realized gain | (7,252) | — | ||||||
| Total distributions | (90,527) | (213,900) | ||||||
| Share transactions - net increase (decrease) | 184,049 | (196,503) | ||||||
| Redemption fees | 136 | 393 | ||||||
| Total increase (decrease) in net assets | 309,479 | (205,807) | ||||||
| Net Assets | ||||||||
| Beginning of period | 2,273,147 | 2,478,954 | ||||||
| End of period (including undistributed net investment | ||||||||
| income of $29,357 and undistributed net investment | ||||||||
| income of $32,860, respectively) | $ 2,582,626 | 2,273,147 | ||||||
See accompanying notes which are an integral part of the financial statements.
25 Semiannual Report
| Financial Highlights Class A | ||||||||||||||||||
| Six months ended | ||||||||||||||||||
| April 30, 2006 | Years ended October 31, | |||||||||||||||||
| (Unaudited) | 2005 | 2004 | 2003 | 2002 | 2001 | |||||||||||||
| Selected Per Share Data | ||||||||||||||||||
| Net asset value, | ||||||||||||||||||
| beginning of period | $ 9.60 | $ 9.64 | $ 9.50 | $ 6.40 | $ 8.17 | $ 9.64 | ||||||||||||
| Income from Investment | ||||||||||||||||||
| Operations | ||||||||||||||||||
| Net investment | ||||||||||||||||||
| incomeE | .334 | .695 | .797 | .873 | .767G,H | .869 | ||||||||||||
| Net realized and un | ||||||||||||||||||
| realized gain (loss) | .552 | .134 | .307 | 2.875 | (1.866)G,H | (1.558) | ||||||||||||
| Total from investment | ||||||||||||||||||
| operations | .886 | .829 | 1.104 | 3.748 | (1.099) | (.689) | ||||||||||||
| Distributions from net | ||||||||||||||||||
| investment income | (.347) | (.871) | (.966) | (.648) | (.671) | (.781) | ||||||||||||
| Distributions from net | ||||||||||||||||||
| realized gain | (.030) | — | — | — | — | — | ||||||||||||
| Total distributions | (.377) | (.871) | (.966) | (.648) | (.671) | (.781) | ||||||||||||
| Redemption fees added | ||||||||||||||||||
| to paid in capitalE | .001 | .002 | .002 | — | — | — | ||||||||||||
| Net asset value, end of | ||||||||||||||||||
| period | $ 10.11 | $ 9.60 | $ 9.64 | $ 9.50 | $ 6.40 | $ 8.17 | ||||||||||||
| Total ReturnB,C,D | 9.40% | 8.71% | 12.23% | 60.58% | (14.39)% | (7.64)% | ||||||||||||
| Ratios to Average Net AssetsF | ||||||||||||||||||
| Expenses before | ||||||||||||||||||
| reductions | .99%A | 1.00% | .98% | .99% | 1.02% | .97% | ||||||||||||
| Expenses net of fee | ||||||||||||||||||
| waivers, if any | .99%A | 1.00% | .98% | .99% | 1.02% | .97% | ||||||||||||
| Expenses net of all | ||||||||||||||||||
| reductions | .99%A | .99% | .98% | .99% | 1.01% | .97% | ||||||||||||
| Net investment income | 6.81%A | 7.08% | 8.38% | 10.45% | 10.12%G,H | 9.53% | ||||||||||||
| Supplemental Data | ||||||||||||||||||
| Net assets, end of | ||||||||||||||||||
| period (in millions) . | $ 520 | $ 424 | $ 297 | $ 307 | $ 157 | $ 189 | ||||||||||||
| Portfolio turnover rate | 45%A | 53% | 67% | 111% | 85% | 68% | ||||||||||||
| AAnnualized BTotal returns for periods of less than one year are not annualized. CTotal returns would have been lower had certain expenses not been reduced during the periods shown. DTotal returns do not include the effect of the sales charges. ECalculated based on average shares outstanding during the period. FExpense ratios reflect operating expenses of the class. Expenses before reductions do not reflect amounts reim bursed by the investment adviser or expense offset arrangements and do not represent the amount paid by the class during periods when reimburse ments or reductions occur. Expenses net of fee waivers reflect expenses after reimbursement by the investment adviser but prior to reductions from expense offset arrangements. Expenses net of all reductions represent the net expenses paid by the class. GEffective November 1, 2001, the fund adopted the provisions of the AICPA Audit and Accounting Guide for Investment Companies and began amortizing premium and discount on all debt securities. Per Share data and ratios for periods prior to adoption have not been restated to reflect this change. HAs a result of a revision to reflect accretion of market discount using the interest method, certain amounts for the year ended October 31, 2002 have been reclassified from what was previously reported. The impact of this change was a decrease to net investment income of $0.068 per share with a corresponding increase to net realized and unrealized gain (loss) per share. The ratio of net investment income to average net assets decreased from 11.01% to 10.12% . The reclassification has no impact on the net assets of the fund. See accompanying notes which are an integral part of the financial statements. |
| Semiannual Report |
| 26 |
| Financial Highlights Class T | ||||||||||||||||||
| Six months ended | ||||||||||||||||||
| April 30, 2006 | Years ended October 31, | |||||||||||||||||
| (Unaudited) | 2005 | 2004 | 2003 | 2002 | 2001 | |||||||||||||
| Selected Per Share Data | ||||||||||||||||||
| Net asset value, | ||||||||||||||||||
| beginning of period | $ 9.63 | $ 9.67 | $ 9.52 | $ 6.42 | $ 8.18 | $ 9.66 | ||||||||||||
| Income from Investment | ||||||||||||||||||
| Operations | ||||||||||||||||||
| Net investment | ||||||||||||||||||
| incomeE | .332 | .693 | .793 | .859 | .766G,H | .865 | ||||||||||||
| Net realized and un | ||||||||||||||||||
| realized gain (loss) | .561 | .129 | .315 | 2.883 | (1.860)G,H | (1.572) | ||||||||||||
| Total from investment | ||||||||||||||||||
| operations | .893 | .822 | 1.108 | 3.742 | (1.094) | (.707) | ||||||||||||
| Distributions from net | ||||||||||||||||||
| investment income | (.344) | (.864) | (.960) | (.642) | (.666) | (.773) | ||||||||||||
| Distributions from net | ||||||||||||||||||
| realized gain | (.030) | — | — | — | — | — | ||||||||||||
| Total distributions | (.374) | (.864) | (.960) | (.642) | (.666) | (.773) | ||||||||||||
| Redemption fees added | ||||||||||||||||||
| to paid in capitalE | .001 | .002 | .002 | — | — | — | ||||||||||||
| Net asset value, end of | ||||||||||||||||||
| period | $ 10.15 | $ 9.63 | $ 9.67 | $ 9.52 | $ 6.42 | $ 8.18 | ||||||||||||
| Total ReturnB,C,D | 9.44% | 8.61% | 12.24% | 60.26% | (14.30)% | (7.81)% | ||||||||||||
| Ratios to Average Net AssetsF | ||||||||||||||||||
| Expenses before | ||||||||||||||||||
| reductions | 1.06%A | 1.06% | 1.06% | 1.06% | 1.08% | 1.06% | ||||||||||||
| Expenses net of fee | ||||||||||||||||||
| waivers, if any | 1.06%A | 1.06% | 1.06% | 1.06% | 1.08% | 1.06% | ||||||||||||
| Expenses net of all | ||||||||||||||||||
| reductions | 1.05%A | 1.06% | 1.06% | 1.06% | 1.08% | 1.05% | ||||||||||||
| Net investment income | 6.75%A | 7.02% | 8.30% | 10.38% | 10.05%G,H | 9.45% | ||||||||||||
| Supplemental Data | ||||||||||||||||||
| Net assets, end of | ||||||||||||||||||
| period (in millions) . | $ 1,068 | $ 1,003 | $ 1,245 | $ 1,398 | $ 1,070 | $ 1,473 | ||||||||||||
| Portfolio turnover rate | 45%A | 53% | 67% | 111% | 85% | 68% | ||||||||||||
| AAnnualized BTotal returns for periods of less than one year are not annualized. CTotal returns would have been lower had certain expenses not been reduced during the periods shown. DTotal returns do not include the effect of the sales charges. ECalculated based on average shares outstanding during the period. FExpense ratios reflect operating expenses of the class. Expenses before reductions do not reflect amounts reim bursed by the investment adviser or expense offset arrangements and do not represent the amount paid by the class during periods when reimburse ments or reductions occur. Expenses net of fee waivers reflect expenses after reimbursement by the investment adviser but prior to reductions from expense offset arrangements. Expenses net of all reductions represent the net expenses paid by the class. GEffective November 1, 2001, the fund adopted the provisions of the AICPA Audit and Accounting Guide for Investment Companies and began amortizing premium and discount on all debt securities. Per Share data and ratios for periods prior to adoption have not been restated to reflect this change. HAs a result of a revision to reflect accretion of market discount using the interest method, certain amounts for the year ended October 31, 2002 have been reclassified from what was previously reported. The impact of this change was a decrease to net investment income of $0.068 per share with a corresponding increase to net realized and unrealized gain (loss) per share. The ratio of net investment income to average net assets decreased from 10.95% to 10.05% . The reclassification has no impact on the net assets of the fund. |
See accompanying notes which are an integral part of the financial statements.
27 Semiannual Report
| Financial Highlights Class B | ||||||||||||||||||
| Six months ended | ||||||||||||||||||
| April 30, 2006 | Years ended October 31, | |||||||||||||||||
| (Unaudited) | 2005 | 2004 | 2003 | 2002 | 2001 | |||||||||||||
| Selected Per Share Data | ||||||||||||||||||
| Net asset value, | ||||||||||||||||||
| beginning of period | $ 9.56 | $ 9.61 | $ 9.47 | $ 6.38 | $ 8.15 | $ 9.61 | ||||||||||||
| Income from Investment | ||||||||||||||||||
| Operations | ||||||||||||||||||
| Net investment | ||||||||||||||||||
| incomeE | 296 | .622 | .723 | .802 | .712G,H | .801 | ||||||||||||
| Net realized and un | ||||||||||||||||||
| realized gain (loss) | 553 | .123 | .310 | 2.873 | (1.868)G,H | (1.549) | ||||||||||||
| Total from investment | ||||||||||||||||||
| operations | 849 | .745 | 1.033 | 3.675 | (1.156) | (.748) | ||||||||||||
| Distributions from net | ||||||||||||||||||
| investment income | (.310) | (.797) | (.895) | (.585) | (.614) | (.712) | ||||||||||||
| Distributions from net | ||||||||||||||||||
| realized gain | (.030) | — | — | — | — | — | ||||||||||||
| Total distributions | (.340) | (.797) | (.895) | (.585) | (.614) | (.712) | ||||||||||||
| Redemption fees added | ||||||||||||||||||
| to paid in capitalE | 001 | .002 | .002 | — | — | — | ||||||||||||
| Net asset value, end of | ||||||||||||||||||
| period | $ 10.07 | $ 9.56 | $ 9.61 | $ 9.47 | $ 6.38 | $ 8.15 | ||||||||||||
| Total ReturnB,C,D | 9.03% | 7.82% | 11.44% | 59.42% | (15.07)% | (8.25)% | ||||||||||||
| Ratios to Average Net AssetsF | ||||||||||||||||||
| Expenses before | ||||||||||||||||||
| reductions | 1.76%A | 1.75% | 1.74% | 1.75% | 1.78% | 1.73% | ||||||||||||
| Expenses net of fee | ||||||||||||||||||
| waivers, if any | 1.75%A | 1.74% | 1.74% | 1.75% | 1.78% | 1.73% | ||||||||||||
| Expenses net of all | ||||||||||||||||||
| reductions | 1.75%A | 1.74% | 1.74% | 1.75% | 1.77% | 1.72% | ||||||||||||
| Net investment income | 6.06%A | 6.33% | 7.62% | 9.69% | 9.36%G,H | 8.78% | ||||||||||||
| Supplemental Data | ||||||||||||||||||
| Net assets, end of | ||||||||||||||||||
| period (in millions) . | $ 268 | $ 313 | $ 498 | $ 613 | $ 426 | $ 704 | ||||||||||||
| Portfolio turnover rate | 45%A | 53% | 67% | 111% | 85% | 68% | ||||||||||||
| AAnnualized BTotal returns for periods of less than one year are not annualized. CTotal returns would have been lower had certain expenses not been reduced during the periods shown. DTotal returns do not include the effect of the contingent deferred sales charge. ECalculated based on average shares outstanding during the period. FExpense ratios reflect operating expenses of the class. Expenses before reductions do not reflect amounts reimbursed by the investment adviser or expense offset arrangements and do not represent the amount paid by the class during periods when reimbursements or reductions occur. Expenses net of fee waivers reflect expenses after reimbursement by the investment adviser but prior to reductions from expense offset arrangements. Expenses net of all reductions represent the net expenses paid by the class. GEffective November 1, 2001, the fund adopted the provisions of the AICPA Audit and Accounting Guide for Investment Companies and began amortizing premium and discount on all debt securities. Per Share data and ratios for periods prior to adoption have not been restated to reflect this change. HAs a result of a revision to reflect accretion of market discount using the interest method, certain amounts for the year ended October 31, 2002 have been reclassified from what was previously reported. The impact of this change was a decrease to net investment income of $0.068 per share with a corresponding increase to net realized and unrealized gain (loss) per share. The ratio of net investment income to average net assets decreased from 10.25% to 9.36% . The reclassification has no impact on the net assets of the fund. See accompanying notes which are an integral part of the financial statements. |
| Semiannual Report |
| 28 |
| Financial Highlights Class C | ||||||||||||||||||
| Six months ended | ||||||||||||||||||
| April 30, 2006 | Years ended October 31, | |||||||||||||||||
| (Unaudited) | 2005 | 2004 | 2003 | 2002 | 2001 | |||||||||||||
| Selected Per Share Data | ||||||||||||||||||
| Net asset value, | ||||||||||||||||||
| beginning of period | $ 9.59 | $ 9.63 | $ 9.49 | $ 6.40 | $ 8.16 | $ 9.63 | ||||||||||||
| Income from Investment | ||||||||||||||||||
| Operations | ||||||||||||||||||
| Net investment | ||||||||||||||||||
| incomeE | .293 | .615 | .718 | .801 | .708G,H | .796 | ||||||||||||
| Net realized and un | ||||||||||||||||||
| realized gain (loss) | .553 | .133 | .309 | 2.868 | (1.859)G,H | (1.560) | ||||||||||||
| Total from investment | ||||||||||||||||||
| operations | .846 | .748 | 1.027 | 3.669 | (1.151) | (.764) | ||||||||||||
| Distributions from net | ||||||||||||||||||
| investment income | (.307) | (.790) | (.889) | (.579) | (.609) | (.706) | ||||||||||||
| Distributions from net | ||||||||||||||||||
| realized gain | (.030) | — | — | — | — | — | ||||||||||||
| Total distributions | (.337) | (.790) | (.889) | (.579) | (.609) | (.706) | ||||||||||||
| Redemption fees added | ||||||||||||||||||
| to paid in capitalE | .001 | .002 | .002 | — | — | — | ||||||||||||
| Net asset value, end of | ||||||||||||||||||
| period | $ 10.10 | $ 9.59 | $ 9.63 | $ 9.49 | $ 6.40 | $ 8.16 | ||||||||||||
| Total ReturnB,C,D | 8.96% | 7.83% | 11.33% | 59.11% | (14.98)% | (8.41)% | ||||||||||||
| Ratios to Average Net AssetsF | ||||||||||||||||||
| Expenses before | ||||||||||||||||||
| reductions | 1.82%A | 1.82% | 1.81% | 1.82% | 1.84% | 1.80% | ||||||||||||
| Expenses net of fee | ||||||||||||||||||
| waivers, if any | 1.82%A | 1.82% | 1.81% | 1.82% | 1.84% | 1.80% | ||||||||||||
| Expenses net of all | ||||||||||||||||||
| reductions | 1.82%A | 1.82% | 1.81% | 1.82% | 1.84% | 1.79% | ||||||||||||
| Net investment income | 5.98%A | 6.26% | 7.55% | 9.62% | 9.29%G,H | 8.71% | ||||||||||||
| Supplemental Data | ||||||||||||||||||
| Net assets, end of | ||||||||||||||||||
| period (in millions) . | $ 198 | $ 182 | $ 193 | $ 219 | $ 132 | $ 197 | ||||||||||||
| Portfolio turnover rate | 45%A | 53% | 67% | 111% | 85% | 68% | ||||||||||||
| AAnnualized BTotal returns for periods of less than one year are not annualized. CTotal returns would have been lower had certain expenses not been reduced during the periods shown. DTotal returns do not include the effect of the contingent deferred sales charge. ECalculated based on average shares outstanding during the period. FExpense ratios reflect operating expenses of the class. Expenses before reductions do not reflect amounts reimbursed by the investment adviser or expense offset arrangements and do not represent the amount paid by the class during periods when reimbursements or reductions occur. Expenses net of fee waivers reflect expenses after reimbursement by the investment adviser but prior to reductions from expense offset arrangements. Expenses net of all reductions represent the net expenses paid by the class. GEffective November 1, 2001, the fund adopted the provisions of the AICPA Audit and Accounting Guide for Investment Companies and began amortizing premium and discount on all debt securities. Per Share data and ratios for periods prior to adoption have not been restated to reflect this change. HAs a result of a revision to reflect accretion of market discount using the interest method, certain amounts for the year ended October 31, 2002 have been reclassified from what was previously reported. The impact of this change was a decrease to net investment income of $0.068 per share with a corresponding increase to net realized and unrealized gain (loss) per share. The ratio of net investment income to average net assets decreased from 10.19% to 9.29% . The reclassification has no impact on the net assets of the fund. |
See accompanying notes which are an integral part of the financial statements.
29 Semiannual Report
| Financial Highlights Institutional Class | ||||||||||||||||||||||
| Six months ended | ||||||||||||||||||||||
| April 30, 2006 | Years ended October 31, | |||||||||||||||||||||
| (Unaudited) | 2005 | 2004 | 2003 | 2002 | 2001 | |||||||||||||||||
| Selected Per Share Data | ||||||||||||||||||||||
| Net asset value, | ||||||||||||||||||||||
| beginning of period | $ 9.28 | $ 9.35 | $ 9.24 | $ 6.24 | $ 7.97 | $ 9.43 | ||||||||||||||||
| Income from Investment | ||||||||||||||||||||||
| Operations | ||||||||||||||||||||||
| Net investment | �� | |||||||||||||||||||||
| incomeD | .330 | .691 | .786 | .867 | .759F,G | .862 | ||||||||||||||||
| Net realized and un | ||||||||||||||||||||||
| realized gain (loss) | .535 | .125 | .305 | 2.796 | (1.805)F,G | (1.528) | ||||||||||||||||
| Total from investment | ||||||||||||||||||||||
| operations | .865 | .816 | 1.091 | 3.663 | (1.046) | (.666) | ||||||||||||||||
| Distributions from net | ||||||||||||||||||||||
| investment income | (.356) | (.888) | (.983) | (.663) | (.684) | (.794) | ||||||||||||||||
| Distributions from net | ||||||||||||||||||||||
| realized gain | (.030) | — | — | — | — | — | ||||||||||||||||
| Total distributions | (.386) | (.888) | (.983) | (.663) | (.684) | (.794) | ||||||||||||||||
| Redemption fees added | ||||||||||||||||||||||
| to paid in capitalD | .001 | .002 | .002 | — | — | — | ||||||||||||||||
| Net asset value, end of | ||||||||||||||||||||||
| period | $ 9.76 | $ 9.28 | $ 9.35 | $ 9.24 | $ 6.24 | $ 7.97 | ||||||||||||||||
| Total ReturnB,C | 9.50% | 8.85% | 12.46% | 60.82% | (14.09)% | (7.58)% | ||||||||||||||||
| Ratios to Average Net AssetsE | ||||||||||||||||||||||
| Expenses before | ||||||||||||||||||||||
| reductions | .82%A | .81% | .83% | .82% | .85% | .83% | ||||||||||||||||
| Expenses net of fee | ||||||||||||||||||||||
| waivers, if any | .82%A | .81% | .83% | .82% | .85% | .83% | ||||||||||||||||
| Expenses net of all | ||||||||||||||||||||||
| reductions | .82%A | .81% | .83% | .82% | .85% | .83% | ||||||||||||||||
| Net investment income | 6.98%A | 7.26% | 8.53% | 10.62% | 10.28%F,G | 9.67% | ||||||||||||||||
| Supplemental Data | ||||||||||||||||||||||
| Net assets, end of | ||||||||||||||||||||||
| period (in millions) . | $ 528 | $ 351 | $ 245 | $ 218 | $ 82 | $ 87 | ||||||||||||||||
| Portfolio turnover rate | 45%A | 53% | 67% | 111% | 85% | 68% | ||||||||||||||||
| AAnnualized BTotal returns for periods of less than one year are not annualized. CTotal returns would have been lower had certain expenses not been reduced during the periods shown. DCalculated based on average shares outstanding during the period. EExpense ratios reflect operating expenses of the class. Expenses before reductions do not reflect amounts reimbursed by the investment adviser or expense offset arrange ments and do not represent the amount paid by the class during periods when reimbursements or reductions occur. Expenses net of fee waivers reflect expenses after reimbursement by the investment adviser but prior to reductions from expense offset arrangements. Expenses net of all reductions represent the net expenses paid by the class. FEffective November 1, 2001, the fund adopted the provisions of the AICPA Audit and Accounting Guide for Investment Companies and began amortizing premium and discount on all debt securities. Per Share data and ratios for periods prior to adoption have not been restated to reflect this change. GAs a result of a revision to reflect accretion of market discount using the interest method, certain amounts for the year ended October 31, 2002 have been reclassified from what was previously reported. The impact of this change was a decrease to net investment income of $0.067 per share with a corresponding increase to net realized and unrealized gain (loss) per share. The ratio of net investment income to average net assets decreased from 11.18% to 10.28% . The reclassification has no impact on the net assets of the fund. See accompanying notes which are an integral part of the financial statements. |
| Semiannual Report |
| 30 |
Notes to Financial Statements
For the period ended April 30, 2006 (Unaudited)
(Amounts in thousands except ratios)
1. Significant Accounting Policies.
Fidelity Advisor High Income Advantage Fund (the fund) is a fund of Fidelity Advisor Series II (the trust) and is authorized to issue an unlimited number of shares. The trust is registered under the Investment Company Act of 1940, as amended (the 1940 Act), as an open end management investment company organized as a Massachusetts business trust.
The fund offers Class A, Class T, Class B, Class C, and Institutional Class shares, each of which has equal rights as to assets and voting privileges. Each class has exclusive voting rights with respect to matters that affect that class. Class B shares will automatically convert to Class A shares after a holding period of seven years from the initial date of purchase. Investment income, realized and unrealized capital gains and losses, the common expenses of the fund, and certain fund level expense reductions, if any, are allocated on a pro rata basis to each class based on the relative net assets of each class to the total net assets of the fund. Each class differs with respect to transfer agent and distribution and service plan fees incurred. Certain expense reductions also differ by class.
The fund may invest in affiliated money market central funds (Money Market Central Funds), which are open end investment companies available to investment companies and other accounts managed by Fidelity Management & Research Company (FMR) and its affiliates. The financial statements have been prepared in conformity with accounting principles generally accepted in the United States of America, which require manage ment to make certain estimates and assumptions at the date of the financial statements. The following summarizes the significant accounting policies of the fund:
Security Valuation. Investments are valued and net asset value per share is calculated (NAV calculation) as of the close of business of the New York Stock Exchange, normally 4:00 p.m. Eastern time. Wherever possible, the fund uses independent pricing services approved by the Board of Trustees to value its investments. Debt securities, including restricted securities, for which quotations are readily available, are valued by indepen dent pricing services or by dealers who make markets in such securities. Pricing services consider yield or price of bonds of comparable quality, coupon, maturity and type as well as dealer supplied prices. Equity securities, including restricted securities, for which market quotations are readily available, are valued at the last reported sale price or official closing price as reported by an independent pricing service on the primary market or exchange on which they are traded. In the event there were no sales during the day or closing prices are not available, securities are valued at the last quoted bid price.
31 Semiannual Report
| Notes to Financial Statements (Unaudited) continued |
| (Amounts in thousands except ratios) |
| 1. Significant Accounting Policies continued |
Security Valuation continued |
When current market prices or quotations are not readily available or do not accurately reflect fair value, valuations may be determined in accordance with procedures adopted by the Board of Trustees. The frequency of when fair value pricing is used is unpredict able. The value of securities used for NAV calculation under fair value pricing may differ from published prices for the same securities. Investments in open end mutual funds are valued at their closing net asset value each business day. Short term securities with remaining maturities of sixty days or less for which quotations are not readily available are valued at amortized cost, which approximates value.
Investment Transactions and Income. Security transactions are accounted for as of trade date. Gains and losses on securities sold are determined on the basis of identified cost and may include proceeds received from litigation. Dividend income is recorded on the ex dividend date, except for certain dividends from foreign securities where the ex dividend date may have passed, which are recorded as soon as the fund is informed of the ex dividend date. Non cash dividends included in dividend income, if any, are recorded at the fair market value of the securities received. Distributions received on securities that represent a return of capital or capital gain are recorded as a reduction of cost of invest ments and/or as a realized gain. The fund estimates the components of distributions received that may be considered return of capital distributions or capital gain distributions. Interest income is accrued as earned. Interest income includes coupon interest and amortization of premium and accretion of discount on debt securities. Debt obligations may be placed on non accrual status and related interest income may be reduced by ceasing current accruals and writing off interest receivables when the collection of all or a portion of interest has become doubtful based on consistently applied procedures. A debt obligation is removed from non accrual status when the issuer resumes interest payments or when collectibility of interest is reasonably assured.
Expenses. Most expenses of the trust can be directly attributed to a fund. Expenses which cannot be directly attributed are apportioned among each fund in the trust.
Deferred Trustee Compensation. Under a Deferred Compensation Plan (the Plan), independent Trustees must defer receipt of a portion of, and may elect to defer receipt of an additional portion of, their annual compensation. Deferred amounts are treated as though equivalent dollar amounts had been invested in shares of the fund or are invested in a cross section of other Fidelity funds, and are marked to market. Deferred amounts remain in the fund until distributed in accordance with the Plan.
| Semiannual Report |
| 32 |
1. Significant Accounting Policies continued
Income Tax Information and Distributions to Shareholders. Each year, the fund intends to qualify as a regulated investment company by distributing all of its taxable income and realized gains under Subchapter M of the Internal Revenue Code. As a result, no provision for income taxes is required in the accompanying financial statements.
Dividends are declared daily and paid monthly from net investment income. Distribu tions from realized gains, if any, are recorded on the ex dividend date. Income dividends and capital gain distributions are declared separately for each class. Income and capital gain distributions are determined in accordance with income tax regulations, which may differ from generally accepted accounting principles.
Capital accounts within the financial statements are adjusted for permanent book tax differences. These adjustments have no impact on net assets or the results of operations. Temporary book tax differences will reverse in a subsequent period.
Book tax differences are primarily due to prior period premium and discount on debt securities, defaulted bonds, market discount, partnerships, deferred trustees compensa tion, capital loss carryforwards, and losses deferred due to wash sales.
The federal tax cost of investments and unrealized appreciation (depreciation) as of period end were as follows:
| Unrealized appreciation | $ 287,780 | |||
| Unrealized depreciation | (142,803) | |||
| Net unrealized appreciation (depreciation) | $ 144,977 | |||
| Cost for federal income tax purposes | $ 2,367,878 |
Short Term Trading (Redemption) Fees. Shares held in the fund less than 90 days are subject to a redemption fee equal to 1.00 % of the proceeds of the redeemed shares. All redemption fees, including any estimated redemption fees paid by FMR, are retained by the funds and accounted for as an addition to paid in capital.
| 2. Operating Policies. |
Repurchase Agreements. FMR has received an Exemptive Order from the Securities and Exchange Commission (the SEC) which permits the fund and other affiliated entities of FMR to transfer uninvested cash balances into joint trading accounts which are then invested in repurchase agreements. The fund may also invest directly with institutions in repurchase agreements. Repurchase agreements are collateralized by government or non government securities. Upon settlement date, collateral is held in segregated accounts with custodian banks and may be obtained in the event of a default of the counterparty. The fund monitors, on a daily basis, the value of the collateral to
33 Semiannual Report
| Notes to Financial Statements (Unaudited) continued | ||
| (Amounts in thousands except ratios) | ||
| 2. Operating Policies continued | ||
Repurchase Agreements continued | ||
ensure it is at least equal to the principal amount of the repurchase agreement (includ ing accrued interest). In the event of a default by the counterparty, realization of the collateral proceeds could be delayed, during which time the value of the collateral may decline.
Restricted Securities. The fund may invest in securities that are subject to legal or contractual restrictions on resale. These securities generally may be resold in transactions exempt from registration or to the public if the securities are registered. Disposal of these securities may involve time consuming negotiations and expense, and prompt sale at an acceptable price may be difficult. Information regarding restricted securities is included at the end of the fund’s Schedule of Investments.
Loans and Other Direct Debt Instruments. The fund may invest in loans and loan participations, trade claims or other receivables. These investments may include standby financing commitments, including revolving credit facilities, that obligate the fund to supply additional cash to the borrower on demand. Loan participations involve a risk of insolvency of the lending bank or other financial intermediary. The fund may be contrac tually obligated to receive approval from the agent bank and/or borrower prior to the sale of these investments.
3. Purchases and Sales of Investments.
Purchases and sales of securities, other than short term securities, aggregated $586,999 and $512,225, respectively.
4. Fees and Other Transactions with Affiliates.
Management Fee. FMR and its affiliates provide the fund with investment manage ment related services for which the fund pays a monthly management fee. The management fee is the sum of an individual fund fee rate that is based on an annual rate of .45% of the fund’s average net assets and a group fee rate that averaged .12% during the period. The group fee rate is based upon the average net assets of all the mutual funds advised by FMR. The group fee rate decreases as assets under management increase and increases as assets under management decrease. For the period, the total annualized management fee rate was .57% of the fund’s average net assets.
Distribution and Service Plan. In accordance with Rule 12b 1 of the 1940 Act, the fund has adopted separate Distribution and Service Plans for each class of shares. Certain classes pay Fidelity Distributors Corporation (FDC), an affiliate of FMR, separate Distribution and Service Fees, each of which is based on an annual percentage of each class’ average net assets. In addition, FDC may pay financial intermediaries for selling
| Semiannual Report |
| 34 |
| 4. Fees and Other Transactions with Affiliates continued | ||
Distribution and Service Plan continued | ||
shares of the fund and providing shareholder support services. For the period, the Distribution and Service Fee rates and the total amounts paid to and retained by FDC were as follows:
| Distribution | Service | Paid to | Retained | |||||||||
| Fee | Fee | FDC | by FDC | |||||||||
| Class A | 0% | .15% | $ 352 | $ 12 | ||||||||
| Class T | 0% | .25% | 1,303 | 38 | ||||||||
| Class B | .65% | .25% | 1,319 | 958 | ||||||||
| Class C | .75% | .25% | 959 | 173 | ||||||||
| $ 3,933 | $ 1,181 |
Sales Load. FDC receives a front end sales charge of up to 4.75% for selling Class A shares, and 3.50% for selling Class T shares, some of which is paid to financial intermediaries for selling shares of the fund. FDC receives the proceeds of contingent deferred sales charges levied on Class A, Class T, Class B, and Class C redemptions. These charges depend on the holding period. The deferred sales charges range from 5% to 1% for Class B, 1% for Class C, 1.00% to .50% for certain purchases of Class A shares (.25% prior to February 24, 2006) and .25% for certain purchases of Class T shares.
| For the period, sales charge amounts retained by FDC were as follows: | ||||
| Retained | ||||
| by FDC | ||||
| Class A | $ 111 | |||
| Class T | 32 | |||
| Class B* | 184 | |||
| Class C* | 18 | |||
| $ 345 | ||||
* When Class B and Class C shares are initially sold, FDC pays commissions from its own resources to financial intermediaries through which the sales are made.
Transfer Agent Fees. Fidelity Investments Institutional Operations Company, Inc. (FIIOC), an affiliate of FMR, is the transfer, dividend disbursing and shareholder servicing agent for each class of the fund. FIIOC receives account fees and asset based fees that vary according to the account size and type of account of the shareholders of the
35 Semiannual Report
| Notes to Financial Statements (Unaudited) continued |
| (Amounts in thousands except ratios) |
| 4. Fees and Other Transactions with Affiliates continued |
Transfer Agent Fees continued |
respective classes of the fund. FIIOC pays for typesetting, printing and mailing of share holder reports, except proxy statements. For the period the total transfer agent fees paid by each class to FIIOC, were as follows:
| % of | ||||||
| Average | ||||||
| Amount | Net Assets | |||||
| Class A | $ 492 | .21* | ||||
| Class T | 904 | .17* | ||||
| Class B | 325 | .22* | ||||
| Class C | 176 | .18* | ||||
| Institutional Class | 403 | .19* | ||||
| $ 2,300 | ||||||
| * Annualized |
Accounting and Security Lending Fees. Fidelity Service Company, Inc. (FSC), an affiliate of FMR, maintains the fund’s accounting records. The accounting fee is based on the level of average net assets for the month. Under a separate contract, FSC administers the security lending program. The security lending fee is based on the number and duration of lending transactions.
Affiliated Central Funds. The fund may invest in Money Market Central Funds which seek preservation of capital and current income and are managed by Fidelity Investments Money Management, Inc. (FIMM), an affiliate of FMR.
The Money Market Central Funds do not pay a management fee.
| 5. Committed Line of Credit. |
The fund participates with other funds managed by FMR in a $4.2 billion credit facility (the “line of credit”) to be utilized for temporary or emergency purposes to fund shareholder redemptions or for other short term liquidity purposes. The fund has agreed to pay commitment fees on its pro rata portion of the line of credit, which amounts to $2 and is reflected in Miscellaneous Expense on the Statement of Operations. During the period, there were no borrowings on this line of credit.
| Semiannual Report |
| 36 |
| 6. Security Lending. |
The fund lends portfolio securities from time to time in order to earn additional income. On the settlement date of the loan, the fund receives collateral (in the form of U.S. Treasury obligations, letters of credit and/or cash) against the loaned securities and maintains collateral in an amount not less than 100% of the market value of the loaned securities during the period of the loan. The market value of the loaned securities is determined at the close of business of the fund and any additional required collateral is delivered to the fund on the next business day. If the borrower defaults on its obligation to return the securities loaned because of insolvency or other reasons, a fund could experience delays and costs in recovering the securities loaned or in gaining access to the collateral. Any cash collateral received is invested in the Fidelity Securities Lending Cash Central Fund. The value of loaned securities and cash collateral at period end are disclosed on the fund’s Statement of Assets and Liabilities. At period end, there were no security loans outstanding. Security lending income represents the income earned on investing cash collateral, less fees and expenses associated with the loan, plus any premium payments that may be received on the loan of certain types of securities. Security lending income is presented in the Statement of Operations as a component of income from affiliated central funds. Net income from lending portfolio securities during the period amounted to $7.
| 7. Expense Reductions. |
FMR voluntarily agreed to reimburse each class to the extent annual operating expenses exceeded certain levels of average net assets as noted in the table below. Some expenses, for example interest expense, are excluded from this reimbursement.
| The following class was in reimbursement during the period: | ||||||
| Expense | Reimbursement | |||||
| Limitations | from adviser | |||||
| Class B | 1.75% | $ 15 | ||||
In addition, through arrangements with the fund’s custodian and each class’ transfer agent, credits realized as a result of uninvested cash balances were used to reduce the fund’s expenses. During the period, these credits reduced the fund’s custody expenses by $11. During the period, credits reduced each class’ transfer agent expense as noted in the table below.
| Transfer Agent | ||||||
| expense reduction | ||||||
| Class A | $ 3 | |||||
| Class B | 1 | |||||
| Institutional Class | 1 | |||||
| $ 5 | ||||||
| 37 | Semiannual Report | |||||
| Notes to Financial Statements (Unaudited) continued | ||
| (Amounts in thousands except ratios) | ||
| 8. Other. | ||
The fund’s organizational documents provide former and current trustees and officers with a limited indemnification against liabilities arising in connection with the performance of their duties to the fund. In the normal course of business, the fund may also enter into contracts that provide general indemnifications. The fund’s maximum exposure under these arrangements is unknown as this would be dependent on future claims that may be made against the fund. The risk of material loss from such claims is considered remote.
| 9. Distributions to Shareholders. | ||||||||
| Distributions to shareholders of each class were as follows: | ||||||||
| Six months ended | Year ended | |||||||
| April 30, | October 31, | |||||||
| 2006 | 2005 | |||||||
| From net investment income | ||||||||
| Class A | $ 16,361 | $ 31,708 | ||||||
| Class T | 36,228 | 99,769 | ||||||
| Class B | 9,323 | 35,847 | ||||||
| Class C | 5,945 | 15,897 | ||||||
| Institutional Class | 15,418 | 30,679 | ||||||
| Total | $ 83,275 | $ 213,900 | ||||||
| From net realized gain | ||||||||
| Class A | $ 1,358 | $ — | ||||||
| Class T | 3,190 | — | ||||||
| Class B | 948 | — | ||||||
| Class C | 578 | — | ||||||
| Institutional Class | 1,178 | — | ||||||
| Total | $ 7,252 | $ — | ||||||
| Semiannual Report |
| 38 |
| 10. Share Transactions. | ||||||||||||
| Transactions for each class of shares were as follows: | ||||||||||||
| Shares | Dollars | |||||||||||
| Six months ended | Year ended | Six months ended | Year ended | |||||||||
| April 30, | October 31, | April 30, | October 31, | |||||||||
| 2006 | 2005 | 2006 | 2005 | |||||||||
| Class A | ||||||||||||
| Shares sold | 12,777 | 23,900 | $ 126,538 | $ 235,068 | ||||||||
| Reinvestment of distributions | 1,248 | 2,176 | 12,335 | 21,461 | ||||||||
| Shares redeemed | (6,792) | (12,687) | (67,173) | (124,289) | ||||||||
| Net increase (decrease) | 7,233 | 13,389 | $ 71,700 | $ 132,240 | ||||||||
| Class T | ||||||||||||
| Shares sold | 14,984 | 25,755 | $ 147,983 | $ 253,520 | ||||||||
| Reinvestment of distributions | 3,298 | 8,206 | 32,667 | 81,282 | ||||||||
| Shares redeemed | (17,188) | (58,557) | (170,254) | (579,615) | ||||||||
| Net increase (decrease) | 1,094 | (24,596) | $ 10,396 | $ (244,813) | ||||||||
| Class B | ||||||||||||
| Shares sold | 1,769 | 4,225 | $ 17,394 | $ 41,379 | ||||||||
| Reinvestment of distributions | 677 | 2,349 | 6,646 | 23,125 | ||||||||
| Shares redeemed | (8,612) | (25,696) | (84,785) | (251,141) | ||||||||
| Net increase (decrease) | (6,166) | (19,122) $ | $ (60,745) | $ (186,637) | ||||||||
| Class C | ||||||||||||
| Shares sold | 3,075 | 5,702 | $ 30,357 | $ 56,070 | ||||||||
| Reinvestment of distributions | 406 | 1,011 | 3,999 | 9,975 | ||||||||
| Shares redeemed | (2,859) | (7,734) | (28,237) | (75,656) | ||||||||
| Net increase (decrease) | 622 | (1,021) | $ 6,119 | $ (9,611) | ||||||||
| Institutional Class | ||||||||||||
| Shares sold | 18,521 | 31,784 | $ 177,728 | $ 303,781 | ||||||||
| Reinvestment of distributions | 1,570 | 2,879 | 15,000 | 27,465 | ||||||||
| Shares redeemed | (3,782) | (23,086) | (36,149) | (218,928) | ||||||||
| Net increase (decrease) | 16,309 | 11,577 | $ 156,579 | $ 112,318 | ||||||||
39 Semiannual Report
Board Approval of Investment Advisory Contracts and Management Fees
Advisor High Income Advantage Fund
On January 19, 2006, the Board of Trustees, including the Independent Trustees (together, the Board), voted to approve a general research services agreement (the Agreement) between FMR, FMR Co., Inc. (FMRC), Fidelity Investments Money Manage ment, Inc. (FIMM), and Fidelity Research & Analysis Company (FRAC) (together, the Investment Advisers) for the fund, effective January 20, 2006, pursuant to which FRAC may provide general research and investment advisory support services to FMRC and FIMM. The Board considered that it has approved previously various sub advisory agreements for the fund with affiliates of FMR that allow FMR to obtain research, non discretionary advice, or discretionary portfolio management at no additional expense to the fund. The Board, assisted by the advice of fund counsel and independent Trustees’ counsel, considered a broad range of information and determined that it would be beneficial for the fund to access the research and investment advisory support services supplied by FRAC at no additional expense to the fund.
The Board reached this determination in part because the new arrangement will involve no changes in (i) the contractual terms of and fees payable under the fund’s manage ment contract or sub advisory agreements; (ii) the investment process or strategies employed in the management of the fund’s assets; (iii) the nature or level of services provided under the fund’s management contract or sub advisory agreements; (iv) the day to day management of the fund or the persons primarily responsible for such man agement; or (v) the ultimate control or beneficial ownership of FMR, FMRC, or FIMM. The Board also considered that the establishment of the Agreement would not necessi tate prior shareholder approval of the Agreement or result in an assignment and termination of the fund’s management contract or sub advisory agreements under the Investment Company Act of 1940.
Because the Board was approving an arrangement with FRAC under which the fund will not bear any additional management fees or expenses and under which the fund’s portfolio manager would not change, it did not consider the fund’s investment perfor mance, competitiveness of management fee and total expenses, costs of services and profitability, or economies of scale to be significant factors in its decision.
In connection with its future renewal of the fund’s management contract and sub advisory agreements, the Board will consider: (i) the nature, extent, and quality of services provided to the fund, including shareholder and administrative services and investment performance; (ii) the competitiveness of the fund’s management fee and total expenses; (iii) the costs of the services and profitability, including the revenues earned and the expenses incurred by Fidelity in conducting the business of developing, marketing, distributing, managing, administering, and servicing the fund and its shareholders; and (iv) whether there have been economies of scale in respect of the management of the Fidelity funds, whether the Fidelity funds (including the fund) have
| Semiannual Report |
| 40 |
appropriately benefited from any such economies of scale, and whether there is potential for realization of any further economies.
Based on its evaluation of all of the conclusions noted above, and after considering all material factors, the Board ultimately concluded that the fund’s Agreement is fair and reasonable, and that the fund’s Agreement should be approved.
41 Semiannual Report
| Semiannual Report |
| 42 |
43 Semiannual Report
| Investment Adviser Fidelity Management & Research Company Boston, MA Investment Sub Advisers FMR Co., Inc. Fidelity Management & Research (U.K.) Inc. Fidelity Research & Analysis Company (formerly Fidelity Management & Research (Far East) Inc.) Fidelity International Investment Advisors Fidelity Investments Japan Limited Fidelity International Investment Advisors (U.K.) Limited General Distributor Fidelity Distributors Corporation Boston, MA Transfer and Service Agents Fidelity Investments Institutional Operations Company, Inc. Boston, MA Fidelity Service Company, Inc. Boston, MA Custodian The Bank of New York New York, NY |
| HY USAN-0606 1.784886.103 |


| Fidelity® Advisor High Income Advantage Fund - Institutional Class |
| Semiannual Report April 30, 2006 |

| Contents | ||||
| Chairman’s Message | 3 | Ned Johnson’s message to shareholders. | ||
| Shareholder Expense | 4 | An example of shareholder expenses. | ||
| Example | ||||
| Investment Changes | 6 | A summary of major shifts in the fund’s | ||
| investments over the past six months. | ||||
| Investments | 8 | A complete list of the fund’s investments | ||
| with their market values. | ||||
| Financial Statements | 22 | Statements of assets and liabilities, | ||
| operations, and changes in net assets, | ||||
| as well as financial highlights. | ||||
| Notes | 31 | Notes to the financial statements. | ||
| Board Approval of | 40 | |||
| Investment Advisory | ||||
| Contracts and | ||||
| Management Fees | ||||
| To view a fund’s proxy voting guidelines and proxy voting record for the 12 month period ended June 30, visit www.fidelity.com/proxyvotingresults or visit the Securities and Exchange Commis sion’s (SEC) web site at www.sec.gov. You may also call 1-877-208-0098 to request a free copy of the proxy voting guidelines. Standard & Poor’s, S&P and S&P 500 are registered service marks of The McGraw Hill Companies, Inc. and have been licensed for use by Fidelity Distributors Corporation. Other third party marks appearing herein are the property of their respective owners. All other marks appearing herein are registered or unregistered trademarks or service marks of FMR Corp. or an affiliated company. |
| This report and the financial statements contained herein are submitted for the general information of the shareholders of the fund. This report is not authorized for distribution to prospective investors in the fund unless preceded or accompanied by an effective prospectus. A fund files its complete schedule of portfolio holdings with the SEC for the first and third quarters of each fiscal year on Form N Q. Forms N Q are available on the SEC’s web site at http://www.sec.gov. A fund’s Forms N Q may be reviewed and copied at the SEC’s Public Refer ence Room in Washington, DC. Information regarding the operation of the SEC’s Public Reference Room may be obtained by calling 1-800-SEC-0330. For a complete list of a fund’s portfolio hold ings, view the most recent quarterly holdings report, semiannual report, or annual report on Fidelity’s web site at http://www.advisor.fidelity.com. NOT FDIC INSURED · MAY LOSE VALUE · NO BANK GUARANTEE Neither the fund nor Fidelity Distributors Corporation is a bank. |
| Semiannual Report |
| 2 |
Chairman’s Message
(photograph of Edward C. Johnson 3d)
Dear Shareholder:
Although many securities markets made gains in early 2006, there is only one certainty when it comes to investing: There is no sure thing. There are, however, a number of time tested, fundamental investment principles that can put the historical odds in your favor.
One of the basic tenets is to invest for the long term. Over time, riding out the markets’ inevitable ups and downs has proven much more effective than selling into panic or chasing the hottest trend. Even missing only a few of the markets’ best days can significantly diminish investor returns. Patience also affords the benefits of compounding of earning interest on additional income or reinvested dividends and capital gains. There are tax advantages and cost benefits to consider as well. The more you sell, the more taxes you pay, and the more you trade, the higher the costs. While staying the course doesn’t eliminate risk, it can considerably lessen the effect of short term declines.
You can further manage your investing risk through diversification. And today, more than ever, geographic diversification should be taken into account. Studies indicate that asset allocation is the single most important determinant of a portfolio’s long term success. The right mix of stocks, bonds and cash aligned to your particular risk tolerance and investment objective is very important. Age appropriate rebalancing is also an essential aspect of asset allocation. For younger investors, an emphasis on equities which historically have been the best performing asset class over time is encouraged. As investors near their specific goal, such as retirement or sending a child to college, consideration may be given to replacing volatile assets (e.g. common stocks) with more stable fixed investments (bonds or savings plans).
A third investment principle investing regularly can help lower the average cost of your purchases. Investing a certain amount of money each month or quarter helps ensure you won’t pay for all your shares at market highs. This strategy known as dollar cost averaging also reduces unconstructive “emotion” from investing, helping shareholders avoid selling weak performers just prior to an upswing, or chasing a hot performer just before a correction.
We invite you to contact us via the Internet, through our Investor Centers or over the phone. It is our privilege to provide you the information you need to make the investments that are right for you.
Sincerely,
/s/ Edward C. Johnson 3d
Edward C. Johnson 3d
3 Semiannual Report
Shareholder Expense Example
As a shareholder of the Fund, you incur two types of costs: (1) transaction costs, including sales charges (loads) on purchase payments or redemption proceeds, and (2) ongoing costs, including management fees, distribution and/or service (12b 1) fees and other Fund expenses. This Example is intended to help you understand your ongoing costs (in dollars) of investing in the Fund and to compare these costs with the ongoing costs of investing in other mutual funds.
The Example is based on an investment of $1,000 invested at the beginning of the period and held for the entire period (November 1, 2005 to April 30, 2006).
| Actual Expenses |
The first line of the table below for each class of the Fund provides information about actual account values and actual expenses. You may use the information in this line, together with the amount you invested, to estimate the expenses that you paid over the period. Simply divide your account value by $1,000.00 (for example, an $8,600 account value divided by $1,000.00 = 8.6), then multiply the result by the number in the first line for a class of the Fund under the heading entitled “Expenses Paid During Period” to estimate the expenses you paid on your account during this period.
Hypothetical Example for Comparison Purposes
The second line of the table below for each class of the Fund provides information about hypothetical account values and hypothetical expenses based on a Class’ actual expense ratio and an assumed rate of return of 5% per year before expenses, which is not the Class’ actual return. The hypothetical account values and expenses may not be used to estimate the actual ending account balance or expenses you paid for the period. You may use this information to compare the ongoing costs of investing in the Fund and other funds. To do so, compare this 5% hypothetical example with the 5% hypothetical examples that appear in the shareholder reports of the other funds.
Please note that the expenses shown in the table are meant to highlight your ongoing costs only and do not reflect any transaction costs. Therefore, the second line of the table is useful in comparing ongoing costs only, and will not help you determine the relative total costs of owning different funds. In addition, if these transactional costs were included, your costs would have been higher.
| Expenses Paid | ||||||||||||
| Beginning | Ending | During Period* | ||||||||||
| Account Value | Account Value | November 1, 2005 | ||||||||||
| November 1, 2005 | April 30, 2006 | to April 30, 2006 | ||||||||||
| Class A | ||||||||||||
| Actual | $ 1,000.00 | $ 1,094.00 | $ 5.14 | |||||||||
| HypotheticalA | $ 1,000.00 | $ 1,019.89 | $ 4.96 | |||||||||
| Class T | ||||||||||||
| Actual | $ 1,000.00 | $ 1,094.40 | $ 5.50 | |||||||||
| HypotheticalA | $ 1,000.00 | $ 1,019.54 | $ 5.31 | |||||||||
| Class B | ||||||||||||
| Actual | $ 1,000.00 | $ 1,090.30 | $ 9.07 | |||||||||
| HypotheticalA | $ 1,000.00 | $ 1,016.12 | $ 8.75 | |||||||||
| Semiannual Report | 4 | |||||||||||
| Expenses Paid | ||||||||||||
| Beginning | Ending | During Period* | ||||||||||
| Account Value | Account Value | November 1, 2005 | ||||||||||
| November 1, 2005 | April 30, 2006 | to April 30, 2006 | ||||||||||
| Class C | ||||||||||||
| Actual | $ 1,000.00 | $ 1,089.60 | $ 9.43 | |||||||||
| HypotheticalA | $ 1,000.00 | $ 1,015.77 | $ 9.10 | |||||||||
| Institutional Class | ||||||||||||
| Actual | $ 1,000.00 | $ 1,095.00 | $ 4.26 | |||||||||
| HypotheticalA | $ 1,000.00 | $ 1,020.73 | $ 4.11 | |||||||||
| A 5% return per year before expenses | ||||||||||||
* Expenses are equal to each Class’ annualized expense ratio (shown in the table below); multiplied by the average account value over the period, multiplied by 181/365 (to reflect the one half year period).
| Annualized | ||
| Expense Ratio | ||
| Class A | .99% | |
| Class T | 1.06% | |
| Class B | 1.75% | |
| Class C | 1.82% | |
| Institutional Class | .82% |
5 Semiannual Report
| Investment Changes | ||||
| Top Five Holdings as of April 30, 2006 | ||||
| (by issuer, excluding cash equivalents) | % of fund’s | % of fund’s net assets | ||
| net assets | 6 months ago | |||
| El Paso Corp. | 5.2 | 2.7 | ||
| Revlon, Inc. | 4.5 | 4.5 | ||
| Six Flags, Inc. | 4.4 | 4.8 | ||
| Tenet Healthcare Corp. | 3.9 | 3.0 | ||
| Levi Strauss & Co. | 3.2 | 3.5 | ||
| 21.2 | ||||
| Top Five Market Sectors as of April 30, 2006 | ||||
| % of fund’s | % of fund’s net assets | |||
| net assets | 6 months ago | |||
| Energy | 9.5 | 10.4 | ||
| Telecommunications | 8.8 | 13.0 | ||
| Healthcare | 8.1 | 7.1 | ||
| Technology | 6.3 | 4.8 | ||
| Consumer Products | 5.2 | 5.0 | ||
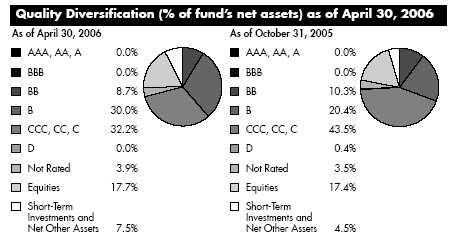
We have used ratings from Moody’s® Investors Services, Inc. Where Moody’s ratings are not available, we have used S&P® ratings.
Semiannual Report 6
7 Semiannual Report
| Investments April 30, 2006 (Unaudited) | ||||||||||
| Showing Percentage of Net Assets | ||||||||||
| Corporate Bonds 72.9% | ||||||||||
| Principal | Value (Note 1) | |||||||||
| Amount (000s) | (000s) | |||||||||
| Convertible Bonds 1.0% | ||||||||||
| Cable TV 0.6% | ||||||||||
| Charter Communications, Inc. 5.875% 11/16/09 (e) | $ 22,580 | $ 16,709 | ||||||||
| Telecommunications – 0.4% | ||||||||||
| ICO North America, Inc. 7.5% 8/15/09 (g) | 8,175 | 10,301 | ||||||||
| TOTAL CONVERTIBLE BONDS | 27,010 | |||||||||
| Nonconvertible Bonds – 71.9% | ||||||||||
| Aerospace – 0.5% | ||||||||||
| Bombardier, Inc. 7.45% 5/1/34 (e) | 8,650 | 7,807 | ||||||||
| L-3 Communications Corp. 5.875% 1/15/15 | 1,225 | 1,148 | ||||||||
| Orbimage Holdings, Inc. 14.2% 7/1/12 (e)(f) | 3,710 | 4,044 | ||||||||
| 12,999 | ||||||||||
| Air Transportation – 4.0% | ||||||||||
| American Airlines, Inc. pass thru trust certificates: | ||||||||||
| 6.817% 5/23/11 | 13,320 | 12,954 | ||||||||
| 6.977% 11/23/22 | 729 | 693 | ||||||||
| 7.377% 5/23/19 | 13,843 | 12,736 | ||||||||
| 7.8% 4/1/08 | 9,740 | 9,643 | ||||||||
| 10.18% 1/2/13 | 5,055 | 4,903 | ||||||||
| Delta Air Lines, Inc.: | ||||||||||
| 7.9% 12/15/09 (h) | 31,370 | 8,078 | ||||||||
| 8% 12/15/07 (e)(h) | 7,900 | 1,896 | ||||||||
| 8.3% 12/15/29 (h) | 99,585 | 25,773 | ||||||||
| 9.5% 11/18/08 (e)(h) | 2,065 | 2,003 | ||||||||
| 10% 8/15/08 (h) | 41,705 | 10,376 | ||||||||
| Delta Air Lines, Inc. pass thru trust certificates 7.779% | ||||||||||
| 1/2/12 | 1,674 | 1,532 | ||||||||
| Northwest Airlines Corp. 10% 2/1/09 (h) | 1,524 | 625 | ||||||||
| Northwest Airlines, Inc.: | ||||||||||
| 7.875% 3/15/08 (h) | 11,925 | 5,068 | ||||||||
| 8.7% 3/15/07 (h) | 1,630 | 701 | ||||||||
| 9.875% 3/15/07 (h) | 6,255 | 2,721 | ||||||||
| 10.5% 4/1/09 (h) | 8,139 | 2,686 | ||||||||
| Northwest Airlines, Inc. pass thru trust certificates | ||||||||||
| 9.179% 10/1/11 | 1,753 | 438 | ||||||||
| 102,826 | ||||||||||
| Automotive 4.0% | ||||||||||
| Accuride Corp. 8.5% 2/1/15 | 4,780 | 4,720 | ||||||||
| Altra Industrial Motion, Inc. 9% 12/1/11 | 2,460 | 2,460 | ||||||||
| American Tire Distributors, Inc. 10.75% 4/1/13 | 6,930 | 6,480 | ||||||||
See accompanying notes which are an integral part of the financial statements. | ||||||||||
| Semiannual Report | 8 | |||||||||
| Corporate Bonds continued | ||||||||||
| Principal | Value (Note 1) | |||||||||
| Amount (000s) | (000s) | |||||||||
| Nonconvertible Bonds continued | ||||||||||
| Automotive continued | ||||||||||
| Delco Remy International, Inc. 9.375% 4/15/12 | $ 1,480 | $ 703 | ||||||||
| General Motors Acceptance Corp.: | ||||||||||
| 5.85% 1/14/09 | 8,675 | 8,156 | ||||||||
| 6.75% 12/1/14 | 30,390 | 27,655 | ||||||||
| 6.875% 9/15/11 | 4,335 | 4,053 | ||||||||
| General Motors Corp. 8.375% 7/15/33 | 38,140 | 28,414 | ||||||||
| IdleAire Technologies Corp. 0% 12/15/12 unit (c)(e) | 16,350 | 12,263 | ||||||||
| Tenneco, Inc. 8.625% 11/15/14 | 2,870 | 2,899 | ||||||||
| Visteon Corp. 8.25% 8/1/10 | 7,200 | 6,336 | ||||||||
| 104,139 | ||||||||||
| Broadcasting – 0.1% | ||||||||||
| Paxson Communications Corp. 11.3183% | ||||||||||
| 1/15/13 (e)(f) | 3,255 | 3,288 | ||||||||
| Building Materials – 1.6% | ||||||||||
| Goodman Global Holdings, Inc. 7.875% 12/15/12 | 13,870 | 13,870 | ||||||||
| Interface, Inc. 9.5% 2/1/14 | 320 | 328 | ||||||||
| MAXX Corp. 9.75% 6/15/12 | 13,888 | 11,840�� | ||||||||
| NTK Holdings, Inc. 0% 3/1/14 (c) | 17,240 | 13,102 | ||||||||
| U.S. Concrete, Inc. 8.375% 4/1/14 | 2,940 | 3,028 | ||||||||
| 42,168 | ||||||||||
| Cable TV 3.6% | ||||||||||
| Cablevision Systems Corp. 8% 4/15/12 | 21,940 | 21,995 | ||||||||
| CCH I LLC / CCH I Capital Corp. 11% 10/1/15 | 65,809 | 57,501 | ||||||||
| Charter Communications Holding II LLC/Charter | ||||||||||
| Communications Holdings II Capital Corp. 10.25% | ||||||||||
| 9/15/10 (e) | 6,495 | 6,544 | ||||||||
| Charter Communications Operating LLC/Charter | ||||||||||
| Communications Operating Capital Corp. 8% | ||||||||||
| 4/30/12 (e) | 6,475 | 6,475 | ||||||||
| 92,515 | ||||||||||
| Capital Goods 1.5% | ||||||||||
| Hawk Corp. 8.75% 11/1/14 | 2,770 | 2,784 | ||||||||
| Invensys PLC 9.875% 3/15/11 (e) | 7,590 | 8,007 | ||||||||
| Park-Ohio Industries, Inc. 8.375% 11/15/14 | 20,525 | 19,345 | ||||||||
| Sensus Metering Systems, Inc. 8.625% 12/15/13 | 4,555 | 4,430 | ||||||||
| Thermadyne Holdings Corp. 9.25% 2/1/14 | 5,710 | 5,139 | ||||||||
| 39,705 | ||||||||||
| See accompanying notes which are an integral part of the financial statements. | ||||||||||
| 9 | Semiannual Report | |||||||||
| Investments (Unaudited) continued | ||||||||||
| Corporate Bonds continued | ||||||||||
| Principal | Value (Note 1) | |||||||||
| Amount (000s) | (000s) | |||||||||
| Nonconvertible Bonds continued | ||||||||||
| Chemicals – 3.8% | ||||||||||
| Crystal US Holding 3 LLC/Crystal US Sub 3 Corp.: | ||||||||||
| Series A, 0% 10/1/14 (c) | $ 7,785 | $ 6,277 | ||||||||
| Series B, 0% 10/1/14 (c) | 15,211 | 11,903 | ||||||||
| Equistar Chemicals LP/Equistar Funding Corp. 10.625% | ||||||||||
| 5/1/11 | 5,920 | 6,453 | ||||||||
| Hexion US Finance Corp. / Hexion Nova Scotia Finance | ||||||||||
| ULC 9.8183% 7/15/10 (f) | 4,990 | 5,090 | ||||||||
| Huntsman LLC 11.625% 10/15/10 | 5,972 | 6,808 | ||||||||
| Nell AF Sarl 8.375% 8/15/15 (e) | 3,990 | 3,950 | ||||||||
| PAHC Holdings Corp. 15% 2/1/10 pay in-kind | 3,610 | 3,682 | ||||||||
| Phibro Animal Health Corp. 13% 12/1/07 unit | 3,404 | 3,506 | ||||||||
| Resolution Performance Products LLC/RPP Capital Corp. | ||||||||||
| 13.5% 11/15/10 | 28,415 | 30,511 | ||||||||
| Rhodia SA 8.875% 6/1/11 | 11,901 | 12,288 | ||||||||
| Rockwood Specialties Group, Inc. 7.5% 11/15/14 | 950 | 950 | ||||||||
| Tronox Worldwide LLC / Tronox Worldwide Finance | ||||||||||
| Corp. 9.5% 12/1/12 (e) | 5,110 | 5,378 | ||||||||
| 96,796 | ||||||||||
| Consumer Products – 0.5% | ||||||||||
| NPI Merger Corp. 10.75% 4/15/14 (e) | 1,880 | 1,939 | ||||||||
| Revlon Consumer Products Corp. 9.5% 4/1/11 | 12,120 | 11,847 | ||||||||
| 13,786 | ||||||||||
| Containers – 2.1% | ||||||||||
| Anchor Glass Container Corp. 11% 2/15/13 (h) | 6,050 | 5,294 | ||||||||
| Constar International, Inc. 11% 12/1/12 | 3,315 | 2,519 | ||||||||
| Graham Packaging Co. LP/ GPC Capital Corp. 9.875% | ||||||||||
| 10/15/14 | 14,530 | 14,821 | ||||||||
| Huntsman Packaging Corp. 13% 6/1/10 (h) | 13,795 | 6,346 | ||||||||
| Owens-Brockway Glass Container, Inc.: | ||||||||||
| 6.75% 12/1/14 | 4,410 | 4,234 | ||||||||
| 8.25% 5/15/13 | 8,535 | 8,748 | ||||||||
| Pliant Corp.: | ||||||||||
| 11.125% 9/1/09 (h) | 1,210 | 1,186 | ||||||||
| 13% 6/1/10 (h) | 7,975 | 3,669 | ||||||||
| Solo Cup Co. 8.5% 2/15/14 | 7,000 | 6,598 | ||||||||
| 53,415 | ||||||||||
| See accompanying notes which are an integral part of the financial statements. | ||||||||||
| Semiannual Report | 10 | |||||||||
| Corporate Bonds continued | ||||||||||
| Principal | Value (Note 1) | |||||||||
| Amount (000s) | (000s) | |||||||||
| Nonconvertible Bonds continued | ||||||||||
| Diversified Financial Services – 0.3% | ||||||||||
| Cardtronics, Inc. 9.25% 8/15/13 (e) | $ 2,840 | $ 2,812 | ||||||||
| Triad Acquisition Corp. 11.125% 5/1/13 | 4,170 | 4,170 | ||||||||
| 6,982 | ||||||||||
| Diversified Media – 0.1% | ||||||||||
| Affinion Group, Inc. 11.5% 10/15/15 (e) | 1,570 | 1,609 | ||||||||
| Electric Utilities – 1.1% | ||||||||||
| Mirant Americas Generation LLC: | ||||||||||
| 8.5% 10/1/21 | 6,645 | 6,695 | ||||||||
| 9.125% 5/1/31 | 9,625 | 10,106 | ||||||||
| Mirant North America LLC/Mirant North America | ||||||||||
| Finance Corp. 7.375% 12/31/13 (e) | 3,880 | 3,895 | ||||||||
| NRG Energy, Inc. 7.375% 2/1/16 | 6,500 | 6,541 | ||||||||
| 27,237 | ||||||||||
| Energy – 7.9% | ||||||||||
| Aventine Renewable Energy Holdings, Inc. 10.91% | ||||||||||
| 12/15/11 (e)(f) | 15,780 | 16,569 | ||||||||
| Chaparral Energy, Inc. 8.5% 12/1/15 (e) | 4,490 | 4,670 | ||||||||
| El Paso Corp.: | ||||||||||
| 6.5% 6/1/08 (e) | 10,390 | 10,401 | ||||||||
| 6.95% 6/1/28 (e) | 15,800 | 14,457 | ||||||||
| 7% 5/15/11 | 38,000 | 37,763 | ||||||||
| 7.75% 6/15/10 (e) | 42,465 | 43,687 | ||||||||
| 7.75% 1/15/32 (e) | 1,970 | 1,975 | ||||||||
| 7.875% 6/15/12 | 12,620 | 13,062 | ||||||||
| El Paso Energy Corp. 7.375% 12/15/12 | 22,275 | 22,498 | ||||||||
| El Paso Production Holding Co. 7.75% 6/1/13 | 8,155 | 8,440 | ||||||||
| Hanover Compressor Co.: | ||||||||||
| 7.5% 4/15/13 | 990 | 1,000 | ||||||||
| 9% 6/1/14 | 1,105 | 1,188 | ||||||||
| Inergy LP/Inergy Finance Corp. 8.25% 3/1/16 (e) | 3,260 | 3,325 | ||||||||
| Mariner Energy, Inc. 7.5% 4/15/13 (e) | 5,850 | 5,792 | ||||||||
| Ocean Rig Norway AS 8.375% 7/1/13 (e) | 2,190 | 2,310 | ||||||||
| Pogo Producing Co.: | ||||||||||
| 6.625% 3/15/15 | 6,505 | 6,294 | ||||||||
| 6.875% 10/1/17 | 6,485 | 6,307 | ||||||||
| Venoco, Inc. 8.75% 12/15/11 | 3,670 | 3,633 | ||||||||
| 203,371 | ||||||||||
| Entertainment/Film 0.0% | ||||||||||
| Livent, Inc. yankee 9.375% 10/15/04 (h) | 11,100 | 333 | ||||||||
See accompanying notes which are an integral part of the financial statements.
11 Semiannual Report
| Investments (Unaudited) continued | ||||||||||
| Corporate Bonds continued | ||||||||||
| Principal | Value (Note 1) | |||||||||
| Amount (000s) | (000s) | |||||||||
| Nonconvertible Bonds continued | ||||||||||
| Environmental – 1.9% | ||||||||||
| Allied Waste North America, Inc.: | ||||||||||
| 7.25% 3/15/15 | $ 27,340 | $ 27,818 | ||||||||
| 7.375% 4/15/14 | 21,790 | 21,518 | ||||||||
| 49,336 | ||||||||||
| Food and Drug Retail – 2.8% | ||||||||||
| Ahold Finance USA, Inc. 8.25% 7/15/10 | 39,237 | 41,444 | ||||||||
| Albertsons, Inc. 8% 5/1/31 | 13,110 | 12,358 | ||||||||
| AmeriQual Group LLC/AmeriQual Finance Corp. 9% | ||||||||||
| 4/1/12 (e) | 3,000 | 3,120 | ||||||||
| Doane Pet Care Co. 10.625% 11/15/15 | 2,770 | 3,379 | ||||||||
| Nutritional Sourcing Corp. 10.125% 8/1/09 | 7,424 | 5,494 | ||||||||
| Pathmark Stores, Inc. 8.75% 2/1/12 | 7,300 | 7,191 | ||||||||
| 72,986 | ||||||||||
| Food/Beverage/Tobacco – 1.0% | ||||||||||
| Pierre Foods, Inc. 9.875% 7/15/12 | 2,240 | 2,318 | ||||||||
| Swift & Co.: | ||||||||||
| 10.125% 10/1/09 | 5,405 | 5,540 | ||||||||
| 12.5% 1/1/10 | 16,705 | 16,705 | ||||||||
| UAP Holding Corp. 0% 7/15/12 (c) | 880 | 792 | ||||||||
| 25,355 | ||||||||||
| Gaming – 0.5% | ||||||||||
| San Pasqual Casino Development Group, Inc. 8% | ||||||||||
| 9/15/13 (e) | 1,660 | 1,656 | ||||||||
| Virgin River Casino Corp./RBG LLC/B&BB, Inc.: | ||||||||||
| 0% 1/15/13 (c) | 2,990 | 2,033 | ||||||||
| 9% 1/15/12 | 1,760 | 1,795 | ||||||||
| Wynn Las Vegas LLC/Wynn Las Vegas Capital Corp. | ||||||||||
| 6.625% 12/1/14 | 6,680 | 6,480 | ||||||||
| 11,964 | ||||||||||
| Healthcare 5.8% | ||||||||||
| Accellent, Inc. 10.5% 12/1/13 | 6,160 | 6,637 | ||||||||
| AMR HoldCo, Inc./EmCare HoldCo, Inc. 10% 2/15/15 | 4,260 | 4,526 | ||||||||
| CRC Health Group, Inc. 10.75% 2/1/16 (e) | 3,340 | 3,432 | ||||||||
| DaVita, Inc. 7.25% 3/15/15 | 7,400 | 7,382 | ||||||||
| IASIS Healthcare LLC/IASIS Capital Corp. 8.75% | ||||||||||
| 6/15/14 | 10,770 | 10,824 | ||||||||
| Lifecare Holdings, Inc. 9.25% 8/15/13 (e) | 6,590 | 4,168 | ||||||||
| Multiplan, Inc. 10.375% 4/15/16 (e) | 3,660 | 3,719 | ||||||||
| See accompanying notes which are an integral part of the financial statements. | ||||||||||
| Semiannual Report | 12 | |||||||||
| Corporate Bonds continued | ||||||||||
| Principal | Value (Note 1) | |||||||||
| Amount (000s) | (000s) | |||||||||
| Nonconvertible Bonds continued | ||||||||||
| Healthcare continued | ||||||||||
| Team Finance LLC / Health Finance Corp. 11.25% | ||||||||||
| 12/1/13 (e) | $ 9,190 | $ 9,489 | ||||||||
| Tenet Healthcare Corp.: | ||||||||||
| 6.375% 12/1/11 | 11,625 | 10,782 | ||||||||
| 6.5% 6/1/12 | 24,700 | 22,539 | ||||||||
| 7.375% 2/1/13 | 49,340 | 46,380 | ||||||||
| 9.25% 2/1/15 (e) | 11,960 | 12,199 | ||||||||
| 9.875% 7/1/14 | 6,675 | 6,942 | ||||||||
| 149,019 | ||||||||||
| Homebuilding/Real Estate – 0.3% | ||||||||||
| Kimball Hill, Inc. 10.5% 12/15/12 (e) | 3,250 | 3,193 | ||||||||
| Technical Olympic USA, Inc. 10.375% 7/1/12 | 4,614 | 4,683 | ||||||||
| 7,876 | ||||||||||
| Insurance – 1.6% | ||||||||||
| Provident Companies, Inc.: | ||||||||||
| 7% 7/15/18 | 3,650 | 3,668 | ||||||||
| 7.25% 3/15/28 | 17,830 | 17,269 | ||||||||
| UnumProvident Corp.: | ||||||||||
| 6.75% 12/15/28 | 11,350 | 10,612 | ||||||||
| 7.375% 6/15/32 | 9,190 | 9,012 | ||||||||
| 40,561 | ||||||||||
| Leisure – 4.3% | ||||||||||
| Festival Fun Parks LLC 10.875% 4/15/14 (e) | 2,470 | 2,485 | ||||||||
| Six Flags, Inc.: | ||||||||||
| 9.625% 6/1/14 | 67,995 | 68,845 | ||||||||
| 9.75% 4/15/13 | 40,010 | 40,610 | ||||||||
| 111,940 | ||||||||||
| Paper 1.6% | ||||||||||
| Bowater Canada Finance Corp. 7.95% 11/15/11 | 10,000 | 10,000 | ||||||||
| Bowater, Inc. 6.5% 6/15/13 | 9,755 | 9,097 | ||||||||
| Georgia-Pacific Corp. 7.7% 6/15/15 | 10,645 | 10,645 | ||||||||
| Jefferson Smurfit Corp. U.S.: | ||||||||||
| 7.5% 6/1/13 | 6,960 | 6,508 | ||||||||
| 8.25% 10/1/12 | 5,000 | 4,838 | ||||||||
| 41,088 | ||||||||||
| See accompanying notes which are an integral part of the financial statements. | ||||||||||
| 13 | Semiannual Report | |||||||||
| Investments (Unaudited) continued | ||||||||||
| Corporate Bonds continued | ||||||||||
| Principal | Value (Note 1) | |||||||||
| Amount (000s) | (000s) | |||||||||
| Nonconvertible Bonds continued | ||||||||||
| Publishing/Printing – 0.7% | ||||||||||
| CBD Media Holdings LLC/CBD Holdings Finance, Inc. | ||||||||||
| 9.25% 7/15/12 | $ 6,140 | $ 6,247 | ||||||||
| Vertis, Inc. 10.875% 6/15/09 | 13,265 | 12,668 | ||||||||
| 18,915 | ||||||||||
| Restaurants 0.8% | ||||||||||
| The Restaurant Co. 10% 10/1/13 | 14,920 | 14,025 | ||||||||
| Uno Restaurant Corp. 10% 2/15/11 (e) | 8,670 | 6,979 | ||||||||
| 21,004 | ||||||||||
| Services – 1.7% | ||||||||||
| Ashtead Holdings PLC 8.625% 8/1/15 (e) | 2,500 | 2,588 | ||||||||
| Cornell Companies, Inc. 10.75% 7/1/12 | 7,345 | 7,712 | ||||||||
| FTI Consulting, Inc. 7.625% 6/15/13 | 1,510 | 1,570 | ||||||||
| Hertz Corp. 10.5% 1/1/16 (e) | 6,990 | 7,689 | ||||||||
| Hydrochem Industrial Services, Inc. 9.25% 2/15/13 (e) . | 5,150 | 5,111 | ||||||||
| Language Line, Inc. 11.125% 6/15/12 | 4,610 | 4,299 | ||||||||
| Muzak LLC/Muzak Finance Corp. 10% 2/15/09 | 12,200 | 10,614 | ||||||||
| Neff Rent LLC/Neff Finance Corp. 11.25% 6/15/12 (e) | 4,350 | 4,807 | ||||||||
| 44,390 | ||||||||||
| Shipping – 0.4% | ||||||||||
| Ship Finance International Ltd. 8.5% 12/15/13 | 11,965 | 11,247 | ||||||||
| Steels – 0.5% | ||||||||||
| Edgen Acquisition Corp. 9.875% 2/1/11 | 5,980 | 5,965 | ||||||||
| RathGibson, Inc. 11.25% 2/15/14 (e) | 6,190 | 6,654 | ||||||||
| 12,619 | ||||||||||
| Super Retail – 1.0% | ||||||||||
| Intcomex, Inc. 11.75% 1/15/11 (e) | 6,260 | 6,197 | ||||||||
| NBC Acquisition Corp. 0% 3/15/13 (c) | 12,830 | 9,109 | ||||||||
| The Bon-Ton Department Stores, Inc. 10.25% | ||||||||||
| 3/15/14 (e) | 10,220 | 9,760 | ||||||||
| 25,066 | ||||||||||
| Technology – 5.9% | ||||||||||
| Activant Solutions, Inc. 9.5% 5/1/16 (e) | 2,310 | 2,342 | ||||||||
| Amkor Technology, Inc.: | ||||||||||
| 7.125% 3/15/11 | 7,505 | 7,130 | ||||||||
| 7.75% 5/15/13 | 16,490 | 15,707 | ||||||||
| 10.5% 5/1/09 | 26,175 | 26,633 | ||||||||
| Avago Technologies Finance Ltd.: | ||||||||||
| 10.125% 12/1/13 (e) | 19,280 | 20,871 | ||||||||
| See accompanying notes which are an integral part of the financial statements. | ||||||||||
| Semiannual Report | 14 | |||||||||
| Corporate Bonds continued | ||||||||||
| Principal | Value (Note 1) | |||||||||
| Amount (000s) | (000s) | |||||||||
| Nonconvertible Bonds continued | ||||||||||
| Technology – continued | ||||||||||
| Avago Technologies Finance Ltd.: – continued | ||||||||||
| 11.875% 12/1/15 (e) | $ 10,280 | $ 11,282 | ||||||||
| Danka Business Systems PLC 11% 6/15/10 | 6,205 | 5,212 | ||||||||
| Freescale Semiconductor, Inc. 7.125% 7/15/14 | 4,460 | 4,572 | ||||||||
| MagnaChip Semiconductor SA/MagnaChip | ||||||||||
| Semiconductor Finance Co.: | ||||||||||
| 6.875% 12/15/11 | 2,465 | 2,366 | ||||||||
| 8.16% 12/15/11 (f) | 3,840 | 3,859 | ||||||||
| New ASAT Finance Ltd. 9.25% 2/1/11 | 9,425 | 8,082 | ||||||||
| SERENA Software, Inc. 10.375% 3/15/16 (e) | 1,450 | 1,537 | ||||||||
| Solectron Global Finance Ltd. 8% 3/15/16 (e) | 2,190 | 2,223 | ||||||||
| SS&C Technologies, Inc. 11.75% 12/1/13 (e) | 9,920 | 10,614 | ||||||||
| SunGard Data Systems, Inc. 10.25% 8/15/15 (e) | 15,470 | 16,553 | ||||||||
| Viasystems, Inc. 10.5% 1/15/11 | 12,680 | 12,617 | ||||||||
| 151,600 | ||||||||||
| Telecommunications – 6.8% | ||||||||||
| Centennial Cellular Operating Co./Centennial | ||||||||||
| Communications Corp. 10.125% 6/15/13 | 5,000 | 5,463 | ||||||||
| Centennial Communications Corp./Centennial Cellular | ||||||||||
| Operating Co. LLC/Centennial Puerto Rico Operations | ||||||||||
| Corp. 8.125% 2/1/14 | 6,680 | 6,864 | ||||||||
| Cincinnati Bell, Inc. 8.375% 1/15/14 | 3,095 | 3,165 | ||||||||
| Eschelon Operating Co. 8.375% 3/15/10 | 2,522 | 2,415 | ||||||||
| Intelsat Ltd.: | ||||||||||
| 6.5% 11/1/13 | 18,795 | 14,754 | ||||||||
| 7.625% 4/15/12 | 19,730 | 16,869 | ||||||||
| Level 3 Financing, Inc. 12.25% 3/15/13 (e) | 6,100 | 6,527 | ||||||||
| Nordic Telephone Co. Holdings Aps 8.875% 5/1/16 (e) | 3,430 | 3,567 | ||||||||
| Qwest Capital Funding, Inc.: | ||||||||||
| 7% 8/3/09 | 22,120 | 22,203 | ||||||||
| 7.25% 2/15/11 | 4,000 | 4,015 | ||||||||
| 7.625% 8/3/21 | 3,210 | 3,186 | ||||||||
| 7.75% 2/15/31 | 29,425 | 30,087 | ||||||||
| Qwest Communications International, Inc. 7.5% | ||||||||||
| 2/15/14 | 14,000 | 14,280 | ||||||||
| Rogers Communications, Inc.: | ||||||||||
| 6.375% 3/1/14 | 12,190 | 11,885 | ||||||||
| 7.5% 3/15/15 | 7,260 | 7,596 | ||||||||
| Rural Cellular Corp. 9.75% 1/15/10 | 4,825 | 4,958 | ||||||||
| See accompanying notes which are an integral part of the financial statements. | ||||||||||
| 15 | Semiannual Report | |||||||||
| Investments (Unaudited) continued | ||||||||||
| Corporate Bonds continued | ||||||||||
| Principal | Value (Note 1) | |||||||||
| Amount (000s) | (000s) | |||||||||
| Nonconvertible Bonds continued | ||||||||||
| Telecommunications – continued | ||||||||||
| U.S. West Capital Funding, Inc. 6.375% 7/15/08 | $ 5,000 | $ 4,950 | ||||||||
| U.S. West Communications 6.875% 9/15/33 | 15,000 | 13,950 | ||||||||
| 176,734 | ||||||||||
| Textiles & Apparel – 3.2% | ||||||||||
| Levi Strauss & Co.: | ||||||||||
| 8.875% 4/1/16 (e) | 6,510 | 6,510 | ||||||||
| 9.75% 1/15/15 | 22,090 | 23,250 | ||||||||
| 12.25% 12/15/12 | 46,975 | 53,317 | ||||||||
| 83,077 | ||||||||||
| TOTAL NONCONVERTIBLE BONDS | 1,855,946 | |||||||||
| TOTAL CORPORATE BONDS | ||||||||||
| (Cost $1,875,776) | 1,882,956 | |||||||||
| Common Stocks 16.9% | ||||||||||
| Shares | ||||||||||
| Cable TV 0.4% | ||||||||||
| NTL, Inc. (a) | 361,330 | 9,929 | ||||||||
| NTL, Inc. warrants 1/13/11 (a) | 3 | 0 | ||||||||
| Pegasus Communications Corp. warrants 1/1/07 (a)(g) | 6,509 | 0 | ||||||||
| 9,929 | ||||||||||
| Chemicals – 0.1% | ||||||||||
| Huntsman Corp. (g) | 96,480 | 1,896 | ||||||||
| Consumer Products – 4.5% | ||||||||||
| Revlon, Inc. Class A (sub. vtg.) (a)(d) | 35,592,996 | 115,669 | ||||||||
| Containers – 0.8% | ||||||||||
| Owens Illinois, Inc. (a) | 1,143,900 | 20,910 | ||||||||
| Trivest 1992 Special Fund Ltd. (a)(g) | 3,037,732 | 15 | ||||||||
| 20,925 | ||||||||||
| Electric Utilities – 1.9% | ||||||||||
| AES Corp. (a) | 2,192,509 | 37,207 | ||||||||
| Mirant Corp. (a) | 523,570 | 12,859 | ||||||||
| 50,066 | ||||||||||
| Energy – 1.0% | ||||||||||
| Chesapeake Energy Corp. | 800,000 | 25,344 | ||||||||
| See accompanying notes which are an integral part of the financial statements. | ||||||||||
| Semiannual Report | 16 | |||||||||
| Common Stocks continued | ||||||
| Shares | Value (Note 1) | |||||
| (000s) | ||||||
| Food and Drug Retail – 0.7% | ||||||
| Pathmark Stores, Inc. (a) | 1,818,878 | $ 18,825 | ||||
| Pathmark Stores, Inc. warrants 9/19/10 (a) | 747,828 | 232 | ||||
| 19,057 | ||||||
| Healthcare 2.3% | ||||||
| DaVita, Inc. (a) | 1,056,946 | 59,464 | ||||
| Metals/Mining – 1.5% | ||||||
| Haynes International, Inc. (a)(d) | 1,140,617 | 37,640 | ||||
| Paper 0.7% | ||||||
| Temple-Inland, Inc. | 365,678 | 16,982 | ||||
| Shipping – 1.2% | ||||||
| Teekay Shipping Corp. | 793,800 | 30,537 | ||||
| Technology – 0.4% | ||||||
| STATS ChipPAC Ltd. sponsored ADR (a) | 261,000 | 2,221 | ||||
| Viasystems Group, Inc. (a)(g) | 1,026,780 | 8,728 | ||||
| 10,949 | ||||||
| Telecommunications – 1.4% | ||||||
| Choice One Communications, Inc. (a)(g) | 571,711 | 2,430 | ||||
| ICO Global Communications Holdings Ltd.: | ||||||
| warrants 5/16/06 (a) | 7,290 | 0 | ||||
| Class A (a) | 43,772 | 241 | ||||
| McLeodUSA, Inc. (a) | 4,914,174 | 34,399 | ||||
| 37,070 | ||||||
| Textiles & Apparel – 0.0% | ||||||
| Arena Brands Holding Corp. Class B (g) | 42,253 | 631 | ||||
| Pillowtex Corp. (a) | 490,256 | 1 | ||||
| 632 | ||||||
| TOTAL COMMON STOCKS | ||||||
| (Cost $321,234) | 436,160 | |||||
| Preferred Stocks 0.8% | ||||||
| Convertible Preferred Stocks 0.6% | ||||||
| Energy – 0.4% | ||||||
| El Paso Corp. 4.99% (e) | 10,000 | 11,493 | ||||
| Leisure – 0.2% | ||||||
| Six Flags, Inc. 7.25% PIERS | 200,000 | 4,582 | ||||
| TOTAL CONVERTIBLE PREFERRED STOCKS | 16,075 | |||||
| See accompanying notes which are an integral part of the financial statements. | ||||||
| 17 | Semiannual Report | |||||
| Investments (Unaudited) continued | ||||||||
| Preferred Stocks continued | ||||||||
| Shares | Value (Note 1) | |||||||
| (000s) | ||||||||
| Nonconvertible Preferred Stocks 0.2% | ||||||||
| Broadcasting – 0.2% | ||||||||
| Spanish Broadcasting System, Inc. Class B, 10.75% | 3,671 | 4,038 | ||||||
| TOTAL PREFERRED STOCKS | ||||||||
| (Cost $18,032) | 20,113 | |||||||
| Floating Rate Loans 1.9% | ||||||||
| Principal | ||||||||
| Amount (000s) | ||||||||
| Building Materials – 1.2% | ||||||||
| Masonite International Corp. term loan: | ||||||||
| 7.106% 4/5/13 (f) | $ 2,590 | $ 2,567 | ||||||
| 11.3619% 4/6/15 (f) | 29,788 | 28,299 | ||||||
| 30,866 | ||||||||
| Cable TV 0.1% | ||||||||
| Wide Open West Finance LLC Tranche 2, term loan | ||||||||
| 10.04% 4/28/14 (f) | 1,770 | 1,783 | ||||||
| Consumer Products – 0.2% | ||||||||
| Amscan Holdings, Inc. Tranche 2, term loan 9.77% | ||||||||
| 12/23/13 (f) | 4,550 | 4,584 | ||||||
| Energy – 0.2% | ||||||||
| Coffeyville Resources LLC Tranche 2, term loan 11.75% | ||||||||
| 7/8/13 (f) | 6,510 | 6,673 | ||||||
| Telecommunications – 0.2% | ||||||||
| Choice One Communications, Inc. Tranche C, term loan | ||||||||
| 9.9794% 11/30/10 (f) | 5,348 | 5,334 | ||||||
| TOTAL FLOATING RATE LOANS | ||||||||
| (Cost $47,594) | 49,240 | |||||||
| Money Market Funds 4.6% | ||||||||
| Shares | ||||||||
| Fidelity Cash Central Fund, 4.8% (b) | ||||||||
| (Cost $119,798) | 119,798,054 | 119,798 | ||||||
| See accompanying notes which are an integral part of the financial statements. | ||||||||
| Semiannual Report | 18 | |||||||
| Cash Equivalents 0.2% | ||||||||||
| Maturity | Value (Note 1) | |||||||||
| Amount (000s) | (000s) | |||||||||
| Investments in repurchase agreements (Collateralized by U.S. | ||||||||||
| Treasury Obligations, in a joint trading account at 4.69%, | ||||||||||
| dated 4/28/06 due 5/1/06) | ||||||||||
| (Cost $4,588) | $ 4,590 | 4,588 | ||||||||
| TOTAL INVESTMENT PORTFOLIO 97.3% | ||||||||||
| (Cost $2,387,022) | 2,512,855 | |||||||||
| NET OTHER ASSETS – 2.7% | 69,771 | |||||||||
| NET ASSETS 100% | $ 2,582,626 | |||||||||
| Security Type Abbreviations | ||||
| PIERS | - | Preferred Income Equity | ||
| Redeemable Securities | ||||
| Legend (a) Non-income producing (b) Affiliated fund that is available only to investment companies and other accounts managed by Fidelity Investments. The rate quoted is the annualized seven-day yield of the fund at period end. A complete unaudited listing of the fund’s holdings as of its most recent quarter end is available upon request. (c) Security initially issued in zero coupon form which converts to coupon form at a specified rate and date. The rate shown is the rate at period end. (d) Affiliated company (e) Security exempt from registration under Rule 144A of the Securities Act of 1933. These securities may be resold in transactions exempt from registration, normally to qualified institutional buyers. At the period end, the value of these securities amounted to $378,570,000 or 14.7% of net assets. |
| (f) The coupon rate shown on floating or adjustable rate securities represents the rate at period end. (g) Restricted securities – Investment in securities not registered under the Securities Act of 1933 (excluding 144A issues). At the end of the period, the value of restricted securities (excluding 144A issues) amounted to $24,001,000 or 0.9% of net assets. |
See accompanying notes which are an integral part of the financial statements.
19 Semiannual Report
Investments (Unaudited) continued
Additional information on each holding is as follows:
| Acquisition | Acquisition | |||||
| Security | Date | Cost (000s) | ||||
| Arena Brands | ||||||
| Holding Corp. | 6/18/97 - | |||||
| Class B | 7/13/98 | $ 1,538 | ||||
| Choice One | ||||||
| Communications, | ||||||
| Inc. | 11/18/04 | $ 2,390 | ||||
| Huntsman Corp. | 4/30/03 | $ 690 | ||||
| ICO North | ||||||
| America, Inc. | ||||||
| 7.5% 8/15/09 | 8/12/05 | $ 8,175 | ||||
| Pegasus | ||||||
| Communications | ||||||
| Corp. warrants | ||||||
| 1/1/07 | 10/17/97 | $ 635 | ||||
| Trivest 1992 | ||||||
| Special Fund Ltd. | 7/30/92 | $ — | ||||
| Viasystems | ||||||
| Group, Inc. | 2/13/04 | $ 20,664 | ||||
| (h) Non-income producing - Issuer is in default. |
Affiliated Central Funds
Information regarding fiscal year to date income earned by the fund from the affiliated Central funds is as follows:
| Fund | Income earned | |||
| (Amounts in thousands) | ||||
| Fidelity Cash Central Fund | $ 1,861 | |||
| Fidelity Securities Lending Cash Central Fund | 7 | |||
| Total | $ 1,868 | |||
See accompanying notes which are an integral part of the financial statements.
Semiannual Report 20
Other Affiliated Issuers
An affiliated company is a company in which the fund has ownership of at least 5% of the voting securities. Fiscal year to date transactions with companies which are or were affiliates are as follows:
| Value, | Purchases | Sales | Dividend | Value, end of | ||||||||||||||||
| Affiliate | beginning of | Proceeds | Income | period | ||||||||||||||||
| (Amounts in thousands) | period | |||||||||||||||||||
| Haynes International, | ||||||||||||||||||||
| Inc. | $ 25,094 | $ — | $ — | $ — | $ 37,640 | |||||||||||||||
| Revlon, Inc. Class A | ||||||||||||||||||||
| (sub. vtg.) | 103,517 | 10,422 | 10,515 | — | 115,669 | |||||||||||||||
| TOTALS | $ 128,611 | $ 10,422 | $ 10,515 | $ — | $ 153,309 | |||||||||||||||
Income Tax Information
At October 31, 2005, the fund had a capital loss carryforward of approximately $955,951,000 of which $477,033,000 and $478,918,000 will expire on October 31, 2009 and 2010, respectively.
See accompanying notes which are an integral part of the financial statements.
21 Semiannual Report
| Financial Statements | ||||||
| Statement of Assets and Liabilities | ||||||
| Amounts in thousands (except per share amounts) | April 30, 2006 (Unaudited) | |||||
| Assets | ||||||
| Investment in securities, at value (including repurchase | ||||||
| agreements of $4,588) See accompanying | ||||||
| schedule: | ||||||
| Unaffiliated issuers (cost $2,182,258) | $ 2,239,748 | |||||
| Affiliated Central Funds (cost $119,798) | 119,798 | |||||
| Other affiliated issuers (cost $84,966) | 153,309 | |||||
| Total Investments (cost $2,387,022) | $ 2,512,855 | |||||
| Cash | 1 | |||||
| Receivable for investments sold | 44,489 | |||||
| Receivable for fund shares sold | 6,295 | |||||
| Dividends receivable | 91 | |||||
| Interest receivable | 45,117 | |||||
| Prepaid expenses | 7 | |||||
| Receivable from investment adviser for expense | ||||||
| reductions | 3 | |||||
| Other affiliated receivables | 40 | |||||
| Other receivables | 1 | |||||
| Total assets | 2,608,899 | |||||
| Liabilities | ||||||
| Payable for investments purchased | $ 15,158 | |||||
| Payable for fund shares redeemed | 6,252 | |||||
| Distributions payable | 2,416 | |||||
| Accrued management fee | 1,209 | |||||
| Distribution fees payable | 652 | |||||
| Other affiliated payables | 545 | |||||
| Other payables and accrued expenses | 41 | |||||
| Total liabilities | 26,273 | |||||
| Net Assets | $ 2,582,626 | |||||
| Net Assets consist of: | ||||||
| Paid in capital | $ 3,399,652 | |||||
| Undistributed net investment income | 29,357 | |||||
| Accumulated undistributed net realized gain (loss) on | ||||||
| investments | (972,216) | |||||
| Net unrealized appreciation (depreciation) on | ||||||
| investments | 125,833 | |||||
| Net Assets | $ 2,582,626 | |||||
See accompanying notes which are an integral part of the financial statements.
Semiannual Report 22
| Statement of Assets and Liabilities continued | ||||
Amounts in thousands (except per share amounts) | April 30, 2006 (Unaudited) | |||
| Calculation of Maximum Offering Price | ||||
| Class A: | ||||
| Net Asset Value and redemption price per share | ||||
| ($520,160 ÷ 51,433 shares) | $ 10.11 | |||
| Maximum offering price per share (100/95.25 of $10.11) | $ 10.61 | |||
| Class T: | ||||
| Net Asset Value and redemption price per share | ||||
| ($1,067,809 ÷ 105,249 shares) | $ 10.15 | |||
| Maximum offering price per share (100/96.50 of $10.15) | $ 10.52 | |||
| Class B: | ||||
| Net Asset Value and offering price per share ($267,877 | ||||
| ÷ 26,598 shares)A | $ 10.07 | |||
| Class C: | ||||
| Net Asset Value and offering price per share ($198,426 | ||||
| ÷ 19,640 shares)A | $ 10.10 | |||
| Institutional Class: | ||||
| Net Asset Value, offering price and redemption price per | ||||
| share ($528,354 ÷ 54,129 shares) | $ 9.76 | |||
| A Redemption price per share is equal to net asset value less any applicable contingent deferred sales charge. | ||||
See accompanying notes which are an integral part of the financial statements.
23 Semiannual Report
| Financial Statements continued | ||||||
| Statement of Operations | ||||||
| Amounts in thousands | Six months ended April 30, 2006 (Unaudited) | |||||
| Investment Income | ||||||
| Dividends | $ 1,212 | |||||
| Interest | 90,428 | |||||
| Income from affiliated Central Funds | 1,868 | |||||
| Total income | 93,508 | |||||
| Expenses | ||||||
| Management fee | $ 6,902 | |||||
| Transfer agent fees | 2,300 | |||||
| Distribution fees | 3,933 | |||||
| Accounting and security lending fees | 416 | |||||
| Independent trustees’ compensation | 5 | |||||
| Appreciation in deferred trustee compensation account | 3 | |||||
| Custodian fees and expenses | 21 | |||||
| Registration fees | 80 | |||||
| Audit | 37 | |||||
| Legal | 8 | |||||
| Miscellaneous | 62 | |||||
| Total expenses before reductions | 13,767 | |||||
| Expense reductions | (31) | 13,736 | ||||
| Net investment income | 79,772 | |||||
| Realized and Unrealized Gain (Loss) | ||||||
| Net realized gain (loss) on: | ||||||
| Investment securities: | ||||||
| Unaffiliated issuers | (12,568) | |||||
| Other affiliated issuers | 4,510 | |||||
| Total net realized gain (loss) | (8,058) | |||||
| Change in net unrealized appreciation (depreciation) on | ||||||
| investment securities | 144,107 | |||||
| Net gain (loss) | 136,049 | |||||
| Net increase (decrease) in net assets resulting from | ||||||
| operations | $ 215,821 | |||||
See accompanying notes which are an integral part of the financial statements.
| Semiannual Report |
| 24 |
| Statement of Changes in Net Assets | ||||||||
| Six months ended | Year ended | |||||||
| April 30, 2006 | October 31, | |||||||
| Amounts in thousands | (Unaudited) | 2005 | ||||||
| Increase (Decrease) in Net Assets | ||||||||
| Operations | ||||||||
| Net investment income | $ 79,772 | $ 167,624 | ||||||
| Net realized gain (loss) | (8,058) | 192,519 | ||||||
| Change in net unrealized appreciation (depreciation) . | 144,107 | (155,940) | ||||||
| Net increase (decrease) in net assets resulting | ||||||||
| from operations | 215,821 | 204,203 | ||||||
| Distributions to shareholders from net investment income . | (83,275) | (213,900) | ||||||
| Distributions to shareholders from net realized gain | (7,252) | — | ||||||
| Total distributions | (90,527) | (213,900) | ||||||
| Share transactions - net increase (decrease) | 184,049 | (196,503) | ||||||
| Redemption fees | 136 | 393 | ||||||
| Total increase (decrease) in net assets | 309,479 | (205,807) | ||||||
| Net Assets | ||||||||
| Beginning of period | 2,273,147 | 2,478,954 | ||||||
| End of period (including undistributed net investment | ||||||||
| income of $29,357 and undistributed net investment | ||||||||
| income of $32,860, respectively) | $ 2,582,626 | $ 2,273,147 | ||||||
See accompanying notes which are an integral part of the financial statements.
25 Semiannual Report
| Financial Highlights Class A | ||||||||||||||||||
| Six months ended | ||||||||||||||||||
| April 30, 2006 | Years ended October 31, | |||||||||||||||||
| (Unaudited) | 2005 | 2004 | 2003 | 2002 | 2001 | |||||||||||||
| Selected Per Share Data | ||||||||||||||||||
| Net asset value, | ||||||||||||||||||
| beginning of period | $ 9.60 | $ 9.64 | $ 9.50 | $ 6.40 | $ 8.17 | $ 9.64 | ||||||||||||
| Income from Investment | ||||||||||||||||||
| Operations | ||||||||||||||||||
| Net investment | ||||||||||||||||||
| incomeE | .334 | .695 | .797 | .873 | .767G,H | .869 | ||||||||||||
| Net realized and un | ||||||||||||||||||
| realized gain (loss) | .552 | .134 | .307 | 2.875 | (1.866)G,H | (1.558) | ||||||||||||
| Total from investment | ||||||||||||||||||
| operations | .886 | .829 | 1.104 | 3.748 | (1.099) | (.689) | ||||||||||||
| Distributions from net | ||||||||||||||||||
| investment income | (.347) | (.871) | (.966) | (.648) | (.671) | (.781) | ||||||||||||
| Distributions from net | ||||||||||||||||||
| realized gain | (.030) | — | — | — | — | — | ||||||||||||
| Total distributions | (.377) | (.871) | (.966) | (.648) | (.671) | (.781) | ||||||||||||
| Redemption fees added | ||||||||||||||||||
| to paid in capitalE | .001 | .002 | .002 | — | — | — | ||||||||||||
| Net asset value, end of | ||||||||||||||||||
| period | $ 10.11 | $ 9.60 | $ 9.64 | $ 9.50 | $ 6.40 | $ 8.17 | ||||||||||||
| Total ReturnB,C,D | 9.40% | 8.71% | 12.23% | 60.58% | (14.39)% | (7.64)% | ||||||||||||
| Ratios to Average Net AssetsF | ||||||||||||||||||
| Expenses before | ||||||||||||||||||
| reductions | .99%A | 1.00% | .98% | .99% | 1.02% | .97% | ||||||||||||
| Expenses net of fee | ||||||||||||||||||
| waivers, if any | .99%A | 1.00% | .98% | .99% | 1.02% | .97% | ||||||||||||
| Expenses net of all | ||||||||||||||||||
| reductions | .99%A | .99% | .98% | .99% | 1.01% | .97% | ||||||||||||
| Net investment income | 6.81%A | 7.08% | 8.38% | 10.45% | 10.12%G,H | 9.53% | ||||||||||||
| Supplemental Data | ||||||||||||||||||
| Net assets, end of | ||||||||||||||||||
| period (in millions) | $ 520 | $ 424 | $ 297 | $ 307 | $ 157 | $ 189 | ||||||||||||
| Portfolio turnover rate | 45%A | 53% | 67% | 111% | 85% | 68% | ||||||||||||
| AAnnualized BTotal returns for periods of less than one year are not annualized. CTotal returns would have been lower had certain expenses not been reduced during the periods shown. DTotal returns do not include the effect of the sales charges. ECalculated based on average shares outstanding during the period. FExpense ratios reflect operating expenses of the class. Expenses before reductions do not reflect amounts reim bursed by the investment adviser or expense offset arrangements and do not represent the amount paid by the class during periods when reimburse ments or reductions occur. Expenses net of fee waivers reflect expenses after reimbursement by the investment adviser but prior to reductions from expense offset arrangements. Expenses net of all reductions represent the net expenses paid by the class. GEffective November 1, 2001, the fund adopted the provisions of the AICPA Audit and Accounting Guide for Investment Companies and began amortizing premium and discount on all debt securities. Per Share data and ratios for periods prior to adoption have not been restated to reflect this change. HAs a result of a revision to reflect accretion of market discount using the interest method, certain amounts for the year ended October 31, 2002 have been reclassified from what was previously reported. The impact of this change was a decrease to net investment income of $0.068 per share with a corresponding increase to net realized and unrealized gain (loss) per share. The ratio of net investment income to average net assets decreased from 11.01% to 10.12% . The reclassification has no impact on the net assets of the fund. See accompanying notes which are an integral part of the financial statements. |
| Semiannual Report |
| 26 |
| Financial Highlights Class T | ||||||||||||||||||
| Six months ended | ||||||||||||||||||
| April 30, 2006 | Years ended October 31, | |||||||||||||||||
| (Unaudited) | 2005 | 2004 | 2003 | 2002 | 2001 | |||||||||||||
| Selected Per Share Data | ||||||||||||||||||
| Net asset value, | ||||||||||||||||||
| beginning of period | $ 9.63 | $ 9.67 | $ 9.52 | $ 6.42 | $ 8.18 | $ 9.66 | ||||||||||||
| Income from Investment | ||||||||||||||||||
| Operations | ||||||||||||||||||
| Net investment | ||||||||||||||||||
| incomeE | .332 | .693 | .793 | .859 | .766G,H | .865 | ||||||||||||
| Net realized and un | ||||||||||||||||||
| realized gain (loss) | .561 | .129 | .315 | 2.883 | (1.860)G,H | (1.572) | ||||||||||||
| Total from investment | ||||||||||||||||||
| operations | .893 | .822 | 1.108 | 3.742 | (1.094) | (.707) | ||||||||||||
| Distributions from net | ||||||||||||||||||
| investment income | (.344) | (.864) | (.960) | (.642) | (.666) | (.773) | ||||||||||||
| Distributions from net | ||||||||||||||||||
| realized gain | (.030) | — | — | — | — | — | ||||||||||||
| Total distributions | (.374) | (.864) | (.960) | (.642) | (.666) | (.773) | ||||||||||||
| Redemption fees added | ||||||||||||||||||
| to paid in capitalE | .001 | .002 | .002 | — | — | — | ||||||||||||
| Net asset value, end of | ||||||||||||||||||
| period | $ 10.15 | $ 9.63 | $ 9.67 | $ 9.52 | $ 6.42 | $ 8.18 | ||||||||||||
| Total ReturnB,C,D | 9.44% | 8.61% | 12.24% | 60.26% | (14.30)% | (7.81)% | ||||||||||||
| Ratios to Average Net AssetsF | ||||||||||||||||||
| Expenses before | ||||||||||||||||||
| reductions | 1.06%A | 1.06% | 1.06% | 1.06% | 1.08% | 1.06% | ||||||||||||
| Expenses net of fee | ||||||||||||||||||
| waivers, if any | 1.06%A | 1.06% | 1.06% | 1.06% | 1.08% | 1.06% | ||||||||||||
| Expenses net of all | ||||||||||||||||||
| reductions | 1.05%A | 1.06% | 1.06% | 1.06% | 1.08% | 1.05% | ||||||||||||
| Net investment income | 6.75%A | 7.02% | 8.30% | 10.38% | 10.05%G,H | 9.45% | ||||||||||||
| Supplemental Data | ||||||||||||||||||
| Net assets, end of | ||||||||||||||||||
| period (in millions) | $ 1,068 | $ 1,003 | $ 1,245 | $ 1,398 | $ 1,070 | $ 1,473 | ||||||||||||
| Portfolio turnover rate | 45%A | 53% | 67% | 111% | 85% | 68% | ||||||||||||
| AAnnualized BTotal returns for periods of less than one year are not annualized. CTotal returns would have been lower had certain expenses not been reduced during the periods shown. DTotal returns do not include the effect of the sales charges. ECalculated based on average shares outstanding during the period. FExpense ratios reflect operating expenses of the class. Expenses before reductions do not reflect amounts reim bursed by the investment adviser or expense offset arrangements and do not represent the amount paid by the class during periods when reimburse ments or reductions occur. Expenses net of fee waivers reflect expenses after reimbursement by the investment adviser but prior to reductions from expense offset arrangements. Expenses net of all reductions represent the net expenses paid by the class. GEffective November 1, 2001, the fund adopted the provisions of the AICPA Audit and Accounting Guide for Investment Companies and began amortizing premium and discount on all debt securities. Per Share data and ratios for periods prior to adoption have not been restated to reflect this change. HAs a result of a revision to reflect accretion of market discount using the interest method, certain amounts for the year ended October 31, 2002 have been reclassified from what was previously reported. The impact of this change was a decrease to net investment income of $0.068 per share with a corresponding increase to net realized and unrealized gain (loss) per share. The ratio of net investment income to average net assets decreased from 10.95% to 10.05% . The reclassification has no impact on the net assets of the fund. |
See accompanying notes which are an integral part of the financial statements.
27 Semiannual Report
| Financial Highlights Class B | ||||||||||||||||||
| Six months ended | ||||||||||||||||||
| April 30, 2006 | Years ended October 31, | |||||||||||||||||
| (Unaudited) | 2005 | 2004 | 2003 | 2002 | 2001 | |||||||||||||
| Selected Per Share Data | ||||||||||||||||||
| Net asset value, | ||||||||||||||||||
| beginning of period | $ 9.56 | $ 9.61 | $ 9.47 | $ 6.38 | $ 8.15 | $ 9.61 | ||||||||||||
| Income from Investment | ||||||||||||||||||
| Operations | ||||||||||||||||||
| Net investment | ||||||||||||||||||
| incomeE | .296 | .622 | .723 | .802 | .712G,H | .801 | ||||||||||||
| Net realized and un | ||||||||||||||||||
| realized gain (loss) | .553 | .123 | .310 | 2.873 | (1.868)G,H | (1.549) | ||||||||||||
| Total from investment | ||||||||||||||||||
| operations | .849 | .745 | 1.033 | 3.675 | (1.156) | (.748) | ||||||||||||
| Distributions from net | ||||||||||||||||||
| investment income | (.310) | (.797) | (.895) | (.585) | (.614) | (.712) | ||||||||||||
| Distributions from net | ||||||||||||||||||
| realized gain | (.030) | — | — | — | — | — | ||||||||||||
| Total distributions | (.340) | (.797) | (.895) | (.585) | (.614) | (.712) | ||||||||||||
| Redemption fees added | ||||||||||||||||||
| to paid in capitalE | .001 | .002 | .002 | — | — | — | ||||||||||||
| Net asset value, end of | ||||||||||||||||||
| period | $ 10.07 | $ 9.56 | $ 9.61 | $ 9.47 | $ 6.38 | $ 8.15 | ||||||||||||
| Total ReturnB,C,D | 9.03% | 7.82% | 11.44% | 59.42% | (15.07)% | (8.25)% | ||||||||||||
| Ratios to Average Net AssetsF | ||||||||||||||||||
| Expenses before | ||||||||||||||||||
| reductions | 1.76%A | 1.75% | 1.74% | 1.75% | 1.78% | 1.73% | ||||||||||||
| Expenses net of fee | ||||||||||||||||||
| waivers, if any | 1.75%A | 1.74% | 1.74% | 1.75% | 1.78% | 1.73% | ||||||||||||
| Expenses net of all | ||||||||||||||||||
| reductions | 1.75%A | 1.74% | 1.74% | 1.75% | 1.77% | 1.72% | ||||||||||||
| Net investment income | 6.06%A | 6.33% | 7.62% | 9.69% | 9.36%G,H | 8.78% | ||||||||||||
| Supplemental Data | ||||||||||||||||||
| Net assets, end of | ||||||||||||||||||
| period (in millions) | $ 268 | $ 313 | $ 498 | $ 613 | $ 426 | $ 704 | ||||||||||||
| Portfolio turnover rate | 45%A | 53% | 67% | 111% | 85% | 68% | ||||||||||||
| AAnnualized BTotal returns for periods of less than one year are not annualized. CTotal returns would have been lower had certain expenses not been reduced during the periods shown. DTotal returns do not include the effect of the contingent deferred sales charge. ECalculated based on average shares outstanding during the period. FExpense ratios reflect operating expenses of the class. Expenses before reductions do not reflect amounts reimbursed by the investment adviser or expense offset arrangements and do not represent the amount paid by the class during periods when reimbursements or reductions occur. Expenses net of fee waivers reflect expenses after reimbursement by the investment adviser but prior to reductions from expense offset arrangements. Expenses net of all reductions represent the net expenses paid by the class. GEffective November 1, 2001, the fund adopted the provisions of the AICPA Audit and Accounting Guide for Investment Companies and began amortizing premium and discount on all debt securities. Per Share data and ratios for periods prior to adoption have not been restated to reflect this change. HAs a result of a revision to reflect accretion of market discount using the interest method, certain amounts for the year ended October 31, 2002 have been reclassified from what was previously reported. The impact of this change was a decrease to net investment income of $0.068 per share with a corresponding increase to net realized and unrealized gain (loss) per share. The ratio of net investment income to average net assets decreased from 10.25% to 9.36% . The reclassification has no impact on the net assets of the fund. See accompanying notes which are an integral part of the financial statements. |
| Semiannual Report |
| 28 |
| Financial Highlights Class C | ||||||||||||||||||
| Six months ended | ||||||||||||||||||
| April 30, 2006 | Years ended October 31, | |||||||||||||||||
| (Unaudited) | 2005 | 2004 | 2003 | 2002 | 2001 | |||||||||||||
| Selected Per Share Data | ||||||||||||||||||
| Net asset value, | ||||||||||||||||||
| beginning of period | $ 9.59 | $ 9.63 | $ 9.49 | $ 6.40 | $ 8.16 | $ 9.63 | ||||||||||||
| Income from Investment | ||||||||||||||||||
| Operations | ||||||||||||||||||
| Net investment | ||||||||||||||||||
| incomeE | .293 | .615 | .718 | .801 | .708G,H | .796 | ||||||||||||
| Net realized and un | ||||||||||||||||||
| realized gain (loss) | .553 | .133 | .309 | 2.868 | (1.859)G,H | (1.560) | ||||||||||||
| Total from investment | ||||||||||||||||||
| operations | .846 | .748 | 1.027 | 3.669 | (1.151) | (.764) | ||||||||||||
| Distributions from net | ||||||||||||||||||
| investment income | (.307) | (.790) | (.889) | (.579) | (.609) | (.706) | ||||||||||||
| Distributions from net | ||||||||||||||||||
| realized gain | (.030) | — | — | — | — | — | ||||||||||||
| Total distributions | (.337) | (.790) | (.889) | (.579) | (.609) | (.706) | ||||||||||||
| Redemption fees added | ||||||||||||||||||
| to paid in capitalE | .001 | .002 | .002 | — | — | — | ||||||||||||
| Net asset value, end of | ||||||||||||||||||
| period | $ 10.10 | $ 9.59 | $ 9.63 | $ 9.49 | $ 6.40 | $ 8.16 | ||||||||||||
| Total ReturnB,C,D | 8.96% | 7.83% | 11.33% | 59.11% | (14.98)% | (8.41)% | ||||||||||||
| Ratios to Average Net AssetsF | ||||||||||||||||||
| Expenses before | ||||||||||||||||||
| reductions | 1.82%A | 1.82% | 1.81% | 1.82% | 1.84% | 1.80% | ||||||||||||
| Expenses net of fee | ||||||||||||||||||
| waivers, if any | 1.82%A | 1.82% | 1.81% | 1.82% | 1.84% | 1.80% | ||||||||||||
| Expenses net of all | ||||||||||||||||||
| reductions | 1.82%A | 1.82% | 1.81% | 1.82% | 1.84% | 1.79% | ||||||||||||
| Net investment income | 5.98%A | 6.26% | 7.55% | 9.62% | 9.29%G,H | 8.71% | ||||||||||||
| Supplemental Data | ||||||||||||||||||
| Net assets, end of | ||||||||||||||||||
| period (in millions) | $ 198 | $ 182 | $ 193 | $ 219 | $ 132 | $ 197 | ||||||||||||
| Portfolio turnover rate | 45%A | 53% | 67% | 111% | 85% | 68% | ||||||||||||
| AAnnualized BTotal returns for periods of less than one year are not annualized. CTotal returns would have been lower had certain expenses not been reduced during the periods shown. DTotal returns do not include the effect of the contingent deferred sales charge. ECalculated based on average shares outstanding during the period. FExpense ratios reflect operating expenses of the class. Expenses before reductions do not reflect amounts reimbursed by the investment adviser or expense offset arrangements and do not represent the amount paid by the class during periods when reimbursements or reductions occur. Expenses net of fee waivers reflect expenses after reimbursement by the investment adviser but prior to reductions from expense offset arrangements. Expenses net of all reductions represent the net expenses paid by the class. GEffective November 1, 2001, the fund adopted the provisions of the AICPA Audit and Accounting Guide for Investment Companies and began amortizing premium and discount on all debt securities. Per Share data and ratios for periods prior to adoption have not been restated to reflect this change. HAs a result of a revision to reflect accretion of market discount using the interest method, certain amounts for the year ended October 31, 2002 have been reclassified from what was previously reported. The impact of this change was a decrease to net investment income of $0.068 per share with a corresponding increase to net realized and unrealized gain (loss) per share. The ratio of net investment income to average net assets decreased from 10.19% to 9.29% . The reclassification has no impact on the net assets of the fund. |
See accompanying notes which are an integral part of the financial statements.
29 Semiannual Report
| Financial Highlights Institutional Class | ||||||||||||||||||||||
| Six months ended | ||||||||||||||||||||||
| April 30, 2006 | Years ended October 31, | |||||||||||||||||||||
| (Unaudited) | 2005 | 2004 | 2003 | 2002 | 2001 | |||||||||||||||||
| Selected Per Share Data | ||||||||||||||||||||||
| Net asset value, | ||||||||||||||||||||||
| beginning of period | $ 9.28 | $ 9.35 | $ 9.24 | $ 6.24 | $ 7.97 | $ 9.43 | ||||||||||||||||
| Income from Investment | ||||||||||||||||||||||
| Operations | ||||||||||||||||||||||
| Net investment | ||||||||||||||||||||||
| incomeD | .330 | .691 | .786 | .867 | .759F,G | .862 | ||||||||||||||||
| Net realized and un | ||||||||||||||||||||||
| realized gain (loss) | .535 | .125 | .305 | 2.796 | (1.805)F,G | (1.528) | ||||||||||||||||
| Total from investment | ||||||||||||||||||||||
| operations | .865 | .816 | 1.091 | 3.663 | (1.046) | (.666) | ||||||||||||||||
| Distributions from net | ||||||||||||||||||||||
| investment income | (.356) | (.888) | (.983) | (.663) | (.684) | (.794) | ||||||||||||||||
| Distributions from net | ||||||||||||||||||||||
| realized gain | (.030) | — | — | — | — | — | ||||||||||||||||
| Total distributions | (.386) | (.888) | (.983) | (.663) | (.684) | (.794) | ||||||||||||||||
| Redemption fees added | ||||||||||||||||||||||
| to paid in capitalD | .001 | .002 | .002 | — | — | — | ||||||||||||||||
| Net asset value, end of | ||||||||||||||||||||||
| period | $ 9.76 | $ 9.28 | $ 9.35 | $ 9.24 | $ 6.24 | $ 7.97 | ||||||||||||||||
| Total ReturnB,C | 9.50% | 8.85% | 12.46% | 60.82% | (14.09)% | (7.58)% | ||||||||||||||||
| Ratios to Average Net AssetsE | ||||||||||||||||||||||
| Expenses before | ||||||||||||||||||||||
| reductions | .82%A | .81% | .83% | .82% | .85% | .83% | ||||||||||||||||
| Expenses net of fee | ||||||||||||||||||||||
| waivers, if any | .82%A | .81% | .83% | .82% | .85% | .83% | ||||||||||||||||
| Expenses net of all | ||||||||||||||||||||||
| reductions | .82%A | .81% | .83% | .82% | .85% | .83% | ||||||||||||||||
| Net investment income | 6.98%A | 7.26% | 8.53% | 10.62% | 10.28%F,G | 9.67% | ||||||||||||||||
| Supplemental Data | ||||||||||||||||||||||
| Net assets, end of | ||||||||||||||||||||||
| period (in millions) | $ 528 | $ 351 | $ 245 | $ 218 | $ 82 | $ 87 | ||||||||||||||||
| Portfolio turnover rate | 45%A | 53% | 67% | 111% | 85% | 68% | ||||||||||||||||
| AAnnualized BTotal returns for periods of less than one year are not annualized. CTotal returns would have been lower had certain expenses not been reduced during the periods shown. DCalculated based on average shares outstanding during the period. EExpense ratios reflect operating expenses of the class. Expenses before reductions do not reflect amounts reimbursed by the investment adviser or expense offset arrange ments and do not represent the amount paid by the class during periods when reimbursements or reductions occur. Expenses net of fee waivers reflect expenses after reimbursement by the investment adviser but prior to reductions from expense offset arrangements. Expenses net of all reductions represent the net expenses paid by the class. FEffective November 1, 2001, the fund adopted the provisions of the AICPA Audit and Accounting Guide for Investment Companies and began amortizing premium and discount on all debt securities. Per Share data and ratios for periods prior to adoption have not been restated to reflect this change. GAs a result of a revision to reflect accretion of market discount using the interest method, certain amounts for the year ended October 31, 2002 have been reclassified from what was previously reported. The impact of this change was a decrease to net investment income of $0.067 per share with a corresponding increase to net realized and unrealized gain (loss) per share. The ratio of net investment income to average net assets decreased from 11.18% to 10.28% . The reclassification has no impact on the net assets of the fund. See accompanying notes which are an integral part of the financial statements. |
| Semiannual Report |
| 30 |
Notes to Financial Statements
For the period ended April 30, 2006 (Unaudited)
(Amounts in thousands except ratios)
1. Significant Accounting Policies.
Fidelity Advisor High Income Advantage Fund (the fund) is a fund of Fidelity Advisor Series II (the trust) and is authorized to issue an unlimited number of shares. The trust is registered under the Investment Company Act of 1940, as amended (the 1940 Act), as an open end management investment company organized as a Massachusetts business trust.
The fund offers Class A, Class T, Class B, Class C, and Institutional Class shares, each of which has equal rights as to assets and voting privileges. Each class has exclusive voting rights with respect to matters that affect that class. Class B shares will automatically convert to Class A shares after a holding period of seven years from the initial date of purchase. Investment income, realized and unrealized capital gains and losses, the common expenses of the fund, and certain fund level expense reductions, if any, are allocated on a pro rata basis to each class based on the relative net assets of each class to the total net assets of the fund. Each class differs with respect to transfer agent and distribution and service plan fees incurred. Certain expense reductions also differ by class.
The fund may invest in affiliated money market central funds (Money Market Central Funds), which are open end investment companies available to investment companies and other accounts managed by Fidelity Management & Research Company (FMR) and its affiliates. The financial statements have been prepared in conformity with accounting principles generally accepted in the United States of America, which require manage ment to make certain estimates and assumptions at the date of the financial statements. The following summarizes the significant accounting policies of the fund:
Security Valuation. Investments are valued and net asset value per share is calculated (NAV calculation) as of the close of business of the New York Stock Exchange, normally 4:00 p.m. Eastern time. Wherever possible, the fund uses independent pricing services approved by the Board of Trustees to value its investments. Debt securities, including restricted securities, for which quotations are readily available, are valued by indepen dent pricing services or by dealers who make markets in such securities. Pricing services consider yield or price of bonds of comparable quality, coupon, maturity and type as well as dealer supplied prices. Equity securities, including restricted securities, for which market quotations are readily available, are valued at the last reported sale price or official closing price as reported by an independent pricing service on the primary market or exchange on which they are traded. In the event there were no sales during the day or closing prices are not available, securities are valued at the last quoted bid price.
31 Semiannual Report
| Notes to Financial Statements (Unaudited) continued |
| (Amounts in thousands except ratios) |
| 1. Significant Accounting Policies continued |
Security Valuation continued |
When current market prices or quotations are not readily available or do not accurately reflect fair value, valuations may be determined in accordance with procedures adopted by the Board of Trustees. The frequency of when fair value pricing is used is unpredict able. The value of securities used for NAV calculation under fair value pricing may differ from published prices for the same securities. Investments in open end mutual funds are valued at their closing net asset value each business day. Short term securities with remaining maturities of sixty days or less for which quotations are not readily available are valued at amortized cost, which approximates value.
Investment Transactions and Income. Security transactions are accounted for as of trade date. Gains and losses on securities sold are determined on the basis of identified cost and may include proceeds received from litigation. Dividend income is recorded on the ex dividend date, except for certain dividends from foreign securities where the ex dividend date may have passed, which are recorded as soon as the fund is informed of the ex dividend date. Non cash dividends included in dividend income, if any, are recorded at the fair market value of the securities received. Distributions received on securities that represent a return of capital or capital gain are recorded as a reduction of cost of invest ments and/or as a realized gain. The fund estimates the components of distributions received that may be considered return of capital distributions or capital gain distributions. Interest income is accrued as earned. Interest income includes coupon interest and amortization of premium and accretion of discount on debt securities. Debt obligations may be placed on non accrual status and related interest income may be reduced by ceasing current accruals and writing off interest receivables when the collection of all or a portion of interest has become doubtful based on consistently applied procedures. A debt obligation is removed from non accrual status when the issuer resumes interest payments or when collectibility of interest is reasonably assured.
Expenses. Most expenses of the trust can be directly attributed to a fund. Expenses which cannot be directly attributed are apportioned among each fund in the trust.
Deferred Trustee Compensation. Under a Deferred Compensation Plan (the Plan), independent Trustees must defer receipt of a portion of, and may elect to defer receipt of an additional portion of, their annual compensation. Deferred amounts are treated as though equivalent dollar amounts had been invested in shares of the fund or are invested in a cross section of other Fidelity funds, and are marked to market. Deferred amounts remain in the fund until distributed in accordance with the Plan.
| Semiannual Report |
| 32 |
1. Significant Accounting Policies continued
Income Tax Information and Distributions to Shareholders. Each year, the fund intends to qualify as a regulated investment company by distributing all of its taxable income and realized gains under Subchapter M of the Internal Revenue Code. As a result, no provision for income taxes is required in the accompanying financial statements.
Dividends are declared daily and paid monthly from net investment income. Distribu tions from realized gains, if any, are recorded on the ex dividend date. Income dividends and capital gain distributions are declared separately for each class. Income and capital gain distributions are determined in accordance with income tax regulations, which may differ from generally accepted accounting principles.
Capital accounts within the financial statements are adjusted for permanent book tax differences. These adjustments have no impact on net assets or the results of operations. Temporary book tax differences will reverse in a subsequent period.
Book tax differences are primarily due to prior period premium and discount on debt securities, defaulted bonds, market discount, partnerships, deferred trustees compensa tion, capital loss carryforwards, and losses deferred due to wash sales.
The federal tax cost of investments and unrealized appreciation (depreciation) as of period end were as follows:
| Unrealized appreciation | $ 287,780 | |||
| Unrealized depreciation | (142,803) | |||
| Net unrealized appreciation (depreciation) | $ 144,977 | |||
| Cost for federal income tax purposes | $ 2,367,878 |
Short Term Trading (Redemption) Fees. Shares held in the fund less than 90 days are subject to a redemption fee equal to 1.00 % of the proceeds of the redeemed shares. All redemption fees, including any estimated redemption fees paid by FMR, are retained by the funds and accounted for as an addition to paid in capital.
| 2. Operating Policies. |
Repurchase Agreements. FMR has received an Exemptive Order from the Securities and Exchange Commission (the SEC) which permits the fund and other affiliated entities of FMR to transfer uninvested cash balances into joint trading accounts which are then invested in repurchase agreements. The fund may also invest directly with institutions in repurchase agreements. Repurchase agreements are collateralized by government or non government securities. Upon settlement date, collateral is held in segregated accounts with custodian banks and may be obtained in the event of a default of the counterparty. The fund monitors, on a daily basis, the value of the collateral to
33 Semiannual Report
| Notes to Financial Statements (Unaudited) continued | ||
| (Amounts in thousands except ratios) | ||
| 2. Operating Policies continued | ||
Repurchase Agreements continued | ||
ensure it is at least equal to the principal amount of the repurchase agreement (includ ing accrued interest). In the event of a default by the counterparty, realization of the collateral proceeds could be delayed, during which time the value of the collateral may decline.
Restricted Securities. The fund may invest in securities that are subject to legal or contractual restrictions on resale. These securities generally may be resold in transactions exempt from registration or to the public if the securities are registered. Disposal of these securities may involve time consuming negotiations and expense, and prompt sale at an acceptable price may be difficult. Information regarding restricted securities is included at the end of the fund’s Schedule of Investments.
Loans and Other Direct Debt Instruments. The fund may invest in loans and loan participations, trade claims or other receivables. These investments may include standby financing commitments, including revolving credit facilities, that obligate the fund to supply additional cash to the borrower on demand. Loan participations involve a risk of insolvency of the lending bank or other financial intermediary. The fund may be contrac tually obligated to receive approval from the agent bank and/or borrower prior to the sale of these investments.
3. Purchases and Sales of Investments.
Purchases and sales of securities, other than short term securities, aggregated $586,999 and $512,225, respectively.
4. Fees and Other Transactions with Affiliates.
Management Fee. FMR and its affiliates provide the fund with investment manage ment related services for which the fund pays a monthly management fee. The management fee is the sum of an individual fund fee rate that is based on an annual rate of .45% of the fund’s average net assets and a group fee rate that averaged .12% during the period. The group fee rate is based upon the average net assets of all the mutual funds advised by FMR. The group fee rate decreases as assets under management increase and increases as assets under management decrease. For the period, the total annualized management fee rate was .57% of the fund’s average net assets.
Distribution and Service Plan. In accordance with Rule 12b 1 of the 1940 Act, the fund has adopted separate Distribution and Service Plans for each class of shares. Certain classes pay Fidelity Distributors Corporation (FDC), an affiliate of FMR, separate Distribution and Service Fees, each of which is based on an annual percentage of each class’ average net assets. In addition, FDC may pay financial intermediaries for selling
| Semiannual Report |
| 34 |
| 4. Fees and Other Transactions with Affiliates continued | ||
Distribution and Service Plan continued | ||
shares of the fund and providing shareholder support services. For the period, the Distribution and Service Fee rates and the total amounts paid to and retained by FDC were as follows:
| Distribution | Service | Paid to | Retained | |||||||||
| Fee | Fee | FDC | by FDC | |||||||||
| Class A | 0% | .15% | $ 352 | $ 12 | ||||||||
| Class T | 0% | .25% | 1,303 | 38 | ||||||||
| Class B | .65% | .25% | 1,319 | 958 | ||||||||
| Class C | .75% | .25% | 959 | 173 | ||||||||
| $ 3,933 | $ 1,181 |
Sales Load. FDC receives a front end sales charge of up to 4.75% for selling Class A shares, and 3.50% for selling Class T shares, some of which is paid to financial intermediaries for selling shares of the fund. FDC receives the proceeds of contingent deferred sales charges levied on Class A, Class T, Class B, and Class C redemptions. These charges depend on the holding period. The deferred sales charges range from 5% to 1% for Class B, 1% for Class C, 1.00% to .50% for certain purchases of Class A shares (.25% prior to February 24, 2006) and .25% for certain purchases of Class T shares.
| For the period, sales charge amounts retained by FDC were as follows: | ||||
| Retained | ||||
| by FDC | ||||
| Class A | $ 111 | |||
| Class T | 32 | |||
| Class B* | 184 | |||
| Class C* | 18 | |||
| $ 345 | ||||
* When Class B and Class C shares are initially sold, FDC pays commissions from its own resources to financial intermediaries through which the sales are made.
Transfer Agent Fees. Fidelity Investments Institutional Operations Company, Inc. (FIIOC), an affiliate of FMR, is the transfer, dividend disbursing and shareholder servicing agent for each class of the fund. FIIOC receives account fees and asset based fees that vary according to the account size and type of account of the shareholders of the
35 Semiannual Report
| Notes to Financial Statements (Unaudited) continued |
| (Amounts in thousands except ratios) |
| 4. Fees and Other Transactions with Affiliates continued |
Transfer Agent Fees continued |
respective classes of the fund. FIIOC pays for typesetting, printing and mailing of share holder reports, except proxy statements. For the period the total transfer agent fees paid by each class to FIIOC, were as follows:
| % of | ||||||
| Average | ||||||
| Amount | Net Assets | |||||
| Class A | $ 492 | .21* | ||||
| Class T | 904 | .17* | ||||
| Class B | 325 | .22* | ||||
| Class C | 176 | .18* | ||||
| Institutional Class | 403 | .19* | ||||
| $ 2,300 | ||||||
| * Annualized |
Accounting and Security Lending Fees. Fidelity Service Company, Inc. (FSC), an affiliate of FMR, maintains the fund’s accounting records. The accounting fee is based on the level of average net assets for the month. Under a separate contract, FSC administers the security lending program. The security lending fee is based on the number and duration of lending transactions.
Affiliated Central Funds. The fund may invest in Money Market Central Funds which seek preservation of capital and current income and are managed by Fidelity Investments Money Management, Inc. (FIMM), an affiliate of FMR.
The Money Market Central Funds do not pay a management fee.
| 5. Committed Line of Credit. |
The fund participates with other funds managed by FMR in a $4.2 billion credit facility (the “line of credit”) to be utilized for temporary or emergency purposes to fund shareholder redemptions or for other short term liquidity purposes. The fund has agreed to pay commitment fees on its pro rata portion of the line of credit, which amounts to $2 and is reflected in Miscellaneous Expense on the Statement of Operations. During the period, there were no borrowings on this line of credit.
| Semiannual Report |
| 36 |
| 6. Security Lending. |
The fund lends portfolio securities from time to time in order to earn additional income. On the settlement date of the loan, the fund receives collateral (in the form of U.S. Treasury obligations, letters of credit and/or cash) against the loaned securities and maintains collateral in an amount not less than 100% of the market value of the loaned securities during the period of the loan. The market value of the loaned securities is determined at the close of business of the fund and any additional required collateral is delivered to the fund on the next business day. If the borrower defaults on its obligation to return the securities loaned because of insolvency or other reasons, a fund could experience delays and costs in recovering the securities loaned or in gaining access to the collateral. Any cash collateral received is invested in the Fidelity Securities Lending Cash Central Fund. The value of loaned securities and cash collateral at period end are disclosed on the fund’s Statement of Assets and Liabilities. At period end, there were no security loans outstanding. Security lending income represents the income earned on investing cash collateral, less fees and expenses associated with the loan, plus any premium payments that may be received on the loan of certain types of securities. Security lending income is presented in the Statement of Operations as a component of income from affiliated central funds. Net income from lending portfolio securities during the period amounted to $7.
| 7. Expense Reductions. |
FMR voluntarily agreed to reimburse each class to the extent annual operating expenses exceeded certain levels of average net assets as noted in the table below. Some expenses, for example interest expense, are excluded from this reimbursement.
| The following class was in reimbursement during the period: | ||||||
| Expense | Reimbursement | |||||
| Limitations | from adviser | |||||
| Class B | 1.75% | $ 15 | ||||
In addition, through arrangements with the fund’s custodian and each class’ transfer agent, credits realized as a result of uninvested cash balances were used to reduce the fund’s expenses. During the period, these credits reduced the fund’s custody expenses by $11. During the period, credits reduced each class’ transfer agent expense as noted in the table below.
| Transfer Agent | ||||||
| expense reduction | ||||||
| Class A | $ 3 | |||||
| Class B | 1 | |||||
| Institutional Class | 1 | |||||
| $ 5 | ||||||
| 37 | Semiannual Report | |||||
| Notes to Financial Statements (Unaudited) continued | ||
| (Amounts in thousands except ratios) | ||
| 8. Other. | ||
The fund’s organizational documents provide former and current trustees and officers with a limited indemnification against liabilities arising in connection with the performance of their duties to the fund. In the normal course of business, the fund may also enter into contracts that provide general indemnifications. The fund’s maximum exposure under these arrangements is unknown as this would be dependent on future claims that may be made against the fund. The risk of material loss from such claims is considered remote.
| 9. Distributions to Shareholders. | ||||||||
| Distributions to shareholders of each class were as follows: | ||||||||
| Six months ended | Year ended | |||||||
| April 30, | October 31, | |||||||
| 2006 | 2005 | |||||||
| From net investment income | ||||||||
| Class A | $ 16,361 | $ | $ 31,708 | |||||
| Class T | 36,228 | 99,769 | ||||||
| Class B | 9,323 | 35,847 | ||||||
| Class C | 5,945 | 15,897 | ||||||
| Institutional Class | 15,418 | 30,679 | ||||||
| Total | $ 83,275 | $ 213,900 | ||||||
| From net realized gain | ||||||||
| Class A | $ 1,358 | $ — | ||||||
| Class T | 3,190 | — | ||||||
| Class B | 948 | — | ||||||
| Class C | 578 | — | ||||||
| Institutional Class | 1,178 | — | ||||||
| Total | $ 7,252 | $ — | ||||||
| Semiannual Report |
| 38 |
| 10. Share Transactions. | ||||||||||||
| Transactions for each class of shares were as follows: | ||||||||||||
| Shares | Dollars | |||||||||||
| Six months ended | Year ended | Six months ended | Year ended | |||||||||
| April 30, | October 31, | April 30, | October 31, | |||||||||
| 2006 | 2005 | 2006 | 2005 | |||||||||
| Class A | ||||||||||||
| Shares sold | 12,777 | 23,900 | $ 126,538 | $ 235,068 | ||||||||
| Reinvestment of distributions | 1,248 | 2,176 | 12,335 | 21,461 | ||||||||
| Shares redeemed | (6,792) | (12,687) | (67,173) | (124,289) | ||||||||
| Net increase (decrease) | 7,233 | 13,389 | $ 71,700 | $ 132,240 | ||||||||
| Class T | ||||||||||||
| Shares sold | 14,984 | 25,755 | $ 147,983 | $ 253,520 | ||||||||
| Reinvestment of distributions | 3,298 | 8,206 | 32,667 | 81,282 | ||||||||
| Shares redeemed | (17,188) | (58,557) | (170,254) | (579,615) | ||||||||
| Net increase (decrease) | 1,094 | (24,596) | $ 10,396 | $ (244,813) | ||||||||
| Class B | ||||||||||||
| Shares sold | 1,769 | 4,225 | $ 17,394 | $ 41,379 | ||||||||
| Reinvestment of distributions | 677 | 2,349 | 6,646 | 23,125 | ||||||||
| Shares redeemed | (8,612) | (25,696) | (84,785) | (251,141) | ||||||||
| Net increase (decrease) | (6,166) | (19,122) | $ (60,745) | $ (186,637) | ||||||||
| Class C | ||||||||||||
| Shares sold | 3,075 | 5,702 | $ 30,357 | $ 56,070 | ||||||||
| Reinvestment of distributions | 406 | 1,011 | 3,999 | 9,975 | ||||||||
| Shares redeemed | (2,859) | (7,734) | (28,237) | (75,656) | ||||||||
| Net increase (decrease) | 622 | (1,021) | $ 6,119 | $ (9,611) | ||||||||
| Institutional Class | ||||||||||||
| Shares sold | 18,521 | 31,784 | $ 177,728 | $ 303,781 | ||||||||
| Reinvestment of distributions | 1,570 | 2,879 | 15,000 | 27,465 | ||||||||
| Shares redeemed | (3,782) | (23,086) | (36,149) | (218,928) | ||||||||
| Net increase (decrease) | 16,309 | 11,577 | $ 156,579 | $ 112,318 | ||||||||
39 Semiannual Report
Board Approval of Investment Advisory Contracts and Management Fees
Advisor High Income Advantage Fund
On January 19, 2006, the Board of Trustees, including the Independent Trustees (together, the Board), voted to approve a general research services agreement (the Agreement) between FMR, FMR Co., Inc. (FMRC), Fidelity Investments Money Manage ment, Inc. (FIMM), and Fidelity Research & Analysis Company (FRAC) (together, the Investment Advisers) for the fund, effective January 20, 2006, pursuant to which FRAC may provide general research and investment advisory support services to FMRC and FIMM. The Board considered that it has approved previously various sub advisory agreements for the fund with affiliates of FMR that allow FMR to obtain research, non discretionary advice, or discretionary portfolio management at no additional expense to the fund. The Board, assisted by the advice of fund counsel and independent Trustees’ counsel, considered a broad range of information and determined that it would be beneficial for the fund to access the research and investment advisory support services supplied by FRAC at no additional expense to the fund.
The Board reached this determination in part because the new arrangement will involve no changes in (i) the contractual terms of and fees payable under the fund’s manage ment contract or sub advisory agreements; (ii) the investment process or strategies employed in the management of the fund’s assets; (iii) the nature or level of services provided under the fund’s management contract or sub advisory agreements; (iv) the day to day management of the fund or the persons primarily responsible for such man agement; or (v) the ultimate control or beneficial ownership of FMR, FMRC, or FIMM. The Board also considered that the establishment of the Agreement would not necessi tate prior shareholder approval of the Agreement or result in an assignment and termination of the fund’s management contract or sub advisory agreements under the Investment Company Act of 1940.
Because the Board was approving an arrangement with FRAC under which the fund will not bear any additional management fees or expenses and under which the fund’s portfolio manager would not change, it did not consider the fund’s investment perfor mance, competitiveness of management fee and total expenses, costs of services and profitability, or economies of scale to be significant factors in its decision.
In connection with its future renewal of the fund’s management contract and sub advisory agreements, the Board will consider: (i) the nature, extent, and quality of services provided to the fund, including shareholder and administrative services and investment performance; (ii) the competitiveness of the fund’s management fee and total expenses; (iii) the costs of the services and profitability, including the revenues earned and the expenses incurred by Fidelity in conducting the business of developing, marketing, distributing, managing, administering, and servicing the fund and its shareholders; and (iv) whether there have been economies of scale in respect of the management of the Fidelity funds, whether the Fidelity funds (including the fund) have
| Semiannual Report |
| 40 |
appropriately benefited from any such economies of scale, and whether there is potential for realization of any further economies.
Based on its evaluation of all of the conclusions noted above, and after considering all material factors, the Board ultimately concluded that the fund’s Agreement is fair and reasonable, and that the fund’s Agreement should be approved.
41 Semiannual Report
| Semiannual Report |
| 42 |
43 Semiannual Report
| Semiannual Report |
| 44 |
45 Semiannual Report
| Investment Adviser Fidelity Management & Research Company Boston, MA Investment Sub Advisers FMR Co., Inc. Fidelity Management & Research (U.K.) Inc. Fidelity Research & Analysis Company (formerly Fidelity Management & Research (Far East) Inc.) Fidelity International Investment Advisors Fidelity Investments Japan Limited Fidelity International Investment Advisors (U.K.) Limited General Distributor Fidelity Distributors Corporation Boston, MA Transfer and Service Agents Fidelity Investments Institutional Operations Company, Inc. Boston, MA Fidelity Service Company, Inc. Boston, MA Custodian The Bank of New York New York, NY |
| HYI-USAN-0606 1.784887.103 |

Item 2. Code of Ethics
Not applicable.
Item 3. Audit Committee Financial Expert
Not applicable.
Item 4. Principal Accountant Fees and Services
Not applicable.
Item 5. Audit Committee of Listed Registrants
Not applicable.
Item 6. Schedule of Investments
Not applicable.
Item 7. Disclosure of Proxy Voting Policies and Procedures for Closed-End Management Investment Companies
Not applicable.
Item 8. Portfolio Managers of Closed-End Management Investment Companies
Not applicable.
Item 9. Purchase of Equity Securities by Closed-End Management Investment Company and Affiliated Purchasers
Not applicable.
Item 10. Submission of Matters to a Vote of Security Holders
There were no material changes to the procedures by which shareholders may recommend nominees to the Fidelity Advisor Series II: Fidelity Advisor High Income Advantage Fund's Board of Trustees.
Item 11. Controls and Procedures
(a)(i) The President and Treasurer and the Chief Financial Officer have concluded that the Fidelity Advisor Series II: Fidelity Advisor High Income Advantage Fund's (the "Fund") disclosure controls and procedures (as defined in Rule 30a-3(c) under the Investment Company Act) provide reasonable assurances that material information relating to the Fund is made known to them by the appropriate persons, based on their evaluation of these controls and procedures as of a date within 90 days of the filing date of this report.
(a)(ii) There was no change in the Fund's internal control over financial reporting (as defined in Rule 30a-3(d) under the Investment Company Act) that occurred during the second fiscal quarter of the period covered by this report that has materially affected, or is reasonably likely to materially affect, the Fund's internal control over financial reporting.
Item 12. Exhibits
(a) | (1) | Not applicable. |
(a) | (2) | Certification pursuant to Rule 30a-2(a) under the Investment Company Act of 1940 (17 CFR 270.30a-2(a)) is filed and attached hereto as Exhibit 99.CERT. |
(a) | (3) | Not applicable. |
(b) | Certification pursuant to Rule 30a-2(b) under the Investment Company Act of 1940 (17 CFR 270.30a-2(b)) is furnished and attached hereto as Exhibit 99.906CERT. |
SIGNATURES
Pursuant to the requirements of the Securities Exchange Act of 1934 and the Investment Company Act of 1940, the registrant has duly caused this report to be signed on its behalf by the undersigned, thereunto duly authorized.
Fidelity Advisor Series II
By: | /s/Christine Reynolds |
Christine Reynolds | |
President and Treasurer | |
Date: | June 22, 2006 |
Pursuant to the requirements of the Securities Exchange Act of 1934 and the Investment Company Act of 1940, this report has been signed below by the following persons on behalf of the registrant and in the capacities and on the dates indicated.
By: | /s/Christine Reynolds |
Christine Reynolds | |
President and Treasurer | |
Date: | June 22, 2006 |
By: | /s/Paul M. Murphy |
Paul M. Murphy | |
Chief Financial Officer | |
Date: | June 22, 2006 |