UNITED STATES
SECURITIES AND EXCHANGE COMMISSION
Washington, D.C. 20549
FORM N-CSR
CERTIFIED SHAREHOLDER REPORT OF REGISTERED
MANAGEMENT INVESTMENT COMPANIES
Investment Company Act file number 811-4707
Fidelity Advisor Series II
(Exact name of registrant as specified in charter)
82 Devonshire St., Boston, Massachusetts 02109
(Address of principal executive offices) (Zip code)
Eric D. Roiter, Secretary
82 Devonshire St.
Boston, Massachusetts 02109
(Name and address of agent for service)
Registrant's telephone number, including area code: 617-563-7000
Date of fiscal year end: | October 31 |
| |
Date of reporting period: | April 30, 2006 |
Item 1. Reports to Stockholders

| | Fidelity® Advisor
Municipal Income Fund -
Class A, Class T, Class B
and Class C
|
| | Semiannual Report
April 30, 2006
|

| Contents | | | | |
| |
| Chairman’s Message | | 3 | | Ned Johnson’s message to shareholders. |
| Shareholder Expense | | 4 | | An example of shareholder expenses. |
| Example | | | | |
| Investment Changes | | 6 | | A summary of major shifts in the fund’s |
| | | | | investments over the past six months. |
| Investments | | 7 | | A complete list of the fund’s investments |
| | | | | with their market values. |
| Financial Statements | | 28 | | Statements of assets and liabilities, |
| | | | | operations, and changes in net assets, |
| | | | | as well as financial highlights. |
| Notes | | 37 | | Notes to the financial statements. |
| Board Approval of | | 44 | | |
| Investment Advisory | | | | |
| Contracts and | | | | |
| Management Fees | | | | |
To view a fund’s proxy voting guidelines and proxy voting record for the 12 month period ended
June 30, visit www.fidelity.com/proxyvotingresults or visit the Securities and Exchange Commis
sion’s (SEC) web site at www.sec.gov. You may also call 1-877-208-0098 to request a free copy of
the proxy voting guidelines.
Standard & Poor’s, S&P and S&P 500 are registered service marks of The McGraw Hill Companies,
Inc. and have been licensed for use by Fidelity Distributors Corporation.
Other third party marks appearing herein are the property of their respective owners.
All other marks appearing herein are registered or unregistered trademarks or service marks
of FMR Corp. or an affiliated company.
|
| | This report and the financial statements contained herein are submitted for the general information
of the shareholders of the fund. This report is not authorized for distribution to prospective investors
in the fund unless preceded or accompanied by an effective prospectus.
A fund files its complete schedule of portfolio holdings with the SEC for the first and third
quarters of each fiscal year on Form N Q. Forms N Q are available on the SEC’s web site at
http://www.sec.gov. A fund’s Forms N Q may be reviewed and copied at the SEC’s Public
Reference Room in Washington, DC. Information regarding the operation of the SEC’s Public
Reference Room may be obtained by calling 1-800-SEC-0330. For a complete list of a fund’s port
folio holdings, view the most recent quarterly holdings report, semiannual report, or annual
report on Fidelity’s web site at http://www.advisor.fidelity.com.
NOT FDIC INSURED · MAY LOSE VALUE · NO BANK GUARANTEE
Neither the fund nor Fidelity Distributors Corporation is a bank.
|
Chairman’s Message
(photograph of Edward C. Johnson 3d)
Dear Shareholder:
Although many securities markets made gains in early 2006, there is only one certainty when it comes to investing: There is no sure thing. There are, however, a number of time tested, fundamental investment principles that can put the historical odds in your favor.
One of the basic tenets is to invest for the long term. Over time, riding out the markets’ inevitable ups and downs has proven much more effective than selling into panic or chasing the hottest trend. Even missing only a few of the markets’ best days can significantly diminish investor returns. Patience also affords the benefits of compounding of earning interest on additional income or reinvested dividends and capital gains. There are tax advantages and cost benefits to consider as well. The more you sell, the more taxes you pay, and the more you trade, the higher the costs. While staying the course doesn’t eliminate risk, it can considerably lessen the effect of short term declines.
You can further manage your investing risk through diversification. And today, more than ever, geographic diversification should be taken into account. Studies indicate that asset allocation is the single most important determinant of a portfolio’s long term success. The right mix of stocks, bonds and cash aligned to your particular risk tolerance and investment objective is very important. Age appropriate rebalancing is also an essential aspect of asset allocation. For younger investors, an emphasis on equities which historically have been the best performing asset class over time is encouraged. As investors near their specific goal, such as retirement or sending a child to college, consideration may be given to replacing volatile assets (e.g. common stocks) with more stable fixed investments (bonds or savings plans).
A third investment principle investing regularly can help lower the average cost of your purchases. Investing a certain amount of money each month or quarter helps ensure you won’t pay for all your shares at market highs. This strategy known as dollar cost averaging also reduces unconstructive “emotion” from investing, helping shareholders avoid selling weak performers just prior to an upswing, or chasing a hot performer just before a correction.
We invite you to contact us via the Internet, through our Investor Centers or over the phone. It is our privilege to provide you the information you need to make the investments that are right for you.
Sincerely,
/s/ Edward C. Johnson 3d
Edward C. Johnson 3d
3 Semiannual Report
Shareholder Expense Example
As a shareholder of the Fund, you incur two types of costs: (1) transaction costs, including sales charges (loads) on purchase payments or redemption proceeds, and (2) ongoing costs, including management fees, distribution and/or service (12b 1) fees and other Fund expenses. This Example is intended to help you understand your ongoing costs (in dollars) of investing in the Fund and to compare these costs with the ongoing costs of investing in other mutual funds.
The Example is based on an investment of $1,000 invested at the beginning of the period and held for the entire period (November 1, 2005 to April 30, 2006).
The first line of the table below for each class of the Fund provides information about actual account values and actual expenses. You may use the information in this line, together with the amount you invested, to estimate the expenses that you paid over the period. Simply divide your account value by $1,000.00 (for example, an $8,600 account value divided by $1,000.00 = 8.6), then multiply the result by the number in the first line for a class of the Fund under the heading entitled “Expenses Paid During Period” to estimate the expenses you paid on your account during this period.
Hypothetical Example for Comparison Purposes
The second line of the table below for each class of the Fund provides information about hypothetical account values and hypothetical expenses based on a Class’ actual expense ratio and an assumed rate of return of 5% per year before expenses, which is not the Class’ actual return. The hypothetical account values and expenses may not be used to estimate the actual ending account balance or expenses you paid for the period. You may use this information to compare the ongoing costs of investing in the Fund and other funds. To do so, compare this 5% hypothetical example with the 5% hypothetical examples that appear in the shareholder reports of the other funds.
Please note that the expenses shown in the table are meant to highlight your ongoing costs only and do not reflect any transaction costs. Therefore, the second line of the table is useful in comparing ongoing costs only, and will not help you determine the relative total costs of owning different funds. In addition, if these transactional costs were included, your costs would have been higher.
| | | | | | | | | | | | | Expenses Paid |
| | | | | Beginning | | | | Ending | | | | During Period* |
| | | | | Account Value | | | | Account Value | | | | November 1, 2005 |
| | | | | November 1, 2005 | | | | April 30, 2006 | | | | to April 30, 2006 |
| Class A | | | | | | | | | | | | |
| Actual | | | | $ 1,000.00 | | | | $ 1,014.40 | | | | $ 3.45 |
| HypotheticalA | | | | $ 1,000.00 | | | | $ 1,021.37 | | | | $ 3.46 |
| Class T | | | | | | | | | | | | |
| Actual | | | | $ 1,000.00 | | | | $ 1,013.10 | | | | $ 3.94 |
| HypotheticalA | | | | $ 1,000.00 | | | | $ 1,020.88 | | | | $ 3.96 |
| Class B | | | | | | | | | | | | |
| Actual | | | | $ 1,000.00 | | | | $ 1,010.60 | | | | $ 7.23 |
| HypotheticalA | | | | $ 1,000.00 | | | | $ 1,017.60 | | | | $ 7.25 |
Semiannual Report 4
| | | | | | | | | | | | | Expenses Paid |
| | | | | Beginning | | | | Ending | | | | During Period* |
| | | | | Account Value | | | | Account Value | | | | November 1, 2005 |
| | | | | November 1, 2005 | | | | April 30, 2006 | | | | to April 30, 2006 |
| Class C | | | | | | | | | | | | |
| Actual | | | | $ 1,000.00 | | | | $ 1,010.10 | | | | $ 7.68 |
| HypotheticalA | | | | $ 1,000.00 | | | | $ 1,017.16 | | | | $ 7.70 |
| Institutional Class | | | | | | | | | | | | |
| Actual | | | | $ 1,000.00 | | | | $ 1,015.20 | | | | $ 2.65 |
| HypotheticalA | | | | $ 1,000.00 | | | | $ 1,022.17 | | | | $ 2.66 |
A 5% return per year before expenses | | | | | | | | |
* Expenses are equal to each Class’ annualized expense ratio (shown in the table below); multiplied by the average account value over the period, multiplied by 181/365 (to reflect the one half year period).
| | | Annualized |
| | | Expense Ratio |
| Class A | | 69% |
| Class T | | 79% |
| Class B | | 1.45% |
| Class C | | 1.54% |
| Institutional Class | | 53% |
5 Semiannual Report
| Investment Changes | | | | |
| |
| |
| Top Five States as of April 30, 2006 | | | | |
| | | % of fund’s | | % of fund’s net assets |
| | | net assets | | 6 months ago |
| Texas | | 15.2 | | 15.4 |
| California | | 11.2 | | 8.2 |
| Illinois | | 10.3 | | 10.8 |
| New York | | 9.3 | | 9.0 |
| Washington | | 7.5 | | 8.0 |
Top Five Sectors as of April 30, 2006 | | | | |
| | | % of fund’s | | % of fund’s net assets |
| | | net assets | | 6 months ago |
| General Obligations | | 37.1 | | 33.8 |
| Health Care | | 10.1 | | 9.7 |
| Escrowed/Pre Refunded | | 9.1 | | 9.8 |
| Transportation | | 8.5 | | 9.7 |
| Electric Utilities | | 8.4 | | 10.4 |
Average Years to Maturity as of April 30, 2006 | | |
| | | | | 6 months ago |
| Years | | 15.3 | | 15.3 |
Average years to maturity is based on the average time remaining to the stated maturity date of each bond, weighted by the market value of each bond.
| Duration as of April 30, 2006 | | | | |
| | | | | | | 6 months ago |
| Years | | | | 6.6 | | 6.9 |
Duration shows how much a bond fund’s price fluctuates with changes in comparable interest rates. If rates rise 1%, for example, a fund with a five year duration is likely to lose about 5% of its value. Other factors also can influence a bond fund’s performance and share price. Accordingly, a bond fund’s actual performance may differ from this example.
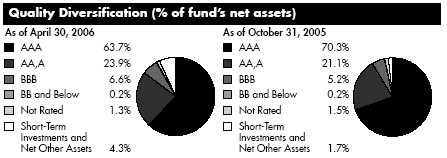
We have used ratings from Moody’s® Investors Services, Inc. Where Moody’s ratings are not available, we have used S&P® ratings.
Semiannual Report 6
| Investments April 30, 2006 (Unaudited) |
| Showing Percentage of Net Assets | | | | |
| |
| Municipal Bonds 95.8% | | | | |
| | | Principal | | Value (Note 1) |
| | | Amount | | |
| Alabama – 0.4% | | | | |
| Birmingham Wtrwks. & Swr. Board Wtr. & Swr. Rev. | | | | |
| Series B, 5% 1/1/43 (MBIA Insured) | | $ 300,000 | | $ 304,221 |
| Oxford Gen. Oblig. 5.75% 5/1/25 (Pre-Refunded to | | | | |
| 5/1/09 @ 102) (e) | | 1,000,000 | | 1,076,410 |
| Phenix City Gen. Oblig. 5.65% 8/1/21 (AMBAC | | | | |
| Insured) | | 1,000,000 | | 1,081,050 |
| | | | | 2,461,681 |
| |
| Alaska – 0.2% | | | | |
| Alaska Student Ln. Corp. Student Ln. Rev. Series A, | | | | |
| 5.45% 7/1/09 (AMBAC Insured) (d) | | 1,500,000 | | 1,527,435 |
| Arizona – 1.3% | | | | |
| Arizona Student Ln. Acquisition Auth. Student Ln. Rev. | | | | |
| Series A1, 5.875% 5/1/18 (d) | | 1,300,000 | | 1,369,511 |
| Chandler Indl. Dev. Auth. Indl. Dev. Rev. (Intel Corp. | | | | |
| Proj.) 4.375%, tender 12/1/10 (c)(d) | | 1,000,000 | | 1,011,760 |
| Glendale Indl. Dev. Auth. Hosp. Rev. (John C. Lincoln | | | | |
| Health Network Proj.) 5% 12/1/29 | | 1,575,000 | | 1,547,107 |
| Phoenix Civic Impt. Corp. Wtr. Sys. Rev. 5% 7/1/29 | | | | |
| (MBIA Insured) | | 1,000,000 | | 1,035,620 |
| Phoenix Indl. Dev. Auth. Single Family Mtg. Rev. 0% | | | | |
| 12/1/14 (Escrowed to Maturity) (e) | | 3,750,000 | | 2,583,825 |
| Univ. of Arizona Univ. Revs. Series 2005 A, 5% 6/1/17 | | | | |
| (AMBAC Insured) | | 1,000,000 | | 1,055,970 |
| | | | | 8,603,793 |
| |
| Arkansas – 0.2% | | | | |
| Little Rock School District Series 2001 C, 5.25% 2/1/33 | | | | |
| (FSA Insured) | | 1,000,000 | | 1,034,240 |
| California – 11.2% | | | | |
| California Dept. of Wtr. Resources Pwr. Supply Rev. | | | | |
| Series A, 5.5% 5/1/15 (AMBAC Insured) | | 1,000,000 | | 1,085,460 |
| California Econ. Recovery Series A: | | | | |
| 5% 7/1/15 (MBIA Insured) | | 1,800,000 | | 1,911,312 |
| 5.25% 7/1/13 (MBIA Insured) | | 1,100,000 | | 1,188,385 |
| 5.25% 7/1/14 (FGIC Insured) | | 900,000 | | 974,367 |
| California Gen. Oblig.: | | | | |
| 5% 3/1/15 | | 1,000,000 | | 1,053,160 |
| 5.25% 2/1/11 | | 2,300,000 | | 2,435,217 |
| 5.25% 2/1/14 | | 2,400,000 | | 2,565,120 |
| 5.25% 2/1/15 | | 1,200,000 | | 1,276,380 |
| 5.25% 2/1/16 | | 1,000,000 | | 1,063,010 |
| 5.25% 2/1/24 | | 1,000,000 | | 1,047,120 |
See accompanying notes which are an integral part of the financial statements.
7 Semiannual Report
| Investments (Unaudited) continued | | | | | | |
| |
| |
| Municipal Bonds continued | | | | | | |
| | | | | Principal | | Value (Note 1) |
| | | | | Amount | | |
| California – continued | | | | | | |
| California Gen. Oblig.: – continued | | | | | | |
| 5.25% 2/1/28 | | | | $ 1,200,000 | | $ 1,249,752 |
| 5.25% 2/1/33 | | | | 2,000,000 | | 2,075,680 |
| 5.25% 12/1/33 | | | | 2,300,000 | | 2,401,407 |
| 5.25% 4/1/34 | | | | 2,200,000 | | 2,293,852 |
| 5.5% 3/1/11 | | | | 3,500,000 | | 3,747,240 |
| 5.5% 9/1/24 (Pre-Refunded to 9/1/09 @ 101) (e) | | | | 200,000 | | 213,648 |
| 5.5% 4/1/30 | | | | 4,000,000 | | 4,288,360 |
| 5.5% 11/1/33 | | | | 5,400,000 | | 5,779,296 |
| 5.625% 5/1/20 | | | | 335,000 | | 357,773 |
| California Poll. Cont. Fing. Auth. Ctfs. of Prtn. (Pacific | | | | | | |
| Gas & Elec. Co. Proj.) Series 2004 B, 3.5%, tender | | | | | | |
| 6/1/07 (FGIC Insured) (c)(d) | | | | 1,200,000 | | 1,195,236 |
| California Pub. Works Board Lease Rev.: | | | | | | |
| (Richmond Lab., Phase III Office Bldg. Proj.) Series B, | | | | | | |
| 5.25% 11/1/25 (XL Cap. Assurance, Inc. Insured) . | | | | 2,585,000 | | 2,754,033 |
| Series 2005 A, 5.25% 6/1/30 | | | | 2,000,000 | | 2,071,480 |
| Series 2005 H, 5% 6/1/18 | | | | 1,425,000 | | 1,473,279 |
| Series 2005 K, 5% 11/1/17 | | | | 2,300,000 | | 2,389,861 |
| California Statewide Cmntys. Dev. Auth. Rev. (Kaiser | | | | | | |
| Fund Hosp./Health Place, Inc. Proj.) Series 2002 C, | | | | | | |
| 3.85%, tender 6/1/12 (c) | | | | 500,000 | | 488,850 |
| Central Valley Fing. Auth. Cogeneration Proj. Rev. | | | | | | |
| (Carson Ice Gen. Proj.) 6% 7/1/09 | | | | 335,000 | | 335,496 |
| Foothill/Eastern Trans. Corridor Agcy. Toll Road Rev.: | | | | | | |
| Series A, 5% 1/1/35 (MBIA Insured) | | | | 700,000 | | 707,175 |
| 5% 1/15/16 (MBIA Insured) | | | | 400,000 | | 417,764 |
| 5.75% 1/15/40 | | | | 600,000 | | 607,458 |
| Golden State Tobacco Securitization Corp.: | | | | | | |
| Series 2003 A1, 6.75% 6/1/39 | | | | 1,200,000 | | 1,335,180 |
| Series A: | | | | | | |
| 5% 6/1/35 (FGIC Insured) | | | | 2,200,000 | | 2,248,554 |
| 5% 6/1/38 (FGIC Insured) | | | | 1,550,000 | | 1,579,388 |
| 5% 6/1/45 | | | | 5,650,000 | | 5,700,229 |
| Los Angeles Dept. of Wtr. & Pwr. Wtrwks. Rev.: | | | | | | |
| Series 2001 A, 5.125% 7/1/41 | | | | 4,000,000 | | 4,060,360 |
| Series A, 5.125% 7/1/41 (MBIA Insured) | | | | 1,300,000 | | 1,328,561 |
| Los Angeles Unified School District Series A: | | | | | | |
| 5.375% 7/1/17 (MBIA Insured) | | | | 835,000 | | 902,051 |
| 5.375% 7/1/18 (Pre-Refunded to 7/1/13 @ 100) (e) | | | | 1,000,000 | | 1,095,260 |
| North City West School Facilities Fing. Auth. Spl. Tax | | | | | | |
| Series C, 5% 9/1/10 (AMBAC Insured) (b) | | | | 1,290,000 | | 1,344,322 |
See accompanying notes which are an integral part of the financial statements.
| Municipal Bonds continued | | | | | | |
| | | | | Principal | | Value (Note 1) |
| | | | | Amount | | |
| California – continued | | | | | | |
| San Diego Unified School District (Election of 1998 Proj.) | | | | | | |
| Series E2, 5.5% 7/1/26 (FSA Insured) | | | | $ 2,300,000 | | $ 2,642,447 |
| San Joaquin Hills Trans. Corridor Agcy. Toll Road Rev. | | | | | | |
| Series A, 0% 1/15/12 (MBIA Insured) | | | | 1,300,000 | | 1,033,825 |
| Univ. of California Revs. (UCLA Med. Ctr. Proj.) Series A: | | | | | | |
| 5.5% 5/15/18 (AMBAC Insured) | | | | 1,755,000 | | 1,896,909 |
| 5.5% 5/15/20 (AMBAC Insured) | | | | 2,000,000 | | 2,155,060 |
| | | | | | | 76,769,317 |
| |
| Colorado – 1.6% | | | | | | |
| Colorado Health Facilities Auth. Retirement Hsg. Rev. | | | | | | |
| (Liberty Heights Proj.) 0% 7/15/22 (Escrowed to | | | | | | |
| Maturity) (e) | | | | 1,365,000 | | 626,317 |
| Colorado Springs Arpt. Rev. Series C, 0% 1/1/08 (MBIA | | | | | | |
| Insured) | | | | 870,000 | | 816,599 |
| Colorado Wtr. Resources and Pwr. Dev. Auth. Clean Wtr. | | | | | | |
| Rev. Series 2001 A: | | | | | | |
| 5.625% 9/1/13 | | | | 235,000 | | 254,552 |
| 5.625% 9/1/14 | | | | 230,000 | | 248,791 |
| Colorado Wtr. Resources and Pwr. Dev. Auth. Wtr. | | | | | | |
| Resources Rev. (Parker Wtr. and Sanitation District | | | | | | |
| Proj.) Series D, 5.25% 9/1/43 (MBIA Insured) | | | | 4,600,000 | | 4,817,580 |
| Dawson Ridge Metropolitan District # 1 Series B, 0% | | | | | | |
| 10/1/22 (Escrowed to Maturity) (e) | | | | 2,000,000 | | 908,420 |
| E-470 Pub. Hwy. Auth. Rev. Series 2000 A, 5.75% | | | | | | |
| 9/1/29 (MBIA Insured) | | | | 1,200,000 | | 1,303,836 |
| Mesa County Residual Rev. 0% 12/1/11 (Escrowed to | | | | | | |
| Maturity) (e) | | | | 2,275,000 | | 1,806,214 |
| | | | | | | 10,782,309 |
| |
| Connecticut – 0.8% | | | | | | |
| Connecticut Health & Edl. Facilities Auth. Rev. (Loomis | | | | | | |
| Chaffee School Proj.) 5.25% 7/1/28 (AMBAC | | | | | | |
| Insured) | | | | 1,760,000 | | 1,946,437 |
| Eastern Connecticut Resources Recovery Auth. Solid | | | | | | |
| Waste Rev. (Wheelabrator Lisbon Proj.) Series A, 5.5% | | | | | | |
| 1/1/20 (d) | | | | 3,350,000 | | 3,354,221 |
| | | | | | | 5,300,658 |
| |
| District Of Columbia – 2.0% | | | | | | |
| District of Columbia Gen. Oblig.: | | | | | | |
| Series A, 6% 6/1/07 (Escrowed to Maturity) (e) | | | | 150,000 | | 150,842 |
| Series B: | | | | | | |
| 0% 6/1/12 (MBIA Insured) | | | | 1,200,000 | | 923,832 |
See accompanying notes which are an integral part of the financial statements.
9 Semiannual Report
| Investments (Unaudited) continued | | | | |
| |
| |
| Municipal Bonds continued | | | | |
| | | | | Principal | | Value (Note 1) |
| | | | | Amount | | |
| District Of Columbia – continued | | | | | | |
| District of Columbia Gen. Oblig.: – continued | | | | | | |
| 5.25% 6/1/26 (FSA Insured) | | | | $ 6,000,000 | | $ 6,228,780 |
| District of Columbia Rev.: | | | | | | |
| (George Washington Univ. Proj.) Series A, 5.75% | | | | | | |
| 9/15/20 (MBIA Insured) | | | | 1,490,000 | | 1,595,030 |
| (Georgetown Univ. Proj.) Series A, 5.95% 4/1/14 | | | | | | |
| (MBIA Insured) | | | | 2,000,000 | | 2,114,540 |
| (Nat’l. Academy of Sciences Proj.) Series A, 5% | | | | | | |
| 1/1/19 (AMBAC Insured) | | | | 2,500,000 | | 2,583,725 |
| | | | | | | 13,596,749 |
| |
| Florida – 1.4% | | | | | | |
| Flagler County School Board Ctfs. Series A, 5% 8/1/12 | | | | | | |
| (FSA Insured) | | | | 1,000,000 | | 1,050,770 |
| Florida Board of Ed. Cap. Outlay Series B, 5.5% | | | | | | |
| 6/1/16 (FGIC Insured) | | | | 1,000,000 | | 1,079,620 |
| Florida Correctional Privatization Communications Ctfs. | | | | | | |
| of Prtn. Series A, 5% 8/1/15 (AMBAC Insured) | | | | 1,000,000 | | 1,049,510 |
| Highlands County Health Facilities Auth. Rev. (Adventist | | | | | | |
| Health Sys./Sunbelt Obligated Group Proj.): | | | | | | |
| Series B, 5% 11/15/14 | | | | 1,000,000 | | 1,043,010 |
| 3.95%, tender 9/1/12 (c) | | | | 1,300,000 | | 1,265,134 |
| 5%, tender 11/16/09 (c) | | | | 1,800,000 | | 1,855,188 |
| JEA Elec. Sys. Rev. Series 3A, 5% 10/1/41 (FSA | | | | | | |
| Insured) | | | | 1,000,000 | | 1,019,410 |
| Miami-Dade County Aviation Rev. Series A, 5% | | | | | | |
| 10/1/38 (CIFG North America Insured) (d) | | | | 1,000,000 | | 1,015,720 |
| Seminole County School Board Ctfs. of Prtn. Series A, | | | | | | |
| 5% 7/1/20 (MBIA Insured) | | | | 500,000 | | 518,190 |
| | | | | | | 9,896,552 |
| |
| Georgia – 2.7% | | | | | | |
| Atlanta Arpt. Rev. Series F, 5.25% 1/1/13 (FSA | | | | | | |
| Insured) (d) | | | | 1,000,000 | | 1,054,460 |
| Atlanta Wtr. & Wastewtr. Rev.: | | | | | | |
| 5% 11/1/37 (FSA Insured) | | | | 2,400,000 | | 2,448,264 |
| 5% 11/1/43 (FSA Insured) | | | | 9,070,000 | | 9,214,304 |
| Augusta Wtr. & Swr. Rev. 5.25% 10/1/39 (FSA Insured) | | | | 2,200,000 | | 2,314,400 |
| College Park Bus. & Indl. Dev. Auth. Civic Ctr. Proj. Rev. | | | | | | |
| Series 2000, 5.75% 9/1/20 (Pre-Refunded to 9/1/10 | | | | | | |
| @ 102) (e) | | | | 1,100,000 | | 1,208,130 |
| Colquitt County Dev. Auth. Rev. Series A, 0% 12/1/21 | | | | | | |
| (Escrowed to Maturity) (e) | | | | 1,100,000 | | 523,226 |
| |
| See accompanying notes which are an integral part of the financial statements. | | |
| |
| Semiannual Report | | 10 | | | | |
| Municipal Bonds continued | | | | | | |
| | | | | Principal | | Value (Note 1) |
| | | | | Amount | | |
| Georgia – continued | | | | | | |
| Richmond County Dev. Auth. Rev. Series C, 0% 12/1/21 | | | | | | |
| (Escrowed to Maturity) (e) | | | | $ 1,165,000 | | $ 554,144 |
| Savannah Econ. Dev. Auth. Rev. (Southern Care Corp. | | | | | | |
| Proj.) Series C, 0% 12/1/21 (Escrowed to | | | | | | |
| Maturity) (e) | | | | 2,500,000 | | 1,189,150 |
| | | | | | | 18,506,078 |
| |
| Hawaii – 0.2% | | | | | | |
| Hawaii Arpts. Sys. Rev. Series 2000 B, 8% 7/1/11 | | | | | | |
| (FGIC Insured) (d) | | | | 1,300,000 | | 1,528,956 |
| Illinois – 10.3% | | | | | | |
| Chicago Board of Ed.: | | | | | | |
| (Westinghouse High School Proj.) Series C, 5.25% | | | | | | |
| 12/1/19 (MBIA Insured) | | | | 1,300,000 | | 1,382,420 |
| Series A: | | | | | | |
| 0% 12/1/16 (FGIC Insured) | | | | 1,300,000 | | 801,905 |
| 5.5% 12/1/27 (AMBAC Insured) | | | | 1,000,000 | | 1,134,130 |
| Chicago Gen. Oblig.: | | | | | | |
| (City Colleges Proj.): | | | | | | |
| 0% 1/1/16 (FGIC Insured) | | | | 6,125,000 | | 3,965,876 |
| 0% 1/1/24 (FGIC Insured) | | | | 6,110,000 | | 2,666,648 |
| (Neighborhoods Alive 21 Prog.) 5% 1/1/43 (AMBAC | | | | | | |
| Insured) | | | | 1,000,000 | | 1,012,630 |
| Series A: | | | | | | |
| 5% 1/1/41 (Pre-Refunded to 1/1/15 @ 100) (e) | | | | 1,000,000 | | 1,050,150 |
| 5% 1/1/42 (AMBAC Insured) | | | | 1,700,000 | | 1,725,993 |
| 5.25% 1/1/33 (MBIA Insured) | | | | 1,070,000 | | 1,108,028 |
| 5.25% 1/1/33 (Pre-Refunded to 1/1/11 @ 101) (e) | | | | 30,000 | | 32,186 |
| 5.5% 1/1/38 (MBIA Insured) | | | | 255,000 | | 269,765 |
| 5.5% 1/1/38 (Pre-Refunded to 1/1/11 @ 101) (e) . | | | | 10,000 | | 10,835 |
| 5.5% 1/1/38 (Pre-Refunded to 1/1/11 @ 101) (e) . | | | | 735,000 | | 796,336 |
| 5.5% 1/1/40 (FGIC Insured) | | | | 525,000 | | 552,930 |
| Chicago Midway Arpt. Rev. Series B, 6% 1/1/09 (MBIA | | | | | | |
| Insured) (d) | | | | 300,000 | | 306,741 |
| Chicago O’Hare Int’l. Arpt. Rev.: | | �� | | | | |
| Series A: | | | | | | |
| 5.5% 1/1/16 (AMBAC Insured) (d) | | | | 900,000 | | 926,442 |
| 6.25% 1/1/09 (AMBAC Insured) (d) | | | | 3,325,000 | | 3,443,237 |
| Series B, 5.25% 1/1/14 (FGIC Insured) | | | | 1,000,000 | | 1,071,500 |
| 5.5% 1/1/09 (AMBAC Insured) (d) | | | | 1,250,000 | | 1,298,100 |
| Chicago Park District Series A, 5.5% 1/1/19 (FGIC | | | | | | |
| Insured) | | | | 155,000 | | 164,788 |
See accompanying notes which are an integral part of the financial statements.
11 Semiannual Report
| Investments (Unaudited) continued | | | | | | |
| |
| |
| Municipal Bonds continued | | | | | | |
| | | | | Principal | | Value (Note 1) |
| | | | | Amount | | |
| Illinois – continued | | | | | | |
| Chicago Transit Auth. Cap. Grant Receipts Rev. (Douglas | | | | | | |
| Branch Proj.) Series 2003 B, 4.25% 6/1/08 (AMBAC | | | | | | |
| Insured) | | | | $ 1,400,000 | | $ 1,400,854 |
| Coles, Cumberland, Moultrie & Shelby Counties Cmnty. | | | | | | |
| Unit School District #2, Mattoon 5.8% 2/1/17 (Pre- | | | | | | |
| Refunded to 2/1/11 @ 100) (e) | | | | 1,000,000 | | 1,089,190 |
| Cook County Gen. Oblig. Series C, 5% 11/15/25 | | | | | | |
| (AMBAC Insured) | | | | 1,100,000 | | 1,130,195 |
| DuPage County Cmnty. High School District #108, Lake | | | | | | |
| Park 5.6% 1/1/17 (FSA Insured) | | | | 3,190,000 | | 3,466,254 |
| Evanston Gen. Oblig. Series C, 5.25% 1/1/20 | | | | 1,500,000 | | 1,588,605 |
| Granite City Solid Waste Disp. Rev. (Waste Mgmt., Inc. | | | | | | |
| Proj.) 3.85%, tender 5/1/08 (c)(d) | | | | 2,810,000 | | 2,791,370 |
| Illinois Dev. Fin. Auth. Retirement 0% 7/15/23 | | | | | | |
| (Escrowed to Maturity) (e) | | | | 2,900,000 | | 1,259,702 |
| Illinois Gen. Oblig.: | | | | | | |
| First Series: | | | | | | |
| 5.5% 8/1/19 (MBIA Insured) | | | | 2,500,000 | | 2,690,925 |
| 5.75% 12/1/18 (MBIA Insured) | | | | 1,000,000 | | 1,074,240 |
| Series 2006, 5.5% 1/1/31 | | | | 1,000,000 | | 1,146,370 |
| 5.5% 4/1/17 (MBIA Insured) | | | | 1,000,000 | | 1,056,740 |
| 5.6% 4/1/21 (MBIA Insured) | | | | 1,000,000 | | 1,055,880 |
| Illinois Health Facilities Auth. Rev.: | | | | | | |
| (Condell Med. Ctr. Proj.) 6.5% 5/15/30 | | | | 3,000,000 | | 3,167,940 |
| (Decatur Memorial Hosp. Proj.) Series 2001, 5.75% | | | | | | |
| 10/1/24 | | | | 2,100,000 | | 2,176,776 |
| (Lake Forest Hosp. Proj.) 6% 7/1/33 | | | | 1,000,000 | | 1,055,800 |
| (Riverside Health Sys. Proj.) 6.8% 11/15/20 | | | | | | |
| (Pre-Refunded to 11/15/10 @ 101) (e) | | | | 1,500,000 | | 1,701,750 |
| Illinois Sales Tax Rev.: | | | | | | |
| First Series 2001, 5.5% 6/15/13 | | | | 3,250,000 | | 3,492,060 |
| 6% 6/15/20 | | | | 600,000 | | 647,700 |
| Joliet School District #86 Gen. Oblig. Cap. Appreciation | | | | | | |
| 0% 11/1/19 (FSA Insured) | | | | 2,000,000 | | 1,069,900 |
| Lake County Cmnty. High School District #117, Antioch | | | | | | |
| Series B, 0% 12/1/20 (FGIC Insured) | | | | 1,805,000 | | 914,377 |
| Lake County Warren Township High School District | | | | | | |
| #121, Gurnee Series C, 5.5% 3/1/23 (AMBAC | | | | | | |
| Insured) | | | | 1,795,000 | | 1,959,637 |
| Metropolitan Pier & Exposition Auth. Dedicated State Tax | | | | | | |
| Rev. (McCormick Place Expansion Proj.): | | | | | | |
| Series 2002 A, 5.75% 6/15/41 (MBIA Insured) | | | | 3,300,000 | | 3,589,509 |
See accompanying notes which are an integral part of the financial statements.
| Municipal Bonds continued | | | | | | |
| | | | | Principal | | Value (Note 1) |
| | | | | Amount | | |
| Illinois – continued | | | | | | |
| Metropolitan Pier & Exposition Auth. Dedicated State Tax | | | | | | |
| Rev. (McCormick Place Expansion Proj.): – continued | | | | | | |
| Series A: | | | | | | |
| 0% 6/15/16 (FGIC Insured) | | | | $ 2,370,000 | | $ 1,500,447 |
| 0% 6/15/22 (MBIA Insured) | | | | 1,060,000 | | 504,518 |
| 0% 12/15/24 (MBIA Insured) | | | | 3,090,000 | | 1,301,230 |
| Ogle, Lee & DeKalb Counties Township High School | | | | | | |
| District #212: | | | | | | |
| 6% 12/1/16 (MBIA Insured) | | | | 60,000 | | 66,228 |
| 6% 12/1/16 (Pre-Refunded to 12/1/11 @ 100) (e) | | | | 940,000 | | 1,044,030 |
| Univ. of Illinois Auxiliary Facilities Sys. Rev. 0% 4/1/15 | | | | | | |
| (MBIA Insured) | | | | 3,700,000 | | 2,497,426 |
| Will County Forest Preservation District Series B, 0% | | | | | | |
| 12/1/14 (FGIC Insured) | | | | 1,000,000 | | 688,440 |
| | | | | | | 70,848,733 |
| |
| Indiana – 2.5% | | | | | | |
| Anderson School Bldg. Corp. 5.5% 7/15/23 (Pre-Re- | | | | | | |
| funded to 7/15/14 @ 100) (e) | | | | 1,330,000 | | 1,464,317 |
| Crown Point Multi-School Bldg. Corp. 5% 1/15/20 | | | | | | |
| (FGIC Insured) | | | | 1,260,000 | | 1,313,701 |
| Franklin Township Independent School Bldg. Corp., | | | | | | |
| Marion County 5.25% 7/15/16 (MBIA Insured) | | | | 1,790,000 | | 1,925,020 |
| Hobart Bldg. Corp. 6.5% 1/15/29 (FGIC Insured) (b) | | | | 2,600,000 | | 3,139,162 |
| Indiana Health Facility Fing. Auth. Rev. (Sisters of Saint | | | | | | |
| Francis Health Svc. Proj.) 5.5% 11/1/31 | | | | 1,500,000 | | 1,556,295 |
| Indiana Trans. Fin. Auth. Hwy. Series A, 0% 6/1/17 | | | | | | |
| (AMBAC Insured) | | | | 1,000,000 | | 601,620 |
| Muncie School Bldg. Corp. 5.25% 7/10/13 (MBIA | | | | | | |
| Insured) | | | | 1,670,000 | | 1,799,158 |
| North Adams Cmnty. Schools Renovation Bldg. Corp. 0% | | | | | | |
| 1/15/17 (FSA Insured) | | | | 1,230,000 | | 752,920 |
| Petersburg Poll. Cont. Rev. 5.95% 12/1/29 (d) | | | | 2,000,000 | | 2,114,300 |
| Portage Township Multi-School Bldg. Corp. 5.25% | | | | | | |
| 7/15/26 (MBIA Insured) | | | | 1,195,000 | | 1,263,677 |
| South Harrison School Bldg. Corp. Series A, 5.25% | | | | | | |
| 1/15/25 (FSA Insured) | | | | 1,150,000 | | 1,218,241 |
| | | | | | | 17,148,411 |
See accompanying notes which are an integral part of the financial statements.
13 Semiannual Report
| Investments (Unaudited) continued | | | | |
| |
| |
| Municipal Bonds continued | | | | | | |
| | | | | Principal | | Value (Note 1) |
| | | | | Amount | | |
| Iowa 0.9% | | | | | | |
| Iowa Fin. Auth. Hosp. Facilities Rev. 5.875% 2/15/30 | | | | | | |
| (Pre-Refunded to 2/15/10 @ 101) (e) | | | | $ 1,870,000 | | $ 2,028,520 |
| Tobacco Settlement Auth. Tobacco Settlement Rev. 5.3% | | | | | | |
| 6/1/25 (Pre-Refunded to 6/1/11 @ 101) (e) | | | | 4,000,000 | | 4,249,480 |
| | | | | | | 6,278,000 |
| |
| Kansas 1.5% | | | | | | |
| Burlington Envir. Impt. Rev. (Kansas City Pwr. & Lt. Co. | | | | | | |
| Proj.) Series A, 4.75%, tender 10/1/07 (c) | | | | 1,000,000 | | 1,007,830 |
| Kansas Dev. Fin. Auth. Health Facilities Rev.: | | | | | | |
| (Hays Med. Ctr. Proj.) Series 2005 L: | | | | | | |
| 5.25% 11/15/15 | | | | 335,000 | | 354,031 |
| 5.25% 11/15/16 | | | | 955,000 | | 1,003,208 |
| (Sisters of Charity of Leavenworth Health Svcs. Corp. | | | | | | |
| Proj.) Series J, 6.25% 12/1/28 | | | | 1,500,000 | | 1,626,750 |
| Kansas Dev. Fin. Auth. Rev. (Sisters of Charity of | | | | | | |
| Leavenworth Health Svcs. Corp. Proj.): | | | | | | |
| 5% 12/1/13 (MBIA Insured) | | | | 2,390,000 | | 2,462,991 |
| 5% 12/1/14 (MBIA Insured) | | | | 500,000 | | 515,270 |
| 5.25% 12/1/09 (MBIA Insured) | | | | 1,420,000 | | 1,473,846 |
| 5.25% 12/1/11 (MBIA Insured) | | | | 1,750,000 | | 1,814,593 |
| | | | | | | 10,258,519 |
| |
| Kentucky 0.3% | | | | | | |
| Louisville & Jefferson County Metropolitan Swr. District | | | | | | |
| Swr. & Drain Sys. Rev. Series A, 5.25% 5/15/37 | | | | | | |
| (FGIC Insured) | | | | 2,170,000 | | 2,301,372 |
| Louisiana – 0.1% | | | | | | |
| New Orleans Gen. Oblig. 0% 9/1/15 (AMBAC Insured) | | | | 700,000 | | 449,722 |
| Tobacco Settlement Fing. Corp. Series 2001 B, 5.5% | | | | | | |
| 5/15/30 | | | | 420,000 | | 435,826 |
| | | | | | | 885,548 |
| |
| Maine – 0.2% | | | | | | |
| Maine Tpk. Auth. Tpk. Rev. 5.25% 7/1/30 (FSA Insured) | | | | 1,000,000 | | 1,055,590 |
| Maryland 0.4% | | | | | | |
| Maryland Health & Higher Edl. Facilities Auth. Rev. | | | | | | |
| (Good Samaritan Hosp. Proj.): | | | | | | |
| 5.75% 7/1/13 (Escrowed to Maturity) (e) | | | | 1,665,000 | | 1,812,486 |
| 5.75% 7/1/13 (Escrowed to Maturity) (e) | | | | 1,015,000 | | 1,104,909 |
| | | | | | | 2,917,395 |
| |
| |
| See accompanying notes which are an integral part of the financial statements. | | |
| |
| Semiannual Report | | 14 | | | | |
| Municipal Bonds continued | | | | | | |
| | | | | Principal | | Value (Note 1) |
| | | | | Amount | | |
| Massachusetts 4.6% | | | | | | |
| Massachusetts Bay Trans. Auth. Series A, 5% 7/1/31 | | | | $ 2,000,000 | | $ 2,063,660 |
| Massachusetts Gen. Oblig.: | | | | | | |
| Series 2005 A, 5% 3/1/22 | | | | 3,500,000 | | 3,641,645 |
| Series 2005 C, 5.25% 9/1/23 | | | | 2,800,000 | | 2,989,140 |
| Series D: | | | | | | |
| 5% 10/1/23 (Pre-Refunded to 10/1/13 @ 100) (e) | | | | 1,000,000 | | 1,058,950 |
| 5.25% 10/1/20 (Pre-Refunded to 10/1/13 @ | | | | | | |
| 100) (e) | | | | 2,000,000 | | 2,149,620 |
| 5.25% 10/1/22 (Pre-Refunded to 10/1/13 @ | | | | | | |
| 100) (e) | | | | 1,200,000 | | 1,289,772 |
| Massachusetts Health & Edl. Facilities Auth. Rev. (New | | | | | | |
| England Med. Ctr. Hosp. Proj.) Series G, 5.375% | | | | | | |
| 7/1/24 (MBIA Insured) | | | | 500,000 | | 501,535 |
| Massachusetts Indl. Fin. Agcy. Rev. (Massachusetts | | | | | | |
| Biomedical Research Corp. Proj.) Series A2: | | | | | | |
| 0% 8/1/08 | | | | 800,000 | | 730,504 |
| 0% 8/1/10 | | | | 4,500,000 | | 3,753,450 |
| Massachusetts School Bldg. Auth. Dedicated Sales Tax | | | | | | |
| Rev. Series A: | | | | | | |
| 5% 8/15/23 (FSA Insured) | | | | 5,000,000 | | 5,222,400 |
| 5% 8/15/30 (FSA Insured) | | | | 4,500,000 | | 4,662,000 |
| Massachusetts Wtr. Poll. Abatement Trust Wtr. Poll. | | | | | | |
| Abatement Rev. (MWRA Ln. Prog.) Series A, 5.25% | | | | | | |
| 8/1/13 | | | | 10,000 | | 10,427 |
| Springfield Gen. Oblig. 5% 8/1/20 (MBIA Insured) | | | | 3,335,000 | | 3,480,273 |
| | | | | | | 31,553,376 |
| |
| Michigan – 1.2% | | | | | | |
| Detroit Wtr. Supply Sys. Rev. Series 2001 A, 5.25% | | | | | | |
| 7/1/33 (FGIC Insured) | | | | 1,065,000 | | 1,110,316 |
| Ferris State Univ. Rev. 5% 10/1/19 (MBIA Insured) | | | | 1,440,000 | | 1,498,090 |
| Michigan Hosp. Fin. Auth. Hosp. Rev. (McLaren Health | | | | | | |
| Care Corp. Proj.) Series A, 5% 6/1/19 | | | | 2,000,000 | | 2,045,780 |
| Royal Oak Hosp. Fin. Auth. Hosp. Rev. (William | | | | | | |
| Beaumont Hosp. Proj.) 6.25% 1/1/09 | | | | 2,310,000 | | 2,443,403 |
| Willow Run Cmnty. Schools County of Washtenaw 5% | | | | | | |
| 5/1/20 (FSA Insured) | | | | 1,000,000 | | 1,040,400 |
| | | | | | | 8,137,989 |
| |
| Minnesota 1.3% | | | | | | |
| Minneapolis & Saint Paul Hsg. & Redev. Auth. Health | | | | | | |
| Care Sys. Rev. (Healthspan Corp. Proj.) Series A, | | | | | | |
| 4.75% 11/15/18 (AMBAC Insured) | | | | 1,800,000 | | 1,812,708 |
See accompanying notes which are an integral part of the financial statements.
15 Semiannual Report
| Investments (Unaudited) continued | | | | |
| |
| |
| Municipal Bonds continued | | | | | | |
| | | | | Principal | | Value (Note 1) |
| | | | | Amount | | |
| Minnesota – continued | | | | | | |
| Minneapolis & Saint Paul Metropolitan Arpts. | | | | | | |
| Commission Arpt. Rev. Series 2001 C, 5.25% 1/1/32 | | | | | | |
| (FGIC Insured) | | | | $ 1,000,000 | | $ 1,037,540 |
| Minneapolis Health Care Sys. Rev. (Allina Health Sys. | | | | | | |
| Proj.) Series 2002 A, 6% 11/15/23 | | | | 1,000,000 | | 1,087,020 |
| Rochester Health Care Facilities Rev. (Mayo Foundation | | | | | | |
| Proj.) Series A, 5.5% 11/15/27 | | | | 590,000 | | 615,022 |
| Saint Cloud Health Care Rev. (Saint Cloud Hosp. Group | | | | | | |
| Oblig. Proj.) Series A, 5.875% 5/1/30 (FSA Insured) | | | | 2,000,000 | | 2,154,240 |
| Saint Paul Port Auth. Lease Rev.: | | | | | | |
| (HealthEast Midway Campus Proj.) Series 2003 A, | | | | | | |
| 5.875% 5/1/30 | | | | 1,400,000 | | 1,425,886 |
| Series 2003 11, 5.25% 12/1/18 | | | | 1,000,000 | | 1,060,180 |
| | | | | | | 9,192,596 |
| |
| Missouri – 0.2% | | | | | | |
| Missouri Envir. Impt. & Energy Resources Auth. Wtr. Poll. | | | | | | |
| Cont. & Drinking Wtr. Rev. (State Revolving Fund | | | | | | |
| Prog.) Series 2003 A, 5.125% 1/1/21 | | | | 1,010,000 | | 1,058,955 |
| Montana 0.4% | | | | | | |
| Forsyth Poll. Cont. Rev. (Portland Gen. Elec. Co. Projs.) | | | | | | |
| Series A, 5.2%, tender 5/1/09 (c) | | | | 1,500,000 | | 1,538,010 |
| Montana Board of Regents Higher Ed. Rev. (Montana | | | | | | |
| State Univ. Proj.) 5% 11/15/34 (AMBAC Insured) | | | | 1,000,000 | | 1,031,510 |
| | | | | | | 2,569,520 |
| |
| Nevada 0.7% | | | | | | |
| Clark County Arpt. Rev. Series C, 5.375% 7/1/22 | | | | | | |
| (AMBAC Insured) (d) | | | | 1,000,000 | | 1,042,430 |
| Clark County Gen. Oblig. Series 2000, 5.5% 7/1/30 | | | | | | |
| (MBIA Insured) | | | | 500,000 | | 524,355 |
| Clark County School District Series C, 5.375% 6/15/15 | | | | | | |
| (Pre-Refunded to 6/15/12 @ 100) (e) | | | | 1,000,000 | | 1,083,500 |
| Las Vegas Valley Wtr. District Series B: | | | | | | |
| 5.25% 6/1/16 (MBIA Insured) | | | | 1,000,000 | | 1,063,310 |
| 5.25% 6/1/17 (MBIA Insured) | | | | 1,000,000 | | 1,060,360 |
| | | | | | | 4,773,955 |
| |
| New Hampshire – 0.2% | | | | | | |
| New Hampshire Bus. Fin. Auth. Poll. Cont. Rev. (United | | | | | | |
| Illumination Co.) Series A, 3.65%, tender 2/1/10 | | | | | | |
| (AMBAC Insured) (c)(d) | | | | 1,000,000 | | 979,380 |
| |
| |
| See accompanying notes which are an integral part of the financial statements. | | |
| |
| Semiannual Report | | 16 | | | | |
| Municipal Bonds continued | | | | | | |
| | | | | Principal | | Value (Note 1) |
| | | | | Amount | | |
| New Jersey – 3.2% | | | | | | |
| New Jersey Econ. Dev. Auth. Rev.: | | | | | | |
| Series 2005 K, 5.5% 12/15/19 (AMBAC Insured) | | | | $ 1,500,000 | | $ 1,677,405 |
| Series 2005 O: | | | | | | |
| 5.25% 3/1/23 | | | | 2,000,000 | | 2,106,660 |
| 5.25% 3/1/26 | | | | 915,000 | | 959,725 |
| Series O: | | | | | | |
| 5.25% 3/1/21 (MBIA Insured) | | | | 1,000,000 | | 1,066,080 |
| 5.25% 3/1/25 | | | | 1,500,000 | | 1,575,540 |
| New Jersey Tpk. Auth. Tpk. Rev. Series A, 5% 1/1/25 | | | | | | |
| (FSA Insured) | | | | 900,000 | | 938,493 |
| New Jersey Trans. Trust Fund Auth. Series B, 5.25% | | | | | | |
| 12/15/22 (AMBAC Insured) | | | | 400,000 | | 437,776 |
| North Hudson Swr. Auth. Swr. Rev. Series A, 5.25% | | | | | | |
| 8/1/17 (FGIC Insured) | | | | 2,000,000 | | 2,126,580 |
| Tobacco Settlement Fing. Corp.: | | | | | | |
| 4.375% 6/1/19 | | | | 2,350,000 | | 2,346,428 |
| 6.125% 6/1/24 | | | | 3,300,000 | | 3,555,486 |
| 6.125% 6/1/42 | | | | 1,600,000 | | 1,679,296 |
| 6.375% 6/1/32 | | | | 1,400,000 | | 1,521,310 |
| 6.75% 6/1/39 | | | | 600,000 | | 668,730 |
| Union County Impt. Auth. (Juvenile Detention Ctr. Facility | | | | | | |
| Proj.) 5.5% 5/1/28 (FGIC Insured) | | | | 1,000,000 | | 1,086,400 |
| | | | | | | 21,745,909 |
| |
| New Mexico – 1.1% | | | | | | |
| Albuquerque Arpt. Rev.: | | | | | | |
| 6.7% 7/1/18 (AMBAC Insured) (d) | | | | 3,970,000 | | 4,160,878 |
| 6.75% 7/1/09 (AMBAC Insured) (d) | | | | 450,000 | | 484,848 |
| 6.75% 7/1/11 (AMBAC Insured) (d) | | | | 1,805,000 | | 2,001,438 |
| New Mexico Edl. Assistance Foundation Student Ln. Rev. | | | | | | |
| Series IV A2, 6.65% 3/1/07 | | | | 1,000,000 | | 1,012,020 |
| | | | | | | 7,659,184 |
| |
| New York – 9.3% | | | | | | |
| Erie County Indl. Dev. Agcy. School Facility Rev. (Buffalo | | | | | | |
| City School District Proj.): | | | | | | |
| Series 2003: | | | | | | |
| 5.75% 5/1/16 (FSA Insured) | | | | 1,500,000 | | 1,648,230 |
| 5.75% 5/1/21 (FSA Insured) | | | | 1,200,000 | | 1,300,968 |
| Series 2004: | | | | | | |
| 5.75% 5/1/21 (FSA Insured) | | | | 4,900,000 | | 5,453,455 |
| 5.75% 5/1/25 (FSA Insured) | | | | 600,000 | | 668,634 |
See accompanying notes which are an integral part of the financial statements.
17 Semiannual Report
| Investments (Unaudited) continued | | | | | | |
| |
| |
| Municipal Bonds continued | | | | | | |
| | | | | Principal | | Value (Note 1) |
| | | | | Amount | | |
| New York – continued | | | | | | |
| Long Island Pwr. Auth. Elec. Sys. Rev. 5% 12/1/26 (XL | | | | | | |
| Cap. Assurance, Inc. Insured) | | | | $ 1,400,000 | | $ 1,453,872 |
| Metropolitan Trans. Auth. Rev.: | | | | | | |
| Series 2002 A, 5.75% 11/15/32 | | | | 4,300,000 | | 4,687,559 |
| Series F, 5.25% 11/15/27 (MBIA Insured) | | | | 500,000 | | 530,305 |
| Metropolitan Trans. Auth. Svc. Contract Rev.: | | | | | | |
| Series 7, 5.625% 7/1/16 (Escrowed to Maturity) (e) | | | | 1,000,000 | | 1,001,310 |
| Series O, 5.75% 7/1/13 (Escrowed to Maturity) (e) | | | | 700,000 | | 754,495 |
| Metropolitan Trans. Auth. Transit Facilities Rev. Series C, | | | | | | |
| 4.75% 7/1/16 (Pre-Refunded to 1/1/12 @ 100) (e) . | | | | 150,000 | | 157,346 |
| Nassau County Gen. Oblig. Series Z, 5% 9/1/11 (FGIC | | | | | | |
| Insured) | | | | 300,000 | | 314,598 |
| New York City Gen. Oblig.: | | | | | | |
| Series 2003 I, 5.75% 3/1/16 | | | | 715,000 | | 779,264 |
| Series 2005 G: | | | | | | |
| 5% 8/1/14 | | | | 3,600,000 | | 3,785,904 |
| 5% 8/1/15 | | | | 1,000,000 | | 1,051,310 |
| Series A, 5.25% 11/1/14 (MBIA Insured) | | | | 600,000 | | 639,960 |
| Series C: | | | | | | |
| 5.75% 3/15/27 (FSA Insured) | | | | 135,000 | | 146,065 |
| 5.75% 3/15/27 (Pre-Refunded to 3/15/12 @ | | | | | | |
| 100) (e) | | | | 365,000 | | 402,500 |
| Subseries 2005 F1, 5.25% 9/1/14 | | | | 1,200,000 | | 1,283,352 |
| New York City Indl. Dev. Agcy. Indl. Dev. Rev. (Japan | | | | | | |
| Airlines Co. Ltd. Proj.) Series 1991, 6% 11/1/15 (FSA | | | | | | |
| Insured) (d) | | | | 705,000 | | 720,841 |
| New York City Indl. Dev. Agcy. Spl. Facilities Rev. | | | | | | |
| (Terminal One Group Assoc. Proj.) 5% 1/1/09 (d) | | | | 1,000,000 | | 1,021,910 |
| New York City Muni. Wtr. Fin. Auth. Wtr. & Swr. Sys. | | | | | | |
| Rev.: | | | | | | |
| Series 2002 A, 5.125% 6/15/34 (FSA Insured) | | | | 500,000 | | 518,960 |
| Series A, 5.125% 6/15/34 (MBIA Insured) | | | | 2,000,000 | | 2,075,840 |
| New York City Trust Cultural Resources Rev. (Museum of | | | | | | |
| Modern Art Proj.) Series 2001 D, 5.125% 7/1/31 | | | | | | |
| (AMBAC Insured) | | | | 1,000,000 | | 1,040,880 |
| New York State Dorm. Auth. Revs.: | | | | | | |
| (City Univ. Sys. Consolidation Proj.): | | | | | | |
| Series A, 5.75% 7/1/13 | | | | 1,500,000 | | 1,622,160 |
| Series C, 7.5% 7/1/10 | | | | 435,000 | | 467,843 |
| (The Jamaica Hosp. Proj.) Series F, 5.2% 2/15/14 | | | | | | |
| (MBIA Insured) | | | | 6,150,000 | | 6,397,107 |
| Series 2002 A, 5.75% 10/1/17 (MBIA Insured) | | | | 1,000,000 | | 1,095,110 |
See accompanying notes which are an integral part of the financial statements.
| Municipal Bonds continued | | | | | | |
| | | | | Principal | | Value (Note 1) |
| | | | | Amount | | |
| New York – continued | | | | | | |
| New York State Envir. Facilities Corp. Clean Wtr. & | | | | | | |
| Drinking Wtr. Rev. Series F: | | | | | | |
| 4.875% 6/15/18 | | | | $ 870,000 | | $ 891,306 |
| 4.875% 6/15/20 | | | | 795,000 | | 813,333 |
| 5% 6/15/15 | | | | 305,000 | | 315,623 |
| New York State Thruway Auth. Gen. Rev. Series 2005 G, | | | | | | |
| 5.25% 1/1/27 (FSA Insured) | | | | 1,600,000 | | 1,706,512 |
| New York State Thruway Auth. Svc. Contract Rev. 5.5% | | | | | | |
| 4/1/16 | | | | 305,000 | | 328,031 |
| New York Transitional Fin. Auth. Rev.: | | | | | | |
| Series 2004 C, 5% 2/1/33 (FGIC Insured) | | | | 1,000,000 | | 1,032,320 |
| Series A, 5.75% 2/15/16 | | | | 10,000 | | 10,720 |
| Series B, 5.25% 2/1/29 (a) | | | | 1,100,000 | | 1,164,669 |
| Sales Tax Asset Receivables Corp. Series A, 5.25% | | | | | | |
| 10/15/27 (AMBAC Insured) | | | | 1,500,000 | | 1,598,940 |
| Tobacco Settlement Fing. Corp.: | | | | | | |
| Series 2003 C1, 5.5% 6/1/19 | | | | 1,400,000 | | 1,503,292 |
| Series A1: | | | | | | |
| 5.25% 6/1/21 (AMBAC Insured) | | | | 1,000,000 | | 1,060,540 |
| 5.25% 6/1/22 (AMBAC Insured) | | | | 950,000 | | 1,003,941 |
| 5.5% 6/1/14 | | | | 1,200,000 | | 1,254,432 |
| 5.5% 6/1/16 | | | | 4,700,000 | | 4,962,683 |
| Series C1: | | | | | | |
| 5.5% 6/1/15 | | | | 1,500,000 | | 1,584,405 |
| 5.5% 6/1/16 | | | | 1,000,000 | | 1,065,910 |
| 5.5% 6/1/17 | | | | 1,300,000 | | 1,382,628 |
| Tsasc, Inc. Rev. Series 1, 5.5% 7/15/24 (Pre-Refunded | | | | | | |
| to 7/15/12 @ 100) (e) | | | | 1,200,000 | | 1,289,496 |
| | | | | | | 63,988,559 |
| |
| New York & New Jersey – 0.3% | | | | | | |
| Port Auth. of New York & New Jersey 124th Series, 5% | | | | | | |
| 8/1/13 (FGIC Insured) (d) | | | | 500,000 | | 513,005 |
| Port Auth. of New York & New Jersey Spl. Oblig. Rev. | | | | | | |
| (JFK Int’l. Air Term. Spl. Proj.) Series 6, 6.25% | | | | | | |
| 12/1/13 (MBIA Insured) (d) | | | | 1,400,000 | | 1,574,902 |
| | | | | | | 2,087,907 |
| |
| North Carolina – 2.3% | | | | | | |
| Charlotte Ctfs. of Prtn. (2003 Govt. Facilities Projs.) | | | | | | |
| Series G, 5% 6/1/33 | | | | 1,000,000 | | 1,022,080 |
| Dare County Ctfs. of Prtn. 5.25% 6/1/15 (AMBAC | | | | | | |
| Insured) | | | | 1,195,000 | | 1,280,156 |
See accompanying notes which are an integral part of the financial statements.
19 Semiannual Report
| Investments (Unaudited) continued | | | | | | |
| |
| |
| Municipal Bonds continued | | | | | | |
| | | | | Principal | | Value (Note 1) |
| | | | | Amount | | |
| North Carolina – continued | | | | | | |
| North Carolina Cap. Facilities Fin. Agcy. Rev. (Duke | | | | | | |
| Univ. Proj.) Series A: | | | | | | |
| 5.125% 10/1/41 | | | | $ 1,745,000 | | $ 1,790,056 |
| 5.125% 7/1/42 | | | | 5,155,000 | | 5,309,341 |
| 5.25% 7/1/42 | | | | 1,300,000 | | 1,355,198 |
| North Carolina Eastern Muni. Pwr. Agcy. Pwr. Sys. Rev.: | | | | | | |
| Series A, 5.5% 1/1/11 | | | | 1,575,000 | | 1,669,658 |
| Series B, 7.25% 1/1/07 | | | | 1,000,000 | | 1,019,800 |
| Series D, 6.7% 1/1/19 | | | | 1,115,000 | | 1,215,004 |
| North Carolina Infrastructure Fin. Corp. Ctfs. of Prtn. | | | | | | |
| (North Carolina Correctional Facilities Proj.) Series A, | | | | | | |
| 5% 2/1/18 | | | | 1,000,000 | | 1,042,280 |
| | | | | | | 15,703,573 |
| |
| Ohio – 0.6% | | | | | | |
| Cincinnati Student Ln. Fdg. Corp. Student Ln. Rev. Series | | | | | | |
| B, 8.875% 8/1/08 (d) | | | | 1,005,000 | | 1,007,884 |
| Fairborn City School District (School Impt. Proj.) 5.75% | | | | | | |
| 12/1/26 (Pre-Refunded to 12/1/10 @ 101) (e) | | | | 1,000,000 | | 1,094,020 |
| Franklin County Hosp. Rev. 5.5% 5/1/21 (Pre-Refunded | | | | | | |
| to 5/1/11 @ 101) (e) | | | | 1,500,000 | | 1,632,435 |
| Plain Local School District 6% 12/1/25 (FGIC Insured) | | | | 410,000 | | 448,118 |
| | | | | | | 4,182,457 |
| |
| Oklahoma – 1.6% | | | | | | |
| Oklahoma City Pub. Property Auth. Hotel Tax Rev.: | | | | | | |
| 5.25% 10/1/29 (FGIC Insured) | | | | 1,000,000 | | 1,063,300 |
| 5.5% 10/1/21 (FGIC Insured) | | | | 1,695,000 | | 1,848,262 |
| Oklahoma Industries Auth. Rev. (Health Sys. Oblig. | | | | | | |
| Group Proj.) Series A: | | | | | | |
| 5.75% 8/15/29 (MBIA Insured) | | | | 865,000 | | 914,573 |
| 5.75% 8/15/29 (Pre-Refunded to 8/15/09 @ | | | | | | |
| 101) (e) | | | | 635,000 | | 678,656 |
| 6% 8/15/19 (MBIA Insured) | | | | 1,740,000 | | 1,866,237 |
| 6% 8/15/19 (Pre-Refunded to 8/15/09 @ 101) (e) | | | | 1,260,000 | | 1,356,264 |
| Tulsa Indl. Auth. Rev. (Univ. of Tulsa Proj.) Series 2000 A, | | | | | | |
| 5.75% 10/1/25 (MBIA Insured) | | | | 3,000,000 | | 3,206,520 |
| | | | | | | 10,933,812 |
See accompanying notes which are an integral part of the financial statements.
| Municipal Bonds continued | | | | |
| | | Principal | | Value (Note 1) |
| | | Amount | | |
| Oregon – 0.4% | | | | |
| Oregon Dept. Administrative Svcs. Ctfs. of Prtn. Series | | | | |
| A, 5.375% 5/1/15 (AMBAC Insured) | | $ 1,715,000 | | $ 1,843,745 |
| Yamhill County School District #029J Newberg 5.5% | | | | |
| 6/15/19 (FGIC Insured) | | 1,000,000 | | 1,118,230 |
| | | | | 2,961,975 |
| |
| Pennsylvania – 2.7% | | | | |
| Annville-Cleona School District 5.5% 3/1/22 (FSA | | | | |
| Insured) | | 1,250,000 | | 1,370,688 |
| Canon McMillan School District: | | | | |
| Series 2001 B, 5.75% 12/1/33 (FGIC Insured) | | 1,000,000 | | 1,074,670 |
| Series 2002 B, 5.75% 12/1/35 (FGIC Insured) | | 1,595,000 | | 1,730,974 |
| Delaware County Auth. College Rev. (Haverford College | | | | |
| Proj.) 5.75% 11/15/29 | | 3,500,000 | | 3,770,270 |
| Montgomery County Higher Ed. & Health Auth. Hosp. | | | | |
| Rev. (Abington Memorial Hosp. Proj.) Series A, 6% | | | | |
| 6/1/16 (AMBAC Insured) | | 1,860,000 | | 2,111,435 |
| Pennsylvania Econ. Dev. Fing. Auth. Exempt Facilities | | | | |
| Rev.: | | | | |
| (Amtrak Proj.) Series 2001 A, 6.25% 11/1/31 (d) | | 2,000,000 | | 2,116,740 |
| (Shippingport Proj.) Series A, 4.35%, tender | | | | |
| 6/1/10 (c)(d) | | 500,000 | | 498,875 |
| Pennsylvania Higher Edl. Facilities Auth. Rev. (Lafayette | | | | |
| College Proj.) 6% 5/1/30 | | 3,065,000 | | 3,297,419 |
| Westmoreland County Muni. Auth. Muni. Svc. Rev. | | | | |
| Series A, 0% 8/15/21 (FGIC Insured) | | 5,000,000 | | 2,439,900 |
| | | | | 18,410,971 |
| |
| Puerto Rico 0.4% | | | | |
| Puerto Rico Commonwealth Infrastructure Fing. Auth.: | | | | |
| Series 2000 A, 5.5% 10/1/32 (Escrowed to | | | | |
| Maturity) (e) | | 745,000 | | 796,010 |
| Series C, 5.5% 7/1/20 (FGIC Insured) | | 2,000,000 | | 2,236,640 |
| | | | | 3,032,650 |
| |
| Rhode Island – 0.8% | | | | |
| Rhode Island Health & Edl. Bldg. Corp. Rev. Series A, | | | | |
| 5.25% 9/15/17 (AMBAC Insured) | | 1,000,000 | | 1,062,500 |
| Rhode Island Port Auth. & Econ. Dev. Corp. Arpt. Rev. | | | | |
| Series A, 7% 7/1/14 (FSA Insured) (d) | | 4,000,000 | | 4,528,880 |
| | | | | 5,591,380 |
| |
| |
| |
| See accompanying notes which are an integral part of the financial statements. | | |
| |
| 21 | | Semiannual Report |
| Investments (Unaudited) continued | | | | | | |
| |
| |
| Municipal Bonds continued | | | | | | |
| | | | | Principal | | Value (Note 1) |
| | | | | Amount | | |
| South Carolina – 1.2% | | | | | | |
| Greenville County School District Installment Purp. Rev. | | | | | | |
| 5% 12/1/12 | | | | $ 3,750,000 | | $ 3,936,113 |
| South Carolina Jobs Econ. Dev. Auth. Hosp. Facilities | | | | | | |
| Rev. (Palmetto Health Alliance Proj.) Series A, 7.375% | | | | | | |
| 12/15/21 (Pre-Refunded to 12/15/10 @ 102) (e) | | | | 1,000,000 | | 1,162,190 |
| South Carolina Pub. Svc. Auth. Rev.: | | | | | | |
| (Santee Cooper Proj.) Series 2005 B, 5% 1/1/18 | | | | | | |
| (MBIA Insured) | | | | 1,000,000 | | 1,059,680 |
| Series A, 5.5% 1/1/16 (FGIC Insured) | | | | 1,000,000 | | 1,103,980 |
| Tobacco Settlement Rev. Mgmt. Auth. Series 2001 B, | | | | | | |
| 6.375% 5/15/28 | | | | 545,000 | | 582,294 |
| | | | | | | 7,844,257 |
| |
| Tennessee – 0.5% | | | | | | |
| Metropolitan Govt. Nashville & Davidson County Health | | | | | | |
| & Edl. Facilities Board Rev. (Ascension Health Cr. | | | | | | |
| Group Proj.) Series A, 6% 11/15/30 (Pre-Refunded to | | | | | | |
| 11/15/09 @ 101) (e) | | | | 200,000 | | 216,582 |
| Shelby County Health Edl. & Hsg. Facility Board Hosp. | | | | | | |
| Rev. (Methodist Hosp. Proj.): | | | | | | |
| 6.5% 9/1/26 (Pre-Refunded to 9/1/12 @ 100) (e) | | | | 1,120,000 | | 1,280,474 |
| 6.5% 9/1/26 (Pre-Refunded to 9/1/12 @ 100) (e) | | | | 1,880,000 | | 2,149,366 |
| | | | | | | 3,646,422 |
| |
| Texas 15.2% | | | | | | |
| Abilene Independent School District 5% 2/15/19 | | | | 1,090,000 | | 1,136,336 |
| Aldine Independent School District 5.5% 2/15/13 | | | | 3,150,000 | | 3,376,328 |
| Aledo Independent School District Series A, 5.125% | | | | | | |
| 2/15/33 | | | | 1,000,000 | | 1,036,050 |
| Austin Cmnty. College District 5.5% 8/1/34 | | | | 1,000,000 | | 1,078,890 |
| Austin Independent School District 5.25% 8/1/14 (b) | | | | 1,000,000 | | 1,078,250 |
| Austin Wtr. & Wastewtr. Sys. Rev. 5% 11/15/12 (MBIA | | | | | | |
| Insured) (b) | | | | 1,000,000 | | 1,041,810 |
| Boerne Independent School District 5.25% 2/1/35 | | | | 1,500,000 | | 1,567,380 |
| Canyon Independent School District Series A, 5.5% | | | | | | |
| 2/15/18 | | | | 1,575,000 | | 1,701,410 |
| Corpus Christi Util. Sys. Rev. 5.25% 7/15/18 (FSA | | | | | | |
| Insured) | | | | 1,000,000 | | 1,076,300 |
| Corsicana Independent School District 5.125% 2/15/28 | | | | 1,015,000 | | 1,060,533 |
| Cypress-Fairbanks Independent School District: | | | | | | |
| Series A: | | | | | | |
| 0% 2/15/14 | | | | 3,200,000 | | 2,285,728 |
| 0% 2/15/16 | | | | 1,400,000 | | 901,516 |
See accompanying notes which are an integral part of the financial statements.
| Municipal Bonds continued | | | | | | |
| | | | | Principal | | Value (Note 1) |
| | | | | Amount | | |
| Texas continued | | | | | | |
| Cypress-Fairbanks Independent School District: - | | | | | | |
| continued | | | | | | |
| 5.75% 2/15/21 (Pre-Refunded to 2/15/12 @ | | | | | | |
| 100) (e) | | | | $ 1,000,000 | | $ 1,098,690 |
| Fort Worth Wtr. & Swr. Rev. 5% 2/15/16 (FSA Insured) | | | | 1,000,000 | | 1,049,870 |
| Garland Independent School District 5.5% 2/15/19 | | | | 2,500,000 | | 2,632,075 |
| Grand Prairie Independent School District 5.375% | | | | | | |
| 2/15/16 (FSA Insured) | | | | 1,000,000 | | 1,071,100 |
| Grapevine Gen. Oblig. 5.75% 8/15/18 (Pre-Refunded | | | | | | |
| to 8/15/10 @ 100) (e) | | | | 1,250,000 | | 1,350,563 |
| Guadalupe-Blanco River Auth. Contract Rev. (Western | | | | | | |
| Canyon Reg’l. Wtr. Supply Proj.) 5.25% 4/15/20 | | | | | | |
| (MBIA Insured) | | | | 1,000,000 | | 1,057,140 |
| Harris County Gen. Oblig.: | | | | | | |
| Series A, 5.25% 8/15/35 (FSA Insured) | | | | 1,600,000 | | 1,669,584 |
| 0% 10/1/17 (MBIA Insured) | | | | 2,500,000 | | 1,484,525 |
| 0% 8/15/24 (MBIA Insured) | | | | 1,000,000 | | 417,870 |
| Harris County Health Facilities Dev. Corp. Rev. (Saint | | | | | | |
| Luke’s Episcopal Hosp. Proj.): | | | | | | |
| Series 2001 A, 5.5% 2/15/12 (Pre-Refunded to | | | | | | |
| 8/15/11 @ 100) (e) | | | | 1,000,000 | | 1,079,130 |
| 5.75% 2/15/21 (Pre-Refunded to 8/15/12 @ | | | | | | |
| 100) (e) | | | | 1,310,000 | | 1,442,284 |
| Hays Consolidated Independent School District Series A, | | | | | | |
| 5.125% 8/15/30 | | | | 1,000,000 | | 1,044,620 |
| Houston Arpt. Sys. Rev.: | | | | | | |
| Series A, 5.625% 7/1/19 (FSA Insured) (d) | | | | 1,000,000 | | 1,058,780 |
| Series B, 5.5% 7/1/30 (FSA Insured) | | | | 1,400,000 | | 1,472,562 |
| Houston Independent School District 0% 8/15/13 | | | | 1,300,000 | | 952,926 |
| Humble Independent School District: | | | | | | |
| Series 2005 B, 5.25% 2/15/20 (FGIC Insured) | | | | 1,800,000 | | 1,918,440 |
| 0% 2/15/17 | | | | 1,000,000 | | 613,660 |
| Hurst Euless Bedford Independent School District 0% | | | | | | |
| 8/15/11 | | | | 1,000,000 | | 807,000 |
| Kennedale Independent School District 5.5% 2/15/29 | | | | 1,100,000 | | 1,187,208 |
| Lewisville Independent School District 0% 8/15/19 | | | | 2,340,000 | | 1,262,453 |
| Los Fresnos Independent School District: | | | | | | |
| 5.75% 8/15/13 | | | | 1,040,000 | | 1,123,668 |
| 5.75% 8/15/14 | | | | 1,100,000 | | 1,188,495 |
| Lower Colorado River Auth. Transmission Contract Rev. | | | | | | |
| (LCRA Transmission Services Corp. Proj.) Series C, | | | | | | |
| 5.25% 5/15/19 (AMBAC Insured) | | | | 1,000,000 | | 1,062,730 |
See accompanying notes which are an integral part of the financial statements.
23 Semiannual Report
| Investments (Unaudited) continued | | | | | | |
| |
| |
| Municipal Bonds continued | | | | | | |
| | | | | Principal | | Value (Note 1) |
| | | | | Amount | | |
| Texas continued | | | | | | |
| Mansfield Independent School District: | | | | | | |
| 5.375% 2/15/26 | | | | $ 1,000,000 | | $ 1,056,140 |
| 5.5% 2/15/17 | | | | 2,000,000 | | 2,145,920 |
| Mesquite Independent School District 3.65%, tender | | | | | | |
| 12/1/08 (Liquidity Facility JPMorgan Chase Bank) (c) | | | | 1,000,000 | | 1,000,000 |
| Montgomery County Muni. Util. District #46 5% 3/1/21 | | | | | | |
| (FSA Insured) | | | | 1,040,000 | | 1,070,919 |
| Mount Pleasant Independent School District 5.5% | | | | | | |
| 2/15/22 | | | | 2,590,000 | | 2,756,718 |
| North Central Health Facilities Dev. Corp. Rev. | | | | | | |
| (Children’s Med. Ctr. of Dallas Proj.) 5.5% 8/15/16 | | | | | | |
| (AMBAC Insured) | | | | 1,230,000 | | 1,317,035 |
| Northside Independent School District 5.5% 2/15/15 | | | | 940,000 | | 1,004,569 |
| Northwest Texas Independent School District 5.5% | | | | | | |
| 8/15/21 | | | | 3,185,000 | | 3,425,053 |
| Sabine River Auth. Poll. Cont. Rev. (Texas Utils. Elec. Co. | | | | | | |
| Proj.) Series B, 5.75%, tender 11/1/11 (c)(d) | | | | 4,000,000 | | 4,243,000 |
| San Antonio Elec. & Gas Systems Rev.: | | | | | | |
| 3.55%, tender 12/1/07 (c) | | | | 1,500,000 | | 1,495,185 |
| 5.5% 2/1/20 (Pre-Refunded to 2/1/07 @ 101) (e) | | | | 75,000 | | 76,736 |
| San Marcos Consolidated Independent School District: | | | | | | |
| 5% 8/1/14 | | | | 1,145,000 | | 1,214,753 |
| 5% 8/1/20 | | | | 1,525,000 | | 1,588,669 |
| 5.125% 8/1/29 | | | | 1,900,000 | | 1,979,572 |
| Southwest Higher Ed. Auth. Rev. (Southern Methodist | | | | | | |
| Univ. Proj.) 5.5% 10/1/14 (AMBAC Insured) | | | | 2,245,000 | | 2,436,341 |
| Spring Branch Independent School District 5.375% | | | | | | |
| 2/1/18 | | | | 1,000,000 | | 1,057,490 |
| Tarrant County Health Facilities Dev. Corp. Hosp. Rev. | | | | | | |
| 5.375% 11/15/20 | | | | 1,000,000 | | 1,025,780 |
| Texas Muni. Pwr. Agcy. Rev.: | | | | | | |
| 0% 9/1/11 (AMBAC Insured) | | | | 4,715,000 | | 3,820,046 |
| 0% 9/1/11 (Escrowed to Maturity) (e) | | | | 35,000 | | 28,224 |
| 0% 9/1/15 (MBIA Insured) | | | | 1,100,000 | | 730,290 |
| Texas Pub. Fin. Auth. Bldg. Rev. (Texas Technical College | | | | | | |
| Proj.) 6.25% 8/1/09 (MBIA Insured) | | | | 825,000 | | 854,807 |
| Texas Tpk. Auth. Central Tpk. Sys. Rev.: | | | | | | |
| 5.5% 8/15/39 (AMBAC Insured) | | | | 4,050,000 | | 4,307,945 |
| 5.75% 8/15/38 (AMBAC Insured) | | | | 3,775,000 | | 4,101,462 |
| Texas Wtr. Dev. Board Rev. Series A, 5.5% 7/15/21 | | | | 1,000,000 | | 1,048,250 |
| Travis County Health Facilities Dev. Corp. Rev. | | | | | | |
| (Ascension Health Cr. Prog.) Series A, 6.25% | | | | | | |
| 11/15/19 (Pre-Refunded to 11/15/09 @ 101) (e) | | | | 4,000,000 | | 4,364,440 |
See accompanying notes which are an integral part of the financial statements.
| Municipal Bonds continued | | | | | | |
| | | | | Principal | | Value (Note 1) |
| | | | | Amount | | |
| Texas continued | | | | | | |
| Trinity River Auth. Rev. (Tarrant County Wtr. Proj.) 5% | | | | | | |
| 2/1/15 (MBIA Insured) | | | | $ 1,860,000 | | $ 1,973,441 |
| Tyler Health Facilities Dev. Corp. Hosp. Rev. (Mother | | | | | | |
| Frances Hosp. Reg’l. Health Care Ctr. Proj.) 6% | | | | | | |
| 7/1/27 | | | | 1,000,000 | | 1,058,900 |
| White Settlement Independent School District 5.75% | | | | | | |
| 8/15/34 | | | | 1,440,000 | | 1,564,531 |
| Williamson County Gen. Oblig.: | | | | | | |
| 5.5% 2/15/19 (FSA Insured) | | | | 35,000 | | 37,200 |
| 6% 8/15/19 (Pre-Refunded to 8/15/10 @ 100) (e) | | | | 1,000,000 | | 1,090,270 |
| Willis Independent School District 5% 2/15/14 | | | | 1,300,000 | | 1,375,439 |
| Ysleta Independent School District 0% 8/15/09 | | | | 4,065,000 | | 3,562,444 |
| | | | | | | 104,197,473 |
| |
| Utah 0.5% | | | | | | |
| Intermountain Pwr. Agcy. Pwr. Supply Rev.: | | | | | | |
| Series A: | | | | | | |
| 6.5% 7/1/09 (AMBAC Insured) | | | | 365,000 | | 393,959 |
| 6.5% 7/1/09 (Escrowed to Maturity) (e) | | | | 635,000 | | 688,137 |
| Series B, 5.75% 7/1/16 (MBIA Insured) | | | | 1,025,000 | | 1,068,019 |
| Salt Lake City School District Series B, 5% 3/1/12 | | | | 1,380,000 | | 1,463,545 |
| | | | | | | 3,613,660 |
| |
| Vermont – 0.2% | | | | | | |
| Vermont Edl. & Health Bldgs. Fing. Agcy. Rev. (Fletcher | | | | | | |
| Allen Health Care, Inc. Proj.): | | | | | | |
| Series 2000 A, 6.125% 12/1/27 (AMBAC Insured) | | | | 1,000,000 | | 1,093,320 |
| Series A, 5.75% 12/1/18 (AMBAC Insured) | | | | 400,000 | | 432,164 |
| | | | | | | 1,525,484 |
| |
| Washington 7.5% | | | | | | |
| Chelan County Pub. Util. District #1 Columbia River-Rock | | | | | | |
| Island Hydro-Elec. Sys. Rev. Series A: | | | | | | |
| 0% 6/1/17 (MBIA Insured) | | | | 1,000,000 | | 598,370 |
| 0% 6/1/29 (MBIA Insured) | | | | 2,000,000 | | 641,280 |
| Clark County School District #114, Evergreen 5.375% | | | | | | |
| 12/1/14 (FSA Insured)�� | | | | 3,040,000 | | 3,261,768 |
| Energy Northwest Elec. Rev. (#1 Proj.): | | | | | | |
| Series 2006 A, 5% 7/1/15 | | | | 1,000,000 | | 1,057,920 |
| Series B, 6% 7/1/17 (MBIA Insured) | | | | 4,000,000 | | 4,435,080 |
| Grant County Pub. Util. District #2 (Priest Rapids Hydro- | | | | | | |
| Elec. Proj.) Second Series B, 5.375% 1/1/16 (MBIA | | | | | | |
| Insured) (d) | | | | 1,715,000 | | 1,794,970 |
See accompanying notes which are an integral part of the financial statements.
25 Semiannual Report
| Investments (Unaudited) continued | | | | | | |
| |
| |
| Municipal Bonds continued | | | | | | |
| | | | | Principal | | Value (Note 1) |
| | | | | Amount | | |
| Washington – continued | | | | | | |
| Grant County Pub. Util. District #2 Wanapum Hydro | | | | | | |
| Elec. Rev. Series B, 5.25% 1/1/22 (FGIC Insured) (d) | | | | $ 1,950,000 | | $ 2,021,253 |
| King County Swr. Rev. Series B: | | | | | | |
| 5.125% 1/1/33 (FSA Insured) | | | | 2,800,000 | | 2,902,760 |
| 5.5% 1/1/21 (FSA Insured) | | | | 1,615,000 | | 1,730,295 |
| Port of Seattle Passenger Facilities Charge Rev. Series B, | | | | | | |
| 5.25% 12/1/14 (AMBAC Insured) (d) | | | | 3,000,000 | | 3,103,050 |
| Spokane County School District #81 5.25% 12/1/18 | | | | | | |
| (FSA Insured) | | | | 1,000,000 | | 1,061,170 |
| Spokane Gen. Oblig. 5.25% 12/1/24 (AMBAC Insured) | | | | 1,000,000 | | 1,057,220 |
| Spokane Pub. Facilities District Hotel/Motel Tax & | | | | | | |
| Sales/Use Tax Rev. 5.75% 12/1/24 (MBIA Insured) | | | | 1,000,000 | | 1,108,570 |
| Tumwater School District #33, Thurston County Series | | | | | | |
| 1996 B, 0% 12/1/10 (FGIC Insured) | | | | 4,000,000 | | 3,336,720 |
| Washington Gen. Oblig.: | | | | | | |
| Series 2001 C, 5.25% 1/1/16 | | | | 1,000,000 | | 1,053,050 |
| Series C, 5.25% 1/1/26 (FSA Insured) | | | | 1,000,000 | | 1,050,450 |
| Series R 97A, 0% 7/1/19 (MBIA Insured) | | | | 1,200,000 | | 649,428 |
| Washington Health Care Facilities Auth. Rev. (Providence | | | | | | |
| Health Systems Proj.) Series 2001 A, 5.5% 10/1/13 | | | | | | |
| (MBIA Insured) | | | | 3,000,000 | | 3,200,370 |
| Washington Pub. Pwr. Supply Sys. Nuclear Proj. #2 Rev. | | | | | | |
| 5.4% 7/1/12 | | | | 16,000,000 | | 17,247,828 |
| | | | | | | 51,311,552 |
| |
| Wisconsin – 1.2% | | | | | | |
| Badger Tobacco Asset Securitization Corp. 6.125% | | | | | | |
| 6/1/27 | | | | 880,000 | | 928,312 |
| Douglas County Gen. Oblig. 5.5% 2/1/18 (FGIC | | | | | | |
| Insured) | | | | 335,000 | | 358,879 |
| Menasha Joint School District: | | | | | | |
| 5.5% 3/1/17 (FSA Insured) | | | | 65,000 | | 69,497 |
| 5.5% 3/1/17 (Pre-Refunded to 3/1/12 @ 100) (e) | | | | 1,095,000 | | 1,189,641 |
| Wisconsin Health & Edl. Facilities Auth. Rev.: | | | | | | |
| (Marshfield Clinic Proj.) Series B, 6% 2/15/25 | | | | 1,500,000 | | 1,591,395 |
| (Wheaton Franciscan Svcs., Inc. Proj.): | | | | | | |
| Series A, 5.5% 8/15/16 | | | | 1,000,000 | | 1,055,090 |
| 5.75% 8/15/30 | | | | 1,500,000 | | 1,575,360 |
See accompanying notes which are an integral part of the financial statements.
| Municipal Bonds continued | | | | | | | | |
| | | | | | | Principal | | Value (Note 1) |
| | | | | | | Amount | | |
| Wisconsin – continued | | | | | | | | |
| Wisconsin Health & Edl. Facilities Auth. Rev.: - | | | | | | | | |
| continued | | | | | | | | |
| (Wheaton Franciscan Svcs., Inc. Proj.): | | | | | | | | |
| 6.25% 8/15/22 | | | | | | $ 600,000 | | $ 649,254 |
| Series A, 5.375% 2/15/34 | | | | | | 1,000,000 | | 1,017,810 |
| | | | | | | | | 8,435,238 |
| |
| |
| TOTAL INVESTMENT PORTFOLIO 95.8% | | | | | | | | |
| (Cost $642,871,457) | | | | | | | | 656,839,570 |
| |
| NET OTHER ASSETS – 4.2% | | | | | | | | 29,149,943 |
| NET ASSETS 100% | | | | | | | | $ 685,989,513 |
Legend
(a) Security initially issued at one coupon
which converts to a higher coupon at a
specified date. The rate shown is the
rate at period end.
(b) Security or a portion of the security
purchased on a delayed delivery or
when-issued basis.
(c) The coupon rate shown on floating or
adjustable rate securities represents the
rate at period end.
(d) Private activity obligations whose
interest is subject to the federal
alternative minimum tax for individuals.
(e) Security collateralized by an amount
sufficient to pay interest and principal.
|
Other Information
The distribution of municipal securities by revenue source, as a percentage of total net assets, is as follows:
| General Obligations | | 37.1% |
| Health Care | | 10.1% |
| Escrowed/Pre Refunded | | 9.1% |
| Transportation | | 8.5% |
| Electric Utilities | | 8.4% |
| Water & Sewer | | 7.2% |
| Education | | 6.0% |
| Special Tax | | 5.7% |
| Others* (individually less than 5%) | | 7.9% |
| | | 100.0% |
*Includes net other assets
See accompanying notes which are an integral part of the financial statements.
27 Semiannual Report
| Financial Statements | | | | | | |
| |
| Statement of Assets and Liabilities | | | | | | |
| | | | | April 30, 2006 (Unaudited) |
| |
| Assets | | | | | | |
| Investment in securities, at value See accompanying | | | | | | |
| schedule: | | | | | | |
| Unaffiliated issuers (cost $642,871,457) | | | | | | $ 656,839,570 |
| Cash | | | | | | 23,588,310 |
| Receivable for investments sold | | | | | | 4,150,309 |
| Receivable for fund shares sold | | | | | | 1,008,718 |
| Interest receivable | | | | | | 9,524,604 |
| Prepaid expenses | | | | | | 1,924 |
| Other affiliated receivables | | | | | | 6,821 |
| Other receivables | | | | | | 60,302 |
| Total assets | | | | | | 695,180,558 |
| |
| Liabilities | | | | | | |
| Payable for investments purchased | | | | | | |
| Regular delivery | | | | $ 5,981 | | |
| Delayed delivery | | | | 6,625,478 | | |
| Payable for fund shares redeemed | | | | 1,281,125 | | |
| Distributions payable | | | | 699,735 | | |
| Accrued management fee | | | | 208,729 | | |
| Distribution fees payable | | | | 190,567 | | |
| Other affiliated payables | | | | 153,466 | | |
| Other payables and accrued expenses | | | | 25,964 | | |
| Total liabilities | | | | | | 9,191,045 |
| |
| Net Assets | | | | | | $ 685,989,513 |
| Net Assets consist of: | | | | | | |
| Paid in capital | | | | | | $ 669,812,083 |
| Distributions in excess of net investment income | | | | | | (221,015) |
| Accumulated undistributed net realized gain (loss) on | | | | | | |
| investments | | | | | | 2,430,332 |
| Net unrealized appreciation (depreciation) on | | | | | | |
| investments | | | | | | 13,968,113 |
| Net Assets | | | | | | $ 685,989,513 |
See accompanying notes which are an integral part of the financial statements.
| Statement of Assets and Liabilities continued | | | | |
| | | April 30, 2006 (Unaudited) |
| |
| Calculation of Maximum Offering Price | | | | |
| Class A: | | | | |
| Net Asset Value and redemption price per share | | | | |
| ($140,470,875 ÷ 11,028,025 shares) | | | | $ 12.74 |
| Maximum offering price per share (100/95.25 of $12.74) | | | | $ 13.38 |
| Class T: | | | | |
| Net Asset Value and redemption price per share | | | | |
| ($313,846,360 ÷ 24,586,559 shares) | | | | $ 12.76 |
| Maximum offering price per share (100/96.50 of $12.76) | | | | $ 13.22 |
| Class B: | | | | |
| Net Asset Value and offering price per share | | | | |
| ($72,451,693 ÷ 5,700,682 shares)A | | | | $ 12.71 |
| Class C: | | | | |
| Net Asset Value and offering price per share | | | | |
| ($63,235,139 ÷ 4,956,128 shares)A | | | | $ 12.76 |
| Institutional Class: | | | | |
| Net Asset Value, offering price and redemption price per | | | | |
| share ($95,985,446 ÷ 7,563,042 shares) | | | | $ 12.69 |
| |
| A Redemption price per share is equal to net asset value less any applicable contingent deferred sales charge. | | | | |
See accompanying notes which are an integral part of the financial statements.
29 Semiannual Report
| Financial Statements continued | | | | |
| |
| |
| Statement of Operations | | | | | | |
| | | Six months ended April 30, 2006 (Unaudited) |
| |
| Investment Income | | | | | | |
| Interest | | | | | | $ 15,205,553 |
| |
| Expenses | | | | | | |
| Management fee | | | | $ 1,241,923 | | |
| Transfer agent fees | | | | 365,781 | | |
| Distribution fees | | | | 1,164,246 | | |
| Accounting fees and expenses | | | | 82,705 | | |
| Independent trustees’ compensation | | | | 1,361 | | |
| Custodian fees and expenses | | | | 5,574 | | |
| Registration fees | | | | 48,275 | | |
| Audit | | | | 26,645 | | |
| Legal | | | | 2,164 | | |
| Miscellaneous | | | | 2,774 | | |
| Total expenses before reductions | | | | 2,941,448 | | |
| Expense reductions | | | | (164,759) | | 2,776,689 |
| |
| Net investment income | | | | | | 12,428,864 |
| Realized and Unrealized Gain (Loss) | | | | | | |
| Net realized gain (loss) on: | | | | | | |
| Investment securities: | | | | | | |
| Unaffiliated issuers | | | | 2,660,091 | | |
| Futures contracts | | | | 94,212 | | |
| Total net realized gain (loss) | | | | | | 2,754,303 |
| Change in net unrealized appreciation (depreciation) on | | | | | | |
| investment securities | | | | | | (6,518,120) |
| Net gain (loss) | | | | | | (3,763,817) |
| Net increase (decrease) in net assets resulting from | | | | | | |
| operations | | | | | | $ 8,665,047 |
See accompanying notes which are an integral part of the financial statements.
| Statement of Changes in Net Assets | | | | |
| | | Six months ended | | Year ended |
| | | April 30, 2006 | | October 31, |
| | | (Unaudited) | | 2005 |
| Increase (Decrease) in Net Assets | | | | |
| Operations | | | | |
| Net investment income | | $ 12,428,864 | | $ 23,857,985 |
| Net realized gain (loss) | | 2,754,303 | | 8,968,764 |
| Change in net unrealized appreciation (depreciation) . | | (6,518,120) | | (19,180,759) |
| Net increase (decrease) in net assets resulting from | | | | |
| operations | | 8,665,047 | | 13,645,990 |
| Distributions to shareholders from net investment income | | (12,476,440) | | (23,793,542) |
| Distributions to shareholders from net realized gain | | (8,244,683) | | (5,181,802) |
| Total distributions | | (20,721,123) | | (28,975,344) |
| Share transactions - net increase (decrease) | | 39,303,489 | | 51,939,913 |
| Total increase (decrease) in net assets | | 27,247,413 | | 36,610,559 |
| |
| Net Assets | | | | |
| Beginning of period | | 658,742,100 | | 622,131,541 |
| End of period (including distributions in excess of net | | | | |
| investment income of $221,015 and distributions in | | | | |
| excess of net investment income of $158,981, | | | | |
| respectively) | | $ 685,989,513 | | $ 658,742,100 |
See accompanying notes which are an integral part of the financial statements.
31 Semiannual Report
| Financial Highlights Class A | | | | | | | | | | | | |
| | | Six months ended | | | | | | | | | | | | | | |
| | | April 30, 2006 | | Years ended October 31, |
| | | (Unaudited) | | 2005 | | 2004 | | | | 2003 | | 2002 | | | | 2001 |
| Selected Per Share Data | | | | | | | | | | | | | | | | |
| Net asset value, | | | | | | | | | | | | | | | | |
| beginning of period | | $ 12.97 | | $ 13.28 | | $ 13.00 | | | | $ 12.87 | | $ 12.70 | | | | $ 12.02 |
| Income from | | | | | | | | | | | | | | | | |
| Investment | | | | | | | | | | | | | | | | |
| Operations | | | | | | | | | | | | | | | | |
| Net investment | | | | | | | | | | | | | | | | |
| incomeE | | .252 | | .521 | | .533 | | | | .539 | | .557G | | | | .584 |
| Net realized and | | | | | | | | | | | | | | | | |
| unrealized gain | | | | | | | | | | | | | | | | |
| (loss) | | (.067) | | (.201) | | .301 | | | | .137 | | .168G | | | | .679 |
| Total from investment | | | | | | | | | | | | | | | | |
| operations | | .185 | | .320 | | .834 | | | | .676 | | .725 | | | | 1.263 |
| Distributions from net | | | | | | | | | | | | | | | | |
| investment income | | (.253) | | (.520) | | (.532) | | | | (.544) | | (.555) | | | | (.583) |
| Distributions from net | | | | | | | | | | | | | | | | |
| realized gain | | (.162) | | (.110) | | (.022) | | | | (.002) | | — | | | | — |
| Total distributions . | | (.415) | | (.630) | | (.554) | | | | (.546) | | (.555) | | | | (.583) |
| Net asset value, end | | | | | | | | | | | | | | | | |
| of period | | $ 12.74 | | $ 12.97 | | $ 13.28 | | | | $ 13.00 | | $ 12.87 | | | | $ 12.70 |
| Total ReturnB,C,D | | 1.44% | | 2.46% | | 6.56% | | | | 5.33% | | 5.88% | | | | 10.72% |
| Ratios to Average Net AssetsF | | | | | | | | | | | | | | | | |
| Expenses before | | | | | | | | | | | | | | | | |
| reductions | | ..69%A | | .69% | | .69% | | | | .68% | | .69% | | | | .69% |
| Expenses net of fee | | | | | | | | | | | | | | | | |
| waivers, if any | | .69%A | | .69% | | .69% | | | | .68% | | .69% | | | | .69% |
| Expenses net of all | | | | | | | | | | | | | | | | |
| reductions | | .64%A | | .67% | | .69% | | | | .68% | | .67% | | | | .62% |
| Net investment | | | | | | | | | | | | | | | | |
| income | | 3.95%A | | 3.96% | | 4.07% | | | | 4.15% | | 4.41%G | | | | 4.70% |
| Supplemental Data | | | | | | | | | | | | | | | | |
| Net assets, | | | | | | | | | | | | | | | | |
| end of period | | | | | | | | | | | | | | | | |
| (000 omitted) | | $140,471 | | $123,844 | | $101,763 | | | | $87,406 | | $67,457 | | | | $46,796 |
| Portfolio turnover | | | | | | | | | | | | | | | | |
| rate | | 26%A | | 22% | | 17% | | | | 26% | | 20% | | | | 16% |
A Annualized
B Total returns for periods of less than one year are not annualized.
C Total returns would have been lower had certain expenses not been reduced during the periods shown.
D Total returns do not include the effect of the sales charges.
E Calculated based on average shares outstanding during the period.
F Expense ratios reflect operating expenses of the class. Expenses before reductions do not reflect amounts reimbursed by the investment adviser or
expense offset arrangements and do not represent the amount paid by the class during periods when reimbursements or reductions occur. Ex
penses net of fee waivers reflect expenses after reimbursement by the investment adviser but prior to reductions from expense offset arrange
ments. Expenses net of all reductions represent the net expenses paid by the class.
G Effective November 1, 2001, the fund adopted the provisions of the AICPA Audit and Accounting Guide for Investment Companies and began
amortizing premium and discount on all debt securities. Per share data and ratios for periods prior to adoption have not been restated to reflect
this change.
|
See accompanying notes which are an integral part of the financial statements.
| Financial Highlights Class T | | | | | | | | | | | | |
| | | Six months ended | | | | | | | | | | | | | | |
| | | April 30, 2006 | | Years ended October 31, |
| | | (Unaudited) | | 2005 | | 2004 | | | | 2003 | | 2002 | | | | 2001 |
| Selected Per Share Data | | | | | | | | | | | | | | | | |
| Net asset value, | | | | | | | | | | | | | | | | |
| beginning of period | | $ 13.00 | | $ 13.31 | | $ 13.03 | | | | $ 12.89 | | $ 12.72 | | | | $ 12.04 |
| Income from | | | | | | | | | | | | | | | | |
| Investment | | | | | | | | | | | | | | | | |
| Operations | | | | | | | | | | | | | | | | |
| Net investment | | | | | | | | | | | | | | | | |
| incomeE | | .246 | | .509 | | .522 | | | | .529 | | .546G | | | | .572 |
| Net realized and | | | | | | | | | | | | | | | | |
| unrealized gain | | | | | | | | | | | | | | | | |
| (loss) | | (.077) | | (.202) | | .299 | | | | .144 | | .166G | | | | .679 |
| Total from investment | | | | | | | | | | | | | | | | |
| operations | | .169 | | .307 | | .821 | | | | .673 | | .712 | | | | 1.251 |
| Distributions from net | | | | | | | | | | | | | | | | |
| investment income | | (.247) | | (.507) | | (.519) | | | | (.531) | | (.542) | | | | (.571) |
| Distributions from net | | | | | | | | | | | | | | | | |
| realized gain | | (.162) | | (.110) | | (.022) | | | | (.002) | | — | | | | — |
| Total distributions . | | (.409) | | (.617) | | (.541) | | | | (.533) | | (.542) | | | | (.571) |
| Net asset value, end | | | | | | | | | | | | | | | | |
| of period | | $ 12.76 | | $ 13.00 | | $ 13.31 | | $ | | $ 13.03 | | $ 12.89 | | | | $ 12.72 |
| Total ReturnB,C,D | | 1.31% | | 2.35% | | 6.44% | | | | 5.30% | | 5.76% | | | | 10.59% |
| Ratios to Average Net AssetsF | | | | | | | | | | | | | | | | |
| Expenses before | | | | | | | | | | | | | | | | |
| reductions | | .79%A | | .79% | | .79% | | | | .78% | | .79% | | | | .79% |
| Expenses net of fee | | | | | | | | | | | | | | | | |
| waivers, if any | | .79%A | | .79% | | .79% | | | | .78% | | .79% | | | | .79% |
| Expenses net of all | | | | | | | | | | | | | | | | |
| reductions | | .74%A | | .77% | | .78% | | | | .77% | | .77% | | | | .72% |
| Net investment | | | | | | | | | | | | | | | | |
| income | | 3.85%A | | 3.86% | | 3.97% | | | | 4.06% | | 4.31%G | | | | 4.60% |
| Supplemental Data | | | | | | | | | | | | | | | | |
| Net assets, | | | | | | | | | | | | | | | | |
| end of period | | | | | | | | | | | | | | | | |
| (000 omitted) | | $313,846 | | $318,973 | | $319,734 | | | | $340,542 | | $354,030 | | | | $369,295 |
| Portfolio turnover | | | | | | | | | | | | | | | | |
| rate | | 26%A | | 22% | | 17% | | | | 26% | | 20% | | | | 16% |
A Annualized
B Total returns for periods of less than one year are not annualized.
C Total returns would have been lower had certain expenses not been reduced during the periods shown.
D Total returns do not include the effect of the sales charges.
E Calculated based on average shares outstanding during the period.
F Expense ratios reflect operating expenses of the class. Expenses before reductions do not reflect amounts reimbursed by the investment adviser or
expense offset arrangements and do not represent the amount paid by the class during periods when reimbursements or reductions occur. Ex
penses net of fee waivers reflect expenses after reimbursement by the investment adviser but prior to reductions from expense offset arrange
ments. Expenses net of all reductions represent the net expenses paid by the class.
G Effective November 1, 2001, the fund adopted the provisions of the AICPA Audit and Accounting Guide for Investment Companies and began
amortizing premium and discount on all debt securities. Per share data and ratios for periods prior to adoption have not been restated to reflect
this change.
|
See accompanying notes which are an integral part of the financial statements.
33 Semiannual Report
| Financial Highlights Class B | | | | | | | | | | | | |
| | | Six months ended | | | | | | | | | | | | | | |
| | | April 30, 2006 | | Years ended October 31, |
| | | (Unaudited) | | 2005 | | 2004 | | | | 2003 | | 2002 | | | | 2001 |
| Selected Per Share Data | | | | | | | | | | | | | | | | |
| Net asset value, | | | | | | | | | | | | | | | | |
| beginning of period | | $ 12.94 | | $ 13.25 | | $ 12.98 | | | | $ 12.85 | | $ 12.67 | | | | $ 12.00 |
| Income from | | | | | | | | | | | | | | | | |
| Investment | | | | | | | | | | | | | | | | |
| Operations | | | | | | | | | | | | | | | | |
| Net investment | | | | | | | | | | | | | | | | |
| incomeE | | .203 | | .421 | | .435 | | | | .443 | | .462G | | | | .489 |
| Net realized and | | | | | | | | | | | | | | | | |
| unrealized gain | | | | | | | | | | | | | | | | |
| (loss) | | (.067) | | (.200) | | .291 | | | | .136 | | .178G | | | | .671 |
| Total from investment | | | | | | | | | | | | | | | | |
| operations | | .136 | | .221 | | .726 | | | | .579 | | .640 | | | | 1.160 |
| Distributions from net | | | | | | | | | | | | | | | | |
| investment income | | (.204) | | (.421) | | (.434) | | | | (.447) | | (.460) | | | | (.490) |
| Distributions from net | | | | | | | | | | | | | | | | |
| realized gain | | (.162) | | (.110) | | (.022) | | | | (.002) | | — | | | | — |
| Total distributions . | | (.366) | | (.531) | | (.456) | | | | (.449) | | (.460) | | | | (.490) |
| Net asset value, end | | | | | | | | | | | | | | | | |
| of period | | $ 12.71 | | $ 12.94 | | $ 13.25 | | | | $ 12.98 | | $ 12.85 | | | | $ 12.67 |
| Total ReturnB,C,D | | 1.06% | | 1.70% | | 5.70% | | | | 4.56% | | 5.19% | | | | 9.83% |
| Ratios to Average Net AssetsF | | | | | | | | | | | | | | | | |
| Expenses before | | | | | | | | | | | | | | | | |
| reductions | | 1.45%A | | 1.45% | | 1.44% | | | | 1.43% | | 1.44% | | | | 1.43% |
| Expenses net of fee | | | | | | | | | | | | | | | | |
| waivers, if any | | 1.45%A | | 1.45% | | 1.44% | | | | 1.43% | | 1.44% | | | | 1.43% |
| Expenses net of all | | | | | | | | | | | | | | | | |
| reductions | | 1.40%A | | 1.42% | | 1.44% | | | | 1.42% | | 1.41% | | | | 1.37% |
| Net investment | | | | | | | | | | | | | | | | |
| income | | 3.18%A | | 3.21% | | 3.32% | | | | 3.41% | | 3.66%G | | | | 3.95% |
| Supplemental Data | | | | | | | | | | | | | | | | |
| Net assets, | | | | | | | | | | | | | | | | |
| end of period | | | | | | | | | | | | | | | | |
| (000 omitted) | | $72,452 | | $82,084 | | $97,487 | | | | $110,853 | | $109,986 | | | | $91,687 |
| Portfolio turnover | | | | | | | | | | | | | | | | |
| rate | | 26%A | | 22% | | 17% | | | | 26% | | 20% | | | | 16% |
A Annualized
B Total returns for periods of less than one year are not annualized.
C Total returns would have been lower had certain expenses not been reduced during the periods shown.
D Total returns do not include the effect of the contingent deferred sales charge.
E Calculated based on average shares outstanding during the period.
F Expense ratios reflect operating expenses of the class. Expenses before reductions do not reflect amounts reimbursed by the investment adviser or
expense offset arrangements and do not represent the amount paid by the class during periods when reimbursements or reductions occur. Ex
penses net of fee waivers reflect expenses after reimbursement by the investment adviser but prior to reductions from expense offset arrange
ments. Expenses net of all reductions represent the net expenses paid by the class.
G Effective November 1, 2001, the fund adopted the provisions of the AICPA Audit and Accounting Guide for Investment Companies and began
amortizing premium and discount on all debt securities. Per share data and ratios for periods prior to adoption have not been restated to reflect
this change.
|
See accompanying notes which are an integral part of the financial statements.
| Financial Highlights Class C | | | | | | | | | | | | |
| | | Six months ended | | | | | | | | | | | | | | |
| | | April 30, 2006 | | Years ended October 31, |
| | | (Unaudited) | | 2005 | | 2004 | | | | 2003 | | 2002 | | | | 2001 |
| Selected Per Share Data | | | | | | | | | | | | | | | | |
| Net asset value, | | | | | | | | | | | | | | | | |
| beginning of period | | $ 12.99 | | $ 13.30 | | $ 13.02 | | | | $ 12.89 | | $ 12.71 | | | | $ 12.04 |
| Income from | | | | | | | | | | | | | | | | |
| Investment | | | | | | | | | | | | | | | | |
| Operations | | | | | | | | | | | | | | | | |
| Net investment | | | | | | | | | | | | | | | | |
| incomeE | | .198 | | .410 | | .423 | | | | .430 | | .451G | | | | .478 |
| Net realized and | | | | | | | | | | | | | | | | |
| unrealized gain | | | | | | | | | | | | | | | | |
| (loss) | | (.068) | | (.202) | | .300 | | | | .135 | | .176G | | | | .669 |
| Total from investment | | | | | | | | | | | | | | | | |
| operations | | .130 | | .208 | | .723 | | | | .565 | | .627 | | | | 1.147 |
| Distributions from net | | | | | | | | | | | | | | | | |
| investment income | | (.198) | | (.408) | | (.421) | | | | (.433) | | (.447) | | | | (.477) |
| Distributions from net | | | | | | | | | | | | | | | | |
| realized gain | | (.162) | | (.110) | | (.022) | | | | (.002) | | — | | | | — |
| Total distributions . | | (.360) | | (.518) | | (.443) | | | | (.435) | | (.447) | | | | (.477) |
| Net asset value, end | | | | | | | | | | | | | | | | |
| of period | | $ 12.76 | | $ 12.99 | | $ 13.30 | | | | $ 13.02 | | $ 12.89 | | | | $ 12.71 |
| Total ReturnB,C,D | | 1.01% | | 1.59% | | 5.65% | | | | 4.44% | | 5.06% | | | | 9.69% |
| Ratios to Average Net AssetsF | | | | | | | | | | | | | | | | |
| Expenses before | | | | | | | | | | | | | | | | |
| reductions | | 1.54%A | | 1.54% | | 1.54% | | | | 1.53% | | 1.53% | | | | 1.53% |
| Expenses net of fee | | | | | | | | | | | | | | | | |
| waivers, if any . | | 1.54%A | | 1.54% | | 1.54% | | | | 1.53% | | 1.53% | | | | 1.53% |
| Expenses net of all | | | | | | | | | | | | | | | | |
| reductions | | 1.49%A | | 1.52% | | 1.54% | | | | 1.52% | | 1.51% | | | | 1.47% |
| Net investment | | | | | | | | | | | | | | | | |
| income | | 3.09%A | | 3.11% | | 3.22% | | | | 3.31% | | 3.57%G | | | | 3.85% |
| Supplemental Data | | | | | | | | | | | | | | | | |
| Net assets, | | | | | | | | | | | | | | | | |
| end of period | | | | | | | | | | | | | | | | |
| (000 omitted) | | $63,235 | | $63,984 | | $58,984 | | | | $59,423 | | $52,019 | | | | $37,324 |
| Portfolio turnover | | | | | | | | | | | | | | | | |
| rate | | 26%A | | 22% | | 17% | | | | 26% | | 20% | | | | 16% |
A Annualized
B Total returns for periods of less than one year are not annualized.
C Total returns would have been lower had certain expenses not been reduced during the periods shown.
D Total returns do not include the effect of the contingent deferred sales charge.
E Calculated based on average shares outstanding during the period.
F Expense ratios reflect operating expenses of the class. Expenses before reductions do not reflect amounts reimbursed by the investment adviser or
expense offset arrangements and do not represent the amount paid by the class during periods when reimbursements or reductions occur. Ex
penses net of fee waivers reflect expenses after reimbursement by the investment adviser but prior to reductions from expense offset arrange
ments. Expenses net of all reductions represent the net expenses paid by the class.
G Effective November 1, 2001, the fund adopted the provisions of the AICPA Audit and Accounting Guide for Investment Companies and began
amortizing premium and discount on all debt securities. Per share data and ratios for periods prior to adoption have not been restated to reflect
this change.
|
See accompanying notes which are an integral part of the financial statements.
35 Semiannual Report
| Financial Highlights Institutional Class | | | | | | | | | | |
| | | Six months ended | | | | | | | | | | | | | | |
| | | April 30, 2006 | | Years ended October 31, |
| | | (Unaudited) | | 2005 | | 2004 | | | | 2003 | | 2002 | | | | 2001 |
| Selected Per Share Data | | | | | | | | | | | | | | | | | | |
| Net asset value, | | | | | | | | | | | | | | | | | | |
| beginning of period | | | | $ 12.92 | | $ 13.24 | | $ 12.96 | | | | $ 12.83 | | $ 12.66 | | | | $ 11.98 |
| Income from | | | | | | | | | | | | | | | | | | |
| Investment | | | | | | | | | | | | | | | | | | |
| Operations | | | | | | | | | | | | | | | | | | |
| Net investment | | | | | | | | | | | | | | | | | | |
| incomeD | | | | .260 | | .540 | | .551 | | | | .556 | | .573F | | | | .598 |
| Net realized and | | | | | | | | | | | | | | | | | | |
| unrealized gain | | | | | | | | | | | | | | | | | | |
| (loss) | | | | (.065) | | (.208) | | .304 | | | | .139 | | .170F | | | | .682 |
| Total from investment | | | | | | | | | | | | | | | | | | |
| operations | | | | .195 | | .332 | | .855 | | | | .695 | | .743 | | | | 1.280 |
| Distributions from net | | | | | | | | | | | | | | | | | | |
| investment income | | | | (.263) | | (.542) | | (.553) | | | | (.563) | | (.573) | | | | (.600) |
| Distributions from net | | | | | | | | | | | | | | | | | | |
| realized gain | | | | (.162) | | (.110) | | (.022) | | | | (.002) | | — | | | | — |
| Total distributions . | | | | (.425) | | (.652) | | (.575) | | | | (.565) | | (.573) | | | | (.600) |
| Net asset value, end | | | | | | | | | | | | | | | | | | |
| of period | | | | $ 12.69 | | $ 12.92 | | $ 13.24 | | | | $ 12.96 | | $ 12.83 | | | | $ 12.66 |
| Total ReturnB,C | | | | 1.52% | | 2.56% | | 6.75% | | | | 5.50% | | 6.05% | | | | 10.91% |
| Ratios to Average Net AssetsE | | | | | | | | | | | | | | | | | | |
| Expenses before | | | | | | | | | | | | | | | | | | |
| reductions | | | | .53%A | | .53% | | .54% | | | | .54% | | .55% | | | | .54% |
| Expenses net of fee | | | | | | | | | | | | | | | | | | |
| waivers, if any | | | | .53%A | | .53% | | .54% | | | | .54% | | .55% | | | | .54% |
| Expenses net of all | | | | | | | | | | | | | | | | | | |
| reductions | | | | .49%A | | .51% | | .53% | | | | .53% | | .52% | | | | .48% |
| Net investment | | | | | | | | | | | | | | | | | | |
| income | | | | 4.10%A | | 4.13% | | 4.23% | | | | 4.30% | | 4.55%F | | | | 4.84% |
| Supplemental Data | | | | | | | | | | | | | | | | | | |
| Net assets, | | | | | | | | | | | | | | | | | | |
| end of period | | | | | | | | | | | | | | | | | | |
| (000 omitted) | | | | $95,985 | | $69,857 | | $44,164 | | | | $44,960 | | $31,703 | | | | $21,842 |
| Portfolio turnover | | | | | | | | | | | | | | | | | | |
| rate | | | | 26%A | | 22% | | 17% | | | | 26% | | 20% | | | | 16% |
A Annualized
B Total returns for periods of less than one year are not annualized.
C Total returns would have been lower had certain expenses not been reduced during the periods shown.
D Calculated based on average shares outstanding during the period.
E Expense ratios reflect operating expenses of the class. Expenses before reductions do not reflect amounts reimbursed by the investment adviser or
expense offset arrangements and do not represent the amount paid by the class during periods when reimbursements or reductions occur. Ex
penses net of fee waivers reflect expenses after reimbursement by the investment adviser but prior to reductions from expense offset arrange
ments. Expenses net of all reductions represent the net expenses paid by the class.
F Effective November 1, 2001, the fund adopted the provisions of the AICPA Audit and Accounting Guide for Investment Companies and began
amortizing premium and discount on all debt securities. Per share data and ratios for periods prior to adoption have not been restated to reflect
this change.
|
See accompanying notes which are an integral part of the financial statements.
Notes to Financial Statements
For the period ended April 30, 2006 (Unaudited)
1. Significant Accounting Policies.
Fidelity Advisor Municipal Income Fund (the fund) is a fund of Fidelity Advisor Series II (the trust) and is authorized to issue an unlimited number of shares. The trust is regis tered under the Investment Company Act of 1940, as amended (the 1940 Act), as an open end management investment company organized as a Massachusetts business trust.
The fund offers Class A, Class T, Class B, Class C, and Institutional Class shares, each of which has equal rights as to assets and voting privileges. Each class has exclusive voting rights with respect to matters that affect that class. Class B shares will automatically convert to Class A shares after a holding period of seven years from the initial date of purchase. Investment income, realized and unrealized capital gains and losses, the common expenses of the fund, and certain fund level expense reductions, if any, are allocated on a pro rata basis to each class based on the relative net assets of each class to the total net assets of the fund. Each class differs with respect to transfer agent and distribution and service plan fees incurred. Certain expense reductions also differ by class.
The financial statements have been prepared in conformity with accounting principles generally accepted in the United States of America, which require management to make certain estimates and assumptions at the date of the financial statements. The following summarizes the significant accounting policies of the fund:
Security Valuation. Investments are valued and net asset value per share is calculated (NAV calculation) as of the close of business of the New York Stock Exchange, normally 4:00 p.m. Eastern time. Wherever possible, the fund uses independent pricing services approved by the Board of Trustees to value its investments. Debt securities, including restricted securities, for which quotes are readily available, are valued by independent pricing services or by dealers who make markets in such securities. Pricing services consider yield or price of bonds of comparable quality, coupon, maturity and type as well as dealer supplied prices. When current market prices or quotations are not readily available or do not accurately reflect fair value, valuations may be determined in accor dance with procedures adopted by the Board of Trustees. The frequency of when fair value pricing is used is unpredictable. The value of securities used for NAV calculation under fair value pricing may differ from published prices for the same securities. Invest ments in open end mutual funds are valued at their closing net asset value each business day. Short term securities with remaining maturities of sixty days or less for which quotations are not readily available are valued at amortized cost, which approximates value.
Investment Transactions and Income. Security transactions are accounted for as of trade date. Gains and losses on securities sold are determined on the basis of identified cost. Interest income is accrued as earned. Interest income includes coupon interest and amortization of premium and accretion of discount on debt securities.
37 Semiannual Report
| Notes to Financial Statements (Unaudited) continued |
1. Significant Accounting Policies continued |
Expenses. Most expenses of the trust can be directly attributed to a fund. Expenses which cannot be directly attributed are apportioned among each fund in the trust.
Income Tax Information and Distributions to Shareholders. Each year, the fund intends to qualify as a regulated investment company by distributing all of its taxable income and realized gains under Subchapter M of the Internal Revenue Code. As a result, no provision for income taxes is required in the accompanying financial statements.
Dividends are declared daily and paid monthly from net investment income. Distribu tions from realized gains, if any, are recorded on the ex dividend date. Income dividends and capital gain distributions are declared separately for each class. Income and capital gain distributions are determined in accordance with income tax regulations, which may differ from generally accepted accounting principles. In addition, the fund claimed a portion of the payment made to redeeming shareholders as a distribution for income tax purposes.
Capital accounts within the financial statements are adjusted for permanent book tax differences. These adjustments have no impact on net assets or the results of operations. Temporary book tax differences will reverse in a subsequent period.
Book tax differences are primarily due to futures transactions, market discount, and losses deferred due to wash sales and futures transactions.
The fund purchases municipal securities whose interest, in the opinion of the issuer, is free from federal income tax. There is no assurance that the Internal Revenue Service (IRS) will agree with this opinion. In the event the IRS determines that the issuer does not comply with relevant tax requirements, interest payments from a security could become federally taxable, possibly retroactively to the date the security was issued.
The federal tax cost of investments and unrealized appreciation (depreciation) as of period end were as follows:
| Unrealized appreciation | | | | $ 18,639,671 |
| Unrealized depreciation | | | | (4,398,350) |
| Net unrealized appreciation (depreciation) | | | | $ 14,241,321 |
| |
| Cost for federal income tax purposes | | | | $ 642,598,249 |
| |
| 2. Operating Policies. | | | | |
Delayed Delivery Transactions and When Issued Securities. The fund may purchase or sell securities on a delayed delivery or when issued basis. Payment and delivery may take place after the customary settlement period for that security. The price of the underlying securities and the date when the securities will be delivered and paid
| 2. Operating Policies continued | | |
Delayed Delivery Transactions and When Issued Securities continued |
for are fixed at the time the transaction is negotiated. During the time a delayed delivery sell is outstanding, the contract is marked to market daily and equivalent deliverable securities are held for the transaction. The value of the securities purchased on a delayed delivery or when issued basis are identified as such in the fund’s Schedule of Investments. The fund may receive compensation for interest forgone in the purchase of a delayed delivery or when issued security. With respect to purchase commitments, the fund identifies securities as segregated in its records with a value at least equal to the amount of the commitment. Losses may arise due to changes in the value of the underly ing securities or if the counterparty does not perform under the contract’s terms, or if the issuer does not issue the securities due to political, economic, or other factors.
Futures Contracts. The fund may use futures contracts to manage its exposure to the bond market and to fluctuations in interest rates. Buying futures tends to increase a fund’s exposure to the underlying instrument, while selling futures tends to decrease a fund’s exposure to the underlying instrument or hedge other fund investments. Upon entering into a futures contract, a fund is required to deposit with a clearing broker, no later than the following business day, an amount (“initial margin”) equal to a certain percentage of the face value of the contract. The initial margin may be in the form of cash or securities and is transferred to a segregated account on settlement date. Subsequent payments (“variation margin”) are made or received by a fund depending on the daily fluctuations in the value of the futures contract and are accounted for as unrealized gains or losses. Realized gains (losses) are recorded upon the expiration or closing of the futures contract. Securities deposited to meet margin requirements are identified in the Schedule of Investments. Losses may arise from changes in the value of the underlying instruments or if the counterparties do not perform under the contract’s terms. Futures contracts are valued at the settlement price established each day by the board of trade or exchange on which they are traded.
3. Purchases and Sales of Investments.
Purchases and sales of securities, other than short term securities, aggregated $96,627,311 and $83,743,692, respectively.
4. Fees and Other Transactions with Affiliates.
Management Fee. Fidelity Management & Research Company (FMR) and its affiliates provide the fund with investment management related services for which the fund pays a monthly management fee. The management fee is the sum of an individual fund fee rate that is based on an annual rate of .25% of the fund’s average net assets and a group fee rate that averaged .12% during the period. The group fee rate is based upon the average
39 Semiannual Report
| Notes to Financial Statements (Unaudited) continued |
4. Fees and Other Transactions with Affiliates continued |
Management Fee continued | | |
net assets of all the mutual funds advised by FMR. The group fee rate decreases as assets under management increase and increases as assets under management decrease. For the period, the total annualized management fee rate was .37% of the fund’s average net assets.
Distribution and Service Plan. In accordance with Rule 12b 1 of the 1940 Act, the fund has adopted separate Distribution and Service Plans for each class of shares. Certain classes pay Fidelity Distributors Corporation (FDC), an affiliate of FMR, separate Distribution and Service Fees, each of which is based on an annual percentage of each class’ average net assets. In addition, FDC may pay financial intermediaries for selling shares of the fund and providing shareholder support services. For the period, the Distribution and Service Fee rates and the total amounts paid to and retained by FDC were as follows:
| | | Distribution | | Service | | | | Paid to | | | | Retained |
| | | Fee | | Fee | | | | FDC | | | | by FDC |
| Class A | | 0% | | .15% | | | | $ 97,978 | | | | $ 2,633 |
| Class T | | 0% | | .25% | | | | 398,209 | | | | 5,234 |
| Class B | | .65% | | .25% | | | | 349,358 | | | | 253,889 |
| Class C | | .75% | | .25% | | | | 318,701 | | | | 65,379 |
| | | | | | | | | $ 1,164,246 | | | | $ 327,135 |
Sales Load. FDC receives a front end sales charge of up to 4.75% for selling Class A shares, and 3.50% for selling Class T shares, some of which is paid to financial intermedi aries for selling shares of the fund. FDC receives the proceeds of contingent deferred sales charges levied on Class A, Class T, Class B, and Class C redemptions. These charges depend on the holding period. The deferred sales charges range from 5% to 1% for Class B, 1% for Class C, .75% to .50% for certain purchases of Class A shares (.25% prior to Febru ary 24, 2006) and .25% for certain purchases of Class T shares.
For the period, sales charge amounts retained by FDC were as follows:
| | | | | Retained |
| | | | | by FDC |
| Class A | | | | $ 40,014 |
| Class T | | | | 18,490 |
| Class B* | | | | 101,130 |
| Class C* | | | | 8,208 |
| | | | | $ 167,842 |
* When Class B and Class C shares are initially sold, FDC pays commissions from its own resources to financial intermediaries through which the sales are made.
Semiannual Report 40
4. Fees and Other Transactions with Affiliates continued
Transfer Agent and Accounting Fees. Citibank, N.A. (Citibank) is the custodian, transfer agent, and shareholder servicing agent for each class of the fund. Citibank has entered into a sub arrangement with Fidelity Investments Institutional Operations Company, Inc. (FIIOC), an affiliate of FMR, with respect to all classes of the fund to perform the transfer, dividend disbursing, and shareholder servicing agent functions. FIIOC receives account fees and asset based fees that vary according to the account size and type of account of the shareholders of the respective classes of the fund. All fees are paid to FIIOC by Citibank, which is reimbursed by each class for such payments. FIIOC pays for typesetting, printing and mailing of shareholder reports, except proxy statements. For the period, each class paid the following transfer agent fees:
| | | | | | | % of |
| | | | | | | Average |
| | | | | Amount | | Net Assets |
| Class A | | | | $ 70,442 | | .11* |
| Class T | | | | 173,265 | | .11* |
| Class B | | | | 45,457 | | .12* |
| Class C | | | | 34,435 | | .11* |
| Institutional Class | | | | 42,182 | | .11* |
| | | | | $ 365,781 | | |
| * Annualized | | | | | | |
Citibank also has a sub arrangement with Fidelity Service Company, Inc. (FSC), an affiliate of FMR, under which FSC maintains the fund’s accounting records. The fee is based on the level of average net assets for the month.
5. Committed Line of Credit.
|
The fund participates with other funds managed by FMR in a $4.2 billion credit facility (the “line of credit”) to be utilized for temporary or emergency purposes to fund share holder redemptions or for other short term liquidity purposes. The fund has agreed to pay commitment fees on its pro rata portion of the line of credit, which amounts to $651 and is reflected in Miscellaneous Expense on the Statement of Operations. During the period, there were no borrowings on this line of credit.
41 Semiannual Report
| Notes to Financial Statements (Unaudited) continued |
6. Expense Reductions. | | |
Through arrangements with the fund’s custodian and each class’ transfer agent, credits realized as a result of uninvested cash balances were used to reduce the fund’s expenses. During the period, these credits reduced the fund’s custody and accounting expenses by $5,574 and $82,705, respectively. During the period, credits reduced each class’ transfer agent expense as noted in the table below.
| | | | | Transfer Agent |
| | | | | expense reduction |
| Class A | | | | $ 14,433 |
| Class T | | | | 37,522 |
| Class B | | | | 9,142 |
| Class C | | | | 6,904 |
| Institutional Class | | | | 8,479 |
| | | | | $ 76,480 |
| |
| 7. Other. | | | | |
The fund’s organizational documents provide former and current trustees and officers with a limited indemnification against liabilities arising in connection with the performance of their duties to the fund. In the normal course of business, the fund may also enter into contracts that provide general indemnifications. The fund’s maximum exposure under these arrangements is unknown as this would be dependent on future claims that may be made against the fund. The risk of material loss from such claims is considered remote.
| 8. Distributions to Shareholders. | | | | | | |
| |
Distributions to shareholders of each class were as follows:
| | | | |
| | | | | Six months ended | | | | Year ended |
| | | | | April 30, | | | | October 31, |
| | | | | 2006 | | | | 2005 |
| From net investment income | | | | | | | | |
| Class A | | | | $ 2,560,161 | | | | $ 4,352,247 |
| Class T | | | | 6,087,752 | | | | 12,293,343 |
| Class B | | | | 1,236,273 | | | | 2,889,040 |
| Class C | | | | 979,661 | | | | 1,912,870 |
| Institutional Class | | | | 1,612,593 | | | | 2,346,042 |
| Total | | | | $ 12,476,440 | | | | $ 23,793,542 |
| From net realized gain | | | | | | | | |
| Class A | | | | $ 1,555,692 | | | | $ 849,843 |
| Class T | | | | 3,978,415 | | | | 2,646,649 |
| Class B | | | | 1,007,878 | | | | 802,913 |
| Class C | | | | 788,459 | | | | 495,651 |
| Institutional Class | | | | 914,239 | | | | 386,746 |
| Total | | | | $ 8,244,683 | | | | $ 5,181,802 |
Semiannual Report 42
| 9. Share Transactions. | | | | | | | | | | |
| |
| Transactions for each class of shares were as follows: | | | | | | | | |
| |
| | | Shares | | | | Dollars |
| | | Six months ended | | Year ended | | | | Six months ended | | | | Year ended |
| | | April 30, | | October 31, | | | | April 30, | | | | October 31, |
| | | 2006 | | 2005 | | | | 2006 | | | | 2005 |
| Class A | | | | | | | | | | | | |
| Shares sold | | 2,427,371 | | 3,538,994 | | | | $31,233,289 | | | | $46,541,886 |
| Reinvestment of | | | | | | | | | | | | |
| distributions | | 220,182 | | 260,181 | | | | 2,829,770 | | | | 3,414,353 |
| Shares redeemed | | (1,168,583) | | (1,912,570) | | | | (15,040,846) | | | | (25,132,123) |
| Net increase (decrease) | | 1,478,970 | | 1,886,605 | | | | $19,022,213 | | | | $24,824,116 |
| Class T | | | | | | | | | | | | |
| Shares sold | | 1,943,929 | | 3,536,120 | | | | $25,087,927 | | | | $46,651,169 |
| Reinvestment of | | | | | | | | | | | | |
| distributions | | 603,080 | | 836,332 | | | | 7,764,803 | | | | 10,998,832 |
| Shares redeemed | | (2,504,156) | | (3,856,498) | | | | (32,295,990) | | | | (50,817,550) |
| Net increase (decrease) | | 42,853 | | 515,954 | | | | $ 556,740 | | | | $ 6,832,451 |
| Class B | | | | | | | | | | | | |
| Shares sold | | 192,632 | | 461,635 | | | | $ 2,474,989 | | | | $ 6,060,771 |
| Reinvestment of | | | | | | | | | | | | |
| distributions | | 106,372 | | 167,091 | | | | 1,363,791 | | | | 2,187,643 |
| Shares redeemed | | (941,220) | | (1,641,543) | | | | (12,089,149) | | | | (21,554,810) |
| Net increase (decrease) | | (642,216) | | (1,012,817) | | | | $ (8,250,369) | | | | $ (13,306,396) |
| Class C | | | | | | | | | | | | |
| Shares sold | | 693,660 | | 1,328,623 | | | | $ 8,945,402 | | | | $17,510,616 |
| Reinvestment of | | | | | | | | | | | | |
| distributions | | 90,773 | | 114,142 | | | | 1,168,187 | | | | 1,500,047 |
| Shares redeemed | | (753,917) | | (951,725) | | | | (9,729,264) | | | | (12,532,673) |
| Net increase (decrease) | | 30,516 | | 491,040 | | | | $ 384,325 | | | | $ 6,477,990 |
| Institutional Class | | | | | | | | | | | | |
| Shares sold | | 2,826,736 | | 2,803,468 | | | | $36,159,443 | | | | $36,736,293 |
| Reinvestment of | | | | | | | | | | | | |
| distributions | | 47,182 | | 26,000 | | | | 602,761 | | | | 340,092 |
| Shares redeemed | | (715,889) | | (760,791) | | | | (9,171,624) | | | | (9,964,633) |
| Net increase (decrease) | | 2,158,029 | | 2,068,677 | | | | $27,590,580 | | | | $27,111,752 |
43 Semiannual Report
Board Approval of Investment Advisory Contracts and Management Fees
Advisor Municipal Income Fund
On January 19, 2006, the Board of Trustees, including the Independent Trustees (together, the Board), voted to approve a general research services agreement (the Agreement) between FMR, FMR Co., Inc. (FMRC), Fidelity Investments Money Manage ment, Inc. (FIMM), and Fidelity Research & Analysis Company (FRAC) (together, the Investment Advisers) for the fund, effective January 20, 2006, pursuant to which FRAC may provide general research and investment advisory support services to FMRC and FIMM. The Board considered that it has approved previously various sub advisory agreements for the fund with affiliates of FMR that allow FMR to obtain research, non discretionary advice, or discretionary portfolio management at no additional expense to the fund. The Board, assisted by the advice of fund counsel and independent Trustees’ counsel, considered a broad range of information and determined that it would be beneficial for the fund to access the research and investment advisory support services supplied by FRAC at no additional expense to the fund.
The Board reached this determination in part because the new arrangement will involve no changes in (i) the contractual terms of and fees payable under the fund’s manage ment contract or sub advisory agreements; (ii) the investment process or strategies employed in the management of the fund’s assets; (iii) the nature or level of services provided under the fund’s management contract or sub advisory agreements; (iv) the day to day management of the fund or the persons primarily responsible for such man agement; or (v) the ultimate control or beneficial ownership of FMR, FMRC, or FIMM. The Board also considered that the establishment of the Agreement would not necessi tate prior shareholder approval of the Agreement or result in an assignment and termination of the fund’s management contract or sub advisory agreements under the Investment Company Act of 1940.
Because the Board was approving an arrangement with FRAC under which the fund will not bear any additional management fees or expenses and under which the fund’s portfolio manager would not change, it did not consider the fund’s investment perfor mance, competitiveness of management fee and total expenses, costs of services and profitability, or economies of scale to be significant factors in its decision.
In connection with its future renewal of the fund’s management contract and sub advisory agreements, the Board will consider: (i) the nature, extent, and quality of services provided to the fund, including shareholder and administrative services and investment performance; (ii) the competitiveness of the fund’s management fee and total expenses; (iii) the costs of the services and profitability, including the revenues earned and the expenses incurred by Fidelity in conducting the business of developing, marketing, distributing, managing, administering, and servicing the fund and its shareholders; and (iv) whether there have been economies of scale in respect of the management of the Fidelity funds, whether the Fidelity funds (including the fund) have
appropriately benefited from any such economies of scale, and whether there is potential for realization of any further economies.
Based on its evaluation of all of the conclusions noted above, and after considering all material factors, the Board ultimately concluded that the fund’s Agreement is fair and reasonable, and that the fund’s Agreement should be approved.
45 Semiannual Report
47 Semiannual Report
49 Semiannual Report
51 Semiannual Report
Investment Adviser
Fidelity Management & Research Company
Boston, MA
Investment Sub Advisers
Fidelity Investments Money
Management, Inc.
Fidelity Research & Analysis Company
(formerly Fidelity Management &
Research (Far East) Inc.)
Fidelity International Investment Advisors
Fidelity International Investment Advisors
(U.K.) Limited
General Distributor
Fidelity Distributors Corporation
Boston, MA
Transfer and Service Agents
Citibank, N.A.
New York, NY
Fidelity Investments Institutional Operations Company, Inc.
Boston, MA
Fidelity Service Company, Inc.
Boston, MA
Custodian
Citibank, N.A.
New York, NY
|
HIM-USAN-0606
1.784901.103
|


| | Fidelity® Advisor
Municipal Income Fund -
Institutional Class
|
| | Semiannual Report
April 30, 2006
|

| Contents | | | | |
| |
| Chairman’s Message | | 3 | | Ned Johnson’s message to shareholders. |
| Shareholder Expense | | 4 | | An example of shareholder expenses. |
| Example | | | | |
| Investment Changes | | 6 | | A summary of major shifts in the fund’s |
| | | | | investments over the past six months. |
| Investments | | 7 | | A complete list of the fund’s investments |
| | | | | with their market values. |
| Financial Statements | | 28 | | Statements of assets and liabilities, |
| | | | | operations, and changes in net assets, |
| | | | | as well as financial highlights. |
| Notes | | 37 | | Notes to the financial statements. |
| Board Approval of | | 44 | | |
| Investment Advisory | | | | |
| Contracts and | | | | |
| Management Fees | | | | |
To view a fund’s proxy voting guidelines and proxy voting record for the 12 month period ended
June 30, visit www.fidelity.com/proxyvotingresults or visit the Securities and Exchange Commis
sion’s (SEC) web site at www.sec.gov. You may also call 1-877-208-0098 to request a free copy of
the proxy voting guidelines.
Standard & Poor’s, S&P and S&P 500 are registered service marks of The McGraw Hill Companies,
Inc. and have been licensed for use by Fidelity Distributors Corporation.
Other third party marks appearing herein are the property of their respective owners.
All other marks appearing herein are registered or unregistered trademarks or service marks
of FMR Corp. or an affiliated company.
|
| | This report and the financial statements contained herein are submitted for the general information
of the shareholders of the fund. This report is not authorized for distribution to prospective investors
in the fund unless preceded or accompanied by an effective prospectus.
A fund files its complete schedule of portfolio holdings with the SEC for the first and third
quarters of each fiscal year on Form N Q. Forms N Q are available on the SEC’s web site at
http://www.sec.gov. A fund’s Forms N Q may be reviewed and copied at the SEC’s Public Reference
Room in Washington, DC. Information regarding the operation of the SEC’s Public Reference
Room may be obtained by calling 1-800-SEC-0330. For a complete list of a fund’s portfolio hold
ings, view the most recent quarterly holdings report, semiannual report, or annual report on
Fidelity’s web site at http://www.advisor.fidelity.com.
NOT FDIC INSURED · MAY LOSE VALUE · NO BANK GUARANTEE
Neither the fund nor Fidelity Distributors Corporation is a bank.
|
Chairman’s Message
(photograph of Edward C. Johnson 3d)
Dear Shareholder:
Although many securities markets made gains in early 2006, there is only one certainty when it comes to investing: There is no sure thing. There are, however, a number of time tested, fundamental investment principles that can put the historical odds in your favor.
One of the basic tenets is to invest for the long term. Over time, riding out the markets’ inevitable ups and downs has proven much more effective than selling into panic or chasing the hottest trend. Even missing only a few of the markets’ best days can significantly diminish investor returns. Patience also affords the benefits of compounding of earning interest on additional income or reinvested dividends and capital gains. There are tax advantages and cost benefits to consider as well. The more you sell, the more taxes you pay, and the more you trade, the higher the costs. While staying the course doesn’t eliminate risk, it can considerably lessen the effect of short term declines.
You can further manage your investing risk through diversification. And today, more than ever, geographic diversification should be taken into account. Studies indicate that asset allocation is the single most important determinant of a portfolio’s long term success. The right mix of stocks, bonds and cash aligned to your particular risk tolerance and investment objective is very important. Age appropriate rebalancing is also an essential aspect of asset allocation. For younger investors, an emphasis on equities which historically have been the best performing asset class over time is encouraged. As investors near their specific goal, such as retirement or sending a child to college, consideration may be given to replacing volatile assets (e.g. common stocks) with more stable fixed investments (bonds or savings plans).
A third investment principle investing regularly can help lower the average cost of your purchases. Investing a certain amount of money each month or quarter helps ensure you won’t pay for all your shares at market highs. This strategy known as dollar cost averaging also reduces unconstructive “emotion” from investing, helping shareholders avoid selling weak performers just prior to an upswing, or chasing a hot performer just before a correction.
We invite you to contact us via the Internet, through our Investor Centers or over the phone. It is our privilege to provide you the information you need to make the investments that are right for you.
Sincerely,
/s/ Edward C. Johnson 3d
Edward C. Johnson 3d
3 Semiannual Report
Shareholder Expense Example
As a shareholder of the Fund, you incur two types of costs: (1) transaction costs, including sales charges (loads) on purchase payments or redemption proceeds, and (2) ongoing costs, including management fees, distribution and/or service (12b 1) fees and other Fund expenses. This Example is intended to help you understand your ongoing costs (in dollars) of investing in the Fund and to compare these costs with the ongoing costs of investing in other mutual funds.
The Example is based on an investment of $1,000 invested at the beginning of the period and held for the entire period (November 1, 2005 to April 30, 2006).
The first line of the table below for each class of the Fund provides information about actual account values and actual expenses. You may use the information in this line, together with the amount you invested, to estimate the expenses that you paid over the period. Simply divide your account value by $1,000.00 (for example, an $8,600 account value divided by $1,000.00 = 8.6), then multiply the result by the number in the first line for a class of the Fund under the heading entitled “Expenses Paid During Period” to estimate the expenses you paid on your account during this period.
Hypothetical Example for Comparison Purposes
The second line of the table below for each class of the Fund provides information about hypothetical account values and hypothetical expenses based on a Class’ actual expense ratio and an assumed rate of return of 5% per year before expenses, which is not the Class’ actual return. The hypothetical account values and expenses may not be used to estimate the actual ending account balance or expenses you paid for the period. You may use this information to compare the ongoing costs of investing in the Fund and other funds. To do so, compare this 5% hypothetical example with the 5% hypothetical examples that appear in the shareholder reports of the other funds.
Please note that the expenses shown in the table are meant to highlight your ongoing costs only and do not reflect any transaction costs. Therefore, the second line of the table is useful in comparing ongoing costs only, and will not help you determine the relative total costs of owning different funds. In addition, if these transactional costs were included, your costs would have been higher.
| | | | | | | | | | | | | Expenses Paid |
| | | | | Beginning | | | | Ending | | | | During Period* |
| | | | | Account Value | | | | Account Value | | | | November 1, 2005 |
| | | | | November 1, 2005 | | | | April 30, 2006 | | | | to April 30, 2006 |
| Class A | | | | | | | | | | | | |
| Actual | | | | $ 1,000.00 | | | | $ 1,014.40 | | | | $ 3.45 |
| HypotheticalA | | | | $ 1,000.00 | | | | $ 1,021.37 | | | | $ 3.46 |
| Class T | | | | | | | | | | | | |
| Actual | | | | $ 1,000.00 | | | | $ 1,013.10 | | | | $ 3.94 |
| HypotheticalA | | | | $ 1,000.00 | | | | $ 1,020.88 | | | | $ 3.96 |
| Class B | | | | | | | | | | | | |
| Actual | | | | $ 1,000.00 | | | | $ 1,010.60 | | | | $ 7.23 |
| HypotheticalA | | | | $ 1,000.00 | | | | $ 1,017.60 | | | | $ 7.25 |
Semiannual Report 4
| | | | | | | | | | | | | Expenses Paid |
| | | | | Beginning | | | | Ending | | | | During Period* |
| | | | | Account Value | | | | Account Value | | | | November 1, 2005 |
| | | | | November 1, 2005 | | | | April 30, 2006 | | | | to April 30, 2006 |
| Class C | | | | | | | | | | | | |
| Actual | | | | $ 1,000.00 | | | | $ 1,010.10 | | | | $ 7.68 |
| HypotheticalA | | | | $ 1,000.00 | | | | $ 1,017.16 | | | | $ 7.70 |
| Institutional Class | | | | | | | | | | | | |
| Actual | | | | $ 1,000.00 | | | | $ 1,015.20 | | | | $ 2.65 |
| HypotheticalA | | | | $ 1,000.00 | | | | $ 1,022.17 | | | | $ 2.66 |
A 5% return per year before expenses | | | | | | | | |
* Expenses are equal to each Class’ annualized expense ratio (shown in the table below); multiplied by the average account value over the period, multiplied by 181/365 (to reflect the one half year period).
| | | Annualized |
| | | Expense Ratio |
| Class A | | 69% |
| Class T | | 79% |
| Class B | | 1.45% |
| Class C | | 1.54% |
| Institutional Class | | 53% |
5 Semiannual Report
| Investment Changes | | | | |
| |
| |
| Top Five States as of April 30, 2006 | | | | |
| | | % of fund’s | | % of fund’s net assets |
| | | net assets | | 6 months ago |
| Texas | | 15.2 | | 15.4 |
| California | | 11.2 | | 8.2 |
| Illinois | | 10.3 | | 10.8 |
| New York | | 9.3 | | 9.0 |
| Washington | | 7.5 | | 8.0 |
Top Five Sectors as of April 30, 2006 | | | | |
| | | % of fund’s | | % of fund’s net assets |
| | | net assets | | 6 months ago |
| General Obligations | | 37.1 | | 33.8 |
| Health Care | | 10.1 | | 9.7 |
| Escrowed/Pre Refunded | | 9.1 | | 9.8 |
| Transportation | | 8.5 | | 9.7 |
| Electric Utilities | | 8.4 | | 10.4 |
Average Years to Maturity as of April 30, 2006 | | |
| | | | | 6 months ago |
| Years | | 15.3 | | 15.3 |
Average years to maturity is based on the average time remaining to the stated maturity date of each bond, weighted by the market value of each bond.
| Duration as of April 30, 2006 | | | | |
| | | | | | | 6 months ago |
| Years | | | | 6.6 | | 6.9 |
Duration shows how much a bond fund’s price fluctuates with changes in comparable interest rates. If rates rise 1%, for example, a fund with a five year duration is likely to lose about 5% of its value. Other factors also can influence a bond fund’s performance and share price. Accordingly, a bond fund’s actual performance may differ from this example.
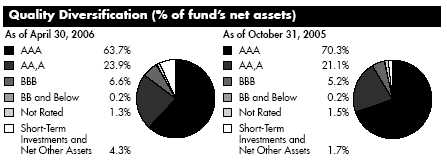
We have used ratings from Moody’s® Investors Services, Inc. Where Moody’s ratings are not available, we have used S&P® ratings.
Semiannual Report 6
| Investments April 30, 2006 (Unaudited) |
| Showing Percentage of Net Assets | | | | |
| |
| Municipal Bonds 95.8% | | | | |
| | | Principal | | Value (Note 1) |
| | | Amount | | |
| Alabama – 0.4% | | | | |
| Birmingham Wtrwks. & Swr. Board Wtr. & Swr. Rev. | | | | |
| Series B, 5% 1/1/43 (MBIA Insured) | | $ 300,000 | | $ 304,221 |
| Oxford Gen. Oblig. 5.75% 5/1/25 (Pre-Refunded to | | | | |
| 5/1/09 @ 102) (e) | | 1,000,000 | | 1,076,410 |
| Phenix City Gen. Oblig. 5.65% 8/1/21 (AMBAC | | | | |
| Insured) | | 1,000,000 | | 1,081,050 |
| | | | | 2,461,681 |
| |
| Alaska – 0.2% | | | | |
| Alaska Student Ln. Corp. Student Ln. Rev. Series A, | | | | |
| 5.45% 7/1/09 (AMBAC Insured) (d) | | 1,500,000 | | 1,527,435 |
| Arizona – 1.3% | | | | |
| Arizona Student Ln. Acquisition Auth. Student Ln. Rev. | | | | |
| Series A1, 5.875% 5/1/18 (d) | | 1,300,000 | | 1,369,511 |
| Chandler Indl. Dev. Auth. Indl. Dev. Rev. (Intel Corp. | | | | |
| Proj.) 4.375%, tender 12/1/10 (c)(d) | | 1,000,000 | | 1,011,760 |
| Glendale Indl. Dev. Auth. Hosp. Rev. (John C. Lincoln | | | | |
| Health Network Proj.) 5% 12/1/29 | | 1,575,000 | | 1,547,107 |
| Phoenix Civic Impt. Corp. Wtr. Sys. Rev. 5% 7/1/29 | | | | |
| (MBIA Insured) | | 1,000,000 | | 1,035,620 |
| Phoenix Indl. Dev. Auth. Single Family Mtg. Rev. 0% | | | | |
| 12/1/14 (Escrowed to Maturity) (e) | | 3,750,000 | | 2,583,825 |
| Univ. of Arizona Univ. Revs. Series 2005 A, 5% 6/1/17 | | | | |
| (AMBAC Insured) | | 1,000,000 | | 1,055,970 |
| | | | | 8,603,793 |
| |
| Arkansas – 0.2% | | | | |
| Little Rock School District Series 2001 C, 5.25% 2/1/33 | | | | |
| (FSA Insured) | | 1,000,000 | | 1,034,240 |
| California – 11.2% | | | | |
| California Dept. of Wtr. Resources Pwr. Supply Rev. | | | | |
| Series A, 5.5% 5/1/15 (AMBAC Insured) | | 1,000,000 | | 1,085,460 |
| California Econ. Recovery Series A: | | | | |
| 5% 7/1/15 (MBIA Insured) | | 1,800,000 | | 1,911,312 |
| 5.25% 7/1/13 (MBIA Insured) | | 1,100,000 | | 1,188,385 |
| 5.25% 7/1/14 (FGIC Insured) | | 900,000 | | 974,367 |
| California Gen. Oblig.: | | | | |
| 5% 3/1/15 | | 1,000,000 | | 1,053,160 |
| 5.25% 2/1/11 | | 2,300,000 | | 2,435,217 |
| 5.25% 2/1/14 | | 2,400,000 | | 2,565,120 |
| 5.25% 2/1/15 | | 1,200,000 | | 1,276,380 |
| 5.25% 2/1/16 | | 1,000,000 | | 1,063,010 |
| 5.25% 2/1/24 | | 1,000,000 | | 1,047,120 |
See accompanying notes which are an integral part of the financial statements.
7 Semiannual Report
| Investments (Unaudited) continued | | | | | | |
| |
| |
| Municipal Bonds continued | | | | | | |
| | | | | Principal | | Value (Note 1) |
| | | | | Amount | | |
| California – continued | | | | | | |
| California Gen. Oblig.: – continued | | | | | | |
| 5.25% 2/1/28 | | | | $ 1,200,000 | | $ 1,249,752 |
| 5.25% 2/1/33 | | | | 2,000,000 | | 2,075,680 |
| 5.25% 12/1/33 | | | | 2,300,000 | | 2,401,407 |
| 5.25% 4/1/34 | | | | 2,200,000 | | 2,293,852 |
| 5.5% 3/1/11 | | | | 3,500,000 | | 3,747,240 |
| 5.5% 9/1/24 (Pre-Refunded to 9/1/09 @ 101) (e) | | | | 200,000 | | 213,648 |
| 5.5% 4/1/30 | | | | 4,000,000 | | 4,288,360 |
| 5.5% 11/1/33 | | | | 5,400,000 | | 5,779,296 |
| 5.625% 5/1/20 | | | | 335,000 | | 357,773 |
| California Poll. Cont. Fing. Auth. Ctfs. of Prtn. (Pacific | | | | | | |
| Gas & Elec. Co. Proj.) Series 2004 B, 3.5%, tender | | | | | | |
| 6/1/07 (FGIC Insured) (c)(d) | | | | 1,200,000 | | 1,195,236 |
| California Pub. Works Board Lease Rev.: | | | | | | |
| (Richmond Lab., Phase III Office Bldg. Proj.) Series B, | | | | | | |
| 5.25% 11/1/25 (XL Cap. Assurance, Inc. Insured) . | | | | 2,585,000 | | 2,754,033 |
| Series 2005 A, 5.25% 6/1/30 | | | | 2,000,000 | | 2,071,480 |
| Series 2005 H, 5% 6/1/18 | | | | 1,425,000 | | 1,473,279 |
| Series 2005 K, 5% 11/1/17 | | | | 2,300,000 | | 2,389,861 |
| California Statewide Cmntys. Dev. Auth. Rev. (Kaiser | | | | | | |
| Fund Hosp./Health Place, Inc. Proj.) Series 2002 C, | | | | | | |
| 3.85%, tender 6/1/12 (c) | | | | 500,000 | | 488,850 |
| Central Valley Fing. Auth. Cogeneration Proj. Rev. | | | | | | |
| (Carson Ice Gen. Proj.) 6% 7/1/09 | | | | 335,000 | | 335,496 |
| Foothill/Eastern Trans. Corridor Agcy. Toll Road Rev.: | | | | | | |
| Series A, 5% 1/1/35 (MBIA Insured) | | | | 700,000 | | 707,175 |
| 5% 1/15/16 (MBIA Insured) | | | | 400,000 | | 417,764 |
| 5.75% 1/15/40 | | | | 600,000 | | 607,458 |
| Golden State Tobacco Securitization Corp.: | | | | | | |
| Series 2003 A1, 6.75% 6/1/39 | | | | 1,200,000 | | 1,335,180 |
| Series A: | | | | | | |
| 5% 6/1/35 (FGIC Insured) | | | | 2,200,000 | | 2,248,554 |
| 5% 6/1/38 (FGIC Insured) | | | | 1,550,000 | | 1,579,388 |
| 5% 6/1/45 | | | | 5,650,000 | | 5,700,229 |
| Los Angeles Dept. of Wtr. & Pwr. Wtrwks. Rev.: | | | | | | |
| Series 2001 A, 5.125% 7/1/41 | | | | 4,000,000 | | 4,060,360 |
| Series A, 5.125% 7/1/41 (MBIA Insured) | | | | 1,300,000 | | 1,328,561 |
| Los Angeles Unified School District Series A: | | | | | | |
| 5.375% 7/1/17 (MBIA Insured) | | | | 835,000 | | 902,051 |
| 5.375% 7/1/18 (Pre-Refunded to 7/1/13 @ 100) (e) | | | | 1,000,000 | | 1,095,260 |
| North City West School Facilities Fing. Auth. Spl. Tax | | | | | | |
| Series C, 5% 9/1/10 (AMBAC Insured) (b) | | | | 1,290,000 | | 1,344,322 |
See accompanying notes which are an integral part of the financial statements.
| Municipal Bonds continued | | | | | | |
| | | | | Principal | | Value (Note 1) |
| | | | | Amount | | |
| California – continued | | | | | | |
| San Diego Unified School District (Election of 1998 Proj.) | | | | | | |
| Series E2, 5.5% 7/1/26 (FSA Insured) | | | | $ 2,300,000 | | $ 2,642,447 |
| San Joaquin Hills Trans. Corridor Agcy. Toll Road Rev. | | | | | | |
| Series A, 0% 1/15/12 (MBIA Insured) | | | | 1,300,000 | | 1,033,825 |
| Univ. of California Revs. (UCLA Med. Ctr. Proj.) Series A: | | | | | | |
| 5.5% 5/15/18 (AMBAC Insured) | | | | 1,755,000 | | 1,896,909 |
| 5.5% 5/15/20 (AMBAC Insured) | | | | 2,000,000 | | 2,155,060 |
| | | | | | | 76,769,317 |
| |
| Colorado – 1.6% | | | | | | |
| Colorado Health Facilities Auth. Retirement Hsg. Rev. | | | | | | |
| (Liberty Heights Proj.) 0% 7/15/22 (Escrowed to | | | | | | |
| Maturity) (e) | | | | 1,365,000 | | 626,317 |
| Colorado Springs Arpt. Rev. Series C, 0% 1/1/08 (MBIA | | | | | | |
| Insured) | | | | 870,000 | | 816,599 |
| Colorado Wtr. Resources and Pwr. Dev. Auth. Clean Wtr. | | | | | | |
| Rev. Series 2001 A: | | | | | | |
| 5.625% 9/1/13 | | | | 235,000 | | 254,552 |
| 5.625% 9/1/14 | | | | 230,000 | | 248,791 |
| Colorado Wtr. Resources and Pwr. Dev. Auth. Wtr. | | | | | | |
| Resources Rev. (Parker Wtr. and Sanitation District | | | | | | |
| Proj.) Series D, 5.25% 9/1/43 (MBIA Insured) | | | | 4,600,000 | | 4,817,580 |
| Dawson Ridge Metropolitan District # 1 Series B, 0% | | | | | | |
| 10/1/22 (Escrowed to Maturity) (e) | | | | 2,000,000 | | 908,420 |
| E-470 Pub. Hwy. Auth. Rev. Series 2000 A, 5.75% | | | | | | |
| 9/1/29 (MBIA Insured) | | | | 1,200,000 | | 1,303,836 |
| Mesa County Residual Rev. 0% 12/1/11 (Escrowed to | | | | | | |
| Maturity) (e) | | | | 2,275,000 | | 1,806,214 |
| | | | | | | 10,782,309 |
| |
| Connecticut – 0.8% | | | | | | |
| Connecticut Health & Edl. Facilities Auth. Rev. (Loomis | | | | | | |
| Chaffee School Proj.) 5.25% 7/1/28 (AMBAC | | | | | | |
| Insured) | | | | 1,760,000 | | 1,946,437 |
| Eastern Connecticut Resources Recovery Auth. Solid | | | | | | |
| Waste Rev. (Wheelabrator Lisbon Proj.) Series A, 5.5% | | | | | | |
| 1/1/20 (d) | | | | 3,350,000 | | 3,354,221 |
| | | | | | | 5,300,658 |
| |
| District Of Columbia – 2.0% | | | | | | |
| District of Columbia Gen. Oblig.: | | | | | | |
| Series A, 6% 6/1/07 (Escrowed to Maturity) (e) | | | | 150,000 | | 150,842 |
| Series B: | | | | | | |
| 0% 6/1/12 (MBIA Insured) | | | | 1,200,000 | | 923,832 |
See accompanying notes which are an integral part of the financial statements.
9 Semiannual Report
| Investments (Unaudited) continued | | | | |
| |
| |
| Municipal Bonds continued | | | | |
| | | | | Principal | | Value (Note 1) |
| | | | | Amount | | |
| District Of Columbia – continued | | | | | | |
| District of Columbia Gen. Oblig.: – continued | | | | | | |
| 5.25% 6/1/26 (FSA Insured) | | | | $ 6,000,000 | | $ 6,228,780 |
| District of Columbia Rev.: | | | | | | |
| (George Washington Univ. Proj.) Series A, 5.75% | | | | | | |
| 9/15/20 (MBIA Insured) | | | | 1,490,000 | | 1,595,030 |
| (Georgetown Univ. Proj.) Series A, 5.95% 4/1/14 | | | | | | |
| (MBIA Insured) | | | | 2,000,000 | | 2,114,540 |
| (Nat’l. Academy of Sciences Proj.) Series A, 5% | | | | | | |
| 1/1/19 (AMBAC Insured) | | | | 2,500,000 | | 2,583,725 |
| | | | | | | 13,596,749 |
| |
| Florida – 1.4% | | | | | | |
| Flagler County School Board Ctfs. Series A, 5% 8/1/12 | | | | | | |
| (FSA Insured) | | | | 1,000,000 | | 1,050,770 |
| Florida Board of Ed. Cap. Outlay Series B, 5.5% | | | | | | |
| 6/1/16 (FGIC Insured) | | | | 1,000,000 | | 1,079,620 |
| Florida Correctional Privatization Communications Ctfs. | | | | | | |
| of Prtn. Series A, 5% 8/1/15 (AMBAC Insured) | | | | 1,000,000 | | 1,049,510 |
| Highlands County Health Facilities Auth. Rev. (Adventist | | | | | | |
| Health Sys./Sunbelt Obligated Group Proj.): | | | | | | |
| Series B, 5% 11/15/14 | | | | 1,000,000 | | 1,043,010 |
| 3.95%, tender 9/1/12 (c) | | | | 1,300,000 | | 1,265,134 |
| 5%, tender 11/16/09 (c) | | | | 1,800,000 | | 1,855,188 |
| JEA Elec. Sys. Rev. Series 3A, 5% 10/1/41 (FSA | | | | | | |
| Insured) | | | | 1,000,000 | | 1,019,410 |
| Miami-Dade County Aviation Rev. Series A, 5% | | | | | | |
| 10/1/38 (CIFG North America Insured) (d) | | | | 1,000,000 | | 1,015,720 |
| Seminole County School Board Ctfs. of Prtn. Series A, | | | | | | |
| 5% 7/1/20 (MBIA Insured) | | | | 500,000 | | 518,190 |
| | | | | | | 9,896,552 |
| |
| Georgia – 2.7% | | | | | | |
| Atlanta Arpt. Rev. Series F, 5.25% 1/1/13 (FSA | | | | |
| Insured) (d) | | | | 1,000,000 | | 1,054,460 |
| Atlanta Wtr. & Wastewtr. Rev.: | | | | | | |
| 5% 11/1/37 (FSA Insured) | | | | 2,400,000 | | 2,448,264 |
| 5% 11/1/43 (FSA Insured) | | | | 9,070,000 | | 9,214,304 |
| Augusta Wtr. & Swr. Rev. 5.25% 10/1/39 (FSA Insured) | | | | 2,200,000 | | 2,314,400 |
| College Park Bus. & Indl. Dev. Auth. Civic Ctr. Proj. Rev. | | | | | | |
| Series 2000, 5.75% 9/1/20 (Pre-Refunded to 9/1/10 | | | | | | |
| @ 102) (e) | | | | 1,100,000 | | 1,208,130 |
| Colquitt County Dev. Auth. Rev. Series A, 0% 12/1/21 | | | | | | |
| (Escrowed to Maturity) (e) | | | | 1,100,000 | | 523,226 |
| |
| See accompanying notes which are an integral part of the financial statements. | | |
| |
| Semiannual Report | | 10 | | | | |
| Municipal Bonds continued | | | | | | |
| | | | | Principal | | Value (Note 1) |
| | | | | Amount | | |
| Georgia – continued | | | | | | |
| Richmond County Dev. Auth. Rev. Series C, 0% 12/1/21 | | | | | | |
| (Escrowed to Maturity) (e) | | | | $ 1,165,000 | | $ 554,144 |
| Savannah Econ. Dev. Auth. Rev. (Southern Care Corp. | | | | | | |
| Proj.) Series C, 0% 12/1/21 (Escrowed to | | | | | | |
| Maturity) (e) | | | | 2,500,000 | | 1,189,150 |
| | | | | | | 18,506,078 |
| |
| Hawaii – 0.2% | | | | | | |
| Hawaii Arpts. Sys. Rev. Series 2000 B, 8% 7/1/11 | | | | | | |
| (FGIC Insured) (d) | | | | 1,300,000 | | 1,528,956 |
| Illinois – 10.3% | | | | | | |
| Chicago Board of Ed.: | | | | | | |
| (Westinghouse High School Proj.) Series C, 5.25% | | | | | | |
| 12/1/19 (MBIA Insured) | | | | 1,300,000 | | 1,382,420 |
| Series A: | | | | | | |
| 0% 12/1/16 (FGIC Insured) | | | | 1,300,000 | | 801,905 |
| 5.5% 12/1/27 (AMBAC Insured) | | | | 1,000,000 | | 1,134,130 |
| Chicago Gen. Oblig.: | | | | | | |
| (City Colleges Proj.): | | | | | | |
| 0% 1/1/16 (FGIC Insured) | | | | 6,125,000 | | 3,965,876 |
| 0% 1/1/24 (FGIC Insured) | | | | 6,110,000 | | 2,666,648 |
| (Neighborhoods Alive 21 Prog.) 5% 1/1/43 (AMBAC | | | | | | |
| Insured) | | | | 1,000,000 | | 1,012,630 |
| Series A: | | | | | | |
| 5% 1/1/41 (Pre-Refunded to 1/1/15 @ 100) (e) | | | | 1,000,000 | | 1,050,150 |
| 5% 1/1/42 (AMBAC Insured) | | | | 1,700,000 | | 1,725,993 |
| 5.25% 1/1/33 (MBIA Insured) | | | | 1,070,000 | | 1,108,028 |
| 5.25% 1/1/33 (Pre-Refunded to 1/1/11 @ 101) (e) | | | | 30,000 | | 32,186 |
| 5.5% 1/1/38 (MBIA Insured) | | | | 255,000 | | 269,765 |
| 5.5% 1/1/38 (Pre-Refunded to 1/1/11 @ 101) (e) . | | | | 10,000 | | 10,835 |
| 5.5% 1/1/38 (Pre-Refunded to 1/1/11 @ 101) (e) . | | | | 735,000 | | 796,336 |
| 5.5% 1/1/40 (FGIC Insured) | | | | 525,000 | | 552,930 |
| Chicago Midway Arpt. Rev. Series B, 6% 1/1/09 (MBIA | | | | | | |
| Insured) (d) | | | | 300,000 | | 306,741 |
| Chicago O’Hare Int’l. Arpt. Rev.: | | | | | | |
| Series A: | | | | | | |
| 5.5% 1/1/16 (AMBAC Insured) (d) | | | | 900,000 | | 926,442 |
| 6.25% 1/1/09 (AMBAC Insured) (d) | | | | 3,325,000 | | 3,443,237 |
| Series B, 5.25% 1/1/14 (FGIC Insured) | | | | 1,000,000 | | 1,071,500 |
| 5.5% 1/1/09 (AMBAC Insured) (d) | | | | 1,250,000 | | 1,298,100 |
| Chicago Park District Series A, 5.5% 1/1/19 (FGIC | | | | | | |
| Insured) | | | | 155,000 | | 164,788 |
See accompanying notes which are an integral part of the financial statements.
11 Semiannual Report
| Investments (Unaudited) continued | | | | | | |
| |
| |
| Municipal Bonds continued | | | | | | |
| | | | | Principal | | Value (Note 1) |
| | | | | Amount | | |
| Illinois – continued | | | | | | |
| Chicago Transit Auth. Cap. Grant Receipts Rev. (Douglas | | | | | | |
| Branch Proj.) Series 2003 B, 4.25% 6/1/08 (AMBAC | | | | | | |
| Insured) | | | | $ 1,400,000 | | $ 1,400,854 |
| Coles, Cumberland, Moultrie & Shelby Counties Cmnty. | | | | | | |
| Unit School District #2, Mattoon 5.8% 2/1/17 (Pre- | | | | | | |
| Refunded to 2/1/11 @ 100) (e) | | | | 1,000,000 | | 1,089,190 |
| Cook County Gen. Oblig. Series C, 5% 11/15/25 | | | | | | |
| (AMBAC Insured) | | | | 1,100,000 | | 1,130,195 |
| DuPage County Cmnty. High School District #108, Lake | | | | | | |
| Park 5.6% 1/1/17 (FSA Insured) | | | | 3,190,000 | | 3,466,254 |
| Evanston Gen. Oblig. Series C, 5.25% 1/1/20 | | | | 1,500,000 | | 1,588,605 |
| Granite City Solid Waste Disp. Rev. (Waste Mgmt., Inc. | | | | | | |
| Proj.) 3.85%, tender 5/1/08 (c)(d) | | | | 2,810,000 | | 2,791,370 |
| Illinois Dev. Fin. Auth. Retirement 0% 7/15/23 | | | | | | |
| (Escrowed to Maturity) (e) | | | | 2,900,000 | | 1,259,702 |
| Illinois Gen. Oblig.: | | | | | | |
| First Series: | | | | | | |
| 5.5% 8/1/19 (MBIA Insured) | | | | 2,500,000 | | 2,690,925 |
| 5.75% 12/1/18 (MBIA Insured) | | | | 1,000,000 | | 1,074,240 |
| Series 2006, 5.5% 1/1/31 | | | | 1,000,000 | | 1,146,370 |
| 5.5% 4/1/17 (MBIA Insured) | | | | 1,000,000 | | 1,056,740 |
| 5.6% 4/1/21 (MBIA Insured) | | | | 1,000,000 | | 1,055,880 |
| Illinois Health Facilities Auth. Rev.: | | | | | | |
| (Condell Med. Ctr. Proj.) 6.5% 5/15/30 | | | | 3,000,000 | | 3,167,940 |
| (Decatur Memorial Hosp. Proj.) Series 2001, 5.75% | | | | | | |
| 10/1/24 | | | | 2,100,000 | | 2,176,776 |
| (Lake Forest Hosp. Proj.) 6% 7/1/33 | | | | 1,000,000 | | 1,055,800 |
| (Riverside Health Sys. Proj.) 6.8% 11/15/20 | | | | | | |
| (Pre-Refunded to 11/15/10 @ 101) (e) | | | | 1,500,000 | | 1,701,750 |
| Illinois Sales Tax Rev.: | | | | | | |
| First Series 2001, 5.5% 6/15/13 | | | | 3,250,000 | | 3,492,060 |
| 6% 6/15/20 | | | | 600,000 | | 647,700 |
| Joliet School District #86 Gen. Oblig. Cap. Appreciation | | | | | | |
| 0% 11/1/19 (FSA Insured) | | | | 2,000,000 | | 1,069,900 |
| Lake County Cmnty. High School District #117, Antioch | | | | | | |
| Series B, 0% 12/1/20 (FGIC Insured) | | | | 1,805,000 | | 914,377 |
| Lake County Warren Township High School District | | | | | | |
| #121, Gurnee Series C, 5.5% 3/1/23 (AMBAC | | | | | | |
| Insured) | | | | 1,795,000 | | 1,959,637 |
| Metropolitan Pier & Exposition Auth. Dedicated State Tax | | | | | | |
| Rev. (McCormick Place Expansion Proj.): | | | | | | |
| Series 2002 A, 5.75% 6/15/41 (MBIA Insured) | | | | 3,300,000 | | 3,589,509 |
See accompanying notes which are an integral part of the financial statements.
| Municipal Bonds continued | | | | | | |
| | | | | Principal | | Value (Note 1) |
| | | | | Amount | | |
| Illinois – continued | | | | | | |
| Metropolitan Pier & Exposition Auth. Dedicated State Tax | | | | | | |
| Rev. (McCormick Place Expansion Proj.): – continued | | | | | | |
| Series A: | | | | | | |
| 0% 6/15/16 (FGIC Insured) | | | | $ 2,370,000 | | $ 1,500,447 |
| 0% 6/15/22 (MBIA Insured) | | | | 1,060,000 | | 504,518 |
| 0% 12/15/24 (MBIA Insured) | | | | 3,090,000 | | 1,301,230 |
| Ogle, Lee & DeKalb Counties Township High School | | | | | | |
| District #212: | | | | | | |
| 6% 12/1/16 (MBIA Insured) | | | | 60,000 | | 66,228 |
| 6% 12/1/16 (Pre-Refunded to 12/1/11 @ 100) (e) | | | | 940,000 | | 1,044,030 |
| Univ. of Illinois Auxiliary Facilities Sys. Rev. 0% 4/1/15 | | | | | | |
| (MBIA Insured) | | | | 3,700,000 | | 2,497,426 |
| Will County Forest Preservation District Series B, 0% | | | | | | |
| 12/1/14 (FGIC Insured) | | | | 1,000,000 | | 688,440 |
| | | | | | | 70,848,733 |
| |
| Indiana – 2.5% | | | | | | |
| Anderson School Bldg. Corp. 5.5% 7/15/23 (Pre-Re- | | | | | | |
| funded to 7/15/14 @ 100) (e) | | | | 1,330,000 | | 1,464,317 |
| Crown Point Multi-School Bldg. Corp. 5% 1/15/20 | | | | | | |
| (FGIC Insured) | | | | 1,260,000 | | 1,313,701 |
| Franklin Township Independent School Bldg. Corp., | | | | | | |
| Marion County 5.25% 7/15/16 (MBIA Insured) | | | | 1,790,000 | | 1,925,020 |
| Hobart Bldg. Corp. 6.5% 1/15/29 (FGIC Insured) (b) | | | | 2,600,000 | | 3,139,162 |
| Indiana Health Facility Fing. Auth. Rev. (Sisters of Saint | | | | | | |
| Francis Health Svc. Proj.) 5.5% 11/1/31 | | | | 1,500,000 | | 1,556,295 |
| Indiana Trans. Fin. Auth. Hwy. Series A, 0% 6/1/17 | | | | | | |
| (AMBAC Insured) | | | | 1,000,000 | | 601,620 |
| Muncie School Bldg. Corp. 5.25% 7/10/13 (MBIA | | | | | | |
| Insured) | | | | 1,670,000 | | 1,799,158 |
| North Adams Cmnty. Schools Renovation Bldg. Corp. 0% | | | | | | |
| 1/15/17 (FSA Insured) | | | | 1,230,000 | | 752,920 |
| Petersburg Poll. Cont. Rev. 5.95% 12/1/29 (d) | | | | 2,000,000 | | 2,114,300 |
| Portage Township Multi-School Bldg. Corp. 5.25% | | | | | | |
| 7/15/26 (MBIA Insured) | | | | 1,195,000 | | 1,263,677 |
| South Harrison School Bldg. Corp. Series A, 5.25% | | | | | | |
| 1/15/25 (FSA Insured) | | | | 1,150,000 | | 1,218,241 |
| | | | | | | 17,148,411 |
See accompanying notes which are an integral part of the financial statements.
13 Semiannual Report
| Investments (Unaudited) continued | | | | |
| |
| |
| Municipal Bonds continued | | | | | | |
| | | | | Principal | | Value (Note 1) |
| | | | | Amount | | |
| Iowa 0.9% | | | | | | |
| Iowa Fin. Auth. Hosp. Facilities Rev. 5.875% 2/15/30 | | | | | | |
| (Pre-Refunded to 2/15/10 @ 101) (e) | | | | $ 1,870,000 | | $ 2,028,520 |
| Tobacco Settlement Auth. Tobacco Settlement Rev. 5.3% | | | | | | |
| 6/1/25 (Pre-Refunded to 6/1/11 @ 101) (e) | | | | 4,000,000 | | 4,249,480 |
| | | | | | | 6,278,000 |
| |
| Kansas 1.5% | | | | | | |
| Burlington Envir. Impt. Rev. (Kansas City Pwr. & Lt. Co. | | | | | | |
| Proj.) Series A, 4.75%, tender 10/1/07 (c) | | | | 1,000,000 | | 1,007,830 |
| Kansas Dev. Fin. Auth. Health Facilities Rev.: | | | | | | |
| (Hays Med. Ctr. Proj.) Series 2005 L: | | | | | | |
| 5.25% 11/15/15 | | | | 335,000 | | 354,031 |
| 5.25% 11/15/16 | | | | 955,000 | | 1,003,208 |
| (Sisters of Charity of Leavenworth Health Svcs. Corp. | | | | | | |
| Proj.) Series J, 6.25% 12/1/28 | | | | 1,500,000 | | 1,626,750 |
| Kansas Dev. Fin. Auth. Rev. (Sisters of Charity of | | | | | | |
| Leavenworth Health Svcs. Corp. Proj.): | | | | | | |
| 5% 12/1/13 (MBIA Insured) | | | | 2,390,000 | | 2,462,991 |
| 5% 12/1/14 (MBIA Insured) | | | | 500,000 | | 515,270 |
| 5.25% 12/1/09 (MBIA Insured) | | | | 1,420,000 | | 1,473,846 |
| 5.25% 12/1/11 (MBIA Insured) | | | | 1,750,000 | | 1,814,593 |
| | | | | | | 10,258,519 |
| |
| Kentucky 0.3% | | | | | | |
| Louisville & Jefferson County Metropolitan Swr. District | | | | | | |
| Swr. & Drain Sys. Rev. Series A, 5.25% 5/15/37 | | | | | | |
| (FGIC Insured) | | | | 2,170,000 | | 2,301,372 |
| Louisiana – 0.1% | | | | | | |
| New Orleans Gen. Oblig. 0% 9/1/15 (AMBAC Insured) | | | | 700,000 | | 449,722 |
| Tobacco Settlement Fing. Corp. Series 2001 B, 5.5% | | | | | | |
| 5/15/30 | | | | 420,000 | | 435,826 |
| | | | | | | 885,548 |
| |
| Maine – 0.2% | | | | | | |
| Maine Tpk. Auth. Tpk. Rev. 5.25% 7/1/30 (FSA Insured) | | | | 1,000,000 | | 1,055,590 |
| Maryland 0.4% | | | | | | |
| Maryland Health & Higher Edl. Facilities Auth. Rev. | | | | | | |
| (Good Samaritan Hosp. Proj.): | | | | | | |
| 5.75% 7/1/13 (Escrowed to Maturity) (e) | | | | 1,665,000 | | 1,812,486 |
| 5.75% 7/1/13 (Escrowed to Maturity) (e) | | | | 1,015,000 | | 1,104,909 |
| | | | | | | 2,917,395 |
| |
| |
| See accompanying notes which are an integral part of the financial statements. | | |
| |
| Semiannual Report | | 14 | | | | |
| Municipal Bonds continued | | | | | | |
| | | | | Principal | | Value (Note 1) |
| | | | | Amount | | |
| Massachusetts 4.6% | | | | | | |
| Massachusetts Bay Trans. Auth. Series A, 5% 7/1/31 | | | | $ 2,000,000 | | $ 2,063,660 |
| Massachusetts Gen. Oblig.: | | | | | | |
| Series 2005 A, 5% 3/1/22 | | | | 3,500,000 | | 3,641,645 |
| Series 2005 C, 5.25% 9/1/23 | | | | 2,800,000 | | 2,989,140 |
| Series D: | | | | | | |
| 5% 10/1/23 (Pre-Refunded to 10/1/13 @ 100) (e) | | | | 1,000,000 | | 1,058,950 |
| 5.25% 10/1/20 (Pre-Refunded to 10/1/13 @ | | | | | | |
| 100) (e) | | | | 2,000,000 | | 2,149,620 |
| 5.25% 10/1/22 (Pre-Refunded to 10/1/13 @ | | | | | | |
| 100) (e) | | | | 1,200,000 | | 1,289,772 |
| Massachusetts Health & Edl. Facilities Auth. Rev. (New | | | | | | |
| England Med. Ctr. Hosp. Proj.) Series G, 5.375% | | | | | | |
| 7/1/24 (MBIA Insured) | | | | 500,000 | | 501,535 |
| Massachusetts Indl. Fin. Agcy. Rev. (Massachusetts | | | | | | |
| Biomedical Research Corp. Proj.) Series A2: | | | | | | |
| 0% 8/1/08 | | | | 800,000 | | 730,504 |
| 0% 8/1/10 | | | | 4,500,000 | | 3,753,450 |
| Massachusetts School Bldg. Auth. Dedicated Sales Tax | | | | | | |
| Rev. Series A: | | | | | | |
| 5% 8/15/23 (FSA Insured) | | | | 5,000,000 | | 5,222,400 |
| 5% 8/15/30 (FSA Insured) | | | | 4,500,000 | | 4,662,000 |
| Massachusetts Wtr. Poll. Abatement Trust Wtr. Poll. | | | | | | |
| Abatement Rev. (MWRA Ln. Prog.) Series A, 5.25% | | | | | | |
| 8/1/13 | | | | 10,000 | | 10,427 |
| Springfield Gen. Oblig. 5% 8/1/20 (MBIA Insured) | | | | 3,335,000 | | 3,480,273 |
| | | | | | | 31,553,376 |
| |
| Michigan – 1.2% | | | | | | |
| Detroit Wtr. Supply Sys. Rev. Series 2001 A, 5.25% | | | | | | |
| 7/1/33 (FGIC Insured) | | | | 1,065,000 | | 1,110,316 |
| Ferris State Univ. Rev. 5% 10/1/19 (MBIA Insured) | | | | 1,440,000 | | 1,498,090 |
| Michigan Hosp. Fin. Auth. Hosp. Rev. (McLaren Health | | | | | | |
| Care Corp. Proj.) Series A, 5% 6/1/19 | | | | 2,000,000 | | 2,045,780 |
| Royal Oak Hosp. Fin. Auth. Hosp. Rev. (William | | | | | | |
| Beaumont Hosp. Proj.) 6.25% 1/1/09 | | | | 2,310,000 | | 2,443,403 |
| Willow Run Cmnty. Schools County of Washtenaw 5% | | | | | | |
| 5/1/20 (FSA Insured) | | | | 1,000,000 | | 1,040,400 |
| | | | | | | 8,137,989 |
| |
| Minnesota 1.3% | | | | | | |
| Minneapolis & Saint Paul Hsg. & Redev. Auth. Health | | | | | | |
| Care Sys. Rev. (Healthspan Corp. Proj.) Series A, | | | | | | |
| 4.75% 11/15/18 (AMBAC Insured) | | | | 1,800,000 | | 1,812,708 |
See accompanying notes which are an integral part of the financial statements.
15 Semiannual Report
| Investments (Unaudited) continued | | | | |
| |
| |
| Municipal Bonds continued | | | | | | |
| | | | | Principal | | Value (Note 1) |
| | | | | Amount | | |
| Minnesota – continued | | | | | | |
| Minneapolis & Saint Paul Metropolitan Arpts. | | | | | | |
| Commission Arpt. Rev. Series 2001 C, 5.25% 1/1/32 | | | | | | |
| (FGIC Insured) | | | | $ 1,000,000 | | $ 1,037,540 |
| Minneapolis Health Care Sys. Rev. (Allina Health Sys. | | | | | | |
| Proj.) Series 2002 A, 6% 11/15/23 | | | | 1,000,000 | | 1,087,020 |
| Rochester Health Care Facilities Rev. (Mayo Foundation | | | | | | |
| Proj.) Series A, 5.5% 11/15/27 | | | | 590,000 | | 615,022 |
| Saint Cloud Health Care Rev. (Saint Cloud Hosp. Group | | | | | | |
| Oblig. Proj.) Series A, 5.875% 5/1/30 (FSA Insured) | | | | 2,000,000 | | 2,154,240 |
| Saint Paul Port Auth. Lease Rev.: | | | | | | |
| (HealthEast Midway Campus Proj.) Series 2003 A, | | | | | | |
| 5.875% 5/1/30 | | | | 1,400,000 | | 1,425,886 |
| Series 2003 11, 5.25% 12/1/18 | | | | 1,000,000 | | 1,060,180 |
| | | | | | | 9,192,596 |
| |
| Missouri – 0.2% | | | | | | |
| Missouri Envir. Impt. & Energy Resources Auth. Wtr. Poll. | | | | | | |
| Cont. & Drinking Wtr. Rev. (State Revolving Fund | | | | | | |
| Prog.) Series 2003 A, 5.125% 1/1/21 | | | | 1,010,000 | | 1,058,955 |
| Montana 0.4% | | | | | | |
| Forsyth Poll. Cont. Rev. (Portland Gen. Elec. Co. Projs.) | | | | | | |
| Series A, 5.2%, tender 5/1/09 (c) | | | | 1,500,000 | | 1,538,010 |
| Montana Board of Regents Higher Ed. Rev. (Montana | | | | | | |
| State Univ. Proj.) 5% 11/15/34 (AMBAC Insured) | | | | 1,000,000 | | 1,031,510 |
| | | | | | | 2,569,520 |
| |
| Nevada 0.7% | | | | | | |
| Clark County Arpt. Rev. Series C, 5.375% 7/1/22 | | | | | | |
| (AMBAC Insured) (d) | | | | 1,000,000 | | 1,042,430 |
| Clark County Gen. Oblig. Series 2000, 5.5% 7/1/30 | | | | | | |
| (MBIA Insured) | | | | 500,000 | | 524,355 |
| Clark County School District Series C, 5.375% 6/15/15 | | | | | | |
| (Pre-Refunded to 6/15/12 @ 100) (e) | | | | 1,000,000 | | 1,083,500 |
| Las Vegas Valley Wtr. District Series B: | | | | | | |
| 5.25% 6/1/16 (MBIA Insured) | | | | 1,000,000 | | 1,063,310 |
| 5.25% 6/1/17 (MBIA Insured) | | | | 1,000,000 | | 1,060,360 |
| | | | | | | 4,773,955 |
| |
| New Hampshire – 0.2% | | | | | | |
| New Hampshire Bus. Fin. Auth. Poll. Cont. Rev. (United | | | | | | |
| Illumination Co.) Series A, 3.65%, tender 2/1/10 | | | | | | |
| (AMBAC Insured) (c)(d) | | | | 1,000,000 | | 979,380 |
| |
| |
| See accompanying notes which are an integral part of the financial statements. | | |
| |
| Semiannual Report | | 16 | | | | |
| Municipal Bonds continued | | | | | | |
| | | | | Principal | | Value (Note 1) |
| | | | | Amount | | |
| New Jersey – 3.2% | | | | | | |
| New Jersey Econ. Dev. Auth. Rev.: | | | | | | |
| Series 2005 K, 5.5% 12/15/19 (AMBAC Insured) | | | | $ 1,500,000 | | $ 1,677,405 |
| Series 2005 O: | | | | | | |
| 5.25% 3/1/23 | | | | 2,000,000 | | 2,106,660 |
| 5.25% 3/1/26 | | | | 915,000 | | 959,725 |
| Series O: | | | | | | |
| 5.25% 3/1/21 (MBIA Insured) | | | | 1,000,000 | | 1,066,080 |
| 5.25% 3/1/25 | | | | 1,500,000 | | 1,575,540 |
| New Jersey Tpk. Auth. Tpk. Rev. Series A, 5% 1/1/25 | | | | | | |
| (FSA Insured) | | | | 900,000 | | 938,493 |
| New Jersey Trans. Trust Fund Auth. Series B, 5.25% | | | | | | |
| 12/15/22 (AMBAC Insured) | | | | 400,000 | | 437,776 |
| North Hudson Swr. Auth. Swr. Rev. Series A, 5.25% | | | | | | |
| 8/1/17 (FGIC Insured) | | | | 2,000,000 | | 2,126,580 |
| Tobacco Settlement Fing. Corp.: | | | | | | |
| 4.375% 6/1/19 | | | | 2,350,000 | | 2,346,428 |
| 6.125% 6/1/24 | | | | 3,300,000 | | 3,555,486 |
| 6.125% 6/1/42 | | | | 1,600,000 | | 1,679,296 |
| 6.375% 6/1/32 | | | | 1,400,000 | | 1,521,310 |
| 6.75% 6/1/39 | | | | 600,000 | | 668,730 |
| Union County Impt. Auth. (Juvenile Detention Ctr. Facility | | | | | | |
| Proj.) 5.5% 5/1/28 (FGIC Insured) | | | | 1,000,000 | | 1,086,400 |
| | | | | | | 21,745,909 |
| |
| New Mexico – 1.1% | | | | | | |
| Albuquerque Arpt. Rev.: | | | | | | |
| 6.7% 7/1/18 (AMBAC Insured) (d) | | | | 3,970,000 | | 4,160,878 |
| 6.75% 7/1/09 (AMBAC Insured) (d) | | | | 450,000 | | 484,848 |
| 6.75% 7/1/11 (AMBAC Insured) (d) | | | | 1,805,000 | | 2,001,438 |
| New Mexico Edl. Assistance Foundation Student Ln. Rev. | | | | | | |
| Series IV A2, 6.65% 3/1/07 | | | | 1,000,000 | | 1,012,020 |
| | | | | | | 7,659,184 |
| |
| New York – 9.3% | | | | | | |
| Erie County Indl. Dev. Agcy. School Facility Rev. (Buffalo | | | | | | |
| City School District Proj.): | | | | | | |
| Series 2003: | | | | | | |
| 5.75% 5/1/16 (FSA Insured) | | | | 1,500,000 | | 1,648,230 |
| 5.75% 5/1/21 (FSA Insured) | | | | 1,200,000 | | 1,300,968 |
| Series 2004: | | | | | | |
| 5.75% 5/1/21 (FSA Insured) | | | | 4,900,000 | | 5,453,455 |
| 5.75% 5/1/25 (FSA Insured) | | | | 600,000 | | 668,634 |
See accompanying notes which are an integral part of the financial statements.
17 Semiannual Report
| Investments (Unaudited) continued | | | | | | |
| |
| |
| Municipal Bonds continued | | | | | | |
| | | | | Principal | | Value (Note 1) |
| | | | | Amount | | |
| New York – continued | | | | | | |
| Long Island Pwr. Auth. Elec. Sys. Rev. 5% 12/1/26 (XL | | | | | | |
| Cap. Assurance, Inc. Insured) | | | | $ 1,400,000 | | $ 1,453,872 |
| Metropolitan Trans. Auth. Rev.: | | | | | | |
| Series 2002 A, 5.75% 11/15/32 | | | | 4,300,000 | | 4,687,559 |
| Series F, 5.25% 11/15/27 (MBIA Insured) | | | | 500,000 | | 530,305 |
| Metropolitan Trans. Auth. Svc. Contract Rev.: | | | | | | |
| Series 7, 5.625% 7/1/16 (Escrowed to Maturity) (e) | | | | 1,000,000 | | 1,001,310 |
| Series O, 5.75% 7/1/13 (Escrowed to Maturity) (e) | | | | 700,000 | | 754,495 |
| Metropolitan Trans. Auth. Transit Facilities Rev. Series C, | | | | | | |
| 4.75% 7/1/16 (Pre-Refunded to 1/1/12 @ 100) (e) . | | | | 150,000 | | 157,346 |
| Nassau County Gen. Oblig. Series Z, 5% 9/1/11 (FGIC | | | | | | |
| Insured) | | | | 300,000 | | 314,598 |
| New York City Gen. Oblig.: | | | | | | |
| Series 2003 I, 5.75% 3/1/16 | | | | 715,000 | | 779,264 |
| Series 2005 G: | | | | | | |
| 5% 8/1/14 | | | | 3,600,000 | | 3,785,904 |
| 5% 8/1/15 | | | | 1,000,000 | | 1,051,310 |
| Series A, 5.25% 11/1/14 (MBIA Insured) | | | | 600,000 | | 639,960 |
| Series C: | | | | | | |
| 5.75% 3/15/27 (FSA Insured) | | | | 135,000 | | 146,065 |
| 5.75% 3/15/27 (Pre-Refunded to 3/15/12 @ | | | | | | |
| 100) (e) | | | | 365,000 | | 402,500 |
| Subseries 2005 F1, 5.25% 9/1/14 | | | | 1,200,000 | | 1,283,352 |
| New York City Indl. Dev. Agcy. Indl. Dev. Rev. (Japan | | | | | | |
| Airlines Co. Ltd. Proj.) Series 1991, 6% 11/1/15 (FSA | | | | | | |
| Insured) (d) | | | | 705,000 | | 720,841 |
| New York City Indl. Dev. Agcy. Spl. Facilities Rev. | | | | | | |
| (Terminal One Group Assoc. Proj.) 5% 1/1/09 (d) | | | | 1,000,000 | | 1,021,910 |
| New York City Muni. Wtr. Fin. Auth. Wtr. & Swr. Sys. | | | | | | |
| Rev.: | | | | | | |
| Series 2002 A, 5.125% 6/15/34 (FSA Insured) | | | | 500,000 | | 518,960 |
| Series A, 5.125% 6/15/34 (MBIA Insured) | | | | 2,000,000 | | 2,075,840 |
| New York City Trust Cultural Resources Rev. (Museum of | | | | | | |
| Modern Art Proj.) Series 2001 D, 5.125% 7/1/31 | | | | | | |
| (AMBAC Insured) | | | | 1,000,000 | | 1,040,880 |
| New York State Dorm. Auth. Revs.: | | | | | | |
| (City Univ. Sys. Consolidation Proj.): | | | | | | |
| Series A, 5.75% 7/1/13 | | | | 1,500,000 | | 1,622,160 |
| Series C, 7.5% 7/1/10 | | | | 435,000 | | 467,843 |
| (The Jamaica Hosp. Proj.) Series F, 5.2% 2/15/14 | | | | | | |
| (MBIA Insured) | | | | 6,150,000 | | 6,397,107 |
| Series 2002 A, 5.75% 10/1/17 (MBIA Insured) | | | | 1,000,000 | | 1,095,110 |
See accompanying notes which are an integral part of the financial statements.
| Municipal Bonds continued | | | | | | |
| | | | | Principal | | Value (Note 1) |
| | | | | Amount | | |
| New York – continued | | | | | | |
| New York State Envir. Facilities Corp. Clean Wtr. & | | | | | | |
| Drinking Wtr. Rev. Series F: | | | | | | |
| 4.875% 6/15/18 | | | | $ 870,000 | | $ 891,306 |
| 4.875% 6/15/20 | | | | 795,000 | | 813,333 |
| 5% 6/15/15 | | | | 305,000 | | 315,623 |
| New York State Thruway Auth. Gen. Rev. Series 2005 G, | | | | | | |
| 5.25% 1/1/27 (FSA Insured) | | | | 1,600,000 | | 1,706,512 |
| New York State Thruway Auth. Svc. Contract Rev. 5.5% | | | | | | |
| 4/1/16 | | | | 305,000 | | 328,031 |
| New York Transitional Fin. Auth. Rev.: | | | | | | |
| Series 2004 C, 5% 2/1/33 (FGIC Insured) | | | | 1,000,000 | | 1,032,320 |
| Series A, 5.75% 2/15/16 | | | | 10,000 | | 10,720 |
| Series B, 5.25% 2/1/29 (a) | | | | 1,100,000 | | 1,164,669 |
| Sales Tax Asset Receivables Corp. Series A, 5.25% | | | | | | |
| 10/15/27 (AMBAC Insured) | | | | 1,500,000 | | 1,598,940 |
| Tobacco Settlement Fing. Corp.: | | | | | | |
| Series 2003 C1, 5.5% 6/1/19 | | | | 1,400,000 | | 1,503,292 |
| Series A1: | | | | | | |
| 5.25% 6/1/21 (AMBAC Insured) | | | | 1,000,000 | | 1,060,540 |
| 5.25% 6/1/22 (AMBAC Insured) | | | | 950,000 | | 1,003,941 |
| 5.5% 6/1/14 | | | | 1,200,000 | | 1,254,432 |
| 5.5% 6/1/16 | | | | 4,700,000 | | 4,962,683 |
| Series C1: | | | | | | |
| 5.5% 6/1/15 | | | | 1,500,000 | | 1,584,405 |
| 5.5% 6/1/16 | | | | 1,000,000 | | 1,065,910 |
| 5.5% 6/1/17 | | | | 1,300,000 | | 1,382,628 |
| Tsasc, Inc. Rev. Series 1, 5.5% 7/15/24 (Pre-Refunded | | | | | | |
| to 7/15/12 @ 100) (e) | | | | 1,200,000 | | 1,289,496 |
| | | | | | | 63,988,559 |
| |
| New York & New Jersey – 0.3% | | | | | | |
| Port Auth. of New York & New Jersey 124th Series, 5% | | | | | | |
| 8/1/13 (FGIC Insured) (d) | | | | 500,000 | | 513,005 |
| Port Auth. of New York & New Jersey Spl. Oblig. Rev. | | | | | | |
| (JFK Int’l. Air Term. Spl. Proj.) Series 6, 6.25% | | | | | | |
| 12/1/13 (MBIA Insured) (d) | | | | 1,400,000 | | 1,574,902 |
| | | | | | | 2,087,907 |
| |
| North Carolina – 2.3% | | | | | | |
| Charlotte Ctfs. of Prtn. (2003 Govt. Facilities Projs.) | | | | | | |
| Series G, 5% 6/1/33 | | | | 1,000,000 | | 1,022,080 |
| Dare County Ctfs. of Prtn. 5.25% 6/1/15 (AMBAC | | | | | | |
| Insured) | | | | 1,195,000 | | 1,280,156 |
See accompanying notes which are an integral part of the financial statements.
19 Semiannual Report
| Investments (Unaudited) continued | | | | | | |
| |
| |
| Municipal Bonds continued | | | | | | |
| | | | | Principal | | Value (Note 1) |
| | | | | Amount | | |
| North Carolina – continued | | | | | | |
| North Carolina Cap. Facilities Fin. Agcy. Rev. (Duke | | | | | | |
| Univ. Proj.) Series A: | | | | | | |
| 5.125% 10/1/41 | | | | $ 1,745,000 | | $ 1,790,056 |
| 5.125% 7/1/42 | | | | 5,155,000 | | 5,309,341 |
| 5.25% 7/1/42 | | | | 1,300,000 | | 1,355,198 |
| North Carolina Eastern Muni. Pwr. Agcy. Pwr. Sys. Rev.: | | | | | | |
| Series A, 5.5% 1/1/11 | | | | 1,575,000 | | 1,669,658 |
| Series B, 7.25% 1/1/07 | | | | 1,000,000 | | 1,019,800 |
| Series D, 6.7% 1/1/19 | | | | 1,115,000 | | 1,215,004 |
| North Carolina Infrastructure Fin. Corp. Ctfs. of Prtn. | | | | | | |
| (North Carolina Correctional Facilities Proj.) Series A, | | | | | | |
| 5% 2/1/18 | | | | 1,000,000 | | 1,042,280 |
| | | | | | | 15,703,573 |
| |
| Ohio – 0.6% | | | | | | |
| Cincinnati Student Ln. Fdg. Corp. Student Ln. Rev. Series | | | | | | |
| B, 8.875% 8/1/08 (d) | | | | 1,005,000 | | 1,007,884 |
| Fairborn City School District (School Impt. Proj.) 5.75% | | | | | | |
| 12/1/26 (Pre-Refunded to 12/1/10 @ 101) (e) | | | | 1,000,000 | | 1,094,020 |
| Franklin County Hosp. Rev. 5.5% 5/1/21 (Pre-Refunded | | | | | | |
| to 5/1/11 @ 101) (e) | | | | 1,500,000 | | 1,632,435 |
| Plain Local School District 6% 12/1/25 (FGIC Insured) | | | | 410,000 | | 448,118 |
| | | | | | | 4,182,457 |
| |
| Oklahoma – 1.6% | | | | | | |
| Oklahoma City Pub. Property Auth. Hotel Tax Rev.: | | | | | | |
| 5.25% 10/1/29 (FGIC Insured) | | | | 1,000,000 | | 1,063,300 |
| 5.5% 10/1/21 (FGIC Insured) | | | | 1,695,000 | | 1,848,262 |
| Oklahoma Industries Auth. Rev. (Health Sys. Oblig. | | | | | | |
| Group Proj.) Series A: | | | | | | |
| 5.75% 8/15/29 (MBIA Insured) | | | | 865,000 | | 914,573 |
| 5.75% 8/15/29 (Pre-Refunded to 8/15/09 @ | | | | | | |
| 101) (e) | | | | 635,000 | | 678,656 |
| 6% 8/15/19 (MBIA Insured) | | | | 1,740,000 | | 1,866,237 |
| 6% 8/15/19 (Pre-Refunded to 8/15/09 @ 101) (e) | | | | 1,260,000 | | 1,356,264 |
| Tulsa Indl. Auth. Rev. (Univ. of Tulsa Proj.) Series 2000 A, | | | | | | |
| 5.75% 10/1/25 (MBIA Insured) | | | | 3,000,000 | | 3,206,520 |
| | | | | | | 10,933,812 |
See accompanying notes which are an integral part of the financial statements.
| Municipal Bonds continued | | | | |
| | | Principal | | Value (Note 1) |
| | | Amount | | |
| Oregon – 0.4% | | | | |
| Oregon Dept. Administrative Svcs. Ctfs. of Prtn. Series | | | | |
| A, 5.375% 5/1/15 (AMBAC Insured) | | $ 1,715,000 | | $ 1,843,745 |
| Yamhill County School District #029J Newberg 5.5% | | | | |
| 6/15/19 (FGIC Insured) | | 1,000,000 | | 1,118,230 |
| | | | | 2,961,975 |
| |
| Pennsylvania – 2.7% | | | | |
| Annville-Cleona School District 5.5% 3/1/22 (FSA | | | | |
| Insured) | | 1,250,000 | | 1,370,688 |
| Canon McMillan School District: | | | | |
| Series 2001 B, 5.75% 12/1/33 (FGIC Insured) | | 1,000,000 | | 1,074,670 |
| Series 2002 B, 5.75% 12/1/35 (FGIC Insured) | | 1,595,000 | | 1,730,974 |
| Delaware County Auth. College Rev. (Haverford College | | | | |
| Proj.) 5.75% 11/15/29 | | 3,500,000 | | 3,770,270 |
| Montgomery County Higher Ed. & Health Auth. Hosp. | | | | |
| Rev. (Abington Memorial Hosp. Proj.) Series A, 6% | | | | |
| 6/1/16 (AMBAC Insured) | | 1,860,000 | | 2,111,435 |
| Pennsylvania Econ. Dev. Fing. Auth. Exempt Facilities | | | | |
| Rev.: | | | | |
| (Amtrak Proj.) Series 2001 A, 6.25% 11/1/31 (d) | | 2,000,000 | | 2,116,740 |
| (Shippingport Proj.) Series A, 4.35%, tender | | | | |
| 6/1/10 (c)(d) | | 500,000 | | 498,875 |
| Pennsylvania Higher Edl. Facilities Auth. Rev. (Lafayette | | | | |
| College Proj.) 6% 5/1/30 | | 3,065,000 | | 3,297,419 |
| Westmoreland County Muni. Auth. Muni. Svc. Rev. | | | | |
| Series A, 0% 8/15/21 (FGIC Insured) | | 5,000,000 | | 2,439,900 |
| | | | | 18,410,971 |
| |
| Puerto Rico 0.4% | | | | |
| Puerto Rico Commonwealth Infrastructure Fing. Auth.: | | | | |
| Series 2000 A, 5.5% 10/1/32 (Escrowed to | | | | |
| Maturity) (e) | | 745,000 | | 796,010 |
| Series C, 5.5% 7/1/20 (FGIC Insured) | | 2,000,000 | | 2,236,640 |
| | | | | 3,032,650 |
| |
| Rhode Island – 0.8% | | | | |
| Rhode Island Health & Edl. Bldg. Corp. Rev. Series A, | | | | |
| 5.25% 9/15/17 (AMBAC Insured) | | 1,000,000 | | 1,062,500 |
| Rhode Island Port Auth. & Econ. Dev. Corp. Arpt. Rev. | | | | |
| Series A, 7% 7/1/14 (FSA Insured) (d) | | 4,000,000 | | 4,528,880 |
| | | | | 5,591,380 |
| |
| |
| |
| See accompanying notes which are an integral part of the financial statements. | | |
| |
| 21 | | Semiannual Report |
| Investments (Unaudited) continued | | | | | | |
| |
| |
| Municipal Bonds continued | | | | | | |
| | | | | Principal | | Value (Note 1) |
| | | | | Amount | | |
| South Carolina – 1.2% | | | | | | |
| Greenville County School District Installment Purp. Rev. | | | | | | |
| 5% 12/1/12 | | | | $ 3,750,000 | | $ 3,936,113 |
| South Carolina Jobs Econ. Dev. Auth. Hosp. Facilities | | | | | | |
| Rev. (Palmetto Health Alliance Proj.) Series A, 7.375% | | | | | | |
| 12/15/21 (Pre-Refunded to 12/15/10 @ 102) (e) | | | | 1,000,000 | | 1,162,190 |
| South Carolina Pub. Svc. Auth. Rev.: | | | | | | |
| (Santee Cooper Proj.) Series 2005 B, 5% 1/1/18 | | | | | | |
| (MBIA Insured) | | | | 1,000,000 | | 1,059,680 |
| Series A, 5.5% 1/1/16 (FGIC Insured) | | | | 1,000,000 | | 1,103,980 |
| Tobacco Settlement Rev. Mgmt. Auth. Series 2001 B, | | | | | | |
| 6.375% 5/15/28 | | | | 545,000 | | 582,294 |
| | | | | | | 7,844,257 |
| |
| Tennessee – 0.5% | | | | | | |
| Metropolitan Govt. Nashville & Davidson County Health | | | | | | |
| & Edl. Facilities Board Rev. (Ascension Health Cr. | | | | | | |
| Group Proj.) Series A, 6% 11/15/30 (Pre-Refunded to | | | | | | |
| 11/15/09 @ 101) (e) | | | | 200,000 | | 216,582 |
| Shelby County Health Edl. & Hsg. Facility Board Hosp. | | | | | | |
| Rev. (Methodist Hosp. Proj.): | | | | | | |
| 6.5% 9/1/26 (Pre-Refunded to 9/1/12 @ 100) (e) | | | | 1,120,000 | | 1,280,474 |
| 6.5% 9/1/26 (Pre-Refunded to 9/1/12 @ 100) (e) | | | | 1,880,000 | | 2,149,366 |
| | | | | | | 3,646,422 |
| |
| Texas 15.2% | | | | | | |
| Abilene Independent School District 5% 2/15/19 | | | | 1,090,000 | | 1,136,336 |
| Aldine Independent School District 5.5% 2/15/13 | | | | 3,150,000 | | 3,376,328 |
| Aledo Independent School District Series A, 5.125% | | | | | | |
| 2/15/33 | | | | 1,000,000 | | 1,036,050 |
| Austin Cmnty. College District 5.5% 8/1/34 | | | | 1,000,000 | | 1,078,890 |
| Austin Independent School District 5.25% 8/1/14 (b) | | | | 1,000,000 | | 1,078,250 |
| Austin Wtr. & Wastewtr. Sys. Rev. 5% 11/15/12 (MBIA | | | | | | |
| Insured) (b) | | | | 1,000,000 | | 1,041,810 |
| Boerne Independent School District 5.25% 2/1/35 | | | | 1,500,000 | | 1,567,380 |
| Canyon Independent School District Series A, 5.5% | | | | | | |
| 2/15/18 | | | | 1,575,000 | | 1,701,410 |
| Corpus Christi Util. Sys. Rev. 5.25% 7/15/18 (FSA | | | | | | |
| Insured) | | | | 1,000,000 | | 1,076,300 |
| Corsicana Independent School District 5.125% 2/15/28 | | | | 1,015,000 | | 1,060,533 |
| Cypress-Fairbanks Independent School District: | | | | | | |
| Series A: | | | | | | |
| 0% 2/15/14 | | | | 3,200,000 | | 2,285,728 |
| 0% 2/15/16 | | | | 1,400,000 | | 901,516 |
See accompanying notes which are an integral part of the financial statements.
| Municipal Bonds continued | | | | | | |
| | | | | Principal | | Value (Note 1) |
| | | | | Amount | | |
| Texas continued | | | | | | |
| Cypress-Fairbanks Independent School District: - | | | | | | |
| continued | | | | | | |
| 5.75% 2/15/21 (Pre-Refunded to 2/15/12 @ | | | | | | |
| 100) (e) | | | | $ 1,000,000 | | $ 1,098,690 |
| Fort Worth Wtr. & Swr. Rev. 5% 2/15/16 (FSA Insured) | | | | 1,000,000 | | 1,049,870 |
| Garland Independent School District 5.5% 2/15/19 | | | | 2,500,000 | | 2,632,075 |
| Grand Prairie Independent School District 5.375% | | | | | | |
| 2/15/16 (FSA Insured) | | | | 1,000,000 | | 1,071,100 |
| Grapevine Gen. Oblig. 5.75% 8/15/18 (Pre-Refunded | | | | | | |
| to 8/15/10 @ 100) (e) | | | | 1,250,000 | | 1,350,563 |
| Guadalupe-Blanco River Auth. Contract Rev. (Western | | | | | | |
| Canyon Reg’l. Wtr. Supply Proj.) 5.25% 4/15/20 | | | | | | |
| (MBIA Insured) | | | | 1,000,000 | | 1,057,140 |
| Harris County Gen. Oblig.: | | | | | | |
| Series A, 5.25% 8/15/35 (FSA Insured) | | | | 1,600,000 | | 1,669,584 |
| 0% 10/1/17 (MBIA Insured) | | | | 2,500,000 | | 1,484,525 |
| 0% 8/15/24 (MBIA Insured) | | | | 1,000,000 | | 417,870 |
| Harris County Health Facilities Dev. Corp. Rev. (Saint | | | | | | |
| Luke’s Episcopal Hosp. Proj.): | | | | | | |
| Series 2001 A, 5.5% 2/15/12 (Pre-Refunded to | | | | | | |
| 8/15/11 @ 100) (e) | | | | 1,000,000 | | 1,079,130 |
| 5.75% 2/15/21 (Pre-Refunded to 8/15/12 @ | | | | | | |
| 100) (e) | | | | 1,310,000 | | 1,442,284 |
| Hays Consolidated Independent School District Series A, | | | | | | |
| 5.125% 8/15/30 | | | | 1,000,000 | | 1,044,620 |
| Houston Arpt. Sys. Rev.: | | | | | | |
| Series A, 5.625% 7/1/19 (FSA Insured) (d) | | | | 1,000,000 | | 1,058,780 |
| Series B, 5.5% 7/1/30 (FSA Insured) | | | | 1,400,000 | | 1,472,562 |
| Houston Independent School District 0% 8/15/13 | | | | 1,300,000 | | 952,926 |
| Humble Independent School District: | | | | | | |
| Series 2005 B, 5.25% 2/15/20 (FGIC Insured) | | | | 1,800,000 | | 1,918,440 |
| 0% 2/15/17 | | | | 1,000,000 | | 613,660 |
| Hurst Euless Bedford Independent School District 0% | | | | | | |
| 8/15/11 | | | | 1,000,000 | | 807,000 |
| Kennedale Independent School District 5.5% 2/15/29 | | | | 1,100,000 | | 1,187,208 |
| Lewisville Independent School District 0% 8/15/19 | | | | 2,340,000 | | 1,262,453 |
| Los Fresnos Independent School District: | | | | | | |
| 5.75% 8/15/13 | | | | 1,040,000 | | 1,123,668 |
| 5.75% 8/15/14 | | | | 1,100,000 | | 1,188,495 |
| Lower Colorado River Auth. Transmission Contract Rev. | | | | | | |
| (LCRA Transmission Services Corp. Proj.) Series C, | | | | | | |
| 5.25% 5/15/19 (AMBAC Insured) | | | | 1,000,000 | | 1,062,730 |
See accompanying notes which are an integral part of the financial statements.
23 Semiannual Report
| Investments (Unaudited) continued | | | | | | |
| |
| |
| Municipal Bonds continued | | | | | | |
| | | | | Principal | | Value (Note 1) |
| | | | | Amount | | |
| Texas continued | | | | | | |
| Mansfield Independent School District: | | | | | | |
| 5.375% 2/15/26 | | | | $ 1,000,000 | | $ 1,056,140 |
| 5.5% 2/15/17 | | | | 2,000,000 | | 2,145,920 |
| Mesquite Independent School District 3.65%, tender | | | | | | |
| 12/1/08 (Liquidity Facility JPMorgan Chase Bank) (c) | | | | 1,000,000 | | 1,000,000 |
| Montgomery County Muni. Util. District #46 5% 3/1/21 | | | | | | |
| (FSA Insured) | | | | 1,040,000 | | 1,070,919 |
| Mount Pleasant Independent School District 5.5% | | | | | | |
| 2/15/22 | | | | 2,590,000 | | 2,756,718 |
| North Central Health Facilities Dev. Corp. Rev. | | | | | | |
| (Children’s Med. Ctr. of Dallas Proj.) 5.5% 8/15/16 | | | | | | |
| (AMBAC Insured) | | | | 1,230,000 | | 1,317,035 |
| Northside Independent School District 5.5% 2/15/15 | | | | 940,000 | | 1,004,569 |
| Northwest Texas Independent School District 5.5% | | | | | | |
| 8/15/21 | | | | 3,185,000 | | 3,425,053 |
| Sabine River Auth. Poll. Cont. Rev. (Texas Utils. Elec. Co. | | | | | | |
| Proj.) Series B, 5.75%, tender 11/1/11 (c)(d) | | | | 4,000,000 | | 4,243,000 |
| San Antonio Elec. & Gas Systems Rev.: | | | | | | |
| 3.55%, tender 12/1/07 (c) | | | | 1,500,000 | | 1,495,185 |
| 5.5% 2/1/20 (Pre-Refunded to 2/1/07 @ 101) (e) | | | | 75,000 | | 76,736 |
| San Marcos Consolidated Independent School District: | | | | | | |
| 5% 8/1/14 | | | | 1,145,000 | | 1,214,753 |
| 5% 8/1/20 | | | | 1,525,000 | | 1,588,669 |
| 5.125% 8/1/29 | | | | 1,900,000 | | 1,979,572 |
| Southwest Higher Ed. Auth. Rev. (Southern Methodist | | | | | | |
| Univ. Proj.) 5.5% 10/1/14 (AMBAC Insured) | | | | 2,245,000 | | 2,436,341 |
| Spring Branch Independent School District 5.375% | | | | | | |
| 2/1/18 | | | | 1,000,000 | | 1,057,490 |
| Tarrant County Health Facilities Dev. Corp. Hosp. Rev. | | | | | | |
| 5.375% 11/15/20 | | | | 1,000,000 | | 1,025,780 |
| Texas Muni. Pwr. Agcy. Rev.: | | | | | | |
| 0% 9/1/11 (AMBAC Insured) | | | | 4,715,000 | | 3,820,046 |
| 0% 9/1/11 (Escrowed to Maturity) (e) | | | | 35,000 | | 28,224 |
| 0% 9/1/15 (MBIA Insured) | | | | 1,100,000 | | 730,290 |
| Texas Pub. Fin. Auth. Bldg. Rev. (Texas Technical College | | | | | | |
| Proj.) 6.25% 8/1/09 (MBIA Insured) | | | | 825,000 | | 854,807 |
| Texas Tpk. Auth. Central Tpk. Sys. Rev.: | | | | | | |
| 5.5% 8/15/39 (AMBAC Insured) | | | | 4,050,000 | | 4,307,945 |
| 5.75% 8/15/38 (AMBAC Insured) | | | | 3,775,000 | | 4,101,462 |
| Texas Wtr. Dev. Board Rev. Series A, 5.5% 7/15/21 | | | | 1,000,000 | | 1,048,250 |
| Travis County Health Facilities Dev. Corp. Rev. | | | | | | |
| (Ascension Health Cr. Prog.) Series A, 6.25% | | | | | | |
| 11/15/19 (Pre-Refunded to 11/15/09 @ 101) (e) | | | | 4,000,000 | | 4,364,440 |
See accompanying notes which are an integral part of the financial statements.
| Municipal Bonds continued | | | | | | |
| | | | | Principal | | Value (Note 1) |
| | | | | Amount | | |
| Texas continued | | | | | | |
| Trinity River Auth. Rev. (Tarrant County Wtr. Proj.) 5% | | | | | | |
| 2/1/15 (MBIA Insured) | | | | $ 1,860,000 | | $ 1,973,441 |
| Tyler Health Facilities Dev. Corp. Hosp. Rev. (Mother | | | | | | |
| Frances Hosp. Reg’l. Health Care Ctr. Proj.) 6% | | | | | | |
| 7/1/27 | | | | 1,000,000 | | 1,058,900 |
| White Settlement Independent School District 5.75% | | | | | | |
| 8/15/34 | | | | 1,440,000 | | 1,564,531 |
| Williamson County Gen. Oblig.: | | | | | | |
| 5.5% 2/15/19 (FSA Insured) | | | | 35,000 | | 37,200 |
| 6% 8/15/19 (Pre-Refunded to 8/15/10 @ 100) (e) | | | | 1,000,000 | | 1,090,270 |
| Willis Independent School District 5% 2/15/14 | | | | 1,300,000 | | 1,375,439 |
| Ysleta Independent School District 0% 8/15/09 | | | | 4,065,000 | | 3,562,444 |
| | | | | | | 104,197,473 |
| |
| Utah 0.5% | | | | | | |
| Intermountain Pwr. Agcy. Pwr. Supply Rev.: | | | | | | |
| Series A: | | | | | | |
| 6.5% 7/1/09 (AMBAC Insured) | | | | 365,000 | | 393,959 |
| 6.5% 7/1/09 (Escrowed to Maturity) (e) | | | | 635,000 | | 688,137 |
| Series B, 5.75% 7/1/16 (MBIA Insured) | | | | 1,025,000 | | 1,068,019 |
| Salt Lake City School District Series B, 5% 3/1/12 | | | | 1,380,000 | | 1,463,545 |
| | | | | | | 3,613,660 |
| |
| Vermont – 0.2% | | | | | | |
| Vermont Edl. & Health Bldgs. Fing. Agcy. Rev. (Fletcher | | | | | | |
| Allen Health Care, Inc. Proj.): | | | | | | |
| Series 2000 A, 6.125% 12/1/27 (AMBAC Insured) | | | | 1,000,000 | | 1,093,320 |
| Series A, 5.75% 12/1/18 (AMBAC Insured) | | | | 400,000 | | 432,164 |
| | | | | | | 1,525,484 |
| |
| Washington 7.5% | | | | | | |
| Chelan County Pub. Util. District #1 Columbia River-Rock | | | | | | |
| Island Hydro-Elec. Sys. Rev. Series A: | | | | | | |
| 0% 6/1/17 (MBIA Insured) | | | | 1,000,000 | | 598,370 |
| 0% 6/1/29 (MBIA Insured) | | | | 2,000,000 | | 641,280 |
| Clark County School District #114, Evergreen 5.375% | | | | | | |
| 12/1/14 (FSA Insured) | | | | 3,040,000 | | 3,261,768 |
| Energy Northwest Elec. Rev. (#1 Proj.): | | | | | | |
| Series 2006 A, 5% 7/1/15 | | | | 1,000,000 | | 1,057,920 |
| Series B, 6% 7/1/17 (MBIA Insured) | | | | 4,000,000 | | 4,435,080 |
| Grant County Pub. Util. District #2 (Priest Rapids Hydro- | | | | | | |
| Elec. Proj.) Second Series B, 5.375% 1/1/16 (MBIA | | | | | | |
| Insured) (d) | | | | 1,715,000 | | 1,794,970 |
See accompanying notes which are an integral part of the financial statements.
25 Semiannual Report
| Investments (Unaudited) continued | | | | | | |
| |
| |
| Municipal Bonds continued | | | | | | |
| | | | | Principal | | Value (Note 1) |
| | | | | Amount | | |
| Washington – continued | | | | | | |
| Grant County Pub. Util. District #2 Wanapum Hydro | | | | | | |
| Elec. Rev. Series B, 5.25% 1/1/22 (FGIC Insured) (d) . | | | | $ 1,950,000 | | $ 2,021,253 |
| King County Swr. Rev. Series B: | | | | | | |
| 5.125% 1/1/33 (FSA Insured) | | | | 2,800,000 | | 2,902,760 |
| 5.5% 1/1/21 (FSA Insured) | | | | 1,615,000 | | 1,730,295 |
| Port of Seattle Passenger Facilities Charge Rev. Series B, | | | | | | |
| 5.25% 12/1/14 (AMBAC Insured) (d) | | | | 3,000,000 | | 3,103,050 |
| Spokane County School District #81 5.25% 12/1/18 | | | | | | |
| (FSA Insured) | | | | 1,000,000 | | 1,061,170 |
| Spokane Gen. Oblig. 5.25% 12/1/24 (AMBAC Insured) | | | | 1,000,000 | | 1,057,220 |
| Spokane Pub. Facilities District Hotel/Motel Tax & | | | | | | |
| Sales/Use Tax Rev. 5.75% 12/1/24 (MBIA Insured) | | | | 1,000,000 | | 1,108,570 |
| Tumwater School District #33, Thurston County Series | | | | | | |
| 1996 B, 0% 12/1/10 (FGIC Insured) | | | | 4,000,000 | | 3,336,720 |
| Washington Gen. Oblig.: | | | | | | |
| Series 2001 C, 5.25% 1/1/16 | | | | 1,000,000 | | 1,053,050 |
| Series C, 5.25% 1/1/26 (FSA Insured) | | | | 1,000,000 | | 1,050,450 |
| Series R 97A, 0% 7/1/19 (MBIA Insured) | | | | 1,200,000 | | 649,428 |
| Washington Health Care Facilities Auth. Rev. (Providence | | | | | | |
| Health Systems Proj.) Series 2001 A, 5.5% 10/1/13 | | | | | | |
| (MBIA Insured) | | | | 3,000,000 | | 3,200,370 |
| Washington Pub. Pwr. Supply Sys. Nuclear Proj. #2 Rev. | | | | | | |
| 5.4% 7/1/12 | | | | 16,000,000 | | 17,247,828 |
| | | | | | | 51,311,552 |
| |
| Wisconsin – 1.2% | | | | | | |
| Badger Tobacco Asset Securitization Corp. 6.125% | | | | | | |
| 6/1/27 | | | | 880,000 | | 928,312 |
| Douglas County Gen. Oblig. 5.5% 2/1/18 (FGIC | | | | | | |
| Insured) | | | | 335,000 | | 358,879 |
| Menasha Joint School District: | | | | | | |
| 5.5% 3/1/17 (FSA Insured) | | | | 65,000 | | 69,497 |
| 5.5% 3/1/17 (Pre-Refunded to 3/1/12 @ 100) (e) | | | | 1,095,000 | | 1,189,641 |
| Wisconsin Health & Edl. Facilities Auth. Rev.: | | | | | | |
| (Marshfield Clinic Proj.) Series B, 6% 2/15/25 | | | | 1,500,000 | | 1,591,395 |
| (Wheaton Franciscan Svcs., Inc. Proj.): | | | | | | |
| Series A, 5.5% 8/15/16 | | | | 1,000,000 | | 1,055,090 |
| 5.75% 8/15/30 | | | | 1,500,000 | | 1,575,360 |
See accompanying notes which are an integral part of the financial statements.
| Municipal Bonds continued | | | | | | | | |
| | | | | | | Principal | | Value (Note 1) |
| | | | | | | Amount | | |
| Wisconsin – continued | | | | | | | | |
| Wisconsin Health & Edl. Facilities Auth. Rev.: - | | | | | | | | |
| continued | | | | | | | | |
| (Wheaton Franciscan Svcs., Inc. Proj.): | | | | | | | | |
| 6.25% 8/15/22 | | | | | | $ 600,000 | | $ 649,254 |
| Series A, 5.375% 2/15/34 | | | | | | 1,000,000 | | 1,017,810 |
| | | | | | | | | 8,435,238 |
| |
| |
| TOTAL INVESTMENT PORTFOLIO 95.8% | | | | | | | | |
| (Cost $642,871,457) | | | | | | | | 656,839,570 |
| |
| NET OTHER ASSETS – 4.2% | | | | | | | | 29,149,943 |
| NET ASSETS 100% | | | | | | | | $ 685,989,513 |
Legend
(a) Security initially issued at one coupon
which converts to a higher coupon at a
specified date. The rate shown is the
rate at period end.
(b) Security or a portion of the security
purchased on a delayed delivery or
when-issued basis.
(c) The coupon rate shown on floating or
adjustable rate securities represents the
rate at period end.
(d) Private activity obligations whose
interest is subject to the federal
alternative minimum tax for individuals.
(e) Security collateralized by an amount
sufficient to pay interest and principal.
|
Other Information
The distribution of municipal securities by revenue source, as a percentage of total net assets, is as follows:
| General Obligations | | 37.1% |
| Health Care | | 10.1% |
| Escrowed/Pre Refunded | | 9.1% |
| Transportation | | 8.5% |
| Electric Utilities | | 8.4% |
| Water & Sewer | | 7.2% |
| Education | | 6.0% |
| Special Tax | | 5.7% |
| Others* (individually less than 5%) | | 7.9% |
| | | 100.0% |
*Includes net other assets
See accompanying notes which are an integral part of the financial statements.
27 Semiannual Report
| Financial Statements | | | | | | |
| |
| Statement of Assets and Liabilities | | | | | | |
| | | | | April 30, 2006 (Unaudited) |
| |
| Assets | | | | | | |
| Investment in securities, at value See accompanying | | | | | | |
| schedule: | | | | | | |
| Unaffiliated issuers (cost $642,871,457) | | | | | | $ 656,839,570 |
| Cash | | | | | | 23,588,310 |
| Receivable for investments sold | | | | | | 4,150,309 |
| Receivable for fund shares sold | | | | | | 1,008,718 |
| Interest receivable | | | | | | 9,524,604 |
| Prepaid expenses | | | | | | 1,924 |
| Other affiliated receivables | | | | | | 6,821 |
| Other receivables | | | | | | 60,302 |
| Total assets | | | | | | 695,180,558 |
| |
| Liabilities | | | | | | |
| Payable for investments purchased | | | | | | |
| Regular delivery | | | | $ 5,981 | | |
| Delayed delivery | | | | 6,625,478 | | |
| Payable for fund shares redeemed | | | | 1,281,125 | | |
| Distributions payable | | | | 699,735 | | |
| Accrued management fee | | | | 208,729 | | |
| Distribution fees payable | | | | 190,567 | | |
| Other affiliated payables | | | | 153,466 | | |
| Other payables and accrued expenses | | | | 25,964 | | |
| Total liabilities | | | | | | 9,191,045 |
| |
| Net Assets | | | | | | $ 685,989,513 |
| Net Assets consist of: | | | | | | |
| Paid in capital | | | | | | $ 669,812,083 |
| Distributions in excess of net investment income | | | | | | (221,015) |
| Accumulated undistributed net realized gain (loss) on | | | | | | |
| investments | | | | | | 2,430,332 |
| Net unrealized appreciation (depreciation) on | | | | | | |
| investments | | | | | | 13,968,113 |
| Net Assets | | | | | | $ 685,989,513 |
See accompanying notes which are an integral part of the financial statements.
| Statement of Assets and Liabilities continued | | | | |
| | | April 30, 2006 (Unaudited) |
| |
| Calculation of Maximum Offering Price | | | | |
| Class A: | | | | |
| Net Asset Value and redemption price per share | | | | |
| ($140,470,875 ÷ 11,028,025 shares) | | | | $ 12.74 |
| Maximum offering price per share (100/95.25 of $12.74) | | | | $ 13.38 |
| Class T: | | | | |
| Net Asset Value and redemption price per share | | | | |
| ($313,846,360 ÷ 24,586,559 shares) | | | | $ 12.76 |
| Maximum offering price per share (100/96.50 of $12.76) | | | | $ 13.22 |
| Class B: | | | | |
| Net Asset Value and offering price per share | | | | |
| ($72,451,693 ÷ 5,700,682 shares)A | | | | $ 12.71 |
| Class C: | | | | |
| Net Asset Value and offering price per share | | | | |
| ($63,235,139 ÷ 4,956,128 shares)A | | | | $ 12.76 |
| Institutional Class: | | | | |
| Net Asset Value, offering price and redemption price per | | | | |
| share ($95,985,446 ÷ 7,563,042 shares) | | | | $ 12.69 |
| |
| A Redemption price per share is equal to net asset value less any applicable contingent deferred sales charge. | | | | |
See accompanying notes which are an integral part of the financial statements.
29 Semiannual Report
| Financial Statements continued | | | | |
| |
| |
| Statement of Operations | | | | | | |
| | | Six months ended April 30, 2006 (Unaudited) |
| |
| Investment Income | | | | | | |
| Interest | | | | | | $ 15,205,553 |
| |
| Expenses | | | | | | |
| Management fee | | | | $ 1,241,923 | | |
| Transfer agent fees | | | | 365,781 | | |
| Distribution fees | | | | 1,164,246 | | |
| Accounting fees and expenses | | | | 82,705 | | |
| Independent trustees’ compensation | | | | 1,361 | | |
| Custodian fees and expenses | | | | 5,574 | | |
| Registration fees | | | | 48,275 | | |
| Audit | | | | 26,645 | | |
| Legal | | | | 2,164 | | |
| Miscellaneous | | | | 2,774 | | |
| Total expenses before reductions | | | | 2,941,448 | | |
| Expense reductions | | | | (164,759) | | 2,776,689 |
| |
| Net investment income | | | | | | 12,428,864 |
| Realized and Unrealized Gain (Loss) | | | | | | |
| Net realized gain (loss) on: | | | | | | |
| Investment securities: | | | | | | |
| Unaffiliated issuers | | | | 2,660,091 | | |
| Futures contracts | | | | 94,212 | | |
| Total net realized gain (loss) | | | | | | 2,754,303 |
| Change in net unrealized appreciation (depreciation) on | | | | | | |
| investment securities | | | | | | (6,518,120) |
| Net gain (loss) | | | | | | (3,763,817) |
| Net increase (decrease) in net assets resulting from | | | | | | |
| operations | | | | | | $ 8,665,047 |
See accompanying notes which are an integral part of the financial statements.
| Statement of Changes in Net Assets | | | | |
| | | Six months ended | | Year ended |
| | | April 30, 2006 | | October 31, |
| | | (Unaudited) | | 2005 |
| Increase (Decrease) in Net Assets | | | | |
| Operations | | | | |
| Net investment income | | $ 12,428,864 | | $ 23,857,985 |
| Net realized gain (loss) | | 2,754,303 | | 8,968,764 |
| Change in net unrealized appreciation (depreciation) . | | (6,518,120) | | (19,180,759) |
| Net increase (decrease) in net assets resulting from | | | | |
| operations | | 8,665,047 | | 13,645,990 |
| Distributions to shareholders from net investment income . | | (12,476,440) | | (23,793,542) |
| Distributions to shareholders from net realized gain | | (8,244,683) | | (5,181,802) |
| Total distributions | | (20,721,123) | | (28,975,344) |
| Share transactions - net increase (decrease) | | 39,303,489 | | 51,939,913 |
| Total increase (decrease) in net assets | | 27,247,413 | | 36,610,559 |
| |
| Net Assets | | | | |
| Beginning of period | | 658,742,100 | | 622,131,541 |
| End of period (including distributions in excess of net | | | | |
| investment income of $221,015 and distributions in | | | | |
| excess of net investment income of $158,981, | | | | |
| respectively) | | $ 685,989,513 | | $ 658,742,100 |
See accompanying notes which are an integral part of the financial statements.
31 Semiannual Report
| Financial Highlights Class A | | | | | | | | | | | | |
| | | Six months ended | | | | | | | | | | | | | | |
| | | April 30, 2006 | | Years ended October 31, |
| | | (Unaudited) | | 2005 | | 2004 | | | | 2003 | | 2002 | | | | 2001 |
| Selected Per Share Data | | | | | | | | | | | | | | | | |
| Net asset value, | | | | | | | | | | | | | | | | |
| beginning of period | | $ 12.97 | | $ 13.28 | | $ 13.00 | | | | $ 12.87 | | $ 12.70 | | | | $ 12.02 |
| Income from | | | | | | | | | | | | | | | | |
| Investment | | | | | | | | | | | | | | | | |
| Operations | | | | | | | | | | | | | | | | |
| Net investment | | | | | | | | | | | | | | | | |
| incomeE | | .252 | | .521 | | .533 | | | | .539 | | .557G | | | | .584 |
| Net realized and | | | | | | | | | | | | | | | | |
| unrealized gain | | | | | | | | | | | | | | | | |
| (loss) | | (.067) | | (.201) | | .301 | | | | .137 | | .168G | | | | .679 |
| Total from investment | | | | | | | | | | | | | | | | |
| operations | | .185 | | .320 | | .834 | | | | .676 | | .725 | | | | 1.263 |
| Distributions from net | | | | | | | | | | | | | | | | |
| investment income | | (.253) | | (.520) | | (.532) | | | | (.544) | | (.555) | | | | (.583) |
| Distributions from net | | | | | | | | | | | | | | | | |
| realized gain | | (.162) | | (.110) | | (.022) | | | | (.002) | | — | | | | — |
| Total distributions . | | (.415) | | (.630) | | (.554) | | | | (.546) | | (.555) | | | | (.583) |
| Net asset value, end | | | | | | | | | | | | | | | | |
| of period | | $ 12.74 | | $ 12.97 | | $ 13.28 | | | | $ 13.00 | | $ 12.87 | | | | $ 12.70 |
| Total ReturnB,C,D | | 1.44% | | 2.46% | | 6.56% | | | | 5.33% | | 5.88% | | | | 10.72% |
| Ratios to Average Net AssetsF | | | | | | | | | | | | | | | | |
| Expenses before | | | | | | | | | | | | | | | | |
| reductions | | .69%A | | .69% | | .69% | | | | .68% | | .69% | | | | .69% |
| Expenses net of fee | | | | | | | | | | | | | | | | |
| waivers, if any | | .69%A | | .69% | | .69% | | | | .68% | | .69% | | | | .69% |
| Expenses net of all | | | | | | | | | | | | | | | | |
| reductions | | .64%A | | .67% | | .69% | | | | .68% | | .67% | | | | .62% |
| Net investment | | | | | | | | | | | | | | | | |
| income | | 3.95%A | | 3.96% | | 4.07% | | | | 4.15% | | 4.41%G | | | | 4.70% |
| Supplemental Data | | | | | | | | | | | | | | | | |
| Net assets, | | | | | | | | | | | | | | | | |
| end of period | | | | | | | | | | | | | | | | |
| (000 omitted) | | $140,471 | | $123,844 | | $101,763 | | | | $87,406 | | $67,457 | | | | $46,796 |
| Portfolio turnover | | | | | | | | | | | | | | | | |
| rate | | 26%A | | 22% | | 17% | | | | 26% | | 20% | | | | 16% |
A Annualized
B Total returns for periods of less than one year are not annualized.
C Total returns would have been lower had certain expenses not been reduced during the periods shown.
D Total returns do not include the effect of the sales charges.
E Calculated based on average shares outstanding during the period.
F Expense ratios reflect operating expenses of the class. Expenses before reductions do not reflect amounts reimbursed by the investment adviser or
expense offset arrangements and do not represent the amount paid by the class during periods when reimbursements or reductions occur. Ex
penses net of fee waivers reflect expenses after reimbursement by the investment adviser but prior to reductions from expense offset arrange
ments. Expenses net of all reductions represent the net expenses paid by the class.
G Effective November 1, 2001, the fund adopted the provisions of the AICPA Audit and Accounting Guide for Investment Companies and began
amortizing premium and discount on all debt securities. Per share data and ratios for periods prior to adoption have not been restated to reflect
this change.
|
See accompanying notes which are an integral part of the financial statements.
| Financial Highlights Class T | | | | | | | | | | | | |
| | | Six months ended | | | | | | | | | | | | | | |
| | | April 30, 2006 | | Years ended October 31, |
| | | (Unaudited) | | 2005 | | 2004 | | | | 2003 | | 2002 | | | | 2001 |
| Selected Per Share Data | | | | | | | | | | | | | | | | |
| Net asset value, | | | | | | | | | | | | | | | | |
| beginning of period | | $ 13.00 | | $ 13.31 | | $ 13.03 | | | | $ 12.89 | | $ 12.72 | | | | $ 12.04 |
| Income from | | | | | | | | | | | | | | | | |
| Investment | | | | | | | | | | | | | | | | |
| Operations | | | | | | | | | | | | | | | | |
| Net investment | | | | | | | | | | | | | | | | |
| incomeE | | .246 | | .509 | | .522 | | | | .529 | | .546G | | | | .572 |
| Net realized and | | | | | | | | | | | | | | | | |
| unrealized gain | | | | | | | | | | | | | | | | |
| (loss) | | (.077) | | (.202) | | .299 | | | | .144 | | .166G | | | | .679 |
| Total from investment | | | | | | | | | | | | | | | | |
| operations | | 169 | | .307 | | .821 | | | | .673 | | .712 | | | | 1.251 |
| Distributions from net | | | | | | | | | | | | | | | | |
| investment income | | (.247) | | (.507) | | (.519) | | | | (.531) | | (.542) | | | | (.571) |
| Distributions from net | | | | | | | | | | | | | | | | |
| realized gain | | (.162) | | (.110) | | (.022) | | | | (.002) | | — | | | | — |
| Total distributions . | | (.409) | | (.617) | | (.541) | | | | (.533) | | (.542) | | | | (.571) |
| Net asset value, end | | | | | | | | | | | | | | | | |
| of period | | $ 12.76 | | $ 13.00 | | $ 13.31 | | | | $ 13.03 | | $ 12.89 | | | | $ 12.72 |
| Total ReturnB,C,D | | 1.31% | | 2.35% | | 6.44% | | | | 5.30% | | 5.76% | | | | 10.59% |
| Ratios to Average Net AssetsF | | | | | | | | | | | | | | | | |
| Expenses before | | | | | | | | | | | | | | | | |
| reductions | | .79%A | | .79% | | .79% | | | | .78% | | .79% | | | | .79% |
| Expenses net of fee | | | | | | | | | | | | | | | | |
| waivers, if any | | .79%A | | .79% | | .79% | | | | .78% | | .79% | | | | .79% |
| Expenses net of all | | | | | | | | | | | | | | | | |
| reductions | | .74%A | | .77% | | .78% | | | | .77% | | .77% | | | | .72% |
| Net investment | | | | | | | | | | | | | | | | |
| income | | 3.85%A | | 3.86% | | 3.97% | | | | 4.06% | | 4.31%G | | | | 4.60% |
| Supplemental Data | | | | | | | | | | | | | | | | |
| Net assets, | | | | | | | | | | | | | | | | |
| end of period | | | | | | | | | | | | | | | | |
| (000 omitted) | | $313,846 | | $318,973 | | $319,734 | | | | $340,542 | | $354,030 | | | | $369,295 |
| Portfolio turnover | | | | | | | | | | | | | | | | |
| rate | | 26%A | | 22% | | 17% | | | | 26% | | 20% | | | | 16% |
A Annualized
B Total returns for periods of less than one year are not annualized.
C Total returns would have been lower had certain expenses not been reduced during the periods shown.
D Total returns do not include the effect of the sales charges.
E Calculated based on average shares outstanding during the period.
F Expense ratios reflect operating expenses of the class. Expenses before reductions do not reflect amounts reimbursed by the investment adviser or
expense offset arrangements and do not represent the amount paid by the class during periods when reimbursements or reductions occur. Ex
penses net of fee waivers reflect expenses after reimbursement by the investment adviser but prior to reductions from expense offset arrange
ments. Expenses net of all reductions represent the net expenses paid by the class.
G Effective November 1, 2001, the fund adopted the provisions of the AICPA Audit and Accounting Guide for Investment Companies and began
amortizing premium and discount on all debt securities. Per share data and ratios for periods prior to adoption have not been restated to reflect
this change.
|
See accompanying notes which are an integral part of the financial statements.
33 Semiannual Report
| Financial Highlights Class B | | | | | | | | | | | | |
| | | Six months ended | | | | | | | | | | | | | | |
| | | April 30, 2006 | | Years ended October 31, |
| | | (Unaudited) | | 2005 | | 2004 | | | | 2003 | | 2002 | | | | 2001 |
| Selected Per Share Data | | | | | | | | | | | | | | | | |
| Net asset value, | | | | | | | | | | | | | | | | |
| beginning of period | | $ 12.94 | | $ 13.25 | | $ 12.98 | | | | $ 12.85 | | $ 12.67 | | | | $ 12.00 |
| Income from | | | | | | | | | | | | | | | | |
| Investment | | | | | | | | | | | | | | | | |
| Operations | | | | | | | | | | | | | | | | |
| Net investment | | | | | | | | | | | | | | | | |
| incomeE | | .203 | | .421 | | .435 | | | | .443 | | .462G | | | | .489 |
| Net realized and | | | | | | | | | | | | | | | | |
| unrealized gain | | | | | | | | | | | | | | | | |
| (loss) | | (.067) | | (.200) | | .291 | | | | .136 | | .178G | | | | .671 |
| Total from investment | | | | | | | | | | | | | | | | |
| operations | | .136 | | .221 | | .726 | | | | .579 | | .640 | | | | 1.160 |
| Distributions from net | | | | | | | | | | | | | | | | |
| investment income | | (.204) | | (.421) | | (.434) | | | | (.447) | | (.460) | | | | (.490) |
| Distributions from net | | | | | | | | | | | | | | | | |
| realized gain | | (.162) | | (.110) | | (.022) | | | | (.002) | | — | | | | — |
| Total distributions . | | (.366) | | (.531) | | (.456) | | | | (.449) | | (.460) | | | | (.490) |
| Net asset value, end | | | | | | | | | | | | | | | | |
| of period | | $ 12.71 | | $ 12.94 | | $ 13.25 | | | | $ 12.98 | | $ 12.85 | | | | $ 12.67 |
| Total ReturnB,C,D | | 1.06% | | 1.70% | | 5.70% | | | | 4.56% | | 5.19% | | | | 9.83% |
| Ratios to Average Net AssetsF | | | | | | | | | | | | | | | | |
| Expenses before | | | | | | | | | | | | | | | | |
| reductions | | 1.45%A | | 1.45% | | 1.44% | | | | 1.43% | | 1.44% | | | | 1.43% |
| Expenses net of fee | | | | | | | | | | | | | | | | |
| waivers, if any . | | 1.45%A | | 1.45% | | 1.44% | | | | 1.43% | | 1.44% | | | | 1.43% |
| Expenses net of all | | | | | | | | | | | | | | | | |
| reductions | | 1.40%A | | 1.42% | | 1.44% | | | | 1.42% | | 1.41% | | | | 1.37% |
| Net investment | | | | | | | | | | | | | | | | |
| income | | 3.18%A | | 3.21% | | 3.32% | | | | 3.41% | | 3.66%G | | | | 3.95% |
| Supplemental Data | | | | | | | | | | | | | | | | |
| Net assets, | | | | | | | | | | | | | | | | |
| end of period | | | | | | | | | | | | | | | | |
| (000 omitted) | | $72,452 | | $82,084 | | $97,487 | | | | $110,853 | | $109,986 | | | | $91,687 |
| Portfolio turnover | | | | | | | | | | | | | | | | |
| rate | | 26%A | | 22% | | 17% | | | | 26% | | 20% | | | | 16% |
A Annualized
B Total returns for periods of less than one year are not annualized.
C Total returns would have been lower had certain expenses not been reduced during the periods shown.
D Total returns do not include the effect of the contingent deferred sales charge.
E Calculated based on average shares outstanding during the period.
F Expense ratios reflect operating expenses of the class. Expenses before reductions do not reflect amounts reimbursed by the investment adviser or
expense offset arrangements and do not represent the amount paid by the class during periods when reimbursements or reductions occur. Ex
penses net of fee waivers reflect expenses after reimbursement by the investment adviser but prior to reductions from expense offset arrange
ments. Expenses net of all reductions represent the net expenses paid by the class.
G Effective November 1, 2001, the fund adopted the provisions of the AICPA Audit and Accounting Guide for Investment Companies and began
amortizing premium and discount on all debt securities. Per share data and ratios for periods prior to adoption have not been restated to reflect
this change.
|
See accompanying notes which are an integral part of the financial statements.
| Financial Highlights Class C | | | | | | | | | | | | |
| | | Six months ended | | | | | | | | | | | | | | |
| | | April 30, 2006 | | Years ended October 31, |
| | | (Unaudited) | | 2005 | | 2004 | | | | 2003 | | 2002 | | | | 2001 |
| Selected Per Share Data | | | | | | | | | | | | | | | | |
| Net asset value, | | | | | | | | | | | | | | | | |
| beginning of period | | $ 12.99 | | $ 13.30 | | $ 13.02 | | | | $ 12.89 | | $ 12.71 | | | | $ 12.04 |
| Income from | | | | | | | | | | | | | | | | |
| Investment | | | | | | | | | | | | | | | | |
| Operations | | | | | | | | | | | | | | | | |
| Net investment | | | | | | | | | | | | | | | | |
| incomeE | | .198 | | .410 | | .423 | | | | .430 | | .451G | | | | .478 |
| Net realized and | | | | | | | | | | | | | | | | |
| unrealized gain | | | | | | | | | | | | | | | | |
| (loss) | | (.068) | | (.202) | | .300 | | | | .135 | | .176G | | | | .669 |
| Total from investment | | | | | | | | | | | | | | | | |
| operations | | .130 | | .208 | | .723 | | | | .565 | | .627 | | | | 1.147 |
| Distributions from net | | | | | | | | | | | | | | | | |
| investment income | | (.198) | | (.408) | | (.421) | | | | (.433) | | (.447) | | | | (.477) |
| Distributions from net | | | | | | | | | | | | | | | | |
| realized gain | | (.162) | | (.110) | | (.022) | | | | (.002) | | — | | | | — |
| Total distributions . | | (.360) | | (.518) | | (.443) | | | | (.435) | | (.447) | | | | (.477) |
| Net asset value, end | | | | | | | | | | | | | | | | |
| of period | | $ 12.76 | | $ 12.99 | | $ 13.30 | | | | $ 13.02 | | $ 12.89 | | | | $ 12.71 |
| Total ReturnB,C,D | | 1.01% | | 1.59% | | 5.65% | | | | 4.44% | | 5.06% | | | | 9.69% |
| Ratios to Average Net AssetsF | | | | | | | | | | | | | | | | |
| Expenses before | | | | | | | | | | | | | | | | |
| reductions | | 1.54%A | | 1.54% | | 1.54% | | | | 1.53% | | 1.53% | | | | 1.53% |
| Expenses net of fee | | | | | | | | | | | | | | | | |
| waivers, if any . | | 1.54%A | | 1.54% | | 1.54% | | | | 1.53% | | 1.53% | | | | 1.53% |
| Expenses net of all | | | | | | | | | | | | | | | | |
| reductions | | 1.49%A | | 1.52% | | 1.54% | | | | 1.52% | | 1.51% | | | | 1.47% |
| Net investment | | | | | | | | | | | | | | | | |
| income | | 3.09%A | | 3.11% | | 3.22% | | | | 3.31% | | 3.57%G | | | | 3.85% |
| Supplemental Data | | | | | | | | | | | | | | | | |
| Net assets, | | | | | | | | | | | | | | | | |
| end of period | | | | | | | | | | | | | | | | |
| (000 omitted) | | $63,235 | | $63,984 | | $58,984 | | | | $59,423 | | $52,019 | | | | $37,324 |
| Portfolio turnover | | | | | | | | | | | | | | | | |
| rate | | 26%A | | 22% | | 17% | | | | 26% | | 20% | | | | 16% |
A Annualized
B Total returns for periods of less than one year are not annualized.
C Total returns would have been lower had certain expenses not been reduced during the periods shown.
D Total returns do not include the effect of the contingent deferred sales charge.
E Calculated based on average shares outstanding during the period.
F Expense ratios reflect operating expenses of the class. Expenses before reductions do not reflect amounts reimbursed by the investment adviser or
expense offset arrangements and do not represent the amount paid by the class during periods when reimbursements or reductions occur. Ex
penses net of fee waivers reflect expenses after reimbursement by the investment adviser but prior to reductions from expense offset arrange
ments. Expenses net of all reductions represent the net expenses paid by the class.
G Effective November 1, 2001, the fund adopted the provisions of the AICPA Audit and Accounting Guide for Investment Companies and began
amortizing premium and discount on all debt securities. Per share data and ratios for periods prior to adoption have not been restated to reflect
this change.
|
See accompanying notes which are an integral part of the financial statements.
35 Semiannual Report
| Financial Highlights Institutional Class | | | | | | | | | | |
| | | Six months ended | | | | | | | | | | | | | | |
| | | April 30, 2006 | | Years ended October 31, |
| | | (Unaudited) | | 2005 | | 2004 | | | | 2003 | | 2002 | | | | 2001 |
| Selected Per Share Data | | | | | | | | | | | | | | | | | | |
| Net asset value, | | | | | | | | | | | | | | | | | | |
| beginning of period | | | | $ 12.92 | | $ 13.24 | | $ 12.96 | | | | $ 12.83 | | $ 12.66 | | | | $ 11.98 |
| Income from | | | | | | | | | | | | | | | | | | |
| Investment | | | | | | | | | | | | | | | | | | |
| Operations | | | | | | | | | | | | | | | | | | |
| Net investment | | | | | | | | | | | | | | | | | | |
| incomeD | | | | .260 | | .540 | | .551 | | | | .556 | | .573F | | | | .598 |
| Net realized and | | | | | | | | | | | | | | | | | | |
| unrealized gain | | | | | | | | | | | | | | | | | | |
| (loss) | | | | (.065) | | (.208) | | .304 | | | | .139 | | .170F | | | | .682 |
| Total from investment | | | | | | | | | | | | | | | | | | |
| operations | | | | .195 | | .332 | | .855 | | | | .695 | | .743 | | | | 1.280 |
| Distributions from net | | | | | | | | | | | | | | | | | | |
| investment income | | | | (.263) | | (.542) | | (.553) | | | | (.563) | | (.573) | | | | (.600) |
| Distributions from net | | | | | | | | | | | | | | | | | | |
| realized gain | | | | (.162) | | (.110) | | (.022) | | | | (.002) | | — | | | | — |
| Total distributions . | | | | (.425) | | (.652) | | (.575) | | | | (.565) | | (.573) | | | | (.600) |
| Net asset value, end | | | | | | | | | | | | | | | | | | |
| of period | | | | $ 12.69 | | $ 12.92 | | $ 13.24 | | | | $ 12.96 | | $ 12.83 | | | | $ 12.66 |
| Total ReturnB,C | | | | 1.52% | | 2.56% | | 6.75% | | | | 5.50% | | 6.05% | | | | 10.91% |
| Ratios to Average Net AssetsE | | | | | | | | | | | | | | | | | | |
| Expenses before | | | | | | | | | | | | | | | | | | |
| reductions | | | | .53%A | | .53% | | .54% | | | | .54% | | .55% | | | | .54% |
| Expenses net of fee | | | | | | | | | | | | | | | | | | |
| waivers, if any | | | | .53%A | | .53% | | .54% | | | | .54% | | .55% | | | | .54% |
| Expenses net of all | | | | | | | | | | | | | | | | | | |
| reductions | | | | .49%A | | .51% | | .53% | | | | .53% | | .52% | | | | .48% |
| Net investment | | | | | | | | | | | | | | | | | | |
| income | | | | 4.10%A | | 4.13% | | 4.23% | | | | 4.30% | | 4.55%F | | | | 4.84% |
| Supplemental Data | | | | | | | | | | | | | | | | | | |
| Net assets, | | | | | | | | | | | | | | | | | | |
| end of period | | | | | | | | | | | | | | | | | | |
| (000 omitted) | | | | $95,985 | | $69,857 | | $44,164 | | | | $44,960 | | $31,703 | | | | $21,842 |
| Portfolio turnover | | | | | | | | | | | | | | | | | | |
| rate | | | | 26%A | | 22% | | 17% | | | | 26% | | 20% | | | | 16% |
A Annualized
B Total returns for periods of less than one year are not annualized.
C Total returns would have been lower had certain expenses not been reduced during the periods shown.
D Calculated based on average shares outstanding during the period.
E Expense ratios reflect operating expenses of the class. Expenses before reductions do not reflect amounts reimbursed by the investment adviser or
expense offset arrangements and do not represent the amount paid by the class during periods when reimbursements or reductions occur. Ex
penses net of fee waivers reflect expenses after reimbursement by the investment adviser but prior to reductions from expense offset arrange
ments. Expenses net of all reductions represent the net expenses paid by the class.
F Effective November 1, 2001, the fund adopted the provisions of the AICPA Audit and Accounting Guide for Investment Companies and began
amortizing premium and discount on all debt securities. Per share data and ratios for periods prior to adoption have not been restated to reflect
this change.
|
See accompanying notes which are an integral part of the financial statements.
Notes to Financial Statements
For the period ended April 30, 2006 (Unaudited)
1. Significant Accounting Policies.
Fidelity Advisor Municipal Income Fund (the fund) is a fund of Fidelity Advisor Series II (the trust) and is authorized to issue an unlimited number of shares. The trust is regis tered under the Investment Company Act of 1940, as amended (the 1940 Act), as an open end management investment company organized as a Massachusetts business trust.
The fund offers Class A, Class T, Class B, Class C, and Institutional Class shares, each of which has equal rights as to assets and voting privileges. Each class has exclusive voting rights with respect to matters that affect that class. Class B shares will automatically convert to Class A shares after a holding period of seven years from the initial date of purchase. Investment income, realized and unrealized capital gains and losses, the common expenses of the fund, and certain fund level expense reductions, if any, are allocated on a pro rata basis to each class based on the relative net assets of each class to the total net assets of the fund. Each class differs with respect to transfer agent and distribution and service plan fees incurred. Certain expense reductions also differ by class.
The financial statements have been prepared in conformity with accounting principles generally accepted in the United States of America, which require management to make certain estimates and assumptions at the date of the financial statements. The following summarizes the significant accounting policies of the fund:
Security Valuation. Investments are valued and net asset value per share is calculated (NAV calculation) as of the close of business of the New York Stock Exchange, normally 4:00 p.m. Eastern time. Wherever possible, the fund uses independent pricing services approved by the Board of Trustees to value its investments. Debt securities, including restricted securities, for which quotes are readily available, are valued by independent pricing services or by dealers who make markets in such securities. Pricing services consider yield or price of bonds of comparable quality, coupon, maturity and type as well as dealer supplied prices. When current market prices or quotations are not readily available or do not accurately reflect fair value, valuations may be determined in accor dance with procedures adopted by the Board of Trustees. The frequency of when fair value pricing is used is unpredictable. The value of securities used for NAV calculation under fair value pricing may differ from published prices for the same securities. Invest ments in open end mutual funds are valued at their closing net asset value each business day. Short term securities with remaining maturities of sixty days or less for which quotations are not readily available are valued at amortized cost, which approximates value.
Investment Transactions and Income. Security transactions are accounted for as of trade date. Gains and losses on securities sold are determined on the basis of identified cost. Interest income is accrued as earned. Interest income includes coupon interest and amortization of premium and accretion of discount on debt securities.
37 Semiannual Report
| Notes to Financial Statements (Unaudited) continued |
1. Significant Accounting Policies continued |
Expenses. Most expenses of the trust can be directly attributed to a fund. Expenses which cannot be directly attributed are apportioned among each fund in the trust.
Income Tax Information and Distributions to Shareholders. Each year, the fund intends to qualify as a regulated investment company by distributing all of its taxable income and realized gains under Subchapter M of the Internal Revenue Code. As a result, no provision for income taxes is required in the accompanying financial statements.
Dividends are declared daily and paid monthly from net investment income. Distribu tions from realized gains, if any, are recorded on the ex dividend date. Income dividends and capital gain distributions are declared separately for each class. Income and capital gain distributions are determined in accordance with income tax regulations, which may differ from generally accepted accounting principles. In addition, the fund claimed a portion of the payment made to redeeming shareholders as a distribution for income tax purposes.
Capital accounts within the financial statements are adjusted for permanent book tax differences. These adjustments have no impact on net assets or the results of operations. Temporary book tax differences will reverse in a subsequent period.
Book tax differences are primarily due to futures transactions, market discount, and losses deferred due to wash sales and futures transactions.
The fund purchases municipal securities whose interest, in the opinion of the issuer, is free from federal income tax. There is no assurance that the Internal Revenue Service (IRS) will agree with this opinion. In the event the IRS determines that the issuer does not comply with relevant tax requirements, interest payments from a security could become federally taxable, possibly retroactively to the date the security was issued.
The federal tax cost of investments and unrealized appreciation (depreciation) as of period end were as follows:
| Unrealized appreciation | | | | $ 18,639,671 |
| Unrealized depreciation | | | | (4,398,350) |
| Net unrealized appreciation (depreciation) | | | | $ 14,241,321 |
| |
| Cost for federal income tax purposes | | | | $ 642,598,249 |
| |
| 2. Operating Policies. | | | | |
Delayed Delivery Transactions and When Issued Securities. The fund may purchase or sell securities on a delayed delivery or when issued basis. Payment and delivery may take place after the customary settlement period for that security. The price of the underlying securities and the date when the securities will be delivered and paid
| 2. Operating Policies continued | | |
Delayed Delivery Transactions and When Issued Securities continued |
for are fixed at the time the transaction is negotiated. During the time a delayed delivery sell is outstanding, the contract is marked to market daily and equivalent deliverable securities are held for the transaction. The value of the securities purchased on a delayed delivery or when issued basis are identified as such in the fund’s Schedule of Investments. The fund may receive compensation for interest forgone in the purchase of a delayed delivery or when issued security. With respect to purchase commitments, the fund identifies securities as segregated in its records with a value at least equal to the amount of the commitment. Losses may arise due to changes in the value of the underly ing securities or if the counterparty does not perform under the contract’s terms, or if the issuer does not issue the securities due to political, economic, or other factors.
Futures Contracts. The fund may use futures contracts to manage its exposure to the bond market and to fluctuations in interest rates. Buying futures tends to increase a fund’s exposure to the underlying instrument, while selling futures tends to decrease a fund’s exposure to the underlying instrument or hedge other fund investments. Upon entering into a futures contract, a fund is required to deposit with a clearing broker, no later than the following business day, an amount (“initial margin”) equal to a certain percentage of the face value of the contract. The initial margin may be in the form of cash or securities and is transferred to a segregated account on settlement date. Subsequent payments (“variation margin”) are made or received by a fund depending on the daily fluctuations in the value of the futures contract and are accounted for as unrealized gains or losses. Realized gains (losses) are recorded upon the expiration or closing of the futures contract. Securities deposited to meet margin requirements are identified in the Schedule of Investments. Losses may arise from changes in the value of the underlying instruments or if the counterparties do not perform under the contract’s terms. Futures contracts are valued at the settlement price established each day by the board of trade or exchange on which they are traded.
3. Purchases and Sales of Investments.
Purchases and sales of securities, other than short term securities, aggregated $96,627,311 and $83,743,692, respectively.
4. Fees and Other Transactions with Affiliates.
Management Fee. Fidelity Management & Research Company (FMR) and its affiliates provide the fund with investment management related services for which the fund pays a monthly management fee. The management fee is the sum of an individual fund fee rate that is based on an annual rate of .25% of the fund’s average net assets and a group fee rate that averaged .12% during the period. The group fee rate is based upon the average
39 Semiannual Report
| Notes to Financial Statements (Unaudited) continued |
4. Fees and Other Transactions with Affiliates continued |
Management Fee continued | | |
net assets of all the mutual funds advised by FMR. The group fee rate decreases as assets under management increase and increases as assets under management decrease. For the period, the total annualized management fee rate was .37% of the fund’s average net assets.
Distribution and Service Plan. In accordance with Rule 12b 1 of the 1940 Act, the fund has adopted separate Distribution and Service Plans for each class of shares. Certain classes pay Fidelity Distributors Corporation (FDC), an affiliate of FMR, separate Distribution and Service Fees, each of which is based on an annual percentage of each class’ average net assets. In addition, FDC may pay financial intermediaries for selling shares of the fund and providing shareholder support services. For the period, the Distribution and Service Fee rates and the total amounts paid to and retained by FDC were as follows:
| | | Distribution | | Service | | | | Paid to | | | | Retained |
| | | Fee | | Fee | | | | FDC | | | | by FDC |
| Class A | | 0% | | .15% | | | | $ 97,978 | | | | $ 2,633 |
| Class T | | 0% | | .25% | | | | 398,209 | | | | 5,234 |
| Class B | | .65% | | .25% | | | | 349,358 | | | | 253,889 |
| Class C | | .75% | | .25% | | | | 318,701 | | | | 65,379 |
| | | | | | | | | $ 1,164,246 | | | | $ 327,135 |
Sales Load. FDC receives a front end sales charge of up to 4.75% for selling Class A shares, and 3.50% for selling Class T shares, some of which is paid to financial intermedi aries for selling shares of the fund. FDC receives the proceeds of contingent deferred sales charges levied on Class A, Class T, Class B, and Class C redemptions. These charges depend on the holding period. The deferred sales charges range from 5% to 1% for Class B, 1% for Class C, .75% to .50% for certain purchases of Class A shares (.25% prior to Febru ary 24, 2006) and .25% for certain purchases of Class T shares.
For the period, sales charge amounts retained by FDC were as follows:
| | | | | Retained |
| | | | | by FDC |
| Class A | | | | $ 40,014 |
| Class T | | | | 18,490 |
| Class B* | | | | 101,130 |
| Class C* | | | | 8,208 |
| | | | | $ 167,842 |
* When Class B and Class C shares are initially sold, FDC pays commissions from its own resources to financial intermediaries through which the sales are made.
Semiannual Report 40
4. Fees and Other Transactions with Affiliates continued
Transfer Agent and Accounting Fees. Citibank, N.A. (Citibank) is the custodian, transfer agent, and shareholder servicing agent for each class of the fund. Citibank has entered into a sub arrangement with Fidelity Investments Institutional Operations Company, Inc. (FIIOC), an affiliate of FMR, with respect to all classes of the fund to perform the transfer, dividend disbursing, and shareholder servicing agent functions. FIIOC receives account fees and asset based fees that vary according to the account size and type of account of the shareholders of the respective classes of the fund. All fees are paid to FIIOC by Citibank, which is reimbursed by each class for such payments. FIIOC pays for typesetting, printing and mailing of shareholder reports, except proxy state ments. For the period, each class paid the following transfer agent fees:
| | | | | | | % of |
| | | | | | | Average |
| | | | | Amount | | Net Assets |
| Class A | | | | $ 70,442 | | .11* |
| Class T | | | | 173,265 | | .11* |
| Class B | | | | 45,457 | | .12* |
| Class C | | | | 34,435 | | .11* |
| Institutional Class | | | | 42,182 | | .11* |
| | | | | $ 365,781 | | |
| * Annualized | | | | | | |
Citibank also has a sub arrangement with Fidelity Service Company, Inc. (FSC), an affiliate of FMR, under which FSC maintains the fund’s accounting records. The fee is based on the level of average net assets for the month.
5. Committed Line of Credit.
|
The fund participates with other funds managed by FMR in a $4.2 billion credit facility (the “line of credit”) to be utilized for temporary or emergency purposes to fund share holder redemptions or for other short term liquidity purposes. The fund has agreed to pay commitment fees on its pro rata portion of the line of credit, which amounts to $651 and is reflected in Miscellaneous Expense on the Statement of Operations. During the period, there were no borrowings on this line of credit.
41 Semiannual Report
| Notes to Financial Statements (Unaudited) continued |
6. Expense Reductions. | | |
Through arrangements with the fund’s custodian and each class’ transfer agent, credits realized as a result of uninvested cash balances were used to reduce the fund’s expenses. During the period, these credits reduced the fund’s custody and accounting expenses by $5,574 and $82,705, respectively. During the period, credits reduced each class’ transfer agent expense as noted in the table below.
| | | | | Transfer Agent |
| | | | | expense reduction |
| Class A | | | | $ 14,433 |
| Class T | | | | 37,522 |
| Class B | | | | 9,142 |
| Class C | | | | 6,904 |
| Institutional Class | | | | 8,479 |
| | | | | $ 76,480 |
| |
| 7. Other. | | | | |
The fund’s organizational documents provide former and current trustees and officers with a limited indemnification against liabilities arising in connection with the performance of their duties to the fund. In the normal course of business, the fund may also enter into contracts that provide general indemnifications. The fund’s maximum exposure under these arrangements is unknown as this would be dependent on future claims that may be made against the fund. The risk of material loss from such claims is considered remote.
| 8. Distributions to Shareholders. | | | | | | |
| |
Distributions to shareholders of each class were as follows:
| | | | |
| | | | | Six months ended | | | | Year ended |
| | | | | April 30, | | | | October 31, |
| | | | | 2006 | | | | 2005 |
| From net investment income | | | | | | | | |
| Class A | | | | $ 2,560,161 | | | | $ 4,352,247 |
| Class T | | | | 6,087,752 | | | | 12,293,343 |
| Class B | | | | 1,236,273 | | | | 2,889,040 |
| Class C | | | | 979,661 | | | | 1,912,870 |
| Institutional Class | | | | 1,612,593 | | | | 2,346,042 |
| Total | | | | $ 12,476,440 | | | | $ 23,793,542 |
| From net realized gain | | | | | | | | |
| Class A | | | | $ 1,555,692 | | | | $ 849,843 |
| Class T | | | | 3,978,415 | | | | 2,646,649 |
| Class B | | | | 1,007,878 | | | | 802,913 |
| Class C | | | | 788,459 | | | | 495,651 |
| Institutional Class | | | | 914,239 | | | | 386,746 |
| Total | | | | $ 8,244,683 | | | | $ 5,181,802 |
Semiannual Report 42
| 9. Share Transactions. | | | | | | | | | | |
| |
| Transactions for each class of shares were as follows: | | | | | | | | |
| |
| | | Shares | | | | Dollars |
| | | Six months ended | | Year ended | | | | Six months ended | | | | Year ended |
| | | April 30, | | October 31, | | | | April 30, | | | | October 31, |
| | | 2006 | | 2005 | | | | 2006 | | | | 2005 |
| Class A | | | | | | | | | | | | |
| Shares sold | | 2,427,371 | | 3,538,994 | | | | $ 31,233,289 | | | | $ 46,541,886 |
| Reinvestment of | | | | | | | | | | | | |
| distributions | | 220,182 | | 260,181 | | | | 2,829,770 | | | | 3,414,353 |
| Shares redeemed | | (1,168,583) | | (1,912,570) | | | | (15,040,846) | | | | (25,132,123) |
| Net increase (decrease) | | 1,478,970 | | 1,886,605 | | | | $ 19,022,213 | | | | $ 24,824,116 |
| Class T | | | | | | | | | | | | |
| Shares sold | | 1,943,929 | | 3,536,120 | | | | $25,087,927 | | | | $46,651,169 |
| Reinvestment of | | | | | | | | | | | | |
| distributions | | 603,080 | | 836,332 | | | | 7,764,803 | | | | 10,998,832 |
| Shares redeemed | | (2,504,156) | | (3,856,498) | | | | (32,295,990) | | | | (50,817,550)�� |
| Net increase (decrease) | | 42,853 | | 515,954 | | | | $ 556,740 | | | | $ 6,832,451 |
| Class B | | | | | | | | | | | | |
| Shares sold | | 192,632 | | 461,635 | | | | $ 2,474,989 | | | | $ 6,060,771 |
| Reinvestment of | | | | | | | | | | | | |
| distributions | | 106,372 | | 167,091 | | | | 1,363,791 | | | | 2,187,643 |
| Shares redeemed | | (941,220) | | (1,641,543) | | | | (12,089,149) | | | | (21,554,810) |
| Net increase (decrease) | | (642,216) | | (1,012,817) | | | | $ (8,250,369) | | | | $ (13,306,396) |
| Class C | | | | | | | | | | | | |
| Shares sold | | 693,660 | | 1,328,623 | | | | 8,945,402 | | | | $17,510,616 |
| Reinvestment of | | | | | | | | | | | | |
| distributions | | 90,773 | | 114,142 | | | | 1,168,187 | | | | 1,500,047 |
| Shares redeemed | | (753,917) | | (951,725) | | | | (9,729,264) | | | | (12,532,673) |
| Net increase (decrease) | | 30,516 | | 491,040 | | | | $ 384,325 | | | | $ 6,477,990 |
| Institutional Class | | | | | | | | | | | | |
| Shares sold | | 2,826,736 | | 2,803,468 | | | | $ 36,159,443 | | | | $ 36,736,293 |
| Reinvestment of | | | | | | | | | | | | |
| distributions | | 47,182 | | 26,000 | | | | 602,761 | | | | 340,092 |
| Shares redeemed | | (715,889) | | (760,791) | | | | (9,171,624) | | | | (9,964,633) |
| Net increase (decrease) | | 2,158,029 | | 2,068,677 | | | | $ 27,590,580 | | | | $ 27,111,752 |
43 Semiannual Report
Board Approval of Investment Advisory Contracts and Management Fees
Advisor Municipal Income Fund
On January 19, 2006, the Board of Trustees, including the Independent Trustees (together, the Board), voted to approve a general research services agreement (the Agreement) between FMR, FMR Co., Inc. (FMRC), Fidelity Investments Money Manage ment, Inc. (FIMM), and Fidelity Research & Analysis Company (FRAC) (together, the Investment Advisers) for the fund, effective January 20, 2006, pursuant to which FRAC may provide general research and investment advisory support services to FMRC and FIMM. The Board considered that it has approved previously various sub advisory agreements for the fund with affiliates of FMR that allow FMR to obtain research, non discretionary advice, or discretionary portfolio management at no additional expense to the fund. The Board, assisted by the advice of fund counsel and independent Trustees’ counsel, considered a broad range of information and determined that it would be beneficial for the fund to access the research and investment advisory support services supplied by FRAC at no additional expense to the fund.
The Board reached this determination in part because the new arrangement will involve no changes in (i) the contractual terms of and fees payable under the fund’s manage ment contract or sub advisory agreements; (ii) the investment process or strategies employed in the management of the fund’s assets; (iii) the nature or level of services provided under the fund’s management contract or sub advisory agreements; (iv) the day to day management of the fund or the persons primarily responsible for such man agement; or (v) the ultimate control or beneficial ownership of FMR, FMRC, or FIMM. The Board also considered that the establishment of the Agreement would not necessi tate prior shareholder approval of the Agreement or result in an assignment and termination of the fund’s management contract or sub advisory agreements under the Investment Company Act of 1940.
Because the Board was approving an arrangement with FRAC under which the fund will not bear any additional management fees or expenses and under which the fund’s portfolio manager would not change, it did not consider the fund’s investment perfor mance, competitiveness of management fee and total expenses, costs of services and profitability, or economies of scale to be significant factors in its decision.
In connection with its future renewal of the fund’s management contract and sub advisory agreements, the Board will consider: (i) the nature, extent, and quality of services provided to the fund, including shareholder and administrative services and investment performance; (ii) the competitiveness of the fund’s management fee and total expenses; (iii) the costs of the services and profitability, including the revenues earned and the expenses incurred by Fidelity in conducting the business of developing, marketing, distributing, managing, administering, and servicing the fund and its shareholders; and (iv) whether there have been economies of scale in respect of the management of the Fidelity funds, whether the Fidelity funds (including the fund) have
appropriately benefited from any such economies of scale, and whether there is potential for realization of any further economies.
Based on its evaluation of all of the conclusions noted above, and after considering all material factors, the Board ultimately concluded that the fund’s Agreement is fair and reasonable, and that the fund’s Agreement should be approved.
45 Semiannual Report
Investment Adviser
Fidelity Management & Research Company
Boston, MA
Investment Sub Advisers
Fidelity Investments Money
Management, Inc.
Fidelity Research & Analysis Company
(formerly Fidelity Management &
Research (Far East) Inc.)
Fidelity International Investment Advisors
Fidelity International Investment Advisors
(U.K.) Limited
General Distributor
Fidelity Distributors Corporation
Boston, MA
Transfer and Service Agents
Citibank, N.A.
New York, NY
Fidelity Investments Institutional Operations Company, Inc.
Boston, MA
Fidelity Service Company, Inc.
Boston, MA
Custodian
Citibank, N.A.
New York, NY
|
HIMI-USAN-0606
1.784902.103
|

Item 2. Code of Ethics
Not applicable.
Item 3. Audit Committee Financial Expert
Not applicable.
Item 4. Principal Accountant Fees and Services
Not applicable.
Item 5. Audit Committee of Listed Registrants
Not applicable.
Item 6. Schedule of Investments
Not applicable.
Item 7. Disclosure of Proxy Voting Policies and Procedures for Closed-End Management Investment Companies
Not applicable.
Item 8. Portfolio Managers of Closed-End Management Investment Companies
Not applicable.
Item 9. Purchase of Equity Securities by Closed-End Management Investment Company and Affiliated Purchasers
Not applicable.
Item 10. Submission of Matters to a Vote of Security Holders
There were no material changes to the procedures by which shareholders may recommend nominees to the Fidelity Advisor Series II: Fidelity Advisor Municipal Income Fund's Board of Trustees.
Item 11. Controls and Procedures
(a)(i) The President and Treasurer and the Chief Financial Officer have concluded that the Fidelity Advisor Series II: Fidelity Advisor Municipal Income Fund's (the "Fund") disclosure controls and procedures (as defined in Rule 30a-3(c) under the Investment Company Act) provide reasonable assurances that material information relating to the Fund is made known to them by the appropriate persons, based on their evaluation of these controls and procedures as of a date within 90 days of the filing date of this report.
(a)(ii) There was no change in the Fund's internal control over financial reporting (as defined in Rule 30a-3(d) under the Investment Company Act) that occurred during the second fiscal quarter of the period covered by this report that has materially affected, or is reasonably likely to materially affect, the Fund's internal control over financial reporting.
Item 12. Exhibits
(a) | (1) | Not applicable. |
(a) | (2) | Certification pursuant to Rule 30a-2(a) under the Investment Company Act of 1940 (17 CFR 270.30a-2(a)) is filed and attached hereto as Exhibit 99.CERT. |
(a) | (3) | Not applicable. |
(b) | | Certification pursuant to Rule 30a-2(b) under the Investment Company Act of 1940 (17 CFR 270.30a-2(b)) is furnished and attached hereto as Exhibit 99.906CERT. |
SIGNATURES
Pursuant to the requirements of the Securities Exchange Act of 1934 and the Investment Company Act of 1940, the registrant has duly caused this report to be signed on its behalf by the undersigned, thereunto duly authorized.
Fidelity Advisor Series II
By: | /s/Christine Reynolds |
| Christine Reynolds |
| President and Treasurer |
| |
Date: | June 16, 2006 |
Pursuant to the requirements of the Securities Exchange Act of 1934 and the Investment Company Act of 1940, this report has been signed below by the following persons on behalf of the registrant and in the capacities and on the dates indicated.
By: | /s/Christine Reynolds |
| Christine Reynolds |
| President and Treasurer |
| |
Date: | June 16, 2006 |
By: | /s/Paul M. Murphy |
| Paul M. Murphy |
| Chief Financial Officer |
| |
Date: | June 16, 2006 |