UNITED STATES
SECURITIES AND EXCHANGE COMMISSION
Washington, D.C. 20549
FORM N-CSR
CERTIFIED SHAREHOLDER REPORT OF REGISTERED
MANAGEMENT INVESTMENT COMPANIES
Investment Company Act file number 811-4707
Fidelity Advisor Series II
(Exact name of registrant as specified in charter)
82 Devonshire St., Boston, Massachusetts 02109
(Address of principal executive offices) (Zip code)
Eric D. Roiter, Secretary
82 Devonshire St.
Boston, Massachusetts 02109
(Name and address of agent for service)
Registrant's telephone number, including area code: 617-563-7000
Date of fiscal year end: | October 31 |
| |
Date of reporting period: | April 30, 2006 |
Item 1. Reports to Stockholders

Fidelity® Advisor
Short Fixed-Income
Fund - Class A, Class T, Class B
and Class C
|
Semiannual Report
April 30, 2006
|

| Contents | | | | |
| |
| Chairman’s Message | | 3 | | Ned Johnson’s message to shareholders. |
| Shareholder Expense | | 4 | | An example of shareholder expenses. |
| Example | | | | |
| Investment Changes | | 6 | | A summary of major shifts in the fund’s |
| | | | | investments over the past six months. |
| Investments | | 7 | | A complete list of the fund’s investments |
| | | | | with their market values. |
| Financial Statements | | 46 | | Statements of assets and liabilities, |
| | | | | operations, and changes in net assets, |
| | | | | as well as financial highlights. |
| Notes | | 55 | | Notes to the financial statements. |
| Board Approval of | | 65 | | |
| Investment Advisory | | | | |
| Contracts and | | | | |
| Management Fees | | | | |
To view a fund’s proxy voting guidelines and proxy voting record for the 12 month period ended
June 30, visit www.fidelity.com/proxyvotingresults or visit the Securities and Exchange Commis
sion’s (SEC) web site at www.sec.gov. You may also call 1-877-208-0098 to request a free copy of
the proxy voting guidelines.
Standard & Poor’s, S&P and S&P 500 are registered service marks of The McGraw Hill Companies,
Inc. and have been licensed for use by Fidelity Distributors Corporation.
Other third party marks appearing herein are the property of their respective owners.
All other marks appearing herein are registered or unregistered trademarks or service marks
of FMR Corp. or an affiliated company.
|
| | This report and the financial statements contained herein are submitted for the general information
of the shareholders of the fund. This report is not authorized for distribution to prospective investors
in the fund unless preceded or accompanied by an effective prospectus.
A fund files its complete schedule of portfolio holdings with the SEC for the first and third
quarters of each fiscal year on Form N Q. Forms N Q are available on the SEC’s web site at
http://www.sec.gov. A fund’s Forms N Q may be reviewed and copied at the SEC’s Public
Reference Room in Washington, DC. Information regarding the operation of the SEC’s Public
Reference Room may be obtained by calling 1-800-SEC-0330. For a complete list of a fund’s port
folio holdings, view the most recent quarterly holdings report, semiannual report, or annual
report on Fidelity’s web site at http://www.advisor.fidelity.com.
NOT FDIC INSURED · MAY LOSE VALUE · NO BANK GUARANTEE
Neither the fund nor Fidelity Distributors Corporation is a bank.
|
Chairman’s Message
(photograph of Edward C. Johnson 3d)
Dear Shareholder:
Although many securities markets made gains in early 2006, there is only one certainty when it comes to investing: There is no sure thing. There are, however, a number of time tested, fundamental investment principles that can put the historical odds in your favor.
One of the basic tenets is to invest for the long term. Over time, riding out the markets’ inevitable ups and downs has proven much more effective than selling into panic or chasing the hottest trend. Even missing only a few of the markets’ best days can significantly diminish investor returns. Patience also affords the benefits of compounding of earning interest on additional income or reinvested dividends and capital gains. There are tax advantages and cost benefits to consider as well. The more you sell, the more taxes you pay, and the more you trade, the higher the costs. While staying the course doesn’t eliminate risk, it can considerably lessen the effect of short term declines.
You can further manage your investing risk through diversification. And today, more than ever, geographic diversification should be taken into account. Studies indicate that asset allocation is the single most important determinant of a portfolio’s long term success. The right mix of stocks, bonds and cash aligned to your particular risk tolerance and investment objective is very important. Age appropriate rebalancing is also an essential aspect of asset allocation. For younger investors, an emphasis on equities which historically have been the best performing asset class over time is encouraged. As investors near their specific goal, such as retirement or sending a child to college, consideration may be given to replacing volatile assets (e.g. common stocks) with more stable fixed investments (bonds or savings plans).
A third investment principle invest ing regularly can help lower the average cost of your purchases. Investing a certain amount of money each month or quarter helps ensure you won’t pay for all your shares at market highs. This strategy known as dollar cost averaging also reduces unconstructive “emotion” from investing, helping shareholders avoid selling weak performers just prior to an upswing, or chasing a hot performer just before a correction.
We invite you to contact us via the Internet, through our Investor Centers or over the phone. It is our privilege to provide you the information you need to make the investments that are right for you.
Sincerely,
/s/ Edward C. Johnson 3d
Edward C. Johnson 3d
3 Semiannual Report
Shareholder Expense Example
As a shareholder of the Fund, you incur two types of costs: (1) transaction costs, including sales charges (loads) on purchase payments or redemption proceeds, and (2) ongoing costs, including management fees, distribution and/or service (12b 1) fees and other Fund expenses. This Example is intended to help you understand your ongoing costs (in dollars) of investing in the Fund and to compare these costs with the ongoing costs of investing in other mutual funds.
The Example is based on an investment of $1,000 invested at the beginning of the period and held for the entire period (November 1, 2005 to April 30, 2006).
The first line of the table below for each class of the Fund provides information about actual account values and actual expenses. You may use the information in this line, together with the amount you invested, to estimate the expenses that you paid over the period. Simply divide your account value by $1,000.00 (for example, an $8,600 account value divided by $1,000.00 = 8.6), then multiply the result by the number in the first line for a class of the Fund under the heading entitled “Expenses Paid During Period” to estimate the expenses you paid on your account during this period. In addition, the fund, as a shareholder in the underlying affiliated central fund, will indirectly bear its pro rata share of the fees and expenses incurred by the underlying affiliated central fund. These fees and expenses are not included in the fund’s annualized expense ratio used to calculate the expense estimate in the table below.
Hypothetical Example for Comparison Purposes
The second line of the table below for each class of the Fund provides information about hypothetical account values and hypothetical expenses based on a Class’ actual expense ratio and an assumed rate of return of 5% per year before expenses, which is not the Class’ actual return. The hypothetical account values and expenses may not be used to estimate the actual ending account balance or expenses you paid for the period. You may use this information to compare the ongoing costs of investing in the Fund and other funds. To do so, compare this 5% hypothetical example with the 5% hypothetical examples that appear in the shareholder reports of the other funds. In addition, the fund, as a shareholder in the underlying affiliated central fund, will indirectly bear its pro rata share of the fees and expenses incurred by the underlying affiliated central fund. These fees and expenses are not included in the fund’s annualized expense ratio used to calculate the expense estimate in the table below.
Please note that the expenses shown in the table are meant to highlight your ongoing costs only and do not reflect any transaction costs. Therefore, the second line of the table is useful in comparing ongoing costs only, and will not help you determine the relative total costs of owning different funds. In addition, if these transactional costs were included, your costs would have been higher.
| | | | | | | | | | | | | Expenses Paid |
| | | | | Beginning | | | | Ending | | | | During Period* |
| | | | | Account Value | | | | Account Value | | | | November 1, 2005 |
| | | | | November 1, 2005 | | | | April 30, 2006 | | | | to April 30, 2006 |
| Class A | | | | | | | | | | | | |
| Actual | | | | $ 1,000.00 | | | | $ 1,015.40 | | | | $ 3.95 |
| HypotheticalA | | | | $ 1,000.00 | | | | $ 1,020.88 | | | | $ 3.96 |
| Class T | | | | | | | | | | | | |
| Actual | | | | $ 1,000.00 | | | | $ 1,015.50 | | | | $ 3.75 |
| HypotheticalA | | | | $ 1,000.00 | | | | $ 1,021.08 | | | | $ 3.76 |
| Class B | | | | | | | | | | | | |
| Actual | | | | $ 1,000.00 | | | | $ 1,011.50 | | | | $ 7.73 |
| HypotheticalA | | | | $ 1,000.00 | | | | $ 1,017.11 | | | | $ 7.75 |
| Class C | | | | | | | | | | | | |
| Actual | | | | $ 1,000.00 | | | | $ 1,011.40 | | | | $ 7.93 |
| HypotheticalA | | | | $ 1,000.00 | | | | $ 1,016.91 | | | | $ 7.95 |
| Institutional Class | | | | | | | | | | | | |
| Actual | | | | $ 1,000.00 | | | | $ 1,016.40 | | | | $ 2.90 |
| HypotheticalA | | | | $ 1,000.00 | | | | $ 1,021.92 | | | | $ 2.91 |
A 5% return per year before expenses | | | | | | | | |
* Expenses are equal to each Class’ annualized expense ratio (shown in the table below); multiplied by the average account value over the period, multiplied by 181/365 (to reflect the one-half year period). The fees and expenses of the underlying affiliated central fund in which the fund invests are not included in the fund’s annualized expense ratio.
| | | Annualized |
| | | Expense Ratio |
| Class A | | 79% |
| Class T | | 75% |
| Class B | | 1.55% |
| Class C | | 1.59% |
| Institutional Class | | 58% |
5 Semiannual Report
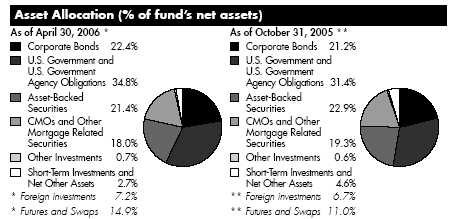
Investment Changes

We have used ratings from Moody’s® Investors Services, Inc. Where Moody’s ratings are not available, we have used S&P® ratings. Securities rated BB or below were rated investment grade at the time of acquisition.
| Average Years to Maturity as of April 30, 2006 | | |
| | | | | 6 months ago |
| Years | | 2.8 | | 2.9 |
Average years to maturity is based on the average time remaining until principal payments are expected from each of the fund’s bonds, weighted by dollar amount.
| Duration as of April 30, 2006 | | | | |
| | | | | | | 6 months ago |
| Years | | | | 1.7 | | 1.5 |
Duration shows how much a bond fund’s price fluctuates with changes in comparable interest rates. If rates rise 1%, for example, a fund with a five year duration is likely to lose about 5% of its value. Other factors also can influence a bond fund’s performance and share price. Accordingly, a bond fund’s actual performance may differ from this example.
The information in the above tables is based on the combined investments of the fund and its pro rata share of the investments of Fidelity’s fixed income central fund.
For an unaudited list of holdings for each fixed income central fund, visit advisor.fidelity.com.
Semiannual Report 6
| Investments April 30, 2006 (Unaudited) |
| Showing Percentage of Net Assets | | | | |
| |
| Nonconvertible Bonds 22.1% | | | | |
| | | Principal | | Value (Note 1) |
| | | Amount | | |
| |
| CONSUMER DISCRETIONARY – 2.4% | | | | |
| Auto Components 0.2% | | | | |
| DaimlerChrysler NA Holding Corp. 5.3% 3/13/09 (d) | | $ 2,650,000 | | $ 2,650,787 |
| Media – 2.2% | | | | |
| British Sky Broadcasting Group PLC (BSkyB) yankee | | | | |
| 7.3% 10/15/06 | | 2,350,000 | | 2,367,054 |
| Continental Cablevision, Inc.: | | | | |
| 8.3% 5/15/06 | | 1,200,000 | | 1,203,000 |
| 9% 9/1/08 | | 3,400,000 | | 3,650,944 |
| Cox Communications, Inc.: | | | | |
| 3.875% 10/1/08 | | 2,680,000 | | 2,574,555 |
| 6.4% 8/1/08 | | 795,000 | | 805,067 |
| 7.75% 8/15/06 | | 2,600,000 | | 2,614,186 |
| Hearst-Argyle Television, Inc. 7% 11/15/07 | | 1,500,000 | | 1,524,311 |
| Lenfest Communications, Inc. 10.5% 6/15/06 | | 1,225,000 | | 1,254,094 |
| Liberty Media Corp.: | | | | |
| 6.41% 9/17/06 (d) | | 3,203,000 | | 3,214,371 |
| 7.75% 7/15/09 | | 2,350,000 | | 2,462,739 |
| Time Warner Entertainment Co. LP 7.25% 9/1/08 | | 3,145,000 | | 3,257,896 |
| Univision Communications, Inc.: | | | | |
| 3.5% 10/15/07 | | 535,000 | | 518,050 |
| 3.875% 10/15/08 | | 2,525,000 | | 2,408,726 |
| Viacom, Inc. 5.75% 4/30/11 (a) | | 1,470,000 | | 1,459,225 |
| | | | | 29,314,218 |
| |
| TOTAL CONSUMER DISCRETIONARY | | | | 31,965,005 |
| |
| CONSUMER STAPLES 0.5% | | | | |
| Food Products 0.4% | | | | |
| H.J. Heinz Co. 6.428% 12/1/08 (a)(d) | | 1,515,000 | | 1,539,528 |
| Kraft Foods, Inc. 5.25% 6/1/07 | | 3,265,000 | | 3,255,202 |
| | | | | 4,794,730 |
| Tobacco 0.1% | | | | |
| Altria Group, Inc. 5.625% 11/4/08 | | 2,000,000 | | 2,002,512 |
| |
| TOTAL CONSUMER STAPLES | | | | 6,797,242 |
| |
| ENERGY 1.8% | | | | |
| Energy Equipment & Services – 0.1% | | | | |
| Cooper Cameron Corp. 2.65% 4/15/07 | | 1,335,000 | | 1,293,423 |
| Oil, Gas & Consumable Fuels – 1.7% | | | | |
| Canadian Oil Sands Ltd. 4.8% 8/10/09 (a) | | 1,865,000 | | 1,808,295 |
See accompanying notes which are an integral part of the financial statements.
7 Semiannual Report
| Investments (Unaudited) continued | | | | | | |
| |
| |
| Nonconvertible Bonds continued | | | | | | |
| | | | | Principal | | Value (Note 1) |
| | | | | Amount | | |
| |
| ENERGY – continued | | | | | | |
| Oil, Gas & Consumable Fuels – continued | | | | | | |
| Delek & Avner Yam Tethys Ltd. 5.326% 8/1/13 (a) | | | | $ 2,230,512 | | $ 2,146,712 |
| Duke Capital LLC: | | | | | | |
| 4.37% 3/1/09 | | | | 2,045,000 | | 1,981,167 |
| 7.5% 10/1/09 | | | | 2,700,000 | | 2,854,670 |
| Enterprise Products Operating LP: | | | | | | |
| 4% 10/15/07 | | | | 2,775,000 | | 2,711,727 |
| 4.625% 10/15/09 | | | | 3,070,000 | | 2,965,509 |
| Kinder Morgan Energy Partners LP 5.35% 8/15/07 | | | | 1,400,000 | | 1,392,493 |
| Pemex Project Funding Master Trust 6.125% 8/15/08 | | | | 4,535,000 | | 4,562,210 |
| Petroleum Export Ltd.: | | | | | | |
| 4.623% 6/15/10 (a) | | | | 1,430,833 | | 1,403,762 |
| 4.633% 6/15/10 (a) | | | | 859,444 | | 843,192 |
| | | | | | | 22,669,737 |
| |
| TOTAL ENERGY | | | | | | 23,963,160 |
| |
| FINANCIALS – 8.4% | | | | | | |
| Capital Markets 0.6% | | | | | | |
| Bank of New York Co., Inc.: | | | | | | |
| 3.4% 3/15/13 (d) | | | | 2,750,000 | | 2,645,357 |
| 4.25% 9/4/12 (d) | | | | 1,285,000 | | 1,265,111 |
| Lehman Brothers Holdings, Inc.: | | | | | | |
| 4% 1/22/08 | | | | 195,000 | | 190,690 |
| 6.25% 5/15/06 | | | | 2,795,000 | | 2,795,844 |
| Merrill Lynch & Co., Inc. 3.7% 4/21/08 | | | | 1,400,000 | | 1,360,183 |
| | | | | | | 8,257,185 |
| Commercial Banks – 0.7% | | | | | | |
| Bank of America Corp.: | | | | | | |
| 7.125% 9/15/06 | | | | 1,750,000 | | 1,761,337 |
| 7.4% 1/15/11 | | | | 275,000 | | 295,686 |
| Bank One Corp. 6% 8/1/08 | | | | 975,000 | | 987,856 |
| Corporacion Andina de Fomento yankee 7.25% 3/1/07 | | | | 965,000 | | 977,285 |
| First National Boston Corp. 7.375% 9/15/06 | | | | 1,145,000 | | 1,153,523 |
| Korea Development Bank: | | | | | | |
| 3.875% 3/2/09 | | | | 2,700,000 | | 2,588,317 |
| 4.75% 7/20/09 | | | | 1,500,000 | | 1,468,443 |
| | | | | | | 9,232,447 |
| Consumer Finance – 1.7% | | | | | | |
| American General Finance Corp. 4.5% 11/15/07 | | | | 1,115,000 | | 1,102,976 |
See accompanying notes which are an integral part of the financial statements.
| Nonconvertible Bonds continued | | | | | | |
| | | | | Principal | | Value (Note 1) |
| | | | | Amount | | |
| |
| FINANCIALS – continued | | | | | | |
| Consumer Finance – continued | | | | | | |
| Ford Motor Credit Co.: | | | | | | |
| 4.95% 1/15/08 | | | | $ 1,990,000 | | $ 1,849,808 |
| 6.5% 1/25/07 | | | | 8,430,000 | | 8,377,818 |
| Household Finance Corp.: | | | | | | |
| 4.125% 12/15/08 | | | | 705,000 | | 684,233 |
| 4.75% 5/15/09 | | | | 1,563,000 | | 1,532,306 |
| 6.4% 6/17/08 | | | | 2,070,000 | | 2,111,698 |
| Household International, Inc. 5.836% 2/15/08 | | | | 2,025,000 | | 2,041,508 |
| HSBC Finance Corp. 4.125% 3/11/08 | | | | 4,145,000 | | 4,058,212 |
| MBNA Capital I 8.278% 12/1/26 | | | | 1,200,000 | | 1,264,025 |
| | | | | | | 23,022,584 |
| Diversified Financial Services – 1.0% | | | | | | |
| Aspetuck Trust 5.33% 10/16/06 (d)(g) | | | | 3,235,000 | | 3,236,585 |
| CC Funding Trust I 6.9% 2/16/07 | | | | 2,040,000 | | 2,060,541 |
| Iberbond 2004 PLC 4.826% 12/24/17 (g) | | | | 3,078,933 | | 2,946,763 |
| ILFC E Capital Trust I 5.9% 12/21/65 (a)(d) | | | | 500,000 | | 487,688 |
| J.P. Morgan & Co., Inc. 6.25% 1/15/09 | | | | 1,075,000 | | 1,094,327 |
| Keycorp Institutional Capital B 8.25% 12/15/26 | | | | 2,620,000 | | 2,759,685 |
| Prime Property Funding II 6.25% 5/15/07 (a) | | | | 1,000,000 | | 1,002,490 |
| | | | | | | 13,588,079 |
| Insurance – 0.6% | | | | | | |
| The Chubb Corp. 4.934% 11/16/07 | | | | 4,000,000 | | 3,970,324 |
| The St. Paul Travelers Companies, Inc.: | | | | | | |
| 5.01% 8/16/07 | | | | 1,905,000 | | 1,894,042 |
| 5.75% 3/15/07 | | | | 1,070,000 | | 1,072,707 |
| Travelers Property Casualty Corp. 3.75% 3/15/08 | | | | 530,000 | | 515,834 |
| | | | | | | 7,452,907 |
| Real Estate 3.0% | | | | | | |
| Arden Realty LP 8.5% 11/15/10 | | | | 2,050,000 | | 2,287,228 |
| AvalonBay Communities, Inc. 5% 8/1/07 | | | | 915,000 | | 906,389 |
| Brandywine Operating Partnership LP: | | | | | | |
| 4.5% 11/1/09 | | | | 2,445,000 | | 2,343,437 |
| 5.625% 12/15/10 | | | | 1,845,000 | | 1,820,201 |
| BRE Properties, Inc.: | | | | | | |
| 5.95% 3/15/07 | | | | 575,000 | | 575,029 |
| 7.2% 6/15/07 | | | | 1,775,000 | | 1,793,197 |
| Camden Property Trust: | | | | | | |
| 4.375% 1/15/10 | | | | 1,385,000 | | 1,330,082 |
| 5.875% 6/1/07 | | | | 580,000 | | 583,043 |
See accompanying notes which are an integral part of the financial statements.
9 Semiannual Report
| Investments (Unaudited) continued | | | | | | |
| |
| |
| Nonconvertible Bonds continued | | | | | | |
| | | | | Principal | | Value (Note 1) |
| | | | | Amount | | |
| |
| FINANCIALS – continued | | | | | | |
| Real Estate continued | | | | | | |
| CarrAmerica Realty Corp. 5.25% 11/30/07 | | | | $ 2,170,000 | | $ 2,164,258 |
| Chelsea GCA Realty Partnership LP 7.25% 10/21/07 | | | | 1,465,000 | | 1,494,426 |
| Colonial Properties Trust: | | | | | | |
| 4.75% 2/1/10 | | | | 1,330,000 | | 1,282,008 |
| 7% 7/14/07 | | | | 1,260,000 | | 1,275,827 |
| Developers Diversified Realty Corp.: | | | | | | |
| 3.875% 1/30/09 | | | | 2,410,000 | | 2,296,431 |
| 5% 5/3/10 | | | | 1,310,000 | | 1,270,707 |
| 7% 3/19/07 | | | | 2,095,000 | | 2,120,270 |
| EOP Operating LP: | | | | | | |
| 6.763% 6/15/07 | | | | 1,625,000 | | 1,646,544 |
| 7.75% 11/15/07 | | | | 1,650,000 | | 1,702,605 |
| iStar Financial, Inc. 6.14% 3/12/07 (d) | | | | 3,120,000 | | 3,146,676 |
| JDN Realty Corp. 6.95% 8/1/07 | | | | 855,000 | | 858,737 |
| Simon Property Group LP: | | | | | | |
| 4.6% 6/15/10 | | | | 1,130,000 | | 1,088,711 |
| 4.875% 8/15/10 | | | | 2,460,000 | | 2,390,749 |
| 6.875% 11/15/06 | | | | 3,785,000 | | 3,812,191 |
| Tanger Properties LP 9.125% 2/15/08 | | | | 2,295,000 | | 2,444,175 |
| | | | | | | 40,632,921 |
| Thrifts & Mortgage Finance – 0.8% | | | | | | |
| Countrywide Home Loans, Inc.: | | | | | | |
| 5.3025% 6/2/06 (d) | | | | 1,250,000 | | 1,250,106 |
| 5.5% 8/1/06 | | | | 1,290,000 | | 1,291,067 |
| 5.625% 5/15/07 | | | | 745,000 | | 746,600 |
| Residential Capital Corp. 6.335% 6/29/07 (d) | | | | 3,960,000 | | 3,977,515 |
| Washington Mutual, Inc. 4.375% 1/15/08 | | | | 2,700,000 | | 2,653,844 |
| | | | | | | 9,919,132 |
| |
| TOTAL FINANCIALS | | | | | | 112,105,255 |
| |
| INDUSTRIALS – 1.5% | | | | | | |
| Aerospace & Defense – 0.2% | | | | | | |
| Northrop Grumman Corp. 4.079% 11/16/06 | | | | 2,900,000 | | 2,881,188 |
| Air Freight & Logistics – 0.0% | | | | | | |
| Federal Express Corp. pass thru trust certificates 7.53% | | | | | | |
| 9/23/06 | | | | 33,276 | | 33,425 |
| Airlines – 1.1% | | | | | | |
| America West Airlines pass thru Trust 7.33% 7/2/08 | | | | 2,575,381 | | 2,588,258 |
See accompanying notes which are an integral part of the financial statements.
| Nonconvertible Bonds continued | | | | | | |
| | | | | Principal | | Value (Note 1) |
| | | | | Amount | | |
| |
| INDUSTRIALS – continued | | | | | | |
| Airlines – continued | | | | | | |
| American Airlines, Inc. pass thru trust certificates: | | | | | | |
| 6.855% 10/15/10 | | | | $ 460,792 | | $ 467,994 |
| 6.978% 10/1/12 | | | | 102,074 | | 104,588 |
| 7.024% 4/15/11 | | | | 2,000,000 | | 2,055,000 |
| Continental Airlines, Inc. pass thru trust certificates: | | | | | | |
| 6.32% 11/1/08 | | | | 4,015,000 | | 4,010,056 |
| 7.056% 3/15/11 | | | | 355,000 | | 365,237 |
| Delta Air Lines, Inc. pass thru trust certificates 7.379% | | | | | | |
| 5/18/10 | | | | 1 | | 1 |
| United Airlines pass thru Certificates: | | | | | | |
| 6.071% 9/1/14 | | | | 1,338,200 | | 1,321,111 |
| 6.201% 3/1/10 | | | | 1,084,358 | | 1,084,358 |
| 6.602% 9/1/13 | | | | 2,602,217 | | 2,592,082 |
| | | | | | | 14,588,685 |
| Industrial Conglomerates – 0.2% | | | | | | |
| Tyco International Group SA yankee 5.8% 8/1/06 | | | | 3,360,000 | | 3,363,058 |
| |
| TOTAL INDUSTRIALS | | | | | | 20,866,356 |
| |
| INFORMATION TECHNOLOGY – 0.4% | | | | | | |
| Communications Equipment – 0.4% | | | | | | |
| Motorola, Inc. 4.608% 11/16/07 | | | | 6,000,000 | | 5,932,962 |
| |
| MATERIALS 0.2% | | | | | | |
| Containers & Packaging – 0.1% | | | | | | |
| Sealed Air Corp. 6.95% 5/15/09 (a) | | | | 855,000 | | 881,505 |
| Paper & Forest Products 0.1% | | | | | | |
| International Paper Co. 4.25% 1/15/09 | | | | 1,465,000 | | 1,415,482 |
| |
| TOTAL MATERIALS | | | | | | 2,296,987 |
| |
| TELECOMMUNICATION SERVICES – 3.2% | | | | | | |
| Diversified Telecommunication Services – 2.6% | | | | | | |
| Ameritech Capital Funding Corp. 6.25% 5/18/09 | | | | 1,765,000 | | 1,785,407 |
| AT&T Corp. 6% 3/15/09 | | | | 3,720,000 | | 3,765,570 |
| BellSouth Corp. 4.2% 9/15/09 | | | | 1,775,000 | | 1,704,225 |
| Sprint Capital Corp. 6% 1/15/07 | | | | 3,240,000 | | 3,252,649 |
| Telecom Italia Capital 4% 11/15/08 | | | | 7,140,000 | | 6,885,073 |
| Telefonos de Mexico SA de CV: | | | | | | |
| 4.5% 11/19/08 | | | | 3,260,000 | | 3,169,212 |
See accompanying notes which are an integral part of the financial statements.
11 Semiannual Report
| Investments (Unaudited) continued | | | | | | |
| |
| |
| Nonconvertible Bonds continued | | | | | | |
| | | | | Principal | | Value (Note 1) |
| | | | | Amount | | |
| |
| TELECOMMUNICATION SERVICES – continued | | | | | | |
| Diversified Telecommunication Services – continued | | | | | | |
| Telefonos de Mexico SA de CV: – continued | | | | | | |
| 4.75% 1/27/10 | | | | $ 3,355,000 | | $ 3,231,231 |
| TELUS Corp. yankee 7.5% 6/1/07 | | | | 4,220,000 | | 4,307,768 |
| Verizon Global Funding Corp.: | | | | | | |
| 6.125% 6/15/07 | | | | 2,140,000 | | 2,156,439 |
| 7.25% 12/1/10 | | | | 4,205,000 | | 4,456,833 |
| | | | | | | 34,714,407 |
| Wireless Telecommunication Services – 0.6% | | | | | | |
| ALLTEL Corp. 4.656% 5/17/07 | | | | 3,915,000 | | 3,888,464 |
| America Movil SA de CV 4.125% 3/1/09 | | | | 3,925,000 | | 3,762,222 |
| | | | | | | 7,650,686 |
| |
| TOTAL TELECOMMUNICATION SERVICES | | | | | | 42,365,093 |
| |
| UTILITIES – 3.7% | | | | | | |
| Electric Utilities – 1.8% | | | | | | |
| American Electric Power Co., Inc. 4.709% 8/16/07 | | | | 3,685,000 | | 3,649,911 |
| Exelon Corp. 4.45% 6/15/10 | | | | 3,750,000 | | 3,588,934 |
| FirstEnergy Corp. 5.5% 11/15/06 | | | | 5,095,000 | | 5,094,618 |
| Monongahela Power Co. 5% 10/1/06 | | | | 2,015,000 | | 2,009,697 |
| Pepco Holdings, Inc.: | | | | | | |
| 4% 5/15/10 | | | | 1,125,000 | | 1,054,537 |
| 5.5% 8/15/07 | | | | 3,995,000 | | 3,993,166 |
| Progress Energy, Inc.: | | | | | | |
| 5.85% 10/30/08 | | | | 1,025,000 | | 1,033,004 |
| 7.1% 3/1/11 | | | | 2,285,000 | | 2,413,975 |
| Southwestern Public Service Co. 5.125% 11/1/06 | | | | 650,000 | | 648,885 |
| TXU Energy Co. LLC 6.125% 3/15/08 | | | | 935,000 | | 941,700 |
| | | | | | | 24,428,427 |
| Gas Utilities 0.1% | | | | | | |
| NiSource Finance Corp. 3.2% 11/1/06 | | | | 1,085,000 | | 1,073,278 |
| Independent Power Producers & Energy Traders – 0.6% | | | | | | |
| Constellation Energy Group, Inc.: | | | | | | |
| 6.125% 9/1/09 | | | | 3,035,000 | | 3,085,056 |
| 6.35% 4/1/07 | | | | 3,025,000 | | 3,047,358 |
| Duke Capital LLC 4.331% 11/16/06 | | | | 1,630,000 | | 1,621,932 |
| | | | | | | 7,754,346 |
| Multi-Utilities – 1.2% | | | | | | |
| Dominion Resources, Inc. 4.125% 2/15/08 | | | | 2,610,000 | | 2,549,213 |
See accompanying notes which are an integral part of the financial statements.
| Nonconvertible Bonds continued | | | | |
| | | Principal | | Value (Note 1) |
| | | Amount | | |
| |
| UTILITIES – continued | | | | |
| Multi-Utilities – continued | | | | |
| DTE Energy Co.: | | | | |
| 5.63% 8/16/07 | | $ 2,965,000 | | $ 2,970,453 |
| 6.45% 6/1/06 | | 1,750,000 | | 1,751,391 |
| MidAmerican Energy Holdings, Inc. 4.625% 10/1/07 | | 705,000 | | 697,358 |
| NiSource, Inc. 3.628% 11/1/06 | | 1,565,000 | | 1,550,857 |
| PSEG Funding Trust I 5.381% 11/16/07 | | 3,575,000 | | 3,561,983 |
| Sempra Energy: | | | | |
| 4.621% 5/17/07 | | 2,495,000 | | 2,474,718 |
| 4.75% 5/15/09 | | 1,055,000 | | 1,032,314 |
| | | | | 16,588,287 |
| |
| TOTAL UTILITIES | | | | 49,844,338 |
| |
| TOTAL NONCONVERTIBLE BONDS | | | | |
| (Cost $300,598,984) | | | | 296,136,398 |
| |
| U.S. Government and Government Agency Obligations 20.3% | | | | |
| |
| U.S. Government Agency Obligations 6.6% | | | | |
| Fannie Mae: | | | | |
| 3.25% 8/15/08 | | 6,089,000 | | 5,842,895 |
| 3.25% 2/15/09 | | 13,000,000 | | 12,361,999 |
| 6% 5/15/08 | | 45,782,000 | | 46,540,882 |
| Federal Home Loan Bank 4.25% 4/16/07 | | 6,000,000 | | 5,947,584 |
| Freddie Mac: | | | | |
| 2.7% 3/16/07 | | 14,000,000 | | 13,698,762 |
| 4% 8/17/07 | | 3,430,000 | | 3,380,083 |
| |
| TOTAL U.S. GOVERNMENT AGENCY OBLIGATIONS | | | | 87,772,205 |
| U.S. Treasury Inflation Protected Obligations 0.9% | | | | |
| U.S. Treasury Inflation-Indexed Notes 3.875% 1/15/09 | | 11,509,250 | | 12,079,440 |
| U.S. Treasury Obligations – 12.8% | | | | |
| U.S. Treasury Bonds 12% 8/15/13 | | 17,526,000 | | 20,202,133 |
| U.S. Treasury Notes: | | | | |
| 3.375% 2/15/08 | | 57,000,000 | | 55,534,929 |
| 3.625% 4/30/07 | | 2,952,000 | | 2,914,409 |
| 3.75% 5/15/08 (c) | | 73,610,000 | | 72,022,807 |
| 3.875% 7/31/07 | | 5,096,000 | | 5,031,903 |
See accompanying notes which are an integral part of the financial statements.
13 Semiannual Report
| Investments (Unaudited) continued | | | | |
| |
| |
| U.S. Government and Government Agency Obligations continued |
| | | | | Principal | | Value (Note 1) |
| | | | | Amount | | |
| U.S. Treasury Obligations continued | | | | | | |
| U.S. Treasury Notes: – continued | | | | | | |
| 4% 8/31/07 | | | | $ 3,544,000 | | $ 3,502,744 |
| 4.375% 11/15/08 | | | | 12,000,000 | | 11,855,160 |
| |
| TOTAL U.S. TREASURY OBLIGATIONS | | | | | | 171,064,085 |
| |
| TOTAL U.S. GOVERNMENT AND | | | | | | |
| GOVERNMENT AGENCY OBLIGATIONS | | | | | | |
| (Cost $276,184,197) | | | | | | 270,915,730 |
| |
| U.S. Government Agency Mortgage Securities 10.3% | | | | | | |
| |
| Fannie Mae – 8.1% | | | | | | |
| 3.734% 1/1/35 (d) | | | | 282,597 | | 277,572 |
| 3.749% 12/1/34 (d) | | | | 210,607 | | 207,042 |
| 3.75% 1/1/34 (d) | | | | 167,036 | | 162,478 |
| 3.752% 10/1/33 (d) | | | | 181,532 | | 177,106 |
| 3.752% 10/1/33 (d) | | | | 203,072 | | 197,843 |
| 3.782% 12/1/34 (d) | | | | 42,238 | | 41,584 |
| 3.792% 6/1/34 (d) | | | | 843,349 | | 815,451 |
| 3.821% 10/1/33 (d) | | | | 2,119,271 | | 2,069,553 |
| 3.824% 6/1/33 (d) | | | | 147,553 | | 144,742 |
| 3.829% 1/1/35 (d) | | | | 177,589 | | 174,748 |
| 3.833% 4/1/33 (d) | | | | 540,434 | | 530,717 |
| 3.847% 1/1/35 (d) | | | | 525,680 | | 516,933 |
| 3.854% 10/1/33 (d) | | | | 4,611,158 | | 4,514,324 |
| 3.869% 1/1/35 (d) | | | | 316,153 | | 311,266 |
| 3.879% 6/1/33 (d) | | | | 772,601 | | 758,192 |
| 3.902% 10/1/34 (d) | | | | 221,275 | | 218,180 |
| 3.913% 5/1/34 (d) | | | | 56,102 | | 56,096 |
| 3.917% 12/1/34 (d) | | | | 171,370 | | 168,774 |
| 3.941% 6/1/34 (d) | | | | 1,347,944 | | 1,309,137 |
| 3.947% 11/1/34 (d) | | | | 357,696 | | 352,724 |
| 3.957% 1/1/35 (d) | | | | 223,882 | | 220,613 |
| 3.96% 5/1/33 (d) | | | | 66,966 | | 65,892 |
| 3.972% 12/1/34 (d) | | | | 177,176 | | 174,684 |
| 3.978% 12/1/34 (d) | | | | 226,129 | | 222,961 |
| 3.983% 12/1/34 (d) | | | | 1,181,261 | | 1,164,735 |
| 3.988% 1/1/35 (d) | | | | 142,408 | | 140,363 |
| 4.003% 12/1/34 (d) | | | | 121,325 | | 119,636 |
| 4.006% 2/1/35 (d) | | | | 151,719 | | 149,521 |
See accompanying notes which are an integral part of the financial statements.
| U.S. Government Agency Mortgage Securities continued | | | | |
| | | | | Principal | | Value (Note 1) |
| | | | | Amount | | | | |
| Fannie Mae continued | | | | | | | | |
| 4.013% 1/1/35 (d) | | | | $ 320,692 | | | | $ 316,205 |
| 4.021% 2/1/35 (d) | | | | 155,188 | | | | 153,103 |
| 4.042% 12/1/34 (d) | | | | 324,818 | | | | 320,482 |
| 4.048% 10/1/18 (d) | | | | 160,600 | | | | 157,607 |
| 4.05% 1/1/35 (d) | | | | 81,961 | | | | 80,788 |
| 4.051% 1/1/35 (d) | | | | 160,920 | | | | 158,771 |
| 4.066% 4/1/33 (d) | | | | 63,154 | | | | 62,315 |
| 4.067% 1/1/35 (d) | | | | 311,967 | | | | 307,750 |
| 4.09% 2/1/35 (d) | | | | 114,413 | | | | 112,808 |
| 4.091% 2/1/35 (d) | | | | 295,643 | | | | 291,605 |
| 4.092% 2/1/35 (d) | | | | 109,656 | | | | 108,233 |
| 4.106% 2/1/35 (d) | | | | 579,180 | | | | 571,975 |
| 4.109% 1/1/35 (d) | | | | 327,308 | | | | 322,977 |
| 4.113% 11/1/34 (d) | | | | 263,296 | | | | 260,084 |
| 4.115% 2/1/35 (d) | | | | 382,129 | | | | 377,023 |
| 4.121% 1/1/35 (d) | | | | 322,114 | | | | 317,985 |
| 4.122% 1/1/35 (d) | | | | 572,158 | | | | 565,029 |
| 4.144% 1/1/35 (d) | | | | 488,043 | | | | 483,568 |
| 4.148% 7/1/34 (d) | | | | 870,993 | | | | 848,774 |
| 4.153% 2/1/35 (d) | | | | 293,656 | | | | 289,906 |
| 4.166% 11/1/34 (d) | | | | 73,739 | | | | 72,941 |
| 4.174% 10/1/34 (d) | | | | 456,020 | | | | 450,849 |
| 4.176% 1/1/35 (d) | | | | 269,916 | | | | 266,644 |
| 4.178% 1/1/35 (d) | | | | 590,203 | | | | 583,640 |
| 4.178% 1/1/35 (d) | | | | 388,306 | | | | 377,589 |
| 4.188% 10/1/34 (d) | | | | 483,132 | | | | 479,403 |
| 4.22% 3/1/34 (d) | | | | 148,064 | | | | 145,045 |
| 4.222% 9/1/34 (d) | | | | 1,023,039 | | | | 997,064 |
| 4.223% 1/1/35 (d) | | | | 157,982 | | | | 156,178 |
| 4.25% 1/1/34 (d) | | | | 284,637 | | | | 279,186 |
| 4.25% 2/1/34 (d) | | | | 219,405 | | | | 215,166 |
| 4.25% 2/1/35 (d) | | | | 191,706 | | | | 186,522 |
| 4.267% 2/1/35 (d) | | | | 98,874 | | | | 97,824 |
| 4.27% 10/1/34 (d) | | | | 61,910 | | | | 61,340 |
| 4.28% 8/1/33 (d) | | | | 371,002 | | | | 366,532 |
| 4.283% 3/1/35 (d) | | | | 170,881 | | | | 168,839 |
| 4.287% 7/1/34 (d) | | | | 149,474 | | | | 149,011 |
| 4.293% 1/1/34 (d) | | | | 245,791 | | | | 241,684 |
| 4.294% 3/1/33 (d) | | | | 216,450 | | | | 214,108 |
| 4.299% 5/1/35 (d) | | | | 245,637 | | | | 243,089 |
| 4.3% 1/1/34 (d) | | | | 1,347,901 | | | | 1,323,963 |
See accompanying notes which are an integral part of the financial statements.
15 Semiannual Report
| Investments (Unaudited) continued | | | | | | |
| |
| |
| U.S. Government Agency Mortgage Securities continued | | | | |
| | | | | Principal | | Value (Note 1) |
| | | | | Amount | | | | |
| Fannie Mae continued | | | | | | | | |
| 4.304% 12/1/34 (d) | | | | $ 109,718 | | | | $ 108,577 |
| 4.315% 10/1/33 (d) | | | | 82,231 | | | | 81,028 |
| 4.316% 3/1/33 (d) | | | | 96,997 | | | | 94,373 |
| 4.32% 3/1/35 (d) | | | | 386,362 | | | | 382,159 |
| 4.339% 9/1/34 (d) | | | | 249,920 | | | | 247,629 |
| 4.345% 6/1/33 (d) | | | | 109,804 | | | | 108,596 |
| 4.352% 10/1/34 (d) | | | | 637,090 | | | | 631,083 |
| 4.354% 9/1/34 (d) | | | | 569,273 | | | | 567,520 |
| 4.356% 1/1/35 (d) | | | | 189,804 | | | | 185,091 |
| 4.357% 4/1/35 (d) | | | | 115,588 | | | | 114,276 |
| 4.362% 2/1/34 (d) | | | | 435,955 | | | | 428,796 |
| 4.375% 1/1/35 (d) | | | | 586,866 | | | | 581,314 |
| 4.392% 1/1/35 (d) | | | | 217,318 | | | | 215,236 |
| 4.395% 5/1/35 (d) | | | | 532,273 | | | | 526,396 |
| 4.398% 2/1/35 (d) | | | | 281,896 | | | | 274,953 |
| 4.401% 10/1/34 (d) | | | | 768,217 | | | | 761,964 |
| 4.402% 10/1/34 (d) | | | | 982,013 | | | | 961,430 |
| 4.402% 10/1/34 (d) | | | | 1,948,663 | | | | 1,931,846 |
| 4.402% 11/1/34 (d) | | | | 542,929 | | | | 538,113 |
| 4.416% 12/1/34 (d) | | | | 912,581 | | | | 904,286 |
| 4.434% 10/1/34 (d) | | | | 906,764 | | | | 899,763 |
| 4.436% 4/1/34 (d) | | | | 280,721 | | | | 277,613 |
| 4.438% 3/1/35 (d) | | | | 253,155 | | | | 247,036 |
| 4.465% 8/1/34 (d) | | | | 564,839 | | | | 556,021 |
| 4.468% 5/1/35 (d) | | | | 1,613,568 | | | | 1,601,628 |
| 4.474% 5/1/35 (d) | | | | 152,742 | | | | 151,246 |
| 4.481% 1/1/35 (d) | | | | 254,170 | | | | 252,230 |
| 4.504% 8/1/34 (d) | | | | 384,046 | | | | 383,167 |
| 4.512% 10/1/35 (d) | | | | 91,797 | | | | 90,674 |
| 4.518% 8/1/35 (d) | | | | 426,241 | | | | 421,582 |
| 4.54% 2/1/35 (d) | | | | 1,193,305 | | | | 1,184,296 |
| 4.541% 7/1/34 (d) | | | | 263,262 | | | | 263,602 |
| 4.543% 2/1/35 (d) | | | | 119,069 | | | | 118,193 |
| 4.545% 7/1/35 (d) | | | | 652,652 | | | | 646,138 |
| 4.546% 2/1/35 (d) | | | | 176,742 | | | | 175,379 |
| 4.555% 1/1/35 (d) | | | | 366,596 | | | | 363,971 |
| 4.559% 9/1/34 (d) | | | | 681,410 | | | | 677,063 |
| 4.575% 7/1/35 (d) | | | | 542,909 | | | | 537,718 |
| 4.584% 8/1/34 (d) | | | | 243,206 | | | | 243,318 |
| 4.587% 2/1/35 (d) | | | | 754,366 | | | | 739,240 |
See accompanying notes which are an integral part of the financial statements.
| U.S. Government Agency Mortgage Securities continued | | | | |
| | | | | Principal | | Value (Note 1) |
| | | | | Amount | | | | |
| Fannie Mae continued | | | | | | | | |
| 4.6% 6/1/35 (d) | | | | $ 593,604 | | | | $ 588,772 |
| 4.608% 2/1/35 (d) | | | | 807,469 | | | | 795,776 |
| 4.629% 9/1/34 (d) | | | | 69,878 | | | | 69,971 |
| 4.633% 3/1/35 (d) | | | | 91,026 | | | | 90,424 |
| 4.641% 1/1/33 (d) | | | | 119,799 | | | | 119,069 |
| 4.677% 3/1/35 (d) | | | | 1,492,131 | | | | 1,483,417 |
| 4.704% 3/1/35 (d) | | | | 322,969 | | | | 317,179 |
| 4.705% 10/1/32 (d) | | | | 43,174 | | | | 43,071 |
| 4.726% 7/1/34 (d) | | | | 544,081 | | | | 536,644 |
| 4.728% 1/1/35 (d) | | | | 849,074 | | | | 845,126 |
| 4.731% 2/1/33 (d) | | | | 38,292 | | | | 38,103 |
| 4.735% 6/1/35 (d) | | | | 1,565,033 | | | | 1,555,847 |
| 4.74% 10/1/34 (d) | | | | 668,827 | | | | 659,571 |
| 4.746% 1/1/35 (d) | | | | 30,039 | | | | 29,887 |
| 4.747% 10/1/32 (d) | | | | 48,174 | | | | 47,932 |
| 4.798% 12/1/32 (d) | | | | 262,679 | | | | 261,715 |
| 4.798% 12/1/34 (d) | | | | 192,176 | | | | 189,616 |
| 4.815% 2/1/33 (d) | | | | 259,983 | | | | 258,966 |
| 4.815% 5/1/33 (d) | | | | 10,604 | | | | 10,567 |
| 4.83% 8/1/34 (d) | | | | 193,227 | | | | 192,885 |
| 4.844% 11/1/34 (d) | | | | 552,213 | | | | 545,487 |
| 4.853% 10/1/35 (d) | | | | 757,989 | | | | 753,653 |
| 4.869% 1/1/35 (d) | | | | 3,481,683 | | | | 3,439,381 |
| 4.873% 7/1/34 (d) | | | | 796,784 | | | | 787,748 |
| 4.875% 9/1/35 (d) | | | | 811,774 | | | | 806,546 |
| 4.887% 10/1/35 (d) | | | | 485,007 | | | | 479,595 |
| 4.928% 2/1/35 (d) | | | | 1,875,343 | | | | 1,854,489 |
| 4.969% 12/1/32 (d) | | | | 16,926 | | | | 16,894 |
| 4.984% 11/1/32 (d) | | | | 133,394 | | | | 133,177 |
| 4.996% 5/1/35 (d) | | | | 855,470 | | | | 845,307 |
| 5% 3/1/18 to 6/1/18 | | | | 3,432,004 | | | | 3,352,073 |
| 5% 2/1/35 (d) | | | | 83,247 | | | | 83,091 |
| 5.008% 9/1/34 (d) | | | | 2,427,554 | | | | 2,406,386 |
| 5.016% 4/1/35 (d) | | | | 593,797 | | | | 592,229 |
| 5.042% 7/1/34 (d) | | | | 104,537 | | | | 103,801 |
| 5.063% 11/1/34 (d) | | | | 42,789 | | | | 42,740 |
| 5.103% 9/1/34 (d) | | | | 200,573 | | | | 199,351 |
| 5.104% 5/1/35 (d) | | | | 1,213,346 | | | | 1,212,157 |
| 5.115% 1/1/34 (d) | | | | 174,278 | | | | 174,580 |
| 5.172% 5/1/35 (d) | | | | 697,977 | | | | 693,273 |
| 5.197% 8/1/33 (d) | | | | 261,309 | | | | 260,381 |
See accompanying notes which are an integral part of the financial statements.
17 Semiannual Report
| Investments (Unaudited) continued | | | | |
| |
| |
| U.S. Government Agency Mortgage Securities continued | | |
| | | | | Principal | | Value (Note 1) |
| | | | | Amount | | |
| Fannie Mae continued | | | | | | |
| 5.197% 6/1/35 (d) | | | | $ 864,575 | | $ 864,861 |
| 5.231% 3/1/35 (d) | | | | 120,681 | | 120,162 |
| 5.318% 7/1/35 (d) | | | | 117,742 | | 117,916 |
| 5.343% 12/1/34 (d) | | | | 318,561 | | 318,013 |
| 5.5% 7/1/13 to 5/1/25 | | | | 17,765,057 | | 17,598,952 |
| 6.5% 2/1/08 to 3/1/35 | | | | 11,869,058 | | 12,126,730 |
| 7% 3/1/08 to 6/1/32 | | | | 1,259,679 | | 1,287,009 |
| 7.5% 5/1/12 to 10/1/14 | | | | 102,664 | | 105,960 |
| 11.5% 11/1/15 | | | | 61,009 | | 66,111 |
| |
| TOTAL FANNIE MAE | | | | | | 107,443,607 |
| Freddie Mac – 2.1% | | | | | | |
| 4.05% 12/1/34 (d) | | | | 184,861 | | 181,769 |
| 4.106% 12/1/34 (d) | | | | 266,506 | | 262,317 |
| 4.152% 1/1/35 (d) | | | | 845,048 | | 832,161 |
| 4.263% 3/1/35 (d) | | | | 255,357 | | 251,739 |
| 4.294% 5/1/35 (d) | | | | 450,694 | | 444,695 |
| 4.304% 12/1/34 (d) | | | | 279,514 | | 271,643 |
| 4.318% 10/1/34 (d) | | | | 465,678 | | 459,945 |
| 4.353% 2/1/35 (d) | | | | 557,407 | | 550,100 |
| 4.379% 2/1/35 (d) | | | | 279,801 | | 272,051 |
| 4.408% 8/1/35 (d) | | | | 4,456,470 | | 4,374,650 |
| 4.443% 3/1/35 (d) | | | | 275,676 | | 268,029 |
| 4.45% 2/1/34 (d) | | | | 254,367 | | 249,829 |
| 4.462% 6/1/35 (d) | | | | 416,698 | | 410,876 |
| 4.482% 3/1/35 (d) | | | | 296,367 | | 288,759 |
| 4.484% 3/1/35 (d) | | | | 1,777,587 | | 1,747,635 |
| 4.552% 2/1/35 (d) | | | | 431,118 | | 420,383 |
| 4.768% 10/1/32 (d) | | | | 32,051 | | 31,821 |
| 4.869% 3/1/33 (d) | | | | 96,288 | | 95,751 |
| 4.939% 11/1/35 (d) | | | | 1,078,065 | | 1,068,621 |
| 5.007% 4/1/35 (d) | | | | 1,380,495 | | 1,373,676 |
| 5.26% 1/1/36 (d) | | | | 1,116,860 | | 1,113,230 |
| 5.338% 6/1/35 (d) | | | | 861,491 | | 856,580 |
| 5.405% 8/1/33 (d) | | | | 128,458 | | 128,688 |
| 5.5% 5/1/21 (b) | | | | 7,571,204 | | 7,513,587 |
| 5.5% 7/1/23 to 4/1/24 | | | | 4,429,968 | | 4,344,735 |
| 5.588% 4/1/32 (d) | | | | 49,956 | | 50,340 |
See accompanying notes which are an integral part of the financial statements.
| U.S. Government Agency Mortgage Securities continued |
| | | | | Principal | | Value (Note 1) |
| | | | | Amount | | |
| Freddie Mac continued | | | | | | |
| 8.5% 5/1/26 to 7/1/28 | | | | $ 202,146 | | $ 216,897 |
| 12% 11/1/19 | | | | 15,038 | | 16,880 |
| |
| TOTAL FREDDIE MAC | | | | | | 28,097,387 |
| Government National Mortgage Association 0.1% | | | | | | |
| 4.25% 7/20/34 (d) | | | | 731,883 | | 721,417 |
| 7% 1/15/25 to 6/15/32 | | | | 984,977 | | 1,025,317 |
| |
| TOTAL GOVERNMENT NATIONAL MORTGAGE ASSOCIATION | | | | | | 1,746,734 |
| |
| TOTAL U.S. GOVERNMENT AGENCY MORTGAGE SECURITIES | | | | | | |
| (Cost $139,046,151) | | | | | | 137,287,728 |
| |
| Asset Backed Securities 19.7% | | | | | | |
| |
| Accredited Mortgage Loan Trust: | | | | | | |
| Series 2003-2 Class A1, 4.23% 10/25/33 | | | | 943,505 | | 917,110 |
| Series 2003-3 Class A1, 4.46% 1/25/34 | | | | 943,299 | | 891,977 |
| Series 2004-2 Class A2, 5.2594% 7/25/34 (d) | | | | 1,150,210 | | 1,153,677 |
| Series 2004-4 Class A2D, 5.3094% 1/25/35 (d) | | | | 545,483 | | 547,094 |
| ACE Securities Corp. Series 2003-HE1: | | | | | | |
| Class A2, 5.3694% 11/25/33 (d) | | | | 82,178 | | 82,193 |
| Class M1, 5.6094% 11/25/33 (d) | | | | 430,000 | | 431,925 |
| Class M2, 6.6594% 11/25/33 (d) | | | | 270,000 | | 273,843 |
| Aesop Funding II LLC Series 2005-1A Class A1, 3.95% | | | | | | |
| 4/20/08 (a) | | | | 2,000,000 | | 1,949,293 |
| American Express Credit Account Master Trust Series | | | | | | |
| 2004-C Class C, 5.4013% 2/15/12 (a)(d) | | | | 1,925,460 | | 1,930,341 |
| AmeriCredit Automobile Receivables Trust: | | | | | | |
| Series 2004-1: | | | | | | |
| Class B, 3.7% 1/6/09 | | | | 150,000 | | 148,314 |
| Class C, 4.22% 7/6/09 | | | | 155,000 | | 152,439 |
| Class D, 5.07% 7/6/10 | | | | 1,105,000 | | 1,092,847 |
| Series 2004-CA Class A4, 3.61% 5/6/11 | | | | 630,000 | | 612,606 |
| Series 2005-1 Class D, 5.04% 5/6/11 | | | | 2,500,000 | | 2,455,683 |
| Series 2005-CF Class A4, 4.63% 6/6/12 | | | | 2,895,000 | | 2,841,269 |
| Series 2005-DA Class A4, 5.02% 11/6/12 | | | | 4,150,000 | | 4,107,975 |
| Series 2006-1 Class D, 5.49% 4/6/12 | | | | 1,115,000 | | 1,104,964 |
| Ameriquest Mortgage Securities, Inc.: | | | | | | |
| Series 2004-R10 Class M1, 5.6594% 11/25/34 (d) | | | | 1,370,000 | | 1,377,454 |
| Series 2004-R11 Class M1, 5.6194% 11/25/34 (d) | | | | 2,040,000 | | 2,054,128 |
See accompanying notes which are an integral part of the financial statements.
19 Semiannual Report
| Investments (Unaudited) continued | | | | | | |
| |
| |
| Asset Backed Securities continued | | | | | | |
| | | | | Principal | | Value (Note 1) |
| | | | | Amount | | |
| Ameriquest Mortgage Securities, Inc.: – continued | | | | | | |
| Series 2004-R9: | | | | | | |
| Class A3, 5.2794% 10/25/34 (d) | | | | $ 544,161 | | $ 544,310 |
| Class M2, 5.6094% 10/25/34 (d) | | | | 1,515,000 | | 1,526,183 |
| Class M4, 6.1294% 10/25/34 (d) | | | | 1,945,000 | | 1,973,550 |
| Amortizing Residential Collateral Trust: | | | | | | |
| Series 2002-BC3 Class A, 5.2894% 6/25/32 (d) | | | | 201,084 | | 201,770 |
| Series 2002-BC7 Class M1, 5.7594% 10/25/32 (d) . | | | | 1,100,000 | | 1,101,534 |
| ARG Funding Corp. Series 2005-1A Class A1, 4.02% | | | | | | |
| 4/20/09 (a) | | | | 4,100,000 | | 3,999,549 |
| Argent Securities, Inc.: | | | | | | |
| Series 2003-W3: | | | | | | |
| Class AV1B, 5.4094% 9/25/33 (d) | | | | 7,615 | | 7,617 |
| Class M2, 6.7594% 9/25/33 (d) | | | | 3,100,000 | | 3,140,996 |
| Series 2003-W7: | | | | | | |
| Class A2, 5.3494% 3/1/34 (d) | | | | 322,456 | | 322,913 |
| Class M1, 5.6494% 3/1/34 (d) | | | | 2,500,000 | | 2,518,523 |
| Series 2003-W9 Class M1, 5.6494% 3/25/34 (d) | | | | 1,800,000 | | 1,813,074 |
| Series 2004-W5 Class M1, 5.5594% 4/25/34 (d) | | | | 830,000 | | 830,942 |
| Series 2004-W9 Class M3, 6.5594% 6/26/34 (d) | | | | 2,230,000 | | 2,272,552 |
| Arran Funding Ltd. Series 2005-A Class C, 5.2% | | | | | | |
| 12/15/10 (d) | | | | 3,530,000 | | 3,528,941 |
| Asset Backed Funding Certificates Series 2004-HE1 | | | | | | |
| Class M2, 6.1094% 1/25/34 (d) | | | | 485,000 | | 493,080 |
| Asset Backed Securities Corp. Home Equity Loan Trust: | | | | | | |
| Series 2003-HE7 Class A3, 5.2613% 12/15/33 (d) | | | | 261,600 | | 262,413 |
| Series 2004-HE3 Class M2, 6.0794% 6/25/34 (d) | | | | 700,000 | | 708,688 |
| Series 2004-HE6 Class A2, 5.3194% 6/25/34 (d) | | | | 2,355,858 | | 2,361,008 |
| Series 2005-HE2: | | | | | | |
| Class M1, 5.4094% 3/25/35 (d) | | | | 1,830,000 | | 1,839,549 |
| Class M2, 5.4594% 3/25/35 (d) | | | | 460,000 | | 462,954 |
| Series 2005-HE3 Class A4, 5.1594% 4/25/35 (d) | | | | 3,200,000 | | 3,201,144 |
| Bayview Financial Acquisition Trust Series 2004-C Class | | | | | | |
| A1, 5.42% 5/28/44 (d) | | | | 1,379,755 | | 1,382,374 |
| Bayview Financial Asset Trust Series 2003-F Class A, | | | | | | |
| 5.5% 9/28/43 (d) | | | | 1,201,891 | | 1,202,718 |
| Bayview Financial Mortgage Loan Trust Series 2004-A | | | | | | |
| Class A, 5.45% 2/28/44 (d) | | | | 857,532 | | 859,660 |
| Bear Stearns Asset Backed Securities I: | | | | | | |
| Series 2004-BO1: | | | | | | |
| Class M2, 5.7094% 9/25/34 (d) | | | | 794,000 | | 803,030 |
| Class M3, 6.0094% 9/25/34 (d) | | | | 540,000 | | 546,085 |
| Class M4, 6.1594% 9/25/34 (d) | | | | 460,000 | | 467,761 |
See accompanying notes which are an integral part of the financial statements.
| Asset Backed Securities continued | | | | | | |
| | | | | Principal | | Value (Note 1) |
| | | | | Amount | | |
| Bear Stearns Asset Backed Securities I: – continued | | | | | | |
| Series 2004-BO1: | | | | | | |
| Class M5, 6.3594% 9/25/34 (d) | | | | $ 435,000 | | $ 442,952 |
| Series 2004-HE8: | | | | | | |
| Class M1, 5.6094% 9/25/34 (d) | | | | 1,800,000 | | 1,808,622 |
| Class M2, 6.1594% 9/25/34 (d) | | | | 890,000 | | 893,354 |
| BMW Vehicle Owner Trust Series 2005-A Class B, | | | | | | |
| 4.42% 4/25/11 | | | | 1,035,000 | | 1,016,385 |
| Capital Auto Receivables Asset Trust: | | | | | | |
| Series 2005-1 Class B, 5.2763% 6/15/10 (d) | | | | 1,240,000 | | 1,246,618 |
| Series 2006-1 Class B, 5.26% 10/15/10 | | | | 500,000 | | 496,017 |
| Capital One Auto Finance Trust: | | | | | | |
| Series 2005-A Class A3, 4.28% 7/15/09 | | | | 2,165,000 | | 2,145,365 |
| Series 2005 BSS: | | | | | | |
| Class B, 4.32% 5/15/10 | | | | 1,430,000 | | 1,398,160 |
| Series D, 4.8% 9/15/12 | | | | 1,220,000 | | 1,178,291 |
| Capital One Master Trust: | | | | | | |
| Series 1999-3 Class B, 5.3813% 9/15/09 (d) | | | | 1,000,000 | | 999,932 |
| Series 2001-1 Class B, 5.4113% 12/15/10 (d) | | | | 1,700,000 | | 1,709,936 |
| Series 2001-6 Class C, 6.7% 6/15/11 (a) | | | | 3,200,000 | | 3,284,000 |
| Series 2001-8A Class A, 4.6% 8/17/09 | | | | 1,390,000 | | 1,386,647 |
| Capital One Prime Auto Receivable Trust Series 2005-1 | | | | | | |
| Class B, 4.58% 8/15/12 | | | | 1,850,000 | | 1,804,050 |
| Capital Trust Ltd. Series 2004-1: | | | | | | |
| Class A2, 5.3725% 7/20/39 (a)(d) | | | | 645,000 | | 645,988 |
| Class B, 5.6725% 7/20/39 (a)(d) | | | | 340,000 | | 342,735 |
| Class C, 6.0225% 7/20/39 (a)(d) | | | | 435,000 | | 438,054 |
| CDC Mortgage Capital Trust Series 2002-HE2 Class M1, | | | | | | |
| 5.6594% 1/25/33 (d) | | | | 835,059 | | 835,645 |
| Chase Credit Card Master Trust Series 2003-6 Class B, | | | | | | |
| 5.2513% 2/15/11 (d) | | | | 2,150,000 | | 2,164,966 |
| Chase Credit Card Owner Trust Series 2004-1 Class B, | | | | | | |
| 5.1013% 5/15/09 (d) | | | | 875,000 | | 874,940 |
| Chase Issuance Trust: | | | | | | |
| Series 2004-C3 Class C3, 5.3713% 6/15/12 (d) | | | | 3,305,000 | | 3,324,856 |
| Series 2006-C3 Class C3, 5.07% 6/15/11 (d) | | | | 2,905,000 | | 2,905,000 |
| CIT Equipment Collateral Trust Series 2006-VT1: | | | | | | |
| Class A3, 5.13% 12/21/08 | | | | 2,870,000 | | 2,861,031 |
| Class B, 5.23% 2/20/13 | | | | 1,063,115 | | 1,060,018 |
| Class D, 5.48% 2/20/13 | | | | 1,183,832 | | 1,177,968 |
| Citibank Credit Card Issuance Trust: | | | | | | |
| Series 2002-C1 Class C1, 5.7% 2/9/09 (d) | | | | 3,000,000 | | 3,022,545 |
| Series 2003-C1 Class C1, 5.65% 4/7/10 (d) | | | | 2,600,000 | | 2,645,407 |
See accompanying notes which are an integral part of the financial statements.
21 Semiannual Report
| Investments (Unaudited) continued | | | | | | |
| |
| |
| Asset Backed Securities continued | | | | | | |
| | | | | Principal | | Value (Note 1) |
| | | | | Amount | | |
| Citigroup Mortgage Loan Trust Series 2003-HE4 | | | | | | |
| Class A, 5.3694% 12/25/33 (a)(d) | | | | $ 1,314,572 | | $ 1,314,708 |
| CNH Equipment Trust Series 2005-B Class B, 4.57% | | | | | | |
| 7/16/12 | | | | 830,000 | | 795,941 |
| College Loan Corp. Trust I Series 2006-1 Class AIO, | | | | | | |
| 10% 7/25/08 (f) | | | | 5,690,000 | | 1,195,393 |
| Countrywide Home Loans, Inc.: | | | | | | |
| Series 2003-BC1 Class M2, 6.9594% 9/25/32 (d) | | | | 2,410,000 | | 2,422,560 |
| Series 2004-2: | | | | | | |
| Class 3A4, 5.2094% 7/25/34 (d) | | | | 553,089 | | 553,363 |
| Class M1, 5.4594% 5/25/34 (d) | | | | 1,075,000 | | 1,078,152 |
| Series 2004-3 Class 3A4, 5.2094% 8/25/34 (d) | | | | 958,423 | | 959,116 |
| Series 2004-4: | | | | | | |
| Class A, 5.3294% 8/25/34 (d) | | | | 241,405 | | 241,641 |
| Class M1, 5.4394% 7/25/34 (d) | | | | 775,000 | | 779,244 |
| Class M2, 5.4894% 6/25/34 (d) | | | | 920,000 | | 923,682 |
| Crown Castle Towers LLC/Crown Atlantic Holdings Sub | | | | | | |
| LLC/Crown Communication, Inc. Series 2005-1A | | | | | | |
| Class C, 5.074% 6/15/35 (a) | | | | 974,000 | | 936,430 |
| CS First Boston Mortgage Securities Corp.: | | | | | | |
| Series 2004-FRE1: | | | | | | |
| Class B1, 6.7594% 4/25/34 (d) | | | | 1,295,000 | | 1,294,933 |
| Class M3, 5.6094% 4/25/34 (d) | | | | 1,315,000 | | 1,314,934 |
| Series 2005-FIX1 Class A2, 4.31% 5/25/35 | | | | 2,090,000 | | 2,048,161 |
| Discover Card Master Trust I Series 2003-4 Class B1, | | | | | | |
| 5.2313% 5/16/11 (d) | | | | 1,775,000 | | 1,784,602 |
| Diversified REIT Trust Series 2000-1A Class A2, 6.971% | | | | | | |
| 3/8/10 (a) | | | | 1,500,000 | | 1,539,988 |
| Drive Auto Receivables Trust: | | | | | | |
| Series 2005-1 Class A3, 3.75% 4/15/09 (a) | | | | 1,035,000 | | 1,022,493 |
| Series 2005-3 Class A3, 4.99% 10/15/10 (a) | | | | 2,665,000 | | 2,646,665 |
| Fannie Mae guaranteed REMIC pass thru certificates | | | | | | |
| Series 2004-T5: | | | | | | |
| Class AB1, 4.5086% 5/28/35 (d) | | | | 752,402 | | 752,167 |
| Class AB3, 4.6418% 5/28/35 (d) | | | | 378,647 | | 378,647 |
| Class AB8, 4.6019% 5/28/35 (d) | | | | 298,536 | | 298,443 |
| First Franklin Mortgage Loan Trust Series 2006-FF4N | | | | | | |
| Class N1, 5.5% 3/25/36 (a) | | | | 840,959 | | 839,383 |
| First Investors Auto Owner Trust Series 2006-A Class A3, | | | | | | |
| 4.93% 2/15/11 (a) | | | | 1,220,000 | | 1,209,611 |
| Ford Credit Auto Owner Trust Series 2005-A: | | | | | | |
| Class A4, 3.72% 10/15/09 | | | | 4,100,000 | | 3,999,938 |
| Class B, 3.88% 1/15/10 | | | | 590,000 | | 572,590 |
See accompanying notes which are an integral part of the financial statements.
| Asset Backed Securities continued | | | | |
| | | Principal | | Value (Note 1) |
| | | Amount | | |
| Fremont Home Loan Trust: | | | | |
| Series 2004-1: | | | | |
| Class M1, 5.4094% 2/25/34 (d) | | $ 150,000 | | $ 150,214 |
| Class M2, 5.4594% 2/25/34 (d) | | 150,000 | | 150,265 |
| Series 2004-A Class M2, 6.1094% 1/25/34 (d) | | 1,100,000 | | 1,109,918 |
| Series 2004-C: | | | | |
| Class M1, 5.6094% 8/25/34 (d) | | 1,120,000 | | 1,131,896 |
| Class M3, 6.1094% 8/25/34 (d) | | 3,000,000 | | 3,051,354 |
| Series 2004 D: | | | | |
| Class M4, 5.9094% 11/25/34 (d) | | 295,000 | | 297,309 |
| Class M5, 5.9594% 11/25/34 (d) | | 245,000 | | 246,930 |
| Series 2005-A Class 2A2, 5.1994% 2/25/35 (d) | | 2,382,676 | | 2,384,646 |
| GCO Slims Trust Series 2006-1A, 5.72% 3/1/22 (a) | | 1,500,000 | | 1,474,219 |
| GE Business Loan Trust: | | | | |
| Series 2004-2 Class A, 0.8454% 12/15/08 (a)(f) | | 74,358,997 | | 1,099,026 |
| Series 2005-2 Class IO, 0.5242% 9/15/17 (a)(f) | | 134,240,000 | | 1,503,488 |
| Greenpoint Credit LLC Series 2001-1 Class 1A, | | | | |
| 5.2625% 4/20/32 (d) | | 671,829 | | 670,487 |
| GSAMP Trust: | | | | |
| Series 2002-NC1 Class A2, 5.2794% 7/25/32 (d) | | 4,389 | | 4,432 |
| Series 2003-HE2 Class M1, 5.6094% 8/25/33 (d) | | 650,000 | | 652,951 |
| Series 2005-MTR1 Class A1, 5.0994% 10/25/35 (d) | | 2,744,754 | | 2,744,754 |
| Guggenheim Structured Real Estate Funding Ltd. | | | | |
| Series 2005-1 Class C, 6.0394% 5/25/30 (a)(d) | | 3,050,000 | | 3,050,000 |
| Harwood Street Funding I LLC Series 2004-1A | | | | |
| Class CTFS, 6.9225% 9/20/09 (a)(d) | | 4,400,000 | | 4,406,662 |
| Home Equity Asset Trust: | | | | |
| Series 2002-2 Class A4, 5.3094% 6/25/32 (d) | | 5,664 | | 5,665 |
| Series 2003-3 Class A4, 5.4194% 2/25/33 (d) | | 493 | | 494 |
| Series 2003-5 Class A2, 5.3094% 12/25/33 (d) | | 238,664 | | 238,853 |
| Series 2003-7 Class A2, 5.3394% 3/25/34 (d) | | 337,512 | | 337,709 |
| Series 2003-8 Class M1, 5.6794% 4/25/34 (d) | | 845,000 | | 853,108 |
| Series 2004-1 Class M2, 6.1594% 6/25/34 (d) | | 655,000 | | 661,386 |
| Series 2004-2 Class A2, 5.2494% 7/25/34 (d) | | 164,579 | | 164,680 |
| Series 2004-3: | | | | |
| Class M1, 5.5294% 8/25/34 (d) | | 425,000 | | 427,468 |
| Class M2, 6.1594% 8/25/34 (d) | | 465,000 | | 471,742 |
| Series 2004-6 Class A2, 5.3094% 12/25/34 (d) | | 1,622,500 | | 1,626,075 |
| Household Automotive Trust Series 2004-1 Class A4, | | | | |
| 3.93% 7/18/11 | | 1,170,000 | | 1,140,701 |
| Household Home Equity Loan Trust Series 2003-2 | | | | |
| Class M, 5.5025% 9/20/33 (d) | | 178,918 | | 179,151 |
See accompanying notes which are an integral part of the financial statements.
23 Semiannual Report
| Investments (Unaudited) continued | | | | | | |
| |
| |
| Asset Backed Securities continued | | | | | | |
| | | | | Principal | | Value (Note 1) |
| | | | | Amount | | |
| Household Mortgage Loan Trust Series 2004-HC1 | | | | | | |
| Class A, 5.2725% 2/20/34 (d) | | | | $ 520,186 | | $ 520,816 |
| Household Private Label Credit Card Master Note Trust I | | | | | | |
| Series 2002-2 Class B, 5.4513% 1/18/11 (d) | | | | 1,000,000 | | 1,003,497 |
| HSBC Home Equity Loan Trust: | | | | | | |
| Series 2005-2: | | | | | | |
| Class M1, 5.2363% 1/20/35 (d) | | | | 432,095 | | 432,703 |
| Class M2, 5.2663% 1/20/35 (d) | | | | 324,071 | | 324,861 |
| Series 2005-3 Class A1, 5.0363% 1/20/35 (d) | | | | 2,635,392 | | 2,637,210 |
| Hyundai Auto Receivables Trust Series 2005-A: | | | | | | |
| Class B, 4.2% 2/15/12 | | | | 1,115,000 | | 1,083,884 |
| Class C, 4.22% 2/15/12 | | | | 185,000 | | 180,558 |
| Lancer Funding Ltd. Series 2006-1A Class A3, 6.6367% | | | | | | |
| 4/6/46 (a)(d) | | | | 1,000,000 | | 1,000,000 |
| Marriott Vacation Club Owner Trust Series 2005-2 | | | | | | |
| Class A, 5.25% 10/20/27 (a) | | | | 1,197,139 | | 1,178,434 |
| MASTR Asset Backed Securities Trust Series 2004-FRE1 | | | | | | |
| Class M1, 5.5094% 7/25/34 (d) | | | | 1,146,000 | | 1,151,944 |
| MBNA Credit Card Master Note Trust: | | | | | | |
| Series 2001-B1 Class B1, 5.2763% 10/15/08 (d) | | | | 1,350,000 | | 1,349,797 |
| Series 2001-B2 Class B2, 5.2613% 1/15/09 (d) | | | | 4,750,000 | | 4,751,530 |
| Series 2002-B1 Class B1, 5.15% 7/15/09 | | | | 1,025,000 | | 1,023,363 |
| Series 2002-B2 Class B2, 5.2813% 10/15/09 (d) | | | | 3,600,000 | | 3,610,512 |
| MBNA Master Credit Card Trust II: | | | | | | |
| Series 1998-E Class B, 5.3983% 9/15/10 (d) | | | | 1,500,000 | | 1,507,033 |
| Series 1998-G Class B, 5.3013% 2/17/09 (d) | | | | 1,550,000 | | 1,550,371 |
| Series 2000-L Class B, 5.4013% 4/15/10 (d) | | | | 650,000 | | 653,186 |
| Meritage Mortgage Loan Trust Series 2004-1 Class M1, | | | | | | |
| 5.4594% 7/25/34 (d) | | | | 425,000 | | 424,978 |
| Merrill Lynch Mortgage Investors, Inc.: | | | | | | |
| Series 2003-OPT1 Class M1, 5.6094% 7/25/34 (d) . | | | | 1,145,000 | | 1,151,858 |
| Series 2004-CB6 Class A1, 5.2894% 7/25/35 (d) | | | | 716,298 | | 718,788 |
| Series 2004-FM1 Class M2, 6.1094% 1/25/35 (d) | | | | 300,000 | | 310,069 |
| Morgan Stanley ABS Capital I, Inc.: | | | | | | |
| Series 2004-HE6 Class A2, 5.2994% 8/25/34 (d) | | | | 1,311,061 | | 1,314,866 |
| Series 2004-NC6 Class A2, 5.2994% 7/25/34 (d) | | | | 355,490 | | 356,974 |
| Series 2004-NC7 Class A3, 5.2594% 7/25/34 (d) | | | | 1,701,565 | | 1,702,104 |
| Morgan Stanley Dean Witter Capital I Trust: | | | | | | |
| Series 2001 NC1 Class M2, 6.5644% 10/25/31 (d) | | | | 28,066 | | 28,094 |
| Series 2002-AM3 Class A3, 5.4494% 2/25/33 (d) | | | | 79,980 | | 80,189 |
| Series 2002-HE2 Class M1, 5.6594% 8/25/32 (d) | | | | 1,150,000 | | 1,151,422 |
| Series 2002-NC1 Class M1, 5.7594% | | | | | | |
| 2/25/32 (a)(d) | | | | 616,912 | | 617,404 |
See accompanying notes which are an integral part of the financial statements.
| Asset Backed Securities continued | | | | | | |
| | | | | Principal | | Value (Note 1) |
| | | | | Amount | | |
| Morgan Stanley Dean Witter Capital I Trust: – continued | | | | | | |
| Series 2003-NC1 Class M1, 6.0094% 11/25/32 (d) . | | | | $ 500,739 | | $ 502,527 |
| National Collegiate Funding LLC Series 2004-GT1 | | | | | | |
| Class IO1, 7.87% 6/25/10 (a)(d)(f) | | | | 1,725,000 | | 493,310 |
| National Collegiate Student Loan Trust: | | | | | | |
| Series 2004-2 Class AIO, 9.75% 10/25/14 (f) | | | | 1,885,000 | | 850,908 |
| Series 2005-2 Class AIO, 7.73% 3/25/12 (f) | | | | 1,265,000 | | 349,659 |
| Series 2005-3W Class AIO1, 4.8% 7/25/12 (f) | | | | 4,090,000 | | 766,875 |
| Series 2005-GT1 Class AIO, 6.75% 12/25/09 (f) | | | | 900,000 | | 203,220 |
| Navistar Financial Corp. Owner Trust Series 2005-A | | | | | | |
| Class A4, 4.43% 1/15/14 | | | | 1,165,000 | | 1,134,652 |
| Nissan Auto Lease Trust Series 2005-A Class A3, 4.7% | | | | | | |
| 10/15/08 | | | | 3,120,000 | | 3,098,816 |
| Nissan Auto Receivables Owner Trust Series 2005-A | | | | | | |
| Class A4, 3.82% 7/15/10 | | | | 1,210,000 | | 1,177,081 |
| Northstar Education Finance, Inc., Delaware Series | | | | | | |
| 2005-1 Class A5, 4.74% 10/30/45 | | | | 1,695,000 | | 1,668,992 |
| Onyx Acceptance Owner Trust Series 2005-A Class A3, | | | | | | |
| 3.69% 5/15/09 | | | | 890,000 | | 879,504 |
| Ownit Mortgage Loan Asset-Backed Certificates Series | | | | | | |
| 2005-4 Class A2A1, 5.0794% 8/25/36 (d) | | | | 2,528,984 | | 2,529,199 |
| Park Place Securities NIM Trust Series 2004-WHQN2 | | | | | | |
| Class A, 4% 2/25/35 (a) | | | | 71,081 | | 70,370 |
| Park Place Securities, Inc.: | | | | | | |
| Series 2004 WWF1 Class M4, 6.0594% 1/25/35 (d) | | | | 1,905,000 | | 1,930,571 |
| Series 2004-WCW1: | | | | | | |
| Class M1, 5.5894% 9/25/34 (d) | | | | 640,000 | | 647,415 |
| Class M2, 5.6394% 9/25/34 (d) | | | | 380,000 | | 383,337 |
| Class M3, 6.2094% 9/25/34 (d) | | | | 730,000 | | 739,178 |
| Class M4, 6.4094% 9/25/34 (d) | | | | 1,000,000 | | 1,012,391 |
| Series 2004-WCW2 Class A2, 5.3394% | | | | | | |
| 10/25/34 (d) | | | | 830,122 | | 831,709 |
| Series 2004-WHQ2 Class A3E, 5.3794% | | | | | | |
| 2/25/35 (d) | | | | 977,072 | | 979,472 |
| Residential Asset Mortgage Products, Inc.: | | | | | | |
| Series 2003 RZ2 Class A1, 3.6% 4/25/33 | | | | 344,302 | | 333,380 |
| Series 2004-RS10 Class MII2, 6.2094% 10/25/34 (d) | | | | 2,600,000 | | 2,647,020 |
| Series 2005-SP2 Class 1A1, 5.1094% 5/25/44 (d) | | | | 1,519,296 | | 1,519,547 |
| Salomon Brothers Mortgage Securities VII, Inc. Series | | | | | | |
| 2003-UP1 Class A, 3.45% 4/25/32 (a) | | | | 471,486 | | 449,016 |
| Saxon Asset Securities Trust Series 2004-2 Class MV1, | | | | | | |
| 5.5394% 8/25/35 (d) | | | | 980,000 | | 983,911 |
See accompanying notes which are an integral part of the financial statements.
25 Semiannual Report
| Investments (Unaudited) continued | | | | | | |
| |
| |
| Asset Backed Securities continued | | | | | | |
| | | | | Principal | | Value (Note 1) |
| | | | | Amount | | |
| SBA CMBS Trust Series 2005 1A: | | | | | | |
| Class D, 6.219% 11/15/35 (a) | | | | $ 1,370,000 | | $ 1,367,066 |
| Class E, 6.706% 11/15/35 (a) | | | | 365,000 | | 360,457 |
| Securitized Asset Backed Receivables LLC Trust | | | | | | |
| Series 2004-NC1: | | | | | | |
| Class A2, 5.2094% 2/25/34 (d) | | | | 457,300 | | 457,277 |
| Class M1, 5.4794% 2/25/34 (d) | | | | 610,000 | | 611,720 |
| SLM Private Credit Student Loan Trust: | | | | | | |
| Series 2004 B Class A2, 5.11% 6/15/21 (d) | | | | 1,800,000 | | 1,810,470 |
| Series 2004 A: | | | | | | |
| Class B, 5.49% 6/15/33 (d) | | | | 400,000 | | 405,788 |
| Class C, 5.86% 6/15/33 (d) | | | | 1,020,000 | | 1,032,502 |
| Series 2004-B Class C, 5.78% 9/15/33 (d) | | | | 1,900,000 | | 1,899,050 |
| SLMA Student Loan Trust Series 2005-7 Class A3, 4.41% | | | | | | |
| 7/25/25 | | | | 2,500,000 | | 2,459,725 |
| Structured Asset Securities Corp. Series 2005-5N | | | | | | |
| Class 3A1A, 5.2594% 11/25/35 (d) | | | | 2,788,462 | | 2,790,714 |
| Superior Wholesale Inventory Financing Trust VII Series | | | | | | |
| 2003-A8 Class CTFS, 5.3513% 3/15/11 (a)(d) | | | | 2,520,000 | | 2,519,606 |
| Superior Wholesale Inventory Financing Trust XII Series | | | | | | |
| 2005-A12 Class C, 6.1013% 6/15/10 (d) | | | | 1,405,000 | | 1,408,264 |
| Terwin Mortgage Trust Series 2003-4HE Class A1, | | | | | | |
| 5.3894% 9/25/34 (d) | | | | 345,311 | | 346,883 |
| Triad Auto Receivables Owner Trust Series 2002-A | | | �� | | | |
| Class A4, 3.24% 8/12/09 | | | | 745,985 | | 739,130 |
| Volkswagen Auto Lease Trust: | | | | | | |
| Series 2004-A Class A3, 2.84% 7/20/07 | | | | 1,851,205 | | 1,840,671 |
| Series 2005-A Class A4, 3.94% 10/20/10 | | | | 3,625,000 | | 3,561,886 |
| WFS Financial Owner Trust: | | | | | | |
| Series 2004-3: | | | | | | |
| Class A4, 3.93% 2/17/12 | | | | 5,000,000 | | 4,897,770 |
| Class D, 4.07% 2/17/12 | | | | 744,647 | | 734,380 |
| Series 2004-4 Class D, 3.58% 5/17/12 | | | | 635,580 | | 623,410 |
| Series 2005-1: | | | | | | |
| Class A3, 3.59% 10/19/09 | | | | 3,465,000 | | 3,420,442 |
| Class D, 4.09% 8/15/12 | | | | 555,508 | | 545,497 |
| Series 2005-3 Class C, 4.54% 5/17/13 | | | | 850,000 | | 831,578 |
| Whinstone Capital Management Ltd. Series 1A Class B3, | | | | | | |
| 6% 10/25/44 (a)(d) | | | | 3,320,000 | | 3,320,000 |
| World Omni Auto Receivables Trust Series 2005-A | | | | | | |
| Class A3, 3.54% 6/12/09 | | | | 1,080,000 | | 1,064,843 |
| TOTAL ASSET BACKED SECURITIES | | | | | | |
| (Cost $263,641,579) | | | | | | 262,793,534 |
See accompanying notes which are an integral part of the financial statements.
| Collateralized Mortgage Obligations 11.1% | | | | |
| | | | | Principal | | Value (Note 1) |
| | | | | Amount | | |
| Private Sponsor 7.5% | | | | | | |
| Adjustable Rate Mortgage Trust floater: | | | | | | |
| Series 2004-1 Class 9A2, 5.3594% 1/25/34 (d) | | | | $ 577,599 | | $ 579,445 |
| Series 2004-2 Class 7A3, 5.3594% 2/25/35 (d) | | | | 1,202,674 | | 1,206,617 |
| Series 2004-4 Class 5A2, 5.3594% 3/25/35 (d) | | | | 481,067 | | 481,885 |
| Bear Stearns Adjustable Rate Mortgage Trust Series | | | | | | |
| 2005-6 Class 1A1, 5.1215% 8/25/35 (d) | | | | 3,058,616 | | 3,035,294 |
| Bear Stearns Alt-A Trust floater: | | | | | | |
| Series 2005-1 Class A1, 5.2394% 1/25/35 (d) | | | | 778,195 | | 779,368 |
| Series 2005-2 Class 1A1, 5.2094% 3/25/35 (d) | | | | 1,937,902 | | 1,937,899 |
| Series 2005-5 Class 1A1, 5.1794% 7/25/35 (d) | | | | 1,283,243 | | 1,282,871 |
| Countrywide Home Loans, Inc. sequential pay: | | | | | | |
| Series 2002-25 Class 2A1, 5.5% 11/27/17 | | | | 618,836 | | 616,534 |
| Series 2002-32 Class 2A3, 5% 1/25/18 | | | | 32,838 | | 32,729 |
| CS First Boston Mortgage Securities Corp. floater: | | | | | | |
| Series 2004-AR4 Class 5A2, 5.3294% 5/25/34 (d) | | . | | 226,675 | | 226,530 |
| Series 2004-AR5 Class 11A2, 5.3294% 6/25/34 (d) | | 311,103 | | 310,551 |
| Series 2004-AR8 Class 8A2, 5.3394% 9/25/34 (d) | | . | | 533,519 | | 534,987 |
| Granite Master Issuer PLC floater: | | | | | | |
| Series 2005-2 Class C1, 5.27% 12/20/54 (d) | | | | 1,800,000 | | 1,801,260 |
| Series 2005-4: | | | | | | |
| Class C1, 5.2% 12/20/54 (d) | | | | 1,350,000 | | 1,349,789 |
| Class M2, 5.05% 12/20/54 (d) | | | | 1,300,000 | | 1,299,797 |
| Series 2006-1A Class C2, 5.2569% 12/20/54 (a)(d) | | 1,100,000 | | 1,099,681 |
| Granite Mortgages PLC floater: | | | | | | |
| Series 2004-1 Class 1C, 5.83% 3/20/44 (d) | | | | 1,920,000 | | 1,921,200 |
| Series 2004-2 Class 1C, 5.63% 6/20/44 (d) | | | | 261,916 | | 262,147 |
| Holmes Financing No. 8 PLC floater Series 2: | | | | | | |
| Class B, 4.77% 7/15/40 (d) | | | | 565,000 | | 564,774 |
| Class C, 5.32% 7/15/40 (d) | | | | 1,295,000 | | 1,297,979 |
| Homestar Mortgage Acceptance Corp. floater | | | | | | |
| Series 2004-5 Class A1, 5.4094% 10/25/34 (d) | | | | 1,559,513 | | 1,567,976 |
| Impac CMB Trust floater: | | | | | | |
| Series 2004-6 Class 1A2, 5.3494% 10/25/34 (d) | | | | 526,413 | | 527,764 |
| Series 2004-9: | | | | | | �� |
| Class M2, 5.6094% 1/25/35 (d) | | | | 557,121 | | 559,169 |
| Class M3, 5.6594% 1/25/35 (d) | | | | 412,990 | | 414,343 |
| Class M4, 6.0094% 1/25/35 (d) | | | | 210,653 | | 211,188 |
| Series 2005-1: | | | | | | |
| Class M1, 5.4194% 4/25/35 (d) | | | | 515,161 | | 516,227 |
| Class M2, 5.4594% 4/25/35 (d) | | | | 888,653 | | 890,370 |
| Class M3, 5.4894% 4/25/35 (d) | | | | 218,943 | | 219,316 |
See accompanying notes which are an integral part of the financial statements.
27 Semiannual Report
| Investments (Unaudited) continued | | | | | | |
| |
| |
| Collateralized Mortgage Obligations continued | | | | |
| | | | | Principal | | Value (Note 1) |
| | | | | Amount | | |
| Private Sponsor continued | | | | | | |
| JPMorgan Mortgage Trust Series 2005-A8 Class 2A3, | | | | | | |
| 4.9624% 11/25/35 (d) | | | | $ 400,000 | | $ 390,045 |
| Lehman Structured Securities Corp. floater Series 2005-1 | | | | | | |
| Class A2, 5.2081% 9/26/45 (a)(d) | | | | 1,444,522 | | 1,446,102 |
| Lehman XS Trust floater Series 2006-GP1 Class A1, | | | | | | |
| 5.09% 5/25/46 (d) | | | | 3,710,000 | | 3,710,000 |
| Master Alternative Loan Trust Series 2004-3 Class 3A1, | | | | | | |
| 6% 4/25/34 | | | | 250,091 | | 246,418 |
| Master Seasoned Securitization Trust Series 2004-1 | | | | | | |
| Class 1A1, 6.237% 8/25/17 (d) | | | | 1,201,380 | | 1,208,809 |
| MASTR Adjustable Rate Mortgages Trust floater Series | | | | | | |
| 2005-1 Class 1A1, 5.2294% 3/25/35 (d) | | | | 1,069,101 | | 1,071,730 |
| Merrill Lynch Mortgage Investors, Inc.: | | | | | | |
| floater: | | | | | | |
| Series 2003-A Class 2A1, 5.3494% 3/25/28 (d) | | | | 1,264,571 | | 1,271,926 |
| Series 2003-F Class A2, 4.43% 10/25/28 (d) | | | | 1,551,561 | | 1,553,251 |
| Series 2004-B Class A2, 4.83% 6/25/29 (d) | | | | 2,197,864 | | 2,194,094 |
| Series 2004-C Class A2, 5.01% 7/25/29 (d) | | | | 1,448,174 | | 1,444,915 |
| Series 2004-D Class A2, 5.3238% 9/25/29 (d) | | | | 1,316,412 | | 1,316,425 |
| Series 2003-E Class XA1, 0.9967% 10/25/28 (d)(f) . | | | | 6,921,567 | | 63,062 |
| Series 2003-G Class XA1, 1% 1/25/29 (f) | | | | 6,052,943 | | 61,181 |
| Series 2003-H Class XA1, 1% 1/25/29 (a)(f) | | | | 5,284,187 | | 54,719 |
| Mortgage Asset Backed Securities Trust floater | | | | | | |
| Series 2002-NC1 Class M1, 5.8094% 10/25/32 (d) . | | | | 119,996 | | 120,234 |
| MortgageIT Trust floater Series 2004-2: | | | | | | |
| Class A1, 5.3294% 12/25/34 (d) | | | | 937,920 | | 937,388 |
| Class A2, 5.4094% 12/25/34 (d) | | | | 1,267,928 | | 1,279,271 |
| Opteum Mortgage Acceptance Corp. floater | | | | | | |
| Series 2005-3 Class APT, 5.2494% 7/25/35 (d) | | | | 2,483,907 | | 2,486,236 |
| Permanent Financing No. 3 PLC floater Series 2 Class C, | | | | | | |
| 5.93% 6/10/42 (d) | | | | 605,000 | | 608,238 |
| Permanent Financing No. 4 PLC floater Series 2: | | | | | | |
| Class C, 5.6% 6/10/42 (d) | | | | 1,495,000 | | 1,501,413 |
| Class M, 5.21% 6/10/42 (d) | | | | 345,000 | | 344,571 |
| Permanent Financing No. 5 PLC floater: | | | | | | |
| Series 2 Class C, 5.53% 6/10/42 (d) | | | | 915,000 | | 918,752 |
| Series 3 Class C, 5.7% 6/10/42 (d) | | | | 1,935,000 | | 1,951,835 |
| Residential Asset Mortgage Products, Inc.: | | | | | | |
| sequential pay Series 2003-SL1 Class A31, 7.125% | | | | | | |
| 4/25/31 | | | | 788,112 | | 788,104 |
| Series 2005-AR5 Class 1A1, 4.8414% 9/19/35 (d) . | | | | 858,790 | | 849,727 |
See accompanying notes which are an integral part of the financial statements.
| Collateralized Mortgage Obligations continued | | | | |
| | | | | Principal | | Value (Note 1) |
| | | | | Amount | | | | |
| Private Sponsor continued | | | | | | | | |
| Sequoia Mortgage Funding Trust Series 2003-A | | | | | | | | |
| Class AX1, 0.8% 10/21/08 (a)(f) | | | | $20,701,520 | | | | $ 97,655 |
| Sequoia Mortgage Trust: | | | | | | | | |
| floater: | | | | | | | | |
| Series 2003-5 Class A2, 5.27% 9/20/33 (d) | | | | 489,025 | | | | 488,905 |
| Series 2003-6 Class A2, 4.69% 11/20/33 (d) | | | | 1,134,065 | | | | 1,134,005 |
| Series 2003-7 Class A2, 4.925% 1/20/34 (d) | | | | 1,209,682 | | | | 1,209,640 |
| Series 2004-2 Class A, 5.21% 3/20/34 (d) | | | | 535,983 | | | | 536,856 |
| Series 2004-3 Class A, 5.3063% 5/20/34 (d) | | | | 1,217,244 | | | | 1,217,504 |
| Series 2004-4 Class A, 4.62% 5/20/34 (d) | | | | 1,021,334 | | | | 1,021,275 |
| Series 2004-5 Class A3, 4.86% 6/20/34 (d) | | | | 1,071,204 | | | | 1,071,204 |
| Series 2004-6 Class A3A, 4.9644% 6/20/35 (d) | | | | 884,693 | | | | 884,096 |
| Series 2004-7 Class A3A, 5.265% 8/20/34 (d) | | | | 967,463 | | | | 966,716 |
| Series 2004-8 Class A2, 5.31% 9/20/34 (d) | | | | 1,308,729 | | | | 1,310,048 |
| Series 2005-1 Class A2, 4.97% 2/20/35 (d) | | | | 1,010,675 | | | | 1,009,395 |
| Series 2003-7 Class X1, 0.6186% 1/20/34 (d)(f) | | | | 53,856,830 | | | | 336,605 |
| Series 2003-8 Class X1, 0.6216% 1/20/34 (d)(f) | | | | 31,349,261 | | | | 205,730 |
| Series 2004-1 Class X1, 0.8% 2/20/34 (f) | | | | 6,782,291 | | | | 26,494 |
| Structured Adjustable Rate Mortgage Loan Trust floater | | | | | | | | |
| Series 2005-10 Class A1, 5.1594% 6/25/35 (d) | | | | 1,089,369 | | | | 1,089,369 |
| Structured Asset Securities Corp. floater Series | | | | | | | | |
| 2004-NP1 Class A, 5.3594% 9/25/33 (a)(d) | | | | 322,529 | | | | 322,750 |
| Wachovia Mortgage Loan Trust LLC Series 2005-B | | | | | | | | |
| Class 2A4, 5.1893% 10/20/35 (d) | | | | 320,000 | | | | 314,817 |
| WAMU Mortgage pass thru certificates floater: | | | | | | | | |
| Series 2005-AR11 Class A1C1, 5.1594% | | | | | | | | |
| 8/25/45 (d) | | | | 2,144,868 | | | | 2,143,952 |
| Series 2005-AR13 Class A1C1, 5.1494% | | | | | | | | |
| 10/25/45 (d) | | | | 1,675,862 | | | | 1,674,954 |
| Washington Mutual Mortgage Securities Corp. | | | | | | | | |
| sequential pay: | | | | | | | | |
| Series 2003-MS9 Class 2A1, 7.5% 12/25/33 | | | | 211,280 | | | | 214,000 |
| Series 2004-RA2 Class 2A, 7% 7/25/33 | | | | 342,485 | | | | 349,656 |
| Wells Fargo Mortgage Backed Securities Trust: | | | | | | | | |
| Series 2003-14 Class 1A1, 4.75% 12/25/18 | | | | 1,677,699 | | | | 1,602,727 |
| Series 2004-M Class A3, 4.6807% 8/25/34 (d) | | | | 3,052,808 | | | | 3,030,818 |
| Series 2005-AR2 Class 2A2, 4.57% 3/25/35 | | | | 5,045,528 | | | | 4,919,279 |
| Series 2005-AR4 Class 2A2, 4.5306% 4/25/35 (d) | | . | | 8,453,241 | | | | 8,227,634 |
| Series 2005-AR9 Class 2A1, 4.3623% 5/25/35 (d) | | . | | 8,032,442 | | | | 7,903,093 |
| Series 2006-AR8 Class 2A6, 5.24% 4/25/36 (d) | | | | 3,295,000 | | | | 3,258,248 |
| |
| TOTAL PRIVATE SPONSOR | | | | | | | | 99,913,561 |
See accompanying notes which are an integral part of the financial statements.
29 Semiannual Report
| Investments (Unaudited) continued | | |
| |
| |
| Collateralized Mortgage Obligations continued | | |
| | | Principal | | Value (Note 1) |
| | | Amount | | |
| U.S. Government Agency 3.6% | | | | |
| Fannie Mae planned amortization class: | | | | |
| Series 1993-187 Class L, 6.5% 7/25/23 | | $ 1,238,596 | | $ 1,261,300 |
| Series 1994-30 Class JA, 5% 7/25/23 | | 657,948 | | 654,260 |
| Fannie Mae guaranteed REMIC pass thru certificates: | | | | |
| sequential pay: | | | | |
| Series 2001-40 Class Z, 6% 8/25/31 | | 1,560,375 | | 1,563,464 |
| Series 2003-76 Class BA, 4.5% 3/25/18 | | 4,132,953 | | 3,979,505 |
| Series 2004-3 Class BA, 4% 7/25/17 | | 174,967 | | 167,060 |
| Series 2004-86 Class KC, 4.5% 5/25/19 | | 687,148 | | 661,458 |
| Series 2004-31 Class IA, 4.5% 6/25/10 (f) | | 752,158 | | 14,482 |
| Freddie Mac sequential pay Series 2114 Class ZM, 6% | | | | |
| 1/15/29 | | 692,062 | | 696,954 |
| Freddie Mac Multi-class participation certificates | | | | |
| guaranteed: | | | | |
| planned amortization class: | | | | |
| Seires 2625 Class QX, 2.25% 3/15/22 | | 307,202 | | 298,950 |
| Series 2489 Class PD, 6% 2/15/31 | | 561,313 | | 563,253 |
| Series 2535 Class PC, 6% 9/15/32 | | 1,975,000 | | 1,976,537 |
| Series 2640 Class QG, 2% 4/15/22 | | 402,347 | | 390,246 |
| Series 2660 Class ML, 3.5% 7/15/22 | | 12,165,000 | | 11,869,654 |
| Series 2690 Class PD, 5% 2/15/27 | | 2,980,000 | | 2,941,792 |
| Series 2755 Class LC, 4% 6/15/27 | | 2,225,000 | | 2,117,713 |
| Series 2901 Class UM, 4.5% 1/15/30 | | 5,500,000 | | 5,366,820 |
| sequential pay: | | | | |
| Series 2523 Class JB, 5% 6/15/15 | | 1,270,160 | | 1,263,272 |
| Series 2609 Class UJ, 6% 2/15/17 | | 1,713,857 | | 1,724,091 |
| Series 2635 Class DG, 4.5% 1/15/18 | | 4,623,652 | | 4,458,182 |
| Series 2780 Class A, 4% 12/15/14 | | 4,470,685 | | 4,317,941 |
| Series 2786 Class GA, 4% 8/15/17 | | 1,964,939 | | 1,875,319 |
| Series 1803 Class A, 6% 12/15/08 | | 335,552 | | 336,792 |
| Ginnie Mae guaranteed REMIC pass thru securities | | | | |
| planned amortization class Series 2002-5 Class PD, | | | | |
| 6.5% 5/16/31 | | 490,305 | | 492,697 |
| |
| TOTAL U.S. GOVERNMENT AGENCY | | | | 48,991,742 |
| |
| TOTAL COLLATERALIZED MORTGAGE OBLIGATIONS | | |
| (Cost $149,920,227) | | | | 148,905,303 |
See accompanying notes which are an integral part of the financial statements.
| Commercial Mortgage Securities 9.4% | | | | |
| | | Principal | | Value (Note 1) |
| | | Amount | | |
| 280 Park Avenue Trust floater Series 2001-280 | | | | |
| Class X1, 1.0077% 2/3/11 (a)(d)(f) | | $15,212,897 | | $ 573,920 |
| Asset Securitization Corp.: | | | | |
| sequential pay Series 1995-MD4 Class A1, 7.1% | | | | |
| 8/13/29 | | 53,715 | | 54,355 |
| Series 1997-D5 Class PS1, 1.107% 2/14/43 (d)(f) | | 10,222,518 | | 428,606 |
| Banc of America Commercial Mortgage, Inc.: | | | | |
| sequential pay Series 2005-1 Class A2, 4.64% | | | | |
| 11/10/42 | | 2,930,000 | | 2,894,284 |
| Series 2002-2 Class XP, 1.7835% 7/11/43 (a)(d)(f) | | 7,279,323 | | 375,872 |
| Series 2003-2 Class XP, 0.4123% 3/11/41 (a)(d)(f) | | 27,233,069 | | 284,888 |
| Series 2004-6 Class XP, 0.6217% 12/10/42 (d)(f) | | 14,145,574 | | 301,609 |
| Series 2005-4 Class XP, 0.2073% 7/10/45 (d)(f) | | 17,628,265 | | 188,670 |
| Banc of America Large Loan, Inc.: | | | | |
| floater: | | | | |
| Series 2003-BBA2: | | | | |
| Class A3, 5.2213% 11/15/15 (a)(d) | | 1,145,000 | | 1,146,007 |
| Class C, 5.3713% 11/15/15 (a)(d) | | 235,000 | | 235,500 |
| Class D, 5.4513% 11/15/15 (a)(d) | | 365,000 | | 366,755 |
| Class F, 5.8013% 11/15/15 (a)(d) | | 260,000 | | 260,876 |
| Class H, 6.3013% 11/15/15 (a)(d) | | 235,000 | | 236,374 |
| Class J, 6.8513% 11/15/15 (a)(d) | | 245,000 | | 247,008 |
| Class K, 7.5013% 11/15/15 (a)(d) | | 220,000 | | 219,036 |
| Series 2006 LAQ: | | | | |
| Class H, 5.6025% 2/9/21 (a)(d) | | 650,000 | | 649,964 |
| Class J, 5.6925% 2/9/21 (a)(d) | | 470,000 | | 469,974 |
| Class K, 5.9225% 2/9/21 (a)(d) | | 1,305,000 | | 1,304,927 |
| Series 2006-ESH: | | | | |
| Class A, 5.74% 7/14/11 (a)(d) | | 1,381,181 | | 1,375,712 |
| Class B, 5.84% 7/14/11 (a)(d) | | 688,752 | | 686,028 |
| Class C, 5.99% 7/14/11 (a)(d) | | 1,379,342 | | 1,373,895 |
| Class D, 6.62% 7/14/11 (a)(d) | | 801,662 | | 799,035 |
| Bayview Commercial Asset Trust: | | | | |
| floater: | | | | |
| Series 2003-2 Class A, 5.5394% 12/25/33 (a)(d) . | | 2,544,799 | | 2,554,342 |
| Series 2004-1: | | | | |
| Class A, 5.3194% 4/25/34 (a)(d) | | 1,115,317 | | 1,116,711 |
| Class B, 6.8594% 4/25/34 (a)(d) | | 139,415 | | 140,722 |
| Class M1, 5.5194% 4/25/34 (a)(d) | | 69,707 | | 69,882 |
| Class M2, 6.1594% 4/25/34 (a)(d) | | 69,707 | | 70,404 |
| Series 2004-2: | | | | |
| Class A, 5.3894% 8/25/34 (a)(d) | | 1,221,306 | | 1,225,123 |
| Class M1, 5.5394% 8/25/34 (a)(d) | | 393,841 | | 396,057 |
See accompanying notes which are an integral part of the financial statements.
31 Semiannual Report
| Investments (Unaudited) continued | | | | | | |
| |
| |
| Commercial Mortgage Securities continued | | | | | | |
| | | | | Principal | | Value (Note 1) |
| | | | | Amount | | |
| Bayview Commercial Asset Trust: – continued | | | | | | |
| floater: | | | | | | |
| Series 2004-3: | | | | | | |
| Class A1, 5.3294% 1/25/35 (a)(d) | | | | $ 1,362,675 | | $ 1,366,082 |
| Class A2, 5.3794% 1/25/35 (a)(d) | | | | 212,918 | | 213,184 |
| Series 2005-4A: | | | | | | |
| Class A2, 5.3494% 1/25/36 (a)(d) | | | | 1,569,332 | | 1,570,313 |
| Class B1, 6.3594% 1/25/36 (a)(d) | | | | 98,083 | | 99,064 |
| Class M1, 5.4094% 1/25/36 (a)(d) | | | | 490,416 | | 491,642 |
| Class M2, 5.4294% 1/25/36 (a)(d) | | | | 196,167 | | 196,780 |
| Class M3, 5.4594% 1/25/36 (a)(d) | | | | 196,167 | | 196,780 |
| Class M4, 5.5694% 1/25/36 (a)(d) | | | | 98,083 | | 98,451 |
| Class M5, 5.6094% 1/25/36 (a)(d) | | | | 98,083 | | 98,451 |
| Class M6, 5.6594% 1/25/36 (a)(d) | | | | 98,083 | | 98,451 |
| Series 2004-1 Class IO, 1.25% 4/25/34 (a)(f) | | | | 12,104,876 | | 669,551 |
| Bear Stearns Commercial Mortgage Securities, Inc.: | | | | | | |
| floater Series 2004-BBA3 Class E, 5.6013% | | | | | | |
| 6/15/17 (a)(d) | | | | 2,265,000 | | 2,269,286 |
| sequential pay Series 2004-ESA Class A3, 4.741% | | | | | | |
| 5/14/16 (a) | | | | 625,000 | | 615,384 |
| Series 2002-TOP8 Class X2, 2.1031% | | | | | | |
| 8/15/38 (a)(d)(f) | | | | 7,763,326 | | 540,538 |
| Series 2003-PWR2 Class X2, 0.5776% | | | | | | |
| 5/11/39 (a)(d)(f) | | | | 20,445,140 | | 422,008 |
| Series 2003-T12 Class X2, 0.7259% | | | | | | |
| 8/13/39 (a)(d)(f) | | | | 19,331,772 | | 414,547 |
| Series 2004-PWR6 Class X2, 0.677% | | | | | | |
| 11/11/41 (a)(d)(f) | | | | 8,167,168 | | 244,443 |
| Series 2005-PWR9 Class X2, 0.4057% 9/11/42 (a)(f) | | | | 51,415,000 | | 1,029,123 |
| CDC Commercial Mortgage Trust Series 2002-FX1 | | | | | | |
| Class XCL, 0.6989% 5/15/35 (a)(d)(f) | | | | 43,447,607 | | 2,380,872 |
| Chase Commercial Mortgage Securities Corp. sequential | | | | | | |
| pay Series 1999-2 Class A1, 7.032% 1/15/32 | | | | 184,271 | | 184,988 |
| Citigroup Commercial Mortgage Trust: | | | | | | |
| sequential pay Series 2005-EMG Class A2, 4.2211% | | | | | | |
| 9/20/51 (a) | | | | 985,000 | | 945,813 |
| Series 2004-C2 Class XP, 0.9799% 10/15/41 (a)(d)(f) | | | | 9,734,251 | | 376,971 |
| COMM: | | | | | | |
| floater: | | | | | | |
| Series 2002-FL6 Class G, 6.8013% 6/14/14 (a)(d) | | | | 800,000 | | 800,000 |
| Series 2002-FL7: | | | | | | |
| Class D, 5.4713% 11/15/14 (a)(d) | | | | 118,857 | | 119,046 |
| Class H, 7.1513% 11/15/14 (a)(d) | | | | 1,232,000 | | 1,232,539 |
See accompanying notes which are an integral part of the financial statements.
| Commercial Mortgage Securities continued | | | | |
| | | Principal | | Value (Note 1) |
| | | Amount | | |
| COMM: – continued | | | | |
| Series 2004-LBN2 Class X2, 1.0437% | | | | |
| 3/10/39 (a)(d)(f) | | $ 3,237,429 | | $ 103,092 |
| Commercial Mortgage Acceptance Corp. | | | | |
| Series 1998-C2 Class B, 5.7252% 9/15/30 (d) | | 3,420,000 | | 3,478,760 |
| Commercial Mortgage Asset Trust sequential pay | | | | |
| Series 1999-C1 Class A3, 6.64% 1/17/32 | | 675,000 | | 695,853 |
| Commercial Mortgage pass thru certificates: | | | | |
| floater Series 2004-HTL1: | | | | |
| Class B, 5.3513% 7/15/16 (a)(d) | | 41,120 | | 41,128 |
| Class D, 5.4513% 7/15/16 (a)(d) | | 95,553 | | 95,573 |
| Class E, 5.6513% 7/15/16 (a)(d) | | 67,426 | | 67,446 |
| Class F, 5.7013% 7/15/16 (a)(d) | | 72,411 | | 72,470 |
| Class H, 6.2013% 7/15/16 (a)(d) | | 206,928 | | 207,222 |
| Class J, 6.3513% 7/15/16 (a)(d) | | 80,225 | | 80,279 |
| Class K, 7.2513% 7/15/16 (a)(d) | | 90,132 | | 90,225 |
| Series 2005-LP5 Class XP, 0.3684% 5/10/43 (d)(f) | | 18,895,000 | | 291,573 |
| CS First Boston Mortgage Securities Corp.: | | | | |
| floater: | | | | |
| Series 2004-HC1: | | | | |
| Class A2, 5.4013% 12/15/21 (a)(d) | | 350,000 | | 349,999 |
| Class B, 5.6513% 12/15/21 (a)(d) | | 915,000 | | 914,995 |
| Series 2005-TFLA: | | | | |
| Class C, 5.1413% 2/15/20 (a)(d) | | 1,210,000 | | 1,210,779 |
| Class E, 5.2313% 2/15/20 (a)(d) | | 440,000 | | 440,361 |
| Class F, 5.2813% 2/15/20 (a)(d) | | 375,000 | | 375,190 |
| Class G, 5.4213% 2/15/20 (a)(d) | | 110,000 | | 110,097 |
| Class H, 5.6513% 2/15/20 (a)(d) | | 155,000 | | 155,137 |
| sequential pay: | | | | |
| Series 1999-C1 Class A2, 7.29% 9/15/41 | | 2,989,755 | | 3,131,252 |
| Series 2004-C1 Class A2, 3.516% 1/15/37 | | 3,035,000 | | 2,914,210 |
| Series 2001-CK6 Class AX, 0.645% 9/15/18 (f) | | 18,770,889 | | 570,703 |
| Series 2003-C3 Class ASP, 1.8185% | | | | |
| 5/15/38 (a)(d)(f) | | 23,826,557 | | 1,179,562 |
| Series 2003-C4 Class ASP, 0.4324% | | | | |
| 8/15/36 (a)(d)(f) | | 16,647,057 | | 240,936 |
| Series 2004-C1 Class ASP, 0.9369% | | | | |
| 1/15/37 (a)(d)(f) | | 15,583,964 | | 487,876 |
| Series 2005-C1 Class ASP, 0.4193% | | | | |
| 2/15/38 (a)(d)(f) | | 19,352,736 | | 326,694 |
| Series 2005-C2 Class ASP, 0.5924% | | | | |
| 4/15/37 (a)(d)(f) | | 16,186,500 | | 420,074 |
| Deutsche Mortgage & Asset Receiving Corp. sequential | | | | |
| pay Series 1998-C1 Class D, 7.231% 6/15/31 | | 975,000 | | 1,011,247 |
See accompanying notes which are an integral part of the financial statements. | | |
| |
| 33 | | Semiannual Report |
| Investments (Unaudited) continued | | | | | | |
| |
| |
| Commercial Mortgage Securities continued | | | | | | |
| | | | | | | Principal | | Value (Note 1) |
| | | | | | | Amount | | |
| DLJ Commercial Mortgage Corp. sequential pay | | | | | | | | |
| Series 2000-CF1: | | | | | | | | |
| Class A1A, 7.45% 6/10/33 | | | | | | $ 188,345 | | $ 188,975 |
| Class A1B, 7.62% 6/10/33 | | | | | | 1,770,000 | | 1,901,150 |
| EQI Financing Partnership I LP Series 1997-1 Class B, | | | | | | | | |
| 7.37% 12/20/15 (a) | | | | | | 361,582 | | 365,070 |
| Equitable Life Assurance Society of the United States: | | | | | | | | |
| sequential pay Series 174 Class A1, 7.24% | | | | | | | | |
| 5/15/06 (a) | | | | | | 1,000,000 | | 1,000,917 |
| Series 174 Class B1, 7.33% 5/15/06 (a) | | | | | | 500,000 | | 500,473 |
| First Union-Lehman Brothers Commercial Mortgage Trust | | | | | | | | |
| sequential pay Series 1997-C2 Class A3, 6.65% | | | | | | | | |
| 11/18/29 | | | | | | 2,053,129 | | 2,078,329 |
| GE Capital Commercial Mortgage Corp. Series 2001-1 | | | | | | | | |
| Class X1, 0.4789% 5/15/33 (a)(d)(f) | | | | | | 11,114,325 | | 379,803 |
| GE Capital Mall Finance Corp. Series 1998-1A | | | | | | | | |
| Class B2, 6.7547% 9/13/28 (a)(d) | | | | | | 1,490,000 | | 1,548,020 |
| GE Commercial Mortgage Corp. sequential pay | | | | | | | | |
| Series 2004-C3 Class A2, 4.433% 7/10/39 | | | | | | 4,015,000 | | 3,907,886 |
| GGP Mall Properties Trust: | | | | | | | | |
| floater Series 2001-C1A Class A3, 5.6013% | | | | | | | | |
| 2/15/14 (a)(d) | | | | | | 421,812 | | 421,810 |
| sequential pay Series 2001-C1A Class A2, 5.007% | | | | | | | | |
| 11/15/11 (a) | | | | | | 1,257,425 | | 1,255,935 |
| Global Signal Trust III Series 2006-1: | | | | | | | | |
| Class B, 5.588% 2/15/36 (a) | | | | | | 735,000 | | 727,762 |
| Class C, 5.707% 2/15/36 (a) | | | | | | 910,000 | | 901,837 |
| GMAC Commercial Mortgage Securities, Inc.: | | | | | | | | |
| sequential pay: | | | | | | | | |
| Series 1997-C2 Class A3, 6.566% 4/15/29 | | | | | | 763,014 | | 773,832 |
| Series 2006-C1 Class XP, 4.975% 11/10/45 | | | | | | 1,659,721 | | 1,643,647 |
| Series 2003-C3 Class X2, 0.7143% | | | | | | | | |
| 12/10/38 (a)(d)(f) | | | | | | 19,655,179 | | 458,233 |
| Series 2004-C3 Class X2, 0.7315% 12/10/41 (d)(f) | | | | | | 13,285,330 | | 331,186 |
| Series 2006-C1 Class XP, 0.1669% 11/10/45 (d)(f) | | | | | | 23,660,000 | | 233,635 |
| Greenwich Capital Commercial Funding Corp.: | | | | | | | | |
| Series 2002-C1 Class SWDB, 5.857% 11/11/19 (a) | | | | | | 1,150,000 | | 1,132,186 |
| Series 2003-C1 Class XP, 2.0977% 7/5/35 (a)(d)(f) | | | | | | 12,056,266 | | 690,331 |
| Series 2003-C2 Class XP, 1.0327% 1/5/36 (a)(d)(f) | | | | | | 22,517,784 | | 734,645 |
| Series 2005-GG3 Class XP, 0.8029% | | | | | | | | |
| 8/10/42 (a)(d)(f) | | | | | | 58,435,000 | | 1,786,042 |
| GS Mortgage Securities Corp. II sequential pay | | | | | | | | |
| Series 2003-C1 Class A2A, 3.59% 1/10/40 | | | | | | 1,705,000 | | 1,660,084 |
See accompanying notes which are an integral part of the financial statements.
| Commercial Mortgage Securities continued | | | | | | |
| | | | | | | Principal | | Value (Note 1) |
| | | | | | | Amount | | |
| Hilton Hotel Pool Trust: | | | | | | | | |
| sequential pay Series 2000-HLTA Class A1, 7.055% | | | | | | | | |
| 10/3/15 (a) | | | | | | $ 572,791 | | $ 594,396 |
| Series 2000-HLTA Class D, 7.555% 10/3/15 (a) | | | | | | 1,275,000 | | 1,324,127 |
| Host Marriott Pool Trust sequential pay Series | | | | | | | | |
| 1999-HMTA: | | | | | | | | |
| Class A, 6.98% 8/3/15 (a) | | | | | | 418,609 | | 429,431 |
| Class B, 7.3% 8/3/15 (a) | | | | | | 505,000 | | 532,362 |
| Class D, 7.97% 8/3/15 (a) | | | | | | 425,000 | | 456,885 |
| JPMorgan Chase Commercial Mortgage Securities | | | | | | | | |
| Corp.: | | | | | | | | |
| sequential pay Series 2001-C1 Class A2, 5.464% | | | | | | | | |
| 10/12/35 | | | | | | 2,846,171 | | 2,839,771 |
| Series 2002-C3 Class X2, 1.2396% 7/12/35 (a)(d)(f) | | | | | | 6,184,400 | | 198,768 |
| Series 2003-CB7 Class X2, 0.7784% | | | | | | | | |
| 1/12/38 (a)(d)(f) | | | | | | 4,338,099 | | 115,345 |
| Series 2003-LN1 Class X2, 0.6878% | | | | | | | | |
| 10/15/37 (a)(d)(f) | | | | | | 26,278,568 | | 588,572 |
| Series 2004-C1 Class X2, 0.9964% 1/15/38 (a)(d)(f) | | | | | | 3,989,019 | | 141,321 |
| Series 2004-CB8 Class X2, 1.162% 1/12/39 (a)(d)(f) | | | | | | 4,864,265 | | 196,583 |
| LB Commercial Conduit Mortgage Trust sequential pay: | | | | | | | | |
| Series 1998-C4 Class A1B, 6.21% 10/15/35 | | | | | | 2,725,834 | | 2,770,016 |
| Series 1999-C1 Class A2, 6.78% 6/15/31 | | | | | | 2,650,000 | | 2,738,330 |
| LB-UBS Commercial Mortgage Trust: | | | | | | | | |
| sequential pay Series 2003-C3 Class A2, 3.086% | | | | | | | | |
| 5/15/27 | | | | | | 1,465,000 | | 1,403,060 |
| Series 2002-C4 Class XCP, 1.4449% | | | | | | | | |
| 10/15/35 (a)(d)(f) | | | | | | 12,294,694 | | 484,770 |
| Series 2002-C7 Class XCP, 1.1897% 1/15/36 (a)(f) | | . | | | | 12,741,084 | | 302,824 |
| Series 2003-C1 Class XCP, 1.3864% | | | | | | | | |
| 12/15/36 (a)(d)(f) | | | | | | 6,459,319 | | 237,766 |
| Series 2004-C2 Class XCP, 1.4108% 3/1/36 (a)(f) | | | | | | 10,840,783 | | 407,288 |
| Series 2004-C6 Class XCP, 0.7189% | | | | | | | | |
| 8/15/36 (a)(d)(f) | | | | | | 15,813,751 | | 386,355 |
| Series 2005-C7 Class XCP, 0.2174% 11/15/40 (d)(f) | | | | | | 82,165,000 | | 906,288 |
| Series 2006-C1 Class XCP, 0.3518% 2/15/41 (d)(f) | | . | | | | 63,405,000 | | 1,213,610 |
| LB-UBS Westfield Trust Series 2001-WM Class X, | | | | | | | | |
| 0.5415% 7/14/16 (a)(d)(f) | | | | | | 12,283,495 | | 322,519 |
| Lehman Brothers Floating Rate Commercial Mortgage | | | | | | | | |
| Trust floater Series 2003-LLFA: | | | | | | | | |
| Class A2, 5.2913% 12/16/14 (a)(d) | | | | | | 665,466 | | 665,515 |
| Class E, 5.8013% 12/16/14 (a)(d) | | | | | | 2,080,000 | | 2,080,341 |
| Class J, 6.9513% 12/16/14 (a)(d) | | | | | | 1,420,000 | | 1,410,757 |
| Class K1, 7.4513% 12/16/14 (a)(d) | | | | | | 730,000 | | 724,453 |
See accompanying notes which are an integral part of the financial statements.
35 Semiannual Report
| Investments (Unaudited) continued | | | | | | |
| |
| |
| Commercial Mortgage Securities continued | | | | | | |
| | | | | Principal | | Value (Note 1) |
| | | | | Amount | | |
| Merrill Lynch Mortgage Trust: | | | | | | |
| Series 2002-MW1 Class XP, 1.5506% | | | | | | |
| 7/12/34 (a)(d)(f) | | | | $ 5,473,083 | | $ 209,946 |
| Series 2005-MCP1 Class XP, 0.5948% 6/12/43 (d)(f) | | | | 15,698,132 | | 448,756 |
| Series 2005-MKB2 Class XP, 0.3063% 9/12/42 (d)(f) | | | | 7,640,446 | | 100,530 |
| Morgan Stanley Capital I, Inc.: | | | | | | |
| sequential pay: | | | | | | |
| Series 1999-CAM1 Class A2, 6.76% 3/15/32 | | | | 1,584 | | 1,582 |
| Series 1999-LIFE Class A1, 6.97% 4/15/33 | | | | 353,512 | | 358,944 |
| Series 2003-IQ5 Class A2, 4.09% 4/15/38 | | | | 1,085,000 | | 1,061,284 |
| Series 1997-RR Class C, 7.3486% 4/30/39 (a)(d) | | | | 715,842 | | 716,023 |
| Series 2003-IQ5 Class X2, 0.9879% | | | | | | |
| 4/15/38 (a)(d)(f) | | | | 9,028,589 | | 291,552 |
| Series 2003-IQ6 Class X2, 0.5991% | | | | | | |
| 12/15/41 (a)(d)(f) | | | | 15,750,625 | | 393,334 |
| Series 2005-HQ5 Class X2, 0.3774% 1/14/42 (d)(f) . | | | | 17,001,554 | | 240,128 |
| Series 2005-IQ9 Class X2, 1.0698% | | | | | | |
| 7/15/56 (a)(d)(f) | | | | 14,860,878 | | 650,819 |
| Series 2005-TOP17 Class X2, 0.6248% | | | | | | |
| 12/13/41 (d)(f) | | | | 11,372,604 | | 328,495 |
| Morgan Stanley Dean Witter Capital I Trust: | | | | | | |
| floater Series 2002-XLF: | | | | | | |
| Class D, 5.73% 8/5/14 (a)(d) | | | | 35,687 | | 35,737 |
| Class F, 6.98% 8/5/14 (a)(d) | | | | 140,875 | | 140,389 |
| Series 2003-HQ2 Class X2, 1.4014% | | | | | | |
| 3/12/35 (a)(d)(f) | | | | 11,724,908 | | 609,458 |
| Series 2003-TOP9 Class X2, 1.5092% | | | | | | |
| 11/13/36 (a)(d)(f) | | | | 7,763,515 | | 396,689 |
| Mortgage Capital Funding, Inc. sequential pay | | | | | | |
| Series 1998-MC2 Class A2, 6.423% 6/18/30 | | | | 1,091,709 | | 1,109,087 |
| Nationslink Funding Corp.: | | | | | | |
| sequential pay Series 1999-2 Class A1C, 7.03% | | | | | | |
| 6/20/31 | | | | 106,159 | | 106,563 |
| Series 1999-1 Class C, 6.571% 1/20/31 | | | | 1,080,000 | | 1,108,629 |
| STRIPS III Ltd./STRIPS III Corp. floater Series 2004-1A | | | | | | |
| Class A, 5.43% 3/24/18 (a)(d) | | | | 1,237,175 | | 1,237,175 |
| Trizechahn Office Properties Trust Series 2001-TZHA: | | | | | | |
| Class C3, 6.522% 3/15/13 (a) | | | | 572,633 | | 581,272 |
| Class E3, 7.253% 3/15/13 (a) | | | | 842,203 | | 864,451 |
| Wachovia Bank Commercial Mortgage Trust: | | | | | | |
| floater: | | | | | | |
| Series 2005-WL5A: | | | | | | |
| Class KHP1, 5.2513% 1/15/18 (a)(d) | | | | 375,000 | | 375,164 |
| Class KHP2, 5.4513% 1/15/18 (a)(d) | | | | 375,000 | | 375,290 |
See accompanying notes which are an integral part of the financial statements.
| Commercial Mortgage Securities continued | | | | |
| | | Principal | | Value (Note 1) |
| | | Amount | | |
| Wachovia Bank Commercial Mortgage Trust: – continued | | | | |
| floater: | | | | |
| Series 2005-WL5A: | | | | |
| Class KHP3, 5.7513% 1/15/18 (a)(d) | | $ 440,000 | | $ 440,264 |
| Class KHP4, 5.8513% 1/15/18 (a)(d) | | 345,000 | | 345,206 |
| Class KHP5, 6.0513% 1/15/18 (a)(d) | | 400,000 | | 399,969 |
| Series 2005-WL6A: | | | | |
| Class A2, 5.1513% 10/15/17 (a)(d) | | 1,460,000 | | 1,460,083 |
| Class B, 5.2013% 10/15/17 (a)(d) | | 290,000 | | 290,017 |
| Class D, 5.3313% 10/15/17 (a)(d) | | 585,000 | | 584,959 |
| sequential pay Series 2003-C7 Class A1, 4.241% | | | | |
| 10/15/35 (a) | | 2,411,723 | | 2,325,650 |
| Series 2003-C8 Class XP, 0.6638% 11/15/35 (a)(d)(f) | | 12,225,979 | | 196,792 |
| Series 2003-C9 Class XP, 0.5908% 12/15/35 (a)(d)(f) | | 8,293,585 | | 155,745 |
| Series 2004-C14 Class PP, 4.7967% 8/15/41 (a)(d) . | | 1,582,285 | | 1,499,975 |
| Series 2005-C18 Class XP, 0.533% 4/15/42 (d)(f) | | 23,498,115 | | 391,845 |
| Series 2006-C23 Class X, 0.25% 1/15/45 (a)(f) | | 286,825,000 | | 2,156,494 |
| Series 2006-C24 Class XP, 0.016% 3/15/45 (a)(d)(f) | | 56,040,000 | | 425,405 |
| TOTAL COMMERCIAL MORTGAGE SECURITIES | | | | |
| (Cost $128,862,400) | | | | 126,290,518 |
| |
| Foreign Government and Government Agency Obligations 0.4% | | | | |
| |
| Chilean Republic 5.625% 7/23/07 | | 740,000 | | 741,850 |
| United Mexican States 10.375% 2/17/09 | | 4,000,000 | | 4,476,000 |
| TOTAL FOREIGN GOVERNMENT AND | | | | |
| GOVERNMENT AGENCY OBLIGATIONS | | | | |
| (Cost $5,226,342) | | | | 5,217,850 |
| |
| Fixed Income Funds 5.3% | | | | |
| | | Shares | | |
| Fidelity Ultra-Short Central Fund (e) | | | | |
| (Cost $71,052,236) | | 716,441 | | 71,278,715 |
See accompanying notes which are an integral part of the financial statements.
37 Semiannual Report
| Investments (Unaudited) continued | | | | |
| |
| |
| Preferred Securities 0.3% | | | | | | |
| | | | | Principal | | Value (Note 1) |
| | | | | Amount | | |
| |
| FINANCIALS – 0.3% | | | | | | |
| Commercial Banks – 0.3% | | | | | | |
| Abbey National PLC 7.35% (d) | | | | $ 2,150,000 | | $ 2,178,856 |
| National Westminster Bank PLC 7.75% (d) | | 1,430,000 | | 1,477,023 |
| | | | | | | 3,655,879 |
| TOTAL PREFERRED SECURITIES | | | | | | |
| (Cost $3,772,889) | | | | | | 3,655,879 |
| Cash Equivalents 1.4% | | | | | | |
| | | | | Maturity | | |
| | | | | Amount | | |
| Investments in repurchase agreements (Collateralized by U.S. | | | | | | |
| Government Obligations), in a joint trading account at | | | | | | |
| 4.78%, dated 4/28/06 due 5/1/06 | | | | | | |
| (Cost $18,607,000) | | | | $18,614,410 | | 18,607,000 |
| |
| TOTAL INVESTMENT PORTFOLIO 100.3% | | | | | | |
| (Cost $1,356,912,005) | | | | | | 1,341,088,655 |
| |
| NET OTHER ASSETS – (0.3)% | | | | | | (3,584,309) |
| NET ASSETS 100% | | | | | | $1,337,504,346 |
| |
| |
| |
| |
| See accompanying notes which are an integral part of the financial statements. | | |
| |
| Semiannual Report | | 38 | | | | |
| Futures Contracts | | | | | | | | |
| | | Expiration | | | | Underlying | | Unrealized |
| | | Date | | | | Face Amount | | Appreciation/ |
| | | | | | | at Value | | (Depreciation) |
| |
| Purchased | | | | | | | | |
| Eurodollar Contracts | | | | | | | | |
| 176 Eurodollar 90 Day Index Contracts | | June 2006 | | | | $ 173,716,400 | | $ (346,745) |
| 176 Eurodollar 90 Day Index Contracts | | Sept. 2006 | | | | 173,694,400 | | (357,892) |
| 176 Eurodollar 90 Day Index Contracts | | Dec. 2006 | | | | 173,692,200 | | (287,819) |
| 176 Eurodollar 90 Day Index Contracts | | March 2007 | | | | 173,707,600 | | (210,279) |
| 176 Eurodollar 90 Day Index Contracts | | June 2007 | | | | 173,716,400 | | (219,954) |
| 176 Eurodollar 90 Day Index Contracts | | Sept. 2007 | | | | 173,718,600 | | (87,654) |
| 127 Eurodollar 90 Day Index Contracts | | Dec. 2007 | | | | 125,350,588 | | (62,946) |
| 31 Eurodollar 90 Day Index Contracts | | March 2008 | | | | 30,596,225 | | (16,799) |
| 2 Eurodollar 90 Day Index Contracts | | June 2008 | | | | 1,973,800 | | (1,133) |
| TOTAL EURODOLLAR CONTRACTS | | | | | | | | (1,591,221) |
Sold | | | | | | | | |
| Eurodollar Contracts | | | | | | | | |
| 46 Eurodollar 90 Day Index Contracts | | Sept. 2008 | | | | 45,393,950 | | 67,966 |
| 35 Eurodollar 90 Day Index Contracts | | Dec. 2008 | | | | 34,534,500 | | 48,410 |
| 24 Eurodollar 90 Day Index Contracts | | March 2009 | | | | 23,679,300 | | 31,279 |
| TOTAL EURODOLLAR CONTRACTS | | | | | | | | 147,655 |
| |
| | | | | | | | | $ (1,443,566) |
See accompanying notes which are an integral part of the financial statements.
39 Semiannual Report
| Investments (Unaudited) continued | | | | | | |
| |
| |
| |
| Swap Agreements | | | | | | | | |
| |
| | | | | Notional | | | | Value |
| | | | | Amount | | | | |
| |
| Credit Default Swaps | | | | | | | | |
| Receive monthly notional amount multiplied | | | | | | | | |
| by 3.05% and pay Merrill Lynch upon | | | | | | | | |
| default event of Morgan Stanley ABS | | | | | | | | |
| Capital I, Inc., par value of the | | | | | | | | |
| proportional notional amount of Morgan | | | | | | | | |
| Stanley ABS Capital I, Inc. Series | | | | | | | | |
| 2004-NC8 Class B3, 7.2913% 9/25/34 | | Oct. 2034 | | $ 400,000 | | | | $ 6,679 |
| Receive monthly notional amount multiplied | | | | | | | | |
| by 3.3% and pay to Morgan Stanley, Inc. | | | | | | | | |
| upon default event of Ameriquest | | | | | | | | |
| Mortgage Securities, Inc., par value of the | | | | | | | | |
| notional amount of Ameriquest Mortgage | | | | | | | | |
| Securities, Inc. Series 2004-R11 Class M9, | | | | | | | | |
| 7.6913% 11/25/34 | | Dec. 2034 | | 405,000 | | | | 7,781 |
| Receive monthly notional amount multiplied | | | | | | | | |
| by 3.35% and pay Morgan Stanley, Inc. | | | | | | | | |
| upon default event of Morgan Stanley ABS | | | | | | | | |
| Capital I, Inc., par value of the notional | | | | | | | | |
| amount of Morgan Stanley ABS Capital I, | | | | | | | | |
| Inc. Series 2004-HE7 Class B3, 7.6913% | | | | | | | | |
| 8/25/34 | | Sept. 2034 | | 362,000 | | | | 8,132 |
| Receive monthly notional amount multiplied | | | | | | | | |
| by 3.35% and pay Morgan Stanley, Inc. | | | | | | | | |
| upon default event of Morgan Stanley ABS | | | | | | | | |
| Capital I, Inc., par value of the notional | | | | | | | | |
| amount of Morgan Stanley ABS Capital I, | | | | | | | | |
| Inc. Series 2004-NC7 Class B3, 7.6913% | | | | | | | | |
| 7/25/34 | | August 2034 | | 362,000 | | | | 7,654 |
| Receive monthly notional amount multiplied | | | | | | | | |
| by 3.35% and pay Morgan Stanley, Inc. | | | | | | | | |
| upon default event of Morgan Stanley ABS | | | | | | | | |
| Capital I, Inc., par value of the notional | | | | | | | | |
| amount of Morgan Stanley ABS Capital I, | | | | | | | | |
| Inc. Series 2004-HE8 Class B3, 7.3913% | | | | | | | | |
| 9/25/34 | | Oct. 2034 | | 362,000 | | | | 8,610 |
| Receive monthly notional amount multiplied | | | | | | | | |
| by .82% and pay UBS upon default event | | | | | | | | |
| of Morgan Stanley ABS Capital I, Inc., par | | | | | | | | |
| value of the notional amount of Morgan | | | | | | | | |
| Stanley ABS Capital I, Inc. Series | | | | | | | | |
| 2004-NC6 Class M3, 5.6413% 7/25/34 | | August 2034 | | 362,000 | | | | 2,371 |
| Receive monthly notional amount multiplied | | | | | | | | |
| by .85% and pay UBS upon default event | | | | | | | | |
| of Ameriquest Mortgage Securities, Inc., | | | | | | | | |
| par value of the notional amount of | | | | | | | | |
| Ameriquest Mortgage Securities, Inc. | | | | | | | | |
| Series 2004-R9 Class M5, 5.5913% | | | | | | | | |
| 10/25/34 | | Nov. 2034 | | 362,000 | | | | 2,014 |
See accompanying notes which are an integral part of the financial statements. | | | | |
| |
| Semiannual Report | | 40 | | | | | | |
| Swap Agreements continued | | | | | | | | |
| |
| | | Expiration | | Notional | | | | Value |
| | | Date | | Amount | | | | |
| |
| Credit Default Swaps – continued | | | | | | | | |
| Receive monthly notional amount multiplied | | | | | | | | |
| by .85% and pay UBS upon default event | | | | | | | | |
| of Morgan Stanley ABS Capital I, Inc., par | | | | | | | | |
| value of the notional amount of Morgan | | | | | | | | |
| Stanley ABS Capital I, Inc. Series | | | | | | | | |
| 2004-NC8 Class M6, 5.4413% 9/25/34 | | Oct. 2034 | | $ 362,000 | | | | $ 2,393 |
| Receive monthly notional amount multiplied | | | | | | | | |
| by 1.6% and pay Morgan Stanley, Inc. | | | | | | | | |
| upon default event of Park Place Securities, | | | | | | | | |
| Inc., par value of the notional amount of | | | | | | | | |
| Park Place Securities, Inc. Series | | | | | | | | |
| 2005-WHQ2 Class M7, 5.4413% | | | | | | | | |
| 5/25/35 | | June 2035 | | 330,000 | | | | 4,473 |
| Receive monthly notional amount multiplied | | | | | | | | |
| by 1.65% and pay Goldman Sachs upon | | | | | | | | |
| default event of Fieldstone Mortgage | | | | | | | | |
| Investment Corp., par value of the notional | | | | | | | | |
| amount of Fieldstone Mortgage Investment | | | | | | | | |
| Corp. Series 2004-2 Class M5, 6.3413% | | | | | | | | |
| 7/25/34 | | August 2034 | | 618,000 | | | | 4,099 |
| Receive monthly notional amount multiplied | | | | | | | | |
| by 1.66% and pay Morgan Stanley, Inc. | | | | | | | | |
| upon default event of Park Place Securities, | | | | | | | | |
| Inc., par value of the notional amount of | | | | | | | | |
| Park Place Securities, Inc. Series | | | | | | | | |
| 2005-WHQ2 Class M7, 5.4413% | | | | | | | | |
| 5/25/35 | | June 2035 | | 362,000 | | | | 5,485 |
| Receive monthly notional amount multiplied | | | | | | | | |
| by 2.54% and pay Merrill Lynch upon | | | | | | | | |
| default event of Countrywide Home Loans, | | | | | | | | |
| Inc., par value of the notional amount of | | | | | | | | |
| Countrywide Home Loans, Inc. Series | | | | | | | | |
| 2003-BC1 Class B1, 7.6913% 3/25/32 | | April 2032 | | 121,647 | | | | 525 |
| Receive monthly notional amount multiplied | | | | | | | | |
| by 2.61% and pay Goldman Sachs upon | | | | | | | | |
| default event of Fremont Home Loan Trust, | | | | | | | | |
| par value of the notional amount of | | | | | | | | |
| Fremont Home Loan Trust Series 2004-1 | | | | | | | | |
| Class M9, 7.3913% 2/25/34 | | March 2034 | | 619,000 | | | | 2,694 |
| Receive monthly notional amount multiplied | | | | | | | | |
| by 2.61% and pay Goldman Sachs upon | | | | | | | | |
| default event of Fremont Home Loan Trust, | | | | | | | | |
| par value of the notional amount of | | | | | | | | |
| Fremont Home Loan Trust Series 2004-A | | | | | | | | |
| Class B3, 7.0413% 1/25/34 | | Feb. 2034 | | 222,297 | | | | 507 |
| |
| |
| |
| See accompanying notes which are an integral part of the financial statements. | | | | |
| |
| | | 41 | | Semiannual Report |
| Investments (Unaudited) continued | | | | | | |
| |
| |
| |
| Swap Agreements continued | | | | | | | | |
| |
| | | Expiration | | Notional | | | | Value |
| | | Date | | Amount | | | | |
| |
| Credit Default Swaps – continued | | | | | | | | |
| Receive monthly notional amount multiplied | | | | | | | | |
| by 2.79% and pay Merrill Lynch, Inc. upon | | | | | | | | |
| default event of New Century Home Equity | | | | | | | | |
| Loan Trust, par value of the notional | | | | | | | | |
| amount of New Century Home Equity Loan | | | | | | | | |
| Trust Series 2004-4 Class M9, 7.0788% | | | | | | | | |
| 2/25/35 | | March 2035 | | $ 900,000 | | | | $ 8,240 |
| Receive monthly notional amount multiplied | | | | | | | | |
| by 5% and pay Deutsche Bank upon | | | | | | | | |
| default event of MASTR Asset Backed | | | | | | | | |
| Securities Trust, par value of the notional | | | | | | | | |
| amount of MASTR Asset Backed Securities | | | | | | | | |
| Trust Series 2003-NC1 Class M6, | | | | | | | | |
| 8.1913% 4/25/33 | | May 2033 | | 362,000 | | | | 4,426 |
| Receive quarterly notional amount multiplied | | | | | | | | |
| by .25% and pay Merrill Lynch, Inc. upon | | | | | | | | |
| default event of Consolidated Natural Gas | | | | | | | | |
| Co., par value of the notional amount of | | | | | | | | |
| Consolidated Natural Gas Co. 6% | | | | | | | | |
| 10/15/10 | | June 2007 | | 1,000,000 | | | | 2,170 |
| Receive quarterly notional amount multiplied | | | | | | | | |
| by .25% and pay Merrill Lynch, Inc. upon | | | | | | | | |
| default event of Consolidated Natural Gas | | | | | | | | |
| Co., par value of the notional amount of | | | | | | | | |
| Consolidated Natural Gas Co. 6% | | | | | | | | |
| 10/15/10 | | July 2007 | | 2,900,000 | | | | 8,120 |
| Receive quarterly notional amount multiplied | | | | | | | | |
| by .26% and pay Morgan Stanley, Inc. | | | | | | | | |
| upon default event of Amerada Hess | | | | | | | | |
| Corp., par value of the notional amount of | | | | | | | | |
| Amerada Hess Corp. 6.65% 8/15/11 | | March 2007 | | 2,400,000 | | | | 3,312 |
| Receive quarterly notional amount multiplied | | | | | | | | |
| by .28% and pay Morgan Stanley, Inc. | | | | | | | | |
| upon default event of Amerada Hess | | | | | | | | |
| Corp., par value of the notional amount of | | | | | | | | |
| Amerada Hess 6.65% 8/15/11 | | March 2007 | | 3,000,000 | | | | 4,680 |
| Receive quarterly notional amount multiplied | | | | | | | | |
| by .30% and pay Deutsche Bank upon | | | | | | | | |
| default event of Entergy Corp., par value | | | | | | | | |
| of the notional amount of Entergy Corp. | | | | | | | | |
| 7.75% 12/15/09 | | March 2008 | | 2,045,000 | | | | 5,624 |
| Receive quarterly notional amount multiplied | | | | | | | | |
| by .30% and pay Goldman Sachs upon | | | | | | | | |
| default event of Entergy Corp., par value | | | | | | | | |
| of the notional amount of Entergy Corp. | | | | | | | | |
| 7.75% 12/15/09 | | March 2008 | | 1,495,000 | | | | 4,111 |
| |
| |
| See accompanying notes which are an integral part of the financial statements. | | | | |
| |
| Semiannual Report | | 42 | | | | | | |
| Swap Agreements continued | | | | | | | | | | |
| |
| | | Expiration | | | | Notional | | | | Value |
| | | Date | | | | Amount | | | | |
| |
| Credit Default Swaps – continued | | | | | | | | | | |
| Receive quarterly notional amount multiplied | | | | | | | | | | |
| by .41% and pay Merrill Lynch, Inc. upon | | | | | | | | | | |
| default event of Talisman Energy, Inc., par | | | | | | | | | | |
| value of the notional amount of Talisman | | | | | | | | | | |
| Energy, Inc. 7.25% 10/15/27 | | March 2009 | | | | $ 1,000,000 | | | | $ 7,130 |
| Receive quarterly notional amount multiplied | | | | | | | | | | |
| by .48% and pay Goldman Sachs upon | | | | | | | | | | |
| default event of TXU Energy Co. LLC, par | | | | | | | | | | |
| value of the notional amount of TXU | | | | | | | | | | |
| Energy Co. LLC 7% 3/15/13 | | Sept. 2008 | | | | 2,675,000 | | | | 15,569 |
| Receive quarterly notional amount multiplied | | | | | | | | | | |
| by .75% and pay Lehman Brothers, Inc. | | | | | | | | | | |
| upon default event of AOL Time Warner, | | | | | | | | | | |
| Inc., par value of the notional amount of | | | | | | | | | | |
| AOL Time Warner, Inc. 6.875% 5/1/12 | | Sept. 2009 | | | | 4,500,000 | | | | 77,175 |
| Receive quarterly notional amount multiplied | | | | | | | | | | |
| by .78% and pay Goldman Sachs upon | | | | | | | | | | |
| default event of TXU Energy, par value of | | | | | | | | | | |
| the notional amount of TXU Energy Co. | | | | | | | | | | |
| LLC 7% 3/15/13 | | Dec. 2008 | | | | 2,600,000 | | | | 34,294 |
| |
| TOTAL CREDIT DEFAULT SWAPS | | | | | | 30,126,944 | | | | 238,268 |
| Total Return Swaps | | | | | | | | | | |
| Receive monthly notional amount multiplied | | | | | | | | | | |
| by the nominal spread appreciation of the | | | | | | | | | | |
| Lehman Brothers CMBS U.S. Aggregate | | | | | | | | | | |
| Index adjusted by a modified duration | | | | | | | | | | |
| factor and pay monthly notional amount | | | | | | | | | | |
| multiplied by the nominal spread depreci- | | | | | | | | | | |
| ation of the Lehman Brothers CMBS U.S. | | | | | | | | | | |
| Aggregate Index adjusted by a modified | | | | | | | | | | |
| duration factor with Lehman Brothers, Inc. | | Oct. 2006 | | | | 8,280,000 | | | | 1,926 |
| Receive monthly notional amount multiplied | | | | | | | | | | |
| by the nominal spread appreciation of the | | | | | | | | | | |
| Lehman Brothers CMBS U.S. Aggregate | | | | | | | | | | |
| Index adjusted by a modified duration | | | | | | | | | | |
| factor plus 15 basis points and pay | | | | | | | | | | |
| monthly notional amount multiplied by the | | | | | | | | | | |
| nominal spread depreciation of the Leh- | | | | | | | | | | |
| man Brothers CMBS U.S. Aggregate Index | | | | | | | | | | |
| adjusted by a modified duration factor | | | | | | | | | | |
| with Lehman Brothers, Inc. | | July 2006 | | | | 10,000,000 | | | | 12,346 |
See accompanying notes which are an integral part of the financial statements.
43 Semiannual Report
| Investments (Unaudited) continued | | | | | | |
| |
| |
| |
| Swap Agreements continued | | | | | | | | |
| |
| | | Expiration | | Notional | | | | Value |
| | | Date | | Amount | | | | |
| |
| Total Return Swaps continued | | | | | | | | |
| Receive monthly notional amount multiplied | | | | | | | | |
| by the nominal spread appreciation of the | | | | | | | | |
| Lehman Brothers CMBS U.S. Aggregate | | | | | | | | |
| Index adjusted by a modified duration | | | | | | | | |
| factor and pay monthly notional amount | | | | | | | | |
| multiplied by the nominal spread depreci- | | | | | | | | |
| ation of the Lehman Brothers CMBS U.S. | | | | | | | | |
| Aggregate Index adjusted by a modified | | | | | | | | |
| duration factor with Citibank | | Sept. 2006 | | $13,500,000 | | | | $ 15,120 |
| Receive monthly a return equal to Lehman | | | | | | | | |
| Brothers U.S. ABS Floating Rate AA Home | | | | | | | | |
| Equity Index and pay monthly a floating | | | | | | | | |
| rate based on 1-month LIBOR with Lehman | | | | | | | | |
| Brothers, Inc. | | May 2006 | | 6,400,000 | | | | 6,617 |
| |
| TOTAL TOTAL RETURN SWAPS | | | | 38,180,000 | | | | 36,009 |
| |
| | | | | $ 68,306,944 | | | | $ 274,277 |
Legend
(a) Security exempt from registration under
Rule 144A of the Securities Act of 1933.
These securities may be resold in
transactions exempt from registration,
normally to qualified institutional buyers.
At the period end, the value of these
securities amounted to $139,900,366
or 10.5% of net assets.
(b) Security or a portion of the security
purchased on a delayed delivery or
when-issued basis.
(c) Security or a portion of the security was
pledged to cover margin requirements
for futures contracts. At the period end,
the value of securities pledged
amounted to $978,438.
(d) The coupon rate shown on floating or
adjustable rate securities represents the
rate at period end.
|
(e) Affiliated fund that is available only to
investment companies and other
accounts managed by Fidelity
Investments. A complete unaudited list of
holdings for each fixed-income central
fund, as of the investing fund’s report
date, is available upon request or at
advisor.fidelity.com. The reports are
located just after the fund’s financial
statements and quarterly reports but are
not part of the financial statements or
quarterly reports. In addition, the
fixed-income central fund’s financial
statements are available on the EDGAR
Database on the SEC’s web site,
www.sec.gov, or upon request.
|
See accompanying notes which are an integral part of the financial statements.
Semiannual Report 44
(f) Security represents right to receive
monthly interest payments on an
underlying pool of mortgages. Principal
shown is the par amount of the
mortgage pool.
(g) Restricted securities – Investment in
securities not registered under the
Securities Act of 1933 (excluding 144A
issues). At the end of the period, the
value of restricted securities (excluding
144A issues) amounted to $6,183,348
or 0.5% of net assets.
|
Additional information on each holding is as follows:
| | | Acquisition | | Acquisition |
| Security | | Date | | Cost |
| Aspetuck Trust | | | | |
| 5.33% 10/16/06 | | 12/14/05 | | $ 3,235,000 |
| Iberbond 2004 | | | | |
| PLC 4.826% | | | | |
| 12/24/17 | | 11/30/05 | | $ 2,986,657 |
Affiliated Central Funds
Information regarding fiscal year to date income earned by the fund from the affiliated Central funds is as follows:
| Fund | | | | Income earned |
| Fidelity Ultra Short Central Fund | | | | $ 1,779,675 |
Additional information regarding the fund’s fiscal year to date purchases and sales, including the ownership percentage, of the following fixed income Central Funds is as follows:
| | | Value, | | Purchases | | Sales | | Value, end of | | % ownership, |
| | | beginning of | | | | | | Proceeds | | period | | end of period |
| Fund | | period | | | | | | | | | | |
| Fidelity Ultra Short | | | | | | | | | | | | |
| Central Fund | | $77,249,478 | | | | $ — | | $6,000,024 | | $71,278,715 | | 1.0% |
Income Tax Information
At October 31, 2005, the fund had a capital loss carryforward of approximately $11,569,000 of which $1,754,000, $3,744,000 and $6,071,000 will expire on October 31, 2007, 2008 and 2013, respectively.
See accompanying notes which are an integral part of the financial statements.
45 Semiannual Report
| Financial Statements | | | | |
| |
| Statement of Assets and Liabilities | | | | |
| | | | | April 30, 2006 (Unaudited) |
| |
| Assets | | | | |
| Investment in securities, at value (including repurchase | | | | |
| agreements of $18,607,000) | | | | |
| See accompanying schedule: | | | | |
| Unaffiliated issuers (cost $1,285,859,769) | | $1,269,809,940 | | |
| Affiliated Central Funds (cost $71,052,236) | | 71,278,715 | | |
| Total Investments (cost $1,356,912,005) | | | | $1,341,088,655 |
| Cash | | | | 40,577 |
| Receivable for investments sold | | | | 247,331 |
| Receivable for swap agreements | | | | 13,953 |
| Receivable for fund shares sold | | | | 2,399,987 |
| Interest receivable | | | | 11,570,712 |
| Receivable for daily variation on futures contracts | | | | 108,899 |
| Swap agreements, at value | | | | 274,277 |
| Prepaid expenses | | | | 3,841 |
| Total assets | | | | 1,355,748,232 |
| |
| Liabilities | | | | |
| Payable for investments purchased | | | | |
| Regular delivery | | $ 3,884,823 | | |
| Delayed delivery | | 7,504,562 | | |
| Payable for fund shares redeemed | | 5,315,639 | | |
| Distributions payable | | 579,940 | | |
| Accrued management fee | | 357,170 | | |
| Distribution fees payable | | 278,909 | | |
| Other affiliated payables | | 283,649 | | |
| Other payables and accrued expenses | | 39,194 | | |
| Total liabilities | | | | 18,243,886 |
| |
| Net Assets | | | | $ 1,337,504,346 |
| Net Assets consist of: | | | | |
| Paid in capital | | | | $1,365,628,158 |
| Undistributed net investment income | | | | 2,168,227 |
| Accumulated undistributed net realized gain (loss) on | | | | |
| investments | | | | (13,299,400) |
| Net unrealized appreciation (depreciation) on | | | | |
| investments | | | | (16,992,639) |
| Net Assets | | | | $ 1,337,504,346 |
See accompanying notes which are an integral part of the financial statements.
| Statement of Assets and Liabilities continued | | | | |
| | | | | April 30, 2006 (Unaudited) |
| |
| Calculation of Maximum Offering Price | | | | | | |
| Class A: | | | | | | |
| Net Asset Value and redemption price per share | | | | | | |
| ($381,516,573 ÷ 40,797,561 shares) | | | | | | $ 9.35 |
| |
| Maximum offering price per share (100/98.50 of $9.35) | | | | | | $ 9.49 |
| Class T: | | | | | | |
| Net Asset Value and redemption price per share | | | | | | |
| ($562,350,779 ÷ 60,094,388 shares) | | | | | | $ 9.36 |
| |
| Maximum offering price per share (100/98.50 of $9.36) | | | | | | $ 9.50 |
| Class B: | | | | | | |
| Net Asset Value and offering price per share | | | | | | |
| ($33,383,986 ÷ 3,563,867 shares)A | | | | | | $ 9.37 |
| |
| Class C: | | | | | | |
| Net Asset Value and offering price per share | | | | | | |
| ($160,447,589 ÷ 17,141,387 shares)A | | | | | | $ 9.36 |
| |
| Institutional Class: | | | | | | |
| Net Asset Value, offering price and redemption price per | | | | |
| share ($199,805,419 ÷ 21,353,969 shares) | | | | | | $ 9.36 |
| |
| A Redemption price per share is equal to net asset value less any applicable contingent deferred sales charge. | | |
See accompanying notes which are an integral part of the financial statements.
47 Semiannual Report
| Financial Statements continued | | | | |
| |
| |
| Statement of Operations | | | | | | |
| | | Six months ended April 30, 2006 (Unaudited) |
| |
| Investment Income | | | | | | |
| Dividends | | | | | | $ 134,424 |
| Interest | | | | | | 27,693,562 |
| Income from affiliated Central Funds | | | | | | 1,779,675 |
| Total income | | | | | | 29,607,661 |
| |
| Expenses | | | | | | |
| Management fee | | | | $ 2,114,542 | | |
| Transfer agent fees | | | | 1,447,525 | | |
| Distribution fees | | | | 1,741,781 | | |
| Accounting fees and expenses | | | | 240,250 | | |
| Independent trustees’ compensation | | | | 2,666 | | |
| Custodian fees and expenses | | | | 27,349 | | |
| Registration fees | | | | 64,399 | | |
| Audit | | | | 30,489 | | |
| Legal | | | | 2,242 | | |
| Miscellaneous | | | | 32,051 | | |
| Total expenses before reductions | | | | 5,703,294 | | |
| Expense reductions | | | | (10,330) | | 5,692,964 |
| |
| Net investment income | | | | | | 23,914,697 |
| Realized and Unrealized Gain (Loss) | | | | |
| Net realized gain (loss) on: | | | | | | |
| Investment securities: | | | | | | |
| Unaffiliated issuers | | | | (1,338,211) | | |
| Affiliated Central Funds | | | | 27,742 | | |
| Futures contracts | | | | (323,189) | | |
| Swap agreements | | | | (105,997) | | |
| Total net realized gain (loss) | | | | | | (1,739,655) |
| Change in net unrealized appreciation (depreciation) on: | | | | | | |
| Investment securities | | | | (2,645,974) | | |
| Futures contracts | | | | (598,271) | | |
| Swap agreements | | | | 458,615 | | |
| Total change in net unrealized appreciation | | | | | | |
| (depreciation) | | | | | | (2,785,630) |
| Net gain (loss) | | | | | | (4,525,285) |
| Net increase (decrease) in net assets resulting from | | | | | | |
| operations | | | | | | $ 19,389,412 |
See accompanying notes which are an integral part of the financial statements.
| Statement of Changes in Net Assets | | | | |
| | | Six months ended | | Year ended |
| | | April 30, 2006 | | October 31, |
| | | (Unaudited) | | 2005 |
| Increase (Decrease) in Net Assets | | | | |
| Operations | | | | |
| Net investment income | | $ 23,914,697 | | $ 36,619,084 |
| Net realized gain (loss) | | (1,739,655) | | (3,684,213) |
| Change in net unrealized appreciation (depreciation) . | | (2,785,630) | | (23,367,389) |
| Net increase (decrease) in net assets resulting | | | | |
| from operations | | 19,389,412 | | 9,567,482 |
| Distributions to shareholders from net investment income . | | (25,162,238) | | (36,325,031) |
| Distributions to shareholders from net realized gain | | — | | (1,086,013) |
| Total distributions | | (25,162,238) | | (37,411,044) |
| Share transactions - net increase (decrease) | | 43,666,032 | | 27,080,998 |
| Total increase (decrease) in net assets | | 37,893,206 | | (762,564) |
| |
| Net Assets | | | | |
| Beginning of period | | 1,299,611,140 | | 1,300,373,704 |
| End of period (including undistributed net investment | | | | |
| income of $2,168,227 and undistributed net | | | | |
| investment income of $3,415,768, respectively) | | $ 1,337,504,346 | | $ 1,299,611,140 |
See accompanying notes which are an integral part of the financial statements.
49 Semiannual Report
| Financial Highlights Class A | | | | | | | | | | | | | | | | | | |
| | | Six months ended | | | | | | | | | | | | | | | | | | | | |
| | | April 30, 2006 | | Years ended October 31, |
| | | (Unaudited) | | 2005 | | 2004 | | 2003 | | | | 2002 | | 2001 |
| Selected Per Share Data | | | | | | | | | | | | | | | | | | | | | | | | |
| Net asset value, | | | | | | | | | | | | | | | | | | | | | | | | |
| beginning of period | | | | $ 9.39 | | | | $ 9.60 | | | | $ 9.55 | | | | $ 9.44 | | | | $ 9.49 | | | | $ 9.12 |
| Income from Investment | | | | | | | | | | | | | | | | | | | | | | | | |
| Operations | | | | | | | | | | | | | | | | | | | | | | | | |
| Net investment | | | | | | | | | | | | | | | | | | | | | | | | |
| incomeE | | | | .174 | | | | .281 | | | | .202 | | | | .261 | | | | .381H | | | | .523 |
| Net realized and un | | | | | | | | | | | | | | | | | | | | | | | | |
| realized gain (loss) | | | | (.031) | | | | (.204) | | | | .040 | | | | .128 | | | | (.034)H | | | | .386 |
| Total from investment | | | | | | | | | | | | | | | | | | | | | | | | |
| operations | | | | .143 | | | | .077 | | | | .242 | | | | .389 | | | | .347 | | | | .909 |
| Distributions from net | | | | | | | | | | | | | | | | | | | | | | | | |
| investment income | | | | (.183) | | | | (.279) | | | | (.192) | | | | (.279) | | | | (.397) | | | | (.539) |
| Distributions from net | | | | | | | | | | | | | | | | | | | | | | | | |
| realized gain | | | | — | | | | (.008) | | | | — | | | | — | | | | — | | | | — |
| Total distributions | | | | (.183) | | | | (.287) | | | | (.192) | | | | (.279) | | | | (.397) | | | | (.539) |
| Net asset value, | | | | | | | | | | | | | | | | | | | | | | | | |
| end of period | | | | $ 9.35 | | | | $ 9.39 | | | | $ 9.60 | | | | $ 9.55 | | | | $ 9.44 | | | | $ 9.49 |
| Total ReturnB,C,D | | | | 1.54% | | | | .81% | | | | 2.56% | | | | 4.16% | | | | 3.78% | | | | 10.22% |
| Ratios to Average Net AssetsF,G | | | | | | | | | | | | | | | | | | | | | | | | |
| Expenses before | | | | | | | | | | | | | | | | | | | | | | | | |
| reductions | | | | .79%A | | | | .85% | | | | .87% | | | | .81% | | | | .80% | | | | .85% |
| Expenses net of fee | | | | | | | | | | | | | | | | | | | | | | | | |
| waivers, if any | | | | .79%A | | | | .85% | | | | .87% | | | | .81% | | | | .80% | | | | .85% |
| Expenses net of all | | | | | | | | | | | | | | | | | | | | | | | | |
| reductions | | | | .79%A | | | | .85% | | | | .87% | | | | .81% | | | | .80% | | | | .84% |
| Net investment | | | | | | | | | | | | | | | | | | | | | | | | |
| income | | | | 3.75%A | | | | 2.96% | | | | 2.13% | | | | 2.74% | | | | 4.09%H | | | | 5.63% |
| Supplemental Data | | | | | | | | | | | | | | | | | | | | | | | | |
| Net assets, | | | | | | | | | | | | | | | | | | | | | | | | |
| end of period | | | | | | | | | | | | | | | | | | | | | | | | |
| (000 omitted) | | | | $381,517 | | | | $369,512 | | | | $357,760 | | | | $186,290 | | | | $106,018 | | | | $38,240 |
| Portfolio turnover rate | | | | 42%A | | | | 94% | | | | 87% | | | | 102% | | | | 111% | | | | 145% |
A Annualized
B Total returns for periods of less than one year are not annualized.
C Total returns would have been lower had certain expenses not been reduced during the periods shown.
D Total returns do not include the effect of the sales charges.
E Calculated based on average shares outstanding during the period.
F Amounts do not include the activity of the affiliated central fund.
G Expense ratios reflect operating expenses of the class. Expenses before reductions do not reflect amounts reimbursed by the investment adviser or expense
offset arrangements and do not represent the amount paid by the class during periods when reimbursements or reductions occur. Expenses net of fee
waivers reflect expenses after reimbursement by the investment adviser but prior to reductions from expense offset arrangements. Expenses net of all
reductions represent the net expenses paid by the class.
H Effective November 1, 2001, the fund adopted the provisions of the AICPA Audit and Accounting Guide for Investment Companies and began amortizing
premium and discount on all debt securities. Per share data and ratios for periods prior to adoption have not been restated to reflect this change.
|
See accompanying notes which are an integral part of the financial statements.
| Financial Highlights Class T | | | | | | | | | | | | | | | | | | |
| | | Six months ended | | | | | | | | | | | | | | | | | | | | |
| | | April 30, 2006 | | Years ended October 31, |
| | | (Unaudited) | | 2005 | | 2004 | | 2003 | | | | 2002 | | 2001 |
| Selected Per Share Data | | | | | | | | | | | | | | | | | | | | | | | | |
| Net asset value, | | | | | | | | | | | | | | | | | | | | | | | | |
| beginning of period | | | | $ 9.40 | | | | $ 9.60 | | | | $ 9.55 | | | | $ 9.45 | | | | $ 9.50 | | | | $ 9.13 |
| Income from Investment | | | | | | | | | | | | | | | | | | | | | | | | |
| Operations | | | | | | | | | | | | | | | | | | | | | | | | |
| Net investment | | | | | | | | | | | | | | | | | | | | | | | | |
| incomeE | | | | .176 | | | | .284 | | | | .207 | | | | .261 | | | | .381H | | | | .525 |
| Net realized and un | | | | | | | | | | | | | | | | | | | | | | | | |
| realized gain (loss) | | | | (.031) | | | | (.194) | | | | .038 | | | | .118 | | | | (.036)H | | | | .383 |
| Total from investment | | | | | | | | | | | | | | | | | | | | | | | | |
| operations | | | | .145 | | | | .090 | | | | .245 | | | | .379 | | | | .345 | | | | .908 |
| Distributions from net | | | | | | | | | | | | | | | | | | | | | | | | |
| investment income | | | | (.185) | | | | (.282) | | | | (.195) | | | | (.279) | | | | (.395) | | | | (.538) |
| Distributions from net | | | | | | | | | | | | | | | | | | | | | | | | |
| realized gain | | | | — | | | | (.008) | | | | — | | | | — | | | | — | | | | — |
| Total distributions | | | | (.185) | | | | (.290) | | | | (.195) | | | | (.279) | | | | (.395) | | | | (.538) |
| Net asset value, | | | | | | | | | | | | | | | | | | | | | | | | |
| end of period | | | | $ 9.36 | | | | $ 9.40 | | | | $ 9.60 | | | | $ 9.55 | | | | $ 9.45 | | | | $ 9.50 |
| Total ReturnB,C,D | | | | 1.55% | | | | .95% | | | | 2.59% | | | | 4.04% | | | | 3.75% | | | | 10.21% |
| Ratios to Average Net AssetsF,G | | | | | | | | | | | | | | | | | | | | | | | | |
| Expenses before | | | | | | | | | | | | | | | | | | | | | | | | |
| reductions | | | | .75%A | | | | .81% | | | | .83% | | | | .82% | | | | .82% | | | | .85% |
| Expenses net of fee | | | | | | | | | | | | | | | | | | | | | | | | |
| waivers, if any | | | | .75%A | | | | .81% | | | | .83% | | | | .82% | | | | .82% | | | | .85% |
| Expenses net of all | | | | | | | | | | | | | | | | | | | | | | | | |
| reductions | | | | .75%A | | | | .81% | | | | .83% | | | | .82% | | | | .82% | | | | .85% |
| Net investment | | | | | | | | | | | | | | | | | | | | | | | | |
| income | | | | 3.79%A | | | | 2.99% | | | | 2.16% | | | | 2.73% | | | | 4.07%H | | | | 5.62% |
| Supplemental Data | | | | | | | | | | | | | | | | | | | | | | | | |
| Net assets, | | | | | | | | | | | | | | | | | | | | | | | | |
| end of period | | | | | | | | | | | | | | | | | | | | | | | | |
| (000 omitted) | | | | $562,351 | | | | $544,662 | | | | $517,440 | | | | $468,931 | | | | $388,495 | | | | $309,958 |
| Portfolio turnover rate | | | | 42%A | | | | 94% | | | | 87% | | | | 102% | | | | 111% | | | | 145% |
A Annualized
B Total returns for periods of less than one year are not annualized.
C Total returns would have been lower had certain expenses not been reduced during the periods shown.
D Total returns do not include the effect of the sales charges.
E Calculated based on average shares outstanding during the period.
F Amounts do not include the activity of the affiliated central fund.
G Expense ratios reflect operating expenses of the class. Expenses before reductions do not reflect amounts reimbursed by the investment adviser or expense
offset arrangements and do not represent the amount paid by the class during periods when reimbursements or reductions occur. Expenses net of fee
waivers reflect expenses after reimbursement by the investment adviser but prior to reductions from expense offset arrangements. Expenses net of all
reductions represent the net expenses paid by the class.
H Effective November 1, 2001, the fund adopted the provisions of the AICPA Audit and Accounting Guide for Investment Companies and began amortizing
premium and discount on all debt securities. Per share data and ratios for periods prior to adoption have not been restated to reflect this change.
|
See accompanying notes which are an integral part of the financial statements.
51 Semiannual Report
| Financial Highlights Class B | | | | | | | | | | | | | | | | |
| | | Six months ended | | | | | | | | | | | | | | | | |
| | | April 30, 2006 | | Years ended October 31, |
| | | (Unaudited) | | 2005 | | 2004 | | 2003 | | | | 2002G |
| Selected Per Share Data | | | | | | | | | | | | | | | | | | | | |
| Net asset value, | | | | | | | | | | | | | | | | | | | | |
| beginning of period | | | | $ 9.41 | | | | $ 9.61 | | | | $ 9.56 | | | | $ 9.46 | | | | $ 9.43 |
| Income from Investment | | | | | | | | | | | | | | | | | | | | |
| Operations | | | | | | | | | | | | | | | | | | | | |
| Net investment incomeE | | | | .140 | | | | .210 | | | | .130 | | | | .183 | | | | .281I |
| Net realized and unrealized | | | | | | | | | | | | | | | | | | | | |
| gain (loss) | | | | (.032) | | | | (.194) | | | | .038 | | | | .120 | | | | (.234)I |
| Total from investment operations | | | | .108 | | | | .016 | | | | .168 | | | | .303 | | | | .047 |
| Distributions from net investment | | | | | | | | | | | | | | | | | | | | |
| income | | | | (.148) | | | | (.208) | | | | (.118) | | | | (.203) | | | | (.017) |
| Distributions from net realized | | | | | | | | | | | | | | | | | | | | |
| gain | | | | — | | | | (.008) | | | | — | | | | — | | | | — |
| Total distributions | | | | (.148) | | | | (.216) | | | | (.118) | | | | (.203) | | | | (.017) |
| Net asset value, | | | | | | | | | | | | | | | | | | | | |
| end of period | | | | $ 9.37 | | | | $ 9.41 | | | | $ 9.61 | | | | $ 9.56 | | | | $ 9.46 |
| Total ReturnB,C,D | | | | 1.15% | | | | .17% | | | | 1.77% | | | | 3.23% | | | | .50% |
| Ratios to Average Net AssetsF,H | | | | | | | | | | | | | | | | | | | | |
| Expenses before reductions | | | | 1.55%A | | | | 1.61% | | | | 1.63% | | | | 1.61% | | | | 1.86%A |
| Expenses net of fee waivers, | | | | | | | | | | | | | | | | | | | | |
| if any | | | | 1.55%A | | | | 1.60% | | | | 1.63% | | | | 1.61% | | | | 1.65%A |
| Expenses net of all reductions | | | | 1.54%A | | | | 1.60% | | | | 1.63% | | | | 1.61% | | | | 1.65%A |
| Net investment income | | | | 2.99%A | | | | 2.21% | | | | 1.36% | | | | 1.94% | | | | 3.59%A,I |
| Supplemental Data | | | | | | | | | | | | | | | | | | | | |
| Net assets, end of period | | | | | | | | | | | | | | | | | | | | |
| (000 omitted) | | | | $33,384 | | | | $39,190 | | | | $53,502 | | | | $49,353 | | | | $ 3,811 |
| Portfolio turnover rate | | | | 42%A | | | | 94% | | | | 87% | | | | 102% | | | | 111% |
A Annualized
B Total returns for periods of less than one year are not annualized.
C Total returns would have been lower had certain expenses not been reduced during the periods shown.
D Total returns do not include the effect of the contingent deferred sales charge.
E Calculated based on average shares outstanding during the period.
F Amounts do not include the activity of the affiliated central fund.
G For the period October 9, 2002 (commencement of sale of shares) to October 31, 2002.
H Expense ratios reflect operating expenses of the class. Expenses before reductions do not reflect amounts reimbursed by the investment adviser or expense
offset arrangements and do not represent the amount paid by the class during periods when reimbursements or reductions occur. Expense ratios before
reductions for start up periods may not be representative of longer term operating periods. Expenses net of fee waivers reflect expenses after reimburse
ment by the investment adviser but prior to reductions from expense offset arrangements. Expenses net of all reductions represent the net expenses paid
by the class.
I Effective November 1, 2001, the fund adopted the provisions of the AICPA Audit and Accounting Guide for Investment Companies and began amortizing
premium and discount on all debt securities. Per share data and ratios for periods prior to adoption have not been restated to reflect this change.
|
See accompanying notes which are an integral part of the financial statements.
| Financial Highlights Class C | | | | | | | | | | | | | | | | | | |
| | | Six months ended | | | | | | | | | | | | | | | | | | | | |
| | | April 30, 2006 | | Years ended October 31, |
| | | (Unaudited) | | 2005 | | 2004 | | 2003 | | | | 2002 | | 2001 |
| Selected Per Share Data | | | | | | | | | | | | | | | | | | | | | | | | |
| Net asset value, | | | | | | | | | | | | | | | | | | | | | | | | |
| beginning of period | | | | $ 9.40 | | | | $ 9.61 | | | | $ 9.55 | | | | $ 9.45 | | | | $ 9.50 | | | | $ 9.13 |
| Income from Investment | | | | | | | | | | | | | | | | | | | | | | | | |
| Operations | | | | | | | | | | | | | | | | | | | | | | | | |
| Net investment | | | | | | | | | | | | | | | | | | | | | | | | |
| incomeE | | | | .138 | | | | .206 | | | | .129 | | | | .182 | | | | .304H | | | | .448 |
| Net realized and un | | | | | | | | | | | | | | | | | | | | | | | | |
| realized gain (loss) | | | | (.032) | | | | (.204) | | | | .048 | | | | .118 | | | | (.037)H | | | | .383 |
| Total from investment | | | | | | | | | | | | | | | | | | | | | | | | |
| operations | | | | .106 | | | | .002 | | | | .177 | | | | .300 | | | | .267 | | | | .831 |
| Distributions from net | | | | | | | | | | | | | | | | | | | | | | | | |
| investment income | | | | (.146) | | | | (.204) | | | | (.117) | | | | (.200) | | | | (.317) | | | | (.461) |
| Distributions from net | | | | | | | | | | | | | | | | | | | | | | | | |
| realized gain | | | | — | | | | (.008) | | | | — | | | | — | | | | — | | | | — |
| Total distributions | | | | (.146) | | | | (.212) | | | | (.117) | | | | (.200) | | | | (.317) | | | | (.461) |
| Net asset value, | | | | | | | | | | | | | | | | | | | | | | | | |
| end of period | | | | $ 9.36 | | | | $ 9.40 | | | | $ 9.61 | | | | $ 9.55 | | | | $ 9.45 | | | | $ 9.50 |
| Total ReturnB,C,D | | | | 1.14% | | | | .02% | | | | 1.86% | | | | 3.19% | | | | 2.90% | | | | 9.30% |
| Ratios to Average Net AssetsF,G | | | | | | | | | | | | | | | | | | | | | | | | |
| Expenses before | | | | | | | | | | | | | | | | | | | | | | | | |
| reductions | | | | 1.59%A | | | | 1.64% | | | | 1.65% | | | | 1.64% | | | | 1.64% | | | | 1.68% |
| Expenses net of fee | | | | | | | | | | | | | | | | | | | | | | | | |
| waivers, if any | | | | 1.59%A | | | | 1.64% | | | | 1.65% | | | | 1.64% | | | | 1.64% | | | | 1.68% |
| Expenses net of all | | | | | | | | | | | | | | | | | | | | | | | | |
| reductions | | | | 1.58%A | | | | 1.64% | | | | 1.65% | | | | 1.64% | | | | 1.63% | | | | 1.68% |
| Net investment | | | | | | | | | | | | | | | | | | | | | | | | |
| income | | | | 2.95%A | | | | 2.16% | | | | 1.34% | | | | 1.91% | | | | 3.25%H | | | | 4.80% |
| Supplemental Data | | | | | | | | | | | | | | | | | | | | | | | | |
| Net assets, | | | | | | | | | | | | | | | | | | | | | | | | |
| end of period | | | | | | | | | | | | | | | | | | | | | | | | |
| (000 omitted) | | | | $160,448 | | | | $194,992 | | | | $273,166 | | | | $359,779 | | | | $283,046 | | | | $99,486 |
| Portfolio turnover rate | | | | 42%A | | | | 94% | | | | 87% | | | | 102% | | | | 111% | | | | 145% |
A Annualized
B Total returns for periods of less than one year are not annualized.
C Total returns would have been lower had certain expenses not been reduced during the periods shown.
D Total returns do not include the effect of the contingent deferred sales charge.
E Calculated based on average shares outstanding during the period.
F Amounts do not include the activity of the affiliated central fund.
G Expense ratios reflect operating expenses of the class. Expenses before reductions do not reflect amounts reimbursed by the investment adviser or expense
offset arrangements and do not represent the amount paid by the class during periods when reimbursements or reductions occur. Expenses net of fee
waivers reflect expenses after reimbursement by the investment adviser but prior to reductions from expense offset arrangements. Expenses net of all
reductions represent the net expenses paid by the class.
H Effective November 1, 2001, the fund adopted the provisions of the AICPA Audit and Accounting Guide for Investment Companies and began amortizing
premium and discount on all debt securities. Per share data and ratios for periods prior to adoption have not been restated to reflect this change.
|
See accompanying notes which are an integral part of the financial statements.
53 Semiannual Report
| Financial Highlights Institutional Class | | | | | | | | | | | | |
| | | Six months ended | | | | | | | | | | | | | | | | | | | | |
| | | April 30, 2006 | | Years ended October 31, |
| | | (Unaudited) | | 2005 | | 2004 | | 2003 | | | | 2002 | | 2001 |
| Selected Per Share Data | | | | | | | | | | | | | | | | | | | | | | | | |
| Net asset value, | | | | | | | | | | | | | | | | | | | | | | | | |
| beginning of period | | | | $ 9.40 | | | | $ 9.60 | | | | $ 9.55 | | | | $ 9.45 | | | | $ 9.50 | | | | $ 9.13 |
| Income from Investment | | | | | | | | | | | | | | | | | | | | | | | | |
| Operations | | | | | | | | | | | | | | | | | | | | | | | | |
| Net investment | | | | | | | | | | | | | | | | | | | | | | | | |
| incomeD | | | | .184 | | | | .301 | | | | .225 | | | | .278 | | | | .397G | | | | .540 |
| Net realized and un | | | | | | | | | | | | | | | | | | | | | | | | |
| realized gain (loss) | | | | (.031) | | | | (.194) | | | | .038 | | | | .119 | | | | (.043)G | | | | .387 |
| Total from investment | | | | | | | | | | | | | | | | | | | | | | | | |
| operations | | | | .153 | | | | .107 | | | | .263 | | | | .397 | | | | .363 | | | | .927 |
| Distributions from net | | | | | | | | | | | | | | | | | | | | | | | | |
| investment income | | | | (.193) | | | | (.299) | | | | (.213) | | | | (.297) | | | | (.413) | | | | (.557) |
| Distributions from net | | | | | | | | | | | | | | | | | | | | | | | | |
| realized gain | | | | — | | | | (.008) | | | | — | | | | — | | | | — | | | | — |
| Total distributions | | | | (.193) | | | | (.307) | | | | (.213) | | | | (.297) | | | | (.413) | | | | (.557) |
| Net asset value, | | | | | | | | | | | | | | | | | | | | | | | | |
| end of period | | | | $ 9.36 | | | | $ 9.40 | | | | $ 9.60 | | | | $ 9.55 | | | | $ 9.45 | | | | $ 9.50 |
| Total ReturnB,C | | | | 1.64% | | | | 1.14% | | | | 2.78% | | | | 4.24% | | | | 3.95% | | | | 10.43% |
| Ratios to Average Net AssetsE,F | | | | | | | | | | | | | | | | | | | | | | | | |
| Expenses before | | | | | | | | | | | | | | | | | | | | | | | | |
| reductions | | | | .58%A | | | | .63% | | | | .64% | | | | .63% | | | | .64% | | | | .66% |
| Expenses net of fee | | | | | | | | | | | | | | | | | | | | | | | | |
| waivers, if any | | | | .58%A | | | | .63% | | | | .64% | | | | .63% | | | | .64% | | | | .66% |
| Expenses net of all | | | | | | | | | | | | | | | | | | | | | | | | |
| reductions | | | | .58%A | | | | .63% | | | | .64% | | | | .63% | | | | .63% | | | | .66% |
| Net investment | | | | | | | | | | | | | | | | | | | | | | | | |
| income | | | | 3.96%A | | | | 3.18% | | | | 2.35% | | | | 2.92% | | | | 4.25%G | | | | 5.81% |
| Supplemental Data | | | | | | | | | | | | | | | | | | | | | | | | |
| Net assets, | | | | | | | | | | | | | | | | | | | | | | | | |
| end of period | | | | | | | | | | | | | | | | | | | | | | | | |
| (000 omitted) | | | | $199,805 | | | | $151,257 | | | | $98,505 | | | | $91,138 | | | | $65,330 | | | | $23,301 |
| Portfolio turnover | | | | | | | | | | | | | | | | | | | | | | | | |
| rate | | | | 42%A | | | | 94% | | | | 87% | | | | 102% | | | | 111% | | | | 145% |
A Annualized
B Total returns for periods of less than one year are not annualized.
C Total returns would have been lower had certain expenses not been reduced during the periods shown.
D Calculated based on average shares outstanding during the period.
E Amounts do not include the activity of the affiliated central fund.
F Expense ratios reflect operating expenses of the class. Expenses before reductions do not reflect amounts reimbursed by the investment adviser or expense
offset arrangements and do not represent the amount paid by the class during periods when reimbursements or reductions occur. Expenses net of fee
waivers reflect expenses after reimbursement by the investment adviser but prior to reductions from expense offset arrangements. Expenses net of all
reductions represent the net expenses paid by the class.
G Effective November 1, 2001, the fund adopted the provisions of the AICPA Audit and Accounting Guide for Investment Companies and began amortizing
premium and discount on all debt securities. Per share data and ratios for periods prior to adoption have not been restated to reflect this change.
|
See accompanying notes which are an integral part of the financial statements.
Notes to Financial Statements
For the period ended April 30, 2006 (Unaudited)
1. Significant Accounting Policies.
Fidelity Advisor Short Fixed Income Fund (the fund) is a fund of Fidelity Advisor Series II (the trust) and is authorized to issue an unlimited number of shares. The trust is regis tered under the Investment Company Act of 1940, as amended (the 1940 Act), as an open end management investment company organized as a Massachusetts business trust.
The fund offers Class A, Class T, Class B, Class C, and Institutional Class shares, each of which has equal rights as to assets and voting privileges. Each class has exclusive voting rights with respect to matters that affect that class. Class B shares will automatically convert to Class A shares after a holding period of four years from the initial date of purchase. Investment income, realized and unrealized capital gains and losses, the common expenses of the fund, and certain fund level expense reductions, if any, are allocated on a pro rata basis to each class based on the relative net assets of each class to the total net assets of the fund. Each class differs with respect to transfer agent and distribution and service plan fees incurred. Certain expense reductions also differ by class.
The fund may invest in affiliated money market central funds (Money Market Central Funds), and fixed income Central Investment Portfolios (CIPs), collectively referred to as Central Funds, which are open end investment companies available to investment companies and other accounts managed by Fidelity Management & Research Company (FMR) and its affiliates. The financial statements have been prepared in conformity with accounting principles generally accepted in the United States of America, which require management to make certain estimates and assumptions at the date of the financial statements. The following summarizes the significant accounting policies of the fund, which are also consistently followed by the Central Funds:
Security Valuation. Investments are valued and net asset value per share is calculated (NAV calculation) as of the close of business of the New York Stock Exchange, normally 4:00 p.m. Eastern time. Wherever possible, the fund uses independent pricing services approved by the Board of Trustees to value its investments. Debt securities, including restricted securities, for which quotations are readily available, are valued by indepen dent pricing services or by dealers who make markets in such securities. Pricing services consider yield or price of bonds of comparable quality, coupon, maturity and type as well as dealer supplied prices. When current market prices or quotations are not readily available or do not accurately reflect fair value, valuations may be determined in accor dance with procedures adopted by the Board of Trustees. The frequency of when fair value pricing is used is unpredictable. The value of securities used for NAV calculation under fair value pricing may differ from published prices for the same securities. Invest ments in open end mutual funds, including Central Funds, are valued at their closing net asset value each business day. Short term securities with remaining maturities of sixty days or less for which quotations are not readily available are valued at amortized cost, which approximates value.
55 Semiannual Report
| Notes to Financial Statements (Unaudited) continued |
1. Significant Accounting Policies continued |
Investment Transactions and Income. Security transactions, including the fund’s investment activity in the Central Funds, are accounted for as of trade date. Gains and losses on securities sold are determined on the basis of identified cost. Distributions received on securities that represent a return of capital or capital gain are recorded as a reduction of cost of investments and/or as a realized gain. Interest income and distribu tions from the Central Funds are accrued as earned. Interest income includes coupon interest and amortization of premium and accretion of discount on debt securities. Invest ment income is recorded net of foreign taxes withheld where recovery of such taxes is uncertain. Debt obligations may be placed on non accrual status and related interest income may be reduced by ceasing current accruals and writing off interest receivables when the collection of all or a portion of interest has become doubtful based on consis tently applied procedures. A debt obligation is removed from non accrual status when the issuer resumes interest payments or when collectibility of interest is reasonably assured.
Expenses. Most expenses of the trust can be directly attributed to a fund. Expenses which cannot be directly attributed are apportioned among each fund in the trust.
Income Tax Information and Distributions to Shareholders. Each year, the fund intends to qualify as a regulated investment company by distributing all of its taxable income and realized gains under Subchapter M of the Internal Revenue Code. As a result, no provision for income taxes is required in the accompanying financial statements. Foreign taxes are provided for based on the fund’s understanding of the tax rules and rates that exist in the foreign markets in which it invests.
Dividends are declared daily and paid monthly from net investment income. Distribu tions from realized gains, if any, are recorded on the ex dividend date. Income dividends and capital gain distributions are declared separately for each class. Income and capital gain distributions are determined in accordance with income tax regulations, which may differ from generally accepted accounting principles. In addition, the fund claimed a portion of the payment made to redeeming shareholders as a distribution for income tax purposes.
Capital accounts within the financial statements are adjusted for permanent book tax differences. These adjustments have no impact on net assets or the results of operations. Temporary book tax differences will reverse in a subsequent period.
Book tax differences are primarily due to futures transactions, swap agreements, prior period premium and discount on debt securities, market discount, deferred trustees compensation, financing transactions, capital loss carryforwards, and losses deferred due to wash sales.
| 1. Significant Accounting Policies continued | | |
Income Tax Information and Distributions to Shareholders continued |
The federal tax cost of investments and unrealized appreciation (depreciation) as of period end were as follows:
| Unrealized appreciation | | | | $ 2,990,386 |
| Unrealized depreciation | | | | (17,258,549) |
| Net unrealized appreciation (depreciation) | | | | $ (14,268,163) |
| Cost for federal income tax purposes | | | | $ 1,355,356,818 |
| |
| 2. Operating Policies. | | | | |
Repurchase Agreements. FMR has received an Exemptive Order from the Securities and Exchange Commission (the SEC) which permits the fund and other affiliated entities of FMR to transfer uninvested cash balances into joint trading accounts which are then invested in repurchase agreements. The fund may also invest directly with institutions in repurchase agreements. Repurchase agreements are collateralized by government or non government securities. Upon settlement date, collateral is held in segregated accounts with custodian banks and may be obtained in the event of a default of the counterparty. The fund monitors, on a daily basis, the value of the collateral to ensure it is at least equal to the principal amount of the repurchase agreement (including accrued interest). In the event of a default by the counterparty, realization of the collateral proceeds could be delayed, during which time the value of the collateral may decline.
Delayed Delivery Transactions and When Issued Securities. The fund may purchase or sell securities on a delayed delivery or when issued basis. Payment and delivery may take place after the customary settlement period for that security. The price of the underlying securities and the date when the securities will be delivered and paid for are fixed at the time the transaction is negotiated. During the time a delayed delivery sell is outstanding, the contract is marked to market daily and equivalent deliverable securities are held for the transaction. The value of the securities purchased on a delayed delivery or when issued basis are identified as such in the fund’s Schedule of Investments. The fund may receive compensation for interest forgone in the purchase of a delayed delivery or when issued security. With respect to purchase commitments, the fund identifies securities as segregated in its records with a value at least equal to the amount of the commitment. Losses may arise due to changes in the value of the underly ing securities or if the counterparty does not perform under the contract’s terms, or if the issuer does not issue the securities due to political, economic, or other factors.
57 Semiannual Report
| Notes to Financial Statements (Unaudited) continued |
2. Operating Policies continued | | |
Futures Contracts. The fund may use futures contracts to manage its exposure to the bond market and to fluctuations in interest rates. Buying futures tends to increase a fund’s exposure to the underlying instrument, while selling futures tends to decrease a fund’s exposure to the underlying instrument or hedge other fund investments. Upon entering into a futures contract, a fund is required to deposit with a clearing broker, no later than the following business day, an amount (“initial margin”) equal to a certain percentage of the face value of the contract. The initial margin may be in the form of cash or securities and is transferred to a segregated account on settlement date. Subsequent payments (“variation margin”) are made or received by a fund depending on the daily fluctuations in the value of the futures contract and are accounted for as unrealized gains or losses. Realized gains (losses) are recorded upon the expiration or closing of the futures contract. Securities deposited to meet margin requirements are identified in the Schedule of Investments. Futures contracts involve, to varying degrees, risk of loss in excess of any futures variation margin reflected in the Statement of Assets and Liabilities. The underly ing face amount at value of any open futures contracts at period end is shown in the Schedule of Investments under the caption “Futures Contracts.” This amount reflects each contract’s exposure to the underlying instrument at period end. Losses may arise from changes in the value of the underlying instruments or if the counterparties do not perform under the contract’s terms. Futures contracts are valued at the settlement price established each day by the board of trade or exchange on which they are traded.
Restricted Securities. The fund may invest in securities that are subject to legal or contractual restrictions on resale. These securities generally may be resold in transac tions exempt from registration or to the public if the securities are registered. Disposal of these securities may involve time consuming negotiations and expense, and prompt sale at an acceptable price may be difficult. Information regarding restricted securities is included at the end of the fund’s Schedule of Investments.
Swap Agreements. The fund may invest in swaps for the purpose of managing its exposure to interest rate, credit or market risk.
Total return swaps are agreements to exchange the return generated by one instrument or index for the return generated by another instrument, for example, the agreement to pay interest in exchange for a market linked return based on a notional amount. To the extent the total return of the index exceeds the offsetting interest obligation, a fund will receive a payment from the counterparty. To the extent it is less, a fund will make a payment to the counterparty. Periodic payments received or made by the fund are recorded in the accompanying Statement of Operations as realized gains or losses, respectively.
2. Operating Policies continued
Swap Agreements continued
Credit default swaps involve the exchange of a fixed rate premium for protection against the loss in value of an underlying debt instrument in the event of a defined credit event (such as payment default or bankruptcy). Under the terms of the swap, one party acts as a “guarantor” receiving a periodic payment that is a fixed percentage applied to a notional principal amount. In return the party agrees to purchase the notional amount of the underlying instrument, at par, if a credit event occurs during the term of the swap. The fund may enter into credit default swaps in which either it or its counterparty act as guarantors. By acting as the guarantor of a swap, a fund assumes the market and credit risk of the underlying instrument including liquidity and loss of value. Periodic payments and premiums received or made by the fund are recorded in the accompanying State ment of Operations as realized gains or losses, respectively.
Swaps are marked to market daily based on dealer supplied valuations and changes in value are recorded as unrealized appreciation (depreciation). Gains or losses are realized upon early termination of the swap agreement. Collateral, in the form of cash or securities, may be required to be held in segregated accounts with a fund’s custodian in compliance with swap contracts. Risks may exceed amounts recognized on the State ment of Assets and Liabilities. These risks include changes in the returns of the underly ing instruments, failure of the counterparties to perform under the contracts’ terms and the possible lack of liquidity with respect to the swap agreements. Details of swap agreements open at period end are included in the fund’s Schedule of Investments under the caption “Swap Agreements.”
Mortgage Dollar Rolls. To earn additional income, the fund may employ trading strategies which involve the sale and simultaneous agreement to repurchase similar securities (“mortgage dollar rolls”) or the purchase and simultaneous agreement to sell similar securities (“reverse mortgage dollar rolls”). The securities traded are mortgage securities and bear the same interest rate but may be collateralized by different pools of mortgages. During the period between the sale and repurchase in a mortgage dollar roll transaction, a fund will not be entitled to receive interest and principal payments on the securities sold but will invest the proceeds of the sale in other securities which may enhance the yield and total return. In addition, the difference between the sale price and the future purchase price is recorded as an adjustment to investment income. During the period between the purchase and subsequent sale in a reverse mortgage dollar roll transaction a fund is entitled to interest and principal payments on the securities purchased. The price differential between the purchase and sale is recorded as an adjustment to investment income. Losses may arise due to changes in the value of
59 Semiannual Report
| Notes to Financial Statements (Unaudited) continued |
2. Operating Policies continued | | |
Mortgage Dollar Rolls continued | | |
the securities or if the counterparty does not perform under the terms of the agreement. If the counterparty files for bankruptcy or becomes insolvent, a fund’s right to repurchase or sell securities may be limited.
3. Purchases and Sales of Investments.
Purchases and sales of securities, other than short term securities and U.S. government securities, aggregated $127,678,207 and $128,701,256, respectively.
4. Fees and Other Transactions with Affiliates.
Management Fee. FMR and its affiliates provide the fund with investment manage ment related services for which the fund pays a monthly management fee. The manage ment fee is the sum of an individual fund fee rate that is based on an annual rate of .20% of the fund’s average net assets and a group fee rate that averaged .12% during the period. The group fee rate is based upon the average net assets of all the mutual funds advised by FMR. The group fee rate decreases as assets under management increase and increases as assets under management decrease. For the period, the total annualized management fee rate was .32% of the fund’s average net assets.
Distribution and Service Plan. In accordance with Rule 12b 1 of the 1940 Act, the fund has adopted separate Distribution and Service Plans for each class of shares. Certain classes pay Fidelity Distributors Corporation (FDC), an affiliate of FMR, separate Distribution and Service Fees, each of which is based on an annual percentage of each class’ average net assets. In addition FDC may pay financial intermediaries for selling shares of the fund and providing shareholder support services. For the period, the Distribution and Service Fee rates and the total amounts paid to and retained by FDC were as follows:
| | | Distribution | | Service | | | | Paid to | | | | Retained |
| | | Fee | | Fee | | | | FDC | | | | by FDC |
| Class A | | 0% | | .15% | | | | $ 282,934 | | | | $ 4,688 |
| Class T | | 0% | | .15% | | | | 412,629 | | | | 6,349 |
| Class B | | .65% | | .25% | | | | 164,507 | | | | 119,280 |
| Class C | | .75% | | .25% | | | | 881,711 | | | | 90,668 |
| | | | | | | | | $ 1,741,781 | | | | $ 220,985 |
4. Fees and Other Transactions with Affiliates continued
Sales Load. FDC receives a front end sales charge of up to 1.50% for selling Class A and Class T shares, some of which is paid to financial intermediaries for selling shares of the fund. FDC receives the proceeds of a contingent deferred sales charges levied on Class A, Class T, Class B and Class C redemptions. These charges depend on the holding period. The deferred sales charges range from 3% to 1% for Class B, 1% for Class C, 75% to .50% for certain purchases of Class A shares (.25% prior to February 24, 2006) and .25% for certain purchases of Class T shares.
| For the period, sales charge amounts retained by FDC were as follows: | | |
| |
| | | | | Retained |
| | | | | by FDC |
| Class A | | | | $ 20,077 |
| Class T | | | | 9,805 |
| Class B* | | | | 33,818 |
| Class C* | | | | 11,976 |
| | | | | $ 75,676 |
| * | When Class B and Class C shares are initially sold, FDC pays commissions from its own resources to financial intermediaries through which the sales are made. |
| |
Transfer Agent Fees. Fidelity Investments Institutional Operations Company, Inc. (FIIOC), an affiliate of FMR, is the transfer, dividend disbursing and shareholder servic ing agent for each class of the fund. FIIOC receives account fees and asset based fees that vary according to the account size and type of account of the shareholders of the respective classes of the fund. FIIOC pays for typesetting, printing and mailing of share holder reports, except proxy statements. For the period the total transfer agent fees paid by each class to FIIOC, were as follows:
| | | | | | | % of |
| | | | | | | Average |
| | | | | Amount | | Net Assets |
| Class A | | | | $ 473,655 | | .25* |
| Class T | | | | 586,692 | | .22* |
| Class B | | | | 46,159 | | .25* |
| Class C | | | | 168,923 | | .19* |
| Institutional Class | | | | 172,096 | | .20* |
| | | | | $ 1,447,525 | | |
| * Annualized | | | | | | |
61 Semiannual Report
| Notes to Financial Statements (Unaudited) continued |
| 4. Fees and Other Transactions with Affiliates continued |
Accounting Fees. Fidelity Service Company, Inc. (FSC), an affiliate of FMR, maintains the fund’s accounting records. The fee is based on the level of average net assets for the month.
Affiliated Central Funds. The fund may invest in Money Market Central Funds which seek preservation of capital and current income and are managed by Fidelity Investments Money Management, Inc. (FIMM), an affiliate of FMR.
The fund may also invest in CIPs managed by FIMM. The Ultra Short Central Fund seeks to obtain a high level of current income consistent with preservation of capital by investing in U.S. dollar denominated money market and investment grade debt securities.
The fund’s Schedule of Investments lists the CIP as an investment of the fund but does not include the underlying holdings of the CIP. Based on its investment objectives, the CIP may invest or participate in various investment vehicles or strategies that are similar to those of the investing fund. These strategies are consistent with the investment objectives of the fund and may involve certain economic risks, including the risk that a counterparty to one or more of these transactions may be unable or unwilling to comply with the terms of the governing agreement. This may result in a decline in value of the CIP and the fund.
A complete unaudited list of holdings for the CIP, as of the fund’s report date, is available upon request or at advisor.fidelity.com. The reports are located just after the fund’s financial statements and quarterly reports but are not part of the financial statements or quarterly reports. In addition, the CIP’s financial statements are available on the EDGAR Database on the SEC’s web site, www.sec.gov, or upon request.
The Central Funds do not pay a management fee.
5. Committed Line of Credit.
|
The fund participates with other funds managed by FMR in a $4.2 billion credit facility (the “line of credit”) to be utilized for temporary or emergency purposes to fund share holder redemptions or for other short term liquidity purposes. The fund has agreed to pay commitment fees on its pro rata portion of the line of credit, which amounts to $1,280 and is reflected in Miscellaneous Expense on the Statement of Operations. During the period, there were no borrowings on this line of credit.
Through arrangements with the fund’s custodian, credits realized as a result of unin vested cash balances were used to reduce the fund’s expenses. During the period, these credits reduced the fund’s custody expenses by $10,330.
The fund’s organizational documents provide former and current trustees and officers with a limited indemnification against liabilities arising in connection with the perfor mance of their duties to the fund. In the normal course of business, the fund may also enter into contracts that provide general indemnifications. The fund’s maximum exposure under these arrangements is unknown as this would be dependent on future claims that may be made against the fund. The risk of material loss from such claims is considered remote.
| 8. Distributions to Shareholders. | | | | | | |
| |
Distributions to shareholders of each class were as follows:
| | | | |
| | | | | Six months ended | | | | Year ended |
| | | | | April 30, 2006 | | | | October 31, 2005 |
| From net investment income | | | | | | | | |
| Class A | | | | $ 7,370,436 | | | | $ 10,743,507 |
| Class T | | | | 10,839,851 | | | | 15,909,371 |
| Class B | | | | 577,640 | | | | 982,753 |
| Class C | | | | 2,754,999 | | | | 4,841,882 |
| Institutional Class | | | | 3,619,312 | | | | 3,847,518 |
| Total | | | | $ 25,162,238 | | | | $ 36,325,031 |
| From net realized gain | | | | | | | | |
| Class A | | | | $ — | | | | $ 299,982 |
| Class T | | | | — | | | | 436,716 |
| Class B | | | | — | | | | 43,394 |
| Class C | | | | — | | | | 219,150 |
| Institutional Class | | | | — | | | | 86,771 |
| Total | | | | $ — | | | | $ 1,086,013 |
63 Semiannual Report
Notes to Financial Statements (Unaudited) continued
| 9. Share Transactions. | | | | | | | | | | |
| |
Transactions for each class of shares were as follows:
| | | | | | | | |
| | | Shares | | | | Dollars |
| | | Six months ended | | Year ended | | | | Six months ended | | | | Year ended |
| | | April 30, 2006 | | October 31, 2005 | | | | April 30, 2006 | | | | October 31, 2005 |
| Class A | | | | | | | | | | | | |
| Shares sold | | 8,453,364 | | 15,866,789 | | | | $ 79,269,029 | | | | $ 150,493,785 |
| Reinvestment of | | | | | | | | | | | | |
| distributions | | 693,838 | | 1,023,632 | | | | 6,502,629 | | | | 9,698,542 |
| Shares redeemed | | (7,691,575) | | (14,827,970) | | | | (72,097,291) | | | | (140,591,886) |
| Net increase (decrease) | | 1,455,627 | | 2,062,451 | | | | $ 13,674,367 | | | | $ 19,600,441 |
| Class T | | | | | | | | | | | | |
| Shares sold | | 12,244,791 | | 25,539,658 | | | | $ 114,899,538 | | | | $ 242,408,838 |
| Reinvestment of | | | | | | | | | | | | |
| distributions | | 1,026,593 | | 1,515,180 | | | | 9,629,269 | | | | 14,364,388 |
| Shares redeemed | | (11,128,237) | | (22,986,919) | | | | (104,426,967) | | | | (218,160,605) |
| Net increase (decrease) | | 2,143,147 | | 4,067,919 | | | | $ 20,101,840 | | | | $ 38,612,621 |
| Class B | | | | | | | | | | | | |
| Shares sold | | 294,357 | | 991,898 | | | | $ 2,766,905 | | | | $ 9,428,825 |
| Reinvestment of | | | | | | | | | | | | |
| distributions | | 52,497 | | 89,903 | | | | 492,980 | | | | 853,530 |
| Shares redeemed | | (948,583) | | (2,482,456) | | | | (8,909,154) | | | | (23,589,493) |
| Net increase (decrease) | | (601,729) | | (1,400,655) | | | | $ (5,649,269) | | | | $ (13,307,138) |
| Class C | | | | | | | | | | | | |
| Shares sold | | 1,393,282 | | 3,789,292 | | | | $ 13,077,563 | | | | $ 35,934,636 |
| Reinvestment of | | | | | | | | | | | | |
| distributions | | 185,746 | | 341,788 | | | | 1,742,905 | | | | 3,242,233 |
| Shares redeemed | | (5,179,396) | | (11,828,809) | | | | (48,619,236) | | | | (112,353,549) |
| Net increase (decrease) | | (3,600,368) | | (7,697,729) | | | | $ (33,798,768) | | | | $ (73,176,680) |
| Institutional Class | | | | | | | | | | | | |
| Shares sold | | 7,310,780 | | 9,882,466 | | | | $ 68,610,370 | | | | $ 93,788,947 |
| Reinvestment of | | | | | | | | | | | | |
| distributions | | 317,212 | | 310,507 | | | | 2,975,026 | | | | 2,942,021 |
| Shares redeemed | | (2,368,873) | | (4,357,149) | | | | (22,247,534) | | | | (41,379,214) |
| Net increase (decrease) | | 5,259,119 | | 5,835,824 | | | | $ 49,337,862 | | | | $ 55,351,754 |
Board Approval of Investment Advisory Contracts and Management Fees
Advisor Short Fixed Income Fund
On January 19, 2006, the Board of Trustees, including the Independent Trustees (together, the Board), voted to approve a general research services agreement (the Agreement) between FMR, FMR Co., Inc. (FMRC), Fidelity Investments Money Manage ment, Inc. (FIMM), and Fidelity Research & Analysis Company (FRAC) (together, the Investment Advisers) for the fund, effective January 20, 2006, pursuant to which FRAC may provide general research and investment advisory support services to FMRC and FIMM. The Board considered that it has approved previously various sub advisory agreements for the fund with affiliates of FMR that allow FMR to obtain research, non discretionary advice, or discretionary portfolio management at no additional expense to the fund. The Board, assisted by the advice of fund counsel and independent Trustees’ counsel, considered a broad range of information and determined that it would be beneficial for the fund to access the research and investment advisory support services supplied by FRAC at no additional expense to the fund.
The Board reached this determination in part because the new arrangement will involve no changes in (i) the contractual terms of and fees payable under the fund’s manage ment contract or sub advisory agreements; (ii) the investment process or strategies employed in the management of the fund’s assets; (iii) the nature or level of services provided under the fund’s management contract or sub advisory agreements; (iv) the day to day management of the fund or the persons primarily responsible for such man agement; or (v) the ultimate control or beneficial ownership of FMR, FMRC, or FIMM. The Board also considered that the establishment of the Agreement would not necessi tate prior shareholder approval of the Agreement or result in an assignment and termination of the fund’s management contract or sub advisory agreements under the Investment Company Act of 1940.
Because the Board was approving an arrangement with FRAC under which the fund will not bear any additional management fees or expenses and under which the fund’s portfolio manager would not change, it did not consider the fund’s investment perfor mance, competitiveness of management fee and total expenses, costs of services and profitability, or economies of scale to be significant factors in its decision.
In connection with its future renewal of the fund’s management contract and sub advisory agreements, the Board will consider: (i) the nature, extent, and quality of services provided to the fund, including shareholder and administrative services and investment performance; (ii) the competitiveness of the fund’s management fee and total expenses; (iii) the costs of the services and profitability, including the revenues earned and the expenses incurred by Fidelity in conducting the business of developing, marketing, distributing, managing, administering, and servicing the fund and its shareholders; and (iv) whether there have been economies of scale in respect of the management of the Fidelity funds, whether the Fidelity funds (including the fund) have
65 Semiannual Report
Board Approval of Investment Advisory Contracts and Management Fees continued
appropriately benefited from any such economies of scale, and whether there is potential for realization of any further economies.
Based on its evaluation of all of the conclusions noted above, and after considering all material factors, the Board ultimately concluded that the fund’s Agreement is fair and reasonable, and that the fund’s Agreement should be approved.
67 Semiannual Report
Investment Adviser
Fidelity Management & Research Company
Boston, MA
Investment Sub Advisers
Fidelity Management &
Research (U.K.) Inc.
Fidelity Research & Analysis Company
(formerly Fidelity Management &
Research (Far East) Inc.)
Fidelity Investments Japan Limited
Fidelity Investments Money
Management, Inc.
Fidelity International
Investment Advisors
Fidelity International
Investment Advisors (U.K.) Limited
General Distributor
Fidelity Distributors Corporation
Boston, MA
Transfer and Service Agents
Fidelity Investments Institutional
Operations Company, Inc.
Boston, MA
Fidelity Service Company, Inc.
Boston, MA
Custodian
The Bank of New York
New York, NY
|
SFI-USAN-0606
1.784905.103
|


Fidelity® Advisor
Short Fixed-Income
Fund - Institutional Class
|
| | Semiannual Report
April 30, 2006
|

| Contents | | | | |
| |
| Chairman’s Message | | 3 | | Ned Johnson’s message to shareholders. |
| Shareholder Expense | | 4 | | An example of shareholder expenses. |
| Example | | | | |
| Investment Changes | | 6 | | A summary of major shifts in the fund’s |
| | | | | investments over the past six months. |
| Investments | | 7 | | A complete list of the fund’s investments |
| | | | | with their market values. |
| Financial Statements | | 46 | | Statements of assets and liabilities, |
| | | | | operations, and changes in net assets, |
| | | | | as well as financial highlights. |
| Notes | | 55 | | Notes to the financial statements. |
| Board Approval of | | 65 | | |
| Investment Advisory | | | | |
| Contracts and | | | | |
| Management Fees | | | | |
To view a fund’s proxy voting guidelines and proxy voting record for the 12 month period ended
June 30, visit www.fidelity.com/proxyvotingresults or visit the Securities and Exchange Commis
sion’s (SEC) web site at www.sec.gov. You may also call 1-877-208-0098 to request a free copy of
the proxy voting guidelines.
Standard & Poor’s, S&P and S&P 500 are registered service marks of The McGraw Hill Companies,
Inc. and have been licensed for use by Fidelity Distributors Corporation.
Other third party marks appearing herein are the property of their respective owners.
All other marks appearing herein are registered or unregistered trademarks or service marks
of FMR Corp. or an affiliated company.
|
| | This report and the financial statements contained herein are submitted for the general information
of the shareholders of the fund. This report is not authorized for distribution to prospective investors
in the fund unless preceded or accompanied by an effective prospectus.
A fund files its complete schedule of portfolio holdings with the SEC for the first and third
quarters of each fiscal year on Form N Q. Forms N Q are available on the SEC’s web site at
http://www.sec.gov. A fund’s Forms N Q may be reviewed and copied at the SEC’s Public
Reference Room in Washington, DC. Information regarding the operation of the SEC’s Public
Reference Room may be obtained by calling 1-800-SEC-0330. For a complete list of a fund’s port
folio holdings, view the most recent quarterly holdings report, semiannual report, or annual
report on Fidelity’s web site at http://www.advisor.fidelity.com.
NOT FDIC INSURED · MAY LOSE VALUE · NO BANK GUARANTEE
Neither the fund nor Fidelity Distributors Corporation is a bank.
|
Chairman’s Message
(photograph of Edward C. Johnson 3d)
Dear Shareholder:
Although many securities markets made gains in early 2006, there is only one certainty when it comes to investing: There is no sure thing. There are, however, a number of time tested, fundamental investment principles that can put the historical odds in your favor.
One of the basic tenets is to invest for the long term. Over time, riding out the markets’ inevitable ups and downs has proven much more effective than selling into panic or chasing the hottest trend. Even missing only a few of the markets’ best days can significantly diminish investor returns. Patience also affords the benefits of compounding of earning interest on additional income or reinvested dividends and capital gains. There are tax advantages and cost benefits to consider as well. The more you sell, the more taxes you pay, and the more you trade, the higher the costs. While staying the course doesn’t eliminate risk, it can considerably lessen the effect of short term declines.
You can further manage your investing risk through diversification. And today, more than ever, geographic diversification should be taken into account. Stud ies indicate that asset allocation is the single most important determinant of a portfolio’s long term success. The right mix of stocks, bonds and cash aligned to your particular risk tolerance and investment objective is very important. Age appropriate rebalancing is also an essential aspect of asset allocation. For younger investors, an emphasis on equities which historically have been the best performing asset class over time is encouraged. As investors near their specific goal, such as retirement or sending a child to college, consideration may be given to replacing volatile assets (e.g. common stocks) with more stable fixed investments (bonds or savings plans).
A third investment principle investing regularly can help lower the average cost of your purchases. Investing a certain amount of money each month or quarter helps ensure you won’t pay for all your shares at market highs. This strategy known as dollar cost averaging also reduces unconstructive “emotion” from investing, helping shareholders avoid selling weak per formers just prior to an upswing, or chasing a hot performer just before a correction.
We invite you to contact us via the Internet, through our Investor Centers or over the phone. It is our privilege to provide you the information you need to make the investments that are right for you.
Sincerely,
/s/ Edward C. Johnson 3d
Edward C. Johnson 3d
3 Semiannual Report
Shareholder Expense Example
As a shareholder of the Fund, you incur two types of costs: (1) transaction costs, including sales charges (loads) on purchase payments or redemption proceeds, and (2) ongoing costs, including management fees, distribution and/or service (12b 1) fees and other Fund expenses. This Example is intended to help you understand your ongoing costs (in dollars) of investing in the Fund and to compare these costs with the ongoing costs of investing in other mutual funds.
The Example is based on an investment of $1,000 invested at the beginning of the period and held for the entire period (November 1, 2005 to April 30, 2006).
The first line of the table below for each class of the Fund provides information about actual account values and actual expenses. You may use the information in this line, together with the amount you invested, to estimate the expenses that you paid over the period. Simply divide your account value by $1,000.00 (for example, an $8,600 account value divided by $1,000.00 = 8.6), then multiply the result by the number in the first line for a class of the Fund under the heading entitled “Expenses Paid During Period” to estimate the expenses you paid on your account during this period. In addition, the fund, as a shareholder in the underlying affiliated central fund, will indirectly bear its pro rata share of the fees and expenses incurred by the underlying affiliated central fund. These fees and expenses are not included in the fund’s annualized expense ratio used to calculate the expense estimate in the table below.
Hypothetical Example for Comparison Purposes
The second line of the table below for each class of the Fund provides information about hypothetical account values and hypothetical expenses based on a Class’ actual expense ratio and an assumed rate of return of 5% per year before expenses, which is not the Class’ actual return. The hypothetical account values and expenses may not be used to estimate the actual ending account balance or expenses you paid for the period. You may use this information to compare the ongoing costs of investing in the Fund and other funds. To do so, compare this 5% hypothetical example with the 5% hypothetical examples that appear in the shareholder reports of the other funds. In addition, the fund, as a shareholder in the underlying affiliated central fund, will indirectly bear its pro rata share of the fees and expenses incurred by the underlying affiliated central fund. These fees and expenses are not included in the fund’s annualized expense ratio used to calculate the expense estimate in the table below.
Please note that the expenses shown in the table are meant to highlight your ongoing costs only and do not reflect any transaction costs. Therefore, the second line of the table is useful in comparing ongoing costs only, and will not help you determine the relative total costs of owning different funds. In addition, if these transactional costs were included, your costs would have been higher.
| | | | | | | | | | | | | Expenses Paid |
| | | | | Beginning | | | | Ending | | | | During Period* |
| | | | | Account Value | | | | Account Value | | | | November 1, 2005 |
| | | | | November 1, 2005 | | | | April 30, 2006 | | | | to April 30, 2006 |
| Class A | | | | | | | | | | | | |
| Actual | | | | $ 1,000.00 | | | | $ 1,015.40 | | | | $ 3.95 |
| HypotheticalA | | | | $ 1,000.00 | | | | $ 1,020.88 | | | | $ 3.96 |
| Class T | | | | | | | | | | | | |
| Actual | | | | $ 1,000.00 | | | | $ 1,015.50 | | | | $ 3.75 |
| HypotheticalA | | | | $ 1,000.00 | | | | $ 1,021.08 | | | | $ 3.76 |
| Class B | | | | | | | | | | | | |
| Actual | | | | $ 1,000.00 | | | | $ 1,011.50 | | | | $ 7.73 |
| HypotheticalA | | | | $ 1,000.00 | | | | $ 1,017.11 | | | | $ 7.75 |
| Class C | | | | | | | | | | | | |
| Actual | | | | $ 1,000.00 | | | | $ 1,011.40 | | | | $ 7.93 |
| HypotheticalA | | | | $ 1,000.00 | | | | $ 1,016.91 | | | | $ 7.95 |
| Institutional Class | | | | | | | | | | | | |
| Actual | | | | $ 1,000.00 | | | | $ 1,016.40 | | | | $ 2.90 |
| HypotheticalA | | | | $ 1,000.00 | | | | $ 1,021.92 | | | | $ 2.91 |
A 5% return per year before expenses | | | | | | | | |
* Expenses are equal to each Class’ annualized expense ratio (shown in the table below); multiplied by the average account value over the period, multiplied by 181/365 (to reflect the one-half year period). The fees and expenses of the underlying affiliated central fund in which the fund invests are not included in the fund’s annualized expense ratio.
| | | Annualized |
| | | Expense Ratio |
| Class A | | 79% |
| Class T | | 75% |
| Class B | | 1.55% |
| Class C | | 1.59% |
| Institutional Class | | 58% |
5 Semiannual Report
Investment Changes
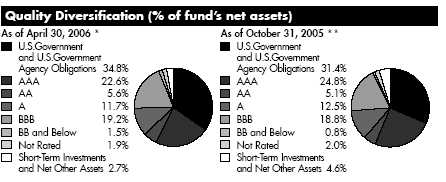
We have used ratings from Moody’s® Investors Services, Inc. Where Moody’s ratings are not available, we have used S&P® ratings. Securities rated BB or below were rated investment grade at the time of acquisition.
| Average Years to Maturity as of April 30, 2006 | | |
| | | | | 6 months ago |
| Years | | 2.8 | | 2.9 |
Average years to maturity is based on the average time remaining until principal payments are expected from each of the fund’s bonds, weighted by dollar amount.
| Duration as of April 30, 2006 | | | | |
| | | | | | | 6 months ago |
| Years | | | | 1.7 | | 1.5 |
Duration shows how much a bond fund’s price fluctuates with changes in comparable interest rates. If rates rise 1%, for example, a fund with a five year duration is likely to lose about 5% of its value. Other factors also can influence a bond fund’s performance and share price. Accordingly, a bond fund’s actual performance may differ from this example.
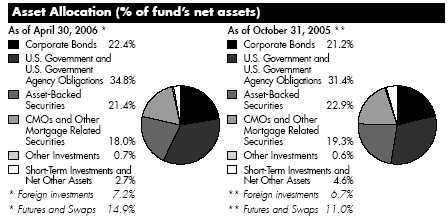
The information in the above tables is based on the combined investments of the fund and its pro rata share of the investments of Fidelity’s fixed income central fund.
For an unaudited list of holdings for each fixed income central fund, visit advisor.fidelity.com.
Semiannual Report 6
| Investments April 30, 2006 (Unaudited) |
| Showing Percentage of Net Assets | | | | |
| |
| Nonconvertible Bonds 22.1% | | | | |
| | | Principal | | Value (Note 1) |
| | | Amount | | |
| |
| CONSUMER DISCRETIONARY – 2.4% | | | | |
| Auto Components 0.2% | | | | |
| DaimlerChrysler NA Holding Corp. 5.3% 3/13/09 (d) | | $ 2,650,000 | | $ 2,650,787 |
| Media – 2.2% | | | | |
| British Sky Broadcasting Group PLC (BSkyB) yankee | | | | |
| 7.3% 10/15/06 | | 2,350,000 | | 2,367,054 |
| Continental Cablevision, Inc.: | | | | |
| 8.3% 5/15/06 | | 1,200,000 | | 1,203,000 |
| 9% 9/1/08 | | 3,400,000 | | 3,650,944 |
| Cox Communications, Inc.: | | | | |
| 3.875% 10/1/08 | | 2,680,000 | | 2,574,555 |
| 6.4% 8/1/08 | | 795,000 | | 805,067 |
| 7.75% 8/15/06 | | 2,600,000 | | 2,614,186 |
| Hearst-Argyle Television, Inc. 7% 11/15/07 | | 1,500,000 | | 1,524,311 |
| Lenfest Communications, Inc. 10.5% 6/15/06 | | 1,225,000 | | 1,254,094 |
| Liberty Media Corp.: | | | | |
| 6.41% 9/17/06 (d) | | 3,203,000 | | 3,214,371 |
| 7.75% 7/15/09 | | 2,350,000 | | 2,462,739 |
| Time Warner Entertainment Co. LP 7.25% 9/1/08 | | 3,145,000 | | 3,257,896 |
| Univision Communications, Inc.: | | | | |
| 3.5% 10/15/07 | | 535,000 | | 518,050 |
| 3.875% 10/15/08 | | 2,525,000 | | 2,408,726 |
| Viacom, Inc. 5.75% 4/30/11 (a) | | 1,470,000 | | 1,459,225 |
| | | | | 29,314,218 |
| |
| TOTAL CONSUMER DISCRETIONARY | | | | 31,965,005 |
| |
| CONSUMER STAPLES 0.5% | | | | |
| Food Products 0.4% | | | | |
| H.J. Heinz Co. 6.428% 12/1/08 (a)(d) | | 1,515,000 | | 1,539,528 |
| Kraft Foods, Inc. 5.25% 6/1/07 | | 3,265,000 | | 3,255,202 |
| | | | | 4,794,730 |
| Tobacco 0.1% | | | | |
| Altria Group, Inc. 5.625% 11/4/08 | | 2,000,000 | | 2,002,512 |
| |
| TOTAL CONSUMER STAPLES | | | | 6,797,242 |
| |
| ENERGY 1.8% | | | | |
| Energy Equipment & Services – 0.1% | | | | |
| Cooper Cameron Corp. 2.65% 4/15/07 | | 1,335,000 | | 1,293,423 |
| Oil, Gas & Consumable Fuels – 1.7% | | | | |
| Canadian Oil Sands Ltd. 4.8% 8/10/09 (a) | | 1,865,000 | | 1,808,295 |
See accompanying notes which are an integral part of the financial statements.
7 Semiannual Report
| Investments (Unaudited) continued | | | | | | |
| |
| |
| Nonconvertible Bonds continued | | | | | | |
| | | | | Principal | | Value (Note 1) |
| | | | | Amount | | |
| |
| ENERGY – continued | | | | | | |
| Oil, Gas & Consumable Fuels – continued | | | | | | |
| Delek & Avner Yam Tethys Ltd. 5.326% 8/1/13 (a) | | | | $ 2,230,512 | | $ 2,146,712 |
| Duke Capital LLC: | | | | | | |
| 4.37% 3/1/09 | | | | 2,045,000 | | 1,981,167 |
| 7.5% 10/1/09 | | | | 2,700,000 | | 2,854,670 |
| Enterprise Products Operating LP: | | | | | | |
| 4% 10/15/07 | | | | 2,775,000 | | 2,711,727 |
| 4.625% 10/15/09 | | | | 3,070,000 | | 2,965,509 |
| Kinder Morgan Energy Partners LP 5.35% 8/15/07 | | | | 1,400,000 | | 1,392,493 |
| Pemex Project Funding Master Trust 6.125% 8/15/08 | | | | 4,535,000 | | 4,562,210 |
| Petroleum Export Ltd.: | | | | | | |
| 4.623% 6/15/10 (a) | | | | 1,430,833 | | 1,403,762 |
| 4.633% 6/15/10 (a) | | | | 859,444 | | 843,192 |
| | | | | | | 22,669,737 |
| |
| TOTAL ENERGY | | | | | | 23,963,160 |
| |
| FINANCIALS – 8.4% | | | | | | |
| Capital Markets 0.6% | | | | | | |
| Bank of New York Co., Inc.: | | | | | | |
| 3.4% 3/15/13 (d) | | | | 2,750,000 | | 2,645,357 |
| 4.25% 9/4/12 (d) | | | | 1,285,000 | | 1,265,111 |
| Lehman Brothers Holdings, Inc.: | | | | | | |
| 4% 1/22/08 | | | | 195,000 | | 190,690 |
| 6.25% 5/15/06 | | | | 2,795,000 | | 2,795,844 |
| Merrill Lynch & Co., Inc. 3.7% 4/21/08 | | | | 1,400,000 | | 1,360,183 |
| | | | | | | 8,257,185 |
| Commercial Banks – 0.7% | | | | | | |
| Bank of America Corp.: | | | | | | |
| 7.125% 9/15/06 | | | | 1,750,000 | | 1,761,337 |
| 7.4% 1/15/11 | | | | 275,000 | | 295,686 |
| Bank One Corp. 6% 8/1/08 | | | | 975,000 | | 987,856 |
| Corporacion Andina de Fomento yankee 7.25% 3/1/07 | | | | 965,000 | | 977,285 |
| First National Boston Corp. 7.375% 9/15/06 | | | | 1,145,000 | | 1,153,523 |
| Korea Development Bank: | | | | | | |
| 3.875% 3/2/09 | | | | 2,700,000 | | 2,588,317 |
| 4.75% 7/20/09 | | | | 1,500,000 | | 1,468,443 |
| | | | | | | 9,232,447 |
| Consumer Finance – 1.7% | | | | | | |
| American General Finance Corp. 4.5% 11/15/07 | | | | 1,115,000 | | 1,102,976 |
See accompanying notes which are an integral part of the financial statements.
| Nonconvertible Bonds continued | | | | | | |
| | | | | Principal | | Value (Note 1) |
| | | | | Amount | | |
| |
| FINANCIALS – continued | | | | | | |
| Consumer Finance – continued | | | | | | |
| Ford Motor Credit Co.: | | | | | | |
| 4.95% 1/15/08 | | | | $ 1,990,000 | | $ 1,849,808 |
| 6.5% 1/25/07 | | | | 8,430,000 | | 8,377,818 |
| Household Finance Corp.: | | | | | | |
| 4.125% 12/15/08 | | | | 705,000 | | 684,233 |
| 4.75% 5/15/09 | | | | 1,563,000 | | 1,532,306 |
| 6.4% 6/17/08 | | | | 2,070,000 | | 2,111,698 |
| Household International, Inc. 5.836% 2/15/08 | | | | 2,025,000 | | 2,041,508 |
| HSBC Finance Corp. 4.125% 3/11/08 | | | | 4,145,000 | | 4,058,212 |
| MBNA Capital I 8.278% 12/1/26 | | | | 1,200,000 | | 1,264,025 |
| | | | | | | 23,022,584 |
| Diversified Financial Services – 1.0% | | | | | | |
| Aspetuck Trust 5.33% 10/16/06 (d)(g) | | | | 3,235,000 | | 3,236,585 |
| CC Funding Trust I 6.9% 2/16/07 | | | | 2,040,000 | | 2,060,541 |
| Iberbond 2004 PLC 4.826% 12/24/17 (g) | | | | 3,078,933 | | 2,946,763 |
| ILFC E Capital Trust I 5.9% 12/21/65 (a)(d) | | | | 500,000 | | 487,688 |
| J.P. Morgan & Co., Inc. 6.25% 1/15/09 | | | | 1,075,000 | | 1,094,327 |
| Keycorp Institutional Capital B 8.25% 12/15/26 | | | | 2,620,000 | | 2,759,685 |
| Prime Property Funding II 6.25% 5/15/07 (a) | | | | 1,000,000 | | 1,002,490 |
| | | | | | | 13,588,079 |
| Insurance – 0.6% | | | | | | |
| The Chubb Corp. 4.934% 11/16/07 | | | | 4,000,000 | | 3,970,324 |
| The St. Paul Travelers Companies, Inc.: | | | | | | |
| 5.01% 8/16/07 | | | | 1,905,000 | | 1,894,042 |
| 5.75% 3/15/07 | | | | 1,070,000 | | 1,072,707 |
| Travelers Property Casualty Corp. 3.75% 3/15/08 | | | | 530,000 | | 515,834 |
| | | | | | | 7,452,907 |
| Real Estate 3.0% | | | | | | |
| Arden Realty LP 8.5% 11/15/10 | | | | 2,050,000 | | 2,287,228 |
| AvalonBay Communities, Inc. 5% 8/1/07 | | | | 915,000 | | 906,389 |
| Brandywine Operating Partnership LP: | | | | | | |
| 4.5% 11/1/09 | | | | 2,445,000 | | 2,343,437 |
| 5.625% 12/15/10 | | | | 1,845,000 | | 1,820,201 |
| BRE Properties, Inc.: | | | | | | |
| 5.95% 3/15/07 | | | | 575,000 | | 575,029 |
| 7.2% 6/15/07 | | | | 1,775,000 | | 1,793,197 |
| Camden Property Trust: | | | | | | |
| 4.375% 1/15/10 | | | | 1,385,000 | | 1,330,082 |
| 5.875% 6/1/07 | | | | 580,000 | | 583,043 |
See accompanying notes which are an integral part of the financial statements.
9 Semiannual Report
| Investments (Unaudited) continued | | | | | | |
| |
| |
| Nonconvertible Bonds continued | | | | | | |
| | | | | Principal | | Value (Note 1) |
| | | | | Amount | | |
| |
| FINANCIALS – continued | | | | | | |
| Real Estate continued | | | | | | |
| CarrAmerica Realty Corp. 5.25% 11/30/07 | | | | $ 2,170,000 | | $ 2,164,258 |
| Chelsea GCA Realty Partnership LP 7.25% 10/21/07 | | | | 1,465,000 | | 1,494,426 |
| Colonial Properties Trust: | | | | | | |
| 4.75% 2/1/10 | | | | 1,330,000 | | 1,282,008 |
| 7% 7/14/07 | | | | 1,260,000 | | 1,275,827 |
| Developers Diversified Realty Corp.: | | | | | | |
| 3.875% 1/30/09 | | | | 2,410,000 | | 2,296,431 |
| 5% 5/3/10 | | | | 1,310,000 | | 1,270,707 |
| 7% 3/19/07 | | | | 2,095,000 | | 2,120,270 |
| EOP Operating LP: | | | | | | |
| 6.763% 6/15/07 | | | | 1,625,000 | | 1,646,544 |
| 7.75% 11/15/07 | | | | 1,650,000 | | 1,702,605 |
| iStar Financial, Inc. 6.14% 3/12/07 (d) | | | | 3,120,000 | | 3,146,676 |
| JDN Realty Corp. 6.95% 8/1/07 | | | | 855,000 | | 858,737 |
| Simon Property Group LP: | | | | | | |
| 4.6% 6/15/10 | | | | 1,130,000 | | 1,088,711 |
| 4.875% 8/15/10 | | | | 2,460,000 | | 2,390,749 |
| 6.875% 11/15/06 | | | | 3,785,000 | | 3,812,191 |
| Tanger Properties LP 9.125% 2/15/08 | | | | 2,295,000 | | 2,444,175 |
| | | | | | | 40,632,921 |
| Thrifts & Mortgage Finance – 0.8% | | | | | | |
| Countrywide Home Loans, Inc.: | | | | | | |
| 5.3025% 6/2/06 (d) | | | | 1,250,000 | | 1,250,106 |
| 5.5% 8/1/06 | | | | 1,290,000 | | 1,291,067 |
| 5.625% 5/15/07 | | | | 745,000 | | 746,600 |
| Residential Capital Corp. 6.335% 6/29/07 (d) | | | | 3,960,000 | | 3,977,515 |
| Washington Mutual, Inc. 4.375% 1/15/08 | | | | 2,700,000 | | 2,653,844 |
| | | | | | | 9,919,132 |
| |
| TOTAL FINANCIALS | | | | | | 112,105,255 |
| |
| INDUSTRIALS – 1.5% | | | | | | |
| Aerospace & Defense – 0.2% | | | | | | |
| Northrop Grumman Corp. 4.079% 11/16/06 | | | | 2,900,000 | | 2,881,188 |
| Air Freight & Logistics – 0.0% | | | | | | |
| Federal Express Corp. pass thru trust certificates 7.53% | | | | | | |
| 9/23/06 | | | | 33,276 | | 33,425 |
| Airlines – 1.1% | | | | | | |
| America West Airlines pass thru Trust 7.33% 7/2/08 | | | | 2,575,381 | | 2,588,258 |
See accompanying notes which are an integral part of the financial statements.
| Nonconvertible Bonds continued | | | | | | |
| | | | | Principal | | Value (Note 1) |
| | | | | Amount | | |
| |
| INDUSTRIALS – continued | | | | | | |
| Airlines – continued | | | | | | |
| American Airlines, Inc. pass thru trust certificates: | | | | | | |
| 6.855% 10/15/10 | | | | $ 460,792 | | $ 467,994 |
| 6.978% 10/1/12 | | | | 102,074 | | 104,588 |
| 7.024% 4/15/11 | | | | 2,000,000 | | 2,055,000 |
| Continental Airlines, Inc. pass thru trust certificates: | | | | | | |
| 6.32% 11/1/08 | | | | 4,015,000 | | 4,010,056 |
| 7.056% 3/15/11 | | | | 355,000 | | 365,237 |
| Delta Air Lines, Inc. pass thru trust certificates 7.379% | | | | | | |
| 5/18/10 | | | | 1 | | 1 |
| United Airlines pass thru Certificates: | | | | | | |
| 6.071% 9/1/14 | | | | 1,338,200 | | 1,321,111 |
| 6.201% 3/1/10 | | | | 1,084,358 | | 1,084,358 |
| 6.602% 9/1/13 | | | | 2,602,217 | | 2,592,082 |
| | | | | | | 14,588,685 |
| Industrial Conglomerates – 0.2% | | | | | | |
| Tyco International Group SA yankee 5.8% 8/1/06 | | | | 3,360,000 | | 3,363,058 |
| |
| TOTAL INDUSTRIALS | | | | | | 20,866,356 |
| |
| INFORMATION TECHNOLOGY – 0.4% | | | | | | |
| Communications Equipment – 0.4% | | | | | | |
| Motorola, Inc. 4.608% 11/16/07 | | | | 6,000,000 | | 5,932,962 |
| |
| MATERIALS 0.2% | | | | | | |
| Containers & Packaging – 0.1% | | | | | | |
| Sealed Air Corp. 6.95% 5/15/09 (a) | | | | 855,000 | | 881,505 |
| Paper & Forest Products 0.1% | | | | | | |
| International Paper Co. 4.25% 1/15/09 | | | | 1,465,000 | | 1,415,482 |
| |
| TOTAL MATERIALS | | | | | | 2,296,987 |
| |
| TELECOMMUNICATION SERVICES – 3.2% | | | | | | |
| Diversified Telecommunication Services – 2.6% | | | | | | |
| Ameritech Capital Funding Corp. 6.25% 5/18/09 | | | | 1,765,000 | | 1,785,407 |
| AT&T Corp. 6% 3/15/09 | | | | 3,720,000 | | 3,765,570 |
| BellSouth Corp. 4.2% 9/15/09 | | | | 1,775,000 | | 1,704,225 |
| Sprint Capital Corp. 6% 1/15/07 | | | | 3,240,000 | | 3,252,649 |
| Telecom Italia Capital 4% 11/15/08 | | | | 7,140,000 | | 6,885,073 |
| Telefonos de Mexico SA de CV: | | | | | | |
| 4.5% 11/19/08 | | | | 3,260,000 | | 3,169,212 |
See accompanying notes which are an integral part of the financial statements.
11 Semiannual Report
| Investments (Unaudited) continued | | | | | | |
| |
| |
| Nonconvertible Bonds continued | | | | | | |
| | | | | Principal | | Value (Note 1) |
| | | | | Amount | | |
| |
| TELECOMMUNICATION SERVICES – continued | | | | | | |
| Diversified Telecommunication Services – continued | | | | | | |
| Telefonos de Mexico SA de CV: – continued | | | | | | |
| 4.75% 1/27/10 | | | | $ 3,355,000 | | $ 3,231,231 |
| TELUS Corp. yankee 7.5% 6/1/07 | | | | 4,220,000 | | 4,307,768 |
| Verizon Global Funding Corp.: | | | | | | |
| 6.125% 6/15/07 | | | | 2,140,000 | | 2,156,439 |
| 7.25% 12/1/10 | | | | 4,205,000 | | 4,456,833 |
| | | | | | | 34,714,407 |
| Wireless Telecommunication Services – 0.6% | | | | | | |
| ALLTEL Corp. 4.656% 5/17/07 | | | | 3,915,000 | | 3,888,464 |
| America Movil SA de CV 4.125% 3/1/09 | | | | 3,925,000 | | 3,762,222 |
| | | | | | | 7,650,686 |
| |
| TOTAL TELECOMMUNICATION SERVICES | | | | | | 42,365,093 |
| |
| UTILITIES – 3.7% | | | | | | |
| Electric Utilities – 1.8% | | | | | | |
| American Electric Power Co., Inc. 4.709% 8/16/07 | | | | 3,685,000 | | 3,649,911 |
| Exelon Corp. 4.45% 6/15/10 | | | | 3,750,000 | | 3,588,934 |
| FirstEnergy Corp. 5.5% 11/15/06 | | | | 5,095,000 | | 5,094,618 |
| Monongahela Power Co. 5% 10/1/06 | | | | 2,015,000 | | 2,009,697 |
| Pepco Holdings, Inc.: | | | | | | |
| 4% 5/15/10 | | | | 1,125,000 | | 1,054,537 |
| 5.5% 8/15/07 | | | | 3,995,000 | | 3,993,166 |
| Progress Energy, Inc.: | | | | | | |
| 5.85% 10/30/08 | | | | 1,025,000 | | 1,033,004 |
| 7.1% 3/1/11 | | | | 2,285,000 | | 2,413,975 |
| Southwestern Public Service Co. 5.125% 11/1/06 | | | | 650,000 | | 648,885 |
| TXU Energy Co. LLC 6.125% 3/15/08 | | | | 935,000 | | 941,700 |
| | | | | | | 24,428,427 |
| Gas Utilities 0.1% | | | | | | |
| NiSource Finance Corp. 3.2% 11/1/06 | | | | 1,085,000 | | 1,073,278 |
| Independent Power Producers & Energy Traders – 0.6% | | | | | | |
| Constellation Energy Group, Inc.: | | | | | | |
| 6.125% 9/1/09 | | | | 3,035,000 | | 3,085,056 |
| 6.35% 4/1/07 | | | | 3,025,000 | | 3,047,358 |
| Duke Capital LLC 4.331% 11/16/06 | | | | 1,630,000 | | 1,621,932 |
| | | | | | | 7,754,346 |
| Multi-Utilities – 1.2% | | | | | | |
| Dominion Resources, Inc. 4.125% 2/15/08 | | | | 2,610,000 | | 2,549,213 |
See accompanying notes which are an integral part of the financial statements.
| Nonconvertible Bonds continued | | | | |
| | | Principal | | Value (Note 1) |
| | | Amount | | |
| |
| UTILITIES – continued | | | | |
| Multi-Utilities – continued | | | | |
| DTE Energy Co.: | | | | |
| 5.63% 8/16/07 | | $ 2,965,000 | | $ 2,970,453 |
| 6.45% 6/1/06 | | 1,750,000 | | 1,751,391 |
| MidAmerican Energy Holdings, Inc. 4.625% 10/1/07 | | 705,000 | | 697,358 |
| NiSource, Inc. 3.628% 11/1/06 | | 1,565,000 | | 1,550,857 |
| PSEG Funding Trust I 5.381% 11/16/07 | | 3,575,000 | | 3,561,983 |
| Sempra Energy: | | | | |
| 4.621% 5/17/07 | | 2,495,000 | | 2,474,718 |
| 4.75% 5/15/09 | | 1,055,000 | | 1,032,314 |
| | | | | 16,588,287 |
| |
| TOTAL UTILITIES | | | | 49,844,338 |
| |
| TOTAL NONCONVERTIBLE BONDS | | | | |
| (Cost $300,598,984) | | | | 296,136,398 |
| |
| U.S. Government and Government Agency Obligations 20.3% | | | | |
| |
| U.S. Government Agency Obligations 6.6% | | | | |
| Fannie Mae: | | | | |
| 3.25% 8/15/08 | | 6,089,000 | | 5,842,895 |
| 3.25% 2/15/09 | | 13,000,000 | | 12,361,999 |
| 6% 5/15/08 | | 45,782,000 | | 46,540,882 |
| Federal Home Loan Bank 4.25% 4/16/07 | | 6,000,000 | | 5,947,584 |
| Freddie Mac: | | | | |
| 2.7% 3/16/07 | | 14,000,000 | | 13,698,762 |
| 4% 8/17/07 | | 3,430,000 | | 3,380,083 |
| |
| TOTAL U.S. GOVERNMENT AGENCY OBLIGATIONS | | | | 87,772,205 |
| U.S. Treasury Inflation Protected Obligations 0.9% | | | | |
| U.S. Treasury Inflation-Indexed Notes 3.875% 1/15/09 | | 11,509,250 | | 12,079,440 |
| U.S. Treasury Obligations – 12.8% | | | | |
| U.S. Treasury Bonds 12% 8/15/13 | | 17,526,000 | | 20,202,133 |
| U.S. Treasury Notes: | | | | |
| 3.375% 2/15/08 | | 57,000,000 | | 55,534,929 |
| 3.625% 4/30/07 | | 2,952,000 | | 2,914,409 |
| 3.75% 5/15/08 (c) | | 73,610,000 | | 72,022,807 |
| 3.875% 7/31/07 | | 5,096,000 | | 5,031,903 |
See accompanying notes which are an integral part of the financial statements.
13 Semiannual Report
| Investments (Unaudited) continued | | | | |
| |
| |
| U.S. Government and Government Agency Obligations continued | | | | | | |
| | | | | Principal | | Value (Note 1) |
| | | | | Amount | | |
| U.S. Treasury Obligations continued | | | | |
| U.S. Treasury Notes: – continued | | | | | | |
| 4% 8/31/07 | | | | $ 3,544,000 | | $ 3,502,744 |
| 4.375% 11/15/08 | | | | 12,000,000 | | 11,855,160 |
| |
| TOTAL U.S. TREASURY OBLIGATIONS | | | | | | 171,064,085 |
| |
| TOTAL U.S. GOVERNMENT AND | | | | |
| GOVERNMENT AGENCY OBLIGATIONS | | | | |
| (Cost $276,184,197) | | | | | | 270,915,730 |
| |
| U.S. Government Agency Mortgage Securities 10.3% | | | | | | |
| |
| Fannie Mae – 8.1% | | | | | | |
| 3.734% 1/1/35 (d) | | | | 282,597 | | 277,572 |
| 3.749% 12/1/34 (d) | | | | 210,607 | | 207,042 |
| 3.75% 1/1/34 (d) | | | | 167,036 | | 162,478 |
| 3.752% 10/1/33 (d) | | | | 181,532 | | 177,106 |
| 3.752% 10/1/33 (d) | | | | 203,072 | | 197,843 |
| 3.782% 12/1/34 (d) | | | | 42,238 | | 41,584 |
| 3.792% 6/1/34 (d) | | | | 843,349 | | 815,451 |
| 3.821% 10/1/33 (d) | | | | 2,119,271 | | 2,069,553 |
| 3.824% 6/1/33 (d) | | | | 147,553 | | 144,742 |
| 3.829% 1/1/35 (d) | | | | 177,589 | | 174,748 |
| 3.833% 4/1/33 (d) | | | | 540,434 | | 530,717 |
| 3.847% 1/1/35 (d) | | | | 525,680 | | 516,933 |
| 3.854% 10/1/33 (d) | | | | 4,611,158 | | 4,514,324 |
| 3.869% 1/1/35 (d) | | | | 316,153 | | 311,266 |
| 3.879% 6/1/33 (d) | | | | 772,601 | | 758,192 |
| 3.902% 10/1/34 (d) | | | | 221,275 | | 218,180 |
| 3.913% 5/1/34 (d) | | | | 56,102 | | 56,096 |
| 3.917% 12/1/34 (d) | | | | 171,370 | | 168,774 |
| 3.941% 6/1/34 (d) | | | | 1,347,944 | | 1,309,137 |
| 3.947% 11/1/34 (d) | | | | 357,696 | | 352,724 |
| 3.957% 1/1/35 (d) | | | | 223,882 | | 220,613 |
| 3.96% 5/1/33 (d) | | | | 66,966 | | 65,892 |
| 3.972% 12/1/34 (d) | | | | 177,176 | | 174,684 |
| 3.978% 12/1/34 (d) | | | | 226,129 | | 222,961 |
| 3.983% 12/1/34 (d) | | | | 1,181,261 | | 1,164,735 |
| 3.988% 1/1/35 (d) | | | | 142,408 | | 140,363 |
| 4.003% 12/1/34 (d) | | | | 121,325 | | 119,636 |
| 4.006% 2/1/35 (d) | | | | 151,719 | | 149,521 |
See accompanying notes which are an integral part of the financial statements.
| U.S. Government Agency Mortgage Securities continued | | | | | | | | |
| | | | | Principal | | Value (Note 1) |
| | | | | Amount | | | | |
| Fannie Mae continued | | | | | | | | |
| 4.013% 1/1/35 (d) | | | | $ 320,692 | | | | $ 316,205 |
| 4.021% 2/1/35 (d) | | | | 155,188 | | | | 153,103 |
| 4.042% 12/1/34 (d) | | | | 324,818 | | | | 320,482 |
| 4.048% 10/1/18 (d) | | | | 160,600 | | | | 157,607 |
| 4.05% 1/1/35 (d) | | | | 81,961 | | | | 80,788 |
| 4.051% 1/1/35 (d) | | | | 160,920 | | | | 158,771 |
| 4.066% 4/1/33 (d) | | | | 63,154 | | | | 62,315 |
| 4.067% 1/1/35 (d) | | | | 311,967 | | | | 307,750 |
| 4.09% 2/1/35 (d) | | | | 114,413 | | | | 112,808 |
| 4.091% 2/1/35 (d) | | | | 295,643 | | | | 291,605 |
| 4.092% 2/1/35 (d) | | | | 109,656 | | | | 108,233 |
| 4.106% 2/1/35 (d) | | | | 579,180 | | | | 571,975 |
| 4.109% 1/1/35 (d) | | | | 327,308 | | | | 322,977 |
| 4.113% 11/1/34 (d) | | | | 263,296 | | | | 260,084 |
| 4.115% 2/1/35 (d) | | | | 382,129 | | | | 377,023 |
| 4.121% 1/1/35 (d) | | | | 322,114 | | | | 317,985 |
| 4.122% 1/1/35 (d) | | | | 572,158 | | | | 565,029 |
| 4.144% 1/1/35 (d) | | | | 488,043 | | | | 483,568 |
| 4.148% 7/1/34 (d) | | | | 870,993 | | | | 848,774 |
| 4.153% 2/1/35 (d) | | | | 293,656 | | | | 289,906 |
| 4.166% 11/1/34 (d) | | | | 73,739 | | | | 72,941 |
| 4.174% 10/1/34 (d) | | | | 456,020 | | | | 450,849 |
| 4.176% 1/1/35 (d) | | | | 269,916 | | | | 266,644 |
| 4.178% 1/1/35 (d) | | | | 590,203 | | | | 583,640 |
| 4.178% 1/1/35 (d) | | | | 388,306 | | | | 377,589 |
| 4.188% 10/1/34 (d) | | | | 483,132 | | | | 479,403 |
| 4.22% 3/1/34 (d) | | | | 148,064 | | | | 145,045 |
| 4.222% 9/1/34 (d) | | | | 1,023,039 | | | | 997,064 |
| 4.223% 1/1/35 (d) | | | | 157,982 | | | | 156,178 |
| 4.25% 1/1/34 (d) | | | | 284,637 | | | | 279,186 |
| 4.25% 2/1/34 (d) | | | | 219,405 | | | | 215,166 |
| 4.25% 2/1/35 (d) | | | | 191,706 | | | | 186,522 |
| 4.267% 2/1/35 (d) | | | | 98,874 | | | | 97,824 |
| 4.27% 10/1/34 (d) | | | | 61,910 | | | | 61,340 |
| 4.28% 8/1/33 (d) | | | | 371,002 | | | | 366,532 |
| 4.283% 3/1/35 (d) | | | | 170,881 | | | | 168,839 |
| 4.287% 7/1/34 (d) | | | | 149,474 | | | | 149,011 |
| 4.293% 1/1/34 (d) | | | | 245,791 | | | | 241,684 |
| 4.294% 3/1/33 (d) | | | | 216,450 | | | | 214,108 |
| 4.299% 5/1/35 (d) | | | | 245,637 | | | | 243,089 |
| 4.3% 1/1/34 (d) | | | | 1,347,901 | | | | 1,323,963 |
See accompanying notes which are an integral part of the financial statements.
15 Semiannual Report
| Investments (Unaudited) continued | | | | | | |
| |
| |
| U.S. Government Agency Mortgage Securities continued | | | | | | | | |
| | | | | Principal | | Value (Note 1) |
| | | | | Amount | | | | |
| Fannie Mae continued | | | | | | | | |
| 4.304% 12/1/34 (d) | | | | $ 109,718 | | | | $ 108,577 |
| 4.315% 10/1/33 (d) | | | | 82,231 | | | | 81,028 |
| 4.316% 3/1/33 (d) | | | | 96,997 | | | | 94,373 |
| 4.32% 3/1/35 (d) | | | | 386,362 | | | | 382,159 |
| 4.339% 9/1/34 (d) | | | | 249,920 | | | | 247,629 |
| 4.345% 6/1/33 (d) | | | | 109,804 | | | | 108,596 |
| 4.352% 10/1/34 (d) | | | | 637,090 | | | | 631,083 |
| 4.354% 9/1/34 (d) | | | | 569,273 | | | | 567,520 |
| 4.356% 1/1/35 (d) | | | | 189,804 | | | | 185,091 |
| 4.357% 4/1/35 (d) | | | | 115,588 | | | | 114,276 |
| 4.362% 2/1/34 (d) | | | | 435,955 | | | | 428,796 |
| 4.375% 1/1/35 (d) | | | | 586,866 | | | | 581,314 |
| 4.392% 1/1/35 (d) | | | | 217,318 | | | | 215,236 |
| 4.395% 5/1/35 (d) | | | | 532,273 | | | | 526,396 |
| 4.398% 2/1/35 (d) | | | | 281,896 | | | | 274,953 |
| 4.401% 10/1/34 (d) | | | | 768,217 | | | | 761,964 |
| 4.402% 10/1/34 (d) | | | | 982,013 | | | | 961,430 |
| 4.402% 10/1/34 (d) | | | | 1,948,663 | | | | 1,931,846 |
| 4.402% 11/1/34 (d) | | | | 542,929 | | | | 538,113 |
| 4.416% 12/1/34 (d) | | | | 912,581 | | | | 904,286 |
| 4.434% 10/1/34 (d) | | | | 906,764 | | | | 899,763 |
| 4.436% 4/1/34 (d) | | | | 280,721 | | | | 277,613 |
| 4.438% 3/1/35 (d) | | | | 253,155 | | | | 247,036 |
| 4.465% 8/1/34 (d) | | | | 564,839 | | | | 556,021 |
| 4.468% 5/1/35 (d) | | | | 1,613,568 | | | | 1,601,628 |
| 4.474% 5/1/35 (d) | | | | 152,742 | | | | 151,246 |
| 4.481% 1/1/35 (d) | | | | 254,170 | | | | 252,230 |
| 4.504% 8/1/34 (d) | | | | 384,046 | | | | 383,167 |
| 4.512% 10/1/35 (d) | | | | 91,797 | | | | 90,674 |
| 4.518% 8/1/35 (d) | | | | 426,241 | | | | 421,582 |
| 4.54% 2/1/35 (d) | | | | 1,193,305 | | | | 1,184,296 |
| 4.541% 7/1/34 (d) | | | | 263,262 | | | | 263,602 |
| 4.543% 2/1/35 (d) | | | | 119,069 | | | | 118,193 |
| 4.545% 7/1/35 (d) | | | | 652,652 | | | | 646,138 |
| 4.546% 2/1/35 (d) | | | | 176,742 | | | | 175,379 |
| 4.555% 1/1/35 (d) | | | | 366,596 | | | | 363,971 |
| 4.559% 9/1/34 (d) | | | | 681,410 | | | | 677,063 |
| 4.575% 7/1/35 (d) | | | | 542,909 | | | | 537,718 |
| 4.584% 8/1/34 (d) | | | | 243,206 | | | | 243,318 |
| 4.587% 2/1/35 (d) | | | | 754,366 | | | | 739,240 |
See accompanying notes which are an integral part of the financial statements.
| U.S. Government Agency Mortgage Securities continued | | | | | | | | |
| | | | | Principal | | Value (Note 1) |
| | | | | Amount | | | | |
| Fannie Mae continued | | | | | | | | |
| 4.6% 6/1/35 (d) | | | | $ 593,604 | | | | $ 588,772 |
| 4.608% 2/1/35 (d) | | | | 807,469 | | | | 795,776 |
| 4.629% 9/1/34 (d) | | | | 69,878 | | | | 69,971 |
| 4.633% 3/1/35 (d) | | | | 91,026 | | | | 90,424 |
| 4.641% 1/1/33 (d) | | | | 119,799 | | | | 119,069 |
| 4.677% 3/1/35 (d) | | | | 1,492,131 | | | | 1,483,417 |
| 4.704% 3/1/35 (d) | | | | 322,969 | | | | 317,179 |
| 4.705% 10/1/32 (d) | | | | 43,174 | | | | 43,071 |
| 4.726% 7/1/34 (d) | | | | 544,081 | | | | 536,644 |
| 4.728% 1/1/35 (d) | | | | 849,074 | | | | 845,126 |
| 4.731% 2/1/33 (d) | | | | 38,292 | | | | 38,103 |
| 4.735% 6/1/35 (d) | | | | 1,565,033 | | | | 1,555,847 |
| 4.74% 10/1/34 (d) | | | | 668,827 | | | | 659,571 |
| 4.746% 1/1/35 (d) | | | | 30,039 | | | | 29,887 |
| 4.747% 10/1/32 (d) | | | | 48,174 | | | | 47,932 |
| 4.798% 12/1/32 (d) | | | | 262,679 | | | | 261,715 |
| 4.798% 12/1/34 (d) | | | | 192,176 | | | | 189,616 |
| 4.815% 2/1/33 (d) | | | | 259,983 | | | | 258,966 |
| 4.815% 5/1/33 (d) | | | | 10,604 | | | | 10,567 |
| 4.83% 8/1/34 (d) | | | | 193,227 | | | | 192,885 |
| 4.844% 11/1/34 (d) | | | | 552,213 | | | | 545,487 |
| 4.853% 10/1/35 (d) | | | | 757,989 | | | | 753,653 |
| 4.869% 1/1/35 (d) | | | | 3,481,683 | | | | 3,439,381 |
| 4.873% 7/1/34 (d) | | | | 796,784 | | | | 787,748 |
| 4.875% 9/1/35 (d) | | | | 811,774 | | | | 806,546 |
| 4.887% 10/1/35 (d) | | | | 485,007 | | | | 479,595 |
| 4.928% 2/1/35 (d) | | | | 1,875,343 | | | | 1,854,489 |
| 4.969% 12/1/32 (d) | | | | 16,926 | | | | 16,894 |
| 4.984% 11/1/32 (d) | | | | 133,394 | | | | 133,177 |
| 4.996% 5/1/35 (d) | | | | 855,470 | | | | 845,307 |
| 5% 3/1/18 to 6/1/18 | | | | 3,432,004 | | | | 3,352,073 |
| 5% 2/1/35 (d) | | | | 83,247 | | | | 83,091 |
| 5.008% 9/1/34 (d) | | | | 2,427,554 | | | | 2,406,386 |
| 5.016% 4/1/35 (d) | | | | 593,797 | | | | 592,229 |
| 5.042% 7/1/34 (d) | | | | 104,537 | | | | 103,801 |
| 5.063% 11/1/34 (d) | | | | 42,789 | | | | 42,740 |
| 5.103% 9/1/34 (d) | | | | 200,573 | | | | 199,351 |
| 5.104% 5/1/35 (d) | | | | 1,213,346 | | | | 1,212,157 |
| 5.115% 1/1/34 (d) | | | | 174,278 | | | | 174,580 |
| 5.172% 5/1/35 (d) | | | | 697,977 | | | | 693,273 |
| 5.197% 8/1/33 (d) | | | | 261,309 | | | | 260,381 |
See accompanying notes which are an integral part of the financial statements.
17 Semiannual Report
| Investments (Unaudited) continued | | | | |
| |
| |
| U.S. Government Agency Mortgage Securities continued | | | | | | |
| | | | | Principal | | Value (Note 1) |
| | | | | Amount | | |
| Fannie Mae continued | | | | | | |
| 5.197% 6/1/35 (d) | | | | $ 864,575 | | $ 864,861 |
| 5.231% 3/1/35 (d) | | | | 120,681 | | 120,162 |
| 5.318% 7/1/35 (d) | | | | 117,742 | | 117,916 |
| 5.343% 12/1/34 (d) | | | | 318,561 | | 318,013 |
| 5.5% 7/1/13 to 5/1/25 | | | | 17,765,057 | | 17,598,952 |
| 6.5% 2/1/08 to 3/1/35 | | | | 11,869,058 | | 12,126,730 |
| 7% 3/1/08 to 6/1/32 | | | | 1,259,679 | | 1,287,009 |
| 7.5% 5/1/12 to 10/1/14 | | | | 102,664 | | 105,960 |
| 11.5% 11/1/15 | | | | 61,009 | | 66,111 |
| |
| TOTAL FANNIE MAE | | | | | | 107,443,607 |
| Freddie Mac – 2.1% | | | | | | |
| 4.05% 12/1/34 (d) | | | | 184,861 | | 181,769 |
| 4.106% 12/1/34 (d) | | | | 266,506 | | 262,317 |
| 4.152% 1/1/35 (d) | | | | 845,048 | | 832,161 |
| 4.263% 3/1/35 (d) | | | | 255,357 | | 251,739 |
| 4.294% 5/1/35 (d) | | | | 450,694 | | 444,695 |
| 4.304% 12/1/34 (d) | | | | 279,514 | | 271,643 |
| 4.318% 10/1/34 (d) | | | | 465,678 | | 459,945 |
| 4.353% 2/1/35 (d) | | | | 557,407 | | 550,100 |
| 4.379% 2/1/35 (d) | | | | 279,801 | | 272,051 |
| 4.408% 8/1/35 (d) | | | | 4,456,470 | | 4,374,650 |
| 4.443% 3/1/35 (d) | | | | 275,676 | | 268,029 |
| 4.45% 2/1/34 (d) | | | | 254,367 | | 249,829 |
| 4.462% 6/1/35 (d) | | | | 416,698 | | 410,876 |
| 4.482% 3/1/35 (d) | | | | 296,367 | | 288,759 |
| 4.484% 3/1/35 (d) | | | | 1,777,587 | | 1,747,635 |
| 4.552% 2/1/35 (d) | | | | 431,118 | | 420,383 |
| 4.768% 10/1/32 (d) | | | | 32,051 | | 31,821 |
| 4.869% 3/1/33 (d) | | | | 96,288 | | 95,751 |
| 4.939% 11/1/35 (d) | | | | 1,078,065 | | 1,068,621 |
| 5.007% 4/1/35 (d) | | | | 1,380,495 | | 1,373,676 |
| 5.26% 1/1/36 (d) | | | | 1,116,860 | | 1,113,230 |
| 5.338% 6/1/35 (d) | | | | 861,491 | | 856,580 |
| 5.405% 8/1/33 (d) | | | | 128,458 | | 128,688 |
| 5.5% 5/1/21 (b) | | | | 7,571,204 | | 7,513,587 |
| 5.5% 7/1/23 to 4/1/24 | | | | 4,429,968 | | 4,344,735 |
| 5.588% 4/1/32 (d) | | | | 49,956 | | 50,340 |
See accompanying notes which are an integral part of the financial statements.
| U.S. Government Agency Mortgage Securities continued | | | | | | |
| | | | | Principal | | Value (Note 1) |
| | | | | Amount | | |
| Freddie Mac continued | | | | | | |
| 8.5% 5/1/26 to 7/1/28 | | | | $ 202,146 | | $ 216,897 |
| 12% 11/1/19 | | | | 15,038 | | 16,880 |
| |
| TOTAL FREDDIE MAC | | | | | | 28,097,387 |
| Government National Mortgage Association 0.1% | | | | | | |
| 4.25% 7/20/34 (d) | | | | 731,883 | | 721,417 |
| 7% 1/15/25 to 6/15/32 | | | | 984,977 | | 1,025,317 |
| |
| TOTAL GOVERNMENT NATIONAL MORTGAGE ASSOCIATION | | | | | | 1,746,734 |
| |
| TOTAL U.S. GOVERNMENT AGENCY MORTGAGE SECURITIES | | | | | | |
| (Cost $139,046,151) | | | | | | 137,287,728 |
| |
| Asset Backed Securities 19.7% | | | | | | |
| |
| Accredited Mortgage Loan Trust: | | | | | | |
| Series 2003-2 Class A1, 4.23% 10/25/33 | | | | 943,505 | | 917,110 |
| Series 2003-3 Class A1, 4.46% 1/25/34 | | | | 943,299 | | 891,977 |
| Series 2004-2 Class A2, 5.2594% 7/25/34 (d) | | | | 1,150,210 | | 1,153,677 |
| Series 2004-4 Class A2D, 5.3094% 1/25/35 (d) | | | | 545,483 | | 547,094 |
| ACE Securities Corp. Series 2003-HE1: | | | | | | |
| Class A2, 5.3694% 11/25/33 (d) | | | | 82,178 | | 82,193 |
| Class M1, 5.6094% 11/25/33 (d) | | | | 430,000 | | 431,925 |
| Class M2, 6.6594% 11/25/33 (d) | | | | 270,000 | | 273,843 |
| Aesop Funding II LLC Series 2005-1A Class A1, 3.95% | | | | | | |
| 4/20/08 (a) | | | | 2,000,000 | | 1,949,293 |
| American Express Credit Account Master Trust Series | | | | | | |
| 2004-C Class C, 5.4013% 2/15/12 (a)(d) | | | | 1,925,460 | | 1,930,341 |
| AmeriCredit Automobile Receivables Trust: | | | | | | |
| Series 2004-1: | | | | | | |
| Class B, 3.7% 1/6/09 | | | | 150,000 | | 148,314 |
| Class C, 4.22% 7/6/09 | | | | 155,000 | | 152,439 |
| Class D, 5.07% 7/6/10 | | | | 1,105,000 | | 1,092,847 |
| Series 2004-CA Class A4, 3.61% 5/6/11 | | | | 630,000 | | 612,606 |
| Series 2005-1 Class D, 5.04% 5/6/11 | | | | 2,500,000 | | 2,455,683 |
| Series 2005-CF Class A4, 4.63% 6/6/12 | | | | 2,895,000 | | 2,841,269 |
| Series 2005-DA Class A4, 5.02% 11/6/12 | | | | 4,150,000 | | 4,107,975 |
| Series 2006-1 Class D, 5.49% 4/6/12 | | | | 1,115,000 | | 1,104,964 |
| Ameriquest Mortgage Securities, Inc.: | | | | | | |
| Series 2004-R10 Class M1, 5.6594% 11/25/34 (d) | | . | | 1,370,000 | | 1,377,454 |
| Series 2004-R11 Class M1, 5.6194% 11/25/34 (d) | | . | | 2,040,000 | | 2,054,128 |
See accompanying notes which are an integral part of the financial statements.
19 Semiannual Report
| Investments (Unaudited) continued | | | | | | |
| |
| |
| Asset Backed Securities continued | | | | | | |
| | | | | Principal | | Value (Note 1) |
| | | | | Amount | | |
| Ameriquest Mortgage Securities, Inc.: – continued | | | | | | |
| Series 2004-R9: | | | | | | |
| Class A3, 5.2794% 10/25/34 (d) | | | | $ 544,161 | | $ 544,310 |
| Class M2, 5.6094% 10/25/34 (d) | | | | 1,515,000 | | 1,526,183 |
| Class M4, 6.1294% 10/25/34 (d) | | | | 1,945,000 | | 1,973,550 |
| Amortizing Residential Collateral Trust: | | | | | | |
| Series 2002-BC3 Class A, 5.2894% 6/25/32 (d) | | | | 201,084 | | 201,770 |
| Series 2002-BC7 Class M1, 5.7594% 10/25/32 (d) . | | | | 1,100,000 | | 1,101,534 |
| ARG Funding Corp. Series 2005-1A Class A1, 4.02% | | | | | | |
| 4/20/09 (a) | | | | 4,100,000 | | 3,999,549 |
| Argent Securities, Inc.: | | | | | | |
| Series 2003-W3: | | | | | | |
| Class AV1B, 5.4094% 9/25/33 (d) | | | | 7,615 | | 7,617 |
| Class M2, 6.7594% 9/25/33 (d) | | | | 3,100,000 | | 3,140,996 |
| Series 2003-W7: | | | | | | |
| Class A2, 5.3494% 3/1/34 (d) | | | | 322,456 | | 322,913 |
| Class M1, 5.6494% 3/1/34 (d) | | | | 2,500,000 | | 2,518,523 |
| Series 2003-W9 Class M1, 5.6494% 3/25/34 (d) | | | | 1,800,000 | | 1,813,074 |
| Series 2004-W5 Class M1, 5.5594% 4/25/34 (d) | | | | 830,000 | | 830,942 |
| Series 2004-W9 Class M3, 6.5594% 6/26/34 (d) | | | | 2,230,000 | | 2,272,552 |
| Arran Funding Ltd. Series 2005-A Class C, 5.2% | | | | | | |
| 12/15/10 (d) | | | | 3,530,000 | | 3,528,941 |
| Asset Backed Funding Certificates Series 2004-HE1 | | | | | | |
| Class M2, 6.1094% 1/25/34 (d) | | | | 485,000 | | 493,080 |
| Asset Backed Securities Corp. Home Equity Loan Trust: | | | | | | |
| Series 2003-HE7 Class A3, 5.2613% 12/15/33 (d) | | | | 261,600 | | 262,413 |
| Series 2004-HE3 Class M2, 6.0794% 6/25/34 (d) | | | | 700,000 | | 708,688 |
| Series 2004-HE6 Class A2, 5.3194% 6/25/34 (d) | | | | 2,355,858 | | 2,361,008 |
| Series 2005-HE2: | | | | | | |
| Class M1, 5.4094% 3/25/35 (d) | | | | 1,830,000 | | 1,839,549 |
| Class M2, 5.4594% 3/25/35 (d) | | | | 460,000 | | 462,954 |
| Series 2005-HE3 Class A4, 5.1594% 4/25/35 (d) | | | | 3,200,000 | | 3,201,144 |
| Bayview Financial Acquisition Trust Series 2004-C Class | | | | | | |
| A1, 5.42% 5/28/44 (d) | | | | 1,379,755 | | 1,382,374 |
| Bayview Financial Asset Trust Series 2003-F Class A, | | | | | | |
| 5.5% 9/28/43 (d) | | | | 1,201,891 | | 1,202,718 |
| Bayview Financial Mortgage Loan Trust Series 2004-A | | | | | | |
| Class A, 5.45% 2/28/44 (d) | | | | 857,532 | | 859,660 |
| Bear Stearns Asset Backed Securities I: | | | | | | |
| Series 2004-BO1: | | | | | | |
| Class M2, 5.7094% 9/25/34 (d) | | | | 794,000 | | 803,030 |
| Class M3, 6.0094% 9/25/34 (d) | | | | 540,000 | | 546,085 |
| Class M4, 6.1594% 9/25/34 (d) | | | | 460,000 | | 467,761 |
See accompanying notes which are an integral part of the financial statements.
| Asset Backed Securities continued | | | | | | |
| | | | | Principal | | Value (Note 1) |
| | | | | Amount | | |
| Bear Stearns Asset Backed Securities I: – continued | | | | | | |
| Series 2004-BO1: | | | | | | |
| Class M5, 6.3594% 9/25/34 (d) | | | | $ 435,000 | | $ 442,952 |
| Series 2004-HE8: | | | | | | |
| Class M1, 5.6094% 9/25/34 (d) | | | | 1,800,000 | | 1,808,622 |
| Class M2, 6.1594% 9/25/34 (d) | | | | 890,000 | | 893,354 |
| BMW Vehicle Owner Trust Series 2005-A Class B, | | | | | | |
| 4.42% 4/25/11 | | | | 1,035,000 | | 1,016,385 |
| Capital Auto Receivables Asset Trust: | | | | | | |
| Series 2005-1 Class B, 5.2763% 6/15/10 (d) | | | | 1,240,000 | | 1,246,618 |
| Series 2006-1 Class B, 5.26% 10/15/10 | | | | 500,000 | | 496,017 |
| Capital One Auto Finance Trust: | | | | | | |
| Series 2005-A Class A3, 4.28% 7/15/09 | | | | 2,165,000 | | 2,145,365 |
| Series 2005 BSS: | | | | | | |
| Class B, 4.32% 5/15/10 | | | | 1,430,000 | | 1,398,160 |
| Series D, 4.8% 9/15/12 | | | | 1,220,000 | | 1,178,291 |
| Capital One Master Trust: | | | | | | |
| Series 1999-3 Class B, 5.3813% 9/15/09 (d) | | | | 1,000,000 | | 999,932 |
| Series 2001-1 Class B, 5.4113% 12/15/10 (d) | | | | 1,700,000 | | 1,709,936 |
| Series 2001-6 Class C, 6.7% 6/15/11 (a) | | | | 3,200,000 | | 3,284,000 |
| Series 2001-8A Class A, 4.6% 8/17/09 | | | | 1,390,000 | | 1,386,647 |
| Capital One Prime Auto Receivable Trust Series 2005-1 | | | | | | |
| Class B, 4.58% 8/15/12 | | | | 1,850,000 | | 1,804,050 |
| Capital Trust Ltd. Series 2004-1: | | | | | | |
| Class A2, 5.3725% 7/20/39 (a)(d) | | | | 645,000 | | 645,988 |
| Class B, 5.6725% 7/20/39 (a)(d) | | | | 340,000 | | 342,735 |
| Class C, 6.0225% 7/20/39 (a)(d) | | | | 435,000 | | 438,054 |
| CDC Mortgage Capital Trust Series 2002-HE2 Class M1, | | | | | | |
| 5.6594% 1/25/33 (d) | | | | 835,059 | | 835,645 |
| Chase Credit Card Master Trust Series 2003-6 Class B, | | | | | | |
| 5.2513% 2/15/11 (d) | | | | 2,150,000 | | 2,164,966 |
| Chase Credit Card Owner Trust Series 2004-1 Class B, | | | | | | |
| 5.1013% 5/15/09 (d) | | | | 875,000 | | 874,940 |
| Chase Issuance Trust: | | | | | | |
| Series 2004-C3 Class C3, 5.3713% 6/15/12 (d) | | | | 3,305,000 | | 3,324,856 |
| Series 2006-C3 Class C3, 5.07% 6/15/11 (d) | | | | 2,905,000 | | 2,905,000 |
| CIT Equipment Collateral Trust Series 2006-VT1: | | | | | | |
| Class A3, 5.13% 12/21/08 | | | | 2,870,000 | | 2,861,031 |
| Class B, 5.23% 2/20/13 | | | | 1,063,115 | | 1,060,018 |
| Class D, 5.48% 2/20/13 | | | | 1,183,832 | | 1,177,968 |
| Citibank Credit Card Issuance Trust: | | | | | | |
| Series 2002-C1 Class C1, 5.7% 2/9/09 (d) | | | | 3,000,000 | | 3,022,545 |
| Series 2003-C1 Class C1, 5.65% 4/7/10 (d) | | | | 2,600,000 | | 2,645,407 |
See accompanying notes which are an integral part of the financial statements.
21 Semiannual Report
| Investments (Unaudited) continued | | | | | | |
| |
| |
| Asset Backed Securities continued | | | | | | |
| | | | | Principal | | Value (Note 1) |
| | | | | Amount | | |
| Citigroup Mortgage Loan Trust Series 2003-HE4 | | | | | | |
| Class A, 5.3694% 12/25/33 (a)(d) | | | | $ 1,314,572 | | $ 1,314,708 |
| CNH Equipment Trust Series 2005-B Class B, 4.57% | | | | | | |
| 7/16/12 | | | | 830,000 | | 795,941 |
| College Loan Corp. Trust I Series 2006-1 Class AIO, | | | | | | |
| 10% 7/25/08 (f) | | | | 5,690,000 | | 1,195,393 |
| Countrywide Home Loans, Inc.: | | | | | | |
| Series 2003-BC1 Class M2, 6.9594% 9/25/32 (d) | | | | 2,410,000 | | 2,422,560 |
| Series 2004-2: | | | | | | |
| Class 3A4, 5.2094% 7/25/34 (d) | | | | 553,089 | | 553,363 |
| Class M1, 5.4594% 5/25/34 (d) | | | | 1,075,000 | | 1,078,152 |
| Series 2004-3 Class 3A4, 5.2094% 8/25/34 (d) | | | | 958,423 | | 959,116 |
| Series 2004-4: | | | | | | |
| Class A, 5.3294% 8/25/34 (d) | | | | 241,405 | | 241,641 |
| Class M1, 5.4394% 7/25/34 (d) | | | | 775,000 | | 779,244 |
| Class M2, 5.4894% 6/25/34 (d) | | | | 920,000 | | 923,682 |
| Crown Castle Towers LLC/Crown Atlantic Holdings Sub | | | | | | |
| LLC/Crown Communication, Inc. Series 2005-1A | | | | | | |
| Class C, 5.074% 6/15/35 (a) | | | | 974,000 | | 936,430 |
| CS First Boston Mortgage Securities Corp.: | | | | | | |
| Series 2004-FRE1: | | | | | | |
| Class B1, 6.7594% 4/25/34 (d) | | | | 1,295,000 | | 1,294,933 |
| Class M3, 5.6094% 4/25/34 (d) | | | | 1,315,000 | | 1,314,934 |
| Series 2005-FIX1 Class A2, 4.31% 5/25/35 | | | | 2,090,000 | | 2,048,161 |
| Discover Card Master Trust I Series 2003-4 Class B1, | | | | | | |
| 5.2313% 5/16/11 (d) | | | | 1,775,000 | | 1,784,602 |
| Diversified REIT Trust Series 2000-1A Class A2, 6.971% | | | | | | |
| 3/8/10 (a) | | | | 1,500,000 | | 1,539,988 |
| Drive Auto Receivables Trust: | | | | | | |
| Series 2005-1 Class A3, 3.75% 4/15/09 (a) | | | | 1,035,000 | | 1,022,493 |
| Series 2005-3 Class A3, 4.99% 10/15/10 (a) | | | | 2,665,000 | | 2,646,665 |
| Fannie Mae guaranteed REMIC pass thru certificates | | | | | | |
| Series 2004-T5: | | | | | | |
| Class AB1, 4.5086% 5/28/35 (d) | | | | 752,402 | | 752,167 |
| Class AB3, 4.6418% 5/28/35 (d) | | | | 378,647 | | 378,647 |
| Class AB8, 4.6019% 5/28/35 (d) | | | | 298,536 | | 298,443 |
| First Franklin Mortgage Loan Trust Series 2006-FF4N | | | | | | |
| Class N1, 5.5% 3/25/36 (a) | | | | 840,959 | | 839,383 |
| First Investors Auto Owner Trust Series 2006-A Class A3, | | | | | | |
| 4.93% 2/15/11 (a) | | | | 1,220,000 | | 1,209,611 |
| Ford Credit Auto Owner Trust Series 2005-A: | | | | | | |
| Class A4, 3.72% 10/15/09 | | | | 4,100,000 | | 3,999,938 |
| Class B, 3.88% 1/15/10 | | | | 590,000 | | 572,590 |
See accompanying notes which are an integral part of the financial statements.
| Asset Backed Securities continued | | | | |
| | | Principal | | Value (Note 1) |
| | | Amount | | |
| Fremont Home Loan Trust: | | | | |
| Series 2004-1: | | | | |
| Class M1, 5.4094% 2/25/34 (d) | | $ 150,000 | | $ 150,214 |
| Class M2, 5.4594% 2/25/34 (d) | | 150,000 | | 150,265 |
| Series 2004-A Class M2, 6.1094% 1/25/34 (d) | | 1,100,000 | | 1,109,918 |
| Series 2004-C: | | | | |
| Class M1, 5.6094% 8/25/34 (d) | | 1,120,000 | | 1,131,896 |
| Class M3, 6.1094% 8/25/34 (d) | | 3,000,000 | | 3,051,354 |
| Series 2004 D: | | | | |
| Class M4, 5.9094% 11/25/34 (d) | | 295,000 | | 297,309 |
| Class M5, 5.9594% 11/25/34 (d) | | 245,000 | | 246,930 |
| Series 2005-A Class 2A2, 5.1994% 2/25/35 (d) | | 2,382,676 | | 2,384,646 |
| GCO Slims Trust Series 2006-1A, 5.72% 3/1/22 (a) | | 1,500,000 | | 1,474,219 |
| GE Business Loan Trust: | | | | |
| Series 2004-2 Class A, 0.8454% 12/15/08 (a)(f) | | 74,358,997 | | 1,099,026 |
| Series 2005-2 Class IO, 0.5242% 9/15/17 (a)(f) | | 134,240,000 | | 1,503,488 |
| Greenpoint Credit LLC Series 2001-1 Class 1A, | | | | |
| 5.2625% 4/20/32 (d) | | 671,829 | | 670,487 |
| GSAMP Trust: | | | | |
| Series 2002-NC1 Class A2, 5.2794% 7/25/32 (d) | | 4,389 | | 4,432 |
| Series 2003-HE2 Class M1, 5.6094% 8/25/33 (d) | | 650,000 | | 652,951 |
| Series 2005-MTR1 Class A1, 5.0994% 10/25/35 (d) | | 2,744,754 | | 2,744,754 |
| Guggenheim Structured Real Estate Funding Ltd. | | | | |
| Series 2005-1 Class C, 6.0394% 5/25/30 (a)(d) | | 3,050,000 | | 3,050,000 |
| Harwood Street Funding I LLC Series 2004-1A | | | | |
| Class CTFS, 6.9225% 9/20/09 (a)(d) | | 4,400,000 | | 4,406,662 |
| Home Equity Asset Trust: | | | | |
| Series 2002-2 Class A4, 5.3094% 6/25/32 (d) | | 5,664 | | 5,665 |
| Series 2003-3 Class A4, 5.4194% 2/25/33 (d) | | 493 | | 494 |
| Series 2003-5 Class A2, 5.3094% 12/25/33 (d) | | 238,664 | | 238,853 |
| Series 2003-7 Class A2, 5.3394% 3/25/34 (d) | | 337,512 | | 337,709 |
| Series 2003-8 Class M1, 5.6794% 4/25/34 (d) | | 845,000 | | 853,108 |
| Series 2004-1 Class M2, 6.1594% 6/25/34 (d) | | 655,000 | | 661,386 |
| Series 2004-2 Class A2, 5.2494% 7/25/34 (d) | | 164,579 | | 164,680 |
| Series 2004-3: | | | | |
| Class M1, 5.5294% 8/25/34 (d) | | 425,000 | | 427,468 |
| Class M2, 6.1594% 8/25/34 (d) | | 465,000 | | 471,742 |
| Series 2004-6 Class A2, 5.3094% 12/25/34 (d) | | 1,622,500 | | 1,626,075 |
| Household Automotive Trust Series 2004-1 Class A4, | | | | |
| 3.93% 7/18/11 | | 1,170,000 | | 1,140,701 |
| Household Home Equity Loan Trust Series 2003-2 | | | | |
| Class M, 5.5025% 9/20/33 (d) | | 178,918 | | 179,151 |
See accompanying notes which are an integral part of the financial statements.
23 Semiannual Report
| Investments (Unaudited) continued | | | | | | |
| |
| |
| Asset Backed Securities continued | | | | | | |
| | | | | Principal | | Value (Note 1) |
| | | | | Amount | | |
| Household Mortgage Loan Trust Series 2004-HC1 | | | | | | |
| Class A, 5.2725% 2/20/34 (d) | | | | $ 520,186 | | $ 520,816 |
| Household Private Label Credit Card Master Note Trust I | | | | | | |
| Series 2002-2 Class B, 5.4513% 1/18/11 (d) | | | | 1,000,000 | | 1,003,497 |
| HSBC Home Equity Loan Trust: | | | | | | |
| Series 2005-2: | | | | | | |
| Class M1, 5.2363% 1/20/35 (d) | | | | 432,095 | | 432,703 |
| Class M2, 5.2663% 1/20/35 (d) | | | | 324,071 | | 324,861 |
| Series 2005-3 Class A1, 5.0363% 1/20/35 (d) | | | | 2,635,392 | | 2,637,210 |
| Hyundai Auto Receivables Trust Series 2005-A: | | | | | | |
| Class B, 4.2% 2/15/12 | | | | 1,115,000 | | 1,083,884 |
| Class C, 4.22% 2/15/12 | | | | 185,000 | | 180,558 |
| Lancer Funding Ltd. Series 2006-1A Class A3, 6.6367% | | | | | | |
| 4/6/46 (a)(d) | | | | 1,000,000 | | 1,000,000 |
| Marriott Vacation Club Owner Trust Series 2005-2 | | | | | | |
| Class A, 5.25% 10/20/27 (a) | | | | 1,197,139 | | 1,178,434 |
| MASTR Asset Backed Securities Trust Series 2004-FRE1 | | | | | | |
| Class M1, 5.5094% 7/25/34 (d) | | | | 1,146,000 | | 1,151,944 |
| MBNA Credit Card Master Note Trust: | | | | | | |
| Series 2001-B1 Class B1, 5.2763% 10/15/08 (d) | | | | 1,350,000 | | 1,349,797 |
| Series 2001-B2 Class B2, 5.2613% 1/15/09 (d) | | | | 4,750,000 | | 4,751,530 |
| Series 2002-B1 Class B1, 5.15% 7/15/09 | | | | 1,025,000 | | 1,023,363 |
| Series 2002-B2 Class B2, 5.2813% 10/15/09 (d) | | | | 3,600,000 | | 3,610,512 |
| MBNA Master Credit Card Trust II: | | | | | | |
| Series 1998-E Class B, 5.3983% 9/15/10 (d) | | | | 1,500,000 | | 1,507,033 |
| Series 1998-G Class B, 5.3013% 2/17/09 (d) | | | | 1,550,000 | | 1,550,371 |
| Series 2000-L Class B, 5.4013% 4/15/10 (d) | | | | 650,000 | | 653,186 |
| Meritage Mortgage Loan Trust Series 2004-1 Class M1, | | | | | | |
| 5.4594% 7/25/34 (d) | | | | 425,000 | | 424,978 |
| Merrill Lynch Mortgage Investors, Inc.: | | | | | | |
| Series 2003-OPT1 Class M1, 5.6094% 7/25/34 (d) . | | | | 1,145,000 | | 1,151,858 |
| Series 2004-CB6 Class A1, 5.2894% 7/25/35 (d) | | | | 716,298 | | 718,788 |
| Series 2004-FM1 Class M2, 6.1094% 1/25/35 (d) | | | | 300,000 | | 310,069 |
| Morgan Stanley ABS Capital I, Inc.: | | | | | | |
| Series 2004-HE6 Class A2, 5.2994% 8/25/34 (d) | | | | 1,311,061 | | 1,314,866 |
| Series 2004-NC6 Class A2, 5.2994% 7/25/34 (d) | | | | 355,490 | | 356,974 |
| Series 2004-NC7 Class A3, 5.2594% 7/25/34 (d) | | | | 1,701,565 | | 1,702,104 |
| Morgan Stanley Dean Witter Capital I Trust: | | | | | | |
| Series 2001 NC1 Class M2, 6.5644% 10/25/31 (d) | | | | 28,066 | | 28,094 |
| Series 2002-AM3 Class A3, 5.4494% 2/25/33 (d) | | | | 79,980 | | 80,189 |
| Series 2002-HE2 Class M1, 5.6594% 8/25/32 (d) | | | | 1,150,000 | | 1,151,422 |
| Series 2002-NC1 Class M1, 5.7594% | | | | | | |
| 2/25/32 (a)(d) | | | | 616,912 | | 617,404 |
See accompanying notes which are an integral part of the financial statements.
| Asset Backed Securities continued | | | | | | |
| | | | | Principal | | Value (Note 1) |
| | | | | Amount | | |
| Morgan Stanley Dean Witter Capital I Trust: – continued | | | | | | |
| Series 2003-NC1 Class M1, 6.0094% 11/25/32 (d) . | | | | $ 500,739 | | $ 502,527 |
| National Collegiate Funding LLC Series 2004-GT1 | | | | | | |
| Class IO1, 7.87% 6/25/10 (a)(d)(f) | | | | 1,725,000 | | 493,310 |
| National Collegiate Student Loan Trust: | | | | | | |
| Series 2004-2 Class AIO, 9.75% 10/25/14 (f) | | | | 1,885,000 | | 850,908 |
| Series 2005-2 Class AIO, 7.73% 3/25/12 (f) | | | | 1,265,000 | | 349,659 |
| Series 2005-3W Class AIO1, 4.8% 7/25/12 (f) | | | | 4,090,000 | | 766,875 |
| Series 2005-GT1 Class AIO, 6.75% 12/25/09 (f) | | | | 900,000 | | 203,220 |
| Navistar Financial Corp. Owner Trust Series 2005-A | | | | | | |
| Class A4, 4.43% 1/15/14 | | | | 1,165,000 | | 1,134,652 |
| Nissan Auto Lease Trust Series 2005-A Class A3, 4.7% | | | | | | |
| 10/15/08 | | | | 3,120,000 | | 3,098,816 |
| Nissan Auto Receivables Owner Trust Series 2005-A | | | | | | |
| Class A4, 3.82% 7/15/10 | | | | 1,210,000 | | 1,177,081 |
| Northstar Education Finance, Inc., Delaware Series | | | | | | |
| 2005-1 Class A5, 4.74% 10/30/45 | | | | 1,695,000 | | 1,668,992 |
| Onyx Acceptance Owner Trust Series 2005-A Class A3, | | | | | | |
| 3.69% 5/15/09 | | | | 890,000 | | 879,504 |
| Ownit Mortgage Loan Asset-Backed Certificates Series | | | | | | |
| 2005-4 Class A2A1, 5.0794% 8/25/36 (d) | | | | 2,528,984 | | 2,529,199 |
| Park Place Securities NIM Trust Series 2004-WHQN2 | | | | | | |
| Class A, 4% 2/25/35 (a) | | | | 71,081 | | 70,370 |
| Park Place Securities, Inc.: | | | | | | |
| Series 2004 WWF1 Class M4, 6.0594% 1/25/35 (d) | | | | 1,905,000 | | 1,930,571 |
| Series 2004-WCW1: | | | | | | |
| Class M1, 5.5894% 9/25/34 (d) | | | | 640,000 | | 647,415 |
| Class M2, 5.6394% 9/25/34 (d) | | | | 380,000 | | 383,337 |
| Class M3, 6.2094% 9/25/34 (d) | | | | 730,000 | | 739,178 |
| Class M4, 6.4094% 9/25/34 (d) | | | | 1,000,000 | | 1,012,391 |
| Series 2004-WCW2 Class A2, 5.3394% | | | | | | |
| 10/25/34 (d) | | | | 830,122 | | 831,709 |
| Series 2004-WHQ2 Class A3E, 5.3794% | | | | | | |
| 2/25/35 (d) | | | | 977,072 | | 979,472 |
| Residential Asset Mortgage Products, Inc.: | | | | | | |
| Series 2003 RZ2 Class A1, 3.6% 4/25/33 | | | | 344,302 | | 333,380 |
| Series 2004-RS10 Class MII2, 6.2094% 10/25/34 (d) | | | | 2,600,000 | | 2,647,020 |
| Series 2005-SP2 Class 1A1, 5.1094% 5/25/44 (d) | | | | 1,519,296 | | 1,519,547 |
| Salomon Brothers Mortgage Securities VII, Inc. Series | | | | | | |
| 2003-UP1 Class A, 3.45% 4/25/32 (a) | | | | 471,486 | | 449,016 |
| Saxon Asset Securities Trust Series 2004-2 Class MV1, | | | | | | |
| 5.5394% 8/25/35 (d) | | | | 980,000 | | 983,911 |
See accompanying notes which are an integral part of the financial statements.
25 Semiannual Report
| Investments (Unaudited) continued | | | | | | |
| |
| |
| Asset Backed Securities continued | | | | | | |
| | | | | Principal | | Value (Note 1) |
| | | | | Amount | | |
| SBA CMBS Trust Series 2005 1A: | | | | | | |
| Class D, 6.219% 11/15/35 (a) | | | | $ 1,370,000 | | $ 1,367,066 |
| Class E, 6.706% 11/15/35 (a) | | | | 365,000 | | 360,457 |
| Securitized Asset Backed Receivables LLC Trust | | | | | | |
| Series 2004-NC1: | | | | | | |
| Class A2, 5.2094% 2/25/34 (d) | | | | 457,300 | | 457,277 |
| Class M1, 5.4794% 2/25/34 (d) | | | | 610,000 | | 611,720 |
| SLM Private Credit Student Loan Trust: | | | | | | |
| Series 2004 B Class A2, 5.11% 6/15/21 (d) | | | | 1,800,000 | | 1,810,470 |
| Series 2004 A: | | | | | | |
| Class B, 5.49% 6/15/33 (d) | | | | 400,000 | | 405,788 |
| Class C, 5.86% 6/15/33 (d) | | | | 1,020,000 | | 1,032,502 |
| Series 2004-B Class C, 5.78% 9/15/33 (d) | | | | 1,900,000 | | 1,899,050 |
| SLMA Student Loan Trust Series 2005-7 Class A3, 4.41% | | | | | | |
| 7/25/25 | | | | 2,500,000 | | 2,459,725 |
| Structured Asset Securities Corp. Series 2005-5N | | | | | | |
| Class 3A1A, 5.2594% 11/25/35 (d) | | | | 2,788,462 | | 2,790,714 |
| Superior Wholesale Inventory Financing Trust VII Series | | | | | | |
| 2003-A8 Class CTFS, 5.3513% 3/15/11 (a)(d) | | | | 2,520,000 | | 2,519,606 |
| Superior Wholesale Inventory Financing Trust XII Series | | | | | | |
| 2005-A12 Class C, 6.1013% 6/15/10 (d) | | | | 1,405,000 | | 1,408,264 |
| Terwin Mortgage Trust Series 2003-4HE Class A1, | | | | | | |
| 5.3894% 9/25/34 (d) | | | | 345,311 | | 346,883 |
| Triad Auto Receivables Owner Trust Series 2002-A | | | | | | |
| Class A4, 3.24% 8/12/09 | | | | 745,985 | | 739,130 |
| Volkswagen Auto Lease Trust: | | | | | | |
| Series 2004-A Class A3, 2.84% 7/20/07 | | | | 1,851,205 | | 1,840,671 |
| Series 2005-A Class A4, 3.94% 10/20/10 | | | | 3,625,000 | | 3,561,886 |
| WFS Financial Owner Trust: | | | | | | |
| Series 2004-3: | | | | | | |
| Class A4, 3.93% 2/17/12 | | | | 5,000,000 | | 4,897,770 |
| Class D, 4.07% 2/17/12 | | | | 744,647 | | 734,380 |
| Series 2004-4 Class D, 3.58% 5/17/12 | | | | 635,580 | | 623,410 |
| Series 2005-1: | | | | | | |
| Class A3, 3.59% 10/19/09 | | | | 3,465,000 | | 3,420,442 |
| Class D, 4.09% 8/15/12 | | | | 555,508 | | 545,497 |
| Series 2005-3 Class C, 4.54% 5/17/13 | | | | 850,000 | | 831,578 |
| Whinstone Capital Management Ltd. Series 1A Class B3, | | | | | | |
| 6% 10/25/44 (a)(d) | | | | 3,320,000 | | 3,320,000 |
| World Omni Auto Receivables Trust Series 2005-A | | | | | | |
| Class A3, 3.54% 6/12/09 | | | | 1,080,000 | | 1,064,843 |
| TOTAL ASSET BACKED SECURITIES | | | | | | |
| (Cost $263,641,579) | | | | | | 262,793,534 |
See accompanying notes which are an integral part of the financial statements.
| Collateralized Mortgage Obligations 11.1% | | | | |
| | | | | Principal | | Value (Note 1) |
| | | | | Amount | | |
| Private Sponsor 7.5% | | | | | | |
| Adjustable Rate Mortgage Trust floater: | | | | | | |
| Series 2004-1 Class 9A2, 5.3594% 1/25/34 (d) | | | | $ 577,599 | | $ 579,445 |
| Series 2004-2 Class 7A3, 5.3594% 2/25/35 (d) | | | | 1,202,674 | | 1,206,617 |
| Series 2004-4 Class 5A2, 5.3594% 3/25/35 (d) | | | | 481,067 | | 481,885 |
| Bear Stearns Adjustable Rate Mortgage Trust Series | | | | | | |
| 2005-6 Class 1A1, 5.1215% 8/25/35 (d) | | | | 3,058,616 | | 3,035,294 |
| Bear Stearns Alt-A Trust floater: | | | | | | |
| Series 2005-1 Class A1, 5.2394% 1/25/35 (d) | | | | 778,195 | | 779,368 |
| Series 2005-2 Class 1A1, 5.2094% 3/25/35 (d) | | | | 1,937,902 | | 1,937,899 |
| Series 2005-5 Class 1A1, 5.1794% 7/25/35 (d) | | | | 1,283,243 | | 1,282,871 |
| Countrywide Home Loans, Inc. sequential pay: | | | | | | |
| Series 2002-25 Class 2A1, 5.5% 11/27/17 | | | | 618,836 | | 616,534 |
| Series 2002-32 Class 2A3, 5% 1/25/18 | | | | 32,838 | | 32,729 |
| CS First Boston Mortgage Securities Corp. floater: | | | | | | |
| Series 2004-AR4 Class 5A2, 5.3294% 5/25/34 (d) | | . | | 226,675 | | 226,530 |
| Series 2004-AR5 Class 11A2, 5.3294% 6/25/34 (d) | | 311,103 | | 310,551 |
| Series 2004-AR8 Class 8A2, 5.3394% 9/25/34 (d) | | . | | 533,519 | | 534,987 |
| Granite Master Issuer PLC floater: | | | | | | |
| Series 2005-2 Class C1, 5.27% 12/20/54 (d) | | | | 1,800,000 | | 1,801,260 |
| Series 2005-4: | | | | | | |
| Class C1, 5.2% 12/20/54 (d) | | | | 1,350,000 | | 1,349,789 |
| Class M2, 5.05% 12/20/54 (d) | | | | 1,300,000 | | 1,299,797 |
| Series 2006-1A Class C2, 5.2569% 12/20/54 (a)(d) | | 1,100,000 | | 1,099,681 |
| Granite Mortgages PLC floater: | | | | | | |
| Series 2004-1 Class 1C, 5.83% 3/20/44 (d) | | | | 1,920,000 | | 1,921,200 |
| Series 2004-2 Class 1C, 5.63% 6/20/44 (d) | | | | 261,916 | | 262,147 |
| Holmes Financing No. 8 PLC floater Series 2: | | | | | | |
| Class B, 4.77% 7/15/40 (d) | | | | 565,000 | | 564,774 |
| Class C, 5.32% 7/15/40 (d) | | | | 1,295,000 | | 1,297,979 |
| Homestar Mortgage Acceptance Corp. floater | | | | | | |
| Series 2004-5 Class A1, 5.4094% 10/25/34 (d) | | | | 1,559,513 | | 1,567,976 |
| Impac CMB Trust floater: | | | | | | |
| Series 2004-6 Class 1A2, 5.3494% 10/25/34 (d) | | | | 526,413 | | 527,764 |
| Series 2004-9: | | | | | | |
| Class M2, 5.6094% 1/25/35 (d) | | | | 557,121 | | 559,169 |
| Class M3, 5.6594% 1/25/35 (d) | | | | 412,990 | | 414,343 |
| Class M4, 6.0094% 1/25/35 (d) | | | | 210,653 | | 211,188 |
| Series 2005-1: | | | | | | |
| Class M1, 5.4194% 4/25/35 (d) | | | | 515,161 | | 516,227 |
| Class M2, 5.4594% 4/25/35 (d) | | | | 888,653 | | 890,370 |
| Class M3, 5.4894% 4/25/35 (d) | | | | 218,943 | | 219,316 |
See accompanying notes which are an integral part of the financial statements.
27 Semiannual Report
| Investments (Unaudited) continued | | | | | | |
| |
| |
| Collateralized Mortgage Obligations continued | | | | |
| | | | | Principal | | Value (Note 1) |
| | | | | Amount | | |
| Private Sponsor continued | | | | | | |
| JPMorgan Mortgage Trust Series 2005-A8 Class 2A3, | | | | | | |
| 4.9624% 11/25/35 (d) | | | | $ 400,000 | | $ 390,045 |
| Lehman Structured Securities Corp. floater Series 2005-1 | | | | | | |
| Class A2, 5.2081% 9/26/45 (a)(d) | | | | 1,444,522 | | 1,446,102 |
| Lehman XS Trust floater Series 2006-GP1 Class A1, | | | | | | |
| 5.09% 5/25/46 (d) | | | | 3,710,000 | | 3,710,000 |
| Master Alternative Loan Trust Series 2004-3 Class 3A1, | | | | | | |
| 6% 4/25/34 | | | | 250,091 | | 246,418 |
| Master Seasoned Securitization Trust Series 2004-1 | | | | | | |
| Class 1A1, 6.237% 8/25/17 (d) | | | | 1,201,380 | | 1,208,809 |
| MASTR Adjustable Rate Mortgages Trust floater Series | | | | | | |
| 2005-1 Class 1A1, 5.2294% 3/25/35 (d) | | | | 1,069,101 | | 1,071,730 |
| Merrill Lynch Mortgage Investors, Inc.: | | | | | | |
| floater: | | | | | | |
| Series 2003-A Class 2A1, 5.3494% 3/25/28 (d) | | | | 1,264,571 | | 1,271,926 |
| Series 2003-F Class A2, 4.43% 10/25/28 (d) | | | | 1,551,561 | | 1,553,251 |
| Series 2004-B Class A2, 4.83% 6/25/29 (d) | | | | 2,197,864 | | 2,194,094 |
| Series 2004-C Class A2, 5.01% 7/25/29 (d) | | | | 1,448,174 | | 1,444,915 |
| Series 2004-D Class A2, 5.3238% 9/25/29 (d) | | | | 1,316,412 | | 1,316,425 |
| Series 2003-E Class XA1, 0.9967% 10/25/28 (d)(f) . | | | | 6,921,567 | | 63,062 |
| Series 2003-G Class XA1, 1% 1/25/29 (f) | | | | 6,052,943 | | 61,181 |
| Series 2003-H Class XA1, 1% 1/25/29 (a)(f) | | | | 5,284,187 | | 54,719 |
| Mortgage Asset Backed Securities Trust floater | | | | | | |
| Series 2002-NC1 Class M1, 5.8094% 10/25/32 (d) . | | | | 119,996 | | 120,234 |
| MortgageIT Trust floater Series 2004-2: | | | | | | |
| Class A1, 5.3294% 12/25/34 (d) | | | | 937,920 | | 937,388 |
| Class A2, 5.4094% 12/25/34 (d) | | | | 1,267,928 | | 1,279,271 |
| Opteum Mortgage Acceptance Corp. floater | | | | | | |
| Series 2005-3 Class APT, 5.2494% 7/25/35 (d) | | | | 2,483,907 | | 2,486,236 |
| Permanent Financing No. 3 PLC floater Series 2 Class C, | | | | | | |
| 5.93% 6/10/42 (d) | | | | 605,000 | | 608,238 |
| Permanent Financing No. 4 PLC floater Series 2: | | | | | | |
| Class C, 5.6% 6/10/42 (d) | | | | 1,495,000 | | 1,501,413 |
| Class M, 5.21% 6/10/42 (d) | | | | 345,000 | | 344,571 |
| Permanent Financing No. 5 PLC floater: | | | | | | |
| Series 2 Class C, 5.53% 6/10/42 (d) | | | | 915,000 | | 918,752 |
| Series 3 Class C, 5.7% 6/10/42 (d) | | | | 1,935,000 | | 1,951,835 |
| Residential Asset Mortgage Products, Inc.: | | | | | | |
| sequential pay Series 2003-SL1 Class A31, 7.125% | | | | | | |
| 4/25/31 | | | | 788,112 | | 788,104 |
| Series 2005-AR5 Class 1A1, 4.8414% 9/19/35 (d) . | | | | 858,790 | | 849,727 |
See accompanying notes which are an integral part of the financial statements.
| Collateralized Mortgage Obligations continued | | | | |
| | | | | Principal | | Value (Note 1) |
| | | | | Amount | | | | |
| Private Sponsor continued | | | | | | | | |
| Sequoia Mortgage Funding Trust Series 2003-A | | | | | | | | |
| Class AX1, 0.8% 10/21/08 (a)(f) | | | | $ 20,701,520 | | | | $ 97,655 |
| Sequoia Mortgage Trust: | | | | | | | | |
| floater: | | | | | | | | |
| Series 2003-5 Class A2, 5.27% 9/20/33 (d) | | | | 489,025 | | | | 488,905 |
| Series 2003-6 Class A2, 4.69% 11/20/33 (d) | | | | 1,134,065 | | | | 1,134,005 |
| Series 2003-7 Class A2, 4.925% 1/20/34 (d) | | | | 1,209,682 | | | | 1,209,640 |
| Series 2004-2 Class A, 5.21% 3/20/34 (d) | | | | 535,983 | | | | 536,856 |
| Series 2004-3 Class A, 5.3063% 5/20/34 (d) | | | | 1,217,244 | | | | 1,217,504 |
| Series 2004-4 Class A, 4.62% 5/20/34 (d) | | | | 1,021,334 | | | | 1,021,275 |
| Series 2004-5 Class A3, 4.86% 6/20/34 (d) | | | | 1,071,204 | | | | 1,071,204 |
| Series 2004-6 Class A3A, 4.9644% 6/20/35 (d) | | | | 884,693 | | | | 884,096 |
| Series 2004-7 Class A3A, 5.265% 8/20/34 (d) | | | | 967,463 | | | | 966,716 |
| Series 2004-8 Class A2, 5.31% 9/20/34 (d) | | | | 1,308,729 | | | | 1,310,048 |
| Series 2005-1 Class A2, 4.97% 2/20/35 (d) | | | | 1,010,675 | | | | 1,009,395 |
| Series 2003-7 Class X1, 0.6186% 1/20/34 (d)(f) | | | | 53,856,830 | | | | 336,605 |
| Series 2003-8 Class X1, 0.6216% 1/20/34 (d)(f) | | | | 31,349,261 | | | | 205,730 |
| Series 2004-1 Class X1, 0.8% 2/20/34 (f) | | | | 6,782,291 | | | | 26,494 |
| Structured Adjustable Rate Mortgage Loan Trust floater | | | | | | | | |
| Series 2005-10 Class A1, 5.1594% 6/25/35 (d) | | | | 1,089,369 | | | | 1,089,369 |
| Structured Asset Securities Corp. floater Series | | | | | | | | |
| 2004-NP1 Class A, 5.3594% 9/25/33 (a)(d) | | | | 322,529 | | | | 322,750 |
| Wachovia Mortgage Loan Trust LLC Series 2005-B | | | | | | | | |
| Class 2A4, 5.1893% 10/20/35 (d) | | | | 320,000 | | | | 314,817 |
| WAMU Mortgage pass thru certificates floater: | | | | | | | | |
| Series 2005-AR11 Class A1C1, 5.1594% | | | | | | | | |
| 8/25/45 (d) | | | | 2,144,868 | | | | 2,143,952 |
| Series 2005-AR13 Class A1C1, 5.1494% | | | | | | | | |
| 10/25/45 (d) | | | | 1,675,862 | | | | 1,674,954 |
| Washington Mutual Mortgage Securities Corp. | | | | | | | | |
| sequential pay: | | | | | | | | |
| Series 2003-MS9 Class 2A1, 7.5% 12/25/33 | | | | 211,280 | | | | 214,000 |
| Series 2004-RA2 Class 2A, 7% 7/25/33 | | | | 342,485 | | | | 349,656 |
| Wells Fargo Mortgage Backed Securities Trust: | | | | | | | | |
| Series 2003-14 Class 1A1, 4.75% 12/25/18 | | | | 1,677,699 | | | | 1,602,727 |
| Series 2004-M Class A3, 4.6807% 8/25/34 (d) | | | | 3,052,808 | | | | 3,030,818 |
| Series 2005-AR2 Class 2A2, 4.57% 3/25/35 | | | | 5,045,528 | | | | 4,919,279 |
| Series 2005-AR4 Class 2A2, 4.5306% 4/25/35 (d) | | . | | 8,453,241 | | | | 8,227,634 |
| Series 2005-AR9 Class 2A1, 4.3623% 5/25/35 (d) | | . | | 8,032,442 | | | | 7,903,093 |
| Series 2006-AR8 Class 2A6, 5.24% 4/25/36 (d) | | | | 3,295,000 | | | | 3,258,248 |
| |
| TOTAL PRIVATE SPONSOR | | | | | | | | 99,913,561 |
See accompanying notes which are an integral part of the financial statements.
29 Semiannual Report
| Investments (Unaudited) continued | | |
| |
| |
| Collateralized Mortgage Obligations continued | | | | |
| | | Principal | | Value (Note 1) |
| | | Amount | | |
| U.S. Government Agency 3.6% | | | | |
| Fannie Mae planned amortization class: | | | | |
| Series 1993-187 Class L, 6.5% 7/25/23 | | $ 1,238,596 | | $ 1,261,300 |
| Series 1994-30 Class JA, 5% 7/25/23 | | 657,948 | | 654,260 |
| Fannie Mae guaranteed REMIC pass thru certificates: | | | | |
| sequential pay: | | | | |
| Series 2001-40 Class Z, 6% 8/25/31 | | 1,560,375 | | 1,563,464 |
| Series 2003-76 Class BA, 4.5% 3/25/18 | | 4,132,953 | | 3,979,505 |
| Series 2004-3 Class BA, 4% 7/25/17 | | 174,967 | | 167,060 |
| Series 2004-86 Class KC, 4.5% 5/25/19 | | 687,148 | | 661,458 |
| Series 2004-31 Class IA, 4.5% 6/25/10 (f) | | 752,158 | | 14,482 |
| Freddie Mac sequential pay Series 2114 Class ZM, 6% | | |
| 1/15/29 | | 692,062 | | 696,954 |
| Freddie Mac Multi-class participation certificates | | | | |
| guaranteed: | | | | |
| planned amortization class: | | | | |
| Seires 2625 Class QX, 2.25% 3/15/22 | | 307,202 | | 298,950 |
| Series 2489 Class PD, 6% 2/15/31 | | 561,313 | | 563,253 |
| Series 2535 Class PC, 6% 9/15/32 | | 1,975,000 | | 1,976,537 |
| Series 2640 Class QG, 2% 4/15/22 | | 402,347 | | 390,246 |
| Series 2660 Class ML, 3.5% 7/15/22 | | 12,165,000 | | 11,869,654 |
| Series 2690 Class PD, 5% 2/15/27 | | 2,980,000 | | 2,941,792 |
| Series 2755 Class LC, 4% 6/15/27 | | 2,225,000 | | 2,117,713 |
| Series 2901 Class UM, 4.5% 1/15/30 | | 5,500,000 | | 5,366,820 |
| sequential pay: | | | | |
| Series 2523 Class JB, 5% 6/15/15 | | 1,270,160 | | 1,263,272 |
| Series 2609 Class UJ, 6% 2/15/17 | | 1,713,857 | | 1,724,091 |
| Series 2635 Class DG, 4.5% 1/15/18 | | 4,623,652 | | 4,458,182 |
| Series 2780 Class A, 4% 12/15/14 | | 4,470,685 | | 4,317,941 |
| Series 2786 Class GA, 4% 8/15/17 | | 1,964,939 | | 1,875,319 |
| Series 1803 Class A, 6% 12/15/08 | | 335,552 | | 336,792 |
| Ginnie Mae guaranteed REMIC pass thru securities | | | | |
| planned amortization class Series 2002-5 Class PD, | | |
| 6.5% 5/16/31 | | 490,305 | | 492,697 |
| |
| TOTAL U.S. GOVERNMENT AGENCY | | | | 48,991,742 |
| |
| TOTAL COLLATERALIZED MORTGAGE OBLIGATIONS | | |
| (Cost $149,920,227) | | | | 148,905,303 |
See accompanying notes which are an integral part of the financial statements.
| Commercial Mortgage Securities 9.4% | | | | |
| | �� | Principal | | Value (Note 1) |
| | | Amount | | |
| 280 Park Avenue Trust floater Series 2001-280 | | | | |
| Class X1, 1.0077% 2/3/11 (a)(d)(f) | | $15,212,897 | | $ 573,920 |
| Asset Securitization Corp.: | | | | |
| sequential pay Series 1995-MD4 Class A1, 7.1% | | | | |
| 8/13/29 | | 53,715 | | 54,355 |
| Series 1997-D5 Class PS1, 1.107% 2/14/43 (d)(f) | | 10,222,518 | | 428,606 |
| Banc of America Commercial Mortgage, Inc.: | | | | |
| sequential pay Series 2005-1 Class A2, 4.64% | | | | |
| 11/10/42 | | 2,930,000 | | 2,894,284 |
| Series 2002-2 Class XP, 1.7835% 7/11/43 (a)(d)(f) | | 7,279,323 | | 375,872 |
| Series 2003-2 Class XP, 0.4123% 3/11/41 (a)(d)(f) | | 27,233,069 | | 284,888 |
| Series 2004-6 Class XP, 0.6217% 12/10/42 (d)(f) | | 14,145,574 | | 301,609 |
| Series 2005-4 Class XP, 0.2073% 7/10/45 (d)(f) | | 17,628,265 | | 188,670 |
| Banc of America Large Loan, Inc.: | | | | |
| floater: | | | | |
| Series 2003-BBA2: | | | | |
| Class A3, 5.2213% 11/15/15 (a)(d) | | 1,145,000 | | 1,146,007 |
| Class C, 5.3713% 11/15/15 (a)(d) | | 235,000 | | 235,500 |
| Class D, 5.4513% 11/15/15 (a)(d) | | 365,000 | | 366,755 |
| Class F, 5.8013% 11/15/15 (a)(d) | | 260,000 | | 260,876 |
| Class H, 6.3013% 11/15/15 (a)(d) | | 235,000 | | 236,374 |
| Class J, 6.8513% 11/15/15 (a)(d) | | 245,000 | | 247,008 |
| Class K, 7.5013% 11/15/15 (a)(d) | | 220,000 | | 219,036 |
| Series 2006 LAQ: | | | | |
| Class H, 5.6025% 2/9/21 (a)(d) | | 650,000 | | 649,964 |
| Class J, 5.6925% 2/9/21 (a)(d) | | 470,000 | | 469,974 |
| Class K, 5.9225% 2/9/21 (a)(d) | | 1,305,000 | | 1,304,927 |
| Series 2006-ESH: | | | | |
| Class A, 5.74% 7/14/11 (a)(d) | | 1,381,181 | | 1,375,712 |
| Class B, 5.84% 7/14/11 (a)(d) | | 688,752 | | 686,028 |
| Class C, 5.99% 7/14/11 (a)(d) | | 1,379,342 | | 1,373,895 |
| Class D, 6.62% 7/14/11 (a)(d) | | 801,662 | | 799,035 |
| Bayview Commercial Asset Trust: | | | | |
| floater: | | | | |
| Series 2003-2 Class A, 5.5394% 12/25/33 (a)(d) . | | 2,544,799 | | 2,554,342 |
| Series 2004-1: | | | | |
| Class A, 5.3194% 4/25/34 (a)(d) | | 1,115,317 | | 1,116,711 |
| Class B, 6.8594% 4/25/34 (a)(d) | | 139,415 | | 140,722 |
| Class M1, 5.5194% 4/25/34 (a)(d) | | 69,707 | | 69,882 |
| Class M2, 6.1594% 4/25/34 (a)(d) | | 69,707 | | 70,404 |
| Series 2004-2: | | | | |
| Class A, 5.3894% 8/25/34 (a)(d) | | 1,221,306 | | 1,225,123 |
| Class M1, 5.5394% 8/25/34 (a)(d) | | 393,841 | | 396,057 |
See accompanying notes which are an integral part of the financial statements.
31 Semiannual Report
| Investments (Unaudited) continued | | | | | | |
| |
| |
| Commercial Mortgage Securities continued | | | | | | |
| | | | | Principal | | Value (Note 1) |
| | | | | Amount | | |
| Bayview Commercial Asset Trust: – continued | | | | | | |
| floater: | | | | | | |
| Series 2004-3: | | | | | | |
| Class A1, 5.3294% 1/25/35 (a)(d) | | | | $ 1,362,675 | | $ 1,366,082 |
| Class A2, 5.3794% 1/25/35 (a)(d) | | | | 212,918 | | 213,184 |
| Series 2005-4A: | | | | | | |
| Class A2, 5.3494% 1/25/36 (a)(d) | | | | 1,569,332 | | 1,570,313 |
| Class B1, 6.3594% 1/25/36 (a)(d) | | | | 98,083 | | 99,064 |
| Class M1, 5.4094% 1/25/36 (a)(d) | | | | 490,416 | | 491,642 |
| Class M2, 5.4294% 1/25/36 (a)(d) | | | | 196,167 | | 196,780 |
| Class M3, 5.4594% 1/25/36 (a)(d) | | | | 196,167 | | 196,780 |
| Class M4, 5.5694% 1/25/36 (a)(d) | | | | 98,083 | | 98,451 |
| Class M5, 5.6094% 1/25/36 (a)(d) | | | | 98,083 | | 98,451 |
| Class M6, 5.6594% 1/25/36 (a)(d) | | | | 98,083 | | 98,451 |
| Series 2004-1 Class IO, 1.25% 4/25/34 (a)(f) | | | | 12,104,876 | | 669,551 |
| Bear Stearns Commercial Mortgage Securities, Inc.: | | | | | | |
| floater Series 2004-BBA3 Class E, 5.6013% | | | | | | |
| �� 6/15/17 (a)(d) | | | | 2,265,000 | | 2,269,286 |
| sequential pay Series 2004-ESA Class A3, 4.741% | | | | | | |
| 5/14/16 (a) | | | | 625,000 | | 615,384 |
| Series 2002-TOP8 Class X2, 2.1031% | | | | | | |
| 8/15/38 (a)(d)(f) | | | | 7,763,326 | | 540,538 |
| Series 2003-PWR2 Class X2, 0.5776% | | | | | | |
| 5/11/39 (a)(d)(f) | | | | 20,445,140 | | 422,008 |
| Series 2003-T12 Class X2, 0.7259% | | | | | | |
| 8/13/39 (a)(d)(f) | | | | 19,331,772 | | 414,547 |
| Series 2004-PWR6 Class X2, 0.677% | | | | | | |
| 11/11/41 (a)(d)(f) | | | | 8,167,168 | | 244,443 |
| Series 2005-PWR9 Class X2, 0.4057% 9/11/42 (a)(f) | | | | 51,415,000 | | 1,029,123 |
| CDC Commercial Mortgage Trust Series 2002-FX1 | | | | | | |
| Class XCL, 0.6989% 5/15/35 (a)(d)(f) | | | | 43,447,607 | | 2,380,872 |
| Chase Commercial Mortgage Securities Corp. sequential | | | | | | |
| pay Series 1999-2 Class A1, 7.032% 1/15/32 | | | | 184,271 | | 184,988 |
| Citigroup Commercial Mortgage Trust: | | | | | | |
| sequential pay Series 2005-EMG Class A2, 4.2211% | | | | | | |
| 9/20/51 (a) | | | | 985,000 | | 945,813 |
| Series 2004-C2 Class XP, 0.9799% 10/15/41 (a)(d)(f) | | | | 9,734,251 | | 376,971 |
| COMM: | | | | | | |
| floater: | | | | | | |
| Series 2002-FL6 Class G, 6.8013% 6/14/14 (a)(d) | | | | 800,000 | | 800,000 |
| Series 2002-FL7: | | | | | | |
| Class D, 5.4713% 11/15/14 (a)(d) | | | | 118,857 | | 119,046 |
| Class H, 7.1513% 11/15/14 (a)(d) | | | | 1,232,000 | | 1,232,539 |
See accompanying notes which are an integral part of the financial statements.
| Commercial Mortgage Securities continued | | | | |
| | | Principal | | Value (Note 1) |
| | | Amount | | |
| COMM: – continued | | | | |
| Series 2004-LBN2 Class X2, 1.0437% | | | | |
| 3/10/39 (a)(d)(f) | | $ 3,237,429 | | $ 103,092 |
| Commercial Mortgage Acceptance Corp. | | | | |
| Series 1998-C2 Class B, 5.7252% 9/15/30 (d) | | 3,420,000 | | 3,478,760 |
| Commercial Mortgage Asset Trust sequential pay | | | | |
| Series 1999-C1 Class A3, 6.64% 1/17/32 | | 675,000 | | 695,853 |
| Commercial Mortgage pass thru certificates: | | | | |
| floater Series 2004-HTL1: | | | | |
| Class B, 5.3513% 7/15/16 (a)(d) | | 41,120 | | 41,128 |
| Class D, 5.4513% 7/15/16 (a)(d) | | 95,553 | | 95,573 |
| Class E, 5.6513% 7/15/16 (a)(d) | | 67,426 | | 67,446 |
| Class F, 5.7013% 7/15/16 (a)(d) | | 72,411 | | 72,470 |
| Class H, 6.2013% 7/15/16 (a)(d) | | 206,928 | | 207,222 |
| Class J, 6.3513% 7/15/16 (a)(d) | | 80,225 | | 80,279 |
| Class K, 7.2513% 7/15/16 (a)(d) | | 90,132 | | 90,225 |
| Series 2005-LP5 Class XP, 0.3684% 5/10/43 (d)(f) | | 18,895,000 | | 291,573 |
| CS First Boston Mortgage Securities Corp.: | | | | |
| floater: | | | | |
| Series 2004-HC1: | | | | |
| Class A2, 5.4013% 12/15/21 (a)(d) | | 350,000 | | 349,999 |
| Class B, 5.6513% 12/15/21 (a)(d) | | 915,000 | | 914,995 |
| Series 2005-TFLA: | | | | |
| Class C, 5.1413% 2/15/20 (a)(d) | | 1,210,000 | | 1,210,779 |
| Class E, 5.2313% 2/15/20 (a)(d) | | 440,000 | | 440,361 |
| Class F, 5.2813% 2/15/20 (a)(d) | | 375,000 | | 375,190 |
| Class G, 5.4213% 2/15/20 (a)(d) | | 110,000 | | 110,097 |
| Class H, 5.6513% 2/15/20 (a)(d) | | 155,000 | | 155,137 |
| sequential pay: | | | | |
| Series 1999-C1 Class A2, 7.29% 9/15/41 | | 2,989,755 | | 3,131,252 |
| Series 2004-C1 Class A2, 3.516% 1/15/37 | | 3,035,000 | | 2,914,210 |
| Series 2001-CK6 Class AX, 0.645% 9/15/18 (f) | | 18,770,889 | | 570,703 |
| Series 2003-C3 Class ASP, 1.8185% | | | | |
| 5/15/38 (a)(d)(f) | | 23,826,557 | | 1,179,562 |
| Series 2003-C4 Class ASP, 0.4324% | | | | |
| 8/15/36 (a)(d)(f) | | 16,647,057 | | 240,936 |
| Series 2004-C1 Class ASP, 0.9369% | | | | |
| 1/15/37 (a)(d)(f) | | 15,583,964 | | 487,876 |
| Series 2005-C1 Class ASP, 0.4193% | | | | |
| 2/15/38 (a)(d)(f) | | 19,352,736 | | 326,694 |
| Series 2005-C2 Class ASP, 0.5924% | | | | |
| 4/15/37 (a)(d)(f) | | 16,186,500 | | 420,074 |
| Deutsche Mortgage & Asset Receiving Corp. sequential | | | | |
| pay Series 1998-C1 Class D, 7.231% 6/15/31 | | 975,000 | | 1,011,247 |
See accompanying notes which are an integral part of the financial statements. | | |
| |
| 33 | | Semiannual Report |
| Investments (Unaudited) continued | | | | | | |
| |
| |
| Commercial Mortgage Securities continued | | | | | | | | |
| | | | | | | Principal | | Value (Note 1) |
| | | | | | | Amount | | |
| DLJ Commercial Mortgage Corp. sequential pay | | | | | | | | |
| Series 2000-CF1: | | | | | | | | |
| Class A1A, 7.45% 6/10/33 | | | | | | $ 188,345 | | $ 188,975 |
| Class A1B, 7.62% 6/10/33 | | | | | | 1,770,000 | | 1,901,150 |
| EQI Financing Partnership I LP Series 1997-1 Class B, | | | | | | | | |
| 7.37% 12/20/15 (a) | | | | | | 361,582 | | 365,070 |
| Equitable Life Assurance Society of the United States: | | | | | | | | |
| sequential pay Series 174 Class A1, 7.24% | | | | | | | | |
| 5/15/06 (a) | | | | | | 1,000,000 | | 1,000,917 |
| Series 174 Class B1, 7.33% 5/15/06 (a) | | | | | | 500,000 | | 500,473 |
| First Union-Lehman Brothers Commercial Mortgage Trust | | | | | | | | |
| sequential pay Series 1997-C2 Class A3, 6.65% | | | | | | | | |
| 11/18/29 | | | | | | 2,053,129 | | 2,078,329 |
| GE Capital Commercial Mortgage Corp. Series 2001-1 | | | | | | | | |
| Class X1, 0.4789% 5/15/33 (a)(d)(f) | | | | | | 11,114,325 | | 379,803 |
| GE Capital Mall Finance Corp. Series 1998-1A | | | | | | | | |
| Class B2, 6.7547% 9/13/28 (a)(d) | | | | | | 1,490,000 | | 1,548,020 |
| GE Commercial Mortgage Corp. sequential pay | | | | | | | | |
| Series 2004-C3 Class A2, 4.433% 7/10/39 | | | | | | 4,015,000 | | 3,907,886 |
| GGP Mall Properties Trust: | | | | | | | | |
| floater Series 2001-C1A Class A3, 5.6013% | | | | | | | | |
| 2/15/14 (a)(d) | | | | | | 421,812 | | 421,810 |
| sequential pay Series 2001-C1A Class A2, 5.007% | | | | | | | | |
| 11/15/11 (a) | | | | | | 1,257,425 | | 1,255,935 |
| Global Signal Trust III Series 2006-1: | | | | | | | | |
| Class B, 5.588% 2/15/36 (a) | | | | | | 735,000 | | 727,762 |
| Class C, 5.707% 2/15/36 (a) | | | | | | 910,000 | | 901,837 |
| GMAC Commercial Mortgage Securities, Inc.: | | | | | | | | |
| sequential pay: | | | | | | | | |
| Series 1997-C2 Class A3, 6.566% 4/15/29 | | | | | | 763,014 | | 773,832 |
| Series 2006-C1 Class XP, 4.975% 11/10/45 | | | | | | 1,659,721 | | 1,643,647 |
| Series 2003-C3 Class X2, 0.7143% | | | | | | | | |
| 12/10/38 (a)(d)(f) | | | | | | 19,655,179 | | 458,233 |
| Series 2004-C3 Class X2, 0.7315% 12/10/41 (d)(f) | | | | | | 13,285,330 | | 331,186 |
| Series 2006-C1 Class XP, 0.1669% 11/10/45 (d)(f) | | | | | | 23,660,000 | | 233,635 |
| Greenwich Capital Commercial Funding Corp.: | | | | | | | | |
| Series 2002-C1 Class SWDB, 5.857% 11/11/19 (a) | | | | | | 1,150,000 | | 1,132,186 |
| Series 2003-C1 Class XP, 2.0977% 7/5/35 (a)(d)(f) | | | | | | 12,056,266 | | 690,331 |
| Series 2003-C2 Class XP, 1.0327% 1/5/36 (a)(d)(f) | | | | | | 22,517,784 | | 734,645 |
| Series 2005-GG3 Class XP, 0.8029% | | | | | | | | |
| 8/10/42 (a)(d)(f) | | | | | | 58,435,000 | | 1,786,042 |
| GS Mortgage Securities Corp. II sequential pay | | | | | | | | |
| Series 2003-C1 Class A2A, 3.59% 1/10/40 | | | | | | 1,705,000 | | 1,660,084 |
See accompanying notes which are an integral part of the financial statements.
| Commercial Mortgage Securities continued | | | | | | |
| | | | | | | Principal | | Value (Note 1) |
| | | | | | | Amount | | |
| Hilton Hotel Pool Trust: | | | | | | | | |
| sequential pay Series 2000-HLTA Class A1, 7.055% | | | | | | | | |
| 10/3/15 (a) | | | | | | $ 572,791 | | $ 594,396 |
| Series 2000-HLTA Class D, 7.555% 10/3/15 (a) | | | | | | 1,275,000 | | 1,324,127 |
| Host Marriott Pool Trust sequential pay Series | | | | | | | | |
| 1999-HMTA: | | | | | | | | |
| Class A, 6.98% 8/3/15 (a) | | | | | | 418,609 | | 429,431 |
| Class B, 7.3% 8/3/15 (a) | | | | | | 505,000 | | 532,362 |
| Class D, 7.97% 8/3/15 (a) | | | | | | 425,000 | | 456,885 |
| JPMorgan Chase Commercial Mortgage Securities | | | | | | | | |
| Corp.: | | | | | | | | |
| sequential pay Series 2001-C1 Class A2, 5.464% | | | | | | | | |
| 10/12/35 | | | | | | 2,846,171 | | 2,839,771 |
| Series 2002-C3 Class X2, 1.2396% 7/12/35 (a)(d)(f) | | | | | | 6,184,400 | | 198,768 |
| Series 2003-CB7 Class X2, 0.7784% | | | | | | | | |
| 1/12/38 (a)(d)(f) | | | | | | 4,338,099 | | 115,345 |
| Series 2003-LN1 Class X2, 0.6878% | | | | | | | | |
| 10/15/37 (a)(d)(f) | | | | | | 26,278,568 | | 588,572 |
| Series 2004-C1 Class X2, 0.9964% 1/15/38 (a)(d)(f) | | | | | | 3,989,019 | | 141,321 |
| Series 2004-CB8 Class X2, 1.162% 1/12/39 (a)(d)(f) | | | | | | 4,864,265 | | 196,583 |
| LB Commercial Conduit Mortgage Trust sequential pay: | | | | | | | | |
| Series 1998-C4 Class A1B, 6.21% 10/15/35 | | | | | | 2,725,834 | | 2,770,016 |
| Series 1999-C1 Class A2, 6.78% 6/15/31 | | | | | | 2,650,000 | | 2,738,330 |
| LB-UBS Commercial Mortgage Trust: | | | | | | | | |
| sequential pay Series 2003-C3 Class A2, 3.086% | | | | | | | | |
| 5/15/27 | | | | | | 1,465,000 | | 1,403,060 |
| Series 2002-C4 Class XCP, 1.4449% | | | | | | | | |
| 10/15/35 (a)(d)(f) | | | | | | 12,294,694 | | 484,770 |
| Series 2002-C7 Class XCP, 1.1897% 1/15/36 (a)(f) | | . | | | | 12,741,084 | | 302,824 |
| Series 2003-C1 Class XCP, 1.3864% | | | | | | | | |
| 12/15/36 (a)(d)(f) | | | | | | 6,459,319 | | 237,766 |
| Series 2004-C2 Class XCP, 1.4108% 3/1/36 (a)(f) | | | | | | 10,840,783 | | 407,288 |
| Series 2004-C6 Class XCP, 0.7189% | | | | | | | | |
| 8/15/36 (a)(d)(f) | | | | | | 15,813,751 | | 386,355 |
| Series 2005-C7 Class XCP, 0.2174% 11/15/40 (d)(f) | | | | | | 82,165,000 | | 906,288 |
| Series 2006-C1 Class XCP, 0.3518% 2/15/41 (d)(f) | | . | | | | 63,405,000 | | 1,213,610 |
| LB-UBS Westfield Trust Series 2001-WM Class X, | | | | | | | | |
| 0.5415% 7/14/16 (a)(d)(f) | | | | | | 12,283,495 | | 322,519 |
| Lehman Brothers Floating Rate Commercial Mortgage | | | | | | | | |
| Trust floater Series 2003-LLFA: | | | | | | | | |
| Class A2, 5.2913% 12/16/14 (a)(d) | | | | | | 665,466 | | 665,515 |
| Class E, 5.8013% 12/16/14 (a)(d) | | | | | | 2,080,000 | | 2,080,341 |
| Class J, 6.9513% 12/16/14 (a)(d) | | | | | | 1,420,000 | | 1,410,757 |
| Class K1, 7.4513% 12/16/14 (a)(d) | | | | | | 730,000 | | 724,453 |
See accompanying notes which are an integral part of the financial statements.
35 Semiannual Report
| Investments (Unaudited) continued | | | | | | |
| |
| |
| Commercial Mortgage Securities continued | | | | | | |
| | | | | Principal | | Value (Note 1) |
| | | | | Amount | | |
| Merrill Lynch Mortgage Trust: | | | | | | |
| Series 2002-MW1 Class XP, 1.5506% | | | | | | |
| 7/12/34 (a)(d)(f) | | | | $ 5,473,083 | | $ 209,946 |
| Series 2005-MCP1 Class XP, 0.5948% 6/12/43 (d)(f) | | | | 15,698,132 | | 448,756 |
| Series 2005-MKB2 Class XP, 0.3063% 9/12/42 (d)(f) | | | | 7,640,446 | | 100,530 |
| Morgan Stanley Capital I, Inc.: | | | | | | |
| sequential pay: | | | | | | |
| Series 1999-CAM1 Class A2, 6.76% 3/15/32 | | | | 1,584 | | 1,582 |
| Series 1999-LIFE Class A1, 6.97% 4/15/33 | | | | 353,512 | | 358,944 |
| Series 2003-IQ5 Class A2, 4.09% 4/15/38 | | | | 1,085,000 | | 1,061,284 |
| Series 1997-RR Class C, 7.3486% 4/30/39 (a)(d) | | | | 715,842 | | 716,023 |
| Series 2003-IQ5 Class X2, 0.9879% | | | | | | |
| 4/15/38 (a)(d)(f) | | | | 9,028,589 | | 291,552 |
| Series 2003-IQ6 Class X2, 0.5991% | | | | | | |
| 12/15/41 (a)(d)(f) | | | | 15,750,625 | | 393,334 |
| Series 2005-HQ5 Class X2, 0.3774% 1/14/42 (d)(f) . | | | | 17,001,554 | | 240,128 |
| Series 2005-IQ9 Class X2, 1.0698% | | | | | | |
| 7/15/56 (a)(d)(f) | | | | 14,860,878 | | 650,819 |
| Series 2005-TOP17 Class X2, 0.6248% | | | | | | |
| 12/13/41 (d)(f) | | | | 11,372,604 | | 328,495 |
| Morgan Stanley Dean Witter Capital I Trust: | | | | | | |
| floater Series 2002-XLF: | | | | | | |
| Class D, 5.73% 8/5/14 (a)(d) | | | | 35,687 | | 35,737 |
| Class F, 6.98% 8/5/14 (a)(d) | | | | 140,875 | | 140,389 |
| Series 2003-HQ2 Class X2, 1.4014% | | | | | | |
| 3/12/35 (a)(d)(f) | | | | 11,724,908 | | 609,458 |
| Series 2003-TOP9 Class X2, 1.5092% | | | | | | |
| 11/13/36 (a)(d)(f) | | | | 7,763,515 | | 396,689 |
| Mortgage Capital Funding, Inc. sequential pay | | | | | | |
| Series 1998-MC2 Class A2, 6.423% 6/18/30 | | | | 1,091,709 | | 1,109,087 |
| Nationslink Funding Corp.: | | | | | | |
| sequential pay Series 1999-2 Class A1C, 7.03% | | | | | | |
| 6/20/31 | | | | 106,159 | | 106,563 |
| Series 1999-1 Class C, 6.571% 1/20/31 | | | | 1,080,000 | | 1,108,629 |
| STRIPS III Ltd./STRIPS III Corp. floater Series 2004-1A | | | | | | |
| Class A, 5.43% 3/24/18 (a)(d) | | | | 1,237,175 | | 1,237,175 |
| Trizechahn Office Properties Trust Series 2001-TZHA: | | | | | | |
| Class C3, 6.522% 3/15/13 (a) | | | | 572,633 | | 581,272 |
| Class E3, 7.253% 3/15/13 (a) | | | | 842,203 | | 864,451 |
| Wachovia Bank Commercial Mortgage Trust: | | | | | | |
| floater: | | | | | | |
| Series 2005-WL5A: | | | | | | |
| Class KHP1, 5.2513% 1/15/18 (a)(d) | | | | 375,000 | | 375,164 |
| Class KHP2, 5.4513% 1/15/18 (a)(d) | | | | 375,000 | | 375,290 |
See accompanying notes which are an integral part of the financial statements.
| Commercial Mortgage Securities continued | | | | |
| | | Principal | | Value (Note 1) |
| | | Amount | | |
| Wachovia Bank Commercial Mortgage Trust: – continued | | | | |
| floater: | | | | |
| Series 2005-WL5A: | | | | |
| Class KHP3, 5.7513% 1/15/18 (a)(d) | | $ 440,000 | | $ 440,264 |
| Class KHP4, 5.8513% 1/15/18 (a)(d) | | 345,000 | | 345,206 |
| Class KHP5, 6.0513% 1/15/18 (a)(d) | | 400,000 | | 399,969 |
| Series 2005-WL6A: | | | | |
| Class A2, 5.1513% 10/15/17 (a)(d) | | 1,460,000 | | 1,460,083 |
| Class B, 5.2013% 10/15/17 (a)(d) | | 290,000 | | 290,017 |
| Class D, 5.3313% 10/15/17 (a)(d) | | 585,000 | | 584,959 |
| sequential pay Series 2003-C7 Class A1, 4.241% | | | | |
| 10/15/35 (a) | | 2,411,723 | | 2,325,650 |
| Series 2003-C8 Class XP, 0.6638% 11/15/35 (a)(d)(f) | | 12,225,979 | | 196,792 |
| Series 2003-C9 Class XP, 0.5908% 12/15/35 (a)(d)(f) | | 8,293,585 | | 155,745 |
| Series 2004-C14 Class PP, 4.7967% 8/15/41 (a)(d) . | | 1,582,285 | | 1,499,975 |
| Series 2005-C18 Class XP, 0.533% 4/15/42 (d)(f) | | 23,498,115 | | 391,845 |
| Series 2006-C23 Class X, 0.25% 1/15/45 (a)(f) | | 286,825,000 | | 2,156,494 |
| Series 2006-C24 Class XP, 0.016% 3/15/45 (a)(d)(f) | | 56,040,000 | | 425,405 |
| TOTAL COMMERCIAL MORTGAGE SECURITIES | | | | |
| (Cost $128,862,400) | | | | 126,290,518 |
| |
| Foreign Government and Government Agency Obligations 0.4% | | | | |
| |
| Chilean Republic 5.625% 7/23/07 | | 740,000 | | 741,850 |
| United Mexican States 10.375% 2/17/09 | | 4,000,000 | | 4,476,000 |
| TOTAL FOREIGN GOVERNMENT AND | | | | |
| GOVERNMENT AGENCY OBLIGATIONS | | | | |
| (Cost $5,226,342) | | | | 5,217,850 |
| |
| Fixed Income Funds 5.3% | | | | |
| | | Shares | | |
| Fidelity Ultra-Short Central Fund (e) | | | | |
| (Cost $71,052,236) | | 716,441 | | 71,278,715 |
See accompanying notes which are an integral part of the financial statements.
37 Semiannual Report
| Investments (Unaudited) continued | | | | |
| |
| |
| Preferred Securities 0.3% | | | | | | |
| | | | | Principal | | Value (Note 1) |
| | | | | Amount | | |
| |
| FINANCIALS – 0.3% | | | | | | |
| Commercial Banks – 0.3% | | | | | | |
| Abbey National PLC 7.35% (d) | | | | $ 2,150,000 | | $ 2,178,856 |
| National Westminster Bank PLC 7.75% (d) | | 1,430,000 | | 1,477,023 |
| | | | | | | 3,655,879 |
| TOTAL PREFERRED SECURITIES | | | | | | |
| (Cost $3,772,889) | | | | | | 3,655,879 |
| Cash Equivalents 1.4% | | | | | | |
| | | | | Maturity | | |
| | | | | Amount | | |
| Investments in repurchase agreements (Collateralized by U.S. | | | | |
| Government Obligations), in a joint trading account at | | | | |
| 4.78%, dated 4/28/06 due 5/1/06 | | | | | | |
| (Cost $18,607,000) | | | | $18,614,410 | | 18,607,000 |
| |
| TOTAL INVESTMENT PORTFOLIO 100.3% | | | | | | |
| (Cost $1,356,912,005) | | | | | | 1,341,088,655 |
| |
| NET OTHER ASSETS – (0.3)% | | | | | | (3,584,309) |
| NET ASSETS 100% | | | | | | $1,337,504,346 |
| |
| |
| |
| |
| See accompanying notes which are an integral part of the financial statements. | | |
| |
| Semiannual Report | | 38 | | | | |
| Futures Contracts | | | | | | | | |
| | | Expiration | | | | Underlying | | Unrealized |
| | | Date | | | | Face Amount | | Appreciation/ |
| | | | | | | at Value | | (Depreciation) |
| |
| Purchased | | | | | | | | |
| Eurodollar Contracts | | | | | | | | |
| 176 Eurodollar 90 Day Index Contracts | | June 2006 | | | | $ 173,716,400 | | $ (346,745) |
| 176 Eurodollar 90 Day Index Contracts | | Sept. 2006 | | | | 173,694,400 | | (357,892) |
| 176 Eurodollar 90 Day Index Contracts | | Dec. 2006 | | | | 173,692,200 | | (287,819) |
| 176 Eurodollar 90 Day Index Contracts | | March 2007 | | | | 173,707,600 | | (210,279) |
| 176 Eurodollar 90 Day Index Contracts | | June 2007 | | | | 173,716,400 | | (219,954) |
| 176 Eurodollar 90 Day Index Contracts | | Sept. 2007 | | | | 173,718,600 | | (87,654) |
| 127 Eurodollar 90 Day Index Contracts | | Dec. 2007 | | | | 125,350,588 | | (62,946) |
| 31 Eurodollar 90 Day Index Contracts | | March 2008 | | | | 30,596,225 | | (16,799) |
| 2 Eurodollar 90 Day Index Contracts | | June 2008 | | | | 1,973,800 | | (1,133) |
| TOTAL EURODOLLAR CONTRACTS | | | | | | | | (1,591,221) |
Sold | | | | | | | | |
| Eurodollar Contracts | | | | | | | | |
| 46 Eurodollar 90 Day Index Contracts | | Sept. 2008 | | | | 45,393,950 | | 67,966 |
| 35 Eurodollar 90 Day Index Contracts | | Dec. 2008 | | | | 34,534,500 | | 48,410 |
| 24 Eurodollar 90 Day Index Contracts | | March 2009 | | | | 23,679,300 | | 31,279 |
| TOTAL EURODOLLAR CONTRACTS | | | | | | | | 147,655 |
| |
| | | | | | | | | $ (1,443,566) |
See accompanying notes which are an integral part of the financial statements.
39 Semiannual Report
| Investments (Unaudited) continued | | | | | | |
| |
| |
| |
| Swap Agreements | | | | | | | | |
| |
| | | | | Notional | | | | Value |
| | | | | Amount | | | | |
| |
| Credit Default Swaps | | | | | | | | |
| Receive monthly notional amount multiplied | | | | | | | | |
| by 3.05% and pay Merrill Lynch upon | | | | | | | | |
| default event of Morgan Stanley ABS | | | | | | | | |
| Capital I, Inc., par value of the | | | | | | | | |
| proportional notional amount of Morgan | | | | | | | | |
| Stanley ABS Capital I, Inc. Series | | | | | | | | |
| 2004-NC8 Class B3, 7.2913% 9/25/34 | | Oct. 2034 | | $ 400,000 | | | | $ 6,679 |
| Receive monthly notional amount multiplied | | | | | | | | |
| by 3.3% and pay to Morgan Stanley, Inc. | | | | | | | | |
| upon default event of Ameriquest | | | | | | | | |
| Mortgage Securities, Inc., par value of the | | | | | | | | |
| notional amount of Ameriquest Mortgage | | | | | | | | |
| Securities, Inc. Series 2004-R11 Class M9, | | | | | | | | |
| 7.6913% 11/25/34 | | Dec. 2034 | | 405,000 | | | | 7,781 |
| Receive monthly notional amount multiplied | | | | | | | | |
| by 3.35% and pay Morgan Stanley, Inc. | | | | | | | | |
| upon default event of Morgan Stanley ABS | | | | | | | | |
| Capital I, Inc., par value of the notional | | | | | | | | |
| amount of Morgan Stanley ABS Capital I, | | | | | | | | |
| Inc. Series 2004-HE7 Class B3, 7.6913% | | | | | | | | |
| 8/25/34 | | Sept. 2034 | | 362,000 | | | | 8,132 |
| Receive monthly notional amount multiplied | | | | | | | | |
| by 3.35% and pay Morgan Stanley, Inc. | | | | | | | | |
| upon default event of Morgan Stanley ABS | | | | | | | | �� |
| Capital I, Inc., par value of the notional | | | | | | | | |
| amount of Morgan Stanley ABS Capital I, | | | | | | | | |
| Inc. Series 2004-NC7 Class B3, 7.6913% | | | | | | | | |
| 7/25/34 | | August 2034 | | 362,000 | | | | 7,654 |
| Receive monthly notional amount multiplied | | | | | | | | |
| by 3.35% and pay Morgan Stanley, Inc. | | | | | | | | |
| upon default event of Morgan Stanley ABS | | | | | | | | |
| Capital I, Inc., par value of the notional | | | | | | | | |
| amount of Morgan Stanley ABS Capital I, | | | | | | | | |
| Inc. Series 2004-HE8 Class B3, 7.3913% | | | | | | | | |
| 9/25/34 | | Oct. 2034 | | 362,000 | | | | 8,610 |
| Receive monthly notional amount multiplied | | | | | | | | |
| by .82% and pay UBS upon default event | | | | | | | | |
| of Morgan Stanley ABS Capital I, Inc., par | | | | | | | | |
| value of the notional amount of Morgan | | | | | | | | |
| Stanley ABS Capital I, Inc. Series | | | | | | | | |
| 2004-NC6 Class M3, 5.6413% 7/25/34 | | August 2034 | | 362,000 | | | | 2,371 |
| Receive monthly notional amount multiplied | | | | | | | | |
| by .85% and pay UBS upon default event | | | | | | | | |
| of Ameriquest Mortgage Securities, Inc., | | | | | | | | |
| par value of the notional amount of | | | | | | | | |
| Ameriquest Mortgage Securities, Inc. | | | | | | | | |
| Series 2004-R9 Class M5, 5.5913% | | | | | | | | |
| 10/25/34 | | Nov. 2034 | | 362,000 | | | | 2,014 |
See accompanying notes which are an integral part of the financial statements. | | | | |
| |
| Semiannual Report | | 40 | | | | | | |
| Swap Agreements continued | | | | | | | | |
| |
| | | Expiration | | Notional | | | | Value |
| | | Date | | Amount | | | | |
| |
| Credit Default Swaps – continued | | | | | | | | |
| Receive monthly notional amount multiplied | | | | | | | | |
| by .85% and pay UBS upon default event | | | | | | | | |
| of Morgan Stanley ABS Capital I, Inc., par | | | | | | | | |
| value of the notional amount of Morgan | | | | | | | | |
| Stanley ABS Capital I, Inc. Series | | | | | | | | |
| 2004-NC8 Class M6, 5.4413% 9/25/34 | | Oct. 2034 | | $ 362,000 | | | | $ 2,393 |
| Receive monthly notional amount multiplied | | | | | | | | |
| by 1.6% and pay Morgan Stanley, Inc. | | | | | | | | |
| upon default event of Park Place Securities, | | | | | | | | |
| Inc., par value of the notional amount of | | | | | | | | |
| Park Place Securities, Inc. Series | | | | | | | | |
| 2005-WHQ2 Class M7, 5.4413% | | | | | | | | |
| 5/25/35 | | June 2035 | | 330,000 | | | | 4,473 |
| Receive monthly notional amount multiplied | | | | | | | | |
| by 1.65% and pay Goldman Sachs upon | | | | | | | | |
| default event of Fieldstone Mortgage | | | | | | | | |
| Investment Corp., par value of the notional | | | | | | | | |
| amount of Fieldstone Mortgage Investment | | | | | | | | |
| Corp. Series 2004-2 Class M5, 6.3413% | | | | | | | | |
| 7/25/34 | | August 2034 | | 618,000 | | | | 4,099 |
| Receive monthly notional amount multiplied | | | | | | | | |
| by 1.66% and pay Morgan Stanley, Inc. | | | | | | | | |
| upon default event of Park Place Securities, | | | | | | | | |
| Inc., par value of the notional amount of | | | | | | | | |
| Park Place Securities, Inc. Series | | | | | | | | |
| 2005-WHQ2 Class M7, 5.4413% | | | | | | | | |
| 5/25/35 | | June 2035 | | 362,000 | | | | 5,485 |
| Receive monthly notional amount multiplied | | | | | | | | |
| by 2.54% and pay Merrill Lynch upon | | | | | | | | |
| default event of Countrywide Home Loans, | | | | | | | | |
| Inc., par value of the notional amount of | | | | | | | | |
| Countrywide Home Loans, Inc. Series | | | | | | | | |
| 2003-BC1 Class B1, 7.6913% 3/25/32 | | April 2032 | | 121,647 | | | | 525 |
| Receive monthly notional amount multiplied | | | | | | | | |
| by 2.61% and pay Goldman Sachs upon | | | | | | | | |
| default event of Fremont Home Loan Trust, | | | | | | | | |
| par value of the notional amount of | | | | | | | | |
| Fremont Home Loan Trust Series 2004-1 | | | | | | | | |
| Class M9, 7.3913% 2/25/34 | | March 2034 | | 619,000 | | | | 2,694 |
| Receive monthly notional amount multiplied | | | | | | | | |
| by 2.61% and pay Goldman Sachs upon | | | | | | | | |
| default event of Fremont Home Loan Trust, | | | | | | | | |
| par value of the notional amount of | | | | | | | | |
| Fremont Home Loan Trust Series 2004-A | | | | | | | | |
| Class B3, 7.0413% 1/25/34 | | Feb. 2034 | | 222,297 | | | | 507 |
| |
| |
| |
| See accompanying notes which are an integral part of the financial statements. | | | | |
| |
| | | 41 | | Semiannual Report |
| Investments (Unaudited) continued | | | | | | |
| |
| |
| |
| Swap Agreements continued | | | | | | | | |
| |
| | | Expiration | | Notional | | | | Value |
| | | Date | | Amount | | | | |
| |
| Credit Default Swaps – continued | | | | | | | | |
| Receive monthly notional amount multiplied | | | | | | | | |
| by 2.79% and pay Merrill Lynch, Inc. upon | | | | | | | | |
| default event of New Century Home Equity | | | | | | | | |
| Loan Trust, par value of the notional | | | | | | | | |
| amount of New Century Home Equity Loan | | | | | | | | |
| Trust Series 2004-4 Class M9, 7.0788% | | | | | | | | |
| 2/25/35 | | March 2035 | | $ 900,000 | | | | $ 8,240 |
| Receive monthly notional amount multiplied | | | | | | | | |
| by 5% and pay Deutsche Bank upon | | | | | | | | |
| default event of MASTR Asset Backed | | | | | | | | |
| Securities Trust, par value of the notional | | | | | | | | |
| amount of MASTR Asset Backed Securities | | | | | | | | |
| Trust Series 2003-NC1 Class M6, | | | | | | | | |
| 8.1913% 4/25/33 | | May 2033 | | 362,000 | | | | 4,426 |
| Receive quarterly notional amount multiplied | | | | | | | | |
| by .25% and pay Merrill Lynch, Inc. upon | | | | | | | | |
| default event of Consolidated Natural Gas | | | | | | | | |
| Co., par value of the notional amount of | | | | | | | | |
| Consolidated Natural Gas Co. 6% | | | | | | | | |
| 10/15/10 | | June 2007 | | 1,000,000 | | | | 2,170 |
| Receive quarterly notional amount multiplied | | | | | | | | |
| by .25% and pay Merrill Lynch, Inc. upon | | | | | | | | |
| default event of Consolidated Natural Gas | | | | | | | | |
| Co., par value of the notional amount of | | | | | | | | |
| Consolidated Natural Gas Co. 6% | | | | | | | | |
| 10/15/10 | | July 2007 | | 2,900,000 | | | | 8,120 |
| Receive quarterly notional amount multiplied | | | | | | | | |
| by .26% and pay Morgan Stanley, Inc. | | | | | | | | |
| upon default event of Amerada Hess | | | | | | | | |
| Corp., par value of the notional amount of | | | | | | | | |
| Amerada Hess Corp. 6.65% 8/15/11 | | March 2007 | | 2,400,000 | | | | 3,312 |
| Receive quarterly notional amount multiplied | | | | | | | | |
| by .28% and pay Morgan Stanley, Inc. | | | | | | | | |
| upon default event of Amerada Hess | | | | | | | | |
| Corp., par value of the notional amount of | | | | | | | | |
| Amerada Hess 6.65% 8/15/11 | | March 2007 | | 3,000,000 | | | | 4,680 |
| Receive quarterly notional amount multiplied | | | | | | | | |
| by .30% and pay Deutsche Bank upon | | | | | | | | |
| default event of Entergy Corp., par value | | | | | | | | |
| of the notional amount of Entergy Corp. | | | | | | | | |
| 7.75% 12/15/09 | | March 2008 | | 2,045,000 | | | | 5,624 |
| Receive quarterly notional amount multiplied | | | | | | | | |
| by .30% and pay Goldman Sachs upon | | | | | | | | |
| default event of Entergy Corp., par value | | | | | | | | |
| of the notional amount of Entergy Corp. | | | | | | | | |
| 7.75% 12/15/09 | | March 2008 | | 1,495,000 | | | | 4,111 |
| |
| |
| See accompanying notes which are an integral part of the financial statements. | | | | |
| |
| Semiannual Report | | 42 | | | | | | |
| Swap Agreements continued | | | | | | | | | | |
| |
| | | Expiration | | | | Notional | | | | Value |
| | | Date | | | | Amount | | | | |
| |
| Credit Default Swaps – continued | | | | | | | | | | |
| Receive quarterly notional amount multiplied | | | | | | | | | | |
| by .41% and pay Merrill Lynch, Inc. upon | | | | | | | | | | |
| default event of Talisman Energy, Inc., par | | | | | | | | | | |
| value of the notional amount of Talisman | | | | | | | | | | |
| Energy, Inc. 7.25% 10/15/27 | | March 2009 | | $ | | 1,000,000 | | | | $ 7,130 |
| Receive quarterly notional amount multiplied | | | | | | | | | | |
| by .48% and pay Goldman Sachs upon | | | | | | | | | | |
| default event of TXU Energy Co. LLC, par | | | | | | | | | | |
| value of the notional amount of TXU | | | | | | | | | | |
| Energy Co. LLC 7% 3/15/13 | | Sept. 2008 | | | | 2,675,000 | | | | 15,569 |
| Receive quarterly notional amount multiplied | | | | | | | | | | |
| by .75% and pay Lehman Brothers, Inc. | | | | | | | | | | |
| upon default event of AOL Time Warner, | | | | | | | | | | |
| Inc., par value of the notional amount of | | | | | | | | | | |
| AOL Time Warner, Inc. 6.875% 5/1/12 | | Sept. 2009 | | | | 4,500,000 | | | | 77,175 |
| Receive quarterly notional amount multiplied | | | | | | | | | | |
| by .78% and pay Goldman Sachs upon | | | | | | | | | | |
| default event of TXU Energy, par value of | | | | | | | | | | |
| the notional amount of TXU Energy Co. | | | | | | | | | | |
| LLC 7% 3/15/13 | | Dec. 2008 | | | | 2,600,000 | | | | 34,294 |
| |
| TOTAL CREDIT DEFAULT SWAPS | | | | | | 30,126,944 | | | | 238,268 |
| Total Return Swaps | | | | | | | | | | |
| Receive monthly notional amount multiplied | | | | | | | | | | |
| by the nominal spread appreciation of the | | | | | | | | | | |
| Lehman Brothers CMBS U.S. Aggregate | | | | | | | | | | |
| Index adjusted by a modified duration | | | | | | | | | | |
| factor and pay monthly notional amount | | | | | | | | | | |
| multiplied by the nominal spread depreci- | | | | | | | | | | |
| ation of the Lehman Brothers CMBS U.S. | | | | | | | | | | |
| Aggregate Index adjusted by a modified | | | | | | | | | | |
| duration factor with Lehman Brothers, Inc. | | Oct. 2006 | | | | 8,280,000 | | | | 1,926 |
| Receive monthly notional amount multiplied | | | | | | | | | | |
| by the nominal spread appreciation of the | | | | | | | | | | |
| Lehman Brothers CMBS U.S. Aggregate | | | | | | | | | | |
| Index adjusted by a modified duration | | | | | | | | | | |
| factor plus 15 basis points and pay | | | | | | | | | | |
| monthly notional amount multiplied by the | | | | | | | | | | |
| nominal spread depreciation of the Leh- | | | | | | | | | | |
| man Brothers CMBS U.S. Aggregate Index | | | | | | | | | | |
| adjusted by a modified duration factor | | | | | | | | | | |
| with Lehman Brothers, Inc. | | July 2006 | | | | 10,000,000 | | | | 12,346 |
See accompanying notes which are an integral part of the financial statements.
43 Semiannual Report
| Investments (Unaudited) continued | | | | | | |
| |
| |
| |
| Swap Agreements continued | | | | | | | | |
| |
| | | Expiration | | Notional | | | | Value |
| | | Date | | Amount | | | | |
| |
| Total Return Swaps continued | | | | | | | | |
| Receive monthly notional amount multiplied | | | | | | | | |
| by the nominal spread appreciation of the | | | | | | | | |
| Lehman Brothers CMBS U.S. Aggregate | | | | | | | | |
| Index adjusted by a modified duration | | | | | | | | |
| factor and pay monthly notional amount | | | | | | | | |
| multiplied by the nominal spread depreci- | | | | | | | | |
| ation of the Lehman Brothers CMBS U.S. | | | | | | | | |
| Aggregate Index adjusted by a modified | | | | | | | | |
| duration factor with Citibank | | Sept. 2006 | | $13,500,000 | | | | $ 15,120 |
| Receive monthly a return equal to Lehman | | | | | | | | |
| Brothers U.S. ABS Floating Rate AA Home | | | | | | | | |
| Equity Index and pay monthly a floating | | | | | | | | |
| rate based on 1-month LIBOR with Lehman | | | | | | | | |
| Brothers, Inc. | | May 2006 | | 6,400,000 | | | | 6,617 |
| |
| TOTAL TOTAL RETURN SWAPS | | | | 38,180,000 | | | | 36,009 |
| |
| | | | | $ 68,306,944 | | | | $ 274,277 |
Legend
(a) Security exempt from registration under
Rule 144A of the Securities Act of 1933.
These securities may be resold in
transactions exempt from registration,
normally to qualified institutional buyers.
At the period end, the value of these
securities amounted to $139,900,366
or 10.5% of net assets.
(b) Security or a portion of the security
purchased on a delayed delivery or
when-issued basis.
(c) Security or a portion of the security was
pledged to cover margin requirements
for futures contracts. At the period end,
the value of securities pledged
amounted to $978,438.
(d) The coupon rate shown on floating or
adjustable rate securities represents the
rate at period end.
|
(e) Affiliated fund that is available only to
investment companies and other
accounts managed by Fidelity
Investments. A complete unaudited list of
holdings for each fixed-income central
fund, as of the investing fund’s report
date, is available upon request or at
advisor.fidelity.com. The reports are
located just after the fund’s financial
statements and quarterly reports but are
not part of the financial statements or
quarterly reports. In addition, the
fixed-income central fund’s financial
statements are available on the EDGAR
Database on the SEC’s web site,
www.sec.gov, or upon request.
|
See accompanying notes which are an integral part of the financial statements.
Semiannual Report 44
(f) Security represents right to receive
monthly interest payments on an
underlying pool of mortgages. Principal
shown is the par amount of the
mortgage pool.
(g) Restricted securities – Investment in
securities not registered under the
Securities Act of 1933 (excluding 144A
issues). At the end of the period, the
value of restricted securities (excluding
144A issues) amounted to $6,183,348
or 0.5% of net assets.
|
Additional information on each holding is as follows:
| | | Acquisition | | Acquisition |
| Security | | Date | | Cost |
| Aspetuck Trust | | | | |
| 5.33% 10/16/06 | | 12/14/05 | | $ 3,235,000 |
| Iberbond 2004 | | | | |
| PLC 4.826% | | | | |
| 12/24/17 | | 11/30/05 | | $ 2,986,657 |
Affiliated Central Funds
Information regarding fiscal year to date income earned by the fund from the affiliated Central funds is as follows:
| Fund | | | | Income earned |
| Fidelity Ultra Short Central Fund | | | | $ 1,779,675 |
Additional information regarding the fund’s fiscal year to date purchases and sales, including the ownership percentage, of the following fixed income Central Funds is as follows:
| | | Value, | | Purchases | | Sales | | Value, end of | | % ownership, |
| | | beginning of | | | | | | Proceeds | | period | | end of period |
| Fund | | period | | | | | | | | | | |
| Fidelity Ultra Short | | | | | | | | | | | | |
| Central Fund | | $77,249,478 | | | | $ — | | $6,000,024 | | $71,278,715 | | 1.0% |
Income Tax Information
At October 31, 2005, the fund had a capital loss carryforward of approximately $11,569,000 of which $1,754,000, $3,744,000 and $6,071,000 will expire on October 31, 2007, 2008 and 2013, respectively.
See accompanying notes which are an integral part of the financial statements.
45 Semiannual Report
| Financial Statements | | | | |
| |
| Statement of Assets and Liabilities | | | | |
| | | | | April 30, 2006 (Unaudited) |
| |
| Assets | | | | |
| Investment in securities, at value (including repurchase | | | | |
| agreements of $18,607,000) | | | | |
| See accompanying schedule: | | | | |
| Unaffiliated issuers (cost $1,285,859,769) | | $1,269,809,940 | | |
| Affiliated Central Funds (cost $71,052,236) | | 71,278,715 | | |
| Total Investments (cost $1,356,912,005) | | | | $1,341,088,655 |
| Cash | | | | 40,577 |
| Receivable for investments sold | | | | 247,331 |
| Receivable for swap agreements | | | | 13,953 |
| Receivable for fund shares sold | | | | 2,399,987 |
| Interest receivable | | | | 11,570,712 |
| Receivable for daily variation on futures contracts | | | | 108,899 |
| Swap agreements, at value | | | | 274,277 |
| Prepaid expenses | | | | 3,841 |
| Total assets | | | | 1,355,748,232 |
| |
| Liabilities | | | | |
| Payable for investments purchased | | | | |
| Regular delivery | | $ 3,884,823 | | |
| Delayed delivery | | 7,504,562 | | |
| Payable for fund shares redeemed | | 5,315,639 | | |
| Distributions payable | | 579,940 | | |
| Accrued management fee | | 357,170 | | |
| Distribution fees payable | | 278,909 | | |
| Other affiliated payables | | 283,649 | | |
| Other payables and accrued expenses | | 39,194 | | |
| Total liabilities | | | | 18,243,886 |
| |
| Net Assets | | | | $ 1,337,504,346 |
| Net Assets consist of: | | | | |
| Paid in capital | | | | $1,365,628,158 |
| Undistributed net investment income | | | | 2,168,227 |
| Accumulated undistributed net realized gain (loss) on | | | | |
| investments | | | | (13,299,400) |
| Net unrealized appreciation (depreciation) on | | | | |
| investments | | | | (16,992,639) |
| Net Assets | | | | $ 1,337,504,346 |
See accompanying notes which are an integral part of the financial statements.
| Statement of Assets and Liabilities continued | | | | |
| | | | | April 30, 2006 (Unaudited) |
| |
| Calculation of Maximum Offering Price | | | | | | |
| Class A: | | | | | | |
| Net Asset Value and redemption price per share | | | | | | |
| ($381,516,573 ÷ 40,797,561 shares) | | | | | | $ 9.35 |
| |
| Maximum offering price per share (100/98.50 of $9.35) | | . | | | | $ 9.49 |
| Class T: | | | | | | |
| Net Asset Value and redemption price per share | | | | | | |
| ($562,350,779 ÷ 60,094,388 shares) | | | | | | $ 9.36 |
| |
| Maximum offering price per share (100/98.50 of $9.36) | | . | | | | $ 9.50 |
| Class B: | | | | | | |
| Net Asset Value and offering price per share | | | | | | |
| ($33,383,986 ÷ 3,563,867 shares)A | | | | | | $ 9.37 |
| |
| Class C: | | | | | | |
| Net Asset Value and offering price per share | | | | | | |
| ($160,447,589 ÷ 17,141,387 shares)A | | | | | | $ 9.36 |
| |
| Institutional Class: | | | | | | |
| Net Asset Value, offering price and redemption price per | | | | |
| share ($199,805,419 ÷ 21,353,969 shares) | | | | | | $ 9.36 |
| |
| A Redemption price per share is equal to net asset value less any applicable contingent deferred sales charge. | | |
See accompanying notes which are an integral part of the financial statements.
47 Semiannual Report
| Financial Statements continued | | | | |
| |
| |
| Statement of Operations | | | | | | |
| | | Six months ended April 30, 2006 (Unaudited) |
| |
| Investment Income | | | | | | |
| Dividends | | | | | | $ 134,424 |
| Interest | | | | | | 27,693,562 |
| Income from affiliated Central Funds | | | | | | 1,779,675 |
| Total income | | | | | | 29,607,661 |
| |
| Expenses | | | | | | |
| Management fee | | | | $ 2,114,542 | | |
| Transfer agent fees | | | | 1,447,525 | | |
| Distribution fees | | | | 1,741,781 | | |
| Accounting fees and expenses | | | | 240,250 | | |
| Independent trustees’ compensation | | | | 2,666 | | |
| Custodian fees and expenses | | | | 27,349 | | |
| Registration fees | | | | 64,399 | | |
| Audit | | | | 30,489 | | |
| Legal | | | | 2,242 | | |
| Miscellaneous | | | | 32,051 | | |
| Total expenses before reductions | | | | 5,703,294 | | |
| Expense reductions | | | | (10,330) | | 5,692,964 |
| |
| Net investment income | | | | | | 23,914,697 |
| Realized and Unrealized Gain (Loss) | | | | |
| Net realized gain (loss) on: | | | | | | |
| Investment securities: | | | | | | |
| Unaffiliated issuers | | | | (1,338,211) | | |
| Affiliated Central Funds | | | | 27,742 | | |
| Futures contracts | | | | (323,189) | | |
| Swap agreements | | | | (105,997) | | |
| Total net realized gain (loss) | | | | | | (1,739,655) |
| Change in net unrealized appreciation (depreciation) on: | | | | | | |
| Investment securities | | | | (2,645,974) | | |
| Futures contracts | | | | (598,271) | | |
| Swap agreements | | | | 458,615 | | |
| Total change in net unrealized appreciation | | | | | | |
| (depreciation) | | | | | | (2,785,630) |
| Net gain (loss) | | | | | | (4,525,285) |
| Net increase (decrease) in net assets resulting from | | | | | | |
| operations | | | | | | $ 19,389,412 |
See accompanying notes which are an integral part of the financial statements.
| Statement of Changes in Net Assets | | | | |
| | | Six months ended | | Year ended |
| | | April 30, 2006 | | October 31, |
| | | (Unaudited) | | 2005 |
| Increase (Decrease) in Net Assets | | | | |
| Operations | | | | |
| Net investment income | | $ 23,914,697 | | $ 36,619,084 |
| Net realized gain (loss) | | (1,739,655) | | (3,684,213) |
| Change in net unrealized appreciation (depreciation) . | | (2,785,630) | | (23,367,389) |
| Net increase (decrease) in net assets resulting | | | | |
| from operations | | 19,389,412 | | 9,567,482 |
| Distributions to shareholders from net investment income . | | (25,162,238) | | (36,325,031) |
| Distributions to shareholders from net realized gain | | — | | (1,086,013) |
| Total distributions | | (25,162,238) | | (37,411,044) |
| Share transactions - net increase (decrease) | | 43,666,032 | | 27,080,998 |
| Total increase (decrease) in net assets | | 37,893,206 | | (762,564) |
| |
| Net Assets | | | | |
| Beginning of period | | 1,299,611,140 | | 1,300,373,704 |
| End of period (including undistributed net investment | | | | |
| income of $2,168,227 and undistributed net | | | | |
| investment income of $3,415,768, respectively) | | $ 1,337,504,346 | | $ 1,299,611,140 |
See accompanying notes which are an integral part of the financial statements.
49 Semiannual Report
| Financial Highlights Class A | | | | | | | | | | | | | | | | | | |
| | | Six months ended | | | | | | | | | | | | | | | | | | | | |
| | | April 30, 2006 | | Years ended October 31, |
| | | (Unaudited) | | 2005 | | 2004 | | 2003 | | | | 2002 | | 2001 |
| Selected Per Share Data | | | | | | | | | | | | | | | | | | | | | | | | |
| Net asset value, | | | | | | | | | | | | | | | | | | | | | | | | |
| beginning of period | | | | $ 9.39 | | | | $ 9.60 | | | | $ 9.55 | | | | $ 9.44 | | | | $ 9.49 | | | | $ 9.12 |
| Income from Investment | | | | | | | | | | | | | | | | | | | | | | | | |
| Operations | | | | | | | | | | | | | | | | | | | | | | | | |
| Net investment | | | | | | | | | | | | | | | | | | | | | | | | |
| incomeE | | | | .174 | | | | .281 | | | | .202 | | | | .261 | | | | .381H | | | | .523 |
| Net realized and un | | | | | | | | | | | | | | | | | | | | | | | | |
| realized gain (loss) | | | | (.031) | | | | (.204) | | | | .040 | | | | .128 | | | | (.034)H | | | | .386 |
| Total from investment | | | | | | | | | | | | | | | | | | | | | | | | |
| operations | | | | .143 | | | | .077 | | | | .242 | | | | .389 | | | | .347 | | | | .909 |
| Distributions from net | | | | | | | | | | | | | | | | | | | | | | | | |
| investment income | | | | (.183) | | | | (.279) | | | | (.192) | | | | (.279) | | | | (.397) | | | | (.539) |
| Distributions from net | | | | | | | | | | | | | | | | | | | | | | | | |
| realized gain | | | | — | | | | (.008) | | | | — | | | | — | | | | — | | | | — |
| Total distributions | | | | (.183) | | | | (.287) | | | | (.192) | | | | (.279) | | | | (.397) | | | | (.539) |
| Net asset value, | | | | | | | | | | | | | | | | | | | | | | | | |
| end of period | | | | $ 9.35 | | | | $ 9.39 | | | | $ 9.60 | | | | $ 9.55 | | | | $ 9.44 | | | | $ 9.49 |
| Total ReturnB,C,D | | | | 1.54% | | | | .81% | | | | 2.56% | | | | 4.16% | | | | 3.78% | | | | 10.22% |
| Ratios to Average Net AssetsF,G | | | | | | | | | | | | | | | | | | | | | | | | |
| Expenses before | | | | | | | | | | | | | | | | | | | | | | | | |
| reductions | | | | .79%A | | | | .85% | | | | .87% | | | | .81% | | | | .80% | | | | .85% |
| Expenses net of fee | | | | | | | | | | | | | | | | | | | | | | | | |
| waivers, if any | | | | .79%A | | | | .85% | | | | .87% | | | | .81% | | | | .80% | | | | .85% |
| Expenses net of all | | | | | | | | | | | | | | | | | | | | | | | | |
| reductions | | | | .79%A | | | | .85% | | | | .87% | | | | .81% | | | | .80% | | | | .84% |
| Net investment | | | | | | | | | | | | | | | | | | | | | | | | |
| income | | | | 3.75%A | | | | 2.96% | | | | 2.13% | | | | 2.74% | | | | 4.09%H | | | | 5.63% |
| Supplemental Data | | | | | | | | | | | | | | | | | | | | | | | | |
| Net assets, | | | | | | | | | | | | | | | | | | | | | | | | |
| end of period | | | | | | | | | | | | | | | | | | | | | | | | |
| (000 omitted) | | | | $381,517 | | | | $369,512 | | | | $357,760 | | | | $186,290 | | | | $106,018 | | | | $38,240 |
| Portfolio turnover rate | | | | 42%A | | | | 94% | | | | 87% | | | | 102% | | | | 111% | | | | 145% |
A Annualized
B Total returns for periods of less than one year are not annualized.
C Total returns would have been lower had certain expenses not been reduced during the periods shown.
D Total returns do not include the effect of the sales charges.
E Calculated based on average shares outstanding during the period.
F Amounts do not include the activity of the affiliated central fund.
G Expense ratios reflect operating expenses of the class. Expenses before reductions do not reflect amounts reimbursed by the investment adviser or expense
offset arrangements and do not represent the amount paid by the class during periods when reimbursements or reductions occur. Expenses net of fee
waivers reflect expenses after reimbursement by the investment adviser but prior to reductions from expense offset arrangements. Expenses net of all
reductions represent the net expenses paid by the class.
H Effective November 1, 2001, the fund adopted the provisions of the AICPA Audit and Accounting Guide for Investment Companies and began amortizing
premium and discount on all debt securities. Per share data and ratios for periods prior to adoption have not been restated to reflect this change.
|
See accompanying notes which are an integral part of the financial statements.
| Financial Highlights Class T | | | | | | | | | | | | | | | | | | |
| | | Six months ended | | | | | | | | | | | | | | | | | | | | |
| | | April 30, 2006 | | Years ended October 31, |
| | | (Unaudited) | | 2005 | | 2004 | | 2003 | | | | 2002 | | 2001 |
| Selected Per Share Data | | | | | | | | | | | | | | | | | | | | | | | | |
| Net asset value, | | | | | | | | | | | | | | | | | | | | | | | | |
| beginning of period | | | | $ 9.40 | | | | $ 9.60 | | | | $ 9.55 | | | | $ 9.45 | | | | $ 9.50 | | | | $ 9.13 |
| Income from Investment | | | | | | | | | | | | | | | | | | | | | | | | |
| Operations | | | | | | | | | | | | | | | | | | | | | | | | |
| Net investment | | | | | | | | | | | | | | | | | | | | | | | | |
| incomeE | | | | .176 | | | | .284 | | | | .207 | | | | .261 | | | | .381H | | | | .525 |
| Net realized and un | | | | | | | | | | | | | | | | | | | | | | | | |
| realized gain (loss) | | | | (.031) | | | | (.194) | | | | .038 | | | | .118 | | | | (.036)H | | | | .383 |
| Total from investment | | | | | | | | | | | | | | | | | | | | | | | | |
| operations | | | | 145 | | | | .090 | | | | .245 | | | | .379 | | | | .345 | | | | .908 |
| Distributions from net | | | | | | | | | | | | | | | | | | | | | | | | |
| investment income | | | | (.185) | | | | (.282) | | | | (.195) | | | | (.279) | | | | (.395) | | | | (.538) |
| Distributions from net | | | | | | | | | | | | | | | | | | | | | | | | |
| realized gain | | | | — | | | | (.008) | | | | — | | | | — | | | | — | | | | — |
| Total distributions | | | | (.185) | | | | (.290) | | | | (.195) | | | | (.279) | | | | (.395) | | | | (.538) |
| Net asset value, | | | | | | | | | | | | | | | | | | | | | | | | |
| end of period | | | | $ 9.36 | | | | $ 9.40 | | | | $ 9.60 | | | | $ 9.55 | | | | $ 9.45 | | | | $ 9.50 |
| Total ReturnB,C,D | | | | 1.55% | | | | .95% | | | | 2.59% | | | | 4.04% | | | | 3.75% | | | | 10.21% |
| Ratios to Average Net AssetsF,G | | | | | | | | | | | | | | | | | | | | | | | | |
| Expenses before | | | | | | | | | | | | | | | | | | | | | | | | |
| reductions | | | | .75%A | | | | .81% | | | | .83% | | | | .82% | | | | .82% | | | | .85% |
| Expenses net of fee | | | | | | | | | | | | | | | | | | | | | | | | |
| waivers, if any | | | | .75%A | | | | .81% | | | | .83% | | | | .82% | | | | .82% | | | | .85% |
| Expenses net of all | | | | | | | | | | | | | | | | | | | | | | | | |
| reductions | | | | .75%A | | | | .81% | | | | .83% | | | | .82% | | | | .82% | | | | .85% |
| Net investment | | | | | | | | | | | | | | | | | | | | | | | | |
| income | | | | 3.79%A | | | | 2.99% | | | | 2.16% | | | | 2.73% | | | | 4.07%H | | | | 5.62% |
| Supplemental Data | | | | | | | | | | | | | | | | | | | | | | | | |
| Net assets, | | | | | | | | | | | | | | | | | | | | | | | | |
| end of period | | | | | | | | | | | | | | | | | | | | | | | | |
| (000 omitted) | | | | $562,351 | | | | $544,662 | | | | $517,440 | | | | $468,931 | | | | $388,495 | | | | $309,958 |
| Portfolio turnover rate | | | | 42%A | | | | 94% | | | | 87% | | | | 102% | | | | 111% | | | | 145% |
A Annualized
B Total returns for periods of less than one year are not annualized.
C Total returns would have been lower had certain expenses not been reduced during the periods shown.
D Total returns do not include the effect of the sales charges.
E Calculated based on average shares outstanding during the period.
F Amounts do not include the activity of the affiliated central fund.
G Expense ratios reflect operating expenses of the class. Expenses before reductions do not reflect amounts reimbursed by the investment adviser or expense
offset arrangements and do not represent the amount paid by the class during periods when reimbursements or reductions occur. Expenses net of fee
waivers reflect expenses after reimbursement by the investment adviser but prior to reductions from expense offset arrangements. Expenses net of all
reductions represent the net expenses paid by the class.
H Effective November 1, 2001, the fund adopted the provisions of the AICPA Audit and Accounting Guide for Investment Companies and began amortizing
premium and discount on all debt securities. Per share data and ratios for periods prior to adoption have not been restated to reflect this change.
|
See accompanying notes which are an integral part of the financial statements.
51 Semiannual Report
| Financial Highlights Class B | | | | | | | | | | | | | | | | |
| | | Six months ended | | | | | | | | | | | | | | | | |
| | | April 30, 2006 | | Years ended October 31, |
| | | (Unaudited) | | 2005 | | 2004 | | 2003 | | | | 2002G |
| Selected Per Share Data | | | | | | | | | | | | | | | | | | | | |
| Net asset value, | | | | | | | | | | | | | | | | | | | | |
| beginning of period | | | | $ 9.41 | | | | $ 9.61 | | | | $ 9.56 | | | | $ 9.46 | | | | $ 9.43 |
| Income from Investment | | | | | | | | | | | | | | | | | | | | |
| Operations | | | | | | | | | | | | | | | | | | | | |
| Net investment incomeE | | | | .140 | | | | .210 | | | | .130 | | | | .183 | | | | .281I |
| Net realized and unrealized | | | | | | | | | | | | | | | | | | | | |
| gain (loss) | | | | (.032) | | | | (.194) | | | | .038 | | | | .120 | | | | (.234)I |
| Total from investment operations | | | | .108 | | | | .016 | | | | .168 | | | | .303 | | | | .047 |
| Distributions from net investment | | | | | | | | | | | | | | | | | | | | |
| income | | | | (.148) | | | | (.208) | | | | (.118) | | | | (.203) | | | | (.017) |
| Distributions from net realized | | | | | | | | | | | | | | | | | | | | |
| gain | | | | — | | | | (.008) | | | | — | | | | — | | | | — |
| Total distributions | | | | (.148) | | | | (.216) | | | | (.118) | | | | (.203) | | | | (.017) |
| Net asset value, | | | | | | | | | | | | | | | | | | | | |
| end of period | | | | $ 9.37 | | | | $ 9.41 | | | | $ 9.61 | | | | $ 9.56 | | | | $ 9.46 |
| Total ReturnB,C,D | | | | 1.15% | | | | .17% | | | | 1.77% | | | | 3.23% | | | | .50% |
| Ratios to Average Net AssetsF,H | | | | | | | | | | | | | | | | | | | | |
| Expenses before reductions | | | | 1.55%A | | | | 1.61% | | | | 1.63% | | | | 1.61% | | | | 1.86%A |
| Expenses net of fee waivers, | | | | | | | | | | | | | | | | | | | | |
| if any | | | | 1.55%A | | | | 1.60% | | | | 1.63% | | | | 1.61% | | | | 1.65%A |
| Expenses net of all reductions . | | | | 1.54%A | | | | 1.60% | | | | 1.63% | | | | 1.61% | | | | 1.65%A |
| Net investment income | | | | 2.99%A | | | | 2.21% | | | | 1.36% | | | | 1.94% | | | | 3.59%A,I |
| Supplemental Data | | | | | | | | | | | | | | | | | | | | |
| Net assets, end of period | | | | | | | | | | | | | | | | | | | | |
| (000 omitted) | | | | $33,384 | | | | $39,190 | | | | $53,502 | | | | $49,353 | | | | $ 3,811 |
| Portfolio turnover rate | | | | 42%A | | | | 94% | | | | 87% | | | | 102% | | | | 111% |
A Annualized
B Total returns for periods of less than one year are not annualized.
C Total returns would have been lower had certain expenses not been reduced during the periods shown.
D Total returns do not include the effect of the contingent deferred sales charge.
E Calculated based on average shares outstanding during the period.
F Amounts do not include the activity of the affiliated central fund.
G For the period October 9, 2002 (commencement of sale of shares) to October 31, 2002.
H Expense ratios reflect operating expenses of the class. Expenses before reductions do not reflect amounts reimbursed by the investment adviser or expense
offset arrangements and do not represent the amount paid by the class during periods when reimbursements or reductions occur. Expense ratios before
reductions for start up periods may not be representative of longer term operating periods. Expenses net of fee waivers reflect expenses after reimburse
ment by the investment adviser but prior to reductions from expense offset arrangements. Expenses net of all reductions represent the net expenses paid
by the class.
I Effective November 1, 2001, the fund adopted the provisions of the AICPA Audit and Accounting Guide for Investment Companies and began amortizing
premium and discount on all debt securities. Per share data and ratios for periods prior to adoption have not been restated to reflect this change.
|
See accompanying notes which are an integral part of the financial statements.
| Financial Highlights Class C | | | | | | | | | | | | | | | | | | |
| | | Six months ended | | | | | | | | | | | | | | | | | | | | |
| | | April 30, 2006 | | Years ended October 31, |
| | | (Unaudited) | | 2005 | | 2004 | | 2003 | | | | 2002 | | 2001 |
| Selected Per Share Data | | | | | | | | | | | | | | | | | | | | | | | | |
| Net asset value, | | | | | | | | | | | | | | | | | | | | | | | | |
| beginning of period | | | | $ 9.40 | | | | $ 9.61 | | | | $ 9.55 | | | | $ 9.45 | | | | $ 9.50 | | | | $ 9.13 |
| Income from Investment | | | | | | | | | | | | | | | | | | | | | | | | |
| Operations | | | | | | | | | | | | | | | | | | | | | | | | |
| Net investment | | | | | | | | | | | | | | | | | | | | | | | | |
| incomeE | | | | 138 | | | | .206 | | | | .129 | | | | .182 | | | | .304H | | | | .448 |
| Net realized and un | | | | | | | | | | | | | | | | | | | | | | | | |
| realized gain (loss) | | | | (.032) | | | | (.204) | | | | .048 | | | | .118 | | | | (.037)H | | | | .383 |
| Total from investment | | | | | | | | | | | | | | | | | | | | | | | | |
| operations | | | | .106 | | | | .002 | | | | .177 | | | | .300 | | | | .267 | | | | .831 |
| Distributions from net | | | | | | | | | | | | | | | | | | | | | | | | |
| investment income | | | | (.146) | | | | (.204) | | | | (.117) | | | | (.200) | | | | (.317) | | | | (.461) |
| Distributions from net | | | | | | | | | | | | | | | | | | | | | | | | |
| realized gain | | | | — | | | | (.008) | | | | — | | | | — | | | | — | | | | — |
| Total distributions | | | | (.146) | | | | (.212) | | | | (.117) | | | | (.200) | | | | (.317) | | | | (.461) |
| Net asset value, | | | | | | | | | | | | | | | | | | | | | | | | |
| end of period | | | | $ 9.36 | | | | $ 9.40 | | | | $ 9.61 | | | | $ 9.55 | | | | $ 9.45 | | | | $ 9.50 |
| Total ReturnB,C,D | | | | 1.14% | | | | .02% | | | | 1.86% | | | | 3.19% | | | | 2.90% | | | | 9.30% |
| Ratios to Average Net AssetsF,G | | | | | | | | | | | | | | | | | | | | | | | | |
| Expenses before | | | | | | | | | | | | | | | | | | | | | | | | |
| reductions | | | | 1.59%A | | | | 1.64% | | | | 1.65% | | | | 1.64% | | | | 1.64% | | | | 1.68% |
| Expenses net of fee | | | | | | | | | | | | | | | | | | | | | | | | |
| waivers, if any | | | | 1.59%A | | | | 1.64% | | | | 1.65% | | | | 1.64% | | | | 1.64% | | | | 1.68% |
| Expenses net of all | | | | | | | | | | | | | | | | | | | | | | | | |
| reductions | | | | 1.58%A | | | | 1.64% | | | | 1.65% | | | | 1.64% | | | | 1.63% | | | | 1.68% |
| Net investment | | | | | | | | | | | | | | | | | | | | | | | | |
| income | | | | 2.95%A | | | | 2.16% | | | | 1.34% | | | | 1.91% | | | | 3.25%H | | | | 4.80% |
| Supplemental Data | | | | | | | | | | | | | | | | | | | | | | | | |
| Net assets, | | | | | | | | | | | | | | | | | | | | | | | | |
| end of period | | | | | | | | | | | | | | | | | | | | | | | | |
| (000 omitted) | | | | $160,448 | | | | $194,992 | | | | $273,166 | | | | $359,779 | | | | $283,046 | | | | $99,486 |
| Portfolio turnover rate | | | | 42%A | | | | 94% | | | | 87% | | | | 102% | | | | 111% | | | | 145% |
A Annualized
B Total returns for periods of less than one year are not annualized.
C Total returns would have been lower had certain expenses not been reduced during the periods shown.
D Total returns do not include the effect of the contingent deferred sales charge.
E Calculated based on average shares outstanding during the period.
F Amounts do not include the activity of the affiliated central fund.
G Expense ratios reflect operating expenses of the class. Expenses before reductions do not reflect amounts reimbursed by the investment adviser or expense
offset arrangements and do not represent the amount paid by the class during periods when reimbursements or reductions occur. Expenses net of fee
waivers reflect expenses after reimbursement by the investment adviser but prior to reductions from expense offset arrangements. Expenses net of all
reductions represent the net expenses paid by the class.
H Effective November 1, 2001, the fund adopted the provisions of the AICPA Audit and Accounting Guide for Investment Companies and began amortizing
premium and discount on all debt securities. Per share data and ratios for periods prior to adoption have not been restated to reflect this change.
|
See accompanying notes which are an integral part of the financial statements.
53 Semiannual Report
| Financial Highlights Institutional Class | | | | | | | | | | | | |
| | | Six months ended | | | | | | | | | | | | | | | | | | | | |
| | | April 30, 2006 | | Years ended October 31, |
| | | (Unaudited) | | 2005 | | 2004 | | 2003 | | | | 2002 | | 2001 |
| Selected Per Share Data | | | | | | | | | | | | | | | | | | | | | | | | |
| Net asset value, | | | | | | | | | | | | | | | | | | | | | | | | |
| beginning of period | | | | $ 9.40 | | | | $ 9.60 | | | | $ 9.55 | | | | $ 9.45 | | | | $ 9.50 | | | | $ 9.13 |
| Income from Investment | | | | | | | | | | | | | | | | | | | | | | | | |
| Operations | | | | | | | | | | | | | | | | | | | | | | | | |
| Net investment | | | | | | | | | | | | | | | | | | | | | | | | |
| incomeD | | | | .184 | | | | .301 | | | | .225 | | | | .278 | | | | .397G | | | | .540 |
| Net realized and un | | | | | | | | | | | | | | | | | | | | | | | | |
| realized gain (loss) | | | | (.031) | | | | (.194) | | | | .038 | | | | .119 | | | | (.043)G | | | | .387 |
| Total from investment | | | | | | | | | | | | | | | | | | | | | | | | |
| operations | | | | .153 | | | | .107 | | | | .263 | | | | .397 | | | | .363 | | | | .927 |
| Distributions from net | | | | | | | | | | | | | | | | | | | | | | | | |
| investment income | | | | (.193) | | | | (.299) | | | | (.213) | | | | (.297) | | | | (.413) | | | | (.557) |
| Distributions from net | | | | | | | | | | | | | | | | | | | | | | | | |
| realized gain | | | | — | | | | (.008) | | | | — | | | | — | | | | — | | | | — |
| Total distributions | | | | (.193) | | | | (.307) | | | | (.213) | | | | (.297) | | | | (.413) | | | | (.557) |
| Net asset value, | | | | | | | | | | | | | | | | | | | | | | | | |
| end of period | | | | $ 9.36 | | | | $ 9.40 | | | | $ 9.60 | | | | $ 9.55 | | | | $ 9.45 | | | | $ 9.50 |
| Total ReturnB,C | | | | 1.64% | | | | 1.14% | | | | 2.78% | | | | 4.24% | | | | 3.95% | | | | 10.43% |
| Ratios to Average Net AssetsE,F | | | | | | | | | | | | | | | | | | | | | | | | |
| Expenses before | | | | | | | | | | | | | | | | | | | | | | | | |
| reductions | | | | .58%A | | | | .63% | | | | .64% | | | | .63% | | | | .64% | | | | .66% |
| Expenses net of fee | | | | | | | | | | | | | | | | | | | | | | | | |
| waivers, if any | | | | .58%A | | | | .63% | | | | .64% | | | | .63% | | | | .64% | | | | .66% |
| Expenses net of all | | | | | | | | | | | | | | | | | | | | | | | | |
| reductions | | | | .58%A | | | | .63% | | | | .64% | | | | .63% | | | | .63% | | | | .66% |
| Net investment | | | | | | | | | | | | | | | | | | | | | | | | |
| income | | | | 3.96%A | | | | 3.18% | | | | 2.35% | | | | 2.92% | | | | 4.25%G | | | | 5.81% |
| Supplemental Data | | | | | | | | | | | | | | | | | | | | | | | | |
| Net assets, | | | | | | | | | | | | | | | | | | | | | | | | |
| end of period | | | | | | | | | | | | | | | | | | | | | | | | |
| (000 omitted) | | | | $199,805 | | | | $151,257 | | | | $98,505 | | | | $91,138 | | | | $65,330 | | | | $23,301 |
| Portfolio turnover | | | | | | | | | | | | | | | | | | | | | | | | |
| rate | | | | 42%A | | | | 94% | | | | 87% | | | | 102% | | | | 111% | | | | 145% |
A Annualized
B Total returns for periods of less than one year are not annualized.
C Total returns would have been lower had certain expenses not been reduced during the periods shown.
D Calculated based on average shares outstanding during the period.
E Amounts do not include the activity of the affiliated central fund.
F Expense ratios reflect operating expenses of the class. Expenses before reductions do not reflect amounts reimbursed by the investment adviser or expense
offset arrangements and do not represent the amount paid by the class during periods when reimbursements or reductions occur. Expenses net of fee
waivers reflect expenses after reimbursement by the investment adviser but prior to reductions from expense offset arrangements. Expenses net of all
reductions represent the net expenses paid by the class.
G Effective November 1, 2001, the fund adopted the provisions of the AICPA Audit and Accounting Guide for Investment Companies and began amortizing
premium and discount on all debt securities. Per share data and ratios for periods prior to adoption have not been restated to reflect this change.
|
See accompanying notes which are an integral part of the financial statements.
Notes to Financial Statements
For the period ended April 30, 2006 (Unaudited)
1. Significant Accounting Policies.
Fidelity Advisor Short Fixed Income Fund (the fund) is a fund of Fidelity Advisor Series II (the trust) and is authorized to issue an unlimited number of shares. The trust is regis tered under the Investment Company Act of 1940, as amended (the 1940 Act), as an open end management investment company organized as a Massachusetts business trust.
The fund offers Class A, Class T, Class B, Class C, and Institutional Class shares, each of which has equal rights as to assets and voting privileges. Each class has exclusive voting rights with respect to matters that affect that class. Class B shares will automatically convert to Class A shares after a holding period of four years from the initial date of purchase. Investment income, realized and unrealized capital gains and losses, the common expenses of the fund, and certain fund level expense reductions, if any, are allocated on a pro rata basis to each class based on the relative net assets of each class to the total net assets of the fund. Each class differs with respect to transfer agent and distribution and service plan fees incurred. Certain expense reductions also differ by class.
The fund may invest in affiliated money market central funds (Money Market Central Funds), and fixed income Central Investment Portfolios (CIPs), collectively referred to as Central Funds, which are open end investment companies available to investment companies and other accounts managed by Fidelity Management & Research Company (FMR) and its affiliates. The financial statements have been prepared in conformity with accounting principles generally accepted in the United States of America, which require management to make certain estimates and assumptions at the date of the financial statements. The following summarizes the significant accounting policies of the fund, which are also consistently followed by the Central Funds:
Security Valuation. Investments are valued and net asset value per share is calculated (NAV calculation) as of the close of business of the New York Stock Exchange, normally 4:00 p.m. Eastern time. Wherever possible, the fund uses independent pricing services approved by the Board of Trustees to value its investments. Debt securities, including restricted securities, for which quotations are readily available, are valued by indepen dent pricing services or by dealers who make markets in such securities. Pricing services consider yield or price of bonds of comparable quality, coupon, maturity and type as well as dealer supplied prices. When current market prices or quotations are not readily available or do not accurately reflect fair value, valuations may be determined in accor dance with procedures adopted by the Board of Trustees. The frequency of when fair value pricing is used is unpredictable. The value of securities used for NAV calculation under fair value pricing may differ from published prices for the same securities. Invest ments in open end mutual funds, including Central Funds, are valued at their closing net asset value each business day. Short term securities with remaining maturities of sixty days or less for which quotations are not readily available are valued at amortized cost, which approximates value.
55 Semiannual Report
| Notes to Financial Statements (Unaudited) continued |
1. Significant Accounting Policies continued |
Investment Transactions and Income. Security transactions, including the fund’s investment activity in the Central Funds, are accounted for as of trade date. Gains and losses on securities sold are determined on the basis of identified cost. Distributions received on securities that represent a return of capital or capital gain are recorded as a reduction of cost of investments and/or as a realized gain. Interest income and distribu tions from the Central Funds are accrued as earned. Interest income includes coupon interest and amortization of premium and accretion of discount on debt securities. Invest ment income is recorded net of foreign taxes withheld where recovery of such taxes is uncertain. Debt obligations may be placed on non accrual status and related interest income may be reduced by ceasing current accruals and writing off interest receivables when the collection of all or a portion of interest has become doubtful based on consis tently applied procedures. A debt obligation is removed from non accrual status when the issuer resumes interest payments or when collectibility of interest is reasonably assured.
Expenses. Most expenses of the trust can be directly attributed to a fund. Expenses which cannot be directly attributed are apportioned among each fund in the trust.
Income Tax Information and Distributions to Shareholders. Each year, the fund intends to qualify as a regulated investment company by distributing all of its taxable income and realized gains under Subchapter M of the Internal Revenue Code. As a result, no provision for income taxes is required in the accompanying financial statements. Foreign taxes are provided for based on the fund’s understanding of the tax rules and rates that exist in the foreign markets in which it invests.
Dividends are declared daily and paid monthly from net investment income. Distribu tions from realized gains, if any, are recorded on the ex dividend date. Income dividends and capital gain distributions are declared separately for each class. Income and capital gain distributions are determined in accordance with income tax regulations, which may differ from generally accepted accounting principles. In addition, the fund claimed a portion of the payment made to redeeming shareholders as a distribution for income tax purposes.
Capital accounts within the financial statements are adjusted for permanent book tax differences. These adjustments have no impact on net assets or the results of operations. Temporary book tax differences will reverse in a subsequent period.
Book tax differences are primarily due to futures transactions, swap agreements, prior period premium and discount on debt securities, market discount, deferred trustees compensation, financing transactions, capital loss carryforwards, and losses deferred due to wash sales.
| 1. Significant Accounting Policies continued | | |
Income Tax Information and Distributions to Shareholders continued |
The federal tax cost of investments and unrealized appreciation (depreciation) as of period end were as follows:
| Unrealized appreciation | | | | $ 2,990,386 |
| Unrealized depreciation | | | | (17,258,549) |
| Net unrealized appreciation (depreciation) | | | | $ (14,268,163) |
| Cost for federal income tax purposes | | | | $ 1,355,356,818 |
| |
| 2. Operating Policies. | | | | |
Repurchase Agreements. FMR has received an Exemptive Order from the Securities and Exchange Commission (the SEC) which permits the fund and other affiliated entities of FMR to transfer uninvested cash balances into joint trading accounts which are then invested in repurchase agreements. The fund may also invest directly with institutions in repurchase agreements. Repurchase agreements are collateralized by government or non government securities. Upon settlement date, collateral is held in segregated accounts with custodian banks and may be obtained in the event of a default of the counterparty. The fund monitors, on a daily basis, the value of the collateral to ensure it is at least equal to the principal amount of the repurchase agreement (including accrued interest). In the event of a default by the counterparty, realization of the collateral proceeds could be delayed, during which time the value of the collateral may decline.
Delayed Delivery Transactions and When Issued Securities. The fund may purchase or sell securities on a delayed delivery or when issued basis. Payment and delivery may take place after the customary settlement period for that security. The price of the underlying securities and the date when the securities will be delivered and paid for are fixed at the time the transaction is negotiated. During the time a delayed delivery sell is outstanding, the contract is marked to market daily and equivalent deliverable securities are held for the transaction. The value of the securities purchased on a delayed delivery or when issued basis are identified as such in the fund’s Schedule of Investments. The fund may receive compensation for interest forgone in the purchase of a delayed delivery or when issued security. With respect to purchase commitments, the fund identifies securities as segregated in its records with a value at least equal to the amount of the commitment. Losses may arise due to changes in the value of the underly ing securities or if the counterparty does not perform under the contract’s terms, or if the issuer does not issue the securities due to political, economic, or other factors.
57 Semiannual Report
| Notes to Financial Statements (Unaudited) continued |
2. Operating Policies continued | | |
Futures Contracts. The fund may use futures contracts to manage its exposure to the bond market and to fluctuations in interest rates. Buying futures tends to increase a fund’s exposure to the underlying instrument, while selling futures tends to decrease a fund’s exposure to the underlying instrument or hedge other fund investments. Upon entering into a futures contract, a fund is required to deposit with a clearing broker, no later than the following business day, an amount (“initial margin”) equal to a certain percentage of the face value of the contract. The initial margin may be in the form of cash or securities and is transferred to a segregated account on settlement date. Subsequent payments (“variation margin”) are made or received by a fund depending on the daily fluctuations in the value of the futures contract and are accounted for as unrealized gains or losses. Realized gains (losses) are recorded upon the expiration or closing of the futures contract. Securities deposited to meet margin requirements are identified in the Schedule of Investments. Futures contracts involve, to varying degrees, risk of loss in excess of any futures variation margin reflected in the Statement of Assets and Liabilities. The underly ing face amount at value of any open futures contracts at period end is shown in the Schedule of Investments under the caption “Futures Contracts.” This amount reflects each contract’s exposure to the underlying instrument at period end. Losses may arise from changes in the value of the underlying instruments or if the counterparties do not perform under the contract’s terms. Futures contracts are valued at the settlement price established each day by the board of trade or exchange on which they are traded.
Restricted Securities. The fund may invest in securities that are subject to legal or contractual restrictions on resale. These securities generally may be resold in transac tions exempt from registration or to the public if the securities are registered. Disposal of these securities may involve time consuming negotiations and expense, and prompt sale at an acceptable price may be difficult. Information regarding restricted securities is included at the end of the fund’s Schedule of Investments.
Swap Agreements. The fund may invest in swaps for the purpose of managing its exposure to interest rate, credit or market risk.
Total return swaps are agreements to exchange the return generated by one instrument or index for the return generated by another instrument, for example, the agreement to pay interest in exchange for a market linked return based on a notional amount. To the extent the total return of the index exceeds the offsetting interest obligation, a fund will receive a payment from the counterparty. To the extent it is less, a fund will make a payment to the counterparty. Periodic payments received or made by the fund are recorded in the accompanying Statement of Operations as realized gains or losses, respectively.
2. Operating Policies continued
Swap Agreements continued
Credit default swaps involve the exchange of a fixed rate premium for protection against the loss in value of an underlying debt instrument in the event of a defined credit event (such as payment default or bankruptcy). Under the terms of the swap, one party acts as a “guarantor” receiving a periodic payment that is a fixed percentage applied to a notional principal amount. In return the party agrees to purchase the notional amount of the underlying instrument, at par, if a credit event occurs during the term of the swap. The fund may enter into credit default swaps in which either it or its counterparty act as guarantors. By acting as the guarantor of a swap, a fund assumes the market and credit risk of the underlying instrument including liquidity and loss of value. Periodic payments and premiums received or made by the fund are recorded in the accompanying State ment of Operations as realized gains or losses, respectively.
Swaps are marked to market daily based on dealer supplied valuations and changes in value are recorded as unrealized appreciation (depreciation). Gains or losses are realized upon early termination of the swap agreement. Collateral, in the form of cash or securities, may be required to be held in segregated accounts with a fund’s custodian in compliance with swap contracts. Risks may exceed amounts recognized on the State ment of Assets and Liabilities. These risks include changes in the returns of the underly ing instruments, failure of the counterparties to perform under the contracts’ terms and the possible lack of liquidity with respect to the swap agreements. Details of swap agreements open at period end are included in the fund’s Schedule of Investments under the caption “Swap Agreements.”
Mortgage Dollar Rolls. To earn additional income, the fund may employ trading strategies which involve the sale and simultaneous agreement to repurchase similar securities (“mortgage dollar rolls”) or the purchase and simultaneous agreement to sell similar securities (“reverse mortgage dollar rolls”). The securities traded are mortgage securities and bear the same interest rate but may be collateralized by different pools of mortgages. During the period between the sale and repurchase in a mortgage dollar roll transaction, a fund will not be entitled to receive interest and principal payments on the securities sold but will invest the proceeds of the sale in other securities which may enhance the yield and total return. In addition, the difference between the sale price and the future purchase price is recorded as an adjustment to investment income. During the period between the purchase and subsequent sale in a reverse mortgage dollar roll transaction a fund is entitled to interest and principal payments on the securities purchased. The price differential between the purchase and sale is recorded as an adjustment to investment income. Losses may arise due to changes in the value of
59 Semiannual Report
| Notes to Financial Statements (Unaudited) continued |
2. Operating Policies continued | | |
Mortgage Dollar Rolls continued | | |
the securities or if the counterparty does not perform under the terms of the agreement. If the counterparty files for bankruptcy or becomes insolvent, a fund’s right to repurchase or sell securities may be limited.
3. Purchases and Sales of Investments.
Purchases and sales of securities, other than short term securities and U.S. government securities, aggregated $127,678,207 and $128,701,256, respectively.
4. Fees and Other Transactions with Affiliates.
Management Fee. FMR and its affiliates provide the fund with investment manage ment related services for which the fund pays a monthly management fee. The manage ment fee is the sum of an individual fund fee rate that is based on an annual rate of .20% of the fund’s average net assets and a group fee rate that averaged .12% during the period. The group fee rate is based upon the average net assets of all the mutual funds advised by FMR. The group fee rate decreases as assets under management increase and increases as assets under management decrease. For the period, the total annualized management fee rate was .32% of the fund’s average net assets.
Distribution and Service Plan. In accordance with Rule 12b 1 of the 1940 Act, the fund has adopted separate Distribution and Service Plans for each class of shares. Certain classes pay Fidelity Distributors Corporation (FDC), an affiliate of FMR, separate Distribution and Service Fees, each of which is based on an annual percentage of each class’ average net assets. In addition FDC may pay financial intermediaries for selling shares of the fund and providing shareholder support services. For the period, the Distribution and Service Fee rates and the total amounts paid to and retained by FDC were as follows:
| | | Distribution | | Service | | | | Paid to | | | | Retained |
| | | Fee | | Fee | | | | FDC | | | | by FDC |
| Class A | | 0% | | .15% | | | | $ 282,934 | | | | $ 4,688 |
| Class T | | 0% | | .15% | | | | 412,629 | | | | 6,349 |
| Class B | | .65% | | .25% | | | | 164,507 | | | | 119,280 |
| Class C | | .75% | | .25% | | | | 881,711 | | | | 90,668 |
| | | | | | | | | $ 1,741,781 | | | | $ 220,985 |
4. Fees and Other Transactions with Affiliates continued
Sales Load. FDC receives a front end sales charge of up to 1.50% for selling Class A and Class T shares, some of which is paid to financial intermediaries for selling shares of the fund. FDC receives the proceeds of a contingent deferred sales charges levied on Class A, Class T, Class B and Class C redemptions. These charges depend on the holding period. The deferred sales charges range from 3% to 1% for Class B, 1% for Class C, 75% to .50% for certain purchases of Class A shares (.25% prior to February 24, 2006) and .25% for certain purchases of Class T shares.
| For the period, sales charge amounts retained by FDC were as follows: | | |
| |
| | | | | Retained |
| | | | | by FDC |
| Class A | | | | $ 20,077 |
| Class T | | | | 9,805 |
| Class B* | | | | 33,818 |
| Class C* | | | | 11,976 |
| | | | | $ 75,676 |
* When Class B and Class C shares are initially sold, FDC pays commissions from its own resources to financial intermediaries through which the sales are made.
Transfer Agent Fees. Fidelity Investments Institutional Operations Company, Inc. (FIIOC), an affiliate of FMR, is the transfer, dividend disbursing and shareholder servic ing agent for each class of the fund. FIIOC receives account fees and asset based fees that vary according to the account size and type of account of the shareholders of the respective classes of the fund. FIIOC pays for typesetting, printing and mailing of shareholder reports, except proxy statements. For the period the total transfer agent fees paid by each class to FIIOC, were as follows:
| | | | | | | % of |
| | | | | | | Average |
| | | | | Amount | | Net Assets |
| Class A | | | | $ 473,655 | | .25* |
| Class T | | | | 586,692 | | .22* |
| Class B | | | | 46,159 | | .25* |
| Class C | | | | 168,923 | | .19* |
| Institutional Class | | | | 172,096 | | .20* |
| | | | | $ 1,447,525 | | |
| * Annualized | | | | | | |
61 Semiannual Report
| Notes to Financial Statements (Unaudited) continued |
| 4. Fees and Other Transactions with Affiliates continued |
Accounting Fees. Fidelity Service Company, Inc. (FSC), an affiliate of FMR, maintains the fund’s accounting records. The fee is based on the level of average net assets for the month.
Affiliated Central Funds. The fund may invest in Money Market Central Funds which seek preservation of capital and current income and are managed by Fidelity Investments Money Management, Inc. (FIMM), an affiliate of FMR.
The fund may also invest in CIPs managed by FIMM. The Ultra Short Central Fund seeks to obtain a high level of current income consistent with preservation of capital by investing in U.S. dollar denominated money market and investment grade debt securities.
The fund’s Schedule of Investments lists the CIP as an investment of the fund but does not include the underlying holdings of the CIP. Based on its investment objectives, the CIP may invest or participate in various investment vehicles or strategies that are similar to those of the investing fund. These strategies are consistent with the investment objectives of the fund and may involve certain economic risks, including the risk that a counterparty to one or more of these transactions may be unable or unwilling to comply with the terms of the governing agreement. This may result in a decline in value of the CIP and the fund.
A complete unaudited list of holdings for the CIP, as of the fund’s report date, is available upon request or at advisor.fidelity.com. The reports are located just after the fund’s financial statements and quarterly reports but are not part of the financial statements or quarterly reports. In addition, the CIP’s financial statements are available on the EDGAR Database on the SEC’s web site, www.sec.gov, or upon request.
The Central Funds do not pay a management fee.
5. Committed Line of Credit.
|
The fund participates with other funds managed by FMR in a $4.2 billion credit facility (the “line of credit”) to be utilized for temporary or emergency purposes to fund share holder redemptions or for other short term liquidity purposes. The fund has agreed to pay commitment fees on its pro rata portion of the line of credit, which amounts to $1,280 and is reflected in Miscellaneous Expense on the Statement of Operations. During the period, there were no borrowings on this line of credit.
Through arrangements with the fund’s custodian, credits realized as a result of unin vested cash balances were used to reduce the fund’s expenses. During the period, these credits reduced the fund’s custody expenses by $10,330.
The fund’s organizational documents provide former and current trustees and officers with a limited indemnification against liabilities arising in connection with the perfor mance of their duties to the fund. In the normal course of business, the fund may also enter into contracts that provide general indemnifications. The fund’s maximum exposure under these arrangements is unknown as this would be dependent on future claims that may be made against the fund. The risk of material loss from such claims is considered remote.
| 8. Distributions to Shareholders. | | | | | | |
| |
Distributions to shareholders of each class were as follows:
| | | | |
| | | | | Six months ended | | | | Year ended |
| | | | | April 30, 2006 | | | | October 31, 2005 |
| From net investment income | | | | | | | | |
| Class A | | | | $ 7,370,436 | | | | $ 10,743,507 |
| Class T | | | | 10,839,851 | | | | 15,909,371 |
| Class B | | | | 577,640 | | | | 982,753 |
| Class C | | | | 2,754,999 | | | | 4,841,882 |
| Institutional Class | | | | 3,619,312 | | | | 3,847,518 |
| Total | | | | $ 25,162,238 | | | | $ 36,325,031 |
| From net realized gain | | | | | | | | |
| Class A | | | | $ — | | | | $ 299,982 |
| Class T | | | | — | | | | 436,716 |
| Class B | | | | — | | | | 43,394 |
| Class C | | | | — | | | | 219,150 |
| Institutional Class | | | | — | | | | 86,771 |
| Total | | | | $ — | | | | $ 1,086,013 |
63 Semiannual Report
Notes to Financial Statements (Unaudited) continued
| 9. Share Transactions. | | | | | | | | | | |
| |
Transactions for each class of shares were as follows:
| | | | | | | | |
| | | Shares | | | | Dollars |
| | | Six months ended | | Year ended | | | | Six months ended | | | | Year ended |
| | | April 30, 2006 | | October 31, 2005 | | | | April 30, 2006 | | | | October 31, 2005 |
| Class A | | | | | | | | | | | | |
| Shares sold | | 8,453,364 | | 15,866,789 | | | | $ 79,269,029 | | | | $ 150,493,785 |
| Reinvestment of | | | | | | | | | | | | |
| distributions | | 693,838 | | 1,023,632 | | | | 6,502,629 | | | | 9,698,542 |
| Shares redeemed | | (7,691,575) | | (14,827,970) | | | | (72,097,291) | | | | (140,591,886) |
| Net increase (decrease) | | 1,455,627 | | 2,062,451 | | | | $ 13,674,367 | | | | $ 19,600,441 |
| Class T | | | | | | | | | | | | |
| Shares sold | | 12,244,791 | | 25,539,658 | | | | $ 114,899,538 | | | | $ 242,408,838 |
| Reinvestment of | | | | | | | | | | | | |
| distributions | | 1,026,593 | | 1,515,180 | | | | 9,629,269 | | | | 14,364,388 |
| Shares redeemed | | (11,128,237) | | (22,986,919) | | | | (104,426,967) | | | | (218,160,605) |
| Net increase (decrease) | | 2,143,147 | | 4,067,919 | | | | $ 20,101,840 | | | | $ 38,612,621 |
| Class B | | | | | | | | | | | | |
| Shares sold | | 294,357 | | 991,898 | | | | $ 2,766,905 | | | | $ 9,428,825 |
| Reinvestment of | | | | | | | | | | | | |
| distributions | | 52,497 | | 89,903 | | | | 492,980 | | | | 853,530 |
| Shares redeemed | | (948,583) | | (2,482,456) | | | | (8,909,154) | | | | (23,589,493) |
| Net increase (decrease) | | (601,729) | | (1,400,655) | | | | $ (5,649,269) | | | | $ (13,307,138) |
| Class C | | | | | | | | | | | | |
| Shares sold | | 1,393,282 | | 3,789,292 | | | | $ 13,077,563 | | | | $ 35,934,636 |
| Reinvestment of | | | | | | | | | | | | |
| distributions | | 185,746 | | 341,788 | | | | 1,742,905 | | | | 3,242,233 |
| Shares redeemed | | (5,179,396) | | (11,828,809) | | | | (48,619,236) | | | | (112,353,549) |
| Net increase (decrease) | | (3,600,368) | | (7,697,729) | | | | $ (33,798,768) | | | | $ (73,176,680) |
| Institutional Class | | | | | | | | | | | | |
| Shares sold | | 7,310,780 | | 9,882,466 | | | | $ 68,610,370 | | | | $ 93,788,947 |
| Reinvestment of | | | | | | | | | | | | |
| distributions | | 317,212 | | 310,507 | | | | 2,975,026 | | | | 2,942,021 |
| Shares redeemed | | (2,368,873) | | (4,357,149) | | | | (22,247,534) | | | | (41,379,214) |
| Net increase (decrease) | | 5,259,119 | | 5,835,824 | | | | $ 49,337,862 | | | | $ 55,351,754 |
Board Approval of Investment Advisory Contracts and Management Fees
Advisor Short Fixed Income Fund
On January 19, 2006, the Board of Trustees, including the Independent Trustees (together, the Board), voted to approve a general research services agreement (the Agreement) between FMR, FMR Co., Inc. (FMRC), Fidelity Investments Money Manage ment, Inc. (FIMM), and Fidelity Research & Analysis Company (FRAC) (together, the Investment Advisers) for the fund, effective January 20, 2006, pursuant to which FRAC may provide general research and investment advisory support services to FMRC and FIMM. The Board considered that it has approved previously various sub advisory agreements for the fund with affiliates of FMR that allow FMR to obtain research, non discretionary advice, or discretionary portfolio management at no additional expense to the fund. The Board, assisted by the advice of fund counsel and independent Trustees’ counsel, considered a broad range of information and determined that it would be beneficial for the fund to access the research and investment advisory support services supplied by FRAC at no additional expense to the fund.
The Board reached this determination in part because the new arrangement will involve no changes in (i) the contractual terms of and fees payable under the fund’s manage ment contract or sub advisory agreements; (ii) the investment process or strategies employed in the management of the fund’s assets; (iii) the nature or level of services provided under the fund’s management contract or sub advisory agreements; (iv) the day to day management of the fund or the persons primarily responsible for such man agement; or (v) the ultimate control or beneficial ownership of FMR, FMRC, or FIMM. The Board also considered that the establishment of the Agreement would not necessi tate prior shareholder approval of the Agreement or result in an assignment and termination of the fund’s management contract or sub advisory agreements under the Investment Company Act of 1940.
Because the Board was approving an arrangement with FRAC under which the fund will not bear any additional management fees or expenses and under which the fund’s portfolio manager would not change, it did not consider the fund’s investment perfor mance, competitiveness of management fee and total expenses, costs of services and profitability, or economies of scale to be significant factors in its decision.
In connection with its future renewal of the fund’s management contract and sub advisory agreements, the Board will consider: (i) the nature, extent, and quality of services provided to the fund, including shareholder and administrative services and investment performance; (ii) the competitiveness of the fund’s management fee and total expenses; (iii) the costs of the services and profitability, including the revenues earned and the expenses incurred by Fidelity in conducting the business of developing, marketing, distributing, managing, administering, and servicing the fund and its shareholders; and (iv) whether there have been economies of scale in respect of the management of the Fidelity funds, whether the Fidelity funds (including the fund) have
65 Semiannual Report
Board Approval of Investment Advisory Contracts and Management Fees continued
appropriately benefited from any such economies of scale, and whether there is potential for realization of any further economies.
Based on its evaluation of all of the conclusions noted above, and after considering all material factors, the Board ultimately concluded that the fund’s Agreement is fair and reasonable, and that the fund’s Agreement should be approved.
67 Semiannual Report
69 Semiannual Report
Investment Adviser
Fidelity Management & Research Company
Boston, MA
Investment Sub Advisers
Fidelity Management &
Research (U.K.) Inc.
Fidelity Research & Analysis Company
(formerly Fidelity Management &
Research (Far East) Inc.)
Fidelity Investments Japan Limited
Fidelity Investments Money
Management, Inc.
Fidelity International Investment Advisors
Fidelity International Investment Advisors
(U.K.) Limited
General Distributor
Fidelity Distributors Corporation
Boston, MA
Transfer and Service Agents
Fidelity Investments Institutional Operations Company, Inc.
Boston, MA
Fidelity Service Company, Inc.
Boston, MA
Custodian
The Bank of New York
New York, NY
|
SFII-USAN-0606
1.784906.103
|

Item 2. Code of Ethics
Not applicable.
Item 3. Audit Committee Financial Expert
Not applicable.
Item 4. Principal Accountant Fees and Services
Not applicable.
Item 5. Audit Committee of Listed Registrants
Not applicable.
Item 6. Schedule of Investments
Not applicable.
Item 7. Disclosure of Proxy Voting Policies and Procedures for Closed-End Management Investment Companies
Not applicable.
Item 8. Portfolio Managers of Closed-End Management Investment Companies
Not applicable.
Item 9. Purchase of Equity Securities by Closed-End Management Investment Company and Affiliated Purchasers
Not applicable.
Item 10. Submission of Matters to a Vote of Security Holders
There were no material changes to the procedures by which shareholders may recommend nominees to the Fidelity Advisor Series II: Fidelity Advisor Short Fixed-Income Fund's Board of Trustees.
Item 11. Controls and Procedures
(a)(i) The President and Treasurer and the Chief Financial Officer have concluded that the Fidelity Advisor Series II: Fidelity Advisor Short Fixed-Income Fund's (the "Fund") disclosure controls and procedures (as defined in Rule 30a-3(c) under the Investment Company Act) provide reasonable assurances that material information relating to the Fund is made known to them by the appropriate persons, based on their evaluation of these controls and procedures as of a date within 90 days of the filing date of this report.
(a)(ii) There was no change in the Fund's internal control over financial reporting (as defined in Rule 30a-3(d) under the Investment Company Act) that occurred during the second fiscal quarter of the period covered by this report that has materially affected, or is reasonably likely to materially affect, the Fund's internal control over financial reporting.
Item 12. Exhibits
(a) | (1) | Not applicable. |
(a) | (2) | Certification pursuant to Rule 30a-2(a) under the Investment Company Act of 1940 (17 CFR 270.30a-2(a)) is filed and attached hereto as Exhibit 99.CERT. |
(a) | (3) | Not applicable. |
(b) | | Certification pursuant to Rule 30a-2(b) under the Investment Company Act of 1940 (17 CFR 270.30a-2(b)) is furnished and attached hereto as Exhibit 99.906CERT. |
SIGNATURES
Pursuant to the requirements of the Securities Exchange Act of 1934 and the Investment Company Act of 1940, the registrant has duly caused this report to be signed on its behalf by the undersigned, thereunto duly authorized.
Fidelity Advisor Series II
By: | /s/Christine Reynolds |
| Christine Reynolds |
| President and Treasurer |
| |
Date: | June 14, 2006 |
Pursuant to the requirements of the Securities Exchange Act of 1934 and the Investment Company Act of 1940, this report has been signed below by the following persons on behalf of the registrant and in the capacities and on the dates indicated.
By: | /s/Christine Reynolds |
| Christine Reynolds |
| President and Treasurer |
| |
Date: | June 14, 2006 |
By: | /s/Paul M. Murphy |
| Paul M. Murphy |
| Chief Financial Officer |
| |
Date: | June 14, 2006 |