Fidelity Advisor® Strategic Income Fund
Class A, Class M (formerly Class T), Class C and Class I
Semi-Annual Report June 30, 2017 |
 |
Contents
To view a fund's proxy voting guidelines and proxy voting record for the 12-month period ended June 30, visit http://www.fidelity.com/proxyvotingresults or visit the Securities and Exchange Commission's (SEC) web site at http://www.sec.gov.
You may also call 1-877-208-0098 to request a free copy of the proxy voting guidelines.
Standard & Poor's, S&P and S&P 500 are registered service marks of The McGraw-Hill Companies, Inc. and have been licensed for use by Fidelity Distributors Corporation.
Other third-party marks appearing herein are the property of their respective owners.
All other marks appearing herein are registered or unregistered trademarks or service marks of FMR LLC or an affiliated company. © 2017 FMR LLC. All rights reserved.
This report and the financial statements contained herein are submitted for the general information of the shareholders of the Fund. This report is not authorized for distribution to prospective investors in the Fund unless preceded or accompanied by an effective prospectus.
A fund files its complete schedule of portfolio holdings with the SEC for the first and third quarters of each fiscal year on Form N-Q. Forms N-Q are available on the SEC’s web site at http://www.sec.gov. A fund's Forms N-Q may be reviewed and copied at the SEC’s Public Reference Room in Washington, DC. Information regarding the operation of the SEC's Public Reference Room may be obtained by calling 1-800-SEC-0330.
For a complete list of a fund's portfolio holdings, view the most recent holdings listing, semiannual report, or annual report on Fidelity's web site at http://www.fidelity.com, http://www.institutional.fidelity.com, or http://www.401k.com, as applicable.
NOT FDIC INSURED •MAY LOSE VALUE •NO BANK GUARANTEE
Neither the Fund nor Fidelity Distributors Corporation is a bank.
Investment Summary (Unaudited)
The information in the following tables is based on the combined investments of the Fund and its pro-rata share of the investments of Fidelity's Fixed-Income Central Funds.
Top Five Holdings as of June 30, 2017
| (by issuer, excluding cash equivalents) | % of fund's net assets | % of fund's net assets 6 months ago |
| U.S. Treasury Obligations | 17.3 | 13.1 |
| Japan Government | 2.8 | 2.1 |
| Ginnie Mae guaranteed REMIC pass-thru certificates | 2.8 | 2.7 |
| German Federal Republic | 2.6 | 0.6 |
| United Kingdom, Great Britain and Northern Ireland | 1.6 | 0.8 |
| | 27.1 | |
Top Five Market Sectors as of June 30, 2017
| | % of fund's net assets | % of fund's net assets 6 months ago |
| Financials | 10.5 | 11.4 |
| Consumer Discretionary | 8.8 | 10.7 |
| Energy | 7.2 | 8.5 |
| Telecommunication Services | 6.2 | 7.0 |
| Information Technology | 4.8 | 5.0 |
Quality Diversification (% of fund's net assets)
| As of June 30, 2017 |
| | U.S. Government and U.S. Government Agency Obligations* | 23.3% |
| | AAA,AA,A | 13.5% |
| | BBB | 5.8% |
| | BB | 15.7% |
| | B | 20.7% |
| | CCC,CC,C | 8.0% |
| | Not Rated | 4.2% |
| | Equities | 5.0% |
| | Short-Term Investments and Net Other Assets | 3.8% |
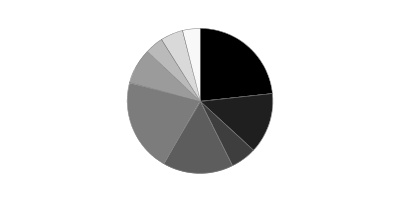
* Includes NCUA Guaranteed Notes
| As of December 31, 2016 |
| | U.S. Government and U.S. Government Agency Obligations* | 20.1% |
| | AAA,AA,A | 9.1% |
| | BBB | 7.3% |
| | BB | 18.8% |
| | B | 22.8% |
| | CCC,CC,C | 9.0% |
| | Not Rated | 3.8% |
| | Equities | 5.2% |
| | Short-Term Investments and Net Other Assets | 3.9% |
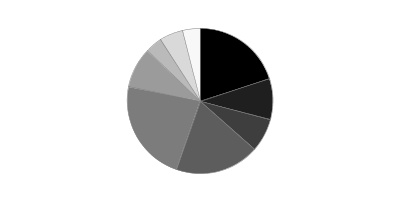
* Includes NCUA Guaranteed Notes
We have used ratings from Moody's Investors Service, Inc. Where Moody's® ratings are not available, we have used S&P® ratings. All ratings are as of the date indicated and do not reflect subsequent changes.
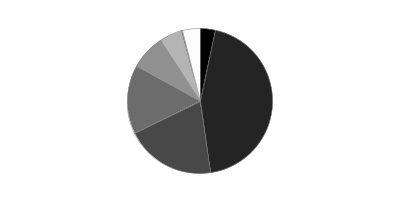
Asset Allocation (% of fund's net assets)
| As of June 30, 2017*,** |
| | Preferred Securities | 3.4% |
| | Corporate Bonds | 38.2% |
| | U.S. Government and U.S. Government Agency Obligations*** | 23.3% |
| | Foreign Government & Government Agency Obligations | 19.7% |
| | Bank Loan Obligations | 6.2% |
| | Stocks | 5.0% |
| | Other Investments | 0.4% |
| | Short-Term Investments and Net Other Assets (Liabilities) | 3.8% |

* Foreign investments – 36.4%
** Futures and Swaps – 1.6%
*** Includes NCUA Guaranteed Notes
| As of December 31, 2016*,** |
| | Preferred Securities | 3.4% |
| | Corporate Bonds | 44.2% |
| | U.S. Government and U.S. Government Agency Obligations*** | 20.1% |
| | Foreign Government & Government Agency Obligations | 15.3% |
| | Bank Loan Obligations | 7.8% |
| | Stocks | 5.2% |
| | Other Investments | 0.1% |
| | Short-Term Investments and Net Other Assets (Liabilities) | 3.9% |
* Foreign investments – 34.7%
** Futures and Swaps – 1.2%
*** Includes NCUA Guaranteed Notes
An unaudited holdings listing for the Fund, which presents direct holdings as well as the pro-rata share of any securities and other investments held indirectly through its investment in underlying non-money market Fidelity Central Funds, is available at fidelity.com and/or institutional.fidelity.com, as applicable.
Investments June 30, 2017
Showing Percentage of Net Assets
| Corporate Bonds - 38.0% | | | |
| | | Principal Amount (000s)(a) | Value (000s) |
| Convertible Bonds - 0.0% | | | |
| CONSUMER DISCRETIONARY - 0.0% | | | |
| Auto Components - 0.0% | | | |
| Exide Technologies 7% 4/30/25 pay-in-kind | | $1,004 | $502 |
| Nonconvertible Bonds - 38.0% | | | |
| CONSUMER DISCRETIONARY - 5.4% | | | |
| Auto Components - 0.4% | | | |
| Allison Transmission, Inc. 5% 10/1/24 (b) | | 4,205 | 4,310 |
| Exide Technologies: | | | |
| 11% 4/30/20 pay-in-kind | | 33 | 24 |
| 11% 4/30/22 pay-in-kind (b)(c) | | 982 | 820 |
| Lear Corp. 4.75% 1/15/23 | | 6,305 | 6,523 |
| Metalsa SA de CV 4.9% 4/24/23 (b) | | 11,094 | 10,955 |
| Tenedora Nemak SA de CV 5.5% 2/28/23 (b) | | 6,704 | 6,888 |
| Tenneco, Inc. 5% 7/15/26 | | 3,090 | 3,125 |
| Tupy Overseas SA 6.625% 7/17/24 (b) | | 1,625 | 1,666 |
| | | | 34,311 |
| Distributors - 0.0% | | | |
| American Builders & Contractors Supply Co., Inc. 5.625% 4/15/21 (b) | | 600 | 617 |
| American Tire Distributors, Inc. 10.25% 3/1/22 (b) | | 1,740 | 1,801 |
| LKQ Corp. 4.75% 5/15/23 | | 1,090 | 1,112 |
| | | | 3,530 |
| Diversified Consumer Services - 0.2% | | | |
| Alpine Finance Merger Sub LLC 6.875% 8/1/25 (b)(d) | | 1,275 | 1,297 |
| Laureate Education, Inc. 8.25% 5/1/25 (b) | | 10,660 | 11,433 |
| | | | 12,730 |
| Hotels, Restaurants & Leisure - 0.9% | | | |
| 24 Hour Holdings III LLC 8% 6/1/22 (b) | | 1,760 | 1,632 |
| Carlson Travel, Inc. 6.75% 12/15/23 (b) | | 1,505 | 1,531 |
| Choice Hotels International, Inc. 5.75% 7/1/22 | | 1,445 | 1,608 |
| Eagle II Acquisition Co. LLC 6% 4/1/25 (b) | | 980 | 1,039 |
| FelCor Lodging LP 6% 6/1/25 | | 4,185 | 4,467 |
| Hilton Worldwide Finance LLC/Hilton Worldwide Finance Corp.: | | | |
| 4.625% 4/1/25 (b) | | 5,815 | 5,997 |
| 4.875% 4/1/27 (b) | | 2,730 | 2,856 |
| Jacobs Entertainment, Inc. 7.875% 2/1/24 (b) | | 955 | 1,036 |
| KFC Holding Co./Pizza Hut Holding LLC: | | | |
| 4.75% 6/1/27 (b) | | 2,865 | 2,926 |
| 5% 6/1/24 (b) | | 3,275 | 3,414 |
| 5.25% 6/1/26 (b) | | 3,275 | 3,447 |
| Landry's Acquisition Co. 6.75% 10/15/24 (b) | | 3,370 | 3,450 |
| LTF Merger Sub, Inc. 8.5% 6/15/23 (b) | | 2,780 | 2,989 |
| MCE Finance Ltd. 4.875% 6/6/25 (b) | | 1,455 | 1,456 |
| MGM Growth Properties Operating Partnership LP 5.625% 5/1/24 | | 2,530 | 2,758 |
| Penn National Gaming, Inc. 5.625% 1/15/27 (b) | | 775 | 790 |
| Playa Resorts Holding BV 8% 8/15/20 (b) | | 3,587 | 3,748 |
| Scientific Games Corp. 10% 12/1/22 | | 8,300 | 9,099 |
| Silversea Cruises 7.25% 2/1/25 (b) | | 1,625 | 1,733 |
| Studio City Co. Ltd.: | | | |
| 5.875% 11/30/19 (b) | | 2,700 | 2,849 |
| 7.25% 11/30/21 (b) | | 7,025 | 7,631 |
| Wynn Las Vegas LLC/Wynn Las Vegas Capital Corp. 5.25% 5/15/27 (b) | | 8,560 | 8,769 |
| | | | 75,225 |
| Household Durables - 0.5% | | | |
| Brookfield Residential Properties, Inc./Brookfield Residential U.S. Corp. 6.125% 7/1/22 (b) | | 3,165 | 3,276 |
| Brookfield Residential Properties, Inc. 6.5% 12/15/20 (b) | | 2,595 | 2,679 |
| Reynolds Group Issuer, Inc./Reynolds Group Issuer LLC/Reynolds Group Issuer (Luxembourg) SA: | | | |
| 5.125% 7/15/23 (b) | | 8,500 | 8,829 |
| 7% 7/15/24 (b) | | 2,460 | 2,639 |
| Springs Industries, Inc. 6.25% 6/1/21 | | 1,475 | 1,525 |
| Taylor Morrison Communities, Inc./Monarch Communities, Inc. 5.875% 4/15/23 (b) | | 3,265 | 3,485 |
| Toll Brothers Finance Corp.: | | | |
| 4.375% 4/15/23 | | 10,429 | 10,789 |
| 5.625% 1/15/24 | | 1,240 | 1,336 |
| TRI Pointe Homes, Inc. 5.875% 6/15/24 | | 6,140 | 6,478 |
| William Lyon Homes, Inc. 5.875% 1/31/25 | | 2,430 | 2,503 |
| | | | 43,539 |
| Internet & Direct Marketing Retail - 0.4% | | | |
| Netflix, Inc.: | | | |
| 4.375% 11/15/26 (b) | | 4,130 | 4,120 |
| 5.375% 2/1/21 (b) | | 4,010 | 4,331 |
| 5.75% 3/1/24 | | 4,405 | 4,807 |
| 5.875% 2/15/25 | | 10,170 | 11,263 |
| Zayo Group LLC/Zayo Capital, Inc.: | | | |
| 5.75% 1/15/27 (b) | | 9,020 | 9,437 |
| 6% 4/1/23 | | 4,435 | 4,668 |
| | | | 38,626 |
| Leisure Products - 0.0% | | | |
| Cedar Fair LP/Magnum Management Corp. 5.375% 4/15/27 (b) | | 2,155 | 2,274 |
| Media - 2.7% | | | |
| Altice SA: | | | |
| 7.625% 2/15/25 (b) | | 11,379 | 12,474 |
| 7.75% 5/15/22 (b) | | 16,510 | 17,521 |
| Altice U.S. Finance SA 5.5% 5/15/26 (b) | | 4,270 | 4,484 |
| AMC Networks, Inc. 4.75% 12/15/22 | | 3,080 | 3,178 |
| Block Communications, Inc. 6.875% 2/15/25 (b) | | 3,010 | 3,228 |
| British Sky Broadcasting Group PLC 1.875% 11/24/23 (Reg. S) | EUR | 4,300 | 5,144 |
| Cablevision SA 6.5% 6/15/21 (b) | | 835 | 885 |
| CBS Outdoor Americas Capital LLC/CBS Outdoor Americas Capital Corp.: | | | |
| 5.25% 2/15/22 | | 980 | 1,016 |
| 5.625% 2/15/24 | | 1,060 | 1,106 |
| CBS Radio, Inc. 7.25% 11/1/24 (b) | | 2,715 | 2,796 |
| CCO Holdings LLC/CCO Holdings Capital Corp.: | | | |
| 5.125% 2/15/23 | | 6,770 | 6,986 |
| 5.125% 5/1/23 (b) | | 5,425 | 5,696 |
| 5.125% 5/1/27 (b) | | 16,095 | 16,457 |
| 5.375% 5/1/25 (b) | | 5,425 | 5,778 |
| 5.5% 5/1/26 (b) | | 6,585 | 6,988 |
| 5.75% 9/1/23 | | 670 | 698 |
| 5.75% 1/15/24 | | 4,245 | 4,473 |
| 5.75% 2/15/26 (b) | | 7,390 | 7,907 |
| Cengage Learning, Inc. 9.5% 6/15/24 (b) | | 7,455 | 6,598 |
| Clear Channel Communications, Inc.: | | | |
| 9% 3/1/21 | | 1,555 | 1,166 |
| 10% 1/15/18 | | 4,050 | 2,430 |
| 11.25% 3/1/21 | | 12,070 | 9,098 |
| 14% 2/1/21 pay-in-kind (c) | | 5,098 | 1,096 |
| Columbus International, Inc. 7.375% 3/30/21 (b) | | 1,680 | 1,783 |
| Globo Comunicacao e Participacoes SA: | | | |
| 4.843% 6/8/25 (b) | | 4,055 | 4,096 |
| 4.875% 4/11/22 (b) | | 1,875 | 1,941 |
| Grupo Televisa SA de CV 6.625% 3/18/25 | | 1,140 | 1,347 |
| iHeartCommunications, Inc. 10.625% 3/15/23 | | 10,220 | 7,716 |
| Liberty Media Corp.: | | | |
| 8.25% 2/1/30 | | 1,985 | 2,134 |
| 8.5% 7/15/29 | | 4,375 | 4,867 |
| Lions Gate Entertainment Corp. 5.875% 11/1/24 (b) | | 1,390 | 1,463 |
| Livent, Inc. yankee 9.375% 10/15/04 (e) | | 300 | 0 |
| Myriad International Holding BV 5.5% 7/21/25 (b) | | 3,185 | 3,406 |
| New Cotai LLC/New Cotai Capital Corp. 10.625% 5/1/19 pay-in-kind (b)(c) | | 8,135 | 7,159 |
| Nielsen Finance LLC/Nielsen Finance Co. 5% 4/15/22 (b) | | 2,335 | 2,423 |
| Quebecor Media, Inc. 5.75% 1/15/23 | | 7,660 | 8,081 |
| Sirius XM Radio, Inc.: | | | |
| 4.625% 5/15/23 (b) | | 2,450 | 2,520 |
| 5% 8/1/27 (b) | | 3,750 | 3,778 |
| 5.375% 4/15/25 (b) | | 4,685 | 4,843 |
| 5.375% 7/15/26 (b) | | 4,230 | 4,378 |
| Tegna, Inc. 5.5% 9/15/24 (b) | | 3,210 | 3,306 |
| TV Azteca SA de CV: | | | |
| 7.5% 5/25/18 (Reg. S) | | 7,915 | 7,875 |
| 7.625% 9/18/20 (Reg S.) | | 4,045 | 4,081 |
| Unitymedia Hessen GmbH & Co. KG/Unitymedia NRW GmbH 5.5% 1/15/23 (b) | | 4,986 | 5,173 |
| Videotron Ltd. 5.125% 4/15/27 (b) | | 3,830 | 3,935 |
| VTR Finance BV 6.875% 1/15/24 (b) | | 6,425 | 6,811 |
| Wave Holdco LLC/Wave Holdco Corp. 8.25% 7/15/19 pay-in-kind (b)(c) | | 1,043 | 1,059 |
| WMG Acquisition Corp. 5.625% 4/15/22 (b) | | 859 | 893 |
| Ziggo Bond Finance BV: | | | |
| 5.875% 1/15/25 (b) | | 435 | 447 |
| 6% 1/15/27 (b) | | 4,190 | 4,237 |
| Ziggo Secured Finance BV 5.5% 1/15/27 (b) | | 8,375 | 8,553 |
| | | | 235,508 |
| Specialty Retail - 0.2% | | | |
| CST Brands, Inc. 5% 5/1/23 | | 1,320 | 1,386 |
| L Brands, Inc. 6.875% 11/1/35 | | 4,825 | 4,656 |
| Penske Automotive Group, Inc. 5.5% 5/15/26 | | 3,185 | 3,169 |
| PetSmart, Inc.: | | | |
| 5.875% 6/1/25 (b) | | 3,920 | 3,778 |
| 8.875% 6/1/25 (b) | | 5,900 | 5,449 |
| Sonic Automotive, Inc.: | | | |
| 5% 5/15/23 | | 800 | 761 |
| 6.125% 3/15/27 (b) | | 1,940 | 1,930 |
| | | | 21,129 |
| Textiles, Apparel & Luxury Goods - 0.1% | | | |
| Hanesbrands, Inc.: | | | |
| 4.625% 5/15/24 (b) | | 2,120 | 2,152 |
| 4.875% 5/15/26 (b) | | 2,120 | 2,152 |
| | | | 4,304 |
| TOTAL CONSUMER DISCRETIONARY | | | 471,176 |
| CONSUMER STAPLES - 1.9% | | | |
| Beverages - 0.1% | | | |
| Central American Bottling Corp. 5.75% 1/31/27 (b) | | 1,030 | 1,088 |
| Molson Coors Brewing Co. 1.25% 7/15/24 | EUR | 4,850 | 5,503 |
| | | | 6,591 |
| Food & Staples Retailing - 0.6% | | | |
| Albertsons Companies LLC/Safeway, Inc./New Albertson's, Inc./Albertson's LLC: | | | |
| 5.75% 3/15/25 (b) | | 7,870 | 7,319 |
| 6.625% 6/15/24 (b) | | 5,475 | 5,434 |
| Albertsons, Inc.: | | | |
| 7.45% 8/1/29 | | 4,935 | 4,787 |
| 8% 5/1/31 | | 4,590 | 4,544 |
| 8.7% 5/1/30 | | 635 | 648 |
| BI-LO LLC/BI-LO Finance Corp.: | | | |
| 9.25% 2/15/19 (b) | | 9,545 | 8,161 |
| 9.375% 9/15/18 pay-in-kind (b)(c) | | 5,950 | 2,559 |
| ESAL GmbH 6.25% 2/5/23 (b) | | 13,590 | 11,857 |
| FAGE International SA/FAGE U.S.A. Dairy Industry, Inc. 5.625% 8/15/26 (b) | | 6,115 | 6,297 |
| Hearthside Group Holdings LLC/Hearthside Finance, Inc. 6.5% 5/1/22 (b) | | 1,265 | 1,259 |
| Minerva Luxembourg SA 7.75% 1/31/23 (Reg. S) | | 3,910 | 4,091 |
| | | | 56,956 |
| Food Products - 0.9% | | | |
| B&G Foods, Inc. 4.625% 6/1/21 | | 5,220 | 5,331 |
| CF Industries Holdings, Inc.: | | | |
| 4.95% 6/1/43 | | 3,725 | 3,204 |
| 5.15% 3/15/34 | | 3,720 | 3,441 |
| 5.375% 3/15/44 | | 3,730 | 3,329 |
| Gruma S.A.B. de CV 4.875% 12/1/24 (b) | | 1,750 | 1,897 |
| H.J. Heinz Co. 2.25% 5/25/28 (Reg. S) | EUR | 8,328 | 9,515 |
| JBS Investments GmbH 7.25% 4/3/24 (b) | | 14,755 | 13,169 |
| JBS U.S.A. LLC/JBS U.S.A. Finance, Inc.: | | | |
| 5.75% 6/15/25 (b) | | 7,650 | 7,191 |
| 5.875% 7/15/24 (b) | | 2,350 | 2,203 |
| 8.25% 2/1/20 (b) | | 3,315 | 3,315 |
| Lamb Weston Holdings, Inc.: | | | |
| 4.625% 11/1/24 (b) | | 2,755 | 2,838 |
| 4.875% 11/1/26 (b) | | 2,785 | 2,886 |
| MHP SA 8.25% 4/2/20 (b) | | 565 | 596 |
| Pilgrim's Pride Corp. 5.75% 3/15/25 (b) | | 5,450 | 5,464 |
| Post Holdings, Inc.: | | | |
| 5% 8/15/26 (b) | | 6,385 | 6,369 |
| 5.5% 3/1/25 (b) | | 3,345 | 3,450 |
| 5.75% 3/1/27 (b) | | 2,560 | 2,630 |
| TreeHouse Foods, Inc. 4.875% 3/15/22 | | 1,660 | 1,714 |
| | | | 78,542 |
| Household Products - 0.1% | | | |
| Edgewell Personal Care Co. 5.5% 6/15/25 (b) | | 2,800 | 2,930 |
| Kronos Acquisition Holdings, Inc. 9% 8/15/23 (b) | | 375 | 374 |
| Spectrum Brands Holdings, Inc. 5.75% 7/15/25 | | 4,470 | 4,795 |
| | | | 8,099 |
| Personal Products - 0.2% | | | |
| Revlon Consumer Products Corp. 5.75% 2/15/21 (c) | | 14,733 | 13,554 |
| TOTAL CONSUMER STAPLES | | | 163,742 |
| ENERGY - 6.4% | | | |
| Energy Equipment & Services - 0.5% | | | |
| Borets Finance DAC 6.5% 4/7/22 (b) | | 2,990 | 3,177 |
| Compressco Partners LP/Compressco Finance, Inc. 7.25% 8/15/22 | | 3,100 | 2,852 |
| Ensco PLC: | | | |
| 4.5% 10/1/24 | | 4,570 | 3,519 |
| 5.2% 3/15/25 | | 2,830 | 2,299 |
| 5.75% 10/1/44 | | 4,085 | 2,676 |
| Exterran Partners LP/EXLP Finance Corp. 6% 10/1/22 | | 3,200 | 3,104 |
| Forum Energy Technologies, Inc. 6.25% 10/1/21 | | 5,850 | 5,704 |
| Hornbeck Offshore Services, Inc. 5.875% 4/1/20 | | 3,120 | 1,794 |
| Noble Holding International Ltd.: | | | |
| 4.625% 3/1/21 | | 420 | 343 |
| 6.2% 8/1/40 | | 1,600 | 960 |
| 7.7% 4/1/25 (c) | | 3,580 | 2,748 |
| 8.7% 4/1/45 (c) | | 795 | 568 |
| Southern Gas Corridor CJSC 6.875% 3/24/26 (b) | | 5,560 | 6,019 |
| Summit Midstream Holdings LLC 5.75% 4/15/25 | | 2,770 | 2,784 |
| Trinidad Drilling Ltd. 6.625% 2/15/25 (b) | | 1,600 | 1,520 |
| Unit Corp. 6.625% 5/15/21 | | 875 | 838 |
| | | | 40,905 |
| Oil, Gas & Consumable Fuels - 5.9% | | | |
| Access Midstream Partners LP/ACMP Finance Corp.: | | | |
| 4.875% 5/15/23 | | 7,005 | 7,269 |
| 4.875% 3/15/24 | | 2,630 | 2,756 |
| Afren PLC: | | | |
| 6.625% 12/9/20 (b)(e) | | 2,932 | 1 |
| 10.25% 4/8/19 (Reg. S) (e) | | 6,109 | 1 |
| American Energy-Permian Basin LLC/AEPB Finance Corp. 13% 11/30/20 (b) | | 6,670 | 7,671 |
| Antero Midstream Partners LP/Antero Midstream Finance Corp. 5.375% 9/15/24 (b) | | 1,635 | 1,672 |
| Antero Resources Corp.: | | | |
| 5.125% 12/1/22 | | 305 | 306 |
| 5.625% 6/1/23 (Reg. S) | | 4,216 | 4,269 |
| Antero Resources Finance Corp. 5.375% 11/1/21 | | 2,120 | 2,141 |
| Callon Petroleum Co. 6.125% 10/1/24 | | 1,510 | 1,536 |
| Carrizo Oil & Gas, Inc. 6.25% 4/15/23 | | 2,860 | 2,753 |
| Cheniere Corpus Christi Holdings LLC: | | | |
| 5.125% 6/30/27 (b) | | 3,835 | 3,931 |
| 7% 6/30/24 | | 4,875 | 5,423 |
| Chesapeake Energy Corp.: | | | |
| 8% 12/15/22 (b) | | 9,616 | 10,169 |
| 8% 6/15/27 (b) | | 6,670 | 6,553 |
| Citgo Holding, Inc. 10.75% 2/15/20 (b) | | 18,372 | 19,957 |
| Concho Resources, Inc. 4.375% 1/15/25 | | 4,050 | 4,131 |
| Consolidated Energy Finance SA: | | | |
| 4.9817% 6/15/22 (b)(c) | | 935 | 935 |
| 6.875% 6/15/25 (b) | | 1,865 | 1,921 |
| Crestwood Midstream Partners LP/Crestwood Midstream Finance Corp. 5.75% 4/1/25 (b) | | 2,910 | 2,903 |
| CVR Refining LLC/Coffeyville Finance, Inc. 6.5% 11/1/22 | | 9,690 | 9,763 |
| Denbury Resources, Inc.: | | | |
| 4.625% 7/15/23 | | 4,155 | 2,202 |
| 5.5% 5/1/22 | | 6,783 | 3,798 |
| 6.375% 8/15/21 | | 5,775 | 3,465 |
| Diamondback Energy, Inc.: | | | |
| 4.75% 11/1/24 (b) | | 3,415 | 3,398 |
| 5.375% 5/31/25 (b) | | 1,585 | 1,609 |
| Eagle Rock Energy Partners LP/Eagle Rock Energy Finance Corp. 8.375% 6/1/19 (e) | | 5,125 | 1,076 |
| EDC Finance Ltd. 4.875% 4/17/20 (b) | | 2,310 | 2,356 |
| Endeavor Energy Resources LP/EER Finance, Inc. 7% 8/15/21 (b) | | 4,190 | 4,337 |
| Energy Transfer Equity LP 5.5% 6/1/27 | | 6,395 | 6,619 |
| EnLink Midstream Partners LP: | | | |
| 4.15% 6/1/25 | | 3,190 | 3,150 |
| 4.4% 4/1/24 | | 3,185 | 3,234 |
| EP Energy LLC/Everest Acquisition Finance, Inc. 8% 11/29/24 (b) | | 2,265 | 2,259 |
| EV Energy Partners LP/EV Energy Finance Corp. 8% 4/15/19 | | 3,705 | 1,978 |
| Genesis Energy LP/Genesis Energy Finance Corp. 5.75% 2/15/21 | | 2,400 | 2,394 |
| Georgian Oil & Gas Corp. 6.75% 4/26/21 (b) | | 4,155 | 4,343 |
| Global Partners LP/GLP Finance Corp.: | | | |
| 6.25% 7/15/22 | | 1,030 | 1,035 |
| 7% 6/15/23 | | 4,305 | 4,283 |
| Hilcorp Energy I LP/Hilcorp Finance Co.: | | | |
| 5% 12/1/24 (b) | | 4,000 | 3,680 |
| 5.75% 10/1/25 (b) | | 4,310 | 4,062 |
| Holly Energy Partners LP/Holly Finance Corp. 6% 8/1/24 (b) | | 2,650 | 2,756 |
| Indika Energy Capital II Pte. Ltd. 6.875% 4/10/22 (b) | | 2,970 | 2,894 |
| Jupiter Resources, Inc. 8.5% 10/1/22 (b) | | 2,760 | 2,070 |
| KazMunaiGaz Finance Sub BV 4.75% 4/19/27 (b) | | 2,665 | 2,612 |
| Kosmos Energy Ltd.: | | | |
| 7.875% 8/1/21 (b) | | 2,200 | 2,244 |
| 7.875% 8/1/21 (b) | | 3,030 | 3,091 |
| Laredo Petroleum, Inc. 7.375% 5/1/22 (Reg. S) | | 4,500 | 4,545 |
| Murphy Oil U.S.A., Inc. 5.625% 5/1/27 | | 1,915 | 1,992 |
| Newfield Exploration Co.: | | | |
| 5.375% 1/1/26 | | 3,608 | 3,734 |
| 5.625% 7/1/24 | | 740 | 771 |
| NGL Energy Partners LP/NGL Energy Finance Corp. 6.125% 3/1/25 (b) | | 3,905 | 3,573 |
| Nostrum Oil & Gas Finance BV 6.375% 2/14/19 (b) | | 6,435 | 6,448 |
| Pacific Exploration and Production Corp.: | | | |
| 10% 11/2/21 pay-in-kind (c) | | 3,233 | 3,641 |
| 10% 11/2/21 pay-in-kind (b)(c) | | 1,255 | 1,413 |
| Pan American Energy LLC 7.875% 5/7/21 (b) | | 7,455 | 8,141 |
| Parsley Energy LLC/Parsley: | | | |
| 5.25% 8/15/25 (b) | | 2,390 | 2,384 |
| 6.25% 6/1/24 (b) | | 2,625 | 2,756 |
| PBF Holding Co. LLC/PBF Finance Corp.: | | | |
| 7% 11/15/23 | | 10,328 | 10,173 |
| 7.25% 6/15/25 (b) | | 3,725 | 3,590 |
| PBF Logistics LP/PBF Logistics Finance, Inc. 6.875% 5/15/23 | | 3,235 | 3,284 |
| PDC Energy, Inc. 6.125% 9/15/24 (b) | | 1,310 | 1,330 |
| Peabody Securities Finance Corp.: | | | |
| 6% 3/31/22 (b) | | 3,040 | 3,017 |
| 6.375% 3/31/25 (b) | | 3,325 | 3,275 |
| Pemex Project Funding Master Trust: | | | |
| 6.625% 6/15/35 | | 12,515 | 12,937 |
| 8.625% 12/1/23 (c) | | 500 | 595 |
| PetroBakken Energy Ltd. 8.625% 2/1/20 (b)(e) | | 9,160 | 0 |
| Petrobras Energia SA 7.375% 7/21/23 (b) | | 1,250 | 1,323 |
| Petrobras Global Finance BV: | | | |
| 6.125% 1/17/22 | | 10,185 | 10,506 |
| 6.25% 3/17/24 | | 2,950 | 3,006 |
| 8.375% 5/23/21 | | 21,695 | 24,285 |
| 8.75% 5/23/26 | | 8,255 | 9,493 |
| Petrobras International Finance Co. Ltd.: | | | |
| 5.75% 1/20/20 | | 3,615 | 3,751 |
| 6.875% 1/20/40 | | 5,235 | 4,960 |
| Petroleos de Venezuela SA: | | | |
| 5.375% 4/12/27 | | 2,160 | 778 |
| 5.5% 4/12/37 | | 3,350 | 1,198 |
| 6% 5/16/24 (b) | | 4,305 | 1,604 |
| 6% 11/15/26 (b) | | 4,635 | 1,715 |
| 8.5% 10/27/20 (b) | | 2,455 | 1,770 |
| 9.75% 5/17/35 (b) | | 13,935 | 6,483 |
| 12.75% 2/17/22 (b) | | 520 | 291 |
| Petroleos Mexicanos: | | | |
| 4.625% 9/21/23 | | 3,370 | 3,410 |
| 4.875% 1/24/22 | | 3,645 | 3,755 |
| 4.875% 1/18/24 | | 2,435 | 2,466 |
| 5.5% 1/21/21 | | 2,295 | 2,407 |
| 6.375% 2/4/21 | | 2,035 | 2,202 |
| 6.375% 1/23/45 | | 5,120 | 4,992 |
| 6.5% 6/2/41 | | 14,650 | 14,547 |
| 6.625% (b)(f) | | 6,873 | 6,882 |
| 6.75% 9/21/47 | | 8,669 | 8,755 |
| 6.875% 8/4/26 | | 1,115 | 1,235 |
| PT Pertamina Persero 6.5% 5/27/41 (b) | | 3,180 | 3,628 |
| QEP Resources, Inc. 5.25% 5/1/23 | | 5,955 | 5,627 |
| Range Resources Corp. 5% 3/15/23 (b) | | 9,130 | 8,925 |
| RSP Permian, Inc.: | | | |
| 5.25% 1/15/25 (b) | | 1,345 | 1,347 |
| 6.625% 10/1/22 | | 1,785 | 1,852 |
| Sabine Pass Liquefaction LLC: | | | |
| 5% 3/15/27 | | 6,285 | 6,690 |
| 5.875% 6/30/26 | | 6,335 | 7,080 |
| SemGroup Corp. 6.375% 3/15/25 (b) | | 1,940 | 1,877 |
| SM Energy Co.: | | | |
| 5.625% 6/1/25 | | 2,100 | 1,895 |
| 6.75% 9/15/26 | | 1,680 | 1,604 |
| Southern Star Central Corp. 5.125% 7/15/22 (b) | | 2,570 | 2,615 |
| Southwestern Energy Co. 4.1% 3/15/22 | | 6,395 | 5,959 |
| Sunoco LP/Sunoco Finance Corp.: | | | |
| 6.25% 4/15/21 | | 6,110 | 6,385 |
| 6.375% 4/1/23 | | 3,040 | 3,194 |
| Teekay Corp. 8.5% 1/15/20 | | 7,885 | 7,185 |
| Teine Energy Ltd. 6.875% 9/30/22 (b) | | 4,615 | 4,678 |
| Tennessee Gas Pipeline Co. 7.625% 4/1/37 | | 1,035 | 1,285 |
| Tesoro Logistics LP/Tesoro Logistics Finance Corp.: | | | |
| 6.125% 10/15/21 | | 1,075 | 1,118 |
| 6.375% 5/1/24 | | 1,695 | 1,835 |
| Transportadora de Gas del Sur SA 9.625% 5/14/20 (b) | | 10,149 | 11,113 |
| Ultra Resources, Inc.: | | | |
| 6.875% 4/15/22 (b) | | 2,860 | 2,839 |
| 7.125% 4/15/25 (b) | | 1,910 | 1,884 |
| Western Refining Logistics LP/WNRL Finance Co. 7.5% 2/15/23 | | 4,965 | 5,350 |
| WPX Energy, Inc.: | | | |
| 5.25% 9/15/24 | | 3,215 | 3,054 |
| 6% 1/15/22 | | 9,170 | 9,078 |
| YPF SA: | | | |
| 8.5% 3/23/21 (b) | | 12,235 | 13,609 |
| 8.75% 4/4/24 (b) | | 11,500 | 13,109 |
| Zhaikmunai International BV 7.125% 11/13/19 (b) | | 8,680 | 8,775 |
| | | | 514,009 |
| TOTAL ENERGY | | | 554,914 |
| FINANCIALS - 6.6% | | | |
| Banks - 1.5% | | | |
| Akbank TAS/Ak Finansal Kiralama A/S 7.2% 3/16/27 (b)(c) | | 1,570 | 1,630 |
| Banco de Bogota SA 6.25% 5/12/26 (b) | | 1,850 | 1,970 |
| Banco de Reservas de La Republica Dominicana 7% 2/1/23 (b) | | 3,670 | 3,834 |
| Banco Hipotecario SA 9.75% 11/30/20 (b) | | 11,615 | 13,345 |
| Banco Macro SA 6.75% 11/4/26 (b)(c) | | 2,075 | 2,158 |
| Banco Mercantil del Norte SA 7.625% (b)(c)(f) | | 1,150 | 1,190 |
| Banco Nacional de Desenvolvimento Economico e Social: | | | |
| 4% 4/14/19 (b) | | 1,350 | 1,362 |
| 6.369% 6/16/18 (b) | | 1,750 | 1,807 |
| Banque Centrale de Tunisie 5.75% 1/30/25 (b) | | 2,225 | 2,133 |
| Barclays PLC 3.125% 1/17/24 (Reg. S) | GBP | 8,557 | 11,517 |
| BBVA Bancomer SA 7.25% 4/22/20 (b) | | 2,475 | 2,707 |
| Biz Finance PLC 9.75% 1/22/25 (b) | | 650 | 665 |
| CBOM Finance PLC 7.5% 10/5/27 (b)(c) | | 2,925 | 2,898 |
| CIT Group, Inc. 5% 8/15/22 | | 8,305 | 8,949 |
| Citigroup, Inc. 1.5% 10/26/28 | EUR | 10,000 | 11,066 |
| Export Credit Bank of Turkey 5.875% 4/24/19 (b) | | 2,395 | 2,486 |
| Export-Import Bank of Korea 6.4% 8/7/17 (Reg. S) | INR | 140,700 | 2,172 |
| GTB Finance BV 6% 11/8/18 (b) | | 2,945 | 3,000 |
| Itau Unibanco Holding SA: | | | |
| 5.125% 5/13/23 (Reg. S) | | 4,160 | 4,227 |
| 5.5% 8/6/22 (b) | | 3,000 | 3,101 |
| JSC BGEO Group 6% 7/26/23 (b) | | 4,235 | 4,299 |
| JSC Halyk Bank of Kazakhstan 7.25% 1/28/21 (b) | | 610 | 670 |
| Kazkommertsbank Jsc Mtn Bank Ent 8.5% 5/11/18 (b) | | 4,220 | 4,334 |
| SB Capital SA 5.5% 2/26/24 (b)(c) | | 3,040 | 3,091 |
| Trade and Development Bank of Mongolia LLC 9.375% 5/19/20 (b) | | 3,215 | 3,432 |
| Turkiye Garanti Bankasi A/S 6.125% 5/24/27 (b)(c) | | 1,265 | 1,252 |
| Turkiye Halk Bankasi A/S: | | | |
| 3.875% 2/5/20 (b) | | 3,400 | 3,305 |
| 4.75% 6/4/19 (b) | | 3,250 | 3,259 |
| Turkiye Is Bankasi A/S: | | | |
| 5.5% 4/21/19 (b) | | 1,085 | 1,113 |
| 5.5% 4/21/22 (b) | | 3,200 | 3,209 |
| Turkiye Vakiflar Bankasi TAO 6.875% 2/3/25 (Reg. S) (c) | | 4,675 | 4,747 |
| Zenith Bank PLC: | | | |
| 6.25% 4/22/19 (b) | | 10,895 | 10,921 |
| 7.375% 5/30/22 (b) | | 6,285 | 6,161 |
| | | | 132,010 |
| Capital Markets - 0.6% | | | |
| Adient Global Holdings Ltd. 4.875% 8/15/26 (b) | | 4,220 | 4,231 |
| BCD Acquisition, Inc. 9.625% 9/15/23 (b) | | 6,335 | 6,842 |
| Goldman Sachs Group, Inc. 3% 2/12/31 (Reg. S) | EUR | 9,656 | 11,837 |
| Morgan Stanley 1.75% 3/11/24 | EUR | 18,590 | 21,923 |
| MSCI, Inc.: | | | |
| 5.25% 11/15/24 (b) | | 2,735 | 2,899 |
| 5.75% 8/15/25 (b) | | 2,685 | 2,908 |
| | | | 50,640 |
| Consumer Finance - 2.3% | | | |
| Ally Financial, Inc.: | | | |
| 4.125% 2/13/22 | | 8,795 | 9,015 |
| 4.625% 3/30/25 | | 6,760 | 6,923 |
| 5.125% 9/30/24 | | 20,806 | 21,949 |
| 8% 11/1/31 | | 76,818 | 94,102 |
| Credito Real S.A.B. de CV 7.5% 3/13/19 (b) | | 3,240 | 3,353 |
| General Motors Acceptance Corp. 8% 11/1/31 | | 9,006 | 11,010 |
| Navient Corp.: | | | |
| 5.875% 10/25/24 | | 11,105 | 11,303 |
| 6.5% 6/15/22 | | 2,950 | 3,127 |
| 7.25% 9/25/23 | | 1,795 | 1,934 |
| SLM Corp.: | | | |
| 5.5% 1/25/23 | | 15,840 | 16,097 |
| 6.125% 3/25/24 | | 5,445 | 5,608 |
| 7.25% 1/25/22 | | 12,155 | 13,279 |
| | | | 197,700 |
| Diversified Financial Services - 1.6% | | | |
| 1MDB Global Investments Ltd. 4.4% 3/9/23 | | 2,000 | 1,851 |
| Cimpor Financial Operations BV 5.75% 7/17/24 (b) | | 3,705 | 3,138 |
| Eagle Holding Co. II LLC 7.625% 5/15/22 pay-in-kind (b)(c) | | 1,725 | 1,775 |
| European Financial Stability Facility 1.25% 5/24/33 (Reg. S) | EUR | 30,625 | 34,306 |
| Grinding Media, Inc./MC Grinding Media Canada, Inc. 7.375% 12/15/23 (b) | | 2,520 | 2,741 |
| Icahn Enterprises LP/Icahn Enterprises Finance Corp.: | | | |
| 5.875% 2/1/22 | | 18,530 | 18,970 |
| 6% 8/1/20 | | 8,545 | 8,796 |
| 6.25% 2/1/22 | | 1,880 | 1,960 |
| 6.75% 2/1/24 | | 3,410 | 3,555 |
| Inception Merger Sub, Inc./Rackspace Hosting, Inc. 8.625% 11/15/24 (b) | | 3,305 | 3,520 |
| j2 Cloud Services LLC/j2 Global Communications, Inc. 6% 7/15/25 (b) | | 2,505 | 2,580 |
| Pontis IV Ltd. 5.125% 3/31/27 (b) | | 2,485 | 2,466 |
| PT Bukit Makmur Mandiri Utama 7.75% 2/13/22 (b) | | 3,100 | 3,171 |
| Radiate Holdco LLC/Radiate Financial Service Ltd. 6.625% 2/15/25 (b) | | 3,545 | 3,545 |
| RegionalCare Hospital Partners Holdings, Inc. 8.25% 5/1/23 (b) | | 4,815 | 5,164 |
| Solera LLC/Solera Finance, Inc. 10.5% 3/1/24 (b) | | 11,225 | 12,895 |
| Springleaf Financial Corp.: | | | |
| 6.125% 5/15/22 | | 2,805 | 2,959 |
| 7.75% 10/1/21 | | 640 | 716 |
| 8.25% 12/15/20 | | 3,195 | 3,586 |
| TMK Capital SA 6.75% 4/3/20 (Reg. S) | | 1,325 | 1,397 |
| Venator Finance SARL/Venator Capital Management Ltd. 5.75% 7/15/25 (b)(d) | | 3,185 | 3,217 |
| Vertiv Inter Holding Corp. 12% 2/15/22 pay-in-kind (b)(c) | | 5,765 | 6,169 |
| Wendel SA: | | | |
| 1% 4/20/23 (Reg. S) | EUR | 3,000 | 3,389 |
| 2.75% 10/2/24 (Reg. S) | EUR | 6,400 | 7,977 |
| | | | 139,843 |
| Insurance - 0.3% | | | |
| Alliant Holdings Co.-Issuer, Inc./Wayne Merger Sub LLC 8.25% 8/1/23 (b) | | 10,645 | 11,310 |
| Hockey Merger Sub 2, Inc. 7.875% 10/1/21 (b) | | 9,770 | 10,185 |
| USIS Merger Sub, Inc. 6.875% 5/1/25 (b) | | 3,815 | 3,882 |
| | | | 25,377 |
| Thrifts & Mortgage Finance - 0.3% | | | |
| Prime Securities Services Borrower LLC/Prime Finance, Inc. 9.25% 5/15/23 (b) | | 23,175 | 25,183 |
| TOTAL FINANCIALS | | | 570,753 |
| HEALTH CARE - 2.5% | | | |
| Biotechnology - 0.0% | | | |
| AMAG Pharmaceuticals, Inc. 7.875% 9/1/23 (b) | | 2,255 | 2,168 |
| Health Care Equipment & Supplies - 0.1% | | | |
| Alere, Inc. 6.375% 7/1/23 (b) | | 1,935 | 2,078 |
| Hill-Rom Holdings, Inc. 5.75% 9/1/23 (b) | | 2,125 | 2,237 |
| Hologic, Inc. 5.25% 7/15/22 (b) | | 4,650 | 4,883 |
| | | | 9,198 |
| Health Care Providers & Services - 2.1% | | | |
| Community Health Systems, Inc.: | | | |
| 6.25% 3/31/23 | | 8,445 | 8,718 |
| 6.875% 2/1/22 | | 21,930 | 19,161 |
| 7.125% 7/15/20 | | 4,425 | 4,309 |
| Double Eagle Acquisition Sub, Inc. 7.5% 10/1/24 (b) | | 2,470 | 2,680 |
| Envision Healthcare Corp. 6.25% 12/1/24 (b) | | 4,120 | 4,398 |
| HCA Holdings, Inc.: | | | |
| 4.75% 5/1/23 | | 6,115 | 6,467 |
| 5.25% 4/15/25 | | 13,180 | 14,169 |
| 5.25% 6/15/26 | | 5,275 | 5,689 |
| 5.375% 2/1/25 | | 8,650 | 9,124 |
| 5.875% 5/1/23 | | 7,155 | 7,790 |
| 5.875% 2/15/26 | | 10,705 | 11,561 |
| 7.5% 2/15/22 | | 12,110 | 13,942 |
| HealthSouth Corp. 5.75% 11/1/24 | | 9,180 | 9,421 |
| Jaguar Holding Co. II/Pharmaceutical Product Development LLC 6.375% 8/1/23 (b) | | 4,215 | 4,442 |
| MPH Acquisition Holdings LLC 7.125% 6/1/24 (b) | | 2,280 | 2,431 |
| Quintiles Transnational Corp. 4.875% 5/15/23 (b) | | 3,340 | 3,419 |
| Sabra Health Care LP/Sabra Capital Corp. 5.375% 6/1/23 | | 2,445 | 2,531 |
| Surgery Center Holdings, Inc. 8.875% 4/15/21 (b) | | 4,265 | 4,622 |
| Tenet Healthcare Corp.: | | | |
| 4.625% 7/15/24 (b) | | 828 | 829 |
| 6.75% 6/15/23 | | 4,740 | 4,740 |
| 6.875% 11/15/31 | | 11,540 | 10,617 |
| 7.5% 1/1/22 (b) | | 2,360 | 2,560 |
| 8.125% 4/1/22 | | 5,360 | 5,688 |
| Tennessee Merger Sub, Inc. 6.375% 2/1/25 (b) | | 5,870 | 5,694 |
| THC Escrow Corp. III: | | | |
| 4.625% 7/15/24 (b) | | 1,037 | 1,040 |
| 5.125% 5/1/25 (b) | | 1,865 | 1,872 |
| 7% 8/1/25 (b) | | 3,725 | 3,711 |
| Vizient, Inc. 10.375% 3/1/24 (b) | | 4,615 | 5,307 |
| Wellcare Health Plans, Inc. 5.25% 4/1/25 | | 2,990 | 3,132 |
| | | | 180,064 |
| Pharmaceuticals - 0.3% | | | |
| Valeant Pharmaceuticals International, Inc.: | | | |
| 5.875% 5/15/23 (b) | | 16,345 | 14,016 |
| 6.5% 3/15/22 (b) | | 3,875 | 4,064 |
| 6.75% 8/15/21 (b) | | 1,935 | 1,838 |
| 7% 3/15/24 (b) | | 5,815 | 6,113 |
| | | | 26,031 |
| TOTAL HEALTH CARE | | | 217,461 |
| INDUSTRIALS - 1.8% | | | |
| Aerospace & Defense - 0.2% | | | |
| Huntington Ingalls Industries, Inc. 5% 11/15/25 (b) | | 3,965 | 4,257 |
| KLX, Inc. 5.875% 12/1/22 (b) | | 11,260 | 11,823 |
| TransDigm, Inc. 6.375% 6/15/26 | | 4,050 | 4,111 |
| | | | 20,191 |
| Air Freight & Logistics - 0.1% | | | |
| Rumo Luxembourg Sarl 7.375% 2/9/24 (b) | | 6,055 | 6,219 |
| XPO Logistics, Inc. 6.125% 9/1/23 (b) | | 3,300 | 3,436 |
| | | | 9,655 |
| Airlines - 0.2% | | | |
| Air Canada 2013-1 Pass Through 5.375% 11/15/22 (b) | | 1,261 | 1,326 |
| Allegiant Travel Co. 5.5% 7/15/19 | | 1,270 | 1,318 |
| Continental Airlines, Inc. pass-thru trust certificates 6.903% 4/19/22 | | 332 | 349 |
| Delta Air Lines, Inc. pass-thru trust certificates 8.021% 2/10/24 | | 2,013 | 2,285 |
| Hawaiian Airlines pass-thru certificates Series 2013-1 Class B, 4.95% 7/15/23 | | 2,049 | 2,093 |
| Northwest Airlines, Inc. pass-thru trust certificates 8.028% 11/1/17 | | 408 | 415 |
| U.S. Airways pass-thru certificates: | | | |
| Series 2011-1 Class A, 7.125% 10/22/23 | | 3,415 | 3,938 |
| Series 2012-2 Class B, 6.75% 6/3/21 | | 1,495 | 1,615 |
| Series 2013-1 Class B, 5.375% 11/15/21 | | 1,939 | 2,041 |
| | | | 15,380 |
| Building Products - 0.0% | | | |
| Shea Homes Ltd. Partnership/Corp.: | | | |
| 5.875% 4/1/23 (b) | | 1,380 | 1,421 |
| 6.125% 4/1/25 (b) | | 1,380 | 1,425 |
| | | | 2,846 |
| Commercial Services & Supplies - 0.4% | | | |
| ADS Waste Holdings, Inc. 5.625% 11/15/24 (b) | | 3,640 | 3,749 |
| APX Group, Inc.: | | | |
| 7.875% 12/1/22 | | 9,685 | 10,508 |
| 8.75% 12/1/20 | | 7,385 | 7,625 |
| Covanta Holding Corp.: | | | |
| 5.875% 3/1/24 | | 3,120 | 3,058 |
| 5.875% 7/1/25 | | 1,045 | 1,014 |
| Harland Clarke Holdings Corp. 8.375% 8/15/22 (b) | | 2,610 | 2,780 |
| KAR Auction Services, Inc. 5.125% 6/1/25 (b) | | 3,180 | 3,240 |
| Kissner Holdings LP/Kissner Milling Co. Ltd./BSC Holding, Inc./Kissner U.S.A. 8.375% 12/1/22 (b) | | 3,420 | 3,548 |
| Ritchie Brothers Auctioneers, Inc. 5.375% 1/15/25 (b) | | 1,215 | 1,267 |
| TMS International Corp. 7.625% 10/15/21 (b) | | 970 | 982 |
| | | | 37,771 |
| Construction & Engineering - 0.3% | | | |
| AECOM 5.125% 3/15/27 | | 3,925 | 3,940 |
| Blueline Rental Finance Corp./Blueline Rental LLC 9.25% 3/15/24 (b) | | 7,435 | 7,732 |
| Cementos Progreso Trust 7.125% 11/6/23 (b) | | 2,245 | 2,380 |
| Odebrecht Finance Ltd.: | | | |
| 4.375% 4/25/25 (b) | | 9,735 | 3,748 |
| 5.25% 6/27/29 (b) | | 3,565 | 1,310 |
| 7.125% 6/26/42 (b) | | 4,445 | 1,789 |
| | | | 20,899 |
| Electrical Equipment - 0.1% | | | |
| Sensata Technologies BV 5% 10/1/25 (b) | | 4,355 | 4,554 |
| Industrial Conglomerates - 0.0% | | | |
| Alfa SA de CV 5.25% 3/25/24 (b) | | 1,490 | 1,602 |
| Machinery - 0.1% | | | |
| Xerium Technologies, Inc. 9.5% 8/15/21 | | 6,385 | 6,784 |
| Marine - 0.1% | | | |
| Navios Maritime Acquisition Corp./Navios Acquisition Finance U.S., Inc. 8.125% 11/15/21 (b) | | 1,065 | 903 |
| Navios South American Logistics, Inc./Navios Logistics Finance U.S., Inc. 7.25% 5/1/22 (b) | | 4,035 | 3,894 |
| | | | 4,797 |
| Professional Services - 0.0% | | | |
| IHS Markit Ltd. 4.75% 2/15/25 (b) | | 3,050 | 3,275 |
| Road & Rail - 0.0% | | | |
| JSC Georgian Railway 7.75% 7/11/22 (b) | | 1,350 | 1,482 |
| Lima Metro Line 2 Finance Ltd. 5.875% 7/5/34 (b) | | 1,870 | 1,992 |
| | | | 3,474 |
| Trading Companies & Distributors - 0.2% | | | |
| Aircastle Ltd.: | | | |
| 5% 4/1/23 | | 2,405 | 2,567 |
| 5.5% 2/15/22 | | 4,250 | 4,633 |
| Ashtead Capital, Inc. 5.625% 10/1/24 (b) | | 4,250 | 4,569 |
| United Rentals North America, Inc. 5.5% 5/15/27 | | 2,625 | 2,704 |
| | | | 14,473 |
| Transportation Infrastructure - 0.1% | | | |
| Aeropuertos Argentina 2000 SA 6.875% 2/1/27 (b) | | 4,485 | 4,643 |
| Global Ports Finance PLC 6.872% 1/25/22 (b) | | 3,375 | 3,556 |
| | | | 8,199 |
| TOTAL INDUSTRIALS | | | 153,900 |
| INFORMATION TECHNOLOGY - 1.8% | | | |
| Communications Equipment - 0.2% | | | |
| Banglalink Digital Communications Ltd. 8.625% 5/6/19 (b) | | 9,075 | 9,483 |
| Brocade Communications Systems, Inc. 4.625% 1/15/23 | | 3,330 | 3,426 |
| CommScope Technologies Finance LLC 5% 3/15/27 (b) | | 4,155 | 4,145 |
| | | | 17,054 |
| Electronic Equipment & Components - 0.1% | | | |
| Conduent Finance, Inc./Xerox Business Service LLC 10.5% 12/15/24 (b) | | 9,120 | 10,625 |
| Internet Software & Services - 0.2% | | | |
| Balboa Merger Sub, Inc. 11.375% 12/1/21 (b) | | 8,050 | 8,875 |
| Camelot Finance SA 7.875% 10/15/24 (b) | | 1,870 | 2,015 |
| CyrusOne LP/CyrusOne Finance Corp.: | | | |
| 5% 3/15/24 (b) | | 1,040 | 1,071 |
| 5.375% 3/15/27 (b) | | 890 | 927 |
| GTT Communications, Inc. 7.875% 12/31/24 (b) | | 1,925 | 2,060 |
| j2 Global, Inc. 8% 8/1/20 | | 3,460 | 3,545 |
| | | | 18,493 |
| IT Services - 0.1% | | | |
| CDW LLC/CDW Finance Corp. 5% 9/1/25 | | 2,085 | 2,163 |
| Ceridian HCM Holding, Inc. 11% 3/15/21 (b) | | 2,360 | 2,493 |
| Everi Payments, Inc. 10% 1/15/22 | | 4,210 | 4,610 |
| Gartner, Inc. 5.125% 4/1/25 (b) | | 1,935 | 2,033 |
| | | | 11,299 |
| Semiconductors & Semiconductor Equipment - 0.7% | | | |
| Entegris, Inc. 6% 4/1/22 (b) | | 1,275 | 1,334 |
| Micron Technology, Inc.: | | | |
| 5.25% 8/1/23 (b) | | 1,740 | 1,807 |
| 5.25% 1/15/24 (b) | | 3,675 | 3,804 |
| 5.875% 2/15/22 | | 2,615 | 2,736 |
| 7.5% 9/15/23 | | 3,925 | 4,388 |
| Microsemi Corp. 9.125% 4/15/23 (b) | | 867 | 993 |
| NXP BV/NXP Funding LLC: | | | |
| 4.625% 6/15/22 (b) | | 4,750 | 5,106 |
| 4.625% 6/1/23 (b) | | 3,805 | 4,105 |
| 5.75% 3/15/23 (b) | | 15,105 | 15,898 |
| Qorvo, Inc.: | | | |
| 6.75% 12/1/23 | | 3,135 | 3,441 |
| 7% 12/1/25 | | 9,580 | 10,873 |
| Sensata Technologies UK Financing Co. PLC 6.25% 2/15/26 (b) | | 4,190 | 4,567 |
| Versum Materials, Inc. 5.5% 9/30/24 (b) | | 2,170 | 2,281 |
| | | | 61,333 |
| Software - 0.5% | | | |
| Ensemble S Merger Sub, Inc. 9% 9/30/23 (b) | | 7,070 | 7,353 |
| Greeneden U.S. Holdings II LLC 10% 11/30/24 (b) | | 5,685 | 6,389 |
| JDA Escrow LLC/JDA Bond Finance, Inc. 7.375% 10/15/24 (b) | | 1,490 | 1,550 |
| Open Text Corp. 5.875% 6/1/26 (b) | | 3,195 | 3,437 |
| Parametric Technology Corp. 6% 5/15/24 | | 1,295 | 1,402 |
| SS&C Technologies Holdings, Inc. 5.875% 7/15/23 | | 3,370 | 3,590 |
| Symantec Corp. 5% 4/15/25 (b) | | 3,335 | 3,490 |
| Veritas U.S., Inc./Veritas Bermuda Ltd.: | | | |
| 7.5% 2/1/23 (b) | | 4,635 | 4,983 |
| 10.5% 2/1/24 (b) | | 9,345 | 10,209 |
| | | | 42,403 |
| TOTAL INFORMATION TECHNOLOGY | | | 161,207 |
| MATERIALS - 3.7% | | | |
| Chemicals - 1.1% | | | |
| Braskem Finance Ltd.: | | | |
| 5.375% 5/2/22 (b) | | 2,950 | 3,039 |
| 5.75% 4/15/21 (b) | | 2,020 | 2,108 |
| 6.45% 2/3/24 | | 2,220 | 2,364 |
| Hexion, Inc. 10.375% 2/1/22 (b) | | 1,495 | 1,480 |
| Kraton Polymers LLC/Kraton Polymers Capital Corp. 10.5% 4/15/23 (b) | | 2,715 | 3,136 |
| Momentive Performance Materials, Inc.: | | | |
| 3.88% 10/24/21 | | 44,218 | 43,886 |
| 4.69% 4/24/22 | | 14,170 | 13,674 |
| 10% 10/15/20 (e) | | 14,170 | 0 |
| MPM Escrow LLC/MPM Finance Escrow Corp. 8.875% 10/15/20 (e) | | 44,218 | 0 |
| NOVA Chemicals Corp.: | | | |
| 4.875% 6/1/24 (b) | | 4,660 | 4,643 |
| 5.25% 6/1/27 (b) | | 3,995 | 3,975 |
| Nufarm Australia Ltd. 6.375% 10/15/19 (b) | | 2,020 | 2,063 |
| OCP SA 5.625% 4/25/24 (b) | | 1,270 | 1,374 |
| Platform Specialty Products Corp.: | | | |
| 6.5% 2/1/22 (b) | | 4,175 | 4,311 |
| 10.375% 5/1/21 (b) | | 1,275 | 1,410 |
| SunCoke Energy Partners LP/SunCoke Energy Partners Finance Corp. 7.5% 6/15/25 (b) | | 3,010 | 2,972 |
| The Chemours Co. LLC 5.375% 5/15/27 | | 1,545 | 1,595 |
| TPC Group, Inc. 8.75% 12/15/20 (b) | | 7,335 | 6,602 |
| Valvoline Finco Two LLC 5.5% 7/15/24 (b) | | 1,550 | 1,639 |
| | | | 100,271 |
| Construction Materials - 0.2% | | | |
| CEMEX Finance LLC: | | | |
| 6% 4/1/24 (b) | | 2,000 | 2,125 |
| 9.375% 10/12/22 (b) | | 2,220 | 2,359 |
| CEMEX S.A.B. de CV 7.75% 4/16/26 (b) | | 1,870 | 2,139 |
| Prince Mineral Holding Corp. 11.5% 12/15/19 (b)(c) | | 1,685 | 1,727 |
| Summit Materials LLC/Summit Materials Finance Corp. 5.125% 6/1/25 (b) | | 1,570 | 1,609 |
| U.S. Concrete, Inc. 6.375% 6/1/24 | | 2,070 | 2,184 |
| Union Andina de Cementos SAA 5.875% 10/30/21 (b) | | 2,055 | 2,134 |
| | | | 14,277 |
| Containers & Packaging - 0.5% | | | |
| Ardagh Packaging Finance PLC/Ardagh MP Holdings U.S.A., Inc.: | | | |
| 4.625% 5/15/23 (b) | | 4,250 | 4,355 |
| 6% 2/15/25 (b) | | 6,620 | 6,951 |
| 7.25% 5/15/24 (b) | | 7,590 | 8,302 |
| Consolidated Container Co. LLC/Consolidated Container Capital, Inc. 10.125% 7/15/20 (b) | | 2,060 | 2,117 |
| Crown Cork & Seal, Inc.: | | | |
| 7.375% 12/15/26 | | 11,295 | 13,074 |
| 7.5% 12/15/96 | | 3,685 | 3,703 |
| Flex Acquisition Co., Inc. 6.875% 1/15/25 (b) | | 1,795 | 1,867 |
| Sealed Air Corp. 5.25% 4/1/23 (b) | | 2,540 | 2,724 |
| | | | 43,093 |
| Metals & Mining - 1.9% | | | |
| Alcoa Nederland Holding BV: | | | |
| 6.75% 9/30/24 (b) | | 2,825 | 3,065 |
| 7% 9/30/26 (b) | | 2,340 | 2,568 |
| Aleris International, Inc. 6% 6/1/20 (b) | | 33 | 33 |
| Bluescope Steel Ltd./Bluescope Steel Finance 6.5% 5/15/21 (b) | | 1,310 | 1,382 |
| Compania Minera Ares SAC 7.75% 1/23/21 (b) | | 5,250 | 5,585 |
| EVRAZ Group SA: | | | |
| 5.375% 3/20/23 (b) | | 4,990 | 5,005 |
| 6.5% 4/22/20 (b) | | 1,099 | 1,162 |
| 8.25% 1/28/21 (Reg. S) | | 6,090 | 6,781 |
| Evraz, Inc. NA Canada 7.5% 11/15/19 (b) | | 139 | 142 |
| Ferrexpo Finance PLC: | | | |
| 10.375% 4/7/19 (b) | | 5,165 | 5,436 |
| 10.375% 4/7/19 (b) | | 1,110 | 1,168 |
| 10.375% 4/7/19 (Reg. S) | | 580 | 611 |
| First Quantum Minerals Ltd.: | | | |
| 7% 2/15/21 (b) | | 5,040 | 5,166 |
| 7.25% 5/15/22 (b) | | 2,945 | 3,011 |
| 7.25% 4/1/23 (b) | | 5,590 | 5,464 |
| 7.5% 4/1/25 (b) | | 4,845 | 4,736 |
| FMG Resources (August 2006) Pty Ltd.: | | | |
| 4.75% 5/15/22 (b) | | 2,455 | 2,464 |
| 5.125% 5/15/24 (b) | | 3,025 | 3,025 |
| Freeport-McMoRan, Inc.: | | | |
| 3.55% 3/1/22 | | 2,130 | 1,996 |
| 3.875% 3/15/23 | | 6,390 | 5,943 |
| 5.4% 11/14/34 | | 2,000 | 1,795 |
| 5.45% 3/15/43 | | 13,105 | 11,300 |
| 6.75% 2/1/22 | | 6,175 | 6,391 |
| Gold Fields Orogen Holding BVI Ltd.: | | | |
| 4.875% 10/7/20 (b) | | 6,867 | 6,901 |
| 4.875% 10/7/20 (Reg. S) | | 400 | 402 |
| GTL Trade Finance, Inc. 5.893% 4/29/24 (b) | | 1,850 | 1,865 |
| JMC Steel Group, Inc. 9.875% 6/15/23 (b) | | 2,775 | 3,118 |
| Joseph T Ryerson & Son, Inc. 11% 5/15/22 (b) | | 2,400 | 2,715 |
| Lundin Mining Corp.: | | | |
| 7.5% 11/1/20 (b) | | 1,465 | 1,540 |
| 7.875% 11/1/22 (b) | | 215 | 234 |
| Metalloinvest Finance Designated Activity Co. 4.85% 5/2/24 (b) | | 1,200 | 1,200 |
| Metinvest BV 9.3725% 12/31/21 pay-in-kind (c) | | 17,059 | 15,439 |
| Mirabela Nickel Ltd. 1% 9/10/44 pay-in-kind (b)(e) | | 15 | 0 |
| Murray Energy Corp. 11.25% 4/15/21 (b) | | 5,075 | 3,832 |
| Polyus Finance PLC 5.25% 2/7/23 (b) | | 1,835 | 1,882 |
| Southern Copper Corp. 7.5% 7/27/35 | | 2,390 | 2,950 |
| Stillwater Mining Co.: | | | |
| 6.125% 6/27/22 (b) | | 6,360 | 6,265 |
| 7.125% 6/27/25 (b) | | 1,630 | 1,603 |
| United States Steel Corp. 8.375% 7/1/21 (b) | | 9,120 | 10,032 |
| Vale Overseas Ltd.: | | | |
| 4.375% 1/11/22 | | 2,440 | 2,483 |
| 5.875% 6/10/21 | | 1,255 | 1,347 |
| 6.875% 11/21/36 | | 1,370 | 1,469 |
| Vedanta Resources PLC: | | | |
| 6% 1/31/19 (b) | | 5,435 | 5,612 |
| 6.375% 7/30/22 (b) | | 2,395 | 2,403 |
| 8.25% 6/7/21 (b) | | 1,745 | 1,903 |
| VM Holding SA 5.375% 5/4/27 (b) | | 4,360 | 4,401 |
| | | | 163,825 |
| Paper & Forest Products - 0.0% | | | |
| NewPage Corp.: | | | |
| 0% 5/1/12 (c)(e) | | 1,770 | 0 |
| 11.375% 12/31/2114 (e) | | 4,404 | 0 |
| Sino-Forest Corp. 6.25% 10/21/17 (b)(e) | | 5,480 | 0 |
| | | | 0 |
| TOTAL MATERIALS | | | 321,466 |
| REAL ESTATE - 0.3% | | | |
| Equity Real Estate Investment Trusts (REITs) - 0.1% | | | |
| Equinix, Inc. 5.375% 5/15/27 | | 3,000 | 3,199 |
| MPT Operating Partnership LP/MPT Finance Corp.: | | | |
| 5.25% 8/1/26 | | 1,495 | 1,554 |
| 6.375% 2/15/22 | | 4,335 | 4,476 |
| | | | 9,229 |
| Real Estate Management & Development - 0.2% | | | |
| Grand City Properties SA 1.5% 4/17/25 (Reg. S) | EUR | 2,700 | 3,083 |
| Howard Hughes Corp. 5.375% 3/15/25 (b) | | 4,160 | 4,254 |
| Inversiones y Representaciones SA 11.5% 7/20/20 (Reg. S) | | 15 | 18 |
| IRSA Propiedades Comerciales SA 8.75% 3/23/23 (b) | | 2,120 | 2,390 |
| Mattamy Group Corp. 6.875% 12/15/23 (b) | | 3,035 | 3,099 |
| Taylor Morrison Communities, Inc./Monarch Communities, Inc. 5.25% 4/15/21 (b) | | 7,370 | 7,554 |
| | | | 20,398 |
| TOTAL REAL ESTATE | | | 29,627 |
| TELECOMMUNICATION SERVICES - 5.5% | | | |
| Diversified Telecommunication Services - 2.7% | | | |
| Altice Financing SA: | | | |
| 6.625% 2/15/23 (b) | | 8,265 | 8,769 |
| 7.5% 5/15/26 (b) | | 8,130 | 9,024 |
| Altice Finco SA 8.125% 1/15/24 (b) | | 8,730 | 9,494 |
| AT&T, Inc.: | | | |
| 1.8% 9/4/26 | EUR | 11,950 | 13,520 |
| 2.35% 9/4/29 | EUR | 3,900 | 4,404 |
| 3.15% 9/4/36 | EUR | 3,550 | 3,998 |
| Citizens Communications Co.: | | | |
| 7.875% 1/15/27 | | 4,895 | 3,647 |
| 9% 8/15/31 | | 3,655 | 2,933 |
| FairPoint Communications, Inc. 8.75% 8/15/19 (b) | | 3,210 | 3,298 |
| Frontier Communications Corp. 11% 9/15/25 | | 8,520 | 7,902 |
| GCI, Inc. 6.875% 4/15/25 | | 4,240 | 4,585 |
| GTH Finance BV: | | | |
| 6.25% 4/26/20 (b) | | 2,490 | 2,634 |
| 7.25% 4/26/23 (b) | | 11,095 | 12,238 |
| Lynx II Corp. 6.375% 4/15/23 (b) | | 1,820 | 1,911 |
| Sable International Finance Ltd. 6.875% 8/1/22 (b) | | 19,275 | 20,817 |
| SFR Group SA: | | | |
| 6% 5/15/22 (b) | | 36,670 | 38,366 |
| 6.25% 5/15/24 (b) | | 34,853 | 36,813 |
| 7.375% 5/1/26 (b) | | 16,760 | 18,185 |
| Sprint Capital Corp.: | | | |
| 6.875% 11/15/28 | | 4,765 | 5,297 |
| 8.75% 3/15/32 | | 3,641 | 4,588 |
| Telefonica Celular del Paraguay SA 6.75% 12/13/22 (b) | | 3,660 | 3,822 |
| U.S. West Communications: | | | |
| 6.875% 9/15/33 | | 2,155 | 2,121 |
| 7.25% 9/15/25 | | 535 | 594 |
| 7.25% 10/15/35 | | 1,455 | 1,453 |
| UPCB Finance IV Ltd. 5.375% 1/15/25 (b) | | 4,635 | 4,849 |
| Virgin Media Finance PLC 4.875% 2/15/22 | | 5,445 | 5,120 |
| | | | 230,382 |
| Wireless Telecommunication Services - 2.8% | | | |
| America Movil S.A.B. de CV 6.45% 12/5/22 | MXN | 79,000 | 4,111 |
| Comcel Trust 6.875% 2/6/24 (b) | | 2,070 | 2,202 |
| Digicel Group Ltd.: | | | |
| 6% 4/15/21 (b) | | 870 | 834 |
| 6.75% 3/1/23 (b) | | 1,430 | 1,345 |
| 7.125% 4/1/22 (b) | | 13,405 | 11,680 |
| 8.25% 9/30/20 (b) | | 10,040 | 9,386 |
| Intelsat Jackson Holdings SA: | | | |
| 5.5% 8/1/23 | | 14,385 | 11,904 |
| 7.25% 10/15/20 | | 22,465 | 21,229 |
| 7.5% 4/1/21 | | 7,635 | 7,043 |
| 9.75% 7/15/25 (b)(d) | | 4,705 | 4,699 |
| Millicom International Cellular SA: | | | |
| 4.75% 5/22/20 (b) | | 2,150 | 2,200 |
| 6% 3/15/25 (b) | | 7,780 | 8,164 |
| 6.625% 10/15/21 (b) | | 8,965 | 9,324 |
| Neptune Finco Corp.: | | | |
| 6.625% 10/15/25 (b) | | 8,175 | 8,993 |
| 10.125% 1/15/23 (b) | | 8,455 | 9,808 |
| 10.875% 10/15/25 (b) | | 20,060 | 24,147 |
| Sprint Communications, Inc. 6% 11/15/22 | | 11,390 | 12,073 |
| Sprint Corp.: | | | |
| 7.125% 6/15/24 | | 21,530 | 23,952 |
| 7.625% 2/15/25 | | 11,980 | 13,792 |
| 7.875% 9/15/23 | | 10,870 | 12,501 |
| T-Mobile U.S.A., Inc.: | | | |
| 6% 4/15/24 | | 6,400 | 6,848 |
| 6.375% 3/1/25 | | 17,345 | 18,754 |
| 6.5% 1/15/24 | | 15,115 | 16,249 |
| Telesat Canada/Telesat LLC 8.875% 11/15/24 (b) | | 3,245 | 3,643 |
| | | | 244,881 |
| TOTAL TELECOMMUNICATION SERVICES | | | 475,263 |
| UTILITIES - 2.1% | | | |
| Electric Utilities - 0.2% | | | |
| CTE Co. 2.125% 7/29/32 (Reg. S) | EUR | 3,200 | 3,666 |
| EDF SA 1.875% 10/13/36 (Reg. S) | EUR | 6,300 | 6,505 |
| InterGen NV 7% 6/30/23 (b) | | 1,730 | 1,665 |
| Israel Electric Corp. Ltd. 7.75% 12/15/27 (Reg. S) | | 1,350 | 1,701 |
| Pampa Holding SA 7.5% 1/24/27 (b) | | 2,335 | 2,437 |
| RJS Power Holdings LLC 4.625% 7/15/19 (b)(c) | | 750 | 731 |
| | | | 16,705 |
| Gas Utilities - 0.1% | | | |
| Southern Natural Gas Co.: | | | |
| 7.35% 2/15/31 | | 6,645 | 8,377 |
| 8% 3/1/32 | | 3,400 | 4,599 |
| | | | 12,976 |
| Independent Power and Renewable Electricity Producers - 1.8% | | | |
| Dynegy, Inc.: | | | |
| 7.375% 11/1/22 | | 13,365 | 13,198 |
| 7.625% 11/1/24 | | 15,245 | 14,788 |
| 8% 1/15/25 (b) | | 5,195 | 5,039 |
| Energy Future Holdings Corp.: | | | |
| 10.875% 11/1/17 (e) | | 10,985 | 3,845 |
| 11.25% 11/1/17 pay-in-kind (c)(e) | | 8,822 | 3,088 |
| Energy Future Intermediate Holding Co. LLC/Energy Future Intermediate Holding Finance, Inc.: | | | |
| 11% 10/1/21 (e) | | 29,362 | 38,023 |
| 12.25% 3/1/22 (b)(c)(e) | | 35,768 | 49,002 |
| Listrindo Capital BV 4.95% 9/14/26 (b) | | 2,110 | 2,136 |
| Pattern Energy Group, Inc. 5.875% 2/1/24 (b) | | 1,860 | 1,958 |
| PPL Energy Supply LLC 6.5% 6/1/25 | | 3,425 | 2,415 |
| TerraForm Power Operating LLC: | | | |
| 6.375% 2/1/23 (b)(c) | | 11,640 | 12,106 |
| 6.625% 6/15/25 (b)(c) | | 2,950 | 3,134 |
| TXU Corp.: | | | |
| 5.55% 11/15/14 (e) | | 1,864 | 196 |
| 6.5% 11/15/24 (e) | | 15,240 | 1,600 |
| 6.55% 11/15/34 (e) | | 29,755 | 3,124 |
| | | | 153,652 |
| TOTAL UTILITIES | | | 183,333 |
|
| TOTAL NONCONVERTIBLE BONDS | | | 3,302,842 |
|
| TOTAL CORPORATE BONDS | | | |
| (Cost $3,167,813) | | | 3,303,344 |
|
| U.S. Government and Government Agency Obligations - 17.9% | | | |
| U.S. Government Agency Obligations - 0.2% | | | |
| Tennessee Valley Authority: | | | |
| 1.75% 10/15/18 | | $15,059 | $15,136 |
| 5.25% 9/15/39 | | 1,138 | 1,495 |
| 5.375% 4/1/56 | | 1,803 | 2,453 |
|
| TOTAL U.S. GOVERNMENT AGENCY OBLIGATIONS | | | 19,084 |
|
| U.S. Treasury Inflation-Protected Obligations - 0.1% | | | |
| U.S. Treasury Inflation-Indexed Bonds 1% 2/15/46 | | 9,013 | 9,015 |
| U.S. Treasury Obligations - 17.2% | | | |
| U.S. Treasury Bonds: | | | |
| 2.5% 2/15/46 | | 14,410 | 13,436 |
| 2.875% 8/15/45 | | 27,219 | 27,414 |
| 3% 11/15/44 | | 5,258 | 5,434 |
| 3% 2/15/47 | | 47,510 | 49,095 |
| 3% 5/15/47 | | 5,500 | 5,686 |
| 3.625% 2/15/44 | | 72,443 | 83,581 |
| 4.25% 5/15/39 | | 30,000 | 37,625 |
| 4.75% 2/15/37 | | 29,000 | 38,678 |
| 5.25% 2/15/29 (g) | | 14,703 | 18,992 |
| 6.125% 8/15/29 (g)(h) | | 27,099 | 37,770 |
| 7.5% 11/15/24 | | 5,690 | 7,780 |
| 7.875% 2/15/21 | | 6,800 | 8,269 |
| 8.125% 5/15/21 | | 9,286 | 11,498 |
| U.S. Treasury Notes: | | | |
| 0.875% 6/15/19 | | 68,717 | 68,049 |
| 0.875% 9/15/19 | | 36,684 | 36,253 |
| 1.125% 1/15/19 | | 648 | 646 |
| 1.125% 7/31/21 | | 17,426 | 16,984 |
| 1.125% 9/30/21 | | 58,579 | 56,973 |
| 1.25% 4/30/19 | | 22,000 | 21,947 |
| 1.25% 5/31/19 | | 39,000 | 38,907 |
| 1.375% 2/29/20 | | 10,262 | 10,226 |
| 1.375% 8/31/23 | | 7,000 | 6,724 |
| 1.5% 1/31/19 | | 919 | 921 |
| 1.5% 4/15/20 | | 36,367 | 36,340 |
| 1.5% 5/15/20 | | 60,925 | 60,854 |
| 1.5% 8/15/26 | | 2,021 | 1,891 |
| 1.625% 4/30/19 | | 7,973 | 8,008 |
| 1.625% 6/30/19 | | 39,152 | 39,332 |
| 1.625% 6/30/20 | | 1,783 | 1,786 |
| 1.75% 12/31/20 | | 1,389 | 1,393 |
| 1.75% 5/31/22 | | 20,000 | 19,880 |
| 1.75% 6/30/22 | | 47,639 | 47,326 |
| 1.875% 1/31/22 | | 24,896 | 24,925 |
| 1.875% 3/31/22 | | 112,286 | 112,347 |
| 2% 9/30/20 | | 114,047 | 115,428 |
| 2% 12/31/21 | | 69,146 | 69,643 |
| 2% 7/31/22 | | 3,557 | 3,572 |
| 2% 6/30/24 | | 139,748 | 138,482 |
| 2% 8/15/25 | | 15,409 | 15,144 |
| 2% 11/15/26 | | 60,766 | 59,259 |
| 2.125% 6/30/21 | | 11,000 | 11,158 |
| 2.125% 3/31/24 | | 20,065 | 20,074 |
| 2.125% 5/15/25 | | 17,332 | 17,221 |
| 2.25% 7/31/21 | | 55,359 | 56,410 |
| 2.25% 2/15/27 | | 23,000 | 22,898 |
| 2.375% 5/15/27 | | 10,500 | 10,568 |
|
| TOTAL U.S. TREASURY OBLIGATIONS | | | 1,496,827 |
|
| Other Government Related - 0.4% | | | |
| National Credit Union Administration Guaranteed Notes: | | | |
| Series 2010-A1 Class A, 1.446% 12/7/20 (NCUA Guaranteed) (c) | | 1,160 | 1,161 |
| Series 2011-R1 Class 1A, 1.4417% 1/8/20 (NCUA Guaranteed) (c) | | 2,825 | 2,829 |
| Series 2011-R4 Class 1A, 1.3683% 3/6/20 (NCUA Guaranteed) (c) | | 207 | 207 |
| National Credit Union Administration Guaranteed Notes Master Trust 3.45% 6/12/21 (NCUA Guaranteed) | | 25,300 | 26,629 |
|
| TOTAL OTHER GOVERNMENT RELATED | | | 30,826 |
|
| TOTAL U.S. GOVERNMENT AND GOVERNMENT AGENCY OBLIGATIONS | | | |
| (Cost $1,545,039) | | | 1,555,752 |
|
| U.S. Government Agency - Mortgage Securities - 1.1% | | | |
| Fannie Mae - 0.8% | | | |
| 2.571% 6/1/42 (c) | | 234 | 242 |
| 2.615% 10/1/35(c) | | 19 | 20 |
| 2.695% 2/1/42 (c) | | 1,213 | 1,272 |
| 2.773% 1/1/42 (c) | | 890 | 934 |
| 2.815% 9/1/36 (c) | | 34 | 35 |
| 2.84% 2/1/36 (c) | | 10 | 11 |
| 2.842% 11/1/35 (c) | | 225 | 233 |
| 2.895% 9/1/33 (c) | | 289 | 299 |
| 2.915% 11/1/33 (c) | | 15 | 15 |
| 2.932% 1/1/35 (c) | | 124 | 129 |
| 2.944% 11/1/40 (c) | | 86 | 90 |
| 3.019% 10/1/41 (c) | | 65 | 68 |
| 3.023% 9/1/41 (c) | | 133 | 141 |
| 3.135% 3/1/33 (c) | | 64 | 67 |
| 3.17% 11/1/36 (c) | | 21 | 22 |
| 3.25% 7/1/41 (c) | | 188 | 196 |
| 3.309% 6/1/47 (c) | | 62 | 66 |
| 3.315% 3/1/37 (c) | | 25 | 26 |
| 3.33% 7/1/35 (c) | | 103 | 109 |
| 3.336% 2/1/37 (c) | | 329 | 347 |
| 3.338% 6/1/36 (c) | | 29 | 30 |
| 3.384% 10/1/41 (c) | | 128 | 136 |
| 3.435% 8/1/35 (c) | | 277 | 295 |
| 3.463% 5/1/36 (c) | | 23 | 24 |
| 3.567% 7/1/41 (c) | | 241 | 251 |
| 3.633% 4/1/36 (c) | | 180 | 190 |
| 4% 5/1/29 | | 9,285 | 9,759 |
| 4% 7/1/47 (d) | | 7,500 | 7,881 |
| 4% 7/1/47 | | 12,600 | 13,241 |
| 4% 7/1/47 | | 13,500 | 14,186 |
| 4% 7/1/47 | | 3,600 | 3,783 |
| 4.5% 11/1/25 | | 1,477 | 1,560 |
| 5% 5/1/22 to 7/1/35 | | 3,048 | 3,336 |
| 5.5% 10/1/20 to 4/1/21 | | 643 | 665 |
| 6% 1/1/34 to 6/1/36 | | 2,043 | 2,321 |
| 6.5% 2/1/22 to 8/1/36 | | 3,237 | 3,726 |
| 7.5% 1/1/28 | | 27 | 31 |
|
| TOTAL FANNIE MAE | | | 65,737 |
|
| Freddie Mac - 0.1% | | | |
| 2.793% 1/1/36 (c) | | 56 | 58 |
| 2.82% 3/1/35 (c) | | 47 | 48 |
| 2.85% 7/1/35 (c) | | 141 | 147 |
| 2.889% 6/1/33 (c) | | 175 | 183 |
| 2.915% 2/1/37 (c) | | 43 | 44 |
| 2.95% 3/1/37 (c) | | 16 | 17 |
| 2.967% 5/1/37 (c) | | 27 | 28 |
| 2.97% 8/1/37 (c) | | 77 | 80 |
| 3.028% 10/1/41 (c) | | 760 | 790 |
| 3.04% 2/1/36 (c) | | 4 | 4 |
| 3.05% 6/1/37 (c) | | 28 | 29 |
| 3.063% 1/1/37 (c) | | 216 | 226 |
| 3.093% 9/1/41 (c) | | 1,350 | 1,428 |
| 3.159% 7/1/35 (c) | | 114 | 120 |
| 3.192% 10/1/42 (c) | | 736 | 775 |
| 3.222% 9/1/41 (c) | | 138 | 143 |
| 3.225% 4/1/41 (c) | | 125 | 131 |
| 3.253% 10/1/36 (c) | | 256 | 269 |
| 3.282% 6/1/41 (c) | | 166 | 174 |
| 3.306% 6/1/37 (c) | | 150 | 159 |
| 3.32% 4/1/37 (c) | | 36 | 38 |
| 3.324% 10/1/35 (c) | | 118 | 124 |
| 3.369% 7/1/36 (c) | | 65 | 69 |
| 3.38% 5/1/37 (c) | | 529 | 549 |
| 3.385% 5/1/37 (c) | | 176 | 186 |
| 3.418% 6/1/37 (c) | | 39 | 41 |
| 3.421% 5/1/41 (c) | | 131 | 140 |
| 3.62% 5/1/41 (c) | | 187 | 196 |
| 3.648% 6/1/41 (c) | | 193 | 202 |
| 4.079% 10/1/35 (c) | | 32 | 33 |
| 6% 1/1/24 | | 717 | 772 |
| 6.5% 7/1/17 | | 0 | 0 |
| 6.5% 5/1/18 to 3/1/22 | | 206 | 220 |
|
| TOTAL FREDDIE MAC | | | 7,423 |
|
| Ginnie Mae - 0.2% | | | |
| 4.3% 8/20/61 (i) | | 1,700 | 1,736 |
| 4.649% 2/20/62 (i) | | 1,683 | 1,738 |
| 4.682% 2/20/62 (i) | | 2,150 | 2,214 |
| 4.684% 1/20/62 (i) | | 10,236 | 10,534 |
| 5.47% 8/20/59 (i) | | 51 | 52 |
| 6% 6/15/36 | | 2,576 | 2,994 |
| 7% 9/15/25 to 8/15/31 | | 18 | 20 |
| 7.5% 2/15/22 to 8/15/28 | | 36 | 42 |
| 8% 12/15/26 | | 0 | 0 |
|
| TOTAL GINNIE MAE | | | 19,330 |
|
| TOTAL U.S. GOVERNMENT AGENCY - MORTGAGE SECURITIES | | | |
| (Cost $91,968) | | | 92,490 |
|
| Asset-Backed Securities - 0.3% | | | |
| Access Group, Inc. Series 2005-2 Class A3, 1.2301% 11/22/24 (c) | | $1,828 | $1,828 |
| Goal Capital Funding Trust Series 2005-2 Class A3, 1.3587% 5/28/30 (c) | | 2,438 | 2,437 |
| Illinois Student Assistance Commission Student Loan Rev. Series 2010-1 Class A2, 2.2062% 4/25/22 (c) | | 918 | 922 |
| Navient Student Loan Trust Series 2017-3A: | | | |
| Class A1, 1.3606% 7/26/66 (b)(c) | | 5,757 | 5,757 |
| Class A2, 1.6606% 7/26/66 (b)(c) | | 6,106 | 6,131 |
| SLM Student Loan Trust: | | | |
| Series 2004-3 Class A5, 1.3262% 7/25/23 (c) | | 4,705 | 4,704 |
| Series 2007-5 Class A5, 1.2362% 1/25/24 (c) | | 5,256 | 5,252 |
| TOTAL ASSET-BACKED SECURITIES | | | |
| (Cost $26,998) | | | 27,031 |
|
| Collateralized Mortgage Obligations - 3.4% | | | |
| U.S. Government Agency - 3.4% | | | |
| Fannie Mae: | | | |
| floater Series 2010-15 Class FJ, 2.1461% 6/25/36 (c) | | 2,878 | 2,923 |
| planned amortization class: | | | |
| Series 2003-70 Class BJ, 5% 7/25/33 | | 301 | 329 |
| Series 2005-19 Class PA, 5.5% 7/25/34 | | 727 | 759 |
| Series 2005-27 Class NE, 5.5% 5/25/34 | | 305 | 307 |
| Series 2005-64 Class PX, 5.5% 6/25/35 | | 831 | 898 |
| Series 2005-68 Class CZ, 5.5% 8/25/35 | | 2,765 | 3,093 |
| Series 2010-118 Class PB, 4.5% 10/25/40 | | 2,950 | 3,125 |
| sequential payer: | | | |
| Series 2002-57 Class BD, 5.5% 9/25/17 | | 1 | 1 |
| Series 2003-117 Class MD, 5% 12/25/23 | | 575 | 610 |
| Series 2004-91 Class Z, 5% 12/25/34 | | 2,575 | 2,823 |
| Series 2005-117 Class JN, 4.5% 1/25/36 | | 519 | 551 |
| Series 2005-14 Class ZB, 5% 3/25/35 | | 967 | 1,059 |
| Series 2006-72 Class CY, 6% 8/25/26 | | 775 | 839 |
| Series 2009-59 Class HB, 5% 8/25/39 | | 1,458 | 1,602 |
| Series 2010-97 Class CX, 4.5% 9/25/25 | | 3,800 | 4,074 |
| Series 2009-85 Class IB, 4.5% 8/25/24 (j) | | 113 | 5 |
| Series 2009-93 Class IC, 4.5% 9/25/24 (j) | | 166 | 8 |
| Series 2010-139 Class NI, 4.5% 2/25/40 (j) | | 1,591 | 180 |
| Series 2010-39 Class FG, 2.1361% 3/25/36 (c) | | 1,790 | 1,830 |
| Series 2010-97 Class CI, 4.5% 8/25/25 (j) | | 421 | 26 |
| Series 2011-67 Class AI, 4% 7/25/26 (j) | | 460 | 44 |
| Series 2012-27 Class EZ, 4.25% 3/25/42 | | 3,278 | 3,557 |
| Series 2016-26 Class CG, 3% 5/25/46 | | 6,238 | 6,374 |
| Freddie Mac: | | | |
| floater: | | | |
| Series 2630 Class FL, 1.4891% 6/15/18 (c) | | 2 | 2 |
| Series 2711 Class FC, 1.8891% 2/15/33 (c) | | 925 | 942 |
| floater planned amortization class Series 2770 Class FH, 1.3891% 3/15/34 (c) | | 1,147 | 1,152 |
| planned amortization class: | | | |
| Series 2101 Class PD, 6% 11/15/28 | | 37 | 39 |
| Series 2996 Class MK, 5.5% 6/15/35 | | 90 | 98 |
| Series 3415 Class PC, 5% 12/15/37 | | 414 | 450 |
| Series 3763 Class QA, 4% 4/15/34 | | 294 | 296 |
| Series 3840 Class VA, 4.5% 9/15/27 | | 1,639 | 1,694 |
| Series 3857 Class ZP, 5% 5/15/41 | | 1,118 | 1,316 |
| sequential payer: | | | |
| Series 2004-2802 Class ZG, 5.5% 5/15/34 | | 4,673 | 5,217 |
| Series 2303 Class ZV, 6% 4/15/31 | | 88 | 98 |
| Series 2877 Class ZD, 5% 10/15/34 | | 3,108 | 3,397 |
| Series 3745 Class KV, 4.5% 12/15/26 | | 2,895 | 3,112 |
| Series 3806 Class L, 3.5% 2/15/26 | | 3,100 | 3,270 |
| Series 3843 Class PZ, 5% 4/15/41 | | 1,143 | 1,328 |
| Freddie Mac Multi-family Structured pass-thru certificates sequential payer: | | | |
| Series 4335 Class AL, 4.25% 3/15/40 | | 2,630 | 2,760 |
| Series 4341 Class ML, 3.5% 11/15/31 | | 3,461 | 3,610 |
| Ginnie Mae guaranteed REMIC pass-thru certificates: | | | |
| floater: | | | |
| Series 2007-59 Class FC, 1.7122% 7/20/37 (c) | | 621 | 624 |
| Series 2008-2 Class FD, 1.6922% 1/20/38 (c) | | 150 | 151 |
| Series 2008-73 Class FA, 2.0722% 8/20/38 (c) | | 980 | 995 |
| Series 2008-83 Class FB, 2.1122% 9/20/38 (c) | | 882 | 901 |
| Series 2009-108 Class CF, 1.7717% 11/16/39 (c) | | 680 | 685 |
| Series 2009-116 Class KF, 1.7017% 12/16/39 (c) | | 512 | 515 |
| Series 2010-H17 Class FA, 1.3738% 7/20/60 (c)(i) | | 4,025 | 3,996 |
| Series 2010-H18 Class AF, 1.2828% 9/20/60 (c)(i) | | 4,965 | 4,926 |
| Series 2010-H19 Class FG, 1.2828% 8/20/60 (c)(i) | | 5,461 | 5,427 |
| Series 2010-H27 Series FA, 1.3628% 12/20/60 (c)(i) | | 1,889 | 1,878 |
| Series 2011-H05 Class FA, 1.4828% 12/20/60 (c)(i) | | 3,084 | 3,084 |
| Series 2011-H07 Class FA, 1.4928% 2/20/61 (c)(i) | | 6,045 | 6,046 |
| Series 2011-H12 Class FA, 1.4828% 2/20/61 (c)(i) | | 7,348 | 7,346 |
| Series 2011-H13 Class FA, 1.4828% 4/20/61 (c)(i) | | 2,604 | 2,604 |
| Series 2011-H14: | | | |
| Class FB, 1.4828% 5/20/61 (c)(i) | | 3,035 | 3,030 |
| Class FC, 1.4828% 5/20/61 (c)(i) | | 2,794 | 2,791 |
| Series 2011-H17 Class FA, 1.5228% 6/20/61 (c)(i) | | 3,690 | 3,694 |
| Series 2011-H21 Class FA, 1.5828% 10/20/61 (c)(i) | | 4,071 | 4,083 |
| Series 2012-H01 Class FA, 1.6828% 11/20/61 (c)(i) | | 3,513 | 3,532 |
| Series 2012-H03 Class FA, 1.6828% 1/20/62 (c)(i) | | 2,257 | 2,269 |
| Series 2012-H06 Class FA, 1.6128% 1/20/62 (c)(i) | | 3,404 | 3,415 |
| Series 2012-H07 Class FA, 1.6128% 3/20/62 (c)(i) | | 2,167 | 2,176 |
| Series 2012-H21 Class DF, 1.6328% 5/20/61 (c)(i) | | 1,659 | 1,663 |
| Series 2013-H19: | | | |
| Class FC, 1.5828% 8/20/63 (c)(i) | | 521 | 522 |
| Class FD, 1.5828% 8/20/63 (c)(i) | | 1,374 | 1,378 |
| Series 2015-H13 Class FL, 1.2728% 5/20/63 (c)(i) | | 6,678 | 6,676 |
| Series 2015-H19 Class FA, 1.1928% 4/20/63 (c)(i) | | 6,632 | 6,625 |
| planned amortization class Series 2011-136 Class WI, 4.5% 5/20/40 (j) | | 1,051 | 130 |
| sequential payer: | | | |
| Series 2011-69 Class GX, 4.5% 5/16/40 | | 4,910 | 5,325 |
| Series 2013-H06 Class HA, 1.65% 1/20/63 (i) | | 1,819 | 1,812 |
| Series 2014-H12 Class KA, 2.75% 5/20/64 (i) | | 2,442 | 2,467 |
| Series 2016-H02 Class FM, 1.4928% 9/20/62 (c)(i) | | 7,557 | 7,560 |
| Series 2016-H04 Class FE, 1.6428% 11/20/65 (c)(i) | | 2,134 | 2,142 |
| Series 2010-169 Class Z, 4.5% 12/20/40 | | 2,484 | 2,689 |
| Series 2010-H15 Class TP, 5.15% 8/20/60 (i) | | 7,800 | 8,114 |
| Series 2010-H17 Class XP, 5.2984% 7/20/60 (c)(i) | | 9,597 | 9,938 |
| Series 2010-H18 Class PL, 5.01% 9/20/60 (c)(i) | | 7,737 | 8,022 |
| Series 2012-64 Class KI, 3.5% 11/20/36 (j) | | 727 | 55 |
| Series 2013-124: | | | |
| Class ES, 7.0504% 4/20/39 (c)(k) | | 3,304 | 3,478 |
| Class ST, 7.1837% 8/20/39 (c)(k) | | 7,301 | 7,853 |
| Series 2013-H07 Class JA, 1.75% 3/20/63 (i) | | 10,774 | 10,736 |
| Series 2015-H17 Class HA, 2.5% 5/20/65 (i) | | 8,570 | 8,643 |
| Series 2015-H21: | | | |
| Class HA, 2.5% 6/20/63 (i) | | 24,450 | 24,637 |
| Class JA, 2.5% 6/20/65 (i) | | 2,244 | 2,262 |
| Series 2015-H30 Class HA, 1.75% 9/20/62 (c)(i) | | 17,944 | 17,814 |
| Series 2016-H13 Class FB, 0.9866% 5/20/66 (c)(i) | | 9,005 | 9,064 |
| Series 2017-H06 Class FA, 1.17% 8/20/66 (c)(i) | | 9,867 | 9,883 |
| Series 2090-118 Class XZ, 5% 12/20/39 | | 5,526 | 6,289 |
| TOTAL U.S. GOVERNMENT AGENCY | | | |
| (Cost $294,165) | | | 293,743 |
|
| Commercial Mortgage Securities - 0.9% | | | |
| Freddie Mac: | | | |
| pass-thru certificates sequential payer Series K011 Class A2, 4.084% 11/25/20 | | 2,480 | 2,642 |
| sequential payer: | | | |
| Series K006 Class A2, 4.251% 1/25/20 | | 10,365 | 10,935 |
| Series K034 Class A1, 2.669% 2/25/23 | | 7,458 | 7,576 |
| Series K710 Class A2, 1.883% 5/25/19 | | 3,065 | 3,076 |
| Series K713 Class A2, 2.313% 3/25/20 | | 1,871 | 1,891 |
| Series K717 Class A2, 2.991% 9/25/21 | | 1,559 | 1,612 |
| Series K504 Class A2, 2.566% 9/25/20 | | 3,177 | 3,236 |
| Series K704 Class A2, 2.412% 8/25/18 | | 2,234 | 2,249 |
| Series K705 Class A2, 2.303% 9/25/18 | | 9,000 | 9,067 |
| Series K706 Class A2, 2.323% 10/25/18 | | 10,111 | 10,191 |
| Series K724 Class A1, 2.776% 3/25/23 | | 6,132 | 6,288 |
| Series K726 Class A1, 2.596% 8/25/23 | | 2,354 | 2,393 |
| Freddie Mac Multi-family floater Series 2017-KT01 Class A, 1.3494% 2/25/20 (c) | | 16,725 | 16,769 |
| TOTAL COMMERCIAL MORTGAGE SECURITIES | | | |
| (Cost $77,769) | | | 77,925 |
|
| Foreign Government and Government Agency Obligations - 19.7% | | | |
| Arab Republic 5.875% 6/11/25 (b) | | 1,298 | 1,269 |
| Arab Republic of Egypt: | | | |
| 5.875% 6/11/25 | | 2,425 | 2,370 |
| 6.125% 1/31/22 (b) | | 6,810 | 6,956 |
| 7.5% 1/31/27 (b) | | 1,335 | 1,418 |
| 8.5% 1/31/47 (b) | | 6,005 | 6,473 |
| Argentine Republic: | | | |
| 5.625% 1/26/22 | | 4,930 | 5,048 |
| 6.875% 4/22/21 | | 24,910 | 26,654 |
| 7.125% 6/28/2117 (b) | | 2,975 | 2,700 |
| 22.8075% 10/9/17 (c) | ARS | 38,995 | 2,340 |
| Australian Commonwealth: | | | |
| 1.75% 11/21/20 | AUD | 52,125 | 39,721 |
| 3% 3/21/47 | AUD | 9,450 | 6,608 |
| 4.25% 4/21/26 | AUD | 20,950 | 18,225 |
| Banco Central del Uruguay: | | | |
| value recovery A rights 1/2/21 (l) | | 500,000 | 0 |
| value recovery B rights 1/2/21 (l) | | 750,000 | 0 |
| Barbados Government: | | | |
| 7% 8/4/22 (b) | | 1,920 | 1,651 |
| 7.25% 12/15/21 (b) | | 220 | 191 |
| Belarus Republic: | | | |
| 6.875% 2/28/23 (b) | | 3,760 | 3,839 |
| 7.625% 6/29/27 (b) | | 2,100 | 2,143 |
| 8.95% 1/26/18 | | 14,600 | 14,973 |
| Brazilian Federative Republic: | | | |
| 5.625% 1/7/41 | | 5,105 | 4,914 |
| 7.125% 1/20/37 | | 10,315 | 11,785 |
| 8.25% 1/20/34 | | 13,920 | 17,400 |
| 10% 1/1/21 | BRL | 9,855 | 2,979 |
| Buenos Aires Province: | | | |
| 6.5% 2/15/23 (b) | | 3,590 | 3,665 |
| 9.95% 6/9/21 (b) | | 5,835 | 6,661 |
| 10.875% 1/26/21 (b) | | 1,750 | 1,996 |
| 10.875% 1/26/21 (Reg. S) | | 14,996 | 17,103 |
| Buoni del Tesoro Poliennali: | | | |
| 1.35% 4/15/22 | EUR | 13,300 | 15,536 |
| 2.05% 8/1/27 | EUR | 25,900 | 29,206 |
| 2.2% 6/1/27 | EUR | 39,850 | 45,764 |
| 2.7% 3/1/47 (b) | EUR | 7,400 | 7,538 |
| 3.45% 3/1/48(b) | EUR | 11,500 | 13,368 |
| 4.5% 3/1/24 | EUR | 17,225 | 23,434 |
| Canadian Government: | | | |
| 0.5% 2/1/19 | CAD | 68,700 | 52,496 |
| 1% 6/1/27 | CAD | 22,500 | 16,149 |
| 3.5% 12/1/45 | CAD | 15,200 | 15,030 |
| Central Bank of Nigeria warrants 11/15/20 (l) | | 6,250 | 347 |
| City of Buenos Aires 8.95% 2/19/21 (b) | | 2,425 | 2,698 |
| Colombian Republic: | | | |
| 7.375% 9/18/37 | | 2,275 | 2,926 |
| 10.375% 1/28/33 | | 4,065 | 6,250 |
| Costa Rican Republic 7% 4/4/44 (b) | | 2,510 | 2,610 |
| Croatia Republic: | | | |
| 5.5% 4/4/23 (b) | | 1,350 | 1,476 |
| 6% 1/26/24 (b) | | 1,100 | 1,232 |
| 6.375% 3/24/21 (b) | | 1,120 | 1,243 |
| Danish Kingdom 1.75% 11/15/25 | DKK | 84,500 | 14,445 |
| Democratic Socialist Republic of Sri Lanka: | | | |
| 6.2% 5/11/27 (b) | | 695 | 694 |
| 6.25% 10/4/20 (b) | | 1,180 | 1,245 |
| 6.25% 7/27/21 (b) | | 1,190 | 1,260 |
| Dominican Republic: | | | |
| 2.25% 8/30/24 (c) | | 12,693 | 12,291 |
| 5.95% 1/25/27 (b) | | 3,375 | 3,527 |
| 6.85% 1/27/45 (b) | | 1,755 | 1,869 |
| 6.875% 1/29/26 (b) | | 2,315 | 2,584 |
| 7.45% 4/30/44 (b) | | 3,390 | 3,865 |
| 7.5% 5/6/21 (b) | | 565 | 624 |
| Ecuador Republic: | | | |
| 9.65% 12/13/26 (b) | | 1,250 | 1,248 |
| 10.5% 3/24/20 (b) | | 900 | 945 |
| El Salvador Republic 8.625% 2/28/29 (b) | | 1,220 | 1,269 |
| French Government: | | | |
| OAT 3.25% 5/25/45 | EUR | 8,425 | 12,779 |
| 0% 2/25/20 | EUR | 96,650 | 111,497 |
| 1% 5/25/27 | EUR | 9,550 | 11,092 |
| 2% 5/25/48 (b) | EUR | 2,000 | 2,362 |
| German Federal Republic: | | | |
| 0% 3/15/19 | EUR | 5,650 | 6,518 |
| 0% 10/8/21 | EUR | 141,250 | 163,401 |
| 0.25% 2/15/27 | EUR | 9,500 | 10,622 |
| 1% 8/15/25(Reg. S) | EUR | 27,050 | 32,805 |
| 2.5% 8/15/46 | EUR | 4,875 | 7,262 |
| Hong Kong Government SAR 1.32% 12/23/19 | HKD | 21,000 | 2,718 |
| Indonesian Republic: | | | |
| 6.625% 2/17/37 (b) | | 995 | 1,232 |
| 7.75% 1/17/38 (b) | | 4,875 | 6,726 |
| 8.375% 3/15/24 | IDR | 78,334,000 | 6,381 |
| 8.5% 10/12/35 (Reg. S) | | 5,370 | 7,730 |
| Irish Republic: | | | |
| 1% 5/15/26(Reg. S) | EUR | 10,700 | 12,344 |
| 2% 2/18/45 (Reg.S) | EUR | 6,329 | 7,334 |
| Islamic Republic of Pakistan: | | | |
| 7.25% 4/15/19 (b) | | 5,745 | 6,058 |
| 8.25% 4/15/24 (b) | | 1,150 | 1,305 |
| Israeli State (guaranteed by U.S. Government through Agency for International Development): | | | |
| 5.5% 9/18/23 | | 28,730 | 34,197 |
| 5.5% 12/4/23 | | 12,385 | 14,720 |
| Ivory Coast 6.125% 6/15/33 (b) | | 1,320 | 1,267 |
| Japan Government: | | | |
| 0.1% 12/20/20 | JPY | 7,410,550 | 66,294 |
| 0.1% 6/20/26 | JPY | 5,550,000 | 49,547 |
| 0.4% 3/20/56 | JPY | 2,250,000 | 16,218 |
| 0.9% 6/20/22 | JPY | 5,732,800 | 53,389 |
| 1.9% 9/20/30 | JPY | 4,533,000 | 49,018 |
| Jordanian Kingdom: | | | |
| 2.503% 10/30/20 | | 25,601 | 26,197 |
| 3% 6/30/25 | | 8,712 | 9,111 |
| Kingdom of Norway 3.75% 5/25/21 | NOK | 36,000 | 4,773 |
| Lebanese Republic: | | | |
| 4% 12/31/17 | | 3,190 | 3,176 |
| 5% 10/12/17 | | 4,420 | 4,420 |
| 5.15% 6/12/18 | | 5,090 | 5,108 |
| 5.15% 11/12/18 | | 2,100 | 2,111 |
| 5.45% 11/28/19 | | 1,330 | 1,334 |
| 6% 5/20/19 | | 3,575 | 3,618 |
| Mongolian People's Republic 8.75% 3/9/24 (b) | | 3,940 | 4,313 |
| New Zealand Government 6% 5/15/21 | NZD | 8,000 | 6,638 |
| Panamanian Republic 9.375% 4/1/29 | | 825 | 1,217 |
| Peruvian Republic: | | | |
| 4% 3/7/27 (m) | | 5,671 | 5,560 |
| 6.35% 8/12/28 (b) | PEN | 13,580 | 4,445 |
| 8.2% 8/12/26 (Reg. S) | PEN | 23,540 | 8,682 |
| Province of Santa Fe 7% 3/23/23 (b) | | 6,105 | 6,363 |
| Provincia de Cordoba: | | | |
| 7.125% 6/10/21 (b) | | 7,915 | 8,318 |
| 7.45% 9/1/24 (b) | | 4,235 | 4,397 |
| 12.375% 8/17/17 (b) | | 3,120 | 3,141 |
| Republic of Angola 7% 8/17/19 (Issued by Northern Lights III BV for Republic of Angola) (Reg. S) | | 2,605 | 2,682 |
| Republic of Armenia: | | | |
| 6% 9/30/20 (b) | | 4,396 | 4,606 |
| 7.15% 3/26/25 (b) | | 2,730 | 2,985 |
| Republic of Iraq 5.8% 1/15/28 (Reg. S) | | 10,395 | 9,222 |
| Republic of Kenya 6.875% 6/24/24 (b) | | 1,750 | 1,789 |
| Republic of Nigeria 6.75% 1/28/21 (b) | | 590 | 625 |
| Republic of Senegal 6.25% 5/23/33 (b) | | 1,755 | 1,781 |
| Republic of Serbia: | | | |
| 4.875% 2/25/20 (b) | | 725 | 755 |
| 6.75% 11/1/24 (b) | | 3,950 | 4,029 |
| 7.25% 9/28/21 (b) | | 1,350 | 1,559 |
| Republic of Singapore 3.25% 9/1/20 | SGD | 32,500 | 24,975 |
| Russian Federation: | | | |
| 5.25% 6/23/47 (b) | | 3,600 | 3,625 |
| 5.625% 4/4/42 (b) | | 2,600 | 2,815 |
| 5.875% 9/16/43 (b) | | 1,260 | 1,411 |
| 12.75% 6/24/28 (Reg. S) | | 12,360 | 21,585 |
| Rwanda Rep 6.625% 5/2/23 (b) | | 2,190 | 2,253 |
| Spanish Kingdom: | | | |
| 1.45% 10/31/27 | EUR | 12,000 | 13,479 |
| 2.75% 10/31/24 (Reg. S) | EUR | 1,475 | 1,891 |
| 2.9% 10/31/46(Reg. S) (b) | EUR | 10,850 | 12,520 |
| Sultanate of Oman 6.5% 3/8/47 (b) | | 1,740 | 1,776 |
| Sweden Kingdom 3.5% 6/1/22 | SEK | 145,350 | 20,215 |
| Switzerland Confederation 3% 1/8/18 | CHF | 25,100 | 26,690 |
| Turkish Republic: | | | |
| 5.125% 3/25/22 | | 3,495 | 3,627 |
| 5.625% 3/30/21 | | 3,665 | 3,885 |
| 6% 3/25/27 | | 2,225 | 2,369 |
| 6.25% 9/26/22 | | 7,180 | 7,801 |
| 6.75% 5/30/40 | | 1,220 | 1,359 |
| 6.875% 3/17/36 | | 3,090 | 3,474 |
| 7% 6/5/20 | | 2,690 | 2,941 |
| 7.25% 3/5/38 | | 2,455 | 2,877 |
| 7.375% 2/5/25 | | 3,805 | 4,406 |
| 8% 2/14/34 | | 1,925 | 2,386 |
| 9.4% 7/8/20 | TRY | 11,505 | 3,182 |
| 11.875% 1/15/30 | | 3,070 | 4,874 |
| Turkiye Ihracat Kredi Bankasi A/S 5.375% 2/8/21 (b) | | 2,155 | 2,222 |
| Ukraine Government: | | | |
| 1.471% 9/29/21 | | 3,400 | 3,332 |
| 7.75% 9/1/21 (b) | | 12,504 | 12,700 |
| 7.75% 9/1/22 (b) | | 15,839 | 15,918 |
| 7.75% 9/1/23 (b) | | 1,589 | 1,573 |
| United Kingdom, Great Britain and Northern Ireland: | | | |
| 0.5% 7/22/22 | GBP | 20,000 | 25,842 |
| 1.25% 7/22/27 | GBP | 36,700 | 47,426 |
| 1.75% 7/22/19 (Reg.S) | GBP | 28,750 | 38,519 |
| United Kingdom, Great Britain and Northern Ireland Treasury Indexed-Linked GILT 2.5% 7/22/65 (Reg. S) | GBP | 16,300 | 26,797 |
| United Mexican States 6.5% 6/10/21 | MXN | 99,320 | 5,451 |
| Uruguay Republic: | | | |
| 7.875% 1/15/33 pay-in-kind | | 2,360 | 3,210 |
| 9.875% 6/20/22 (b) | UYU | 41,580 | 1,492 |
| Venezuelan Republic: | | | |
| oil recovery warrants 4/15/20 (l)(n) | | 97,601 | 390 |
| 9.25% 9/15/27 | | 9,555 | 4,730 |
| 11.95% 8/5/31 (Reg. S) | | 4,715 | 2,381 |
| 12.75% 8/23/22 | | 1,950 | 1,048 |
| Vietnamese Socialist Republic: | | | |
| 2.25% 3/13/28 (c) | | 530 | 468 |
| 4% 3/12/28 (m) | | 13,528 | 13,494 |
| 4.8% 11/19/24 (b) | | 590 | 620 |
| 6.75% 1/29/20 (b) | | 1,770 | 1,930 |
| TOTAL FOREIGN GOVERNMENT AND GOVERNMENT AGENCY OBLIGATIONS | | | |
| (Cost $1,668,619) | | | 1,715,981 |
|
| Supranational Obligations - 0.0% | | | |
European Bank for Reconstruction & Development 6% 5/4/20 (Reg. S)
(Cost $1,675) | INR | 108,300 | 1,700 |
| | | Shares | Value (000s) |
|
| Common Stocks - 4.9% | | | |
| CONSUMER DISCRETIONARY - 1.6% | | | |
| Auto Components - 0.4% | | | |
| Adient PLC | | 71,100 | 4,649 |
| Chassix Holdings, Inc. (n) | | 302,830 | 9,942 |
| Chassix Holdings, Inc. warrants 7/29/20 (n) | | 16,209 | 139 |
| Delphi Automotive PLC | | 58,300 | 5,110 |
| Exide Technologies (n) | | 3,795 | 0 |
| Exide Technologies (n) | | 12,652 | 0 |
| Lear Corp. | | 41,700 | 5,925 |
| Tenneco, Inc. | | 117,300 | 6,783 |
| | | | 32,548 |
| Diversified Consumer Services - 0.0% | | | |
| Houghton Mifflin Harcourt Co. warrants 6/22/19 (n)(o) | | 32,078 | 60 |
| Hotels, Restaurants & Leisure - 0.5% | | | |
| Extended Stay America, Inc. unit | | 664,300 | 12,861 |
| Melco Crown Entertainment Ltd. sponsored ADR | | 205,200 | 4,607 |
| MGM Mirage, Inc. | | 111,800 | 3,498 |
| Red Rock Resorts, Inc. | | 868,644 | 20,457 |
| | | | 41,423 |
| Household Durables - 0.2% | | | |
| CalAtlantic Group, Inc. | | 155,500 | 5,497 |
| Newell Brands, Inc. | | 74,045 | 3,970 |
| Taylor Morrison Home Corp. (n) | | 296,100 | 7,109 |
| | | | 16,576 |
| Internet & Direct Marketing Retail - 0.0% | | | |
| Expedia, Inc. | | 34,900 | 5,198 |
| Media - 0.5% | | | |
| Cinemark Holdings, Inc. | | 156,300 | 6,072 |
| DISH Network Corp. Class A (n) | | 57,300 | 3,596 |
| Liberty Global PLC Class A (n) | | 293,800 | 9,437 |
| Naspers Ltd. Class N | | 73,600 | 14,494 |
| Sinclair Broadcast Group, Inc. Class A | | 253,300 | 8,334 |
| | | | 41,933 |
|
| TOTAL CONSUMER DISCRETIONARY | | | 137,738 |
|
| CONSUMER STAPLES - 0.0% | | | |
| Food & Staples Retailing - 0.0% | | | |
| Ovation Acquisition I LLC (n)(o) | | 1,446,490 | 0 |
| Food Products - 0.0% | | | |
| Reddy Ice Holdings, Inc. (n) | | 142,776 | 43 |
|
| TOTAL CONSUMER STAPLES | | | 43 |
|
| ENERGY - 0.1% | | | |
| Energy Equipment & Services - 0.0% | | | |
| Forbes Energy Services Ltd. (n) | | 70,406 | 1,197 |
| Oil, Gas & Consumable Fuels - 0.1% | | | |
| Chaparral Energy, Inc.: | | | |
| Class A (n) | | 44,026 | 964 |
| Class B | | 10,647 | 233 |
| Crestwood Equity Partners LP | | 60,500 | 1,422 |
| Goodrich Petroleum Corp. | | 48,395 | 590 |
| Pacific Exploration and Production Corp. | | 168,535 | 4,451 |
| | | | 7,660 |
|
| TOTAL ENERGY | | | 8,857 |
|
| FINANCIALS - 0.1% | | | |
| Capital Markets - 0.0% | | | |
| Penson Worldwide, Inc. Class A (n) | | 3,883,237 | 0 |
| Consumer Finance - 0.1% | | | |
| OneMain Holdings, Inc. (n) | | 206,600 | 5,080 |
|
| TOTAL FINANCIALS | | | 5,080 |
|
| HEALTH CARE - 0.3% | | | |
| Health Care Providers & Services - 0.1% | | | |
| Envision Healthcare Corp. (n) | | 108,700 | 6,812 |
| HCA Holdings, Inc. (n) | | 75,400 | 6,575 |
| Rotech Healthcare, Inc. (n) | | 68,276 | 76 |
| | | | 13,463 |
| Pharmaceuticals - 0.2% | | | |
| Allergan PLC | | 58,800 | 14,294 |
|
| TOTAL HEALTH CARE | | | 27,757 |
|
| INDUSTRIALS - 0.5% | | | |
| Airlines - 0.2% | | | |
| Air Canada (n) | | 806,200 | 10,805 |
| Delta Air Lines, Inc. | | 78,000 | 4,192 |
| | | | 14,997 |
| Commercial Services & Supplies - 0.0% | | | |
| WP Rocket Holdings, Inc. (n)(o) | | 9,383,257 | 563 |
| Marine - 0.0% | | | |
| U.S. Shipping Partners Corp. (n) | | 12,063 | 0 |
| U.S. Shipping Partners Corp. warrants 12/31/29 (n) | | 112,939 | 0 |
| | | | 0 |
| Trading Companies & Distributors - 0.3% | | | |
| Air Lease Corp. Class A | | 123,200 | 4,603 |
| HD Supply Holdings, Inc. (n) | | 281,900 | 8,635 |
| Penhall Acquisition Co.: | | | |
| Class A (n) | | 6,088 | 488 |
| Class B (n) | | 2,029 | 163 |
| United Rentals, Inc. (n) | | 99,442 | 11,208 |
| | | | 25,097 |
| Transportation Infrastructure - 0.0% | | | |
| Tricer Holdco SCA (o) | | 213,632 | 1,470 |
|
| TOTAL INDUSTRIALS | | | 42,127 |
|
| INFORMATION TECHNOLOGY - 1.9% | | | |
| Communications Equipment - 0.0% | | | |
| CommScope Holding Co., Inc. (n) | | 115,000 | 4,373 |
| Electronic Equipment & Components - 0.1% | | | |
| CDW Corp. | | 79,800 | 4,990 |
| Internet Software & Services - 0.6% | | | |
| Alibaba Group Holding Ltd. sponsored ADR (n) | | 140,000 | 19,726 |
| Alphabet, Inc. Class A (n) | | 19,300 | 17,943 |
| Facebook, Inc. Class A (n) | | 125,400 | 18,933 |
| | | | 56,602 |
| IT Services - 0.4% | | | |
| First Data Corp. Class A (n) | | 359,700 | 6,547 |
| Global Payments, Inc. | | 61,200 | 5,528 |
| MasterCard, Inc. Class A | | 64,900 | 7,882 |
| PayPal Holdings, Inc. (n) | | 140,000 | 7,514 |
| Visa, Inc. Class A | | 37,300 | 3,498 |
| | | | 30,969 |
| Semiconductors & Semiconductor Equipment - 0.6% | | | |
| Broadcom Ltd. | | 58,100 | 13,540 |
| Cypress Semiconductor Corp. | | 5,171 | 71 |
| MagnaChip Semiconductor Corp. (n)(p) | | 49,030 | 480 |
| Microsemi Corp. (n) | | 157,800 | 7,385 |
| ON Semiconductor Corp. (n) | | 290,900 | 4,084 |
| Qorvo, Inc. (n) | | 146,227 | 9,259 |
| Qualcomm, Inc. | | 123,600 | 6,825 |
| Skyworks Solutions, Inc. | | 141,800 | 13,606 |
| | | | 55,250 |
| Software - 0.2% | | | |
| Adobe Systems, Inc. (n) | | 49,200 | 6,959 |
| Electronic Arts, Inc. (n) | | 69,700 | 7,369 |
| Nuance Communications, Inc. (n) | | 184,800 | 3,217 |
| | | | 17,545 |
|
| TOTAL INFORMATION TECHNOLOGY | | | 169,729 |
|
| MATERIALS - 0.1% | | | |
| Chemicals - 0.0% | | | |
| LyondellBasell Industries NV Class A | | 41,300 | 3,485 |
| Containers & Packaging - 0.0% | | | |
| Berry Global Group, Inc. (n) | | 68,600 | 3,911 |
| Metals & Mining - 0.1% | | | |
| Aleris Corp. (n) | | 38,307 | 223 |
| Freeport-McMoRan, Inc. (n) | | 348,000 | 4,179 |
| Mirabela Nickel Ltd. (n) | | 2,473,165 | 0 |
| | | | 4,402 |
|
| TOTAL MATERIALS | | | 11,798 |
|
| TELECOMMUNICATION SERVICES - 0.2% | | | |
| Diversified Telecommunication Services - 0.0% | | | |
| Altice U.S.A., Inc. Class A | | 146,000 | 4,716 |
| Wireless Telecommunication Services - 0.2% | | | |
| T-Mobile U.S., Inc. (n) | | 272,900 | 16,543 |
|
| TOTAL TELECOMMUNICATION SERVICES | | | 21,259 |
|
| UTILITIES - 0.1% | | | |
| Electric Utilities - 0.0% | | | |
| Portland General Electric Co. | | 7,275 | 332 |
| Independent Power and Renewable Electricity Producers - 0.1% | | | |
| The AES Corp. | | 464,200 | 5,157 |
|
| TOTAL UTILITIES | | | 5,489 |
|
| TOTAL COMMON STOCKS | | | |
| (Cost $371,861) | | | 429,877 |
|
| Preferred Stocks - 0.1% | | | |
| Convertible Preferred Stocks - 0.1% | | | |
| CONSUMER STAPLES - 0.0% | | | |
| Food Products - 0.0% | | | |
| Reddy Ice Holdings, Inc. 7.00% pay-in-kind (n) | | 57,438 | 534 |
| HEALTH CARE - 0.1% | | | |
| Pharmaceuticals - 0.1% | | | |
| Allergan PLC 5.50% | | 8,700 | 7,526 |
|
| TOTAL CONVERTIBLE PREFERRED STOCKS | | | 8,060 |
|
| Nonconvertible Preferred Stocks - 0.0% | | | |
| INDUSTRIALS - 0.0% | | | |
| Transportation Infrastructure - 0.0% | | | |
| Tricer Holdco SCA (o) | | 94,947,700 | 949 |
| TOTAL PREFERRED STOCKS | | | |
| (Cost $12,495) | | | 9,009 |
| | | Principal Amount (000s)(a) | Value (000s) |
|
| Bank Loan Obligations - 0.9% | | | |
| CONSUMER DISCRETIONARY - 0.1% | | | |
| Auto Components - 0.0% | | | |
| Chassix, Inc. term loan 12% 7/29/19 | | 3,382 | 3,382 |
| Diversified Consumer Services - 0.1% | | | |
| KUEHG Corp. Tranche B 1LN, term loan 5.0464% 8/13/22 (c) | | 4,810 | 4,831 |
| Media - 0.0% | | | |
| Livent, Inc. Tranche A, term loan 18% 1/15/49 pay-in-kind | CAD | 29 | 11 |
|
| TOTAL CONSUMER DISCRETIONARY | | | 8,224 |
|
| ENERGY - 0.4% | | | |
| Energy Equipment & Services - 0.1% | | | |
| Forbes Energy Services LLC Tranche B, term loan 12% 4/13/21 (c) | | 671 | 671 |
| Seadrill Operating LP Tranche B, term loan 4.2964% 2/21/21 (c) | | 8,381 | 5,331 |
| | | | 6,002 |
| Oil, Gas & Consumable Fuels - 0.3% | | | |
| Alon U.S.A. Partners LP term loan 9.25% 11/26/18 (c) | | 3,109 | 3,109 |
| California Resources Corp. Tranche 1LN, term loan 11.5339% 12/31/21 (c) | | 14,895 | 15,714 |
| Chesapeake Energy Corp. Tranche 1LN, term loan 8.6864% 8/23/21 (c) | | 5,265 | 5,562 |
| | | | 24,385 |
|
| TOTAL ENERGY | | | 30,387 |
|
| FINANCIALS - 0.0% | | | |
| Consumer Finance - 0.0% | | | |
| Sears Roebuck Acceptance Corp. Tranche B, term loan 8.5759% 7/20/20 (c) | | 3,242 | 3,272 |
| HEALTH CARE - 0.0% | | | |
| Health Care Providers & Services - 0.0% | | | |
| Bcp Raptor LLC Tranche B, term loan 5.4656% 6/22/24 (c) | | 2,785 | 2,750 |
| INDUSTRIALS - 0.0% | | | |
| Commercial Services & Supplies - 0.0% | | | |
| Optiv Security, Inc. Tranche 2LN, term loan 8.4375% 2/1/25 (c) | | 120 | 117 |
| INFORMATION TECHNOLOGY - 0.2% | | | |
| Software - 0.2% | | | |
| Almonde, Inc.: | | | |
| Tranche 2LN, term loan 8.4589% 6/13/25 (c) | | 385 | 392 |
| Tranche B 1LN, term loan 4.7364% 6/13/24 (c) | | 1,780 | 1,779 |
| Kronos, Inc. term loan 9.4196% 11/1/24 (c) | | 7,095 | 7,358 |
| Landesk Group, Inc. term loan: | | | |
| 5.48% 1/20/24 (c) | | 1,072 | 1,065 |
| 10.23% 1/20/25 (c) | | 3,390 | 3,384 |
| | | | 13,978 |
| MATERIALS - 0.1% | | | |
| Containers & Packaging - 0.0% | | | |
| Caraustar Industries, Inc. Tranche B, term loan 6.7964% 3/14/22 (c) | | 544 | 543 |
| Metals & Mining - 0.1% | | | |
| Essar Steel Algoma, Inc. Tranche B, term loan 0% 8/16/19 (e) | | 2,104 | 722 |
| Murray Energy Corp. Tranche B 2LN, term loan 8.5464% 4/16/20 (c) | | 8,030 | 7,830 |
| | | | 8,552 |
|
| TOTAL MATERIALS | | | 9,095 |
|
| UTILITIES - 0.1% | | | |
| Independent Power and Renewable Electricity Producers - 0.1% | | | |
| Energy Future Holdings Corp. Tranche B, term loan 6/23/18 (q) | | 11,245 | 11,273 |
| TOTAL BANK LOAN OBLIGATIONS | | | |
| (Cost $78,641) | | | 79,096 |
|
| Sovereign Loan Participations - 0.1% | | | |
| Indonesian Republic loan participation: | | | |
| Citibank 2.1875% 12/14/19 (c) | | 1,939 | 1,919 |
| Goldman Sachs 2.1875% 12/14/19 (c) | | 1,776 | 1,759 |
| Mizuho 2.1875% 12/14/19 (c) | | 1,269 | 1,256 |
| TOTAL SOVEREIGN LOAN PARTICIPATIONS | | | |
| (Cost $4,754) | | | 4,934 |
| | | Shares | Value (000s) |
|
| Fixed-Income Funds - 5.5% | | | |
| Fidelity Floating Rate Central Fund (r) | | | |
| (Cost $493,996) | | 4,670,412 | 482,500 |
| | | Principal Amount (000s)(a) | Value (000s) |
|
| Preferred Securities - 3.4% | | | |
| CONSUMER STAPLES - 0.1% | | | |
| Food Products - 0.1% | | | |
| Cosan Overseas Ltd. 8.25% (f) | | 8,065 | 8,173 |
| FINANCIALS - 3.2% | | | |
| Banks - 2.9% | | | |
| Alfa Bond Issuance PLC 8% (Reg. S) (c)(f) | | 4,225 | 4,511 |
| Banco Do Brasil SA 9% (b)(c)(f) | | 4,160 | 4,225 |
| Bank of America Corp.: | | | |
| 5.125% (c)(f) | | 10,690 | 10,938 |
| 5.2% (c)(f) | | 23,520 | 23,854 |
| 6.25% (c)(f) | | 7,170 | 7,941 |
| Barclays Bank PLC 7.625% 11/21/22 | | 8,780 | 10,117 |
| Citigroup, Inc.: | | | |
| 5.8% (c)(f) | | 8,960 | 9,407 |
| 5.9% (c)(f) | | 13,975 | 15,267 |
| 5.95% (c)(f) | | 25,260 | 27,501 |
| 6.25% (c)(f) | | 6,405 | 7,256 |
| 6.3% (c)(f) | | 2,145 | 2,302 |
| JPMorgan Chase & Co.: | | | |
| 5% (c)(f) | | 12,930 | 13,544 |
| 5.3% (c)(f) | | 6,510 | 6,836 |
| 6% (c)(f) | | 28,270 | 31,146 |
| 6.125% (c)(f) | | 5,990 | 6,539 |
| 6.75% (c)(f) | | 3,295 | 3,836 |
| Royal Bank of Scotland Group PLC 8.625% (c)(f) | | 13,440 | 14,654 |
| Wells Fargo & Co.: | | | |
| 5.875% (c)(f) | | 19,480 | 21,516 |
| 5.9% (c)(f) | | 24,365 | 26,158 |
| | | | 247,548 |
| Capital Markets - 0.3% | | | |
| Goldman Sachs Group, Inc.: | | | |
| 5.375% (c)(f) | | 11,780 | 12,468 |
| 5.7% (c)(f) | | 13,704 | 14,373 |
| | | | 26,841 |
| Diversified Financial Services - 0.0% | | | |
| Magnesita Finance Ltd.: | | | |
| 8.625% (b)(f) | | 3,075 | 3,139 |
| 8.625% (Reg. S) (f) | | 380 | 388 |
| | | | 3,527 |
|
| TOTAL FINANCIALS | | | 277,916 |
|
| INDUSTRIALS - 0.1% | | | |
| Construction & Engineering - 0.1% | | | |
| Odebrecht Finance Ltd.: | | | |
| 7.5% (b)(f) | | 16,385 | 7,481 |
| 7.5% (Reg. S) (f) | | 250 | 114 |
| | | | 7,595 |
| MATERIALS - 0.0% | | | |
| Metals & Mining - 0.0% | | | |
| CSN Islands XII Corp. 7% (Reg. S) (f) | | 5,650 | 3,489 |
| TOTAL PREFERRED SECURITIES | | | |
| (Cost $287,349) | | | 297,173 |
| | | Shares | Value (000s) |
|
| Money Market Funds - 4.2% | | | |
| Fidelity Cash Central Fund, 1.10% (s) | | 367,910,670 | 367,984 |
| Fidelity Securities Lending Cash Central Fund 1.09% (s)(t) | | 264,987 | 265 |
| TOTAL MONEY MARKET FUNDS | | | |
| (Cost $368,226) | | | 368,249 |
| TOTAL INVESTMENT PORTFOLIO - 100.4% | | | |
| (Cost $8,491,368) | | | 8,738,804 |
| NET OTHER ASSETS (LIABILITIES) - (0.4)% | | | (38,385) |
| NET ASSETS - 100% | | | $8,700,419 |
| Futures Contracts | | | |
| | Expiration Date | Underlying Face Amount at Value (000s) | Unrealized Appreciation/(Depreciation) (000s) |
| Purchased | | | |
| Treasury Contracts | | | |
| 166 CBOT 10-Year U.S. Treasury Note Contracts (United States) | Sept. 2017 | 20,838 | $(50) |
| 271 CBOT 2-Year U.S. Treasury Note Contracts (United States) | Sept. 2017 | 58,566 | (89) |
| 203 CBOT Ultra Long Term U.S. Treasury Bond Contracts (United States) | Sept. 2017 | 33,673 | 510 |
| TOTAL FUTURES CONTRACTS | | | $371 |
The face value of futures purchased as a percentage of Net Assets is 1.3%
Swaps
| Clearinghouse/Counterparty(1) | Expiration Date | Notional Amount (000s) | Payment Received | Payment Paid | Value (000s) | Upfront Premium Received/(Paid) (000s)(2) | Unrealized Appreciation/(Depreciation) (000s) |
| Interest Rate Swaps | | | | | | | |
| CME | Sep. 2019 | USD 25,000 | 1.75% | 3-month LIBOR | $(28) | $0 | $(28) |
(1) Swaps with CME Group (CME) are centrally cleared over-the-counter (OTC) swaps.
(2) Any premiums for centrally cleared OTC swaps are recorded periodically throughout the term of the swap to variation margin and included in unrealized appreciation (depreciation).
Currency Abbreviations
ARS – Argentine peso
AUD – Australian dollar
BRL – Brazilian real
CAD – Canadian dollar
CHF – Swiss franc
DKK – Danish krone
EUR – European Monetary Unit
GBP – British pound
HKD – Hong Kong dollar
IDR – Indonesian rupiah
INR – Indian rupee
JPY – Japanese yen
MXN – Mexican peso
NOK – Norwegian krone
NZD – New Zealand dollar
PEN – Peruvian new sol
SEK – Swedish krona
SGD – Singapore dollar
TRY – Turkish Lira
UYU – Uruguay peso
Values shown as $0 may reflect amounts less than $500.
Legend
(a) Amount is stated in United States dollars unless otherwise noted.
(b) Security exempt from registration under Rule 144A of the Securities Act of 1933. These securities may be resold in transactions exempt from registration, normally to qualified institutional buyers. At the end of the period, the value of these securities amounted to $1,947,420,000 or 22.4% of net assets.
(c) Coupon rates for floating and adjustable rate securities reflect the rates in effect at period end.
(d) Security or a portion of the security purchased on a delayed delivery or when-issued basis.
(e) Non-income producing - Security is in default.
(f) Security is perpetual in nature with no stated maturity date.
(g) Security or a portion of the security was pledged to cover margin requirements for futures contracts. At period end, the value of securities pledged amounted to $1,343,000.
(h) Security or a portion of the security was pledged to cover margin requirements for centrally cleared OTC swaps. At period end, the value of securities pledged amounted to $208,000.
(i) Represents an investment in an underlying pool of reverse mortgages which typically do not require regular principal and interest payments as repayment is deferred until a maturity event.
(j) Security represents right to receive monthly interest payments on an underlying pool of mortgages or assets. Principal shown is the outstanding par amount of the pool as of the end of the period.
(k) Coupon is inversely indexed to a floating interest rate multiplied by a specified factor. The price may be considerably more volatile than the price of a comparable fixed rate security.
(l) Quantity represents share amount.
(m) Security initially issued at one coupon which converts to a higher coupon at a specified date. The rate shown is the rate at period end.
(n) Non-income producing
(o) Restricted securities - Investment in securities not registered under the Securities Act of 1933 (excluding 144A issues). At the end of the period, the value of restricted securities (excluding 144A issues) amounted to $3,043,000 or 0.0% of net assets.
(p) Security or a portion of the security is on loan at period end.
(q) The coupon rate will be determined upon settlement of the loan after period end.
(r) Affiliated fund that is generally available only to investment companies and other accounts managed by Fidelity Investments. A complete unaudited schedule of portfolio holdings for each Fidelity Central Fund is filed with the SEC for the first and third quarters of each fiscal year on Form N-Q and is available upon request or at the SEC's website at www.sec.gov. An unaudited holdings listing for the Fund, which presents direct holdings as well as the pro-rata share of securities and other investments held indirectly through its investment in underlying non-money market Fidelity Central Funds, is available at fidelity.com and/or institutional.fidelity.com, as applicable. In addition, each Fidelity Central Fund's financial statements, which are not covered by the Fund's Report of Independent Registered Public Accounting Firm, are available on the SEC's website or upon request.
(s) Affiliated fund that is generally available only to investment companies and other accounts managed by Fidelity Investments. The rate quoted is the annualized seven-day yield of the fund at period end. A complete unaudited listing of the fund's holdings as of its most recent quarter end is available upon request. In addition, each Fidelity Central Fund's financial statements, which are not covered by the Fund's Report of Independent Registered Public Accounting Firm, are available on the SEC's website or upon request.
(t) Investment made with cash collateral received from securities on loan.
Additional information on each restricted holding is as follows:
| Security | Acquisition Date | Acquisition Cost (000s) |
| Houghton Mifflin Harcourt Co. warrants 6/22/19 | 6/22/12 | $62 |
| Ovation Acquisition I LLC | 12/23/15 | $14 |
| Tricer Holdco SCA | 12/19/16 | $5,239 |
| Tricer Holdco SCA | 12/19/16 | $3,385 |
| WP Rocket Holdings, Inc. | 6/24/11 - 2/2/15 | $4,887 |
Affiliated Central Funds
Information regarding fiscal year to date income earned by the Fund from investments in Fidelity Central Funds is as follows:
| Fund | Income earned |
| | (Amounts in thousands) |
| Fidelity Cash Central Fund | $868 |
| Fidelity Floating Rate Central Fund | 13,573 |
| Fidelity Securities Lending Cash Central Fund | 1 |
| Total | $14,442 |
Additional information regarding the Fund's fiscal year to date purchases and sales, including the ownership percentage, of the non Money Market Central Funds is as follows:
| Fund (Amounts in thousands) | Value, beginning of period | Purchases | Sales Proceeds | Value, end of period | % ownership, end of period |
| Fidelity Floating Rate Central Fund | $590,803 | $1,649 | $109,143 | $482,500 | 32.2% |
| Total | $590,803 | $1,649 | $109,143 | $482,500 | |
Investment Valuation
The following is a summary of the inputs used, as of June 30, 2017, involving the Fund's assets and liabilities carried at fair value. The inputs or methodology used for valuing securities may not be an indication of the risk associated with investing in those securities. For more information on valuation inputs, and their aggregation into the levels used below, please refer to the Investment Valuation section in the accompanying Notes to Financial Statements.
| | Valuation Inputs at Reporting Date: |
| Description | Total | Level 1 | Level 2 | Level 3 |
| (Amounts in thousands) | | | | |
| Investments in Securities: | | | | |
| Equities: | | | | |
| Consumer Discretionary | $137,738 | $113,103 | $14,554 | $10,081 |
| Consumer Staples | 577 | -- | -- | 577 |
| Energy | 8,857 | 8,857 | -- | -- |
| Financials | 5,080 | 5,080 | -- | -- |
| Health Care | 35,283 | 27,681 | 7,526 | 76 |
| Industrials | 43,076 | 39,443 | -- | 3,633 |
| Information Technology | 169,729 | 169,729 | -- | -- |
| Materials | 11,798 | 11,575 | -- | 223 |
| Telecommunication Services | 21,259 | 21,259 | -- | -- |
| Utilities | 5,489 | 5,489 | -- | -- |
| Corporate Bonds | 3,303,344 | -- | 3,296,376 | 6,968 |
| U.S. Government and Government Agency Obligations | 1,555,752 | -- | 1,555,752 | -- |
| U.S. Government Agency - Mortgage Securities | 92,490 | -- | 92,490 | -- |
| Asset-Backed Securities | 27,031 | -- | 27,031 | -- |
| Collateralized Mortgage Obligations | 293,743 | -- | 293,743 | -- |
| Commercial Mortgage Securities | 77,925 | -- | 77,925 | -- |
| Foreign Government and Government Agency Obligations | 1,715,981 | -- | 1,696,069 | 19,912 |
| Supranational Obligations | 1,700 | -- | 1,700 | -- |
| Bank Loan Obligations | 79,096 | -- | 75,032 | 4,064 |
| Sovereign Loan Participations | 4,934 | -- | -- | 4,934 |
| Fixed-Income Funds | 482,500 | 482,500 | -- | -- |
| Preferred Securities | 297,173 | -- | 297,173 | -- |
| Money Market Funds | 368,249 | 368,249 | -- | -- |
| Total Investments in Securities: | $8,738,804 | $1,252,965 | $7,435,371 | $50,468 |
| Derivative Instruments: | | | | |
| Assets | | | | |
| Futures Contracts | $510 | $510 | $-- | $-- |
| Total Assets | $510 | $510 | $-- | $-- |
| Liabilities | | | | |
| Futures Contracts | $(139) | $(139) | $-- | $-- |
| Swaps | (28) | -- | (28) | -- |
| Total Liabilities | $(167) | $(139) | $(28) | $-- |
| Total Derivative Instruments: | $343 | $371 | $(28) | $-- |
Value of Derivative Instruments
The following table is a summary of the Fund's value of derivative instruments by primary risk exposure as of June 30, 2017. For additional information on derivative instruments, please refer to the Derivative Instruments section in the accompanying Notes to Financial Statements.
| Primary Risk Exposure / Derivative Type | Value |
| | Asset | Liability |
| (Amounts in thousands) | | |
| Interest Rate Risk | | |
| Futures Contracts(a) | $510 | $(139) |
| Swaps(b) | 0 | (28) |
| Total Value of Derivatives | $510 | $(167) |
(a) Reflects gross cumulative appreciation (depreciation) on futures contracts as presented in the Schedule of Investments. In the Statement of Assets and Liabilities, the period end daily variation margin is included in receivable or payable for daily variation margin for derivative instruments, and the net cumulative appreciation (depreciation) is included in net unrealized appreciation (depreciation).
(b) For centrally cleared OTC swaps, reflects gross cumulative appreciation (depreciation) as presented in the Schedule of Investments. In the Statement of Assets and Liabilities, the period end daily variation margin for centrally cleared OTC swaps is included in receivable or payable for daily variation margin for derivative instruments, and the net cumulative appreciation (depreciation) for centrally cleared OTC swaps is included in net unrealized appreciation (depreciation).
Other Information
Distribution of investments by country or territory of incorporation, as a percentage of Total Net Assets, is as follows (Unaudited):
| United States of America | 63.6% |
| Luxembourg | 3.0% |
| France | 2.9% |
| Japan | 2.8% |
| Germany | 2.7% |
| United Kingdom | 2.7% |
| Canada | 2.6% |
| Netherlands | 2.0% |
| Argentina | 1.9% |
| Italy | 1.6% |
| Mexico | 1.1% |
| Ireland | 1.0% |
| Others (Individually Less Than 1%) | 12.1% |
| | 100.0% |
The information in the above tables is based on the combined investments of the fund and its pro-rata share of the investments of Fidelity's Fixed-Income Central Funds
See accompanying notes which are an integral part of the financial statements.
Financial Statements
Statement of Assets and Liabilities
| Amounts in thousands (except per-share amounts) | | June 30, 2017 |
| Assets | | |
Investment in securities, at value (including securities loaned of $260) — See accompanying schedule:
Unaffiliated issuers (cost $7,629,146) | $7,888,055 | |
| Fidelity Central Funds (cost $862,222) | 850,749 | |
| Total Investments (cost $8,491,368) | | $8,738,804 |
| Foreign currency held at value (cost $15) | | 15 |
| Receivable for investments sold | | 113,052 |
| Receivable for fund shares sold | | 10,702 |
| Dividends receivable | | 236 |
| Interest receivable | | 76,732 |
| Distributions receivable from Fidelity Central Funds | | 2,213 |
| Other receivables | | 641 |
| Total assets | | 8,942,395 |
| Liabilities | | |
| Payable to custodian bank | $2 | |
| Payable for investments purchased | | |
| Regular delivery | 170,953 | |
| Delayed delivery | 48,373 | |
| Payable for fund shares redeemed | 13,923 | |
| Distributions payable | 1,140 | |
| Accrued management fee | 4,016 | |
| Distribution and service plan fees payable | 1,717 | |
| Payable for daily variation margin for derivative instruments | 224 | |
| Other affiliated payables | 1,209 | |
| Other payables and accrued expenses | 154 | |
| Collateral on securities loaned | 265 | |
| Total liabilities | | 241,976 |
| Net Assets | | $8,700,419 |
| Net Assets consist of: | | |
| Paid in capital | | $8,359,180 |
| Undistributed net investment income | | 40,058 |
| Accumulated undistributed net realized gain (loss) on investments and foreign currency transactions | | 53,269 |
| Net unrealized appreciation (depreciation) on investments and assets and liabilities in foreign currencies | | 247,912 |
| Net Assets | | $8,700,419 |
| Calculation of Maximum Offering Price | | |
| Class A: | | |
| Net Asset Value and redemption price per share ($1,967,205 ÷ 160,541 shares) | | $12.25 |
| Maximum offering price per share (100/96.00 of $12.25) | | $12.76 |
| Class M: | | |
| Net Asset Value and redemption price per share ($875,340 ÷ 71,473 shares) | | $12.25 |
| Maximum offering price per share (100/96.00 of $12.25) | | $12.76 |
| Class C: | | |
| Net Asset Value and offering price per share ($1,336,565 ÷ 109,356 shares)(a) | | $12.22 |
| Class I: | | |
| Net Asset Value, offering price and redemption price per share ($4,521,309 ÷ 364,030 shares) | | $12.42 |
(a) Redemption price per share is equal to net asset value less any applicable contingent deferred sales charge.
See accompanying notes which are an integral part of the financial statements.
Statement of Operations
| Amounts in thousands | | Six months ended June 30, 2017 |
| Investment Income | | |
| Dividends | | $11,295 |
| Interest (including $38 from security lending) | | 158,794 |
| Income from Fidelity Central Funds | | 14,442 |
| Total income | | 184,531 |
| Expenses | | |
| Management fee | $23,554 | |
| Transfer agent fees | 6,481 | |
| Distribution and service plan fees | 10,925 | |
| Accounting and security lending fees | 754 | |
| Custodian fees and expenses | 127 | |
| Independent trustees' fees and expenses | 16 | |
| Registration fees | 143 | |
| Audit | 127 | |
| Legal | (50) | |
| Miscellaneous | 42 | |
| Total expenses before reductions | 42,119 | |
| Expense reductions | (42) | 42,077 |
| Net investment income (loss) | | 142,454 |
| Realized and Unrealized Gain (Loss) | | |
| Net realized gain (loss) on: | | |
| Investment securities: | | |
| Unaffiliated issuers | 55,856 | |
| Fidelity Central Funds | 16,375 | |
| Foreign currency transactions | (56) | |
| Futures contracts | 1,228 | |
| Swaps | (84) | |
| Total net realized gain (loss) | | 73,319 |
Change in net unrealized appreciation (depreciation) on:
Investment securities | 165,141 | |
| Assets and liabilities in foreign currencies | 513 | |
| Futures contracts | 822 | |
| Swaps | 106 | |
| Total change in net unrealized appreciation (depreciation) | | 166,582 |
| Net gain (loss) | | 239,901 |
| Net increase (decrease) in net assets resulting from operations | | $382,355 |
See accompanying notes which are an integral part of the financial statements.
Statement of Changes in Net Assets
| Amounts in thousands | Six months ended June 30, 2017 | Year ended December 31, 2016 |
| Increase (Decrease) in Net Assets | | |
| Operations | | |
| Net investment income (loss) | $142,454 | $300,896 |
| Net realized gain (loss) | 73,319 | 7,311 |
| Change in net unrealized appreciation (depreciation) | 166,582 | 366,805 |
| Net increase (decrease) in net assets resulting from operations | 382,355 | 675,012 |
| Distributions to shareholders from net investment income | (125,635) | (269,601) |
| Share transactions - net increase (decrease) | 175,829 | (553,605) |
| Total increase (decrease) in net assets | 432,549 | (148,194) |
| Net Assets | | |
| Beginning of period | 8,267,870 | 8,416,064 |
| End of period | $8,700,419 | $8,267,870 |
| Other Information | | |
| Undistributed net investment income end of period | $40,058 | $23,239 |
See accompanying notes which are an integral part of the financial statements.
Financial Highlights — Fidelity Advisor Strategic Income Fund Class A
| | Six months ended June 30, | Years ended December 31, | | | | |
| | 2017 | 2016 | 2015 | 2014 | 2013 | 2012 |
| Selected Per–Share Data | | | | | | |
| Net asset value, beginning of period | $11.88 | $11.32 | $11.92 | $12.10 | $12.69 | $12.07 |
| Income from Investment Operations | | | | | | |
| Net investment income (loss)A | .207 | .428 | .420 | .422 | .449 | .479 |
| Net realized and unrealized gain (loss) | .344 | .516 | (.629) | .005 | (.441) | .776 |
| Total from investment operations | .551 | .944 | (.209) | .427 | .008 | 1.255 |
| Distributions from net investment income | (.181) | (.384) | (.307) | (.419) | (.431) | (.442) |
| Distributions from net realized gain | – | – | (.007) | (.188) | (.167) | (.193) |
| Tax return of capital | – | – | (.077) | – | – | – |
| Total distributions | (.181) | (.384) | (.391) | (.607) | (.598) | (.635) |
| Net asset value, end of period | $12.25 | $11.88 | $11.32 | $11.92 | $12.10 | $12.69 |
| Total ReturnB,C,D | 4.66% | 8.42% | (1.84)% | 3.52% | .08% | 10.57% |
| Ratios to Average Net AssetsE,F | | | | | | |
| Expenses before reductions | 1.00%G | 1.01% | 1.00% | .99% | .98% | .98% |
| Expenses net of fee waivers, if any | 1.00%G | 1.01% | 1.00% | .99% | .98% | .98% |
| Expenses net of all reductions | 1.00%G | 1.01% | 1.00% | .99% | .98% | .98% |
| Net investment income (loss) | 3.41%G | 3.64% | 3.55% | 3.42% | 3.61% | 3.83% |
| Supplemental Data | | | | | | |
| Net assets, end of period (in millions) | $1,967 | $3,098 | $3,274 | $3,794 | $4,205 | $5,582 |
| Portfolio turnover rateH | 128%G | 76% | 88% | 121% | 135% | 126% |
A Calculated based on average shares outstanding during the period.
B Total returns for periods of less than one year are not annualized.
C Total returns would have been lower if certain expenses had not been reduced during the applicable periods shown.
D Total returns do not include the effect of the sales charges.
E Fees and expenses of any underlying Fidelity Central Funds are not included in the Fund's expense ratio. The Fund indirectly bears its proportionate share of the expenses of any underlying Fidelity Central Funds. Based on their most recent shareholder report date, the expenses of any underlying non-money market Fidelity Central Funds were .05%.
F Expense ratios reflect operating expenses of the class. Expenses before reductions do not reflect amounts reimbursed by the investment adviser or reductions from brokerage service arrangements or reductions from other expense offset arrangements and do not represent the amount paid by the class during periods when reimbursements or reductions occur. Expenses net of fee waivers reflect expenses after reimbursement by the investment adviser but prior to reductions from brokerage service arrangements or other expense offset arrangements. Expenses net of all reductions represent the net expenses paid by the class.
G Annualized
H Amount does not include the portfolio activity of any underlying Fidelity Central Funds.
See accompanying notes which are an integral part of the financial statements.
Financial Highlights — Fidelity Advisor Strategic Income Fund Class M
| | Six months ended June 30, | Years ended December 31, | | | | |
| | 2017 | 2016 | 2015 | 2014 | 2013 | 2012 |
| Selected Per–Share Data | | | | | | |
| Net asset value, beginning of period | $11.88 | $11.31 | $11.92 | $12.10 | $12.68 | $12.07 |
| Income from Investment Operations | | | | | | |
| Net investment income (loss)A | .206 | .428 | .420 | .422 | .449 | .479 |
| Net realized and unrealized gain (loss) | .345 | .526 | (.639) | .006 | (.431) | .766 |
| Total from investment operations | .551 | .954 | (.219) | .428 | .018 | 1.245 |
| Distributions from net investment income | (.181) | (.384) | (.307) | (.420) | (.431) | (.442) |
| Distributions from net realized gain | – | – | (.007) | (.188) | (.167) | (.193) |
| Tax return of capital | – | – | (.077) | – | – | – |
| Total distributions | (.181) | (.384) | (.391) | (.608) | (.598) | (.635) |
| Net asset value, end of period | $12.25 | $11.88 | $11.31 | $11.92 | $12.10 | $12.68 |
| Total ReturnB,C,D | 4.66% | 8.52% | (1.93)% | 3.52% | .17% | 10.49% |
| Ratios to Average Net AssetsE,F | | | | | | |
| Expenses before reductions | 1.00%G | 1.01% | 1.00% | .99% | .98% | .98% |
| Expenses net of fee waivers, if any | 1.00%G | 1.00% | 1.00% | .99% | .98% | .98% |
| Expenses net of all reductions | 1.00%G | 1.00% | 1.00% | .99% | .98% | .98% |
| Net investment income (loss) | 3.42%G | 3.64% | 3.55% | 3.42% | 3.61% | 3.83% |
| Supplemental Data | | | | | | |
| Net assets, end of period (in millions) | $875 | $967 | $1,008 | $1,179 | $1,265 | $1,554 |
| Portfolio turnover rateH | 128%G | 76% | 88% | 121% | 135% | 126% |
A Calculated based on average shares outstanding during the period.
B Total returns for periods of less than one year are not annualized.
C Total returns would have been lower if certain expenses had not been reduced during the applicable periods shown.
D Total returns do not include the effect of the sales charges.
E Fees and expenses of any underlying Fidelity Central Funds are not included in the Fund's expense ratio. The Fund indirectly bears its proportionate share of the expenses of any underlying Fidelity Central Funds. Based on their most recent shareholder report date, the expenses of any underlying non-money market Fidelity Central Funds were .05%.
F Expense ratios reflect operating expenses of the class. Expenses before reductions do not reflect amounts reimbursed by the investment adviser or reductions from brokerage service arrangements or reductions from other expense offset arrangements and do not represent the amount paid by the class during periods when reimbursements or reductions occur. Expenses net of fee waivers reflect expenses after reimbursement by the investment adviser but prior to reductions from brokerage service arrangements or other expense offset arrangements. Expenses net of all reductions represent the net expenses paid by the class.
G Annualized
H Amount does not include the portfolio activity of any underlying Fidelity Central Funds.
See accompanying notes which are an integral part of the financial statements.
Financial Highlights — Fidelity Advisor Strategic Income Fund Class C
| | Six months ended June 30, | Years ended December 31, | | | | |
| | 2017 | 2016 | 2015 | 2014 | 2013 | 2012 |
| Selected Per–Share Data | | | | | | |
| Net asset value, beginning of period | $11.85 | $11.29 | $11.89 | $12.07 | $12.66 | $12.05 |
| Income from Investment Operations | | | | | | |
| Net investment income (loss)A | .160 | .339 | .331 | .329 | .355 | .384 |
| Net realized and unrealized gain (loss) | .346 | .516 | (.629) | .007 | (.440) | .767 |
| Total from investment operations | .506 | .855 | (.298) | .336 | (.085) | 1.151 |
| Distributions from net investment income | (.136) | (.295) | (.236) | (.328) | (.338) | (.348) |
| Distributions from net realized gain | – | – | (.007) | (.188) | (.167) | (.193) |
| Tax return of capital | – | – | (.059) | – | – | – |
| Total distributions | (.136) | (.295) | (.302) | (.516) | (.505) | (.541) |
| Net asset value, end of period | $12.22 | $11.85 | $11.29 | $11.89 | $12.07 | $12.66 |
| Total ReturnB,C,D | 4.28% | 7.63% | (2.59)% | 2.76% | (.66)% | 9.68% |
| Ratios to Average Net AssetsE,F | | | | | | |
| Expenses before reductions | 1.75%G | 1.75% | 1.75% | 1.73% | 1.73% | 1.73% |
| Expenses net of fee waivers, if any | 1.75%G | 1.75% | 1.75% | 1.73% | 1.73% | 1.73% |
| Expenses net of all reductions | 1.75%G | 1.75% | 1.75% | 1.73% | 1.73% | 1.73% |
| Net investment income (loss) | 2.66%G | 2.90% | 2.80% | 2.67% | 2.86% | 3.08% |
| Supplemental Data | | | | | | |
| Net assets, end of period (in millions) | $1,337 | $1,376 | $1,429 | $1,664 | $1,767 | $2,238 |
| Portfolio turnover rateH | 128%G | 76% | 88% | 121% | 135% | 126% |
A Calculated based on average shares outstanding during the period.
B Total returns for periods of less than one year are not annualized.
C Total returns would have been lower if certain expenses had not been reduced during the applicable periods shown.
D Total returns do not include the effect of the contingent deferred sales charge.
E Fees and expenses of any underlying Fidelity Central Funds are not included in the Fund's expense ratio. The Fund indirectly bears its proportionate share of the expenses of any underlying Fidelity Central Funds. Based on their most recent shareholder report date, the expenses of any underlying non-money market Fidelity Central Funds were .05%.
F Expense ratios reflect operating expenses of the class. Expenses before reductions do not reflect amounts reimbursed by the investment adviser or reductions from brokerage service arrangements or reductions from other expense offset arrangements and do not represent the amount paid by the class during periods when reimbursements or reductions occur. Expenses net of fee waivers reflect expenses after reimbursement by the investment adviser but prior to reductions from brokerage service arrangements or other expense offset arrangements. Expenses net of all reductions represent the net expenses paid by the class.
G Annualized
H Amount does not include the portfolio activity of any underlying Fidelity Central Funds.
See accompanying notes which are an integral part of the financial statements.
Financial Highlights — Fidelity Advisor Strategic Income Fund Class I
| | Six months ended June 30, | Years ended December 31, | | | | |
| | 2017 | 2016 | 2015 | 2014 | 2013 | 2012 |
| Selected Per–Share Data | | | | | | |
| Net asset value, beginning of period | $12.05 | $11.47 | $12.09 | $12.26 | $12.84 | $12.21 |
| Income from Investment Operations | | | | | | |
| Net investment income (loss)A | .221 | .463 | .452 | .455 | .484 | .514 |
| Net realized and unrealized gain (loss) | .348 | .535 | (.650) | .012 | (.437) | .779 |
| Total from investment operations | .569 | .998 | (.198) | .467 | .047 | 1.293 |
| Distributions from net investment income | (.199) | (.418) | (.332) | (.449) | (.460) | (.470) |
| Distributions from net realized gain | – | – | (.007) | (.188) | (.167) | (.193) |
| Tax return of capital | – | – | (.083) | – | – | – |
| Total distributions | (.199) | (.418) | (.422) | (.637) | (.627) | (.663) |
| Net asset value, end of period | $12.42 | $12.05 | $11.47 | $12.09 | $12.26 | $12.84 |
| Total ReturnB,C | 4.75% | 8.80% | (1.73)% | 3.80% | .39% | 10.78% |
| Ratios to Average Net AssetsD,E | | | | | | |
| Expenses before reductions | .74%F | .76% | .78% | .76% | .75% | .75% |
| Expenses net of fee waivers, if any | .74%F | .76% | .78% | .76% | .75% | .75% |
| Expenses net of all reductions | .74%F | .76% | .78% | .76% | .75% | .75% |
| Net investment income (loss) | 3.67%F | 3.89% | 3.77% | 3.65% | 3.84% | 4.07% |
| Supplemental Data | | | | | | |
| Net assets, end of period (in millions) | $4,521 | $2,827 | $2,640 | $2,682 | $2,179 | $2,759 |
| Portfolio turnover rateG | 128%F | 76% | 88% | 121% | 135% | 126% |
A Calculated based on average shares outstanding during the period.
B Total returns for periods of less than one year are not annualized.
C Total returns would have been lower if certain expenses had not been reduced during the applicable periods shown.
D Fees and expenses of any underlying Fidelity Central Funds are not included in the Fund's expense ratio. The Fund indirectly bears its proportionate share of the expenses of any underlying Fidelity Central Funds. Based on their most recent shareholder report date, the expenses of any underlying non-money market Fidelity Central Funds were .05%.
E Expense ratios reflect operating expenses of the class. Expenses before reductions do not reflect amounts reimbursed by the investment adviser or reductions from brokerage service arrangements or reductions from other expense offset arrangements and do not represent the amount paid by the class during periods when reimbursements or reductions occur. Expenses net of fee waivers reflect expenses after reimbursement by the investment adviser but prior to reductions from brokerage service arrangements or other expense offset arrangements. Expenses net of all reductions represent the net expenses paid by the class.
F Annualized
G Amount does not include the portfolio activity of any underlying Fidelity Central Funds.
See accompanying notes which are an integral part of the financial statements.
Notes to Financial Statements
For the period ended June 30, 2017
(Amounts in thousands except percentages)
1. Organization.
Fidelity Advisor Strategic Income Fund (the Fund) is a fund of Fidelity Advisor Series II (the Trust) and is authorized to issue an unlimited number of shares. The Trust is registered under the Investment Company Act of 1940, as amended (the 1940 Act), as an open-end management investment company organized as a Massachusetts business trust. The Fund offers Class A, Class M (formerly Class T), Class C and Class I shares, each of which has equal rights as to assets and voting privileges. Each class has exclusive voting rights with respect to matters that affect that class. The Fund's investments in emerging markets can be subject to social, economic, regulatory, and political uncertainties and can be extremely volatile.
After the close of business on June 24, 2016, all outstanding Class B shares were converted to Class A shares. All prior fiscal period dollar and share amounts for Class B presented in the Notes to Financial Statements are for the period January 1, 2016 through June 24, 2016.
2. Investments in Fidelity Central Funds.
The Fund invests in Fidelity Central Funds, which are open-end investment companies generally available only to other investment companies and accounts managed by the investment adviser and its affiliates. The Fund's Schedule of Investments lists each of the Fidelity Central Funds held as of period end, if any, as an investment of the Fund, but does not include the underlying holdings of each Fidelity Central Fund. As an Investing Fund, the Fund indirectly bears its proportionate share of the expenses of the underlying Fidelity Central Funds.
Based on its investment objective, each Fidelity Central Fund may invest or participate in various investment vehicles or strategies that are similar to those of the Fund. These strategies are consistent with the investment objectives of the Fund and may involve certain economic risks which may cause a decline in value of each of the Fidelity Central Funds and thus a decline in the value of the Fund. The Money Market Central Funds seek preservation of capital and current income and are managed by Fidelity Investments Money Management, Inc. (FIMM), an affiliate of the investment adviser. Annualized expenses of the Money Market Central Funds as of their most recent shareholder report date are less than .005%. The following summarizes the Fund's investment in each non-money market Fidelity Central Fund.
| Fidelity Central Fund | Investment Manager | Investment Objective | Investment Practices | Expense Ratio(a) |
| Fidelity Floating Rate Central Fund | FMR Co., Inc. (FMRC) | Seeks a high level of income by normally investing in floating rate loans and other floating rate securities. | Loans & Direct Debt Instruments
Restricted Securities | 0.05% |
(a) Expenses expressed as a percentage of average net assets and are as of each underlying Central Fund's most recent annual or semi-annual shareholder report.
An unaudited holdings listing for the Fund, which presents direct holdings as well as the pro-rata share of any securities and other investments held indirectly through its investment in underlying non-money market Fidelity Central Funds, is available at institutional.fidelity.com. A complete unaudited list of holdings for each Fidelity Central Fund is available upon request or at the Securities and Exchange Commission (the SEC) website at www.sec.gov. In addition, the financial statements of the Fidelity Central Funds which contain the significant accounting policies (including investment valuation policies) of those funds, which are not covered by the Fund's Report of Independent Registered Public Accounting Firm, are available on the SEC website or upon request.
3. Significant Accounting Policies.
The Fund is an investment company and applies the accounting and reporting guidance of the Financial Accounting Standards Board (FASB) Accounting Standards Codification Topic 946 Financial Services – Investments Companies. The financial statements have been prepared in conformity with accounting principles generally accepted in the United States of America (GAAP), which require management to make certain estimates and assumptions at the date of the financial statements. Actual results could differ from those estimates. Subsequent events, if any, through the date that the financial statements were issued have been evaluated in the preparation of the financial statements. The following summarizes the significant accounting policies of the Fund:
Investment Valuation. Investments are valued as of 4:00 p.m. Eastern time on the last calendar day of the period. The Board of Trustees (the Board) has delegated the day to day responsibility for the valuation of the Fund's investments to the Fair Value Committee (the Committee) established by the Fund's investment adviser. In accordance with valuation policies and procedures approved by the Board, the Fund attempts to obtain prices from one or more third party pricing vendors or brokers to value its investments. When current market prices, quotations or currency exchange rates are not readily available or reliable, investments will be fair valued in good faith by the Committee, in accordance with procedures adopted by the Board. Factors used in determining fair value vary by investment type and may include market or investment specific events, changes in interest rates and credit quality. The frequency with which these procedures are used cannot be predicted and they may be utilized to a significant extent. The Committee oversees the Fund's valuation policies and procedures and reports to the Board on the Committee's activities and fair value determinations. The Board monitors the appropriateness of the procedures used in valuing the Fund's investments and ratifies the fair value determinations of the Committee.
The Fund categorizes the inputs to valuation techniques used to value its investments into a disclosure hierarchy consisting of three levels as shown below:
- Level 1 – quoted prices in active markets for identical investments
- Level 2 – other significant observable inputs (including quoted prices for similar investments, interest rates, prepayment speeds, etc.)
- Level 3 – unobservable inputs (including the Fund's own assumptions based on the best information available)
Valuation techniques used to value the Fund's investments by major category are as follows:
Debt securities, including restricted securities, are valued based on evaluated prices received from third party pricing vendors or from brokers who make markets in such securities. Corporate bonds, bank loan obligations, foreign government and government agency obligations, preferred securities, supranational obligations, U.S. government and government agency obligations and sovereign loan participations are valued by pricing vendors who utilize matrix pricing which considers yield or price of bonds of comparable quality, coupon, maturity and type or by broker-supplied prices. Asset backed securities, collateralized mortgage obligations, commercial mortgage securities and U.S. government agency mortgage securities are valued by pricing vendors who utilize matrix pricing which considers prepayment speed assumptions, attributes of the collateral, yield or price of bonds of comparable quality, coupon, maturity and type or by broker-supplied prices. Swaps are marked-to-market daily based on valuations from third party pricing vendors, registered derivatives clearing organizations (clearinghouses) or broker-supplied valuations. These pricing sources may utilize inputs such as interest rate curves, credit spread curves, default possibilities and recovery rates. When independent prices are unavailable or unreliable, debt securities and swaps may be valued utilizing pricing methodologies which consider similar factors that would be used by third party pricing vendors. For foreign debt securities, when significant market or security specific events arise, valuations may be determined in good faith in accordance with procedures adopted by the Board. Debt securities and swaps are generally categorized as Level 2 in the hierarchy but may be Level 3 depending on the circumstances. The Fund invests a significant portion of its assets in below investment grade securities. The value of these securities can be more volatile due to changes in the credit quality of the issuer and is sensitive to changes in economic, market and regulatory conditions.
Equity securities, including restricted securities, for which market quotations are readily available, are valued at the last reported sale price or official closing price as reported by a third party pricing vendor on the primary market or exchange on which they are traded and are categorized as Level 1 in the hierarchy. In the event there were no sales during the day or closing prices are not available, securities are valued at the last quoted bid price or may be valued using the last available price and are generally categorized as Level 2 in the hierarchy. For foreign equity securities, when market or security specific events arise, comparisons to the valuation of American Depositary Receipts (ADRs), futures contracts, Exchange-Traded Funds (ETFs) and certain indexes as well as quoted prices for similar securities may be used and would be categorized as Level 2 in the hierarchy. Utilizing these techniques may result in transfers between Level 1 and Level 2. For equity securities, including restricted securities, where observable inputs are limited, assumptions about market activity and risk are used and these securities may be categorized as Level 3 in the hierarchy.
Futures contracts are valued at the settlement price established each day by the board of trade or exchange on which they are traded and are categorized as Level 1 in the hierarchy. Investments in open-end mutual funds, including the Fidelity Central Funds, are valued at their closing net asset value (NAV) each business day and are categorized as Level 1 in the hierarchy.
Changes in valuation techniques may result in transfers in or out of an assigned level within the disclosure hierarchy. The aggregate value of investments by input level as of June 30, 2017 is included at the end of the Fund's Schedule of Investments.
Foreign Currency. The Fund may use foreign currency contracts to facilitate transactions in foreign-denominated securities. Gains and losses from these transactions may arise from changes in the value of the foreign currency or if the counterparties do not perform under the contracts' terms.
Foreign-denominated assets, including investment securities, and liabilities are translated into U.S. dollars at the exchange rates at period end. Purchases and sales of investment securities, income and dividends received and expenses denominated in foreign currencies are translated into U.S. dollars at the exchange rate in effect on the transaction date.
The effects of exchange rate fluctuations on investments are included with the net realized and unrealized gain (loss) on investment securities. Other foreign currency transactions resulting in realized and unrealized gain (loss) are disclosed separately.
Investment Transactions and Income. For financial reporting purposes, the Fund's investment holdings and NAV include trades executed through the end of the last business day of the period. The NAV per share for processing shareholder transactions is calculated as of the close of business of the New York Stock Exchange (NYSE), normally 4:00 p.m. Eastern time and includes trades executed through the end of the prior business day. Gains and losses on securities sold are determined on the basis of identified cost and may include proceeds received from litigation. Dividend income is recorded on the ex-dividend date, except for certain dividends from foreign securities where the ex-dividend date may have passed, which are recorded as soon as the Fund is informed of the ex-dividend date. Non-cash dividends included in dividend income, if any, are recorded at the fair market value of the securities received. Income and capital gain distributions from Fidelity Central Funds, if any, are recorded on the ex-dividend date. Certain distributions received by the Fund represent a return of capital or capital gain. The Fund determines the components of these distributions subsequent to the ex-dividend date, based upon receipt of tax filings or other correspondence relating to the underlying investment. These distributions are recorded as a reduction of cost of investments and/or as a realized gain. Interest income is accrued as earned and includes coupon interest and amortization of premium and accretion of discount on debt securities as applicable. The principal amount on inflation-indexed securities is periodically adjusted to the rate of inflation and interest is accrued based on the principal amount. The adjustments to principal due to inflation are reflected as increases or decreases to Interest in the accompanying Statement of Operations. Investment income is recorded net of foreign taxes withheld where recovery of such taxes is uncertain. Debt obligations may be placed on non-accrual status and related interest income may be reduced by ceasing current accruals and writing off interest receivables when the collection of all or a portion of interest has become doubtful based on consistently applied procedures. A debt obligation is removed from non-accrual status when the issuer resumes interest payments or when collectability of interest is reasonably assured.
Class Allocations and Expenses. Investment income, realized and unrealized capital gains and losses, common expenses of the Fund, and certain fund-level expense reductions, if any, are allocated daily on a pro-rata basis to each class based on the relative net assets of each class to the total net assets of the Fund. Each class differs with respect to transfer agent and distribution and service plan fees incurred. Certain expense reductions may also differ by class. For the reporting period, the allocated portion of income and expenses to each class as a percent of its average net assets may vary due to the timing of recording these transactions in relation to fluctuating net assets of the classes. Expenses directly attributable to a fund are charged to that fund. Expenses attributable to more than one fund are allocated among the respective funds on the basis of relative net assets or other appropriate methods. Expense estimates are accrued in the period to which they relate and adjustments are made when actual amounts are known.
Income Tax Information and Distributions to Shareholders. Each year, the Fund intends to qualify as a regulated investment company under Subchapter M of the Internal Revenue Code, including distributing substantially all of its taxable income and realized gains. As a result, no provision for U.S. Federal income taxes is required. The Fund files a U.S. federal tax return, in addition to state and local tax returns as required. The Fund's federal income tax returns are subject to examination by the Internal Revenue Service (IRS) for a period of three fiscal years after they are filed. State and local tax returns may be subject to examination for an additional fiscal year depending on the jurisdiction. Foreign taxes are provided for based on the Fund's understanding of the tax rules and rates that exist in the foreign markets in which it invests.
Dividends are declared and recorded daily and paid monthly from net investment income. Distributions from realized gains, if any, are declared and recorded on the ex-dividend date. Income dividends and capital gain distributions are declared separately for each class. Income and capital gain distributions are determined in accordance with income tax regulations, which may differ from GAAP.
Capital accounts within the financial statements are adjusted for permanent book-tax differences. These adjustments have no impact on net assets or the results of operations. Capital accounts are not adjusted for temporary book-tax differences which will reverse in a subsequent period.
Book-tax differences are primarily due to the short-term gain distributions from the Fidelity Central Funds, futures contracts, swaps, foreign currency transactions, defaulted bonds, market discount, partnerships (including allocations from Fidelity Central Funds), deferred trustees compensation, capital loss carryforwards, losses deferred due to wash sales, futures contracts and excise tax regulations.
The federal tax cost of investment securities and unrealized appreciation (depreciation) as of period end were as follows:
| Gross unrealized appreciation | $472,068 |
| Gross unrealized depreciation | (185,353) |
| Net unrealized appreciation (depreciation) on securities | $286,715 |
| Tax cost | $8,452,089 |
Capital loss carryforwards are only available to offset future capital gains of the Fund to the extent provided by regulations and may be limited. Under the Regulated Investment Company Modernization Act of 2010 (the Act), the Fund is permitted to carry forward capital losses incurred in taxable years beginning after December 22, 2010 for an unlimited period and such capital losses are required to be used prior to any losses that expire. The capital loss carryforward information presented below, including any applicable limitation, is estimated as of prior fiscal period end and is subject to adjustment.
| No expiration | |
| Short-term | $(10,036) |
At the prior fiscal period end, the Fund was required to defer approximately $288 of losses on futures contracts.
Delayed Delivery Transactions and When-Issued Securities. During the period, the Fund transacted in securities on a delayed delivery or when-issued basis. Payment and delivery may take place after the customary settlement period for that security. The price of the underlying securities and the date when the securities will be delivered and paid for are fixed at the time the transaction is negotiated. The securities purchased on a delayed delivery or when-issued basis are identified as such in the Fund's Schedule of Investments. The Fund may receive compensation for interest forgone in the purchase of a delayed delivery or when-issued security. With respect to purchase commitments, the Fund identifies securities as segregated in its records with a value at least equal to the amount of the commitment. Losses may arise due to changes in the value of the underlying securities or if the counterparty does not perform under the contract's terms, or if the issuer does not issue the securities due to political, economic, or other factors.
To-Be-Announced (TBA) Securities and Mortgage Dollar Rolls. During the period, the Fund transacted in TBA securities that involved buying or selling mortgage-backed securities (MBS) on a forward commitment basis. A TBA transaction typically does not designate the actual security to be delivered and only includes an approximate principal amount; however delivered securities must meet specified terms defined by industry guidelines, including issuer, rate and current principal amount outstanding on underlying mortgage pools. The Fund may enter into a TBA transaction with the intent to take possession of or deliver the underlying MBS, or the Fund may elect to extend the settlement by entering into either a mortgage or reverse mortgage dollar roll. Mortgage dollar rolls are transactions where a fund sells TBA securities and simultaneously agrees to repurchase MBS on a later date at a lower price and with the same counterparty. Reverse mortgage dollar rolls involve the purchase and simultaneous agreement to sell TBA securities on a later date at a lower price. Transactions in mortgage dollar rolls and reverse mortgage dollar rolls are accounted for as purchases and sales and may result in an increase to the Fund's portfolio turnover rate.
Purchases and sales of TBA securities involve risks similar to those discussed above for delayed delivery and when-issued securities. Also, if the counterparty in a mortgage dollar roll or a reverse mortgage dollar roll transaction files for bankruptcy or becomes insolvent, the Fund's right to repurchase or sell securities may be limited. Additionally, when a fund sells TBA securities without already owning or having the right to obtain the deliverable securities (an uncovered forward commitment to sell), it incurs a risk of loss because it could have to purchase the securities at a price that is higher than the price at which it sold them. A fund may be unable to purchase the deliverable securities if the corresponding market is illiquid.
Restricted Securities. The Fund may invest in securities that are subject to legal or contractual restrictions on resale. These securities generally may be resold in transactions exempt from registration or to the public if the securities are registered. Disposal of these securities may involve time-consuming negotiations and expense, and prompt sale at an acceptable price may be difficult. Information regarding restricted securities is included at the end of the Fund's Schedule of Investments.
Loans and Other Direct Debt Instruments. The Fund invests in direct debt instruments which are interests in amounts owed to lenders by corporate or other borrowers. These instruments may be in the form of loans, trade claims or other receivables and may include standby financing commitments such as revolving credit facilities that obligate the Fund to supply additional cash to the borrower on demand. Loans may be acquired through assignment or participation, or may be made directly to a borrower. The Fund did not have any unfunded loan commitments, which are contractual obligations for future funding, at period end.
New Accounting Pronouncement. In March 2017, the Financial Accounting Standards Board (FASB) issued an Accounting Standards Update (ASU), ASU 2017-08, which amends the amortization period for certain callable debt securities that are held at a premium. The amendment requires the premium to be amortized to the earliest call date. The amendments do not require an accounting change for securities held at a discount. The ASU is effective for annual periods beginning after December 15, 2018. Management is currently evaluating the potential impact of these changes to the financial statements.
4. Derivative Instruments.
Risk Exposures and the Use of Derivative Instruments. The Fund's investment objective allows the Fund to enter into various types of derivative contracts, including futures contracts and swaps. Derivatives are investments whose value is primarily derived from underlying assets, indices or reference rates and may be transacted on an exchange or over-the-counter (OTC). Derivatives may involve a future commitment to buy or sell a specified asset based on specified terms, to exchange future cash flows at periodic intervals based on a notional principal amount, or for one party to make one or more payments upon the occurrence of specified events in exchange for periodic payments from the other party.
The Fund used derivatives to increase returns, to gain exposure to certain types of assets and to manage exposure to certain risks as defined below. The success of any strategy involving derivatives depends on analysis of numerous economic factors, and if the strategies for investment do not work as intended, the Fund may not achieve its objectives.
The Fund's use of derivatives increased or decreased its exposure to the following risk:
| Interest Rate Risk | Interest rate risk relates to the fluctuations in the value of interest-bearing securities due to changes in the prevailing levels of market interest rates. |
The Fund is also exposed to additional risks from investing in derivatives, such as liquidity risk and counterparty credit risk. Liquidity risk is the risk that the Fund will be unable to close out the derivative in the open market in a timely manner. Counterparty credit risk is the risk that the counterparty will not be able to fulfill its obligation to the Fund. Counterparty credit risk related to exchange-traded futures contracts may be mitigated by the protection provided by the exchange on which they trade. Counterparty credit risk related to centrally cleared OTC swaps may be mitigated by the protection provided by the clearinghouse.
Investing in derivatives may involve greater risks than investing in the underlying assets directly and, to varying degrees, may involve risk of loss in excess of any initial investment and collateral received and amounts recognized in the Statement of Assets and Liabilities. In addition, there may be the risk that the change in value of the derivative contract does not correspond to the change in value of the underlying instrument.
Net Realized Gain (Loss) and Change in Net Unrealized Appreciation (Depreciation) on Derivatives. The table below, which reflects the impacts of derivatives on the financial performance of the Fund, summarizes the net realized gain (loss) and change in net unrealized appreciation (depreciation) for derivatives during the period as presented in the Statement of Operations.
| Primary Risk Exposure / Derivative Type | Net Realized Gain (Loss) | Change in Net Unrealized Appreciation (Depreciation) |
| Interest Rate Risk | | |
| Futures Contracts | $1,228 | $822 |
| Swaps | (84) | 106 |
| Totals | $1,144 | $928 |
A summary of the value of derivatives by primary risk exposure as of period end is included at the end of the Schedule of Investments.
Futures Contracts. A futures contract is an agreement between two parties to buy or sell a specified underlying instrument for a fixed price at a specified future date. The Fund used futures contracts to manage its exposure to the bond market and fluctuations in interest rates.
Upon entering into a futures contract, a fund is required to deposit either cash or securities (initial margin) with a clearing broker in an amount equal to a certain percentage of the face value of the contract. Futures contracts are marked-to-market daily and subsequent daily payments (variation margin) are made or received by a fund depending on the daily fluctuations in the value of the futures contracts and are recorded as unrealized appreciation or (depreciation). This receivable and/or payable, if any, is included in daily variation margin for derivative instruments in the Statement of Assets and Liabilities. Realized gain or (loss) is recorded upon the expiration or closing of a futures contract.
Any open futures contracts at period end are presented in the Schedule of Investments under the caption "Futures Contracts". The underlying face amount at value reflects each contract's exposure to the underlying instrument or index at period end and is representative of volume of activity during the period. Securities deposited to meet initial margin requirements are identified in the Schedule of Investments.
Swaps. A swap is a contract between two parties to exchange future cash flows at periodic intervals based on a notional principal amount. A centrally cleared OTC swap is a transaction executed between a fund and a dealer counterparty, then cleared by a futures commission merchant (FCM) through a clearinghouse. Once cleared, the clearinghouse serves as a central counterparty, with whom a fund exchanges cash flows for the life of the transaction, similar to transactions in futures contracts.
Centrally cleared OTC swaps require a fund to deposit either cash or securities (initial margin) with the FCM, at the instruction of and for the benefit of the clearinghouse. Securities deposited to meet initial margin requirements are identified in the Schedule of Investments. Centrally cleared OTC swaps are marked-to-market daily and subsequent payments (variation margin) are made or received depending on the daily fluctuations in the value of the swaps and are recorded as unrealized appreciation or (depreciation). These daily payments, if any, are included in receivable or payable for daily variation margin for derivative instruments in the Statement of Assets and Liabilities. Any premiums for centrally cleared OTC swaps are recorded periodically throughout the term of the swap to variation margin and included in unrealized appreciation (depreciation) in the Statement of Assets and Liabilities. Any premiums are recognized as realized gain (loss) upon termination or maturity of the swap.
Payments are exchanged at specified intervals, accrued daily commencing with the effective date of the contract and recorded as realized gain or (loss). Some swaps may be terminated prior to the effective date and realize a gain or loss upon termination. The net realized gain (loss) and change in net unrealized appreciation (depreciation) on swaps during the period is included in the Statement of Operations.
Any open swaps at period end are included in the Schedule of Investments under the caption "Swaps" and are representative of volume of activity during the period.
Interest Rate Swaps. Interest rate swaps are agreements between counterparties to exchange cash flows, one based on a fixed rate, and the other on a floating rate. The Fund entered into interest rate swaps to manage its exposure to interest rate changes. Changes in interest rates can have an effect on both the value of bond holdings as well as the amount of interest income earned. In general, the value of bonds can fall when interest rates rise and can rise when interest rates fall.
5. Purchases and Sales of Investments.
Purchases and sales of securities (including the Fixed-Income Central Funds), other than short-term securities and U.S. government securities, aggregated $3,465,005 and $3,687,080, respectively.
6. Fees and Other Transactions with Affiliates.
Management Fee. Fidelity Management & Research Company (the investment adviser) and its affiliates provide the Fund with investment management related services for which the Fund pays a monthly management fee. The management fee is the sum of an individual fund fee rate that is based on an annual rate of .45% of the Fund's average net assets and an annualized group fee rate that averaged .11% during the period. The group fee rate is based upon the average net assets of all the mutual funds advised by the investment adviser, including any mutual funds previously advised by the investment adviser that are currently advised by Fidelity SelectCo, LLC, an affiliate of the investment adviser. The group fee rate decreases as assets under management increase and increases as assets under management decrease. For the reporting period, the total annualized management fee rate was .56% of the Fund's average net assets.
Distribution and Service Plan Fees. In accordance with Rule 12b-1 of the 1940 Act, the Fund has adopted separate Distribution and Service Plans for each class of shares. Certain classes pay Fidelity Distributors Corporation (FDC), an affiliate of the investment adviser, separate Distribution and Service Fees, each of which is based on an annual percentage of each class' average net assets. In addition, FDC may pay financial intermediaries for selling shares of the Fund and providing shareholder support services. For the period, the Distribution and Service Fee rates, total fees and amounts retained by FDC were as follows:
| | Distribution
Fee | Service
Fee | Total Fees | Retained
by FDC |
| Class A | -% | .25% | $2,972 | $42 |
| Class M | -% | .25% | 1,140 | 14 |
| Class C | .75% | .25% | 6,813 | 486 |
| | | | $10,925 | $542 |
Sales Load. FDC may receive a front-end sales charge of up to 4.00% for selling Class A shares and Class M shares, some of which is paid to financial intermediaries for selling shares of the Fund. Depending on the holding period, FDC may receive contingent deferred sales charges levied on Class A, Class M and Class C redemptions. The deferred sales charges are 1.00% for Class C shares, 1.00% for certain purchases of Class A shares and .25% for certain purchases of Class M shares.
For the period, sales charge amounts retained by FDC were as follows:
| | Retained
by FDC |
| Class A | $74 |
| Class M | 19 |
| Class C(a) | 85 |
| | $178 |
(a) When Class C shares are initially sold, FDC pays commissions from its own resources to financial intermediaries through which the sales are made.
Transfer Agent Fees. Fidelity Investments Institutional Operations Company, Inc., (FIIOC), an affiliate of the investment adviser, is the transfer, dividend disbursing and shareholder servicing agent for each class of the Fund. FIIOC receives account fees and asset-based fees that vary according to the account size and type of account of the shareholders of the respective classes of the Fund. FIIOC pays for typesetting, printing and mailing of shareholder reports, except proxy statements.
For the period, transfer agent fees for each class were as follows:
| | Amount | % of
Class-Level Average
Net Assets(a) |
| Class A | $1,872 | .16 |
| Class M | 700 | .15 |
| Class C | 1,026 | .15 |
| Class I | 2,883 | .15 |
| | $6,481 | |
(a) Annualized
Accounting and Security Lending Fees. Fidelity Service Company, Inc. (FSC), an affiliate of the investment adviser, maintains the Fund's accounting records. The accounting fee is based on the level of average net assets for each month. Under a separate contract, FSC administers the security lending program. The security lending fee is based on the number and duration of lending transactions.
Brokerage Commissions. The Fund placed a portion of its portfolio transactions with brokerage firms which are affiliates of the investment adviser. Brokerage commissions are included in net realized gain (loss) and change in net unrealized appreciation (depreciation) in the Statement of Operations. The commissions paid to these affiliated firms were $3 for the period.
Interfund Trades. The Fund may purchase from or sell securities to other Fidelity Funds under procedures adopted by the Board. The procedures have been designed to ensure these interfund trades are executed in accordance with Rule 17a-7 of the 1940 Act. Interfund trades are included within the respective purchases and sales amounts shown in the Purchases and Sales of Investments note.
7. Committed Line of Credit.
The Fund participates with other funds managed by the investment adviser or an affiliate in a $4.25 billion credit facility (the "line of credit") to be utilized for temporary or emergency purposes to fund shareholder redemptions or for other short-term liquidity purposes. The Fund has agreed to pay commitment fees on its pro-rata portion of the line of credit, which amounted to $14 and is reflected in Miscellaneous expenses on the Statement of Operations. During the period, the Fund did not borrow on this line of credit.
8. Security Lending.
The Fund lends portfolio securities from time to time in order to earn additional income. For equity securities, a lending agent is used and may loan securities to certain qualified borrowers, including Fidelity Capital Markets (FCM), a broker-dealer affiliated with the Fund. On the settlement date of the loan, the Fund receives collateral (in the form of U.S. Treasury obligations, letters of credit and/or cash) against the loaned securities and maintains collateral in an amount not less than 100% of the market value of the loaned securities during the period of the loan. The market value of the loaned securities is determined at the close of business of the Fund and any additional required collateral is delivered to the Fund on the next business day. The Fund or borrower may terminate the loan at any time, and if the borrower defaults on its obligation to return the securities loaned because of insolvency or other reasons, the Fund may apply collateral received from the borrower against the obligation. The Fund may experience delays and costs in recovering the securities loaned. Any cash collateral received is maintained at the Fund's custodian and/or invested in the Fidelity Securities Lending Cash Central Fund. The value of loaned securities and cash collateral at period end are disclosed on the Fund's Statement of Assets and Liabilities. The value of securities loaned to FCM at period end was $72. Security lending income represents the income earned on investing cash collateral, less rebates paid to borrowers and any lending agent fees associated with the loan, plus any premium payments received for lending certain types of securities. Total security lending income during the period, presented in the Statement of Operations as a component of interest income, amounted to $38. Net income from the Fidelity Securities Lending Cash Central Fund during the period, presented in the Statement of Operations as a component of income from Fidelity Central Funds, amounted to $1, including an amount of less than five hundred dollars from securities loaned to FCM.
9. Expense Reductions.
Commissions paid to certain brokers with whom the investment adviser, or its affiliates, places trades on behalf of the Fund include an amount in addition to trade execution, which may be rebated back to the Fund to offset certain expenses. This amount totaled $11 for the period.
In addition, through arrangements with the Fund's custodian, credits realized as a result of certain uninvested cash balances were used to reduce the Fund's expenses. During the period, these credits reduced the Fund's custody expenses by $6.
In addition, during the period the investment adviser reimbursed and/or waived a portion of fund-level operating expenses in the amount of $25.
10. Distributions to Shareholders.
Distributions to shareholders of each class were as follows:
| | Six months ended
June 30, 2017 | Year ended December 31, 2016 |
| From net investment income | | |
| Class A | $35,821 | $105,285 |
| Class M | 13,670 | 32,421 |
| Class B | – | 693 |
| Class C | 15,308 | 35,849 |
| Class I | 60,836 | 95,353 |
| Total | $125,635 | $269,601 |
11. Share Transactions.
Share transactions for each class were as follows and may contain automatic conversions between classes or exchanges between affiliated funds:
| | Shares | Shares | Dollars | Dollars |
| | Six months ended June 30, 2017 | Year ended December 31, 2016 | Six months ended June 30, 2017 | Year ended December 31, 2016 |
| Class A | | | | |
| Shares sold | 16,772 | 45,966 | $202,864 | $539,975 |
| Reinvestment of distributions | 2,851 | 8,576 | 34,586 | 100,874 |
| Shares redeemed | (119,782) | (83,137) | (1,449,144) | (974,275) |
| Net increase (decrease) | (100,159) | (28,595) | $(1,211,694) | $(333,426) |
| Class M | | | | |
| Shares sold | 4,827 | 10,145 | $58,396 | $119,353 |
| Reinvestment of distributions | 1,090 | 2,634 | 13,233 | 30,978 |
| Shares redeemed | (15,858) | (20,492) | (191,831) | (239,762) |
| Net increase (decrease) | (9,941) | (7,713) | $(120,202) | $(89,431) |
| Class B | | | | |
| Shares sold | – | 64 | $– | $739 |
| Reinvestment of distributions | – | 47 | – | 542 |
| Shares redeemed | – | (5,773) | – | (67,637) |
| Net increase (decrease) | – | (5,662) | $– | $(66,356) |
| Class C | | | | |
| Shares sold | 6,012 | 13,190 | $72,661 | $154,715 |
| Reinvestment of distributions | 1,145 | 2,669 | 13,869 | 31,318 |
| Shares redeemed | (13,881) | (26,365) | (167,785) | (308,384) |
| Net increase (decrease) | (6,724) | (10,506) | $(81,255) | $(122,351) |
| Class I | | | | |
| Shares sold | 168,838 | 81,336 | $2,073,454 | $970,701 |
| Reinvestment of distributions | 4,576 | 7,280 | 56,390 | 86,872 |
| Shares redeemed | (44,052) | (84,104) | (540,864) | (999,614) |
| Net increase (decrease) | 129,362 | 4,512 | $1,588,980 | $57,959 |
12. Other.
The Fund's organizational documents provide former and current trustees and officers with a limited indemnification against liabilities arising in connection with the performance of their duties to the Fund. In the normal course of business, the Fund may also enter into contracts that provide general indemnifications. The Fund's maximum exposure under these arrangements is unknown as this would be dependent on future claims that may be made against the Fund. The risk of material loss from such claims is considered remote.
13. Credit Risk.
The Fund's relatively large investment in countries with limited or developing capital markets may involve greater risks than investments in more developed markets and the prices of such investments may be volatile. The yields of emerging market debt obligations reflect, among other things, perceived credit risk. The consequences of political, social or economic changes in these markets may have disruptive effects on the market prices of the Fund's investments and the income they generate, as well as the Fund's ability to repatriate such amounts.
14. Litigation.
The Fund, and other entities managed by FMR or its affiliates were named as defendants in a lawsuit filed in the United States Bankruptcy Court for the Southern District of New York in 2009. The lawsuit was brought by creditors of Motors Liquidation Company (f/k/a General Motors), which went through Chapter 11 bankruptcy proceedings in 2009, and is captioned Official Committee of Unsecured Creditors of Motors Liquidation Company v. JPMorgan Chase Bank, N.A., et al., Adversary No. 09-00504 (REG). The plaintiffs are seeking an order that the Fund and other defendants return proceeds received in 2009 in full payment of the principal and interest on General Motors secured debt. The plaintiffs contend that the Fund and the other defendants were not secured creditors at the time of the 2009 payments and, thus, were not entitled to payment in full. In January 2015, the Court of Appeals ruled that JPMorgan, as administrative agent for all of the debtholders, released the security interest on certain collateral securing the debt prior to the 2009 payments. A decision is pending in a trial intended to help determine the value of any remaining, unreleased collateral. At this time, Management cannot determine the amount of loss that may be realized, but expects the amount to be less than the $24,325 received in 2009. The Fund is also incurring legal costs in defending the case.
Report of Independent Registered Public Accounting Firm
To the Trustees of Fidelity Advisor Series II and Shareholders of Fidelity Advisor Strategic Income Fund:
We have audited the accompanying statement of assets and liabilities of Fidelity Advisor Strategic Income Fund (the Fund), a fund of Fidelity Advisor Series II, including the schedule of investments, as of June 30, 2017, and the related statement of operations for the six months then ended, the statement of changes in net assets for the six months ended June 30, 2017 and for the year ended December 31, 2016, and the financial highlights for the six months ended June 30, 2017 and for each of the five years in the period ended December 31, 2016. These financial statements and financial highlights are the responsibility of the Fund's management. Our responsibility is to express an opinion on these financial statements and financial highlights based on our audits.
We conducted our audits in accordance with the standards of the Public Company Accounting Oversight Board (United States). Those standards require that we plan and perform the audit to obtain reasonable assurance about whether the financial statements and financial highlights are free of material misstatement. The Fund is not required to have, nor were we engaged to perform, an audit of its internal control over financial reporting. Our audits included consideration of internal control over financial reporting as a basis for designing audit procedures that are appropriate in the circumstances, but not for the purpose of expressing an opinion on the effectiveness of the Fund's internal control over financial reporting. Accordingly, we express no such opinion. An audit also includes examining, on a test basis, evidence supporting the amounts and disclosures in the financial statements, assessing the accounting principles used and significant estimates made by management, as well as evaluating the overall financial statement presentation. Our procedures included confirmation of securities owned as of June 30, 2017, by correspondence with the custodians and brokers; when replies were not received from brokers, we performed other auditing procedures. We believe that our audits provide a reasonable basis for our opinion.
In our opinion, such financial statements and financial highlights referred to above present fairly, in all material respects, the financial position of Fidelity Advisor Strategic Income Fund as of June 30, 2017, the results of its operations for the six months then ended, the changes in its net assets for the six months ended June 30, 2017 and for the year ended December 31, 2016, and the financial highlights for the six months ended June 30, 2017 and for each of the five years in the period ended December 31, 2016 in conformity with accounting principles generally accepted in the United States of America.
DELOITTE & TOUCHE LLP
Boston, Massachusetts
August 18, 2017
Shareholder Expense Example
As a shareholder of the Fund, you incur two types of costs: (1) transaction costs, including sales charges (loads) on purchase payments or redemption proceeds, and (2) ongoing costs, including management fees, distribution and/or service (12b-1) fees and other Fund expenses. This Example is intended to help you understand your ongoing costs (in dollars) of investing in the Fund and to compare these costs with the ongoing costs of investing in other mutual funds.
The Example is based on an investment of $1,000 invested at the beginning of the period and held for the entire period (January 1, 2017 to June 30, 2017).
Actual Expenses
The first line of the accompanying table for each class of the Fund provides information about actual account values and actual expenses. You may use the information in this line, together with the amount you invested, to estimate the expenses that you paid over the period. Simply divide your account value by $1,000.00 (for example, an $8,600 account value divided by $1,000.00 = 8.6), then multiply the result by the number in the first line for a class of the Fund under the heading entitled "Expenses Paid During Period" to estimate the expenses you paid on your account during this period. In addition, the Fund, as a shareholder in the underlying Fidelity Central Funds, will indirectly bear its pro-rata share of the fees and expenses incurred by the underlying Fidelity Central Funds. These fees and expenses are not included in the Fund's annualized expense ratio used to calculate the expense estimate in the table below.
Hypothetical Example for Comparison Purposes
The second line of the accompanying table for each class of the Fund provides information about hypothetical account values and hypothetical expenses based on a Class' actual expense ratio and an assumed rate of return of 5% per year before expenses, which is not the Class' actual return. The hypothetical account values and expenses may not be used to estimate the actual ending account balance or expenses you paid for the period. You may use this information to compare the ongoing costs of investing in the Fund and other funds. To do so, compare this 5% hypothetical example with the 5% hypothetical examples that appear in the shareholder reports of the other funds. In addition, the Fund, as a shareholder in the underlying Fidelity Central Funds, will indirectly bear its pro-rata share of the fees and expenses incurred by the underlying Fidelity Central Funds. These fees and expenses are not included in the Fund's annualized expense ratio used to calculate the expense estimate in the table below.
Please note that the expenses shown in the table are meant to highlight your ongoing costs only and do not reflect any transaction costs. Therefore, the second line of the table is useful in comparing ongoing costs only, and will not help you determine the relative total costs of owning different funds. In addition, if these transactional costs were included, your costs would have been higher.
| | Annualized Expense Ratio-A | Beginning
Account Value
January 1, 2017 | Ending
Account Value
June 30, 2017 | Expenses Paid
During Period-B
January 1, 2017
to June 30, 2017 |
| Class A | 1.00% | | | |
| Actual | | $1,000.00 | $1,046.60 | $5.07 |
| Hypothetical-C | | $1,000.00 | $1,019.84 | $5.01 |
| Class M | 1.00% | | | |
| Actual | | $1,000.00 | $1,046.60 | $5.07 |
| Hypothetical-C | | $1,000.00 | $1,019.84 | $5.01 |
| Class C | 1.75% | | | |
| Actual | | $1,000.00 | $1,042.80 | $8.86 |
| Hypothetical-C | | $1,000.00 | $1,016.12 | $8.75 |
| Class I | .74% | | | |
| Actual | | $1,000.00 | $1,047.50 | $3.76 |
| Hypothetical-C | | $1,000.00 | $1,021.12 | $3.71 |
A Annualized expense ratio reflects expenses net of applicable fee waivers.
B Expenses are equal to each Class' annualized expense ratio, multiplied by the average account value over the period, multiplied by 181/365 (to reflect the one-half year period). In addition to the expenses noted above, the Fund also indirectly bears its proportional share of the expenses of the underlying Fidelity Central Funds. Annualized expenses of the underlying non-money market Fidelity Central Funds as of their most recent fiscal half year were less than .05%.
C 5% return per year before expenses

SI-SANN-0817
1.705747.119