UNITED STATES
SECURITIES AND EXCHANGE COMMISSION
Washington, D.C. 20549
FORM N-CSR
CERTIFIED SHAREHOLDER REPORT OF REGISTERED
MANAGEMENT INVESTMENT COMPANIES
Investment Company Act file number 811-4707
Fidelity Advisor Series II
(Exact name of registrant as specified in charter)
245 Summer St., Boston, Massachusetts 02210
(Address of principal executive offices) (Zip code)
Marc Bryant, Secretary
245 Summer St.
Boston, Massachusetts 02210
(Name and address of agent for service)
Registrant's telephone number, including area code:
617-563-7000
| |
Date of fiscal year end: | August 31 |
| |
Date of reporting period: | August 31, 2017 |
Item 1.
Reports to Stockholders
Fidelity Advisor® Mortgage Securities Fund Class A, Class M (formerly Class T), Class C and Class I
Annual Report August 31, 2017 |
 |
Contents
To view a fund's proxy voting guidelines and proxy voting record for the 12-month period ended June 30, visit http://www.fidelity.com/proxyvotingresults or visit the Securities and Exchange Commission's (SEC) web site at http://www.sec.gov.
You may also call 1-877-208-0098 to request a free copy of the proxy voting guidelines.
Standard & Poor's, S&P and S&P 500 are registered service marks of The McGraw-Hill Companies, Inc. and have been licensed for use by Fidelity Distributors Corporation.
Other third-party marks appearing herein are the property of their respective owners.
All other marks appearing herein are registered or unregistered trademarks or service marks of FMR LLC or an affiliated company. © 2017 FMR LLC. All rights reserved.
This report and the financial statements contained herein are submitted for the general information of the shareholders of the Fund. This report is not authorized for distribution to prospective investors in the Fund unless preceded or accompanied by an effective prospectus.
A fund files its complete schedule of portfolio holdings with the SEC for the first and third quarters of each fiscal year on Form N-Q. Forms N-Q are available on the SEC’s web site at http://www.sec.gov. A fund's Forms N-Q may be reviewed and copied at the SEC’s Public Reference Room in Washington, DC. Information regarding the operation of the SEC's Public Reference Room may be obtained by calling 1-800-SEC-0330.
For a complete list of a fund's portfolio holdings, view the most recent holdings listing, semiannual report, or annual report on Fidelity's web site at http://www.fidelity.com, http://www.institutional.fidelity.com, or http://www.401k.com, as applicable.
NOT FDIC INSURED •MAY LOSE VALUE •NO BANK GUARANTEE
Neither the Fund nor Fidelity Distributors Corporation is a bank.
Performance: The Bottom Line
Average annual total return reflects the change in the value of an investment, assuming reinvestment of distributions from dividend income and capital gains (the profits earned upon the sale of securities that have grown in value, if any) and assuming a constant rate of performance each year. The hypothetical investment and the average annual total returns do not reflect the deduction of taxes that a shareholder would pay on fund distributions or the redemption of fund shares. During periods of reimbursement by Fidelity, a fund’s total return will be greater than it would be had the reimbursement not occurred. How a fund did yesterday is no guarantee of how it will do tomorrow.
Average Annual Total Returns
| For the periods ended August 31, 2017 | Past 1 year | Past 5 years | Past 10 years |
| Class A (incl. 4.00% sales charge) | (3.47)% | 0.99% | 3.12% |
| Class M (incl. 4.00% sales charge) | (3.47)% | 0.98% | 3.13% |
| Class C (incl. contingent deferred sales charge) | (1.18)% | 1.06% | 2.79% |
| Class I | 0.76% | 2.10% | 3.85% |
Class C shares' contingent deferred sales charges included in the past one year, past five years and past ten years total return figures are 1%, 0% and 0%, respectively.
$10,000 Over 10 Years
Let's say hypothetically that $10,000 was invested in Fidelity Advisor® Mortgage Securities Fund - Class A on August 31, 2007, and the current 4.00% sales charge was paid.
The chart shows how the value of your investment would have changed, and also shows how the Bloomberg Barclays U.S. MBS Index performed over the same period.
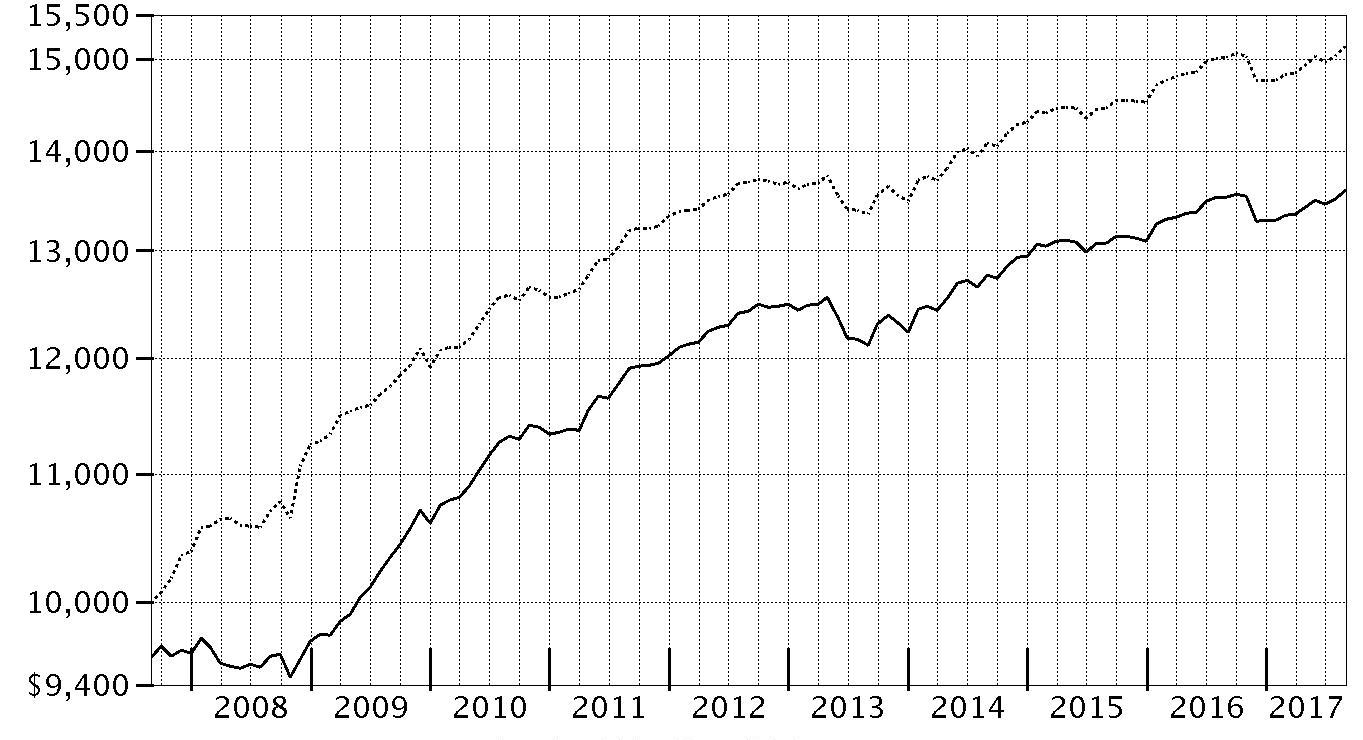
| Period Ending Values |
| $13,600 | Fidelity Advisor® Mortgage Securities Fund - Class A |
| $15,144 | Bloomberg Barclays U.S. MBS Index |
Effective August 24, 2016, all Barclays benchmark indices were co-branded as the Bloomberg Barclays Indices for a period of five years.
Management's Discussion of Fund Performance
Market Recap: U.S. taxable investment-grade bonds rose slightly for the 12 months ending August 31, 2017, as yields increased markedly following the U.S. presidential election then moderated as the period progressed. The Bloomberg Barclays U.S. Aggregate Bond Index gained 0.49% for the year. Bond yields rose slightly early in the period, prior to the U.S. election, then surged in November and December, as many investors viewed then-President-elect Donald Trump’s economic agenda as stimulative and potentially inflationary. Yields also rode the Fed’s decision in December to raise policy interest rates. Longer-term bond yields declined slightly in the first half of 2017, even though the Fed raised rates in June 2017 for the third time in as many quarters, as it became clear that changes to tax, health care and fiscal policies would take time to develop and implement. Fairly cool inflation readings also held back yields late in the period. Within the Bloomberg Barclays index, investment-grade corporate bonds led all major market segments, up 2.13%, while U.S. Treasuries returned -0.95%. Securitized sectors advanced more modestly than corporates. Outside the index, riskier, non-core fixed-income segments led the broader market, while Treasury Inflation-Protected Securities (TIPS) rose 0.46%, according to Bloomberg Barclays.
Comments from Lead Portfolio Manager William Irving and Co-Portfolio Manager Franco Castagliuolo: For the fiscal year, the fund’s share classes (excluding sales charges, if applicable) had roughly breakeven returns, net of fees, about in line with the 0.80% return of the benchmark Bloomberg Barclays U.S. MBS Index. We continued to execute our strategy of attempting to exploit market inefficiencies and identify attractively priced securities. Relative contributors and detractors had only a minor effect this period. Our out-of-benchmark allocations to non-agency MBS and non-agency commercial mortgage-backed securities added some value. These “private label” bonds—issued by financial institutions—outpaced many agency MBS. In terms of security selection, our overweighting in 30-year fixed-rate agency MBS with a measure of resistance to prepayment was beneficial. Our decision to hold TBA (to be announced) securities, which we typically paired with floating-rate securities, added value. As expected, this pair combination outperformed many of the MBS in the index. That said, some of the securities we used in tandem were very short-term, fixed rate securities Their interest payments didn’t adjust higher with rising rates and, as such, lagged the index.
The views expressed above reflect those of the portfolio manager(s) only through the end of the period as stated on the cover of this report and do not necessarily represent the views of Fidelity or any other person in the Fidelity organization. Any such views are subject to change at any time based upon market or other conditions and Fidelity disclaims any responsibility to update such views. These views may not be relied on as investment advice and, because investment decisions for a Fidelity fund are based on numerous factors, may not be relied on as an indication of trading intent on behalf of any Fidelity fund.
Investment Summary (Unaudited)
Coupon Distribution as of August 31, 2017
| | % of fund's investments | % of fund's investments 6 months ago |
| Zero coupon bonds | 0.0 | 0.0 |
| 0.01 - 0.99% | 0.2 | 1.0 |
| 1 - 1.99% | 3.7 | 4.5 |
| 2 - 2.99% | 8.1 | 5.9 |
| 3 - 3.99% | 53.6 | 52.7 |
| 4 - 4.99% | 19.1 | 20.9 |
| 5 - 5.99% | 6.0 | 6.1 |
| 6 - 6.99% | 1.9 | 1.9 |
| 7% and above | 0.9 | 1.0 |
Coupon distribution shows the range of stated interest rates on the fund's investments, excluding short-term investments.
Asset Allocation (% of fund's net assets)
| As of August 31, 2017* |
| | Mortgage Securities | 86.4% |
| | CMOs and Other Mortgage Related Securities | 15.9% |
| | Asset-Backed Securities | 5.2% |
| | Short-Term Investments and Net Other Assets (Liabilities)** | (7.5)% |

* Futures and Swaps - 4.6%
** Short-Term Investments and Net Other Assets (Liabilities) are not included in the pie chart
| As of February 28, 2017* |
| | Mortgage Securities | 90.0% |
| | CMOs and Other Mortgage Related Securities | 17.3% |
| | Asset-Backed Securities | 3.7% |
| | Short-Term Investments and Net Other Assets (Liabilities)** | (11.0)% |

* Futures and Swaps - 2.7%
** Short-Term Investments and Net Other Assets (Liabilities) are not included in the pie chart
Percentages in the above tables are adjusted for the effect of TBA Sale Commitments.
Percentages shown as 0.0% may reflect amounts less than 0.05%.
Investments August 31, 2017
Showing Percentage of Net Assets
| U.S. Government Agency - Mortgage Securities - 91.8% | | | |
| | | Principal Amount (000s) | Value (000s) |
| Fannie Mae - 50.3% | | | |
| 12 month U.S. LIBOR + 1.445% 3.195% 4/1/37 (a)(b) | | 64 | 67 |
| 12 month U.S. LIBOR + 1.495% 2.963% 1/1/35 (a)(b) | | 117 | 121 |
| 12 month U.S. LIBOR + 1.523% 3.219% 3/1/36 (a)(b) | | 89 | 93 |
| 12 month U.S. LIBOR + 1.553% 3.338% 6/1/36 (a)(b) | | 23 | 23 |
| 12 month U.S. LIBOR + 1.594% 3.448% 5/1/36 (a)(b) | | 149 | 156 |
| 12 month U.S. LIBOR + 1.643% 2.815% 9/1/36 (a)(b) | | 31 | 32 |
| 12 month U.S. LIBOR + 1.685% 3.435% 4/1/36 (a)(b) | | 64 | 67 |
| 12 month U.S. LIBOR + 1.690% 3.121% 8/1/35 (a)(b) | | 194 | 205 |
| 12 month U.S. LIBOR + 1.728% 3.314% 11/1/36 (a)(b) | | 23 | 24 |
| 12 month U.S. LIBOR + 1.741% 3.332% 3/1/40 (a)(b) | | 128 | 136 |
| 12 month U.S. LIBOR + 1.745% 3.374% 7/1/35 (a)(b) | | 30 | 31 |
| 12 month U.S. LIBOR + 1.750% 3.031% 8/1/41 (a)(b) | | 240 | 254 |
| 12 month U.S. LIBOR + 1.800% 2.759% 1/1/42 (a)(b) | | 287 | 301 |
| 12 month U.S. LIBOR + 1.812% 3.471% 12/1/40 (a)(b) | | 2,753 | 2,875 |
| 12 month U.S. LIBOR + 1.815% 3.109% 9/1/41 (a)(b) | | 85 | 89 |
| 12 month U.S. LIBOR + 1.818% 2.695% 2/1/42 (a)(b) | | 403 | 423 |
| 12 month U.S. LIBOR + 1.851% 3.573% 5/1/36 (a)(b) | | 22 | 23 |
| 12 month U.S. LIBOR + 1.875% 3.375% 10/1/36 (a)(b) | | 167 | 177 |
| 6 month U.S. LIBOR + 1.439% 2.689% 9/1/36 (a)(b) | | 81 | 84 |
| U.S. TREASURY 1 YEAR INDEX + 2.158% 3.095% 7/1/35 (a)(b) | | 3 | 3 |
| U.S. TREASURY 1 YEAR INDEX + 2.208% 3.083% 3/1/35 (a)(b) | | 15 | 16 |
| U.S. TREASURY 1 YEAR INDEX + 2.270% 2.899% 6/1/36 (a)(b) | | 248 | 262 |
| U.S. TREASURY 1 YEAR INDEX + 2.295% 2.798% 10/1/33 (a)(b) | | 31 | 32 |
| 2.5% 2/1/30 | | 108 | 110 |
| 2.5% 9/1/32 (c) | | 4,500 | 4,563 |
| 3% 8/1/27 to 8/1/47 | | 142,863 | 145,765 |
| 3% 9/1/32 (c) | | 13,000 | 13,422 |
| 3% 9/1/32 (c) | | 12,200 | 12,596 |
| 3% 9/1/32 (c) | | 32,300 | 33,349 |
| 3% 9/1/32 (c) | | 6,600 | 6,814 |
| 3% 9/1/32 (c) | | 6,500 | 6,711 |
| 3% 9/1/47 (c) | | 4,000 | 4,046 |
| 3.5% 9/1/29 to 10/1/56 (c) | | 109,144 | 113,774 |
| 3.5% 9/1/47 (c) | | 17,750 | 18,390 |
| 3.5% 9/1/47 (c) | | 16,950 | 17,561 |
| 3.5% 9/1/47 (c) | | 7,300 | 7,563 |
| 4% 11/1/31 to 10/1/46 | | 76,891 | 81,702 |
| 4.5% 5/1/25 to 8/1/56 | | 15,623 | 16,885 |
| 5% 5/1/20 to 8/1/56 | | 30,495 | 33,546 |
| 5.255% 8/1/41 | | 673 | 747 |
| 5.5% 2/1/18 to 4/1/39 | | 2,335 | 2,616 |
| 6% 7/1/39 | | 1,148 | 1,310 |
| 6.309% 2/1/39 | | 1,012 | 1,100 |
| 6.5% 2/1/20 to 8/1/39 | | 6,261 | 7,250 |
| 7% 9/1/21 to 5/1/30 | | 696 | 800 |
| 7.5% 8/1/22 to 9/1/32 | | 487 | 575 |
| 8% 12/1/29 to 3/1/37 | | 14 | 17 |
| 8.5% 2/1/22 to 3/1/23 | | 40 | 44 |
| 9% 10/1/30 | | 187 | 232 |
| 9.5% 10/1/21 to 8/1/22 | | 0 | 1 |
| | | | 536,983 |
| Freddie Mac - 21.8% | | | |
| 12 month U.S. LIBOR + 1.500% 3.129% 3/1/36 (a)(b) | | 215 | 225 |
| 12 month U.S. LIBOR + 1.515% 2.93% 11/1/35 (a)(b) | | 104 | 108 |
| 12 month U.S. LIBOR + 1.750% 3.394% 12/1/40 (a)(b) | | 1,362 | 1,418 |
| 12 month U.S. LIBOR + 1.754% 3.098% 9/1/41 (a)(b) | | 394 | 417 |
| 12 month U.S. LIBOR + 1.793% 3.32% 4/1/37 (a)(b) | | 38 | 40 |
| 12 month U.S. LIBOR + 1.874% 3.432% 10/1/42 (a)(b) | | 244 | 256 |
| 12 month U.S. LIBOR + 1.961% 3.807% 6/1/33 (a)(b) | | 488 | 518 |
| 12 month U.S. LIBOR + 2.045% 3.81% 7/1/36 (a)(b) | | 62 | 66 |
| 12 month U.S. LIBOR + 2.200% 3.7% 12/1/36 (a)(b) | | 139 | 146 |
| 12 month U.S. LIBOR + 2.280% 3.53% 10/1/36 (a)(b) | | 9 | 9 |
| 6 month U.S. LIBOR + 1.445% 2.82% 3/1/35 (a)(b) | | 44 | 46 |
| 6 month U.S. LIBOR + 1.675% 3.05% 6/1/37 (a)(b) | | 28 | 29 |
| 6 month U.S. LIBOR + 1.720% 3.095% 8/1/37 (a)(b) | | 52 | 54 |
| 6 month U.S. LIBOR + 1.746% 2.967% 5/1/37 (a)(b) | | 26 | 27 |
| 6 month U.S. LIBOR + 2.010% 3.385% 6/1/37 (a)(b) | | 20 | 21 |
| 6 month U.S. LIBOR + 2.040% 3.415% 6/1/37 (a)(b) | | 122 | 127 |
| 6 month U.S. LIBOR + 2.066% 3.428% 6/1/37 (a)(b) | | 362 | 383 |
| 6 month U.S. LIBOR + 2.755% 4.096% 10/1/35 (a)(b) | | 30 | 32 |
| U.S. TREASURY 1 YEAR INDEX + 2.231% 3.231% 5/1/34 (a)(b) | | 4 | 4 |
| 2.5% 7/1/31 | | 1,642 | 1,667 |
| 3% 3/1/32 to 2/1/47 | | 50,775 | 51,551 |
| 3.5% 6/1/27 to 9/1/46 (d) | | 97,750 | 101,969 |
| 3.5% 8/1/47 | | 1,066 | 1,106 |
| 4% 2/1/41 to 6/1/47 | | 40,809 | 43,362 |
| 4% 9/1/47 (c) | | 4,900 | 5,178 |
| 4.5% 7/1/25 to 3/1/44 | | 5,860 | 6,344 |
| 5% 7/1/33 to 7/1/41 | | 3,312 | 3,631 |
| 5.5% 10/1/17 to 10/1/39 | | 5,886 | 6,520 |
| 6% 11/1/17 to 6/1/39 | | 1,423 | 1,612 |
| 6.5% 4/1/21 to 9/1/39 | | 2,551 | 2,880 |
| 7% 6/1/21 to 9/1/36 | | 973 | 1,125 |
| 7.5% 1/1/27 to 7/1/34 | | 1,188 | 1,403 |
| 8% 4/1/21 to 1/1/37 | | 6 | 7 |
| 8.5% 9/1/20 | | 0 | 0 |
| 9% 10/1/19 to 5/1/21 | | 1 | 1 |
| | | | 232,282 |
| Ginnie Mae - 19.7% | | | |
| 3% 6/15/42 to 5/20/47 | | 50,368 | 51,495 |
| 3% 9/1/47 (c) | | 25,000 | 25,517 |
| 3.5% 11/20/41 to 6/20/46 (d) | | 60,717 | 63,644 |
| 4% 7/20/33 to 12/20/44 | | 33,546 | 35,755 |
| 4.5% 8/15/33 to 6/15/41 | | 24,703 | 26,821 |
| 5% 9/20/33 to 6/15/41 | | 4,314 | 4,820 |
| 5.5% 12/15/38 to 9/15/39 | | 694 | 784 |
| 6.5% 10/15/34 to 7/15/36 | | 173 | 201 |
| 7% 2/15/24 to 4/20/32 | | 705 | 828 |
| 7.5% 12/15/21 to 12/15/29 | | 191 | 219 |
| 8% 6/15/21 to 12/15/25 | | 102 | 116 |
| 8.5% 11/15/27 to 10/15/28 | | 97 | 113 |
| | | | 210,313 |
| TOTAL U.S. GOVERNMENT AGENCY - MORTGAGE SECURITIES | | | |
| (Cost $973,726) | | | 979,578 |
|
| Asset-Backed Securities - 5.2% | | | |
| American Credit Acceptance Receivable Trust Series 2016-1A Class A, 2.37% 5/12/20 (e) | | $269 | $269 |
| Avis Budget Rental Car Funding (AESOP) LLC Series 2012-3A Class A, 2.1% 3/20/19 (e) | | 5,560 | 5,566 |
| CAM Mortgage Trust Series 2017-1 Class A1, 3.22% 8/1/57 (e) | | 4,383 | 4,387 |
| Citi Mortgage Loan Trust Series 2007-1 Class 1A, 1 month U.S. LIBOR + 1.350% 2.5844% 10/25/37 (a)(b)(e) | | 4,820 | 4,788 |
| CLUB Credit Trust Series 2017-NP1 Class A, 2.39% 4/17/23 (e) | | 258 | 258 |
| Countrywide Home Loans, Inc. Series 2005-3 Class MV4, 1 month U.S. LIBOR + 0.620% 1.8544% 8/25/35 (a)(b) | | 148 | 148 |
| CPS Auto Trust Series 2015-C Class A, 1.77% 6/17/19 (e) | | 1,130 | 1,131 |
| Exeter Automobile Receivables Trust: | | | |
| Series 2016-1A Class A, 2.8% 7/15/20 (e) | | 1,165 | 1,166 |
| Series 2017-2A Class A, 2.22% 6/15/21 (e) | | 1,161 | 1,163 |
| Fannie Mae Series 2017-T1 Class A, 2.898% 6/25/27 | | 11,699 | 11,846 |
| Flagship Credit Auto Trust Series 2015-3 Class A, 2.38% 10/15/20 (e) | | 1,089 | 1,090 |
| GSAMP Trust Series 2004-AR1 Class B4, 5.5% 6/25/34 (e) | | 29 | 2 |
| Merrill Lynch Mortgage Investors Trust Series 2006-FF1 Class M2, 1 month U.S. LIBOR + 0.290% 1.5244% 8/25/36 (a)(b) | | 5,300 | 5,269 |
| Nationstar HECM Loan Trust Series 2017-1A Class A, 1.9679% 5/25/27 (e)(f) | | 4,844 | 4,844 |
| OneMain Financial Issuance Trust Series 2014-1A Class A, 2.43% 6/18/24 (e) | | 42 | 42 |
| Prosper Marketplace Issuance Trust: | | | |
| Series 2017-1A Class A, 2.56% 6/15/23 (e) | | 2,937 | 2,946 |
| Series 2017-2A Class A, 2.42% 9/15/23 (e) | | 2,097 | 2,101 |
| Structured Asset Securities Corp. Series 2005-NC2 Class M3, 1 month U.S. LIBOR + 0.430% 1.6622% 5/25/35 (a)(b) | | 1,286 | 1,285 |
| Towd Point Mortgage Trust Series 2017-1 Class A1, 2.75% 10/25/56 (a)(e) | | 7,538 | 7,628 |
| Vericrest Opportunity Loan Trust Series 2014-NP11 Class A1, 3.875% 4/25/55 (e) | | 130 | 130 |
| TOTAL ASSET-BACKED SECURITIES | | | |
| (Cost $55,634) | | | 56,059 |
|
| Collateralized Mortgage Obligations - 12.9% | | | |
| Private Sponsor - 5.1% | | | |
| Banc of America Funding Corp. Series 2015-R3 Class 10A1, 1 month U.S. LIBOR + 0.140% 1.3561% 6/27/36 (a)(b)(e) | | 4,424 | 4,311 |
| Banc of America Funding Trust sequential payer Series 2010-R3 Class 1A1, 3.3685% 12/26/35 (a)(e) | | 589 | 591 |
| BCAP LLC Trust sequential payer: | | | |
| Series 2010-RR11 Class 6A1, 3.2852% 3/27/36 (a)(e) | | $1,785 | $1,783 |
| Series 2010-RR2 Class 5A2, 5% 12/26/36 (e) | | 270 | 276 |
| Series 2012-RR5 Class 8A5, 1.4122% 7/26/36 (a)(e) | | 586 | 566 |
| Citigroup Mortgage Loan Trust sequential payer Series 2014-8 Class 2A1, 3.45% 6/27/37 (a)(e) | | 4,412 | 4,406 |
| Citigroup Mortgage Loan Trust, Inc. sequential payer Series 2009-5 Class 5A1, 3.4927% 1/25/37 (a)(e) | | 652 | 665 |
| Credit Suisse Commercial Mortgage Trust Series 2014-15R Class 7A3, 1.8991% 10/26/37 (a)(e) | | 119 | 118 |
| Credit Suisse Mortgage Trust: | | | |
| Series 2010-9R Class 2A5, 4% 2/27/38 (e) | | 1,812 | 1,860 |
| Series 2012-2R Class 1A1, 3.2057% 5/27/35 (a)(e) | | 318 | 320 |
| CSMC: | | | |
| floater Series 2015-1R Class 6A1, 1 month U.S. LIBOR + 0.280% 1.4945% 5/27/37 (a)(b)(e) | | 2,962 | 2,838 |
| Series 2011-2R Class 2A1, 3.3199% 7/27/36 (a)(e) | | 405 | 405 |
| Series 2014-3R Class 2A1, 1 month U.S. LIBOR + 0.700% 1.9161% 5/27/37 (a)(b)(e) | | 657 | 635 |
| Exeter Automobile Receivables Trust Series 2015-2A Class A, 1.54% 11/15/19 (e) | | 294 | 294 |
| First Horizon Mortgage pass-thru Trust Series 2004-AR5 Class 2A1, 3.1125% 10/25/34 (a) | | 204 | 205 |
| Freddie Mac Seasoned Credit Risk Transfer Series sequential payer Series 2017-1 Class MA, 3% 1/25/56 | | 3,782 | 3,848 |
| JP Morgan Resecuritization Trust floater Series 2012-2 Class 6A1, 1 month U.S. LIBOR + 0.210% 1.4182% 6/21/36 (a)(b)(e) | | 1,463 | 1,447 |
| MASTR Alternative Loan Trust Series 2004-6 Class 5A1, 5.4262% 7/25/19 (a) | | 477 | 480 |
| Merrill Lynch Alternative Note Asset Trust floater Series 2007-OAR1 Class A1, 1 month U.S. LIBOR + 0.170% 1.3861% 2/25/37 (a)(b) | | 709 | 690 |
| Morgan Stanley Re-REMIC Trust Series 2010-R6 Class 1A, 3.1187% 2/26/37 (a)(e) | | 733 | 735 |
| Mortgage Repurchase Agreement Funding Trust floater Series 2016-5 Class A, 1 month U.S. LIBOR + 1.170% 2.4006% 6/10/19 (a)(b)(e) | | 11,230 | 11,212 |
| Nomura Resecuritization Trust sequential payer Series 2011-3RA Class 2A1, 3.2922% 3/26/37 (a)(e) | | 590 | 590 |
| Structured Asset Securities Corp. Series 2003-15A Class 4A, 3.368% 4/25/33 (a) | | 54 | 53 |
| Thornburg Mortgage Securities Trust floater Series 2003-4 Class A1, 1 month U.S. LIBOR + 0.640% 1.8744% 9/25/43 (a)(b) | | 3,019 | 2,916 |
| Towd Point Mortgage Trust: | | | |
| Series 2015-5 Class A1B, 2.75% 5/25/55 (e) | | 1,125 | 1,136 |
| Series 2017-2 Class A1, 2.75% 4/25/57 (a)(e) | | 6,756 | 6,827 |
| WaMu Mortgage pass-thru certificates sequential payer: | | | |
| Series 2002-S8 Class 2A7, 5.25% 1/25/18 | | 48 | 48 |
| Series 2003-MS5 Class 1A1, 5% 3/25/18 | | 42 | 42 |
| Wells Fargo Mortgage Backed Securities Trust: | | | |
| Series 2003-I Class A1, 3.0527% 9/25/33 (a) | | 570 | 581 |
| Series 2005-AR10 Class 2A15, 3.1989% 6/25/35 (a) | | 3,544 | 3,577 |
| Series 2005-AR2 Class 1A2, 3.1522% 3/25/35 (a) | | 154 | 154 |
| Series 2006-AR10 Class 3A1, 3.2467% 7/25/36 (a) | | 87 | 87 |
| Wells Fargo Mortgage Loan Trust sequential payer Series 2011-RR4: | | | |
| Class 1A1, 3.5051% 6/27/36 (a)(e) | | 336 | 337 |
| Class 2A1, 3.3412% 6/27/36 (a)(e) | | 478 | 476 |
| | | | 54,509 |
| U.S. Government Agency - 7.8% | | | |
| Fannie Mae: | | | |
| floater Series 2003-118 Class S, 8.100% - 1 month U.S. LIBOR 6.8656% 12/25/33 (a)(g)(h) | | 240 | 58 |
| planned amortization class: | | | |
| Series 1999-17 Class PG, 6% 4/25/29 | | 422 | 466 |
| Series 1999-32 Class PL, 6% 7/25/29 | | 410 | 454 |
| Series 1999-33 Class PK, 6% 7/25/29 | | 283 | 314 |
| Series 2001-52 Class YZ, 6.5% 10/25/31 | | 34 | 40 |
| Series 2005-39 Class TE, 5% 5/25/35 | | 635 | 696 |
| Series 2005-73 Class SA, 17.500% - 1 month U.S. LIBOR 14.3404% 8/25/35 (a)(h) | | 42 | 53 |
| sequential payer: | | | |
| Series 2001-20 Class Z, 6% 5/25/31 | | 436 | 479 |
| Series 2001-31 Class ZC, 6.5% 7/25/31 | | 196 | 223 |
| Series 2002-16 Class ZD, 6.5% 4/25/32 | | 67 | 78 |
| Series 2002-74 Class SV, 1 month U.S. LIBOR + 7.550% 6.3156% 11/25/32 (a)(b)(g) | | 167 | 28 |
| Series 2012-67 Class AI, 4.5% 7/25/27 (g) | | 527 | 56 |
| Series 06-116 Class SG, 6.640% - 1 month U.S. LIBOR 5.4056% 12/25/36 (a)(g)(h) | | 164 | 35 |
| Series 07-40 Class SE, 6.440% - 1 month U.S. LIBOR 5.2056% 5/25/37 (a)(g)(h) | | 89 | 16 |
| Series 1993-165 Class SH, 19.800% - 1 month U.S. LIBOR 16.3081% 9/25/23 (a)(h) | | 21 | 27 |
| Series 2003-21 Class SK, 8.100% - 1 month U.S. LIBOR 6.8656% 3/25/33 (a)(g)(h) | | 65 | 14 |
| Series 2003-35 Class TQ, 7.500% - 1 month U.S. LIBOR 6.2656% 5/25/18 (a)(g)(h) | | 6 | 0 |
| Series 2005-79 Class ZC, 5.9% 9/25/35 | | 356 | 409 |
| Series 2007-57 Class SA, 40.600% - 1 month U.S. LIBOR 33.2134% 6/25/37 (a)(h) | | 319 | 645 |
| Series 2007-66 Class SB, 39.600% - 1 month U.S. LIBOR 32.1934% 7/25/37 (a)(h) | | 98 | 179 |
| Series 2008-12 Class SG, 6.350% - 1 month U.S. LIBOR 5.1156% 3/25/38 (a)(g)(h) | | 491 | 84 |
| Series 2009-16 Class SA, 6.250% - 1 month U.S. LIBOR 5.0156% 3/25/24 (a)(g)(h) | | 1 | 0 |
| Series 2009-76 Class MI, 5.5% 9/25/24 (g) | | 15 | 0 |
| Series 2009-85 Class IB, 4.5% 8/25/24 (g) | | 37 | 2 |
| Series 2009-93 Class IC, 4.5% 9/25/24 (g) | | 54 | 2 |
| Series 2010-12 Class AI, 5% 12/25/18 (g) | | 84 | 1 |
| Series 2010-135 Class LS, 6.050% - 1 month U.S. LIBOR 4.8156% 12/25/40 (a)(g)(h) | | 464 | 76 |
| Series 2010-139 Class NI, 4.5% 2/25/40 (g) | | 562 | 61 |
| Series 2010-150 Class ZC, 4.75% 1/25/41 | | 1,331 | 1,487 |
| Series 2010-23: | | | |
| Class AI, 5% 12/25/18 (g) | | 24 | 0 |
| Class HI, 4.5% 10/25/18 (g) | | 32 | 1 |
| Series 2010-29 Class LI, 4.5% 6/25/19 (g) | | 80 | 1 |
| Series 2010-95 Class ZC, 5% 9/25/40 | | 2,810 | 3,163 |
| Series 2010-97 Class CI, 4.5% 8/25/25 (g) | | 138 | 8 |
| Series 2011-110 Class SA, 6.610% - 1 month U.S. LIBOR 5.3756% 4/25/41 (a)(g)(h) | | 918 | 132 |
| Series 2011-112 Class SA, 6.550% - 1 month U.S. LIBOR 5.3156% 11/25/41 (a)(g)(h) | | 863 | 151 |
| Series 2011-123 Class SD, 6.600% - 1 month U.S. LIBOR 5.3656% 8/25/39 (a)(g)(h) | | 780 | 102 |
| Series 2011-4 Class PZ, 5% 2/25/41 | | 583 | 666 |
| Series 2011-67 Class AI, 4% 7/25/26 (g) | | 147 | 14 |
| Series 2011-83 Class DI, 6% 9/25/26 (g) | | 186 | 18 |
| Series 2012-100 Class WI, 3% 9/25/27 (g) | | 1,402 | 129 |
| Series 2012-14 Class JS, 6.650% - 1 month U.S. LIBOR 5.4156% 12/25/30 (a)(g)(h) | | 519 | 67 |
| Series 2012-47 Class SD, 6.450% - 1 month U.S. LIBOR 5.2156% 5/25/42 (a)(g)(h) | | 1,803 | 344 |
| Series 2012-9 Class SH, 6.550% - 1 month U.S. LIBOR 5.3156% 6/25/41 (a)(g)(h) | | 662 | 95 |
| Series 2013-133 Class IB, 3% 4/25/32 (g) | | 965 | 89 |
| Series 2013-134 Class SA, 6.050% - 1 month U.S. LIBOR 4.8156% 1/25/44 (a)(g)(h) | | 418 | 70 |
| Series 2013-51 Class GI, 3% 10/25/32 (g) | | 309 | 33 |
| Series 2013-N1 Class A, 6.720% - 1 month U.S. LIBOR 5.4856% 6/25/35 (a)(g)(h) | | 514 | 97 |
| Series 2015-42: | | | |
| Class IL, 6% 6/25/45 (g) | | 2,049 | 477 |
| Class LS, 6.200% - 1 month U.S. LIBOR 4.9656% 6/25/45 (a)(g)(h) | | 2,288 | 379 |
| Series 2015-70 Class JC, 3% 10/25/45 | | 2,596 | 2,666 |
| Series 2016-78 Class CS, 6.100% - 1 month U.S. LIBOR 4.8656% 5/25/39 (a)(g)(h) | | 3,947 | 692 |
| Series 2017-30 Class AI, 5.5% 5/25/47 (g) | | 987 | 221 |
| Fannie Mae Stripped Mortgage-Backed Securities: | | | |
| Series 339 Class 29, 5.5% 8/25/18 (g) | | 8 | 0 |
| Series 348 Class 14, 6.5% 8/25/34 (a)(g) | | 134 | 31 |
| Series 351: | | | |
| Class 12, 5.5% 4/25/34 (a)(g) | | 86 | 14 |
| Class 13, 6% 3/25/34 (g) | | 119 | 24 |
| Series 359 Class 19, 6% 7/25/35 (a)(g) | | 78 | 15 |
| Series 384 Class 6, 5% 7/25/37 (g) | | 272 | 48 |
| Freddie Mac: | | | |
| planned amortization class: | | | |
| Series 2095 Class PE, 6% 11/15/28 | | 471 | 522 |
| Series 2104 Class PG, 6% 12/15/28 | | 134 | 148 |
| Series 2121 Class MG, 6% 2/15/29 | | 197 | 218 |
| Series 2154 Class PT, 6% 5/15/29 | | 342 | 381 |
| Series 2162 Class PH, 6% 6/15/29 | | 51 | 55 |
| Series 2520 Class BE, 6% 11/15/32 | | 232 | 251 |
| Series 2585 Class KS, 7.600% - 1 month U.S. LIBOR 6.3733% 3/15/23 (a)(g)(h) | | 19 | 2 |
| Series 2693 Class MD, 5.5% 10/15/33 | | 4,157 | 4,633 |
| Series 2802 Class OB, 6% 5/15/34 | | 1,033 | 1,133 |
| Series 3002 Class NE, 5% 7/15/35 | | 380 | 415 |
| Series 3189 Class PD, 6% 7/15/36 | | 378 | 433 |
| Series 3415 Class PC, 5% 12/15/37 | | 111 | 121 |
| Series 3786 Class HI, 4% 3/15/38 (g) | | 547 | 43 |
| Series 3806 Class UP, 4.5% 2/15/41 | | 1,009 | 1,077 |
| Series 3832 Class PE, 5% 3/15/41 | | 960 | 1,075 |
| Series 70 Class C, 9% 9/15/20 | | 0 | 0 |
| sequential payer: | | | |
| Series 2114 Class ZM, 6% 1/15/29 | | 66 | 74 |
| Series 2135 Class JE, 6% 3/15/29 | | 259 | 288 |
| Series 2274 Class ZM, 6.5% 1/15/31 | | 117 | 133 |
| Series 2281 Class ZB, 6% 3/15/30 | | 94 | 101 |
| Series 2357 Class ZB, 6.5% 9/15/31 | | 228 | 264 |
| Series 2502 Class ZC, 6% 9/15/32 | | 239 | 259 |
| Series 3871 Class KB, 5.5% 6/15/41 | | 1,045 | 1,216 |
| Series 06-3115 Class SM, 6.600% - 1 month U.S. LIBOR 5.3733% 2/15/36 (a)(g)(h) | | 132 | 27 |
| Series 1658 Class GZ, 7% 1/15/24 | | 263 | 284 |
| Series 2013-4281 Class AI, 4% 12/15/28 (g) | | 1,201 | 105 |
| Series 2017-4683 Class LM, 3% 5/15/47 | | 2,032 | 2,087 |
| Series 2380 Class SY, 8.200% - 1 month U.S. LIBOR 6.9733% 11/15/31 (a)(g)(h) | | 936 | 159 |
| Series 2587 Class IM, 6.5% 3/15/33 (g) | | 134 | 31 |
| Series 2844: | | | |
| Class SC, 46.800% - 1 month U.S. LIBOR 38.8266% 8/15/24 (a)(h) | | 7 | 11 |
| Class SD, 86.400% - 1 month U.S. LIBOR 70.5033% 8/15/24 (a)(h) | | 11 | 21 |
| Series 2933 Class ZM, 5.75% 2/15/35 | | 760 | 885 |
| Series 2935 Class ZK, 5.5% 2/15/35 | | 1,312 | 1,481 |
| Series 2947 Class XZ, 6% 3/15/35 | | 486 | 541 |
| Series 2996 Class ZD, 5.5% 6/15/35 | | 603 | 692 |
| Series 3055 Class CS, 1 month U.S. LIBOR + 6.590% 5.3633% 10/15/35 (a)(b)(g) | | 180 | 36 |
| Series 3237 Class C, 5.5% 11/15/36 | | 892 | 1,014 |
| Series 3244 Class SG, 6.660% - 1 month U.S. LIBOR 5.4333% 11/15/36 (a)(g)(h) | | 359 | 71 |
| Series 3284 Class CI, 1 month U.S. LIBOR + 6.120% 4.8933% 3/15/37 (a)(b)(g) | | 771 | 147 |
| Series 3287 Class SD, 6.750% - 1 month U.S. LIBOR 5.5233% 3/15/37 (a)(g)(h) | | 494 | 102 |
| Series 3297 Class BI, 6.760% - 1 month U.S. LIBOR 5.5333% 4/15/37 (a)(g)(h) | | 743 | 158 |
| Series 3336 Class LI, 1 month U.S. LIBOR + 6.580% 5.3533% 6/15/37 (a)(b)(g) | | 299 | 53 |
| Series 3772 Class BI, 4.5% 10/15/18 (g) | | 64 | 1 |
| Series 3949 Class MK, 4.5% 10/15/34 | | 272 | 292 |
| Series 3955: | | | |
| Class GS, 5.950% - 1 month U.S. LIBOR 4.7233% 9/15/41 (a)(g)(h) | | 783 | 122 |
| Class YI, 3% 11/15/21 (g) | | 776 | 34 |
| Series 4055 Class BI, 3.5% 5/15/31 (g) | | 885 | 86 |
| Series 4149 Class IO, 3% 1/15/33 (g) | | 132 | 17 |
| Series 4314 Class AI, 5% 3/15/34 (g) | | 337 | 37 |
| Series 4427 Class LI, 3.5% 2/15/34 (g) | | 1,514 | 177 |
| Series 4471 Class PA 4% 12/15/40 | | 3,685 | 3,861 |
| Freddie Mac Manufactured Housing participation certificates guaranteed planned amortization class Series 2043 Class CJ, 6.5% 4/15/28 | | 186 | 211 |
| Freddie Mac Multi-family Structured pass-thru certificates Series 4386 Class AZ, 4.5% 11/15/40 | | 2,721 | 2,915 |
| Ginnie Mae guaranteed REMIC pass-thru certificates: | | | |
| floater: | | | |
| Series 2007-37 Class TS, 6.690% - 1 month U.S. LIBOR 5.4622% 6/16/37 (a)(g)(h) | | 177 | 37 |
| Series 2010-H17 Class FA, 1 month U.S. LIBOR + 0.330% 1.5628% 7/20/60 (a)(b)(i) | | 251 | 249 |
| Series 2010-H18 Class AF, 1 month U.S. LIBOR + 0.300% 1.5239% 9/20/60 (a)(b)(i) | | 315 | 312 |
| Series 2010-H19 Class FG, 1 month U.S. LIBOR + 0.300% 1.5239% 8/20/60 (a)(b)(i) | | 350 | 347 |
| Series 2011-H13 Class FA, 1 month U.S. LIBOR + 0.500% 1.7239% 4/20/61 (a)(b)(i) | | 141 | 141 |
| Series 2012-H21 Class DF, 1 month U.S. LIBOR + 0.650% 1.8739% 5/20/61 (a)(b)(i) | | 934 | 936 |
| planned amortization class Series 2011-136 Class WI, 4.5% 5/20/40 (g) | | 332 | 38 |
| sequential payer: | | | |
| Series 2002-24 Class SK, 7.950% - 1 month U.S. LIBOR 6.7222% 4/16/32 (a)(g)(h) | | 882 | 174 |
| Series 2002-42 Class ZA, 6% 6/20/32 | | 304 | 344 |
| Series 2004-24 Class ZM, 5% 4/20/34 | | 601 | 658 |
| Series 2010-160 Class DY, 4% 12/20/40 | | 3,841 | 4,115 |
| Series 2010-170 Class B, 4% 12/20/40 | | 868 | 930 |
| Series 2001-3 Class S, 1 month U.S. LIBOR + 8.100% 6.8722% 2/16/31 (a)(b)(g) | | 191 | 33 |
| Series 2001-36: | | | |
| Class SB, 8.100% - 1 month U.S. LIBOR 6.8722% 12/16/23 (a)(g)(h) | | 457 | 64 |
| Class SP, 1 month U.S. LIBOR + 8.750% 7.5222% 9/16/26 (a)(b)(g) | | 263 | 32 |
| Series 2001-38 Class SB, 7.580% - 1 month U.S. LIBOR 6.3522% 8/16/31 (a)(g)(h) | | 317 | 54 |
| Series 2001-49: | | | |
| Class SC, 7.600% - 1 month U.S. LIBOR 6.3722% 12/16/25 (a)(g)(h) | | 617 | 83 |
| Class SL, 7.600% - 1 month U.S. LIBOR 6.3722% 5/16/30 (a)(g)(h) | | 883 | 150 |
| Class SV, 8.250% - 1 month U.S. LIBOR 7.0222% 12/16/28 (a)(g)(h) | | 74 | 9 |
| Series 2001-50: | | | |
| Class SD, 8.200% - 1 month U.S. LIBOR 6.9694% 11/20/31 (a)(g)(h) | | 455 | 101 |
| Class ST, 7.700% - 1 month U.S. LIBOR 6.4722% 8/16/27 (a)(g)(h) | | 201 | 35 |
| Series 2002-5 Class SP, 7.450% - 1 month U.S. LIBOR 6.2222% 1/16/32 (a)(g)(h) | | 315 | 47 |
| Series 2004-32 Class GS, 6.500% - 1 month U.S. LIBOR 5.2722% 5/16/34 (a)(g)(h) | | 306 | 56 |
| Series 2004-73 Class AL, 7.200% - 1 month U.S. LIBOR 5.9722% 8/17/34 (a)(g)(h) | | 118 | 27 |
| Series 2011-52 Class HI, 7% 4/16/41 (g) | | 1,251 | 294 |
| Series 2012-76 Class GS, 6.700% - 1 month U.S. LIBOR 5.4722% 6/16/42 (a)(g)(h) | | 551 | 106 |
| Series 2013-124: | | | |
| Class ES, 8.667% - 1 month U.S. LIBOR 7.0259% 4/20/39 (a)(h) | | 1,077 | 1,134 |
| Class ST, 8.800% - 1 month U.S. LIBOR 7.1593% 8/20/39 (a)(h) | | 2,498 | 2,683 |
| Series 2013-149 Class MA, 2.5% 5/20/40 | | 4,648 | 4,685 |
| Series 2015-H13 Class HA, 2.5% 8/20/64 (i) | | 10,796 | 10,879 |
| Series 2015-H17 Class HA, 2.5% 5/20/65 (i) | | 4,374 | 4,409 |
| Series 2017-H06 Class FA, U.S. TREASURY 1 YEAR INDEX + 0.350% 1.57% 8/20/66 (a)(b)(i) | | 6,336 | 6,351 |
| | | | 83,743 |
| TOTAL COLLATERALIZED MORTGAGE OBLIGATIONS | | | |
| (Cost $137,318) | | | 138,252 |
|
| Commercial Mortgage Securities - 3.0% | | | |
| Asset Securitization Corp. Series 1997-D5 Class PS1, 1.6895% 2/14/43 (a)(g) | | 113 | 1 |
| Barclays Commercial Mortgage Securities LLC Series 2015-STP Class A, 3.3228% 9/10/28 (e) | | 1,642 | 1,693 |
| Bayview Commercial Asset Trust floater Series 2007-3: | | | |
| Class M1, 1 month U.S. LIBOR + 0.310% 1.5261% 7/25/37 (a)(b)(e) | | 30 | 27 |
| Class M2, 1 month U.S. LIBOR + 0.340% 1.5561% 7/25/37 (a)(b)(e) | | 31 | 28 |
| Class M3, 1 month U.S. LIBOR + 0.370% 1.5861% 7/25/37 (a)(b)(e) | | 50 | 38 |
| Citigroup Commercial Mortgage Trust: | | | |
| Series 2015-GC33 Class XA, 0.968% 9/10/58 (a)(g) | | 22,734 | 1,345 |
| Series 2016-P6 Class XA, 0.8365% 12/10/49 (a)(g) | | 22,587 | 1,118 |
| COMM Mortgage Trust: | | | |
| Series 2014-CR19 Class XA, 1.2398% 8/10/47 (a)(g) | | 27,988 | 1,517 |
| Series 2014-CR20 Class XA, 1.1713% 11/10/47 (a)(g) | | 6,165 | 359 |
| Series 2014-LC17 Class XA, 1.143% 10/10/47 (a)(g) | | 25,285 | 986 |
| Series 2014-UBS4 Class XA, 1.2342% 8/10/47 (a)(g) | | 28,487 | 1,612 |
| Series 2014-UBS6 Class XA, 1.0295% 12/10/47 (a)(g) | | 15,073 | 748 |
| Series 2015-DC1 Class XA, 1.1664% 2/10/48 (a)(g) | | 37,457 | 2,145 |
| CSMC Series 2015-TOWN: | | | |
| Class A, 1 month U.S. LIBOR + 1.250% 2.4756% 3/15/28 (a)(b)(e) | | 7,804 | 7,798 |
| Class B, 1 month U.S. LIBOR + 1.900% 3.1256% 3/15/28 (a)(b)(e) | | 185 | 185 |
| Class C, 1 month U.S. LIBOR + 2.250% 3.4756% 3/15/28 (a)(b)(e) | | 180 | 180 |
| Class D, 1 month U.S. LIBOR + 3.200% 4.4256% 3/15/28 (a)(b)(e) | | 273 | 273 |
| GAHR Commercial Mortgage Trust floater Series 2015-NRF Class AFL1, 1 month U.S. LIBOR + 1.300% 2.459% 12/15/34 (a)(b)(e) | | 2,082 | 2,086 |
| GE Capital Commercial Mortgage Corp. Series 2007-C1 Class A1A, 5.483% 12/10/49 | | 713 | 712 |
| GS Mortgage Securities Trust: | | | |
| Series 2013-GC12 Class XA, 1.5475% 6/10/46 (a)(g) | | 7,462 | 455 |
| Series 2014-GC20 Class XA, 1.0078% 4/10/47 (a)(g) | | 6,624 | 341 |
| Series 2015-GC34 Class XA, 1.3631% 10/10/48 (a)(g) | | 10,576 | 872 |
| JPMBB Commercial Mortgage Securities Trust Series 2014-C19 Class XA, 1.1728% 4/15/47 (a)(g) | | 6,634 | 197 |
| JPMorgan Chase Commercial Mortgage Securities Trust Series 2016-WP Class TA, 1 month U.S. LIBOR + 1.450% 2.6089% 10/15/33 (a)(b)(e) | | 769 | 772 |
| Morgan Stanley BAML Trust Series 2015-C25 Class XA, 1.14% 10/15/48 (a)(g) | | 13,714 | 941 |
| MSCG Trust Series 2016-SNR Class A, 3.348% 11/15/34 (a)(e) | | 1,220 | 1,233 |
| SCG Trust Series 2013-SRP1 Class A, 1 month U.S. LIBOR + 1.400% 2.8089% 11/15/26 (a)(b)(e) | | 2,783 | 2,763 |
| Wells Fargo Commercial Mortgage Trust Series 2015-C31 Class XA, 1.1023% 11/15/48 (a)(g) | | 11,045 | 738 |
| WF-RBS Commercial Mortgage Trust Series 2014-C24 Class XA, 0.9591% 11/15/47 (a)(g) | | 8,573 | 429 |
| TOTAL COMMERCIAL MORTGAGE SECURITIES | | | |
| (Cost $31,658) | | | 31,592 |
| | | Shares | Value (000s) |
|
| Money Market Funds - 2.1% | | | |
| Fidelity Cash Central Fund, 1.11% (j) | | | |
| (Cost $22,471) | | 22,466,534 | 22,471 |
| TOTAL INVESTMENT IN SECURITIES - 115.0% | | | |
| (Cost $1,220,807) | | | 1,227,952 |
| NET OTHER ASSETS (LIABILITIES) - (15.0)% | | | (160,480) |
| NET ASSETS - 100% | | | $1,067,472 |
| TBA Sale Commitments | | |
| | Principal Amount (000s) | Value (000s) |
| Fannie Mae | | |
| 3% 9/1/47 | $(1,300) | $(1,315) |
| 3% 9/1/47 | (2,000) | (2,023) |
| 3% 9/1/47 | (5,200) | (5,260) |
| 3.5% 9/1/47 | (7,300) | (7,563) |
| 3.5% 9/1/47 | (7,300) | (7,563) |
| 3.5% 9/1/47 | (29,400) | (30,461) |
|
| TOTAL FANNIE MAE | | (54,185) |
|
| Ginnie Mae | | |
| 3% 9/1/47 | (2,700) | (2,756) |
| TOTAL TBA SALE COMMITMENTS | | |
| (Proceeds $56,762) | | $(56,941) |
| Futures Contracts | | | | | |
| | Number of contracts | Expiration Date | Notional amount (000s) | Value (000s) | Unrealized Appreciation/(Depreciation) (000s) |
| Purchased | | | | | |
| Treasury Contracts | | | | | |
| CBOT 5-Year U.S. Treasury Note Contracts (United States) | 56 | Dec. 2017 | $6,636 | $9 | $9 |
| CBOT Long Term U.S. Treasury Bond Contracts (United States) | 3 | Dec. 2017 | 468 | 4 | 4 |
| CBOT Ultra Long Term U.S. Treasury Bond Contracts (United States) | 6 | Dec. 2017 | 1,014 | 6 | 6 |
| TOTAL PURCHASED | | | | | 19 |
| Sold | | | | | |
| Treasury Contracts | | | | | |
| CBOT 10-Year U.S. Treasury Note Contracts (United States) | 202 | Dec. 2017 | 25,651 | (74) | (74) |
| CBOT 2-Year U.S. Treasury Note Contracts (United States) | 148 | Dec. 2017 | 32,014 | (10) | (10) |
| TOTAL SOLD | | | | | (84) |
| TOTAL FUTURES CONTRACTS | | | | | $(65) |
The notional amount of futures purchased as a percentage of Net Assets is 0.8%
The notional amount of futures sold as a percentage of Net Assets is 5.4%
For the period, the average monthly notional amount for futures contracts in the aggregate was $50,111,000.
Values shown as $0 may reflect amounts less than $500.
Legend
(a) Coupon rates for floating and adjustable rate securities reflect the rates in effect at period end.
(b) Coupon is indexed to a floating interest rate which may be multiplied by a specified factor and/or subject to caps or floors.
(c) Security or a portion of the security purchased on a delayed delivery or when-issued basis.
(d) Security or a portion of the security was pledged to cover margin requirements for futures contracts. At period end, the value of securities pledged amounted to $240,000.
(e) Security exempt from registration under Rule 144A of the Securities Act of 1933. These securities may be resold in transactions exempt from registration, normally to qualified institutional buyers. At the end of the period, the value of these securities amounted to $96,415,000 or 9.0% of net assets.
(f) Level 3 instrument
(g) Security represents right to receive monthly interest payments on an underlying pool of mortgages or assets. Principal shown is the outstanding par amount of the pool as of the end of the period.
(h) Coupon is inversely indexed to a floating interest rate multiplied by a specified factor. The price may be considerably more volatile than the price of a comparable fixed rate security.
(i) Represents an investment in an underlying pool of reverse mortgages which typically do not require regular principal and interest payments as repayment is deferred until a maturity event.
(j) Affiliated fund that is generally available only to investment companies and other accounts managed by Fidelity Investments. The rate quoted is the annualized seven-day yield of the fund at period end. A complete unaudited listing of the fund's holdings as of its most recent quarter end is available upon request. In addition, each Fidelity Central Fund's financial statements, which are not covered by the Fund's Report of Independent Registered Public Accounting Firm, are available on the SEC's website or upon request.
Affiliated Central Funds
Information regarding fiscal year to date income earned by the Fund from investments in Fidelity Central Funds is as follows:
| Fund | Income earned |
| | (Amounts in thousands) |
| Fidelity Cash Central Fund | $190 |
| Fidelity Mortgage Backed Securities Central Fund | 1 |
| Total | $191 |
Additional information regarding the Fund's fiscal year to date purchases and sales, including the ownership percentage, of the non Money Market Central Funds is as follows:
| Fund (Amounts in thousands) | Value, beginning of period | Purchases | Sales Proceeds | Realized Gain/Loss | Change in Unrealized appreciation (depreciation) | Value, end of period | % ownership, end of period |
| Fidelity Mortgage Backed Securities Central Fund | $86 | $1 | $84 | $(3) | $-- | $-- | 0.0% |
| Total | $86 | $1 | $84 | $(3) | $-- | $-- | |
Investment Valuation
The following is a summary of the inputs used, as of August 31, 2017, involving the Fund's assets and liabilities carried at fair value. The inputs or methodology used for valuing securities may not be an indication of the risk associated with investing in those securities. For more information on valuation inputs, and their aggregation into the levels used below, please refer to the Investment Valuation section in the accompanying Notes to Financial Statements.
| | Valuation Inputs at Reporting Date: |
| Description | Total | Level 1 | Level 2 | Level 3 |
| (Amounts in thousands) | | | | |
| Investments in Securities: | | | | |
| U.S. Government Agency - Mortgage Securities | $979,578 | $-- | $979,578 | $-- |
| Asset-Backed Securities | 56,059 | -- | 51,215 | 4,844 |
| Collateralized Mortgage Obligations | 138,252 | -- | 138,252 | -- |
| Commercial Mortgage Securities | 31,592 | -- | 31,592 | -- |
| Money Market Funds | 22,471 | 22,471 | -- | -- |
| Total Investments in Securities: | $1,227,952 | $22,471 | $1,200,637 | $4,844 |
| Derivative Instruments: | | | | |
| Assets | | | | |
| Futures Contracts | $19 | $19 | $-- | $-- |
| Total Assets | $19 | $19 | $-- | $-- |
| Liabilities | | | | |
| Futures Contracts | $(84) | $(84) | $-- | $-- |
| Total Liabilities | $(84) | $(84) | $-- | $-- |
| Total Derivative Instruments: | $(65) | $(65) | $-- | $-- |
| Other Financial Instruments: | | | | |
| TBA Sale Commitments | $(56,941) | $-- | $(56,941) | $-- |
| Total Other Financial Instruments: | $(56,941) | $-- | $(56,941) | $-- |
Value of Derivative Instruments
The following table is a summary of the Fund's value of derivative instruments by primary risk exposure as of August 31, 2017. For additional information on derivative instruments, please refer to the Derivative Instruments section in the accompanying Notes to Financial Statements.
| Primary Risk Exposure / Derivative Type | Value |
| | Asset | Liability |
| (Amounts in thousands) | | |
| Interest Rate Risk | | |
| Futures Contracts(a) | $19 | $(84) |
| Total Interest Rate Risk | 19 | (84) |
| Total Value of Derivatives | $19 | $(84) |
(a) Reflects gross cumulative appreciation (depreciation) on futures contracts as presented in the Schedule of Investments. In the Statement of Assets and Liabilities, the period end daily variation margin is included in receivable or payable for daily variation margin on futures contracts, and the net cumulative appreciation (depreciation) is included in net unrealized appreciation (depreciation).
See accompanying notes which are an integral part of the financial statements.
Financial Statements
Statement of Assets and Liabilities
| Amounts in thousands (except per-share amounts) | | August 31, 2017 |
| Assets | | |
Investment in securities, at value — See accompanying schedule:
Unaffiliated issuers (cost $1,198,336) | $1,205,481 | |
| Fidelity Central Funds (cost $22,471) | 22,471 | |
| Total Investment in Securities (cost $1,220,807) | | $1,227,952 |
| Cash | | 90 |
| Receivable for investments sold | | 154 |
| Receivable for TBA sale commitments | | 56,762 |
| Receivable for fund shares sold | | 261 |
| Interest receivable | | 3,166 |
| Distributions receivable from Fidelity Central Funds | | 21 |
| Total assets | | 1,288,406 |
| Liabilities | | |
| TBA sale commitments, at value | $56,941 | |
| Payable for investments purchased on a delayed delivery basis | 162,685 | |
| Payable for fund shares redeemed | 669 | |
| Distributions payable | 188 | |
| Accrued management fee | 272 | |
| Distribution and service plan fees payable | 22 | |
| Payable for daily variation margin on futures contracts | 23 | |
| Other affiliated payables | 134 | |
| Total liabilities | | 220,934 |
| Net Assets | | $1,067,472 |
| Net Assets consist of: | | |
| Paid in capital | | $1,067,393 |
| Distributions in excess of net investment income | | (4,158) |
| Accumulated undistributed net realized gain (loss) on investments | | (2,664) |
| Net unrealized appreciation (depreciation) on investments | | 6,901 |
| Net Assets | | $1,067,472 |
| Calculation of Maximum Offering Price | | |
| Class A: | | |
| Net Asset Value and redemption price per share ($35,227 ÷ 3,118 shares) | | $11.30 |
| Maximum offering price per share (100/96.00 of $11.30) | | $11.77 |
| Class M: | | |
| Net Asset Value and redemption price per share ($19,615 ÷ 1,733 shares) | | $11.32 |
| Maximum offering price per share (100/96.00 of $11.32) | | $11.79 |
| Class C: | | |
| Net Asset Value and offering price per share ($13,221 ÷ 1,172 shares)(a) | | $11.28 |
| Fidelity Mortgage Securities Fund: | | |
| Net Asset Value, offering price and redemption price per share ($926,057 ÷ 81,769 shares) | | $11.33 |
| Class I: | | |
| Net Asset Value, offering price and redemption price per share ($73,352 ÷ 6,500 shares) | | $11.28 |
(a) Redemption price per share is equal to net asset value less any applicable contingent deferred sales charge.
See accompanying notes which are an integral part of the financial statements.
Statement of Operations
| Amounts in thousands | | Year ended August 31, 2017 |
| Investment Income | | |
| Interest | | $26,132 |
| Income from Fidelity Central Funds | | 191 |
| Total income | | 26,323 |
| Expenses | | |
| Management fee | $3,350 | |
| Transfer agent fees | 1,185 | |
| Distribution and service plan fees | 314 | |
| Fund wide operations fee | 442 | |
| Independent trustees' fees and expenses | 4 | |
| Miscellaneous | 5 | |
| Total expenses before reductions | 5,300 | |
| Expense reductions | (1) | 5,299 |
| Net investment income (loss) | | 21,024 |
| Realized and Unrealized Gain (Loss) | | |
| Net realized gain (loss) on: | | |
| Investment securities: | | |
| Unaffiliated issuers | (2,598) | |
| Fidelity Central Funds | (2) | |
| Futures contracts | 871 | |
| Swaps | 25 | |
| Total net realized gain (loss) | | (1,704) |
| Change in net unrealized appreciation (depreciation) on: | | |
| Investment securities: | | |
| Unaffiliated issuers | (10,375) | |
| Fidelity Central Funds | (1) | |
| Futures contracts | (130) | |
| Swaps | (42) | |
| Delayed delivery commitments | (190) | |
| Total change in net unrealized appreciation (depreciation) | | (10,738) |
| Net gain (loss) | | (12,442) |
| Net increase (decrease) in net assets resulting from operations | | $8,582 |
See accompanying notes which are an integral part of the financial statements.
Statement of Changes in Net Assets
| Amounts in thousands | Year ended August 31, 2017 | Year ended August 31, 2016 |
| Increase (Decrease) in Net Assets | | |
| Operations | | |
| Net investment income (loss) | $21,024 | $23,905 |
| Net realized gain (loss) | (1,704) | 10,209 |
| Change in net unrealized appreciation (depreciation) | (10,738) | 6,345 |
| Net increase (decrease) in net assets resulting from operations | 8,582 | 40,459 |
| Distributions to shareholders from net investment income | (22,676) | (25,324) |
| Distributions to shareholders from net realized gain | – | (552) |
| Total distributions | (22,676) | (25,876) |
| Share transactions - net increase (decrease) | (36,959) | 101,086 |
| Total increase (decrease) in net assets | (51,053) | 115,669 |
| Net Assets | | |
| Beginning of period | 1,118,525 | 1,002,856 |
| End of period | $1,067,472 | $1,118,525 |
| Other Information | | |
| Distributions in excess of net investment income end of period | $(4,158) | $(2,421) |
See accompanying notes which are an integral part of the financial statements.
Financial Highlights — Fidelity Advisor Mortgage Securities Fund Class A
| Years ended August 31, | 2017 | 2016 | 2015 | 2014 | 2013 |
| Selected Per–Share Data | | | | | |
| Net asset value, beginning of period | $11.44 | $11.29 | $11.24 | $10.89 | $11.34 |
| Income from Investment Operations | | | | | |
| Net investment income (loss)A | .185 | .217 | .223 | .239 | .169 |
| Net realized and unrealized gain (loss) | (.124) | .173 | .047 | .341 | (.457) |
| Total from investment operations | .061 | .390 | .270 | .580 | (.288) |
| Distributions from net investment income | (.201) | (.234) | (.217) | (.230) | (.162) |
| Distributions from net realized gain | – | (.006) | (.003) | – | – |
| Total distributions | (.201) | (.240) | (.220) | (.230) | (.162) |
| Net asset value, end of period | $11.30 | $11.44 | $11.29 | $11.24 | $10.89 |
| Total ReturnB,C | .56% | 3.49% | 2.41% | 5.37% | (2.57)% |
| Ratios to Average Net AssetsD,E | | | | | |
| Expenses before reductions | .79% | .79% | .81% | .81% | .79% |
| Expenses net of fee waivers, if any | .79% | .79% | .81% | .81% | .79% |
| Expenses net of all reductions | .79% | .79% | .81% | .81% | .79% |
| Net investment income (loss) | 1.64% | 1.92% | 1.97% | 2.15% | 1.51% |
| Supplemental Data | | | | | |
| Net assets, end of period (in millions) | $35 | $49 | $38 | $41 | $50 |
| Portfolio turnover rateF | 357% | 404% | 439% | 398% | 474% |
A Calculated based on average shares outstanding during the period.
B Total returns would have been lower if certain expenses had not been reduced during the applicable periods shown.
C Total returns do not include the effect of the sales charges.
D Fees and expenses of any underlying Fidelity Central Funds are not included in the Fund's expense ratio. The Fund indirectly bears its proportionate share of the expenses of any underlying Fidelity Central Funds. Based on their most recent shareholder report date, the expenses of any underlying non-money market Fidelity Central Funds were less than .005%.
E Expense ratios reflect operating expenses of the class. Expenses before reductions do not reflect amounts reimbursed by the investment adviser or reductions from expense offset arrangements and do not represent the amount paid by the class during periods when reimbursements or reductions occur. Expenses net of fee waivers reflect expenses after reimbursement by the investment adviser but prior to reductions from expense offset arrangements. Expenses net of all reductions represent the net expenses paid by the class.
F Amount does not include the portfolio activity of any underlying Fidelity Central Funds.
See accompanying notes which are an integral part of the financial statements.
Financial Highlights — Fidelity Advisor Mortgage Securities Fund Class M
| Years ended August 31, | 2017 | 2016 | 2015 | 2014 | 2013 |
| Selected Per–Share Data | | | | | |
| Net asset value, beginning of period | $11.46 | $11.31 | $11.27 | $10.92 | $11.37 |
| Income from Investment Operations | | | | | |
| Net investment income (loss)A | .184 | .218 | .225 | .242 | .173 |
| Net realized and unrealized gain (loss) | (.123) | .172 | .037 | .340 | (.458) |
| Total from investment operations | .061 | .390 | .262 | .582 | (.285) |
| Distributions from net investment income | (.201) | (.234) | (.219) | (.232) | (.165) |
| Distributions from net realized gain | – | (.006) | (.003) | – | – |
| Total distributions | (.201) | (.240) | (.222) | (.232) | (.165) |
| Net asset value, end of period | $11.32 | $11.46 | $11.31 | $11.27 | $10.92 |
| Total ReturnB,C | .55% | 3.48% | 2.33% | 5.38% | (2.54)% |
| Ratios to Average Net AssetsD,E | | | | | |
| Expenses before reductions | .79% | .80% | .79% | .79% | .77% |
| Expenses net of fee waivers, if any | .79% | .79% | .79% | .79% | .77% |
| Expenses net of all reductions | .79% | .79% | .79% | .79% | .77% |
| Net investment income (loss) | 1.63% | 1.92% | 1.98% | 2.17% | 1.53% |
| Supplemental Data | | | | | |
| Net assets, end of period (in millions) | $20 | $25 | $20 | $22 | $26 |
| Portfolio turnover rateF | 357% | 404% | 439% | 398% | 474% |
A Calculated based on average shares outstanding during the period.
B Total returns would have been lower if certain expenses had not been reduced during the applicable periods shown.
C Total returns do not include the effect of the sales charges.
D Fees and expenses of any underlying Fidelity Central Funds are not included in the Fund's expense ratio. The Fund indirectly bears its proportionate share of the expenses of any underlying Fidelity Central Funds. Based on their most recent shareholder report date, the expenses of any underlying non-money market Fidelity Central Funds were less than .005%.
E Expense ratios reflect operating expenses of the class. Expenses before reductions do not reflect amounts reimbursed by the investment adviser or reductions from expense offset arrangements and do not represent the amount paid by the class during periods when reimbursements or reductions occur. Expenses net of fee waivers reflect expenses after reimbursement by the investment adviser but prior to reductions from expense offset arrangements. Expenses net of all reductions represent the net expenses paid by the class.
F Amount does not include the portfolio activity of any underlying Fidelity Central Funds.
See accompanying notes which are an integral part of the financial statements.
Financial Highlights — Fidelity Advisor Mortgage Securities Fund Class C
| Years ended August 31, | 2017 | 2016 | 2015 | 2014 | 2013 |
| Selected Per–Share Data | | | | | |
| Net asset value, beginning of period | $11.42 | $11.27 | $11.23 | $10.88 | $11.33 |
| Income from Investment Operations | | | | | |
| Net investment income (loss)A | .100 | .133 | .141 | .160 | .088 |
| Net realized and unrealized gain (loss) | (.123) | .172 | .037 | .342 | (.457) |
| Total from investment operations | (.023) | .305 | .178 | .502 | (.369) |
| Distributions from net investment income | (.117) | (.149) | (.135) | (.152) | (.081) |
| Distributions from net realized gain | – | (.006) | (.003) | – | – |
| Total distributions | (.117) | (.155) | (.138) | (.152) | (.081) |
| Net asset value, end of period | $11.28 | $11.42 | $11.27 | $11.23 | $10.88 |
| Total ReturnB,C | (.19)% | 2.72% | 1.59% | 4.64% | (3.28)% |
| Ratios to Average Net AssetsD,E | | | | | |
| Expenses before reductions | 1.54% | 1.54% | 1.53% | 1.52% | 1.52% |
| Expenses net of fee waivers, if any | 1.54% | 1.54% | 1.53% | 1.52% | 1.52% |
| Expenses net of all reductions | 1.54% | 1.54% | 1.53% | 1.52% | 1.52% |
| Net investment income (loss) | .89% | 1.17% | 1.25% | 1.44% | .78% |
| Supplemental Data | | | | | |
| Net assets, end of period (in millions) | $13 | $19 | $16 | $17 | $17 |
| Portfolio turnover rateF | 357% | 404% | 439% | 398% | 474% |
A Calculated based on average shares outstanding during the period.
B Total returns would have been lower if certain expenses had not been reduced during the applicable periods shown.
C Total returns do not include the effect of the contingent deferred sales charge.
D Fees and expenses of any underlying Fidelity Central Funds are not included in the Fund's expense ratio. The Fund indirectly bears its proportionate share of the expenses of any underlying Fidelity Central Funds. Based on their most recent shareholder report date, the expenses of any underlying non-money market Fidelity Central Funds were less than .005%.
E Expense ratios reflect operating expenses of the class. Expenses before reductions do not reflect amounts reimbursed by the investment adviser or reductions from expense offset arrangements and do not represent the amount paid by the class during periods when reimbursements or reductions occur. Expenses net of fee waivers reflect expenses after reimbursement by the investment adviser but prior to reductions from expense offset arrangements. Expenses net of all reductions represent the net expenses paid by the class.
F Amount does not include the portfolio activity of any underlying Fidelity Central Funds.
See accompanying notes which are an integral part of the financial statements.
Financial Highlights — Fidelity Mortgage Securities Fund
| Years ended August 31, | 2017 | 2016 | 2015 | 2014 | 2013 |
| Selected Per–Share Data | | | | | |
| Net asset value, beginning of period | $11.47 | $11.31 | $11.27 | $10.92 | $11.37 |
| Income from Investment Operations | | | | | |
| Net investment income (loss)A | .223 | .257 | .264 | .279 | .209 |
| Net realized and unrealized gain (loss) | (.123) | .182 | .037 | .341 | (.458) |
| Total from investment operations | .100 | .439 | .301 | .620 | (.249) |
| Distributions from net investment income | (.240) | (.273) | (.258) | (.270) | (.201) |
| Distributions from net realized gain | – | (.006) | (.003) | – | – |
| Total distributions | (.240) | (.279) | (.261) | (.270) | (.201) |
| Net asset value, end of period | $11.33 | $11.47 | $11.31 | $11.27 | $10.92 |
| Total ReturnB | .90% | 3.93% | 2.68% | 5.73% | (2.23)% |
| Ratios to Average Net AssetsC,D | | | | | |
| Expenses before reductions | .45% | .45% | .45% | .45% | .45% |
| Expenses net of fee waivers, if any | .45% | .45% | .45% | .45% | .45% |
| Expenses net of all reductions | .45% | .45% | .45% | .45% | .45% |
| Net investment income (loss) | 1.98% | 2.26% | 2.33% | 2.51% | 1.85% |
| Supplemental Data | | | | | |
| Net assets, end of period (in millions) | $926 | $948 | $856 | $785 | $778 |
| Portfolio turnover rateE | 357% | 404% | 439% | 398% | 474% |
A Calculated based on average shares outstanding during the period.
B Total returns would have been lower if certain expenses had not been reduced during the applicable periods shown.
C Fees and expenses of any underlying Fidelity Central Funds are not included in the Fund's expense ratio. The Fund indirectly bears its proportionate share of the expenses of any underlying Fidelity Central Funds. Based on their most recent shareholder report date, the expenses of any underlying non-money market Fidelity Central Funds were less than .005%.
D Expense ratios reflect operating expenses of the class. Expenses before reductions do not reflect amounts reimbursed by the investment adviser or reductions from expense offset arrangements and do not represent the amount paid by the class during periods when reimbursements or reductions occur. Expenses net of fee waivers reflect expenses after reimbursement by the investment adviser but prior to reductions from expense offset arrangements. Expenses net of all reductions represent the net expenses paid by the class.
E Amount does not include the portfolio activity of any underlying Fidelity Central Funds.
See accompanying notes which are an integral part of the financial statements.
Financial Highlights — Fidelity Advisor Mortgage Securities Fund Class I
| Years ended August 31, | 2017 | 2016 | 2015 | 2014 | 2013 |
| Selected Per–Share Data | | | | | |
| Net asset value, beginning of period | $11.43 | $11.27 | $11.23 | $10.88 | $11.33 |
| Income from Investment Operations | | | | | |
| Net investment income (loss)A | .218 | .250 | .256 | .271 | .200 |
| Net realized and unrealized gain (loss) | (.134) | .182 | .038 | .342 | (.456) |
| Total from investment operations | .084 | .432 | .294 | .613 | (.256) |
| Distributions from net investment income | (.234) | (.266) | (.251) | (.263) | (.194) |
| Distributions from net realized gain | – | (.006) | (.003) | – | – |
| Total distributions | (.234) | (.272) | (.254) | (.263) | (.194) |
| Net asset value, end of period | $11.28 | $11.43 | $11.27 | $11.23 | $10.88 |
| Total ReturnB | .76% | 3.88% | 2.64% | 5.69% | (2.30)% |
| Ratios to Average Net AssetsC,D | | | | | |
| Expenses before reductions | .49% | .50% | .50% | .51% | .51% |
| Expenses net of fee waivers, if any | .49% | .50% | .50% | .51% | .51% |
| Expenses net of all reductions | .49% | .50% | .50% | .51% | .51% |
| Net investment income (loss) | 1.94% | 2.21% | 2.28% | 2.45% | 1.79% |
| Supplemental Data | | | | | |
| Net assets, end of period (in millions) | $73 | $79 | $72 | $48 | $34 |
| Portfolio turnover rateE | 357% | 404% | 439% | 398% | 474% |
A Calculated based on average shares outstanding during the period.
B Total returns would have been lower if certain expenses had not been reduced during the applicable periods shown.
C Fees and expenses of any underlying Fidelity Central Funds are not included in the Fund's expense ratio. The Fund indirectly bears its proportionate share of the expenses of any underlying Fidelity Central Funds. Based on their most recent shareholder report date, the expenses of any underlying non-money market Fidelity Central Funds were less than .005%.
D Expense ratios reflect operating expenses of the class. Expenses before reductions do not reflect amounts reimbursed by the investment adviser or reductions from expense offset arrangements and do not represent the amount paid by the class during periods when reimbursements or reductions occur. Expenses net of fee waivers reflect expenses after reimbursement by the investment adviser but prior to reductions from expense offset arrangements. Expenses net of all reductions represent the net expenses paid by the class.
E Amount does not include the portfolio activity of any underlying Fidelity Central Funds.
See accompanying notes which are an integral part of the financial statements.
Notes to Financial Statements
For the period ended August 31, 2017
(Amounts in thousands except percentages)
1. Organization.
Fidelity Advisor Mortgage Securities Fund (the Fund) is a fund of Fidelity Advisor Series II (the Trust) and is authorized to issue an unlimited number of shares. The Trust is registered under the Investment Company Act of 1940, as amended (the 1940 Act), as an open-end management investment company organized as a Massachusetts business trust. The Fund offers Class A, Class M (formerly Class T), Class C, Fidelity Mortgage Securities Fund and Class I shares, each of which has equal rights as to assets and voting privileges. Each class has exclusive voting rights with respect to matters that affect that class.
After the close of business on June 24, 2016, all outstanding Class B shares were converted to Class A shares. All prior fiscal period dollar and share amounts for Class B presented in the Notes to Financial Statements are for the period September 1, 2015 through June 24, 2016.
2. Investments in Fidelity Central Funds.
The Fund invests in Fidelity Central Funds, which are open-end investment companies generally available only to other investment companies and accounts managed by the investment adviser and its affiliates. The Fund's Schedule of Investments lists each of the Fidelity Central Funds held as of period end, if any, as an investment of the Fund, but does not include the underlying holdings of each Fidelity Central Fund. As an Investing Fund, the Fund indirectly bears its proportionate share of the expenses of the underlying Fidelity Central Funds.
The Money Market Central Funds seek preservation of capital and current income and are managed by Fidelity Investments Money Management, Inc. (FIMM), an affiliate of the investment adviser. Annualized expenses of the Money Market Central Funds as of their most recent shareholder report date are less than .005%.
A complete unaudited list of holdings for each Fidelity Central Fund is available upon request or at the Securities and Exchange Commission (the SEC) website at www.sec.gov. In addition, the financial statements of the Fidelity Central Funds, which are not covered by the Fund's Report of Independent Registered Public Accounting Firm, are available on the SEC website or upon request.
3. Significant Accounting Policies.
The Fund is an investment company and applies the accounting and reporting guidance of the Financial Accounting Standards Board (FASB) Accounting Standards Codification Topic 946 Financial Services – Investments Companies. The financial statements have been prepared in conformity with accounting principles generally accepted in the United States of America (GAAP), which require management to make certain estimates and assumptions at the date of the financial statements. Actual results could differ from those estimates. Subsequent events, if any, through the date that the financial statements were issued have been evaluated in the preparation of the financial statements. The following summarizes the significant accounting policies of the Fund:
Investment Valuation. Investments are valued as of 4:00 p.m. Eastern time on the last calendar day of the period. The Board of Trustees (the Board) has delegated the day to day responsibility for the valuation of the Fund's investments to the Fair Value Committee (the Committee) established by the Fund's investment adviser. In accordance with valuation policies and procedures approved by the Board, the Fund attempts to obtain prices from one or more third party pricing vendors or brokers to value its investments. When current market prices, quotations or currency exchange rates are not readily available or reliable, investments will be fair valued in good faith by the Committee, in accordance with procedures adopted by the Board. Factors used in determining fair value vary by investment type and may include market or investment specific events, changes in interest rates and credit quality. The frequency with which these procedures are used cannot be predicted and they may be utilized to a significant extent. The Committee oversees the Fund's valuation policies and procedures and reports to the Board on the Committee's activities and fair value determinations. The Board monitors the appropriateness of the procedures used in valuing the Fund's investments and ratifies the fair value determinations of the Committee.
The Fund categorizes the inputs to valuation techniques used to value its investments into a disclosure hierarchy consisting of three levels as shown below:
- Level 1 – quoted prices in active markets for identical investments
- Level 2 – other significant observable inputs (including quoted prices for similar investments, interest rates, prepayment speeds, etc.)
- Level 3 – unobservable inputs (including the Fund's own assumptions based on the best information available)
Valuation techniques used to value the Fund's investments by major category are as follows:
Debt securities, including restricted securities, are valued based on evaluated prices received from third party pricing vendors or from brokers who make markets in such securities. Asset backed securities, collateralized mortgage obligations, commercial mortgage securities and U.S. government agency mortgage securities are valued by pricing vendors who utilize matrix pricing which considers prepayment speed assumptions, attributes of the collateral, yield or price of bonds of comparable quality, coupon, maturity and type or by broker-supplied prices. Brokers which make markets in asset backed securities, collateralized mortgage obligations and commercial mortgage securities may also consider such factors as the structure of the issue, cash flow assumptions, the value of underlying assets as well as any guarantees. These pricing sources may utilize inputs such as interest rate curves, credit spread curves, default possibilities and recovery rates. When independent prices are unavailable or unreliable, debt securities may be valued utilizing pricing methodologies which consider similar factors that would be used by third party pricing vendors. Debt securities are generally categorized as Level 2 in the hierarchy but may be Level 3 depending on the circumstances.
Futures contracts are valued at the settlement price established each day by the board of trade or exchange on which they are traded and are categorized as Level 1 in the hierarchy. Investments in open-end mutual funds, including the Fidelity Central Funds, are valued at their closing net asset value (NAV) each business day and are categorized as Level 1 in the hierarchy.
Changes in valuation techniques may result in transfers in or out of an assigned level within the disclosure hierarchy. The aggregate value of investments by input level as of August 31, 2017 is included at the end of the Fund's Schedule of Investments.
Investment Transactions and Income. For financial reporting purposes, the Fund's investment holdings and NAV include trades executed through the end of the last business day of the period. The NAV per share for processing shareholder transactions is calculated as of the close of business of the New York Stock Exchange (NYSE), normally 4:00 p.m. Eastern time and includes trades executed through the end of the prior business day. Gains and losses on securities sold are determined on the basis of identified cost and may include proceeds received from litigation. Income and capital gain distributions from Fidelity Central Funds, if any, are recorded on the ex-dividend date. Interest income is accrued as earned and includes coupon interest and amortization of premium and accretion of discount on debt securities as applicable.
Class Allocations and Expenses. Investment income, realized and unrealized capital gains and losses, common expenses of the Fund, and certain fund-level expense reductions, if any, are allocated daily on a pro-rata basis to each class based on the relative net assets of each class to the total net assets of the Fund. Each class differs with respect to transfer agent and distribution and service plan fees incurred. Certain expense reductions may also differ by class. For the reporting period, the allocated portion of income and expenses to each class as a percent of its average net assets may vary due to the timing of recording these transactions in relation to fluctuating net assets of the classes. Expenses directly attributable to a fund are charged to that fund. Expenses attributable to more than one fund are allocated among the respective funds on the basis of relative net assets or other appropriate methods. Expense estimates are accrued in the period to which they relate and adjustments are made when actual amounts are known.
Income Tax Information and Distributions to Shareholders. Each year, the Fund intends to qualify as a regulated investment company under Subchapter M of the Internal Revenue Code, including distributing substantially all of its taxable income and realized gains. As a result, no provision for U.S. Federal income taxes is required. As of August 31, 2017, the Fund did not have any unrecognized tax benefits in the financial statements; nor is the Fund aware of any tax positions for which it is reasonably possible that the total amounts of unrecognized tax benefits will significantly change in the next twelve months. The Fund files a U.S. federal tax return, in addition to state and local tax returns as required. The Fund's federal income tax returns are subject to examination by the Internal Revenue Service (IRS) for a period of three fiscal years after they are filed. State and local tax returns may be subject to examination for an additional fiscal year depending on the jurisdiction.
Dividends are declared and recorded daily and paid monthly from net investment income. Distributions from realized gains, if any, are declared and recorded on the ex-dividend date. Income dividends and capital gain distributions are declared separately for each class. Income and capital gain distributions are determined in accordance with income tax regulations, which may differ from GAAP. In addition, the Fund claimed a portion of the payment made to redeeming shareholders as a distribution for income tax purposes.
Capital accounts within the financial statements are adjusted for permanent book-tax differences. These adjustments have no impact on net assets or the results of operations. Capital accounts are not adjusted for temporary book-tax differences which will reverse in a subsequent period.
Book-tax differences are primarily due to short-term gain distributions from the Underlying Funds, futures contracts, swaps, market discount, partnerships (including allocations from Fidelity Central Funds), deferred trustees compensation, expiring capital loss carryforwards, losses deferred due to wash sales and excise tax regulations.
As of period end, the cost and unrealized appreciation (depreciation) in securities, and derivatives if applicable, for federal income tax purposes were as follows:
| Gross unrealized appreciation | $6,304 |
| Gross unrealized depreciation | (8,285) |
| Net unrealized appreciation (depreciation) | $(1,981) |
| Tax Cost | $1,229,754 |
The tax-based components of distributable earnings as of period end were as follows:
| Undistributed ordinary income | $4,790 |
| Net unrealized appreciation (depreciation) on securities and other investments | $(1,981) |
The Fund intends to elect to defer to its next fiscal year $2,728 of capital losses recognized during the period November 1, 2016 to August 31, 2017.
The tax character of distributions paid was as follows:
| | August 31, 2017 | August 31, 2016 |
| Ordinary Income | $22,676 | $ 25,876 |
Delayed Delivery Transactions and When-Issued Securities. During the period, the Fund transacted in securities on a delayed delivery or when-issued basis. Payment and delivery may take place after the customary settlement period for that security. The price of the underlying securities and the date when the securities will be delivered and paid for are fixed at the time the transaction is negotiated. The securities purchased on a delayed delivery or when-issued basis are identified as such in the Fund's Schedule of Investments. The Fund may receive compensation for interest forgone in the purchase of a delayed delivery or when-issued security. With respect to purchase commitments, the Fund identifies securities as segregated in its records with a value at least equal to the amount of the commitment. Losses may arise due to changes in the value of the underlying securities or if the counterparty does not perform under the contract's terms, or if the issuer does not issue the securities due to political, economic, or other factors.
To-Be-Announced (TBA) Securities and Mortgage Dollar Rolls. During the period, the Fund transacted in TBA securities that involved buying or selling mortgage-backed securities (MBS) on a forward commitment basis. A TBA transaction typically does not designate the actual security to be delivered and only includes an approximate principal amount; however delivered securities must meet specified terms defined by industry guidelines, including issuer, rate and current principal amount outstanding on underlying mortgage pools. The Fund may enter into a TBA transaction with the intent to take possession of or deliver the underlying MBS, or the Fund may elect to extend the settlement by entering into either a mortgage or reverse mortgage dollar roll. Mortgage dollar rolls are transactions where a fund sells TBA securities and simultaneously agrees to repurchase MBS on a later date at a lower price and with the same counterparty. Reverse mortgage dollar rolls involve the purchase and simultaneous agreement to sell TBA securities on a later date at a lower price. Transactions in mortgage dollar rolls and reverse mortgage dollar rolls are accounted for as purchases and sales and may result in an increase to the Fund's portfolio turnover rate.
Purchases and sales of TBA securities involve risks similar to those discussed above for delayed delivery and when-issued securities. Also, if the counterparty in a mortgage dollar roll or a reverse mortgage dollar roll transaction files for bankruptcy or becomes insolvent, the Fund's right to repurchase or sell securities may be limited. Additionally, when a fund sells TBA securities without already owning or having the right to obtain the deliverable securities (an uncovered forward commitment to sell), it incurs a risk of loss because it could have to purchase the securities at a price that is higher than the price at which it sold them. A fund may be unable to purchase the deliverable securities if the corresponding market is illiquid.
TBA securities subject to a forward commitment to sell at period end are included at the end of the Fund's Schedule of Investments under the caption "TBA Sale Commitments." The proceeds and value of these commitments are reflected in the Fund's Statement of Assets and Liabilities as Receivable for TBA sale commitments and TBA sale commitments, at value, respectively.
Restricted Securities. The Fund may invest in securities that are subject to legal or contractual restrictions on resale. These securities generally may be resold in transactions exempt from registration or to the public if the securities are registered. Disposal of these securities may involve time-consuming negotiations and expense, and prompt sale at an acceptable price may be difficult. Information regarding restricted securities is included at the end of the Fund's Schedule of Investments.
New Accounting Pronouncement. In March 2017, the Financial Accounting Standards Board (FASB) issued an Accounting Standards Update (ASU), ASU 2017-08, which amends the amortization period for certain callable debt securities that are held at a premium. The amendment requires the premium to be amortized to the earliest call date. The amendments do not require an accounting change for securities held at a discount. The ASU is effective for annual periods beginning after December 15, 2018. Management is currently evaluating the potential impact of these changes to the financial statements.
4. Derivative Instruments.
Risk Exposures and the Use of Derivative Instruments. The Fund's investment objective allows the Fund to enter into various types of derivative contracts, including futures contracts and swaps. Derivatives are investments whose value is primarily derived from underlying assets, indices or reference rates and may be transacted on an exchange or over-the-counter (OTC). Derivatives may involve a future commitment to buy or sell a specified asset based on specified terms, to exchange future cash flows at periodic intervals based on a notional principal amount, or for one party to make one or more payments upon the occurrence of specified events in exchange for periodic payments from the other party.
The Fund used derivatives to increase returns, to gain exposure to certain types of assets and to manage exposure to certain risks as defined below. The success of any strategy involving derivatives depends on analysis of numerous economic factors, and if the strategies for investment do not work as intended, the Fund may not achieve its objectives.
The Fund's use of derivatives increased or decreased its exposure to the following risk:
| Interest Rate Risk | Interest rate risk relates to the fluctuations in the value of interest-bearing securities due to changes in the prevailing levels of market interest rates. |
The Fund is also exposed to additional risks from investing in derivatives, such as liquidity risk and counterparty credit risk. Liquidity risk is the risk that the Fund will be unable to close out the derivative in the open market in a timely manner. Counterparty credit risk is the risk that the counterparty will not be able to fulfill its obligation to the Fund. Counterparty credit risk related to exchange-traded futures contracts may be mitigated by the protection provided by the exchange on which they trade. Counterparty credit risk related to centrally cleared OTC swaps may be mitigated by the protection provided by the clearinghouse.
Investing in derivatives may involve greater risks than investing in the underlying assets directly and, to varying degrees, may involve risk of loss in excess of any initial investment and collateral received and amounts recognized in the Statement of Assets and Liabilities. In addition, there may be the risk that the change in value of the derivative contract does not correspond to the change in value of the underlying instrument.
Net Realized Gain (Loss) and Change in Net Unrealized Appreciation (Depreciation) on Derivatives. The table below, which reflects the impacts of derivatives on the financial performance of the Fund, summarizes the net realized gain (loss) and change in net unrealized appreciation (depreciation) for derivatives during the period as presented in the Statement of Operations.
| Primary Risk Exposure / Derivative Type | Net Realized Gain (Loss) | Change in Net Unrealized Appreciation (Depreciation) |
| Interest Rate Risk | | |
| Futures Contracts | $871 | $(130) |
| Swaps | 25 | (42) |
| Totals | $896 | $(172) |
A summary of the value of derivatives by primary risk exposure as of period end is included at the end of the Schedule of Investments.
Futures Contracts. A futures contract is an agreement between two parties to buy or sell a specified underlying instrument for a fixed price at a specified future date. The Fund used futures contracts to manage its exposure to the bond market and fluctuations in interest rates.
Upon entering into a futures contract, a fund is required to deposit either cash or securities (initial margin) with a clearing broker in an amount equal to a certain percentage of the face value of the contract. Futures contracts are marked-to-market daily and subsequent daily payments (variation margin) are made or received by a fund depending on the daily fluctuations in the value of the futures contracts and are recorded as unrealized appreciation or (depreciation). This receivable and/or payable, if any, is included in daily variation margin on futures contracts in the Statement of Assets and Liabilities. Realized gain or (loss) is recorded upon the expiration or closing of a futures contract. The net realized gain (loss) and change in net unrealized appreciation (depreciation) on futures contracts during the period is included in the Statement of Operations.
Any open futures contracts at period end are presented in the Schedule of Investments under the caption "Futures Contracts". The underlying face amount at value reflects each contract's exposure to the underlying instrument or index at period end. Securities deposited to meet initial margin requirements are identified in the Schedule of Investments.
Swaps. A swap is a contract between two parties to exchange future cash flows at periodic intervals based on a notional principal amount. A centrally cleared OTC swap is a transaction executed between a fund and a dealer counterparty, then cleared by a futures commission merchant (FCM) through a clearinghouse. Once cleared, the clearinghouse serves as a central counterparty, with whom a fund exchanges cash flows for the life of the transaction, similar to transactions in futures contracts.
Centrally cleared OTC swaps require a fund to deposit either cash or securities (initial margin) with the FCM, at the instruction of and for the benefit of the clearinghouse. Securities deposited to meet initial margin requirements are identified in the Schedule of Investments. Centrally cleared OTC swaps are marked-to-market daily and subsequent payments (variation margin) are made or received depending on the daily fluctuations in the value of the swaps and are recorded as unrealized appreciation or (depreciation). These daily payments, if any, are included in receivable or payable for daily variation margin on centrally cleared OTC swaps in the Statement of Assets and Liabilities. Any premiums for centrally cleared OTC swaps are recorded periodically throughout the term of the swap to variation margin and included in unrealized appreciation (depreciation) in the Statement of Assets and Liabilities. Any premiums are recognized as realized gain (loss) upon termination or maturity of the swap.
Payments are exchanged at specified intervals, accrued daily commencing with the effective date of the contract and recorded as realized gain or (loss). Some swaps may be terminated prior to the effective date and realize a gain or loss upon termination. The net realized gain (loss) and change in net unrealized appreciation (depreciation) on swaps during the period is included in the Statement of Operations.
Any open swaps at period end are included in the Schedule of Investments under the caption "Swaps."
Interest Rate Swaps. Interest rate swaps are agreements between counterparties to exchange cash flows, one based on a fixed rate, and the other on a floating rate. The Fund entered into interest rate swaps to manage its exposure to interest rate changes. Changes in interest rates can have an effect on both the value of bond holdings as well as the amount of interest income earned. In general, the value of bonds can fall when interest rates rise and can rise when interest rates fall.
5. Purchases and Sales of Investments.
Purchases and sales of securities (including the Fixed-Income Central Funds), other than short-term securities and U.S. government securities, aggregated $83,939 and $129,746, respectively.
6. Fees and Other Transactions with Affiliates.
Management Fee. Fidelity Management & Research Company (the investment adviser) and its affiliates provide the Fund with investment management related services for which the Fund pays a monthly management fee. The management fee is the sum of an individual fund fee rate that is based on an annual rate of .20% of the Fund's average net assets and an annualized group fee rate that averaged .11% during the period. The group fee rate is based upon the average net assets of all the mutual funds advised by the investment adviser, including any mutual funds previously advised by the investment adviser that are currently advised by Fidelity SelectCo, LLC, an affiliate of the investment adviser. The group fee rate decreases as assets under management increase and increases as assets under management decrease. For the reporting period, the total annual management fee rate was .31% of the Fund's average net assets.
Distribution and Service Plan Fees. In accordance with Rule 12b-1 of the 1940 Act, the Fund has adopted separate Distribution and Service Plans for each class of shares. Certain classes pay Fidelity Distributors Corporation (FDC), an affiliate of the investment adviser, separate Distribution and Service Fees, each of which is based on an annual percentage of each class' average net assets. In addition, FDC may pay financial intermediaries for selling shares of the Fund and providing shareholder support services. For the period, the Distribution and Service Fee rates, total fees and amounts retained by FDC were as follows:
| | Distribution
Fee | Service
Fee | Total Fees | Retained
by FDC |
| Class A | -% | .25% | $101 | $3 |
| Class M | -% | .25% | 54 | – |
| Class C | .75% | .25% | 159 | 12 |
| | | | $314 | $15 |
Sales Load. FDC may receive a front-end sales charge of up to 4.00% for selling Class A shares and Class M shares, some of which is paid to financial intermediaries for selling shares of the Fund. Depending on the holding period, FDC may receive contingent deferred sales charges levied on Class A, Class M and Class C redemptions. The deferred sales charges are 1.00% for Class C shares, .75% for certain purchases of Class A shares and .25% for certain purchases of Class M shares.
For the period, sales charge amounts retained by FDC were as follows:
| | Retained
by FDC |
| Class M | $1 |
| Class C (a) | 2 |
| | $3 |
(a) When Class C shares are initially sold, FDC pays commissions from its own resources to financial intermediaries through which the sales are made.
Transfer Agent Fees. Fidelity Investments Institutional Operations Company, Inc., (FIIOC), an affiliate of the investment adviser, is the transfer, dividend disbursing and shareholder servicing agent for each class of the Fund. FIIOC receives account fees and asset-based fees that vary according to the account size and type of account of the shareholders of each respective class of the Fund, with the exception of Fidelity Mortgage Securities Fund. FIIOC receives an asset-based fee of .10% of Fidelity Mortgage Securities Fund's average net assets. FIIOC pays for typesetting, printing and mailing of shareholder reports, except proxy statements. For the period, transfer agent fees for each class were as follows:
| | Amount | % of
Class-Level Average
Net Assets |
| Class A | $75 | .19 |
| Class M | 42 | .19 |
| Class C | 30 | .19 |
| Fidelity Mortgage Securities Fund | 931 | .10 |
| Class I | 107 | .14 |
| | $1,185 | |
Fund Wide Operations Fee. Pursuant to the Fund Wide Operations and Expense Agreement (FWOE), the investment adviser has agreed to provide for fund level expenses (which do not include transfer agent, Rule 12b-1 fees, compensation of the independent Trustees, interest (including commitment fees), taxes or extraordinary expenses, if any) in return for a FWOE fee equal to .35% of the Fund's average net assets less the total amount of the management fee. The FWOE paid by the Fund is reduced by an amount equal to the fees and expenses paid to the independent Trustees. For the period, the FWOE fee was equivalent to an annual rate of .04% of average net assets.
Interfund Trades. The Fund may purchase from or sell securities to other Fidelity Funds under procedures adopted by the Board. The procedures have been designed to ensure these interfund trades are executed in accordance with Rule 17a-7 of the 1940 Act. Interfund trades are included within the respective purchases and sales amounts shown in the Purchases and Sales of Investments note.
Other. During the period, the investment adviser reimbursed the Fund for certain losses in the amount of $1.
7. Committed Line of Credit.
The Fund participates with other funds managed by the investment adviser or an affiliate in a $4.25 billion credit facility (the "line of credit") to be utilized for temporary or emergency purposes to fund shareholder redemptions or for other short-term liquidity purposes. The Fund has agreed to pay commitment fees on its pro-rata portion of the line of credit, which amounted to $4 and is reflected in Miscellaneous expenses on the Statement of Operations. During the period, the Fund did not borrow on this line of credit.
8. Expense Reductions.
Through arrangements with the Fund's custodian, credits realized as a result of certain uninvested cash balances were used to reduce the Fund's expenses. During the period, these credits reduced the Fund's expenses by $1.
9. Distributions to Shareholders.
Distributions to shareholders of each class were as follows:
| | Year ended
August 31, 2017 | Year ended
August 31, 2016 |
| From net investment income | | |
| Class A | $725 | $861 |
| Class M | 387 | 483 |
| Class B | – | 8 |
| Class C | 167 | 232 |
| Fidelity Mortgage Securities Fund | 19,807 | 21,950 |
| Class I | 1,590 | 1,790 |
| Total | $22,676 | $25,324 |
| From net realized gain | | |
| Class A | $– | $20 |
| Class M | $– | $13 |
| Class B | – | –(a) |
| Class C | – | 9 |
| Fidelity Mortgage Securities Fund | – | 471 |
| Class I | – | 39 |
| Total | $– | $552 |
(a) In the amount less than five hundred dollars.
10. Share Transactions.
Share transactions for each class were as follows and may contain automatic conversions between classes or exchanges between affiliated funds:
| | Shares | Shares | Dollars | Dollars |
| | Year ended August 31, 2017 | Year ended August 31, 2016 | Year ended August 31, 2017 | Year ended August 31, 2016 |
| Class A | | | | |
| Shares sold | 465 | 1,855 | $5,257 | $21,074 |
| Reinvestment of distributions | 59 | 70 | 666 | 792 |
| Shares redeemed | (1,657) | (1,066) | (18,650) | (12,097) |
| Net increase (decrease) | (1,133) | 859 | $(12,727) | $9,769 |
| Class M | | | | |
| Shares sold | 135 | 1,069 | $1,524 | $12,171 |
| Reinvestment of distributions | 33 | 42 | 373 | 474 |
| Shares redeemed | (588) | (769) | (6,623) | (8,717) |
| Net increase (decrease) | (420) | 342 | $(4,726) | $3,928 |
| Class B | | | | |
| Shares sold | – | 10 | $– | $102 |
| Reinvestment of distributions | – | –(a) | – | 5 |
| Shares redeemed | – | (84) | – | (944) |
| Net increase (decrease) | – | (74) | $– | $(837) |
| Class C | | | | |
| Shares sold | 218 | 756 | $2,442 | $8,561 |
| Reinvestment of distributions | 13 | 18 | 151 | 204 |
| Shares redeemed | (713) | (499) | (7,980) | (5,659) |
| Net increase (decrease) | (482) | 275 | $(5,387) | $3,106 |
| Fidelity Mortgage Securities Fund | | | | |
| Shares sold | 26,395 | 24,692 | $297,107 | $280,765 |
| Reinvestment of distributions | 1,642 | 1,859 | 18,507 | 21,143 |
| Shares redeemed | (28,916) | (19,583) | $(325,419) | $(222,910) |
| Net increase (decrease) | (879) | 6,968 | $(9,805) | $78,998 |
| Class I | | | | |
| Shares sold | 566 | 1,158 | $6,350 | $13,096 |
| Reinvestment of distributions | 139 | 158 | 1,563 | 1,786 |
| Shares redeemed | (1,090) | (773) | (12,227) | (8,760) |
| Net increase (decrease) | (385) | 543 | $(4,314) | $6,122 |
(a) In the amount less than five hundred shares.
11. Other.
The Fund's organizational documents provide former and current trustees and officers with a limited indemnification against liabilities arising in connection with the performance of their duties to the Fund. In the normal course of business, the Fund may also enter into contracts that provide general indemnifications. The Fund's maximum exposure under these arrangements is unknown as this would be dependent on future claims that may be made against the Fund. The risk of material loss from such claims is considered remote.
12. Credit Risk.
The Fund invests a portion of its assets in structured securities of issuers backed by commercial and residential mortgage loans, credit card receivables and automotive loans. The value and related income of these securities is sensitive to changes in economic conditions, including delinquencies and/or defaults.
Report of Independent Registered Public Accounting Firm
To the Trustees of Fidelity Advisor Series II and Shareholders of Fidelity Advisor Mortgage Securities Fund:
In our opinion, the accompanying statement of assets and liabilities, including the schedule of investments, and the related statements of operations and of changes in net assets and the financial highlights present fairly, in all material respects, the financial position of Fidelity Advisor Mortgage Securities Fund (a fund of Fidelity Advisor Series II) as of August 31, 2017, the results of its operations for the year then ended, the changes in its net assets for each of the two years in the period then ended and the financial highlights for each of the five years in the period then ended, in conformity with accounting principles generally accepted in the United States of America. These financial statements and financial highlights (hereafter referred to as “financial statements”) are the responsibility of the Fidelity Advisor Mortgage Securities Fund’s management. Our responsibility is to express an opinion on these financial statements based on our audits. We conducted our audits of these financial statements in accordance with the standards of the Public Company Accounting Oversight Board (United States). Those standards require that we plan and perform the audit to obtain reasonable assurance about whether the financial statements are free of material misstatement. An audit includes examining, on a test basis, evidence supporting the amounts and disclosures in the financial statements, assessing the accounting principles used and significant estimates made by management, and evaluating the overall financial statement presentation. Our procedures included confirmation of securities owned as of August 31, 2017 by correspondence with the custodian and brokers; when replies were not received from brokers, we performed other auditing procedures. We believe that our audits provide a reasonable basis for our opinion.
PricewaterhouseCoopers LLP
Boston, Massachusetts
October 18, 2017
Trustees and Officers
The Trustees, Members of the Advisory Board (if any), and officers of the trust and fund, as applicable, are listed below. The Board of Trustees governs the fund and is responsible for protecting the interests of shareholders. The Trustees are experienced executives who meet periodically throughout the year to oversee the fund's activities, review contractual arrangements with companies that provide services to the fund, oversee management of the risks associated with such activities and contractual arrangements, and review the fund's performance. Each of the Trustees oversees 246 funds.
The Trustees hold office without limit in time except that (a) any Trustee may resign; (b) any Trustee may be removed by written instrument, signed by at least two-thirds of the number of Trustees prior to such removal; (c) any Trustee who requests to be retired or who has become incapacitated by illness or injury may be retired by written instrument signed by a majority of the other Trustees; and (d) any Trustee may be removed at any special meeting of shareholders by a two-thirds vote of the outstanding voting securities of the trust. Each Trustee who is not an interested person (as defined in the 1940 Act) of the trust and the fund is referred to herein as an Independent Trustee. Each Independent Trustee shall retire not later than the last day of the calendar year in which his or her 75th birthday occurs. The Independent Trustees may waive this mandatory retirement age policy with respect to individual Trustees. Officers and Advisory Board Members hold office without limit in time, except that any officer or Advisory Board Member may resign or may be removed by a vote of a majority of the Trustees at any regular meeting or any special meeting of the Trustees. Except as indicated, each individual has held the office shown or other offices in the same company for the past five years.
The fund’s Statement of Additional Information (SAI) includes more information about the Trustees. To request a free copy, call Fidelity at 1-800-208-0098.
Experience, Skills, Attributes, and Qualifications of the Trustees. The Governance and Nominating Committee has adopted a statement of policy that describes the experience, qualifications, attributes, and skills that are necessary and desirable for potential Independent Trustee candidates (Statement of Policy). The Board believes that each Trustee satisfied at the time he or she was initially elected or appointed a Trustee, and continues to satisfy, the standards contemplated by the Statement of Policy. The Governance and Nominating Committee also engages professional search firms to help identify potential Independent Trustee candidates who have the experience, qualifications, attributes, and skills consistent with the Statement of Policy. From time to time, additional criteria based on the composition and skills of the current Independent Trustees, as well as experience or skills that may be appropriate in light of future changes to board composition, business conditions, and regulatory or other developments, have also been considered by the professional search firms and the Governance and Nominating Committee. In addition, the Board takes into account the Trustees' commitment and participation in Board and committee meetings, as well as their leadership of standing and ad hoc committees throughout their tenure.
In determining that a particular Trustee was and continues to be qualified to serve as a Trustee, the Board has considered a variety of criteria, none of which, in isolation, was controlling. The Board believes that, collectively, the Trustees have balanced and diverse experience, qualifications, attributes, and skills, which allow the Board to operate effectively in governing the fund and protecting the interests of shareholders. Information about the specific experience, skills, attributes, and qualifications of each Trustee, which in each case led to the Board's conclusion that the Trustee should serve (or continue to serve) as a trustee of the fund, is provided below.
Board Structure and Oversight Function. Abigail P. Johnson is an interested person and currently serves as Chairman. The Trustees have determined that an interested Chairman is appropriate and benefits shareholders because an interested Chairman has a personal and professional stake in the quality and continuity of services provided to the fund. Independent Trustees exercise their informed business judgment to appoint an individual of their choosing to serve as Chairman, regardless of whether the Trustee happens to be independent or a member of management. The Independent Trustees have determined that they can act independently and effectively without having an Independent Trustee serve as Chairman and that a key structural component for assuring that they are in a position to do so is for the Independent Trustees to constitute a substantial majority for the Board. The Independent Trustees also regularly meet in executive session. Marie L. Knowles serves as Chairman of the Independent Trustees and as such (i) acts as a liaison between the Independent Trustees and management with respect to matters important to the Independent Trustees and (ii) with management prepares agendas for Board meetings.
Fidelity® funds are overseen by different Boards of Trustees. The fund's Board oversees Fidelity's investment-grade bond, money market, asset allocation and certain equity funds, and other Boards oversee Fidelity's high income, sector and other equity funds. The asset allocation funds may invest in Fidelity® funds that are overseen by such other Boards. The use of separate Boards, each with its own committee structure, allows the Trustees of each group of Fidelity® funds to focus on the unique issues of the funds they oversee, including common research, investment, and operational issues. On occasion, the separate Boards establish joint committees to address issues of overlapping consequences for the Fidelity® funds overseen by each Board.
The Trustees operate using a system of committees to facilitate the timely and efficient consideration of all matters of importance to the Trustees, the fund, and fund shareholders and to facilitate compliance with legal and regulatory requirements and oversight of the fund's activities and associated risks. The Board, acting through its committees, has charged FMR and its affiliates with (i) identifying events or circumstances the occurrence of which could have demonstrably adverse effects on the fund's business and/or reputation; (ii) implementing processes and controls to lessen the possibility that such events or circumstances occur or to mitigate the effects of such events or circumstances if they do occur; and (iii) creating and maintaining a system designed to evaluate continuously business and market conditions in order to facilitate the identification and implementation processes described in (i) and (ii) above. Because the day-to-day operations and activities of the fund are carried out by or through FMR, its affiliates, and other service providers, the fund's exposure to risks is mitigated but not eliminated by the processes overseen by the Trustees. While each of the Board's committees has responsibility for overseeing different aspects of the fund's activities, oversight is exercised primarily through the Operations and Audit Committees. In addition, an ad hoc Board committee of Independent Trustees has worked with FMR to enhance the Board's oversight of investment and financial risks, legal and regulatory risks, technology risks, and operational risks, including the development of additional risk reporting to the Board. Appropriate personnel, including but not limited to the fund's Chief Compliance Officer (CCO), FMR's internal auditor, the independent accountants, the fund's Treasurer and portfolio management personnel, make periodic reports to the Board's committees, as appropriate, including an annual review of Fidelity's risk management program for the Fidelity® funds. The responsibilities of each standing committee, including their oversight responsibilities, are described further under "Standing Committees of the Trustees."
Interested Trustees*:
Correspondence intended for a Trustee who is an interested person may be sent to Fidelity Investments, 245 Summer Street, Boston, Massachusetts 02210.
Name, Year of Birth; Principal Occupations and Other Relevant Experience+
Abigail P. Johnson (1961)
Year of Election or Appointment: 2009
Trustee
Chairman of the Board of Trustees
Ms. Johnson also serves as Trustee of other Fidelity® funds. Ms. Johnson serves as Chairman (2016-present), Chief Executive Officer (2014-present), and Director (2007-present) of FMR LLC (diversified financial services company), President of Fidelity Financial Services (2012-present) and President of Personal, Workplace and Institutional Services (2005-present). Ms. Johnson is Chairman and Director of FMR Co., Inc. (investment adviser firm, 2011-present) and Chairman and Director of FMR (investment adviser firm, 2011-present). Previously, Ms. Johnson served as Vice Chairman (2007-2016) and President (2013-2016) of FMR LLC, President and a Director of FMR (2001-2005), a Trustee of other investment companies advised by FMR, Fidelity Investments Money Management, Inc. (investment adviser firm), and FMR Co., Inc. (2001-2005), Senior Vice President of the Fidelity® funds (2001-2005), and managed a number of Fidelity® funds. Ms. Abigail P. Johnson and Mr. Arthur E. Johnson are not related.
Jennifer Toolin McAuliffe (1959)
Year of Election or Appointment: 2016
Trustee
Ms. McAuliffe also serves as Trustee of other Fidelity® funds. Ms. McAuliffe previously served as a Member of the Advisory Board of certain Fidelity® funds (2016) and as Co-Head of Fixed Income of Fidelity Investments Limited (now known as FIL Limited (FIL)) (diversified financial services company). Earlier roles at FIL included Director of Research for FIL’s credit and quantitative teams in London, Hong Kong and Tokyo. Ms. McAuliffe also was the Director of Research for taxable and municipal bonds at Fidelity Investments Money Management, Inc. Ms. McAuliffe is also a director or trustee of several not-for-profit entities.
* Determined to be an “Interested Trustee” by virtue of, among other things, his or her affiliation with the trust or various entities under common control with FMR.
+ The information includes the Trustee's principal occupation during the last five years and other information relating to the experience, attributes, and skills relevant to the Trustee's qualifications to serve as a Trustee, which led to the conclusion that the Trustee should serve as a Trustee for the fund.
Independent Trustees:
Correspondence intended for an Independent Trustee may be sent to Fidelity Investments, P.O. Box 55235, Boston, Massachusetts 02205-5235.
Name, Year of Birth; Principal Occupations and Other Relevant Experience+
Elizabeth S. Acton (1951)
Year of Election or Appointment: 2016
Trustee
Ms. Acton also serves as Trustee of other Fidelity® funds. Prior to her retirement in April 2012, Ms. Acton was Executive Vice President, Finance (2011-2012), Executive Vice President, Chief Financial Officer (2002-2011), and Treasurer (2004-2005) of Comerica Incorporated (financial services). Prior to joining Comerica, Ms. Acton held a variety of positions at Ford Motor Company (1983-2002), including Vice President and Treasurer (2000-2002) and Executive Vice President and Chief Financial Officer of Ford Motor Credit Company (1998-2000). Ms. Acton currently serves as a member of the Board of Directors and Audit and Finance Committees of Beazer Homes USA, Inc. (homebuilding, 2012-present). Previously, Ms. Acton served as a Member of the Advisory Board of certain Fidelity® funds (2013-2016).
John Engler (1948)
Year of Election or Appointment: 2016
Trustee
Mr. Engler also serves as Trustee of other Fidelity® funds. He serves on the board of directors for Universal Forest Products (manufacturer and distributor of wood and wood-alternative products, 2003-present) and K12 Inc. (technology-based education company, 2012-present). Previously, Mr. Engler served as a Member of the Advisory Board of certain Fidelity® funds (2014-2016), president of the Business Roundtable (2011-2017), a trustee of The Munder Funds (2003-2014), president and CEO of the National Association of Manufacturers (2004-2011), member of the Board of Trustees of the Annie E. Casey Foundation (2004-2015), and as governor of Michigan (1991-2003). He is a past chairman of the National Governors Association.
Albert R. Gamper, Jr. (1942)
Year of Election or Appointment: 2006
Trustee
Mr. Gamper also serves as Trustee of other Fidelity® funds. Prior to his retirement in December 2004, Mr. Gamper served as Chairman of the Board of CIT Group Inc. (commercial finance). During his tenure with CIT Group Inc. Mr. Gamper served in numerous senior management positions, including Chairman (1987-1989; 1999-2001; 2002-2004), Chief Executive Officer (1987-2004), and President (2002-2003). Mr. Gamper currently serves as a member of the Board of Directors of Public Service Enterprise Group (utilities, 2000-present), and Member of the Board of Trustees of Barnabas Health Care System (1997-present). Previously, Mr. Gamper served as Chairman (2012-2015) and Vice Chairman (2011-2012) of the Independent Trustees of certain Fidelity® funds and as Chairman of the Board of Governors, Rutgers University (2004-2007).
Robert F. Gartland (1951)
Year of Election or Appointment: 2010
Trustee
Mr. Gartland also serves as Trustee of other Fidelity® funds. Mr. Gartland is Chairman and an investor in Gartland & Mellina Group Corp. (consulting, 2009-present). Previously, Mr. Gartland served as a partner and investor of Vietnam Partners LLC (investments and consulting, 2008-2011). Prior to his retirement, Mr. Gartland held a variety of positions at Morgan Stanley (financial services, 1979-2007) including Managing Director (1987-2007).
Arthur E. Johnson (1947)
Year of Election or Appointment: 2008
Trustee
Vice Chairman of the Independent Trustees
Mr. Johnson also serves as Trustee of other Fidelity® funds. Mr. Johnson serves as a member of the Board of Directors of Eaton Corporation plc (diversified power management, 2009-present) and Booz Allen Hamilton (management consulting, 2011-present). Prior to his retirement, Mr. Johnson served as Senior Vice President of Corporate Strategic Development of Lockheed Martin Corporation (defense contractor, 1999-2009). He previously served on the Board of Directors of IKON Office Solutions, Inc. (1999-2008), AGL Resources, Inc. (holding company, 2002-2016), and Delta Airlines (2005-2007). Mr. Arthur E. Johnson is not related to Ms. Abigail P. Johnson.
Michael E. Kenneally (1954)
Year of Election or Appointment: 2009
Trustee
Mr. Kenneally also serves as Trustee of other Fidelity® funds. Prior to his retirement, Mr. Kenneally served as Chairman and Global Chief Executive Officer of Credit Suisse Asset Management. Before joining Credit Suisse, he was an Executive Vice President and Chief Investment Officer for Bank of America Corporation. Earlier roles at Bank of America included Director of Research, Senior Portfolio Manager and Research Analyst, and Mr. Kenneally was awarded the Chartered Financial Analyst (CFA) designation in 1991.
Marie L. Knowles (1946)
Year of Election or Appointment: 2001
Trustee
Chairman of the Independent Trustees
Ms. Knowles also serves as Trustee of other Fidelity® funds. Prior to Ms. Knowles' retirement in June 2000, she served as Executive Vice President and Chief Financial Officer of Atlantic Richfield Company (ARCO) (diversified energy, 1996-2000). From 1993 to 1996, she was a Senior Vice President of ARCO and President of ARCO Transportation Company (pipeline and tanker operations). Ms. Knowles currently serves as a Director and Chairman of the Audit Committee of McKesson Corporation (healthcare service, since 2002). Ms. Knowles is a member of the Board of the Santa Catalina Island Company (real estate, 2009-present). Ms. Knowles is a Member of the Investment Company Institute Board of Governors and a Member of the Governing Council of the Independent Directors Council (2014-present). She also serves as a member of the Advisory Board for the School of Engineering of the University of Southern California. Previously, Ms. Knowles served as a Director of Phelps Dodge Corporation (copper mining and manufacturing, 1994-2007), URS Corporation (engineering and construction, 2000-2003) and America West (airline, 1999-2002). Ms. Knowles previously served as Vice Chairman of the Independent Trustees of certain Fidelity® funds (2012-2015).
Mark A. Murray (1954)
Year of Election or Appointment: 2016
Trustee
Mr. Murray also serves as Trustee of other Fidelity® funds. Mr. Murray is Vice Chairman (2013-present) of Meijer, Inc. (regional retail chain). Previously, Mr. Murray served as a Member of the Advisory Board of certain Fidelity® funds (2016) and as Co-Chief Executive Officer (2013-2016) and President (2006-2013) of Meijer, Inc. Mr. Murray serves as a member of the Board of Directors and Nuclear Review and Public Policy and Responsibility Committees of DTE Energy Company (diversified energy company, 2009-present). Mr. Murray also serves as a member of the Board of Directors of Spectrum Health (not-for-profit health system, 2015-present). Mr. Murray previously served as President of Grand Valley State University (2001-2006), Treasurer for the State of Michigan (1999-2001), Vice President of Finance and Administration for Michigan State University (1998-1999), and a member of the Board of Directors and Audit Committee and Chairman of the Nominating and Corporate Governance Committee of Universal Forest Products, Inc. (manufacturer and distributor of wood and wood-alternative products, 2004-2016). Mr. Murray is also a director or trustee of many community and professional organizations.
+ The information includes the Trustee's principal occupation during the last five years and other information relating to the experience, attributes, and skills relevant to the Trustee's qualifications to serve as a Trustee, which led to the conclusion that the Trustee should serve as a Trustee for the fund.
Advisory Board Members and Officers:
Correspondence intended for an officer may be sent to Fidelity Investments, 245 Summer Street, Boston, Massachusetts 02210. Officers appear below in alphabetical order.
Name, Year of Birth; Principal Occupation
Elizabeth Paige Baumann (1968)
Year of Election or Appointment: 2017
Anti-Money Laundering (AML) Officer
Ms. Baumann also serves as AML Officer of other funds. She is Chief AML Officer (2012-present) and Senior Vice President (2014-present) of FMR LLC (diversified financial services company) and is an employee of Fidelity Investments. Previously, Ms. Baumann served as AML Officer of the funds (2012-2016), and Vice President (2007-2014) and Deputy Anti-Money Laundering Officer (2007-2012) of FMR LLC.
Marc R. Bryant (1966)
Year of Election or Appointment: 2015
Secretary and Chief Legal Officer (CLO)
Mr. Bryant also serves as Secretary and CLO of other funds. Mr. Bryant serves as CLO, Secretary, and Senior Vice President of Fidelity Management & Research Company (investment adviser firm, 2015-present) and FMR Co., Inc. (investment adviser firm, 2015-present); Secretary of Fidelity SelectCo, LLC (investment adviser firm, 2015-present) and Fidelity Investments Money Management, Inc. (investment adviser firm, 2015-present); and CLO of Fidelity Management & Research (Hong Kong) Limited and FMR Investment Management (UK) Limited (investment adviser firms, 2015-present) and Fidelity Management & Research (Japan) Limited (investment adviser firm, 2016-present). He is Senior Vice President and Deputy General Counsel of FMR LLC (diversified financial services company). Previously, Mr. Bryant served as Secretary and CLO of Fidelity Rutland Square Trust II (2010-2014) and Assistant Secretary of Fidelity's Fixed Income and Asset Allocation Funds (2013-2015). Prior to joining Fidelity Investments, Mr. Bryant served as a Senior Vice President and the Head of Global Retail Legal for AllianceBernstein L.P. (2006-2010), and as the General Counsel for ProFund Advisors LLC (2001-2006).
Jonathan Davis (1968)
Year of Election or Appointment: 2010
Assistant Treasurer
Mr. Davis also serves as Assistant Treasurer of other funds, and is an employee of Fidelity Investments. Previously, Mr. Davis served as Vice President and Associate General Counsel of FMR LLC (diversified financial services company, 2003-2010).
Adrien E. Deberghes (1967)
Year of Election or Appointment: 2010
Assistant Treasurer
Mr. Deberghes also serves as an officer of other funds. He serves as Executive Vice President of Fidelity Investments Money Management, Inc. (FIMM) (investment adviser firm, 2016-present) and is an employee of Fidelity Investments (2008-present). Prior to joining Fidelity Investments, Mr. Deberghes was Senior Vice President of Mutual Fund Administration at State Street Corporation (2007-2008), Senior Director of Mutual Fund Administration at Investors Bank & Trust (2005-2007), and Director of Finance for Dunkin' Brands (2000-2005). Previously, Mr. Deberghes served in other fund officer roles.
Stephanie J. Dorsey (1969)
Year of Election or Appointment: 2013
President and Treasurer
Ms. Dorsey also serves as an officer of other funds. She is an employee of Fidelity Investments (2008-present) and has served in other fund officer roles. Prior to joining Fidelity Investments, Ms. Dorsey served as Treasurer (2004-2008) of the JPMorgan Mutual Funds and Vice President (2004-2008) of JPMorgan Chase Bank.
Howard J. Galligan III (1966)
Year of Election or Appointment: 2014
Chief Financial Officer
Mr. Galligan also serves as Chief Financial Officer of other funds. Mr. Galligan serves as President of Fidelity Pricing and Cash Management Services (FPCMS) (2014-present) and as a Director of Strategic Advisers, Inc. (investment adviser firm, 2008-present). Previously, Mr. Galligan served as Chief Administrative Officer of Asset Management (2011-2014) and Chief Operating Officer and Senior Vice President of Investment Support for Strategic Advisers, Inc. (2003-2011).
Colm A. Hogan (1973)
Year of Election or Appointment: 2016
Assistant Treasurer
Mr. Hogan also serves as an officer of other funds. Mr. Hogan is an employee of Fidelity Investments (2005-present).
Chris Maher (1972)
Year of Election or Appointment: 2013
Assistant Treasurer
Mr. Maher serves as Assistant Treasurer of other funds. Mr. Maher is Vice President of Valuation Oversight and is an employee of Fidelity Investments. Previously, Mr. Maher served as Vice President of Asset Management Compliance (2013), Vice President of the Program Management Group of FMR (investment adviser firm, 2010-2013), and Vice President of Valuation Oversight (2008-2010).
John B. McGinty, Jr. (1962)
Year of Election or Appointment: 2016
Chief Compliance Officer
Mr. McGinty also serves as Chief Compliance Officer of other funds. Mr. McGinty is Senior Vice President of Asset Management Compliance for Fidelity Investments and is an employee of Fidelity Investments (2016-present). Mr. McGinty previously served as Vice President, Senior Attorney at Eaton Vance Management (investment management firm, 2015-2016), and prior to Eaton Vance as global CCO for all firm operations and registered investment companies at GMO LLC (investment management firm, 2009-2015). Before joining GMO LLC, Mr. McGinty served as Senior Vice President, Deputy General Counsel for Fidelity Investments (2007-2009).
Rieco E. Mello (1969)
Year of Election or Appointment: 2017
Assistant Treasurer
Mr. Mello also serves as Assistant Treasurer of other funds. Mr. Mello is an employee of Fidelity Investments (1995-present).
Jamie Pagliocco (1964)
Year of Election or Appointment: 2017
Vice President
Mr. Pagliocco also serves as Vice President of other funds. Mr. Pagliocco serves as Chief Investment Officer of FMR's Bond Group (2017-present) and is an employee of Fidelity Investments (2001-present).
Jason P. Pogorelec (1975)
Year of Election or Appointment: 2015
Assistant Secretary
Mr. Pogorelec also serves as Assistant Secretary of other funds. Mr. Pogorelec serves as Vice President, Associate General Counsel (2010-present) and is an employee of Fidelity Investments (2006-present).
Nancy D. Prior (1967)
Year of Election or Appointment: 2014
Vice President
Ms. Prior also serves as Vice President of other funds. Ms. Prior serves as a Director of FMR Investment Management (UK) Limited (investment adviser firm, 2015-present), President (2016-present) and Director (2014-present) of Fidelity Investments Money Management, Inc. (FIMM) (investment adviser firm), President, Fixed Income (2014-present), Vice Chairman of FIAM LLC (investment adviser firm, 2014-present), and is an employee of Fidelity Investments (2002-present). Previously, Ms. Prior served as Vice President of Fidelity's Money Market Funds (2012-2014), President, Money Market and Short Duration Bond Group of Fidelity Management & Research (FMR) (investment adviser firm, 2013-2014), President, Money Market Group of FMR (2011-2013), Managing Director of Research (2009-2011), Senior Vice President and Deputy General Counsel (2007-2009), and Assistant Secretary of certain Fidelity® funds (2008-2009).
Stacie M. Smith (1974)
Year of Election or Appointment: 2013
Assistant Treasurer
Ms. Smith also serves as an officer of other funds. She is an employee of Fidelity Investments (2009-present) and has served in other fund officer roles. Prior to joining Fidelity Investments, Ms. Smith served as Senior Audit Manager of Ernst & Young LLP (accounting firm, 1996-2009). Previously, Ms. Smith served as Deputy Treasurer of certain Fidelity® funds (2013-2016).
Marc L. Spector (1972)
Year of Election or Appointment: 2016
Deputy Treasurer
Mr. Spector also serves as an officer of other funds. Mr. Spector is an employee of Fidelity Investments (2016-present). Prior to joining Fidelity Investments, Mr. Spector served as Director at the Siegfried Group (accounting firm, 2013-2016), and prior to Siegfried Group as audit senior manager at Deloitte & Touche (accounting firm, 2005-2013).
Renee Stagnone (1975)
Year of Election or Appointment: 2016
Assistant Treasurer
Ms. Stagnone also serves as an officer of other funds. Ms. Stagnone is an employee of Fidelity Investments (1997-present). Previously, Ms. Stagnone served as Deputy Treasurer of certain Fidelity® funds (2013-2016).
Christine J. Thompson (1958)
Year of Election or Appointment: 2015
Vice President of Fidelity's Bond Funds
Ms. Thompson also serves as Vice President of other funds. Ms. Thompson also serves as Chief Investment Officer of FMR's Bond Group (2010-present) and is an employee of Fidelity Investments (1985-present). Previously, Ms. Thompson served as Vice President of Fidelity's Bond Funds (2010-2012).
Shareholder Expense Example
As a shareholder of the Fund, you incur two types of costs: (1) transaction costs, including sales charges (loads) on purchase payments or redemption proceeds, and (2) ongoing costs, including management fees, distribution and/or service (12b-1) fees and other Fund expenses. This Example is intended to help you understand your ongoing costs (in dollars) of investing in the Fund and to compare these costs with the ongoing costs of investing in other mutual funds.
The Example is based on an investment of $1,000 invested at the beginning of the period and held for the entire period (March 1, 2017 to August 31, 2017).
Actual Expenses
The first line of the accompanying table for each class of the Fund provides information about actual account values and actual expenses. You may use the information in this line, together with the amount you invested, to estimate the expenses that you paid over the period. Simply divide your account value by $1,000.00 (for example, an $8,600 account value divided by $1,000.00 = 8.6), then multiply the result by the number in the first line for a class of the Fund under the heading entitled "Expenses Paid During Period" to estimate the expenses you paid on your account during this period. A small balance maintenance fee of $12.00 that is charged once a year may apply for certain accounts with a value of less than $2,000. This fee is not included in the table below. If it was, the estimate of expenses you paid during the period would be higher, and your ending account value lower, by this amount. In addition, the Fund, as a shareholder in the underlying Fidelity Central Funds, will indirectly bear its pro-rata share of the fees and expenses incurred by the underlying Fidelity Central Funds. These fees and expenses are not included in the Fund's annualized expense ratio used to calculate the expense estimate in the table below.
Hypothetical Example for Comparison Purposes
The second line of the accompanying table for each class of the Fund provides information about hypothetical account values and hypothetical expenses based on a Class' actual expense ratio and an assumed rate of return of 5% per year before expenses, which is not the Class' actual return. The hypothetical account values and expenses may not be used to estimate the actual ending account balance or expenses you paid for the period. You may use this information to compare the ongoing costs of investing in the Fund and other funds. To do so, compare this 5% hypothetical example with the 5% hypothetical examples that appear in the shareholder reports of the other funds. A small balance maintenance fee of $12.00 that is charged once a year may apply for certain accounts with a value of less than $2,000. This fee is not included in the table below. If it was, the estimate of expenses you paid during the period would be higher, and your ending account value lower, by this amount. In addition, the Fund, as a shareholder in the underlying Fidelity Central Funds, will indirectly bear its pro-rata share of the fees and expenses incurred by the underlying Fidelity Central Funds. These fees and expenses are not included in the Fund's annualized expense ratio used to calculate the expense estimate in the table below.
Please note that the expenses shown in the table are meant to highlight your ongoing costs only and do not reflect any transaction costs. Therefore, the second line of the table is useful in comparing ongoing costs only, and will not help you determine the relative total costs of owning different funds. In addition, if these transactional costs were included, your costs would have been higher.
| | Annualized Expense Ratio-A | Beginning
Account Value
March 1, 2017 | Ending
Account Value
August 31, 2017 | Expenses Paid
During Period-B
March 1, 2017
to August 31, 2017 |
| Class A | .78% | | | |
| Actual | | $1,000.00 | $1,019.00 | $3.97 |
| Hypothetical-C | | $1,000.00 | $1,021.27 | $3.97 |
| Class M | .79% | | | |
| Actual | | $1,000.00 | $1,018.00 | $4.02 |
| Hypothetical-C | | $1,000.00 | $1,021.22 | $4.02 |
| Class C | 1.52% | | | |
| Actual | | $1,000.00 | $1,014.30 | $7.72 |
| Hypothetical-C | | $1,000.00 | $1,017.54 | $7.73 |
| Fidelity Mortgage Securities Fund | .45% | | | |
| Actual | | $1,000.00 | $1,020.60 | $2.29 |
| Hypothetical-C | | $1,000.00 | $1,022.94 | $2.29 |
| Class I | .49% | | | |
| Actual | | $1,000.00 | $1,019.60 | $2.49 |
| Hypothetical-C | | $1,000.00 | $1,022.74 | $2.50 |
A Annualized expense ratio reflects expenses net of applicable fee waivers.
B Expenses are equal to each Class' annualized expense ratio, multiplied by the average account value over the period, multiplied by 184/365 (to reflect the one-half year period). The fees and expenses of the underlying Fidelity Central Funds in which the Fund invests are not included in each Class' annualized expense ratio. In addition to the expenses noted above, the Fund also indirectly bears its proportional share of the expenses of the underlying Fidelity Central Funds. Annualized expenses of the underlying non-money market Fidelity Central Funds as of their most recent fiscal half year were less than .005%.
C 5% return per year before expenses
Distributions (Unaudited)
A total of 0.09% of the dividends distributed during the fiscal year was derived from interest on U.S. Government securities which is generally exempt from state income tax.
The fund designates $14,381,474 of distributions paid during the period January 1,2017 to August 31, 2017 as qualifying to be taxed as interest-related dividends for nonresident alien shareholders.
The fund will notify shareholders in January 2018 of amounts for use in preparing 2017 income tax returns.

AMOR-ANN-1017
1.704047.120
Fidelity® Mortgage Securities Fund
Annual Report August 31, 2017 Fidelity® Mortgage Securities Fund is a class of Fidelity Advisor® Mortgage Securities Fund |
|
Contents
To view a fund's proxy voting guidelines and proxy voting record for the 12-month period ended June 30, visit http://www.fidelity.com/proxyvotingresults or visit the Securities and Exchange Commission's (SEC) web site at http://www.sec.gov.
You may also call 1-800-544-8544 to request a free copy of the proxy voting guidelines.
Standard & Poor's, S&P and S&P 500 are registered service marks of The McGraw-Hill Companies, Inc. and have been licensed for use by Fidelity Distributors Corporation.
Other third-party marks appearing herein are the property of their respective owners.
All other marks appearing herein are registered or unregistered trademarks or service marks of FMR LLC or an affiliated company. © 2017 FMR LLC. All rights reserved.
This report and the financial statements contained herein are submitted for the general information of the shareholders of the Fund. This report is not authorized for distribution to prospective investors in the Fund unless preceded or accompanied by an effective prospectus.
A fund files its complete schedule of portfolio holdings with the SEC for the first and third quarters of each fiscal year on Form N-Q. Forms N-Q are available on the SEC’s web site at http://www.sec.gov. A fund's Forms N-Q may be reviewed and copied at the SEC’s Public Reference Room in Washington, DC. Information regarding the operation of the SEC's Public Reference Room may be obtained by calling 1-800-SEC-0330.
For a complete list of a fund's portfolio holdings, view the most recent holdings listing, semiannual report, or annual report on Fidelity's web site at http://www.fidelity.com, http://www.institutional.fidelity.com, or http://www.401k.com, as applicable.
NOT FDIC INSURED •MAY LOSE VALUE •NO BANK GUARANTEE
Neither the Fund nor Fidelity Distributors Corporation is a bank.
Performance: The Bottom Line
Average annual total return reflects the change in the value of an investment, assuming reinvestment of distributions from dividend income and capital gains (the profits earned upon the sale of securities that have grown in value, if any) and assuming a constant rate of performance each year. The hypothetical investment and the average annual total returns do not reflect the deduction of taxes that a shareholder would pay on fund distributions or the redemption of fund shares. During periods of reimbursement by Fidelity, a fund’s total return will be greater than it would be had the reimbursement not occurred. How a fund did yesterday is no guarantee of how it will do tomorrow.
Average Annual Total Returns
| For the periods ended August 31, 2017 | Past 1 year | Past 5 years | Past 10 years |
| Fidelity® Mortgage Securities Fund | 0.90% | 2.17% | 3.92% |
$10,000 Over 10 Years
Let's say hypothetically that $10,000 was invested in Fidelity® Mortgage Securities Fund, a class of the fund, on August 31, 2007.
The chart shows how the value of your investment would have changed, and also shows how the Bloomberg Barclays U.S. MBS Index performed over the same period.
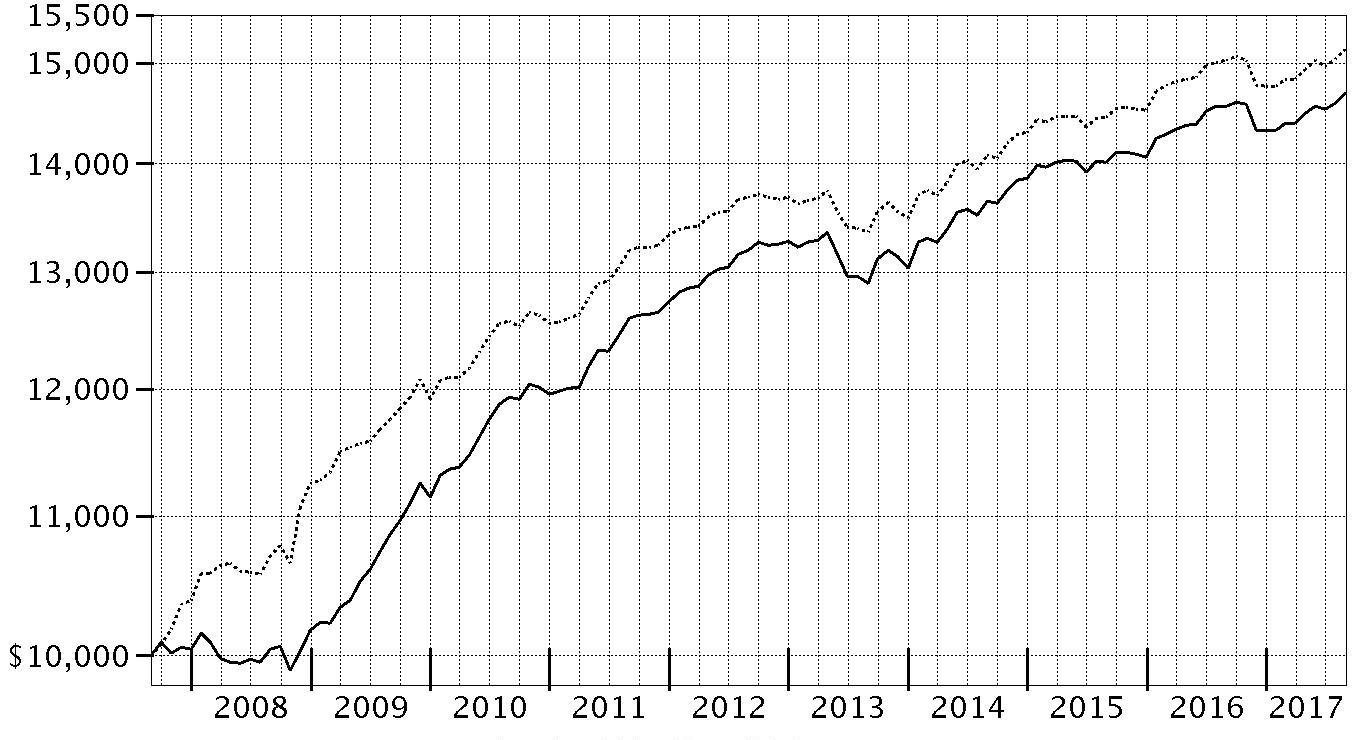
| Period Ending Values |
| $14,691 | Fidelity® Mortgage Securities Fund |
| $15,144 | Bloomberg Barclays U.S. MBS Index |
Effective August 24, 2016, all Barclays benchmark indices were co-branded as the Bloomberg Barclays Indices for a period of five years.
Management's Discussion of Fund Performance
Market Recap: U.S. taxable investment-grade bonds rose slightly for the 12 months ending August 31, 2017, as yields increased markedly following the U.S. presidential election then moderated as the period progressed. The Bloomberg Barclays U.S. Aggregate Bond Index gained 0.49% for the year. Bond yields rose slightly early in the period, prior to the U.S. election, then surged in November and December, as many investors viewed then-President-elect Donald Trump’s economic agenda as stimulative and potentially inflationary. Yields also rode the Fed’s decision in December to raise policy interest rates. Longer-term bond yields declined slightly in the first half of 2017, even though the Fed raised rates in June 2017 for the third time in as many quarters, as it became clear that changes to tax, health care and fiscal policies would take time to develop and implement. Fairly cool inflation readings also held back yields late in the period. Within the Bloomberg Barclays index, investment-grade corporate bonds led all major market segments, up 2.13%, while U.S. Treasuries returned -0.95%. Securitized sectors advanced more modestly than corporates. Outside the index, riskier, non-core fixed-income segments led the broader market, while Treasury Inflation-Protected Securities (TIPS) rose 0.46%, according to Bloomberg Barclays.
Comments from Lead Portfolio Manager William Irving and Co-Portfolio Manager Franco Castagliuolo: For the fiscal year, the fund’s share classes (excluding sales charges, if applicable) had roughly breakeven returns, net of fees, about in line with the 0.80% return of the benchmark Bloomberg Barclays U.S. MBS Index. We continued to execute our strategy of attempting to exploit market inefficiencies and identify attractively priced securities. Relative contributors and detractors had only a minor effect this period. Our out-of-benchmark allocations to non-agency MBS and non-agency commercial mortgage-backed securities added some value. These “private label” bonds—issued by financial institutions—outpaced many agency MBS. In terms of security selection, our overweighting in 30-year fixed-rate agency MBS with a measure of resistance to prepayment was beneficial. Our decision to hold TBA (to be announced) securities, which we typically paired with floating-rate securities, added value. As expected, this pair combination outperformed many of the MBS in the index. That said, some of the securities we used in tandem were very short-term, fixed rate securities Their interest payments didn’t adjust higher with rising rates and, as such, lagged the index.
The views expressed above reflect those of the portfolio manager(s) only through the end of the period as stated on the cover of this report and do not necessarily represent the views of Fidelity or any other person in the Fidelity organization. Any such views are subject to change at any time based upon market or other conditions and Fidelity disclaims any responsibility to update such views. These views may not be relied on as investment advice and, because investment decisions for a Fidelity fund are based on numerous factors, may not be relied on as an indication of trading intent on behalf of any Fidelity fund.
Investment Summary (Unaudited)
Coupon Distribution as of August 31, 2017
| | % of fund's investments | % of fund's investments 6 months ago |
| Zero coupon bonds | 0.0 | 0.0 |
| 0.01 - 0.99% | 0.2 | 1.0 |
| 1 - 1.99% | 3.7 | 4.5 |
| 2 - 2.99% | 8.1 | 5.9 |
| 3 - 3.99% | 53.6 | 52.7 |
| 4 - 4.99% | 19.1 | 20.9 |
| 5 - 5.99% | 6.0 | 6.1 |
| 6 - 6.99% | 1.9 | 1.9 |
| 7% and above | 0.9 | 1.0 |
Coupon distribution shows the range of stated interest rates on the fund's investments, excluding short-term investments.
Asset Allocation (% of fund's net assets)
| As of August 31, 2017* |
| | Mortgage Securities | 86.4% |
| | CMOs and Other Mortgage Related Securities | 15.9% |
| | Asset-Backed Securities | 5.2% |
| | Short-Term Investments and Net Other Assets (Liabilities)** | (7.5)% |

* Futures and Swaps - 4.6%
** Short-Term Investments and Net Other Assets (Liabilities) are not included in the pie chart
| As of February 28, 2017* |
| | Mortgage Securities | 90.0% |
| | CMOs and Other Mortgage Related Securities | 17.3% |
| | Asset-Backed Securities | 3.7% |
| | Short-Term Investments and Net Other Assets (Liabilities)** | (11.0)% |

* Futures and Swaps - 2.7%
** Short-Term Investments and Net Other Assets (Liabilities) are not included in the pie chart
Percentages in the above tables are adjusted for the effect of TBA Sale Commitments.
Percentages shown as 0.0% may reflect amounts less than 0.05%.
Investments August 31, 2017
Showing Percentage of Net Assets
| U.S. Government Agency - Mortgage Securities - 91.8% | | | |
| | | Principal Amount (000s) | Value (000s) |
| Fannie Mae - 50.3% | | | |
| 12 month U.S. LIBOR + 1.445% 3.195% 4/1/37 (a)(b) | | 64 | 67 |
| 12 month U.S. LIBOR + 1.495% 2.963% 1/1/35 (a)(b) | | 117 | 121 |
| 12 month U.S. LIBOR + 1.523% 3.219% 3/1/36 (a)(b) | | 89 | 93 |
| 12 month U.S. LIBOR + 1.553% 3.338% 6/1/36 (a)(b) | | 23 | 23 |
| 12 month U.S. LIBOR + 1.594% 3.448% 5/1/36 (a)(b) | | 149 | 156 |
| 12 month U.S. LIBOR + 1.643% 2.815% 9/1/36 (a)(b) | | 31 | 32 |
| 12 month U.S. LIBOR + 1.685% 3.435% 4/1/36 (a)(b) | | 64 | 67 |
| 12 month U.S. LIBOR + 1.690% 3.121% 8/1/35 (a)(b) | | 194 | 205 |
| 12 month U.S. LIBOR + 1.728% 3.314% 11/1/36 (a)(b) | | 23 | 24 |
| 12 month U.S. LIBOR + 1.741% 3.332% 3/1/40 (a)(b) | | 128 | 136 |
| 12 month U.S. LIBOR + 1.745% 3.374% 7/1/35 (a)(b) | | 30 | 31 |
| 12 month U.S. LIBOR + 1.750% 3.031% 8/1/41 (a)(b) | | 240 | 254 |
| 12 month U.S. LIBOR + 1.800% 2.759% 1/1/42 (a)(b) | | 287 | 301 |
| 12 month U.S. LIBOR + 1.812% 3.471% 12/1/40 (a)(b) | | 2,753 | 2,875 |
| 12 month U.S. LIBOR + 1.815% 3.109% 9/1/41 (a)(b) | | 85 | 89 |
| 12 month U.S. LIBOR + 1.818% 2.695% 2/1/42 (a)(b) | | 403 | 423 |
| 12 month U.S. LIBOR + 1.851% 3.573% 5/1/36 (a)(b) | | 22 | 23 |
| 12 month U.S. LIBOR + 1.875% 3.375% 10/1/36 (a)(b) | | 167 | 177 |
| 6 month U.S. LIBOR + 1.439% 2.689% 9/1/36 (a)(b) | | 81 | 84 |
| U.S. TREASURY 1 YEAR INDEX + 2.158% 3.095% 7/1/35 (a)(b) | | 3 | 3 |
| U.S. TREASURY 1 YEAR INDEX + 2.208% 3.083% 3/1/35 (a)(b) | | 15 | 16 |
| U.S. TREASURY 1 YEAR INDEX + 2.270% 2.899% 6/1/36 (a)(b) | | 248 | 262 |
| U.S. TREASURY 1 YEAR INDEX + 2.295% 2.798% 10/1/33 (a)(b) | | 31 | 32 |
| 2.5% 2/1/30 | | 108 | 110 |
| 2.5% 9/1/32 (c) | | 4,500 | 4,563 |
| 3% 8/1/27 to 8/1/47 | | 142,863 | 145,765 |
| 3% 9/1/32 (c) | | 13,000 | 13,422 |
| 3% 9/1/32 (c) | | 12,200 | 12,596 |
| 3% 9/1/32 (c) | | 32,300 | 33,349 |
| 3% 9/1/32 (c) | | 6,600 | 6,814 |
| 3% 9/1/32 (c) | | 6,500 | 6,711 |
| 3% 9/1/47 (c) | | 4,000 | 4,046 |
| 3.5% 9/1/29 to 10/1/56 (c) | | 109,144 | 113,774 |
| 3.5% 9/1/47 (c) | | 17,750 | 18,390 |
| 3.5% 9/1/47 (c) | | 16,950 | 17,561 |
| 3.5% 9/1/47 (c) | | 7,300 | 7,563 |
| 4% 11/1/31 to 10/1/46 | | 76,891 | 81,702 |
| 4.5% 5/1/25 to 8/1/56 | | 15,623 | 16,885 |
| 5% 5/1/20 to 8/1/56 | | 30,495 | 33,546 |
| 5.255% 8/1/41 | | 673 | 747 |
| 5.5% 2/1/18 to 4/1/39 | | 2,335 | 2,616 |
| 6% 7/1/39 | | 1,148 | 1,310 |
| 6.309% 2/1/39 | | 1,012 | 1,100 |
| 6.5% 2/1/20 to 8/1/39 | | 6,261 | 7,250 |
| 7% 9/1/21 to 5/1/30 | | 696 | 800 |
| 7.5% 8/1/22 to 9/1/32 | | 487 | 575 |
| 8% 12/1/29 to 3/1/37 | | 14 | 17 |
| 8.5% 2/1/22 to 3/1/23 | | 40 | 44 |
| 9% 10/1/30 | | 187 | 232 |
| 9.5% 10/1/21 to 8/1/22 | | 0 | 1 |
| | | | 536,983 |
| Freddie Mac - 21.8% | | | |
| 12 month U.S. LIBOR + 1.500% 3.129% 3/1/36 (a)(b) | | 215 | 225 |
| 12 month U.S. LIBOR + 1.515% 2.93% 11/1/35 (a)(b) | | 104 | 108 |
| 12 month U.S. LIBOR + 1.750% 3.394% 12/1/40 (a)(b) | | 1,362 | 1,418 |
| 12 month U.S. LIBOR + 1.754% 3.098% 9/1/41 (a)(b) | | 394 | 417 |
| 12 month U.S. LIBOR + 1.793% 3.32% 4/1/37 (a)(b) | | 38 | 40 |
| 12 month U.S. LIBOR + 1.874% 3.432% 10/1/42 (a)(b) | | 244 | 256 |
| 12 month U.S. LIBOR + 1.961% 3.807% 6/1/33 (a)(b) | | 488 | 518 |
| 12 month U.S. LIBOR + 2.045% 3.81% 7/1/36 (a)(b) | | 62 | 66 |
| 12 month U.S. LIBOR + 2.200% 3.7% 12/1/36 (a)(b) | | 139 | 146 |
| 12 month U.S. LIBOR + 2.280% 3.53% 10/1/36 (a)(b) | | 9 | 9 |
| 6 month U.S. LIBOR + 1.445% 2.82% 3/1/35 (a)(b) | | 44 | 46 |
| 6 month U.S. LIBOR + 1.675% 3.05% 6/1/37 (a)(b) | | 28 | 29 |
| 6 month U.S. LIBOR + 1.720% 3.095% 8/1/37 (a)(b) | | 52 | 54 |
| 6 month U.S. LIBOR + 1.746% 2.967% 5/1/37 (a)(b) | | 26 | 27 |
| 6 month U.S. LIBOR + 2.010% 3.385% 6/1/37 (a)(b) | | 20 | 21 |
| 6 month U.S. LIBOR + 2.040% 3.415% 6/1/37 (a)(b) | | 122 | 127 |
| 6 month U.S. LIBOR + 2.066% 3.428% 6/1/37 (a)(b) | | 362 | 383 |
| 6 month U.S. LIBOR + 2.755% 4.096% 10/1/35 (a)(b) | | 30 | 32 |
| U.S. TREASURY 1 YEAR INDEX + 2.231% 3.231% 5/1/34 (a)(b) | | 4 | 4 |
| 2.5% 7/1/31 | | 1,642 | 1,667 |
| 3% 3/1/32 to 2/1/47 | | 50,775 | 51,551 |
| 3.5% 6/1/27 to 9/1/46 (d) | | 97,750 | 101,969 |
| 3.5% 8/1/47 | | 1,066 | 1,106 |
| 4% 2/1/41 to 6/1/47 | | 40,809 | 43,362 |
| 4% 9/1/47 (c) | | 4,900 | 5,178 |
| 4.5% 7/1/25 to 3/1/44 | | 5,860 | 6,344 |
| 5% 7/1/33 to 7/1/41 | | 3,312 | 3,631 |
| 5.5% 10/1/17 to 10/1/39 | | 5,886 | 6,520 |
| 6% 11/1/17 to 6/1/39 | | 1,423 | 1,612 |
| 6.5% 4/1/21 to 9/1/39 | | 2,551 | 2,880 |
| 7% 6/1/21 to 9/1/36 | | 973 | 1,125 |
| 7.5% 1/1/27 to 7/1/34 | | 1,188 | 1,403 |
| 8% 4/1/21 to 1/1/37 | | 6 | 7 |
| 8.5% 9/1/20 | | 0 | 0 |
| 9% 10/1/19 to 5/1/21 | | 1 | 1 |
| | | | 232,282 |
| Ginnie Mae - 19.7% | | | |
| 3% 6/15/42 to 5/20/47 | | 50,368 | 51,495 |
| 3% 9/1/47 (c) | | 25,000 | 25,517 |
| 3.5% 11/20/41 to 6/20/46 (d) | | 60,717 | 63,644 |
| 4% 7/20/33 to 12/20/44 | | 33,546 | 35,755 |
| 4.5% 8/15/33 to 6/15/41 | | 24,703 | 26,821 |
| 5% 9/20/33 to 6/15/41 | | 4,314 | 4,820 |
| 5.5% 12/15/38 to 9/15/39 | | 694 | 784 |
| 6.5% 10/15/34 to 7/15/36 | | 173 | 201 |
| 7% 2/15/24 to 4/20/32 | | 705 | 828 |
| 7.5% 12/15/21 to 12/15/29 | | 191 | 219 |
| 8% 6/15/21 to 12/15/25 | | 102 | 116 |
| 8.5% 11/15/27 to 10/15/28 | | 97 | 113 |
| | | | 210,313 |
| TOTAL U.S. GOVERNMENT AGENCY - MORTGAGE SECURITIES | | | |
| (Cost $973,726) | | | 979,578 |
|
| Asset-Backed Securities - 5.2% | | | |
| American Credit Acceptance Receivable Trust Series 2016-1A Class A, 2.37% 5/12/20 (e) | | $269 | $269 |
| Avis Budget Rental Car Funding (AESOP) LLC Series 2012-3A Class A, 2.1% 3/20/19 (e) | | 5,560 | 5,566 |
| CAM Mortgage Trust Series 2017-1 Class A1, 3.22% 8/1/57 (e) | | 4,383 | 4,387 |
| Citi Mortgage Loan Trust Series 2007-1 Class 1A, 1 month U.S. LIBOR + 1.350% 2.5844% 10/25/37 (a)(b)(e) | | 4,820 | 4,788 |
| CLUB Credit Trust Series 2017-NP1 Class A, 2.39% 4/17/23 (e) | | 258 | 258 |
| Countrywide Home Loans, Inc. Series 2005-3 Class MV4, 1 month U.S. LIBOR + 0.620% 1.8544% 8/25/35 (a)(b) | | 148 | 148 |
| CPS Auto Trust Series 2015-C Class A, 1.77% 6/17/19 (e) | | 1,130 | 1,131 |
| Exeter Automobile Receivables Trust: | | | |
| Series 2016-1A Class A, 2.8% 7/15/20 (e) | | 1,165 | 1,166 |
| Series 2017-2A Class A, 2.22% 6/15/21 (e) | | 1,161 | 1,163 |
| Fannie Mae Series 2017-T1 Class A, 2.898% 6/25/27 | | 11,699 | 11,846 |
| Flagship Credit Auto Trust Series 2015-3 Class A, 2.38% 10/15/20 (e) | | 1,089 | 1,090 |
| GSAMP Trust Series 2004-AR1 Class B4, 5.5% 6/25/34 (e) | | 29 | 2 |
| Merrill Lynch Mortgage Investors Trust Series 2006-FF1 Class M2, 1 month U.S. LIBOR + 0.290% 1.5244% 8/25/36 (a)(b) | | 5,300 | 5,269 |
| Nationstar HECM Loan Trust Series 2017-1A Class A, 1.9679% 5/25/27 (e)(f) | | 4,844 | 4,844 |
| OneMain Financial Issuance Trust Series 2014-1A Class A, 2.43% 6/18/24 (e) | | 42 | 42 |
| Prosper Marketplace Issuance Trust: | | | |
| Series 2017-1A Class A, 2.56% 6/15/23 (e) | | 2,937 | 2,946 |
| Series 2017-2A Class A, 2.42% 9/15/23 (e) | | 2,097 | 2,101 |
| Structured Asset Securities Corp. Series 2005-NC2 Class M3, 1 month U.S. LIBOR + 0.430% 1.6622% 5/25/35 (a)(b) | | 1,286 | 1,285 |
| Towd Point Mortgage Trust Series 2017-1 Class A1, 2.75% 10/25/56 (a)(e) | | 7,538 | 7,628 |
| Vericrest Opportunity Loan Trust Series 2014-NP11 Class A1, 3.875% 4/25/55 (e) | | 130 | 130 |
| TOTAL ASSET-BACKED SECURITIES | | | |
| (Cost $55,634) | | | 56,059 |
|
| Collateralized Mortgage Obligations - 12.9% | | | |
| Private Sponsor - 5.1% | | | |
| Banc of America Funding Corp. Series 2015-R3 Class 10A1, 1 month U.S. LIBOR + 0.140% 1.3561% 6/27/36 (a)(b)(e) | | 4,424 | 4,311 |
| Banc of America Funding Trust sequential payer Series 2010-R3 Class 1A1, 3.3685% 12/26/35 (a)(e) | | 589 | 591 |
| BCAP LLC Trust sequential payer: | | | |
| Series 2010-RR11 Class 6A1, 3.2852% 3/27/36 (a)(e) | | $1,785 | $1,783 |
| Series 2010-RR2 Class 5A2, 5% 12/26/36 (e) | | 270 | 276 |
| Series 2012-RR5 Class 8A5, 1.4122% 7/26/36 (a)(e) | | 586 | 566 |
| Citigroup Mortgage Loan Trust sequential payer Series 2014-8 Class 2A1, 3.45% 6/27/37 (a)(e) | | 4,412 | 4,406 |
| Citigroup Mortgage Loan Trust, Inc. sequential payer Series 2009-5 Class 5A1, 3.4927% 1/25/37 (a)(e) | | 652 | 665 |
| Credit Suisse Commercial Mortgage Trust Series 2014-15R Class 7A3, 1.8991% 10/26/37 (a)(e) | | 119 | 118 |
| Credit Suisse Mortgage Trust: | | | |
| Series 2010-9R Class 2A5, 4% 2/27/38 (e) | | 1,812 | 1,860 |
| Series 2012-2R Class 1A1, 3.2057% 5/27/35 (a)(e) | | 318 | 320 |
| CSMC: | | | |
| floater Series 2015-1R Class 6A1, 1 month U.S. LIBOR + 0.280% 1.4945% 5/27/37 (a)(b)(e) | | 2,962 | 2,838 |
| Series 2011-2R Class 2A1, 3.3199% 7/27/36 (a)(e) | | 405 | 405 |
| Series 2014-3R Class 2A1, 1 month U.S. LIBOR + 0.700% 1.9161% 5/27/37 (a)(b)(e) | | 657 | 635 |
| Exeter Automobile Receivables Trust Series 2015-2A Class A, 1.54% 11/15/19 (e) | | 294 | 294 |
| First Horizon Mortgage pass-thru Trust Series 2004-AR5 Class 2A1, 3.1125% 10/25/34 (a) | | 204 | 205 |
| Freddie Mac Seasoned Credit Risk Transfer Series sequential payer Series 2017-1 Class MA, 3% 1/25/56 | | 3,782 | 3,848 |
| JP Morgan Resecuritization Trust floater Series 2012-2 Class 6A1, 1 month U.S. LIBOR + 0.210% 1.4182% 6/21/36 (a)(b)(e) | | 1,463 | 1,447 |
| MASTR Alternative Loan Trust Series 2004-6 Class 5A1, 5.4262% 7/25/19 (a) | | 477 | 480 |
| Merrill Lynch Alternative Note Asset Trust floater Series 2007-OAR1 Class A1, 1 month U.S. LIBOR + 0.170% 1.3861% 2/25/37 (a)(b) | | 709 | 690 |
| Morgan Stanley Re-REMIC Trust Series 2010-R6 Class 1A, 3.1187% 2/26/37 (a)(e) | | 733 | 735 |
| Mortgage Repurchase Agreement Funding Trust floater Series 2016-5 Class A, 1 month U.S. LIBOR + 1.170% 2.4006% 6/10/19 (a)(b)(e) | | 11,230 | 11,212 |
| Nomura Resecuritization Trust sequential payer Series 2011-3RA Class 2A1, 3.2922% 3/26/37 (a)(e) | | 590 | 590 |
| Structured Asset Securities Corp. Series 2003-15A Class 4A, 3.368% 4/25/33 (a) | | 54 | 53 |
| Thornburg Mortgage Securities Trust floater Series 2003-4 Class A1, 1 month U.S. LIBOR + 0.640% 1.8744% 9/25/43 (a)(b) | | 3,019 | 2,916 |
| Towd Point Mortgage Trust: | | | |
| Series 2015-5 Class A1B, 2.75% 5/25/55 (e) | | 1,125 | 1,136 |
| Series 2017-2 Class A1, 2.75% 4/25/57 (a)(e) | | 6,756 | 6,827 |
| WaMu Mortgage pass-thru certificates sequential payer: | | | |
| Series 2002-S8 Class 2A7, 5.25% 1/25/18 | | 48 | 48 |
| Series 2003-MS5 Class 1A1, 5% 3/25/18 | | 42 | 42 |
| Wells Fargo Mortgage Backed Securities Trust: | | | |
| Series 2003-I Class A1, 3.0527% 9/25/33 (a) | | 570 | 581 |
| Series 2005-AR10 Class 2A15, 3.1989% 6/25/35 (a) | | 3,544 | 3,577 |
| Series 2005-AR2 Class 1A2, 3.1522% 3/25/35 (a) | | 154 | 154 |
| Series 2006-AR10 Class 3A1, 3.2467% 7/25/36 (a) | | 87 | 87 |
| Wells Fargo Mortgage Loan Trust sequential payer Series 2011-RR4: | | | |
| Class 1A1, 3.5051% 6/27/36 (a)(e) | | 336 | 337 |
| Class 2A1, 3.3412% 6/27/36 (a)(e) | | 478 | 476 |
| | | | 54,509 |
| U.S. Government Agency - 7.8% | | | |
| Fannie Mae: | | | |
| floater Series 2003-118 Class S, 8.100% - 1 month U.S. LIBOR 6.8656% 12/25/33 (a)(g)(h) | | 240 | 58 |
| planned amortization class: | | | |
| Series 1999-17 Class PG, 6% 4/25/29 | | 422 | 466 |
| Series 1999-32 Class PL, 6% 7/25/29 | | 410 | 454 |
| Series 1999-33 Class PK, 6% 7/25/29 | | 283 | 314 |
| Series 2001-52 Class YZ, 6.5% 10/25/31 | | 34 | 40 |
| Series 2005-39 Class TE, 5% 5/25/35 | | 635 | 696 |
| Series 2005-73 Class SA, 17.500% - 1 month U.S. LIBOR 14.3404% 8/25/35 (a)(h) | | 42 | 53 |
| sequential payer: | | | |
| Series 2001-20 Class Z, 6% 5/25/31 | | 436 | 479 |
| Series 2001-31 Class ZC, 6.5% 7/25/31 | | 196 | 223 |
| Series 2002-16 Class ZD, 6.5% 4/25/32 | | 67 | 78 |
| Series 2002-74 Class SV, 1 month U.S. LIBOR + 7.550% 6.3156% 11/25/32 (a)(b)(g) | | 167 | 28 |
| Series 2012-67 Class AI, 4.5% 7/25/27 (g) | | 527 | 56 |
| Series 06-116 Class SG, 6.640% - 1 month U.S. LIBOR 5.4056% 12/25/36 (a)(g)(h) | | 164 | 35 |
| Series 07-40 Class SE, 6.440% - 1 month U.S. LIBOR 5.2056% 5/25/37 (a)(g)(h) | | 89 | 16 |
| Series 1993-165 Class SH, 19.800% - 1 month U.S. LIBOR 16.3081% 9/25/23 (a)(h) | | 21 | 27 |
| Series 2003-21 Class SK, 8.100% - 1 month U.S. LIBOR 6.8656% 3/25/33 (a)(g)(h) | | 65 | 14 |
| Series 2003-35 Class TQ, 7.500% - 1 month U.S. LIBOR 6.2656% 5/25/18 (a)(g)(h) | | 6 | 0 |
| Series 2005-79 Class ZC, 5.9% 9/25/35 | | 356 | 409 |
| Series 2007-57 Class SA, 40.600% - 1 month U.S. LIBOR 33.2134% 6/25/37 (a)(h) | | 319 | 645 |
| Series 2007-66 Class SB, 39.600% - 1 month U.S. LIBOR 32.1934% 7/25/37 (a)(h) | | 98 | 179 |
| Series 2008-12 Class SG, 6.350% - 1 month U.S. LIBOR 5.1156% 3/25/38 (a)(g)(h) | | 491 | 84 |
| Series 2009-16 Class SA, 6.250% - 1 month U.S. LIBOR 5.0156% 3/25/24 (a)(g)(h) | | 1 | 0 |
| Series 2009-76 Class MI, 5.5% 9/25/24 (g) | | 15 | 0 |
| Series 2009-85 Class IB, 4.5% 8/25/24 (g) | | 37 | 2 |
| Series 2009-93 Class IC, 4.5% 9/25/24 (g) | | 54 | 2 |
| Series 2010-12 Class AI, 5% 12/25/18 (g) | | 84 | 1 |
| Series 2010-135 Class LS, 6.050% - 1 month U.S. LIBOR 4.8156% 12/25/40 (a)(g)(h) | | 464 | 76 |
| Series 2010-139 Class NI, 4.5% 2/25/40 (g) | | 562 | 61 |
| Series 2010-150 Class ZC, 4.75% 1/25/41 | | 1,331 | 1,487 |
| Series 2010-23: | | | |
| Class AI, 5% 12/25/18 (g) | | 24 | 0 |
| Class HI, 4.5% 10/25/18 (g) | | 32 | 1 |
| Series 2010-29 Class LI, 4.5% 6/25/19 (g) | | 80 | 1 |
| Series 2010-95 Class ZC, 5% 9/25/40 | | 2,810 | 3,163 |
| Series 2010-97 Class CI, 4.5% 8/25/25 (g) | | 138 | 8 |
| Series 2011-110 Class SA, 6.610% - 1 month U.S. LIBOR 5.3756% 4/25/41 (a)(g)(h) | | 918 | 132 |
| Series 2011-112 Class SA, 6.550% - 1 month U.S. LIBOR 5.3156% 11/25/41 (a)(g)(h) | | 863 | 151 |
| Series 2011-123 Class SD, 6.600% - 1 month U.S. LIBOR 5.3656% 8/25/39 (a)(g)(h) | | 780 | 102 |
| Series 2011-4 Class PZ, 5% 2/25/41 | | 583 | 666 |
| Series 2011-67 Class AI, 4% 7/25/26 (g) | | 147 | 14 |
| Series 2011-83 Class DI, 6% 9/25/26 (g) | | 186 | 18 |
| Series 2012-100 Class WI, 3% 9/25/27 (g) | | 1,402 | 129 |
| Series 2012-14 Class JS, 6.650% - 1 month U.S. LIBOR 5.4156% 12/25/30 (a)(g)(h) | | 519 | 67 |
| Series 2012-47 Class SD, 6.450% - 1 month U.S. LIBOR 5.2156% 5/25/42 (a)(g)(h) | | 1,803 | 344 |
| Series 2012-9 Class SH, 6.550% - 1 month U.S. LIBOR 5.3156% 6/25/41 (a)(g)(h) | | 662 | 95 |
| Series 2013-133 Class IB, 3% 4/25/32 (g) | | 965 | 89 |
| Series 2013-134 Class SA, 6.050% - 1 month U.S. LIBOR 4.8156% 1/25/44 (a)(g)(h) | | 418 | 70 |
| Series 2013-51 Class GI, 3% 10/25/32 (g) | | 309 | 33 |
| Series 2013-N1 Class A, 6.720% - 1 month U.S. LIBOR 5.4856% 6/25/35 (a)(g)(h) | | 514 | 97 |
| Series 2015-42: | | | |
| Class IL, 6% 6/25/45 (g) | | 2,049 | 477 |
| Class LS, 6.200% - 1 month U.S. LIBOR 4.9656% 6/25/45 (a)(g)(h) | | 2,288 | 379 |
| Series 2015-70 Class JC, 3% 10/25/45 | | 2,596 | 2,666 |
| Series 2016-78 Class CS, 6.100% - 1 month U.S. LIBOR 4.8656% 5/25/39 (a)(g)(h) | | 3,947 | 692 |
| Series 2017-30 Class AI, 5.5% 5/25/47 (g) | | 987 | 221 |
| Fannie Mae Stripped Mortgage-Backed Securities: | | | |
| Series 339 Class 29, 5.5% 8/25/18 (g) | | 8 | 0 |
| Series 348 Class 14, 6.5% 8/25/34 (a)(g) | | 134 | 31 |
| Series 351: | | | |
| Class 12, 5.5% 4/25/34 (a)(g) | | 86 | 14 |
| Class 13, 6% 3/25/34 (g) | | 119 | 24 |
| Series 359 Class 19, 6% 7/25/35 (a)(g) | | 78 | 15 |
| Series 384 Class 6, 5% 7/25/37 (g) | | 272 | 48 |
| Freddie Mac: | | | |
| planned amortization class: | | | |
| Series 2095 Class PE, 6% 11/15/28 | | 471 | 522 |
| Series 2104 Class PG, 6% 12/15/28 | | 134 | 148 |
| Series 2121 Class MG, 6% 2/15/29 | | 197 | 218 |
| Series 2154 Class PT, 6% 5/15/29 | | 342 | 381 |
| Series 2162 Class PH, 6% 6/15/29 | | 51 | 55 |
| Series 2520 Class BE, 6% 11/15/32 | | 232 | 251 |
| Series 2585 Class KS, 7.600% - 1 month U.S. LIBOR 6.3733% 3/15/23 (a)(g)(h) | | 19 | 2 |
| Series 2693 Class MD, 5.5% 10/15/33 | | 4,157 | 4,633 |
| Series 2802 Class OB, 6% 5/15/34 | | 1,033 | 1,133 |
| Series 3002 Class NE, 5% 7/15/35 | | 380 | 415 |
| Series 3189 Class PD, 6% 7/15/36 | | 378 | 433 |
| Series 3415 Class PC, 5% 12/15/37 | | 111 | 121 |
| Series 3786 Class HI, 4% 3/15/38 (g) | | 547 | 43 |
| Series 3806 Class UP, 4.5% 2/15/41 | | 1,009 | 1,077 |
| Series 3832 Class PE, 5% 3/15/41 | | 960 | 1,075 |
| Series 70 Class C, 9% 9/15/20 | | 0 | 0 |
| sequential payer: | | | |
| Series 2114 Class ZM, 6% 1/15/29 | | 66 | 74 |
| Series 2135 Class JE, 6% 3/15/29 | | 259 | 288 |
| Series 2274 Class ZM, 6.5% 1/15/31 | | 117 | 133 |
| Series 2281 Class ZB, 6% 3/15/30 | | 94 | 101 |
| Series 2357 Class ZB, 6.5% 9/15/31 | | 228 | 264 |
| Series 2502 Class ZC, 6% 9/15/32 | | 239 | 259 |
| Series 3871 Class KB, 5.5% 6/15/41 | | 1,045 | 1,216 |
| Series 06-3115 Class SM, 6.600% - 1 month U.S. LIBOR 5.3733% 2/15/36 (a)(g)(h) | | 132 | 27 |
| Series 1658 Class GZ, 7% 1/15/24 | | 263 | 284 |
| Series 2013-4281 Class AI, 4% 12/15/28 (g) | | 1,201 | 105 |
| Series 2017-4683 Class LM, 3% 5/15/47 | | 2,032 | 2,087 |
| Series 2380 Class SY, 8.200% - 1 month U.S. LIBOR 6.9733% 11/15/31 (a)(g)(h) | | 936 | 159 |
| Series 2587 Class IM, 6.5% 3/15/33 (g) | | 134 | 31 |
| Series 2844: | | | |
| Class SC, 46.800% - 1 month U.S. LIBOR 38.8266% 8/15/24 (a)(h) | | 7 | 11 |
| Class SD, 86.400% - 1 month U.S. LIBOR 70.5033% 8/15/24 (a)(h) | | 11 | 21 |
| Series 2933 Class ZM, 5.75% 2/15/35 | | 760 | 885 |
| Series 2935 Class ZK, 5.5% 2/15/35 | | 1,312 | 1,481 |
| Series 2947 Class XZ, 6% 3/15/35 | | 486 | 541 |
| Series 2996 Class ZD, 5.5% 6/15/35 | | 603 | 692 |
| Series 3055 Class CS, 1 month U.S. LIBOR + 6.590% 5.3633% 10/15/35 (a)(b)(g) | | 180 | 36 |
| Series 3237 Class C, 5.5% 11/15/36 | | 892 | 1,014 |
| Series 3244 Class SG, 6.660% - 1 month U.S. LIBOR 5.4333% 11/15/36 (a)(g)(h) | | 359 | 71 |
| Series 3284 Class CI, 1 month U.S. LIBOR + 6.120% 4.8933% 3/15/37 (a)(b)(g) | | 771 | 147 |
| Series 3287 Class SD, 6.750% - 1 month U.S. LIBOR 5.5233% 3/15/37 (a)(g)(h) | | 494 | 102 |
| Series 3297 Class BI, 6.760% - 1 month U.S. LIBOR 5.5333% 4/15/37 (a)(g)(h) | | 743 | 158 |
| Series 3336 Class LI, 1 month U.S. LIBOR + 6.580% 5.3533% 6/15/37 (a)(b)(g) | | 299 | 53 |
| Series 3772 Class BI, 4.5% 10/15/18 (g) | | 64 | 1 |
| Series 3949 Class MK, 4.5% 10/15/34 | | 272 | 292 |
| Series 3955: | | | |
| Class GS, 5.950% - 1 month U.S. LIBOR 4.7233% 9/15/41 (a)(g)(h) | | 783 | 122 |
| Class YI, 3% 11/15/21 (g) | | 776 | 34 |
| Series 4055 Class BI, 3.5% 5/15/31 (g) | | 885 | 86 |
| Series 4149 Class IO, 3% 1/15/33 (g) | | 132 | 17 |
| Series 4314 Class AI, 5% 3/15/34 (g) | | 337 | 37 |
| Series 4427 Class LI, 3.5% 2/15/34 (g) | | 1,514 | 177 |
| Series 4471 Class PA 4% 12/15/40 | | 3,685 | 3,861 |
| Freddie Mac Manufactured Housing participation certificates guaranteed planned amortization class Series 2043 Class CJ, 6.5% 4/15/28 | | 186 | 211 |
| Freddie Mac Multi-family Structured pass-thru certificates Series 4386 Class AZ, 4.5% 11/15/40 | | 2,721 | 2,915 |
| Ginnie Mae guaranteed REMIC pass-thru certificates: | | | |
| floater: | | | |
| Series 2007-37 Class TS, 6.690% - 1 month U.S. LIBOR 5.4622% 6/16/37 (a)(g)(h) | | 177 | 37 |
| Series 2010-H17 Class FA, 1 month U.S. LIBOR + 0.330% 1.5628% 7/20/60 (a)(b)(i) | | 251 | 249 |
| Series 2010-H18 Class AF, 1 month U.S. LIBOR + 0.300% 1.5239% 9/20/60 (a)(b)(i) | | 315 | 312 |
| Series 2010-H19 Class FG, 1 month U.S. LIBOR + 0.300% 1.5239% 8/20/60 (a)(b)(i) | | 350 | 347 |
| Series 2011-H13 Class FA, 1 month U.S. LIBOR + 0.500% 1.7239% 4/20/61 (a)(b)(i) | | 141 | 141 |
| Series 2012-H21 Class DF, 1 month U.S. LIBOR + 0.650% 1.8739% 5/20/61 (a)(b)(i) | | 934 | 936 |
| planned amortization class Series 2011-136 Class WI, 4.5% 5/20/40 (g) | | 332 | 38 |
| sequential payer: | | | |
| Series 2002-24 Class SK, 7.950% - 1 month U.S. LIBOR 6.7222% 4/16/32 (a)(g)(h) | | 882 | 174 |
| Series 2002-42 Class ZA, 6% 6/20/32 | | 304 | 344 |
| Series 2004-24 Class ZM, 5% 4/20/34 | | 601 | 658 |
| Series 2010-160 Class DY, 4% 12/20/40 | | 3,841 | 4,115 |
| Series 2010-170 Class B, 4% 12/20/40 | | 868 | 930 |
| Series 2001-3 Class S, 1 month U.S. LIBOR + 8.100% 6.8722% 2/16/31 (a)(b)(g) | | 191 | 33 |
| Series 2001-36: | | | |
| Class SB, 8.100% - 1 month U.S. LIBOR 6.8722% 12/16/23 (a)(g)(h) | | 457 | 64 |
| Class SP, 1 month U.S. LIBOR + 8.750% 7.5222% 9/16/26 (a)(b)(g) | | 263 | 32 |
| Series 2001-38 Class SB, 7.580% - 1 month U.S. LIBOR 6.3522% 8/16/31 (a)(g)(h) | | 317 | 54 |
| Series 2001-49: | | | |
| Class SC, 7.600% - 1 month U.S. LIBOR 6.3722% 12/16/25 (a)(g)(h) | | 617 | 83 |
| Class SL, 7.600% - 1 month U.S. LIBOR 6.3722% 5/16/30 (a)(g)(h) | | 883 | 150 |
| Class SV, 8.250% - 1 month U.S. LIBOR 7.0222% 12/16/28 (a)(g)(h) | | 74 | 9 |
| Series 2001-50: | | | |
| Class SD, 8.200% - 1 month U.S. LIBOR 6.9694% 11/20/31 (a)(g)(h) | | 455 | 101 |
| Class ST, 7.700% - 1 month U.S. LIBOR 6.4722% 8/16/27 (a)(g)(h) | | 201 | 35 |
| Series 2002-5 Class SP, 7.450% - 1 month U.S. LIBOR 6.2222% 1/16/32 (a)(g)(h) | | 315 | 47 |
| Series 2004-32 Class GS, 6.500% - 1 month U.S. LIBOR 5.2722% 5/16/34 (a)(g)(h) | | 306 | 56 |
| Series 2004-73 Class AL, 7.200% - 1 month U.S. LIBOR 5.9722% 8/17/34 (a)(g)(h) | | 118 | 27 |
| Series 2011-52 Class HI, 7% 4/16/41 (g) | | 1,251 | 294 |
| Series 2012-76 Class GS, 6.700% - 1 month U.S. LIBOR 5.4722% 6/16/42 (a)(g)(h) | | 551 | 106 |
| Series 2013-124: | | | |
| Class ES, 8.667% - 1 month U.S. LIBOR 7.0259% 4/20/39 (a)(h) | | 1,077 | 1,134 |
| Class ST, 8.800% - 1 month U.S. LIBOR 7.1593% 8/20/39 (a)(h) | | 2,498 | 2,683 |
| Series 2013-149 Class MA, 2.5% 5/20/40 | | 4,648 | 4,685 |
| Series 2015-H13 Class HA, 2.5% 8/20/64 (i) | | 10,796 | 10,879 |
| Series 2015-H17 Class HA, 2.5% 5/20/65 (i) | | 4,374 | 4,409 |
| Series 2017-H06 Class FA, U.S. TREASURY 1 YEAR INDEX + 0.350% 1.57% 8/20/66 (a)(b)(i) | | 6,336 | 6,351 |
| | | | 83,743 |
| TOTAL COLLATERALIZED MORTGAGE OBLIGATIONS | | | |
| (Cost $137,318) | | | 138,252 |
|
| Commercial Mortgage Securities - 3.0% | | | |
| Asset Securitization Corp. Series 1997-D5 Class PS1, 1.6895% 2/14/43 (a)(g) | | 113 | 1 |
| Barclays Commercial Mortgage Securities LLC Series 2015-STP Class A, 3.3228% 9/10/28 (e) | | 1,642 | 1,693 |
| Bayview Commercial Asset Trust floater Series 2007-3: | | | |
| Class M1, 1 month U.S. LIBOR + 0.310% 1.5261% 7/25/37 (a)(b)(e) | | 30 | 27 |
| Class M2, 1 month U.S. LIBOR + 0.340% 1.5561% 7/25/37 (a)(b)(e) | | 31 | 28 |
| Class M3, 1 month U.S. LIBOR + 0.370% 1.5861% 7/25/37 (a)(b)(e) | | 50 | 38 |
| Citigroup Commercial Mortgage Trust: | | | |
| Series 2015-GC33 Class XA, 0.968% 9/10/58 (a)(g) | | 22,734 | 1,345 |
| Series 2016-P6 Class XA, 0.8365% 12/10/49 (a)(g) | | 22,587 | 1,118 |
| COMM Mortgage Trust: | | | |
| Series 2014-CR19 Class XA, 1.2398% 8/10/47 (a)(g) | | 27,988 | 1,517 |
| Series 2014-CR20 Class XA, 1.1713% 11/10/47 (a)(g) | | 6,165 | 359 |
| Series 2014-LC17 Class XA, 1.143% 10/10/47 (a)(g) | | 25,285 | 986 |
| Series 2014-UBS4 Class XA, 1.2342% 8/10/47 (a)(g) | | 28,487 | 1,612 |
| Series 2014-UBS6 Class XA, 1.0295% 12/10/47 (a)(g) | | 15,073 | 748 |
| Series 2015-DC1 Class XA, 1.1664% 2/10/48 (a)(g) | | 37,457 | 2,145 |
| CSMC Series 2015-TOWN: | | | |
| Class A, 1 month U.S. LIBOR + 1.250% 2.4756% 3/15/28 (a)(b)(e) | | 7,804 | 7,798 |
| Class B, 1 month U.S. LIBOR + 1.900% 3.1256% 3/15/28 (a)(b)(e) | | 185 | 185 |
| Class C, 1 month U.S. LIBOR + 2.250% 3.4756% 3/15/28 (a)(b)(e) | | 180 | 180 |
| Class D, 1 month U.S. LIBOR + 3.200% 4.4256% 3/15/28 (a)(b)(e) | | 273 | 273 |
| GAHR Commercial Mortgage Trust floater Series 2015-NRF Class AFL1, 1 month U.S. LIBOR + 1.300% 2.459% 12/15/34 (a)(b)(e) | | 2,082 | 2,086 |
| GE Capital Commercial Mortgage Corp. Series 2007-C1 Class A1A, 5.483% 12/10/49 | | 713 | 712 |
| GS Mortgage Securities Trust: | | | |
| Series 2013-GC12 Class XA, 1.5475% 6/10/46 (a)(g) | | 7,462 | 455 |
| Series 2014-GC20 Class XA, 1.0078% 4/10/47 (a)(g) | | 6,624 | 341 |
| Series 2015-GC34 Class XA, 1.3631% 10/10/48 (a)(g) | | 10,576 | 872 |
| JPMBB Commercial Mortgage Securities Trust Series 2014-C19 Class XA, 1.1728% 4/15/47 (a)(g) | | 6,634 | 197 |
| JPMorgan Chase Commercial Mortgage Securities Trust Series 2016-WP Class TA, 1 month U.S. LIBOR + 1.450% 2.6089% 10/15/33 (a)(b)(e) | | 769 | 772 |
| Morgan Stanley BAML Trust Series 2015-C25 Class XA, 1.14% 10/15/48 (a)(g) | | 13,714 | 941 |
| MSCG Trust Series 2016-SNR Class A, 3.348% 11/15/34 (a)(e) | | 1,220 | 1,233 |
| SCG Trust Series 2013-SRP1 Class A, 1 month U.S. LIBOR + 1.400% 2.8089% 11/15/26 (a)(b)(e) | | 2,783 | 2,763 |
| Wells Fargo Commercial Mortgage Trust Series 2015-C31 Class XA, 1.1023% 11/15/48 (a)(g) | | 11,045 | 738 |
| WF-RBS Commercial Mortgage Trust Series 2014-C24 Class XA, 0.9591% 11/15/47 (a)(g) | | 8,573 | 429 |
| TOTAL COMMERCIAL MORTGAGE SECURITIES | | | |
| (Cost $31,658) | | | 31,592 |
| | | Shares | Value (000s) |
|
| Money Market Funds - 2.1% | | | |
| Fidelity Cash Central Fund, 1.11% (j) | | | |
| (Cost $22,471) | | 22,466,534 | 22,471 |
| TOTAL INVESTMENT IN SECURITIES - 115.0% | | | |
| (Cost $1,220,807) | | | 1,227,952 |
| NET OTHER ASSETS (LIABILITIES) - (15.0)% | | | (160,480) |
| NET ASSETS - 100% | | | $1,067,472 |
| TBA Sale Commitments | | |
| | Principal Amount (000s) | Value (000s) |
| Fannie Mae | | |
| 3% 9/1/47 | $(1,300) | $(1,315) |
| 3% 9/1/47 | (2,000) | (2,023) |
| 3% 9/1/47 | (5,200) | (5,260) |
| 3.5% 9/1/47 | (7,300) | (7,563) |
| 3.5% 9/1/47 | (7,300) | (7,563) |
| 3.5% 9/1/47 | (29,400) | (30,461) |
|
| TOTAL FANNIE MAE | | (54,185) |
|
| Ginnie Mae | | |
| 3% 9/1/47 | (2,700) | (2,756) |
| TOTAL TBA SALE COMMITMENTS | | |
| (Proceeds $56,762) | | $(56,941) |
| Futures Contracts | | | | | |
| | Number of contracts | Expiration Date | Notional amount (000s) | Value (000s) | Unrealized Appreciation/(Depreciation) (000s) |
| Purchased | | | | | |
| Treasury Contracts | | | | | |
| CBOT 5-Year U.S. Treasury Note Contracts (United States) | 56 | Dec. 2017 | $6,636 | $9 | $9 |
| CBOT Long Term U.S. Treasury Bond Contracts (United States) | 3 | Dec. 2017 | 468 | 4 | 4 |
| CBOT Ultra Long Term U.S. Treasury Bond Contracts (United States) | 6 | Dec. 2017 | 1,014 | 6 | 6 |
| TOTAL PURCHASED | | | | | 19 |
| Sold | | | | | |
| Treasury Contracts | | | | | |
| CBOT 10-Year U.S. Treasury Note Contracts (United States) | 202 | Dec. 2017 | 25,651 | (74) | (74) |
| CBOT 2-Year U.S. Treasury Note Contracts (United States) | 148 | Dec. 2017 | 32,014 | (10) | (10) |
| TOTAL SOLD | | | | | (84) |
| TOTAL FUTURES CONTRACTS | | | | | $(65) |
The notional amount of futures purchased as a percentage of Net Assets is 0.8%
The notional amount of futures sold as a percentage of Net Assets is 5.4%
For the period, the average monthly notional amount for futures contracts in the aggregate was $50,111,000.
Values shown as $0 may reflect amounts less than $500.
Legend
(a) Coupon rates for floating and adjustable rate securities reflect the rates in effect at period end.
(b) Coupon is indexed to a floating interest rate which may be multiplied by a specified factor and/or subject to caps or floors.
(c) Security or a portion of the security purchased on a delayed delivery or when-issued basis.
(d) Security or a portion of the security was pledged to cover margin requirements for futures contracts. At period end, the value of securities pledged amounted to $240,000.
(e) Security exempt from registration under Rule 144A of the Securities Act of 1933. These securities may be resold in transactions exempt from registration, normally to qualified institutional buyers. At the end of the period, the value of these securities amounted to $96,415,000 or 9.0% of net assets.
(f) Level 3 instrument
(g) Security represents right to receive monthly interest payments on an underlying pool of mortgages or assets. Principal shown is the outstanding par amount of the pool as of the end of the period.
(h) Coupon is inversely indexed to a floating interest rate multiplied by a specified factor. The price may be considerably more volatile than the price of a comparable fixed rate security.
(i) Represents an investment in an underlying pool of reverse mortgages which typically do not require regular principal and interest payments as repayment is deferred until a maturity event.
(j) Affiliated fund that is generally available only to investment companies and other accounts managed by Fidelity Investments. The rate quoted is the annualized seven-day yield of the fund at period end. A complete unaudited listing of the fund's holdings as of its most recent quarter end is available upon request. In addition, each Fidelity Central Fund's financial statements, which are not covered by the Fund's Report of Independent Registered Public Accounting Firm, are available on the SEC's website or upon request.
Affiliated Central Funds
Information regarding fiscal year to date income earned by the Fund from investments in Fidelity Central Funds is as follows:
| Fund | Income earned |
| | (Amounts in thousands) |
| Fidelity Cash Central Fund | $190 |
| Fidelity Mortgage Backed Securities Central Fund | 1 |
| Total | $191 |
Additional information regarding the Fund's fiscal year to date purchases and sales, including the ownership percentage, of the non Money Market Central Funds is as follows:
| Fund (Amounts in thousands) | Value, beginning of period | Purchases | Sales Proceeds | Realized Gain/Loss | Change in Unrealized appreciation (depreciation) | Value, end of period | % ownership, end of period |
| Fidelity Mortgage Backed Securities Central Fund | $86 | $1 | $84 | $(3) | $-- | $-- | 0.0% |
| Total | $86 | $1 | $84 | $(3) | $-- | $-- | |
Investment Valuation
The following is a summary of the inputs used, as of August 31, 2017, involving the Fund's assets and liabilities carried at fair value. The inputs or methodology used for valuing securities may not be an indication of the risk associated with investing in those securities. For more information on valuation inputs, and their aggregation into the levels used below, please refer to the Investment Valuation section in the accompanying Notes to Financial Statements.
| | Valuation Inputs at Reporting Date: |
| Description | Total | Level 1 | Level 2 | Level 3 |
| (Amounts in thousands) | | | | |
| Investments in Securities: | | | | |
| U.S. Government Agency - Mortgage Securities | $979,578 | $-- | $979,578 | $-- |
| Asset-Backed Securities | 56,059 | -- | 51,215 | 4,844 |
| Collateralized Mortgage Obligations | 138,252 | -- | 138,252 | -- |
| Commercial Mortgage Securities | 31,592 | -- | 31,592 | -- |
| Money Market Funds | 22,471 | 22,471 | -- | -- |
| Total Investments in Securities: | $1,227,952 | $22,471 | $1,200,637 | $4,844 |
| Derivative Instruments: | | | | |
| Assets | | | | |
| Futures Contracts | $19 | $19 | $-- | $-- |
| Total Assets | $19 | $19 | $-- | $-- |
| Liabilities | | | | |
| Futures Contracts | $(84) | $(84) | $-- | $-- |
| Total Liabilities | $(84) | $(84) | $-- | $-- |
| Total Derivative Instruments: | $(65) | $(65) | $-- | $-- |
| Other Financial Instruments: | | | | |
| TBA Sale Commitments | $(56,941) | $-- | $(56,941) | $-- |
| Total Other Financial Instruments: | $(56,941) | $-- | $(56,941) | $-- |
Value of Derivative Instruments
The following table is a summary of the Fund's value of derivative instruments by primary risk exposure as of August 31, 2017. For additional information on derivative instruments, please refer to the Derivative Instruments section in the accompanying Notes to Financial Statements.
| Primary Risk Exposure / Derivative Type | Value |
| | Asset | Liability |
| (Amounts in thousands) | | |
| Interest Rate Risk | | |
| Futures Contracts(a) | $19 | $(84) |
| Total Interest Rate Risk | 19 | (84) |
| Total Value of Derivatives | $19 | $(84) |
(a) Reflects gross cumulative appreciation (depreciation) on futures contracts as presented in the Schedule of Investments. In the Statement of Assets and Liabilities, the period end daily variation margin is included in receivable or payable for daily variation margin on futures contracts, and the net cumulative appreciation (depreciation) is included in net unrealized appreciation (depreciation).
See accompanying notes which are an integral part of the financial statements.
Financial Statements
Statement of Assets and Liabilities
| Amounts in thousands (except per-share amounts) | | August 31, 2017 |
| Assets | | |
Investment in securities, at value — See accompanying schedule:
Unaffiliated issuers (cost $1,198,336) | $1,205,481 | |
| Fidelity Central Funds (cost $22,471) | 22,471 | |
| Total Investment in Securities (cost $1,220,807) | | $1,227,952 |
| Cash | | 90 |
| Receivable for investments sold | | 154 |
| Receivable for TBA sale commitments | | 56,762 |
| Receivable for fund shares sold | | 261 |
| Interest receivable | | 3,166 |
| Distributions receivable from Fidelity Central Funds | | 21 |
| Total assets | | 1,288,406 |
| Liabilities | | |
| TBA sale commitments, at value | $56,941 | |
| Payable for investments purchased on a delayed delivery basis | 162,685 | |
| Payable for fund shares redeemed | 669 | |
| Distributions payable | 188 | |
| Accrued management fee | 272 | |
| Distribution and service plan fees payable | 22 | |
| Payable for daily variation margin on futures contracts | 23 | |
| Other affiliated payables | 134 | |
| Total liabilities | | 220,934 |
| Net Assets | | $1,067,472 |
| Net Assets consist of: | | |
| Paid in capital | | $1,067,393 |
| Distributions in excess of net investment income | | (4,158) |
| Accumulated undistributed net realized gain (loss) on investments | | (2,664) |
| Net unrealized appreciation (depreciation) on investments | | 6,901 |
| Net Assets | | $1,067,472 |
| Calculation of Maximum Offering Price | | |
| Class A: | | |
| Net Asset Value and redemption price per share ($35,227 ÷ 3,118 shares) | | $11.30 |
| Maximum offering price per share (100/96.00 of $11.30) | | $11.77 |
| Class M: | | |
| Net Asset Value and redemption price per share ($19,615 ÷ 1,733 shares) | | $11.32 |
| Maximum offering price per share (100/96.00 of $11.32) | | $11.79 |
| Class C: | | |
| Net Asset Value and offering price per share ($13,221 ÷ 1,172 shares)(a) | | $11.28 |
| Fidelity Mortgage Securities Fund: | | |
| Net Asset Value, offering price and redemption price per share ($926,057 ÷ 81,769 shares) | | $11.33 |
| Class I: | | |
| Net Asset Value, offering price and redemption price per share ($73,352 ÷ 6,500 shares) | | $11.28 |
(a) Redemption price per share is equal to net asset value less any applicable contingent deferred sales charge.
See accompanying notes which are an integral part of the financial statements.
Statement of Operations
| Amounts in thousands | | Year ended August 31, 2017 |
| Investment Income | | |
| Interest | | $26,132 |
| Income from Fidelity Central Funds | | 191 |
| Total income | | 26,323 |
| Expenses | | |
| Management fee | $3,350 | |
| Transfer agent fees | 1,185 | |
| Distribution and service plan fees | 314 | |
| Fund wide operations fee | 442 | |
| Independent trustees' fees and expenses | 4 | |
| Miscellaneous | 5 | |
| Total expenses before reductions | 5,300 | |
| Expense reductions | (1) | 5,299 |
| Net investment income (loss) | | 21,024 |
| Realized and Unrealized Gain (Loss) | | |
| Net realized gain (loss) on: | | |
| Investment securities: | | |
| Unaffiliated issuers | (2,598) | |
| Fidelity Central Funds | (2) | |
| Futures contracts | 871 | |
| Swaps | 25 | |
| Total net realized gain (loss) | | (1,704) |
| Change in net unrealized appreciation (depreciation) on: | | |
| Investment securities: | | |
| Unaffiliated issuers | (10,375) | |
| Fidelity Central Funds | (1) | |
| Futures contracts | (130) | |
| Swaps | (42) | |
| Delayed delivery commitments | (190) | |
| Total change in net unrealized appreciation (depreciation) | | (10,738) |
| Net gain (loss) | | (12,442) |
| Net increase (decrease) in net assets resulting from operations | | $8,582 |
See accompanying notes which are an integral part of the financial statements.
Statement of Changes in Net Assets
| Amounts in thousands | Year ended August 31, 2017 | Year ended August 31, 2016 |
| Increase (Decrease) in Net Assets | | |
| Operations | | |
| Net investment income (loss) | $21,024 | $23,905 |
| Net realized gain (loss) | (1,704) | 10,209 |
| Change in net unrealized appreciation (depreciation) | (10,738) | 6,345 |
| Net increase (decrease) in net assets resulting from operations | 8,582 | 40,459 |
| Distributions to shareholders from net investment income | (22,676) | (25,324) |
| Distributions to shareholders from net realized gain | – | (552) |
| Total distributions | (22,676) | (25,876) |
| Share transactions - net increase (decrease) | (36,959) | 101,086 |
| Total increase (decrease) in net assets | (51,053) | 115,669 |
| Net Assets | | |
| Beginning of period | 1,118,525 | 1,002,856 |
| End of period | $1,067,472 | $1,118,525 |
| Other Information | | |
| Distributions in excess of net investment income end of period | $(4,158) | $(2,421) |
See accompanying notes which are an integral part of the financial statements.
Financial Highlights — Fidelity Advisor Mortgage Securities Fund Class A
| Years ended August 31, | 2017 | 2016 | 2015 | 2014 | 2013 |
| Selected Per–Share Data | | | | | |
| Net asset value, beginning of period | $11.44 | $11.29 | $11.24 | $10.89 | $11.34 |
| Income from Investment Operations | | | | | |
| Net investment income (loss)A | .185 | .217 | .223 | .239 | .169 |
| Net realized and unrealized gain (loss) | (.124) | .173 | .047 | .341 | (.457) |
| Total from investment operations | .061 | .390 | .270 | .580 | (.288) |
| Distributions from net investment income | (.201) | (.234) | (.217) | (.230) | (.162) |
| Distributions from net realized gain | – | (.006) | (.003) | – | – |
| Total distributions | (.201) | (.240) | (.220) | (.230) | (.162) |
| Net asset value, end of period | $11.30 | $11.44 | $11.29 | $11.24 | $10.89 |
| Total ReturnB,C | .56% | 3.49% | 2.41% | 5.37% | (2.57)% |
| Ratios to Average Net AssetsD,E | | | | | |
| Expenses before reductions | .79% | .79% | .81% | .81% | .79% |
| Expenses net of fee waivers, if any | .79% | .79% | .81% | .81% | .79% |
| Expenses net of all reductions | .79% | .79% | .81% | .81% | .79% |
| Net investment income (loss) | 1.64% | 1.92% | 1.97% | 2.15% | 1.51% |
| Supplemental Data | | | | | |
| Net assets, end of period (in millions) | $35 | $49 | $38 | $41 | $50 |
| Portfolio turnover rateF | 357% | 404% | 439% | 398% | 474% |
A Calculated based on average shares outstanding during the period.
B Total returns would have been lower if certain expenses had not been reduced during the applicable periods shown.
C Total returns do not include the effect of the sales charges.
D Fees and expenses of any underlying Fidelity Central Funds are not included in the Fund's expense ratio. The Fund indirectly bears its proportionate share of the expenses of any underlying Fidelity Central Funds. Based on their most recent shareholder report date, the expenses of any underlying non-money market Fidelity Central Funds were less than .005%.
E Expense ratios reflect operating expenses of the class. Expenses before reductions do not reflect amounts reimbursed by the investment adviser or reductions from expense offset arrangements and do not represent the amount paid by the class during periods when reimbursements or reductions occur. Expenses net of fee waivers reflect expenses after reimbursement by the investment adviser but prior to reductions from expense offset arrangements. Expenses net of all reductions represent the net expenses paid by the class.
F Amount does not include the portfolio activity of any underlying Fidelity Central Funds.
See accompanying notes which are an integral part of the financial statements.
Financial Highlights — Fidelity Advisor Mortgage Securities Fund Class M
| Years ended August 31, | 2017 | 2016 | 2015 | 2014 | 2013 |
| Selected Per–Share Data | | | | | |
| Net asset value, beginning of period | $11.46 | $11.31 | $11.27 | $10.92 | $11.37 |
| Income from Investment Operations | | | | | |
| Net investment income (loss)A | .184 | .218 | .225 | .242 | .173 |
| Net realized and unrealized gain (loss) | (.123) | .172 | .037 | .340 | (.458) |
| Total from investment operations | .061 | .390 | .262 | .582 | (.285) |
| Distributions from net investment income | (.201) | (.234) | (.219) | (.232) | (.165) |
| Distributions from net realized gain | – | (.006) | (.003) | – | – |
| Total distributions | (.201) | (.240) | (.222) | (.232) | (.165) |
| Net asset value, end of period | $11.32 | $11.46 | $11.31 | $11.27 | $10.92 |
| Total ReturnB,C | .55% | 3.48% | 2.33% | 5.38% | (2.54)% |
| Ratios to Average Net AssetsD,E | | | | | |
| Expenses before reductions | .79% | .80% | .79% | .79% | .77% |
| Expenses net of fee waivers, if any | .79% | .79% | .79% | .79% | .77% |
| Expenses net of all reductions | .79% | .79% | .79% | .79% | .77% |
| Net investment income (loss) | 1.63% | 1.92% | 1.98% | 2.17% | 1.53% |
| Supplemental Data | | | | | |
| Net assets, end of period (in millions) | $20 | $25 | $20 | $22 | $26 |
| Portfolio turnover rateF | 357% | 404% | 439% | 398% | 474% |
A Calculated based on average shares outstanding during the period.
B Total returns would have been lower if certain expenses had not been reduced during the applicable periods shown.
C Total returns do not include the effect of the sales charges.
D Fees and expenses of any underlying Fidelity Central Funds are not included in the Fund's expense ratio. The Fund indirectly bears its proportionate share of the expenses of any underlying Fidelity Central Funds. Based on their most recent shareholder report date, the expenses of any underlying non-money market Fidelity Central Funds were less than .005%.
E Expense ratios reflect operating expenses of the class. Expenses before reductions do not reflect amounts reimbursed by the investment adviser or reductions from expense offset arrangements and do not represent the amount paid by the class during periods when reimbursements or reductions occur. Expenses net of fee waivers reflect expenses after reimbursement by the investment adviser but prior to reductions from expense offset arrangements. Expenses net of all reductions represent the net expenses paid by the class.
F Amount does not include the portfolio activity of any underlying Fidelity Central Funds.
See accompanying notes which are an integral part of the financial statements.
Financial Highlights — Fidelity Advisor Mortgage Securities Fund Class C
| Years ended August 31, | 2017 | 2016 | 2015 | 2014 | 2013 |
| Selected Per–Share Data | | | | | |
| Net asset value, beginning of period | $11.42 | $11.27 | $11.23 | $10.88 | $11.33 |
| Income from Investment Operations | | | | | |
| Net investment income (loss)A | .100 | .133 | .141 | .160 | .088 |
| Net realized and unrealized gain (loss) | (.123) | .172 | .037 | .342 | (.457) |
| Total from investment operations | (.023) | .305 | .178 | .502 | (.369) |
| Distributions from net investment income | (.117) | (.149) | (.135) | (.152) | (.081) |
| Distributions from net realized gain | – | (.006) | (.003) | – | – |
| Total distributions | (.117) | (.155) | (.138) | (.152) | (.081) |
| Net asset value, end of period | $11.28 | $11.42 | $11.27 | $11.23 | $10.88 |
| Total ReturnB,C | (.19)% | 2.72% | 1.59% | 4.64% | (3.28)% |
| Ratios to Average Net AssetsD,E | | | | | |
| Expenses before reductions | 1.54% | 1.54% | 1.53% | 1.52% | 1.52% |
| Expenses net of fee waivers, if any | 1.54% | 1.54% | 1.53% | 1.52% | 1.52% |
| Expenses net of all reductions | 1.54% | 1.54% | 1.53% | 1.52% | 1.52% |
| Net investment income (loss) | .89% | 1.17% | 1.25% | 1.44% | .78% |
| Supplemental Data | | | | | |
| Net assets, end of period (in millions) | $13 | $19 | $16 | $17 | $17 |
| Portfolio turnover rateF | 357% | 404% | 439% | 398% | 474% |
A Calculated based on average shares outstanding during the period.
B Total returns would have been lower if certain expenses had not been reduced during the applicable periods shown.
C Total returns do not include the effect of the contingent deferred sales charge.
D Fees and expenses of any underlying Fidelity Central Funds are not included in the Fund's expense ratio. The Fund indirectly bears its proportionate share of the expenses of any underlying Fidelity Central Funds. Based on their most recent shareholder report date, the expenses of any underlying non-money market Fidelity Central Funds were less than .005%.
E Expense ratios reflect operating expenses of the class. Expenses before reductions do not reflect amounts reimbursed by the investment adviser or reductions from expense offset arrangements and do not represent the amount paid by the class during periods when reimbursements or reductions occur. Expenses net of fee waivers reflect expenses after reimbursement by the investment adviser but prior to reductions from expense offset arrangements. Expenses net of all reductions represent the net expenses paid by the class.
F Amount does not include the portfolio activity of any underlying Fidelity Central Funds.
See accompanying notes which are an integral part of the financial statements.
Financial Highlights — Fidelity Mortgage Securities Fund
| Years ended August 31, | 2017 | 2016 | 2015 | 2014 | 2013 |
| Selected Per–Share Data | | | | | |
| Net asset value, beginning of period | $11.47 | $11.31 | $11.27 | $10.92 | $11.37 |
| Income from Investment Operations | | | | | |
| Net investment income (loss)A | .223 | .257 | .264 | .279 | .209 |
| Net realized and unrealized gain (loss) | (.123) | .182 | .037 | .341 | (.458) |
| Total from investment operations | .100 | .439 | .301 | .620 | (.249) |
| Distributions from net investment income | (.240) | (.273) | (.258) | (.270) | (.201) |
| Distributions from net realized gain | – | (.006) | (.003) | – | – |
| Total distributions | (.240) | (.279) | (.261) | (.270) | (.201) |
| Net asset value, end of period | $11.33 | $11.47 | $11.31 | $11.27 | $10.92 |
| Total ReturnB | .90% | 3.93% | 2.68% | 5.73% | (2.23)% |
| Ratios to Average Net AssetsC,D | | | | | |
| Expenses before reductions | .45% | .45% | .45% | .45% | .45% |
| Expenses net of fee waivers, if any | .45% | .45% | .45% | .45% | .45% |
| Expenses net of all reductions | .45% | .45% | .45% | .45% | .45% |
| Net investment income (loss) | 1.98% | 2.26% | 2.33% | 2.51% | 1.85% |
| Supplemental Data | | | | | |
| Net assets, end of period (in millions) | $926 | $948 | $856 | $785 | $778 |
| Portfolio turnover rateE | 357% | 404% | 439% | 398% | 474% |
A Calculated based on average shares outstanding during the period.
B Total returns would have been lower if certain expenses had not been reduced during the applicable periods shown.
C Fees and expenses of any underlying Fidelity Central Funds are not included in the Fund's expense ratio. The Fund indirectly bears its proportionate share of the expenses of any underlying Fidelity Central Funds. Based on their most recent shareholder report date, the expenses of any underlying non-money market Fidelity Central Funds were less than .005%.
D Expense ratios reflect operating expenses of the class. Expenses before reductions do not reflect amounts reimbursed by the investment adviser or reductions from expense offset arrangements and do not represent the amount paid by the class during periods when reimbursements or reductions occur. Expenses net of fee waivers reflect expenses after reimbursement by the investment adviser but prior to reductions from expense offset arrangements. Expenses net of all reductions represent the net expenses paid by the class.
E Amount does not include the portfolio activity of any underlying Fidelity Central Funds.
See accompanying notes which are an integral part of the financial statements.
Financial Highlights — Fidelity Advisor Mortgage Securities Fund Class I
| Years ended August 31, | 2017 | 2016 | 2015 | 2014 | 2013 |
| Selected Per–Share Data | | | | | |
| Net asset value, beginning of period | $11.43 | $11.27 | $11.23 | $10.88 | $11.33 |
| Income from Investment Operations | | | | | |
| Net investment income (loss)A | .218 | .250 | .256 | .271 | .200 |
| Net realized and unrealized gain (loss) | (.134) | .182 | .038 | .342 | (.456) |
| Total from investment operations | .084 | .432 | .294 | .613 | (.256) |
| Distributions from net investment income | (.234) | (.266) | (.251) | (.263) | (.194) |
| Distributions from net realized gain | – | (.006) | (.003) | – | – |
| Total distributions | (.234) | (.272) | (.254) | (.263) | (.194) |
| Net asset value, end of period | $11.28 | $11.43 | $11.27 | $11.23 | $10.88 |
| Total ReturnB | .76% | 3.88% | 2.64% | 5.69% | (2.30)% |
| Ratios to Average Net AssetsC,D | | | | | |
| Expenses before reductions | .49% | .50% | .50% | .51% | .51% |
| Expenses net of fee waivers, if any | .49% | .50% | .50% | .51% | .51% |
| Expenses net of all reductions | .49% | .50% | .50% | .51% | .51% |
| Net investment income (loss) | 1.94% | 2.21% | 2.28% | 2.45% | 1.79% |
| Supplemental Data | | | | | |
| Net assets, end of period (in millions) | $73 | $79 | $72 | $48 | $34 |
| Portfolio turnover rateE | 357% | 404% | 439% | 398% | 474% |
A Calculated based on average shares outstanding during the period.
B Total returns would have been lower if certain expenses had not been reduced during the applicable periods shown.
C Fees and expenses of any underlying Fidelity Central Funds are not included in the Fund's expense ratio. The Fund indirectly bears its proportionate share of the expenses of any underlying Fidelity Central Funds. Based on their most recent shareholder report date, the expenses of any underlying non-money market Fidelity Central Funds were less than .005%.
D Expense ratios reflect operating expenses of the class. Expenses before reductions do not reflect amounts reimbursed by the investment adviser or reductions from expense offset arrangements and do not represent the amount paid by the class during periods when reimbursements or reductions occur. Expenses net of fee waivers reflect expenses after reimbursement by the investment adviser but prior to reductions from expense offset arrangements. Expenses net of all reductions represent the net expenses paid by the class.
E Amount does not include the portfolio activity of any underlying Fidelity Central Funds.
See accompanying notes which are an integral part of the financial statements.
Notes to Financial Statements
For the period ended August 31, 2017
(Amounts in thousands except percentages)
1. Organization.
Fidelity Advisor Mortgage Securities Fund (the Fund) is a fund of Fidelity Advisor Series II (the Trust) and is authorized to issue an unlimited number of shares. The Trust is registered under the Investment Company Act of 1940, as amended (the 1940 Act), as an open-end management investment company organized as a Massachusetts business trust. The Fund offers Class A, Class M (formerly Class T), Class C, Fidelity Mortgage Securities Fund and Class I shares, each of which has equal rights as to assets and voting privileges. Each class has exclusive voting rights with respect to matters that affect that class.
After the close of business on June 24, 2016, all outstanding Class B shares were converted to Class A shares. All prior fiscal period dollar and share amounts for Class B presented in the Notes to Financial Statements are for the period September 1, 2015 through June 24, 2016.
2. Investments in Fidelity Central Funds.
The Fund invests in Fidelity Central Funds, which are open-end investment companies generally available only to other investment companies and accounts managed by the investment adviser and its affiliates. The Fund's Schedule of Investments lists each of the Fidelity Central Funds held as of period end, if any, as an investment of the Fund, but does not include the underlying holdings of each Fidelity Central Fund. As an Investing Fund, the Fund indirectly bears its proportionate share of the expenses of the underlying Fidelity Central Funds.
The Money Market Central Funds seek preservation of capital and current income and are managed by Fidelity Investments Money Management, Inc. (FIMM), an affiliate of the investment adviser. Annualized expenses of the Money Market Central Funds as of their most recent shareholder report date are less than .005%.
A complete unaudited list of holdings for each Fidelity Central Fund is available upon request or at the Securities and Exchange Commission (the SEC) website at www.sec.gov. In addition, the financial statements of the Fidelity Central Funds, which are not covered by the Fund's Report of Independent Registered Public Accounting Firm, are available on the SEC website or upon request.
3. Significant Accounting Policies.
The Fund is an investment company and applies the accounting and reporting guidance of the Financial Accounting Standards Board (FASB) Accounting Standards Codification Topic 946 Financial Services – Investments Companies. The financial statements have been prepared in conformity with accounting principles generally accepted in the United States of America (GAAP), which require management to make certain estimates and assumptions at the date of the financial statements. Actual results could differ from those estimates. Subsequent events, if any, through the date that the financial statements were issued have been evaluated in the preparation of the financial statements. The following summarizes the significant accounting policies of the Fund:
Investment Valuation. Investments are valued as of 4:00 p.m. Eastern time on the last calendar day of the period. The Board of Trustees (the Board) has delegated the day to day responsibility for the valuation of the Fund's investments to the Fair Value Committee (the Committee) established by the Fund's investment adviser. In accordance with valuation policies and procedures approved by the Board, the Fund attempts to obtain prices from one or more third party pricing vendors or brokers to value its investments. When current market prices, quotations or currency exchange rates are not readily available or reliable, investments will be fair valued in good faith by the Committee, in accordance with procedures adopted by the Board. Factors used in determining fair value vary by investment type and may include market or investment specific events, changes in interest rates and credit quality. The frequency with which these procedures are used cannot be predicted and they may be utilized to a significant extent. The Committee oversees the Fund's valuation policies and procedures and reports to the Board on the Committee's activities and fair value determinations. The Board monitors the appropriateness of the procedures used in valuing the Fund's investments and ratifies the fair value determinations of the Committee.
The Fund categorizes the inputs to valuation techniques used to value its investments into a disclosure hierarchy consisting of three levels as shown below:
- Level 1 – quoted prices in active markets for identical investments
- Level 2 – other significant observable inputs (including quoted prices for similar investments, interest rates, prepayment speeds, etc.)
- Level 3 – unobservable inputs (including the Fund's own assumptions based on the best information available)
Valuation techniques used to value the Fund's investments by major category are as follows:
Debt securities, including restricted securities, are valued based on evaluated prices received from third party pricing vendors or from brokers who make markets in such securities. Asset backed securities, collateralized mortgage obligations, commercial mortgage securities and U.S. government agency mortgage securities are valued by pricing vendors who utilize matrix pricing which considers prepayment speed assumptions, attributes of the collateral, yield or price of bonds of comparable quality, coupon, maturity and type or by broker-supplied prices. Brokers which make markets in asset backed securities, collateralized mortgage obligations and commercial mortgage securities may also consider such factors as the structure of the issue, cash flow assumptions, the value of underlying assets as well as any guarantees. These pricing sources may utilize inputs such as interest rate curves, credit spread curves, default possibilities and recovery rates. When independent prices are unavailable or unreliable, debt securities may be valued utilizing pricing methodologies which consider similar factors that would be used by third party pricing vendors. Debt securities are generally categorized as Level 2 in the hierarchy but may be Level 3 depending on the circumstances.
Futures contracts are valued at the settlement price established each day by the board of trade or exchange on which they are traded and are categorized as Level 1 in the hierarchy. Investments in open-end mutual funds, including the Fidelity Central Funds, are valued at their closing net asset value (NAV) each business day and are categorized as Level 1 in the hierarchy.
Changes in valuation techniques may result in transfers in or out of an assigned level within the disclosure hierarchy. The aggregate value of investments by input level as of August 31, 2017 is included at the end of the Fund's Schedule of Investments.
Investment Transactions and Income. For financial reporting purposes, the Fund's investment holdings and NAV include trades executed through the end of the last business day of the period. The NAV per share for processing shareholder transactions is calculated as of the close of business of the New York Stock Exchange (NYSE), normally 4:00 p.m. Eastern time and includes trades executed through the end of the prior business day. Gains and losses on securities sold are determined on the basis of identified cost and may include proceeds received from litigation. Income and capital gain distributions from Fidelity Central Funds, if any, are recorded on the ex-dividend date. Interest income is accrued as earned and includes coupon interest and amortization of premium and accretion of discount on debt securities as applicable.
Class Allocations and Expenses. Investment income, realized and unrealized capital gains and losses, common expenses of the Fund, and certain fund-level expense reductions, if any, are allocated daily on a pro-rata basis to each class based on the relative net assets of each class to the total net assets of the Fund. Each class differs with respect to transfer agent and distribution and service plan fees incurred. Certain expense reductions may also differ by class. For the reporting period, the allocated portion of income and expenses to each class as a percent of its average net assets may vary due to the timing of recording these transactions in relation to fluctuating net assets of the classes. Expenses directly attributable to a fund are charged to that fund. Expenses attributable to more than one fund are allocated among the respective funds on the basis of relative net assets or other appropriate methods. Expense estimates are accrued in the period to which they relate and adjustments are made when actual amounts are known.
Income Tax Information and Distributions to Shareholders. Each year, the Fund intends to qualify as a regulated investment company under Subchapter M of the Internal Revenue Code, including distributing substantially all of its taxable income and realized gains. As a result, no provision for U.S. Federal income taxes is required. As of August 31, 2017, the Fund did not have any unrecognized tax benefits in the financial statements; nor is the Fund aware of any tax positions for which it is reasonably possible that the total amounts of unrecognized tax benefits will significantly change in the next twelve months. The Fund files a U.S. federal tax return, in addition to state and local tax returns as required. The Fund's federal income tax returns are subject to examination by the Internal Revenue Service (IRS) for a period of three fiscal years after they are filed. State and local tax returns may be subject to examination for an additional fiscal year depending on the jurisdiction.
Dividends are declared and recorded daily and paid monthly from net investment income. Distributions from realized gains, if any, are declared and recorded on the ex-dividend date. Income dividends and capital gain distributions are declared separately for each class. Income and capital gain distributions are determined in accordance with income tax regulations, which may differ from GAAP. In addition, the Fund claimed a portion of the payment made to redeeming shareholders as a distribution for income tax purposes.
Capital accounts within the financial statements are adjusted for permanent book-tax differences. These adjustments have no impact on net assets or the results of operations. Capital accounts are not adjusted for temporary book-tax differences which will reverse in a subsequent period.
Book-tax differences are primarily due to short-term gain distributions from the Underlying Funds, futures contracts, swaps, market discount, partnerships (including allocations from Fidelity Central Funds), deferred trustees compensation, expiring capital loss carryforwards, losses deferred due to wash sales and excise tax regulations.
As of period end, the cost and unrealized appreciation (depreciation) in securities, and derivatives if applicable, for federal income tax purposes were as follows:
| Gross unrealized appreciation | $6,304 |
| Gross unrealized depreciation | (8,285) |
| Net unrealized appreciation (depreciation) | $(1,981) |
| Tax Cost | $1,229,754 |
The tax-based components of distributable earnings as of period end were as follows:
| Undistributed ordinary income | $4,790 |
| Net unrealized appreciation (depreciation) on securities and other investments | $(1,981) |
The Fund intends to elect to defer to its next fiscal year $2,728 of capital losses recognized during the period November 1, 2016 to August 31, 2017.
The tax character of distributions paid was as follows:
| | August 31, 2017 | August 31, 2016 |
| Ordinary Income | $22,676 | $ 25,876 |
Delayed Delivery Transactions and When-Issued Securities. During the period, the Fund transacted in securities on a delayed delivery or when-issued basis. Payment and delivery may take place after the customary settlement period for that security. The price of the underlying securities and the date when the securities will be delivered and paid for are fixed at the time the transaction is negotiated. The securities purchased on a delayed delivery or when-issued basis are identified as such in the Fund's Schedule of Investments. The Fund may receive compensation for interest forgone in the purchase of a delayed delivery or when-issued security. With respect to purchase commitments, the Fund identifies securities as segregated in its records with a value at least equal to the amount of the commitment. Losses may arise due to changes in the value of the underlying securities or if the counterparty does not perform under the contract's terms, or if the issuer does not issue the securities due to political, economic, or other factors.
To-Be-Announced (TBA) Securities and Mortgage Dollar Rolls. During the period, the Fund transacted in TBA securities that involved buying or selling mortgage-backed securities (MBS) on a forward commitment basis. A TBA transaction typically does not designate the actual security to be delivered and only includes an approximate principal amount; however delivered securities must meet specified terms defined by industry guidelines, including issuer, rate and current principal amount outstanding on underlying mortgage pools. The Fund may enter into a TBA transaction with the intent to take possession of or deliver the underlying MBS, or the Fund may elect to extend the settlement by entering into either a mortgage or reverse mortgage dollar roll. Mortgage dollar rolls are transactions where a fund sells TBA securities and simultaneously agrees to repurchase MBS on a later date at a lower price and with the same counterparty. Reverse mortgage dollar rolls involve the purchase and simultaneous agreement to sell TBA securities on a later date at a lower price. Transactions in mortgage dollar rolls and reverse mortgage dollar rolls are accounted for as purchases and sales and may result in an increase to the Fund's portfolio turnover rate.
Purchases and sales of TBA securities involve risks similar to those discussed above for delayed delivery and when-issued securities. Also, if the counterparty in a mortgage dollar roll or a reverse mortgage dollar roll transaction files for bankruptcy or becomes insolvent, the Fund's right to repurchase or sell securities may be limited. Additionally, when a fund sells TBA securities without already owning or having the right to obtain the deliverable securities (an uncovered forward commitment to sell), it incurs a risk of loss because it could have to purchase the securities at a price that is higher than the price at which it sold them. A fund may be unable to purchase the deliverable securities if the corresponding market is illiquid.
TBA securities subject to a forward commitment to sell at period end are included at the end of the Fund's Schedule of Investments under the caption "TBA Sale Commitments." The proceeds and value of these commitments are reflected in the Fund's Statement of Assets and Liabilities as Receivable for TBA sale commitments and TBA sale commitments, at value, respectively.
Restricted Securities. The Fund may invest in securities that are subject to legal or contractual restrictions on resale. These securities generally may be resold in transactions exempt from registration or to the public if the securities are registered. Disposal of these securities may involve time-consuming negotiations and expense, and prompt sale at an acceptable price may be difficult. Information regarding restricted securities is included at the end of the Fund's Schedule of Investments.
New Accounting Pronouncement. In March 2017, the Financial Accounting Standards Board (FASB) issued an Accounting Standards Update (ASU), ASU 2017-08, which amends the amortization period for certain callable debt securities that are held at a premium. The amendment requires the premium to be amortized to the earliest call date. The amendments do not require an accounting change for securities held at a discount. The ASU is effective for annual periods beginning after December 15, 2018. Management is currently evaluating the potential impact of these changes to the financial statements.
4. Derivative Instruments.
Risk Exposures and the Use of Derivative Instruments. The Fund's investment objective allows the Fund to enter into various types of derivative contracts, including futures contracts and swaps. Derivatives are investments whose value is primarily derived from underlying assets, indices or reference rates and may be transacted on an exchange or over-the-counter (OTC). Derivatives may involve a future commitment to buy or sell a specified asset based on specified terms, to exchange future cash flows at periodic intervals based on a notional principal amount, or for one party to make one or more payments upon the occurrence of specified events in exchange for periodic payments from the other party.
The Fund used derivatives to increase returns, to gain exposure to certain types of assets and to manage exposure to certain risks as defined below. The success of any strategy involving derivatives depends on analysis of numerous economic factors, and if the strategies for investment do not work as intended, the Fund may not achieve its objectives.
The Fund's use of derivatives increased or decreased its exposure to the following risk:
| Interest Rate Risk | Interest rate risk relates to the fluctuations in the value of interest-bearing securities due to changes in the prevailing levels of market interest rates. |
The Fund is also exposed to additional risks from investing in derivatives, such as liquidity risk and counterparty credit risk. Liquidity risk is the risk that the Fund will be unable to close out the derivative in the open market in a timely manner. Counterparty credit risk is the risk that the counterparty will not be able to fulfill its obligation to the Fund. Counterparty credit risk related to exchange-traded futures contracts may be mitigated by the protection provided by the exchange on which they trade. Counterparty credit risk related to centrally cleared OTC swaps may be mitigated by the protection provided by the clearinghouse.
Investing in derivatives may involve greater risks than investing in the underlying assets directly and, to varying degrees, may involve risk of loss in excess of any initial investment and collateral received and amounts recognized in the Statement of Assets and Liabilities. In addition, there may be the risk that the change in value of the derivative contract does not correspond to the change in value of the underlying instrument.
Net Realized Gain (Loss) and Change in Net Unrealized Appreciation (Depreciation) on Derivatives. The table below, which reflects the impacts of derivatives on the financial performance of the Fund, summarizes the net realized gain (loss) and change in net unrealized appreciation (depreciation) for derivatives during the period as presented in the Statement of Operations.
| Primary Risk Exposure / Derivative Type | Net Realized Gain (Loss) | Change in Net Unrealized Appreciation (Depreciation) |
| Interest Rate Risk | | |
| Futures Contracts | $871 | $(130) |
| Swaps | 25 | (42) |
| Totals | $896 | $(172) |
A summary of the value of derivatives by primary risk exposure as of period end is included at the end of the Schedule of Investments.
Futures Contracts. A futures contract is an agreement between two parties to buy or sell a specified underlying instrument for a fixed price at a specified future date. The Fund used futures contracts to manage its exposure to the bond market and fluctuations in interest rates.
Upon entering into a futures contract, a fund is required to deposit either cash or securities (initial margin) with a clearing broker in an amount equal to a certain percentage of the face value of the contract. Futures contracts are marked-to-market daily and subsequent daily payments (variation margin) are made or received by a fund depending on the daily fluctuations in the value of the futures contracts and are recorded as unrealized appreciation or (depreciation). This receivable and/or payable, if any, is included in daily variation margin on futures contracts in the Statement of Assets and Liabilities. Realized gain or (loss) is recorded upon the expiration or closing of a futures contract. The net realized gain (loss) and change in net unrealized appreciation (depreciation) on futures contracts during the period is included in the Statement of Operations.
Any open futures contracts at period end are presented in the Schedule of Investments under the caption "Futures Contracts". The underlying face amount at value reflects each contract's exposure to the underlying instrument or index at period end. Securities deposited to meet initial margin requirements are identified in the Schedule of Investments.
Swaps. A swap is a contract between two parties to exchange future cash flows at periodic intervals based on a notional principal amount. A centrally cleared OTC swap is a transaction executed between a fund and a dealer counterparty, then cleared by a futures commission merchant (FCM) through a clearinghouse. Once cleared, the clearinghouse serves as a central counterparty, with whom a fund exchanges cash flows for the life of the transaction, similar to transactions in futures contracts.
Centrally cleared OTC swaps require a fund to deposit either cash or securities (initial margin) with the FCM, at the instruction of and for the benefit of the clearinghouse. Securities deposited to meet initial margin requirements are identified in the Schedule of Investments. Centrally cleared OTC swaps are marked-to-market daily and subsequent payments (variation margin) are made or received depending on the daily fluctuations in the value of the swaps and are recorded as unrealized appreciation or (depreciation). These daily payments, if any, are included in receivable or payable for daily variation margin on centrally cleared OTC swaps in the Statement of Assets and Liabilities. Any premiums for centrally cleared OTC swaps are recorded periodically throughout the term of the swap to variation margin and included in unrealized appreciation (depreciation) in the Statement of Assets and Liabilities. Any premiums are recognized as realized gain (loss) upon termination or maturity of the swap.
Payments are exchanged at specified intervals, accrued daily commencing with the effective date of the contract and recorded as realized gain or (loss). Some swaps may be terminated prior to the effective date and realize a gain or loss upon termination. The net realized gain (loss) and change in net unrealized appreciation (depreciation) on swaps during the period is included in the Statement of Operations.
Any open swaps at period end are included in the Schedule of Investments under the caption "Swaps."
Interest Rate Swaps. Interest rate swaps are agreements between counterparties to exchange cash flows, one based on a fixed rate, and the other on a floating rate. The Fund entered into interest rate swaps to manage its exposure to interest rate changes. Changes in interest rates can have an effect on both the value of bond holdings as well as the amount of interest income earned. In general, the value of bonds can fall when interest rates rise and can rise when interest rates fall.
5. Purchases and Sales of Investments.
Purchases and sales of securities (including the Fixed-Income Central Funds), other than short-term securities and U.S. government securities, aggregated $83,939 and $129,746, respectively.
6. Fees and Other Transactions with Affiliates.
Management Fee. Fidelity Management & Research Company (the investment adviser) and its affiliates provide the Fund with investment management related services for which the Fund pays a monthly management fee. The management fee is the sum of an individual fund fee rate that is based on an annual rate of .20% of the Fund's average net assets and an annualized group fee rate that averaged .11% during the period. The group fee rate is based upon the average net assets of all the mutual funds advised by the investment adviser, including any mutual funds previously advised by the investment adviser that are currently advised by Fidelity SelectCo, LLC, an affiliate of the investment adviser. The group fee rate decreases as assets under management increase and increases as assets under management decrease. For the reporting period, the total annual management fee rate was .31% of the Fund's average net assets.
Distribution and Service Plan Fees. In accordance with Rule 12b-1 of the 1940 Act, the Fund has adopted separate Distribution and Service Plans for each class of shares. Certain classes pay Fidelity Distributors Corporation (FDC), an affiliate of the investment adviser, separate Distribution and Service Fees, each of which is based on an annual percentage of each class' average net assets. In addition, FDC may pay financial intermediaries for selling shares of the Fund and providing shareholder support services. For the period, the Distribution and Service Fee rates, total fees and amounts retained by FDC were as follows:
| | Distribution
Fee | Service
Fee | Total Fees | Retained
by FDC |
| Class A | -% | .25% | $101 | $3 |
| Class M | -% | .25% | 54 | – |
| Class C | .75% | .25% | 159 | 12 |
| | | | $314 | $15 |
Sales Load. FDC may receive a front-end sales charge of up to 4.00% for selling Class A shares and Class M shares, some of which is paid to financial intermediaries for selling shares of the Fund. Depending on the holding period, FDC may receive contingent deferred sales charges levied on Class A, Class M and Class C redemptions. The deferred sales charges are 1.00% for Class C shares, .75% for certain purchases of Class A shares and .25% for certain purchases of Class M shares.
For the period, sales charge amounts retained by FDC were as follows:
| | Retained
by FDC |
| Class M | $1 |
| Class C (a) | 2 |
| | $3 |
(a) When Class C shares are initially sold, FDC pays commissions from its own resources to financial intermediaries through which the sales are made.
Transfer Agent Fees. Fidelity Investments Institutional Operations Company, Inc., (FIIOC), an affiliate of the investment adviser, is the transfer, dividend disbursing and shareholder servicing agent for each class of the Fund. FIIOC receives account fees and asset-based fees that vary according to the account size and type of account of the shareholders of each respective class of the Fund, with the exception of Fidelity Mortgage Securities Fund. FIIOC receives an asset-based fee of .10% of Fidelity Mortgage Securities Fund's average net assets. FIIOC pays for typesetting, printing and mailing of shareholder reports, except proxy statements. For the period, transfer agent fees for each class were as follows:
| | Amount | % of
Class-Level Average
Net Assets |
| Class A | $75 | .19 |
| Class M | 42 | .19 |
| Class C | 30 | .19 |
| Fidelity Mortgage Securities Fund | 931 | .10 |
| Class I | 107 | .14 |
| | $1,185 | |
Fund Wide Operations Fee. Pursuant to the Fund Wide Operations and Expense Agreement (FWOE), the investment adviser has agreed to provide for fund level expenses (which do not include transfer agent, Rule 12b-1 fees, compensation of the independent Trustees, interest (including commitment fees), taxes or extraordinary expenses, if any) in return for a FWOE fee equal to .35% of the Fund's average net assets less the total amount of the management fee. The FWOE paid by the Fund is reduced by an amount equal to the fees and expenses paid to the independent Trustees. For the period, the FWOE fee was equivalent to an annual rate of .04% of average net assets.
Interfund Trades. The Fund may purchase from or sell securities to other Fidelity Funds under procedures adopted by the Board. The procedures have been designed to ensure these interfund trades are executed in accordance with Rule 17a-7 of the 1940 Act. Interfund trades are included within the respective purchases and sales amounts shown in the Purchases and Sales of Investments note.
Other. During the period, the investment adviser reimbursed the Fund for certain losses in the amount of $1.
7. Committed Line of Credit.
The Fund participates with other funds managed by the investment adviser or an affiliate in a $4.25 billion credit facility (the "line of credit") to be utilized for temporary or emergency purposes to fund shareholder redemptions or for other short-term liquidity purposes. The Fund has agreed to pay commitment fees on its pro-rata portion of the line of credit, which amounted to $4 and is reflected in Miscellaneous expenses on the Statement of Operations. During the period, the Fund did not borrow on this line of credit.
8. Expense Reductions.
Through arrangements with the Fund's custodian, credits realized as a result of certain uninvested cash balances were used to reduce the Fund's expenses. During the period, these credits reduced the Fund's expenses by $1.
9. Distributions to Shareholders.
Distributions to shareholders of each class were as follows:
| | Year ended
August 31, 2017 | Year ended
August 31, 2016 |
| From net investment income | | |
| Class A | $725 | $861 |
| Class M | 387 | 483 |
| Class B | – | 8 |
| Class C | 167 | 232 |
| Fidelity Mortgage Securities Fund | 19,807 | 21,950 |
| Class I | 1,590 | 1,790 |
| Total | $22,676 | $25,324 |
| From net realized gain | | |
| Class A | $– | $20 |
| Class M | $– | $13 |
| Class B | – | –(a) |
| Class C | – | 9 |
| Fidelity Mortgage Securities Fund | – | 471 |
| Class I | – | 39 |
| Total | $– | $552 |
(a) In the amount less than five hundred dollars.
10. Share Transactions.
Share transactions for each class were as follows and may contain automatic conversions between classes or exchanges between affiliated funds:
| | Shares | Shares | Dollars | Dollars |
| | Year ended August 31, 2017 | Year ended August 31, 2016 | Year ended August 31, 2017 | Year ended August 31, 2016 |
| Class A | | | | |
| Shares sold | 465 | 1,855 | $5,257 | $21,074 |
| Reinvestment of distributions | 59 | 70 | 666 | 792 |
| Shares redeemed | (1,657) | (1,066) | (18,650) | (12,097) |
| Net increase (decrease) | (1,133) | 859 | $(12,727) | $9,769 |
| Class M | | | | |
| Shares sold | 135 | 1,069 | $1,524 | $12,171 |
| Reinvestment of distributions | 33 | 42 | 373 | 474 |
| Shares redeemed | (588) | (769) | (6,623) | (8,717) |
| Net increase (decrease) | (420) | 342 | $(4,726) | $3,928 |
| Class B | | | | |
| Shares sold | – | 10 | $– | $102 |
| Reinvestment of distributions | – | –(a) | – | 5 |
| Shares redeemed | – | (84) | – | (944) |
| Net increase (decrease) | – | (74) | $– | $(837) |
| Class C | | | | |
| Shares sold | 218 | 756 | $2,442 | $8,561 |
| Reinvestment of distributions | 13 | 18 | 151 | 204 |
| Shares redeemed | (713) | (499) | (7,980) | (5,659) |
| Net increase (decrease) | (482) | 275 | $(5,387) | $3,106 |
| Fidelity Mortgage Securities Fund | | | | |
| Shares sold | 26,395 | 24,692 | $297,107 | $280,765 |
| Reinvestment of distributions | 1,642 | 1,859 | 18,507 | 21,143 |
| Shares redeemed | (28,916) | (19,583) | $(325,419) | $(222,910) |
| Net increase (decrease) | (879) | 6,968 | $(9,805) | $78,998 |
| Class I | | | | |
| Shares sold | 566 | 1,158 | $6,350 | $13,096 |
| Reinvestment of distributions | 139 | 158 | 1,563 | 1,786 |
| Shares redeemed | (1,090) | (773) | (12,227) | (8,760) |
| Net increase (decrease) | (385) | 543 | $(4,314) | $6,122 |
(a) In the amount less than five hundred shares.
11. Other.
The Fund's organizational documents provide former and current trustees and officers with a limited indemnification against liabilities arising in connection with the performance of their duties to the Fund. In the normal course of business, the Fund may also enter into contracts that provide general indemnifications. The Fund's maximum exposure under these arrangements is unknown as this would be dependent on future claims that may be made against the Fund. The risk of material loss from such claims is considered remote.
12. Credit Risk.
The Fund invests a portion of its assets in structured securities of issuers backed by commercial and residential mortgage loans, credit card receivables and automotive loans. The value and related income of these securities is sensitive to changes in economic conditions, including delinquencies and/or defaults.
Report of Independent Registered Public Accounting Firm
To the Trustees of Fidelity Advisor Series II and Shareholders of Fidelity Advisor Mortgage Securities Fund:
In our opinion, the accompanying statement of assets and liabilities, including the schedule of investments, and the related statements of operations and of changes in net assets and the financial highlights present fairly, in all material respects, the financial position of Fidelity Advisor Mortgage Securities Fund (a fund of Fidelity Advisor Series II) as of August 31, 2017, the results of its operations for the year then ended, the changes in its net assets for each of the two years in the period then ended and the financial highlights for each of the five years in the period then ended, in conformity with accounting principles generally accepted in the United States of America. These financial statements and financial highlights (hereafter referred to as “financial statements”) are the responsibility of the Fidelity Advisor Mortgage Securities Fund’s management. Our responsibility is to express an opinion on these financial statements based on our audits. We conducted our audits of these financial statements in accordance with the standards of the Public Company Accounting Oversight Board (United States). Those standards require that we plan and perform the audit to obtain reasonable assurance about whether the financial statements are free of material misstatement. An audit includes examining, on a test basis, evidence supporting the amounts and disclosures in the financial statements, assessing the accounting principles used and significant estimates made by management, and evaluating the overall financial statement presentation. Our procedures included confirmation of securities owned as of August 31, 2017 by correspondence with the custodian and brokers; when replies were not received from brokers, we performed other auditing procedures. We believe that our audits provide a reasonable basis for our opinion.
PricewaterhouseCoopers LLP
Boston, Massachusetts
October 18, 2017
Trustees and Officers
The Trustees, Members of the Advisory Board (if any), and officers of the trust and fund, as applicable, are listed below. The Board of Trustees governs the fund and is responsible for protecting the interests of shareholders. The Trustees are experienced executives who meet periodically throughout the year to oversee the fund's activities, review contractual arrangements with companies that provide services to the fund, oversee management of the risks associated with such activities and contractual arrangements, and review the fund's performance. Each of the Trustees oversees 246 funds.
The Trustees hold office without limit in time except that (a) any Trustee may resign; (b) any Trustee may be removed by written instrument, signed by at least two-thirds of the number of Trustees prior to such removal; (c) any Trustee who requests to be retired or who has become incapacitated by illness or injury may be retired by written instrument signed by a majority of the other Trustees; and (d) any Trustee may be removed at any special meeting of shareholders by a two-thirds vote of the outstanding voting securities of the trust. Each Trustee who is not an interested person (as defined in the 1940 Act) of the trust and the fund is referred to herein as an Independent Trustee. Each Independent Trustee shall retire not later than the last day of the calendar year in which his or her 75th birthday occurs. The Independent Trustees may waive this mandatory retirement age policy with respect to individual Trustees. Officers and Advisory Board Members hold office without limit in time, except that any officer or Advisory Board Member may resign or may be removed by a vote of a majority of the Trustees at any regular meeting or any special meeting of the Trustees. Except as indicated, each individual has held the office shown or other offices in the same company for the past five years.
The fund’s Statement of Additional Information (SAI) includes more information about the Trustees. To request a free copy, call Fidelity at 1-800-544-8544.
Experience, Skills, Attributes, and Qualifications of the Trustees. The Governance and Nominating Committee has adopted a statement of policy that describes the experience, qualifications, attributes, and skills that are necessary and desirable for potential Independent Trustee candidates (Statement of Policy). The Board believes that each Trustee satisfied at the time he or she was initially elected or appointed a Trustee, and continues to satisfy, the standards contemplated by the Statement of Policy. The Governance and Nominating Committee also engages professional search firms to help identify potential Independent Trustee candidates who have the experience, qualifications, attributes, and skills consistent with the Statement of Policy. From time to time, additional criteria based on the composition and skills of the current Independent Trustees, as well as experience or skills that may be appropriate in light of future changes to board composition, business conditions, and regulatory or other developments, have also been considered by the professional search firms and the Governance and Nominating Committee. In addition, the Board takes into account the Trustees' commitment and participation in Board and committee meetings, as well as their leadership of standing and ad hoc committees throughout their tenure.
In determining that a particular Trustee was and continues to be qualified to serve as a Trustee, the Board has considered a variety of criteria, none of which, in isolation, was controlling. The Board believes that, collectively, the Trustees have balanced and diverse experience, qualifications, attributes, and skills, which allow the Board to operate effectively in governing the fund and protecting the interests of shareholders. Information about the specific experience, skills, attributes, and qualifications of each Trustee, which in each case led to the Board's conclusion that the Trustee should serve (or continue to serve) as a trustee of the fund, is provided below.
Board Structure and Oversight Function. Abigail P. Johnson is an interested person and currently serves as Chairman. The Trustees have determined that an interested Chairman is appropriate and benefits shareholders because an interested Chairman has a personal and professional stake in the quality and continuity of services provided to the fund. Independent Trustees exercise their informed business judgment to appoint an individual of their choosing to serve as Chairman, regardless of whether the Trustee happens to be independent or a member of management. The Independent Trustees have determined that they can act independently and effectively without having an Independent Trustee serve as Chairman and that a key structural component for assuring that they are in a position to do so is for the Independent Trustees to constitute a substantial majority for the Board. The Independent Trustees also regularly meet in executive session. Marie L. Knowles serves as Chairman of the Independent Trustees and as such (i) acts as a liaison between the Independent Trustees and management with respect to matters important to the Independent Trustees and (ii) with management prepares agendas for Board meetings.
Fidelity® funds are overseen by different Boards of Trustees. The fund's Board oversees Fidelity's investment-grade bond, money market, asset allocation and certain equity funds, and other Boards oversee Fidelity's high income, sector and other equity funds. The asset allocation funds may invest in Fidelity® funds that are overseen by such other Boards. The use of separate Boards, each with its own committee structure, allows the Trustees of each group of Fidelity® funds to focus on the unique issues of the funds they oversee, including common research, investment, and operational issues. On occasion, the separate Boards establish joint committees to address issues of overlapping consequences for the Fidelity® funds overseen by each Board.
The Trustees operate using a system of committees to facilitate the timely and efficient consideration of all matters of importance to the Trustees, the fund, and fund shareholders and to facilitate compliance with legal and regulatory requirements and oversight of the fund's activities and associated risks. The Board, acting through its committees, has charged FMR and its affiliates with (i) identifying events or circumstances the occurrence of which could have demonstrably adverse effects on the fund's business and/or reputation; (ii) implementing processes and controls to lessen the possibility that such events or circumstances occur or to mitigate the effects of such events or circumstances if they do occur; and (iii) creating and maintaining a system designed to evaluate continuously business and market conditions in order to facilitate the identification and implementation processes described in (i) and (ii) above. Because the day-to-day operations and activities of the fund are carried out by or through FMR, its affiliates, and other service providers, the fund's exposure to risks is mitigated but not eliminated by the processes overseen by the Trustees. While each of the Board's committees has responsibility for overseeing different aspects of the fund's activities, oversight is exercised primarily through the Operations and Audit Committees. In addition, an ad hoc Board committee of Independent Trustees has worked with FMR to enhance the Board's oversight of investment and financial risks, legal and regulatory risks, technology risks, and operational risks, including the development of additional risk reporting to the Board. Appropriate personnel, including but not limited to the fund's Chief Compliance Officer (CCO), FMR's internal auditor, the independent accountants, the fund's Treasurer and portfolio management personnel, make periodic reports to the Board's committees, as appropriate, including an annual review of Fidelity's risk management program for the Fidelity® funds. The responsibilities of each standing committee, including their oversight responsibilities, are described further under "Standing Committees of the Trustees."
Interested Trustees*:
Correspondence intended for a Trustee who is an interested person may be sent to Fidelity Investments, 245 Summer Street, Boston, Massachusetts 02210.
Name, Year of Birth; Principal Occupations and Other Relevant Experience+
Abigail P. Johnson (1961)
Year of Election or Appointment: 2009
Trustee
Chairman of the Board of Trustees
Ms. Johnson also serves as Trustee of other Fidelity® funds. Ms. Johnson serves as Chairman (2016-present), Chief Executive Officer (2014-present), and Director (2007-present) of FMR LLC (diversified financial services company), President of Fidelity Financial Services (2012-present) and President of Personal, Workplace and Institutional Services (2005-present). Ms. Johnson is Chairman and Director of FMR Co., Inc. (investment adviser firm, 2011-present) and Chairman and Director of FMR (investment adviser firm, 2011-present). Previously, Ms. Johnson served as Vice Chairman (2007-2016) and President (2013-2016) of FMR LLC, President and a Director of FMR (2001-2005), a Trustee of other investment companies advised by FMR, Fidelity Investments Money Management, Inc. (investment adviser firm), and FMR Co., Inc. (2001-2005), Senior Vice President of the Fidelity® funds (2001-2005), and managed a number of Fidelity® funds. Ms. Abigail P. Johnson and Mr. Arthur E. Johnson are not related.
Jennifer Toolin McAuliffe (1959)
Year of Election or Appointment: 2016
Trustee
Ms. McAuliffe also serves as Trustee of other Fidelity® funds. Ms. McAuliffe previously served as a Member of the Advisory Board of certain Fidelity® funds (2016) and as Co-Head of Fixed Income of Fidelity Investments Limited (now known as FIL Limited (FIL)) (diversified financial services company). Earlier roles at FIL included Director of Research for FIL’s credit and quantitative teams in London, Hong Kong and Tokyo. Ms. McAuliffe also was the Director of Research for taxable and municipal bonds at Fidelity Investments Money Management, Inc. Ms. McAuliffe is also a director or trustee of several not-for-profit entities.
* Determined to be an “Interested Trustee” by virtue of, among other things, his or her affiliation with the trust or various entities under common control with FMR.
+ The information includes the Trustee's principal occupation during the last five years and other information relating to the experience, attributes, and skills relevant to the Trustee's qualifications to serve as a Trustee, which led to the conclusion that the Trustee should serve as a Trustee for the fund.
Independent Trustees:
Correspondence intended for an Independent Trustee may be sent to Fidelity Investments, P.O. Box 55235, Boston, Massachusetts 02205-5235.
Name, Year of Birth; Principal Occupations and Other Relevant Experience+
Elizabeth S. Acton (1951)
Year of Election or Appointment: 2016
Trustee
Ms. Acton also serves as Trustee of other Fidelity® funds. Prior to her retirement in April 2012, Ms. Acton was Executive Vice President, Finance (2011-2012), Executive Vice President, Chief Financial Officer (2002-2011), and Treasurer (2004-2005) of Comerica Incorporated (financial services). Prior to joining Comerica, Ms. Acton held a variety of positions at Ford Motor Company (1983-2002), including Vice President and Treasurer (2000-2002) and Executive Vice President and Chief Financial Officer of Ford Motor Credit Company (1998-2000). Ms. Acton currently serves as a member of the Board of Directors and Audit and Finance Committees of Beazer Homes USA, Inc. (homebuilding, 2012-present). Previously, Ms. Acton served as a Member of the Advisory Board of certain Fidelity® funds (2013-2016).
John Engler (1948)
Year of Election or Appointment: 2016
Trustee
Mr. Engler also serves as Trustee of other Fidelity® funds. He serves on the board of directors for Universal Forest Products (manufacturer and distributor of wood and wood-alternative products, 2003-present) and K12 Inc. (technology-based education company, 2012-present). Previously, Mr. Engler served as a Member of the Advisory Board of certain Fidelity® funds (2014-2016), president of the Business Roundtable (2011-2017), a trustee of The Munder Funds (2003-2014), president and CEO of the National Association of Manufacturers (2004-2011), member of the Board of Trustees of the Annie E. Casey Foundation (2004-2015), and as governor of Michigan (1991-2003). He is a past chairman of the National Governors Association.
Albert R. Gamper, Jr. (1942)
Year of Election or Appointment: 2006
Trustee
Mr. Gamper also serves as Trustee of other Fidelity® funds. Prior to his retirement in December 2004, Mr. Gamper served as Chairman of the Board of CIT Group Inc. (commercial finance). During his tenure with CIT Group Inc. Mr. Gamper served in numerous senior management positions, including Chairman (1987-1989; 1999-2001; 2002-2004), Chief Executive Officer (1987-2004), and President (2002-2003). Mr. Gamper currently serves as a member of the Board of Directors of Public Service Enterprise Group (utilities, 2000-present), and Member of the Board of Trustees of Barnabas Health Care System (1997-present). Previously, Mr. Gamper served as Chairman (2012-2015) and Vice Chairman (2011-2012) of the Independent Trustees of certain Fidelity® funds and as Chairman of the Board of Governors, Rutgers University (2004-2007).
Robert F. Gartland (1951)
Year of Election or Appointment: 2010
Trustee
Mr. Gartland also serves as Trustee of other Fidelity® funds. Mr. Gartland is Chairman and an investor in Gartland & Mellina Group Corp. (consulting, 2009-present). Previously, Mr. Gartland served as a partner and investor of Vietnam Partners LLC (investments and consulting, 2008-2011). Prior to his retirement, Mr. Gartland held a variety of positions at Morgan Stanley (financial services, 1979-2007) including Managing Director (1987-2007).
Arthur E. Johnson (1947)
Year of Election or Appointment: 2008
Trustee
Vice Chairman of the Independent Trustees
Mr. Johnson also serves as Trustee of other Fidelity® funds. Mr. Johnson serves as a member of the Board of Directors of Eaton Corporation plc (diversified power management, 2009-present) and Booz Allen Hamilton (management consulting, 2011-present). Prior to his retirement, Mr. Johnson served as Senior Vice President of Corporate Strategic Development of Lockheed Martin Corporation (defense contractor, 1999-2009). He previously served on the Board of Directors of IKON Office Solutions, Inc. (1999-2008), AGL Resources, Inc. (holding company, 2002-2016), and Delta Airlines (2005-2007). Mr. Arthur E. Johnson is not related to Ms. Abigail P. Johnson.
Michael E. Kenneally (1954)
Year of Election or Appointment: 2009
Trustee
Mr. Kenneally also serves as Trustee of other Fidelity® funds. Prior to his retirement, Mr. Kenneally served as Chairman and Global Chief Executive Officer of Credit Suisse Asset Management. Before joining Credit Suisse, he was an Executive Vice President and Chief Investment Officer for Bank of America Corporation. Earlier roles at Bank of America included Director of Research, Senior Portfolio Manager and Research Analyst, and Mr. Kenneally was awarded the Chartered Financial Analyst (CFA) designation in 1991.
Marie L. Knowles (1946)
Year of Election or Appointment: 2001
Trustee
Chairman of the Independent Trustees
Ms. Knowles also serves as Trustee of other Fidelity® funds. Prior to Ms. Knowles' retirement in June 2000, she served as Executive Vice President and Chief Financial Officer of Atlantic Richfield Company (ARCO) (diversified energy, 1996-2000). From 1993 to 1996, she was a Senior Vice President of ARCO and President of ARCO Transportation Company (pipeline and tanker operations). Ms. Knowles currently serves as a Director and Chairman of the Audit Committee of McKesson Corporation (healthcare service, since 2002). Ms. Knowles is a member of the Board of the Santa Catalina Island Company (real estate, 2009-present). Ms. Knowles is a Member of the Investment Company Institute Board of Governors and a Member of the Governing Council of the Independent Directors Council (2014-present). She also serves as a member of the Advisory Board for the School of Engineering of the University of Southern California. Previously, Ms. Knowles served as a Director of Phelps Dodge Corporation (copper mining and manufacturing, 1994-2007), URS Corporation (engineering and construction, 2000-2003) and America West (airline, 1999-2002). Ms. Knowles previously served as Vice Chairman of the Independent Trustees of certain Fidelity® funds (2012-2015).
Mark A. Murray (1954)
Year of Election or Appointment: 2016
Trustee
Mr. Murray also serves as Trustee of other Fidelity® funds. Mr. Murray is Vice Chairman (2013-present) of Meijer, Inc. (regional retail chain). Previously, Mr. Murray served as a Member of the Advisory Board of certain Fidelity® funds (2016) and as Co-Chief Executive Officer (2013-2016) and President (2006-2013) of Meijer, Inc. Mr. Murray serves as a member of the Board of Directors and Nuclear Review and Public Policy and Responsibility Committees of DTE Energy Company (diversified energy company, 2009-present). Mr. Murray also serves as a member of the Board of Directors of Spectrum Health (not-for-profit health system, 2015-present). Mr. Murray previously served as President of Grand Valley State University (2001-2006), Treasurer for the State of Michigan (1999-2001), Vice President of Finance and Administration for Michigan State University (1998-1999), and a member of the Board of Directors and Audit Committee and Chairman of the Nominating and Corporate Governance Committee of Universal Forest Products, Inc. (manufacturer and distributor of wood and wood-alternative products, 2004-2016). Mr. Murray is also a director or trustee of many community and professional organizations.
+ The information includes the Trustee's principal occupation during the last five years and other information relating to the experience, attributes, and skills relevant to the Trustee's qualifications to serve as a Trustee, which led to the conclusion that the Trustee should serve as a Trustee for the fund.
Advisory Board Members and Officers:
Correspondence intended for an officer may be sent to Fidelity Investments, 245 Summer Street, Boston, Massachusetts 02210. Officers appear below in alphabetical order.
Name, Year of Birth; Principal Occupation
Elizabeth Paige Baumann (1968)
Year of Election or Appointment: 2017
Anti-Money Laundering (AML) Officer
Ms. Baumann also serves as AML Officer of other funds. She is Chief AML Officer (2012-present) and Senior Vice President (2014-present) of FMR LLC (diversified financial services company) and is an employee of Fidelity Investments. Previously, Ms. Baumann served as AML Officer of the funds (2012-2016), and Vice President (2007-2014) and Deputy Anti-Money Laundering Officer (2007-2012) of FMR LLC.
Marc R. Bryant (1966)
Year of Election or Appointment: 2015
Secretary and Chief Legal Officer (CLO)
Mr. Bryant also serves as Secretary and CLO of other funds. Mr. Bryant serves as CLO, Secretary, and Senior Vice President of Fidelity Management & Research Company (investment adviser firm, 2015-present) and FMR Co., Inc. (investment adviser firm, 2015-present); Secretary of Fidelity SelectCo, LLC (investment adviser firm, 2015-present) and Fidelity Investments Money Management, Inc. (investment adviser firm, 2015-present); and CLO of Fidelity Management & Research (Hong Kong) Limited and FMR Investment Management (UK) Limited (investment adviser firms, 2015-present) and Fidelity Management & Research (Japan) Limited (investment adviser firm, 2016-present). He is Senior Vice President and Deputy General Counsel of FMR LLC (diversified financial services company). Previously, Mr. Bryant served as Secretary and CLO of Fidelity Rutland Square Trust II (2010-2014) and Assistant Secretary of Fidelity's Fixed Income and Asset Allocation Funds (2013-2015). Prior to joining Fidelity Investments, Mr. Bryant served as a Senior Vice President and the Head of Global Retail Legal for AllianceBernstein L.P. (2006-2010), and as the General Counsel for ProFund Advisors LLC (2001-2006).
Jonathan Davis (1968)
Year of Election or Appointment: 2010
Assistant Treasurer
Mr. Davis also serves as Assistant Treasurer of other funds, and is an employee of Fidelity Investments. Previously, Mr. Davis served as Vice President and Associate General Counsel of FMR LLC (diversified financial services company, 2003-2010).
Adrien E. Deberghes (1967)
Year of Election or Appointment: 2010
Assistant Treasurer
Mr. Deberghes also serves as an officer of other funds. He serves as Executive Vice President of Fidelity Investments Money Management, Inc. (FIMM) (investment adviser firm, 2016-present) and is an employee of Fidelity Investments (2008-present). Prior to joining Fidelity Investments, Mr. Deberghes was Senior Vice President of Mutual Fund Administration at State Street Corporation (2007-2008), Senior Director of Mutual Fund Administration at Investors Bank & Trust (2005-2007), and Director of Finance for Dunkin' Brands (2000-2005). Previously, Mr. Deberghes served in other fund officer roles.
Stephanie J. Dorsey (1969)
Year of Election or Appointment: 2013
President and Treasurer
Ms. Dorsey also serves as an officer of other funds. She is an employee of Fidelity Investments (2008-present) and has served in other fund officer roles. Prior to joining Fidelity Investments, Ms. Dorsey served as Treasurer (2004-2008) of the JPMorgan Mutual Funds and Vice President (2004-2008) of JPMorgan Chase Bank.
Howard J. Galligan III (1966)
Year of Election or Appointment: 2014
Chief Financial Officer
Mr. Galligan also serves as Chief Financial Officer of other funds. Mr. Galligan serves as President of Fidelity Pricing and Cash Management Services (FPCMS) (2014-present) and as a Director of Strategic Advisers, Inc. (investment adviser firm, 2008-present). Previously, Mr. Galligan served as Chief Administrative Officer of Asset Management (2011-2014) and Chief Operating Officer and Senior Vice President of Investment Support for Strategic Advisers, Inc. (2003-2011).
Colm A. Hogan (1973)
Year of Election or Appointment: 2016
Assistant Treasurer
Mr. Hogan also serves as an officer of other funds. Mr. Hogan is an employee of Fidelity Investments (2005-present).
Chris Maher (1972)
Year of Election or Appointment: 2013
Assistant Treasurer
Mr. Maher serves as Assistant Treasurer of other funds. Mr. Maher is Vice President of Valuation Oversight and is an employee of Fidelity Investments. Previously, Mr. Maher served as Vice President of Asset Management Compliance (2013), Vice President of the Program Management Group of FMR (investment adviser firm, 2010-2013), and Vice President of Valuation Oversight (2008-2010).
John B. McGinty, Jr. (1962)
Year of Election or Appointment: 2016
Chief Compliance Officer
Mr. McGinty also serves as Chief Compliance Officer of other funds. Mr. McGinty is Senior Vice President of Asset Management Compliance for Fidelity Investments and is an employee of Fidelity Investments (2016-present). Mr. McGinty previously served as Vice President, Senior Attorney at Eaton Vance Management (investment management firm, 2015-2016), and prior to Eaton Vance as global CCO for all firm operations and registered investment companies at GMO LLC (investment management firm, 2009-2015). Before joining GMO LLC, Mr. McGinty served as Senior Vice President, Deputy General Counsel for Fidelity Investments (2007-2009).
Rieco E. Mello (1969)
Year of Election or Appointment: 2017
Assistant Treasurer
Mr. Mello also serves as Assistant Treasurer of other funds. Mr. Mello is an employee of Fidelity Investments (1995-present).
Jamie Pagliocco (1964)
Year of Election or Appointment: 2017
Vice President
Mr. Pagliocco also serves as Vice President of other funds. Mr. Pagliocco serves as Chief Investment Officer of FMR's Bond Group (2017-present) and is an employee of Fidelity Investments (2001-present).
Jason P. Pogorelec (1975)
Year of Election or Appointment: 2015
Assistant Secretary
Mr. Pogorelec also serves as Assistant Secretary of other funds. Mr. Pogorelec serves as Vice President, Associate General Counsel (2010-present) and is an employee of Fidelity Investments (2006-present).
Nancy D. Prior (1967)
Year of Election or Appointment: 2014
Vice President
Ms. Prior also serves as Vice President of other funds. Ms. Prior serves as a Director of FMR Investment Management (UK) Limited (investment adviser firm, 2015-present), President (2016-present) and Director (2014-present) of Fidelity Investments Money Management, Inc. (FIMM) (investment adviser firm), President, Fixed Income (2014-present), Vice Chairman of FIAM LLC (investment adviser firm, 2014-present), and is an employee of Fidelity Investments (2002-present). Previously, Ms. Prior served as Vice President of Fidelity's Money Market Funds (2012-2014), President, Money Market and Short Duration Bond Group of Fidelity Management & Research (FMR) (investment adviser firm, 2013-2014), President, Money Market Group of FMR (2011-2013), Managing Director of Research (2009-2011), Senior Vice President and Deputy General Counsel (2007-2009), and Assistant Secretary of certain Fidelity® funds (2008-2009).
Stacie M. Smith (1974)
Year of Election or Appointment: 2013
Assistant Treasurer
Ms. Smith also serves as an officer of other funds. She is an employee of Fidelity Investments (2009-present) and has served in other fund officer roles. Prior to joining Fidelity Investments, Ms. Smith served as Senior Audit Manager of Ernst & Young LLP (accounting firm, 1996-2009). Previously, Ms. Smith served as Deputy Treasurer of certain Fidelity® funds (2013-2016).
Marc L. Spector (1972)
Year of Election or Appointment: 2016
Deputy Treasurer
Mr. Spector also serves as an officer of other funds. Mr. Spector is an employee of Fidelity Investments (2016-present). Prior to joining Fidelity Investments, Mr. Spector served as Director at the Siegfried Group (accounting firm, 2013-2016), and prior to Siegfried Group as audit senior manager at Deloitte & Touche (accounting firm, 2005-2013).
Renee Stagnone (1975)
Year of Election or Appointment: 2016
Assistant Treasurer
Ms. Stagnone also serves as an officer of other funds. Ms. Stagnone is an employee of Fidelity Investments (1997-present). Previously, Ms. Stagnone served as Deputy Treasurer of certain Fidelity® funds (2013-2016).
Christine J. Thompson (1958)
Year of Election or Appointment: 2015
Vice President of Fidelity's Bond Funds
Ms. Thompson also serves as Vice President of other funds. Ms. Thompson also serves as Chief Investment Officer of FMR's Bond Group (2010-present) and is an employee of Fidelity Investments (1985-present). Previously, Ms. Thompson served as Vice President of Fidelity's Bond Funds (2010-2012).
Shareholder Expense Example
As a shareholder of the Fund, you incur two types of costs: (1) transaction costs, including sales charges (loads) on purchase payments or redemption proceeds, and (2) ongoing costs, including management fees, distribution and/or service (12b-1) fees and other Fund expenses. This Example is intended to help you understand your ongoing costs (in dollars) of investing in the Fund and to compare these costs with the ongoing costs of investing in other mutual funds.
The Example is based on an investment of $1,000 invested at the beginning of the period and held for the entire period (March 1, 2017 to August 31, 2017).
Actual Expenses
The first line of the accompanying table for each class of the Fund provides information about actual account values and actual expenses. You may use the information in this line, together with the amount you invested, to estimate the expenses that you paid over the period. Simply divide your account value by $1,000.00 (for example, an $8,600 account value divided by $1,000.00 = 8.6), then multiply the result by the number in the first line for a class of the Fund under the heading entitled "Expenses Paid During Period" to estimate the expenses you paid on your account during this period. A small balance maintenance fee of $12.00 that is charged once a year may apply for certain accounts with a value of less than $2,000. This fee is not included in the table below. If it was, the estimate of expenses you paid during the period would be higher, and your ending account value lower, by this amount. In addition, the Fund, as a shareholder in the underlying Fidelity Central Funds, will indirectly bear its pro-rata share of the fees and expenses incurred by the underlying Fidelity Central Funds. These fees and expenses are not included in the Fund's annualized expense ratio used to calculate the expense estimate in the table below.
Hypothetical Example for Comparison Purposes
The second line of the accompanying table for each class of the Fund provides information about hypothetical account values and hypothetical expenses based on a Class' actual expense ratio and an assumed rate of return of 5% per year before expenses, which is not the Class' actual return. The hypothetical account values and expenses may not be used to estimate the actual ending account balance or expenses you paid for the period. You may use this information to compare the ongoing costs of investing in the Fund and other funds. To do so, compare this 5% hypothetical example with the 5% hypothetical examples that appear in the shareholder reports of the other funds. A small balance maintenance fee of $12.00 that is charged once a year may apply for certain accounts with a value of less than $2,000. This fee is not included in the table below. If it was, the estimate of expenses you paid during the period would be higher, and your ending account value lower, by this amount. In addition, the Fund, as a shareholder in the underlying Fidelity Central Funds, will indirectly bear its pro-rata share of the fees and expenses incurred by the underlying Fidelity Central Funds. These fees and expenses are not included in the Fund's annualized expense ratio used to calculate the expense estimate in the table below.
Please note that the expenses shown in the table are meant to highlight your ongoing costs only and do not reflect any transaction costs. Therefore, the second line of the table is useful in comparing ongoing costs only, and will not help you determine the relative total costs of owning different funds. In addition, if these transactional costs were included, your costs would have been higher.
| | Annualized Expense Ratio-A | Beginning
Account Value
March 1, 2017 | Ending
Account Value
August 31, 2017 | Expenses Paid
During Period-B
March 1, 2017
to August 31, 2017 |
| Class A | .78% | | | |
| Actual | | $1,000.00 | $1,019.00 | $3.97 |
| Hypothetical-C | | $1,000.00 | $1,021.27 | $3.97 |
| Class M | .79% | | | |
| Actual | | $1,000.00 | $1,018.00 | $4.02 |
| Hypothetical-C | | $1,000.00 | $1,021.22 | $4.02 |
| Class C | 1.52% | | | |
| Actual | | $1,000.00 | $1,014.30 | $7.72 |
| Hypothetical-C | | $1,000.00 | $1,017.54 | $7.73 |
| Fidelity Mortgage Securities Fund | .45% | | | |
| Actual | | $1,000.00 | $1,020.60 | $2.29 |
| Hypothetical-C | | $1,000.00 | $1,022.94 | $2.29 |
| Class I | .49% | | | |
| Actual | | $1,000.00 | $1,019.60 | $2.49 |
| Hypothetical-C | | $1,000.00 | $1,022.74 | $2.50 |
A Annualized expense ratio reflects expenses net of applicable fee waivers.
B Expenses are equal to each Class' annualized expense ratio, multiplied by the average account value over the period, multiplied by 184/365 (to reflect the one-half year period). The fees and expenses of the underlying Fidelity Central Funds in which the Fund invests are not included in each Class' annualized expense ratio. In addition to the expenses noted above, the Fund also indirectly bears its proportional share of the expenses of the underlying Fidelity Central Funds. Annualized expenses of the underlying non-money market Fidelity Central Funds as of their most recent fiscal half year were less than .005%.
C 5% return per year before expenses
Distributions (Unaudited)
A total of 0.09% of the dividends distributed during the fiscal year was derived from interest on U.S. Government securities which is generally exempt from state income tax.
The fund designates $14,381,474 of distributions paid during the period January 1,2017 to August 31, 2017 as qualifying to be taxed as interest-related dividends for nonresident alien shareholders.
The fund will notify shareholders in January 2018 of amounts for use in preparing 2017 income tax returns.
Corporate Headquarters
245 Summer St.
Boston, MA 02210
www.fidelity.com
MOR-ANN-1017
1.538542.120
Fidelity® Limited Term Bond Fund
Annual Report August 31, 2017 Fidelity® Limited Term Bond Fund is a class of Fidelity Advisor® Limited Term Bond Fund |
|
Contents
To view a fund's proxy voting guidelines and proxy voting record for the 12-month period ended June 30, visit http://www.fidelity.com/proxyvotingresults or visit the Securities and Exchange Commission's (SEC) web site at http://www.sec.gov.
You may also call 1-800-544-8544 to request a free copy of the proxy voting guidelines.
Standard & Poor's, S&P and S&P 500 are registered service marks of The McGraw-Hill Companies, Inc. and have been licensed for use by Fidelity Distributors Corporation.
Other third-party marks appearing herein are the property of their respective owners.
All other marks appearing herein are registered or unregistered trademarks or service marks of FMR LLC or an affiliated company. © 2017 FMR LLC. All rights reserved.
This report and the financial statements contained herein are submitted for the general information of the shareholders of the Fund. This report is not authorized for distribution to prospective investors in the Fund unless preceded or accompanied by an effective prospectus.
A fund files its complete schedule of portfolio holdings with the SEC for the first and third quarters of each fiscal year on Form N-Q. Forms N-Q are available on the SEC’s web site at http://www.sec.gov. A fund's Forms N-Q may be reviewed and copied at the SEC’s Public Reference Room in Washington, DC. Information regarding the operation of the SEC's Public Reference Room may be obtained by calling 1-800-SEC-0330.
For a complete list of a fund's portfolio holdings, view the most recent holdings listing, semiannual report, or annual report on Fidelity's web site at http://www.fidelity.com, http://www.institutional.fidelity.com, or http://www.401k.com, as applicable.
NOT FDIC INSURED •MAY LOSE VALUE •NO BANK GUARANTEE
Neither the Fund nor Fidelity Distributors Corporation is a bank.
Performance: The Bottom Line
Average annual total return reflects the change in the value of an investment, assuming reinvestment of distributions from dividend income and capital gains (the profits earned upon the sale of securities that have grown in value, if any) and assuming a constant rate of performance each year. The hypothetical investment and the average annual total returns do not reflect the deduction of taxes that a shareholder would pay on fund distributions or the redemption of fund shares. During periods of reimbursement by Fidelity, a fund’s total return will be greater than it would be had the reimbursement not occurred. How a fund did yesterday is no guarantee of how it will do tomorrow.
Average Annual Total Returns
| For the periods ended August 31, 2017 | Past 1 year | Past 5 years | Past 10 years |
| Fidelity® Limited Term Bond Fund | 1.40% | 1.60% | 3.72% |
The initial offering of Fidelity® Limited Term Bond Fund took place on November 1, 2013. Returns prior to November 1, 2013, are those of Class I.
Prior to October 30, 2013, the fund was named Fidelity Advisor® Intermediate Bond Fund, and the fund operated under certain different investment policies and compared its performance to a different index. The fund's historical performance may not represent its current investment policies.
$10,000 Over 10 Years
Let's say hypothetically that $10,000 was invested in Fidelity® Limited Term Bond Fund, a class of the fund, on August 31, 2007.
The chart shows how the value of your investment would have changed, and also shows how the Bloomberg Barclays U.S. 1-5 Year Government/Credit Bond Index performed over the same period.
See (previous page) for additional information regarding the performance of Fidelity® Limited Term Bond Fund.
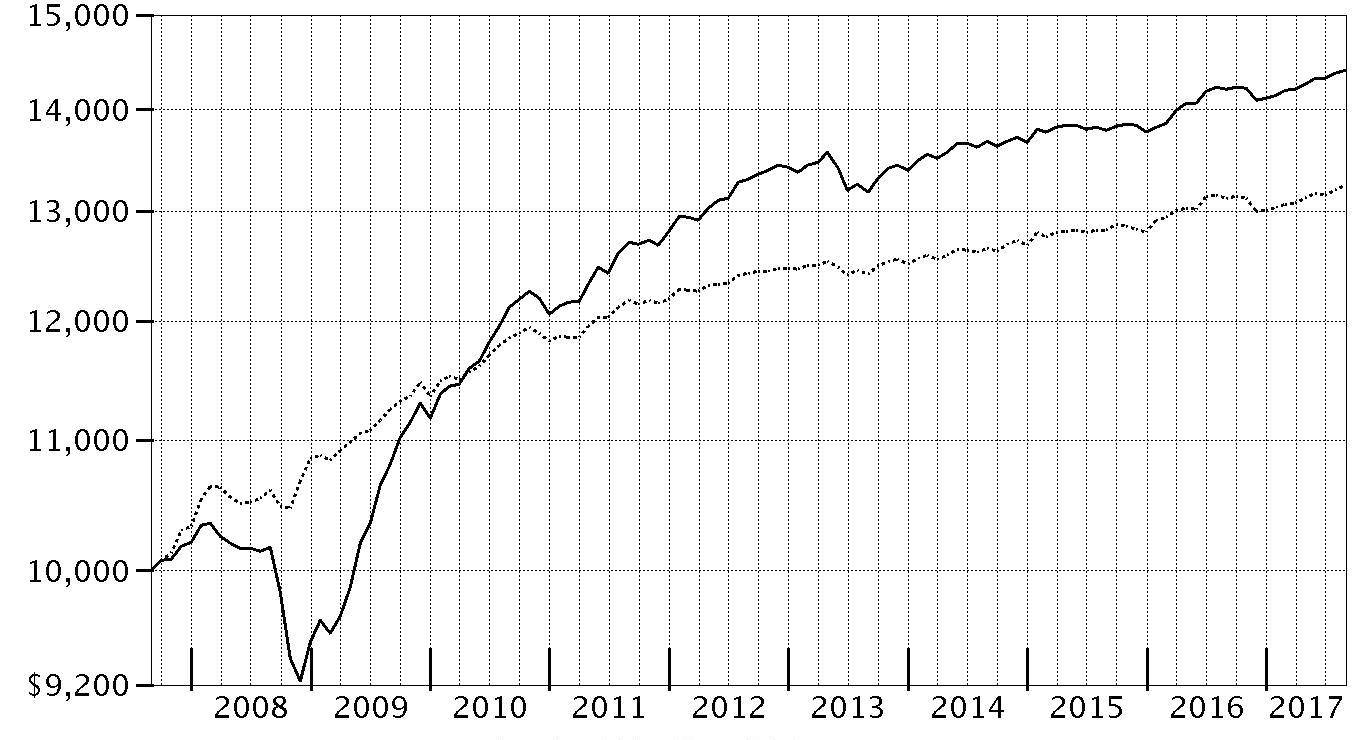
| Period Ending Values |
| $14,413 | Fidelity® Limited Term Bond Fund |
| $13,245 | Bloomberg Barclays U.S. 1-5 Year Government/Credit Bond Index |
Effective August 24, 2016, all Barclays benchmark indices were co-branded as the Bloomberg Barclays Indices for a period of five years.
Management's Discussion of Fund Performance
Market Recap: U.S. taxable investment-grade bonds rose slightly for the 12 months ending August 31, 2017, as yields increased markedly following the U.S. presidential election then moderated as the period progressed. The Bloomberg Barclays U.S. Aggregate Bond Index gained 0.49% for the year. Bond yields posted slight gains early in the period, prior to the U.S. election, then rallied strongly in November and December, as many investors viewed then-President-elect Donald Trump’s economic agenda as stimulative and potentially inflationary. Yields also rode the Fed’s decision in December to raise policy interest rates. Longer-term bond yields declined slightly in the first half of 2017, even though the Fed raised rates in June 2017 for the third time in as many quarters, as it became clear that changes to tax, health care and fiscal policies would take time to develop and implement. Fairly cool inflation readings also held back yields late in the period. Within the Bloomberg Barclays index, investment-grade corporate bonds led all major market segments, up 2.13%, while U.S. Treasuries returned -0.95%. Securitized sectors advanced more modestly than corporates. Outside the index, riskier, non-core fixed-income segments led the broader market, while Treasury Inflation-Protected Securities (TIPS) rose 0.46%, according to Bloomberg Barclays.
Comments from Portfolio Manager Rob Galusza: For the annual reporting period ending August 31, 2017, the fund’s share classes returned about 0% to 1%. All slightly trailed the 1.53% return of the benchmark Fidelity Limited Term Composite Index℠. Spreads on corporate securities narrowed, driven in part by a strong technical backdrop. While the decline in spreads supported the performance of the corporate sector, it also made it more challenging to find attractive combinations of risk and return, particularly later in the period. Bond returns remained lackluster on an absolute basis, but the fund’s corporate holdings out-earned comparable-maturity U.S. Treasuries, which the fund underweighted. This positioning contributed to benchmark-relative performance. Within corporates, overweighting the bonds of financial institutions added value, while underweighting bonds in the basic industry segment hurt. Conversely, an overweighting and picks in the industrial sector hampered fund results somewhat, especially those of communications issuers. Elsewhere, a fairly small allocation to mortgage-backed securities detracted. However, underweighting government-related agency securities and avoiding debt of foreign-government institutions contributed versus the index.
The views expressed above reflect those of the portfolio manager(s) only through the end of the period as stated on the cover of this report and do not necessarily represent the views of Fidelity or any other person in the Fidelity organization. Any such views are subject to change at any time based upon market or other conditions and Fidelity disclaims any responsibility to update such views. These views may not be relied on as investment advice and, because investment decisions for a Fidelity fund are based on numerous factors, may not be relied on as an indication of trading intent on behalf of any Fidelity fund.
Investment Summary (Unaudited)
The information in the following tables is based on the combined investments of the Fund and its pro-rata share of the investments of Fidelity's Fixed-Income Central Funds.
Quality Diversification (% of fund's net assets)
| As of August 31, 2017 |
| | U.S. Government and U.S. Government Agency Obligations | 14.5% |
| | AAA | 11.3% |
| | AA | 3.3% |
| | A | 22.8% |
| | BBB | 41.2% |
| | BB and Below | 4.9% |
| | Not Rated | 0.2% |
| | Short-Term Investments and Net Other Assets | 1.8% |

| As of February 28, 2017 |
| | U.S. Government and U.S. Government Agency Obligations | 12.8% |
| | AAA | 12.7% |
| | AA | 3.9% |
| | A | 22.8% |
| | BBB | 41.9% |
| | BB and Below | 4.1% |
| | Not Rated | 0.5% |
| | Short-Term Investments and Net Other Assets | 1.3% |

We have used ratings from Moody's Investors Service, Inc. Where Moody's® ratings are not available, we have used S&P® ratings. All ratings are as of the date indicated and do not reflect subsequent changes.
Asset Allocation (% of fund's net assets)
| As of August 31, 2017 *,** |
| | Corporate Bonds | 69.6% |
| | U.S. Government and U.S. Government Agency Obligations | 14.5% |
| | Asset-Backed Securities | 5.5% |
| | CMOs and Other Mortgage Related Securities | 6.2% |
| | Municipal Bonds | 0.4% |
| | Other Investments | 2.0% |
| | Short-Term Investments and Net Other Assets (Liabilities) | 1.8% |

* Foreign investments - 17.2%
** Futures and Swaps - 0.0%
| As of February 28, 2017 *,** |
| | Corporate Bonds | 70.4% |
| | U.S. Government and U.S. Government Agency Obligations | 12.8% |
| | Asset-Backed Securities | 7.4% |
| | CMOs and Other Mortgage Related Securities | 5.8% |
| | Municipal Bonds | 0.3% |
| | Other Investments | 2.0% |
| | Short-Term Investments and Net Other Assets (Liabilities) | 1.3% |

* Foreign investments - 17.3%
** Futures and Swaps - 0.0%
An unaudited holdings listing for the Fund, which presents direct holdings as well as the pro-rata share of any securities and other investments held indirectly through its investment in underlying non-money market Fidelity Central Funds, is available at fidelity.com and/or institutional.fidelity.com, as applicable.
Percentages shown as 0.0% may reflect amounts less than 0.05%.
Investments August 31, 2017
Showing Percentage of Net Assets
| Nonconvertible Bonds - 69.0% | | | |
| | | Principal Amount | Value |
| CONSUMER DISCRETIONARY - 7.3% | | | |
| Automobiles - 3.1% | | | |
| American Honda Finance Corp.: | | | |
| 1.7% 2/22/19 | | $1,918,000 | $1,919,013 |
| 1.7% 9/9/21 | | 3,613,000 | 3,566,325 |
| 2% 2/14/20 | | 5,000,000 | 5,026,476 |
| 2.125% 10/10/18 | | 500,000 | 503,233 |
| BMW U.S. Capital LLC: | | | |
| 2.15% 4/6/20 (a) | | 7,000,000 | 7,064,917 |
| 2.7% 4/6/22 (a) | | 5,799,000 | 5,881,755 |
| Daimler Finance North America LLC: | | | |
| 1.5% 7/5/19 (a) | | 5,000,000 | 4,961,050 |
| 1.65% 5/18/18 (a) | | 3,000,000 | 3,000,995 |
| 2.25% 3/2/20 (a) | | 3,020,000 | 3,036,070 |
| 2.3% 1/6/20 (a) | | 5,000,000 | 5,026,754 |
| 2.375% 8/1/18 (a) | | 1,000,000 | 1,005,998 |
| 2.45% 5/18/20 (a) | | 6,415,000 | 6,471,823 |
| 2.85% 1/6/22 (a) | | 3,175,000 | 3,226,361 |
| General Motors Financial Co., Inc.: | | | |
| 2.35% 10/4/19 | | 5,000,000 | 5,011,813 |
| 2.4% 4/10/18 | | 3,000,000 | 3,011,044 |
| 2.65% 4/13/20 | | 7,684,000 | 7,747,470 |
| 3.15% 1/15/20 | | 5,000,000 | 5,101,949 |
| 3.2% 7/13/20 | | 5,000,000 | 5,105,657 |
| 4.2% 3/1/21 | | 3,000,000 | 3,158,893 |
| Volkswagen Group of America Finance LLC 2.4% 5/22/20 (a) | | 4,458,000 | 4,486,609 |
| Volkswagen International Finance NV: | | | |
| 1.6% 11/20/17 (a) | | 620,000 | 619,771 |
| 2.125% 11/20/18 (a) | | 1,500,000 | 1,503,751 |
| | | | 86,437,727 |
| Diversified Consumer Services - 0.0% | | | |
| Ingersoll-Rand Global Holding Co. Ltd. 6.875% 8/15/18 | | 1,020,000 | 1,069,112 |
| Hotels, Restaurants & Leisure - 0.5% | | | |
| McDonald's Corp.: | | | |
| 2.1% 12/7/18 | | 742,000 | 746,807 |
| 2.2% 5/26/20 | | 5,000,000 | 5,052,011 |
| 2.625% 1/15/22 | | 3,229,000 | 3,278,203 |
| 2.75% 12/9/20 | | 5,345,000 | 5,474,957 |
| | | | 14,551,978 |
| Household Durables - 0.3% | | | |
| D.R. Horton, Inc.: | | | |
| 3.75% 3/1/19 | | 2,000,000 | 2,042,938 |
| 4% 2/15/20 | | 3,000,000 | 3,122,100 |
| Toll Brothers Finance Corp. 4% 12/31/18 | | 2,500,000 | 2,553,125 |
| | | | 7,718,163 |
| Internet & Direct Marketing Retail - 0.2% | | | |
| Amazon.com, Inc. 2.8% 8/22/24 (a) | | 4,922,000 | 4,983,388 |
| Media - 3.2% | | | |
| 21st Century Fox America, Inc. 4.5% 2/15/21 | | 13,000,000 | 13,974,110 |
| British Sky Broadcasting Group PLC 2.625% 9/16/19 (a) | | 3,000,000 | 3,029,868 |
| CBS Corp. 2.3% 8/15/19 | | 3,663,000 | 3,691,026 |
| Charter Communications Operating LLC/Charter Communications Operating Capital Corp. 3.579% 7/23/20 | | 15,000,000 | 15,389,109 |
| Comcast Corp.: | | | |
| 1.625% 1/15/22 | | 15,111,000 | 14,824,711 |
| 6.3% 11/15/17 | | 11,000,000 | 11,102,812 |
| NBCUniversal Enterprise, Inc. 1.974% 4/15/19 (a) | | 3,000,000 | 3,014,751 |
| Time Warner Cable, Inc.: | | | |
| 6.75% 7/1/18 | | 5,651,000 | 5,869,976 |
| 8.25% 4/1/19 | | 500,000 | 546,226 |
| Time Warner, Inc.: | | | |
| 2.1% 6/1/19 | | 2,000,000 | 2,005,301 |
| 4.75% 3/29/21 | | 3,683,000 | 3,981,360 |
| 6.875% 6/15/18 | | 5,095,000 | 5,293,500 |
| Walt Disney Co. 1.85% 5/30/19 | | 6,000,000 | 6,028,482 |
| | | | 88,751,232 |
|
| TOTAL CONSUMER DISCRETIONARY | | | 203,511,600 |
|
| CONSUMER STAPLES - 5.1% | | | |
| Beverages - 1.3% | | | |
| Anheuser-Busch InBev Finance, Inc.: | | | |
| 1.9% 2/1/19 | | 5,000,000 | 5,016,244 |
| 2.15% 2/1/19 | | 1,500,000 | 1,509,983 |
| 2.65% 2/1/21 | | 12,890,000 | 13,132,473 |
| 3.3% 2/1/23 | | 9,190,000 | 9,533,301 |
| Anheuser-Busch InBev Worldwide, Inc. 2.2% 8/1/18 | | 2,310,000 | 2,321,894 |
| PepsiCo, Inc. 1.7% 10/6/21 | | 5,000,000 | 4,944,927 |
| | | | 36,458,822 |
| Food & Staples Retailing - 1.0% | | | |
| CVS Health Corp.: | | | |
| 1.9% 7/20/18 | | 1,549,000 | 1,553,161 |
| 2.25% 12/5/18 | | 8,376,000 | 8,430,206 |
| 2.25% 8/12/19 | | 10,000,000 | 10,076,299 |
| 2.8% 7/20/20 | | 1,496,000 | 1,528,138 |
| Kroger Co. 3.3% 1/15/21 | | 5,000,000 | 5,146,848 |
| | | | 26,734,652 |
| Food Products - 0.8% | | | |
| General Mills, Inc. 2.2% 10/21/19 | | 2,000,000 | 2,013,458 |
| Kraft Foods Group, Inc. 5.375% 2/10/20 | | 5,000,000 | 5,389,663 |
| The J.M. Smucker Co.: | | | |
| 1.75% 3/15/18 | | 5,874,000 | 5,875,989 |
| 2.5% 3/15/20 | | 1,964,000 | 1,988,988 |
| Tyson Foods, Inc. 2.65% 8/15/19 | | 7,000,000 | 7,092,074 |
| | | | 22,360,172 |
| Tobacco - 2.0% | | | |
| Altria Group, Inc. 2.625% 1/14/20 | | 5,000,000 | 5,089,855 |
| Bat Capital Corp. 2.764% 8/15/22 (a) | | 10,000,000 | 10,055,763 |
| BAT International Finance PLC: | | | |
| 1.85% 6/15/18 (a) | | 10,000,000 | 10,000,984 |
| 2.75% 6/15/20 (a) | | 3,160,000 | 3,210,462 |
| Imperial Tobacco Finance PLC: | | | |
| 2.05% 2/11/18 (a) | | 3,906,000 | 3,906,580 |
| 2.05% 7/20/18 (a) | | 2,866,000 | 2,867,201 |
| 2.95% 7/21/20 (a) | | 3,000,000 | 3,055,241 |
| Philip Morris International, Inc.: | | | |
| 1.875% 1/15/19 | | 2,641,000 | 2,649,668 |
| 1.875% 2/25/21 | | 6,954,000 | 6,889,278 |
| Reynolds American, Inc.: | | | |
| 2.3% 6/12/18 | | 5,704,000 | 5,725,789 |
| 3.25% 6/12/20 | | 1,162,000 | 1,197,294 |
| 4% 6/12/22 | | 1,077,000 | 1,142,372 |
| | | | 55,790,487 |
|
| TOTAL CONSUMER STAPLES | | | 141,344,133 |
|
| ENERGY - 6.0% | | | |
| Energy Equipment & Services - 0.6% | | | |
| El Paso Pipeline Partners Operating Co. LLC 6.5% 4/1/20 | | 768,000 | 843,299 |
| National Oilwell Varco, Inc. 1.35% 12/1/17 | | 620,000 | 619,338 |
| Noble Holding International Ltd. 5.75% 3/16/18 | | 102,000 | 102,745 |
| Petrofac Ltd. 3.4% 10/10/18 (a) | | 1,000,000 | 986,880 |
| Schlumberger Holdings Corp.: | | | |
| 2.35% 12/21/18 (a) | | 9,662,000 | 9,727,754 |
| 3% 12/21/20 (a) | | 5,000,000 | 5,132,687 |
| | | | 17,412,703 |
| Oil, Gas & Consumable Fuels - 5.4% | | | |
| Anadarko Petroleum Corp. 4.85% 3/15/21 | | 559,000 | 594,204 |
| BP Capital Markets PLC: | | | |
| 1.375% 5/10/18 | | 5,000,000 | 4,995,881 |
| 1.674% 2/13/18 | | 5,000,000 | 5,004,253 |
| 1.676% 5/3/19 | | 989,000 | 988,979 |
| 2.315% 2/13/20 | | 4,411,000 | 4,461,446 |
| 2.521% 1/15/20 | | 4,688,000 | 4,770,101 |
| Canadian Natural Resources Ltd.: | | | |
| 1.75% 1/15/18 | | 415,000 | 414,818 |
| 3.45% 11/15/21 | | 7,927,000 | 8,189,082 |
| Cenovus Energy, Inc. 5.7% 10/15/19 | | 297,000 | 312,177 |
| Chevron Corp. 1.961% 3/3/20 | | 4,000,000 | 4,026,972 |
| Columbia Pipeline Group, Inc.: | | | |
| 2.45% 6/1/18 | | 2,107,000 | 2,114,406 |
| 3.3% 6/1/20 | | 1,439,000 | 1,480,267 |
| ConocoPhillips Co. 2.2% 5/15/20 | | 1,962,000 | 1,975,739 |
| DCP Midstream LLC 5.35% 3/15/20 (a) | | 6,738,000 | 7,091,745 |
| DCP Midstream Operating LP: | | | |
| 2.5% 12/1/17 | | 292,000 | 291,635 |
| 2.7% 4/1/19 | | 821,000 | 815,869 |
| Devon Energy Corp. 3.25% 5/15/22 | | 7,000,000 | 7,084,572 |
| Encana Corp.: | | | |
| 3.9% 11/15/21 | | 4,500,000 | 4,635,731 |
| 6.5% 5/15/19 | | 5,000,000 | 5,347,272 |
| Energy Transfer Partners LP 2.5% 6/15/18 | | 1,332,000 | 1,338,371 |
| EnLink Midstream Partners LP 2.7% 4/1/19 | | 785,000 | 786,081 |
| Enterprise Products Operating LP: | | | |
| 1.65% 5/7/18 | | 3,631,000 | 3,629,433 |
| 2.55% 10/15/19 | | 178,000 | 179,494 |
| 2.85% 4/15/21 | | 1,590,000 | 1,616,982 |
| Exxon Mobil Corp.: | | | |
| 2.222% 3/1/21 | | 3,780,000 | 3,827,693 |
| 2.726% 3/1/23 | | 2,954,000 | 3,029,609 |
| Kinder Morgan Energy Partners LP 2.65% 2/1/19 | | 1,737,000 | 1,750,429 |
| Kinder Morgan, Inc.: | | | |
| 2% 12/1/17 | | 393,000 | 393,210 |
| 3.05% 12/1/19 | | 4,285,000 | 4,353,233 |
| Marathon Oil Corp. 2.8% 11/1/22 | | 7,000,000 | 6,843,350 |
| Marathon Petroleum Corp. 2.7% 12/14/18 | | 3,202,000 | 3,229,872 |
| Petro-Canada 6.05% 5/15/18 | | 3,326,000 | 3,427,671 |
| Petrobras Global Finance BV 6.125% 1/17/22 | | 7,000,000 | 7,420,000 |
| Petroleos Mexicanos: | | | |
| 3.5% 7/23/20 | | 1,355,000 | 1,390,908 |
| 4.625% 9/21/23 | | 4,535,000 | 4,720,935 |
| 5.375% 3/13/22 (a) | | 1,440,000 | 1,545,120 |
| 5.5% 2/4/19 | | 2,000,000 | 2,089,000 |
| 6.375% 2/4/21 | | 2,000,000 | 2,207,000 |
| Plains All American Pipeline LP/PAA Finance Corp.: | | | |
| 2.6% 12/15/19 | | 9,900,000 | 9,915,603 |
| 5.75% 1/15/20 | | 962,000 | 1,027,649 |
| Shell International Finance BV 2.125% 5/11/20 | | 2,287,000 | 2,311,112 |
| Southwestern Energy Co. 5.8% 1/23/20 (b) | | 864,000 | 889,920 |
| Spectra Energy Partners LP 2.95% 9/25/18 | | 90,000 | 90,911 |
| Total Capital International SA 2.125% 1/10/19 | | 2,000,000 | 2,013,868 |
| TransCanada PipeLines Ltd.: | | | |
| 3 month U.S. LIBOR + 0.790% 2.0941% 1/12/18 (b)(c) | | 2,500,000 | 2,505,517 |
| 1.625% 11/9/17 | | 3,000,000 | 3,000,526 |
| 1.875% 1/12/18 | | 3,000,000 | 3,001,207 |
| 2.5% 8/1/22 | | 2,372,000 | 2,388,524 |
| 3.125% 1/15/19 | | 1,693,000 | 1,722,324 |
| Western Gas Partners LP: | | | |
| 2.6% 8/15/18 | | 1,257,000 | 1,261,640 |
| 5.375% 6/1/21 | | 2,351,000 | 2,539,399 |
| | | | 151,041,740 |
|
| TOTAL ENERGY | | | 168,454,443 |
|
| FINANCIALS - 31.3% | | | |
| Banks - 15.3% | | | |
| ABN AMRO Bank NV: | | | |
| 2.1% 1/18/19 (a) | | 5,000,000 | 5,024,205 |
| 2.5% 10/30/18 (a) | | 4,000,000 | 4,033,408 |
| Australia & New Zealand Banking Group Ltd. 2.25% 6/13/19 | | 3,250,000 | 3,285,062 |
| Banco Nacional de Desenvolvimento Economico e Social: | | | |
| 4% 4/14/19 (a) | | 2,575,000 | 2,625,522 |
| 6.369% 6/16/18 (a) | | 962,000 | 990,985 |
| Bank of America Corp.: | | | |
| 2.25% 4/21/20 | | 8,140,000 | 8,178,548 |
| 2.369% 7/21/21 (b) | | 5,000,000 | 5,013,562 |
| 2.6% 1/15/19 | | 7,495,000 | 7,569,500 |
| 2.625% 10/19/20 | | 12,000,000 | 12,166,870 |
| 2.625% 4/19/21 | | 13,000,000 | 13,138,112 |
| 2.65% 4/1/19 | | 11,100,000 | 11,232,090 |
| Bank of Nova Scotia 2.8% 7/21/21 | | 2,000,000 | 2,048,510 |
| Bank of Tokyo-Mitsubishi UFJ Ltd.: | | | |
| 2.3% 3/5/20 (a) | | 3,000,000 | 3,017,833 |
| 2.35% 9/8/19 (a) | | 3,050,000 | 3,071,179 |
| 2.7% 9/9/18 (a) | | 4,500,000 | 4,542,214 |
| Barclays PLC: | | | |
| 2% 3/16/18 | | 5,000,000 | 5,005,000 |
| 2.75% 11/8/19 | | 5,331,000 | 5,395,201 |
| 2.875% 6/8/20 | | 3,000,000 | 3,037,401 |
| 3.2% 8/10/21 | | 5,045,000 | 5,151,016 |
| 3.25% 1/12/21 | | 2,046,000 | 2,090,938 |
| BNP Paribas 2.375% 9/14/17 | | 6,000,000 | 6,001,346 |
| BNP Paribas SA 2.375% 5/21/20 | | 3,000,000 | 3,037,125 |
| BPCE SA: | | | |
| 2.5% 12/10/18 | | 5,000,000 | 5,046,822 |
| 2.5% 7/15/19 | | 2,000,000 | 2,021,096 |
| Capital One NA: | | | |
| 2.35% 1/31/20 | | 1,000,000 | 1,003,656 |
| 2.4% 9/5/19 | | 2,000,000 | 2,012,427 |
| CIT Group, Inc. 3.875% 2/19/19 | | 5,090,000 | 5,204,525 |
| Citigroup, Inc.: | | | |
| 1.7% 4/27/18 | | 1,500,000 | 1,500,020 |
| 2.05% 6/7/19 | | 2,000,000 | 2,004,194 |
| 2.15% 7/30/18 | | 2,000,000 | 2,007,120 |
| 2.35% 8/2/21 | | 10,000,000 | 9,977,364 |
| 2.4% 2/18/20 | | 4,000,000 | 4,036,220 |
| 2.45% 1/10/20 | | 3,000,000 | 3,029,160 |
| 2.5% 9/26/18 | | 1,500,000 | 1,511,112 |
| 2.5% 7/29/19 | | 2,000,000 | 2,021,119 |
| 2.55% 4/8/19 | | 3,000,000 | 3,031,209 |
| 2.65% 10/26/20 | | 3,000,000 | 3,042,296 |
| 2.7% 3/30/21 | | 5,000,000 | 5,068,929 |
| 2.75% 4/25/22 | | 4,010,000 | 4,046,220 |
| 4.4% 6/10/25 | | 2,604,000 | 2,753,706 |
| Citizens Bank NA: | | | |
| 2.45% 12/4/19 | | 5,526,000 | 5,575,372 |
| 2.55% 5/13/21 | | 6,501,000 | 6,557,571 |
| 2.65% 5/26/22 | | 3,000,000 | 3,018,797 |
| Citizens Financial Group, Inc. 2.375% 7/28/21 | | 417,000 | 416,093 |
| Comerica, Inc. 2.125% 5/23/19 | | 345,000 | 345,273 |
| Commonwealth Bank of Australia: | | | |
| 2.25% 3/13/19 | | 750,000 | 755,553 |
| 2.3% 9/6/19 | | 2,000,000 | 2,017,558 |
| Cooperatieve Centrale Raiffeisen-Boerenleenbank BA 1.7% 3/19/18 | | 2,000,000 | 2,002,911 |
| Credit Agricole SA 2.75% 6/10/20 (a) | | 8,000,000 | 8,146,656 |
| Credit Suisse Group Funding Guernsey Ltd. 3.45% 4/16/21 | | 6,000,000 | 6,192,209 |
| Credit Suisse New York Branch: | | | |
| 2.3% 5/28/19 | | 5,750,000 | 5,798,814 |
| 3% 10/29/21 | | 1,500,000 | 1,539,323 |
| Discover Bank: | | | |
| 2% 2/21/18 | | 5,920,000 | 5,929,182 |
| 2.6% 11/13/18 | | 4,000,000 | 4,032,330 |
| Fifth Third Bancorp: | | | |
| 2.3% 3/1/19 | | 279,000 | 281,042 |
| 2.875% 7/27/20 | | 3,200,000 | 3,274,080 |
| 4.5% 6/1/18 | | 3,024,000 | 3,086,143 |
| First Horizon National Corp. 3.5% 12/15/20 | | 3,000,000 | 3,097,907 |
| HBOS PLC 6.75% 5/21/18 (a) | | 509,000 | 525,915 |
| HSBC Holdings PLC 2.95% 5/25/21 | | 4,000,000 | 4,083,111 |
| HSBC U.S.A., Inc.: | | | |
| 2.375% 11/13/19 | | 3,000,000 | 3,030,207 |
| 2.625% 9/24/18 | | 262,000 | 264,732 |
| Huntington Bancshares, Inc.: | | | |
| 2.3% 1/14/22 | | 5,000,000 | 4,963,393 |
| 3.15% 3/14/21 | | 3,000,000 | 3,087,284 |
| 7% 12/15/20 | | 180,000 | 206,469 |
| Huntington National Bank 2.2% 4/1/19 | | 1,000,000 | 1,005,009 |
| ING Bank NV 1.8% 3/16/18 (a) | | 5,000,000 | 5,006,585 |
| ING Groep NV 3.15% 3/29/22 | | 5,250,000 | 5,378,025 |
| JPMorgan Chase & Co.: | | | |
| 2.2% 10/22/19 | | 10,058,000 | 10,153,512 |
| 2.25% 1/23/20 | | 8,000,000 | 8,066,195 |
| 2.35% 1/28/19 | | 1,942,000 | 1,960,901 |
| 2.55% 10/29/20 | | 7,500,000 | 7,609,797 |
| 2.75% 6/23/20 | | 7,000,000 | 7,145,742 |
| KeyCorp. 2.3% 12/13/18 | | 2,000,000 | 2,014,029 |
| La Caisse Centrale 1.75% 1/29/18 (a) | | 4,000,000 | 4,003,680 |
| Mitsubishi UFJ Financial Group, Inc.: | | | |
| 2.19% 9/13/21 | | 5,000,000 | 4,971,892 |
| 2.95% 3/1/21 | | 4,000,000 | 4,091,552 |
| 2.998% 2/22/22 | | 2,619,000 | 2,679,159 |
| Mizuho Bank Ltd.: | | | |
| 2.45% 4/16/19 (a) | | 1,400,000 | 1,410,543 |
| 2.65% 9/25/19 (a) | | 2,000,000 | 2,024,123 |
| Mizuho Financial Group, Inc.: | | | |
| 2.273% 9/13/21 | | 3,000,000 | 2,974,857 |
| 2.632% 4/12/21 (a) | | 5,180,000 | 5,217,417 |
| 2.953% 2/28/22 | | 6,000,000 | 6,101,235 |
| MUFG Americas Holdings Corp. 2.25% 2/10/20 | | 1,241,000 | 1,249,418 |
| Nordea Bank AB 2.375% 4/4/19 (a) | | 1,000,000 | 1,009,725 |
| PNC Bank NA: | | | |
| 1.8% 11/5/18 | | 2,000,000 | 2,004,260 |
| 2.15% 4/29/21 | | 5,000,000 | 5,014,015 |
| 2.4% 10/18/19 | | 3,000,000 | 3,035,123 |
| Regions Financial Corp.: | | | |
| 2.75% 8/14/22 | | 4,251,000 | 4,275,077 |
| 3.2% 2/8/21 | | 4,000,000 | 4,106,811 |
| Royal Bank of Canada: | | | |
| 1.5% 7/29/19 | | 5,000,000 | 4,974,192 |
| 2.125% 3/2/20 | | 5,350,000 | 5,386,341 |
| Royal Bank of Scotland Group PLC 3.875% 9/12/23 | | 7,000,000 | 7,166,474 |
| Sumitomo Mitsui Banking Corp.: | | | |
| 2.25% 7/11/19 | | 3,500,000 | 3,524,911 |
| 2.45% 1/10/19 | | 590,000 | 595,597 |
| 2.45% 1/16/20 | | 3,000,000 | 3,034,930 |
| 2.65% 7/23/20 | | 3,000,000 | 3,050,466 |
| Sumitomo Mitsui Financial Group, Inc. 2.934% 3/9/21 | | 2,449,000 | 2,502,471 |
| SunTrust Banks, Inc.: | | | |
| 2.5% 5/1/19 | | 550,000 | 555,980 |
| 2.9% 3/3/21 | | 2,828,000 | 2,892,177 |
| Synchrony Bank 3% 6/15/22 | | 2,328,000 | 2,331,649 |
| The Toronto-Dominion Bank: | | | |
| 2.125% 4/7/21 | | 4,000,000 | 4,014,678 |
| 2.25% 11/5/19 | | 2,000,000 | 2,018,941 |
| Wells Fargo & Co.: | | | |
| 1.5% 1/16/18 | | 1,300,000 | 1,300,029 |
| 2.15% 1/15/19 | | 5,500,000 | 5,538,885 |
| 2.6% 7/22/20 | | 13,000,000 | 13,214,434 |
| Westpac Banking Corp.: | | | |
| 1.6% 8/19/19 | | 5,000,000 | 4,981,570 |
| 2.8% 1/11/22 | | 5,000,000 | 5,120,971 |
| | | | 427,914,125 |
| Capital Markets - 6.2% | | | |
| Credit Suisse Group AG 3.574% 1/9/23 (a) | | 15,000,000 | 15,430,028 |
| Deutsche Bank AG 2.7% 7/13/20 | | 10,000,000 | 10,061,871 |
| Deutsche Bank AG London Branch: | | | |
| 2.5% 2/13/19 | | 2,250,000 | 2,261,309 |
| 2.85% 5/10/19 | | 10,968,000 | 11,091,338 |
| E*TRADE Financial Corp. 2.95% 8/24/22 | | 10,000,000 | 10,050,509 |
| Goldman Sachs Group, Inc.: | | | |
| 3 month U.S. LIBOR + 0.800% 2.0456% 12/15/17 (b)(c) | | 3,000,000 | 3,005,371 |
| 2.375% 1/22/18 | | 8,850,000 | 8,875,520 |
| 2.625% 1/31/19 | | 13,000,000 | 13,134,273 |
| 2.625% 4/25/21 | | 2,097,000 | 2,111,303 |
| 2.905% 7/24/23 (b) | | 10,000,000 | 10,039,596 |
| 5.95% 1/18/18 | | 1,693,000 | 1,719,466 |
| 6.15% 4/1/18 | | 402,000 | 412,082 |
| IntercontinentalExchange, Inc.: | | | |
| 2.5% 10/15/18 | | 347,000 | 350,080 |
| 2.75% 12/1/20 | | 2,647,000 | 2,706,289 |
| Lazard Group LLC 4.25% 11/14/20 | | 543,000 | 576,665 |
| Legg Mason, Inc. 2.7% 7/15/19 | | 2,000,000 | 2,021,377 |
| Merrill Lynch & Co., Inc. 6.875% 4/25/18 | | 726,000 | 749,517 |
| Moody's Corp.: | | | |
| 2.625% 1/15/23 (a) | | 5,950,000 | 5,964,212 |
| 2.75% 7/15/19 | | 8,000,000 | 8,123,622 |
| 2.75% 12/15/21 | | 647,000 | 657,671 |
| Morgan Stanley: | | | |
| 2.375% 7/23/19 | | 9,660,000 | 9,734,508 |
| 2.5% 1/24/19 | | 1,750,000 | 1,766,463 |
| 2.5% 4/21/21 | | 6,200,000 | 6,241,953 |
| 2.625% 11/17/21 | | 5,350,000 | 5,392,813 |
| 2.65% 1/27/20 | | 11,000,000 | 11,173,729 |
| 4.875% 11/1/22 | | 7,000,000 | 7,623,486 |
| 5.5% 1/26/20 | | 2,000,000 | 2,158,998 |
| 5.625% 9/23/19 | | 112,000 | 120,039 |
| 7.3% 5/13/19 | | 603,000 | 656,426 |
| S&P Global, Inc. 2.5% 8/15/18 | | 1,049,000 | 1,055,799 |
| Thomson Reuters Corp. 1.65% 9/29/17 | | 5,050,000 | 5,050,173 |
| UBS AG London Branch 2.2% 6/8/20 (a) | | 8,000,000 | 8,034,504 |
| UBS AG Stamford Branch 2.375% 8/14/19 | | 5,843,000 | 5,902,545 |
| | | | 174,253,535 |
| Consumer Finance - 4.1% | | | |
| AerCap Ireland Capital Ltd./AerCap Global Aviation Trust 3.5% 5/26/22 | | 915,000 | 940,316 |
| Ally Financial, Inc.: | | | |
| 3.25% 2/13/18 | | 3,000,000 | 3,007,500 |
| 3.25% 11/5/18 | | 3,000,000 | 3,025,380 |
| 4.25% 4/15/21 | | 2,920,000 | 3,014,900 |
| American Express Credit Corp.: | | | |
| 2.125% 3/18/19 | | 5,520,000 | 5,553,807 |
| 2.2% 3/3/20 | | 5,000,000 | 5,040,563 |
| 2.25% 5/5/21 | | 4,000,000 | 4,019,166 |
| Capital One Financial Corp. 2.45% 4/24/19 | | 5,450,000 | 5,490,426 |
| Discover Financial Services 5.2% 4/27/22 | | 3,239,000 | 3,547,107 |
| Ford Motor Credit Co. LLC: | | | |
| 1.684% 9/8/17 | | 1,000,000 | 1,000,000 |
| 1.897% 8/12/19 | | 3,000,000 | 2,989,803 |
| 2.24% 6/15/18 | | 6,000,000 | 6,023,084 |
| 2.425% 6/12/20 | | 3,000,000 | 3,006,778 |
| 2.597% 11/4/19 | | 7,000,000 | 7,064,787 |
| 2.681% 1/9/20 | | 4,063,000 | 4,103,874 |
| 3.157% 8/4/20 | | 3,000,000 | 3,064,865 |
| 3.336% 3/18/21 | | 4,500,000 | 4,609,701 |
| 3.339% 3/28/22 | | 2,246,000 | 2,289,358 |
| Hyundai Capital America: | | | |
| 2% 3/19/18 (a) | | 1,891,000 | 1,892,391 |
| 2% 7/1/19 (a) | | 3,000,000 | 2,982,250 |
| 2.125% 10/2/17 (a) | | 2,437,000 | 2,437,665 |
| 2.55% 2/6/19 (a) | | 4,759,000 | 4,778,548 |
| 2.6% 3/19/20 (a) | | 2,000,000 | 2,010,584 |
| 2.875% 8/9/18 (a) | | 2,606,000 | 2,627,689 |
| Synchrony Financial: | | | |
| 2.6% 1/15/19 | | 5,887,000 | 5,929,010 |
| 2.7% 2/3/20 | | 2,500,000 | 2,524,352 |
| 3% 8/15/19 | | 5,516,000 | 5,595,941 |
| Toyota Motor Credit Corp.: | | | |
| 1.55% 7/13/18 | | 5,000,000 | 5,002,550 |
| 1.55% 10/18/19 | | 2,244,000 | 2,237,451 |
| 2% 10/24/18 | | 2,500,000 | 2,514,754 |
| 2.6% 1/11/22 | | 5,500,000 | 5,606,679 |
| | | | 113,931,279 |
| Diversified Financial Services - 0.8% | | | |
| Berkshire Hathaway, Inc. 2.2% 3/15/21 | | 1,436,000 | 1,453,358 |
| Brixmor Operating Partnership LP 3.875% 8/15/22 | | 2,222,000 | 2,297,462 |
| GE Capital International Funding Co. 2.342% 11/15/20 | | 11,630,000 | 11,772,421 |
| General Electric Capital Corp. 2.2% 1/9/20 | | 2,577,000 | 2,605,889 |
| ING Bank NV 1.65% 8/15/19 (a) | | 4,000,000 | 3,974,360 |
| | | | 22,103,490 |
| Insurance - 4.9% | | | |
| ACE INA Holdings, Inc. 2.3% 11/3/20 | | 1,173,000 | 1,185,720 |
| AFLAC, Inc. 2.4% 3/16/20 | | 6,000,000 | 6,080,745 |
| AIA Group Ltd. 2.25% 3/11/19 (a) | | 8,529,000 | 8,538,315 |
| American International Group, Inc.: | | | |
| 2.3% 7/16/19 | | 10,304,000 | 10,381,474 |
| 3.3% 3/1/21 | | 4,987,000 | 5,161,312 |
| 4.875% 6/1/22 | | 1,484,000 | 1,640,458 |
| Aon Corp. 5% 9/30/20 | | 2,178,000 | 2,358,970 |
| Aon PLC 2.8% 3/15/21 | | 7,000,000 | 7,129,917 |
| Assurant, Inc. 2.5% 3/15/18 | | 2,000,000 | 2,007,380 |
| Great-West Life & Annuity Insurance Co. 3 month U.S. LIBOR + 2.538% 3.8522% 5/16/46 (a)(b)(c) | | 259,000 | 255,115 |
| Hartford Financial Services Group, Inc. 5.5% 3/30/20 | | 4,601,000 | 4,989,738 |
| Liberty Mutual Group, Inc. 5% 6/1/21 (a) | | 16,714,000 | 18,253,474 |
| Marsh & McLennan Companies, Inc.: | | | |
| 2.35% 3/6/20 | | 5,000,000 | 5,054,793 |
| 2.75% 1/30/22 | | 2,231,000 | 2,275,104 |
| 3.3% 3/14/23 | | 1,731,000 | 1,796,372 |
| MassMutual Global Funding II: | | | |
| 2.35% 4/9/19 (a) | | 1,000,000 | 1,009,853 |
| 2.5% 4/13/22 (a) | | 5,440,000 | 5,473,535 |
| Metropolitan Life Global Funding I: | | | |
| 1.5% 1/10/18 (a) | | 4,431,000 | 4,431,835 |
| 2% 4/14/20 (a) | | 3,000,000 | 3,007,229 |
| 2.65% 4/8/22 (a) | | 5,000,000 | 5,081,247 |
| New York Life Global Funding 1.55% 11/2/18 (a) | | 3,500,000 | 3,503,268 |
| Pacific LifeCorp 6% 2/10/20 (a) | | 10,698,000 | 11,615,720 |
| Pricoa Global Funding I 1.6% 5/29/18 (a) | | 967,000 | 967,123 |
| Principal Life Global Funding II 2.375% 9/11/19 (a) | | 2,200,000 | 2,221,965 |
| Protective Life Global Funding 2.615% 8/22/22 (a) | | 10,240,000 | 10,307,807 |
| Prudential Financial, Inc. 3.5% 5/15/24 | | 2,550,000 | 2,683,651 |
| TIAA Asset Management Finance LLC 2.95% 11/1/19 (a) | | 5,280,000 | 5,369,165 |
| Unum Group 5.625% 9/15/20 | | 2,743,000 | 3,007,697 |
| | | | 135,788,982 |
|
| TOTAL FINANCIALS | | | 873,991,411 |
|
| HEALTH CARE - 5.9% | | | |
| Biotechnology - 0.7% | | | |
| AbbVie, Inc.: | | | |
| 1.8% 5/14/18 | | 3,972,000 | 3,976,066 |
| 2.5% 5/14/20 | | 5,952,000 | 6,028,233 |
| Amgen, Inc.: | | | |
| 2.125% 5/1/20 | | 1,618,000 | 1,627,591 |
| 2.2% 5/22/19 | | 4,290,000 | 4,314,431 |
| Celgene Corp.: | | | |
| 2.125% 8/15/18 | | 1,549,000 | 1,555,858 |
| 2.875% 8/15/20 | | 3,000,000 | 3,075,363 |
| | | | 20,577,542 |
| Health Care Equipment & Supplies - 1.5% | | | |
| Abbott Laboratories: | | | |
| 2.35% 11/22/19 | | 5,000,000 | 5,044,025 |
| 2.8% 9/15/20 | | 4,182,000 | 4,251,605 |
| 2.9% 11/30/21 | | 4,980,000 | 5,066,037 |
| Becton, Dickinson & Co.: | | | |
| 2.675% 12/15/19 | | 287,000 | 291,136 |
| 2.894% 6/6/22 | | 15,000,000 | 15,066,353 |
| Danaher Corp.: | | | |
| 1.65% 9/15/18 | | 3,976,000 | 3,979,743 |
| 2.4% 9/15/20 | | 619,000 | 629,207 |
| Medtronic, Inc.: | | | |
| 1.5% 3/15/18 | | 1,770,000 | 1,769,962 |
| 2.5% 3/15/20 | | 2,200,000 | 2,237,952 |
| Zimmer Biomet Holdings, Inc. 2% 4/1/18 | | 2,702,000 | 2,705,730 |
| | | | 41,041,750 |
| Health Care Providers & Services - 0.6% | | | |
| Cardinal Health, Inc. 1.95% 6/15/18 | | 462,000 | 463,233 |
| Express Scripts Holding Co. 2.25% 6/15/19 | | 1,000,000 | 1,004,498 |
| McKesson Corp. 2.284% 3/15/19 | | 686,000 | 690,104 |
| UnitedHealth Group, Inc.: | | | |
| 1.4% 10/15/17 | | 2,128,000 | 2,127,952 |
| 1.9% 7/16/18 | | 3,000,000 | 3,008,996 |
| 2.125% 3/15/21 | | 3,000,000 | 3,013,519 |
| 2.7% 7/15/20 | | 1,361,000 | 1,395,621 |
| 2.875% 12/15/21 | | 2,000,000 | 2,061,063 |
| WellPoint, Inc.: | | | |
| 1.875% 1/15/18 | | 326,000 | 326,095 |
| 2.25% 8/15/19 | | 2,950,000 | 2,969,985 |
| | | | 17,061,066 |
| Life Sciences Tools & Services - 0.3% | | | |
| Thermo Fisher Scientific, Inc.: | | | |
| 2.15% 12/14/18 | | 881,000 | 884,608 |
| 2.4% 2/1/19 | | 3,086,000 | 3,108,496 |
| 3% 4/15/23 | | 5,000,000 | 5,103,994 |
| | | | 9,097,098 |
| Pharmaceuticals - 2.8% | | | |
| Actavis Funding SCS: | | | |
| 3% 3/12/20 | | 11,438,000 | 11,673,394 |
| 3.45% 3/15/22 | | 5,000,000 | 5,194,767 |
| Bayer U.S. Finance LLC 1.5% 10/6/17 (a) | | 1,863,000 | 1,862,932 |
| Mylan N.V.: | | | |
| 2.5% 6/7/19 | | 9,824,000 | 9,856,007 |
| 3% 12/15/18 | | 3,000,000 | 3,031,124 |
| 3.15% 6/15/21 | | 2,306,000 | 2,338,791 |
| Perrigo Co. PLC 3.5% 3/15/21 | | 1,920,000 | 1,978,439 |
| Perrigo Finance PLC 3.5% 12/15/21 | | 1,375,000 | 1,425,318 |
| Shire Acquisitions Investments Ireland DAC: | | | |
| 1.9% 9/23/19 | | 5,000,000 | 4,985,006 |
| 2.4% 9/23/21 | | 7,000,000 | 6,949,793 |
| Teva Pharmaceutical Finance Netherlands III BV: | | | |
| 1.7% 7/19/19 | | 8,234,000 | 8,047,002 |
| 2.2% 7/21/21 | | 13,726,000 | 13,062,529 |
| 2.8% 7/21/23 | | 1,238,000 | 1,166,714 |
| Zoetis, Inc.: | | | |
| 1.875% 2/1/18 | | 5,445,000 | 5,444,839 |
| 3.45% 11/13/20 | | 493,000 | 512,486 |
| | | | 77,529,141 |
|
| TOTAL HEALTH CARE | | | 165,306,597 |
|
| INDUSTRIALS - 2.0% | | | |
| Aerospace & Defense - 0.5% | | | |
| BAE Systems Holdings, Inc. 2.85% 12/15/20 (a) | | 5,615,000 | 5,712,056 |
| Lockheed Martin Corp. 2.5% 11/23/20 | | 2,361,000 | 2,401,797 |
| Rockwell Collins, Inc. 1.95% 7/15/19 | | 2,148,000 | 2,150,712 |
| The Boeing Co. 1.65% 10/30/20 | | 3,000,000 | 2,995,171 |
| | | | 13,259,736 |
| Airlines - 0.2% | | | |
| Continental Airlines, Inc.: | | | |
| 6.648% 9/15/17 | | 18,172 | 18,172 |
| 6.795% 8/2/18 | | 1,040 | 1,071 |
| 6.9% 1/2/18 | | 5,585 | 5,641 |
| Delta Air Lines, Inc. 2.875% 3/13/20 | | 5,500,000 | 5,588,304 |
| U.S. Airways pass-thru trust certificates: | | | |
| 6.85% 1/30/18 | | 32,656 | 33,309 |
| 8.36% 1/20/19 | | 29,200 | 29,200 |
| | | | 5,675,697 |
| Electrical Equipment - 0.1% | | | |
| Fortive Corp.: | | | |
| 1.8% 6/15/19 | | 910,000 | 908,275 |
| 2.35% 6/15/21 | | 1,547,000 | 1,550,105 |
| | | | 2,458,380 |
| Industrial Conglomerates - 0.4% | | | |
| Roper Technologies, Inc.: | | | |
| 2.05% 10/1/18 | | 2,919,000 | 2,925,925 |
| 2.8% 12/15/21 | | 3,883,000 | 3,934,417 |
| 3% 12/15/20 | | 5,100,000 | 5,226,017 |
| | | | 12,086,359 |
| Machinery - 0.0% | | | |
| Ingersoll-Rand Luxembourg Finance SA 2.625% 5/1/20 | | 263,000 | 266,518 |
| Trading Companies & Distributors - 0.8% | | | |
| Air Lease Corp.: | | | |
| 2.125% 1/15/18 | | 414,000 | 414,576 |
| 2.625% 9/4/18 | | 1,628,000 | 1,641,420 |
| 2.625% 7/1/22 | | 5,000,000 | 4,993,901 |
| 3.375% 6/1/21 | | 8,097,000 | 8,352,583 |
| 3.75% 2/1/22 | | 1,228,000 | 1,290,692 |
| 3.875% 4/1/21 | | 500,000 | 523,569 |
| 4.75% 3/1/20 | | 605,000 | 642,676 |
| International Lease Finance Corp. 5.875% 4/1/19 | | 4,000,000 | 4,233,720 |
| | | | 22,093,137 |
|
| TOTAL INDUSTRIALS | | | 55,839,827 |
|
| INFORMATION TECHNOLOGY - 1.9% | | | |
| Communications Equipment - 0.3% | | | |
| Cisco Systems, Inc.: | | | |
| 1.65% 6/15/18 | | 3,000,000 | 3,005,303 |
| 2.125% 3/1/19 | | 1,500,000 | 1,512,239 |
| 2.45% 6/15/20 | | 3,000,000 | 3,061,154 |
| | | | 7,578,696 |
| Electronic Equipment & Components - 1.0% | | | |
| Amphenol Corp.: | | | |
| 1.55% 9/15/17 | | 1,426,000 | 1,425,995 |
| 2.2% 4/1/20 | | 5,000,000 | 5,023,205 |
| 3.2% 4/1/24 | | 896,000 | 915,704 |
| Diamond 1 Finance Corp./Diamond 2 Finance Corp.: | | | |
| 3.48% 6/1/19 (a) | | 4,200,000 | 4,292,423 |
| 4.42% 6/15/21 (a) | | 4,200,000 | 4,425,785 |
| Tyco Electronics Group SA: | | | |
| 2.35% 8/1/19 | | 3,000,000 | 3,018,554 |
| 2.375% 12/17/18 | | 4,049,000 | 4,072,394 |
| 6.55% 10/1/17 | | 4,476,000 | 4,491,353 |
| | | | 27,665,413 |
| IT Services - 0.1% | | | |
| The Western Union Co.: | | | |
| 2.875% 12/10/17 | | 773,000 | 775,107 |
| 3.65% 8/22/18 | | 3,111,000 | 3,166,843 |
| | | | 3,941,950 |
| Software - 0.2% | | | |
| Oracle Corp.: | | | |
| 1.9% 9/15/21 | | 5,000,000 | 4,987,616 |
| 2.25% 10/8/19 | | 1,552,000 | 1,572,254 |
| | | | 6,559,870 |
| Technology Hardware, Storage & Peripherals - 0.3% | | | |
| Apple, Inc. 2.85% 5/6/21 | | 850,000 | 877,761 |
| Hewlett Packard Enterprise Co. 2.85% 10/5/18 | | 4,000,000 | 4,041,960 |
| Xerox Corp. 2.75% 3/15/19 | | 2,585,000 | 2,599,821 |
| | | | 7,519,542 |
|
| TOTAL INFORMATION TECHNOLOGY | | | 53,265,471 |
|
| MATERIALS - 0.7% | | | |
| Chemicals - 0.5% | | | |
| Chevron Phillips Chemical Co. LLC / Chevron Phillips Chemical Co. LP 1.7% 5/1/18 (a) | | 5,340,000 | 5,344,481 |
| Ecolab, Inc.: | | | |
| 1.45% 12/8/17 | | 335,000 | 334,906 |
| 1.55% 1/12/18 | | 2,500,000 | 2,499,675 |
| Monsanto Co. 2.125% 7/15/19 | | 3,000,000 | 3,008,138 |
| Sherwin-Williams Co. 1.35% 12/15/17 | | 620,000 | 619,122 |
| | | | 11,806,322 |
| Metals & Mining - 0.2% | | | |
| Anglo American Capital PLC 3.625% 5/14/20 (a) | | 1,513,000 | 1,544,637 |
| Freeport-McMoRan, Inc.: | | | |
| 2.3% 11/14/17 | | 670,000 | 670,000 |
| 2.375% 3/15/18 | | 4,000,000 | 4,000,000 |
| | | | 6,214,637 |
|
| TOTAL MATERIALS | | | 18,020,959 |
|
| REAL ESTATE - 2.5% | | | |
| Equity Real Estate Investment Trusts (REITs) - 1.2% | | | |
| Alexandria Real Estate Equities, Inc. 4.6% 4/1/22 | | 189,000 | 203,235 |
| American Campus Communities Operating Partnership LP 3.35% 10/1/20 | | 1,272,000 | 1,309,831 |
| Boston Properties, Inc.: | | | |
| 3.7% 11/15/18 | | 1,787,000 | 1,820,523 |
| 5.875% 10/15/19 | | 446,000 | 479,709 |
| DDR Corp.: | | | |
| 3.5% 1/15/21 | | 360,000 | 366,733 |
| 3.9% 8/15/24 | | 390,000 | 394,779 |
| 4.25% 2/1/26 | | 1,865,000 | 1,882,166 |
| 4.625% 7/15/22 | | 779,000 | 824,644 |
| ERP Operating LP: | | | |
| 2.375% 7/1/19 | | 1,641,000 | 1,657,355 |
| 3.375% 6/1/25 | | 3,000,000 | 3,086,105 |
| Federal Realty Investment Trust: | | | |
| 2.55% 1/15/21 | | 5,000,000 | 5,056,672 |
| 5.9% 4/1/20 | | 5,000 | 5,472 |
| Government Properties Income Trust 3.75% 8/15/19 | | 3,000,000 | 3,044,774 |
| Health Care REIT, Inc.: | | | |
| 2.25% 3/15/18 | | 250,000 | 250,426 |
| 4.7% 9/15/17 | | 2,436,000 | 2,437,890 |
| Kimco Realty Corp. 3.3% 2/1/25 | | 5,500,000 | 5,539,943 |
| Omega Healthcare Investors, Inc. 4.375% 8/1/23 | | 2,877,000 | 3,005,339 |
| Select Income REIT 2.85% 2/1/18 | | 1,515,000 | 1,519,274 |
| Simon Property Group LP: | | | |
| 2.2% 2/1/19 | | 462,000 | 465,095 |
| 2.35% 1/30/22 | | 1,046,000 | 1,049,395 |
| United Dominion Realty Trust, Inc. 4.25% 6/1/18 | | 431,000 | 438,872 |
| | | | 34,838,232 |
| Real Estate Management & Development - 1.3% | | | |
| Brandywine Operating Partnership LP: | | | |
| 3.95% 2/15/23 | | 360,000 | 368,256 |
| 4.95% 4/15/18 | | 51,000 | 51,850 |
| Digital Realty Trust LP: | | | |
| 2.75% 2/1/23 | | 2,037,000 | 2,041,846 |
| 3.4% 10/1/20 | | 5,590,000 | 5,785,806 |
| 3.625% 10/1/22 | | 1,040,000 | 1,088,365 |
| Healthcare Trust of America Holdings LP 2.95% 7/1/22 | | 4,165,000 | 4,219,311 |
| Liberty Property LP 4.75% 10/1/20 | | 1,045,000 | 1,113,242 |
| Mack-Cali Realty LP: | | | |
| 2.5% 12/15/17 | | 439,000 | 439,482 |
| 4.5% 4/18/22 | | 185,000 | 190,423 |
| Ventas Realty LP 3.125% 6/15/23 | | 591,000 | 597,208 |
| Ventas Realty LP/Ventas Capital Corp.: | | | |
| 2% 2/15/18 | | 1,743,000 | 1,744,783 |
| 4% 4/30/19 | | 11,000,000 | 11,318,691 |
| 4.25% 3/1/22 | | 4,000,000 | 4,260,603 |
| Washington Prime Group LP 3.85% 4/1/20 | | 2,090,000 | 2,135,655 |
| | | | 35,355,521 |
|
| TOTAL REAL ESTATE | | | 70,193,753 |
|
| TELECOMMUNICATION SERVICES - 2.5% | | | |
| Diversified Telecommunication Services - 2.3% | | | |
| AT&T, Inc.: | | | |
| 2.375% 11/27/18 | | 10,000,000 | 10,066,254 |
| 2.45% 6/30/20 | | 5,088,000 | 5,131,471 |
| 2.8% 2/17/21 | | 4,000,000 | 4,054,339 |
| 5.875% 10/1/19 | | 5,034,000 | 5,421,525 |
| British Telecommunications PLC 2.35% 2/14/19 | | 4,296,000 | 4,324,268 |
| CenturyLink, Inc. 6.15% 9/15/19 | | 592,000 | 624,560 |
| Deutsche Telekom International Financial BV 6.75% 8/20/18 | | 2,911,000 | 3,048,198 |
| SBA Tower Trust 3.168% 4/9/47 (a) | | 7,000,000 | 7,085,843 |
| Verizon Communications, Inc.: | | | |
| 1.75% 8/15/21 | | 15,000,000 | 14,725,052 |
| 2.625% 2/21/20 | | 1,710,000 | 1,744,910 |
| 3% 11/1/21 | | 4,318,000 | 4,420,147 |
| 4.5% 9/15/20 | | 4,000,000 | 4,290,804 |
| | | | 64,937,371 |
| Wireless Telecommunication Services - 0.2% | | | |
| Vodafone Group PLC: | | | |
| 1.5% 2/19/18 | | 2,625,000 | 2,624,999 |
| 5.45% 6/10/19 | | 2,000,000 | 2,121,007 |
| | | | 4,746,006 |
|
| TOTAL TELECOMMUNICATION SERVICES | | | 69,683,377 |
|
| UTILITIES - 3.8% | | | |
| Electric Utilities - 2.0% | | | |
| American Electric Power Co., Inc. 1.65% 12/15/17 | | 1,827,000 | 1,827,234 |
| Commonwealth Edison Co. 2.15% 1/15/19 | | 188,000 | 189,190 |
| Duke Energy Corp.: | | | |
| 1.8% 9/1/21 | | 1,354,000 | 1,335,210 |
| 2.1% 6/15/18 | | 5,395,000 | 5,409,855 |
| Duquesne Light Holdings, Inc. 6.4% 9/15/20 (a) | | 48,000 | 53,796 |
| Edison International 2.95% 3/15/23 | | 730,000 | 743,853 |
| Eversource Energy: | | | |
| 1.45% 5/1/18 | | 153,000 | 152,903 |
| 2.5% 3/15/21 | | 896,000 | 902,913 |
| 2.75% 3/15/22 | | 3,489,000 | 3,549,572 |
| Exelon Corp.: | | | |
| 2.85% 6/15/20 | | 2,479,000 | 2,533,467 |
| 3.497% 6/1/22 (b) | | 7,287,000 | 7,553,956 |
| FirstEnergy Corp. 4.25% 3/15/23 | | 600,000 | 636,689 |
| FirstEnergy Solutions Corp. 6.05% 8/15/21 | | 655,000 | 299,663 |
| IPALCO Enterprises, Inc.: | | | |
| 3.45% 7/15/20 | | 2,576,000 | 2,601,760 |
| 3.7% 9/1/24 (a) | | 1,115,000 | 1,124,572 |
| LG&E and KU Energy LLC 3.75% 11/15/20 | | 5,002,000 | 5,232,017 |
| Nevada Power Co.: | | | |
| 6.5% 5/15/18 | | 1,562,000 | 1,613,547 |
| 6.5% 8/1/18 | | 273,000 | 284,982 |
| NextEra Energy Capital Holdings, Inc. 1.649% 9/1/18 | | 950,000 | 948,879 |
| PacifiCorp 5.5% 1/15/19 | | 2,750,000 | 2,888,080 |
| Pennsylvania Electric Co. 6.05% 9/1/17 | | 115,000 | 115,000 |
| PG&E Corp. 2.4% 3/1/19 | | 74,000 | 74,510 |
| Public Service Electric & Gas Co. 2.3% 9/15/18 | | 2,000,000 | 2,013,008 |
| Southern Co.: | | | |
| 1.85% 7/1/19 | | 3,000,000 | 3,002,481 |
| 2.35% 7/1/21 | | 5,250,000 | 5,243,699 |
| TECO Finance, Inc.: | | | |
| 3 month U.S. LIBOR + 0.600% 1.9041% 4/10/18 (b)(c) | | 3,000,000 | 3,004,001 |
| 5.15% 3/15/20 | | 252,000 | 269,191 |
| Xcel Energy, Inc. 2.4% 3/15/21 | | 1,050,000 | 1,059,602 |
| | | | 54,663,630 |
| Gas Utilities - 0.0% | | | |
| Texas Eastern Transmission LP 6% 9/15/17 (a) | | 1,096,000 | 1,097,190 |
| Independent Power and Renewable Electricity Producers - 0.2% | | | |
| Emera U.S. Finance LP: | | | |
| 2.15% 6/15/19 | | 557,000 | 557,822 |
| 2.7% 6/15/21 | | 548,000 | 553,640 |
| Kinder Morgan Finance Co. LLC 6% 1/15/18 (a) | | 2,500,000 | 2,535,742 |
| Southern Power Co.: | | | |
| 1.85% 12/1/17 | | 704,000 | 704,279 |
| 2.375% 6/1/20 | | 1,087,000 | 1,097,585 |
| | | | 5,449,068 |
| Multi-Utilities - 1.6% | | | |
| Ameren Illinois Co. 6.125% 11/15/17 | | 62,000 | 62,534 |
| Berkshire Hathaway Energy Co. 2% 11/15/18 | | 544,000 | 546,000 |
| CenterPoint Energy, Inc. 2.5% 9/1/22 | | 1,229,000 | 1,235,661 |
| Consolidated Edison, Inc.: | | | |
| 2% 3/15/20 | | 1,355,000 | 1,359,723 |
| 2% 5/15/21 | | 1,538,000 | 1,532,538 |
| Dominion Resources, Inc.: | | | |
| 3 month U.S. LIBOR + 2.300% 3.5964% 9/30/66 (b)(c) | | 651,000 | 596,902 |
| 3 month U.S. LIBOR + 2.825% 4.1214% 6/30/66 (b)(c) | | 567,000 | 549,281 |
| 1.4% 9/15/17 | | 3,225,000 | 3,224,925 |
| 1.9% 6/15/18 | | 2,540,000 | 2,544,788 |
| 2% 8/15/21 | | 843,000 | 831,594 |
| 2.5% 12/1/19 | | 10,382,000 | 10,503,628 |
| NiSource Finance Corp. 3.85% 2/15/23 | | 700,000 | 734,973 |
| NSTAR 4.5% 11/15/19 | | 2,500,000 | 2,631,830 |
| Public Service Enterprise Group, Inc. 2% 11/15/21 | | 1,782,000 | 1,755,083 |
| Puget Energy, Inc. 6.5% 12/15/20 | | 991,000 | 1,113,282 |
| Sempra Energy: | | | |
| 1.625% 10/7/19 | | 4,189,000 | 4,170,041 |
| 2.4% 3/15/20 | | 1,890,000 | 1,906,148 |
| 2.85% 11/15/20 | | 1,392,000 | 1,422,232 |
| Wisconsin Energy Corp.: | | | |
| 3 month U.S. LIBOR + 2.113% 3.4275% 5/15/67 (b)(c) | | 454,000 | 439,245 |
| 1.65% 6/15/18 | | 3,006,000 | 3,008,509 |
| 2.45% 6/15/20 | | 5,901,000 | 5,975,845 |
| | | | 46,144,762 |
|
| TOTAL UTILITIES | | | 107,354,650 |
|
| TOTAL NONCONVERTIBLE BONDS | | | |
| (Cost $1,911,925,023) | | | 1,926,966,221 |
|
| U.S. Treasury Obligations - 13.4% | | | |
| U.S. Treasury Notes: | | | |
| 1.125% 7/31/21 | | $45,000,000 | $44,203,711 |
| 1.375% 3/31/20 | | 54,612,000 | 54,601,334 |
| 1.375% 4/30/20 | | 6,478,000 | 6,474,457 |
| 1.375% 1/31/21 | | 45,000,000 | 44,785,547 |
| 1.5% 5/15/20 | | 8,065,000 | 8,085,478 |
| 1.75% 12/31/20 | | 62,000,000 | 62,484,370 |
| 1.75% 6/30/22 | | 39,871,000 | 39,944,201 |
| 1.875% 8/31/24 | | 39,386,000 | 39,192,142 |
| 2.125% 7/31/24 | | 17,248,000 | 17,450,799 |
| 2.25% 3/31/21 | | 55,000,000 | 56,347,070 |
| TOTAL U.S. TREASURY OBLIGATIONS | | | |
| (Cost $373,517,216) | | | 373,569,109 |
|
| U.S. Government Agency - Mortgage Securities - 0.3% | | | |
| Fannie Mae - 0.2% | | | |
| 12 month U.S. LIBOR + 1.685% 3.31% 1/1/40 (b)(c) | | 95,201 | 98,796 |
| 12 month U.S. LIBOR + 1.725% 2.583% 6/1/42 (b)(c) | | 38,568 | 39,860 |
| 12 month U.S. LIBOR + 1.728% 3.314% 11/1/36 (b)(c) | | 88,172 | 93,031 |
| 12 month U.S. LIBOR + 1.741% 3.332% 3/1/40 (b)(c) | | 59,310 | 62,929 |
| 12 month U.S. LIBOR + 1.800% 2.759% 1/1/42 (b)(c) | | 224,736 | 236,042 |
| 12 month U.S. LIBOR + 1.800% 3.558% 7/1/41 (b)(c) | | 37,029 | 38,577 |
| 12 month U.S. LIBOR + 1.805% 3.029% 10/1/41 (b)(c) | | 14,354 | 15,219 |
| 12 month U.S. LIBOR + 1.810% 3.435% 12/1/39 (b)(c) | | 22,959 | 24,107 |
| 12 month U.S. LIBOR + 1.815% 2.944% 11/1/40 (b)(c) | | 14,124 | 14,787 |
| 12 month U.S. LIBOR + 1.818% 2.695% 2/1/42 (b)(c) | | 334,671 | 351,261 |
| 12 month U.S. LIBOR + 1.818% 3.023% 9/1/41 (b)(c) | | 22,050 | 23,393 |
| 12 month U.S. LIBOR + 1.818% 3.231% 4/1/35 (b)(c) | | 258,521 | 273,282 |
| 12 month U.S. LIBOR + 1.818% 3.249% 7/1/41 (b)(c) | | 30,543 | 31,889 |
| 12 month U.S. LIBOR + 1.830% 3.38% 10/1/41 (b)(c) | | 19,668 | 20,882 |
| 12 month U.S. LIBOR + 1.835% 3.572% 3/1/40 (b)(c) | | 79,416 | 83,377 |
| 12 month U.S. LIBOR + 2.253% 2.994% 7/1/35 (b)(c) | | 55,265 | 58,492 |
| U.S. TREASURY 1 YEAR INDEX + 2.244% 3.105% 12/1/33 (b)(c) | | 462,832 | 488,847 |
| 3.5% 7/1/26 to 10/1/29 | | 2,957,046 | 3,103,673 |
| 4.5% 3/1/35 | | 28,019 | 30,299 |
| 6.5% 10/1/17 to 8/1/36 | | 347,086 | 402,150 |
| 7% 9/1/18 to 6/1/33 | | 227,308 | 266,209 |
| 7.5% 6/1/26 to 3/1/28 | | 67,945 | 78,767 |
| 8.5% 5/1/21 to 9/1/25 | | 4,338 | 4,887 |
| 9.5% 2/1/25 | | 218 | 226 |
| 10.5% 8/1/20 | | 1,781 | 1,831 |
|
| TOTAL FANNIE MAE | | | 5,842,813 |
|
| Freddie Mac - 0.1% | | | |
| 12 month U.S. LIBOR + 1.785% 3.529% 4/1/40 (b)(c) | | 55,774 | 58,350 |
| 12 month U.S. LIBOR + 1.877% 3.215% 4/1/41 (b)(c) | | 20,225 | 21,010 |
| 12 month U.S. LIBOR + 1.880% 3.222% 9/1/41 (b)(c) | | 22,843 | 24,241 |
| 12 month U.S. LIBOR + 1.905% 3.613% 2/1/40 (b)(c) | | 70,865 | 74,460 |
| 12 month U.S. LIBOR + 1.905% 3.655% 4/1/40 (b)(c) | | 64,103 | 67,323 |
| 12 month U.S. LIBOR + 1.910% 3.282% 6/1/41 (b)(c) | | 27,697 | 28,919 |
| 12 month U.S. LIBOR + 1.910% 3.421% 5/1/41 (b)(c) | | 22,488 | 23,876 |
| 12 month U.S. LIBOR + 1.910% 3.625% 5/1/41 (b)(c) | | 29,609 | 31,001 |
| 12 month U.S. LIBOR + 1.910% 3.647% 6/1/41 (b)(c) | | 31,466 | 32,938 |
| 3.5% 8/1/26 | | 2,032,407 | 2,129,320 |
| 4.5% 8/1/18 | | 44,505 | 45,018 |
| 5% 3/1/19 | | 77,367 | 78,415 |
| 8.5% 9/1/24 to 8/1/27 | | 24,514 | 28,690 |
|
| TOTAL FREDDIE MAC | | | 2,643,561 |
|
| Ginnie Mae - 0.0% | | | |
| 7% 7/15/28 to 11/15/28 | | 55,070 | 63,641 |
| 7.5% 2/15/28 to 10/15/28 | | 3,201 | 3,775 |
| 8% 6/15/24 | | 32 | 37 |
| 8.5% 10/15/21 | | 17,313 | 18,936 |
| 11% 7/20/19 | | 436 | 449 |
|
| TOTAL GINNIE MAE | | | 86,838 |
|
| TOTAL U.S. GOVERNMENT AGENCY - MORTGAGE SECURITIES | | | |
| (Cost $8,497,647) | | | 8,573,212 |
|
| Asset-Backed Securities - 5.5% | | | |
| Accredited Mortgage Loan Trust Series 2005-1 Class M1, 1 month U.S. LIBOR + 0.705% 1.9394% 4/25/35 (b)(c) | | $56,669 | $55,843 |
| ACE Securities Corp. Home Equity Loan Trust Series 2004-HE1 Class M2, 1 month U.S. LIBOR + 1.650% 2.8844% 3/25/34 (b)(c) | | 25,818 | 25,768 |
| Ally Master Owner Trust: | | | |
| Series 2012-5 Class A, 1.54% 9/15/19 | | 11,057,000 | 11,056,506 |
| Series 2014-5 Class A2, 1.6% 10/15/19 | | 3,000,000 | 3,000,299 |
| Series 2015-3 Class A, 1.63% 5/15/20 | | 3,130,000 | 3,130,763 |
| AmeriCredit Automobile Receivables Trust: | | | |
| Series 2014-4 Class A3, 1.27% 7/8/19 | | 56,396 | 56,387 |
| Series 2015-2 Class A3, 1.27% 1/8/20 | | 1,127,492 | 1,127,055 |
| Series 2016-1 Class A3, 1.81% 10/8/20 | | 1,888,000 | 1,890,704 |
| Series 2016-2 Class A2A, 1.42% 10/8/19 | | 837,950 | 837,760 |
| Ameriquest Mortgage Securities, Inc. pass-thru certificates: | | | |
| Series 2003-10 Class M1, 1 month U.S. LIBOR + 1.050% 2.2844% 12/25/33 (b)(c) | | 3,888 | 3,751 |
| Series 2004-R2 Class M3, 1 month U.S. LIBOR + 0.825% 2.0594% 4/25/34 (b)(c) | | 10,238 | 9,098 |
| Argent Securities, Inc. pass-thru certificates: | | | |
| Series 2003-W7 Class A2, 1 month U.S. LIBOR + 0.780% 2.0144% 3/25/34 (b)(c) | | 4,092 | 3,863 |
| Series 2004-W11 Class M2, 1 month U.S. LIBOR + 1.050% 2.2844% 11/25/34 (b)(c) | | 52,658 | 52,435 |
| Series 2004-W7 Class M1, 1 month U.S. LIBOR + 0.825% 2.0594% 5/25/34 (b)(c) | | 145,622 | 139,730 |
| Series 2006-W4 Class A2C, 1 month U.S. LIBOR + 0.160% 1.3944% 5/25/36 (b)(c) | | 123,946 | 48,118 |
| Asset Backed Securities Corp. Home Equity Loan Trust: | | | |
| Series 2004-HE2 Class M1, 1 month U.S. LIBOR + 0.825% 2.0594% 4/25/34 (b)(c) | | 118,260 | 110,923 |
| Series 2006-HE2 Class M1, 1 month U.S. LIBOR + 0.370% 1.6044% 3/25/36 (b)(c) | | 2,306 | 842 |
| Bear Stearns Asset Backed Securities I Trust Series 2005-HE2 Class M2, 1 month U.S. LIBOR + 1.125% 2.3594% 2/25/35 (b)(c) | | 314,243 | 315,584 |
| Capital One Multi-Asset Execution Trust Series 2016-A4 Class A4, 1.33% 6/15/22 | | 4,860,000 | 4,835,587 |
| Carrington Mortgage Loan Trust Series 2007-RFC1 Class A3, 1 month U.S. LIBOR + 0.140% 1.3744% 12/25/36 (b)(c) | | 205,465 | 171,086 |
| Chesapeake Funding II LLC Series 2017-2A Class A1, 1.99% 5/15/29 (a) | | 4,582,000 | 4,595,710 |
| Chrysler Capital Auto Receivables Trust: | | | |
| Series 2015-AA Class A3, 1.22% 7/15/19 (a) | | 367,531 | 367,433 |
| Series 2016-BA Class A2, 1.36% 1/15/20 (a) | | 3,034,046 | 3,031,792 |
| CIT Equipment Collateral Series 2014-VT1 Class A3, 1.5% 10/21/19 (a) | | 424,386 | 424,329 |
| Citibank Credit Card Issuance Trust Series 2014-A6 Class A6, 2.15% 7/15/21 | | 2,896,000 | 2,923,608 |
| Countrywide Home Loans, Inc.: | | | |
| Series 2003-BC1 Class B1, 1 month U.S. LIBOR + 5.250% 6.4844% 3/25/32 (b)(c) | | 9,741 | 9,734 |
| Series 2004-3 Class M4, 1 month U.S. LIBOR + 1.455% 2.6894% 4/25/34 (b)(c) | | 5,913 | 5,575 |
| Series 2004-4 Class M2, 1 month U.S. LIBOR + 0.795% 2.0294% 6/25/34 (b)(c) | | 6,708 | 6,664 |
| Credit Suisse First Boston Mortgage Securities Corp.: | | | |
| Series 2003-2 Class M1, 1 month U.S. LIBOR + 1.320% 2.5544% 8/25/33 (b)(c) | | 26,426 | 26,037 |
| Series 2003-5 Class A2, 1 month U.S. LIBOR + 0.700%1.9322% 12/25/33 (b)(c) | | 2,817 | 2,729 |
| Discover Card Master Trust: | | | |
| Series 2016-A1 Class A1, 1.64% 7/15/21 | | 3,630,000 | 3,635,528 |
| Series 2016-A4 Class A4, 1.39% 3/15/22 | | 5,019,000 | 4,996,131 |
| Enterprise Fleet Financing LLC: | | | |
| Series 2014-2 Class A2, 1.05% 3/20/20 (a) | | 146,993 | 146,913 |
| Series 2015-1 Class A2, 1.3% 9/20/20 (a) | | 533,923 | 533,653 |
| Series 2016-2 Class A2, 1.74% 2/22/22 (a) | | 2,007,810 | 2,007,332 |
| Series 2017-1 Class A2, 2.13% 7/20/22 (a) | | 3,338,000 | 3,355,295 |
| Fannie Mae Series 2004-T5 Class AB3, 1 month U.S. LIBOR + 0.392% 1.9452% 5/28/35 (b)(c) | | 4,436 | 4,272 |
| Fieldstone Mortgage Investment Corp. Series 2004-3 Class M5, 1 month U.S. LIBOR + 2.175% 3.4094% 8/25/34 (b)(c) | | 24,752 | 24,058 |
| Flagship Credit Auto Trust Series 2016-1 Class A, 2.77% 12/15/20 (a) | | 1,695,125 | 1,706,528 |
| Ford Credit Auto Owner Trust: | | | |
| Series 2014-2 Class A, 2.31% 4/15/26 (a) | | 9,142,000 | 9,247,910 |
| Series 2015-1 Class A, 2.12% 7/15/26 (a) | | 2,785,000 | 2,807,361 |
| Series 2015-2 Class A, 2.44% 1/15/27 (a) | | 6,181,000 | 6,276,836 |
| Series 2016-1 Class A, 2.31% 8/15/27 (a) | | 5,938,000 | 6,003,618 |
| Series 2017-1 Class A, 2.62% 8/15/28 (a) | | 5,415,000 | 5,525,371 |
| Ford Credit Floorplan Master Owner Trust: | | | |
| Series 2015-1 Class A1, 1.42% 1/15/20 | | 6,000,000 | 5,998,474 |
| Series 2015-5 Class A, 2.39% 8/15/22 | | 10,511,000 | 10,661,376 |
| Series 2016-3 Class A1, 1.55% 7/15/21 | | 4,844,000 | 4,830,215 |
| Fremont Home Loan Trust Series 2005-A: | | | |
| Class M3, 1 month U.S. LIBOR + 0.735% 1.9694% 1/25/35 (b)(c) | | 81,136 | 79,355 |
| Class M4, 1 month U.S. LIBOR + 1.020% 2.2544% 1/25/35 (b)(c) | | 39,567 | 23,125 |
| GCO Education Loan Funding Master Trust II Series 2007-1A Class C1L, 3 month U.S. LIBOR + 0.380% 1.6972% 2/25/47 (a)(b)(c) | | 56,869 | 53,827 |
| GE Business Loan Trust Series 2006-2A: | | | |
| Class A, 1 month U.S. LIBOR + 0.180% 1.4089% 11/15/34 (a)(b)(c) | | 52,391 | 50,707 |
| Class B, 1 month U.S. LIBOR + 0.280% 1.5067% 11/15/34 (a)(b)(c) | | 19,009 | 17,783 |
| Class C, 1 month U.S. LIBOR + 0.380% 1.6067% 11/15/34 (a)(b)(c) | | 31,373 | 29,085 |
| Class D, 1 month U.S. LIBOR + 0.750% 1.9767% 11/15/34 (a)(b)(c) | | 11,900 | 10,850 |
| GM Financial Automobile Leasing Trust Series 2015-1 Class A3, 1.53% 9/20/18 | | 938,774 | 938,885 |
| GMF Floorplan Owner Revolving Trust: | | | |
| Series 2015-1 Class A1, 1.65% 5/15/20 (a) | | 3,732,000 | 3,733,955 |
| Series 2016-1 Class A1, 1.86% 5/17/21 (a) | | 3,160,000 | 3,173,194 |
| Series 2017-1 Class A1, 2.22% 1/18/22 (a) | | 4,092,000 | 4,119,202 |
| GSAMP Trust Series 2004-AR1 Class B4, 5.5% 6/25/34 (a) | | 19,112 | 1,603 |
| HSI Asset Securitization Corp. Trust Series 2007-HE1 Class 2A3, 1 month U.S. LIBOR + 0.190% 1.4244% 1/25/37 (b)(c) | | 135,907 | 96,745 |
| Hyundai Auto Lease Securitization Trust Series 2015-B Class A3, 1.4% 11/15/18 (a) | | 1,303,622 | 1,303,561 |
| Hyundai Floorplan Master Owner Trust Series 2016-1A Class A2, 1.81% 3/15/21 (a) | | 2,151,000 | 2,151,162 |
| Keycorp Student Loan Trust Series 2006-A Class 2C, 3 month U.S. LIBOR + 1.150% 2.4433% 3/27/42 (b)(c) | | 392,000 | 270,674 |
| MASTR Asset Backed Securities Trust Series 2007-HE1 Class M1, 1 month U.S. LIBOR + 0.300% 1.5344% 5/25/37 (b)(c) | | 31,431 | 9,402 |
| Mercedes-Benz Auto Receivables Trust Series 2016-1 Class A3, 1.26% 2/16/21 | | 4,798,000 | 4,778,609 |
| Meritage Mortgage Loan Trust Series 2004-1 Class M1, 1 month U.S. LIBOR + 0.750% 1.9844% 7/25/34 (b)(c) | | 11,142 | 10,490 |
| Merrill Lynch Mortgage Investors Trust: | | | |
| Series 2003-OPT1 Class M1, 1 month U.S. LIBOR + 0.975% 2.2094% 7/25/34 (b)(c) | | 16,316 | 15,776 |
| Series 2006-FM1 Class A2B, 1 month U.S. LIBOR + 0.110% 1.3444% 4/25/37 (b)(c) | | 251 | 154 |
| Series 2006-OPT1 Class A1A, 1 month U.S. LIBOR + 0.520% 1.7544% 6/25/35 (b)(c) | | 122,451 | 118,738 |
| Morgan Stanley ABS Capital I Trust: | | | |
| Series 2004-HE6 Class A2, 1 month U.S. LIBOR + 0.680% 1.9144% 8/25/34 (b)(c) | | 4,895 | 4,355 |
| Series 2004-NC8 Class M6, 1 month U.S. LIBOR + 1.875% 3.1094% 9/25/34 (b)(c) | | 44,974 | 44,337 |
| Series 2005-NC1 Class M1, 1 month U.S. LIBOR + 0.660% 1.8944% 1/25/35 (b)(c) | | 13,946 | 13,444 |
| Series 2005-NC2 Class B1, 1 month U.S. LIBOR + 1.755% 2.9894% 3/25/35 (b)(c) | | 14,235 | 465 |
| Nationstar HECM Loan Trust Series 2016-3A Class A, 2.0125% 8/25/26 (a) | | 2,848,274 | 2,842,894 |
| New Century Home Equity Loan Trust Series 2005-4 Class M2, 1 month U.S. LIBOR + 0.510% 1.7444% 9/25/35 (b)(c) | | 162,650 | 159,420 |
| Nissan Master Owner Trust Receivables Series 2016-A Class A2, 1.54% 6/15/21 | | 2,442,000 | 2,434,294 |
| Park Place Securities, Inc.: | | | |
| Series 2004-WCW1: | | | |
| Class M3, 1 month U.S. LIBOR + 1.875% 3.1072% 9/25/34 (b)(c) | | 54,672 | 54,130 |
| Class M4, 1 month U.S. LIBOR + 2.175% 3.4072% 9/25/34 (b)(c) | | 77,891 | 62,840 |
| Series 2005-WCH1 Class M4, 1 month U.S. LIBOR + 1.245% 2.4794% 1/25/36 (b)(c) | | 126,217 | 124,314 |
| Prosper Marketplace Issuance Trust Series 2017-2A Class A, 2.42% 9/15/23 (a) | | 5,000,000 | 5,008,770 |
| Salomon Brothers Mortgage Securities VII, Inc. Series 2003-HE1 Class A, 1 month U.S. LIBOR + 0.800% 2.0344% 4/25/33 (b)(c) | | 582 | 530 |
| Saxon Asset Securities Trust Series 2004-1 Class M1, 1 month U.S. LIBOR + 0.795% 2.0294% 3/25/35 (b)(c) | | 54,943 | 53,895 |
| Securitized Term Auto Receivables Trust Series 2016-1A Class A3, 1.524% 3/25/20 (a) | | 2,886,000 | 2,876,413 |
| SLM Private Credit Student Loan Trust Series 2004-A Class C, 3 month U.S. LIBOR + 0.950% 2.1956% 6/15/33 (b)(c) | | 20,694 | 20,674 |
| Structured Asset Investment Loan Trust Series 2004-8 Class M5, 1 month U.S. LIBOR + 1.725% 2.9594% 9/25/34 (b)(c) | | 3,760 | 3,476 |
| Synchrony Credit Card Master Note Trust Series 2016-1 Class A, 2.04% 3/15/22 | | 1,000,000 | 1,006,002 |
| TCF Auto Receivables Owner Trust Series 2016-1A Class A2, 1.39% 11/15/19 (a) | | 1,751,029 | 1,749,646 |
| Terwin Mortgage Trust Series 2003-4HE Class A1, 1 month U.S. LIBOR + 0.860% 2.0944% 9/25/34 (b)(c) | | 2,472 | 2,346 |
| Trapeza CDO XII Ltd./Trapeza CDO XII, Inc. Series 2007-12A Class B, 3 month U.S. LIBOR + 0.560% 1.7098% 4/6/42 (a)(b)(c)(d) | | 304,000 | 153,520 |
| Verizon Owner Trust: | | | |
| Series 2016-1A Class A, 1.42% 1/20/21 (a) | | 4,069,000 | 4,056,376 |
| Series 2016-2A Class A, 1.68% 5/20/21 (a) | | 5,279,000 | 5,277,258 |
| Volvo Financial Equipment LLC Series 2015-1A Class A3, 1.51% 6/17/19 (a) | | 1,225,804 | 1,226,282 |
| TOTAL ASSET-BACKED SECURITIES | | | |
| (Cost $152,963,366) | | | 154,189,147 |
|
| Collateralized Mortgage Obligations - 1.1% | | | |
| Private Sponsor - 0.3% | | | |
| Credit Suisse Mortgage Trust Series 2012-2R Class 1A1, 3.2057% 5/27/35 (a)(b) | | 340,240 | 342,264 |
| CSAIL Commercial Mortgage Trust Series 2015-C2 Class ASB, 3.2241% 6/15/57 | | 1,352,000 | 1,398,457 |
| Merrill Lynch Alternative Note Asset Trust floater Series 2007-OAR1 Class A1, 1 month U.S. LIBOR + 0.170% 1.3861% 2/25/37 (b)(c) | | 35,565 | 34,621 |
| Mortgage Repurchase Agreement Funding Trust floater Series 2016-5 Class A, 1 month U.S. LIBOR + 1.170% 2.4006% 6/10/19 (a)(b)(c) | | 7,000,000 | 6,988,877 |
| RESI Finance LP/RESI Finance DE Corp. floater Series 2003-B: | | | |
| Class B5, 1 month U.S. LIBOR + 2.350% 3.5744% 6/10/35 (a)(b)(c) | | 25,906 | 18,410 |
| Class B6, 1 month U.S. LIBOR + 2.850% 4.0744% 6/10/35 (a)(b)(c) | | 43,098 | 23,819 |
| Sequoia Mortgage Trust floater Series 2004-6 Class A3B, 6 month U.S. LIBOR + 0.880% 2.3127% 7/20/34 (b)(c) | | 2,195 | 2,167 |
|
| TOTAL PRIVATE SPONSOR | | | 8,808,615 |
|
| U.S. Government Agency - 0.8% | | | |
| Fannie Mae: | | | |
| pass-thru certificates Series 2012-127 Class DH, 4% 11/25/27 | | 205,457 | 212,372 |
| planned amortization class Series 2015-28 Class P, 2.5% 5/25/45 | | 5,757,087 | 5,804,361 |
| Series 2014-57 Class A, 3% 9/25/44 | | 1,572,439 | 1,598,932 |
| Series 2015-28 Class JE, 3% 5/25/45 | | 4,041,484 | 4,154,041 |
| Freddie Mac: | | | |
| Series 3777 Class AC, 3.5% 12/15/25 | | 337,533 | 349,801 |
| Series 3949 Class MK, 4.5% 10/15/34 | | 154,087 | 165,288 |
| Series 4472 Class WL, 3% 5/15/45 | | 1,843,213 | 1,895,870 |
| Ginnie Mae guaranteed REMIC pass-thru certificates Series 2015-H17 Class HA, 2.5% 5/20/65 (e) | | 6,549,518 | 6,600,950 |
|
| TOTAL U.S. GOVERNMENT AGENCY | | | 20,781,615 |
|
| TOTAL COLLATERALIZED MORTGAGE OBLIGATIONS | | | |
| (Cost $29,834,952) | | | 29,590,230 |
|
| Commercial Mortgage Securities - 5.9% | | | |
| 7 WTC Depositor LLC Trust Series 2012-7WTC Class A, 4.0824% 3/13/31 (a) | | 174,689 | 176,073 |
| Asset Securitization Corp. Series 1997-D5 Class PS1, 1.6895% 2/14/43 (b)(f) | | 7,049 | 61 |
| Bank of America Commercial Mortgage Trust Series 2016-UB10 Class A2, 2.723% 7/15/49 | | 2,685,000 | 2,734,527 |
| Barclays Commercial Mortgage Securities LLC: | | | |
| floater Series 2015-RRI Class A, 1 month U.S. LIBOR + 1.250% 2.4089% 5/15/32 (a)(b)(c) | | 1,927,035 | 1,927,033 |
| Series 2015-STP Class A, 3.3228% 9/10/28 (a) | | 7,379,258 | 7,611,149 |
| Bayview Commercial Asset Trust floater: | | | |
| Series 2003-2 Class M1, 1 month U.S. LIBOR + 0.850% 2.5094% 12/25/33 (a)(b)(c) | | 2,411 | 2,284 |
| Series 2005-4A: | | | |
| Class A2, 1 month U.S. LIBOR + 0.390% 1.6244% 1/25/36 (a)(b)(c) | | 65,813 | 60,969 |
| Class B1, 1 month U.S. LIBOR + 1.400% 2.6344% 1/25/36 (a)(b)(c) | | 2,953 | 2,419 |
| Class M1, 1 month U.S. LIBOR + 0.450% 1.6844% 1/25/36 (a)(b)(c) | | 21,230 | 19,697 |
| Class M2, 1 month U.S. LIBOR + 0.470% 1.7044% 1/25/36 (a)(b)(c) | | 6,369 | 5,658 |
| Class M3, 1 month U.S. LIBOR + 0.500% 1.7344% 1/25/36 (a)(b)(c) | | 9,301 | 7,672 |
| Class M4, 1 month U.S. LIBOR + 0.610% 1.8444% 1/25/36 (a)(b)(c) | | 5,144 | 4,676 |
| Class M5, 1 month U.S. LIBOR + 0.650% 1.8844% 1/25/36 (a)(b)(c) | | 5,144 | 3,925 |
| Class M6, 1 month U.S. LIBOR + 0.700% 1.9344% 1/25/36 (a)(b)(c) | | 5,464 | 4,196 |
| Series 2006-3A Class M4, 1 month U.S. LIBOR + 0.430% 1.6644% 10/25/36 (a)(b)(c) | | 2,880 | 2,249 |
| Series 2007-1 Class A2, 1 month U.S. LIBOR + 0.270% 1.5044% 3/25/37 (a)(b)(c) | | 43,147 | 38,213 |
| Series 2007-2A: | | | |
| Class A1, 1 month U.S. LIBOR + 0.270% 1.4861% 7/25/37 (a)(b)(c) | | 44,505 | 41,965 |
| Class A2, 1 month U.S. LIBOR + 0.320% 1.5361% 7/25/37 (a)(b)(c) | | 41,608 | 38,276 |
| Class M1, 1 month U.S. LIBOR + 0.370% 1.5861% 7/25/37 (a)(b)(c) | | 14,611 | 11,658 |
| Class M2, 1 month U.S. LIBOR + 0.410% 1.6261% 7/25/37 (a)(b)(c) | | 7,894 | 6,312 |
| Class M3, 1 month U.S. LIBOR + 0.490% 1.7061% 7/25/37 (a)(b)(c) | | 6,190 | 5,150 |
| Series 2007-3: | | | |
| Class A2, 1 month U.S. LIBOR + 0.290% 1.5061% 7/25/37 (a)(b)(c) | | 39,735 | 37,033 |
| Class M1, 1 month U.S. LIBOR + 0.310% 1.5261% 7/25/37 (a)(b)(c) | | 8,815 | 7,905 |
| Class M2, 1 month U.S. LIBOR + 0.340% 1.5561% 7/25/37 (a)(b)(c) | | 9,457 | 8,428 |
| Class M3, 1 month U.S. LIBOR + 0.370% 1.5861% 7/25/37 (a)(b)(c) | | 14,589 | 11,143 |
| Class M4, 1 month U.S. LIBOR + 0.500% 1.7161% 7/25/37 (a)(b)(c) | | 23,084 | 15,815 |
| Class M5, 1 month U.S. LIBOR + 0.600% 1.8161% 7/25/37 (a)(b)(c) | | 8,701 | 4,721 |
| Series 2007-4A Class M1, 1 month U.S. LIBOR + 0.950% 2.1844% 9/25/37 (a)(b)(c) | | 1,099 | 409 |
| CGBAM Commercial Mortgage Trust Series 2015-SMRT Class A, 2.808% 4/10/28 (a) | | 6,819,000 | 6,945,057 |
| CGDBB Commercial Mortgage Trust floater Series 2017-BIOC Class A, 1 month U.S. LIBOR + 0.790% 2% 7/15/28 (a)(b)(c) | | 3,948,000 | 3,948,851 |
| CGMS Commercial Mortgage Trust Series 2017-MDRA Class A, 3.2% 7/10/30 (a) | | 10,000,000 | 10,355,618 |
| Citigroup Commercial Mortgage Trust: | | | |
| sequential payer Series 2012-GC8 Class A4, 3.024% 9/10/45 | | 837,000 | 865,149 |
| Series 2015-GC29 Class A2, 2.674% 4/10/48 | | 1,388,000 | 1,407,924 |
| Series 2016-P4 Class A2, 2.446% 7/10/49 | | 1,073,000 | 1,085,070 |
| Series 2017-P7 Class A2, 3.199% 4/14/50 | | 2,399,000 | 2,498,944 |
| COMM Mortgage Trust: | | | |
| sequential payer: | | | |
| Series 2012-CR3 Class A3, 2.822% 10/15/45 | | 1,310,000 | 1,338,341 |
| Series 2012-LC4 Class A4, 3.288% 12/10/44 | | 5,915,000 | 6,151,364 |
| Series 2013-CR7 Class A4, 3.213% 3/10/46 | | 4,365,000 | 4,538,091 |
| Series 2015-CR23 Class ASB, 3.257% 5/10/48 | | 1,587,000 | 1,662,562 |
| Series 2013-CR6 Class A4, 3.101% 3/10/46 | | 1,715,000 | 1,777,481 |
| Series 2013-LC6 Class ASB, 2.478% 1/10/46 | | 2,180,000 | 2,210,266 |
| Series 2014-CR15 Class A2, 2.928% 2/10/47 | | 3,957,000 | 4,010,731 |
| Series 2014-CR17 Class A2, 3.012% 5/10/47 | | 790,000 | 805,475 |
| Series 2014-CR20 Class A2, 2.801% 11/10/47 | | 987,000 | 1,003,882 |
| Series 2014-UBS3 Class A2, 2.844% 6/10/47 | | 1,960,000 | 1,992,573 |
| Series 2015-CR22 Class A2, 2.856% 3/10/48 | | 953,000 | 973,019 |
| Commercial Mortgage Loan Trust Series 2008-LS1 Class A1A, 6.1552% 12/10/49 (b) | | 1,053,407 | 1,052,629 |
| CSMC Series 2015-TOWN: | | | |
| Class B, 1 month U.S. LIBOR + 1.900% 3.1256% 3/15/28 (a)(b)(c) | | 264,000 | 263,977 |
| Class C, 1 month U.S. LIBOR + 2.250% 3.4756% 3/15/28 (a)(b)(c) | | 257,000 | 257,064 |
| Class D, 1 month U.S. LIBOR + 3.200% 4.4256% 3/15/28 (a)(b)(c) | | 1,003,000 | 1,003,000 |
| GAHR Commercial Mortgage Trust: | | | |
| floater Series 2015-NRF Class AFL1, 1 month U.S. LIBOR + 1.300% 2.459% 12/15/34 (a)(b)(c) | | 833,576 | 835,021 |
| Series 2015-NRF: | | | |
| Class BFX, 3.3822% 12/15/34 (a)(b) | | 2,358,850 | 2,414,795 |
| Class CFX, 3.3822% 12/15/34 (a)(b) | | 1,059,000 | 1,080,568 |
| GE Capital Commercial Mortgage Corp. Series 2007-C1 Class A1A, 5.483% 12/10/49 | | 743,570 | 742,755 |
| GS Mortgage Securities Trust: | | | |
| sequential payer: | | | |
| Series 2012-GCJ7 Class A4, 3.377% 5/10/45 | | 2,492,821 | 2,598,866 |
| Series 2012-GCJ9 Class A3, 2.773% 11/10/45 | | 3,718,000 | 3,797,261 |
| Series 2013-GC10: | | | |
| Class A4, 2.681% 2/10/46 | | 1,061,000 | 1,075,780 |
| Class A5, 2.943% 2/10/46 | | 2,028,000 | 2,082,683 |
| Series 2014-GC18 Class AAB, 3.648% 1/10/47 | | 702,000 | 741,824 |
| Series 2014-GC20 Class AAB, 3.655% 4/10/47 | | 817,000 | 862,924 |
| Series 2015-GC28 Class AAB, 3.206% 2/10/48 | | 1,764,000 | 1,839,490 |
| Series 2015-GC32 Class A2, 3.062% 7/10/48 | | 2,500,000 | 2,564,279 |
| JP Morgan Chase Commercial Mortgage Securities Trust Series 2015-JP1 Class A2, 3.1438% 1/15/49 | | 1,975,000 | 2,041,031 |
| JPMBB Commercial Mortgage Securities sequential payer Series 2014-C25 Class ASB, 3.4074% 11/15/47 | | 1,831,000 | 1,924,068 |
| JPMBB Commercial Mortgage Securities Trust sequential payer Series 2013-C17 Class ASB, 3.705% 1/15/47 | | 895,000 | 946,269 |
| JPMBB Commercial Mortgage Secutities Trust Series 2015-C29 Class A2, 2.9213% 5/15/48 | | 1,567,000 | 1,605,662 |
| JPMCC Commercial Mortgage Securities Trust sequential payer Series 2016-JP4 Class A2, 2.9838% 12/15/49 | | 3,027,000 | 3,122,340 |
| JPMorgan Chase Commercial Mortgage Securities Trust: | | | |
| floater Series 2014-FL5 Class A, 1 month U.S. LIBOR + 0.980% 2.1389% 7/15/31 (a)(b)(c) | | 582,130 | 583,039 |
| sequential payer Series 2011-C3 Class A3, 4.3877% 2/15/46 (a) | | 1,425,010 | 1,440,498 |
| Series 2013-C10 Class A5, 3.1425% 12/15/47 | | 3,570,000 | 3,697,281 |
| Series 2016-WP Class TA, 1 month U.S. LIBOR + 1.450% 2.6089% 10/15/33 (a)(b)(c) | | 1,811,000 | 1,818,419 |
| LB-UBS Commercial Mortgage Trust Series 2007-C7 Class A3, 5.866% 9/15/45 | | 346,852 | 347,065 |
| Morgan Stanley BAML Trust: | | | |
| sequential payer: | | | |
| Series 2012-C6 Class A4, 2.858% 11/15/45 | | 5,000,000 | 5,128,080 |
| Series 2013-C11 Class A4, 4.1695% 8/15/46 (b) | | 1,443,000 | 1,559,470 |
| Series 2014-C14 Class A2, 2.916% 2/15/47 | | 811,226 | 823,265 |
| Series 2014-C17 Class ASB, 3.477% 8/15/47 | | 3,656,000 | 3,844,614 |
| Series 2015-C22 Class ASB, 3.04% 4/15/48 | | 1,170,000 | 1,207,199 |
| Morgan Stanley Capital I Trust sequential payer: | | | |
| Series 2011-C1 Class A4, 5.033% 9/15/47 (a)(b) | | 6,000,000 | 6,491,378 |
| Series 2011-C2 Class A4, 4.661% 6/15/44 (a) | | 2,725,000 | 2,948,736 |
| MSCG Trust Series 2016-SNR: | | | |
| Class A, 3.348% 11/15/34 (a)(b) | | 2,922,000 | 2,951,986 |
| Class B, 4.181% 11/15/34 (a) | | 1,031,000 | 1,049,246 |
| SCG Trust Series 2013-SRP1 Class A, 1 month U.S. LIBOR + 1.400% 2.8089% 11/15/26 (a)(b)(c) | | 2,027,000 | 2,012,681 |
| UBS-Barclays Commercial Mortgage Trust sequential payer Series 2012-C2 Class A4, 3.525% 5/10/63 | | 2,703,000 | 2,841,853 |
| Wachovia Bank Commercial Mortgage Trust sequential payer Series 2007-34 Class A1A, 5.608% 5/15/46 | | 985,487 | 984,468 |
| Waldorf Astoria Boca Raton Trust floater Series 2016-BOCA Class A, 1 month U.S. LIBOR + 1.500% 2.5756% 6/15/29 (a)(b)(c) | | 2,645,000 | 2,653,319 |
| Wells Fargo Commercial Mortgage Trust: | | | |
| sequential payer: | | | |
| Series 2012-LC5 Class A3, 2.918% 10/15/45 | | 3,207,000 | 3,292,175 |
| Series 2015-C27 Class ASB, 3.278% 2/15/48 | | 3,047,000 | 3,185,336 |
| Series 2016-C35 Class A2, 2.495% 7/15/48 | | 859,000 | 868,836 |
| Wells Fargo Commercial Mtg Trust 2016-C sequential payer Series 2016-C37 Class A1, 3.03% 12/15/49 | | 2,128,000 | 2,199,615 |
| WF-RBS Commercial Mortgage Trust: | | | |
| sequential payer: | | | |
| Series 2011-C2 Class A4, 4.869% 2/15/44 (a)(b) | | 4,245,000 | 4,606,562 |
| Series 2012-C9 Class A3, 2.87% 11/15/45 | | 3,163,000 | 3,240,282 |
| Series 2013-C11 Class A5, 3.071% 3/15/45 | | 3,652,000 | 3,773,736 |
| Series 2013-C12 Class ASB, 2.838% 3/15/48 | | 541,000 | 553,225 |
| Series 2013-C16 Class ASB, 3.963% 9/15/46 | | 1,101,000 | 1,167,691 |
| Series 2013-C11 Class ASB, 2.63% 3/15/45 | | 1,310,000 | 1,329,499 |
| TOTAL COMMERCIAL MORTGAGE SECURITIES | | | |
| (Cost $166,164,610) | | | 165,811,854 |
|
| Municipal Securities - 0.4% | | | |
| Illinois Gen. Oblig.: | | | |
| Series 2003, 4.95% 6/1/23 | | $2,645,000 | $2,750,377 |
| Series 2011: | | | |
| 5.665% 3/1/18 | | 630,000 | 640,439 |
| 5.877% 3/1/19 | | 4,715,000 | 4,906,759 |
| Series 2013, 2.69% 12/1/17 | | 500,000 | 500,445 |
| New York City Transitional Fin. Auth. Rev. Series 2017 E, 2.85% 2/1/24 | | 1,320,000 | 1,347,760 |
| TOTAL MUNICIPAL SECURITIES | | | |
| (Cost $10,076,898) | | | 10,145,780 |
|
| Bank Notes - 1.9% | | | |
| Capital One Bank U.S.A. NA 2.25% 2/13/19 | | 1,000,000 | 1,003,736 |
| Capital One NA 1.85% 9/13/19 | | 3,000,000 | 2,987,448 |
| Citibank NA 2.1% 6/12/20 | | 5,000,000 | 5,027,151 |
| Citizens Bank NA 2.3% 12/3/18 | | 1,384,000 | 1,390,974 |
| Compass Bank 2.875% 6/29/22 | | 2,943,000 | 2,954,502 |
| Discover Bank: | | | |
| (Delaware) 3.2% 8/9/21 | | 2,000,000 | 2,052,434 |
| 3.1% 6/4/20 | | 3,590,000 | 3,678,222 |
| Fifth Third Bank: | | | |
| 2.375% 4/25/19 | | 2,000,000 | 2,021,268 |
| 2.875% 10/1/21 | | 2,000,000 | 2,047,378 |
| First Tennessee Bank NA 2.95% 12/1/19 | | 5,000,000 | 5,064,236 |
| KeyBank NA: | | | |
| 1.65% 2/1/18 | | 397,000 | 397,199 |
| 2.35% 3/8/19 | | 2,000,000 | 2,020,294 |
| 2.5% 12/15/19 | | 3,783,000 | 3,833,001 |
| Manufacturers & Traders Trust Co.: | | | |
| 2.1% 2/6/20 | | 3,000,000 | 3,009,976 |
| 2.3% 1/30/19 | | 1,100,000 | 1,108,914 |
| PNC Bank NA 1.5% 2/23/18 | | 2,100,000 | 2,100,181 |
| RBS Citizens NA 2.5% 3/14/19 | | 1,153,000 | 1,163,389 |
| Regions Bank 7.5% 5/15/18 | | 250,000 | 259,661 |
| Regions Financial Corp. 2.25% 9/14/18 | | 4,000,000 | 4,015,483 |
| The Toronto-Dominion Bank 2.125% 7/2/19 | | 5,000,000 | 5,039,059 |
| U.S. Bank NA 2.125% 10/28/19 | | 2,186,000 | 2,204,314 |
| Wachovia Bank NA 6% 11/15/17 | | 570,000 | 574,955 |
| TOTAL BANK NOTES | | | |
| (Cost $53,522,607) | | | 53,953,775 |
|
| Commercial Paper - 0.2% | | | |
| Vodafone Group PLC yankee 1.6% 9/12/17 | | | |
| (Cost $4,997,556) | | 5,000,000 | 4,997,569 |
| | | Shares | Value |
|
| Fixed-Income Funds - 0.7% | | | |
| Fidelity Specialized High Income Central Fund (g) | | | |
| (Cost $18,363,306) | | 177,012 | 18,520,804 |
|
| Money Market Funds - 1.8% | | | |
| Fidelity Cash Central Fund, 1.11% (h) | | | |
| (Cost $50,206,486) | | 50,195,834 | 50,205,874 |
| TOTAL INVESTMENT IN SECURITIES - 100.2% | | | |
| (Cost $2,780,069,667) | | | 2,796,523,575 |
| NET OTHER ASSETS (LIABILITIES) - (0.2)% | | | (4,430,467) |
| NET ASSETS - 100% | | | $2,792,093,108 |
Legend
(a) Security exempt from registration under Rule 144A of the Securities Act of 1933. These securities may be resold in transactions exempt from registration, normally to qualified institutional buyers. At the end of the period, the value of these securities amounted to $485,745,989 or 17.4% of net assets.
(b) Coupon rates for floating and adjustable rate securities reflect the rates in effect at period end.
(c) Coupon is indexed to a floating interest rate which may be multiplied by a specified factor and/or subject to caps or floors.
(d) Level 3 instrument
(e) Represents an investment in an underlying pool of reverse mortgages which typically do not require regular principal and interest payments as repayment is deferred until a maturity event.
(f) Security represents right to receive monthly interest payments on an underlying pool of mortgages or assets. Principal shown is the outstanding par amount of the pool as of the end of the period.
(g) Affiliated fund that is generally available only to investment companies and other accounts managed by Fidelity Investments. A complete unaudited schedule of portfolio holdings for each Fidelity Central Fund is filed with the SEC for the first and third quarters of each fiscal year on Form N-Q and is available upon request or at the SEC's website at www.sec.gov. An unaudited holdings listing for the Fund, which presents direct holdings as well as the pro-rata share of securities and other investments held indirectly through its investment in underlying non-money market Fidelity Central Funds, is available at fidelity.com and/or institutional.fidelity.com, as applicable. In addition, each Fidelity Central Fund's financial statements, which are not covered by the Fund's Report of Independent Registered Public Accounting Firm, are available on the SEC's website or upon request.
(h) Affiliated fund that is generally available only to investment companies and other accounts managed by Fidelity Investments. The rate quoted is the annualized seven-day yield of the fund at period end. A complete unaudited listing of the fund's holdings as of its most recent quarter end is available upon request. In addition, each Fidelity Central Fund's financial statements, which are not covered by the Fund's Report of Independent Registered Public Accounting Firm, are available on the SEC's website or upon request.
Affiliated Central Funds
Information regarding fiscal year to date income earned by the Fund from investments in Fidelity Central Funds is as follows:
| Fund | Income earned |
| Fidelity Cash Central Fund | $307,758 |
| Fidelity Specialized High Income Central Fund | 950,577 |
| Total | $1,258,335 |
Additional information regarding the Fund's fiscal year to date purchases and sales, including the ownership percentage, of the non Money Market Central Funds is as follows:
| Fund | Value, beginning of period | Purchases | Sales Proceeds | Realized Gain/Loss | Change in Unrealized appreciation (depreciation) | Value, end of period | % ownership, end of period |
| Fidelity Specialized High Income Central Fund | $17,246,563 | $999,552 | $-- | $-- | $274,689 | $18,520,804 | 2.4% |
| Total | $17,246,563 | $999,552 | $-- | $-- | $274,689 | $18,520,804 | |
Investment Valuation
The following is a summary of the inputs used, as of August 31, 2017, involving the Fund's assets and liabilities carried at fair value. The inputs or methodology used for valuing securities may not be an indication of the risk associated with investing in those securities. For more information on valuation inputs, and their aggregation into the levels used below, please refer to the Investment Valuation section in the accompanying Notes to Financial Statements.
| | Valuation Inputs at Reporting Date: |
| Description | Total | Level 1 | Level 2 | Level 3 |
| Investments in Securities: | | | | |
| Corporate Bonds | $1,926,966,221 | $-- | $1,926,966,221 | $-- |
| U.S. Government and Government Agency Obligations | 373,569,109 | -- | 373,569,109 | -- |
| U.S. Government Agency - Mortgage Securities | 8,573,212 | -- | 8,573,212 | -- |
| Asset-Backed Securities | 154,189,147 | -- | 154,035,627 | 153,520 |
| Collateralized Mortgage Obligations | 29,590,230 | -- | 29,590,230 | -- |
| Commercial Mortgage Securities | 165,811,854 | -- | 165,811,854 | -- |
| Municipal Securities | 10,145,780 | -- | 10,145,780 | -- |
| Bank Notes | 53,953,775 | -- | 53,953,775 | -- |
| Commercial Paper | 4,997,569 | -- | 4,997,569 | -- |
| Fixed-Income Funds | 18,520,804 | 18,520,804 | -- | -- |
| Money Market Funds | 50,205,874 | 50,205,874 | -- | -- |
| Total Investments in Securities: | $2,796,523,575 | $68,726,678 | $2,727,643,377 | $153,520 |
Other Information
Distribution of investments by country or territory of incorporation, as a percentage of Total Net Assets, is as follows (Unaudited):
| United States of America | 82.8% |
| United Kingdom | 4.1% |
| Netherlands | 2.8% |
| Canada | 2.5% |
| Japan | 1.8% |
| Luxembourg | 1.1% |
| France | 1.0% |
| Others (Individually Less Than 1%) | 3.9% |
| | 100.0% |
See accompanying notes which are an integral part of the financial statements.
Financial Statements
Statement of Assets and Liabilities
| | | August 31, 2017 |
| Assets | | |
Investment in securities, at value — See accompanying schedule:
Unaffiliated issuers (cost $2,711,499,875) | $2,727,796,897 | |
| Fidelity Central Funds (cost $68,569,792) | 68,726,678 | |
| Total Investment in Securities (cost $2,780,069,667) | | $2,796,523,575 |
| Receivable for investments sold | | 19,752,849 |
| Receivable for fund shares sold | | 3,969,002 |
| Interest receivable | | 15,812,248 |
| Distributions receivable from Fidelity Central Funds | | 55,436 |
| Total assets | | 2,836,113,110 |
| Liabilities | | |
| Payable to custodian bank | $133 | |
| Payable for investments purchased | 39,173,291 | |
| Payable for fund shares redeemed | 3,194,547 | |
| Distributions payable | 393,535 | |
| Accrued management fee | 711,184 | |
| Distribution and service plan fees payable | 166,128 | |
| Other affiliated payables | 381,184 | |
| Total liabilities | | 44,020,002 |
| Net Assets | | $2,792,093,108 |
| Net Assets consist of: | | |
| Paid in capital | | $2,791,148,562 |
| Undistributed net investment income | | 1,935,492 |
| Accumulated undistributed net realized gain (loss) on investments | | (17,444,854) |
| Net unrealized appreciation (depreciation) on investments | | 16,453,908 |
| Net Assets | | $2,792,093,108 |
| Calculation of Maximum Offering Price | | |
| Class A: | | |
| Net Asset Value and redemption price per share ($289,757,718 ÷ 25,119,074 shares) | | $11.54 |
| Maximum offering price per share (100/97.25 of $11.54) | | $11.87 |
| Class M: | | |
| Net Asset Value and redemption price per share ($174,571,257 ÷ 15,124,494 shares) | | $11.54 |
| Maximum offering price per share (100/97.25 of $11.54) | | $11.87 |
| Class C: | | |
| Net Asset Value and offering price per share ($79,249,293 ÷ 6,885,641 shares)(a) | | $11.51 |
| Fidelity Limited Term Bond Fund: | | |
| Net Asset Value, offering price and redemption price per share ($1,643,205,079 ÷ 142,084,843 shares) | | $11.56 |
| Class I: | | |
| Net Asset Value, offering price and redemption price per share ($605,309,761 ÷ 52,329,828 shares) | | $11.57 |
(a) Redemption price per share is equal to net asset value less any applicable contingent deferred sales charge.
See accompanying notes which are an integral part of the financial statements.
Statement of Operations
| | | Year ended August 31, 2017 |
| Investment Income | | |
| Interest | | $56,654,548 |
| Income from Fidelity Central Funds | | 1,258,335 |
| Total income | | 57,912,883 |
| Expenses | | |
| Management fee | $8,175,760 | |
| Transfer agent fees | 3,289,885 | |
| Distribution and service plan fees | 2,181,145 | |
| Fund wide operations fee | 1,079,770 | |
| Independent trustees' fees and expenses | 10,317 | |
| Miscellaneous | 8,442 | |
| Total expenses before reductions | 14,745,319 | |
| Expense reductions | (1,967) | 14,743,352 |
| Net investment income (loss) | | 43,169,531 |
| Realized and Unrealized Gain (Loss) | | |
| Net realized gain (loss) on: | | |
| Investment securities: | | |
| Unaffiliated issuers | 244,677 | |
| Fidelity Central Funds | 16,186 | |
| Swaps | 11 | |
| Capital gain distributions from Fidelity Central Funds | 48,996 | |
| Total net realized gain (loss) | | 309,870 |
| Change in net unrealized appreciation (depreciation) on: | | |
| Investment securities: | | |
| Unaffiliated issuers | (8,466,960) | |
| Fidelity Central Funds | 274,077 | |
| Swaps | 6 | |
| Total change in net unrealized appreciation (depreciation) | | (8,192,877) |
| Net gain (loss) | | (7,883,007) |
| Net increase (decrease) in net assets resulting from operations | | $35,286,524 |
See accompanying notes which are an integral part of the financial statements.
Statement of Changes in Net Assets
| | Year ended August 31, 2017 | Year ended August 31, 2016 |
| Increase (Decrease) in Net Assets | | |
| Operations | | |
| Net investment income (loss) | $43,169,531 | $34,135,463 |
| Net realized gain (loss) | 309,870 | 1,996,257 |
| Change in net unrealized appreciation (depreciation) | (8,192,877) | 23,804,916 |
| Net increase (decrease) in net assets resulting from operations | 35,286,524 | 59,936,636 |
| Distributions to shareholders from net investment income | (41,051,469) | (32,385,208) |
| Share transactions - net increase (decrease) | 292,353,532 | 747,404,314 |
| Total increase (decrease) in net assets | 286,588,587 | 774,955,742 |
| Net Assets | | |
| Beginning of period | 2,505,504,521 | 1,730,548,779 |
| End of period | $2,792,093,108 | $2,505,504,521 |
| Other Information | | |
| Undistributed net investment income end of period | $1,935,492 | $1,452,233 |
See accompanying notes which are an integral part of the financial statements.
Financial Highlights — Fidelity Advisor Limited Term Bond Fund Class A
| Years ended August 31, | 2017 | 2016 | 2015 | 2014 | 2013 |
| Selected Per–Share Data | | | | | |
| Net asset value, beginning of period | $11.56 | $11.42 | $11.52 | $11.33 | $11.69 |
| Income from Investment Operations | | | | | |
| Net investment income (loss)A | .165 | .179 | .170 | .232 | .243 |
| Net realized and unrealized gain (loss) | (.030) | .132 | (.111) | .160 | (.384) |
| Total from investment operations | .135 | .311 | .059 | .392 | (.141) |
| Distributions from net investment income | (.155) | (.171) | (.159) | (.202) | (.219) |
| Total distributions | (.155) | (.171) | (.159) | (.202) | (.219) |
| Net asset value, end of period | $11.54 | $11.56 | $11.42 | $11.52 | $11.33 |
| Total ReturnB,C | 1.18% | 2.75% | .51% | 3.48% | (1.24)% |
| Ratios to Average Net AssetsD,E | | | | | |
| Expenses before reductions | .76% | .76% | .76% | .79% | .82% |
| Expenses net of fee waivers, if any | .76% | .76% | .76% | .79% | .82% |
| Expenses net of all reductions | .76% | .76% | .76% | .79% | .82% |
| Net investment income (loss) | 1.43% | 1.56% | 1.48% | 2.02% | 2.09% |
| Supplemental Data | | | | | |
| Net assets, end of period (000 omitted) | $289,758 | $362,481 | $304,040 | $215,800 | $155,980 |
| Portfolio turnover rateF | 39% | 50% | 44% | 94% | 112% |
A Calculated based on average shares outstanding during the period.
B Total returns would have been lower if certain expenses had not been reduced during the applicable periods shown.
C Total returns do not include the effect of the sales charges.
D Fees and expenses of any underlying Fidelity Central Funds are not included in the Fund's expense ratio. The Fund indirectly bears its proportionate share of the expenses of any underlying Fidelity Central Funds. Based on their most recent shareholder report date, the expenses of any underlying non-money market Fidelity Central Funds were less than .005%.
E Expense ratios reflect operating expenses of the class. Expenses before reductions do not reflect amounts reimbursed by the investment adviser or reductions from expense offset arrangements and do not represent the amount paid by the class during periods when reimbursements or reductions occur. Expenses net of fee waivers reflect expenses after reimbursement by the investment adviser but prior to reductions from expense offset arrangements. Expenses net of all reductions represent the net expenses paid by the class.
F Amount does not include the portfolio activity of any underlying Fidelity Central Funds.
See accompanying notes which are an integral part of the financial statements.
Financial Highlights — Fidelity Advisor Limited Term Bond Fund Class M
| Years ended August 31, | 2017 | 2016 | 2015 | 2014 | 2013 |
| Selected Per–Share Data | | | | | |
| Net asset value, beginning of period | $11.57 | $11.42 | $11.53 | $11.34 | $11.70 |
| Income from Investment Operations | | | | | |
| Net investment income (loss)A | .164 | .178 | .170 | .234 | .246 |
| Net realized and unrealized gain (loss) | (.040) | .142 | (.121) | .161 | (.384) |
| Total from investment operations | .124 | .320 | .049 | .395 | (.138) |
| Distributions from net investment income | (.154) | (.170) | (.159) | (.205) | (.222) |
| Total distributions | (.154) | (.170) | (.159) | (.205) | (.222) |
| Net asset value, end of period | $11.54 | $11.57 | $11.42 | $11.53 | $11.34 |
| Total ReturnB,C | 1.09% | 2.83% | .42% | 3.50% | (1.21)% |
| Ratios to Average Net AssetsD,E | | | | | |
| Expenses before reductions | .76% | .76% | .76% | .77% | .80% |
| Expenses net of fee waivers, if any | .76% | .76% | .76% | .77% | .80% |
| Expenses net of all reductions | .76% | .76% | .76% | .77% | .80% |
| Net investment income (loss) | 1.42% | 1.56% | 1.48% | 2.04% | 2.11% |
| Supplemental Data | | | | | |
| Net assets, end of period (000 omitted) | $174,571 | $191,505 | $193,612 | $198,510 | $210,150 |
| Portfolio turnover rateF | 39% | 50% | 44% | 94% | 112% |
A Calculated based on average shares outstanding during the period.
B Total returns would have been lower if certain expenses had not been reduced during the applicable periods shown.
C Total returns do not include the effect of the sales charges.
D Fees and expenses of any underlying Fidelity Central Funds are not included in the Fund's expense ratio. The Fund indirectly bears its proportionate share of the expenses of any underlying Fidelity Central Funds. Based on their most recent shareholder report date, the expenses of any underlying non-money market Fidelity Central Funds were less than .005%.
E Expense ratios reflect operating expenses of the class. Expenses before reductions do not reflect amounts reimbursed by the investment adviser or reductions from expense offset arrangements and do not represent the amount paid by the class during periods when reimbursements or reductions occur. Expenses net of fee waivers reflect expenses after reimbursement by the investment adviser but prior to reductions from expense offset arrangements. Expenses net of all reductions represent the net expenses paid by the class.
F Amount does not include the portfolio activity of any underlying Fidelity Central Funds.
See accompanying notes which are an integral part of the financial statements.
Financial Highlights — Fidelity Advisor Limited Term Bond Fund Class C
| Years ended August 31, | 2017 | 2016 | 2015 | 2014 | 2013 |
| Selected Per–Share Data | | | | | |
| Net asset value, beginning of period | $11.54 | $11.39 | $11.50 | $11.31 | $11.67 |
| Income from Investment Operations | | | | | |
| Net investment income (loss)A | .075 | .090 | .081 | .143 | .155 |
| Net realized and unrealized gain (loss) | (.039) | .142 | (.121) | .162 | (.384) |
| Total from investment operations | .036 | .232 | (.040) | .305 | (.229) |
| Distributions from net investment income | (.066) | (.082) | (.070) | (.115) | (.131) |
| Total distributions | (.066) | (.082) | (.070) | (.115) | (.131) |
| Net asset value, end of period | $11.51 | $11.54 | $11.39 | $11.50 | $11.31 |
| Total ReturnB,C | .32% | 2.05% | (.35)% | 2.70% | (1.98)% |
| Ratios to Average Net AssetsD,E | | | | | |
| Expenses before reductions | 1.53% | 1.53% | 1.54% | 1.56% | 1.58% |
| Expenses net of fee waivers, if any | 1.53% | 1.53% | 1.54% | 1.56% | 1.58% |
| Expenses net of all reductions | 1.53% | 1.53% | 1.54% | 1.56% | 1.58% |
| Net investment income (loss) | .66% | .79% | .71% | 1.25% | 1.34% |
| Supplemental Data | | | | | |
| Net assets, end of period (000 omitted) | $79,249 | $97,987 | $81,929 | $64,333 | $53,096 |
| Portfolio turnover rateF | 39% | 50% | 44% | 94% | 112% |
A Calculated based on average shares outstanding during the period.
B Total returns would have been lower if certain expenses had not been reduced during the applicable periods shown.
C Total returns do not include the effect of the contingent deferred sales charge.
D Fees and expenses of any underlying Fidelity Central Funds are not included in the Fund's expense ratio. The Fund indirectly bears its proportionate share of the expenses of any underlying Fidelity Central Funds. Based on their most recent shareholder report date, the expenses of any underlying non-money market Fidelity Central Funds were less than .005%.
E Expense ratios reflect operating expenses of the class. Expenses before reductions do not reflect amounts reimbursed by the investment adviser or reductions from expense offset arrangements and do not represent the amount paid by the class during periods when reimbursements or reductions occur. Expenses net of fee waivers reflect expenses after reimbursement by the investment adviser but prior to reductions from expense offset arrangements. Expenses net of all reductions represent the net expenses paid by the class.
F Amount does not include the portfolio activity of any underlying Fidelity Central Funds.
See accompanying notes which are an integral part of the financial statements.
Financial Highlights — Fidelity Limited Term Bond Fund
| Years ended August 31, | 2017 | 2016 | 2015 | 2014 A |
| Selected Per–Share Data | | | | |
| Net asset value, beginning of period | $11.59 | $11.45 | $11.55 | $11.50 |
| Income from Investment Operations | | | | |
| Net investment income (loss)B | .200 | .214 | .205 | .209 |
| Net realized and unrealized gain (loss) | (.039) | .133 | (.110) | .038 |
| Total from investment operations | .161 | .347 | .095 | .247 |
| Distributions from net investment income | (.191) | (.207) | (.195) | (.197) |
| Total distributions | (.191) | (.207) | (.195) | (.197) |
| Net asset value, end of period | $11.56 | $11.59 | $11.45 | $11.55 |
| Total ReturnC,D | 1.40% | 3.06% | .83% | 2.17% |
| Ratios to Average Net AssetsE,F | | | | |
| Expenses before reductions | .45% | .45% | .45% | .46%G |
| Expenses net of fee waivers, if any | .45% | .45% | .45% | .46%G |
| Expenses net of all reductions | .45% | .45% | .45% | .46%G |
| Net investment income (loss) | 1.74% | 1.87% | 1.79% | 2.22%G |
| Supplemental Data | | | | |
| Net assets, end of period (000 omitted) | $1,643,205 | $1,315,947 | $758,240 | $147,629 |
| Portfolio turnover rateH | 39% | 50% | 44% | 94% |
A For the period November 1, 2013 (commencement of sale of shares) to August 31, 2014.
B Calculated based on average shares outstanding during the period.
C Total returns for periods of less than one year are not annualized.
D Total returns would have been lower if certain expenses had not been reduced during the applicable periods shown.
E Fees and expenses of any underlying Fidelity Central Funds are not included in the Fund's expense ratio. The Fund indirectly bears its proportionate share of the expenses of any underlying Fidelity Central Funds. Based on their most recent shareholder report date, the expenses of any underlying non-money market Fidelity Central Funds were less than .005%.
F Expense ratios reflect operating expenses of the class. Expenses before reductions do not reflect amounts reimbursed by the investment adviser or reductions from expense offset arrangements and do not represent the amount paid by the class during periods when reimbursements or reductions occur. Expense ratios before reductions for start-up periods may not be representative of longer-term operating periods. Expenses net of fee waivers reflect expenses after reimbursement by the investment adviser but prior to reductions from expense offset arrangements. Expenses net of all reductions represent the net expenses paid by the class.
G Annualized
H Amount does not include the portfolio activity of any underlying Fidelity Central Funds.
See accompanying notes which are an integral part of the financial statements.
Financial Highlights — Fidelity Advisor Limited Term Bond Fund Class I
| Years ended August 31, | 2017 | 2016 | 2015 | 2014 | 2013 |
| Selected Per–Share Data | | | | | |
| Net asset value, beginning of period | $11.60 | $11.45 | $11.55 | $11.36 | $11.72 |
| Income from Investment Operations | | | | | |
| Net investment income (loss)A | .194 | .209 | .200 | .262 | .273 |
| Net realized and unrealized gain (loss) | (.039) | .142 | (.111) | .161 | (.385) |
| Total from investment operations | .155 | .351 | .089 | .423 | (.112) |
| Distributions from net investment income | (.185) | (.201) | (.189) | (.233) | (.248) |
| Total distributions | (.185) | (.201) | (.189) | (.233) | (.248) |
| Net asset value, end of period | $11.57 | $11.60 | $11.45 | $11.55 | $11.36 |
| Total ReturnB | 1.36% | 3.10% | .78% | 3.74% | (.99)% |
| Ratios to Average Net AssetsC,D | | | | | |
| Expenses before reductions | .50% | .50% | .50% | .53% | .57% |
| Expenses net of fee waivers, if any | .50% | .50% | .50% | .53% | .57% |
| Expenses net of all reductions | .50% | .50% | .50% | .53% | .57% |
| Net investment income (loss) | 1.69% | 1.82% | 1.74% | 2.28% | 2.34% |
| Supplemental Data | | | | | |
| Net assets, end of period (000 omitted) | $605,310 | $537,585 | $391,808 | $174,568 | $84,843 |
| Portfolio turnover rateE | 39% | 50% | 44% | 94% | 112% |
A Calculated based on average shares outstanding during the period.
B Total returns would have been lower if certain expenses had not been reduced during the applicable periods shown.
C Fees and expenses of any underlying Fidelity Central Funds are not included in the Fund's expense ratio. The Fund indirectly bears its proportionate share of the expenses of any underlying Fidelity Central Funds. Based on their most recent shareholder report date, the expenses of any underlying non-money market Fidelity Central Funds were less than .005%.
D Expense ratios reflect operating expenses of the class. Expenses before reductions do not reflect amounts reimbursed by the investment adviser or reductions from expense offset arrangements and do not represent the amount paid by the class during periods when reimbursements or reductions occur. Expenses net of fee waivers reflect expenses after reimbursement by the investment adviser but prior to reductions from expense offset arrangements. Expenses net of all reductions represent the net expenses paid by the class.
E Amount does not include the portfolio activity of any underlying Fidelity Central Funds.
See accompanying notes which are an integral part of the financial statements.
Notes to Financial Statements
For the period ended August 31, 2017
1. Organization.
Fidelity Advisor Limited Term Bond Fund (the Fund) is a fund of Fidelity Advisor Series II (the Trust) and is authorized to issue an unlimited number of shares. The Trust is registered under the Investment Company Act of 1940, as amended (the 1940 Act), as an open-end management investment company organized as a Massachusetts business trust. The Fund offers Class A, Class M (formerly Class T), Class C, Fidelity Limited Term Bond and Class I shares, each of which has equal rights as to assets and voting privileges. Each class has exclusive voting rights with respect to matters that affect that class.
After the close of business on June 24, 2016, all outstanding Class B shares were converted to Class A shares. All prior fiscal period dollar and share amounts for Class B presented in the Notes to Financial Statements are for the period September 1, 2015 through June 24, 2016.
2. Investments in Fidelity Central Funds.
The Fund invests in Fidelity Central Funds, which are open-end investment companies generally available only to other investment companies and accounts managed by the investment adviser and its affiliates. The Fund's Schedule of Investments lists each of the Fidelity Central Funds held as of period end, if any, as an investment of the Fund, but does not include the underlying holdings of each Fidelity Central Fund. As an Investing Fund, the Fund indirectly bears its proportionate share of the expenses of the underlying Fidelity Central Funds.
Based on its investment objective, each Fidelity Central Fund may invest or participate in various investment vehicles or strategies that are similar to those of the Fund. These strategies are consistent with the investment objectives of the Fund and may involve certain economic risks which may cause a decline in value of each of the Fidelity Central Funds and thus a decline in the value of the Fund. The Money Market Central Funds seek preservation of capital and current income and are managed by Fidelity Investments Money Management, Inc. (FIMM), an affiliate of the investment adviser. Annualized expenses of the Money Market Central Funds as of their most recent shareholder report date are less than .005%. The following summarizes the Fund's investment in each non-money market Fidelity Central Fund.
| Fidelity Central Fund | Investment Manager | Investment Objective | Investment Practices | Expense Ratio(a) |
| Fidelity Specialized High Income Central Fund | FMR Co., Inc. (FMRC)FMRC | Seeks a high level of current income by normally investing in income-producing debt securities, with an emphasis on lower-quality debt securities. | Loans & Direct Debt Instruments
Restricted Securities | .005% |
(a) Expenses expressed as a percentage of average net assets and are as of each underlying Central Fund's most recent annual or semi-annual shareholder report.
An unaudited holdings listing for the Fund, which presents direct holdings as well as the pro-rata share of any securities and other investments held indirectly through its investment in underlying non-money market Fidelity Central Funds, is available at fidelity.com and/or institutional.fidelity.com, as applicable. A complete unaudited list of holdings for each Fidelity Central Fund is available upon request or at the Securities and Exchange Commission (the SEC) website at www.sec.gov. In addition, the financial statements of the Fidelity Central Funds which contain the significant accounting policies (including investment valuation policies) of those funds, which are not covered by the Fund's Report of Independent Registered Public Accounting Firm, are available on the SEC website or upon request.
3. Significant Accounting Policies.
The Fund is an investment company and applies the accounting and reporting guidance of the Financial Accounting Standards Board (FASB) Accounting Standards Codification Topic 946 Financial Services – Investments Companies. The financial statements have been prepared in conformity with accounting principles generally accepted in the United States of America (GAAP), which require management to make certain estimates and assumptions at the date of the financial statements. Actual results could differ from those estimates. Subsequent events, if any, through the date that the financial statements were issued have been evaluated in the preparation of the financial statements. The following summarizes the significant accounting policies of the Fund:
Investment Valuation. Investments are valued as of 4:00 p.m. Eastern time on the last calendar day of the period. The Board of Trustees (the Board) has delegated the day to day responsibility for the valuation of the Fund's investments to the Fair Value Committee (the Committee) established by the Fund's investment adviser. In accordance with valuation policies and procedures approved by the Board, the Fund attempts to obtain prices from one or more third party pricing vendors or brokers to value its investments. When current market prices, quotations or currency exchange rates are not readily available or reliable, investments will be fair valued in good faith by the Committee, in accordance with procedures adopted by the Board. Factors used in determining fair value vary by investment type and may include market or investment specific events, changes in interest rates and credit quality. The frequency with which these procedures are used cannot be predicted and they may be utilized to a significant extent. The Committee oversees the Fund's valuation policies and procedures and reports to the Board on the Committee's activities and fair value determinations. The Board monitors the appropriateness of the procedures used in valuing the Fund's investments and ratifies the fair value determinations of the Committee.
The Fund categorizes the inputs to valuation techniques used to value its investments into a disclosure hierarchy consisting of three levels as shown below:
- Level 1 – quoted prices in active markets for identical investments
- Level 2 – other significant observable inputs (including quoted prices for similar investments, interest rates, prepayment speeds, etc.)
- Level 3 – unobservable inputs (including the Fund's own assumptions based on the best information available)
Valuation techniques used to value the Fund's investments by major category are as follows:
Debt securities, including restricted securities, are valued based on evaluated prices received from third party pricing vendors or from brokers who make markets in such securities. Corporate bonds, bank notes, municipal securities, U.S. government and government agency obligations and commercial paper are valued by pricing vendors who utilize matrix pricing which considers yield or price of bonds of comparable quality, coupon, maturity and type or by broker-supplied prices. Asset backed securities, collateralized mortgage obligations, commercial mortgage securities, and U.S. government agency mortgage securities are valued by pricing vendors who utilize matrix pricing which considers prepayment speed assumptions, attributes of the collateral, yield or price of bonds of comparable quality, coupon, maturity and type or by broker-supplied prices. When independent prices are unavailable or unreliable, debt securities may be valued utilizing pricing methodologies which consider similar factors that would be used by third party pricing vendors. Debt securities are generally categorized as Level 2 in the hierarchy but may be Level 3 depending on the circumstances.
Investments in open-end mutual funds, including the Fidelity Central Funds, are valued at their closing net asset value (NAV) each business day and are categorized as Level 1 in the hierarchy.
Changes in valuation techniques may result in transfers in or out of an assigned level within the disclosure hierarchy. The aggregate value of investments by input level as of August 31, 2017 is included at the end of the Fund's Schedule of Investments.
Investment Transactions and Income. For financial reporting purposes, the Fund's investment holdings and NAV include trades executed through the end of the last business day of the period. The NAV per share for processing shareholder transactions is calculated as of the close of business of the New York Stock Exchange (NYSE), normally 4:00 p.m. Eastern time and includes trades executed through the end of the prior business day. Gains and losses on securities sold are determined on the basis of identified cost and may include proceeds received from litigation. Income and capital gain distributions from Fidelity Central Funds, if any, are recorded on the ex-dividend date. Interest income is accrued as earned and includes coupon interest and amortization of premium and accretion of discount on debt securities as applicable. Debt obligations may be placed on non-accrual status and related interest income may be reduced by ceasing current accruals and writing off interest receivables when the collection of all or a portion of interest has become doubtful based on consistently applied procedures. A debt obligation is removed from non-accrual status when the issuer resumes interest payments or when collectability of interest is reasonably assured.
Class Allocations and Expenses. Investment income, realized and unrealized capital gains and losses, common expenses of the Fund, and certain fund-level expense reductions, if any, are allocated daily on a pro-rata basis to each class based on the relative net assets of each class to the total net assets of the Fund. Each class differs with respect to transfer agent and distribution and service plan fees incurred. Certain expense reductions may also differ by class. For the reporting period, the allocated portion of income and expenses to each class as a percent of its average net assets may vary due to the timing of recording these transactions in relation to fluctuating net assets of the classes. Expenses directly attributable to a fund are charged to that fund. Expenses attributable to more than one fund are allocated among the respective funds on the basis of relative net assets or other appropriate methods. Expense estimates are accrued in the period to which they relate and adjustments are made when actual amounts are known.
Income Tax Information and Distributions to Shareholders. Each year, the Fund intends to qualify as a regulated investment company under Subchapter M of the Internal Revenue Code, including distributing substantially all of its taxable income and realized gains. As a result, no provision for U.S. Federal income taxes is required. As of August 31, 2017, the Fund did not have any unrecognized tax benefits in the financial statements; nor is the Fund aware of any tax positions for which it is reasonably possible that the total amounts of unrecognized tax benefits will significantly change in the next twelve months. The Fund files a U.S. federal tax return, in addition to state and local tax returns as required. The Fund's federal income tax returns are subject to examination by the Internal Revenue Service (IRS) for a period of three fiscal years after they are filed. State and local tax returns may be subject to examination for an additional fiscal year depending on the jurisdiction.
Dividends are declared and recorded daily and paid monthly from net investment income. Distributions from realized gains, if any, are declared and recorded on the ex-dividend date. Income dividends and capital gain distributions are declared separately for each class. Income and capital gain distributions are determined in accordance with income tax regulations, which may differ from GAAP.
Capital accounts within the financial statements are adjusted for permanent book-tax differences. These adjustments have no impact on net assets or the results of operations. Capital accounts are not adjusted for temporary book-tax differences which will reverse in a subsequent period.
Book-tax differences are primarily due to swaps, market discount, partnerships (including allocations from Fidelity Central Funds), deferred trustees compensation, capital loss carryforwards and losses deferred due to wash sales.
As of period end, the cost and unrealized appreciation (depreciation) in securities, and derivatives if applicable, for federal income tax purposes were as follows:
| Gross unrealized appreciation | $24,122,999 |
| Gross unrealized depreciation | (6,214,607) |
| Net unrealized appreciation (depreciation) | $17,908,392 |
| Tax Cost | $2,778,615,183 |
The tax-based components of distributable earnings as of period end were as follows:
| Capital loss carryforward | $(15,392,575) |
| Net unrealized appreciation (depreciation) on securities and other investments | $17,908,392 |
Capital loss carryforwards are only available to offset future capital gains of the Fund to the extent provided by regulations and may be limited. Under the Regulated Investment Company Modernization Act of 2010 (the Act), the Fund is permitted to carry forward capital losses incurred in taxable years beginning after December 22, 2010 for an unlimited period and such capital losses are required to be used prior to any losses that expire. The capital loss carryforward information presented below, including any applicable limitation, is estimated as of fiscal period end and is subject to adjustment.
| Fiscal year of expiration | |
| 2018 | $(15,392,575) |
The Fund intends to elect to defer to its next fiscal year $1,266,069 of capital losses recognized during the period November 1, 2016 to August 31, 2017.
The tax character of distributions paid was as follows:
| | August 31, 2017 | August 31, 2016 |
| Ordinary Income | $41,051,469 | $ 32,385,208 |
Restricted Securities. The Fund may invest in securities that are subject to legal or contractual restrictions on resale. These securities generally may be resold in transactions exempt from registration or to the public if the securities are registered. Disposal of these securities may involve time-consuming negotiations and expense, and prompt sale at an acceptable price may be difficult. Information regarding restricted securities is included at the end of the Fund's Schedule of Investments.
New Accounting Pronouncement. In March 2017, the Financial Accounting Standards Board (FASB) issued an Accounting Standards Update (ASU), ASU 2017-08, which amends the amortization period for certain callable debt securities that are held at a premium. The amendment requires the premium to be amortized to the earliest call date. The amendments do not require an accounting change for securities held at a discount. The ASU is effective for annual periods beginning after December 15, 2018. Management is currently evaluating the potential impact of these changes to the financial statements.
4. Derivative Instruments.
Risk Exposures and the Use of Derivative Instruments. The Fund's investment objective allows the Fund to enter into various types of derivative contracts, including swaps. Derivatives are investments whose value is primarily derived from underlying assets, indices or reference rates and may be transacted on an exchange or over-the-counter (OTC). Derivatives may involve a future commitment to buy or sell a specified asset based on specified terms, to exchange future cash flows at periodic intervals based on a notional principal amount, or for one party to make one or more payments upon the occurrence of specified events in exchange for periodic payments from the other party.
The Fund used derivatives to increase returns, to gain exposure to certain types of assets and to manage exposure to certain risks as defined below. The success of any strategy involving derivatives depends on analysis of numerous economic factors, and if the strategies for investment do not work as intended, the Fund may not achieve its objectives.
The Fund's use of derivatives increased or decreased its exposure to the following risk:
| Credit Risk | Credit risk relates to the ability of the issuer of a financial instrument to make further principal or interest payments on an obligation or commitment that it has to the Fund.
|
The Fund is also exposed to additional risks from investing in derivatives, such as liquidity risk and counterparty credit risk. Liquidity risk is the risk that the Fund will be unable to close out the derivative in the open market in a timely manner. Counterparty credit risk is the risk that the counterparty will not be able to fulfill its obligation to the Fund. Derivative counterparty credit risk is managed through formal evaluation of the creditworthiness of all potential counterparties. On certain OTC derivatives such as bi-lateral swaps, the Fund attempts to reduce its exposure to counterparty credit risk by entering into an International Swaps and Derivatives Association, Inc. (ISDA) Master Agreement with each of its counterparties. The ISDA Master Agreement gives the Fund the right to terminate all transactions traded under such agreement upon the deterioration in the credit quality of the counterparty beyond specified levels. The ISDA Master Agreement gives each party the right, upon an event of default by the other party or a termination of the agreement, to close out all transactions traded under such agreement and to net amounts owed under each transaction to one net payable by one party to the other. To mitigate counterparty credit risk on bi-lateral OTC derivatives, the Fund receives collateral in the form of cash or securities once the Fund's net unrealized appreciation on outstanding derivative contracts under an ISDA Master Agreement exceeds certain applicable thresholds, subject to certain minimum transfer provisions. The collateral received is held in segregated accounts with the Fund's custodian bank in accordance with the collateral agreements entered into between the Fund, the counterparty and the Fund's custodian bank. The Fund could experience delays and costs in gaining access to the collateral even though it is held by the Fund's custodian bank. The Fund's maximum risk of loss from counterparty credit risk related to bi-lateral OTC derivatives is generally the aggregate unrealized appreciation and unpaid counterparty payments in excess of any collateral pledged by the counterparty to the Fund. The Fund may be required to pledge collateral for the benefit of the counterparties on bi-lateral OTC derivatives in an amount not less than each counterparty's unrealized appreciation on outstanding derivative contracts, subject to certain minimum transfer provisions, and any such pledged collateral is identified in the Schedule of Investments.
Investing in derivatives may involve greater risks than investing in the underlying assets directly and, to varying degrees, may involve risk of loss in excess of any initial investment and collateral received and amounts recognized in the Statement of Assets and Liabilities. In addition, there may be the risk that the change in value of the derivative contract does not correspond to the change in value of the underlying instrument.
Net Realized Gain (Loss) and Change in Net Unrealized Appreciation (Depreciation) on Derivatives. The table below, which reflects the impacts of derivatives on the financial performance of the Fund, summarizes the net realized gain (loss) and change in net unrealized appreciation (depreciation) for derivatives during the period as presented in the Statement of Operations.
| Primary Risk Exposure / Derivative Type | Net Realized Gain (Loss) | Change in Net Unrealized Appreciation (Depreciation) |
| Credit Risk | | |
| Swaps | $ 11 | $ 6 |
A summary of the value of derivatives by primary risk exposure as of period end, if any, is included at the end of the Schedule of Investments.
Swaps. A swap is a contract between two parties to exchange future cash flows at periodic intervals based on a notional principal amount. A bi-lateral OTC swap is a transaction between a fund and a dealer counterparty where cash flows are exchanged between the two parties for the life of the swap.
Bi-lateral OTC swaps are marked-to-market daily and changes in value are reflected in the Statement of Assets and Liabilities in the bi-lateral OTC swaps at value line items. Any upfront premiums paid or received upon entering a bi-lateral OTC swap to compensate for differences between stated terms of the swap and prevailing market conditions (e.g. credit spreads, interest rates or other factors) are recorded in net unrealized appreciation (depreciation) in the Statement of Assets and Liabilities and amortized to realized gain or (loss) ratably over the term of the swap. Any unamortized upfront premiums are presented in the Schedule of Investments.
Payments are exchanged at specified intervals, accrued daily commencing with the effective date of the contract and recorded as realized gain or (loss). Some swaps may be terminated prior to the effective date and realize a gain or loss upon termination. The net realized gain (loss) and change in net unrealized appreciation (depreciation) on swaps during the period is included in the Statement of Operations.
Any open swaps at period end are included in the Schedule of Investments under the caption "Swaps".
Credit Default Swaps. Credit default swaps enable the Fund to buy or sell protection against specified credit events on a single-name issuer or a traded credit index. Under the terms of a credit default swap the buyer of protection (buyer) receives credit protection in exchange for making periodic payments to the seller of protection (seller) based on a fixed percentage applied to a notional principal amount. In return for these payments, the seller will be required to make a payment upon the occurrence of one or more specified credit events. The Fund enters into credit default swaps as a seller to gain credit exposure to an issuer and/or as a buyer to obtain a measure of protection against defaults of an issuer. Periodic payments are made over the life of the contract by the buyer provided that no credit event occurs.
For credit default swaps on most corporate and sovereign issuers, credit events include bankruptcy, failure to pay or repudiation/moratorium. For credit default swaps on corporate or sovereign issuers, the obligation that may be put to the seller is not limited to the specific reference obligation described in the Schedule of Investments. For credit default swaps on asset-backed securities, a credit event may be triggered by events such as failure to pay principal, maturity extension, rating downgrade or write-down. For credit default swaps on asset-backed securities, the reference obligation described represents the security that may be put to the seller. For credit default swaps on a traded credit index, a specified credit event may affect all or individual underlying securities included in the index.
As a seller, if an underlying credit event occurs, the Fund will pay a net settlement amount of cash equal to the notional amount of the swap less the recovery value of the reference obligation or underlying securities comprising an index. Only in the event of the industry's inability to value the underlying asset will the Fund be required to take delivery of the reference obligation or underlying securities comprising an index and pay an amount equal to the notional amount of the swap.
As a buyer, if an underlying credit event occurs, the Fund will receive a net settlement amount of cash equal to the notional amount of the swap less the recovery value of the reference obligation or underlying securities comprising an index. Only in the event of the industry's inability to value the underlying asset will the Fund be required to deliver the reference obligation or underlying securities comprising an index in exchange for payment of an amount equal to the notional amount of the swap.
Typically, the value of each credit default swap and credit rating disclosed for each reference obligation in the Schedule of Investments, where the Fund is the seller, can be used as measures of the current payment/performance risk of the swap. As the value of the swap changes as a positive or negative percentage of the total notional amount, the payment/performance risk may decrease or increase, respectively. In addition to these measures, the investment adviser monitors a variety of factors including cash flow assumptions, market activity and market sentiment as part of its ongoing process of assessing payment/performance risk.
5. Purchases and Sales of Investments.
Purchases and sales of securities (including the Fixed-Income Central Funds), other than short-term securities and U.S. government securities, aggregated $862,506,867 and $540,558,726, respectively.
6. Fees and Other Transactions with Affiliates.
Management Fee. Fidelity Management & Research Company (the investment adviser) and its affiliates provide the Fund with investment management related services for which the Fund pays a monthly management fee. The management fee is the sum of an individual fund fee rate that is based on an annual rate of .20% of the Fund's average net assets and an annualized group fee rate that averaged .11% during the period. The group fee rate is based upon the average net assets of all the mutual funds advised by the investment adviser, including any mutual funds previously advised by the investment adviser that are currently advised by Fidelity SelectCo, LLC, an affiliate of the investment adviser. The group fee rate decreases as assets under management increase and increases as assets under management decrease. For the reporting period, the total annual management fee rate was .31% of the Fund's average net assets.
Distribution and Service Plan Fees. In accordance with Rule 12b-1 of the 1940 Act, the Fund has adopted separate Distribution and Service Plans for each class of shares. Certain classes pay Fidelity Distributors Corporation (FDC), an affiliate of the investment adviser, separate Distribution and Service Fees, each of which is based on an annual percentage of each class' average net assets. In addition, FDC may pay financial intermediaries for selling shares of the Fund and providing shareholder support services. For the period, the Distribution and Service Fee rates, total fees and amounts retained by FDC were as follows:
| | Distribution
Fee | Service
Fee | Total Fees | Retained
by FDC |
| Class A | -% | .25% | $844,078 | $112,558 |
| Class M | -% | .25% | 453,835 | 4,307 |
| Class C | .75% | .25% | 883,232 | 113,295 |
| | | | $2,181,145 | $230,160 |
Sales Load. FDC may receive a front-end sales charge of up to 2.75% for selling Class A shares and Class M shares, some of which is paid to financial intermediaries for selling shares of the Fund. Depending on the holding period, FDC may receive contingent deferred sales charges levied on Class A, Class M and Class C redemptions. The deferred sales charges are 1.00% for Class C shares, .75% or .50% for certain purchases of Class A shares and .25% for certain purchases of Class M shares.
For the period, sales charge amounts retained by FDC were as follows:
| | Retained
by FDC |
| Class A | $39,039 |
| Class M | 4,107 |
| Class C(a) | 19,188 |
| | $62,334 |
(a) When Class C shares are initially sold, FDC pays commissions from its own resources to financial intermediaries through which the sales are made.
Transfer Agent Fees. Fidelity Investments Institutional Operations Company, Inc., (FIIOC), an affiliate of the investment adviser, is the transfer, dividend disbursing and shareholder servicing agent for each class of the Fund. FIIOC receives account fees and asset-based fees that vary according to the account size and type of account of the shareholders of each respective class of the Fund, with the exception of Fidelity Limited Term Bond. FIIOC receives an asset-based fee of .10% of Fidelity Limited Term Bond's average net assets. FIIOC pays for typesetting, printing and mailing of shareholder reports, except proxy statements. For the period, transfer agent fees for each class were as follows:
| | Amount | % of
Class-Level Average
Net Assets |
| Class A | $522,406 | .15 |
| Class M | 297,316 | .16 |
| Class C | 159,228 | .18 |
| Fidelity Limited Term Bond Fund | 1,467,302 | .10 |
| Class I | 843,633 | .15 |
| | $3,289,885 | |
Fund Wide Operations Fee. Pursuant to the Fund Wide Operations and Expense Agreement (FWOE), the investment adviser has agreed to provide for fund level expenses (which do not include transfer agent, Rule 12b-1 fees, compensation of the independent Trustees, interest (including commitment fees), taxes or extraordinary expenses, if any) in return for a FWOE fee equal to .35% of the Fund's average net assets less the total amount of the management fee. The FWOE paid by the Fund is reduced by an amount equal to the fees and expenses paid to the independent Trustees. For the period, the FWOE fee was equivalent to an annual rate of .04% of average net assets.
Interfund Trades. The Fund may purchase from or sell securities to other Fidelity Funds under procedures adopted by the Board. The procedures have been designed to ensure these interfund trades are executed in accordance with Rule 17a-7 of the 1940 Act. Interfund trades are included within the respective purchases and sales amounts shown in the Purchases and Sales of Investments note.
7. Committed Line of Credit.
The Fund participates with other funds managed by the investment adviser or an affiliate in a $4.25 billion credit facility (the "line of credit") to be utilized for temporary or emergency purposes to fund shareholder redemptions or for other short-term liquidity purposes. The Fund has agreed to pay commitment fees on its pro-rata portion of the line of credit, which amounted to $8,442 and is reflected in Miscellaneous expenses on the Statement of Operations. During the period, the Fund did not borrow on this line of credit.
8. Expense Reductions.
Through arrangements with the Fund's custodian, credits realized as a result of certain uninvested cash balances were used to reduce the Fund's expenses. During the period, these credits reduced the Fund's expenses by $1,967.
9. Distributions to Shareholders.
Distributions to shareholders of each class were as follows:
| | Year ended
August 31, 2017 | Year ended
August 31, 2016 |
| From net investment income | | |
| Class A | $4,518,379 | $4,761,029 |
| Class M | 2,427,595 | 2,871,639 |
| Class B | – | 5,842 |
| Class C | 500,470 | 692,331 |
| Fidelity Limited Term Bond Fund | 24,371,965 | 16,082,729 |
| Class I | 9,233,060 | 7,971,638 |
| Total | $41,051,469 | $32,385,208 |
10. Share Transactions.
Share transactions for each class were as follows and may contain automatic conversions between classes or exchanges between affiliated funds:
| | Shares | Shares | Dollars | Dollars |
| | Year ended August 31, 2017 | Year ended August 31, 2016 | Year ended August 31, 2017 | Year ended August 31, 2016 |
| Class A | | | | |
| Shares sold | 15,817,734 | 20,292,208 | $181,623,365 | $232,299,567 |
| Reinvestment of distributions | 371,201 | 383,701 | 4,263,466 | 4,391,933 |
| Shares redeemed | (22,416,990) | (15,960,237) | (257,141,286) | (182,641,693) |
| Net increase (decrease) | (6,228,055) | 4,715,672 | $(71,254,455) | $54,049,807 |
| Class M | | | | |
| Shares sold | 3,595,932 | 5,184,484 | $41,318,598 | $59,323,000 |
| Reinvestment of distributions | 197,203 | 235,748 | 2,265,769 | 2,698,835 |
| Shares redeemed | (5,220,343) | (5,817,689) | (59,946,959) | (66,587,159) |
| Net increase (decrease) | (1,427,208) | (397,457) | $(16,362,592) | $(4,565,324) |
| Class B | | | | |
| Shares sold | – | 32,756 | $– | $373,130 |
| Reinvestment of distributions | – | 438 | – | 4,985 |
| Shares redeemed | – | (113,795) | – | (1,305,693) |
| Net increase (decrease) | – | (80,601) | $– | $(927,578) |
| Class C | | | | |
| Shares sold | 1,854,442 | 5,293,797 | $21,247,507 | $60,296,153 |
| Reinvestment of distributions | 39,929 | 53,649 | 457,654 | 611,667 |
| Shares redeemed | (3,501,926) | (4,047,030) | (40,064,795) | (46,268,973) |
| Net increase (decrease) | (1,607,555) | 1,300,416 | $(18,359,634) | $14,638,847 |
| Fidelity Limited Term Bond Fund | | | | |
| Shares sold | 81,352,366 | 83,235,883 | $936,348,816 | $957,055,992 |
| Reinvestment of distributions | 1,936,026 | 1,273,968 | 22,295,140 | 14,633,176 |
| Shares redeemed | (54,717,281) | (37,243,869) | (628,932,829) | (427,177,020) |
| Net increase (decrease) | 28,571,111 | 47,265,982 | $329,711,127 | $544,512,148 |
| Class I | | | | |
| Shares sold | 27,667,723 | 29,985,672 | $318,213,399 | $344,469,999 |
| Reinvestment of distributions | 667,292 | 549,729 | 7,686,267 | 6,312,028 |
| Shares redeemed | (22,368,346) | (18,397,774) | (257,280,580) | (211,085,613) |
| Net increase (decrease) | 5,966,669 | 12,137,627 | $68,619,086 | $139,696,414 |
11. Other.
The Fund's organizational documents provide former and current trustees and officers with a limited indemnification against liabilities arising in connection with the performance of their duties to the Fund. In the normal course of business, the Fund may also enter into contracts that provide general indemnifications. The Fund's maximum exposure under these arrangements is unknown as this would be dependent on future claims that may be made against the Fund. The risk of material loss from such claims is considered remote.
12. Credit Risk.
The Fund invests a portion of its assets in structured securities of issuers backed by commercial and residential mortgage loans, credit card receivables and automotive loans. The value and related income of these securities is sensitive to changes in economic conditions, including delinquencies and/or defaults.
Report of Independent Registered Public Accounting Firm
To the Trustees of Fidelity Advisor Series II and Shareholders of Fidelity Advisor Limited Term Bond Fund:
In our opinion, the accompanying statement of assets and liabilities, including the schedule of investments, and the related statements of operations and of changes in net assets and the financial highlights present fairly, in all material respects, the financial position of Fidelity Advisor Limited Term Bond Fund (a fund of Fidelity Advisor Series II) as of August 31, 2017, the results of its operations for the year then ended, the changes in its net assets for each of the two years in the period then ended and the financial highlights for each of the five years in the period ended, in conformity with accounting principles generally accepted in the United States of America. These financial statements and financial highlights (hereafter referred to as “financial statements”) are the responsibility of the Fidelity Advisor Limited Term Bond Fund’s management. Our responsibility is to express an opinion on these financial statements based on our audits. We conducted our audits of these financial statements in accordance with the standards of the Public Company Accounting Oversight Board (United States). Those standards require that we plan and perform the audit to obtain reasonable assurance about whether the financial statements are free of material misstatement. An audit includes examining, on a test basis, evidence supporting the amounts and disclosures in the financial statements, assessing the accounting principles used and significant estimates made by management, and evaluating the overall financial statement presentation. Our procedures included confirmation of securities owned as of August 31, 2017 by correspondence with the custodian and brokers; when replies were not received from brokers, we performed other auditing procedures. We believe that our audits provide a reasonable basis for our opinion.
PricewaterhouseCoopers LLP
Boston, Massachusetts
October 17, 2017
Trustees and Officers
The Trustees, Members of the Advisory Board (if any), and officers of the trust and fund, as applicable, are listed below. The Board of Trustees governs the fund and is responsible for protecting the interests of shareholders. The Trustees are experienced executives who meet periodically throughout the year to oversee the fund's activities, review contractual arrangements with companies that provide services to the fund, oversee management of the risks associated with such activities and contractual arrangements, and review the fund's performance. Each of the Trustees oversees 246 funds.
The Trustees hold office without limit in time except that (a) any Trustee may resign; (b) any Trustee may be removed by written instrument, signed by at least two-thirds of the number of Trustees prior to such removal; (c) any Trustee who requests to be retired or who has become incapacitated by illness or injury may be retired by written instrument signed by a majority of the other Trustees; and (d) any Trustee may be removed at any special meeting of shareholders by a two-thirds vote of the outstanding voting securities of the trust. Each Trustee who is not an interested person (as defined in the 1940 Act) of the trust and the fund is referred to herein as an Independent Trustee. Each Independent Trustee shall retire not later than the last day of the calendar year in which his or her 75th birthday occurs. The Independent Trustees may waive this mandatory retirement age policy with respect to individual Trustees. Officers and Advisory Board Members hold office without limit in time, except that any officer or Advisory Board Member may resign or may be removed by a vote of a majority of the Trustees at any regular meeting or any special meeting of the Trustees. Except as indicated, each individual has held the office shown or other offices in the same company for the past five years.
The fund’s Statement of Additional Information (SAI) includes more information about the Trustees. To request a free copy, call Fidelity at 1-800-544-8544.
Experience, Skills, Attributes, and Qualifications of the Trustees. The Governance and Nominating Committee has adopted a statement of policy that describes the experience, qualifications, attributes, and skills that are necessary and desirable for potential Independent Trustee candidates (Statement of Policy). The Board believes that each Trustee satisfied at the time he or she was initially elected or appointed a Trustee, and continues to satisfy, the standards contemplated by the Statement of Policy. The Governance and Nominating Committee also engages professional search firms to help identify potential Independent Trustee candidates who have the experience, qualifications, attributes, and skills consistent with the Statement of Policy. From time to time, additional criteria based on the composition and skills of the current Independent Trustees, as well as experience or skills that may be appropriate in light of future changes to board composition, business conditions, and regulatory or other developments, have also been considered by the professional search firms and the Governance and Nominating Committee. In addition, the Board takes into account the Trustees' commitment and participation in Board and committee meetings, as well as their leadership of standing and ad hoc committees throughout their tenure.
In determining that a particular Trustee was and continues to be qualified to serve as a Trustee, the Board has considered a variety of criteria, none of which, in isolation, was controlling. The Board believes that, collectively, the Trustees have balanced and diverse experience, qualifications, attributes, and skills, which allow the Board to operate effectively in governing the fund and protecting the interests of shareholders. Information about the specific experience, skills, attributes, and qualifications of each Trustee, which in each case led to the Board's conclusion that the Trustee should serve (or continue to serve) as a trustee of the fund, is provided below.
Board Structure and Oversight Function. Abigail P. Johnson is an interested person and currently serves as Chairman. The Trustees have determined that an interested Chairman is appropriate and benefits shareholders because an interested Chairman has a personal and professional stake in the quality and continuity of services provided to the fund. Independent Trustees exercise their informed business judgment to appoint an individual of their choosing to serve as Chairman, regardless of whether the Trustee happens to be independent or a member of management. The Independent Trustees have determined that they can act independently and effectively without having an Independent Trustee serve as Chairman and that a key structural component for assuring that they are in a position to do so is for the Independent Trustees to constitute a substantial majority for the Board. The Independent Trustees also regularly meet in executive session. Marie L. Knowles serves as Chairman of the Independent Trustees and as such (i) acts as a liaison between the Independent Trustees and management with respect to matters important to the Independent Trustees and (ii) with management prepares agendas for Board meetings.
Fidelity® funds are overseen by different Boards of Trustees. The fund's Board oversees Fidelity's investment-grade bond, money market, asset allocation and certain equity funds, and other Boards oversee Fidelity's high income, sector and other equity funds. The asset allocation funds may invest in Fidelity® funds that are overseen by such other Boards. The use of separate Boards, each with its own committee structure, allows the Trustees of each group of Fidelity® funds to focus on the unique issues of the funds they oversee, including common research, investment, and operational issues. On occasion, the separate Boards establish joint committees to address issues of overlapping consequences for the Fidelity® funds overseen by each Board.
The Trustees operate using a system of committees to facilitate the timely and efficient consideration of all matters of importance to the Trustees, the fund, and fund shareholders and to facilitate compliance with legal and regulatory requirements and oversight of the fund's activities and associated risks. The Board, acting through its committees, has charged FMR and its affiliates with (i) identifying events or circumstances the occurrence of which could have demonstrably adverse effects on the fund's business and/or reputation; (ii) implementing processes and controls to lessen the possibility that such events or circumstances occur or to mitigate the effects of such events or circumstances if they do occur; and (iii) creating and maintaining a system designed to evaluate continuously business and market conditions in order to facilitate the identification and implementation processes described in (i) and (ii) above. Because the day-to-day operations and activities of the fund are carried out by or through FMR, its affiliates, and other service providers, the fund's exposure to risks is mitigated but not eliminated by the processes overseen by the Trustees. While each of the Board's committees has responsibility for overseeing different aspects of the fund's activities, oversight is exercised primarily through the Operations and Audit Committees. In addition, an ad hoc Board committee of Independent Trustees has worked with FMR to enhance the Board's oversight of investment and financial risks, legal and regulatory risks, technology risks, and operational risks, including the development of additional risk reporting to the Board. Appropriate personnel, including but not limited to the fund's Chief Compliance Officer (CCO), FMR's internal auditor, the independent accountants, the fund's Treasurer and portfolio management personnel, make periodic reports to the Board's committees, as appropriate, including an annual review of Fidelity's risk management program for the Fidelity® funds. The responsibilities of each standing committee, including their oversight responsibilities, are described further under "Standing Committees of the Trustees."
Interested Trustees*:
Correspondence intended for a Trustee who is an interested person may be sent to Fidelity Investments, 245 Summer Street, Boston, Massachusetts 02210.
Name, Year of Birth; Principal Occupations and Other Relevant Experience+
Abigail P. Johnson (1961)
Year of Election or Appointment: 2009
Trustee
Chairman of the Board of Trustees
Ms. Johnson also serves as Trustee of other Fidelity® funds. Ms. Johnson serves as Chairman (2016-present), Chief Executive Officer (2014-present), and Director (2007-present) of FMR LLC (diversified financial services company), President of Fidelity Financial Services (2012-present) and President of Personal, Workplace and Institutional Services (2005-present). Ms. Johnson is Chairman and Director of FMR Co., Inc. (investment adviser firm, 2011-present) and Chairman and Director of FMR (investment adviser firm, 2011-present). Previously, Ms. Johnson served as Vice Chairman (2007-2016) and President (2013-2016) of FMR LLC, President and a Director of FMR (2001-2005), a Trustee of other investment companies advised by FMR, Fidelity Investments Money Management, Inc. (investment adviser firm), and FMR Co., Inc. (2001-2005), Senior Vice President of the Fidelity® funds (2001-2005), and managed a number of Fidelity® funds. Ms. Abigail P. Johnson and Mr. Arthur E. Johnson are not related.
Jennifer Toolin McAuliffe (1959)
Year of Election or Appointment: 2016
Trustee
Ms. McAuliffe also serves as Trustee of other Fidelity® funds. Ms. McAuliffe previously served as a Member of the Advisory Board of certain Fidelity® funds (2016) and as Co-Head of Fixed Income of Fidelity Investments Limited (now known as FIL Limited (FIL)) (diversified financial services company). Earlier roles at FIL included Director of Research for FIL’s credit and quantitative teams in London, Hong Kong and Tokyo. Ms. McAuliffe also was the Director of Research for taxable and municipal bonds at Fidelity Investments Money Management, Inc. Ms. McAuliffe is also a director or trustee of several not-for-profit entities.
* Determined to be an “Interested Trustee” by virtue of, among other things, his or her affiliation with the trust or various entities under common control with FMR.
+ The information includes the Trustee's principal occupation during the last five years and other information relating to the experience, attributes, and skills relevant to the Trustee's qualifications to serve as a Trustee, which led to the conclusion that the Trustee should serve as a Trustee for the fund.
Independent Trustees:
Correspondence intended for an Independent Trustee may be sent to Fidelity Investments, P.O. Box 55235, Boston, Massachusetts 02205-5235.
Name, Year of Birth; Principal Occupations and Other Relevant Experience+
Elizabeth S. Acton (1951)
Year of Election or Appointment: 2016
Trustee
Ms. Acton also serves as Trustee of other Fidelity® funds. Prior to her retirement in April 2012, Ms. Acton was Executive Vice President, Finance (2011-2012), Executive Vice President, Chief Financial Officer (2002-2011), and Treasurer (2004-2005) of Comerica Incorporated (financial services). Prior to joining Comerica, Ms. Acton held a variety of positions at Ford Motor Company (1983-2002), including Vice President and Treasurer (2000-2002) and Executive Vice President and Chief Financial Officer of Ford Motor Credit Company (1998-2000). Ms. Acton currently serves as a member of the Board of Directors and Audit and Finance Committees of Beazer Homes USA, Inc. (homebuilding, 2012-present). Previously, Ms. Acton served as a Member of the Advisory Board of certain Fidelity® funds (2013-2016).
John Engler (1948)
Year of Election or Appointment: 2016
Trustee
Mr. Engler also serves as Trustee of other Fidelity® funds. He serves on the board of directors for Universal Forest Products (manufacturer and distributor of wood and wood-alternative products, 2003-present) and K12 Inc. (technology-based education company, 2012-present). Previously, Mr. Engler served as a Member of the Advisory Board of certain Fidelity® funds (2014-2016), president of the Business Roundtable (2011-2017), a trustee of The Munder Funds (2003-2014), president and CEO of the National Association of Manufacturers (2004-2011), member of the Board of Trustees of the Annie E. Casey Foundation (2004-2015), and as governor of Michigan (1991-2003). He is a past chairman of the National Governors Association.
Albert R. Gamper, Jr. (1942)
Year of Election or Appointment: 2006
Trustee
Mr. Gamper also serves as Trustee of other Fidelity® funds. Prior to his retirement in December 2004, Mr. Gamper served as Chairman of the Board of CIT Group Inc. (commercial finance). During his tenure with CIT Group Inc. Mr. Gamper served in numerous senior management positions, including Chairman (1987-1989; 1999-2001; 2002-2004), Chief Executive Officer (1987-2004), and President (2002-2003). Mr. Gamper currently serves as a member of the Board of Directors of Public Service Enterprise Group (utilities, 2000-present), and Member of the Board of Trustees of Barnabas Health Care System (1997-present). Previously, Mr. Gamper served as Chairman (2012-2015) and Vice Chairman (2011-2012) of the Independent Trustees of certain Fidelity® funds and as Chairman of the Board of Governors, Rutgers University (2004-2007).
Robert F. Gartland (1951)
Year of Election or Appointment: 2010
Trustee
Mr. Gartland also serves as Trustee of other Fidelity® funds. Mr. Gartland is Chairman and an investor in Gartland & Mellina Group Corp. (consulting, 2009-present). Previously, Mr. Gartland served as a partner and investor of Vietnam Partners LLC (investments and consulting, 2008-2011). Prior to his retirement, Mr. Gartland held a variety of positions at Morgan Stanley (financial services, 1979-2007) including Managing Director (1987-2007).
Arthur E. Johnson (1947)
Year of Election or Appointment: 2008
Trustee
Vice Chairman of the Independent Trustees
Mr. Johnson also serves as Trustee of other Fidelity® funds. Mr. Johnson serves as a member of the Board of Directors of Eaton Corporation plc (diversified power management, 2009-present) and Booz Allen Hamilton (management consulting, 2011-present). Prior to his retirement, Mr. Johnson served as Senior Vice President of Corporate Strategic Development of Lockheed Martin Corporation (defense contractor, 1999-2009). He previously served on the Board of Directors of IKON Office Solutions, Inc. (1999-2008), AGL Resources, Inc. (holding company, 2002-2016), and Delta Airlines (2005-2007). Mr. Arthur E. Johnson is not related to Ms. Abigail P. Johnson.
Michael E. Kenneally (1954)
Year of Election or Appointment: 2009
Trustee
Mr. Kenneally also serves as Trustee of other Fidelity® funds. Prior to his retirement, Mr. Kenneally served as Chairman and Global Chief Executive Officer of Credit Suisse Asset Management. Before joining Credit Suisse, he was an Executive Vice President and Chief Investment Officer for Bank of America Corporation. Earlier roles at Bank of America included Director of Research, Senior Portfolio Manager and Research Analyst, and Mr. Kenneally was awarded the Chartered Financial Analyst (CFA) designation in 1991.
Marie L. Knowles (1946)
Year of Election or Appointment: 2001
Trustee
Chairman of the Independent Trustees
Ms. Knowles also serves as Trustee of other Fidelity® funds. Prior to Ms. Knowles' retirement in June 2000, she served as Executive Vice President and Chief Financial Officer of Atlantic Richfield Company (ARCO) (diversified energy, 1996-2000). From 1993 to 1996, she was a Senior Vice President of ARCO and President of ARCO Transportation Company (pipeline and tanker operations). Ms. Knowles currently serves as a Director and Chairman of the Audit Committee of McKesson Corporation (healthcare service, since 2002). Ms. Knowles is a member of the Board of the Santa Catalina Island Company (real estate, 2009-present). Ms. Knowles is a Member of the Investment Company Institute Board of Governors and a Member of the Governing Council of the Independent Directors Council (2014-present). She also serves as a member of the Advisory Board for the School of Engineering of the University of Southern California. Previously, Ms. Knowles served as a Director of Phelps Dodge Corporation (copper mining and manufacturing, 1994-2007), URS Corporation (engineering and construction, 2000-2003) and America West (airline, 1999-2002). Ms. Knowles previously served as Vice Chairman of the Independent Trustees of certain Fidelity® funds (2012-2015).
Mark A. Murray (1954)
Year of Election or Appointment: 2016
Trustee
Mr. Murray also serves as Trustee of other Fidelity® funds. Mr. Murray is Vice Chairman (2013-present) of Meijer, Inc. (regional retail chain). Previously, Mr. Murray served as a Member of the Advisory Board of certain Fidelity® funds (2016) and as Co-Chief Executive Officer (2013-2016) and President (2006-2013) of Meijer, Inc. Mr. Murray serves as a member of the Board of Directors and Nuclear Review and Public Policy and Responsibility Committees of DTE Energy Company (diversified energy company, 2009-present). Mr. Murray also serves as a member of the Board of Directors of Spectrum Health (not-for-profit health system, 2015-present). Mr. Murray previously served as President of Grand Valley State University (2001-2006), Treasurer for the State of Michigan (1999-2001), Vice President of Finance and Administration for Michigan State University (1998-1999), and a member of the Board of Directors and Audit Committee and Chairman of the Nominating and Corporate Governance Committee of Universal Forest Products, Inc. (manufacturer and distributor of wood and wood-alternative products, 2004-2016). Mr. Murray is also a director or trustee of many community and professional organizations.
+ The information includes the Trustee's principal occupation during the last five years and other information relating to the experience, attributes, and skills relevant to the Trustee's qualifications to serve as a Trustee, which led to the conclusion that the Trustee should serve as a Trustee for the fund.
Advisory Board Members and Officers:
Correspondence intended for an officer may be sent to Fidelity Investments, 245 Summer Street, Boston, Massachusetts 02210. Officers appear below in alphabetical order.
Name, Year of Birth; Principal Occupation
Elizabeth Paige Baumann (1968)
Year of Election or Appointment: 2017
Anti-Money Laundering (AML) Officer
Ms. Baumann also serves as AML Officer of other funds. She is Chief AML Officer (2012-present) and Senior Vice President (2014-present) of FMR LLC (diversified financial services company) and is an employee of Fidelity Investments. Previously, Ms. Baumann served as AML Officer of the funds (2012-2016), and Vice President (2007-2014) and Deputy Anti-Money Laundering Officer (2007-2012) of FMR LLC.
Marc R. Bryant (1966)
Year of Election or Appointment: 2015
Secretary and Chief Legal Officer (CLO)
Mr. Bryant also serves as Secretary and CLO of other funds. Mr. Bryant serves as CLO, Secretary, and Senior Vice President of Fidelity Management & Research Company (investment adviser firm, 2015-present) and FMR Co., Inc. (investment adviser firm, 2015-present); Secretary of Fidelity SelectCo, LLC (investment adviser firm, 2015-present) and Fidelity Investments Money Management, Inc. (investment adviser firm, 2015-present); and CLO of Fidelity Management & Research (Hong Kong) Limited and FMR Investment Management (UK) Limited (investment adviser firms, 2015-present) and Fidelity Management & Research (Japan) Limited (investment adviser firm, 2016-present). He is Senior Vice President and Deputy General Counsel of FMR LLC (diversified financial services company). Previously, Mr. Bryant served as Secretary and CLO of Fidelity Rutland Square Trust II (2010-2014) and Assistant Secretary of Fidelity's Fixed Income and Asset Allocation Funds (2013-2015). Prior to joining Fidelity Investments, Mr. Bryant served as a Senior Vice President and the Head of Global Retail Legal for AllianceBernstein L.P. (2006-2010), and as the General Counsel for ProFund Advisors LLC (2001-2006).
Jonathan Davis (1968)
Year of Election or Appointment: 2010
Assistant Treasurer
Mr. Davis also serves as Assistant Treasurer of other funds, and is an employee of Fidelity Investments. Previously, Mr. Davis served as Vice President and Associate General Counsel of FMR LLC (diversified financial services company, 2003-2010).
Adrien E. Deberghes (1967)
Year of Election or Appointment: 2010
Assistant Treasurer
Mr. Deberghes also serves as an officer of other funds. He serves as Executive Vice President of Fidelity Investments Money Management, Inc. (FIMM) (investment adviser firm, 2016-present) and is an employee of Fidelity Investments (2008-present). Prior to joining Fidelity Investments, Mr. Deberghes was Senior Vice President of Mutual Fund Administration at State Street Corporation (2007-2008), Senior Director of Mutual Fund Administration at Investors Bank & Trust (2005-2007), and Director of Finance for Dunkin' Brands (2000-2005). Previously, Mr. Deberghes served in other fund officer roles.
Stephanie J. Dorsey (1969)
Year of Election or Appointment: 2013
President and Treasurer
Ms. Dorsey also serves as an officer of other funds. She is an employee of Fidelity Investments (2008-present) and has served in other fund officer roles. Prior to joining Fidelity Investments, Ms. Dorsey served as Treasurer (2004-2008) of the JPMorgan Mutual Funds and Vice President (2004-2008) of JPMorgan Chase Bank.
Howard J. Galligan III (1966)
Year of Election or Appointment: 2014
Chief Financial Officer
Mr. Galligan also serves as Chief Financial Officer of other funds. Mr. Galligan serves as President of Fidelity Pricing and Cash Management Services (FPCMS) (2014-present) and as a Director of Strategic Advisers, Inc. (investment adviser firm, 2008-present). Previously, Mr. Galligan served as Chief Administrative Officer of Asset Management (2011-2014) and Chief Operating Officer and Senior Vice President of Investment Support for Strategic Advisers, Inc. (2003-2011).
Colm A. Hogan (1973)
Year of Election or Appointment: 2016
Assistant Treasurer
Mr. Hogan also serves as an officer of other funds. Mr. Hogan is an employee of Fidelity Investments (2005-present).
Chris Maher (1972)
Year of Election or Appointment: 2013
Assistant Treasurer
Mr. Maher serves as Assistant Treasurer of other funds. Mr. Maher is Vice President of Valuation Oversight and is an employee of Fidelity Investments. Previously, Mr. Maher served as Vice President of Asset Management Compliance (2013), Vice President of the Program Management Group of FMR (investment adviser firm, 2010-2013), and Vice President of Valuation Oversight (2008-2010).
John B. McGinty, Jr. (1962)
Year of Election or Appointment: 2016
Chief Compliance Officer
Mr. McGinty also serves as Chief Compliance Officer of other funds. Mr. McGinty is Senior Vice President of Asset Management Compliance for Fidelity Investments and is an employee of Fidelity Investments (2016-present). Mr. McGinty previously served as Vice President, Senior Attorney at Eaton Vance Management (investment management firm, 2015-2016), and prior to Eaton Vance as global CCO for all firm operations and registered investment companies at GMO LLC (investment management firm, 2009-2015). Before joining GMO LLC, Mr. McGinty served as Senior Vice President, Deputy General Counsel for Fidelity Investments (2007-2009).
Rieco E. Mello (1969)
Year of Election or Appointment: 2017
Assistant Treasurer
Mr. Mello also serves as Assistant Treasurer of other funds. Mr. Mello is an employee of Fidelity Investments (1995-present).
Jamie Pagliocco (1964)
Year of Election or Appointment: 2017
Vice President
Mr. Pagliocco also serves as Vice President of other funds. Mr. Pagliocco serves as Chief Investment Officer of FMR's Bond Group (2017-present) and is an employee of Fidelity Investments (2001-present).
Jason P. Pogorelec (1975)
Year of Election or Appointment: 2015
Assistant Secretary
Mr. Pogorelec also serves as Assistant Secretary of other funds. Mr. Pogorelec serves as Vice President, Associate General Counsel (2010-present) and is an employee of Fidelity Investments (2006-present).
Nancy D. Prior (1967)
Year of Election or Appointment: 2014
Vice President
Ms. Prior also serves as Vice President of other funds. Ms. Prior serves as a Director of FMR Investment Management (UK) Limited (investment adviser firm, 2015-present), President (2016-present) and Director (2014-present) of Fidelity Investments Money Management, Inc. (FIMM) (investment adviser firm), President, Fixed Income (2014-present), Vice Chairman of FIAM LLC (investment adviser firm, 2014-present), and is an employee of Fidelity Investments (2002-present). Previously, Ms. Prior served as Vice President of Fidelity's Money Market Funds (2012-2014), President, Money Market and Short Duration Bond Group of Fidelity Management & Research (FMR) (investment adviser firm, 2013-2014), President, Money Market Group of FMR (2011-2013), Managing Director of Research (2009-2011), Senior Vice President and Deputy General Counsel (2007-2009), and Assistant Secretary of certain Fidelity® funds (2008-2009).
Stacie M. Smith (1974)
Year of Election or Appointment: 2013
Assistant Treasurer
Ms. Smith also serves as an officer of other funds. She is an employee of Fidelity Investments (2009-present) and has served in other fund officer roles. Prior to joining Fidelity Investments, Ms. Smith served as Senior Audit Manager of Ernst & Young LLP (accounting firm, 1996-2009). Previously, Ms. Smith served as Deputy Treasurer of certain Fidelity® funds (2013-2016).
Marc L. Spector (1972)
Year of Election or Appointment: 2016
Deputy Treasurer
Mr. Spector also serves as an officer of other funds. Mr. Spector is an employee of Fidelity Investments (2016-present). Prior to joining Fidelity Investments, Mr. Spector served as Director at the Siegfried Group (accounting firm, 2013-2016), and prior to Siegfried Group as audit senior manager at Deloitte & Touche (accounting firm, 2005-2013).
Renee Stagnone (1975)
Year of Election or Appointment: 2016
Assistant Treasurer
Ms. Stagnone also serves as an officer of other funds. Ms. Stagnone is an employee of Fidelity Investments (1997-present). Previously, Ms. Stagnone served as Deputy Treasurer of certain Fidelity® funds (2013-2016).
Christine J. Thompson (1958)
Year of Election or Appointment: 2015
Vice President of Fidelity's Bond Funds
Ms. Thompson also serves as Vice President of other funds. Ms. Thompson also serves as Chief Investment Officer of FMR's Bond Group (2010-present) and is an employee of Fidelity Investments (1985-present). Previously, Ms. Thompson served as Vice President of Fidelity's Bond Funds (2010-2012).
Shareholder Expense Example
As a shareholder of the Fund, you incur two types of costs: (1) transaction costs, including sales charges (loads) on purchase payments or redemption proceeds, and (2) ongoing costs, including management fees, distribution and/or service (12b-1) fees and other Fund expenses. This Example is intended to help you understand your ongoing costs (in dollars) of investing in the Fund and to compare these costs with the ongoing costs of investing in other mutual funds.
The Example is based on an investment of $1,000 invested at the beginning of the period and held for the entire period (March 1, 2017 to August 31, 2017).
Actual Expenses
The first line of the accompanying table for each class of the Fund provides information about actual account values and actual expenses. You may use the information in this line, together with the amount you invested, to estimate the expenses that you paid over the period. Simply divide your account value by $1,000.00 (for example, an $8,600 account value divided by $1,000.00 = 8.6), then multiply the result by the number in the first line for a class of the Fund under the heading entitled "Expenses Paid During Period" to estimate the expenses you paid on your account during this period. A small balance maintenance fee of $12.00 that is charged once a year may apply for certain accounts with a value of less than $2,000. This fee is not included in the table below. If it was, the estimate of expenses you paid during the period would be higher, and your ending account value lower, by this amount. In addition, the Fund, as a shareholder in the underlying Fidelity Central Funds, will indirectly bear its pro-rata share of the fees and expenses incurred by the underlying Fidelity Central Funds. These fees and expenses are not included in the Fund's annualized expense ratio used to calculate the expense estimate in the table below.
Hypothetical Example for Comparison Purposes
The second line of the accompanying table for each class of the Fund provides information about hypothetical account values and hypothetical expenses based on a Class' actual expense ratio and an assumed rate of return of 5% per year before expenses, which is not the Class' actual return. The hypothetical account values and expenses may not be used to estimate the actual ending account balance or expenses you paid for the period. You may use this information to compare the ongoing costs of investing in the Fund and other funds. To do so, compare this 5% hypothetical example with the 5% hypothetical examples that appear in the shareholder reports of the other funds. A small balance maintenance fee of $12.00 that is charged once a year may apply for certain accounts with a value of less than $2,000. This fee is not included in the table below. If it was, the estimate of expenses you paid during the period would be higher, and your ending account value lower, by this amount. In addition, the Fund, as a shareholder in the underlying Fidelity Central Funds, will indirectly bear its pro-rata share of the fees and expenses incurred by the underlying Fidelity Central Funds. These fees and expenses are not included in the Fund's annualized expense ratio used to calculate the expense estimate in the table below.
Please note that the expenses shown in the table are meant to highlight your ongoing costs only and do not reflect any transaction costs. Therefore, the second line of the table is useful in comparing ongoing costs only, and will not help you determine the relative total costs of owning different funds. In addition, if these transactional costs were included, your costs would have been higher.
| | Annualized Expense Ratio-A | Beginning
Account Value
March 1, 2017 | Ending
Account Value
August 31, 2017 | Expenses Paid
During Period-B
March 1, 2017
to August 31, 2017 |
| Class A | .75% | | | |
| Actual | | $1,000.00 | $1,014.50 | $3.81 |
| Hypothetical-C | | $1,000.00 | $1,021.42 | $3.82 |
| Class M | .76% | | | |
| Actual | | $1,000.00 | $1,014.40 | $3.86 |
| Hypothetical-C | | $1,000.00 | $1,021.37 | $3.87 |
| Class C | 1.52% | | | |
| Actual | | $1,000.00 | $1,010.60 | $7.70 |
| Hypothetical-C | | $1,000.00 | $1,017.54 | $7.73 |
| Fidelity Limited Term Bond Fund | .45% | | | |
| Actual | | $1,000.00 | $1,015.10 | $2.29 |
| Hypothetical-C | | $1,000.00 | $1,022.94 | $2.29 |
| Class I | .49% | | | |
| Actual | | $1,000.00 | $1,015.80 | $2.49 |
| Hypothetical-C | | $1,000.00 | $1,022.74 | $2.50 |
A Annualized expense ratio reflects expenses net of applicable fee waivers.
B Expenses are equal to each Class' annualized expense ratio, multiplied by the average account value over the period, multiplied by 184/365 (to reflect the one-half year period). The fees and expenses of the underlying Fidelity Central Funds in which the Fund invests are not included in each Class' annualized expense ratio. In addition to the expenses noted above, the Fund also indirectly bears its proportional share of the expenses of the underlying Fidelity Central Funds. Annualized expenses of the underlying non-money market Fidelity Central Funds as of their most recent fiscal half year were less than .005%.
C 5% return per year before expenses
Distributions (Unaudited)
A total of 7.03% of the dividends distributed during the fiscal year was derived from interest on U.S. Government securities which is generally exempt from state income tax.
The fund designates $24,458,129 of distributions paid during the period January 1, 2017 to August 31, 2017 as qualifying to be taxed as interest-related dividends for nonresident alien shareholders.
The fund will notify shareholders in January 2018 of amounts for use in preparing 2017 income tax returns.
Corporate Headquarters
245 Summer St.
Boston, MA 02210
www.fidelity.com
BTL-ANN-1017
1.9584915.103
Fidelity Advisor® Limited Term Bond Fund Class A, Class M (formerly Class T), Class C and Class I
Annual Report August 31, 2017 |
|
Contents
To view a fund's proxy voting guidelines and proxy voting record for the 12-month period ended June 30, visit http://www.fidelity.com/proxyvotingresults or visit the Securities and Exchange Commission's (SEC) web site at http://www.sec.gov.
You may also call 1-877-208-0098 to request a free copy of the proxy voting guidelines.
Standard & Poor's, S&P and S&P 500 are registered service marks of The McGraw-Hill Companies, Inc. and have been licensed for use by Fidelity Distributors Corporation.
Other third-party marks appearing herein are the property of their respective owners.
All other marks appearing herein are registered or unregistered trademarks or service marks of FMR LLC or an affiliated company. © 2017 FMR LLC. All rights reserved.
This report and the financial statements contained herein are submitted for the general information of the shareholders of the Fund. This report is not authorized for distribution to prospective investors in the Fund unless preceded or accompanied by an effective prospectus.
A fund files its complete schedule of portfolio holdings with the SEC for the first and third quarters of each fiscal year on Form N-Q. Forms N-Q are available on the SEC’s web site at http://www.sec.gov. A fund's Forms N-Q may be reviewed and copied at the SEC’s Public Reference Room in Washington, DC. Information regarding the operation of the SEC's Public Reference Room may be obtained by calling 1-800-SEC-0330.
For a complete list of a fund's portfolio holdings, view the most recent holdings listing, semiannual report, or annual report on Fidelity's web site at http://www.fidelity.com, http://www.institutional.fidelity.com, or http://www.401k.com, as applicable.
NOT FDIC INSURED •MAY LOSE VALUE •NO BANK GUARANTEE
Neither the Fund nor Fidelity Distributors Corporation is a bank.
Performance: The Bottom Line
Average annual total return reflects the change in the value of an investment, assuming reinvestment of distributions from dividend income and capital gains (the profits earned upon the sale of securities that have grown in value, if any) and assuming a constant rate of performance each year. The hypothetical investment and the average annual total returns do not reflect the deduction of taxes that a shareholder would pay on fund distributions or the redemption of fund shares. During periods of reimbursement by Fidelity, a fund’s total return will be greater than it would be had the reimbursement not occurred. How a fund did yesterday is no guarantee of how it will do tomorrow.
Average Annual Total Returns
| For the periods ended August 31, 2017 | Past 1 year | Past 5 years | Past 10 years |
| Class A (incl. 2.75% sales charge) | (1.60)% | 0.76% | 3.14% |
| Class M (incl. 2.75% sales charge) | (1.69)% | 0.75% | 3.16% |
| Class C (incl. contingent deferred sales charge) | (0.68)% | 0.53% | 2.66% |
| Class I | 1.36% | 1.58% | 3.71% |
Prior to October 30, 2013, the fund was named Fidelity Advisor® Intermediate Bond Fund, and the fund operated under certain different investment policies and compared its performance to a different index. The fund's historical performance may not represent its current investment policies.
Class C shares' contingent deferred sales charges included in the past one year, past five years and past ten years total return figures are 1%, 0% and 0%, respectively.
$10,000 Over 10 Years
Let's say hypothetically that $10,000 was invested in Fidelity Advisor® Limited Term Bond Fund - Class A on August 31, 2007, and the current 2.75% sales charge was paid.
The chart shows how the value of your investment would have changed, and also shows how the Bloomberg Barclays U.S. 1-5 Year Government/Credit Bond Index performed over the same period.
See (previous page) for additional information regarding the performance of Class A.
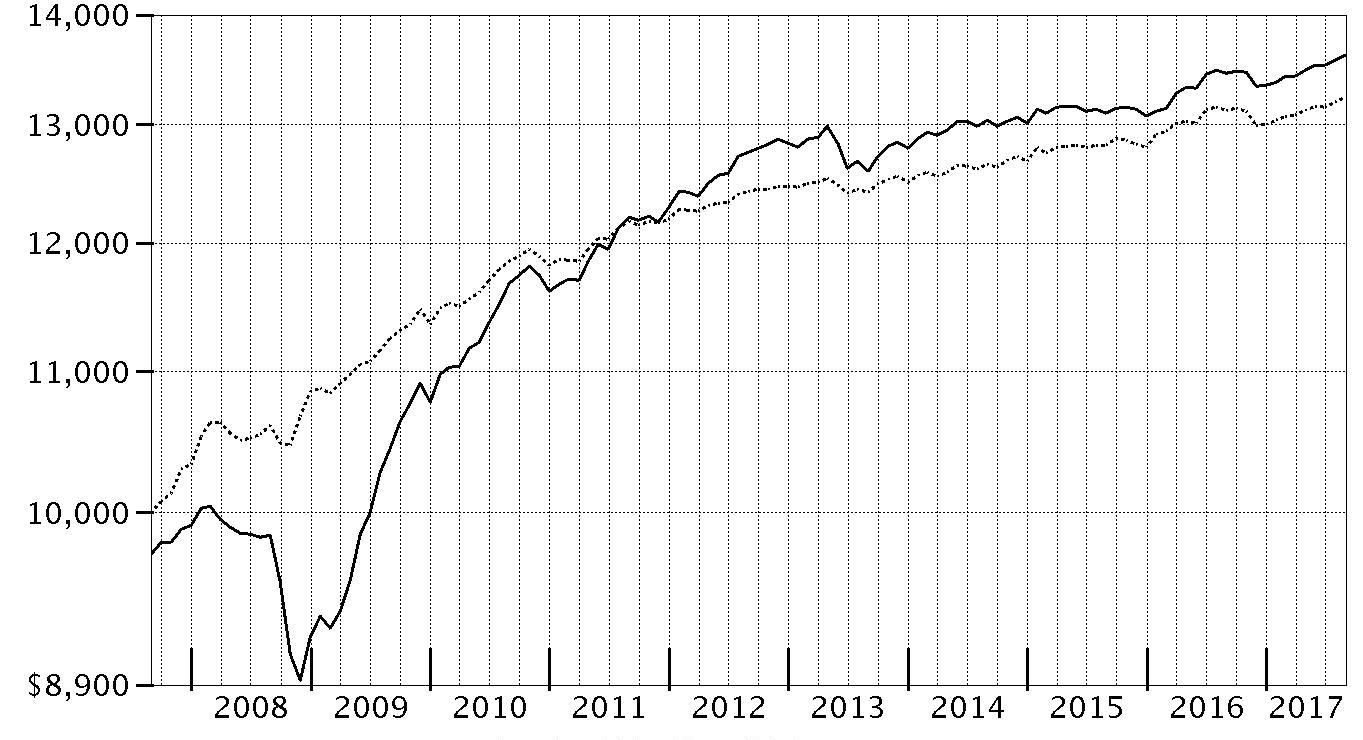
| Period Ending Values |
| $13,622 | Fidelity Advisor® Limited Term Bond Fund - Class A |
| $13,245 | Bloomberg Barclays U.S. 1-5 Year Government/Credit Bond Index |
Effective August 24, 2016, all Barclays benchmark indices were co-branded as the Bloomberg Barclays Indices for a period of five years.
Management's Discussion of Fund Performance
Market Recap: U.S. taxable investment-grade bonds rose slightly for the 12 months ending August 31, 2017, as yields increased markedly following the U.S. presidential election then moderated as the period progressed. The Bloomberg Barclays U.S. Aggregate Bond Index gained 0.49% for the year. Bond yields posted slight gains early in the period, prior to the U.S. election, then rallied strongly in November and December, as many investors viewed then-President-elect Donald Trump’s economic agenda as stimulative and potentially inflationary. Yields also rode the Fed’s decision in December to raise policy interest rates. Longer-term bond yields declined slightly in the first half of 2017, even though the Fed raised rates in June 2017 for the third time in as many quarters, as it became clear that changes to tax, health care and fiscal policies would take time to develop and implement. Fairly cool inflation readings also held back yields late in the period. Within the Bloomberg Barclays index, investment-grade corporate bonds led all major market segments, up 2.13%, while U.S. Treasuries returned -0.95%. Securitized sectors advanced more modestly than corporates. Outside the index, riskier, non-core fixed-income segments led the broader market, while Treasury Inflation-Protected Securities (TIPS) rose 0.46%, according to Bloomberg Barclays.
Comments from Portfolio Manager Rob Galusza: For the annual reporting period ending August 31, 2017, the fund’s share classes returned about 0% to 1%. All slightly trailed the 1.53% return of the benchmark Fidelity Limited Term Composite Index℠. Spreads on corporate securities narrowed, driven in part by a strong technical backdrop. While the decline in spreads supported the performance of the corporate sector, it also made it more challenging to find attractive combinations of risk and return, particularly later in the period. Bond returns remained lackluster on an absolute basis, but the fund’s corporate holdings out-earned comparable-maturity U.S. Treasuries, which the fund underweighted. This positioning contributed to benchmark-relative performance. Within corporates, overweighting the bonds of financial institutions added value, while underweighting bonds in the basic industry segment hurt. Conversely, an overweighting and picks in the industrial sector hampered fund results somewhat, especially those of communications issuers. Elsewhere, a fairly small allocation to mortgage-backed securities detracted. However, underweighting government-related agency securities and avoiding debt of foreign-government institutions contributed versus the index.
The views expressed above reflect those of the portfolio manager(s) only through the end of the period as stated on the cover of this report and do not necessarily represent the views of Fidelity or any other person in the Fidelity organization. Any such views are subject to change at any time based upon market or other conditions and Fidelity disclaims any responsibility to update such views. These views may not be relied on as investment advice and, because investment decisions for a Fidelity fund are based on numerous factors, may not be relied on as an indication of trading intent on behalf of any Fidelity fund.
Investment Summary (Unaudited)
The information in the following tables is based on the combined investments of the Fund and its pro-rata share of the investments of Fidelity's Fixed-Income Central Funds.
Quality Diversification (% of fund's net assets)
| As of August 31, 2017 |
| | U.S. Government and U.S. Government Agency Obligations | 14.5% |
| | AAA | 11.3% |
| | AA | 3.3% |
| | A | 22.8% |
| | BBB | 41.2% |
| | BB and Below | 4.9% |
| | Not Rated | 0.2% |
| | Short-Term Investments and Net Other Assets | 1.8% |

| As of February 28, 2017 |
| | U.S. Government and U.S. Government Agency Obligations | 12.8% |
| | AAA | 12.7% |
| | AA | 3.9% |
| | A | 22.8% |
| | BBB | 41.9% |
| | BB and Below | 4.1% |
| | Not Rated | 0.5% |
| | Short-Term Investments and Net Other Assets | 1.3% |

We have used ratings from Moody's Investors Service, Inc. Where Moody's® ratings are not available, we have used S&P® ratings. All ratings are as of the date indicated and do not reflect subsequent changes.
Asset Allocation (% of fund's net assets)
| As of August 31, 2017*,** |
| | Corporate Bonds | 69.6%�� |
| | U.S. Government and U.S. Government Agency Obligations | 14.5% |
| | Asset-Backed Securities | 5.5% |
| | CMOs and Other Mortgage Related Securities | 6.2% |
| | Municipal Bonds | 0.4% |
| | Other Investments | 2.0% |
| | Short-Term Investments and Net Other Assets (Liabilities) | 1.8% |

* Foreign investments - 17.2%
** Futures and Swaps - 0.0%
| As of February 28, 2017*,** |
| | Corporate Bonds | 70.4% |
| | U.S. Government and U.S. Government Agency Obligations | 12.8% |
| | Asset-Backed Securities | 7.4% |
| | CMOs and Other Mortgage Related Securities | 5.8% |
| | Municipal Bonds | 0.3% |
| | Other Investments | 2.0% |
| | Short-Term Investments and Net Other Assets (Liabilities) | 1.3% |

* Foreign investments - 17.3%
** Futures and Swaps - 0.0%
An unaudited holdings listing for the Fund, which presents direct holdings as well as the pro-rata share of any securities and other investments held indirectly through its investment in underlying non-money market Fidelity Central Funds, is available at fidelity.com and/or institutional.fidelity.com, as applicable.
Percentages shown as 0.0% may reflect amounts less than 0.05%.
Investments August 31, 2017
Showing Percentage of Net Assets
| Nonconvertible Bonds - 69.0% | | | |
| | | Principal Amount | Value |
| CONSUMER DISCRETIONARY - 7.3% | | | |
| Automobiles - 3.1% | | | |
| American Honda Finance Corp.: | | | |
| 1.7% 2/22/19 | | $1,918,000 | $1,919,013 |
| 1.7% 9/9/21 | | 3,613,000 | 3,566,325 |
| 2% 2/14/20 | | 5,000,000 | 5,026,476 |
| 2.125% 10/10/18 | | 500,000 | 503,233 |
| BMW U.S. Capital LLC: | | | |
| 2.15% 4/6/20 (a) | | 7,000,000 | 7,064,917 |
| 2.7% 4/6/22 (a) | | 5,799,000 | 5,881,755 |
| Daimler Finance North America LLC: | | | |
| 1.5% 7/5/19 (a) | | 5,000,000 | 4,961,050 |
| 1.65% 5/18/18 (a) | | 3,000,000 | 3,000,995 |
| 2.25% 3/2/20 (a) | | 3,020,000 | 3,036,070 |
| 2.3% 1/6/20 (a) | | 5,000,000 | 5,026,754 |
| 2.375% 8/1/18 (a) | | 1,000,000 | 1,005,998 |
| 2.45% 5/18/20 (a) | | 6,415,000 | 6,471,823 |
| 2.85% 1/6/22 (a) | | 3,175,000 | 3,226,361 |
| General Motors Financial Co., Inc.: | | | |
| 2.35% 10/4/19 | | 5,000,000 | 5,011,813 |
| 2.4% 4/10/18 | | 3,000,000 | 3,011,044 |
| 2.65% 4/13/20 | | 7,684,000 | 7,747,470 |
| 3.15% 1/15/20 | | 5,000,000 | 5,101,949 |
| 3.2% 7/13/20 | | 5,000,000 | 5,105,657 |
| 4.2% 3/1/21 | | 3,000,000 | 3,158,893 |
| Volkswagen Group of America Finance LLC 2.4% 5/22/20 (a) | | 4,458,000 | 4,486,609 |
| Volkswagen International Finance NV: | | | |
| 1.6% 11/20/17 (a) | | 620,000 | 619,771 |
| 2.125% 11/20/18 (a) | | 1,500,000 | 1,503,751 |
| | | | 86,437,727 |
| Diversified Consumer Services - 0.0% | | | |
| Ingersoll-Rand Global Holding Co. Ltd. 6.875% 8/15/18 | | 1,020,000 | 1,069,112 |
| Hotels, Restaurants & Leisure - 0.5% | | | |
| McDonald's Corp.: | | | |
| 2.1% 12/7/18 | | 742,000 | 746,807 |
| 2.2% 5/26/20 | | 5,000,000 | 5,052,011 |
| 2.625% 1/15/22 | | 3,229,000 | 3,278,203 |
| 2.75% 12/9/20 | | 5,345,000 | 5,474,957 |
| | | | 14,551,978 |
| Household Durables - 0.3% | | | |
| D.R. Horton, Inc.: | | | |
| 3.75% 3/1/19 | | 2,000,000 | 2,042,938 |
| 4% 2/15/20 | | 3,000,000 | 3,122,100 |
| Toll Brothers Finance Corp. 4% 12/31/18 | | 2,500,000 | 2,553,125 |
| | | | 7,718,163 |
| Internet & Direct Marketing Retail - 0.2% | | | |
| Amazon.com, Inc. 2.8% 8/22/24 (a) | | 4,922,000 | 4,983,388 |
| Media - 3.2% | | | |
| 21st Century Fox America, Inc. 4.5% 2/15/21 | | 13,000,000 | 13,974,110 |
| British Sky Broadcasting Group PLC 2.625% 9/16/19 (a) | | 3,000,000 | 3,029,868 |
| CBS Corp. 2.3% 8/15/19 | | 3,663,000 | 3,691,026 |
| Charter Communications Operating LLC/Charter Communications Operating Capital Corp. 3.579% 7/23/20 | | 15,000,000 | 15,389,109 |
| Comcast Corp.: | | | |
| 1.625% 1/15/22 | | 15,111,000 | 14,824,711 |
| 6.3% 11/15/17 | | 11,000,000 | 11,102,812 |
| NBCUniversal Enterprise, Inc. 1.974% 4/15/19 (a) | | 3,000,000 | 3,014,751 |
| Time Warner Cable, Inc.: | | | |
| 6.75% 7/1/18 | | 5,651,000 | 5,869,976 |
| 8.25% 4/1/19 | | 500,000 | 546,226 |
| Time Warner, Inc.: | | | |
| 2.1% 6/1/19 | | 2,000,000 | 2,005,301 |
| 4.75% 3/29/21 | | 3,683,000 | 3,981,360 |
| 6.875% 6/15/18 | | 5,095,000 | 5,293,500 |
| Walt Disney Co. 1.85% 5/30/19 | | 6,000,000 | 6,028,482 |
| | | | 88,751,232 |
|
| TOTAL CONSUMER DISCRETIONARY | | | 203,511,600 |
|
| CONSUMER STAPLES - 5.1% | | | |
| Beverages - 1.3% | | | |
| Anheuser-Busch InBev Finance, Inc.: | | | |
| 1.9% 2/1/19 | | 5,000,000 | 5,016,244 |
| 2.15% 2/1/19 | | 1,500,000 | 1,509,983 |
| 2.65% 2/1/21 | | 12,890,000 | 13,132,473 |
| 3.3% 2/1/23 | | 9,190,000 | 9,533,301 |
| Anheuser-Busch InBev Worldwide, Inc. 2.2% 8/1/18 | | 2,310,000 | 2,321,894 |
| PepsiCo, Inc. 1.7% 10/6/21 | | 5,000,000 | 4,944,927 |
| | | | 36,458,822 |
| Food & Staples Retailing - 1.0% | | | |
| CVS Health Corp.: | | | |
| 1.9% 7/20/18 | | 1,549,000 | 1,553,161 |
| 2.25% 12/5/18 | | 8,376,000 | 8,430,206 |
| 2.25% 8/12/19 | | 10,000,000 | 10,076,299 |
| 2.8% 7/20/20 | | 1,496,000 | 1,528,138 |
| Kroger Co. 3.3% 1/15/21 | | 5,000,000 | 5,146,848 |
| | | | 26,734,652 |
| Food Products - 0.8% | | | |
| General Mills, Inc. 2.2% 10/21/19 | | 2,000,000 | 2,013,458 |
| Kraft Foods Group, Inc. 5.375% 2/10/20 | | 5,000,000 | 5,389,663 |
| The J.M. Smucker Co.: | | | |
| 1.75% 3/15/18 | | 5,874,000 | 5,875,989 |
| 2.5% 3/15/20 | | 1,964,000 | 1,988,988 |
| Tyson Foods, Inc. 2.65% 8/15/19 | | 7,000,000 | 7,092,074 |
| | | | 22,360,172 |
| Tobacco - 2.0% | | | |
| Altria Group, Inc. 2.625% 1/14/20 | | 5,000,000 | 5,089,855 |
| Bat Capital Corp. 2.764% 8/15/22 (a) | | 10,000,000 | 10,055,763 |
| BAT International Finance PLC: | | | |
| 1.85% 6/15/18 (a) | | 10,000,000 | 10,000,984 |
| 2.75% 6/15/20 (a) | | 3,160,000 | 3,210,462 |
| Imperial Tobacco Finance PLC: | | | |
| 2.05% 2/11/18 (a) | | 3,906,000 | 3,906,580 |
| 2.05% 7/20/18 (a) | | 2,866,000 | 2,867,201 |
| 2.95% 7/21/20 (a) | | 3,000,000 | 3,055,241 |
| Philip Morris International, Inc.: | | | |
| 1.875% 1/15/19 | | 2,641,000 | 2,649,668 |
| 1.875% 2/25/21 | | 6,954,000 | 6,889,278 |
| Reynolds American, Inc.: | | | |
| 2.3% 6/12/18 | | 5,704,000 | 5,725,789 |
| 3.25% 6/12/20 | | 1,162,000 | 1,197,294 |
| 4% 6/12/22 | | 1,077,000 | 1,142,372 |
| | | | 55,790,487 |
|
| TOTAL CONSUMER STAPLES | | | 141,344,133 |
|
| ENERGY - 6.0% | | | |
| Energy Equipment & Services - 0.6% | | | |
| El Paso Pipeline Partners Operating Co. LLC 6.5% 4/1/20 | | 768,000 | 843,299 |
| National Oilwell Varco, Inc. 1.35% 12/1/17 | | 620,000 | 619,338 |
| Noble Holding International Ltd. 5.75% 3/16/18 | | 102,000 | 102,745 |
| Petrofac Ltd. 3.4% 10/10/18 (a) | | 1,000,000 | 986,880 |
| Schlumberger Holdings Corp.: | | | |
| 2.35% 12/21/18 (a) | | 9,662,000 | 9,727,754 |
| 3% 12/21/20 (a) | | 5,000,000 | 5,132,687 |
| | | | 17,412,703 |
| Oil, Gas & Consumable Fuels - 5.4% | | | |
| Anadarko Petroleum Corp. 4.85% 3/15/21 | | 559,000 | 594,204 |
| BP Capital Markets PLC: | | | |
| 1.375% 5/10/18 | | 5,000,000 | 4,995,881 |
| 1.674% 2/13/18 | | 5,000,000 | 5,004,253 |
| 1.676% 5/3/19 | | 989,000 | 988,979 |
| 2.315% 2/13/20 | | 4,411,000 | 4,461,446 |
| 2.521% 1/15/20 | | 4,688,000 | 4,770,101 |
| Canadian Natural Resources Ltd.: | | | |
| 1.75% 1/15/18 | | 415,000 | 414,818 |
| 3.45% 11/15/21 | | 7,927,000 | 8,189,082 |
| Cenovus Energy, Inc. 5.7% 10/15/19 | | 297,000 | 312,177 |
| Chevron Corp. 1.961% 3/3/20 | | 4,000,000 | 4,026,972 |
| Columbia Pipeline Group, Inc.: | | | |
| 2.45% 6/1/18 | | 2,107,000 | 2,114,406 |
| 3.3% 6/1/20 | | 1,439,000 | 1,480,267 |
| ConocoPhillips Co. 2.2% 5/15/20 | | 1,962,000 | 1,975,739 |
| DCP Midstream LLC 5.35% 3/15/20 (a) | | 6,738,000 | 7,091,745 |
| DCP Midstream Operating LP: | | | |
| 2.5% 12/1/17 | | 292,000 | 291,635 |
| 2.7% 4/1/19 | | 821,000 | 815,869 |
| Devon Energy Corp. 3.25% 5/15/22 | | 7,000,000 | 7,084,572 |
| Encana Corp.: | | | |
| 3.9% 11/15/21 | | 4,500,000 | 4,635,731 |
| 6.5% 5/15/19 | | 5,000,000 | 5,347,272 |
| Energy Transfer Partners LP 2.5% 6/15/18 | | 1,332,000 | 1,338,371 |
| EnLink Midstream Partners LP 2.7% 4/1/19 | | 785,000 | 786,081 |
| Enterprise Products Operating LP: | | | |
| 1.65% 5/7/18 | | 3,631,000 | 3,629,433 |
| 2.55% 10/15/19 | | 178,000 | 179,494 |
| 2.85% 4/15/21 | | 1,590,000 | 1,616,982 |
| Exxon Mobil Corp.: | | | |
| 2.222% 3/1/21 | | 3,780,000 | 3,827,693 |
| 2.726% 3/1/23 | | 2,954,000 | 3,029,609 |
| Kinder Morgan Energy Partners LP 2.65% 2/1/19 | | 1,737,000 | 1,750,429 |
| Kinder Morgan, Inc.: | | | |
| 2% 12/1/17 | | 393,000 | 393,210 |
| 3.05% 12/1/19 | | 4,285,000 | 4,353,233 |
| Marathon Oil Corp. 2.8% 11/1/22 | | 7,000,000 | 6,843,350 |
| Marathon Petroleum Corp. 2.7% 12/14/18 | | 3,202,000 | 3,229,872 |
| Petro-Canada 6.05% 5/15/18 | | 3,326,000 | 3,427,671 |
| Petrobras Global Finance BV 6.125% 1/17/22 | | 7,000,000 | 7,420,000 |
| Petroleos Mexicanos: | | | |
| 3.5% 7/23/20 | | 1,355,000 | 1,390,908 |
| 4.625% 9/21/23 | | 4,535,000 | 4,720,935 |
| 5.375% 3/13/22 (a) | | 1,440,000 | 1,545,120 |
| 5.5% 2/4/19 | | 2,000,000 | 2,089,000 |
| 6.375% 2/4/21 | | 2,000,000 | 2,207,000 |
| Plains All American Pipeline LP/PAA Finance Corp.: | | | |
| 2.6% 12/15/19 | | 9,900,000 | 9,915,603 |
| 5.75% 1/15/20 | | 962,000 | 1,027,649 |
| Shell International Finance BV 2.125% 5/11/20 | | 2,287,000 | 2,311,112 |
| Southwestern Energy Co. 5.8% 1/23/20 (b) | | 864,000 | 889,920 |
| Spectra Energy Partners LP 2.95% 9/25/18 | | 90,000 | 90,911 |
| Total Capital International SA 2.125% 1/10/19 | | 2,000,000 | 2,013,868 |
| TransCanada PipeLines Ltd.: | | | |
| 3 month U.S. LIBOR + 0.790% 2.0941% 1/12/18 (b)(c) | | 2,500,000 | 2,505,517 |
| 1.625% 11/9/17 | | 3,000,000 | 3,000,526 |
| 1.875% 1/12/18 | | 3,000,000 | 3,001,207 |
| 2.5% 8/1/22 | | 2,372,000 | 2,388,524 |
| 3.125% 1/15/19 | | 1,693,000 | 1,722,324 |
| Western Gas Partners LP: | | | |
| 2.6% 8/15/18 | | 1,257,000 | 1,261,640 |
| 5.375% 6/1/21 | | 2,351,000 | 2,539,399 |
| | | | 151,041,740 |
|
| TOTAL ENERGY | | | 168,454,443 |
|
| FINANCIALS - 31.3% | | | |
| Banks - 15.3% | | | |
| ABN AMRO Bank NV: | | | |
| 2.1% 1/18/19 (a) | | 5,000,000 | 5,024,205 |
| 2.5% 10/30/18 (a) | | 4,000,000 | 4,033,408 |
| Australia & New Zealand Banking Group Ltd. 2.25% 6/13/19 | | 3,250,000 | 3,285,062 |
| Banco Nacional de Desenvolvimento Economico e Social: | | | |
| 4% 4/14/19 (a) | | 2,575,000 | 2,625,522 |
| 6.369% 6/16/18 (a) | | 962,000 | 990,985 |
| Bank of America Corp.: | | | |
| 2.25% 4/21/20 | | 8,140,000 | 8,178,548 |
| 2.369% 7/21/21 (b) | | 5,000,000 | 5,013,562 |
| 2.6% 1/15/19 | | 7,495,000 | 7,569,500 |
| 2.625% 10/19/20 | | 12,000,000 | 12,166,870 |
| 2.625% 4/19/21 | | 13,000,000 | 13,138,112 |
| 2.65% 4/1/19 | | 11,100,000 | 11,232,090 |
| Bank of Nova Scotia 2.8% 7/21/21 | | 2,000,000 | 2,048,510 |
| Bank of Tokyo-Mitsubishi UFJ Ltd.: | | | |
| 2.3% 3/5/20 (a) | | 3,000,000 | 3,017,833 |
| 2.35% 9/8/19 (a) | | 3,050,000 | 3,071,179 |
| 2.7% 9/9/18 (a) | | 4,500,000 | 4,542,214 |
| Barclays PLC: | | | |
| 2% 3/16/18 | | 5,000,000 | 5,005,000 |
| 2.75% 11/8/19 | | 5,331,000 | 5,395,201 |
| 2.875% 6/8/20 | | 3,000,000 | 3,037,401 |
| 3.2% 8/10/21 | | 5,045,000 | 5,151,016 |
| 3.25% 1/12/21 | | 2,046,000 | 2,090,938 |
| BNP Paribas 2.375% 9/14/17 | | 6,000,000 | 6,001,346 |
| BNP Paribas SA 2.375% 5/21/20 | | 3,000,000 | 3,037,125 |
| BPCE SA: | | | |
| 2.5% 12/10/18 | | 5,000,000 | 5,046,822 |
| 2.5% 7/15/19 | | 2,000,000 | 2,021,096 |
| Capital One NA: | | | |
| 2.35% 1/31/20 | | 1,000,000 | 1,003,656 |
| 2.4% 9/5/19 | | 2,000,000 | 2,012,427 |
| CIT Group, Inc. 3.875% 2/19/19 | | 5,090,000 | 5,204,525 |
| Citigroup, Inc.: | | | |
| 1.7% 4/27/18 | | 1,500,000 | 1,500,020 |
| 2.05% 6/7/19 | | 2,000,000 | 2,004,194 |
| 2.15% 7/30/18 | | 2,000,000 | 2,007,120 |
| 2.35% 8/2/21 | | 10,000,000 | 9,977,364 |
| 2.4% 2/18/20 | | 4,000,000 | 4,036,220 |
| 2.45% 1/10/20 | | 3,000,000 | 3,029,160 |
| 2.5% 9/26/18 | | 1,500,000 | 1,511,112 |
| 2.5% 7/29/19 | | 2,000,000 | 2,021,119 |
| 2.55% 4/8/19 | | 3,000,000 | 3,031,209 |
| 2.65% 10/26/20 | | 3,000,000 | 3,042,296 |
| 2.7% 3/30/21 | | 5,000,000 | 5,068,929 |
| 2.75% 4/25/22 | | 4,010,000 | 4,046,220 |
| 4.4% 6/10/25 | | 2,604,000 | 2,753,706 |
| Citizens Bank NA: | | | |
| 2.45% 12/4/19 | | 5,526,000 | 5,575,372 |
| 2.55% 5/13/21 | | 6,501,000 | 6,557,571 |
| 2.65% 5/26/22 | | 3,000,000 | 3,018,797 |
| Citizens Financial Group, Inc. 2.375% 7/28/21 | | 417,000 | 416,093 |
| Comerica, Inc. 2.125% 5/23/19 | | 345,000 | 345,273 |
| Commonwealth Bank of Australia: | | | |
| 2.25% 3/13/19 | | 750,000 | 755,553 |
| 2.3% 9/6/19 | | 2,000,000 | 2,017,558 |
| Cooperatieve Centrale Raiffeisen-Boerenleenbank BA 1.7% 3/19/18 | | 2,000,000 | 2,002,911 |
| Credit Agricole SA 2.75% 6/10/20 (a) | | 8,000,000 | 8,146,656 |
| Credit Suisse Group Funding Guernsey Ltd. 3.45% 4/16/21 | | 6,000,000 | 6,192,209 |
| Credit Suisse New York Branch: | | | |
| 2.3% 5/28/19 | | 5,750,000 | 5,798,814 |
| 3% 10/29/21 | | 1,500,000 | 1,539,323 |
| Discover Bank: | | | |
| 2% 2/21/18 | | 5,920,000 | 5,929,182 |
| 2.6% 11/13/18 | | 4,000,000 | 4,032,330 |
| Fifth Third Bancorp: | | | |
| 2.3% 3/1/19 | | 279,000 | 281,042 |
| 2.875% 7/27/20 | | 3,200,000 | 3,274,080 |
| 4.5% 6/1/18 | | 3,024,000 | 3,086,143 |
| First Horizon National Corp. 3.5% 12/15/20 | | 3,000,000 | 3,097,907 |
| HBOS PLC 6.75% 5/21/18 (a) | | 509,000 | 525,915 |
| HSBC Holdings PLC 2.95% 5/25/21 | | 4,000,000 | 4,083,111 |
| HSBC U.S.A., Inc.: | | | |
| 2.375% 11/13/19 | | 3,000,000 | 3,030,207 |
| 2.625% 9/24/18 | | 262,000 | 264,732 |
| Huntington Bancshares, Inc.: | | | |
| 2.3% 1/14/22 | | 5,000,000 | 4,963,393 |
| 3.15% 3/14/21 | | 3,000,000 | 3,087,284 |
| 7% 12/15/20 | | 180,000 | 206,469 |
| Huntington National Bank 2.2% 4/1/19 | | 1,000,000 | 1,005,009 |
| ING Bank NV 1.8% 3/16/18 (a) | | 5,000,000 | 5,006,585 |
| ING Groep NV 3.15% 3/29/22 | | 5,250,000 | 5,378,025 |
| JPMorgan Chase & Co.: | | | |
| 2.2% 10/22/19 | | 10,058,000 | 10,153,512 |
| 2.25% 1/23/20 | | 8,000,000 | 8,066,195 |
| 2.35% 1/28/19 | | 1,942,000 | 1,960,901 |
| 2.55% 10/29/20 | | 7,500,000 | 7,609,797 |
| 2.75% 6/23/20 | | 7,000,000 | 7,145,742 |
| KeyCorp. 2.3% 12/13/18 | | 2,000,000 | 2,014,029 |
| La Caisse Centrale 1.75% 1/29/18 (a) | | 4,000,000 | 4,003,680 |
| Mitsubishi UFJ Financial Group, Inc.: | | | |
| 2.19% 9/13/21 | | 5,000,000 | 4,971,892 |
| 2.95% 3/1/21 | | 4,000,000 | 4,091,552 |
| 2.998% 2/22/22 | | 2,619,000 | 2,679,159 |
| Mizuho Bank Ltd.: | | | |
| 2.45% 4/16/19 (a) | | 1,400,000 | 1,410,543 |
| 2.65% 9/25/19 (a) | | 2,000,000 | 2,024,123 |
| Mizuho Financial Group, Inc.: | | | |
| 2.273% 9/13/21 | | 3,000,000 | 2,974,857 |
| 2.632% 4/12/21 (a) | | 5,180,000 | 5,217,417 |
| 2.953% 2/28/22 | | 6,000,000 | 6,101,235 |
| MUFG Americas Holdings Corp. 2.25% 2/10/20 | | 1,241,000 | 1,249,418 |
| Nordea Bank AB 2.375% 4/4/19 (a) | | 1,000,000 | 1,009,725 |
| PNC Bank NA: | | | |
| 1.8% 11/5/18 | | 2,000,000 | 2,004,260 |
| 2.15% 4/29/21 | | 5,000,000 | 5,014,015 |
| 2.4% 10/18/19 | | 3,000,000 | 3,035,123 |
| Regions Financial Corp.: | | | |
| 2.75% 8/14/22 | | 4,251,000 | 4,275,077 |
| 3.2% 2/8/21 | | 4,000,000 | 4,106,811 |
| Royal Bank of Canada: | | | |
| 1.5% 7/29/19 | | 5,000,000 | 4,974,192 |
| 2.125% 3/2/20 | | 5,350,000 | 5,386,341 |
| Royal Bank of Scotland Group PLC 3.875% 9/12/23 | | 7,000,000 | 7,166,474 |
| Sumitomo Mitsui Banking Corp.: | | | |
| 2.25% 7/11/19 | | 3,500,000 | 3,524,911 |
| 2.45% 1/10/19 | | 590,000 | 595,597 |
| 2.45% 1/16/20 | | 3,000,000 | 3,034,930 |
| 2.65% 7/23/20 | | 3,000,000 | 3,050,466 |
| Sumitomo Mitsui Financial Group, Inc. 2.934% 3/9/21 | | 2,449,000 | 2,502,471 |
| SunTrust Banks, Inc.: | | | |
| 2.5% 5/1/19 | | 550,000 | 555,980 |
| 2.9% 3/3/21 | | 2,828,000 | 2,892,177 |
| Synchrony Bank 3% 6/15/22 | | 2,328,000 | 2,331,649 |
| The Toronto-Dominion Bank: | | | |
| 2.125% 4/7/21 | | 4,000,000 | 4,014,678 |
| 2.25% 11/5/19 | | 2,000,000 | 2,018,941 |
| Wells Fargo & Co.: | | | |
| 1.5% 1/16/18 | | 1,300,000 | 1,300,029 |
| 2.15% 1/15/19 | | 5,500,000 | 5,538,885 |
| 2.6% 7/22/20 | | 13,000,000 | 13,214,434 |
| Westpac Banking Corp.: | | | |
| 1.6% 8/19/19 | | 5,000,000 | 4,981,570 |
| 2.8% 1/11/22 | | 5,000,000 | 5,120,971 |
| | | | 427,914,125 |
| Capital Markets - 6.2% | | | |
| Credit Suisse Group AG 3.574% 1/9/23 (a) | | 15,000,000 | 15,430,028 |
| Deutsche Bank AG 2.7% 7/13/20 | | 10,000,000 | 10,061,871 |
| Deutsche Bank AG London Branch: | | | |
| 2.5% 2/13/19 | | 2,250,000 | 2,261,309 |
| 2.85% 5/10/19 | | 10,968,000 | 11,091,338 |
| E*TRADE Financial Corp. 2.95% 8/24/22 | | 10,000,000 | 10,050,509 |
| Goldman Sachs Group, Inc.: | | | |
| 3 month U.S. LIBOR + 0.800% 2.0456% 12/15/17 (b)(c) | | 3,000,000 | 3,005,371 |
| 2.375% 1/22/18 | | 8,850,000 | 8,875,520 |
| 2.625% 1/31/19 | | 13,000,000 | 13,134,273 |
| 2.625% 4/25/21 | | 2,097,000 | 2,111,303 |
| 2.905% 7/24/23 (b) | | 10,000,000 | 10,039,596 |
| 5.95% 1/18/18 | | 1,693,000 | 1,719,466 |
| 6.15% 4/1/18 | | 402,000 | 412,082 |
| IntercontinentalExchange, Inc.: | | | |
| 2.5% 10/15/18 | | 347,000 | 350,080 |
| 2.75% 12/1/20 | | 2,647,000 | 2,706,289 |
| Lazard Group LLC 4.25% 11/14/20 | | 543,000 | 576,665 |
| Legg Mason, Inc. 2.7% 7/15/19 | | 2,000,000 | 2,021,377 |
| Merrill Lynch & Co., Inc. 6.875% 4/25/18 | | 726,000 | 749,517 |
| Moody's Corp.: | | | |
| 2.625% 1/15/23 (a) | | 5,950,000 | 5,964,212 |
| 2.75% 7/15/19 | | 8,000,000 | 8,123,622 |
| 2.75% 12/15/21 | | 647,000 | 657,671 |
| Morgan Stanley: | | | |
| 2.375% 7/23/19 | | 9,660,000 | 9,734,508 |
| 2.5% 1/24/19 | | 1,750,000 | 1,766,463 |
| 2.5% 4/21/21 | | 6,200,000 | 6,241,953 |
| 2.625% 11/17/21 | | 5,350,000 | 5,392,813 |
| 2.65% 1/27/20 | | 11,000,000 | 11,173,729 |
| 4.875% 11/1/22 | | 7,000,000 | 7,623,486 |
| 5.5% 1/26/20 | | 2,000,000 | 2,158,998 |
| 5.625% 9/23/19 | | 112,000 | 120,039 |
| 7.3% 5/13/19 | | 603,000 | 656,426 |
| S&P Global, Inc. 2.5% 8/15/18 | | 1,049,000 | 1,055,799 |
| Thomson Reuters Corp. 1.65% 9/29/17 | | 5,050,000 | 5,050,173 |
| UBS AG London Branch 2.2% 6/8/20 (a) | | 8,000,000 | 8,034,504 |
| UBS AG Stamford Branch 2.375% 8/14/19 | | 5,843,000 | 5,902,545 |
| | | | 174,253,535 |
| Consumer Finance - 4.1% | | | |
| AerCap Ireland Capital Ltd./AerCap Global Aviation Trust 3.5% 5/26/22 | | 915,000 | 940,316 |
| Ally Financial, Inc.: | | | |
| 3.25% 2/13/18 | | 3,000,000 | 3,007,500 |
| 3.25% 11/5/18 | | 3,000,000 | 3,025,380 |
| 4.25% 4/15/21 | | 2,920,000 | 3,014,900 |
| American Express Credit Corp.: | | | |
| 2.125% 3/18/19 | | 5,520,000 | 5,553,807 |
| 2.2% 3/3/20 | | 5,000,000 | 5,040,563 |
| 2.25% 5/5/21 | | 4,000,000 | 4,019,166 |
| Capital One Financial Corp. 2.45% 4/24/19 | | 5,450,000 | 5,490,426 |
| Discover Financial Services 5.2% 4/27/22 | | 3,239,000 | 3,547,107 |
| Ford Motor Credit Co. LLC: | | | |
| 1.684% 9/8/17 | | 1,000,000 | 1,000,000 |
| 1.897% 8/12/19 | | 3,000,000 | 2,989,803 |
| 2.24% 6/15/18 | | 6,000,000 | 6,023,084 |
| 2.425% 6/12/20 | | 3,000,000 | 3,006,778 |
| 2.597% 11/4/19 | | 7,000,000 | 7,064,787 |
| 2.681% 1/9/20 | | 4,063,000 | 4,103,874 |
| 3.157% 8/4/20 | | 3,000,000 | 3,064,865 |
| 3.336% 3/18/21 | | 4,500,000 | 4,609,701 |
| 3.339% 3/28/22 | | 2,246,000 | 2,289,358 |
| Hyundai Capital America: | | | |
| 2% 3/19/18 (a) | | 1,891,000 | 1,892,391 |
| 2% 7/1/19 (a) | | 3,000,000 | 2,982,250 |
| 2.125% 10/2/17 (a) | | 2,437,000 | 2,437,665 |
| 2.55% 2/6/19 (a) | | 4,759,000 | 4,778,548 |
| 2.6% 3/19/20 (a) | | 2,000,000 | 2,010,584 |
| 2.875% 8/9/18 (a) | | 2,606,000 | 2,627,689 |
| Synchrony Financial: | | | |
| 2.6% 1/15/19 | | 5,887,000 | 5,929,010 |
| 2.7% 2/3/20 | | 2,500,000 | 2,524,352 |
| 3% 8/15/19 | | 5,516,000 | 5,595,941 |
| Toyota Motor Credit Corp.: | | | |
| 1.55% 7/13/18 | | 5,000,000 | 5,002,550 |
| 1.55% 10/18/19 | | 2,244,000 | 2,237,451 |
| 2% 10/24/18 | | 2,500,000 | 2,514,754 |
| 2.6% 1/11/22 | | 5,500,000 | 5,606,679 |
| | | | 113,931,279 |
| Diversified Financial Services - 0.8% | | | |
| Berkshire Hathaway, Inc. 2.2% 3/15/21 | | 1,436,000 | 1,453,358 |
| Brixmor Operating Partnership LP 3.875% 8/15/22 | | 2,222,000 | 2,297,462 |
| GE Capital International Funding Co. 2.342% 11/15/20 | | 11,630,000 | 11,772,421 |
| General Electric Capital Corp. 2.2% 1/9/20 | | 2,577,000 | 2,605,889 |
| ING Bank NV 1.65% 8/15/19 (a) | | 4,000,000 | 3,974,360 |
| | | | 22,103,490 |
| Insurance - 4.9% | | | |
| ACE INA Holdings, Inc. 2.3% 11/3/20 | | 1,173,000 | 1,185,720 |
| AFLAC, Inc. 2.4% 3/16/20 | | 6,000,000 | 6,080,745 |
| AIA Group Ltd. 2.25% 3/11/19 (a) | | 8,529,000 | 8,538,315 |
| American International Group, Inc.: | | | |
| 2.3% 7/16/19 | | 10,304,000 | 10,381,474 |
| 3.3% 3/1/21 | | 4,987,000 | 5,161,312 |
| 4.875% 6/1/22 | | 1,484,000 | 1,640,458 |
| Aon Corp. 5% 9/30/20 | | 2,178,000 | 2,358,970 |
| Aon PLC 2.8% 3/15/21 | | 7,000,000 | 7,129,917 |
| Assurant, Inc. 2.5% 3/15/18 | | 2,000,000 | 2,007,380 |
| Great-West Life & Annuity Insurance Co. 3 month U.S. LIBOR + 2.538% 3.8522% 5/16/46 (a)(b)(c) | | 259,000 | 255,115 |
| Hartford Financial Services Group, Inc. 5.5% 3/30/20 | | 4,601,000 | 4,989,738 |
| Liberty Mutual Group, Inc. 5% 6/1/21 (a) | | 16,714,000 | 18,253,474 |
| Marsh & McLennan Companies, Inc.: | | | |
| 2.35% 3/6/20 | | 5,000,000 | 5,054,793 |
| 2.75% 1/30/22 | | 2,231,000 | 2,275,104 |
| 3.3% 3/14/23 | | 1,731,000 | 1,796,372 |
| MassMutual Global Funding II: | | | |
| 2.35% 4/9/19 (a) | | 1,000,000 | 1,009,853 |
| 2.5% 4/13/22 (a) | | 5,440,000 | 5,473,535 |
| Metropolitan Life Global Funding I: | | | |
| 1.5% 1/10/18 (a) | | 4,431,000 | 4,431,835 |
| 2% 4/14/20 (a) | | 3,000,000 | 3,007,229 |
| 2.65% 4/8/22 (a) | | 5,000,000 | 5,081,247 |
| New York Life Global Funding 1.55% 11/2/18 (a) | | 3,500,000 | 3,503,268 |
| Pacific LifeCorp 6% 2/10/20 (a) | | 10,698,000 | 11,615,720 |
| Pricoa Global Funding I 1.6% 5/29/18 (a) | | 967,000 | 967,123 |
| Principal Life Global Funding II 2.375% 9/11/19 (a) | | 2,200,000 | 2,221,965 |
| Protective Life Global Funding 2.615% 8/22/22 (a) | | 10,240,000 | 10,307,807 |
| Prudential Financial, Inc. 3.5% 5/15/24 | | 2,550,000 | 2,683,651 |
| TIAA Asset Management Finance LLC 2.95% 11/1/19 (a) | | 5,280,000 | 5,369,165 |
| Unum Group 5.625% 9/15/20 | | 2,743,000 | 3,007,697 |
| | | | 135,788,982 |
|
| TOTAL FINANCIALS | | | 873,991,411 |
|
| HEALTH CARE - 5.9% | | | |
| Biotechnology - 0.7% | | | |
| AbbVie, Inc.: | | | |
| 1.8% 5/14/18 | | 3,972,000 | 3,976,066 |
| 2.5% 5/14/20 | | 5,952,000 | 6,028,233 |
| Amgen, Inc.: | | | |
| 2.125% 5/1/20 | | 1,618,000 | 1,627,591 |
| 2.2% 5/22/19 | | 4,290,000 | 4,314,431 |
| Celgene Corp.: | | | |
| 2.125% 8/15/18 | | 1,549,000 | 1,555,858 |
| 2.875% 8/15/20 | | 3,000,000 | 3,075,363 |
| | | | 20,577,542 |
| Health Care Equipment & Supplies - 1.5% | | | |
| Abbott Laboratories: | | | |
| 2.35% 11/22/19 | | 5,000,000 | 5,044,025 |
| 2.8% 9/15/20 | | 4,182,000 | 4,251,605 |
| 2.9% 11/30/21 | | 4,980,000 | 5,066,037 |
| Becton, Dickinson & Co.: | | | |
| 2.675% 12/15/19 | | 287,000 | 291,136 |
| 2.894% 6/6/22 | | 15,000,000 | 15,066,353 |
| Danaher Corp.: | | | |
| 1.65% 9/15/18 | | 3,976,000 | 3,979,743 |
| 2.4% 9/15/20 | | 619,000 | 629,207 |
| Medtronic, Inc.: | | | |
| 1.5% 3/15/18 | | 1,770,000 | 1,769,962 |
| 2.5% 3/15/20 | | 2,200,000 | 2,237,952 |
| Zimmer Biomet Holdings, Inc. 2% 4/1/18 | | 2,702,000 | 2,705,730 |
| | | | 41,041,750 |
| Health Care Providers & Services - 0.6% | | | |
| Cardinal Health, Inc. 1.95% 6/15/18 | | 462,000 | 463,233 |
| Express Scripts Holding Co. 2.25% 6/15/19 | | 1,000,000 | 1,004,498 |
| McKesson Corp. 2.284% 3/15/19 | | 686,000 | 690,104 |
| UnitedHealth Group, Inc.: | | | |
| 1.4% 10/15/17 | | 2,128,000 | 2,127,952 |
| 1.9% 7/16/18 | | 3,000,000 | 3,008,996 |
| 2.125% 3/15/21 | | 3,000,000 | 3,013,519 |
| 2.7% 7/15/20 | | 1,361,000 | 1,395,621 |
| 2.875% 12/15/21 | | 2,000,000 | 2,061,063 |
| WellPoint, Inc.: | | | |
| 1.875% 1/15/18 | | 326,000 | 326,095 |
| 2.25% 8/15/19 | | 2,950,000 | 2,969,985 |
| | | | 17,061,066 |
| Life Sciences Tools & Services - 0.3% | | | |
| Thermo Fisher Scientific, Inc.: | | | |
| 2.15% 12/14/18 | | 881,000 | 884,608 |
| 2.4% 2/1/19 | | 3,086,000 | 3,108,496 |
| 3% 4/15/23 | | 5,000,000 | 5,103,994 |
| | | | 9,097,098 |
| Pharmaceuticals - 2.8% | | | |
| Actavis Funding SCS: | | | |
| 3% 3/12/20 | | 11,438,000 | 11,673,394 |
| 3.45% 3/15/22 | | 5,000,000 | 5,194,767 |
| Bayer U.S. Finance LLC 1.5% 10/6/17 (a) | | 1,863,000 | 1,862,932 |
| Mylan N.V.: | | | |
| 2.5% 6/7/19 | | 9,824,000 | 9,856,007 |
| 3% 12/15/18 | | 3,000,000 | 3,031,124 |
| 3.15% 6/15/21 | | 2,306,000 | 2,338,791 |
| Perrigo Co. PLC 3.5% 3/15/21 | | 1,920,000 | 1,978,439 |
| Perrigo Finance PLC 3.5% 12/15/21 | | 1,375,000 | 1,425,318 |
| Shire Acquisitions Investments Ireland DAC: | | | |
| 1.9% 9/23/19 | | 5,000,000 | 4,985,006 |
| 2.4% 9/23/21 | | 7,000,000 | 6,949,793 |
| Teva Pharmaceutical Finance Netherlands III BV: | | | |
| 1.7% 7/19/19 | | 8,234,000 | 8,047,002 |
| 2.2% 7/21/21 | | 13,726,000 | 13,062,529 |
| 2.8% 7/21/23 | | 1,238,000 | 1,166,714 |
| Zoetis, Inc.: | | | |
| 1.875% 2/1/18 | | 5,445,000 | 5,444,839 |
| 3.45% 11/13/20 | | 493,000 | 512,486 |
| | | | 77,529,141 |
|
| TOTAL HEALTH CARE | | | 165,306,597 |
|
| INDUSTRIALS - 2.0% | | | |
| Aerospace & Defense - 0.5% | | | |
| BAE Systems Holdings, Inc. 2.85% 12/15/20 (a) | | 5,615,000 | 5,712,056 |
| Lockheed Martin Corp. 2.5% 11/23/20 | | 2,361,000 | 2,401,797 |
| Rockwell Collins, Inc. 1.95% 7/15/19 | | 2,148,000 | 2,150,712 |
| The Boeing Co. 1.65% 10/30/20 | | 3,000,000 | 2,995,171 |
| | | | 13,259,736 |
| Airlines - 0.2% | | | |
| Continental Airlines, Inc.: | | | |
| 6.648% 9/15/17 | | 18,172 | 18,172 |
| 6.795% 8/2/18 | | 1,040 | 1,071 |
| 6.9% 1/2/18 | | 5,585 | 5,641 |
| Delta Air Lines, Inc. 2.875% 3/13/20 | | 5,500,000 | 5,588,304 |
| U.S. Airways pass-thru trust certificates: | | | |
| 6.85% 1/30/18 | | 32,656 | 33,309 |
| 8.36% 1/20/19 | | 29,200 | 29,200 |
| | | | 5,675,697 |
| Electrical Equipment - 0.1% | | | |
| Fortive Corp.: | | | |
| 1.8% 6/15/19 | | 910,000 | 908,275 |
| 2.35% 6/15/21 | | 1,547,000 | 1,550,105 |
| | | | 2,458,380 |
| Industrial Conglomerates - 0.4% | | | |
| Roper Technologies, Inc.: | | | |
| 2.05% 10/1/18 | | 2,919,000 | 2,925,925 |
| 2.8% 12/15/21 | | 3,883,000 | 3,934,417 |
| 3% 12/15/20 | | 5,100,000 | 5,226,017 |
| | | | 12,086,359 |
| Machinery - 0.0% | | | |
| Ingersoll-Rand Luxembourg Finance SA 2.625% 5/1/20 | | 263,000 | 266,518 |
| Trading Companies & Distributors - 0.8% | | | |
| Air Lease Corp.: | | | |
| 2.125% 1/15/18 | | 414,000 | 414,576 |
| 2.625% 9/4/18 | | 1,628,000 | 1,641,420 |
| 2.625% 7/1/22 | | 5,000,000 | 4,993,901 |
| 3.375% 6/1/21 | | 8,097,000 | 8,352,583 |
| 3.75% 2/1/22 | | 1,228,000 | 1,290,692 |
| 3.875% 4/1/21 | | 500,000 | 523,569 |
| 4.75% 3/1/20 | | 605,000 | 642,676 |
| International Lease Finance Corp. 5.875% 4/1/19 | | 4,000,000 | 4,233,720 |
| | | | 22,093,137 |
|
| TOTAL INDUSTRIALS | | | 55,839,827 |
|
| INFORMATION TECHNOLOGY - 1.9% | | | |
| Communications Equipment - 0.3% | | | |
| Cisco Systems, Inc.: | | | |
| 1.65% 6/15/18 | | 3,000,000 | 3,005,303 |
| 2.125% 3/1/19 | | 1,500,000 | 1,512,239 |
| 2.45% 6/15/20 | | 3,000,000 | 3,061,154 |
| | | | 7,578,696 |
| Electronic Equipment & Components - 1.0% | | | |
| Amphenol Corp.: | | | |
| 1.55% 9/15/17 | | 1,426,000 | 1,425,995 |
| 2.2% 4/1/20 | | 5,000,000 | 5,023,205 |
| 3.2% 4/1/24 | | 896,000 | 915,704 |
| Diamond 1 Finance Corp./Diamond 2 Finance Corp.: | | | |
| 3.48% 6/1/19 (a) | | 4,200,000 | 4,292,423 |
| 4.42% 6/15/21 (a) | | 4,200,000 | 4,425,785 |
| Tyco Electronics Group SA: | | | |
| 2.35% 8/1/19 | | 3,000,000 | 3,018,554 |
| 2.375% 12/17/18 | | 4,049,000 | 4,072,394 |
| 6.55% 10/1/17 | | 4,476,000 | 4,491,353 |
| | | | 27,665,413 |
| IT Services - 0.1% | | | |
| The Western Union Co.: | | | |
| 2.875% 12/10/17 | | 773,000 | 775,107 |
| 3.65% 8/22/18 | | 3,111,000 | 3,166,843 |
| | | | 3,941,950 |
| Software - 0.2% | | | |
| Oracle Corp.: | | | |
| 1.9% 9/15/21 | | 5,000,000 | 4,987,616 |
| 2.25% 10/8/19 | | 1,552,000 | 1,572,254 |
| | | | 6,559,870 |
| Technology Hardware, Storage & Peripherals - 0.3% | | | |
| Apple, Inc. 2.85% 5/6/21 | | 850,000 | 877,761 |
| Hewlett Packard Enterprise Co. 2.85% 10/5/18 | | 4,000,000 | 4,041,960 |
| Xerox Corp. 2.75% 3/15/19 | | 2,585,000 | 2,599,821 |
| | | | 7,519,542 |
|
| TOTAL INFORMATION TECHNOLOGY | | | 53,265,471 |
|
| MATERIALS - 0.7% | | | |
| Chemicals - 0.5% | | | |
| Chevron Phillips Chemical Co. LLC / Chevron Phillips Chemical Co. LP 1.7% 5/1/18 (a) | | 5,340,000 | 5,344,481 |
| Ecolab, Inc.: | | | |
| 1.45% 12/8/17 | | 335,000 | 334,906 |
| 1.55% 1/12/18 | | 2,500,000 | 2,499,675 |
| Monsanto Co. 2.125% 7/15/19 | | 3,000,000 | 3,008,138 |
| Sherwin-Williams Co. 1.35% 12/15/17 | | 620,000 | 619,122 |
| | | | 11,806,322 |
| Metals & Mining - 0.2% | | | |
| Anglo American Capital PLC 3.625% 5/14/20 (a) | | 1,513,000 | 1,544,637 |
| Freeport-McMoRan, Inc.: | | | |
| 2.3% 11/14/17 | | 670,000 | 670,000 |
| 2.375% 3/15/18 | | 4,000,000 | 4,000,000 |
| | | | 6,214,637 |
|
| TOTAL MATERIALS | | | 18,020,959 |
|
| REAL ESTATE - 2.5% | | | |
| Equity Real Estate Investment Trusts (REITs) - 1.2% | | | |
| Alexandria Real Estate Equities, Inc. 4.6% 4/1/22 | | 189,000 | 203,235 |
| American Campus Communities Operating Partnership LP 3.35% 10/1/20 | | 1,272,000 | 1,309,831 |
| Boston Properties, Inc.: | | | |
| 3.7% 11/15/18 | | 1,787,000 | 1,820,523 |
| 5.875% 10/15/19 | | 446,000 | 479,709 |
| DDR Corp.: | | | |
| 3.5% 1/15/21 | | 360,000 | 366,733 |
| 3.9% 8/15/24 | | 390,000 | 394,779 |
| 4.25% 2/1/26 | | 1,865,000 | 1,882,166 |
| 4.625% 7/15/22 | | 779,000 | 824,644 |
| ERP Operating LP: | | | |
| 2.375% 7/1/19 | | 1,641,000 | 1,657,355 |
| 3.375% 6/1/25 | | 3,000,000 | 3,086,105 |
| Federal Realty Investment Trust: | | | |
| 2.55% 1/15/21 | | 5,000,000 | 5,056,672 |
| 5.9% 4/1/20 | | 5,000 | 5,472 |
| Government Properties Income Trust 3.75% 8/15/19 | | 3,000,000 | 3,044,774 |
| Health Care REIT, Inc.: | | | |
| 2.25% 3/15/18 | | 250,000 | 250,426 |
| 4.7% 9/15/17 | | 2,436,000 | 2,437,890 |
| Kimco Realty Corp. 3.3% 2/1/25 | | 5,500,000 | 5,539,943 |
| Omega Healthcare Investors, Inc. 4.375% 8/1/23 | | 2,877,000 | 3,005,339 |
| Select Income REIT 2.85% 2/1/18 | | 1,515,000 | 1,519,274 |
| Simon Property Group LP: | | | |
| 2.2% 2/1/19 | | 462,000 | 465,095 |
| 2.35% 1/30/22 | | 1,046,000 | 1,049,395 |
| United Dominion Realty Trust, Inc. 4.25% 6/1/18 | | 431,000 | 438,872 |
| | | | 34,838,232 |
| Real Estate Management & Development - 1.3% | | | |
| Brandywine Operating Partnership LP: | | | |
| 3.95% 2/15/23 | | 360,000 | 368,256 |
| 4.95% 4/15/18 | | 51,000 | 51,850 |
| Digital Realty Trust LP: | | | |
| 2.75% 2/1/23 | | 2,037,000 | 2,041,846 |
| 3.4% 10/1/20 | | 5,590,000 | 5,785,806 |
| 3.625% 10/1/22 | | 1,040,000 | 1,088,365 |
| Healthcare Trust of America Holdings LP 2.95% 7/1/22 | | 4,165,000 | 4,219,311 |
| Liberty Property LP 4.75% 10/1/20 | | 1,045,000 | 1,113,242 |
| Mack-Cali Realty LP: | | | |
| 2.5% 12/15/17 | | 439,000 | 439,482 |
| 4.5% 4/18/22 | | 185,000 | 190,423 |
| Ventas Realty LP 3.125% 6/15/23 | | 591,000 | 597,208 |
| Ventas Realty LP/Ventas Capital Corp.: | | | |
| 2% 2/15/18 | | 1,743,000 | 1,744,783 |
| 4% 4/30/19 | | 11,000,000 | 11,318,691 |
| 4.25% 3/1/22 | | 4,000,000 | 4,260,603 |
| Washington Prime Group LP 3.85% 4/1/20 | | 2,090,000 | 2,135,655 |
| | | | 35,355,521 |
|
| TOTAL REAL ESTATE | | | 70,193,753 |
|
| TELECOMMUNICATION SERVICES - 2.5% | | | |
| Diversified Telecommunication Services - 2.3% | | | |
| AT&T, Inc.: | | | |
| 2.375% 11/27/18 | | 10,000,000 | 10,066,254 |
| 2.45% 6/30/20 | | 5,088,000 | 5,131,471 |
| 2.8% 2/17/21 | | 4,000,000 | 4,054,339 |
| 5.875% 10/1/19 | | 5,034,000 | 5,421,525 |
| British Telecommunications PLC 2.35% 2/14/19 | | 4,296,000 | 4,324,268 |
| CenturyLink, Inc. 6.15% 9/15/19 | | 592,000 | 624,560 |
| Deutsche Telekom International Financial BV 6.75% 8/20/18 | | 2,911,000 | 3,048,198 |
| SBA Tower Trust 3.168% 4/9/47 (a) | | 7,000,000 | 7,085,843 |
| Verizon Communications, Inc.: | | | |
| 1.75% 8/15/21 | | 15,000,000 | 14,725,052 |
| 2.625% 2/21/20 | | 1,710,000 | 1,744,910 |
| 3% 11/1/21 | | 4,318,000 | 4,420,147 |
| 4.5% 9/15/20 | | 4,000,000 | 4,290,804 |
| | | | 64,937,371 |
| Wireless Telecommunication Services - 0.2% | | | |
| Vodafone Group PLC: | | | |
| 1.5% 2/19/18 | | 2,625,000 | 2,624,999 |
| 5.45% 6/10/19 | | 2,000,000 | 2,121,007 |
| | | | 4,746,006 |
|
| TOTAL TELECOMMUNICATION SERVICES | | | 69,683,377 |
|
| UTILITIES - 3.8% | | | |
| Electric Utilities - 2.0% | | | |
| American Electric Power Co., Inc. 1.65% 12/15/17 | | 1,827,000 | 1,827,234 |
| Commonwealth Edison Co. 2.15% 1/15/19 | | 188,000 | 189,190 |
| Duke Energy Corp.: | | | |
| 1.8% 9/1/21 | | 1,354,000 | 1,335,210 |
| 2.1% 6/15/18 | | 5,395,000 | 5,409,855 |
| Duquesne Light Holdings, Inc. 6.4% 9/15/20 (a) | | 48,000 | 53,796 |
| Edison International 2.95% 3/15/23 | | 730,000 | 743,853 |
| Eversource Energy: | | | |
| 1.45% 5/1/18 | | 153,000 | 152,903 |
| 2.5% 3/15/21 | | 896,000 | 902,913 |
| 2.75% 3/15/22 | | 3,489,000 | 3,549,572 |
| Exelon Corp.: | | | |
| 2.85% 6/15/20 | | 2,479,000 | 2,533,467 |
| 3.497% 6/1/22 (b) | | 7,287,000 | 7,553,956 |
| FirstEnergy Corp. 4.25% 3/15/23 | | 600,000 | 636,689 |
| FirstEnergy Solutions Corp. 6.05% 8/15/21 | | 655,000 | 299,663 |
| IPALCO Enterprises, Inc.: | | | |
| 3.45% 7/15/20 | | 2,576,000 | 2,601,760 |
| 3.7% 9/1/24 (a) | | 1,115,000 | 1,124,572 |
| LG&E and KU Energy LLC 3.75% 11/15/20 | | 5,002,000 | 5,232,017 |
| Nevada Power Co.: | | | |
| 6.5% 5/15/18 | | 1,562,000 | 1,613,547 |
| 6.5% 8/1/18 | | 273,000 | 284,982 |
| NextEra Energy Capital Holdings, Inc. 1.649% 9/1/18 | | 950,000 | 948,879 |
| PacifiCorp 5.5% 1/15/19 | | 2,750,000 | 2,888,080 |
| Pennsylvania Electric Co. 6.05% 9/1/17 | | 115,000 | 115,000 |
| PG&E Corp. 2.4% 3/1/19 | | 74,000 | 74,510 |
| Public Service Electric & Gas Co. 2.3% 9/15/18 | | 2,000,000 | 2,013,008 |
| Southern Co.: | | | |
| 1.85% 7/1/19 | | 3,000,000 | 3,002,481 |
| 2.35% 7/1/21 | | 5,250,000 | 5,243,699 |
| TECO Finance, Inc.: | | | |
| 3 month U.S. LIBOR + 0.600% 1.9041% 4/10/18 (b)(c) | | 3,000,000 | 3,004,001 |
| 5.15% 3/15/20 | | 252,000 | 269,191 |
| Xcel Energy, Inc. 2.4% 3/15/21 | | 1,050,000 | 1,059,602 |
| | | | 54,663,630 |
| Gas Utilities - 0.0% | | | |
| Texas Eastern Transmission LP 6% 9/15/17 (a) | | 1,096,000 | 1,097,190 |
| Independent Power and Renewable Electricity Producers - 0.2% | | | |
| Emera U.S. Finance LP: | | | |
| 2.15% 6/15/19 | | 557,000 | 557,822 |
| 2.7% 6/15/21 | | 548,000 | 553,640 |
| Kinder Morgan Finance Co. LLC 6% 1/15/18 (a) | | 2,500,000 | 2,535,742 |
| Southern Power Co.: | | | |
| 1.85% 12/1/17 | | 704,000 | 704,279 |
| 2.375% 6/1/20 | | 1,087,000 | 1,097,585 |
| | | | 5,449,068 |
| Multi-Utilities - 1.6% | | | |
| Ameren Illinois Co. 6.125% 11/15/17 | | 62,000 | 62,534 |
| Berkshire Hathaway Energy Co. 2% 11/15/18 | | 544,000 | 546,000 |
| CenterPoint Energy, Inc. 2.5% 9/1/22 | | 1,229,000 | 1,235,661 |
| Consolidated Edison, Inc.: | | | |
| 2% 3/15/20 | | 1,355,000 | 1,359,723 |
| 2% 5/15/21 | | 1,538,000 | 1,532,538 |
| Dominion Resources, Inc.: | | | |
| 3 month U.S. LIBOR + 2.300% 3.5964% 9/30/66 (b)(c) | | 651,000 | 596,902 |
| 3 month U.S. LIBOR + 2.825% 4.1214% 6/30/66 (b)(c) | | 567,000 | 549,281 |
| 1.4% 9/15/17 | | 3,225,000 | 3,224,925 |
| 1.9% 6/15/18 | | 2,540,000 | 2,544,788 |
| 2% 8/15/21 | | 843,000 | 831,594 |
| 2.5% 12/1/19 | | 10,382,000 | 10,503,628 |
| NiSource Finance Corp. 3.85% 2/15/23 | | 700,000 | 734,973 |
| NSTAR 4.5% 11/15/19 | | 2,500,000 | 2,631,830 |
| Public Service Enterprise Group, Inc. 2% 11/15/21 | | 1,782,000 | 1,755,083 |
| Puget Energy, Inc. 6.5% 12/15/20 | | 991,000 | 1,113,282 |
| Sempra Energy: | | | |
| 1.625% 10/7/19 | | 4,189,000 | 4,170,041 |
| 2.4% 3/15/20 | | 1,890,000 | 1,906,148 |
| 2.85% 11/15/20 | | 1,392,000 | 1,422,232 |
| Wisconsin Energy Corp.: | | | |
| 3 month U.S. LIBOR + 2.113% 3.4275% 5/15/67 (b)(c) | | 454,000 | 439,245 |
| 1.65% 6/15/18 | | 3,006,000 | 3,008,509 |
| 2.45% 6/15/20 | | 5,901,000 | 5,975,845 |
| | | | 46,144,762 |
|
| TOTAL UTILITIES | | | 107,354,650 |
|
| TOTAL NONCONVERTIBLE BONDS | | | |
| (Cost $1,911,925,023) | | | 1,926,966,221 |
|
| U.S. Treasury Obligations - 13.4% | | | |
| U.S. Treasury Notes: | | | |
| 1.125% 7/31/21 | | $45,000,000 | $44,203,711 |
| 1.375% 3/31/20 | | 54,612,000 | 54,601,334 |
| 1.375% 4/30/20 | | 6,478,000 | 6,474,457 |
| 1.375% 1/31/21 | | 45,000,000 | 44,785,547 |
| 1.5% 5/15/20 | | 8,065,000 | 8,085,478 |
| 1.75% 12/31/20 | | 62,000,000 | 62,484,370 |
| 1.75% 6/30/22 | | 39,871,000 | 39,944,201 |
| 1.875% 8/31/24 | | 39,386,000 | 39,192,142 |
| 2.125% 7/31/24 | | 17,248,000 | 17,450,799 |
| 2.25% 3/31/21 | | 55,000,000 | 56,347,070 |
| TOTAL U.S. TREASURY OBLIGATIONS | | | |
| (Cost $373,517,216) | | | 373,569,109 |
|
| U.S. Government Agency - Mortgage Securities - 0.3% | | | |
| Fannie Mae - 0.2% | | | |
| 12 month U.S. LIBOR + 1.685% 3.31% 1/1/40 (b)(c) | | 95,201 | 98,796 |
| 12 month U.S. LIBOR + 1.725% 2.583% 6/1/42 (b)(c) | | 38,568 | 39,860 |
| 12 month U.S. LIBOR + 1.728% 3.314% 11/1/36 (b)(c) | | 88,172 | 93,031 |
| 12 month U.S. LIBOR + 1.741% 3.332% 3/1/40 (b)(c) | | 59,310 | 62,929 |
| 12 month U.S. LIBOR + 1.800% 2.759% 1/1/42 (b)(c) | | 224,736 | 236,042 |
| 12 month U.S. LIBOR + 1.800% 3.558% 7/1/41 (b)(c) | | 37,029 | 38,577 |
| 12 month U.S. LIBOR + 1.805% 3.029% 10/1/41 (b)(c) | | 14,354 | 15,219 |
| 12 month U.S. LIBOR + 1.810% 3.435% 12/1/39 (b)(c) | | 22,959 | 24,107 |
| 12 month U.S. LIBOR + 1.815% 2.944% 11/1/40 (b)(c) | | 14,124 | 14,787 |
| 12 month U.S. LIBOR + 1.818% 2.695% 2/1/42 (b)(c) | | 334,671 | 351,261 |
| 12 month U.S. LIBOR + 1.818% 3.023% 9/1/41 (b)(c) | | 22,050 | 23,393 |
| 12 month U.S. LIBOR + 1.818% 3.231% 4/1/35 (b)(c) | | 258,521 | 273,282 |
| 12 month U.S. LIBOR + 1.818% 3.249% 7/1/41 (b)(c) | | 30,543 | 31,889 |
| 12 month U.S. LIBOR + 1.830% 3.38% 10/1/41 (b)(c) | | 19,668 | 20,882 |
| 12 month U.S. LIBOR + 1.835% 3.572% 3/1/40 (b)(c) | | 79,416 | 83,377 |
| 12 month U.S. LIBOR + 2.253% 2.994% 7/1/35 (b)(c) | | 55,265 | 58,492 |
| U.S. TREASURY 1 YEAR INDEX + 2.244% 3.105% 12/1/33 (b)(c) | | 462,832 | 488,847 |
| 3.5% 7/1/26 to 10/1/29 | | 2,957,046 | 3,103,673 |
| 4.5% 3/1/35 | | 28,019 | 30,299 |
| 6.5% 10/1/17 to 8/1/36 | | 347,086 | 402,150 |
| 7% 9/1/18 to 6/1/33 | | 227,308 | 266,209 |
| 7.5% 6/1/26 to 3/1/28 | | 67,945 | 78,767 |
| 8.5% 5/1/21 to 9/1/25 | | 4,338 | 4,887 |
| 9.5% 2/1/25 | | 218 | 226 |
| 10.5% 8/1/20 | | 1,781 | 1,831 |
|
| TOTAL FANNIE MAE | | | 5,842,813 |
|
| Freddie Mac - 0.1% | | | |
| 12 month U.S. LIBOR + 1.785% 3.529% 4/1/40 (b)(c) | | 55,774 | 58,350 |
| 12 month U.S. LIBOR + 1.877% 3.215% 4/1/41 (b)(c) | | 20,225 | 21,010 |
| 12 month U.S. LIBOR + 1.880% 3.222% 9/1/41 (b)(c) | | 22,843 | 24,241 |
| 12 month U.S. LIBOR + 1.905% 3.613% 2/1/40 (b)(c) | | 70,865 | 74,460 |
| 12 month U.S. LIBOR + 1.905% 3.655% 4/1/40 (b)(c) | | 64,103 | 67,323 |
| 12 month U.S. LIBOR + 1.910% 3.282% 6/1/41 (b)(c) | | 27,697 | 28,919 |
| 12 month U.S. LIBOR + 1.910% 3.421% 5/1/41 (b)(c) | | 22,488 | 23,876 |
| 12 month U.S. LIBOR + 1.910% 3.625% 5/1/41 (b)(c) | | 29,609 | 31,001 |
| 12 month U.S. LIBOR + 1.910% 3.647% 6/1/41 (b)(c) | | 31,466 | 32,938 |
| 3.5% 8/1/26 | | 2,032,407 | 2,129,320 |
| 4.5% 8/1/18 | | 44,505 | 45,018 |
| 5% 3/1/19 | | 77,367 | 78,415 |
| 8.5% 9/1/24 to 8/1/27 | | 24,514 | 28,690 |
|
| TOTAL FREDDIE MAC | | | 2,643,561 |
|
| Ginnie Mae - 0.0% | | | |
| 7% 7/15/28 to 11/15/28 | | 55,070 | 63,641 |
| 7.5% 2/15/28 to 10/15/28 | | 3,201 | 3,775 |
| 8% 6/15/24 | | 32 | 37 |
| 8.5% 10/15/21 | | 17,313 | 18,936 |
| 11% 7/20/19 | | 436 | 449 |
|
| TOTAL GINNIE MAE | | | 86,838 |
|
| TOTAL U.S. GOVERNMENT AGENCY - MORTGAGE SECURITIES | | | |
| (Cost $8,497,647) | | | 8,573,212 |
|
| Asset-Backed Securities - 5.5% | | | |
| Accredited Mortgage Loan Trust Series 2005-1 Class M1, 1 month U.S. LIBOR + 0.705% 1.9394% 4/25/35 (b)(c) | | $56,669 | $55,843 |
| ACE Securities Corp. Home Equity Loan Trust Series 2004-HE1 Class M2, 1 month U.S. LIBOR + 1.650% 2.8844% 3/25/34 (b)(c) | | 25,818 | 25,768 |
| Ally Master Owner Trust: | | | |
| Series 2012-5 Class A, 1.54% 9/15/19 | | 11,057,000 | 11,056,506 |
| Series 2014-5 Class A2, 1.6% 10/15/19 | | 3,000,000 | 3,000,299 |
| Series 2015-3 Class A, 1.63% 5/15/20 | | 3,130,000 | 3,130,763 |
| AmeriCredit Automobile Receivables Trust: | | | |
| Series 2014-4 Class A3, 1.27% 7/8/19 | | 56,396 | 56,387 |
| Series 2015-2 Class A3, 1.27% 1/8/20 | | 1,127,492 | 1,127,055 |
| Series 2016-1 Class A3, 1.81% 10/8/20 | | 1,888,000 | 1,890,704 |
| Series 2016-2 Class A2A, 1.42% 10/8/19 | | 837,950 | 837,760 |
| Ameriquest Mortgage Securities, Inc. pass-thru certificates: | | | |
| Series 2003-10 Class M1, 1 month U.S. LIBOR + 1.050% 2.2844% 12/25/33 (b)(c) | | 3,888 | 3,751 |
| Series 2004-R2 Class M3, 1 month U.S. LIBOR + 0.825% 2.0594% 4/25/34 (b)(c) | | 10,238 | 9,098 |
| Argent Securities, Inc. pass-thru certificates: | | | |
| Series 2003-W7 Class A2, 1 month U.S. LIBOR + 0.780% 2.0144% 3/25/34 (b)(c) | | 4,092 | 3,863 |
| Series 2004-W11 Class M2, 1 month U.S. LIBOR + 1.050% 2.2844% 11/25/34 (b)(c) | | 52,658 | 52,435 |
| Series 2004-W7 Class M1, 1 month U.S. LIBOR + 0.825% 2.0594% 5/25/34 (b)(c) | | 145,622 | 139,730 |
| Series 2006-W4 Class A2C, 1 month U.S. LIBOR + 0.160% 1.3944% 5/25/36 (b)(c) | | 123,946 | 48,118 |
| Asset Backed Securities Corp. Home Equity Loan Trust: | | | |
| Series 2004-HE2 Class M1, 1 month U.S. LIBOR + 0.825% 2.0594% 4/25/34 (b)(c) | | 118,260 | 110,923 |
| Series 2006-HE2 Class M1, 1 month U.S. LIBOR + 0.370% 1.6044% 3/25/36 (b)(c) | | 2,306 | 842 |
| Bear Stearns Asset Backed Securities I Trust Series 2005-HE2 Class M2, 1 month U.S. LIBOR + 1.125% 2.3594% 2/25/35 (b)(c) | | 314,243 | 315,584 |
| Capital One Multi-Asset Execution Trust Series 2016-A4 Class A4, 1.33% 6/15/22 | | 4,860,000 | 4,835,587 |
| Carrington Mortgage Loan Trust Series 2007-RFC1 Class A3, 1 month U.S. LIBOR + 0.140% 1.3744% 12/25/36 (b)(c) | | 205,465 | 171,086 |
| Chesapeake Funding II LLC Series 2017-2A Class A1, 1.99% 5/15/29 (a) | | 4,582,000 | 4,595,710 |
| Chrysler Capital Auto Receivables Trust: | | | |
| Series 2015-AA Class A3, 1.22% 7/15/19 (a) | | 367,531 | 367,433 |
| Series 2016-BA Class A2, 1.36% 1/15/20 (a) | | 3,034,046 | 3,031,792 |
| CIT Equipment Collateral Series 2014-VT1 Class A3, 1.5% 10/21/19 (a) | | 424,386 | 424,329 |
| Citibank Credit Card Issuance Trust Series 2014-A6 Class A6, 2.15% 7/15/21 | | 2,896,000 | 2,923,608 |
| Countrywide Home Loans, Inc.: | | | |
| Series 2003-BC1 Class B1, 1 month U.S. LIBOR + 5.250% 6.4844% 3/25/32 (b)(c) | | 9,741 | 9,734 |
| Series 2004-3 Class M4, 1 month U.S. LIBOR + 1.455% 2.6894% 4/25/34 (b)(c) | | 5,913 | 5,575 |
| Series 2004-4 Class M2, 1 month U.S. LIBOR + 0.795% 2.0294% 6/25/34 (b)(c) | | 6,708 | 6,664 |
| Credit Suisse First Boston Mortgage Securities Corp.: | | | |
| Series 2003-2 Class M1, 1 month U.S. LIBOR + 1.320% 2.5544% 8/25/33 (b)(c) | | 26,426 | 26,037 |
| Series 2003-5 Class A2, 1 month U.S. LIBOR + 0.700%1.9322% 12/25/33 (b)(c) | | 2,817 | 2,729 |
| Discover Card Master Trust: | | | |
| Series 2016-A1 Class A1, 1.64% 7/15/21 | | 3,630,000 | 3,635,528 |
| Series 2016-A4 Class A4, 1.39% 3/15/22 | | 5,019,000 | 4,996,131 |
| Enterprise Fleet Financing LLC: | | | |
| Series 2014-2 Class A2, 1.05% 3/20/20 (a) | | 146,993 | 146,913 |
| Series 2015-1 Class A2, 1.3% 9/20/20 (a) | | 533,923 | 533,653 |
| Series 2016-2 Class A2, 1.74% 2/22/22 (a) | | 2,007,810 | 2,007,332 |
| Series 2017-1 Class A2, 2.13% 7/20/22 (a) | | 3,338,000 | 3,355,295 |
| Fannie Mae Series 2004-T5 Class AB3, 1 month U.S. LIBOR + 0.392% 1.9452% 5/28/35 (b)(c) | | 4,436 | 4,272 |
| Fieldstone Mortgage Investment Corp. Series 2004-3 Class M5, 1 month U.S. LIBOR + 2.175% 3.4094% 8/25/34 (b)(c) | | 24,752 | 24,058 |
| Flagship Credit Auto Trust Series 2016-1 Class A, 2.77% 12/15/20 (a) | | 1,695,125 | 1,706,528 |
| Ford Credit Auto Owner Trust: | | | |
| Series 2014-2 Class A, 2.31% 4/15/26 (a) | | 9,142,000 | 9,247,910 |
| Series 2015-1 Class A, 2.12% 7/15/26 (a) | | 2,785,000 | 2,807,361 |
| Series 2015-2 Class A, 2.44% 1/15/27 (a) | | 6,181,000 | 6,276,836 |
| Series 2016-1 Class A, 2.31% 8/15/27 (a) | | 5,938,000 | 6,003,618 |
| Series 2017-1 Class A, 2.62% 8/15/28 (a) | | 5,415,000 | 5,525,371 |
| Ford Credit Floorplan Master Owner Trust: | | | |
| Series 2015-1 Class A1, 1.42% 1/15/20 | | 6,000,000 | 5,998,474 |
| Series 2015-5 Class A, 2.39% 8/15/22 | | 10,511,000 | 10,661,376 |
| Series 2016-3 Class A1, 1.55% 7/15/21 | | 4,844,000 | 4,830,215 |
| Fremont Home Loan Trust Series 2005-A: | | | |
| Class M3, 1 month U.S. LIBOR + 0.735% 1.9694% 1/25/35 (b)(c) | | 81,136 | 79,355 |
| Class M4, 1 month U.S. LIBOR + 1.020% 2.2544% 1/25/35 (b)(c) | | 39,567 | 23,125 |
| GCO Education Loan Funding Master Trust II Series 2007-1A Class C1L, 3 month U.S. LIBOR + 0.380% 1.6972% 2/25/47 (a)(b)(c) | | 56,869 | 53,827 |
| GE Business Loan Trust Series 2006-2A: | | | |
| Class A, 1 month U.S. LIBOR + 0.180% 1.4089% 11/15/34 (a)(b)(c) | | 52,391 | 50,707 |
| Class B, 1 month U.S. LIBOR + 0.280% 1.5067% 11/15/34 (a)(b)(c) | | 19,009 | 17,783 |
| Class C, 1 month U.S. LIBOR + 0.380% 1.6067% 11/15/34 (a)(b)(c) | | 31,373 | 29,085 |
| Class D, 1 month U.S. LIBOR + 0.750% 1.9767% 11/15/34 (a)(b)(c) | | 11,900 | 10,850 |
| GM Financial Automobile Leasing Trust Series 2015-1 Class A3, 1.53% 9/20/18 | | 938,774 | 938,885 |
| GMF Floorplan Owner Revolving Trust: | | | |
| Series 2015-1 Class A1, 1.65% 5/15/20 (a) | | 3,732,000 | 3,733,955 |
| Series 2016-1 Class A1, 1.86% 5/17/21 (a) | | 3,160,000 | 3,173,194 |
| Series 2017-1 Class A1, 2.22% 1/18/22 (a) | | 4,092,000 | 4,119,202 |
| GSAMP Trust Series 2004-AR1 Class B4, 5.5% 6/25/34 (a) | | 19,112 | 1,603 |
| HSI Asset Securitization Corp. Trust Series 2007-HE1 Class 2A3, 1 month U.S. LIBOR + 0.190% 1.4244% 1/25/37 (b)(c) | | 135,907 | 96,745 |
| Hyundai Auto Lease Securitization Trust Series 2015-B Class A3, 1.4% 11/15/18 (a) | | 1,303,622 | 1,303,561 |
| Hyundai Floorplan Master Owner Trust Series 2016-1A Class A2, 1.81% 3/15/21 (a) | | 2,151,000 | 2,151,162 |
| Keycorp Student Loan Trust Series 2006-A Class 2C, 3 month U.S. LIBOR + 1.150% 2.4433% 3/27/42 (b)(c) | | 392,000 | 270,674 |
| MASTR Asset Backed Securities Trust Series 2007-HE1 Class M1, 1 month U.S. LIBOR + 0.300% 1.5344% 5/25/37 (b)(c) | | 31,431 | 9,402 |
| Mercedes-Benz Auto Receivables Trust Series 2016-1 Class A3, 1.26% 2/16/21 | | 4,798,000 | 4,778,609 |
| Meritage Mortgage Loan Trust Series 2004-1 Class M1, 1 month U.S. LIBOR + 0.750% 1.9844% 7/25/34 (b)(c) | | 11,142 | 10,490 |
| Merrill Lynch Mortgage Investors Trust: | | | |
| Series 2003-OPT1 Class M1, 1 month U.S. LIBOR + 0.975% 2.2094% 7/25/34 (b)(c) | | 16,316 | 15,776 |
| Series 2006-FM1 Class A2B, 1 month U.S. LIBOR + 0.110% 1.3444% 4/25/37 (b)(c) | | 251 | 154 |
| Series 2006-OPT1 Class A1A, 1 month U.S. LIBOR + 0.520% 1.7544% 6/25/35 (b)(c) | | 122,451 | 118,738 |
| Morgan Stanley ABS Capital I Trust: | | | |
| Series 2004-HE6 Class A2, 1 month U.S. LIBOR + 0.680% 1.9144% 8/25/34 (b)(c) | | 4,895 | 4,355 |
| Series 2004-NC8 Class M6, 1 month U.S. LIBOR + 1.875% 3.1094% 9/25/34 (b)(c) | | 44,974 | 44,337 |
| Series 2005-NC1 Class M1, 1 month U.S. LIBOR + 0.660% 1.8944% 1/25/35 (b)(c) | | 13,946 | 13,444 |
| Series 2005-NC2 Class B1, 1 month U.S. LIBOR + 1.755% 2.9894% 3/25/35 (b)(c) | | 14,235 | 465 |
| Nationstar HECM Loan Trust Series 2016-3A Class A, 2.0125% 8/25/26 (a) | | 2,848,274 | 2,842,894 |
| New Century Home Equity Loan Trust Series 2005-4 Class M2, 1 month U.S. LIBOR + 0.510% 1.7444% 9/25/35 (b)(c) | | 162,650 | 159,420 |
| Nissan Master Owner Trust Receivables Series 2016-A Class A2, 1.54% 6/15/21 | | 2,442,000 | 2,434,294 |
| Park Place Securities, Inc.: | | | |
| Series 2004-WCW1: | | | |
| Class M3, 1 month U.S. LIBOR + 1.875% 3.1072% 9/25/34 (b)(c) | | 54,672 | 54,130 |
| Class M4, 1 month U.S. LIBOR + 2.175% 3.4072% 9/25/34 (b)(c) | | 77,891 | 62,840 |
| Series 2005-WCH1 Class M4, 1 month U.S. LIBOR + 1.245% 2.4794% 1/25/36 (b)(c) | | 126,217 | 124,314 |
| Prosper Marketplace Issuance Trust Series 2017-2A Class A, 2.42% 9/15/23 (a) | | 5,000,000 | 5,008,770 |
| Salomon Brothers Mortgage Securities VII, Inc. Series 2003-HE1 Class A, 1 month U.S. LIBOR + 0.800% 2.0344% 4/25/33 (b)(c) | | 582 | 530 |
| Saxon Asset Securities Trust Series 2004-1 Class M1, 1 month U.S. LIBOR + 0.795% 2.0294% 3/25/35 (b)(c) | | 54,943 | 53,895 |
| Securitized Term Auto Receivables Trust Series 2016-1A Class A3, 1.524% 3/25/20 (a) | | 2,886,000 | 2,876,413 |
| SLM Private Credit Student Loan Trust Series 2004-A Class C, 3 month U.S. LIBOR + 0.950% 2.1956% 6/15/33 (b)(c) | | 20,694 | 20,674 |
| Structured Asset Investment Loan Trust Series 2004-8 Class M5, 1 month U.S. LIBOR + 1.725% 2.9594% 9/25/34 (b)(c) | | 3,760 | 3,476 |
| Synchrony Credit Card Master Note Trust Series 2016-1 Class A, 2.04% 3/15/22 | | 1,000,000 | 1,006,002 |
| TCF Auto Receivables Owner Trust Series 2016-1A Class A2, 1.39% 11/15/19 (a) | | 1,751,029 | 1,749,646 |
| Terwin Mortgage Trust Series 2003-4HE Class A1, 1 month U.S. LIBOR + 0.860% 2.0944% 9/25/34 (b)(c) | | 2,472 | 2,346 |
| Trapeza CDO XII Ltd./Trapeza CDO XII, Inc. Series 2007-12A Class B, 3 month U.S. LIBOR + 0.560% 1.7098% 4/6/42 (a)(b)(c)(d) | | 304,000 | 153,520 |
| Verizon Owner Trust: | | | |
| Series 2016-1A Class A, 1.42% 1/20/21 (a) | | 4,069,000 | 4,056,376 |
| Series 2016-2A Class A, 1.68% 5/20/21 (a) | | 5,279,000 | 5,277,258 |
| Volvo Financial Equipment LLC Series 2015-1A Class A3, 1.51% 6/17/19 (a) | | 1,225,804 | 1,226,282 |
| TOTAL ASSET-BACKED SECURITIES | | | |
| (Cost $152,963,366) | | | 154,189,147 |
|
| Collateralized Mortgage Obligations - 1.1% | | | |
| Private Sponsor - 0.3% | | | |
| Credit Suisse Mortgage Trust Series 2012-2R Class 1A1, 3.2057% 5/27/35 (a)(b) | | 340,240 | 342,264 |
| CSAIL Commercial Mortgage Trust Series 2015-C2 Class ASB, 3.2241% 6/15/57 | | 1,352,000 | 1,398,457 |
| Merrill Lynch Alternative Note Asset Trust floater Series 2007-OAR1 Class A1, 1 month U.S. LIBOR + 0.170% 1.3861% 2/25/37 (b)(c) | | 35,565 | 34,621 |
| Mortgage Repurchase Agreement Funding Trust floater Series 2016-5 Class A, 1 month U.S. LIBOR + 1.170% 2.4006% 6/10/19 (a)(b)(c) | | 7,000,000 | 6,988,877 |
| RESI Finance LP/RESI Finance DE Corp. floater Series 2003-B: | | | |
| Class B5, 1 month U.S. LIBOR + 2.350% 3.5744% 6/10/35 (a)(b)(c) | | 25,906 | 18,410 |
| Class B6, 1 month U.S. LIBOR + 2.850% 4.0744% 6/10/35 (a)(b)(c) | | 43,098 | 23,819 |
| Sequoia Mortgage Trust floater Series 2004-6 Class A3B, 6 month U.S. LIBOR + 0.880% 2.3127% 7/20/34 (b)(c) | | 2,195 | 2,167 |
|
| TOTAL PRIVATE SPONSOR | | | 8,808,615 |
|
| U.S. Government Agency - 0.8% | | | |
| Fannie Mae: | | | |
| pass-thru certificates Series 2012-127 Class DH, 4% 11/25/27 | | 205,457 | 212,372 |
| planned amortization class Series 2015-28 Class P, 2.5% 5/25/45 | | 5,757,087 | 5,804,361 |
| Series 2014-57 Class A, 3% 9/25/44 | | 1,572,439 | 1,598,932 |
| Series 2015-28 Class JE, 3% 5/25/45 | | 4,041,484 | 4,154,041 |
| Freddie Mac: | | | |
| Series 3777 Class AC, 3.5% 12/15/25 | | 337,533 | 349,801 |
| Series 3949 Class MK, 4.5% 10/15/34 | | 154,087 | 165,288 |
| Series 4472 Class WL, 3% 5/15/45 | | 1,843,213 | 1,895,870 |
| Ginnie Mae guaranteed REMIC pass-thru certificates Series 2015-H17 Class HA, 2.5% 5/20/65 (e) | | 6,549,518 | 6,600,950 |
|
| TOTAL U.S. GOVERNMENT AGENCY | | | 20,781,615 |
|
| TOTAL COLLATERALIZED MORTGAGE OBLIGATIONS | | | |
| (Cost $29,834,952) | | | 29,590,230 |
|
| Commercial Mortgage Securities - 5.9% | | | |
| 7 WTC Depositor LLC Trust Series 2012-7WTC Class A, 4.0824% 3/13/31 (a) | | 174,689 | 176,073 |
| Asset Securitization Corp. Series 1997-D5 Class PS1, 1.6895% 2/14/43 (b)(f) | | 7,049 | 61 |
| Bank of America Commercial Mortgage Trust Series 2016-UB10 Class A2, 2.723% 7/15/49 | | 2,685,000 | 2,734,527 |
| Barclays Commercial Mortgage Securities LLC: | | | |
| floater Series 2015-RRI Class A, 1 month U.S. LIBOR + 1.250% 2.4089% 5/15/32 (a)(b)(c) | | 1,927,035 | 1,927,033 |
| Series 2015-STP Class A, 3.3228% 9/10/28 (a) | | 7,379,258 | 7,611,149 |
| Bayview Commercial Asset Trust floater: | | | |
| Series 2003-2 Class M1, 1 month U.S. LIBOR + 0.850% 2.5094% 12/25/33 (a)(b)(c) | | 2,411 | 2,284 |
| Series 2005-4A: | | | |
| Class A2, 1 month U.S. LIBOR + 0.390% 1.6244% 1/25/36 (a)(b)(c) | | 65,813 | 60,969 |
| Class B1, 1 month U.S. LIBOR + 1.400% 2.6344% 1/25/36 (a)(b)(c) | | 2,953 | 2,419 |
| Class M1, 1 month U.S. LIBOR + 0.450% 1.6844% 1/25/36 (a)(b)(c) | | 21,230 | 19,697 |
| Class M2, 1 month U.S. LIBOR + 0.470% 1.7044% 1/25/36 (a)(b)(c) | | 6,369 | 5,658 |
| Class M3, 1 month U.S. LIBOR + 0.500% 1.7344% 1/25/36 (a)(b)(c) | | 9,301 | 7,672 |
| Class M4, 1 month U.S. LIBOR + 0.610% 1.8444% 1/25/36 (a)(b)(c) | | 5,144 | 4,676 |
| Class M5, 1 month U.S. LIBOR + 0.650% 1.8844% 1/25/36 (a)(b)(c) | | 5,144 | 3,925 |
| Class M6, 1 month U.S. LIBOR + 0.700% 1.9344% 1/25/36 (a)(b)(c) | | 5,464 | 4,196 |
| Series 2006-3A Class M4, 1 month U.S. LIBOR + 0.430% 1.6644% 10/25/36 (a)(b)(c) | | 2,880 | 2,249 |
| Series 2007-1 Class A2, 1 month U.S. LIBOR + 0.270% 1.5044% 3/25/37 (a)(b)(c) | | 43,147 | 38,213 |
| Series 2007-2A: | | | |
| Class A1, 1 month U.S. LIBOR + 0.270% 1.4861% 7/25/37 (a)(b)(c) | | 44,505 | 41,965 |
| Class A2, 1 month U.S. LIBOR + 0.320% 1.5361% 7/25/37 (a)(b)(c) | | 41,608 | 38,276 |
| Class M1, 1 month U.S. LIBOR + 0.370% 1.5861% 7/25/37 (a)(b)(c) | | 14,611 | 11,658 |
| Class M2, 1 month U.S. LIBOR + 0.410% 1.6261% 7/25/37 (a)(b)(c) | | 7,894 | 6,312 |
| Class M3, 1 month U.S. LIBOR + 0.490% 1.7061% 7/25/37 (a)(b)(c) | | 6,190 | 5,150 |
| Series 2007-3: | | | |
| Class A2, 1 month U.S. LIBOR + 0.290% 1.5061% 7/25/37 (a)(b)(c) | | 39,735 | 37,033 |
| Class M1, 1 month U.S. LIBOR + 0.310% 1.5261% 7/25/37 (a)(b)(c) | | 8,815 | 7,905 |
| Class M2, 1 month U.S. LIBOR + 0.340% 1.5561% 7/25/37 (a)(b)(c) | | 9,457 | 8,428 |
| Class M3, 1 month U.S. LIBOR + 0.370% 1.5861% 7/25/37 (a)(b)(c) | | 14,589 | 11,143 |
| Class M4, 1 month U.S. LIBOR + 0.500% 1.7161% 7/25/37 (a)(b)(c) | | 23,084 | 15,815 |
| Class M5, 1 month U.S. LIBOR + 0.600% 1.8161% 7/25/37 (a)(b)(c) | | 8,701 | 4,721 |
| Series 2007-4A Class M1, 1 month U.S. LIBOR + 0.950% 2.1844% 9/25/37 (a)(b)(c) | | 1,099 | 409 |
| CGBAM Commercial Mortgage Trust Series 2015-SMRT Class A, 2.808% 4/10/28 (a) | | 6,819,000 | 6,945,057 |
| CGDBB Commercial Mortgage Trust floater Series 2017-BIOC Class A, 1 month U.S. LIBOR + 0.790% 2% 7/15/28 (a)(b)(c) | | 3,948,000 | 3,948,851 |
| CGMS Commercial Mortgage Trust Series 2017-MDRA Class A, 3.2% 7/10/30 (a) | | 10,000,000 | 10,355,618 |
| Citigroup Commercial Mortgage Trust: | | | |
| sequential payer Series 2012-GC8 Class A4, 3.024% 9/10/45 | | 837,000 | 865,149 |
| Series 2015-GC29 Class A2, 2.674% 4/10/48 | | 1,388,000 | 1,407,924 |
| Series 2016-P4 Class A2, 2.446% 7/10/49 | | 1,073,000 | 1,085,070 |
| Series 2017-P7 Class A2, 3.199% 4/14/50 | | 2,399,000 | 2,498,944 |
| COMM Mortgage Trust: | | | |
| sequential payer: | | | |
| Series 2012-CR3 Class A3, 2.822% 10/15/45 | | 1,310,000 | 1,338,341 |
| Series 2012-LC4 Class A4, 3.288% 12/10/44 | | 5,915,000 | 6,151,364 |
| Series 2013-CR7 Class A4, 3.213% 3/10/46 | | 4,365,000 | 4,538,091 |
| Series 2015-CR23 Class ASB, 3.257% 5/10/48 | | 1,587,000 | 1,662,562 |
| Series 2013-CR6 Class A4, 3.101% 3/10/46 | | 1,715,000 | 1,777,481 |
| Series 2013-LC6 Class ASB, 2.478% 1/10/46 | | 2,180,000 | 2,210,266 |
| Series 2014-CR15 Class A2, 2.928% 2/10/47 | | 3,957,000 | 4,010,731 |
| Series 2014-CR17 Class A2, 3.012% 5/10/47 | | 790,000 | 805,475 |
| Series 2014-CR20 Class A2, 2.801% 11/10/47 | | 987,000 | 1,003,882 |
| Series 2014-UBS3 Class A2, 2.844% 6/10/47 | | 1,960,000 | 1,992,573 |
| Series 2015-CR22 Class A2, 2.856% 3/10/48 | | 953,000 | 973,019 |
| Commercial Mortgage Loan Trust Series 2008-LS1 Class A1A, 6.1552% 12/10/49 (b) | | 1,053,407 | 1,052,629 |
| CSMC Series 2015-TOWN: | | | |
| Class B, 1 month U.S. LIBOR + 1.900% 3.1256% 3/15/28 (a)(b)(c) | | 264,000 | 263,977 |
| Class C, 1 month U.S. LIBOR + 2.250% 3.4756% 3/15/28 (a)(b)(c) | | 257,000 | 257,064 |
| Class D, 1 month U.S. LIBOR + 3.200% 4.4256% 3/15/28 (a)(b)(c) | | 1,003,000 | 1,003,000 |
| GAHR Commercial Mortgage Trust: | | | |
| floater Series 2015-NRF Class AFL1, 1 month U.S. LIBOR + 1.300% 2.459% 12/15/34 (a)(b)(c) | | 833,576 | 835,021 |
| Series 2015-NRF: | | | |
| Class BFX, 3.3822% 12/15/34 (a)(b) | | 2,358,850 | 2,414,795 |
| Class CFX, 3.3822% 12/15/34 (a)(b) | | 1,059,000 | 1,080,568 |
| GE Capital Commercial Mortgage Corp. Series 2007-C1 Class A1A, 5.483% 12/10/49 | | 743,570 | 742,755 |
| GS Mortgage Securities Trust: | | | |
| sequential payer: | | | |
| Series 2012-GCJ7 Class A4, 3.377% 5/10/45 | | 2,492,821 | 2,598,866 |
| Series 2012-GCJ9 Class A3, 2.773% 11/10/45 | | 3,718,000 | 3,797,261 |
| Series 2013-GC10: | | | |
| Class A4, 2.681% 2/10/46 | | 1,061,000 | 1,075,780 |
| Class A5, 2.943% 2/10/46 | | 2,028,000 | 2,082,683 |
| Series 2014-GC18 Class AAB, 3.648% 1/10/47 | | 702,000 | 741,824 |
| Series 2014-GC20 Class AAB, 3.655% 4/10/47 | | 817,000 | 862,924 |
| Series 2015-GC28 Class AAB, 3.206% 2/10/48 | | 1,764,000 | 1,839,490 |
| Series 2015-GC32 Class A2, 3.062% 7/10/48 | | 2,500,000 | 2,564,279 |
| JP Morgan Chase Commercial Mortgage Securities Trust Series 2015-JP1 Class A2, 3.1438% 1/15/49 | | 1,975,000 | 2,041,031 |
| JPMBB Commercial Mortgage Securities sequential payer Series 2014-C25 Class ASB, 3.4074% 11/15/47 | | 1,831,000 | 1,924,068 |
| JPMBB Commercial Mortgage Securities Trust sequential payer Series 2013-C17 Class ASB, 3.705% 1/15/47 | | 895,000 | 946,269 |
| JPMBB Commercial Mortgage Secutities Trust Series 2015-C29 Class A2, 2.9213% 5/15/48 | | 1,567,000 | 1,605,662 |
| JPMCC Commercial Mortgage Securities Trust sequential payer Series 2016-JP4 Class A2, 2.9838% 12/15/49 | | 3,027,000 | 3,122,340 |
| JPMorgan Chase Commercial Mortgage Securities Trust: | | | |
| floater Series 2014-FL5 Class A, 1 month U.S. LIBOR + 0.980% 2.1389% 7/15/31 (a)(b)(c) | | 582,130 | 583,039 |
| sequential payer Series 2011-C3 Class A3, 4.3877% 2/15/46 (a) | | 1,425,010 | 1,440,498 |
| Series 2013-C10 Class A5, 3.1425% 12/15/47 | | 3,570,000 | 3,697,281 |
| Series 2016-WP Class TA, 1 month U.S. LIBOR + 1.450% 2.6089% 10/15/33 (a)(b)(c) | | 1,811,000 | 1,818,419 |
| LB-UBS Commercial Mortgage Trust Series 2007-C7 Class A3, 5.866% 9/15/45 | | 346,852 | 347,065 |
| Morgan Stanley BAML Trust: | | | |
| sequential payer: | | | |
| Series 2012-C6 Class A4, 2.858% 11/15/45 | | 5,000,000 | 5,128,080 |
| Series 2013-C11 Class A4, 4.1695% 8/15/46 (b) | | 1,443,000 | 1,559,470 |
| Series 2014-C14 Class A2, 2.916% 2/15/47 | | 811,226 | 823,265 |
| Series 2014-C17 Class ASB, 3.477% 8/15/47 | | 3,656,000 | 3,844,614 |
| Series 2015-C22 Class ASB, 3.04% 4/15/48 | | 1,170,000 | 1,207,199 |
| Morgan Stanley Capital I Trust sequential payer: | | | |
| Series 2011-C1 Class A4, 5.033% 9/15/47 (a)(b) | | 6,000,000 | 6,491,378 |
| Series 2011-C2 Class A4, 4.661% 6/15/44 (a) | | 2,725,000 | 2,948,736 |
| MSCG Trust Series 2016-SNR: | | | |
| Class A, 3.348% 11/15/34 (a)(b) | | 2,922,000 | 2,951,986 |
| Class B, 4.181% 11/15/34 (a) | | 1,031,000 | 1,049,246 |
| SCG Trust Series 2013-SRP1 Class A, 1 month U.S. LIBOR + 1.400% 2.8089% 11/15/26 (a)(b)(c) | | 2,027,000 | 2,012,681 |
| UBS-Barclays Commercial Mortgage Trust sequential payer Series 2012-C2 Class A4, 3.525% 5/10/63 | | 2,703,000 | 2,841,853 |
| Wachovia Bank Commercial Mortgage Trust sequential payer Series 2007-34 Class A1A, 5.608% 5/15/46 | | 985,487 | 984,468 |
| Waldorf Astoria Boca Raton Trust floater Series 2016-BOCA Class A, 1 month U.S. LIBOR + 1.500% 2.5756% 6/15/29 (a)(b)(c) | | 2,645,000 | 2,653,319 |
| Wells Fargo Commercial Mortgage Trust: | | | |
| sequential payer: | | | |
| Series 2012-LC5 Class A3, 2.918% 10/15/45 | | 3,207,000 | 3,292,175 |
| Series 2015-C27 Class ASB, 3.278% 2/15/48 | | 3,047,000 | 3,185,336 |
| Series 2016-C35 Class A2, 2.495% 7/15/48 | | 859,000 | 868,836 |
| Wells Fargo Commercial Mtg Trust 2016-C sequential payer Series 2016-C37 Class A1, 3.03% 12/15/49 | | 2,128,000 | 2,199,615 |
| WF-RBS Commercial Mortgage Trust: | | | |
| sequential payer: | | | |
| Series 2011-C2 Class A4, 4.869% 2/15/44 (a)(b) | | 4,245,000 | 4,606,562 |
| Series 2012-C9 Class A3, 2.87% 11/15/45 | | 3,163,000 | 3,240,282 |
| Series 2013-C11 Class A5, 3.071% 3/15/45 | | 3,652,000 | 3,773,736 |
| Series 2013-C12 Class ASB, 2.838% 3/15/48 | | 541,000 | 553,225 |
| Series 2013-C16 Class ASB, 3.963% 9/15/46 | | 1,101,000 | 1,167,691 |
| Series 2013-C11 Class ASB, 2.63% 3/15/45 | | 1,310,000 | 1,329,499 |
| TOTAL COMMERCIAL MORTGAGE SECURITIES | | | |
| (Cost $166,164,610) | | | 165,811,854 |
|
| Municipal Securities - 0.4% | | | |
| Illinois Gen. Oblig.: | | | |
| Series 2003, 4.95% 6/1/23 | | $2,645,000 | $2,750,377 |
| Series 2011: | | | |
| 5.665% 3/1/18 | | 630,000 | 640,439 |
| 5.877% 3/1/19 | | 4,715,000 | 4,906,759 |
| Series 2013, 2.69% 12/1/17 | | 500,000 | 500,445 |
| New York City Transitional Fin. Auth. Rev. Series 2017 E, 2.85% 2/1/24 | | 1,320,000 | 1,347,760 |
| TOTAL MUNICIPAL SECURITIES | | | |
| (Cost $10,076,898) | | | 10,145,780 |
|
| Bank Notes - 1.9% | | | |
| Capital One Bank U.S.A. NA 2.25% 2/13/19 | | 1,000,000 | 1,003,736 |
| Capital One NA 1.85% 9/13/19 | | 3,000,000 | 2,987,448 |
| Citibank NA 2.1% 6/12/20 | | 5,000,000 | 5,027,151 |
| Citizens Bank NA 2.3% 12/3/18 | | 1,384,000 | 1,390,974 |
| Compass Bank 2.875% 6/29/22 | | 2,943,000 | 2,954,502 |
| Discover Bank: | | | |
| (Delaware) 3.2% 8/9/21 | | 2,000,000 | 2,052,434 |
| 3.1% 6/4/20 | | 3,590,000 | 3,678,222 |
| Fifth Third Bank: | | | |
| 2.375% 4/25/19 | | 2,000,000 | 2,021,268 |
| 2.875% 10/1/21 | | 2,000,000 | 2,047,378 |
| First Tennessee Bank NA 2.95% 12/1/19 | | 5,000,000 | 5,064,236 |
| KeyBank NA: | | | |
| 1.65% 2/1/18 | | 397,000 | 397,199 |
| 2.35% 3/8/19 | | 2,000,000 | 2,020,294 |
| 2.5% 12/15/19 | | 3,783,000 | 3,833,001 |
| Manufacturers & Traders Trust Co.: | | | |
| 2.1% 2/6/20 | | 3,000,000 | 3,009,976 |
| 2.3% 1/30/19 | | 1,100,000 | 1,108,914 |
| PNC Bank NA 1.5% 2/23/18 | | 2,100,000 | 2,100,181 |
| RBS Citizens NA 2.5% 3/14/19 | | 1,153,000 | 1,163,389 |
| Regions Bank 7.5% 5/15/18 | | 250,000 | 259,661 |
| Regions Financial Corp. 2.25% 9/14/18 | | 4,000,000 | 4,015,483 |
| The Toronto-Dominion Bank 2.125% 7/2/19 | | 5,000,000 | 5,039,059 |
| U.S. Bank NA 2.125% 10/28/19 | | 2,186,000 | 2,204,314 |
| Wachovia Bank NA 6% 11/15/17 | | 570,000 | 574,955 |
| TOTAL BANK NOTES | | | |
| (Cost $53,522,607) | | | 53,953,775 |
|
| Commercial Paper - 0.2% | | | |
| Vodafone Group PLC yankee 1.6% 9/12/17 | | | |
| (Cost $4,997,556) | | 5,000,000 | 4,997,569 |
| | | Shares | Value |
|
| Fixed-Income Funds - 0.7% | | | |
| Fidelity Specialized High Income Central Fund (g) | | | |
| (Cost $18,363,306) | | 177,012 | 18,520,804 |
|
| Money Market Funds - 1.8% | | | |
| Fidelity Cash Central Fund, 1.11% (h) | | | |
| (Cost $50,206,486) | | 50,195,834 | 50,205,874 |
| TOTAL INVESTMENT IN SECURITIES - 100.2% | | | |
| (Cost $2,780,069,667) | | | 2,796,523,575 |
| NET OTHER ASSETS (LIABILITIES) - (0.2)% | | | (4,430,467) |
| NET ASSETS - 100% | | | $2,792,093,108 |
Legend
(a) Security exempt from registration under Rule 144A of the Securities Act of 1933. These securities may be resold in transactions exempt from registration, normally to qualified institutional buyers. At the end of the period, the value of these securities amounted to $485,745,989 or 17.4% of net assets.
(b) Coupon rates for floating and adjustable rate securities reflect the rates in effect at period end.
(c) Coupon is indexed to a floating interest rate which may be multiplied by a specified factor and/or subject to caps or floors.
(d) Level 3 instrument
(e) Represents an investment in an underlying pool of reverse mortgages which typically do not require regular principal and interest payments as repayment is deferred until a maturity event.
(f) Security represents right to receive monthly interest payments on an underlying pool of mortgages or assets. Principal shown is the outstanding par amount of the pool as of the end of the period.
(g) Affiliated fund that is generally available only to investment companies and other accounts managed by Fidelity Investments. A complete unaudited schedule of portfolio holdings for each Fidelity Central Fund is filed with the SEC for the first and third quarters of each fiscal year on Form N-Q and is available upon request or at the SEC's website at www.sec.gov. An unaudited holdings listing for the Fund, which presents direct holdings as well as the pro-rata share of securities and other investments held indirectly through its investment in underlying non-money market Fidelity Central Funds, is available at fidelity.com and/or institutional.fidelity.com, as applicable. In addition, each Fidelity Central Fund's financial statements, which are not covered by the Fund's Report of Independent Registered Public Accounting Firm, are available on the SEC's website or upon request.
(h) Affiliated fund that is generally available only to investment companies and other accounts managed by Fidelity Investments. The rate quoted is the annualized seven-day yield of the fund at period end. A complete unaudited listing of the fund's holdings as of its most recent quarter end is available upon request. In addition, each Fidelity Central Fund's financial statements, which are not covered by the Fund's Report of Independent Registered Public Accounting Firm, are available on the SEC's website or upon request.
Affiliated Central Funds
Information regarding fiscal year to date income earned by the Fund from investments in Fidelity Central Funds is as follows:
| Fund | Income earned |
| Fidelity Cash Central Fund | $307,758 |
| Fidelity Specialized High Income Central Fund | 950,577 |
| Total | $1,258,335 |
Additional information regarding the Fund's fiscal year to date purchases and sales, including the ownership percentage, of the non Money Market Central Funds is as follows:
| Fund | Value, beginning of period | Purchases | Sales Proceeds | Realized Gain/Loss | Change in Unrealized appreciation (depreciation) | Value, end of period | % ownership, end of period |
| Fidelity Specialized High Income Central Fund | $17,246,563 | $999,552 | $-- | $-- | $274,689 | $18,520,804 | 2.4% |
| Total | $17,246,563 | $999,552 | $-- | $-- | $274,689 | $18,520,804 | |
Investment Valuation
The following is a summary of the inputs used, as of August 31, 2017, involving the Fund's assets and liabilities carried at fair value. The inputs or methodology used for valuing securities may not be an indication of the risk associated with investing in those securities. For more information on valuation inputs, and their aggregation into the levels used below, please refer to the Investment Valuation section in the accompanying Notes to Financial Statements.
| | Valuation Inputs at Reporting Date: |
| Description | Total | Level 1 | Level 2 | Level 3 |
| Investments in Securities: | | | | |
| Corporate Bonds | $1,926,966,221 | $-- | $1,926,966,221 | $-- |
| U.S. Government and Government Agency Obligations | 373,569,109 | -- | 373,569,109 | -- |
| U.S. Government Agency - Mortgage Securities | 8,573,212 | -- | 8,573,212 | -- |
| Asset-Backed Securities | 154,189,147 | -- | 154,035,627 | 153,520 |
| Collateralized Mortgage Obligations | 29,590,230 | -- | 29,590,230 | -- |
| Commercial Mortgage Securities | 165,811,854 | -- | 165,811,854 | -- |
| Municipal Securities | 10,145,780 | -- | 10,145,780 | -- |
| Bank Notes | 53,953,775 | -- | 53,953,775 | -- |
| Commercial Paper | 4,997,569 | -- | 4,997,569 | -- |
| Fixed-Income Funds | 18,520,804 | 18,520,804 | -- | -- |
| Money Market Funds | 50,205,874 | 50,205,874 | -- | -- |
| Total Investments in Securities: | $2,796,523,575 | $68,726,678 | $2,727,643,377 | $153,520 |
Other Information
Distribution of investments by country or territory of incorporation, as a percentage of Total Net Assets, is as follows (Unaudited):
| United States of America | 82.8% |
| United Kingdom | 4.1% |
| Netherlands | 2.8% |
| Canada | 2.5% |
| Japan | 1.8% |
| Luxembourg | 1.1% |
| France | 1.0% |
| Others (Individually Less Than 1%) | 3.9% |
| | 100.0% |
See accompanying notes which are an integral part of the financial statements.
Financial Statements
Statement of Assets and Liabilities
| | | August 31, 2017 |
| Assets | | |
Investment in securities, at value — See accompanying schedule:
Unaffiliated issuers (cost $2,711,499,875) | $2,727,796,897 | |
| Fidelity Central Funds (cost $68,569,792) | 68,726,678 | |
| Total Investment in Securities (cost $2,780,069,667) | | $2,796,523,575 |
| Receivable for investments sold | | 19,752,849 |
| Receivable for fund shares sold | | 3,969,002 |
| Interest receivable | | 15,812,248 |
| Distributions receivable from Fidelity Central Funds | | 55,436 |
| Total assets | | 2,836,113,110 |
| Liabilities | | |
| Payable to custodian bank | $133 | |
| Payable for investments purchased | 39,173,291 | |
| Payable for fund shares redeemed | 3,194,547 | |
| Distributions payable | 393,535 | |
| Accrued management fee | 711,184 | |
| Distribution and service plan fees payable | 166,128 | |
| Other affiliated payables | 381,184 | |
| Total liabilities | | 44,020,002 |
| Net Assets | | $2,792,093,108 |
| Net Assets consist of: | | |
| Paid in capital | | $2,791,148,562 |
| Undistributed net investment income | | 1,935,492 |
| Accumulated undistributed net realized gain (loss) on investments | | (17,444,854) |
| Net unrealized appreciation (depreciation) on investments | | 16,453,908 |
| Net Assets | | $2,792,093,108 |
| Calculation of Maximum Offering Price | | |
| Class A: | | |
| Net Asset Value and redemption price per share ($289,757,718 ÷ 25,119,074 shares) | | $11.54 |
| Maximum offering price per share (100/97.25 of $11.54) | | $11.87 |
| Class M: | | |
| Net Asset Value and redemption price per share ($174,571,257 ÷ 15,124,494 shares) | | $11.54 |
| Maximum offering price per share (100/97.25 of $11.54) | | $11.87 |
| Class C: | | |
| Net Asset Value and offering price per share ($79,249,293 ÷ 6,885,641 shares)(a) | | $11.51 |
| Fidelity Limited Term Bond Fund: | | |
| Net Asset Value, offering price and redemption price per share ($1,643,205,079 ÷ 142,084,843 shares) | | $11.56 |
| Class I: | | |
| Net Asset Value, offering price and redemption price per share ($605,309,761 ÷ 52,329,828 shares) | | $11.57 |
(a) Redemption price per share is equal to net asset value less any applicable contingent deferred sales charge.
See accompanying notes which are an integral part of the financial statements.
Statement of Operations
| | | Year ended August 31, 2017 |
| Investment Income | | |
| Interest | | $56,654,548 |
| Income from Fidelity Central Funds | | 1,258,335 |
| Total income | | 57,912,883 |
| Expenses | | |
| Management fee | $8,175,760 | |
| Transfer agent fees | 3,289,885 | |
| Distribution and service plan fees | 2,181,145 | |
| Fund wide operations fee | 1,079,770 | |
| Independent trustees' fees and expenses | 10,317 | |
| Miscellaneous | 8,442 | |
| Total expenses before reductions | 14,745,319 | |
| Expense reductions | (1,967) | 14,743,352 |
| Net investment income (loss) | | 43,169,531 |
| Realized and Unrealized Gain (Loss) | | |
| Net realized gain (loss) on: | | |
| Investment securities: | | |
| Unaffiliated issuers | 244,677 | |
| Fidelity Central Funds | 16,186 | |
| Swaps | 11 | |
| Capital gain distributions from Fidelity Central Funds | 48,996 | |
| Total net realized gain (loss) | | 309,870 |
| Change in net unrealized appreciation (depreciation) on: | | |
| Investment securities: | | |
| Unaffiliated issuers | (8,466,960) | |
| Fidelity Central Funds | 274,077 | |
| Swaps | 6 | |
| Total change in net unrealized appreciation (depreciation) | | (8,192,877) |
| Net gain (loss) | | (7,883,007) |
| Net increase (decrease) in net assets resulting from operations | | $35,286,524 |
See accompanying notes which are an integral part of the financial statements.
Statement of Changes in Net Assets
| | Year ended August 31, 2017 | Year ended August 31, 2016 |
| Increase (Decrease) in Net Assets | | |
| Operations | | |
| Net investment income (loss) | $43,169,531 | $34,135,463 |
| Net realized gain (loss) | 309,870 | 1,996,257 |
| Change in net unrealized appreciation (depreciation) | (8,192,877) | 23,804,916 |
| Net increase (decrease) in net assets resulting from operations | 35,286,524 | 59,936,636 |
| Distributions to shareholders from net investment income | (41,051,469) | (32,385,208) |
| Share transactions - net increase (decrease) | 292,353,532 | 747,404,314 |
| Total increase (decrease) in net assets | 286,588,587 | 774,955,742 |
| Net Assets | | |
| Beginning of period | 2,505,504,521 | 1,730,548,779 |
| End of period | $2,792,093,108 | $2,505,504,521 |
| Other Information | | |
| Undistributed net investment income end of period | $1,935,492 | $1,452,233 |
See accompanying notes which are an integral part of the financial statements.
Financial Highlights — Fidelity Advisor Limited Term Bond Fund Class A
| Years ended August 31, | 2017 | 2016 | 2015 | 2014 | 2013 |
| Selected Per–Share Data | | | | | |
| Net asset value, beginning of period | $11.56 | $11.42 | $11.52 | $11.33 | $11.69 |
| Income from Investment Operations | | | | | |
| Net investment income (loss)A | .165 | .179 | .170 | .232 | .243 |
| Net realized and unrealized gain (loss) | (.030) | .132 | (.111) | .160 | (.384) |
| Total from investment operations | .135 | .311 | .059 | .392 | (.141) |
| Distributions from net investment income | (.155) | (.171) | (.159) | (.202) | (.219) |
| Total distributions | (.155) | (.171) | (.159) | (.202) | (.219) |
| Net asset value, end of period | $11.54 | $11.56 | $11.42 | $11.52 | $11.33 |
| Total ReturnB,C | 1.18% | 2.75% | .51% | 3.48% | (1.24)% |
| Ratios to Average Net AssetsD,E | | | | | |
| Expenses before reductions | .76% | .76% | .76% | .79% | .82% |
| Expenses net of fee waivers, if any | .76% | .76% | .76% | .79% | .82% |
| Expenses net of all reductions | .76% | .76% | .76% | .79% | .82% |
| Net investment income (loss) | 1.43% | 1.56% | 1.48% | 2.02% | 2.09% |
| Supplemental Data | | | | | |
| Net assets, end of period (000 omitted) | $289,758 | $362,481 | $304,040 | $215,800 | $155,980 |
| Portfolio turnover rateF | 39% | 50% | 44% | 94% | 112% |
A Calculated based on average shares outstanding during the period.
B Total returns would have been lower if certain expenses had not been reduced during the applicable periods shown.
C Total returns do not include the effect of the sales charges.
D Fees and expenses of any underlying Fidelity Central Funds are not included in the Fund's expense ratio. The Fund indirectly bears its proportionate share of the expenses of any underlying Fidelity Central Funds. Based on their most recent shareholder report date, the expenses of any underlying non-money market Fidelity Central Funds were less than .005%.
E Expense ratios reflect operating expenses of the class. Expenses before reductions do not reflect amounts reimbursed by the investment adviser or reductions from expense offset arrangements and do not represent the amount paid by the class during periods when reimbursements or reductions occur. Expenses net of fee waivers reflect expenses after reimbursement by the investment adviser but prior to reductions from expense offset arrangements. Expenses net of all reductions represent the net expenses paid by the class.
F Amount does not include the portfolio activity of any underlying Fidelity Central Funds.
See accompanying notes which are an integral part of the financial statements.
Financial Highlights — Fidelity Advisor Limited Term Bond Fund Class M
| Years ended August 31, | 2017 | 2016 | 2015 | 2014 | 2013 |
| Selected Per–Share Data | | | | | |
| Net asset value, beginning of period | $11.57 | $11.42 | $11.53 | $11.34 | $11.70 |
| Income from Investment Operations | | | | | |
| Net investment income (loss)A | .164 | .178 | .170 | .234 | .246 |
| Net realized and unrealized gain (loss) | (.040) | .142 | (.121) | .161 | (.384) |
| Total from investment operations | .124 | .320 | .049 | .395 | (.138) |
| Distributions from net investment income | (.154) | (.170) | (.159) | (.205) | (.222) |
| Total distributions | (.154) | (.170) | (.159) | (.205) | (.222) |
| Net asset value, end of period | $11.54 | $11.57 | $11.42 | $11.53 | $11.34 |
| Total ReturnB,C | 1.09% | 2.83% | .42% | 3.50% | (1.21)% |
| Ratios to Average Net AssetsD,E | | | | | |
| Expenses before reductions | .76% | .76% | .76% | .77% | .80% |
| Expenses net of fee waivers, if any | .76% | .76% | .76% | .77% | .80% |
| Expenses net of all reductions | .76% | .76% | .76% | .77% | .80% |
| Net investment income (loss) | 1.42% | 1.56% | 1.48% | 2.04% | 2.11% |
| Supplemental Data | | | | | |
| Net assets, end of period (000 omitted) | $174,571 | $191,505 | $193,612 | $198,510 | $210,150 |
| Portfolio turnover rateF | 39% | 50% | 44% | 94% | 112% |
A Calculated based on average shares outstanding during the period.
B Total returns would have been lower if certain expenses had not been reduced during the applicable periods shown.
C Total returns do not include the effect of the sales charges.
D Fees and expenses of any underlying Fidelity Central Funds are not included in the Fund's expense ratio. The Fund indirectly bears its proportionate share of the expenses of any underlying Fidelity Central Funds. Based on their most recent shareholder report date, the expenses of any underlying non-money market Fidelity Central Funds were less than .005%.
E Expense ratios reflect operating expenses of the class. Expenses before reductions do not reflect amounts reimbursed by the investment adviser or reductions from expense offset arrangements and do not represent the amount paid by the class during periods when reimbursements or reductions occur. Expenses net of fee waivers reflect expenses after reimbursement by the investment adviser but prior to reductions from expense offset arrangements. Expenses net of all reductions represent the net expenses paid by the class.
F Amount does not include the portfolio activity of any underlying Fidelity Central Funds.
See accompanying notes which are an integral part of the financial statements.
Financial Highlights — Fidelity Advisor Limited Term Bond Fund Class C
| Years ended August 31, | 2017 | 2016 | 2015 | 2014 | 2013 |
| Selected Per–Share Data | | | | | |
| Net asset value, beginning of period | $11.54 | $11.39 | $11.50 | $11.31 | $11.67 |
| Income from Investment Operations | | | | | |
| Net investment income (loss)A | .075 | .090 | .081 | .143 | .155 |
| Net realized and unrealized gain (loss) | (.039) | .142 | (.121) | .162 | (.384) |
| Total from investment operations | .036 | .232 | (.040) | .305 | (.229) |
| Distributions from net investment income | (.066) | (.082) | (.070) | (.115) | (.131) |
| Total distributions | (.066) | (.082) | (.070) | (.115) | (.131) |
| Net asset value, end of period | $11.51 | $11.54 | $11.39 | $11.50 | $11.31 |
| Total ReturnB,C | .32% | 2.05% | (.35)% | 2.70% | (1.98)% |
| Ratios to Average Net AssetsD,E | | | | | |
| Expenses before reductions | 1.53% | 1.53% | 1.54% | 1.56% | 1.58% |
| Expenses net of fee waivers, if any | 1.53% | 1.53% | 1.54% | 1.56% | 1.58% |
| Expenses net of all reductions | 1.53% | 1.53% | 1.54% | 1.56% | 1.58% |
| Net investment income (loss) | .66% | .79% | .71% | 1.25% | 1.34% |
| Supplemental Data | | | | | |
| Net assets, end of period (000 omitted) | $79,249 | $97,987 | $81,929 | $64,333 | $53,096 |
| Portfolio turnover rateF | 39% | 50% | 44% | 94% | 112% |
A Calculated based on average shares outstanding during the period.
B Total returns would have been lower if certain expenses had not been reduced during the applicable periods shown.
C Total returns do not include the effect of the contingent deferred sales charge.
D Fees and expenses of any underlying Fidelity Central Funds are not included in the Fund's expense ratio. The Fund indirectly bears its proportionate share of the expenses of any underlying Fidelity Central Funds. Based on their most recent shareholder report date, the expenses of any underlying non-money market Fidelity Central Funds were less than .005%.
E Expense ratios reflect operating expenses of the class. Expenses before reductions do not reflect amounts reimbursed by the investment adviser or reductions from expense offset arrangements and do not represent the amount paid by the class during periods when reimbursements or reductions occur. Expenses net of fee waivers reflect expenses after reimbursement by the investment adviser but prior to reductions from expense offset arrangements. Expenses net of all reductions represent the net expenses paid by the class.
F Amount does not include the portfolio activity of any underlying Fidelity Central Funds.
See accompanying notes which are an integral part of the financial statements.
Financial Highlights — Fidelity Limited Term Bond Fund
| Years ended August 31, | 2017 | 2016 | 2015 | 2014 A |
| Selected Per–Share Data | | | | |
| Net asset value, beginning of period | $11.59 | $11.45 | $11.55 | $11.50 |
| Income from Investment Operations | | | | |
| Net investment income (loss)B | .200 | .214 | .205 | .209 |
| Net realized and unrealized gain (loss) | (.039) | .133 | (.110) | .038 |
| Total from investment operations | .161 | .347 | .095 | .247 |
| Distributions from net investment income | (.191) | (.207) | (.195) | (.197) |
| Total distributions | (.191) | (.207) | (.195) | (.197) |
| Net asset value, end of period | $11.56 | $11.59 | $11.45 | $11.55 |
| Total ReturnC,D | 1.40% | 3.06% | .83% | 2.17% |
| Ratios to Average Net AssetsE,F | | | | |
| Expenses before reductions | .45% | .45% | .45% | .46%G |
| Expenses net of fee waivers, if any | .45% | .45% | .45% | .46%G |
| Expenses net of all reductions | .45% | .45% | .45% | .46%G |
| Net investment income (loss) | 1.74% | 1.87% | 1.79% | 2.22%G |
| Supplemental Data | | | | |
| Net assets, end of period (000 omitted) | $1,643,205 | $1,315,947 | $758,240 | $147,629 |
| Portfolio turnover rateH | 39% | 50% | 44% | 94% |
A For the period November 1, 2013 (commencement of sale of shares) to August 31, 2014.
B Calculated based on average shares outstanding during the period.
C Total returns for periods of less than one year are not annualized.
D Total returns would have been lower if certain expenses had not been reduced during the applicable periods shown.
E Fees and expenses of any underlying Fidelity Central Funds are not included in the Fund's expense ratio. The Fund indirectly bears its proportionate share of the expenses of any underlying Fidelity Central Funds. Based on their most recent shareholder report date, the expenses of any underlying non-money market Fidelity Central Funds were less than .005%.
F Expense ratios reflect operating expenses of the class. Expenses before reductions do not reflect amounts reimbursed by the investment adviser or reductions from expense offset arrangements and do not represent the amount paid by the class during periods when reimbursements or reductions occur. Expense ratios before reductions for start-up periods may not be representative of longer-term operating periods. Expenses net of fee waivers reflect expenses after reimbursement by the investment adviser but prior to reductions from expense offset arrangements. Expenses net of all reductions represent the net expenses paid by the class.
G Annualized
H Amount does not include the portfolio activity of any underlying Fidelity Central Funds.
See accompanying notes which are an integral part of the financial statements.
Financial Highlights — Fidelity Advisor Limited Term Bond Fund Class I
| Years ended August 31, | 2017 | 2016 | 2015 | 2014 | 2013 |
| Selected Per–Share Data | | | | | |
| Net asset value, beginning of period | $11.60 | $11.45 | $11.55 | $11.36 | $11.72 |
| Income from Investment Operations | | | | | |
| Net investment income (loss)A | .194 | .209 | .200 | .262 | .273 |
| Net realized and unrealized gain (loss) | (.039) | .142 | (.111) | .161 | (.385) |
| Total from investment operations | .155 | .351 | .089 | .423 | (.112) |
| Distributions from net investment income | (.185) | (.201) | (.189) | (.233) | (.248) |
| Total distributions | (.185) | (.201) | (.189) | (.233) | (.248) |
| Net asset value, end of period | $11.57 | $11.60 | $11.45 | $11.55 | $11.36 |
| Total ReturnB | 1.36% | 3.10% | .78% | 3.74% | (.99)% |
| Ratios to Average Net AssetsC,D | | | | | |
| Expenses before reductions | .50% | .50% | .50% | .53% | .57% |
| Expenses net of fee waivers, if any | .50% | .50% | .50% | .53% | .57% |
| Expenses net of all reductions | .50% | .50% | .50% | .53% | .57% |
| Net investment income (loss) | 1.69% | 1.82% | 1.74% | 2.28% | 2.34% |
| Supplemental Data | | | | | |
| Net assets, end of period (000 omitted) | $605,310 | $537,585 | $391,808 | $174,568 | $84,843 |
| Portfolio turnover rateE | 39% | 50% | 44% | 94% | 112% |
A Calculated based on average shares outstanding during the period.
B Total returns would have been lower if certain expenses had not been reduced during the applicable periods shown.
C Fees and expenses of any underlying Fidelity Central Funds are not included in the Fund's expense ratio. The Fund indirectly bears its proportionate share of the expenses of any underlying Fidelity Central Funds. Based on their most recent shareholder report date, the expenses of any underlying non-money market Fidelity Central Funds were less than .005%.
D Expense ratios reflect operating expenses of the class. Expenses before reductions do not reflect amounts reimbursed by the investment adviser or reductions from expense offset arrangements and do not represent the amount paid by the class during periods when reimbursements or reductions occur. Expenses net of fee waivers reflect expenses after reimbursement by the investment adviser but prior to reductions from expense offset arrangements. Expenses net of all reductions represent the net expenses paid by the class.
E Amount does not include the portfolio activity of any underlying Fidelity Central Funds.
See accompanying notes which are an integral part of the financial statements.
Notes to Financial Statements
For the period ended August 31, 2017
1. Organization.
Fidelity Advisor Limited Term Bond Fund (the Fund) is a fund of Fidelity Advisor Series II (the Trust) and is authorized to issue an unlimited number of shares. The Trust is registered under the Investment Company Act of 1940, as amended (the 1940 Act), as an open-end management investment company organized as a Massachusetts business trust. The Fund offers Class A, Class M (formerly Class T), Class C, Fidelity Limited Term Bond and Class I shares, each of which has equal rights as to assets and voting privileges. Each class has exclusive voting rights with respect to matters that affect that class.
After the close of business on June 24, 2016, all outstanding Class B shares were converted to Class A shares. All prior fiscal period dollar and share amounts for Class B presented in the Notes to Financial Statements are for the period September 1, 2015 through June 24, 2016.
2. Investments in Fidelity Central Funds.
The Fund invests in Fidelity Central Funds, which are open-end investment companies generally available only to other investment companies and accounts managed by the investment adviser and its affiliates. The Fund's Schedule of Investments lists each of the Fidelity Central Funds held as of period end, if any, as an investment of the Fund, but does not include the underlying holdings of each Fidelity Central Fund. As an Investing Fund, the Fund indirectly bears its proportionate share of the expenses of the underlying Fidelity Central Funds.
Based on its investment objective, each Fidelity Central Fund may invest or participate in various investment vehicles or strategies that are similar to those of the Fund. These strategies are consistent with the investment objectives of the Fund and may involve certain economic risks which may cause a decline in value of each of the Fidelity Central Funds and thus a decline in the value of the Fund. The Money Market Central Funds seek preservation of capital and current income and are managed by Fidelity Investments Money Management, Inc. (FIMM), an affiliate of the investment adviser. Annualized expenses of the Money Market Central Funds as of their most recent shareholder report date are less than .005%. The following summarizes the Fund's investment in each non-money market Fidelity Central Fund.
| Fidelity Central Fund | Investment Manager | Investment Objective | Investment Practices | Expense Ratio(a) |
| Fidelity Specialized High Income Central Fund | FMR Co., Inc. (FMRC)FMRC | Seeks a high level of current income by normally investing in income-producing debt securities, with an emphasis on lower-quality debt securities. | Loans & Direct Debt Instruments
Restricted Securities | .005% |
(a) Expenses expressed as a percentage of average net assets and are as of each underlying Central Fund's most recent annual or semi-annual shareholder report.
An unaudited holdings listing for the Fund, which presents direct holdings as well as the pro-rata share of any securities and other investments held indirectly through its investment in underlying non-money market Fidelity Central Funds, is available at fidelity.com and/or institutional.fidelity.com, as applicable. A complete unaudited list of holdings for each Fidelity Central Fund is available upon request or at the Securities and Exchange Commission (the SEC) website at www.sec.gov. In addition, the financial statements of the Fidelity Central Funds which contain the significant accounting policies (including investment valuation policies) of those funds, which are not covered by the Fund's Report of Independent Registered Public Accounting Firm, are available on the SEC website or upon request.
3. Significant Accounting Policies.
The Fund is an investment company and applies the accounting and reporting guidance of the Financial Accounting Standards Board (FASB) Accounting Standards Codification Topic 946 Financial Services – Investments Companies. The financial statements have been prepared in conformity with accounting principles generally accepted in the United States of America (GAAP), which require management to make certain estimates and assumptions at the date of the financial statements. Actual results could differ from those estimates. Subsequent events, if any, through the date that the financial statements were issued have been evaluated in the preparation of the financial statements. The following summarizes the significant accounting policies of the Fund:
Investment Valuation. Investments are valued as of 4:00 p.m. Eastern time on the last calendar day of the period. The Board of Trustees (the Board) has delegated the day to day responsibility for the valuation of the Fund's investments to the Fair Value Committee (the Committee) established by the Fund's investment adviser. In accordance with valuation policies and procedures approved by the Board, the Fund attempts to obtain prices from one or more third party pricing vendors or brokers to value its investments. When current market prices, quotations or currency exchange rates are not readily available or reliable, investments will be fair valued in good faith by the Committee, in accordance with procedures adopted by the Board. Factors used in determining fair value vary by investment type and may include market or investment specific events, changes in interest rates and credit quality. The frequency with which these procedures are used cannot be predicted and they may be utilized to a significant extent. The Committee oversees the Fund's valuation policies and procedures and reports to the Board on the Committee's activities and fair value determinations. The Board monitors the appropriateness of the procedures used in valuing the Fund's investments and ratifies the fair value determinations of the Committee.
The Fund categorizes the inputs to valuation techniques used to value its investments into a disclosure hierarchy consisting of three levels as shown below:
- Level 1 – quoted prices in active markets for identical investments
- Level 2 – other significant observable inputs (including quoted prices for similar investments, interest rates, prepayment speeds, etc.)
- Level 3 – unobservable inputs (including the Fund's own assumptions based on the best information available)
Valuation techniques used to value the Fund's investments by major category are as follows:
Debt securities, including restricted securities, are valued based on evaluated prices received from third party pricing vendors or from brokers who make markets in such securities. Corporate bonds, bank notes, municipal securities, U.S. government and government agency obligations and commercial paper are valued by pricing vendors who utilize matrix pricing which considers yield or price of bonds of comparable quality, coupon, maturity and type or by broker-supplied prices. Asset backed securities, collateralized mortgage obligations, commercial mortgage securities, and U.S. government agency mortgage securities are valued by pricing vendors who utilize matrix pricing which considers prepayment speed assumptions, attributes of the collateral, yield or price of bonds of comparable quality, coupon, maturity and type or by broker-supplied prices. When independent prices are unavailable or unreliable, debt securities may be valued utilizing pricing methodologies which consider similar factors that would be used by third party pricing vendors. Debt securities are generally categorized as Level 2 in the hierarchy but may be Level 3 depending on the circumstances.
Investments in open-end mutual funds, including the Fidelity Central Funds, are valued at their closing net asset value (NAV) each business day and are categorized as Level 1 in the hierarchy.
Changes in valuation techniques may result in transfers in or out of an assigned level within the disclosure hierarchy. The aggregate value of investments by input level as of August 31, 2017 is included at the end of the Fund's Schedule of Investments.
Investment Transactions and Income. For financial reporting purposes, the Fund's investment holdings and NAV include trades executed through the end of the last business day of the period. The NAV per share for processing shareholder transactions is calculated as of the close of business of the New York Stock Exchange (NYSE), normally 4:00 p.m. Eastern time and includes trades executed through the end of the prior business day. Gains and losses on securities sold are determined on the basis of identified cost and may include proceeds received from litigation. Income and capital gain distributions from Fidelity Central Funds, if any, are recorded on the ex-dividend date. Interest income is accrued as earned and includes coupon interest and amortization of premium and accretion of discount on debt securities as applicable. Debt obligations may be placed on non-accrual status and related interest income may be reduced by ceasing current accruals and writing off interest receivables when the collection of all or a portion of interest has become doubtful based on consistently applied procedures. A debt obligation is removed from non-accrual status when the issuer resumes interest payments or when collectability of interest is reasonably assured.
Class Allocations and Expenses. Investment income, realized and unrealized capital gains and losses, common expenses of the Fund, and certain fund-level expense reductions, if any, are allocated daily on a pro-rata basis to each class based on the relative net assets of each class to the total net assets of the Fund. Each class differs with respect to transfer agent and distribution and service plan fees incurred. Certain expense reductions may also differ by class. For the reporting period, the allocated portion of income and expenses to each class as a percent of its average net assets may vary due to the timing of recording these transactions in relation to fluctuating net assets of the classes. Expenses directly attributable to a fund are charged to that fund. Expenses attributable to more than one fund are allocated among the respective funds on the basis of relative net assets or other appropriate methods. Expense estimates are accrued in the period to which they relate and adjustments are made when actual amounts are known.
Income Tax Information and Distributions to Shareholders. Each year, the Fund intends to qualify as a regulated investment company under Subchapter M of the Internal Revenue Code, including distributing substantially all of its taxable income and realized gains. As a result, no provision for U.S. Federal income taxes is required. As of August 31, 2017, the Fund did not have any unrecognized tax benefits in the financial statements; nor is the Fund aware of any tax positions for which it is reasonably possible that the total amounts of unrecognized tax benefits will significantly change in the next twelve months. The Fund files a U.S. federal tax return, in addition to state and local tax returns as required. The Fund's federal income tax returns are subject to examination by the Internal Revenue Service (IRS) for a period of three fiscal years after they are filed. State and local tax returns may be subject to examination for an additional fiscal year depending on the jurisdiction.
Dividends are declared and recorded daily and paid monthly from net investment income. Distributions from realized gains, if any, are declared and recorded on the ex-dividend date. Income dividends and capital gain distributions are declared separately for each class. Income and capital gain distributions are determined in accordance with income tax regulations, which may differ from GAAP.
Capital accounts within the financial statements are adjusted for permanent book-tax differences. These adjustments have no impact on net assets or the results of operations. Capital accounts are not adjusted for temporary book-tax differences which will reverse in a subsequent period.
Book-tax differences are primarily due to swaps, market discount, partnerships (including allocations from Fidelity Central Funds), deferred trustees compensation, capital loss carryforwards and losses deferred due to wash sales.
As of period end, the cost and unrealized appreciation (depreciation) in securities, and derivatives if applicable, for federal income tax purposes were as follows:
| Gross unrealized appreciation | $24,122,999 |
| Gross unrealized depreciation | (6,214,607) |
| Net unrealized appreciation (depreciation) | $17,908,392 |
| Tax Cost | $2,778,615,183 |
The tax-based components of distributable earnings as of period end were as follows:
| Capital loss carryforward | $(15,392,575) |
| Net unrealized appreciation (depreciation) on securities and other investments | $17,908,392 |
Capital loss carryforwards are only available to offset future capital gains of the Fund to the extent provided by regulations and may be limited. Under the Regulated Investment Company Modernization Act of 2010 (the Act), the Fund is permitted to carry forward capital losses incurred in taxable years beginning after December 22, 2010 for an unlimited period and such capital losses are required to be used prior to any losses that expire. The capital loss carryforward information presented below, including any applicable limitation, is estimated as of fiscal period end and is subject to adjustment.
| Fiscal year of expiration | |
| 2018 | $(15,392,575) |
The Fund intends to elect to defer to its next fiscal year $1,266,069 of capital losses recognized during the period November 1, 2016 to August 31, 2017.
The tax character of distributions paid was as follows:
| | August 31, 2017 | August 31, 2016 |
| Ordinary Income | $41,051,469 | $ 32,385,208 |
Restricted Securities. The Fund may invest in securities that are subject to legal or contractual restrictions on resale. These securities generally may be resold in transactions exempt from registration or to the public if the securities are registered. Disposal of these securities may involve time-consuming negotiations and expense, and prompt sale at an acceptable price may be difficult. Information regarding restricted securities is included at the end of the Fund's Schedule of Investments.
New Accounting Pronouncement. In March 2017, the Financial Accounting Standards Board (FASB) issued an Accounting Standards Update (ASU), ASU 2017-08, which amends the amortization period for certain callable debt securities that are held at a premium. The amendment requires the premium to be amortized to the earliest call date. The amendments do not require an accounting change for securities held at a discount. The ASU is effective for annual periods beginning after December 15, 2018. Management is currently evaluating the potential impact of these changes to the financial statements.
4. Derivative Instruments.
Risk Exposures and the Use of Derivative Instruments. The Fund's investment objective allows the Fund to enter into various types of derivative contracts, including swaps. Derivatives are investments whose value is primarily derived from underlying assets, indices or reference rates and may be transacted on an exchange or over-the-counter (OTC). Derivatives may involve a future commitment to buy or sell a specified asset based on specified terms, to exchange future cash flows at periodic intervals based on a notional principal amount, or for one party to make one or more payments upon the occurrence of specified events in exchange for periodic payments from the other party.
The Fund used derivatives to increase returns, to gain exposure to certain types of assets and to manage exposure to certain risks as defined below. The success of any strategy involving derivatives depends on analysis of numerous economic factors, and if the strategies for investment do not work as intended, the Fund may not achieve its objectives.
The Fund's use of derivatives increased or decreased its exposure to the following risk:
| Credit Risk | Credit risk relates to the ability of the issuer of a financial instrument to make further principal or interest payments on an obligation or commitment that it has to the Fund.
|
The Fund is also exposed to additional risks from investing in derivatives, such as liquidity risk and counterparty credit risk. Liquidity risk is the risk that the Fund will be unable to close out the derivative in the open market in a timely manner. Counterparty credit risk is the risk that the counterparty will not be able to fulfill its obligation to the Fund. Derivative counterparty credit risk is managed through formal evaluation of the creditworthiness of all potential counterparties. On certain OTC derivatives such as bi-lateral swaps, the Fund attempts to reduce its exposure to counterparty credit risk by entering into an International Swaps and Derivatives Association, Inc. (ISDA) Master Agreement with each of its counterparties. The ISDA Master Agreement gives the Fund the right to terminate all transactions traded under such agreement upon the deterioration in the credit quality of the counterparty beyond specified levels. The ISDA Master Agreement gives each party the right, upon an event of default by the other party or a termination of the agreement, to close out all transactions traded under such agreement and to net amounts owed under each transaction to one net payable by one party to the other. To mitigate counterparty credit risk on bi-lateral OTC derivatives, the Fund receives collateral in the form of cash or securities once the Fund's net unrealized appreciation on outstanding derivative contracts under an ISDA Master Agreement exceeds certain applicable thresholds, subject to certain minimum transfer provisions. The collateral received is held in segregated accounts with the Fund's custodian bank in accordance with the collateral agreements entered into between the Fund, the counterparty and the Fund's custodian bank. The Fund could experience delays and costs in gaining access to the collateral even though it is held by the Fund's custodian bank. The Fund's maximum risk of loss from counterparty credit risk related to bi-lateral OTC derivatives is generally the aggregate unrealized appreciation and unpaid counterparty payments in excess of any collateral pledged by the counterparty to the Fund. The Fund may be required to pledge collateral for the benefit of the counterparties on bi-lateral OTC derivatives in an amount not less than each counterparty's unrealized appreciation on outstanding derivative contracts, subject to certain minimum transfer provisions, and any such pledged collateral is identified in the Schedule of Investments.
Investing in derivatives may involve greater risks than investing in the underlying assets directly and, to varying degrees, may involve risk of loss in excess of any initial investment and collateral received and amounts recognized in the Statement of Assets and Liabilities. In addition, there may be the risk that the change in value of the derivative contract does not correspond to the change in value of the underlying instrument.
Net Realized Gain (Loss) and Change in Net Unrealized Appreciation (Depreciation) on Derivatives. The table below, which reflects the impacts of derivatives on the financial performance of the Fund, summarizes the net realized gain (loss) and change in net unrealized appreciation (depreciation) for derivatives during the period as presented in the Statement of Operations.
| Primary Risk Exposure / Derivative Type | Net Realized Gain (Loss) | Change in Net Unrealized Appreciation (Depreciation) |
| Credit Risk | | |
| Swaps | $ 11 | $ 6 |
A summary of the value of derivatives by primary risk exposure as of period end, if any, is included at the end of the Schedule of Investments.
Swaps. A swap is a contract between two parties to exchange future cash flows at periodic intervals based on a notional principal amount. A bi-lateral OTC swap is a transaction between a fund and a dealer counterparty where cash flows are exchanged between the two parties for the life of the swap.
Bi-lateral OTC swaps are marked-to-market daily and changes in value are reflected in the Statement of Assets and Liabilities in the bi-lateral OTC swaps at value line items. Any upfront premiums paid or received upon entering a bi-lateral OTC swap to compensate for differences between stated terms of the swap and prevailing market conditions (e.g. credit spreads, interest rates or other factors) are recorded in net unrealized appreciation (depreciation) in the Statement of Assets and Liabilities and amortized to realized gain or (loss) ratably over the term of the swap. Any unamortized upfront premiums are presented in the Schedule of Investments.
Payments are exchanged at specified intervals, accrued daily commencing with the effective date of the contract and recorded as realized gain or (loss). Some swaps may be terminated prior to the effective date and realize a gain or loss upon termination. The net realized gain (loss) and change in net unrealized appreciation (depreciation) on swaps during the period is included in the Statement of Operations.
Any open swaps at period end are included in the Schedule of Investments under the caption "Swaps".
Credit Default Swaps. Credit default swaps enable the Fund to buy or sell protection against specified credit events on a single-name issuer or a traded credit index. Under the terms of a credit default swap the buyer of protection (buyer) receives credit protection in exchange for making periodic payments to the seller of protection (seller) based on a fixed percentage applied to a notional principal amount. In return for these payments, the seller will be required to make a payment upon the occurrence of one or more specified credit events. The Fund enters into credit default swaps as a seller to gain credit exposure to an issuer and/or as a buyer to obtain a measure of protection against defaults of an issuer. Periodic payments are made over the life of the contract by the buyer provided that no credit event occurs.
For credit default swaps on most corporate and sovereign issuers, credit events include bankruptcy, failure to pay or repudiation/moratorium. For credit default swaps on corporate or sovereign issuers, the obligation that may be put to the seller is not limited to the specific reference obligation described in the Schedule of Investments. For credit default swaps on asset-backed securities, a credit event may be triggered by events such as failure to pay principal, maturity extension, rating downgrade or write-down. For credit default swaps on asset-backed securities, the reference obligation described represents the security that may be put to the seller. For credit default swaps on a traded credit index, a specified credit event may affect all or individual underlying securities included in the index.
As a seller, if an underlying credit event occurs, the Fund will pay a net settlement amount of cash equal to the notional amount of the swap less the recovery value of the reference obligation or underlying securities comprising an index. Only in the event of the industry's inability to value the underlying asset will the Fund be required to take delivery of the reference obligation or underlying securities comprising an index and pay an amount equal to the notional amount of the swap.
As a buyer, if an underlying credit event occurs, the Fund will receive a net settlement amount of cash equal to the notional amount of the swap less the recovery value of the reference obligation or underlying securities comprising an index. Only in the event of the industry's inability to value the underlying asset will the Fund be required to deliver the reference obligation or underlying securities comprising an index in exchange for payment of an amount equal to the notional amount of the swap.
Typically, the value of each credit default swap and credit rating disclosed for each reference obligation in the Schedule of Investments, where the Fund is the seller, can be used as measures of the current payment/performance risk of the swap. As the value of the swap changes as a positive or negative percentage of the total notional amount, the payment/performance risk may decrease or increase, respectively. In addition to these measures, the investment adviser monitors a variety of factors including cash flow assumptions, market activity and market sentiment as part of its ongoing process of assessing payment/performance risk.
5. Purchases and Sales of Investments.
Purchases and sales of securities (including the Fixed-Income Central Funds), other than short-term securities and U.S. government securities, aggregated $862,506,867 and $540,558,726, respectively.
6. Fees and Other Transactions with Affiliates.
Management Fee. Fidelity Management & Research Company (the investment adviser) and its affiliates provide the Fund with investment management related services for which the Fund pays a monthly management fee. The management fee is the sum of an individual fund fee rate that is based on an annual rate of .20% of the Fund's average net assets and an annualized group fee rate that averaged .11% during the period. The group fee rate is based upon the average net assets of all the mutual funds advised by the investment adviser, including any mutual funds previously advised by the investment adviser that are currently advised by Fidelity SelectCo, LLC, an affiliate of the investment adviser. The group fee rate decreases as assets under management increase and increases as assets under management decrease. For the reporting period, the total annual management fee rate was .31% of the Fund's average net assets.
Distribution and Service Plan Fees. In accordance with Rule 12b-1 of the 1940 Act, the Fund has adopted separate Distribution and Service Plans for each class of shares. Certain classes pay Fidelity Distributors Corporation (FDC), an affiliate of the investment adviser, separate Distribution and Service Fees, each of which is based on an annual percentage of each class' average net assets. In addition, FDC may pay financial intermediaries for selling shares of the Fund and providing shareholder support services. For the period, the Distribution and Service Fee rates, total fees and amounts retained by FDC were as follows:
| | Distribution
Fee | Service
Fee | Total Fees | Retained
by FDC |
| Class A | -% | .25% | $844,078 | $112,558 |
| Class M | -% | .25% | 453,835 | 4,307 |
| Class C | .75% | .25% | 883,232 | 113,295 |
| | | | $2,181,145 | $230,160 |
Sales Load. FDC may receive a front-end sales charge of up to 2.75% for selling Class A shares and Class M shares, some of which is paid to financial intermediaries for selling shares of the Fund. Depending on the holding period, FDC may receive contingent deferred sales charges levied on Class A, Class M and Class C redemptions. The deferred sales charges are 1.00% for Class C shares, .75% or .50% for certain purchases of Class A shares and .25% for certain purchases of Class M shares.
For the period, sales charge amounts retained by FDC were as follows:
| | Retained
by FDC |
| Class A | $39,039 |
| Class M | 4,107 |
| Class C(a) | 19,188 |
| | $62,334 |
(a) When Class C shares are initially sold, FDC pays commissions from its own resources to financial intermediaries through which the sales are made.
Transfer Agent Fees. Fidelity Investments Institutional Operations Company, Inc., (FIIOC), an affiliate of the investment adviser, is the transfer, dividend disbursing and shareholder servicing agent for each class of the Fund. FIIOC receives account fees and asset-based fees that vary according to the account size and type of account of the shareholders of each respective class of the Fund, with the exception of Fidelity Limited Term Bond. FIIOC receives an asset-based fee of .10% of Fidelity Limited Term Bond's average net assets. FIIOC pays for typesetting, printing and mailing of shareholder reports, except proxy statements. For the period, transfer agent fees for each class were as follows:
| | Amount | % of
Class-Level Average
Net Assets |
| Class A | $522,406 | .15 |
| Class M | 297,316 | .16 |
| Class C | 159,228 | .18 |
| Fidelity Limited Term Bond Fund | 1,467,302 | .10 |
| Class I | 843,633 | .15 |
| | $3,289,885 | |
Fund Wide Operations Fee. Pursuant to the Fund Wide Operations and Expense Agreement (FWOE), the investment adviser has agreed to provide for fund level expenses (which do not include transfer agent, Rule 12b-1 fees, compensation of the independent Trustees, interest (including commitment fees), taxes or extraordinary expenses, if any) in return for a FWOE fee equal to .35% of the Fund's average net assets less the total amount of the management fee. The FWOE paid by the Fund is reduced by an amount equal to the fees and expenses paid to the independent Trustees. For the period, the FWOE fee was equivalent to an annual rate of .04% of average net assets.
Interfund Trades. The Fund may purchase from or sell securities to other Fidelity Funds under procedures adopted by the Board. The procedures have been designed to ensure these interfund trades are executed in accordance with Rule 17a-7 of the 1940 Act. Interfund trades are included within the respective purchases and sales amounts shown in the Purchases and Sales of Investments note.
7. Committed Line of Credit.
The Fund participates with other funds managed by the investment adviser or an affiliate in a $4.25 billion credit facility (the "line of credit") to be utilized for temporary or emergency purposes to fund shareholder redemptions or for other short-term liquidity purposes. The Fund has agreed to pay commitment fees on its pro-rata portion of the line of credit, which amounted to $8,442 and is reflected in Miscellaneous expenses on the Statement of Operations. During the period, the Fund did not borrow on this line of credit.
8. Expense Reductions.
Through arrangements with the Fund's custodian, credits realized as a result of certain uninvested cash balances were used to reduce the Fund's expenses. During the period, these credits reduced the Fund's expenses by $1,967.
9. Distributions to Shareholders.
Distributions to shareholders of each class were as follows:
| | Year ended
August 31, 2017 | Year ended
August 31, 2016 |
| From net investment income | | |
| Class A | $4,518,379 | $4,761,029 |
| Class M | 2,427,595 | 2,871,639 |
| Class B | – | 5,842 |
| Class C | 500,470 | 692,331 |
| Fidelity Limited Term Bond Fund | 24,371,965 | 16,082,729 |
| Class I | 9,233,060 | 7,971,638 |
| Total | $41,051,469 | $32,385,208 |
10. Share Transactions.
Share transactions for each class were as follows and may contain automatic conversions between classes or exchanges between affiliated funds:
| | Shares | Shares | Dollars | Dollars |
| | Year ended August 31, 2017 | Year ended August 31, 2016 | Year ended August 31, 2017 | Year ended August 31, 2016 |
| Class A | | | | |
| Shares sold | 15,817,734 | 20,292,208 | $181,623,365 | $232,299,567 |
| Reinvestment of distributions | 371,201 | 383,701 | 4,263,466 | 4,391,933 |
| Shares redeemed | (22,416,990) | (15,960,237) | (257,141,286) | (182,641,693) |
| Net increase (decrease) | (6,228,055) | 4,715,672 | $(71,254,455) | $54,049,807 |
| Class M | | | | |
| Shares sold | 3,595,932 | 5,184,484 | $41,318,598 | $59,323,000 |
| Reinvestment of distributions | 197,203 | 235,748 | 2,265,769 | 2,698,835 |
| Shares redeemed | (5,220,343) | (5,817,689) | (59,946,959) | (66,587,159) |
| Net increase (decrease) | (1,427,208) | (397,457) | $(16,362,592) | $(4,565,324) |
| Class B | | | | |
| Shares sold | – | 32,756 | $– | $373,130 |
| Reinvestment of distributions | – | 438 | – | 4,985 |
| Shares redeemed | – | (113,795) | – | (1,305,693) |
| Net increase (decrease) | – | (80,601) | $– | $(927,578) |
| Class C | | | | |
| Shares sold | 1,854,442 | 5,293,797 | $21,247,507 | $60,296,153 |
| Reinvestment of distributions | 39,929 | 53,649 | 457,654 | 611,667 |
| Shares redeemed | (3,501,926) | (4,047,030) | (40,064,795) | (46,268,973) |
| Net increase (decrease) | (1,607,555) | 1,300,416 | $(18,359,634) | $14,638,847 |
| Fidelity Limited Term Bond Fund | | | | |
| Shares sold | 81,352,366 | 83,235,883 | $936,348,816 | $957,055,992 |
| Reinvestment of distributions | 1,936,026 | 1,273,968 | 22,295,140 | 14,633,176 |
| Shares redeemed | (54,717,281) | (37,243,869) | (628,932,829) | (427,177,020) |
| Net increase (decrease) | 28,571,111 | 47,265,982 | $329,711,127 | $544,512,148 |
| Class I | | | | |
| Shares sold | 27,667,723 | 29,985,672 | $318,213,399 | $344,469,999 |
| Reinvestment of distributions | 667,292 | 549,729 | 7,686,267 | 6,312,028 |
| Shares redeemed | (22,368,346) | (18,397,774) | (257,280,580) | (211,085,613) |
| Net increase (decrease) | 5,966,669 | 12,137,627 | $68,619,086 | $139,696,414 |
11. Other.
The Fund's organizational documents provide former and current trustees and officers with a limited indemnification against liabilities arising in connection with the performance of their duties to the Fund. In the normal course of business, the Fund may also enter into contracts that provide general indemnifications. The Fund's maximum exposure under these arrangements is unknown as this would be dependent on future claims that may be made against the Fund. The risk of material loss from such claims is considered remote.
12. Credit Risk.
The Fund invests a portion of its assets in structured securities of issuers backed by commercial and residential mortgage loans, credit card receivables and automotive loans. The value and related income of these securities is sensitive to changes in economic conditions, including delinquencies and/or defaults.
Report of Independent Registered Public Accounting Firm
To the Trustees of Fidelity Advisor Series II and Shareholders of Fidelity Advisor Limited Term Bond Fund:
In our opinion, the accompanying statement of assets and liabilities, including the schedule of investments, and the related statements of operations and of changes in net assets and the financial highlights present fairly, in all material respects, the financial position of Fidelity Advisor Limited Term Bond Fund (a fund of Fidelity Advisor Series II) as of August 31, 2017, the results of its operations for the year then ended, the changes in its net assets for each of the two years in the period then ended and the financial highlights for each of the five years in the period ended, in conformity with accounting principles generally accepted in the United States of America. These financial statements and financial highlights (hereafter referred to as “financial statements”) are the responsibility of the Fidelity Advisor Limited Term Bond Fund’s management. Our responsibility is to express an opinion on these financial statements based on our audits. We conducted our audits of these financial statements in accordance with the standards of the Public Company Accounting Oversight Board (United States). Those standards require that we plan and perform the audit to obtain reasonable assurance about whether the financial statements are free of material misstatement. An audit includes examining, on a test basis, evidence supporting the amounts and disclosures in the financial statements, assessing the accounting principles used and significant estimates made by management, and evaluating the overall financial statement presentation. Our procedures included confirmation of securities owned as of August 31, 2017 by correspondence with the custodian and brokers; when replies were not received from brokers, we performed other auditing procedures. We believe that our audits provide a reasonable basis for our opinion.
PricewaterhouseCoopers LLP
Boston, Massachusetts
October 17, 2017
Trustees and Officers
The Trustees, Members of the Advisory Board (if any), and officers of the trust and fund, as applicable, are listed below. The Board of Trustees governs the fund and is responsible for protecting the interests of shareholders. The Trustees are experienced executives who meet periodically throughout the year to oversee the fund's activities, review contractual arrangements with companies that provide services to the fund, oversee management of the risks associated with such activities and contractual arrangements, and review the fund's performance. Each of the Trustees oversees 246 funds.
The Trustees hold office without limit in time except that (a) any Trustee may resign; (b) any Trustee may be removed by written instrument, signed by at least two-thirds of the number of Trustees prior to such removal; (c) any Trustee who requests to be retired or who has become incapacitated by illness or injury may be retired by written instrument signed by a majority of the other Trustees; and (d) any Trustee may be removed at any special meeting of shareholders by a two-thirds vote of the outstanding voting securities of the trust. Each Trustee who is not an interested person (as defined in the 1940 Act) of the trust and the fund is referred to herein as an Independent Trustee. Each Independent Trustee shall retire not later than the last day of the calendar year in which his or her 75th birthday occurs. The Independent Trustees may waive this mandatory retirement age policy with respect to individual Trustees. Officers and Advisory Board Members hold office without limit in time, except that any officer or Advisory Board Member may resign or may be removed by a vote of a majority of the Trustees at any regular meeting or any special meeting of the Trustees. Except as indicated, each individual has held the office shown or other offices in the same company for the past five years.
The fund’s Statement of Additional Information (SAI) includes more information about the Trustees. To request a free copy, call Fidelity at 1-877-208-0098.
Experience, Skills, Attributes, and Qualifications of the Trustees. The Governance and Nominating Committee has adopted a statement of policy that describes the experience, qualifications, attributes, and skills that are necessary and desirable for potential Independent Trustee candidates (Statement of Policy). The Board believes that each Trustee satisfied at the time he or she was initially elected or appointed a Trustee, and continues to satisfy, the standards contemplated by the Statement of Policy. The Governance and Nominating Committee also engages professional search firms to help identify potential Independent Trustee candidates who have the experience, qualifications, attributes, and skills consistent with the Statement of Policy. From time to time, additional criteria based on the composition and skills of the current Independent Trustees, as well as experience or skills that may be appropriate in light of future changes to board composition, business conditions, and regulatory or other developments, have also been considered by the professional search firms and the Governance and Nominating Committee. In addition, the Board takes into account the Trustees' commitment and participation in Board and committee meetings, as well as their leadership of standing and ad hoc committees throughout their tenure.
In determining that a particular Trustee was and continues to be qualified to serve as a Trustee, the Board has considered a variety of criteria, none of which, in isolation, was controlling. The Board believes that, collectively, the Trustees have balanced and diverse experience, qualifications, attributes, and skills, which allow the Board to operate effectively in governing the fund and protecting the interests of shareholders. Information about the specific experience, skills, attributes, and qualifications of each Trustee, which in each case led to the Board's conclusion that the Trustee should serve (or continue to serve) as a trustee of the fund, is provided below.
Board Structure and Oversight Function. Abigail P. Johnson is an interested person and currently serves as Chairman. The Trustees have determined that an interested Chairman is appropriate and benefits shareholders because an interested Chairman has a personal and professional stake in the quality and continuity of services provided to the fund. Independent Trustees exercise their informed business judgment to appoint an individual of their choosing to serve as Chairman, regardless of whether the Trustee happens to be independent or a member of management. The Independent Trustees have determined that they can act independently and effectively without having an Independent Trustee serve as Chairman and that a key structural component for assuring that they are in a position to do so is for the Independent Trustees to constitute a substantial majority for the Board. The Independent Trustees also regularly meet in executive session. Marie L. Knowles serves as Chairman of the Independent Trustees and as such (i) acts as a liaison between the Independent Trustees and management with respect to matters important to the Independent Trustees and (ii) with management prepares agendas for Board meetings.
Fidelity® funds are overseen by different Boards of Trustees. The fund's Board oversees Fidelity's investment-grade bond, money market, asset allocation and certain equity funds, and other Boards oversee Fidelity's high income, sector and other equity funds. The asset allocation funds may invest in Fidelity® funds that are overseen by such other Boards. The use of separate Boards, each with its own committee structure, allows the Trustees of each group of Fidelity® funds to focus on the unique issues of the funds they oversee, including common research, investment, and operational issues. On occasion, the separate Boards establish joint committees to address issues of overlapping consequences for the Fidelity® funds overseen by each Board.
The Trustees operate using a system of committees to facilitate the timely and efficient consideration of all matters of importance to the Trustees, the fund, and fund shareholders and to facilitate compliance with legal and regulatory requirements and oversight of the fund's activities and associated risks. The Board, acting through its committees, has charged FMR and its affiliates with (i) identifying events or circumstances the occurrence of which could have demonstrably adverse effects on the fund's business and/or reputation; (ii) implementing processes and controls to lessen the possibility that such events or circumstances occur or to mitigate the effects of such events or circumstances if they do occur; and (iii) creating and maintaining a system designed to evaluate continuously business and market conditions in order to facilitate the identification and implementation processes described in (i) and (ii) above. Because the day-to-day operations and activities of the fund are carried out by or through FMR, its affiliates, and other service providers, the fund's exposure to risks is mitigated but not eliminated by the processes overseen by the Trustees. While each of the Board's committees has responsibility for overseeing different aspects of the fund's activities, oversight is exercised primarily through the Operations and Audit Committees. In addition, an ad hoc Board committee of Independent Trustees has worked with FMR to enhance the Board's oversight of investment and financial risks, legal and regulatory risks, technology risks, and operational risks, including the development of additional risk reporting to the Board. Appropriate personnel, including but not limited to the fund's Chief Compliance Officer (CCO), FMR's internal auditor, the independent accountants, the fund's Treasurer and portfolio management personnel, make periodic reports to the Board's committees, as appropriate, including an annual review of Fidelity's risk management program for the Fidelity® funds. The responsibilities of each standing committee, including their oversight responsibilities, are described further under "Standing Committees of the Trustees."
Interested Trustees*:
Correspondence intended for a Trustee who is an interested person may be sent to Fidelity Investments, 245 Summer Street, Boston, Massachusetts 02210.
Name, Year of Birth; Principal Occupations and Other Relevant Experience+
Abigail P. Johnson (1961)
Year of Election or Appointment: 2009
Trustee
Chairman of the Board of Trustees
Ms. Johnson also serves as Trustee of other Fidelity® funds. Ms. Johnson serves as Chairman (2016-present), Chief Executive Officer (2014-present), and Director (2007-present) of FMR LLC (diversified financial services company), President of Fidelity Financial Services (2012-present) and President of Personal, Workplace and Institutional Services (2005-present). Ms. Johnson is Chairman and Director of FMR Co., Inc. (investment adviser firm, 2011-present) and Chairman and Director of FMR (investment adviser firm, 2011-present). Previously, Ms. Johnson served as Vice Chairman (2007-2016) and President (2013-2016) of FMR LLC, President and a Director of FMR (2001-2005), a Trustee of other investment companies advised by FMR, Fidelity Investments Money Management, Inc. (investment adviser firm), and FMR Co., Inc. (2001-2005), Senior Vice President of the Fidelity® funds (2001-2005), and managed a number of Fidelity® funds. Ms. Abigail P. Johnson and Mr. Arthur E. Johnson are not related.
Jennifer Toolin McAuliffe (1959)
Year of Election or Appointment: 2016
Trustee
Ms. McAuliffe also serves as Trustee of other Fidelity® funds. Ms. McAuliffe previously served as a Member of the Advisory Board of certain Fidelity® funds (2016) and as Co-Head of Fixed Income of Fidelity Investments Limited (now known as FIL Limited (FIL)) (diversified financial services company). Earlier roles at FIL included Director of Research for FIL’s credit and quantitative teams in London, Hong Kong and Tokyo. Ms. McAuliffe also was the Director of Research for taxable and municipal bonds at Fidelity Investments Money Management, Inc. Ms. McAuliffe is also a director or trustee of several not-for-profit entities.
* Determined to be an “Interested Trustee” by virtue of, among other things, his or her affiliation with the trust or various entities under common control with FMR.
+ The information includes the Trustee's principal occupation during the last five years and other information relating to the experience, attributes, and skills relevant to the Trustee's qualifications to serve as a Trustee, which led to the conclusion that the Trustee should serve as a Trustee for the fund.
Independent Trustees:
Correspondence intended for an Independent Trustee may be sent to Fidelity Investments, P.O. Box 55235, Boston, Massachusetts 02205-5235.
Name, Year of Birth; Principal Occupations and Other Relevant Experience+
Elizabeth S. Acton (1951)
Year of Election or Appointment: 2016
Trustee
Ms. Acton also serves as Trustee of other Fidelity® funds. Prior to her retirement in April 2012, Ms. Acton was Executive Vice President, Finance (2011-2012), Executive Vice President, Chief Financial Officer (2002-2011), and Treasurer (2004-2005) of Comerica Incorporated (financial services). Prior to joining Comerica, Ms. Acton held a variety of positions at Ford Motor Company (1983-2002), including Vice President and Treasurer (2000-2002) and Executive Vice President and Chief Financial Officer of Ford Motor Credit Company (1998-2000). Ms. Acton currently serves as a member of the Board of Directors and Audit and Finance Committees of Beazer Homes USA, Inc. (homebuilding, 2012-present). Previously, Ms. Acton served as a Member of the Advisory Board of certain Fidelity® funds (2013-2016).
John Engler (1948)
Year of Election or Appointment: 2016
Trustee
Mr. Engler also serves as Trustee of other Fidelity® funds. He serves on the board of directors for Universal Forest Products (manufacturer and distributor of wood and wood-alternative products, 2003-present) and K12 Inc. (technology-based education company, 2012-present). Previously, Mr. Engler served as a Member of the Advisory Board of certain Fidelity® funds (2014-2016), president of the Business Roundtable (2011-2017), a trustee of The Munder Funds (2003-2014), president and CEO of the National Association of Manufacturers (2004-2011), member of the Board of Trustees of the Annie E. Casey Foundation (2004-2015), and as governor of Michigan (1991-2003). He is a past chairman of the National Governors Association.
Albert R. Gamper, Jr. (1942)
Year of Election or Appointment: 2006
Trustee
Mr. Gamper also serves as Trustee of other Fidelity® funds. Prior to his retirement in December 2004, Mr. Gamper served as Chairman of the Board of CIT Group Inc. (commercial finance). During his tenure with CIT Group Inc. Mr. Gamper served in numerous senior management positions, including Chairman (1987-1989; 1999-2001; 2002-2004), Chief Executive Officer (1987-2004), and President (2002-2003). Mr. Gamper currently serves as a member of the Board of Directors of Public Service Enterprise Group (utilities, 2000-present), and Member of the Board of Trustees of Barnabas Health Care System (1997-present). Previously, Mr. Gamper served as Chairman (2012-2015) and Vice Chairman (2011-2012) of the Independent Trustees of certain Fidelity® funds and as Chairman of the Board of Governors, Rutgers University (2004-2007).
Robert F. Gartland (1951)
Year of Election or Appointment: 2010
Trustee
Mr. Gartland also serves as Trustee of other Fidelity® funds. Mr. Gartland is Chairman and an investor in Gartland & Mellina Group Corp. (consulting, 2009-present). Previously, Mr. Gartland served as a partner and investor of Vietnam Partners LLC (investments and consulting, 2008-2011). Prior to his retirement, Mr. Gartland held a variety of positions at Morgan Stanley (financial services, 1979-2007) including Managing Director (1987-2007).
Arthur E. Johnson (1947)
Year of Election or Appointment: 2008
Trustee
Vice Chairman of the Independent Trustees
Mr. Johnson also serves as Trustee of other Fidelity® funds. Mr. Johnson serves as a member of the Board of Directors of Eaton Corporation plc (diversified power management, 2009-present) and Booz Allen Hamilton (management consulting, 2011-present). Prior to his retirement, Mr. Johnson served as Senior Vice President of Corporate Strategic Development of Lockheed Martin Corporation (defense contractor, 1999-2009). He previously served on the Board of Directors of IKON Office Solutions, Inc. (1999-2008), AGL Resources, Inc. (holding company, 2002-2016), and Delta Airlines (2005-2007). Mr. Arthur E. Johnson is not related to Ms. Abigail P. Johnson.
Michael E. Kenneally (1954)
Year of Election or Appointment: 2009
Trustee
Mr. Kenneally also serves as Trustee of other Fidelity® funds. Prior to his retirement, Mr. Kenneally served as Chairman and Global Chief Executive Officer of Credit Suisse Asset Management. Before joining Credit Suisse, he was an Executive Vice President and Chief Investment Officer for Bank of America Corporation. Earlier roles at Bank of America included Director of Research, Senior Portfolio Manager and Research Analyst, and Mr. Kenneally was awarded the Chartered Financial Analyst (CFA) designation in 1991.
Marie L. Knowles (1946)
Year of Election or Appointment: 2001
Trustee
Chairman of the Independent Trustees
Ms. Knowles also serves as Trustee of other Fidelity® funds. Prior to Ms. Knowles' retirement in June 2000, she served as Executive Vice President and Chief Financial Officer of Atlantic Richfield Company (ARCO) (diversified energy, 1996-2000). From 1993 to 1996, she was a Senior Vice President of ARCO and President of ARCO Transportation Company (pipeline and tanker operations). Ms. Knowles currently serves as a Director and Chairman of the Audit Committee of McKesson Corporation (healthcare service, since 2002). Ms. Knowles is a member of the Board of the Santa Catalina Island Company (real estate, 2009-present). Ms. Knowles is a Member of the Investment Company Institute Board of Governors and a Member of the Governing Council of the Independent Directors Council (2014-present). She also serves as a member of the Advisory Board for the School of Engineering of the University of Southern California. Previously, Ms. Knowles served as a Director of Phelps Dodge Corporation (copper mining and manufacturing, 1994-2007), URS Corporation (engineering and construction, 2000-2003) and America West (airline, 1999-2002). Ms. Knowles previously served as Vice Chairman of the Independent Trustees of certain Fidelity® funds (2012-2015).
Mark A. Murray (1954)
Year of Election or Appointment: 2016
Trustee
Mr. Murray also serves as Trustee of other Fidelity® funds. Mr. Murray is Vice Chairman (2013-present) of Meijer, Inc. (regional retail chain). Previously, Mr. Murray served as a Member of the Advisory Board of certain Fidelity® funds (2016) and as Co-Chief Executive Officer (2013-2016) and President (2006-2013) of Meijer, Inc. Mr. Murray serves as a member of the Board of Directors and Nuclear Review and Public Policy and Responsibility Committees of DTE Energy Company (diversified energy company, 2009-present). Mr. Murray also serves as a member of the Board of Directors of Spectrum Health (not-for-profit health system, 2015-present). Mr. Murray previously served as President of Grand Valley State University (2001-2006), Treasurer for the State of Michigan (1999-2001), Vice President of Finance and Administration for Michigan State University (1998-1999), and a member of the Board of Directors and Audit Committee and Chairman of the Nominating and Corporate Governance Committee of Universal Forest Products, Inc. (manufacturer and distributor of wood and wood-alternative products, 2004-2016). Mr. Murray is also a director or trustee of many community and professional organizations.
+ The information includes the Trustee's principal occupation during the last five years and other information relating to the experience, attributes, and skills relevant to the Trustee's qualifications to serve as a Trustee, which led to the conclusion that the Trustee should serve as a Trustee for the fund.
Advisory Board Members and Officers:
Correspondence intended for an officer may be sent to Fidelity Investments, 245 Summer Street, Boston, Massachusetts 02210. Officers appear below in alphabetical order.
Name, Year of Birth; Principal Occupation
Elizabeth Paige Baumann (1968)
Year of Election or Appointment: 2017
Anti-Money Laundering (AML) Officer
Ms. Baumann also serves as AML Officer of other funds. She is Chief AML Officer (2012-present) and Senior Vice President (2014-present) of FMR LLC (diversified financial services company) and is an employee of Fidelity Investments. Previously, Ms. Baumann served as AML Officer of the funds (2012-2016), and Vice President (2007-2014) and Deputy Anti-Money Laundering Officer (2007-2012) of FMR LLC.
Marc R. Bryant (1966)
Year of Election or Appointment: 2015
Secretary and Chief Legal Officer (CLO)
Mr. Bryant also serves as Secretary and CLO of other funds. Mr. Bryant serves as CLO, Secretary, and Senior Vice President of Fidelity Management & Research Company (investment adviser firm, 2015-present) and FMR Co., Inc. (investment adviser firm, 2015-present); Secretary of Fidelity SelectCo, LLC (investment adviser firm, 2015-present) and Fidelity Investments Money Management, Inc. (investment adviser firm, 2015-present); and CLO of Fidelity Management & Research (Hong Kong) Limited and FMR Investment Management (UK) Limited (investment adviser firms, 2015-present) and Fidelity Management & Research (Japan) Limited (investment adviser firm, 2016-present). He is Senior Vice President and Deputy General Counsel of FMR LLC (diversified financial services company). Previously, Mr. Bryant served as Secretary and CLO of Fidelity Rutland Square Trust II (2010-2014) and Assistant Secretary of Fidelity's Fixed Income and Asset Allocation Funds (2013-2015). Prior to joining Fidelity Investments, Mr. Bryant served as a Senior Vice President and the Head of Global Retail Legal for AllianceBernstein L.P. (2006-2010), and as the General Counsel for ProFund Advisors LLC (2001-2006).
Jonathan Davis (1968)
Year of Election or Appointment: 2010
Assistant Treasurer
Mr. Davis also serves as Assistant Treasurer of other funds, and is an employee of Fidelity Investments. Previously, Mr. Davis served as Vice President and Associate General Counsel of FMR LLC (diversified financial services company, 2003-2010).
Adrien E. Deberghes (1967)
Year of Election or Appointment: 2010
Assistant Treasurer
Mr. Deberghes also serves as an officer of other funds. He serves as Executive Vice President of Fidelity Investments Money Management, Inc. (FIMM) (investment adviser firm, 2016-present) and is an employee of Fidelity Investments (2008-present). Prior to joining Fidelity Investments, Mr. Deberghes was Senior Vice President of Mutual Fund Administration at State Street Corporation (2007-2008), Senior Director of Mutual Fund Administration at Investors Bank & Trust (2005-2007), and Director of Finance for Dunkin' Brands (2000-2005). Previously, Mr. Deberghes served in other fund officer roles.
Stephanie J. Dorsey (1969)
Year of Election or Appointment: 2013
President and Treasurer
Ms. Dorsey also serves as an officer of other funds. She is an employee of Fidelity Investments (2008-present) and has served in other fund officer roles. Prior to joining Fidelity Investments, Ms. Dorsey served as Treasurer (2004-2008) of the JPMorgan Mutual Funds and Vice President (2004-2008) of JPMorgan Chase Bank.
Howard J. Galligan III (1966)
Year of Election or Appointment: 2014
Chief Financial Officer
Mr. Galligan also serves as Chief Financial Officer of other funds. Mr. Galligan serves as President of Fidelity Pricing and Cash Management Services (FPCMS) (2014-present) and as a Director of Strategic Advisers, Inc. (investment adviser firm, 2008-present). Previously, Mr. Galligan served as Chief Administrative Officer of Asset Management (2011-2014) and Chief Operating Officer and Senior Vice President of Investment Support for Strategic Advisers, Inc. (2003-2011).
Colm A. Hogan (1973)
Year of Election or Appointment: 2016
Assistant Treasurer
Mr. Hogan also serves as an officer of other funds. Mr. Hogan is an employee of Fidelity Investments (2005-present).
Chris Maher (1972)
Year of Election or Appointment: 2013
Assistant Treasurer
Mr. Maher serves as Assistant Treasurer of other funds. Mr. Maher is Vice President of Valuation Oversight and is an employee of Fidelity Investments. Previously, Mr. Maher served as Vice President of Asset Management Compliance (2013), Vice President of the Program Management Group of FMR (investment adviser firm, 2010-2013), and Vice President of Valuation Oversight (2008-2010).
John B. McGinty, Jr. (1962)
Year of Election or Appointment: 2016
Chief Compliance Officer
Mr. McGinty also serves as Chief Compliance Officer of other funds. Mr. McGinty is Senior Vice President of Asset Management Compliance for Fidelity Investments and is an employee of Fidelity Investments (2016-present). Mr. McGinty previously served as Vice President, Senior Attorney at Eaton Vance Management (investment management firm, 2015-2016), and prior to Eaton Vance as global CCO for all firm operations and registered investment companies at GMO LLC (investment management firm, 2009-2015). Before joining GMO LLC, Mr. McGinty served as Senior Vice President, Deputy General Counsel for Fidelity Investments (2007-2009).
Rieco E. Mello (1969)
Year of Election or Appointment: 2017
Assistant Treasurer
Mr. Mello also serves as Assistant Treasurer of other funds. Mr. Mello is an employee of Fidelity Investments (1995-present).
Jamie Pagliocco (1964)
Year of Election or Appointment: 2017
Vice President
Mr. Pagliocco also serves as Vice President of other funds. Mr. Pagliocco serves as Chief Investment Officer of FMR's Bond Group (2017-present) and is an employee of Fidelity Investments (2001-present).
Jason P. Pogorelec (1975)
Year of Election or Appointment: 2015
Assistant Secretary
Mr. Pogorelec also serves as Assistant Secretary of other funds. Mr. Pogorelec serves as Vice President, Associate General Counsel (2010-present) and is an employee of Fidelity Investments (2006-present).
Nancy D. Prior (1967)
Year of Election or Appointment: 2014
Vice President
Ms. Prior also serves as Vice President of other funds. Ms. Prior serves as a Director of FMR Investment Management (UK) Limited (investment adviser firm, 2015-present), President (2016-present) and Director (2014-present) of Fidelity Investments Money Management, Inc. (FIMM) (investment adviser firm), President, Fixed Income (2014-present), Vice Chairman of FIAM LLC (investment adviser firm, 2014-present), and is an employee of Fidelity Investments (2002-present). Previously, Ms. Prior served as Vice President of Fidelity's Money Market Funds (2012-2014), President, Money Market and Short Duration Bond Group of Fidelity Management & Research (FMR) (investment adviser firm, 2013-2014), President, Money Market Group of FMR (2011-2013), Managing Director of Research (2009-2011), Senior Vice President and Deputy General Counsel (2007-2009), and Assistant Secretary of certain Fidelity® funds (2008-2009).
Stacie M. Smith (1974)
Year of Election or Appointment: 2013
Assistant Treasurer
Ms. Smith also serves as an officer of other funds. She is an employee of Fidelity Investments (2009-present) and has served in other fund officer roles. Prior to joining Fidelity Investments, Ms. Smith served as Senior Audit Manager of Ernst & Young LLP (accounting firm, 1996-2009). Previously, Ms. Smith served as Deputy Treasurer of certain Fidelity® funds (2013-2016).
Marc L. Spector (1972)
Year of Election or Appointment: 2016
Deputy Treasurer
Mr. Spector also serves as an officer of other funds. Mr. Spector is an employee of Fidelity Investments (2016-present). Prior to joining Fidelity Investments, Mr. Spector served as Director at the Siegfried Group (accounting firm, 2013-2016), and prior to Siegfried Group as audit senior manager at Deloitte & Touche (accounting firm, 2005-2013).
Renee Stagnone (1975)
Year of Election or Appointment: 2016
Assistant Treasurer
Ms. Stagnone also serves as an officer of other funds. Ms. Stagnone is an employee of Fidelity Investments (1997-present). Previously, Ms. Stagnone served as Deputy Treasurer of certain Fidelity® funds (2013-2016).
Christine J. Thompson (1958)
Year of Election or Appointment: 2015
Vice President of Fidelity's Bond Funds
Ms. Thompson also serves as Vice President of other funds. Ms. Thompson also serves as Chief Investment Officer of FMR's Bond Group (2010-present) and is an employee of Fidelity Investments (1985-present). Previously, Ms. Thompson served as Vice President of Fidelity's Bond Funds (2010-2012).
Shareholder Expense Example
As a shareholder of the Fund, you incur two types of costs: (1) transaction costs, including sales charges (loads) on purchase payments or redemption proceeds, and (2) ongoing costs, including management fees, distribution and/or service (12b-1) fees and other Fund expenses. This Example is intended to help you understand your ongoing costs (in dollars) of investing in the Fund and to compare these costs with the ongoing costs of investing in other mutual funds.
The Example is based on an investment of $1,000 invested at the beginning of the period and held for the entire period (March 1, 2017 to August 31, 2017).
Actual Expenses
The first line of the accompanying table for each class of the Fund provides information about actual account values and actual expenses. You may use the information in this line, together with the amount you invested, to estimate the expenses that you paid over the period. Simply divide your account value by $1,000.00 (for example, an $8,600 account value divided by $1,000.00 = 8.6), then multiply the result by the number in the first line for a class of the Fund under the heading entitled "Expenses Paid During Period" to estimate the expenses you paid on your account during this period. A small balance maintenance fee of $12.00 that is charged once a year may apply for certain accounts with a value of less than $2,000. This fee is not included in the table below. If it was, the estimate of expenses you paid during the period would be higher, and your ending account value lower, by this amount. In addition, the Fund, as a shareholder in the underlying Fidelity Central Funds, will indirectly bear its pro-rata share of the fees and expenses incurred by the underlying Fidelity Central Funds. These fees and expenses are not included in the Fund's annualized expense ratio used to calculate the expense estimate in the table below.
Hypothetical Example for Comparison Purposes
The second line of the accompanying table for each class of the Fund provides information about hypothetical account values and hypothetical expenses based on a Class' actual expense ratio and an assumed rate of return of 5% per year before expenses, which is not the Class' actual return. The hypothetical account values and expenses may not be used to estimate the actual ending account balance or expenses you paid for the period. You may use this information to compare the ongoing costs of investing in the Fund and other funds. To do so, compare this 5% hypothetical example with the 5% hypothetical examples that appear in the shareholder reports of the other funds. A small balance maintenance fee of $12.00 that is charged once a year may apply for certain accounts with a value of less than $2,000. This fee is not included in the table below. If it was, the estimate of expenses you paid during the period would be higher, and your ending account value lower, by this amount. In addition, the Fund, as a shareholder in the underlying Fidelity Central Funds, will indirectly bear its pro-rata share of the fees and expenses incurred by the underlying Fidelity Central Funds. These fees and expenses are not included in the Fund's annualized expense ratio used to calculate the expense estimate in the table below.
Please note that the expenses shown in the table are meant to highlight your ongoing costs only and do not reflect any transaction costs. Therefore, the second line of the table is useful in comparing ongoing costs only, and will not help you determine the relative total costs of owning different funds. In addition, if these transactional costs were included, your costs would have been higher.
| | Annualized Expense Ratio-A | Beginning
Account Value
March 1, 2017 | Ending
Account Value
August 31, 2017 | Expenses Paid
During Period-B
March 1, 2017
to August 31, 2017 |
| Class A | .75% | | | |
| Actual | | $1,000.00 | $1,014.50 | $3.81 |
| Hypothetical-C | | $1,000.00 | $1,021.42 | $3.82 |
| Class M | .76% | | | |
| Actual | | $1,000.00 | $1,014.40 | $3.86 |
| Hypothetical-C | | $1,000.00 | $1,021.37 | $3.87 |
| Class C | 1.52% | | | |
| Actual | | $1,000.00 | $1,010.60 | $7.70 |
| Hypothetical-C | | $1,000.00 | $1,017.54 | $7.73 |
| Fidelity Limited Term Bond Fund | .45% | | | |
| Actual | | $1,000.00 | $1,015.10 | $2.29 |
| Hypothetical-C | | $1,000.00 | $1,022.94 | $2.29 |
| Class I | .49% | | | |
| Actual | | $1,000.00 | $1,015.80 | $2.49 |
| Hypothetical-C | | $1,000.00 | $1,022.74 | $2.50 |
A Annualized expense ratio reflects expenses net of applicable fee waivers.
B Expenses are equal to each Class' annualized expense ratio, multiplied by the average account value over the period, multiplied by 184/365 (to reflect the one-half year period). The fees and expenses of the underlying Fidelity Central Funds in which the Fund invests are not included in each Class' annualized expense ratio. In addition to the expenses noted above, the Fund also indirectly bears its proportional share of the expenses of the underlying Fidelity Central Funds. Annualized expenses of the underlying non-money market Fidelity Central Funds as of their most recent fiscal half year were less than .005%.
C 5% return per year before expenses
Distributions (Unaudited)
A total of 7.03% of the dividends distributed during the fiscal year was derived from interest on U.S. Government securities which is generally exempt from state income tax.
The fund designates $24,458,129 of distributions paid during the period January 1, 2017 to August 31, 2017 as qualifying to be taxed as interest-related dividends for nonresident alien shareholders.
The fund will notify shareholders in January 2018 of amounts for use in preparing 2017 income tax returns.
LTB-ANN-1017
1.539398.120
Item 2.
Code of Ethics
As of the end of the period, August 31, 2017, Fidelity Advisor Series II (the trust) has adopted a code of ethics, as defined in Item 2 of Form N-CSR, that applies to its President and Treasurer and its Chief Financial Officer. A copy of the code of ethics is filed as an exhibit to this Form N-CSR.
Item 3.
Audit Committee Financial Expert
The Board of Trustees of the trust has determined that Elizabeth S. Acton is an audit committee financial expert, as defined in Item 3 of Form N-CSR. Ms. Acton is independent for purposes of Item 3 of Form N-CSR.
Item 4.
Principal Accountant Fees and Services
Fees and Services
The following table presents fees billed by PricewaterhouseCoopers LLP (“PwC”) in each of the last two fiscal years for services rendered to Fidelity Advisor Limited Term Bond Fund and Fidelity Advisor Mortgage Securities Fund (the “Funds”):
Services Billed by PwC
August 31, 2017 FeesA
| | | | |
| Audit Fees | Audit-Related Fees | Tax Fees | All Other Fees |
Fidelity Advisor Limited Term Bond Fund | $94,000 | $9,000 | $9,200 | $4,400 |
Fidelity Advisor Mortgage Securities Fund | $98,000 | $9,300 | $6,400 | $4,500 |
| | | | |
| Audit Fees | Audit-Related Fees | Tax Fees | All Other Fees |
Fidelity Advisor Limited Term Bond Fund | $95,000 | $7,900 | $9,200 | $3,900 |
Fidelity Advisor Mortgage Securities Fund | $99,000 | $7,900 | $6,400 | $3,900 |
A Amounts may reflect rounding.
B Certain amounts have been reclassified to align with current period presentation.
The following table presents fees billed by PwC that were required to be approved by the Audit Committee for services that relate directly to the operations and financial reporting of the Funds and that are rendered on behalf of Fidelity Management & Research Company (“FMR”) and entities controlling, controlled by, or under common control with
FMR (not including any sub-adviser whose role is primarily portfolio management and is subcontracted with or overseen by another investment adviser) that provide ongoing services to the Funds (“Fund Service Providers”):
Services Billed by PwC
| | |
| August 31, 2017A | August 31, 2016A,B |
Audit-Related Fees | $9,815,000 | $5,530,000 |
Tax Fees | $105,000 | $10,000 |
All Other Fees | $- | $- |
A Amounts may reflect rounding.
B Certain amounts have been reclassified to align with current period presentation.
“Audit-Related Fees” represent fees billed for assurance and related services that are reasonably related to the performance of the fund audit or the review of the fund's financial statements and that are not reported under Audit Fees.
“Tax Fees” represent fees billed for tax compliance, tax advice or tax planning that relate directly to the operations and financial reporting of the fund.
“All Other Fees” represent fees billed for services provided to the fund or Fund Service Provider, a significant portion of which are assurance related, that relate directly to the operations and financial reporting of the fund, excluding those services that are reported under Audit Fees, Audit-Related Fees or Tax Fees.
Assurance services must be performed by an independent public accountant.
* * *
The aggregate non-audit fees billed by PwC for services rendered to the Funds, FMR (not including any sub-adviser whose role is primarily portfolio management and is subcontracted with or overseen by another investment adviser), and any Fund Service Provider for each of the last two fiscal years of the Funds are as follows:
| | |
Billed By | August 31, 2017A | August 31, 2016A,B |
PwC | $13,010,000 | $6,565,000 |
A Amounts may reflect rounding.
B Certain amounts have been reclassified to align with current period presentation.
The trust's Audit Committee has considered non-audit services that were not pre-approved that were provided by PwC to Fund Service Providers to be compatible with maintaining the independence of PwC in their audits of the Funds, taking into account representations from PwC, in accordance with Public Company Accounting Oversight
Board rules, regarding their independence from the Funds and their related entities and FMR’s review of the appropriateness and permissibility under applicable law of such non-audit services prior to their provision to the Fund Service Providers.
Audit Committee Pre-Approval Policies and Procedures
The trust’s Audit Committee must pre-approve all audit and non-audit services provided by a fund’s independent registered public accounting firm relating to the operations or financial reporting of the fund. Prior to the commencement of any audit or non-audit services to a fund, the Audit Committee reviews the services to determine whether they are appropriate and permissible under applicable law.
The Audit Committee has adopted policies and procedures to, among other purposes, provide a framework for the Committee’s consideration of non-audit services by the audit firms that audit the Fidelity funds. The policies and procedures require that any non-audit service provided by a fund audit firm to a Fidelity fund and any non-audit service provided by a fund auditor to a Fund Service Provider that relates directly to the operations and financial reporting of a Fidelity fund (“Covered Service”) are subject to approval by the Audit Committee before such service is provided.
All Covered Services must be approved in advance of provision of the service either: (i) by formal resolution of the Audit Committee, or (ii) by oral or written approval of the service by the Chair of the Audit Committee (or if the Chair is unavailable, such other member of the Audit Committee as may be designated by the Chair to act in the Chair’s absence). The approval contemplated by (ii) above is permitted where the Treasurer determines that action on such an engagement is necessary before the next meeting of the Audit Committee.
Non-audit services provided by a fund audit firm to a Fund Service Provider that do not relate directly to the operations and financial reporting of a Fidelity fund are reported to the Audit Committee on a periodic basis.
Non-Audit Services Approved Pursuant to Rule 2-01(c)(7)(i)(C) and (ii) of Regulation S-X (“De Minimis Exception”)
There were no non-audit services approved or required to be approved by the Audit Committee pursuant to the De Minimis Exception during the Funds’ last two fiscal years relating to services provided to (i) the Funds or (ii) any Fund Service Provider that relate directly to the operations and financial reporting of the Funds.
Item 5.
Audit Committee of Listed Registrants
Not applicable.
Item 6.
Investments
(a)
Not applicable.
(b)
Not applicable
Item 7.
Disclosure of Proxy Voting Policies and Procedures for Closed-End Management Investment Companies
Not applicable.
Item 8.
Portfolio Managers of Closed-End Management Investment Companies
Not applicable.
Item 9.
Purchase of Equity Securities by Closed-End Management Investment Company and Affiliated Purchasers
Not applicable.
Item 10.
Submission of Matters to a Vote of Security Holders
There were no material changes to the procedures by which shareholders may recommend nominees to the trust’s Board of Trustees.
Item 11.
Controls and Procedures
(a)(i) The President and Treasurer and the Chief Financial Officer have concluded that the trust’s disclosure controls and procedures (as defined in Rule 30a-3(c) under the Investment Company Act) provide reasonable assurances that material information relating to the trust is made known to them by the appropriate persons, based on their evaluation of these controls and procedures as of a date within 90 days of the filing date of this report.
(a)(ii) There was no change in the trust’s internal control over financial reporting (as defined in Rule 30a-3(d) under the Investment Company Act) that occurred during the second fiscal quarter of the period covered by this report that has materially affected, or is reasonably likely to materially affect, the trust’s internal control over financial reporting.
Item 12.
Exhibits
| | |
(a) | (1) | Code of Ethics pursuant to Item 2 of Form N-CSR is filed and attached hereto as EX-99.CODE ETH. |
(a) | (2) | Certification pursuant to Rule 30a-2(a) under the Investment Company Act of 1940 (17 CFR 270.30a-2(a)) is filed and attached hereto as Exhibit 99.CERT. |
(a) | (3) | Not applicable. |
(b) | | Certification pursuant to Rule 30a-2(b) under the Investment Company Act of 1940 (17 CFR 270.30a-2(b)) is furnished and attached hereto as Exhibit 99.906CERT. |
SIGNATURES
Pursuant to the requirements of the Securities Exchange Act of 1934 and the Investment Company Act of 1940, the registrant has duly caused this report to be signed on its behalf by the undersigned, thereunto duly authorized.
Fidelity Advisor Series II
| |
By: | /s/ Stephanie J. Dorsey |
| Stephanie J. Dorsey |
| President and Treasurer |
| |
Date: | October 26, 2017 |
Pursuant to the requirements of the Securities Exchange Act of 1934 and the Investment Company Act of 1940, this report has been signed below by the following persons on behalf of the registrant and in the capacities and on the dates indicated.
| |
By: | /s/Stephanie J. Dorsey |
| Stephanie J. Dorsey |
| President and Treasurer |
| |
Date: | October 26, 2017 |
| |
By: | /s/Howard J. Galligan III |
| Howard J. Galligan III |
| Chief Financial Officer |
| |
Date: | October 26, 2017 |