Fidelity Advisor® Municipal Income Fund Class A, Class M (formerly Class T), Class C and Class I
Annual Report October 31, 2017 |
 |
Contents
To view a fund's proxy voting guidelines and proxy voting record for the 12-month period ended June 30, visit http://www.fidelity.com/proxyvotingresults or visit the Securities and Exchange Commission's (SEC) web site at http://www.sec.gov.
You may also call 1-877-208-0098 to request a free copy of the proxy voting guidelines.
Standard & Poor's, S&P and S&P 500 are registered service marks of The McGraw-Hill Companies, Inc. and have been licensed for use by Fidelity Distributors Corporation.
Other third-party marks appearing herein are the property of their respective owners.
All other marks appearing herein are registered or unregistered trademarks or service marks of FMR LLC or an affiliated company. © 2017 FMR LLC. All rights reserved.
This report and the financial statements contained herein are submitted for the general information of the shareholders of the Fund. This report is not authorized for distribution to prospective investors in the Fund unless preceded or accompanied by an effective prospectus.
A fund files its complete schedule of portfolio holdings with the SEC for the first and third quarters of each fiscal year on Form N-Q. Forms N-Q are available on the SEC’s web site at http://www.sec.gov. A fund's Forms N-Q may be reviewed and copied at the SEC’s Public Reference Room in Washington, DC. Information regarding the operation of the SEC's Public Reference Room may be obtained by calling 1-800-SEC-0330.
For a complete list of a fund's portfolio holdings, view the most recent holdings listing, semiannual report, or annual report on Fidelity's web site at http://www.fidelity.com, http://www.institutional.fidelity.com, or http://www.401k.com, as applicable.
NOT FDIC INSURED •MAY LOSE VALUE •NO BANK GUARANTEE
Neither the Fund nor Fidelity Distributors Corporation is a bank.
Performance: The Bottom Line
Average annual total return reflects the change in the value of an investment, assuming reinvestment of distributions from dividend income and capital gains (the profits earned upon the sale of securities that have grown in value, if any) and assuming a constant rate of performance each year. The hypothetical investment and the average annual total returns do not reflect the deduction of taxes that a shareholder would pay on fund distributions or the redemption of fund shares. During periods of reimbursement by Fidelity, a fund’s total return will be greater than it would be had the reimbursement not occurred. How a fund did yesterday is no guarantee of how it will do tomorrow.
Average Annual Total Returns
| For the periods ended October 31, 2017 | Past 1 year | Past 5 years | Past 10 years |
| Class A (incl. 4.00% sales charge) | (2.31)% | 2.19% | 3.85% |
| Class M (incl. 4.00% sales charge) | (2.37)% | 2.22% | 3.86% |
| Class C (incl. contingent deferred sales charge) | (0.05)% | 2.26% | 3.49% |
| Class I | 2.01% | 3.29% | 4.53% |
Class C shares' contingent deferred sales charges included in the past one year, past five years and past ten years total return figures are 1%, 0% and 0%, respectively.
$10,000 Over 10 Years
Let's say hypothetically that $10,000 was invested in Fidelity Advisor® Municipal Income Fund - Class A on October 31, 2007, and the current 4.00% sales charge was paid.
The chart shows how the value of your investment would have changed, and also shows how the Bloomberg Barclays Municipal Bond Index performed over the same period.
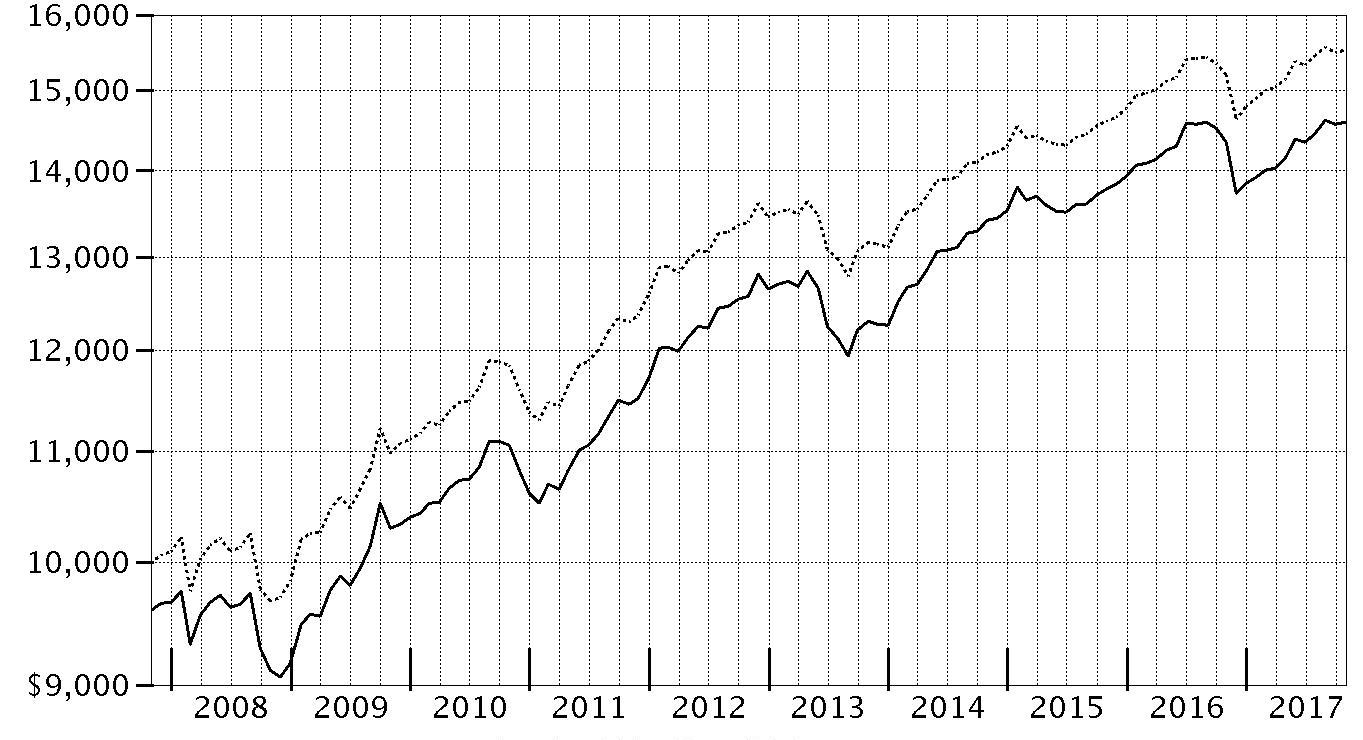
| Period Ending Values |
| $14,593 | Fidelity Advisor® Municipal Income Fund - Class A |
| $15,528 | Bloomberg Barclays Municipal Bond Index |
Management's Discussion of Fund Performance
Market Recap: For the year ending October 31, 2017, tax-exempt municipal bonds advanced modestly, with the Bloomberg Barclays Municipal Bond Index returning 2.19%. The market sold off at the beginning of the period in response to the result of last year’s presidential election. In fact, November 2016 was the worst month for the muni market since 2008. Investors were concerned that then-President-elect Donald Trump’s promises to lower taxes, repeal the Affordable Care Act and increase infrastructure spending could negatively affect market valuations. Adding to the early pessimism, fixed income markets were hurt by investor anticipation of further increases in policy interest rates. However, the muni market subsequently recovered, as it became clear that tax and health care reform, as well as new infrastructure initiatives, would take time to develop and implement. Strong demand, reduced supply and slow but steady economic growth supported the market. There was some differentiation in performance across municipal sectors this period. General obligation bonds overall returned 2.03%, while securities tied to specific revenue streams or projects performed slightly better, up 2.38%. Looking ahead, market volatility is possible as the details of proposed policy changes emerge and the U.S. Federal Reserve reacts to job growth and inflation trends.
Comments from Co-Portfolio Managers Cormac Cullen, Kevin Ramundo and Mark Sommer: For the fiscal year, the fund’s share classes (excluding sales charges, if applicable) posted gains in the range of roughly 1% to 2%, modestly lagging, net of fees, the 2.36% return of the Bloomberg Barclays 3+ Year Municipal Bond Index. We estimate that differences in the way fund holdings are priced and how benchmark holdings are priced modestly detracted from the fund’s relative performance. The fund’s larger-than-benchmark exposure to bonds that were advance refunded contributed versus the index. Overweighting bonds backed by the state of Illinois and related issuers also added value. Similarly, overweighting New Jersey state-appropriated securities helped the relative return. In contrast, the fund’s underweighting in California state-backed bonds, which posted benchmark-beating gains, detracted. In terms of sectors, larger-than-index exposure to airport and hospital bonds worked to the fund’s advantage versus the index.
The views expressed above reflect those of the portfolio manager(s) only through the end of the period as stated on the cover of this report and do not necessarily represent the views of Fidelity or any other person in the Fidelity organization. Any such views are subject to change at any time based upon market or other conditions and Fidelity disclaims any responsibility to update such views. These views may not be relied on as investment advice and, because investment decisions for a Fidelity fund are based on numerous factors, may not be relied on as an indication of trading intent on behalf of any Fidelity fund.
Note to Shareholders: The Board of Trustees unanimously approved a proposal to merge Fidelity Advisor
® Municipal Income Fund into Fidelity
® Municipal Income Fund. The merger is expected to be completed in March 2018, and shareholders of Fidelity Advisor Municipal Income Fund will receive Advisor Class shares of Fidelity Municipal Income Fund.
Investment Summary (Unaudited)
Top Five States as of October 31, 2017
| | % of fund's net assets | % of fund's net assets 6 months ago |
| Illinois | 22.5 | 15.6 |
| Florida | 13.4 | 11.2 |
| Texas | 8.7 | 10.5 |
| California | 8.2 | 9.1 |
| New York | 5.5 | 6.2 |
Top Five Sectors as of October 31, 2017
| | % of fund's net assets | % of fund's net assets 6 months ago |
| General Obligations | 32.8 | 33.0 |
| Transportation | 26.4 | 22.7 |
| Health Care | 16.2 | 14.1 |
| Education | 6.3 | 8.1 |
| Electric Utilities | 5.1 | 5.2 |
Quality Diversification (% of fund's net assets)
| As of October 31, 2017 |
| | AAA | 2.8% |
| | AA,A | 72.5% |
| | BBB | 19.4% |
| | BB and Below | 2.7% |
| | Not Rated | 2.3% |
| | Short-Term Investments and Net Other Assets | 0.3% |

| As of April 30, 2017 |
| | AAA | 6.7% |
| | AA,A | 72.4% |
| | BBB | 16.2% |
| | BB and Below | 0.5% |
| | Not Rated | 2.2% |
| | Short-Term Investments and Net Other Assets | 2.0% |

We have used ratings from Moody's Investors Service, Inc. Where Moody's® ratings are not available, we have used S&P® ratings. All ratings are as of the date indicated and do not reflect subsequent changes.
Investments October 31, 2017
Showing Percentage of Net Assets
| Municipal Bonds - 99.7% | | | |
| | | Principal Amount | Value |
| Alabama - 0.1% | | | |
| Montgomery Med. Clinic Facilities 5% 3/1/33 | | 1,000,000 | 1,102,210 |
| Alaska - 0.3% | | | |
| Alaska Int'l. Arpts. Revs. Series 2016 B, 5% 10/1/35 | | 2,600,000 | 3,009,448 |
| Arizona - 0.9% | | | |
| Arizona Ctfs. of Prtn. Series 2010 A: | | | |
| 5.25% 10/1/26 (FSA Insured) | | $500,000 | $537,405 |
| 5.25% 10/1/28 (FSA Insured) | | 1,600,000 | 1,719,376 |
| Glendale Gen. Oblig. Series 2017, 5% 7/1/28 | | 2,755,000 | 3,350,879 |
| Maricopa County Indl. Dev. Auth. Sr. Living Facilities Series 2016: | | | |
| 5.75% 1/1/36 (a) | | 155,000 | 156,857 |
| 6% 1/1/48 (a) | | 755,000 | 768,228 |
| Maricopa County Poll. Cont. Rev. (Southern California Edison Co. Proj.) Series 2000 A, 5% 6/1/35 | | 700,000 | 755,118 |
| Salt Verde Finl. Corp. Sr. Gas Rev.: | | | |
| Series 2007, 5.5% 12/1/29 | | 1,000,000 | 1,237,990 |
| 5.25% 12/1/22 | | 1,500,000 | 1,726,545 |
| Scottsdale Indl. Dev. Auth. Hosp. Rev. (Scottsdale Healthcare Proj.) Series 2006 C, 5% 9/1/35 (FSA Insured) | | 205,000 | 219,496 |
|
| TOTAL ARIZONA | | | 10,471,894 |
|
| California - 8.2% | | | |
| Bay Area Toll Auth. San Francisco Bay Toll Bridge Rev. Bonds: | | | |
| Series A, 2.95%, tender 4/1/26 (b) | | 1,980,000 | 2,078,465 |
| Series B, 2.85%, tender 4/1/25 (b) | | 1,620,000 | 1,701,000 |
| Series C, 2.1%, tender 4/1/22 (b) | | 1,510,000 | 1,539,672 |
| California Gen. Oblig.: | | | |
| Series 2016, 5% 9/1/29 | | 630,000 | 764,656 |
| Series 2017, 5.25% 3/1/38 (Pre-Refunded to 3/1/18 @ 100) | | 215,000 | 218,049 |
| 5% 8/1/29 | | 1,590,000 | 1,928,352 |
| 5% 9/1/31 | | 1,440,000 | 1,729,944 |
| 5.25% 12/1/33 | | 20,000 | 20,072 |
| 5.25% 4/1/35 | | 2,200,000 | 2,545,950 |
| 5.25% 11/1/40 | | 700,000 | 781,900 |
| 5.5% 8/1/30 | | 2,000,000 | 2,066,500 |
| 5.5% 3/1/40 | | 1,000,000 | 1,096,570 |
| 5.6% 3/1/36 | | 400,000 | 441,104 |
| 6% 4/1/38 | | 5,300,000 | 5,662,520 |
| 6% 11/1/39 | | 9,570,000 | 10,485,849 |
| California Health Facilities Fing. Auth. Rev. (Providence Health and Svcs. Proj.) Series C, 6.5% 10/1/38 (Pre-Refunded to 10/1/18 @ 100) | | 25,000 | 26,259 |
| California Pub. Works Board Lease Rev.: | | | |
| (Coalinga State Hosp. Proj.) Series 2013 E, 5% 6/1/26 | | 2,400,000 | 2,801,832 |
| (Dept. of Forestry & Fire Protection Proj.) Series 2007 E: | | | |
| 5% 11/1/19 | | 1,600,000 | 1,605,424 |
| 5% 11/1/21 | | 1,760,000 | 1,765,931 |
| (Office of Emergency Svcs. Proj.) Series 2007 A, 5% 3/1/22 | | 1,000,000 | 1,003,490 |
| (Various Cap. Projs.): | | | |
| Series 2012 A, 5% 4/1/24 | | 3,190,000 | 3,678,357 |
| Series 2012 G, 5% 11/1/24 | | 650,000 | 761,527 |
| California Statewide Cmntys. Dev. Auth. Series 2016: | | | |
| 3.25% 5/15/31 | | 520,000 | 528,154 |
| 5% 5/15/29 | | 1,250,000 | 1,481,475 |
| 5% 5/15/30 | | 1,000,000 | 1,177,630 |
| Folsom Cordova Union School District No. 4 Series A, 0% 10/1/31 (Nat'l. Pub. Fin. Guarantee Corp. Insured) | | 1,835,000 | 1,181,391 |
| Golden State Tobacco Securitization Corp. Tobacco Settlement Rev. Series 2017 A1: | | | |
| 5% 6/1/21 | | 465,000 | 521,353 |
| 5% 6/1/22 | | 650,000 | 741,052 |
| 5% 6/1/23 | | 745,000 | 861,175 |
| 5% 6/1/24 | | 420,000 | 489,434 |
| Long Beach Unified School District Series 2009, 5.5% 8/1/29 | | 60,000 | 64,479 |
| Los Angeles Dept. Arpt. Rev. Series 2016 B: | | | |
| 5% 5/15/32 (c) | | 1,830,000 | 2,136,800 |
| 5% 5/15/33 (c) | | 1,620,000 | 1,883,574 |
| 5% 5/15/46 (c) | | 6,400,000 | 7,285,248 |
| Los Angeles Muni. Impt. Corp. Lease Rev. Series 2012 C, 5% 3/1/25 | | 1,455,000 | 1,665,087 |
| Madera County Ctfs. of Prtn. (Children's Hosp. Central California Proj.) Series 2010, 5.375% 3/15/36 | | 1,000,000 | 1,071,870 |
| Oakland Gen. Oblig. Series 2012, 5% 1/15/24 | | 2,500,000 | 2,791,700 |
| Poway Unified School District: | | | |
| (District #2007-1 School Facilities Proj.) Series 2008 A, 0% 8/1/32 | | 1,000,000 | 618,920 |
| Series B, 0% 8/1/39 | | 3,700,000 | 1,656,379 |
| Poway Unified School District Pub. Fing. 5% 9/1/24 | | 1,000,000 | 1,164,240 |
| Sacramento City Fing. Auth. Rev. Series A, 0% 12/1/26 (Nat'l. Pub. Fin. Guarantee Corp. Insured) | | 800,000 | 619,264 |
| Sacramento Muni. Util. District Elec. Rev. Series 2012 Y, 5% 8/15/28 | | 2,200,000 | 2,548,766 |
| San Bernardino County Ctfs. of Prtn. (Arrowhead Proj.) Series 2009 A, 5.25% 8/1/26 | | 1,000,000 | 1,067,380 |
| San Diego Convention Ctr. Expansion Series 2012 A, 5% 4/15/24 | | 2,200,000 | 2,549,998 |
| San Diego Unified School District Series 2008 E, 0% 7/1/47 (d) | | 1,300,000 | 884,390 |
| San Francisco City & County Arpts. Commission Int'l. Arpt. Rev. Series 2014 A, 5% 5/1/44 (c) | | 2,200,000 | 2,459,358 |
| San Jose Int'l. Arpt. Rev. Series 2017 A: | | | |
| 5% 3/1/20 (c) | | 2,080,000 | 2,257,570 |
| 5% 3/1/23 (c) | | 1,500,000 | 1,745,385 |
| 5% 3/1/24 (c) | | 1,700,000 | 2,011,780 |
| 5% 3/1/26 (c) | | 1,750,000 | 2,106,300 |
| San Marcos Unified School District Series 2010 B, 0% 8/1/47 | | 8,365,000 | 2,660,237 |
| Union Elementary School District Series A, 0% 9/1/20 (Nat'l. Pub. Fin. Guarantee Corp. Insured) | | 1,000,000 | 961,550 |
| Univ. of California Revs. Series 2017 AV, 5% 5/15/36 | | 675,000 | 804,749 |
| Washington Township Health Care District Gen. Oblig. Series 2013 B, 5.5% 8/1/38 | | 1,000,000 | 1,211,420 |
| Washington Township Health Care District Rev. Series 2010 A, 5.25% 7/1/30 | | 1,100,000 | 1,182,753 |
| West Contra Costa Unified School District Series 2012, 5% 8/1/26 | | 2,000,000 | 2,316,560 |
|
| TOTAL CALIFORNIA | | | 99,410,844 |
|
| Colorado - 1.0% | | | |
| Colorado Health Facilities Auth. (Parkview Med. Ctr., Inc. Proj.) Series 2016: | | | |
| 4% 9/1/36 | | 1,300,000 | 1,345,019 |
| 5% 9/1/46 | | 1,300,000 | 1,439,893 |
| Colorado Health Facilities Auth. Retirement Hsg. Rev. (Liberty Heights Proj.) Series B, 0% 7/15/20 (Escrowed to Maturity) | | 1,200,000 | 1,150,032 |
| Colorado Health Facilities Auth. Rev. (Valley View Hosp. Proj.) Series 2008, 5.75% 5/15/36 | | 2,000,000 | 2,038,660 |
| Colorado Univ. Co. Hosp. Auth. Rev. Bonds: | | | |
| Series 2017C-1, 4%, tender 3/1/20 (b) | | 2,155,000 | 2,259,345 |
| Series 2017C-2, 5%, tender 3/1/22 (b) | | 1,615,000 | 1,814,356 |
| E-470 Pub. Hwy. Auth. Rev.: | | | |
| Series 2000 B, 0% 9/1/20 (Nat'l. Pub. Fin. Guarantee Corp. Insured) | | 1,500,000 | 1,438,275 |
| Series 2010 C, 5.25% 9/1/25 | | 1,000,000 | 1,099,130 |
|
| TOTAL COLORADO | | | 12,584,710 |
|
| Connecticut - 0.3% | | | |
| Connecticut Health & Edl. Facilities Auth. Rev. Series 2016 K, 4% 7/1/46 | | 1,520,000 | 1,509,679 |
| Eastern Connecticut Resources Recovery Auth. Solid Waste Rev. (Wheelabrator Lisbon Proj.) Series A, 5.5% 1/1/20 (c) | | 2,190,000 | 2,224,887 |
|
| TOTAL CONNECTICUT | | | 3,734,566 |
|
| District Of Columbia - 1.5% | | | |
| District of Columbia Gen. Oblig. Series 2017 A: | | | |
| 5% 6/1/33 | | 900,000 | 1,080,432 |
| 5% 6/1/34 | | 1,300,000 | 1,553,318 |
| District of Columbia Rev. Series B, 4.75% 6/1/32 | | 500,000 | 533,755 |
| Metropolitan Washington DC Arpts. Auth. Sys. Rev.: | | | |
| Series 2012 A, 5% 10/1/22 (c) | | 1,450,000 | 1,675,388 |
| Series 2014 A, 5% 10/1/23 (c) | | 1,990,000 | 2,333,514 |
| Series 2017 A: | | | |
| 5% 10/1/28 (c) | | 2,785,000 | 3,395,695 |
| 5% 10/1/29 (c) | | 1,200,000 | 1,452,576 |
| 5% 10/1/30 (c) | | 1,050,000 | 1,263,864 |
| 5% 10/1/31 (c) | | 1,450,000 | 1,735,563 |
| 5% 10/1/42 (c) | | 1,000,000 | 1,155,530 |
| Washington D.C. Metropolitan Transit Auth. Rev. Series 2017 B, 5% 7/1/31 | | 1,875,000 | 2,276,944 |
|
| TOTAL DISTRICT OF COLUMBIA | | | 18,456,579 |
|
| Florida - 13.4% | | | |
| Brevard County School Board Ctfs. of Prtn. Series 2015 C, 5% 7/1/26 | | 750,000 | 897,338 |
| Broward County Arpt. Sys. Rev.: | | | |
| Series 2012 P-1, 5% 10/1/22 (c) | | 965,000 | 1,103,719 |
| Series A: | | | |
| 5% 10/1/23 (c) | | 1,425,000 | 1,654,539 |
| 5% 10/1/28 (c) | | 500,000 | 580,280 |
| 5% 10/1/31 (c) | | 1,000,000 | 1,147,520 |
| 5% 10/1/32 (c) | | 400,000 | 456,884 |
| Broward County School Board Ctfs. of Prtn.: | | | |
| (Broward County School District Proj.) Series 2016 A, 5% 7/1/28 | | 670,000 | 811,350 |
| Series 2012 A, 5% 7/1/24 | | 4,400,000 | 5,050,408 |
| Series 2015 A: | | | |
| 5% 7/1/24 | | 325,000 | 388,450 |
| 5% 7/1/26 | | 1,200,000 | 1,434,804 |
| 5% 7/1/27 | | 1,000,000 | 1,187,920 |
| Series 2015 B, 5% 7/1/24 | | 815,000 | 974,112 |
| Series 2016, 5% 7/1/32 | | 430,000 | 504,480 |
| Collier County Indl. Dev. Auth. Healthcare Facilities Rev. (NCH Healthcare Sys. Proj.) Series 2011, 6.25% 10/1/39 | | 2,560,000 | 2,881,536 |
| Duval County School Board Ctfs. of Prtn.: | | | |
| Series 2015 B, 5% 7/1/28 | | 2,060,000 | 2,439,164 |
| Series 2016 A: | | | |
| 5% 7/1/31 | | 1,305,000 | 1,523,366 |
| 5% 7/1/33 | | 1,340,000 | 1,546,400 |
| Florida Board of Ed. Pub. Ed. Cap. Outlay Series A, 5.5% 6/1/38 (Pre-Refunded to 6/1/18 @ 101) | | 400,000 | 414,128 |
| Florida Mid-Bay Bridge Auth. Rev.: | | | |
| Series 2015 A, 5% 10/1/35 | | 1,000,000 | 1,120,490 |
| Series 2015 C, 5% 10/1/40 | | 1,000,000 | 1,096,360 |
| Florida Muni. Pwr. Agcy. Rev.: | | | |
| (Requirements Pwr. Supply Proj.) Series 2016 A: | | | |
| 5% 10/1/30 | | 350,000 | 417,673 |
| 5% 10/1/31 | | 380,000 | 452,135 |
| (St. Lucie Proj.) Series 2012 A, 5% 10/1/26 | | 600,000 | 679,926 |
| Gainesville Utils. Sys. Rev. Series 2017 A, 5% 10/1/30 (e) | | 3,190,000 | 3,885,516 |
| Greater Orlando Aviation Auth. Arpt. Facilities Rev.: | | | |
| Series 2016: | | | |
| 5% 10/1/20 (c) | | 200,000 | 220,486 |
| 5% 10/1/21 (c) | | 1,545,000 | 1,747,905 |
| 5% 10/1/22 (c) | | 1,000,000 | 1,151,870 |
| 5% 10/1/23 (c) | | 2,545,000 | 2,990,528 |
| Series 2017 A: | | | |
| 5% 10/1/23 (c) | | 1,600,000 | 1,880,096 |
| 5% 10/1/30 (c) | | 1,270,000 | 1,516,456 |
| 5% 10/1/31 (c) | | 1,720,000 | 2,042,276 |
| 5% 10/1/32 (c) | | 1,345,000 | 1,588,082 |
| 5% 10/1/33 (c) | | 1,995,000 | 2,342,409 |
| 5% 10/1/34 (c) | | 1,195,000 | 1,396,381 |
| 5% 10/1/35 (c) | | 1,580,000 | 1,840,368 |
| 5% 10/1/36 (c) | | 1,495,000 | 1,735,815 |
| 5% 10/1/37 (c) | | 1,245,000 | 1,442,084 |
| Halifax Hosp. Med. Ctr. Rev.: | | | |
| 4% 6/1/27 | | 205,000 | 218,946 |
| 5% 6/1/24 | | 275,000 | 321,560 |
| 5% 6/1/26 | | 250,000 | 293,100 |
| 5% 6/1/46 | | 425,000 | 462,392 |
| Highlands County Health Facilities Auth. Rev. (Adventist Health Sys./Sunbelt, Inc. Prog.) Series 2008 B, 6% 11/15/37 | | 2,000,000 | 2,173,960 |
| Jacksonville Sales Tax Rev. Series 2012, 5% 10/1/25 | | 1,000,000 | 1,145,270 |
| Lake County School Board Ctfs. of Prtn. Series 2014 A, 5% 6/1/30 (FSA Insured) | | 600,000 | 681,132 |
| Lee County Arpt. Rev. Series 2011 A, 5.375% 10/1/32 (c) | | 1,050,000 | 1,165,994 |
| Miami-Dade County Aviation Rev.: | | | |
| Series 2010 A, 5.375% 10/1/41 | | 1,500,000 | 1,660,110 |
| Series 2010, 5.5% 10/1/30 | | 760,000 | 849,353 |
| Series 2012 A: | | | |
| 5% 10/1/21 (c) | | 1,900,000 | 2,141,794 |
| 5% 10/1/22 (c) | | 1,000,000 | 1,146,280 |
| 5% 10/1/31 (c) | | 1,500,000 | 1,673,100 |
| Series 2014 A: | | | |
| 5% 10/1/28 (c) | | 1,000,000 | 1,161,940 |
| 5% 10/1/36 (c) | | 3,100,000 | 3,490,631 |
| 5% 10/1/37 | | 1,825,000 | 2,076,978 |
| Series 2015 A, 5% 10/1/35 (c) | | 2,100,000 | 2,370,228 |
| Miami-Dade County Cap. Asset Acquisition Series 2012 A, 5% 10/1/23 | | 750,000 | 868,493 |
| Miami-Dade County Expressway Auth.: | | | |
| Series 2014 A, 5% 7/1/44 | | 500,000 | 563,190 |
| Series 2014 B, 5% 7/1/28 | | 1,000,000 | 1,167,250 |
| Series A: | | | |
| 5% 7/1/32 | | 4,300,000 | 5,005,157 |
| 5% 7/1/33 | | 3,650,000 | 4,224,291 |
| Miami-Dade County School Board Ctfs. of Prtn.: | | | |
| Series 2015 A: | | | |
| 5% 5/1/27 (FSA Insured) | | 780,000 | 921,913 |
| 5% 5/1/29 | | 4,075,000 | 4,743,341 |
| Series 2015 B: | | | |
| 5% 5/1/27 | | 4,650,000 | 5,496,021 |
| 5% 5/1/28 | | 2,530,000 | 2,959,974 |
| Series 2016 A, 5% 5/1/30 | | 3,620,000 | 4,230,441 |
| Series 2016 B, 5% 8/1/26 | | 1,595,000 | 1,931,593 |
| Miami-Dade County Transit Sales Surtax Rev. Series 2012, 5% 7/1/42 | | 300,000 | 338,736 |
| Miami-Dade County Wtr. & Swr. Rev. Series 2008 A, 5.25% 10/1/22 (FSA Insured) | | 4,000,000 | 4,693,440 |
| North Brevard County Hosp. District Rev. 5.75% 10/1/38 | | 600,000 | 618,432 |
| Orange County Health Facilities Auth. Series 2012 A, 5% 10/1/42 | | 2,350,000 | 2,590,617 |
| Orange County School Board Ctfs. of Prtn.: | | | |
| Series 2015 C, 5% 8/1/30 | | 1,500,000 | 1,764,885 |
| Series 2016 C, 5% 8/1/33 | | 3,770,000 | 4,428,544 |
| Palm Beach County Arpt. Sys. Rev. Series 2016: | | | |
| 5% 10/1/34 (c) | | 4,505,000 | 5,167,055 |
| 5% 10/1/35 (c) | | 4,745,000 | 5,426,429 |
| 5% 10/1/36 (c) | | 4,980,000 | 5,678,594 |
| Palm Beach County Health Facilities Auth. Hosp. Rev. Series 2014: | | | |
| 5% 12/1/23 | | 80,000 | 91,702 |
| 5% 12/1/24 | | 155,000 | 179,891 |
| 5% 12/1/31 | | 500,000 | 554,935 |
| Palm Beach County School Board Ctfs. of Prtn.: | | | |
| Series 2014 B, 5% 8/1/22 | | 2,000,000 | 2,311,600 |
| Series 2015 D: | | | |
| 5% 8/1/28 | | 680,000 | 805,875 |
| 5% 8/1/29 | | 2,330,000 | 2,752,266 |
| 5% 8/1/30 | | 2,405,000 | 2,825,995 |
| 5% 8/1/31 | | 2,415,000 | 2,828,472 |
| South Florida Wtr. Mgmt. District Ctfs. of Prtn. Series 2015: | | | |
| 5% 10/1/27 | | 1,500,000 | 1,799,295 |
| 5% 10/1/29 | | 1,000,000 | 1,183,620 |
| 5% 10/1/32 | | 1,165,000 | 1,359,718 |
| South Lake County Hosp. District (South Lake Hosp., Inc.) Series 2009 A, 6% 4/1/29 | | 1,400,000 | 1,472,632 |
| Tallahassee Health Facilities Rev.: | | | |
| (Tallahassee Memorial Healthcare, Inc. Proj.) Series 2016 A, 5% 12/1/41 | | 1,100,000 | 1,197,460 |
| Series 2015 A, 5% 12/1/40 | | 300,000 | 325,566 |
| Tampa Tax Allocation (H. Lee Moffitt Cancer Ctr. Proj.) Series 2012 A, 5% 9/1/25 | | 410,000 | 467,462 |
| Volusia County School Board Ctfs. of Prtn.: | | | |
| (Florida Master Lease Prog.) Series 2016 A, 5% 8/1/29 (Build America Mutual Assurance Insured) | | 1,000,000 | 1,172,220 |
| (Master Lease Prog.) Series 2014 B, 5% 8/1/26 | | 340,000 | 403,362 |
|
| TOTAL FLORIDA | | | 162,126,489 |
|
| Georgia - 1.4% | | | |
| Bartow County Dev. Auth. Poll. Cont. Rev. Bonds (Georgia Pwr. Co. Plant Bowen Proj.) Series 1997 1, 2.05%, tender 11/19/21 (b) | | 2,000,000 | 1,996,900 |
| Burke County Indl. Dev. Auth. Poll. Cont. Rev. Bonds (Oglethorpe Pwr. Corp. Vogtle Proj.) Series 2013 A, 2.4%, tender 4/1/20 (b) | | 1,120,000 | 1,121,030 |
| Colquitt County Dev. Auth. Rev.: | | | |
| Series A, 0% 12/1/21 (Escrowed to Maturity) | | 1,100,000 | 1,026,993 |
| Series C, 0% 12/1/21 (Escrowed to Maturity) | | 1,800,000 | 1,680,534 |
| DeKalb County Hosp. Auth. Rev. (DeKalb Med. Ctr., Inc. Proj.) Series 2010: | | | |
| 6% 9/1/30 | | 1,400,000 | 1,534,652 |
| 6.125% 9/1/40 | | 2,385,000 | 2,590,420 |
| Private Colleges & Univs. Auth. Rev. (The Savannah College of Art and Design Projs.) Series 2014: | | | |
| 5% 4/1/30 | | 800,000 | 898,432 |
| 5% 4/1/44 | | 3,815,000 | 4,152,513 |
| Washington Wilkes Payroll Dev. Auth. Rev. Series C, 0% 12/1/21 (Escrowed to Maturity) | | 2,310,000 | 2,165,440 |
|
| TOTAL GEORGIA | | | 17,166,914 |
|
| Hawaii - 0.8% | | | |
| Hawaii Arpts. Sys. Rev. Series 2015 A, 5% 7/1/45 (c) | | 5,370,000 | 6,041,519 |
| Hawaii Gen. Oblig. Series 2017 FK, 5% 5/1/33 | | 1,700,000 | 2,047,752 |
| State of Hawaii Dept. of Trans. Series 2013, 5% 8/1/22 (c) | | 1,575,000 | 1,806,383 |
|
| TOTAL HAWAII | | | 9,895,654 |
|
| Idaho - 0.2% | | | |
| Idaho Health Facilities Auth. Rev.: | | | |
| (St. Luke's Health Sys. Proj.) Series 2008 A, 6.75% 11/1/37 | | 1,200,000 | 1,258,740 |
| Series 2015 ID, 5% 12/1/24 | | 1,000,000 | 1,202,670 |
|
| TOTAL IDAHO | | | 2,461,410 |
|
| Illinois - 22.3% | | | |
| Chicago Board of Ed.: | | | |
| Series 1999 A: | | | |
| 0% 12/1/18 (Nat'l. Pub. Fin. Guarantee Corp. Insured) | | 1,000,000 | 974,130 |
| 5.25% 12/1/21 (Nat'l. Pub. Fin. Guarantee Corp. Insured) | | 470,000 | 512,718 |
| Series 2008 C: | | | |
| 5.25% 12/1/23 | | 360,000 | 362,426 |
| 5.25% 12/1/24 | | 245,000 | 246,291 |
| Series 2010 F, 5% 12/1/20 | | 195,000 | 199,627 |
| Series 2011 A: | | | |
| 5% 12/1/41 | | 2,190,000 | 2,162,735 |
| 5.25% 12/1/41 | | 605,000 | 593,620 |
| Series 2012 A, 5% 12/1/42 | | 1,415,000 | 1,397,015 |
| Series 2015 C, 5.25% 12/1/39 | | 300,000 | 294,981 |
| Series 2016 B, 6.5% 12/1/46 | | 150,000 | 170,238 |
| Series 2017 A, 7% 12/1/46 (a) | | 600,000 | 710,820 |
| Chicago Midway Arpt. Rev.: | | | |
| Series 2014 A, 5% 1/1/28 (c) | | 4,200,000 | 4,793,628 |
| Series 2016 A, 5% 1/1/28 (c) | | 2,000,000 | 2,330,160 |
| Series 2016 B: | | | |
| 5% 1/1/36 | | 400,000 | 456,908 |
| 5% 1/1/37 | | 500,000 | 570,750 |
| 5% 1/1/46 | | 2,175,000 | 2,444,265 |
| Chicago O'Hare Int'l. Arpt. Rev.: | | | |
| Series 2011 C, 6.5% 1/1/41 (Pre-Refunded to 1/1/21 @ 100) | | 2,335,000 | 2,708,530 |
| Series 2012 A, 5% 1/1/22 (c) | | 1,140,000 | 1,286,661 |
| Series 2013 D, 5% 1/1/27 | | 2,200,000 | 2,505,998 |
| Series 2015 A: | | | |
| 5% 1/1/25 (c) | | 905,000 | 1,066,162 |
| 5% 1/1/31 (c) | | 1,040,000 | 1,180,317 |
| 5% 1/1/32 (c) | | 2,100,000 | 2,373,189 |
| Series 2015 C, 5% 1/1/24 (c) | | 1,435,000 | 1,667,183 |
| Series 2016 B, 5% 1/1/34 | | 1,200,000 | 1,382,916 |
| Series 2016 C: | | | |
| 5% 1/1/33 | | 540,000 | 624,440 |
| 5% 1/1/34 | | 625,000 | 720,269 |
| Series 2016 G, 5% 1/1/42 (c) | | 700,000 | 787,521 |
| Series 2017 B: | | | |
| 5% 1/1/35 | | 400,000 | 465,060 |
| 5% 1/1/37 | | 1,515,000 | 1,752,188 |
| Series 2017 C: | | | |
| 5% 1/1/30 | | 600,000 | 715,104 |
| 5% 1/1/31 | | 600,000 | 710,814 |
| 5% 1/1/32 | | 650,000 | 766,006 |
| Series 2017 D: | | | |
| 5% 1/1/28 (c) | | 595,000 | 701,713 |
| 5% 1/1/29 (c) | | 1,075,000 | 1,260,212 |
| 5% 1/1/34 (c) | | 800,000 | 914,920 |
| 5% 1/1/35 (c) | | 600,000 | 684,144 |
| 5% 1/1/36 (c) | | 730,000 | 829,893 |
| 5% 1/1/37 (c) | | 400,000 | 455,076 |
| Chicago Transit Auth.: | | | |
| Series 2014, 5.25% 12/1/49 | | 5,000,000 | 5,531,200 |
| Series 2017, 5% 12/1/46 | | 700,000 | 756,714 |
| Chicago Transit Auth. Cap. Grant Receipts Rev. Series 2017: | | | |
| 5% 6/1/22 | | 405,000 | 459,630 |
| 5% 6/1/23 | | 360,000 | 414,698 |
| 5% 6/1/24 | | 305,000 | 354,614 |
| 5% 6/1/25 | | 305,000 | 356,206 |
| 5% 6/1/26 | | 245,000 | 287,691 |
| Cmnty. College District #525 Gen. Oblig.: | | | |
| 5.75% 6/1/28 | | 625,000 | 640,988 |
| 5.75% 6/1/28 (Pre-Refunded to 6/1/18 @ 100) | | 375,000 | 385,061 |
| Cook County Forest Preservation District Series 2012 C, 5% 12/15/21 | | 1,000,000 | 1,085,410 |
| Cook County Gen. Oblig.: | | | |
| Series 2006 B, 5% 11/15/18 (Nat'l. Pub. Fin. Guarantee Corp. Insured) | | 1,000,000 | 1,003,000 |
| Series 2010 A: | | | |
| 5.25% 11/15/22 | | 690,000 | 752,328 |
| 5.25% 11/15/33 | | 3,250,000 | 3,490,988 |
| Series 2012 C, 5% 11/15/24 | | 1,700,000 | 1,899,920 |
| Series 2016 A: | | | |
| 5% 11/15/27 | | 1,560,000 | 1,821,456 |
| 5% 11/15/28 | | 1,900,000 | 2,203,696 |
| 5% 11/15/30 | | 1,000,000 | 1,147,030 |
| Grundy & Will Cntys Cmnty. Series 2017, 5% 2/1/25 | | 900,000 | 1,066,608 |
| Illinois Fin. Auth. Rev.: | | | |
| ( Bradley Univ. Proj.) Series 2017 C, 5% 8/1/30 | | 620,000 | 718,419 |
| (Central DuPage Health Proj.) Series 2009 B, 5.375% 11/1/39 | | 1,200,000 | 1,288,068 |
| (Depaul Univ. Proj.) Series 2016 A: | | | |
| 5% 10/1/30 | | 1,000,000 | 1,178,510 |
| 5% 10/1/35 | | 2,000,000 | 2,300,660 |
| (Palos Cmnty. Hosp. Proj.) Series 2010 C: | | | |
| 5.375% 5/15/25 | | 5,000,000 | 5,429,450 |
| 5.375% 5/15/30 | | 1,110,000 | 1,187,833 |
| (Presence Health Proj.) Series 2016 C: | | | |
| 5% 2/15/25 | | 230,000 | 264,604 |
| 5% 2/15/26 | | 600,000 | 694,584 |
| 5% 2/15/29 | | 605,000 | 693,953 |
| (Provena Health Proj.) Series 2010 A, 6% 5/1/28 (Pre-Refunded to 5/1/20 @ 100) | | 2,700,000 | 3,013,659 |
| (Rosalind Franklin Unversity Research Bldg. Proj.) Series 2017 C, 5% 8/1/46 | | 195,000 | 213,114 |
| (Rush Univ. Med. Ctr. Proj.) Series 2015 A, 5% 11/15/34 | | 500,000 | 558,510 |
| (Silver Cross Hosp. and Med. Ctr. Proj.) Series 2008 A, 5.5% 8/15/30 | | 350,000 | 357,749 |
| Bonds (Ascension Health Cr. Group Proj.) Series 2012 E2, 1.75%, tender 4/1/21 (b) | | 440,000 | 442,605 |
| Series 2010 A: | | | |
| 5.5% 8/15/24 (Pre-Refunded to 2/15/20 @ 100) | | 545,000 | 597,293 |
| 5.75% 8/15/29 (Pre-Refunded to 2/15/20 @ 100) | | 360,000 | 396,562 |
| Series 2011 L, 5% 12/1/22 | | 395,000 | 450,865 |
| Series 2012 A: | | | |
| 5% 5/15/20 | | 500,000 | 542,450 |
| 5% 5/15/23 | | 300,000 | 339,420 |
| Series 2012: | | | |
| 4% 9/1/32 | | 1,315,000 | 1,306,216 |
| 5% 9/1/32 | | 1,900,000 | 2,022,094 |
| 5% 9/1/38 | | 2,300,000 | 2,409,250 |
| 5% 11/15/43 | | 820,000 | 867,913 |
| Series 2013: | | | |
| 5% 11/15/24 | | 500,000 | 566,730 |
| 5% 11/15/27 | | 100,000 | 111,552 |
| 5% 5/15/43 | | 1,700,000 | 1,800,946 |
| Series 2014, 5% 8/1/38 | | 2,400,000 | 2,705,736 |
| Series 2015 A: | | | |
| 5% 11/15/21 | | 600,000 | 676,866 |
| 5% 11/15/45 | | 455,000 | 496,833 |
| Series 2015 C: | | | |
| 5% 8/15/35 | | 1,035,000 | 1,125,977 |
| 5% 8/15/44 | | 5,600,000 | 5,994,352 |
| Series 2016 A: | | | |
| 5% 8/15/22 | | 1,000,000 | 1,105,890 |
| 5% 7/1/24 | | 1,395,000 | 1,633,015 |
| 5% 7/1/31 | | 510,000 | 579,890 |
| 5% 7/1/33 | | 650,000 | 731,725 |
| 5% 7/1/34 | | 400,000 | 448,688 |
| 5% 8/15/35 | | 510,000 | 554,135 |
| 5% 8/15/36 | | 2,035,000 | 2,204,780 |
| 5.25% 8/15/31 | | 600,000 | 677,346 |
| Series 2016 B, 5% 8/15/32 | | 5,000,000 | 5,727,500 |
| Series 2016 C: | | | |
| 3.75% 2/15/34 | | 290,000 | 286,503 |
| 4% 2/15/36 | | 1,040,000 | 1,065,106 |
| 4% 2/15/41 | | 1,105,000 | 1,120,360 |
| 5% 2/15/24 | | 135,000 | 153,757 |
| 5% 2/15/30 | | 3,000,000 | 3,415,200 |
| 5% 2/15/31 | | 400,000 | 451,940 |
| 5% 2/15/41 | | 1,800,000 | 1,986,858 |
| Series 2017 A, 5% 8/1/42 | | 175,000 | 192,561 |
| Series 2017: | | | |
| 5% 1/1/22 | | 1,705,000 | 1,944,979 |
| 5% 7/1/29 | | 2,330,000 | 2,806,462 |
| 5% 7/1/31 | | 2,080,000 | 2,479,027 |
| 5% 7/1/33 | | 1,360,000 | 1,605,126 |
| 5% 7/1/34 | | 1,120,000 | 1,314,936 |
| 5% 7/1/35 | | 1,000,000 | 1,173,170 |
| Illinois Gen. Oblig.: | | | |
| Series 2006: | | | |
| 5% 1/1/19 | | 1,000,000 | 1,036,900 |
| 5.5% 1/1/31 | | 1,400,000 | 1,574,958 |
| Series 2010: | | | |
| 5% 1/1/18 | | 1,900,000 | 1,910,564 |
| 5% 1/1/21 (FSA Insured) | | 500,000 | 527,515 |
| 5% 1/1/23 (FSA Insured) | | 1,300,000 | 1,367,574 |
| Series 2012 A, 4% 1/1/23 | | 505,000 | 522,008 |
| Series 2012: | | | |
| 5% 8/1/19 | | 465,000 | 490,222 |
| 5% 8/1/21 | | 400,000 | 428,136 |
| 5% 3/1/23 | | 1,000,000 | 1,074,300 |
| 5% 8/1/23 | | 700,000 | 759,129 |
| 5% 3/1/28 | | 220,000 | 231,607 |
| Series 2013: | | | |
| 5% 1/1/22 | | 2,925,000 | 3,051,565 |
| 5.5% 7/1/24 | | 1,000,000 | 1,102,440 |
| 5.5% 7/1/25 | | 975,000 | 1,079,101 |
| Series 2014: | | | |
| 5% 2/1/22 | | 1,060,000 | 1,139,087 |
| 5% 4/1/28 | | 200,000 | 214,954 |
| 5% 5/1/32 | | 500,000 | 531,005 |
| 5.25% 2/1/31 | | 435,000 | 468,256 |
| Series 2016: | | | |
| 5% 11/1/20 | | 935,000 | 995,682 |
| 5% 2/1/23 | | 360,000 | 389,246 |
| 5% 2/1/24 | | 2,005,000 | 2,168,849 |
| 5% 6/1/25 | | 1,515,000 | 1,649,335 |
| 5% 11/1/25 | | 600,000 | 653,568 |
| 5% 6/1/26 | | 210,000 | 228,780 |
| 5% 2/1/27 | | 1,490,000 | 1,628,227 |
| 5% 2/1/28 | | 1,200,000 | 1,309,368 |
| 5% 2/1/29 | | 1,125,000 | 1,224,788 |
| Series 2017 D: | | | |
| 5% 11/1/22 (e) | | 4,230,000 | 4,571,869 |
| 5% 11/1/23 (e) | | 4,430,000 | 4,810,626 |
| 5% 11/1/24 (e) | | 6,200,000 | 6,719,560 |
| 5% 11/1/25 (e) | | 6,200,000 | 6,752,544 |
| 5% 11/1/26 (e) | | 4,430,000 | 4,827,725 |
| 5% 2/1/26 | | 415,000 | 447,706 |
| Illinois Health Facilities Auth. Rev. (Delnor-Cmnty. Hosp. Proj.): | | | |
| Series 2002 D, 5.25% 5/15/32 (FSA Insured) | | 2,000,000 | 2,032,660 |
| 5.25% 5/15/32 (FSA Insured) | | 360,000 | 365,782 |
| Illinois Muni. Elec. Agcy. Pwr. Supply Series 2015 A: | | | |
| 5% 2/1/26 | | 6,000,000 | 7,105,980 |
| 5% 2/1/31 | | 795,000 | 927,463 |
| Illinois Sales Tax Rev.: | | | |
| Series 2016 A: | | | |
| 4% 6/15/30 | | 1,760,000 | 1,847,666 |
| 4% 6/15/32 | | 400,000 | 414,760 |
| Series 2016 D, 4% 6/15/30 | | 3,120,000 | 3,275,407 |
| Illinois Toll Hwy. Auth. Toll Hwy. Rev.: | | | |
| Series 2015 A: | | | |
| 5% 1/1/37 | | 700,000 | 800,856 |
| 5% 1/1/40 | | 2,300,000 | 2,616,135 |
| Series 2015 B, 5% 1/1/40 | | 1,300,000 | 1,473,888 |
| Series 2016 A: | | | |
| 5% 12/1/31 | | 400,000 | 466,352 |
| 5% 12/1/32 | | 2,400,000 | 2,784,768 |
| Joliet School District #86 Gen. Oblig. Series 2002, 0% 11/1/19 (FSA Insured) | | 2,000,000 | 1,929,680 |
| Kane, McHenry, Cook & DeKalb Counties Unit School District #300: | | | |
| 0% 12/1/17 (AMBAC Insured) | | 905,000 | 904,059 |
| 6.5% 1/1/20 (AMBAC Insured) | | 385,000 | 425,737 |
| Kendall, Kane & Will Counties Cmnty. Unit School District #308 Series 2016, 5% 2/1/36 | | 3,400,000 | 3,848,290 |
| Lake County Cmnty. High School District #117, Antioch Series 2000 B, 0% 12/1/20 (Nat'l. Pub. Fin. Guarantee Corp. Insured) | | 1,805,000 | 1,682,224 |
| McHenry & Kane Counties Cmnty. Consolidated School District #158 Series 2004, 0% 1/1/24 (FSA Insured) | | 800,000 | 684,736 |
| Metropolitan Pier & Exposition: | | | |
| (McCormick Place Expansion Proj.): | | | |
| Series 1994 A, 0% 6/15/19 (Nat'l. Pub. Fin. Guarantee Corp. Insured) | | 3,710,000 | 3,573,398 |
| Series 1996 A, 0% 6/15/23 (Nat'l. Pub. Fin. Guarantee Corp. Insured) | | 1,000,000 | 849,670 |
| Series 2002 A: | | | |
| 0% 12/15/30 (Nat'l. Pub. Fin. Guarantee Corp. Insured) | | 5,900,000 | 3,554,514 |
| 0% 6/15/36 (Nat'l. Pub. Fin. Guarantee Corp. Insured) | | 1,080,000 | 495,385 |
| Series 2010 B1: | | | |
| 0% 6/15/43 (FSA Insured) | | 5,310,000 | 1,794,355 |
| 0% 6/15/44 (FSA Insured) | | 4,700,000 | 1,518,429 |
| 0% 6/15/45 (FSA Insured) | | 2,600,000 | 802,880 |
| 0% 6/15/47 (FSA Insured) | | 2,085,000 | 587,928 |
| Series 2012 B, 0% 12/15/51 | | 1,900,000 | 271,909 |
| Series A: | | | |
| 0% 6/15/22 (Nat'l. Pub. Fin. Guarantee Corp. Insured) | | 1,265,000 | 1,115,566 |
| 0% 12/15/24 (Nat'l. Pub. Fin. Guarantee Corp. Insured) | | 3,090,000 | 2,473,545 |
| Series 2002 A: | | | |
| 0% 12/15/33 (Nat'l. Pub. Fin. Guarantee Corp. Insured) | | 5,730,000 | 2,988,195 |
| 0% 12/15/34 (Nat'l. Pub. Fin. Guarantee Corp. Insured) | | 1,540,000 | 763,594 |
| Series 2002, 0% 12/15/29 (Nat'l. Pub. Fin. Guarantee Corp. Insured) | | 3,705,000 | 2,336,632 |
| Quincy Hosp. Rev. Series 2007, 5% 11/15/18 | | 1,000,000 | 1,003,210 |
| Univ. of Illinois Rev.: | | | |
| (Auxiliary Facilities Sys. Proj.) Series 1999 A, 0% 4/1/20 (Nat'l. Pub. Fin. Guarantee Corp. Insured) | | 1,600,000 | 1,518,048 |
| Series 2010 A: | | | |
| 5% 4/1/25 | | 1,000,000 | 1,077,950 |
| 5.25% 4/1/30 | | 1,000,000 | 1,079,640 |
| Series 2013: | | | |
| 6% 10/1/42 | | 900,000 | 1,026,963 |
| 6.25% 10/1/38 | | 900,000 | 1,045,224 |
| Will County Cmnty. Unit School District #365-U: | | | |
| Series 2007 B, 0% 11/1/26 (FSA Insured) | | 1,090,000 | 838,265 |
| Series 2012, 0% 11/1/25 | | 790,000 | 625,546 |
| 0% 11/1/19 (Escrowed to Maturity) | | 790,000 | 767,991 |
| 0% 11/1/19 (FSA Insured) | | 5,085,000 | 4,906,211 |
|
| TOTAL ILLINOIS | | | 268,336,278 |
|
| Indiana - 1.9% | | | |
| Indiana Fin. Auth. Health Sys. Rev. (Sisters of Saint Francis Health Svcs., Inc. Obligated Group Proj.) Series 2009 A, 5.25% 11/1/39 | | 1,000,000 | 1,072,100 |
| Indiana Fin. Auth. Rev.: | | | |
| (Trinity Health Cr. Group Proj.) Series 2009 A, 5.25% 12/1/38 | | 2,000,000 | 2,141,180 |
| Series 2012: | | | |
| 5% 3/1/30 | | 675,000 | 744,977 |
| 5% 3/1/41 | | 1,290,000 | 1,396,502 |
| Series 2015 A, 5.25% 2/1/32 | | 1,040,000 | 1,245,119 |
| Series 2016: | | | |
| 5% 9/1/23 | | 450,000 | 523,935 |
| 5% 9/1/26 | | 225,000 | 270,700 |
| 5% 9/1/27 | | 650,000 | 775,548 |
| 5% 9/1/29 | | 500,000 | 586,630 |
| Indiana Fin. Auth. Wastewtr. Util. Rev. (CWA Auth. Proj.): | | | |
| Series 2012 A, 5% 10/1/24 | | 400,000 | 463,812 |
| Series 2015 A: | | | |
| 5% 10/1/28 | | 1,000,000 | 1,170,270 |
| 5% 10/1/45 | | 3,940,000 | 4,545,539 |
| Indianapolis Local Pub. Impt. Series 2016: | | | |
| 4% 1/1/34 (c) | | 1,000,000 | 1,041,610 |
| 5% 1/1/21 (c) | | 810,000 | 898,590 |
| 5% 1/1/22 (c) | | 1,590,000 | 1,801,406 |
| 5% 1/1/23 (c) | | 600,000 | 690,102 |
| Purdue Univ. Ctfs. of Prtn. Series 2016 A, 5% 7/1/30 | | 3,000,000 | 3,593,820 |
|
| TOTAL INDIANA | | | 22,961,840 |
|
| Kansas - 0.7% | | | |
| Kansas Dev. Fin. Agcy. (Adventist Health Sys./Sunbelt Obligated Group Proj.) Series 2009 C, 5.75% 11/15/38 | | 1,900,000 | 2,064,825 |
| Wyandotte County/Kansas City Unified Govt. Util. Sys. Rev.: | | | |
| Series 2012 A, 5% 9/1/26 | | 1,950,000 | 2,234,486 |
| Series 2016 A: | | | |
| 5% 9/1/40 | | 1,400,000 | 1,603,518 |
| 5% 9/1/45 | | 1,800,000 | 2,050,848 |
|
| TOTAL KANSAS | | | 7,953,677 |
|
| Kentucky - 0.2% | | | |
| Louisville & Jefferson County Series 2013 A: | | | |
| 5.5% 10/1/33 | | 500,000 | 574,430 |
| 5.75% 10/1/38 | | 1,355,000 | 1,557,545 |
|
| TOTAL KENTUCKY | | | 2,131,975 |
|
| Louisiana - 1.0% | | | |
| Louisiana Pub. Facilities Auth. Rev. (Tulane Univ. of Louisiana Proj.) Series 2016 A: | | | |
| 5% 12/15/25 | | 185,000 | 222,102 |
| 5% 12/15/26 | | 1,000,000 | 1,212,700 |
| 5% 12/15/29 | | 1,085,000 | 1,283,577 |
| New Orleans Aviation Board Rev.: | | | |
| (North Term. Proj.): | | | |
| Series 2015 B: | | | |
| 5% 1/1/27 (c) | | 1,400,000 | 1,644,272 |
| 5% 1/1/30 (c) | | 2,335,000 | 2,695,758 |
| 5% 1/1/40 (c) | | 1,400,000 | 1,562,036 |
| Series 2017 B: | | | |
| 5% 1/1/28 (c) | | 245,000 | 293,767 |
| 5% 1/1/34 (c) | | 215,000 | 248,847 |
| Series 2007 A, 5.25% 1/1/19 (Pre-Refunded to 1/1/18 @ 100) (c) | | 1,570,000 | 1,580,346 |
| Series 2017 D2: | | | |
| 5% 1/1/31 (c) | | 340,000 | 399,177 |
| 5% 1/1/33 (c) | | 1,025,000 | 1,191,716 |
|
| TOTAL LOUISIANA | | | 12,334,298 |
|
| Maine - 1.4% | | | |
| Maine Health & Higher Ed. Facilities Auth. Rev. (Eastern Maine Healthcare Systems Proj.) Series 2013, 5% 7/1/43 | | 705,000 | 727,384 |
| Maine Health & Higher Edl. Facilities Auth. Rev.: | | | |
| Series 2008 D, 5.75% 7/1/38 (Pre-Refunded to 7/1/18 @ 100) | | 330,000 | 340,095 |
| Series 2016 A: | | | |
| 4% 7/1/41 | | 455,000 | 405,601 |
| 4% 7/1/46 | | 625,000 | 543,163 |
| 5% 7/1/41 | | 1,800,000 | 1,875,690 |
| 5% 7/1/46 | | 5,105,000 | 5,293,579 |
| Series 2017 B: | | | |
| 4% 7/1/25 | | 450,000 | 503,798 |
| 4% 7/1/31 | | 700,000 | 746,809 |
| 4% 7/1/32 | | 500,000 | 528,740 |
| 4% 7/1/34 | | 1,010,000 | 1,058,672 |
| 5% 7/1/26 | | 325,000 | 391,300 |
| 5% 7/1/28 | | 510,000 | 611,572 |
| 5% 7/1/29 | | 400,000 | 475,532 |
| 5% 7/1/33 | | 1,000,000 | 1,160,290 |
| 5% 7/1/35 | | 760,000 | 875,642 |
| Series 2017 D, 5.75% 7/1/38 | | 165,000 | 169,924 |
| Maine Tpk. Auth. Tpk. Rev. Series 2015, 5% 7/1/38 | | 670,000 | 764,557 |
|
| TOTAL MAINE | | | 16,472,348 |
|
| Maryland - 0.7% | | | |
| Baltimore Proj. Rev. (Wtr. Projs.) Series 2009 A: | | | |
| 5.375% 7/1/34 (Pre-Refunded to 7/1/19 @ 100) | | 185,000 | 197,843 |
| 5.375% 7/1/34 (Pre-Refunded to 7/1/19 @ 100) | | 315,000 | 337,138 |
| City of Westminster Series 2016: | | | |
| 5% 11/1/27 | | 1,000,000 | 1,143,120 |
| 5% 11/1/31 | | 1,245,000 | 1,397,264 |
| Maryland Econ. Dev. Corp. (Purple Line Lt. Rail Proj.) Series 2016 D, 5% 3/31/41 (c) | | 1,815,000 | 2,032,147 |
| Maryland Health & Higher Edl. Facilities Auth. Rev.: | | | |
| (Anne Arundel Med. Ctr., MD Proj.) Series 2017 A, 4% 7/1/33 (e) | | 750,000 | 790,568 |
| (Univ. of Maryland Med. Sys. Proj.) Series 2008 F, 5.25% 7/1/21 | | 1,000,000 | 1,028,260 |
| (Upper Chesapeake Hosp. Proj.) Series 2008 C, 5.5% 1/1/18 (Escrowed to Maturity) | | 130,000 | 130,943 |
| Series 2010, 5.625% 7/1/30 (Pre-Refunded to 7/1/20 @ 100) | | 500,000 | 556,710 |
| Series 2016 A: | | | |
| 4% 7/1/42 | | 275,000 | 275,789 |
| 5% 7/1/35 | | 120,000 | 132,592 |
| Rockville Mayor & Council Econ. Dev. (Rfdg.-Ingleside King Farm Proj.) Series 2017: | | | |
| 2.5% 11/1/24 (e) | | 350,000 | 350,504 |
| 3% 11/1/25 (e) | | 260,000 | 260,372 |
| 5% 11/1/30 (e) | | 90,000 | 100,792 |
|
| TOTAL MARYLAND | | | 8,734,042 |
|
| Massachusetts - 1.6% | | | |
| Massachusetts Bay Trans. Auth. Sales Tax Rev. Series 2015 A: | | | |
| 5% 7/1/40 | | 310,000 | 356,506 |
| 5% 7/1/45 | | 305,000 | 349,170 |
| Massachusetts Dev. Fin. Agcy. Rev.: | | | |
| (Tufts Med. Ctr. Proj.) Series 2011, 6.75% 1/1/36 | | 395,000 | 451,710 |
| (Wentworth Institute of Technology Proj.) Series 2017, 5% 10/1/28 | | 1,055,000 | 1,218,936 |
| Series 2011, 6.75% 1/1/36 (Pre-Refunded to 1/1/21 @ 100) | | 605,000 | 706,459 |
| Massachusetts Edl. Fing. Auth. Rev. Series 2017 B, 4.25% 7/1/46 (c) | | 1,985,000 | 1,987,759 |
| Massachusetts Gen. Oblig.: | | | |
| Series 2016 A, 5% 3/1/46 | | 445,000 | 509,467 |
| Series 2016 B, 5% 7/1/31 | | 470,000 | 563,032 |
| Series 2017 A, 5% 4/1/33 | | 4,345,000 | 5,210,698 |
| Series 2017 D: | | | |
| 5% 2/1/33 | | 1,345,000 | 1,608,755 |
| 5% 2/1/34 | | 2,455,000 | 2,929,748 |
| Massachusetts Port Auth. Rev. Series 2016 B, 5% 7/1/43 (c) | | 3,185,000 | 3,610,516 |
|
| TOTAL MASSACHUSETTS | | | 19,502,756 |
|
| Michigan - 2.0% | | | |
| Detroit Swr. Disp. Rev. Series 2001 E, 5.75% 7/1/31 (Pre-Refunded to 7/1/18 @ 100) | | 385,000 | 396,908 |
| Grand Rapids Pub. Schools Series 2016, 5% 5/1/26 (FSA Insured) | | 3,065,000 | 3,716,251 |
| Lansing Board of Wtr. & Lt. Util. Rev. 5.5% 7/1/41 | | 500,000 | 565,680 |
| Michigan Bldg. Auth. Rev.: | | | |
| (Facilities Prog.): | | | |
| Series 2015 I, 5% 4/15/30 | | 5,000,000 | 5,892,450 |
| Series 2016 I, 5% 4/15/24 | | 295,000 | 351,274 |
| 5% 4/15/33 | | 2,500,000 | 2,907,075 |
| Michigan Fin. Auth. Rev.: | | | |
| Series 2012 A: | | | |
| 4.125% 6/1/32 (Pre-Refunded to 6/1/22 @ 100) | | 1,150,000 | 1,283,136 |
| 5% 6/1/21 (Escrowed to Maturity) | | 350,000 | 394,240 |
| 5% 6/1/27 (Pre-Refunded to 6/1/22 @ 100) | | 500,000 | 577,180 |
| 5% 6/1/39 (Pre-Refunded to 6/1/22 @ 100) | | 1,100,000 | 1,269,796 |
| Series 2012, 5% 11/15/42 | | 2,175,000 | 2,403,179 |
| Michigan Hosp. Fin. Auth. Rev.: | | | |
| Bonds (Ascension Health Cr. Group Proj.) Series F5: | | | |
| 1.9%, tender 4/1/21 (b) | | 1,855,000 | 1,866,835 |
| 2.4%, tender 3/15/23 (b) | | 1,395,000 | 1,419,050 |
| 6.5% 12/1/33 (Pre-Refunded to 12/1/18 @ 100) | | 80,000 | 84,329 |
| Portage Pub. Schools Series 2016, 5% 11/1/33 | | 1,130,000 | 1,313,128 |
|
| TOTAL MICHIGAN | | | 24,440,511 |
|
| Minnesota - 0.5% | | | |
| Duluth Independent School District #709 Ctfs. of Prtn. Series 2009 B, 4% 3/1/20 | | 1,620,000 | 1,644,737 |
| Maple Grove Health Care Sys. Rev. Series 2017: | | | |
| 4% 5/1/21 | | 500,000 | 539,415 |
| 5% 5/1/25 | | 800,000 | 946,760 |
| Minneapolis Health Care Sys. Rev.: | | | |
| 6.5% 11/15/38 | | 845,000 | 888,002 |
| 6.5% 11/15/38 (Pre-Refunded to 11/15/18 @ 100) | | 155,000 | 163,632 |
| Moorhead Edl. Facilities Rev. (The Concordia College Corp. Proj.) Series 2016, 5% 12/1/25 | | 1,195,000 | 1,396,883 |
|
| TOTAL MINNESOTA | | | 5,579,429 |
|
| Missouri - 0.3% | | | |
| Cape Girardeau County Indl. Dev. Auth. (Southeast Hosp. Proj.) Series 2017 A, 5% 3/1/30 | | 700,000 | 791,868 |
| Missouri Health & Edl. Facilities Auth. Edl. Facilities Rev. Series 2015 B: | | | |
| 3.125% 2/1/27 | | 200,000 | 207,566 |
| 3.25% 2/1/28 | | 200,000 | 208,136 |
| 4% 2/1/40 | | 100,000 | 103,231 |
| 5% 2/1/29 | | 1,240,000 | 1,446,609 |
| 5% 2/1/36 | | 400,000 | 452,556 |
|
| TOTAL MISSOURI | | | 3,209,966 |
|
| Nebraska - 0.4% | | | |
| Central Plains Energy Proj. Rev. (Nebraska Gas Proj.) Series 2007 B, 3 month U.S. LIBOR + 0.500% 1.382% 12/1/17 (b)(f) | | 555,000 | 554,989 |
| Nebraska Pub. Pwr. District Rev. Series 2016 B, 5% 1/1/40 | | 1,130,000 | 1,297,816 |
| Omaha Arpt. Auth. Arpt. Rev.: | | | |
| Series 2017 A: | | | |
| 5% 12/15/22 (c) | | 750,000 | 865,665 |
| 5% 12/15/23 (c) | | 750,000 | 879,915 |
| 5% 12/15/31 (c) | | 785,000 | 922,430 |
| Series 2017 C, 5% 12/15/21 (c) | | 410,000 | 466,408 |
|
| TOTAL NEBRASKA | | | 4,987,223 |
|
| Nevada - 1.6% | | | |
| Clark County Arpt. Rev. (Sub Lien Proj.) Series 2017 A-1: | | | |
| 5% 7/1/20 (c) | | 1,375,000 | 1,503,961 |
| 5% 7/1/21 (c) | | 1,370,000 | 1,540,291 |
| Clark County McCarran Int'l. Arpt. Passenger Facility Charge Rev. (Clark County Arpt. Rev. Proj.) Series 2017 B: | | | |
| 5% 7/1/20 (c) | | 1,960,000 | 2,143,828 |
| 5% 7/1/21 (c) | | 2,405,000 | 2,703,942 |
| 5% 7/1/22 (c) | | 2,250,000 | 2,576,070 |
| 5% 7/1/23 (c) | | 3,000,000 | 3,498,840 |
| Las Vegas Valley Wtr. District Wtr. Impt. Gen. Oblig. Series 2016 B, 5% 6/1/36 | | 4,530,000 | 5,323,158 |
|
| TOTAL NEVADA | | | 19,290,090 |
|
| New Hampshire - 0.6% | | | |
| New Hampshire Health & Ed. Facilities Auth.: | | | |
| Series 2017 A, 5.25% 7/1/27 (a) | | 100,000 | 102,365 |
| Series 2017 B, 4.125% 7/1/24 (a) | | 400,000 | 401,932 |
| Series 2017 C, 3.5% 7/1/22 (a) | | 130,000 | 130,519 |
| New Hampshire Health & Ed. Facilities Auth. Rev.: | | | |
| Series 2012: | | | |
| 4% 7/1/32 | | 400,000 | 414,100 |
| 5% 7/1/27 | | 500,000 | 554,225 |
| Series 2016: | | | |
| 3% 10/1/20 | | 110,000 | 113,889 |
| 4% 10/1/38 | | 510,000 | 518,410 |
| 5% 10/1/22 | | 1,055,000 | 1,189,228 |
| 5% 10/1/29 | | 2,675,000 | 3,043,562 |
| 5% 10/1/38 | | 1,200,000 | 1,319,400 |
|
| TOTAL NEW HAMPSHIRE | | | 7,787,630 |
|
| New Jersey - 5.2% | | | |
| New Jersey Econ. Dev. Auth. Rev.: | | | |
| (New Jersey Gen. Oblig. Proj.): | | | |
| Series 2015 XX, 5% 6/15/25 | | 2,585,000 | 2,923,454 |
| Series 2017 B: | | | |
| 5% 11/1/23 | | 7,200,000 | 8,073,144 |
| 5% 11/1/24 | | 2,800,000 | 3,160,500 |
| Series 2009 AA, 5.5% 12/15/29 | | 330,000 | 345,929 |
| Series 2013 NN, 5% 3/1/27 | | 11,810,000 | 12,885,991 |
| Series 2013: | | | |
| 5% 3/1/23 | | 3,270,000 | 3,640,949 |
| 5% 3/1/24 | | 3,000,000 | 3,313,650 |
| 5% 3/1/25 | | 300,000 | 329,496 |
| Series 2015 XX, 5% 6/15/22 | | 640,000 | 707,904 |
| Series 2016 BBB: | | | |
| 5% 6/15/21 | | 1,000,000 | 1,093,230 |
| 5% 6/15/22 | | 1,620,000 | 1,791,882 |
| 5% 6/15/23 | | 2,600,000 | 2,904,018 |
| 6% 12/15/34 (Pre-Refunded to 12/15/18 @ 100) | | 25,000 | 26,379 |
| New Jersey Edl. Facility Series 2016 A, 5% 7/1/31 | | 1,000,000 | 1,131,180 |
| New Jersey Health Care Facilities Fing. Auth. Rev. Series 2016 A: | | | |
| 5% 7/1/20 | | 500,000 | 539,930 |
| 5% 7/1/21 | | 65,000 | 71,781 |
| 5% 7/1/22 | | 65,000 | 73,024 |
| 5% 7/1/23 | | 230,000 | 261,747 |
| 5% 7/1/24 | | 180,000 | 207,340 |
| 5% 7/1/25 | | 195,000 | 226,588 |
| 5% 7/1/26 | | 65,000 | 75,876 |
| 5% 7/1/27 | | 100,000 | 115,817 |
| 5% 7/1/28 | | 365,000 | 426,995 |
| 5% 7/1/29 | | 700,000 | 799,778 |
| 5% 7/1/30 | | 275,000 | 311,740 |
| New Jersey Trans. Trust Fund Auth.: | | | |
| Series 2005 B, 5.25% 12/15/22 (AMBAC Insured) | | 400,000 | 452,744 |
| Series 2010 D, 5.25% 12/15/23 | | 6,305,000 | 7,187,006 |
| Series 2014 AA, 5% 6/15/23 | | 5,250,000 | 5,878,425 |
| Series 2016 A: | | | |
| 5% 6/15/27 | | 400,000 | 454,496 |
| 5% 6/15/29 | | 1,650,000 | 1,853,610 |
| Series 2016 A-2, 5% 6/15/23 | | 1,050,000 | 1,179,759 |
|
| TOTAL NEW JERSEY | | | 62,444,362 |
|
| New Mexico - 0.2% | | | |
| New Mexico Edl. Assistance Foundation Series 2010 A1, 5% 12/1/19 | | 2,000,000 | 2,150,960 |
| New York - 5.5% | | | |
| Dorm. Auth. New York Univ. Rev.: | | | |
| Series 2017 4% 12/1/20 (a) | | 1,000,000 | 1,053,320 |
| Series 2017: | | | |
| 4% 12/1/21 (a) | | 1,100,000 | 1,170,653 |
| 5% 12/1/22 (a) | | 1,700,000 | 1,899,835 |
| Hudson Yards Infrastructure Corp. New York Rev. Series 2012 A, 5.75% 2/15/47 | | 1,075,000 | 1,224,651 |
| MTA Hudson Rail Yards Trust Oblig. Series 2016 A, 5% 11/15/56 | | 3,400,000 | 3,816,738 |
| New York City Gen. Oblig.: | | | |
| Series 2009, 5.625% 4/1/29 | | 25,000 | 26,539 |
| Series 2012 A1, 5% 8/1/24 | | 1,300,000 | 1,467,700 |
| Series 2012 E, 5% 8/1/24 | | 5,000,000 | 5,715,150 |
| Series 2012 G1, 5% 4/1/25 | | 2,500,000 | 2,866,550 |
| Series 2014 J, 5% 8/1/23 | | 1,425,000 | 1,677,995 |
| Series 2015 C, 5% 8/1/27 | | 700,000 | 836,311 |
| New York City Muni. Wtr. Fin. Auth. Wtr. & Swr. Sys. Rev.: | | | |
| Series 2009 CC, 5% 6/15/34 | | 2,100,000 | 2,152,521 |
| Series 2011 EE, 5.375% 6/15/43 | | 4,000,000 | 4,474,480 |
| Series 2013 CC, 5% 6/15/47 | | 4,000,000 | 4,559,360 |
| New York City Transitional Fin. Auth. Bldg. Aid Rev.: | | | |
| Series 2009 S3: | | | |
| 5.25% 1/15/34 | | 2,500,000 | 2,623,275 |
| 5.25% 1/15/39 | | 1,000,000 | 1,048,690 |
| Series 2015 S1, 5% 7/15/43 | | 5,000,000 | 5,730,350 |
| Series 2015 S2, 5% 7/15/35 | | 1,770,000 | 2,071,466 |
| New York City Transitional Fin. Auth. Rev. Series 2015 E1, 5% 2/1/41 | | 510,000 | 585,633 |
| New York Dorm. Auth. Sales Tax Rev. Series 2016 A: | | | |
| 5% 3/15/31 | | 1,830,000 | 2,212,909 |
| 5% 3/15/32 | | 800,000 | 962,424 |
| 5% 3/15/34 | | 1,300,000 | 1,549,080 |
| New York Metropolitan Trans. Auth. Rev.: | | | |
| Series 2010 D, 5.25% 11/15/40 | | 1,400,000 | 1,549,520 |
| Series 2012 D, 5% 11/15/25 | | 4,600,000 | 5,332,090 |
| Series 2014 B, 5% 11/15/44 | | 1,500,000 | 1,713,165 |
| Series 2015 A1, 5% 11/15/45 | | 2,600,000 | 2,970,994 |
| Series 2016, 6.5% 11/15/28 | | 190,000 | 200,845 |
| New York State Dorm. Auth. Series A, 5% 2/15/34 | | 55,000 | 57,485 |
| New York Trans. Dev. Corp. (Laguardia Arpt. Term. Redev. Proj.) Series 2016 A, 5% 7/1/41 (c) | | 2,100,000 | 2,311,911 |
| Rockland County Gen. Oblig. Series 2014 A, 4% 3/1/23 (FSA Insured) | | 1,125,000 | 1,238,209 |
| Triborough Bridge & Tunnel Auth. Revs. Series 2015 A, 5.25% 11/15/45 | | 1,000,000 | 1,166,880 |
|
| TOTAL NEW YORK | | | 66,266,729 |
|
| North Carolina - 0.8% | | | |
| Charlotte Int'l. Arpt. Rev.: | | | |
| Series 2017 A, 5% 7/1/29 | | 1,000,000 | 1,222,070 |
| Series 2017 B: | | | |
| 5% 7/1/20 (c) | | 200,000 | 219,144 |
| 5% 7/1/21 (c) | | 210,000 | 236,424 |
| 5% 7/1/22 (c) | | 150,000 | 172,247 |
| 5% 7/1/23 (c) | | 165,000 | 193,210 |
| 5% 7/1/24 (c) | | 190,000 | 226,436 |
| 5% 7/1/25 (c) | | 100,000 | 120,585 |
| 5% 7/1/26 (c) | | 100,000 | 121,975 |
| 5% 7/1/27 (c) | | 195,000 | 240,573 |
| 5% 7/1/28 (c) | | 165,000 | 201,960 |
| Series 2017 C: | | | |
| 4% 7/1/32 | | 1,440,000 | 1,581,538 |
| 5% 7/1/28 | | 1,035,000 | 1,272,864 |
| Nash Health Care Sys. Health Care Facilities Rev.: | | | |
| Series 2012, 5% 11/1/41 | | 800,000 | 853,808 |
| 5% 11/1/30 (FSA Insured) | | 1,275,000 | 1,308,405 |
| North Carolina Med. Care Commission Health Care Facilities Rev. (Rex Healthcare Proj.) Series 2010 A, 5% 7/1/30 | | 1,600,000 | 1,712,176 |
| North Carolina Muni. Pwr. Agcy. #1 Catawba Elec. Rev. Series 2009 A, 5% 1/1/30 | | 285,000 | 296,967 |
|
| TOTAL NORTH CAROLINA | | | 9,980,382 |
|
| North Dakota - 0.3% | | | |
| Cass County Health Care Facilities Rev. (Essentia Health Obligated Group Proj.) Series 2008, 5.125% 2/15/37 (Assured Guaranty Corp. Insured) | | 750,000 | 796,553 |
| McLean County Solid Waste Facilities Rev. (Great River Energy Projs.) Series 2010 B, 5.15% 7/1/40 | | 2,300,000 | 2,410,561 |
|
| TOTAL NORTH DAKOTA | | | 3,207,114 |
|
| Ohio - 1.2% | | | |
| Akron Bath Copley Hosp. District Rev. Series 2016, 5.25% 11/15/46 | | 1,500,000 | 1,674,735 |
| American Muni. Pwr., Inc. Rev. (Prairie State Energy Campus Proj.) Series 2015, 5% 2/15/28 | | 2,000,000 | 2,328,300 |
| Columbus City School District 5% 12/1/29 | | 300,000 | 362,223 |
| Hamilton County Convention Facilities Auth. Rev. Series 2014, 5% 12/1/26 | | 670,000 | 765,957 |
| Lake County Hosp. Facilities Rev.: | | | |
| Series 2015, 5% 8/15/29 | | 400,000 | 458,136 |
| 5.75% 8/15/38 | | 165,000 | 169,958 |
| Lucas County Hosp. Rev. (ProMedica Healthcare Oblig. Group Proj.) Series 2011 A, 6.5% 11/15/37 | | 1,200,000 | 1,428,924 |
| Muskingum County Hosp. Facilities (Genesis Healthcare Sys. Obligated Group Proj.) Series 2013: | | | |
| 5% 2/15/33 | | 850,000 | 900,465 |
| 5% 2/15/44 | | 1,100,000 | 1,145,496 |
| 5% 2/15/48 | | 2,000,000 | 2,078,860 |
| Ohio Hosp. Facilities Rev. Series 2017 A, 5% 1/1/28 | | 1,740,000 | 2,158,748 |
| Ohio Tpk. Commission Tpk. Rev. (Infastructure Proj.) Series 2005 A, 0% 2/15/42 | | 2,600,000 | 1,054,664 |
| Scioto County Hosp. Facilities Rev. Series 2016, 5% 2/15/34 | | 445,000 | 505,048 |
|
| TOTAL OHIO | | | 15,031,514 |
|
| Oklahoma - 0.5% | | | |
| Canadian Cny Edl. Facilities Auth. (Mustang Pub. Schools Proj.) Series 2017: | | | |
| 5% 9/1/27 | | 695,000 | 834,938 |
| 5% 9/1/28 | | 1,000,000 | 1,190,850 |
| Oklahoma City Pub. Property Auth. Hotel Tax Rev. Series 2015: | | | |
| 5% 10/1/29 | | 700,000 | 829,346 |
| 5% 10/1/39 | | 150,000 | 172,244 |
| Oklahoma Dev. Fin. Auth. Rev. (Saint John Health Sys. Proj.) Series 2012, 5% 2/15/42 (Pre-Refunded to 2/15/22 @ 100) | | 1,775,000 | 2,040,682 |
| Oklahoma Pwr. Auth. Pwr. Supply Sys. Rev. Series 2014 A, 5% 1/1/38 | | 1,295,000 | 1,473,322 |
|
| TOTAL OKLAHOMA | | | 6,541,382 |
|
| Pennsylvania - 4.9% | | | |
| Allegheny County Hosp. Dev. Auth. Rev. (Univ. of Pittsburgh Med. Ctr. Proj.) Series 2009 A, 5.625% 8/15/39 | | 1,100,000 | 1,173,546 |
| Centre County Pennsylvania Hosp. Auth. Rev. (Mount Nittany Med. Ctr. Proj.) Series 2011, 7% 11/15/46 (Pre-Refunded to 11/15/21 @ 100) | | 500,000 | 609,940 |
| Dauphin County Gen. Auth. (Pinnacle Health Sys. Proj.) Series 2016 A: | | | |
| 5% 6/1/21 | | 350,000 | 391,384 |
| 5% 6/1/22 | | 500,000 | 571,815 |
| 5% 6/1/23 | | 500,000 | 581,275 |
| Lehigh County Gen. Purp. Auth. Rev. (Muhlenberg College Proj.) Series 2017, 5% 2/1/39 | | 2,585,000 | 2,957,007 |
| Lehigh County Indl. Dev. Auth. Poll. Cont. Rev. Bonds: | | | |
| (PPL Elec. Utils. Corp. Proj.) Series 2016 A, 1.8%, tender 9/1/22 (b) | | 1,000,000 | 994,940 |
| Series B, 1.8%, tender 8/15/22 (b) | | 1,330,000 | 1,323,323 |
| Montgomery County Higher Ed. & Health Auth. Hosp. Rev. (Abington Memorial Hosp. Proj.) Series 2012 A, 5% 6/1/24 | | 600,000 | 680,490 |
| Montgomery County Higher Ed. & Health Auth. Rev.: | | | |
| Series 2014 A: | | | |
| 5% 10/1/23 | | 80,000 | 91,354 |
| 5% 10/1/25 | | 1,045,000 | 1,182,961 |
| Series 2016 A: | | | |
| 5% 10/1/28 | | 1,515,000 | 1,750,416 |
| 5% 10/1/36 | | 1,140,000 | 1,257,089 |
| 5% 10/1/40 | | 700,000 | 759,682 |
| Northampton County Gen. Purp. Auth. Hosp. Rev.: | | | |
| (St Lukes Hosp. & Health Ntw Proj.) Series 2016 A, 5% 8/15/36 | | 745,000 | 830,779 |
| Series 2016 A, 5% 8/15/46 | | 5,125,000 | 5,625,354 |
| Pennsylvania Higher Edl. Facilities Auth. Rev. Series 2016, 5% 5/1/28 | | 500,000 | 590,125 |
| Philadelphia Gas Works Rev. Series 9: | | | |
| 5.25% 8/1/40 | | 490,000 | 532,620 |
| 5.25% 8/1/40 (Pre-Refunded to 8/1/20 @ 100) | | 310,000 | 343,111 |
| Philadelphia School District Series 2016 D: | | | |
| 5% 9/1/25 | | 8,790,000 | 10,201,322 |
| 5% 9/1/26 | | 9,180,000 | 10,703,146 |
| 5% 9/1/27 | | 9,690,000 | 11,191,369 |
| Scranton-Lackawanna Health & Welfare Auth. Rev. (Marywood Univ. Proj.) Series 2016, 5% 6/1/36 | | 4,000,000 | 4,145,760 |
|
| TOTAL PENNSYLVANIA | | | 58,488,808 |
|
| Rhode Island - 1.0% | | | |
| Rhode Island Comm Corp. Rev. Series 2016 A: | | | |
| 5% 6/15/21 | | 3,000,000 | 3,374,160 |
| 5% 6/15/22 | | 5,000,000 | 5,749,200 |
| Rhode Island Health & Edl. Bldg. Corp. Higher Ed. Facilities Rev.: | | | |
| Series 2016 B: | | | |
| 5% 9/1/31 | | 140,000 | 152,496 |
| 5% 9/1/36 | | 1,400,000 | 1,490,356 |
| Series 2016, 5% 5/15/39 | | 1,000,000 | 1,099,780 |
|
| TOTAL RHODE ISLAND | | | 11,865,992 |
|
| South Carolina - 2.6% | | | |
| Horry County School District (South Carolina Gen. Oblig. Proj.) Series 2016, 5% 3/1/23 | | 1,490,000 | 1,751,167 |
| Lancaster County School District ( South Carolina Gen. Oblig. Proj.) Series 2017, 5% 3/1/23 | | 1,000,000 | 1,178,640 |
| Scago Edl. Facilities Corp. for Colleton School District (School District of Colleton County Proj.) Series 2015, 5% 12/1/26 | | 1,400,000 | 1,653,022 |
| South Carolina Jobs-Econ. Dev. Auth. Econ. Dev. Rev. Series 2013, 5% 11/1/27 | | 1,400,000 | 1,588,342 |
| South Carolina Ports Auth. Ports Rev. Series 2015 (AMT), 5% 7/1/45 (c) | | 5,215,000 | 5,747,660 |
| South Carolina Pub. Svc. Auth. Rev.: | | | |
| Series 2012 B, 5% 12/1/20 | | 2,500,000 | 2,756,850 |
| Series 2013 E, 5.5% 12/1/53 | | 6,100,000 | 6,855,180 |
| Series 2014 A: | | | |
| 5% 12/1/49 | | 1,340,000 | 1,466,255 |
| 5.5% 12/1/54 | | 2,500,000 | 2,821,300 |
| Series 2014 C, 5% 12/1/46 | | 720,000 | 793,836 |
| Series 2015 A, 5% 12/1/50 | | 2,175,000 | 2,405,768 |
| Series 2015 E, 5.25% 12/1/55 | | 1,100,000 | 1,241,867 |
| South Carolina Trans. Infrastructure Bank Rev. Series 2015 A, 5% 10/1/23 | | 600,000 | 706,878 |
|
| TOTAL SOUTH CAROLINA | | | 30,966,765 |
|
| Tennessee - 0.4% | | | |
| Jackson Hosp. Rev. 5.75% 4/1/41 | | 270,000 | 274,555 |
| Memphis-Shelby County Arpt. Auth. Arpt. Rev. Series 2010 B, 5.75% 7/1/24 (c) | | 1,600,000 | 1,773,776 |
| Tennessee Engy Acq Corp. Bonds (Gas Rev. Proj.) Series A, 4%, tender 5/1/23 (b)(e) | | 2,280,000 | 2,492,131 |
|
| TOTAL TENNESSEE | | | 4,540,462 |
|
| Texas - 8.7% | | | |
| Austin Arpt. Sys. Rev. Series 2014: | | | |
| 5% 11/15/28 (c) | | 500,000 | 576,005 |
| 5% 11/15/39 (c) | | 1,700,000 | 1,898,203 |
| 5% 11/15/44 (c) | | 4,405,000 | 4,865,895 |
| Austin Wtr. & Wastewtr. Sys. Rev. Series 2016, 5% 11/15/37 | | 1,400,000 | 1,640,716 |
| Central Reg'l. Mobility Auth.: | | | |
| Series 2015 A: | | | |
| 5% 1/1/28 | | 1,300,000 | 1,521,390 |
| 5% 1/1/31 | | 475,000 | 544,849 |
| 5% 1/1/45 | | 1,000,000 | 1,112,100 |
| Series 2016: | | | |
| 5% 1/1/40 | | 1,000,000 | 1,120,750 |
| 5% 1/1/46 | | 685,000 | 763,049 |
| Comal County Tex Series 2017, 4% 2/1/23 | | 1,660,000 | 1,857,059 |
| Comal Independent School District 5.25% 2/1/23 | | 35,000 | 35,378 |
| Corpus Christi Util. Sys. Rev. 5% 7/15/23 | | 1,600,000 | 1,836,064 |
| Cypress-Fairbanks Independent School District: | | | |
| Series 2014 C, 5% 2/15/44 | | 1,100,000 | 1,252,152 |
| Series 2016, 5% 2/15/27 | | 795,000 | 970,154 |
| Dallas Area Rapid Transit Sales Tax Rev. Series 2016 A, 5% 12/1/33 | | 700,000 | 821,156 |
| Dallas Fort Worth Int'l. Arpt. Rev.: | | | |
| Series 2012 D, 5% 11/1/42 (c) | | 400,000 | 441,664 |
| Series 2012 H, 5% 11/1/42 (c) | | 1,000,000 | 1,104,160 |
| Series 2014 D, 5% 11/1/23 (c) | | 575,000 | 668,501 |
| Grand Parkway Trans. Corp. Series 2013 B: | | | |
| 5% 4/1/53 | | 220,000 | 249,539 |
| 5.25% 10/1/51 | | 8,500,000 | 9,747,205 |
| 5.5% 4/1/53 | | 1,000,000 | 1,136,270 |
| Harris County Gen. Oblig. Series 2002, 0% 8/15/24 (Nat'l. Pub. Fin. Guarantee Corp. Insured) | | 1,000,000 | 873,380 |
| Houston Arpt. Sys. Rev.: | | | |
| Series 2011 A, 5% 7/1/24 (c) | | 1,250,000 | 1,391,188 |
| Series 2012 A, 5% 7/1/23 (c) | | 600,000 | 678,042 |
| Houston Independent School District Series 2017, 5% 2/15/35 | | 700,000 | 830,795 |
| Houston Util. Sys. Rev.: | | | |
| Series 2014 C, 5% 5/15/28 | | 600,000 | 702,150 |
| Series 2016 B, 5% 11/15/33 | | 600,000 | 710,520 |
| Lewisville Independent School District 0% 8/15/19 | | 2,340,000 | 2,298,348 |
| Love Field Arpt. Modernization Rev.: | | | |
| Series 2015: | | | |
| 5% 11/1/26 (c) | | 1,000,000 | 1,182,580 |
| 5% 11/1/28 (c) | | 3,325,000 | 3,892,611 |
| Series 2017: | | | |
| 5% 11/1/22 (c) | | 750,000 | 859,185 |
| 5% 11/1/23 (c) | | 1,100,000 | 1,278,871 |
| 5% 11/1/29 (c) | | 1,250,000 | 1,465,213 |
| 5% 11/1/36 (c) | | 1,000,000 | 1,141,440 |
| Newark Higher Ed. Fin. Corp. (Abilene Christian Univ. Proj.) Series 2016 A, 5% 4/1/27 | | 720,000 | 845,654 |
| North Texas Tollway Auth. Rev.: | | | |
| Series 2008 I, 6.2% 1/1/42 (Assured Guaranty Corp. Insured) | | 1,100,000 | 1,378,509 |
| Series 2009, 6.25% 1/1/39 | | 335,000 | 353,083 |
| Series 2011 A: | | | |
| 5.5% 9/1/41 (Pre-Refunded to 9/1/21 @ 100) | | 2,315,000 | 2,658,407 |
| 6% 9/1/41 (Pre-Refunded to 9/1/21 @ 100) | | 1,200,000 | 1,400,256 |
| Series 2011 D, 5% 9/1/28 (Pre-Refunded to 9/1/21 @ 100) | | 2,300,000 | 2,612,340 |
| Series 2014 A: | | | |
| 5% 1/1/23 | | 400,000 | 465,200 |
| 5% 1/1/25 | | 1,000,000 | 1,179,490 |
| Series 2015 A, 5% 1/1/32 | | 655,000 | 751,586 |
| Series 2015 B, 5% 1/1/40 | | 2,000,000 | 2,249,000 |
| Series 2016 A, 5% 1/1/36 | | 1,250,000 | 1,440,538 |
| 6% 1/1/24 | | 230,000 | 231,875 |
| San Antonio Arpt. Sys. Rev. 5.25% 7/1/18 (FSA Insured) (c) | | 2,505,000 | 2,513,742 |
| San Antonio Elec. & Gas Sys. Rev.: | | | |
| Series 2012, 5.25% 2/1/25 | | 800,000 | 978,200 |
| Series 2016, 5% 2/1/21 | | 1,225,000 | 1,369,048 |
| San Antonio Independent School District Series 2016, 5% 8/15/31 | | 850,000 | 1,018,887 |
| Tarrant County Cultural Ed. Facilities Fin. Corp. Hosp. Rev.: | | | |
| (Hendrick Med. Ctr. Proj.) Series 2009 B, 5.25% 9/1/28 (Assured Guaranty Corp. Insured) | | 1,235,000 | 1,308,445 |
| 5.75% 11/15/24 (Pre-Refunded to 11/15/18 @ 100) | | 480,000 | 502,776 |
| Tarrant County Cultural Ed. Facilities Fin. Corp. Rev. Series 2016 A, 5% 2/15/25 | | 165,000 | 198,153 |
| Texas Gen. Oblig.: | | | |
| Series 2017 A, 5% 10/1/33 | | 2,700,000 | 3,284,118 |
| Series 2017 B, 5% 10/1/36 | | 400,000 | 480,316 |
| 5% 4/1/25 (Pre-Refunded to 4/1/18 @ 100) | | 75,000 | 76,210 |
| Texas Private Activity Bond Surface Trans. Corp.: | | | |
| (LBJ Infrastructure Group LLC IH-635 Managed Lanes Proj.) Series 2010, 7% 6/30/40 | | 1,200,000 | 1,354,356 |
| Series 2013, 6.75% 6/30/43 (c) | | 2,400,000 | 2,779,224 |
| Texas State Univ. Sys. Fing. Rev. Series 2017 A: | | | |
| 5% 3/15/28 | | 1,280,000 | 1,569,766 |
| 5% 3/15/29 | | 1,035,000 | 1,258,591 |
| Univ. of Houston Univ. Revs. Series 2017 A: | | | |
| 5% 2/15/26 | | 3,170,000 | 3,895,486 |
| 5% 2/15/32 | | 1,505,000 | 1,776,321 |
| 5% 2/15/33 | | 2,500,000 | 2,938,475 |
| 5% 2/15/34 | | 1,000,000 | 1,171,330 |
| 5% 2/15/35 | | 1,000,000 | 1,167,280 |
| 5% 2/15/36 | | 2,000,000 | 2,328,120 |
| Univ. of North Texas Univ. Rev. Series 2017 A, 5% 4/15/32 | | 5,000,000 | 5,949,150 |
| Univ. of Texas Permanent Univ. Fund Rev. Series 2016 B, 5% 7/1/29 | | 395,000 | 477,986 |
|
| TOTAL TEXAS | | | 105,428,500 |
|
| Utah - 1.3% | | | |
| Salt Lake City Arpt. Rev. Series 2017 A: | | | |
| 5% 7/1/22 (c) | | 400,000 | 458,548 |
| 5% 7/1/27 (c) | | 1,645,000 | 2,016,655 |
| 5% 7/1/29 (c) | | 700,000 | 846,720 |
| 5% 7/1/30 (c) | | 500,000 | 599,110 |
| 5% 7/1/31 (c) | | 600,000 | 714,420 |
| 5% 7/1/32 (c) | | 700,000 | 828,919 |
| 5% 7/1/33 (c) | | 800,000 | 942,152 |
| 5% 7/1/34 (c) | | 700,000 | 820,512 |
| 5% 7/1/35 (c) | | 800,000 | 934,792 |
| 5% 7/1/36 (c) | | 1,100,000 | 1,281,324 |
| 5% 7/1/37 (c) | | 800,000 | 929,688 |
| 5% 7/1/42 (c) | | 4,800,000 | 5,526,048 |
|
| TOTAL UTAH | | | 15,898,888 |
|
| Vermont - 0.1% | | | |
| Vermont Edl. & Health Bldg. Fin. Agcy. Rev. (Champlain College Proj.) Series 2016 A: | | | |
| 5% 10/15/41 | | 600,000 | 657,534 |
| 5% 10/15/46 | | 1,000,000 | 1,089,540 |
|
| TOTAL VERMONT | | | 1,747,074 |
|
| Virginia - 0.4% | | | |
| Fredericksburg Econ. Dev. Auth. Rev. Series 2014, 5% 6/15/30 | | 1,250,000 | 1,413,463 |
| Stafford County Econ. Dev. Auth. Hosp. Facilities Rev. Series 2016: | | | |
| 4% 6/15/37 | | 120,000 | 121,393 |
| 5% 6/15/30 | | 400,000 | 454,816 |
| 5% 6/15/33 | | 425,000 | 474,411 |
| 5% 6/15/34 | | 805,000 | 892,882 |
| Virginia College Bldg. Auth. Edl. Facilities Rev. Series 2015 A, 5% 1/1/40 | | 500,000 | 570,585 |
| Winchester Econ. Dev. Auth. Series 2015, 5% 1/1/44 | | 1,000,000 | 1,111,070 |
|
| TOTAL VIRGINIA | | | 5,038,620 |
|
| Washington - 2.1% | | | |
| Port of Seattle Rev. Series 2016 B, 5% 10/1/30 (c) | | 1,000,000 | 1,169,600 |
| Port of Seattle Spl. Facility Rev. Series 2013, 5% 6/1/24 (c) | | 560,000 | 636,552 |
| Spokane Pub. Facilities District Hotel/Motel Tax & Sales/Use Tax Rev. Series 2013 B, 5% 12/1/27 | | 1,500,000 | 1,724,505 |
| Washington Gen. Oblig.: | | | |
| Series 2015 C: | | | |
| 5% 2/1/33 | | 670,000 | 785,220 |
| 5% 2/1/34 | | 1,000,000 | 1,166,900 |
| Series 2017 D, 5% 2/1/33 | | 900,000 | 1,074,042 |
| Series R 2017 A, 5% 8/1/33 | | 6,115,000 | 7,277,462 |
| Series R 97A, 0% 7/1/19 (Escrowed to Maturity) | | 1,200,000 | 1,175,376 |
| Series R-2015 B, 5% 7/1/24 | | 1,000,000 | 1,201,470 |
| Series R-2017 A: | | | |
| 5% 8/1/27 | | 400,000 | 490,448 |
| 5% 8/1/28 | | 400,000 | 487,240 |
| 5% 8/1/30 | | 400,000 | 482,304 |
| Washington Health Care Facilities Auth. Rev.: | | | |
| (Catholic Health Initiatives Proj.) Series 2008 D, 6.375% 10/1/36 | | 3,000,000 | 3,130,980 |
| (Overlake Hosp. Med. Ctr.) Series 2010, 5.7% 7/1/38 | | 2,270,000 | 2,475,185 |
| Series 2015, 5% 1/1/27 | | 700,000 | 826,889 |
| Washington Higher Ed. Facilities Auth. Rev. (Whitworth Univ. Proj.) Series 2016 A: | | | |
| 5% 10/1/36 | | 1,000,000 | 1,119,670 |
| 5% 10/1/40 | | 570,000 | 634,045 |
|
| TOTAL WASHINGTON | | | 25,857,888 |
|
| West Virginia - 0.2% | | | |
| West Virginia Econ. Dev. Auth. Solid Waste Disp. Facilities Rev. Bonds (Appalachian Pwr. Co. Amos Proj.) Series 2011 A, 1.7%, tender 9/1/20 (b)(c) | | 1,360,000 | 1,352,153 |
| West Virginia Univ. Revs. (West Virginia Univ. Projs.) Series 2014 A, 5% 10/1/44 | | 1,100,000 | 1,263,801 |
|
| TOTAL WEST VIRGINIA | | | 2,615,954 |
|
| Wisconsin - 0.8% | | | |
| Pub. Fin. Auth. Sr Liv Rev. (Mary's Woods At Marylhurst, Inc. Proj.): | | | |
| Series 2017 A: | | | |
| 5% 5/15/21 (a) | | 300,000 | 324,912 |
| 5% 5/15/28 (a) | | 300,000 | 329,574 |
| 5.25% 5/15/37 (a) | | 80,000 | 86,543 |
| 5.25% 5/15/42 (a) | | 100,000 | 107,447 |
| 5.25% 5/15/47 (a) | | 95,000 | 101,614 |
| 5.25% 5/15/52 (a) | | 185,000 | 197,136 |
| Series 2017 B-1 3.95% 11/15/24 (a) | | 80,000 | 82,256 |
| Series 2017 B-2, 3.5% 11/15/23 (a) | | 105,000 | 106,794 |
| Series 2017 B-3, 3% 11/15/22 (a) | | 145,000 | 146,573 |
| Pub. Fin. Auth. Wis Edl. Facilities Series 2016: | | | |
| 5% 1/1/37 | | 1,100,000 | 1,159,895 |
| 5% 1/1/42 | | 900,000 | 943,164 |
| Wisconsin Health & Edl. Facilities: | | | |
| Series 2010: | | | |
| 5.75% 7/1/30 | | 310,000 | 338,672 |
| 5.75% 7/1/30 (Pre-Refunded to 7/1/20 @ 100) | | 190,000 | 212,169 |
| Series 2014: | | | |
| 4% 5/1/33 | | 510,000 | 507,664 |
| 5% 5/1/22 | | 795,000 | 885,018 |
| Series 2016, 5% 2/15/29 | | 435,000 | 503,643 |
| Series 2017 A, 5% 9/1/31 | | 1,000,000 | 1,130,030 |
| Wisconsin Health & Edl. Facilities Auth. Rev.: | | | |
| (Agnesian HealthCare, Inc. Proj.): | | | |
| Series 2010, 5.5% 7/1/40 (Pre-Refunded to 7/1/20 @ 100) | | 500,000 | 555,775 |
| Series 2013 B, 5% 7/1/36 | | 925,000 | 1,017,842 |
| Series 2012, 5% 6/1/27 | | 300,000 | 332,061 |
|
| TOTAL WISCONSIN | | | 9,068,782 |
|
| Wyoming - 0.2% | | | |
| Campbell County Solid Waste Facilities Rev. (Basin Elec. Pwr. Coop. - Dry Fork Station Facilities Proj.) Series 2009 A, 5.75% 7/15/39 | | 1,700,000 | 1,802,323 |
| TOTAL MUNICIPAL BONDS | | | |
| (Cost $1,160,958,920) | | | 1,203,085,280 |
|
| Municipal Notes - 0.2% | | | |
| Illinois - 0.2% | | | |
| Chicago Board of Ed. Participating VRDN Series Floaters XG 01 08, 1.1% 11/7/17 (Liquidity Facility Barclays Bank PLC) (b)(g) | | | |
| (Cost $2,100,000) | | 2,100,000 | 2,100,000 |
| TOTAL INVESTMENT IN SECURITIES - 99.9% | | | |
| (Cost $1,163,058,920) | | | 1,205,185,280 |
| NET OTHER ASSETS (LIABILITIES) - 0.1% | | | 859,056 |
| NET ASSETS - 100% | | | $1,206,044,336 |
Security Type Abbreviations
VRDN – VARIABLE RATE DEMAND NOTE (A debt instrument that is payable upon demand, either daily, weekly or monthly)
Legend
(a) Security exempt from registration under Rule 144A of the Securities Act of 1933. These securities may be resold in transactions exempt from registration, normally to qualified institutional buyers. At the end of the period, the value of these securities amounted to $7,877,378 or 0.7% of net assets.
(b) Coupon rates for floating and adjustable rate securities reflect the rates in effect at period end.
(c) Private activity obligations whose interest is subject to the federal alternative minimum tax for individuals.
(d) Security initially issued in zero coupon form which converts to coupon form at a specified rate and date. The rate shown is the rate at period end.
(e) Security or a portion of the security purchased on a delayed delivery or when-issued basis.
(f) Coupon is indexed to a floating interest rate which may be multiplied by a specified factor and/or subject to caps or floors.
(g) Provides evidence of ownership in one or more underlying municipal bonds.
Affiliated Central Funds
Information regarding fiscal year to date income earned by the Fund from investments in Fidelity Central Funds is as follows:
| Fund | Income earned |
| Fidelity Municipal Cash Central Fund | $60,170 |
| Total | $60,170 |
Investment Valuation
All investments are categorized as Level 2 under the Fair Value Hierarchy. The inputs or methodology used for valuing securities may not be an indication of the risk associated with investing in those securities. For more information on valuation inputs please refer to the Investment Valuation section in the accompanying Notes to Financial Statements.
Other Information
The distribution of municipal securities by revenue source, as a percentage of total Net Assets, is as follows (Unaudited):
| General Obligations | 32.8% |
| Transportation | 26.4% |
| Health Care | 16.2% |
| Education | 6.3% |
| Electric Utilities | 5.1% |
| Others* (Individually Less Than 5%) | 13.2% |
| | 100.0% |
* Includes net other assets
See accompanying notes which are an integral part of the financial statements.
Financial Statements
Statement of Assets and Liabilities
| | | October 31, 2017 |
| Assets | | |
Investment in securities, at value — See accompanying schedule:
Unaffiliated issuers (cost $1,163,058,920) | | $1,205,185,280 |
| Cash | | 26,181,852 |
| Receivable for investments sold | | 2,467,126 |
| Receivable for fund shares sold | | 1,266,457 |
| Interest receivable | | 14,174,732 |
| Prepaid expenses | | 2,991 |
| Receivable from investment adviser for expense reductions | | 6,778 |
| Other receivables | | 3,932 |
| Total assets | | 1,249,289,148 |
| Liabilities | | |
| Payable for investments purchased | | |
| Regular delivery | $4,247,714 | |
| Delayed delivery | 34,766,382 | |
| Payable for fund shares redeemed | 2,503,128 | |
| Distributions payable | 934,009 | |
| Accrued management fee | 358,167 | |
| Distribution and service plan fees payable | 179,178 | |
| Other affiliated payables | 207,768 | |
| Other payables and accrued expenses | 48,466 | |
| Total liabilities | | 43,244,812 |
| Net Assets | | $1,206,044,336 |
| Net Assets consist of: | | |
| Paid in capital | | $1,150,611,539 |
| Undistributed net investment income | | 535,274 |
| Accumulated undistributed net realized gain (loss) on investments | | 12,771,163 |
| Net unrealized appreciation (depreciation) on investments | | 42,126,360 |
| Net Assets | | $1,206,044,336 |
| Calculation of Maximum Offering Price | | |
| Class A: | | |
| Net Asset Value and redemption price per share ($250,004,299 ÷ 18,866,788 shares) | | $13.25 |
| Maximum offering price per share (100/96.00 of $13.25) | | $13.80 |
| Class M: | | |
| Net Asset Value and redemption price per share ($163,496,966 ÷ 12,301,005 shares) | | $13.29 |
| Maximum offering price per share (100/96.00 of $13.29) | | $13.84 |
| Class C: | | |
| Net Asset Value and offering price per share ($110,091,834 ÷ 8,288,612 shares)(a) | | $13.28 |
| Class I: | | |
| Net Asset Value, offering price and redemption price per share ($682,451,237 ÷ 51,782,879 shares) | | $13.18 |
(a) Redemption price per share is equal to net asset value less any applicable contingent deferred sales charge.
See accompanying notes which are an integral part of the financial statements.
Statement of Operations
| | | Year ended October 31, 2017 |
| Investment Income | | |
| Interest | | $44,196,274 |
| Income from Fidelity Central Funds | | 60,170 |
| Total income | | 44,256,444 |
| Expenses | | |
| Management fee | $4,627,397 | |
| Transfer agent fees | 2,162,826 | |
| Distribution and service plan fees | 2,326,907 | |
| Accounting fees and expenses | 252,883 | |
| Custodian fees and expenses | 11,363 | |
| Independent trustees' fees and expenses | 4,948 | |
| Registration fees | 90,926 | |
| Audit | 56,114 | |
| Legal | 3,274 | |
| Miscellaneous | 9,985 | |
| Total expenses before reductions | 9,546,623 | |
| Expense reductions | (153,482) | 9,393,141 |
| Net investment income (loss) | | 34,863,303 |
| Realized and Unrealized Gain (Loss) | | |
| Net realized gain (loss) on: | | |
| Investment securities: | | |
| Unaffiliated issuers | 15,186,147 | |
| Total net realized gain (loss) | | 15,186,147 |
| Change in net unrealized appreciation (depreciation) on investment securities | | (21,033,654) |
| Net gain (loss) | | (5,847,507) |
| Net increase (decrease) in net assets resulting from operations | | $29,015,796 |
See accompanying notes which are an integral part of the financial statements.
Statement of Changes in Net Assets
| | Year ended October 31, 2017 | Year ended October 31, 2016 |
| Increase (Decrease) in Net Assets | | |
| Operations | | |
| Net investment income (loss) | $34,863,303 | $32,593,562 |
| Net realized gain (loss) | 15,186,147 | 14,308,316 |
| Change in net unrealized appreciation (depreciation) | (21,033,654) | (3,015,733) |
| Net increase (decrease) in net assets resulting from operations | 29,015,796 | 43,886,145 |
| Distributions to shareholders from net investment income | (34,803,295) | (32,549,100) |
| Distributions to shareholders from net realized gain | (13,766,589) | (7,430,609) |
| Total distributions | (48,569,884) | (39,979,709) |
| Share transactions - net increase (decrease) | 7,184,992 | 202,876,476 |
| Total increase (decrease) in net assets | (12,369,096) | 206,782,912 |
| Net Assets | | |
| Beginning of period | 1,218,413,432 | 1,011,630,520 |
| End of period | $1,206,044,336 | $1,218,413,432 |
| Other Information | | |
| Undistributed net investment income end of period | $535,274 | $585,890 |
See accompanying notes which are an integral part of the financial statements.
Financial Highlights
Fidelity Advisor Municipal Income Fund Class A
| Years ended October 31, | 2017 | 2016 | 2015 | 2014 | 2013 |
| Selected Per–Share Data | | | | | |
| Net asset value, beginning of period | $13.53 | $13.47 | $13.59 | $13.00 | $13.74 |
| Income from Investment Operations | | | | | |
| Net investment income (loss)A | .346 | .389 | .438 | .462 | .453 |
| Net realized and unrealized gain (loss) | (.126) | .159 | (.076) | .682 | (.738) |
| Total from investment operations | .220 | .548 | .362 | 1.144 | (.285) |
| Distributions from net investment income | (.345) | (.390) | (.439) | (.461) | (.451) |
| Distributions from net realized gain | (.155) | (.098) | (.043) | (.093) | (.004) |
| Total distributions | (.500) | (.488) | (.482) | (.554) | (.455) |
| Net asset value, end of period | $13.25 | $13.53 | $13.47 | $13.59 | $13.00 |
| Total ReturnB,C | 1.76% | 4.11% | 2.71% | 9.02% | (2.12)% |
| Ratios to Average Net AssetsD,E | | | | | |
| Expenses before reductions | .81% | .81% | .81% | .79% | .77% |
| Expenses net of fee waivers, if any | .80% | .80% | .80% | .79% | .77% |
| Expenses net of all reductions | .80% | .80% | .80% | .79% | .77% |
| Net investment income (loss) | 2.63% | 2.86% | 3.25% | 3.49% | 3.36% |
| Supplemental Data | | | | | |
| Net assets, end of period (000 omitted) | $250,004 | $397,834 | $374,081 | $325,539 | $335,492 |
| Portfolio turnover rateF | 46% | 22% | 14% | 10% | 12% |
A Calculated based on average shares outstanding during the period.
B Total returns would have been lower if certain expenses had not been reduced during the applicable periods shown.
C Total returns do not include the effect of the sales charges.
D Fees and expenses of any underlying Fidelity Central Funds are not included in the Fund's expense ratio. The Fund indirectly bears its proportionate share of the expenses of any underlying Fidelity Central Funds.
E Expense ratios reflect operating expenses of the class. Expenses before reductions do not reflect amounts reimbursed by the investment adviser or reductions from expense offset arrangements and do not represent the amount paid by the class during periods when reimbursements or reductions occur. Expenses net of fee waivers reflect expenses after reimbursement by the investment adviser but prior to reductions from expense offset arrangements. Expenses net of all reductions represent the net expenses paid by the class.
F Amount does not include the portfolio activity of any underlying Fidelity Central Funds.
See accompanying notes which are an integral part of the financial statements.
Fidelity Advisor Municipal Income Fund Class M
| Years ended October 31, | 2017 | 2016 | 2015 | 2014 | 2013 |
| Selected Per–Share Data | | | | | |
| Net asset value, beginning of period | $13.58 | $13.51 | $13.63 | $13.03 | $13.77 |
| Income from Investment Operations | | | | | |
| Net investment income (loss)A | .347 | .392 | .443 | .466 | .454 |
| Net realized and unrealized gain (loss) | (.135) | .169 | (.079) | .691 | (.739) |
| Total from investment operations | .212 | .561 | .364 | 1.157 | (.285) |
| Distributions from net investment income | (.347) | (.393) | (.441) | (.464) | (.451) |
| Distributions from net realized gain | (.155) | (.098) | (.043) | (.093) | (.004) |
| Total distributions | (.502) | (.491) | (.484) | (.557) | (.455) |
| Net asset value, end of period | $13.29 | $13.58 | $13.51 | $13.63 | $13.03 |
| Total ReturnB,C | 1.69% | 4.20% | 2.72% | 9.10% | (2.12)% |
| Ratios to Average Net AssetsD,E | | | | | |
| Expenses before reductions | .79% | .79% | .79% | .78% | .77% |
| Expenses net of fee waivers, if any | .79% | .79% | .79% | .78% | .77% |
| Expenses net of all reductions | .79% | .79% | .79% | .78% | .77% |
| Net investment income (loss) | 2.64% | 2.87% | 3.26% | 3.51% | 3.37% |
| Supplemental Data | | | | | |
| Net assets, end of period (000 omitted) | $163,497 | $181,049 | $170,263 | $204,607 | $207,208 |
| Portfolio turnover rateF | 46% | 22% | 14% | 10% | 12% |
A Calculated based on average shares outstanding during the period.
B Total returns would have been lower if certain expenses had not been reduced during the applicable periods shown.
C Total returns do not include the effect of the sales charges.
D Fees and expenses of any underlying Fidelity Central Funds are not included in the Fund's expense ratio. The Fund indirectly bears its proportionate share of the expenses of any underlying Fidelity Central Funds.
E Expense ratios reflect operating expenses of the class. Expenses before reductions do not reflect amounts reimbursed by the investment adviser or reductions from expense offset arrangements and do not represent the amount paid by the class during periods when reimbursements or reductions occur. Expenses net of fee waivers reflect expenses after reimbursement by the investment adviser but prior to reductions from expense offset arrangements. Expenses net of all reductions represent the net expenses paid by the class.
F Amount does not include the portfolio activity of any underlying Fidelity Central Funds.
See accompanying notes which are an integral part of the financial statements.
Fidelity Advisor Municipal Income Fund Class C
| Years ended October 31, | 2017 | 2016 | 2015 | 2014 | 2013 |
| Selected Per–Share Data | | | | | |
| Net asset value, beginning of period | $13.57 | $13.50 | $13.62 | $13.03 | $13.77 |
| Income from Investment Operations | | | | | |
| Net investment income (loss)A | .247 | .287 | .339 | .363 | .351 |
| Net realized and unrealized gain (loss) | (.135) | .169 | (.078) | .681 | (.739) |
| Total from investment operations | .112 | .456 | .261 | 1.044 | (.388) |
| Distributions from net investment income | (.247) | (.288) | (.338) | (.361) | (.348) |
| Distributions from net realized gain | (.155) | (.098) | (.043) | (.093) | (.004) |
| Total distributions | (.402) | (.386) | (.381) | (.454) | (.352) |
| Net asset value, end of period | $13.28 | $13.57 | $13.50 | $13.62 | $13.03 |
| Total ReturnB,C | .93% | 3.41% | 1.94% | 8.19% | (2.86)% |
| Ratios to Average Net AssetsD,E | | | | | |
| Expenses before reductions | 1.56% | 1.56% | 1.56% | 1.55% | 1.54% |
| Expenses net of fee waivers, if any | 1.55% | 1.55% | 1.55% | 1.55% | 1.54% |
| Expenses net of all reductions | 1.55% | 1.55% | 1.55% | 1.55% | 1.54% |
| Net investment income (loss) | 1.88% | 2.10% | 2.50% | 2.74% | 2.60% |
| Supplemental Data | | | | | |
| Net assets, end of period (000 omitted) | $110,092 | $137,050 | $117,528 | $118,088 | $123,530 |
| Portfolio turnover rateF | 46% | 22% | 14% | 10% | 12% |
A Calculated based on average shares outstanding during the period.
B Total returns would have been lower if certain expenses had not been reduced during the applicable periods shown.
C Total returns do not include the effect of the contingent deferred sales charge.
D Fees and expenses of any underlying Fidelity Central Funds are not included in the Fund's expense ratio. The Fund indirectly bears its proportionate share of the expenses of any underlying Fidelity Central Funds.
E Expense ratios reflect operating expenses of the class. Expenses before reductions do not reflect amounts reimbursed by the investment adviser or reductions from expense offset arrangements and do not represent the amount paid by the class during periods when reimbursements or reductions occur. Expenses net of fee waivers reflect expenses after reimbursement by the investment adviser but prior to reductions from expense offset arrangements. Expenses net of all reductions represent the net expenses paid by the class.
F Amount does not include the portfolio activity of any underlying Fidelity Central Funds.
See accompanying notes which are an integral part of the financial statements.
Fidelity Advisor Municipal Income Fund Class I
| Years ended October 31, | 2017 | 2016 | 2015 | 2014 | 2013 |
| Selected Per–Share Data | | | | | |
| Net asset value, beginning of period | $13.46 | $13.40 | $13.51 | $12.93 | $13.67 |
| Income from Investment Operations | | | | | |
| Net investment income (loss)A | .374 | .420 | .470 | .493 | .481 |
| Net realized and unrealized gain (loss) | (.124) | .160 | (.067) | .674 | (.735) |
| Total from investment operations | .250 | .580 | .403 | 1.167 | (.254) |
| Distributions from net investment income | (.375) | (.422) | (.470) | (.494) | (.482) |
| Distributions from net realized gain | (.155) | (.098) | (.043) | (.093) | (.004) |
| Total distributions | (.530) | (.520) | (.513) | (.587) | (.486) |
| Net asset value, end of period | $13.18 | $13.46 | $13.40 | $13.51 | $12.93 |
| Total ReturnB | 2.01% | 4.38% | 3.03% | 9.27% | (1.90)% |
| Ratios to Average Net AssetsC,D | | | | | |
| Expenses before reductions | .57% | .56% | .57% | .54% | .54% |
| Expenses net of fee waivers, if any | .55% | .55% | .55% | .54% | .54% |
| Expenses net of all reductions | .55% | .55% | .55% | .54% | .54% |
| Net investment income (loss) | 2.88% | 3.10% | 3.50% | 3.75% | 3.60% |
| Supplemental Data | | | | | |
| Net assets, end of period (000 omitted) | $682,451 | $502,479 | $346,521 | $312,038 | $290,117 |
| Portfolio turnover rateE | 46% | 22% | 14% | 10% | 12% |
A Calculated based on average shares outstanding during the period.
B Total returns would have been lower if certain expenses had not been reduced during the applicable periods shown.
C Fees and expenses of any underlying Fidelity Central Funds are not included in the Fund's expense ratio. The Fund indirectly bears its proportionate share of the expenses of any underlying Fidelity Central Funds.
D Expense ratios reflect operating expenses of the class. Expenses before reductions do not reflect amounts reimbursed by the investment adviser or reductions from expense offset arrangements and do not represent the amount paid by the class during periods when reimbursements or reductions occur. Expenses net of fee waivers reflect expenses after reimbursement by the investment adviser but prior to reductions from expense offset arrangements. Expenses net of all reductions represent the net expenses paid by the class.
E Amount does not include the portfolio activity of any underlying Fidelity Central Funds.
See accompanying notes which are an integral part of the financial statements.
Notes to Financial Statements
For the period ended October 31, 2017
1. Organization.
Fidelity Advisor Municipal Income Fund (the Fund) is a fund of Fidelity Advisor Series II (the Trust) and is authorized to issue an unlimited number of shares. The Trust is registered under the Investment Company Act of 1940, as amended (the 1940 Act), as an open-end management investment company organized as a Massachusetts business trust. The Fund offers Class A, Class M (formerly Class T), Class C and Class I shares, each of which has equal rights as to assets and voting privileges. Each class has exclusive voting rights with respect to matters that affect that class.
After the close of business on June 24, 2016, all outstanding Class B shares were converted to Class A shares. All prior fiscal period dollar and share amounts for Class B presented in the Notes to Financial Statements are for the period November 1, 2015 through June 24, 2016.
2. Investments in Fidelity Central Funds.
The Fund invests in Fidelity Central Funds, which are open-end investment companies generally available only to other investment companies and accounts managed by the investment adviser and its affiliates. The Fund's Schedule of Investments lists each of the Fidelity Central Funds held as of period end, if any, as an investment of the Fund, but does not include the underlying holdings of each Fidelity Central Fund. As an Investing Fund, the Fund indirectly bears its proportionate share of the expenses of the underlying Fidelity Central Funds.
The Money Market Central Funds seek preservation of capital and current income and are managed by Fidelity Investments Money Management, Inc. (FIMM), an affiliate of the investment adviser. Annualized expenses of the Money Market Central Funds as of their most recent shareholder report date are less than .005%.
A complete unaudited list of holdings for each Fidelity Central Fund is available upon request or at the Securities and Exchange Commission (the SEC) website at www.sec.gov. In addition, the financial statements of the Fidelity Central Funds, which are not covered by the Fund's Report of Independent Registered Public Accounting Firm, are available on the SEC website or upon request.
3. Significant Accounting Policies.
The Fund is an investment company and applies the accounting and reporting guidance of the Financial Accounting Standards Board (FASB) Accounting Standards Codification Topic 946 Financial Services – Investments Companies. The financial statements have been prepared in conformity with accounting principles generally accepted in the United States of America (GAAP), which require management to make certain estimates and assumptions at the date of the financial statements. Actual results could differ from those estimates. Subsequent events, if any, through the date that the financial statements were issued have been evaluated in the preparation of the financial statements. The following summarizes the significant accounting policies of the Fund:
Investment Valuation. Investments are valued as of 4:00 p.m. Eastern time on the last calendar day of the period. The Board of Trustees (the Board) has delegated the day to day responsibility for the valuation of the Fund's investments to the Fair Value Committee (the Committee) established by the Fund's investment adviser. In accordance with valuation policies and procedures approved by the Board, the Fund attempts to obtain prices from one or more third party pricing vendors or brokers to value its investments. When current market prices, quotations or currency exchange rates are not readily available or reliable, investments will be fair valued in good faith by the Committee, in accordance with procedures adopted by the Board. Factors used in determining fair value vary by investment type and may include market or investment specific events, changes in interest rates and credit quality. The frequency with which these procedures are used cannot be predicted and they may be utilized to a significant extent. The Committee oversees the Fund's valuation policies and procedures and reports to the Board on the Committee's activities and fair value determinations. The Board monitors the appropriateness of the procedures used in valuing the Fund's investments and ratifies the fair value determinations of the Committee.
The Fund categorizes the inputs to valuation techniques used to value its investments into a disclosure hierarchy consisting of three levels as shown below:
- Level 1 – quoted prices in active markets for identical investments
- Level 2 – other significant observable inputs (including quoted prices for similar investments, interest rates, prepayment speeds, etc.)
- Level 3 – unobservable inputs (including the Fund's own assumptions based on the best information available)
Valuation techniques used to value the Fund's investments by major category are as follows:
Debt securities, including restricted securities, are valued based on evaluated prices received from third party pricing vendors or from brokers who make markets in such securities. Municipal securities are valued by pricing vendors who utilize matrix pricing which considers yield or price of bonds of comparable quality, coupon, maturity and type or by broker-supplied prices. When independent prices are unavailable or unreliable, debt securities may be valued utilizing pricing methodologies which consider similar factors that would be used by third party pricing vendors. Debt securities are generally categorized as Level 2 in the hierarchy but may be Level 3 depending on the circumstances.
Investments in open-end mutual funds, including the Fidelity Central Funds, are valued at their closing net asset value (NAV) each business day and are categorized as Level 1 in the hierarchy.
Changes in valuation techniques may result in transfers in or out of an assigned level within the disclosure hierarchy.
Investment Transactions and Income. For financial reporting purposes, the Fund's investment holdings and NAV include trades executed through the end of the last business day of the period. The NAV per share for processing shareholder transactions is calculated as of the close of business of the New York Stock Exchange (NYSE), normally 4:00 p.m. Eastern time and includes trades executed through the end of the prior business day. Income and capital gain distributions from Fidelity Central Funds, if any, are recorded on the ex-dividend date. Interest income is accrued as earned and includes coupon interest and amortization of premium and accretion of discount on debt securities as applicable. Gains and losses on securities sold are determined on the basis of identified cost. Debt obligations may be placed on non-accrual status and related interest income may be reduced by ceasing current accruals and writing off interest receivables when the collection of all or a portion of interest has become doubtful based on consistently applied procedures. A debt obligation is removed from non-accrual status when the issuer resumes interest payments or when collectability of interest is reasonably assured.
Class Allocations and Expenses. Investment income, realized and unrealized capital gains and losses, common expenses of the Fund, and certain fund-level expense reductions, if any, are allocated daily on a pro-rata basis to each class based on the relative net assets of each class to the total net assets of the Fund. Each class differs with respect to transfer agent and distribution and service plan fees incurred. Certain expense reductions may also differ by class. For the reporting period, the allocated portion of income and expenses to each class as a percent of its average net assets may vary due to the timing of recording these transactions in relation to fluctuating net assets of the classes. Expenses directly attributable to a fund are charged to that fund. Expenses attributable to more than one fund are allocated among the respective funds on the basis of relative net assets or other appropriate methods. Expense estimates are accrued in the period to which they relate and adjustments are made when actual amounts are known.
Income Tax Information and Distributions to Shareholders. Each year, the Fund intends to qualify as a regulated investment company under Subchapter M of the Internal Revenue Code, including distributing substantially all of its taxable income and realized gains. As a result, no provision for U.S. Federal income taxes is required. As of October 31, 2017, the Fund did not have any unrecognized tax benefits in the financial statements; nor is the Fund aware of any tax positions for which it is reasonably possible that the total amounts of unrecognized tax benefits will significantly change in the next twelve months. The Fund files a U.S. federal tax return, in addition to state and local tax returns as required. The Fund's federal income tax returns are subject to examination by the Internal Revenue Service (IRS) for a period of three fiscal years after they are filed. State and local tax returns may be subject to examination for an additional fiscal year depending on the jurisdiction.
Dividends are declared and recorded daily and paid monthly from net investment income. Distributions from realized gains, if any, are declared and recorded on the ex-dividend date. Income dividends and capital gain distributions are declared separately for each class. Income and capital gain distributions are determined in accordance with income tax regulations, which may differ from GAAP. In addition, the Fund claimed a portion of the payment made to redeeming shareholders as a distribution for income tax purposes.
Capital accounts within the financial statements are adjusted for permanent book-tax differences. These adjustments have no impact on net assets or the results of operations. Capital accounts are not adjusted for temporary book-tax differences which will reverse in a subsequent period.
Book-tax differences are primarily due to market discount and deferred trustees compensation.
The Fund purchases municipal securities whose interest, in the opinion of the issuer, is free from federal income tax. There is no assurance that the IRS will agree with this opinion. In the event the IRS determines that the issuer does not comply with relevant tax requirements, interest payments from a security could become federally taxable, possibly retroactively to the date the security was issued.
As of period end, the cost and unrealized appreciation (depreciation) in securities, and derivatives if applicable, for federal income tax purposes were as follows:
| Gross unrealized appreciation | $46,359,186 |
| Gross unrealized depreciation | (3,861,962) |
| Net unrealized appreciation (depreciation) | $42,497,224 |
| Tax Cost | $1,162,688,056 |
The tax-based components of distributable earnings as of period end were as follows:
| Undistributed tax-exempt income | $165,015 |
| Undistributed long-term capital gain | $12,771,162 |
| Net unrealized appreciation (depreciation) on securities and other investments | $42,497,224 |
The tax character of distributions paid was as follows:
| | October 31, 2017 | October 31, 2016 |
| Tax-exempt Income | $34,803,295 | $32,549,100 |
| Long-term Capital Gains | 13,766,589 | 7,430,609 |
| Total | $48,569,884 | $ 39,979,709 |
Delayed Delivery Transactions and When-Issued Securities. During the period, the Fund transacted in securities on a delayed delivery or when-issued basis. Payment and delivery may take place after the customary settlement period for that security. The price of the underlying securities and the date when the securities will be delivered and paid for are fixed at the time the transaction is negotiated. The securities purchased on a delayed delivery or when-issued basis are identified as such in the Fund's Schedule of Investments. The Fund may receive compensation for interest forgone in the purchase of a delayed delivery or when-issued security. With respect to purchase commitments, the Fund identifies securities as segregated in its records with a value at least equal to the amount of the commitment. Losses may arise due to changes in the value of the underlying securities or if the counterparty does not perform under the contract's terms, or if the issuer does not issue the securities due to political, economic, or other factors.
Restricted Securities. The Fund may invest in securities that are subject to legal or contractual restrictions on resale. These securities generally may be resold in transactions exempt from registration or to the public if the securities are registered. Disposal of these securities may involve time-consuming negotiations and expense, and prompt sale at an acceptable price may be difficult. Information regarding restricted securities is included at the end of the Fund's Schedule of Investments.
New Accounting Pronouncement. In March 2017, the Financial Accounting Standards Board (FASB) issued an Accounting Standards Update (ASU), ASU 2017-08, which amends the amortization period for certain callable debt securities that are held at a premium. The amendment requires the premium to be amortized to the earliest call date. The amendments do not require an accounting change for securities held at a discount. The ASU is effective for annual periods beginning after December 15, 2018. Management is currently evaluating the potential impact of these changes to the financial statements.
4. Purchases and Sales of Investments.
Purchases and sales of securities, other than short-term securities, aggregated $585,709,900 and $573,577,583, respectively.
5. Fees and Other Transactions with Affiliates.
Management Fee. Fidelity Management & Research Company (the investment adviser) and its affiliates provide the Fund with investment management related services for which the Fund pays a monthly management fee. The management fee is the sum of an individual fund fee rate that is based on an annual rate of .25% of the Fund's average net assets and an annualized group fee rate that averaged .11% during the period. The group fee rate is based upon the average net assets of all the mutual funds advised by the investment adviser, including any mutual funds previously advised by the investment adviser that are currently advised by Fidelity SelectCo, LLC, an affiliate of the investment adviser. The group fee rate decreases as assets under management increase and increases as assets under management decrease. For the reporting period, the total annual management fee rate was .36% of the Fund's average net assets.
Distribution and Service Plan Fees. In accordance with Rule 12b-1 of the 1940 Act, the Fund has adopted separate Distribution and Service Plans for each class of shares. Certain classes pay Fidelity Distributors Corporation (FDC), an affiliate of the investment adviser, separate Distribution and Service Fees, each of which is based on an annual percentage of each class' average net assets. In addition, FDC may pay financial intermediaries for selling shares of the Fund and providing shareholder support services. For the period, the Distribution and Service Fee rates, total fees and amounts retained by FDC were as follows:
| | Distribution
Fee | Service
Fee | Total Fees | Retained
by FDC |
| Class A | -% | .25% | $729,708 | $12,042 |
| Class M | -% | .25% | 418,776 | – |
| Class C | .75% | .25% | 1,178,423 | 109,454 |
| | | | $2,326,907 | $121,496 |
Sales Load. FDC may receive a front-end sales charge of up to 4.00% for selling Class A shares and Class M shares, some of which is paid to financial intermediaries for selling shares of the Fund. Depending on the holding period, FDC may receive contingent deferred sales charges levied on Class A, Class M and Class C redemptions. The deferred sales charges are 1.00% for Class C shares, .75% for certain purchases of Class A shares and .25% for certain purchases of Class M shares.
For the period, sales charge amounts retained by FDC were as follows:
| | Retained
by FDC |
| Class A | $24,116 |
| Class M | 5,132 |
| Class C(a) | 17,433 |
| | $46,681 |
(a) When Class C shares are initially sold, FDC pays commissions from its own resources to financial intermediaries through which the sales are made.
Transfer Agent Fees. Fidelity Investments Institutional Operations Company, Inc. (FIIOC), an affiliate of the investment adviser, is the transfer, dividend disbursing and shareholder servicing agent for the Fund. FIIOC receives account fees and asset-based fees that vary according to the account size and type of account of the shareholders of the respective classes of the Fund. FIIOC pays for typesetting, printing and mailing of shareholder reports, except proxy statements. For the period, transfer agent fees for each class were as follows:
| | Amount | % of
Class-Level Average
Net Assets |
| Class A | $477,221 | .16 |
| Class M | 250,438 | .15 |
| Class C | 192,397 | .16 |
| Class I | 1,242,770 | .17 |
| | $2,162,826 | |
Accounting Fees. Fidelity Service Company, Inc. (FSC), an affiliate of the investment adviser, maintains the Fund's accounting records. The fee is based on the level of average net assets for each month.
Interfund Trades. The Fund may purchase from or sell securities to other Fidelity Funds under procedures adopted by the Board. The procedures have been designed to ensure these interfund trades are executed in accordance with Rule 17a-7 of the 1940 Act. Interfund trades are included within the respective purchases and sales amounts shown in the Purchases and Sales of Investments note.
6. Committed Line of Credit.
The Fund participates with other funds managed by the investment adviser or an affiliate in a $4.25 billion credit facility (the "line of credit") to be utilized for temporary or emergency purposes to fund shareholder redemptions or for other short-term liquidity purposes. The Fund has agreed to pay commitment fees on its pro-rata portion of the line of credit, which amounted to $4,125 and is reflected in Miscellaneous expenses on the Statement of Operations. During the period, the Fund did not borrow on this line of credit.
7. Expense Reductions.
The investment adviser voluntarily agreed to reimburse each class to the extent annual operating expenses exceeded certain levels of average net assets as noted in the table below. Some expenses, for example the compensation of the independent Trustees, and certain miscellaneous expenses such as proxy and shareholder meeting expenses, including commitment fees, are excluded from this reimbursement.
The following classes were in reimbursement during the period:
| | Expense
Limitations | Reimbursement |
| Class A | .80% | $21,755 |
| Class C | 1.55% | 6,985 |
| Class I | .55% | 106,628 |
| | | $135,368 |
In addition, through arrangements with the Fund's custodian, credits realized as a result of certain uninvested cash balances were used to reduce the Fund's expenses. During the period, these credits reduced the Fund's custody expenses by $11,363.
In addition, during the period the investment adviser reimbursed and/or waived a portion of fund-level operating expenses in the amount of $6,751.
8. Distributions to Shareholders.
Distributions to shareholders of each class were as follows:
| | Year ended October 31, 2017 | Year ended October 31, 2016 |
| From net investment income | | |
| Class A | $7,734,440 | $11,430,094 |
| Class M | 4,427,300 | 5,088,206 |
| Class B | – | 40,433 |
| Class C | 2,232,332 | 2,775,558 |
| Class I | 20,409,223 | 13,214,809 |
| Total | $34,803,295 | $32,549,100 |
| From net realized gain | | |
| Class A | $4,461,010 | $2,737,715 |
| Class M | 2,062,872 | 1,238,857 |
| Class B | – | 21,921 |
| Class C | 1,520,681 | 861,022 |
| Class I | 5,722,026 | 2,571,094 |
| Total | $13,766,589 | $7,430,609 |
9. Share Transactions.
Share transactions for each class were as follows and may contain automatic conversions between classes or exchanges between affiliated funds:
| | Shares | Shares | Dollars | Dollars |
| | Year ended October 31, 2017 | Year ended October 31, 2016 | Year ended October 31, 2017 | Year ended October 31, 2016 |
| Class A | | | | |
| Shares sold | 3,283,420 | 8,172,855 | $42,699,157 | $111,082,108 |
| Reinvestment of distributions | 857,107 | 925,359 | 11,115,193 | 12,571,741 |
| Shares redeemed | (14,668,589) | (7,480,454) | (189,601,990) | (101,888,648) |
| Net increase (decrease) | (10,528,062) | 1,617,760 | $(135,787,640) | $21,765,201 |
| Class M | | | | |
| Shares sold | 1,387,096 | 1,738,732 | $18,166,841 | $23,802,963 |
| Reinvestment of distributions | 445,400 | 399,450 | 5,806,246 | 5,443,122 |
| Shares redeemed | (2,868,248) | (1,406,154) | (37,435,781) | (19,233,053) |
| Net increase (decrease) | (1,035,752) | 732,028 | $(13,462,694) | $10,013,032 |
| Class B | | | | |
| Shares sold | – | 4,634 | $– | $62,699 |
| Reinvestment of distributions | – | 3,379 | – | 45,427 |
| Shares redeemed | – | (249,168) | – | (3,404,715) |
| Net increase (decrease) | – | (241,155) | $– | $(3,296,589) |
| Class C | | | | |
| Shares sold | 841,216 | 2,706,356 | $11,023,247 | $36,910,696 |
| Reinvestment of distributions | 239,723 | 217,205 | 3,117,472 | 2,956,187 |
| Shares redeemed | (2,894,434) | (1,527,402) | (37,830,231) | (20,855,277) |
| Net increase (decrease) | (1,813,495) | 1,396,159 | $(23,689,512) | $19,011,606 |
| Class I | | | | |
| Shares sold | 43,894,804 | 18,349,252 | $565,658,448 | $249,013,755 |
| Reinvestment of distributions | 1,346,485 | 908,351 | 17,426,297 | 12,290,257 |
| Shares redeemed | (30,783,984) | (7,799,446) | (402,959,907) | (105,920,786) |
| Net increase (decrease) | 14,457,305 | 11,458,157 | $180,124,838 | $155,383,226 |
10. Proposed Reorganization.
The Board of Trustees of the Fund approved an Agreement and Plan of Reorganization (the Agreement) between the Fund and Fidelity Municipal Income Fund. The Agreement provides for the transfer of all the assets and the assumption of all the liabilities of the Fund in exchange for corresponding shares of the Fidelity Municipal Income Fund equal in value to the net assets of the Fund on the day the reorganization is effective. The reorganization does not require shareholder approval and is expected to become effective in March 2018. The reorganization is expected to qualify as a tax-free transaction for federal income tax purposes with no gain or loss recognized by the funds or their shareholders.
11. Other.
The Fund's organizational documents provide former and current trustees and officers with a limited indemnification against liabilities arising in connection with the performance of their duties to the Fund. In the normal course of business, the Fund may also enter into contracts that provide general indemnifications. The Fund's maximum exposure under these arrangements is unknown as this would be dependent on future claims that may be made against the Fund. The risk of material loss from such claims is considered remote.
Report of Independent Registered Public Accounting Firm
To the Trustees of Fidelity Advisor Series II and Shareholders of Fidelity Advisor Municipal Income Fund:
In our opinion, the accompanying statement of assets and liabilities, including the schedule of investments, and the related statements of operations and of changes in net assets and the financial highlights present fairly, in all material respects, the financial position of Fidelity Advisor Municipal Income Fund (a fund of Fidelity Advisor Series II) (the "Fund") as of October 31, 2017, the results of its operations for the year then ended, the changes in its net assets for each of the two years in the period then ended and the financial highlights for each of the five years in the period then ended, in conformity with accounting principles generally accepted in the United States of America. These financial statements and financial highlights (hereafter referred to as “financial statements”) are the responsibility of the Fund's management. Our responsibility is to express an opinion on these financial statements based on our audits. We conducted our audits of these financial statements in accordance with the standards of the Public Company Accounting Oversight Board (United States). Those standards require that we plan and perform the audit to obtain reasonable assurance about whether the financial statements are free of material misstatement. An audit includes examining, on a test basis, evidence supporting the amounts and disclosures in the financial statements, assessing the accounting principles used and significant estimates made by management, and evaluating the overall financial statement presentation. Our procedures included confirmation of securities owned as of October 31, 2017 by correspondence with the custodian and brokers; when replies were not received from brokers, we performed other auditing procedures. We believe that our audits provide a reasonable basis for our opinion.
PricewaterhouseCoopers LLP
Boston, Massachusetts
December 14, 2017
Trustees and Officers
The Trustees, Members of the Advisory Board (if any), and officers of the trust and fund, as applicable, are listed below. The Board of Trustees governs the fund and is responsible for protecting the interests of shareholders. The Trustees are experienced executives who meet periodically throughout the year to oversee the fund's activities, review contractual arrangements with companies that provide services to the fund, oversee management of the risks associated with such activities and contractual arrangements, and review the fund's performance. Each of the Trustees oversees 249 funds.
The Trustees hold office without limit in time except that (a) any Trustee may resign; (b) any Trustee may be removed by written instrument, signed by at least two-thirds of the number of Trustees prior to such removal; (c) any Trustee who requests to be retired or who has become incapacitated by illness or injury may be retired by written instrument signed by a majority of the other Trustees; and (d) any Trustee may be removed at any special meeting of shareholders by a two-thirds vote of the outstanding voting securities of the trust. Each Trustee who is not an interested person (as defined in the 1940 Act) of the trust and the fund is referred to herein as an Independent Trustee. Each Independent Trustee shall retire not later than the last day of the calendar year in which his or her 75th birthday occurs. The Independent Trustees may waive this mandatory retirement age policy with respect to individual Trustees. Officers and Advisory Board Members hold office without limit in time, except that any officer or Advisory Board Member may resign or may be removed by a vote of a majority of the Trustees at any regular meeting or any special meeting of the Trustees. Except as indicated, each individual has held the office shown or other offices in the same company for the past five years.
The fund’s Statement of Additional Information (SAI) includes more information about the Trustees. To request a free copy, call Fidelity at 1-877-208-0098.
Experience, Skills, Attributes, and Qualifications of the Trustees. The Governance and Nominating Committee has adopted a statement of policy that describes the experience, qualifications, attributes, and skills that are necessary and desirable for potential Independent Trustee candidates (Statement of Policy). The Board believes that each Trustee satisfied at the time he or she was initially elected or appointed a Trustee, and continues to satisfy, the standards contemplated by the Statement of Policy. The Governance and Nominating Committee also engages professional search firms to help identify potential Independent Trustee candidates who have the experience, qualifications, attributes, and skills consistent with the Statement of Policy. From time to time, additional criteria based on the composition and skills of the current Independent Trustees, as well as experience or skills that may be appropriate in light of future changes to board composition, business conditions, and regulatory or other developments, have also been considered by the professional search firms and the Governance and Nominating Committee. In addition, the Board takes into account the Trustees' commitment and participation in Board and committee meetings, as well as their leadership of standing and ad hoc committees throughout their tenure.
In determining that a particular Trustee was and continues to be qualified to serve as a Trustee, the Board has considered a variety of criteria, none of which, in isolation, was controlling. The Board believes that, collectively, the Trustees have balanced and diverse experience, qualifications, attributes, and skills, which allow the Board to operate effectively in governing the fund and protecting the interests of shareholders. Information about the specific experience, skills, attributes, and qualifications of each Trustee, which in each case led to the Board's conclusion that the Trustee should serve (or continue to serve) as a trustee of the fund, is provided below.
Board Structure and Oversight Function. Abigail P. Johnson is an interested person and currently serves as Chairman. The Trustees have determined that an interested Chairman is appropriate and benefits shareholders because an interested Chairman has a personal and professional stake in the quality and continuity of services provided to the fund. Independent Trustees exercise their informed business judgment to appoint an individual of their choosing to serve as Chairman, regardless of whether the Trustee happens to be independent or a member of management. The Independent Trustees have determined that they can act independently and effectively without having an Independent Trustee serve as Chairman and that a key structural component for assuring that they are in a position to do so is for the Independent Trustees to constitute a substantial majority for the Board. The Independent Trustees also regularly meet in executive session. Marie L. Knowles serves as Chairman of the Independent Trustees and as such (i) acts as a liaison between the Independent Trustees and management with respect to matters important to the Independent Trustees and (ii) with management prepares agendas for Board meetings.
Fidelity® funds are overseen by different Boards of Trustees. The fund's Board oversees Fidelity's investment-grade bond, money market, asset allocation and certain equity funds, and other Boards oversee Fidelity's high income, sector and other equity funds. The asset allocation funds may invest in Fidelity® funds that are overseen by such other Boards. The use of separate Boards, each with its own committee structure, allows the Trustees of each group of Fidelity® funds to focus on the unique issues of the funds they oversee, including common research, investment, and operational issues. On occasion, the separate Boards establish joint committees to address issues of overlapping consequences for the Fidelity® funds overseen by each Board.
The Trustees operate using a system of committees to facilitate the timely and efficient consideration of all matters of importance to the Trustees, the fund, and fund shareholders and to facilitate compliance with legal and regulatory requirements and oversight of the fund's activities and associated risks. The Board, acting through its committees, has charged FMR and its affiliates with (i) identifying events or circumstances the occurrence of which could have demonstrably adverse effects on the fund's business and/or reputation; (ii) implementing processes and controls to lessen the possibility that such events or circumstances occur or to mitigate the effects of such events or circumstances if they do occur; and (iii) creating and maintaining a system designed to evaluate continuously business and market conditions in order to facilitate the identification and implementation processes described in (i) and (ii) above. Because the day-to-day operations and activities of the fund are carried out by or through FMR, its affiliates, and other service providers, the fund's exposure to risks is mitigated but not eliminated by the processes overseen by the Trustees. While each of the Board's committees has responsibility for overseeing different aspects of the fund's activities, oversight is exercised primarily through the Operations and Audit Committees. In addition, an ad hoc Board committee of Independent Trustees has worked with FMR to enhance the Board's oversight of investment and financial risks, legal and regulatory risks, technology risks, and operational risks, including the development of additional risk reporting to the Board. Appropriate personnel, including but not limited to the fund's Chief Compliance Officer (CCO), FMR's internal auditor, the independent accountants, the fund's Treasurer and portfolio management personnel, make periodic reports to the Board's committees, as appropriate, including an annual review of Fidelity's risk management program for the Fidelity® funds. The responsibilities of each standing committee, including their oversight responsibilities, are described further under "Standing Committees of the Trustees."
Interested Trustees*:
Correspondence intended for a Trustee who is an interested person may be sent to Fidelity Investments, 245 Summer Street, Boston, Massachusetts 02210.
Name, Year of Birth; Principal Occupations and Other Relevant Experience+
Abigail P. Johnson (1961)
Year of Election or Appointment: 2009
Trustee
Chairman of the Board of Trustees
Ms. Johnson also serves as Trustee of other Fidelity® funds. Ms. Johnson serves as Chairman (2016-present), Chief Executive Officer (2014-present), and Director (2007-present) of FMR LLC (diversified financial services company), President of Fidelity Financial Services (2012-present) and President of Personal, Workplace and Institutional Services (2005-present). Ms. Johnson is Chairman and Director of FMR Co., Inc. (investment adviser firm, 2011-present) and Chairman and Director of FMR (investment adviser firm, 2011-present). Previously, Ms. Johnson served as Vice Chairman (2007-2016) and President (2013-2016) of FMR LLC, President and a Director of FMR (2001-2005), a Trustee of other investment companies advised by FMR, Fidelity Investments Money Management, Inc. (investment adviser firm), and FMR Co., Inc. (2001-2005), Senior Vice President of the Fidelity® funds (2001-2005), and managed a number of Fidelity® funds. Ms. Abigail P. Johnson and Mr. Arthur E. Johnson are not related.
Jennifer Toolin McAuliffe (1959)
Year of Election or Appointment: 2016
Trustee
Ms. McAuliffe also serves as Trustee of other Fidelity® funds. Ms. McAuliffe previously served as a Member of the Advisory Board of certain Fidelity® funds (2016) and as Co-Head of Fixed Income of Fidelity Investments Limited (now known as FIL Limited (FIL)) (diversified financial services company). Earlier roles at FIL included Director of Research for FIL’s credit and quantitative teams in London, Hong Kong and Tokyo. Ms. McAuliffe also was the Director of Research for taxable and municipal bonds at Fidelity Investments Money Management, Inc. Ms. McAuliffe is also a director or trustee of several not-for-profit entities.
* Determined to be an “Interested Trustee” by virtue of, among other things, his or her affiliation with the trust or various entities under common control with FMR.
+ The information includes the Trustee's principal occupation during the last five years and other information relating to the experience, attributes, and skills relevant to the Trustee's qualifications to serve as a Trustee, which led to the conclusion that the Trustee should serve as a Trustee for the fund.
Independent Trustees:
Correspondence intended for an Independent Trustee may be sent to Fidelity Investments, P.O. Box 55235, Boston, Massachusetts 02205-5235.
Name, Year of Birth; Principal Occupations and Other Relevant Experience+
Elizabeth S. Acton (1951)
Year of Election or Appointment: 2016
Trustee
Ms. Acton also serves as Trustee of other Fidelity® funds. Prior to her retirement in April 2012, Ms. Acton was Executive Vice President, Finance (2011-2012), Executive Vice President, Chief Financial Officer (2002-2011), and Treasurer (2004-2005) of Comerica Incorporated (financial services). Prior to joining Comerica, Ms. Acton held a variety of positions at Ford Motor Company (1983-2002), including Vice President and Treasurer (2000-2002) and Executive Vice President and Chief Financial Officer of Ford Motor Credit Company (1998-2000). Ms. Acton currently serves as a member of the Board of Directors and Audit and Finance Committees of Beazer Homes USA, Inc. (homebuilding, 2012-present). Previously, Ms. Acton served as a Member of the Advisory Board of certain Fidelity® funds (2013-2016).
John Engler (1948)
Year of Election or Appointment: 2016
Trustee
Mr. Engler also serves as Trustee of other Fidelity® funds. He serves on the board of directors for Universal Forest Products (manufacturer and distributor of wood and wood-alternative products, 2003-present) and K12 Inc. (technology-based education company, 2012-present). Previously, Mr. Engler served as a Member of the Advisory Board of certain Fidelity® funds (2014-2016), president of the Business Roundtable (2011-2017), a trustee of The Munder Funds (2003-2014), president and CEO of the National Association of Manufacturers (2004-2011), member of the Board of Trustees of the Annie E. Casey Foundation (2004-2015), and as governor of Michigan (1991-2003). He is a past chairman of the National Governors Association.
Albert R. Gamper, Jr. (1942)
Year of Election or Appointment: 2006
Trustee
Mr. Gamper also serves as Trustee of other Fidelity® funds. Prior to his retirement in December 2004, Mr. Gamper served as Chairman of the Board of CIT Group Inc. (commercial finance). During his tenure with CIT Group Inc. Mr. Gamper served in numerous senior management positions, including Chairman (1987-1989; 1999-2001; 2002-2004), Chief Executive Officer (1987-2004), and President (2002-2003). Mr. Gamper currently serves as a member of the Board of Directors of Public Service Enterprise Group (utilities, 2000-present), and Member of the Board of Trustees of Barnabas Health Care System (1997-present). Previously, Mr. Gamper served as Chairman (2012-2015) and Vice Chairman (2011-2012) of the Independent Trustees of certain Fidelity® funds and as Chairman of the Board of Governors, Rutgers University (2004-2007).
Robert F. Gartland (1951)
Year of Election or Appointment: 2010
Trustee
Mr. Gartland also serves as Trustee of other Fidelity® funds. Mr. Gartland is Chairman and an investor in Gartland & Mellina Group Corp. (consulting, 2009-present). Previously, Mr. Gartland served as a partner and investor of Vietnam Partners LLC (investments and consulting, 2008-2011). Prior to his retirement, Mr. Gartland held a variety of positions at Morgan Stanley (financial services, 1979-2007), including Managing Director (1987-2007), and Chase Manhattan Bank (1975-1978).
Arthur E. Johnson (1947)
Year of Election or Appointment: 2008
Trustee
Vice Chairman of the Independent Trustees
Mr. Johnson also serves as Trustee of other Fidelity® funds. Mr. Johnson serves as a member of the Board of Directors of Eaton Corporation plc (diversified power management, 2009-present) and Booz Allen Hamilton (management consulting, 2011-present). Prior to his retirement, Mr. Johnson served as Senior Vice President of Corporate Strategic Development of Lockheed Martin Corporation (defense contractor, 1999-2009). He previously served on the Board of Directors of IKON Office Solutions, Inc. (1999-2008), AGL Resources, Inc. (holding company, 2002-2016), and Delta Airlines (2005-2007). Mr. Arthur E. Johnson is not related to Ms. Abigail P. Johnson.
Michael E. Kenneally (1954)
Year of Election or Appointment: 2009
Trustee
Mr. Kenneally also serves as Trustee of other Fidelity® funds. Prior to his retirement, Mr. Kenneally served as Chairman and Global Chief Executive Officer of Credit Suisse Asset Management. Before joining Credit Suisse, he was an Executive Vice President and Chief Investment Officer for Bank of America Corporation. Earlier roles at Bank of America included Director of Research, Senior Portfolio Manager and Research Analyst, and Mr. Kenneally was awarded the Chartered Financial Analyst (CFA) designation in 1991.
Marie L. Knowles (1946)
Year of Election or Appointment: 2001
Trustee
Chairman of the Independent Trustees
Ms. Knowles also serves as Trustee of other Fidelity® funds. Prior to Ms. Knowles' retirement in June 2000, she served as Executive Vice President and Chief Financial Officer of Atlantic Richfield Company (ARCO) (diversified energy, 1996-2000). From 1993 to 1996, she was a Senior Vice President of ARCO and President of ARCO Transportation Company (pipeline and tanker operations). Ms. Knowles currently serves as a Director and Chairman of the Audit Committee of McKesson Corporation (healthcare service, since 2002). Ms. Knowles is a member of the Board of the Santa Catalina Island Company (real estate, 2009-present). Ms. Knowles is a Member of the Investment Company Institute Board of Governors and a Member of the Governing Council of the Independent Directors Council (2014-present). She also serves as a member of the Advisory Board for the School of Engineering of the University of Southern California. Previously, Ms. Knowles served as a Director of Phelps Dodge Corporation (copper mining and manufacturing, 1994-2007), URS Corporation (engineering and construction, 2000-2003) and America West (airline, 1999-2002). Ms. Knowles previously served as Vice Chairman of the Independent Trustees of certain Fidelity® funds (2012-2015).
Mark A. Murray (1954)
Year of Election or Appointment: 2016
Trustee
Mr. Murray also serves as Trustee of other Fidelity® funds. Mr. Murray is Vice Chairman (2013-present) of Meijer, Inc. (regional retail chain). Previously, Mr. Murray served as a Member of the Advisory Board of certain Fidelity® funds (2016) and as Co-Chief Executive Officer (2013-2016) and President (2006-2013) of Meijer, Inc. Mr. Murray serves as a member of the Board of Directors and Nuclear Review and Public Policy and Responsibility Committees of DTE Energy Company (diversified energy company, 2009-present). Mr. Murray also serves as a member of the Board of Directors of Spectrum Health (not-for-profit health system, 2015-present). Mr. Murray previously served as President of Grand Valley State University (2001-2006), Treasurer for the State of Michigan (1999-2001), Vice President of Finance and Administration for Michigan State University (1998-1999), and a member of the Board of Directors and Audit Committee and Chairman of the Nominating and Corporate Governance Committee of Universal Forest Products, Inc. (manufacturer and distributor of wood and wood-alternative products, 2004-2016). Mr. Murray is also a director or trustee of many community and professional organizations.
+ The information includes the Trustee's principal occupation during the last five years and other information relating to the experience, attributes, and skills relevant to the Trustee's qualifications to serve as a Trustee, which led to the conclusion that the Trustee should serve as a Trustee for the fund.
Advisory Board Members and Officers:
Correspondence intended for an officer may be sent to Fidelity Investments, 245 Summer Street, Boston, Massachusetts 02210. Officers appear below in alphabetical order.
Name, Year of Birth; Principal Occupation
Elizabeth Paige Baumann (1968)
Year of Election or Appointment: 2017
Anti-Money Laundering (AML) Officer
Ms. Baumann also serves as AML Officer of other funds. She is Chief AML Officer (2012-present) and Senior Vice President (2014-present) of FMR LLC (diversified financial services company) and is an employee of Fidelity Investments. Previously, Ms. Baumann served as AML Officer of the funds (2012-2016), and Vice President (2007-2014) and Deputy Anti-Money Laundering Officer (2007-2012) of FMR LLC.
Marc R. Bryant (1966)
Year of Election or Appointment: 2015
Secretary and Chief Legal Officer (CLO)
Mr. Bryant also serves as Secretary and CLO of other funds. Mr. Bryant serves as CLO, Secretary, and Senior Vice President of Fidelity Management & Research Company (investment adviser firm, 2015-present) and FMR Co., Inc. (investment adviser firm, 2015-present); Secretary of Fidelity SelectCo, LLC (investment adviser firm, 2015-present) and Fidelity Investments Money Management, Inc. (investment adviser firm, 2015-present); and CLO of Fidelity Management & Research (Hong Kong) Limited and FMR Investment Management (UK) Limited (investment adviser firms, 2015-present) and Fidelity Management & Research (Japan) Limited (investment adviser firm, 2016-present). He is Senior Vice President and Deputy General Counsel of FMR LLC (diversified financial services company). Previously, Mr. Bryant served as Secretary and CLO of Fidelity Rutland Square Trust II (2010-2014) and Assistant Secretary of Fidelity's Fixed Income and Asset Allocation Funds (2013-2015). Prior to joining Fidelity Investments, Mr. Bryant served as a Senior Vice President and the Head of Global Retail Legal for AllianceBernstein L.P. (2006-2010), and as the General Counsel for ProFund Advisors LLC (2001-2006).
Jonathan Davis (1968)
Year of Election or Appointment: 2010
Assistant Treasurer
Mr. Davis also serves as Assistant Treasurer of other funds, and is an employee of Fidelity Investments. Previously, Mr. Davis served as Vice President and Associate General Counsel of FMR LLC (diversified financial services company, 2003-2010).
Adrien E. Deberghes (1967)
Year of Election or Appointment: 2010
Assistant Treasurer
Mr. Deberghes also serves as an officer of other funds. He serves as Executive Vice President of Fidelity Investments Money Management, Inc. (FIMM) (investment adviser firm, 2016-present) and is an employee of Fidelity Investments (2008-present). Prior to joining Fidelity Investments, Mr. Deberghes was Senior Vice President of Mutual Fund Administration at State Street Corporation (2007-2008), Senior Director of Mutual Fund Administration at Investors Bank & Trust (2005-2007), and Director of Finance for Dunkin' Brands (2000-2005). Previously, Mr. Deberghes served in other fund officer roles.
Stephanie J. Dorsey (1969)
Year of Election or Appointment: 2013
President and Treasurer
Ms. Dorsey also serves as an officer of other funds. She is an employee of Fidelity Investments (2008-present) and has served in other fund officer roles. Prior to joining Fidelity Investments, Ms. Dorsey served as Treasurer (2004-2008) of the JPMorgan Mutual Funds and Vice President (2004-2008) of JPMorgan Chase Bank.
Howard J. Galligan III (1966)
Year of Election or Appointment: 2014
Chief Financial Officer
Mr. Galligan also serves as Chief Financial Officer of other funds. Mr. Galligan serves as President of Fidelity Pricing and Cash Management Services (FPCMS) (2014-present) and as a Director of Strategic Advisers, Inc. (investment adviser firm, 2008-present). Previously, Mr. Galligan served as Chief Administrative Officer of Asset Management (2011-2014) and Chief Operating Officer and Senior Vice President of Investment Support for Strategic Advisers, Inc. (2003-2011).
Colm A. Hogan (1973)
Year of Election or Appointment: 2016
Assistant Treasurer
Mr. Hogan also serves as an officer of other funds. Mr. Hogan is an employee of Fidelity Investments (2005-present).
Chris Maher (1972)
Year of Election or Appointment: 2013
Assistant Treasurer
Mr. Maher serves as Assistant Treasurer of other funds. Mr. Maher is Vice President of Valuation Oversight and is an employee of Fidelity Investments. Previously, Mr. Maher served as Vice President of Asset Management Compliance (2013), Vice President of the Program Management Group of FMR (investment adviser firm, 2010-2013), and Vice President of Valuation Oversight (2008-2010).
John B. McGinty, Jr. (1962)
Year of Election or Appointment: 2016
Chief Compliance Officer
Mr. McGinty also serves as Chief Compliance Officer of other funds. Mr. McGinty is Senior Vice President of Asset Management Compliance for Fidelity Investments and is an employee of Fidelity Investments (2016-present). Mr. McGinty previously served as Vice President, Senior Attorney at Eaton Vance Management (investment management firm, 2015-2016), and prior to Eaton Vance as global CCO for all firm operations and registered investment companies at GMO LLC (investment management firm, 2009-2015). Before joining GMO LLC, Mr. McGinty served as Senior Vice President, Deputy General Counsel for Fidelity Investments (2007-2009).
Rieco E. Mello (1969)
Year of Election or Appointment: 2017
Assistant Treasurer
Mr. Mello also serves as Assistant Treasurer of other funds. Mr. Mello is an employee of Fidelity Investments (1995-present).
Jamie Pagliocco (1964)
Year of Election or Appointment: 2017
Vice President
Mr. Pagliocco also serves as Vice President of other funds. Mr. Pagliocco serves as Chief Investment Officer of FMR's Bond Group (2017-present) and is an employee of Fidelity Investments (2001-present).
Jason P. Pogorelec (1975)
Year of Election or Appointment: 2015
Assistant Secretary
Mr. Pogorelec also serves as Assistant Secretary of other funds. Mr. Pogorelec serves as Vice President, Associate General Counsel (2010-present) and is an employee of Fidelity Investments (2006-present).
Nancy D. Prior (1967)
Year of Election or Appointment: 2014
Vice President
Ms. Prior also serves as Vice President of other funds. Ms. Prior serves as a Director of FMR Investment Management (UK) Limited (investment adviser firm, 2015-present), President (2016-present) and Director (2014-present) of Fidelity Investments Money Management, Inc. (FIMM) (investment adviser firm), President, Fixed Income (2014-present), Vice Chairman of FIAM LLC (investment adviser firm, 2014-present), and is an employee of Fidelity Investments (2002-present). Previously, Ms. Prior served as Vice President of Fidelity's Money Market Funds (2012-2014), President, Money Market and Short Duration Bond Group of Fidelity Management & Research (FMR) (investment adviser firm, 2013-2014), President, Money Market Group of FMR (2011-2013), Managing Director of Research (2009-2011), Senior Vice President and Deputy General Counsel (2007-2009), and Assistant Secretary of certain Fidelity® funds (2008-2009).
Stacie M. Smith (1974)
Year of Election or Appointment: 2013
Assistant Treasurer
Ms. Smith also serves as an officer of other funds. She is an employee of Fidelity Investments (2009-present) and has served in other fund officer roles. Prior to joining Fidelity Investments, Ms. Smith served as Senior Audit Manager of Ernst & Young LLP (accounting firm, 1996-2009). Previously, Ms. Smith served as Deputy Treasurer of certain Fidelity® funds (2013-2016).
Marc L. Spector (1972)
Year of Election or Appointment: 2016
Deputy Treasurer
Mr. Spector also serves as an officer of other funds. Mr. Spector is an employee of Fidelity Investments (2016-present). Prior to joining Fidelity Investments, Mr. Spector served as Director at the Siegfried Group (accounting firm, 2013-2016), and prior to Siegfried Group as audit senior manager at Deloitte & Touche (accounting firm, 2005-2013).
Renee Stagnone (1975)
Year of Election or Appointment: 2016
Assistant Treasurer
Ms. Stagnone also serves as an officer of other funds. Ms. Stagnone is an employee of Fidelity Investments (1997-present). Previously, Ms. Stagnone served as Deputy Treasurer of certain Fidelity® funds (2013-2016).
Christine J. Thompson (1958)
Year of Election or Appointment: 2015
Vice President of Fidelity's Bond Funds
Ms. Thompson also serves as Vice President of other funds. Ms. Thompson also serves as Chief Investment Officer of FMR's Bond Group (2010-present) and is an employee of Fidelity Investments (1985-present). Previously, Ms. Thompson served as Vice President of Fidelity's Bond Funds (2010-2012).
Shareholder Expense Example
As a shareholder of the Fund, you incur two types of costs: (1) transaction costs, including sales charges (loads) on purchase payments or redemption proceeds, and (2) ongoing costs, including management fees, distribution and/or service (12b-1) fees and other Fund expenses. This Example is intended to help you understand your ongoing costs (in dollars) of investing in the Fund and to compare these costs with the ongoing costs of investing in other mutual funds.
The Example is based on an investment of $1,000 invested at the beginning of the period and held for the entire period (May 1, 2017 to October 31, 2017).
Actual Expenses
The first line of the accompanying table for each class of the Fund provides information about actual account values and actual expenses. You may use the information in this line, together with the amount you invested, to estimate the expenses that you paid over the period. Simply divide your account value by $1,000.00 (for example, an $8,600 account value divided by $1,000.00 = 8.6), then multiply the result by the number in the first line for a class of the Fund under the heading entitled "Expenses Paid During Period" to estimate the expenses you paid on your account during this period. In addition, the Fund, as a shareholder in the underlying Fidelity Central Funds, will indirectly bear its pro-rata share of the fees and expenses incurred by the underlying Fidelity Central Funds. These fees and expenses are not included in the Fund's annualized expense ratio used to calculate the expense estimate in the table below.
Hypothetical Example for Comparison Purposes
The second line of the accompanying table for each class of the Fund provides information about hypothetical account values and hypothetical expenses based on a Class' actual expense ratio and an assumed rate of return of 5% per year before expenses, which is not the Class' actual return. The hypothetical account values and expenses may not be used to estimate the actual ending account balance or expenses you paid for the period. You may use this information to compare the ongoing costs of investing in the Fund and other funds. To do so, compare this 5% hypothetical example with the 5% hypothetical examples that appear in the shareholder reports of the other funds. In addition, the Fund, as a shareholder in the underlying Fidelity Central Funds, will indirectly bear its pro-rata share of the fees and expenses incurred by the underlying Fidelity Central Funds. These fees and expenses are not included in the Fund's annualized expense ratio used to calculate the expense estimate in the table below.
Please note that the expenses shown in the table are meant to highlight your ongoing costs only and do not reflect any transaction costs. Therefore, the second line of the table is useful in comparing ongoing costs only, and will not help you determine the relative total costs of owning different funds. In addition, if these transactional costs were included, your costs would have been higher.
| | Annualized Expense Ratio-A | Beginning
Account Value
May 1, 2017 | Ending
Account Value
October 31, 2017 | Expenses Paid
During Period-B
May 1, 2017
to October 31, 2017 |
| Class A | .80% | | | |
| Actual | | $1,000.00 | $1,031.50 | $4.10 |
| Hypothetical-C | | $1,000.00 | $1,021.17 | $4.08 |
| Class M | .78% | | | |
| Actual | | $1,000.00 | $1,031.50 | $3.99 |
| Hypothetical-C | | $1,000.00 | $1,021.27 | $3.97 |
| Class C | 1.55% | | | |
| Actual | | $1,000.00 | $1,027.50 | $7.92 |
| Hypothetical-C | | $1,000.00 | $1,017.39 | $7.88 |
| Class I | .55% | | | |
| Actual | | $1,000.00 | $1,032.90 | $2.82 |
| Hypothetical-C | | $1,000.00 | $1,022.43 | $2.80 |
A Annualized expense ratio reflects expenses net of applicable fee waivers.
B Expenses are equal to each Class' annualized expense ratio, multiplied by the average account value over the period, multiplied by 184/365 (to reflect the one-half year period).
C 5% return per year before expenses
Distributions (Unaudited)
The Board of Trustees of Fidelity Advisor Municipal Income Fund voted to pay to shareholders of record at the opening of business on record date, the following distributions per share derived from capital gains realized from sales of portfolio securities:
| | Pay Date | Record Date | Capital Gains |
| Fidelity Advisor Municipal Income Fund | | | |
| Class A | 11/29/17 | 11/28/17 | $0.139 |
| Class M | 11/29/17 | 11/28/17 | $0.139 |
| Class C | 11/29/17 | 11/28/17 | $0.139 |
| Class I | 11/29/17 | 11/28/17 | $0.139 |
|
The fund hereby designates as a capital gain dividend with respect to the taxable year ended October 31, 2017, $14,456,953, or, if subsequently determined to be different, the net capital gain of such year.
During fiscal year ended 2017, 100% of the fund's income dividends was free from federal income tax, and 12% of the fund's income dividends was subject to the federal alternative minimum tax.
The fund will notify shareholders in January 2018 of amounts for use in preparing 2017 income tax returns.
Board Approval of Investment Advisory Contracts and Management Fees
Fidelity Advisor Municipal Income Fund
Each year, the Board of Trustees, including the Independent Trustees (together, the Board), votes on the renewal of the management contract with Fidelity Management & Research Company (FMR) and the sub-advisory agreements (together, the Advisory Contracts) for the fund. FMR and the sub-advisers are referred to herein as the Investment Advisers. The Board, assisted by the advice of fund counsel and Independent Trustees' counsel, requests and considers a broad range of information relevant to the renewal of the Advisory Contracts throughout the year.
The Board meets regularly and, at each of its meetings, covers an extensive agenda of topics and materials and considers factors that are relevant to its annual consideration of the renewal of the fund's Advisory Contracts, including the services and support provided to the fund and its shareholders. The Board has established four standing committees (Committees) — Operations, Audit, Fair Valuation, and Governance and Nominating — each composed of and chaired by Independent Trustees with varying backgrounds, to which the Board has assigned specific subject matter responsibilities in order to enhance effective decision-making by the Board. The Operations Committee, of which all of the Independent Trustees are members, meets regularly throughout the year and considers, among other matters, information specifically related to the annual consideration of the renewal of the fund's Advisory Contracts. The Board, acting directly and through its Committees, requests and receives information concerning the annual consideration of the renewal of the fund's Advisory Contracts. The Board also meets as needed to review matters specifically related to the Board's annual consideration of the renewal of the Advisory Contracts. Members of the Board may also meet with trustees of other Fidelity funds through ad hoc joint committees to discuss certain matters relevant to all of the Fidelity funds.
At its September 2017 meeting, the Board unanimously determined to renew the fund's Advisory Contracts. In reaching its determination, the Board considered all factors it believed relevant, including (i) the nature, extent, and quality of the services to be provided to the fund and its shareholders (including the investment performance of the fund); (ii) the competitiveness of the fund's management fee and total expense ratio relative to peer funds; (iii) the total costs of the services to be provided by and the profits to be realized by Fidelity from its relationships with the fund; and (iv) the extent to which, if any, economies of scale exist and would be realized as the fund grows, and whether any economies of scale are appropriately shared with fund shareholders.
In considering whether to renew the Advisory Contracts for the fund, the Board reached a determination, with the assistance of fund counsel and Independent Trustees' counsel and through the exercise of its business judgment, that the renewal of the Advisory Contracts was in the best interests of the fund and its shareholders and that the compensation payable under the Advisory Contracts was fair and reasonable. The Board's decision to renew the Advisory Contracts was not based on any single factor, but rather was based on a comprehensive consideration of all the information provided to the Board at its meetings throughout the year. The Board, in reaching its determination to renew the Advisory Contracts, was aware that shareholders of the fund have a broad range of investment choices available to them, including a wide choice among funds offered by Fidelity's competitors, and that the fund's shareholders, who have the opportunity to review and weigh the disclosure provided by the fund in its prospectus and other public disclosures, have chosen to invest in this fund, which is part of the Fidelity family of funds.
Amendment to Group Fee Rate. The Board also approved an amendment to the management contract for the fund to add an additional breakpoint to the group fee schedule, effective October 1, 2017. The Board noted that the additional breakpoint would result in lower management fee rates as Fidelity's assets under management increase above the new breakpoint.
Nature, Extent, and Quality of Services Provided. The Board considered Fidelity's staffing as it relates to the fund, including the backgrounds of investment personnel of Fidelity, and also considered the fund's investment objective, strategies, and related investment philosophy. The Independent Trustees also had discussions with senior management of Fidelity's investment operations and investment groups. The Board considered the structure of the investment personnel compensation program and whether this structure provides appropriate incentives to act in the best interests of the fund. Additionally, the Board considered the portfolio managers' investments, if any, in the funds that they manage.
Resources Dedicated to Investment Management and Support Services. The Board reviewed the general qualifications and capabilities of Fidelity's investment staff, including its size, education, experience, and resources, as well as Fidelity's approach to recruiting, managing, and compensating investment personnel. The Board noted that Fidelity has continued to increase the resources devoted to non-U.S. offices, including expansion of Fidelity's global investment organization. The Board also noted that Fidelity's analysts have extensive resources, tools and capabilities that allow them to conduct sophisticated quantitative and fundamental analysis, as well as credit analysis of issuers, counterparties and guarantors. Further, the Board considered that Fidelity's investment professionals have sufficient access to global information and data so as to provide competitive investment results over time, and that those professionals also have access to sophisticated tools that permit them to assess portfolio construction and risk and performance attribution characteristics continuously, as well as to transmit new information and research conclusions rapidly around the world. Additionally, in its deliberations, the Board considered Fidelity's trading, risk management, compliance, and technology and operations capabilities and resources, which are integral parts of the investment management process.
Shareholder and Administrative Services. The Board considered (i) the nature, extent, quality, and cost of advisory, administrative, and shareholder services performed by the Investment Advisers and their affiliates under the Advisory Contracts and under separate agreements covering transfer agency and pricing and bookkeeping services for the fund; (ii) the nature and extent of the supervision of third party service providers, principally custodians, subcustodians, and pricing vendors; and (iii) the resources devoted to, and the record of compliance with, the fund's compliance policies and procedures.
The Board noted that the growth of fund assets over time across the complex allows Fidelity to reinvest in the development of services designed to enhance the value or convenience of the Fidelity funds as investment vehicles. These services include 24-hour access to account information and market information through telephone representatives and over the Internet, investor education materials and asset allocation tools, and the expanded availability of Fidelity Investor Centers.
Investment in a Large Fund Family. The Board considered the benefits to shareholders of investing in a Fidelity fund, including the benefits of investing in a fund that is part of a large family of funds offering a variety of investment disciplines and providing a large variety of mutual fund investor services. The Board noted that Fidelity had taken, or had made recommendations that resulted in the Fidelity funds taking, a number of actions over the previous year that benefited particular funds, including: (i) continuing to dedicate additional resources to Fidelity's investment research process, which includes meetings with management of issuers in which the funds invest, and to the support of the senior management team that oversees asset management; (ii) continuing efforts to enhance Fidelity's global research capabilities; (iii) launching new funds and making other enhancements to meet client needs; (iv) launching new share classes of existing funds; (v) eliminating purchase minimums and broadening eligibility requirements for certain lower-priced share classes; (vi) reducing management fees and total expenses for certain growth equity funds and index funds; (vii) lowering expense caps for certain existing funds and classes to reduce expenses borne by shareholders; (viii) eliminating short-term redemption fees for certain funds; (ix) introducing a new pricing structure for certain funds of funds that is expected to reduce overall expenses paid by shareholders; (x) rationalizing product lines and gaining increased efficiencies through proposals for fund mergers and share class consolidations; (xi) continuing to develop, acquire and implement systems and technology to improve services to the funds and shareholders, strengthen information security, and increase efficiency; and (xii) implementing enhancements to further strengthen Fidelity's product line to increase investors' probability of success in achieving their investment goals, including retirement income goals.
Investment Performance. The Board considered whether the fund has operated in accordance with its investment objective, as well as its record of compliance with its investment restrictions and its performance history.
The Board took into account discussions with representatives of the Investment Advisers about fund investment performance that occur at Board meetings throughout the year. In this regard the Board noted that as part of regularly scheduled fund reviews and other reports to the Board on fund performance, the Board considers annualized return information for the fund for different time periods, measured against a securities market index ("benchmark index") and a peer group of funds with similar objectives ("peer group"), if any. In its evaluation of fund investment performance at meetings throughout the year, the Board gave particular attention to information indicating underperformance of certain Fidelity funds for specific time periods and discussed with the Investment Advisers the reasons for such underperformance.
In addition to reviewing absolute and relative fund performance, the Independent Trustees periodically consider the appropriateness of fund performance metrics in evaluating the results achieved. In general, the Independent Trustees believe that fund performance should be evaluated based on gross performance (before fees and expenses but after transaction costs) compared to appropriate benchmark indices, over appropriate time periods that may include full market cycles, and on net performance (after fees and expenses) compared to peer groups, as applicable, over the same periods, taking into account relevant factors including the following: general market conditions; expectations for interest rate levels and credit conditions; issuer-specific information including credit quality; the potential for incremental return versus the fund's benchmark index weighed against the risks involved in obtaining that incremental return, including the risk of diminished or negative total returns; and fund cash flows and other factors. Depending on the circumstances, the Independent Trustees may be satisfied with a fund's performance notwithstanding that it lags its benchmark index or peer group for certain periods.
The Independent Trustees recognize that shareholders evaluate performance on a net basis over their own holding periods, for which one-, three-, and five-year periods are often used as a proxy. For this reason, the performance information reviewed by the Board also included net cumulative calendar year total return information for the fund and an appropriate benchmark index and peer group for the most recent one-, three-, and five-year periods.
Based on its review, the Board concluded that the nature, extent, and quality of services provided to the fund under the Advisory Contracts should continue to benefit the shareholders of the fund.
Competitiveness of Management Fee and Total Expense Ratio. The Board considered the fund's management fee and total expense ratio compared to "mapped groups" of competitive funds and classes created for the purpose of facilitating the Trustees' competitive analysis of management fees and total expenses. Fidelity creates "mapped groups" by combining similar Lipper investment objective categories that have comparable investment mandates. Combining Lipper investment objective categories aids the Board's management fee and total expense ratio comparisons by broadening the competitive group used for comparison.
Management Fee. The Board considered two proprietary management fee comparisons for the 12-month periods shown in basis points (BP) in the chart below. The group of Lipper funds used by the Board for management fee comparisons is referred to below as the "Total Mapped Group" and, for the reasons explained above, is broader than the Lipper peer group used by the Board for performance comparisons. The Total Mapped Group comparison focuses on a fund's standing in terms of gross management fees before expense reimbursements or caps relative to the total universe of funds with comparable investment mandates, regardless of whether their management fee structures also are comparable. Funds with comparable investment mandates offer exposure to similar types of securities. Funds with comparable management fee structures have similar management fee contractual arrangements (
e.g., flat rate charged for advisory services, all-inclusive fee rate,
etc.). "TMG %" represents the percentage of funds in the Total Mapped Group that had management fees that were lower than the fund's. For example, a hypothetical TMG % of 20% would mean that 80% of the funds in the Total Mapped Group had higher, and 20% had lower, management fees than the fund. The fund's actual TMG %s and the number of funds in the Total Mapped Group are in the chart below. The "Asset-Size Peer Group" (ASPG) comparison focuses on a fund's standing relative to a subset of non-Fidelity funds within the Total Mapped Group that are similar in size and management fee structure. For example, if a fund is in the first quartile of the ASPG, the fund's management fee ranks in the least expensive or lowest 25% of funds in the ASPG. The ASPG represents at least 15% of the funds in the Total Mapped Group with comparable asset size and management fee structures, subject to a minimum of 50 funds (or all funds in the Total Mapped Group if fewer than 50). Additional information, such as the ASPG quartile in which the fund's management fee rate ranked, is also included in the chart and considered by the Board.
Fidelity Advisor Municipal Income Fund
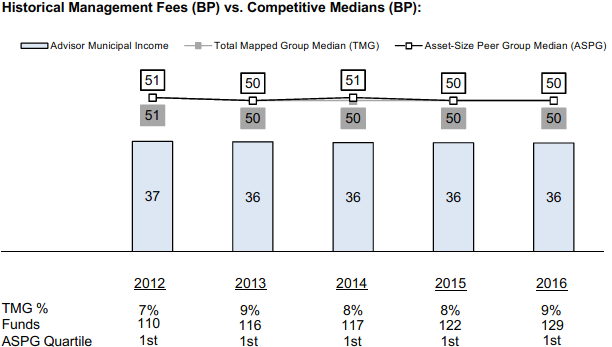
The Board noted that the fund's management fee rate ranked below the median of its Total Mapped Group and below the median of its ASPG for 2016.
The Board noted that it and the boards of other Fidelity funds formed an ad hoc Committee on Group Fee, which meets periodically, to conduct an in-depth review of the "group fee" component of the management fee of funds with such management fee structures. The Committee's focus included the mechanics of the group fee, the competitive landscape of group fee structures, Fidelity funds with no group fee component and investment products not included in group fee assets. The Board also considered that, for funds subject to the group fee, FMR agreed to voluntarily waive fees over a specified period of time in amounts designed to account for assets converted from certain funds to certain collective investment trusts.
Based on its review, the Board concluded that the fund's management fee is fair and reasonable in light of the services that the fund receives and the other factors considered.
Total Expense Ratio. In its review of each class's total expense ratio, the Board considered the fund's management fee rate as well as other fund or class expenses, as applicable, such as transfer agent fees, pricing and bookkeeping fees, fund-paid 12b-1 fees, and custodial, legal, and audit fees. The Board also noted that Fidelity may agree to waive fees and expenses from time to time, and the extent to which, if any, it has done so for the fund. As part of its review, the Board also considered the current and historical total expense ratios of each class of the fund compared to competitive fund median expenses. Each class of the fund is compared to those funds and classes in the Total Mapped Group (used by the Board for management fee comparisons) that have a similar sales load structure.
The Board noted that the total expense ratio of each of Class A, Class M (formerly Class T), and Class I ranked below the competitive median for 2016 and the total expense ratio of Class C ranked equal to the competitive median for 2016.
Fees Charged to Other Fidelity Clients. The Board also considered Fidelity fee structures and other information with respect to clients of Fidelity, such as other funds advised or subadvised by Fidelity, pension plan clients, and other institutional clients with similar mandates. The Board noted that an ad hoc joint committee created by it and the boards of other Fidelity funds periodically reviews and compares Fidelity's institutional investment advisory business with its business of providing services to the Fidelity funds, including the differences in services provided, fees charged, and costs incurred, as well as competition in their respective marketplaces.
Based on its review of total expense ratios and fees charged to other Fidelity clients, the Board concluded that the total expense ratio of each class of the fund was reasonable in light of the services that the fund and its shareholders receive and the other factors considered.
Costs of the Services and Profitability. The Board considered the revenues earned and the expenses incurred by Fidelity in conducting the business of developing, marketing, distributing, managing, administering and servicing the fund and servicing the fund's shareholders. The Board also considered the level of Fidelity's profits in respect of all the Fidelity funds.
On an annual basis, Fidelity presents to the Board information about the profitability of its relationships with the fund. Fidelity calculates profitability information for each fund, as well as aggregate profitability information for groups of Fidelity funds and all Fidelity funds, using a series of detailed revenue and cost allocation methodologies which originate with the books and records of Fidelity on which Fidelity's audited financial statements are based. The Audit Committee of the Board reviews any significant changes from the prior year's methodologies.
PricewaterhouseCoopers LLP (PwC), independent registered public accounting firm and auditor to Fidelity and certain Fidelity funds, has been engaged annually by the Board as part of the Board's assessment of Fidelity's profitability analysis. PwC's engagement includes the review and assessment of the methodologies used by Fidelity in determining the revenues and expenses attributable to Fidelity's mutual fund business, and completion of agreed-upon procedures in respect of the mathematical accuracy of the fund profitability information and its conformity to established allocation methodologies. After considering PwC's reports issued under the engagement and information provided by Fidelity, the Board concluded that while other allocation methods may also be reasonable, Fidelity's profitability methodologies are reasonable in all material respects.
The Board also reviewed Fidelity's non-fund businesses and potential fall-out benefits related to the mutual fund business as well as cases where Fidelity's affiliates may benefit from or be related to the fund's business.
The Board considered the costs of the services provided by and the profits realized by Fidelity in connection with the operation of the fund and was satisfied that the profitability was not excessive.
Economies of Scale. The Board considered whether there have been economies of scale in respect of the management of the Fidelity funds, whether the Fidelity funds (including the fund) have appropriately benefited from any such economies of scale, and whether there is potential for realization of any further economies of scale. The Board considered the extent to which the fund will benefit from economies of scale as assets grow through increased services to the fund, through waivers or reimbursements, or through fee or expense ratio reductions. The Board also noted that a committee (the Economies of Scale Committee) created by it and the boards of other Fidelity funds periodically analyzes whether Fidelity attains economies of scale in respect of the management and servicing of the Fidelity funds, whether the Fidelity funds have appropriately benefited from such economies of scale, and whether there is potential for realization of any further economies of scale.
The Board recognized that the fund's management contract incorporates a "group fee" structure, which provides for lower group fee rates as total group assets increase, and for higher group fee rates as total group assets decrease (with "group assets" defined to include fund assets under FMR's management plus the assets of sector funds previously under FMR's management). FMR calculates the group fee rates based on a tiered asset "breakpoint" schedule that varies based on asset class. The Board considered that the group fee is designed to deliver the benefits of economies of scale to fund shareholders when total Fidelity fund assets increase, even if assets of any particular fund are unchanged or have declined, because some portion of Fidelity's costs are attributable to services provided to all Fidelity funds, and all funds benefit if those costs can be allocated among more assets. The Board concluded that, given the group fee structure, fund shareholders will benefit from lower management fees as group assets increase at the fund complex level, regardless of whether Fidelity achieves any such economies of scale.
The Board concluded, taking into account the analysis of the Economies of Scale Committee, that economies of scale, if any, are being appropriately shared between fund shareholders and Fidelity.
Additional Information Requested by the Board. In order to develop fully the factual basis for consideration of the Fidelity funds' advisory contracts, the Board requested and received additional information on certain topics, including: (i) Fidelity's fund profitability methodology, profitability trends for certain funds, and the impact of certain factors on fund profitability results; (ii) portfolio manager changes that have occurred during the past year and the amount of the investment that each portfolio manager has made in the Fidelity fund(s) that he or she manages; (iii) Fidelity's compensation structure for portfolio managers, research analysts, and other key personnel, including its effects on fund profitability, the rationale for the compensation structure, and the extent to which current market conditions have affected retention and recruitment; (iv) the arrangements with and compensation paid to certain fund sub-advisers on behalf of the Fidelity funds; (v) the terms of Fidelity's contractual and voluntary expense cap and waiver arrangements with the funds; (vi) the methodology with respect to competitive fund data and peer group classifications; (vii) Fidelity's transfer agent fee, expense, and service structures for different funds and classes relative to competitive trends, and the impact of the increased use of omnibus accounts; (viii) Fidelity's long-term expectations for its offerings in the workplace investing channel; (ix) new developments in the retail and institutional marketplaces and the competitive positioning of the funds relative to other investment products and services; (x) the approach to considering "fall-out" benefits; (xi) the impact of money market reform on Fidelity's money market funds, including with respect to costs and profitability; (xii) the funds' share class structures and distribution channels, including the impact of the Department of Labor's new fiduciary rule on the funds' distribution arrangements; and (xiii) explanations regarding the relative total expense ratios of certain funds and classes, total expense competitive trends and methodologies for total expense competitive comparisons, and actions that might be taken by Fidelity to reduce total expense ratios for certain classes. In addition, the Board considered its discussions with Fidelity throughout the year regarding enhanced information security initiatives and the funds' fair valuation policies.
Based on its evaluation of all of the conclusions noted above, and after considering all factors it believed relevant, the Board concluded that the advisory fee structures are fair and reasonable, and that the fund's Advisory Contracts should be renewed.

HIM-ANN-1217
1.538412.120