Fidelity Advisor® Strategic Income Fund
Semi-Annual Report
June 30, 2020
Includes Fidelity and Fidelity Advisor share classes

See the inside front cover for important information about access to your fund’s shareholder reports.

Beginning on January 1, 2021, as permitted by regulations adopted by the Securities and Exchange Commission, paper copies of a fund’s shareholder reports will no longer be sent by mail, unless you specifically request paper copies of the reports from the fund or from your financial intermediary, such as a financial advisor, broker-dealer or bank. Instead, the reports will be made available on a website, and you will be notified by mail each time a report is posted and provided with a website link to access the report.
If you already elected to receive shareholder reports electronically, you will not be affected by this change and you need not take any action. You may elect to receive shareholder reports and other communications from a fund electronically, by contacting your financial intermediary. For Fidelity customers, visit Fidelity's web site or call Fidelity using the contact information listed below.
You may elect to receive all future reports in paper free of charge. If you wish to continue receiving paper copies of your shareholder reports, you may contact your financial intermediary or, if you are a Fidelity customer, visit Fidelity’s website, or call Fidelity at the applicable toll-free number listed below. Your election to receive reports in paper will apply to all funds held with the fund complex/your financial intermediary.
| Account Type | Website | Phone Number |
| Brokerage, Mutual Fund, or Annuity Contracts: | fidelity.com/mailpreferences | 1-800-343-3548 |
| Employer Provided Retirement Accounts: | netbenefits.fidelity.com/preferences (choose 'no' under Required Disclosures to continue to print) | 1-800-343-0860 |
| Advisor Sold Accounts Serviced Through Your Financial Intermediary: | Contact Your Financial Intermediary | Your Financial Intermediary's phone number |
| Advisor Sold Accounts Serviced by Fidelity: | institutional.fidelity.com | 1-877-208-0098 |
To view a fund's proxy voting guidelines and proxy voting record for the 12-month period ended June 30, visit http://www.fidelity.com/proxyvotingresults or visit the Securities and Exchange Commission's (SEC) web site at http://www.sec.gov.
You may also call 1-800-544-8544 if you’re an individual investing directly with Fidelity, call 1-800-835-5092 if you’re a plan sponsor or participant with Fidelity as your recordkeeper or call 1-877-208-0098 on institutional accounts or if you’re an advisor or invest through one to request a free copy of the proxy voting guidelines.
Standard & Poor's, S&P and S&P 500 are registered service marks of The McGraw-Hill Companies, Inc. and have been licensed for use by Fidelity Distributors Corporation.
Other third-party marks appearing herein are the property of their respective owners.
All other marks appearing herein are registered or unregistered trademarks or service marks of FMR LLC or an affiliated company. © 2020 FMR LLC. All rights reserved.
This report and the financial statements contained herein are submitted for the general information of the shareholders of the Funds. This report is not authorized for distribution to prospective investors in the Funds unless preceded or accompanied by an effective prospectus.
A fund files its complete schedule of portfolio holdings with the SEC for the first and third quarters of each fiscal year on Form N-PORT. Forms N-PORT are available on the SEC’s web site at http://www.sec.gov. A fund's Forms N-PORT may be reviewed and copied at the SEC’s Public Reference Room in Washington, DC. Information regarding the operation of the SEC's Public Reference Room may be obtained by calling 1-800-SEC-0330.
For a complete list of a fund's portfolio holdings, view the most recent holdings listing, semiannual report, or annual report on Fidelity's web site at http://www.fidelity.com, http://www.institutional.fidelity.com, or http://www.401k.com, as applicable.
NOT FDIC INSURED •MAY LOSE VALUE •NO BANK GUARANTEE
Neither the Funds nor Fidelity Distributors Corporation is a bank.
Note to Shareholders:
Early in 2020, the outbreak and spread of a new coronavirus emerged as a public health emergency that had a major influence on financial markets, primarily based on its impact on the global economy and the outlook for corporate earnings. The virus causes a respiratory disease known as COVID-19. On March 11, the World Health Organization declared the COVID-19 outbreak a pandemic, citing sustained risk of further global spread.
In the weeks following, as the crisis worsened, we witnessed an escalating human tragedy with wide-scale social and economic consequences from coronavirus-containment measures. The outbreak of COVID-19 prompted a number of measures to limit the spread, including travel and border restrictions, quarantines, and restrictions on large gatherings. In turn, these resulted in lower consumer activity, diminished demand for a wide range of products and services, disruption in manufacturing and supply chains, and – given the wide variability in outcomes regarding the outbreak – significant market uncertainty and volatility. Amid the turmoil, the U.S. government took unprecedented action – in concert with the U.S. Federal Reserve and central banks around the world – to help support consumers, businesses, and the broader economy, and to limit disruption to the financial system.
The situation continues to unfold, and the extent and duration of its impact on financial markets and the economy remain highly uncertain. Extreme events such as the coronavirus crisis are “exogenous shocks” that can have significant adverse effects on mutual funds and their investments. Although multiple asset classes may be affected by market disruption, the duration and impact may not be the same for all types of assets.
Fidelity is committed to helping you stay informed amid news about COVID-19 and during increased market volatility, and we’re taking extra steps to be responsive to customer needs. We encourage you to visit our websites, where we offer ongoing updates, commentary, and analysis on the markets and our funds.
Fidelity Advisor® Strategic Income Fund
Investment Summary (Unaudited)
The information in the following tables is based on the combined investments of the Fund and its pro-rata share of the investments of Fidelity's Fixed-Income Central Funds.
Top Five Holdings as of June 30, 2020
| (by issuer, excluding cash equivalents) | % of fund's net assets |
| U.S. Treasury Obligations | 16.1 |
| German Federal Republic | 2.9 |
| Ginnie Mae guaranteed REMIC pass-thru certificates | 1.9 |
| CCO Holdings LLC/CCO Holdings Capital Corp. | 1.6 |
| Ally Financial, Inc. | 1.6 |
| | 24.1 |
Top Five Market Sectors as of June 30, 2020
| | % of fund's net assets |
| Financials | 11.6 |
| Communication Services | 9.7 |
| Energy | 8.0 |
| Consumer Discretionary | 5.9 |
| Information Technology | 5.8 |
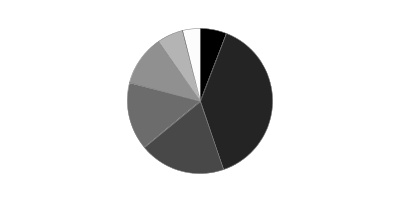
Quality Diversification (% of fund's net assets)
| As of June 30, 2020 |
| | U.S. Government and U.S. Government Agency Obligations* | 19.3% |
| | AAA,AA,A | 6.8% |
| | BBB | 7.5% |
| | BB | 19.5% |
| | B | 23.1% |
| | CCC,CC,C | 6.8% |
| | D | 0.2% |
| | Not Rated | 7.2% |
| | Equities | 5.8% |
| | Short-Term Investments and Net Other Assets | 3.8% |
* Includes NCUA Guaranteed Notes
We have used ratings from Moody’s Investors Service, Inc. Where Moody’s® ratings are not available, we have used S&P® ratings. All ratings are as of the date indicated and do not reflect subsequent changes.
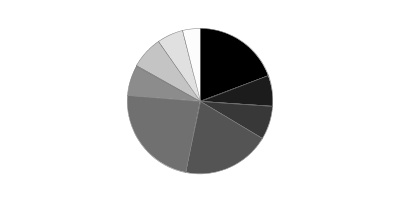
Asset Allocation (% of fund's net assets)
| As of June 30, 2020*,**,***,† |
| | Preferred Securities | 5.9% |
| | Corporate Bonds | 38.8% |
| | U.S. Government and U.S. Government Agency Obligations†† | 19.3% |
| | Foreign Government & Government Agency Obligations | 15.0% |
| | Bank Loan Obligations | 11.3% |
| | Stocks | 5.8% |
| | Other Investments | 0.1% |
| | Short-Term Investments and Net Other Assets (Liabilities) | 3.8% |
* Foreign investments – 31.2%
** Futures and Swaps – 2.3%
*** Written options – (2.3)%
† Forward Currency Contracts – (8.9)%
†† Includes NCUA Guaranteed Notes
An unaudited holdings listing for the Fund, which presents direct holdings as well as the pro-rata share of any securities and other investments held indirectly through its investment in underlying non-money market Fidelity Central Funds, is available at fidelity.com and/or institutional.fidelity.com, as applicable.
Fidelity Advisor® Strategic Income Fund
Schedule of Investments June 30, 2020 (Unaudited)
Showing Percentage of Net Assets
| Corporate Bonds - 32.1% | | | |
| | | Principal Amount (000s)(a) | Value (000s) |
| Convertible Bonds - 0.0% | | | |
| ENERGY - 0.0% | | | |
| Oil, Gas & Consumable Fuels - 0.0% | | | |
| Denbury Resources, Inc. 6.375% 12/31/24 (b) | | $24,702 | $2,469 |
| Nonconvertible Bonds - 32.1% | | | |
| COMMUNICATION SERVICES - 6.6% | | | |
| Diversified Telecommunication Services - 2.2% | | | |
| C&W Senior Financing Designated Activity Co. 6.875% 9/15/27 (b) | | 13,810 | 13,706 |
| Front Range BidCo, Inc. 4% 3/1/27 (b) | | 9,545 | 9,059 |
| Frontier Communications Corp. 8.5% 4/1/26 (b) | | 25,262 | 23,885 |
| GCI, Inc. 6.875% 4/15/25 | | 8,000 | 8,240 |
| Sable International Finance Ltd. 5.75% 9/7/27 (b) | | 12,405 | 12,653 |
| SFR Group SA: | | | |
| 5.5% 1/15/28 (b) | | 13,345 | 13,478 |
| 7.375% 5/1/26 (b) | | 62,475 | 65,149 |
| 8.125% 2/1/27 (b) | | 4,495 | 4,916 |
| Sprint Capital Corp.: | | | |
| 6.875% 11/15/28 | | 78,162 | 95,256 |
| 8.75% 3/15/32 | | 39,078 | 55,930 |
| Telenet Finance Luxembourg Notes SARL 5.5% 3/1/28 (b) | | 9,200 | 9,591 |
| U.S. West Communications 7.25% 9/15/25 | | 955 | 1,083 |
| Virgin Media Finance PLC 5% 7/15/30 (b) | | 14,025 | 13,712 |
| | | | 326,658 |
| Entertainment - 0.6% | | | |
| Allen Media LLC 10.5% 2/15/28 (b) | | 6,415 | 5,874 |
| Lions Gate Entertainment Corp. 5.875% 11/1/24 (b) | | 2,640 | 2,521 |
| Livent, Inc. 9.375% 10/15/04 (c)(d) | | 300 | 0 |
| Netflix, Inc.: | | | |
| 4.375% 11/15/26 | | 3,920 | 4,077 |
| 4.875% 4/15/28 | | 16,980 | 18,156 |
| 5.375% 11/15/29 (b) | | 6,760 | 7,425 |
| 5.875% 11/15/28 | | 38,210 | 43,512 |
| New Cotai LLC/New Cotai Capital Corp. 10.625% 5/1/19 pay-in-kind (b)(c)(e) | | 19,050 | 8,572 |
| | | | 90,137 |
| Media - 3.4% | | | |
| Altice Financing SA 5% 1/15/28 (b) | | 6,470 | 6,427 |
| Block Communications, Inc. 4.875% 3/1/28 (b) | | 4,405 | 4,351 |
| CCO Holdings LLC/CCO Holdings Capital Corp.: | | | |
| 4.5% 8/15/30 (b) | | 16,805 | 17,150 |
| 4.75% 3/1/30 (b) | | 51,010 | 52,193 |
| 5% 2/1/28 (b) | | 54,720 | 56,498 |
| 5.125% 5/1/27 (b) | | 42,005 | 43,458 |
| 5.375% 6/1/29 (b) | | 34,085 | 35,960 |
| 5.5% 5/1/26 (b) | | 12,355 | 12,803 |
| 5.875% 5/1/27 (b) | | 10,315 | 10,763 |
| CSC Holdings LLC: | | | |
| 5.375% 2/1/28 (b) | | 13,855 | 14,478 |
| 5.5% 5/15/26 (b) | | 31,192 | 32,015 |
| 5.75% 1/15/30 (b) | | 61,690 | 64,435 |
| 6.5% 2/1/29 (b) | | 15,380 | 16,822 |
| 7.5% 4/1/28 (b) | | 8,475 | 9,248 |
| Getty Images, Inc. 9.75% 3/1/27 (b) | | 6,255 | 5,893 |
| iHeartCommunications, Inc. 4.75% 1/15/28 (b) | | 4,965 | 4,580 |
| LCPR Senior Secured Financing DAC 6.75% 10/15/27 (b) | | 6,785 | 6,921 |
| Nexstar Escrow, Inc. 5.625% 7/15/27 (b) | | 14,270 | 14,271 |
| Outfront Media Capital LLC / Corp. 4.625% 3/15/30 (b) | | 6,620 | 6,068 |
| Quebecor Media, Inc. 5.75% 1/15/23 | | 14,205 | 14,880 |
| Sirius XM Radio, Inc.: | | | |
| 4.625% 5/15/23 (b) | | 4,550 | 4,575 |
| 5% 8/1/27 (b) | | 8,740 | 8,966 |
| 5.375% 4/15/25 (b) | | 8,845 | 9,084 |
| 5.375% 7/15/26 (b) | | 7,940 | 8,200 |
| Tegna, Inc. 5% 9/15/29 (b) | | 7,290 | 6,869 |
| Videotron Ltd. 5.125% 4/15/27 (b) | | 7,325 | 7,601 |
| Ziggo Bond Co. BV: | | | |
| 5.125% 2/28/30 (b) | | 3,375 | 3,349 |
| 6% 1/15/27 (b) | | 7,930 | 8,049 |
| Ziggo BV: | | | |
| 4.875% 1/15/30 (b) | | 4,805 | 4,831 |
| 5.5% 1/15/27 (b) | | 14,355 | 14,535 |
| | | | 505,273 |
| Wireless Telecommunication Services - 0.4% | | | |
| Intelsat Jackson Holdings SA: | | | |
| 5.5% 8/1/23 (c) | | 19,430 | 11,069 |
| 8% 2/15/24 (b) | | 12,960 | 13,144 |
| 8.5% 10/15/24 (b)(c) | | 12,990 | 7,810 |
| 9.75% 7/15/25 (b)(c) | | 22,015 | 13,524 |
| Sprint Corp. 7.625% 3/1/26 | | 3,615 | 4,267 |
| | | | 49,814 |
| TOTAL COMMUNICATION SERVICES | | | 971,882 |
| CONSUMER DISCRETIONARY - 3.1% | | | |
| Auto Components - 0.1% | | | |
| Allison Transmission, Inc.: | | | |
| 5% 10/1/24 (b) | | 7,960 | 7,940 |
| 5.875% 6/1/29 (b) | | 4,830 | 5,023 |
| Exide International Holdings LP 10.75% 10/31/21 pay-in-kind (b)(d)(e) | | 624 | 580 |
| Exide Technologies: | | | |
| 11% 10/31/24 pay-in-kind (b)(c)(d)(e) | | 1,560 | 1,014 |
| 11% 10/31/24 pay-in-kind (b)(c)(d)(e) | | 632 | 285 |
| | | | 14,842 |
| Automobiles - 0.2% | | | |
| Tesla, Inc. 5.3% 8/15/25 (b) | | 835 | 834 |
| Volkswagen Financial Services AG 3.375% 4/6/28 (Reg. S) | EUR | 18,219 | 22,827 |
| | | | 23,661 |
| Diversified Consumer Services - 0.0% | | | |
| GEMS MENASA Cayman Ltd. 7.125% 7/31/26 (b) | | 5,300 | 5,030 |
| Hotels, Restaurants & Leisure - 2.2% | | | |
| 1011778 BC Unlimited Liability Co./New Red Finance, Inc.: | | | |
| 4.375% 1/15/28 (b) | | 6,265 | 6,141 |
| 5% 10/15/25 (b) | | 34,125 | 33,954 |
| Carnival Corp. 11.5% 4/1/23 (b) | | 20,180 | 21,895 |
| Choice Hotels International, Inc. 5.75% 7/1/22 | | 2,690 | 2,862 |
| Colt Merger Sub, Inc. 5.75% 7/1/25 (b)(f) | | 8,510 | 8,553 |
| Eldorado Resorts, Inc.: | | | |
| 6.25% 7/1/25 (b)(f) | | 25,535 | 25,336 |
| 8.125% 7/1/27 (b)(f) | | 34,045 | 33,109 |
| FelCor Lodging LP 6% 6/1/25 | | 7,895 | 7,666 |
| Golden Nugget, Inc. 6.75% 10/15/24 (b) | | 14,400 | 10,350 |
| Hilton Domestic Operating Co., Inc.: | | | |
| 4.875% 1/15/30 | | 11,025 | 10,860 |
| 5.125% 5/1/26 | | 10,820 | 10,773 |
| Hilton Worldwide Finance LLC/Hilton Worldwide Finance Corp.: | | | |
| 4.625% 4/1/25 | | 11,100 | 10,853 |
| 4.875% 4/1/27 | | 5,210 | 5,086 |
| Marriott Ownership Resorts, Inc. 6.5% 9/15/26 | | 4,860 | 4,896 |
| MCE Finance Ltd.: | | | |
| 4.875% 6/6/25 (b) | | 17,840 | 17,930 |
| 5.25% 4/26/26 (b) | | 7,345 | 7,395 |
| 5.375% 12/4/29 (b) | | 4,785 | 4,776 |
| Merlin Entertainments PLC 5.75% 6/15/26 (b) | | 4,580 | 4,411 |
| MGM Mirage, Inc. 6.75% 5/1/25 | | 15,075 | 14,925 |
| NCL Corp. Ltd. 12.25% 5/15/24 (b) | | 9,110 | 9,529 |
| Royal Caribbean Cruises Ltd.: | | | |
| 9.125% 6/15/23 (b) | | 9,880 | 9,793 |
| 10.875% 6/1/23 (b) | | 8,545 | 8,781 |
| 11.5% 6/1/25 (b) | | 12,420 | 12,960 |
| Scientific Games Corp.: | | | |
| 7% 5/15/28 (b) | | 4,965 | 3,972 |
| 7.25% 11/15/29 (b) | | 4,965 | 3,972 |
| Studio City Co. Ltd. 7.25% 11/30/21 (b) | | 4,230 | 4,274 |
| Vail Resorts, Inc. 6.25% 5/15/25 (b) | | 3,855 | 4,033 |
| Viking Cruises Ltd.: | | | |
| 5.875% 9/15/27 (b) | | 3,395 | 2,021 |
| 13% 5/15/25 (b) | | 5,740 | 6,056 |
| Voc Escrow Ltd. 5% 2/15/28 (b) | | 6,285 | 4,667 |
| Wynn Macau Ltd. 5.125% 12/15/29 (b) | | 9,840 | 9,545 |
| | | | 321,374 |
| Household Durables - 0.2% | | | |
| Brookfield Residential Properties, Inc./Brookfield Residential U.S. Corp. 4.875% 2/15/30 (b) | | 4,370 | 3,652 |
| Lennar Corp. 4.75% 11/29/27 | | 7,175 | 7,785 |
| LGI Homes, Inc. 6.875% 7/15/26 (b) | | 7,205 | 7,331 |
| TRI Pointe Homes, Inc.: | | | |
| 5.7% 6/15/28 | | 2,010 | 2,040 |
| 5.875% 6/15/24 | | 11,770 | 12,146 |
| | | | 32,954 |
| Internet & Direct Marketing Retail - 0.3% | | | |
| Expedia, Inc.: | | | |
| 6.25% 5/1/25 (b) | | 9,105 | 9,722 |
| 7% 5/1/25 (b) | | 8,465 | 8,799 |
| Terrier Media Buyer, Inc. 8.875% 12/15/27 (b) | | 23,835 | 22,852 |
| | | | 41,373 |
| Specialty Retail - 0.1% | | | |
| Asbury Automotive Group, Inc.: | | | |
| 4.5% 3/1/28 (b) | | 1,987 | 1,927 |
| 4.75% 3/1/30 (b) | | 1,980 | 1,931 |
| Burlington Coat Factory Warehouse Corp. 6.25% 4/15/25 (b) | | 2,035 | 2,127 |
| Penske Automotive Group, Inc. 5.5% 5/15/26 | | 5,975 | 5,960 |
| | | | 11,945 |
| TOTAL CONSUMER DISCRETIONARY | | | 451,179 |
| CONSUMER STAPLES - 1.6% | | | |
| Beverages - 0.4% | | | |
| Anheuser-Busch InBev SA NV 3.7% 4/2/40 (Reg. S) | EUR | 7,879 | 10,720 |
| Heineken NV: | | | |
| 1.25% 5/7/33 (Reg. S) | EUR | 22,700 | 25,604 |
| 1.75% 5/7/40 (Reg. S) | EUR | 13,600 | 15,312 |
| | | | 51,636 |
| Food & Staples Retailing - 0.3% | | | |
| Albertsons Companies LLC/Safeway, Inc./New Albertson's, Inc./Albertson's LLC: | | | |
| 4.625% 1/15/27 (b) | | 9,415 | 9,415 |
| 4.875% 2/15/30 (b) | | 18,930 | 19,368 |
| KeHE Distributors LLC / KeHE Finance Corp. 8.625% 10/15/26 (b) | | 5,880 | 6,262 |
| Performance Food Group, Inc. 5.5% 10/15/27 (b) | | 5,345 | 5,158 |
| | | | 40,203 |
| Food Products - 0.9% | | | |
| Del Monte Foods, Inc. 11.875% 5/15/25 (b) | | 3,895 | 3,934 |
| JBS Investments II GmbH: | | | |
| 5.75% 1/15/28 (b) | | 6,485 | 6,411 |
| 7% 1/15/26 (b) | | 6,745 | 7,079 |
| JBS U.S.A. LLC/JBS U.S.A. Finance, Inc.: | | | |
| 5.75% 6/15/25 (b) | | 17,240 | 17,456 |
| 6.75% 2/15/28 (b) | | 10,725 | 11,328 |
| JBS U.S.A. Lux SA / JBS Food Co.: | | | |
| 5.5% 1/15/30 (b) | | 12,225 | 12,531 |
| 6.5% 4/15/29 (b) | | 17,835 | 18,927 |
| Lamb Weston Holdings, Inc.: | | | |
| 4.625% 11/1/24 (b) | | 5,230 | 5,426 |
| 4.875% 11/1/26 (b) | | 5,285 | 5,470 |
| Pilgrim's Pride Corp. 5.75% 3/15/25 (b) | | 12,675 | 12,638 |
| Post Holdings, Inc.: | | | |
| 4.625% 4/15/30 (b) | | 6,415 | 6,295 |
| 5% 8/15/26 (b) | | 12,030 | 12,075 |
| 5.5% 12/15/29 (b) | | 9,145 | 9,457 |
| 5.75% 3/1/27 (b) | | 4,885 | 5,056 |
| | | | 134,083 |
| TOTAL CONSUMER STAPLES | | | 225,922 |
| ENERGY - 4.1% | | | |
| Energy Equipment & Services - 0.3% | | | |
| Diamond Offshore Drilling, Inc.: | | | |
| 4.875% 11/1/43 (c) | | 308 | 35 |
| 5.7% 10/15/39 (c) | | 1,585 | 161 |
| Exterran Energy Solutions LP 8.125% 5/1/25 | | 3,270 | 2,706 |
| Forum Energy Technologies, Inc. 6.25% 10/1/21 | | 10,950 | 4,284 |
| Jonah Energy LLC 7.25% 10/15/25 (b) | | 10,845 | 1,329 |
| Nabors Industries Ltd.: | | | |
| 7.25% 1/15/26 (b) | | 6,565 | 4,037 |
| 7.5% 1/15/28 (b) | | 5,660 | 3,481 |
| Nabors Industries, Inc. 5.75% 2/1/25 | | 11,690 | 4,734 |
| Nine Energy Service, Inc. 8.75% 11/1/23 (b) | | 3,620 | 1,765 |
| NuStar Logistics LP 6% 6/1/26 | | 7,285 | 7,139 |
| SESI LLC 7.75% 9/15/24 | | 4,340 | 1,584 |
| Summit Midstream Holdings LLC 5.75% 4/15/25 | | 3,405 | 1,907 |
| Transocean, Inc.: | | | |
| 7.25% 11/1/25 (b) | | 7,140 | 3,891 |
| 7.5% 1/15/26 (b) | | 7,620 | 4,153 |
| | | | 41,206 |
| Oil, Gas & Consumable Fuels - 3.8% | | | |
| Antero Midstream Partners LP/Antero Midstream Finance Corp. 5.75% 1/15/28 (b) | | 10,640 | 8,406 |
| Antero Resources Corp. 5.625% 6/1/23 (Reg. S) | | 1,645 | 1,053 |
| Antero Resources Finance Corp. 5.375% 11/1/21 | | 1,900 | 1,758 |
| Callon Petroleum Co. 6.125% 10/1/24 | | 2,855 | 971 |
| Carrizo Oil & Gas, Inc. 6.25% 4/15/23 | | 5,395 | 2,043 |
| Cenovus Energy, Inc.: | | | |
| 5.25% 6/15/37 | | 1,795 | 1,552 |
| 5.4% 6/15/47 | | 10,235 | 8,784 |
| 6.75% 11/15/39 | | 3,215 | 3,163 |
| Chesapeake Energy Corp.: | | | |
| 7% 10/1/24 | | 3,985 | 100 |
| 8% 1/15/25 | | 1,955 | 44 |
| 8% 6/15/27 | | 1,240 | 28 |
| 11.5% 1/1/25 (b) | | 14,711 | 1,545 |
| Citgo Holding, Inc. 9.25% 8/1/24 (b) | | 16,430 | 16,348 |
| Citgo Petroleum Corp. 7% 6/15/25 (b) | | 13,580 | 13,597 |
| CNX Midstream Partners LP 6.5% 3/15/26 (b) | | 3,935 | 3,620 |
| Comstock Resources, Inc.: | | | |
| 9.75% 8/15/26 | | 36,490 | 34,132 |
| 9.75% 8/15/26 | | 4,500 | 4,202 |
| Continental Resources, Inc.: | | | |
| 3.8% 6/1/24 | | 11,880 | 11,208 |
| 4.375% 1/15/28 | | 3,040 | 2,676 |
| 4.5% 4/15/23 | | 1,645 | 1,571 |
| 4.9% 6/1/44 | | 7,565 | 6,024 |
| Covey Park Energy LLC 7.5% 5/15/25 (b) | | 6,555 | 5,940 |
| Crestwood Midstream Partners LP/Crestwood Midstream Finance Corp.: | | | |
| 5.625% 5/1/27 (b) | | 11,025 | 9,191 |
| 5.75% 4/1/25 | | 2,960 | 2,557 |
| CVR Energy, Inc.: | | | |
| 5.25% 2/15/25 (b) | | 9,740 | 8,961 |
| 5.75% 2/15/28 (b) | | 24,505 | 21,442 |
| DCP Midstream LLC 5.85% 5/21/43 (b)(e) | | 10,780 | 7,546 |
| Denbury Resources, Inc.: | | | |
| 7.75% 2/15/24 (b) | | 26,375 | 10,023 |
| 9% 5/15/21 (b) | | 27,890 | 10,807 |
| 9.25% 3/31/22 (b) | | 4,210 | 1,684 |
| EG Global Finance PLC 8.5% 10/30/25 (b) | | 9,545 | 9,784 |
| Endeavor Energy Resources LP/EER Finance, Inc.: | | | |
| 5.5% 1/30/26 (b) | | 5,820 | 5,573 |
| 5.75% 1/30/28 (b) | | 10,149 | 9,743 |
| 6.625% 7/15/25 (b) | | 3,395 | 3,422 |
| Energy Transfer Equity LP 5.5% 6/1/27 | | 12,065 | 12,509 |
| EP Energy LLC/Everest Acquisition Finance, Inc. 7.75% 5/15/26 (b)(c) | | 55,595 | 11,119 |
| EQM Midstream Partners LP: | | | |
| 6% 7/1/25 (b) | | 5,705 | 5,762 |
| 6.5% 7/1/27 (b) | | 6,805 | 6,971 |
| EQT Corp. 3.9% 10/1/27 | | 15,848 | 12,891 |
| Extraction Oil & Gas, Inc. 7.375% 5/15/24 (b)(c) | | 4,315 | 831 |
| Genesis Energy LP/Genesis Energy Finance Corp. 6.25% 5/15/26 | | 5,405 | 4,637 |
| Global Partners LP/GLP Finance Corp. 7% 6/15/23 | | 8,125 | 7,810 |
| Hess Midstream Partners LP: | | | |
| 5.125% 6/15/28 (b) | | 6,600 | 6,352 |
| 5.625% 2/15/26 (b) | | 9,140 | 9,044 |
| Hilcorp Energy I LP/Hilcorp Finance Co.: | | | |
| 5% 12/1/24 (b) | | 7,550 | 6,493 |
| 5.75% 10/1/25 (b) | | 8,135 | 6,915 |
| 6.25% 11/1/28 (b) | | 7,130 | 5,722 |
| Holly Energy Partners LP/Holly Energy Finance Corp. 5% 2/1/28 (b) | | 4,350 | 4,143 |
| Indigo Natural Resources LLC 6.875% 2/15/26 (b) | | 13,168 | 12,246 |
| Laredo Petroleum, Inc.: | | | |
| 9.5% 1/15/25 | | 6,490 | 4,486 |
| 10.125% 1/15/28 | | 4,870 | 3,360 |
| MEG Energy Corp. 7.125% 2/1/27 (b) | | 6,490 | 5,395 |
| MPLX LP 6.375% 5/1/24 | | 3,185 | 3,289 |
| Murphy Oil U.S.A., Inc.: | | | |
| 4.75% 9/15/29 | | 4,155 | 4,248 |
| 5.625% 5/1/27 | | 3,665 | 3,784 |
| Newfield Exploration Co. 5.375% 1/1/26 | | 6,813 | 6,380 |
| NGL Energy Partners LP/NGL Energy Finance Corp.: | | | |
| 6.125% 3/1/25 | | 7,480 | 5,647 |
| 7.5% 4/15/26 | | 9,630 | 7,319 |
| NGPL PipeCo LLC: | | | |
| 4.375% 8/15/22 (b) | | 1,800 | 1,857 |
| 4.875% 8/15/27 (b) | | 1,800 | 1,978 |
| Occidental Petroleum Corp.: | | | |
| 2.9% 8/15/24 | | 8,270 | 7,071 |
| 3.2% 8/15/26 | | 515 | 416 |
| 3.4% 4/15/26 | | 670 | 548 |
| 4.4% 4/15/46 | | 5,820 | 4,058 |
| 4.4% 8/15/49 | | 14,725 | 10,237 |
| 4.625% 6/15/45 | | 4,795 | 3,357 |
| 6.2% 3/15/40 | | 3,565 | 2,986 |
| 6.45% 9/15/36 | | 11,875 | 10,164 |
| 6.6% 3/15/46 | | 9,520 | 8,287 |
| 7.2% 3/15/29 | | 2,440 | 2,172 |
| 7.5% 5/1/31 | | 680 | 632 |
| Parsley Energy LLC/Parsley Finance Corp.: | | | |
| 5.375% 1/15/25 (b) | | 685 | 666 |
| 5.625% 10/15/27 (b) | | 2,270 | 2,236 |
| PBF Holding Co. LLC/PBF Finance Corp.: | | | |
| 6% 2/15/28 (b) | | 15,760 | 13,081 |
| 7.25% 6/15/25 | | 13,580 | 12,324 |
| 9.25% 5/15/25 (b) | | 10,160 | 10,846 |
| PBF Logistics LP/PBF Logistics Finance, Inc. 6.875% 5/15/23 | | 6,110 | 5,884 |
| PDC Energy, Inc. 6.125% 9/15/24 | | 2,480 | 2,306 |
| Sabine Pass Liquefaction LLC 4.5% 5/15/30 (b) | | 84 | 93 |
| Sanchez Energy Corp. 7.25% 2/15/23 (b)(c) | | 12,834 | 128 |
| SM Energy Co.: | | | |
| 5.625% 6/1/25 | | 5,060 | 2,682 |
| 6.625% 1/15/27 | | 12,830 | 6,287 |
| 6.75% 9/15/26 | | 3,175 | 1,597 |
| Southern Star Central Corp. 5.125% 7/15/22 (b) | | 4,930 | 4,926 |
| Southwestern Energy Co.: | | | |
| 6.2% 1/23/25 (e) | | 1,095 | 938 |
| 7.5% 4/1/26 | | 12,420 | 10,871 |
| 7.75% 10/1/27 | | 7,830 | 6,812 |
| SRC Energy, Inc. 6.25% 12/1/25 | | 4,370 | 3,682 |
| Sunoco LP/Sunoco Finance Corp.: | | | |
| 4.875% 1/15/23 | | 5,390 | 5,309 |
| 5.5% 2/15/26 | | 6,865 | 6,659 |
| Teine Energy Ltd. 6.875% 9/30/22 (b) | | 8,820 | 8,710 |
| Tennessee Gas Pipeline Co. 7.625% 4/1/37 | | 2,585 | 3,431 |
| Ultra Resources, Inc. 11% 7/12/24 pay-in-kind (c) | | 6,493 | 341 |
| Unit Corp. 6.625% 5/15/21 (c) | | 1,660 | 220 |
| W&T Offshore, Inc. 9.75% 11/1/23 (b) | | 24,200 | 15,149 |
| Whiting Petroleum Corp. 6.625% 1/15/26 (c) | | 4,965 | 881 |
| | | | 566,673 |
| TOTAL ENERGY | | | 607,879 |
| FINANCIALS - 3.9% | | | |
| Banks - 0.6% | | | |
| Commerzbank AG 4% 3/23/26 (Reg. S) | EUR | 12,050 | 14,016 |
| Danske Bank A/S 2.5% 6/21/29 (Reg. S) (e) | EUR | 23,652 | 27,110 |
| Lloyds Banking Group PLC 4.5% 3/18/30 (Reg. S) (e) | EUR | 12,510 | 15,162 |
| UniCredit SpA 2.731% 1/15/32 (Reg. S) (e) | EUR | 11,593 | 11,763 |
| Wells Fargo & Co. 1.741% 5/4/30 (Reg. S) (e) | EUR | 20,118 | 23,499 |
| | | | 91,550 |
| Capital Markets - 0.1% | | | |
| AssuredPartners, Inc. 7% 8/15/25 (b) | | 2,930 | 2,930 |
| j2 Cloud Services LLC/j2 Global Communications, Inc. 6% 7/15/25 (b) | | 4,875 | 4,960 |
| MSCI, Inc. 4% 11/15/29 (b) | | 3,780 | 3,856 |
| | | | 11,746 |
| Consumer Finance - 2.1% | | | |
| Ally Financial, Inc.: | | | |
| 8% 11/1/31 | | 16,761 | 21,194 |
| 8% 11/1/31 | | 155,842 | 201,041 |
| Springleaf Finance Corp.: | | | |
| 5.375% 11/15/29 | | 5,560 | 5,226 |
| 6.625% 1/15/28 | | 4,415 | 4,371 |
| 6.875% 3/15/25 | | 30,605 | 31,399 |
| 7.125% 3/15/26 | | 41,215 | 42,657 |
| | | | 305,888 |
| Diversified Financial Services - 0.6% | | | |
| Enviva Partners LP / Enviva Partners Finance Corp. 6.5% 1/15/26 (b) | | 6,600 | 6,864 |
| Icahn Enterprises LP/Icahn Enterprises Finance Corp.: | | | |
| 5.25% 5/15/27 | | 17,335 | 16,728 |
| 6.25% 5/15/26 | | 14,625 | 14,645 |
| 6.375% 12/15/25 | | 32,405 | 32,081 |
| 6.75% 2/1/24 | | 6,490 | 6,539 |
| James Hardie International Finance Ltd.: | | | |
| 4.75% 1/15/25 (b) | | 5,220 | 5,311 |
| 5% 1/15/28 (b) | | 5,270 | 5,375 |
| MPH Acquisition Holdings LLC 7.125% 6/1/24 (b) | | 4,280 | 3,980 |
| | | | 91,523 |
| Insurance - 0.3% | | | |
| Acrisure LLC / Acrisure Finance, Inc.: | | | |
| 7% 11/15/25 (b) | | 20,290 | 19,402 |
| 8.125% 2/15/24 (b) | | 7,875 | 8,188 |
| 10.125% 8/1/26 (b) | | 6,810 | 7,321 |
| Alliant Holdings Intermediate LLC 6.75% 10/15/27 (b) | | 3,340 | 3,329 |
| HUB International Ltd. 7% 5/1/26 (b) | | 6,980 | 6,980 |
| | | | 45,220 |
| Mortgage Real Estate Investment Trusts - 0.0% | | | |
| Starwood Property Trust, Inc. 4.75% 3/15/25 | | 6,855 | 6,238 |
| Thrifts & Mortgage Finance - 0.2% | | | |
| Nationwide Building Society 2% 7/25/29 (Reg. S) (e) | EUR | 20,943 | 23,505 |
| TOTAL FINANCIALS | | | 575,670 |
| HEALTH CARE - 2.2% | | | |
| Health Care Equipment & Supplies - 0.1% | | | |
| Hologic, Inc.: | | | |
| 4.375% 10/15/25 (b) | | 3,700 | 3,736 |
| 4.625% 2/1/28 (b) | | 2,505 | 2,599 |
| Ortho-Clinical Diagnostics, Inc. 7.25% 2/1/28 (b) | | 4,155 | 4,223 |
| | | | 10,558 |
| Health Care Providers & Services - 1.8% | | | |
| BCPE Cycle Merger Sub II, Inc. 10.625% 7/15/27 (b) | | 18,900 | 19,467 |
| Centene Corp.: | | | |
| 4.25% 12/15/27 | | 6,820 | 7,038 |
| 4.625% 12/15/29 | | 23,795 | 25,193 |
| 4.75% 1/15/25 | | 5,425 | 5,553 |
| 5.25% 4/1/25 (b) | | 5,705 | 5,874 |
| 5.375% 6/1/26 (b) | | 18,035 | 18,696 |
| 5.375% 8/15/26 (b) | | 4,655 | 4,842 |
| Community Health Systems, Inc.: | | | |
| 6.625% 2/15/25 (b) | | 7,415 | 6,970 |
| 8% 3/15/26 (b) | | 37,390 | 35,341 |
| 8.125% 6/30/24 (b) | | 25,507 | 17,090 |
| 9.875% 6/30/23 (b) | | 21,652 | 16,844 |
| Encompass Health Corp. 5.75% 11/1/24 | | 10,048 | 10,048 |
| Horizon Pharma U.S.A., Inc. 5.5% 8/1/27 (b) | | 7,300 | 7,595 |
| Jaguar Holding Co. II/Pharmaceutical Product Development LLC 5% 6/15/28 (b) | | 7,220 | 7,391 |
| Molina Healthcare, Inc. 4.375% 6/15/28 (b) | | 4,690 | 4,702 |
| Radiology Partners, Inc. 9.25% 2/1/28 (b) | | 11,755 | 11,079 |
| Tenet Healthcare Corp.: | | | |
| 4.625% 7/15/24 | | 3,640 | 3,567 |
| 4.625% 9/1/24 (b) | | 7,305 | 7,141 |
| 4.875% 1/1/26 (b) | | 18,260 | 17,885 |
| 5.125% 5/1/25 | | 3,640 | 3,513 |
| 5.125% 11/1/27 (b) | | 10,955 | 10,809 |
| 6.25% 2/1/27 (b) | | 11,115 | 11,032 |
| Vizient, Inc. 6.25% 5/15/27 (b) | | 1,690 | 1,770 |
| | | | 259,440 |
| Health Care Technology - 0.0% | | | |
| IMS Health, Inc. 5% 5/15/27 (b) | | 5,660 | 5,790 |
| Life Sciences Tools & Services - 0.1% | | | |
| Avantor, Inc. 6% 10/1/24 (b) | | 7,285 | 7,613 |
| Charles River Laboratories International, Inc. 4.25% 5/1/28 (b) | | 2,045 | 2,044 |
| | | | 9,657 |
| Pharmaceuticals - 0.2% | | | |
| Catalent Pharma Solutions: | | | |
| 4.875% 1/15/26 (b) | | 2,365 | 2,401 |
| 5% 7/15/27 (b) | | 2,295 | 2,383 |
| Mylan NV 3.125% 11/22/28 (Reg. S) | EUR | 21,360 | 26,941 |
| | | | 31,725 |
| TOTAL HEALTH CARE | | | 317,170 |
| INDUSTRIALS - 2.9% | | | |
| Aerospace & Defense - 1.5% | | | |
| Airbus Group NV 2% 4/7/28 (Reg. S) | EUR | 8,069 | 9,564 |
| BBA U.S. Holdings, Inc. 5.375% 5/1/26 (b) | | 2,610 | 2,612 |
| Bombardier, Inc.: | | | |
| 6.125% 1/15/23 (b) | | 6,590 | 4,533 |
| 7.5% 12/1/24 (b) | | 5,505 | 3,578 |
| 7.5% 3/15/25 (b) | | 16,070 | 10,487 |
| 7.875% 4/15/27 (b) | | 30,330 | 19,866 |
| BWX Technologies, Inc.: | | | |
| 4.125% 6/30/28 (b) | | 6,400 | 6,384 |
| 5.375% 7/15/26 (b) | | 4,990 | 5,142 |
| Moog, Inc. 4.25% 12/15/27 (b) | | 2,025 | 1,974 |
| Spirit Aerosystems, Inc. 7.5% 4/15/25 (b) | | 9,205 | 9,078 |
| TransDigm UK Holdings PLC 6.875% 5/15/26 | | 21,085 | 19,609 |
| TransDigm, Inc.: | | | |
| 5.5% 11/15/27 | | 57,420 | 50,124 |
| 6.25% 3/15/26 (b) | | 11,120 | 11,113 |
| 6.375% 6/15/26 | | 37,890 | 34,575 |
| 6.5% 5/15/25 | | 9,710 | 9,080 |
| 7.5% 3/15/27 | | 11,028 | 10,599 |
| Wolverine Escrow LLC: | | | |
| 8.5% 11/15/24 (b) | | 13,041 | 8,542 |
| 9% 11/15/26 (b) | | 13,634 | 8,930 |
| | | | 225,790 |
| Air Freight & Logistics - 0.1% | | | |
| Cargo Aircraft Management, Inc. 4.75% 2/1/28 (b) | | 3,960 | 3,925 |
| XPO Logistics, Inc. 6.25% 5/1/25 (b) | | 11,590 | 12,141 |
| | | | 16,066 |
| Airlines - 0.1% | | | |
| Air Canada 2013-1 Pass Through Trust 5.375% 11/15/22 (b) | | 1,602 | 1,444 |
| Continental Airlines, Inc. pass-thru certificates 6.903% 10/19/23 | | 152 | 128 |
| Delta Air Lines, Inc. 7% 5/1/25 (b) | | 2,860 | 2,952 |
| Delta Air Lines, Inc. pass-thru trust certificates 8.021% 2/10/24 | | 2,157 | 2,024 |
| Hawaiian Airlines pass-thru certificates Series 2013-1 Class B, 4.95% 7/15/23 | | 3,082 | 2,921 |
| U.S. Airways pass-thru certificates: | | | |
| Series 2011-1 Class A, 7.125% 4/22/25 | | 4,597 | 3,832 |
| Series 2012-2 Class B, 6.75% 12/3/22 | | 2,256 | 1,822 |
| Series 2013-1 Class B, 5.375% 5/15/23 | | 2,982 | 2,422 |
| | | | 17,545 |
| Building Products - 0.0% | | | |
| Advanced Drain Systems, Inc. 5% 9/30/27 (b) | | 1,400 | 1,411 |
| Commercial Services & Supplies - 0.3% | | | |
| ADS Waste Holdings, Inc. 5.625% 11/15/24 (b) | | 6,910 | 7,169 |
| Covanta Holding Corp.: | | | |
| 5.875% 3/1/24 | | 5,895 | 5,947 |
| 5.875% 7/1/25 | | 1,995 | 2,020 |
| 6% 1/1/27 | | 7,080 | 7,169 |
| IAA Spinco, Inc. 5.5% 6/15/27 (b) | | 2,830 | 2,926 |
| KAR Auction Services, Inc. 5.125% 6/1/25 (b) | | 6,210 | 6,117 |
| Ritchie Bros. Auctioneers, Inc. 5.375% 1/15/25 (b) | | 2,315 | 2,382 |
| The Brink's Co. 4.625% 10/15/27 (b) | | 7,200 | 6,912 |
| | | | 40,642 |
| Construction & Engineering - 0.1% | | | |
| AECOM 5.125% 3/15/27 | | 7,490 | 8,052 |
| Odebrecht Finance Ltd.: | | | |
| 4.375% 4/25/25 (b)(c) | | 7,474 | 404 |
| 5.25% 6/27/29 (b)(c) | | 6,800 | 272 |
| 7.125% 6/26/42 (b)(c) | | 3,310 | 182 |
| | | | 8,910 |
| Electrical Equipment - 0.1% | | | |
| Sensata Technologies BV 5% 10/1/25 (b) | | 8,215 | 8,747 |
| Machinery - 0.1% | | | |
| Stevens Holding Co., Inc. 6.125% 10/1/26 (b) | | 1,880 | 1,965 |
| Vertical Holdco GmbH 7.625% 7/15/28 (b)(f) | | 1,870 | 1,870 |
| Vertical U.S. Newco, Inc. 0% 6/30/27 (b)(f) | | 6,830 | 6,830 |
| | | | 10,665 |
| Marine - 0.0% | | | |
| Navios South American Logistics, Inc./Navios Logistics Finance U.S., Inc. 7.25% 5/1/22 (b) | | 7,680 | 7,678 |
| Professional Services - 0.0% | | | |
| ASGN, Inc. 4.625% 5/15/28 (b) | | 5,670 | 5,537 |
| Road & Rail - 0.5% | | | |
| Hertz Corp.: | | | |
| 5.5% 10/15/24 (b)(c) | | 5,950 | 1,850 |
| 6% 1/15/28 (b)(c) | | 3,435 | 1,073 |
| 6.25% 10/15/22 (c) | | 4,635 | 1,448 |
| 7.125% 8/1/26 (b)(c) | | 6,315 | 1,973 |
| Uber Technologies, Inc.: | | | |
| 7.5% 9/15/27 (b) | | 31,625 | 31,625 |
| 8% 11/1/26 (b) | | 29,170 | 29,695 |
| | | | 67,664 |
| Trading Companies & Distributors - 0.1% | | | |
| FLY Leasing Ltd. 5.25% 10/15/24 | | 5,695 | 4,613 |
| United Rentals North America, Inc.: | | | |
| 3.875% 11/15/27 | | 3,345 | 3,337 |
| 5.5% 5/15/27 | | 4,980 | 5,129 |
| | | | 13,079 |
| TOTAL INDUSTRIALS | | | 423,734 |
| INFORMATION TECHNOLOGY - 1.1% | | | |
| Electronic Equipment & Components - 0.0% | | | |
| MTS Systems Corp. 5.75% 8/15/27 (b) | | 1,905 | 1,748 |
| IT Services - 0.3% | | | |
| Banff Merger Sub, Inc. 9.75% 9/1/26 (b) | | 5,645 | 5,680 |
| Camelot Finance SA 4.5% 11/1/26 (b) | | 6,365 | 6,365 |
| CDW LLC/CDW Finance Corp. 5% 9/1/25 | | 3,980 | 4,094 |
| Go Daddy Operating Co. LLC / GD Finance Co., Inc. 5.25% 12/1/27 (b) | | 5,665 | 5,764 |
| GTT Communications, Inc. 7.875% 12/31/24 (b) | | 640 | 336 |
| Northwest Fiber LLC/Northwest Fiber Finance Sub, Inc. 10.75% 6/1/28 (b) | | 3,695 | 3,843 |
| RP Crown Parent, LLC 7.375% 10/15/24 (b) | | 2,820 | 2,813 |
| Tempo Acquisition LLC 6.75% 6/1/25 (b) | | 5,340 | 5,407 |
| | | | 34,302 |
| Semiconductors & Semiconductor Equipment - 0.2% | | | |
| Infineon Technologies AG 2% 6/24/32 (Reg. S) | EUR | 15,500 | 17,333 |
| Qorvo, Inc. 5.5% 7/15/26 | | 3,615 | 3,760 |
| Sensata Technologies UK Financing Co. PLC 6.25% 2/15/26 (b) | | 7,880 | 8,176 |
| | | | 29,269 |
| Software - 0.5% | | | |
| Ascend Learning LLC: | | | |
| 6.875% 8/1/25 (b) | | 7,330 | 7,367 |
| 6.875% 8/1/25 (b) | | 2,480 | 2,498 |
| Boxer Parent Co., Inc. 7.125% 10/2/25 (b) | | 3,445 | 3,618 |
| Ensemble S Merger Sub, Inc. 9% 9/30/23 (b) | | 13,310 | 13,443 |
| Fair Isaac Corp. 4% 6/15/28 (b) | | 6,420 | 6,436 |
| Nortonlifelock, Inc. 5% 4/15/25 (b) | | 6,360 | 6,455 |
| Open Text Corp.: | | | |
| 3.875% 2/15/28 (b) | | 3,220 | 3,100 |
| 5.875% 6/1/26 (b) | | 6,000 | 6,226 |
| Open Text Holdings, Inc. 4.125% 2/15/30 (b) | | 3,220 | 3,164 |
| Parametric Technology Corp.: | | | |
| 3.625% 2/15/25 (b) | | 3,755 | 3,727 |
| 4% 2/15/28 (b) | | 3,715 | 3,687 |
| Veritas U.S., Inc./Veritas Bermuda Ltd.: | | | |
| 7.5% 2/1/23 (b) | | 9,915 | 9,766 |
| 10.5% 2/1/24 (b) | | 8,750 | 7,831 |
| | | | 77,318 |
| Technology Hardware, Storage & Peripherals - 0.1% | | | |
| NCR Corp.: | | | |
| 5.75% 9/1/27 (b) | | 5,480 | 5,480 |
| 6.125% 9/1/29 (b) | | 5,480 | 5,507 |
| 8.125% 4/15/25 (b) | | 2,910 | 3,085 |
| | | | 14,072 |
| TOTAL INFORMATION TECHNOLOGY | | | 156,709 |
| MATERIALS - 3.0% | | | |
| Chemicals - 1.4% | | | |
| CF Industries Holdings, Inc.: | | | |
| 4.95% 6/1/43 | | 40,343 | 43,482 |
| 5.15% 3/15/34 | | 19,208 | 20,539 |
| 5.375% 3/15/44 | | 34,489 | 37,293 |
| Consolidated Energy Finance SA: | | | |
| 3 month U.S. LIBOR + 3.750% 4.0634% 6/15/22 (b)(e)(g) | | 1,820 | 1,620 |
| 6.5% 5/15/26 (b) | | 31,160 | 26,174 |
| 6.875% 6/15/25 (b) | | 6,400 | 5,440 |
| Element Solutions, Inc. 5.875% 12/1/25 (b) | | 10,955 | 11,061 |
| LSB Industries, Inc. 9.625% 5/1/23 (b) | | 3,600 | 3,466 |
| Neon Holdings, Inc. 10.125% 4/1/26 (b) | | 7,305 | 7,250 |
| OCI NV: | | | |
| 5.25% 11/1/24 (b) | | 10,040 | 9,638 |
| 6.625% 4/15/23 (b) | | 3,185 | 3,201 |
| Starfruit Finco BV / Starfruit U.S. Holdco LLC 8% 10/1/26 (b) | | 4,977 | 5,095 |
| SunCoke Energy Partners LP/SunCoke Energy Partners Finance Corp. 7.5% 6/15/25 (b) | | 5,880 | 4,970 |
| The Chemours Co. LLC 5.375% 5/15/27 | | 18,470 | 16,691 |
| Tronox, Inc. 6.5% 5/1/25 (b) | | 5,410 | 5,464 |
| Valvoline, Inc. 4.25% 2/15/30 (b) | | 4,680 | 4,610 |
| | | | 205,994 |
| Construction Materials - 0.0% | | | |
| Summit Materials LLC/Summit Materials Finance Corp. 5.125% 6/1/25 (b) | | 3,060 | 3,022 |
| U.S. Concrete, Inc. 6.375% 6/1/24 | | 3,885 | 3,856 |
| | | | 6,878 |
| Containers & Packaging - 0.5% | | | |
| ARD Finance SA 6.5% 6/30/27 pay-in-kind (b)(e) | | 6,625 | 6,555 |
| Cascades, Inc.: | | | |
| 5.125% 1/15/26 (b) | | 3,310 | 3,360 |
| 5.375% 1/15/28 (b) | | 3,310 | 3,360 |
| Crown Cork & Seal, Inc.: | | | |
| 7.375% 12/15/26 | | 16,535 | 19,346 |
| 7.5% 12/15/96 | | 7,695 | 8,157 |
| Labl Escrow Issuer LLC: | | | |
| 6.75% 7/15/26 (b) | | 11,010 | 11,454 |
| 10.5% 7/15/27 (b) | | 7,340 | 7,799 |
| Trivium Packaging Finance BV: | | | |
| 5.5% 8/15/26 (b) | | 4,195 | 4,232 |
| 8.5% 8/15/27 (b) | | 7,180 | 7,674 |
| | | | 71,937 |
| Metals & Mining - 1.1% | | | |
| Alcoa Nederland Holding BV: | | | |
| 6.125% 5/15/28 (b) | | 2,110 | 2,161 |
| 6.75% 9/30/24 (b) | | 5,350 | 5,464 |
| 7% 9/30/26 (b) | | 4,430 | 4,541 |
| Algoma Steel SCA 0% 12/31/23 (d) | | 1,518 | 926 |
| Arconic Rolled Products Corp.: | | | |
| 6% 5/15/25 (b) | | 4,090 | 4,208 |
| 6.125% 2/15/28 (b) | | 9,123 | 9,121 |
| Cleveland-Cliffs, Inc.: | | | |
| 4.875% 1/15/24 (b) | | 7,215 | 6,782 |
| 5.75% 3/1/25 | | 1,889 | 1,608 |
| 5.875% 6/1/27 | | 11,010 | 9,097 |
| Commercial Metals Co. 5.75% 4/15/26 | | 5,405 | 5,540 |
| Compass Minerals International, Inc. 6.75% 12/1/27 (b) | | 14,455 | 15,178 |
| First Quantum Minerals Ltd.: | | | |
| 6.5% 3/1/24 (b) | | 6,560 | 6,166 |
| 6.875% 3/1/26 (b) | | 14,330 | 13,891 |
| 7.25% 5/15/22 (b) | | 4,105 | 3,942 |
| 7.25% 4/1/23 (b) | | 1,985 | 1,896 |
| 7.5% 4/1/25 (b) | | 12,105 | 11,712 |
| FMG Resources (August 2006) Pty Ltd.: | | | |
| 4.5% 9/15/27 (b) | | 5,450 | 5,452 |
| 4.75% 5/15/22 (b) | | 4,780 | 4,872 |
| 5.125% 3/15/23 (b) | | 7,615 | 7,824 |
| 5.125% 5/15/24 (b) | | 5,885 | 6,062 |
| Infrabuild Australia Pty Ltd. 12% 10/1/24 (b) | | 5,460 | 4,928 |
| Joseph T Ryerson & Son, Inc. 11% 5/15/22 (b) | | 4,505 | 4,601 |
| Kaiser Aluminum Corp. 4.625% 3/1/28 (b) | | 6,615 | 6,326 |
| Mineral Resources Ltd. 8.125% 5/1/27 (b) | | 11,025 | 11,714 |
| Murray Energy Corp.: | | | |
| 11.25% 4/15/21 (b)(c) | | 5,925 | 0 |
| 12% 4/15/24 pay-in-kind (b)(c)(e) | | 6,364 | 0 |
| United States Steel Corp. 6.25% 3/15/26 | | 7,180 | 4,541 |
| | | | 158,553 |
| Paper & Forest Products - 0.0% | | | |
| Boise Cascade Co. 5.625% 9/1/24 (b) | | 1,355 | 1,365 |
| TOTAL MATERIALS | | | 444,727 |
| REAL ESTATE - 1.1% | | | |
| Equity Real Estate Investment Trusts (REITs) - 0.8% | | | |
| Iron Mountain, Inc.: | | | |
| 4.875% 9/15/29 (b) | | 14,590 | 14,189 |
| 5% 7/15/28 (b) | | 6,370 | 6,219 |
| 5.25% 7/15/30 (b) | | 5,915 | 5,792 |
| 5.625% 7/15/32 (b) | | 5,915 | 5,903 |
| MPT Operating Partnership LP/MPT Finance Corp.: | | | |
| 4.625% 8/1/29 | | 10,950 | 11,005 |
| 5% 10/15/27 | | 15,435 | 15,859 |
| SBA Communications Corp. 3.875% 2/15/27 (b) | | 9,720 | 9,671 |
| The GEO Group, Inc.: | | | |
| 5.125% 4/1/23 | | 7,555 | 6,535 |
| 5.875% 10/15/24 | | 8,101 | 6,365 |
| 6% 4/15/26 | | 5,755 | 4,417 |
| Uniti Group, Inc. 7.875% 2/15/25 (b) | | 9,940 | 10,072 |
| VICI Properties, Inc.: | | | |
| 4.25% 12/1/26 (b) | | 12,650 | 12,139 |
| 4.625% 12/1/29 (b) | | 7,220 | 7,040 |
| | | | 115,206 |
| Real Estate Management & Development - 0.3% | | | |
| DTZ U.S. Borrower LLC 6.75% 5/15/28 (b) | | 6,575 | 6,854 |
| Howard Hughes Corp. 5.375% 3/15/25 (b) | | 7,940 | 7,389 |
| Realogy Group LLC/Realogy Co-Issuer Corp. 7.625% 6/15/25 (b) | | 20,305 | 20,254 |
| Taylor Morrison Communities, Inc./Monarch Communities, Inc.: | | | |
| 5.625% 3/1/24 (b) | | 775 | 794 |
| 5.875% 1/31/25 (b) | | 4,625 | 4,694 |
| 5.875% 6/15/27 (b) | | 5,610 | 5,811 |
| 6% 9/1/23 (b) | | 4,385 | 4,484 |
| | | | 50,280 |
| TOTAL REAL ESTATE | | | 165,486 |
| UTILITIES - 2.5% | | | |
| Electric Utilities - 2.1% | | | |
| Clearway Energy Operating LLC 4.75% 3/15/28 (b) | | 4,055 | 4,136 |
| Energias de Portugal SA 1.625% 4/15/27 (Reg. S) | EUR | 15,000 | 17,867 |
| NextEra Energy Partners LP: | | | |
| 4.25% 7/15/24 (b) | | 4,030 | 4,075 |
| 4.25% 9/15/24 (b) | | 2,830 | 2,830 |
| NRG Energy, Inc.: | | | |
| 5.75% 1/15/28 | | 20,240 | 21,353 |
| 6.625% 1/15/27 | | 15,685 | 16,391 |
| Pacific Gas & Electric Co.: | | | |
| 3.5% 10/1/20 (c) | | 3,350 | 3,652 |
| 3.75% 8/15/42 (c) | | 6,290 | 6,510 |
| 3.95% 12/1/47 (c) | | 32,835 | 34,345 |
| 4% 12/1/46 (c) | | 14,690 | 15,461 |
| 4.25% 3/15/46 (c) | | 1,475 | 1,621 |
| 4.3% 3/15/45 (c) | | 3,690 | 4,068 |
| 5.8% 3/1/37 (c) | | 23,540 | 28,071 |
| 6.05% 3/1/34 (c) | | 75,170 | 89,640 |
| PG&E Corp.: | | | |
| 5% 7/1/28 | | 13,615 | 13,564 |
| 5.25% 7/1/30 | | 5,150 | 5,176 |
| Vistra Operations Co. LLC: | | | |
| 5% 7/31/27 (b) | | 13,800 | 14,031 |
| 5.5% 9/1/26 (b) | | 9,975 | 10,206 |
| 5.625% 2/15/27 (b) | | 17,455 | 17,926 |
| | | | 310,923 |
| Gas Utilities - 0.2% | | | |
| Southern Natural Gas Co.: | | | |
| 7.35% 2/15/31 | | 14,890 | 19,155 |
| 8% 3/1/32 | | 9,400 | 13,625 |
| | | | 32,780 |
| Independent Power and Renewable Electricity Producers - 0.2% | | | |
| Pattern Energy Group, Inc. 5.875% 2/1/24 (b) | | 3,540 | 3,558 |
| Talen Energy Supply LLC 7.625% 6/1/28 (b) | | 6,835 | 6,835 |
| TerraForm Power Operating LLC: | | | |
| 4.25% 1/31/23 (b) | | 3,700 | 3,719 |
| 4.75% 1/15/30 (b) | | 6,690 | 6,790 |
| 5% 1/31/28 (b) | | 3,715 | 3,882 |
| The AES Corp. 4.5% 3/15/23 | | 2,769 | 2,746 |
| | | | 27,530 |
| TOTAL UTILITIES | | | 371,233 |
|
| TOTAL NONCONVERTIBLE BONDS | | | 4,711,591 |
|
| TOTAL CORPORATE BONDS | | | |
| (Cost $4,832,782) | | | 4,714,060 |
|
| U.S. Government and Government Agency Obligations - 15.8% | | | |
| U.S. Government Agency Obligations - 0.1% | | | |
| Fannie Mae 0.625% 4/22/25 | | 2,128 | 2,145 |
| Tennessee Valley Authority: | | | |
| 5.25% 9/15/39 | | $2,106 | $3,249 |
| 5.375% 4/1/56 | | 3,503 | 6,013 |
|
| TOTAL U.S. GOVERNMENT AGENCY OBLIGATIONS | | | 11,407 |
|
| U.S. Treasury Obligations - 15.3% | | | |
| U.S. Treasury Bonds: | | | |
| 1.25% 5/15/50 | | 8,390 | 8,055 |
| 2% 2/15/50 | | 12,270 | 14,044 |
| 2.5% 2/15/45 (h)(i)(j) | | 216,056 | 266,416 |
| 3% 5/15/45 | | 20,100 | 26,979 |
| 3% 2/15/49 | | 145,860 | 201,258 |
| 4.75% 2/15/37 (h)(j) | | 74,200 | 118,308 |
| 5.25% 2/15/29 (h) | | 5,406 | 7,540 |
| 6.125% 8/15/29 (h) | | 3,663 | 5,470 |
| U.S. Treasury Notes: | | | |
| 0.125% 5/31/22 | | 66,923 | 66,873 |
| 0.125% 6/30/22 | | 5,144 | 5,141 |
| 0.25% 6/15/23 | | 3,146 | 3,153 |
| 0.25% 6/30/25 | | 18,840 | 18,803 |
| 0.375% 3/31/22 | | 92,800 | 93,134 |
| 0.375% 4/30/25 | | 82,771 | 83,146 |
| 0.5% 6/30/27 | | 122,492 | 122,569 |
| 0.625% 5/15/30 | | 93,835 | 93,549 |
| 1.375% 8/31/23 | | 11,000 | 11,415 |
| 1.5% 8/31/21 | | 22,000 | 22,338 |
| 1.5% 9/30/21 | | 25,180 | 25,596 |
| 1.5% 10/31/24 | | 480 | 506 |
| 1.5% 1/31/27 | | 34,389 | 36,714 |
| 1.625% 11/15/22 | | 14,901 | 15,414 |
| 1.625% 5/31/23 | | 19,717 | 20,547 |
| 1.625% 9/30/26 | | 3,093 | 3,322 |
| 1.75% 7/31/21 | | 9,325 | 9,483 |
| 1.875% 7/31/22 | | 43,433 | 44,975 |
| 2.125% 3/31/24 | | 56,643 | 60,690 |
| 2.125% 7/31/24 | | 118,408 | 127,515 |
| 2.125% 5/15/25 (h) | | 12,033 | 13,102 |
| 2.25% 3/31/21 | | 9,900 | 10,055 |
| 2.25% 7/31/21 | | 52,019 | 53,181 |
| 2.25% 4/30/24 | | 24,428 | 26,326 |
| 2.25% 3/31/26 | | 34,717 | 38,421 |
| 2.375% 4/15/21 | | 74,550 | 75,849 |
| 2.5% 12/31/20 | | 80,000 | 80,931 |
| 2.5% 1/31/21 | | 42,832 | 43,414 |
| 2.5% 2/28/21 | | 90,000 | 91,392 |
| 2.5% 1/15/22 | | 136,816 | 141,695 |
| 2.5% 2/28/26 | | 38,997 | 43,663 |
| 2.625% 12/31/23 | | 69,183 | 75,034 |
| 2.75% 6/30/25 | | 197 | 221 |
| 3.125% 11/15/28 | | 31,330 | 37,875 |
|
| TOTAL U.S. TREASURY OBLIGATIONS | | | 2,244,112 |
|
| Other Government Related - 0.4% | | | |
| National Credit Union Administration Guaranteed Notes Series 2010-A1 Class A, 1 month U.S. LIBOR + 0.350% 0.5301% 12/7/20 (NCUA Guaranteed) (e)(g) | | 1,392 | 1,390 |
| National Credit Union Administration Guaranteed Notes Master Trust 3.45% 6/12/21 (NCUA Guaranteed) | | 49,900 | 51,347 |
| Private Export Funding Corp. Secured 1.75% 11/15/24 | | 11,520 | 12,137 |
|
| TOTAL OTHER GOVERNMENT RELATED | | | 64,874 |
|
| TOTAL U.S. GOVERNMENT AND GOVERNMENT AGENCY OBLIGATIONS | | | |
| (Cost $2,104,122) | | | 2,320,393 |
|
| U.S. Government Agency - Mortgage Securities - 0.8% | | | |
| Fannie Mae - 0.3% | | | |
| 12 month U.S. LIBOR + 1.360% 3.693% 10/1/35 (e)(g) | | 28 | 29 |
| 12 month U.S. LIBOR + 1.490% 3.548% 1/1/35 (e)(g) | | 106 | 110 |
| 12 month U.S. LIBOR + 1.550% 4.303% 6/1/36 (e)(g) | | 12 | 12 |
| 12 month U.S. LIBOR + 1.560% 3.565% 3/1/37 (e)(g) | | 43 | 45 |
| 12 month U.S. LIBOR + 1.630% 3.76% 3/1/33 (e)(g) | | 69 | 72 |
| 12 month U.S. LIBOR + 1.640% 3.722% 6/1/47 (e)(g) | | 91 | 96 |
| 12 month U.S. LIBOR + 1.670% 3.744% 11/1/36 (e)(g) | | 16 | 17 |
| 12 month U.S. LIBOR + 1.700% 3.051% 6/1/42 (e)(g) | | 114 | 119 |
| 12 month U.S. LIBOR + 1.730% 2.972% 5/1/36 (e)(g) | | 15 | 16 |
| 12 month U.S. LIBOR + 1.750% 3.719% 7/1/35 (e)(g) | | 74 | 77 |
| 12 month U.S. LIBOR + 1.760% 3.784% 2/1/37 (e)(g) | | 277 | 291 |
| 12 month U.S. LIBOR + 1.800% 3.814% 1/1/42 (e)(g) | | 306 | 319 |
| 12 month U.S. LIBOR + 1.800% 4.501% 7/1/41 (e)(g) | | 119 | 124 |
| 12 month U.S. LIBOR + 1.810% 3.825% 2/1/42 (e)(g) | | 341 | 356 |
| 12 month U.S. LIBOR + 1.810% 4.068% 9/1/41 (e)(g) | | 49 | 51 |
| 12 month U.S. LIBOR + 1.810% 4.27% 7/1/41 (e)(g) | | 91 | 95 |
| 12 month U.S. LIBOR + 1.830% 3.888% 10/1/41 (e)(g) | | 51 | 53 |
| 12 month U.S. LIBOR + 1.890% 3.416% 8/1/35 (e)(g) | | 98 | 103 |
| 12 month U.S. LIBOR + 1.890% 3.889% 4/1/36 (e)(g) | | 226 | 239 |
| 6 month U.S. LIBOR + 1.550% 3.375% 9/1/33 (e)(g) | | 242 | 250 |
| 2.5% 11/1/29 | | 12,841 | 13,446 |
| 3% 5/1/33 to 7/1/33 | | 6,017 | 6,387 |
| 3.5% 7/1/32 to 10/1/34 | | 17,644 | 18,824 |
| 4% 5/1/29 | | 2,704 | 2,863 |
| 4.5% 11/1/25 | | 981 | 1,028 |
| 5% 2/1/22 to 5/1/22 | | 5 | 6 |
| 6% to 6% 1/1/34 to 6/1/36 | | 2,223 | 2,614 |
| 6.5% 2/1/22 to 8/1/36 | | 3,284 | 3,798 |
| 7.5% 1/1/28 | | 21 | 24 |
|
| TOTAL FANNIE MAE | | | 51,464 |
|
| Freddie Mac - 0.2% | | | |
| 12 month U.S. LIBOR + 1.320% 3.412% 1/1/36 (e)(g) | | 52 | 54 |
| 12 month U.S. LIBOR + 1.600% 4.35% 7/1/35 (e)(g) | | 49 | 51 |
| 12 month U.S. LIBOR + 1.750% 4.008% 9/1/41 (e)(g) | | 795 | 825 |
| 12 month U.S. LIBOR + 1.790% 3.793% 4/1/37 (e)(g) | | 13 | 14 |
| 12 month U.S. LIBOR + 1.870% 4.283% 10/1/42 (e)(g) | | 386 | 403 |
| 12 month U.S. LIBOR + 1.880% 3.719% 4/1/41 (e)(g) | | 34 | 36 |
| 12 month U.S. LIBOR + 1.880% 3.838% 10/1/41(e)(g) | | 480 | 501 |
| 12 month U.S. LIBOR + 1.880% 4.13% 9/1/41 (e)(g) | | 72 | 74 |
| 12 month U.S. LIBOR + 1.910% 4.284% 5/1/41 (e)(g) | | 139 | 146 |
| 12 month U.S. LIBOR + 1.910% 4.42% 5/1/41 (e)(g) | | 104 | 109 |
| 12 month U.S. LIBOR + 1.910% 4.611% 6/1/41 (e)(g) | | 155 | 162 |
| 12 month U.S. LIBOR + 1.910% 4.66% 6/1/41 (e)(g) | | 67 | 69 |
| 12 month U.S. LIBOR + 2.040% 4.784% 7/1/36 (e)(g) | | 91 | 95 |
| 6 month U.S. LIBOR + 1.660% 3.415% 1/1/37 (e)(g) | | 28 | 29 |
| 6 month U.S. LIBOR + 1.720% 3.595% 8/1/37 (e)(g) | | 89 | 93 |
| 6 month U.S. LIBOR + 1.720% 3.597% 2/1/37 (e)(g) | | 19 | 20 |
| 6 month U.S. LIBOR + 1.830% 3.58% 5/1/37 (e)(g) | | 24 | 25 |
| 6 month U.S. LIBOR + 1.840% 3.588% 10/1/36 (e)(g) | | 245 | 256 |
| 6 month U.S. LIBOR + 1.860% 3.625% 10/1/35 (e)(g) | | 130 | 136 |
| 6 month U.S. LIBOR + 2.010% 3.385% 5/1/37 (e)(g) | | 41 | 43 |
| 6 month U.S. LIBOR + 2.010% 3.576% 5/1/37 (e)(g) | | 54 | 57 |
| 6 month U.S. LIBOR + 2.020% 3.995% 6/1/37 (e)(g) | | 44 | 46 |
| 6 month U.S. LIBOR + 2.040% 3.978% 6/1/37 (e)(g) | | 34 | 35 |
| 6 month U.S. LIBOR + 2.680% 4.294% 10/1/35 (e)(g) | | 12 | 13 |
| U.S. TREASURY 1 YEAR INDEX + 2.030% 3.926% 6/1/33 (e)(g) | | 191 | 200 |
| U.S. TREASURY 1 YEAR INDEX + 2.310% 3.91% 2/1/36 (e)(g) | | 1 | 1 |
| U.S. TREASURY 1 YEAR INDEX + 2.540% 4.956% 7/1/35 (e)(g) | | 160 | 166 |
| 3% 4/1/33 to 11/1/33 | | 18,421 | 19,605 |
| 3.5% 7/1/32 | | 3,543 | 3,785 |
| 6% 1/1/24 | | 367 | 386 |
| 6.5% 9/1/21 to 3/1/22 | | 63 | 64 |
|
| TOTAL FREDDIE MAC | | | 27,499 |
|
| Ginnie Mae - 0.3% | | | |
| 6% 6/15/36 | | 2,937 | 3,434 |
| 7% 9/15/25 to 8/15/31 | | 8 | 9 |
| 7.5% 2/15/22 to 8/15/28 | | 17 | 19 |
| 8% 12/15/26 | | 0 | 0 |
| 3.5% 8/20/42 to 3/20/44 | | 22,950 | 25,003 |
| 4% 10/20/43 to 7/20/47 | | 13,305 | 14,337 |
| 4.7% 2/20/62 (e)(k) | | 48 | 49 |
| 4.94% 2/20/62 (e)(k) | | 7 | 7 |
| 5% 4/20/48 | | 686 | 759 |
| 5.196% 1/20/62 (e)(k) | | 40 | 41 |
| 5.47% 8/20/59 (e)(k) | | 8 | 8 |
|
| TOTAL GINNIE MAE | | | 43,666 |
|
| TOTAL U.S. GOVERNMENT AGENCY - MORTGAGE SECURITIES | | | |
| (Cost $117,692) | | | 122,629 |
|
| Asset-Backed Securities - 0.1% | | | |
ALG Student Loan Trust Series 2017-1A Class A3, 3 month U.S. LIBOR + 0.090% 0.9771% 6/28/23
(Cost $7,183)(b)(e)(g) | | $7,208 | $7,153 |
|
| Collateralized Mortgage Obligations - 1.9% | | | |
| U.S. Government Agency - 1.9% | | | |
| Fannie Mae: | | | |
| floater Series 2010-15 Class FJ, 1 month U.S. LIBOR + 0.930% 1.1145% 6/25/36 (e)(g) | | 3,093 | 3,137 |
| planned amortization class: | | | |
| Series 2003-70 Class BJ, 5% 7/25/33 | | 318 | 362 |
| Series 2005-64 Class PX, 5.5% 6/25/35 | | 543 | 582 |
| Series 2005-68 Class CZ, 5.5% 8/25/35 | | 3,339 | 3,879 |
| Series 2010-118 Class PB, 4.5% 10/25/40 | | 3,069 | 3,441 |
| Series 2012-149: | | | |
| Class DA, 1.75% 1/25/43 | | 716 | 736 |
| Class GA, 1.75% 6/25/42 | | 765 | 785 |
| sequential payer: | | | |
| Series 2003-117 Class MD, 5% 12/25/23 | | 359 | 377 |
| Series 2004-91 Class Z, 5% 12/25/34 | | 2,635 | 3,004 |
| Series 2005-117 Class JN, 4.5% 1/25/36 | | 442 | 489 |
| Series 2005-14 Class ZB, 5% 3/25/35 | | 1,029 | 1,173 |
| Series 2006-72 Class CY, 6% 8/25/26 | | 682 | 743 |
| Series 2009-59 Class HB, 5% 8/25/39 | | 1,434 | 1,636 |
| Series 2010-139 Class NI, 4.5% 2/25/40 (l) | | 1,119 | 76 |
| Series 2010-39 Class FG, 1 month U.S. LIBOR + 0.920% 1.1045% 3/25/36 (e)(g) | | 2,000 | 2,043 |
| Series 2010-97 Class CI, 4.5% 8/25/25 (l) | | 2 | 0 |
| Series 2011-67 Class AI, 4% 7/25/26 (l) | | 346 | 21 |
| Freddie Mac: | | | |
| floater Series 2711 Class FC, 1 month U.S. LIBOR + 0.900% 1.0848% 2/15/33 (e)(g) | | 921 | 934 |
| floater planned amortization class Series 2770 Class FH, 1 month U.S. LIBOR + 0.400% 0.5848% 3/15/34 (e)(g) | | 1,247 | 1,250 |
| planned amortization class: | | | |
| Series 2101 Class PD, 6% 11/15/28 | | 33 | 36 |
| Series 2996 Class MK, 5.5% 6/15/35 | | 71 | 80 |
| Series 3415 Class PC, 5% 12/15/37 | | 423 | 475 |
| Series 3857 Class ZP, 5% 5/15/41 | | 2,470 | 3,118 |
| Series 4135 Class AB, 1.75% 6/15/42 | | 575 | 591 |
| sequential payer: | | | |
| Series 2303 Class ZV, 6% 4/15/31 | | 101 | 113 |
| Series 2877 Class ZD, 5% 10/15/34 | | 3,312 | 3,776 |
| Series 3745 Class KV, 4.5% 12/15/26 | | 3,978 | 4,233 |
| Series 3843 Class PZ, 5% 4/15/41 | | 2,504 | 3,062 |
| Freddie Mac Multi-family Structured pass-thru certificates sequential payer: | | | |
| Series 4335 Class AL, 4.25% 3/15/40 | | 1,521 | 1,563 |
| Series 4341 Class ML, 3.5% 11/15/31 | | 3,577 | 3,867 |
| Ginnie Mae guaranteed REMIC pass-thru certificates: | | | |
| floater: | | | |
| Series 2007-59 Class FC, 1 month U.S. LIBOR + 0.500% 0.69% 7/20/37 (e)(g) | | 650 | 655 |
| Series 2008-2 Class FD, 1 month U.S. LIBOR + 0.480% 0.67% 1/20/38 (e)(g) | | 166 | 167 |
| Series 2008-73 Class FA, 1 month U.S. LIBOR + 0.860% 1.05% 8/20/38 (e)(g) | | 1,143 | 1,162 |
| Series 2008-83 Class FB, 1 month U.S. LIBOR + 0.900% 1.09% 9/20/38 (e)(g) | | 874 | 891 |
| Series 2009-108 Class CF, 1 month U.S. LIBOR + 0.600% 0.7951% 11/16/39 (e)(g) | | 718 | 725 |
| Series 2009-116 Class KF, 1 month U.S. LIBOR + 0.530% 0.7251% 12/16/39 (e)(g) | | 541 | 545 |
| Series 2010-H17 Class FA, 1 month U.S. LIBOR + 0.330% 0.7709% 7/20/60 (e)(g)(k) | | 5,506 | 5,474 |
| Series 2010-H18 Class AF, 1 month U.S. LIBOR + 0.300% 0.6034% 9/20/60 (e)(g)(k) | | 6,536 | 6,495 |
| Series 2010-H19 Class FG, 1 month U.S. LIBOR + 0.300% 0.6034% 8/20/60 (e)(g)(k) | | 6,733 | 6,692 |
| Series 2010-H27 Series FA, 1 month U.S. LIBOR + 0.380% 0.6834% 12/20/60 (e)(g)(k) | | 2,619 | 2,608 |
| Series 2011-H05 Class FA, 1 month U.S. LIBOR + 0.500% 0.8034% 12/20/60 (e)(g)(k) | | 3,618 | 3,615 |
| Series 2011-H07 Class FA, 1 month U.S. LIBOR + 0.500% 0.8034% 2/20/61 (e)(g)(k) | | 6,351 | 6,348 |
| Series 2011-H12 Class FA, 1 month U.S. LIBOR + 0.490% 0.7934% 2/20/61 (e)(g)(k) | | 7,931 | 7,925 |
| Series 2011-H13 Class FA, 1 month U.S. LIBOR + 0.500% 0.8034% 4/20/61 (e)(g)(k) | | 2,967 | 2,965 |
| Series 2011-H14: | | | |
| Class FB, 1 month U.S. LIBOR + 0.500% 0.8034% 5/20/61 (e)(g)(k) | | 3,915 | 3,912 |
| Class FC, 1 month U.S. LIBOR + 0.500% 0.8034% 5/20/61 (e)(g)(k) | | 3,452 | 3,449 |
| Series 2011-H17 Class FA, 1 month U.S. LIBOR + 0.530% 0.8334% 6/20/61 (e)(g)(k) | | 4,047 | 4,047 |
| Series 2011-H21 Class FA, 1 month U.S. LIBOR + 0.600% 0.9034% 10/20/61 (e)(g)(k) | | 4,511 | 4,518 |
| Series 2012-H01 Class FA, 1 month U.S. LIBOR + 0.700% 1.0034% 11/20/61 (e)(g)(k) | | 4,221 | 4,238 |
| Series 2012-H03 Class FA, 1 month U.S. LIBOR + 0.700% 1.0034% 1/20/62 (e)(g)(k) | | 2,764 | 2,774 |
| Series 2012-H06 Class FA, 1 month U.S. LIBOR + 0.630% 0.9334% 1/20/62 (e)(g)(k) | | 3,991 | 4,000 |
| Series 2012-H07 Class FA, 1 month U.S. LIBOR + 0.630% 0.9334% 3/20/62 (e)(g)(k) | | 2,572 | 2,576 |
| Series 2012-H21 Class DF, 1 month U.S. LIBOR + 0.650% 0.9534% 5/20/61 (e)(g)(k) | | 59 | 59 |
| Series 2013-H19: | | | |
| Class FC, 1 month U.S. LIBOR + 0.600% 0.9034% 8/20/63 (e)(g)(k) | | 775 | 776 |
| Class FD, 1 month U.S. LIBOR + 0.600% 0.9034% 8/20/63 (e)(g)(k) | | 1,932 | 1,934 |
| Series 2015-H13 Class FL, 1 month U.S. LIBOR + 0.280% 0.5834% 5/20/63 (e)(g)(k) | | 176 | 176 |
| Series 2015-H19 Class FA, 1 month U.S. LIBOR + 0.200% 0.5034% 4/20/63 (e)(g)(k) | | 203 | 201 |
| Series 2017-161 Class DF, 1 month U.S. LIBOR + 0.250% 0.44% 10/20/47 (e)(g) | | 4,396 | 4,372 |
| Series 2018-65 Class DF, 1 month U.S. LIBOR + 0.300% 0.49% 5/20/48 (e)(g) | | 5,195 | 5,175 |
| Series 2018-77 Class FA, 1 month U.S. LIBOR + 0.300% 0.49% 6/20/48 (e)(g) | | 6,153 | 6,129 |
| Series 2019-115 Class FA, 1 month U.S. LIBOR + 0.450% 0.64% 9/20/49 (e)(g) | | 13,259 | 13,284 |
| Series 2019-98 Class FC, 1 month U.S. LIBOR + 0.450% 0.64% 8/20/49 (e)(g) | | 29,309 | 29,334 |
| planned amortization class: | | | |
| Series 2010-31 Class BP, 5% 3/20/40 | | 3,810 | 4,349 |
| Series 2011-136 Class WI, 4.5% 5/20/40 (l) | | 781 | 48 |
| Series 2017-134 Class BA, 2.5% 11/20/46 | | 837 | 879 |
| sequential payer: | | | |
| Series 2011-69 Class GX, 4.5% 5/16/40 | | 9,450 | 10,136 |
| Series 2013-H06 Class HA, 1.65% 1/20/63 (k) | | 210 | 211 |
| Series 2014-H04 Class HA, 2.75% 2/20/64 (k) | | 10,001 | 10,346 |
| Series 2014-H12 Class KA, 2.75% 5/20/64 (k) | | 3,082 | 3,151 |
| Series 2016-H02 Class FM, 1 month U.S. LIBOR + 0.500% 0.8034% 9/20/62 (e)(g)(k) | | 456 | 456 |
| Series 2016-H04 Class FE, 1 month U.S. LIBOR + 0.650% 0.9534% 11/20/65 (e)(g)(k) | | 125 | 125 |
| Series 2018-H12 Class HA, 3.25% 8/20/68 (k) | | 8,205 | 8,912 |
| Series 2004-22 Class M1, 5.5% 4/20/34 | | 648 | 888 |
| Series 2010-169 Class Z, 4.5% 12/20/40 | | 5,411 | 5,975 |
| Series 2010-H15 Class TP, 5.15% 8/20/60 (k) | | 16 | 16 |
| Series 2010-H16 Class BA, 3.55% 7/20/60 (k) | | 601 | 640 |
| Series 2010-H18 Class PL, 5.01% 9/20/60 (e)(k) | | 57 | 62 |
| Series 2010-H28 Class KA, 3.75% 12/20/60 (k) | | 6 | 6 |
| Series 2012-64 Class KI, 3.5% 11/20/36 (l) | | 383 | 6 |
| Series 2013-124: | | | |
| Class ES, 8.667% - 1 month U.S. LIBOR 8.4133% 4/20/39 (e)(m) | | 815 | 847 |
| Class ST, 8.800% - 1 month U.S. LIBOR 8.5467% 8/20/39 (e)(m) | | 3,249 | 3,359 |
| Series 2013-H07 Class JA, 1.75% 3/20/63 (k) | | 2,299 | 2,303 |
| Series 2013-H08 Class MA, 3% 3/20/63 (k) | | 2,565 | 2,585 |
| Series 2015-H17 Class HA, 2.5% 5/20/65 (k) | | 1,087 | 1,089 |
| Series 2015-H21: | | | |
| Class HA, 2.5% 6/20/63 (k) | | 505 | 504 |
| Class JA, 2.5% 6/20/65 (k) | | 245 | 245 |
| Series 2015-H30 Class HA, 1.75% 9/20/62 (e)(k) | | 1,665 | 1,675 |
| Series 2016-H13 Class FB, U.S. TREASURY 1 YEAR INDEX + 0.500% 0.67% 5/20/66 (e)(g)(k) | | 10,071 | 10,003 |
| Series 2017-H06 Class FA, U.S. TREASURY 1 YEAR INDEX + 0.350% 0.52% 8/20/66 (e)(g)(k) | | 11,081 | 10,969 |
| Series 2090-118 Class XZ, 5% 12/20/39 | | 12,063 | 14,018 |
| TOTAL COLLATERALIZED MORTGAGE OBLIGATIONS | | | |
| (Cost $273,287) | | | 276,606 |
|
| Foreign Government and Government Agency Obligations - 7.9% | | | |
| Australian Commonwealth: | | | |
| 2.5% 5/21/30 (Reg. S) | AUD | 26,770 | 21,283 |
| 3% 3/21/47 | AUD | 58,350 | 51,221 |
| Buoni del Tesoro Poliennali: | | | |
| 1.85% 7/1/25 (Reg. S) (b) | EUR | 50,000 | 59,244 |
| 2.45% 9/1/50 (Reg. S) (b) | EUR | 14,339 | 16,856 |
| Canadian Government: | | | |
| 1.25% 3/1/25 | CAD | 74,000 | 56,757 |
| 1.25% 6/1/30 | CAD | 35,890 | 28,278 |
| 1.75% 8/1/20 | CAD | 126,760 | 93,487 |
| 2% 12/1/51 | CAD | 14,000 | 13,120 |
| German Federal Republic: | | | |
| 0% 9/11/20(Reg. S) | EUR | 62,050 | 69,785 |
| 0% 2/15/30 (Reg. S) | EUR | 45,430 | 53,406 |
| 0.25% 2/15/29 | EUR | 249,860 | 300,436 |
| Israeli State (guaranteed by U.S. Government through Agency for International Development): | | | |
| 5.5% 9/18/23 | | 57,646 | 67,093 |
| 5.5% 12/4/23 | | 19,812 | 23,323 |
| Japan Government: | | | |
| 0.1% 9/20/29 | JPY | 8,451,850 | 78,938 |
| 0.4% 3/20/56 | JPY | 3,024,550 | 26,110 |
| 0.9% 6/20/22 | JPY | 5,350,000 | 50,560 |
| Jordanian Kingdom 3% 6/30/25 | | 16,691 | 18,510 |
| Spanish Kingdom 1% 10/31/50 (Reg. S) (b) | EUR | 5,000 | 5,215 |
| Ukraine Government 1.471% 9/29/21 | | 6,753 | 6,853 |
| United Kingdom, Great Britain and Northern Ireland: | | | |
| 0.875% 10/22/29 (Reg. S) | GBP | 73,660 | 97,511 |
| 2% 7/22/20 (Reg. S) | GBP | 24,390 | 30,253 |
| TOTAL FOREIGN GOVERNMENT AND GOVERNMENT AGENCY OBLIGATIONS | | | |
| (Cost $1,124,990) | | | 1,168,239 |
| | | Shares | Value (000s) |
|
| Common Stocks - 5.7% | | | |
| COMMUNICATION SERVICES - 0.7% | | | |
| Interactive Media & Services - 0.3% | | | |
| Alphabet, Inc. Class A (n) | | 13,900 | 19,711 |
| Facebook, Inc. Class A (n) | | 92,600 | 21,027 |
| | | | 40,738 |
| Media - 0.2% | | | |
| Altice U.S.A., Inc. Class A (n) | | 482,800 | 10,882 |
| iHeartMedia, Inc. warrants 5/1/39 (n) | | 26 | 0 |
| Nexstar Broadcasting Group, Inc. Class A | | 137,200 | 11,482 |
| | | | 22,364 |
| Wireless Telecommunication Services - 0.2% | | | |
| T-Mobile U.S., Inc. | | 346,800 | 36,119 |
| T-Mobile U.S., Inc. rights 7/28/20 (n) | | 346,800 | 58 |
| | | | 36,177 |
|
| TOTAL COMMUNICATION SERVICES | | | 99,279 |
|
| CONSUMER DISCRETIONARY - 0.5% | | | |
| Auto Components - 0.0% | | | |
| Chassix Holdings, Inc. warrants 7/29/20 (d)(n) | | 30,337 | 1 |
| Exide Technologies (d)(n) | | 7,093 | 7 |
| Exide Technologies (d)(n) | | 418,807 | 0 |
| UC Holdings, Inc. (d)(n) | | 560,355 | 8,069 |
| | | | 8,077 |
| Hotels, Restaurants & Leisure - 0.3% | | | |
| Boyd Gaming Corp. | | 449,600 | 9,397 |
| Eldorado Resorts, Inc. (n) | | 394,353 | 15,798 |
| MGM Mirage, Inc. | | 241,800 | 4,062 |
| Penn National Gaming, Inc. (n) | | 343,406 | 10,488 |
| Studio City International Holdings Ltd. ADR (n) | | 133,400 | 2,121 |
| | | | 41,866 |
| Household Durables - 0.1% | | | |
| Tempur Sealy International, Inc. (n) | | 183,762 | 13,222 |
| Internet & Direct Marketing Retail - 0.1% | | | |
| Amazon.com, Inc. (n) | | 4,900 | 13,518 |
|
| TOTAL CONSUMER DISCRETIONARY | | | 76,683 |
|
| CONSUMER STAPLES - 0.3% | | | |
| Food & Staples Retailing - 0.1% | | | |
| Southeastern Grocers, Inc. (d)(n) | | 134,915 | 7,223 |
| Food Products - 0.2% | | | |
| Darling Ingredients, Inc. (n) | | 489,800 | 12,059 |
| JBS SA | | 4,515,500 | 17,562 |
| Reddy Ice Holdings, Inc. (d) | | 133,255 | 14 |
| Reddy Ice Holdings, Inc. (d)(n) | | 331,236 | 0 |
| | | | 29,635 |
|
| TOTAL CONSUMER STAPLES | | | 36,858 |
|
| ENERGY - 0.0% | | | |
| Energy Equipment & Services - 0.0% | | | |
| Forbes Energy Services Ltd. (n) | | 135,187 | 11 |
| Oil, Gas & Consumable Fuels - 0.0% | | | |
| Chaparral Energy, Inc. Class A (n)(o) | | 108,327 | 70 |
| Goodrich Petroleum Corp. (n) | | 90,737 | 653 |
| Harvest Oil & Gas Corp. | | 19,388 | 407 |
| MEG Energy Corp. (n) | | 870,000 | 2,416 |
| Ultra Petroleum Corp. warrants 7/14/25 (n) | | 127,890 | 0 |
| | | | 3,546 |
|
| TOTAL ENERGY | | | 3,557 |
|
| FINANCIALS - 0.2% | | | |
| Banks - 0.1% | | | |
| Bank of America Corp. | | 296,000 | 7,030 |
| JPMorgan Chase & Co. | | 115,500 | 10,864 |
| | | | 17,894 |
| Capital Markets - 0.0% | | | |
| Motors Liquidation Co. GUC Trust (n) | | 5,066 | 8 |
| Penson Worldwide, Inc. Class A (d)(n) | | 7,403,098 | 0 |
| | | | 8 |
| Consumer Finance - 0.1% | | | |
| American Express Co. | | 80,400 | 7,654 |
| OneMain Holdings, Inc. | | 262,600 | 6,444 |
| | | | 14,098 |
|
| TOTAL FINANCIALS | | | 32,000 |
|
| HEALTH CARE - 0.8% | | | |
| Biotechnology - 0.1% | | | |
| Alexion Pharmaceuticals, Inc. (n) | | 67,800 | 7,610 |
| Regeneron Pharmaceuticals, Inc. (n) | | 900 | 561 |
| | | | 8,171 |
| Health Care Providers & Services - 0.3% | | | |
| Cigna Corp. | | 57,400 | 10,771 |
| HCA Holdings, Inc. | | 101,300 | 9,832 |
| Humana, Inc. | | 37,500 | 14,541 |
| Rotech Healthcare, Inc. (d)(n) | | 129,242 | 1,345 |
| UnitedHealth Group, Inc. | | 51,300 | 15,131 |
| | | | 51,620 |
| Life Sciences Tools & Services - 0.3% | | | |
| Charles River Laboratories International, Inc. (n) | | 66,800 | 11,647 |
| IQVIA Holdings, Inc. (n) | | 139,300 | 19,764 |
| Thermo Fisher Scientific, Inc. | | 39,200 | 14,204 |
| | | | 45,615 |
| Pharmaceuticals - 0.1% | | | |
| Bausch Health Cos., Inc. (Canada) (n) | | 256,100 | 4,686 |
| Jazz Pharmaceuticals PLC (n) | | 51,000 | 5,627 |
| | | | 10,313 |
|
| TOTAL HEALTH CARE | | | 115,719 |
|
| INDUSTRIALS - 0.6% | | | |
| Air Freight & Logistics - 0.1% | | | |
| XPO Logistics, Inc. (n) | | 100,100 | 7,733 |
| Airlines - 0.1% | | | |
| Air Canada (n) | | 1,531,900 | 19,126 |
| Building Products - 0.1% | | | |
| Carrier Global Corp. | | 459,000 | 10,199 |
| Commercial Services & Supplies - 0.0% | | | |
| Novus Holdings Ltd. | | 48,111 | 3 |
| Machinery - 0.1% | | | |
| Allison Transmission Holdings, Inc. | | 151,000 | 5,554 |
| Fortive Corp. | | 134,900 | 9,127 |
| | | | 14,681 |
| Marine - 0.0% | | | |
| U.S. Shipping Partners Corp. (d)(n) | | 22,876 | 0 |
| U.S. Shipping Partners Corp. warrants 12/31/29 (d)(n) | | 214,176 | 0 |
| | | | 0 |
| Professional Services - 0.0% | | | |
| ASGN, Inc. (n) | | 101,200 | 6,748 |
| Trading Companies & Distributors - 0.2% | | | |
| HD Supply Holdings, Inc. (n) | | 358,700 | 12,429 |
| Penhall Acquisition Co.: | | | |
| Class A (d)(n) | | 11,553 | 887 |
| Class B (d)(n) | | 3,850 | 296 |
| United Rentals, Inc. (n) | | 112,170 | 16,718 |
| | | | 30,330 |
| Transportation Infrastructure - 0.0% | | | |
| Tricer Holdco SCA: | | | |
| Class A1 (d)(n)(p) | | 403,760 | 0 |
| Class A2 (d)(n)(p) | | 403,760 | 0 |
| Class A3 (d)(n)(p) | | 403,760 | 0 |
| Class A4 (d)(n)(p) | | 403,760 | 0 |
| Class A5 (d)(n)(p) | | 403,760 | 0 |
| Class A6 (d)(n)(p) | | 403,760 | 0 |
| Class A7 (d)(n)(p) | | 403,760 | 0 |
| Class A8 (d)(n)(p) | | 403,760 | 0 |
| Class A9 (d)(n)(p) | | 403,760 | 0 |
| | | | 0 |
|
| TOTAL INDUSTRIALS | | | 88,820 |
|
| INFORMATION TECHNOLOGY - 2.1% | | | |
| Electronic Equipment & Components - 0.3% | | | |
| CDW Corp. | | 96,400 | 11,200 |
| Zebra Technologies Corp. Class A (n) | | 123,100 | 31,507 |
| | | | 42,707 |
| IT Services - 0.8% | | | |
| EPAM Systems, Inc. (n) | | 85,100 | 21,446 |
| Fiserv, Inc. (n) | | 112,625 | 10,994 |
| Global Payments, Inc. | | 122,500 | 20,778 |
| GoDaddy, Inc. (n) | | 113,400 | 8,316 |
| MasterCard, Inc. Class A | | 54,900 | 16,234 |
| PayPal Holdings, Inc. (n) | | 128,000 | 22,301 |
| Visa, Inc. Class A | | 84,900 | 16,400 |
| | | | 116,469 |
| Semiconductors & Semiconductor Equipment - 0.3% | | | |
| Broadcom, Inc. | | 23,000 | 7,259 |
| Lam Research Corp. | | 60,200 | 19,472 |
| Microchip Technology, Inc. | | 76,000 | 8,004 |
| ON Semiconductor Corp. (n) | | 460,400 | 9,125 |
| | | | 43,860 |
| Software - 0.7% | | | |
| Adobe, Inc. (n) | | 93,600 | 40,745 |
| Microsoft Corp. | | 191,700 | 39,013 |
| Palo Alto Networks, Inc. (n) | | 42,900 | 9,853 |
| SS&C Technologies Holdings, Inc. | | 193,939 | 10,954 |
| VMware, Inc. Class A (n)(o) | | 43,200 | 6,690 |
| | | | 107,255 |
|
| TOTAL INFORMATION TECHNOLOGY | | | 310,291 |
|
| MATERIALS - 0.2% | | | |
| Chemicals - 0.1% | | | |
| CF Industries Holdings, Inc. | | 269,200 | 7,575 |
| The Chemours Co. LLC | | 278,110 | 4,269 |
| | | | 11,844 |
| Containers & Packaging - 0.1% | | | |
| Berry Global Group, Inc. (n) | | 247,500 | 10,969 |
| WestRock Co. | | 279,900 | 7,910 |
| | | | 18,879 |
| Metals & Mining - 0.0% | | | |
| Algoma Steel GP (d)(n) | | 151,792 | 3 |
| Algoma Steel SCA (d)(n) | | 151,792 | 21 |
| Elah Holdings, Inc. (n) | | 517 | 25 |
| First Quantum Minerals Ltd. | | 709,700 | 5,656 |
| | | | 5,705 |
|
| TOTAL MATERIALS | | | 36,428 |
|
| UTILITIES - 0.3% | | | |
| Electric Utilities - 0.2% | | | |
| NRG Energy, Inc. | | 329,000 | 10,712 |
| Pacific Gas & Electric Co.: | | | |
| rights 8/29/20 (d)(n) | | 6,000,000 | 360 |
| rights (d)(n) | | 261,364 | 261 |
| PG&E Corp. (n) | | 796,300 | 7,063 |
| Portland General Electric Co. | | 13,962 | 584 |
| | | | 18,980 |
| Independent Power and Renewable Electricity Producers - 0.1% | | | |
| Vistra Energy Corp. | | 984,600 | 18,333 |
|
| TOTAL UTILITIES | | | 37,313 |
|
| TOTAL COMMON STOCKS | | | |
| (Cost $699,181) | | | 836,948 |
|
| Nonconvertible Preferred Stocks - 0.0% | | | |
| INDUSTRIALS - 0.0% | | | |
| Transportation Infrastructure - 0.0% | | | |
| Tricer Holdco SCA (d)(n)(p) | | | |
| (Cost $6,908) | | 193,792,711 | 65 |
| | | Principal Amount (000s)(a) | Value (000s) |
|
| Bank Loan Obligations - 2.2% | | | |
| COMMUNICATION SERVICES - 0.1% | | | |
| Diversified Telecommunication Services - 0.1% | | | |
| Connect Finco Sarl Tranche B 1LN, term loan 3 month U.S. LIBOR + 4.500% 5.5% 12/11/26 (e)(g)(q) | | 5,451 | 5,114 |
| Zayo Group Holdings, Inc. 1LN, term loan 3 month U.S. LIBOR + 3.000% 3.1782% 3/9/27 (e)(g)(q) | | 4,868 | 4,609 |
| | | | 9,723 |
| Entertainment - 0.0% | | | |
| Allen Media LLC Tranche B 1LN, term loan 3 month U.S. LIBOR + 5.500% 5.8079% 2/10/27 (e)(g)(q) | | 4,797 | 4,541 |
| Media - 0.0% | | | |
| LCPR Loan Financing LLC Tranche B 1LN, term loan 3 month U.S. LIBOR + 5.000% 5.1848% 10/22/26 (e)(g)(q) | | 1,285 | 1,272 |
| Nexstar Broadcasting, Inc. Tranche B, term loan 3 month U.S. LIBOR + 2.750% 2.9226% 9/19/26 (e)(g)(q) | | 2,603 | 2,471 |
| | | | 3,743 |
| Wireless Telecommunication Services - 0.0% | | | |
| Intelsat Jackson Holdings SA Tranche DD 1LN, term loan 3 month U.S. LIBOR + 5.500% 5.05% 7/13/21 (e)(g)(q)(r) | | 3,215 | 3,257 |
|
| TOTAL COMMUNICATION SERVICES | | | 21,264 |
|
| CONSUMER DISCRETIONARY - 0.2% | | | |
| Diversified Consumer Services - 0.1% | | | |
| KUEHG Corp. Tranche B 2LN, term loan 3 month U.S. LIBOR + 8.250% 9.25% 8/22/25 (e)(g)(q) | | 3,640 | 2,730 |
| Sotheby's 1LN, term loan 3 month U.S. LIBOR + 5.500% 6.5% 1/3/27 (e)(g)(q) | | 6,765 | 6,302 |
| | | | 9,032 |
| Hotels, Restaurants & Leisure - 0.0% | | | |
| Travelport Finance Luxembourg SARL Tranche B 2LN, term loan 3 month U.S. LIBOR + 9.000% 10.072% 5/28/27 (e)(g)(q) | | 7,655 | 2,174 |
| Specialty Retail - 0.1% | | | |
| Wand NewCo 3, Inc. Tranche B 1LN, term loan 3 month U.S. LIBOR + 3.000% 4.072% 2/5/26 (e)(g)(q) | | 11,323 | 10,728 |
|
| TOTAL CONSUMER DISCRETIONARY | | | 21,934 |
|
| ENERGY - 0.6% | | | |
| Energy Equipment & Services - 0.0% | | | |
| BCP Raptor II LLC Tranche B, term loan 3 month U.S. LIBOR + 4.750% 4.9282% 11/3/25 (e)(g)(q) | | 3,495 | 2,254 |
| Forbes Energy Services LLC Tranche B, term loan 18% 4/13/21 (d)(e)(q) | | 1,389 | 1,399 |
| | | | 3,653 |
| Oil, Gas & Consumable Fuels - 0.6% | | | |
| BCP Raptor LLC Tranche B, term loan 3 month U.S. LIBOR + 4.250% 5.25% 6/24/24 (e)(g)(q) | | 5,272 | 3,769 |
| California Resources Corp.: | | | |
| Tranche 1LN, term loan 3 month U.S. LIBOR + 10.375% 11.375% 12/31/21 (e)(g)(q) | | 59,940 | 2,697 |
| Tranche B, term loan 3 month U.S. LIBOR + 4.750% 5.75% 12/31/22 (e)(g)(q) | | 71,920 | 24,543 |
| Chesapeake Energy Corp. term loan 3 month U.S. LIBOR + 8.000% 0% 6/9/24 (c)(e)(g)(q) | | 57,825 | 33,167 |
| Citgo Holding, Inc. Tranche B 1LN, term loan 3 month U.S. LIBOR + 7.000% 8% 8/1/23 (e)(g)(q) | | 844 | 800 |
| EG America LLC 2LN, term loan 3 month U.S. LIBOR + 8.000% 9.072% 3/23/26 (e)(g)(q) | | 3,290 | 2,994 |
| Epic Crude Services LP Tranche B 1LN, term loan 3 month U.S. LIBOR + 5.000% 5.37% 3/1/26 (e)(g)(q) | | 22,150 | 16,908 |
| Sanchez Energy Corp.: | | | |
| 1LN, term loan 3 month U.S. LIBOR + 8.000% 0% 12/31/49 (c)(d)(g)(q) | | 3,423 | 1,198 |
| term loan 0% 12/31/49 (c)(d)(e)(q) | | 1,476 | 517 |
| | | | 86,593 |
|
| TOTAL ENERGY | | | 90,246 |
|
| FINANCIALS - 0.0% | | | |
| Capital Markets - 0.0% | | | |
| Citadel Securities LP Tranche B 1LN, term loan 3 month U.S. LIBOR + 2.750% 2.9282% 2/27/26 (e)(g)(q) | | 2,205 | 2,141 |
| Diversified Financial Services - 0.0% | | | |
| RPI Intermediate Finance Trust Tranche B 1LN, term loan 3 month U.S. LIBOR + 1.750% 1.9283% 2/11/27 (e)(g)(q) | | 2,826 | 2,732 |
|
| TOTAL FINANCIALS | | | 4,873 |
|
| HEALTH CARE - 0.2% | | | |
| Health Care Providers & Services - 0.2% | | | |
| U.S. Renal Care, Inc. Tranche B 1LN, term loan 3 month U.S. LIBOR + 5.000% 5.1782% 6/13/26 (e)(g)(q) | | 26,341 | 25,284 |
| Pharmaceuticals - 0.0% | | | |
| Valeant Pharmaceuticals International, Inc. Tranche B, term loan 3 month U.S. LIBOR + 3.000% 3.19% 6/1/25 (e)(g)(q) | | 1,046 | 1,015 |
|
| TOTAL HEALTH CARE | | | 26,299 |
|
| INDUSTRIALS - 0.2% | | | |
| Air Freight & Logistics - 0.0% | | | |
| Dynasty Acquisition Co., Inc.: | | | |
| Tranche B 1LN, term loan 3 month U.S. LIBOR + 3.500% 3.8079% 4/8/26 (e)(g)(q) | | 1,545 | 1,315 |
| Tranche B2 1LN, term loan 3 month U.S. LIBOR + 3.500% 3.8079% 4/8/26 (e)(g)(q) | | 830 | 707 |
| | | | 2,022 |
| Building Products - 0.0% | | | |
| ACProducts, Inc. 1LN, term loan 3 month U.S. LIBOR + 6.500% 7.5% 8/13/25 (e)(g)(q) | | 2,638 | 2,574 |
| Commercial Services & Supplies - 0.1% | | | |
| Maverick Purchaser Sub LLC Tranche B 1LN, term loan 3 month U.S. LIBOR + 4.000% 4.1782% 1/23/27 (e)(g)(q) | | 1,255 | 1,229 |
| Sabert Corp. Tranche B 1LN, term loan 3 month U.S. LIBOR + 4.500% 5.5% 12/10/26 (e)(g)(q) | | 4,838 | 4,701 |
| | | | 5,930 |
| Construction & Engineering - 0.0% | | | |
| Traverse Midstream Partners Ll Tranche B, term loan 3 month U.S. LIBOR + 4.000% 5% 9/27/24 (e)(g)(q) | | 1,764 | 1,462 |
| Electrical Equipment - 0.1% | | | |
| Vertiv Group Corp. Tranche B 1LN, term loan 3 month U.S. LIBOR + 3.000% 3.1825% 3/2/27 (e)(g)(q) | | 19,192 | 18,088 |
|
| TOTAL INDUSTRIALS | | | 30,076 |
|
| INFORMATION TECHNOLOGY - 0.8% | | | |
| Electronic Equipment & Components - 0.0% | | | |
| Curie Merger Sub LLC 1LN, term loan 3 month U.S. LIBOR + 4.250% 4.4283% 11/4/26 (e)(g)(q) | | 359 | 345 |
| IT Services - 0.3% | | | |
| Camelot Finance SA Tranche B, term loan 3 month U.S. LIBOR + 3.000% 3.1782% 10/31/26 (e)(g)(q) | | 687 | 664 |
| GTT Communications, Inc. Tranche B, term loan 3 month U.S. LIBOR + 2.750% 2.93% 5/31/25 (e)(g)(q) | | 15,579 | 11,418 |
| Northwest Fiber LLC Tranche B 1LN, term loan 3 month U.S. LIBOR + 5.500% 5.6728% 5/1/27 (e)(g)(q) | | 13,740 | 13,603 |
| Web.com Group, Inc.: | | | |
| 2LN, term loan 3 month U.S. LIBOR + 7.750% 7.9401% 10/11/26 (e)(g)(q) | | 9,150 | 7,741 |
| Tranche B 1LN, term loan 3 month U.S. LIBOR + 3.750% 3.9401% 10/11/25 (e)(g)(q) | | 6,574 | 6,202 |
| | | | 39,628 |
| Semiconductors & Semiconductor Equipment - 0.0% | | | |
| ON Semiconductor Corp. Tranche B 1LN, term loan 3 month U.S. LIBOR + 2.000% 2.1783% 9/19/26 (e)(g)(q) | | 4,699 | 4,500 |
| Software - 0.5% | | | |
| Boxer Parent Co., Inc. Tranche B, term loan 3 month U.S. LIBOR + 4.250% 4.4282% 10/2/25 (e)(g)(q) | | 21,773 | 20,549 |
| Kronos, Inc. 2LN, term loan 3 month U.S. LIBOR + 8.250% 9.25% 11/1/24 (e)(g)(q) | | 13,470 | 13,462 |
| Landesk Group, Inc. term loan: | | | |
| 3 month U.S. LIBOR + 4.250% 5.25% 1/20/24 (e)(g)(q) | | 1,982 | 1,890 |
| 3 month U.S. LIBOR + 9.000% 10% 1/20/25 (e)(g)(q) | | 6,500 | 5,744 |
| McAfee LLC Tranche B, term loan: | | | |
| 3 month U.S. LIBOR + 3.750% 3.9336% 9/29/24 (e)(g)(q) | | 2,751 | 2,672 |
| 3 month U.S. LIBOR + 8.500% 9.5% 9/29/25 (e)(g)(q) | | 14,801 | 14,697 |
| Ultimate Software Group, Inc.: | | | |
| 1LN, term loan 3 month U.S. LIBOR + 4.000% 5/3/26 (g)(q)(s) | | 6,805 | 6,713 |
| 2LN, term loan 3 month U.S. LIBOR + 6.750% 5/3/27 (g)(q)(s) | | 1,430 | 1,451 |
| VS Buyer LLC Tranche B 1LN, term loan 3 month U.S. LIBOR + 3.250% 3.4283% 2/28/27 (e)(g)(q) | | 1,307 | 1,258 |
| | | | 68,436 |
|
| TOTAL INFORMATION TECHNOLOGY | | | 112,909 |
|
| MATERIALS - 0.0% | | | |
| Metals & Mining - 0.0% | | | |
| Murray Energy Corp.: | | | |
| term loan 3 month U.S. LIBOR + 11.000% 13% 7/31/20 (e)(g)(q) | | 3,073 | 1,636 |
| Tranche B 2LN, term loan 3 month U.S. LIBOR + 7.250% 0% 10/17/22 (c)(g)(q) | | 14,942 | 199 |
| | | | 1,835 |
| UTILITIES - 0.1% | | | |
| Electric Utilities - 0.1% | | | |
| Pacific Gas & Electric Co. Tranche B 1LN, term loan 3 month U.S. LIBOR + 4.500% 6/18/25 (g)(q)(s) | | 17,015 | 16,696 |
| TOTAL BANK LOAN OBLIGATIONS | | | |
| (Cost $473,335) | | | 326,132 |
| | | Shares | Value (000s) |
|
| Fixed-Income Funds - 25.9% | | | |
| Fidelity Emerging Markets Debt Central Fund (t) | | 266,484,806 | 2,363,720 |
| Fidelity Floating Rate Central Fund (t) | | 15,382,005 | 1,444,370 |
| TOTAL FIXED-INCOME FUNDS | | | |
| (Cost $4,106,530) | | | 3,808,090 |
| | | Principal Amount (000s)(a) | Value (000s) |
|
| Preferred Securities - 4.6% | | | |
| ENERGY - 0.4% | | | |
| Oil, Gas & Consumable Fuels - 0.4% | | | |
| DCP Midstream Partners LP 7.375% (e)(u) | | 8,965 | 6,252 |
| Energy Transfer Partners LP: | | | |
| 6.25% (e)(u) | | 40,712 | 32,201 |
| 6.625% (e)(u) | | 15,640 | 12,358 |
| MPLX LP 6.875% (e)(u) | | 18,000 | 16,486 |
| Summit Midstream Partners LP 9.5% (e)(u) | | 8,965 | 1,203 |
| | | | 68,500 |
| FINANCIALS - 4.2% | | | |
| Banks - 3.6% | | | |
| Bank of America Corp.: | | | |
| 5.125% (e)(u) | | 22,020 | 21,812 |
| 5.2% (e)(u) | | 48,090 | 46,567 |
| 5.875% (e)(u) | | 60,475 | 62,811 |
| 6.25% (e)(u) | | 18,480 | 19,499 |
| Citigroup, Inc.: | | | |
| 4.7% (e)(u) | | 8,755 | 7,943 |
| 5% (e)(u) | | 36,455 | 34,865 |
| 5.9% (e)(u) | | 25,875 | 26,304 |
| 5.95% (e)(u) | | 46,925 | 47,627 |
| 6.3% (e)(u) | | 4,120 | 4,160 |
| Huntington Bancshares, Inc. 5.7% (e)(u) | | 7,660 | 6,584 |
| JPMorgan Chase & Co.: | | | |
| 3 month U.S. LIBOR + 3.320% 4.7534% (e)(g)(u) | | 30,810 | 27,556 |
| 4% (e)(u) | | 19,100 | 16,986 |
| 4.4866% (e)(g)(u) | | 12,280 | 11,738 |
| 4.6% (e)(u) | | 13,385 | 12,203 |
| 5% (e)(u) | | 18,675 | 18,349 |
| 6% (e)(u) | | 54,840 | 56,616 |
| 6.125% (e)(u) | | 12,865 | 13,262 |
| 6.75% (e)(u) | | 6,270 | 6,916 |
| Wells Fargo & Co.: | | | |
| 5.875% (e)(u) | | 36,775 | 38,317 |
| 5.9% (e)(u) | | 46,445 | 46,097 |
| | | | 526,212 |
| Capital Markets - 0.5% | | | |
| Goldman Sachs Group, Inc.: | | | |
| 4.3696% (e)(g)(u) | | 22,175 | 20,465 |
| 4.4% (e)(u) | | 4,530 | 4,116 |
| 4.95% (e)(u) | | 7,885 | 7,735 |
| 5% (e)(u) | | 50,754 | 47,299 |
| | | | 79,615 |
| Insurance - 0.1% | | | |
| MAPFRE SA 4.375% 3/31/47 (Reg. S) (e) | EUR | 6,100 | 7,503 |
|
| TOTAL FINANCIALS | | | 613,330 |
|
| INDUSTRIALS - 0.0% | | | |
| Construction & Engineering - 0.0% | | | |
| Odebrecht Finance Ltd. 7.5% (b)(c)(u) | | 1,825 | 103 |
| TOTAL PREFERRED SECURITIES | | | |
| (Cost $721,469) | | | 681,933 |
| | | Shares | Value (000s) |
|
| Money Market Funds - 3.0% | | | |
| Fidelity Cash Central Fund 0.12% (v) | | 447,622,523 | 447,713 |
| Fidelity Securities Lending Cash Central Fund 0.12% (v)(w) | | 189,904 | 190 |
| TOTAL MONEY MARKET FUNDS | | | |
| (Cost $447,859) | | | 447,903 |
| Purchased Swaptions - 0.1%(x) | | | | |
| | | Expiration Date | Notional Amount (000s) | Value (000s) |
| Put Options - 0.0% | | | | |
| Option on an interest rate swap with Bank of America N.A. to pay semi-annually a fixed rate of 1.7375% and receive quarterly a floating rate based on 3-month LIBOR, expiring September 2029 | | 9/20/24 | 55,600 | $560 |
| Option on an interest rate swap with Bank of America, N.A. to pay semi-annually a fixed rate of 2.3275% and receive quarterly a floating rate based on 3-month LIBOR, expiring June 2029 | | 6/11/24 | 19,200 | 89 |
| Option on an interest rate swap with Goldman Sachs Bank U.S.A. to pay semi-annually a fixed rate of 1.4025% and receive quarterly a floating rate based on 3-month LIBOR, expiring February 2030 | | 2/26/25 | 20,100 | 332 |
| Option on an interest rate swap with JPMorgan Chase Bank N.A. to pay semi-annually a fixed rate of 1.57125% and receive quarterly a floating rate based on 3-month LIBOR, expiring September 2029 | | 9/5/24 | 19,800 | 234 |
|
| TOTAL PUT OPTIONS | | | | 1,215 |
|
| Call Options - 0.1% | | | | |
| Option on an interest rate swap with Bank of America N.A. to receive semi-annually a fixed rate of 1.7375% and pay quarterly a floating rate based on 3-month LIBOR, expiring September 2029 | | 9/20/24 | 55,600 | 2,941 |
| Option on an interest rate swap with Bank of America, N.A. to receive semi-annually a fixed rate of 2.3275% and pay quarterly a floating rate based on 3-month LIBOR, expiring June 2029 | | 6/11/24 | 19,200 | 1,502 |
| Option on an interest rate swap with Goldman Sachs Bank U.S.A. to receive semi-annually a fixed rate of 1.4025% and pay quarterly a floating rate based on 3-month LIBOR, expiring February 2030 | | 2/26/25 | 20,100 | 814 |
| Option on an interest rate swap with JPMorgan Chase Bank N.A. to receive semi-annually a fixed rate of 1.57125% and pay quarterly a floating rate based on 3-month LIBOR, expiring September 2029 | | 9/5/24 | 19,800 | 925 |
|
| TOTAL CALL OPTIONS | | | | 6,182 |
|
| TOTAL PURCHASED SWAPTIONS | | | | |
| (Cost $6,470) | | | | 7,397 |
| TOTAL INVESTMENT IN SECURITIES - 100.1% | | | | |
| (Cost $14,921,808) | | | | 14,717,548 |
| NET OTHER ASSETS (LIABILITIES) - (0.1)% | | | | (11,849) |
| NET ASSETS - 100% | | | | $14,705,699 |
| Written Swaptions | | | |
| | Expiration Date | Notional Amount | Value (000s) |
| Put Swaptions | | | |
| Option on an interest rate swap with Bank of America N.A. to pay semi-annually a fixed rate of 1.45% and receive quarterly a floating rate based on 3-month LIBOR, expiring September 2029 | 9/4/24 | 20,300 | $(272) |
| Option on an interest rate swap with Bank of America N.A. to pay semi-annually a fixed rate of 1.57% and receive quarterly a floating rate based on 3-month LIBOR, expiring February 2030 | 2/20/25 | 36,100 | (505) |
| Option on an interest rate swap with Bank of America N.A. to pay semi-annually a fixed rate of 1.89% and receive quarterly a floating rate based on 3-month LIBOR, expiring December 2029 | 12/9/24 | 1,800 | (17) |
| Option on an interest rate swap with Bank of America N.A. to pay semi-annually a fixed rate of 1.92% and receive quarterly a floating rate based on 3-month LIBOR, expiring January 2030 | 1/8/25 | 47,000 | (444) |
| Option on an interest rate swap with Goldman Sachs Bank U.S.A. to pay semi-annually a fixed rate of 1.27% and receive quarterly a floating rate based on 3-month LIBOR, expiring March 2030 | 3/18/25 | 32,000 | (610) |
| Option on an interest rate swap with Goldman Sachs Bank U.S.A. to pay semi-annually a fixed rate of 1.487% and receive quarterly a floating rate based on 3-month LIBOR, expiring October 2030 | 10/2/20 | 28,100 | (14) |
|
| TOTAL PUT SWAPTIONS | | | (1,862) |
|
| Call Swaptions | | | |
| Option on an interest rate swap with Bank of America N.A. to receive semi-annually a fixed rate of 1.45% and pay quarterly a floating rate based on 3-month LIBOR, expiring September 2029 | 9/4/24 | 20,300 | (860) |
| Option on an interest rate swap with Bank of America N.A. to receive semi-annually a fixed rate of 1.57% and pay quarterly a floating rate based on 3-month LIBOR, expiring February 2030 | 2/20/25 | 36,100 | (1,668) |
| Option on an interest rate swap with Bank of America N.A. to receive semi-annually a fixed rate of 1.89% and pay quarterly a floating rate based on 3-month LIBOR, expiring December 2029 | 12/9/24 | 1,800 | (105) |
| Option on an interest rate swap with Bank of America N.A. to receive semi-annually a fixed rate of 1.92% and pay quarterly a floating rate based on 3-month LIBOR, expiring January 2030 | 1/8/25 | 47,000 | (2,797) |
| Option on an interest rate swap with Goldman Sachs Bank U.S.A. to receive semi-annually a fixed rate of 1.27% and pay quarterly a floating rate based on 3-month LIBOR, expiring March 2030 | 3/18/25 | 32,000 | (1,159) |
| Option on an interest rate swap with Goldman Sachs Bank U.S.A. to receive semi-annually a fixed rate of 1.487% and pay quarterly a floating rate based on 3-month LIBOR, expiring October 2030 | 10/2/20 | 28,100 | (2,324) |
|
| TOTAL CALL SWAPTIONS | | | (8,913) |
|
| TOTAL WRITTEN SWAPTIONS | | | $(10,775) |
| Futures Contracts | | | | | |
| | Number of contracts | Expiration Date | Notional Amount (000s) | Value (000s) | Unrealized Appreciation/(Depreciation) (000s) |
| Purchased | | | | | |
| Treasury Contracts | | | | | |
| CBOT 10-Year U.S. Treasury Note Contracts (United States) | 1,271 | Sept. 2020 | $176,887 | $354 | $354 |
| CBOT 2-Year U.S. Treasury Note Contracts (United States) | 90 | Sept. 2020 | 19,875 | 1 | 1 |
| TOTAL FUTURES CONTRACTS | | | | | $355 |
The notional amount of futures purchased as a percentage of Net Assets is 1.3%
For the period, the average monthly notional amount at value for futures contracts in the aggregate was $378,672,000.
| Forward Foreign Currency Contracts | | | | | | |
| Currency Purchased | Currency Sold | Counterparty | Settlement Date | Unrealized Appreciation/(Depreciation) (000s) |
| USD | 5,357 | EUR | 4,778 | BNP Paribas | 7/1/20 | $(11) |
| AUD | 2,321 | USD | 1,605 | Citibank NA | 8/13/20 | (3) |
| AUD | 2,065 | USD | 1,444 | Citibank NA | 8/13/20 | (18) |
| AUD | 8,758 | USD | 5,619 | National Australia Bank | 8/13/20 | 426 |
| CAD | 2,273 | USD | 1,692 | Bank Of America NA | 8/13/20 | (18) |
| CAD | 40,824 | USD | 28,992 | JPMorgan Chase Bank, N.A. | 8/13/20 | 1,082 |
| EUR | 4,994 | USD | 5,605 | BNP Paribas | 8/13/20 | 11 |
| EUR | 2,852 | USD | 3,100 | BNP Paribas SA | 8/13/20 | 107 |
| EUR | 26,449 | USD | 28,877 | BNP Paribas SA | 8/13/20 | 866 |
| EUR | 4,994 | USD | 5,605 | BNP Paribas SA | 8/13/20 | 11 |
| EUR | 13,730 | USD | 15,431 | Citibank NA | 8/13/20 | 9 |
| EUR | 13,730 | USD | 15,431 | Citibank NA | 8/13/20 | 9 |
| EUR | 1,383 | USD | 1,501 | Hsbc-Fx Custodian | 8/13/20 | 54 |
| EUR | 1,187 | USD | 1,331 | JPMorgan Chase Bank, N.A. | 8/13/20 | 4 |
| EUR | 1,187 | USD | 1,331 | JPMorgan Chase Bank, N.A. | 8/13/20 | 4 |
| EUR | 6,695 | USD | 7,551 | Morgan Stanley | 8/13/20 | (22) |
| EUR | 8,362 | USD | 9,104 | National Australia Bank | 8/13/20 | 300 |
| EUR | 1,297 | USD | 1,416 | National Australia Bank | 8/13/20 | 43 |
| EUR | 16,434 | USD | 18,603 | National Australia Bank | 8/13/20 | (122) |
| EUR | 1,922 | USD | 2,191 | National Australia Bank | 8/13/20 | (30) |
| EUR | 24,767 | USD | 26,739 | Royal Bank Of Canada | 8/13/20 | 1,114 |
| EUR | 2,516 | USD | 2,759 | Societe Generale SA | 8/13/20 | 71 |
| JPY | 434,555 | USD | 4,050 | Hsbc-Fx Custodian | 8/13/20 | (24) |
| JPY | 1,575,230 | USD | 14,754 | State Street Bank | 8/13/20 | (157) |
| NOK | 188,940 | USD | 18,418 | CIBC World Markets | 8/13/20 | 1,215 |
| NOK | 173,757 | USD | 16,885 | National Australia Bank | 8/13/20 | 1,171 |
| USD | 2,178 | AUD | 3,175 | BNP Paribas SA | 8/13/20 | (13) |
| USD | 72,775 | AUD | 112,907 | National Australia Bank | 8/13/20 | (5,158) |
| USD | 207,590 | CAD | 291,097 | CIBC World Markets | 8/13/20 | (6,853) |
| USD | 6,408 | CAD | 9,002 | National Australia Bank | 8/13/20 | (224) |
| USD | 17,729 | EUR | 15,798 | BNP Paribas SA | 8/13/20 | (37) |
| USD | 2,656 | EUR | 2,354 | BNP Paribas SA | 8/13/20 | 9 |
| USD | 203,443 | EUR | 187,171 | BNP Paribas SA | 8/13/20 | (7,043) |
| USD | 190,242 | EUR | 175,000 | Bank Of America NA | 8/13/20 | (6,559) |
| USD | 2,294 | EUR | 2,115 | CIBC World Markets | 8/13/20 | (84) |
| USD | 13,473 | EUR | 12,078 | Citibank NA | 8/13/20 | (110) |
| USD | 192,447 | EUR | 177,000 | Citibank NA | 8/13/20 | (6,603) |
| USD | 2,679 | EUR | 2,426 | JPMorgan Chase Bank, N.A. | 8/13/20 | (50) |
| USD | 1,587 | EUR | 1,406 | Morgan Stanley | 8/13/20 | 6 |
| USD | 30,198 | EUR | 27,608 | Royal Bank Of Canada | 8/13/20 | (849) |
| USD | 191,331 | EUR | 176,000 | Royal Bank Of Canada | 8/13/20 | (6,594) |
| USD | 31,020 | EUR | 28,187 | Societe Generale SA | 8/13/20 | (679) |
| USD | 1,883 | EUR | 1,675 | Societe Generale SA | 8/13/20 | (1) |
| USD | 11,827 | GBP | 9,492 | Brown Brothers Harriman & Co. | 8/13/20 | 63 |
| USD | 95,944 | GBP | 77,000 | Brown Brothers Harriman & Co. | 8/13/20 | 508 |
| USD | 19,328 | GBP | 15,644 | Royal Bank Of Canada | 8/13/20 | (62) |
| USD | 175,942 | JPY | 18,744,168 | CIBC World Markets | 8/13/20 | 2,249 |
| USD | 35,212 | NOK | 362,697 | National Australia Bank | 8/13/20 | (2,476) |
| TOTAL FORWARD FOREIGN CURRENCY CONTRACTS | | | | | | $(34,468) |
| | | | | | Unrealized Appreciation | 9,332 |
| | | | | | Unrealized Depreciation | (43,800) |
For the period, the average contract value for forward foreign currency contracts was $2,779,255,000. Contract value represents contract amount in United States dollars plus or minus unrealized appreciation or depreciation, respectively.
Swaps
| Payment Received | Payment Frequency | Payment Paid | Payment Frequency | Clearinghouse / Counterparty(1) | Maturity Date | Notional Amount (000s) | Value (000s) | Upfront Premium Received/(Paid) (000s)(2) | Unrealized Appreciation/(Depreciation) (000s) |
| Interest Rate Swaps | | | | | | | | | |
| 0.5% | Semi - annual | 3-month LIBOR(3) | Quarterly | LCH | Sep. 2022 | $82,762 | $72 | $0 | $72 |
| 0.5% | Semi - annual | 3-month LIBOR(3) | Quarterly | LCH | Sep. 2025 | 23,510 | 1,070 | 0 | 1,070 |
| 3-month LIBOR(3) | Quarterly | 0.75% | Semi - annual | LCH | Sep. 2027 | 10,214 | (35) | 0 | (35) |
| 0.75% | Semi - annual | 3-month LIBOR(3) | Quarterly | LCH | Sep. 2030 | 46,349 | 190 | 0 | 190 |
| 0.75% | Semi - annual | 3-month LIBOR(3) | Quarterly | LCH | Sep. 2050 | 2,752 | 396 | 0 | 396 |
|
| TOTAL INTEREST RATE SWAPS | | | | | | | $1,693 | $0 | $1,693 |
|
(1) Swaps with LCH Clearnet Group (LCH) are centrally cleared over-the-counter (OTC) swaps.
(2) Any premiums for centrally cleared over-the-counter (OTC) swaps are recorded periodically throughout the term of the swap to variation margin and included in unrealized appreciation (depreciation).
(3) Represents floating rate.
Currency Abbreviations
AUD – Australian dollar
CAD – Canadian dollar
EUR – European Monetary Unit
GBP – British pound
JPY – Japanese yen
NOK – Norwegian krone
USD – U.S. dollar
Values shown as $0 in the Schedule of Investments may reflect amounts less than $500.
Legend
(a) Amount is stated in United States dollars unless otherwise noted.
(b) Security exempt from registration under Rule 144A of the Securities Act of 1933. These securities may be resold in transactions exempt from registration, normally to qualified institutional buyers. At the end of the period, the value of these securities amounted to $2,777,788,000 or 18.9% of net assets.
(c) Non-income producing - Security is in default.
(d) Level 3 security
(e) Coupon rates for floating and adjustable rate securities reflect the rates in effect at period end.
(f) Security or a portion of the security purchased on a delayed delivery or when-issued basis.
(g) Coupon is indexed to a floating interest rate which may be multiplied by a specified factor and/or subject to caps or floors.
(h) Security or a portion of the security was pledged to cover margin requirements for futures contracts. At period end, the value of securities pledged amounted to $2,282,000.
(i) Security or a portion of the security has been segregated as collateral for open options. At period end, the value of securities pledged amounted to $793,000.
(j) Security or a portion of the security was pledged to cover margin requirements for centrally cleared OTC swaps. At period end, the value of securities pledged amounted to $3,658,000.
(k) Represents an investment in an underlying pool of reverse mortgages which typically do not require regular principal and interest payments as repayment is deferred until a maturity event.
(l) Security represents right to receive monthly interest payments on an underlying pool of mortgages or assets. Principal shown is the outstanding par amount of the pool as of the end of the period.
(m) Coupon is inversely indexed to a floating interest rate multiplied by a specified factor. The price may be considerably more volatile than the price of a comparable fixed rate security.
(n) Non-income producing
(o) Security or a portion of the security is on loan at period end.
(p) Restricted securities (including private placements) - Investment in securities not registered under the Securities Act of 1933 (excluding 144A issues). At the end of the period, the value of restricted securities (excluding 144A issues) amounted to $65,000 or 0.0% of net assets.
(q) Remaining maturities of bank loan obligations may be less than the stated maturities shown as a result of contractual or optional prepayments by the borrower. Such prepayments cannot be predicted with certainty.
(r) Position or a portion of the position represents an unfunded loan commitment. At period end, the total principal amount and market value of unfunded commitments totaled 1,573,000 and 1,594,000, respectively.
(s) The coupon rate will be determined upon settlement of the loan after period end.
(t) Affiliated fund that is generally available only to investment companies and other accounts managed by Fidelity Investments. A complete unaudited schedule of portfolio holdings for each Fidelity Central Fund is filed with the SEC for the first and third quarters of each fiscal year on Form N-PORT and is available upon request or at the SEC's website at www.sec.gov. An unaudited holdings listing for the Fund, which presents direct holdings as well as the pro-rata share of securities and other investments held indirectly through its investment in underlying non-money market Fidelity Central Funds, is available at fidelity.com and/or institutional.fidelity.com, as applicable. In addition, each Fidelity Central Fund's financial statements are available on the SEC's website or upon request.
(u) Security is perpetual in nature with no stated maturity date.
(v) Affiliated fund that is generally available only to investment companies and other accounts managed by Fidelity Investments. The rate quoted is the annualized seven-day yield of the fund at period end. A complete unaudited listing of the fund's holdings as of its most recent quarter end is available upon request. In addition, each Fidelity Central Fund's financial statements are available on the SEC's website or upon request.
(w) Investment made with cash collateral received from securities on loan.
(x) For the period, the average monthly notional amount for purchased swaptions was $586,300,000.
Additional information on each restricted holding is as follows:
| Security | Acquisition Date | Cost (000s) |
| Tricer Holdco SCA | 10/16/09 - 12/30/17 | $6,909 |
| Tricer Holdco SCA Class A1 | 10/16/09 - 10/29/09 | $1,100 |
| Tricer Holdco SCA Class A2 | 10/16/09 - 10/29/09 | $1,100 |
| Tricer Holdco SCA Class A3 | 10/16/09 - 10/29/09 | $1,100 |
| Tricer Holdco SCA Class A4 | 10/16/09 - 10/29/09 | $1,100 |
| Tricer Holdco SCA Class A5 | 10/16/09 - 10/29/09 | $1,100 |
| Tricer Holdco SCA Class A6 | 10/16/09 - 10/29/09 | $1,100 |
| Tricer Holdco SCA Class A7 | 10/16/09 - 10/29/09 | $1,100 |
| Tricer Holdco SCA Class A8 | 10/16/09 - 10/29/09 | $1,100 |
| Tricer Holdco SCA Class A9 | 10/16/09 - 10/29/09 | $1,100 |
Affiliated Central Funds
Information regarding fiscal year to date income earned by the Fund from investments in Fidelity Central Funds is as follows:
| Fund | Income earned |
| | (Amounts in thousands) |
| Fidelity Cash Central Fund | $2,376 |
| Fidelity Emerging Markets Debt Central Fund | 63,731 |
| Fidelity Floating Rate Central Fund | 37,686 |
| Fidelity Securities Lending Cash Central Fund | 3 |
| Total | $103,796 |
Amounts in the income column in the above table include any capital gain distributions from underlying funds, which are presented in the corresponding line-item in the Statement of Operations, if applicable. Amount for Fidelity Securities Lending Cash Central Fund represents the income earned on investing cash collateral, less rebates paid to borrowers and any lending agent fees associated with the loan, plus any premium payments received for lending certain types of securities.
Fiscal year to date information regarding the Fund’s investments in non-Money Market Central Funds, including the ownership percentage, is presented below.
| Fund (Amounts in thousands) | Value, beginning of period | Purchases | Sales Proceeds | Realized Gain/Loss | Change in Unrealized appreciation (depreciation) | Value, end of period | % ownership, end of period |
| Fidelity Emerging Markets Debt Central Fund | $2,613,139 | $63,731 | $165,020 | $(824) | $(147,306) | $2,363,720 | 88.7% |
| Fidelity Floating Rate Central Fund | 1,518,627 | 89,186 | 52,999 | (960) | (109,484) | 1,444,370 | 77.1% |
| Total | $4,131,766 | $152,917 | $218,019 | $(1,784) | $(256,790) | $3,808,090 | |
Investment Valuation
The following is a summary of the inputs used, as of June 30, 2020, involving the Fund's assets and liabilities carried at fair value. The inputs or methodology used for valuing securities may not be an indication of the risk associated with investing in those securities. For more information on valuation inputs, and their aggregation into the levels used below, please refer to the Investment Valuation section in the accompanying Notes to Financial Statements.
| | Valuation Inputs at Reporting Date: |
| Description | Total | Level 1 | Level 2 | Level 3 |
| (Amounts in thousands) | | | | |
| Investments in Securities: | | | | |
| Equities: | | | | |
| Communication Services | $99,279 | $99,279 | $-- | $-- |
| Consumer Discretionary | 76,683 | 68,606 | -- | 8,077 |
| Consumer Staples | 36,858 | 29,621 | -- | 7,237 |
| Energy | 3,557 | 3,557 | -- | -- |
| Financials | 32,000 | 32,000 | -- | -- |
| Health Care | 115,719 | 114,374 | -- | 1,345 |
| Industrials | 88,885 | 87,637 | -- | 1,248 |
| Information Technology | 310,291 | 310,291 | -- | -- |
| Materials | 36,428 | 36,404 | -- | 24 |
| Utilities | 37,313 | 36,692 | -- | 621 |
| Corporate Bonds | 4,714,060 | -- | 4,711,255 | 2,805 |
| U.S. Government and Government Agency Obligations | 2,320,393 | -- | 2,320,393 | -- |
| U.S. Government Agency - Mortgage Securities | 122,629 | -- | 122,629 | -- |
| Asset-Backed Securities | 7,153 | -- | 7,153 | -- |
| Collateralized Mortgage Obligations | 276,606 | -- | 276,606 | -- |
| Foreign Government and Government Agency Obligations | 1,168,239 | -- | 1,168,239 | -- |
| Bank Loan Obligations | 326,132 | -- | 323,018 | 3,114 |
| Fixed-Income Funds | 3,808,090 | 3,808,090 | -- | -- |
| Preferred Securities | 681,933 | -- | 681,933 | -- |
| Money Market Funds | 447,903 | 447,903 | -- | -- |
| Purchased Swaptions | 7,397 | -- | 7,397 | -- |
| Total Investments in Securities: | $14,717,548 | $5,074,454 | $9,618,623 | $24,471 |
| Derivative Instruments: | | | | |
| Assets | | | | |
| Forward Foreign Currency Contracts | $9,322 | $-- | $9,322 | $-- |
| Futures Contracts | 355 | 355 | | |
| Swaps | 1,728 | -- | 1,728 | -- |
| Total Assets | $11,405 | $355 | $11,050 | $-- |
| Liabilities | | | | |
| Forward Foreign Currency Contracts | $(43,800) | $-- | $(43,800) | $-- |
| Swaps | (35) | -- | (35) | -- |
| Written Swaptions | (10,775) | -- | (10,775) | -- |
| Total Liabilities | $(54,610) | $-- | $(54,610) | $-- |
| Total Derivative Instruments: | $(43,205) | $355 | $(43,560) | $-- |
Value of Derivative Instruments
The following table is a summary of the Fund's value of derivative instruments by primary risk exposure as of June 30, 2020. For additional information on derivative instruments, please refer to the Derivative Instruments section in the accompanying Notes to Financial Statements.
| Primary Risk Exposure / Derivative Type | Value |
| | Asset | Liability |
| (Amounts in thousands) | | |
| Foreign Exchange Risk | | |
| Forward Foreign Currency Contracts(a) | $9,322 | $(43,800) |
| Total Foreign Exchange Risk | 9,322 | (43,800) |
| Interest Rate Risk | | |
| Futures Contracts(b) | 355 | 0 |
| Purchased Swaptions(c) | 7,397 | 0 |
| Swaps(d) | 1,728 | (35) |
| Written Swaptions(e) | 0 | (10,775) |
| Total Interest Rate Risk | 9,480 | (10,810) |
| Total Value of Derivatives | $18,802 | $(54,610) |
(a) Gross value is presented in the Statement of Assets and Liabilities in the unrealized appreciation/depreciation on forward foreign currency contracts line-items.
(b) Reflects gross cumulative appreciation (depreciation) on futures contracts as presented in the Schedule of Investments. In the Statement of Assets and Liabilities, the period end daily variation margin is included in receivable or payable for daily variation margin on futures contracts, and the net cumulative appreciation (depreciation) is included in Total accumulated earnings (loss).
(c) Gross value is included in the Statement of Assets and Liabilities in the investments, at value line-item.
(d) For centrally cleared over-the-counter (OTC) swaps, reflects gross cumulative appreciation (depreciation) as presented in the Schedule of Investments. In the Statement of Assets and Liabilities, the period end daily variation margin for centrally cleared OTC swaps is included in receivable or payable for daily variation margin on centrally cleared OTC swaps, and the net cumulative appreciation (depreciation) for centrally cleared OTC swaps is included in Total accumulated earnings (loss).
(e) Gross value is presented in the Statement of Assets and Liabilities in the written options, at value line-item.
Other Information
Distribution of investments by country or territory of incorporation, as a percentage of Total Net Assets, is as follows (Unaudited):
| United States of America | 70.6% |
| Germany | 3.3% |
| Canada | 2.8% |
| Netherlands | 2.1% |
| Luxembourg | 2.1% |
| United Kingdom | 2.0% |
| Cayman Islands | 1.6% |
| Mexico | 1.5% |
| Argentina | 1.2% |
| Japan | 1.0% |
| Others (Individually Less Than 1%) | 11.8% |
| | 100% |
The information in the above tables is based on the combined investments of the fund and its pro-rata share of the investments of Fidelity's Fixed-Income Central Funds
See accompanying notes which are an integral part of the financial statements.
Fidelity Advisor® Strategic Income Fund
Financial Statements
Statement of Assets and Liabilities
| Amounts in thousands (except per-share amounts) | | June 30, 2020 (Unaudited) |
| Assets | | |
Investment in securities, at value (including securities loaned of $161) — See accompanying schedule:
Unaffiliated issuers (cost $10,367,419) | $10,461,555 | |
| Fidelity Central Funds (cost $4,554,389) | 4,255,993 | |
| Total Investment in Securities (cost $14,921,808) | | $14,717,548 |
| Cash | | 68,945 |
| Foreign currency held at value (cost $5) | | 5 |
| Receivable for investments sold | | 39,805 |
| Receivable for premium on written options | | 9,295 |
| Unrealized appreciation on forward foreign currency contracts | | 9,332 |
| Receivable for fund shares sold | | 13,279 |
| Dividends receivable | | 364 |
| Interest receivable | | 95,858 |
| Distributions receivable from Fidelity Central Funds | | 54 |
| Other receivables | | 35 |
| Total assets | | 14,954,520 |
| Liabilities | | |
| Payable for investments purchased | | |
| Regular delivery | $87,312 | |
| Delayed delivery | 76,790 | |
| Unrealized depreciation on forward foreign currency contracts | 43,800 | |
| Payable for fund shares redeemed | 17,604 | |
| Distributions payable | 2,463 | |
| Accrued management fee | 6,797 | |
| Distribution and service plan fees payable | 1,035 | |
| Payable for daily variation margin on futures contracts | 198 | |
| Payable for daily variation margin on centrally cleared OTC swaps | 93 | |
| Written options, at value (premium receivable $9,295) | 10,775 | |
| Other affiliated payables | 1,683 | |
| Other payables and accrued expenses | 82 | |
| Collateral on securities loaned | 189 | |
| Total liabilities | | 248,821 |
| Net Assets | | $14,705,699 |
| Net Assets consist of: | | |
| Paid in capital | | $14,641,298 |
| Total accumulated earnings (loss) | | 64,401 |
| Net Assets | | $14,705,699 |
| Net Asset Value and Maximum Offering Price | | |
| Class A: | | |
| Net Asset Value and redemption price per share ($1,788,781 ÷ 149,128 shares)(a) | | $11.99 |
| Maximum offering price per share (100/96.00 of $11.99) | | $12.49 |
| Class M: | | |
| Net Asset Value and redemption price per share ($737,456 ÷ 61,515 shares)(a) | | $11.99 |
| Maximum offering price per share (100/96.00 of $11.99) | | $12.49 |
| Class C: | | |
| Net Asset Value and offering price per share ($597,988 ÷ 49,989 shares)(a) | | $11.96 |
| Fidelity Strategic Income Fund: | | |
| Net Asset Value, offering price and redemption price per share ($6,593,464 ÷ 542,174 shares) | | $12.16 |
| Class I: | | |
| Net Asset Value, offering price and redemption price per share ($4,442,743 ÷ 365,274 shares) | | $12.16 |
| Class Z: | | |
| Net Asset Value, offering price and redemption price per share ($545,267 ÷ 44,806 shares) | | $12.17 |
(a) Redemption price per share is equal to net asset value less any applicable contingent deferred sales charge.
See accompanying notes which are an integral part of the financial statements.
Statement of Operations
| Amounts in thousands | | Six months ended June 30, 2020 (Unaudited) |
| Investment Income | | |
| Dividends | | $23,444 |
| Interest (including $22 from security lending) | | 192,441 |
| Income from Fidelity Central Funds (including $3 from security lending) | | 103,796 |
| Total income | | 319,681 |
| Expenses | | |
| Management fee | $42,243 | |
| Transfer agent fees | 9,682 | |
| Distribution and service plan fees | 6,318 | |
| Accounting fees | 895 | |
| Custodian fees and expenses | 33 | |
| Independent trustees' fees and expenses | 27 | |
| Registration fees | 178 | |
| Audit | 76 | |
| Legal | (363) | |
| Miscellaneous | 115 | |
| Total expenses before reductions | 59,204 | |
| Expense reductions | (47) | |
| Total expenses after reductions | | 59,157 |
| Net investment income (loss) | | 260,524 |
| Realized and Unrealized Gain (Loss) | | |
| Net realized gain (loss) on: | | |
| Investment securities: | | |
| Unaffiliated issuers | 138,944 | |
| Fidelity Central Funds | (1,775) | |
| Forward foreign currency contracts | 46,247 | |
| Foreign currency transactions | 2,773 | |
| Futures contracts | 32,403 | |
| Swaps | (11,589) | |
| Written options | (1,782) | |
| Total net realized gain (loss) | | 205,221 |
| Change in net unrealized appreciation (depreciation) on: | | |
| Investment securities: | | |
| Unaffiliated issuers (net of decrease in deferred foreign taxes of $23,124) | (455,664) | |
| Fidelity Central Funds | (256,789) | |
| Forward foreign currency contracts | (24,159) | |
| Assets and liabilities in foreign currencies | (30) | |
| Futures contracts | 4,177 | |
| Swaps | 109 | |
| Written options | (1,639) | |
| Delayed delivery commitments | 371 | |
| Total change in net unrealized appreciation (depreciation) | | (733,624) |
| Net gain (loss) | | (528,403) |
| Net increase (decrease) in net assets resulting from operations | | $(267,879) |
See accompanying notes which are an integral part of the financial statements.
Statement of Changes in Net Assets
| Amounts in thousands | Six months ended June 30, 2020 (Unaudited) | Year ended December 31, 2019 |
| Increase (Decrease) in Net Assets | | |
| Operations | | |
| Net investment income (loss) | $260,524 | $600,996 |
| Net realized gain (loss) | 205,221 | 159,227 |
| Change in net unrealized appreciation (depreciation) | (733,624) | 976,082 |
| Net increase (decrease) in net assets resulting from operations | (267,879) | 1,736,305 |
| Distributions to shareholders | (199,835) | (718,416) |
| Share transactions - net increase (decrease) | (1,853,509) | (195,579) |
| Total increase (decrease) in net assets | (2,321,223) | 822,310 |
| Net Assets | | |
| Beginning of period | 17,026,922 | 16,204,612 |
| End of period | $14,705,699 | $17,026,922 |
See accompanying notes which are an integral part of the financial statements.
Financial Highlights
Fidelity Advisor Strategic Income Fund Class A
| | Six months ended (Unaudited) June 30, | Years endedDecember 31, | | | | |
| | 2020 | 2019 | 2018 | 2017 | 2016 | 2015 |
| Selected Per–Share Data | | | | | | |
| Net asset value, beginning of period | $12.29 | $11.56 | $12.32 | $11.88 | $11.32 | $11.92 |
| Income from Investment Operations | | | | | | |
| Net investment income (loss)A | .190 | .412 | .424 | .399 | .428 | .420 |
| Net realized and unrealized gain (loss) | (.347) | .818 | (.780) | .526 | .516 | (.629) |
| Total from investment operations | (.157) | 1.230 | (.356) | .925 | .944 | (.209) |
| Distributions from net investment income | (.133) | (.390) | (.392) | (.382) | (.384) | (.307) |
| Distributions from net realized gain | (.010) | (.110) | (.012) | (.103) | – | (.007) |
| Tax return of capital | – | – | – | – | – | (.077) |
| Total distributions | (.143) | (.500) | (.404) | (.485) | (.384) | (.391) |
| Net asset value, end of period | $11.99 | $12.29 | $11.56 | $12.32 | $11.88 | $11.32 |
| Total ReturnB,C,D | (1.26)% | 10.74% | (2.95)% | 7.87% | 8.42% | (1.84)% |
| Ratios to Average Net AssetsE,F | | | | | | |
| Expenses before reductions | .98%G | .98% | .98% | 1.00% | 1.01% | 1.00% |
| Expenses net of fee waivers, if any | .98%G | .97% | .98% | .99% | 1.01% | 1.00% |
| Expenses net of all reductions | .98%G | .97% | .98% | .99% | 1.01% | 1.00% |
| Net investment income (loss) | 3.22%G | 3.38% | 3.52% | 3.24% | 3.64% | 3.55% |
| Supplemental Data | | | | | | |
| Net assets, end of period (in millions) | $1,789 | $1,918 | $1,631 | $1,921 | $3,098 | $3,274 |
| Portfolio turnover rateH | 122%G | 138%I | 113%J | 123% | 76% | 88% |
A Calculated based on average shares outstanding during the period.
B Total returns for periods of less than one year are not annualized.
C Total returns would have been lower if certain expenses had not been reduced during the applicable periods shown.
D Total returns do not include the effect of the sales charges.
E Fees and expenses of any underlying Fidelity Central Funds are not included in the Fund's expense ratio. The Fund indirectly bears its proportionate share of the expenses of any underlying Fidelity Central Funds. Based on their most recent shareholder report date, the expenses of any underlying non-money market Fidelity Central Funds were less than .005%.
F Expense ratios reflect operating expenses of the class. Expenses before reductions do not reflect amounts reimbursed by the investment adviser or reductions from brokerage service arrangements or reductions from other expense offset arrangements and do not represent the amount paid by the class during periods when reimbursements or reductions occur. Expenses net of fee waivers reflect expenses after reimbursement by the investment adviser but prior to reductions from brokerage service arrangements or other expense offset arrangements. Expenses net of all reductions represent the net expenses paid by the class.
G Annualized
H Amount does not include the portfolio activity of any underlying Fidelity Central Funds.
I Portfolio turnover rate excludes securities received or delivered in-kind.
J The portfolio turnover rate does not include the assets acquired in the merger.
See accompanying notes which are an integral part of the financial statements.
Fidelity Advisor Strategic Income Fund Class M
| | Six months ended (Unaudited) June 30, | Years endedDecember 31, | | | | |
| | 2020 | 2019 | 2018 | 2017 | 2016 | 2015 |
| Selected Per–Share Data | | | | | | |
| Net asset value, beginning of period | $12.28 | $11.55 | $12.31 | $11.88 | $11.31 | $11.92 |
| Income from Investment Operations | | | | | | |
| Net investment income (loss)A | .191 | .412 | .424 | .398 | .428 | .420 |
| Net realized and unrealized gain (loss) | (.338) | .818 | (.779) | .517 | .526 | (.639) |
| Total from investment operations | (.147) | 1.230 | (.355) | .915 | .954 | (.219) |
| Distributions from net investment income | (.133) | (.390) | (.393) | (.382) | (.384) | (.307) |
| Distributions from net realized gain | (.010) | (.110) | (.012) | (.103) | – | (.007) |
| Tax return of capital | – | – | – | – | – | (.077) |
| Total distributions | (.143) | (.500) | (.405) | (.485) | (.384) | (.391) |
| Net asset value, end of period | $11.99 | $12.28 | $11.55 | $12.31 | $11.88 | $11.31 |
| Total ReturnB,C,D | (1.18)% | 10.75% | (2.95)% | 7.78% | 8.52% | (1.93)% |
| Ratios to Average Net AssetsE,F | | | | | | |
| Expenses before reductions | .97%G | .97% | .98% | .99% | 1.01% | 1.00% |
| Expenses net of fee waivers, if any | .97%G | .97% | .97% | .99% | 1.00% | 1.00% |
| Expenses net of all reductions | .97%G | .97% | .97% | .99% | 1.00% | 1.00% |
| Net investment income (loss) | 3.23%G | 3.39% | 3.52% | 3.24% | 3.64% | 3.55% |
| Supplemental Data | | | | | | |
| Net assets, end of period (in millions) | $737 | $806 | $755 | $864 | $967 | $1,008 |
| Portfolio turnover rateH | 122%G | 138%I | 113%J | 123% | 76% | 88% |
A Calculated based on average shares outstanding during the period.
B Total returns for periods of less than one year are not annualized.
C Total returns would have been lower if certain expenses had not been reduced during the applicable periods shown.
D Total returns do not include the effect of the sales charges.
E Fees and expenses of any underlying Fidelity Central Funds are not included in the Fund's expense ratio. The Fund indirectly bears its proportionate share of the expenses of any underlying Fidelity Central Funds. Based on their most recent shareholder report date, the expenses of any underlying non-money market Fidelity Central Funds were less than .005%.
F Expense ratios reflect operating expenses of the class. Expenses before reductions do not reflect amounts reimbursed by the investment adviser or reductions from brokerage service arrangements or reductions from other expense offset arrangements and do not represent the amount paid by the class during periods when reimbursements or reductions occur. Expenses net of fee waivers reflect expenses after reimbursement by the investment adviser but prior to reductions from brokerage service arrangements or other expense offset arrangements. Expenses net of all reductions represent the net expenses paid by the class.
G Annualized
H Amount does not include the portfolio activity of any underlying Fidelity Central Funds.
I Portfolio turnover rate excludes securities received or delivered in-kind.
J The portfolio turnover rate does not include the assets acquired in the merger.
See accompanying notes which are an integral part of the financial statements.
Fidelity Advisor Strategic Income Fund Class C
| | Six months ended (Unaudited) June 30, | Years endedDecember 31, | | | | |
| | 2020 | 2019 | 2018 | 2017 | 2016 | 2015 |
| Selected Per–Share Data | | | | | | |
| Net asset value, beginning of period | $12.26 | $11.53 | $12.28 | $11.85 | $11.29 | $11.89 |
| Income from Investment Operations | | | | | | |
| Net investment income (loss)A | .146 | .320 | .334 | .305 | .339 | .331 |
| Net realized and unrealized gain (loss) | (.348) | .818 | (.770) | .518 | .516 | (.629) |
| Total from investment operations | (.202) | 1.138 | (.436) | .823 | .855 | (.298) |
| Distributions from net investment income | (.088) | (.298) | (.302) | (.290) | (.295) | (.236) |
| Distributions from net realized gain | (.010) | (.110) | (.012) | (.103) | – | (.007) |
| Tax return of capital | – | – | – | – | – | (.059) |
| Total distributions | (.098) | (.408) | (.314) | (.393) | (.295) | (.302) |
| Net asset value, end of period | $11.96 | $12.26 | $11.53 | $12.28 | $11.85 | $11.29 |
| Total ReturnB,C,D | (1.64)% | 9.94% | (3.60)% | 7.00% | 7.63% | (2.59)% |
| Ratios to Average Net AssetsE,F | | | | | | |
| Expenses before reductions | 1.73%G | 1.72% | 1.72% | 1.74% | 1.75% | 1.75% |
| Expenses net of fee waivers, if any | 1.73%G | 1.72% | 1.72% | 1.74% | 1.75% | 1.75% |
| Expenses net of all reductions | 1.73%G | 1.72% | 1.72% | 1.74% | 1.75% | 1.75% |
| Net investment income (loss) | 2.47%G | 2.63% | 2.78% | 2.50% | 2.90% | 2.80% |
| Supplemental Data | | | | | | |
| Net assets, end of period (in millions) | $598 | $678 | $1,006 | $1,302 | $1,376 | $1,429 |
| Portfolio turnover rateH | 122%G | 138%I | 113%J | 123% | 76% | 88% |
A Calculated based on average shares outstanding during the period.
B Total returns for periods of less than one year are not annualized.
C Total returns would have been lower if certain expenses had not been reduced during the applicable periods shown.
D Total returns do not include the effect of the contingent deferred sales charge.
E Fees and expenses of any underlying Fidelity Central Funds are not included in the Fund's expense ratio. The Fund indirectly bears its proportionate share of the expenses of any underlying Fidelity Central Funds. Based on their most recent shareholder report date, the expenses of any underlying non-money market Fidelity Central Funds were less than .005%.
F Expense ratios reflect operating expenses of the class. Expenses before reductions do not reflect amounts reimbursed by the investment adviser or reductions from brokerage service arrangements or reductions from other expense offset arrangements and do not represent the amount paid by the class during periods when reimbursements or reductions occur. Expenses net of fee waivers reflect expenses after reimbursement by the investment adviser but prior to reductions from brokerage service arrangements or other expense offset arrangements. Expenses net of all reductions represent the net expenses paid by the class.
G Annualized
H Amount does not include the portfolio activity of any underlying Fidelity Central Funds.
I Portfolio turnover rate excludes securities received or delivered in-kind.
J The portfolio turnover rate does not include the assets acquired in the merger.
See accompanying notes which are an integral part of the financial statements.
Fidelity Strategic Income Fund
| | Six months ended (Unaudited) June 30, | Years endedDecember 31, | |
| | 2020 | 2019 | 2018 A |
| Selected Per–Share Data | | | |
| Net asset value, beginning of period | $12.46 | $11.72 | $12.38 |
| Income from Investment Operations | | | |
| Net investment income (loss)B | .212 | .454 | .314 |
| Net realized and unrealized gain (loss) | (.349) | .827 | (.657) |
| Total from investment operations | (.137) | 1.281 | (.343) |
| Distributions from net investment income | (.153) | (.431) | (.317) |
| Distributions from net realized gain | (.010) | (.110) | – |
| Total distributions | (.163) | (.541) | (.317) |
| Net asset value, end of period | $12.16 | $12.46 | $11.72 |
| Total ReturnC,D | (1.08)% | 11.04% | (2.78)% |
| Ratios to Average Net AssetsE,F | | | |
| Expenses before reductions | .67%G | .68% | .69%G |
| Expenses net of fee waivers, if any | .67%G | .68% | .68%G |
| Expenses net of all reductions | .67%G | .68% | .68%G |
| Net investment income (loss) | 3.52%G | 3.68% | 3.64%G |
| Supplemental Data | | | |
| Net assets, end of period (in millions) | $6,593 | $8,139 | $7,817 |
| Portfolio turnover rateH | 122%G | 138%I | 113%J |
A For the period April 13, 2018 (commencement of sale of shares) to December 31, 2018.
B Calculated based on average shares outstanding during the period.
C Total returns for periods of less than one year are not annualized.
D Total returns would have been lower if certain expenses had not been reduced during the applicable periods shown.
E Fees and expenses of any underlying Fidelity Central Funds are not included in the Fund's expense ratio. The Fund indirectly bears its proportionate share of the expenses of any underlying Fidelity Central Funds. Based on their most recent shareholder report date, the expenses of any underlying non-money market Fidelity Central Funds were less than .005%.
F Expense ratios reflect operating expenses of the class. Expenses before reductions do not reflect amounts reimbursed by the investment adviser or reductions from brokerage service arrangements or reductions from other expense offset arrangements and do not represent the amount paid by the class during periods when reimbursements or reductions occur. Expense ratios before reductions for start-up periods may not be representative of longer-term operating periods. Expenses net of fee waivers reflect expenses after reimbursement by the investment adviser but prior to reductions from brokerage service arrangements or other expense offset arrangements. Expenses net of all reductions represent the net expenses paid by the class.
G Annualized
H Amount does not include the portfolio activity of any underlying Fidelity Central Funds.
I Portfolio turnover rate excludes securities received or delivered in-kind.
J The portfolio turnover rate does not include the assets acquired in the merger.
See accompanying notes which are an integral part of the financial statements.
Fidelity Advisor Strategic Income Fund Class I
| | Six months ended (Unaudited) June 30, | Years endedDecember 31, | | | | |
| | 2020 | 2019 | 2018 | 2017 | 2016 | 2015 |
| Selected Per–Share Data | | | | | | |
| Net asset value, beginning of period | $12.46 | $11.72 | $12.49 | $12.05 | $11.47 | $12.09 |
| Income from Investment Operations | | | | | | |
| Net investment income (loss)A | .209 | .449 | .458 | .432 | .463 | .452 |
| Net realized and unrealized gain (loss) | (.349) | .827 | (.789) | .528 | .535 | (.650) |
| Total from investment operations | (.140) | 1.276 | (.331) | .960 | .998 | (.198) |
| Distributions from net investment income | (.150) | (.426) | (.427) | (.417) | (.418) | (.332) |
| Distributions from net realized gain | (.010) | (.110) | (.012) | (.103) | – | (.007) |
| Tax return of capital | – | – | – | – | – | (.083) |
| Total distributions | (.160) | (.536) | (.439) | (.520) | (.418) | (.422) |
| Net asset value, end of period | $12.16 | $12.46 | $11.72 | $12.49 | $12.05 | $11.47 |
| Total ReturnB,C | (1.10)% | 11.00% | (2.71)% | 8.06% | 8.80% | (1.73)% |
| Ratios to Average Net AssetsD,E | | | | | | |
| Expenses before reductions | .72%F | .72% | .73% | .75% | .76% | .78% |
| Expenses net of fee waivers, if any | .72%F | .72% | .73% | .74% | .76% | .78% |
| Expenses net of all reductions | .72%F | .72% | .73% | .74% | .76% | .78% |
| Net investment income (loss) | 3.48%F | 3.64% | 3.76% | 3.49% | 3.89% | 3.77% |
| Supplemental Data | | | | | | |
| Net assets, end of period (in millions) | $4,443 | $4,899 | $4,831 | $5,039 | $2,827 | $2,640 |
| Portfolio turnover rateG | 122%F | 138%H | 113%I | 123% | 76% | 88% |
A Calculated based on average shares outstanding during the period.
B Total returns for periods of less than one year are not annualized.
C Total returns would have been lower if certain expenses had not been reduced during the applicable periods shown.
D Fees and expenses of any underlying Fidelity Central Funds are not included in the Fund's expense ratio. The Fund indirectly bears its proportionate share of the expenses of any underlying Fidelity Central Funds. Based on their most recent shareholder report date, the expenses of any underlying non-money market Fidelity Central Funds were less than .005%.
E Expense ratios reflect operating expenses of the class. Expenses before reductions do not reflect amounts reimbursed by the investment adviser or reductions from brokerage service arrangements or reductions from other expense offset arrangements and do not represent the amount paid by the class during periods when reimbursements or reductions occur. Expenses net of fee waivers reflect expenses after reimbursement by the investment adviser but prior to reductions from brokerage service arrangements or other expense offset arrangements. Expenses net of all reductions represent the net expenses paid by the class.
F Annualized
G Amount does not include the portfolio activity of any underlying Fidelity Central Funds.
H Portfolio turnover rate excludes securities received or delivered in-kind.
I The portfolio turnover rate does not include the assets acquired in the merger.
See accompanying notes which are an integral part of the financial statements.
Fidelity Advisor Strategic Income Fund Class Z
| | Six months ended (Unaudited) June 30, | Years endedDecember 31, | |
| | 2020 | 2019 | 2018 A |
| Selected Per–Share Data | | | |
| Net asset value, beginning of period | $12.47 | $11.72 | $12.17 |
| Income from Investment Operations | | | |
| Net investment income (loss)B | .215 | .461 | .119 |
| Net realized and unrealized gain (loss) | (.349) | .837 | (.437) |
| Total from investment operations | (.134) | 1.298 | (.318) |
| Distributions from net investment income | (.156) | (.438) | (.132) |
| Distributions from net realized gain | (.010) | (.110) | – |
| Total distributions | (.166) | (.548) | (.132) |
| Net asset value, end of period | $12.17 | $12.47 | $11.72 |
| Total ReturnC,D | (1.05)% | 11.19% | (2.62)% |
| Ratios to Average Net AssetsE,F | | | |
| Expenses before reductions | .62%G | .62% | .62%G |
| Expenses net of fee waivers, if any | .62%G | .62% | .62%G |
| Expenses net of all reductions | .62%G | .62% | .62%G |
| Net investment income (loss) | 3.58%G | 3.74% | 3.95%G |
| Supplemental Data | | | |
| Net assets, end of period (in millions) | $545 | $587 | $166 |
| Portfolio turnover rateH | 122%G | 138%I | 113%J |
A For the period October 2, 2018 (commencement of sale of shares) to December 31, 2018.
B Calculated based on average shares outstanding during the period.
C Total returns for periods of less than one year are not annualized.
D Total returns would have been lower if certain expenses had not been reduced during the applicable periods shown.
E Fees and expenses of any underlying Fidelity Central Funds are not included in the Fund's expense ratio. The Fund indirectly bears its proportionate share of the expenses of any underlying Fidelity Central Funds. Based on their most recent shareholder report date, the expenses of any underlying non-money market Fidelity Central Funds were less than .005%.
F Expense ratios reflect operating expenses of the class. Expenses before reductions do not reflect amounts reimbursed by the investment adviser or reductions from brokerage service arrangements or reductions from other expense offset arrangements and do not represent the amount paid by the class during periods when reimbursements or reductions occur. Expense ratios before reductions for start-up periods may not be representative of longer-term operating periods. Expenses net of fee waivers reflect expenses after reimbursement by the investment adviser but prior to reductions from brokerage service arrangements or other expense offset arrangements. Expenses net of all reductions represent the net expenses paid by the class.
G Annualized
H Amount does not include the portfolio activity of any underlying Fidelity Central Funds.
I Portfolio turnover rate excludes securities received or delivered in-kind.
J The portfolio turnover rate does not include the assets acquired in the merger.
See accompanying notes which are an integral part of the financial statements.
Notes to Financial Statements (Unaudited)
For the period ended June 30, 2020
(Amounts in thousands except percentages)
1. Organization.
Fidelity Advisor Strategic Income Fund (the Fund) is a fund of Fidelity Advisor Series II (the Trust) and is authorized to issue an unlimited number of shares. The Trust is registered under the Investment Company Act of 1940, as amended (the 1940 Act), as an open-end management investment company organized as a Massachusetts business trust. The Fund offers Class A, Class M, Class C, Fidelity Strategic Income Fund, Class I and Class Z shares, each of which has equal rights as to assets and voting privileges. Each class has exclusive voting rights with respect to matters that affect that class. Class C shares will automatically convert to Class A shares after a holding period of ten years from the initial date of purchase, with certain exceptions. The Fund's investments in emerging markets can be subject to social, economic, regulatory, and political uncertainties and can be extremely volatile.
Effective January 1, 2020:
Investment advisers Fidelity Investments Money Management, Inc., FMR Co., Inc., and Fidelity SelectCo, LLC, merged with and into Fidelity Management & Research Company. In connection with the merger transactions, the resulting, merged investment adviser was then redomiciled from Massachusetts to Delaware, changed its corporate structure from a corporation to a limited liability company, and changed its name to "Fidelity Management & Research Company LLC".
Broker-dealer Fidelity Distributors Corporation merged with and into Fidelity Investments Institutional Services Company, Inc. ("FIISC"). FIISC was then redomiciled from Massachusetts to Delaware, changed its corporate structure from a corporation to a limited liability company, and changed its name to "Fidelity Distributors Company LLC".
Fidelity Investments Institutional Operations Company, Inc. converted from a Massachusetts corporation to a Massachusetts LLC, and changed its name to "Fidelity Investments Institutional Operations Company LLC".
2. Investments in Fidelity Central Funds.
The Fund invests in Fidelity Central Funds, which are open-end investment companies generally available only to other investment companies and accounts managed by the investment adviser and its affiliates. The Fund's Schedule of Investments lists each of the Fidelity Central Funds held as of period end, if any, as an investment of the Fund, but does not include the underlying holdings of each Fidelity Central Fund. As an Investing Fund, the Fund indirectly bears its proportionate share of the expenses of the underlying Fidelity Central Funds.
Based on its investment objective, each Fidelity Central Fund may invest or participate in various investment vehicles or strategies that are similar to those of the Fund. These strategies are consistent with the investment objectives of the Fund and may involve certain economic risks which may cause a decline in value of each of the Fidelity Central Funds and thus a decline in the value of the Fund. The Money Market Central Funds seek preservation of capital and current income and are managed by the investment adviser. Annualized expenses of the Money Market Central Funds as of their most recent shareholder report date ranged from less than .005% to .01%. The following summarizes the Fund's investment in each non-money market Fidelity Central Fund.
| Fidelity Central Fund | Investment Manager | Investment Objective | Investment Practices | Expense Ratio(a) |
| Fidelity Emerging Markets Debt Central Fund | FMR Co., Inc. (FMR) | Seeks high total return by normally investing in debt securities of issuers in emerging markets and other debt investments that are tied economically to emerging markets. | Foreign Securities
Restricted Securities
| Less than .005% |
| Fidelity Floating Rate Central Fund | FMR | Seeks a high level of income by normally investing in floating rate loans and other floating rate securities. | Loans & Direct Debt Instruments
Restricted Securities
| Less than .005% |
(a) Expenses expressed as a percentage of average net assets and are as of each underlying Central Fund's most recent annual or semi-annual shareholder report.
An unaudited holdings listing for the Fund, which presents direct holdings as well as the pro-rata share of any securities and other investments held indirectly through its investment in underlying non-money market Fidelity Central Funds, is available at fidelity.com and/or institutional.fidelity.com, as applicable. A complete unaudited list of holdings for each Fidelity Central Fund is available upon request or at the Securities and Exchange Commission (the SEC) website at www.sec.gov. In addition, the financial statements of the Fidelity Central Funds which contain the significant accounting policies (including investment valuation policies) of those funds are available on the SEC website or upon request.
3. Significant Accounting Policies.
The Fund is an investment company and applies the accounting and reporting guidance of the Financial Accounting Standards Board (FASB) Accounting Standards Codification Topic 946 Financial Services – Investments Companies. The financial statements have been prepared in conformity with accounting principles generally accepted in the United States of America (GAAP), which require management to make certain estimates and assumptions at the date of the financial statements. Actual results could differ from those estimates. Subsequent events, if any, through the date that the financial statements were issued have been evaluated in the preparation of the financial statements. The following summarizes the significant accounting policies of the Fund:
Investment Valuation. Investments are valued as of 4:00 p.m. Eastern time on the last calendar day of the period. The Board of Trustees (the Board) has delegated the day to day responsibility for the valuation of the Fund's investments to the Fair Value Committee (the Committee) established by the Fund's investment adviser. In accordance with valuation policies and procedures approved by the Board, the Fund attempts to obtain prices from one or more third party pricing vendors or brokers to value its investments. When current market prices, quotations or currency exchange rates are not readily available or reliable, investments will be fair valued in good faith by the Committee, in accordance with procedures adopted by the Board. Factors used in determining fair value vary by investment type and may include market or investment specific events, changes in interest rates and credit quality. The frequency with which these procedures are used cannot be predicted and they may be utilized to a significant extent. The Committee oversees the Fund's valuation policies and procedures and reports to the Board on the Committee's activities and fair value determinations. The Board monitors the appropriateness of the procedures used in valuing the Fund's investments and ratifies the fair value determinations of the Committee.
The Fund categorizes the inputs to valuation techniques used to value its investments into a disclosure hierarchy consisting of three levels as shown below:
- Level 1 – quoted prices in active markets for identical investments
- Level 2 – other significant observable inputs (including quoted prices for similar investments, interest rates, prepayment speeds, etc.)
- Level 3 – unobservable inputs (including the Fund's own assumptions based on the best information available)
Valuation techniques used to value the Fund's investments by major category are as follows:
Debt securities, including restricted securities, are valued based on evaluated prices received from third party pricing vendors or from brokers who make markets in such securities. Corporate bonds, bank loan obligations, foreign government and government agency obligations, preferred securities, U.S. government and government agency obligations are valued by pricing vendors who utilize matrix pricing which considers yield or price of bonds of comparable quality, coupon, maturity and type or by broker-supplied prices. Asset backed securities, collateralized mortgage obligations and U.S. government agency mortgage securities are valued by pricing vendors who utilize matrix pricing which considers prepayment speed assumptions, attributes of the collateral, yield or price of bonds of comparable quality, coupon, maturity and type or by broker-supplied prices. Swaps are marked-to-market daily based on valuations from third party pricing vendors, registered derivatives clearing organizations (clearinghouses) or broker-supplied valuations. These pricing sources may utilize inputs such as interest rate curves, credit spread curves, default possibilities and recovery rates. When independent prices are unavailable or unreliable, debt securities and swaps may be valued utilizing pricing methodologies which consider similar factors that would be used by third party pricing vendors. For foreign debt securities, when significant market or security specific events arise, valuations may be determined in good faith in accordance with procedures adopted by the Board. Debt securities and swaps are generally categorized as Level 2 in the hierarchy but may be Level 3 depending on the circumstances. The Fund invests a significant portion of its assets in below investment grade securities. The value of these securities can be more volatile due to changes in the credit quality of the issuer and is sensitive to changes in economic, market and regulatory conditions.
Equity securities, including restricted securities, for which market quotations are readily available, are valued at the last reported sale price or official closing price as reported by a third party pricing vendor on the primary market or exchange on which they are traded and are categorized as Level 1 in the hierarchy. In the event there were no sales during the day or closing prices are not available, securities are valued at the last quoted bid price or may be valued using the last available price and are generally categorized as Level 2 in the hierarchy. For foreign equity securities, when market or security specific events arise, comparisons to the valuation of American Depositary Receipts (ADRs), futures contracts, Exchange-Traded Funds (ETFs) and certain indexes as well as quoted prices for similar securities may be used and would be categorized as Level 2 in the hierarchy. For equity securities, including restricted securities, where observable inputs are limited, assumptions about market activity and risk are used and these securities may be categorized as Level 3 in the hierarchy.
The U.S. dollar value of foreign currency contracts is determined using currency exchange rates supplied by a pricing service and are categorized as Level 2 in the hierarchy. Futures contracts are valued at the settlement price established each day by the board of trade or exchange on which they are traded and are categorized as Level 1 in the hierarchy. Options traded over-the-counter are valued using vendor or broker-supplied valuations and are categorized as Level 2 in the hierarchy. Investments in open-end mutual funds, including the Fidelity Central Funds, are valued at their closing net asset value (NAV) each business day and are categorized as Level 1 in the hierarchy.
Changes in valuation techniques may result in transfers in or out of an assigned level within the disclosure hierarchy. The aggregate value of investments by input level as of June 30, 2020 is included at the end of the Fund's Schedule of Investments.
Foreign Currency. Foreign-denominated assets, including investment securities, and liabilities are translated into U.S. dollars at the exchange rates at period end. Purchases and sales of investment securities, income and dividends received and expenses denominated in foreign currencies are translated into U.S. dollars at the exchange rate in effect on the transaction date.
The effects of exchange rate fluctuations on investments are included with the net realized and unrealized gain (loss) on investment securities. Other foreign currency transactions resulting in realized and unrealized gain (loss) are disclosed separately.
Realized gains and losses on foreign currency transactions arise from the disposition of foreign currency, realized changes in the value of foreign currency between the trade and settlement dates on security transactions, and the difference between the amounts of dividends, interest and foreign withholding taxes recorded on transaction date and the U.S. dollar equivalent of the amounts actually received or paid. Unrealized gains and losses on assets and liabilities in foreign currencies arise from changes in the value of foreign currency, and from assets and liabilities denominated in foreign currencies, other than investments, which are held at period end.
Investment Transactions and Income. For financial reporting purposes, the Fund's investment holdings and NAV include trades executed through the end of the last business day of the period. The NAV per share for processing shareholder transactions is calculated as of the close of business of the New York Stock Exchange (NYSE), normally 4:00 p.m. Eastern time and includes trades executed through the end of the prior business day. Gains and losses on securities sold are determined on the basis of identified cost and include proceeds received from litigation. Dividend income is recorded on the ex-dividend date, except for certain dividends from foreign securities where the ex-dividend date may have passed, which are recorded as soon as the Fund is informed of the ex-dividend date. Non-cash dividends included in dividend income, if any, are recorded at the fair market value of the securities received. Income and capital gain distributions from Fidelity Central Funds, if any, are recorded on the ex-dividend date. Certain distributions received by the Fund represent a return of capital or capital gain. The Fund determines the components of these distributions subsequent to the ex-dividend date, based upon receipt of tax filings or other correspondence relating to the underlying investment. These distributions are recorded as a reduction of cost of investments and/or as a realized gain. Interest income is accrued as earned and includes coupon interest and amortization of premium and accretion of discount on debt securities as applicable. Paid in Kind (PIK) income is recorded at the fair market value of the securities received. The principal amount on inflation-indexed securities is periodically adjusted to the rate of inflation and interest is accrued based on the principal amount. The adjustments to principal due to inflation are reflected as increases or decreases to Interest in the accompanying Statement of Operations. Investment income is recorded net of foreign taxes withheld where recovery of such taxes is uncertain. Debt obligations may be placed on non-accrual status and related interest income may be reduced by ceasing current accruals and writing off interest receivables when the collection of all or a portion of interest has become doubtful based on consistently applied procedures. A debt obligation is removed from non-accrual status when the issuer resumes interest payments or when collectability of interest is reasonably assured.
Class Allocations and Expenses. Investment income, realized and unrealized capital gains and losses, common expenses of the Fund, and certain fund-level expense reductions, if any, are allocated daily on a pro-rata basis to each class based on the relative net assets of each class to the total net assets of the Fund. Each class differs with respect to transfer agent and distribution and service plan fees incurred. Certain expense reductions may also differ by class. For the reporting period, the allocated portion of income and expenses to each class as a percent of its average net assets may vary due to the timing of recording these transactions in relation to fluctuating net assets of the classes. Expenses directly attributable to a fund are charged to that fund. Expenses attributable to more than one fund are allocated among the respective funds on the basis of relative net assets or other appropriate methods. Expense estimates are accrued in the period to which they relate and adjustments are made when actual amounts are known.
Income Tax Information and Distributions to Shareholders. Each year, the Fund intends to qualify as a regulated investment company under Subchapter M of the Internal Revenue Code, including distributing substantially all of its taxable income and realized gains. As a result, no provision for U.S. Federal income taxes is required. The Fund files a U.S. federal tax return, in addition to state and local tax returns as required. The Fund's federal income tax returns are subject to examination by the Internal Revenue Service (IRS) for a period of three fiscal years after they are filed. State and local tax returns may be subject to examination for an additional fiscal year depending on the jurisdiction. Foreign taxes are provided for based on the Fund's understanding of the tax rules and rates that exist in the foreign markets in which it invests.
Distributions are declared and recorded daily and paid monthly from net investment income. Distributions from realized gains, if any, are declared and recorded on the ex-dividend date. Income and capital gain distributions are declared separately for each class. Income and capital gain distributions are determined in accordance with income tax regulations, which may differ from GAAP.
Capital accounts within the financial statements are adjusted for permanent book-tax differences. These adjustments have no impact on net assets or the results of operations. Capital accounts are not adjusted for temporary book-tax differences which will reverse in a subsequent period.
Book-tax differences are primarily due to defaulted bonds, futures contracts, swaps, foreign currency transactions, market discount, partnerships, capital loss carryforwards and losses deferred due to futures contracts, wash sales and excise tax regulations.
As of period end, the cost and unrealized appreciation (depreciation) in securities, and derivatives if applicable, for federal income tax purposes were as follows:
| Gross unrealized appreciation | $814,712 |
| Gross unrealized depreciation | (1,026,436) |
| Net unrealized appreciation (depreciation) | $(211,724) |
| Tax cost | $14,895,372 |
The Fund elected to defer to its next fiscal year approximately $5,563 of capital losses recognized during the period November 1, 2019 to December 31, 2019. The Fund elected to defer to its next fiscal year $949 of ordinary losses recognized during the period November 1, 2019 to December 31, 2019.
Delayed Delivery Transactions and When-Issued Securities. During the period, the Fund transacted in securities on a delayed delivery or when-issued basis. Payment and delivery may take place after the customary settlement period for that security. The price of the underlying securities and the date when the securities will be delivered and paid for are fixed at the time the transaction is negotiated. The securities purchased on a delayed delivery or when-issued basis are identified as such in the Fund's Schedule of Investments. The Fund may receive compensation for interest forgone in the purchase of a delayed delivery or when-issued security. With respect to purchase commitments, the Fund identifies securities as segregated in its records with a value at least equal to the amount of the commitment. Losses may arise due to changes in the value of the underlying securities or if the counterparty does not perform under the contract's terms, or if the issuer does not issue the securities due to political, economic, or other factors.
Restricted Securities (including Private Placements). The Fund may invest in securities that are subject to legal or contractual restrictions on resale. These securities generally may be resold in transactions exempt from registration or to the public if the securities are registered. Disposal of these securities may involve time-consuming negotiations and expense, and prompt sale at an acceptable price may be difficult. Information regarding restricted securities is included at the end of the Fund's Schedule of Investments.
Loans and Other Direct Debt Instruments. The Fund invests in direct debt instruments which are interests in amounts owed to lenders by corporate or other borrowers. These instruments may be in the form of loans, trade claims or other receivables and may include standby financing commitments such as revolving credit facilities that obligate the Fund to supply additional cash to the borrower on demand. Loans may be acquired through assignment or participation. The Fund also invests in unfunded loan commitments, which are contractual obligations for future funding. Information regarding unfunded commitments is included at the end of the Fund's Schedule of Investments.
4. Derivative Instruments.
Risk Exposures and the Use of Derivative Instruments. The Fund's investment objective allows the Fund to enter into various types of derivative contracts, including futures contracts, forward foreign currency contracts, options and swaps. Derivatives are investments whose value is primarily derived from underlying assets, indices or reference rates and may be transacted on an exchange or over-the-counter (OTC). Derivatives may involve a future commitment to buy or sell a specified asset based on specified terms, to exchange future cash flows at periodic intervals based on a notional principal amount, or for one party to make one or more payments upon the occurrence of specified events in exchange for periodic payments from the other party.
The Fund used derivatives to increase returns, to gain exposure to certain types of assets, to facilitate transactions in foreign-denominated securities and to manage exposure to certain risks as defined below. The success of any strategy involving derivatives depends on analysis of numerous economic factors, and if the strategies for investment do not work as intended, the Fund may not achieve its objectives.
The Fund's use of derivatives increased or decreased its exposure to the following risks:
| Foreign Exchange Risk | Foreign exchange rate risk relates to fluctuations in the value of an asset or liability due to changes in currency exchange rates.
|
| Interest Rate Risk | Interest rate risk relates to the fluctuations in the value of interest-bearing securities due to changes in the prevailing levels of market interest rates. |
The Fund is also exposed to additional risks from investing in derivatives, such as liquidity risk and counterparty credit risk. Liquidity risk is the risk that the Fund will be unable to close out the derivative in the open market in a timely manner. Counterparty credit risk is the risk that the counterparty will not be able to fulfill its obligation to the Fund. Derivative counterparty credit risk is managed through formal evaluation of the creditworthiness of all potential counterparties. On certain OTC derivatives such as forward foreign currency contracts and options, the Fund attempts to reduce its exposure to counterparty credit risk by entering into an International Swaps and Derivatives Association, Inc. (ISDA) Master Agreement with each of its counterparties. The ISDA Master Agreement gives the Fund the right to terminate all transactions traded under such agreement upon the deterioration in the credit quality of the counterparty beyond specified levels. The ISDA Master Agreement gives each party the right, upon an event of default by the other party or a termination of the agreement, to close out all transactions traded under such agreement and to net amounts owed under each transaction to one net payable by one party to the other. To mitigate counterparty credit risk on bi-lateral OTC derivatives, the Fund receives collateral in the form of cash or securities once the Fund's net unrealized appreciation on outstanding derivative contracts under an ISDA Master Agreement exceeds certain applicable thresholds, subject to certain minimum transfer provisions. The collateral received is held in segregated accounts with the Fund's custodian bank in accordance with the collateral agreements entered into between the Fund, the counterparty and the Fund's custodian bank. The Fund could experience delays and costs in gaining access to the collateral even though it is held by the Fund's custodian bank. The Fund's maximum risk of loss from counterparty credit risk related to bi-lateral OTC derivatives is generally the aggregate unrealized appreciation and unpaid counterparty payments in excess of any collateral pledged by the counterparty to the Fund. For OTC written options with upfront premiums received, the Fund is obligated to perform and therefore does not have counterparty risk. For OTC written options with premiums to be received at a future date, the maximum risk of loss from counterparty credit risk is the amount of the premium in excess of any collateral pledged by the counterparty. The Fund may be required to pledge collateral for the benefit of the counterparties on bi-lateral OTC derivatives in an amount not less than each counterparty's unrealized appreciation on outstanding derivative contracts, subject to certain minimum transfer provisions, and any such pledged collateral is identified in the Schedule of Investments. Exchange-traded futures contracts are not covered by the ISDA Master Agreement; however counterparty credit risk related to exchange-traded futures contracts may be mitigated by the protection provided by the exchange on which they trade. Counterparty credit risk related to centrally cleared OTC swaps may be mitigated by the protection provided by the clearinghouse.
Investing in derivatives may involve greater risks than investing in the underlying assets directly and, to varying degrees, may involve risk of loss in excess of any initial investment and collateral received and amounts recognized in the Statement of Assets and Liabilities. In addition, there may be the risk that the change in value of the derivative contract does not correspond to the change in value of the underlying instrument.
Net Realized Gain (Loss) and Change in Net Unrealized Appreciation (Depreciation) on Derivatives. The table below, which reflects the impacts of derivatives on the financial performance of the Fund, summarizes the net realized gain (loss) and change in net unrealized appreciation (depreciation) for derivatives during the period as presented in the Statement of Operations.
| Primary Risk Exposure / Derivative Type | Net Realized Gain (Loss) | Change in Net Unrealized Appreciation (Depreciation) |
| Foreign Exchange Risk | | |
| Forward Foreign Currency Contracts | $46,247 | $(24,159) |
| Total Foreign Exchange Risk | 46,247 | (24,159) |
| Interest Rate Risk | | |
| Futures Contracts | 32,403 | 4,177 |
| Purchased Options | 22,424 | 369 |
| Written Options | (1,782) | (1,639) |
| Swaps | (11,589) | 109 |
| Total Interest Rate Risk | $41,456 | $3,016 |
| Totals | $87,703 | $(21,143) |
A summary of the value of derivatives by primary risk exposure as of period end, if any, is included at the end of the Schedule of Investments.
Forward Foreign Currency Contracts. Forward foreign currency contracts represent obligations to purchase or sell foreign currency on a specified future date at a price fixed at the time the contracts are entered into. The Fund used forward foreign currency contracts to facilitate transactions in foreign-denominated securities and to manage exposure to certain foreign currencies.
Forward foreign currency contracts are valued daily and fluctuations in exchange rates on open contracts are recorded as unrealized appreciation or (depreciation) and reflected in the Statement of Assets and Liabilities. When the contract is closed, the Fund realizes a gain or loss equal to the difference between the closing value and the value at the time it was opened. Non-deliverable forward foreign currency exchange contracts are settled with the counterparty in cash without the delivery of foreign currency. The net realized gain (loss) and change in net unrealized appreciation (depreciation) on forward foreign currency contracts during the period is presented in the Statement of Operations.
Any open forward foreign currency contracts at period end are presented in the Schedule of Investments under the caption "Forward Foreign Currency Contracts." The contract amount and unrealized appreciation (depreciation) reflects each contract's exposure to the underlying currency at period end and is representative of volume of activity during the period.
Futures Contracts. A futures contract is an agreement between two parties to buy or sell a specified underlying instrument for a fixed price at a specified future date. The Fund used futures contracts to manage its exposure to the bond market and fluctuations in interest rates.
Upon entering into a futures contract, a fund is required to deposit either cash or securities (initial margin) with a clearing broker in an amount equal to a certain percentage of the face value of the contract. Futures contracts are marked-to-market daily and subsequent daily payments (variation margin) are made or received by a fund depending on the daily fluctuations in the value of the futures contracts and are recorded as unrealized appreciation or (depreciation). This receivable and/or payable, if any, is included in daily variation margin on futures contracts in the Statement of Assets and Liabilities. Realized gain or (loss) is recorded upon the expiration or closing of a futures contract. The net realized gain (loss) and change in net unrealized appreciation (depreciation) on futures contracts during the period is presented in the Statement of Operations.
Any open futures contracts at period end are presented in the Schedule of Investments under the caption "Futures Contracts". The notional amount at value reflects each contract's exposure to the underlying instrument or index at period end. Securities deposited to meet initial margin requirements are identified in the Schedule of Investments.
Options. Options give the purchaser the right, but not the obligation, to buy (call) or sell (put) an underlying security or financial instrument at an agreed exercise or strike price between or on certain dates. Options obligate the seller (writer) to buy (put) or sell (call) an underlying instrument at the exercise or strike price or cash settle an underlying derivative instrument if the holder exercises the option on or before the expiration date. The Fund uses OTC options, such as swaptions, which are options where the underlying instrument is a swap, to manage its exposure to fluctuations in interest rates.
Upon entering into an options contract, a fund will pay or receive a premium. Premiums paid on purchased options are reflected as cost of investments and premiums received on written options are reflected as a liability on the Statement of Assets and Liabilities. Certain options may be purchased or written with premiums to be paid or received on a future date. Options are valued daily and any unrealized appreciation (depreciation) is reflected on the Statement of Assets and Liabilities. When an option is exercised, the cost or proceeds of the underlying instrument purchased or sold is adjusted by the amount of the premium. When an option is closed the Fund will realize a gain or loss depending on whether the proceeds or amount paid for the closing sale transaction is greater or less than the premium received or paid. When an option expires, gains and losses are realized to the extent of premiums received and paid, respectively. The net realized and unrealized gains (losses) on purchased options are included in the Statement of Operations in net realized gain (loss) and change in net unrealized appreciation (depreciation) on investment securities. The net realized gain (loss) and change in net unrealized appreciation (depreciation) on written options are presented in the Statement of Operations.
Any open options at period end are presented in the Schedule of Investments under the captions "Purchased Options," "Purchased Swaptions," "Written Options" and "Written Swaptions," as applicable, and are representative of volume of activity during the period for written options.
Writing puts and buying calls tend to increase exposure to the underlying instrument while buying puts and writing calls tend to decrease exposure to the underlying instrument. For purchased options, risk of loss is limited to the premium paid, and for written options, risk of loss is the change in value in excess of the premium received.
Swaps. A swap is a contract between two parties to exchange future cash flows at periodic intervals based on a notional principal amount. A centrally cleared OTC swap is a transaction executed between a fund and a dealer counterparty, then cleared by a futures commission merchant (FCM) through a clearinghouse. Once cleared, the clearinghouse serves as a central counterparty, with whom a fund exchanges cash flows for the life of the transaction, similar to transactions in futures contracts.
Centrally cleared OTC swaps require a fund to deposit either cash or securities (initial margin) with the FCM, at the instruction of and for the benefit of the clearinghouse. Securities deposited to meet initial margin requirements are identified in the Schedule of Investments. Centrally cleared OTC swaps are marked-to-market daily and subsequent payments (variation margin) are made or received depending on the daily fluctuations in the value of the swaps and are recorded as unrealized appreciation or (depreciation). These daily payments, if any, are included in receivable or payable for daily variation margin on centrally cleared OTC swaps in the Statement of Assets and Liabilities. Any premiums for centrally cleared OTC swaps are recorded periodically throughout the term of the swap to variation margin and included in unrealized appreciation (depreciation) in the Statement of Assets and Liabilities. Any premiums are recognized as realized gain (loss) upon termination or maturity of the swap.
Payments are exchanged at specified intervals, accrued daily commencing with the effective date of the contract and recorded as realized gain or (loss). Some swaps may be terminated prior to the effective date and realize a gain or loss upon termination. The net realized gain (loss) and change in net unrealized appreciation (depreciation) on swaps during the period is presented in the Statement of Operations.
Any open swaps at period end are included in the Schedule of Investments under the caption "Swaps" and are representative of volume of activity during the period.
Interest Rate Swaps. Interest rate swaps are agreements between counterparties to exchange cash flows, one based on a fixed rate, and the other on a floating rate. The Fund entered into interest rate swaps to manage its exposure to interest rate changes. Changes in interest rates can have an effect on both the value of bond holdings as well as the amount of interest income earned. In general, the value of bonds can fall when interest rates rise and can rise when interest rates fall.
5. Purchases and Sales of Investments.
Purchases and sales of securities (including the Fixed-Income Central Funds), other than short-term securities and U.S. government securities are noted in the table below.
| | Purchases ($) | Sales ($) |
| Fidelity Advisor Strategic Income Fund | 6,264,314 | 6,740,991 |
6. Fees and Other Transactions with Affiliates.
Management Fee. Fidelity Management & Research Company LLC (the investment adviser) and its affiliates provide the Fund with investment management related services for which the Fund pays a monthly management fee. The management fee is the sum of an individual fund fee rate that is based on an annual rate of .45% of the Fund's average net assets and an annualized group fee rate that averaged .10% during the period. The group fee rate is based upon the monthly average net assets of a group of registered investment companies with which the investment adviser has management contracts. The group fee rate decreases as assets under management increase and increases as assets under management decrease. For the reporting period, the total annualized management fee rate was .55% of the Fund's average net assets.
Distribution and Service Plan Fees. In accordance with Rule 12b-1 of the 1940 Act, the Fund has adopted separate Distribution and Service Plans for each class of shares. Certain classes pay Fidelity Distributors Company LLC (FDC), an affiliate of the investment adviser, separate Distribution and Service Fees, each of which is based on an annual percentage of each class' average net assets. In addition, FDC may pay financial intermediaries for selling shares of the Fund and providing shareholder support services. For the period, the Distribution and Service Fee rates, total fees and amounts retained by FDC were as follows:
| | Distribution Fee | Service Fee | Total Fees | Retained by FDC |
| Class A | -% | .25% | $2,261 | $54 |
| Class M | -% | .25% | 945 | 14 |
| Class C | .75% | .25% | 3,112 | 269 |
| | | | $6,318 | $337 |
Sales Load. FDC may receive a front-end sales charge of up to 4.00% for selling Class A shares and Class M shares, some of which is paid to financial intermediaries for selling shares of the Fund. Depending on the holding period, FDC may receive contingent deferred sales charges levied on Class A, Class M and Class C redemptions. The deferred sales charges are 1.00% for Class C shares, 1.00% for certain purchases of Class A shares and .25% for certain purchases of Class M shares.
For the period, sales charge amounts retained by FDC were as follows:
| | Retained by FDC |
| Class A | $86 |
| Class M | 10 |
| Class C(a) | 32 |
| | $128 |
(a) When Class C shares are initially sold, FDC pays commissions from its own resources to financial intermediaries through which the sales are made.
Transfer Agent Fees. Fidelity Investments Institutional Operations Company LLC (FIIOC), an affiliate of the investment adviser, is the transfer, dividend disbursing and shareholder servicing agent for each class of the Fund, except for Class Z. FIIOC receives account fees and asset-based fees that vary according to the account size and type of account of the shareholders of the respective classes of the Fund. FIIOC receives an asset-based fee of Class Z's average net assets. FIIOC pays for typesetting, printing and mailing of shareholder reports, except proxy statements.
For the period, transfer agent fees for each class were as follows:
| | Amount | % of Class-Level Average Net Assets(a) |
| Class A | $1,415 | .16 |
| Class M | 569 | .15 |
| Class C | 486 | .16 |
| Fidelity Strategic Income Fund | 3,680 | .11 |
| Class I | 3,396 | .15 |
| Class Z | 136 | .05 |
| | $9,682 | |
(a) Annualized
Accounting Fees. Fidelity Service Company, Inc. (FSC), an affiliate of the investment adviser, maintains the Fund's accounting records. The accounting fee is based on the level of average net assets for each month. For the period, the fees were equivalent to the following annualized rates:
| | % of Average Net Assets |
| Fidelity Advisor Strategic Income Fund | .01 |
Brokerage Commissions. A portion of portfolio transactions were placed with brokerage firms which are affiliates of the investment adviser. Brokerage commissions are included in net realized gain (loss) and change in net unrealized appreciation (depreciation) in the Statement of Operations. The commissions paid to these affiliated firms were as follows:
| | Amount |
| Fidelity Advisor Strategic Income Fund | $4 |
Interfund Trades. Funds may purchase from or sell securities to other Fidelity Funds under procedures adopted by the Board. The procedures have been designed to ensure these interfund trades are executed in accordance with Rule 17a-7 of the 1940 Act. Interfund trades are included within the respective purchases and sales amounts shown in the Purchases and Sales of Investments note.
Other. During the period, the investment adviser reimbursed the Fund for certain losses in the amount of $22.
Prior Fiscal Year Exchanges In-Kind. During the prior period, the Fidelity Advisor Strategic Income Fund completed an exchange in-kind with Fidelity Emerging Markets Debt Central Fund. The amount of in-kind exchanges is included in share transactions in the accompanying Statement of Changes in Net Assets. For additional information of the Fidelity Advisor Strategic Income Fund in-kind transactions, please refer to the Fidelity Emerging Markets Debt Central Fund prior annual shareholder report.
7. Committed Line of Credit.
Certain Funds participate with other funds managed by the investment adviser or an affiliate in a $4.25 billion credit facility (the "line of credit") to be utilized for temporary or emergency purposes to fund shareholder redemptions or for other short-term liquidity purposes. The participating funds have agreed to pay commitment fees on their pro-rata portion of the line of credit, which are reflected in Miscellaneous expenses on the Statement of Operations, and are as follows:
| | Amount |
| Fidelity Advisor Strategic Income Fund | $20 |
During the period, there were no borrowings on this line of credit.
8. Security Lending.
The Fund lends portfolio securities from time to time in order to earn additional income. For equity securities, lending agents are used, including National Financial Services (NFS), an affiliate of the Fund. Pursuant to a securities lending agreement, NFS will receive a fee, which is capped at 9.9% of daily lending revenue, for its services as lending agent. The Fund may lend securities to certain qualified borrowers, including NFS. On the settlement date of the loan, the Fund receives collateral (in the form of U.S. Treasury obligations, letters of credit and/or cash) against the loaned securities and maintains collateral in an amount not less than 100% of the market value of the loaned securities during the period of the loan. The market value of the loaned securities is determined at the close of business of the Fund and any additional required collateral is delivered to the Fund on the next business day. The Fund or borrower may terminate the loan at any time, and if the borrower defaults on its obligation to return the securities loaned because of insolvency or other reasons, the Fund may apply collateral received from the borrower against the obligation. The Fund may experience delays and costs in recovering the securities loaned. Any cash collateral received is maintained at the Fund's custodian and/or invested in cash equivalents and/or the Fidelity Securities Lending Cash Central Fund. The value of loaned securities and cash collateral at period end are disclosed on the Fund's Statement of Assets and Liabilities. Total fees paid by the Fund to NFS, as lending agent, amounted to less than five hundred dollars. Security lending income represents the income earned on investing cash collateral, less rebates paid to borrowers and any lending agent fees associated with the loan, plus any premium payments received for lending certain types of securities. Total security lending income during the period is presented in the Statement of Operations as a component of interest income. Net income from the Fidelity Securities Lending Cash Central Fund during the period is presented in the Statement of Operations as a component of income from Fidelity Central Funds. During the period, there were no securities loaned to NFS.
9. Expense Reductions.
Commissions paid to certain brokers with whom the investment adviser, or its affiliates, places trades on behalf of the Fund include an amount in addition to trade execution, which may be rebated back to the Fund to offset certain expenses. This amount totaled $6 for the period. In addition, through arrangements with the Fund's custodian and each class' transfer agent, credits realized as a result of certain uninvested cash balances were used to reduce the Fund's expenses. During the period, custodian credits reduced the Fund's expenses by $24. During the period, transfer agent credits reduced each class' expenses as noted in the table below.
| | Expense reduction |
| Class C | $–(a) |
(a) In the amount of less than five hundred dollars.
In addition, during the period the investment adviser or an affiliate reimbursed and/or waived a portion of fund-level operating expenses in the amount of $17.
10. Distributions to Shareholders.
Distributions to shareholders of each class were as follows:
| | Six months ended
June 30, 2020 | Year ended
December 31, 2019 |
| Distributions to shareholders | | |
| Class A | $21,780 | $76,009 |
| Class M | 9,123 | 32,492 |
| Class C | 5,171 | 25,288 |
| Fidelity Strategic Income Fund | 95,600 | 353,007 |
| Class I | 60,664 | 211,541 |
| Class Z | 7,497 | 20,079 |
| Total | $199,835 | $718,416 |
11. Share Transactions.
Share transactions for each class were as follows and may contain automatic conversions between classes or exchanges between affiliated funds:
| | Shares | Shares | Dollars | Dollars |
| | Six months ended June 30, 2020 | Year ended December 31, 2019 | Six months ended June 30, 2020 | Year ended December 31, 2019 |
| Class A | | | | |
| Shares sold | 12,205 | 43,566 | $145,795 | $528,485 |
| Reinvestment of distributions | 1,755 | 5,960 | 20,862 | 72,944 |
| Shares redeemed | (20,939) | (34,497) | (245,246) | (420,095) |
| Net increase (decrease) | (6,979) | 15,029 | $(78,589) | $181,334 |
| Class M | | | | |
| Shares sold | 4,297 | 9,378 | $51,265 | $113,952 |
| Reinvestment of distributions | 751 | 2,601 | 8,922 | 31,804 |
| Shares redeemed | (9,160) | (11,692) | (107,148) | (142,125) |
| Net increase (decrease) | (4,112) | 287 | $(46,961) | $3,631 |
| Class C | | | | |
| Shares sold | 3,060 | 7,648 | $36,406 | $92,857 |
| Reinvestment of distributions | 410 | 1,951 | 4,867 | 23,766 |
| Shares redeemed | (8,817) | (41,561) | (103,357) | (501,565) |
| Net increase (decrease) | (5,347) | (31,962) | $(62,084) | $(384,942) |
| Fidelity Strategic Income Fund | | | | |
| Shares sold | 41,578 | 100,407 | $504,203 | $1,238,415 |
| Reinvestment of distributions | 7,093 | 24,054 | 85,545 | 298,403 |
| Shares redeemed | (159,707) | (138,469) | (1,922,986) | (1,706,366) |
| Net increase (decrease) | (111,036) | (14,008) | $(1,333,238) | $(169,548) |
| Class I | | | | |
| Shares sold | 57,760 | 115,327 | $695,447 | $1,420,553 |
| Reinvestment of distributions | 4,667 | 15,859 | 56,267 | 196,642 |
| Shares redeemed | (90,332) | (150,285) | (1,062,381) | (1,848,390) |
| Net increase (decrease) | (27,905) | (19,099) | $(310,667) | $(231,195) |
| Class Z | | | | |
| Shares sold | 10,003 | 40,054 | $121,320 | $493,698 |
| Reinvestment of distributions | 504 | 1,315 | 6,083 | 16,369 |
| Shares redeemed | (12,761) | (8,437) | (149,373) | (104,926) |
| Net increase (decrease) | (2,254) | 32,932 | $(21,970) | $405,141 |
12. Other.
The Fund's organizational documents provide former and current trustees and officers with a limited indemnification against liabilities arising in connection with the performance of their duties to the Fund. In the normal course of business, the Fund may also enter into contracts that provide general indemnifications. The Fund's maximum exposure under these arrangements is unknown as this would be dependent on future claims that may be made against the Fund. The risk of material loss from such claims is considered remote.
13. Credit Risk.
The Fund's relatively large investment in countries with limited or developing capital markets may involve greater risks than investments in more developed markets and the prices of such investments may be volatile. The yields of emerging market debt obligations reflect, among other things, perceived credit risk. The consequences of political, social or economic changes in these markets may have disruptive effects on the market prices of the Fund's investments and the income they generate, as well as the Fund's ability to repatriate such amounts.
14. Coronavirus (COVID-19) Pandemic.
An outbreak of COVID-19 first detected in China during December 2019 has since spread globally and was declared a pandemic by the World Health Organization during March 2020. Developments that disrupt global economies and financial markets, such as the COVID-19 pandemic, may magnify factors that affect the Fund's performance.
Shareholder Expense Example
As a shareholder of the Fund, you incur two types of costs: (1) transaction costs, including sales charges (loads) on purchase payments or redemption proceeds, and (2) ongoing costs, including management fees, distribution and/or service (12b-1) fees and other Fund expenses. This Example is intended to help you understand your ongoing costs (in dollars) of investing in the Fund and to compare these costs with the ongoing costs of investing in other mutual funds.
The Example is based on an investment of $1,000 invested at the beginning of the period and held for the entire period (January 1, 2020 to June 30, 2020).
Actual Expenses
The first line of the accompanying table for each class of the Fund provides information about actual account values and actual expenses. You may use the information in this line, together with the amount you invested, to estimate the expenses that you paid over the period. Simply divide your account value by $1,000.00 (for example, an $8,600 account value divided by $1,000.00 = 8.6), then multiply the result by the number in the first line for a class of the Fund under the heading entitled "Expenses Paid During Period" to estimate the expenses you paid on your account during this period. In addition, the Fund, as a shareholder in the underlying Fidelity Central Funds, will indirectly bear its pro-rata share of the fees and expenses incurred by the underlying Fidelity Central Funds. These fees and expenses are not included in the Fund's annualized expense ratio used to calculate the expense estimate in the table below.
Hypothetical Example for Comparison Purposes
The second line of the accompanying table for each class of the Fund provides information about hypothetical account values and hypothetical expenses based on a Class' actual expense ratio and an assumed rate of return of 5% per year before expenses, which is not the Class' actual return. The hypothetical account values and expenses may not be used to estimate the actual ending account balance or expenses you paid for the period. You may use this information to compare the ongoing costs of investing in the Fund and other funds. To do so, compare this 5% hypothetical example with the 5% hypothetical examples that appear in the shareholder reports of the other funds. In addition, the Fund, as a shareholder in the underlying Fidelity Central Funds, will indirectly bear its pro-rata share of the fees and expenses incurred by the underlying Fidelity Central Funds. These fees and expenses are not included in the Fund's annualized expense ratio used to calculate the expense estimate in the table below.
Please note that the expenses shown in the table are meant to highlight your ongoing costs only and do not reflect any transaction costs. Therefore, the second line of the table is useful in comparing ongoing costs only, and will not help you determine the relative total costs of owning different funds. In addition, if these transactional costs were included, your costs would have been higher.
| | Annualized Expense Ratio-A | Beginning
Account Value
January 1, 2020 | Ending
Account Value
June 30, 2020 | Expenses Paid
During Period-B
January 1, 2020
to June 30, 2020 |
| Class A | .98% | | | |
| Actual | | $1,000.00 | $987.40 | $4.84 |
| Hypothetical-C | | $1,000.00 | $1,019.99 | $4.92 |
| Class M | .97% | | | |
| Actual | | $1,000.00 | $988.20 | $4.80 |
| Hypothetical-C | | $1,000.00 | $1,020.04 | $4.87 |
| Class C | 1.73% | | | |
| Actual | | $1,000.00 | $983.60 | $8.53 |
| Hypothetical-C | | $1,000.00 | $1,016.26 | $8.67 |
| Fidelity Strategic Income Fund | .67% | | | |
| Actual | | $1,000.00 | $989.20 | $3.31 |
| Hypothetical-C | | $1,000.00 | $1,021.53 | $3.37 |
| Class I | .72% | | | |
| Actual | | $1,000.00 | $989.00 | $3.56 |
| Hypothetical-C | | $1,000.00�� | $1,021.28 | $3.62 |
| Class Z | .62% | | | |
| Actual | | $1,000.00 | $989.50 | $3.07 |
| Hypothetical-C | | $1,000.00 | $1,021.78 | $3.12 |
A Annualized expense ratio reflects expenses net of applicable fee waivers.
B Expenses are equal to each Class' annualized expense ratio, multiplied by the average account value over the period, multiplied by 182/366 (to reflect the one-half year period). The fees and expenses of the underlying Fidelity Central Funds in which the Fund invests are not included in each Class' annualized expense ratio. In addition to the expenses noted above, the Fund also indirectly bears its proportional share of the expenses of the underlying Fidelity Central Funds. Annualized expenses of the underlying non-money market Fidelity Central Funds as of their most recent fiscal half year were less than .005%.
C 5% return per year before expenses
Liquidity Risk Management Program
The Securities and Exchange Commission adopted Rule 22e-4 under the Investment Company Act of 1940 (the Liquidity Rule) to promote effective liquidity risk management throughout the open-end investment company industry, thereby reducing the risk that funds will be unable to meet their redemption obligations and mitigating dilution of the interests of fund shareholders.
The Fund has adopted and implemented a liquidity risk management program pursuant to the Liquidity Rule (the Program) effective December 1, 2018. The Program is reasonably designed to assess and manage the Fund’s liquidity risk and to comply with the requirements of the Liquidity Rule. The Fund’s Board of Trustees (the Board) has designated the Fund’s investment adviser as administrator of the Program. The Fidelity advisers have established a Liquidity Risk Management Committee (the LRM Committee) to manage the Program for each of the Fidelity Funds. The LRM Committee monitors the adequacy and effectiveness of implementation of the Program and on a periodic basis assesses each Fund’s liquidity risk based on a variety of factors including (1) the Fund’s investment strategy, (2) portfolio liquidity and cash flow projections during normal and reasonably foreseeable stressed conditions, (3) shareholder redemptions, (4) borrowings and other funding sources and (5) in the case of exchange-traded funds, certain additional factors including the effect of the Fund’s prices and spreads, market participants, and basket compositions on the overall liquidity of the Fund’s portfolio, as applicable.
In accordance with the Program, each of the Fund’s portfolio investments is classified into one of four liquidity categories described below based on a determination of a reasonable expectation for how long it would take to convert the investment to cash (or sell or dispose of the investment) without significantly changing its market value.
- Highly liquid investments – cash or convertible to cash within three business days or less
- Moderately liquid investments – convertible to cash in three to seven calendar days
- Less liquid investments – can be sold or disposed of, but not settled, within seven calendar days
- Illiquid investments – cannot be sold or disposed of within seven calendar days
Liquidity classification determinations take into account a variety of factors including various market, trading and investment-specific considerations, as well as market depth, and generally utilize analysis from a third-party liquidity metrics service.
The Liquidity Rule places a 15% limit on a fund’s illiquid investments and requires funds that do not primarily hold assets that are highly liquid investments to determine and maintain a minimum percentage of the fund’s net assets to be invested in highly liquid investments (highly liquid investment minimum or HLIM). The Program includes provisions reasonably designed to comply with the 15% limit on illiquid investments and for determining, periodically reviewing and complying with the HLIM requirement as applicable.
At a recent meeting of the Fund’s Board of Trustees, the LRM Committee provided a written report to the Board pertaining to the operation, adequacy, and effectiveness of implementation of the Program for the annual period from December 1, 2018 through November 30, 2019. The report concluded that the Program has been implemented and is operating effectively and is reasonably designed to assess and manage the Fund’s liquidity risk.
The following are the financial statements for the Fidelity® Emerging Markets Debt Central Fund as of June 30, 2020 which is a direct investment of Fidelity® Strategic Income Fund.
Note to Shareholders:
Early in 2020, the outbreak and spread of a new coronavirus emerged as a public health emergency that had a major influence on financial markets, primarily based on its impact on the global economy and the outlook for corporate earnings. The virus causes a respiratory disease known as COVID-19. On March 11, the World Health Organization declared the COVID-19 outbreak a pandemic, citing sustained risk of further global spread.
In the weeks following, as the crisis worsened, we witnessed an escalating human tragedy with wide-scale social and economic consequences from coronavirus-containment measures. The outbreak of COVID-19 prompted a number of measures to limit the spread, including travel and border restrictions, quarantines, and restrictions on large gatherings. In turn, these resulted in lower consumer activity, diminished demand for a wide range of products and services, disruption in manufacturing and supply chains, and – given the wide variability in outcomes regarding the outbreak – significant market uncertainty and volatility. Amid the turmoil, the U.S. government took unprecedented action – in concert with the U.S. Federal Reserve and central banks around the world – to help support consumers, businesses, and the broader economy, and to limit disruption to the financial system.
The situation continues to unfold, and the extent and duration of its impact on financial markets and the economy remain highly uncertain. Extreme events such as the coronavirus crisis are “exogenous shocks” that can have significant adverse effects on mutual funds and their investments. Although multiple asset classes may be affected by market disruption, the duration and impact may not be the same for all types of assets.
Fidelity is committed to helping you stay informed amid news about COVID-19 and during increased market volatility, and we’re taking extra steps to be responsive to customer needs. We encourage you to visit our websites, where we offer ongoing updates, commentary, and analysis on the markets and our funds.
Fidelity® Emerging Markets Debt Central Fund
Investment Summary (Unaudited)
Top Five Countries as of June 30, 2020
| (excluding cash equivalents) | % of fund's net assets |
| Mexico | 8.7 |
| United States of America | 7.4 |
| Argentina | 6.2 |
| Turkey | 5.7 |
| Ukraine | 4.8 |
Percentages are adjusted for the effect of futures contracts, if applicable.
Top Five Holdings as of June 30, 2020
| (by issuer, excluding cash equivalents) | % of fund's net assets |
| U.S. Treasury Obligations | 5.0 |
| Ukraine Government | 4.8 |
| Turkish Republic | 4.2 |
| Ministry of Finance of the Russian Federation | 3.9 |
| Petroleos Mexicanos | 3.9 |
| | 21.8 |
Asset Allocation (% of fund's net assets)
| As of June 30, 2020 |
| | Corporate Bonds | 38.0% |
| | Government Obligations | 45.9% |
| | Preferred Securities | 2.4% |
| | Short-Term Investments and Net Other Assets (Liabilities) | 13.7% |
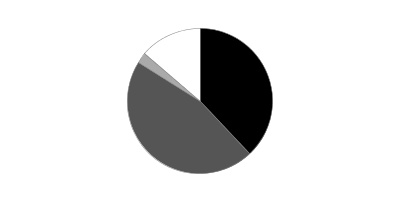
Fidelity® Emerging Markets Debt Central Fund
Schedule of Investments June 30, 2020 (Unaudited)
Showing Percentage of Net Assets
| Nonconvertible Bonds - 38.0% | | | |
| | | Principal Amount(a) | Value |
| Argentina - 2.6% | | | |
| Aeropuertos Argentina 2000 SA: | | | |
| 6.875% 2/1/27 (b) | | $43,750 | $30,570 |
| 9.375% 2/1/27 pay-in-kind (b)(c) | | 15,384,928 | 12,120,439 |
| Banco Macro SA 6.75% 11/4/26 (b)(c) | | 9,860,000 | 7,945,004 |
| Pampa Holding SA: | | | |
| 7.375% 7/21/23 (b) | | 4,720,000 | 4,012,425 |
| 7.5% 1/24/27 (b) | | 2,185,000 | 1,748,683 |
| Pan American Energy LLC 7.875% 5/7/21 (b) | | 266,667 | 267,167 |
| Tecpetrol SA 4.875% 12/12/22 (b) | | 2,190,000 | 2,042,134 |
| Telecom Argentina SA 6.5% 6/15/21 (b) | | 2,466,000 | 2,266,408 |
| Transportadora de Gas del Sur SA 6.75% 5/2/25 (b) | | 5,965,000 | 5,105,928 |
| YPF SA: | | | |
| 8.5% 3/23/21 (b) | | 10,062,000 | 8,502,390 |
| 8.5% 6/27/29 (b) | | 2,461,000 | 1,800,375 |
| 8.75% 4/4/24 (b) | | 29,160,000 | 23,488,380 |
|
| TOTAL ARGENTINA | | | 69,329,903 |
|
| Austria - 0.3% | | | |
| ESAL GmbH 6.25% 2/5/23 (b) | | 4,489,000 | 4,455,333 |
| JBS Investments II GmbH 7% 1/15/26 (b) | | 2,360,000 | 2,476,820 |
|
| TOTAL AUSTRIA | | | 6,932,153 |
|
| Azerbaijan - 0.0% | | | |
| Southern Gas Corridor CJSC 6.875% 3/24/26 (b) | | 1,095,000 | 1,256,369 |
| Bahrain - 0.2% | | | |
| The Oil and Gas Holding Co.: | | | |
| 7.5% 10/25/27 (b) | | 1,635,000 | 1,750,983 |
| 7.625% 11/7/24 (b) | | 4,425,000 | 4,792,828 |
|
| TOTAL BAHRAIN | | | 6,543,811 |
|
| Belarus - 0.0% | | | |
| Development Bank of the Republic of Belarus 6.75% 5/2/24 (b) | | 1,300,000 | 1,239,063 |
| Bermuda - 0.5% | | | |
| Digicel Group Ltd. 6.75% 3/1/23 (b) | | 4,120,000 | 2,060,206 |
| GeoPark Ltd. 6.5% 9/21/24 (b) | | 3,660,000 | 3,347,756 |
| Qtel International Finance Ltd.: | | | |
| 3.25% 2/21/23 (b) | | 5,230,000 | 5,458,813 |
| 5% 10/19/25 (b) | | 2,795,000 | 3,207,263 |
|
| TOTAL BERMUDA | | | 14,074,038 |
|
| Brazil - 0.2% | | | |
| Banco BMG SA 8.875% 8/5/20 (b) | | 206,000 | 203,683 |
| Embraer SA 5.15% 6/15/22 | | 3,135,000 | 3,041,930 |
| Globo Comunicacao e Participacoes SA 4.843% 6/8/25 (b) | | 2,935,000 | 2,921,242 |
|
| TOTAL BRAZIL | | | 6,166,855 |
|
| British Virgin Islands - 1.8% | | | |
| 1MDB Global Investments Ltd. 4.4% 3/9/23 | | 39,500,000 | 37,142,344 |
| Central American Bottling Corp. 5.75% 1/31/27 (b) | | 1,295,000 | 1,299,452 |
| Gold Fields Orogen Holding BVI Ltd.: | | | |
| 4.875% 10/7/20 (b) | | 7,612,000 | 7,627,224 |
| 5.125% 5/15/24 (b) | | 1,850,000 | 1,985,281 |
|
| TOTAL BRITISH VIRGIN ISLANDS | | | 48,054,301 |
|
| Canada - 1.0% | | | |
| First Quantum Minerals Ltd.: | | | |
| 7.25% 4/1/23 (b) | | 21,465,000 | 20,499,075 |
| 7.5% 4/1/25 (b) | | 2,900,000 | 2,805,750 |
| Frontera Energy Corp. 9.7% 6/25/23 (b) | | 3,375,000 | 2,736,914 |
|
| TOTAL CANADA | | | 26,041,739 |
|
| Cayman Islands - 0.9% | | | |
| Comcel Trust 6.875% 2/6/24 (b) | | 11,400,000 | 11,658,438 |
| DP World Crescent Ltd. 3.875% 7/18/29 (Reg. S) | | 1,815,000 | 1,780,969 |
| Embraer Overseas Ltd. 5.696% 9/16/23 (b) | | 1,415,000 | 1,347,802 |
| NagaCorp Ltd. 9.375% 5/21/21 (b) | | 4,645,000 | 4,714,675 |
| Odebrecht Finance Ltd.: | | | |
| 4.375% 4/25/25 (b)(d) | | 11,075,000 | 598,742 |
| 7.125% 6/26/42 (b)(d) | | 14,263,000 | 784,465 |
| Sable International Finance Ltd. 5.75% 9/7/27 (b) | | 1,435,000 | 1,463,700 |
| Sparc Em Spc 0% 12/5/22 (b) | | 678,510 | 653,473 |
|
| TOTAL CAYMAN ISLANDS | | | 23,002,264 |
|
| Colombia - 0.3% | | | |
| Colombia Telecomunicaciones SA 5.375% 9/27/22 (b) | | 7,424,000 | 7,421,096 |
| Curacao - 0.1% | | | |
| Teva Pharmaceutical Finance Co. BV: | | | |
| 2.95% 12/18/22 | | 3,125,000 | 3,015,625 |
| 3.65% 11/10/21 | | 1,030,000 | 1,022,996 |
|
| TOTAL CURACAO | | | 4,038,621 |
|
| Dominican Republic - 0.0% | | | |
| Banco de Reservas de La Republica Dominicana 7% 2/1/23 (b) | | 1,075,000 | 1,040,063 |
| Georgia - 0.7% | | | |
| Georgia Bank Joint Stock Co. 6% 7/26/23 (b) | | 10,695,000 | 10,467,731 |
| Georgian Oil & Gas Corp. 6.75% 4/26/21 (b) | | 4,663,000 | 4,534,766 |
| JSC Georgian Railway 7.75% 7/11/22 (b) | | 1,290,000 | 1,307,334 |
| TBC Bank JSC 5.75% 6/19/24 (b) | | 1,445,000 | 1,421,519 |
|
| TOTAL GEORGIA | | | 17,731,350 |
|
| India - 0.1% | | | |
| Shriram Transport Finance Co. Ltd. 5.1% 7/16/23 (b) | | 1,850,000 | 1,626,844 |
| Indonesia - 0.7% | | | |
| Delta Merlin Dunia Tekstil PT 8.625% 3/12/24 (b)(d) | | 1,970,000 | 217,316 |
| PT Adaro Indonesia 4.25% 10/31/24 (b) | | 9,750,000 | 9,174,141 |
| PT Bukit Makmur Mandiri Utama 7.75% 2/13/22 (b) | | 9,910,000 | 8,237,688 |
|
| TOTAL INDONESIA | | | 17,629,145 |
|
| Ireland - 1.0% | | | |
| Alfa Bond Issuance PLC 5.95% 4/15/30 (b)(c) | | 2,605,000 | 2,582,206 |
| Bonitron Designated Activity Co. 8.75% 10/30/22 (b) | | 9,085,000 | 9,198,563 |
| Borets Finance DAC 6.5% 4/7/22 (b) | | 2,775,000 | 2,769,797 |
| C&W Senior Financing Designated Activity Co. 6.875% 9/15/27 (b) | | 1,950,000 | 1,935,375 |
| CBOM Finance PLC: | | | |
| 4.7% 1/29/25 (b) | | 1,460,000 | 1,450,875 |
| 5.55% 2/14/23 (b) | | 4,190,000 | 4,297,369 |
| Celtic Resources Holdings DAC 4.125% 10/9/24 (b) | | 3,700,000 | 3,866,500 |
|
| TOTAL IRELAND | | | 26,100,685 |
|
| Isle of Man - 0.1% | | | |
| Sasol Financing International PLC 4.5% 11/14/22 | | 4,275,000 | 3,859,043 |
| Kazakhstan - 0.5% | | | |
| BTA Bank JSC 5.5% 12/21/22 (b) | | 7,959,968 | 7,910,218 |
| KazMunaiGaz National Co.: | | | |
| 3.875% 4/19/22 (b) | | 3,970,000 | 4,039,475 |
| 4.75% 4/24/25 (b) | | 1,325,000 | 1,423,547 |
|
| TOTAL KAZAKHSTAN | | | 13,373,240 |
|
| Korea (South) - 0.1% | | | |
| POSCO 4% 8/1/23 (b) | | 1,720,000 | 1,838,577 |
| Luxembourg - 2.2% | | | |
| CSN Resources SA 7.625% 2/13/23 (b) | | 22,265,000 | 20,595,125 |
| MHP SA 7.75% 5/10/24 (b) | | 3,960,000 | 4,138,200 |
| Millicom International Cellular SA 6% 3/15/25 (b) | | 4,210,000 | 4,336,300 |
| Petrobras International Finance Co. Ltd. 6.875% 1/20/40 | | 6,673,000 | 6,981,835 |
| Rumo Luxembourg SARL: | | | |
| 5.25% 1/10/28 (b) | | 1,535,000 | 1,535,000 |
| 7.375% 2/9/24 (b) | | 19,098,000 | 20,019,479 |
| Usiminas International SARL 5.875% 7/18/26 (b) | | 1,245,000 | 1,134,506 |
|
| TOTAL LUXEMBOURG | | | 58,740,445 |
|
| Malaysia - 0.2% | | | |
| Petronas Capital Ltd. 3.5% 4/21/30 (b) | | 3,905,000 | 4,327,278 |
| Mauritius - 0.2% | | | |
| MTN (Mauritius) Investments Ltd.: | | | |
| 5.373% 2/13/22 (b) | | 1,400,000 | 1,420,563 |
| 6.5% 10/13/26 (b) | | 2,670,000 | 2,816,016 |
|
| TOTAL MAURITIUS | | | 4,236,579 |
|
| Mexico - 6.3% | | | |
| Aerovias de Mexico SA de CV 7% 2/5/25 (b) | | 1,615,000 | 373,469 |
| America Movil S.A.B. de CV 6.45% 12/5/22 | MXN | 224,420,000 | 9,892,124 |
| Axtel S.A.B. de CV 6.375% 11/14/24 (b) | | 4,440,000 | 4,611,029 |
| CEMEX S.A.B. de CV 7.75% 4/16/26 (b) | | 2,630,000 | 2,676,469 |
| Credito Real S.A.B. de CV 9.5% 2/7/26 (b) | | 2,715,000 | 2,773,542 |
| Elementia S.A.B. de CV 5.5% 1/15/25 (b) | | 4,230,000 | 3,402,506 |
| Metalsa SA de CV 4.9% 4/24/23 (b) | | 10,002,000 | 9,801,960 |
| Pemex Project Funding Master Trust: | | | |
| 6.625% 6/15/35 | | 21,100,000 | 17,093,243 |
| 8.625% 2/1/22 | | 1,575,000 | 1,646,367 |
| 8.625% 12/1/23 (c) | | 930,000 | 897,450 |
| Petroleos Mexicanos: | | | |
| 3 month U.S. LIBOR + 3.650% 3.9646% 3/11/22 (c)(e) | | 4,025,000 | 3,880,100 |
| 3.5% 1/30/23 | | 7,330,000 | 6,930,515 |
| 4.875% 1/24/22 | | 9,840,000 | 9,732,375 |
| 4.875% 1/18/24 | | 27,065,000 | 26,024,689 |
| 5.375% 3/13/22 | | 4,290,000 | 4,279,275 |
| 5.5% 1/21/21 | | 2,190,000 | 2,190,684 |
| 6.375% 2/4/21 | | 300,000 | 301,125 |
| 6.5% 6/2/41 | | 2,675,000 | 2,044,285 |
| 6.75% 9/21/47 | | 8,752,000 | 6,719,348 |
| 7.69% 1/23/50 (b) | | 47,424,000 | 39,563,472 |
| TV Azteca SA de CV 8.25% 8/9/24 (Reg. S) | | 26,515,000 | 12,056,039 |
|
| TOTAL MEXICO | | | 166,890,066 |
|
| Mongolia - 0.0% | | | |
| Development Bank of Mongolia 7.25% 10/23/23 (b) | | 1,405,000 | 1,350,556 |
| Morocco - 0.1% | | | |
| OCP SA 6.875% 4/25/44 (b) | | 1,260,000 | 1,528,931 |
| Netherlands - 4.8% | | | |
| Cimpor Financial Operations BV 5.75% 7/17/24 (b) | | 10,950,000 | 6,419,438 |
| GTH Finance BV 7.25% 4/26/23 (b) | | 6,930,000 | 7,664,026 |
| IHS Netherlands Holdco BV 7.125% 3/18/25 (b) | | 10,715,000 | 10,802,059 |
| MDC GMTN BV 2.875% 11/7/29 (b) | | 6,010,000 | 6,290,126 |
| Metinvest BV 7.75% 4/23/23 (b) | | 18,515,000 | 18,306,706 |
| Nostrum Oil & Gas Finance BV 8% 7/25/22 (b) | | 30,870,000 | 8,180,550 |
| Petrobras Global Finance BV: | | | |
| 5.75% 2/1/29 | | 3,710,000 | 3,801,591 |
| 6.125% 1/17/22 | | 2,370,000 | 2,474,428 |
| 6.25% 3/17/24 | | 14,055,000 | 14,885,123 |
| 6.9% 3/19/49 | | 2,395,000 | 2,520,738 |
| 8.75% 5/23/26 | | 11,250,000 | 13,275,000 |
| SABIC Capital II BV 4% 10/10/23 (b) | | 9,280,000 | 9,894,800 |
| Teva Pharmaceutical Finance Netherlands III BV 2.8% 7/21/23 | | 2,740,000 | 2,588,444 |
| VTR Finance BV: | | | |
| 6.375% 7/15/28 (b) | | 3,655,000 | 3,755,513 |
| 6.875% 1/15/24 (b) | | 17,090,000 | 17,454,017 |
|
| TOTAL NETHERLANDS | | | 128,312,559 |
|
| Nigeria - 0.1% | | | |
| Fidelity Bank PLC 10.5% 10/16/22 (b) | | 1,875,000 | 1,903,125 |
| Paraguay - 0.1% | | | |
| Telefonica Celular del Paraguay SA 5.875% 4/15/27 (b) | | 2,585,000 | 2,688,400 |
| Peru - 0.2% | | | |
| Telefonica del Peru SA 7.375% 4/10/27 (b) | PEN | 19,410,000 | 5,477,148 |
| Saudi Arabia - 2.1% | | | |
| Saudi Arabian Oil Co.: | | | |
| 3.5% 4/16/29 (b) | | 25,745,000 | 27,788,509 |
| 4.25% 4/16/39 (b) | | 12,520,000 | 13,991,100 |
| 4.375% 4/16/49 (b) | | 13,200,000 | 14,878,875 |
|
| TOTAL SAUDI ARABIA | | | 56,658,484 |
|
| Singapore - 0.8% | | | |
| Indika Energy Capital II Pte. Ltd. 6.875% 4/10/22 (b) | | 14,560,000 | 14,141,400 |
| Medco Platinum Road Pte Ltd. 6.75% 1/30/25 (b) | | 1,530,000 | 1,431,571 |
| TBG Global Pte. Ltd. 5.25% 2/10/22 (Reg. S) | | 5,650,000 | 5,635,367 |
|
| TOTAL SINGAPORE | | | 21,208,338 |
|
| South Africa - 2.5% | | | |
| Eskom Holdings SOC Ltd.: | | | |
| 5.75% 1/26/21 (b) | | 63,640,000 | 60,617,100 |
| 6.75% 8/6/23 (b) | | 7,660,000 | 7,238,700 |
|
| TOTAL SOUTH AFRICA | | | 67,855,800 |
|
| Tunisia - 0.2% | | | |
| Banque Centrale de Tunisie 5.75% 1/30/25 (b) | | 7,050,000 | 6,532,266 |
| Turkey - 1.5% | | | |
| Akbank TAS: | | | |
| 5.125% 3/31/25 (b) | | 1,350,000 | 1,268,578 |
| 7.2% 3/16/27 (b)(c) | | 3,365,000 | 3,227,876 |
| Petkim Petrokimya Holding A/S 5.875% 1/26/23 (b) | | 10,715,000 | 10,607,850 |
| T.C. Ziraat Bankasi A/S 5.125% 5/3/22 (b) | | 6,135,000 | 6,006,548 |
| Turk Sise ve Cam Fabrikalari A/S 6.95% 3/14/26 (b) | | 1,420,000 | 1,466,150 |
| Turk Telekomunikasyon A/S 6.875% 2/28/25 (b) | | 2,600,000 | 2,734,875 |
| Turkiye Garanti Bankasi A/S 6.125% 5/24/27 (b)(c) | | 3,605,000 | 3,366,169 |
| Turkiye Sinai Kalkinma Bankasi A/S 6% 1/23/25 (b) | | 4,070,000 | 3,869,044 |
| Turkiye Vakiflar Bankasi TAO 5.75% 1/30/23 (b) | | 6,445,000 | 6,265,748 |
|
| TOTAL TURKEY | | | 38,812,838 |
|
| Ukraine - 0.0% | | | |
| VFU Funding PLC (VF Ukraine) 6.2% 2/11/25 (b) | | 530,000 | 524,197 |
| United Arab Emirates - 0.3% | | | |
| ADES International Holding Ltd. 8.625% 4/24/24 (b) | | 6,560,000 | 6,035,200 |
| DP World Ltd. 5.625% 9/25/48 (b) | | 1,795,000 | 1,952,164 |
|
| TOTAL UNITED ARAB EMIRATES | | | 7,987,364 |
|
| United Kingdom - 2.9% | | | |
| Biz Finance PLC: | | | |
| 9.625% 4/27/22 (b) | | 4,074,333 | 4,162,186 |
| 9.75% 1/22/25 (b) | | 605,000 | 620,421 |
| DTEK Finance PLC 10.75% 12/31/24 pay-in-kind (c) | | 15,480,000 | 9,128,363 |
| NAK Naftogaz Ukraine: | | | |
| 7.375% 7/19/22 (Reg. S) | | 8,875,000 | 8,827,852 |
| 7.625% 11/8/26 (b) | | 2,455,000 | 2,385,953 |
| Oschadbank Via SSB #1 PLC 9.375% 3/10/23 (b) | | 2,299,500 | 2,354,832 |
| Tullow Oil PLC 6.25% 4/15/22 (b) | | 29,360,000 | 21,590,316 |
| Ukraine Railways via Shortline PLC 9.875% 9/15/21 (b) | | 3,143,700 | 3,159,418 |
| Vedanta Resources PLC: | | | |
| 6.375% 7/30/22 (b) | | 26,635,000 | 20,192,659 |
| 8.25% 6/7/21 (b) | | 4,365,000 | 3,807,153 |
|
| TOTAL UNITED KINGDOM | | | 76,229,153 |
|
| United States of America - 2.4% | | | |
| Azul Investments LLP 5.875% 10/26/24 (b) | | 10,825,000 | 4,708,875 |
| CEMEX Finance LLC 6% 4/1/24 (b) | | 1,485,000 | 1,466,456 |
| Citgo Holding, Inc. 9.25% 8/1/24 (b) | | 5,685,000 | 5,656,575 |
| Citgo Petroleum Corp. 6.25% 8/15/22 (b) | | 18,970,000 | 18,851,817 |
| Kosmos Energy Ltd. 7.125% 4/4/26 (b) | | 18,315,000 | 16,323,244 |
| Sasol Financing U.S.A. LLC 5.875% 3/27/24 | | 1,515,000 | 1,359,713 |
| Stillwater Mining Co. 6.125% 6/27/22 (b) | | 15,295,000 | 15,440,111 |
|
| TOTAL UNITED STATES OF AMERICA | | | 63,806,791 |
|
| Venezuela - 0.0% | | | |
| Petroleos de Venezuela SA: | | | |
| 5.375% 4/12/27 (d) | | 5,000,000 | 132,500 |
| 5.5% 4/12/37 (d) | | 330,000 | 9,900 |
| 6% 5/16/24 (b)(d) | | 9,685,000 | 271,180 |
| 6% 11/15/26 (b)(d) | | 12,130,000 | 351,770 |
| 9.75% 5/17/35 (b)(d) | | 1,315,000 | 39,450 |
| 12.75% 2/17/22 (b)(d) | | 1,310,000 | 39,300 |
|
| TOTAL VENEZUELA | | | 844,100 |
|
| TOTAL NONCONVERTIBLE BONDS | | | |
| (Cost $1,111,870,107) | | | 1,013,213,578 |
|
| Government Obligations - 45.9% | | | |
| Argentina - 3.6% | | | |
| Argentine Republic: | | | |
| 5.625% 1/26/22 (d) | | 21,655,000 | 8,932,688 |
| 6.875% 4/22/21 (d) | | 72,290,000 | 30,090,713 |
| 7.5% 4/22/26 (d) | | 49,985,000 | 20,087,722 |
| 8.28% 12/31/33 (d) | | 9,996,531 | 4,460,952 |
| City of Buenos Aires: | | | |
| 7.5% 6/1/27 (Reg. S) | | 1,299,000 | 1,000,230 |
| 8.95% 2/19/21 (b) | | 3,292,900 | 2,934,797 |
| Mendoza Province 8.375% 5/19/24 (b)(d) | | 965,000 | 454,684 |
| Province of Santa Fe 7% 3/23/23 (b) | | 14,050,000 | 9,150,063 |
| Provincia de Cordoba: | | | |
| 7.125% 6/10/21 (b) | | 19,290,000 | 11,833,209 |
| 7.45% 9/1/24 (b) | | 9,710,000 | 5,704,625 |
|
| TOTAL ARGENTINA | | | 94,649,683 |
|
| Armenia - 0.0% | | | |
| Republic of Armenia 7.15% 3/26/25 (b) | | 720,000 | 807,075 |
| Azerbaijan - 0.2% | | | |
| Azerbaijan Republic 4.75% 3/18/24 (b) | | 4,125,000 | 4,398,281 |
| Bahamas (Nassau) - 0.0% | | | |
| Bahamian Republic 6% 11/21/28 (b) | | 1,095,000 | 941,700 |
| Barbados - 0.4% | | | |
| Barbados Government: | | | |
| 6.5% 2/1/21 (b) | | 2,936,800 | 2,909,268 |
| 6.5% 10/1/29 (b) | | 7,990,000 | 7,198,491 |
|
| TOTAL BARBADOS | | | 10,107,759 |
|
| Belarus - 0.5% | | | |
| Belarus Republic 6.875% 2/28/23 (b) | | 13,655,000 | 13,667,802 |
| Bermuda - 0.4% | | | |
| Bermuda Government: | | | |
| 3.717% 1/25/27 (b) | | 3,310,000 | 3,512,738 |
| 4.75% 2/15/29 (b) | | 6,745,000 | 7,596,556 |
|
| TOTAL BERMUDA | | | 11,109,294 |
|
| Brazil - 1.8% | | | |
| Brazilian Federative Republic: | | | |
| 2.875% 6/6/25 | | 1,865,000 | 1,838,890 |
| 3.875% 6/12/30 | | 1,935,000 | 1,867,275 |
| 4.5% 5/30/29 | | 4,455,000 | 4,581,689 |
| 4.75% 1/14/50 | | 3,195,000 | 3,021,272 |
| 5.625% 1/7/41 | | 1,345,000 | 1,397,539 |
| 7.125% 1/20/37 | | 4,065,000 | 4,886,892 |
| 8.25% 1/20/34 | | 22,860,000 | 29,639,419 |
|
| TOTAL BRAZIL | | | 47,232,976 |
|
| Cameroon - 0.6% | | | |
| Cameroon Republic 9.5% 11/19/25 (b) | | 17,220,000 | 17,268,431 |
| Colombia - 0.1% | | | |
| Colombian Republic 3.125% 4/15/31 | | 2,845,000 | 2,825,085 |
| Dominican Republic - 1.7% | | | |
| Dominican Republic: | | | |
| 4.5% 1/30/30 (b) | | 575,000 | 520,195 |
| 5.5% 1/27/25 (b) | | 2,710,000 | 2,738,794 |
| 5.875% 1/30/60 (b) | | 4,500,000 | 3,865,781 |
| 5.95% 1/25/27 (b) | | 6,410,000 | 6,448,059 |
| 6% 7/19/28 (b) | | 3,370,000 | 3,387,903 |
| 6.4% 6/5/49 (b) | | 5,070,000 | 4,640,634 |
| 6.5% 2/15/48 (Reg. S) | | 930,000 | 855,891 |
| 6.85% 1/27/45 (b) | | 2,830,000 | 2,710,609 |
| 6.875% 1/29/26 (b) | | 9,945,000 | 10,426,711 |
| 7.45% 4/30/44 (b) | | 7,520,000 | 7,726,800 |
| 7.5% 5/6/21 (b) | | 2,177,333 | 2,247,416 |
|
| TOTAL DOMINICAN REPUBLIC | | | 45,568,793 |
|
| Egypt - 2.7% | | | |
| Arab Republic of Egypt: | | | |
| 5.75% 5/29/24 (b) | | 1,905,000 | 1,913,334 |
| 6.125% 1/31/22 (b) | | 8,265,000 | 8,463,877 |
| 7.0529% 1/15/32 (b) | | 1,665,000 | 1,581,750 |
| 7.5% 1/31/27 (b) | | 33,460,000 | 34,997,069 |
| 7.6003% 3/1/29 (b) | | 12,740,000 | 12,970,913 |
| 7.903% 2/21/48 (b) | | 4,290,000 | 3,966,909 |
| 8.5% 1/31/47 (b) | | 7,395,000 | 7,228,613 |
| 8.7002% 3/1/49 (b) | | 1,150,000 | 1,126,641 |
|
| TOTAL EGYPT | | | 72,249,106 |
|
| El Salvador - 0.5% | | | |
| El Salvador Republic: | | | |
| 7.1246% 1/20/50 (b) | | 2,200,000 | 1,793,000 |
| 7.625% 2/1/41 (b) | | 1,335,000 | 1,128,492 |
| 7.75% 1/24/23 (b) | | 11,335,000 | 10,566,345 |
|
| TOTAL EL SALVADOR | | | 13,487,837 |
|
| Georgia - 0.1% | | | |
| Georgia Republic 6.875% 4/12/21 (b) | | 3,440,000 | 3,500,200 |
| Ghana - 0.1% | | | |
| Ghana Republic: | | | |
| 7.875% 3/26/27 (b) | | 2,515,000 | 2,487,492 |
| 9.25% 9/15/22 (b) | | 520,000 | 520,000 |
|
| TOTAL GHANA | | | 3,007,492 |
|
| Guatemala - 0.1% | | | |
| Guatemalan Republic 5.375% 4/24/32 (b) | | 1,870,000 | 2,062,259 |
| Honduras - 0.2% | | | |
| Republic of Honduras: | | | |
| 5.625% 6/24/30 (b) | | 1,185,000 | 1,204,256 |
| 8.75% 12/16/20 (b) | | 4,461,000 | 4,537,673 |
|
| TOTAL HONDURAS | | | 5,741,929 |
|
| Indonesia - 2.9% | | | |
| Indonesian Republic: | | | |
| 3.85% 10/15/30 | | 3,790,000 | 4,206,900 |
| 4.1% 4/24/28 | | 7,105,000 | 7,879,889 |
| 4.35% 1/11/48 | | 5,270,000 | 5,928,750 |
| 5.125% 1/15/45 (b) | | 9,585,000 | 11,694,647 |
| 5.25% 1/17/42 (b) | | 4,340,000 | 5,362,613 |
| 5.95% 1/8/46 (b) | | 4,505,000 | 6,128,966 |
| 6.625% 2/17/37 (b) | | 821,000 | 1,124,257 |
| 6.75% 1/15/44 (b) | | 3,710,000 | 5,408,063 |
| 7.75% 1/17/38 (b) | | 11,250,000 | 16,917,188 |
| 8.5% 10/12/35 (b) | | 7,965,000 | 12,422,911 |
|
| TOTAL INDONESIA | | | 77,074,184 |
|
| Iraq - 1.0% | | | |
| Republic of Iraq 5.8% 1/15/28 (Reg. S) | | 29,005,000 | 26,077,308 |
| Ivory Coast - 0.3% | | | |
| Ivory Coast 5.75% 12/31/32 | | 8,071,750 | 7,935,539 |
| Jamaica - 0.1% | | | |
| Jamaican Government: | | | |
| 6.75% 4/28/28 | | 725,000 | 816,531 |
| 7.875% 7/28/45 | | 1,995,000 | 2,436,394 |
| 8% 3/15/39 | | 555,000 | 684,558 |
|
| TOTAL JAMAICA | | | 3,937,483 |
|
| Jordan - 0.4% | | | |
| Jordanian Kingdom: | | | |
| 4.95% 7/7/25 (b) | | 3,175,000 | 3,175,000 |
| 5.85% 7/7/30 (b) | | 1,915,000 | 1,915,000 |
| 6.125% 1/29/26 (b) | | 5,330,000 | 5,608,159 |
|
| TOTAL JORDAN | | | 10,698,159 |
|
| Kazakhstan - 0.0% | | | |
| Kazakhstan Republic 6.5% 7/21/45 (b) | | 825,000 | 1,217,648 |
| Lebanon - 0.1% | | | |
| Lebanese Republic: | | | |
| 5.8% 12/31/49 (d) | | 7,162,000 | 1,358,542 |
| 6.375% 12/31/49 (d) | | 10,163,000 | 1,880,155 |
|
| TOTAL LEBANON | | | 3,238,697 |
|
| Mexico - 2.4% | | | |
| United Mexican States: | | | |
| 3.25% 4/16/30 | | 6,095,000 | 6,043,193 |
| 3.75% 1/11/28 | | 6,690,000 | 6,982,688 |
| 3.9% 4/27/25 | | 2,875,000 | 3,082,000 |
| 4.5% 4/22/29 | | 3,355,000 | 3,634,933 |
| 4.75% 4/27/32 | | 1,910,000 | 2,103,865 |
| 5.75% 10/12/2110 | | 20,520,000 | 22,790,025 |
| 6.05% 1/11/40 | | 15,105,000 | 18,432,820 |
| 6.5% 6/9/22 | MXN | 16,030,000 | 721,488 |
|
| TOTAL MEXICO | | | 63,791,012 |
|
| Morocco - 0.2% | | | |
| Moroccan Kingdom: | | | |
| 4.25% 12/11/22 (b) | | 2,775,000 | 2,924,156 |
| 5.5% 12/11/42 (b) | | 850,000 | 1,038,063 |
|
| TOTAL MOROCCO | | | 3,962,219 |
|
| Nigeria - 0.8% | | | |
| Republic of Nigeria: | | | |
| 6.75% 1/28/21 (b) | | 2,415,000 | 2,447,452 |
| 7.625% 11/21/25 (b) | | 17,780,000 | 18,141,156 |
|
| TOTAL NIGERIA | | | 20,588,608 |
|
| Oman - 0.4% | | | |
| Sultanate of Oman: | | | |
| 3.875% 3/8/22 (b) | | 6,325,000 | 6,234,078 |
| 4.125% 1/17/23 (b) | | 2,130,000 | 2,088,731 |
| 6.75% 1/17/48 (b) | | 1,620,000 | 1,395,731 |
|
| TOTAL OMAN | | | 9,718,540 |
|
| Pakistan - 0.2% | | | |
| Islamic Republic of Pakistan 8.25% 4/15/24 (b) | | 1,300,000 | 1,354,438 |
| The Third Pakistan International Sukuk Co. Ltd. 5.5% 10/13/21 (b) | | 3,625,000 | 3,547,969 |
|
| TOTAL PAKISTAN | | | 4,902,407 |
|
| Papua New Guinea - 0.1% | | | |
| Papua New Guinea 8.375% 10/4/28 (b) | | 3,640,000 | 3,494,400 |
| Paraguay - 0.2% | | | |
| Republic of Paraguay 4.95% 4/28/31 (b) | | 4,575,000 | 5,078,250 |
| Qatar - 2.7% | | | |
| State of Qatar: | | | |
| 3.75% 4/16/30 (b) | | 21,965,000 | 25,060,692 |
| 4% 3/14/29 (b) | | 8,120,000 | 9,338,000 |
| 4.5% 4/23/28 (b) | | 1,100,000 | 1,296,625 |
| 4.817% 3/14/49 (b) | | 12,025,000 | 15,835,422 |
| 5.103% 4/23/48 (b) | | 8,925,000 | 12,135,211 |
| 9.75% 6/15/30 (b) | | 4,350,000 | 7,214,203 |
|
| TOTAL QATAR | | | 70,880,153 |
|
| Romania - 0.1% | | | |
| Romanian Republic 4.375% 8/22/23 (b) | | 2,435,000 | 2,590,231 |
| Russia - 3.9% | | | |
| Ministry of Finance of the Russian Federation: | | | |
| 4.375% 3/21/29(Reg. S) | | 9,200,000 | 10,442,000 |
| 5.1% 3/28/35 (b) | | 26,000,000 | 32,134,375 |
| 5.1% 3/28/35(Reg. S) | | 9,200,000 | 11,370,625 |
| 5.25% 6/23/47 (b) | | 16,000,000 | 21,136,000 |
| 5.25% 6/23/47(Reg. S) | | 3,600,000 | 4,755,600 |
| 5.625% 4/4/42 (b) | | 2,825,000 | 3,830,523 |
| 5.875% 9/16/43 (b) | | 1,195,000 | 1,681,216 |
| 5.875% 9/16/43 (Reg. S) | | 600,000 | 844,125 |
| 7.25% 5/10/34 | RUB | 45,415,000 | 708,338 |
| 7.6% 7/20/22 | RUB | 724,350,000 | 10,793,469 |
| 8.15% 2/3/27 | RUB | 381,395,000 | 6,174,615 |
|
| TOTAL RUSSIA | | | 103,870,886 |
|
| Rwanda - 0.3% | | | |
| Rwanda Republic 6.625% 5/2/23 (b) | | 7,500,000 | 7,403,906 |
| Saudi Arabia - 0.7% | | | |
| Kingdom of Saudi Arabia: | | | |
| 2.9% 10/22/25 (b) | | 4,675,000 | 4,955,500 |
| 3.625% 3/4/28 (b) | | 5,415,000 | 5,953,116 |
| 4.625% 10/4/47 (b) | | 5,515,000 | 6,424,975 |
|
| TOTAL SAUDI ARABIA | | | 17,333,591 |
|
| Senegal - 0.0% | | | |
| Republic of Senegal 8.75% 5/13/21 (b) | | 865,000 | 895,005 |
| Serbia - 0.2% | | | |
| Republic of Serbia 7.25% 9/28/21 (b) | | 4,910,000 | 5,223,013 |
| Sri Lanka - 0.3% | | | |
| Democratic Socialist Republic of Sri Lanka 6.25% 10/4/20 (b) | | 7,705,000 | 7,290,856 |
| Trinidad & Tobago - 0.1% | | | |
| Republic of Trinidad & Tobago 4.5% 6/26/30 (b) | | 2,570,000 | 2,534,663 |
| Turkey - 4.2% | | | |
| Turkish Republic: | | | |
| 3.25% 3/23/23 | | 37,210,000 | 35,175,078 |
| 4.25% 3/13/25 | | 4,985,000 | 4,645,397 |
| 5.125% 3/25/22 | | 21,935,000 | 21,955,564 |
| 5.25% 3/13/30 | | 2,900,000 | 2,596,406 |
| 5.75% 5/11/47 | | 10,975,000 | 8,985,781 |
| 6.25% 9/26/22 | | 32,905,000 | 33,316,313 |
| 6.35% 8/10/24 | | 3,290,000 | 3,328,041 |
| 7.25% 12/23/23 | | 2,780,000 | 2,886,856 |
|
| TOTAL TURKEY | | | 112,889,436 |
|
| Ukraine - 4.8% | | | |
| Ukraine Government: | | | |
| 7.375% 9/25/32 (b) | | 4,110,000 | 4,127,981 |
| 7.75% 9/1/20 (b) | | 39,221,000 | 39,417,105 |
| 7.75% 9/1/21 (b) | | 67,912,000 | 70,187,052 |
| 7.75% 9/1/22 (b) | | 3,762,000 | 3,921,885 |
| 7.75% 9/1/23 (b) | | 1,645,000 | 1,723,138 |
| 7.75% 9/1/24 (b) | | 5,595,000 | 5,832,788 |
| 7.75% 9/1/26 (b) | | 2,195,000 | 2,288,288 |
| 7.75% 9/1/27 (b) | | 1,360,000 | 1,414,825 |
|
| TOTAL UKRAINE | | | 128,913,062 |
|
| United Arab Emirates - 0.3% | | | |
| Emirate of Abu Dhabi: | | | |
| 2.5% 4/16/25 (b) | | 2,485,000 | 2,581,294 |
| 3.125% 9/30/49 (b) | | 4,100,000 | 4,269,125 |
| 3.875% 4/16/50 (b) | | 1,385,000 | 1,632,569 |
|
| TOTAL UNITED ARAB EMIRATES | | | 8,482,988 |
|
| United States of America - 5.0% | | | |
| U.S. Treasury Notes: | | | |
| 0.375% 4/30/25 | | 16,566,000 | 16,641,065 |
| 2% 11/15/26 | | 106,714,000 | 117,181,127 |
|
| TOTAL UNITED STATES OF AMERICA | | | 133,822,192 |
|
| Uruguay - 0.0% | | | |
| Banco Central del Uruguay: | | | |
| value recovery A rights 1/2/21 (f)(g) | | 1,000,000 | 10 |
| value recovery B rights 1/2/21 (f)(g) | | 1,500,000 | 15 |
|
| TOTAL URUGUAY | | | 25 |
|
| Uzbekistan - 0.1% | | | |
| Republic of Uzbekistan 4.75% 2/20/24 (b) | | 2,255,000 | 2,369,864 |
| Venezuela - 0.1% | | | |
| Venezuelan Republic: | | | |
| 9.25% 9/15/27 (d) | | 32,390,000 | 1,943,400 |
| 11.95% 8/5/31 (Reg. S) (d) | | 14,080,000 | 844,800 |
| 12.75% 8/23/22 (d) | | 2,705,000 | 162,300 |
|
| TOTAL VENEZUELA | | | 2,950,500 |
|
| Vietnam - 1.0% | | | |
| Vietnamese Socialist Republic: | | | |
| 6 month U.S. LIBOR + 0.810% 2.625% 3/13/28 (c)(e) | | 1,040,000 | 933,571 |
| 4.8% 11/19/24 (b) | | 705,000 | 768,255 |
| 5.5% 3/12/28 | | 23,954,250 | 23,789,564 |
|
| TOTAL VIETNAM | | | 25,491,390 |
|
| TOTAL GOVERNMENT OBLIGATIONS | | | |
| (Cost $1,288,212,218) | | | 1,223,281,917 |
|
| Preferred Securities - 2.4% | | | |
| Cayman Islands - 1.6% | | | |
| Banco Do Brasil SA: | | | |
| 6.25% (b)(c)(h) | | 3,590,000 | 3,195,635 |
| 8.5% (b)(c)(h) | | 2,375,000 | 2,435,494 |
| Banco Mercantil del Norte SA 7.625% (b)(c)(h) | | 2,830,000 | 2,749,161 |
| Cosan Overseas Ltd. 8.25% (h) | | 23,591,000 | 23,929,319 |
| Itau Unibanco Holding SA: | | | |
| 5.5% 8/6/22 (b) | | 5,655,000 | 6,035,994 |
| 6.125% (b)(c)(h) | | 3,325,000 | 3,119,449 |
| Odebrecht Finance Ltd. 7.5% (b)(d)(h) | | 22,325,000 | 1,262,758 |
|
| TOTAL CAYMAN ISLANDS | | | 42,727,810 |
|
| Georgia - 0.0% | | | |
| Georgia Bank Joint Stock Co. 11.125% (Reg. S) (c)(h) | | 1,300,000 | 1,236,183 |
| Ireland - 0.8% | | | |
| Alfa Bond Issuance PLC 8% (Reg. S) (c)(h) | | 10,187,000 | 10,394,999 |
| Tinkoff Credit Systems 9.25% (Reg. S) (c)(h) | | 9,739,000 | 9,902,949 |
|
| TOTAL IRELAND | | | 20,297,948 |
|
| TOTAL PREFERRED SECURITIES | | | |
| (Cost $77,930,794) | | | 64,261,941 |
| | | Shares | Value |
|
| Money Market Funds - 12.6% | | | |
| Fidelity Cash Central Fund 0.12% (i) | | | |
| (Cost $334,135,807) | | 334,069,485 | 334,136,299 |
| TOTAL INVESTMENT IN SECURITIES - 98.9% | | | |
| (Cost $2,812,148,926) | | | 2,634,893,735 |
| NET OTHER ASSETS (LIABILITIES) - 1.1% | | | 29,147,355 |
| NET ASSETS - 100% | | | $2,664,041,090 |
Currency Abbreviations
MXN – Mexican peso
PEN – Peruvian new sol
RUB – Russian ruble
Categorizations in the Schedule of Investments are based on country or territory of incorporation.
Legend
(a) Amount is stated in United States dollars unless otherwise noted.
(b) Security exempt from registration under Rule 144A of the Securities Act of 1933. These securities may be resold in transactions exempt from registration, normally to qualified institutional buyers. At the end of the period, the value of these securities amounted to $1,472,166,711 or 55.3% of net assets.
(c) Coupon rates for floating and adjustable rate securities reflect the rates in effect at period end.
(d) Non-income producing - Security is in default.
(e) Coupon is indexed to a floating interest rate which may be multiplied by a specified factor and/or subject to caps or floors.
(f) Level 3 security
(g) Quantity represents share amount.
(h) Security is perpetual in nature with no stated maturity date.
(i) Affiliated fund that is generally available only to investment companies and other accounts managed by Fidelity Investments. The rate quoted is the annualized seven-day yield of the fund at period end. A complete unaudited listing of the fund's holdings as of its most recent quarter end is available upon request. In addition, each Fidelity Central Fund's financial statements are available on the SEC's website or upon request.
Affiliated Central Funds
Information regarding fiscal year to date income earned by the Fund from investments in Fidelity Central Funds is as follows:
| Fund | Income earned |
| Fidelity Cash Central Fund | $1,175,025 |
| Total | $1,175,025 |
Amounts in the income column in the above table include any capital gain distributions from underlying funds, which are presented in the corresponding line-item in the Statement of Operations, if applicable.
Investment Valuation
The following is a summary of the inputs used, as of June 30, 2020, involving the Fund's assets and liabilities carried at fair value. The inputs or methodology used for valuing securities may not be an indication of the risk associated with investing in those securities. For more information on valuation inputs, and their aggregation into the levels used below, please refer to the Investment Valuation section in the accompanying Notes to Financial Statements.
| | Valuation Inputs at Reporting Date: |
| Description | Total | Level 1 | Level 2 | Level 3 |
| Investments in Securities: | | | | |
| Corporate Bonds | $1,013,213,578 | $-- | $1,013,213,578 | $-- |
| Government Obligations | 1,223,281,917 | -- | 1,223,281,892 | 25 |
| Preferred Securities | 64,261,941 | -- | 64,261,941 | -- |
| Money Market Funds | 334,136,299 | 334,136,299 | -- | -- |
| Total Investments in Securities: | $2,634,893,735 | $334,136,299 | $2,300,757,411 | $25 |
Other Information
The composition of credit quality ratings as a percentage of Total Net Assets is as follows (Unaudited):
| U.S. Government and U.S. Government Agency Obligations | 5.0% |
| AAA,AA,A | 7.7% |
| BBB | 7.6% |
| BB | 21.6% |
| B | 24.1% |
| CCC,CC,C | 12.5% |
| D | 0.1% |
| Not Rated | 7.7% |
| Short-Term Investments and Net Other Assets | 13.7% |
| | 100% |
We have used ratings from Moody's Investors Service, Inc. Where Moody's® ratings are not available, we have used S&P® ratings. All ratings are as of the date indicated and do not reflect subsequent changes.
See accompanying notes which are an integral part of the financial statements.
Fidelity® Emerging Markets Debt Central Fund
Financial Statements
Statement of Assets and Liabilities
| | | June 30, 2020 (Unaudited) |
| Assets | | |
Investment in securities, at value — See accompanying schedule:
Unaffiliated issuers (cost $2,478,013,119) | $2,300,757,436 | |
| Fidelity Central Funds (cost $334,135,807) | 334,136,299 | |
| Total Investment in Securities (cost $2,812,148,926) | | $2,634,893,735 |
| Foreign currency held at value (cost $457) | | 457 |
| Receivable for investments sold | | 8,521,973 |
| Receivable for fund shares sold | | 11,166 |
| Interest receivable | | 46,760,876 |
| Distributions receivable from Fidelity Central Funds | | 33,818 |
| Total assets | | 2,690,222,025 |
| Liabilities | | |
| Payable to custodian bank | $319,750 | |
| Payable for investments purchased | 25,675,887 | |
| Payable for fund shares redeemed | 161,924 | |
| Other payables and accrued expenses | 23,374 | |
| Total liabilities | | 26,180,935 |
| Net Assets | | $2,664,041,090 |
| Net Assets consist of: | | |
| Paid in capital | | $2,865,390,831 |
| Total accumulated earnings (loss) | | (201,349,741) |
| Net Assets | | $2,664,041,090 |
| Net Asset Value, offering price and redemption price per share ($2,664,041,090 ÷ 300,180,785 shares) | | $8.87 |
See accompanying notes which are an integral part of the financial statements.
Statement of Operations
| | | Six months ended June 30, 2020 (Unaudited) |
| Investment Income | | |
| Dividends | | $2,613,097 |
| Interest | | 77,948,224 |
| Income from Fidelity Central Funds | | 1,175,025 |
| Income before foreign taxes withheld | | 81,736,346 |
| Less foreign taxes withheld | | 15,319 |
| Total income | | 81,751,665 |
| Expenses | | |
| Custodian fees and expenses | $25,266 | |
| Independent trustees' fees and expenses | 8,564 | |
| Legal | 281 | |
| Total expenses before reductions | 34,111 | |
| Expense reductions | (8,677) | |
| Total expenses after reductions | | 25,434 |
| Net investment income (loss) | | 81,726,231 |
| Realized and Unrealized Gain (Loss) | | |
| Net realized gain (loss) on: | | |
| Investment securities: | | |
| Unaffiliated issuers | (43,367,264) | |
| Fidelity Central Funds | (1,570) | |
| Foreign currency transactions | (199,821) | |
| Total net realized gain (loss) | | (43,568,655) |
| Change in net unrealized appreciation (depreciation) on: | | |
| Investment securities: | | |
| Unaffiliated issuers | (133,094,104) | |
| Assets and liabilities in foreign currencies | (16,861) | |
| Total change in net unrealized appreciation (depreciation) | | (133,110,965) |
| Net gain (loss) | | (176,679,620) |
| Net increase (decrease) in net assets resulting from operations | | $(94,953,389) |
See accompanying notes which are an integral part of the financial statements.
Statement of Changes in Net Assets
| | Six months ended June 30, 2020 (Unaudited) | Year ended December 31, 2019 |
| Increase (Decrease) in Net Assets | | |
| Operations | | |
| Net investment income (loss) | $81,726,231 | $128,631,573 |
| Net realized gain (loss) | (43,568,655) | 18,623,816 |
| Change in net unrealized appreciation (depreciation) | (133,110,965) | (11,366,369) |
| Net increase (decrease) in net assets resulting from operations | (94,953,389) | 135,889,020 |
| Distributions to shareholders | (71,843,491) | (135,285,645) |
| Share transactions | | |
| Proceeds from sales of shares | 6,979,318 | 2,746,218,804 |
| Reinvestment of distributions | 71,843,491 | 135,271,409 |
| Cost of shares redeemed | (184,238,520) | (74,335,058) |
| Net increase (decrease) in net assets resulting from share transactions | (105,415,711) | 2,807,155,155 |
| Total increase (decrease) in net assets | (272,212,591) | 2,807,758,530 |
| Net Assets | | |
| Beginning of period | 2,936,253,681 | 128,495,151 |
| End of period | $2,664,041,090 | $2,936,253,681 |
| Other Information | | |
| Shares | | |
| Sold | 770,450 | 290,519,318 |
| Issued in reinvestment of distributions | 8,223,892 | 14,388,766 |
| Redeemed | (19,884,996) | (7,945,966) |
| Net increase (decrease) | (10,890,654) | 296,962,118 |
See accompanying notes which are an integral part of the financial statements.
Financial Highlights
Fidelity Emerging Markets Debt Central Fund
| | Six months ended (Unaudited) June 30, | Years endedDecember 31, | | | | |
| | 2020 | 2019 | 2018 | 2017 | 2016 | 2015 |
| Selected Per–Share Data | | | | | | |
| Net asset value, beginning of period | $9.44 | $9.11 | $10.11 | $9.81 | $9.04 | $9.47 |
| Income from Investment Operations | | | | | | |
| Net investment income (loss)A | .271 | .582 | .564 | .686 | .754 | .744 |
| Net realized and unrealized gain (loss) | (.603) | .353 | (1.013) | .370 | .707 | (.526) |
| Total from investment operations | (.332) | .935 | (.449) | 1.056 | 1.461 | .218 |
| Distributions from net investment income | (.238) | (.548) | (.551) | (.730) | (.691) | (.648) |
| Distributions from net realized gain | – | (.057) | – | (.026) | – | – |
| Total distributions | (.238) | (.605) | (.551) | (.756) | (.691) | (.648) |
| Net asset value, end of period | $8.87 | $9.44 | $9.11 | $10.11 | $9.81 | $9.04 |
| Total ReturnB,C | (3.44)% | 10.48% | (4.52)% | 10.99% | 16.50% | 2.26% |
| Ratios to Average Net AssetsD,E | | | | | | |
| Expenses before reductions | - %F,G | - %G | .01% | .01% | .01% | .01% |
| Expenses net of fee waivers, if any | - %F,G | - %G | .01% | .01% | .01% | .01% |
| Expenses net of all reductions | - %F,G | - %G | - %G | .01% | .01% | .01% |
| Net investment income (loss) | 6.19%F | 6.23% | 5.91% | 6.76% | 7.80% | 7.89% |
| Supplemental Data | | | | | | |
| Net assets, end of period (000 omitted) | $2,664,041 | $2,936,254 | $128,495 | $133,138 | $116,523 | $103,080 |
| Portfolio turnover rateH | 63%F | 72%I | 40% | 57% | 48% | 39% |
A Calculated based on average shares outstanding during the period.
B Total returns for periods of less than one year are not annualized.
C Total returns would have been lower if certain expenses had not been reduced during the applicable periods shown.
D Fees and expenses of any underlying Fidelity Central Funds are not included in the Fund's expense ratio. The Fund indirectly bears its proportionate share of the expenses of any underlying Fidelity Central Funds.
E Expense ratios reflect operating expenses of the Fund. Expenses before reductions do not reflect amounts reimbursed by the investment adviser or reductions from expense offset arrangements and do not represent the amount paid by the Fund during periods when reimbursements or reductions occur. Expenses net of fee waivers reflect expenses after reimbursement by the investment adviser but prior to reductions from expense offset arrangements. Expenses net of all reductions represent the net expenses paid by the Fund.
F Annualized
G Amount represents less than .005%.
H Amount does not include the portfolio activity of any underlying Fidelity Central Funds.
I Portfolio turnover rate excludes securities received or delivered in-kind.
See accompanying notes which are an integral part of the financial statements.
Notes to Financial Statements (Unaudited)
For the period ended June 30, 2020
1. Organization.
Fidelity Emerging Markets Debt Central Fund (the Fund) is a non-diversified fund of Fidelity Hanover Street Trust (the Trust) and is authorized to issue an unlimited number of shares. Shares of the Fund are only offered to other investment companies and accounts managed by Fidelity Management & Research Company LLC (FMR), or its affiliates (the Investing Funds). The Trust is registered under the Investment Company Act of 1940, as amended (the 1940 Act), as an open-end management investment company organized as a Massachusetts business trust.
Effective January 1, 2020:
Investment advisers Fidelity Investments Money Management, Inc., FMR Co., Inc., and Fidelity SelectCo, LLC, merged with and into Fidelity Management & Research Company. In connection with the merger transactions, the resulting, merged investment adviser was then redomiciled from Massachusetts to Delaware, changed its corporate structure from a corporation to a limited liability company, and changed its name to "Fidelity Management & Research Company LLC".
2. Investments in Fidelity Central Funds.
The Fund invest in Fidelity Central Funds, which are open-end investment companies generally available only to other investment companies and accounts managed by the investment adviser and its affiliates. The Fund's Schedule of Investments lists each of the Fidelity Central Funds held as of period end, if any, as an investment of the Fund, but does not include the underlying holdings of each Fidelity Central Fund. As an Investing Fund, the Fund indirectly bears its proportionate share of the expenses of the underlying Fidelity Central Funds.
The Money Market Central Funds seek preservation of capital and current income and are managed by the investment adviser. Annualized expenses of the Money Market Central Funds as of their most recent shareholder report date ranged from less than .005% to .01%.
A complete unaudited list of holdings for each Fidelity Central Fund is available upon request or at the Securities and Exchange Commission (the SEC) website at www.sec.gov. In addition, the financial statements of the Fidelity Central Funds are available on the SEC website or upon request.
3. Significant Accounting Policies.
The Fund is an investment company and applies the accounting and reporting guidance of the Financial Accounting Standards Board (FASB) Accounting Standards Codification Topic 946 Financial Services – Investments Companies. The financial statements have been prepared in conformity with accounting principles generally accepted in the United States of America (GAAP), which require management to make certain estimates and assumptions at the date of the financial statements. Actual results could differ from those estimates. Subsequent events, if any, through the date that the financial statements were issued have been evaluated in the preparation of the financial statements. The following summarizes the significant accounting policies of the Fund:
Investment Valuation. Investments are valued as of 4:00 p.m. Eastern time on the last calendar day of the period. The Board of Trustees (the Board) has delegated the day to day responsibility for the valuation of the Fund's investments to the Fair Value Committee (the Committee) established by the Fund's investment adviser. In accordance with valuation policies and procedures approved by the Board, the Fund attempts to obtain prices from one or more third party pricing vendors or brokers to value its investments. When current market prices, quotations or currency exchange rates are not readily available or reliable, investments will be fair valued in good faith by the Committee, in accordance with procedures adopted by the Board. Factors used in determining fair value vary by investment type and may include market or investment specific events, changes in interest rates and credit quality. The frequency with which these procedures are used cannot be predicted and they may be utilized to a significant extent. The Committee oversees the Fund's valuation policies and procedures and reports to the Board on the Committee's activities and fair value determinations. The Board monitors the appropriateness of the procedures used in valuing the Fund's investments and ratifies the fair value determinations of the Committee.
The Fund categorizes the inputs to valuation techniques used to value its investments into a disclosure hierarchy consisting of three levels as shown below:
- Level 1 – quoted prices in active markets for identical investments
- Level 2 – other significant observable inputs (including quoted prices for similar investments, interest rates, prepayment speeds, etc.)
- Level 3 – unobservable inputs (including the Fund's own assumptions based on the best information available)
Valuation techniques used to value the Fund's investments by major category are as follows:
Debt securities, including restricted securities, are valued based on evaluated prices received from third party pricing vendors or from brokers who make markets in such securities. Corporate bonds, foreign government and government agency obligations, preferred securities and U.S. government and government agency obligations are valued by pricing vendors who utilize matrix pricing which considers prepayment speed assumptions, attributes of the collateral, yield or price of bonds of comparable quality, coupon, maturity and type or by broker-supplied prices. When independent prices are unavailable or unreliable, debt securities may be valued utilizing pricing methodologies which consider similar factors that would be used by third party pricing vendors. For foreign debt securities, when significant market or security specific events arise, valuations may be determined in good faith in accordance with procedures adopted by the Board. Debt securities are generally categorized as Level 2 in the hierarchy but may be Level 3 depending on the circumstances. The Fund invests a significant portion of its assets in below investment grade securities. The value of these securities can be more volatile due to changes in the credit quality of the issuer and is sensitive to changes in economic, market and regulatory conditions.
Investments in open-end mutual funds, including the Fidelity Central Funds, are valued at their closing net asset value (NAV) each business day and are categorized as Level 1 in the hierarchy.
Changes in valuation techniques may result in transfers in or out of an assigned level within the disclosure hierarchy. The aggregate value of investments by input level as of June 30, 2020 is included at the end of the Fund's Schedule of Investments.
Foreign Currency. The Fund may use foreign currency contracts to facilitate transactions in foreign-denominated securities. Gains and losses from these transactions may arise from changes in the value of the foreign currency or if the counterparties do not perform under the contracts' terms.
Foreign-denominated assets, including investment securities, and liabilities are translated into U.S. dollars at the exchange rates at period end. Purchases and sales of investment securities, income and dividends received and expenses denominated in foreign currencies are translated into U.S. dollars at the exchange rate in effect on the transaction date.
The effects of exchange rate fluctuations on investments are included with the net realized and unrealized gain (loss) on investment securities. Other foreign currency transactions resulting in realized and unrealized gain (loss) are disclosed separately.
Investment Transactions and Income. For financial reporting purposes, the Fund's investment holdings and NAV include trades executed through the end of the last business day of the period. The NAV per share for processing shareholder transactions is calculated as of the close of business of the New York Stock Exchange (NYSE), normally 4:00 p.m. Eastern time and includes trades executed through the end of the prior business day. Gains and losses on securities sold are determined on the basis of identified cost and include proceeds received from litigation. Dividend income is recorded on the ex-dividend date. Income and capital gain distributions from Fidelity Central Funds, if any, are recorded on the ex-dividend date. Interest income is accrued as earned and includes coupon interest and amortization of premium and accretion of discount on debt securities as applicable. Paid in Kind (PIK) income is recorded at the fair market value of the securities received. Investment income is recorded net of foreign taxes withheld where recovery of such taxes is uncertain. Debt obligations may be placed on non-accrual status and related interest income may be reduced by ceasing current accruals and writing off interest receivables when the collection of all or a portion of interest has become doubtful based on consistently applied procedures. A debt obligation is removed from non-accrual status when the issuer resumes interest payments or when collectability of interest is reasonably assured.
Expenses. Expenses directly attributable to a fund are charged to that fund. Expenses attributable to more than one fund are allocated among the respective funds on the basis of relative net assets or other appropriate methods. Expense estimates are accrued in the period to which they relate and adjustments are made when actual amounts are known.
Income Tax Information and Distributions to Shareholders. Each year, the Fund intends to qualify as a regulated investment company under Subchapter M of the Internal Revenue Code, including distributing substantially all of its taxable income and realized gains. As a result, no provision for U.S. Federal income taxes is required. The Fund files a U.S. federal tax return, in addition to state and local tax returns as required. The Fund's federal income tax returns are subject to examination by the Internal Revenue Service (IRS) for a period of three fiscal years after they are filed. State and local tax returns may be subject to examination for an additional fiscal year depending on the jurisdiction. Foreign taxes are provided for based on the Fund's understanding of the tax rules and rates that exist in the foreign markets in which it invests.
Distributions are declared and recorded daily and paid monthly from net investment income. Distributions from realized gains, if any, are declared and recorded on the ex-dividend date. Income and capital gain distributions are determined in accordance with income tax regulations, which may differ from GAAP.
Capital accounts within the financial statements are adjusted for permanent book-tax differences. These adjustments have no impact on net assets or the results of operations. Capital accounts are not adjusted for temporary book-tax differences which will reverse in a subsequent period.
Book-tax differences are primarily due to foreign currency transactions, market discount, capital loss carryforwards and losses deferred due to wash sales.
As of period end, the cost and unrealized appreciation (depreciation) in securities, and derivatives if applicable, for federal income tax purposes were as follows:
| Gross unrealized appreciation | $111,010,741 |
| Gross unrealized depreciation | (274,676,493) |
| Net unrealized appreciation (depreciation) | $(163,665,752) |
| Tax cost | $2,798,559,487 |
Restricted Securities (including Private Placements). The Fund may invest in securities that are subject to legal or contractual restrictions on resale. These securities generally may be resold in transactions exempt from registration or to the public if the securities are registered. Disposal of these securities may involve time-consuming negotiations and expense, and prompt sale at an acceptable price may be difficult. Information regarding restricted securities is included at the end of the Fund's Schedule of Investments.
4. Purchases and Sales of Investments.
Purchases and sales of securities, other than short-term securities and U.S. government securities, are noted in the table below.
| | Purchases ($) | Sales ($) |
| Fidelity Emerging Markets Debt Central Fund | 679,979,318 | 758,690,950 |
5. Fees and Other Transactions with Affiliates.
Management Fee and Expense Contract. Fidelity Management & Research Company LLC (the investment adviser) provides the Fund with investment management services. The Fund does not pay any fees for these services. Pursuant to the Fund's management contract, the investment adviser receives a monthly management fee that represents a portion of the management fees it receives from the Investing Funds. In addition, under an expense contract, the investment adviser also pays all other expenses of the Fund, excluding custody fees, the compensation of the independent Trustees, and certain miscellaneous expenses such as proxy and shareholder meeting expenses.
Interfund Trades. Funds may purchase from or sell securities to other Fidelity Funds under procedures adopted by the Board. The procedures have been designed to ensure these interfund trades are executed in accordance with Rule 17a-7 of the 1940 Act. Interfund trades are included within the respective purchases and sales amounts shown in the Purchases and Sales of Investments note.
Prior Fiscal Year Affiliated Exchange In-Kind. During the prior period, Fidelity Advisor Strategic Income Fund (the Investing Fund) completed an exchange in-kind transaction with the Fund. The Investing Fund delivered investments, including accrued interest, valued at $2,529,798,896 (which included $23,123,655 of unrealized depreciation), in exchange for 268,001,366 shares of the Fund. The value of investments delivered from the Investing Fund is included in proceeds from sales of shares in the accompanying Statement of Changes in Net Assets. This transaction was treated as a tax free exchange with carry forward basis for book and tax.
6. Expense Reductions.
Through arrangements with the Fund's custodian, credits realized as a result of certain uninvested cash balances were used to reduce the Fund's expenses by $8,677.
7. Other.
The Fund's organizational documents provide former and current trustees and officers with a limited indemnification against liabilities arising in connection with the performance of their duties to the Fund. In the normal course of business, the Fund may also enter into contracts that provide general indemnifications. The Fund's maximum exposure under these arrangements is unknown as this would be dependent on future claims that may be made against the Fund. The risk of material loss from such claims is considered remote.
At the end of the period, mutual funds managed by the investment advisor or its affiliates were the owners of record of all of the outstanding shares of the Fund.
8. Credit Risk.
The Fund's relatively large investment in countries with limited or developing capital markets may involve greater risks than investments in more developed markets and the prices of such investments may be volatile. The yields of emerging market debt obligations reflect, among other things, perceived credit risk. The consequences of political, social or economic changes in these markets may have disruptive effects on the market prices of the Fund's investments and the income they generate, as well as the Fund's ability to repatriate such amounts.
9. Coronavirus (COVID-19) Pandemic.
An outbreak of COVID-19 first detected in China during December 2019 has since spread globally and was declared a pandemic by the World Health Organization during March 2020. Developments that disrupt global economies and financial markets, such as the COVID-19 pandemic, may magnify factors that affect the Fund's performance.
Shareholder Expense Example
As a shareholder of the Fund, you incur two types of costs: (1) transaction costs and (2) ongoing costs, including other Fund expenses. This Example is intended to help you understand your ongoing costs (in dollars) of investing in the Fund and to compare these costs with the ongoing costs of investing in other mutual funds.
The Example is based on an investment of $1,000 invested at the beginning of the period and held for the entire period (January 1, 2020 to June 30, 2020).
Actual Expenses
The first line of the accompanying table provides information about actual account values and actual expenses. You may use the information in this line, together with the amount you invested, to estimate the expenses that you paid over the period. Simply divide your account value by $1,000.00 (for example, an $8,600 account value divided by $1,000.00 = 8.6), then multiply the result by the number in the first line under the heading entitled "Expenses Paid During Period" to estimate the expenses you paid on your account during this period. In addition, the Fund, as a shareholder in the underlying Fidelity Central Funds, will indirectly bear its pro-rata share of the fees and expenses incurred by the underlying Fidelity Central Funds. These fees and expenses are not included in the Fund's annualized expense ratio used to calculate the expense estimate in the table below.
Hypothetical Example for Comparison Purposes
The second line of the accompanying table provides information about hypothetical account values and hypothetical expenses based on the Fund's actual expense ratio and an assumed rate of return of 5% per year before expenses, which is not the Fund's actual return. The hypothetical account values and expenses may not be used to estimate the actual ending account balance or expenses you paid for the period. You may use this information to compare the ongoing costs of investing in the Fund and other funds. To do so, compare this 5% hypothetical example with the 5% hypothetical examples that appear in the shareholder reports of the other funds. In addition, the Fund, as a shareholder in the underlying Fidelity Central Funds, will indirectly bear its pro-rata share of the fees and expenses incurred by the underlying Fidelity Central Funds. These fees and expenses are not included in the Fund's annualized expense ratio used to calculate the expense estimate in the table below.
Please note that the expenses shown in the table are meant to highlight your ongoing costs only and do not reflect any transaction costs. Therefore, the second line of the table is useful in comparing ongoing costs only, and will not help you determine the relative total costs of owning different funds.
| | Annualized Expense Ratio-A | Beginning
Account Value
January 1, 2020 | Ending
Account Value
June 30, 2020 | Expenses Paid
During Period-B
January 1, 2020
to June 30, 2020 |
| Actual | .0026% | $1,000.00 | $965.60 | $.01 |
| Hypothetical-C | | $1,000.00 | $1,024.85 | $.01 |
A Annualized expense ratio reflects expenses net of applicable fee waivers.
B Expenses are equal to the Fund's annualized expense ratio, multiplied by the average account value over the period, multiplied by 182/366 (to reflect the one-half year period).
C 5% return per year before expenses
Board Approval of Investment Advisory Contracts and Management Fees
Fidelity Emerging Markets Debt Central Fund
Each year, the Board of Directors, including the Independent Directors (together, the Board), votes on the renewal of the management contract with Fidelity Management & Research Company LLC (FMR) and the sub-advisory agreements (together, the Advisory Contracts) for the fund. FMR and the sub-advisers are referred to herein as the Investment Advisers. The Board, assisted by the advice of fund counsel and Independent Directors' counsel, requests and considers a broad range of information relevant to the renewal of the Advisory Contracts throughout the year.
The Board meets regularly and, at each of its meetings, covers an extensive agenda of topics and materials and considers factors that are relevant to its annual consideration of the renewal of the fund's Advisory Contracts, including the services and support provided to the fund and its shareholders. The Board has established various standing committees (Committees), each composed of and chaired by Independent Directors with varying backgrounds, to which the Board has assigned specific subject matter responsibilities in order to enhance effective decision-making by the Board. The Board, acting directly and through its Committees, requests and receives information concerning the annual consideration of the renewal of the fund's Advisory Contracts. The Board also meets as needed to review matters specifically related to the Board's annual consideration of the renewal of the Advisory Contracts. Members of the Board may also meet with trustees of other Fidelity funds through joint ad hoc committees to discuss certain matters relevant to all of the Fidelity funds.
At its January 2020 meeting, the Board unanimously determined to renew the fund's Advisory Contracts. In reaching its determination, the Board considered all factors it believed relevant and reached a determination, with the assistance of fund counsel and Independent Directors' counsel and through the exercise of its business judgment, that the renewal of the Advisory Contracts was in the best interests of the fund and its shareholders and the fact that no fee is payable under the management contract was fair and reasonable.
Nature, Extent, and Quality of Services Provided. The Board considered Fidelity's staffing as it relates to the fund, including the backgrounds of investment personnel of Fidelity, and also considered the fund's investment objective, strategies, and related investment philosophy. The Independent Directors also had discussions with senior management of Fidelity's investment operations and investment groups. The Board considered the structure of the investment personnel compensation program and whether this structure provides appropriate incentives to act in the best interests of the fund.
Resources Dedicated to Investment Management and Support Services. The Board and the Fund Oversight and Research Committees reviewed the general qualifications and capabilities of Fidelity's investment staff, including its size, education, experience, and resources, as well as Fidelity's approach to recruiting, training, managing, and compensating investment personnel. The Board noted that Fidelity has continued to increase the resources devoted to non-U.S. offices, including expansion of Fidelity's global investment organization. The Board also noted that Fidelity's analysts have extensive resources, tools and capabilities that allow them to conduct sophisticated quantitative and fundamental analysis, as well as credit analysis of issuers, counterparties and guarantors. Further, the Board considered that Fidelity's investment professionals have sufficient access to global information and data so as to provide competitive investment results over time, and that those professionals also have access to sophisticated tools that permit them to assess portfolio construction and risk and performance attribution characteristics continuously, as well as to transmit new information and research conclusions rapidly around the world. Additionally, in its deliberations, the Board considered Fidelity's trading, risk management, compliance, and technology and operations capabilities and resources, which are integral parts of the investment management process.
Administrative Services. The Board considered (i) the nature, extent, quality, and cost of advisory and administrative services performed by the Investment Advisers and their affiliates under the Advisory Contracts and under separate agreements covering transfer agency, pricing and bookkeeping, and securities lending services for the fund; (ii) the nature and extent of the supervision of third party service providers, principally custodians, subcustodians, and pricing vendors; and (iii) the resources devoted to, and the record of compliance with, the fund's compliance policies and procedures. The Board also reviewed the allocation of fund brokerage, including allocations to brokers affiliated with the Investment Advisers, and the use of "soft" commission dollars to pay for research services.
Investment Performance. The Board considered whether the fund has operated in accordance with its investment objective, as well as its record of compliance with its investment restrictions. The Board reviewed the fund's absolute investment performance, as well as the fund's relative investment performance, but did not consider performance to be a material factor in its decision to renew the fund's Advisory Contracts, as the fund is not publicly offered as a stand-alone investment product. In this regard, the Board noted that the fund is designed to offer a liquid investment option for other investment companies managed by Fidelity and ultimately to enhance the performance of those investment companies.
Based on its review, the Board concluded that the nature, extent, and quality of services provided to the fund under the Advisory Contracts should continue to benefit the shareholders of the fund.
Competitiveness of Management Fee and Total Expense Ratio. The Board considered that while the fund does not pay a management fee, FMR receives fees for providing services to funds that invest in the fund. The Board also noted that FMR bears all expenses of the fund with certain exceptions. Based on its review, the Board concluded that the management fee paid on behalf of the fund and the fund's total expense ratio were reasonable in light of the services that the fund and its shareholders receive and the other factors considered.
Costs of the Services and Profitability. The Board considered the level of Fidelity's profits in respect of all the Fidelity funds, as well as the profitability of the funds that invest in the fund.
PricewaterhouseCoopers LLP (PwC), auditor to Fidelity and certain Fidelity funds, has been engaged annually by the Board as part of the Board's assessment of Fidelity's profitability analysis. PwC's engagement includes the review and assessment of the methodologies used by Fidelity in determining the revenues and expenses attributable to Fidelity's mutual fund business, and completion of agreed-upon procedures in respect of the mathematical accuracy of the fund profitability information and its conformity to established allocation methodologies. After considering PwC's reports issued under the engagement and information provided by Fidelity, the Board concluded that while other allocation methods may also be reasonable, Fidelity's profitability methodologies are reasonable in all material respects.
The Board also reviewed Fidelity's non-fund businesses and potential indirect benefits such businesses may have received as a result of their association with Fidelity's mutual fund business (i.e., fall-out benefits) as well as cases where Fidelity's affiliates may benefit from the funds' business. The Board noted that changes to fall-out benefits year-over-year reflect business developments at Fidelity's various businesses. The Board considered that a joint ad hoc committee created by it and the boards of other Fidelity funds had recently been established, and met periodically, to evaluate potential fall-out benefits (PFOB Committee). The Board noted that the PFOB Committee, among other things: (i) discussed the legal framework surrounding potential fall-out benefits; (ii) reviewed the Board's responsibilities and approach to potential fall-out benefits; and (iii) reviewed practices employed by competitor funds regarding the review of potential fall-out benefits.
The Board concluded that the costs of the services provided by and the profits realized by Fidelity in connection with the operation of the fund were not relevant to the renewal of the Advisory Contracts because the fund pays no advisory fees and FMR bears all expenses of the fund with certain exceptions.
Economies of Scale. The Board concluded that because the fund pays no advisory fees and FMR bears all expenses of the fund with certain exceptions, the realization of economies of scale was not a material factor in the Board's decision to renew the fund's Advisory Contract.
Additional Information Requested by the Board. In order to develop fully the factual basis for consideration of the Fidelity funds' advisory contracts, the Board requested and received additional information on certain topics, including: (i) fund flow and performance trends, in particular the underperformance of certain funds and strategies, and Fidelity's long-term strategies for certain funds; (ii) consideration of performance fees for additional funds; (iii) changes in Fidelity's non-fund businesses and the impact of such changes on the funds; (iv) metrics for evaluating index fund and ETF performance and information about ETF trading characteristics; (v) the methodology with respect to evaluating competitive fund data and peer group classifications and fee comparisons; (vi) the expense structures for different funds and classes; (vii) information regarding other accounts managed by Fidelity, including collective investment trusts and separately managed accounts; and (viii) Fidelity's philosophies and strategies for evaluating funds and classes with lower or declining asset levels.
Based on its evaluation of all of the conclusions noted above, and after considering all factors it believed relevant, the Board concluded that the advisory fee arrangements are fair and reasonable, and that the fund's Advisory Contracts should be renewed.
Liquidity Risk Management Program
The Securities and Exchange Commission adopted Rule 22e-4 under the Investment Company Act of 1940 (the Liquidity Rule) to promote effective liquidity risk management throughout the open-end investment company industry, thereby reducing the risk that funds will be unable to meet their redemption obligations and mitigating dilution of the interests of fund shareholders.
The Fund has adopted and implemented a liquidity risk management program pursuant to the Liquidity Rule (the Program) effective December 1, 2018. The Program is reasonably designed to assess and manage the Fund’s liquidity risk and to comply with the requirements of the Liquidity Rule. The Fund’s Board of Trustees (the Board) has designated the Fund’s investment adviser as administrator of the Program. The Fidelity advisers have established a Liquidity Risk Management Committee (the LRM Committee) to manage the Program for each of the Fidelity Funds. The LRM Committee monitors the adequacy and effectiveness of implementation of the Program and on a periodic basis assesses each Fund’s liquidity risk based on a variety of factors including (1) the Fund’s investment strategy, (2) portfolio liquidity and cash flow projections during normal and reasonably foreseeable stressed conditions, (3) shareholder redemptions, (4) borrowings and other funding sources and (5) in the case of exchange-traded funds, certain additional factors including the effect of the Fund’s prices and spreads, market participants, and basket compositions on the overall liquidity of the Fund’s portfolio, as applicable.
In accordance with the Program, each of the Fund’s portfolio investments is classified into one of four liquidity categories described below based on a determination of a reasonable expectation for how long it would take to convert the investment to cash (or sell or dispose of the investment) without significantly changing its market value.
- Highly liquid investments – cash or convertible to cash within three business days or less
- Moderately liquid investments – convertible to cash in three to seven calendar days
- Less liquid investments – can be sold or disposed of, but not settled, within seven calendar days
- Illiquid investments – cannot be sold or disposed of within seven calendar days
Liquidity classification determinations take into account a variety of factors including various market, trading and investment-specific considerations, as well as market depth, and generally utilize analysis from a third-party liquidity metrics service.
The Liquidity Rule places a 15% limit on a fund’s illiquid investments and requires funds that do not primarily hold assets that are highly liquid investments to determine and maintain a minimum percentage of the fund’s net assets to be invested in highly liquid investments (highly liquid investment minimum or HLIM). The Program includes provisions reasonably designed to comply with the 15% limit on illiquid investments and for determining, periodically reviewing and complying with the HLIM requirement as applicable.
At a recent meeting of the Fund’s Board of Trustees, the LRM Committee provided a written report to the Board pertaining to the operation, adequacy, and effectiveness of implementation of the Program for the annual period from December 1, 2018 through November 30, 2019. The report concluded that the Program has been implemented and is operating effectively and is reasonably designed to assess and manage the Fund’s liquidity risk.

SI-SANN-0820
1.705747.122