UNITED STATES
SECURITIES AND EXCHANGE COMMISSION
Washington, D.C. 20549
FORM N-CSR
CERTIFIED SHAREHOLDER REPORT OF REGISTERED
MANAGEMENT INVESTMENT COMPANIES
| | |
| Investment Company Act file number: | | 811-04710 |
| |
| Exact name of registrant as specified in charter: | | The Asia Pacific Fund, Inc. |
| |
| Address of principal executive offices: | | Gateway Center 3, |
| | 100 Mulberry Street, |
| | Newark, New Jersey 07102 |
| |
| Name and address of agent for service: | | Deborah A. Docs |
| | Gateway Center 3, |
| | 100 Mulberry Street, |
| | Newark, New Jersey 07102 |
| |
| Registrant’s telephone number, including area code: | | 973-367-7521 |
| |
| Date of fiscal year end: | | 3/31/2015 |
| |
| Date of reporting period: | | 3/31/2015 |
Item 1 – Reports to Stockholders

ANNUAL REPORT
March 31, 2015

The Asia Pacific Fund, Inc.
Contents
Notice is hereby given in accordance with Section 23(c) of the Investment Company Act of 1940 that The Asia Pacific Fund, Inc. (the “Fund”) may purchase, from time to time, shares of its common stock at market prices.
This report, including the financial statements herein, is transmitted to the shareholders of the Fund for their information. This is not a prospectus, circular or representation intended for use in the purchase of shares of the Fund or any securities mentioned in this report.
The Asia Pacific Fund, Inc.
Gateway Center Three
100 Mulberry Street
Newark, NJ 07102-4077
For general information on the Fund, please call (toll-free) the Pristine Advisers, our shareholders’ servicing agent, at: 1-(888) 4-ASIA-PAC
Current information about the Fund is available on its website (http://www.asiapacificfund.com). This website includes monthly updates of the Fund’s performance and other data as well as the Investment Manager’s quarterly presentation of performance and asset allocations and comments on the current Asian outlook.
NYSE: APB
CUSIP: 044901106
1
The Asia Pacific Fund, Inc.
Share Price, Net Asset Value and Distribution History (Unaudited)
| | | | | | | | | | | | |
| | | |
| Quarter End | | Closing Price
at Quarter End | | | Net Asset Value
per Share
at Quarter End | | | Dividends and
Distributions During Quarter* | |
| Financial Year 2014/2015 | | | | | | | | | | | | |
| June | | $ | 11.05 | | | $ | 12.33 | | | | — | |
| September | | | 11.28 | | | | 12.54 | | | | — | |
| December | | | 11.28 | | | | 12.55 | | | | — | |
| March | | | 11.61 | | | | 13.07 | | | | — | |
| | | | | | | | | | | | |
| Financial Year 2013/2014 | | | | | | | | | | | | |
| June | | $ | 10.10 | | | $ | 11.17 | | | | — | |
| September | | | 10.12 | | | | 11.28 | | | | — | |
| December | | | 10.51 | | | | 11.71 | | | | — | |
| March | | | 10.33 | | | | 11.50 | | | | — | |
| | | | | | | | | | | | |
| Financial Year 2012/2013 | | | | | | | | | | | | |
| June | | $ | 9.54 | | | $ | 10.71 | | | | — | |
| September | | | 10.28 | | | | 11.51 | | | | — | |
| December | | | 10.82 | | | | 12.19 | | | | — | |
| March | | | 10.76 | | | | 11.92 | | | | — | |
| | | | | | | | | | | | |
| Financial Year 2011/2012 | | | | | | | | | | | | |
| June | | $ | 12.12 | | | $ | 13.21 | | | | — | |
| September | | | 9.36 | | | | 10.00 | | | | — | |
| December | | | 9.40 | | | | 10.37 | | | | — | |
| March | | | 10.58 | | | | 11.67 | | | | — | |
| | | | | | | | | | | | |
| Financial Year 2010/2011 | | | | | | | | | | | | |
| June | | $ | 9.19 | | | $ | 10.08 | | | | — | |
| September | | | 11.02 | | | | 12.10 | | | | — | |
| December | | | 11.95 | | | | 12.94 | | | | — | |
| March | | | 11.83 | | | | 13.06 | | | | — | |
| * | There were no distributions over the 5 years to March 31, 2015. Total per share distributions over the Fund’s life (commencement of operations: May 4, 1987) have amounted to $30.78 per share. |
2
The Asia Pacific Fund, Inc.
The Fund’s Management
Directors
Michael J. Downey, Chairman
Jessica M. Bibliowicz
Robert F. Gunia
Duncan M. McFarland
David G. P. Scholfield
Nicholas T. Sibley
Christopher Sykes
William G. Tung
Officers
Raymond Tam, President
M. Sadiq Peshimam, Treasurer and Chief Financial Officer
Deborah A. Docs, Secretary and Chief Legal Officer
Andrew R. French, Assistant Secretary
Valerie M. Simpson, Chief Compliance Officer
Theresa C. Thompson, Deputy Chief Compliance Officer
Investment Manager
Value Partners Hong Kong Limited
9th Floor, Nexxus Building
41 Connaught Road Central
Hong Kong
Administrator
Prudential Investments LLC
Gateway Center Three
100 Mulberry Street
Newark, NJ 07102-4077
Custodian
The Bank of New York Mellon
One Wall Street
New York, NY 10286
Transfer Agent
Computershare Trust Company N.A.
P.O. Box 43011
Providence, RI 02940-3011
Independent Registered Public Accounting Firm
KPMG LLP
345 Park Avenue
New York, NY 10154
Legal Counsel
Sullivan & Cromwell LLP
125 Broad Street
New York, New York 10004
3
The Asia Pacific Fund, Inc.
Report of the Investment Manager (Unaudited)
for the fiscal year ended March 31, 2015
Overview
During the fiscal year ended March 31, 2015, the Fund’s net asset value (NAV) per share increased 13.7%.
This compares with an increase of 11.0% in the Fund’s reference benchmark, the MSCI All Countries (AC) Asia Ex-Japan Gross Index. By way of international comparison, returns of the S&P 500 Price and MSCI World Gross indices were +10.4% and +6.6%, respectively.
The top three performing major markets within the region, as measured by the MSCI country indices in US dollar terms over the period, were the Philippines (+26.2%), China (+24.3%) and India (+20.7%). The major laggards were Vietnam (-13.6%), Malaysia (-11.7%) and Korea (-4.9%). Most Asian currencies weakened against the US Dollar except for the Renminbi, the Hong Kong Dollar and the Philippine Peso. The Indonesia Rupiah, the Malaysian Ringgit and the Singapore Dollar were the ones which weakened the most.
The review period was a volatile but fruitful year for Asian equity markets. In China, equities drifted lower in the first half of 2014 but rallied throughout the fourth quarter of 2014 and the first quarter of 2015 as market sentiment was boosted by continuous easing measures from the People’s Bank of China (PBoC). Meanwhile, Korean stocks underperformed amid investors’ concerns over Korean exporters which have been hurt by a weak Japanese yen. ASEAN markets saw a mixed performance with Thailand, Indonesia and the Philippines recording strong gains while Malaysia was the laggard.
Since Value Partners took over the management of the portfolio on October 1, 2013, we have pursued a benchmark agnostic strategy to identify high-dividend stocks by investing in businesses with the ability and willingness to pay dividends. As such, we seek companies that may generate strong cash flow from operations, which reflects a higher quality of earnings and a more robust business at an attractive valuation.
The Fund outperformed its reference benchmark during the fiscal year. The outperformance primarily came from two sources: (i) Overweight to Hong Kong H shares and China A shares which experienced a good rally during the period; and (ii) Successful stock selections in South Korea which saw good gains during the period despite relatively weak market performance. Sector-wise, the Fund’s stock picks in the consumer staples and industrials sectors contributed to the Fund’s performance during the period. From an allocation perspective, the Fund maintained a low exposure to India and Philippines due to their comparatively more expensive valuation, hindering the Fund from delivering stronger performance.
4
The Asia Pacific Fund, Inc.
Table 1. Stock Market Performance
April 2014 – March 2015 (MSCI indices on a gross basis in USD terms)
| | | | | | | | | | | | | | | | | | | | |
| | | | | |
| Country - Index | | 2Q 2014 % | | | 3Q 2014 % | | | 4Q 2014 % | | | 1Q 2015 % | | | 1 Yr to
03/31/2015 % | |
| North Asia | | | | | | | | | | | | | | | | | | | | |
| Hong Kong | | | 8.3 | | | | –2.6 | | | | 3.1 | | | | 6.0 | | | | 15.3 | |
| Taiwan | | | 10.4 | | | | –3.0 | | | | 1.7 | | | | 4.0 | | | | 13.2 | |
| Korea | | | 6.4 | | | | –7.3 | | | | –7.7 | | | | 4.4 | | | | –4.9 | |
| China | | | 5.7 | | | | 1.5 | | | | 7.2 | | | | 8.1 | | | | 24.3 | |
| ASEAN | | | | | | | | | | | | | | | | | | | | |
| Singapore | | | 5.7 | | | | –1.2 | | | | –0.5 | | | | –1.9 | | | | 2.0 | |
| Malaysia | | | 3.5 | | | | –3.2 | | | | –10.5 | | | | –1.6 | | | | –11.7 | |
| Thailand | | | 7.8 | | | | 7.7 | | | | –6.4 | | | | 2.5 | | | | 11.4 | |
| Indonesia | | | 0.8 | | | | 3.5 | | | | 0.7 | | | | 2.5 | | | | 7.5 | |
| Philippines | | | 9.2 | | | | 4.2 | | | | 0.7 | | | | 10.2 | | | | 26.2 | |
| South Asia | | | | | | | | | | | | | | | | | | | | |
| Sri Lanka | | | 3.1 | | | | 13.7 | | | | 1.4 | | | | –15.1 | | | | 0.8 | |
| India | | | 12.7 | | | | 2.3 | | | | –0.7 | | | | 5.4 | | | | 20.7 | |
| Vietnam | | | –5.2 | | | | 3.2 | | | | –7.3 | | | | –4.7 | | | | –13.6 | |
| Region | | | | | | | | | | | | | | | | | | | | |
| MSCI AC Asia Ex-Japan Gross | | | 7.3 | | | | –1.5 | | | | 0.2 | | | | 4.9 | | | | 11.0 | |
| Source: Morningstar (Value Partners). | |
Table 2. Currency Market Performance vs USD (Month-ends)
March 2014 – March 2015
| | | | | | | | | | | | | | | | | | | | | | | | |
| | | | | | |
| Currency US$/local rate | | Mar
2014 | | | Jun
2014 | | | Sep
2014 | | | Dec
2014 | | | Mar
2015 | | | 12M
Change %* | |
| North Asia | | | | | | | | | | | | | | | | | | | | | | | | |
| South Korean Won | | | 1,064 | | | | 1,012 | | | | 1,055 | | | | 1,099 | | | | 1,109 | | | | –4.1 | |
| Chinese Renminbi | | | 6.22 | | | | 6.21 | | | | 6.14 | | | | 6.20 | | | | 6.20 | | | | 0.3 | |
| Hong Kong Dollar | | | 7.76 | | | | 7.75 | | | | 7.77 | | | | 7.75 | | | | 7.75 | | | | 0.1 | |
| New Taiwan Dollar | | | 30.45 | | | | 29.86 | | | | 30.42 | | | | 31.60 | | | | 31.29 | | | | –2.7 | |
| ASEAN | | | | | | | | | | | | | | | | | | | | | | | | |
| Thai Baht | | | 32.44 | | | | 32.46 | | | | 32.43 | | | | 32.90 | | | | 32.54 | | | | –0.3 | |
| Philippine Peso | | | 44.85 | | | | 43.65 | | | | 44.88 | | | | 44.73 | | | | 44.70 | | | | 0.3 | |
| Singapore Dollar | | | 1.26 | | | | 1.25 | | | | 1.28 | | | | 1.33 | | | | 1.37 | | | | –8.3 | |
| Malaysian Ringgit | | | 3.27 | | | | 3.21 | | | | 3.28 | | | | 3.50 | | | | 3.70 | | | | –11.8 | |
| Indonesian Rupiah | | | 11,360 | | | | 11,855 | | | | 12,185 | | | | 12,385 | | | | 13,075 | | | | –13.1 | |
| South Asia | | | | | | | | | | | | | | | | | | | | | | | | |
| Sri Lankan Rupee | | | 130.70 | | | | 130.33 | | | | 130.43 | | | | 131.20 | | | | 133.18 | | | | –1.9 | |
| Vietnamese Dong | | | 21,098 | | | | 21,330 | | | | 21,228 | | | | 21,388 | | | | 21,555 | | | | –2.1 | |
| Indian Rupee | | | 59.72 | | | | 60.15 | | | | 61.76 | | | | 63.12 | | | | 62.58 | | | | –4.6 | |
| Source: Morningstar (Value Partners). | |
| * | Rounded up to the nearest tenth of one percent. |
5
The Asia Pacific Fund, Inc.
Report of the Investment Manager (Unaudited)
continued
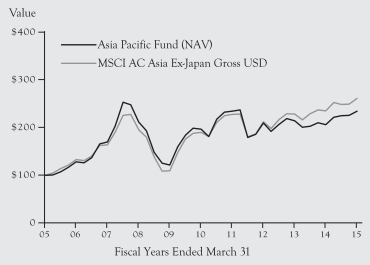
Chart 1. Performance of the Asia Pacific Fund’s NAV against its Benchmark Index*
| * | Investment involves risk. Past performance figures shown are not indicative of future performance. |
| Note: | The graph compares a $100 investment in the The Asia Pacific Fund, Inc. with a similar investment in the MSCI AC Asia Ex-Japan Gross Index by portraying the initial account values at the beginning of the 10-year period (March 31, 2005) and the account values at the end of the current fiscal year (March 31, 2015) as measured on a quarterly basis. |
Source: Lipper, a Thompson Reuters Company (Prudential Investments LLC).
Performance
During the 12-month period ended March 31, 2015, the Fund’s NAV per share increased by $1.57 as it increased from $11.50 to $13.07 an increase of 13.7%. This compares with an increase of 11.0% by the reference benchmark index, the MSCI AC Asia Ex-Japan Gross Index. The Fund’s share price increased by 12.4% over the period, from $10.33 to $11.61. As the portfolio carried forward losses from previous fiscal years, the Fund did not have to pay a distribution of its net capital gains.
The outperformance primarily came from two sources: (i) Overweight to Hong Kong H shares and China A shares which experienced a good rally during the period; and (ii) Successful stock selections in South Korea which saw good gains during the period despite relatively weak market performance. Sector-wise, the Fund’s stock picks in the consumer staples and industrial sectors contributed to the Fund’s performance during the period. Among the contributors are Amorepacific Corp. (“Amorepacific”), a leading cosmetics company in South Korea with over 30% market share, together with a leading menswear enterprise in China.
6
The Asia Pacific Fund, Inc.
Table 3. Performance of Asia Pacific Fund, the Region and Major World Markets* (on a gross (dividend reinvested) basis to March 31, 2015, in USD terms)
| | | | | | | | | | | | | | | | |
| | | | |
| | | 1 Yr % | | | 3 Yrs % | | | 5 Yrs % | | | 10 Yrs % | |
| Asia Pacific Fund – NAV | | | 13.7 | | | | 12.0 | | | | 19.1 | | | | 134.8 | |
| Asia Pacific Fund – Price | | | 12.4 | | | | 9.9 | | | | 16.7 | | | | 131.1 | |
| MSCI AC Asia Ex-Japan | | | 11.0 | | | | 22.9 | | | | 37.2 | | | | 161.2 | |
| S&P 500 Composite (Price Return) | | | 10.4 | | | | 46.8 | | | | 76.8 | | | | 75.2 | |
| MSCI Europe | | | –4.4 | | | | 33.2 | | | | 40.4 | | | | 71.1 | |
| MSCI Japan | | | 12.4 | | | | 31.7 | | | | 34.3 | | | | 43.8 | |
| Source: Morningstar (Value Partners) | |
| * | In view of the growing importance of the Indian economy and stock market in Asia and as part of the Fund’s investment portfolio, the Fund has adopted as its reference index as of April 1, 2010, the MSCI All Countries Asia ex Japan Index, which includes India. Prior to this the Fund was shown against MSCI AC FE Free Ex-Japan Index Total Gross Return. |
Portfolio Strategy
During the review period, we maintained an overweight exposure to China and Korea, which is mainly a valuation call. This strategy has proved to serve us well in this environment, especially when global investors started to recognize the opportunities in China.
China loosened home purchase restrictions at the beginning of the second half of 2014. With this initial wave of loosening in the property sector, we believed property stocks were attractively valued, and anticipated that an improvement in consumer confidence would drive strong sell-through. As such, we increased our exposure to China Vanke Co., Ltd. (“China Vanke”), the largest residential property developer in China in the last quarter of 2014. With one of the most diversified land banks in China, together with a strong brand and seasoned management, we believe China Vanke has an extra edge in the sector. It continued to remain one of the portfolio’s top holdings by the end of the review period.
We are particularly enthusiastic about the development of dividend policy in Korea and believe this will pave the way for a re-rating of the market on the back of improving dividend payouts. In August 2014, we continued to build on existing positions in Korean preference shares through Amorepacific, that turned out to be a leading contributor to the portfolio’s return and remained one of our top holdings as of the end of the review period. During the last quarter of 2014, we also added exposure to a company that invests in infrastructure assets in Korea and is capable of providing stable dividends in a low interest rate environment. To make room for the additions, we trimmed our exposure in select names across the region, including the Korean financials and Chinese banks.
7
The Asia Pacific Fund, Inc.
Report of the Investment Manager (Unaudited)
continued
As we entered the first quarter of 2014, we remained overweight in Hong Kong H shares as they continued to trade at a cheap valuation. Before the Chinese New Year, we increased our exposure to Chinese financials due to undemanding valuation and in anticipation of more accommodative monetary policies. Meanwhile, as we found value in a Hong Kong conglomerate which is undergoing restructuring to unlock value in the entity, we also added the name to our portfolio and it remained one of the top holdings by the end of the review period. To make room for the additions we have reduced our positions mainly in the consumer discretionary sector, particularly a Korean automobile manufacturer. Towards the end of the review period, we had taken profit on some companies which we felt were fully valued, including a Chinese insurer which had rallied after the PBoC’s rate cut, and a Chinese electronics manufacturer which had rallied significantly in early 2015 following results above market expectations.
For ASEAN, we continued to maintain a low exposure to the region as it had been trading at a significant premium to China and Korea.
Table 4. Asset Allocation at Quarter Ends (% of Fund’s Net Assets)*
| | | | | | | | | | | | | | | | | | | | |
| | | | | |
| Country | | Mar 31,
2014
% | | | Jun 30,
2014
% | | | Sep 30,
2014
% | | | Dec 31,
2014
% | | | Mar 31,
2015
% | |
| North Asia | | | 84.6 | | | | 86.4 | | | | 86.5 | | | | 88.1 | | | | 85.3 | |
| China/Hong Kong/Macau | | | 50.7 | | | | 53.0 | | | | 54.5 | | | | 59.5 | | | | 61.5 | |
| South Korea | | | 26.1 | | | | 26.1 | | | | 26.7 | | | | 24.9 | | | | 21.6 | |
| Taiwan | | | 7.8 | | | | 7.3 | | | | 5.3 | | | | 3.7 | | | | 2.2 | |
| ASEAN | | | 10.5 | | | | 10.4 | | | | 11.5 | | | | 10.2 | | | | 10.5 | |
| Singapore | | | 6.4 | | | | 5.5 | | | | 6.1 | | | | 5.8 | | | | 5.0 | |
| Thailand | | | 1.2 | | | | 0.8 | | | | 1.6 | | | | 2.0 | | | | 3.2 | |
| Indonesia | | | 1.7 | | | | 1.9 | | | | 1.7 | | | | 0.8 | | | | 0.5 | |
| Philippines | | | 0.0 | | | | 0.0 | | | | 0.0 | ** | | | 0.0 | ** | | | 0.0 | ** |
| Malaysia | | | 1.2 | | | | 2.2 | | | | 2.1 | | | | 1.6 | | | | 1.8 | |
| Cash & Others | | | 4.9 | | | | 3.2 | | | | 2.0 | | | | 1.7 | | | | 4.2 | |
| Source: Value Partners | |
| * | Rounded up to the nearest tenth of one percent |
Outlook
At the National People’s Congress (NPC) meeting in March, China announced a lowering of its economic growth target for 2015 to 7%, a widely anticipated move to achieve a soft landing. As economic data deteriorated early in 2015, Premier Li Keqiang called for “more forceful” fiscal policy and “appropriate” monetary policy to stabilize growth. The PBoC announced an across-the-board reserve requirement ratio cut and a symmetrical interest rate cut in February. The central bank also relaxed property measures further by lowering required down
8
The Asia Pacific Fund, Inc.
payments for second-home buyers to 40% from 60% in March. The enhanced stimulus reconfirms our expectations for continuous easing measures.
We remain optimistic about the acceleration of China’s structural reforms. At the NPC meeting, Premier Li pledged that there will be breakthroughs in major reforms. In the near term, we believe that financial reforms remain the lowest hanging fruit. With the establishment of a deposit insurance scheme, we believe that interest rate deregulation will likely happen earlier and improve the efficiency of capital allocation. With lower lending rates, banks may consider lending more to the private sector to maintain margins. We are hopeful that some of the pilot programs announced in the third quarter of 2014, especially the reduction of capital expenditure that is driving state-owned enterprise (SOE) reform, will see some initial results in 2015. With these reforms driving governance and growth, we believe that this will likely reverse the price-to-earnings de-rating trend of Chinese stocks and bring about significant multiple expansion in the coming years.
We recognize that many investors remain wary about the China story, particularly as the country’s development model matures, resulting in a slower growth rate. No doubt, it is going to be a volatile market. But at this point of the cycle, a combination of monetary loosening and reform measures has drawn capital into the A-share equity market. At the end of March, the China Securities Regulatory Commission (CSRC) announced that domestic fund management companies could buy Hong Kong-listed shares via the Shanghai-Hong Kong Stock Connect program without a Qualified Domestic Institutional Investor (QDII) license requirement. Immediately, we saw a revival in the southbound leg of the Connect program. We believe that the active market environment in the A-share market will likely continue to spill over into the Hong Kong market.
In China, we expect the further opening up of capital markets via the proposed Shenzhen-Hong Kong Stock Connect program, as well as the potential A-share inclusion in international indices. These will act as a long-term catalyst for market re-rating. While it is only four months into the year, we are anticipating a stronger market environment, which is particularly beneficial to value investing as investors are less focused on a few smaller fast-growing sectors but more focused on the merits of each company on a fundamental basis. Despite the strong rally recently, we continue to find value there.
For Korea, the Bank of Korea announced a surprising rate cut in March as it lowered its base rate by 25 basis points to a record low of 1.75%. Meanwhile, more Korean companies announced boosts in dividend payouts after the 2014 Tax Revision Bill had been passed by Korea’s National Assembly in December. With increasing push for higher dividend payments, we hope to see more shareholder-friendly capital management from cash-rich Korean chaebols. As such, dividend payments are expected to remain one of the main drivers for Korean equities in the coming year.
9
The Asia Pacific Fund, Inc.
Report of the Investment Manager (Unaudited)
continued
In the ASEAN region, we observed some improvements in terms of political stability. For instance, the Thai government has recently lifted martial law which had been in place since May 2014. This had been sought by the country’s tourism operators who hope for a revival in the tourism industry – a key growth driver of Thailand’s economy. Nevertheless, we remain mindful of the ongoing strength of the US dollar as weaker ASEAN economies’ currencies have been vulnerable to foreign exchange risks in the past few years. We are selective across the region, maintaining a careful value and dividend discipline.
Value Partners Hong Kong Limited
April 22, 2015
Past performance does not guarantee future results and current performance may be lower or higher than the past performance data quoted. The investment return and principal value will fluctuate, and shares, when sold, may be worth more or less than their original cost. Index returns do not include the effect of any sales charges, fund operating expenses or taxes. An investment cannot be made directly in an index.
The views expressed are the views of Value Partners Hong Kong Limited (“VPHK”) only and are subject to change based on market and other conditions. The information provided does not constitute investment advice and it should not be relied on as such. All material has been obtained from sources believed to be reliable, but its accuracy is not guaranteed. This material contains certain statements that may be deemed forward-looking statements. Please note that any such statements are not guarantees of any future performance and actual results or developments may differ materially from those projected.
Unless specified, all information contained on the pages is quoted as March 31, 2015. This document is prepared by VPHK for information purposes only. It does not constitute a prospectus, an offer or an invitation to subscribe any securities, or a recommendation in relation to any securities. The Fund is not authorized by the Hong Kong Securities and Futures Commission (“SFC”) and therefore shares of the Fund are not available to retail investors in Hong Kong. This document has not been reviewed by the SFC. Issuer : Value Partners Hong Kong Limited.
10
The Asia Pacific Fund, Inc.
Portfolio of Investments
as of March 31, 2015
| | | | | | | | | | | | |
| Shares | | | Description | | | | | Value
(Note 1) | |
| | | | LONG-TERM INVESTMENTS – 96.7% | |
| |
| | | | COMMON STOCKS – 76.0% | |
| |
| | | | CHINA (INCLUDING HONG KONG and MACAU SAR) – 54.9% | |
| | 6,739,000 | | | Agricultural Bank of China Ltd. (Class “H” Shares) (Banking) | | | $ | | | | 3,337,924 | |
| | 373,000 | | | BAIC Motor Corp. Ltd. (Class “H” Shares) (Consumer Discretionary) | | | | | | | 465,730 | |
| | 11,096,000 | | | Bank of China Ltd. (Class “H” Shares) (Banking) | | | | | | | 6,412,011 | |
| | 982,000 | | | Belle International Holdings Ltd. (Real Estate – Developers) | | | | | | | 1,143,797 | |
| | 574,500 | | | BOC Hong Kong Holdings Ltd. (Banking) | | | | | | | 2,048,967 | |
| | 569,000 | | | Chaowei Power Holdings Ltd. (Consumer Discretionary) | | | | | | | 279,632 | |
| | 726,000 | | | China BlueChemical Ltd. (Class “H” Shares) (Materials) | | | | | | | 277,190 | |
| | 6,483,000 | | | China Construction Bank Corp. (Class “H” Shares) (Banking) | | | | | | | 5,385,322 | |
| | 161,000 | | | China Life Insurance Co. Ltd. (Class “H” Shares) (Insurance) | | | | | | | 705,043 | |
| | 2,080,000 | | | China Lilang Ltd. (Consumer Discretionary) | | | | | | | 1,604,406 | |
| | 1,680,000 | | | China Machinery Engineering Corp. (Class “H” Shares) (Materials) | | | | | | | 1,698,929 | |
| | 82,000 | | | China Overseas Land & Investment Ltd. (Real Estate – Developers) | | | | | | | 264,955 | |
| | 6,189,000 | | | China Power International Development Ltd. (Utilities) | | | | | | | 3,241,129 | |
| | 1,046,000 | | | China Resources Cement Holdings Ltd. (Materials) | | | | | | | 592,306 | |
| | 988,000 | | | China Resources Power Holdings Co. Ltd. (Utilities) | | | | | | | 2,479,988 | |
| | 247,000 | | | China Shenhua Energy Co. Ltd. (Class “H” Shares) (Energy) | | | | | | | 630,830 | |
| | 2,025,938 | | | China Vanke Co. Ltd. (Class “H” Shares)* (Real Estate – Developers) | | | | | | | 4,808,325 | |
| | 257,000 | | | Chow Sang Sang Holdings International Ltd. (Consumer Discretionary) | | | | | | | 556,919 | |
| | 4,462,000 | | | CIFI Holdings Group Co. Ltd. (Real Estate – Developers) | | | | | | | 1,007,204 | |
| | 180,000 | | | CK Hutchison Holdings Ltd. (Real Estate – Developers) | | | | | | | 3,686,997 | |
| | 30,750,000 | | | CSI Properties Ltd. (Real Estate – Developers) | | | | | | | 1,090,756 | |
| | 442,000 | | | Dongfeng Motor Group Co. Ltd. (Class “H” Shares) (Consumer Discretionary) | | | | | | | 709,239 | |
| | 1,200,000 | | | EGL Holdings Co. Ltd.* (Consumer Discretionary) | | | | | | | 272,423 | |
| | 2,334,000 | | | Far East Consortium International Ltd. (Real Estate – Developers) | | | | | | | 888,122 | |
| | 93,600 | | | GF Securities Co. Ltd. (Class “H” Shares) (Banking) | | | | | | | 227,582 | |
| | 109,500 | | | Great Wall Motor Co. Ltd. (Class “H” Shares) (Consumer Discretionary) | | | | | | | 774,006 | |
| | 1,188,000 | | | Haitong International Securities Group Ltd. (Capital Markets) | | | | | | | 822,888 | |
See Notes to Financial Statements.
11
The Asia Pacific Fund, Inc.
Portfolio of Investments
continued
| | | | | | | | | | | | |
| Shares | | | Description | | | | | Value
(Note 1) | |
| | 5,276,000 | | | Hopefluent Group Holdings Ltd. (Real Estate – Developers) | | | $ | | | | 1,544,829 | |
| | 1,845,481 | | | Hui Xian Real Estate Investment Trust (Real Estate Investment Trusts) | | | | | | | 1,006,150 | |
| | 134,000 | | | Hutchison Whampoa Ltd. (Industrials) | | | | | | | 1,859,803 | |
| | 4,184,000 | | | Jiangnan Group Ltd. (Industrials) | | | | | | | 901,276 | |
| | 1,074,000 | | | Lee & Man Chemical Co. Ltd. (Industrials) | | | | | | | 519,500 | |
| | 813,000 | | | Longfor Properties Co. Ltd. (Real Estate – Developers) | | | | | | | 1,151,444 | |
| | 326,000 | | | Luk Fook Holdings International Ltd. (Consumer Discretionary) | | | | | | | 908,283 | |
| | 698,979 | | | Luthai Textile Co. Ltd. (Class “B” Shares) (Consumer Discretionary) | | | | | | | 1,017,005 | |
| | 692,000 | | | MGM China Holdings Ltd. (Consumer Discretionary) | | | | | | | 1,303,193 | |
| | 2,500,000 | | | Modern Beauty Salon Holdings Ltd. (Consumer Discretionary) | | | | | | | 209,606 | |
| | 997,533 | | | PCCW Ltd. (Telecommunication Services) | | | | | | | 608,609 | |
| | 2,404,000 | | | PetroChina Co. Ltd. (Class “H” Shares) (Energy) | | | | | | | 2,660,551 | |
| | 40,000 | | | Qingdao Port International Co. Ltd. (Class “H” Shares) (Industrials) | | | | | | | 19,658 | |
| | 893,000 | | | Shimao Property Holdings Ltd.
(Real Estate – Developers) | | | | | | | 1,877,539 | |
| | 742,000 | | | Sino Land Co. Ltd. (Real Estate – Developers) | | | | | | | 1,209,764 | |
| | 1,384,025 | | | Sino-Ocean Land Holdings Ltd. (Real Estate – Developers) | | | | | | | 837,272 | |
| | 1,131,000 | | | Sinopec Engineering Group Co. Ltd. (Class “H” Shares) (Industrials) | | | | | | | 980,351 | |
| | 1,960,000 | | | SITC International Holdings Co. Ltd. (Industrials) | | | | | | | 1,034,021 | |
| | 970,859 | | | Skyworth Digital Holdings Ltd. (Consumer Discretionary) | | | | | | | 763,899 | |
| | 2,042,000 | | | Spring Real Estate Investment Trust (Real Estate Investment Trusts) | | | | | | | 966,655 | |
| | 3,398,000 | | | Springland International Holdings Ltd. (Consumer Discretionary) | | | | | | | 1,038,775 | |
| | 3,010,000 | | | Time Watch Investments Ltd. (Consumer Discretionary) | | | | | | | 380,489 | |
| | 2,138,000 | | | TK Group Holdings Ltd. (Industrials) | | | | | | | 546,038 | |
| | 2,162,000 | | | Trigiant Group Ltd. (Information Technology) | | | | | | | 493,604 | |
| | 4,992,000 | | | Welling Holding Ltd. (Consumer Discretionary) | | | | | | | 952,985 | |
| | 2,314,000 | | | Wonderful Sky Financial Group Holdings Ltd. (Consumer Discretionary) | | | | | | | 492,490 | |
| | 178,000 | | | Xinyi Glass Holdings Ltd. (Consumer Discretionary) | | | | | | | 109,978 | |
| | 1,424,000 | | | Xtep International Holdings Ltd. (Consumer Discretionary) | | | | | | | 442,667 | |
| | 765,000 | | | Yangtze Optical Fibre and Cable Joint Stock Ltd. Co. (Class “H” Shares)* (Information Technology) | | | | | | | 700,599 | |
| | 2,527,100 | | | Yangzijiang Shipbuilding Holdings Ltd. (Telecommunication Services) | | | | | | | 2,329,421 | |
See Notes to Financial Statements.
12
The Asia Pacific Fund, Inc.
| | | | | | | | | | | | |
| Shares | | | Description | | | | | Value
(Note 1) | |
| | 981,000 | | | Yuexiu Real Estate Investment Trust (Real Estate Investment Trusts) | | | $ | | | | 559,295 | |
| | 390,800 | | | Zhengzhou Coal Mining Machinery Group Co. Ltd. (Class “H” Shares) (Industrials) | | | | | | | 266,661 | |
| | 641,400 | | | Zoomlion Heavy Industry Science & Technology Co. Ltd. (Class “H” Shares) (Industrials) | | | | | | | 442,622 | |
| | | | | | | | | | | | |
| | | | | | | | | | | 75,547,652 | |
| | | | | | | | | | | | |
| | | |
| | | | INDONESIA – 0.5% | | | | | | | | |
| | 2,900,900 | | | PT Telekomunikasi Indonesia (Persero) Tbk (Telecommunication Services) | | | | | | | 641,193 | |
| | | | | | | | | | | | |
| | | |
| | | | MALAYSIA – 1.8% | | | | | | | | |
| | 2,500,100 | | | Mah Sing Group Bhd (Real Estate – Developers) | | | | | | | 1,390,632 | |
| | 2,808,000 | | | Nam Cheong Ltd. (Industrials) | | | | | | | 624,068 | |
| | 1 | | | United Overseas Australia Ltd. (Real Estate – Developers) | | | | | | | 1 | |
| | 796,400 | | | UOA Development Bhd (Real Estate – Developers) | | | | | | | 475,238 | |
| | | | | | | | | | | | |
| | | | | | | | | | | 2,489,939 | |
| | | | | | | | | | | | |
| | | |
| | | | PHILIPPINES | | | | | | | | |
| | 126,700 | | | Leisure & Resorts World Corp. (Consumer Discretionary) | | | | | | | 24,093 | |
| | | | | | | | | | | | |
| | | |
| | | | SINGAPORE – 5.0% | | | | | | | | |
| | 218,256 | | | AIMS AMP Capital Industrial REIT
(Real Estate Investment Trusts) | | | | | | | 236,967 | |
| | 2,565,700 | | | Asian Pay Television Trust (Consumer Discretionary) | | | | | | | 1,663,914 | |
| | 902,000 | | | China Merchants Holdings Pacific Ltd. (Industrials) | | | | | | | 690,130 | |
| | 957,000 | | | Croesus Retail Trust (Real Estate Investment Trusts) | | | | | | | 648,530 | |
| | 129,700 | | | DBS Group Holdings Ltd. (Banking) | | | | | | | 1,924,212 | |
| | 1,080,400 | | | Ezion Holdings Ltd. (Energy) | | | | | | | 846,307 | |
| | 179,000 | | | Frasers Commercial Trust (Real Estate Investment Trusts) | | | | | | | 195,650 | |
| | 83,000 | | | Keppel Corp. Ltd. (Industrials) | | | | | | | 544,322 | |
| | | | | | | | | | | | |
| | | | | | | | | | | 6,750,032 | |
| | | | | | | | | | | | |
| | | |
| | | | SOUTH KOREA – 6.5% | | | | | | | | |
| | 759 | | | Alticast Corp.* (Software & Services) | | | | | | | 7,149 | |
| | 15,350 | | | BGF retail Co. Ltd.* (Consumer Staples) | | | | | | | 1,563,432 | |
| | 101,593 | | | DGB Financial Group, Inc. (Banking) | | | | | | | 1,108,004 | |
| | 26,489 | | | GS Retail Co. Ltd. (Consumer Staples) | | | | | | | 797,452 | |
| | 97,974 | | | Macquarie Korea Infrastructure Fund (Capital Markets) | | | | | | | 691,457 | |
| | 27,993 | | | SK Hynix, Inc.*
(Semiconductors & Semiconductor Equipment) | | | | | | | 1,149,291 | |
See Notes to Financial Statements.
13
The Asia Pacific Fund, Inc.
Portfolio of Investments
continued
| | | | | | | | | | | | |
| Shares | | | Description | | | | | Value
(Note 1) | |
| | 14,164 | | | SK Telecom Co. Ltd. (Telecommunication Services) | | | $ | | | | 3,478,922 | |
| | | | | | | | | | | | |
| | | | | | | | | | | 8,795,707 | |
| | | | | | | | | | | | |
| | | |
| | | | TAIWAN – 2.2% | | | | | | | | |
| | 738,000 | | | Advanced Semiconductor Engineering, Inc. (Semiconductors & Semiconductor Equipment) | | | | | | | 996,501 | |
| | 39,000 | | | Chipbond Technology Corp.
(Semiconductors & Semiconductor Equipment) | | | | | | | 82,387 | |
| | 267,000 | | | Huaku Development Co. Ltd. (Real Estate – Developers) | | | | | | | 546,117 | |
| | 666,000 | | | King Yuan Electronics Co. Ltd.
(Semiconductors & Semiconductor Equipment) | | | | | | | 605,551 | |
| | 853,000 | | | Mega Financial Holding Co. Ltd. (Banking) | | | | | | | 707,426 | |
| | | | | | | | | | | | |
| | | | | | | | | | | 2,937,982 | |
| | | | | | | | | | | | |
| | | |
| | | | THAILAND – 3.2% | | | | | | | | |
| | 25,900 | | | AP Thailand PCL (Real Estate – Developers) | | | | | | | 5,731 | |
| | 1,014,700 | | | Bangchak Petroleum PCL (The) (Energy) | | | | | | | 1,005,657 | |
| | 3,038,900 | | | Jasmine Broadband Internet Infrastructure Fund
(Class “F” Shares)* (Capital Markets) | | | | | | | 859,185 | |
| | 1,228,400 | | | Somboon Advance Technology PCL
(Consumer Discretionary) | | | | | | | 732,359 | |
| | 300,600 | | | Tisco Financial Group PCL (Banking) | | | | | | | 422,632 | |
| | 3,620,300 | | | TRUE Telecommunication Growth Infrastructure Fund (Class “F” Shares) (Telecommunication Services) | | | | | | | 1,312,832 | |
| | | | | | | | | | | | |
| | | | | | | | | | | 4,338,396 | |
| | | | | | | | | | | | |
| | | |
| | | | UNITED KINGDOM – 0.9% | | | | | | | | |
| | 140,800 | | | HSBC Holdings PLC (Banking) | | | | | | | 1,210,466 | |
| | | | | | | | | | | | |
| | | | Total common stocks (cost $96,215,931) | | | | | | | 102,735,460 | |
| | | | | | | | | | | | |
| Units | | | | | | | | | |
| | | | PARTICIPATORY NOTES* – 5.6% | | | | | | | | |
| |
| | | | CHINA (INCLUDING HONG KONG and MACAU SAR) | |
| | 988,900 | | | China Vanke Co. Ltd. (Class “A” Shares), expiring 02/23/16 (Real Estate – Developers) | | | | | | | 2,204,432 | |
| | 200,000 | | | Daqin Railway Co. Ltd. (Class “A” Shares), expiring 03/11/16 (Industrials) | | | | | | | 355,829 | |
| | 240,000 | | | Gree Electric Appliances, Inc. of Zhuhai
(Class “A” Shares), expiring 03/10/16 (Industrials) | | | | | | | 1,694,819 | |
| | 518,400 | | | Haier Co. Ltd. (Class “A” Shares), expiring 02/23/16 (Consumer Staples) | | | | | | | 2,160,697 | |
See Notes to Financial Statements.
14
The Asia Pacific Fund, Inc.
| | | | | | | | | | | | |
| Units | | | Description | | | | | Value
(Note 1) | |
| | 286,000 | | | SAIC Motor Corp. Ltd. (Class “A” Shares), expiring 02/23/16 (Consumer Discretionary) | | | $ | | | | 1,146,842 | |
| | | | | | | | | | | | |
| | | | Total participatory notes
(cost $6,648,012) | | | | | | | 7,562,619 | |
| | | | | | | | | | | | |
| Shares | | | | | | | | | |
| | | | PREFERENCE SHARES – 15.1% | | | | | | | | |
| | | |
| | | | SOUTH KOREA | | | | | | | | |
| | 3,569 | | | Amorepacific Corp. (Consumer Staples) | | | | | | | 5,375,455 | |
| | 36,594 | | | Hyundai Motor Co. (Non-participating)
(Consumer Discretionary) | | | | | | | 3,661,214 | |
| | 22,698 | | | Hyundai Motor Co. (Participating)
(Consumer Discretionary) | | | | | | | 2,178,861 | |
| | 43,997 | | | LG Corp. (Industrials) | | | | | | | 1,389,963 | |
| | 4,095 | | | Samsung Electronics Co. Ltd.
(Semiconductors & Semiconductor Equipment) | | | | | | | 4,074,884 | |
| | 26,724 | | | Samsung Fire & Marine Insurance Co. Ltd. (Insurance) | | | | | | | 3,733,580 | |
| | | | | | | | | | | | |
| | | | Total preference shares
(cost $15,969,168) | | | | | | | 20,413,957 | |
| | | | | | | | | | | | |
| Units | | | | | | | | | |
| | | | WARRANTS* | | | | | | | | |
| | | |
| | | | MALAYSIA | | | | | | | | |
| | 338,910 | | | Mah Sing Group Bhd, expiring 02/21/20
(cost $0) (Real Estate – Developers) | | | | | | | 18,302 | |
| | | | | | | | | | | | |
| | | | Total long-term investments
(cost $118,833,111) | | | | | | | 130,730,338 | |
| | | | | | | | | | | | |
| Shares | | | | | | | | | |
| | | | SHORT-TERM INVESTMENT – 0.3% | | | | | | | | |
| | | |
| | | | MONEY MARKET MUTUAL FUND | | | | | | | | |
| | 469,883 | | | JPMorgan Prime Money Market Fund/Premier
(cost $469,883) | | | | | | | 469,883 | |
| | | | | | | | | | | | |
| | | | Total Investments – 97.0%
(cost $119,302,994; Note 5) | | | | | | | 131,200,221 | |
| | | | Other assets in excess of liabilities – 3.0% | | | | | | | 4,042,294 | |
| | | | | | | | | | | | |
| | | | Net Assets – 100.0% | | | $ | | | | 135,242,515 | |
| | | | | | | | | | | | |
The following abbreviation is used in the portfolio descriptions:
REIT Real Estate Investment Trust
* Non-income producing security.
See Notes to Financial Statements.
15
The Asia Pacific Fund, Inc.
Portfolio of Investments
continued
Various inputs are used in determining the value of the Fund’s investments. These inputs are summarized in the three broad levels listed below.
Level 1 – quoted prices generally in active markets for identical securities.
Level 2 – quoted prices for similar securities, interest rates and yield curves, prepayment speeds, foreign currency exchange rates and other observable inputs.
Level 3 – unobservable inputs for securities valued in accordance with Board approved fair valuation procedures.
The following is a summary of the inputs used as of March 31, 2015 in valuing such portfolio securities:
| | | | | | | | | | | | |
| | | Level 1 | | | Level 2 | | | Level 3 | |
| Investments in Securities | | | | | | | | | | | | |
| Common Stocks | | | | | | | | | | | | |
China (including Hong Kong and Macau SAR) | | $ | 75,547,652 | | | $ | — | | | $ | — | |
Indonesia | | | 641,193 | | | | — | | | | — | |
Malaysia | | | 2,489,939 | | | | — | | | | — | |
Philippines | | | 24,093 | | | | — | | | | — | |
Singapore | | | 6,750,032 | | | | — | | | | — | |
South Korea | | | 8,795,707 | | | | — | | | | — | |
Taiwan | | | 2,937,982 | | | | — | | | | — | |
Thailand | | | 4,338,396 | | | | — | | | | — | |
United Kingdom | | | 1,210,466 | | | | — | | | | — | |
Participatory Notes | | | | | | | | | | | | |
China (including Hong Kong and Macau SAR) | | | — | | | | 7,562,619 | | | | — | |
Preference Shares | | | | | | | | | | | | |
South Korea | | | 20,413,957 | | | | — | | | | — | |
Warrants | | | | | | | | | | | | |
Malaysia | | | 18,302 | | | | — | | | | — | |
| Money Market Mutual Fund | | | 469,883 | | | | — | | | | — | |
| | | | | | | | | | | | |
| Total | | $ | 123,637,602 | | | $ | 7,562,619 | | | $ | — | |
| | | | | | | | | | | | |
See Notes to Financial Statements.
16
The Asia Pacific Fund, Inc.
The industry classification of investments and other assets in excess of liabilities shown as a percentage of net assets as of March 31, 2015 was as follows (Unaudited):
| | | | |
| Real Estate – Developers | | | 17.6 | % |
| Banking | | | 16.8 | |
| Consumer Discretionary | | | 16.1 | |
| Industrials | | | 10.2 | |
| Consumer Staples | | | 7.4 | |
| Telecommunication Services | | | 6.2 | |
| Semiconductors & Semiconductor Equipment | | | 5.1 | |
| Utilities | | | 4.2 | |
| Energy | | | 3.9 | |
| Insurance | | | 3.3 | |
| Real Estate Investment Trusts | | | 2.7 | |
| Capital Markets | | | 1.7 | |
| Information Technology | | | 0.9 | |
| Materials | | | 0.6 | |
| Money Market Mutual Fund | | | 0.3 | |
| | | | |
| | | 97.0 | |
| Other assets in excess of liabilities | | | 3.0 | |
| | | | |
| | | 100.0 | % |
| | | | |
The Fund invested in derivative instruments during the reporting period. The primary type of risk associated with these derivative instruments is equity risk. The effect of such derivative instruments on the Fund’s financial position and financial performance as reflected in the Statement of Assets and Liabilities and Statement of Operations is presented in the summary below.
Fair values of derivative instruments as of March 31, 2015 as presented in the Statement of Assets and Liabilities:
| | | | | | | | | | | | | | |
Derivatives not accounted for
as hedging instruments,
carried at fair value | | Asset
Derivatives | | | Liability
Derivatives | |
| | Balance
Sheet
Location | | | Fair
Value | | | Balance
Sheet
Location | | Fair
Value | |
| Equity contracts | | | Investments | | | $ | 7,580,921 | | | — | | $ | — | |
| | | | | | | | | | | | | | |
See Notes to Financial Statements.
17
The Asia Pacific Fund, Inc.
Portfolio of Investments
continued
The effects of derivative instruments on the Statement of Operations for the year ended March 31, 2015 are as follows:
For the year ended March 31, 2015, the Fund did not have any realized gain or (loss) on derivatives recognized in income on the Statement of Operations.
| | | | | | | | | | | | |
| |
Change in Unrealized Appreciation or (Depreciation) on Derivatives
Recognized in Income | |
Derivatives not accounted for
as hedging instruments, carried
at fair value | | Participatory
Notes* | | | Warrants* | | | Total | |
| Equity contracts | | $ | 914,607 | | | $ | 18,302 | | | $ | 932,909 | |
| | | | | | | | | | | | |
* Included in net change in unrealized (depreciation) on investments in the Statement of Operations.
See Notes to Financial Statements.
18
The Asia Pacific Fund, Inc.
Statement of Assets and Liabilities
as of March 31, 2015
| | | | | | | | |
| Assets | | | | | | | | |
| Investments at value: | | | | | | | | |
Investments, at value (cost $119,302,994) | | $ | | | | | 131,200,221 | |
| Foreign currency, at value (cost $5,068,186) | | | | | | | 5,071,409 | |
| Receivable for investments sold | | | | | | | 1,826,543 | |
| Dividends receivable | | | | | | | 626,827 | |
| Tax reclaim receivable | | | | | | | 788 | |
| Prepaid expenses | | | | | | | 49,027 | |
| | | | | | | | |
Total assets | | | | | | | 138,774,815 | |
| | | | | | | | |
| | |
| Liabilities | | | | | | | | |
| Loan payable | | | | | | | 2,200,000 | |
| Payable for investments purchased | | | | | | | 1,001,503 | |
| Accrued expenses and other liabilities | | | | | | | 198,580 | |
| Investment management fee payable | | | | | | | 103,847 | |
| Administration fee payable | | | | | | | 27,989 | |
| Loan interest payable | | | | | | | 381 | |
| | | | | | | | |
Total liabilities | | | | | | | 3,532,300 | |
| | | | | | | | |
| Net Assets | | $ | | | | | 135,242,515 | |
| | | | | | | | |
| | |
| Net assets were comprised of: | | | | | | | | |
Common stock, at par | | $ | | | | | 103,441 | |
Paid-in capital in excess of par | | | | | | | 127,414,209 | |
| | | | | | | | |
| | | | | | | 127,517,650 | |
| Undistributed net investment income | | | | | | | 2,414,243 | |
| Accumulated net realized loss on investment and foreign currency transactions | | | | | | | (6,583,596 | ) |
| Net unrealized appreciation on investments and foreign currencies | | | | | | | 11,894,218 | |
| | | | | | | | |
| Net Assets, March 31, 2015 | | $ | | | | | 135,242,515 | |
| | | | | | | | |
| | |
| Net Asset value per share | | | | | | | | |
($135,242,515 ÷ 10,344,073 shares of common stock outstanding) | | $ | | | | | 13.07 | |
| | | | | | | | |
See Notes to Financial Statements.
19
The Asia Pacific Fund, Inc.
Statement of Operations
Year Ended March 31, 2015
| | | | | | | | |
| Net Investment Income | | | | | | | | |
| | |
| Income | | | | | | | | |
| Dividends (net of foreign withholding taxes of $437,330) | | $ | | | | | 5,023,146 | |
| | | | | | | | |
| | |
| Expenses | | | | | | | | |
| Investment management fee | | | | | | | 1,212,494 | |
| Administration fee | | | | | | | 324,130 | |
| Directors’ fees and board expenses | | | | | | | 250,000 | |
| Custodian’s fees and expenses | | | | | | | 230,000 | |
| Legal fees and expenses | | | | | | | 202,000 | |
| Insurance | | | | | | | 139,000 | |
| Reports to shareholders | | | | | | | 120,000 | |
| Audit fee | | | | | | | 41,000 | |
| Loan interest and commitment fees | | | | | | | 29,000 | |
| Registration fees | | | | | | | 25,000 | |
| Transfer agent’s fees and expenses | | | | | | | 22,000 | |
| Miscellaneous | | | | | | | 59,908 | |
| | | | | | | | |
Total expenses | | | | | | | 2,654,532 | |
| | | | | | | | |
| Net investment income | | | | | | | 2,368,614 | |
| | | | | | | | |
| | |
| Realized and Unrealized Gain (Loss) on Investment and Foreign Currency Transactions | | | | | | | | |
| Net realized gain (loss) on: | | | | | | | | |
Investment transactions | | | | | | | 6,433,946 | |
Foreign currency transactions | | | | | | | (57,978 | ) |
| | | | | | | | |
| | | | | | | 6,375,968 | |
| | | | | | | | |
| Net change in unrealized appreciation (depreciation) on: | | | | | | | | |
Investments | | | | | | | 7,516,166 | |
Foreign currencies | | | | | | | (9,391 | ) |
| | | | | | | | |
| | | | | | | 7,506,775 | |
| | | | | | | | |
| Net gain on investment and foreign currency transactions | | | | | | | 13,882,743 | |
| | | | | | | | |
Net Increase in Net Assets
Resulting From Operations | | $ | | | | | 16,251,357 | |
| | | | | | | | |
See Notes to Financial Statements.
20
The Asia Pacific Fund, Inc.
Statement of Changes in Net Assets
| | | | | | | | | | | | | | | | |
| | | | | | Year Ended March 31, | |
| Increase (Decrease) in Net Assets | | | | | 2015 | | | | | | 2014 | |
| | | | |
| Operations | | | | | | | | | | | | | | | | |
| Net investment income (loss) | | $ | | | | | 2,368,614 | | | $ | | | | | (212,887 | ) |
| Net realized gain on investment and foreign currency transactions | | | | | | | 6,375,968 | | | | | | | | 10,191,467 | |
| Net change in unrealized appreciation (depreciation) on investments and foreign currencies | | | | | | | 7,506,775 | | | | | | | | (14,256,638 | ) |
| | | | | | | | | | | | | | | | |
Total increase (decrease) | | | | | | | 16,251,357 | | | | | | | | (4,278,058 | ) |
| | | | |
| Net Assets: | | | | | | | | | | | | | | | | |
| Beginning of year | | $ | | | | | 118,991,158 | | | $ | | | | | 123,269,216 | |
| | | | | | | | | | | | | | | | |
| End of year (a) | | $ | | | | | 135,242,515 | | | $ | | | | | 118,991,158 | |
| | | | | | | | | | | | | | | | |
| (a) Includes undistributed net investment income of: | | $ | | | | | 2,414,243 | | | $ | | | | | — | |
| | | | | | | | | | | | | | | | |
See Notes to Financial Statements.
21
The Asia Pacific Fund, Inc.
Notes to Financial Statements
The Asia Pacific Fund, Inc. (the “Fund”) is registered under the Investment Company Act of 1940, as amended, as a diversified, closed-end, management investment company. The Fund’s investment objective is to achieve long-term capital appreciation through investment of at least 80% of investable assets in equity securities of companies in the Asia Pacific countries.
| Note 1. | Accounting Policies |
The Fund follows investment company accounting and reporting guidance of the Financial Accounting Standards Board (FASB) Accounting Standard Codification Topic 946 Financial Services—Investment Companies. The following accounting policies conform to U.S. generally accepted accounting principles. The Fund consistently follows such policies in the preparation of its financial statements.
Securities Valuation: The Fund holds portfolio securities and other assets that are fair valued at the close of each day the New York Stock Exchange (“NYSE”) is open for trading. Fair value is the price that would be received to sell an asset or paid to transfer a liability in an orderly transaction between market participants on the measurement date. The Board of Directors (the “Board”) has adopted Valuation Procedures for security valuation under which fair valuation responsibilities have been delegated to the Investment Manager, Value Partners Hong Kong Limited. Under the current Valuation Procedures, the established Valuation Committee is responsible for supervising the valuation of portfolio securities and other assets. The Valuation Procedures permit the Fund to utilize independent pricing vendor services, quotations from market makers and alternative valuation methods when market quotations are not readily available or not deemed representative of fair value. A record of the Valuation Committee’s actions is subject to the Board’s review, approval, and ratification at its next regularly-scheduled quarterly meeting.
Various inputs determine how the Fund’s investments are valued, all of which are categorized according to the three broad levels (Level 1, 2, or 3) detailed in the table following the Portfolio of Investments.
Common stocks and preference shares, exchange-traded funds, and derivative instruments such as futures or options that are traded on a national securities exchange are valued at the last sale price as of the close of trading on the applicable exchange where the security principally trades. Securities traded via NASDAQ are valued at the NASDAQ official closing price. To the extent these securities are valued at the last sale price or NASDAQ official closing price, they are classified as Level 1 of the fair value hierarchy.
Participatory Notes (P-notes) are generally valued based upon the value of a related underlying security that trades actively in the market and are classified as Level 2 in the fair value hierarchy.
22
The Asia Pacific Fund, Inc.
Over-the-counter derivative instruments are generally valued using pricing vendor services, which derive the valuation based on inputs such as underlying asset prices, indices, spreads, interest rates, and exchange rates. These instruments are categorized as Level 2 in the fair value hierarchy.
Centrally cleared swaps listed or traded on a multilateral or trade facility platform, such as a registered exchange, are valued at the daily settlement price determined by the respective exchange. These securities are classified as Level 2 in the fair value hierarchy, as the daily settlement price is not public.
In the event that no sale or official closing price on the valuation date exists, these securities are generally valued at the mean between the last reported bid and asked prices, or at the last bid price in absence of an asked price. These securities are classified as Level 2 of the fair value hierarchy.
For common stocks and preference shares traded on foreign securities exchanges, certain valuation adjustments will be applied when events occur after the close of the security’s foreign market and before the Fund’s normal pricing time. These securities are valued using pricing vendor services that provide adjustment factors based on information such as local closing price, relevant general and sector indices, currency fluctuations, depositary receipts, and futures, as applicable. Securities valued using such model prices are classified as Level 2 in the fair value hierarchy as the adjustment factors are observable. Such securities are valued using model prices to the extent that the valuation meets the established confidence level for each security. If the confidence level is not met or the vendor does not provide a model price, securities are valued in accordance with exchange-traded common and preferred stocks discussed above.
Investments in open end, non-exchange-traded mutual funds are valued at their net asset values as of the close of the NYSE on the date of valuation. These securities are classified as Level 1 in the fair value hierarchy since they may be purchased or sold at their net asset value on the date of valuation.
Securities and other assets that cannot be priced using the methods described above are valued based on pricing methodologies approved by the Board. In the event that unobservable inputs are used when determining such valuations, the securities will be classified as Level 3 of the fair value hierarchy.
When determining the fair value of securities, some of the factors influencing the valuation include: the nature of any restrictions on disposition of the securities; assessment of the general liquidity of the securities; the issuer’s financial condition and the markets in which it does business; the cost of the investment; the size of the holding and the capitalization of the issuer; the prices of any recent transactions or bids/offers for such securities or any comparable securities; any available analyst media or other reports or information deemed reliable by the investment manager regarding the issuer or the markets or industry in which it operates. Using fair value to price securities may result in a
23
The Asia Pacific Fund, Inc.
Notes to Financial Statements
continued
value that is different from a security’s most recent closing price and from the price used by other mutual funds to calculate their net asset values.
Foreign Currency Translation
The books and records of the Fund are maintained in U.S. dollars. Foreign currency amounts are translated into U.S. dollars on the following basis:
(i) market value of investment securities, other assets and liabilities—at the current rates of exchange.
(ii) purchases and sales of investment securities, income and expenses—at the rates of exchange prevailing on the respective dates of such transactions.
Although the net assets of the Fund are presented at the foreign exchange rates and market values at the close of the fiscal period, the Fund does not isolate that portion of the results of operations arising as a result of changes in the foreign exchange rates from the fluctuations arising from changes in the market prices of long-term portfolio securities held at fiscal period end. Similarly, the Fund does not isolate the effect of changes in foreign exchange rates from the fluctuations arising from changes in the market prices of long-term portfolio securities sold during the fiscal period. Accordingly, these realized foreign currency gains or losses are included in the reported net realized gains or losses on investment transactions.
Net realized gains or losses on foreign currency transactions represent net foreign exchange gains or losses from holdings of foreign currencies, forward currency contracts, disposition of foreign currencies, currency gains or losses realized between the trade and settlement dates on security transactions, and the difference between the amounts of interest, dividends and foreign withholding taxes recorded on the Fund’s books and the U.S. dollar equivalent amounts actually received or paid. Net unrealized currency gains or losses from valuing foreign currency denominated assets and liabilities (other than investments) at fiscal period end exchange rates are reflected as a component of unrealized appreciation (depreciation) on foreign currencies.
Foreign security and currency transactions may involve certain considerations and risks not typically associated with those of U.S. companies as a result of, among other factors, the level of governmental supervision and regulation of foreign securities markets and the possibility of political or economic instability.
Participatory Notes (P-notes)
The Fund may gain exposure to securities in certain foreign markets through investments in participatory notes (“P-notes”). The Fund may purchase P-notes pending ability to invest directly in a foreign market due to restrictions applicable to foreign investors or other market factors. P-notes are generally issued by banks or broker-dealers and are designed to offer a return linked to a particular underlying security. P-notes involve transaction costs, which may be higher than those applicable to the equity securities. An investment in a P-note may
24
The Asia Pacific Fund, Inc.
involve risks, including counter-party risk, beyond those normally associated with a direct investment in the underlying security. The Fund must rely on the creditworthiness of the counterparty and would have no rights against the issuer of the underlying security. Furthermore, the P-note’s performance may differ from that of the underlying security. The holder of a P-note is entitled to receive from the bank or broker-dealer, an amount equal to dividends paid by the issuer of the underlying security; however, the holder is not entitled to the same rights (e.g., dividends, voting rights) as an owner of the underlying security. There is also no assurance that there will be a secondary trading market for a P-note or that the trading price of a P-note will equal the value of the underlying security.
Stock Index Futures Contracts
A stock index futures contract is an agreement to purchase (long) or sell (short) an agreed amount of securities at a set price for delivery on a future date. Upon entering into a stock index futures contract, the Fund is required to pledge to the broker an amount of cash and/or other assets equal to a certain percentage of the contract amount. This amount is known as the “initial margin.” Subsequent payments known as “variation margin,” are made or received by the Fund each day, depending on the daily fluctuations in the value of the underlying security. Such variation margin is recorded for financial statement purposes on a daily basis as unrealized gain or loss. When the contract expires or is closed, the gain or loss is realized and is presented in the Statement of Operations as net realized gain or loss on stock index futures contracts.
The Fund may utilize stock index futures contracts for hedging and investment purposes. Should market prices for the futures contracts or the underlying assets move in ways not anticipated by the Fund, losses may result. The use of futures contracts involves the risk of imperfect correlation in movements in the price of futures contracts and the underlying assets being hedged or the exposures desired by the Fund.
Master Netting Arrangements
The Fund is subject to various Master Agreements, or netting arrangements, with select counterparties. These are agreements which an investment adviser (adviser) may have negotiated and entered into on behalf of the Fund. A master netting arrangement between the Fund and the counterparty permits the Fund to offset amounts payable by the Fund to the same counterparty against amounts to be received; and by the receipt of collateral from the counterparty by the Fund to cover the Fund’s exposure to the counterparty. However, there is no assurance that such mitigating factors are easily enforceable. The right to set-off exists when all the conditions are met such that each of the parties owes the other a determinable amount, the reporting party has the right to set-off the amount owed with the amount owed by the other party, the reporting party intends to set-off, and the right of set-off is enforceable by law. During the reporting period, there were no instances where the right of set-off existed and management has not elected to offset.
25
The Asia Pacific Fund, Inc.
Notes to Financial Statements
continued
Securities Transactions and Net Investment Income
Securities transactions are recorded on the trade date. Realized and unrealized gains or losses from security and currency transactions are calculated on the identified cost basis. Dividend income is recorded on the ex-dividend date, and interest income is recorded on an accrual basis. Expenses are recorded on the accrual basis which may require the use of certain estimates by management. Actual results may differ from such estimates.
Dividends and Distributions
Dividends from net investment income, if any, are declared and paid at least annually in a manner that qualifies for the dividends-paid deduction. The Fund’s current intention is to distribute at least annually any current year net capital gains in excess of net capital loss carryforwards in a manner that avoids income and excise taxes being imposed on the Fund. Dividends and distributions are recorded on the ex-dividend date. The Fund may choose to satisfy the foregoing by making distributions in cash, additional Fund shares, or both.
The Fund could determine in the future to retain net long-term capital gains in respect of any fiscal year without affecting the ability of the Fund to qualify as a regulated investment company. In that case, the Fund would be subject to taxation on the retained amount and shareholders subject to U.S. federal income taxation would be required to include in income for tax purposes their shares of the undistributed amount and would be entitled to credits or refunds against their U.S. federal income tax liabilities with respect to their proportionate shares of the tax paid by the Fund.
Income distributions and capital gain distributions are determined in accordance with income tax regulations, which may differ from U.S. generally accepted accounting principles.
Taxes
It is the Fund’s current intention to continue to meet the requirements of the U.S. Internal Revenue Code of 1986, as amended (“the Code”) applicable to regulated investment companies and to distribute all of its taxable income and net capital gains to shareholders. Therefore, no federal income tax provision is required. If the Fund determines in the future to retain taxable capital gains, the Fund will provide for all required taxes.
Withholding tax on foreign dividends and interest and foreign capital gains tax is accrued in accordance with the Fund’s understanding of the applicable country’s tax rules and rates.
Estimates
The preparation of the financial statements requires management to make estimates and assumptions that affect the reported amounts and disclosures in the financial statements. Actual results could differ from those estimates.
26
The Asia Pacific Fund, Inc.
| Note 2. | Investment Management and Administration Agreements |
The Fund has a management agreement with Value Partners Hong Kong Limited (the “Investment Manager”), and an administration agreement with Prudential Investments LLC (the “Administrator”).
The investment management fee is computed weekly and payable monthly at the following annual rates: 1.00% of the Fund’s average weekly net assets up to $100 million and 0.70% of such assets in excess of $100 million.
The administration fee is also computed weekly and payable monthly at the following annual rates: 0.25% of the Fund’s average weekly net assets up to $200 million and 0.20% of such assets in excess of $200 million.
Pursuant to the agreements, the Investment Manager provides continuous supervision of the investment portfolio and the Administrator provides occupancy and certain clerical, administrative and accounting services for the Fund. The Investment Manager and the Administrator each pays the cost of compensation of certain officers of the Fund. The Fund bears all other costs and expenses.
| Note 3. | Portfolio Securities |
Cost of purchases and proceeds from sales of investment securities, other than short-term investments, for the year ended March 31, 2015 aggregated $100,072,558 and $96,471,422 respectively.
Distributions to shareholders are determined in accordance with United States federal income tax regulations, which may differ from generally accepted accounting principles. In order to present undistributed net investment income, accumulated net realized loss on investment and foreign currency transactions and paid-in capital in excess of par on the Statement of Assets and Liabilities that more closely represent their tax character, certain adjustments have been made to undistributed net investment income and accumulated net realized loss on investment and foreign currency transactions. For the year ended March 31, 2015, the adjustments were to increase undistributed net investment income and increase accumulated net realized loss on investment and foreign currency transactions by $78,087 due to differences in the treatment for book and tax purposes of certain transactions involving foreign securities and currencies, investments in passive foreign investment companies and other book to tax differences. Net investment income, net realized gain (loss) on investment and foreign currency transactions and net assets were not affected by these adjustments.
27
The Asia Pacific Fund, Inc.
Notes to Financial Statements
continued
During the years ended March 31, 2015 and March 31, 2014, the Fund did not make any distributions to shareholders.
As of March 31, 2015, the Fund had accumulated undistributed earnings on a tax basis of $2,795,594 of ordinary income.
The United States federal income tax basis of the Fund’s investments and the net unrealized appreciation as of March 31, 2015 were as follows:
| | | | | | | | | | | | | | | | | | | | | | |
| Tax Basis | | | Appreciation | | | Depreciation | | | Net
Unrealized
Appreciation | | | Other
Cost Basis
Adjustments | | | Total Net
Unrealized
Appreciation | |
| $ | 119,738,596 | | | $ | 17,186,073 | | | $ | (5,724,448 | ) | | $ | 11,461,625 | | | $ | (3,009 | ) | | $ | 11,458,616 | |
The difference between book basis and tax basis was primarily attributable to deferred losses on wash sales and investments in passive foreign investment companies. Other cost basis adjustments are primarily attributable to appreciation/depreciation of foreign currencies.
Under the Regulated Investment Company Modernization Act of 2010 (the “Act”), the Fund is permitted to carryforward capital losses realized on or after April 1, 2011 (“post-enactment losses”) for an unlimited period. Post-enactment losses are required to be utilized before the utilization of losses incurred prior to the effective date of the Act. As a result of this ordering rule, capital loss carryforwards related to taxable years ending before March 31, 2012 (“pre-enactment losses”) may have an increased likelihood to expire unused. The Fund utilized approximately $5,516,000 of its pre-enactment losses to offset net taxable gains realized in the fiscal year ended March 31, 2015. No capital gains distributions are expected to be paid to shareholders until net gains have been realized in excess of such losses. As of March 31, 2015, the pre and post-enactment losses were approximately:
| | | | |
Post-Enactment Losses: | | $ | 0 | |
| | | | |
Pre-Enactment Losses: | | | | |
Expiring 2018 | | $ | 6,529,000 | |
| | | | |
Management has analyzed the Fund’s tax positions taken on federal, state and local income tax returns for all open tax years and has concluded that no provision for income tax is required in the Fund’s financial statements for the current reporting period. The Fund’s U.S. federal, state and local income and federal excise tax returns for tax years for which the applicable statutes of limitations have not expired are subject to examination by the U.S. Internal Revenue Service and state departments of revenue.
There are 30 million shares of $0.01 par value common stock authorized.
28
The Asia Pacific Fund, Inc.
The Fund currently is a party to a committed credit facility with a bank. The credit facility provides for a maximum commitment of $20,000,000. Interest on any borrowings under the credit facility is at contracted market rates. The Fund pays a commitment fee on the unused portion of the facility. The commitment fee is accrued daily and paid quarterly. The Fund’s obligations under the credit facility are secured by substantially all the assets of the Fund. The purpose of the credit facility is to assist the Fund with its general cash flow requirements, including the provision of portfolio leverage.
During the year ended March 31, 2015, the Fund utilized the credit facility and had an average daily outstanding loan balance of $2,748,571 during the 133 day period that the facility was utilized, at an average interest rate of 0.59%. The maximum amount of loan outstanding during the period was $5,060,000. The amount outstanding at year-end was $2,200,000.
| Note 7. | New Accounting Pronouncement |
In May 2015, the Financial Accounting Standards Board (FASB) issued Accounting Standards Update (ASU) No. 2015-07 regarding “Disclosures for Investments in Certain Entities That Calculate Net Asset Value per Share”. The amendments in this update are effective for fiscal years beginning after December 15, 2015, and interim periods within those fiscal years. ASU No. 2015-07 will eliminate the requirement to categorize investments in the fair value hierarchy if their fair value is measured at net asset value (NAV) per share (or its equivalent) using the practical expedient in the FASB’s fair value measurement guidance. At this time, management is evaluating the implications of ASU No. 2015-07 and its impact on the financial statements has not yet been determined.
29
The Asia Pacific Fund, Inc.
Financial Highlights
| | | | | | | | |
| | | Year ended March 31, | |
| Per Share Operating Performance: | | 2015 | | | 2014 | |
Net asset value, beginning of year | | | $11.50 | | | | $11.92 | |
| | | | | | | | |
Net investment income (loss) | | | .23 | | | | (.02 | ) |
Net realized and unrealized gain
(loss) on investment and foreign
currency transactions | | | 1.34 | | | | (.40 | ) |
| | | | | | | | |
Total from investment operations | | | 1.57 | | | | (.42 | ) |
| | | | | | | | |
Net asset value, end of year | | | $13.07 | | | | $11.50 | |
| | | | | | | | |
Market value, end of year | | | $11.61 | | | | $10.33 | |
| | | | | | | | |
Total investment return (a): | | | 12.39 | % | | | (4.00 | )% |
| | | | | | | | |
| | | | | | | | | |
| | |
| Ratios to Average Net Assets: | | | | | | | | |
Total expenses (including loan
interest) (c) | | | 2.05 | %(b) | | | 2.33 | % |
Net investment income (loss) | | | 1.83 | % | | | (.18 | )% |
| | |
| Supplemental Data: | | | | | | | | |
Average net assets | | | $129,506,000 | | | | $119,204,000 | |
Portfolio turnover rate | | | 76 | % | | | 175 | % |
Net assets, end of year | | | $135,243,000 | | | | $118,991,000 | |
| (a) | Total investment return is calculated assuming a purchase of common stock at the current market value on the first day and a sale at the current market value on the last day of each fiscal year reported. Dividends and distributions, if any, are assumed, for purposes of this calculation, to be reinvested at prices obtained under the Fund’s dividend reinvestment plan. These calculations do not include brokerage commissions. |
| (b) | The expense ratios without loan interest expense would have been 2.05%, 2.11%, 2.15% and 2.00% for the fiscal years ended March 31, 2015, 2013, 2012 and 2011, respectively. No loan interest was incurred during the fiscal year ended March 31, 2014. |
| (c) | Does not include expenses of the underlying funds in which the Fund invests. |
Shown above is selected data for a share of common stock outstanding-total investment return, ratios to average net assets and other supplemental data for the years indicated. This information has been determined based upon information provided in the financial statements and market price data for the Fund’s share.
See Notes to Financial Statements.
30
The Asia Pacific Fund, Inc.
| | | | | | | | | | | | |
| | | Year ended March 31, | |
| Per Share Operating Performance: | | 2013 | | | 2012 | | | 2011 | |
Net asset value, beginning of year | | | $11.67 | | | | $13.06 | | | | $10.97 | |
| | | | | | | | | | | | |
Net investment income (loss) | | | (0.03 | ) | | | (0.05 | ) | | | (0.06 | ) |
Net realized and unrealized gain (loss) on investment and foreign currency transactions | | | 0.28 | | | | (1.34 | ) | | | 2.15 | |
| | | | | | | | | | | | |
Total from investment operations | | | 0.25 | | | | (1.39 | ) | | | 2.09 | |
| | | | | | | | | | | | |
Net asset value, end of year | | | $11.92 | | | | $11.67 | | | | $13.06 | |
| | | | | | | | | | | | |
Market value, end of year | | | $10.76 | | | | $10.58 | | | | $11.83 | |
| | | | | | | | | | | | |
Total investment return (a): | | | 1.70 | % | | | (10.57 | )% | | | 18.89 | % |
| | | | | | | | | | | | |
| | | | | | | | | | | | | |
| | | |
| Ratios to Average Net Assets: | | | | | | | | | | | | |
Total expenses (including loan interest) (c) | | | 2.16 | %(b) | | | 2.15 | %(b) | | | 2.01 | %(b) |
Net investment income (loss) | | | (0.28 | )% | | | (0.40 | )% | | | (0.51 | )% |
| | | |
| Supplemental Data: | | | | | | | | | | | | |
Average net assets | | | $117,996,000 | | | | $123,601,000 | | | | $120,668,000 | |
Portfolio turnover rate | | | 180 | % | | | 137 | % | | | 136 | % |
Net assets, end of year | | | $123,269,000 | | | | $120,715,000 | | | | $135,076,000 | |
See Notes to Financial Statements.
31
The Asia Pacific Fund, Inc.
Report of Independent Registered Public Accounting Firm
The Board of Directors and Shareholders
The Asia Pacific Fund, Inc.:
We have audited the accompanying statement of assets and liabilities of The Asia Pacific Fund, Inc. (hereafter referred to as the “Fund”), including the portfolio of investments, as of March 31, 2015, and the related statement of operations for the year then ended, the statements of changes in net assets for each of the years in the two-year period then ended and the financial highlights for each of the years in the five-year period then ended. These financial statements and financial highlights are the responsibility of the Fund’s management. Our responsibility is to express an opinion on these financial statements and financial highlights based on our audits.
We conducted our audits in accordance with the standards of the Public Company Accounting Oversight Board (United States). Those standards require that we plan and perform the audit to obtain reasonable assurance about whether the financial statements and financial highlights are free of material misstatement. An audit includes examining, on a test basis, evidence supporting the amounts and disclosures in the financial statements. Our procedures included confirmation of securities owned as of March 31, 2015, by correspondence with the custodian, and brokers or by other appropriate auditing procedures where replies from brokers were not received. An audit also includes assessing the accounting principles used and significant estimates made by management, as well as evaluating the overall financial statement presentation. We believe that our audits provide a reasonable basis for our opinion.
In our opinion, the financial statements and financial highlights referred to above present fairly, in all material respects, the financial position of the Fund as of March 31, 2015, and the results of its operations, the changes in its net assets and the financial highlights for the periods described in the first paragraph above, in conformity with U.S. generally accepted accounting principles.

New York, New York
May 15, 2015
32
The Asia Pacific Fund, Inc.
Tax Information (Unaudited)
For the fiscal year ended March 31, 2015, the Fund made an election to pass through the maximum amount of the portion of the ordinary income dividends derived from foreign source income as well as any foreign taxes paid by the Fund in accordance with Section 853 of the U.S. Internal Revenue Code of the following amounts: $433,405 foreign tax credit from recognized foreign source income of $5,458,824.
In January 2016, shareholders will be advised on IRS Form 1099-DIV or Substitute Form 1099-DIV as to the federal tax status of dividends and distributions received in calendar year 2015.
33
The Asia Pacific Fund, Inc.
Dividend Reinvestment Plan (Unaudited)
Shareholders may elect to have all distributions of dividends and capital gains automatically re-invested in Fund shares (“Shares”) pursuant to the Fund’s Dividend Reinvestment Plan (“the Plan”). Shareholders who do not participate in the Plan will receive all distributions in cash paid by check in United States Dollars mailed directly to the shareholders of record (or if the shares are held in street or other nominee name, then to the nominee) by the custodian, as dividend disbursing agent. Shareholders who wish to participate in the Plan should complete the attached enrollment card or contact the Fund at 1-(800) 451-6788.
After the Fund declares a dividend or determines to make a capital gains distribution, if (1) the market price is lower than net asset value, the participants in the Plan will receive the equivalent in Shares valued at the market price determined as of the time of purchase (generally, following the payment date of the dividend or distribution); or if (2) the market price of Shares on the payment date of the dividend or distribution is equal to or exceeds their net asset value, participants will be issued Shares at the higher of net asset value or 95% of the market price.
There is no charge to participants for reinvesting dividends or capital gain distributions, except for certain brokerage commissions, as described below. The Plan Agent’s (Computershare Trust Company N.A.) fees for the handling of the reinvestment of dividends and distributions will be paid by the Fund. There will be no brokerage commissions charged with respect to shares issued directly by the Fund. However, each participant will pay a pro rata share of brokerage commissions incurred with respect to the Plan Agent’s open market purchases in connection with the reinvestment of dividends and distributions. The automatic reinvestment of dividends and distributions will not relieve participants of any federal income tax that may be payable on such dividends or distributions.
The Fund reserves the right to amend or terminate the Plan upon 90 days’ written notice to shareholders of the Fund.
Participants in the Plan may withdraw from the Plan upon written notice to the Plan Agent and will receive certificates for whole Shares and cash for fractional Shares.
34
The Asia Pacific Fund, Inc.
Miscellaneous Information (Unaudited)
Proxy Voting
A description of the policies and procedures that the Fund uses to determine how to vote proxies relating to portfolio securities is available:
| • | | Without charge, by calling the Fund’s toll-free telephone number (888) “ASIA-PAC”. |
| • | | On the Securities and Exchange Commission website, http://www.sec.gov. |
Information regarding the Fund’s proxy voting record for the 12-month period ending June 30 of each year is filed with the SEC on Form N-PX no later than August 31 of each year. The Fund’s Form N-PX is available without charge, upon request, by calling the Fund at its toll free number 1-(888) 4-ASIA-PAC and on the SEC’s website (http://www.sec.gov).
New York Stock Exchange and Securities and Exchange Commission Certifications
The Fund is listed on the New York Stock Exchange. As a result, it is subject to certain corporate governance rules and related interpretations issued by the Exchange. Pursuant to those requirements, the Fund must include information in this report regarding certain certifications.
The Fund’s President and Treasurer file certifications with the Securities and Exchange Commission regarding the quality of the Fund’s public disclosure. The certifications are made pursuant to Section 302 of the Sarbanes-Oxley Act (“Section 302 Certifications”). The section 302 Certifications are filed as exhibits to the Fund’s annual report on Form N-CSR, which include a copy of the annual report together with certain other information about the Fund.
Availability of Quarterly Portfolio Schedule
The Fund files its complete schedule of portfolio holdings with the Commission for the first and third quarters of each fiscal year on Form N-Q. The Fund’s N-Q Forms are available on the Commission’s website at http://www.sec.gov. The Fund’s N-Q Forms may also be reviewed and copied at the Commission’s Public Reference Room in Washington, D.C. Information on the operation of the Public Reference Room may be obtained by calling (800) SEC-0330 (732-0330).
35
The Asia Pacific Fund, Inc.
Directors and Officers of the Fund (Unaudited)
Information pertaining to the Directors of the Fund is set forth below. Directors who are not deemed to be “interested persons” of the Fund as defined in the Investment Company Act of 1940, as amended (the 1940 Act) are referred to as “Independent Directors.” Directors who are deemed to be “interested persons” of the Fund are referred to as “Interested Directors.” The “Fund Complex” consists of the Fund and any other investment companies managed by Value Partners Hong Kong Limited (the Investment Manager).
Independent Directors
| | | | |
Name, Address** and Age | | Positions with Fund*** | |
Term of Office***
and Length of Time Served |
| | |
| Jessica M. Bibliowicz (55) | | Director (Class II) | | Since 2006 |
| | |
| Michael J. Downey (71) | | Director and
Chairman
(Class I) | | Since 1986 Since 1999 |
| | |
| Robert F. Gunia (68) | | Director (Class III) | | Since 1989 |
| | |
| Duncan M. McFarland (71) | | Director (Class I) | | Since 2005 |
36
The Asia Pacific Fund, Inc.
| | | | | | |
Principal Occupations During Past 5 Years | | Number of
Portfolios in
Fund Complex
Overseen by
Director | | | Other Directorships Held by the
Director**** |
| | |
| Private Investor; formerly, Chief Executive Officer of National Financial Partners. (NYSE:NFP), an independent distributor of financial services products. Formerly, President and Chief Operating Officer of John A. Levin & Co., a registered investment advisor. | | | 1 | | | Director of Realogy Holdings Corp. Director of Advanced Series Trust (since September 2014), Prudential’s Gibraltar Fund, Inc. and The Prudential Series Fund (since March 2015). |
| | |
| Private Investor. | | | 1 | | | Director, AB Mutual Fund Complex (101 funds); Trustee, The Merger Fund. |
| | |
| Independent Consultant (since October 2009); formerly Chief Administrative Officer (September 1999-September 2009) and Executive Vice President (December 1996-September 2009) of Prudential Investments LLC; formerly Executive Vice President (March 1999-September 2009) and Treasurer (May 2000-September 2009) of Prudential Mutual Fund Services LLC; formerly President (April 1999-December 2008) and Executive Vice President and Chief Operating Officer (December 2008-December 2009) of Prudential Investment Management Services LLC; formerly Chief Administrative Officer, Executive Vice President and Director (May 2003-September 2009) of AST Investment Services, Inc. | | | 1 | | | Director of Advanced Series Trust, Prudential’s Gibraltar Fund, Inc. and The Prudential Series Fund. Director of ICI Mutual Insurance Company (since June 2012); Vice President and Director of Prudential Retail Mutual Fund Complex through September 2009. |
| | |
| Formerly, Managing Partner and Chief Executive Officer, Wellington Management Company, LLP. (1994-2004); formerly Trustee, Financial Accounting Foundation (2001-2009). | | | 1 | | | Director of Via Science Inc. |
37
The Asia Pacific Fund, Inc.
Directors and Officers of the Fund (Unaudited)
continued
Independent Directors continued
| | | | |
Name, Address** and Age | | Positions
with Fund*** | |
Term of Office***
and Length of
Time Served |
| | |
| David G. P. Scholfield (71) | | Director (Class II) | | Since 1988 |
| | |
| Nicholas T. Sibley (76) | | Director (Class III) | | Since 2001 |
| | |
| Christopher Sykes (60) | | Director (Class III) | | Since 2014 |
| William G. Tung (65) | | Director (Class II)
| | Since 2013 |
38
The Asia Pacific Fund, Inc.
| | | | | | |
Principal Occupations
During Past 5 Years | | Number of
Portfolios in
Fund Complex
Overseen by
Director | | | Other Directorships
Held by the
Director**** |
| | |
| Chairman, Acru China+ Absolute Return Fund; Director, Bank of China HK RMB Bond Fund and Wealth Achieve Series; Trustee and Investment Committee member of two UK-registered Charitable Trusts; formerly, Managing Director Bank of Bermuda, Hong Kong (1998-2004) and Bank of Bermuda Country Head, Asia (2001-2004). | | | 1 | | | |
| | |
| Fellow of the Institute of Chartered Accountants in England and Wales; formerly Chairman of Aquarius Platinum Ltd. (2003-2015). | | | 1 | | | |
| | |
| Chairman and Co-Founder of Charlesworth Sykes and Company. | | | | | | |
| | |
| President and CEO of GT International Associates (2011-Present); Managing Partner of AT-BCM LLC (2013-Present); Executive Director of the Shanghai Bund de Rockefeller Group Master Development Co. Ltd (2009-Present), formerly Chairman & Legal Rep (2005-2008); formerly, Managing Director of the Rockefeller Group Asia Pacific (2003-2010). | | | 1 | | | |
39
The Asia Pacific Fund, Inc.
Directors and Officers of the Fund (Unaudited)
continued
Information pertaining to the Officers of the Fund is set forth below.
Officers
| | | | |
Name, Address** and Age | | Positions
with Fund | | Term of Office and Length of
Time Served |
| | |
| Raymond Tam (41) | | President | | Since 2013 |
| | |
| M. Sadiq Peshimam (51) | | Treasurer and Chief Financial Officer Assistant Treasurer | | Since 2008 2005-2008 |
| | |
| Deborah A. Docs (57) | | Secretary Chief Legal Officer Assistant Secretary | | Since 1998 Since 2006 1989-1998 |
| | |
| Andrew R. French (52) | | Assistant Secretary | | Since 2007 |
| | |
| Valerie M. Simpson (56) | | Chief Compliance Officer | | Since 2007 |
| | |
| Theresa C. Thompson (52) | | Deputy Chief Compliance Officer | | Since 2008 |
| ** | The address of the Directors and Officers is c/o: Prudential Investments LLC, Gateway Center Three, 100 Mulberry Street, Newark, New Jersey, 07102-4077. |
40
The Asia Pacific Fund, Inc.
|
Principal Occupations During Past 5 Years |
|
| Deputy Chief Executive Officer and Head of Sales of Value Partners Limited (since June 2012); formerly, Vice President at BlackRock. |
|
| Treasurer and Principal Accounting Officer of PI Mutual Fund Complex (since May 2014); formerly, Assistant Treasurer and Vice President (since 2005) of PI. |
|
| Vice President and Corporate Counsel (since January 2001) of Prudential; Vice President (since December 1996) and Assistant Secretary (since March 1999) of PI.; formerly, Chief Legal-Officer and Secretary of The Greater China Fund, Inc. (January 2007-February 2014). |
|
| Vice President and Corporate Counsel (since February 2010) of Prudential; formerly Director and Corporate Counsel (2006-2010) of Prudential; Vice President and Assistant Secretary (since January 2007) of PI; Vice President and Assistant Secretary of PMFS; formerly, Assistant Secretary of The Greater China Fund, Inc. (June 2007-February 2014). |
|
| Vice President Corporate Compliance and Chief Investment Office (May 2013-Present); formerly Chief Compliance Officer (April 2007-May 2013) of Prudential Investments and AST Investment Services, Inc.; formerly Vice President-Financial Reporting (June 1999-March 2006) for Prudential Life and Annuities Finance; formerly, Chief Compliance Officer of The Greater China Fund, Inc. (June 2007-February 2014). |
|
| Vice President, Compliance, PI (since April 2004); and Director, Compliance, PI (2001-2004); formerly, Deputy Chief Compliance Officer of The Greater China Fund, Inc. (December 2007-February 2014). |
| *** | The Fund’s Charter and Bylaws provide that the Board of Directors is divided into three classes of Directors, as nearly equal in number as possible. Each Director serves for a term of three years, with one class being elected each year. Each year the term of office of one class will expire. |
| **** | This column includes all directorships of companies required to register, or file reports with the Commission under the Securities Exchange Act of 1934 (the Exchange Act) (i.e., “public companies”) and other investment companies registered under the 1940 Act. |
41
Privacy Notice
This privacy notice is being provided on behalf of the companies listed in this notice. It describes how information about you is handled and the steps we take to protect your privacy. We call this information “customer data” or just “data.” If you have other Prudential products or relationships, you may receive a separate privacy notice describing the practices that apply to those products or relationships. If your relationship with us ends, we will continue to handle data about you the same way we handle customer data.
Protecting Customer Data
We maintain physical, electronic, and procedural safeguards to protect customer data. The only persons who are authorized to have access to it are those who need access to do their jobs. We require them to keep the data secure and confidential.
Information We Collect
We collect data you give us and data about the products and relationships you have with us, so that we can serve you, including offering products and services to you. It includes, for example:
| | • | | income and Social Security number. |
We also collect data others give us about you, for example:
| | • | | medical information for insurance applications, |
| | • | | consumer reports from consumer reporting agencies, and |
| | • | | participant information from organizations that purchase products or services from us for the benefit of their members or employees, for example, group life insurance. |
Sharing Data
We may share data with affiliated companies and with other companies so that they can perform services for us or on our behalf. We may, for example, disclose data to other companies for customer service or administrative purposes. We may disclose limited information such as:
| | • | | the types of products you own |
to service providers so they can provide marketing services to us.
We may also disclose data as permitted or required by law, for example:
| | • | | to law enforcement officials, |
| | • | | in response to subpoenas, |
We do not disclose data to Prudential affiliates or other companies to allow them to market their products or services to you. We may tell you about a product or service that a Prudential company or other companies offer. If you respond, that company will know that you were in the group selected to receive the information.
Annual Notices
We will send notices at least once a year, as federal and state laws require. We reserve the right to modify this policy at any time.
If you have questions about Prudential’s Privacy Notice please call us. The toll-free number is (800) 236-6848.

Prudential, the Prudential logo and the Rock symbol are service marks of Prudential Financial, Inc. and its related entities, registered in many jurisdictions worldwide.
Your Financial Security, Your Satisfaction & Your Privacy | Privacy 0019 Ed. 3/2015 |
MUTU-D5862
Many Prudential Financial companies are required to send privacy notices to their customers. This notice is being provided to customers of the Prudential Financial companies listed below:
Insurance Companies and Separate Accounts
Prudential Insurance Company of America, The
Prudential Annuities Life Assurance Corporation
Pruco Life Insurance Company
Pruco Life Insurance Company of New Jersey
Prudential Retirement Insurance and Annuity Company (PRIAC)
PRIAC Variable Contract Account A
CG Variable Annuity Account I & II (Connecticut General)
Prudential Legacy Insurance Company of New Jersey
All separate accounts that include the following names: Prudential, Pruco, or PRIAC
Insurance Agencies
Prudential Insurance Agency, LLC
Broker-Dealers and Registered Investment Advisers
AST Investment Services, Inc.
Prudential Annuities Distributors, Inc.
Global Portfolio Strategies, Inc.
Pruco Securities, LLC
Prudential Investment Management, Inc.
Prudential Investment Management Services LLC
Prudential Investments LLC
Prudential Private Placement Investors, L.P.
Bank and Trust Companies
Prudential Bank & Trust, FSB
Prudential Trust Company
Investment Companies and Other Investment Vehicles
Asia Pacific Fund, Inc., The
Prudential Investments Mutual Funds
Prudential Capital Partners, L.P.
Target Portfolio Trust, The
Advanced Series Trust
The Prudential Series Fund
Private Placement Trust Investors, LLC
All funds that include the following names: Prudential or PCP
MUTU-D5862

Item 2 – Code of Ethics – – See Exhibit (a)
As of the end of the period covered by this report, the registrant has adopted a code of ethics (the “Section 406 Standards for Investment Companies – Ethical Standards for Principal Executive and Financial Officers”) that applies to the registrant’s Principal Executive Officer and Principal Financial Officer; the registrant’s Principal Financial Officer also serves as the Principal Accounting Officer.
The registrant hereby undertakes to provide any person, without charge, upon request, a copy of the code of ethics. To request a copy of the code of ethics, contact the registrant 973-367-7521, and ask for a copy of the Section 406 Standards for Investment Companies - Ethical Standards for Principal Executive and Financial Officers.
Item 3 – Audit Committee Financial Expert –
The registrant’s Board has determined that Mr. Robert F. Gunia, member of the Board’s Audit Committee is an “audit committee financial expert” and that he is “independent” for purpose of this Item.
Item 4 – Principal Accountant Fees and Services –
(a) Audit Fees
For the fiscal years ended March 31, 2015 and March 31, 2014, KPMG, the Registrant’s principal accountant, billed the Registrant $40,800 and $40,800, respectively for professional services rendered for the audit of the Registrant’s annual financial statements or services that are normally provided in connection with statutory and regulatory filings.
(b) Audit-Related Fees
None.
(c) Tax Fees
None.
(d) All Other Fees
None.
(e) (1) Audit Committee Pre-Approval Policies and Procedures
The Audit committee must pre-approve, or adopt appropriate procedures to pre-approve, all audit and non-audit services to be provided by the independent auditors, including applicable non-audit services provided to the Company’s investment adviser and any entity in a control relationship with the investment adviser that provides ongoing services to the Company that relate directly to the operations and financial reporting of the Company.
(e) (2) Percentage of services referred to in 4(b)- (4)(d) that were approved by the audit committee –
Not applicable.
(f) Percentage of hours expended attributable to work performed by other than full time employees of principal accountant if greater than 50%.
The percentage of hours expended on the principal accountant’s engagement to audit the registrant’s financial statements for the most recent fiscal year that were attributed to work performed by persons other than the principal accountant’s full-time, permanent employees was 0%.
(g) Non-Audit Fees
Not applicable to Registrant and to the registrant’s investment adviser and any entity controlling, controlled by, or under common control with the investment adviser that provides ongoing services to the registrant.
(h) Principal Accountants Independence
The Registrant’s audit committee was not required to consider whether the provision of non-audit services that were rendered to the Registrant’s investment adviser (not including any sub-adviser whose role is primarily portfolio management and is subcontracted with or overseen by another investment adviser), and any entity controlling, controlled by, or under common control with the investment adviser that provides ongoing services to the Registrant that were not pre-approved pursuant to paragraph (c)(7)(ii) of Rule 2-01 of Regulation S-X is compatible with maintaining the principal accountant’s independence.
Item 5 – Audit Committee of Listed Registrants –
The registrant has a separately designated standing audit committee (the “Audit Committee”) established in accordance with Section 3(a)(58)(A) of the Securities Exchange Act of 1934. The members of the Audit Committee are: Robert F. Gunia, Duncan M. McFarland, David G.P. Scholfield and Nicholas T. Sibley.
Item 6 – Schedule of Investments – The schedule is included as part of the report to shareholders filed under Item 1 of this Form.
Item 7 – Disclosure of Proxy Voting Policies and Procedures for Closed-End Management Investment Companies –
The registrant has adopted policies and procedures with respect to the voting of proxies related to portfolio securities. These procedures delegate to Value Partners Hong Kong Limited, the investment manager, the responsibility for voting proxies, subject to the continuing oversight of the registrant’s board of directors. The registrant’s procedures provide that the board of directors annually reviews the investment manager’s proxy voting policies and procedures and the investment manager’s proxy votes on behalf of the registrant.
A copy of the investment manager’s proxy voting policies and procedures is set forth below:
Value Partners Group Limited
Proxy Voting Policies and Procedures
Under SEC Rule 206(4)-6, an investment adviser has to (i) adopt and implement written policies and procedures that are reasonably designed to ensure that it votes client securities in the best interests of its clients, (ii) describe its proxy voting policies and procedures to clients and provide copies on request, and (iii) disclose to clients how they may obtain information on how the adviser voted their securities.
Value Partners (“VP”) has adopted the following policies and procedures for proxy voting.
If client agreements for services are silent as to proxies, the SEC believes the adviser is generally responsible for voting proxies.
| 2. | General Voting Principles |
Where VP has responsibility for voting proxies, VP will take measures reasonably designed to ensure that they are voted in the best interest of its clients, which generally means voting with a view to enhancing the value of client securities.
The financial interest of VP’s clients is the primary consideration in determining how their proxies should be voted. VP will take reasonable measures to obtain knowledge of meetings; to ensure that proxies are received by VP in sufficient time for it to take action; to vote them; and to return them in time to be counted.
VP may refrain from voting if it reasonably believes that the matters to be voted on have no significant effect on clients’ interests or if there is a pending sell order for the security. VP may also refrain from voting if the cost or other burden would be unreasonable (e.g., where translation of documentation regarding foreign securities would be required). VP may vote against or refrain from voting on a particular agenda item if it reasonably believes that the proxy statement has not provided sufficient information to justify a vote in favor.
VP will take measures reasonably designed to permit it to act on an informed basis with respect to issues presented by proxies. The sources of VP’s information will include the knowledge on the basis of which VP has invested client funds in the company and knowledge gained in following the investment. VP may supplement its knowledge by reference to publications or other readily available public sources but VP does not expect to independently investigate facts relating to issues presented by proxy statements.
| 2.1 | Conflicts of interests |
There may be occasions where voting may present an actual or potential conflict of interest between VP, as the investment adviser, and its clients.
Potential conflicts of interest situations may include:
| 1. | Business relationships, where VP has a substantial business relationship with a company and failure to vote in favor of management could harm VP’s relationship with the company; |
| 2. | Personal relationships, where VP has a personal relationship with corporate directors or candidates for directorship; or |
| 3. | Family relationships where VP may have personal or business relationships relating to a company (e.g. a spouse or relative who serves as a director of a publicly traded company). |
For any voting proposals where VP determines that it has a material conflict of interest, VP will take steps designed to ensure a decision to vote that is based on the clients’ best interest and is not the product of the conflict, in which, VP may:
(i) refer the proposals to the clients and obtain instructions from the clients on how to vote the proxies relating to those proposals;
(ii) (if VP is in a position to disclose the conflict to the clients i.e., such information is not confidential) determine how it proposes to vote the proposals on which it has a conflict, disclose the conflict to the clients and seek their consent before exercising a proxy;
(iii) take such other action such as consulting an independent third party such as external legal counsel as VP reasonably deems appropriate.
Proxy proposals that are “routine” are presumed not to involve a material conflict of interest for VP, unless VP has actual knowledge that a routine proposal should be treated differently. For this purpose, “routine” proposals would typically include matters such as uncontested election of directors, meeting formalities, and approval of periodic reports/financial statements.
| 2.2 | Substantive issues presented for voting |
It is not possible to present a comprehensive roadmap for the voting of proxies. The following general guidelines set out our general approach but each situation must be judged on its own merits.
The decision to invest in a company normally represents confidence in the management of that company. Consequently, in the absence of evidence reducing our confidence in management, VP will give considerable weight (by no means conclusive weight) to management recommendations, except in the case of issues directly affecting the interests of management itself, such as management compensation.
VP will generally support management recommendations about the internal operations of the company or which are not expected to have a significant economic effect on the company or its security-holders. Proposals which are likely to have significant economic effect on the company and its security-holders will be subject to greater scrutiny on a case-by-case basis.
VP favors having strong independent directors and supports the delegation of key functions (such as compensation, audit and nominating committees) to independent directors. VP will generally oppose classification of directors.
Proposals for re-capitalizations, mergers, corporate restructuring and anti-takeover measures such as “poison pills” will be carefully scrutinized to ascertain possible benefits and disadvantages to security-holders. Management recommendations with respect to such transactions will be reviewed in the light of possible management self-interest.
Proposals regarding stock-option plans and other compensation issues will be carefully scrutinized. Since VP’s investment philosophy strongly favors long-term capital appreciation, its assessment of proposals for management compensation will take into account positioning for achievement of long-term goals as well as short-term performance.
Unless VP concludes that substantial financial interests of its clients are at risk or has client instructions to the contrary, VP will generally leave to management discretion matters involving social, environmental, ethical or similar issues.
These general guidelines are not exhaustive and do not include all potential voting issues. Proposals not covered by the guidelines and contested situations are evaluated on a case-by-case basis, taking into consideration all of the relevant facts and circumstances at the time of the vote.
Regardless of the issues presented VP will be mindful of its duty to vote proxies in the best interest of its clients. VP may defer to instructions of its clients as to voting their securities with respect to specific issues as it deems appropriate.
| 3.1 | Responsibility of Fund Administration Team |
Fund Administration Team is responsible for coordinating with respective custodians to assure that proxies are received by VP in sufficient time to take action. Also, they will follow up with responsible Fund Managers for voting and to ensure that reasons for the decision on voting non-routine proxy proposals (e.g. special resolution for an EGM, cash/scrip dividend selection, etc) are clearly stated by the responsible Fund Manager.
Fund Administration Team should arrange for signature and return the proxies in time to be counted. All relevant documents should be properly kept as stated in Section 4 below.
| 3.2 | Responsibility of Fund Managers |
Proxy voting decisions should be made primarily by the Fund Manager who follows the particular stock under investment. However, the respective Portfolio Manager can revise the vote and make the final decision for his/her managed portfolio. The decision/vote should be made in accordance with the principles above and in a timely manner.
Upon voting on non-routine proxy proposals (e.g. special resolution for an EGM, cash/scrip dividend selection, etc), reasons for making the voting decision must be clearly stated so as to support the decision made by the responsible Fund Manager.
| 3.3 | Independent Checking by Internal Auditor |
An independent review on proxy voting measures and documents will be performed by Internal Auditor periodically to ensure VP votes the proxies in the best interests of its clients and properly complies with the company policy.
In compliance with another SEC rule (Rule 204-2) VP will maintain appropriate records regarding proxies as follows: VP will maintain
(1) copies of these proxy voting policies and procedures and any amendments to them;
(2) proxy statements received regarding client securities;
(3) records of how proxies were voted;
(4) written client requests for VP’s proxy voting records and copies of VP’s written responses to such requests;
(5) documents created by VP that were material to its decisions on how to vote proxies or that memorialized the bases for its decisions; and
(6) documentation relating to the identification and resolution of conflicts of interest, if any.
These records will be retained for at least five years in a readily accessible place, and for the first two years in VP’s own office.
VP has disclosed in Form ADV Part 2A: (i) a description of VP’s Proxy Voting Policy and Procedures and (ii) information about how clients may obtain information on how VP voted their securities.
| 5. | Client requests for information and/or copies |
Clients may obtain copies of these proxy voting policies and procedures at any time.
Clients may obtain information as to what issues were voted upon by VP in respect of their securities and how their proxies were voted on such issues. Information will be provided promptly with respect to any period for which VP retains records on-site, and after a reasonable period of time if resort to off-site records is required.
The above information may be obtained by making request in writing to VP’s Chief Compliance Officer at 9th Floor, Nexxus Building, 41 Connaught Road Central, Hong Kong.
Item 8 – Portfolio Managers of Closed-End Management Investment Companies –
| | |
| (a)(1) | | Norman Man Kei Ho, Senior Investment Director, Value Partners Limited |
Length of Service at Value Partners Limited: 19 years
Norman joined Value Partners in 1995 and was promoted to Investment Director and Senior Investment Director in 2010 and January 2014, respectively. He has extensive experience in the fund management and investment industry, with a focus on research and portfolio management. He is a key leader in Value Partners’ investment process, including a high degree of responsibility for portfolio management.
He graduated with a Bachelor’s degree in Social Sciences (majoring in Management Studies) from The University of Hong Kong. He is a CFA charterholder.
| | |
| (a)(2) | | In addition to the Fund, Mr. Ho was also responsible for the day-to-day management of the portfolio of the following accounts as of March 31, 2015: |
| | | | | | | | | | | | | | | | |
| | | Number
of Accounts | | | Number of Accounts
with Performance Fee | | | Assets
Under Management ($ US mil) | | | Assets
Under Management
with Performance
Fee ($ US mil) | |
Registered Investment Companies | | | — | | | | — | | | | — | | | | — | |
Segregated Institutional | | | — | | | | — | | | | — | | | | — | |
Other Pooled Investment Vehicles | | | 3 | | | | 3 | | | $ | 3,691 | | | $ | 3,691 | |
There is no material conflict between the management of Asia Pacific Fund versus other funds.
| | |
| (a)(3) | | Portfolio Managers are compensated via his/her annual salary plus potential for a performance bonus if the majority of the funds managed by the Portfolio Managers and his/her team achieved their excess returns objectives. |
| | |
| (a)(4) | | As of March 31, 2015, Mr. Ho did not beneficially own any equity securities in the Fund. |
Item 9 – Purchases of Equity Securities by Closed-End Management Investment Company and Affiliated Purchasers –
There were no purchases made by or on behalf of the registrant or any “affiliated purchaser,” as defined in Rule 10b-18(a)(3) under the Securities Exchange Act of 1934, as amended, of shares of the registrant’s equity securities made in the period covered by this report.
Item 10 – Submission of Matters to a Vote of Security Holders – Not applicable.
Item 11 – Controls and Procedures
| | (a) | It is the conclusion of the registrant’s principal executive officer and principal financial officer that the effectiveness of the registrant’s current disclosure controls and procedures (such disclosure controls and procedures having been evaluated within 90 days of the date of this filing) provide reasonable assurance that the information required to be disclosed by the registrant has been recorded, processed, summarized and reported within the time period specified in the Commission’s rules and forms and that the information required to be disclosed by the registrant has been accumulated and communicated to the registrant’s principal executive officer and principal financial officer in order to allow timely decisions regarding required disclosure. |
| | (b) | There has been no significant change in the registrant’s internal control over financial reporting that occurred during the registrant’s most recent fiscal quarter of the period covered by this report that has materially affected, or is likely to materially affect, the registrant’s internal control over financial reporting. |
Item 12 – Exhibits
| | (a) (1) | Code of Ethics – Attached hereto as Exhibit EX-99.CODE-ETH |
| | (2) | Certifications pursuant to Section 302 of the Sarbanes-Oxley Act – Attached hereto as Exhibit EX-99.CERT. |
| | (3) | Any written solicitation to purchase securities under Rule 23c-1. – Not applicable. |
| | (b) | Certifications pursuant to Section 906 of the Sarbanes-Oxley Act – Attached hereto as Exhibit EX-99.906CERT. |
SIGNATURES
Pursuant to the requirements of the Securities Exchange Act of 1934 and the Investment Company Act of 1940, the registrant has duly caused this report to be signed on its behalf by the undersigned, thereunto duly authorized.
| | |
| (Registrant) | | The Asia Pacific Fund, Inc. |
| | |
| By (Signature and Title)* | | /s/ Deborah A. Docs |
| | Deborah A. Docs |
| | Secretary |
Pursuant to the requirements of the Securities Exchange Act of 1934 and the Investment Company Act of 1940, this report has been signed below by the following persons on behalf of the registrant and in the capacities and on the dates indicated.
| | |
| By (Signature and Title)* | | /s/ Raymond Tam |
| | Raymond Tam |
| | President and Principal Executive Officer |
| | |
| By (Signature and Title)* | | /s/ M. Sadiq Peshimam |
| | M. Sadiq Peshimam |
| | Treasurer and Chief Financial Officer |
| * | Print the name and title of each signing officer under his or her signature. |