UNITED STATES
SECURITIES AND EXCHANGE COMMISSION
Washington, D.C. 20549
FORM N-CSR
CERTIFIED SHAREHOLDER REPORT OF REGISTERED
MANAGEMENT INVESTMENT COMPANIES
Investment Company Act file number
811-04722
FMI Mutual Funds, Inc.
(Exact name of registrant as specified in charter)
100 East Wisconsin Avenue
Suite 2200
Milwaukee, WI 53202
(Address of principal executive offices) (Zip code)
Ted D. Kellner
Fiduciary Management, Inc.
100 East Wisconsin Avenue
Suite 2200
Milwaukee, WI 53202
(Name and address of agent for service)
(414) 226-4555
(Registrant's telephone number, including area code)
Date of fiscal year end: September 30
Date of reporting period: March 31, 2008
Item 1. Reports to Stockholders.
SEMIANNUAL REPORT
March 31, 2008
FMI Provident Trust
Strategy Fund
A NO-LOAD MUTUAL FUND
FMI Provident Trust Strategy Fund
April 15, 2008
Dear Fellow Shareholders:
The first quarter of 2008 was one of the most difficult we have seen in a long time. FMI Provident Trust Strategy Fund declined 5.41%, and it is small solace that the Fund outperformed the S&P 500, which was down 9.45%. Investors are paying the piper for the incredible financial excesses of recent years, but this too will end.
One year ago a managing director of one of the largest private equity firms in the world, was quoted as saying “[Liquidity] has enabled us to do transactions that were previously unimaginable. Frankly, there is so much liquidity in the world financial system that lenders (even our lenders) are making very risky credit decisions.” He continued, “…most investors in most asset classes are not being paid for the risk being taken.” That firm was Carlyle Group, a primary sponsor of the Carlyle Capital Fund, which, in an irony that is all too common on Wall Street, was virtually wiped out in the first quarter of 2008. Like the Bear Stearns hedge funds last summer, this fund was built on credulity and optimism, rather than prudence and risk sensitivity.
The Bear Stearns problems from 2007 spiraled out of control in March and resulted in a highly unusual takeover of the firm by J.P. Morgan, supported by guarantees by the Federal Reserve and the Treasury on $30 billion of dicey Bear Stearns’ investments. The list of casualties grows daily, along with questionable actions by the government as they seek to put out one fire after another. The Fed’s primary role is to maintain the value of the currency, a role abdicated in an effort to stem the fallout from a credit crisis they should have curbed several years ago.
As always, the problems we face today will create investment opportunities. Scott Harkness, in his letter, talks about the signposts that he will watch for as he works to redeploy the significant cash reserves that he has been holding in the Fund. The headwinds for the economy are significant. It is our view that we are already in a recession. As that reality is increasingly being acknowledged in broader circles, the markets have factored much of the downturn into share prices, and will begin to anticipate an economic recovery before we see an actual upturn.
We thank you very much for your continued support of, and investment in, the FMI Provident Trust Strategy Fund.
Sincerely,
Ted D. Kellner, CFA
President
100 E. Wisconsin Ave. • Milwaukee, WI 53202 • 414-226-4555
www.fmifunds.com
FMI Provident Trust Strategy Fund
April 10, 2008
Dear Fellow FMI Provident Trust Strategy Shareholders,
FMI Provident Trust Strategy Fund (FMIRX) declined 8.82%(1) for the six months ended March 2008, outperforming the S&P 500’s(2) 12.46% decline. The out-performance was solely due to the Fund’s high cash position, 51% on March 31, 2008, to us a prudent defensive measure after a five year 100% stock market rally that ended last September. Over the past five years, FMIRX gained 13.19% annually, modestly ahead of the 11.31% return of the S&P 500.
2008 March quarter GDP should be up modestly, proving the resilience of America’s economy to the rolling recession, thanks to about 2% “real” consumer spending along with a nice lift in net exports. We estimate two quarters of negative 2008 GDP, and full year growth of about 1% for the 17th consecutive calendar year of economic growth. Falling house prices are the greatest risk to our economic forecast. After gaining 60% cumulatively from 2002 to March 2007, the median sale price of existing homes declined by 15% over the past year, while the pace of sales dropped 30%. Homes in foreclosure represent 1-2% of total homes and analysts estimate that 10% of total 2008-2009 home sales will be foreclosed properties. We estimate a 2-3% “drag” on 2008 consumer spending from lower house prices, along with a $4-$5 trillion reduction in America’s $57 trillion of household net worth, both of which will unequally harm recent home buyers.
Our 2008 S&P 500 stock market outlook is 1300-1600, a significant reduction from our October 2007 outlook of 1600-2000. Lower earnings, (we now estimate flat S&P 500 profits of $85-$90), multiplied by a lower valuation of 15-18X, produces the lower outlook.
Although the S&P 500’s inflation-adjusted return was negative over the past nine years, we contend forward returns favor equities. Specifically, stocks traded at a 6% earnings yield (after tax dividend plus book value increase) on a growing stream of profits versus a flat 2.0-3.5% pre-tax earnings yield for government bonds. Market bottoms coincide with maximum pessimism; accordingly, we are encouraged by the current record level of negative stock market sentiment and note the previous bottoms in 1990 and 2002 were followed by significant market advances. We will actively reduce our cash position as house prices and corporate earnings stabilize, investing in growing companies with prospects for improved earnings.
We believe that FMI Provident Trust Strategy Fund is positioned to benefit from a slow economy. As always, we will flexibly realign the portfolio to reflect changes in our economic, valuation and company specific outlook.
Best regards,
J. Scott Harkness, CFA
Portfolio Manager
| (1) | The Fund’s one-year and annualized five and ten-year returns through March 31, 2008 were –3.98%, 13.19%, and 5.03%, respectively. |
| (2) | The Standard & Poor’s 500 Index consists of 500 selected common stocks, most of which are listed on the New York Stock Exchange. The Standard & Poor’s Ratings Group designates the stocks to be included in the Index on a statistical basis. A particular stock’s weighting in the Index is based on its relative total market value (i.e. its market price per share times the number of shares outstanding). Stocks may be added or deleted from the Index from time to time. |
FMI Provident Trust Strategy Fund
COST DISCUSSION
As a shareholder of the FMI Provident Trust Strategy Fund, you incur ongoing costs, including management fees and other Fund expenses. This example is intended to help you understand your ongoing costs (in dollars) of investing in the Fund, and to compare these costs with the ongoing costs of investing in other mutual funds.
The example is based on an investment of $1,000 invested at the beginning of the period and held for the entire period from October 1, 2007 through March 31, 2008.
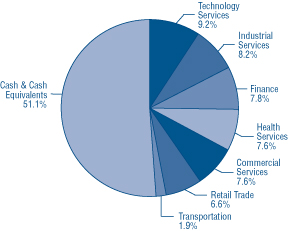
Industry Sectors as of March 31, 2008
Actual Expenses
The first line of the table below provides information about actual account values and actual expenses. You may use the information in this line, together with the amount you invested, to estimate the expenses that you paid over the period. Simply divide your account value by $1,000 (for example, an $8,600 account value divided by $1,000 = 8.6), then multiply the result by the number in the first line under the heading entitled “Expenses Paid During Period” to estimate the expenses you paid on your account during this period.
In addition to the costs highlighted and described below, the only Fund transaction costs you might currently incur would be wire fees ($15 per wire), if you choose to have proceeds from a redemption wired to your bank account instead of receiving a check. Additionally, U.S. Bank charges an annual processing fee ($15) if you maintain an IRA account with the Fund. To determine your total costs of investing in the Fund, you would need to add any applicable wire or IRA processing fees you’ve incurred during the period to the costs provided in the example below.
Hypothetical Example for Comparison Purposes
The second line of the table below provides information about hypothetical account values and hypothetical expenses based on the Fund’s actual expense ratio and an assumed rate of return of 5% per year before expenses, which is not the Fund’s actual return. The hypothetical account values and expenses may not be used to estimate the actual ending account balance or expenses you paid for the period. You may use this information to compare the ongoing costs of investing in the Fund and other funds. To do so, compare this 5% hypothetical example with the 5% hypothetical examples that appear in the shareholder reports of the other funds.
Please note that the expenses shown in the table are meant to highlight your ongoing costs only and do not reflect any transactional costs, such as sales charges (loads), redemption fees or exchange fees. Therefore, the second line of the table is useful in comparing ongoing costs only, and will not help you determine the relative total costs of owning different funds. In addition, if these transactional costs were included, your costs would have been higher.
| | Beginning Account | Ending Account | Expenses Paid During |
| | Value 10/01/07 | Value 3/31/08 | Period* 10/01/07-3/31/08 |
| FMI Provident Trust Strategy Fund Actual | $1,000.00 | $ 911.80 | $4.78 |
| Hypothetical (5% return before expenses) | $1,000.00 | $1,020.00 | $5.05 |
| * | Expenses are equal to the Fund’s annualized expense ratio of 1.00%, multiplied by the average account value over the period, multiplied by 183/366 (to reflect the one-half year period between October 1, 2007 and March 31, 2008). |
FMI Provident Trust Strategy Fund
STATEMENT OF NET ASSETS
March 31, 2008 (Unaudited)
| Shares/Principal Amount | | Cost | | | Value | |
COMMON STOCKS — 48.9% (a) | | | | | | |
COMMERCIAL SERVICES SECTOR — 7.6% | | | | | | |
| | | Personnel Services — 7.6% | | | | | | |
| | 47,000 | | Manpower Inc. | | $ | 2,826,107 | | | $ | 2,644,220 | |
| | 58,300 | | Robert Half | | | | | | | | |
| | | | International Inc. | | | 2,014,502 | | | | 1,500,642 | |
| | | | | | | 4,840,609 | | | | 4,144,862 | |
| FINANCE SECTOR — 7.8% | | | | | | | | |
| | | | Investment Banks/Brokers — 3.2% | | | | | | | | |
| | 92,900 | | Charles Schwab Corp. | | | 1,387,272 | | | | 1,749,307 | |
| | | | Investment Managers — 4.6% | | | | | | | | |
| | 50,000 | | T. Rowe Price Group Inc. | | | 1,695,549 | | | | 2,500,000 | |
HEALTH SERVICES SECTOR — 7.6% | | | | | | | | |
| | | | Health Industry Services — 7.6% | | | | | | | | |
| | 32,220 | | Express Scripts, Inc.* | | | 687,940 | | | | 2,072,391 | |
| | 50,000 | | Pharmaceutical Product | | | | | | | | |
| | | | Development, Inc. | | | 1,758,725 | | | | 2,095,000 | |
| | | | | | | 2,446,665 | | | | 4,167,391 | |
| INDUSTRIAL SERVICES SECTOR — 8.2% | | | | | | | | |
| | | | Contract Drilling — 4.4% | | | | | | | | |
| | 51,760 | | Helmerich & Payne, Inc. | | | 1,375,545 | | | | 2,425,991 | |
| | | | Engineering & Construction — 3.8% | | | | | | | | |
| | 28,280 | | Jacobs Engineering | | | | | | | | |
| | | | Group Inc.* | | | 565,204 | | | | 2,081,125 | |
RETAIL TRADE SECTOR — 6.6% | | | | | | | | |
| | | | Home Improvement Chains — 6.6% | | | | | | | | |
| | 78,150 | | Fastenal Co. | | | 2,398,988 | | | | 3,589,430 | |
TECHNOLOGY SERVICES SECTOR — 9.2% | | | | | | | | |
| | | | Information Technology Services — 9.2% | | | | | | | | |
| | 92,970 | | Cognizant Technology | | | | | | | | |
| | | | Solutions Corp.* | | | 3,409,900 | | | | 2,680,325 | |
| | 65,790 | | Infosys Technologies | | | | | | | | |
| | | | Ltd. SP-ADR | | | 3,154,716 | | | | 2,353,308 | |
| | | | | | | 6,564,616 | | | | 5,033,633 | |
| TRANSPORTATION SECTOR — 1.9% | | | | | | | | |
| | | | Trucking — 1.9% | | | | | | | | |
| | 72,000 | | Heartland Express, Inc. | | | 1,070,856 | | | | 1,026,720 | |
| | | | Total common stocks | | | 22,345,304 | | | | 26,718,459 | |
SHORT-TERM INVESTMENTS — 50.2% (a) | | | | | | | | |
| | | | Federal Agencies — 42.0% | | | | | | | | |
| $ | 5,000,000 | | Federal Home Loan Bank, | | | | | | | | |
| | | | 2.60%, due 4/02/08 | | | 4,999,639 | | | | 4,999,639 | |
| | 3,000,000 | | Federal Farm Credit Bank, | | | | | | | | |
| | | | 1.90%, due 4/11/08 | | | 2,998,417 | | | | 2,998,417 | |
| | 2,000,000 | | Federal Farm Credit Bank, | | | | | | | | |
| | | | 2.20%, due 4/17/08 | | | 1,998,044 | | | | 1,998,044 | |
| | 3,000,000 | | Federal National | | | | | | | | |
| | | | Mortgage Association, | | | | | | | | |
| | | | 1.85%, due 4/30/08 | | | 2,995,529 | | | | 2,995,529 | |
| | 5,000,000 | | Federal Home Loan | | | | | | | | |
| | | | Mortgage Corp., | | | | | | | | |
| | | | 1.80%, due 5/16/08 | | | 4,988,750 | | | | 4,988,750 | |
| | 5,000,000 | | Federal Home Loan Bank, | | | | | | | | |
| | | | 2.05%, due 5/21/08 | | | 4,985,764 | | | | 4,985,764 | |
| | | | Total federal agencies | | | 22,966,143 | | | | 22,966,143 | |
| | | | Variable Rate Demand Notes — 8.2% | | | | | | | | |
| | 2,470,616 | | U.S. Bank, N.A., 2.40% | | | 2,470,616 | | | | 2,470,616 | |
| | 2,000,000 | | Wisconsin Corporate | | | | | | | | |
| | | | Central Credit | | | | | | | | |
| | | | Union, 2.32% | | | 2,000,000 | | | | 2,000,000 | |
| | | | Total variable rate | | | | | | | | |
| | | | demand notes | | | 4,470,616 | | | | 4,470,616 | |
| | | | Total short-term | | | | | | | | |
| | | | investments | | | 27,436,759 | | | | 27,436,759 | |
| | | | Total investments | | $ | 49,782,063 | | | | 54,155,218 | |
| | | | Cash and receivables, less | | | | | | | | |
| | | | liabilities — 0.9% (a) | | | | | | | 494,711 | |
| | | | Net Assets | | | | | | $ | 54,649,929 | |
| | | | Net Asset Value Per Share | | | | | | | | |
| | | | ($0.01 par value, 300,000,000 | | | | | | | | |
| | | | shares authorized), offering | | | | | | | | |
| | | | and redemption price | | | | | | | | |
| | | | ($54,649,929 ÷ 7,446,496 | | | | | | | | |
| | | | shares outstanding) | | | | | | $ | 7.34 | |
| * | Non-income producing security. |
| (a) | Percentages for the various classifications relate to net assets. |
ADR – American Depositary Receipts
The accompanying notes to financial statements are an integral part of this statement.
FMI Provident Trust Strategy Fund
STATEMENT OF OPERATIONS
For the Six Month Period Ending March 31, 2008 (Unaudited)
| INCOME: | | | |
| Dividends | | $ | 178,269 | |
| Interest | | | 334,867 | |
| Total income | | | 513,136 | |
| | | | | |
| EXPENSES: | | | | |
| Management fees | | | 197,022 | |
| Administrative and accounting services | | | 42,041 | |
| Transfer agent fees | | | 31,710 | |
| Professional fees | | | 23,813 | |
| Registration fees | | | 21,192 | |
| Printing and postage expense | | | 9,899 | |
| Custodian fees | | | 6,902 | |
| Board of Directors fees | | | 6,100 | |
| Insurance expense | | | 4,781 | |
| Other expenses | | | 5,536 | |
| Total expenses before reimbursement | | | 348,996 | |
| Less expenses reimbursed by adviser | | | (68,862 | ) |
| Net expenses | | | 280,134 | |
| NET INVESTMENT INCOME | | | 233,002 | |
| NET REALIZED LOSS ON INVESTMENTS | | | (1,727,180 | ) |
| NET DECREASE IN UNREALIZED APPRECIATION ON INVESTMENTS | | | (3,839,202 | ) |
| NET LOSS ON INVESTMENTS | | | (5,566,382 | ) |
| NET DECREASE IN NET ASSETS RESULTING FROM OPERATIONS | | $ | (5,333,380 | ) |
The accompanying notes to financial statements are an integral part of this statement.
FMI Provident Trust Strategy Fund
STATEMENTS OF CHANGES IN NET ASSETS
For the Six Month Period Ending March 31, 2008 (Unaudited) and For the Year Ended September 30, 2007
| | | 2008 | | | 2007 | |
| OPERATIONS: | | | | | | |
| Net investment income | | $ | 233,002 | | | $ | 559,224 | |
| Net realized loss on investments | | | (1,727,180 | ) | | | (746,024 | ) |
| Net (decrease) increase in unrealized appreciation on investments | | | (3,839,202 | ) | | | 5,656,701 | |
| Net (decrease) increase in net assets from operations | | | (5,333,380 | ) | | | 5,469,901 | |
| DISTRIBUTIONS TO SHAREHOLDERS: | | | | | | | | |
| Distributions from net investment income | | | | | | | | |
| ($0.0790 and $0.0683 per share, respectively) | | | (586,973 | ) | | | (336,652 | ) |
| Distributions from net realized gains ($0.3060 per share) | | | — | | | | (1,471,861 | ) |
| Total distributions | | | (586,973 | ) | | | (1,808,513 | )* |
| FUND SHARE ACTIVITIES: | | | | | | | | |
| Proceeds from shares issued (1,168,025 and 3,585,909 shares, respectively) | | | 8,871,930 | | | | 28,510,228 | |
| Net asset value of shares issued in distributions reinvested | | | | | | | | |
| (72,733 and 235,709 shares, respectively) | | | 580,889 | | | | 1,757,646 | |
| Cost of shares redeemed (1,210,047 and 1,167,183 shares, respectively) | | | (9,136,577 | ) | | | (9,195,841 | ) |
| Net increase in net assets derived from Fund share activities | | | 316,242 | | | | 21,072,033 | |
| TOTAL (DECREASE) INCREASE | | | (5,604,111 | ) | | | 24,733,421 | |
| NET ASSETS AT THE BEGINNING OF THE PERIOD | | | 60,254,040 | | | | 35,520,619 | |
| NET ASSETS AT THE END OF THE PERIOD (Includes undistributed | | | | | | | | |
| net investment income of $28,614 and $382,585, respectively) | | $ | 54,649,929 | | | $ | 60,254,040 | |
The accompanying notes to financial statements are an integral part of these statements.
FMI Provident Trust Strategy Fund
FINANCIAL HIGHLIGHTS
(Selected data for each share of the Fund outstanding throughout each period)
| | | | | | Years Ended September 30, | | | | | | Years Ended June 30, | |
| | | 2008 | | | 2007 | | | 2006 | | | 2005 | | | 2005 | | | 2004 | | | 2003 | |
| PER SHARE OPERATING PERFORMANCE: | | | | | | | | | | | | | | | | | | | | | |
Net asset value, beginning of period | | $ | 8.13 | | | $ | 7.46 | | | $ | 7.12 | | | $ | 7.10 | | | $ | 6.56 | | | $ | 5.22 | | | $ | 6.04 | |
Income from investment operations: | | | | | | | | | | | | | | | | | | | | | | | | | | | | |
Net investment income (loss) | | | 0.03 | | | | 0.09 | | | | 0.04 | | | | (0.00 | )* | | | (0.02 | ) | | | (0.03 | ) | | | (0.02 | ) |
Net realized and unrealized | | | | | | | | | | | | | | | | | | | | | | | | | | | | |
(losses) gains on investments | | | (0.74 | ) | | | 0.95 | | | | 0.51 | | | | 0.25 | | | | 1.05 | | | | 1.37 | | | | (0.14 | )(c) |
Total from investment operations | | | (0.71 | ) | | | 1.04 | | | | 0.55 | | | | 0.25 | | | | 1.03 | | | | 1.34 | | | | (0.16 | ) |
| Less distributions: | | | | | | | | | | | | | | | | | | | | | | | | | | | | |
Distributions from net investment income | | | (0.08 | ) | | | (0.07 | ) | | | — | | | | — | | | | — | | | | (0.00 | )* | | | (0.01 | ) |
Distributions from net realized gains | | | — | | | | (0.30 | ) | | | (0.21 | ) | | | (0.23 | ) | | | (0.49 | ) | | | — | | | | (0.65 | ) |
| Total from distributions | | | (0.08 | ) | | | (0.37 | ) | | | (0.21 | ) | | | (0.23 | ) | | | (0.49 | ) | | | (0.00 | )* | | | (0.66 | ) |
Net asset value, end of period | | $ | 7.34 | | | $ | 8.13 | | | $ | 7.46 | | | $ | 7.12 | | | $ | 7.10 | | | $ | 6.56 | | | $ | 5.22 | |
| TOTAL RETURN | | | (8.82 | %)** | | | 14.47 | % | | | 7.77 | % | | | 3.49 | %** | | | 16.96 | % | | | 25.74 | % | | | (2.45 | %) |
RATIOS/SUPPLEMENTAL DATA: | | | | | | | | | | | | | | | | | | | | | | | | | | | | |
Net assets, end of period (in 000’s $) | | | 54,650 | | | | 60,254 | | | | 35,521 | | | | 23,100 | | | | 19,534 | | | | 8,187 | | | | 5,802 | |
Ratio of expenses (after reimbursement) | | | | | | | | | | | | | | | | | | | | | | | | | | | | |
| to average net assets (a) | | | 1.00 | %*** | | | 1.00 | % | | | 1.00 | % | | | 1.00 | %*** | | | 1.20 | % | | | 1.20 | % | | | 1.21 | % |
Ratio of net investment income (loss) | | | | | | | | | | | | | | | | | | | | | | | | | | | | |
| to average net assets (b) | | | 0.83 | %*** | | | 1.17 | % | | | 0.51 | % | | | (0.05 | %)*** | | | (0.28 | %) | | | (0.54 | %) | | | (0.54 | %) |
| Portfolio turnover rate | | | 27.0 | % | | | 52.0 | % | | | 84.1 | % | | | 8.3 | % | | | 38.5 | % | | | 48.8 | % | | | 51.8 | % |
| * | Amount less than $0.005 per share. |
| (a) | Computed after giving effect to adviser’s expense limitation undertaking. If the Fund had paid all of its expenses for the six month period ending March 31, 2008, for the years ended September 30, 2007 and 2006, for the period from July 1, 2005 to September 30, 2005, and for the years ended June 30, 2005, 2004 and 2003, the ratios would have been 1.25%***, 1.23%, 1.40%, 2.18%***, 1.82%, 1.89% and 3.11%, respectively. |
| (b) | If the Fund had paid all of its expenses for the six month period ending March 31, 2008, for the years ended September 30, 2007 and 2006, for the period from July 1, 2005 to September 30, 2005, and for the years ended June 30, 2005, 2004 and 2003, the ratios would have been 0.58%***, 0.94%, 0.11%, (1.23)%***, (0.90%), (1.23%) and (2.44%), respectively. |
| (c) | The amount shown may not correlate with the aggregate gains and losses of portfolio securities due to the timing of subscriptions and redemptions of Fund shares. |
The accompanying notes to financial statements are an integral part of this statement.
FMI Provident Trust Strategy Fund
NOTES TO FINANCIAL STATEMENTS
March 31, 2008 (Unaudited)
| (1) | Summary of Significant Accounting Policies — |
The following is a summary of significant accounting policies of the FMI Mutual Funds, Inc. (the "Company"), which is registered as an open-end management investment company under the Investment Company Act of 1940, as amended. This Company consists of one non-diversified fund – FMI Provident Trust Strategy Fund (the "Fund"). The Company was incorporated under the laws of Wisconsin on May 23, 1986.
The investment objective of the Fund is to realize a combination of capital appreciation and income which will result in the highest total return by investing in a combination of equity and debt securities, while assuming reasonable risks.
| (a) | Each security, excluding short-term investments, is valued at the last sale price reported by the principal security exchange on which the issue is traded. Securities that are traded on the Nasdaq Markets are valued at the Nasdaq Official Closing Price, or if no sale is reported, the latest bid price. Securities which are traded over-the-counter are valued at the latest bid price. Securities for which quotations are not readily available are valued at fair value as determined by the investment adviser under the supervision of the Board of Directors. The fair value of a security may differ from the last quoted price and the Fund may not be able to sell a security at the fair value. Market quotations may not be available, for example, if trading in particular securities has halted during the day and not resumed prior to the close of trading on the New York Stock Exchange. Short-term investments with maturities of 60 days or less are valued at amortized cost which approximates value. For financial reporting purposes, investment transactions are recorded on the trade date. |
In September 2006, the Financial Accounting Standards Board ("FASB") issued Statement of Financial Accounting Standards ("SFAS") No. 157, "Fair Value Measurements." This standard establishes a single authoritative definition of fair value, sets out a framework for measuring fair value and requires additional disclosures about fair value measurements. SFAS No. 157 applies to fair value measurements already required or permitted by existing standards. SFAS No. 157 is effective for financial statements issued for fiscal years beginning after November 15, 2007 and interim periods within those fiscal years. The changes to current generally accepted accounting principles from the application of this standard relate to the definition of fair value, the methods used to measure fair value, and the expanded disclosures about fair value measurements. The Fund does not believe the adoption of SFAS No. 157 will impact the financial statement amounts; however, additional disclosures may be required about the inputs used to develop the measurements and the effect of certain of the measurements included within the Statement of Operations for the period.
| | (b) | The Fund may purchase securities on a when-issued or delayed delivery basis. Although the payment and interest terms of these securities are established at the time the purchaser enters into the agreement, these securities may be delivered and paid for at a future date, generally within 45 days. The Fund records purchases of when-issued securities and reflects the value of such securities in determining net asset value in the same manner as other portfolio securities. |
| | (c) | Net realized gains and losses on sales of securities are computed on the identified cost basis. |
| | (d) | Dividend income is recorded on the ex-dividend date. Interest income is recorded on the accrual basis. |
| | (e) | The Fund has investments in short-term variable rate demand notes, which are unsecured instruments. The Fund may be susceptible to credit risk with respect to these notes to the extent the issuer defaults on its payment obligation. The Fund’s policy is to monitor the creditworthiness of the issuer and nonperformance by these issuers is not anticipated. |
| | (f) | Accounting principles generally accepted in the United States of America ("GAAP") require that permanent differences between income for financial reporting and tax purposes be reclassified in the capital accounts. |
| | (g) | The preparation of financial statements in conformity with GAAP requires management to make estimates and assumptions that affect the reported amounts of assets and liabilities and disclosure of contingent assets and liabilities at the date of the financial statements and the reported amounts of revenues and expenses during the reporting period. Actual results could differ from these estimates. |
| | (h) | Provision has not been made for Federal income taxes since the Fund has elected to be taxed as a "regulated investment company" and intends to distribute substantially all net investment company taxable income and net capital gains to shareholders and otherwise comply with the provisions of the Internal Revenue Code applicable to regulated investment companies. |
FMI Provident Trust Strategy Fund
NOTES TO FINANCIAL STATEMENTS (Continued)
March 31, 2008 (Unaudited)
| (1) | Summary of Significant Accounting Policies — (Continued) |
| | Accounting Pronouncements – Effective March 31, 2008, the Fund became subject to FASB Interpretation No. 48, "Accounting for Uncertainty in Income Taxes" ("FIN 48"). FIN 48 requires the evaluation, recognition, measurement, and disclosure in financial statements of tax positions taken on previously filed tax returns or expected to be taken on future returns. Each tax position must meet a recognition threshold that is "more-likely-than-not" (i.e., has a likelihood of more than 50%), based on the technical merits, that the position will be sustained upon examination by the applicable taxing authority. In evaluating whether a tax position has met the threshold, the Fund must presume that the position will be examined by the appropriate taxing authority that has full knowledge of all relevant information. A tax position not deemed to meet the "more-likely-than-not" threshold is recorded as a tax expense in the current year. |
| | The Fund has reviewed all taxable years that are open for examination (i.e., not barred by the applicable statute of limitations) by taxing authorities of the major taxing jurisdictions, including the Internal Revenue Service. As of March 31, 2008, open taxable years consisted of the taxable years ended September 30, 2004 through 2007. No examination of the Fund is currently in progress. |
| | The Fund has reviewed all its open taxable years for the major taxing jurisdictions and concluded that application of FIN 48 resulted in no effect to the Fund’s financial position or results of operations. There is no tax liability resulting from unrecognized tax benefits relating to uncertain income tax positions taken or expected to be taken on the Fund’s tax return for the taxable year ended September 30, 2007. The Fund is also not aware of any tax positions for which it is reasonably possible that the total amounts of unrecognized tax benefits will significantly change in the next twelve months. |
| | (i) | The Fund changed its fiscal year from June 30 to September 30 in 2005. |
| (2) | Investment Adviser and Management Agreement and Transactions With Related Parties — |
| | The Fund has entered into a management agreement with Fiduciary Management, Inc. ("FMI"), with whom certain officers and a director of the Fund are affiliated, to serve as investment adviser and manager. Under the terms of the agreement, the Fund pays 0.75% on the first $30,000,000 of the daily net assets and 0.65% on the daily net assets in excess of $30,000,000 and less than $100,000,000 and 0.60% on the daily net assets over $100,000,000. |
| | The Adviser entered into a sub-advisory agreement with Provident Trust Company ("PTC") to assist it in the day-to-day management of the Fund. PTC determines which securities will be purchased, retained or sold for the Fund. The Adviser pays PTC a fee equal to 0.60% of the daily net assets up to $30,000,000 and 0.50% of the daily net assets over $30,000,000. |
| | FMI is contractually obligated to reimburse the Fund for expenses over 2.00% of the daily net assets of the Fund. In addition to the reimbursement required under the management agreement, FMI has voluntarily reimbursed the Fund for expenses over 1.00% of the Fund’s daily net assets. These reimbursements amounted to $68,862 for the six month period ending March 31, 2008. PTC in turn, pays to FMI 80% of the amount reimbursed by FMI. |
| | The Fund has an administrative agreement with FMI to supervise all aspects of the Fund’s operations except those performed by FMI pursuant to the management agreement. Under the terms of the agreement, the Fund pays FMI a monthly administrative fee at the annual rate of 0.20% on the first $25,000,000 of the daily net assets of the Fund, 0.10% on the daily net assets of the Fund on the next $20,000,000 and 0.05% on the daily net assets of the Fund over $45,000,000, subject to a fiscal year minimum of twenty thousand dollars. |
| | The Fund has entered into a Distribution Plan (the "Plan"), pursuant to Rule 12b-1 under the Investment Company Act of 1940. The Plan provides that the Fund may incur certain costs which may not exceed the lesser of a monthly amount equal to 0.25% of the Fund’s daily net assets or the actual distribution costs incurred during the year. Amounts payable under the Plan are paid monthly for any activities or expenses primarily intended to result in the sale of shares of the Fund. For the six month period ending March 31, 2008, no such expenses were incurred. |
| | In the normal course of business the Fund enters into contracts with service providers that contain general indemnification clauses. The Fund’s maximum exposure under these arrangements is unknown as this would involve future claims that may be made against the Fund that have not yet occurred. However, based on experience, the Fund expects the risk of loss to be remote. |
| (3) | Distributions to Shareholders — |
Net investment income and net realized gains, if any, are distributed to shareholders at least annually.
FMI Provident Trust Strategy Fund
NOTES TO FINANCIAL STATEMENTS (Continued)
March 31, 2008 (Unaudited)
| (4) | Investment Transactions — |
For the six month period ending March 31, 2008, purchases and proceeds of sales of investment securities (excluding short-term securities) were $10,107,129 and $21,187,988, respectively.
| (5) | Accounts Payable and Accrued Liabilities — |
As of March 31, 2008, liabilities of the Fund included the following:
| Due to custodian | | $ | 76,861 | |
| Payable to FMI for management and administrative fees | | | 35,140 | |
| Other liabilities | | | 2,729 | |
(6) Sources of Net Assets —
As of March 31, 2008 the sources of net assets were as follows:
| Fund shares issued and outstanding | | $ | 52,722,529 | |
| Net unrealized appreciation on investments | | | 4,373,155 | |
| Net realized losses on investments | | | (2,474,369 | ) |
| Undistributed net investment income | | | 28,614 | |
| | | $ | 54,649,929 | |
(7) Income Tax Information —
| | The following information for the Fund is presented on an income tax basis as of March 31, 2008: |
| | Gross | Gross | Net Unrealized |
| Cost of | Unrealized | Unrealized | Appreciation |
| Investments | Appreciation | Depreciation | on Investments |
| $49,782,063 | $6,854,174 | $2,481,019 | $4,373,155 |
| | The following information for the Fund is presented on an income tax basis as of September 30, 2007: |
| | Gross | Gross | Net Unrealized | Distributable | Distributable |
| Cost of | Unrealized | Unrealized | Appreciation | Ordinary | Long-Term |
| Investments | Appreciation | Depreciation | on Investments | Income | Capital Gains |
| $53,069,171 | $9,371,994 | $1,160,800 | $8,211,194 | $382,585 | — |
| | The difference between the cost amounts for financial statement and federal income tax purposes, if any, is due primarily to timing differences in recognizing certain gains and losses in security transactions. |
| | The tax components of dividends paid during the year ended September 30, 2007 and September 30, 2006, capital loss carryovers, which may be used to offset future capital gains, subject to Internal Revenue Code limitations (expiring in 2015), as of September 30, 2007, and tax basis post-October losses as of September 30, 2007, which are not recognized for tax purposes until the first day of the following fiscal year are: |
| September 30, 2007 | | September 30, 2006 |
| Ordinary | Long-Term | Net Capital | | | Ordinary | Long-Term |
| Income | Capital Gains | Loss | Post-October | | Income | Capital Gains |
| Distributions | Distributions | Carryovers | Losses | | Distributions | Distributions |
| $336,652 | $1,471,861 | $155 | $745,869 | | $348,505 | $412,690 |
| | For corporate shareholders of the Fund, the percentage of dividend income distributed for the year ended September 30, 2007 which is designated as qualifying for the dividends received deduction is 100% (unaudited). |
| | For all shareholders of the Fund, the percentage of dividend income distributed for the year ended September 30, 2007 which is designated as qualified dividend income under the Jobs and Growth Tax Relief Act of 2003, is 100% (unaudited). |
FMI Provident Trust Strategy Fund
ADVISORY AGREEMENT
On December 21, 2007, the Board of Directors of the FMI Provident Trust Strategy Fund ("Directors") approved the continuation of the Fund’s investment advisory agreement with Fiduciary Management, Inc. and its sub-advisory agreement with Provident Trust Company. Prior to approving the continuation of the agreements, the Directors considered:
| • | the nature, extent and quality of the services provided by Fiduciary Management, Inc. and Provident Trust Company |
| • | the investment performance of the Fund |
| • | the cost of the services to be provided and profits to be realized by Fiduciary Management, Inc. and Provident Trust Company from their relationship with the Fund |
| • | the extent to which economies of scale would be realized as the Fund grew and whether fee levels reflect any economies of scale |
| • | the expense ratio of the Fund |
| • | the manner in which portfolio transactions for the Fund are conducted, including the use of soft dollars |
In considering the nature, extent and quality of the services provided by Fiduciary Management, Inc. and Provident Trust Company, the Directors reviewed a report describing the portfolio management, shareholder communication and servicing, prospective shareholder assistance and regulatory compliance services provided by Fiduciary Management, Inc. and Provident Trust Company to the Fund. The Directors concluded that Fiduciary Management, Inc. and Provident Trust Company were providing essential services to the Fund. In particular, the Directors concluded that Fiduciary Management, Inc. and Provident Trust Company were preparing reports to shareholders in addition to those required by law, and were providing services to the Fund that were in addition to the services investment advisers typically provided non-mutual fund clients.
The Directors compared the performance of the Fund to benchmark indices over various periods of time and concluded that the performance of the Fund warranted the continuation of the agreements.
In concluding that the advisory fees payable by the Fund were reasonable, the Directors reviewed a report that concluded that Fiduciary Management, Inc. was realizing only a small profit from its relationship with the Fund because of the Fund’s small size and the reimbursement being made by Fiduciary Management, Inc. The Directors also reviewed reports comparing the Fund’s expense ratio and advisory fees paid by the Fund to those of other comparable mutual funds and concluded that the advisory fee paid by the Fund and the Fund’s expense ratio were within the range of comparable mutual funds. The Directors noted that the investment advisory fee was adjusted if economies of scale were realized as the Fund grew.
Finally, the Directors reviewed reports discussing the manner in which portfolio transactions for the Fund were conducted, including the use of soft dollars. Based on these reports, the Directors concluded that the research obtained by Provident Trust Company was beneficial to the Fund and that Provident Trust Company was executing the Fund’s portfolio transactions in a manner designed to obtain best execution for the Fund.
For additional information about the Directors and Officers or for a description of the policies and procedures that the Fund uses to determine how to vote proxies relating to portfolio securities, please call (800) 811-5311 and request a Statement of Additional Information. One will be mailed to you free of charge. The Statement of Additional Information is also available on the website of the Securities and Exchange Commission (the "Commission") at http://www.sec.gov. Information on how the Fund voted proxies relating to portfolio securities is available on the Fund’s website at http://www.fmifunds.com or the website of the Commission no later than August 31 for the prior 12 months ending June 30. The Fund files its complete schedule of portfolio holdings with the Commission for the first and third quarters of each fiscal year on Form N-Q. The Fund’s Form N-Q is available on the Commission’s website. The Fund’s Form N-Q may be reviewed and copied at the Commission’s Public Reference Room in Washington, D.C., and that information on the operation of the Public Reference Room may be obtained by calling 1-800-SEC-0330.
FMI Provident Trust Strategy Fund
100 East Wisconsin Avenue, Suite 2200
Milwaukee, Wisconsin 53202
www.fmifunds.com
414-226-4555
BOARD OF DIRECTORS
BARRY K. ALLEN
ROBERT C. ARZBAECHER
GEORGE D. DALTON
GORDON H. GUNNLAUGSSON
PAUL S. SHAIN
DONALD S. WILSON
INVESTMENT ADVISER AND ADMINISTRATOR
FIDUCIARY MANAGEMENT, INC.
100 East Wisconsin Avenue, Suite 2200
Milwaukee, Wisconsin 53202
PORTFOLIO MANAGER
PROVIDENT TRUST COMPANY
N16 W23217 Stone Ridge Drive, Suite 310
Waukesha, Wisconsin 53188
TRANSFER AGENT AND
DIVIDEND DISBURSING AGENT
U.S. BANCORP FUND SERVICES, LLC
615 East Michigan Street
Milwaukee, Wisconsin 53202
800-811-5311 or 414-765-4124
CUSTODIAN
U.S. BANK, N.A.
1555 North RiverCenter Drive, Suite 302
Milwaukee, Wisconsin 53212
INDEPENDENT REGISTERED
PUBLIC ACCOUNTING FIRM
PRICEWATERHOUSECOOPERS LLP
100 East Wisconsin Avenue
Suite 1800
Milwaukee, Wisconsin 53202
LEGAL COUNSEL
FOLEY & LARDNER LLP
777 East Wisconsin Avenue
Milwaukee, Wisconsin 53202
This report is not authorized for use as an offer of sale or a solicitation of an offer to buy shares of FMI Provident Trust Strategy Fund unless accompanied or preceded by the Fund’s current prospectus. Performance data quoted represents past performance; past performance does not guarantee future results. The investment return and principal value of an investment will fluctuate so that an investor’s shares, when redeemed, may be worth more or less than their original cost. Investment returns do not reflect deduction of taxes that a shareholder would pay on Fund distributions or the redemption of Fund shares. Current performance of the Fund may be lower or higher than the performance quoted. Performance data current to the most recent month end may be obtained by visiting www.fmifunds.com.
Item 2. Code of Ethics.
Not applicable.
Item 3. Audit Committee Financial Expert.
Not applicable.
Item 4. Principal Accountant Fees and Services.
Not applicable.
Item 5. Audit Committee of Listed Registrants.
Not applicable.
Item 6. Schedule of Investments.
Not applicable.
Item 7. Disclosure of Proxy Voting Policies and Procedures for Closed-End Management Investment Companies
Not applicable.
Item 8. Portfolio Managers of Closed-End Management Investment Companies.
Not applicable.
Item 9. Purchases of Equity Securities by Closed-End Management Investment Company and Affiliated Purchasers.
Not applicable.
Item 10. Submission of Matters to a Vote of Security Holders.
None.
Item 11. Controls and Procedures.
| (a) | The disclosure controls and procedures of the FMI Mutual Funds, Inc. are periodically evaluated. As of March 31, 2008, the date of the last evaluation, we concluded that our disclosure controls and procedures are adequate. |
| (b) | The internal controls of the FMI Mutual Funds, Inc. are periodically evaluated. There were no changes to FMI Mutual Funds’ internal control over financial reporting that occurred during the first fiscal quarter of the period covered by this report that have materially affected, or are reasonably likely to materially affect, such controls. |
Item 12. Exhibits.
| (a) | Any code of ethics or amendment thereto. Not applicable. |
| (b) | Certifications pursuant to Section 302 of the Sarbanes-Oxley Act of 2002. Filed herewith. |
| (c) | Certification pursuant to Section 906 of the Sarbanes-Oxley Act of 2002. Filed herewith. |
SIGNATURES
Pursuant to the requirements of the Securities Exchange Act of 1934 and the Investment Company Act of 1940, the registrant has duly caused this report to be signed on its behalf by the undersigned, thereunto duly authorized.
FMI Mutual Funds, Inc.
Registrant
By /s/Ted D. Kellner
Ted D. Kellner, Principal Executive Officer
Date April 22, 2008
Pursuant to the requirements of the Securities Exchange Act of 1934 and the Investment Company Act of 1940, this report has been signed below by the following persons on behalf of the registrant and in the capacities and on the dates indicated.
FMI Mutual Funds, Inc.
Registrant
By /s/Ted D. Kellner
Ted D. Kellner, Principal Financial Officer
Date April 22, 2008