UNITED STATES
SECURITIES AND EXCHANGE COMMISSION
Washington, D.C. 20549
FORM N-CSR
CERTIFIED SHAREHOLDER REPORT OF REGISTERED
MANAGEMENT INVESTMENT COMPANIES
Investment Company Act file number 811-04722
FMI Mutual Funds, Inc.
(Exact name of registrant as specified in charter)
100 East Wisconsin Avenue
Suite 2200
Milwaukee, WI 53202
(Address of principal executive offices) (Zip code)
Ted D. Kellner
Fiduciary Management, Inc.
100 East Wisconsin Avenue
Suite 2200
Milwaukee, WI 53202
(Name and address of agent for service)
(414) 226-4555
(Registrant's telephone number, including area code)
Date of fiscal year end: September 30
Date of reporting period: March 31, 2011
Item 1. Reports to Stockholders.
SEMIANNUAL REPORT
March 31, 2011
FMI Provident Trust
Strategy Fund
(FMIRX)
A NO-LOAD MUTUAL FUND
FMI Provident Trust Strategy Fund
April 14, 2011
Dear Fellow Shareholders:
The bull market celebrated its second birthday on March 9, 2011, and threw itself quite a party in the first quarter. Many of the indices have doubled in the past two years, and the first quarter continued the strong trend of the past 24 months. All indices enjoyed robust gains, with the Russell 2000 leading the advance +7.94%, the Dow Jones Industrial Average +7.06%, the Standard & Poor’s 500 +5.92%, and the NASDAQ Index +5.05%. The near 100% gains for most indices in the past two years is the fastest doubling of the averages in over 75 years, and whereas bearishness was rampant in March of 2009, the bulls now outnumber the bears by a margin of better than two-to-one, according to Investors Intelligence.
What has driven this incredibly strong bull market? In our opinion, it stems from three factors. First, corporations have done an incredible job of improving profitability by paring costs and improving productivity, and positioning their companies in a still rather disappointing overall economy. Second, the Fed, led by Chairman Bernanke, has fostered an unprecedented easing of monetary policy. The monetary base has nearly tripled in the last 30 months, from $800 billion to over $2.4 trillion. Many believe that inflation is a monetary phenomenon, and if indeed this is so, increased inflation is not a question of “if,” but “when.” Finally, our government is currently spending approximately $1.60 for every $1.00 in tax revenue it is taking in, an unprecedented level of deficit spending.
Indeed, inflation signs are rearing their ugly heads with many commodities soaring to all-time highs, including the recent run-up in crude oil to $107 per barrel at the end of March. Wholesale food prices spiked at their fastest rate since 1974 in the month of March. Wal-Mart CEO Bill Simon, in a recent USA Today article, said that “inflation is going to be a serious problem soon.” When we look at what is occurring around us on a day-to-day basis, almost all prices are on the rise. Additionally, we remain skeptical, as always, of the economic data we receive from Washington. For example, if the CPI were calculated using methodologies employed by the government in 1990, the reported inflation number for 2010 would have been 4.5%, not the 1.5% actually measured by the Bureau of Labor Statistics. Additionally, it will be interesting to see what path the Fed pursues in the next several months. Currently, it appears that QEII, the $600 billion Fed monetary stimulus package that buys approximately $100 billion of bonds per month, will cease in June. It will be interesting to see the market’s reaction once this opiate is removed. Remember what happened in the spring of 2010, when the housing market’s $8,000 first time buyer credit was removed? Stay tuned!
As indicated above, almost every asset class has been on a tear. We are reminded of the Warren Buffett quote that “the less the prudence with which others conduct their affairs, the greater the prudence with which we should conduct our own affairs.” We are not predicting an end to the extremely strong markets. However, we are of the opinion that prudence and increased selectivity will be increasingly important in the months ahead. As Scott and his team indicate in their attached letter, we like our portfolio very much, and believe it will serve you well, going forward. While sounding a cautious note with some of the above comments, we strongly believe that equities will provide investors with good risk-adjusted investment returns over the next several years. We believe this is particularly true with regard to the FMI Provident Trust Strategy Fund portfolio.
As always, we thank you for your continued investment in, and support of, the FMI Provident Trust Strategy Fund.
Sincerely,
| |
 |
| Ted D. Kellner, CFA |
| Executive Chairman |
| Fiduciary Management, Inc. (Adviser) |
100 E. Wisconsin Ave. • Milwaukee, WI 53202 • 414-226-4555
www.fmifunds.com
FMI Provident Trust Strategy Fund
April 5, 2011
Dear FMI Provident Trust Strategy Fund Shareholders,
FMI Provident Trust Strategy Fund (FMIRX) gained +4.78%(1) for the three months ended March 31 versus the S&P 500’s +5.92%(2) advance. Since being named manager on September 9, 2002, FMIRX gained +111.41% cumulatively versus +74.03% for the S&P 500. Our equity exposure remains at about 80% while the average market capitalization increased to $38.5 billion from $7.0 billion (March 2009) reflecting the improved relative valuation and earnings growth potential of large company stocks. The Leuthold Group reports since December 1999 large company stock valuation relative to small companies moved from a 67% premium (28X P/E versus 17X) to a 15% discount (14X versus 17X). Our estimated 2011 S&P 500 price range of 1250-1500 (15-18X $85 EPS) represents a flat to +20% year. Compared to the investment alternatives, stocks are also attractive with a 6.5% earnings yield vs. 0% for money market and 3.4% for 10-year Treasuries. FMIRX continues to emphasize our best research ideas with the top ten positions representing 59% of total net assets with technology services our largest sector weighting. Oracle (ORCL) is a good example of the shift in investor sentiment: since 2000 Oracle’s stock price declined -9%, despite a 5X earnings improvement, 3.5X revenue gain, and -14% shares outstanding, for a P/E ratio decline from over 100X to 17X.
We believe the best approach to an uncertain world is an open mind. We remain committed to the greater return potential of common stocks (6.3% average after inflation over the past 140 years) and the resilience of the American economy.
Thank you for your investment in, and support of, the FMI Provident Trust Strategy Fund.
Best Regards,
| |
 |
| J. Scott Harkness, CFA |
| Portfolio Manager |
| (1) | The Fund’s one-year and annualized 5-year and 10-year returns through March 31, 2011 were: 10.99%, 4.59% and 5.68%, respectively. |
| (2) | The S&P 500’s one-year and annualized 5-year and 10-year returns through March 31, 2011 were: 15.65%, 2.62% and 3.29%, respectively. |
The returns do not reflect the deduction of taxes that a shareholder would pay on Fund distributions or the redemption of Fund shares. Performance data quoted represents past performance; past performance does not guarantee future results. The investment return and principal value of an investment will fluctuate so that an investor’s shares, when redeemed, may be worth more or less than their original cost. Current performance since the above time period may be lower or higher than the performance quoted. Performance data current to the most recent month-end may be obtained by visiting www.fmifunds.com or by calling 1-800-811-5311. As of the Fund’s Prospectus dated January 31, 2011, the Fund’s annual operating expense ratio is 1.00%.
As of March 31, 2011, the security holding mentioned above represented the following percentage of the Fund’s total assets: Oracle Corp. 6.4%. Portfolio holdings are subject to change without notice and are not intended as recommendations of individual securities.
For more information about the FMI Provident Trust Strategy Fund, call (800) 811-5311 for a free prospectus. Please read the prospectus carefully to consider the investment objectives, risks, charges and expenses, before investing or sending money. The prospectus contains this and more information about the FMI Provident Trust Strategy Fund. Please read the prospectus carefully before investing.
Distributed by Rafferty Capital Markets, LLC
FMI Provident Trust Strategy Fund
As a shareholder of the FMI Provident Trust Strategy Fund, you incur ongoing costs, including management fees and other Fund expenses. You do not incur transaction costs such as sales charges (loads) on purchase payments, reinvested dividends, or other distributions; redemption fees; and exchange fees because the Fund does not charge these fees. This example is intended to help you understand your ongoing costs (in dollars) of investing in the Fund, and to compare these costs with the ongoing costs of investing in other mutual funds.
The example is based on an investment of $1,000 invested at the beginning of the period and held for the entire period from October 1, 2010 through March 31, 2011.
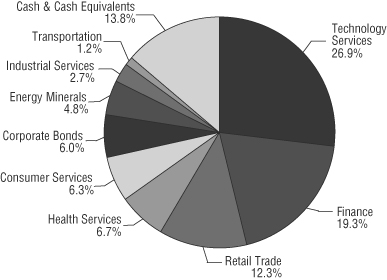
| Industry Sectors as of March 31, 2011 |
|
Actual Expenses
The first line of the table below provides information about actual account values and actual expenses. You may use the information in this line, together with the amount you invested, to estimate the expenses that you paid over the period. Simply divide your account value by $1,000 (for example, an $8,600 account value divided by $1,000 = 8.6), then multiply the result by the number in the first line under the heading entitled “Expenses Paid During Period” to estimate the expenses you paid on your account during this period.
In addition to the costs highlighted and described below, the only Fund transaction costs you might currently incur would be wire fees ($15 per wire), if you choose to have proceeds from a redemption wired to your bank account instead of receiving a check. Additionally, U.S. Bank charges an annual processing fee ($15) if you maintain an IRA account with the Fund. To determine your total costs of investing in the Fund, you would need to add any applicable wire or IRA processing fees you’ve incurred during the period to the costs provided in the example below.
Hypothetical Example for Comparison Purposes
The second line of the table below provides information about hypothetical account values and hypothetical expenses based on the Fund’s actual expense ratio and an assumed rate of return of 5% per year before expenses, which is not the Fund’s actual return. The hypothetical account values and expenses may not be used to estimate the actual ending account balance or expenses you paid for the period. You may use this information to compare the ongoing costs of investing in the Fund and other funds. To do so, compare this 5% hypothetical example with the 5% hypothetical examples that appear in the shareholder reports of the other funds.
Please note that the expenses shown in the table are meant to highlight your ongoing costs only and do not reflect any transactional costs, such as sales charges (loads), redemption fees or exchange fees. Therefore, the second line of the table is useful in comparing ongoing costs only, and will not help you determine the relative total costs of owning different funds. In addition, if these transactional costs were included, your costs would have been higher.
| | | | Expenses Paid During |
| | | | Period* 10/01/10-3/31/11 |
| | | | |
| FMI Provident Trust Strategy Fund Actual | $1,000.00 | $1,132.20 | $5.32 |
| Hypothetical (5% return before expenses) | $1,000.00 | $1,019.90 | $5.04 |
| * | Expenses are equal to the Fund’s annualized expense ratio of 1.00%, multiplied by the average account value over the period, multiplied by 182/365 (to reflect the one-half year period between October 1, 2010 and March 31, 2011). |
FMI Provident Trust Strategy Fund
STATEMENT OF ASSETS AND LIABILITIES
March 31, 2011 (Unaudited)
| ASSETS: | | | |
| Investments in securities, at value (cost $106,151,058) | | $ | 143,403,633 | |
| Cash | | | 6,389,784 | |
| Receivable from investments sold | | | 3,371,878 | |
| Receivable from shareholders for purchases | | | 244,881 | |
| Dividends & interest receivable | | | 76,756 | |
| Total assets | | $ | 153,486,932 | |
| | | | | |
| | | | | |
| LIABILITIES: | | | | |
| Payable to brokers for investments purchased | | $ | 873,233 | |
| Payable to adviser for management fees | | | 64,653 | |
| Payable to shareholders for redemptions | | | 48,151 | |
| Other liabilities | | | 43,401 | |
| Total liabilities | | | 1,029,438 | |
| | | | | |
| NET ASSETS: | | | | |
| Capital Stock, $0.01 par value; 300,000,000 shares authorized; 16,952,337 shares outstanding | | | 118,337,020 | |
| Net unrealized appreciation on investments | | | 37,252,575 | |
| Accumulated net realized loss on investments | | | (3,138,495 | ) |
| Undistributed net investment income | | | 6,394 | |
| Net assets | | | 152,457,494 | |
| Total liabilities and net assets | | $ | 153,486,932 | |
| | | | | |
| CALCULATION OF NET ASSET VALUE PER SHARE: | | | | |
| Net asset value, offering and redemption price per share ($152,457,494 ÷ 16,952,337 shares outstanding) | | $ | 8.99 | |
The accompanying notes to financial statements are an integral part of this statement.
SCHEDULE OF INVESTMENTS
March 31, 2011 (Unaudited)
| Shares | | | | Cost | | | Value | |
| | | | | | | |
| LONG-TERM INVESTMENTS — 86.2% (a) | | | | | | |
| | | | | | | |
| COMMON STOCKS — 80.2% (a) | | | | | | |
| | | | | | | |
| CONSUMER SERVICES SECTOR — 6.3% | | | | | | |
| | | Other Consumer Services — 6.3% | | | | | | |
| | 173,010 | | DeVry, Inc. | | $ | 8,154,001 | | | $ | 9,527,661 | |
| | | | | | | |
| ENERGY MINERALS SECTOR — 4.8% | | | | | | |
| | | | Oil & Gas Production — 4.8% | | | | | | |
| | 56,230 | | Apache Corporation | | | 5,140,303 | | | | 7,361,632 | |
| | | | | | | | | |
| FINANCE SECTOR — 19.3% | | | | | | | | |
| | | | Finance/Rental/Leasing — 4.6% | | | | | | | | |
| | 95,560 | | Visa Inc. | | | 6,493,368 | | | | 7,035,127 | |
| | | | Investment Banks/Brokers — 4.7% | | | | | | | | |
| | 23,800 | | CME Group Inc. | | | 6,400,327 | | | | 7,176,890 | |
| | | | Investment Managers — 4.7% | | | | | | | | |
| | 57,340 | | Franklin | | | | | | | | |
| | | | Resources, Inc. | | 6,239,050 | | | 7,172,087 | |
| | | | Major Banks — 5.3% | | | | | | | | |
| | 127,480 | | PNC Financial Services | | | | | | | | |
| | | | Group, Inc. | | | 6,829,766 | | | | 8,029,965 | |
| | | | | | | | | |
| HEALTH SERVICES SECTOR — 6.7% | | | | | | | | |
| | | | Health Industry Services — 6.7% | | | | | | | | |
| | 182,780 | | Express Scripts, Inc.* | | | 4,867,759 | | | | 10,164,396 | |
| | | | | | | | | |
| INDUSTRIAL SERVICES SECTOR — 2.7% | | | | | | | | |
| | | | Engineering & Construction — 2.7% | | | | | | | | |
| | 81,200 | | Jacobs Engineering | | | | | | | | |
| | | | Group Inc.* | | | 2,706,169 | | | | 4,176,116 | |
FMI Provident Trust Strategy Fund
SCHEDULE OF INVESTMENTS (Continued)
March 31, 2011 (Unaudited)
| Shares or | | | | | | | | |
| Principal | | | | | | | | |
| Amount | | | | Cost | | | Value | |
| | | | | | | | | |
| LONG-TERM INVESTMENTS — 86.2% (a) (Continued) | | | | | | |
| | | | | | | |
| COMMON STOCKS — 80.2% (a) (Continued) | | | | | | |
| | | | | | | |
| RETAIL TRADE SECTOR — 12.3% | | | | | | |
| | | Apparel/Footwear Retail — 4.6% | | | | | | |
| | 142,300 | | The TJX | | | | | | |
| | | | Companies, Inc. | | $ | 4,717,862 | | | $ | 7,076,579 | |
| | | | Department Stores — 4.4% | | | | | | | | |
| | 126,000 | | Kohl’s Corp. | | | 5,687,677 | | | | 6,683,040 | |
| | | | Home Improvement Chains — 3.3% | | | | | | | | |
| | 78,270 | | Fastenal Co. | | | 3,572,251 | | | | 5,074,244 | |
| | | | | | | | | |
| TECHNOLOGY SERVICES SECTOR — 26.9% | | | | | | | | |
| | | | Information Technology Services — 20.5% | | | | | | | | |
| | 146,240 | | Accenture PLC | | | 4,373,850 | | | | 8,038,813 | |
| | 157,648 | | Cognizant Technology | | | | | | | | |
| | | | Solutions Corp.* | | | 4,544,445 | | | | 12,832,547 | |
| | 145,600 | | Infosys Technologies | | | | | | | | |
| | | | Ltd. SP-ADR | | | 6,437,478 | | | | 10,439,520 | |
| | | | | | | 15,355,773 | | | | 31,310,880 | |
| | | | Packaged Software — 6.4% | | | | | | | | |
| | 291,650 | | Oracle Corp. | | | 7,469,868 | | | | 9,732,360 | |
| | | | | | | | | |
| TRANSPORTATION SECTOR — 1.2% | | | | | | | | |
| | | | Trucking — 1.2% | | | | | | | | |
| | 99,880 | | Heartland | | | | | | | | |
| | | | Express, Inc. | | | 1,478,854 | | | | 1,753,893 | |
| | | | Total common stocks | | | 85,113,028 | | | | 122,274,870 | |
| | | | | | | | | |
| CORPORATE BONDS — 6.0%(a) | | | | | | | | |
| $ | 100,000 | | Hewlett-Packard Co., | | | | | | | | |
| | | | 4.75 %, | | | | | | | | |
| | | | due 06/02/14 | | | 100,023 | | | | 108,736 | |
| | 3,800,000 | | JP Morgan Chase & Co., | | | | | | | | |
| | | | 3.70%, due 01/20/15 | | | 3,840,376 | | | | 3,909,113 | |
| | 2,315,000 | | Shell International | | | | | | | | |
| | | | Finance B.V., 3.10%, | | | | | | | | |
| | | | due 06/28/15 | | | 2,351,790 | | | | 2,372,160 | |
| | 2,747,000 | | Westpac Banking Corp., | | | | | | | | |
| | | | 3.00%, due 08/04/15 | | | 2,747,334 | | | | 2,740,182 | |
| | | | | | | | | | | | |
| | | | Total corporate | | | | | | | | |
| | | | bonds | | | 9,039,523 | | | | 9,130,191 | |
| | | | | | | | | | | | |
| | | | Total long-term | | | | | | | | |
| | | | investments | | | 94,152,551 | | | | 131,405,061 | |
| SHORT-TERM INVESTMENTS — 7.9% (a) | | | | | | |
| | | U.S. Treasury Securities — 7.9% | | | | | | |
| | 6,000,000 | | U.S. Treasury Bills, | | | | | | |
| | | | 0.06%, due 05/19/11 | | | 5,999,520 | | | | 5,999,520 | |
| | 6,000,000 | | U.S. Treasury Bills, | | | | | | | | |
| | | | 0.08%, due 06/16/11 | | | 5,998,987 | | | | 5,999,052 | |
| | | | | | | | | | | | |
| | | | Total U.S. treasury | | | | | | | | |
| | | | securities | | | 11,998,507 | | | | 11,998,572 | |
| | | | | | | | | | | | |
| | | | Total short-term | | | | | | | | |
| | | | investments | | | 11,998,507 | | | | 11,998,572 | |
| | | | | | | | | | | | |
| | | | Total investments | | | | | | | | |
| | | | — 94.1% | | $ | 106,151,058 | | | | 143,403,633 | |
| | | | | | | | | | | | |
| | | | Cash and receivables, | | | | | | | | |
| | | | less liabilities | | | | | | | | |
| | | | — 5.9% (a) | | | | | | | 9,053,861 | |
| | | | | | | | | | | | |
| | | | TOTAL NET | | | | | | | | |
| | | | ASSETS — 100.0% | | | | | | $ | 152,457,494 | |
| | | | | | | | | | | | |
| | | | | | | | | | | | |
| * | Non-income producing security. |
| (a) | Percentages for the various classifications relate to net assets. |
PLC – Public Limited Company
SP-ADR – Sponsored American Depositary Receipt
The accompanying notes to financial statements are an integral part of this schedule.
FMI Provident Trust Strategy Fund
STATEMENT OF OPERATIONS
For the Six Month Period Ending March 31, 2011 (Unaudited)
| INCOME: | | | |
| Dividends | | $ | 538,334 | |
| Interest | | | 165,140 | |
| Total income | | | 703,474 | |
| | | | | |
| EXPENSES: | | | | |
| Management fees | | | 458,597 | |
| Transfer agent fees | | | 80,260 | |
| Administrative and accounting services | | | 60,572 | |
| Professional fees | | | 24,080 | |
| Registration fees | | | 22,750 | |
| Printing and postage expense | | | 13,560 | |
| Custodian fees | | | 10,515 | |
| Board of Directors fees | | | 6,600 | |
| Insurance expense | | | 4,571 | |
| Other expenses | | | 15,575 | |
| Total expenses | | | 697,080 | |
| NET INVESTMENT INCOME | | | 6,394 | |
| NET REALIZED LOSS ON INVESTMENTS | | | (33,246 | ) |
| NET INCREASE IN UNREALIZED APPRECIATION ON INVESTMENTS | | | 17,686,601 | |
| NET GAIN ON INVESTMENTS | | | 17,653,355 | |
| NET INCREASE IN NET ASSETS RESULTING FROM OPERATIONS | | $ | 17,659,749 | |
| | | | | |
STATEMENTS OF CHANGES IN NET ASSETSFor the Six Month Period Ending March 31, 2011 (Unaudited) and For the Year Ended September 30, 2010
| | | 2011 | | | 2010 | |
| | | | | | | |
| OPERATIONS: | | | | | | |
| Net investment income | | $ | 6,394 | | | $ | 77,792 | |
| Net realized (loss) gain on investments | | | (33,246 | ) | | | 4,119,296 | |
| Net increase in unrealized appreciation on investments | | | 17,686,601 | | | | 4,012,095 | |
| Net increase in net assets from operations | | | 17,659,749 | | | | 8,209,183 | |
| | | | | | | | | |
| DISTRIBUTIONS TO SHAREHOLDERS: | | | | | | | | |
| Distributions from net investment income ($0.0115 per share) | | | — | | | | (162,272 | ) |
| FUND SHARE ACTIVITIES: | | | | | | | | |
| Proceeds from shares issued (4,534,969 and 6,769,451 shares, respectively) | | | 37,544,420 | | | | 51,973,491 | |
| Net asset value of shares issued in distributions reinvested (20,856 shares) | | | — | | | | 159,549 | |
| Cost of shares redeemed (2,161,922 and 5,784,493 shares, respectively) | | | (18,507,471 | ) | | | (44,285,410 | ) |
| Net increase in net assets derived from Fund share activities | | | 19,036,949 | | | | 7,847,630 | |
| TOTAL INCREASE | | | 36,696,698 | | | | 15,894,541 | |
| NET ASSETS AT THE BEGINNING OF THE PERIOD | | | 115,760,796 | | | | 99,866,255 | |
| NET ASSETS AT THE END OF THE PERIOD (Includes undistributed | | | | | | | | |
| net investment income of $6,394 and $0, respectively) | | $ | 152,457,494 | | | $ | 115,760,796 | |
| | | | | | | | | |
The accompanying notes to financial statements are an integral part of these statements.
FMI Provident Trust Strategy Fund
FINANCIAL HIGHLIGHTS
(Selected data for each share of the Fund outstanding throughout each period)
| | | | | | | | | | | | | | | | | | | |
| | | (Unaudited) | | | | | | | | | | | | | | | | |
| | | For the | | | | | | | | | | | | | | | | |
| | | Six Month | | | | | | | | | | | | | | | | |
| | | Period Ending | | | Years Ended September 30, | |
| | | March 31, | | | | | | | | | | | | | | | | |
| | | | | | | | | | | | | | | | | | 2006 | |
| | | | | | | | | | | | | | | | | | | |
| PER SHARE OPERATING PERFORMANCE: | | | | | | | | | | | | | | | | | | |
| Net asset value, beginning of period | | $ | 7.94 | | | $ | 7.36 | | | $ | 7.19 | | | $ | 8.13 | | | $ | 7.46 | | | $ | 7.12 | |
| Income from investment operations: | | | | | | | | | | | | | | | | | | | | | | | | |
| Net investment income (loss) | | | 0.00 | * | | | 0.01 | | | | (0.00 | )* | | | 0.05 | | | | 0.09 | | | | 0.04 | |
| Net realized and unrealized | | | | | | | | | | | | | | | | | | | | | | | | |
| gains (loss) on investments | | | 1.05 | | | | 0.58 | | | | 0.20 | | | | (0.91 | ) | | | 0.95 | | | | 0.51 | |
| Total from investment operations | | | 1.05 | | | | 0.59 | | | | 0.20 | | | | (0.86 | ) | | | 1.04 | | | | 0.55 | |
| | | | | | | | | | | | | | | | | | | | | | | | | |
| Less distributions: | | | | | | | | | | | | | | | | | | | | | | | | |
| Distributions from net investment income | | | — | | | | (0.01 | ) | | | (0.03 | ) | | | (0.08 | ) | | | (0.07 | ) | | | — | |
| Distributions from net realized gains | | | — | | | | — | | | | — | | | | — | | | | (0.30 | ) | | | (0.21 | ) |
| Total from distributions | | | — | | | | (0.01 | ) | | | (0.03 | ) | | | (0.08 | ) | | | (0.37 | ) | | | (0.21 | ) |
| Net asset value, end of period | | $ | 8.99 | | | $ | 7.94 | | | $ | 7.36 | | | $ | 7.19 | | | $ | 8.13 | | | $ | 7.46 | |
| | | | | | | | | | | | | | | | | | | | | | | | | |
| | | | | | | | | | | | | | | | | | | | | | | | | |
| TOTAL RETURN | | | 13.22 | %** | | | 8.04 | % | | | 2.87 | % | | | (10.69 | %) | | | 14.47 | % | | | 7.77 | % |
| RATIOS/SUPPLEMENTAL DATA: | | | | | | | | | | | | | | | | | | | | | | | | |
| Net assets, end of period (in 000’s $) | | | 152,457 | | | | 115,761 | | | | 99,866 | | | | 56,498 | | | | 60,254 | | | | 35,521 | |
| Ratio of expenses (after reimbursement) | | | | | | | | | | | | | | | | | | | | | | | | |
| to average net assets (a) | | | 1.00 | %*** | | | 1.00 | % | | | 1.00 | % | | | 1.00 | % | | | 1.00 | % | | | 1.00 | % |
| Ratio of net investment income (loss) | | | | | | | | | | | | | | | | | | | | | | | | |
| to average net assets (b) | | | 0.01 | %*** | | | 0.07 | % | | | (0.04 | %) | | | 0.67 | % | | | 1.17 | % | | | 0.51 | % |
| Portfolio turnover rate | | | 12 | % | | | 51 | % | | | 47 | % | | | 78 | % | | | 52 | % | | | 84 | % |
| (a) | Computed after giving effect to adviser’s expense limitation undertaking. If the Fund had paid all of its expenses for the years ended September 30, 2010, 2009, 2008, 2007 and 2006 the ratios would have been 1.07%, 1.17%, 1.20%, 1.23% and 1.40%, respectively. |
| (b) | If the Fund had paid all of its expenses for the years ended September 30, 2010, 2009, 2008, 2007 and 2006, the ratios would have been 0.00%, (0.21%), 0.47%, 0.94% and 0.11%, respectively. |
| * | Amount less than $0.005 per share. |
The accompanying notes to financial statements are an integral part of this statement.
FMI Provident Trust Strategy Fund
NOTES TO FINANCIAL STATEMENTS
March 31, 2011 (Unaudited)
| (1) | Summary of Significant Accounting Policies — |
The following is a summary of significant accounting policies of the FMI Mutual Funds, Inc. (the “Company”), which is registered as an open-end management investment company under the Investment Company Act of 1940 (the “Act”), as amended. This Company consists of one non-diversified fund – FMI Provident Trust Strategy Fund (the “Fund”). The Company was incorporated under the laws of Wisconsin on May 23, 1986.
The investment objective of the Fund is to realize a combination of capital appreciation and income which will result in the highest total return by investing in a combination of equity and debt securities, while assuming reasonable risks.
| | (a) | Each security, excluding short-term investments, is valued at the last sale price reported by the principal security exchange on which the issue is traded. Securities that are traded on the Nasdaq Markets are valued at the Nasdaq Official Closing Price, or if no sale is reported, the latest bid price. Securities which are traded over-the-counter, bonds and short-term securities with greater than 60 days to maturity are valued at the latest bid price. Securities for which quotations are not readily available are valued at fair value as determined by the investment adviser under the supervision of the Board of Directors. The fair value of a security may differ from the last quoted price and the Fund may not be able to sell a security at the estimated fair value. Market quotations may not be available, for example, if trading in particular securities has halted during the day and not resumed prior to the close of trading on the New York Stock Exchange. As of March 31, 2011, there were no securities that were internally fair valued. Variable rate demand notes are recorded at par value which approximates market value. Short-term investments with maturities of 60 days or less are valued at amortized cost which approximates value. For financial reporting purposes, investment transactions are recorded on the trade date. |
| | | The Fund applies the provisions of the Financial Accounting Standards Board (“FASB”) Accounting Standards Codification “Fair Value Measurements and Disclosures” Topic 820 (“ASC 820”), which defines fair value as the price that would be received to sell an asset or paid to transfer a liability (i.e., the “exit price”) in an orderly transaction between market participants at the measurement date. |
| | | In determining fair value, the Fund uses various valuation approaches. ASC 820 establishes a fair value hierarchy for inputs used in measuring fair value that maximizes the use of observable inputs and minimizes the use of unobservable inputs by generally requiring that the most observable inputs be used when available. Observable inputs are those that market participants would use in pricing the asset or liability based on market data obtained from sources independent of the Fund. Unobservable inputs reflect the Fund’s assumptions about the inputs market participants would use in pricing the asset or liability developed based on the best information available in the circumstances. The inputs or methodologies used for valuing securities are not necessarily an indication of the risks associated with investing in those securities. |
| | | The fair value hierarchy is categorized into three levels based on the inputs as follows: |
| | Level 1 — | Valuations based on unadjusted quoted prices in active markets for identical assets. |
| | Level 2 — | Valuations based on quoted prices for similar securities or in markets that are not active or for which all significant inputs are observable, either directly or indirectly. |
| | Level 3 — | Valuations based on inputs that are unobservable and significant to the overall fair value measurement. |
| | The following table summarizes the Fund’s investments as of March 31, 2011, based on the inputs used to value them: |
| | Valuation Inputs | | | Investments in Securities | |
| | Level 1 — | Common Stocks | | $ | 122,274,870 | |
| | | | | | | |
| | Level 2 — | Long-Term Corporate Bonds | | | 9,130,191 | |
| | | Short-Term U.S. Treasury Securities | | | 11,998,572 | |
| | | Total Level 2 | | | 21,128,763 | |
| | Level 3 — | | | | — | |
| | Total | | | $ | 143,403,633 | |
| | | | | | | |
| | | It is the Fund’s policy to recognize transfers between levels at the end of the quarterly reporting period. There were no transfers between levels during the six month period ending March 31, 2011. |
| | | See the Schedule of Investments for investments detailed by industry classification. |
FMI Provident Trust Strategy Fund
NOTES TO FINANCIAL STATEMENTS (Continued)
March 31, 2011 (Unaudited)
| (1) | Summary of Significant Accounting Policies — (Continued) |
| | (b) | The Fund may purchase securities on a when-issued or delayed delivery basis. Although the payment and interest terms of these securities are established at the time the purchaser enters into the agreement, these securities may be delivered and paid for at a future date, generally within 45 days. The Fund records purchases of when-issued securities and reflects the value of such securities in determining net asset value in the same manner as other portfolio securities. For the six month period ending March 31, 2011 there were no such securities. |
| (c) | Net realized gains and losses on sales of securities are computed on the identified cost basis. |
| (d) | Dividend income is recorded on the ex-dividend date. Interest income is recorded on the accrual basis. |
| (e) | The Fund may have investments in short-term variable rate demand notes, which are unsecured instruments. The Fund may be susceptible to credit risk with respect to these notes to the extent the issuer defaults on its payment obligation. The Fund’s policy is to monitor the creditworthiness of the issuer and nonperformance by these issuers is not anticipated. |
| | (f) | Accounting principles generally accepted in the United States of America (“GAAP”) require that permanent differences between income for financial reporting and tax purposes be reclassified in the capital accounts. |
| | (g) | The preparation of financial statements in conformity with GAAP requires management to make estimates and assumptions that affect the reported amounts of assets and liabilities and disclosure of contingent assets and liabilities at the date of the financial statements and the reported amounts of revenues and expenses during the reporting period. Actual results could differ from these estimates. |
| | (h) | No provision has been made for Federal income taxes since the Fund has elected to be taxed as a “regulated investment company” and intends to distribute substantially all net investment company taxable income and net capital gains to shareholders and otherwise comply with the provisions of the Internal Revenue Code applicable to regulated investment companies. |
| | (i) | The Fund has reviewed all open tax years and major jurisdictions, which include Federal and the state of Wisconsin, and concluded that there are no significant uncertain tax positions that would require recognition in the financial statements. Open tax years are those that are open for exam by taxing authorities and, as of March 31, 2011, open Federal tax years include the tax years ended September 30, 2007 through 2010. The Fund has no examinations in progress and is also not aware of any tax positions for which it is reasonably possible that the total amounts of unrecognized tax benefits will significantly change in the next twelve months. |
| (2) | Investment Adviser and Management Agreement and Transactions With Related Parties — |
The Fund has entered into a management agreement with Fiduciary Management, Inc. (“FMI”), with whom certain officers and a director of the Fund are affiliated, to serve as investment adviser and manager. Under the terms of the agreement, the Fund pays 0.75% on the first $30,000,000 of the daily net assets, 0.65% on the daily net assets in excess of $30,000,000 and less than $100,000,000 and 0.60% on the daily net assets over $100,000,000. The Fund is responsible for paying its proportionate share of the compensation, benefits and expenses of its Chief Compliance Officer. For administrative convenience, FMI initially makes these payments and is later reimbursed by the Fund.
The Adviser entered into a sub-advisory agreement with Provident Trust Company (“PTC”) to assist it in the day-to-day management of the Fund. PTC determines which securities will be purchased, retained or sold for the Fund. The Adviser pays PTC a fee equal to 0.60% of the daily net assets up to $30,000,000 and 0.50% of the daily net assets over $30,000,000.
FMI is contractually obligated to reimburse the Fund for expenses over 2.00% of the daily net assets of the Fund. In addition to the reimbursement required under the management agreement, FMI will voluntarily reimburse the Fund for expenses over 1.00% of the Fund’s daily net assets. For the six month period ending March 31, 2011, there were no contractual or voluntary reimbursements required.
The Fund has entered into a Distribution Plan (the “Plan”), pursuant to Rule 12b-1 under the Act. The Plan provides that the Fund may incur certain costs which may not exceed the lesser of a monthly amount equal to 0.25% of the Fund’s daily net assets or the actual distribution costs incurred during the year. Amounts payable under the Plan are paid monthly for any activities or expenses primarily intended to result in the sale of shares of the Fund. For the six month period ending March 31, 2011, no such expenses were incurred.
FMI Provident Trust Strategy Fund
NOTES TO FINANCIAL STATEMENTS (Continued)
March 31, 2011 (Unaudited)
| (2) | Investment Adviser and Management Agreement and Transactions With Related Parties — (Continued) |
Under the Fund’s organizational documents, each director, officer, employee or other agent of the Fund (including the Fund’s investment manager) is indemnified, to the extent permitted by the Act, against certain liabilities that may arise out of performance of their duties to the Fund. Additionally, in the normal course of business, the Fund enters into contracts that contain a variety of indemnification clauses. The Fund’s maximum exposure under these arrangements is unknown as this would involve future claims that may be made against the Fund that have not yet occurred. However, the Fund has not had prior claims or losses pursuant to these contracts and believes the risk of loss to be remote.
At March 31, 2011, approximately 6% of the outstanding shares of the Fund are owned by an affiliate of the sub-advisor.
| (3) | Distributions to Shareholders — |
Net investment income and net realized gains, if any, are distributed to shareholders at least annually.
| (4) | Investment Transactions — |
For the six month period ending March 31, 2011, purchases and proceeds of sales of investment securities (excluding short-term securities) were $24,549,989 and $14,539,181, respectively.
| (5) | Income Tax Information — |
| | The following information for the Fund is presented on an income tax basis as of September 30, 2010: |
| | | Gross | Gross | Net Unrealized | Distributable | Distributable |
| | Cost of | Unrealized | Unrealized | Appreciation | Ordinary | Long-Term |
| | Investments | Appreciation | Depreciation | on Investments | Income | Capital Gains |
| | $89,227,304 | $21,104,387 | $1,580,516 | $19,523,871 | $ — | $ — |
The difference between the cost amounts for financial statement and federal income tax purposes, if any, is due primarily to timing differences in recognizing certain gains and losses in security transactions.
The tax components of dividends paid during the year ended September 30, 2010 and September 30, 2009, capital loss carryovers, which may be used to offset future capital gains, subject to Internal Revenue Code limitations (expiring in 2017), as of September 30, 2010, and tax basis post-October losses as of September 30, 2010, which are not recognized for tax purposes until the first day of the following fiscal year are:
| | September 30, 2010 | | September 30, 2009 |
| | Ordinary | Long-Term | Net Capital | | | Ordinary | Long-Term |
| | Income | Capital Gains | Loss | Post-October | | Income | Capital Gains |
| | Distributions | Distributions | Carryovers | Losses | | Distributions | Distributions |
| | $162,272 | $ — | $3,063,146 | $ — | | $257,500 | $ — |
For corporate shareholders of the Fund, the percentage of dividend income distributed for the year ended September 30, 2010 which is designated as qualifying for the dividends received deduction is 100% (unaudited).
For all shareholders of the Fund, the percentage of dividend income distributed for the year ended September 30, 2010 which is designated as qualified dividend income under the Jobs and Growth Tax Relief Act of 2003, is 100% (unaudited).
FMI Provident Trust Strategy Fund
On December 17, 2010, the Board of Directors of the FMI Provident Trust Strategy Fund (“Directors”) approved the continuation of the Fund’s investment advisory agreement with Fiduciary Management, Inc. (“FMI”) and its sub-advisory agreement with Provident Trust Company (“PTC”). Prior to approving the continuation of the agreements, the Directors considered:
•the nature, extent and quality of the services provided by FMI and PTC
•the investment performance of the Fund
•the cost of the services to be provided and profits to be realized by FMI and PTC from their relationship with the Fund
•the extent to which economies of scale would be realized as the Fund grew and whether fee levels reflect any economies of scale
•the expense ratio of the Fund
•the manner in which portfolio transactions for the Fund were conducted, including the use of soft dollars
In considering the nature, extent and quality of the services provided by FMI and PTC, the Directors reviewed a report describing the portfolio management, shareholder communication and servicing, prospective shareholder assistance and regulatory compliance services provided by FMI and PTC to the Fund. The Directors concluded that FMI and PTC were providing essential services to the Fund. In particular, the Directors concluded that FMI and PTC were, or will be, preparing reports to shareholders in addition to those required by law, and were providing services to the Fund that were in addition to the services investment advisers typically provided non-mutual fund clients.
The Directors compared the performance of the Fund to the benchmark index over various periods of time and concluded that the performance of the Fund warranted the continuation of the agreements.
In concluding that the advisory fees payable by the Fund were reasonable, the Directors reviewed a report that concluded that FMI was realizing only a small profit from its relationship with the Fund because of the Fund’s small size and the reimbursement made by FMI. The Directors also reviewed reports comparing the Fund’s expense ratio and advisory fee paid by the Fund to those of other comparable mutual funds and concluded that the advisory fee paid by the Fund and the Fund’s expense ratio were within the range of comparable mutual funds. The Directors noted that the investment advisory fee was adjusted if economies of scale were realized as the Fund grew.
Finally, the Directors reviewed reports discussing the manner in which portfolio transactions for the Fund were conducted, including the use of soft dollars. Based on these reports, the Directors concluded that the research obtained by PTC was beneficial to the Fund and that PTC was executing the Fund’s portfolio transactions in a manner designed to obtain best execution for the Fund.
For additional information about the Directors and Officers or for a description of the policies and procedures that the Fund uses to determine how to vote proxies relating to portfolio securities, please call (800) 811-5311 and request a Statement of Additional Information. One will be mailed to you free of charge. The Statement of Additional Information is also available on the website of the Securities and Exchange Commission (the “Commission”) at http://www.sec.gov. Information on how the Fund voted proxies relating to portfolio securities is available on the Fund’s website at http://www.fmifunds.com or the website of the Commission no later than August 31 for the prior 12 months ending June 30. The Fund files its complete schedule of portfolio holdings with the Commission for the first and third quarters of each fiscal year on Form N-Q. The Fund’s Form N-Q is available on the Commission’s website. The Fund’s Form N-Q may be reviewed and copied at the Commission’s Public Reference Room in Washington, D.C., and that information on the operation of the Public Reference Room may be obtained by calling 1-800-SEC-0330.
FMI Provident Trust Strategy Fund
100 East Wisconsin Avenue, Suite 2200
Milwaukee, Wisconsin 53202
www.fmifunds.com
414-226-4555
BOARD OF DIRECTORS
BARRY K. ALLEN
ROBERT C. ARZBAECHER
JOHN S. BRANDSER
GORDON H. GUNNLAUGSSON
PAUL S. SHAIN
INVESTMENT ADVISER
FIDUCIARY MANAGEMENT, INC.
100 East Wisconsin Avenue, Suite 2200
Milwaukee, Wisconsin 53202
PORTFOLIO MANAGER
PROVIDENT TRUST COMPANY
N16 W23217 Stone Ridge Drive, Suite 310
Waukesha, Wisconsin 53188
ADMINISTRATOR, ACCOUNTANT, TRANSFER
AGENT AND DIVIDEND DISBURSING AGENT
U.S. BANCORP FUND SERVICES, LLC
615 East Michigan Street
Milwaukee, Wisconsin 53202
800-811-5311 or 414-765-4124
CUSTODIAN
U.S. BANK, N.A.
1555 North RiverCenter Drive, Suite 302
Milwaukee, Wisconsin 53212
DISTRIBUTOR
RAFFERTY CAPITAL MARKETS, LLC
59 Hilton Avenue
Garden City, New York 11530
INDEPENDENT REGISTERED
PUBLIC ACCOUNTING FIRM
PRICEWATERHOUSECOOPERS LLP
100 East Wisconsin Avenue, Suite 1800
Milwaukee, Wisconsin 53202
LEGAL COUNSEL
FOLEY & LARDNER LLP
777 East Wisconsin Avenue
Milwaukee, Wisconsin 53202
This report is not authorized for use as an offer of sale or a solicitation of an offer to buy shares of FMI Provident Trust Strategy Fund unless accompanied or preceded by the Fund’s current prospectus. Performance data quoted represents past performance; past performance does not guarantee future results. The investment return and principal value of an investment will fluctuate so that an investor’s shares, when redeemed, may be worth more or less than their original cost. Investment returns do not reflect deduction of taxes that a shareholder would pay on Fund distributions or the redemption of Fund shares. Current performance of the Fund may be lower or higher than the performance quoted. Performance data current to the most recent month end may be obtained by visiting www.fmifunds.com
Item 2. Code of Ethics.
Not applicable for semi-annual reports.
Item 3. Audit Committee Financial Expert.
Not applicable for semi-annual reports.
Item 4. Principal Accountant Fees and Services.
Not applicable for semi-annual reports.
Item 5. Audit Committee of Listed Registrants.
Not applicable to registrants who are not listed issuers (as defined in Rule 10A-3 under the Securities Exchange Act of 1934).
Item 6. Schedule of Investments.
| (a) | The Schedule of Investments in securities of unaffiliated issuers is included as part of the report to shareholders filed under Item 1 of this Form. |
Item 7. Disclosure of Proxy Voting Policies and Procedures for Closed-End Management Investment Companies
Not applicable.
Item 8. Portfolio Managers of Closed-End Management Investment Companies.
Not applicable.
Item 9. Purchases of Equity Securities by Closed-End Management Investment Company and Affiliated Purchasers.
Not applicable.
Item 10. Submission of Matters to a Vote of Security Holders.
None.
Item 11. Controls and Procedures.
| (a) | The Registrant’s disclosure controls and procedures are periodically evaluated. As of April 15, 2011, the date of the last evaluation, the Registrant’s officers have concluded that the Registrant’s disclosure controls and procedures are adequate. |
| (b) | The Registrant’s internal controls are periodically evaluated. There were no changes in the Registrant’s internal control over financial reporting that occurred during the second fiscal quarter of the period covered by this report that have materially affected, or are reasonably likely to materially affect, such controls. |
Item 12. Exhibits.
| (a) | (1) Any code of ethics or amendment thereto. Not applicable. |
| | (2) Certifications pursuant to Section 302 of the Sarbanes-Oxley Act of 2002. Filed herewith. |
| (3) | Any written solicitation to purchase securities under Rule 23c-1 under the Act sent or given during the period covered by the report by or on behalf of the Registrant to 10 or more persons. Not applicable to open-end investment companies. |
| (b) | Certification pursuant to Section 906 of the Sarbanes-Oxley Act of 2002. Furnished herewith. |
SIGNATURES
Pursuant to the requirements of the Securities Exchange Act of 1934 and the Investment Company Act of 1940, the registrant has duly caused this report to be signed on its behalf by the undersigned, thereunto duly authorized.
FMI Mutual Funds, Inc.
Registrant
By /s/ Ted D. Kellner
Ted D. Kellner, President, Principal Executive Officer
Date 5/4/11
Pursuant to the requirements of the Securities Exchange Act of 1934 and the Investment Company Act of 1940, this report has been signed below by the following persons on behalf of the registrant and in the capacities and on the dates indicated.
FMI Mutual Funds, Inc.
Registrant
By /s/ Ted D. Kellner
Ted D. Kellner, President, Principal Executive Officer
Date 5/4/11
FMI Mutual Funds, Inc.
Registrant
By /s/ Ted D. Kellner
Ted D. Kellner, Treasurer, Principal Financial Officer
Date 5/4/11