UNITED STATES
SECURITIES AND EXCHANGE COMMISSION
Washington, D.C. 20549
FORM N-CSR
CERTIFIED SHAREHOLDER REPORT OF REGISTERED
MANAGEMENT INVESTMENT COMPANIES
Investment Company Act file number 811-04722
Provident Mutual Funds, Inc.
(Exact name of registrant as specified in charter)
N16 W23217 Stone Ridge Drive,
Suite 310
Waukesha, WI 53188
(Address of principal executive offices) (Zip code)
J. Scott Harkness
Provident Trust Company
N16 W23217 Stone Ridge Drive,
Suite 310
Waukesha, WI 53188
(Name and address of agent for service)
1-855-739-9950
Registrant's telephone number, including area code:
Date of fiscal year end: September 30
Date of reporting period: March 31, 2013
Item 1. Reports to Stockholders.
Semiannual Report
March 31, 2013
Provident Trust Strategy Fund
(PROVX)
A NO-LOAD MUTUAL FUND
| Letter to Shareholders | | | 2 |
| | | | | |
| Expense Example | | | 4 |
| | | | | |
| Schedule of Investments | | | 6 |
| | | | | |
| Statement of Assets and Liabilities | | | 8 |
| | | | | |
| Statement of Operations | | | 9 |
| | | | | |
| Statements of Changes in Net Assets | | | 10 |
| | | | | |
| Financial Highlights | | | 11 |
| | | | | |
| Notes to Financial Statements | | | 12 |
| | | | | |
| Additional Information | | | 17 |
Provident Trust Strategy Fund
Letter to Shareholders
April 2, 2013
Dear Fellow Provident Trust Strategy Fund Shareholders,
Provident Trust Strategy Fund (PROVX) gained +7.06% for the quarter ended March, 2013, vs. the S&P 500’s +10.61% advance. During Provident’s tenure as Portfolio Manager (September 9, 2002), PROVX gained +135.18% cumulatively vs. +115.27% for the S&P 500. 1Q 2013 was the ninth calendar quarter of 3% or greater underperformance to the S&P 500 out of the 42 quarters since Provident was named Portfolio Manager. PROVX’s 78.4% equity exposure hindered our 1Q results vs. the 100% equity S&P 500, as did underperformance from large positions Oracle, Apache, and Cognizant (representing 19.2% of total portfolio assets). The Fund remains concentrated with the 10 largest equity holdings representing 60.7% of total net assets.
We manage PROVX to serve as the core, or sole, investment for shareholders seeking growth of inflation-adjusted purchasing power over successive investment cycles (which we define as a five to seven year period including a greater than 20% stock market decline and a greater than 30% advance). We attempt to navigate this now 13 year old stagnant investment cycle (the price of the S&P 500 increased only +5% since 1Q 2000) by paying attention to relative valuation, a willingness to place concentrated “bets” on companies meeting our investment criteria, and flexible asset allocation.
The S&P 500 index regained the twin 2000 and 2007 price peaks (see chart) and we believe that 2013 GDP should advance +2 – +3% despite the Federal spending sequester, increasing income and social security taxes, and costs associated with Obamacare.
Positive trends supportive of 2013 stock market and GDP growth include:
•Record corporate profits, 22% above the 2006 peak; profits and stock prices grew at a sustainable 6% annual rate since 1990 (see chart).
•Record housing affordability; the monthly house payment for the median priced existing home is $670 vs. $1,150 in 2007 (ISI).
•Rebounding consumer net worth; retirement assets in 401(k)’s and IRA’s almost doubled over the past ten years (IBD).
•Record wages, +6% above the 2Q 2008 peak (ISI).
We are raising our estimated S&P 500 2013 EPS to $110 and our price/earnings range to 15-16X, which we contend should result in positive 2013 stock market returns.
Since the 2007 stock market peak, the yield on the 10-year Treasury dropped from 4.6% to 1.8%, while the earnings yield for the S&P 500 rose from 5.2% to 6.7%, as of March 31, 2013, reflecting massive bond mutual fund purchases ($1.1T) and equity fund redemptions ($455 billion). 1Q 2013 equity mutual fund flows reversed course, reaching a seven year peak +$68B (ISI), a sign the “bond fever” appears to have broken.
We contend investors able to ignore the incessant drumbeat of impending financial doom (fiscal cliff, Eurocrisis, etc.) should again fare well in 2013. We will attempt to improve PROVX ‘s return
potential by identifying growing companies at reasonable valuations. During the March quarter we purchased PetSmart and sold Heartland Express.
Thank you for your investment in, and support of, the Provident Trust Strategy Fund.
Best regards,
J. Scott Harkness, CFA
President
The Fund’s 1-year and annualized 5-year and 10-year returns through March 31, 2013 were: 8.26%, 6.52% and 9.80%, respectively.
The S&P 500, the Fund’s benchmark index, 1-year and annualized 5-year and 10-year returns through March 31, 2013 were: 13.96%, 5.81% and 8.53%, respectively.
The returns do not reflect the deduction of taxes that a shareholder would pay on Fund distributions or the redemption of Fund shares. Performance data quoted represents past performance; past performance does not guarantee future results. The investment return and principal value of an investment will fluctuate so that an investor’s shares, when redeemed, may be worth more or less than their original cost. Current performance since the above time period may be higher or lower than the performance quoted. Performance data current to the most recent month end may be obtained by visiting www.provtrust.com.
As of the Fund’s Prospectus dated January 31, 2013, the Fund’s annual operating expense ratio is 0.95%.
Mutual fund investing involves risk. Principal loss is possible. The Fund is non-diversified, meaning it may concentrate its assets in fewer individual holdings than a diversified fund. Therefore, the Fund is more exposed to individual stock volatility than a diversified fund. The Fund may invest in smaller and medium sized companies, which involve additional risk such as more limited liquidity and greater volatility. Investments in debt securities typically decrease in value when interest rates rise.
The Fund may invest in money market funds. An investment in a money market fund is neither insured nor guaranteed by the Federal Deposit Insurance Corporation or any other government agency.
Although the money market fund seeks to preserve the value of an investment at $1.00 per share, it is possible to lose money by investing in the fund.
While the Fund is no-load, management and other expenses still apply. Please refer to the prospectus for further details.
P/E ratio: The weighted average of the price/earnings ratios of the stocks in the index based on earnings per share.
Earnings per Share (EPS): The portion of a company’s stock allocated to each outstanding share of common stock.
The S&P 500 Index consists of 500 selected common stocks, most of which are listed on the New York Stock Exchange. The Standard & Poor’s Ratings Group designates the stocks to be included in the Index on a statistical basis. A particular stock’s weighting in the Index is based on its relative total market value (i.e., its market price per share times the number of shares outstanding). Stocks may be added or deleted from the Index from time to time. It is not possible to invest directly into an index.
ISI: International Strategy & Investment
IBD: Investor’s Business Daily
You may obtain a hardcopy of the prospectus and the most recent performance data by calling (855) 739-9950 (also available at www.provtrust.com/mutualfund). Please read the statutory and summary prospectus carefully to consider the investment objectives, risks, charges and expenses before investing or sending money. The prospectus contains this and more information. Please read the prospectus carefully before investing.
Provident Trust Strategy Fund
Expense Example
As a shareholder of the Provident Trust Strategy Fund, you incur ongoing costs, including management fees and other Fund expenses. You do not incur transaction costs such as sales charges (loads) on purchase payments, reinvested dividends, or other distributions; redemption fees; and exchange fees because the Fund does not charge these fees. This example is intended to help you understand your ongoing costs (in dollars) of investing in the Fund, and to compare these costs with the ongoing costs of investing in other mutual funds.
The example is based on an investment of $1,000 invested at the beginning of the period and held for the entire period from October 1, 2012 through March 31, 2013.
Actual Expenses
The first line of the following table provides information about actual account values and actual expenses. You may use the information in this line, together with the amount you invested, to estimate the expenses that you paid over the period. Simply divide your account value by $1,000 (for example, an $8,600 account value divided by $1,000 = 8.6), then multiply the result by the number in the first line under the heading entitled “Expenses Paid During Period” to estimate the expenses you paid on your account during this period.
In addition to the costs highlighted and described below, the only Fund transaction costs you might currently incur would be wire fees ($15 per wire), if you choose to have proceeds from a redemption wired to your bank account instead of receiving a check. Additionally, U.S. Bank charges an annual processing fee ($15) if you maintain an IRA account with the Fund. To determine your total costs of investing in the Fund, you would need to add any applicable wire or IRA processing fees you’ve incurred during the period to the costs provided in the example below.
Hypothetical Example for Comparison Purposes
The second line of the following table provides information about hypothetical account values and hypothetical expenses based on the Fund’s actual expense ratio and an assumed rate of return of 5% per year before expenses, which is not the Fund’s actual return. The hypothetical account values and expenses may not be used to estimate the actual ending account balance or expenses you paid for the period. You may use this information to compare the ongoing costs of investing in the Fund and other funds. To do so, compare this 5% hypothetical example with the 5% hypothetical examples that appear in the shareholder reports of the other funds.
Please note that the expenses shown in the table are meant to highlight your ongoing costs only and do not reflect any transactional costs, such as sales charges (loads), redemption fees or exchange fees. Therefore, the second line of the table is useful in comparing ongoing
Provident Trust Strategy Fund
Expense Example (Continued)
costs only, and will not help you determine the relative total costs of owning different funds. In addition, if these transactional costs were included, your costs would have been higher.
| | Beginning | Ending | Expenses Paid |
| | Account Value | Account Value | During Period* |
| | 10/01/12 | 3/31/13 | 10/01/12 – 3/31/13 |
| Provident Trust Strategy Fund | | | |
| Actual | $1,000.00 | $1,072.10 | $5.17 |
| Hypothetical | | | |
| (5% return before expenses) | $1,000.00 | $1,019.95 | $5.04 |
| * | Expenses are equal to the Fund’s annualized expense ratio of 1.00%, multiplied by the average account value over the period, multiplied by 182/365 (to reflect the one-half year period between October 1, 2012 and March 31, 2013). |
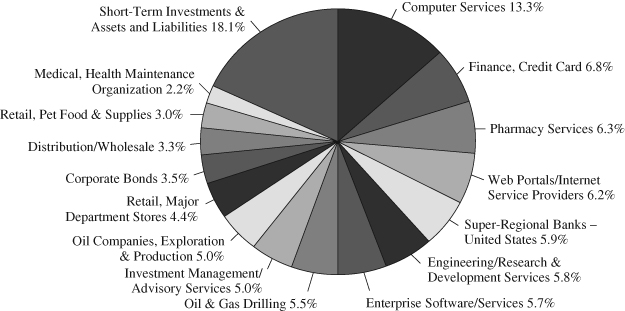
Percentage of Net Assets
March 31, 2013
Provident Trust Strategy Fund
Schedule of Investments
March 31, 2013 (Unaudited)
| Shares | | | | Cost | | | Value | |
| | | | | | | |
| LONG-TERM INVESTMENTS – 81.9% (a) | | | | | | |
| | | | | | | |
| COMMON STOCKS – 78.4% (a) | | | | | | |
| | | | | | | |
| | | Computer Services – 13.3% | | | | | | |
| | 106,000 | | Accenture PLC | | $ | 3,082,436 | | | $ | 8,052,820 | |
| | 189,980 | | Cognizant Technology Solutions Corp.* | | | 6,486,763 | | | | 14,554,368 | |
| | | | | | | 9,569,199 | | | | 22,607,188 | |
| | | | Distribution/Wholesale – 3.3% | | | | | | | | |
| | 110,000 | | Fastenal Co. | | | 2,804,669 | | | | 5,648,500 | |
| | | | | | | | | | | | |
| | | | Engineering/Research & | | | | | | | | |
| | | | Development Services – 5.8% | | | | | | | | |
| | 175,000 | | Jacobs Engineering Group, Inc.* | | | 6,288,395 | | | | 9,842,000 | |
| | | | | | | | | | | | |
| | | | Enterprise Software/Services – 5.7% | | | | | | | | |
| | 300,000 | | Oracle Corp. | | | 7,767,857 | | | | 9,702,000 | |
| | | | | | | | | | | | |
| | | | Finance, Credit Card – 6.8% | | | | | | | | |
| | 68,160 | | Visa Inc. | | | 4,501,225 | | | | 11,576,294 | |
| | | | | | | | | | | | |
| | | | Investment Management/ | | | | | | | | |
| | | | Advisory Services – 5.0% | | | | | | | | |
| | 56,660 | | Franklin Resources, Inc. | | | 6,138,107 | | | | 8,544,895 | |
| | | | | | | | | | | | |
| | | | Medical, Health | | | | | | | | |
| | | | Maintenance Organization – 2.2% | | | | | | | | |
| | 65,000 | | UnitedHealth Group Inc. | | | 3,450,955 | | | | 3,718,650 | |
| | | | | | | | | | | | |
| | | | Oil & Gas Drilling – 5.5% | | | | | | | | |
| | 154,000 | | Helmerich & Payne, Inc. | | | 8,638,581 | | | | 9,347,800 | |
| | | | | | | | | | | | |
| | | | Oil Companies, | | | | | | | | |
| | | | Exploration & Production – 5.0% | | | | | | | | |
| | 110,000 | | Apache Corporation | | | 9,943,435 | | | | 8,487,600 | |
| | | | | | | | | | | | |
| | | | Pharmacy Services – 6.3% | | | | | | | | |
| | 185,000 | | Express Scripts Holding Company* | | | 5,169,793 | | | | 10,665,250 | |
| | | | | | | | | | | | |
| | | | Retail, Pet Food & Supplies – 3.0% | | | | | | | | |
| | 82,680 | | PetSmart, Inc. | | | 5,125,268 | | | | 5,134,428 | |
| | | | | | | | | | | | |
| | | | Retail, Major Department Stores – 4.4% | | | | | | | | |
| | 160,850 | | The TJX Companies, Inc. | | | 2,410,733 | | | | 7,519,737 | |
The accompanying notes to financial statements are an integral part of this schedule.
Provident Trust Strategy Fund
Schedule of Investments (Continued)
March 31, 2013 (Unaudited)
| Shares | | | | Cost | | | Value | |
| | | | | | | | | |
| | | Super-Regional Banks – | | | | | | |
| | | United States – 5.9% | | | | | | |
| | 150,000 | | PNC Financial Services Group, Inc. | | $ | 8,257,433 | | | $ | 9,975,000 | |
| | | | | | | | | | | | |
| | | | Web Portals/Internet | | | | | | | | |
| | | | Service Providers – 6.2% | | | | | | | | |
| | 13,400 | | Google Inc.* | | | 7,311,393 | | | | 10,640,002 | |
| | | | Total common stocks | | | 87,377,043 | | | | 133,409,344 | |
| | | | | | | | | | | | |
| Principal | | | | | | | | | | |
| Amount | | | | | | | | | | |
| | | | | | | | | |
| CORPORATE BONDS – 3.5% (a) | | | | | | | | |
| | | | | | | | | | | | |
| | | | Commercial Banks, | | | | | | | | |
| | | | Non-United States – 1.7% | | | | | | | | |
| $ | 2,747,000 | | | | | | | | | | |
| | | | 3.00%, due 08/04/15 | | | 2,747,181 | | | | 2,884,875 | |
| | | | | | | | | | | | |
| | | | Finance, Credit Card – 1.8% | | | | | | | | |
| | 2,850,000 | | American Express Credit Corp., | | | | | | | | |
| | | | 2.80%, due 09/19/16 | | | 2,861,989 | | | | 3,017,682 | |
| | | | Total corporate bonds | | | 5,609,170 | | | | 5,902,557 | |
| | | | Total long-term investments | | | 92,986,213 | | | | 139,311,901 | |
| | | | | | | | | | | | |
| Shares | | | | | | | | | | |
| | | | | | | | | | | | |
| SHORT-TERM INVESTMENTS – 18.1% (a) | | | | | | | | |
| | | | | | | | | | | | |
| | | | Money Market Fund – 18.1% | | | | | | | | |
| | 30,808,027 | | Invesco Treasury Portfolio, 0.02%^ | | | 30,808,027 | | | | 30,808,027 | |
| | | | Total short-term investments | | | 30,808,027 | | | | 30,808,027 | |
| | | | Total investments – 100.0% | | $ | 123,794,240 | | | | 170,119,928 | |
| | | | Other assets, less liabilities – 0.0% (a) | | | | | | | 13,559 | |
| | | | TOTAL NET ASSETS – 100.0% | | | | | | $ | 170,133,487 | |
| (a) | Percentages for the various classifications relate to net assets. |
| * | Non-income producing security. |
| ^ | The rate quoted is the annualized 7 day yield as of March 31, 2013. |
PLC – Public Limited Company
The accompanying notes to financial statements are an integral part of this schedule.
Provident Trust Strategy Fund
Statement of Assets and Liabilities
March 31, 2013 (Unaudited)
| ASSETS: | | | |
| Investments in securities, at value (cost $123,794,240) | | $ | 170,119,928 | |
| Receivables from shareholders for purchases | | | 205,736 | |
| Dividends & interest receivable | | | 32,563 | |
| Prepaid expenses | | | 29,059 | |
| Total assets | | $ | 170,387,286 | |
| | | | | |
| LIABILITIES: | | | | |
| Payable to adviser for management fees | | $ | 105,160 | |
| Payable to shareholders for redemptions | | | 99,184 | |
| Other liabilities | | | 49,455 | |
| Total liabilities | | | 253,799 | |
| | | | | |
| NET ASSETS: | | | | |
| Capital Stock, $0.01 par value; 300,000,000 shares | | | | |
| authorized; 17,546,547 shares outstanding | | | 123,854,265 | |
| Net unrealized appreciation on investments | | | 46,325,688 | |
| Accumulated net realized gain on investments | | | 15,505 | |
| Undistributed net investment loss | | | (61,971 | ) |
| Net assets | | | 170,133,487 | |
| Total liabilities and net assets | | $ | 170,387,286 | |
| | | | | |
| CALCULATION OF NET ASSET VALUE PER SHARE: | | | | |
| Net asset value, offering and redemption price per share | | | | |
| ($170,133,487 ÷ 17,546,547) shares outstanding) | | $ | 9.70 | |
The accompanying notes to financial statements are an integral part of this statement.
Provident Trust Strategy Fund
Statement of Operations
For the Six Month Period Ending March 31, 2013 (Unaudited)
| INCOME: | | | |
| Dividends | | $ | 853,777 | |
| Interest | | | 138,426 | |
| Total investment income | | | 992,203 | |
| | | | | |
| EXPENSES: | | | | |
| Management fees | | | 531,054 | |
| Transfer agent fees | | | 85,044 | |
| Professional fees | | | 81,641 | |
| Administration and accounting services | | | 69,787 | |
| Other expenses | | | 31,706 | |
| Registration fees | | | 11,955 | |
| Printing and postage expense | | | 11,565 | |
| Board of directors fees | | | 10,612 | |
| Custodian fees | | | 6,578 | |
| Total expenses before reimbursement | | | 839,942 | |
| Less expenses reimbursed by adviser | | | (21,336 | ) |
| Net expenses | | | 818,606 | |
| NET INVESTMENT INCOME | | | 173,597 | |
| | | | | |
| NET REALIZED GAIN ON INVESTMENTS | | | 80,161 | |
| NET INCREASE IN UNREALIZED | | | | |
| APPRECIATION ON INVESTMENTS | | | 11,013,395 | |
| NET GAIN ON INVESTMENTS | | | 11,093,556 | |
| NET INCREASE IN NET ASSETS | | | | |
| RESULTING FROM OPERATIONS | | $ | 11,267,153 | |
| | | | | |
The accompanying notes to financial statements are an integral part of this statement.
Provident Trust Strategy Fund
Statements of Changes in Net Assets
For the Six Month Period Ending March 31, 2013 (Unaudited) and
For the Year Ended September 30, 2012
| | | 2013 | | | 2012 | |
| OPERATIONS: | | | | | | |
| Net investment income | | $ | 173,597 | | | $ | 378,688 | |
| Net realized gain on investments | | | 80,161 | | | | 7,363,275 | |
| Net increase in unrealized | | | | | | | | |
| appreciation on investments | | | 11,013,395 | | | | 20,135,931 | |
| Net increase in net assets | | | | | | | | |
| from operations | | | 11,267,153 | | | | 27,877,894 | |
| | | | | | | | | |
| DISTRIBUTIONS TO SHAREHOLDERS: | | | | | | | | |
| Distributions from net investment income | | | | | | | | |
| ($0.02784 and $0.00715 per share, | | | | | | | | |
| respectively) | | | (489,558 | ) | | | (124,698 | ) |
| Distributions from net realized gains | | | | | | | | |
| ($0.2324 per share) | | | (4,064,179 | ) | | | — | |
| Total distributions | | | (4,553,737 | ) | | | (124,698 | ) |
| | | | | | | | | |
| FUND SHARE ACTIVITIES | | | | | | | | |
| Proceeds from shares issued (1,078,782 and | | | | | | | | |
| 5,525,126 shares, respectively) | | | 10,091,074 | | | | 48,943,522 | |
| Net asset value of shares issued in | | | | | | | | |
| distributions reinvested (522,166 and | | | | | | | | |
| 14,959 shares, respectively) | | | 4,519,608 | | | | 123,863 | |
| Cost of shares redeemed (1,932,978 and | | | | | | | | |
| 4,430,755 shares, respectively) | | | (17,875,781 | ) | | | (38,617,720 | ) |
| Net (decrease) increase in net assets derived | | | | | | | | |
| from Fund share activities | | | (3,265,099 | ) | | | 10,449,665 | |
| TOTAL INCREASE | | | 3,448,317 | | | | 38,202,861 | |
| | | | | | | | | |
| NET ASSETS AT THE BEGINNING | | | | | | | | |
| OF THE PERIOD | | | 166,685,170 | | | | 128,482,309 | |
| NET ASSETS AT THE END | | | | | | | | |
| OF THE PERIOD (Includes undistributed | | | | | | | | |
| net investment (loss) income of (($61,971) | | | | | | | | |
| and $253,990, respectively) | | $ | 170,133,487 | | | $ | 166,685,170 | |
The accompanying notes to financial statements are an integral part of these statements.
Provident Trust Strategy Fund
Financial Highlights
(Selected data for each share of the Fund outstanding throughout each period)
| | | (Unaudited) | | | | | | | | | | | | | | | | |
| | | For the Six | | | | | | | | | | | | | | | | |
| | | Month Period | | | | | | | | | | | | | | | | |
| | | Ending | | | | | | | | | | | | | | | | |
| | | March 31, | | | Years Ended September 30, | |
| | | 2013 | | | 2012 | | | 2011 | | | 2010 | | | 2009 | | | 2008 | |
| PER SHARE OPERATING | | | | | | | | | | | | | | | | | | |
| PERFORMANCE: | | | | | | | | | | | | | | | | | | |
| Net asset value, beginning of period | | $ | 9.32 | | | $ | 7.66 | | | $ | 7.94 | | | $ | 7.36 | | | $ | 7.19 | | | $ | 8.13 | |
| Income from investment operations: | | | | | | | | | | | | | | | | | | | | | | | | |
| Net investment income (loss) | | | 0.01 | | | | 0.02 | | | | (0.00 | )* | | | 0.01 | | | | (0.00 | )* | | | 0.05 | |
| Net realized and unrealized gains | | | | | | | | | | | | | | | | | | | | | | | | |
| (losses) on investments | | | 0.63 | | | | 1.65 | | | | (0.28 | ) | | | 0.58 | | | | 0.20 | | | | (0.91 | ) |
| Total from investment operations | | | 0.64 | | | | 1.67 | | | | (0.28 | ) | | | 0.59 | | | | 0.20 | | | | (0.86 | ) |
| Less distributions: | | | | | | | | | | | | | | | | | | | | | | | | |
| Distributions from net investment income | | | (0.03 | ) | | | (0.01 | ) | | | — | | | | (0.01 | ) | | | (0.03 | ) | | | (0.08 | ) |
| Distributions from net realized gains | | | (0.23 | ) | | | — | | | | — | | | | — | | | | — | | | | — | |
| Total from distributions | | | (0.26 | ) | | | (0.01 | ) | | | — | | | | (0.01 | ) | | | (0.03 | ) | | | (0.08 | ) |
| Net asset value, end of period | | $ | 9.70 | | | $ | 9.32 | | | $ | 7.66 | | | $ | 7.94 | | | $ | 7.36 | | | $ | 7.19 | |
| | | | | | | | | | | | | | | | | | | | | | | | | |
| TOTAL RETURN | | | 7.21 | %(1) | | | 21.78 | % | | | (3.53 | %) | | | 8.04 | % | | | 2.87 | % | | | (10.69 | %) |
| | | | | | | | | | | | | | | | | | | | | | | | | |
| RATIOS/SUPPLEMENTAL DATA: | | | | | | | | | | | | | | | | | | | | | | | | |
| Net assets, end of period (in 000’s $) | | | 170,133 | | | | 166,685 | | | | 128,482 | | | | 115,761 | | | | 99,866 | | | | 56,498 | |
| Ratio of expenses to average net assets: | | | | | | | | | | | | | | | | | | | | | | | | |
| Before expense reimbursement | | | 1.03 | %(2) | | | 0.95 | % | | | 0.98 | % | | | 1.07 | % | | | 1.17 | % | | | 1.20 | % |
| After expense reimbursement | | | 1.00 | %(2) | | | 0.95 | % | | | 0.98 | % | | | 1.00 | % | | | 1.00 | % | | | 1.00 | % |
| Ratio of net investment income (loss) | | | | | | | | | | | | | | | | | | | | | | | | |
| to average net assets (a) | | | 0.21 | %(2) | | | 0.26 | % | | | (0.01 | %) | | | 0.07 | % | | | (0.04 | %) | | | 0.67 | % |
| Portfolio turnover rate | | | 4 | % | | | 33 | % | | | 28 | % | | | 51 | % | | | 47 | % | | | 78 | % |
| | | | | | | | | | | | | | | | | | | | | | | | | |
| * | Amount is less than $0.005. |
| (a) | If the Fund had paid all of its expenses for the six month period ending March 31, 2013 and for the years ended September 30, 2010, 2009, and 2008, the ratios would have been 0.18%(2), 0.00%, (0.21%) and 0.47%, respectively. |
The accompanying notes to financial statements are an integral part of this statement.
Provident Trust Strategy Fund
Notes to Financial Statements
March 31, 2013 (Unaudited)
| (1) | Summary of Significant Accounting Policies |
| | The following is a summary of significant accounting policies of Provident Mutual Funds, Inc. (the “Company”), which is registered as an open-end management investment company under the Investment Company Act of 1940, as amended (the “1940 Act”). The Company consists of one non-diversified fund – Provident Trust Strategy Fund (the “Fund”). The Company was incorporated under the laws of Wisconsin on May 23, 1986. |
| | The investment objective of the Fund is long-term growth of capital. |
| | (a) | Each security, excluding short-term investments with maturities of 60 days or less, is valued at the last sale price reported by the principal security exchange on which the issue is traded. Securities that are traded on the Nasdaq Markets are valued at the Nasdaq Official Closing Price, or if no sale is reported, the latest bid price. Securities which are traded over-the-counter, bonds and short-term securities with greater than 60 days to maturity are valued at the latest bid price. Variable rate demand notes are recorded at par value which approximates market value. Short-term investments with maturities of 60 days or less are valued at amortized cost. Securities for which quotations are not readily available are valued at fair value as determined by the investment adviser under the supervision of the Board of Directors. The fair value of a security may differ from the last quoted price and the Fund may not be able to sell a security at the estimated fair value. Market quotations may not be available, for example, if trading in particular securities has halted during the day and not resumed prior to the close of trading on the New York Stock Exchange. As of March 31, 2013, there were no securities that were internally fair valued. For financial reporting purposes, investment transactions are recorded on the trade date. |
| | | In determining fair value, the Fund uses various valuation approaches. Generally accepted accounting principles in the United States of America (“GAAP”) establishes a fair value hierarchy for inputs used in measuring fair value that maximizes the use of observable inputs and minimizes the use of unobservable inputs by generally requiring that the most observable inputs be used when available. Observable inputs are those that market participants would use in pricing the asset or liability based on market data obtained from sources independent of the Fund. Unobservable inputs reflect the Fund’s assumptions about the inputs market participants would use in pricing the asset or liability developed based on the best information available in the circumstances. The inputs or methodologies used for valuing securities are not necessarily an indication of the risks associated with investing in those securities. |
| | | The fair value hierarchy is categorized into three levels based on the inputs as follows: |
Provident Trust Strategy Fund
Notes to Financial Statements (Continued)
March 31, 2013 (Unaudited)
| | Level 1 — | Valuations based on unadjusted quoted prices in active markets for identical assets. |
| | Level 2 — | Valuations based on quoted prices for similar securities or in markets that are not active or for which all significant inputs are observable, either directly or indirectly. |
| | Level 3 — | Valuations based on inputs that are unobservable and significant to the overall fair value measurement. |
The following table summarizes the Fund’s investments as of March 31, 2013, based on the inputs used to value them:
| | | | Investments | |
| | Valuation Inputs | | in Securities | |
| | Level 1 — Common Stocks | | $ | 133,409,344 | |
| | Short-Term Money Market Fund | | | 30,808,027 | |
| | Total Level 1 | | | 164,217,371 | |
| | Level 2 — Long-Term Corporate Bonds | | | 5,902,557 | |
| | Level 3 — | | | — | |
| | Total | | $ | 170,119,928 | |
It is the Fund’s policy to recognize transfers between levels at the end of the reporting period. During the period ending March 31, 2013, the Fund recognized no transfers to/from level 1 or level 2. The Fund did not invest in any level 3 investments during the six month period.
| | | See the Schedule of Investments for investments detailed by industry classification. |
| | (b) | The Fund may purchase securities on a when-issued or delayed delivery basis. Although the payment and interest terms of these securities are established at the time the purchaser enters into the agreement, these securities may be delivered and paid for at a future date, generally within 45 days. The Fund records purchases of when-issued securities and reflects the value of such securities in determining net asset value in the same manner as other portfolio securities. For the six months period ending March 31, 2013 there were no such securities. |
| | (c) | Net realized gains and losses on sales of securities are computed on the identified cost basis. |
| | (d) | Dividend income is recorded on the ex-dividend date. Interest income is recorded on the accrual basis. During the period, a change was made to record the amortization and accretion of the discounts and premiums on securities purchased using the effective interest method in accordance with GAAP, which is not materially different than the method previously used by the Fund. |
Provident Trust Strategy Fund
Notes to Financial Statements (Continued)
March 31, 2013 (Unaudited)
| | (e) | The preparation of financial statements in conformity with GAAP requires management to make estimates and assumptions that affect the reported amounts of assets and liabilities and disclosure of contingent assets and liabilities at the date of the financial statements and the reported amounts of revenues and expenses during the reporting period. Actual results could differ from these estimates. |
| | (f) | No provision has been made for federal income taxes since the Fund has elected to be taxed as a “regulated investment company” and intends to distribute substantially all net investment company taxable income and net capital gains to shareholders and otherwise comply with the requirements of Subchapter M of the Internal Revenue Code of 1986, as amended, applicable to regulated investment companies. |
| | (g) | The Fund has reviewed all open tax years and major jurisdictions, which include Federal and the state of Wisconsin, and concluded that there are no significant uncertain tax positions that would require recognition in the financial statements. The Fund recognizes interest and penalties, if any, related to unrecognized tax benefits on uncertain tax positions as income tax expense in the Statement of Operations. During the six month period ending March 31, 2013, the Fund did not incur any interest or penalties. Open tax years are those that are open for exam by taxing authorities and, as of March 31, 2013, open federal tax years include the tax years ended September 30, 2009 through 2012. The Fund has no examinations in progress and is also not aware of any tax positions for which it is reasonably possible that the total amounts of unrecognized tax benefits will significantly change in the next twelve months. |
| | (h) | GAAP requires that certain components of net assets relating to permanent differences be reclassified for financial and tax reporting. These differences are caused primarily by differences in the timing of the recognition of certain components of income, expense or realized capital gain for federal income tax purposes. These reclassifications have no effect on net assets, results of operations or net asset value per share. For the year ended September 30, 2012, the Fund had no reclassifications. |
| (2) | Investment Adviser and Management Agreement and Transactions With Related Parties |
The Fund entered into an investment advisory agreement (the “Advisory Agreement”) with Provident Trust Company (“PTC”), with whom certain officers and a director of the Fund are affiliated, to serve as the investment adviser. Under the terms of the Advisory Agreement, the Fund pays 0.75% on the first $30,000,000 of the daily net assets, 0.65% on the daily net assets in excess of $30,000,000 and less than $100,000,000 and 0.60% on the daily net assets over $100,000,000. The
Provident Trust Strategy Fund
Notes to Financial Statements (Continued)
March 31, 2013 (Unaudited)
Fund is responsible for paying a share of the compensation, benefits and expenses of its Chief Compliance Officer. For administrative convenience, the adviser initially makes these payments and is later reimbursed by the Fund.
Pursuant to an expense cap/reimbursement agreement between PTC and the Company, PTC has agreed to waive a portion of its management fee and/or assume expenses for the Fund to the extent necessary to ensure that the Fund’s total operating expenses, excluding taxes, interest, brokerage commissions and other costs relating to portfolio securities transactions (including the costs, fees and expenses associated with the Fund’s investments in other investment companies) and other extraordinary expenses, do not exceed 1.00% of the Fund’s average daily net assets on an annual basis. The expense cap/reimbursement agreement will continue in effect until January 31, 2014 with successive renewal terms of one year unless terminated by PTC or the Company prior to any such renewal. PTC is entitled to recoup such amounts from the Fund for a period of up to three years from the date PTC reduced its compensation and/or assumed expenses for the Fund. For the six month period ending March 31, 2013, all such reimbursements amount to $21,336.
The Fund adopted a Distribution Plan (the “Plan”) pursuant to Rule 12b-1 under the 1940 Act. The Plan provides that the Fund may charge a distribution and service fee equal to 0.25% (on an annualized basis) of the Fund’s average daily net assets. Amounts payable under the Plan are paid monthly for any activities or expenses primarily intended to result in the sale of shares of the Fund. For the six month period ending March 31, 2013, no such expenses were incurred.
Under the Company’s organizational documents, each director, officer, employee or other agent of the Company is indemnified, to the extent permitted by the 1940 Act, against certain liabilities that may arise out of performance of their duties to the Company. Additionally, in the normal course of business, the Company, on behalf of the Fund, enters into contracts that contain a variety of indemnification clauses. The Fund’s maximum exposure under these arrangements is unknown as this would involve future claims that may be made against the Fund that have not yet occurred. However, the Fund has not had prior claims or losses pursuant to these contracts and believes the risk of loss to be remote.
At March 31, 2013, approximately 8% of the outstanding shares of the Fund are owned by the Adviser.
For the period February 2, 2013 through March 31, 2013, the Fund entered into a line of credit in the amount of $4,800,000, maturing February 1, 2014. This unsecured line of credit was intended to provide short-term financing, if necessary, subject to certain restrictions in connection with shareholder redemptions. Under the terms of
Provident Trust Strategy Fund
Notes to Financial Statements (Continued)
March 31, 2013 (Unaudited)
the loan agreement, interest was accrued at prime rate minus one percent or 2.25% (as of March 31, 2013). The credit facility was with U.S. Bank, N.A., the Fund’s custodian. During the period of February 2, 2013 through March 31, 2013, the Fund did not utilize the line of credit.
| (4) | Distributions to Shareholders |
Net investment income and net realized gains, if any, are distributed to shareholders at least annually. Distributions to shareholders are recorded on the ex-dividend date.
| (5) | Investment Transactions |
For the six months period ending March 31, 2013, purchases and proceeds of sales of investment securities (excluding short-term securities) were $5,125,267 and $11,213,442, respectively.
| (6) | Income Tax Information |
The following information for the Fund is presented on an income tax basis as of September 30, 2012:
| | | | Net | | Distributable |
| | Gross | Gross | Unrealized | Distributable | Long-Term |
| Cost of | Unrealized | Unrealized | Appreciation | Ordinary | Capital |
| Investments | Appreciation | Depreciation | on Investments | Income | Gains |
| $120,174,427 | $37,701,591 | $(2,453,954) | $35,247,637 | $253,990 | $4,064,179 |
The difference between the cost amounts for financial statement and federal income tax purposes, if any, is due primarily to timing differences in recognizing certain gains and losses in security transactions.
On December 22, 2010, the Regulated Investment Company Modernization Act of 2010 (the “RIC Act”) was enacted, which changed various technical rules governing the tax treatment of RICs. The changes are generally effective for taxable years beginning after the date of enactment. Capital losses incurred in taxable years beginning after the date of enactment may now be carried forward indefinitely, and retain the character of the original loss. Post-enactment losses must be utilized prior to pre-enactment losses. Under pre-enactment law, capital losses could be carried forward for up to eight years, and carried forward as short-term capital loss, irrespective of the character of the original loss. The RIC Act now allows RICs to elect to “push” to the first day of the next taxable year all or part of any late year ordinary loss, which is defined as the sum of the specified post-October losses and other post-December ordinary losses, over the specified post-October gains and other post-December ordinary gains. This reduces the circumstances under which a RIC might be required to file amended Forms 1099 to restate previously reported distributions.
Provident Trust Strategy Fund
Notes to Financial Statements (Continued)
March 31, 2013 (Unaudited)
The tax components of dividends paid during the years ended September 30, 2012 and 2011 are:
| September 30, 2012 | | September 30, 2011 |
| | Long-Term | | | Long-Term |
| Ordinary | Capital | | Ordinary | Capital |
| Income | Gains | | Income | Gains |
| Distributions | Distributions | | Distributions | Distributions |
| $124,698 | $— | | $— | $— |
The Fund has utilized $3,033,857 of its capital loss carryovers during the year ended September 30, 2012.
For corporate shareholders of the Fund, the percentage of dividend income distributed for the year ended September 30, 2012 which is designated as qualifying for the dividends received deduction is 100%.
For all shareholders of the Fund, the percentage of dividend income distributed for the year ended September 30, 2012 which is designated as qualified dividend income under the Jobs and Growth Tax Relief Act of 2003, is 100%.
Additional Information
For additional information about the Directors and Officers or for a description of the policies and procedures that the Fund uses to determine how to vote proxies relating to portfolio securities, please call 1-855-739-9950 and request a Statement of Additional Information. One will be mailed to you free of charge. The Statement of Additional Information is also available on the website of the Securities and Exchange Commission (the “Commission”) at http://www.sec.gov. Information on how the Fund voted proxies relating to portfolio securities is available without charge by calling 1-855-739-9950, or on the Fund’s website at http://www.provtrust.com, or the website of the Commission no later than August 31 for the prior 12 months ending June 30. The Fund files its complete schedule of portfolio holdings with the Commission for the first and third quarters of each fiscal year on Form N-Q. The Fund’s Form N-Q is available on the Commission’s website. The Fund’s Form N-Q may be reviewed and copied at the Commission’s Public Reference Room in Washington, D.C., and information on the operation of the Public Reference Room may be obtained by calling 1-800-SEC-0330.
Provident Trust Strategy Fund
N16 W23217 Stone Ridge Drive, Suite 310
Waukesha, Wisconsin 53188
BOARD OF DIRECTORS
JOHN F. HENSLER
DOUGLAS C. MALMQUIST
ROBERT H. MANEGOLD
THOMAS N. TUTTLE, JR.
INVESTMENT ADVISER
PROVIDENT TRUST COMPANY
N16 W23217 Stone Ridge Drive, Suite 310
Waukesha, Wisconsin 53188
ADMINISTRATOR, ACCOUNTANT, TRANSFER AGENT
AND DIVIDEND DISBURSING AGENT
U.S. BANCORP FUND SERVICES, LLC
615 East Michigan Street
Milwaukee, Wisconsin 53202
800-811-5311 or 414-765-4124
CUSTODIAN
U.S. BANK, N.A.
1555 North RiverCenter Drive, Suite 302
Milwaukee, Wisconsin 53212
DISTRIBUTOR
QUASAR DISTRIBUTORS, LLC
615 East Michigan Street
Milwaukee, Wisconsin 53202
INDEPENDENT REGISTERED PUBLIC ACCOUNTING FIRM
COHEN FUND AUDIT SERVICES, LTD.
1350 Euclid Avenue, Suite 800
Cleveland, Ohio 44115
LEGAL COUNSEL
GODFREY & KAHN, S.C.
780 North Water Street
Milwaukee, Wisconsin 53202
Item 2. Code of Ethics.
Not applicable for semi-annual reports.
Item 3. Audit Committee Financial Expert.
Not applicable for semi-annual reports.
Item 4. Principal Accountant Fees and Services.
Not applicable for semi-annual reports.
Item 5. Audit Committee of Listed Registrants.
Not applicable to registrants who are not listed issuers (as defined in Rule 10A-3 under the Securities Exchange Act of 1934).
Item 6. Schedule of Investments.
| (a) | The Schedule of Investments in securities of unaffiliated issuers is included as part of the report to shareholders filed under Item 1 of this Form. |
Item 7. Disclosure of Proxy Voting Policies and Procedures for Closed-End Management Investment Companies
Not applicable.
Item 8. Portfolio Managers of Closed-End Management Investment Companies.
Not applicable.
Item 9. Purchases of Equity Securities By Closed-End Management Investment Company and Affiliated Purchasers.
Not applicable.
Item 10. Submission of Matters to a Vote of Security Holders.
None.
Item 11. Controls and Procedures.
| (a) | The Registrant’s disclosure controls and procedures are periodically evaluated. As of April 22, 2013, the date of the last evaluation, the Registrant’s officers have concluded that the Registrant’s disclosure controls and procedures are adequate. |
| (b) | The Registrant’s internal controls are periodically evaluated. There were no changes in the Registrant’s internal control over financial reporting that occurred during the second fiscal quarter of the period covered by this report that have materially affected, or are reasonably likely to materially affect, such controls. |
Item 12. Exhibits.
| (a) | (1) Any code of ethics or amendment thereto. Not applicable. |
| (2) | Certifications pursuant to Section 302 of the Sarbanes-Oxley Act of 2002. Filed herewith. |
| (3) | Any written solicitation to purchase securities under Rule 23c-1 under the Act sent or given during the period covered by the report by or on behalf of the Registrant to 10 or more persons. Not applicable to open-end investment companies. |
| (b) | Certification pursuant to Section 906 of the Sarbanes-Oxley Act of 2002. Furnished herewith. |
SIGNATURES
Pursuant to the requirements of the Securities Exchange Act of 1934 and the Investment Company Act of 1940, the registrant has duly caused this report to be signed on its behalf by the undersigned, thereunto duly authorized.
Provident Mutual Funds, Inc.
Registrant
By /s/J. Scott Harkness
J. Scott Harkness, Principal Executive Officer
Date 5/8/2013
Pursuant to the requirements of the Securities Exchange Act of 1934 and the Investment Company Act of 1940, this report has been signed below by the following persons on behalf of the registrant and in the capacities and on the dates indicated.
Provident Mutual Funds, Inc.
Registrant
By /s/Michael A. Schelble
Michael A. Schelble, Principal Financial Officer