SECURITIES AND EXCHANGE COMMISSION
Washington, D.C. 20549
FORM N-CSR
Investment Company Act file number 811-04750
________________
Fenimore Asset Management Trust
________________________________________________________________
(Exact name of registrant as specified in charter)
384 North Grand Street
P.O. Box 399
Cobleskill, New York 12043
________________________________________________________________
(Address of principal executive offices) (Zip code)
Thomas O. Putnam
Fenimore Asset Management Trust
384 North Grand Street
Cobleskill, New York 12043
________________________________________________________________
Name and address of agent for service
Registrant’s telephone number, including area code: 1-800-453-4392
_________________
Date of fiscal year end: December 31
_________________
Form N-CSR is to be used by management investment companies to file reports with the Commission not later than 10 days after the transmission to stockholders of any report that is required to be transmitted to stockholders under Rule 30e-1 under the Investment Company Act of 1940 (17 CFR 270.30e-1).
The Commission may use the information provided on Form N-CSR in its regulatory disclosure review, inspection, and policymaking roles. A registrant is required to disclose the information specified by Form N-CSR, and the Commission will make this information public. A registrant is not required to respond to the collection of information contained in Form N-CSR unless the Form displays a currently valid Office of Management and Budget (“OMB”) control number. Please direct comments concerning the accuracy of the information collection burden estimate and any suggestions for reducing the burden to Secretary, Securities and Exchange Commission, 450 Fifth Street, NW, Washington, DC 20549-0609. The OMB has reviewed this collection of information under the clearance requiresments of 44 U.S.C. ss. 3507.
Item 1. Report to Stockholders.
The annual report to stockholders is filed herewith.

In-depth research. Insightful investing.
ANNUAL REPORT
DECEMBER 31, 2015
VALUE FUND
EQUITY-INCOME FUND
SMALL CAP FUND
Table of Contents
Chairman’s Commentary | 1 |
| FAM Value Fund |
| Letter to Shareholders | 4 |
| Performance Summary | 9 |
| Portfolio Data | 11 |
| Statement of Investments | 12 |
| FAM Equity-Income Fund |
| Letter to Shareholders | 17 |
| Performance Summary | 23 |
| Portfolio Data | 25 |
| Statement of Investments | 26 |
| FAM Small Cap Fund |
| Letter to Shareholders | 30 |
| Performance Summary | 35 |
| Portfolio Data | 37 |
| Statement of Investments | 38 |
| Statements of Assets and Liabilities | 42 |
| Statements of Operations | 43 |
| Statements of Changes in Net Assets | 44 |
| Notes to Financial Statements | 46 |
| Report of Independent Registered Public Accounting Firm | 57 |
| Investment Advisor Contract Renewal Disclosure | 58 |
| Information About Trustees and Officers | 63 |
| Expense Data | 65 |
| Supplemental Information | 66 |
FAM Funds has adopted a Code of Ethics that applies to its principal executive and principal financial officers. You may obtain a copy of this Code without charge, by calling FAM Funds at (800) 932-3271. |
Chairman’s Commentary
December 31, 2015
Dear Fellow Shareholder,
Financial market commentaries are replete with sports analogies. Among the most common are “playing offense” or “playing defense.” Typically, the authors of the articles are goading the audience to get more aggressive (offense) in their portfolio positioning or more conservative (defense) in an effort to maximize returns. Do not be fooled, it is market timing wrapped in a sports uniform. The authors view the investing environment as black or white and the time to switch from offense to defense – or vice versa – is clear-cut. We view the investing environment, and our mandate, quite differently. The environment is always ambiguous and our mission in the context of uncertainty is to first protect the capital entrusted to us, then to grow it over the long term. We are constantly playing “defensive offense.” We do not field the offense to try to make a big play, then send in the defense. Our offense is always on the field steadily powering the ball forward and being careful to avoid a turnover. A defensive offense has served us well and we think it may be even more important in the months and years ahead.
2015 Recap
After a stumble off the line in 2015, the U.S. stock market, as measured by the S&P 500 Index, was relatively calm for the first two-thirds of the year, vacillating between flat and +3 %. Then, in August, fears about a slowing Chinese economy erupted to the surface when The Peoples Bank of China unexpectedly devalued their currency in an effort to, among other things, boost growth through exports. The S&P 500 fell -11% in the following days, bottoming -12.4% below its 2015 peak. The aftershocks of this surprise move, along with the continued slide in prices of oil and other commodities and strengthening dollar, led to increased volatility in the final months of the year.
Despite the volatility, the S&P 500 Index finished the year nearly where it started falling -0.70%; however, including dividends (total return) the index returned 1.38%. The Russell 3000 Index, a broader measure of the market which includes the 3000 largest companies, finished at 0.48% (total return). Similar to a calm body of water belying strong crosscurrents beneath a smooth surface, there was significant, disparate performance within subsets of the market. Large companies, as represented by the Russell 1000 Index, ended 2015 at 0.92%, outperforming smaller companies represented by the Russell 2000 Index which dropped -4.41%. Even starker was the difference between stocks deemed growth versus those con- sidered value. The Russell 3000 Growth Index was up 5.09% while the Russell 3000 Value Index fell -4.13%. This more than 9% point difference is the widest gap in years and presented challenges for investors who, like us, seek to invest in businesses at a discount to their intrinsic value.
1
Chairman’s Commentary
With this as our backdrop, our three Funds performed well in 2015 relative to both our benchmarks and our peers (please read the Fund letters that follow for more detail). On an absolute basis, we strive to do better than we did. But after three strong years in the markets and the Funds, it isn’t a surprise to have a flat-to-down year. One consequence of the more volatile markets is that we were more active in the Funds than past years. On several occasions we took the opportunity to sell richly-valued holdings and buy positions in businesses that we believe have better risk/reward profiles. Also adding to our portfolio activity, several of our holdings were acquired or announced the intention to be acquired. Throughout the year, we initiated positions in 14 new companies and sold or were bought out of 16 holdings. If volatility persists, which we think is probable, we will continue to be more active than usual.
Oil prices finished the year -30% below where they started and -70% from their mid-2014 peak. At this time last year, we were pondering the effects of the then six-month-old bear market in oil. Most of the outside commentary was positive, anticipating the beneficial effects on consumers’ budgets with many predicting higher prices by year-end. We had no point of view as to future price movements but we cautioned that while it might make for a more pleasant trip to the gas station for many people, the drop in oil would not come without costs. Even with our cautious stance, we have been surprised by how harmful lower oil has been on the U.S. economy. When you drop a stone in calm water, the ripple wave emanates far from the point of impact. Similarly, the ripple wave of lower oil is being felt far beyond exploration and production companies and oil service firms. “Oil and gas exposure” has become a primary topic of conversation between Wall Street and managements of businesses ranging from industrial manufacturers to real estate services. As prospects for a quick rebound in oil prices (appear to) fade, many investors are shunning corporations that might feel effects, regardless of their quality or long-term prospects. These “oil ripple” businesses are just one area we are finding interesting opportunities. While we continue to monitor companies with direct exposure to oil and gas, we are excited about those increasingly unloved businesses with indirect exposure.
After months of investor anticipation and fixation, Janet Yellen and her colleagues at the Federal Reserve ripped off the proverbial “Band-Aid” and raised the target Fed Funds rates a quarter of a point during their final meeting of 2015. While metaphorically appealing, calling seven years of near-zero interest rates a Band-Aid might be deemed an understatement for the ages. Some would call it a tourniquet, others a noose. Regardless, the process of normalizing short-term rates has begun. I stress short-term, because the Fed does not control medium- and long-term rates. Indeed, between the rate hike on December 16 and the end of the year, the yield on the 10-Year Treasury fell three basis points to 2.27%. The Federal Open Market Committee will meet eight times in 2016; some likely resulting in further rate increases, all likely preceded by market skittishness. Of course, we do not know at what speed or to what extent short-term rates may increase or what will happen to longer term rates, but we continue to be
2
Chairman’s Commentary
vigilant about both the risks and opportunities of higher rates, including their effects on the dollar. We will also be ready to take advantage of stock market volatility surrounding the meetings as it often leads to indiscriminate buying and selling. This can create opportunities for us to invest in quality businesses at attractive prices.
One of the outcomes of the challenges in developing markets, Europe, and the oil patch is that revenue growth has become harder to achieve. With fewer opportunities to grow sales organically (i.e. by doing more of the same thing) and access to cheap capital, companies are opting to “buy growth” by merging with or acquiring other businesses. In fact, 2015 was a record-setting year for mergers and acquisitions (M&A) with almost $3 trillion in announced and/or consummated transactions in just North America. Our Funds benefitted from this trend in a couple of ways. First, as I mentioned, we had several companies acquired at prices above – sometimes well above – our cost. Next, a couple of our holdings have exploited the frothy M&A market by selling non-core segments and redeploying or returning the capital. Lastly, some of our businesses have been acquirers, using low-cost capital to make accretive acquisitions. Even with short-term rates on the rise, we expect to continue to benefit from heightened acquisition activity in 2016.
Outlook
We have no view on where the market will end in 2016 and do not know if the volatility that surfaced at the end of 2015 will carry into this year. What we do know is that when you are a long-term, patient investor with a solid playbook of defensive offense, volatility is opportunity.
Thank you for your continued trust in us.
| Thomas O. Putnam, Chairman |
| |
| Research Team: |
| Andrew F. Boord |
John D. Fox, CFA |
| Kevin D. Gioia, CFA |
| Paul C. Hogan, CFA |
| Drew P. Wilson, CFA |
3
FAM Value Fund
December 31, 2015
Dear Fellow Value Fund Shareholder:
The U.S. stock market reached an all-time high in May 2015, but declined over the sum- mer as concerns about a slowing economy in China reduced stock prices. From the peak in May to the trough in August stock prices declined -12%. This was the first decline of -10% or more in four years. Looking back on the year it was a difficult time to make money in financial markets. The stock market, as measured by the S&P 500 Index, was up about 1% and the bond market, as measured by the Barclays U.S. Aggregate Bond Index, delivered a total return of less than -1%. In some areas there were considerable losses. Previous market darlings like emerging markets were down more than -10% last year. One of the S&P 500’s worst areas was energy and commodity stocks – the largest energy ETF (exchange traded fund), Energy Select Sector SPDR Fund, was down more than -20% for the year.
Performance Detail
At December 31, 2015 the net asset value of the FAM Value Fund was $60.06 representing a decrease of -1.74% from the beginning of the year. For comparison, the S&P 500 Index increased 1.38% and the Russell Midcap Index declined -2.44%.
Best Performers
The best performer for the year, on a dollar-weighted basis, was Markel Corporation with a gain of $13.06 million. Markel is an insurance company with headquarters in Richmond, VA. Originally a family business started in 1930 by Sam Markel in Norfolk, today Markel is a global corporation selling almost $5 billion a year of insurance premiums. The company has offices in the United States, London, and Singapore. Markel focuses on underwriting profits and a unique approach to investing with a much larger percentage of their invested assets in stocks than the typical insurer.
The second-best performer was MEDNAX, Inc. with a gain of almost $6.89 million. MEDNAX is a healthcare service company that runs neonatal intensive care units at hospitals and provides anesthesia services. Over the last year, MEDNAX has expanded into new healthcare businesses such as virtual radiology and hospital revenue management. Earnings growth over the last decade has been terrific due to a combination of internal growth and many profitable acquisitions.
The third-best performer was Ross Stores, Inc. with a gain of more than $6.72 million. Ross is one of the best stocks we have owned in the 29-year history of the Fund. Shoppers continue to be attracted to Ross’ offering of brand-name clothes at discount prices. The current fiscal year (ending January 2016) will be the eleventh year in a row of positive earnings per share growth. In addition to providing growth, the business maintains its excellent financial strength. Ross Stores ended the last quarter
4
FAM Value Fund
with more than $500 million of cash in the bank. Management continues to allocate profits wisely with shareholders receiving significant dividends and share buybacks over the last five years.
Worst Performers
The worst performer for the year, on a dollar-weighted basis, was Franklin Resources, Inc. with a loss of -$8.38 million. Franklin Resources is an investment management firm and its brands include Franklin Bond Funds and Templeton Global Funds. Over the past year, the company experienced large redemptions out of its bond and global stock funds. Investors are worried about a slowdown in China and related emerging markets. As a result, they are pulling money out of their global funds. As conditions change around the world, we think these funds can do well in the future and recapture investors’ interest. While Franklin’s stock price declined sharply, we believe it remains financially strong with more than $9 billion in net cash and the stock is undervalued at about 7x earnings net of the cash per share.
The second-worst performer was CarMax, Inc. with a loss of -$7.08 million. CarMax is the nation’s largest used car superstore. Founded in Richmond, VA in 1983, CarMax management believed there was a real opportunity to improve the car buying process. Management designed a car retailing model based on integrity and trust. The CarMax business model includes fixed prices for their cars, transparent financing options, and a cash offer for your car with no obligation. We first purchased CarMax in the Fund in May 2004 at around $12.50 per share when the company had 52 stores and a plan to expand nationally. In the most recent quarter, they had 153 stores with plans to open at least 36 new stores over the next three years. We continue to like the CarMax business model based on transparency and their ability to continue opening new stores to drive growth.
The third-worst performer was EOG Resources, Inc. with a loss of more than -$6.31 million. EOG is an energy producer which has been impacted by the sharp decline in the price of oil and natural gas. We continue to like EOG’s low-cost structure, strong balance sheet, and management’s focus on return on capital versus growth. While all energy companies are struggling with low commodity prices, we think EOG should continue to generate cash and be in a strong position when commodity prices increase.
Portfolio Activity
Purchases
We invested in five new companies during the year: DSW Inc., Fossil Group, Inc., Keysight Technologies, Inc., Precision Castparts Corp. and Xilinx, Inc.
DSW is the operator of more than 400 Designer Shoe Warehouse stores in 42 states. In addition, DSW runs shoe departments for other retailers. Each retail location has more than 20,000 pairs of shoes. The company offers shoppers convenience, selection, and
5
FAM Value Fund
great prices. At the time of our first purchase the stock price had declined -40% from its all-time high. The stock declined due to concerns about retail sales being affected by warm weather and online sales impacting brick and mortar retailers. Living in Upstate New York, we have experienced the very warm winter weather and estimate that this has had a real impact on cold weather products like coats and boots. DSW normally sells a lot of boots this time of year, but those sales have not materialized due to the weather. We believe that the unusual climate is temporary and DSW is somewhat insulated from online sales as the need to try on shoes is an important part of a customer’s buying experience. The business has an excellent financial profile with a debt-free balance sheet and 15% return on equity.
Fossil Group designs, markets, and distributes fashion accessories, primarily watches, while having an extremely diverse product and distribution portfolio. The company’s watch brands include Fossil, Michael Kors, Kate Spade, and Burberry. Their products are sold in Fossil stores, department stores, jewelry stores, and online. Their financial profile is excellent with high profit margins, returns on equity in excess of 25%, and a strong balance sheet. We also like the fact that the CEO takes no salary and owns 12% of Fossil.
Keysight Technologies provides electronic measurement solutions to the Communications and Electronics industries. The test equipment operation was the original business of the Hewlett-Packard Corporation in Palo Alto, CA. While Hewlett-Packard has been around for more than 50 years, Keysight is relatively new as a public company and became an independent entity in October of 2014. We believe that, as an independent firm, management should be able to focus its resources on product development and growth. Keysight meets our financial criteria with 19% operating margins, considerable free cash flow generation, and a strong balance sheet.
Precision Castparts manufactures metal components and products. It provides investment castings, forgings, fasteners, and fastener systems for critical aerospace and industrial gas turbine applications. Some of Precision’s products are sold into the energy business, which is currently experiencing a severe slowdown. As a result of the weakening in Precision’s sales, the stock declined from a high of $275 to below $200 per share this past summer. While we acknowledged its earnings power had declined, we thought the company had terrific products and a strong competitive advantage. We began buying the stock below $200 a share in July. Unknown to us, Precision was in talks to be acquired by another one of our holdings – Berkshire Hathaway. The acquisition was announced on August 10, 2015 and we sold our shares for a relatively quick gain.
Xilinx is a semiconductor business that designs and markets programmable circuits and chips. We purchased a position in the Fund in January after a disappointing earnings re- port caused the stock to decline below what we thought it was worth. Xilinx is extremely profitable with a gross profit margin of almost 70%. The company generates significant free cash flow which has been used to pay dividends and reduce the shares outstanding. Additionally, it has an extremely strong balance sheet
6
FAM Value Fund
with cash balances in excess of $3 billion. Xilinx is one of two businesses that specialize in programmable chips. The other, Altera, was recently acquired by Intel.
Sales
We sold our entire position in five holdings during the year: Bed Bath & Beyond, Inc., Evolution Petroleum Corporation, Southwestern Energy Company, Protective Life Corporation, and Precision Castparts Corp.
Bed Bath & Beyond is a well-known retailer that specializes in merchandise for the home. The company’s brands include Bed Bath & Beyond, Christmas Tree Shops, and buybuy Baby. We had owned stock in Bed Bath for many years. We originally liked its strong balance sheet and management’s skill at merchandising in its stores. While this had been a profitable holding for the Fund in recent years, we have become concerned about the long- term profitability of the business due to increased competition from online retailers. Not only are online retailers taking sales from physical stores, but the increased competition is requiring retailers like Bed Bath & Beyond to invest in their own online capabilities. We estimate that the combination of these two forces will reduce profit margins over time.
We sold all of our shares in two energy names: Evolution Petroleum and Southwestern Energy. Both positions were very small and would not have a material effect on Fund performance if they rebounded. To maintain a similar exposure to commodity prices, we invested a comparable dollar amount from these sales into additional shares of EOG Resources which should benefit from higher commodity prices. We believe that EOG’s superior land position and strong balance sheet should allow it to do well when oil prices rise. These trades allowed us to reduce the capital gains paid to shareholders and maintain some exposure to rising commodity prices.
Protective Life was acquired by a Japanese insurance company on February 1, 2015 and the Fund received $70 a share in cash for its shares. This acquisition capped a successful investment that the Fund had owned for more than 15 years.
Finally, as mentioned above within “Purchases,” Precision Castparts is in the process of being acquired by Berkshire Hathaway so we sold our position.
Our Investment Approach: Value Is In Our Name
One of the most important parts of our investment process is the belief that every business has an intrinsic value (economic worth). This value is derived by the amount of cash a company generates, its profitability, and the ability to grow in the future. Businesses that generate more cash, are more profitable, and have better growth prospects are more valuable. It’s important to note that at certain points in time, intrinsic value is different from the current stock price. Our investment process is designed to find these situations. When a quality company is selling below its intrinsic value, we seek to invest in it for the Fund. Once we own a stock we monitor the relationship between the market price
7
FAM Value Fund
and our assessment of intrinsic value. When we believe a stock is selling far above its own value, we will sell some or all of our shares. As good businesses usually get more valuable over time, we tend to hold stocks for a long time resulting in low turnover and the generation of long- term capital gains when we do sell. For example, 100% of this year’s capital gains distribution was from long-term profits which are taxed at a lower rate than short-term gains.
Notice above we said good businesses get more valuable over time. This is an important point. Our strategy is to invest in companies that have certain qualities that allow them to increase in value. The first of these characteristics is that it has some kind of competitive advantage that allows it to earn strong profits and continue to do so in the future. Second, the company must be financially strong with limited debt, high profitability, and the ability to generate cash profits. Finally, the business must be well-managed. Management is critical as they are responsible for allocating profits for the benefit of their shareholders. We assess management by analyzing the financial statements and meeting face-to-face with the corporate executives. Our objective for the Fund is to invest in a relatively small number of well-managed businesses selling at or below intrinsic value.
Outlook
As we enter the New Year, the most important question is about the pace of worldwide growth. Since the middle of 2015, the primary question for investors has been the rate of growth for the Chinese economy. This is an important consideration as China is a large source of demand for many commodities and industrial products. Therefore, to some extent, in the short term as China goes so goes the world economy. Here in the U.S.A. we see continued slow growth driven by job creation, low interest rates, and low energy prices. We don’t expect anything spectacular. As we look at the stock prices of many businesses compared to their intrinsic values, we don’t see a lot of bargains but perhaps a few more than one year ago.
Thank you for investing with us in the FAM Value Fund.
| John D. Fox | Thomas O. Putnam |
| Co-Manager | Co-Manager |
The opinions expressed herein are those of the portfolio managers as of the date of the report and are subject to change. There is no guarantee that any forecast made will come to pass. This material does not constitute investment advice and is not intended as an endorsement of any specific investment.
Performance data quoted above is historical. Past performance is no guarantee of future results. Current performance may be higher or lower than the performance data quoted. The principal value and investment return of an investment will fluctuate so that your shares, when redeemed, may be worth more or less than their original cost.
8
FAM Value Fund - Performance Summary (Unaudited)
Annual Total Investment Returns:
| JANUARY 2, 1987 TO DECEMBER 31, 2015 |
| | FAM VALUE FUND | RUSSELL MIDCAP INDEX | S&P 500 INDEX |
| FISCAL YEAR | TOTAL RETURN | TOTAL RETURN | TOTAL RETURN |
| 1987 | -17.40% | 0.23% | 5.25% |
| 1988 | 35.50% | 19.80% | 16.61% |
| 1989 | 20.32% | 26.27% | 31.69% |
| 1990 | -5.36% | -11.50% | -3.11% |
| 1991 | 47.63% | 41.51% | 30.47% |
| 1992 | 25.08% | 16.34% | 7.60% |
| 1993 | 0.21% | 14.30% | 10.06% |
| 1994 | 6.82% | -2.09% | 1.31% |
| 1995 | 19.71% | 34.45% | 37.53% |
| 1996 | 11.23% | 19.00% | 22.95% |
| 1997 | 39.06% | 29.01% | 33.35% |
| 1998 | 6.19% | 10.09% | 28.58% |
| 1999 | -4.84% | 18.23% | 21.04% |
| 2000 | 19.21% | 8.25% | -9.10% |
| 2001 | 15.07% | -5.62% | -11.88% |
| 2002 | -5.33% | -16.19% | -22.09% |
| 2003 | 24.98% | 40.06% | 28.67% |
| 2004 | 16.86% | 20.22% | 10.88% |
| 2005 | 5.56% | 12.65% | 4.91% |
| 2006 | 8.73% | 15.26% | 15.79% |
| 2007 | -0.79% | 5.60% | 5.49% |
| 2008 | -28.68% | -41.46% | -37.00% |
| 2009 | 22.18% | 40.48% | 26.46% |
| 2010 | 17.02% | 25.48% | 14.76% |
| 2011 | -0.41% | -1.55% | 2.11% |
| 2012 | 11.39% | 17.28% | 16.00% |
| 2013 | 32.96% | 34.76% | 32.44% |
| 2014 | 13.41% | 13.22% | 13.69% |
| 2015 | -1.74% | -2.44% | 1.38% |
9
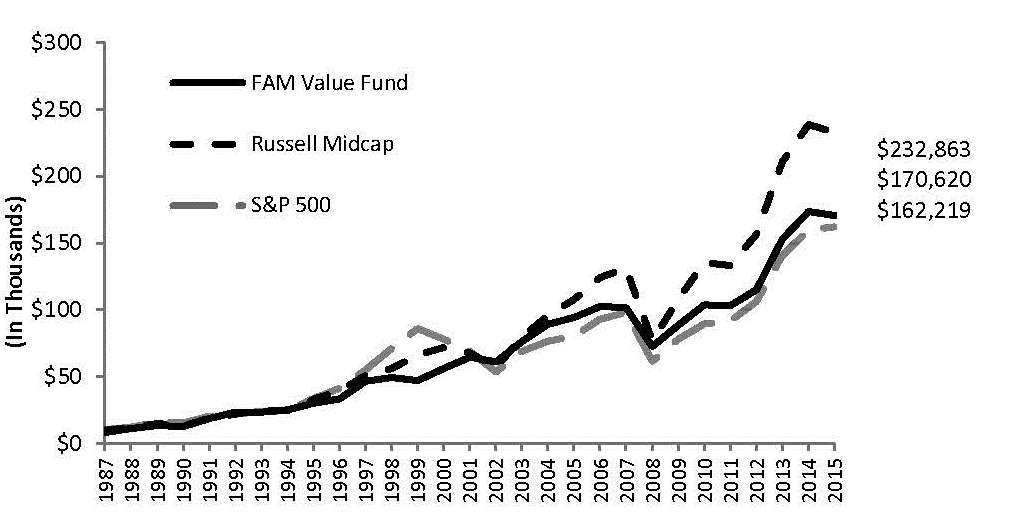
FAM Value Fund - Performance Summary (Unaudited)
The chart below depicts the change in value of a $10,000 investment in the FAM Value Fund since inception on January 2, 1987, as compared with the growth of the Russell Midcap Index, the Fund’s primary benchmark index, and the Standard & Poor’s 500 Index, an additional comparative index, during the same period. The information assumes reinvestment of dividends and capital gain distributions. The Russell Midcap Index is an unmanaged index generally representative of the market for the stocks of mid-size U.S. companies. The Standard & Poor’s 500 Index is an unmanaged index generally representative of the market for the stocks of large size U.S. companies.
COMPARISON OF CHANGE IN VALUE OF $10,000 INVESTMENT IN FAM VALUE FUND, THE RUSSELL MIDCAP INDEX, AND THE S&P 500 INDEX
This information represents past performance of the FAM Value Fund and is not indicative of future results. The investment return and the principal value of an investment will fluctuate so that an investor’s shares, when redeemed, may be worth more or less than the original cost.
| Average Annual Total Returns as of December 31, 2015 |
| | 1-Year | 3-Year | 5-Year | 10-Year | Life of Fund (1/2/87) |
| FAM Value Fund | -1.74% | 14.01% | 10.45% | 6.10% | 10.28% |
| Russell Midcap Index | -2.44% | 14.18% | 11.44% | 8.00% | 11.47% |
| S&P 500 Index | 1.38% | 15.13% | 12.57% | 7.31% | 10.10% |
| The graph and performance table do not reflect the deduction of taxes that a shareholder would pay on Fund distributions or the redemption of Fund shares. |
10
FAM Value Fund — Portfolio Data (Unaudited)
December 31, 2015
| TOP TEN EQUITY HOLDINGS |
| (% of Total Investments) |
| Markel Corporation | 5.7% |
| Ross Stores, Inc. | 5.3% |
| Brown & Brown, Inc. | 4.7% |
| IDEX Corporation | 4.6% |
| White Mountains Insurance Group, Ltd. | 3.8% |
| CDW Corporation | 3.8% |
Brookfield Asset Management Inc. - Class A | 3.6% |
| MEDNAX, Inc. | 3.4% |
| Berkshire Hathaway Inc. - Class A | 3.4% |
| Illinois Tool Works Inc. | 3.3% |
| COMPOSITION OF TOTAL INVESTMENTS |
| Fire, Marine & Casualty Insurance | 13.9% |
| Money Market Fund | 7.5% |
| State Commercial Banks | 6.6% |
| Pumps & Pumping Equipment | 6.0% |
| Retail - Family Clothing Stores | 5.3% |
| Insurance Agents, Brokers & Service | 4.7% |
| Retail - Catalog & Mail-Order Houses | 3.8% |
| Operators of NonResidential Buildings | 3.6% |
| Services - Hospitals | 3.4% |
| General Industrial Machinery & Equip | 3.3% |
| Retail - Auto & Home Store | 3.2% |
| Retail - Auto Dealers | 3.1% |
| Services - Advertising Agencies | 2.9% |
| Retail - Eating Places | 2.5% |
| Crude Petroleum & Natural Gas | 2.5% |
| Security & Commodity Brokers, Dealers, Exchanges Services | 2.1% |
| Wholesale - Medical, Dental Hospital Equipment Supplies | 2.1% |
| Surgical & Medical Instruments Apparatus | 2.1% |
| Carpets & Rugs | 2.0% |
| Other | 19.4% |
Statement Regarding Availability of Quarterly Portfolio Schedule. Please note that (i) the Fund files its complete schedule of portfolio holdings with the Securities and Exchange Commission for the first and third quarters of each fiscal year on Form N-Q; (ii) the Fund’s Forms N-Q are available on the Commission’s website at http://www.sec.gov; (iii) the Fund’s Forms N-Q may be reviewed and copied at the Commission’s Public Reference Room in Washington, DC, and information on the operation of the Public Reference Room may be obtained by calling 1-800-SEC-0330; and (iv) the Fund makes the information on Form N-Q available to shareholders, upon request, by calling FAM Funds at 1-800-932-3271.
11
FAM Value Fund — Statement of Investments
December 31, 2015
| | SHARES | VALUE |
| COMMON STOCKS (92.5%) |
| Books: Publishing or Publishing & Printing (1.0%) |
John Wiley & Sons, Inc. - Class A • publisher of print and electronic products, specializing in scientific, technical, professional and medical books and journals | 217,000 | $ 9,771,510 |
| Carpets & Rugs (2.0%) |
Mohawk Industries, Inc.* • produces floor covering products for residential and commercial applications | 103,100 | 19,526,109 |
| Crude Petroleum & Natural Gas (2.5%) |
EOG Resources, Inc. • engages in the exploration, development, production and marketing of natural gas and crude oil | 335,000 | 23,714,650 |
| Fire, Marine & Casualty Insurance (13.9%) |
Berkshire Hathaway Inc. – Class A* • holding company for various insurance and industrial companies | 269,700 | 10,356,480 |
Loews Corporation • operates primarily as a commercial property and casualty insurance company | 269,700 | 10,356,480 |
Markel Corporation* • sells specialty insurance products 61,850 54,635,197 |
White Mountain Insurance Group, Ltd. • personal property and casualty insurance, and reinsurance | 49,897 | 36,265,639 133,498,716 |
| General Industrial Machinery & Equipment (3.3%) |
Illinois Tool Works Inc. • manufactures engineered products such as plastic and metal components and fasteners | 339,950 | 31,506,566 |
| Industrial & Commercial Fans & Blowers & Air Purifing Equipment (1.9%) |
Donaldson Company, Inc. • designs, manufactures and sells filtration systems and replacement parts | 642,400 | 18,411,184 |
See Notes to Financial Statements
12
FAM Value Fund — Statement of Investments continued
| December 31, 2015 | SHARES | VALUE |
| Industrial Instruments For Measurement, Display, and Control (1.3%) |
Keysight Technologies, Inc.* • provides electronic measurement solutions to the communications and electronics industries in the United States and internationally | 433,000 | $ 12,266,890 |
| Insurance Agents, Brokers & Service (4.7%) |
Brown & Brown, Inc. • one of the largest independent general insurance agencies in the U.S. | 1,409,696 | 45,251,242 |
| Investment Advice (1.8%) |
Franklin Resources, Inc. • provides investment management and fund administration services as well as retail-banking and consumer lending services | 480,000 | 17,673,600 |
| Laboratory Analytical Instruments (1.8%) |
Waters Corporation* • designs, manufactures, sells and services analytical instruments used in a wide range of scientific research | 125,000 | 16,822,500 |
| Operators of NonResidential Buildings (3.6%) |
Brookfield Asset Management Inc. - Class A • asset management holding company that invests in property, power and infrastructure | 1,102,500 | 34,761,825 |
| Pumps & Pumping Equipment (6.0%) |
Graco Inc. • supplies systems and equipment for the management of fluids in industrial, commercial and vehicle lubrication applications | 180,550 | 13,012,239 |
IDEX Corporation • manufactures proprietary, highly engineered industrial products and pumps | 576,750 | 44,184,817 57,197,056 |
| Real Estate Investment Trusts (1.2%) |
Starwood Hotels & Resorts Worldwide, Inc. • operates as a hotel and leisure company | 161,000 | 11,154,080 |
| Retail - Auto & Home Stores (3.2%) |
AutoZone, Inc.* • retail and distribution of automotive replacement parts and accessories | 41,700 | 30,937,647 |
See Notes to Financial Statements
13
FAM Value Fund — Statement of Investments continued
| December 31, 2015 | SHARES | VALUE |
| Retail - Auto Dealers (3.1%) |
CarMax, Inc.* • specialty retailer of used cars and light-trucks in the USA | 550,000 | $ 29,683,500 |
| Retail - Catalog & Mail-Order Houses (3.8%) |
CDW Corporation • provides information technology (IT) solutions | 858,000 | 36,070,320 |
| Retail - Eating Places (2.5%) |
YUM! Brands, Inc. • quick service restaurants including KFC, Pizza Hut and Taco Bell | 330,600 | 24,150,330 |
| Retail - Family Clothing Stores (5.3%) |
Ross Stores, Inc. • chain of off-price retail apparel and home accessories stores | 939,688 | 50,564,611 |
| Retail - Shoe Stores (1.2%) |
DSW Inc. - Class A • operates as a branded footwear and accessories retailer | 495,000 | 11,810,700 |
| Operators of Non-Residential Buildings (1.4%) |
Forest City Enterprises, Inc. - Class A* • acquires, owns, develops, and manages commercial and residential real estate and land in the United States | 600,000 | 13,158,000 |
| Search, Detection, Navigation, Guidance, Aeronautical Systems (1.7%) |
FLIR Systems, Inc. • designs, manufactures, and markets thermal imaging systems worldwide | 564,728 | 15,851,915 |
| Security & Commodity Brokers, Dealers, Exchanges & Services (2.1%) |
T Rowe Price Group, Inc. • publicly owned asset managment holding company providing its services to individual and institutional investors, retirement plans, and financial intermediaries | 284,500 | 20,338,905 |
See Notes to Financial Statements
14
FAM Value Fund — Statement of Investments continued
December 31, 2015
| | SHARES | VALUE |
| Semiconductors & Related Devices (1.7%) |
Microchip Technology Incorporated • develops, manufactures and sells semiconductor products for various embedded control applications | 260,000 | $12,100,400 |
Xilinx, Inc. • worldwide leader of programmable logic solutions | 100,000 | 4,697,000 |
| 16,797,400 |
| Services - Advertising Agencies (2.9%) |
Interpublic Group of Companies, Inc. • provides advertising and marketing services | 1,182,700 | 27,533,256 |
| Services - Equipment Rental & Leasing (0.9%) |
McGrath RentCorp • modular building and electronic test equipment rentals, subsidiary classroom manufacturing | 347,000 | 8,740,930 |
| Services - Hospitals (3.4%) |
MEDNAX, Inc.* • health care services company focused on physician services for newborn, maternal-fetal and other pediatric subspecialty care | 451,400 | 32,347,324 |
| State Commercial Banks (6.6%) |
Bank of the Ozarks, Inc. • retail and commercial banking services in the Southeast | 506,000 | 25,026,760 |
M&T Bank Corporation • commercial and retail banking services to individuals, businesses, corporations and institutions in the Northeast and Mid-Atlantic | 174,000 | 21,085,320 |
South State Corporation • banking services to individual and corporate customers in the Carolinas | 234,110 | 16,844,215 |
| | | 62,956,295 |
| Surgical & Medical Instruments & Apparatus (2.1%) |
Stryker Corporation • operates a medical technology company offering Orthopedic Implants and MedSurg Equipment | 216,000 | 20,075,040 |
See Notes to Financial Statements
15
FAM Value Fund — Statement of Investments continued
December 31, 2015
| | SHARES | VALUE |
| Transportation of Freight & Cargo (1.7%) |
Forward Air Corporation • provides surface transportation and related logistics services to the deferred air freight market in North America | 389,233 | $ 16,740,911 |
| Trucking (No Local) (1.5%) |
Knight Transportation, Inc. • transportation of general commodities in the U.S. | 576,900 | 13,978,287 |
| Watches, Clocks, Clockwork Operated Devices/Parts (0.3%) |
Fossil Group, Inc.* • designs, develops, markets, and distributes consumer fashion accessories | 75,000 | 2,742,000 |
| Wholesale - Medical, Dental & Hospital Equipment & Supplies (2.1%) |
Patterson Companies, Inc. • operates as a distributor serving dental, companion-pet, veterinarian, and rehabilitation supply markets in the USA and Canada | 445,000 | 20,118,450 |
Total Common Stocks (Cost $377,342,140) | | $886,151,749 |
| TEMPORARY INVESTMENTS (7.5%) |
| Money Market Fund (7.5%) |
Invesco Short Term Treasury Fund (Institutional Class) ($0.02%)** | 71,555,901 | 71,555,901 |
| Total Temporary Investments (Cost $71,555,901) | | $ 71,555,901 |
| Total Investments (Cost $448,898,041) | | $957,707,650 |
* Non-income producing securities ** The rate shown represents the effective yield at 12/31/15 |
See Notes to Financial Statements
16
FAM Equity-Income Fund
December 31, 2015
Dear Fellow Equity-Income Fund Shareholder, Highlights
| · Holdings in the Fund increased their dividends more than 11%, on average, for the last 12 months. |
| · The 5-Year compounded annualized growth rate of the dividends for the Fund’s holdings was 11% as of 12/31/2015. |
The FAM Equity-Income Fund focuses on investing in companies that pay a growing dividend over time and each holding pays a dividend. We invest in businesses that are primarily in the mid-cap spectrum as they tend to grow faster than larger capitalization corporations. Our Investment Research Team strives to generate investment returns with lower volatility and less risk than the overall market by investing in financially solid enterprises with strong balance sheets that have little or no debt. In other words, we like to purchase shares in companies that allow our investors and us to sleep well at night.
Performance Detail
We are pleased with the performance of the FAM Equity-Income Fund in 2015 outperforming its benchmark, the Russell Midcap Index, by 171 basis points or 1.71%. The FAM Equity-Income Fund declined less than -1%. Mid- and small-cap indices posted negative returns for the year, while only large-cap stocks, as represented by the S&P 500 Index, eked out a modestly positive return for the year.
| Performance | 1 Year | 3 Year | 5 Year | 10 Years |
| FAM Equity-Income Fund | -0.73% | 11.59% | 10.50% | 5.53% |
| Russell Midcap Index | -2.44% | 14.18% | 11.44% | 8.00% |
| S&P 500 Index | 1.38% | 15.13% | 12.57% | 7.31% |
One of the major benefits to the FAM Equity-Income Fund’s performance in 2015 came from other companies buying ones held in the portfolio. We had two investments in the Fund which were bought for cash at considerable premiums. Altera Corporation agreed to be purchased by Intel, and Airgas, Inc. agreed to be purchased by Air Liquide. In addition, a number of holdings in the portfolio made acquisitions of other businesses that makes them more valuable to shareholders and should likely drive future earnings growth. Examples are: Flowers Foods, Inc. bought Dave’s Killer Bread; Patterson Companies, Inc. purchased Animal Health International; and Microchip Technology Incorporated bought Micrel Inc.
17
FAM Equity-Income Fund
Best Performers
The best performing company for the year, on a dollar-weighted basis, was Airgas, Inc. which increased the value of the portfolio by $2.53 million. The reason behind the strong stock performance was because Airgas agreed to be purchased by Air Liquide for a significant premium. This was a new position in the Fund in 2015 after we followed it for several years and waited for an attractive valuation to surface. We put our toe in the water during the middle part of the year, buying a few shares at a price that was a little higher than we would have liked with the intention of averaging down our cost if we got the chance. We were given this opportunity when the market sold-off in the early fall and aggressively added to the position at attractive prices. At the same time, a larger player in the industry also thought Airgas was trading at an attractive price and offered to buy the entire business for $143 per share in cash.
CDW Corporation was the second-best performing stock in the portfolio, contributing
$1.56 million to the value of the Fund. This is the second year in a row that CDW has been one of the best performing businesses in the Fund. CDW is a reseller of Information Tech- nology (IT) products and services. Management has done a nice job growing the enterprise faster than the overall IT market as well as expanding their profitability. For the first nine months of 2015, adjusted EBITDA (earnings before interest, taxes, depreciation, and amortization) had grown more than 11%. In addition, management utilized cash flow to pay down their high-cost debt which was associated with the company going public again two years ago. CDW also made a well-targeted investment in a UK business that gives them a way to serve their international customers. CDW is doing so well that the board raised the dividend by 59% this year. Additionally, management is buying back stock. These actions are all characteristics we like to see in a corporation. We believe CDW has a long runway for growth because they continue to take share from smaller Value Added Resellers (VARs) and these VARs represent more than 50% of the market.
Flowers Foods, Inc. was the third-best performing company contributing $1.53 million to the value of the Fund. Flowers is one of the largest bread, bun, and snack cake businesses in the U.S. Their primary bread brands are Nature’s Own, Wonder, and Whitewheat. They also make snack cakes under the TastyKake and Mrs. Freshly’s brands. Flowers continued to make nice market share gains and augmented their growth with the recent acquisitions of Dave’s Killer Bread and Alpine Valley Bread Co. – this allowed Flowers to enter into the organic bread market. The organic bread market is attractive because it is the fastest growing segment in breads and management plans to take these brands nationwide. This should allow Flowers to grow earnings faster than the overall market. Separately, Flowers also benefitted from lower commodity input prices, such as wheat, as well as lower natural gas prices (used to power their ovens).
18
FAM Equity-Income Fund
Worst Performers
The worst performer, on a dollar-weighted basis, was DSW Inc. declining -$1.76 million. DSW is a retailer of shoes and accessories at prices that are significantly below department stores. The retail industry was hurt in 2015 by the mild weather during the fall and early winter months. Since temperatures were warmer than usual, DSW customers delayed buying winter boots and seasonal footwear. This negatively impacted same-store sales as well as margins and earnings. We think DSW is a well-run operation and offers consumers compelling bargains. The business is making it easier for customers to shop by giving them the capability to order shoes online and have them shipped to their homes or the nearest store. This helps mitigate the threat of Internet competitors. During the year, management increased the dividend by 6.4% and bought back shares at an attractive price during the third quarter. In 2015, DSW opened 38 new stores and we estimate that management may open a similar number in 2016. Over the next 12 months, we expect expenses related to IT initiatives to moderate which should help earnings growth. We added to the position in DSW as the price fell back into our buy range.
EOG Resources, Inc. was the second-worst performing investment in the Fund, detracting from the value by -$1.61 million. EOG is an Oil & Gas Exploration Company that is financially strong and well-run. The decline in the stock price was solely due to the decline in the price of oil. We still hold the position and believe that EOG is well-positioned for the future. The balance sheet is rock solid so there is little risk of the business not being able to pay their bills like many of their competitors. It is likely that they could be a consolidator in the industry when the dust settles which should be financially rewarding for shareholders over the long term. The one unknown is how long this process will take.
McGrath RentCorp was the third-worst performer with a loss of -$1.36 million. The stock traded down after reporting poor second quarter results and reducing the earnings outlook for the year. The shortfall was in the TRS Rentelco operation where test and measurement equipment used in deploying next generation communications networks was sluggish. This type of equipment is rented out at a high price so any drop-off negatively impacts earnings. The second area of weakness was in the Adler Tank business where rental rates for large fracking tanks have declined due to lower activity levels in the Exploration & Production Industry within the Energy Sector. On a positive note their largest operation, Modular Buildings, had a terrific year and is seeing nice growth in utilization. Despite the strength in this operation, it wasn’t enough to overcome the weakness in TRS Rentelco and Adler Tanks. The dividend was increased over the prior year, but only by a modest 2%. We did buy more shares after a large stock price decline because the valuation was exceptionally attractive. We felt we could earn a nice return on those shares even if McGrath was slow to recover from the current environment. Overall, we have this investment on a short leash as we have become a little more skeptical that it will be able to meet our return hurdles going forward.
19
FAM Equity-Income Fund
Portfolio Activity
Purchases
We purchased four new holdings in the portfolio in 2015: Airgas, Inc., Ingersoll-Rand, Joy Global Inc., and Macquarie Infrastructure Company.
Ingersoll-Rand is an industrial conglomerate which is best known for their air compressors. For several years the company has been in transition mode as they sold off a number of businesses that didn’t meet their goals for return on invested capital (ROIC). Ingersoll also spun off their security operation, Allegion PLC, to shareholders. Management wanted to focus more on the climate control business, which has attractive investment characteristics, so they purchased Trane Inc., one of the leading HVAC companies in the U.S. This fit in nicely with Thermo King, their transportation refrigeration operation. We expect cash flow to keep growing as they continue to buy back shares and grow the dividend.
We purchased a small position in Joy Global after the stock had fallen more than 60% from its 52-week high. In fact, at the time of our initial purchase the stock was down more than 80% from its all-time high set in 2011. Joy manufactures mining equipment used in above and below ground mining. This includes mining for coal, iron ore, gold, and copper. Since the price of these commodities are all down significantly, the demand for new mining equipment has dried up. The replacement parts business, however, is their crown jewel and is much more stable than new equipment. At the current price, we are only paying for the replacement parts operation and getting everything else for free. It’s also likely that Joy could get purchased by another company since they are the only quality pure play equipment manufacturer left after Caterpillar bought Bucyrus a number of years ago. We previously owned Joy in one of our other portfolios and our shareholders benefitted handsomely when the outlook was just as murky as it is today.
We initiated a position in Macquarie Infrastructure which owns, operates, and invests in a portfolio of infrastructure businesses consisting of services to private jet terminals at airports, bulk liquid terminalling, gas processing and distribution, and solar power generation facilities. The common thread to these enterprises is that they tend to have relatively inelastic demand characteristics and have long-term contracts with escalators. This allows assets to generate predictable and growing cash flow while not being exposed to commodity price risk. This cash flow is used to buy more assets if prices are attractive as well as pay dividends to shareholders. We believe the assets are conservatively financed unlike many of the infrastructure companies which have too much debt on the balance sheet.
20
FAM Equity-Income Fund
Sales
We sold Destination Maternity Corporation and Landauer, Inc. because the risk of loss was higher than any potential return in the future. Both of these investments were mistakes which resulted in a loss.
We sold all our shares in Physicians Realty Trust, Questar Corporation, The Western Union Company, and Winthrop Realty Trust because they reached our sell prices and we believed that all future expectations were already reflected in the stock prices. Each of these names made a substantial contribution to performance.
Two other names came out of the portfolio because they were being acquired: Altera Corporation and Sigma-Aldrich Corporation.
Dividend-Growth Strategy
There has been extensive research conducted on the benefits of investing in companies that pay dividends. In fact, Standard & Poors published an in-depth article in 2013, “Dividend Investing And A Look Inside The S&P Dow Jones Dividend Indices,” on how dividends contribute to investor returns. They concluded that over the 87-year period from 1926 to 2012, dividend income contributed approximately one-third to equity returns for the S&P 500 Index. We view these annual dividends as giving the investor a “head start” on investment returns. Every holding in the FAM Equity-Income Fund pays a dividend. We invest in a mix of high dividend-paying businesses as well as ones that are growing their dividend quickly. On average, the Fund’s holdings increased their dividends at more than an 11% annualized growth rate over the past five years (as of 12/31/15). This growth is broad-based across the portfolio. In fact, 70% of the companies represented in the Fund raised their dividend in the last 12 months. We favor investing in businesses that are growing their dividends swiftly because it means the underlying operation is expanding. It also means that they are generating more cash than needed to reinvest back into the company. These growing dividends contribute to stock price appreciation.
Outlook
We believe the majority of the Fund’s holdings could grow their cash flow in 2016. This in turn should increase the intrinsic values for these holdings. We are also confident that the holdings should continue growing their dividends paid to shareholders. In addition, the Fund is trading at a slight discount to intrinsic value. Taken together, future returns should be similar to the growth rate in earnings for the companies in the Fund.
We continue to invest in businesses that have a long runway for growth; however, we pay as much attention to the downside risk as we do upside potential. As always, we continue to work diligently on your behalf and appreciate your continued support.
21
FAM Equity-Income Fund
| Paul Hogan, CFA | Thomas O. Putnam |
| Co-Manager | Co-Manager |
The opinions expressed herein are those of the portfolio managers as of the date of the report and are subject to change. There is no guarantee that any forecast made will come to pass. This material does not constitute investment advice and is not intended as an endorsement of any specific investment.
Performance data quoted above is historical. Past performance is no guarantee of future results. Current performance may be higher or lower than the performance data quoted. The principal value and investment return of an investment will fluctuate so that your shares, when redeemed, may be worth more or less than their original cost.
22
FAM Equity-Income Fund - Performance Summary (Unaudited)
Annual Total Investment Returns:
| APRIL 1, 1996 TO DECEMBER 31, 2015 |
| | FAM EQUITY-INCOME FUND | RUSSELL MIDCAP INDEX | S&P 500 INDEX |
| FISCAL YEAR | TOTAL RETURN | TOTAL RETURN | TOTAL RETURN |
| 4/1/96-12/31/96 | 11.84% | 12.00% | 15.20% |
| 1997 | 26.90% | 29.01% | 33.35% |
| 1998 | 4.67% | 10.09% | 28.58% |
| 1999 | -6.98% | 18.23% | 21.04% |
| 2000 | 17.18% | 8.25% | -9.10% |
| 2001 | 20.79% | -5.62% | -11.88% |
| 2002 | -2.25% | -16.19% | -22.09% |
| 2003 | 20.30% | 40.06% | 28.67% |
| 2004 | 14.04% | 20.22% | 10.88% |
| 2005 | 5.75% | 12.65% | 4.91% |
| 2006 | 6.57% | 15.26% | 15.79% |
| 2007 | -3.64% | 5.60% | 5.49% |
| 2008 | -29.04% | -41.46% | -37.00% |
| 2009 | 21.43% | 40.48% | 26.46% |
| 2010 | 17.47% | 25.48% | 14.76% |
| 2011 | 6.79% | -1.55% | 2.11% |
| 2012 | 11.02% | 17.28% | 16.00% |
| 2013 | 29.79% | 34.76% | 32.44% |
| 2014 | 7.85% | 13.22% | 13.69% |
| 2015 | -0.73% | -2.44% | 1.38% |
23
FAM Equity-Income Fund - Performance Summary (Unaudited)
The chart below depicts the change in value of a $10,000 investment in the FAM Equity-Income Fund since inception on April 1, 1996, as compared with the growth of the Russell Midcap Index, the Fund’s primary benchmark index, and the Standard and Poor’s 500 Index, an additional comparative index, during the same period. The information assumes reinvestment of dividends and capital gain distributions. The Russell Midcap Index is an unmanaged index generally representative of the market for the stocks of mid-size U.S. companies. The Standard and Poor’s 500 Index is an unmanaged index generally representative of the market for the stocks of large size U.S. companies.
COMPARISON OF CHANGE IN VALUE OF $10,000 INVESTMENT IN FAM EQUITY-INCOME FUND, THE RUSSELL MIDCAP INDEX AND THE S&P 500 INDEX

This information represents past performance of the FAM Equity-Income Fund and is not indicative of future results. The investment return and the principal value of an investment will fluctuate so that an investor’s shares, when redeemed, may be worth more or less than the original cost.
| Average Annual Total Returns as of December 31, 2015 |
| | 1-Year | 3-Year | 5-Year | 10-Year | Life of Fund (4/1/96) |
| FAM Equity-Income Fund | -0.73% | 11.59% | 10.50% | 5.53% | 8.20% |
| Russell MidCap Index | -2.44% | 14.18% | 11.44% | 8.00% | 10.03% |
| S&P 500 Index | 1.38% | 15.13% | 12.57% | 7.31% | 7.92% |
| The graph and performance table do not reflect the deduction of taxes that a shareholder would pay on Fund distributions or the redemption of Fund shares. |
24
FAM Equity-Income Fund — Portfolio Data (Unaudited)
December 31, 2015 TOP TEN EQUITY HOLDINGS |
| (% of Total Investments) |
| Ross Stores, Inc. | 7.2% |
| CDW Corporation | 6.1% |
| Stryker Corporation | 6.0% |
| Airgas, Inc. | 5.3% |
| Xilinx, Inc. | 4.9% |
| US Ecology, Inc. | 4.3% |
| Flowers Foods, Inc. | 4.1% |
| DSW Inc. | 4.0% |
| Aqua America, Inc. | 4.0% |
| Digital Realty Trust, Inc. | 3.9% |
| COMPOSITION OF TOTAL INVESTMENTS |
| Retail - Family Clothing | 8.4% |
| Semiconductors & Related Devices | 8.1% |
| Retail - Catalog & Mail-Order Houses | 6.1% |
| Surgical & Medical Instruments & App | 6.0% |
| Wholesale – Industrial Mach & Equip | 5.3% |
| Refuse Systems | 4.3% |
| Food and Kindred Products | 4.1% |
| State Commercial Banks | 4.0% |
| Retail - Shoe Stores | 4.0% |
| Water Supply | 4.0% |
| Real Estate Investment Trusts | 3.9% |
| Insurance Agents, Brokers & Service | 3.8% |
| Crude Petroleum & Natural Gas | 3.7% |
| Money Market Fund | 3.5% |
| Pumps & Pumping Equipment | 3.2% |
| Wholesale – Petroleum & Petro Prod | 3.2% |
| Fire, Marine & Casualty Insurance | 3.0% |
Wholesale – Medical, Dental & Hospital Equipment & Supplies | 2.9% |
| Plastics Products | 2.5% |
| Industrial & Commercial Fans & Blowers & Air Purifing Equipment | 2.4% |
| Services - Prepackaged Software | 2.4% |
| Services - Equip Rental & Leasing | 2.4% |
| Investment Advice | 2.2% |
| Other | 6.6% |
Statement Regarding Availability of Quarterly Portfolio Schedule. Please note that (i) the Fund files its complete schedule of portfolio holdings with the Securities and Exchange Commission for the first and third quarters of each fiscal year on Form N-Q; (ii) the Fund’s Forms N-Q are available on the Commission’s website at http://www.sec.gov; (iii) the Fund’s Forms N-Q may be reviewed and copied at the Commission’s Public Reference Room in Washington, DC, and information on the operation of the Pub- lic Reference Room may be obtained by calling 1-800-SEC-0330; and (iv) the Fund makes the information on Form N-Q available to shareholders, upon request, by calling FAM Funds at 1-800-932-3271.
25
FAM Equity-Income Fund — Statement of Investments
December 31, 2015
| | SHARES | VALUE |
| COMMON STOCKS (96.5%) |
| Crude Petroleum & Natural Gas (3.7%) |
EOG Resources, Inc. • engages in the exploration, development, production and marketing of natural gas and crude oil | 78,000 | $5,521,620 |
| Dolls & Stuffed Toys (1.8%) |
Mattel, Inc. • designs, manufactures, and markets various toy products | 98,299 | 2,670,784 |
| Fire, Marine & Casualty Insurance (3.0%) |
OneBeacon Insurance Group, Ltd. • commercial, personal and specialty insurance products | 355,866 | 4,416,297 |
| Food and Kindred Products (4.1%) |
Flowers Foods, Inc. • produces and markets bakery products in the USA | 282,850 | 6,078,446 |
| General Industrial Machinery & Equipment (1.4%) |
Ingersoll-Rand • designs, manufactures, sells, and services a portfolio of industrial and commercial products | 38,000 | 2,101,020 |
| In Vitro & In Vivo Diagnostic Substances (1.1%) |
Meridian Bioscience, Inc. • life science company that manufactures, markets and distributes a broad range of innovative diagnostic test kits | 78,000 | 1,600,560 |
| Industrial & Commercial Fans & Blowers & Air Purifing Equipment (2.4%) |
Donaldson Company, Inc. • designs, manufactures and sells filtration systems and replacement parts | 125,600 | 3,599,696 |
| Insurance Agents, Brokers & Service (3.8%) |
Arthur J. Gallagher & Co. • provides insurance brokerage and risk management services to commercial, industrial, institutional, and governmental organizations | 137,920 | 5,646,445 |
| Investment Advice (2.2%) |
Franklin Resources, Inc. • provides investment management and fund administration services as well as retail-banking and consumer lending services | 89,900 | 3,310,118 |
See Notes to Financial Statements
26
FAM Equity-Income Fund — Statement of Investments continued
December 31, 2015
| | SHARES | VALUE |
| Mining Machinery & Equipment (1.0%) |
Joy Global Inc. • manufactures and services mining equipment | 118,000 | $ 1,487,980 |
| Miscellaneous Food Preparations & Kindred Products (1.3%) |
McCormick & Company • manufactures, markets and distributes spices, seasonings, specialty foods and flavorings to the entire food industry | 22,000 | 1,882,320 |
| Plastics Products (2.5%) |
Tupperware Brands Corporation • manufacture and sales of preparation, storage, and serving solutions for the kitchen and home | 66,000 | 3,672,900 |
| Pumps & Pumping Equipment (3.2%) |
IDEX Corporation • manufactures proprietary, highly engineered industrial products and pumps | 62,984 | 4,825,204 |
| Real Estate Invesment Trusts (3.9%) |
Digital Realty Trust, Inc. • engages in the ownership, acquisition, development, redevelopment and management of technology-related real estate | 77,000 | 5,822,740 |
| Refuse Systems (4.3%) |
US Ecology, Inc. • provides radioactive, pcb, hazardous and non-hazardous waste services to commercial and government customers | 176,569 | 6,434,174 |
| Retail - Catalog & Mail-Order Houses (6.1%) |
CDW Corporation • provides information technology (IT) solutions | 217,000 | 9,122,680 |
| Retail - Family Clothing Stores (8.4%) |
American Eagle Outfitters, Inc. • specialty retailer of clothing, accessories, and personal care products | 114,000 | 1,767,000 |
Ross Stores, Inc. • chain of off-price retail apparel and home accessories stores | 197,686 | 10,637,484 |
| 12,404,484 |
See Notes to Financial Statements
27
FAM Equity-Income Fund — Statement of Investments continued
December 31, 2015
| December 31, 2015 | SHARES | VALUE |
| Retail - Shoe Stores (4.0%) |
DSW Inc. • operates as a branded footwear and accessories retailer | 250,201 | $ 5,969,796 |
| Semiconductors & Related Devices (8.1%) |
Microchip Technology Incorporated • develops, manufactures and sells semiconductor products for various embedded control applications | 101,000 | 4,700,540 |
Xilinx, Inc. • worldwide leader of programmable logic solutions | 156,414 | 7,346,766 |
| 12,047,306 |
| Services - Equipment Rental & Leasing (2.4%) |
McGrath RentCorp • modular building and electronic test equipment rentals, subsidiary classroom manufacturing | 138,819 | 3,496,851 |
| Services - Prepackaged Software (2.4%) |
National Instruments • manufactures and supplies measurement and automation products | 122,000 | 3,500,180 |
| State Commercial Banks (4.0%) |
M&T Bank Corporation • commercial and retail banking services to individuals, businesses, corporations and other institutions in the Northeast and Mid-Atlantic | 15,000 | 1,817,700 |
South State Corporation • banking services to individual and corporate customers in the Carolinas | 58,000 | 4,173,100 |
| | | 5,990,800 |
| Surgical & Medical Instruments & Apparatus (6.0%) |
Stryker Corporation • operates a medical technology company offering Orthopedic Implants and MedSurg Equipment | 95,500 | 8,875,770 |
See Notes to Financial Statements
28
FAM Equity-Income Fund — Statement of Investments continued
| December 31, 2015 | SHARES | VALUE |
| Water Supply (4.0%) |
Aqua America, Inc. • water and waste water utility | 198,750 | $ 5,922,750 |
| Wholesale - Industrial Machinery & Equipment (5.3%) |
Airgas, Inc. • supplies industrial, medical, and specialty gases; and welding equip- ment and related products | 57,000 | 7,884,240 |
| Wholesale - Medical, Dental & Hospital Equipment & Supplies (2.9%) |
Patterson Companies, Inc. • operates as a distributor serving dental, companion-pet, veterinarian, and rehabilitation supply markets in the USA and Canada | 96,000 | 4,340,160 |
| Wholesale - Petroleum & Petroleum Products (No Bulk Stations) (3.2%) |
Macquarie Infrastructure Company • owns, operates, and invests in infrastructure businesses that provide services to businesses and individuals | 66,000 | 4,791,600 |
Total Common Stocks (Cost $91,023,404) | | $143,416,921 |
| TEMPORARY INVESTMENTS (3.5%) |
| Money Market Fund (3.5%) |
Invesco Short Term Treasury Fund (Institutional Class) ($0.02%)** | 5,166,147 | 5,166,147 |
| Total Temporary Investments (Cost $5,166,147) | | $ 5,166,147 |
| Total Investments (Cost $96,189,551) | | $148,583,068 |
* Non-income producing securities ** The rate shown represents the effective yield at 12/31/15 |
See Notes to Financial Statements
29
FAM Small Cap Fund
December 31, 2015
Dear Fellow Small Cap Fund Shareholder,
This past year was a challenge for many investors. Interest rates remained stubbornly low, most commodity prices collapsed, many emerging markets continued to slow, and “potholes” surfaced in several sectors of the equity markets. Prudence allowed us to miss many of these potholes completely and in other cases at least avoid their center. At FAM Funds, we do not invest by “looking through the rearview mirror” or look to what has been “working” to guide us in allocating capital. Rather, we stick to our time-tested process with a dual focus on both absolute returns and capital preservation.
While our “driving record” is not unblemished, and we are not satisfied with our absolute returns for the year, on a portfolio basis we avoided the large destruction of capital from which it is extremely difficult to recover. This is due to our continued focus on businesses with solid balance sheets, free cash flow generation, and quality management teams. Fur- thermore we estimate that, in aggregate, the intrinsic value (economic worth) of the Fund grew in 2015. We continue to believe that over the long term, stock prices follow intrinsic value.
Performance Detail
The FAM Small Cap Fund has outperformed its benchmark, the Russell 2000 Index (a collection of smaller companies), over the past 1 Year, 3 Year, and Since Inception time periods. Results versus the S&P 500 Index, an index of much larger businesses, are less impressive as larger company stocks have generally outperformed their smaller counterparts the past few years.
As of 12/31/2015 | 1 Year | 3 Year (annualized) | Since Inception 3/1/2012 (annualized) |
| FAM Small Cap Fund | -3.49% | 12.70% | 12.65% |
| Russell 2000 Index | -4.41% | 11.65% | 10.55% |
| S&P 500 Index | 1.38% | 15.13% | 13.29% |
Best Performers
The Fund’s best performer, on a dollar-weighted basis, was Fabrinet with a gain of $1.65 million for the 12 months ending December 31, 2015. Fabrinet is a contract manufacturer of sophisticated optoelectronics (electronic devices for emitting, modulating, transmitting, and sensing light). We purchased our first shares in 2012, after their primary factory suffered a tremendous flood and
30
FAM Small Cap Fund
then added more over the years when we felt the stock was attractively priced. We have done very well in this investment for shareholders, especially as the business rebounded. Fabrinet is in the process of constructing their new manufacturing campus. If plans go ahead to build three new buildings at this location, it has the potential to increase their current capacity by 150%.
The second-best performing stock was JBT Corporation with a gain of $727,004. JBT was originally purchased in 2012 when few investors seemed to follow the company and management’s execution was not as crisp as desired. Thankfully, JBT executed very well and both the earnings and stock price accelerated. However, the stock reached a valuation level where the logical response was to sell the position.
The third-best performing stock was Diamond Hill Investment Group, Inc. with a gain of $714,901. Diamond Hill is an investment manager, obviously a business we understand well. We purchased shares in the winter of 2014-2015. Our profits came from a combination of both rising profits and improved valuation metrics. As the bulk of their assets are weighted toward the equity markets, assets under management have grown quite significantly in recent years; as a result, so has cash flow.
Worst Performers
The worst performing stock, on a dollar-weighted basis, was Destination Maternity Corporation with a loss of -$1.47 million for the 12 months ending December 31, 2015. Owning this stock was a mistake and our failure to recognize earlier resulted in a loss for the Fund. Business results for Destination Maternity deteriorated greatly over the past couple of years and although we believe new CEO Tony Romano could turn the company around, we believe it is in shareholders’ best interests for us to reinvest the capital elsewhere. We strive to avoid mistakes, but unfortunately this will not be our last. We certainly learned from this, although regrettably this lesson came at a cost.
The second-worst performing stock was Houston Wire & Cable Company with a loss of
-$1.29 million. Unfortunately, the company has been in the crosshairs of not one, but two falling commodities: oil and copper. Houston Wire supplies specialty wire and cable pre- dominantly for America’s infrastructure projects. Over time, their exposure to oil-related infrastructure became a larger piece of their business, as it has for many industrial companies. With oil prices down dramatically, demand for wire and cable is off considerably. Furthermore, copper is a major input cost for Houston Wire and falling copper prices mean lower selling prices, so higher cost copper purchased earlier is sold at lower gross margins. While we think Houston Wire should do fine over time, we took advantage of the commodity downturn to upgrade the portfolio by selling most of our position in Houston Wire and investing in another business temporarily struggling with lower commodity prices – Franklin Electric Co., Inc. By year-end, we held a small position in Houston Wire as we established a position in Franklin Electric. We believe Franklin Electric, a maker of water
31
FAM Small Cap Fund
and fuel pumps for many applications including energy, should outperform Houston Wire over the long term, especially from our initial buy price.
The third-worst performing stock was Echo Global Logistics, Inc. with a loss of -$1.26 million. Echo has taken us on an inconsistent ride since our initial purchases in the fall of 2013. While they have done a great job growing the volume of truckload brokerage they handle, and thus the intrinsic value of the business, results are quite uneven. Over the past few years we have seen wonderful and disappointing quarters, usually due to vagaries like weather, often allowing us to trim or add to our position. The latest results were disap- pointing. However, we estimated that the stock was attractively priced and recently added to our position.
Portfolio Activity
In 2015 we added seven new holdings. These included: two high-performing southern banks, Stonegate Bank and National Commerce Corporation; the above mentioned Franklin Electric Co., Inc.; a specialty materials maker, Ferro Corporation; an owner of neighborhood shopping centers, Retail Opportunity Investments; and an owner of highend hotels, Ashford Hospitality Prime. Additionally, we added to several existing holdings. With each of these we believe we invested in a great business in solid financial shape and run by top-notch managers at a price that we estimate was below the true intrinsic value.
We also sold eight holdings completely. Five were winners that simply reached valuations where we felt selling was the only prudent decision. Examples include Physicians Realty Trust, an owner of medical office buildings and clinics and US Physical Therapy, Inc., an operator of physical therapy clinics. We sold out of JBT Corporation, part of our original portfolio. This was a good investment for the Fund as detailed above. The others positions we sold were mistakes, including the previously mentioned Destination Maternity Corporation and Rosetta Stone Inc.
One holding has the dubious honor of both being purchased and sold in the same calendar year. We purchased shares in Joy Global Inc., a maker of mining equipment, which is experiencing a major downturn due to soft demand from mine operators. During a previous mining down cycle, we purchased Joy shares in one of our other portfolios and eventually made a handsome return. The current fears over commodity prices and growth in China created what we thought was another opportunity to buy shares at a discount to our estimate of intrinsic value. However, we ultimately decided that the situation is more severe than we realized.
32
FAM Small Cap Fund
During the year we invested roughly $26 million, net of sales. However, a good amount of net inflows largely offset these efforts. At year-end our cash balance stood at 12.6%, a bit higher than we would like. We are poised to put this cash to good use and invest in quality businesses when their stock prices fall within our buy prices.
Outlook
We remain comfortable with our strategy of closely monitoring macro factors while still focusing our efforts on understanding a modest number of high-quality, smaller companies. After a year of relatively flat stock prices in aggregate, but a wide variation in per- formance of underlying industries and specific companies, we believe we are beginning to see more opportunities to deploy capital. Near-term results, both macroeconomic and stock market returns, remain completely unpredictable. However, we remain convinced that opportunistically purchasing shares in well-run, excellent enterprises should create value for shareholders over time.
New Institutional Shares Class
Effective as of January 1, 2016, the FAM Small Cap Fund Institutional Shares provides an opportunity to invest at a lower expense ratio in exchange for a higher minimum investment. The minimum investment for the newly launched share class is $1 million and the ticker symbol for the Institutional Shares is FAMDX.
A Message from Tom Putnam, Founder & Chairman
I would like to inform you of a management change that has occurred with your Fund. Marc Roberts, who was Co-Manager of the FAM Small Cap Fund and had been with us since he graduated from college eight years ago, left the firm as of December 31, 2015. When Marc first informed John Fox, our Chief Investment Officer, and me of his decision to pursue another opportunity, we of course were disappointed. Upon further reflection of Marc’s announcement, I realized that I made a similar decision when I was his age. I took a risk and opted for a new career path – the result of which was the creation of Fenimore Asset Management in 1974 – so I understand the choice he made. On behalf of the whole team, I wish Marc all the best. We enjoyed working with him and greatly appreciated his contributions to the Investment Research Team and firm.
As to the status of the FAM Small Cap Fund’s investment management, I can assure you that the transition has occurred very smoothly and will continue on the same path. I remain as a Co-Manager of the Fund and am pleased to announce that Andrew Boord has joined me as fellow Co-Manager.
Andrew has been with us for 11 of his 21 years in the Investment Industry and offers considerable small-cap and portfolio management experience. He is a firm Principal, has been the Portfolio Manager overseeing Fenimore Asset Management’s separately man- aged account portfolios (which
33
FAM Small Cap Fund
encompasses a small-cap strategy), and is well-versed in the area of fund management. Between running the separately managed account version of the strategy and contributing many of the Fund’s positions, Andrew is uniquely qualified to join me as Co-Manager.
Additionally, we have a strong, experienced Investment Research Team. We foster a collaborative investment process and all of our analysts contribute investment ideas and insights to our mutual fund managers. Our team is dedicated to the success of each of our funds and remains focused on the continued success of your FAM Small Cap Fund.
We search diligently for high-quality, bargain-priced opportunities on your behalf. Thank you for investing with us in the FAM Small Cap Fund.
| Andrew F. Boord | Thomas O. Putnam |
| Co-Manager | Co-Manager |
The opinions expressed herein are those of the portfolio managers as of the date of the report and are subject to change. There is no guarantee that any forecast made will come to pass. This material does not constitute investment advice and is not intended as an endorsement of any specific investment.
Performance data quoted above is historical. Past performance is no guarantee of future results. Current performance may be higher or lower than the performance data quoted. The principal value and investment return of an investment will fluctuate so that your shares, when redeemed, may be worth more or less than their original cost.
34
FAM Small Cap Fund - Performance Summary (Unaudited)
Annual Total Investment Returns:
| MARCH 1, 2012 TO DECEMBER 31, 2015 |
| | FAM SMALL CAP FUND | RUSSELL 2000 INDEX | S&P 500 INDEX |
| FISCAL YEAR | TOTAL RETURN | TOTAL RETURN | TOTAL RETURN |
| 3/1/12-12/31/12* | 10.30%** | 16.35%*** | 16.00%*** |
| 2013 | 40.49% | 38.82% | 32.44% |
| 2014 | 5.58% | 4.89% | 13.69% |
| 2015 | -3.49% | -4.41% | 1.38% |
*Commenced operations 3/1/2012 **Annualized since inception date 3/1/2012 ***Annualized full year |
35
FAM Small Cap Fund - Performance Summary (Unaudited)
The chart below depicts the change in the value of a $10,000 investment in the FAM Small Cap Fund, since inception on March 1, 2012 as compared with the growth of the Standard & Poor’s 500 Index and the Russell 2000 Index during the same period. The information assumes reinvestment of dividends and capital gain distributions. The Russell 2000 Index, the Fund’s primary benchmark, is an unmanaged index generally representative of the market for the stocks of smaller size U.S. companies. The Standard & Poor’s 500 Index is an unmanaged index generally representative of the market for the stocks of large size
U.S. companies.
COMPARISON OF CHANGE IN VALUE OF $10,000 INVESTMENT IN
FAM SMALL CAP FUND, THE S&P 500 INDEX AND THE RUSSELL 2000 INDEX

This information represents past performance of the FAM Small Cap Fund and is not indicative of future results. The investment return and the principal value of an investment will fluctuate so that an investor’s shares, when redeemed, may be worth more or less than the original cost.
| Average Annual Total Returns as of December 31, 2015 |
| | 1-Year | 3-Year | Life of Fund (3/1/2012) |
| FAM Small Cap Fund | -3.49% | 12.70% | 12.65% |
| Russell 2000 Index | -4.41% | 11.65% | 10.55% |
| S&P 500 Index | 1.38% | 15.13% | 13.29% |
| The graph and performance table do not reflect the deduction of taxes that a shareholder would pay on Fund distributions or the redemption of Fund shares. |
36
FAM Small Cap Fund — Portfolio Data (Unaudited)
December 31, 2015
| TOP TEN EQUITY HOLDINGS |
| (% of Total Investments) |
| Fabrinet | 6.4% |
| National Commerce Corporation | 5.9% |
| PC Connection, Inc. | 5.2% |
| FRP Holdings, Inc. | 5.1% |
| Mistras Group, Inc. | 4.9% |
| Echo Global Logistics, Inc. | 4.8% |
| First NBC Bank Holding Company | 4.6% |
| US Ecology, Inc. | 4.1% |
| Franklin Electric Co., Inc. | 3.9% |
| Stonegate Bank | 3.8% |
| COMPOSITION OF TOTAL INVESTMENTS |
| Money Market | 12.5% |
| State Commercial Banks | 10.7% |
| Real Estate | 7.9% |
| Telephone & Telegraph Apparatus | 6.4% |
| Investment Advice | 6.0% |
| National Commercial Banks | 5.9% |
| Real Estate Investment Trusts | 5.7% |
| Retail - Catalog & Mail-Order Houses | 5.2% |
| Services - Engineering Services | 4.9% |
| Transportation of Freight & Cargo | 4.8% |
| Refuse Systems | 4.1% |
| Motors & Generators | 3.9% |
Paints, Varnishes, Lacquers, Enamels & Allied Products | 3.7% |
| Insurance Carriers | 3.6% |
| Retail - Eating Places | 3.6% |
| Fire, Marine & Casualty Insurance | 2.9% |
| Crude Petroleum & Natural Gas | 2.4% |
| Measuring & Controlling Devices | 2.0% |
| Other | 3.8% |
Statement Regarding Availability of Quarterly Portfolio Schedule. Please note that (i) the Fund files its complete schedule of portfolio holdings with the Securities and Exchange Commission for the first and third quarters of each fiscal year on Form N-Q; (ii) the Fund’s Forms N-Q are available on the Commission’s website at http://www.sec.gov; (iii) the Fund’s Forms N-Q may be reviewed and copied at the Commission’s Public Reference Room in Washington, DC, and information on the operation of the Pub- lic Reference Room may be obtained by calling 1-800-SEC-0330; and (iv) the Fund makes the information on Form N-Q available to shareholders, upon request, by calling FAM Funds at 1-800-932-3271.
37
FAM Small Cap Fund — Statement of Investments
December 31, 2015
| | SHARES | VALUE |
| COMMON STOCKS (87.5%) |
| Crude Petroleum & Natural Gas (2.4%) |
Evolution Petroleum Corporation • engages in the acquisition, exploitation, and development of properties for the production of crude oil and natural gas | 487,300 | $ 2,343,913 |
| Fire, Marine & Casualty Insurance (2.9%) |
Infinity Property and Casualty Corporation • provides personal automobile insurance with a focus on nonstandard auto insurance | 34,265 | 2,817,611 |
| In Vitro & In Vivo Diagnostic Substances (0.8%) |
Meridian Bioscience, Inc. • life science company that manufactures, markets and distributes a broad range of innovative diagnostic test kits | 40,000 | 820,800 |
| Insurance Carriers (3.6%) |
Hallmark Financial Services, Inc.* • insurance holding company that markets, distributes, underwrites, and services property/casualty insurance products to businesses and individuals | 304,647 | 3,561,323 |
| Investment Advice (6.0%) |
Diamond Hill Investment Group, Inc. • provides investment management services to institutions and individuals | 12,250 | 2,315,250 |
Westwood Holdings Group, Inc. • manages investment assets and provides services for its clients | 69,087 | 3,598,742 |
| 5,913,992 |
| Measuring & Controlling Devices (2.0%) |
Landauer, Inc. • provides personal radiation dosimeters and radiation related services | 58,578 | 1,928,388 |
See Notes to Financial Statements
38
FAM Small Cap Fund — Statement of Investments continued
December 31, 2015
| | SHARES | VALUE |
| Motors & Generators (3.9%) |
Franklin Electric Co., Inc. • designs, manufactures, and distributes water and fuel pumping systems | 140,000 | $ 3,784,200 |
| National Commercial Banks (5.9%) |
National Commerce Corporation* • holding company for National Bank of Commerce and United Legacy Bank that provides various financial services | 232,400 | 5,821,620 |
| Paints, Varnishes, Lacquers, Enamels & Allied Products (3.7%) |
Ferro Corporation* • produces specialty materials in the United States and internationally | 324,474 | 3,608,151 |
| Real Estate (7.9%) |
Consolidated-Tomoka Land Co. • operates as a diversified real estate operating company | 53,200 | 2,804,172 |
FRP Holdings, Inc.* • engages in the transportation and real estate businesses | 146,335 | 4,966,610 |
| 7,770,782 |
| Real Estate Investment Trusts (5.7%) |
Ashford Hospitality Prime, Inc. • real estate investment trust that invests primarily in high revenue per 155,180 2,250,110 available room full-service and urban select-service hotels |
Ashford Hospitality Prime, Inc. • real estate investment trust that invests primarily in high revenue per available room full-service and urban select service hotels | 155,180 | 2,250,110 |
Retail Opportunity Investments Corp. • real estate investment trust that engages in the acquisition, ownership, and management of necessity-based community and neighborhood shopping centers | 120,000 | 2,148,000 |
Winthrop Realty Trust • real estate investment trust that engages in the ownership and management of real property and real estate-related assets | 90,750 | 1,177,027 |
| | | 5,575,137 |
See Notes to Financial Statements
39
FAM Small Cap Fund — Statement of Investments continued
December 31, 2015
| | SHARES | VALUE |
| Refuse Systems (4.1%) |
US Ecology, Inc. • provides radioactive, pcb, hazardous and non-hazardous waste services to commercial and government customers | 110,300 | $ 4,019,332 |
| Retail - Catalog & Mail-Order Houses (5.2%) |
PC Connection, Inc. • operates as a direct marketer of a range of information technology (IT) solutions. | 223,600 | 5,062,304 |
| Retail - Eating Places (3.6%) |
Biglari Holdings Inc.* • engages in the ownership, development, operation, and franchising of restaurants | 10,883 | 3,545,899 |
| Services - Engineering Services (4.9%) |
Mistras Group, Inc.* • provides technology-enabled asset protection solutions | 252,600 | 4,822,134 |
| Services - Equipment Rental & Leasing (1.9%) |
McGrath RentCorp • modular building and electronic test equipment rentals, subsidiary classroom manufacturing | 74,500 | 1,876,655 |
| State Commercial Banks (10.7%) |
First NBC Bank Holding Company* • holding company for First NBC Bank that provides various financial services for businesses, institutions, and individuals. | 121,000 | 4,524,190 |
Pinnacle Financial Partners, Inc. • holding company for Pinnacle National Bank that provides a commercial banking services to individuals, small to mid-size businesses and professional entities | 26,500 | 1,361,040 |
South State Corporation • banking services to individual and corporate customers in the Carolinas. | 13,300 | 956,935 |
Stonegate Bank • banking services to individual and corporate customers in Tampa and Southeast and Southwest Florida. | 113,000 | 3,713,180 |
| | | 10,555,345 |
See Notes to Financial Statements
40
FAM Small Cap Fund — Statement of Investments continued
December 31, 2015
| December 31, 2015 | SHARES | VALUE |
| Telephone & Telegraph Apparatus (6.4%) |
Fabrinet* • provides precision optical, electro-mechanical, and electronic manufac- turing services | 263,950 | $ 6,287,289 |
| Transportation of Freight & Cargo (4.8%) |
Echo Global Logistics, Inc.* • provides technology-enabled transportation and supply chain manage- ment solutions | 232,200 | 4,734,558 |
| Trucking & Courier Services (No Air) (0.9%) |
Patriot Transportation Holding, Inc. • operates as a tank truck carrier in North America | 35,944 | 833,901 |
| Wholesale - Electrical Apparatus & Equipment, Wiring Supplies (0.2%) |
Houston Wire and Cable Company • distributor of wire and cable products in the U.S. | 40,025 | 211,332 |
Total Common Stocks (Cost $77,205,197) | | $ 85,894,666 |
| TEMPORARY INVESTMENTS (12.5%) |
| Money Market Fund (12.5%) |
Invesco Short Term Treasury Fund (Institutional Class) ($0.01%)** | 12,321,711 | 12,321,711 |
| Total Temporary Investments (Cost $12,321,711) | | $ 12,321,711 |
| Total Investments (Cost $89,526,908) | | $ 98,216,377 |
* Non-income producing securities ** The rate shown represents the effective yield at 12/31/15 |
See Notes to Financial Statements
41
FAM Funds — Statements of Assets and Liabilities
December 31, 2015
| | Value Fund | Equity-Income Fund | Small Cap Fund |
| Assets |
Investments in securities at value (Cost $448,898,041; $96,189,551; and $89,526,908 respectively) | $957,707,650 | $148,583,068 | $98,216,377 |
| Cash | 372,292 | 147,776 | 163,445 |
| Dividends and interest receivable | 421,824 | 169,343 | 154,993 |
| Receivable for Fund shares purchased | 152,232 | 3,923 | 101,726 |
| Total Assets | 958,653,998 | 148,904,110 | 98,636,541 |
| Liabilities |
| Accrued investment advisory fee | 824,015 | 127,747 | 84,044 |
| Accrued shareholder servicing and administrative fees | 102,420 | 16,350 | 10,786 |
| Accrued trustee fees | 6,833 | 6,833 | 6,833 |
| Accrued expenses | 180,986 | 68,875 | 42,594 |
| Payable for Fund shares redeemed | 177,323 | 35,370 | 15,194 |
| Total Liabilities | 1,291,577 | 255,175 | 159,451 |
| | | | |
| Net Assets | $957,362,421 | $148,648,935 | $98,477,090 |
Net Assets Consist Of: |
| Net capital paid in on shares of beneficial interest | $448,478,214 | $96,031,365 | $89,782,434 |
| Accumulated net investment income/(loss) | — | — | — |
| Accumulated net realized gain/(loss) on investments | 74,598 | 224,053 | 5,187 |
| Net unrealized appreciation | 508,809,609 | 52,393,517 | 8,689,469 |
| Net Assets | $957,362,421 | $148,648,935 | $98,477,090 |
| | | | |
| Fund shares outstanding | 15,939,799 | 6,164,495 | 6,674,424 |
Net Asset Value, Offering and Redemption Price per share (unlimited shares of beneficial interest authorized at $0.001 par value) | $60.06 | $24.11 | $14.75 |
See Notes to Financial Statements
42
FAM Funds — Statements of Operations
Year Ended December 31, 2015
| Value Fund | Equity-Income Fund | Small Cap Fund |
| Investment Income |
| Income |
| Dividends | $9,947,617 | $3,208,238 | $ 841,938 |
| Interest | 19,093 | 2,030 | 2,232 |
| Total Investment Income | 9,966,710 | 3,210,268 | 844,170 |
| Expenses |
| Investment advisory fee (Note 2) | 10,022,276 | 1,531,012 | 784,447 |
| Administrative fee (Note 2) | 827,186 | 130,137 | 66,679 |
| Shareholder servicing and related expenses (Note 2) | 411,772 | 66,246 | 38,158 |
| Printing and mailing | 125,822 | 21,691 | 11,936 |
| Professional fees | 157,891 | 50,357 | 26,415 |
| Registration fees | 43,766 | 33,390 | 35,957 |
| Custodial fees | 120,084 | 22,189 | 18,102 |
| Trustee’s fees | 45,553 | 45,553 | 45,553 |
| Officer’s fees (Note 2) | 29,620 | 29,620 | 29,620 |
| Other | 74,597 | 15,936 | 12,566 |
| Total Expenses | 11,858,567 | 1,946,131 | 1,069,433 |
| Less: Expenses paid indirectly (Note 3) | (749) | (120) | (68) |
| Net Expenses | 11,857,818 | 1,946,011 | 1,069,365 |
| Net Investment Income/(Loss) | (1,891,108) | 1,264,257 | (225,195) |
| Realized and Unrealized Gain on Investments |
| Net realized gain on investments | 80,153,275 | 6,761,847 | 421,640 |
| Net change in unrealized appreciation of investments | (93,786,775) | (8,952,871) | (3,261,227) |
| Net Realized and Unrealized Loss on Investments | (13,633,500) | (2,191,024) | (2,839,587) |
| Net Decrease In Net Assets From Operations | ($15,524,608) | ($ 926,767) | ($3,064,782) |
See Notes to Financial Statements
43
FAM Funds — Statements of Changes in Net Assets
Years Ended December 31, 2015 and 2014
| Value Fund |
| | 2015 | 2014 |
| Change in Net Assets |
| From operations |
| Net investment income (loss) | $ (1,891,108) | $ (2,317,895) |
| Net realized gain on investments | 80,153,275 | 50,506,610 |
Net change in unrealized appreciation/ depreciation of investments (93,786,775) 71,000,696 |
| Net increase (decrease) in net assets from operations | (15,524,608) | 119,189,411 |
Distributions to shareholders from: |
| Net investment income | — | — |
| Net realized gain on investments | (80,079,150) | (50,506,137) |
| Return of capital distributions | — | — |
| Total distributions | (80,079,150) | (50,506,137) |
| | | |
| Capital share transactions (Note 4) | 57,731,154 | (15,213,144) |
| Total increase (decrease) in net assets | (37,872,604) | 53,470,130 |
Net Assets |
| Beginning of year | 995,235,025 | 941,764,895 |
| End of year* | $957,362,421 | $995,235,025 |
| *Includes Accumulated net investment income/(loss) of $0, $0, $0, $0, $0 and $0, respectively. |
See Notes to Financial Statements
44
FAM Funds — Statements of Changes in Net Assets
Years Ended December 31, 2015 and 2014
| Equity-Income Fund | Small Cap Fund |
| 2015 | 2014 | 2015 | 2014 |
$ 1,264,257 | $ 1,157,486 | $ (225,195) | $ (47,747) |
| 6,761,847 | 5,232,174 | 421,640 | 838,067 |
| (8,952,871) | 5,340,279 | (3,261,227) | 3,133,832 |
| (926,767) | 11,729,939 | (3,064,782) | 3,924,152 |
(1,264,257) | (1,157,486) | (29,566) | — |
| (6,155,528) | (5,232,174) | (204,380) | (788,736) |
| — | (876,582) | — | (388,333) |
| (7,419,785) | (7,266,242) | (233,946) | (1,177,069) |
| | | | |
| (4,526,004) | 10,489,363 | 34,870,936 | 21,483,442 |
| (12,872,556) | 14,953,060 | 31,572,208 | 24,230,525 |
161,521,491 | 146,568,431 | 66,904,882 | 42,674,357 |
| $148,648,935 | $161,521,491 | $98,477,090 | $66,904,882 |
See Notes to Financial Statements
45
FAM Funds — Statements of Changes in Net Assets
Note 1 Nature of Business and Summary of Significant Accounting Policies
FAM Value Fund, FAM Equity-Income Fund and FAM Small Cap Fund are each a series of Fenimore Asset Management Trust, a diversified, open-end management investment company registered under the Investment Company Act of 1940. Each Fund offers a single class of shares. The investment objective of the FAM Value Fund is to maximize long-term return on capital. The investment objective of the FAM Equity-Income Fund is to provide current income and long term capital appreciation from investing primarily in income-producing equity securities. The investment objective of the FAM Small Cap Fund is to maximize long-term return on capital.
The following is a summary of each Fund’s significant accounting policies, which are in accordance with accounting principles generally accepted in the United States of America (“GAAP”), followed by the Funds in the preparation of their financial statements.
a) Valuation of Securities
Securities traded on a national securities exchange or admitted to trading on NASDAQ are valued at the last reported sale price or the NASDAQ official closing price. Common stocks for which no sale was reported, and over-the-counter securities, are valued at the last reported bid price. Short-term securities are carried at amortized cost, which approximates value. Securities for which market quotations are not readily available or have not traded are valued at fair value as determined by procedures established by the Board of Trustees. Investments in Invesco Short Term Treasury Fund are valued at that fund’s net asset value.
GAAP establishes a three-tier framework for measuring fair value based on a hier- archy of inputs. The hierarchy distinguishes between market data obtained from independent sources (observable inputs) and the Funds’ own market assumptions (unobservable inputs). These inputs are used in determining the value of the Funds’ investments. These inputs are summarized in the three broad levels listed below:
Level 1 – quoted prices in active markets for identical securities
Level 2 – other significant observable inputs (including quoted prices for identical securities in inactive markets and quoted prices for similar securities)
Level 3 – significant unobservable inputs (including the Funds’ own assumptions in determining the fair value of investments)
The inputs or methodology used for valuing securities are not necessarily an indica- tion of the risk associated with investing in those securities.
46
FAM Funds - Notes to Financial Statements
The following is a summary of the inputs used to value each Funds’ investments as of December 31, 2015:
| FAM Value Fund | |
| | Level 1 |
| Common Stocks | $886,151,749 |
| Temporary Investments | 71,555,901 |
| Total Investments in Securities | $957,707,650 |
| FAM Equity-Income Fund | |
| | Level 1 |
| Common Stocks | $143,416,921 |
| Temporary Investments | 5,166,147 |
| Total Investments in Securities | $148,583,068 |
| FAM Small Cap Fund | |
| | Level 1 |
| Common Stocks | $85,894,666 |
| Temporary Investments | 12,321,711 |
| Total Investments in Securities | $98,216,377 |
During the year ended December 31, 2015 there were no Level 2 or 3 inputs used to value the Funds’ net assets. Refer to each Fund’s Statement of Investments to view securities segregated by industry type.
b) Federal Income Taxes
It is each Fund’s policy to comply with the requirements of the Internal Revenue Code applicable to regulated investment companies and to distribute all of its taxable income to its shareholders. Therefore, no provision for federal income or excise tax is required.
GAAP requires uncertain tax positions to be recognized, measured, presented and disclosed in the financial statements. For the year ended December 31, 2015 management has evaluated the tax positions taken or expected to be taken in the course of preparing the Funds’ tax returns to determine whether the tax positions are “more-likely-than-not” of being sustained upon review by the applicable tax author-
47
FAM Funds - Notes to Financial Statements
ity. Tax positions not deemed to meet the “more-likely-than-not” threshold would be recorded as a tax expense in the current year. Based on the evaluation, management has determined that no liability for unrecognized tax expense is required. Tax years 2012 through present remain subject to examination by U.S. and New York taxing authorities. No examination of the Fund’s tax filings is presently in progress.
c) Use of Estimates
The preparation of financial statements in conformity with GAAP requires manage- ment to make estimates and assumptions that affect the reported amounts of assets and liabilities and disclosure of contingent assets and liabilities at the date of the financial statements and the reported amounts of increases and decreases in net assets from operations during the reporting period. Actual results could differ from those estimates.
d) Other
Securities transactions are recorded on trade date. Realized gains and losses on securities sold are determined on the basis of identified cost. Interest income is accrued as earned and dividend income is recorded on the ex-dividend date. Non-cash dividends are included in dividends on the ex-dividend date at the fair market value of the shares received. The Funds record distributions received in excess of income from underlying investments as a reduction of cost of investments and/or realized gain. Such amounts are based on estimates if actual amounts are not available, and actual amounts of income, realized gain and return of capital may differ from the estimated amounts. The Funds adjust the estimated amounts of the components of distributions (and consequently its net investment income) as an increase to unrealized appreciation/(depreciation) and realized gain/(loss) on investments as necessary once the issuers provide information about the actual composition of the distributions. Distributions to shareholders are recorded on the ex-dividend date.
Distributions to shareholders are determined in accordance with income tax regula- tions and may differ from those determined for financial statement purposes. To the extent these differences are permanent such amounts are reclassified within the capital accounts.
Note 2 Investment Advisory Fees and Other Transactions with Affiliates
Under each Investment Advisory Contract, each Fund pays an investment advisory fee to Fenimore Asset Management, Inc. (the “Advisor”) equal, on an annual basis, to 1% of each Fund’s average daily net assets. The Advisor has entered into a voluntary agreement with each Fund to reduce the investment advisory fee for each Fund through December 31, 2015 to 0.95% of a Fund’s average daily net assets in excess of $1 billion. No such fee reduction was required for the FAM Equity-Income Fund nor for the FAM Small Cap Fund for the year ended December 31, 2015. With respect to the FAM Value Fund, as a result of the voluntary fee reduction agreement with the Advisor,
48
FAM Funds - Notes to Financial Statements
the advisory fee payable to the Advisor by the FAM Value Fund was reduced by $6,903 as a result of the assets of the FAM Value Fund being in excess of $1 billion for a portion of the year ended December 31, 2015. Thomas Putnam is an officer and trustee of the Funds and also an officer and director of the Advisor. The Chief Compliance Officer is an officer of the Funds and compensated by the Funds in the amount of $88,860 as well as an officer of the Advisor and compensated additionally by the Advisor.
The Investment Advisory Contract requires the Advisor to reimburse the Funds their expenses to the extent that such expenses, including the advisory fee, for the fiscal year exceed 2.00% of the average daily net assets. For the year ended December 31, 2015 the Advisor contractually agreed to reimburse the FAM Value Fund for its expenses to the ex- tent such expenses exceeded 1.28% of the average daily net assets; the FAM Equity-Income Fund for its expenses to the extent such expenses exceeded 1.40% of the average daily net assets; and the FAM Small Cap Fund for its expenses to the extent such expenses exceed 1.50% of the average daily net assets. No such reimbursement was required for the year ended December 31, 2015 for the FAM Value, FAM Equity-Income Fund and FAM Small Cap Fund.
FAM Shareholder Services, Inc. (“FSS”), a company under common control with the Advi- sor, serves as shareholder servicing agent and receives a monthly fee of $2.33 per share- holder account. For the year ended December 31, 2015, shareholder servicing agent fees paid to FSS were as follows:
| FAM Value Fund | $411,772 |
| FAM Equity-Income Fund | $ 66,246 |
| FAM Small Cap Fund | $ 38,158 |
Additionally, FSS serves as the Fund administrative agent and receives an annual fee of 0.085% on the first $750,000,000 of each Fund’s average daily net assets, and 0.075% thereafter. For the year ended December 31, 2015, the Funds’ administrative fees paid to FSS amounted to:
| FAM Value Fund | $827,186 |
| FAM Equity-Income Fund | $130,137 |
| FAM Small Cap Fund | $ 66,679 |
Fenimore Securities, Inc. (“FSI”), a company also under common control with the Advisor, acts as distributor of the Funds’ shares. FSI receives no compensation for providing distribution services to the Funds.
49
FAM Funds - Notes to Financial Statements
Note 3. Indirect Expenses
The Funds’ custodian bank has also agreed to reduce its fees when the Funds maintain cash on deposit in the non-interest bearing custody account. For the year ended December 31, 2015, these arrangements reduced the FAM Value Fund’s custodian fees by $749, FAM Equity-Income Fund’s custodian fees by $120, and FAM Small Cap Fund’s custodian fees by $68.
Note 4. Shares of Beneficial Interest
At December 31, 2015 an unlimited number of $0.001 par value of beneficial interest were authorized.
Transactions for each Fund are as follows:
| | YEAR ENDED 12/31/15 | YEAR ENDED 12/31/14 |
| FAM Value Fund | | |
| | Shares | Amount | Shares | Amount |
| Shares sold | 1,223,205 | $ 81,490,613 | 649,597 | $41,866,671 |
| Shares issued on reinvest- ment of distributions | 1,257,459 | 76,642,147 | 716,244 | 48,031,304 |
| Shares redeemed | (1,489,528) | (100,401,606) | (1,653,946) | (105,111,119) |
| Net Increase/(Decrease) | 991,136 | $ 57,731,154 | (288,105) | $(15,213,144) |
| FAM Equity-Income Fund | |
| Shares sold | 430,857 | $ 10,978,552 | 722,585 | $18,261,703 |
| Shares issued on reinvest- ment of distributions | 281,977 | 6,945,967 | 243,320 | 6,249,652 |
| Shares redeemed | (875,750) | (22,450,523) | (556,848) | (14,021,992) |
| Net Increase/Decrease | (162,916) | $( 4,526,004) | 409,057 | $10,489,363 |
| FAM Small Cap Fund | | | | |
| Shares sold | 2,817,279 | $42,680,792 | 1,657,490 | $24,023,657 |
| Shares issued on reinvest- ment of distributions | 15,122 | 227,125 | 76,153 | 1,168,953 |
| Shares redeemed | (524,159) | (8,036,981) | (256,337) | (3,709,168) |
| Net Increase | 2,308,242 | $34,870,936 | 1,477,306 | $21,483,442 |
50
FAM Funds - Notes to Financial Statements
Note 5. Investment Transactions
During the year ended December 31, 2015, purchases and sales of investment securities, other than short-term obligations were:
| | Purchases | Sales |
| FAM Value Fund | $79,006,589 | $133,789,142 |
| FAM Equity-Income Fund | $23,186,014 | $ 32,934,184 |
| FAM Small Cap Fund | $44,997,183 | $ 18,824,071 |
The cost of securities for federal income tax purposes is the same as shown in the state- ment of investments.
Note 6. Income Taxes and Distributions to Shareholders
The components of accumulated income/(losses) on a tax basis at December 31, 2015 (the Funds’ most recent tax year end) were as follows:
| | Undistributed Ordinary Income | Undistributed Long-Term Gain | Unrealized Appreciation |
| FAM Value Fund | — | $74,598 | $508,809,609 |
| FAM Equity-Income Fund | — | $ 224,053 | $ 52,393,517 |
| FAM Small Cap Fund | — | $ 5,187 | $ 8,689,469 |
The primary reason for the difference between the amounts of accumulated earnings re- ported on a tax basis and the amounts recorded on the statement of assets and liabilities is the treatment of short term capital gains as net investment income for tax purposes.
The aggregate gross unrealized appreciation and depreciation of portfolio securities at December 31, 2015, based on cost for federal income tax purposes, was as follows:
| FAM Value Fund | Unrealized appreciation | $518,704,502 |
| | Unrealized depreciation | (9,894,893) |
| | Net unrealized appreciation | $508,809,609 |
| FAM Equity-Income Fund | Unrealized appreciation | $ 55,451,931 |
| | Unrealized depreciation | (3,058,414) |
| | Net unrealized appreciation | $ 52,393,517 |
51
FAM Funds - Notes to Financial Statements
| FAM Small Cap Fund | Unrealized appreciation | $12,638,936 |
| | Unrealized depreciation | (3,949,467) |
| | Net unrealized appreciation | $ 8,689,469 |
The tax composition of dividends and distributions paid to shareholders for the years ended December 31, 2015 and 2014:
| | 2015 | 2014 |
| FAM Value Fund | | |
| Ordinary income | — | — |
| Long-term capital gain | $80,079,150 | $50,506,137 |
| Return of capital | — | — |
| | $80,079,150 | $50,506,137 |
| FAM Equity-Income Fund | | |
| Ordinary income | $1,591,324 | $ 1,157,486 |
| Long-term capital gain | 6,210,727 | 5,232,174 |
| Return of capital | — | 876,582 |
| | $7,802,051 | $7,266,242 |
| FAM Small Cap Fund | | |
| Ordinary income | $ — | $ 454,776 |
| Long-term capital gain | 416,453 | 333,960 |
| Return of capital | — | 388,333 |
| | $416,453 | $1,177,069 |
Equilization debits included in long-term capital gain distributions were as follows:
| | 2015 | 2014 |
| FAM Value Fund | — | — |
| FAM Equity-Income Fund | $ 382,266 | — |
| FAM Small Cap Fund | $ 182,507 | — |
52
FAM Funds - Notes to Financial Statements
Permanent book and tax differences, primarily attributable to net investment losses and the deduction of equalization debits, resulted in the following reclassification for the year ended December 31, 2015:
| | Paid in Capital | Undistributed Net Investment Income | Accumulated Net Realized Gain on Investments |
| FAM Value Fund | (1,891,108) | 1,891,108 | — |
| FAM Equity-Income Fund | 382,266 | — | (382,266) |
| FAM Small Cap Fund | (42,688) | 254,761 | (212,073) |
These reclassifications had no impact on the net assets or net asset values per share of the FAM Value Fund.
Note 7. Line of Credit
The FAM Value Fund, Equity-Income Fund, and Small Cap Fund each has a line of credit up to 33 1/3% of its net assets with a maximum of $125,000,000, $20,000,000, and
$3,000,000, respectively.
Borrowings under the agreement bear interest at the prime rate as announced by the lending bank. The line of credit is available until December 1, 2016, when any advances are to be repaid. During the year ended December 31, 2015, no amounts were drawn from the available lines.
Note 8. Commitments and Contingencies
In the normal course of business, the Funds enter into contracts that contain a variety of representations and warranties which provide general indemnifications. The Funds’ maximum exposure under these arrangements is unknown as this would involve future claims that might be made against the Funds that have not yet occurred. However, based on the experience of the Advisor, the Funds expect the risk of loss to be remote.
Note 9. Subsequent Events
Management has evaluated subsequent events through the date the financial statements were available to be issued, and has determined that there were no subsequent events requiring recognition or disclosure in the financial statements.
Effective as of January 1, 2016, the Funds are subject to a Multi-Class Plan adopted pursu- ant to Rule 18f-3 under the 1940 Act which provides that each Fund may issue two separate classes of shares, Investor Shares and Institutional Shares.
53
FAM Funds - Notes to Financial Statements
Note 10. Financial Highlights
| FAM Value Fund | | | Years Ended December 31, |
Per share information (For a share outstanding throughout each year) | 2015 | 2014 | 2013 | 2012 | 2011 |
| Net asset value, beginning of year | $66.58 | $61.81 | $48.88 | $45.15 | $45.34 |
| Income/Loss from investment operations: |
| Net investment income/(loss)† | (0.13) | (0.16) | (0.18) | 0.06 | (0.04) |
| Net realized and unrealized gain/(loss) on investments | (0.95) | 8.47 | 16.28 | 5.07 | (0.15) |
| Total from investment operations | (1.08) | 8.31 | 16.10 | 5.13 | (0.19) |
| Less distributions: |
| Dividends from net investment income | — | — | — | (0.07) | —* |
| Distributions from net realized gains | (5.44) | (3.54) | (3.16) | (1.32) | —* |
| Return of capital | — | — | (0.01) | (0.01) | — |
| Total distributions | (5.44) | (3.54) | (3.17) | (1.40) | —* |
| Change in net asset value for the year | (6.52) | 4.77 | 12.93 | 3.73 | (0.19) |
| Net asset value, end of year | $60.06 | $66.58 | $61.81 | $48.88 | $45.15 |
| Total Return | (1.74)% | 13.41% | 32.96% | 11.39% | (0.41)% |
Ratios/supplemental data |
| Net assets, end of year (000) | $957,362 | $995,235 | $941,765 | $731,983 | $698,546 |
| Ratios to average net assets of: |
| Expenses | 1.18% | 1.18% | 1.19% | 1.21% | 1.22% |
| Net investment income/(loss) | (0.19)% | (0.25)% | (0.24)% | 0.13% | (0.10)% |
| Portfolio turnover rate | 8.53% | 6.08% | 8.38% | 4.41% | 7.78% |
†Based on average shares outstanding. *Per share amount is less than $0.005. |
54
FAM Funds - Notes to Financial Statements
Note 10. Financial Highlights
| FAM Equity-Income Fund | | | Years Ended December 31, | |
Per share information (For a share outstanding throughout each year) | 2015 | 2014 | 2013 | 2012 | 2011 |
| Net asset value, beginning of year | $25.53 | $24.77 | $20.08 | $19.39 | $18.43 |
| Income/Loss from investment operations: |
| Net investment income† | 0.21 | 0.19 | 0.17 | 0.24 | 0.29 |
| Net realized and unrealized gain (loss) on investments | (0.38) | 1.75 | 5.79 | 1.88 | 0.95 |
| Total from investment operations | (0.17) | 1.94 | 5.96 | 2.12 | 1.24 |
| Less distributions: |
| Dividends from net investment income | (0.21) | (0.19) | (0.18) | (0.26) | (0.28) |
| Distributions from net realized gains | (1.04) | (0.85) | (1.03) | (1.14) | — |
| Return of capital | — | (0.14) | (0.06) | (0.03) | — |
| Total distributions | (1.25) | (1.18) | (1.27) | (1.43) | (0.28) |
| Change in net asset value for the year | (1.42) | 0.76 | 4.69 | 0.69 | 0.96 |
| Net asset value, end of year | $24.11 | $25.53 | $24.77 | $20.08 | $19.39 |
| Total Return | (0.73)% | 7.85% | 29.79% | 11.02% | 6.79% |
Ratios/supplemental data |
| Net assets, end of year (000) | $148,649 | $161,521 | $146,568 | $112,940 | $125,832 |
| Ratios to average net assets of: |
| Expenses | 1.27% | 1.26% | 1.29% | 1.31% | 1.40% |
| Net investment income | 0.83% | 0.76% | 0.71% | 1.17% | 1.57% |
| Portfolio turnover rate | 15.67% | 10.73% | 10.33% | 43.0% | 17.96% |
| † Based on average shares outstanding. |
55
FAM Funds - Notes to Financial Statements
Note 10. Financial Highlights
| FAM Small Cap Fund |
Per share information (For a share outstanding throughout each period) | 2015 | 2014 | 2013 | For the Period Ended December 31, 2012* |
| Net asset value, beginning of period | $15.32 | $14.77 | $11.03 | $10.00 |
| Income/Loss from investment operations: |
| Net investment income/(loss)† | (0.04) | (0.01) | 0.04 | (0.04) |
| Net realized and unrealized gain/(loss) on investments | (0.50) | 0.83 | 4.43 | 1.07 |
| Total from investment operations | (0.54) | 0.82 | 4.47 | 1.03 |
| Less distributions: |
| Dividends from net investment income | (0.00)(a) | — | (0.03) | — |
| Distributions from net realized gains | (0.03) | (0.18) | (0.70) | — |
| Return of capital | — | (0.09) | (0.00)(a) | — |
| Total distributions | (0.03) | (0.27) | (0.73) | — |
| Change in net asset value for the period | (0.57) | 0.55 | 3.74 | 1.03 |
| Net asset value, end of period | $14.75 | $15.32 | $14.77 | $11.03 |
| Total Return | (3.49)% | 5.58% | 40.49% | 10.30%** |
| Ratios/supplemental data |
| Net assets, end of period (000) | $98,477 | $66,905 | $42,674 | $16,841 |
| Ratios to average net assets of: |
| Before waivers: |
| Expenses | 1.36% | 1.42% | 1.57% | 2.79%*** |
| Net investment income/(loss) | (0.29)% | (0.09)% | 0.05% | (1.89)%*** |
| After waivers: |
| Expenses | 1.36% | 1.42% | 1.35% | 1.46%*** |
| Net investment income/(loss) | (0.29)% | (0.09)% | 0.27% | (0.56)%*** |
| Portfolio turnover rate | 26.84% | 13.40% | 19.65% | 7.59%** |
† Based on average shares outstanding.
* Small Cap Fund inception 3/1/12
** Not Annualized
*** Annualized
(a)Amount is less than $0.01 per share.
56
FAM Funds — Report of Independent Registered Public Accounting Firm
We have audited the accompanying statements of assets and liabilities of the FAM Value Fund and FAM Equity-Income Fund, each a series of shares of beneficial interest in the Fenimore Asset Management Trust, including the statements of investments, as of December 31, 2015, and the related statements of operations for the year then ended, the statements of changes in net assets for each of the years in the two-year period then ended and the financial highlights for each of the years in the five-year period then ended. We have also audited the accompanying statement of assets and liabilities of FAM Small Cap Fund, a series of shares of beneficial interest in the Fenimore Asset Management Trust (together with the FAM Value Fund and FAM Equity-Income Fund, the “Funds”), including the statement of investments, as of December 31, 2015, and the related statement of operations for the year then ended, the statements of changes in net assets for each of the years in the two-year period then ended and the financial highlights for each of the years in the three year period then ended and for the period March 1, 2012 (commencement of operations) through December 31, 2012. These financial statements and financial highlights are the responsibility of the Funds’ management. Our responsibility is to express an opinion on these financial statements and financial highlights based on our audits.
We conducted our audits in accordance with the standards of the Public Company Accounting Oversight Board (United States). Those standards require that we plan and per- form the audits to obtain reasonable assurance about whether the financial statements and financial highlights are free of material misstatement. An audit includes examining, on a test basis, evidence supporting the amounts and disclosures in the financial statements. Our procedures included confirmation of securities owned as of December 31, 2015 by correspondence with the custodian. An audit also includes assessing the accounting principles used and significant estimates made by management, as well as evaluating the overall financial statement presentation. We believe that our audits provide a reason- able basis for our opinion.
In our opinion, the financial statements and financial highlights referred to above present fairly, in all material respects, the financial position of the FAM Value Fund, FAM Equity- Income Fund and FAM Small Cap Fund as of December 31, 2015, and the results of their operations for the year then ended, the changes in their net assets for each of the years in the two-year period then ended and their financial highlights for each of the years or periods presented in the five-year period then ended, in conformity with accounting principles generally accepted in the United States of America.
Philadelphia, Pennsylvania
February 18, 2016
57
FAM Funds (Unaudited)
Board Consideration of the Continuation of the Investment Advisory Agreements for the Funds
In accordance with the Investment Company Act of 1940, the Board of Trustees of the Funds is required, on an annual basis, to consider the approval of each of the Investment Advisory Agreements between the Funds and the Advisor, and this must take place at an in-person meeting of the Board. The relevant provisions of the Investment Company Act of 1940 specifically provide that it is the duty of the Board to request and evaluate such information as the Board determines is necessary to allow them to properly consider the approval of the Investment Advisory Agreements, and it is the duty of the Advisor to fur- nish the Trustees with such information that is responsive to their request.
At its meeting held on November 12, 2015, the Board considered various matters presented by the Advisor regarding the management and operation of the Funds, including a proposal to implement a new multi-class share structure for the Funds (the “Multi- Class Proposal”) pursuant to which the Funds would be authorized to begin issuing two separate classes of shares, the Investor Shares (consisting of the currently issued and outstanding shares of the Funds) and Institutional Shares, a newly established class of shares. In connection with the proposed implementation of the Multi-Class Proposal, the Board considered certain proposed amendments to the existing operational structure of the Funds, which would provide that effective as of January 1, 2016: (i) the Funds would begin operating pursuant to a plan adopted pursuant to Rule 18f-3 under the 1940 Act providing for multiple classes of shares of the Funds (the “Multi-Class Plan”) (ii) each Fund would issue a new class of shares, Institutional Shares, pursuant to the Multi-Class Plan; (iii) the Investor Shares and the Institutional Shares would each become subject to proposed new Shareholder Administrative Services Plans pursuant to which each respective class of shares would undertake the payment for various types of non-distribution related shareholder administrative support services; (iv) the Advisor would undertake the payment of certain distribution-related payments to various third party intermediary firms that provide services to their clients and customers that are invested in the Funds, which payments by the Advisor would be characterized as “revenue sharing” payments and would be paid out of the Advisor’s own financial resources and would not be borne by the Funds; (v) the Advisor’s affiliate, FAM Shareholder Services, Inc. (“FSS”), would continue to provide fund accounting services to the Funds, but such services would now be treated as “class level” expenses and would be paid by each class of shares pursuant to the terms of new Fund Accounting Agreements between the Funds and FSS with respect to each share class; and (vi) the Advisor would enter into a new Business Management Agreement with the Funds pursuant to which the Advisor would begin providing certain business management services to the Funds, which services are essentially identical to those business management services that the Funds were previously receiving from FSS under a contractual arrangement between the Funds and FSS, which arrangements would be replaced by the Business Management Agreement.
58
FAM Funds (Unaudited)
In addition, the Board also considered the Advisor’s proposal to have the Board approve Amended Investment Advisory Agreements with each of the Funds (the “Amended Advi- sory Agreements”) pursuant to which the investment advisory fees payable to the Advi- sor by each of the Funds would be reduced from 1.00% of the average daily net assets of each Fund to 0.90% of the average daily net assets of each Fund. In connection with its proposal to reduce the investment advisory fees payable to it, the Advisor represented to the Board that the Advisor would not reduce the level or quality of the investment advi- sory services that it provides to the Funds.
Accordingly, in determining whether to approve the Amended Advisory Agreements between the Value Fund, the Equity-Income Fund, and the Small Cap Fund with the Advisor, the Board of Trustees requested, and the Advisor provided, information and data relevant to the Board’s consideration. This included materials prepared by the Advisor and mate- rials prepared by an independent mutual fund industry consulting firm that produced materials specifically for the Board that provided them with information regarding the investment performance of the Funds and information regarding the fees and expenses of the Funds, compared to other similar mutual funds. As part of its deliberations, the Board also considered and relied upon the information about the Funds and the Advisor that had been provided to them throughout the year in connection with their regular Board meetings at which they engage in the ongoing oversight of the Funds and their operations.
The Board engaged in a thorough review process in order to determine whether to ap- prove the Amended Advisory Agreements with the Advisor. After receiving the materials that they had requested to assist them with their review, the Board had a preliminary meeting by conference call on November 6, 2015, with representatives of the Advisor in order to discuss the proposed approval of the Amended Advisory Agreements and to review the materials that had been presented. The Board then requested certain additional information which the Advisor provided and the Board also met separately on November 11, 2015, and then with representatives of the Advisor again on November 12, 2015, prior to their required in-person meeting in order to further consider and discuss the proposed approval of the Amended Advisory Agreements.
The Board then met to consider the approval of the Amended Advisory Agreements at an in-person meeting of the Board held on November 12, 2015. Among the factors the Board considered was: (i) the overall performance of each of the Value Fund and the Equity- Income Fund relative to the performance of other similar mutual funds on a long-term basis (five years and longer) and over shorter time periods (less than five years); and (ii) the overall performance of the Small Cap Fund since its inception on March 1, 2012. In connection with its review of the performance results achieved for the Funds, the Board discussed with management the fact that the Advisor maintains a particular focus on long-term investment performance results and they reviewed the reasons why this may, from time to time, cause the longer-term performance results and the shorter-term performance results to under-perform when compared to other funds for similar time periods. In connection with this, the Board took note of management’s stated position that
59
FAM Funds (Unaudited)
achieving favorable long-term investment results is a primary objective of the firm. The Board also considered and discussed with the Advisor their focus on “value investing” which may result in short-term performance that lags the performance results achieved by other managers, especially those managers that emphasize other types of investment strategies, such as “growth investing”. The Board also took into consideration the Advisor’s stated objective of attaining investment results with less risk and less volatility than other funds. The Board determined that it has been beneficial to shareholders that the Advisor has continued to invest on behalf of the Funds in a manner that is consistent with its long-term investment objectives due to the fact that the Advisor has been able
to achieve favorable long-term performance results for the Value Fund and the Equity- Income Fund and favorable investment results for the Small Cap Fund since its inception, and, when performance is adjusted for risk, it shows even more favorable results.
The Board also took note of the relationship between the Advisor and each of the Funds and the efforts that have been undertaken by the Advisor to foster the growth and development of the Funds since the inception of each of the Funds. In connection with these matters, the Board took note of the fact that Thomas Putnam, the Chairman and founder of the Advisor and the co-manager of each of the Funds, has been advising each of the Funds since their inception, during which time each of the Funds have experienced favorable investment results on a comparative basis. The Board also noted that the Advi- sor has continued to retain and develop additional portfolio managers and investment analysts to work with Mr. Putnam in an effort to provide for the continued long-term management and oversight of the Funds and their portfolios.
In addition, the Board compared expenses of each Fund to the expenses of other mutual funds of similar size and investment objective. They also noted the range of investment advisory and administrative services provided by the Advisor and its affiliates to the Funds and the level and quality of these services, and in particular, they considered the quality of the personnel providing these services noting that they were of a high caliber. In connection with the Board’s consideration of the approval of the Business Management Agreement with the Advisor, the Board determined that the fees payable to the Ad- visor for the business management services to be provided by the Advisor were reason- able and that the business management services are expected to be of a level and quality at least equal to the same or similar services that could be provided by independent third parties.
The Board considered that the Funds receive shareholder account services and fund ac- counting services from an affiliate of the Advisor, FSS, and the Board reviewed the fees that are proposed to be payable to FSS under the new contractual arrangements that are being put in place as of January 1, 2016, between FSS and the Funds in connection with the Multi-Class Proposal, and the Board determined that the fees are reasonable based upon the nature and quality of the services expected to be provided to the Funds by FSS for shareholder account services and fund accounting services and based upon the level and quality of services that FSS has previously provided to the Funds. The Board also con- sidered the fees that will be payable to FSS by each Fund under the Shareholder Services
60
FAM Funds (Unaudited)
Agreements entered into between the Funds and FSS, and the extent to which FSS may pay the Advisor for providing FSS with certain administrative support services that the Advisor has agreed to provide to FSS for purposes of assisting FSS with its provision of shareholder account services to the Funds.
The Board also considered that the Funds are distributed by an affiliate of the Advisor, Fenimore Securities, Inc., (“FSI”), and the Board reviewed the distribution-related services provided by FSI and they determined that the distribution services provided by FSI are useful and beneficial to the ongoing operations of the Funds. In connection with their consideration of the services provided to the Funds by FSI, the Board took into consideration that FSI does not receive any revenue or compensation from the Funds for the services that it provides to the Funds, and the Board further considered that the Advisor supports the ongoing operations of FSI from its own financial resources.
The Board also reviewed financial information concerning the Advisor and its affiliates relating to the operation of the Funds, noting the overall profitability of the relationship with the Funds to the Advisor and the financial soundness of the Advisor and its affili- ates as demonstrated by the financial information provided. The Board also took note of the fact that the Advisor has previously used revenue sharing payments from its own financial resources to pay for all of the distribution-related costs incurred in connection with the marketing and sale of the Funds’ shares because the Funds are not subject to a Rule 12b-1 plan of distribution, and they further took note of the fact that in connection with the implementation of the Multi-Class Proposal, the Advisor will continue its practice of using revenue sharing payments from its own financial resources to make payments to those financial intermediaries that provide certain types of distribution-related services to shareholders of each class of shares of the Funds. The members of the Board considered the profitability of the Advisor both before and after the impact of the marketing and distribution-related expenses that the Advisor incurs out of its own resources in connection with its management of the Funds.
The Board reviewed the Advisor’s brokerage practices and best-execution procedures, and noted that these were reasonable and consistent with standard industry practice. In con- nection with this review, the Board considered the fact that while the Advisor does not have any express arrangements in place with respect to “soft dollar” arrangements with brokers or other similar parties relating to the direct use of Fund brokerage commissions to obtain research or execution services, the Advisor does receive research services from certain broker-dealers with which it executes securities transactions on behalf of the Funds which is done in a manner that is consistent with the provisions of Section 28(e)
of the Securities Exchange Act of 1934. With respect to the Advisor’s brokerage practices, the Board also took into consideration the fact that the Advisor has maintained low port- folio turnover rates for the Funds that are substantially lower than industry averages for equity-type funds, which the Board determined is beneficial to shareholders due to the reduced brokerage expenses that are attributable to low portfolio turnover rates.
61
FAM Funds (Unaudited)
The Board also considered information regarding the fees that the Advisor charges other clients, including privately managed accounts and a privately offered investment fund, for investment advisory services that are similar to the advisory services provided to the Funds and noted that the Funds’ fees were reasonable when compared to the relevant circumstances of the types of accounts involved and the services provided and the differ- ent types of additional services that are required in connection with the management of regulated investment companies such as the Funds.
In connection with the Board’s consideration of the ways in which economies of scale are reflected with respect to the Amended Advisory Agreements, the Board took note of the fact that the Advisor had agreed to lower the investment advisory fees payable to it by each of the Funds effective as of January 1, 2016. In addition, the Board took into con- sideration that the Advisor had agreed to the use of an Expense Limitation Agreement with respect to each Fund which provides for a limit on the total operating expenses of each Fund and each class of shares of each Fund through May 1, 2017. With respect to the Board’s approval of the Expense Limitation Agreement between the Funds and the Advi- sor, the Board took into consideration that pursuant to the terms of the Expense Limitation Agreement, the Advisor may seek recoupment of fees and expenses that it had previ- ously waived or reimbursed under certain circumstances provided that such recoupment does not result in a Fund incurring total operating expenses that are in excess of the amounts provided under the terms of the Expense Limitation Agreement with respect to each class of shares of the Funds.
In reaching their conclusion with respect to the approval of the Amended Advisory Agreements, the Trustees did not identify any one single factor as being controlling, rather, the Board took note of a combination of factors that influenced their decision making process. The Board did, however, identify the overall favorable long-term investment performance of each of the Value Fund and the Equity-Income Fund, and the performance of the Small Cap Fund since its inception, as well as the commitment of the Advisor to the successful operation of each of the Funds, and the level of expenses of the Funds, in addition to the Advisor’s willingness to enter into a contractual Expense Limitation Agreement in order to limit the overall operating expenses of each of the Funds and each class of shares of the Funds, as being important elements of their consideration. Based upon their review and consideration of these factors and other matters deemed relevant by the Board in reaching an informed business judgment, the Board of Trustees, including all of the Independent Trustees, unanimously concluded that the terms of the Amended Advisory Agreements are fair and reasonable and the Board voted to approve the Amended Advisory Agreements for a one-year period, subject to the applicable limitations on the total operating expenses of the Funds, as considered and approved at the meeting.
62
FAM Funds — Information About Trustees and Officers (Unaudited)
The business and affairs of the Funds are managed under the direction of the Funds’ Board of Trustees. Information pertaining to the Trustees and Officers of the Funds is set forth below. The Statement of Additional Information includes additional information about Trustees and is available, without charge, upon request by calling the Fund at 1-800-932-3271. |
| Independent Trustees** |
Name, Address, and Age | Position(s) Held With Fund and Length of Time Served† | Principal Occupation(s) During Past 5 Years | Number of Portfolios in Fund Complex* Overseen by Trustee | Other Directorships Held by Trustee During Past 5 Years |
Fred “Chico” Lager 384 North Grand St. Cobleskill, NY 12043 Age: 61 | Trustee since 1996 | Business Consultant; Retired President and Chief Executive Officer of Ben & Jerry’s Home- made, Inc. | 3 | None |
John J. McCormack, Jr. 384 North Grand St. Cobleskill, NY 12043 Age: 71 | Trustee since 2004; Chair- man since 2007 | Retired Group President, TIAA-Cref Enterprises | 3 | None |
Barbara V. Weidlich 384 North Grand St. Cobleskill, NY 12043 Age: 71 | Trustee since 2004 | Retired President, National Investment Company Service Association | 3 | None |
Kevin J. McCoy, CPA 384 North Grand St. Cobleskill, NY 12043 Age: 63 | Trustee since 2007 | Principal, Marvin and Company, P.C., certified public accounting firm | 3 | None |
Paul A. Keller, CPA 384 North Grand St. Cobleskill, NY 12043 Age: 61 | Trustee since 2010 | Business Consultant; Retired Assurance Partner, Pricewater- houseCoopers, LLP Investment Manage- ment Services Group | 3 | None |
Donald J. Boteler 384 North Grand St. Cobleskill, NY 12043 Age: 67 | Trustee since 2012 | Retired Vice President of Operations & Continuing Education,Investment Company Institute | 3 | Parnasus Funds and Parnasus Income Funds |
63
FAM Funds — Information About Trustees and Officers (Unaudited)
Interested Trustee and Officers***
Name, Address, and Age | Position(s) Held With Fund and Length of Time Served† | Principal Occupation(s) During Past 5 Years | Number of Portfolios in Fund Complex* Overseen by Trustee | Other Directorships Held by Trustee During Past 5 Years |
| Interested Trustee |
Thomas O. Putnam**** 384 North Grand St. Cobleskill, NY 12043 Age: 71 | President since 1986; Chairman from 1986- November 2004 | Chairman, Fenimore Asset Management, Inc. | 3 | None |
| Officers |
Joseph A. Bucci 384 North Grand St. Cobleskill, NY 12043 Age: 62 | Secretary and Treasurer since 2000 | Chief Financial Officer, Fenimore Asset Management, Inc. | N/A | N/A |
Charles Richter, Esq. 384 North Grand St. Cobleskill, NY 12043 Age: 59 | ChiefCompliance Officer and Anti-Money Laundering Compliance Officer since 2005 | March 2005 to Present, Chief Compliance Officer, Fenimore Asset Management Trust. November 2004 to Present, Chief Compliance Officer, Fenimore Asset Management, Inc., Fenimore Securities, Inc. | N/A | N/A |
†Trustees serve until their successors are elected and qualified, or until the Trustee dies, resigns or is removed, or becomes incapacitated. *”Fund Complex” includes the three series of the Trust, FAM Value Fund, FAM Equity-Income Fund and FAM Small Cap Fund. |
| **The “Independent Trustees” are those Trustees that are not considered “interested persons” of the Trust, as that term is defined in the 1940 Act. |
| ***Mr. Putnam, by virtue of his employment with Fenimore Asset Management, Inc., the Trust’s investment advisor, is considered an “interested person” of the Trust. |
| ****Mr. Putnam was Chairman of the Board through October 2004. |
64
FAM Funds — Expense Data
December 31, 2015 (Unaudited)
As a shareholder of the Funds, you incur ongoing costs, including management fees, and other Fund expenses. This Example is intended to help you understand your ongoing costs (in dollars) of investing in the Funds and to compare these costs with the ongoing costs of investing in other mutual funds.
The Example is based on an investment of $1,000 at the beginning of the period and held for the entire period (7/1/2015 to 12/31/2015).
Actual Expenses
Line (A) of the following tables provides information about actual account values and ac- tual expenses. You may use the information in this line, together with the amount you in- vested, to estimate the expenses that you paid over the period. Simply divide your account value by $1,000 (for example, an $8,600 account value divided by $1,000 = 8.6), then mul- tiply the result by the number in the line for your share class under the heading entitled “Expenses Paid During Period” to estimate the expenses you paid on your account during this period.
Hypothetical Example for Comparison Purposes
Line (B) of the following table provides information about hypothetical account values and hypothetical expenses based on the Fund’s actual expense ratio and an assumed rate of re- turn of 5% per year before expenses, which is not the Fund’s actual return. The hypotheti- cal account values and expenses may not be used to estimate the actual ending account balance or expenses you paid for the period. You may use this information to compare the ongoing costs of investing in the Fund and other funds. To do so, compare this 5% hypo- thetical example with the 5% hypothetical examples that appear in the shareholder reports of other funds.
Please note that the expenses shown in the table are meant to highlight your ongoing costs only. Therefore, line (B) of the table is useful in comparing ongoing costs only, and will not help you determine the relative costs of owning different funds.
65
FAM Funds — Expense Data continued
Six months ended December 31, 2015 (Unaudited)
| FAM Value Fund |
| | Beginning Account Value 7/1/2015 | Ending Account Value 12/31/2015 | Expenses Paid During Period |
| A. Ongoing Costs Based on Actual Fund Return | $1,000.00 | $ 972.80 | $6.02* |
| B. Ongoing Costs Based on Hypothetical 5% Yearly Return | $1,000.00 | $1,018.90 | $6.16* |
*Expenses are equal to the Fund’s annualized expense ratio of (1.21%), multiplied by the average account value over the period, multiplied by 184/365 (to reflect the one-half year period). |
| FAM Equity-Income Fund |
| | Beginning Account Value 7/1/2015 | Ending Account Value 12/31/2015 | Expenses Paid During Period |
| A. Ongoing Costs Based on Actual Fund Return | $1,000.00 | $ 985.90 | $6.61* |
| B. Ongoing Costs Based on Hypothetical 5% Yearly Return | $1,000.00 | $1,018.35 | $6.72* |
*Expenses are equal to the Fund’s annualized expense ratio of (1.32%), multiplied by the average account value over the period, multiplied by 184/365 (to reflect the one-half year period). |
| FAM Small Cap Fund |
| | Beginning Account Value 7/1/2015 | Ending Account Value 12/31/2015 | Expenses Paid During Period |
| A. Ongoing Costs Based on Actual Fund Return | $1,000.00 | $ 935.20 | $6.73* |
| B. Ongoing Costs Based on Hypothetical 5% Yearly Return | $1,000.00 | $1,018.04 | $7.02* |
* Expenses are equal to the Fund’s annualized expense ratio of (1.38%), multiplied by the average account value over the period, multiplied by 184/365 (to reflect the one-half year period). |
66
FAM Funds — Supplemental Information (Unaudited)
Statement Regarding Availability of Proxy Voting Policies and Procedures.
Please note that a description of the policies and procedures the Funds use to determine how to vote proxies relating to portfolio securities is available (i) without charge, upon request, by calling FAM Funds at 1-800-932-3271; (ii) and on the Securities and Exchange Commission’s website at http://www.sec.gov.
Statement Regarding Availability of Proxy Voting Record.
Please note that information regarding how the Funds voted proxies relating to portfolio securities during the most recent 12-month period ended June 30 is available (i) without charge, upon request, by calling FAM Funds at 1-800-932-3271; or on the FAM Funds’ Website at http://famfunds.com (ii) and on the Securities and Exchange Commission’s website at http://www.sec.gov.
| SPECIAL SPECIAL 2015 TAX INFORMATION FOR FAM FUNDS |
| This information for the fiscal year ended December 31, 2015, is included pursuant to provisions of the Internal Revenue Code. |
| The Value Fund distributed $80,079,150, or the maximum amount available, as capital gain dividends (from net long-term capital gains) to shareholders during the fiscal year. |
| The Equity-Income Fund distributed $6,761,847, or the maximum amount available, as capital gain dividends (from net long-term capital gains) to shareholders during the fiscal year. |
| The Small Cap Fund distributed $421,640, or the maximum amount available, as capital gain dividends (from net long-term capital gains) to shareholders during the fiscal year. |
| For Equity-Income Fund taxable non-corporate shareholders, 85.8% of the Fund’s income represents qualified dividend income subject to the 20% rate category. |
| For Small Cap Fund taxable non-corporate shareholders, 0.0% of the Fund’s income represents qualified dividend income subject to the 20% rate category. |
| For Equity-Income Fund corporate shareholders, 85.8% of investment income (dividend income plus short-term gains, if any) qualifies for the dividends-received deduction. |
| For Small Cap Fund corporate shareholders, 0.0% of investment income (dividend income plus short-term gains, if any) qualifies for the dividends-received deduction. |
See Notes to Financial Statements
67
Investment Advisor
Fenimore Asset
Management, Inc.
Cobleskill, NY
Custodian
U.S. Bank, N.A.
Cincinnati, OH
Independent Registered
Public Accounting Firm
BBD, LLP
Philadelphia, PA
Trustees
Donald J. Boteler
Paul Keller, CPA
Fred “Chico” Lager
John J. McCormack, Jr.,
Independent Chairman
Kevin J. McCoy, CPA
Thomas O. Putnam
Barbara V. Weidlich
Legal Counsel
Dechert LLP
Washington, DC
Shareholder Servicing Agent
FAM Shareholder Services, Inc.
Cobleskill, NY
Distributor
Fenimore Securities, Inc.
Cobleskill, NY
384 North Grand Street
PO Box 399
Cobleskill, New York
12043-0399
(800) 932-3271
www.famfunds.com
Item 2. Code of Ethics.
The Registrant has adopted a code of ethics that applies to the Registrant's principal executive officer, principal financial officer, principal accounting officer or controller, or persons performing similar functions, regardless of whether these individuals are employed by the Registrant or a third party. The Registrant has undertaken in this report filed on Form N-CSR to provide to any person without charge, upon request by calling 1-(800) 932-3271, a copy of such code of ethics. During 2015, there were no amendments to the Code of Ethics or Waivers from the Code of Ethics.
Item 3. Audit Committee Financial Expert.
The Registrant's Board of Trustees has determined that Fred Lager, Paul A. Keller, Donald J. Boteler and Kevin J. McCoy are each an "audit committee financial expert" and are "independent", as these terms are defined in this Item 3.
Item 4. Principal Accountant Fees and Services.
(a) Audit Fees 2015 - $86,500. ; Audit Fees 2014 - $86,500
(b) Audit-Related Fees - None.
(c) Tax Fees 2015 - $12,500.; Tax Fees 2014 - $12,500.; Tax Preparation Expenses
(d) All Other Fees –2015 – None; 2014 - None-
(e)(1) Audit Committee Pre-Approval Policy. All services to be performed for the Registrant by BBD, LLP must be pre-approved by the audit committee. All services performed during 2015 and 2014 were pre-approved by the committee.
(e)(2) 100 percent of any Fees for services described in each of paragraphs (b) through (d) of this item were approved by the audit committee pursuant to paragraph (c)(7)(i)(C) of Rule 2-01 of Regulation S-X.
(f) Not applicable.
(g) The aggregate fees paid to BBD, LLP for professional services to Registrant's affiliated broker-dealer for 2015 were $6,500., and 2014 were $6,000., respectively. The aggregate fees paid to BBD, LLP for professional services to Registrant's affiliated Private Offering-Limited Liability Company for 2015 were $18,000 and for 2014 were $18,000 respectively.
(h) Not applicable.
Item 5. Audit Committee of Listed Registrants
Not Applicable.
Item 6. Schedule of Investments
This Schedule of Investments in securities of unaffiliated issuers is
included as part of the Report to Shareholders.
Item 7. Disclosure of Proxy Voting Policies and Procedures for
Closed-End Management Investment Companies
Not applicable.
Item 8. Portfolio Managers of Closed-End Management Companies
Not applicable.
Item 9. Purchases of Equity Securities by Closed-End Management
Investment Company and Affiliated Purchasers
Not applicable.
Item 10. Submission of Matters to a Vote of Security Holders
Not applicable.
Item 11. Controls and Procedures.
(a) The registrant's principal executive officer and principal financial officer have concluded that the registrant's disclosure controls and procedures (as defined in Rule 30a-3(c)) under the Investment Company Act of 1940, as amended (the "Act") are effective based on their evaluation of these controls and procedures as of a date within 90 days of the filing date of this document.
(b) There were no changes in the registrant's internal control over financial reporting (as defined in Rule 30a-3(d) under the Act that occurred during the registrant's second fiscal half-year of the period covered by this report that has materially affected, or is easonably likely to materially affect, the registrant's internal control over financial reporting.
Item 12. Exhibits.
File the exhibits listed below as part of this Form. Letter or number the
exhibits in the sequence indicated.
(a) A separate certification for each principal executive officer and principal financial officer of the registrant as required by Rule 30a-2 under the Act (17 CFR 270.30a-2) in the exact form set forth below:
(Attached hereto).
SIGNATURES
Pursuant to the requirements of the Securities Exchange Act of 1934 and the Investment Company Act of 1940, the registrant has duly caused this report to be signed on its behalf by the undersigned, thereunto duly authorized.
| (Registrant) | Fenimore Asset Management Trust |
| By (Signature and Title)* | /s/ Thomas O. Putnam |
| | Thomas O. Putnam, President |
Date February 23, 2016
Pursuant to the requirements of the Securities Exchange Act of 1934 and the Investment Company Act of 1940, this report has been signed below by the following persons on behalf of the registrant and in the capacities and on the dates indicated.
| By (Signature and Title)* | /s/ Thomas O. Putnam |
| | Thomas O. Putnam, President |
Date February 23, 2016
| By (Signature and Title)* | /s/ Joseph A. Bucci |
| | Joseph A. Bucci, Treasurer |
Date February 23, 2016