| OMB APPROVAL |
OMB Number: 3235-0570 Expires: August 31, 2020 Estimated average burden hours per response: 20.6 |
UNITED STATES
SECURITIES AND EXCHANGE COMMISSION
Washington, D.C. 20549
FORM N-CSR
CERTIFIED SHAREHOLDER REPORT OF REGISTERED MANAGEMENT
INVESTMENT COMPANIES
| Investment Company Act file number | 811-04750 | |
| Fenimore Asset Management Trust |
| (Exact name of registrant as specified in charter) |
| 384 North Grand Street, P.O. Box 399 Cobleskill, New York | 12043 |
| (Address of principal executive offices) | (Zip code) |
Thomas O. Putnam
| Fenimore Asset Management Trust 384 North Grand Street, P.O. Box 399 Cobleskill, New York, 12043 |
| (Name and address of agent for service) |
| Registrant's telephone number, including area code: | 1-800-453-4392 | |
| Date of fiscal year end: | December 31 | |
| | | |
| Date of reporting period: | December 31, 2018 | |
Form N-CSR is to be used by management investment companies to file reports with the Commission not later than 10 days after the transmission to stockholders of any report that is required to be transmitted to stockholders under Rule 30e-1 under the Investment Company Act of 1940 (17 CFR 270.30e-1). The Commission may use the information provided on Form N-CSR in its regulatory, disclosure review, inspection, and policymaking roles.
A registrant is required to disclose the information specified by Form N-CSR, and the Commission will make this information public. A registrant is not required to respond to the collection of information contained in Form N-CSR unless the Form displays a currently valid Office of Management and Budget (“OMB”) control number. Please direct comments concerning the accuracy of the information collection burden estimate and any suggestions for reducing the burden to Secretary, Securities and Exchange Commission, 450 Fifth Street, NW, Washington, DC 20549-0609. The OMB has reviewed this collection of information under the clearance requirements of 44 U.S.C. § 3507.
| Item 1. | Reports to Stockholders. |

Beginning on January 1, 2021, as permitted by regulations adopted by the U.S. Securities and Exchange Commission, paper copies of the Funds’ shareholder reports like this one will no longer be sent by mail, unless you specifically request paper copies of the reports from the Funds or from your financial intermediary, such as a broker-dealer or bank. Instead, the reports will be made available on a website, and you will be notified by mail each time a report is posted and provided with a website link to access the report.
If you already elected to receive shareholder reports electronically, you will not be affected by this change and you need not take any action. You may elect to receive shareholder reports and other communications from the Funds electronically by contacting the Funds at 1-800-932-3271 or, if you own these shares through a financial intermediary, by contacting your financial intermediary.
You may elect to receive all future reports in paper free of charge. You can inform the Funds that you wish to continue receiving paper copies of your shareholder reports by contacting the Fund at 1-800-932-3271. If you own shares through a financial intermediary, you may contact your financial intermediary or follow instructions included with this document to elect to continue to receive paper copies of your shareholder reports. Your election to receive reports in paper will apply to all funds held with the fund complex or at your financial intermediary.
Table of Contents
Chairman’s Commentary | 1 |
FAM Value Fund | |
Letter to Shareholders | 4 |
Performance Summary | 10 |
Portfolio Data | 13 |
Schedule of Investments | 14 |
FAM Equity-Income Fund | |
Letter to Shareholders | 18 |
Performance Summary | 24 |
Portfolio Data | 27 |
Schedule of Investments | 28 |
FAM Small Cap Fund | |
Letter to Shareholders | 31 |
Performance Summary | 37 |
Portfolio Data | 40 |
Schedule of Investments | 41 |
Statements of Assets and Liabilities | 44 |
Statements of Operations | 45 |
Statements of Changes in Net Assets | 46 |
Notes to Financial Statements | 49 |
Report of Independent Registered Public Accounting Firm | 65 |
Board Consideration of the Continuation of the Investment Advisory Agreements for the Funds | 67 |
Information About Trustees and Officers | 72 |
Expense Data | 75 |
Supplemental Information | 77 |
Privacy Policy | 79 |
FAM Funds has adopted a Code of Ethics that applies to its principal
executive and principal financial officers. You may obtain a copy of this Code
without charge, by calling FAM Funds at (800) 932-3271.
Chairman’s Commentary
December 31, 2018
Dear Fellow Shareholder,
We began last year’s annual letter by recounting a Wall Street Journal article that described 2017 as “the year pretty much everything went up.” The opposite was true this year – 2018 could aptly be described as “the year pretty much everything went down.” 2017’s celebration of coordinated global growth turned to fears of a global slowdown. Safe-haven assets such as U.S. Treasuries were among the few winners. The total return of U.S. stocks as measured by the S&P 500, an index of the 500 largest corporations, was -4.38%. Smaller companies, as measured by the Russell 2000 Index, fared worse returning -11.01%.1
Within this context, we believe that FAM Funds performed well (please see individual fund letters for details). A standout was the FAM Equity-Income Fund, which outperformed most funds and indices during the year. A down year such as 2018 is not a surprise given the strength of equity markets in all but one of the last six years. And, for us, it is not disheartening either. As we had written a year ago, price-earnings multiples coming into 2018 were becoming stretched and opportunities were few. Today, the opposite is true. Valuations are becoming reasonable and opportunities plentiful. While there may be more fear in the markets, we at FAM Funds are becoming more excited.
Volatility  Opportunity
If investors were asked to describe the domestic stock markets in 2018 using only one word, many might say “volatile” (partially because you could not escape this word in the financial press). The placid 2017 market carried over into a very strong January of 2018. Then fears of inflation and rising interest rates caused investors to reassess the earnings growth and valuations of businesses, creating a surge in volatility through May. Things calmed down over the summer as the S&P 500 climbed to new highs on September 20. Along the way, on August 22, it was crowned the longest bull market in history at 3,453 days. No sooner had the coronation celebration ended when investors became fearful of a global slowdown and escalating trade wars. By the end of December, the longest running bull market threatened to give way to a bear market.
Opportunity  Activity
Long-term shareholders and those who have read our literature know that while downside volatility is not fun, FAM Funds embraces it rather than fears it. How? One insight crucial to embracing turbulent markets is that price does not equal value. The stock prices of many wonderful companies fell 30% or more in 2018, but we estimate that in most of these cases their value did not. This created an opportunity for long-term investors such as
1
Chairman’s Commentary
us. Similar to the shoppers who get excited when prices of ultra-high-definition television sets are marked down 30% on Black Friday, we get excited when market leading, highly profitable, growing, well-capitalized businesses trade 30% cheaper.
Our team used this environment of improving opportunities to enhance, in our opinion, the collective quality and expected return of our funds. Between the three funds, we took ownership stakes in 11 new businesses ranging from dental/medical distributors and label makers to faucet manufacturers and the company responsible for your neon orange fingers after eating a bag of CHEETOS®. We believe these are good firms and have long admired them, but we estimated that they were too expensive to offer us an adequate margin of safety. As volatility picked up through the year, more of these long admired and perennially expensive “wish list” companies began approaching attractive valuations. We hope to buy shares of more of these in 2019! Additionally, we added to many existing positions.
Preparation  Opportunity
Warren Buffett’s business partner Charlie Munger, paraphrasing Louis Pasteur, said, “Opportunity comes to the prepared mind.” We agree. The seven members of your investment research team spent countless hours on the road in 2018 visiting the management teams of companies we are either already invested in or assessing for future ownership. In addition, our analysts talked to hundreds of management teams over the phone. All these conversations, more than 275 in all, become tiles in the mosaic of opportunities and threats on the investment landscape. We get a better picture of the prospects for each enterprise, their competitors, and businesses in associated industries. Each interaction adds to the mosaic and helps us refine our investment opportunity set and outlook.
From company managements, we heard recurring concerns about tariffs and inflation in 2018. However, we heard much optimism about the ability to grow revenue (organically and by acquisition), improve profitability, invest in future growth, and return capital to us – the owners. Indeed, the median 2019 estimated revenue growth rate for all our fund holdings is approximately 5%, on top of nearly 7% in 2018. Median earnings per share growth in 2019 is expected to be more than 8%, after 20% tax-reform-infused growth in 2018.2 These are healthy numbers that reflect the optimism heard from many management teams. Some could certainly fall short of these expectations because growth is not as easy to achieve as in years past. But many could, in our opinion, continue to grow their earnings power and drive increases in per share value.
2
Chairman’s Commentary
Outlook
Though the FAM Funds team is optimistic, we do not have our heads in the sand. Your team is monitoring the trade issue and ability of our holdings to protect profit margins if the trade war intensifies or lingers on while watching for signs of a protracted downturn in China. We are also paying close attention to inflationary pressures on wages, raw materials, and other operating expenses such as transportation. Most of our holdings’ leaders have thus far been able to reduce the effects of these dynamics by a combination of raising prices, making operational improvements, and rerouting supply chains. Though optimistic, we are on the lookout for signs of a significant economic slowdown. If one occurs, investing in market leading, conservatively capitalized, and well-run businesses should serve us well as it has since we first opened our doors.
Please call us at 800-932-3271 if you have questions or need some reassurance. We also welcome you to visit us in our Albany or Cobleskill offices. Thank you for the ongoing trust and confidence that you place in us.

Thomas O. Putnam, Chairman
Research Team
Andrew F. Boord
John D. Fox, CFA
Kevin D. Gioia,CFA
Paul C. Hogan, CFA
William W. Preston, CFA
Drew P. Wilson, CFA
The opinions expressed herein are those of the portfolio managers as of the date of the report and are subject to change. There is no guarantee that any forecast made will come to pass. This material does not constitute investment advice and is not intended as an endorsement of any specific investment.
Performance data quoted above is historical. Past performance is no guarantee of future results. Current performance may be higher or lower than the performance data quoted. The principal value and investment return of an investment will fluctuate so that your shares, when redeemed, may be worth more or less than their original cost.
3
FAM Value Fund
December 31, 2018
Dear Fellow Value Fund Shareholder,
In 2018, most investments declined with U.S. stocks, international stocks, real estate, and some bonds providing a negative return for the year. It was the opposite of 2017 when these asset classes produced positive returns overall.1 In this difficult environment, the FAM Value Fund declined -6.18% for the year. This was a little better than the Fund’s primary benchmark, the Russell Midcap Index, which declined -9.06%.1 As 2018 was the FAM Value Fund’s 32nd year, we have experience in many different market environments. During this time, the Fund has declined nine of those years, a little less than one-third of the time. The table below shows the calendar years and the amount of the annual decline.
Year | Annual Return | Year | Annual Return | Year | Annual Return |
1987 | -17.2% | 2002 | -5.3% | 2011 | -0.4% |
1990 | -5.4% | 2007 | -0.8% | 2015 | -1.7% |
1999 | -4.8% | 2008 | -28.7% | 2018 | -6.2% |
Of course, every decline is a little different and the bear market of 2018 came on suddenly after stock prices hit a number of all-time highs during the year. It may be hard to remember that the Dow Jones Industrial Average closed at more than 25,000 for the first time in January.1 Given the speed of the decline, we are being asked the question, “What’s happening in the market?” Our thought is that the combination of slowing worldwide eco- nomic growth and high stock valuations has contributed to a fall in prices. The point about high valuations is important. We have been concerned about valuations for a couple years. The sentences below were written two years ago in the 2016 FAM Value Fund Annual Letter:
“The net result of these trends could be a record year for corporate earnings. We should point out that the stock market has already anticipated this good news. The price to earnings ratio on the S&P 500 Index is the highest in more than a decade and many individual stocks that we look at are trading at, or above, our estimate of fair value.”
When we wrote these words, the U.S. stock market, defined as the S&P 500 Index, was trading at 18.8 times trailing earnings compared to a long-term average of 17.7 times. By the end of calendar year 2017, the multiple of earnings was even higher at 20 times.1 In short, investors were willing to pay a high multiple for corporate earnings due to low interest rates and expectations of strong future growth. Using the weather as an analogy, many investors were expecting blue skies forever. Now, with some storm clouds brewing, they are likely re-
4
FAM Value Fund
evaluating their outlook. These clouds include slower economic growth in China and Europe, political uncertainty around the world, and concerns about the future level of interest rates in the United States. If there is a silver lining in these clouds, it is the fact that stocks are a much better value today and we are finding more investment opportunities.
To illustrate this point, in the first nine months of the year we made only one significant investment, a purchase in Henry Schein (HSIC). In addition, we made small purchases in three existing holdings. During this time, the portfolio’s cash balance drifted up to nearly 10% of the Fund’s assets. Since September 30, we have invested more than $85 million in two new stocks and several existing holdings (please see the Portfolio Activity section for details).
When we tell people that our investment team has been fairly active in the market the immediate question is usually, “Well what are you buying?” The answer to that question is consistent over time. While the company names change in any particular year, we continue to execute our investment philosophy and process. Our philosophy can be summed up in the idea of intrinsic value. We believe that every asset – be it a bond, a piece of real estate, or a company – has a value that is “intrinsic” to that asset. A share of stock represents a fractional ownership in a business. The value of that business comes from the amount of cash it produces and the rate of growth in that cash flow into the future. If you know those two variables, it is fairly easy to figure out what a firm is worth. Of course, making accurate projections about the future is difficult. As a result, we build some guardrails into our investment process to protect us if our forecasts are wrong.
Our process revolves around four core criteria that we seek:
| | 1. | A good business that is growing and protected by some competitive advantage |
| | 2. | A strong financial position with low debt, high profit margins, cash profits, and high returns on capital |
| | 3. | An excellent management team that exhibits both honesty and the ability to allocate capital |
| | 4. | A purchase price that is below what we think the stock is worth |
Once we purchase a stock, we follow it closely and try to meet with the management team face-to-face at least once a year. We also monitor the price to value relationship over time. As long as the stock does not become significantly overvalued, we tend to hold onto our stocks for many years. This long-term view is reflected in the Fund’s low turnover ratio which is significantly lower than the mutual fund industry average. One benefit of a long holding period is that when we do sell a stock and realize a capital gain, it is usually a long-term gain which is taxed at a lower rate than a short-term gain.
5
FAM Value Fund
Portfolio Activity
Purchases
During the first nine months of the year, we purchased one new position and added a small amount to three existing holdings: Air Products & Chemicals (APD), Dollar General Corp. (DG), and Mohawk Industries (MHK).
As mentioned above, the new holding from early 2018 is Henry Schein (HSIC). Schein is a distributor of dental, medical, and veterinary products to office-based practices. The main product categories are consumables, equipment, and software. It is a global enterprise with one-third of their sales outside of the United States. We have long admired Schein and their management. The corporation has a long track record of success with a 10-year sales growth rate of almost 8% per year and eight consecutive years of earnings per share growth.2 This strong performance has been reflected in the valuation of Schein’s stock. Over the last 10 years, the stock has had an average price-earnings ratio of nearly 19 times earnings and has regularly traded above 20 times earnings.3 Given uncertainty in the distribution industry, we were able to purchase the stock in the first quarter at less than 17 times earnings.
Since our purchase, the company has reported solid earnings with positive organic sales growth in all six of their segments. In addition, management is taking steps to unlock shareholder value through the creation of a software joint venture and the spin out of their veterinary business into a separate firm. While there are questions about the role of distributors in the dental industry going forward, we believe Schein’s lead over the other players and the proactive moves by management could result in a higher stock price.
In the fourth quarter, we were very active adding to 13 existing holdings and purchasing one significant new position, Avery Dennison Corp. (AVY). The existing buys covered a number of industries including banking, energy, and industrials. In each case we believe the stock was selling at a price that was below the true intrinsic value of the company. With several purchases in the last quarter, the Fund’s cash is down to 5.49% of assets. We believe the future returns on these purchases should be much higher than the returns on cash over the long term.
Based on sales and market share, Avery Dennison is the leader in manufacturing pressure-sensitive labels. These labels are used on thousands of products from bottles to automotive tires. Avery’s size and 40% market share give them an advantage over their competitors in product pricing and delivery.4 Management has done an excellent job in growing the operation and profit margins over time. We estimate that the return on invested capital is above 15% and that Avery generates significantly more cash than is needed to grow the business. We purchased the stock after it declined more than 25% from its high price.
2 | Henry Schein 2017 Annual Report |
4 | Avery Dennison 2017 Annual Report |
6
FAM Value Fund
Sales
There were three significant sales during the year.
When the market was roaring in January, we sold our entire position in Loews Corp. (L) after a 40% increase in the stock price over the last two years. Loews is a holding company in New York City managed by the Tisch family. The enterprise has five primary assets and a liquid investment portfolio, so it is fairly simple to add up the value of the pieces and determine a per share value. The challenge has been that the public stock price has typically traded at a significant discount to the sum of the parts. We believed this was due to management’s poor capital allocation decisions. After observing management’s choices over a few years, we determined the value of the business was growing at only a modest rate and that it was unlikely that the discount to fair value would close.
Our longtime real estate investment, Forest City Realty Trust (FCE.A), was acquired by another one of our holdings for $25.35 in cash. We valued Forest City at $25 a share and made a substantial purchase in 2016 at below $19 a share. Our value was confirmed this summer when one of our holdings, Brookfield Asset Management, offered $25.35 to acquire it. The acquisition closed in December and we were able to redeploy the cash proceeds into other investments.
Finally, we sold the majority of our shares in the advertising agency Interpublic Group of Companies (IPG). We originally purchased the stock in April of 2012 when IPG was the operating laggard among the four, global advertising holding companies. These firms are in the flow of most advertising dollars spent around the world helping organizations with creative ideas, purchasing advertising time, and developing campaigns. Historically, these were great businesses as agencies earned a commission on every dollar spent by advertisers to promote their products. IPG was the laggard, but we thought the problems were solvable by a new management team. We were right. The new team fixed the balance sheet and increased profit margins over the last six years. The stock price doubled over this time. In the last few years, we have been questioning the ad agency business model given the amount of new competition and disruption in the industry. The emergence of new competitors such as Google and Facebook may have changed the game for the traditional advertising model. In addition to our concerns about competition, IPG made a large acquisition funded in part by increased debt. This added to our concern and we sold almost all of our shares.
Closing Thoughts
After a very quiet 2017, stock prices swung wildly in 2018’s fourth quarter. Given the recent twists and turns in stock prices, it seems more perilous than usual to make a prediction about 2019. With all the normal caveats about predicting the future, this is what we are seeing today. Corporate news and economic data released the first week of January indicate
7
FAM Value Fund
that the global economy is slowing and expectations about earnings for 2019 may be too high. We should learn much more in the third week of January when companies begin to report their financial results.
In the meantime, the Fund’s holdings are generating considerable cash profits that can be used for investment, acquisitions, dividends, or stock buybacks. We think we have invested in management teams that can use these cash profits wisely and create value per share. The recent decline in stock prices has created more opportunities to purchase shares in well-run operations at a discount to what we think they are worth. After a few years of writing about fair to high valuations and limited opportunities, we see good opportunities to invest in what we believe to be great businesses at attractive prices.
Thank you for investing with us in the FAM Value Fund.
Best & Worst Performers for 2018
Best Performers | Worst Performers |
CDW Corp. | 0.95% | Mohawk Industries | -2.13% |
AutoZone | 0.67% | Illinois Tool Works | -0.85% |
Interpublic Group of Companies | 0.46% | MEDNAX | -0.69% |
Brown & Brown | 0.36% | South State Corp. | -0.64% |
Henry Schein | 0.30% | EOG Resources | -0.63% |
This reflects the FAM Value Fund’s best and worst performers, in descending order, based on individual stock performance. Past performance does not indicate future results.
8
FAM Value Fund
Performance (as of 12/31/18)
| | 1-Year | 3-Year | 5-Year | 10-Year | Since Inception 1/2/1987 |
FAM Value Fund Investor Shares | -6.18% | 8.26% | 7.18% | 11.55% | 10.08% |
Russell Midcap Index | -9.06% | 7.04% | 6.26% | 14.03% | 11.04% |
S&P 500 Index | -4.38% | 9.26% | 8.49% | 13.12% | 10.02% |
Past performance does not indicate future results.

| 
|  |
John D. Fox, CFA
Co-Manager | Thomas O. Putnam
Co-Manager | Drew P. Wilson, CFA
Co-Manager |
The opinions expressed herein are those of the portfolio managers as of the date of the report and are subject to change. There is no guarantee that any forecast made will come to pass. This material does not constitute investment advice and is not intended as an endorsement of any specific investment.
Performance data quoted above is historical. Past performance is no guarantee of future results. Current performance may be higher or lower than the performance data quoted. The principal value and investment return of an investment will fluctuate so that your shares, when redeemed, may be worth more or less than their original cost.
9
FAM Value Fund — Performance Summary (Unaudited)
Annual Total Investment Returns:
January 2, 1987 to December 31, 2018 |
| | FAM VALUE FUND | RUSSELL MIDCAP INDEX | S&P 500 INDEX |
FISCAL YEAR | TOTAL RETURN* | TOTAL RETURN | TOTAL RETURN |
1987 | -17.40% | 0.23% | 5.25% |
1988 | 35.50% | 19.80% | 16.61% |
1989 | 20.32% | 26.27% | 31.69% |
1990 | -5.36% | -11.50% | -3.11% |
1991 | 47.63% | 41.51% | 30.47% |
1992 | 25.08% | 16.34% | 7.60% |
1993 | 0.21% | 14.30% | 10.06% |
1994 | 6.82% | -2.09% | 1.31% |
1995 | 19.71% | 34.45% | 37.53% |
1996 | 11.23% | 19.00% | 22.95% |
1997 | 39.06% | 29.01% | 33.35% |
1998 | 6.19% | 10.09% | 28.58% |
1999 | -4.84% | 18.23% | 21.04% |
2000 | 19.21% | 8.25% | -9.10% |
2001 | 15.07% | -5.62% | -11.88% |
2002 | -5.33% | -16.19% | -22.09% |
2003 | 24.98% | 40.06% | 28.67% |
2004 | 16.86% | 20.22% | 10.88% |
2005 | 5.56% | 12.65% | 4.91% |
2006 | 8.73% | 15.26% | 15.79% |
2007 | -0.79% | 5.60% | 5.49% |
2008 | -28.68% | -41.46% | -37.00% |
2009 | 22.18% | 40.48% | 26.46% |
2010 | 17.02% | 25.48% | 14.76% |
2011 | -0.41% | -1.55% | 2.11% |
2012 | 11.39% | 17.28% | 16.00% |
2013 | 32.96% | 34.76% | 32.44% |
2014 | 13.41% | 13.22% | 13.69% |
2015 | -1.74% | -2.44% | 1.38% |
2016 | 15.60% | 13.80% | 11.96% |
2017 | 17.00% | 18.52% | 21.83% |
2018 | -6.18% | -9.06% | -4.38% |
| * | The performance results shown are for the Investor Shares of the Fund. The Fund also offers Institutional Shares, which commenced operations on January 3, 2017, and therefore have a limited performance history. Because of differences in the level of fees paid by the Investor Shares and the Institutional Shares, performance results for each share class will differ. |
10
FAM Value Fund — Performance Summary (Unaudited)
The chart below depicts the change in value of a $10,000 investment in the Investor Shares of the FAM Value Fund since inception on January 2, 1987, as compared with the growth of the Russell Midcap Index, the Fund’s primary benchmark index, and the Standard & Poor’s 500 Index, an additional comparative index, during the same period. The information assumes reinvestment of dividends and capital gain distributions. The Russell Midcap Index is an unmanaged index generally representative of the market for the stocks of mid-size U.S. companies. The Standard & Poor’s 500 Index is an unmanaged index generally representative of the market for the stocks of large size U.S. companies. Investors cannot invest directly in an index.
COMPARISON OF CHANGE IN VALUE OF $10,000 INVESTMENT IN FAM VALUE FUND,
THE RUSSELL MIDCAP INDEX AND THE S&P 500 INDEX

This information represents past performance of the FAM Value Fund and is not indicative of future results. The investment return and the principal value of an investment will fluctuate so that an investor’s shares, when redeemed, may be worth more or less than the original cost.
11
FAM Value Fund — Performance Summary (Unaudited)
AVERAGE ANNUAL TOTAL RETURNS AS OF DECEMBER 31, 2018
The performance data quoted represents past performance.
| | 1 YEAR | 3 YEAR | 5 YEAR | 10 YEAR | SINCE INCEPTION | TOTAL FUND OPERATING EXPENSES* |
FAM VALUE FUND Investor Shares (1/2/87) | -6.18% | 8.26% | 7.18% | 11.55% | 10.08% | 1.20%* |
Institutional Shares
(1/3/17) | -6.00% | N/A | N/A | N/A | 4.96% | 1.01%* |
Russell Midcap Index | -9.06% | 7.04% | 6.26% | 14.03% | 11.04% | N/A |
S&P 500 Index | -4.38% | 9.26% | 8.49% | 13.12% | 10.02% | N/A |
* | Disclosure: The total annual operating expense ratio as stated in the fee table of the Fund’s most recent prospectus is 1.20% after fee waivers of (0.01)% for the Investor Class. The Fund’s total annual operating expense ratio as stated in the fee table of the Fund’s most recent prospectus is 1.01% after fee waivers of (0.18)% for the Institutional Class. The total annual operating expense as reported in the Fund’s audited financial statements is 1.18% as of 12/31/2017 after a fee waiver of (0.01%) for the Investor Class. The Advisor has contractually agreed, untl May 1, 2019, to waive fees and/or reimburse the Fund certain expenses (excluding interest, taxes, brokerage costs, Acquired Fund Fees and Expenses, dividend expense and extraordinary expenses) to the extent necessary to maintain Net Fund Operating Expenses for Investor Shares at 1.18% and Institutional Shares at 0.99%. |
| Past performance is not indicative of future results, current performance may be lower or higher than the performance date quoted. Investment returns may fluctuate; the value of your investment upon redemption may be more or less than the initial amount invested. |
| Please consider a fund’s investment objectives, risks, charges and expenses carefully before investing. The FAM Funds prospectus or summary prospectus contains this and other important information about the FAM Value Fund and should be read carefully before you invest or send money. The principal risks of investing in the Funds are: stock market risk (stocks fluctuate in response to the activities of individual companies and to general stock market and economic conditions), stock selection risk (Fenimore utilizes a value approach to stock selection and there is risk that the stocks selected may not realize their intrinsic value, or their price may go down over time), and small-cap risk (prices of small-cap companies can fluctuate more than the stocks of larger companies and may not correspond to changes in the stock market in general). |
| To obtain a prospectus or summary prospectus and performance data that is current to the most recent month-end for each fund as well as other information on the FAM Value Fund, please go to famfunds.com or call (800) 932-3271. |
| This presentation was prepared by Fenimore Asset Management, Inc. (“Fenimore”). Neither this presentation nor any of its contents may be distributed or used for any other purpose without the prior written consent of Fenimore. |
| In part, the purpose of this presentation is to provide investors with an update on financial market conditions. The description of certain aspects of the market herein is a condensed summary only. This summary does not purport to be complete and no obligation to update or otherwise revise such information is being assumed. These materials are provided for informational purposes only and are not otherwise intended as an offer to sell, or the solicitation of an offer to purchase, any security or other financial instrument. This summary is not advice, a recommendation or an offer to enter into any transaction with Fenimore or any of their affiliated funds |
| This presentation may contain statements based on the current beliefs and expectations of Fenimore’s management and are subject to significant risks and uncertainties. Actual results may differ from those set forth in the forward-looking statements. |
| Any references herein to any of Fenimore’s past or present investments, portfolio characteristics, or performance, have been provided for illustrative purposes only. It should not be assumed that these investments were or will be profitable or that any future investments will be profitable or will equal the performance of these investments. There can be no guarantee that the investment objectives of Fenimore will be achieved. Any investment entails a risk of loss. Unless otherwise noted, information included herein is presented as of the date indicated on the cover page and may change at any time without notice. |
12
FAM Value Fund — Portfolio Data (Unaudited)
December 31, 2018
TOP TEN EQUITY HOLDINGS |
(% of Net Assets) | |
CDW Corp. | 6.1% |
Ross Stores | 5.9% |
IDEX Corp. | 5.3% |
Markel Corp. | 5.1% |
Brown & Brown | 4.7% |
Berkshire Hathaway, Inc. - Class A | 4.4% |
Brookfield Asset Management Inc. - Class A | 3.7% |
CarMax, Inc. | 3.4% |
AutoZone | 3.4% |
Illinois Tool Works, Inc. | 3.2% |
TOTAL NET ASSETS | $1,132,404,096 |
COMPOSITION OF NET ASSETS |
Machinery | 15.7% |
Specialty Retail | 12.7% |
Insurance | 10.8% |
Electronic Equipment, Instruments & Components | 9.2% |
Capital Markets | 6.5% |
Diversified Financial Services | 4.4% |
Banks | 4.3% |
Health Care Providers & Services | 3.5% |
Hotels, Restaurants & Leisure | 3.1% |
Life Sciences Tools & Services | 2.9% |
Oil, Gas & Consumable Fuels | 2.9% |
Health Care Equipment & Supplies | 2.6% |
Household Durables | 2.5% |
Chemicals | 2.5% |
Air Freight & Logistics | 1.9% |
Multi-Line Retail | 1.9% |
Road & Rail | 1.7% |
IT Services | 1.6% |
Containers & Packaging | 1.5% |
Semiconductors & Semiconductor Equipment | 1.3% |
Media | 0.5% |
Building Products | 0.5% |
Money Market Funds | 5.5% |
Statement Regarding Availability of Quarterly Portfolio Schedule. Please note that (i) the Fund files its complete schedule of portfolio holdings with the Securities and Exchange Commission as of the end of the first and third quarters of each fiscal year on Form N-Q; (ii) the Fund’s Forms N-Q are available on the Commission’s website at http://www.sec.gov; and (iii) the Fund makes the information on Form N-Q available to shareholders, upon request, by calling FAM Funds at 1-800-932-3271.
13
FAM Value Fund — Schedule of Investments
December 31, 2018
| | Shares | | | Value | |
COMMON STOCKS — 94.5% | | | | | | | | |
Air Freight & Logistics — 1.9% | | | | | | | | |
Forward Air Corporation | | | 389,233 | | | $ | 21,349,430 | |
Banks — 4.3% | | | | | | | | |
M&T Bank Corporation | | | 179,000 | | | | 25,620,270 | |
South State Corporation | | | 388,110 | | | | 23,267,194 | |
| | | | | | | | 48,887,464 | |
Building Products — 0.5% | | | | | | | | |
Fortune Brands Home & Security, Inc. | | | 147,000 | | | | 5,584,530 | |
Capital Markets — 6.5% | | | | | | | | |
Brookfield Asset Management, Inc. - Class A | | | 1,102,500 | | | | 42,280,875 | |
Franklin Resources, Inc. | | | 290,000 | | | | 8,601,400 | |
T. Rowe Price Group, Inc. | | | 239,500 | | | | 22,110,640 | |
| | | | | | | | 72,992,915 | |
Chemicals — 2.5% | | | | | | | | |
Air Products & Chemicals, Inc. | | | 175,500 | | | | 28,088,775 | |
Containers & Packaging — 1.5% | | | | | | | | |
Avery Dennison Corporation | | | 187,000 | | | | 16,798,210 | |
Diversified Financial Services — 4.4% | | | | | | | | |
Berkshire Hathaway, Inc. - Class A (a) | | | 163 | | | | 49,878,000 | |
Electronic Equipment, Instruments & Components — 9.2% | | | | | | | | |
CDW Corporation | | | 858,000 | | | | 69,540,900 | |
FLIR Systems, Inc. | | | 794,728 | | | | 34,602,457 | |
| | | | | | | | 104,143,357 | |
Health Care Equipment & Supplies — 2.6% | | | | | | | | |
Stryker Corporation | | | 191,000 | | | | 29,939,250 | |
See Notes to Financial Statements
14
FAM Value Fund — Schedule of Investments (continued)
December 31, 2018
| | SHARES | | | VALUE | |
COMMON STOCKS — 94.5% (continued) | | | | | | | | |
Health Care Providers & Services — 3.5% | | | | | | | | |
Henry Schein, Inc. (a) | | | 350,000 | | | $ | 27,482,000 | |
MEDNAX, Inc. (a) | | | 381,400 | | | | 12,586,200 | |
| | | | | | | | 40,068,200 | |
Hotels, Restaurants & Leisure — 3.1% | | | | | | | | |
Marriott International, Inc. - Class A | | | 113,800 | | | | 12,354,128 | |
Yum! Brands, Inc. | | | 245,600 | | | | 22,575,552 | |
| | | | | | | | 34,929,680 | |
Household Durables — 2.5% | | | | | | | | |
Mohawk Industries, Inc. (a) | | | 241,100 | | | | 28,199,056 | |
Insurance — 10.8% | | | | | | | | |
Brown & Brown, Inc. | | | 1,919,392 | | | | 52,898,443 | |
Markel Corporation (a) | | | 55,850 | | | | 57,975,092 | |
White Mountains Insurance Group Ltd. | | | 13,233 | | | | 11,349,812 | |
| | | | | | | | 122,223,347 | |
IT Services — 1.6% | | | | | | | | |
Black Knight, Inc. (a) | | | 406,711 | | | | 18,326,398 | |
Life Sciences Tools & Services — 2.9% | | | | | | | | |
Waters Corporation (a) | | | 171,702 | | | | 32,391,583 | |
Machinery — 15.7% | | | | | | | | |
Donaldson Company, Inc. | | | 755,400 | | | | 32,776,806 | |
Graco, Inc. | | | 716,650 | | | | 29,991,803 | |
IDEX Corporation | | | 476,750 | | | | 60,194,455 | |
Illinois Tool Works, Inc. | | | 289,950 | | | | 36,733,765 | |
Snap-on, Inc. | | | 127,000 | | | | 18,451,830 | |
| | | | | | | | 178,148,659 | |
See Notes to Financial Statements
15
FAM Value Fund — Schedule of Investments (continued)
December 31, 2018
| | SHARES | | | VALUE | |
COMMON STOCKS — 94.5% (continued) | | | | | | | | |
Media — 0.5% | | | | | | | | |
Interpublic Group of Companies, Inc. (The) | | | 300,000 | | | $ | 6,189,000 | |
Multi-Line Retail — 1.9% | | | | | | | | |
Dollar General Corporation | | | 196,300 | | | | 21,216,104 | |
Oil, Gas & Consumable Fuels — 2.9% | | | | | | | | |
EOG Resources, Inc. | | | 370,000 | | | | 32,267,700 | |
Road & Rail — 1.7% | | | | | | | | |
Landstar System, Inc. | | | 204,221 | | | | 19,537,823 | |
Semiconductors & Semiconductor Equipment — 1.3% | | | | | | | | |
Microchip Technology, Inc. | | | 203,000 | | | | 14,599,760 | |
Specialty Retail — 12.7% | | | | | | | | |
AutoZone, Inc. (a) | | | 45,700 | | | | 38,312,138 | |
CarMax, Inc. (a) | | | 615,000 | | | | 38,578,950 | |
Ross Stores, Inc. | | | 810,688 | | | | 67,449,242 | |
| | | | | | | | 144,340,330 | |
| | | | | | | | | |
Total Common Stocks (Cost $455,887,840) | | | | | | $ | 1,070,099,571 | |
See Notes to Financial Statements
16
FAM Value Fund — Schedule of Investments (continued)
December 31, 2018
| | SHARES | | | VALUE | |
MONEY MARKET FUND — 5.5% | | | | | | | | |
Invesco Short-Term Investments Trust - Treasury Portfolio - Institutional Shares, 2.30% (b) (Cost $62,181,640) | | | 62,181,640 | | | $ | 62,181,640 | |
| | | | | | | | | |
Investments in Securities at Value — 100.0% (Cost $518,069,480) | | | | | | $ | 1,132,281,211 | |
| | | | | | | | | |
Other Assets in Excess of Liabilities — 0.0% (c) | | | | | | | 122,885 | |
| | | | | | | | | |
Net Assets — 100.0% | | | | | | $ | 1,132,404,096 | |
(a) | Non-income producing security. |
(b) | The rate shown is the 7-day effective yield as of December 31, 2018. |
(c) | Percentage rounds to less than 0.1%. |
See Notes to Financial Statements
17
FAM Equity-Income Fund
December 31, 2018
Dear Fellow Equity-Income Fund Shareholder,
The Fund performed well in a turbulent market posting a slightly positive return of +0.06%. This result was considerably ahead of our benchmark the Russell Midcap Index, which fell -9.06% for the year. The Fund also performed better than the S&P 500 Index which declined -4.38% for the year.1 According to Morningstar, an industry-rating firm, 94% of all U.S. Equity Midcap funds posted negative returns for the year while only 6% earned returns above zero. We are pleased to be part of that 6%.2
We attribute the outperformance of the Fund relative to the Russell Midcap Index to three factors. Firstly, over the last few years, we exited positions that were disappointments rather than waiting for them to work out their problems in the hope of generating a higher return. This process of quickly getting out of poor performers and weaker holdings allowed us to concentrate more assets in names that had demonstrated the ability to compound capital. The result of this strategy was that more than 45% of the Fund’s holdings posted a positive return in the down market. Our batting average was even better for the largest holdings with seven out of the Top 10 Holdings posting positive results. This was due to the strength of the businesses in the portfolio and their ability to compound capital over time.
The second reason the Fund beat the benchmark, in our opinion, is our strategy of letting the “compounders” compound. This simply means resisting the temptation of trimming names in the portfolio when they perform well and grow to larger weightings in order to recycle the capital into names that may not be performing as well. In our minds, this is like cutting the flowers and watering the weeds. In theory, this sounds like a good strategy, but, in practice, our team believes it diminishes long-term returns. We define compounders as companies that have consistently performed well and have a long runway for growth. They also tend to earn high returns on invested capital.
Thirdly, two companies in the portfolio were acquired at significant premiums and the transactions closed in December. These acquisitions immediately added to performance, but also had the effect of insulating a small portion of the portfolio to the fourth quarter’s market gyrations.
The overarching strategy of the Fund is to invest in companies that pay a dividend and consistently increase that dividend over time. Every Fund holding pays a dividend and the majority grow that dividend every year. In fact, on average, the companies in the Fund have increased their dividends more than 10.6% compounded over the last five years (as of 12/31/18).3 We believe dividend growth is important because companies that are growing
2 | Morningstar.com, 12/31/18 |
3 | FactSet & Bloomberg, 12/31/18 |
18
FAM Equity-Income Fund
their cash flow are potentially able to consistently grow their dividends. We favor investing in businesses that are growing their dividends quickly because it usually means the underlying company is expanding. It also means that they are generating more cash than needed to reinvest back into the operation. These growing dividends contribute to the total return of the investment.
Portfolio Activity
There was considerable activity in the portfolio during the past year. The focus was on selling a few underperforming names that were disappointments where our team could not make the investment case that holding the names would be better than reinvesting that capital into higher quality names. We also replaced two companies that were acquired late in the year. Overall, it is our belief that the new portfolio holdings are of much higher quality than the positions we exited.
Purchases
We bought shares in Avery Dennison (AVY). Based on sales and market share, they are the leader in manufacturing pressure-sensitive labels. We were attracted to Avery because of their ability to grow over the business cycle and their remarkable consistency. During our due diligence, we learned how strong their competitive position is with 40% market share and how they can pass on higher prices to customers.4 This dynamic is rare. We were also impressed with the management team. We first started buying shares in the second quarter and added to the position throughout the year as the price fell.
Broadridge Financial Solutions (BR) was invested in during the fourth quarter after the price declined significantly from its peak. Broadridge offers a broad array of products serving financial services firms and public companies. Their flagship product is Proxy Edge which aggregates shareholder and voting information. The company has a long history of growth augmented by acquisition. It also has a significant base of recurring revenue. According to our estimates, Broadridge earns close to a 20% return on invested capital, has more than doubled their dividend over the last five years, and regularly buys back stock. We expect that financial firms could increasingly outsource many of their functions to companies such as Broadridge as complexity grows and the cost to maintain in-house systems increases.
We initiated a position in Forest City Realty Trust (FCE.A) in the first quarter after the stock sold off. The board concluded their strategic review process and decided that shareholder value would be better enhanced on a standalone basis rather than pursuing the sale of Forest at the price of received offers. Our valuation work indicated a significantly higher value than the price we paid for the initial position. A few months later, this proved correct as Forest accepted a higher acquisition price.
4 | Avery Dennison 2017 Annual Report |
19
FAM Equity-Income Fund
Our team also bought an initial position in International Flavors & Fragrances (IFF). IFF is a global manufacturer and supplier of flavor and fragrance ingredients that are used in a wide variety of consumer products. Their broad geographic footprint, defensive end markets, and diversified customer base support consistent financial results and a growing dividend. International Flavors recently completed the acquisition of Israeli-based competitor Frutarom, which led to a sell-off in their stock price as concerns emerged over the price of the transaction and the use of debt to partially fund the deal. We believe the acquisition better aligns International Flavors with changing consumer trends and the balance sheet concerns are very manageable. The sell-off presented us with an opportunity to start our initial position.
We bought shares in Watsco (WSO) – the largest HVAC distribution company in the U.S. They represent 1,000 manufacturers, serve their customer base of 80,000 contractors through 568 stores in 37 states, and carry more than 300,000 SKUs.5 Watsco’s locations are primarily in the Sun Belt states with the highest concentration of stores in Florida and Texas. We believe this is an attractive industry because every air conditioning unit the firm sells will ultimately break or wear out and need to be replaced. When units break, they are typically replaced immediately and customers are less price sensitive. The replacement cycle of Watsco’s growing installed base increases the profitability of each store and their operation is driven primarily by replacement of existing units. In fact, replacement sales make up 85% of industry revenue.
We took a small position in Marriott International (MAR) after the company disclosed a data breach that sent the stock lower to nearly 25% below its 52-week high. Marriott has more than doubled their dividend over the last five years.6 We believe this hotel chain is a premier lodging franchise and expect to build a larger position over time.
In addition to new holdings, our team put capital to work by adding to existing names including Digital Realty Trust (DLR), Ingersoll Rand (IR), M&T Bank (MTB), Snap-on (SNA), Versum Materials (VSM), Ross Stores (ROST), Robert Half International (RHI), and US Ecology (ECOL). The sell-off in the market at year-end gave us a good opportunity to buy shares in these companies at what we estimated to be attractive prices.
Sales
Interpublic Group of Companies (IPG) was sold from the portfolio because we believe the advertising market is shifting more in favor of online firms such as Google and Facebook. This puts Interpublic Group at a disadvantage that could increase over time. We were able to get a good price for our shares before the market turned down.
5 | Watsco 2017 Annual Report |
6 | FactSet & Bloomberg, 12/31/18 |
20
FAM Equity-Income Fund
We exited a long-term holding, Flowers Foods (FLO), at a price approximately 49% above the low set in September of 2016. This was a case where we wanted to move on from the holding 18 months earlier, but estimated we could get a higher price for our shares by just waiting. The return from the low point was double the market return. The moral of the story, in this case, is that patience pays.
Fast food restaurant company, Sonic Corp. (SONC), is no longer held in the portfolio after it was acquired for cash. Sonic was sold at a 21% premium over the previous 30-day trading range.7 The transaction closed on December 6.
Forest City Realty Trust (FCE.A) was also acquired for cash by Brookfield Asset Management. We only held this position for a few months before the transaction was announced and the price represented a premium of 26% over the previous closing price.7
We sold our position in Patterson Companies (PDCO) after a long string of missteps by management. Patterson was one of the premier companies in the distribution of dental products, but poor management allowed their strong position to be competed away. The business struggled as the market slowed and price inflation disappeared. This meant that pricing pressure could have a more pronounced impact on earnings growth.
Macquarie Infrastructure (MIC) was sold from the portfolio as well. When we initially invested in Macquarie, we liked the assets they held – petrochemical storage tanks, general aviation operations, power generation, and a gas utility – and believed management had a growing track record of creating value through additional acquisitions. However, Macquarie announced a softening in their storage tank business in February 2018 and we had viewed this as their most stable segment. In our view, the fundamental deterioration was swift and, given the immediate capital needs this created, it led them to substantially cut their dividend.8 Our team determined the financial profile no longer fit FAM Funds’ criteria and exited the entire position.
In addition to exiting positions, we trimmed US Ecology (ECOL) due to its strong performance over the last 12 months and high valuation. Their business tends to be lumpy, so we expect to be able to buy those shares back at a lower price in the future. We also trimmed Franklin Resources (BEN) because we believed it was an inferior holding.
Closing Thoughts
Our team is optimistic over the long term and believes the Fund’s holdings should be able to continue their growth leading to higher dividends to shareholders. In short, the “compounders” should continue to compound. In the near term, however, the picture is murkier and the market could exhibit more turbulence. While this may be uncomfortable for
8 | FactSet & Bloomberg, 12/31/18 |
21
FAM Equity-Income Fund
many investors, it has historically provided the Fund with great purchasing opportunities. We have cash at the ready to potentially invest in more great companies or add to existing holdings when opportunities arise.
As always, we will continue to work diligently on your behalf. Thank you for investing with us in the FAM Equity Income Fund.
Best & Worst Performers for 2018
Best Performers | Worst Performers |
CDW Corp. | 1.13% | South State Corp. | -0.85% |
Sonic Corp. | 1.12% | Patterson Companies | -0.74% |
Xilinx | 0.96% | Microchip Technology | -0.69% |
Arthur J. Gallagher & Co. | 0.92% | Macquarie Infrastructure | -0.65% |
US Ecology | 0.78% | EOG Resources | -0.65% |
This reflects the FAM Value Fund’s best and worst performers, in descending order, based on individual stock performance. Past performance does not indicate future results.
Performance (as of 12/31/18)
| | 1-Year | 3-Year | 5-Year | 10-Year | Since Inception 4/1/1996 |
FAM Equity-Income Fund | 0.06% | 11.07% | 7.97% | 12.41% | 8.59% |
Russell Midcap Index | -9.06% | 7.04% | 6.26% | 14.03% | 9.63% |
S&P 500 Index | -4.38% | 9.26% | 8.49% | 13.12% | 8.17% |
Past performance does not indicate future results.

|  |
Paul Hogan, CFA
Co-Manager | Thomas O. Putnam
Co-Manager |
The opinions expressed herein are those of the portfolio managers as of the date of the report and are subject to change. There is no guarantee that any forecast made will come to pass. This material does not constitute investment advice and is not intended as an endorsement of any specific investment.
22
FAM Equity-Income Fund
Performance data quoted above is historical. Past performance is no guarantee of future results. Current performance may be higher or lower than the performance data quoted. The principal value and investment return of an investment will fluctuate so that your shares, when redeemed, may be worth more or less than their original cost.
23
FAM Equity-Income Fund — Performance Summary (Unaudited)
Annual Total Investment Returns:
APRIL 1, 1996 TO DECEMBER 31, 2018 |
| | FAM EQUITY-INCOME FUND | RUSSELL MIDCAP INDEX | S&P 500 INDEX |
FISCAL YEAR | TOTAL RETURN | TOTAL RETURN | TOTAL RETURN |
4/1/96-12/31/96 | 11.84% | 12.00% | 15.20% |
1997 | 26.90% | 29.01% | 33.35% |
1998 | 4.67% | 10.09% | 28.58% |
1999 | -6.98% | 18.23% | 21.04% |
2000 | 17.18% | 8.25% | -9.10% |
2001 | 20.79% | -5.62% | -11.88% |
2002 | -2.25% | -16.19% | -22.09% |
2003 | 20.30% | 40.06% | 28.67% |
2004 | 14.04% | 20.22% | 10.88% |
2005 | 5.75% | 12.65% | 4.91% |
2006 | 6.57% | 15.26% | 15.79% |
2007 | -3.64% | 5.60% | 5.49% |
2008 | -29.04% | -41.46% | -37.00% |
2009 | 21.43% | 40.48% | 26.46% |
2010 | 17.47% | 25.48% | 14.76% |
2011 | 6.79% | -1.55% | 2.11% |
2012 | 11.02% | 17.28% | 16.00% |
2013 | 29.79% | 34.76% | 32.44% |
2014 | 7.85% | 13.22% | 13.69% |
2015 | -0.73% | -2.44% | 1.38% |
2016 | 21.59% | 13.80% | 11.96% |
2017 | 12.64% | 18.52% | 21.83% |
2018 | 0.06% | -9.06% | -4.38% |
24
FAM Equity-Income Fund — Performance Summary (Unaudited)
The chart below depicts the change in value of a $10,000 investment in the FAM Equity-Income Fund since inception on April 1, 1996, as compared with the growth of the Russell Midcap Index, the Fund’s primary benchmark index, and the Standard and Poor’s 500 Index, an additional comparative index, during the same period. The information assumes reinvestment of dividends and capital gain distributions. The Russell Midcap Index is an unmanaged index generally representative of the market for the stocks of mid-size U.S. companies. The Standard and Poor’s 500 Index is an unmanaged index generally representative of the market for the stocks of large size U.S. companies. Investors cannot invest directly in an index.
COMPARISON OF CHANGE IN VALUE OF $10,000 INVESTMENT IN FAM EQUITY-INCOME FUND,
THE RUSSELL MIDCAP INDEX AND THE S&P 500 INDEX

This information represents past performance of the FAM Equity-Income Fund and is not indicative of future results. The investment return and the principal value of an investment will fluctuate so that an investor’s shares, when redeemed, may be worth more or less than the original cost.
25
FAM Equity-Income Fund — Performance Summary (Unaudited)
AVERAGE ANNUAL TOTAL RETURNS AS OF DECEMBER 31, 2018
The performance data quoted represents past performance.
| | 1 YEAR | 3 YEAR | 5 YEAR | 10 YEAR | SINCE INCEPTION | TOTAL FUND OPERATING EXPENSES* |
FAM Equity-Income Fund (4/1/96) | 0.06% | 11.07% | 7.97% | 12.41% | 8.59% | 1.26%* |
Russell Midcap Index | -9.06% | 7.04% | 6.26% | 14.03% | 9.63% | N/A |
S&P 500 Index | -4.38% | 9.26% | 8.49% | 13.12% | 8.17% | N/A |
* | Disclosure: The Fund’s total annual operating expense ratio as stated in the fee table of the Fund’s most recent prospectus is 1.26%. The total operating expense as reported in the FAM Equity-Income Fund’s audited financial statements as of 12/31/17 is 1.25%. The Advisor has contractually agreed, until May 1, 2019, to waive fees and/or reimburse the Fund certain expenses (excluding interest, taxes, brokerage costs, Acquired Fund Fees and Expenses, dividend expense and extraordinary expenses) to the extent necessary to maintain Net Fund Operating Expenses for Investor Shares at 1.26%. |
| Past performance is not indicative of future results, current performance may be lower or higher than the performance date quoted. Investment returns may fluctuate; the value of your investment upon redemption may be more or less than the initial amount invested. |
| Please consider a fund’s investment objectives, risks, charges and expenses carefully before investing. The FAM Funds prospectus or summary prospectus contains this and other important information about the FAM Equity-Income Fund and should be read carefully before you invest or send money. The principal risks of investing in the Funds are: stock market risk (stocks fluctuate in response to the activities of individual companies and to general stock market and economic conditions), stock selection risk (Fenimore utilizes a value approach to stock selection and there is risk that the stocks selected may not realize their intrinsic value, or their price may go down over time), and small-cap risk (prices of small-cap companies can fluctuate more than the stocks of larger companies and may not correspond to changes in the stock market in general). |
| To obtain a prospectus or summary prospectus and performance data that is current to the most recent month-end for each fund as well as other information on the FAM Equity-Income Fund, please go to famfunds.com or call (800) 932-3271. |
| This presentation was prepared by Fenimore Asset Management, Inc. (“Fenimore”). Neither this presentation nor any of its contents may be distributed or used for any other purpose without the prior written consent of Fenimore. |
| In part, the purpose of this presentation is to provide investors with an update on financial market conditions. The description of certain aspects of the market herein is a condensed summary only. This summary does not purport to be complete and no obligation to update or otherwise revise such information is being assumed. These materials are provided for informational purposes only and are not otherwise intended as an offer to sell, or the solicitation of an offer to purchase, any security or other financial instrument. This summary is not advice, a recommendation or an offer to enter into any transaction with Fenimore or any of their affiliated funds |
| This presentation may contain statements based on the current beliefs and expectations of Fenimore’s management and are subject to significant risks and uncertainties. Actual results may differ from those set forth in the forward-looking statements. |
| Any references herein to any of Fenimore’s past or present investments, portfolio characteristics, or performance, have been provided for illustrative purposes only. It should not be assumed that these investments were or will be profitable or that any future investments will be profitable or will equal the performance of these investments. There can be no guarantee that the investment objectives of Fenimore will be achieved. Any investment entails a risk of loss. Unless otherwise noted, information included herein is presented as of the date indicated on the cover page and may change at any time without notice. |
26
FAM Equity-Income Fund — Portfolio Data (Unaudited)
December 31, 2018
TOP TEN EQUITY HOLDINGS |
(% of Net Assets) | |
CDW Corp. | 7.3% |
Air Products & Chemicals | 5.8% |
Arthur J. Gallagher & Co. | 5.6% |
Stryker Corp. | 5.6% |
Ross Stores | 5.1% |
Ingersoll Rand | 4.3% |
Xilinx, Inc. | 4.3% |
AveryDennison Corp. | 4.0% |
Digital Realty Trust | 3.9% |
Microchip Technology | 3.5% |
TOTAL NET ASSETS | $240,545,373 |
COMPOSITION OF NET ASSETS |
Machinery | 11.3% |
Semiconductors & Semiconductor Equipment | 9.7% |
Electronic Equipment, Instruments & Components | 9.6% |
Specialty Retail | 9.0% |
Money Market Funds | 8.6% |
Chemicals | 7.5% |
Banks | 6.0% |
Insurance | 5.6% |
Health Care Equipment & Supplies | 5.6% |
Containers & Packaging | 4.0% |
Equity Real Estate Investment Trusts (REITs) | 3.9% |
Oil, Gas & Consumable Fuels | 2.8% |
Water Utilities | 2.7% |
Professional Services | 2.6% |
IT Services | 2.4% |
Capital Markets | 2.3% |
Commercial Services & Supplies | 1.9% |
Food Products | 1.5% |
Trading Companies & Distributors | 1.4% |
Hotels, Restaurants & Leisure | 1.0% |
Other | 0.6% |
Statement Regarding Availability of Quarterly Portfolio Schedule. Please note that (i) the Fund files its complete schedule of portfolio holdings with the Securities and Exchange Commission as of the end of the first and third quarters of each fiscal year on Form N-Q; (ii) the Fund’s Forms N-Q are available on the Commission’s website at http://www.sec.gov; and (iii) the Fund makes the information on Form N-Q available to shareholders, upon request, by calling FAM Funds at 1-800-932-3271.
27
FAM Equity-Income Fund — Schedule of Investments
December 31, 2018
| | SHARES | | | VALUE | |
COMMON STOCKS — 90.8% | | | | | | | | |
Banks — 6.0% | | | | | | | | |
M&T Bank Corporation | | | 47,000 | | | $ | 6,727,110 | |
South State Corporation | | | 88,000 | | | | 5,275,600 | |
Stock Yards Bancorp, Inc. | | | 70,664 | | | | 2,317,779 | |
| | | | | | | | 14,320,489 | |
Capital Markets — 2.3% | | | | | | | | |
Franklin Resources, Inc. | | | 33,900 | | | | 1,005,474 | |
T. Rowe Price Group, Inc. | | | 48,000 | | | | 4,431,360 | |
| | | | | | | | 5,436,834 | |
Chemicals — 7.5% | | | | | | | | |
Air Products & Chemicals, Inc. | | | 87,000 | | | | 13,924,350 | |
International Flavors & Fragrances, Inc. | | | 30,000 | | | | 4,028,100 | |
| | | | | | | | 17,952,450 | |
Commercial Services & Supplies — 1.9% | | | | | | | | |
US Ecology, Inc. | | | 71,647 | | | | 4,512,328 | |
Containers & Packaging — 4.0% | | | | | | | | |
Avery Dennison Corporation | | | 108,000 | | | | 9,701,640 | |
Electronic Equipment, Instruments & Components — 9.6% | | | | | | | | |
CDW Corporation | | | 217,000 | | | | 17,587,850 | |
National Instruments Corporation | | | 122,000 | | | | 5,536,360 | |
| | | | | | | | 23,124,210 | |
Equity Real Estate Investment Trusts (REITs) - 3.9% | | | | | | | | |
Digital Realty Trust, Inc. | | | 89,000 | | | | 9,482,950 | |
Food Products — 1.5% | | | | | | | | |
McCormick & Company, Inc. | | | 26,000 | | | | 3,620,240 | |
Health Care Equipment & Supplies — 5.6% | | | | | | | | |
Stryker Corporation | | | 85,500 | | | | 13,402,125 | |
See Notes to Financial Statements
28
FAM Equity-Income Fund — Schedule of Investments (continued)
December 31, 2018
| | SHARES | | | VALUE | |
COMMON STOCKS — 90.8% (continued) | | | | | | | | |
Hotels, Restaurants & Leisure — 1.0% | | | | | | | | |
Marriott International, Inc. - Class A | | | 22,000 | | | $ | 2,388,320 | |
Insurance — 5.6% | | | | | | | | |
Arthur J. Gallagher & Company | | | 183,920 | | | | 13,554,904 | |
IT Services — 2.4% | | | | | | | | |
Broadridge Financial Solutions, Inc. | | | 60,000 | | | | 5,775,000 | |
Machinery — 11.3% | | | | | | | | |
Donaldson Company, Inc. | | | 91,600 | | | | 3,974,524 | |
IDEX Corporation | | | 62,984 | | | | 7,952,360 | |
Ingersoll-Rand plc | | | 114,000 | | | | 10,400,220 | |
Snap-on, Inc. | | | 33,700 | | | | 4,896,273 | |
| | | | | | | | 27,223,377 | |
Oil, Gas & Consumable Fuels — 2.8% | | | | | | | | |
EOG Resources, Inc. | | | 78,000 | | | | 6,802,380 | |
Professional Services — 2.6% | | | | | | | | |
Robert Half International, Inc. | | | 110,000 | | | | 6,292,000 | |
Semiconductors & Semiconductor Equipment — 9.7% | | | | | | | | |
Microchip Technology, Inc. | | | 117,000 | | | | 8,414,640 | |
Versum Materials, Inc. | | | 165,710 | | | | 4,593,481 | |
Xilinx, Inc. | | | 120,414 | | | | 10,255,661 | |
| | | | | | | | 23,263,782 | |
See Notes to Financial Statements
29
FAM Equity-Income Fund — Schedule of Investments (continued)
December 31, 2018
| | SHARES | | | VALUE | |
COMMON STOCKS — 90.8% (continued) | | | | | | | | |
Specialty Retail — 9.0% | | | | | | | | |
Monro, Inc. | | | 96,000 | | | $ | 6,600,000 | |
Penske Automotive Group, Inc. | | | 70,000 | | | | 2,822,400 | |
Ross Stores, Inc. | | | 147,686 | | | | 12,287,475 | |
| | | | | | | | 21,709,875 | |
Trading Companies & Distributors — 1.4% | | | | | | | | |
Watsco, Inc. | | | 24,000 | | | | 3,339,360 | |
Water Utilities — 2.7% | | | | | | | | |
Aqua America, Inc. | | | 190,750 | | | | 6,521,742 | |
| | | | | | | | | |
Total Common Stocks (Cost $128,015,087) | | | | | | $ | 218,424,006 | |
MONEY MARKET FUND — 8.6% | | | | | | | | |
Invesco Short-Term Investments Trust - Treasury Portfolio - Institutional Shares, 2.30% (a) (Cost $20,727,438) | | | 20,727,438 | | | | 20,727,438 | |
| | | | | | | | | |
Investments in Securities at Value — 99.4% (Cost $148,742,525) | | | | | | | 239,151,444 | |
| | | | | | | | | |
Other Assets in Excess of Liabilities — 0.6% | | | | | | | 1,393,929 | |
| | | | | | | | | |
Net Assets — 100.0% | | | | | | $ | 240,545,373 | |
(a) | The rate shown is the 7-day effective yield as of December 31, 2018. |
See Notes to Financial Statements
30
FAM Small Cap Fund
December 31, 2018
Dear Fellow Small Cap Fund Shareholder,
Clearly, the past few months have been volatile with concern about a slowing economy spreading among many investors. As investors turned from optimism to pessimism, the Russell 2000 Index (the primary index for small, publicly traded U.S. companies) at its August 31 peak was up 14.3% year-to-date before falling to end the year down -11.01%.1 We are studying various economic and political concerns, especially the setting of new trade rules and tariffs, inflation (both labor and materials), and falling optimism (which potentially creates a self-fulfilling prophecy). Our team is also assessing the risk that the Federal Reserve may accidentally raise interest rates too high, thus stemming growth rates. So far, our conclusion is that while these issues are quite real – we see many companies reporting slower growth and thinner profit margins – it remains unclear if they are severe enough to trigger a recession, as some may fear, or justify the 25.31% drop in small-cap stock prices.2
The impact of these issues differs at every business our team follows. At one extreme, a firm might rely on a Chinese-centered supply chain now facing tariffs, suffer through higher trucking costs, and face a step up in government mandated minimum wage rates while having little ability to raise prices. At the other extreme, some businesses do not encounter many of these issues. For example, consider enterprises that hire experts and resell their advice, such as in real estate brokerage or accounting services. While they too would be impacted by a recession if it occurs, they do not import goods, use trucks to move anything, or hire many minimum-wage employees. Plus, they have some ability to raise prices to reflect their higher costs. Much of our time is devoted to studying various industries and companies to better ascertain the impact of these new realities.
Meanwhile, there are reasons to be optimistic. Many of the problems facing us will likely be resolved. For instance, the U.S. and China may eventually strike a trade agreement with lower tariffs. Furthermore, the longer this uncertainty goes on, the more firms move sourcing to places such as Mexico, India, or Vietnam to avoid the China tariffs. Additionally, the Federal Reserve may decide that conditions no longer warrant further interest rate increases. It is quite possible that a year from now many of these issues may have passed. Humans certainly have their shortcomings, but they excel at adaptation.
In volatile days such as these, it is worth reiterating what our investment research analysts are striving to accomplish. Most of our shareholders have longer-term goals they wish to achieve – saving for retirement, funding college educations, providing for the care of a disabled child, or the like. However, it is a virtual certainty that while saving for these big
2 | Bloomberg, 12/31/18: from the intra-day high on 8/31/18 to the 12/31/18 close |
31
FAM Small Cap Fund
goals in life, we will see a tremendous variety of macro environments and swings in investor sentiment. Additionally, the shifts from extremes are essentially unpredictable; however, this is nothing new.
In just the past 20 years, we have seen: the devaluation of several emerging market currencies in 1998 (and a debt default by Russia); a massive bubble in technology stocks in the late 1990s; a recession in 2001; the horrific events of 9/11; a slew of accounting scandals in the early 2000s; a rash of hurricanes including Katrina; a housing bubble; the Great Recession of 2008-2009; unemployment touching 10% in October 2009 and frustratingly slow growth in the years after; struggles in Greece (and Portugal, Spain, Italy, etc.) so severe the European Union almost unwound; and a collection of various epidemics and government shutdowns – and this is only a partial list.3 Despite all these events, the Russell 2000 Index compounded at 7.40% per annum in the past 20 years as of December 31, 2018. What this means is that $100 invested 20 years ago is now worth approximately $417 (this assumes all dividends and capital gains were reinvested).4
Our goal for your capital and ours, as we too are investors in the Fund, is to find about 25 to 30 of what we deem to be the best businesses possible. Enterprises that have some advantage over competitors which, when combined with strong management, should allow them to be much larger in 5 to 10 years. This may involve grinding through challenging economic or political climates along the way.
Not only that, we wish to buy our shares “on the cheap” – at a discount to what a rational competitor or private equity firm would pay for the entire company. This is where the swings in investor sentiment pay off. When investors are overly optimistic, seeing nothing but opportunity on the horizon, prices tend to be so expensive as to make future returns unimpressive. However, good times are difficult to sustain. Eventually, conditions change and anxiety typically returns. When most investors are fearful, this is the time for value investors such as us to scoop up bargains. Sooner or later, the skies clear and optimism reappears – and the never-ending cycle continues. While our team tends to benefit from knowing companies well, our true advantage is the ability to be less emotional than the average investor.
In the short term, stock prices are unquestionably driven by emotions, but over the long term they are typically more rational and driven primarily by earnings growth. Specifically, in our small-cap universe, if a profitable, growing enterprise is ignored by investors for too long, then a larger competitor or private investor often buys the entire operation. This is one of the underpinnings of our long-term enthusiasm for investing in smaller companies.
3 | Wikipedia, 12/31/18 (our predecessors faced the same reality with 24 recessions in the 19th century) |
4 | Cumulative performance of a hypothetical $100 investment in the Russell 2000 Index. The returns do not reflect the payment of any brokerage commissions or brokerage costs incurred as a result of buying or selling Russell 2000 Index fund shares or trading shares on an exchange and do not reflect the deduction of taxes to which an investor would be subject as a result of owning or selling shares of a fund. If they did, the returns would be lower than those shown. |
32
FAM Small Cap Fund
We have successfully assembled a collection of high-quality businesses from our viewpoint. Each seems to have the potential and necessary leadership to grow profits considerably over time under our most reasonable assumptions. Perhaps more importantly, after several years of struggle to find attractively priced opportunities, today’s bargains are more prevalent. In our opinion, many of the Fund’s holdings trade at a considerable discount to the price a knowledgeable, private, cash buyer would offer for the whole company.
Portfolio Activity
Earlier this year, we struggled to find interesting investment opportunities, but as prices declined our team put quite a bit of capital to work. This is demonstrated in our cash balances, which are essentially a residual of our efforts to find interesting opportunities. The Fund entered the year with only 5.3% in cash, but as prices rose bargains were difficult to find. Cash reached 11.5% by September 30. However, with the recent price declines, we found additional attractive investments. The cash balance declined to 2.4% by year-end. During 2018, we initiated four new positions and exited six.
Three of our purchases and sales were really “swaps” where, in our opinion, our team sold admirable, well-run companies only because we found an even more attractive opportunity in a similar business. In the first case, we sold our shares in Evolution Petroleum (EPM) after concluding that Matador Resources (MTDR) was an even better investment opportunity. Similarly, we sold real estate owner Consolidated-Tomoka Land Co. (CTO) and invested in real estate service provider/broker Colliers International Group (CIGI). Finally, we sold our shares in value manager Westwood Holdings Group (WHG) while adding to our existing position in Diamond Hill Investment Group (DHIL).
Purchases
Matador Resources (MTDR) is a domestic energy firm, primarily focused on finding oil in southeast New Mexico and West Texas. Two things separate Matador from the dozens of other small-cap energy businesses, in our opinion. Firstly, they are good operators, routinely drilling good wells at solid economics. Secondly, although harder to define but definitely important, their culture is excellent in our view. This shows up several ways, but is best highlighted by their contrarian approach to capital allocation. Management has a long history of smart moves such as buying reserves when prices are low, selling most of their natural gas operations when prices were near a peak, and leveraging their own oil assets to develop a valuable pipeline serving themselves and neighboring competitors.
Colliers International Group (CIGI) is a global real estate services company offering everything from building management and lease negotiations to valuation services and brokering the sales of buildings. While the business could undoubtedly remain cyclical, it is a growing, profitable corporation in a prosperous industry where all the major players tend to do well. What makes Colliers particularly interesting, from our viewpoint, is its sharp leadership that allows for both organic growth and smart bolt-on acquisitions of smaller peers at attractive returns on capital.
33
FAM Small Cap Fund
Natus Medical (BABY) was added to the portfolio in the second quarter. Natus is a medical instrument/device firm with impressive franchises in newborn care (e.g., newborn hearing), neurology (e.g., sleep diagnostics), and audiology (e.g., hearing aid tuning). However, Natus stumbled recently, the largest factor being unexpected difficulty integrating an acquisition. We believe these challenges should abate, leading to a rebound in profitability. Some of our best purchases have come from a good business faltering temporarily and we believe Natus falls into this category.
In the fourth quarter, we began buying shares in Frontdoor (FTDR), the leading U.S. home warranty provider, recently spun off from its former parent company (ServiceMaster). We believe Frontdoor was already attractively priced after the spinoff. Investors in ServiceMaster received shares, but most had little interest in holding a small company such as Frontdoor and thus sold quickly. Unfortunately, the stock fell even further after they disappointed investors with a poor third quarter report. Our team continued to add to the position at these lower prices. Our assessment is that Frontdoor is already a good business with a history of impressive growth, the best profit margins in the industry, and strong free cash flow while trading at what we estimate to be a cheap price. That alone can lead us to a nice outcome. However, Frontdoor has the potential to be much larger if new CEO Rex Tibbens (formerly Chief Operating Officer at Lyft) can successfully lead them into the “on-demand” side of home repair. It is an imaginable future where consumers simply use a phone to order a home repair from one of Frontdoor’s 45,000 independent technicians.
Sales
As mentioned, we sold our shares in Evolution Petroleum (EPM), Consolidated-Tomoka Land Co. (CTO), and Westwood Holdings Group (WHG).
We exited our position in Lindsay Corp. (LNN) after a nice gain. Lindsay’s primary business is selling agricultural irrigation equipment under the Zimmatic brand name. Despite virtually no change in commodity prices or demand from farmers, Lindsay’s share price rose approximately 50% over the two years the stock was held. As a result, our team decided that the smart move was to sell, but we remain fans and, at the right price, could reestablish a position.
Mistras Group (MG) was sold early in the year. Mistras provides testing and related services to a few industries – particularly refineries and petrochemical plants. Those customers reduced their demand for services when oil prices began falling in late 2014 and Mistras’ share price fell as well. After years of watching Mistras and its competitor (Team, Inc.), we thought there was finally an opportunity. We started buying shares shortly thereafter with the theory that this was a good enterprise facing a difficult environment that could revert to normal in time. Yet, as oil prices began to rebound off their early 2016 bottom, demand for Mistras’ services improved only modestly. Clearly, something seems to have changed in the industry dynamic and, despite our best efforts, we were unable to fully comprehend the changes. Our team decided to exit the position, but happily generated a small positive return.
34
FAM Small Cap Fund
In September, Sonic Corp. (SONC) announced their sale to Inspire Brands (the private owner of chains such as Arby’s and Buffalo Wild Wings) for $43.50 per share in cash. This capped off a wonderful investment for us. We initially purchased shares in early 2017 after Sonic and most of their peers struggled, primarily due to an increase in competitive intensity. Believing that the condition was temporary, we purchased shares at a nice discount to what we thought Sonic was truly worth. Thankfully, results improved and Inspire was kind enough to prove us right on the valuation.
In addition to new ideas and outright sales, we often expand and trim existing positions as warranted. Our largest moves were additions to two of our bank holdings – Pinnacle Financial Partners (PNFP) and South State Corp. (SSB) – late in the year as bank stocks sold off. We also made a sizable reduction in US Ecology (ECOL), a hazardous waste disposal operation.
Closing Thoughts
As mentioned earlier, after a solid start to the year, stock prices declined in the final four months. It was certainly disappointing to be down in 2018, but we were pleased to outperform the Russell 2000 Index. Within this environment, “growth” investors dramatically outperformed us “value” investors in both 2017 and 2018. Much of this was driven by the healthcare sector, which includes many unprofitable businesses with big dreams that we consider to be much too speculative. A few may succeed, but many could fail.
As the saying goes, the only constant is change. The economic and political backdrop in which we invest is always shifting. While the specific events of the day might be surprising, we are never surprised to find conditions changing. It is because of this that FAM Funds favors enterprises that we estimate can do well and grow in a wide variety of scenarios. We believe that we have a nice collection of solid companies within the portfolio and that they could achieve healthy, long-term returns from current, reasonably attractive valuation levels.
As always, we are grateful for the trust you have put in us. It is an honor we do not take lightly.
35
FAM Small Cap Fund
Best & Worst Performers for 2018
Best Performers | Worst Performers |
Sonic Corp. | 2.57% | Multi-Color Corp. | -3.00% |
CBIZ | 1.35% | Carriage Services | -2.07% |
US Ecology | 1.11% | Hostess Brands | -1.44% |
Monro | 1.11% | Frontdoor | -1.38% |
AngioDynamics | 0.83% | Matador Resources | -1.38% |
This reflects the FAM Value Fund’s best and worst performers, in descending order, based on individual stock performance. Past performance does not indicate future results.
Performance (as of 12/31/18)
| | 1-Year | 3-Year | 5-Year | Since Inception 3/1/2012 |
FAM Small Cap Fund Investor Shares | -9.37% | 5.58% | 3.70% | 9.49% |
Russell 2000 Index | -11.01% | 7.36% | 4.41% | 9.14% |
S&P 500 Index | -4.38% | 9.26% | 8.49% | 11.50% |
Past performance does not indicate future results.

|  |
Andrew F. Boord
Co-Manager | Thomas O. Putnam
Co-Manager |
The opinions expressed herein are those of the portfolio managers as of the date of the report and are subject to change. There is no guarantee that any forecast made will come to pass. This material does not constitute investment advice and is not intended as an endorsement of any specific investment.
Performance data quoted above is historical. Past performance is no guarantee of future results. Current performance may be higher or lower than the performance data quoted. The principal value and investment return of an investment will fluctuate so that your shares, when redeemed, may be worth more or less than their original cost.
36
FAM Small Cap Fund — Performance Summary (Unaudited)
Annual Total Investment Returns:
MARCH 1, 2012 TO DECEMBER 31, 2018 |
| | FAM SMALL CAP FUND | RUSSELL 2000 INDEX | S&P 500 INDEX |
FISCAL YEAR | TOTAL RETURN* | TOTAL RETURN | TOTAL RETURN |
3/1/12-12/31/12** | 12.45%*** | 16.35%**** | 16.00%**** |
2013 | 40.49% | 38.82% | 32.44% |
2014 | 5.58% | 4.89% | 13.69% |
2015 | -3.49% | -4.41% | 1.38% |
2016 | 24.21% | 21.31% | 11.96% |
2017 | 4.55% | 14.65% | 21.83% |
2018 | -9.37% | -11.01% | -4.38% |
* | The performance results shown are for the Investor Shares of the Fund. The Fund also offers Institutional Shares, which commenced operations on January 1, 2016, and therefore have a limited performance history. Because of differences in the level of fees paid by the Investor Shares and the Institutional Shares, performance results for each share class will differ. |
** | Commenced operations 3/1/2012 |
*** | Annualized since inception date 3/1/2012 |
37
FAM Small Cap Fund — Performance Summary (Unaudited)
The chart below depicts the change in the value of a $10,000 investment in the Investor Shares of the FAM Small Cap Fund, since inception on March 1, 2012 as compared with the growth of the Russell 2000 Index and the Standard & Poor’s 500 Index during the same period. The information assumes reinvestment of dividends and capital gain distributions. The Russell 2000 Index, the Fund’s primary benchmark, is an unmanaged index generally representative of the market for the stocks of smaller size U.S. companies. The Standard & Poor’s 500 Index is an unmanaged index generally representative of the market for the stocks of large size U.S. companies. Investors cannot invest directly in an index.
COMPARISON OF CHANGE IN VALUE OF $10,000 INVESTMENT IN
FAM SMALL CAP FUND, THE RUSSELL 2000 INDEX AND THE S&P 500 INDEX
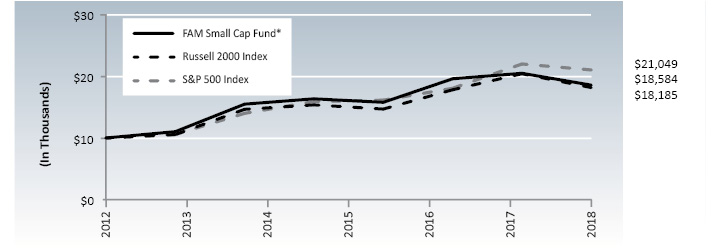
This information represents past performance of the FAM Small Cap Fund and is not indicative of future results. The investment return and the principal value of an investment will fluctuate so that an investor’s shares, when redeemed, may be worth more or less than the original cost.
38
FAM Small Cap Fund — Performance Summary (Unaudited)
AVERAGE ANNUAL TOTAL RETURNS AS OF DECEMBER 31, 2018
The performance data quoted represents past performance.
| | 1 Year | 3 Year | 5 Year | Since Inception | Total Fund
Operating
Expenses* |
| FAM SMALL CAP FUNDInvestor Class (3/1/12) | -9.37% | 5.58% | 3.70% | 9.49% | 1.34%* |
| Institutional Class (1/1/16) | -9.29% | 5.71% | N/A | 5.71% | 1.21%* |
| Russell 2000 Index | -11.01% | 7.36% | 4.41% | 9.14% | N/A |
| S&P 500 Index | -4.38% | 9.26% | 8.49% | 11.50% | N/A |
* | Disclosure: The Fund’s total annual operating expense ratio as stated in the fee table of the Fund’s most recent prospectus is 1.34% for the Investor Class. The Fund’s total annual operating expense ratio as stated in the fee table of the Fund’s most recent prospectus is 1.21% after fee waivers of (0.02)% for the Institutional Class. When excluding Acquired Funds Fees and Expenses, which are not direct costs paid by the Fund’s shareholders and fee waivers, the total annual operating expense as reported in the FAM Small Cap Fund’s audited financial statements as of 12/31/17 Investor Class is 1.30% and Institutional Class is 1.20% as of 12/31/17. The Advisor has contractually agreed, until May 1, 2019, to waive fees and/or reimburse the Fund certain expenses (excluding interest, taxes, brokerage costs, Acquired Fund Fees and Expenses, dividend expense and extraordinary expenses) to the extent necessary to maintain Net Fund Operating Expenses for Institutional Shares at 1.20%. |
| Past performance is not indicative of future results, current performance may be lower or higher than the performance date quoted. Investment returns may fluctuate; the value of your investment upon redemption may be more or less than the initial amount invested. |
| Please consider a fund’s investment objectives, risks, charges and expenses carefully before investing. The FAM Funds prospectus or summary prospectus contains this and other important information about the FAM Small Cap Fund and should be read carefully before you invest or send money. The principal risks of investing in the Funds are: stock market risk (stocks fluctuate in response to the activities of individual companies and to general stock market and economic conditions), stock selection risk (Fenimore utilizes a value approach to stock selection and there is risk that the stocks selected may not realize their intrinsic value, or their price may go down over time), and small-cap risk (prices of small-cap companies can fluctuate more than the stocks of larger companies and may not correspond to changes in the stock market in general). |
| To obtain a prospectus or summary prospectus and performance data that is current to the most recent month-end for each fund as well as other information on the FAM Small Cap, please go to famfunds.com or call (800) 932-3271. |
| This presentation was prepared by Fenimore Asset Management, Inc. (“Fenimore”). Neither this presentation nor any of its contents may be distributed or used for any other purpose without the prior written consent of Fenimore. |
| In part, the purpose of this presentation is to provide investors with an update on financial market conditions. The description of certain aspects of the market herein is a condensed summary only. This summary does not purport to be complete and no obligation to update or otherwise revise such information is being assumed. These materials are provided for informational purposes only and are not otherwise intended as an offer to sell, or the solicitation of an offer to purchase, any security or other financial instrument. This summary is not advice, a recommendation or an offer to enter into any transaction with Fenimore or any of their affiliated funds |
| This presentation may contain statements based on the current beliefs and expectations of Fenimore’s management and are subject to significant risks and uncertainties. Actual results may differ from those set forth in the forward-looking statements. |
| Any references herein to any of Fenimore’s past or present investments, portfolio characteristics, or performance, have been provided for illustrative purposes only. It should not be assumed that these investments were or will be profitable or that any future investments will be profitable or will equal the performance of these investments. There can be no guarantee that the investment objectives of Fenimore will be achieved. Any investment entails a risk of loss. Unless otherwise noted, information included herein is presented as of the date indicated on the cover page and may change at any time without notice. |
39
FAM Small Cap Fund — Portfolio Data (Unaudited)
December 31, 2018
TOP TEN EQUITY HOLDINGS |
(% of Net Assets) | |
Hostess Brands, Inc. | 5.4% |
frontdoor, inc. | 5.0% |
National Commerce Corp. | 4.9% |
CBIZ, Inc. | 4.9% |
ExlService Holdings, Inc. | 4.8% |
Choice Hotels International, Inc. | 4.7% |
Monro | 4.7% |
Natus Medical, Inc. | 4.6% |
Diamond Hill Investment Group | 4.2% |
Pinnacle Financial Partners | 4.1% |
TOTAL NET ASSETS | $147,820,716 |
COMPOSITION OF TOTAL INVESTMENTS |
Banks | 12.1% |
Specialty Retail | 9.3% |
Health Care Equipment & Supplies | 8.6% |
Diversified Consumer Services | 8.3% |
Real Estate Management & Development | 8.0% |
Electronic Equipment, Instruments & Components | 6.9% |
Food Products | 5.4% |
Professional Services | 4.9% |
IT Services | 4.8% |
Hotels, Restaurants & Leisure | 4.7% |
Capital Markets | 4.2% |
Machinery | 3.6% |
Electrical Equipment | 3.4% |
Road & Rail | 2.8% |
Insurance | 2.8% |
Commercial Services & Supplies | 2.8% |
Money Market Funds | 2.4% |
Oil, Gas & Consumable Fuels | 2.2% |
Media | 2.2% |
Other | 0.6% |
Statement Regarding Availability of Quarterly Portfolio Schedule. Please note that (i) the Fund files its complete schedule of portfolio holdings with the Securities and Exchange Commission as of the end of the first and third quarters of each fiscal year on Form N-Q; (ii) the Fund’s Forms N-Q are available on the Commission’s website at http://www.sec.gov; and (iii) the Fund makes the information on Form N-Q available to shareholders, upon request, by calling FAM Funds at 1-800-932-3271.
40
FAM Small Cap Fund — Schedule of Investments
December 31, 2018
| | SHARES | | | VALUE | |
COMMON STOCKS — 97.0% | | | | | | | | |
Banks — 12.1% | | | | | | | | |
National Commerce Corporation (a) | | | 202,400 | | | $ | 7,286,400 | |
Pinnacle Financial Partners, Inc. | | | 132,000 | | | | 6,085,200 | |
South State Corporation | | | 75,000 | | | | 4,496,250 | |
| | | | | | | | 17,867,850 | |
Capital Markets — 4.2% | | | | | | | | |
Diamond Hill Investment Group, Inc. | | | 41,357 | | | | 6,180,804 | |
Commercial Services & Supplies — 2.8% | | | | | | | | |
Multi-Color Corporation | | | 87,000 | | | | 3,052,830 | |
US Ecology, Inc. | | | 17,700 | | | | 1,114,746 | |
| | | | | | | | 4,167,576 | |
Diversified Consumer Services — 8.3% | | | | | | | | |
Carriage Services, Inc. | | | 318,500 | | | | 4,936,750 | |
frontdoor, inc. (a) | | | 278,000 | | | | 7,397,580 | |
| | | | | | | | 12,334,330 | |
Electrical Equipment — 3.4% | | | | | | | | |
Thermon Group Holdings, Inc. (a) | | | 251,000 | | | | 5,090,280 | |
Electronic Equipment, Instruments & Components — 6.9% | | | | | | | | |
PC Connection, Inc. | | | 163,600 | | | | 4,863,828 | |
ScanSource, Inc. (a) | | | 154,000 | | | | 5,294,520 | |
| | | | | | | | 10,158,348 | |
Food Products — 5.4% | | | | | | | | |
Hostess Brands, Inc. (a) | | | 733,000 | | | | 8,019,020 | |
Health Care Equipment & Supplies — 8.6% | | | | | | | | |
AngioDynamics, Inc. (a) | | | 292,000 | | | | 5,877,960 | |
Natus Medical, Inc. (a) | | | 200,000 | | | | 6,806,000 | |
| | | | | | | | 12,683,960 | |
See Notes to Financial Statements
41
FAM Small Cap Fund — Schedule of Investments (continued)
December 31, 2018
| | SHARES | | | VALUE | |
COMMON STOCKS — 97.0% (continued) | | | | | | | | |
Hotels, Restaurants & Leisure — 4.7% | | | | | | | | |
Choice Hotels International, Inc. | | | 97,000 | | | $ | 6,943,260 | |
Insurance — 2.8% | | | | | | | | |
Hallmark Financial Services, Inc. (a) | | | 393,032 | | | | 4,201,512 | |
IT Services — 4.8% | | | | | | | | |
ExlService Holdings, Inc. (a) | | | 136,000 | | | | 7,156,320 | |
Machinery — 3.6% | | | | | | | | |
Franklin Electric Company, Inc. | | | 123,000 | | | | 5,274,240 | |
Media — 2.2% | | | | | | | | |
Boston Omaha Corporation - Class A (a) | | | 135,600 | | | | 3,173,040 | |
Oil, Gas & Consumable Fuels — 2.2% | | | | | | | | |
Matador Resources Company (a) | | | 207,000 | | | | 3,214,710 | |
Professional Services — 4.9% | | | | | | | | |
CBIZ, Inc. (a) | | | 365,000 | | | | 7,190,500 | |
Real Estate Management & Development — 8.0% | | | | | | | | |
Colliers International Group, Inc. | | | 105,000 | | | | 5,779,200 | |
FRP Holdings, Inc. (a) | | | 132,100 | | | | 6,077,921 | |
| | | | | | | | 11,857,121 | |
Road & Rail — 2.8% | | | | | | | | |
Landstar System, Inc. | | | 43,959 | | | | 4,205,557 | |
Specialty Retail — 9.3% | | | | | | | | |
Monro, Inc. | | | 100,000 | | | | 6,875,000 | |
Penske Automotive Group, Inc. | | | 150,000 | | | | 6,048,000 | |
Winmark Corporation | | | 4,831 | | | | 768,129 | |
| | | | | | | | 13,691,129 | |
| | | | | | | | | |
Total Common Stocks (Cost $136,986,891) | | | | | | $ | 143,409,557 | |
See Notes to Financial Statements
42
FAM Small Cap Fund — Schedule of Investments (continued)
December 31, 2018
| | SHARES | | | VALUE | |
MONEY MARKET FUND — 2.4% | | | | | | | | |
Invesco Short-Term Investments Trust - Treasury Portfolio - Institutional Shares, 2.30% (b) (Cost $3,558,083) | | | 3,558,083 | | | $ | 3,558,083 | |
| | | | | | | | | |
Investments in Securities at Value — 99.4% (Cost $140,544,974) | | | | | | $ | 146,967,640 | |
| | | | | | | | | |
Other Assets in Excess of Liabilities — 0.6% | | | | | | | 853,076 | |
| | | | | | | | | |
Net Assets — 100.0% | | | | | | $ | 147,820,716 | |
(a) | Non-income producing security. |
(b) | The rate shown is the 7-day effective yield as of December 31, 2018. |
See Notes to Financial Statements
43
FAM Funds — Statements of Assets and Liabilities | December 31, 2018 |
| | | Value
Fund | | | Equity-Income
Fund | | | Small Cap
Fund | |
Assets |
Investments in securities, at cost | | $ | 518,069,480 | | | $ | 148,742,525 | | | $ | 140,544,974 | |
Investments in securities, at value | | $ | 1,132,281,211 | | | $ | 239,151,444 | | | $ | 146,967,640 | |
Cash | | | 53,567 | | | | 63,653 | | | | 633 | |
Receivable for Fund shares sold | | | 897,227 | | | | 1,350,238 | | | | 1,049,682 | |
Dividends and interest receivable | | | 807,759 | | | | 329,423 | | | | 87,155 | |
Other assets | | | 26,835 | | | | 14,583 | | | | 16,033 | |
Total Assets | | | 1,134,066,599 | | | | 240,909,341 | | | | 148,121,143 | |
Liabilities |
Payable for Fund shares redeemed | | | 366,835 | | | | 60,007 | | | | 111,543 | |
Accrued investment advisory fees | | | 837,679 | | | | 184,179 | | | | 116,506 | |
Accrued shareholder servicing and fund accounting fees | | | 235,846 | | | | 47,355 | | | | 23,286 | |
Accrued business management and administrative fees | | | 138,119 | | | | 27,983 | | | | 23,380 | |
Accrued expenses | | | 84,024 | | | | 44,444 | | | | 25,712 | |
Total Liabilities | | | 1,662,503 | | | | 363,968 | | | | 300,427 | |
Net Assets | | $ | 1,132,404,096 | | | $ | 240,545,373 | | | $ | 147,820,716 | |
Net Assets Consist of: |
Net capital paid in on shares of beneficial interest | | $ | 520,616,402 | | | $ | 149,779,017 | | | $ | 141,398,050 | |
Accumulated earnings | | | 611,787,694 | | | | 90,766,356 | | | | 6,422,666 | |
Net Assets | | $ | 1,132,404,096 | | | $ | 240,545,373 | | | $ | 147,820,716 | |
Net asset value and offering per share |
Net assets - Investor Shares | | $ | 1,106,471,499 | | | $ | 240,545,373 | | | $ | 111,156,348 | |
Net assets - Institutional Shares | | $ | 25,932,597 | | | | N/A | | | $ | 36,664,368 | |
Shares outstanding - Investor Shares | | | 16,703,817 | | | | 8,090,247 | | | | 7,422,383 | |
Shares outstanding - Institutional Shares | | | 390,893 | | | | N/A | | | | 2,437,209 | |
Net Asset Value, Offering and Redemption Price per share (unlimited shares of beneficial interest authorized at $0.001 par value) | | | | | | | | | | | | |
Investor Shares | | $ | 66.24 | | | $ | 29.73 | | | $ | 14.98 | |
Institutional Shares | | $ | 66.34 | | | | N/A | | | $ | 15.04 | |
See Notes to Financial Statements
44
FAM Funds — Statements of Operations | Year Ended December 31, 2018 |
| | | Value
Fund | | | Equity-Income
Fund | | | Small Cap
Fund | |
Investment Income |
Income | | | | | | | | | | | | |
Dividends | | $ | 16,038,426 | | | $ | 4,583,521 | | | $ | 1,626,313 | |
Foreign withholding taxes on dividends | | | (99,225 | ) | | | — | | | | (680 | ) |
Total Investment Income | | | 15,939,201 | | | | 4,583,521 | | | | 1,625,633 | |
Expenses |
Investment advisory fees (Note 2) | | | 11,297,925 | | | | 2,133,889 | | | | 1,541,806 | |
Shareholder servicing fees (Note 2) | | | | | | | | | | | | |
Investor shares | | | 1,029,001 | | | | 192,651 | | | | 83,753 | |
Institutional shares | | | 501 | | | | — | | | | 4,099 | |
Fund accounting fees (Note 2) | | | | | | | | | | | | |
Investor shares | | | 860,560 | | | | 166,316 | | | | 87,176 | |
Institutional shares | | | 19,590 | | | | — | | | | 33,047 | |
Shareholder administrative fees (Note 2) | | | | | | | | | | | | |
Investor shares | | | 706,268 | | | | 131,903 | | | | 109,619 | |
Institutional shares | | | 12,656 | | | | — | | | | 18,925 | |
Business management fees (Note 2) | | | 379,168 | | | | 71,577 | | | | 51,825 | |
Professional fees | | | 188,759 | | | | 60,618 | | | | 37,864 | |
Custodian and bank servicing fees | | | 128,196 | | | | 28,563 | | | | 23,469 | |
Trustee’s fees | | | 45,234 | | | | 45,234 | | | | 45,234 | |
Printing of shareholder reports | | | 59,996 | | | | 16,294 | | | | 14,916 | |
Registration and filing fees | | | 21,897 | | | | 20,700 | | | | 29,214 | |
Compliance services fees (Note 2) | | | 18,334 | | | | 18,333 | | | | 18,333 | |
Other | | | 141,361 | | | | 32,868 | | | | 30,183 | |
Total Expenses | | | 14,909,446 | | | | 2,918,946 | | | | 2,129,463 | |
Prior year investment advisory fee reductions recouped by Advisor (Note 2) | | | — | | | | 4,149 | | | | 10,280 | |
Fee reductions by Advisor (Note 2) | | | (154,067 | ) | | | — | | | | — | |
Net Expenses | | | 14,755,379 | | | | 2,923,095 | | | | 2,139,743 | |
Net Investment Income (Loss) | | | 1,183,822 | | | | 1,660,426 | | | | (514,110 | ) |
Realized and Unrealized Gains (Losses) on Investments |
Net realized gains on investments | | | 40,167,228 | | | | 5,790,114 | | | | 13,414,599 | |
Net change in unrealized appreciation (depreciation) on investments | | | (115,958,435 | ) | | | (8,544,648 | ) | | | (28,671,068 | ) |
Net Realized and Unrealized Losses | | | (75,791,207 | ) | | | (2,754,534 | ) | | | (15,256,469 | ) |
Net Decrease In Net Assets From Operations | | $ | (74,607,385 | ) | | $ | (1,094,108 | ) | | $ | (15,770,579 | ) |
See Notes to Financial Statements
45
FAM Funds — Statements of Changes in Net Assets
| | | Value Fund | |
| | | Year Ended
December 31,
2018 | | | Year Ended
December 31,
2017(a) | |
Change in Net Assets | | | | | | | | |
From operations: | | | | | | | | |
Net investment income (loss) | | $ | 1,183,822 | | | $ | (988,805 | ) |
Net realized gains on investments | | | 40,167,228 | | | | 59,136,907 | |
Net change in unrealized appreciation (depreciation) on investments | | | (115,958,435 | ) | | | 127,811,802 | |
Net increase (decrease) in net assets from operations | | | (74,607,385 | ) | | | 185,959,904 | |
| | | | | | | | | |
Distributions to shareholders (Note 5): | | | | | | | | |
Investor Shares | | | (43,639,043 | ) | | | (59,784,079 | ) |
Institutional Shares | | | (1,106,941 | ) | | | (1,168,420 | ) |
Total distributions | | | (44,745,984 | ) | | | (60,952,499 | ) |
| | | | | | | | | |
Capital share transactions (Note 3) | | | (8,105,573 | ) | | | 34,475,960 | |
Total increase (decrease) in net assets | | | (127,458,942 | ) | | | 159,483,365 | |
| | | | | | | | | |
Net Assets | | | | | | | | |
Beginning of year | | | 1,259,863,038 | | | | 1,100,379,673 | |
End of year | | $ | 1,132,404,096 | | | $ | 1,259,863,038 | |
(a) | The presentation of Distributions to Shareholders has been updated to reflect the changes prescribed in amendments to Regulations S-X, effective November 5, 2018 (Note 1). For the year ended December 31, 2017, distributions to shareholders for the Investor Shares and Institutional Shares consisted of net realized gains on investments. As of December 31, 2017, undistributed net investment income was $0. |
See Notes to Financial Statements
46
FAM Funds — Statements of Changes in Net Assets
| | | Equity-Income Fund | |
| | | Year Ended
December 31,
2018 | | | Year Ended
December 31,
2017(a) | |
Change in Net Assets | | | | | | | | |
From operations: | | | | | | | | |
Net investment income | | $ | 1,660,426 | | | $ | 1,800,753 | |
Net realized gains (losses) on investments | | | 5,790,114 | | | | (4,202,319 | ) |
Net change in unrealized appreciation (depreciation) on investments | | | (8,544,648 | ) | | | 27,936,672 | |
Net increase (decrease) in net assets from operations | | | (1,094,108 | ) | | | 25,535,106 | |
| | | | | | | | | |
Distributions to shareholders - Investor Shares (Note 5) | | | (3,096,115 | ) | | | (1,595,422 | ) |
| | | | | | | | | |
Capital share transactions (Note 3) | | | 20,259,458 | | | | 2,172,637 | |
Total increase in net assets | | | 16,069,235 | | | | 26,112,321 | |
| | | | | | | | | |
Net Assets | | | | | | | | |
Beginning of year | | | 224,476,138 | | | | 198,363,817 | |
End of year | | $ | 240,545,373 | | | $ | 224,476,138 | |
(a) | The presentation of Distributions to Shareholders has been updated to reflect the changes prescribed in amendments to Regulations S-X, effective November 5, 2018 (Note 1). For the year ended December 31, 2017, distributions to shareholders consisted of net investment income. As of December 31, 2017, undistributed net investment income was $205,331. |
See Notes to Financial Statements
47
FAM Funds — Statements of Changes in Net Assets
| | | Small Cap Fund | |
| | | Year Ended
December 31,
2018 | | | Year Ended
December 31,
2017(a) | |
Change in Net Assets | | | | | | | | |
From operations: | | | | | | | | |
Net investment loss | | $ | (514,110 | ) | | $ | (411,246 | ) |
Net realized gains on investments | | | 13,414,599 | | | | 3,450,476 | |
Net change in unrealized appreciation (depreciation) on investments | | | (28,671,068 | ) | | | 4,177,931 | |
Net increase (decrease) in net assets from operations | | | (15,770,579 | ) | | | 7,217,161 | |
| | | | | | | | | |
Distributions to shareholders from (Note 5): | | | | | | | | |
Investor Shares | | | (10,079,359 | ) | | | (2,543,963 | ) |
Institutional Shares | | | (3,335,749 | ) | | | (915,660 | ) |
Total distributions | | | (13,415,108 | ) | | | (3,459,623 | ) |
| | | | | | | | | |
Capital share transactions (Note 3) | | | 13,715,078 | | | | 14,269,853 | |
Total increase (decrease) in net assets | | | (15,470,609 | ) | | | 18,027,391 | |
| | | | | | | | | |
Net Assets | | | | | | | | |
Beginning of year | | | 163,291,325 | | | | 145,263,934 | |
End of year | | $ | 147,820,716 | | | $ | 163,291,325 | |
(a) | The presentation of Distributions to Shareholders has been updated to reflect the changes prescribed in amendments to Regulations S-X, effective November 5, 2018 (Note 1). For the year ended December 31, 2017, distributions to shareholders for the Investor Shares consisted of $2,543,963 from net realized gains on investments and for the Institutional Shares consisted of $3,489 and $912,171 from net investment income and net realized gains on investments, respectively. As of December 31, 2017, undistributed net investment income was $0. |
See Notes to Financial Statements
48
FAM Funds — Notes to Financial Statements
Note 1. Nature of Business and Summary of Significant Accounting Policies
FAM Value Fund, FAM Equity-Income Fund and FAM Small Cap Fund (individually a “Fund”, and collectively, the “Funds”) are each a series of Fenimore Asset Management Trust, a diversified, open-end management investment company registered under the Investment Company Act of 1940, as amended (the “1940 Act”). Each Fund is authorized to issue two classes of shares; Investor Shares and Institutional Shares. The Investor Shares and the Institutional Shares represent interests in the same portfolio of investments in each Fund, however, each class of shares is subject to different expenses and have different investment minimums. Each share class has exclusive voting rights with respect to matters that affect just that class of shares. The investment objective of the FAM Value Fund is to maximize long-term return on capital. The investment objective of the FAM Equity-Income Fund is to provide current income and long-term capital appreciation from investing primarily in income-producing equity securities. The investment objective of the FAM Small Cap Fund is to maximize long-term return on capital.
Each Fund is an investment company and accordingly follows accounting and reporting guidance of the Financial Accounting Standards Board (“FASB”) Accounting Standards Codification (“ASC”) Topic 946 “Financial Services – Investment Companies.” The following is a summary of each Fund’s significant accounting policies, which are in accordance with accounting principles generally accepted in the United States of America (“GAAP”), and followed by the Funds in the preparation of their financial statements.
In August 2018, the Securities and Exchange Commission (the “SEC”) adopted regulations that eliminated or amended disclosure requirements that were redundant or outdated in light of changes in SEC requirements, GAAP, International Financial Reporting Standards, or changes in technology or the business environment. These regulations were effective November 5, 2018, and as such, the Funds are complying with them.
New Accounting Pronouncement
In August 2018, FASB issued Accounting Standards Update No. 2018-13 (“ASU 2018-13”), “Disclosure Framework – Changes to the Disclosure Requirements for Fair Value Measurement,” which amends the fair value measurement disclosure requirements of ASC Topic 820 (“ASC 820”), “Fair Value Measurement.” ASU 2018-13 includes new, eliminated, and modified disclosure requirements for ASC 820. In addition, ASU 2018-13 clarifies that materiality is an appropriate consideration of entities when evaluating disclosure requirements. ASU 2018-13 is effective for fiscal years beginning after December 15, 2019, including interim periods therein. Early adoption is permitted and the Funds have adopted ASU 2018-13 with these financial statements.
49
FAM Funds — Notes to Financial Statements
a) Valuation of Securities
Each Fund values its portfolio securities at market value as of the close of regular trading on the New York Stock Exchange, Inc. (the “NYSE”) (normally 4:00 p.m. Eastern time) on each business day that the NYSE is open for business. Securities traded on a national securities exchange or admitted to trading on NASDAQ are valued at the last reported sale price or the NASDAQ official closing price. Common stocks for which no sale was reported, and over-the-counter securities, are valued at the last reported bid price. Short-term securities may be carried at amortized cost, which approximates fair value. Securities for which market quotations are not readily available or have not traded are valued at fair value as determined by procedures established by the Board of Trustees. Investments in other open-end investment companies, including money market funds, are valued at their net asset value (“NAV”) as reported by such companies.
GAAP establishes a three-tier framework for measuring fair value based on a hierarchy of inputs. The hierarchy distinguishes between market data obtained from independent sources (observable inputs) and the Funds’ own market assumptions (unobservable inputs). These inputs are used in determining the value of each Fund’s investments. These inputs are summarized in the three broad levels listed below:
Level 1 – quoted prices in active markets for identical securities
Level 2 – other significant observable inputs (including quoted prices for identical securities in inactive markets and quoted prices for similar securities)
Level 3 – significant unobservable inputs (including each Fund’s own assumptions in determining the fair value of investments)
The inputs or methods used for valuing securities are not necessarily an indication of the risks associated with investing in those securities. The inputs used to measure fair value may fall into different levels of the fair value hierarchy. In such cases, for disclosure purposes, the level in the fair value hierarchy within which the fair value measurement falls in its entirety is determined based on the lowest level input that is significant to the fair value measurement.
50
FAM Funds — Notes to Financial Statements
The following is a summary of the inputs used to value each Fund’s investments as of December 31, 2018:
FAM Value Fund | | | | | | | | | | | | | | | | |
| | | Level 1 | | | Level 2 | | | Level 3 | | | Total | |
Common Stocks | | $ | 1,070,099,571 | | | $ | — | | | $ | — | | | $ | 1,070,099,571 | |
Money Market Fund | | | 62,181,640 | | | | — | | | | — | | | | 62,181,640 | |
Total | | $ | 1,132,281,211 | | | $ | — | | | $ | — | | | $ | 1,132,281,211 | |
FAM Equity-Income Fund | | | | | | | | | | | | | | | | |
| | | Level 1 | | | Level 2 | | | Level 3 | | | Total | |
Common Stocks | | $ | 218,424,006 | | | $ | — | | | $ | — | | | $ | 218,424,006 | |
Money Market Fund | | | 20,727,438 | | | | — | | | | — | | | | 20,727,438 | |
Total | | $ | 239,151,444 | | | $ | — | | | $ | — | | | $ | 239,151,444 | |
FAM Small Cap Fund | | | | | | | | | | | | | | | | |
| | | Level 1 | | | Level 2 | | | Level 3 | | | Total | |
Common Stocks | | $ | 143,409,557 | | | $ | — | | | $ | — | | | $ | 143,409,557 | |
Money Market Fund | | | 3,558,083 | | | | — | | | | — | | | | 3,558,083 | |
Total | | $ | 146,967,640 | | | $ | — | | | $ | — | | | $ | 146,967,640 | |
As of December 31, 2018, the Funds did not hold any derivative instruments or any assets or liabilities that were measured at fair value on a recurring basis using significant unobservable inputs (Level 3).
Refer to each Fund’s Schedule of Investments to view securities segregated by industry type.
51
FAM Funds — Notes to Financial Statements
b) Investment Transactions
Investment transactions are recorded on trade date. Realized gains and losses on investments sold are determined on the basis of identified cost.
c) Investment Income
Interest income is accrued as earned and dividend income is recorded on the ex-dividend date. Withholding taxes on foreign dividends have been recorded in accordance with the Trust’s understanding of the applicable country’s tax rules and tax rates. Non-cash dividends are included in dividends on the ex-dividend date at the fair market value of the shares received. The Funds record distributions received in excess of income from underlying investments as a reduction of cost of investments and/or realized gain. Such amounts are based on estimates if actual amounts are not available, and actual amounts of income, realized gain and return of capital may differ from the estimated amounts. The Funds adjust the estimated amounts of the components of distributions (and consequently its net investment income) as an increase to unrealized appreciation (depreciation) and realized gain (loss) on investments as necessary once the issuers provide information about the composition of the distributions.
d) Share Valuation
The NAV per share of each class of shares of each Fund is calculated daily by dividing the total value of a Fund’s assets attributable to that class, less liabilities attributable to that class, by the number of shares of that class outstanding.
e) Distributions to Shareholders
Dividends from net investment income are declared and paid quarterly by the FAM Equity-Income Fund. Dividends from net investment income are declared and paid on an annual basis by each of the FAM Value Fund and FAM Small Cap Fund. Dividends are declared separately for each class. No class has preferential dividend rights; differences in per share rates are due to differences in the expenses of each class. Net realized capital gains, if any, are distributed at least annually. Distributions from net investment income and from net realized capital gains are determined in accordance with U.S. income tax regulations, which may differ from GAAP. Permanent book and tax basis differences, if any, are reclassified among the components of net assets. Dividends and distributions to shareholders are recorded on the ex-dividend date.
f) Federal Income Taxes
It is each Fund’s policy to comply with the requirements of the Internal Revenue Code applicable to regulated investment companies and to distribute all of its taxable income to its shareholders. Therefore, no provision for federal income or excise tax is required.
52
FAM Funds — Notes to Financial Statements
GAAP requires uncertain tax positions to be recognized, measured, presented and disclosed in the financial statements. For the year ended December 31, 2018, management has evaluated the tax positions taken or expected to be taken in the course of preparing the Funds’ tax returns to determine whether the tax positions are “more-likely-than-not” of being sustained upon review by the applicable tax authority. Tax positions not deemed to meet the “more-likely-than-not” threshold would be recorded as a tax expense in the current year. Based on its evaluation, management has determined that no liability for unrecognized tax expense is required. Tax years 2015 through present remain subject to examination by U.S. and New York taxing authorities. No examination of the Funds’ tax filings is presently in progress.
g) Common Expenses
Expenses of the Trust not attributable solely to one of the Funds are allocated among the Funds based on relative net assets of each Fund or the nature of the expense and the relative applicability to each Fund.
h) Use of Estimates
The preparation of financial statements in conformity with GAAP requires management to make estimates and assumptions that affect the reported amounts of assets and liabilities and disclosure of contingent assets and liabilities at the date of the financial statements and the reported amounts of increases and decreases in net assets from operations during the reporting period. Actual results could differ from those estimates.
Note 2. Investment Advisory Fees and Other Transactions with Affiliates
Under an Investment Advisory Agreement, each Fund pays an investment advisory fee to Fenimore Asset Management, Inc. (the “Advisor”) equal, on an annual basis, to 0.90% of its average daily net assets. In addition, under a Business Management Agreement, each Fund pays a business management fee to the Advisor equal, on an annual basis, to 0.03% of its average daily net assets.
A Trustee and certain officers of the Funds are also officers of the Advisor.
Pursuant to an Expense Limitation Agreement (the “ELA”) entered into between the Advisor and the Trust, on behalf of each Fund, the Advisor has contractually agreed, until May 1, 2020, to reduce its fees and/or reimburse certain expenses (excluding interest, taxes, brokerage costs, Acquired Fund Fees and Expenses, dividend expense and extraordinary expenses) to the extent necessary to maintain annual operating expenses of each class of shares of each of the Funds as follows: for the Investor Shares: 1.18% for FAM Value Fund, 1.26% for FAM Equity-Income Fund and 1.42% for FAM Small Cap Fund; and for the Institutional Shares: 0.99% for FAM Value Fund, 1.10% for FAM Equity-Income Fund and 1.20% for FAM Small Cap Fund. Each Fund has agreed to repay the Advisor for fee reductions or expense reimbursements by the Advisor pursuant to the ELA provided that such repayment does
53
FAM Funds — Notes to Financial Statements
not cause the annual operating expenses for the applicable class of shares to exceed the applicable limit and the repayment is made within three years after the year in which the Advisor reduced its fee or reimbursed expenses.
During the year ended December 31, 2018, pursuant to the terms of the ELA, the Advisor reduced its fees for FAM Value Fund in the amount of $154,067. The FAM Equity-Income and FAM Small Cap Fund did not have any advisory fee reductions for the year ended December 31, 2018. The Advisor is permitted to seek reimbursement from the Funds for fee reductions and/or expense reimbursements during the following three years after such payment. The Funds must pay their current ordinary operating expenses before the Advisor is entitled to be repaid for any previously reduced fees and expense reimbursements. During the year ended December 31, 2018, the Advisor recouped prior years’ fee reductions from FAM Equity-Income Fund and FAM Small Cap Fund of $4,149 and $10,280, respectively.
As of December 31, 2018, the amounts of previously reduced fees that the Advisor may recoup from FAM Value Fund is shown below, along with the expiration date of such recoupment:
| | | May 1,
2020 | | | May 1,
2021 | | | May 1,
2022 | | | Total | |
FAM Value Fund | | $ | 137,822 | | | $ | 70,548 | | | $ | 154,067 | | | $ | 362,437 | |
As of December 31, 2018, all previously reduced fees for FAM Equity-Income Fund and FAM Small Cap Fund have been recouped by the Advisor.
The Funds have adopted Shareholder Administrative Services Plans for each class of shares pursuant to which each Fund may pay shareholder administrative servicing fees to the Advisor and to financial intermediaries for providing, or arranging for the provision of, certain types of shareholder administrative services to shareholders of each respective class of shares that are serviced by the Advisor, affiliates of the Advisor or the financial intermediary. Pursuant to the Shareholder Administrative Services Plan for Investor Shares, the Investor Shares of each Fund may pay shareholder administrative servicing fees of up to 0.25% per annum of the average daily net assets allocable to Investor Shares of each respective Fund, and pursuant to the Shareholder Administrative Services Plan for Institutional Shares, the Institutional Shares of each Fund may pay shareholder administrative servicing fees of up to 0.15% per annum of the average daily net assets allocable to Institutional Shares of each respective Fund.
54
FAM Funds — Notes to Financial Statements
FAM Shareholder Services, Inc. (“FSS”), a company under common control with the Advisor, serves as shareholder account servicing agent and receives a fee at the annual rates of 0.11% of average daily net assets allocable to the Investor Shares of each Fund and 0.03% of average daily net assets allocable to Institutional Shares of each Fund. For the year ended December 31, 2018, shareholder account service fees paid to FSS were as follows:
FAM Value Fund | | $ | 1,029,502 | |
FAM Equity-Income Fund | | $ | 192,651 | |
FAM Small Cap Fund | | $ | 87,852 | |
The Advisor serves as the fund accounting agent and receives a fee at the annual rate of 0.07% on each Fund’s average daily net assets. For the year ended December 31, 2018, the Funds’ fund accounting fees paid to the Advisor amounted to:
FAM Value Fund | | $ | 880,150 | |
FAM Equity-Income Fund | | $ | 166,316 | |
FAM Small Cap Fund | | $ | 120,223 | |
Fenimore Securities, Inc. (“FSI”), a company also under common control with the Advisor, acts as distributor of the Funds’ shares. FSI receives no compensation for providing distribution services from the Funds.
Ultimus Fund Solutions, LLC (“Ultimus”) provides the Chief Compliance Officer to the Funds, as well as certain additional compliance support functions. The Funds pay Ultimus fees in accordance with the agreement for such services. During the year ended December 31, 2018, Ultimus earned $55,000 from the Funds for such services.
Certain officers of the Trust may also be officers or employees of the Adviser, FSI, or Ultimus.
Note 3. Shares of Beneficial Interest
At December 31, 2018, an unlimited number of shares of beneficial interest ($0.001 par value) of each Fund were authorized.
55
FAM Funds — Notes to Financial Statements
Transactions for each Fund are as follows:
| | | Year Ended
December 31, 2018 | | | Year Ended
December 31, 2017 | |
FAM Value Fund | | | | | | | | | | | | | | | | |
| | | Shares | | | Amount | | | Shares | | | Amount | |
Investor Shares | | | | | | | | | | | | | | | | |
Shares sold | | | 566,851 | | | $ | 42,196,570 | | | | 915,108 | | | $ | 63,803,955 | |
Shares issued on reinvestment of distributions | | | 635,911 | | | | 41,670,136 | | | | 777,257 | | | | 57,400,408 | |
Shares redeemed | | | (1,312,457 | ) | | | (97,375,579 | ) | | | (1,552,052 | ) | | | (108,764,934 | ) |
Investor Share Transactions | | | (109,695 | ) | | $ | (13,508,873 | ) | | | 140,313 | | | $ | 12,439,429 | |
Institutional Shares | | | | | | | | | | | | | | | | |
Shares sold | | | 216,555 | | | $ | 16,369,854 | | | | 359,370 | | | $ | 24,822,776 | |
Shares issued on reinvestment of distributions | | | 12,940 | | | | 849,256 | | | | 9,765 | | | | 722,339 | |
Shares redeemed | | | (160,332 | ) | | | (11,815,810 | ) | | | (47,405 | ) | | | (3,508,584 | ) |
Institutional Share Transactions | | | 69,163 | | | $ | 5,403,300 | | | | 321,730 | | | $ | 22,036,531 | |
Net increase (decrease) from capital transactions | | | (40,532 | ) | | $ | (8,105,573 | ) | | | 462,043 | | | $ | 34,475,960 | |
56
FAM Funds — Notes to Financial Statements
| | | Year Ended
December 31, 2018 | | | Year Ended
December 31, 2017 | |
FAM Equity-Income Fund | | | | | | | | | | | | | | | | |
| | | Shares | | | Amount | | | Shares | | | Amount | |
Investor Shares | | | | | | | | | | | | | | | | |
Shares sold | | | 1,280,105 | | | $ | 40,504,732 | | | | 1,074,307 | | | $ | 30,059,458 | |
Shares issued on reinvestment of distributions | | | 98,466 | | | | 2,963,315 | | | | 51,494 | | | | 1,479,719 | |
Shares redeemed | | | (742,304 | ) | | | (23,208,589 | ) | | | (1,039,082 | ) | | | (29,366,540 | ) |
Net increase from capital transactions | | | 636,267 | | | $ | 20,259,458 | | | | 86,719 | | | $ | 2,172,637 | |
| | | Year Ended
December 31, 2018 | | | Year Ended
December 31, 2017 | |
FAM Small Cap Fund | | | | | | | | | | | | | | | | |
| | | Shares | | | Amount | | | Shares | | | Amount | |
Investor Shares | | | | | | | | | | | | | | | | |
Shares sold | | | 1,197,810 | | | $ | 21,705,880 | | | | 1,672,579 | | | $ | 29,633,045 | |
Shares issued on reinvestment of distributions | | | 665,227 | | | | 9,805,451 | | | | 136,108 | | | | 2,494,859 | |
Shares redeemed | | | (1,048,753 | ) | | | (19,098,463 | ) | | | (1,447,661 | ) | | | (25,564,705 | ) |
Investor Share Transactions | | | 814,284 | | | $ | 12,412,868 | | | | 361,026 | | | $ | 6,563,199 | |
Institutional Shares | | | | | | | | | | | | | | | | |
Shares sold | | | 665,998 | | | $ | 12,006,719 | | | | 749,517 | | | $ | 13,306,416 | |
Shares issued on reinvestment of distributions | | | 165,908 | | | | 2,457,097 | | | | 35,360 | | | | 649,922 | |
Shares redeemed | | | (748,874 | ) | | | (13,161,606 | ) | | | (346,952 | ) | | | (6,249,684 | ) |
Institutional Share Transactions | | | 83,032 | | | $ | 1,302,210 | | | | 437,925 | | | $ | 7,706,654 | |
Net increase from capital transactions | | | 897,316 | | | $ | 13,715,078 | | | | 798,951 | | | $ | 14,269,853 | |
57
FAM Funds — Notes to Financial Statements
Note 4. Investment Transactions
During the year ended December 31, 2018, purchases and sales of investment securities, other than short-term obligations, were:
| | | Purchases | | | Sales | |
FAM Value Fund | | $ | 134,416,632 | | | $ | 142,567,853 | |
FAM Equity-Income Fund | | | 46,889,150 | | | | 40,005,659 | |
FAM Small Cap Fund | | | 53,693,511 | | | | 49,613,700 | |
Note 5. Income Taxes and Distributions to Shareholders
The tax composition of dividends and distributions paid to shareholders during the year ended December 31, 2018 and 2017 were:
| | | FAM Value Fund | | | FAM Equity-
Income Fund | | | FAM Small Cap Fund | |
| | | 2018 | | | 2017 | | | 2018 | | | 2017 | | | 2018 | | | 2017 | |
Distributions paid from: | | | | | | | | | | | | | | | | | | | | | | | | |
Ordinary income | | $ | 1,219,835 | | | $ | — | | | $ | 1,865,756 | | | $ | 1,595,422 | | | $ | — | | | $ | — | |
Long-term capital gains | | | 43,526,149 | | | | 60,952,499 | | | | 1,230,359 | | | | — | | | | 13,415,108 | | | | 3,459,623 | |
Total distributions | | $ | 44,745,984 | | | $ | 60,952,499 | | | $ | 3,096,115 | | | $ | 1,595,422 | | | $ | 13,415,108 | | | $ | 3,459,623 | |
The following information is computed on a tax basis for each item as of December 31, 2018:
| | | FAM Value Fund | | | FAM Equity-
Income Fund | | | FAM Small
Cap Fund | |
Tax cost of portfolio investments | | $ | 520,493,517 | | | $ | 148,742,525 | | | $ | 140,544,974 | |
Gross unrealized appreciation | | | 622,452,985 | | | | 93,813,740 | | | | 23,036,173 | |
Gross unrealized depreciation | | | (10,665,291 | ) | | | (3,404,821 | ) | | | (16,613,507 | ) |
Net unrealized appreciation | | | 611,787,694 | | | | 90,408,919 | | | | 6,422,666 | |
Undistributed long-term gains | | | — | | | | 357,437 | | | | — | |
Accumulated earnings | | $ | 611,787,694 | | | $ | 90,766,356 | | | $ | 6,422,666 | |
58
FAM Funds — Notes to Financial Statements
The difference between the federal income tax cost of portfolio investments and the financial statement cost of portfolio investments for FAM Value Fund is due to certain timing differences in the recognition of capital gains or losses under income tax regulations and GAAP. These “book/tax” differences are temporary in nature and are due to losses deferred due to wash sales.
During the year ended December 31, 2018, FAM Equity-Income Fund utilized $4,202,319 of capital loss carryforwards to offset current year gains.
Permanent book and tax differences, primarily attributable to net investment losses and recharacterization of distributions, resulted in the following reclassifications for the year ended December 31, 2018:
| | | FAM Value
Fund | | | FAM Equity-
Income Fund | | | FAM Small
Cap Fund | |
| Paid-in capital | | $ | (970,897 | ) | | $ | (10,540 | ) | | $ | (514,619 | ) |
| Accumuated earnings | | | 970,897 | | | | 10,540 | | | | 514,619 | |
These reclassifications had no impact on the net assets or NAVs per share of the Funds.
Note 6. Line of Credit
FAM Value Fund, FAM Equity-Income Fund and FAM Small Cap Fund each have a line of credit up to 33 1/3% of its net assets, with a maximum of $155,000,000, $30,000,000, and $20,000,000, respectively.
Borrowings under the agreement bear interest at the prime rate as announced by the lending bank. The line of credit is available until November 25, 2019, when any advances are to be repaid. During the year ended December 31, 2018, no amounts were drawn from the available lines.
Note 7. Commitments and Contingencies
In the normal course of business, the Funds enter into contracts that contain a variety of representations and warranties which provide general indemnifications. The Funds’ maximum exposure under these arrangements is unknown as this would involve future claims that might be made against the Funds that have not yet occurred. However, based on experience, the Trust expects the risk of loss to be remote.
Note 8. Subsequent Events
Management has evaluated subsequent events through the date these financial statements were available to be issued and has determined that there were no subsequent events requiring recognition or disclosure in these financial statements.
59
FAM Funds — Notes to Financial Statements
Note 9. Financial Highlights
FAM Value Fund
(Investor Shares) | |
Years Ended December 31,
| |
Per share information
(For a share outstanding throughout each year) | | 2018 | | | 2017 | | | 2016 | | | 2015 | | | 2014 | |
Net asset value, beginning of year | | $ | 73.52 | | | $ | 66.00 | | | $ | 60.06 | | | $ | 66.58 | | | $ | 61.81 | |
Income (loss) from investment operations: | | | | | | | | | | | | | | | | | | | | |
Net investment income (loss)(a) | | | 0.07 | | | | (0.06 | ) | | | (0.07 | ) | | | (0.13 | ) | | | (0.16 | ) |
Net realized and unrealized gain (loss) on investments | | | (4.64 | ) | | | 11.30 | | | | 9.44 | | | | (0.95 | ) | | | 8.47 | |
Total from investment operations | | | (4.57 | ) | | | 11.24 | | | | 9.37 | | | | (1.08 | ) | | | 8.31 | |
Less distributions from: | | | | | | | | | | | | | | | | | | | | |
Net investment income | | | (0.07 | ) | | | — | | | | — | | | | — | | | | — | |
Net realized gains on investments | | | (2.64 | ) | | | (3.72 | ) | | | (3.43 | ) | | | (5.44 | ) | | | (3.54 | ) |
Total distributions | | | (2.71 | ) | | | (3.72 | ) | | | (3.43 | ) | | | (5.44 | ) | | | (3.54 | ) |
Change in net asset value for the year | | | (7.28 | ) | | | 7.52 | | | | 5.94 | | | | (6.52 | ) | | | 4.77 | |
Net asset value, end of year | | $ | 66.24 | | | $ | 73.52 | | | $ | 66.00 | | | $ | 60.06 | | | $ | 66.58 | |
Total return | | | (6.18 | %) | | | 17.00 | % | | | 15.60 | % | | | (1.74 | %) | | | 13.41 | % |
| | | | | | | | | | | | | | | | | | | | | |
Ratios/supplemental data | | | | | | | | | | | | | | | | | | | | |
Net assets, end of year (000) | | $ | 1,106,471 | | | $ | 1,236,170 | | | $ | 1,100,380 | | | $ | 957,362 | | | $ | 995,235 | |
Ratios to average net assets of: | | | | | | | | | | | | | | | | | | | | |
Expenses, total | | | 1.19 | % | | | 1.19 | % | | | 1.19 | % | | | 1.18 | % | | | 1.18 | % |
Expenses, net (includes fees reduced by Advisor) | | | 1.18 | % | | | 1.18 | % | | | 1.18 | % | | | 1.18 | % | | | 1.18 | % |
Net investment income (loss) | | | 0.09 | % | | | (0.09 | %) | | | (0.11 | %) | | | (0.19 | %) | | | (0.25 | %) |
Portfolio turnover rate | | | 12 | % | | | 10 | % | | | 4 | % | | | 9 | % | | | 6 | % |
(a) | Based on average shares outstanding. |
60
FAM Funds — Notes to Financial Statements
Note 9. Financial Highlights
FAM Value Fund
(Institutional Shares) | |
Periods Ended December 31,
| |
Per share information
(For a share outstanding
throughout each period) | | 2018 | | | 2017(a) | |
Net asset value, beginning of period | | $ | 73.64 | | | $ | 66.85 | |
Income (loss) from investment operations: | | | | | | | | |
Net investment income(b) | | | 0.21 | | | | 0.08 | |
Net realized and unrealized gain (loss) on investments | | | (4.65 | ) | | | 10.43 | |
Total from investment operations | | | (4.44 | ) | | | 10.51 | |
Less distributions from: | | | | | | | | |
Net investment income | | | (0.22 | ) | | | — | |
Net realized gains on investments | | | (2.64 | ) | | | (3.72 | ) |
Total distributions | | | (2.86 | ) | | | (3.72 | ) |
Change in net asset value for the period | | | (7.30 | ) | | | 6.79 | |
Net asset value, end of period | | $ | 66.34 | | | $ | 73.64 | |
Total return | | | (6.00 | %) | | | 15.69 | %(c) |
| | | | | | | | | |
Ratios/supplemental data | | | | | | | | |
Net assets, end of period (000) | | $ | 25,933 | | | | $23,693 | |
Ratios to average net assets of: | | | | | | | | |
Expenses, total | | | 1.10 | % | | | 1.17 | %(d) |
Expenses, net (includes fees reduced by Advisor) | | | 0.99 | % | | | 0.99 | %(d) |
Net investment income | | | 0.25 | % | | | 0.11 | %(d) |
Portfolio turnover rate | | | 12 | % | | | 10 | %(e) |
(a) | Value Fund Institutional Shares inception January 3, 2017. |
(b) | Based on average shares outstanding. |
(e) | Represents the year ended December 31, 2017. |
61
FAM Funds — Notes to Financial Statements
Note 9. Financial Highlights
FAM Equity-Income Fund | | Years Ended December 31, | |
Per share information
(For a share outstanding throughout each year) | | 2018 | | | 2017 | | | 2016 | | | 2015 | | | 2014 | |
Net asset value, beginning of year | | $ | 30.11 | | | $ | 26.93 | | | $ | 24.11 | | | $ | 25.53 | | | $ | 24.77 | |
Income (loss) from investment operations: | | | | | | | | | | | | | | | | | | | | |
Net investment income(a) | | | 0.22 | | | | 0.24 | | | | 0.18 | | | | 0.21 | | | | 0.19 | |
Net realized and unrealized gain (loss) on investments | | | (0.20 | ) | | | 3.15 | | | | 5.00 | | | | (0.38 | ) | | | 1.75 | |
Total from investment operations | | | 0.02 | | | | 3.39 | | | | 5.18 | | | | (0.17 | ) | | | 1.94 | |
Less distributions from: | | | | | | | | | | | | | | | | | | | | |
Net investment income | | | (0.25 | ) | | | (0.21 | ) | | | (0.18 | ) | | | (0.21 | ) | | | (0.19 | ) |
Net realized gains on investments | | | (0.15 | ) | | | — | | | | (2.09 | ) | | | (1.04 | ) | | | (0.85 | ) |
Return of capital | | | — | | | | — | | | | (0.09 | ) | | | — | | | | (0.14 | ) |
Total distributions | | | (0.40 | ) | | | (0.21 | ) | | | (2.36 | ) | | | (1.25 | ) | | | (1.18 | ) |
Change in net asset value for the year | | | (0.38 | ) | | | 3.18 | | | | 2.82 | | | | (1.42 | ) | | | 0.76 | |
Net asset value, end of year | | $ | 29.73 | | | $ | 30.11 | | | $ | 26.93 | | | $ | 24.11 | | | $ | 25.53 | |
Total return | | | 0.06 | % | | | 12.64 | % | | | 21.59 | % | | | (0.73 | %) | | | 7.85 | % |
| | | | | | | | | | | | | | | | | | | | | |
Ratios/supplemental data | | | | | | | | | | | | | | | | | | | | |
Net assets, end of year (000) | | $ | 240,545 | | | $ | 224,476 | | | $ | 198,364 | | | $ | 148,649 | | | $ | 161,521 | |
Ratios to average net assets of: | | | | | | | | | | | | | | | | | | | | |
Expenses, total | | | 1.23 | % | | | 1.25 | % | | | 1.26 | % | | | 1.27 | % | | | 1.26 | % |
Expenses, net (includes fees reduced and recoupment of previously reduced fees by the Advisor) | | | 1.23 | % | | | 1.25 | % | | | 1.26 | % | | | 1.27 | % | | | 1.26 | % |
Net investment income | | | 0.70 | % | | | 0.84 | % | | | 0.70 | % | | | 0.83 | % | | | 0.76 | % |
Portfolio turnover rate | | | 18 | % | | | 12 | % | | | 26 | % | | | 16 | % | | | 11 | % |
(a) | Based on average shares outstanding. |
62
FAM Funds — Notes to Financial Statements
Note 9. Financial Highlights
FAM Small Cap Fund
(Investor Shares) | |
Years Ended December 31,
| |
Per share information
(For a share outstanding throughout each year) | | 2018 | | | 2017 | | | 2016 | | | 2015 | | | 2014 | |
Net asset value, beginning of year | | $ | 18.21 | | | $ | 17.79 | | | $ | 14.75 | | | $ | 15.32 | | | $ | 14.77 | |
Income (loss) from investment operations: | | | | | | | | | | | | | | | | | | | | |
Net investment loss(a) | | | (0.06 | ) | | | (0.05 | ) | | | (0.03 | ) | | | (0.04 | ) | | | (0.01 | ) |
Net realized and unrealized gain (loss) on investments | | | (1.67 | ) | | | 0.86 | | | | 3.60 | | | | (0.50 | ) | | | 0.83 | |
Total from investment operations | | | (1.73 | ) | | | 0.81 | | | | 3.57 | | | | (0.54 | ) | | | 0.82 | |
Less distributions from: | | | | | | | | | | | | | | | | | | | | |
Net investment income | | | — | | | | — | | | | — | | | | (0.00 | )(b) | | | — | |
Net realized gains on investments | | | (1.50 | ) | | | (0.39 | ) | | | (0.53 | ) | | | (0.03 | ) | | | (0.18 | ) |
Return of capital | | | — | | | | — | | | | — | | | | — | | | | (0.09 | ) |
Total distributions | | | (1.50 | ) | | | (0.39 | ) | | | (0.53 | ) | | | (0.03 | ) | | | (0.27 | ) |
Change in net asset value for the year | | | (3.23 | ) | | | 0.42 | | | | 3.04 | | | | (0.57 | ) | | | 0.55 | |
Net asset value, end of year | | $ | 14.98 | | | $ | 18.21 | | | $ | 17.79 | | | $ | 14.75 | | | $ | 15.32 | |
Total return | | | (9.37 | %) | | | 4.55 | % | | | 24.21 | % | | | (3.49 | %) | | | 5.58 | % |
| | | | | | | | | | | | | | | | | | | | | |
Ratios/supplemental data | | | | | | | | | | | | | | | | | | | | |
Net assets, end of year (000) | | $ | 111,156 | | | $ | 120,303 | | | $ | 111,122 | | | $ | 98,477 | | | $ | 66,905 | |
Ratios to average net assets of: | | | | | | | | | | | | | | | | | | | | |
Expenses, total | | | 1.27 | % | | | 1.30 | % | | | 1.36 | % | | | 1.36 | % | | | 1.42 | % |
Expenses, net (includes fees reduced and recoupment of previously reduced fees by Advisor) | | | 1.28 | % | | | 1.33 | % | | | 1.36 | % | | | 1.36 | % | | | 1.42 | % |
Net investment loss | | | (0.33 | %) | | | (0.30 | %) | | | (0.23 | %) | | | (0.29 | %) | | | (0.09 | %) |
Portfolio turnover rate | | | 31 | % | | | 19 | % | | | 26 | % | | | 27 | % | | | 13 | % |
(a) | Based on average shares outstanding. |
(b) | Amount is less than $0.01 per share. |
63
FAM Funds — Notes to Financial Statements
Note 9. Financial Highlights
FAM Small Cap Fund
(Institutional Shares) | |
Years Ended December 31,
| |
Per share information
(For a share outstanding throughout each year) | | 2018 | | | 2017 | | | 2016 | |
Net asset value, beginning of year | | $ | 18.26 | | | $ | 17.82 | | | $ | 14.75 | |
Income (loss) from investment operations: | | | | | | | | | | | | |
Net investment loss(a) | | | (0.04 | ) | | | (0.03 | ) | | | (0.00 | )(b) |
Net realized and unrealized gain (loss) on investments | | | (1.68 | ) | | | 0.86 | | | | 3.60 | |
Total from investment operations | | | (1.72 | ) | | | 0.83 | | | | 3.60 | |
Less distributions from: | | | | | | | | | | | | |
Net investment income | | | — | | | | (0.00 | )(b) | | | — | |
Net realized gains on investments | | | (1.50 | ) | | | (0.39 | ) | | | (0.53 | ) |
Total distributions | | | (1.50 | ) | | | (0.39 | ) | | | (0.53 | ) |
Change in net asset value for the year | | | (3.22 | ) | | | 0.44 | | | | 3.07 | |
Net asset value, end of year | | $ | 15.04 | | | $ | 18.26 | | | $ | 17.82 | |
Total Return | | | (9.29 | %) | | | 4.66 | % | | | 24.42 | % |
| | | | | | | | | | | | | |
Ratios/supplemental data | | | | | | | | | | | | |
Net assets, end of year (000) | | $ | 36,664 | | | $ | 42,989 | | | $ | 34,142 | |
Ratios to average net assets of: | | | | | | | | | | | | |
Expenses, total | | | 1.16 | % | | | 1.22 | % | | | 1.23 | % |
Expenses, net (includes fees reduced and recoupment of previously reduced fees by Advisor) | | | 1.17 | % | | | 1.20 | % | | | 1.16 | % |
Net investment loss | | | (0.22 | %) | | | (0.16 | %) | | | (0.03 | %) |
Portfolio turnover rate | | | 31 | % | | | 19 | % | | | 26 | % |
(a) | Based on average shares outstanding. |
(b) | Amount is less than $0.01 per share. |
64
FAM Funds — Report of Independent Registered Public Accounting Firm
REPORT OF INDEPENDENT REGISTERED PUBLIC ACCOUNTING FIRM
To the Board of Trustees of Fenimore Asset Management Trust
and the Shareholders of FAM Value Fund, FAM Equity-Income Fund, and FAM Small Cap Fund
Opinion on the Financial Statements
We have audited the accompanying statements of assets and liabilities of FAM Value Fund, FAM Equity-Income Fund, and FAM Small Cap Fund, each a series of shares of beneficial interest in Fenimore Asset Management Trust (the “Funds”), including the schedules of investments, as of December 31, 2018, and the related statements of operations for the year then ended, the statements of changes in net assets for each of the years in the two-year period then ended and the financial highlights as noted in the table below, and the related notes (collectively referred to as the “financial statements”). In our opinion, the financial statements present fairly, in all material respects, the financial position of the Funds as of December 31, 2018, and the results of their operations for the year then ended, the changes in their net assets for each of the years in the two-year period then ended and their financial highlights as noted in the table below, in conformity with accounting principles generally accepted in the United States of America.
| Financial Highlights |
FAM Value Fund – Investor Shares | For each of the years in the five-year period ended December 31, 2018 |
FAM Value Fund – Institutional Shares | For the period January 3, 2017 (commencement of operations) to December 31, 2017 and for the year ended December 31, 2018 |
FAM Equity-Income Fund | For each of the years in the five-year period ended December 31, 2018 |
FAM Small Cap Fund – Investor Shares | For each of the years in the five-year period ended December 31, 2018 |
FAM Small Cap Fund – Institutional Shares | For each of the years in the three-year period ended December 31, 2018 |
Basis for Opinion
These financial statements and financial highlights are the responsibility of the Funds’ management. Our responsibility is to express an opinion on the Funds’ financial statements based on our audits. We are a public accounting firm registered with the Public Company Accounting Oversight Board (United States) (“PCAOB”) and are required to be independent with respect to the Funds in accordance with the U.S. federal securities law and the applicable rules and regulations of the Securities and Exchange Commission and the PCAOB.
65
FAM Funds — Report of Independent Registered Public Accounting Firm
We conducted our audits in accordance with the standards of the PCAOB. Those standards require that we plan and perform the audits to obtain reasonable assurance about whether the financial statements are free of material misstatement, whether due to error or fraud. The Funds are not required to have, nor were we engaged to perform, an audit of their internal control over financial reporting. As part of our audits we are required to obtain an understanding of internal control over financial reporting but not for the purpose of expressing an opinion on the effectiveness of the Funds’ internal control over financial reporting. Accordingly, we express no such opinion.
Our audits included performing procedures to assess the risk of material misstatement of those financial statements, whether due to error or fraud, and performing procedures that respond to those risks. Such procedures included examining, on a test basis, evidence regarding the amounts and disclosures in the financial statements. Our procedures included confirmation of securities owned as of December 31, 2018 by correspondence with the custodian. Our audits also included evaluating the accounting principles used and significant estimates made by management, as well as evaluating the overall presentation of the financial statements. We believe that our audits provide a reasonable basis for our opinion.
| 
|
| BBD, LLP |
We have served as the auditor of one or more of the Funds in the Fenimore Asset Management Trust since 2007.
Philadelphia, Pennsylvania
February 25, 2019
66
FAM Funds (Unaudited)
Board Consideration of the Continuation of the Investment Advisory Agreements for the Funds
In accordance with the Investment Company Act of 1940, the Board of Trustees of the Funds is required, on an annual basis, to consider the approval of each of the Investment Advisory Agreements between the Funds and the Advisor, and this must take place at an in-person meeting of the Board. The relevant provisions of the Investment Company Act of 1940 specifically provide that it is the duty of the Board to request and evaluate such information as the Board determines is necessary to allow them to properly consider the approval of the continuation of the Advisory Agreements, and it is the duty of the Advisor to furnish the Trustees with such information that is responsive to their request.
Accordingly, in determining whether to renew each of the Advisory Agreements between the Value Fund, the Equity-Income Fund and the Small Cap Fund with the Advisor, the Board of Trustees requested, and the Advisor provided, information and data relevant to the Board’s consideration. This included materials prepared by the Advisor and materials prepared by an independent mutual fund industry consulting firm that produced materials specifically for the Board that provided them with information regarding the investment performance of the Funds and information regarding the fees and expenses of the Funds, compared to other similar mutual funds. As part of its deliberations, the Board also considered and relied upon the information about the Funds and the Advisor that had been provided to them throughout the year in connection with their regular Board meetings at which they engage in the ongoing oversight of the Funds and their operations.
The Board engaged in a thorough review process in order to determine whether to approve the continuation of the Advisory Agreements with the Advisor. After receiving the materials that they had requested to assist them with their review, the Board had a preliminary meeting by conference call on November 5, 2018, with representatives of the Advisor in order to discuss the proposed approval of the continuation of the Advisory Agreements and to review the materials that had been presented. The Board then met again with representatives of the Advisor on November 14, 2018, prior to the start of their required in-person meeting in order to further consider and discuss the proposed approval of the Advisory Agreements.
The Board then met to consider the approval of the continuation of the Advisory Agreements at an in-person meeting of the Board held on November 14-15, 2018. Among the factors the Board considered was the overall performance of each of the Funds relative to the performance of other similar mutual funds on a long-term basis (five years and longer) and over shorter time periods (less than five years). In connection with its review of the performance results achieved for the Funds, the Board discussed with management the fact that the Advisor maintains a particular focus on long-term investment performance results and they reviewed the reasons why this may, from time to time, cause the longer-term performance results and the shorter-term performance results to under-perform when compared to other funds for similar time periods. In connection with this, the Board
67
FAM Funds (Unaudited)
took note of management’s stated position that achieving favorable long-term investment results is a primary objective of the firm. The Board also considered and discussed with the Advisor their focus on “value investing” which may result in short-term performance that lags the performance results achieved by other managers, especially those managers that emphasize other types of investment strategies, such as “growth investing”. The Board also took into consideration the Advisor’s stated objective of attaining investment results with less risk and less volatility than other funds. The Board determined that it has been beneficial to shareholders that the Advisor has continued to invest on behalf of the Funds in a manner that is consistent with its long-term investment objectives due to the fact that the Advisor has been able to achieve favorable long-term performance results for the Funds, and, when performance is adjusted for risk, it shows even more favorable results.
The Board also took note of the long-term relationship between the Advisor and each of the Funds and the efforts that have been undertaken by the Advisor to foster the growth and development of each of the Funds since their inception. In connection with this, the Board took note of the fact that Thomas Putnam, the Chair and founder of the Advisor and the co-manager of each of the Funds, has been advising each of the Funds since their inception, during which time each of the Funds have experienced favorable investment results on a comparative basis. The Board also noted that the Advisor has continued to retain and develop additional portfolio managers and investment analysts to work with Mr. Putnam in an effort to provide for the continued long-term management and oversight of the Funds and their portfolios.
In addition, the Board compared expenses of each Fund to the expenses of other similar mutual funds. They noted the range of investment advisory and administrative services provided by the Advisor and its affiliates to the Funds and the level and quality of these services, and in particular, they considered the quality of the personnel providing these services noting that they were of a high caliber.
In connection with these matters, the Board took notice of the fact that the Funds’ investment advisory fees are not subject to breakpoints on increased assets in the Funds. The Board also took note of the fact that there is no uniform set of guidelines within the mutual fund industry with respect to the application of breakpoints on fund assets, and they concluded that they will continue to evaluate the potential for the application of breakpoints in the future to the extent that assets in the Funds increase, at which time a determination can be made as to the potential appropriateness of implementing breakpoints. The Board also observed that the Advisor has been willing to implement and maintain the effectiveness of the Expense Limitation Agreement for the Funds which is intended to limit the total overall operating expenses of the Funds.
In connection with the Board’s consideration of the approval of the continuation of the Business Management Agreement with the Advisor, the Board determined that the fees payable to the Advisor for the business management services that are currently provided
68
FAM Funds (Unaudited)
by the Advisor to the Funds were reasonable and that the business management services continued to be of a level and quality at least equal to the same or similar services that could be provided by independent third parties. With respect to its review of matters in connection with the continuation of the Business Management Agreement, the Board took into consideration the fact that the Advisor has retained the services of Ultimus Fund Solutions, LLC (“Ultimus”), an independent third-party service provider to provide certain of the services that the Advisor is contractually obligated to provide to, or procure for, the Funds under the terms of the Business Management Agreement, and the Board reviewed the terms of the fee arrangements entered into between the Advisor and Ultimus for these purposes and the nature and extent of the business management services that are being provided to the Funds in accordance with these arrangements. Following their review of these matters, the Board determined that the nature of the services and the level of the fees were reasonable and that this arrangement for obtaining the required business management services for the Funds was in the best interest of the Funds and their shareholders.
The Board also considered that the Funds receive fund accounting services from the Advisor, and the Board reviewed the fees that are payable to the Advisor under the terms of the Fund Accounting Services Agreements entered into between the Advisor and the Funds and the Board determined that the fees payable to the Advisor for the fund accounting services provided by the Advisor were reasonable and that the fund accounting services continued to be of a level and quality at least equal to the same or similar services that could be provided by independent third parties based upon the nature and quality of the services that are provided to the Funds by the Advisor for fund accounting services. With respect to its review of matters in connection with the continuation of the Fund Accounting Services Agreements, the Board took into consideration the fact that the Advisor has retained the services of Ultimus to also provide certain of the services that the Advisor is contractually obligated to provide to, or procure for, the Funds under the terms of the Fund Accounting Services Agreements, and the Board reviewed the terms of the fee arrangements entered into between the Advisor and Ultimus for these purposes and the nature and extent of the fund accounting services that are being provided to the Funds in accordance with these arrangements. Following their review of these matters, the Board determined that the nature of the services and the level of the fees were reasonable and that this arrangement for obtaining the required fund accounting services for the Funds was in the best interest of the Funds and their shareholders.
The Board also considered that the Funds receive shareholder account services from the Advisor’s affiliate FSS, and the Board reviewed the fees that are payable to FSS under the contractual arrangements between FSS and the Funds and the Board determined that the fees continue to be reasonable based upon the nature and quality of the services that are provided to the Funds by FSS for shareholder account services and that the shareholder account services continued to be of a level and quality at least equal to the same or similar services that could be provided by independent third parties based upon the nature and
69
FAM Funds (Unaudited)
quality of the services that are provided to the Funds by FSS for shareholder account services. Following their review of these matters, the Board determined that the nature of the services and the level of the fees were reasonable and that this arrangement for obtaining the required shareholder account services for the Funds was in the best interest of the Funds and their shareholders.
The Board also considered that the Funds are distributed by an affiliate of the Advisor, Fenimore Securities, Inc., (“FSI”), and the Board reviewed the distribution-related services provided by FSI and they determined that the distribution services provided by FSI are useful and beneficial to the ongoing operations of the Funds. In connection with their consideration of the services provided to the Funds by FSI, the Board took into consideration that FSI does not receive any revenue or compensation from the Funds for the services that it provides to the Funds, and the Board further considered that the Advisor supports the ongoing operations of FSI from its own financial resources.
The Board also reviewed financial information concerning the Advisor and its affiliates relating to the operation of the Funds, noting the overall profitability of the relationship with the Funds to the Advisor and the financial soundness of the Advisor and its affiliates as demonstrated by the financial information provided. The Board also took note of the fact that the Advisor has previously used revenue sharing payments from its own financial resources to pay for all of the distribution-related costs incurred in connection with the marketing and sale of the Funds’ shares because the Funds are not subject to a Rule 12b-1 plan of distribution, and they further took note of the fact that the Advisor has continued its practice of using revenue sharing payments from its own financial resources to make payments to those financial intermediaries that provide certain types of distribution-related services to shareholders of each class of shares of the Funds. The members of the Board considered the profitability of the Advisor both before and after the impact of the marketing and distribution-related expenses that the Advisor incurs out of its own resources in connection with its management of the Funds.
The Board reviewed the Advisor’s brokerage practices and best-execution procedures, and noted that these were reasonable and consistent with standard industry practice. In connection with this review, the Board considered the fact that while the Advisor does not have any express arrangements in place with respect to “soft dollar” arrangements with brokers or other similar parties relating to the direct use of Fund brokerage commissions to obtain research or execution services, the Advisor does receive research services from certain broker-dealers with which it executes securities transactions on behalf of the Funds which is done in a manner that is consistent with the provisions of Section 28(e) of the Securities Exchange Act of 1934. With respect to the Advisor’s brokerage practices, the Board also took into consideration the fact that the Advisor has maintained low portfolio turnover rates for the Funds that are substantially lower than industry averages for equity-type funds, which the Board determined is beneficial to shareholders due to the reduced brokerage expenses that are attributable to low portfolio turnover rates.
70
FAM Funds (Unaudited)
The Board also considered information regarding the fees that the Advisor charges other clients, including privately managed accounts and a privately offered investment fund, for investment advisory services that are similar to the advisory services provided to the Funds and noted that the Funds’ fees were reasonable when compared to the relevant circumstances of the types of accounts involved and the services provided and the different types of additional services that are required in connection with the management of regulated investment companies such as the Funds.
In connection with the Board’s consideration of the ways in which economies of scale are reflected with respect to the Advisory Agreements, the Board took note of the fact that the Advisor had agreed to continue the use of an Expense Limitation Agreement with respect to each Fund which provides for a limit on the total operating expenses of each Fund and each class of shares of each Fund through May 1, 2020. With respect to the Board’s approval of the continuation of the Expense Limitation Agreement between the Funds and the Advisor, the Board took into consideration that pursuant to the terms of the Expense Limitation Agreement, the Advisor may seek recoupment of fees and expenses that it had previously waived or reimbursed under certain circumstances provided that such recoupment does not result in a Fund incurring total operating expenses that are in excess of the amounts provided under the terms of the Expense Limitation Agreement with respect to each class of shares of the Funds.
In reaching their conclusion with respect to the approval of the continuation of the Advisory Agreements, the Trustees did not identify any one single factor as being controlling, rather, the Board took note of a combination of factors that influenced their decision making process. The Board did, however, identify the overall favorable investment performance of the Funds on a long term basis, the commitment of the Advisor to the successful operation of each of the Funds, and the level of expenses of the Funds, in addition to the Advisor’s willingness to enter into a contractual Expense Limitation Agreement in order to limit the overall operating expenses of each of the Funds and each class of shares of the Funds, as being important elements of their consideration. Based upon their review and consideration of these factors and other matters deemed relevant by the Board in reaching an informed business judgment, the Board of Trustees, including all of the Independent Trustees, unanimously concluded that the terms of the Advisory Agreements are fair and reasonable and the Board voted to approve the continuation of the Advisory Agreements for a one-year period, subject to the applicable limitations on the total operating expenses of the Funds, as considered and approved at the meeting.
71
FAM Funds — Information About Trustees and Officers (Unaudited)
The business and affairs of the Funds are managed under the direction of the Funds’ Board of Trustees. Information pertaining to the Trustees and Officers of the Funds is set forth below.
The Statement of Additional Information includes additional information about the Trustees and officers and is available, without charge, upon request by calling the Fund at 1-800-932-3271.
Independent Trustees**
Name, Address, and
Year of Birth | Position(s)
Held With
Fund and
Length of
Time Served† | Principal
Occupation(s)
During Past
5 Years | Number of
Portfolios
in Fund
Complex*
Overseen
by Trustee | Other
Directorships
Held by Trustee
During Past
5 Years |
Fred "Chico” Lager 384 North Grand St. Cobleskill, NY 12043 1954 | Trustee since 1996 | Business Consultant; Retired President and Chief Executive Officer of Ben & Jerry’s Homemade, Inc. | 3 | None |
John J. McCormack, Jr. 384 North Grand St. Cobleskill, NY 12043 1944 | Trustee since 2004; Chairman since 2007 | Retired Group President, TIAA-Cref Enterprises | 3 | None |
Barbara V. Weidlich 384 North Grand St. Cobleskill, NY 12043 1944 | Trustee since 2004 | Retired President, National Investment Company Service Association | 3 | None |
Kevin J. McCoy, CPA 384 North Grand St. Cobleskill, NY 12043 1952 | Trustee since 2007 | Principal, Marvin and Company, P.C., certified public accounting firm | 3 | None |
Paul A. Keller, CPA 384 North Grand St. Cobleskill, NY 12043 1954 | Trustee since 2010 | Business Consultant; Retired Assurance Partner, PricewaterhouseCoopers, LLP Investment Management Services Group | 3 | Pacific Select Funds and the Pacific Funds |
Donald J. Boteler 384 North Grand St. Cobleskill, NY 12043 1948 | Trustee since 2012 | Retired Vice President of Operations & Continuing Education, Investment Company Institute | 3 | Parnassus Funds and Parnassus Income Funds |
72
FAM Funds — Information About Trustees and Officers (Unaudited)
Interested Trustee and Officers
Name, Address, and
Year of Birth | Position(s)
Held With
Fund and
Length of
Time Served† | Principal
Occupation(s)
During Past
5 Years | Number of
Portfolios
in Fund
Complex*
Overseen
by Trustee | Other
Directorships
Held by Trustee
During Past
5 Years |
Interested Trustee | | | | |
Thomas 0. Putnam*** 384 North Grand St Cobleskill, NY 12043 1944 | President since 1986; Chairman from 1986- November 2004 | Chairman, Fenimore Asset Management, Inc. | 3 | None |
Officers | | | | |
Michael F. Balboa 384 North Grand St. Cobleskill, NY 12043 1983 | Secretary and Treasurer since May 2016 | February 2016 to Present Chief Financial Officer, Fenimore Asset Management, Inc. Prior to February 2016 Senior Manager - Ernst & Young, LLP | N/A | N/A |
Brian Lutes 225 Pictoria Drive,
Suite 450 Cincinnati, OH 45246 1975 | Assistant Treasurer since November 2017 | Vice President, Mutual Fund Controller of Fund Accounting of Ultimus Fund Solutions, LLC | N/A | N/A |
Maggie Bull 2 Easton Oval,
Suite 300 Columbus, OH 43219 1965 | Assistant Secretary since November 2017 | Senior Attorney, Ultimus Fund Solutions, LLC (since June 2017); Legal Counsel, Meeder Investment Management, (January 2011 to September 2016); Chief Compliance Officer, Meeder Funds (March 2011 to September 2016) | N/A | N/A |
73
FAM Funds — Information About Trustees and Officers (Unaudited)
Name, Address, and
Year of Birth | Position(s)
Held With
Fund and
Length of
Time Served† | Principal
Occupation(s)
During Past
5 Years | Number of
Portfolios
in Fund
Complex*
Overseen
by Trustee | Other
Directorships
Held by Trustee
During Past
5 Years |
Brandon R. Kipp 2 Easton Oval, Suite 300 Columbus, OH 43219 1983 | Chief Compliance Officer since October 2017 | Senior Fund Compliance Officer, Ultimus Fund Solutions, LLC (since July 2017); Assistant Vice President and Compliance Manager, UMB Fund Services, Inc. (March 2014 to July 2017); Officer and Lead Fund Administrator, UMB Fund Services, Inc. (May 2012 to March 2014). | N/A | N/A |
† | Trustees serve until their successors are elected and qualified, or until the Trustee dies, resigns or is removed, or becomes incapacitated. |
* | “Fund Complex” includes the three series of the Trust, FAM Value Fund, FAM Equity-Income Fund and FAM Small Cap Fund. |
** | The “Independent Trustees” are those Trustees that are not considered “interested persons” of the Trust, as that term is defined in the 1940 Act. |
*** | Mr. Putnam, by virtue of his employment with Fenimore Asset Management, Inc., the Trust’s investment advisor, is considered an “interested person” of the Trust. |
74
FAM Funds — Expense Data (Unaudited)
We believe it is important for you to understand the impact of costs on your investment. As a shareholder of the Funds, you incur ongoing costs, including management fees, shareholder servicing fees and other operating expenses. The following examples are intended to help you understand your ongoing costs (in dollars) of investing in the Funds and to compare these costs with the ongoing costs of investing in other mutual funds.
A mutual fund’s ongoing costs are expressed as a percentage of its average net assets. This figure is known as the expense ratio. The expenses in the table below are based on an investment of $1,000 made at the beginning of the most recent period (July 1, 2018) and held until the end of the period (December 31, 2018).
The table below illustrates each Fund’s ongoing costs in two ways:
Actual Expenses
The first line for each Fund in the following tables provides information about actual account values and actual expenses. You may use the information in this line, together with the amount you invested, to estimate the expenses that you paid over the period. Simply divide your account value by $1,000 (for example, an $8,600 account value divided by $1,000 = 8.6), then multiply the result by the number in the line for your share class under the heading entitled “Expenses Paid During Period” to estimate the expenses you paid on your account during this period.
Hypothetical Example for Comparison Purposes
The second line for each Fund in the following table provides information about hypothetical account values and hypothetical expenses based on each Fund’s actual expense ratio and an assumed rate of return of 5% per year before expenses, which is not each Fund’s actual return. The hypothetical account values and expenses may not be used to estimate the actual ending account balance or expenses you paid for the period. You may use this information to compare the ongoing costs of investing in the Funds and other funds. To do so, compare this 5% hypothetical example with the 5% hypothetical examples that appear in the shareholder reports of other funds.
Please note that the expenses shown in the table are meant to highlight your ongoing costs only. Therefore, the hypothetical example of the table is useful in comparing ongoing costs only, and will not help you determine the relative costs of owning different funds.
75
FAM Funds — Expense Data (Unaudited) continued
| | Beginning
Account
Value
July 1,
2018 | Ending
Account
Value
December 31,
2018 | Net
Expense
Ratio | Expenses
Paid During
Period * |
| | | | | |
FAM Value Fund -
Investor Shares: Actual Return | $1,000.00 | $ 933.30 | 1.18% | $5.75 |
Hypothetical 5% Return | $1,000.00 | $ 1,019.26 | 1.18% | $6.01 |
| | | | | |
FAM Value Fund -
Institutional Shares: Actual Return | $1,000.00 | $ 934.10 | 0.99% | $4.83 |
Hypothetical 5% Return | $1,000.00 | $ 1,020.21 | 0.99% | $5.04 |
| | | | | |
FAM Equity-Income Fund -
Investor Shares: Actual Return | $1,000.00 | $ 968.80 | 1.23% | $6.10 |
Hypothetical 5% Return | $1,000.00 | $ 1,019.00 | 1.23% | $6.26 |
| | | | | |
FAM Small Cap Fund -
Investor Shares: Actual Return | $1,000.00 | $ 856.50 | 1.27% | $5.94 |
Hypothetical 5% Return | $1,000.00 | $ 1,018.80 | 1.27% | $6.46 |
| | | | | |
FAM Small Cap Fund -
Institutional Shares: Actual Return | $1,000.00 | $ 856.40 | 1.17% | $5.47 |
Hypothetical 5% Return | $1,000.00 | $ 1,019.31 | 1.17% | $5.96 |
* | Expenses are calculated using each Fund’s annualized net expense ratios, which represent net expenses as a percentage of average daily net assets for the one-half year period ended December 31, 2018. Expenses are calculated by multiplying the annualized expense ratio by the average account value of the period; then multiplying the result by the number of days in the most recent one-half year period (184); and then dividing that result by the number of days in the current fiscal year (365). |
76
FAM Funds — Supplemental Information (Unaudited)
Statement Regarding Availability of Proxy Voting Policies and Procedures.
Please note that a description of the policies and procedures the Funds use to determine how to vote proxies relating to portfolio securities is available (i) without charge, upon request, by calling FAM Funds at 1-800-932-3271; (ii) and on the Securities and Exchange Commission’s website at http://www.sec.gov.
Statement Regarding Availability of Proxy Voting Record.
Please note that information regarding how the Funds voted proxies relating to portfolio securities during the most recent 12-month period ended June 30 is available (i) without charge, upon request, by calling FAM Funds at 1-800-932-3271; or on the FAM Funds’ Website at http://famfunds.com (ii) and on the Securities and Exchange Commission’s website at http://www.sec.gov.
SPECIAL 2018 TAX INFORMATION FOR FAM FUNDS |
This information for the fiscal year ended December 31, 2018, is included pursuant to provisions of the Internal Revenue Code. The Value Fund distributed $43,526,149, or the maximum amount available, as capital gain dividends (from net long-term capital gains) to shareholders during the fiscal year. The Equity-Income Fund distributed $1,219,819, or the maximum amount available, as capital gain dividends (from net long-term capital gains) to shareholders during the fiscal year. The Small Cap Fund distributed $13,415,108, or the maximum amount available, as capital gain dividends (from net long-term capital gains) to shareholders during the fiscal year. For Value Fund taxable non-corporate shareholders, 100.0% of the Fund’s income represents qualified dividend income subject to the 20% rate category. For Value Fund corporate shareholders, 100.0% of investment income (dividend income plus short-term gains, if any) qualifies for the dividends-received deduction For Equity-Income Fund taxable non-corporate shareholders, 99.4% of the Fund’s income represents qualified dividend income subject to the 20% rate category. For Equity-Income Fund corporate shareholders, 100.0% of investment income (dividend income plus short-term gains, if any) qualifies for the dividends-received deduction. |
77
Investment Advisor
Fenimore Asset Management, Inc.
Cobleskill, NY
Custodian
U.S. Bank, N.A.
Cincinnati, OH
Independent Registered
Public Accounting Firm
BBD, LLP
Philadelphia, PA
Trustees
Donald J. Boteler
Paul Keller, CPA
Fred “Chico” Lager
John J. McCormack, Jr., Independent Chairman
Kevin J. McCoy, CPA
Thomas O. Putnam
Barbara V. Weidlich
Legal Counsel
Dechert LLP
Washington, DC
Shareholder Servicing Agent
FAM Shareholder Services, Inc.
Cobleskill, NY
Distributor
Fenimore Securities, Inc.
Cobleskill, NY
384 North Grand Street
PO Box 399

Cobleskill, New York
12043-0399
(800) 932-3271
www.famfunds.com
Rev. 01/2019
FACTS | WHAT DOES FAM FUNDS (FENIMORE ASSET MANAGEMENT TRUST) DO WITH YOUR PERSONAL INFORMATION? |
| | | |
Why? | Financial companies choose how they share your personal information. Federal law gives consumers the right to limit some but not all sharing. Federal law also requires us to tell you how we collect, share, and protect your personal information. Please read this notice carefully to understand what we do. |
| | | |
What? | The types of personal information we collect and share depend on the product or service you have with us. This information can include: ● Social Security number and account balances ● Transaction history and investment experience ● Retirement assets and wire transfer instructions When you are no longer our customer, we continue to share your information as described in this notice. |
| | | |
How? | All financial companies need to share customers’ personal information to run their everyday business. In the section below, we list the reasons financial companies can share their customers’ personal information; the reasons FAM Funds (Fenimore Asset Management Trust) chooses to share; and whether you can limit this sharing. |
| | | |
Reasons we can share your
personal information | Does
Fenimore Asset Management Trust share? | Can you limit this sharing? |
For our everyday business purposes - such as to process your transactions, maintain your account(s), respond to court orders and legal investigations, or report to credit bureaus | Yes | No |
For our marketing purposes - to offer our products and services to you | No | We don’t share |
For joint marketing with other financial companies | No | We don’t share |
For our affiliates' everyday business purposes - information about your transactions and experiences | Yes | No |
For our affiliates' everyday business purposes - information about your creditworthiness | No | We don’t share |
For affiliates to market to you | Yes | Yes |
For nonaffiliates to market to you | No | We don’t share |
| | | |
To limit our sharing | ● Call (800) 932-3271 ● Visit us online: www.famfunds.com ● Mail the form on page 2 Please note: If you are a new customer, we can begin sharing your information 30 days from the date we sent this notice. When you are no longer our customer, we continue to share your information as described above in this notice. However, you can contact us at any time to limit our sharing. |
| | | |
Questions? | Call (800) 932-3271 or go to www.famfunds.com |
Mail-in form |
Leave Blank OR If you have a joint account, your choice(s) will apply to everyone on your account unless you mark below □ Apply my choices only to me | Mark any/all you want to limit: □ Do not allow your affiliates to use my personal information to market to me |
Name | | Mail to: FAM Funds
PO Box 399
Cobleskill, NY 12043 |
Address | |
City/ST/Zip | |
Account # | |
| | |
What We Do |
How does FAM Funds (Fenimore Asset Management Trust) protect my personal information? | To protect your personal information from unauthorized access and use, we use security measures that comply with federal law. These measures include computer safeguards and secured files and buildings. |
How does FAM Funds (Fenimore Asset Management Trust) collect my personal information? | We collect your personal information, for example, when you: ● open an account ● direct us to buy securities ● direct us to sell your securities ● make deposits or withdrawals from your account ● tell us about your investment or retirement portfolio |
Why can’t I limit all sharing? | Federal law gives you the right to limit only: ● sharing for affiliates’ everyday business purposes - information about your creditworthiness ● affiliates from using your information to market to you ● sharing for nonaffiliates to market to you State laws and individual companies may give you additional rights to limit sharing. See below for more on your rights under state law. |
| | |
Definitions |
Affiliates | Companies related by common ownership or control. They can be financial and nonfinancial companies. ● FAM Funds (Fenimore Asset Management Trust) shares with our affiliates. |
Nonaffiliates | Companies not related by common ownership or control. They can be financial and nonfinancial companies. ● FAM Funds (Fenimore Asset Management Trust) does not share with nonaffiliates so they can market to you. |
Joint Marketing | A formal agreement between nonaffiliated financial companies that together market financial products or services to you. ● FAM Funds (Fenimore Asset Management Trust) does not market jointly. |
Notice to European Union Investors:
Please be advised that our privacy policy is designed to comply solely with applicable U.S. law. It is the general policy of FAM Funds (Fenimore Asset Management Trust) to not offer or sell their shares to individuals resident in any member state of the European Union (the “EU”). Accordingly, the Funds does not offer goods or services to EU residents or monitor the behavior of EU residents, and are therefore not subject to the personal data protection requirements of the EU’s General Data Protection Regulation (“GDPR”) provisions that are otherwise applicable to certain activities with respect to the personal data of investors resident in the EU.
THIS PAGE INTENTIONALLY LEFT BLANK

384 North Grand Street
PO Box 399
Cobleskill, NY 12043
800.932.3271 / famfunds.com
Distributed by Fenimore Securities, Inc. Member FINRA/SIPC
As of the end of the period covered by this report, the registrant has adopted a code of ethics that applies to the registrant’s principal executive officer, principal financial officer, principal accounting officer or controller, or persons performing similar functions, regardless of whether these individuals are employed by the registrant or a third party. The Registrant has undertaken in this report filed on Form N-CSR to provide to any person without charge, upon request by calling 1-(800) 932-3271, a copy of such code of ethics. Pursuant to Item 13(a)(1), a copy of registrant’s code of ethics is filed as an exhibit to this Form N-CSR. During the period covered by this report, the code of ethics has not been amended, and the registrant has not granted any waivers, including implicit waivers, from the provisions of the code of ethics.
| Item 3. | Audit Committee Financial Expert. |
The registrant’s board of trustees has determined that Fred Lager, Paul A. Keller, Donald J. Boteler and Kevin J. McCoy are each an "audit committee financial expert" and are "independent", as these terms are defined in this Item.
| Item 4. | Principal Accountant Fees and Services. |
| (a) | Audit Fees. The aggregate fees billed for professional services rendered by the principal accountant for the audit of the registrant’s annual financial statements or for services that are normally provided by the accountant in connection with statutory and regulatory filings or engagements were $88,500 and $88,500 with respect to the registrant’s fiscal years ended December 31, 2018 and December 31, 2017, respectively. |
| (b) | Audit-Related Fees. No fees were billed in either of the last two fiscal years for assurance and related services by the principal accountant that are reasonably related to the performance of the audit of the registrant’s financial statements and are not reported under paragraph (a) of this Item. |
| (c) | Tax Fees. The aggregate fees billed for professional services rendered by the principal accountant for tax compliance, tax advice, and tax planning were $12,500 and $12,500 with respect to the registrant’s fiscal years ended December 31, 2018 and December 31, 2017, respectively. The services comprising these fees are the preparation of the registrant’s federal income and excise tax returns. |
| (d) | All Other Fees. No fees were billed in either of the last two fiscal years for products and services provided by the principal accountant, other than the services reported in paragraphs (a) through (c) of this Item. |
| (e)(1) | All services to be performed for the Registrant by BBD, LLP must be pre-approved by the audit committee. With respect to the fiscal years ended December 31, 2018 and December 31, 2017, all services performed were pre-approved by the committee. |
| (e)(2) | 100 percent of any fees for services described in each of paragraphs (b) through (d) of this item were approved by the audit committee pursuant to paragraph (c)(7)(i)(C) of Rule 2-01 of Regulation S-X. |
| (f) | Less than 50% of hours expended on the principal accountant’s engagement to audit the registrant’s financial statements for the most recent fiscal year were attributed to work performed by persons other than the principal accountant’s full-time, permanent employees. |
| (g) | With respect to the fiscal years ended December 31, 2018 and December 31, 2017, aggregate non-audit fees of $12,500 and $12,500, respectively, were billed by the registrant’s principal accountant for services rendered to the registrant. With respect to the fiscal years ended December 31, 2018 and December 31, 2017, aggregate non-audit fees of $8,200 and $8,200, respectively, were billed by the registrant’s accountant for professional services rendered to the registrant’s affiliated broker-dealer. With respect to the fiscal years ended December 31, 2018 and December 31, 2017, aggregate non-audit fees of $18,000 and $18,000, respectively, were billed by the registrant’s accountant for professional services rendered to the registrant’s affiliated Private Offering-Limited Liability Company. |
| (h) | The principal accountant has not provided any non-audit services to the registrant’s investment adviser (not including any sub-adviser whose role is primarily portfolio management and is subcontracted with or overseen by another investment adviser), and any entity controlling, controlled by, or under common control with the investment adviser that provides ongoing services to the registrant. |
| Item 5. | Audit Committee of Listed Registrants. |
Not applicable
| Item 6. | Schedule of Investments. |
| (a) | See Schedule I (Investments in securities of unaffiliated issuers) |
| Item 7. | Disclosure of Proxy Voting Policies and Procedures for Closed-End Management Investment Companies. |
Not applicable
| Item 8. | Portfolio Managers of Closed-End Management Investment Companies. |
Not applicable
| Item 9. | Purchases of Equity Securities by Closed-End Management Investment Company and Affiliated Purchasers. |
Not applicable
| Item 10. | Submission of Matters to a Vote of Security Holders. |
The registrant has not adopted procedures by which shareholders may recommend nominees to the registrant’s board of trustees.
| Item 11. | Controls and Procedures. |
(a) Based on their evaluation of the registrant’s disclosure controls and procedures (as defined in Rule 30a-3(c) under the Investment Company Act of 1940) as of a date within 90 days of the filing date of this report, the registrant’s principal executive officer and principal financial officer have concluded that such disclosure controls and procedures are reasonably designed and are operating effectively to ensure that material information relating to the registrant, including its consolidated subsidiaries, is made known to them by others within those entities, particularly during the period in which this report is being prepared, and that the information required in filings on Form N-CSR is recorded, processed, summarized, and reported on a timely basis.
(b) There were no changes in the registrant’s internal control over financial reporting (as defined in Rule 30a-3(d) under the Investment Company Act of 1940) that occurred during the second fiscal quarter of the period covered by this report that have materially affected, or are reasonably likely to materially affect, the registrant’s internal control over financial reporting.
| Item 12. | Disclosure of Securities Lending Activities for Closed-End Management Investment Companies. |
Not applicable
File the exhibits listed below as part of this Form. Letter or number the exhibits in the sequence indicated.
(a)(1) Any code of ethics, or amendment thereto, that is the subject of the disclosure required by Item 2, to the extent that the registrant intends to satisfy the Item 2 requirements through filing of an exhibit: Attached hereto
(a)(2) A separate certification for each principal executive officer and principal financial officer of the registrant as required by Rule 30a-2(a) under the Act (17 CFR 270.30a-2(a)): Attached hereto
(a)(3) Any written solicitation to purchase securities under Rule 23c-1 under the Act (17 CFR 270.23c-1) sent or given during the period covered by the report by or on behalf of the registrant to 10 or more persons: Not applicable
(a)(4) Change in the registrant’s independent public accountants. Not applicable
(b) Certifications required by Rule 30a-2(b) under the Act (17 CFR 270.30a-2(b)): Attached hereto
| Exhibit 99.CODE ETH | Code of Ethics |
| Exhibit 99.CERT | Certifications required by Rule 30a-2(a) under the Act |
| Exhibit 99.906CERT | Certifications required by Rule 30a-2(b) under the Act |
SIGNATURES
Pursuant to the requirements of the Securities Exchange Act of 1934 and the Investment Company Act of 1940, the registrant has duly caused this report to be signed on its behalf by the undersigned, thereunto duly authorized.
| (Registrant) | Fenimore Asset Management Trust | | |
| | | | |
| By (Signature and Title)* | /s/ Thomas O. Putnam | |
| | | Thomas O. Putnam, President | |
| | | | |
| Date | March 6, 2019 | | |
| | | | |
| Pursuant to the requirements of the Securities Exchange Act of 1934 and the Investment Company Act of 1940, this report has been signed below by the following persons on behalf of the registrant and in the capacities and on the dates indicated. |
| | | | |
| By (Signature and Title)* | /s/ Thomas O. Putnam | |
| | | Thomas O. Putnam, President | |
| | | | |
| Date | March 6, 2019 | | |
| | | | |
| By (Signature and Title)* | /s/ Michael F. Balboa | |
| | | Michael F. Balboa, Treasurer | |
| | | | |
| Date | March 6, 2019 | | |
| * | Print the name and title of each signing officer under his or her signature. |