8
Fourth Quarter 2008 Earnings –
Full Year 2008 Results
Core Results FY2008 - $7.3 Billion vs. $4.4 Billion in FY2007
Core EPS $8.95 (diluted) vs. $5.25 in FY2007
Net Income FY2008 - $6.9 Billion vs. $5.4 Billion in FY2007
EPS $8.35 (diluted) vs. $6.44 in FY2007
2008 Net Income includes after-tax charges of $491 mm.
2007 Net Income includes an after-tax benefit of $1 Billion.
2008 Disclosure Reclassification:
We have broken out oil and gas production taxes and ad valorem taxes into
a separate line item called “taxes – other than on income”.
This highlights their sensitivity to product price variations;
These taxes were $2.62/boe in 2008 compared to $1.97/boe in 2007.
Oil and gas cash production costs (excl. the taxes above) were $12.13/boe
for 2008 versus $10.37/boe in 2007.
Increase is due to higher maintenance, workovers and field operating costs.

9
Fourth Quarter 2008 Earnings –
2008 Oil & Gas Reserves
We currently estimate that we replaced approximately 200%
of our oil and gas production in 2008.
This excludes the effect of price changes from 2007 to 2008.
Including the effect of price changes, we estimate that we
replaced around 150% of our 2008 production.
Slightly over half of the reserve additions, excluding effect of
price changes, came from internal sources resulting in over
100% reserve replacement.
Major reserve increases were in:
the California properties;
the Permian and the Rockies, and;
Oman.
In aggregate, these areas constituted more than half of such reserve
adds.
9

10
Fourth Quarter 2008 Earnings – Capital Spending
Last year’s capital program was about $4.7 billion, and we
spent another $4.7 billion for acquisitions.
As a result, we have accumulated a sizeable inventory of projects which can
be delayed until the industry cost structure is in line with product prices.
We believe that the service company cost structure is more
reflective of an $80 oil environment rather than a $40 one.
An illustration of our ability to defer drilling is that we have 5 mm net acres
in the US;
70% of this acreage is held by production;
about 10% consists of long-term leases, with many years on average to run,
and;
the remainder in mineral acres held in perpetuity.
This year’s capital program of $3.5 billion will focus on
ensuring that our returns remain well above our cost of capital
given current oil and gas prices and contractor costs.
About 80% of the capital will be in Oil and Gas and the
remainder in Midstream and Chemical.
10

11
Fourth Quarter 2008 Earnings – Capital Spending
Gas drilling with less than $5 per mcf gas is unattractive.
We will continue to fully fund much of our Middle East
operations, successful exploration programs in California,
Utah, and exploration in Argentina.
Formerly "quick payout" wells in the Permian and California
will be deferred until they become "quick payout" again.
We will continue to fund our Midstream and CO2 programs.
Expect our capital run rate in 1Q09 to be greater than the $3.5
billion level and will decline all year unless economic
conditions improve.
The effect of this program on our production should be modest in 2009, around
10 mboe/d, with a probable production range of 620 to 660 mboe/d and, with
about 630 to 650 mboe/d in 1Q09.
Year-over-year, Argentina and Oman will show the most growth.
11

12
Fourth Quarter 2008 Earnings – Capital Spending
We are also focusing on internal costs.
Some reductions in overhead will be made this year which should improve our
overhead levels by at least $1/boe.
We are renegotiating our supplier contracts to further reduce
costs and are laying down rigs, including paying cancellation
costs when that makes sense.
We expect these efforts to result in a reduction in the cost of executing our
capital programs, as well as, a reduction of our operating expenses.
Oxy’s focus has been and will continue to be delivering
returns well in excess of our cost of capital.
When costs and prices are inline, our capital program will be
boosted and the project inventory worked down faster.
12
13
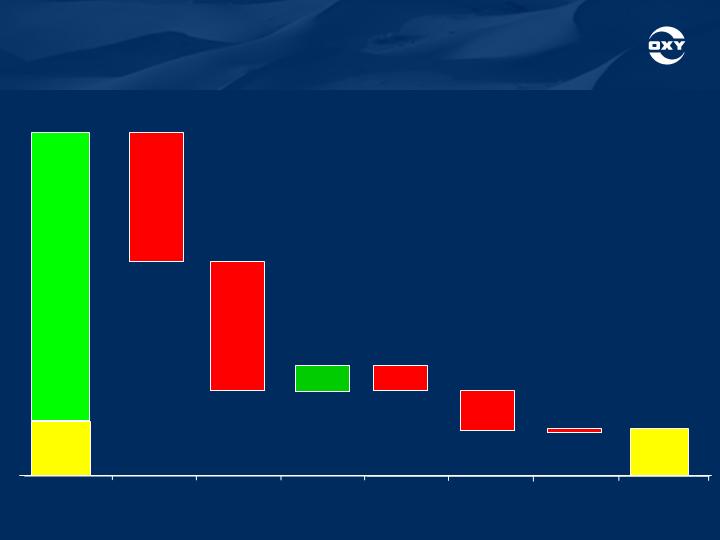
Fourth Quarter 2008 Earnings –
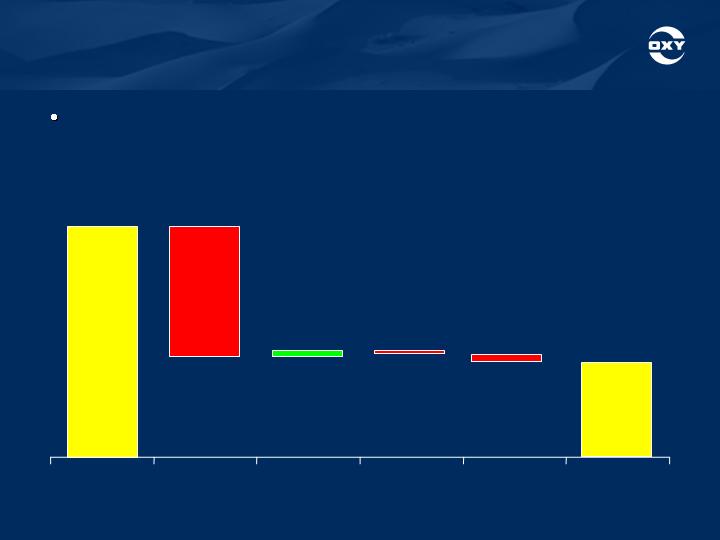
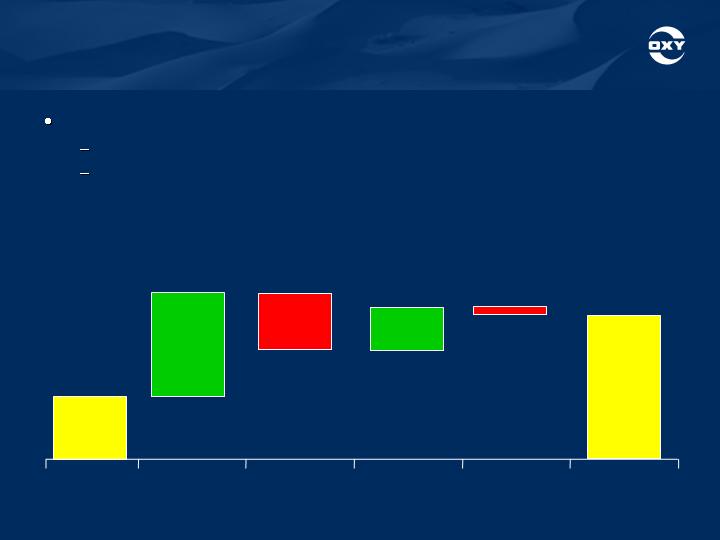
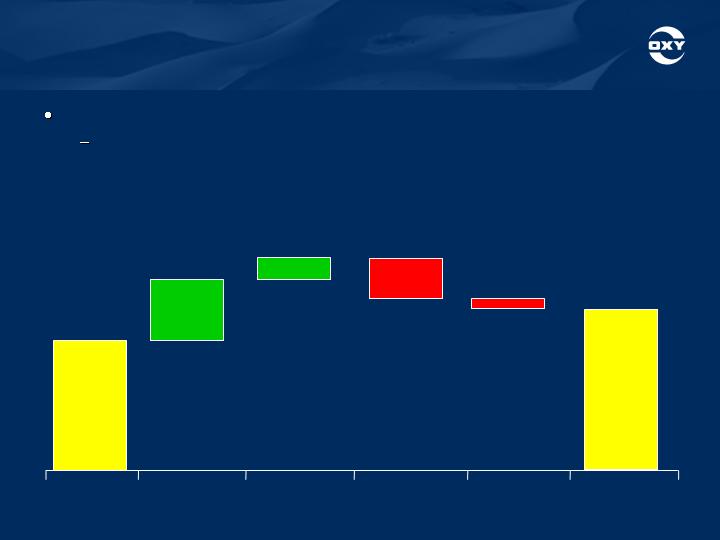
Full Year 2008 Cash Flow
($ in millions)
$12,700
Cash
Flow From
Operations
$10,700
Beginning
Cash
$2,000
Available
Cash
$4,700
Capex
$4,700
Acquisitions
$950
Debt
$940
Dividends
$1,500
Share
Repurchase
$10
Other
$1,800
Ending Cash
Balance
12/31/08
13

14
Fourth Quarter 2008 Earnings –
Shares Outstanding, Debt and Returns
Shares Outstanding (mm)
2008
12/31/08
Weighted Average Basic
817.6
Weighted Average Diluted
820.8
Basic Shares Outstanding
810.4
Diluted Shares Outstanding
813.5
2008
2007
Debt/Capital
9%
7%
ROE
27%
26%
ROCE*
25%
24%
*See the investor relations supplemental schedules for the reconciliation of non-GAAP items.
14

15
Fourth Quarter 2008 Earnings - Outlook
We expect 1Q09 exploration expense to be about $60 mm.
We expect 1Q09 Chemical earnings to be $100 mm.
High caustic soda margins are expected to continue through the period, offset
by continued weakness in the construction and housing markets impacting
domestic demand.
Despite the difficult economic conditions, exports are anticipated to show
modest improvement over abysmal demand of 4Q08.
We expect our combined worldwide tax rate to be about 46%
in 1Q09, compared to 40% for full-year 2008.
Increase is caused by higher expected foreign-sourced income expected in
2009 as a percentage of total income.
We expect our Oil & Gas DD&A expense for 2009 to be
approximately $11.50/boe. Depreciation for the other two
segments should be approximately $400 mm.
We expect to have severance and similar charges in 1Q09.
15
Occidental Petroleum Corporation
Return on Capital Employed (% )
($ Millions)
Reconciliation to Generally Accepted Accounting Principles (GAAP) | | 2007 | 2008 | | | | |
GAAP measure - earnings applicable to common shareholders | | | 5,400 | | | 6,857 | | | | | |
Interest expense | | | 199 | | | 26 | | | | | |
Tax effect of interest expense | | | (70 | ) | | (9 | ) | | | | |
Earnings before tax-effected interest expense | | | 5,529 | | | 6,874 | | | | | |
| | | | | | | | | | | |
GAAP stockholders' equity | | | 22,823 | | | 27,300 | | | | | |
| | | | | | | | | | | |
DEBT | | | | | | | | | | | |
GAAP debt | | | | | | | | | | | |
Debt, including current maturities | | | 1,788 | | | 2,747 | | | | | |
Non-GAAP debt | | | | | | | | | | | |
Capital lease obligation | | | 25 | | | 25 | | | | | |
Subsidiary preferred stock | | | - | | | - | | | | | |
Total debt | | | 1,813 | | | 2,772 | | | | | |
| | | | | | | | | | | |
Total capital employed | | | 24,636 | | | 30,072 | | | | | |
| | | | | | | | | | | |
Return on Capital Employed (%) | | | 23.6 | | | 25.1 | | | | | |