EXHIBIT 99.4
First Quarter 2010
First Quarter 2010
Earnings Conference Call
Earnings Conference Call
April 29, 2010
April 29, 2010
1

2
First Quarter 2010 Earnings - Highlights
• Core Results - $1.1 Billion vs. $407 Million in 1Q09
– Core EPS $1.32 (diluted) vs. $0.50 in 1Q09.
• Net Income - $1.1 Billion vs. $368 Million in 1Q09
– EPS $1.31 (diluted) vs. $0.45 in 1Q09.
– For comparability purposes, all prior period volumes, and
volume based statistics, such as operating costs per
barrel, are being stated on a pretax basis as we
previously discussed.
volume based statistics, such as operating costs per
barrel, are being stated on a pretax basis as we
previously discussed.
2
3
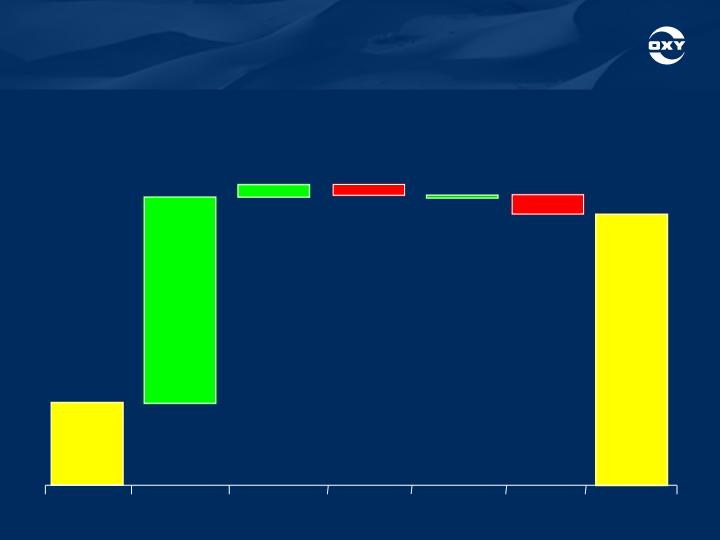
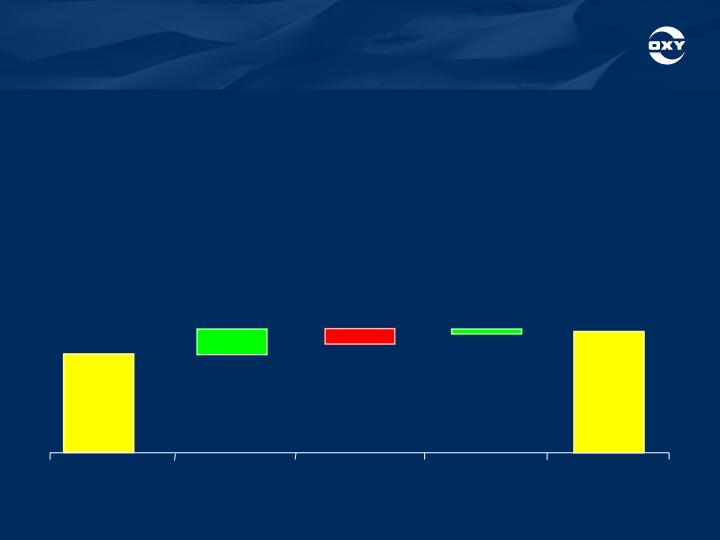
*All Others include: Lower FX gains and higher operating costs.
1Q 09
Sales Price
Sales
Volume
Exploration
Expense
All
Others*
1Q 10
$553
$1,819
$1,385
$85
$2
$132
($ in millions)
$74
Higher
DD&A Rate
First Quarter 2010 Earnings - Oil & Gas
Segment Variance Analysis - 1Q10 vs. 1Q09
Segment Variance Analysis - 1Q10 vs. 1Q09
• Core Results for 1Q10 of $1.819 B vs. $553 mm in 1Q09
– Results reflect significantly higher commodity prices and higher volumes, partially offset by
fully expensing CO2 costs in 2010, and higher DD&A rates.
fully expensing CO2 costs in 2010, and higher DD&A rates.
3
4
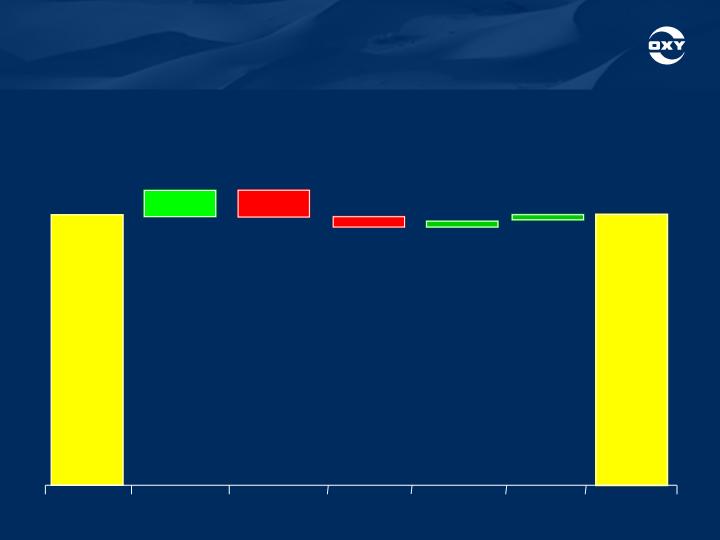
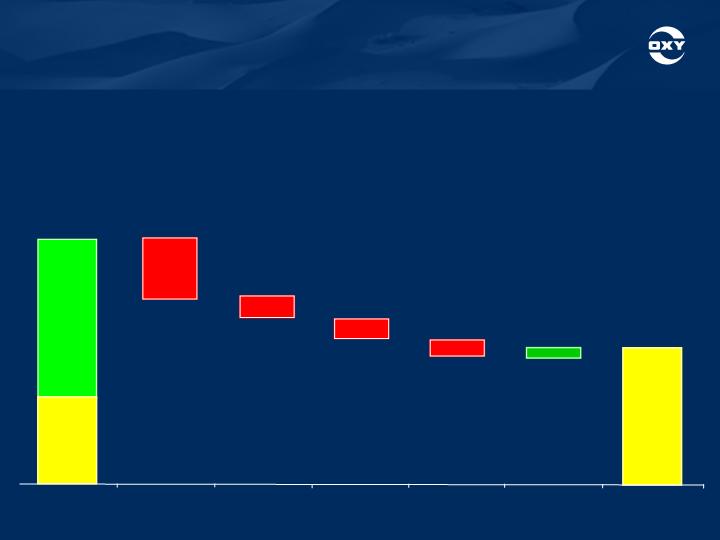
*All Others include: Lower operating and administrative costs, partially offset by higher CO2 costs.
4Q 09
Sales Price
Sales
Volume
Exploration
Expense
All
Others*
1Q 10
$1,813
$1,819
$174
$179
$43
$37
($ in millions)
$69
Higher
DD&A Rate
First Quarter 2010 Earnings - Oil & Gas
Segment Variance Analysis - 1Q10 vs. 4Q09
Segment Variance Analysis - 1Q10 vs. 4Q09
• Core Results for 1Q10 of $1.819 B vs. $1.813 B in 4Q09
– Similar sequential results reflect higher oil and natural gas prices, partially offset by
increased DD&A rates, the effect of fully expensing CO2, and lower total volumes.
increased DD&A rates, the effect of fully expensing CO2, and lower total volumes.
4

5
1Q10 4Q09
1Q10 4Q09
Reported Segment Earnings ($ mm) $1,819 $1,643
Reported Segment Earnings ($ mm) $1,819 $1,643
WTI Oil Price ($/bbl) $78.71 $76.19
WTI Oil Price ($/bbl) $78.71 $76.19
NYMEX Gas Price ($/mcf) $5.39 $4.29
NYMEX Gas Price ($/mcf) $5.39 $4.29
Oxy’s Realized Prices
Oxy’s Realized Prices
Worldwide Oil ($/bbl) $71.88 $69.39
Worldwide Oil ($/bbl) $71.88 $69.39
US Natural Gas ($/mcf) $5.62 $4.37
US Natural Gas ($/mcf) $5.62 $4.37
First Quarter 2010 Earnings -
Oil & Gas Segment
Oil & Gas Segment
5

6
First Quarter 2010 Earnings - Oil & Gas
Segment Variance Analysis - 1Q10 vs. 4Q09
Segment Variance Analysis - 1Q10 vs. 4Q09
First Quarter 2010 Earnings - Oil & Gas
Segment Variance Analysis - 1Q10 vs. 4Q09
Segment Variance Analysis - 1Q10 vs. 4Q09
1Q10 4Q09
• Oil and Gas Production Volumes (mboe/d) 743 717
– sequential increase of over 3.5%.
• Sequential production volume increase includes:
– In Bahrain, daily volume increases of 2,000 bbl of oil and 126 mmcf
of gas;
of gas;
– Domestic operations + 5 mboe/d largely in the Kern County
discovery area;
discovery area;
– Partially offsetting these increases were 5 mboe/d of lower volumes
resulting from the Dolphin gas plant maintenance, which shut-in
50% of the production for approximately two weeks.
resulting from the Dolphin gas plant maintenance, which shut-in
50% of the production for approximately two weeks.
6

7
First Quarter 2010 Earnings - Oil & Gas
Segment Variance Analysis - 1Q10 vs. 4Q09
Segment Variance Analysis - 1Q10 vs. 4Q09
First Quarter 2010 Earnings - Oil & Gas
Segment Variance Analysis - 1Q10 vs. 4Q09
Segment Variance Analysis - 1Q10 vs. 4Q09
1Q10 4Q09
• Oil and Gas Sales Volumes (mboe/d) 726 722
• Sales volumes were lower than the production volumes due to the timing
of liftings of 13 mboe/d in the Middle East/North Africa and Latin America,
of which 11 mboe/d were in Libya.
of liftings of 13 mboe/d in the Middle East/North Africa and Latin America,
of which 11 mboe/d were in Libya.
• Exploration expense was $56 million in 1Q10.
• Oil and gas cash production costs, excluding production and property
taxes, were $10.05 a boe for 1Q10, compared to last year's twelve-month
costs of $9.37 a boe. The increase reflects $0.32 a boe higher CO2 costs,
due to our decision to expense 100% of CO2 injected beginning in 2010,
and higher field support operations and maintenance costs.
taxes, were $10.05 a boe for 1Q10, compared to last year's twelve-month
costs of $9.37 a boe. The increase reflects $0.32 a boe higher CO2 costs,
due to our decision to expense 100% of CO2 injected beginning in 2010,
and higher field support operations and maintenance costs.
• Taxes - other than on income were $1.82 per boe for 1Q10 compared to
$1.60 per boe for all of 2009. These costs, which are sensitive to product
prices, reflect the effect of higher crude oil and gas prices in 2010.
$1.60 per boe for all of 2009. These costs, which are sensitive to product
prices, reflect the effect of higher crude oil and gas prices in 2010.
7

8
First Quarter 2010 Earnings - Oil & Gas
Segment Variance Analysis - 1Q10 vs. 4Q09
Segment Variance Analysis - 1Q10 vs. 4Q09
First Quarter 2010 Earnings - Oil & Gas
Segment Variance Analysis - 1Q10 vs. 4Q09
Segment Variance Analysis - 1Q10 vs. 4Q09
• As a result of the factors discussed above, 1Q10, compared
to 4Q09 benefitted by:
to 4Q09 benefitted by:
– $174 million from higher prices;
– $43 million lower exploration expense and,
– $62 million of lower cash operating costs and G&A expense.
• These gains were offset by:
– the effect of lower liftings of $102 million;
– the effect of two fewer sales days of $77 million;
– higher DD&A rates of $69 million and,
– higher CO2 costs of $25 million.
8
9
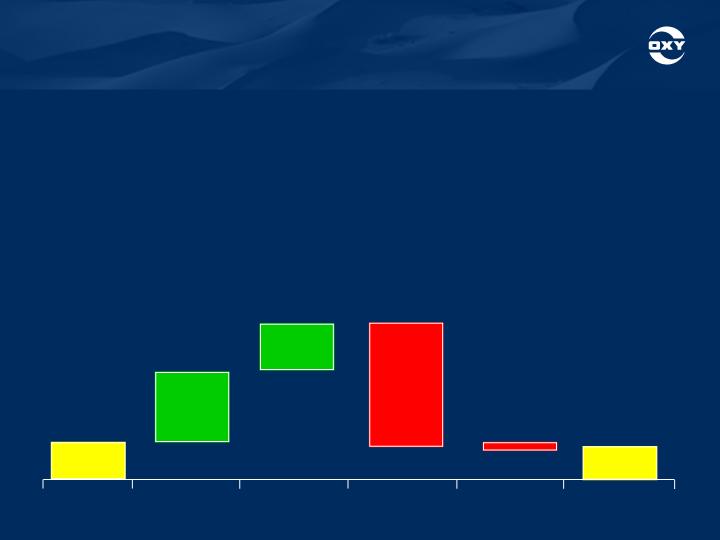
4Q 09
Sales
Volume/Mix
Operations/
Manufacturing*
Sales Price
All Others
1Q 10
$33
$30
$64
$53
$113
$7
($ in millions)
*Higher energy and feedstock costs.
First Quarter 2010 Earnings - Chemical
Segment Variance Analysis - 1Q10 vs. 4Q09
Segment Variance Analysis - 1Q10 vs. 4Q09
First Quarter 2010 Earnings - Chemical
Segment Variance Analysis - 1Q10 vs. 4Q09
Segment Variance Analysis - 1Q10 vs. 4Q09
• Core Results for 1Q10 of $30 mm vs. $33 mm in 4Q09
• Core Results for 1Q10 of $30 mm vs. $33 mm in 4Q09
– Reflects the continued weakness in domestic markets, particularly in the housing and
construction sectors, and the significant margin erosion that was experienced
through 2009 that carried into 1Q10.
construction sectors, and the significant margin erosion that was experienced
through 2009 that carried into 1Q10.
9
10
($ in millions)
($ in millions)
4Q 09
Marketing
and
Trading
Dolphin
Pipeline
All Others
1Q 10
$81
$94
$21
$13
$5
First Quarter 2010 Earnings - Midstream
Segment Variance Analysis - 1Q10 vs. 4Q09
Segment Variance Analysis - 1Q10 vs. 4Q09
• Core Results for 1Q10 of $94 mm vs. $81 mm in 4Q09
– Increase in earnings was due to improved margins in the marketing and trading
business, partially offset by lower pipeline income from Dolphin from the two-week
partial shutdown of the gas plant for maintenance.
business, partially offset by lower pipeline income from Dolphin from the two-week
partial shutdown of the gas plant for maintenance.
– Phibro’s earnings for 1Q10 were not significant.
10

11
First Quarter 2010 Earnings -
Capital Spending
Capital Spending
First Quarter 2010 Earnings -
Capital Spending
Capital Spending
• Capital spending for the first quarter of 2010 was about $850
million.
million.
• Capital spending for the first quarter of 2010 was about $850
million.
million.
– Capital expenditures by segment were 80 percent in Oil and Gas, 15
percent in Midstream with the remainder in Chemicals.
percent in Midstream with the remainder in Chemicals.
– Capital expenditures by segment were 80 percent in Oil and Gas, 15
percent in Midstream with the remainder in Chemicals.
percent in Midstream with the remainder in Chemicals.
– The spending run rate will increase through the year as we ramp up
in California, Bahrain and Iraq.
in California, Bahrain and Iraq.
– The spending run rate will increase through the year as we ramp up
in California, Bahrain and Iraq.
in California, Bahrain and Iraq.
– Our total year forecast for capital spending has been increased by
$200 million to $4.5 billion.
$200 million to $4.5 billion.
– Our total year forecast for capital spending has been increased by
$200 million to $4.5 billion.
$200 million to $4.5 billion.
11
12
$3,400
$225
$270
$300
$1,900
Available
Cash
Capex
Debt
Reduction
Dividends
Acquisitions
& Foreign
Bonuses
Ending Cash
Balance
3/31/10
Cash
Flow From
Operations
$2,200
($ in millions)
Beginning
Cash
$1,200
12/31/09
$850
Other
$145
– Free Cash Flow for 1Q10 after capex and dividends but before
acquisitions and debt reduction was about $1.1 billion.
acquisitions and debt reduction was about $1.1 billion.
– Free Cash Flow for 1Q10 after capex and dividends but before
acquisitions and debt reduction was about $1.1 billion.
acquisitions and debt reduction was about $1.1 billion.
First Quarter 2010 Earnings -
2010 YTD Cash Flow
2010 YTD Cash Flow
12

13
First Quarter 2010 Earnings -
Shares Outstanding and Debt
Shares Outstanding and Debt
Shares Outstanding (mm) 1Q10 3/31/10
Weighted Average Basic 812.1
Weighted Average Diluted 813.5
Basic Shares Outstanding 812.2
Diluted Shares Outstanding 813.6
3/31/10 12/31/09
Debt/Capital 8% 9%
13

14
First Quarter 2010 Earnings -
Oil and Gas Production - 2Q10 Outlook
Oil and Gas Production - 2Q10 Outlook
• We expect oil and gas sales volumes to be in the range of
750 to 760 mboe/d at about current oil prices, with
production slightly above these levels.
750 to 760 mboe/d at about current oil prices, with
production slightly above these levels.
• Production volume increases in 2Q10 are expected from the
following sources:
following sources:
– Domestically, the Kern County discovery area is expected to show
modest improvement during 2Q10.
modest improvement during 2Q10.
• The production continues to be constrained by a lack of additional
processing capacity.
processing capacity.
• More significant increases are expected late in 2Q10, when we add the
skid mounted gas processing facilities.
skid mounted gas processing facilities.
• We are continuing with drilling and have completed a number of wells.
• We have sufficient completed wells to fill the entire capacity of the skid
mounted processing facilities.
mounted processing facilities.
• Our oil production is also constrained by the lack of gas processing
capacity, since these wells also produce natural gas.
capacity, since these wells also produce natural gas.
– The Midcontinent Gas region where we are currently drilling shallow
oil wells is also expected to show production growth.
oil wells is also expected to show production growth.
14

15
First Quarter 2010 Earnings -
Oil and Gas Production - 2Q10 Outlook
Oil and Gas Production - 2Q10 Outlook
• In the Middle East, increases are expected in the Oman
Mukhaizna field and in Dolphin where the plant maintenance
down-time in 1Q10 is not expected to repeat.
Mukhaizna field and in Dolphin where the plant maintenance
down-time in 1Q10 is not expected to repeat.
• In Latin America, assuming no labor related stoppages,
increases are expected in Argentina, where the current run
rate is about 2 mboe/d higher than 1Q10, which was
negatively affected by a short strike.
increases are expected in Argentina, where the current run
rate is about 2 mboe/d higher than 1Q10, which was
negatively affected by a short strike.
– The Argentine provincial legislature passed enabling legislation in the
first quarter that will allow a 10-year extension for hydrocarbon
concessions.
first quarter that will allow a 10-year extension for hydrocarbon
concessions.
– We are now negotiating the specific contract terms of a 10-year
extension of our concession.
extension of our concession.
15

16
First Quarter 2010 Earnings - 2Q10 Outlook
• Commodity Price Sensitivity - Earnings
– At current market prices, a $1.00 per barrel change in oil prices impacts oil and
gas quarterly earnings before income taxes by about $36 mm;
gas quarterly earnings before income taxes by about $36 mm;
– A swing of $0.50 per mm BTU in domestic gas prices has a $31 mm impact on
quarterly pretax income; the current NYMEX gas price is around $4 p/mcf.
quarterly pretax income; the current NYMEX gas price is around $4 p/mcf.
• We expect 2Q10 exploration expense to be about $80 mm for
seismic and drilling for our exploration programs.
seismic and drilling for our exploration programs.
16

17
First Quarter 2010 Earnings - 2Q10 Outlook
First Quarter 2010 Earnings - 2Q10 Outlook
• For the Chemical segment:
– Demand for caustic soda and vinyls is expected to continue to
improve in both the US and the international markets.
improve in both the US and the international markets.
– Improving caustic soda pricing and low natural gas prices will
contribute to margin improvement.
contribute to margin improvement.
– The Chemical segment is expected to provide about $80 mm of
earnings in 2Q10.
earnings in 2Q10.
• We expect our combined worldwide tax rate in 2Q10 to be
about 42 percent depending on the split between domestic
and foreign sourced income.
about 42 percent depending on the split between domestic
and foreign sourced income.
17

18
18