Free signup for more
- Track your favorite companies
- Receive email alerts for new filings
- Personalized dashboard of news and more
- Access all data and search results
Filing tables
Filing exhibits
Related financial report
OXY similar filings
- 13 Dec 10 Margaret M. Foran Elected to Occidental Petroleum Board of Directors
- 13 Dec 10 Regulation FD Disclosure
- 10 Dec 10 Regulation FD Disclosure
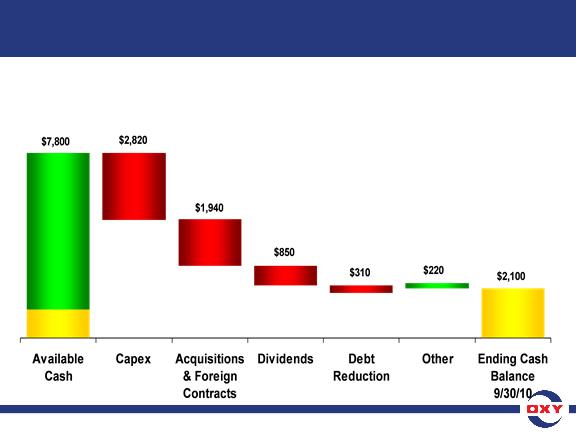
- 19 Oct 10 Occidental Petroleum Announces Third Quarter of 2010 Results
- 14 Oct 10 Occidental Petroleum Elects Howard I. Atkins to Board of Directors
- 3 Aug 10 Departure of Directors or Certain Officers
- 27 Jul 10 Occidental Petroleum Announces Second Quarter and First Six Months of 2010 Results
Filing view
External links