EXHIBIT 99.3
Investor Relations Supplemental Schedules

| Investor Relations Supplemental Schedules | |||||||
| Summary | |||||||
| ($ Millions) | |||||||
| 3Q 2010 | 3Q 2009 | ||||||
| Reported Net Income | $1,191 | $927 | |||||
| EPS - Diluted | $1.46 | $1.14 | |||||
| Core Results | $1,196 | $929 | |||||
| EPS - Diluted | $1.47 | $1.14 | |||||
| Total Worldwide Sales Volumes (mboe/day) | 749 | 702 | |||||
| Total Worldwide Crude Oil Realizations ($/BBL) | $70.71 | $62.79 | |||||
| Domestic Natural Gas Realizations ($/MCF) | $4.20 | $3.04 | |||||
| Wtd. Average Basic Shares O/S (mm) | 812.7 | 811.8 | |||||
| Wtd. Average Diluted Shares O/S (mm) | 813.9 | 814.4 | |||||
| YTD 2010 | YTD 2009 | ||||||
| Reported Net Income | $3,318 | $1,977 | |||||
| EPS - Diluted | $4.07 | $2.43 | |||||
| Core Results | $3,336 | $2,025 | |||||
| EPS - Diluted | $4.09 | $2.48 | |||||
| Total Worldwide Sales Volumes (mboe/day) | 741 | 711 | |||||
| Total Worldwide Crude Oil Realizations ($/BBL) | $71.57 | $51.44 | |||||
| Domestic Natural Gas Realizations ($/MCF) | $4.67 | $3.15 | |||||
| Wtd. Average Basic Shares O/S (mm) | 812.4 | 811.1 | |||||
| Wtd. Average Diluted Shares O/S (mm) | 813.8 | 813.9 | |||||
| Shares Outstanding (mm) | 812.6 | 811.7 | |||||
| Cash Flow from Operations | $ | 6,600 | $ | 3,800 | |||
1
Investor Relations Supplemental Schedules
| 2010 Third Quarter | ||||||||||||||
| Net Income (Loss) | ||||||||||||||
| ($ millions) | ||||||||||||||
| Reported | Core | |||||||||||||
| Income | Significant Items Affecting Income | Results | ||||||||||||
| Oil & Gas | $ | 1,745 | $ | 1,745 | ||||||||||
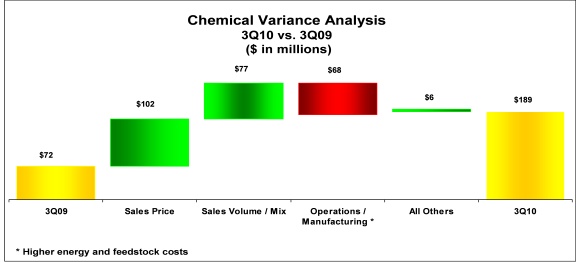
| Chemical | 189 | 189 | ||||||||||||
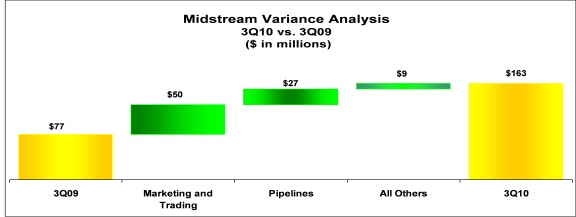
| Midstream, marketing and other | 163 | 163 | ||||||||||||
| Corporate | ||||||||||||||
| Interest expense, net | (19 | ) | (19 | ) | ||||||||||
| Other | (66 | ) | (66 | ) | ||||||||||
| Taxes | (816 | ) | (816 | ) | ||||||||||
| Income from continuing operations | 1,196 | - | 1,196 | |||||||||||
| Discontinued operations, net of tax | (5 | ) | 5 | Discontinued operations, net | - | |||||||||
| Net Income | $ | 1,191 | $ | 5 | $ | 1,196 | ||||||||
| Basic Earnings Per Common Share | ||||||||||||||
| Income from continuing operations | $ | 1.47 | ||||||||||||
| Discontinued operations, net | (0.01 | ) | ||||||||||||
| Net Income | $ | 1.46 | $ | 1.47 | ||||||||||
| Diluted Earnings Per Common Share | ||||||||||||||
| Income from continuing operations | $ | 1.47 | ||||||||||||
| Discontinued operations, net | (0.01 | ) | ||||||||||||
| Net Income | $ | 1.46 | $ | 1.47 | ||||||||||
2
Investor Relations Supplemental Schedules
| OCCIDENTAL PETROLEUM | ||||||||||||||
| 2009 Third Quarter | ||||||||||||||
| Net Income (Loss) | ||||||||||||||
| ($ millions) | ||||||||||||||
| Reported | Core | |||||||||||||
| Income | Significant Items Affecting Income | Results | ||||||||||||
| Oil & Gas | $ | 1,464 | $ | 1,464 | ||||||||||
| Chemical | 72 | 72 | ||||||||||||
| Midstream, marketing and other | 77 | 77 | ||||||||||||
| Corporate | ||||||||||||||
| Interest expense, net | (33 | ) | (33 | ) | ||||||||||
| Other | (102 | ) | (102 | ) | ||||||||||
| Taxes | (549 | ) | (549 | ) | ||||||||||
| Income from continuing operations | 929 | - | 929 | |||||||||||
| Discontinued operations, net of tax | (2 | ) | 2 | Discontinued operations, net | - | |||||||||
| Net Income | $ | 927 | $ | 2 | $ | 929 | ||||||||
| Basic Earnings Per Common Share | ||||||||||||||
| Income from continuing operations | $ | 1.14 | ||||||||||||
| Discontinued operations, net | - | |||||||||||||
| Net Income | $ | 1.14 | $ | 1.14 | ||||||||||
| Diluted Earnings Per Common Share | ||||||||||||||
| Income from continuing operations | $ | 1.14 | ||||||||||||
| Discontinued operations, net | - | |||||||||||||
| Net Income | $ | 1.14 | $ | 1.14 | ||||||||||
3
Investor Relations Supplemental Schedules
| OCCIDENTAL PETROLEUM | ||||||||||||||
| 2010 First Nine Months | ||||||||||||||
| Net Income (Loss) | ||||||||||||||
| ($ millions) | ||||||||||||||
| Reported | Core | |||||||||||||
| Income | Significant Items Affecting Income | Results | ||||||||||||
| Oil & Gas | $ | 5,417 | $ | 5,417 | ||||||||||
| Chemical | 327 | 327 | ||||||||||||
| Midstream, marketing and other | 270 | 270 | ||||||||||||
| Corporate | ||||||||||||||
| Interest expense, net | (77 | ) | (77 | ) | ||||||||||
| Other | (256 | ) | (256 | ) | ||||||||||
| Taxes | (2,345 | ) | (2,345 | ) | ||||||||||
| Income from continuing operations | 3,336 | - | 3,336 | |||||||||||
| Discontinued operations, net of tax | (18 | ) | 18 | Discontinued operations, net | - | |||||||||
| Net Income | $ | 3,318 | $ | 18 | $ | 3,336 | ||||||||
| Basic Earnings Per Common Share | ||||||||||||||
| Income from continuing operations | $ | 4.10 | ||||||||||||
| Discontinued operations, net | (0.02 | ) | ||||||||||||
| Net Income | $ | 4.08 | $ | 4.10 | ||||||||||
| Diluted Earnings Per Common Share | ||||||||||||||
| Income from continuing operations | $ | 4.09 | ||||||||||||
| Discontinued operations, net | (0.02 | ) | ||||||||||||
| Net Income | $ | 4.07 | $ | 4.09 | ||||||||||
4
Investor Relations Supplemental Schedules
| OCCIDENTAL PETROLEUM | ||||||||||||||
| 2009 First Nine Months | ||||||||||||||
| Net Income (Loss) | ||||||||||||||
| ($ millions) | ||||||||||||||
| Reported | Core | |||||||||||||
| Income | Significant Items Affecting Income | Results | ||||||||||||
| Oil & Gas | $ | 3,092 | $ | 8 | Rig contract terminations | $ | 3,100 | |||||||
| Chemical | 356 | 356 | ||||||||||||
| Midstream, marketing and other | 154 | 154 | ||||||||||||
| Corporate | ||||||||||||||
| Interest expense, net | (76 | ) | (76 | ) | ||||||||||
| Other | (297 | ) | 40 | Severance | (242 | ) | ||||||||
| 15 | Railcar leases | |||||||||||||
| Taxes | (1,245 | ) | (22 | ) | Tax effect of adjustments | (1,267 | ) | |||||||
| Income from continuing operations | 1,984 | 41 | 2,025 | |||||||||||
| Discontinued operations, net of tax | (7 | ) | 7 | Discontinued operations, net | - | |||||||||
| Net Income | $ | 1,977 | $ | 48 | $ | 2,025 | ||||||||
| Basic Earnings Per Common Share | ||||||||||||||
| Income from continuing operations | $ | 2.44 | ||||||||||||
| Discontinued operations, net | (0.01 | ) | ||||||||||||
| Net Income | $ | 2.43 | $ | 2.49 | ||||||||||
| Diluted Earnings Per Common Share | ||||||||||||||
| Income from continuing operations | $ | 2.44 | ||||||||||||
| Discontinued operations, net | (0.01 | ) | ||||||||||||
| Net Income | $ | 2.43 | $ | 2.48 | ||||||||||
5
Investor Relations Supplemental Schedules
| OCCIDENTAL PETROLEUM | |||||||||||
| Items Affecting Comparability of Core Results Between Periods | |||||||||||
| The item(s) below are included in core results and are shown in this table | |||||||||||
| because they affect the comparability between periods. | |||||||||||
| Pre-tax | |||||||||||
| Income / (Expense) | Third Quarter | Nine Months | |||||||||
| 2010 | 2009 | 2010 | 2009 | ||||||||
| Foreign Exchange Gains & (Losses) * | 2 | (3 | ) | 1 | 28 | ||||||
| *Amounts shown after-tax | |||||||||||
6
Investor Relations Supplemental Schedules
| OCCIDENTAL PETROLEUM | |||||||||||||||
| Worldwide Effective Tax Rate | |||||||||||||||
| QUARTERLY | YEAR-TO-DATE | ||||||||||||||
| 2010 | 2010 | 2009 | 2010 | 2009 | |||||||||||
| REPORTED INCOME | QTR 3 | QTR 2 | QTR 3 | 9 Months | 9 Months | ||||||||||
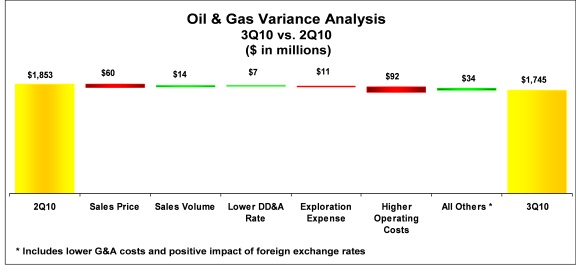
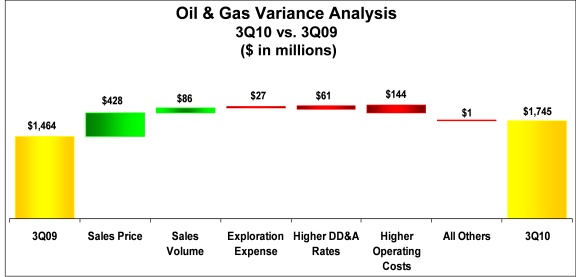
| Oil & Gas | 1,745 | 1,853 | 1,464 | 5,417 | 3,092 | ||||||||||
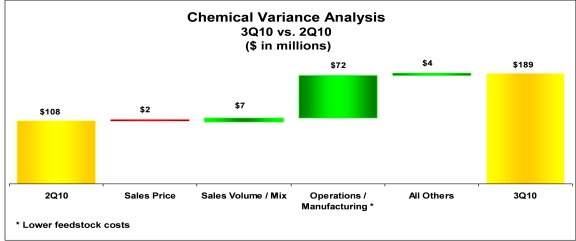
| Chemicals | 189 | 108 | 72 | 327 | 356 | ||||||||||
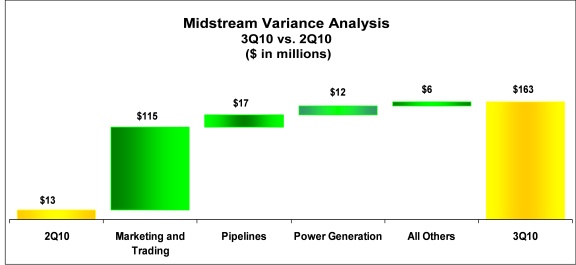
| Midstream, marketing and other | 163 | 13 | 77 | 270 | 154 | ||||||||||
| Corporate & other | (85 | ) | (105 | ) | (135 | ) | (333 | ) | (373 | ) | |||||
| Pre-tax income | 2,012 | 1,869 | 1,478 | 5,681 | 3,229 | ||||||||||
| Income tax expense | |||||||||||||||
| Federal and state | 322 | 329 | 189 | 958 | 349 | ||||||||||
| Foreign | 494 | 471 | 360 | 1,387 | 896 | ||||||||||
| Total | 816 | 800 | 549 | 2,345 | 1,245 | ||||||||||
| Income from continuing operations | 1,196 | 1,069 | 929 | 3,336 | 1,984 | ||||||||||
| Worldwide effective tax rate | 41% | 43% | 37% | 41% | 39% | ||||||||||
| 2010 | 2010 | 2009 | 2010 | 2009 | |||||||||||
| CORE RESULTS | QTR 3 | QTR 2 | QTR 3 | 9 Months | 9 Months | ||||||||||
| Oil & Gas | 1,745 | 1,853 | 1,464 | 5,417 | 3,100 | ||||||||||
| Chemicals | 189 | 108 | 72 | 327 | 356 | ||||||||||
| Midstream, marketing and other | 163 | 13 | 77 | 270 | 154 | ||||||||||
| Corporate & other | (85 | ) | (105 | ) | (135 | ) | (333 | ) | (318 | ) | |||||
| Pre-tax income | 2,012 | 1,869 | 1,478 | 5,681 | 3,292 | ||||||||||
| Income tax expense | |||||||||||||||
| Federal and state | 322 | 329 | 189 | 958 | 371 | ||||||||||
| Foreign | 494 | 471 | 360 | 1,387 | 896 | ||||||||||
| Total | 816 | 800 | 549 | 2,345 | 1,267 | ||||||||||
| Core results | 1,196 | 1,069 | 929 | 3,336 | 2,025 | ||||||||||
| Worldwide effective tax rate | 41% | 43% | 37% | 41% | 38% | ||||||||||
7
Investor Relations Supplemental Schedules
| OCCIDENTAL PETROLEUM | ||||||||||||
| 2010 Third Quarter Net Income (Loss) | ||||||||||||
| Reported Income Comparison | ||||||||||||
| Third | Second | |||||||||||
| Quarter | Quarter | |||||||||||
| 2010 | 2010 | B / (W) | ||||||||||
| Oil & Gas | $ | 1,745 | $ | 1,853 | $ | (108 | ) | |||||
| Chemical | 189 | 108 | 81 | |||||||||
| Midstream, marketing and other | 163 | 13 | 150 | |||||||||
| Corporate | ||||||||||||
| Interest expense, net | (19 | ) | (22 | ) | 3 | |||||||
| Other | (66 | ) | (83 | ) | 17 | |||||||
| Taxes | (816 | ) | (800 | ) | (16 | ) | ||||||
| Income from continuing operations | 1,196 | 1,069 | 127 | |||||||||
| Discontinued operations, net | (5 | ) | (6 | ) | 1 | |||||||
| Net Income | $ | 1,191 | $ | 1,063 | $ | 128 | ||||||
| Earnings Per Common Share | ||||||||||||
| Basic | $ | 1.46 | $ | 1.31 | $ | 0.15 | ||||||
| Diluted | $ | 1.46 | $ | 1.31 | $ | 0.15 | ||||||
| Worldwide Effective Tax Rate | 41% | 43% | 2% | |||||||||
| OCCIDENTAL PETROLEUM | ||||||||||||
| 2010 Third Quarter Net Income (Loss) | ||||||||||||
| Core Results Comparison | ||||||||||||
| Third | Second | |||||||||||
| Quarter | Quarter | |||||||||||
| 2010 | 2010 | B / (W) | ||||||||||
| Oil & Gas | $ | 1,745 | $ | 1,853 | $ | (108 | ) | |||||
| Chemical | 189 | 108 | 81 | |||||||||
| Midstream, marketing and other | 163 | 13 | 150 | |||||||||
| Corporate | ||||||||||||
| Interest expense, net | (19 | ) | (22 | ) | 3 | |||||||
| Other | (66 | ) | (83 | ) | 17 | |||||||
| Taxes | (816 | ) | (800 | ) | (16 | ) | ||||||
| Core Results | $ | 1,196 | $ | 1,069 | $ | 127 | ||||||
| Core Results Per Common Share | ||||||||||||
| Basic | $ | 1.47 | $ | 1.31 | $ | 0.16 | ||||||
| Diluted | $ | 1.47 | $ | 1.31 | $ | 0.16 | ||||||
| Worldwide Effective Tax Rate | 41% | 43% | 2% | |||||||||
8
Investor Relations Supplemental Schedules
9
Investor Relations Supplemental Schedules
| OCCIDENTAL PETROLEUM | ||||||||||||
| 2010 Third Quarter Net Income (Loss) | ||||||||||||
| Reported Income Comparison | ||||||||||||
| Third | Third | |||||||||||
| Quarter | Quarter | |||||||||||
| 2010 | 2009 | B / (W) | ||||||||||
| Oil & Gas | $ | 1,745 | $ | 1,464 | $ | 281 | ||||||
| Chemical | 189 | 72 | 117 | |||||||||
| Midstream, marketing and other | 163 | 77 | 86 | |||||||||
| Corporate | ||||||||||||
| Interest expense, net | (19 | ) | (33 | ) | 14 | |||||||
| Other | (66 | ) | (102 | ) | 36 | |||||||
| Taxes | (816 | ) | (549 | ) | (267 | ) | ||||||
| Income from continuing operations | 1,196 | 929 | 267 | |||||||||
| Discontinued operations, net | (5 | ) | (2 | ) | (3 | ) | ||||||
| Net Income | $ | 1,191 | $ | 927 | $ | 264 | ||||||
| Earnings Per Common Share | ||||||||||||
| Basic | $ | 1.46 | $ | 1.14 | $ | 0.32 | ||||||
| Diluted | $ | 1.46 | $ | 1.14 | $ | 0.32 | ||||||
| Worldwide Effective Tax Rate | 41% | 37% | -4% | |||||||||
| OCCIDENTAL PETROLEUM | ||||||||||||
| 2010 Third Quarter Net Income (Loss) | ||||||||||||
| Core Results Comparison | ||||||||||||
| Third | Third | |||||||||||
| Quarter | Quarter | |||||||||||
| 2010 | 2009 | B / (W) | ||||||||||
| Oil & Gas | $ | 1,745 | $ | 1,464 | $ | 281 | ||||||
| Chemical | 189 | 72 | 117 | |||||||||
| Midstream, marketing and other | 163 | 77 | 86 | |||||||||
| Corporate | ||||||||||||
| Interest expense, net | (19 | ) | (33 | ) | 14 | |||||||
| Other | (66 | ) | (102 | ) | 36 | |||||||
| Taxes | (816 | ) | (549 | ) | (267 | ) | ||||||
| Core Results | $ | 1,196 | $ | 929 | $ | 267 | ||||||
| Core Results Per Common Share | ||||||||||||
| Basic | $ | 1.47 | $ | 1.14 | $ | 0.33 | ||||||
| Diluted | $ | 1.47 | $ | 1.14 | $ | 0.33 | ||||||
| Worldwide Effective Tax Rate | 41% | 37% | -4% | |||||||||
10
Investor Relations Supplemental Schedules
11
Investor Relations Supplemental Schedules
| SUMMARY OF OPERATING STATISTICS | ||||||||||||||
| Third Quarter | Nine Months | |||||||||||||
| 2010 | 2009 | 2010 | 2009 | |||||||||||
| NET SALES VOLUMES PER DAY: | ||||||||||||||
| United States | ||||||||||||||
| Crude Oil and Liquids (MBBL) | ||||||||||||||
| California | 92 | 92 | 92 | 93 | ||||||||||
| Permian | 160 | 162 | 160 | 164 | ||||||||||
| Midcontinent Gas | 18 | 15 | 18 | 14 | ||||||||||
| Total | 270 | 269 | 270 | 271 | ||||||||||
| Natural Gas (MMCF) | ||||||||||||||
| California | 276 | 269 | 288 | 240 | ||||||||||
| Permian | 122 | 133 | 126 | 127 | ||||||||||
| Midcontinent Gas | 258 | 251 | 257 | 265 | ||||||||||
| Total | 656 | 653 | 671 | 632 | ||||||||||
| Latin America | ||||||||||||||
| Crude Oil (MBBL) | ||||||||||||||
| Argentina | 30 | 30 | 34 | 37 | ||||||||||
| Colombia | 36 | 39 | 32 | 40 | ||||||||||
| Total | 66 | 69 | 66 | 77 | ||||||||||
| Natural Gas (MMCF) | ||||||||||||||
| Argentina | 35 | 27 | 33 | 30 | ||||||||||
| Bolivia | 19 | 18 | 15 | 17 | ||||||||||
| Total | 54 | 45 | 48 | 47 | ||||||||||
| Middle East / North Africa | ||||||||||||||
| Crude Oil and Liquids (MBBL) | ||||||||||||||
| Bahrain | 3 | - | 3 | - | ||||||||||
| Dolphin | 25 | 26 | 24 | 26 | ||||||||||
| Libya | 12 | 9 | 13 | 10 | ||||||||||
| Oman | 66 | 50 | 60 | 48 | ||||||||||
| Qatar | 79 | 77 | 77 | 78 | ||||||||||
| Yemen | 30 | 34 | 32 | 36 | ||||||||||
| Total | 215 | 196 | 209 | 198 | ||||||||||
| Natural Gas (MMCF) | ||||||||||||||
| Bahrain | 181 | - | 169 | - | ||||||||||
| Dolphin | 250 | 258 | 238 | 258 | ||||||||||
| Oman | 47 | 48 | 49 | 50 | ||||||||||
| Total | 478 | 306 | 456 | 308 | ||||||||||
| Barrels of Oil Equivalent (MBOE) | 749 | 702 | 741 | 711 | ||||||||||
12
Investor Relations Supplemental Schedules
| OCCIDENTAL PETROLEUM | ||||||||||||||
| SUMMARY OF OPERATING STATISTICS | ||||||||||||||
| Third Quarter | Nine Months | |||||||||||||
| 2010 | 2009 | 2010 | 2009 | |||||||||||
| NET PRODUCTION PER DAY: | ||||||||||||||
| United States | ||||||||||||||
| Crude Oil and Liquids (MBBL) | 270 | 269 | 270 | 271 | ||||||||||
| Natural Gas (MMCF) | 656 | 653 | 671 | 632 | ||||||||||
| Latin America | ||||||||||||||
| Crude Oil (MBBL) | ||||||||||||||
| Argentina | 39 | 31 | 37 | 36 | ||||||||||
| Colombia | 33 | 38 | 33 | 40 | ||||||||||
| Total | 72 | 69 | 70 | 76 | ||||||||||
| Natural Gas (MMCF) | 54 | 45 | 48 | 47 | ||||||||||
| Middle East / North Africa | ||||||||||||||
| Crude Oil and Liquids (MBBL) | ||||||||||||||
| Bahrain | 3 | - | 3 | - | ||||||||||
| Dolphin | 25 | 26 | 24 | 26 | ||||||||||
| Libya | 12 | 10 | 14 | 11 | ||||||||||
| Oman | 63 | 51 | 60 | 48 | ||||||||||
| Qatar | 78 | 79 | 77 | 79 | ||||||||||
| Yemen | 30 | 34 | 32 | 36 | ||||||||||
| Total | 211 | 200 | 210 | 200 | ||||||||||
| Natural Gas (MMCF) | 478 | 306 | 456 | 308 | ||||||||||
| Barrels of Oil Equivalent (MBOE) | 751 | 705 | 746 | 711 | ||||||||||
13
Investor Relations Supplemental Schedules
| OCCIDENTAL PETROLEUM | |||||||||||||||||
| SUMMARY OF OPERATING STATISTICS | |||||||||||||||||
| Third Quarter | Nine Months | ||||||||||||||||
| 2010 | 2009 | 2010 | 2009 | ||||||||||||||
| OIL & GAS: | |||||||||||||||||
| PRICES | |||||||||||||||||
| United States | |||||||||||||||||
| Crude Oil ($/BBL) | 71.14 | 63.37 | 71.96 | 52.04 | |||||||||||||
| Natural gas ($/MCF) | 4.20 | 3.04 | 4.67 | 3.15 | |||||||||||||
| Latin America | |||||||||||||||||
| Crude Oil ($/BBL) | 61.01 | 55.40 | 59.91 | 46.51 | |||||||||||||
| Natural Gas ($/MCF) | 3.83 | 2.87 | 3.71 | 3.04 | |||||||||||||
| Middle East / North Africa | |||||||||||||||||
| Crude Oil ($/BBL) | 73.66 | 66.04 | 75.39 | 53.55 | |||||||||||||
| Total Worldwide | |||||||||||||||||
| Crude Oil ($/BBL) | 70.71 | 62.79 | 71.57 | 51.44 | |||||||||||||
| Natural Gas ($/MCF) | 2.82 | 2.53 | 3.13 | 2.59 | |||||||||||||
| Third Quarter | Nine Months | ||||||||||||||||
| 2010 | 2009 | 2010 | 2009 | ||||||||||||||
| Exploration Expense | |||||||||||||||||
| United States | $ | 63 | $ | 45 | $ | 135 | $ | 107 | |||||||||
| Latin America | - | 4 | 5 | 14 | |||||||||||||
| Middle East / North Africa | 20 | 7 | 72 | 47 | |||||||||||||
| TOTAL REPORTED | $ | 83 | $ | 56 | $ | 212 | $ | 168 | |||||||||
14
Investor Relations Supplemental Schedules
| OCCIDENTAL PETROLEUM | ||||||||||||||||
| SUMMARY OF OPERATING STATISTICS | ||||||||||||||||
| Third Quarter | Nine Months | |||||||||||||||
| Capital Expenditures ($MM) | 2010 | 2009 | 2010 | 2009 | ||||||||||||
| Oil & Gas | ||||||||||||||||
| California | $ | 215 | $ | 118 | $ | 544 | $ | 402 | ||||||||
| Permian | 136 | 57 | 290 | 328 | ||||||||||||
| Midcontinent Gas | 52 | 9 | 138 | 77 | ||||||||||||
| Latin America | 120 | 93 | 335 | 401 | ||||||||||||
| Middle East / North Africa | 340 | 234 | 855 | 768 | ||||||||||||
| Exploration | 46 | 18 | 138 | 95 | ||||||||||||
| Chemicals | 50 | 43 | 129 | 114 | ||||||||||||
| Midstream, marketing and other | 128 | 165 | 357 | 430 | ||||||||||||
| Corporate | 13 | 9 | 30 | 34 | ||||||||||||
| TOTAL | $ | 1,100 | $ | 746 | $ | 2,816 | $ | 2,649 | ||||||||
| Depreciation, Depletion & | Third Quarter | Nine Months | ||||||||||||||
| Amortization of Assets ($MM) | 2010 | 2009 | 2010 | 2009 | ||||||||||||
| Oil & Gas | ||||||||||||||||
| Domestic | $ | 346 | $ | 317 | $ | 1,046 | $ | 932 | ||||||||
| Latin America | 99 | 140 | 346 | 463 | ||||||||||||
| Middle East / North Africa | 294 | 199 | 853 | 586 | ||||||||||||
| Chemicals | 81 | 78 | 242 | 222 | ||||||||||||
| Midstream, marketing and other | 32 | 30 | 105 | 79 | ||||||||||||
| Corporate | 6 | 5 | 16 | 15 | ||||||||||||
| TOTAL | $ | 858 | $ | 769 | $ | 2,608 | $ | 2,297 | ||||||||
15
Investor Relations Supplemental Schedules
| OCCIDENTAL PETROLEUM | ||||||||||||
| CORPORATE | ||||||||||||
| ($ millions) | ||||||||||||
| 30-Sep-10 | 31-Dec-09 | |||||||||||
| CAPITALIZATION | ||||||||||||
| Long-Term Debt (including current maturities) | $ | 2,512 | $ | 2,796 | ||||||||
| Others | - | 25 | ||||||||||
| Total Debt | $ | 2,512 | $ | 2,821 | ||||||||
| EQUITY | $ | 31,844 | $ | 29,159 | ||||||||
| Total Debt To Total Capitalization | 7% | 9% | ||||||||||
16