EXHIBIT 99.3
Investor Relations Supplemental Schedules

| Investor Relations Supplemental Schedules |
| Summary |
| | | | |
| | | | |
| | | | |
| | | | |
| | 4Q 2013 | | 4Q 2012 |
| | | | |
| Core Results (millions) | $1,379 | | $1,479 |
| EPS - Diluted | $1.72 | | $1.83 |
| | | | |
| Reported Net Income (millions) | $1,643 | | $336 |
| EPS - Diluted | $2.04 | | $0.42 |
| | | | |
| Total Worldwide Sales Volumes (mboe/day) | 772 | | 784 |
| Total Worldwide Production Volumes (mboe/day) | 750 | | 779 |
| | | | |
| Total Worldwide Crude Oil Realizations ($/BBL) | $99.27 | | $96.19 |
| Total Worldwide NGL Realizations ($/BBL) | $44.69 | | $45.08 |
| Domestic Natural Gas Realizations ($/MCF) | $3.33 | | $3.09 |
| | | | |
| Wtd. Average Basic Shares O/S (millions) | 801.7 | | 807.1 |
| Wtd. Average Diluted Shares O/S (millions) | 802.1 | | 807.7 |
| | | | |
| | | | |
| | YTD 2013 | | YTD 2012 |
| | | | |
| Core Results (millions) | $5,602 | | $5,750 |
| EPS - Diluted | $6.95 | | $7.09 |
| | | | |
| Reported Net Income (millions) | $5,903 | | $4,598 |
| EPS - Diluted | $7.32 | | $5.67 |
| | | | |
| Total Worldwide Sales Volumes (mboe/day) | 762 | | 764 |
| Total Worldwide Production Volumes (mboe/day) | 763 | | 766 |
| | | | |
| Total Worldwide Crude Oil Realizations ($/BBL) | $99.84 | | $99.87 |
| Total Worldwide NGL Realizations ($/BBL) | $41.03 | | $45.18 |
| Domestic Natural Gas Realizations ($/MCF) | $3.37 | | $2.62 |
| | | | |
| Wtd. Average Basic Shares O/S (millions) | 804.1 | | 809.3 |
| Wtd. Average Diluted Shares O/S (millions) | 804.6 | | 810.0 |
| | | | |
| Shares Outstanding (millions) | 796.0 | | 805.5 |
| | | | |
| Cash Flow from Operations (millions) | $12,900 | | $11,300 |
1
Investor Relations Supplemental Schedules
| OCCIDENTAL PETROLEUM |
| 2013 Fourth Quarter |
| Net Income (Loss) |
| ($ millions, except per share amounts) |
| | | | | | | | | | | | | | |
| | | | | | | | | | | | | | |
| | Reported | | | | | | | | Core |
| | Income | | Significant Items Affecting Income | | Results |
| Oil & Gas | $ | 1,511 | | | $ | 607 | | | Asset impairments | | $ | 2,118 | |
| | | | | | | | | | | | | | |
| Chemical | | 128 | | | | | | | | | | 128 | |
| | | | | | | | | | | | | | |
| Midstream, marketing and other | | 1,098 | | | | (1,030 | ) | | Plains Pipeline sale gain and other | | | 68 | |
| | | | | | | | | | | | | | |
| Corporate | | | | | | | | | | | | | |
| Interest expense, net | | (23 | ) | | | | | | | | | (23 | ) |
| | | | | | | | | | | | | | |
| Other | | (93 | ) | | | | | | | | | (93 | ) |
| | | | | | | | | | | | | | |
| Taxes | | (973 | ) | | | 154 | | | Tax effect of pre-tax adjustments | | | (819 | ) |
| | | | | | | | | | | | | | |
| | | | | | | | | | | | | | |
| Income from continuing operations | | 1,648 | | | | (269 | ) | | | | | 1,379 | |
| Discontinued operations, net of tax | | (5 | ) | | | 5 | | | Discontinued operations, net | | | - | |
| Net Income | $ | 1,643 | | | $ | (264 | ) | | | | $ | 1,379 | |
| | | | | | | | | | | | | | |
| | | | | | | | | | | | | | |
| Basic Earnings Per Common Share | | | | | | | | | | | | | |
| Income from continuing operations | $ | 2.05 | | | | | | | | | | | |
| Discontinued operations, net | | (0.01 | ) | | | | | | | | | | |
| Net Income | $ | 2.04 | | | | | | | | | $ | 1.72 | |
| | | | | | | | | | | | | | |
| Diluted Earnings Per Common Share | | | | | | | | | | | | | |
| Income from continuing operations | $ | 2.05 | | | | | | | | | | | |
| Discontinued operations, net | | (0.01 | ) | | | | | | | | | | |
| Net Income | $ | 2.04 | | | | | | | | | $ | 1.72 | |
Investor Relations Supplemental Schedules
| OCCIDENTAL PETROLEUM |
| 2012 Fourth Quarter |
| Net Income (Loss) |
| ($ millions, except per share amounts) |
| | | | | | | | | | | | | | |
| | | | | | | | | | | | | | |
| | Reported | | | | | | | | Core |
| | Income | | Significant Items Affecting Income | | Results |
| Oil & Gas | $ | 522 | | | $ | 1,731 | | | Asset impairments and related items | $ | 2,253 | |
| | | | | | | | | | | | | | |
| Chemical | | 180 | | | | | | | | | | 180 | |
| | | | | | | | | | | | | | |
| Midstream, marketing and other | | 75 | | | | | | | | | | 75 | |
| | | | | | | | | | | | | | |
| Corporate | | | | | | | | | | | | | |
| Interest expense, net | | (30 | ) | | | | | | | | | (30 | ) |
| | | | | | | | | | | | | | |
| Other | | (134 | ) | | | 20 | | | Litigation reserves | | | (114 | ) |
| | | | | | | | | | | | | | |
| Taxes | | (249 | ) | | | (636 | ) | | Tax effect of adjustments | | | (885 | ) |
| | | | | | | | | | | | | | |
| | | | | | | | | | | | | | |
| Income from continuing operations | | 364 | | | | 1,115 | | | | | | 1,479 | |
| Discontinued operations, net of tax | | (28 | ) | | | 28 | | | Discontinued operations, net | | | - | |
| Net Income | $ | 336 | | | $ | 1,143 | | | | | $ | 1,479 | |
| | | | | | | | | | | | | | |
| | | | | | | | | | | | | | |
| Basic Earnings Per Common Share | | | | | | | | | | | | | |
| Income from continuing operations | $ | 0.45 | | | | | | | | | | | |
| Discontinued operations, net | | (0.03 | ) | | | | | | | | | | |
| Net Income | $ | 0.42 | | | | | | | | | $ | 1.83 | |
| | | | | | | | | | | | | | |
| Diluted Earnings Per Common Share | | | | | | | | | | | | | |
| Income from continuing operations | $ | 0.45 | | | | | | | | | | | |
| Discontinued operations, net | | (0.03 | ) | | | | | | | | | | |
| Net Income | $ | 0.42 | | | | | | | | | $ | 1.83 | |
| | | | | | | | | | | | | | |
3
Investor Relations Supplemental Schedules
| OCCIDENTAL PETROLEUM |
| 2013 Twelve Months |
| Net Income (Loss) |
| ($ millions, except per share amounts) |
| | | | | | | | | | | | | | |
| | | | | | | | | | | | | | |
| | Reported | | | | | | | | Core |
| | Income | | Significant Items Affecting Income | | Results |
| Oil & Gas | $ | 7,894 | | | $ | 607 | | | Asset impairments | | $ | 8,501 | |
| | | | | | | | | | | | | | |
| Chemical | | 743 | | | | (131 | ) | | Carbocloro sale gain | | | 612 | |
| | | | | | | | | | | | | | |
| Midstream, marketing and other | | 1,573 | | | | (1,030 | ) | | Plains Pipeline sale gain and other | | | 543 | |
| | | | | | | | | | | | | | |
| Corporate | | | | | | | | | | | | | |
| Interest expense, net | | (110 | ) | | | | | | | | | (110 | ) |
| | | | | | | | | | | | | | |
| Other | | (423 | ) | | | 55 | | | Charge for former executives and consultants (a) | | | (368 | ) |
| | | | | | | | | | | | | | |
| Taxes | | (3,755 | ) | | | 179 | | | Tax effect of pre-tax adjustments | | | (3,576 | ) |
| | | | | | | | | | | | | | |
| | | | | | | | | | | | | | |
| Income from continuing operations | | 5,922 | | | | (320 | ) | | | | | 5,602 | |
| Discontinued operations, net of tax | | (19 | ) | | | 19 | | | Discontinued operations, net | | | - | |
| Net Income | $ | 5,903 | | | $ | (301 | ) | | | | $ | 5,602 | |
| | | | | | | | | | | | | | |
| | | | | | | | | | | | | | |
| Basic Earnings Per Common Share | | | | | | | | | | | | | |
| Income from continuing operations | $ | 7.35 | | | | | | | | | | | |
| Discontinued operations, net | | (0.02 | ) | | | | | | | | | | |
| Net Income | $ | 7.33 | | | | | | | | | $ | 6.95 | |
| | | | | | | | | | | | | | |
| Diluted Earnings Per Common Share | | | | | | | | | | | | | |
| Income from continuing operations | $ | 7.34 | | | | | | | | | | | |
| Discontinued operations, net | | (0.02 | ) | | | | | | | | | | |
| Net Income | $ | 7.32 | | | | | | | | | $ | 6.95 | |
| | | | | | | | | | | | | | |
| | | | | | | | | | | | | | |
| (a) Reflects pre-tax charge for the estimated cost related to the employment and post-employment benefits for the | | | | |
| Company's former Executive Chairman and termination of certain other employees and consulting arrangements. | | | | |
4
Investor Relations Supplemental Schedules
| OCCIDENTAL PETROLEUM |
| 2012 Twelve Months |
| Net Income (Loss) |
| ($ millions, except per share amounts) |
| | | | | | | | | | | | | | |
| | | | | | | | | | | | | | |
| | Reported | | | | | | | | Core |
| | Income | | Significant Items Affecting Income | | Results |
| Oil & Gas | $ | 7,095 | | | $ | 1,731 | | | Asset impairments and related items | $ | 8,826 | |
| | | | | | | | | | | | | | |
| Chemical | | 720 | | | | | | | | | | 720 | |
| | | | | | | | | | | | | | |
| Midstream, marketing and other | | 439 | | | | | | | | | | 439 | |
| | | | | | | | | | | | | | |
| Corporate | | | | | | | | | | | | | |
| Interest expense, net | | (117 | ) | | | | | | | | | (117 | ) |
| | | | | | | | | | | | | | |
| Other | | (384 | ) | | | 20 | | | Litigation reserves | | | (364 | ) |
| | | | | | | | | | | | | | |
| Taxes | | (3,118 | ) | | | (636 | ) | | Tax effect of adjustments | | | (3,754 | ) |
| | | | | | | | | | | | | | |
| | | | | | | | | | | | | | |
| Income from continuing operations | | 4,635 | | | | 1,115 | | | | | | 5,750 | |
| Discontinued operations, net of tax | | (37 | ) | | | 37 | | | Discontinued operations, net | | | - | |
| Net Income | $ | 4,598 | | | $ | 1,152 | | | | | $ | 5,750 | |
| | | | | | | | | | | | | | |
| | | | | | | | | | | | | | |
| Basic Earnings Per Common Share | | | | | | | | | | | | | |
| Income from continuing operations | $ | 5.72 | | | | | | | | | | | |
| Discontinued operations, net | | (0.05 | ) | | | | | | | | | | |
| Net Income | $ | 5.67 | | | | | | | | | $ | 7.09 | |
| | | | | | | | | | | | | | |
| Diluted Earnings Per Common Share | | | | | | | | | | | | | |
| Income from continuing operations | $ | 5.71 | | | | | | | | | | | |
| Discontinued operations, net | | (0.04 | ) | | | | | | | | | | |
| Net Income | $ | 5.67 | | | | | | | | | $ | 7.09 | |
5
Investor Relations Supplemental Schedules
| OCCIDENTAL PETROLEUM |
| Worldwide Effective Tax Rate |
| | | | | | | | | | | | | | | |
| | QUARTERLY | | YEAR-TO-DATE |
| | 2013 | | 2013 | | 2012 | | 2013 | | 2012 |
| REPORTED INCOME | QTR 4 | | QTR 3 | | QTR 4 | | 12 Months | | 12 Months |
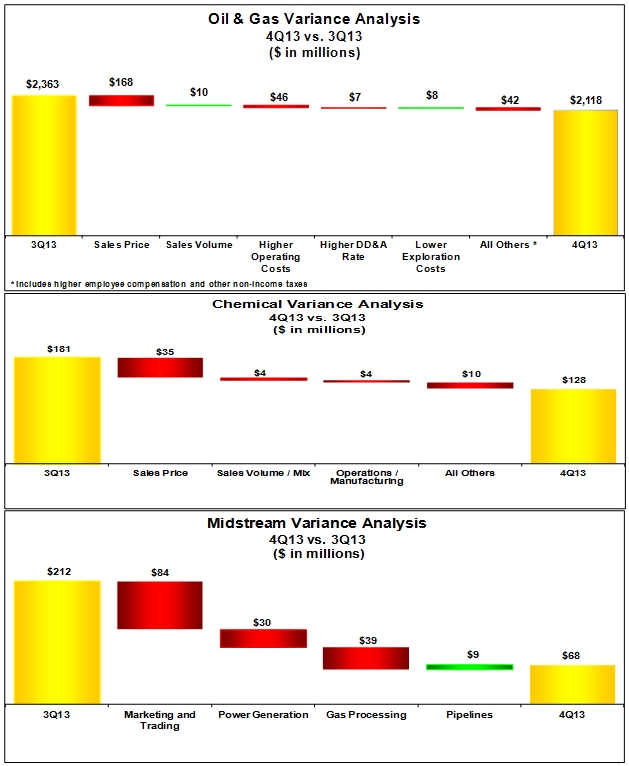
| Oil & Gas | 1,511 | | | 2,363 | | | 522 | | | 7,894 | | | 7,095 | |
| Chemical | 128 | | | 181 | | | 180 | | | 743 | | | 720 | |
| Midstream, marketing and other | 1,098 | | | 212 | | | 75 | | | 1,573 | | | 439 | |
| Corporate & other | (116 | ) | | (131 | ) | | (164 | ) | | (533 | ) | | (501 | ) |
| Pre-tax income | 2,621 | | | 2,625 | | | 613 | | | 9,677 | | | 7,753 | |
| | | | | | | | | | | | | | | |
| Income tax expense | | | | | | | | | | | | | | |
| Federal and state | 517 | | | 461 | | | (293 | ) | | 1,602 | | | 694 | |
| Foreign | 456 | | | 576 | | | 542 | | | 2,153 | | | 2,424 | |
| Total | 973 | | | 1,037 | | | 249 | | | 3,755 | | | 3,118 | |
| | | | | | | | | | | | | | | |
| Income from continuing operations | 1,648 | | | 1,588 | | | 364 | | | 5,922 | | | 4,635 | |
| | | | | | | | | | | | | | | |
| Worldwide effective tax rate | 37% | | 40% | | 41% | | 39% | | 40% |
| | | | | | | | | | | | | | | |
| | | | | | | | | | | | | | | |
| | 2013 | | 2013 | | 2012 | | 2013 | | 2012 |
| CORE RESULTS | QTR 4 | | QTR 3 | | QTR 4 | | 12 Months | | 12 Months |
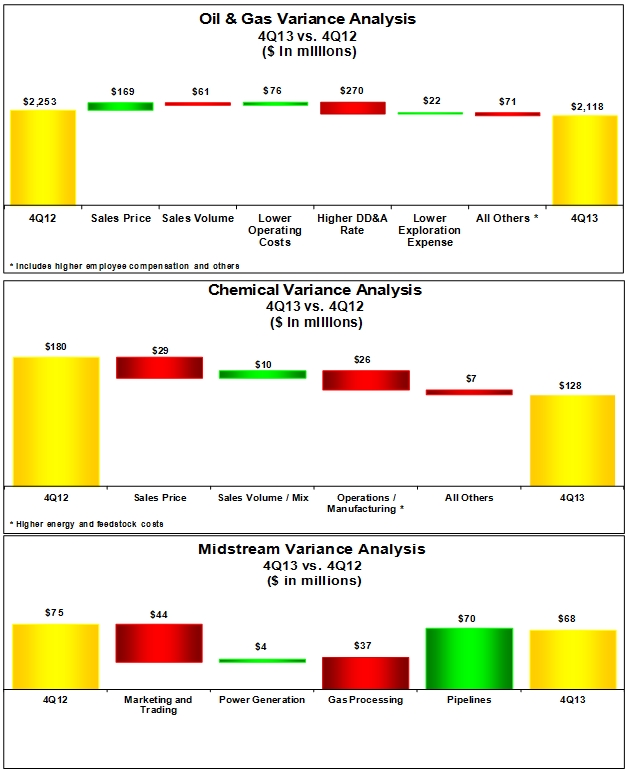
| Oil & Gas | 2,118 | | | 2,363 | | | 2,253 | | | 8,501 | | | 8,826 | |
| Chemical | 128 | | | 181 | | | 180 | | | 612 | | | 720 | |
| Midstream, marketing and other | 68 | | | 212 | | | 75 | | | 543 | | | 439 | |
| Corporate & other | (116 | ) | | (131 | ) | | (144 | ) | | (478 | ) | | (481 | ) |
| Pre-tax income | 2,198 | | | 2,625 | | | 2,364 | | | 9,178 | | | 9,504 | |
| | | | | | | | | | | | | | | |
| Income tax expense | | | | | | | | | | | | | | |
| Federal and state | 363 | | | 461 | | | 343 | | | 1,447 | | | 1,330 | |
| Foreign | 456 | | | 576 | | | 542 | | | 2,129 | | | 2,424 | |
| Total | 819 | | | 1,037 | | | 885 | | | 3,576 | | | 3,754 | |
| | | | | | | | | | | | | | | |
| Core results | 1,379 | | | 1,588 | | | 1,479 | | | 5,602 | | | 5,750 | |
| | | | | | | | | | | | | | | |
| Worldwide effective tax rate | 37% | | 40% | | 37% | | 39% | | 39% |
6
Investor Relations Supplemental Schedules
| OCCIDENTAL PETROLEUM |
| 2013 Fourth Quarter Net Income (Loss) |
| Reported Income Comparison |
| | | | | | | | | | | | | |
| | | Fourth | | Third | | | | |
| | | Quarter | | Quarter | | | | |
| | | 2013 | | 2013 | | B / (W) |
| Oil & Gas | | $ | 1,511 | | | $ | 2,363 | | | $ | (852 | ) |
| Chemical | | | 128 | | | | 181 | | | | (53 | ) |
| Midstream, marketing and other | | | 1,098 | | | | 212 | | | | 886 | |
| Corporate | | | | | | | | | | | | |
| Interest expense, net | | | (23 | ) | | | (28 | ) | | | 5 | |
| Other | | | (93 | ) | | | (103 | ) | | | 10 | |
| Taxes | | | (973 | ) | | | (1,037 | ) | | | 64 | |
| Income from continuing operations | | | 1,648 | | | | 1,588 | | | | 60 | |
| Discontinued operations, net | | | (5 | ) | | | (5 | ) | | | - | |
| Net Income | | $ | 1,643 | | | $ | 1,583 | | | $ | 60 | |
| | | | | | | | | | | | | |
| Earnings Per Common Share | | | | | | | | | | | | |
| Basic | | $ | 2.04 | | | $ | 1.96 | | | $ | 0.08 | |
| Diluted | | $ | 2.04 | | | $ | 1.96 | | | $ | 0.08 | |
| | | | | | | | | | | | | |
| | | | | | | | | | | | | |
| Worldwide Effective Tax Rate | | | 37% | | | 40% | | | 3% |
| | | | | | | | | | | | | |
| | | | | | | | | | | | | |
| | | | | | | | | | | | | |
| OCCIDENTAL PETROLEUM |
| 2013 Fourth Quarter Net Income (Loss) |
| Core Results Comparison |
| | | | | | | | | | | | | |
| | | Fourth | | Third | | | | |
| | | Quarter | | Quarter | | | | |
| | | 2013 | | 2013 | | B / (W) |
| Oil & Gas | | $ | 2,118 | | | $ | 2,363 | | | $ | (245 | ) |
| Chemical | | | 128 | | | | 181 | | | | (53 | ) |
| Midstream, marketing and other | | | 68 | | | | 212 | | | | (144 | ) |
| Corporate | | | | | | | | | | | | |
| Interest expense, net | | | (23 | ) | | | (28 | ) | | | 5 | |
| Other | | | (93 | ) | | | (103 | ) | | | 10 | |
| Taxes | | | (819 | ) | | | (1,037 | ) | | | 218 | |
| Core Results | | $ | 1,379 | | | $ | 1,588 | | | $ | (209 | ) |
| | | | | | | | | | | | | |
| Core Results Per Common Share | | | | | | | | | | | | |
| Basic | | $ | 1.72 | | | $ | 1.97 | | | $ | (0.25 | ) |
| Diluted | | $ | 1.72 | | | $ | 1.97 | | | $ | (0.25 | ) |
| | | | | | | | | | | | | |
| Worldwide Effective Tax Rate | | | 37% | | | 40% | | | 3% |
7
Investor Relations Supplemental Schedules
8
Investor Relations Supplemental Schedules
| OCCIDENTAL PETROLEUM |
| 2013 Fourth Quarter Net Income (Loss) |
| Reported Income Comparison |
| | | | | | | | | | | | | |
| | | Fourth | | Fourth | | | | |
| | | Quarter | | Quarter | | | | |
| | | 2013 | | 2012 | | B / (W) |
| Oil & Gas | | $ | 1,511 | | | $ | 522 | | | $ | 989 | |
| Chemical | | | 128 | | | | 180 | | | | (52 | ) |
| Midstream, marketing and other | | | 1,098 | | | | 75 | | | | 1,023 | |
| Corporate | | | | | | | | | | | | |
| Interest expense, net | | | (23 | ) | | | (30 | ) | | | 7 | |
| Other | | | (93 | ) | | | (134 | ) | | | 41 | |
| Taxes | | | (973 | ) | | | (249 | ) | | | (724 | ) |
| Income from continuing operations | | | 1,648 | | | | 364 | | | | 1,284 | |
| Discontinued operations, net | | | (5 | ) | | | (28 | ) | | | 23 | |
| Net Income | | $ | 1,643 | | | $ | 336 | | | $ | 1,307 | |
| | | | | | | | | | | | | |
| Earnings Per Common Share | | | | | | | | | | | | |
| Basic | | $ | 2.04 | | | $ | 0.42 | | | $ | 1.62 | |
| Diluted | | $ | 2.04 | | | $ | 0.42 | | | $ | 1.62 | |
| | | | | | | | | | | | | |
| | | | | | | | | | | | | |
| Worldwide Effective Tax Rate | | | 37% | | | 41% | | | 4% |
| | | | | | | | | | | | | |
| | | | | | | | | | | | | |
| | | | | | | | | | | | | |
| | | | | | | | | | | | | |
| | | | | | | | | | | | | |
| OCCIDENTAL PETROLEUM |
| 2013 Fourth Quarter Net Income (Loss) |
| Core Results Comparison |
| | | | | | | | | | | | | |
| | | Fourth | | Fourth | | | | |
| | | Quarter | | Quarter | | | | |
| | | 2013 | | 2012 | | B / (W) |
| Oil & Gas | | $ | 2,118 | | | $ | 2,253 | | | $ | (135 | ) |
| Chemical | | | 128 | | | | 180 | | | | (52 | ) |
| Midstream, marketing and other | | | 68 | | | | 75 | | | | (7 | ) |
| Corporate | | | | | | | | | | | | |
| Interest expense, net | | | (23 | ) | | | (30 | ) | | | 7 | |
| Other | | | (93 | ) | | | (114 | ) | | | 21 | |
| Taxes | | | (819 | ) | | | (885 | ) | | | 66 | |
| Core Results | | $ | 1,379 | | | $ | 1,479 | | | $ | (100 | ) |
| | | | | | | | | | | | | |
| Core Results Per Common Share | | | | | | | | | | | | |
| Basic | | $ | 1.72 | | | $ | 1.83 | | | $ | (0.11 | ) |
| Diluted | | $ | 1.72 | | | $ | 1.83 | | | $ | (0.11 | ) |
| | | | | | | | | | | | | |
| Worldwide Effective Tax Rate | | | 37% | | | 37% | | | 0% |
9
Investor Relations Supplemental Schedules
Investor Relations Supplemental Schedules
| OCCIDENTAL PETROLEUM |
| SUMMARY OF OPERATING STATISTICS |
| | | | | | | | | | | | | | | |
| | | | Fourth Quarter | | | Twelve Months |
| | | | 2013 | | 2012 | | | 2013 | | 2012 |
| NET PRODUCTION PER DAY: | | | | | | | | | | | | | | |
| | | | | | | | | | | | | | | |
| United States | | | | | | | | | | | | | | |
| Oil (MBBL) | | | | | | | | | | | | | | |
| | California | | 94 | | | 92 | | | | 90 | | | 88 | |
| | Permian | | 146 | | | 146 | | | | 146 | | | 142 | |
| Midcontinent and other | | 30 | | | 27 | | | | 30 | | | 25 | |
| | Total | | 270 | | | 265 | | | | 266 | | | 255 | |
| NGLs (MBBL) | | | | | | | | | | | | | | |
| | California | | 20 | | | 21 | | | | 20 | | | 17 | |
| | Permian | | 36 | | | 40 | | | | 39 | | | 39 | |
| Midcontinent and other | | 17 | | | 16 | | | | 18 | | | 17 | |
| | Total | | 73 | | | 77 | | | | 77 | | | 73 | |
| Natural Gas (MMCF) | | | | | | | | | | | | | | |
| | California | | 260 | | | 242 | | | | 260 | | | 256 | |
| | Permian | | 147 | | | 162 | | | | 157 | | | 155 | |
| Midcontinent and other | | 355 | | | 396 | | | | 371 | | | 410 | |
| | Total | | 762 | | | 800 | | | | 788 | | | 821 | |
| | | | | | | | | | | | | | | |
| | | | | | | | | | | | | | | |
| Latin America | | | | | | | | | | | | | | |
| Oil (MBBL) | Colombia | | 29 | | | 30 | | | | 29 | | | 29 | |
| | | | | | | | | | | | | | | |
| Natural Gas (MMCF) | Bolivia | | 12 | | | 12 | | | | 12 | | | 13 | |
| | | | | | | | | | | | | | | |
| | | | | | | | | | | | | | | |
| Middle East / North Africa | | | | | | | | | | | | | | |
| Oil (MBBL) | | | | | | | | | | | | | | |
| | Dolphin | | 7 | | | 7 | | | | 6 | | | 8 | |
| | Oman | | 64 | | | 74 | | | | 66 | | | 67 | |
| | Qatar | | 69 | | | 71 | | | | 68 | | | 71 | |
| | Other | | 29 | | | 40 | | | | 39 | | | 40 | |
| | Total | | 169 | | | 192 | | | | 179 | | | 186 | |
| | | | | | | | | | | | | | | |
| NGLs (MBBL) | Dolphin | | 7 | | | 7 | | | | 7 | | | 8 | |
| | Other | | - | | | - | | | | - | | | 1 | |
| | Total | | 7 | | | 7 | | | | 7 | | | 9 | |
| | | | | | | | | | | | | | | |
| Natural Gas (MMCF) | | | | | | | | | | | | | | |
| | Dolphin | | 145 | | | 138 | | | | 142 | | | 163 | |
| | Oman | | 42 | | | 56 | | | | 51 | | | 57 | |
| | Other | | 253 | | | 242 | | | | 241 | | | 232 | |
| | Total | | 440 | | | 436 | | | | 434 | | | 452 | |
| | | | | | | | | | | | | | | |
| | | | | | | | | | | | | | | |
| Barrels of Oil Equivalent (MBOE) | | | 750 | | | 779 | | | | 763 | | | 766 | |
11
Investor Relations Supplemental Schedules
| OCCIDENTAL PETROLEUM | | | | | |
| SUMMARY OF OPERATING STATISTICS | | | | | |
| | | | | | | | | | | | | | | |
| | | | Fourth Quarter | | | Twelve Months |
| | | | 2013 | | 2012 | | | 2013 | | 2012 |
| NET SALES VOLUMES PER DAY: | | | | | | | | | | | | | | |
| United States | | | | | | | | | | | | | | |
| Oil (MBBL) | | | 270 | | | 265 | | | | 266 | | | 255 | |
| NGLs (MBBL) | | | 73 | | | 77 | | | | 77 | | | 73 | |
| Natural Gas (MMCF) | | | 762 | | | 800 | | | | 789 | | | 819 | |
| | | | | | | | | | | | | | | |
| Latin America | | | | | | | | | | | | | | |
| Oil (MBBL) | | | 23 | | | 30 | | | | 27 | | | 28 | |
| Natural Gas (MMCF) | | | 12 | | | 12 | | | | 12 | | | 13 | |
| | | | | | | | | | | | | | | |
| Middle East / North Africa | | | | | | | | | | | | | | |
| Oil (MBBL) | | | | | | | | | | | | | | |
| | Dolphin | | 7 | | | 7 | | | | 6 | | | 8 | |
| | Oman | | 65 | | | 70 | | | | 68 | | | 66 | |
| | Qatar | | 66 | | | 75 | | | | 67 | | | 71 | |
| | Other | | 59 | | | 43 | | | | 38 | | | 40 | |
| | Total | | 197 | | | 195 | | | | 179 | | | 185 | |
| | | | | | | | | | | | | | | |
| NGLs (MBBL) | Dolphin | | 7 | | | 7 | | | | 7 | | | 8 | |
| | Other | | - | | | 2 | | | | - | | | 1 | |
| | | | 7 | | | 9 | | | | 7 | | | 9 | |
| | | | | | | | | | | | | | | |
| Natural Gas (MMCF) | | | 440 | | | 436 | | | | 434 | | | 452 | |
| | | | | | | | | | | | | | | |
| | | | | | | | | | | | | | | |
| Barrels of Oil Equivalent (MBOE) | | | 772 | | | 784 | | | | 762 | | | 764 | |
12
Investor Relations Supplemental Schedules
| OCCIDENTAL PETROLEUM |
| SUMMARY OF OPERATING STATISTICS |
| | | | | | | | | | | | | | | | | |
| | | Fourth Quarter | | Twelve Months |
| | | 2013 | | 2012 | | 2013 | | 2012 |
| | | | | | | | | | | | | | | | | |
| OIL & GAS: | | | | | | | | | | | | | | | | |
| REALIZED PRICES | | | | | | | | | | | | | | | | |
| United States | | | | | | | | | | | | | | | | |
| Oil ($/BBL) | | | 94.52 | | | | 87.81 | | | | 96.42 | | | | 93.72 | |
| NGLs ($/BBL) | | | 45.72 | | | | 44.54 | | | | 41.80 | | | | 46.07 | |
| Natural gas ($/MCF) | | | 3.33 | | | | 3.09 | | | | 3.37 | | | | 2.62 | |
| | | | | | | | | | | | | | | | | |
| Latin America | | | | | | | | | | | | | | | | |
| Oil ($/BBL) | | | 99.77 | | | | 97.95 | | | | 103.21 | | | | 98.35 | |
| Natural gas ($/MCF) | | | 10.58 | | | | 11.56 | | | | 11.17 | | | | 11.85 | |
| | | | | | | | | | | | | | | | | |
| Middle East / North Africa | | | | | | | | | | | | | | | | |
| Oil ($/BBL) | | | 105.83 | | | | 107.50 | | | | 104.48 | | | | 108.76 | |
| NGLs ($/BBL) | | | 35.01 | | | | 49.14 | | | | 33.00 | | | | 37.74 | |
| | | | | | | | | | | | | | | | | |
| Total Worldwide | | | | | | | | | | | | | | | | |
| Oil ($/BBL) | | | 99.27 | | | | 96.19 | | | | 99.84 | | | | 99.87 | |
| NGLs ($/BBL) | | | 44.69 | | | | 45.08 | | | | 41.03 | | | | 45.18 | |
| Natural gas ($/MCF) | | | 2.47 | | | | 2.35 | | | | 2.54 | | | | 2.06 | |
| | | | | | | | | | | | | | | | | |
| INDEX PRICES | | | | | | | | | | | | | | | | |
| WTI oil ($/BBL) | | | 97.46 | | | | 88.18 | | | | 97.97 | | | | 94.21 | |
| Brent oil ($/BBL) | | | 109.35 | | | | 110.08 | | | | 108.76 | | | | 111.70 | |
| NYMEX gas ($/MCF) | | | 3.64 | | | | 3.37 | | | | 3.66 | | | | 2.81 | |
| | | | | | | | | | | | | | | | | |
| REALIZED PRICES AS PERCENTAGE OF INDEX PRICES | | | | | | | | | | | | | | | | |
| Worldwide oil as a percentage of WTI | | | 102% | | | 109% | | | 102% | | | 106% |
| Worldwide oil as a percentage of Brent | | | 91% | | | 87% | | | 92% | | | 89% |
| Worldwide NGLs as a percentage of WTI | | | 46% | | | 51% | | | 42% | | | 48% |
| Domestic natural gas as a percentage of NYMEX | | | 92% | | | 92% | | | 92% | | | 93% |
| | | | | | | | | | | | | | | | | |
| | | | | | | | | | | | | | | | | |
| | | | | | | | | | | | | | | | | |
| | | Fourth Quarter | | Twelve Months |
| | | 2013 | | 2012 | | 2013 | | 2012 |
| Exploration Expense | | | | | | | | | | | | | | | | |
| United States | | $ | 50 | | | $ | 46 | | | $ | 187 | | | $ | 232 | |
| Latin America | | | 1 | | | | 1 | | | | 6 | | | | 2 | |
| Middle East / North Africa | | | 9 | | | | 35 | | | | 63 | | | | 111 | |
| | | $ | 60 | | | $ | 82 | | | $ | 256 | | | $ | 345 | |
Investor Relations Supplemental Schedules
| OCCIDENTAL PETROLEUM |
| SUMMARY OF OPERATING STATISTICS |
| | | | | | | | | | | | | | | | | |
| | | | | | | | | | | | | | | | | |
| | | Fourth Quarter | | Twelve Months |
| Capital Expenditures ($MM) | | 2013 | | 2012 | | 2013 | | 2012 |
| Oil & Gas | | | | | | | | | | | | | | | | |
| California | | $ | 457 | | | $ | 382 | | | $ | 1,533 | | | $ | 2,029 | |
| Permian | | | 435 | | | | 424 | | | | 1,722 | | | | 1,920 | |
| Midcontinent and other | | | 260 | | | | 204 | | | | 901 | | | | 1,324 | |
| Latin America | | | 103 | | | | 124 | | | | 339 | | | | 309 | |
| Middle East / North Africa | | | 519 | | | | 638 | | | | 2,120 | | | | 2,016 | |
| Exploration | | | 143 | | | | 108 | | | | 430 | | | | 622 | |
| Chemical | | | 125 | | | | 165 | | | | 424 | | | | 357 | |
| Midstream, marketing and other | | 425 | | | | 440 | | | | 1,404 | | | | 1,558 | |
| Corporate | | | 19 | | | | 25 | | | | 164 | | | | 91 | |
| | TOTAL | | 2,486 | | | | 2,510 | | | | 9,037 | | | | 10,226 | |
| Non-controlling interest contributions | | (67 | ) | | | - | | | | (212 | ) | | | - | |
| Cracker JV contribution | | | 23 | | | | - | | | | 23 | | | | - | |
| | | $ | 2,442 | | | $ | 2,510 | | | $ | 8,848 | | | $ | 10,226 | |
| | | | | | | | | | | | | | | | | |
| | | | | | | | | | | | | | | | | |
| Depreciation, Depletion & | | Fourth Quarter | | Twelve Months |
| Amortization of Assets ($MM) | | 2013 | | 2012 | | 2013 | | 2012 |
| Oil & Gas | | | | | | | | | | | | | | | | |
| Domestic | | $ | 745 | | | $ | 628 | | | $ | 2,967 | | | $ | 2,412 | |
| Latin America | | | 20 | | | | 31 | | | | 107 | | | | 117 | |
| Middle East / North Africa | | | 534 | | | | 385 | | | | 1,679 | | | | 1,404 | |
| Chemical | | | 86 | | | | 88 | | | | 346 | | | | 345 | |
| Midstream, marketing and other | | 58 | | | | 52 | | | | 212 | | | | 206 | |
| Corporate | | | 8 | | | | 7 | | | | 36 | | | | 27 | |
| | TOTAL | $ | 1,451 | | | $ | 1,191 | | | $ | 5,347 | | | $ | 4,511 | |
14
Investor Relations Supplemental Schedules
| OCCIDENTAL PETROLEUM | |
| CORPORATE | |
| ($ millions) | |
| | | | | | | | | | | | | |
| | | 31-Dec-13 | | 31-Dec-12 |
| | | | | | | | | | | | | |
| CAPITALIZATION | | | | | | | | | | | | |
| | | | | | | | | | | | | |
| Long-Term Debt (including current maturities) | | | $ | 6,939 | | | | | $ | 7,623 | | |
| | | | | | | | | | | | | |
| EQUITY | | | $ | 43,372 | | | | | $ | 40,048 | | |
| | | | | | | | | | | | | |
| Total Debt To Total Capitalization | | | | 14% | | | | | 16% | |
15