In November 2003, Citigroup Asset Management (“CAM”) disclosed an investigation by the Securities and Exchange Commission (“SEC”) and the U.S. Attorney relating to Citigroup Asset Management’s entry into the transfer agency business during 1997-1999. Citigroup has disclosed that the Staff of the SEC is considering recommending a civil injunctive action and/or an administrative proceeding against certain advisory and transfer agent entities affiliated with Citigroup, the former CEO of CAM, two former employees and a current employee of CAM, relating to the creation, operation and fees of its internal transfer agent unit that serves various CAM-managed funds. Citigroup is cooperating with the SEC and will seek to resolve this matter in discussion with the SEC Staff. Although there can be no assurance, Citigroup does not believe that this matter will have a material adverse effect on the fund.
As always, thank you for your confidence in our stewardship of your assets.We look forward to helping you continue to meet your financial goals.
M A N A G E R O V E R V I E W
Performance Review
For the 12 months ended October 31, 2004, Class A shares of the Smith Barney Health Sciences Fund, excluding sales charges, returned 3.36% .These shares underperformed the fund’s unmanaged benchmarks the Russell 3000 Indexiv and the Goldman Sachs Healthcare Index,v which returned 9.51% and 3.88%, respectively, for the same period.They also underperformed the Lipper health/biotechnology funds category average,1 which was 5.93% .
Market Overview
The overall healthcare sector generated positive returns over the fiscal year.After a strong run from November 2003 to February 2004, healthcare stocks peaked in the spring and declined through the summer and autumn.The strongest returns in the sector came from biotechnology, medical device and managed care stocks. Biotechnology stocks moved higher as a result of positive developments from several new products perceived as offering promising potential.These included Genentech Inc.’s novel anticancer therapy Avastin and Biogen Idec’s drug Antegren for multiple sclerosis. However, biotechnology stocks pulled back along with the overall healthcare sector in the summer. Medical device stocks continued to perform well, especially in the orthopedic area, where device manufacturers benefited from strong demand and improved pricing power for their new products.
Conversely, large-capitalization pharmaceutical stocks performed poorly during the reporting period. Despite compelling valuations, the combination of political uncertainty, a lack of new products in their pipelines, and legal challenges dragged down these stocks. Concerns were heightened when Merck & Co. Inc. withdrew Vioxx, a painkiller, from the market due to increased risk of heart attacks. Merck had to lower revenue guidance and it reportedly faces an investigation from the SEC and the Justice Department, as well as the risk of litigation.
| PERFORMANCE SNAPSHOT AS OF OCTOBER 31, 2004 (excluding sales charges) |
|
| | 6 Months | | 12 Months |
|
| Class A Shares—Health | | | | |
|
| Sciences Fund | –6.74 | % | 3.36 | % |
|
| Russell 3000 Index | 3.17 | % | 9.51 | % |
|
| Goldman Sachs Healthcare Index | –7.70 | % | 3.88 | % |
|
| Lipper Health/Biotechnology | | | | |
| Funds Category Average | –6.77 | % | 5.93 | % |
|
The performance shown represents past performance. Past performance is no guarantee of future results and current performance may be higher or lower than the performance shown above. Principal value and investment returns will fluctuate and investors’ shares, when redeemed, may be worth more or less than their original cost. To obtain performance data current to the most recent month-end, please visit our website at www.smithbarneymutualfunds.com.
Performance figures may reflect reimbursements or fee waivers, without which the performance would have been lower.
Class A share returns assume the reinvestment of income dividends and capital gains distributions at net asset value and the deduction of all fund expenses. Returns have not been adjusted to include sales charges that may apply when shares are purchased or the deduction of taxes that a shareholder would pay on fund distributions. Excluding sales charges, Class B shares returned –7.12% and Class C shares returned –7.13% over the six months ended October 31, 2004. Excluding sales charges, Class B shares returned 2.69% and Class C shares returned 2.59% over the twelve months ended October 31, 2004.
Lipper, Inc. is a major independent mutual-fund tracking organization. Returns are based on the period ended October 31, 2004, calculated among the 198 funds for the six-month period and among the 194 funds for the 12-month period in the fund’s Lipper category including the reinvestment of dividends and capital gains, if any, and excluding sales charges.
Factors Influencing Fund Performance
During the fiscal year, the fund’s performance was driven by stock selection. In the biotechnology area, our holding in Biogen Idec enhanced portfolio results. In pharmaceuticals, we benefited from holding diversified
| 1 | Lipper, Inc. is a major independent mutual-fund tracking organization. Returns are based on the 12-month period ended October 31, 2004, calculated among the 194 funds in the fund’s Lipper category, including the reinvestment of dividends and capital gains, if any, and excluding sales charges. |
3 Smith Barney Sector Series Inc. | 2004 Annual Report
healthcare conglomerate Johnson & Johnson Inc. and by de-emphasizing large-capitalization underperformers such as Merck & Co. Inc. and Bristol-Myers Squibb Co. In medical devices, the fund was helped by its ownership in the stock of orthopedic device maker Biomet Inc., as it enjoyed strong demand for its products. Another positive performer in this subsector was C.R. Bard Inc., a medical instrument manufacturer.
Earlier in the fiscal year the fund’s holding in pharmaceutical company Wyeth detracted from performance.The company’s stock performed poorly as a result of an adverse court decision regarding litigation for its diet drug. Despite this event, we believed our analysis for the company remained intact and we added to the fund’s position on weakness.This proved to be beneficial, as the stock subsequently recouped some of its earlier losses.
Watson Pharmaceuticals Inc. and Teva Pharmaceutical Industries Ltd. were examples of stocks that detracted from performance over the fiscal year.Watson’s first-quarter 2004 results came in below analyst estimates, and Teva suffered from perceived competition from Biogen Idecs for its multiple sclerosis product. Our holdings in pharmaceutical distributors
AmerisourceBergen Corp. and McKesson Corp. also hurt performance. Both firms suffered from falling profits as they instituted changes to their business models.
During the period, we reduced the fund’s exposure to medical device firms Medtronic Inc. and St. Jude Medical Inc., managed care company Aetna Inc., and specialty pharmaceutical company Alcon Inc..
Conversely, we added to the fund’s positions in biotech company Genentech Inc. as well as C.R. Bard Inc., Guidant Corp., McKesson Corp., AmerisourceBergen Corp., and Wyeth.We also established a position in Biomet Inc. during the period.
Thank you for your investment in the Smith Barney Health Sciences Fund. As ever, we appreciate that you have chosen us to manage your assets and we remain focused on seeking to achieve the fund’s investment goals.
Sincerely,
The Portfolio Management Team
Citigroup Asset Management Limited
November 12, 2004
The information provided is not intended to be a forecast of future events, a guarantee of future results or investment advice. Views expressed may differ from those of the firm as a whole.
Portfolio holdings and breakdowns are as of October 31, 2004 and are subject to change and may not be representative of the portfolio manager’s current or future investments. The fund’s top ten holdings (as a % of net assets) as of this date were: Johnson & Johnson Inc. (10.3%), Wyeth (7.3%), Pfizer Inc. (6.8%), Abbott Laboratories (6.8%), Eli Lilly and Co. (6.5%), Merck & Co. Inc. (5.6%), UnitedHealth Group Inc. (4.9%), Guidant Corp. (4.8%), Medtronic Inc. (4.3%), Medicis Pharmaceutical Corp., Class A Shares (3.8%) . Please refer to page 10 for a list and percentage breakdown of the fund’s holdings.
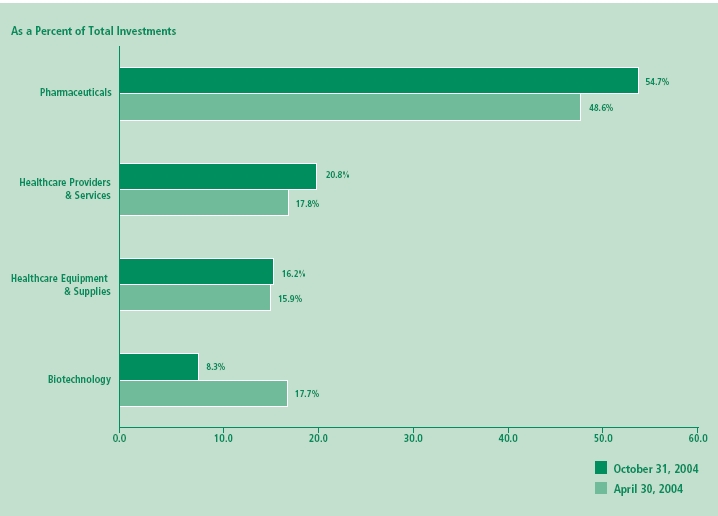
The mention of sector breakdowns is for informational purposes only and should not be construed as a recommendation to purchase or sell any securities. The information provided regarding such sectors is not a sufficient basis upon which to make an investment decision. Investors seeking financial advice regarding the appropriateness of investing in any securities or investment strategies discussed should consult their financial professional. Portfolio holdings are subject to change at any time and may not be representative of the portfolio manager’s current or future investments. The fund’s top four sector holdings (as a % of net assets) as of October 31, 2004 were: Pharmaceuticals (54.7%); Healthcare Provider and Services (20.7%); Healthcare Equipment and Supplies (16.2%); Biotechnology (8.3%) . The fund’s portfolio composition is subject to change at any time.
RISKS: In addition to normal risks associated with equity investing, narrowly focused investments typically exhibit higher volatility. The health care sector may be subject to greater governmental regulation, competitive pressures and rapid technological change and obsolescence, which may have a materially adverse effect on the sector. Additionally, the fund’s performance will be influenced by political, social and economic factors affecting investments in companies in foreign countries. Investing in foreign securities is subject to certain risks not associated with domestic investing, such as currency fluctuations, and changes in political and economic conditions. The securities of small- and mid-sized companies tend to be more volatile than those of larger companies. The fund may use derivatives, such as options and futures, which can be illiquid, may disproportionately increase losses, and have a potentially large impact on fund performance.
All index performance reflects no deduction for fees, expenses or taxes. Please note an investor cannot invest directly in an index.
| i | Source: Commerce Department (Bureau of Economic Analysis). Refers to quarterly growth of Gross Domestic Product (“GDP”). GDP is a market value of goods and services produced by labor and property in a given country. |
| |
| ii | Source: U.S. Federal Reserve Board. The Fed is responsible for the formulation of a policy designed to promote economic growth, full employment, stable prices, and a sustainable pat- tern of international trade and payments. |
| |
| iii | The federal funds rate is the interest rate that banks with excess reserves at a Federal Reserve district bank charge other banks that need overnight loans. |
| |
| iv | The Russell 3000 Index measures the performance of the 3,000 largest U.S. companies based on total market capitalization, which represent approximately 98% of the U.S. equity market. |
| |
| v | The Goldman Sachs Healthcare Index is an unmanaged market-value weighted index comprised of healthcare service companies including long-term care and hospital facilities, healthcare management organizations and continuing care services and pharmaceutical companies. |
| |
4 Smith Barney Sector Series Inc. | 2004 Annual Report
Fund at a Glance (unaudited)
Investment Breakdown
5 Smith Barney Sector Series Inc. | 2004 Annual Report
Fund Expenses (unaudited)
Example
As a shareholder of the Fund, you may incur two types of costs: (1) transaction costs, including front-end and back-end sales charges (loads) on purchase payments, reinvested dividends, or other distributions; and (2) ongoing costs, including management fees; distribution and/or service (12b-1) fees; and other Fund expenses.This example is intended to help you understand your ongoing costs (in dollars) of investing in the Fund and to compare these costs with the ongoing costs of investing in other mutual funds.
This example is based on an investment of $1,000 invested on May 1, 2004 and held for the six months ended October 31, 2004.
Actual Expenses
The table below titled “Based on Actual Total Return” provides information about actual account values and actual expenses. You may use the information provided in this table, together with the amount you invested, to estimate the expenses that you paid over the period. To estimate the expenses you paid on your account, divide your ending account value by $1,000 (for example, an $8,600 ending account value divided by $1,000 = 8.6), then multiply the result by the number under the heading entitled “Expenses Paid During the Period”.
Based on Actual Total Return(1)
| | | Actual | | | | | | | | | |
| | | Total Return | | Beginning | | Ending | | Annualized | | Expenses |
| | | Without | | Account | | Account | | Expense | | Paid During |
| | | Sales Charges(2) | | Value | | Value | | Ratios | | the Period(3) |
|
| |
| Class A | | (6.74 | )% | | $1,000.00 | | $932.60 | | 1.44 | % | | $7.00 |
|
| |
| Class B | | (7.12 | ) | | 1,000.00 | | 928.80 | | 2.18 | | | 10.57 |
|
| |
| Class C(4) | | (7.13 | ) | | 1,000.00 | | 928.70 | | 2.18 | | | 10.57 |
|
| (1) | For the six months ended October 31, 2004. |
| |
| (2) | Assumes reinvestment of all dividends and capital gain distributions, if any, at net asset value and does not reflect the deduction of the applicable sales charges with respect to Class A shares or the applicable contingent deferred sales charges (“CDSC”) with respect to Class B and C shares. Total return is not annualized, as it may not be representative of the total return for the year. Performance figures may reflect fee waivers and/or expense reimbursements. In the absence of fee waivers and/or expense reimbursement, the total return would have been lower. |
| |
| (3) | Expenses (net of voluntary waiver) are equal to each class’ respective annualized expense ratio multiplied by the average account value over the period, multiplied by the number of days in the most recent fiscal half-year, then divided by 366. |
| |
| (4) | On April 29, 2004, Class L shares were renamed Class C shares. |
| |
6 Smith Barney Sector Series Inc. | 2004 Annual Report
Fund Expenses (unaudited) (continued)
Hypothetical Example for Comparison Purposes
The table below titled “Based on Hypothetical Total Return” provides information about hypothetical account values and hypothetical expenses based on the actual expense ratio and an assumed rate of return of 5.00% per year before expenses, which is not the Fund’s actual return.The hypothetical account values and expenses may not be used to estimate the actual ending account balance or expenses you paid for the period.You may use the information provided in this table to compare the ongoing costs of investing in the Fund and other funds.To do so, compare the 5.00% hypothetical example relating to the Fund with the 5.00% hypothetical examples that appear in the shareholder reports of the other funds.
Please note that the expenses shown in the table below are meant to highlight your ongoing costs only and do not reflect any transactional costs, such as front-end or back-end sales charges (loads).Therefore, the table is useful in comparing ongoing costs only, and will not help you determine the relative total costs of owning different funds. In addition, if these transaction costs were included, your costs would have been higher.
Based on Hypothetical Total Return(1)
| | | | | Beginning | | Ending | | Annualized | | Expenses |
| | | Hypothetical | | Account | | Account | | Expense | | Paid During |
| | | Total Return | | Value | | Value | | Ratios | | the Period(2) |
|
| Class A | | 5.00 | % | | $ | 1,000.00 | | $1,017.90 | | 1.44 | % | | $ 7.30 |
|
| Class B | | 5.00 | | | | 1,000.00 | | 1,014.18 | | 2.18 | | | 11.04 |
|
| Class C(3) | | 5.00 | | | | 1,000.00 | | 1,014.18 | | 2.18 | | | 11.04 |
|
| (1) | For the six months ended October 31, 2004. |
| |
| (2) | Expenses (net of voluntary waiver) are equal to each class’ respective annualized expense ratio multiplied by the average account value over the period, multiplied by the number of days in the recent fiscal half-year, then divided by 366. |
| |
| (3) | On April 29, 2004, Class L shares were renamed as Class C shares. |
| |
7 Smith Barney Sector Series Inc. | 2004 Annual Report
|
| Average Annual Total Returns(1) (unaudited) | | |
|
| | Without Sales Charges(2) |
|
|
| | Class A | | Class B | | Class C(3) |
|
| Twelve Months Ended 10/31/04 | 3.36 | % | | 2.69 | % | | 2.59 | % |
|
| Inception* through 10/31/04 | 0.22 | | | (0.52 | ) | | (0.54 | ) |
|
| |
| | With Sales Charges(4) |
|
|
| | Class A | | Class B | | Class C(3) |
|
| Twelve Months Ended 10/31/04 | (1.77 | )% | | (2.31 | )% | | 1.59 | % |
|
| Inception* through 10/31/04 | (0.88 | ) | | (0.73 | ) | | (0.54 | ) |
|
| |
|
| Cumulative Total Returns(1) (unaudited) | | | | | | | | |
|
| | Without Sales Charges(2) |
|
| Class A (Inception* through 10/31/04) | | | | 1.03 | % | | | |
|
| Class B (Inception* through 10/31/04) | | | | (2.41 | ) | | | |
|
| Class C(3) (Inception* through 10/31/04) | | | | (2.50 | ) | | | |
|
| (1 ) | All figures represent past performance and are not a guarantee of future results. Investment return and principal value of an investment will fluctuate so that an investor’s shares, when redeemed, may be worth more or less than their original cost. The returns shown do not reflect the deduction of taxes that a shareholder would pay on fund distributions or the redemption of fund shares. Performance figures may reflect the waivers and/or expense reimbursements. In the absence of fee waivers and/or expense reimbursements, the total return would have been lower.
|
| (2) | Assumes reinvestment of all dividends and capital gain distributions, if any, at net asset value and does not reflect the deduction of the applicable sales charge with respect to Class A shares or the applicable contingent deferred sales charges (“CDSC”) with respect to Class B and C shares.
|
| (3) | On April 29, 2004, Class L shares were renamed as Class C shares.
|
| (4) | Assumes reinvestment of all dividends and capital gain distributions, if any, at net asset value. In addition, Class A shares reflect the deduction of the maximum sales charge of 5.00%; Class B shares reflect the deduction of a 5.00% CDSC, which applies if shares are redeemed within one year from purchase payment. Thereafter, the CDSC declines by 1.00% per year until no CDSC is incurred. Class C shares reflect the deduction of a 1.00% CDSC, which applies if shares are redeemed within one year from purchase payment. The 1.00% initial sales charge on Class C shares is no longer imposed effective February 2, 2004.
|
| * | | | Inception date for Class A, B and C shares is February 28, 2000. |
8 Smith Barney Sector Series Inc. | 2004 Annual Report
Historical Performance (unaudited)
Value of $10,000 Invested in Class A, B and C Shares of the
Smith Barney Health Sciences Fund vs. Goldman Sachs Healthcare Index and Russell 3000 Index†
February 2000 — October 2004
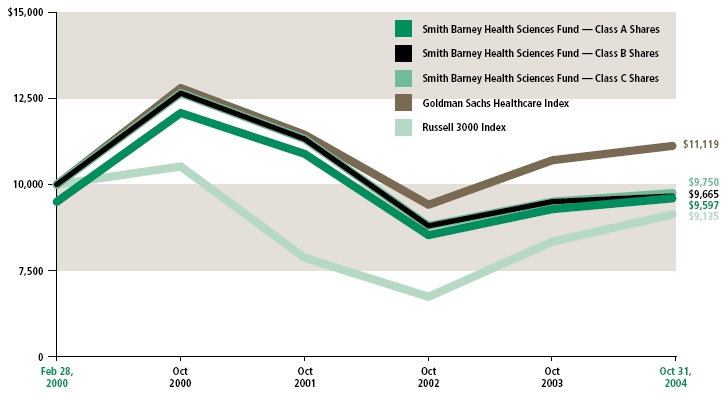
| † | Hypothetical illustration of $10,000 invested in Class A, B and C shares at inception on February 28, 2000 assuming deduction of the maximum 5.00% sales charge at the time of investment for Class A and the deduction of the maximum 5.00% and 1.00% CDSC for Class B and C shares, respectively. It also assumes reinvestment of dividends and capital gains, if any, at net asset value through October 31, 2004. The Russell 3000 Index is an unmanaged index comprised of the 3,000 largest U.S. companies based on total market capitalization. The Goldman Sachs Healthcare Index is comprised of healthcare service companies, including long-term care and hospital facilities, healthcare management organizations and continuing care services and pharmaceutical companies. The Index is unmanaged and is not subject to the same management and trading expenses of a mutual fund. Please note that an investor cannot invest directly in an index. The returns shown do not re flect the deduction of taxes that a shareholder would pay on fund distributions or the redemption of fund shares.
|
| | All figures represent past performance and are not a guarantee of future results. The investment return and principal value of an investment will fluctuate so that an investor’s shares, when redeemed, may be worth more or less than their original cost. The returns shown do not reflect the deduction of taxes that a shareholder would pay on fund distributions or the redemption of fund shares. Performance figures may reflect fee waivers and/or expense reimbursements. In the absence of fee waivers and/or expense reimbursements, the total return would have been lower. |
9 Smith Barney Sector Series Inc. | 2004 Annual Report
|
Schedule of Investments | | October 31, 2004 |
|
| SHARES | | SECURITY | VALUE |
|
| COMMON STOCK — 99.9% | | |
Biotechnology — 8.3% |
| 28,929 | | Amgen Inc. (a) | $ | 1,643,167 |
| 15,761 | | Biogen Idec Inc. (a) | | 916,660 |
| 53,032 | | Genentech, Inc. (a) | | 2,414,547 |
| 9,842 | | Genzyme Corp. (a) | | 516,410 |
| | | | | 5,490,784 |
|
| Healthcare Equipment & Supplies — 16.2% | | |
| 53,541 | | Biomet, Inc. | | 2,499,294 |
| 42,449 | | Boston Scientific Corp. (a) | | 1,498,450 |
| 12,680 | | C.R. Bard, Inc. | | 720,224 |
| 47,559 | | Guidant Corp. | | 3,168,381 |
| 55,158 | | Medtronic, Inc. | | 2,819,125 |
|
| | | | | 10,705,474 |
|
| Healthcare Providers & Services — 20.7% | | |
| 6,993 | | Aetna Inc. | | 664,335 |
| 43,544 | | AmerisourceBergen Corp. | | 2,396,662 |
| 29,186 | | Anthem, Inc. (a) | | 2,346,554 |
| 24,052 | | Cardinal Health, Inc. | | 1,124,431 |
| 7,381 | | HCA, Inc. | | 271,104 |
| 60,115 | | McKesson Corp. | | 1,602,666 |
| 19,015 | | Triad Hospitals, Inc. (a) | | 628,065 |
| 44,449 | | UnitedHealth Group Inc. | | 3,218,108 |
| 7,824 | | Universal Health Services, Inc., Class B Shares | | 325,165 |
| 11,656 | | WellPoint Health Networks Inc. (a) | | 1,138,325 |
|
| | | | | 13,715,415 |
|
| Pharmaceuticals — 54.7% | | |
| 105,379 | | Abbott Laboratories | | 4,492,307 |
| 78,541 | | Eli Lilly & Co. | | 4,312,686 |
| 38,695 | | Forest Laboratories, Inc. (a) | | 1,725,797 |
| 116,214 | | Johnson & Johnson | | 6,784,573 |
| 62,079 | | Medicis Pharmaceutical Corp., Class A Shares | | 2,524,753 |
| 118,714 | | Merck & Co. Inc. | | 3,716,935 |
| 155,403 | | Pfizer Inc. | | 4,498,917 |
| 82,406 | | Teva Pharmaceutical Industries Ltd., Sponsored ADR | | 2,142,556 |
| 39,889 | | Watson Pharmaceuticals, Inc. (a) | | 1,118,089 |
| 122,060 | | Wyeth | | 4,839,679 |
|
| | | | | 36,156,292 |
|
| | | TOTAL INVESTMENTS — 99.9% (Cost — $65,841,269*) | | 66,067,965 |
| | | Other Assets in Excess of Liabilities — 0.1% | | 34,874 |
| |
| | | TOTAL NET ASSETS — 100.0% | $ | 66,102,839 |
|
| (a) | | Non-income producing security. |
| * | | Aggregate cost for federal income tax purposes is $66,904,303. |
| | | |
| | | Abbreviation used in this schedule: |
| | |
| |
| | | ADR — American Depositary Receipt |
See Notes to Financial Statements.
10 Smith Barney Sector Series Inc. | 2004 Annual Report
|
| Statement of Assets and Liabilities | | October 31, 2004 |
|
| ASSETS: | | | | |
| Investments, at value (Cost — $65,841,269) | | $ | 66,067,965 | |
| Receivable for securities sold | | | 2,094,031 | |
| Dividends receivable | | | 29,880 | |
| Receivable for Fund shares sold | | | 18,863 | |
| Prepaid expenses | | | 10,747 | |
|
| Total Assets | | | 68,221,486 | |
|
| LIABILITIES: | | | | |
| Payable for securities purchased | | | 1,758,022 | |
| Due to custodian | | | 147,057 | |
| Payable for Fund shares reacquired | | | 85,242 | |
| Management fee payable | | | 45,002 | |
| Distribution plan fees payable | | | 13,859 | |
| Accrued expenses | | | 69,465 | |
|
| Total Liabilities | | | 2,118,647 | |
|
| Total Net Assets | | $ | 66,102,839 | |
|
| NET ASSETS: | | | | |
| Par value of capital shares ($0.001 par value, 750 million shares authorized) | $ | 6,124 | |
| Capital paid in excess of par value | | | 82,033,988 | |
| Accumulated net investment loss | | | (484 | ) |
| Accumulated net realized loss from investment transactions | | | (16,163,485 | ) |
| Net unrealized appreciation of investments and foreign currencies | | | 226,696 | |
|
| Total Net Assets | | $ | 66,102,839 | |
|
| Shares Outstanding: | | | | |
| Class A | | | 1,747,663 | |
|
| Class B | | | 2,662,747 | |
|
| Class C | | | 1,713,195 | |
|
| Net Asset Value: | | | | |
| Class A (and redemption price) | | $ | 11.07 | |
|
| Class B * | | $ | 10.69 | |
|
| Class C * | | $ | 10.68 | |
|
| |
| Maximum Public Offering Price Per Share: | | | | |
| Class A (based on maximum sales charge of 5.00%) | | $ | 11.65 | |
|
| * | Redemption price is NAV of Class B and C shares reduced by a 5.00% and 1.00% CDSC, respectively, if shares are redeemed within one year from purchase payment (See Note 2). |
See Notes to Financial Statements.
11 Smith Barney Sector Series Inc. | 2004 Annual Report
|
Statement of Operations | | For the Year Ended October 31, 2004 |
|
| INVESTMENT INCOME: | | | | |
| Dividends | | $ | 770,702 | |
| Interest | | | 1,509 | |
| Less: Foreign withholding tax | | | (2,960 | ) |
|
| Total Investment Income | | | 769,251 | |
|
| EXPENSES: | | | | |
| Management fees (Note 2) | | | 588,191 | |
| Distribution plan fees (Notes 2 and 4) | | | 579,215 | |
| Transfer agency services (Notes 2 and 4) | | | 134,422 | |
| Shareholder communications (Note 4) | | | 55,674 | |
| Audit and legal | | | 34,741 | |
| Registration fees | | | 34,030 | |
| Custody | | | 18,267 | |
| Directors’ fees | | | 16,096 | |
| Other | | | 7,571 | |
|
| Total Expenses | | | 1,468,207 | |
| Less: Management fee waiver (Notes 2 and 8) | | | (27,364 | ) |
|
| Net Expenses | | | 1,440,843 | |
|
| Net Investment Loss | | | (671,592 | ) |
|
| REALIZED AND UNREALIZED GAIN ON INVESTMENTS | | | |
| AND FOREIGN CURRENCIES (NOTES 1 AND 3): | | | |
| Realized Gain From: | | | | |
| Investment transactions | | | 5,653,880 | |
| Foreign currency transactions | | | 702 | |
|
| Net Realized Gain | | | 5,654,582 | |
|
| Net Change In Unrealized Appreciation From: | | | | |
| Investments | | | (2,611,802 | ) |
| Foreign currencies | | | (523 | ) |
|
| Net Decrease in Unrealized Appreciation | | | (2,612,325 | ) |
|
| Net Gain on Investments and Foreign Currencies | | 3,042,257 | |
|
| Increase in Net Assets From Operations | | $ | 2,370,665 | |
|
See Notes to Financial Statements.
12 Smith Barney Sector Series Inc. | 2004 Annual Report
|
Statements of Changes in Net Assets | | For the Years Ended October 31, |
| | | 2004 | | 2003 |
|
| OPERATIONS: | | | | | | | | |
| Net investment loss | | $ | (671,592 | ) | | $ | (569,042 | ) |
| Net realized gain (loss) | | | 5,654,582 | | | | (8,863,347 | ) |
| Net increase (decrease) in unrealized appreciation | | | (2,612,325 | ) | | | 13,129,196 | |
|
| Increase in Net Assets From Operations | | | 2,370,665 | | | | 3,696,807 | |
|
| FUND SHARE TRANSACTIONS (NOTE 6): | | | | | | | | |
| Net proceeds from sale of shares | | | 8,694,811 | | | | 8,315,118 | |
| Net asset value of shares issued in connection with the transfer of the | | | | | | | |
| Smith Barney Sector Series Inc. – Biotechnology Fund’s net assets (Note 5) | | — | | | | 17,667,510 | |
| Cost of shares reacquired | | | (18,460,190 | ) | | | (16,121,557 | ) |
|
| Increase (Decrease) in Net Assets From Fund Share Transactions | | (9,765,379 | ) | | | 9,861,071 | |
|
| Increase (Decrease) in Net Assets | | | (7,394,714 | ) | | | 13,557,878 | |
| | | | | | | | | |
| NET ASSETS: | | | | | | | | |
| Beginning of year | | | 73,497,553 | | | | 59,939,675 | |
|
| End of year* | | $ | 66,102,839 | | | $ | 73,497,553 | |
|
| |
| * Includes accumulated net investment loss of: | | $ | (484 | ) | | $ | (2,332 | ) |
|
See Notes to Financial Statements.
13 Smith Barney Sector Series Inc. | 2004 Annual Report
Financial Highlights
For a share of each class of capital stock outstanding throughout each year or period ended October 31,
| Class A Shares | | 2004 (1) | | 2003 (1) | | 2002 (1) | | 2001 | | 2000 (2) |
| |
| Net Asset Value, Beginning of Period | $ | 10.71 | | | $ | 9.84 | | | $ | 12.72 | | | $ | 14.49 | | | $ | 11.40 | |
|
| Income (Loss) From Operations: | | | | | | | | | | | | | | | | | | | |
| Net investment loss | | (0.04 | ) | | | (0.03 | ) | | | (0.07 | ) | | | (0.08 | ) | | | (0.04 | ) |
| Net realized and unrealized gain (loss) | | 0.40 | | | | 0.90 | | | | (2.64 | ) | | | (1.29 | ) | | | 3.13 | |
|
| Total Income (Loss) From Operations | | 0.36 | | | | 0.87 | | | | (2.71 | ) | | | (1.37 | ) | | | 3.09 | |
|
| Less Distributions From: | | | | | | | | | | | | | | | | | | | |
| Net realized gains | | | — | | | | — | | | | (0.17 | ) | | | (0.40 | ) | | | — | |
|
| Total Distributions | | | — | | | | — | | | | (0.17 | ) | | | (0.40 | ) | | | — | |
|
| Net Asset Value, End of Period | $ | 11.07 | | | $ | 10.71 | | | $ | 9.84 | | | $ | 12.72 | | | $ | 14.49 | |
|
| Total Return(3) | | | 3.36 | % | | | 8.84 | % | | | (21.65 | )% | | | (9.83 | )% | | | 27.11 | %‡ |
|
| Net Assets, End of Period (000s) | $ | 19,346 | | | $ | 20,636 | | | $ | 16,251 | | | $ | 19,806 | | | $ | 16,980 | |
|
| Ratios to Average Net Assets: | | | | | | | | | | | | | | | | | | | |
| Expenses(4) | | | 1.42 | %(5) | | | 1.35 | % | | | 1.49 | % | | | 1.50% | (5) | | | 1.52 | %(5)† |
| Net investment loss | | (0.38 | ) | | | (0.30 | ) | | | (0.58 | ) | | | (0.63 | ) | | | (0.67 | )† |
|
| Portfolio Turnover Rate | | 65 | % | | | 68 | % | | | 26 | % | | | 34 | % | | | 26 | % |
|
| |
| Class B Shares | | | 2004 | (1) | | | 2003 | (1) | | | 2002 | (1) | | | 2001 | | | | 2000 | (2) |
|
| Net Asset Value, Beginning of Period | $ | 10.41 | | | $ | 9.64 | | | $ | 12.56 | | | $ | 14.42 | | | $ | 11.40 | |
|
| Income (Loss) From Operations: | | | | | | | | | | | | | | | | | | | |
| Net investment loss | | (0.13 | ) | | | (0.11 | ) | | | (0.15 | ) | | | (0.18 | ) | | | (0.09 | ) |
| Net realized and unrealized gain (loss) | | 0.41 | | | | 0.88 | | | | (2.60 | ) | | | (1.28 | ) | | | 3.11 | |
|
| Total Income (Loss) From Operations | | 0.28 | | | | 0.77 | | | | (2.75 | ) | | | (1.46 | ) | | | 3.02 | |
|
| Less Distributions From: | | | | | | | | | | | | | | | | | | | |
| Net realized gains | | | — | | | | — | | | | (0.17 | ) | | | (0.40 | ) | | | — | |
|
| Total Distributions | | | — | | | | — | | | | (0.17 | ) | | | (0.40 | ) | | | — | |
|
| Net Asset Value, End of Period | $ | 10.69 | | | $ | 10.41 | | | $ | 9.64 | | | $ | 12.56 | | | $ | 14.42 | |
|
| Total Return(3) | | | 2.69 | % | | | 7.99 | % | | | (22.25 | )% | | | (10.51 | )% | | | 26.49 | %‡ |
|
| Net Assets, End of Period (000s) | $ | 28,452 | | | $ | 31,380 | | | $ | 26,258 | | | $ | 34,146 | | | $ | 28,694 | |
|
| Ratios to Average Net Assets: | | | | | | | | | | | | | | | | | | | |
| Expenses(6) | | | 2.17 | %(5) | | | 2.11 | % | | | 2.24 | % | | | 2.25 | %(5) | | | 2.26 | %(5)† |
| Net investment loss | | (1.13 | ) | | | (1.05 | ) | | | (1.33 | ) | | | (1.38 | ) | | | (1.41 | )† |
|
| Portfolio Turnover Rate | | 65 | % | | | 68 | % | | | 26 | % | | | 34 | % | | | 26 | % |
|
| (1 | ) | | Per share amounts have been calculated using the monthly average shares method. |
| (2 | ) | | For the period February 28, 2000 (inception date) to October 31, 2000. |
| (3 | ) | | Performance figures may reflect fee waivers and/or expense reimbursements. Past performance is no guarantee of future results. In the absence of fee waivers and/or expense reimbursements, the total return would have been lower. |
| | |
| (4 | ) | | As a result of voluntary expense limitations, the ratio of expenses to average net assets will not exceed 1.50% for Class A shares. |
| (5 | ) | | The investment manager waived a portion of its management fees for the years ended October 31, 2004, 2001 and for the period ended October 31, 2000. If such fees were not waived, the actual expense ratios would have been 1.46%, 1.53%, and 1.94% annualized, respectively, for Class A shares and 2.21%, 2.28% and 2.68%, respectively, for Class B shares. |
| | |
| | |
| (6 | ) | | As a result of voluntary expense limitations, the ratio of expenses to average net assets will not exceed 2.25% for Class B shares. |
| ‡ | | | Total return is not annualized, as it may not be representative of the total return for the year. |
| † | | | Annualized. |
See Notes to Financial Statements.
14 Smith Barney Sector Series Inc. | 2004 Annual Report
Financial Highlights (continued)
For a share of each class of capital stock outstanding throughout each year or period ended October 31,
| Class C Shares(1) | | 2004 (2) | | 2003 (2) | | 2002 (2) | | 2001 | | 2000 (3) |
|
| Net Asset Value, Beginning of Period | $ | 10.41 | | | $ | 9.64 | | | $ | 12.56 | | | $ | 14.42 | | | $ | 11.40 | |
|
| Income (Loss) From Operations: | | | | | | | | | | | | | | | | | | | |
| Net investment loss | | (0.12 | ) | | | (0.11 | ) | | | (0.15 | ) | | | (0.18 | ) | | | (0.09 | ) |
| Net realized and unrealized gain (loss) | | 0.39 | | | | 0.88 | | | | (2.60 | ) | | | (1.28 | ) | | | 3.11 | |
|
| Total Income (Loss) From Operations | | 0.27 | | | | 0.77 | | | | (2.75 | ) | | | (1.46 | ) | | | 3.02 | |
|
| Less Distributions From: | | | | | | | | | | | | | | | | | | | |
| Net realized gains | | | — | | | | — | | | | (0.17 | ) | | | (0.40 | ) | | | — | |
|
| Total Distributions | | | — | | | | — | | | | (0.17 | ) | | | (0.40 | ) | | | — | |
|
| Net Asset Value, End of Period | $ | 10.68 | | | $ | 10.41 | | | $ | 9.64 | | | $ | 12.56 | | | $ | 14.42 | |
|
| Total Return(4) | | | 2.59 | % | | | 7.99 | % | | | (22.25 | )% | | | (10.51 | )% | | | 26.49 | %‡ |
|
| Net Assets, End of Period (000s) | $ | 18,305 | | | $ | 21,482 | | | $ | 17,431 | | | $ | 26,932 | | | $ | 26,273 | |
|
| Ratios to Average Net Assets: | | | | | | | | | | | | | | | | | | | |
| Expenses(5) | | | 2.17 | %(6) | | | 2.10 | % | | | 2.24 | % | | | 2.25 | %(6) | | | 2.27 | %(6)† |
| Net investment loss | | (1.12 | ) | | | (1.05 | ) | | | (1.33 | ) | | | (1.37 | ) | | | (1.42 | )† |
|
| Portfolio Turnover Rate | | 65 | % | | | 68 | % | | | 26 | % | | | 34 | % | | | 26 | % |
|
| (1 | ) | | On April 29, 2004, Class L shares were renamed Class C shares. |
| (2 | ) | | Per share amounts have been calculated using the monthly average shares method. |
| (3 | ) | | For the period February 28, 2000 (inception date) to October 31, 2000. |
| (4 | ) | | Performance figures may reflect fee waivers and/or expense reimbursements. Past performance is no guarantee of future results. In the absence of fee waivers and/or expense reimbursements, the total return would have been lower. |
| | |
| (5 | ) | | As a result of voluntary expense limitations, the ratio of expenses to average net assets will not exceed 2.25% for Class C shares. The investment manager waived a portion of its management fees for the years ended October 31, 2004, 2001 and for the period ended October 31, 2000. If such fees were not waived, the actual expense ratios would have been 2.21%, 2.28% and 2.68% annualized, respectively. |
| (6 | ) | |
| | |
| ‡ | | | Total return is not annualized, as it may not be representative of the total return for the year. |
| † | | | Annualized. |
See Notes to Financial Statements.15 Smith Barney Sector Series Inc. | 2004 Annual Report
Notes to Financial Statements
1. Organization and Significant Accounting Policies
The Smith Barney Health Sciences Fund (“Fund”) is a separate non-diversified investment fund of the Smith Barney Sector Series (“Company”), a Maryland corporation, which is registered under the Investment Company Act of 1940, as amended (“1940 Act”), as an open-end management investment company.
The following are significant accounting policies consistently followed by the Fund and are in conformity with U.S. generally accepted accounting principles (“GAAP”). Estimates and assumptions are required to be made regarding assets, liabilities and changes in net assets resulting from operations when financial statements are prepared. Changes in the economic environment, financial markets and any other parameters used in determining these estimates could cause actual results to differ.
(a) Investment Valuation. Securities traded on national securities markets are valued at the closing price in the primary exchange on which they are traded. Securities listed or traded on certain foreign exchanges or other markets whose operations are similar to the U.S over-the-counter market (including securities listed on exchanges where the primary market is believed to be over-the-counter) and securities for which no sale was reported on that date are valued at the mean between the bid and asked prices. Securities listed on the NASDAQ National Market System for which market quotations are available are valued at the official closing price or, if there is no official closing price on that day, at the last sales price. Securities which are listed or traded on more than one exchange or market are valued at the quotations on the exchange or market determined to be the primary market for such securities.When market quotations or official closing prices are not readily available, or are determined not to reflect accurately fair value, such as when the value of a security has been significantly affected by events after the close of the exchange or market on which the security is principally traded, but before the Fund calculates its net asset value, the Fund may value these investments at fair value as determined in accordance with the procedures approved by the Fund’s Board of Directors. Fair valuing of securities may be determined with the assistance of a pricing service using calculations based on indices of domestic securities and other appropriate indicators, such as prices of relevant ADRs and futures contracts. Short-term obligations maturing with maturities of 60 days or less are valued at amortized cost, which approximates value.
(b) Repurchase Agreements. When entering into repurchase agreements, it is the Fund’s policy that a custodian takes possession of the underlying collateral securities, the value of which at least equals the principal amount of the repurchase transaction, including accrued interest.To the extent that any repurchase transaction exceeds one business day, the value of the collateral is marked-to-market to ensure the adequacy of the collateral. If the seller defaults and the value of the collateral declines or if bankruptcy proceedings are commenced with respect to the seller of the security, realization of the collateral by the Fund may be delayed or limited.
(c) Concentration of Risk. The Fund normally invests at least 80% of its assets in health related investments.As a result of this concentration policy, the Fund’s investments may be subject to greater risk and market fluctuation than a fund that invests in securities representing a broader range of investment alternatives.
(d) Investment Transactions and Investment Income. Security transactions are accounted for on trade date. Dividend income is recorded on ex-dividend date. Foreign dividends are recorded on the ex-dividend date or as soon as practical after the Fund determines the existence of a dividend declaration after exercising reasonable due diligence. Interest income, adjusted for amortization of premium and accretion of discount, is recorded on an accrual basis. Gains or losses on the sale of securities are calculated by using the specific identification method.
16 Smith Barney Sector Series Inc. | 2004 Annual Report
Notes to Financial Statements (continued)
(e) Foreign Currency Translation. The accounting records are maintained in U.S dollars.All assets and liabilities denominated in foreign currencies are translated into U.S dollars based on the rate of exchange of such currencies against U.S dollars on the date of valuation. Purchase and sales of securities and income and expenses are translated at the rate of exchange quoted on the respective date that such transactions are recorded. Difference between income and expense amounts recorded and collected or paid are adjusted when reported by the custodian bank.
(f) Dividends and Distributions to Shareholders. Dividends and distributions to shareholders are recorded on the ex-dividend date.The Fund distributes dividends and capital gains, if any, at least annually.The character of income and gains to be distributed is determined in accordance with income tax regulations, which may differ from GAAP.
(g) Class Accounting. Class specific expenses are charged to each class; management fees, general fund expenses, income, gains and/or losses are allocated on the basis of relative net assets of each class or on another reasonable basis.
(h) Federal and Other Taxes. It is the Fund’s policy to comply with the federal income and excise tax requirements of the Internal Revenue Code 1986, as amended, applicable to regulated investment companies. Accordingly, the Fund intends to distribute substantially all of its taxable income and net realized gains on investments, if any, to shareholders each year. Therefore, no federal income tax provision is required. Under the applicable foreign tax law, a withholding tax may be imposed on interest, dividends and capital gains at various rates.
(i) Year End Tax Reclassifications. GAAP requires that certain components of net assets be adjusted to reflect permanent differences between financial and tax reporting. Accordingly, during the current year, $672,738 has been reclassified between paid-in-capital and accumulated net investment loss as a result of permanent differences attributable to a tax net operating loss. Also, $702 has been reclassified between accumulated net realized loss from investment transactions and accumulated net investment loss due to book foreign currency transactions treated as ordinary income for tax. These reclassifications have no effect on net assets or net asset values per share.
2. Management Agreement and Other Transactions
Smith Barney Fund Management LLC (“SBFM”), an indirect wholly-owned subsidiary of Citigroup Inc. (“Citigroup”), acts as investment manager to the Fund. The Fund pays SBFM a management fee calculated at an annual rate of 0.80% of the Fund’s average daily net assets. This fee is calculated daily and paid monthly. SBFM has entered into a sub-advisory agreement with Citigroup Asset Management Ltd. (“CAM Ltd.”), an affiliate of SBFM. Pursuant to the sub-advisory agreement, CAM Ltd. is responsible for the day-to-day portfolio operations and investment decisions and is compensated by SBFM for such services at an annual rate of 0.50% of the Fund’s average daily net assets.
During the year ended October 31, 2004, the Fund’s Class A, B, and C shares had voluntary expense limitations in place of 1.50%, 2.25%, and 2.25%, respectively.These expense limitations can be terminated at any time by SBFM. During the year ended October 31, 2004, SBFM waived a portion of its management fees totaling $27,364.
Citicorp Trust Bank, fsb. (“CTB”), another subsidiary of Citigroup, acts as the Fund’s transfer agent. PFPC Inc. (“PFPC”) and Primerica Shareholder Services (“PSS”), another subsidiary of Citigroup, act as the Fund’s sub-transfer agents. CTB receives account fees and asset-based fees that vary according to the size and type of account. PFPC and PSS are responsible for share-
17 Smith Barney Sector Series Inc. | 2004 Annual Report
Notes to Financial Statements (continued)
holder recordkeeping and financial processing for all shareholder accounts and are paid by CTB. For the year ended October 31, 2004, the Fund paid transfer agent fees of $73,507.35 to CTB.
Citigroup Global Markets Inc. (“CGM”) and PFS Distributors, Inc., both of which are subsidiaries of Citigroup, act as the Fund’s distributors.
For the year ended October 31, 2004, CGM and its affiliates received brokerage commissions of $5,289.
On February 2, 2004, sales charges on Class L shares were eliminated. Effective April 29, 2004, Class L shares were renamed as Class C shares.
There is a maximum sales charge of 5.00% for Class A shares.There is a contingent deferred sales charge (“CDSC”) of 5.00% on Class B shares, which applies if redemption occurs within one year from purchase payment and declines thereafter by 1.00% per year until no CDSC is incurred. Class C shares have a 1.00% CDSC, which applies if redemption occurs within one year from purchase payment. In addition, Class A shares have a 1.00% CDSC, which applies if redemption occurs within one year from purchase payment.This CDSC only applies to those purchases of Class A shares which, when combined with current holdings of Class A shares, equal or exceed $1,000,000 in the aggregate.These purchases do not incur an initial sales charge.
For the year ended October 31, 2004, CGM and its affiliates received sales charges of approximately $91,000 and $10,000 on sales of the Fund’s Class A and C shares, respectively. In addition, for the year ended October 31, 2004, CDSCs paid to CGM and its affiliates were approximately $82,000 for Class B shares.
All officers and one Director of the Company are employees of Citigroup or its affiliates and do not receive compensation from the Company.
3. Investments
During the year ended October 31, 2004, the aggregate cost of purchases and proceeds from sales of investments (excluding short-term investments) were as follows:
|
| Purchases | | $ | 47,909,179 |
|
| Sales | | | 57,903,480 |
|
At October 31, 2004, the aggregate gross unrealized appreciation and depreciation of investments for federal income tax purposes were as follows:
|
| Gross unrealized appreciation | | $ | 6,423,475 | |
| Gross unrealized depreciation | | | (7,259,813 | ) |
|
| Net unrealized depreciation | | $ | (836,338 | ) |
|
18 Smith Barney Sector Series Inc. | 2004 Annual Report
Notes to Financial Statements (continued)
4. Class Specific Expenses
Pursuant to a Rule 12b-1 Distribution Plan, the Fund pays a service fee with respect to its Class A, B and C shares calculated at the annual rate of 0.25% of the average daily net assets of each respective class.The Fund also pays a distribution fee with respect to Class B and C shares calculated at the annual rate of 0.75% of the average daily net assets of each class, respectively. For the year ended October 31, 2004, total Rule 12b-1 Distribution Plan fees, which are accrued daily and paid monthly, were as follows:
| | Class A | | Class B | | Class C |
|
| Rule 12b-1 Distribution Plan Fees | $ | 52,008 | | $ | 316,397 | | $ | 210,810 |
|
| For the year ended October 31, 2004, total Transfer Agency Service expenses were as follows: | | | | | | |
| | Class A | | Class B | | Class C |
|
| Transfer Agency Service Expenses | $ | 38,290 | | $ | 57,863 | | $ | 38,269 |
|
| For the year ended October 31, 2004, total Shareholder Communication expenses were as follows: | | | | | | |
| | Class A | | Class B | | Class C |
|
| Shareholder Communication Expenses | $ | 15,828 | | $ | 23,959 | | $ | 15,887 |
|
5. Transfer of Net Assets
On May 9, 2003, the Fund acquired the assets and certain liabilities of the Smith Barney Sector Series Inc. – Biotechnology Fund pursuant to a plan of reorganization approved by Smith Barney Sector Series Inc. – Biotechnology Fund shareholders on May 7, 2003.Total shares issued by the Fund, the total net assets of the Smith Barney Sector Series Inc. – Biotechnology Fund and total net assets of the Fund on the date of the transfer were as follows:
| | | | Total Net Assets of the Smith | | Total Net |
| | Shares Issued by | | Barney Sector Series Inc. – | | Assets of the |
| Acquired Fund | the Fund | | Biotechnology Fund | | Fund |
|
| Smith Barney Sector Series Inc. – Biotechnology Fund | 1,588,578 | | $16,177,147 | | | $59,712,675 |
|
The total net assets of the Smith Barney Sector Series Inc. – Biotechnology Fund before acquisition included unrealized depreciation of $1,490,363 and accumulated net realized loss of $22,301,542.Total net assets of the Fund immediately after the transfer were $75,889,822. The transaction was structured to qualify as a tax-free reorganization under the Internal Revenue Code of 1986, as amended.
19 Smith Barney Sector Series Inc. | 2004 Annual Report
Notes to Financial Statements (continued)
6. Capital Shares
At October 31, 2004, the Fund had 750 million shares of capital stock authorized with a par value of $0.001 per share.The Fund has the ability to issue multiple classes of shares. Each share of a class represents an identical interest in the Fund and has the same rights, except that each class bears certain expenses specifically related to the distribution of its shares. Effective April 29, 2004, the Fund renamed Class L shares as Class C shares.
Transactions in shares of each class were as follows:
| | Year Ended | | Year Ended |
| | October 30, 2004 | | October 31, 2003 |
|
| |
|
| | Shares | | Amount | | Shares | | Amount |
| |
|
| Class A | | | | | | | | | | | |
| Shares sold | 364,847 | | $ | 4,170,489 | | | 369,574 | | $ | 3,805,312 | |
| Net asset value of shares issued in connection with the transfer of the | | | | | | | | | | | |
| Smith Barney Sector Series Inc. – Biotechnology Fund’s net assets (Note 5) | — | | | — | | | 441,379 | | | 4,707,530 | |
| Shares reacquired | (544,455 | ) | | (6,221,756 | ) | | (534,761 | ) | | (5,533,776 | ) |
|
| Net Increase (Decrease) | (179,608 | ) | $ | (2,051,267 | ) | | 276,192 | | $ | 2,979,066 | |
|
|
| Class B | | | | | | | | | | | |
| Shares sold | 246,288 | | $ | 2,751,788 | | | 338,709 | | $ | 3,402,113 | |
| Net asset value of shares issued in connection with the transfer of the | | | | | | | | | | | |
| Smith Barney Sector Series Inc. – Biotechnology Fund’s net assets (Note 5) | — | | | — | | | 485,123 | | | 5,592,990 | |
| Shares reacquired | (596,977 | ) | | (6,599,087 | ) | | (532,954 | ) | | (5,379,753 | ) |
|
| Net Increase (Decrease) | (350,689 | ) | $ | (3,847,299 | ) | | 290,878 | | $ | 3,615,350 | |
|
|
| Class C† | | | | | | | | | | | |
| Shares sold | 160,016 | | $ | 1,772,534 | | | 108,563 | | $ | 1,107,693 | |
| Net asset value of shares issued in connection with the transfer of the | | | | | | | | | | | |
| Smith Barney Sector Series Inc. – Biotechnology Fund’s net assets (Note 5) | — | | | — | | | 662,076 | | | 7,366,990 | |
| Shares reacquired | (509,931 | ) | | (5,639,347 | ) | | (514,940 | ) | | (5,208,028 | ) |
|
| Net Increase (Decrease) | (349,915 | ) | $ | (3,866,813 | ) | | 255,699 | | $ | 3,266,655 | |
|
|
| † On April 29, 2004, Class L shares were renamed as Class C shares. | | | | | | | | | | | |
7. Income Tax Information and Distributions to Shareholders
For the years ended October 31, 2004 and 2003, the Fund did not make any distributions.
As of October 31, 2004, the components of accumulated losses on a tax basis were as follows:
| | | | |
|
| Capital loss carryforward | $ | (15,100,451 | )* |
| Other book/tax temporary differences | | (484 | )** |
| Unrealized depreciation | | (836,338 | )*** |
|
| Total accumulated losses | $ | (15,937,273 | ) |
|
| * | | On October 31, 2004, the Fund had a net capital loss carryforward of approximately $15,100,451, of which $478,325 expires in 2009, $5,690,484 expires in 2010 and $8,931,642 expires in 2011. This amount will be available to offset like amounts of any future taxable gains. |
| | |
| ** | | Other book/tax temporary differences are attributable primarily to differences in book/tax treatment of various items. |
| *** | | The difference between book-basis and tax-basis unrealized depreciation is attributable primarily to the tax deferral of losses on wash sales. |
8. Additional Information
In connection with an investigation previously disclosed by Citigroup, the Staff of the Securities and Exchange Commission (“SEC”) has notified Citigroup Asset Management (“CAM”), the Citigroup business unit that includes the funds’ investment manager and other investment advisory companies; Citicorp Trust Bank (“CTB”), an affiliate of CAM;Thomas W. Jones, the former CEO of CAM; and three other individuals, one of whom is an employee and the other two of whom are former
20 Smith Barney Sector Series Inc. | 2004 Annual Report
Notes to Financial Statements (continued)
employees of CAM, that the SEC Staff is considering recommending a civil injunctive action and/or an administrative proceeding against each of them relating to the creation and operation of an internal transfer agent unit to serve various CAM-managed funds.
In 1999, CTB entered the transfer agent business. CTB hired an unaffiliated subcontractor to perform some of the transfer agent services.The subcontractor, in exchange, had signed a separate agreement with CAM in 1998 that guaranteed investment management revenue to CAM and investment banking revenue to a CAM affiliate. The subcontractor’s business was later taken over by PFPC Inc., and at that time the revenue guarantee was eliminated and a one-time payment was made by the subcontractor to a CAM affiliate.
CAM did not disclose the revenue guarantee when the boards of various CAM-managed funds hired CTB as transfer agent. Nor did CAM disclose to the boards of the various CAM-managed funds the one-time payment received by the CAM affiliate when it was made.
In addition, the SEC Staff has indicated that it is considering recommending action based on the adequacy of the disclosures made to the fund boards that approved the transfer agency arrangement, CAM’s initiation and operation of, and compensation for, the transfer agent business and CAM’s retention of, and agreements with, the subcontractor.
Citigroup is cooperating fully in the investigation and will seek to resolve the matter in discussions with the SEC Staff. Although there can be no assurance, Citigroup does not believe that this matter will have a material adverse effect on the funds. As previously disclosed, CAM has already agreed to pay the applicable funds, primarily through fee waivers, a total of approximately $17 million (plus interest) that is the amount of the revenue received by Citigroup relating to the revenue guarantee.
9. Legal Matters
Beginning in June 2004, class action lawsuits alleging violations of the federal securities laws were filed against Citigroup Global Markets Inc. (the “Distributor”) and a number of its affiliates, including Smith Barney Fund Management LLC and Salomon Brothers Asset Management Inc (the “Advisers”), substantially all of the mutual funds managed by the Advisers, including the Fund (the “Funds”), and directors or trustees of the Funds (collectively, the “Defendants”). The complaints alleged, among other things, that the Distributor created various undisclosed incentives for its brokers to sell Smith Barney and Salomon Brothers funds. In addition, according to the complaints, the Advisers caused the Funds to pay excessive brokerage commissions to the Distributor for steering clients towards proprietary funds. The complaints also alleged that the defendants breached their fiduciary duty to the Funds by improperly charging Rule 12b-1 fees and by drawing on fund assets to make undisclosed payments of soft dollars and excessive brokerage commissions.The complaints also alleged that the Funds failed to adequately disclose certain of the allegedly wrongful conduct.The complaints sought injunctive relief and compensatory and punitive damages, rescission of the Funds’ contracts with the Advisers, recovery of all fees paid to the Advisers pursuant to such contracts and an award of attorneys’ fees and litigation expenses.
On December 15, 2004, a consolidated amended complaint (the “Complaint”) was filed alleging substantially similar causes of action.While the lawsuit is in its earliest stages, to the extent that the Complaint purports to state causes of action against the Funds, Citigroup Asset Management believes the Funds have significant defenses to such allegations, which the Funds intend to vigorously assert in responding to the Complaint.
Additional lawsuits arising out of these circumstances and presenting similar allegations and requests for relief may be filed against the Defendants in the future.
As of the date of this report, Citigroup Asset Management and the Funds believe that the resolution of the pending lawsuit will not have a material effect on the financial position or results of operations of the Funds or the ability of the Advisers and their affiliates to continue to render services to the Funds under their respective contracts.
21 Smith Barney Sector Series Inc. | 2004 Annual Report
Report of Independent Registered Public Accounting Firm
The Shareholders and Board of Directors of
Smith Barney Sector Series Inc.:
We have audited the accompanying statement of assets and liabilities, including the schedule of investments, of Smith Barney Health Sciences Fund of Smith Barney Sector Series Inc. (“Fund”) as of October 31, 2004, and the related statement of operations for the year then ended, the statements of changes in net assets for each of the years in the two-year period then ended and the financial highlights for each of the years in the four-year period then ended, and for the period from February 28, 2000 (commencement of operations) through October 31, 2000.These financial statements and financial highlights are the responsibility of the Fund’s management. Our responsibility is to express an opinion on these financial statements and financial highlights based on our audit.
We conducted our audit in accordance with the standards of the Public Company Accounting Oversight Board (United States).Those standards require that we plan and perform the audit to obtain reasonable assurance about whether the financial statements and financial highlights are free of material misstatement.An audit includes examining, on a test basis, evidence supporting the amounts and disclosures in the financial statements. Our procedures included confirmation of securities owned as of October 31, 2004, by correspondence with the custodian and brokers or by other appropriate auditing procedures where replies from brokers were not received. An audit also includes assessing the accounting principles used and significant estimates made by management, as well as evaluating the overall financial statement presentation. We believe that our audit provides a reasonable basis for our opinion.
In our opinion, the financial statements and financial highlights referred to above present fairly, in all material respects, the financial position of the Fund as of October 31, 2004, and the results of its operations for the year then ended, the changes in its net assets for each of the years in the two-year period then ended and the financial highlights for each of the years in the four-year period then ended, and for the period from February 28, 2000 through October 31, 2000 in conformity with U.S. generally accepted accounting principles.
/s/ KPMG LLP
New York, New York
December 17, 2004
22 Smith Barney Sector Series Inc. | 2004 Annual Report
Additional Information (unaudited)
Information about Directors and Officers
The business and affairs of the Smith Barney Health Sciences Fund (“Fund”) are managed under the direction of the Smith Barney Sector Series Inc.’s (“Company”) Board of Directors. Information pertaining to the Directors and Officers of the Company is set forth below.The Statement of Additional Information includes additional information about the Company’s Directors and is available, without charge, upon request by calling the Fund’s transfer agent (Citicorp Trust Bank, fsb. at 1-800-451-2010) or the Fund’s sub-transfer agents (PFPC at 1-800-451-2010 and Primerica Shareholder Services at 1-800-544-5445).
| | | | | | | | Number of | | |
| | | | | | | | Portfolios In | | Other |
| | | | Term of Office* | | Principal | | Fund Complex | | Board |
| | Position(s) Held | | and Length of | | Occupation(s) During | | Overseen by | | Memberships |
| Name, Address and Age | with Fund | | Time Served | | Past Five Years | | Director | | Held by Director |
|
| |
| Non-Interested Directors: | | | | | | | | | |
| |
| Dwight B. Crane | Director | | Since | | Professor, Harvard Business | | 49 | | None |
| Harvard Business School | | | 2000 | | School | | | | |
| Soldiers Field | | | | | | | | | |
| Morgan Hall #375 | | | | | | | | | |
| Boston, MA 02163 | | | | | | | | | |
| DOB: 1/24/37 | | | | | | | | | |
| |
| Burt N. Dorsett | Director | | Since | | President of Dorsett McCabe | | 27 | | None |
| The Straford #702 | | | 2000 | | Capital Management Inc.; | | | | |
| 5601 Turtle Bay Drive | | | | | Chief Investment Officer — | | | | |
| Naples, FL 34108 | | | | | Leeb Capital Management, Inc. | | | | |
| DOB: 11/08/30 | | | | | (1999–Present) | | | | |
| |
| Elliot S. Jaffe | Director | | Since | | Chairman of | | 27 | | The Dress Barn, Inc. |
| The Dress Barn Inc. | | | 2000 | | The Dress Barn Inc. | | | | |
| Executive Office | | | | | | | | | |
| 30 Dunnigan Drive | | | | | | | | | |
| Suffern, NY 10901 | | | | | | | | | |
| DOB: 5/03/26 | | | | | | | | | |
| |
| Stephen E. Kaufman | Director | | Since | | Attorney | | 55 | | None |
| Stephen E. Kaufman PC | | | 2000 | | | | | | |
| 277 Park Avenue, 47th Floor | | | | | | | | | |
| New York, NY 10172 | | | | | | | | | |
| DOB: 2/16/32 | | | | | | | | | |
| |
| Cornelius C. Rose, Jr. | Director | | Since | | Chief Executive Officer — | | 27 | | None |
| P.O. Box 5388 | | | 2000 | | Performance Learning | | | | |
| West Lebanon, NH 03784 | | | | | Systems | | | | |
| DOB: 11/12/32 | | | | | | | | | |
| |
| |
| Interested Director: | | | | | | | | | |
| |
| R. Jay Gerken, CFA | Chairman, | | Since | | Managing Director of Citigroup | | 221 | | None |
| Citigroup Asset Management (“CAM”) | President and | | 2002 | | Global Markets Inc. (“CGM”); Chairman, | | | | |
| 399 Park Avenue, 4th Floor | Chief Executive Officer | | | | President and Chief Executive Officer | | | | |
| New York, NY 10022 | | | | | of Smith Barney Fund Management LLC | | | | |
| DOB: 4/05/51 | | | | | (“SBFM”), Travelers Investment Adviser, | | | | |
| | | | | | Inc. (“TIA”) and Citi Fund Management | | | | |
| | | | | | Inc. (“CFM”); President and Chief Executive | | | | |
| | | | | | Officer of certain mutual funds associated with | | | | |
| | | | | | Citigroup Inc. (“Citigroup”); Formerly, Portfolio | | | | |
| | | | | | Manager of Smith Barney Allocation Series Inc. | | | | |
| | | | | | (from 1996–2001) and Smith Barney Growth | | | | |
| | | | | | and Income Fund (from 1996–2000) | | | | |
23 Smith Barney Sector Series Inc. | 2004 Annual Report
Additional Information (unaudited) (continued)
| | | | | | | | Number of | | |
| | | | | | | | Portfolios In | | Other |
| | | | Term of Office* | | Principal | | Fund Complex | | Board |
| | Position(s) Held | | and Length of | | Occupation(s) During | | Overseen by | | Memberships |
| Name, Address and Age | with Fund | | Time Served | | Past Five Years | | Director | | Held by Director |
|
| |
| Officers: | | | | | | | | | |
| Andrew B. Shoup | Senior Vice | | Since | | Director of CAM; Senior Vice President | | N/A | | N/A |
| CAM | President and | | 2003 | | and Chief Administrative Officer of mutual | | | | |
| 125 Broad Street, 11th Floor | Chief Administrative | | | | funds associated with Citigroup; Head of | | | | |
| New York, NY 10004 | Officer | | | | International Funds Administration of CAM | | | | |
| DOB: 8/01/56 | | | | | from 2001 to 2003; Director of Global Funds | | | | |
| | | | | | Administration of CAM from 2000 to 2001; | | | | |
| | | | | | Head of U.S. Citibank Funds Administration | | | | |
| | | | | | of CAM from 1998 to 2000 | | | | |
| | | | | | | | | | |
| James M. Giallanza | Chief | | Since | | Director of CGM; Chief Financial | | N/A | | N/A |
| CAM | Financial | | 2004 | | Officer and Treasurer of certain | | | | |
| 125 Broad Street, 11th Floor | Officer and | | | | mutual funds associated with | | | | |
| New York, NY 10004 | Treasurer | | | | Citigroup; Director and Controller | | | | |
| DOB: 3/31/66 | | | | | of the U.S. wholesale business at | | | | |
| | | | | | UBS Global Asset Management US, | | | | |
| | | | | | Inc. (from September 2001 to July | | | | |
| | | | | | 2004); Director of Global Funds | | | | |
| | | | | | Administration at CAM (from June | | | | |
| | | | | | 2000 to September 2001); | | | | |
| | | | | | Treasurer of the Lazard Funds | | | | |
| | | | | | (from June 1998 to June 2000) | | | | |
| | | | | | | | | | |
| Andrew Beagley | Chief Anti-Money | | Since | | Director of CGM (since 2000); Director | | N/A | | N/A |
| CAM | Laundering | | 2002 | | of Compliance North America, CAM | | | | |
| 399 Park Avenue, 4th Floor | Compliance | | | | (since 2000); Chief Anti-Money Laundering | | | | |
| New York, NY 10022 | Officer | | | | Compliance Officer, Chief Compliance | | | | |
| DOB: 10/09/62 | | | | | Officer and Vice President of certain mutual | | | | |
| | Chief Compliance | | Since | | funds and investment advisors associated | | | | |
| | Officer | | 2004 | | with Citigroup; Director of Compliance Europe, | | | | |
| | | | | | the Middle East and Africa, Citigroup Asset | | | | |
| | | | | | Management (from1999 to 2000); Compliance | | | | |
| | | | | | Officer: SBFM, CFM, TIA, Salomon | | | | |
| | | | | | Brothers Asset Management Limited, | | | | |
| | | | | | SmithBarney Global Capital Management Inc. | | | | |
| | | | | | Salomon Brothers Asset Management Asia | | | | |
| | | | | | Pacific Limited (from 1997 to 1999) | | | | |
| | | | | | | | | | |
| Kaprel Ozsolak | Controller | | Since | | Vice President of CGM; Controller | | N/A | | N/A |
| CAM | | | 2002 | | of certain funds associated with | | | | |
| 125 Broad Street, 11th Floor | | | | | Citigroup | | | | |
| New York, NY 10004 | | | | | | | | | |
| DOB: 10/26/65 | | | | | | | | | |
| | | | | | | | | | |
| Robert I. Frenkel | Secretary and | | Since | | Managing Director and General Counsel | | N/A | | N/A |
| CAM | Chief Legal | | 2003 | | of Global Mutual Funds for CAM and its | | | | |
| 300 First Stamford Place, 4th Floor | Officer | | | | predecessor (since 1994); Secretary and | | | | |
| Stamford, CT 06902 | | | | | Chief Legal Officer of mutual funds | | | | |
| DOB: 12/12/54 | | | | | associated with Citigroup Inc. | | | | |
|
| * | Each Director and Officer serves until his or her respective successor has been duly elected and qualified. |
| |
| ** | Mr. Gerken is an “interested person” of the Fund as defined in the Investment Company Act of 1940, as amended, because Mr. Gerken is an officer of SBFM and certain of its affiliates. |
| |
24 Smith Barney Sector Series Inc. | 2004 Annual Report
SMITH BARNEY
H E A LT H S C I E N C E S F U N D
|
| | DIRECTORS | INVESTMENT MANAGER |
| | Dwight B. Crane | Smith Barney Fund Management LLC |
| | Burt N. Dorsett | |
| | R. Jay Gerken, CFA | SUB-ADVISER |
| | Chairman | Citigroup Asset Management Ltd. |
| | Elliot S. Jaffe | |
| | Stephen E. Kaufman | DISTRIBUTORS |
| | Cornelius C. Rose, Jr. | Citigroup Global Markets Inc. |
| | | PFS Distributors, Inc. |
| | OFFICERS | |
| | R. Jay Gerken, CFA | CUSTODIAN |
| | President and | State Street Bank and |
| | Chief Executive Officer | Trust Company |
| | | |
| | Andrew B. Shoup | TRANSFER AGENT |
| | Senior Vice President and | Citicorp Trust Bank, fsb. |
| | Chief Administrative Officer | 125 Broad Street, 11th Floor |
| | | New York, New York 10004 |
| | James M. Giallanza | |
| | Chief Financial Officer | SUB-TRANSFER AGENTS |
| | and Treasurer | PFPC Inc. |
| | | P.O. Box 9699 |
| | Andrew Beagley | Providence, Rhode Island |
| | Chief Anti-Money Laundering | 02940-9699 |
| | Compliance Officer and | |
| | Chief Compliance Officer | Primerica Shareholder Services |
| | | P.O. Box 9662 |
| | Kaprel Ozsolak | Providence, Rhode Island |
| | Controller | 02940-9662 |
| | | |
| | Robert I. Frenkel | |
| | Secretary and | |
| | Chief Legal Officer | |
Smith Barney Sector Series Inc.
|
Smith Barney Health Sciences Fund
The Fund is a separate investment fund of the Smith Barney Sector Series Inc., a
Maryland corporation. | | This report is submitted for the general information of the shareholders of Smith Barney Sector Series Inc. — Smith Barney Health Sciences Fund, but it may also be used as sales literature when preceded or accompanied by the current Prospectus. SMITH BARNEY HEALTH SCIENCES FUND
Smith Barney Mutual Funds
125 Broad Street
10th Floor, MF-2
New York, New York 10004 |
| | | |
| | | This document must be preceded or accompanied by a free prospectus. Investors should consider the fund’s investment objectives, risks, charges and expenses carefully before investing. This prospectus contains this and other important information about the fund. Please read the prospectus carefully before you invest or send money. www.smithbarneymutualfunds.com |
| | |
| The Fund files its complete schedule of portfolio holdings with the Securities and Exchange Commission for the first and third quarters of each fiscal year on Form N-Q. The Fund’s Forms N-Q are available on the Commission’s website at www.sec.gov. The Fund’s Forms N-Q may be reviewed and copied at the Commission’s Public Reference Room in Washington D.C., and information on the operation of the Public Reference Room may be obtained by calling 1-800-SEC-0330. To obtain information on Form N-Q from the Fund, shareholders can call 1-800-451-2010. | | |
| | | |
| Information on how the Fund voted proxies relating to portfolio securities during the 12 month period ended June 30, 2004 and a description of the policies and procedures that the Fund uses to determine how to vote proxies relating to portfolio securities is available (1) without charge, upon request, by calling 1-800-451-2010, (2) on the Fund’s website at www.citigroupAM.com and (3) on the SEC’s website at www.sec.gov. | | ©2004 Citigroup Global Markets Inc.
Member NASD, SIPC FD02128 12/04 | 04-7551 |
| ITEM 2. | CODE OF ETHICS. |
|
| The registrant has adopted a code of ethics that applies to the |
| registrant’s principal executive officer, principal financial |
| officer, principal accounting officer or controller. |
| | |
| ITEM 3. | AUDIT COMMITTEE FINANCIAL EXPERT. |
|
| The Board of Directors of the registrant has determined that Dwight |
| B. Crane, a Member of the Board’s Audit Committee, possesses the |
| technical attributes identified in Instruction 2(b) of Item 3 to |
| Form N-CSR to qualify as an “audit committee financial expert,” and |
| has designated Mr. Crane as the Audit Committee’s financial expert. |
| Mr. Crane is an “independent” Director pursuant to paragraph (a)(2) |
| of Item 3 to Form N-CSR. |
| | |
| ITEM 4. | PRINCIPAL ACCOUNTANT FEES AND SERVICES. |
| |
| | (a) | Audit Fees for the Smith Barney Sector Series Inc. were $47,700 and $46,000 for the years ended 10/31/04 and 10/31/03. |
| | | |
| | (b) | Audit-Related Fees for the Smith Barney Sector Series Inc. were $0 and $0 for the years ended 10/31/04 and 10/31/03. |
| | | |
| | (c)
| Tax Fees for Smith Barney Sector Series Inc. of $7,200 and $6,600 for the years ended 10/31/04 and 10/31/03. These amounts represent aggregate fees paid for tax compliance, tax advice and tax planning services, which include (the filing and amendment of federal, state and local income tax returns, timely RIC qualification review and tax distribution and analysis planning) rendered by the Accountant to Smith Barney Sector Series Inc. |
| | | |
| | (d)
| All Other Fees for Smith Barney Sector Series Inc. of $0 and $0 for the years ended 10/31/04 and 10/31/03. |
| | | |
| | (e)
| (1) Audit Committee’s pre–approval policies and procedures described in paragraph (c) (7) of Rule 2-01 of Regulation S-X. |
| | | |
| | | The Charter for the Audit Committee (the “Committee”) of the Board of each registered investment company (the “Fund”) advised by Smith Barney Fund Management LLC or Salomon Brothers Asset Management Inc. or one of their affiliates (each, an “Adviser”) requires that the Committee shall approve (a) all audit and permissible non-audit services to be provided to the Fund and (b) all permissible non-audit services to be provided by the Fund’s independent auditors to the Adviser and any Covered Service Providers if the engagement relates directly to the operations and financial reporting of the Fund. The Committee may implement policies and procedures by which such services are approved other than by the full Committee. |
| | | |
| | | The Committee shall not approve non-audit services that the Committee believes may impair the independence of the auditors. As of the date of the approval of this Audit Committee Charter, permissible non-audit services include any professional services (including tax services), that are not prohibited services as described below, provided to the Fund by the independent auditors, other than those provided to the Fund in connection with an audit or a review of the financial statements of the Fund. Permissible non-audit services may not include: (i) bookkeeping or other services related to the accounting records or financial statements of the Fund; (ii) financial information systems design and implementation; (iii) appraisal or valuation services, fairness opinions or contribution-in-kind reports; (iv) actuarial services; (v) internal audit outsourcing services; (vi) management functions or human resources; (vii) broker or dealer, investment adviser or investment b anking services; (viii) legal services and expert services unrelated to the audit; and (ix) any other service the Public Company Accounting Oversight Board determines, by regulation, is impermissible. |
| | | |
| | | Pre-approval by the Committee of any permissible non-audit services is not required so long as: (i) the aggregate amount of all such permissible non-audit services provided to the Fund, the Adviser and any service providers controlling, controlled by or under common control with the Adviser that provide ongoing services to the Fund (“Covered Service Providers”) constitutes not more than 5% of the total amount of revenues paid to the independent auditors during the fiscal year in which the permissible non-audit services are provided to (a) the Fund, (b) the Adviser and (c) any entity controlling, controlled by or under common control with the Adviser that provides ongoing services to the Fund during the fiscal year in which the services are provided that would have to be approved by the Committee; (ii) the permissible non-audit services were not recognized by the Fund at the time of the engagement to be non-audit services; and (iii) such services are pro mptly brought to the attention of the Committee and approved by the Committee (or its delegate(s)) prior to the completion of the audit. |
| |
| | | (2) For the Smith Barney Sector Series Inc., the percentage of fees that were approved by the audit committee, with respect to: Audit-Related Fees were 100% and 100% for the years ended 10/31/04 and 10/31/03; Tax Fees were 100% and 100% for the years ended 10/31/04 and 10/31/03; and Other Fees were 100% and 100% for the years ended 10/31/04 and 10/31/03. |
| | | |
| | (f)
| N/A |
| | | |
| | (g)
| Non-audit fees billed by the Accountant for services rendered to Smith Barney Sector Series Inc. and CAM and any entity controlling, controlled by, or under common control with CAM that provides ongoing services to Smith Barney Sector Series Inc. were $0 and $0 for the years ended 10/31/04 and 10/31/03. |
| | | |
| | (h)
| Yes. The Smith Barney Sector Series Inc.’s Audit Committee has considered whether the provision of non-audit services that were rendered to Service Affiliates which were not pre-approved (not requiring pre-approval) is compatible with maintaining the Accountant's independence. All services provided by the Accountant to the Smith Barney Sector Series Inc. or to Service Affiliates which were required to be pre-approved were pre-approved as required. |
| | |
| ITEM 5. | AUDIT COMMITTEE OF LISTED REGISTRANTS. |
| | Not applicable. |
| | | |
| ITEM 6. | [RESERVED] | |
| |
| ITEM 7. | DISCLOSURE OF PROXY VOTING POLICIES AND PROCEDURES FOR CLOSED-END |
| | MANAGEMENT INVESTMENT COMPANIES. |
| |
| | Not applicable. | |
| |
| ITEM 8. | [RESERVED] | |
| |
| ITEM 9. | SUBMISSION OF MATTERS TO A VOTE OF SECURITY HOLDERS. |
| |
| | Not applicable. | |
| |
| ITEM 10. | CONTROLS AND PROCEDURES. | |
| |
| | (a) | The registrant’s principal executive officer and principal |
| | | financial officer have concluded that the registrant’s |
| | | disclosure controls and procedures (as defined in Rule 30a- |
| | | 3(c) under the Investment Company Act of 1940, as amended (the |
| | | “1940 Act”)) are effective as of a date within 90 days of the |
| | | filing date of this report that includes the disclosure |
| | | required by this paragraph, based on their evaluation of the |
| | | disclosure controls and procedures required by Rule 30a-3(b) |
| | | under the 1940 Act and 15d-15(b) under the Securities Exchange |
| | | Act of 1934. | |
| |
| | (b) | There were no changes in the registrant’s internal control |
| | | over financial reporting (as defined in Rule 30a-3(d) under |
| | | the 1940 Act) that occurred during the registrant’s last |
| | | fiscal half-year (the registrant’s second fiscal half-year in |
| | | the case of an annual report) that have materially affected, |
| | | or are likely to materially affect the registrant’s internal |
| | | control over financial reporting. |
| |
| ITEM 11. | EXHIBITS. | |
| |
| | (a) | Code of Ethics attached hereto. |
| |
| | Exhibit 99.CODE ETH | |
| |
| | (b) | Attached hereto. | |
| |
| | Exhibit 99.CERT | Certifications pursuant to section 302 of |
| | | | the Sarbanes-Oxley Act of 2002 |
| |
| | Exhibit 99.906CERT | Certifications pursuant to Section 906 of |
| | | | the Sarbanes-Oxley Act of 2002 |
SIGNATURES
Pursuant to the requirements of the Securities Exchange Act of 1934 and the Investment Company Act of 1940, the registrant has duly caused this Report to be signed on its behalf by the undersigned, there unto duly authorized.
Smith Barney Sector Series Inc.
| By: | /s/ R. Jay Gerken |
| R. Jay Gerken |
| Chief Executive Officer of |
| Smith Barney Sector Series Inc. |
| |
| |
| Date: | January 7, 2005 |
Pursuant to the requirements of the Securities Exchange Act of 1934 and the Investment Company Act of 1940, this report has been signed below by the following persons on behalf of the registrant and in the capacities and on the dates indicated.
| By: | /s/ R. Jay Gerken |
| | R. Jay Gerken |
| | Chief Executive Officer of |
| | Smith Barney Sector Series Inc. |
| Date: | January 7, 2005 |
| |
| |
| By: | /s/ James M. Giallanza |
| | James M. Giallanza |
| | Chief Financial Officer of |
| | Smith Barney Sector Series Inc. |
| Date: | January 7, 2005 |
 Research Series