UNITED STATES
SECURITIES AND EXCHANGE COMMISSION
WASHINGTON, D. C. 20549
FORM N-CSR
Investment Company Act file number | 811-04760 |
DWS Advisor Funds
(Exact Name of Registrant as Specified in Charter)
345 Park Avenue
New York, NY 10154-0004
(Address of principal executive offices) (Zip code)
Registrant’s Telephone Number, including Area Code: (212) 454-7190
Paul Schubert
345 Park Avenue
New York, NY 10154-0004
(Name and Address of Agent for Service)
Date of fiscal year end: | 12/31 |
Date of reporting period: | 12/31/08 |
ITEM 1. REPORT TO STOCKHOLDERS
DECEMBER 31, 2008 Annual Report |
|
DWS RREEF Real Estate |
 |
Contents
4 Performance Summary 10 Information About Your Fund's Expenses 12 Portfolio Management Review 18 Portfolio Summary 20 Investment Portfolio 23 Financial Statements 27 Financial Highlights 33 Notes to Financial Statements 41 Report of Independent Registered Public Accounting Firm 42 Tax Information 43 Investment Management Agreement Approval 48 Summary of Management Fee Evaluation by Independent Fee Consultant 53 Summary of Administrative Fee Evaluation by Independent Fee Consultant 54 Board Members and Officers 58 Account Management Resources |
This report must be preceded or accompanied by a prospectus. To obtain a prospectus for any of our funds, refer to the Account Management Resources information provided in the back of this booklet. We advise you to consider the fund's objectives, risks, charges and expenses carefully before investing. The prospectus contains this and other important information about the fund. Please read the prospectus carefully before you invest.
Investments in mutual funds involve risk. Some funds have more risk than others. This fund is nondiversified and can take larger positions in fewer companies, increasing its overall potential risk. The fund involves additional risk due to its narrow focus. There are special risks associated with an investment in real estate, including credit risk, interest rate fluctuations and the impact of varied economic conditions. Please read this fund's prospectus for specific details regarding its investments and risk profile.
DWS Investments is part of Deutsche Bank's Asset Management division and, within the US, represents the retail asset management activities of Deutsche Bank AG, Deutsche Bank Trust Company Americas, Deutsche Investment Management Americas Inc. and DWS Trust Company.
NOT FDIC/NCUA INSURED NO BANK GUARANTEE MAY LOSE VALUE NOT A DEPOSIT NOT INSURED BY ANY FEDERAL GOVERNMENT AGENCY
Performance Summary December 31, 2008
Classes A, B, C, R and Institutional Class
All performance shown is historical, assumes reinvestment of all dividend and capital gain distributions, and does not guarantee future results. Investment return and principal value fluctuate with changing market conditions so that, when redeemed, shares may be worth more or less than their original cost. Current performance may be lower or higher than the performance quoted. Please visit www.dws-investments.com for the Fund's most recent month-end performance.
The maximum sales charge for Class A shares is 5.75%. For Class B shares, the maximum contingent deferred sales charge (CDSC) is 4% within the first year after purchase, declining to 0% after six years. Class C shares have no front-end sales charge but redemptions within one year of purchase may be subject to a CDSC of 1%. Unadjusted returns do not reflect sales charges and would have been lower if they had. Institutional Class and Class R shares are not subject to sales charges.
The total annual fund operating expense ratios, gross of any fee waivers or expense reimbursements, as stated in the fee table of the prospectus dated May 1, 2008 are 0.97%, 1.73%, 1.69%, 1.14% and 0.57% for Class A, Class B, Class C, Class R and Institutional Class shares, respectively. Please see the Information About Your Fund's Expenses, the Financial Highlights and Notes to the Financial Statements (Note C, Related Parties) sections of this report for gross and net expense related disclosure for the period ended December 31, 2008.
To discourage short-term trading, the Fund imposes a 2% redemption fee on shareholders redeeming shares held less than 15 days, which has the effect of lowering total return.
Returns and rankings for the 3-year, 5-year and Life of Fund periods shown for Classes A, B, C and Institutional Class shares reflect a fee waiver and/or expense reimbursement. Without this waiver/reimbursement, returns and rankings would have been lower.
Performance figures do not reflect the deduction of taxes that a shareholder would pay on fund distributions or the redemption of fund shares. Returns and rankings may differ by share class.
On September 3, 2002 the Fund's original share class, RREEF Class A shares, were redesignated Institutional Class. In addition, the Fund began offering additional classes of shares, namely Class A, B and C shares. Returns shown for Class A, B and C shares for the period prior to their inception on September 3, 2002 and Class R prior to its inception on October 1, 2003 are derived from the historical performance of Institutional Class shares of the DWS RREEF Real Estate Securities Fund during such period and have been adjusted to reflect the higher total annual operating expenses of each specific class. Any difference in expenses will affect performance.
Average Annual Total Returns (Unadjusted for Sales Charge) as of 12/31/08 | ||||
DWS RREEF Real Estate Securities Fund | 1-Year | 3-Year | 5-Year | Life of Fund* |
Class A | -39.34% | -11.10% | .68% | 9.64% |
Class B | -39.71% | -11.75% | -.16% | 8.76% |
Class C | -39.76% | -11.73% | -.10% | 8.82% |
Class R | -39.42% | -11.23% | .43% | 9.41% |
Institutional Class | -38.99% | -10.70% | 1.05% | 10.04% |
| S&P 500® Index+ | -37.00% | -8.36% | -2.19% | -2.96% |
| MSCI US REIT Index++ | -40.33% | -12.56% | -.29% | 8.28% |
Sources: Lipper Inc. and Deutsche Investment Management Americas Inc.
* DWS RREEF Real Estate Securities Fund commenced operations on December 1, 1999. Index returns began on November 30, 1999.Net Asset Value and Distribution Information | |||||
| Class A | Class B | Class C | Class R | Institutional Class |
Net Asset Value: 12/31/08 | $ 11.09 | $ 11.09 | $ 11.12 | $ 11.11 | $ 11.09 |
| 12/31/07 | $ 19.07 | $ 19.04 | $ 19.10 | $ 19.09 | $ 19.09 |
Distribution Information: Twelve Months as of 12/31/08:Income Dividends | $ .46 | $ .31 | $ .32 | $ .42 | $ .53 |
Capital Gain Distributions | $ .09 | $ .09 | $ .09 | $ .09 | $ .09 |
Return of Capital | $ .09 | $ .09 | $ .09 | $ .09 | $ .09 |
Institutional Class Lipper Rankings — Real Estate Funds Category as of 12/31/08 | ||||
Period | Rank |
| Number of Funds Tracked | Percentile Ranking (%) |
| 1-Year | 117 | of | 232 | 51 |
| 3-Year | 50 | of | 192 | 26 |
| 5-Year | 52 | of | 160 | 33 |
Source: Lipper Inc. Rankings are historical and do not guarantee future results. Rankings are based on total returns unadjusted for sales charges with distributions reinvested. If sales charges had been included, rankings might have been less favorable. Rankings are for Institutional Class shares; other share classes may vary.
Growth of an Assumed $10,000 Investment (Adjusted for Maximum Sales Charge) |
[] DWS RREEF Real Estate Securities Fund — Class A [] S&P 500 Index+ [] MSCI US REIT (Morgan Stanley US Real Estate Investment Trust) Index++ |
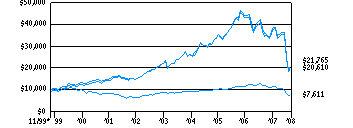 |
Yearly periods ended December 31 |
The Fund's growth of an assumed $10,000 investment is adjusted for the maximum sales charge of 5.75%. This results in a net initial investment of $9,425.
Comparative Results (Adjusted for Maximum Sales Charge) as of 12/31/08 | |||||
DWS RREEF Real Estate Securities Fund | 1-Year | 3-Year | 5-Year | Life of Fund* | |
Class A | Growth of $10,000 | $5,717 | $6,623 | $9,749 | $21,765 |
| Average annual total return | -42.83% | -12.84% | -.51% | 8.93% | |
Class B | Growth of $10,000 | $5,854 | $6,766 | $9,857 | $21,459 |
| Average annual total return | -41.46% | -12.21% | -.29% | 8.76% | |
Class C | Growth of $10,000 | $6,024 | $6,877 | $9,951 | $21,558 |
| Average annual total return | -39.76% | -11.73% | -.10% | 8.82% | |
Class R | Growth of $10,000 | $6,058 | $6,995 | $10,219 | $22,655 |
| Average annual total return | -39.42% | -11.23% | .43% | 9.41% | |
| S&P 500 Index+ | Growth of $10,000 | $6,300 | $7,696 | $8,953 | $7,611 |
| Average annual total return | -37.00% | -8.36% | -2.19% | -2.96% | |
| MSCI US REIT Index++ | Growth of $10,000 | $5,967 | $6,685 | $9,857 | $20,610 |
| Average annual total return | -40.33% | -12.56% | -.29% | 8.28% | |
The growth of $10,000 is cumulative.
* DWS RREEF Real Estate Securities Fund commenced operations on December 1, 1999. Index returns began on November 30, 1999.Growth of an Assumed $1,000,000 Investment |
[] DWS RREEF Real Estate Securities Fund — Institutional Class [] S&P 500 Index+ [] MSCI US REIT (Morgan Stanley US Real Estate Investment Trust) Index++ |
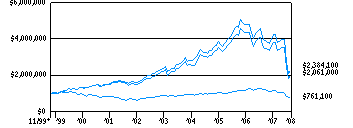 |
Yearly periods ended December 31 |
Comparative Results as of 12/31/08 | |||||
DWS RREEF Real Estate Securities Fund | 1-Year | 3-Year | 5-Year | Life of Fund* | |
Institutional Class | Growth of $1,000,000 | $610,100 | $712,200 | $1,053,700 | $2,384,100 |
| Average annual total return | -38.99% | -10.70% | 1.05% | 10.04% | |
| S&P 500 Index+ | Growth of $1,000,000 | $630,000 | $769,600 | $895,300 | $761,100 |
| Average annual total return | -37.00% | -8.36% | -2.19% | -2.96% | |
| MSCI US REIT Index++ | Growth of $1,000,000 | $596,700 | $668,500 | $985,700 | $2,061,000 |
| Average annual total return | -40.33% | -12.56% | -.29% | 8.28% | |
The growth of $1,000,000 is cumulative.
The minimum initial investment for Institutional Class shares is $1,000,000.
* DWS RREEF Real Estate Securities Fund commenced operations on December 1, 1999. Index returns began on November 30, 1999.+ The Standard and Poor's 500 (S&P 500) Index is an unmanaged, capitalization-weighted index of 500 stocks. The index is designed to measure performance of the broad domestic economy through changes in the aggregate market value of 500 stocks representing all major industries.
++ The MSCI US REIT Index is an unmanaged, free float-adjusted market capitalization weighted index that is comprised of equity REITs that are included in the MSCI US Investable Market 2500 Index, with the exception of specialty equity REITs that do not generate a majority of their revenue and income from real estate rental and leasing operations. The index represents approximately 85% of the US REIT universe.
Index returns assume reinvestment of dividends and, unlike Fund returns, do not reflect any fees or expenses. It is not possible to invest directly into an index.
Class S
Class S shares are generally not available to new investors except under certain circumstances. (Please refer to the Fund's Statement of Additional Information.)
All performance shown is historical, assumes reinvestment of all dividend and capital gain distributions and does not guarantee future results. Investment return and principal value fluctuate with changing market conditions so that, when redeemed, shares may be worth more or less than their original cost. Current performance may be lower or higher than the performance quoted. Please visit www.dws-investments.com for the Fund's most recent month-end performance.
The total annual fund operating expense ratio, gross of any fee waivers or expense reimbursements, as stated in the fee table of the prospectus dated May 1, 2008 is 0.83% for Class S shares. Please see the Information About Your Fund's Expenses, the Financial Highlights and Notes to the Financial Statements (Note C, Related Parties) sections of this report for gross and net expense related disclosure for the period ended December 31, 2008.
To discourage short-term trading, the Fund imposes a 2% redemption fee on shareholders redeeming shares held less than 15 days, which has the effect of lowering total return.
Performance figures do not reflect the deduction of taxes that a shareholder would pay on fund distributions or the redemptions of fund shares. Returns and rankings may differ by share class.
Returns shown for Class S shares for the periods prior to its inception on May 2, 2005 are derived from the historical performance of Institutional Class shares of the DWS RREEF Real Estate Securities Fund during such periods and have been adjusted to reflect the higher total annual operating expenses of Class S. Any difference in expenses will affect performance.
Average Annual Total Returns as of 12/31/08 | ||||
DWS RREEF Real Estate Securities Fund | 1-Year | 3-Year | 5-Year | Life of Fund* |
Class S | -39.34% | -10.95% | .77% | 9.71% |
| S&P 500 Index+ | -37.00% | -8.36% | -2.19% | -2.96% |
| MSCI US REIT Index++ | -40.33% | -12.56% | -.29% | 8.28% |
Sources: Lipper Inc. and Deutsche Investment Management Americas Inc.
* DWS RREEF Real Estate Securities Fund commenced operations on December 1, 1999. Index returns began on November 30, 1999.Net Asset Value and Distribution Information | |
| Class S |
Net Asset Value: 12/31/08 | $ 11.11 |
| 12/31/07 | $ 19.11 |
Distribution Information: Twelve Months as of 12/31/08:Income Dividends | $ .49 |
Capital Gain Distributions | $ .09 |
Return of Capital | $ .09 |
Class S Lipper Rankings — Real Estate Funds Category as of 12/31/08 | ||||
Period | Rank |
| Number of Funds Tracked | Percentile Ranking (%) |
| 1-Year | 128 | of | 232 | 55 |
| 3-Year | 59 | of | 192 | 31 |
Source: Lipper Inc. Rankings are historical and do not guarantee future results. Rankings are based on total returns with distributions reinvested. Rankings are for Class S shares; other share classes may vary.
Growth of an Assumed $10,000 Investment |
[] DWS RREEF Real Estate Securities Fund — Class S [] S&P 500 Index+ [] MSCI US REIT (Morgan Stanley US Real Estate Investment Trust) Index++ |
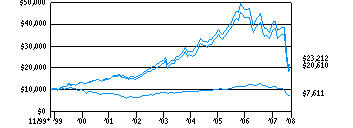 |
Yearly periods ended December 31 |
Comparative Results as of 12/31/08 | |||||
DWS RREEF Real Estate Securities Fund | 1-Year | 3-Year | 5-Year | Life of Fund* | |
Class S | Growth of $10,000 | $6,066 | $7,062 | $10,390 | $23,212 |
| Average annual total return | -39.34% | -10.95% | .77% | 9.71% | |
| S&P 500 Index+ | Growth of $10,000 | $6,300 | $7,696 | $8,953 | $7,611 |
| Average annual total return | -37.00% | -8.36% | -2.19% | -2.96% | |
| MSCI US REIT Index++ | Growth of $10,000 | $5,967 | $6,685 | $9,857 | $20,610 |
| Average annual total return | -40.33% | -12.56% | -.29% | 8.28% | |
The growth of $10,000 is cumulative.
* DWS RREEF Real Estate Securities Fund commenced operations on December 1, 1999. Index returns began on November 30, 1999.+ The Standard and Poor's 500 (S&P 500) Index is an unmanaged, capitalization-weighted index of 500 stocks. The index is designed to measure performance of the broad domestic economy through changes in the aggregate market value of 500 stocks representing all major industries.
++ The MSCI US REIT Index is an unmanaged, free float-adjusted market capitalization weighted index that is comprised of equity REITs that are included in the MSCI US Investable Market 2500 Index, with the exception of specialty equity REITs that do not generate a majority of their revenue and income from real estate rental and leasing operations. The index represents approximately 85% of the US REIT universe.
Index returns assume reinvestment of dividends and, unlike Fund returns, do not reflect any fees or expenses. It is not possible to invest directly into an index.
Information About Your Fund's Expenses
As an investor of the Fund, you incur two types of costs: ongoing expenses and transaction costs. Ongoing expenses include management fees, distribution and service (12b-1) fees and other Fund expenses. Examples of transaction costs include sales charges (loads), redemption fees and account maintenance fees, which are not shown in this section. The following tables are intended to help you understand your ongoing expenses (in dollars) of investing in the Fund and to help you compare these expenses with the ongoing expenses of investing in other mutual funds. The example in the table is based on an investment of $1,000 invested at the beginning of the six-month period and held for the entire period (July 1, 2008 to December 31, 2008).
The tables illustrate your Fund's expenses in two ways:
• Actual Fund Return. This helps you estimate the actual dollar amount of ongoing expenses (but not transaction costs) paid on a $1,000 investment in the Fund using the Fund's actual return during the period. To estimate the expenses you paid over the period, simply divide your account value by $1,000 (for example, an $8,600 account value divided by $1,000 = 8.6), then multiply the result by the number in the "Expenses Paid per $1,000" line under the share class you hold.
• Hypothetical 5% Fund Return. This helps you to compare your Fund's ongoing expenses (but not transaction costs) with those of other mutual funds using the Fund's actual expense ratio and a hypothetical rate of return of 5% per year before expenses. Examples using a 5% hypothetical fund return may be found in the shareholder reports of other mutual funds. The hypothetical account values and expenses may not be used to estimate the actual ending account balance or expenses you paid for the period.
Please note that the expenses shown in these tables are meant to highlight your ongoing expenses only and do not reflect any transaction costs. The "Expenses Paid per $1,000" line of the tables is useful in comparing ongoing expenses only and will not help you determine the relative total expense of owning different funds. An account maintenance fee of $6.25 per quarter for Class S shares may apply for certain accounts whose balances do not meet the applicable minimum initial investment. This fee is not included in these tables. If it was, the estimate of expenses paid for Class S shares during the period would be higher, and account value during the period would be lower, by this amount.
Expenses and Value of a $1,000 Investment for the six months ended December 31, 2008 | ||||||
Actual Fund Return | Class A | Class B | Class C | Class R | Class S | Institutional Class |
| Beginning Account Value 7/1/08 | $ 1,000.00 | $ 1,000.00 | $ 1,000.00 | $ 1,000.00 | $ 1,000.00 | $ 1,000.00 |
| Ending Account Value 12/31/08 | $ 626.90 | $ 626.30 | $ 625.50 | $ 627.30 | $ 626.80 | $ 630.00 |
| Expenses Paid per $1,000* | $ 3.97 | $ 7.36 | $ 7.27 | $ 4.34 | $ 3.48 | $ 2.66 |
Hypothetical 5% Fund Return | Class A | Class B | Class C | Class R | Class S | Institutional Class |
| Beginning Account Value 7/1/08 | $ 1,000.00 | $ 1,000.00 | $ 1,000.00 | $ 1,000.00 | $ 1,000.00 | $ 1,000.00 |
| Ending Account Value 12/31/08 | $ 1,020.26 | $ 1,016.09 | $ 1,016.19 | $ 1,019.81 | $ 1,020.86 | $ 1,021.87 |
| Expenses Paid per $1,000* | $ 4.93 | $ 9.12 | $ 9.02 | $ 5.38 | $ 4.32 | $ 3.30 |
Annualized Expense Ratios | Class A | Class B | Class C | Class R | Class S | Institutional Class |
| DWS RREEF Real Estate Securities Fund | .97% | 1.80% | 1.78% | 1.06% | .85% | .65% |
For more information, please refer to the Fund's prospectuses.
DWS RREEF Real Estate Securities Fund:
A Team Approach to Investing
Deutsche Investment Management Americas Inc. ("DIMA" or the "Advisor"), which is part of Deutsche Asset Management, is the investment advisor for DWS RREEF Real Estate Securities Fund. DIMA and its predecessors have more than 80 years of experience managing mutual funds and DIMA provides a full range of investment advisory services to institutional and retail clients.
RREEF America L.L.C. ("RREEF"), which is also part of Deutsche Asset Management, is an indirect, wholly owned subsidiary of Deutsche Bank AG, is the subadvisor for the fund. RREEF makes the investment decisions, buys and sells securities for the fund and conducts research that leads to these purchase and sale decisions.
Deutsche Asset Management is a global asset management organization that offers a wide range of investing expertise and resources. This well-resourced global investment platform brings together a wide variety of experience and investment insight across industries, regions, asset classes and investing styles.
DIMA is an indirect, wholly owned subsidiary of Deutsche Bank AG. Deutsche Bank AG is a major global banking institution that is engaged in a wide range of financial services, including investment management, mutual funds, retail, private and commercial banking, investment banking and insurance.
Portfolio Management Team
John F. Robertson, CFA
Managing Director of Deutsche Asset Management and of RREEF and Co-Manager of the fund.
• Joined RREEF in 1997, Deutsche Asset Management in 2002 and the fund in 1999.
• Prior to that, Assistant Vice President of Lincoln Investment Management responsible for REIT research.
• Over 16 years of investment industry experience.
• BA, Wabash College; MBA, Indiana University.
Jerry W. Ehlinger, CFA
Managing Director of Deutsche Asset Management and of RREEF and Co-Manager of the fund.
• Joined RREEF, Deutsche Asset Management and the fund in 2004.
• Prior to that, Senior Vice President at Heitman Real Estate Investment Management from 2000-2004.
• Prior to that, Senior Research Associate at Morgan Stanley Asset Management from 1996-2000.
• Over 11 years of investment industry experience.
• BA, University of Wisconsin-Whitewater; MS, University of Wisconsin-Madison.
John W. Vojticek
Managing Director of RREEF and Co-Manager of the fund.
• Joined RREEF, Deutsche Asset Management and the fund in September 2004.
• Prior to that, Principal at KG Redding and Associates, March 2004-September 2004.
• Prior to that, Managing Director of RREEF from 1996-March 2004, Deutsche Asset Management from 2002-March 2004 and the fund from 1999-March 2004.
• Over 11 years of investment industry experience.
• BS, University of Southern California.
Asad Kazim
Director of RREEF and Co-Manager of the fund.
• Joined RREEF and Deutsche Asset Management in 2002 and the fund in 2005.
• Prior to that, Financial Analyst at Clarion CRA Securities from 2000-2002.
• Over 8 years of investment industry experience.
• BS, The College of New Jersey.
In the following interview, the portfolio management team discusses the market environment, performance results and positioning of DWS RREEF Real Estate Securities Fund during the fund's most recent annual period ended December 31, 2008.
The views expressed in the following discussion reflect those of the portfolio management team only through the end of the period of the report as stated on the cover. The management team's views are subject to change at any time based on market and other conditions and should not be construed as a recommendation. Past performance is no guarantee of future results. Current and future portfolio holdings are subject to risk.
Q: How did DWS RREEF Real Estate Securities Fund perform during its most recent annual period?
A: After holding up reasonably well amid increasing market volatility in the first nine months of 2008, US real estate investment trusts ("REITs") were hit by unprecedented and intense volatility in October and November of last year arising from investor fears related to the worldwide credit crunch. For the 12-month period ended December 31, 2008, DWS RREEF Real Estate Securities Fund returned -39.34%. (Class A shares; returns are unadjusted for sales charges. If sales charges had been included, returns would have been lower. Past performance is no guarantee of future results. Please see pages 4 through 9 for the performance of other share classes and for more complete performance information.) In comparison, the fund's benchmark, the MSCI US REIT Index, returned -40.33% over the same period.1
1 The MSCI US REIT Index is an unmanaged, free-float-adjusted, market-capitalization- weighted index that is comprised of equity REITs that are included in the MSCI US Investable Market 2500 Index, with the exception of specialty equity REITs that do not generate a majority of their revenue and income from real estate rental and leasing operations. The index represents approximately 85% of the US REIT universe. Index returns assume reinvestment of dividends and, unlike fund returns, do not reflect any fees or expenses. It is not possible to invest directly into an index.Q: What factors influenced the performance of REITs during the 12-month period?
A: In the first half of 2008, volatility within the real estate securities market (and financial markets in general) was severe at times, but REITs nevertheless recorded several of their largest-ever single-day gains, as real estate investors responded positively to actions taken by the US Federal Reserve Board (the Fed) to restore liquidity to the markets and bolster the faltering US economy. However, in May and June of 2008, higher commodity and food prices began to take their toll on US consumer spending, and the retail REIT sector was hit especially hard. In the third quarter, as concern about a possible economic recession pulled down commodity prices and eased inflation concerns, REITs significantly outperformed the broader stock market.
In October, the outperformance of the REIT sector ended abruptly. Volatility had been on the rise for the real estate securities market throughout the year, but at the start of the fourth quarter it suddenly skyrocketed. Investors had been worrying for some time about how much more expensive it would be for REIT companies to roll over debt that was coming due in the next 18 to 24 months. However, in October and November of 2008, with more and more bad news arising regarding failing US financial firms and a general drying up of liquidity and credit nationwide, concern over whether it would even be possible for US REITs to refinance short-term debt sparked massive declines in REIT prices. Other factors that contributed to REIT market volatility during the fourth quarter included large hedge fund transactions and forced selling by closed-end funds. In December 2008, the REIT market rebounded slightly as investors regained some certainty in light of the completion of the presidential election, and an increase in the number of commercial real estate transactions.
Q: What contributed to and detracted from the fund's performance over the period?
A: During the 12-month period, sector selection contributed to performance; the fund's cash position was helpful in a broadly declining REIT market. Stock selection in the industrial sector was the largest drag on performance, and within the sector ProLogis — a manager and developer of commercial distribution facilities — represented by far the largest individual detractor. ProLogis was badly hurt by the darkening global economic outlook, short-term debt coming due and investor perception that its development pipeline had lost value. In addition, an overweight in the regional mall sector subtracted from returns.2
2 "Overweight" means that a fund holds a higher weighting in a given sector or security compared with its benchmark index; an "underweight" means that a fund holds a lower weighting.* Not held in the portfolio as of December 31, 2008.
Q: Describe the performance of the various REIT sectors.
A: Among REIT sectors, industrials were the worst-performing sector by a wide margin, hurt badly by the significant economic slowdown that emerged over the course of last year. Prices of industrial REITs were propped up in the first half of 2008 because investors believed that some industrial companies' international development pipelines would boost revenue. However, as the credit crunch hit home in the fourth quarter, investors began to discount these development pipelines and to judge harshly the industrial REITs that would need to roll over debt in the midst of a worldwide credit shortage. Hotels as a sector also posted negative returns for the year based on worries that a faltering US economy would negatively affect vacation-related and business travel. Regional malls also disappointed, as second-tier malls faced steeply declining sales and in some cases an inability to roll over debt. As an example, the fund's regional mall holding General Growth Properties, Inc.* was hit hard as investors focused on the large amount of debt the company must refinance within the next two years in an environment of extremely tight credit.
In contrast, the self-storage and apartment sectors performed well on a relative basis. Self-storage REITs, as represented in the portfolio by Public Storage, Inc. and Extra Space Storage, Inc., have profited from homeowner dislocations stemming from the home loan/mortgage crisis. The Federal National Mortgage Association (Fannie Mae) and the Federal Home Loan Mortgage Corporation (Freddie Mac), despite their well-publicized troubles, have been providing loans and other forms of liquidity to the apartment sector despite the debt market being largely frozen. There are concerns, though, about the availability of this liquidity going forward. Retail REITs also slightly outperformed the benchmark, as the fund holding Regency Centers Corp. benefited from its attractive valuation and a stronger balance sheet than many of its competitors. Finally, the fund's positions in several health care REITs contributed to performance as investors viewed the sector as defensive.
Q: What is your view concerning the prospects for the REIT market going forward?
A: We believe that volatility in the REIT market will likely persist well into 2009. If and when private real estate market write-downs come to the attention of investors, additional volatility could ensue. Though some REITs have shown an ability to refinance debt coming due, rolling over debt will continue to be expensive to nearly impossible for some companies because so many fewer financing options exist. Dividend cuts by REIT firms could also prompt volatility, though such actions may be prudent in the long run if they can help to shore up balance sheets.
A major uncertainty for the REIT market over the coming year — as well as for investment markets in general — is the question of when credit flows will normalize. We have seen some signs of an increase in lending, but nowhere near that which is required for normal business operations. Many REITs are attractively priced at present, but not all of them have the wherewithal (in terms of holding high quality assets, and possessing a healthy balance sheet, able management and sufficient access to credit) to succeed in such a tremendously difficult economic environment. Over the coming months we will continue to search for high-quality REITs with experienced management teams that we believe are well positioned to succeed over the long term.
Asset Allocation (As a % of Investment Portfolio excluding Securities Lending Collateral) | 12/31/08 | 12/31/07 |
|
|
|
Common Stocks | 98% | 99% |
Cash Equivalents | 2% | 1% |
| 100% | 100% |
Sector Diversification (As a % of Common Stocks) | 12/31/08 | 12/31/07 |
|
|
|
Office | 20% | 21% |
Health Care | 18% | 9% |
Apartments | 18% | 16% |
Shopping Centers | 12% | 11% |
Regional Malls | 11% | 19% |
Storage | 10% | 3% |
Industrial | 6% | 9% |
Hotels | 2% | 8% |
Manufactured Homes | 2% | 2% |
Specialty Services | 1% | 1% |
Other | — | 1% |
| 100% | 100% |
Asset allocation and sector diversification are subject to change.
Ten Largest Equity Holdings at December 31, 2008 (59.1% of Net Assets) | |
| 1. Simon Property Group, Inc. Owner and operator of regional shopping malls | 9.1% |
| 2. Public Storage, Inc. Owner and operator of self-storage facilities | 8.2% |
| 3. Vornado Realty Trust Owner and manager of investments in community shopping centers | 7.8% |
| 4. AvalonBay Communities, Inc. Owner, operator and developer of apartment communities | 6.2% |
| 5. Ventas, Inc. Owner and lessor of long-term health care facilities | 5.8% |
| 6. Regency Centers Corp. Owner, developer and operator of community shopping centers | 5.5% |
| 7. Equity Residential Owner, operator and developer of multifamily properties | 4.7% |
| 8. Federal Realty Investment Trust Owner, manager, developer and redevelopment of prime community and neighborhood shopping centers | 4.2% |
| 9. Nationwide Health Properties, Inc. Owner of health care facilities | 3.8% |
| 10. Boston Properties, Inc. Owner, manager and developer of commercial and industrial real estate | 3.8% |
Portfolio holdings are subject to change.
For more complete details about the Fund's investment portfolio, see page 20. A quarterly Fact Sheet is available upon request. A complete list of the Fund's portfolio holdings is posted as of the month end on www.dws-investments.com on or about the 15th day of the following month. More frequent posting of portfolio holdings information may be made from time to time on www.dws-investments.com. Please see the Account Management Resources section for contact information.
Following the Fund's fiscal first and third quarter-end, a complete portfolio holdings listing is filed with the SEC on Form N-Q. The form will be available on the SEC's Web site at www.sec.gov, and it also may be reviewed and copied at the SEC's Public Reference Room in Washington, D.C. Information on the operation of the SEC's Public Reference Room may be obtained by calling (800) SEC-0330.
Investment Portfolio as of December 31, 2008
|
| Value ($) |
|
| |
Common Stocks 97.0% | ||
Real Estate Investment Trusts ("REITs") 97.0% | ||
Apartments 17.6% | ||
American Campus Communities, Inc. (a) | 810,950 | 16,608,256 |
AvalonBay Communities, Inc. (a) | 916,207 | 55,503,820 |
BRE Properties, Inc. (a) | 625,750 | 17,508,485 |
Camden Property Trust | 405,300 | 12,702,102 |
Equity Residential | 1,424,075 | 42,465,916 |
Post Properties, Inc. (a) | 803,925 | 13,264,763 |
| 158,053,342 | |
Diversified 0.1% | ||
Du Pont Fabros Technology, Inc. | 619,550 | 1,282,469 |
Health Care 17.8% | ||
Cogdell Spencer, Inc. | 237,444 | 2,222,476 |
HCP, Inc. | 351,500 | 9,761,155 |
LTC Properties, Inc. | 706,024 | 14,318,167 |
Medical Properties Trust, Inc. (a) | 1,507,000 | 9,509,170 |
Nationwide Health Properties, Inc. (a) | 1,188,999 | 34,148,051 |
OMEGA Healthcare Investors, Inc. | 556,057 | 8,880,230 |
Senior Housing Properties Trust | 1,587,808 | 28,453,519 |
Ventas, Inc. | 1,559,199 | 52,342,311 |
| 159,635,079 | |
Hotels 2.2% | ||
Hospitality Properties Trust | 246,158 | 3,660,369 |
Host Hotels & Resorts, Inc. | 2,164,500 | 16,385,265 |
| 20,045,634 | |
Industrial 5.7% | ||
AMB Property Corp. | 524,550 | 12,284,961 |
DCT Industrial Trust, Inc. | 1,791,593 | 9,065,461 |
Liberty Property Trust (a) | 749,317 | 17,106,907 |
ProLogis | 935,150 | 12,989,233 |
| 51,446,562 | |
Manufactured Homes 2.1% | ||
Equity Lifestyle Properties, Inc. | 488,065 | 18,722,173 |
Office 19.1% | ||
BioMed Realty Trust, Inc. | 1,101,160 | 12,905,595 |
Boston Properties, Inc. | 616,856 | 33,927,080 |
Digital Realty Trust, Inc. (a) | 993,020 | 32,620,707 |
Kilroy Realty Corp. | 257,050 | 8,600,893 |
SL Green Realty Corp. (a) | 501,302 | 12,983,722 |
Vornado Realty Trust | 1,160,450 | 70,033,158 |
| 171,071,155 | |
Regional Malls 10.9% | ||
Simon Property Group, Inc. (a) | 1,533,404 | 81,469,755 |
Taubman Centers, Inc. (a) | 405,252 | 10,317,716 |
The Macerich Co. (a) | 335,896 | 6,099,871 |
| 97,887,342 | |
Shopping Centers 11.2% | ||
Federal Realty Investment Trust (a) | 609,365 | 37,829,379 |
Kite Realty Group Trust | 1,177,117 | 6,544,771 |
Regency Centers Corp. (a) | 1,046,100 | 48,852,870 |
Saul Centers, Inc. | 170,550 | 6,736,725 |
| 99,963,745 | |
Specialty Services 0.9% | ||
Entertainment Properties Trust | 265,523 | 7,912,585 |
Storage 9.4% | ||
Extra Space Storage, Inc. | 1,071,350 | 11,056,332 |
Public Storage, Inc. | 925,278 | 73,559,601 |
| 84,615,933 | |
Other 0.0% | ||
FrontLine Capital Group* | 12,400 | 0 |
Total Common Stocks (Cost $966,326,003) | 870,636,019 | |
| ||
Securities Lending Collateral 15.4% | ||
Daily Assets Fund Institutional, 1.69% (b) (c) (Cost $137,747,526) | 137,747,526 | 137,747,526 |
| | ||
Cash Equivalents 2.3% | ||
Cash Management QP Trust, 1.42% (b) (Cost $20,236,292) | 20,236,292 | 20,236,292 |
| % of Net Assets | Value ($) |
|
| |
Total Investment Portfolio (Cost $1,124,309,821)+ | 114.7 | 1,028,619,837 |
Other Assets and Liabilities, Net (a) | (14.7) | (131,501,371) |
Net Assets | 100.0 | 897,118,466 |
+ The cost for federal income tax purposes was $1,224,582,688. At December 31, 2008, net unrealized depreciation for all securities based on tax cost was $195,962,851. This consisted of aggregate gross unrealized appreciation for all securities in which there was an excess of value over tax cost of $63,791,449 and aggregate gross unrealized depreciation for all securities in which there was an excess of tax cost over value of $259,754,300.
(a) All or a portion of these securities were on loan amounting to $140,366,930. In addition, included in other assets and liabilities, net is a pending sale, amounting to $116,544 that is also on loan (see Notes to Financial Statements). The value of all securities loaned at December 31, 2008 amounted to $140,483,474, which is 15.7% of net assets.
(b) Affiliated fund managed by Deutsche Investment Management Americas Inc. The rate shown is the annualized seven-day yield at period end.
(c) Represents collateral held in connection with securities lending. Income earned by the Fund is net of borrower rebates.
Fair Value Measurements
Financial Accounting Standards Board Statement of Financial Accounting Standards No. 157, "Fair Value Measurements," establishes a three-tier hierarchy for measuring fair value and requires additional disclosure about the classification of fair value measurements.
Various inputs are used in determining the value of the Fund's investments. These inputs are summarized in three broad levels. Level 1 includes quoted prices in active markets for identical securities. Level 2 includes other significant observable inputs (including quoted prices for similar securities, interest rates, prepayment speeds and credit risk). Level 3 includes significant unobservable inputs (including the Fund's own assumptions in determining the fair value of investments). The inputs or methodology used for valuing securities are not necessarily an indication of the risk associated with investing in those securities.
The following is a summary of the inputs used as of December 31, 2008 in valuing the Fund's investments. For information on the Fund's policy regarding the valuation of investments, please refer to the Security Valuation section of Note A in the accompanying Notes to the Financial Statements.
Valuation Inputs | Investments in Securities |
| Level 1 | $ 1,008,383,545 |
| Level 2 | 20,236,292 |
| Level 3 | 0++ |
Total | $ 1,028,619,837 |
The following is a reconciliation of the Fund's Level 3 investments for which significant unobservable inputs were used in determining value at December 31, 2008:
Balance as of January 1, 2008 | Investments in Securities | ||
| Net realized gain (loss) | $ 0 | ||
| Change in unrealized appreciation (depreciation) | — | ||
| Amortization Premium/Discount | — | ||
| Net purchases (sales) | — | ||
| Net transfers in (out) of Level 3 | — | ||
Balance as of December 31, 2008 | $ 0 | ||
The accompanying notes are an integral part of the financial statements.
Statement of Assets and Liabilities as of December 31, 2008 | |
Assets | |
| Investments: Investments in securities, at value (cost $966,326,003) — including $140,366,930 of securities loaned | $ 870,636,019 |
Investment in Daily Assets Fund Institutional (cost $137,747,526)* | 137,747,526 |
Investment in Cash Management QP Trust (cost $20,236,292) | 20,236,292 |
| Total investments, at value (cost $1,124,309,821) | 1,028,619,837 |
| Cash | 10,000 |
| Receivable for investments sold | 12,269,484 |
| Dividends receivable | 6,854,361 |
| Interest receivable | 147,993 |
| Receivable for Fund shares sold | 15,308,153 |
| Due from Advisor | 25,095 |
| Other assets | 305,320 |
| Total assets | 1,063,540,243 |
Liabilities | |
| Payable for investments purchased | 19,954,558 |
| Payable for Fund shares redeemed | 7,187,859 |
| Payable upon return of securities loaned | 137,747,526 |
| Accrued management fee | 277,254 |
| Other accrued expenses and payables | 1,254,580 |
| Total liabilities | 166,421,777 |
Net assets, at value | $ 897,118,466 |
Net Assets Consist of | |
| Undistributed net investment income | 2,658,641 |
| Net unrealized appreciation (depreciation) on investments | (95,689,984) |
| Accumulated net realized gain (loss) | (377,626,647) |
| Paid-in capital | 1,367,776,456 |
Net assets, at value | $ 897,118,466 |
The accompanying notes are an integral part of the financial statements.
Statement of Assets and Liabilities as of December 31, 2008 (continued) | |
Net Asset Value | |
Class A Net Asset Value and redemption price(a) per share ($383,559,072 ÷ 34,590,659 outstanding shares of beneficial interest, $.001 par value, unlimited number of shares authorized) | $ 11.09 |
| Maximum offering price per share (100 ÷ 94.25 of $11.09) | $ 11.77 |
Class B Net Asset Value, offering and redemption price(a) (subject to contingent deferred sales charge) per share ($7,980,285 ÷ 719,673 outstanding shares of beneficial interest, $.001 par value, unlimited number of shares authorized) | $ 11.09 |
Class C Net Asset Value, offering and redemption price(a) (subject to contingent deferred sales charge) per share ($27,206,570 ÷ 2,447,274 outstanding shares of beneficial interest, $.001 par value, unlimited number of shares authorized) | $ 11.12 |
Class R Net Asset Value, offering and redemption price(a) per share ($9,125,635 ÷ 821,183 outstanding shares of beneficial interest, $.001 par value, unlimited number of shares authorized) | $ 11.11 |
Class S Net Asset Value, offering and redemption price(a) per share ($173,523,258 ÷ 15,614,384 outstanding shares of beneficial interest, $.001 par value, unlimited number of shares authorized) | $ 11.11 |
Institutional Class Net Asset Value, offering and redemption price(a) per share ($295,723,646 ÷ 26,655,546 outstanding shares of beneficial interest, $.001 par value, unlimited number of shares authorized) | $ 11.09 |
The accompanying notes are an integral part of the financial statements.
Statement of Operations for the year ended December 31, 2008 | |
Investment Income | |
| Income: Dividends (net of foreign taxes withheld of $8,901) | $ 40,741,453 |
| Interest — Cash Management QP Trust | 382,782 |
| Securities lending income, including income from Daily Assets Fund Institutional, net of borrower rebates | 2,325,754 |
| Total Income | 43,449,989 |
| Expenses: Management fee | 5,070,966 |
| Administration fee | 1,293,415 |
| Services to shareholders | 2,188,588 |
| Custodian fee | 49,954 |
| Distribution and service fees | 1,887,783 |
| Professional fees | 144,110 |
| Trustees' fees and expenses | 54,757 |
| Reports to shareholders | 174,244 |
| Registration fees | 111,420 |
| Other | 80,552 |
| Total expenses before expense reductions | 11,055,789 |
| Expense reductions | (16,295) |
| Total expenses after expense reductions | 11,039,494 |
Net investment income | 32,410,495 |
Realized and Unrealized Gain (Loss) | |
| Net realized gain (loss) from: Investments | (371,356,924) |
| Capital gains dividends received | 14,043,060 |
| Payments by affiliates (see Note H) | 2,935 |
| | (357,310,929) |
| Change in net unrealized appreciation (depreciation) on investments | (241,318,383) |
Net gain (loss) | (598,629,312) |
Net increase (decrease) in net assets resulting from operations | $ (566,218,817) |
The accompanying notes are an integral part of the financial statements.
Statement of Changes in Net Assets | ||
| Years Ended December 31, | |
Increase (Decrease) in Net Assets | 2008 | 2007 |
| Operations: Net investment income | $ 32,410,495 | $ 30,890,075 |
| Net realized gain (loss) | (357,310,929) | 130,684,127 |
| Change in net unrealized appreciation (depreciation) | (241,318,383) | (459,143,115) |
| Net increase (decrease) in net assets resulting from operations | (566,218,817) | (297,568,913) |
| Distributions to shareholders from: Net investment income: Class A | (15,451,813) | (10,629,179) |
Class B | (271,535) | (131,791) |
Class C | (881,261) | (457,078) |
Class R | (363,996) | (239,913) |
Class S | (7,352,396) | (4,173,832) |
Institutional Class | (12,763,355) | (9,692,700) |
| Net realized gains: Class A | (2,916,245) | (78,698,274) |
Class B | (85,734) | (2,636,631) |
Class C | (244,297) | (8,119,379) |
Class R | (73,763) | (2,041,136) |
Class S | (1,317,902) | (36,201,231) |
Institutional Class | (2,172,550) | (53,630,596) |
| Return of capital: Class A | (2,771,938) | — |
Class B | (48,711) | — |
Class C | (158,092) | — |
Class R | (65,298) | — |
Class S | (1,318,964) | — |
Institutional Class | (2,289,649) | — |
| Total distributions | (50,547,499) | (206,651,740) |
| Fund share transactions: Proceeds from shares sold | 533,653,212 | 1,094,894,412 |
| Reinvestment of distributions | 42,616,112 | 180,544,640 |
| Cost of shares redeemed | (449,761,226) | (1,515,180,643) |
| Redemption fees | 144,167 | 158,659 |
| Net increase (decrease) in net assets from Fund share transactions | 126,652,265 | (239,582,932) |
Increase (decrease) in net assets | (490,114,051) | (743,803,585) |
| Net assets at beginning of period | 1,387,232,517 | 2,131,036,102 |
| Net assets at end of period (including undistributed net investment income of $2,658,641 and $7,421,043, respectively) | $ 897,118,466 | $ 1,387,232,517 |
The accompanying notes are an integral part of the financial statements.
Class A Years Ended December 31, | 2008 | 2007 | 2006 | 2005 | 2004 |
Selected Per Share Data | |||||
Net asset value, beginning of period | $ 19.07 | $ 26.53 | $ 20.83 | $ 20.40 | $ 17.09 |
Income (loss) from investment operations: Net investment incomea | .41 | .39 | .39 | .42 | .48 |
Net realized and unrealized gain (loss) | (7.75) | (4.61) | 7.33 | 1.96 | 4.79 |
Total from investment operations | (7.34) | (4.22) | 7.72 | 2.38 | 5.27 |
Less distributions from: Net investment income | (.46) | (.35) | (.51) | (.65) | (.58) |
Net realized gains | (.09) | (2.89) | (1.51) | (1.30) | (1.38) |
Return of capital | (.09) | — | — | — | — |
Total distributions | (.64) | (3.24) | (2.02) | (1.95) | (1.96) |
| Redemption fee | .00* | .00* | .00* | .00* | — |
Net asset value, end of period | $ 11.09 | $ 19.07 | $ 26.53 | $ 20.83 | $ 20.40 |
| Total Return (%)b | (39.34) | (15.89) | 37.73c | 11.89 | 31.57 |
Ratios to Average Net Assets and Supplemental Data | |||||
| Net assets, end of period ($ millions) | 384 | 596 | 1,205 | 723 | 814 |
| Ratio of expenses before expense reductions (%) | .94 | .97 | .91 | .80 | .82 |
| Ratio of expenses after expense reductions (%) | .94 | .97 | .82 | .80 | .82 |
| Ratio of net investment income (%) | 2.42 | 1.50 | 1.62 | 2.05 | 2.60 |
| Portfolio turnover rate (%) | 84 | 81 | 60 | 66d | 79 |
| a Based on average shares outstanding during the period. b Total return does not reflect the effect of any sales charges. c Total return would have been lower had certain expenses not been reduced. d Excludes portfolio securities delivered as a result of processing in-kind redemptions. * Amount is less than $.005. | |||||
Class B Years Ended December 31, | 2008 | 2007 | 2006 | 2005 | 2004 |
Selected Per Share Data | |||||
Net asset value, beginning of period | $ 19.04 | $ 26.48 | $ 20.83 | $ 20.40 | $ 17.08 |
Income (loss) from investment operations: Net investment incomea | .26 | .19 | .18 | .23 | .30 |
Net realized and unrealized gain (loss) | (7.72) | (4.60) | 7.33 | 1.96 | 4.80 |
Total from investment operations | (7.46) | (4.41) | 7.51 | 2.19 | 5.10 |
Less distributions from: Net investment income | (.31) | (.14) | (.35) | (.46) | (.40) |
Net realized gains | (.09) | (2.89) | (1.51) | (1.30) | (1.38) |
Return of capital | (.09) | — | — | — | — |
Total distributions | (.49) | (3.03) | (1.86) | (1.76) | (1.78) |
| Redemption fees | .00* | .00* | .00* | .00* | — |
Net asset value, end of period | $ 11.09 | $ 19.04 | $ 26.48 | $ 20.83 | $ 20.40 |
| Total Return (%)b | (39.71) | (16.51) | 36.53c | 10.84 | 30.24 |
Ratios to Average Net Assets and Supplemental Data | |||||
| Net assets, end of period ($ millions) | 8 | 20 | 36 | 29 | 32 |
| Ratio of expenses before expense reductions (%) | 1.82 | 1.73 | 1.73 | 1.72 | 1.79 |
| Ratio of expenses after expense reductions (%) | 1.82 | 1.73 | 1.72 | 1.72 | 1.79 |
| Ratio of net investment income (%) | 1.54 | .74 | .72 | 1.13 | 1.63 |
| Portfolio turnover rate (%) | 84 | 81 | 60 | 66d | 79 |
| a Based on average shares outstanding during the period. b Total return does not reflect the effect of any sales charges. c Total return would have been lower had certain expenses not been reduced. d Excludes portfolio securities delivered as a result of processing in-kind redemptions. * Amount is less than $.005. | |||||
Class C Years Ended December 31, | 2008 | 2007 | 2006 | 2005 | 2004 |
Selected Per Share Data | |||||
Net asset value, beginning of period | $ 19.10 | $ 26.55 | $ 20.88 | $ 20.44 | $ 17.12 |
Income (loss) from investment operations: Net investment incomea | .27 | .20 | .20 | .26 | .32 |
Net realized and unrealized gain (loss) | (7.75) | (4.61) | 7.35 | 1.96 | 4.80 |
Total from investment operations | (7.48) | (4.41) | 7.55 | 2.22 | 5.12 |
Less distributions from: Net investment income | (.32) | (.15) | (.37) | (.48) | (.42) |
Net realized gains | (.09) | (2.89) | (1.51) | (1.30) | (1.38) |
Return of capital | (.09) | — | — | — | — |
Total distributions | (.50) | (3.04) | (1.88) | (1.78) | (1.80) |
| Redemption fees | .00* | .00* | .00* | .00* | — |
Net asset value, end of period | $ 11.12 | $ 19.10 | $ 26.55 | $ 20.88 | $ 20.44 |
| Total Return (%)b | (39.76) | (16.46)c | 36.67c | 11.00 | 30.35 |
Ratios to Average Net Assets and Supplemental Data | |||||
| Net assets, end of period ($ millions) | 27 | 60 | 126 | 93 | 81 |
| Ratio of expenses before expense reductions (%) | 1.78 | 1.69 | 1.64 | 1.61 | 1.68 |
| Ratio of expenses after expense reductions (%) | 1.78 | 1.69 | 1.62 | 1.61 | 1.68 |
| Ratio of net investment income (%) | 1.58 | .78 | .82 | 1.24 | 1.74 |
| Portfolio turnover rate (%) | 84 | 81 | 60 | 66d | 79 |
| a Based on average shares outstanding during the period. b Total return does not reflect the effect of any sales charges. c Total return would have been lower had certain expenses not been reduced. d Excludes portfolio securities delivered as a result of processing in-kind redemptions. * Amount is less than $.005. | |||||
Class R Years Ended December 31, | 2008 | 2007 | 2006 | 2005 | 2004 |
Selected Per Share Data | |||||
Net asset value, beginning of period | $ 19.09 | $ 26.55 | $ 20.83 | $ 20.39 | $ 17.09 |
Income (loss) from investment operations: Net investment incomea | .38 | .34 | .34 | .35 | .38 |
Net realized and unrealized gain (loss) | (7.76) | (4.61) | 7.34 | 1.96 | 4.81 |
Total from investment operations | (7.38) | (4.27) | 7.68 | 2.31 | 5.19 |
Less distributions from: Net investment income | (.42) | (.30) | (.45) | (.57) | (.51) |
Net realized gains | (.09) | (2.89) | (1.51) | (1.30) | (1.38) |
Return of capital | (.09) | — | — | — | — |
Total distributions | (.60) | (3.19) | (1.96) | (1.87) | (1.89) |
| Redemption fees | .00* | .00* | .00* | .00* | — |
Net asset value, end of period | $ 11.11 | $ 19.09 | $ 26.55 | $ 20.83 | $ 20.39 |
| Total Return (%) | (39.42) | (16.00) | 37.45 | 11.51 | 31.01 |
Ratios to Average Net Assets and Supplemental Data | |||||
| Net assets, end of period ($ millions) | 9 | 16 | 25 | 9 | 2 |
| Ratio of expenses (%) | 1.14 | 1.14 | 1.03 | 1.16 | 1.33 |
| Ratio of net investment income (%) | 2.22 | 1.33 | 1.41 | 1.69 | 2.09 |
| Portfolio turnover rate (%) | 84 | 81 | 60 | 66b | 79 |
| a Based on average shares outstanding during the period. b Excludes portfolio securities delivered as a result of processing in-kind redemptions. * Amount is less than $.005. | |||||
Class S Years Ended December 31, | 2008 | 2007 | 2006 | 2005a |
Selected Per Share Data | ||||
Net asset value, beginning of period | $ 19.11 | $ 26.53 | $ 20.80 | $ 19.81 |
Income (loss) from investment operations: Net investment incomeb | .44 | .44 | .41 | .29 |
Net realized and unrealized gain (loss) | (7.77) | (4.60) | 7.35 | 2.45 |
Total from investment operations | (7.33) | (4.16) | 7.76 | 2.74 |
Less distributions from: Net investment income | (.49) | (.37) | (.52) | (.45) |
Net realized gains | (.09) | (2.89) | (1.51) | (1.30) |
Return of capital | (.09) | — | — | — |
Total distributions | (.67) | (3.26) | (2.03) | (1.75) |
| Redemption fees*** | .00 | .00 | .00 | .00 |
Net asset value, end of period | $ 11.11 | $ 19.11 | $ 26.53 | $ 20.80 |
| Total Return (%) | (39.34) | (15.63) | 37.98 | 13.84** |
Ratios to Average Net Assets and Supplemental Data | ||||
| Net assets, end of period ($ millions) | 174 | 288 | 19 | 2 |
| Ratio of expenses (%) | .79 | .83 | .73 | .76* |
| Ratio of net investment income (%) | 2.57 | 1.64 | 1.71 | 2.00* |
| Portfolio turnover rate (%) | 84 | 81 | 60 | 66c |
| a For the period from May 2, 2005 (commencement of operations of Class S shares) to December 31, 2005. b Based on average shares outstanding during the period. c Excludes portfolio securities delivered as a result of processing in-kind redemptions. * Annualized ** Not annualized *** Amount is less than $.005. | ||||
Institutional Class Years Ended December 31, | 2008 | 2007 | 2006 | 2005 | 2004 |
Selected Per Share Data | |||||
Net asset value, beginning of period | $ 19.09 | $ 26.53 | $ 20.81 | $ 20.38 | $ 17.08 |
Income (loss) from investment operations: Net investment incomea | .47 | .49 | .46 | .48 | .53 |
Net realized and unrealized gain (loss) | (7.76) | (4.61) | 7.33 | 1.96 | 4.77 |
Total from investment operations | (7.29) | (4.12) | 7.79 | 2.44 | 5.30 |
Less distributions from: Net investment income | (.53) | (.43) | (.56) | (.71) | (.62) |
Net realized gains | (.09) | (2.89) | (1.51) | (1.30) | (1.38) |
Return of capital | (.09) | — | — | — | — |
Total distributions | (.71) | (3.32) | (2.07) | (2.01) | (2.00) |
| Redemption fees | .00* | .00* | .00* | .00* | — |
Net asset value, end of period | $ 11.09 | $ 19.09 | $ 26.53 | $ 20.81 | $ 20.38 |
| Total Return (%) | (38.99) | (15.50)b | 38.14b | 12.19 | 31.88 |
Ratios to Average Net Assets and Supplemental Data | |||||
| Net assets, end of period ($ millions) | 296 | 409 | 720 | 464 | 353 |
| Ratio of expenses before expense reductions (%) | .63 | .57 | .58 | .53 | .54 |
| Ratio of expenses after expense reductions (%) | .63 | .56 | .54 | .53 | .54 |
| Ratio of net investment income (%) | 2.73 | 1.91 | 1.90 | 2.32 | 2.88 |
| Portfolio turnover rate (%) | 84 | 81 | 60 | 66c | 79 |
| a Based on average shares outstanding during the period. b Total return would have been lower had certain expenses not been reduced. c Excludes portfolio securities delivered as a result of processing in-kind redemptions. * Amount is less than $.005 | |||||
A. Significant Accounting Policies
DWS RREEF Real Estate Securities Fund (the "Fund") is a non-diversified series of DWS Advisor Funds (the "Trust") which is registered under the Investment Company Act of 1940, as amended (the "1940 Act"), as an open-end management investment company organized as a business trust under the laws of the state of Delaware.
The Fund offers multiple classes of shares which provide investors with different purchase options. Class A shares are offered to investors subject to an initial sales charge. Class B shares are offered to investors without an initial sales charge but are subject to higher ongoing expenses than Class A shares and a contingent deferred sales charge payable upon certain redemptions. Class B shares automatically convert to Class A shares six years after issuance. Class C shares are offered to investors without an initial sales charge and are subject to higher ongoing expenses than Class A shares and a contingent deferred sales charge payable upon certain redemptions within one year of purchase. Class C shares do not automatically convert into another class. Institutional Class shares are offered to a limited group of investors, are not subject to initial or contingent deferred sales charges and have lower ongoing expenses than other classes. Class R shares are only available to participants in certain retirement plans and are offered to investors without an initial sales charge or contingent deferred sales charge. Class S shares are not subject to initial or contingent deferred sales charges and are generally not available to new investors except under certain circumstances.
Investment income, realized and unrealized gains and losses, and certain fund-level expenses and expense reductions, if any, are borne pro rata on the basis of relative net assets by the holders of all classes of shares, except that each class bears certain expenses unique to that class such as distribution and service fees, services to shareholders and certain other class-specific expenses. Differences in class-level expenses may result in payment of different per share dividends by class. All shares of the Fund have equal rights with respect to voting subject to class-specific arrangements.
The Fund's financial statements are prepared in accordance with accounting principles generally accepted in the United States of America which require the use of management estimates. Actual results could differ from those estimates. The policies described below are followed consistently by the Fund in the preparation of its financial statements.
Security Valuation. Investments are stated at value determined as of the close of regular trading on the New York Stock Exchange on each day the exchange is open for trading. Equity securities are valued at the most recent sale price or official closing price reported on the exchange (US or foreign) or over-the-counter market on which the security is traded most extensively. Securities for which no sales are reported are valued at the calculated mean between the most recent bid and asked quotations on the relevant market or, if a mean cannot be determined, at the most recent bid quotation.
Money market instruments purchased with an original or remaining maturity of sixty days or less, maturing at par, are valued at amortized cost. Investments in Cash Management QP Trust are valued at their net asset value each business day.
Securities and other assets for which market quotations are not readily available or for which the above valuation procedures are deemed not to reflect fair value are valued in a manner that is intended to reflect their fair value as determined in accordance with procedures approved by the Trustees.
The Fund adopted Financial Accounting Standards Board Statement of Financial Accounting Standards No. 157, "Fair Value Measurements," effective at the beginning of the Fund's fiscal year. Disclosure about the classification of fair value measurements is included at the end of the Fund's Investment Portfolio.
Securities Lending. The Fund may lend securities to financial institutions. The Fund retains beneficial ownership of the securities it has loaned and continues to receive interest and dividends paid by the issuer of securities and to participate in any changes in their market value. The Fund requires the borrowers of the securities to maintain collateral with the Fund consisting of liquid, unencumbered assets having a value at least equal to the value of the securities loaned. When the collateral falls below specified amounts, the lending agents will use their best efforts to obtain additional collateral on the next business day to meet required amounts under the security lending agreement. The Fund may invest the cash collateral into a joint trading account in an affiliated money market fund pursuant to Exemptive Orders issued by the SEC. The Fund receives compensation for lending its securities either in the form of fees or by earning interest on invested cash collateral net of borrower rebates and fees paid to a lending agent. Either the Fund or the borrower may terminate the loan. There may be risks of delay and costs in recovery of securities or even loss of rights in the collateral should the borrower of the securities fail financially. The Fund is also subject to all investment risks associated with the reinvestment of any cash collateral received, including, but not limited to, interest rate, credit and liquidity risk associated with such investments.
Federal Income Taxes. The Fund's policy is to comply with the requirements of the Internal Revenue Code, as amended, which are applicable to regulated investment companies, and to distribute all of its taxable income to its shareholders.
At December 31, 2008, the Fund had a net tax basis capital loss carryforward of approximately $79,152,000, which may be applied against any realized net taxable capital gains of each succeeding year until fully utilized or until December 31, 2016, the expiration date, whichever occurs first.
In addition, from November 1, 2008 through December 31, 2008, the Fund incurred approximately $198,202,000 of net realized capital losses. As permitted by tax regulations, the Fund intends to elect to defer these losses and treat them as arising in the fiscal year ending December 31, 2009.
The Fund has reviewed the tax positions for the open tax years as of December 31, 2008 and has determined that no provision for income tax is required in the Fund's financial statements. The Fund's federal tax returns for the prior three years remain subject to examination by the Internal Revenue Service.
Distribution of Income and Gains. Net investment income of the Fund is declared and distributed to shareholders quarterly. Net realized gains from investment transactions, in excess of available capital loss carryforwards, would be taxable to the Fund if not distributed, and, therefore, will be distributed to shareholders at least annually.
The timing and characterization of certain income and capital gains distributions are determined annually in accordance with federal tax regulations which may differ from accounting principles generally accepted in the United States of America. These differences primarily relate to certain securities sold at a loss. As a result, net investment income and net realized gain (loss) on investment transactions for a reporting period may differ significantly from distributions during such period. Accordingly, the Fund may periodically make reclassifications among certain of its capital accounts without impacting the net asset value of the Fund.
At December 31, 2008, the Fund's components of distributable earnings (accumulated losses) on a tax-basis were as follows:
| Capital loss carryforwards | $ (79,152,000) |
| Unrealized appreciation (depreciation) on investments | $ (195,962,851) |
In addition, the tax character of distributions paid to shareholders by the Fund is summarized as follows:
| Years Ended December 31, | |
| 2008 | 2007 |
| Distributions from ordinary income* | $ 37,090,215 | $ 60,394,626 |
| Distributions from long-term capital gains | $ 6,804,632 | $ 146,257,114 |
| Return of capital | $ 6,652,652 | $ — |
Redemption Fees. The Fund imposes a redemption fee of 2% of the total redemption amount on all Fund shares redeemed or exchanged within 15 days of buying them, either by purchase or exchange. This fee is assessed and retained by the Fund for the benefit of the remaining shareholders. The redemption fee is accounted for as an addition to paid-in capital.
Contingencies. In the normal course of business, the Fund may enter into contracts with service providers that contain general indemnification clauses. The Fund's maximum exposure under these arrangements is unknown as this would involve future claims that may be made against the Fund that have not yet been made. However, based on experience, the Fund expects the risk of loss to be remote.
Real Estate Investment Trusts. The Fund periodically recharacterizes distributions received from a Real Estate Investment Trust ("REIT") investment based on information provided by the REIT into the following categories: ordinary income, long-term and short-term capital gains, and return of capital. If information is not available timely from a REIT, the recharacterization will be estimated and a recharacterization will be made in the following year when such information becomes available. Distributions received from REITs in excess of income are recorded as either a reduction of cost of investments or realized gains. The Fund distinguishes between dividends on a tax basis and a financial reporting basis and only distributions in excess of tax basis earnings and profits are reported in the financial statements as a return of capital for tax reporting purposes.
Expenses. Expenses of the Trust arising in connection with a specific fund are allocated to that fund. Other Trust expenses which cannot be directly attributed to a fund are apportioned among the funds in the Trust.
Other. Investment transactions are accounted for on the trade date plus one basis for daily net asset value calculations. However, for financial reporting purposes, investment security transactions are reported on trade date. Interest income is recorded on the accrual basis. Dividend income is recorded on the ex-dividend date net of foreign withholding taxes. Realized gains and losses from investment transactions are recorded on an identified cost basis.
B. Purchases and Sales of Securities
During the year ended December 31, 2008, purchases and sales of investment securities (excluding short-term investments) aggregated $1,201,518,434 and $1,083,196,775, respectively.
C. Related Parties
Management Agreement. Under the Investment Management Agreement with Deutsche Investment Management Americas Inc. ("DIMA" or the "Advisor"), an indirect, wholly owned subsidiary of Deutsche Bank AG, the Advisor directs the investments of the Fund in accordance with its investment objectives, policies and restrictions. The Advisor determines the securities, instruments and other contracts relating to investments to be purchased, sold or entered into by the Fund or delegates such responsibility to the Fund's subadvisor.
RREEF America L.L.C. ("RREEF") is the subadvisor for the Fund. While DIMA is the investment advisor to the Fund, the day-to-day activities of managing the Fund's portfolio have been delegated to RREEF. RREEF is responsible for decisions to buy and sell securities for the Fund and conducts the research that leads to the purchase and sale decisions. DIMA compensates RREEF out of its management fee.
Under the Investment Management Agreement with the Advisor, the Fund pays a monthly management fee based on the Fund's average daily net assets, computed and accrued daily and payable monthly, at the following annual rates:
| First $100 million of the Fund's average daily net assets | .565% |
| Next $100 million of such net assets | .465% |
| Next $100 million of such net assets | .415% |
| Over $300 million of such net assets | .365% |
Accordingly for the year ended December 31, 2008, the fee pursuant to the management agreement was equivalent to an annual effective rate of 0.39% of the Fund's average daily net assets.
Administration Fee. Pursuant to the Administrative Services Agreement, DIMA provides most administrative services to the Fund. For all services provided under the Administrative Services Agreement, the Fund pays the Advisor an annual fee ("Administration Fee") of 0.10% of the Fund's average daily net assets, computed and accrued daily and payable monthly. For the year ended December 31, 2008, the Advisor received an Administration Fee of $1,293,415, of which $67,569 is unpaid.
Service Provider Fees. DWS Investments Service Company ("DISC"), an affiliate of the Advisor, is the transfer agent, dividend-paying agent and shareholder service agent for the Fund. Pursuant to a sub-transfer agency agreement between DISC and DST Systems, Inc. ("DST"), DISC has delegated certain transfer agent, dividend-paying agent and shareholder service agent functions to DST. DISC compensates DST out of the shareholder servicing fee it receives from the Fund. For the year ended December 31, 2008, the amounts charged to the Fund by DISC were as follows:
Services to Shareholders | Total Aggregated | Unpaid at December 31, 2008 |
| Class A | $ 767,541 | $ 202,536 |
| Class B | 34,671 | 7,929 |
| Class C | 89,816 | 21,801 |
| Class R | 4,085 | 105 |
| Class S | 57,346 | 16,083 |
| Institutional Class | 106,117 | 36,451 |
| $ 1,059,576 | $ 284,905 |
Distribution and Service Fees. Under the Fund's Class B, Class C and Class R 12b-1 Plans, DWS Investments Distributors, Inc. ("DIDI"), an affiliate of the Advisor, receives a fee ("Distribution Fee") of 0.75% of average daily net assets of each of Class B and C shares and 0.25% of average daily net assets of Class R shares. In accordance with the Fund's Underwriting and Distribution Services Agreement, DIDI enters into related selling group agreements with various firms at various rates for sales of Class B, C and R shares. For the year ended December 31, 2008, the Distribution Fee was as follows:
Distribution Fee | Total Aggregated | Unpaid at December 31, 2008 |
| Class B | $ 112,212 | $ 5,017 |
| Class C | 340,962 | 14,752 |
| Class R | 35,358 | 1,971 |
| $ 488,532 | $ 21,740 |
In addition, DIDI provides information and administrative services for a fee ("Service Fee") to Class A, B, C and R shareholders at an annual rate of up to 0.25% of average daily net assets for each such class. DIDI in turn has various agreements with financial services firms that provide these services and pays these fees based upon the assets of shareholder accounts the firms service. For the year ended December 31, 2008, the Service Fee was as follows:
Service Fee | Total Aggregated | Unpaid at December 31, 2008 | Annual Effective Rate |
| Class A | $ 1,233,061 | $ 109,333 | .22% |
| Class B | 37,181 | 2,602 | .25% |
| Class C | 114,341 | 7,693 | .25% |
| Class R | 14,668 | 1,875 | .10% |
| $ 1,399,251 | $ 121,503 |
|
Underwriting Agreement and Contingent Deferred Sales Charge. DIDI is the principal underwriter for the Fund. Underwriting commissions paid in connection with the distribution of Class A shares for the year ended December 31, 2008 aggregated $13,400.
In addition, DIDI receives any contingent deferred sales charge ("CDSC") from Class B share redemptions occurring within six years of purchase and Class C share redemptions occurring within one year of purchase. There is no such charge upon redemption of any share appreciation or reinvested dividends. The CDSC is based on declining rates ranging from 4% to 1% for Class B and 1% for Class C, of the value of the shares redeemed. For the year ended December 31, 2008, the CDSC for Class B and C shares aggregated $46,117 and $5,375, respectively. A deferred sales charge of up to 1% is assessed on certain redemptions of Class A shares. For the year ended December 31, 2008, DIDI received $2,247 for Class A shares.
Typesetting and Filing Service Fees. Under an agreement with DIMA, DIMA is compensated for providing typesetting and certain regulatory filing services to the Fund. For the year ended December 31, 2008, the amount charged to the Fund by DIMA included in the Statement of Operations under "reports to shareholders" aggregated $21,176, of which $7,978 is unpaid.
Trustees' Fees and Expenses. The Fund paid each Trustee not affiliated with the Advisor retainer fees plus specified amounts for various committee services and for the Board Chairperson and Vice Chairperson.
In connection with the board consolidation on April 1, 2008, of the two DWS Funds' Boards of Trustees, certain Independent Board Members retired prior to their normal retirement date, and received a one-time retirement benefit. DIMA has agreed to reimburse the Funds for the cost of this benefit. During the period ended December 31, 2008, the Fund paid its allocated portion of the retirement benefit of $7,041 to the non-continuing Independent Board Members, and the Fund was reimbursed by DIMA for this payment.
Cash Management QP Trust. Pursuant to an Exemptive Order issued by the SEC, the Fund may invest in the Cash Management QP Trust (the "QP Trust") and other affiliated funds managed by the Advisor. The QP Trust seeks to provide as high a level of current income as is consistent with the preservation of capital and the maintenance of liquidity. The QP Trust does not pay the Advisor a management fee for the affiliated funds' investments in the QP Trust.
D. Fee Reductions
The Fund has entered into an arrangement with its custodian and transfer agent whereby credits realized as a result of uninvested cash balances were used to reduce a portion of the Fund's custodian expenses. During the year ended December 31, 2008, the Fund's custodian fee was reduced by $4,260 and $4,994, respectively, for custody and transfer agent credits earned.
E. Line of Credit
The Fund and other affiliated funds (the "Participants") share in a $490 million revolving credit facility provided by a syndication of banks. The Fund may borrow for temporary or emergency purposes, including the meeting of redemption requests that otherwise might require the untimely disposition of securities. The Participants are charged an annual commitment fee which is allocated based on net assets, among each of the Participants. Interest is calculated at the Federal Funds Rate plus 0.35 percent. The Fund may borrow up to a maximum of 20 percent of its net assets under the agreement.
F. Share Transactions
The following table summarizes share and dollar activity in the Fund:
| Year Ended December 31, 2008 | Year Ended December 31, 2007 | ||
| Shares | Dollars | Shares | Dollars |
Shares sold | ||||
| Class A | 14,526,021 | $ 230,838,467 | 11,076,640 | $ 290,450,889 |
| Class B | 47,956 | 811,884 | 45,245 | 1,162,364 |
| Class C | 571,139 | 9,653,142 | 130,543 | 3,225,625 |
| Class R | 305,266 | 5,181,796 | 316,720 | 8,412,285 |
| Class S | 3,483,124 | 56,921,432 | 17,805,605 | 478,512,359 |
| Institutional Class | 14,004,334 | 230,246,491 | 12,065,861 | 313,130,890 |
| |
| $ 533,653,212 |
| $ 1,094,894,412 |
Shares issued to shareholders in reinvestment of distributions | ||||
| Class A | 1,308,458 | $ 19,531,417 | 4,346,577 | $ 83,562,625 |
| Class B | 23,224 | 350,396 | 126,730 | 2,391,850 |
| Class C | 71,151 | 1,057,283 | 373,505 | 7,080,136 |
| Class R | 33,542 | 498,794 | 118,064 | 2,265,797 |
| Class S | 645,899 | 9,703,967 | 2,107,664 | 40,353,684 |
| Institutional Class | 760,757 | 11,474,255 | 2,316,308 | 44,890,548 |
| |
| $ 42,616,112 |
| $ 180,544,640 |
Shares redeemed | ||||
| Class A | (12,485,957) | $ (200,484,097) | (29,614,915) | $ (786,247,514) |
| Class B | (378,731) | (6,232,356) | (493,781) | (12,495,549) |
| Class C | (1,316,246) | (21,741,621) | (2,129,969) | (54,755,327) |
| Class R | (340,935) | (5,442,833) | (538,618) | (13,780,739) |
| Class S | (3,583,177) | (59,319,269) | (5,568,984) | (140,243,328) |
| Institutional Class | (9,524,983) | (156,541,050) | (20,108,984) | (507,658,186) |
| |
| $ (449,761,226) |
| $ (1,515,180,643) |
Redemption fees |
| $ 144,167 |
| $ 158,659 |
Net increase (decrease) | ||||
| Class A | 3,348,522 | $ 49,897,045 | (14,191,698) | $ (412,154,512) |
| Class B | (307,551) | (5,069,321) | (321,806) | (8,941,285) |
| Class C | (673,956) | (11,030,438) | (1,625,921) | (44,449,392) |
| Class R | (2,127) | 248,451 | (103,834) | (3,102,629) |
| Class S | 545,846 | 7,410,916 | 14,344,285 | 378,677,251 |
| Institutional Class | 5,240,108 | 85,195,612 | (5,726,815) | (149,612,365) |
| |
| $ 126,652,265 |
| $ (239,582,932) |
G. Real Estate Concentration Risk
The Fund concentrates its investments in real estate securities, including REITs. A fund with a concentrated portfolio is vulnerable to the risks of the industry in which it invests and is subject to greater risks and market fluctuations than funds investing in a broader range of industries. Real estate securities are susceptible to the risks associated with direct ownership of real estate such as declines in property values; increases in property taxes, operating expenses, interest rates or competition; zoning changes; and losses from casualty and condemnation.
H. Payments Made by Affiliates
During the year ended December 31, 2008, the Advisor fully reimbursed the Fund $2,935 for losses incurred on operation errors. The amount of the losses was less than 0.01% of the Fund's average daily net assets, thus having no impact on the Fund's total return.
Report of Independent Registered Public Accounting Firm
To the Trustees of DWS Advisor Funds and Shareholders of DWS RREEF Real Estate Securities Fund:
In our opinion, the accompanying statement of assets and liabilities, including the investment portfolio, and the related statements of operations and of changes in net assets and the financial highlights present fairly, in all material respects, the financial position of DWS RREEF Real Estate Securities Fund (the "Fund") at December 31, 2008, and the results of its operations, the changes in its net assets and the financial highlights for each of the periods indicated therein, in conformity with accounting principles generally accepted in the United States of America. These financial statements and financial highlights (hereafter referred to as "financial statements") are the responsibility of the Fund's management. Our responsibility is to express an opinion on these financial statements based on our audits. We conducted our audits of these financial statements in accordance with the standards of the Public Company Accounting Oversight Board (United States). Those standards require that we plan and perform the audit to obtain reasonable assurance about whether the financial statements are free of material misstatement. An audit includes examining, on a test basis, evidence supporting the amounts and disclosures in the financial statements, assessing the accounting principles used and significant estimates made by management, and evaluating the overall financial statement presentation. We believe that our audits, which included confirmation of securities at December 31, 2008 by correspondence with the custodian and brokers, provide a reasonable basis for our opinion.
Boston, Massachusetts | PricewaterhouseCoopers LLP |
The Fund paid distributions of $0.09 per share from net long-term capital gains during the year ended December 31, 2008, of which 100% represents 15% rate gains.
Please consult a tax advisor if you have questions about federal or state income tax laws, or on how to prepare your tax returns. If you have specific questions about your account, please call (800) 621-1048
Investment Management Agreement Approval
The Board of Trustees, including the Independent Trustees, approved the renewal of your Fund's investment management agreement (the "Agreement") with Deutsche Investment Management Americas Inc. ("DIMA") and sub-advisory agreement (the "Sub-Advisory Agreement," and together with the Agreement, the "Agreements") between DIMA and RREEF America LLC ("RREEF"), an affiliate of DIMA, in September 2008.
In terms of the process that the Board followed prior to approving the Agreements, shareholders should know that:
• At the present time, all but one of your Fund's Trustees are independent of DIMA and its affiliates.
• The Trustees meet frequently to discuss fund matters. Each year, the Trustees dedicate part or all of several meetings to contract review matters. Over the course of several months, the Board's Contract Committee, in coordination with the Board's Equity Oversight Committee, reviewed comprehensive materials received from DIMA, independent third parties and independent counsel. These materials included an analysis of the Fund's performance, fees and expenses, and profitability compiled by the Fund's independent fee consultant. The Board also received extensive information throughout the year regarding performance of the Fund.
• The Trustees regularly meet privately with their independent counsel (and, as needed, other advisors) to discuss contract review and other matters. In addition, the Trustees were also advised by the Fund's independent fee consultant in the course of their review of the Fund's contractual arrangements and considered a comprehensive report prepared by the independent fee consultant in connection with their deliberations (the "IFC Report").
• In connection with reviewing the Agreements, the Board also reviewed the terms of the Fund's Rule 12b-1 plan, distribution agreement, administrative services agreement, transfer agency agreement and other material service agreements.
• Based on its evaluation of the information provided, the Contract Committee presented its findings and recommendations to the Independent Trustees as a group. The Independent Trustees reviewed the Contract Committee's findings and recommendations and presented their recommendations to the full Board.
In connection with the contract review process, the Contract Committee and the Board considered the factors discussed below, among others. The Board also considered that DIMA and its predecessors have managed the Fund since its inception, and the Board believes that a long-term relationship with a capable, conscientious advisor is in the best interests of the Fund. The Board considered, generally, that shareholders chose to invest or remain invested in the Fund knowing that DIMA managed the Fund, and that the Agreements were approved by the Fund's shareholders at a special meeting held in 2006. DIMA and RREEF are part of Deutsche Bank, a major global banking institution that is engaged in a wide range of financial services. The Board believes that there are significant advantages to being part of a global asset management business that offers a wide range of investing expertise and resources, including hundreds of portfolio managers and analysts with research capabilities in many countries throughout the world.
While shareholders may focus primarily on fund performance and fees, the Fund's Board considers these and many other factors, including the quality and integrity of DIMA's and RREEF's personnel and such other issues as back-office operations, fund valuations, and compliance policies and procedures.
Nature, Quality and Extent of Services. The Board considered the terms of the Agreements, including the scope of advisory services provided under the Agreements. The Board noted that, under the Agreements, DIMA and RREEF provide portfolio management services to the Fund and that, pursuant to a separate administrative services agreement, DIMA provides administrative services to the Fund. The Board considered the experience and skills of senior management and investment personnel, the resources made available to such personnel, the ability of DIMA and RREEF to attract and retain high-quality personnel, and the organizational depth and stability of DIMA and RREEF. The Board reviewed the Fund's performance over short-term and long-term periods and compared those returns to various agreed-upon performance measures, including market indices and a peer universe compiled by the independent fee consultant using information supplied by Lipper Inc. ("Lipper"). The Board also noted that it has put a process into place of identifying "Focus Funds" (e.g., funds performing poorly relative to their benchmark or a peer group compiled by Lipper), and receives more frequent reporting and information from DIMA regarding such funds, along with DIMA's remedial plans to address underperformance. The Board believes this process is an effective manner of identifying and addressing underperforming funds. Based on the information provided, the Board noted that for each of the one-, three- and five-year periods ended December 31, 2007, the Fund's performance (Class A shares) was in the 2nd quartile of the applicable Lipper universe (the 1st quartile being the best performers and the 4th quartile being the worst performers). The Board also observed that the Fund has outperformed its benchmark in each of the one-, three- and five-year periods ended December 31, 2007.
On the basis of this evaluation and the ongoing review of investment results by the Board, the Board concluded that the nature, quality and extent of services provided by DIMA and RREEF historically have been and continue to be satisfactory.
Fees and Expenses. The Board considered the Fund's investment management fee schedule, sub-advisory fee schedule, operating expenses, and total expense ratios, and comparative information provided by Lipper and the independent fee consultant regarding investment management fee rates paid to other investment advisors by similar funds (1st quartile being the most favorable and 4th quartile being the least favorable). With respect to management fees paid to other investment advisors by similar funds, the Board noted that the contractual fee rates paid by the Fund, which include the 0.10% fee paid to DIMA under the Fund's administrative services agreement, were lower than the median (1st quartile) of the applicable Lipper peer group (based on Lipper data provided as of December 31, 2007). With respect to the sub-advisory fee paid to RREEF, the Board noted that the fee is paid by DIMA out of its fee and not directly by the Fund. The Board noted that the Fund's Class A shares' total (net) operating expenses (excluding 12b-1 fees) were expected to be lower than the median (1st quartile) of the applicable Lipper expense universe (based on Lipper data provided as of December 31, 2007, and analyzing Lipper expense universe Class A expenses less any applicable 12b-1 fees) ("Lipper Universe Expenses"). The Board also reviewed each other share class's total (net) operating expenses relative to the Lipper Universe Expenses. The Board considered the Fund's management fee rate as compared to fees charged by DIMA and certain of its affiliates for comparable mutual funds and considered differences in fund and fee structures between the DWS Funds. The Board also considered how the Fund's total (net) operating expenses compared to the total (net) operating expenses of a more customized peer group selected by Lipper (based on such factors as asset size).
On the basis of the information provided, the Board concluded that management fees were reasonable and appropriate in light of the nature, quality and extent of services provided by DIMA and RREEF.
Profitability. The Board reviewed detailed information regarding revenues received by DIMA under the Agreement. The Board considered the estimated costs and pre-tax profits realized by DIMA from advising the DWS Funds, as well as estimates of the pre-tax profits attributable to managing the Fund in particular. The Board also received information regarding the estimated enterprise-wide profitability of the DWS Investments organization with respect to all fund services in totality and by fund. The Board reviewed DIMA's methodology in allocating its costs to the management of the Fund. Based on the information provided, the Board concluded that the pre-tax profits realized by DIMA in connection with the management of the Fund were not unreasonable. The Board also reviewed information regarding the profitability of certain similar investment management firms. The Board noted that while information regarding the profitability of such firms is limited (and in some cases is not necessarily prepared on a comparable basis), DIMA and its affiliates' overall profitability with respect to the DWS Investments fund complex (after taking into account distribution and other services provided to the funds by DIMA and its affiliates) was lower than the overall profitability levels of many comparable firms for which such data was available.
Economies of Scale. The Board considered whether there are economies of scale with respect to the management of the Fund and whether the Fund benefits from any economies of scale. The Board noted that the Fund's management fee schedule includes fee breakpoints. The Board concluded that the Fund's fee schedule represents an appropriate sharing between the Fund and DIMA of such economies of scale as may exist in the management of the Fund at current asset levels.
Other Benefits to DIMA and Its Affiliates. The Board also considered the character and amount of other incidental benefits received by DIMA and its affiliates, including any fees received by DIMA for administrative services provided to the Fund and any fees received by an affiliate of DIMA for distribution services. The Board also considered benefits to DIMA related to brokerage and soft-dollar allocations, including allocating brokerage to pay for research generated by parties other than the executing broker dealers, which pertain primarily to funds investing in equity securities, along with the incidental public relations benefits to DIMA related to DWS Funds advertising and cross-selling opportunities among DWS Investments products and services. The Board concluded that management fees were reasonable in light of these fallout benefits.
Compliance. The Board considered the significant attention and resources dedicated by DIMA to documenting and enhancing its compliance processes in recent years. The Board noted in particular (i) the experience and seniority of DIMA's chief compliance officer; (ii) the large number of compliance personnel who report to DIMA's chief compliance officer; and (iii) the substantial commitment of resources by DIMA and its affiliates to compliance matters.
Based on all of the information considered and the conclusions reached, the Board (including a majority of the Independent Trustees) determined that the continuation of the Agreements is in the best interests of the Fund. In making this determination the Board did not give particular weight to any single factor identified above. The Board considered these factors over the course of numerous meetings, certain of which were in executive session with only the Independent Trustees and their counsel present. It is possible that individual Trustees may have weighed these factors differently in reaching their individual decisions to approve the continuation of the Agreements.
Summary of Management Fee Evaluation by Independent Fee Consultant
October 24, 2008
Pursuant to an Order entered into by Deutsche Investment Management Americas and affiliates (collectively, "DeAM") with the Attorney General of New York, I, Thomas H. Mack, have been appointed the Independent Fee Consultant for the DWS Funds (formerly the DWS Scudder Funds). My duties include preparing an annual written evaluation of the management fees DeAM charges the Funds, considering among other factors the management fees charged by other mutual fund companies for like services, management fees DeAM charges other clients for like services, DeAM's costs of supplying services under the management agreements and related profit margins, possible economies of scale if a Fund grows larger, and the nature and quality of DeAM's services, including fund performance. This report summarizes my evaluation for 2008, including my qualifications, the evaluation process for each of the DWS Funds, consideration of certain complex-level factors, and my conclusions. I served in substantially the same capacity in 2007.
Qualifications
For more than 35 years I have served in various professional capacities within the investment management business. I have held investment analysis and advisory positions, including securities analyst, portfolio strategist and director of investment policy with a large investment firm. I have also performed business management functions, including business development, financial management and marketing research and analysis.
Since 1991, I have been an independent consultant within the asset management industry. I have provided services to over 125 client organizations, including investment managers, mutual fund boards, product distributors and related organizations. Over the past ten years I have completed a number of assignments for mutual fund boards, specifically including assisting boards with management contract renewal.
I hold a Master of Business Administration degree, with highest honors, from Harvard University and Master of Science and Bachelor of Science (highest honors) degrees from the University of California at Berkeley. I am an independent director and audit committee financial expert for two closed-end mutual funds, serve on the board of directors of a private market research company, and have served in various leadership and financial oversight capacities with non-profit organizations.
Evaluation of Fees for each DWS Fund
My work focused primarily on evaluating, fund-by-fund, the fees charged to each of the 129 Fund portfolios in the DWS Fund family. For each Fund, I considered each of the key factors mentioned above, as well as any other relevant information. In doing so I worked closely with the Funds' Independent Directors in their annual contract renewal process, as well as in their approval of contracts for several new funds (documented separately).
In evaluating each Fund's fees, I reviewed comprehensive materials provided by or on behalf of DeAM, including expense information prepared by Lipper Analytical, comparative performance information, profitability data, manager histories, and other materials. I also accessed certain additional information from the Lipper, Strategic Insight, and Morningstar databases and drew on my industry knowledge and experience.
To facilitate evaluating this considerable body of information, I prepared for each Fund a document summarizing the key data elements in each area as well as additional analytics discussed below. This made it possible to consider each key data element in the context of the others.
In the course of contract renewal, DeAM agreed to implement a number of fee and expense adjustments requested by the Independent Directors which will favorably impact future fees and expenses, and my evaluation includes the effects of these changes.
Fees and Expenses Compared with Other Funds
The competitive fee and expense evaluation for each fund focused on two primary comparisons:
The Fund's contractual management fee (the advisory fee plus the administration fee where applicable) compared with those of a group of typically 12-15 funds in the same Lipper investment category (e.g. Large Capitalization Growth) having similar distribution arrangements and being of similar size.
The Fund's total expenses compared with a broader universe of funds from the same Lipper investment category and having similar distribution arrangements.
These two comparisons provide a view of not only the level of the fee compared with funds of similar scale but also the total expense the Fund bears for all the services it receives, in comparison with the investment choices available in the Fund's investment category and distribution channel. The principal figure-of-merit used in these comparisons was the subject Fund's percentile ranking against peers.
DeAM's Fees for Similar Services to Others
DeAM provided management fee schedules for all of its US domiciled fund and non-fund investment management accounts in any of the investment categories where there is a DWS Fund. These similar products included the other DWS Funds, non-fund pooled accounts, institutional accounts and sub-advisory accounts. Using this information, I calculated for each Fund the fee that would be charged to each similar product, at the subject Fund's asset level.
Evaluating information regarding non-fund products is difficult because there are varying levels of services required for different types of accounts, with mutual funds generally requiring considerably more regulatory and administrative types of service as well as having more frequent cash flows than other types of accounts. Also, while mutual fund fees for similar fund products can be expected to be similar, there will be some differences due to different pricing conditions in different distribution channels (e.g. retail funds versus those used in variable insurance products), differences in underlying investment processes and other factors.
Costs and Profit Margins
DeAM provided a detailed profitability analysis for each Fund. After making some adjustments so that the presentation would be more comparable to the available industry figures, I reviewed profit margins from investment management alone, from investment management plus other fund services (excluding distribution) provided to the Funds by DeAM (principally shareholder services), and DeAM profits from all sources, including distribution. A later section comments on overall profitability.
Economies of Scale
Economies of scale — an expected decline in management cost per dollar of fund assets as fund assets grow — are very rarely quantified and documented because of inherent difficulties in collecting and analyzing relevant data. However, in virtually every investment category that I reviewed, larger funds tend to have lower fees and lower total expenses than smaller funds. To see how each DWS Fund compares with this industry observation, I reviewed:
The trend in Fund assets over the last five years and the accompanying trend in total expenses. This shows if the Fund has grown and, if so, whether total expense (management fees as well as other expenses) have declined as a percent of assets.
Whether the Fund has break-points in its management fee schedule, the extent of the fee reduction built into the schedule and the asset levels where the breaks take effect, and in the case of a sub-advised Fund how the Fund's break-points compare with those of the sub-advisory fee schedule.
How the Fund's contractual fee schedule compares with trends in the industry data. To accomplish this, I constructed a chart showing how actual latest-fiscal-year contractual fees of the Fund and of other similar funds relate to average fund assets, with the subject Fund's contractual fee schedule superimposed.
Quality of Service — Performance
The quality-of-service evaluation focused on investment performance, which is the principal result of the investment management service. Each Fund's performance was reviewed over the past 1, 3, 5 and 10 years, as applicable, and compared with that of other funds in the same investment category and with a suitable market index.
In addition, I calculated and reviewed risk-adjusted returns relative to an index of similar mutual funds' returns and a suitable market index. The risk-adjusted returns analysis provides a way of determining the extent to which the Fund's return comparisons are mainly the product of investment value-added (or lack thereof) or alternatively taking considerably more or less risk than is typical in its investment category.
I also received and considered the history of portfolio manager changes for each Fund, as this provided an important context for evaluating the performance results.
Complex-Level Considerations
While this evaluation was conducted mainly at the individual fund level, there are some issues relating to the reasonableness of fees that can alternatively be considered across the whole fund complex:
I reviewed DeAM's profitability analysis for all DWS Funds, with a view toward determining if the allocation procedures used were reasonable and how profit levels compared with public data for other investment managers.
I considered whether DeAM and affiliates receive any significant ancillary or "fall-out" benefits that should be considered in interpreting the direct profitability results. These would be situations where serving as the investment manager of the Funds is beneficial to another part of the Deutsche Bank organization.
I considered how aggregated DWS Fund expenses had varied over the years, by asset class and in the context of trends in asset levels.
I reviewed the structure of the DeAM organization, trends in staffing levels, and information on compensation of investment management and other professionals compared with industry data.
Findings
Based on the process and analysis discussed above, which included reviewing a wide range of information from management and external data sources and considering among other factors the fees DeAM charges other clients, the fees charged by other fund managers, DeAM's costs and profits associated with managing the Funds, economies of scale, possible fall-out benefits, and the nature and quality of services provided, in my opinion the management fees charged the DWS Funds are reasonable.

Thomas H. Mack
Summary of Administrative Fee Evaluation by Independent Fee Consultant
September 29, 2008
Pursuant to an Order entered into by Deutsche Asset Management (DeAM) with the Attorney General of New York, I, Thomas H. Mack, have been appointed the Independent Fee Consultant for the DWS Funds and have as part of my duties evaluated the reasonableness of the proposed management fees to be charged by DeAM to the DWS Funds, taking onto account a proposal to pass through to the funds certain fund accounting-related charges in connection with new regulatory requirements. My evaluation considered the following:
• While the proposal would alter the services to be provided under the Administration Agreement, which I consider to be part of fund management under the Order, it is my opinion that the change in services is slight and that the scope of prospective services under the combination of the Advisory and Administration Agreements continues to be comparable with those typically provided to competitive funds under their management agreements.
• While the proposal would increase fund expenses, according to a pro forma analysis performed by management, the prospective effect is less than .01% for all but seven of the DeAM Funds' 438 active share classes, and in all cases the effect is less than .03% and overall expenses would remain reasonable in my opinion.
Based on the foregoing considerations, in my opinion the fees and expenses for all of the DWS Funds will remain reasonable if the Directors adopt this proposal.

Thomas H. Mack
The following table presents certain information regarding the Board Members and Officers of the Trust as of December 31, 2008. Each Board Member's year of birth is set forth in parentheses after his or her name. Unless otherwise noted, (i) each Board Member has engaged in the principal occupation(s) noted in the table for at least the most recent five years, although not necessarily in the same capacity; and (ii) the address of each Independent Board Member is c/o Dawn-Marie Driscoll, PO Box 100176, Cape Coral, FL 33904. Except as otherwise noted below, the term of office for each Board Member is until the election and qualification of a successor, or until such Board Member sooner dies, resigns, is removed or as otherwise provided in the governing documents of the fund. Because the fund does not hold an annual meeting of shareholders, each Board Member will hold office for an indeterminate period. The Board Members may also serve in similar capacities with other funds in the fund complex. The Length of Time Served represents the year in which the Board Member joined the board of one or more DWS funds now overseen by the Board.
Independent Board Members | ||
Name, Year of Birth, Position with the Fund and Length of Time Served1 | Business Experience and Directorships During the Past Five Years | Number of Funds in DWS Fund Complex Overseen |
| Paul K. Freeman (1950) Chairperson since 20092 Board Member since 1993 | Consultant, World Bank/Inter-American Development Bank; Governing Council of the Independent Directors Council (governance, executive committees); formerly, Project Leader, International Institute for Applied Systems Analysis (1998-2001); Chief Executive Officer, The Eric Group, Inc. (environmental insurance) (1986-1998) | 134 |
| Dawn-Marie Driscoll (1946) Board Member since 1987 | President, Driscoll Associates (consulting firm); Executive Fellow, Center for Business Ethics, Bentley University; formerly, Partner, Palmer & Dodge (1988-1990); Vice President of Corporate Affairs and General Counsel, Filene's (1978-1988). Directorships: Trustee of 20 open-end mutual funds managed by Sun Capital Advisers, Inc. (since 2007); Director of ICI Mutual Insurance Company (since 2007); Advisory Board, Center for Business Ethics, Bentley University; Trustee, Southwest Florida Community Foundation (charitable organization). Former Directorships: Investment Company Institute (audit, executive, nominating committees) and Independent Directors Council (governance, executive committees) | 134 |
| John W. Ballantine (1946) Board Member since 1999 | Retired; formerly, Executive Vice President and Chief Risk Management Officer, First Chicago NBD Corporation/The First National Bank of Chicago (1996-1998); Executive Vice President and Head of International Banking (1995-1996). Directorships: Healthways, Inc. (provider of disease and care management services); Portland General Electric (utility company); Stockwell Capital Investments PLC (private equity). Former Directorships: First Oak Brook Bancshares, Inc. and Oak Brook Bank | 134 |
| Henry P. Becton, Jr. (1943) Board Member since 1990 | Vice Chair, WGBH Educational Foundation. Directorships: Association of Public Television Stations; Becton Dickinson and Company3 (medical technology company); Belo Corporation3 (media company); Boston Museum of Science; Public Radio International; PRX, The Public Radio Exchange; The PBS Foundation. Former Directorships: American Public Television; Concord Academy; New England Aquarium; Mass. Corporation for Educational Telecommunications; Committee for Economic Development; Public Broadcasting Service | 134 |
| Keith R. Fox (1954) Board Member since 1996 | Managing General Partner, Exeter Capital Partners (a series of private investment funds). Directorships: Progressive Holding Corporation (kitchen goods importer and distributor); Box Top Media Inc. (advertising); The Kennel Shop (retailer) | 134 |
| Kenneth C. Froewiss (1945) Board Member since 2001 | Clinical Professor of Finance, NYU Stern School of Business (1997-present); Member, Finance Committee, Association for Asian Studies (2002-present); Director, Mitsui Sumitomo Insurance Group (US) (2004-present); prior thereto, Managing Director, J.P. Morgan (investment banking firm) (until 1996) | 134 |
| Richard J. Herring (1946) Board Member since 1990 | Jacob Safra Professor of International Banking and Professor, Finance Department, The Wharton School, University of Pennsylvania (since July 1972); Co-Director, Wharton Financial Institutions Center (since July 2000); Director, Japan Equity Fund, Inc. (since September 2007), Thai Capital Fund, Inc. (since September 2007), Singapore Fund, Inc. (since September 2007). Formerly, Vice Dean and Director, Wharton Undergraduate Division (July 1995-June 2000); Director, Lauder Institute of International Management Studies (July 2000-June 2006) | 134 |
| William McClayton (1944) Board Member since 2004 | Managing Director, Diamond Management & Technology Consultants, Inc. (global management consulting firm) (2001-present); Directorship: Board of Managers, YMCA of Metropolitan Chicago; formerly: Senior Partner, Arthur Andersen LLP (accounting) (1966-2001); Trustee, Ravinia Festival | 134 |
| Rebecca W. Rimel (1951) Board Member since 1995 | President and Chief Executive Officer, The Pew Charitable Trusts (charitable organization) (1994 to present); Trustee, Thomas Jefferson Foundation (charitable organization) (1994 to present); Trustee, Executive Committee, Philadelphia Chamber of Commerce (2001-2007); Trustee, Pro Publica (2007-present) (charitable organization). Formerly, Executive Vice President, The Glenmede Trust Company (investment trust and wealth management) (1983-2004); Board Member, Investor Education (charitable organization) (2004-2005); Director, Viasys Health Care3 (January 2007-June 2007) | 134 |
| William N. Searcy, Jr. (1946) Board Member since 1993 | Private investor since October 2003; Trustee of 20 open-end mutual funds managed by Sun Capital Advisers, Inc. (since October 1998). Formerly, Pension & Savings Trust Officer, Sprint Corporation3 (telecommunications) (November 1989-September 2003) | 134 |
| Jean Gleason Stromberg (1943) Board Member since 1997 | Retired. Formerly, Consultant (1997-2001); Director, US Government Accountability Office (1996-1997); Partner, Fulbright & Jaworski, L.L.P. (law firm) (1978-1996). Directorships: The William and Flora Hewlett Foundation; Business Leadership Council, Wellesley College. Former Directorships: Service Source, Inc., Mutual Fund Directors Forum (2002-2004), American Bar Retirement Association (funding vehicle for retirement plans) (1987-1990 and 1994-1996) | 134 |
| Robert H. Wadsworth (1940) Board Member since 1999 | President, Robert H. Wadsworth & Associates, Inc. (consulting firm) (1983 to present); Director, The Phoenix Boys Choir Association | 137 |
Interested Board Member | ||
Name, Year of Birth, Position with the Fund and Length of Time Served1 | Business Experience and Directorships During the Past Five Years | Number of Funds in Fund Complex Overseen |
| Axel Schwarzer4 (1958) Board Member since 2006 | Managing Director5, Deutsche Asset Management; Head of Deutsche Asset Management Americas; CEO of DWS Investments; formerly, board member of DWS Investments, Germany (1999-2005); formerly, Head of Sales and Product Management for the Retail and Private Banking Division of Deutsche Bank in Germany (1997-1999); formerly, various strategic and operational positions for Deutsche Bank Germany Retail and Private Banking Division in the field of investment funds, tax driven instruments and asset management for corporates (1989-1996) | 134 |
Officers6 | |
Name, Year of Birth, Position with the Fund and Length of Time Served7 | Principal Occupation(s) During Past 5 Years and Other Directorships Held |
| Michael G. Clark8 (1965) President, 2006-present | Managing Director5, Deutsche Asset Management (2006-present); President of DWS family of funds; Director, ICI Mutual Insurance Company (since October 2007); formerly, Director of Fund Board Relations (2004-2006) and Director of Product Development (2000-2004), Merrill Lynch Investment Managers; Senior Vice President Operations, Merrill Lynch Asset Management (1999-2000) |
| John Millette9 (1962) Vice President and Secretary, 1999-present | Director5, Deutsche Asset Management |
| Paul H. Schubert8 (1963) Chief Financial Officer, 2004-present Treasurer, 2005-present | Managing Director5, Deutsche Asset Management (since July 2004); formerly, Executive Director, Head of Mutual Fund Services and Treasurer for UBS Family of Funds (1998-2004); Vice President and Director of Mutual Fund Finance at UBS Global Asset Management (1994-1998) |
| Caroline Pearson9 (1962) Assistant Secretary, 1997-present | Managing Director5, Deutsche Asset Management |
| Rita Rubin10 (1970) Assistant Secretary, 2009-present | Vice President and Counsel, Deutsche Asset Management (since October 2007); formerly, Vice President, Morgan Stanley Investment Management (2004-2007); Attorney, Shearman & Sterling LLP (2004); Vice President and Associate General Counsel, UBS Global Asset Management (2001-2004) |
| Paul Antosca9 (1957) Assistant Treasurer, 2007-present | Director5, Deutsche Asset Management (since 2006); Vice President, The Manufacturers Life Insurance Company (U.S.A.) (1990-2006) |
| Jack Clark9 (1967) Assistant Treasurer, 2007-present | Director5, Deutsche Asset Management (since 2007); formerly, Vice President, State Street Corporation (2002-2007) |
| Diane Kenneally9 (1966) Assistant Treasurer, 2007-present | Director5, Deutsche Asset Management |
| Jason Vazquez10 (1972) Anti-Money Laundering Compliance Officer, 2007-present | Vice President, Deutsche Asset Management (since 2006); formerly, AML Operations Manager for Bear Stearns (2004-2006), Supervising Compliance Principal and Operations Manager for AXA Financial (1999-2004) |
| Robert Kloby10 (1962) Chief Compliance Officer, 2006-present | Managing Director5, Deutsche Asset Management (2004-present); formerly, Chief Compliance Officer/Chief Risk Officer, Robeco USA (2000-2004); Vice President, The Prudential Insurance Company of America (1988-2000); E.F. Hutton and Company (1984-1988) |
| J. Christopher Jackson10 (1951) Chief Legal Officer, 2006-present | Director5, Deutsche Asset Management (2006-present); formerly, Director, Senior Vice President, General Counsel and Assistant Secretary, Hansberger Global Investors, Inc. (1996-2006); Director, National Society of Compliance Professionals (2002-2005) (2006-2009) |
2 Mr. Freeman assumed the Chairperson role as of January 1, 2009. Prior to that Ms. Driscoll served as Chairperson of certain DWS funds since 2004.
3 A publicly held company with securities registered pursuant to Section 12 of the Securities Exchange Act of 1934.
4 The mailing address of Axel Schwarzer is c/o Deutsche Investment Management Americas Inc., 345 Park Avenue, New York, New York 10154. Mr. Schwarzer is an interested Board Member by virtue of his positions with Deutsche Asset Management. As an interested person, Mr. Schwarzer receives no compensation from the fund.
5 Executive title, not a board directorship.
6 As a result of their respective positions held with the Advisor, these individuals are considered "interested persons" of the Advisor within the meaning of the 1940 Act. Interested persons receive no compensation from the fund.
7 The length of time served represents the year in which the officer was first elected in such capacity for one or more DWS funds.
8 Address: 345 Park Avenue, New York, New York 10154.
9 Address: One Beacon Street, Boston, MA 02108.
10 Address: 280 Park Avenue, New York, New York 10017.
The fund's Statement of Additional Information ("SAI") includes additional information about the Board Members. The SAI is available, without charge, upon request. If you would like to request a copy of the SAI, you may do so by calling the following toll-free number: (800) 621-1048.
| |
For More Information | The automated telephone system allows you to access personalized account information and obtain information on other DWS funds using either your voice or your telephone keypad. Certain account types within Classes A, B, C and S also have the ability to purchase, exchange or redeem shares using this system. For more information, contact your financial advisor. You may also access our automated telephone system or speak with a DWS Investments representative by calling the appropriate number below: For shareholders of Classes A, B, C and Institutional Class: (800) 621-1048For shareholders of Class S: (800) 728-3337 |
Web Site | www.dws-investments.com View your account transactions and balances, trade shares, monitor your asset allocation, and change your address, 24 hours a day.Obtain prospectuses and applications, blank forms, interactive worksheets, news about DWS funds, subscription to fund updates by e-mail, retirement planning information, and more. |
Written Correspondence | DWS Investments PO Box 219151Kansas City, MO 64121-9151 |
Proxy Voting | The fund's policies and procedures for voting proxies for portfolio securities and information about how the fund voted proxies related to its portfolio securities during the 12-month period ended June 30 are available on our Web site — www.dws-investments.com (click on "proxy voting"at the bottom of the page) — or on the SEC's Web site — www.sec.gov. To obtain a written copy of the fund's policies and procedures without charge, upon request, call us toll free at (800) 621-1048. |
Principal Underwriter | If you have questions, comments or complaints, contact: DWS Investments Distributors, Inc. 222 South Riverside PlazaChicago, IL 60606-5808 (800) 621-1148 |
| Class A | Class B | Class C | Class S | Institutional Class |
Nasdaq Symbol | RRRAX | RRRBX | RRRCX | RRREX | RRRRX |
CUSIP Number | 23339E 491 | 23339E 483 | 23339E 475 | 23339E 459 | 23339E 442 |
Fund Number | 425 | 625 | 725 | 2325 | 595 |
For shareholders of Class R | |
Automated Information Line | DWS Investments Flex Plan Access (800) 532-8411 24-hour access to your retirement plan account. |
Web Site | www.dws-investments.com Click "Retirement Plans" to reallocate assets, process transactions and review your funds through our secure online account access.Obtain prospectuses and applications, blank forms, interactive worksheets, news about DWS funds, subscription to fund updates by e-mail, retirement planning information, and more. |
For More Information | (800) 543-5776 To speak with a service representative. |
Written Correspondence | DWS Investments Service Company 222 South Riverside PlazaChicago, IL 60606-5806 |
Proxy Voting | The fund's policies and procedures for voting proxies for portfolio securities and information about how the fund voted proxies related to its portfolio securities during the 12-month period ended June 30 are available on our Web site — www.dws-investments.com (click on "proxy voting"at the bottom of the page) — or on the SEC's Web site — www.sec.gov. To obtain a written copy of the fund's policies and procedures without charge, upon request, call us toll free at (800) 621-1048. |
Principal Underwriter | If you have questions, comments or complaints, contact: DWS Investments Distributors, Inc. 222 South Riverside PlazaChicago, IL 60606-5808 (800) 621-1148 |
| Class R |
Nasdaq Symbol | RRRSX |
CUSIP Number | 23339E 467 |
Fund Number | 1502 |
Notes
Notes
Notes
Notes
Notes

ITEM 2. | CODE OF ETHICS |
|
|
| As of the end of the period, December 31, 2008, DWS RREEF Real Estate Securities Fund has a code of ethics, as defined in Item 2 of Form N-CSR, that applies to its Principal Executive Officer and Principal Financial Officer.
There have been no amendments to, or waivers from, a provision of the code of ethics during the period covered by this report that would require disclosure under Item 2.
A copy of the code of ethics is filed as an exhibit to this Form N-CSR.
|
|
|
ITEM 3. | AUDIT COMMITTEE FINANCIAL EXPERT |
|
|
| The Funds’ audit committee is comprised solely of trustees who are “independent” (as such term has been defined by the Securities and Exchange Commission (“SEC”) in regulations implementing Section 407 of the Sarbanes-Oxley Act (the “Regulations”)). The Funds’ Board of Trustees has determined that there are several “audit committee financial experts” (as such term has been defined by the Regulations) serving on the Funds’ audit committee including Mr. William McClayton, the chair of the Funds’ audit committee. The SEC has stated that an audit committee financial expert is not an “expert” for any purpose, including for purposes of Section 11 of the Securities Act of 1933 and the designation or identification of a person as an audit committee financial expert pursuant to this Item 3 of Form N-CSR does not impose on such person any duties, obligations or liability that are greater than the duties, obligations and liability imposed on such person as a member of the audit committee and board of directors in the absence of such designation or identification. |
|
|
ITEM 4. | PRINCIPAL ACCOUNTANT FEES AND SERVICES |
|
|
DWS RREEF REAL ESTATE SECURITIES FUND
FORM N-CSR DISCLOSURE RE: AUDIT FEES
The following table shows the amount of fees that PricewaterhouseCoopers, LLP (“PWC”), the Fund’s independent registered public accounting firm, billed to the Fund during the Fund’s last two fiscal years. The Audit Committee approved in advance all audit services and non-audit services that PWC provided to the Fund.
The Audit Committee has delegated certain pre-approval responsibilities to its Chairman (or, in his absence, any other member of the Audit Committee).
Services that the Fund’s Independent Registered Public Accounting Firm Billed to the Fund
Fiscal Year | Audit Fees Billed to Fund | Audit-Related | Tax Fees Billed to Fund | All |
2008 | $65,650 | $0 | $0 | $0 |
2007 | $64,650 | $0 | $0 | $0 |
Services that the Fund’s Independent Registered Public Accounting Firm Billed to the Adviser and Affiliated Fund Service Providers
The following table shows the amount of fees billed by PWC to Deutsche Investment Management Americas, Inc. (“DeIM” or the “Adviser”), and any entity controlling, controlled by or under common control with DeIM (“Control Affiliate”) that provides ongoing services to the Fund (“Affiliated Fund Service Provider”), for engagements directly related to the Fund’s operations and financial reporting, during the Fund’s last two fiscal years.
Fiscal Year | Audit-Related | Tax Fees Billed to Adviser and Affiliated Fund Service Providers | All |
2008 | $0 | $19,000 | $0 |
2007 | $58,500 | $25,000 | $0 |
The “Audit-Related Fees” were billed for services in connection with the agreed-upon procedures related to fund mergers and the above “Tax Fees” were billed in connection with tax consultation and agreed-upon procedures.
Non-Audit Services
The following table shows the amount of fees that PWC billed during the Fund’s last two fiscal years for non-audit services. The Audit Committee pre-approved all non-audit services that PWC provided to the Adviser and any Affiliated Fund Service Provider that related directly to the Fund’s operations and financial reporting. The Audit Committee requested and received information from PWC about any non-audit services that PWC rendered during the Fund’s last fiscal year to the Adviser and any Affiliated Fund Service Provider. The Committee considered this information in evaluating PWC’s independence.
Fiscal Year | Total (A) | Total Non-Audit Fees billed to Adviser and Affiliated Fund Service Providers (engagements related directly to the operations and financial reporting of the Fund) (B) | Total Non-Audit Fees billed to Adviser and Affiliated Fund Service Providers (all other engagements) (C) | Total of (A), (B) |
2008 | $0 | $19,000 | $0 | $19,000 |
2007 | $0 | $25,000 | $600,000 | $625,000 |
All other engagement fees were billed for services provided by PWC for services related to consulting on an IT project.
***
PwC advised the Fund's Audit Committee that PwC has identified two matters that it determined to be inconsistent with the SEC's auditor independence rules. In the first instance, an employee of PwC had power of attorney over an account which included DWS funds. The employee did not perform any audit services for the DWS Funds, but did work on a non audit project for Deutsche Bank AG. In the second instance, an employee of PwC served as a nominee shareholder (effectively equivalent to a Trustee) of various companies/trusts since 2001. Some of these companies held shares of Aberdeen, a sub advisor to certain DWS Funds, and of certain funds sponsored by subsidiaries of Deutsche Bank AG. The trustee relationship has ceased. PwC informed the Audit Committee that these matters could have constituted an investment in an affiliate of an audit client in violation of the Rule 2-01(c)(1) of Regulation S-X. PwC advised the Audit Committee that PwC believes its independence had not been impacted as it related to the audits of the Fund. In reaching this conclusion, PwC noted that during the time of its audit, the engagement team was not aware of the investment and that PwC does not believe these situations affected PwC's ability to act objectively and impartially and to issue a report on financial statements as the funds' independent auditor.
|
|
ITEM 5. | AUDIT COMMITTEE OF LISTED REGISTRANTS |
|
|
| Not Applicable |
|
|
ITEM 6. | SCHEDULE OF INVESTMENTS |
|
|
| Not Applicable |
|
|
ITEM 7. | DISCLOSURE OF PROXY VOTING POLICIES AND PROCEDURES FOR CLOSED-END MANAGEMENT INVESTMENT COMPANIES |
|
|
| Not applicable. |
|
|
ITEM 8. | PORTFOLIO MANAGERS OF CLOSED-END MANAGEMENT INVESTMENT COMPANIES |
|
|
| Not applicable. |
ITEM 9. | PURCHASES OF EQUITY SECURITIES BY CLOSED-END MANAGEMENT INVESTMENT COMPANY AND AFFILIATED PURCHASERS |
|
|
| Not Applicable. |
ITEM 10. | SUBMISSION OF MATTERS TO A VOTE OF SECURITY HOLDERS |
|
|
| The primary function of the Nominating and Governance Committee is to identify and recommend individuals for membership on the Board and oversee the administration of the Board Governance Guidelines. Shareholders may recommend candidates for Board positions by forwarding their correspondence by U.S. mail or courier service to Chairman of the Board, P.O. Box 100176, Cape Coral, FL 33910. |
|
|
ITEM 11. | CONTROLS AND PROCEDURES |
|
|
| (a) The Chief Executive and Financial Officers concluded that the Registrant’s Disclosure Controls and Procedures are effective based on the evaluation of the Disclosure Controls and Procedures as of a date within 90 days of the filing date of this report. |
|
|
| (b) There have been no changes in the registrant’s internal control over financial reporting that occurred during the second fiscal quarter of the period covered by this report that has materially affected, or is reasonably likely to materially affect, the registrant’s internal controls over financial reporting. |
|
|
ITEM 12. | EXHIBITS |
|
|
| (a)(1) Code of Ethics pursuant to Item 2 of Form N-CSR is filed and attached hereto as EX-99.CODE ETH. |
|
|
| (a)(2) Certification pursuant to Rule 30a-2(a) under the Investment Company Act of 1940 (17 CFR 270.30a-2(a)) is filed and attached hereto as Exhibit 99.CERT. |
|
|
| (b) Certification pursuant to Rule 30a-2(b) under the Investment Company Act of 1940 (17 CFR 270.30a-2(b)) is furnished and attached hereto as Exhibit 99.906CERT. |
Form N-CSR Item F
SIGNATURES
Pursuant to the requirements of the Securities Exchange Act of 1934 and the Investment Company Act of 1940, the registrant has duly caused this report to be signed on its behalf by the undersigned, thereunto duly authorized.
Registrant: | DWS RREEF Real Estate Securities Fund, a series of DWS Advisor Funds |
By: | /s/Michael G. Clark |
| Michael G. Clark |
President
Date: | March 2, 2009 |
Pursuant to the requirements of the Securities Exchange Act of 1934 and the Investment Company Act of 1940, this report has been signed below by the following persons on behalf of the registrant and in the capacities and on the dates indicated.
Registrant: | DWS RREEF Real Estate Securities Fund, a series of DWS Advisor Funds |
By: | /s/Michael G. Clark |
| Michael G. Clark |
President
Date: | March 2, 2009 |
By: | /s/Paul Schubert |
| Paul Schubert |
Chief Financial Officer and Treasurer
Date: March 2, 2009