UNITED STATES
SECURITIES AND EXCHANGE COMMISSION
WASHINGTON, D. C. 20549
FORM N-CSR
Investment Company Act file number | 811-04760 |
DWS Advisor Funds
(Exact Name of Registrant as Specified in Charter)
345 Park Avenue
New York, NY 10154-0004
(Address of Principal Executive Offices) (Zip Code)
Registrant’s Telephone Number, including Area Code: (212) 454-7190
Paul Schubert
345 Park Avenue
New York, NY 10154-0004
(Name and Address of Agent for Service)
Date of fiscal year end: | 09/30 |
Date of reporting period: | 09/30/09 |
ITEM 1. REPORT TO STOCKHOLDERS
SEPTEMBER 30, 2009 Annual Report |
|
DWS Short Duration Plus Fund |
 |
Contents
4 Performance Summary 8 Information About Your Fund's Expenses 10 Portfolio Management Review 15 Portfolio Summary 17 Investment Portfolio 40 Financial Statements 44 Financial Highlights 49 Notes to Financial Statements 65 Report of Independent Registered Public Accounting Firm 66 Tax Information 67 Investment Management Agreement Approval 72 Summary of Management Fee Evaluation by Independent Fee Consultant 77 Board Members and Officers 81 Account Management Resources |
This report must be preceded or accompanied by a prospectus. To obtain a prospectus for any of our funds, refer to the Account Management Resources information provided in the back of this booklet. We advise you to consider the fund's objectives, risks, charges and expenses carefully before investing. The prospectus contains this and other important information about the fund. Please read the prospectus carefully before you invest.
Investments in mutual funds involve risk. Some funds have more risk than others. In the current market environment, mortgage-backed securities are experiencing increased volatility. The fund may invest in lower-quality and nonrated securities, which present greater risk of loss of principal and interest than higher-quality securities. Derivatives may be more volatile and less liquid than traditional securities, and the fund could suffer losses on its derivatives positions. Additionally, investing in foreign securities presents certain risks, such as currency fluctuation, political and economic changes and market risks. All of these factors may result in greater share price volatility. Bond investments are subject to interest-rate risk such that when interest rates rise, the prices of the bonds, and thus the value of the bond fund, can decline and the investor can lose principal value. In addition, the fund is subject to liquidity risk. Liquidity risk is the risk that a security cannot be sold quickly at a price that reflects our estimate of its value. The fund limits its investments in illiquid securities to 15% of net assets. Please read the fund's prospectus for specific details regarding its risk profile.
DWS Investments is part of Deutsche Bank's Asset Management division and, within the US, represents the retail asset management activities of Deutsche Bank AG, Deutsche Bank Trust Company Americas, Deutsche Investment Management Americas Inc. and DWS Trust Company.
NOT FDIC/NCUA INSURED NO BANK GUARANTEE MAY LOSE VALUE NOT A DEPOSIT NOT INSURED BY ANY FEDERAL GOVERNMENT AGENCY
Performance Summary September 30, 2009
Average Annual Total Returns as of 9/30/09 | |||||
Unadjusted for Sales Charge | 1-Year | 3-Year | 5-Year | 10-Year |
|
Class A | 5.50% | 3.43% | 4.04% | 4.55% |
|
Class B | 4.66% | 2.46% | 2.92% | 3.41% |
|
Class C | 4.72% | 2.68% | 3.31% | 3.79% |
|
Adjusted for the Maximum Sales Charge |
|
|
|
|
|
Class A (max 2.75% load) | 2.60% | 2.47% | 3.46% | 4.26% |
|
Class B (max 4.00% CDSC) | 1.66% | 1.85% | 2.76% | 3.41% |
|
Class C (max 1.00% CDSC) | 4.72% | 2.68% | 3.31% | 3.79% |
|
No Sales Charges |
|
|
|
| Life of Institutional Class* |
Class S | 5.71% | 3.58% | 4.16% | 4.74% | N/A |
Institutional Class | 5.74% | N/A | N/A | N/A | 3.53% |
| Barclays Capital 1-3 Year Government/Credit Index+ | 6.20% | 5.43% | 4.26% | 4.89% | 5.13% |
Sources: Lipper Inc. and Deutsche Investment Management Americas Inc.
* Institutional Class commenced operations on August 27, 2008. Index returns began on August 31, 2008.Performance in the Average Annual Total Returns table above and the Growth of an Assumed $10,000 Investment line graph that follows is historical and does not guarantee future results. Investment return and principal fluctuate, so your shares may be worth more or less when redeemed. Current performance may differ from performance data shown. Please visit www.dws-investments.com for the Fund's most recent month-end performance. Performance includes reinvestment of all distributions.
The gross expense ratios of the Fund, as stated in the fee table of the prospectus dated February 1, 2009 are 0.88%, 1.76%, 1.59%, 0.71% and 0.54% for Class A, Class B, Class C, Class S and Institutional Class shares, respectively, and may differ from the expense ratios disclosed in the Financial Highlights tables in this report.
Index returns, unlike Fund returns, do not reflect any fees or expenses. It is not possible to invest directly into an index.
Performance figures do not reflect the deduction of taxes that a shareholder would pay on fund distributions or the redemption of fund shares.
Returns shown for Class A shares prior to its inception on November 29, 2002, Class B shares prior to its inception on April 23, 2007 and for Class C shares prior to its inception on February 3, 2003 are derived from the historical performance of the Investment Class shares of DWS Short Duration Plus Fund (which was renamed Class S shares on October 23, 2006) during such periods and have been adjusted to reflect the higher total annual operating expenses of each specific class. Any difference in expenses will affect performance.
Prior to November 17, 2004, performance of the Fund shown in this section was obtained while the Fund had a different investment objective and investment strategies, and different fees and expenses. The returns during the year 2004 include a 2.7% one-time effect of the conversion of the Fund from a stable value fund to a short-term bond fund and in the absence of such conversion, the returns would have been lower.
Growth of an Assumed $10,000 Investment (Adjusted for Maximum Sales Charge) |
[] DWS Short Duration Plus Fund — Class A [] Barclays Capital 1-3 Year Government/Credit Index+ |
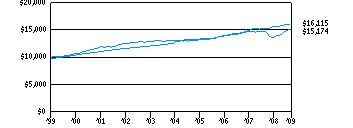 |
Yearly periods ended September 30 |
The Fund's growth of an assumed $10,000 investment is adjusted for the maximum sales charge of 2.75%. This results in a net initial investment of $9,725.
The growth of $10,000 is cumulative.
Performance of other share classes will vary based on the sales charges and the fee structure of those classes.
+ Barclays Capital 1-3 Year Government/Credit Index is an unmanaged index consisting of all US government agency and Treasury securities, as well as all investment-grade corporate debt securities with maturities of one to three years.Net Asset Value and Distribution Information | |||||
| Class A | Class B | Class C | Class S | Institutional Class |
Net Asset Value: 9/30/09 | $ 9.40 | $ 9.42 | $ 9.39 | $ 9.43 | $ 9.42 |
| 9/30/08 | $ 9.34 | $ 9.35 | $ 9.33 | $ 9.36 | $ 9.36 |
Distribution Information: Twelve Months as of 9/30/09:Income Dividends | $ .30 | $ .23 | $ .24 | $ .32 | $ .33 |
Return of capital | $ .12 | $ .12 | $ .12 | $ .12 | $ .12 |
| September Income Dividend | $ .0330 | $ .0270 | $ .0272 | $ .0348 | $ .0357 |
| SEC 30-day Yield++ | 2.46% | 1.74% | 1.79% | 2.75% | 2.88% |
| Current Annualized Distribution Rate++ | 4.21% | 3.44% | 3.48% | 4.43% | 4.55% |
Lipper Rankings — Short Investment Grade Debt Funds Category as of 9/30/09 | ||||
Period | Rank |
| Number of Fund Classes Tracked | Percentile Ranking (%) |
Class A 1-Year | 135 | of | 256 | 53 |
3-Year | 98 | of | 208 | 47 |
5-Year | 24 | of | 177 | 14 |
Class B 1-Year | 159 | of | 256 | 62 |
Class C 1-Year | 156 | of | 256 | 61 |
3-Year | 120 | of | 208 | 58 |
5-Year | 76 | of | 177 | 43 |
Class S 1-Year | 127 | of | 256 | 50 |
3-Year | 93 | of | 208 | 45 |
5-Year | 17 | of | 177 | 10 |
10-Year | 13 | of | 92 | 14 |
Institutional Class 1-Year | 126 | of | 256 | 50 |
Prior to November 17, 2004 the Fund had a different investment objective and investment strategy. On February 28, 2005 the Fund's Lipper category changed from the Intermediate Investment Grade Debt Funds Category to the Short Investment Grade Debt Funds Category. Performance and rankings prior to November 17, 2004 should not be considered representative of the present Fund.
Source: Lipper Inc. Rankings are historical and do not guarantee future results. Rankings are based on total return unadjusted for sales charges with distributions reinvested. If sales charges had been included, rankings might have been less favorable.
Information About Your Fund's Expenses
As an investor of the Fund, you incur two types of costs: ongoing expenses and transaction costs. Ongoing expenses include management fees, distribution and service (12b-1) fees and other Fund expenses. Examples of transaction costs include sales charges (loads), redemption fees and account maintenance fees, which are not shown in this section. The following tables are intended to help you understand your ongoing expenses (in dollars) of investing in the Fund and to help you compare these expenses with the ongoing expenses of investing in other mutual funds. In the most recent six-month period, the Fund limited these expenses for Class A, B, C and S shares; had it not done so, expenses would have been higher. The example in the table is based on an investment of $1,000 invested at the beginning of the six-month period and held for the entire period (April 1, 2009 to September 30, 2009).
The tables illustrate your Fund's expenses in two ways:
• Actual Fund Return. This helps you estimate the actual dollar amount of ongoing expenses (but not transaction costs) paid on a $1,000 investment in the Fund using the Fund's actual return during the period. To estimate the expenses you paid over the period, simply divide your account value by $1,000 (for example, an $8,600 account value divided by $1,000 = 8.6), then multiply the result by the number in the "Expenses Paid per $1,000" line under the share class you hold.
• Hypothetical 5% Fund Return. This helps you to compare your Fund's ongoing expenses (but not transaction costs) with those of other mutual funds using the Fund's actual expense ratio and a hypothetical rate of return of 5% per year before expenses. Examples using a 5% hypothetical fund return may be found in the shareholder reports of other mutual funds. The hypothetical account values and expenses may not be used to estimate the actual ending account balance or expenses you paid for the period.
Please note that the expenses shown in these tables are meant to highlight your ongoing expenses only and do not reflect any transaction costs. The "Expenses Paid per $1,000" line of the tables is useful in comparing ongoing expenses only and will not help you determine the relative total expense of owning different funds. An account maintenance fee of $6.25 per quarter for Class S shares may apply for certain accounts whose balances do not meet the applicable minimum initial investment. This fee is not included in these tables. If it was, the estimate of expenses paid for Class S shares during the period would be higher, and account value during the period would be lower, by this amount.
Expenses and Value of a $1,000 Investment for the six months ended September 30, 2009 | |||||
Actual Fund Return | Class A | Class B | Class C | Class S | Institutional Class |
| Beginning Account Value 4/1/09 | $ 1,000.00 | $ 1,000.00 | $ 1,000.00 | $ 1,000.00 | $ 1,000.00 |
| Ending Account Value 9/30/09 | $ 1,084.60 | $ 1,080.20 | $ 1,080.60 | $ 1,085.60 | $ 1,086.30 |
| Expenses Paid per $1,000* | $ 4.55 | $ 8.60 | $ 8.45 | $ 3.40 | $ 2.77 |
Hypothetical 5% Fund Return | Class A | Class B | Class C | Class S | Institutional Class |
| Beginning Account Value 4/1/09 | $ 1,000.00 | $ 1,000.00 | $ 1,000.00 | $ 1,000.00 | $ 1,000.00 |
| Ending Account Value 9/30/09 | $ 1,020.71 | $ 1,016.80 | $1,016.95 | $ 1,021.81 | $ 1,022.41 |
| Expenses Paid per $1,000* | $ 4.41 | $ 8.34 | $ 8.19 | $ 3.29 | $ 2.69 |
Annualized Expense Ratios | Class A | Class B | Class C | Class S | Institutional Class |
| DWS Short Duration Plus Fund | .87% | 1.65% | 1.62% | .65% | .53% |
For more information, please refer to the Fund's prospectus.
DWS Short Duration Plus Fund: A Team Approach to Investing
Deutsche Investment Management Americas Inc. ("DIMA" or the "Advisor"), which is part of Deutsche Asset Management, is the investment advisor for DWS Short Duration Plus Fund. DIMA and its predecessors have more than 80 years of experience managing mutual funds and DIMA provides a full range of investment advisory services to institutional and retail clients.
Deutsche Asset Management is a global asset management organization that offers a wide range of investing expertise and resources. This well-resourced global investment platform brings together a wide variety of experience and investment insight across industries, regions, asset classes and investing styles.
DIMA is an indirect, wholly owned subsidiary of Deutsche Bank AG. Deutsche Bank AG is a major global banking institution that is engaged in a wide range of financial services, including investment management, mutual funds, retail, private and commercial banking, investment banking and insurance.
Portfolio Management Team
William Chepolis, CFA Portfolio Manager Matthew F. MacDonald Portfolio Manager Eric S. Meyer, CFA Portfolio Manager | Thomas Picciochi Portfolio Manager Gary Sullivan, CFA Portfolio Manager RobertWang Portfolio Manager |
Overview of Market and Fund Performance
The views expressed in the following discussion reflect those of the portfolio management team only through the end of the period of the report as stated on the cover. The management team's views are subject to change at any time based on market and other conditions and should not be construed as a recommendation. Past performance is no guarantee of future results. Current and future portfolio holdings are subject to risk.
The fund produced a total return of 5.50% (Class A shares, unadjusted sales charges) for the 12 months ended September 30, 2009. The fund's benchmark, the Barclays Capital 1-3 Year Government/Credit Index, produced a total return of 6.20% for the same period.1 The average return for the Lipper Short Investment Grade Debt Funds category for the six months was 5.13%.2 (Returns are unadjusted for sales charges. If sales charges had been included, returns would have been lower. Past performance is no guarantee of future results. Please see pages 4 through 7 for the performance of other share classes and more complete performance information.)
For much of the period, any research-based approach such as ours was overwhelmed by the extraordinary conditions that prevailed. The fund's focus on so-called "spread sectors" that offer higher yields than US government securities was the principal factor in our performance over the 12 months.
As the period began, sentiment in the credit markets continued to deteriorate in the wake of the September 2008 turmoil among leading global financial institutions. The highlight was leading investment bank Lehman Brothers falling victim to a liquidity crisis. However, what sent the credit sectors into free fall was the two remaining giant investment banks, Goldman Sachs and Morgan Stanley, converting to bank holding companies in order to qualify for government liquidity support. Both firms were required to reduce their leverage at the same time as Lehman holdings were being liquidated, which was accomplished by a wave of fixed-income selling beginning in October of 2008. As a consequence, the fourth quarter of 2008 saw sharp declines in even high-quality non-government sectors, as investors placed a tremendous premium on safety.
Investor risk appetites began to return over the first quarter of 2009, as the extensive government actions to support the financial sector gained traction with market participants. As a result, sectors that trade at a yield spread over Treasuries have generally performed well over the first nine months of 2009.3 In a reversal of trends, corporate bonds, especially high-yield issues and leveraged bank loans, outperformed Treasuries. Among other credit-oriented sectors, asset-backed securities in particular rose sharply.
During the year, the US Federal Reserve Board (the Fed) did everything it could to bring rates down and keep them there, including lowering the fed funds rate to the unprecedented 0% to 0.25% range.4 Yields on Treasuries finished lower along the length of the curve, with largest declines on the shorter-term issues. To illustrate, the two-year Treasury yield fell by 101 basis points, from 1.96% to 0.95%, the five-year fell by 67 basis points, from 2.98% to 2.31%, while the 10-year fell 54 basis points, from 3.85% to 3.31% (100 basis points equals one percentage point).
US Treasury Yield Curve (as of 9/30/08 and 9/30/09) |
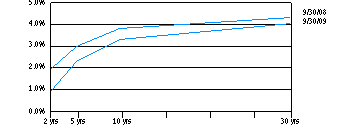 |
Source: Bloomberg
Chart is for illustrative purposes only and does not represent any DWS Investments product.
Past performance is no guarantee of future results.
Positive Contributors to Performance
As investor risk appetites returned in 2009, our largest position, in short-term corporate issues, outperformed comparable Treasuries significantly. Within the corporate segment, financial issues rebounded especially strongly as massive government liquidity programs helped stabilize the sector. In adding to our corporate exposure, we took advantage of attractive new issue concessions to add income generation to the fund.
Our significant positions in commercial mortgage-backed securities and asset-backed securities, as well as smaller holdings of leveraged loans and high-yield corporates, rebounded sharply and have outperformed Treasuries by wide margins in 2009.
Early in 2009, we purchased bank issuances guaranteed by the government as part of efforts to improve financial sector stability and liquidity. These issues are higher quality than government agency issues, as they are backed by the FDIC, but they offered above-agency yields. This position worked well for the fund as prices rose and yield spreads narrowed on these issues.
As part of our approach, we seek to enhance total returns by employing a "portable alpha" strategy.5 This strategy seeks to identify the relative value to be found among global bond and currency markets, and then to benefit from disparities through the use of fixed-income futures and currency forward contracts. For the period, the alpha strategy added modestly to the fund's return.
Negative Contributors to Performance
Although it would have been difficult to anticipate the rush to the exits occasioned by the deleveraging of Morgan Stanley and Goldman Sachs, in retrospect a lighter credit exposure going into the beginning of the fiscal period may have been beneficial. Market participants fearing contagion drove a wave of risk-reduction selling in October and November, pummeling spread sectors. Even very high quality non-Treasury sectors were penalized as investors seeking liquidity found them the easiest to sell. We had significant exposure to commercial mortgage-backed securities with heavy protection against defaults that nonetheless experienced unprecedented declines in the fourth quarter of 2008.
Outlook and Positioning
As of September 30, 2009, the bulk of the portfolio was allocated to investment-grade corporate bonds and government- backed securities. The fund's overall quality profile remained high, with the average credit quality of investments in the fund at AA as of the end of the period.6 At period end, the fund's overall duration was 1.83 years versus 1.87 years for the Barclays 1-3 Year US Capital Government/Credit Index.7
While the severe liquidity issues and grave concern over the financial sector appear to have abated in recent months, we view the outlook for the economy as lukewarm given continued anemic housing and employment numbers.
Within the corporate segment, we are not chasing yield given the less generous pricing and tighter spreads following the recent rally, but have been adding exposure to high-quality issues. We have also been adding to government-backed issues. Valuations appear reasonably full in the mortgage-backed sector and we are allowing that exposure to gradually diminish with prepayments and growth in fund assets.
We currently expect the Fed to remain on hold for the near-to-intermediate term, as it has signaled, and we will be focusing strongly on credit analysis. Given the economic backdrop, we remain comfortable with our focus on high-quality credits.
1 The Barclays Capital 1-3 Year Government/Credit Index is an unmanaged index consisting of all US government agency and Treasury securities, as well as all investment-grade corporate debt securities with maturities of one to three years. Index returns, unlike fund returns, do not reflect any fees or expenses. It is not possible to invest directly into an index.2 The Lipper Short Investment Grade Debt Funds category includes funds that invest at least 65% of their assets in investment-grade debt issues (rated in the top four grades) with dollar-weighted average maturities of less than three years. Lipper figures represent the average of the total returns reported by all of the mutual funds designated by Lipper Inc. as falling into the Lipper Short Investment Grade Debt Funds category. For the 1- and 5-year periods, this category's average was 5.13% (256 funds) and 2.57% (177 funds), respectively, as of 9/30/09. It is not possible to invest directly into a category or any index.
3 "Spread" refers to the excess yield various bond sectors offer over Treasuries with similar maturities. When spreads widen, yield differences are increasing between bonds in the two sectors being compared. When spreads narrow, the opposite is true.
4 The federal funds rate is the interest rate, set by the US Federal Reserve, at which banks lend money to each other, usually on an overnight basis.
5 The portable alpha strategy is designed to add value by taking advantage of short-term mispricings in the global equity, bond and currency markets. The portable alpha strategy may use instruments including but not limited to futures, options and currency forwards. Derivatives may be more volatile and less liquid than traditional securities, and the strategy could suffer losses on its derivatives positions.
6 Credit quality is a measure of a bond issuer's ability to repay interest and principal in a timely manner. Rating agencies assign letter designations such as AAA, AA and so forth. The lower the rating, the higher the probability of default.
7 Duration is a measure of bond price volatility. Duration can be defined as the approximate percentage change in price for a 100-basis-point (one single percentage point) change in market interest rate levels. A duration of 1.25, for example, means that the price of a bond or bond portfolio should rise by approximately 1.25% for a one-percentage-point drop in interest rates, and that it should fall by 1.25% for a one-percentage-point rise in interest rates.
Asset Allocation (As a % of Investment Portfolio excluding Securities Lending Collateral) | 9/30/09 | 9/30/08 |
|
|
|
Corporate Bonds | 37% | 27% |
Government & Agency Obligations | 27% | 13% |
Commercial Mortgage-Backed Securities | 10% | 15% |
Collateralized Mortgage Obligations | 8% | 20% |
Asset Backed | 6% | 12% |
Loan Participations and Assignments | 5% | 4% |
Cash Equivalents | 4% | 7% |
Mortgage-Backed Securities Pass-Throughs | 3% | 2% |
| 100% | 100% |
Quality (Excluding Securities Lending Collateral and Cash Equivalents) | 9/30/09 | 9/30/08 |
|
|
|
US Government & Treasury Obligations | 19% | 22% |
AAA | 27% | 38% |
AA | 10% | 5% |
A | 15% | 11% |
BBB | 21% | 14% |
BB | 4% | 1% |
B | 1% | 1% |
CCC | 1% | — |
Not Rated | 2% | 8% |
| 100% | 100% |
The quality ratings represent the lower of Moody's Investors Service, Inc. ("Moody's") or Standard & Poor's Corporation ("S&P") credit ratings. The ratings of Moody's and S&P represent their opinions as to the quality of the securities they rate. Ratings are relative and subjective and are not absolute standards of quality. The Fund's credit quality does not remove market risk.
Asset allocation and quality are subject to change.
Effective Maturity | 9/30/09 | 9/30/08 |
|
|
|
Less than 1 year | 22% | 23% |
1-2.99 years | 47% | 47% |
3-4.99 years | 24% | 22% |
5-9.99 years | 6% | 5% |
10-14.99 years | 1% | 1% |
15+ years | — | 2% |
| 100% | 100% |
Weighted average effective maturity: 2.6 years and 2.8 years, respectively.
Effective maturity is subject to change.
For more complete details about the Fund's investment portfolio, see page 17. A quarterly Fact Sheet is available upon request. A complete list of the Fund's portfolio holdings is posted as of the month end on www.dws-investments.com on or about the 15th day of the following month. More frequent posting of portfolio holdings information may be made from time to time on www.dws-investments.com. Please see the Account Management Resources section for contact information.
Following the Fund's fiscal first and third quarter-end, a complete portfolio holdings listing is filed with the SEC on Form N-Q. The form will be available on the SEC's Web site at www.sec.gov, and it also may be reviewed and copied at the SEC's Public Reference Room in Washington, D.C. Information on the operation of the SEC's Public Reference Room may be obtained by calling (800) SEC-0330.
Investment Portfolio as of September 30, 2009
| Principal Amount ($) | Value ($) | |
|
| ||
Corporate Bonds 36.9% | |||
Consumer Discretionary 2.1% | |||
AMC Entertainment, Inc., 8.0%, 3/1/2014 | 54,000 | 52,110 | |
Asbury Automotive Group, Inc.: | |||
| 7.625%, 3/15/2017 | 35,000 | 30,975 |
| 8.0%, 3/15/2014 | 20,000 | 18,600 |
Ashtead Holdings PLC, 144A, 8.625%, 8/1/2015 | 110,000 | 105,600 | |
AutoZone, Inc., 5.75%, 1/15/2015 | 6,660,000 | 7,091,002 | |
Comcast Corp., 5.5%, 3/15/2011 | 5,000,000 | 5,258,145 | |
CSC Holdings, Inc.: | |||
| 6.75%, 4/15/2012 | 50,000 | 51,500 |
| Series B, 7.625%, 4/1/2011 | 35,000 | 36,313 |
DirecTV Holdings LLC: | |||
| 144A, 4.75%, 10/1/2014 | 3,230,000 | 3,230,000 |
| 7.625%, 5/15/2016 | 140,000 | 149,800 |
DISH DBS Corp.: | |||
| 6.375%, 10/1/2011 | 85,000 | 86,700 |
| 6.625%, 10/1/2014 | 59,000 | 57,377 |
| 7.125%, 2/1/2016 | 50,000 | 49,625 |
Dollarama Group Holdings LP, 7.468%**, 8/15/2012 (a) | 38,000 | 38,760 | |
Fortune Brands, Inc., 6.375%, 6/15/2014 | 8,075,000 | 8,390,030 | |
Great Canadian Gaming Corp., 144A, 7.25%, 2/15/2015 | 50,000 | 47,500 | |
Group 1 Automotive, Inc., 8.25%, 8/15/2013 | 30,000 | 29,700 | |
Hertz Corp., 8.875%, 1/1/2014 | 90,000 | 90,900 | |
Home Depot, Inc., 0.42%**, 12/16/2009 | 2,665,000 | 2,663,577 | |
Idearc, Inc., 8.0%, 11/15/2016* | 115,000 | 5,175 | |
Isle of Capri Casinos, Inc., 7.0%, 3/1/2014 | 31,000 | 27,590 | |
JC Penney Corp., Inc., 9.0%, 8/1/2012 | 4,000,000 | 4,350,000 | |
Lamar Media Corp., Series C, 6.625%, 8/15/2015 | 30,000 | 27,450 | |
Norcraft Holdings LP, 9.75%, 9/1/2012 | 10,000 | 9,500 | |
Penske Automotive Group, Inc., 7.75%, 12/15/2016 | 105,000 | 96,862 | |
Seminole Hard Rock Entertainment, Inc., 144A, 2.799%**, 3/15/2014 | 55,000 | 44,275 | |
Shaw Communications, Inc., 8.25%, 4/11/2010 | 1,430,000 | 1,480,050 | |
Shingle Springs Tribal Gaming Authority, 144A, 9.375%, 6/15/2015 | 40,000 | 28,800 | |
Sonic Automotive, Inc., Series B, 8.625%, 8/15/2013 | 40,000 | 38,200 | |
Time Warner Cable, Inc., 6.2%, 7/1/2013 | 4,445,000 | 4,842,370 | |
Viacom, Inc., 4.375%, 9/15/2014 | 4,210,000 | 4,299,054 | |
Videotron Ltd., 9.125%, 4/15/2018 | 15,000 | 16,238 | |
Wyndham Worldwide Corp., 9.875%, 5/1/2014 | 5,984,000 | 6,429,706 | |
| 49,173,484 | ||
Consumer Staples 2.6% |
| ||
Altria Group, Inc., 7.125%, 6/22/2010 | 4,620,000 | 4,788,903 | |
Anheuser-Busch InBev Worldwide, Inc., 144A, 5.375%, 11/15/2014 | 9,230,000 | 9,848,318 | |
Campbell Soup Co., 3.375%, 8/15/2014 | 8,855,000 | 9,055,964 | |
ConAgra Foods, Inc., 7.875%, 9/15/2010 | 1,056,000 | 1,117,748 | |
CVS Caremark Corp., 0.661%**, 6/1/2010 | 6,000,000 | 6,004,350 | |
Dr. Pepper Snapple Group, Inc., 6.12%, 5/1/2013 | 1,400,000 | 1,527,985 | |
H.J. Heinz Co., 5.35%, 7/15/2013 | 5,840,000 | 6,271,004 | |
Kraft Foods, Inc., 0.961%**, 8/11/2010 | 5,000,000 | 4,992,385 | |
PepsiAmericas, Inc., 4.375%, 2/15/2014 | 1,915,000 | 1,997,808 | |
Procter & Gamble Co., 4.6%, 1/15/2014 | 4,735,000 | 5,086,787 | |
Reynolds American, Inc.: | |||
| 0.999%**, 6/15/2011 | 5,000,000 | 4,916,945 |
| 6.5%, 7/15/2010 | 5,000,000 | 5,143,185 |
Viskase Companies, Inc., 11.5%, 6/15/2011 | 155,000 | 137,175 | |
| 60,888,557 | ||
Energy 2.8% | |||
Anadarko Petroleum Corp.: | |||
| 5.75%, 6/15/2014 | 890,000 | 955,212 |
| 7.625%, 3/15/2014 | 4,500,000 | 5,134,455 |
Atlas Energy Operating Co., LLC, 144A, 10.75%, 2/1/2018 | 100,000 | 103,750 | |
Bristow Group, Inc., 7.5%, 9/15/2017 | 65,000 | 61,750 | |
Canadian Natural Resources Ltd., 5.15%, 2/1/2013 | 7,435,000 | 7,907,494 | |
Cenovus Energy, Inc., 144A, 4.5%, 9/15/2014 | 3,900,000 | 3,984,856 | |
Chaparral Energy, Inc., 8.5%, 12/1/2015 | 10,000 | 8,050 | |
Chesapeake Energy Corp.: | |||
| 6.25%, 1/15/2018 | 35,000 | 31,325 |
| 6.875%, 1/15/2016 | 155,000 | 146,863 |
| 7.25%, 12/15/2018 | 105,000 | 99,225 |
| 7.5%, 6/15/2014 | 40,000 | 39,550 |
Chevron Corp., 3.45%, 3/3/2012 | 9,000,000 | 9,369,603 | |
Devon Energy Corp., 5.625%, 1/15/2014 | 4,600,000 | 4,945,207 | |
El Paso Corp.: | |||
| 7.25%, 6/1/2018 | 35,000 | 34,426 |
| 9.625%, 5/15/2012 | 50,000 | 51,920 |
Enterprise Products Operating LLC: | |||
| 4.6%, 8/1/2012 | 5,770,000 | 5,978,609 |
| 4.95%, 6/1/2010 | 1,000,000 | 1,015,591 |
| Series G, 5.6%, 10/15/2014 | 3,940,000 | 4,196,561 |
| Series M, 5.65%, 4/1/2013 | 1,175,000 | 1,246,089 |
Frontier Oil Corp.: | |||
| 6.625%, 10/1/2011 | 40,000 | 40,000 |
| 8.5%, 9/15/2016 | 80,000 | 81,900 |
Hess Corp., 7.0%, 2/15/2014 | 2,100,000 | 2,343,468 | |
Husky Energy, Inc., 5.9%, 6/15/2014 | 4,030,000 | 4,347,346 | |
KCS Energy, Inc., 7.125%, 4/1/2012 | 195,000 | 193,050 | |
Kinder Morgan Energy Partners LP, 5.625%, 2/15/2015 | 3,680,000 | 3,950,075 | |
Marathon Oil Corp., 6.5%, 2/15/2014 | 3,080,000 | 3,391,634 | |
Mariner Energy, Inc.: | |||
| 7.5%, 4/15/2013 | 55,000 | 53,075 |
| 8.0%, 5/15/2017 | 75,000 | 68,625 |
Newfield Exploration Co., 7.125%, 5/15/2018 | 90,000 | 89,775 | |
OPTI Canada, Inc.: | |||
| 7.875%, 12/15/2014 | 75,000 | 57,375 |
| 8.25%, 12/15/2014 | 55,000 | 42,625 |
Petrohawk Energy Corp.: | |||
| 7.875%, 6/1/2015 | 35,000 | 34,475 |
| 9.125%, 7/15/2013 | 50,000 | 51,375 |
Plains All American Pipeline LP, 4.25%, 9/1/2012 | 4,805,000 | 4,939,612 | |
Plains Exploration & Production Co.: | |||
| 7.0%, 3/15/2017 | 50,000 | 47,625 |
| 7.625%, 6/1/2018 | 95,000 | 93,100 |
Quicksilver Resources, Inc., 7.125%, 4/1/2016 | 135,000 | 117,113 | |
Regency Energy Partners LP, 8.375%, 12/15/2013 | 65,000 | 65,650 | |
Southwestern Energy Co., 7.5%, 2/1/2018 | 75,000 | 75,750 | |
Stone Energy Corp., 6.75%, 12/15/2014 | 60,000 | 45,600 | |
Whiting Petroleum Corp.: | |||
| 7.25%, 5/1/2012 | 105,000 | 105,000 |
| 7.25%, 5/1/2013 | 30,000 | 29,925 |
Williams Companies, Inc., 8.125%, 3/15/2012 | 143,000 | 155,437 | |
| 65,730,146 | ||
Financials 18.3% | |||
American Express Bank FSB, 5.55%, 10/17/2012 | 8,000,000 | 8,479,048 | |
American Express Credit Corp., Series D, 5.125%, 8/25/2014 | 6,460,000 | 6,682,334 | |
American General Finance Corp., Series J, 0.549%**, 12/15/2011 | 7,000,000 | 5,404,406 | |
Anglo American Capital PLC, 144A, 9.375%, 4/8/2014 | 4,690,000 | 5,463,850 | |
Ashton Woods USA LLC, 144A, Step-up Coupon, 0% to 6/30/2012, 11.0% to 6/30/2015 | 57,200 | 20,867 | |
Barclays Bank PLC, 5.2%, 7/10/2014 | 4,555,000 | 4,811,524 | |
Bank of New York Mellon Corp., Series G, 4.95%, 11/1/2012 | 10,370,000 | 11,236,175 | |
BB&T Corp., 6.5%, 8/1/2011 | 8,000,000 | 8,447,088 | |
Berkshire Hathaway Finance Corp., 4.0%, 4/15/2012 | 4,500,000 | 4,717,719 | |
Buffalo Thunder Development Authority, 144A, 9.375%, 12/15/2014* | 30,000 | 5,325 | |
Capital One Financial Corp., 7.375%, 5/23/2014 | 6,460,000 | 7,209,450 | |
Caterpillar Financial Services Corp., Series F, 4.85%, 12/7/2012 | 4,000,000 | 4,246,180 | |
Citigroup, Inc.: | |||
| 5.25%, 2/27/2012 | 10,000,000 | 10,270,990 |
| 6.5%, 8/19/2013 | 15,000 | 15,746 |
CME Group, Inc., 5.75%, 2/15/2014 | 4,000,000 | 4,377,796 | |
Commonwealth Bank of Australia, 144A, 5.0%, 11/6/2012 | 5,000,000 | 5,319,895 | |
Conproca SA de CV, REG S, 12.0%, 6/16/2010 | 100,170 | 105,429 | |
Countrywide Financial Corp., 5.8%, 6/7/2012 | 7,000,000 | 7,384,328 | |
Credit Suisse New York, 5.5%, 5/1/2014 | 9,410,000 | 10,111,788 | |
Daimler Finance North America LLC, 6.5%, 11/15/2013 | 10,000,000 | 10,773,530 | |
Depfa ACS Bank, 144A, 9.5%**, 10/6/2023 | 15,000,000 | 12,450,000 | |
Deutsche Telekom International Finance BV, 4.875%, 7/8/2014 | 9,230,000 | 9,690,485 | |
Diageo Capital PLC, 4.375%, 5/3/2010 | 5,015,000 | 5,126,734 | |
Discover Financial Services, 0.83%**, 6/11/2010 | 11,480,000 | 11,224,696 | |
Duke Realty LP, (REIT), 7.375%, 2/15/2015 | 1,690,000 | 1,742,971 | |
EnCana Holdings Finance Corp., 5.8%, 5/1/2014 | 6,238,000 | 6,751,468 | |
Ford Motor Credit Co., LLC, 7.25%, 10/25/2011 | 249,000 | 241,831 | |
General Electric Capital Corp.: | |||
| 3.5%, 8/13/2012 | 5,650,000 | 5,720,393 |
| 5.9%, 5/13/2014 | 9,305,000 | 9,977,668 |
Glitnir HF, 144A, 2.951%**, 10/15/2008* | 6,000,000 | 1,470,000 | |
GMAC, Inc., 144A, 6.875%, 9/15/2011 | 264,000 | 249,480 | |
Hartford Financial Services Group, Inc., 7.9%, 6/15/2010 (b) | 3,950,000 | 4,063,559 | |
Hexion US Finance Corp., 9.75%, 11/15/2014 | 30,000 | 25,800 | |
Hospitality Properties Trust, (REIT), 7.875%, 8/15/2014 | 6,280,000 | 6,292,083 | |
HSBC Finance Corp., 5.9%, 6/19/2012 | 12,000,000 | 12,665,484 | |
Iberdrola Finance Ireland Ltd., 144A, 3.8%, 9/11/2014 | 3,840,000 | 3,893,449 | |
Inmarsat Finance II PLC, 10.375%, 11/15/2012 | 135,000 | 139,725 | |
John Deere Capital Corp., Series D, 4.5%, 4/3/2013 | 7,000,000 | 7,400,848 | |
JPMorgan Chase & Co., 4.65%, 6/1/2014 | 13,850,000 | 14,445,356 | |
KeyCorp, Series H, 6.5%, 5/14/2013 | 5,190,000 | 5,312,868 | |
Macquarie Group Ltd., 144A, 7.3%, 8/1/2014 | 8,350,000 | 8,916,314 | |
Merrill Lynch & Co., Inc., 5.77%, 7/25/2011 | 8,640,000 | 9,043,799 | |
Morgan Stanley: | |||
| Series F, 5.625%, 1/9/2012 | 6,850,000 | 7,258,253 |
| 6.0%, 5/13/2014 | 3,750,000 | 3,992,272 |
Northern Trust Corp., 4.625%, 5/1/2014 | 2,770,000 | 2,947,416 | |
Novartis Capital Corp., 4.125%, 2/10/2014 | 4,395,000 | 4,640,891 | |
Orascom Telecom Finance SCA, 144A, 7.875%, 2/8/2014 | 100,000 | 95,500 | |
PC Financial Partnership, 5.0%, 11/15/2014 | 9,200,000 | 9,483,756 | |
Pricoa Global Funding I, 144A, 5.45%, 6/11/2014 | 5,325,000 | 5,610,319 | |
Principal Financial Group, Inc., 7.875%, 5/15/2014 | 9,230,000 | 10,199,778 | |
Prudential Financial, Inc.: | |||
| Series D, 3.625%, 9/17/2012 | 2,800,000 | 2,817,279 |
| 6.2%, 1/15/2015 | 2,770,000 | 2,930,558 |
Rabobank Nederland — Cooperatieve Centrale Raiffeisen-Boerenleenbank BA, 144A, 4.2%, 5/13/2014 | 9,230,000 | 9,614,051 | |
Rainbow National Services LLC, 144A, 10.375%, 9/1/2014 | 19,000 | 19,998 | |
Rio Tinto Finance (USA) Ltd.: | |||
| 5.875%, 7/15/2013 | 3,000,000 | 3,232,278 |
| 8.95%, 5/1/2014 | 5,680,000 | 6,703,462 |
Royal Bank of Scotland PLC, 144A, 4.875%, 8/25/2014 | 6,920,000 | 7,026,360 | |
Shell International Finance BV, 1.3%, 9/22/2011 | 14,600,000 | 14,639,551 | |
Simon Property Group LP, (REIT), 5.6%, 9/1/2011 | 4,500,000 | 4,684,248 | |
Sovereign Bancorp., Inc., 4.8%, 9/1/2010 | 4,500,000 | 4,631,769 | |
Sprint Capital Corp.: | |||
| 7.625%, 1/30/2011 | 45,000 | 46,069 |
| 8.375%, 3/15/2012 | 20,000 | 20,650 |
Svenska Handelsbanken AB, 144A, 2.875%, 9/14/2012 | 13,850,000 | 13,884,833 | |
Telecom Italia Capital SA: | |||
| 5.25%, 11/15/2013 | 4,600,000 | 4,838,942 |
| 6.175%, 6/18/2014 | 6,150,000 | 6,671,194 |
Telefonica Emisiones SAU, 5.984%, 6/20/2011 | 3,000,000 | 3,196,503 | |
Textron Financial Corp., 5.4%, 4/28/2013 | 5,000,000 | 4,909,490 | |
The Goldman Sachs Group, Inc.: | |||
| 3.625%, 8/1/2012 | 3,355,000 | 3,444,240 |
| 6.0%, 5/1/2014 | 8,445,000 | 9,184,242 |
Tyco International Finance SA, 4.125%, 10/15/2014 (c) | 2,260,000 | 2,252,158 | |
Universal City Development Partners Ltd., 11.75%, 4/1/2010 | 155,000 | 156,163 | |
Verizon Wireless Capital LLC: | |||
| 144A, 3.75%, 5/20/2011 | 4,620,000 | 4,766,579 |
| 144A, 5.25%, 2/1/2012 | 6,750,000 | 7,207,832 |
Virgin Media Finance PLC, 8.75%, 4/15/2014 | 95,000 | 96,900 | |
Wachovia Bank NA, 7.8%, 8/18/2010 | 7,650,000 | 8,065,670 | |
Wells Fargo & Co., Series I, 3.75%, 10/1/2014 (c) | 4,680,000 | 4,656,581 | |
Wind Acquisition Finance SA, 144A, 10.75%, 12/1/2015 | 75,000 | 82,500 | |
Woori Bank, 144A, 7.0%, 2/2/2015 | 3,660,000 | 3,946,790 | |
| 429,883,554 | ||
Health Care 2.4% | |||
Boston Scientific Corp., 6.0%, 6/15/2011 | 70,000 | 71,925 | |
CareFusion Corp., 144A, 4.125%, 8/1/2012 | 1,320,000 | 1,354,973 | |
Community Health Systems, Inc., 8.875%, 7/15/2015 | 180,000 | 184,500 | |
Eli Lilly & Co., 3.55%, 3/6/2012 | 4,750,000 | 4,974,247 | |
Express Scripts, Inc.: | |||
| 5.25%, 6/15/2012 | 4,530,000 | 4,808,772 |
| 6.25%, 6/15/2014 | 1,835,000 | 2,016,564 |
HCA, Inc.: | |||
| 9.125%, 11/15/2014 | 45,000 | 46,462 |
| 9.25%, 11/15/2016 | 270,000 | 279,112 |
| 9.625%, 11/15/2016 (PIK) | 105,000 | 109,200 |
McKesson Corp., 6.5%, 2/15/2014 | 1,680,000 | 1,841,524 | |
Medtronic, Inc., 4.5%, 3/15/2014 | 4,020,000 | 4,300,198 | |
Merck & Co., Inc., 1.875%, 6/30/2011 | 7,075,000 | 7,153,391 | |
Pfizer, Inc., 4.45%, 3/15/2012 | 8,000,000 | 8,497,768 | |
Roche Holdings, Inc., 144A, 4.5%, 3/1/2012 | 8,675,000 | 9,179,226 | |
The Cooper Companies, Inc., 7.125%, 2/15/2015 | 70,000 | 67,900 | |
Watson Pharmaceuticals, Inc., 5.0%, 8/15/2014 | 4,610,000 | 4,725,656 | |
Wyeth, 5.5%, 2/1/2014 | 7,380,000 | 8,059,750 | |
| 57,671,168 | ||
Industrials 1.5% | |||
3M Co., 4.65%, 12/15/2012 | 6,460,000 | 7,004,223 | |
Actuant Corp., 6.875%, 6/15/2017 | 30,000 | 27,900 | |
ARAMARK Corp., 8.5%, 2/1/2015 | 20,000 | 20,175 | |
BAE Systems Holdings, Inc., 144A, 4.95%, 6/1/2014 | 4,615,000 | 4,785,432 | |
BE Aerospace, Inc., 8.5%, 7/1/2018 | 95,000 | 97,375 | |
Belden, Inc., 7.0%, 3/15/2017 | 35,000 | 33,294 | |
Bombardier, Inc., 144A, 6.75%, 5/1/2012 | 100,000 | 100,500 | |
Burlington Northern Santa Fe Corp., 7.0%, 2/1/2014 | 10,600,000 | 12,121,206 | |
Cenveo Corp., 144A, 10.5%, 8/15/2016 | 50,000 | 47,000 | |
Esco Corp., 144A, 4.174%**, 12/15/2013 | 260,000 | 234,000 | |
FedEx Corp., 7.375%, 1/15/2014 | 2,000,000 | 2,255,270 | |
Ingersoll-Rand Global Holding Co., Ltd., 9.5%, 4/15/2014 | 1,930,000 | 2,280,544 | |
K. Hovnanian Enterprises, Inc., 8.875%, 4/1/2012 | 44,000 | 36,960 | |
Kansas City Southern de Mexico SA de CV: | |||
| 7.375%, 6/1/2014 | 55,000 | 53,350 |
| 9.375%, 5/1/2012 | 145,000 | 147,175 |
Mobile Mini, Inc., 9.75%, 8/1/2014 | 55,000 | 55,962 | |
Navios Maritime Holdings, Inc., 9.5%, 12/15/2014 | 50,000 | 47,250 | |
R.H. Donnelley Corp., Series A-4, 8.875%, 10/15/2017* | 145,000 | 8,337 | |
Textron, Inc., 6.2%, 3/15/2015 | 4,620,000 | 4,638,291 | |
Titan International, Inc., 8.0%, 1/15/2012 | 140,000 | 135,450 | |
TransDigm, Inc., 7.75%, 7/15/2014 | 30,000 | 29,775 | |
United Rentals North America, Inc., 7.0%, 2/15/2014 | 60,000 | 52,200 | |
US Concrete, Inc., 8.375%, 4/1/2014 | 20,000 | 13,000 | |
| 34,224,669 | ||
Information Technology 1.5% | |||
Alcatel-Lucent USA, Inc., 6.45%, 3/15/2029 | 48,000 | 36,540 | |
Cisco Systems, Inc., 5.25%, 2/22/2011 | 7,000,000 | 7,378,294 | |
Hewlett-Packard Co.: | |||
| 2.25%, 5/27/2011 | 2,880,000 | 2,933,778 |
| 2.95%, 8/15/2012 | 1,610,000 | 1,650,726 |
| 4.25%, 2/24/2012 | 9,000,000 | 9,509,049 |
L-3 Communications Corp.: | |||
| 5.875%, 1/15/2015 | 100,000 | 99,500 |
| Series B, 6.375%, 10/15/2015 | 60,000 | 60,600 |
| 7.625%, 6/15/2012 | 165,000 | 167,269 |
MasTec, Inc., 7.625%, 2/1/2017 | 55,000 | 51,700 | |
Oracle Corp., 3.75%, 7/8/2014 | 6,120,000 | 6,357,744 | |
Vangent, Inc., 9.625%, 2/15/2015 | 35,000 | 32,594 | |
Xerox Corp.: | |||
| 5.65%, 5/15/2013 | 2,830,000 | 2,944,861 |
| 7.125%, 6/15/2010 | 5,000,000 | 5,148,460 |
| 36,371,115 | ||
Materials 1.0% | |||
Appleton Papers, Inc., Series B, 8.125%, 6/15/2011 | 25,000 | 20,281 | |
ARCO Chemical Co., 9.8%, 2/1/2020* | 315,000 | 212,625 | |
Bemis Co., Inc., 5.65%, 8/1/2014 | 1,900,000 | 2,017,291 | |
Cascades, Inc., 7.25%, 2/15/2013 | 17,000 | 16,660 | |
Clondalkin Acquisition BV, 144A, 2.299%**, 12/15/2013 | 75,000 | 61,125 | |
CPG International I, Inc., 10.5%, 7/1/2013 | 90,000 | 76,050 | |
Dow Chemical Co.: | |||
| 4.85%, 8/15/2012 | 3,000,000 | 3,119,574 |
| 5.9%, 2/15/2015 | 9,370,000 | 9,617,209 |
Exopack Holding Corp., 11.25%, 2/1/2014 | 115,000 | 113,563 | |
Freeport-McMoRan Copper & Gold, Inc.: | |||
| 8.25%, 4/1/2015 | 130,000 | 138,287 |
| 8.375%, 4/1/2017 | 245,000 | 260,619 |
GEO Specialty Chemicals, Inc.: | |||
| 144A, 7.5%**, 3/31/2015 (PIK) | 62,745 | 47,059 |
| 10.0%, 3/31/2015 | 62,080 | 46,560 |
Georgia-Pacific LLC: | |||
| 144A, 7.125%, 1/15/2017 | 35,000 | 34,213 |
| 9.5%, 12/1/2011 | 50,000 | 53,250 |
Hexcel Corp., 6.75%, 2/1/2015 | 280,000 | 266,700 | |
Koppers Holdings, Inc., Step-up Coupon, 0% to 11/15/2009, 9.875% to 11/15/2014 | 125,000 | 125,312 | |
Millar Western Forest Products Ltd., 7.75%, 11/15/2013 | 25,000 | 17,344 | |
NewMarket Corp., 7.125%, 12/15/2016 | 80,000 | 76,400 | |
NewPage Corp., 10.0%, 5/1/2012 | 75,000 | 49,500 | |
Pliant Corp., 11.85%, 6/15/2009* | 5 | 4 | |
Potash Corp. of Saskatchewan, Inc., 5.25%, 5/15/2014 | 5,770,000 | 6,242,286 | |
Terra Capital, Inc., Series B, 7.0%, 2/1/2017 | 80,000 | 83,400 | |
The Mosaic Co., 144A, 7.375%, 12/1/2014 | 205,000 | 217,594 | |
| 22,912,906 | ||
Telecommunication Services 1.1% | |||
Centennial Communications Corp., 10.125%, 6/15/2013 | 3,280,000 | 3,378,400 | |
Cincinnati Bell, Inc.: | |||
| 7.25%, 7/15/2013 | 146,000 | 148,190 |
| 8.375%, 1/15/2014 | 60,000 | 60,300 |
France Telecom SA, 4.375%, 7/8/2014 | 11,090,000 | 11,625,481 | |
Intelsat Corp., 9.25%, 6/15/2016 | 245,000 | 252,350 | |
iPCS, Inc., 2.608%**, 5/1/2013 | 30,000 | 25,350 | |
Millicom International Cellular SA, 10.0%, 12/1/2013 | 190,000 | 197,125 | |
Qwest Corp.: | |||
| 7.875%, 9/1/2011 | 9,380,000 | 9,673,125 |
| 8.875%, 3/15/2012 | 35,000 | 36,837 |
Windstream Corp.: | |||
| 7.0%, 3/15/2019 | 60,000 | 56,100 |
| 8.625%, 8/1/2016 | 20,000 | 20,450 |
| 25,473,708 | ||
Utilities 3.6% | |||
AES Corp.: | |||
| 8.0%, 6/1/2020 | 40,000 | 39,700 |
| 144A, 8.75%, 5/15/2013 | 340,000 | 346,375 |
Ameren Corp., 8.875%, 5/15/2014 (b) | 2,468,000 | 2,774,146 | |
Baltimore Gas & Electric Co., 6.125%, 7/1/2013 | 6,335,000 | 6,884,859 | |
CMS Energy Corp., 8.5%, 4/15/2011 | 241,000 | 253,326 | |
Consolidated Edison Co. of New York, 5.55%, 4/1/2014 | 7,020,000 | 7,683,179 | |
Consumers Energy Co.: | |||
| Series F, 4.0%, 5/15/2010 | 5,500,000 | 5,579,541 |
| Series J, 6.0%, 2/15/2014 | 3,270,000 | 3,567,420 |
DTE Energy Co., 7.625%, 5/15/2014 | 3,460,000 | 3,819,179 | |
Duke Energy Corp., 6.3%, 2/1/2014 | 4,890,000 | 5,409,694 | |
FirstEnergy Solutions Corp., 144A, 4.8%, 2/15/2015 | 4,720,000 | 4,849,890 | |
Florida Power Corp., 4.8%, 3/1/2013 | 8,900,000 | 9,468,176 | |
Kinder Morgan, Inc., 6.5%, 9/1/2012 | 105,000 | 107,887 | |
MidAmerican Energy Holdings Co., 3.15%, 7/15/2012 | 11,100,000 | 11,236,985 | |
Mirant Americas Generation LLC, 8.3%, 5/1/2011 | 30,000 | 30,525 | |
Mirant North America LLC, 7.375%, 12/31/2013 | 50,000 | 49,750 | |
Niagara Mohawk Power Corp., 144A, 3.553%, 10/1/2014 | 2,880,000 | 2,897,421 | |
NRG Energy, Inc.: | |||
| 7.25%, 2/1/2014 | 115,000 | 112,987 |
| 7.375%, 2/1/2016 | 110,000 | 106,425 |
| 7.375%, 1/15/2017 | 100,000 | 96,750 |
NV Energy, Inc.: | |||
| 6.75%, 8/15/2017 | 15,000 | 14,705 |
| 8.625%, 3/15/2014 | 33,000 | 33,949 |
Oncor Electric Delivery Co., 6.375%, 5/1/2012 | 4,620,000 | 5,016,844 | |
Orion Power Holdings, Inc., 12.0%, 5/1/2010 | 180,000 | 186,300 | |
Sempra Energy, 8.9%, 11/15/2013 | 5,000,000 | 5,843,510 | |
Virginia Electric & Power Co., Series B, 4.5%, 12/15/2010 | 8,000,000 | 8,252,960 | |
| 84,662,483 | ||
| Total Corporate Bonds (Cost $834,665,480) | 866,991,790 | ||
| | |||
Mortgage-Backed Securities Pass-Throughs 2.8% | |||
Federal Home Loan Mortgage Corp.: | |||
| 4.5%, 4/1/2023 | 7,950,889 | 8,251,843 |
| 5.583%**, 6/1/2031 | 7,890,429 | 8,175,889 |
Federal National Mortgage Association: | |||
| 4.5%, 4/1/2023 | 11,478,267 | 11,911,840 |
| 5.0%, 9/1/2023 | 8,423,984 | 8,845,368 |
| 6.0%, with various maturities from 11/1/2017 until 8/1/2021 | 9,896,194 | 10,587,285 |
Government National Mortgage Association: | |||
| 6.5%, with various maturities from 10/20/2038 until 2/20/2039 | 10,125,074 | 10,805,749 |
| 7.0%, 9/20/2038 | 5,792,802 | 6,250,343 |
| 9.5%, with various maturities from 12/15/2016 until 7/15/2020 | 1,831 | 2,065 |
| Total Mortgage-Backed Securities Pass-Throughs (Cost $63,911,698) | 64,830,382 | ||
| | |||
Asset-Backed 6.1% | |||
Automobile Receivables 2.0% | |||
AmeriCredit Prime Automobile Receivables, "C", Series 2007-1, 5.43%, 2/10/2014 | 2,680,000 | 2,413,790 | |
Capital Auto Receivables Asset Trust: | |||
| "A3A", Series 2006-2, 4.98%, 5/15/2011 | 2,225,683 | 2,258,938 |
| "A3A", Series 2007-3, 5.02%, 9/15/2011 | 2,706,268 | 2,757,211 |
| "B", Series 2006-1, 5.26%, 10/15/2010 | 2,900,923 | 2,916,216 |
CPS Auto Trust, "A4", Series 2007-B, 144A, 5.6%, 1/15/2014 | 9,999,998 | 9,887,306 | |
Ford Credit Auto Owner Trust: | |||
| "A2", Series 2009-B, 2.1%, 11/15/2011 | 2,308,000 | 2,327,773 |
| "A4", Series 2006-A, 5.07%, 12/15/2010 | 1,385,782 | 1,398,123 |
| "A3A", Series 2007-B, 5.15%, 11/15/2011 | 2,100,651 | 2,150,065 |
| "B", Series 2007-A, 5.6%, 10/15/2012 | 5,000,000 | 5,292,698 |
| "B", Series 2007-B, 5.69%, 11/15/2012 | 1,264,000 | 1,340,744 |
GS Auto Loan Trust, "C", Series 2006-1, 5.85%, 1/15/2014 | 1,798,585 | 1,787,021 | |
Nissan Auto Receivables Owner Trust: | |||
| "A3", Series 2008-B, 4.46%, 4/16/2012 | 2,791,000 | 2,885,177 |
| "A4", Series 2006-A, 4.77%, 7/15/2011 | 1,977,848 | 1,993,000 |
USAA Auto Owner Trust: | |||
| "A2", Series 2008-2, 3.91%, 1/15/2011 | 741,630 | 743,633 |
| "A3", Series 2007-2, 4.9%, 2/15/2012 | 2,526,606 | 2,571,491 |
Volkswagen Auto Loan Enhanced Trust, "A2", Series 2008-1, 3.71%, 4/20/2011 | 2,184,779 | 2,197,180 | |
World Omni Auto Receivables Trust, "A3A", Series 2007-B, 5.28%, 1/17/2012 | 1,920,762 | 1,961,326 | |
| 46,881,692 | ||
Credit Card Receivables 2.3% | |||
American Express Credit Account Master Trust: | |||
| "C", Series 2007-4, 144A, 0.503%**, 12/17/2012 | 6,000,000 | 5,907,868 |
| "C", Series 2007-6, 144A, 0.633%**, 1/15/2013 | 6,000,000 | 5,897,174 |
Bank of America Credit Card Trust, "C2", Series 2007-C2, 0.513%**, 9/17/2012 | 10,000,000 | 9,841,411 | |
Capital One Multi-Asset Execution Trust: | |||
| "A2", Series 2009-A2, 3.2%, 4/15/2014 | 9,230,000 | 9,501,487 |
| "A5", Series 2008-A5, 4.85%, 2/18/2014 | 5,000,000 | 5,262,612 |
Chase Issuance Trust, "C4", Series 2006-C4, 0.533%**, 1/15/2014 | 10,000,000 | 9,492,296 | |
Washington Mutual Master Note Trust, "C1", Series 2007-C1, 144A, 0.643%**, 5/15/2014 | 7,550,000 | 7,426,595 | |
| 53,329,443 | ||
Home Equity Loans 0.6% | |||
Ameriquest Mortgage Securities, Inc., "A6", Series 2003-5, 4.541%, 4/25/2033 | 1,423,054 | 1,063,610 | |
C-Bass CBO Resecuritization, "D2", 7.25%, 6/1/2032 | 1,460,068 | 87,604 | |
Countrywide Asset-Backed Certificates, "1AF2", Series 2005-17, 5.363%, 5/25/2036 | 4,384,781 | 3,434,824 | |
Credit-Based Asset Servicing and Securitization LLC, "AF2", Series 2006-CB2, 5.501%, 12/25/2036 | 5,387,823 | 4,153,459 | |
First Alliance Mortgage Loan Trust, "A1", Series 1999-4, 8.02%, 3/20/2031 | 122,225 | 100,890 | |
GMAC Mortgage Corp. Loan Trust: | |||
| "A5", Series 2003-HE2, 4.59%, 4/25/2033 | 2,691,888 | 1,950,920 |
| "A2", Series 2006-HE3, 5.75%, 10/25/2036 | 2,409,072 | 1,735,006 |
IMC Home Equity Loan Trust, "A8", Series 1998-3, 6.34%, 8/20/2029 | 134,529 | 110,298 | |
Residential Asset Mortgage Products, Inc., "A5", Series 2003-RZ4, 4.66%, 2/25/2032 | 797,922 | 770,294 | |
Specialty Underwriting & Residential Finance, "A2B", Series 2006-BC2, 5.573%, 2/25/2037 | 2,979,742 | 1,568,317 | |
| 14,975,222 | ||
Manufactured Housing Receivables 0.1% | |||
Green Tree Financial Corp.: | |||
| "A4", Series 1996-1, 6.5%, 3/15/2027 | 18,229 | 18,211 |
| "B2", Series 1996-5, 8.45%, 7/15/2027* | 5,302,252 | 0 |
Lehman ABS Manufactured Housing Contracts, "A6", Series 2001-B, 6.467%, 8/15/2028 | 1,773,772 | 1,522,806 | |
Vanderbilt Mortgage Finance, "A4", Series 2000-D, 7.715%, 7/7/2027 | 693,969 | 718,152 | |
| 2,259,169 | ||
Miscellaneous 1.1% | |||
Caterpillar Financial Asset Trust, "A2A", Series 2008-A, 4.09%, 12/27/2010 | 1,303,098 | 1,309,296 | |
CIT RV Trust, "A5", Series 1999-A, 6.24%, 8/15/2015 | 295,590 | 296,267 | |
Detroit Edison Securitization Funding LLC, "A4", Series 2001-1, 6.19%, 3/1/2013 | 5,303,111 | 5,564,540 | |
Duane Street CLO, "A", Series 2005-1A, 144A, 0.714%**, 11/8/2017 | 7,706,166 | 6,434,648 | |
E-Trade RV and Marine Trust, "A3", Series 2004-1, 3.62%, 10/8/2018 | 4,118,455 | 4,152,982 | |
John Deere Owner Trust, "A2", Series 2008-A, 3.63%, 3/15/2011 | 657,583 | 658,337 | |
National Collegiate Student Loan Trust: | |||
| "AIO", Series 2006-2, Interest Only, 6.0%, 8/25/2011 | 17,100,000 | 1,539,000 |
| "AIO", Series 2006-3, Interest Only, 7.1%, 1/25/2012 | 24,886,000 | 2,239,740 |
SLM Student Loan Trust, "A6", Series 2004-1, 144A, 1.254%**, 7/25/2039 | 5,500,000 | 3,241,563 | |
| 25,436,373 | ||
| Total Asset-Backed (Cost $160,432,430) | 142,881,899 | ||
| | |||
Commercial Mortgage-Backed Securities 9.8% | |||
Banc of America Commercial Mortgage, Inc.: | |||
| "A2", Series 2005-3, 4.501%, 7/10/2043 | 10,500,000 | 10,512,113 |
| "A1", Series 2008-1, 5.268%, 2/10/2051 | 7,408,799 | 7,076,186 |
Bear Stearns Commercial Mortgage Securities, Inc.: | |||
| "A1", Series 2007-PW17, 5.282%, 6/11/2050 | 3,386,777 | 3,418,989 |
| "A2", Series 2001-TOP2, 6.48%, 2/15/2035 | 9,050,000 | 9,385,797 |
Citigroup Commercial Mortgage Trust, "A1", Series 2007-C6, 5.622%, 12/10/2049 | 8,929,522 | 9,147,655 | |
Citigroup/Deutsche Bank Commercial Mortgage Trust, "A2B", Series 2007-CD4, 5.205%, 12/11/2049 | 12,000,000 | 11,943,530 | |
Credit Suisse Mortgage Capital Certificates, "A1", Series 2007-C4, 5.54%, 9/15/2039 | 5,811,302 | 5,922,076 | |
CS First Boston Mortgage Securities Corp.: | |||
| "A3", Series 2002-CKN2, 6.133%, 4/15/2037 | 11,150,000 | 11,782,213 |
| "A4", Series 2001-CP4, 6.18%, 12/15/2035 | 8,096,929 | 8,472,266 |
| "A4", Series 2001-CF2, 6.505%, 2/15/2034 | 7,517,398 | 7,745,178 |
Deutsche Mortgage Securities, Inc., "1A1", Series 2005-WF1, 144A, 5.139%**, 6/26/2035 | 1,568,135 | 1,546,046 | |
GMAC Commercial Mortgage Securities, Inc., "A2", Series 2001-C1, 6.465%, 4/15/2034 | 5,272,961 | 5,464,806 | |
Greenwich Capital Commercial Funding Corp.: | |||
| "A3", Series 2004-GG1, 4.344%, 6/10/2036 | 944,534 | 943,949 |
| "A3", Series 2005-GG3, 4.569%, 8/10/2042 | 8,989,000 | 8,912,835 |
| "A2", Series 2005-GG5, 5.117%, 4/10/2037 | 11,400,000 | 11,372,141 |
| "A2", Series 2007-GG9, 5.381%, 3/10/2039 | 7,867,000 | 7,812,633 |
JPMorgan Chase Commercial Mortgage Securities Corp.: | |||
| "A2", Series 2004-CB8, 3.837%, 1/12/2039 | 5,234,000 | 5,232,597 |
| "A1", Series 2004-C2, 4.278%, 5/15/2041 | 359,229 | 358,866 |
| "A2", Series 2005-LDP2, 4.575%, 7/15/2042 | 11,181,884 | 11,229,743 |
| "A2", Series 2005-LDP3, 4.851%, 8/15/2042 | 12,020,000 | 12,085,570 |
| "A1", Series 2007-C1, 4.98%, 2/15/2051 | 7,854,665 | 7,955,847 |
| "A2", Series 2004-CB9, 5.108%, 6/12/2041 | 7,873,845 | 7,741,214 |
LB-UBS Commercial Mortgage Trust: | |||
| "A3", Series 2004-C2, 3.973%, 3/15/2029 | 1,500,000 | 1,459,970 |
| "A2", Series 2005-C1, 4.31%, 2/15/2030 | 7,620,361 | 7,636,118 |
| "A2", Series 2005-C3, 4.553%, 7/15/2030 | 10,253,768 | 10,357,025 |
| "A3", Series 2004-C4, 5.249%**, 6/15/2029 | 10,000,000 | 10,068,327 |
Morgan Stanley Capital I, "A1", Series 2007-IQ16, 5.32%, 12/12/2049 | 10,059,440 | 10,321,905 | |
Morgan Stanley Dean Witter Capital I, "A4", Series 2001-TOP1, 6.66%, 2/15/2033 | 4,105,744 | 4,247,194 | |
TIAA Seasoned Commercial Mortgage Trust, "A1", Series 2007-C4, 5.666%**, 8/15/2039 | 4,652,802 | 4,781,934 | |
Wachovia Bank Commercial Mortgage Trust: | |||
| "A2", Series 2005-C17, 4.782%, 3/15/2042 | 6,677,215 | 6,675,073 |
| "A2", Series 2007-C32, 5.924%**, 6/15/2049 | 10,000,000 | 9,804,626 |
| Total Commercial Mortgage-Backed Securities (Cost $227,501,666) | 231,414,422 | ||
| | |||
Collateralized Mortgage Obligations 8.3% | |||
Banc of America Mortgage Securities, Inc.: | |||
| "1A3", Series 2002-K, 3.715%**, 10/20/2032 | 190,932 | 180,903 |
| "1A1O", Series 2005-4, 5.25%, 5/25/2035 | 2,087,137 | 2,070,819 |
| "A15", Series 2006-2, 6.0%, 7/25/2046 | 4,702,278 | 3,906,391 |
Citicorp Mortgage Securities, Inc.: | |||
| "A1", Series 2003-8, 5.5%, 8/25/2033 | 5,855,659 | 5,887,626 |
| "1A1", Series 2005-7, 5.5%, 10/25/2035 | 4,496,429 | 4,141,094 |
| "1A2", Series 2006-5, 6.0%, 10/25/2036 | 5,336,158 | 4,995,241 |
Countrywide Alternative Loan Trust: | |||
| "3A3", Series 2005-20CB, 5.5%, 7/25/2035 | 3,185,540 | 2,847,560 |
| "1A4", Series 2006-43CB, 6.0%, 2/25/2037 | 5,566,792 | 4,608,704 |
Countrywide Home Loans: | |||
| "A3", Series 2003-18, 5.25%, 7/25/2033 | 9,599,544 | 9,475,141 |
| "A35", Series 2005-24, 5.5%, 11/25/2035 | 7,817,890 | 6,903,991 |
CS First Boston Mortgage Securities Corp., "2A1", Series 2004-AR8, 3.695%**, 9/25/2034 | 5,651,866 | 5,164,602 | |
Fannie Mae Grantor Trust: | |||
| "1A1", Series 2004-T1, 6.0%, 1/25/2044 | 5,357,264 | 5,720,556 |
| "A1", Series 2002-T4, 6.5%, 12/25/2041 | 2,746,701 | 2,967,399 |
Federal Home Loan Mortgage Corp.: | |||
| "MA", Series 2664, 5.0%, 4/15/2030 | 10,709,348 | 11,083,468 |
| "QP", Series 3149, 5.0%, 10/15/2031 | 7,500,000 | 7,750,948 |
| "DC", Series 2541, 5.05%, 3/15/2031 | 4,215,876 | 4,306,909 |
| "EB", Series 3062, 5.5%, 9/15/2021 | 4,088,809 | 4,226,223 |
| "PA", Series 3283, 5.5%, 7/15/2036 | 10,722,660 | 11,237,162 |
| "PA", Series 2301, 6.0%, 10/15/2013 | 9,810,489 | 10,304,870 |
| "PT", Series 3586, 6.0%, 10/15/2036 (c) | 5,000,000 | 5,050,000 |
| "BT", Series 2448, 6.0%, 5/15/2017 | 4,694 | 5,076 |
Federal National Mortgage Association: | |||
| "TA", Series 2007-77, 5.5%, 12/25/2029 | 5,606,253 | 5,817,217 |
| "AB", Series 2006-3, 5.5%, 10/25/2032 | 13,021,188 | 13,446,598 |
| "A1", Series 2003-7, 6.5%, 12/25/2042 | 3,145,255 | 3,336,181 |
First Horizon Alternative Mortgage Securities, "1A1", Series 2007-FA2, 5.5%, 4/25/2037 | 6,895,039 | 4,783,266 | |
Government National Mortgage Association, "AB", Series 2008-30, 4.2%, 2/20/2037 | 12,958,114 | 13,324,237 | |
IndyMac INDX Mortgage Loan Trust, "4A1", Series 2005-AR9, 5.084%**, 7/25/2035 | 1,819,641 | 1,213,691 | |
JPMorgan Mortgage Trust, "2A7", Series 2004-S2, 5.25%, 11/25/2034 | 224,430 | 221,609 | |
Paine Webber Mortgage Acceptance Corp., "1B2", Series 1999-4, 144A, 6.46%**, 7/28/2024 | 82,374 | 53,566 | |
PHHMC Mortgage Pass-Through Certificates, "A2", Series 2006-2, 6.153%**, 7/18/2036 | 11,414,029 | 11,075,367 | |
Provident Funding Mortgage Loan Trust, "2A1", Series 2005-1, 4.371%**, 5/25/2035 | 6,803,399 | 6,512,109 | |
Prudential Home Mortgage Securities, "4B", Series 1994-A, 144A, 6.73%**, 4/28/2024 | 17,037 | 16,254 | |
Residential Funding Mortgage Securities I: | |||
| "A16", Series 2003-S7, 0.696%**, 5/25/2033 | 6,652,861 | 6,451,741 |
| "A5", Series 2005-S9, 5.75%, 12/25/2035 | 5,633,978 | 4,574,613 |
Residential Funding Mortgage Security I, "A11", Series 2006-S5, 6.0%, 6/25/2036 | 1,822,908 | 1,762,754 | |
Structured Adjustable Rate Mortgage Loan Trust, "5A4", Series 2004-8, 4.654%**, 7/25/2034 | 2,635,000 | 2,456,555 | |
Structured Asset Securities Corp., "2A16", Series 2005-6, 5.5%, 5/25/2035 | 3,353,216 | 2,954,262 | |
Wells Fargo Mortgage-Backed Securities Trust, "3A1", Series 2004-EE, 4.222%**, 12/25/2034 | 5,754,011 | 5,581,001 | |
| Total Collateralized Mortgage Obligations (Cost $200,874,957) | 196,415,704 | ||
| | |||
Government & Agency Obligations 27.1% | |||
Other Government Related 14.1% | |||
African Development Bank: | |||
| 1.75%, 10/1/2012 (c) | 7,505,000 | 7,482,410 |
| 3.0%, 5/27/2014 | 6,923,000 | 7,022,027 |
ANZ National International Ltd., 144A, 3.25%, 4/2/2012 | 2,770,000 | 2,866,531 | |
Asian Development Bank, 2.75%, 5/21/2014 | 4,382,000 | 4,427,608 | |
Australia & New Zealand Banking Group Ltd.: | |||
| 144A, 0.572%**, 6/18/2012 | 2,770,000 | 2,746,364 |
| 144A, 0.993%**, 12/17/2010 | 9,230,000 | 9,275,255 |
Barclays Bank PLC: | |||
| 1.095%**, 3/16/2012 | 4,600,000 | 4,664,492 |
| 144A, 2.7%, 3/5/2012 | 8,010,000 | 8,163,319 |
Commonwealth Bank of Australia, 1.292%**, 7/27/2012 | 9,200,000 | 9,351,156 | |
Citibank NA, FDIC Guaranteed, 1.25%, 11/15/2011 (c) | 10,310,000 | 10,284,225 | |
Danske Bank AS, 144A, 2.5%, 5/10/2012 | 11,720,000 | 11,844,478 | |
Dexia Credit Local, 144A, 0.939%**, 9/23/2011 | 9,230,000 | 9,318,423 | |
European Bank for Reconstruction & Development, 1.25%, 6/10/2011 | 9,230,000 | 9,250,749 | |
European Investment Bank, 1.75%, 9/14/2012 | 13,000,000 | 12,987,929 | |
FIH Erhvervsbank AS, 144A, 2.45%, 8/17/2012 | 6,000,000 | 6,068,928 | |
General Electric Capital Corp., Series G, FDIC Guaranteed, 3.0%, 12/9/2011 | 9,000,000 | 9,314,640 | |
GMAC, Inc., FDIC Guaranteed, 2.2%, 12/19/2012 | 7,535,000 | 7,615,443 | |
HSBC USA, Inc., FDIC Guaranteed, 3.125%, 12/16/2011 | 4,500,000 | 4,673,169 | |
ING Bank NV, 144A, 2.625%, 2/9/2012 | 10,000,000 | 10,169,400 | |
Inter-American Development Bank, 1.5%, 6/23/2011 | 9,140,000 | 9,210,043 | |
KeyBank NA, FDIC Guaranteed, 3.2%, 6/15/2012 | 5,000,000 | 5,211,585 | |
Korea Electric Power Corp., 144A, 5.5%, 7/21/2014 (b) | 8,880,000 | 9,289,652 | |
Korea Gas Corp., 144A, 6.0%, 7/15/2014 | 1,467,000 | 1,546,359 | |
Korea National Oil Corp., 144A, 5.375%, 7/30/2014 | 7,030,000 | 7,210,699 | |
Lloyds TSB Bank PLC: | |||
| 144A, 1.417%**, 4/1/2011 | 9,000,000 | 8,986,734 |
| 144A, 2.3%, 4/1/2011 | 4,620,000 | 4,691,333 |
Macquarie Bank Ltd., Series B, 144A, 2.6%, 1/20/2012 | 3,970,000 | 4,076,122 | |
Morgan Stanley, FDIC Guaranteed, 3.25%, 12/1/2011 | 5,000,000 | 5,201,400 | |
National Agricultural Cooperative Federation, 144A, 5.0%, 9/30/2014 | 7,075,000 | 7,137,034 | |
National Australia Bank Ltd., 144A, 2.55%, 1/13/2012 | 11,720,000 | 11,944,919 | |
Nationwide Building Society: | |||
| 144A, 0.62%**, 5/17/2012 | 2,000,000 | 1,994,098 |
| 144A, 2.5%, 8/17/2012 | 12,000,000 | 12,104,328 |
Nordic Investment Bank, 2.625%, 10/6/2014 (c) | 9,380,000 | 9,336,852 | |
Pemex Project Funding Master Trust, Series 2, 9.125%, 10/13/2010 | 838,000 | 892,470 | |
Petroleos Mexicanos, 144A, 4.875%, 3/15/2015 (b) | 6,420,000 | 6,339,750 | |
Private Export Funding Corp., 3.05%, 10/15/2014 | 5,775,000 | 5,810,222 | |
Ras Laffan Liquefied Natural Gas Co., Ltd. III, 144A, 4.5%, 9/30/2012 | 2,910,000 | 3,013,968 | |
Royal Bank of Scotland PLC, 144A, 2.625%, 5/11/2012 | 10,000,000 | 10,148,570 | |
Sovereign Bank, FDIC Guaranteed, 2.75%, 1/17/2012 | 6,125,000 | 6,304,383 | |
Suncorp-Metway Ltd., 144A, 0.668%**, 12/17/2010 | 12,000,000 | 12,032,340 | |
Svensk Exportkredit AB, 3.25%, 9/16/2014 | 6,500,000 | 6,523,556 | |
The Goldman Sachs Group, Inc., FDIC Guaranteed, 3.25%, 6/15/2012 (b) | 10,000,000 | 10,436,310 | |
US Bancorp., FDIC Guaranteed, 2.25%, 3/13/2012 | 7,545,000 | 7,684,877 | |
Wells Fargo & Co., FDIC Guaranteed, 2.125%, 6/15/2012 (b) | 5,145,000 | 5,218,795 | |
Westpac Banking Corp., 144A, 2.9%, 9/10/2014 | 4,650,000 | 4,626,666 | |
Westpac Securities NZ Ltd.: | |||
| 144A, 2.5%, 5/25/2012 | 4,750,000 | 4,827,900 |
| 144A, 3.45%, 7/28/2014 | 3,000,000 | 3,043,842 |
| 332,371,353 | ||
Sovereign Bonds 4.1% | |||
Caisse d'Amortissement de la Dette Sociale, 3.5%, 7/1/2014 | 10,000,000 | 10,336,500 | |
Export Development Canada, 2.375%, 3/19/2012 | 4,200,000 | 4,290,304 | |
Federal Republic of Germany, 144A, 1.5%, 9/21/2012 | 8,685,000 | 8,649,565 | |
Instituto de Credito Oficial, Series 192, 4.625%, 10/26/2010 | 4,620,000 | 4,793,292 | |
Japan Finance Corp., 2.0%, 6/24/2011 | 4,568,000 | 4,626,393 | |
Kingdom of Belgium, 144A, 2.875%, 9/15/2014 | 6,150,000 | 6,105,904 | |
Kingdom of Spain, 144A, 2.0%, 9/17/2012 | 13,000,000 | 13,000,996 | |
Province of Ontario, Canada, 4.1%, 6/16/2014 | 9,230,000 | 9,758,556 | |
Republic of Austria, 144A, 2.0%, 11/15/2012 | 15,625,000 | 15,648,075 | |
Republic of Italy, 2.125%, 10/5/2012 (c) | 17,810,000 | 17,793,437 | |
| 95,003,022 | ||
US Government Sponsored Agencies 8.5% | |||
Federal Farm Credit Bank, 3.0%, 9/22/2014 | 4,000,000 | 4,074,016 | |
Federal Home Loan Bank: | |||
| 1.625%, 9/26/2012 | 16,000,000 | 15,959,456 |
| 1.75%, 8/22/2012 | 12,675,000 | 12,714,254 |
| 1.875%, 6/20/2012 | 11,600,000 | 11,712,880 |
| 2.3%**, 9/10/2019 | 9,200,000 | 9,154,000 |
| 3.625%, 10/18/2013 | 10,000,000 | 10,533,060 |
| 7.45%**, 10/16/2023 | 10,000,000 | 9,967,000 |
Federal Home Loan Mortgage Corp.: | |||
| 1.625%, 4/26/2011 | 7,275,000 | 7,366,403 |
| 1.75%, 6/15/2012 | 16,375,000 | 16,461,444 |
| 2.125%, 3/23/2012 | 9,455,000 | 9,630,125 |
| 2.125%, 9/21/2012 (b) | 10,000,000 | 10,127,460 |
| 3.0%, 7/28/2014 | 2,770,000 | 2,823,860 |
| 8.125%**, 8/20/2024 | 5,500,000 | 5,431,250 |
Federal National Mortgage Association: | |||
| CPI plus 0.25%, 0.0%, 8/8/2011** | 18,000,000 | 17,640,000 |
| 1.375%, 4/28/2011 | 9,020,000 | 9,098,627 |
| 1.75%, 3/23/2011 | 9,400,000 | 9,540,286 |
| 1.75%, 8/10/2012 | 13,630,000 | 13,692,112 |
| 1.875%, 4/20/2012 | 5,200,000 | 5,270,278 |
| 3.625%, 8/15/2011 | 5,000,000 | 5,257,695 |
| 8.45%**, 2/27/2023 | 14,000,000 | 14,000,000 |
| 200,454,206 | ||
US Treasury Obligation 0.4% | |||
US Treasury Bill, 0.19%***, 3/18/2010 (d) | 9,936,000 | 9,928,955 | |
| Total Government & Agency Obligations (Cost $632,207,358) | 637,757,536 | ||
| | |||
Loan Participations and Assignments 5.1% | |||
Senior Loans 4.9% | |||
AEI Finance Holding LLC: | |||
| Term Loan, LIBOR plus 3.0%, 3.246%**, 3/30/2012 | 101,932 | 92,928 |
| Term Loan, LIBOR plus 3.0%, 3.283%**, 3/30/2014 | 1,854,160 | 1,690,374 |
Ashland Chemicals, Term Loan B, Prime plus 3.4%, 7.65%**, 5/13/2014 | 511,748 | 524,262 | |
Aspect Software, Inc., Term Loan, LIBOR plus 3.0%, 3.313%**, 7/11/2011 | 1,400,000 | 1,289,750 | |
Asurion Corp., First Lien Term Loan, LIBOR plus 3.0%, 3.256%**, 7/3/2014 | 2,750,000 | 2,629,124 | |
Atlas Pipeline Partners LP, Term Loan, LIBOR plus 4.75%, 6.75%**, 7/27/2014 | 2,438,776 | 2,371,710 | |
Avaya Inc., Term Loan, LIBOR plus 2.75%, 3.137%**, 10/26/2014 | 3,000,000 | 2,430,000 | |
Bausch & Lomb, Inc.: | |||
| Term Delay Draw, LIBOR plus 3.25%, 3.533%**, 4/24/2015 | 379,593 | 363,223 |
| Term Loan, LIBOR plus 3.25%, 3.533%**, 4/24/2015 | 1,563,126 | 1,495,716 |
Bresnan Communications LLC, Second Lien Term Loan, LIBOR plus 4.5%, 4.75%**, 3/29/2014 | 2,000,000 | 1,853,330 | |
Calpine Corp., Term Loan, LIBOR plus 2.875%, 3.165%**, 3/29/2014 | 1,994,924 | 1,832,258 | |
Caritor, Inc.: | |||
| Letter of Credit, LIBOR plus 2.25%, 2.63%**, 6/4/2013 | 142,180 | 129,384 |
| Term Loan B, LIBOR plus 2.25%, 2.63%**, 6/4/2013 | 1,853,081 | 1,686,303 |
Cequel Communications LLC, Term Loan, LIBOR plus 2.0%, 2.253%**, 11/5/2013 | 992,366 | 939,265 | |
Collective Brands Finance, Inc., Term Loan A, LIBOR plus 2.75%, 3.19%**, 8/17/2014 | 2,500,000 | 2,408,337 | |
Community Health Systems, Inc.: | |||
| Term Delay Draw, LIBOR plus 2.25%, 2.496%**, 7/25/2014 | 190,651 | 179,291 |
| Term Loan, LIBOR plus 2.25%, 2.622%**, 7/25/2014 | 3,737,128 | 3,522,635 |
CSC Holdings, Inc., Term Loan B2, LIBOR plus 1.75%, 2.049%**, 3/29/2016 | 2,000,000 | 1,974,640 | |
Discovery Communications Holdings LLC: | |||
| Term Loan B, LIBOR plus 2.0%, 2.283%**, 5/14/2014 | 249,364 | 243,254 |
| Term Loan C, LIBOR plus 3.25%, 5.25%**, 5/14/2014 | 299,250 | 304,674 |
Dresser, Inc., Second Lien Term Loan, LIBOR plus 5.75%, 5.994%**, 5/4/2015 | 500,000 | 436,667 | |
Essar Steel Algoma, Inc., Term Loan B, LIBOR plus 6.5%, 8.0%**, 6/20/2013 | 1,497,456 | 1,435,685 | |
First Data Corp., Term Loan B2, LIBOR plus 2.75%, 3.036%**, 9/24/2014 | 2,000,000 | 1,727,250 | |
Flextronics International Ltd.: | |||
| Term Delay Draw A-1-B, LIBOR plus 2.25%, 2.496%**, 10/1/2014 | 997,462 | 897,965 |
| Term Delay Draw A-2, LIBOR plus 2.25%, 2.496%**, 10/1/2014 | 229,601 | 206,698 |
| Term Delay Draw A-3, LIBOR plus 2.25%, 2.496%**, 10/1/2014 | 267,867 | 241,147 |
| Term Loan B, LIBOR plus 2.25%, 2.847%**, 10/1/2012 | 498,728 | 448,980 |
Freescale Semiconductor, Inc.: | |||
| Term Loan B, LIBOR plus 1.75%, 1.996%**, 11/29/2013 | 1,000,000 | 803,750 |
| Incremental Term Loan, 12.5%, 12/15/2014 | 1,000,000 | 1,008,335 |
Georgia-Pacific Corp.: | |||
| Term Loan B, LIBOR plus 2.0%, 2.302%**, 12/20/2012 | 900,921 | 869,393 |
| Term Loan C, LIBOR plus 3.25%, 3.552%**, 12/20/2014 | 496,171 | 495,397 |
Getty Images, Inc., Term Loan, Prime plus 3.0%, 6.25%**, 7/2/2015 | 2,906,953 | 2,932,026 | |
Goodyear Tire & Rubber Co., Second Lien Term Loan, LIBOR plus 1.75%, 2.0%**, 4/30/2014 | 1,000,000 | 936,405 | |
Hanesbrands, Inc., Term Loan B, LIBOR plus 4.75%, 5.254%**, 9/5/2013 | 3,277,336 | 3,295,084 | |
HCA, Inc., Term Loan B, LIBOR plus 2.25%, 2.533%**, 11/18/2013 | 2,998,895 | 2,838,514 | |
Hercules Offshore LLC, Term Loan B, LIBOR plus 6.5%, 8.5%**, 7/11/2013 | 879,438 | 861,849 | |
Hughes Network Systems LLC, Term Loan, LIBOR plus 2.5%, 2.875%**, 4/15/2014 | 1,000,000 | 922,500 | |
Huntsman International LLC: | |||
| Term Loan, LIBOR plus 1.75%, 1.996%**, 4/21/2014 | 1,979,798 | 1,831,313 |
| Term Loan C, LIBOR plus 2.25%, 2.496%**, 6/30/2016 | 1,500,000 | 1,396,875 |
IASIS Healthcare LLC: | |||
| Letter of Credit, LIBOR plus 2.1%, 2.246%**, 3/14/2014 | 127,186 | 120,376 |
| Term Delay Draw, LIBOR plus 2.0%, 2.246%**, 3/14/2014 | 1,177,464 | 1,114,417 |
| Term Loan B, LIBOR plus 2.0%, 2.246%**, 3/14/2014 | 1,443,038 | 1,365,770 |
Ineos US Finance LLC: | |||
| Term Loan B2, LIBOR plus 4.5%, 7.501%**, 12/16/2013 | 494,898 | 416,952 |
| Term Loan C2, LIBOR plus 5.0%, 8.001%**, 12/16/2014 | 494,898 | 418,600 |
Intelsat Jackson Holdings Ltd., Term Loan, LIBOR plus 3.0%, 3.246%**, 2/2/2014 | 1,000,000 | 899,065 | |
Jarden Corp.: | |||
| Term Loan B1, LIBOR plus 1.75%, 2.033%**, 1/24/2012 | 788,958 | 768,741 |
| Term Loan B4, LIBOR plus 3.25%, 3.533%**, 1/26/2015 | 850,340 | 851,403 |
Life Technologies Corp., Term Loan B, Prime plus 2.0%, 5.25%**, 11/20/2015 | 79,250 | 79,910 | |
Lyondell Basell Industries AF SCA: | |||
| Dutch Term Loan A, LIBOR plus 3.5%, 3.746%**, 12/20/2013 | 55,457 | 36,498 |
| Dutch Term Loan, LIBOR plus 3.5%, 3.746%**, 12/22/2014 | 24,183 | 15,915 |
| Term Loan A, LIBOR plus 3.5%, 3.746%**, 12/22/2014 | 172,781 | 113,712 |
| Term Loan, LIBOR plus 3.5%, 3.746%**, 12/22/2014 | 90,685 | 59,682 |
| German Term Loan B-1, LIBOR plus 3.75%, 3.996%**, 12/22/2014 | 69,426 | 45,691 |
| German Term Loan B-2, LIBOR plus 3.75%, 3.996%**, 12/22/2014 | 69,426 | 45,691 |
| German Term Loan B-3, LIBOR plus 3.75%, 3.996%**, 12/22/2014 | 69,426 | 45,691 |
| Debtor in Possession Term Loan, Prime plus 3.69%**, 5.799%**, 12/15/2009 | 536,848 | 524,508 |
| Term Loan B-1, LIBOR plus 3.75%, 7.0%**, 12/22/2014 | 301,260 | 198,267 |
| Term Loan B-2, LIBOR plus 3.75%, 7.0%**, 12/22/2014 | 301,260 | 198,267 |
| Term Loan B-3, LIBOR plus 3.75%, 7.0%**, 12/22/2014 | 301,260 | 198,267 |
| Debtor in Possession Term Loan, Prime plus 9.0%, 13.0%**, 12/15/2009 | 358,483 | 374,534 |
Manitowoc Co., Inc., Term Loan B, LIBOR plus 4.5%, 7.5%**, 11/6/2014 | 2,994,975 | 2,848,221 | |
Mediacom Illinois LLC: | |||
| Term Loan C, LIBOR plus 1.5%, 1.75%**, 1/31/2015 | 496,173 | 460,821 |
| Term Loan D, LIBOR plus 3.5%, 5.5%**, 3/31/2017 | 1,000,000 | 1,003,000 |
MetroPCS Wireless, Inc., Term Loan B, LIBOR plus 2.25%, 2.75%**, 11/4/2013 | 3,989,770 | 3,828,803 | |
Mylan Laboratories, Inc., Term Loan B, LIBOR plus 3.25%, 3.563%**, 10/2/2014 | 2,949,749 | 2,882,022 | |
Nebraska Book Co., Inc., Term Loan, LIBOR plus 6.0%, 9.25%**, 3/4/2011 | 966,277 | 968,694 | |
Neiman Marcus Group, Inc., Term Loan B, LIBOR plus 2.0%, 2.322%**, 4/6/2013 | 2,000,000 | 1,740,680 | |
NEP II, Inc., Term Loan B, LIBOR plus 2.25%, 2.533%**, 2/16/2014 | 2,000,000 | 1,850,000 | |
Oshkosh Truck Corp., Term Loan B, LIBOR plus 6.0%, 6.33%**, 12/6/2013 | 3,558,474 | 3,565,146 | |
OSI Restaurant Partners LLC: | |||
| Term Loan, LIBOR plus 1.25%, 0.12%**, 6/14/2013 | 156,439 | 132,895 |
| Term Loan B, LIBOR plus 2.25%, 2.563%**, 6/14/2014 | 1,843,561 | 1,566,105 |
Pinnacle Foods Holdings Corp., Term Loan B, LIBOR plus 2.75%, 3.009%**, 4/2/2014 | 2,887,526 | 2,719,241 | |
Psychiatric Solutions, Inc., Term Loan B, LIBOR plus 1.75%, 2.073%**, 7/1/2012 | 2,185,539 | 2,111,100 | |
QVC, Inc.: | |||
| Term Loan 6-J, LIBOR plus 5.5%, 5.745%**, 3/30/2014 | 1,006,661 | 1,003,717 |
| Term Loan 6-W, LIBOR plus 5.5%, 5.745%**, 3/30/2014 | 1,007,047 | 1,004,101 |
Regal Cinemas, Inc., Term Loan, LIBOR plus 3.75%, 4.033%**, 10/28/2013 | 1,515,272 | 1,512,431 | |
Rockwood Specialties Group, Inc., Term Loan H, LIBOR plus 4.0%, 6.0%**, 5/15/2014 | 1,938,711 | 1,964,768 | |
Sorenson Communications, Inc., Term Loan C, LIBOR plus 2.5%, 2.75%**, 2/16/2014 | 4,500,000 | 4,201,875 | |
Sun Healthcare Group, Inc.: | |||
| Letter of Credit, LIBOR plus 2.1%, 2.283%**, 4/21/2014 | 242,439 | 227,440 |
| Term Loan B, LIBOR plus 2.0%, 2.502%**, 4/21/2014 | 1,148,573 | 1,077,511 |
SunGard Data Systems, Inc.: |
| ||
| Term Loan A, LIBOR plus 1.75%, 2.004%**, 2/28/2014 | 111,345 | 104,664 |
| Term Loan B, LIBOR plus 3.625%, 4.089%**, 2/26/2016 | 2,853,186 | 2,681,995 |
Talecris Biotherapeutics, Inc., First Lien Term Loan, LIBOR plus 3.5.%, 3.96%**, 12/6/2013 | 1,500,000 | 1,476,247 | |
Telesat Canada: | |||
| Term Loan I, LIBOR plus 3.0%, 3.25%**, 10/31/2014 | 1,810,282 | 1,744,912 |
| Term Loan II, LIBOR plus 3.0%, 3.25%**, 10/31/2014 | 155,359 | 149,749 |
Texas Competitive Electric Holdings Co., LLC, Term Delay Draw, LIBOR plus 3.5%, 3.754%**, 10/10/2014 | 992,424 | 792,813 | |
Toys 'R' Us, Inc., Term Loan B, LIBOR plus 4.25%, 4.496%**, 7/19/2012 | 4,000,000 | 3,854,980 | |
Travelport LLC: | |||
| Term Loan, LIBOR plus 2.5%, 2.746%**, 8/23/2013 | 832,882 | 782,909 |
| Term Delay Draw, LIBOR plus 2.5%, 2.746%**, 8/23/2013 | 1,334,236 | 1,254,182 |
VML US Finance LLC: | |||
| Term Delay Draw Loan B, LIBOR plus 5.5%, 5.79%**, 5/25/2012 | 730,427 | 699,841 |
| Term Loan B, LIBOR plus 5.5%, 5.79%**, 5/27/2013 | 1,264,561 | 1,211,607 |
West Corp.: |
|
| |
| Term Loan B-2, LIBOR plus 2.375%, 2.624%**, 10/24/2013 | 799,047 | 757,321 |
| Term Loan B-4, LIBOR plus 3.875%, 4.124%**, 7/15/2016 | 1,160,651 | 1,100,038 |
World Color Press, Inc., Term Loan, Prime plus 5.0%, 9.0%**, 7/23/2012 | 3,000,000 | 3,004,995 | |
| 115,723,072 | ||
Sovereign Loan 0.2% | |||
Gazprom, 144A, 8.125%, 7/31/2014 | 5,330,000 | 5,703,100 | |
| Total Loan Participations and Assignments (Cost $118,982,564) | 121,426,172 | ||
| | |||
Municipal Bonds and Notes 0.4% | |||
California, State General Obligation, Series 3, 5.65%, 4/1/2039 | 2,865,000 | 3,048,217 | |
Louisiana, Public Facilities Authority Systems Revenue, Restoration Bonds, Series A-1, 4.5%, 2/1/2014 | 5,584,806 | 5,932,907 | |
| Total Municipal Bonds and Notes (Cost $8,459,755) | 8,981,124 | ||
| | |||
Preferred Security 0.0% | |||
Financials | |||
Xerox Capital Trust I, 8.0%, 2/1/2027 (Cost $32,932) | 32,000 | 31,280 | |
|
| Value ($) | |
|
| ||
Securities Lending Collateral 1.3% | |||
Daily Assets Fund Institutional, 0.29% (e) (f) (Cost $29,823,820) | 29,823,820 | 29,823,820 | |
| | |||
Cash Equivalents 4.2% | |||
Cash Management QP Trust, 0.18% (e) (Cost $97,809,884) | 97,809,884 | 97,809,884 | |
| % of Net Assets | Value ($) |
|
| |
Total Investment Portfolio (Cost $2,374,702,544)+ | 102.0 | 2,398,364,013 |
Other Assets and Liabilities, Net | (2.0) | (47,511,790) |
Net Assets | 100.0 | 2,350,852,223 |
Security | Coupon | Maturity Date | Principal Amount ($) | Acquisition Cost ($) | Value ($) | |
| ARCO Chemical Co. | 9.8% | 2/1/2020 | 315,000 | USD | 357,144 | 212,625 |
| Buffalo Thunder Development Authority | 9.375% | 12/15/2014 | 30,000 | USD | 30,000 | 5,325 |
| Glitnir HF | 2.951% | 10/15/2008 | 6,000,000 | USD | 6,000,930 | 1,470,000 |
| Green Tree Financial Corp.,"B2", Series 1996-5 | 8.45% | 7/15/2027 | 5,302,252 | USD | 5,817,407 | 0 |
| Idearc, Inc. | 8.0% | 11/15/2016 | 115,000 | USD | 88,300 | 5,175 |
| Pliant Corp. | 11.85% | 6/15/2009 | 5 | USD | 5 | 4 |
| R.H. Donnelley Corp. | 8.875% | 10/15/2017 | 145,000 | USD | 139,993 | 8,337 |
| |
|
|
|
| 12,433,779 | 1,701,466 |
*** Annualized yield at time of purchase; not a coupon rate.
+ The cost for federal income tax purposes was $2,376,291,564. At September 30, 2009, net unrealized appreciation for all securities based on tax cost was $22,072,449. This consisted of aggregate gross unrealized appreciation for all securities in which there was an excess of value over tax cost of $61,270,779 and aggregate gross unrealized depreciation for all securities in which there was an excess of tax cost over value of $39,198,330.
(a) Security has deferred its 6/15/2008, 12/15/2008 and 6/15/2009 interest payments until 12/31/2009.
(b) All or a portion of these securities were on loan (see Notes to Financial Statements). The value of all securities loaned at September 30, 2009 amounted to $28,955,663, which is 1.2% of net assets.
(c) When-issued or delayed delivery securities included.
(d) At September 30, 2009, this security has been pledged, in whole or in part, to cover initial margin requirements for open futures contracts.
(e) Affiliated fund managed by Deutsche Investment Management Americas Inc. The rate shown is the annualized seven-day yield at period end.
(f) Represents collateral held in connection with securities lending. Income earned by the Fund is net of borrower rebates.
144A: Security exempt from registration under Rule 144A of the Securities Act of 1933. These securities may be resold in transactions exempt from registration, normally to qualified institutional buyers.
CPI: Consumer Price Index
FDIC: Federal Deposit Insurance Corp.
FSB: Federal Savings Bank
Interest Only: Interest Only (IO) bonds represent the "interest only" portion of payments on a pool of underlying mortgages or mortgage-backed securities. IO securities are subject to prepayment risk of the pool of underlying mortgages.
LIBOR: London InterBank Offered Rate.
PIK: Denotes that all or a portion of the income is paid in kind.
Prime: Interest rate charged by banks to their most credit worthy customers.
REG S: Securities sold under Regulation S may not be offered, sold or delivered within the United States or to, or for the account or benefit of, US persons, except pursuant to an exemption from, or in a transaction not subject to, the registration requirements of the Securities Act of 1933.
REIT: Real Estate Investment Trust
Included in the portfolio are investments in mortgage or asset-backed securities which are interests in separate pools of mortgages or assets. Effective maturities of these investments may be shorter than stated maturities due to prepayments. Some separate investments in the Federal National Mortgage Association and Government National Mortgage Association issues which have similar coupon rates have been aggregated for presentation purposes in this investment portfolio.
At September 30, 2009, the Fund had unfunded loan commitments of $178,114, which could be extended at the option of the borrower, pursuant to the following loan agreement:
Borrower | Unfunded Loan Commitment ($) | Value ($) | Unrealized Appreciation ($) |
| Lyondell Basell Industries AF SCA, Debtor in Possession Term Loan, Prime plus 9.0%, 13.0%, 12/15/2009 | 178,114 | 187,181 | 9,067 |
At September 30, 2009, open futures contracts purchased were as follows:
Futures | Expiration Date | Contracts | Aggregate Face Value ($) | Value ($) | Unrealized Appreciation ($) |
| 10 Year Canadian Government Bond | 12/18/2009 | 17 | 1,907,290 | 1,926,979 | 19,689 |
| 10 Year US Treasury Note | 12/21/2009 | 400 | 46,797,370 | 47,331,250 | 533,880 |
| Federal Republic of Germany Euro-Bund | 12/8/2009 | 401 | 71,167,460 | 71,519,542 | 352,082 |
| Federal Republic of Germany Euro-Schatz | 12/8/2009 | 974 | 153,904,874 | 154,160,652 | 255,778 |
Total unrealized appreciation | 1,161,429 | ||||
At September 30, 2009, open futures contracts sold were as follows:
Futures | Expiration Date | Contracts | Aggregate Face Value ($) | Value ($) | Unrealized Appreciation/ (Depreciation) ($) |
| 10 Year Australian Treasury Bond | 12/15/2009 | 403 | 37,038,865 | 37,100,617 | (61,752) |
| 10 Year Japanese Government Bond | 12/10/2009 | 53 | 81,888,598 | 82,270,595 | (381,997) |
| 2 Year US Treasury Note | 12/31/2009 | 376 | 81,133,798 | 81,580,250 | (446,452) |
| 5 Year US Treasury Note | 12/31/2009 | 2,568 | 294,451,664 | 298,128,750 | (3,677,086) |
| 90 Day Eurodollar | 12/13/2010 | 250 | 61,386,113 | 61,403,125 | (17,012) |
| 90 Day Eurodollar | 9/13/2010 | 250 | 61,642,363 | 61,646,875 | (4,512) |
| 90 Day Eurodollar | 3/15/2010 | 250 | 62,103,800 | 62,109,375 | (5,575) |
| 90 Day Eurodollar | 12/14/2009 | 250 | 62,239,175 | 62,268,750 | (29,575) |
| 90 Day Eurodollar | 6/14/2010 | 250 | 61,882,987 | 61,893,750 | (10,763) |
| 90 Day Eurodollar | 6/13/2011 | 250 | 60,920,487 | 60,987,500 | (67,013) |
| 90 Day Eurodollar | 9/19/2011 | 250 | 60,721,550 | 60,809,375 | (87,825) |
| 90 Day Eurodollar | 3/14/2011 | 250 | 61,148,612 | 61,187,500 | (38,888) |
| United Kingdom Long Gilt Bond | 12/29/2009 | 133 | 25,246,571 | 25,200,416 | 46,155 |
Total net unrealized depreciation | (4,782,295) | ||||
At September 30, 2009, open credit default swap contracts purchased were as follows:
Effective/ | Notional Amount ($) | Fixed Cash Flows Paid | Underlying Debt Obligation/ Quality Rating (h) | Value ($) | Upfront Premiums Paid/ (Received) ($) | Unrealized Depreciation ($) |
9/21/2009 | 4,625,0001 | 1.0% | Dow Chemical Co., 7.375%, 11/1/2029, BBB- | 87,278 | 87,278 | (1,285) |
At September 30, 2009, open credit default swap contracts sold were as follows:
Effective/ Expiration Dates | Notional Amount ($)(g) | Fixed Cash Flows Received | Underlying Debt Obligation/ Quality Rating (h) | Value ($) | Upfront Premiums Paid/ (Received) ($) | Unrealized Appreciation ($) |
6/22/2009 | 12,000,0001 | 5.0% | MetLife, Inc., 5.0%, 6/15/2015, A- | 1,427,161 | (191,373) | 1,636,616 |
9/21/2009 | 4,625,0001 | 1.0% | Valero Energy Corp., 8.75%, 6/15/2030, BBB | (233,095) | (233,095) | 1,285 |
Total unrealized appreciation | 1,637,901 | |||||
(h) The quality ratings represent the lower of Moody's Investors Service, Inc. ("Moody's") or Standard & Poor's Corporation ("S&P") credit ratings.
At September 30, 2009, open interest rate swaps were as follows:
Effective/ Expiration Dates | Notional Amount ($) | Cash Flows Paid by the Fund | Cash Flows Received by the Fund | Unrealized Appreciation ($) | |
| 6/26/2009 6/27/2011 | 60,000,0002 | Fixed — 1.597% | Floating — LIBOR | 738,301 | |
| 6/26/2009 6/26/2012 | 20,000,0002 | Fixed — 2.26% | Floating — LIBOR | 397,474 | |
| 6/29/2009 7/1/2013 | 20,000,0003 | Fixed — 2.71% | Floating — LIBOR | 487,080 | |
| 9/15/2010 9/15/2014 | 59,400,0004 | Fixed — 3.15% | Floating — LIBOR | 13,433 | |
| 9/15/2010 9/15/2014 | 59,400,0004 | Fixed — 3.15% | Floating — LIBOR | 13,433 | |
| 9/8/2009 9/8/2024 | 9,300,0004 | Fixed — 8.125% | Floating — LIBOR-SIFMA | 87,474 | |
Total unrealized appreciation | 1,737,195 | ||||
At September 30, 2009, total return swap contracts were as follows:
Effective/ Expiration Dates | Notional Amount ($) | Fixed Cash Flows Paid | Reference Entity | Value ($) | Upfront Premiums Paid/ (Received) ($) | Unrealized Depreciation ($) |
6/1/2009 | 76,400,0003 | 0.425% | Global Interest Rate Strategy Index | (439,042) | 77,000 | (546,042) |
| Counterparties: 1 JPMorgan Chase Securities, Inc. 2 Bank of America 3 Citigroup, Inc. 4 Morgan Stanley SIFMA: Securities Industry and Financial Markets Association | ||||||
At September 30, 2009, the Fund had the following open forward foreign currency exchange contracts:
Contracts to Deliver | In Exchange For | Settlement Date | Unrealized Appreciation ($) | Counterparty | ||
| USD | 34,136,829 | AUD | 39,612,000 | 10/14/2009 | 769,261 | Credit Suisse |
| USD | 108,620 | CAD | 117,000 | 10/14/2009 | 662 | Bank of New York Mellon Corp. |
| USD | 24,325,024 | CHF | 25,371,000 | 10/14/2009 | 160,025 | USB AG |
| USD | 8,347,784 | NZD | 11,980,000 | 10/14/2009 | 295,721 | Bank of New York Mellon Corp. |
| GBP | 262,000 | USD | 433,589 | 10/14/2009 | 14,900 | Barclays Bank PLC |
Total unrealized appreciation | 1,240,569 |
| ||||
Contracts to Deliver | In Exchange For | Settlement Date | Unrealized Depreciation ($) | Counterparty | ||
| EUR | 15,316,000 | USD | 22,299,943 | 10/14/2009 | (112,567) | HSBC Bank USA |
| JPY | 427,171,000 | USD | 4,628,698 | 10/14/2009 | (130,521) | HSBC Bank USA |
| NOK | 23,701,000 | USD | 4,006,796 | 10/14/2009 | (94,748) | Barclays Bank PLC |
| SEK | 15,152,000 | USD | 2,155,626 | 10/14/2009 | (18,060) | Barclays Bank PLC |
Total unrealized depreciation | (355,896) |
| ||||
Currency Abbreviations |
| AUD Australian Dollar CAD Canadian Dollar CHF Swiss Franc EUR Euro GBP British Pound JPY Japanese Yen NOK Norwegian Krone NZD New Zealand Dollar SEK Swedish Krona USD United States Dollar |
For information on the Fund's policy and additional disclosures regarding futures contracts, credit default swap contracts, interest rate swap contracts, total return swap contracts and forward foreign currency exchange contracts, please refer to the Derivatives section of Note A in the accompanying Notes to the Financial Statements.
Fair Value Measurements
Various inputs are used in determining the value of the Fund's investments. These inputs are summarized in three broad levels. Level 1 includes quoted prices in active markets for identical securities. Level 2 includes other significant observable inputs (including quoted prices for similar securities, interest rates, prepayment speeds and credit risk). Level 3 includes significant unobservable inputs (including the Fund's own assumptions in determining the fair value of investments). The inputs or methodology used for valuing securities are not necessarily an indication of the risk associated with investing in those securities.
The following is a summary of the inputs used as of September 30, 2009 in valuing the Fund's investments. For information on the Fund's policy regarding the valuation of investments, please refer to the Security Valuation section of Note A in the accompanying Notes to the Financial Statements.
Assets | Level 1 | Level 2 | Level 3 | Total |
| Fixed Income Investments (i) |
|
| ||
Corporate Bonds | $ — | $ 854,427,304 | $ 12,564,486 | $ 866,991,790 |
Mortgage-Backed Securities Pass-Throughs | — | 64,830,382 | — | 64,830,382 |
Asset-Backed | — | 134,820,647 | 8,061,252 | 142,881,899 |
Commercial Mortgage-Backed Securities | — | 231,414,422 | — | 231,414,422 |
Collateralized Mortgage Obligations | — | 191,365,704 | 5,050,000 | 196,415,704 |
Government & Agency Obligations | — | 594,790,331 | 33,038,250 | 627,828,581 |
Loan Participation & Assignments | — | 117,161,798 | 4,264,374 | 121,426,172 |
Municipal Bonds and Notes | — | 8,981,124 | — | 8,981,124 |
Preferred Security | — | 31,280 | — | 31,280 |
| Short-Term Investments (i) | 29,823,820 | 107,738,839 | — | 137,562,659 |
| Unfunded Loan Commitment | — | 9,067 | — | 9,067 |
| Derivatives (j) | — | 4,615,665 | — | 4,615,665 |
Total | $ 29,823,820 | $ 2,310,186,563 | $ 62,978,362 | $ 2,402,988,745 |
Liabilities |
|
|
|
|
| Derivatives (j) | $ (3,620,866) | $ (903,223) | $ — | $ (4,524,089) |
Total | $ (3,620,866) | $ (903,223) | $ — | $ (4,524,089) |
(j) Derivatives include unrealized appreciation (depreciation) on open futures, credit default swaps, interest rate swaps, total return swaps and forward foreign currency exchange contracts.
The following is a reconciliation of the Fund's Level 3 investments for which significant unobservable inputs were used in determining value:
| Corporate Bonds | Collateralized Mortgage Obligations | Asset-Backed |
Balance as of September 30, 2008 ($) | 15,000,000 | — | 2,896,475 |
Realized gains (loss) | — | — | 11,876 |
Change in unrealized appreciation (depreciation) | (2,566,281) | — | (975,965) |
Amortization premium/discount | 1,258 | — | (900,123) |
Net purchases (sales) | 87,027 | 5,050,000 | 7,028,989 |
Net transfers in (out) of Level 3 | 42,482 | — | — |
Balance as of September 30, 2009 ($) | 12,564,486 | 5,050,000 | 8,061,252 |
Net change in unrealized appreciation (depreciation) from investments still held at September 30, 2009 ($) | (2,566,281) | — | (975,965) |
| Government & Agency Obligations | Loan Participations and Assignments | Total |
Balance as of September 30, 2008 ($) | 45,800,819 | 5,590,941 | 69,288,235 |
Realized gains (loss) | (1,920) | (51,770) | (41,814) |
Change in unrealized appreciation (depreciation) | (236,848) | 754,825 | (3,024,269) |
Amortization premium/discount | 44,949 | 51,253 | (802,663) |
Net purchases (sales) | (12,568,750) | (1,256,251) | (1,658,985) |
Net transfers in (out) of Level 3 | — | (824,624) | (782,142) |
Balance as of September 30, 2009 ($) | 33,038,250 | 4,264,374 | 62,978,362 |
Net change in unrealized appreciation (depreciation) from investments still held at September 30, 2009 ($) | (289,504) | 65,886 | (3,765,864) |
The accompanying notes are an integral part of the financial statements.
Statement of Assets and Liabilities as of September 30, 2009 | |
Assets | |
| Investments: Investments in securities, at value (cost $2,247,068,840) — including $28,955,663 of securities loaned | $ 2,270,730,309 |
Investment in Daily Assets Fund Institutional (cost $29,823,820)* | 29,823,820 |
Investment in Cash Management QP Trust (cost $97,809,884) | 97,809,884 |
| Total investments, at value (cost $2,374,702,544) | 2,398,364,013 |
| Cash | 2,676,546 |
| Deposit with brokers for open futures contracts | 4,450,738 |
| Deposit from broker for open swap contracts | 95,000 |
| Receivable for investments sold | 22,986,052 |
| Receivable for Fund shares sold | 20,441,308 |
| Interest receivable | 16,992,876 |
| Unrealized appreciation on swap contracts | 3,375,096 |
| Unrealized appreciation on unfunded loan commitments | 9,067 |
| Unrealized appreciation on forward foreign currency exchange contracts | 1,240,569 |
| Foreign taxes recoverable | 172,213 |
| Due from Advisor | 2,429 |
| Other assets | 120,792 |
| Total assets | 2,470,926,699 |
Liabilities | |
| Payable upon return of deposit | 95,000 |
| Payable upon return of securities loaned | 29,823,820 |
| Payable for investments purchased | 24,506,835 |
| Payable for when-issued and delayed delivery securities purchased | 56,871,209 |
| Payable for Fund shares redeemed | 4,906,074 |
| Payable for daily variation margin on open futures contracts | 341,029 |
| Unrealized depreciation on swap contracts | 547,327 |
| Unrealized depreciation on forward foreign currency exchange contracts | 355,896 |
| Accrued management fee | 698,422 |
| Accrued expenses and payables | 1,928,864 |
| Total liabilities | 120,074,476 |
Net assets, at value | $ 2,350,852,223 |
The accompanying notes are an integral part of the financial statements.
Statement of Assets and Liabilities as of September 30, 2009 (continued) | |
Net Assets Consist of | |
| Distributions in excess of net investment income | $ (2,531,010) |
| Net unrealized appreciation (depreciation) on: Investments | 23,661,469 |
Futures | (3,620,866) |
Swap contracts | 2,827,769 |
Unfunded loan commitments | 9,067 |
Foreign currency | 908,716 |
| Accumulated net realized gain (loss) | (158,905,198) |
| Paid-in capital | 2,488,502,276 |
Net assets, at value | $ 2,350,852,223 |
Net Asset Value | |
Class A Net Asset Value and redemption price per share ($988,243,827 ÷ 105,086,958 outstanding shares of beneficial interest, $.001 par value, unlimited number of shares authorized) | $ 9.40 |
| Maximum offering price per share (100 ÷ 97.25 of $9.40) | $ 9.67 |
Class B Net Asset Value, offering and redemption price (subject to contingent deferred sales charge) per share ($2,035,115 ÷ 216,128 outstanding shares of beneficial interest, $.001 par value, unlimited number of shares authorized) | $ 9.42 |
Class C Net Asset Value, offering and redemption price (subject to contingent deferred sales charge) per share ($328,544,531 ÷ 34,977,838 outstanding shares of beneficial interest, $.001 par value, unlimited number of shares authorized) | $ 9.39 |
Class S Net Asset Value, offering and redemption price per share ($1,019,404,870 ÷ 108,150,378 shares of outstanding capital stock, $.001 par value, unlimited number of shares authorized) | $ 9.43 |
Institutional Class Net Asset Value, offering and redemption price per share ($12,623,880 ÷ 1,340,456 shares of outstanding capital stock, $.001 par value, unlimited number of shares authorized) | $ 9.42 |
The accompanying notes are an integral part of the financial statements.
Statement of Operations for the year ended September 30, 2009 | |
Investment Income | |
| Income: Interest (net of foreign taxes withheld of $1,142) | $ 83,193,227 |
Interest — Cash Management QP Trust | 851,339 |
| Securities lending income, including income from Daily Assets Fund Institutional, net of borrower rebates | 740,580 |
| Total Income | 84,785,146 |
| Expenses: Management fee | 6,405,024 |
| Administration fee | 1,777,259 |
| Services to shareholders | 2,739,121 |
| Custodian fee | 121,013 |
| Distribution and service fees | 3,810,755 |
| Professional fees | 130,683 |
| Trustees' fees and expenses | 47,325 |
| Reports to shareholders | 227,620 |
| Registration fees | 151,281 |
| Interest expense | 90,291 |
| Other | 126,285 |
| Total expenses before expense reductions | 15,626,657 |
| Expense reductions | (543,631) |
| Total expenses after expense reductions | 15,083,026 |
Net investment income | 69,702,120 |
Realized and Unrealized Gain (Loss) | |
| Net realized gain (loss) from: Investments | (48,447,075) |
| Futures | (7,047,783) |
| Written Options | (531,900) |
| Swap contracts | (680,623) |
| Foreign currency | (11,903,199) |
| | (68,610,580) |
| Change in net unrealized appreciation (depreciation) on: Investments | 106,507,194 |
| Futures | (1,965,906) |
| Written options | 316,791 |
| Swap contracts | 2,848,424 |
| Unfunded loan commitments | 29,270 |
| Foreign currency | 1,451,705 |
| | 109,187,478 |
Net gain (loss) | 40,576,898 |
Net increase (decrease) in net assets resulting from operations | $ 110,279,018 |
The accompanying notes are an integral part of the financial statements.
Statement of Changes in Net Assets | ||
Increase (Decrease) in Net Assets | Years Ended September 30, | |
2009 | 2008 | |
| Operations: Net investment income | $ 69,702,120 | $ 62,832,715 |
| Net realized gain (loss) | (68,610,580) | (1,629,296) |
| Change in net unrealized appreciation (depreciation) | 109,187,478 | (78,440,129) |
| Net increase (decrease) in net assets resulting from operations | 110,279,018 | (17,236,710) |
| Distributions to shareholders: Net investment income: Class A | (23,666,318) | (24,712,236) |
Class B | (76,606) | (221,025) |
Class C | (6,001,713) | (6,596,339) |
Class S | (29,193,065) | (45,887,444) |
Institutional Class | (953,356) | (172,311) |
| Net realized gains: Class A | — | (1,914,927) |
Class B | — | (30,426) |
Class C | — | (672,167) |
Class S | — | (4,219,770) |
| Return of capital: Class A | (9,308,604) | — |
Class B | (30,131) | — |
Class C | (2,360,637) | — |
Class S | (11,482,423) | — |
Institutional Class | (374,981) | — |
| Total distributions | (83,447,834) | (84,426,645) |
| Fund share transactions: Proceeds from shares sold | 1,380,606,392 | 948,647,520 |
| Reinvestment of distributions | 70,058,207 | 69,208,872 |
| Cost of shares redeemed | (851,986,913) | (531,216,632) |
| Redemption fees | 59,512 | 73,795 |
| Net increase (decrease) in net assets from Fund share transactions | 598,737,198 | 486,713,555 |
Increase (decrease) in net assets | 625,568,382 | 385,050,200 |
| Net assets at beginning of period | 1,725,283,841 | 1,340,233,641 |
| Net assets at end of period (including distributions in excess of net investment income of $2,531,010 and $14,058,143, respectively) | $ 2,350,852,223 | $ 1,725,283,841 |
The accompanying notes are an integral part of the financial statements.
Class A Years Ended September 30, | 2009 | 2008 | 2007 | 2006 | 2005a |
Selected Per Share Data | |||||
Net asset value, beginning of period | $ 9.34 | $ 9.94 | $ 9.88 | $ 9.93 | $ 10.00 |
Income (loss) from investment operations: Net investment incomeb | .35 | .38 | .38 | .35 | .33 |
Net realized and unrealized gain (loss) | .13 | (.46) | .17 | .10 | .19 |
Total from investment operations | .48 | (.08) | .55 | .45 | .52 |
Less distributions from: Net investment income | (.30) | (.47) | (.43) | (.38) | (.34) |
Net realized gains | — | (.05) | (.06) | (.12) | (.25) |
Return of capital | (.12) | — | — | — | — |
Total distributions | (.42) | (.52) | (.49) | (.50) | (.59) |
| Redemption fees | .00* | .00* | .00* | .00* | .00* |
Net asset value, end of period | $ 9.40 | $ 9.34 | $ 9.94 | $ 9.88 | $ 9.93 |
| Total Return (%)c,d | 5.50 | (.88) | 5.79 | 4.71 | 5.24 |
Ratios to Average Net Assets and Supplemental Data | |||||
| Net assets, end of period ($ millions) | 988 | 625 | 325 | 85 | 119 |
| Ratio of expenses before expense reductions | .88 | .88 | .93 | 1.34e | 1.45e |
| Ratio of expenses after expense reductions | .87 | .86 | .86 | .88e | .95e |
| Ratio of net investment income (%) | 3.91 | 3.89 | 3.83 | 3.61 | 3.21 |
| Portfolio turnover rate | 112 | 83 | 57 | 129f | 298 |
| a Effective November 17, 2004, the Fund converted from a stable value fund to a short-term bond fund. The return for the Fund includes a one-time adjustment of 2.7% related to the conversion and in the absence of the conversion, the return would have been lower. b Based on average shares outstanding during the period. c Total return does not reflect the effect of any sales charges. d Total return would have been lower had certain expenses not been reduced. e Includes expenses allocated from Scudder Limited-Duration Plus Portfolio. f On January 13, 2006, the Scudder Limited-Duration Plus Portfolio was closed. This ratio includes the purchase and sale of portfolio securities of the DWS Short Duration Plus Fund as a stand-alone fund in addition to the Scudder Limited-Duration Plus Portfolio. * Amount is less than $.005. | |||||
Class B Years Ended September 30, | 2009 | 2008 | 2007a |
Selected Per Share Data | |||
Net asset value, beginning of period | $ 9.35 | $ 9.94 | $ 9.97 |
Income (loss) from investment operations: Net investment incomeb | .28 | .30 | .13 |
Net realized and unrealized gain (loss) | .14 | (.45) | .01 |
Total from investment operations | .42 | (.15) | .14 |
Less distributions from: Net investment income | (.23) | (.39) | (.17) |
Net realized gains | — | (.05) | — |
Return of capital | (.12) | — | — |
Total distributions | (.35) | (.44) | (.17) |
| Redemption fees | .00*** | .00*** | .00*** |
Net asset value, end of period | $ 9.42 | $ 9.35 | $ 9.94 |
| Total Return (%)c,d | 4.66 | (1.61) | 1.39** |
Ratios to Average Net Assets and Supplemental Data | |||
| Net assets, end of period ($ millions) | 2 | 4 | 7 |
| Ratio of expenses before expense reductions | 1.85 | 1.76 | 1.82* |
| Ratio of expenses after expense reductions | 1.65 | 1.67 | 1.72* |
| Ratio of net investment income (%) | 3.12 | 3.08 | 2.94* |
| Portfolio turnover rate | 112 | 83 | 57 |
| a For the period April 23, 2007 (commencement of operations of Class B shares) to September 30, 2007. b Based on average shares outstanding during the period. c Total return does not reflect the effect of any sales charges. d Total return would have been lower had certain expenses not been reduced. * Annualized ** Not annualized *** Amount is less than $.005. | |||
Class C Years Ended September 30, | 2009 | 2008 | 2007 | 2006 | 2005a |
Selected Per Share Data | |||||
Net asset value, beginning of period | $ 9.33 | $ 9.92 | $ 9.87 | $ 9.93 | $ 10.00 |
Income (loss) from investment operations: Net investment incomeb | .29 | .31 | .31 | .29 | .26 |
Net realized and unrealized gain (loss) | .13 | (.45) | .17 | .09 | .19 |
Total from investment operations | .42 | (.14) | .48 | .38 | .45 |
Less distributions from: Net investment income | (.24) | (.40) | (.37) | (.32) | (.27) |
Net realized gains | — | (.05) | (.06) | (.12) | (.25) |
Return of capital | (.12) | — | — | — | — |
Total distributions | (.36) | (.45) | (.43) | (.44) | (.52) |
| Redemption fees | .00* | .00* | .00* | .00* | .00* |
Net asset value, end of period | $ 9.39 | $ 9.33 | $ 9.92 | $ 9.87 | $ 9.93 |
| Total Return (%)c | 4.72d | (1.53) | 4.98d | 4.07d | 4.47d |
Ratios to Average Net Assets and Supplemental Data | |||||
| Net assets, end of period ($ millions) | 329 | 176 | 130 | 100 | 139 |
| Ratio of expenses before expense reductions | 1.62 | 1.59 | 1.66 | 2.09e | 2.19e |
| Ratio of expenses after expense reductions | 1.62 | 1.59 | 1.61 | 1.50e | 1.57e |
| Ratio of net investment income (%) | 3.16 | 3.16 | 3.08 | 2.99 | 2.59 |
| Portfolio turnover rate | 112 | 83 | 57 | 129f | 298 |
| a Effective November 17, 2004, the Fund converted from a stable value fund to a short-term bond fund. The return for the Fund includes a one-time adjustment of 2.7% related to the conversion and in the absence of the conversion, the return would have been lower. b Based on average shares outstanding during the period. c Total return does not reflect the effect of sales charges. d Total return would have been lower had certain expenses not been reduced. e Includes expenses allocated from Scudder Limited-Duration Plus Portfolio. f On January 13, 2006, the Scudder Limited-Duration Plus Portfolio was closed. This ratio includes the purchase and sale of portfolio securities of the DWS Short Duration Plus Fund as a stand-alone fund in addition to the Scudder Limited-Duration Plus Portfolio. * Amount is less than $.005. | |||||
Class S+ Years Ended September 30, | 2009 | 2008 | 2007 | 2006 | 2005a |
Selected Per Share Data | |||||
Net asset value, beginning of period | $ 9.36 | $ 9.95 | $ 9.89 | $ 9.93 | $ 10.00 |
Income (loss) from investment operations: Net investment incomeb | .37 | .40 | .39 | .35 | .33 |
Net realized and unrealized gain (loss) | .14 | (.45) | .16 | .11 | .19 |
Total from investment operations | .51 | (.05) | .55 | .46 | .52 |
Less distributions from: Net investment income | (.32) | (.49) | (.43) | (.38) | (.34) |
Net realized gains | — | (.05) | (.06) | (.12) | (.25) |
Return of capital | (.12) | — | — | — | — |
Total distributions | (.44) | (.54) | (.49) | (.50) | (.59) |
| Redemption fees | .00* | .00* | .00* | .00* | .00* |
Net asset value, end of period | $ 9.43 | $ 9.36 | $ 9.95 | $ 9.89 | $ 9.93 |
| Total Return (%)c | 5.71 | (.62) | 5.79 | 4.80 | 5.28 |
Ratios to Average Net Assets and Supplemental Data | |||||
| Net assets, end of period ($ millions) | 1,019 | 869 | 879 | 287 | 518 |
| Ratio of expenses before expense reductions | .70 | .71 | .79 | 1.27d | 1.38d |
| Ratio of expenses after expense reductions | .65 | .67 | .73 | .88d | .90d |
| Ratio of net investment income (%) | 4.12 | 4.08 | 3.97 | 3.61 | 3.26 |
| Portfolio turnover rate | 112 | 83 | 57 | 129e | 298 |
| + On October 23, 2006, Investment Class was renamed Class S. a Effective November 17, 2004, the Fund converted from a stable value fund to a short-term bond fund. The return for the Fund includes a one-time adjustment of 2.7% related to the conversion and in the absence of the conversion, the return would have been lower. b Based on average shares outstanding during the period. c Total return would have been lower had certain expenses not been reduced. d Includes expenses allocated from Scudder Limited-Duration Plus Portfolio. e On January 13, 2006, the Scudder Limited-Duration Plus Portfolio was closed. This ratio includes the purchase and sale of portfolio securities of the DWS Short Duration Plus Fund as a stand-alone fund in addition to the Scudder Limited-Duration Plus Portfolio. * Amount is less than $.005. | |||||
Institutional Class Years Ended September 30, | 2009 | 2008a |
Selected Per Share Data | ||
Net asset value, beginning of period | $ 9.36 | $ 9.56 |
Income (loss) from investment operations: Net investment incomeb | .38 | .04 |
Net realized and unrealized gain (loss) | .13 | (.21) |
Total from investment operations | .51 | (.17) |
Less distributions from: Net investment income | (.33) | (.03) |
Return of capital | (.12) | — |
Total distributions | (.45) | (.03) |
| Redemption fees | .00*** | .00*** |
Net asset value, end of period | $ 9.42 | $ 9.36 |
| Total Return (%) | 5.74 | (1.76)** |
Ratios to Average Net Assets and Supplemental Data | ||
| Net assets, end of period ($ millions) | 13 | 50 |
| Ratio of expenses | .52 | .54* |
| Ratio of net investment income (%) | 4.25 | 4.20* |
| Portfolio turnover rate | 112 | 83 |
| a For the period from August 27, 2008 (commencement of operations of Institutional Class shares) to September 30, 2008. b Based on average shares outstanding during the period. * Annualized ** Not annualized *** Amount is less than $.005. | ||
A. Organization and Significant Accounting Policies
DWS Short Duration Plus Fund (the "Fund") is a diversified series of DWS Advisor Funds (the "Trust"), which is registered under the Investment Company Act of 1940, as amended (the "1940 Act"), as an open-end investment management company organized as a Massachusetts business trust.
The Fund offers multiple classes of shares which provide investors with different purchase options. Class A shares are offered to investors subject to an initial sales charge. Class B shares are offered to investors without an initial sales charge but are subject to higher ongoing expenses than Class A shares and a contingent deferred sales charge payable upon certain redemptions. Class B shares automatically convert to Class A shares six years after issuance. Class C shares are offered without an initial sales charge but are subject to higher ongoing expenses than Class A shares and a contingent deferred sales charge payable upon certain redemptions within one year of purchase. Class C shares do not automatically convert into another class. Institutional Class shares are offered to a limited group of investors, are not subject to initial or contingent deferred sales charges and have lower ongoing expenses than other classes. Class S shares are not subject to initial or contingent deferred sales charges and are generally not available to new investors except under certain circumstances.
Investment income, realized and unrealized gains and losses, and certain fund-level expenses and expense reductions, if any, are borne pro rata on the basis of relative net assets by the holders of all classes of shares, except that each class bears certain expenses unique to that class such as distribution and service fees, services to shareholders, and certain other class-specific expenses. Differences in class-level expenses may result in payment of different per share dividends by class. All shares of the Fund have equal rights with respect to voting, subject to class-specific arrangements.
The Fund's financial statements are prepared in accordance with accounting principles generally accepted in the United States of America which require the use of management estimates. Actual results could differ from those estimates. The policies described below are followed consistently by the Fund in the preparation of its financial statements.
Security Valuation. Investments are stated at value determined as of the close of regular trading on the New York Stock Exchange on each day the exchange is open for trading. Debt securities are valued by independent pricing services approved by the Trustees of the Fund. If the pricing services are unable to provide valuations, securities are valued at the most recent bid quotation or evaluated price, as applicable, obtained from one or more broker-dealers. Such services may use various pricing techniques which take into account appropriate factors such as yield, quality, coupon rate, maturity, type of issue, trading characteristics and other data, as well as broker quotes.
Money market instruments purchased with an original or remaining maturity of sixty days or less, maturing at par, are valued at amortized cost. Investments in open-end investment companies and Cash Management QP Trust are valued at their net asset value each business day.
Securities and other assets for which market quotations are not readily available or for which the above valuation procedures are deemed not to reflect fair value are valued in a manner that is intended to reflect their fair value as determined in accordance with procedures approved by the Trustees. In accordance with the Fund's valuation procedures, factors used in determining value may include, but are not limited to, the type of the security, the size of the holding, the initial cost of the security, the existence of any contractual restrictions on the security's disposition, the price and extent of public trading in similar securities of the issuer or of comparable companies, quotations or evaluated prices from broker-dealers and/or pricing services, information obtained from the issuer, analysts, and/or the appropriate stock exchange (for exchange-traded securities), an analysis of the company's financial statements, an evaluation of the forces that influence the issuer and the market(s) in which the security is purchased and sold and with respect to debt securities, the maturity, coupon, creditworthiness, currency denomination, and the movement of the market in which the security is normally traded. The value determined under these procedures may differ from published values for the same securities.
Disclosure about the classification of fair value measurements is included in a table following the Fund's Investment Portfolio.
Foreign Currency Translations. The books and records of the Fund are maintained in US dollars. Investment securities and other assets and liabilities denominated in a foreign currency are translated into US dollars at the prevailing exchange rates at period end. Purchases and sales of investment securities, income and expenses are translated into US dollars at the prevailing exchange rates on the respective dates of the transactions.
Net realized and unrealized gains and losses on foreign currency transactions represent net gains and losses between trade and settlement dates on securities transactions, the disposition of forward foreign currency exchange contracts and foreign currencies, and the difference between the amount of net investment income accrued and the US dollar amount actually received. That portion of both realized and unrealized gains and losses on investments that results from fluctuations in foreign currency exchange rates is not separately disclosed but is included with net realized and unrealized gain/appreciation and loss/depreciation on investments.
Securities Lending. The Fund may lend securities to financial institutions. The Fund retains beneficial ownership of the securities it has loaned and continues to receive interest and dividends paid by the issuer of securities and to participate in any changes in their market value. The Fund requires the borrowers of the securities to maintain collateral with the Fund consisting of liquid, unencumbered assets having a value at least equal to the value of the securities loaned. When the collateral falls below specified amounts, the lending agents will use their best efforts to obtain additional collateral on the next business day to meet required amounts under the security lending agreement. The Fund may invest the cash collateral into a joint trading account in an affiliated money market fund pursuant to Exemptive Orders issued by the SEC. The Fund receives compensation for lending its securities either in the form of fees or by earning interest on invested cash collateral net of borrower rebates and fees paid to a lending agent. Either the Fund or the borrower may terminate the loan. There may be risks of delay and costs in recovery of securities or even loss of rights in the collateral should the borrower of the securities fail financially. The Fund is also subject to all investment risks associated with the reinvestment of any cash collateral received, including, but not limited to, interest rate, credit and liquidity risk associated with such investments.
Senior Loans. Senior loans are portions of loans originated by banks and sold in pieces to investors. These US dollar-denominated fixed and floating rate loans ("Loans") in which the Fund invests, are arranged through private negotiations between the borrower and one or more financial institutions ("Lenders"). The Fund invests in such Loans in the form of participations in Loans ("Participations") or assignments of all or a portion of loans from third parties ("Assignments"). Participations typically result in the Fund having a contractual relationship only with the Lender, not with the borrower. The Fund has the right to receive payments of principal, interest and any fees to which it is entitled from the Lender selling the Participation and only upon receipt by the Lender of the payments from the borrower. In connection with purchasing Participations, the Fund generally has no right to enforce compliance by the borrower with the terms of the loan agreement relating to the Loan, nor any rights of set-off against the borrower, and the Fund will not benefit directly from any collateral supporting the Loan in which it has purchased the Participation. As a result, the Fund assumes the credit risk of both the borrower and the Lender that is selling the Participation. Assignments typically result in the Fund having a direct contractual relationship with the borrower, and the Fund may enforce compliance by the borrower with the terms of the loan agreement. All Senior Loans involve interest rate risk, liquidity risk and credit risk, including the potential default or insolvency of the borrower.
When-Issued/Delayed Delivery Securities. The Fund may purchase securities with delivery or payment to occur at a later date beyond the normal settlement period. At the time the Fund enters into a commitment to purchase a security, the transaction is recorded and the value of the security is reflected in the net asset value. The price of such security and the date when the security will be delivered and paid for are fixed at the time the transaction is negotiated. The value of the security may vary with market fluctuations. No interest accrues to the Fund until payment takes place. At the time the Fund enters into this type of transaction, it is required to segregate cash or other liquid assets at least equal to the amount of the commitment.
Certain risks may arise upon entering into when-issued or delayed delivery securities from the potential inability of counterparties to meet the terms of their contracts or if the issuer does not issue the securities due to political, economic, or other factors. Additionally, losses may arise due to changes in the value of the underlying securities.
Derivatives. Authoritative accounting guidance requires that disclosures about the Fund's derivative and hedging activities and derivatives accounted for as hedging instruments must be disclosed separately from derivatives that do not qualify for hedge accounting. Because investment companies account for their derivatives at fair value and record any changes in fair value in current period earnings, the Fund's derivatives are not accounted for as hedging instruments. As such, even though the Fund may use derivatives in an attempt to achieve an economic hedge, the Fund's derivatives are not considered to be hedging instruments. The disclosure below is presented in accordance with authoritative accounting guidance.
Interest Rate Swap Contracts. The Fund may enter into interest rate swap transactions to gain exposure to different parts of the yield curve while managing overall duration. The use of interest rate swaps is a highly specialized activity that involves investment techniques and risks different from those associated with ordinary portfolio security transactions. In an interest rate swap, the Fund agrees to pay to the other party to the interest rate swap (which is known as the "counterparty") a fixed rate payment in exchange for the counterparty agreeing to pay to the Fund a variable rate payment, or the Fund agrees to receive from the counterparty a fixed rate payment in exchange for the counterparty agreeing to receive from the Fund a variable rate payment. The payment obligations are based on the notional amount of the swap. Certain risks may arise when entering into swap transactions including counterparty default, liquidity or unfavorable changes in interest rates. In connection with these agreements, securities and or cash may be identified as collateral in accordance with the terms of the swap agreements to provide assets of value and recourse in the event of default. The maximum counterparty credit risk is the net present value of the cash flows to be received from or paid to the counterparty over the term of the interest rate swap contract, to the extent that this amount is beneficial to the Fund, in addition to any related collateral posted to the counterparty by the Fund. This risk may be partially reduced by a master netting arrangement between the Fund and the counterparty. Payments received or made at the end of the measurement period are recorded as realized gain or loss in the Statement of Operations. The value of the swap is adjusted daily based upon a price supplied by a Board-approved pricing vendor and the change in value is recorded as unrealized appreciation or depreciation.
A summary of the open interest rate swap contracts as of September 30, 2009 is included in a table following the Fund's Investment Portfolio.
Credit Default Swap Contracts. A credit default swap is a contract between a buyer and a seller of protection against pre-defined credit events for the reference entity. The Fund may buy or sell credit default swap contracts to gain exposure to an underlying issuer's credit quality characteristics without directly investing in that issuer, or to hedge the risk of default on Fund securities. As a seller in the credit default swap contract, the Fund is required to pay the par (or other agreed-upon) value of the referenced entity to the counterparty with the occurrence of a credit event by a third party, such as a US or foreign corporate issuer, on the reference entity, which would likely result in a loss to the Fund. In return, the Fund receives from the counterparty a periodic stream of payments over the term of the contract provided that no credit event has occurred. If no credit event occurs, the Fund keeps the stream of payments with no payment obligations. The Fund may also buy credit default swap contracts in order to hedge against the risk of a credit event on debt securities, in which case the Fund functions as the counterparty referenced above. This involves the risk that the contract may expire worthless. It also involves counterparty risk that the seller may fail to satisfy its payment obligations to the Fund with the occurrence of a credit event. When the Fund sells a credit default swap contract it will cover its commitment. This may be achieved by, among other methods, maintaining cash or liquid assets equal to the aggregate notional value of the reference entities for all outstanding credit default swap contracts sold by the Fund.
Credit default swap contracts are marked to market daily based upon quotations from a Board-approved pricing vendor and the change in value, if any, is recorded daily as unrealized gain or loss. An upfront payment made by the Fund is recorded as an asset in the Statement of Assets and Liabilities. An upfront payment received by the Fund is recorded as a liability in the Statement of Assets and Liabilities. Under the terms of the credit default swap contracts, the Fund receives or makes quarterly payments based on a specified interest rate on a fixed notional amount. These payments are recorded as a realized gain or loss in the Statement of Operations. Payments received or made as a result of a credit event or termination of the contract are recognized, net of a proportional amount of the upfront payment, as realized gains or losses.
A summary of the open credit default swap contracts as of September 30, 2009 is included in a table following the Fund's Investment Portfolio. The volume indicated is generally indicative of the volume throughout the period.
Total Return Swap Contracts. Total return swaps involve commitments to pay interest in exchange for a market-linked return based on a notional amount. The Fund may enter into total return swap transactions to gain exposure to different parts of the yield curve while managing overall duration. To the extent the total return of the reference security or index underlying the total return swap exceeds or falls short of the offsetting interest rate obligation, the Fund will receive a payment or make a payment to the counterparty, respectively. Certain risks may arise when entering into swap transactions including counterparty default, liquidity or unfavorable changes in the value of underlying reference security or index. Payments received or made at the end of each measurement period are recorded as realized gain or loss in the Statement of Operations. The value of the swap is adjusted daily based upon a price supplied by a Board-approved pricing vendor and the change in value is recorded as unrealized appreciation or depreciation.
A summary of the open total return swap contracts as of September 30, 2009 is included in a table following the Fund's Investment Portfolio. The volume indicated is generally indicative of the volume throughout the period.
Options. An option contract is a contract in which the writer (seller) of the option grants the buyer of the option, upon payment of a premium, the right to purchase from (call option), or sell to (put option), the writer a designated instrument at a specified price within a specified period of time. Certain options, including options on indices, will require cash settlement by the Fund if the option is exercised. The Fund may enter into options on interest rate swaps. The Fund may enter into option contracts in order to hedge against potential adverse price movements in the value of portfolio assets; as a temporary substitute for selling selected investments; to lock in the purchase price of a security or currency which it expects to purchase in the near future; as a temporary substitute for purchasing selected investments; and to enhance potential gain. The Fund may also enter into option contracts as part of its global tactical asset allocation strategy.
The liability representing the Fund's obligation under an exchange traded written option or investment in a purchased option is valued at the last sale price or, in the absence of a sale, the mean between the closing bid and asked prices or at the most recent asked price (bid for purchased options) if no bid and asked price are available. Over-the-counter written or purchased options are valued using dealer-supplied quotations. Gain or loss is recognized when the option contract expires or is closed.
If the Fund writes a covered call option, the Fund foregoes, in exchange for the premium, the opportunity to profit during the option period from an increase in the market value of the underlying security above the exercise price. If the Fund writes a put option it accepts the risk of a decline in the value of the underlying security below the exercise price. Over-the-counter options have the risk of the potential inability of counterparties to meet the terms of their contracts. The Fund's maximum exposure to purchased options is limited to the premium initially paid. In addition, certain risks may arise upon entering into option contracts including the risk that an illiquid secondary market will limit the Fund's ability to close out an option contract prior to the expiration date and that a change in the value of the option contract may not correlate exactly with changes in the value of the securities or currencies hedged.
There are no open options contracts as of September 30, 2009.
Futures Contracts. A futures contract is an agreement between a buyer or seller and an established futures exchange or its clearinghouse in which the buyer or seller agrees to take or make a delivery of a specific amount of a financial instrument at a specified price on a specific date (settlement date). The Fund may enter into interest rate futures to gain exposure to different parts of the yield curve while managing overall duration. In addition, the Fund seeks to enhance returns by employing a global tactical asset allocation overlay strategy. The Fund may enter into futures contracts on fixed-income securities, including on financial indices, and security indices and on currency as part of its global tactical asset allocation overlay strategy. As part of this strategy, the Fund may use futures contracts to take advantage of short-term and medium-term inefficiencies and relative mispricings within the global bond and currency markets. Futures contracts are valued at the most recent settlement price. Upon entering into a futures contract, the Fund is required to deposit with a financial intermediary cash or securities ("initial margin") in an amount equal to a certain percentage of the face value indicated in the futures contract. Subsequent payments ("variation margin") are made or received by the Fund dependent upon the daily fluctuations in the value and are recorded for financial reporting purposes as unrealized gains or losses by the Fund. Gains or losses are realized when the contract expires or is closed. Since all futures contracts are exchange traded, counterparty risk is minimized as the exchange's clearinghouse acts as the counterparty, and guarantees the futures against default.
Certain risks may arise upon entering into futures contracts, including the risk that an illiquid market will limit the Fund's ability to close out a futures contract prior to the settlement date and that a change in the value of a futures contract may not correlate exactly with the changes in the value of the underlying hedged security, index or currency. Risk of loss may exceed amounts recognized in the Statement of Assets and Liabilities.
A summary of the open future contracts as of September 30, 2009 is included in a table following the Fund's Investment Portfolio. The volume indicated is generally indicative of the volume throughout the period.
Forward Foreign Currency Exchange Contracts. A forward foreign currency exchange contract (forward currency contract) is a commitment to purchase or sell a foreign currency at the settlement date at a negotiated rate. The Fund seeks to enhance returns by employing a global tactical asset allocation overlay strategy. As part of this strategy, the Fund may use forward currency exchange contracts to gain exposure to changes in the value of foreign currencies, and to take advantage of short-term and medium-term mispricings within the currency markets. Forward currency contracts are valued at the prevailing forward exchange rate of the underlying currencies and unrealized gain (loss) is recorded daily. Certain risks may arise upon entering into forward currency contracts from the potential inability of counterparties to meet the terms of their contracts. The maximum counterparty credit risk to the Fund is measured by the unrealized gain on appreciated contracts. Additionally, when utilizing forward currency contracts to hedge, the Fund gives up the opportunity to profit from favorable exchange rate movements during the term of the contract.
A summary of the open forward foreign currency exchange contracts as of September 30, 2009 is included in a table following the Fund's Investment Portfolio. The volume indicated is generally indicative of the volume throughout the period.
The following tables summarize the value of the Fund's derivative instruments held as of September 30, 2009 and the related location in the accompanying Statement of Assets and Liabilities, presented by primary underlying risk exposure:
Asset Derivatives | Forward Contracts | Swap Contracts | Total Value |
| Interest Rate Contracts (a) | $ — | $ 1,737,195 | $ 1,737,195 |
| Credit Contracts (a) | — | 1,637,901 | 1,637,901 |
| Foreign Exchange Contracts (b) | 1,240,569 | — | 1,240,569 |
| $ 1,240,569 | $ 3,375,096 | $ 4,615,665 |
Each of the above derivatives is located in the following Statement of Assets and Liabilities accounts:
(a) Unrealized appreciation on swap contracts(b) Unrealized appreciation on forward foreign currency exchange contracts
Liability Derivatives | Forward Contracts | Swap Contracts | Futures Contracts | Total Value |
| Interest Rate Contracts (a) | $ — | $ (546,042) | $ (3,620,866) | $ (4,166,908) |
| Credit Contracts (a) | — | (1,285) | — | (1,285) |
| Foreign Exchange Contracts (b) | (355,896) | — | — | (355,896) |
| $ (355,896) | $ (547,327) | $ (3,620,866) | $ (4,524,089) |
Each of the above derivatives is located in the following Statement of Assets and Liabilities accounts:
(a) Unrealized depreciation on swap contracts and net unrealized appreciation (depreciation) on futures. Payable for daily variation margin on open futures contracts reflects unsettled variation margin(b) Unrealized depreciation on forward foreign currency exchange contracts
Additionally, the amount of unrealized and realized gains and losses on derivative instruments recognized in Fund earnings during the year ended September 30, 2009 and the related location in the accompanying Statement of Operations is summarized in the following tables by primary underlying risk exposure:
| Realized Gain (Loss) |
| Written Options | Forward Contracts | Swap Contracts | Futures Contracts | Total Value |
| Interest Rate Contracts (a) | $ (531,900) | $ — | $ (329,679) | $ (7,047,783) | $ (7,909,362) |
| Credit Contracts (a) | — | — | (350,944) | — | (350,944) |
| Foreign Exchange Contracts (b) | — | (12,109,051) | — | — | (12,109,051) |
| $ (531,900) | $ (12,109,051) | $ (680,623) | $ (7,047,783) | $ (20,369,357) |
Each of the above derivatives is located in the following Statement of Operations accounts:
(a) Net realized gain (loss) from written options, swaps and futures, respectively(b) Net realized gain (loss) from foreign currency (Statement of Operations includes both forward currency contracts and foreign currency transactions)
| Change in Net Unrealized Appreciation (Depreciation) | |||||
| Written Options | Forward Contracts | Swap Contracts | Futures Contracts | Total Value |
| Interest Rate Contracts (a) | $ 316,791 | $ — | $ 1,191,153 | $ (1,965,906) | $ (457,962) |
| Credit Contracts (a) | — | — | 1,657,271 | — | 1,657,271 |
| Foreign Exchange Contracts (b) | — | 1,362,048 | — | — | 1,362,048 |
| $ 316,791 | $ 1,362,048 | $ 2,848,424 | $ (1,965,906) | $ 2,561,357 |
Each of the above derivatives is located in the following Statement of Operations accounts:
(a) Change in net unrealized appreciation (depreciation) on written options, swaps and futures, respectively(b) Change in net unrealized appreciation (depreciation) on foreign currency (Statement of Operations includes both forward currency contracts and foreign currency transactions)
Federal Income Taxes. The Fund's policy is to comply with the requirements of the Internal Revenue Code, as amended, which are applicable to regulated investment companies, and to distribute all of its taxable income to its shareholders.
At September 30, 2009, the Fund had a net tax basis capital loss carryforward of approximately $98,367,000, including $60,677,000 inherited from its merger with an affiliated fund in fiscal year 2007, which may be applied against any realized net taxable capital gains of each succeeding year until fully utilized or until September 30, 2011 ($14,467,000), September 30, 2012 ($25,866,000), September 30, 2013 ($18,693,000), September 30, 2014 ($3,620,000), September 30, 2015 ($15,741,000), September 30, 2016 ($2,969,000) and September 30, 2017 ($17,011,000), the respective expiration dates, whichever occurs first, subject to certain limitations under Sections 381-384 of the Internal Revenue Code.
In addition, from November 1, 2008 through September 30, 2009, the Fund incurred approximately $62,800,000 of net realized capital losses. As permitted by tax regulations, the Fund intends to elect to defer these losses and treat them as arising in the fiscal year ending September 30, 2010.
The Fund has reviewed the tax positions for the open tax years as of September 30, 2009 and has determined that no provision for income tax is required in the Fund's financial statements. The Fund's federal tax returns for the prior three fiscal years remain subject to examination by the Internal Revenue Service.
Distribution of Income and Gains. Net investment income of the Fund is declared and distributed to shareholders monthly. Net realized gains from investment transactions, in excess of available capital loss carryforwards, would be taxable to the Fund if not distributed, and, therefore, will be distributed to shareholders at least annually.
The timing and characterization of certain income and capital gains distributions are determined annually in accordance with federal tax regulations, which may differ from accounting principles generally accepted in the United States of America. These differences primarily relate to premium amortization on debt securities, investments in foreign denominated investments, forward currency contracts, futures contracts, recognition of certain foreign currency gains (losses) as ordinary income (loss), and certain securities sold at a loss. As a result, net investment income (loss) and net realized gain (loss) on investment transactions for a reporting period may differ significantly from distributions during such period. Accordingly, the Fund may periodically make reclassifications among certain of its capital accounts without impacting the net asset value of the Fund.
At September 30, 2009, the Fund's components of distributable earnings (accumulated losses) on a tax basis are as follows:
| Capital loss carryforwards | $ (98,367,000) |
| Net unrealized appreciation (depreciation) on investments | $ 22,072,449 |
In addition, the tax character of distributions paid to shareholders by the Fund is summarized as follows:
| Years Ended September 30, | |
| 2009 | 2008 |
| Distributions from ordinary income* | $ 59,891,058 | $ 84,426,645 |
| Return of capital | $ 23,556,776 | $ — |
Redemption Fees. During the year, the Fund imposed a redemption fee of 2% of the total redemption amount on all Fund shares redeemed or exchanged within 15 days of buying them, either by purchase or exchange. This fee was assessed and retained by the Fund for the benefit of the remaining shareholders. The redemption fee was accounted for as an addition to paid-in capital. The Fund no longer imposes the 2% redemption fee on Fund shares acquired (either by purchase or exchange) on or after June 1, 2009.
Contingencies. In the normal course of business, the Fund may enter into contracts with service providers that contain general indemnification clauses. The Fund's maximum exposure under these arrangements is unknown as this would involve future claims that may be made against the Fund that have not yet been made. However, based on experience, the Fund expects the risk of loss to be remote.
Other. Investment transactions are accounted for on a trade date plus one basis for daily net asset value calculations. However, for financial reporting purposes, investment security transactions are reported on trade date. Interest income is recorded on the accrual basis. Dividend income is recorded on the ex-dividend date net of foreign withholding taxes. Realized gains and losses from investment transactions are recorded on an identified cost basis. All premiums and discounts are amortized/accreted for financial reporting purposes.
B. Purchases and Sales of Securities
During the year ended September 30, 2009, purchases and sales of investment securities (excluding short-term instruments and US Treasury obligations) aggregated $2,328,492,866 and $1,674,931,427, respectively. Purchases and sales of US Treasury obligations aggregated $145,465,729 and $195,377,490, respectively.
For the year ended September 30, 2009, transactions for written options on swaps were as follows:
| Contract Amount | Premium |
| Outstanding, beginning of period | 108,000,000 | $ 602,100 |
| Options written | 108,000,000 | 675,000 |
| Options closed | (216,000,000) | (1,277,100) |
Outstanding, end of period | — | $ — |
C. Related Parties
Management Agreement. Under the Investment Management Agreement with Deutsche Investment Management Americas Inc. ("DIMA" or the "Advisor"), an indirect, wholly owned subsidiary of Deutsche Bank AG, the Advisor directs the investments of the Fund in accordance with its investment objectives, policies and restrictions. The Advisor determines the securities, instruments and other contracts relating to investments to be purchased, sold or entered into by the Fund.
Under the Investment Management Agreement with the Advisor, the Fund pays a monthly management fee based on the average daily net assets of the Fund, computed and accrued daily and payable monthly, at the following annual rates:
| First $1.5 billion of the Fund's average daily net assets | .365% |
| Next $500 million of such net assets | .340% |
| Next $1.0 billion of such net assets | .315% |
| Next $1.0 billion of such net assets | .300% |
| Next $1.0 billion of such net assets | .285% |
| Next $1.0 billion of such net assets | .270% |
| Over $6.0 billion of such net assets | .255% |
Accordingly, for the year ended September 30, 2009, the fee pursuant to the Investment Management Agreement was equivalent to an annual effective rate of 0.36% of the Fund's average daily net assets.
For the period from October 1, 2008 through September 30, 2009, the Advisor has contractually agreed to waive all or a portion of its management fee and reimburse or pay certain operating expenses of the Fund (excluding expenses such as extraordinary expenses, taxes, brokerage and interest) to the extent necessary to maintain the operating expenses of certain classes as follows:
| Class A | .94% |
| Class B | 1.64% |
| Class S | .64% |
| Institutional Class | .64% |
Effective October 1, 2009 through September 30, 2010 (through April 22, 2010 for Class S), the Advisor has contractually agreed to waive all or a portion of its management fee and reimburse or pay certain operating expenses of the Fund (excluding expenses such as extraordinary expenses, taxes, brokerage and interest) to the extent necessary to maintain the operating expenses of each class as follows:
| Class A | .90% |
| Class B | 1.65% |
| Class C | 1.65% |
| Class S | .73% |
| Institutional Class | .65% |
In addition, for the period from October 1, 2008 through September 30, 2009, the Advisor has voluntarily agreed to waive all or a portion of its management fee and reimburse or pay certain operating expenses (excluding certain expenses such as extraordinary expenses, taxes,brokerage and interest) to the extent necessary to maintain the operating expenses of certain classes as follows:
| Class A | .86% |
| Class C | 1.61% |
Effective October 1, 2009, the Advisor has voluntarily agreed to waive all or a portion of its management fee and reimburse or pay certain operating expenses of the Fund (excluding expenses such as extraordinary expenses, taxes, brokerage and interest) to the extent necessary to maintain the operating expenses of each class as follows:
| Class A | .88% |
| Class B | 1.63% |
| Class C | 1.63% |
| Class S | .63% |
| Institutional Class | .63% |
Administration Fee. Pursuant to an Administrative Services Agreement, DIMA provides most administrative services to the Fund. For all services provided under the Administrative Services Agreement, the Fund pays the Advisor an annual fee ("Administration Fee") of 0.10% of the Fund's average daily net assets, computed and accrued daily and payable monthly. For the year ended September 30, 2009, the Administration Fee was $1,777,259, of which $188,883 is unpaid.
Service Provider Fees. DWS Investments Service Company ("DISC"), an affiliate of the Advisor, is the transfer agent, dividend-paying agent and shareholder service agent for the Fund. Pursuant to a sub-transfer agency agreement between DISC and DST Systems, Inc. ("DST"), DISC has delegated certain transfer agent, dividend-paying agent and shareholder service agent functions to DST. DISC compensates DST out of the shareholder servicing fees it receives from the Fund. For the year ended September 30, 2009, the amounts charged to the Fund by DISC were as follows:
Services to Shareholders | Total Aggregated | Waived | Unpaid at September 30, 2009 |
| Class A | $ 333,996 | $ 80,921 | $ 100,861 |
| Class B | 8,946 | 5,717 | — |
| Class C | 151,071 | 10,219 | 48,868 |
| Class S | 797,205 | 444,365 | 184,874 |
| Institutional Class | 235 | — | 58 |
| $ 1,291,453 | $ 541,222 | $ 334,661 |
Distribution and Service Fees. Under the Fund's Class B and Class C 12b-1 plans, DWS Investments Distributors, Inc. ("DIDI"), an affiliate of the Advisor, receives a fee ("Distribution Fee") of 0.75% of average daily net assets of each of Class B and C shares. In accordance with the Fund's Underwriting and Distribution Services Agreement, DIDI enters into related selling group agreements with various firms at various rates for sales of Class B and C shares. For the year ended September 30, 2009, the Distribution Fee was as follows:
Distribution Fee | Total Aggregated | Unpaid at September 30, 2009 |
| Class B | $ 20,697 | $ 1,278 |
| Class C | 1,593,453 | 195,503 |
| $ 1,614,150 | $ 196,781 |
In addition, DIDI provides information and administrative services for a fee ("Service Fee") to Class A, B and C shareholders at an annual rate of up to 0.25% of average daily net assets. DIDI in turn has various agreements with financial services firms that provide these services and pays these fees based upon the assets of shareholder accounts the firms service. For the year ended September 30, 2009, the Service Fee was as follows:
Service Fee | Total Aggregated | Unpaid at September 30, 2009 | Annual Effective Rate |
| Class A | $ 1,659,068 | $ 487,531 | .24% |
| Class B | 6,651 | 4,225 | .24% |
| Class C | 530,886 | 184,589 | .25% |
| $ 2,196,605 | $ 676,345 |
|
Underwriting Agreement and Contingent Deferred Sales Charge. DIDI is the principal underwriter for the Fund. Underwriting commissions paid in connection with the distribution of Class A shares for the year ended September 30, 2009 aggregated $218,300.
In addition, DIDI receives any contingent deferred sales charge ("CDSC") from Class B share redemptions occurring within six years of purchase and Class C share redemptions occurring within one year of purchase. There is no such charge upon redemption of any share appreciation or reinvested dividends. The CDSC is based on declining rates ranging from 4% to 1% for Class B and 1% for Class C, of the value of the shares redeemed. For the year ended September 30, 2009, the CDSC for Class B and C shares aggregated $5,895 and $88,169, respectively. A deferred sales charge of up to 0.50% is assessed on certain redemptions of Class A shares. For the year ended September 30, 2009, DIDI received $23,182 for Class A shares.
Typesetting and Filing Service Fees. Under an agreement with DIMA, DIMA is compensated for providing typesetting and certain regulatory filing services to the Fund. For the year ended September 30, 2009, the amount charged to the Fund by DIMA included in the Statement of Operations under "reports to shareholders" aggregated $48,165, of which $11,602 is unpaid.
Trustees' Fees and Expenses. The Fund paid each Trustee not affiliated with the Advisor retainer fees plus specified amounts for various committee services and for the Board Chairperson.
Affiliated Cash Management Vehicles. The Fund may invest cash balances that have not been invested in portfolio securities in affiliated funds managed by the Advisor. Prior to October 2, 2009, the Fund invested in Cash Management QP Trust (the "QP Trust"). Effective October 2, 2009, the QP Trust merged into the Central Cash Management Fund. The Central Cash Management Fund seeks to provide as high a level of current income as is consistent with the preservation of capital and the maintenance of liquidity. Affiliated cash management vehicles do not pay the Advisor a management fee.
D. Fee Reductions
The Fund has entered into an arrangement with its custodian and transfer agent whereby credits realized as a result of uninvested cash balances are used to reduce a portion of the Fund's custodian expenses. During the year ended September 30, 2009, the Fund's custodian fee was reduced by $ 2,371 and $38, respectively, for custody and transfer agent credits earned.
E. Line of Credit
The Fund and other affiliated funds (the "Participants") share in a $450 million revolving credit facility provided by a syndication of banks. The Fund may borrow for temporary or emergency purposes, including the meeting of redemption requests that otherwise might require the untimely disposition of securities. The Participants are charged an annual commitment fee, which is allocated based on net assets, among each of the Participants. Interest is calculated at a rate per annum equal to the sum of the Federal Funds Rate plus 1.25 percent plus if LIBOR exceeds the Federal Funds Rate the amount of such excess. The Fund may borrow up to a maximum of 33 percent of its net assets under the agreement.
F. Share Transactions
The following table summarizes share and dollar activity in the Fund:
| Year Ended September 30, 2009 | Year Ended September 30, 2008 | ||
| Shares | Dollars | Shares | Dollars |
Shares sold | ||||
| Class A | 79,668,475 | $ 722,400,815 | 53,344,693 | $ 519,834,931 |
| Class B | 22,254 | 197,699 | 43,622 | 426,195 |
| Class C | 21,516,412 | 195,222,062 | 8,607,658 | 83,969,179 |
| Class S | 49,878,513 | 454,287,504 | 29,998,347 | 293,254,988 |
| Institutional Class | 942,056 | 8,498,312 | 5,351,265* | 51,162,227* |
| |
| $ 1,380,606,392 |
| $ 948,647,520 |
Shares issued to shareholders in reinvestment of distributions | ||||
| Class A | 3,197,242 | $ 28,806,118 | 2,213,935 | $ 21,458,427 |
| Class B | 9,771 | 87,281 | 21,063 | 205,482 |
| Class C | 686,778 | 6,187,524 | 563,809 | 5,469,891 |
| Class S | 3,735,498 | 33,649,238 | 4,305,821 | 41,902,761 |
| Institutional Class | 149,625 | 1,328,046 | 18,253* | 172,311* |
| |
| $ 70,058,207 |
| $ 69,208,872 |
Shares redeemed | ||||
| Class A | (44,717,389) | $ (403,731,875) | (21,305,463) | $ (206,076,589) |
| Class B | (244,288) | (2,191,168) | (329,518) | (3,215,165) |
| Class C | (6,088,461) | (54,798,788) | (3,400,419) | (32,955,463) |
| Class S | (38,315,163) | (345,434,999) | (29,725,361) | (288,969,415) |
| Institutional Class | (5,120,743) | (45,830,083) | — | — |
| |
| $ (851,986,913) |
| $ (531,216,632) |
Redemption fees |
| $ 59,512 |
| $ 73,795 |
Net increase (decrease) | ||||
| Class A | 38,148,328 | $ 347,514,053 | 34,253,165 | $ 335,264,399 |
| Class B | (212,263) | (1,906,188) | (264,833) | (2,583,488) |
| Class C | 16,114,729 | 146,615,156 | 5,771,048 | 56,485,902 |
| Class S | 15,298,848 | 142,517,902 | 4,578,807 | 46,212,204 |
| Institutional Class | (4,029,062) | (36,003,725) | 5,369,518* | 51,334,538* |
| |
| $ 598,737,198 |
| $ 486,713,555 |
G. Review for Subsequent Events
Management has reviewed the events and transactions from October 1, 2009 through November 25, 2009, the date the financial statements were available to be issued, for subsequent events, and has determined that there were no material events that would require disclosure in the Fund's financial statements through this date.
Report of Independent Registered Public Accounting Firm
To the Board of Trustees of DWS Advisor Funds and the Shareholders of DWS Short Duration Plus Fund:
In our opinion, the accompanying statement of assets and liabilities and the related statements of operations and of changes in net assets and the financial highlights present fairly, in all material respects, the financial position of DWS Short Duration Plus Fund (the "Fund") at September 30, 2009, the results of its operations for the year then ended, the changes in its net assets for each of the two years in the period then ended, and the financial highlights for each of the four years ended September 30, 2009, in conformity with accounting principles generally accepted in the United States of America. These financial statements and financial highlights (hereafter referred to as "financial statements") are the responsibility of the Fund's management. Our responsibility is to express an opinion on these financial statements based on our audits. We conducted our audits of these financial statements in accordance with the standards of the Public Company Accounting Oversight Board (United States). Those standards require that we plan and perform the audit to obtain reasonable assurance about whether the financial statements are free of material misstatement. An audit includes examining, on a test basis, evidence supporting the amounts and disclosures in the financial statements, assessing the accounting principles used and significant estimates made by management, and evaluating the overall financial statement presentation. We believe that our audits, which included confirmation of securities at September 30, 2009 by correspondence with the custodian and brokers, provide a reasonable basis for our opinion.
Boston, Massachusetts | PricewaterhouseCoopers LLP |
A total of 3% of the dividends distributed during the fiscal year was derived from interest on US government securities, which is generally exempt from state income tax.
Please consult a tax advisor if you have questions about federal or state income tax laws, or how to prepare your tax returns. If you have specific questions about your account, please call (800) 621-1048.
Investment Management Agreement Approval
The Board of Trustees, including the Independent Trustees, approved the renewal of your Fund's investment management agreement (the "Agreement") with Deutsche Investment Management Americas Inc. ("DWS") in September 2009.
In terms of the process that the Board followed prior to approving the Agreement, shareholders should know that:
• In September 2009, all but one of the Fund's Trustees were independent of DWS and its affiliates.
• The Trustees meet frequently to discuss fund matters. Each year, the Trustees dedicate substantial time to contract review matters. Over the course of several months, the Board's Contract Committee, in coordination with the Board's Fixed Income and Quant Oversight Committee, reviewed comprehensive materials received from DWS, independent third parties and independent counsel. These materials included an analysis of the Fund's performance, fees and expenses, and profitability compiled by the Fund's independent fee consultant. The Board also received extensive information throughout the year regarding performance of the Fund.
• The Independent Trustees regularly meet privately with their independent counsel to discuss contract review and other matters. In addition, the Independent Trustees were also advised by the Fund's independent fee consultant in the course of their review of the Fund's contractual arrangements and considered a comprehensive report prepared by the independent fee consultant in connection with their deliberations (the "IFC Report").
• In connection with reviewing the Agreement, the Board also reviewed the terms of the Fund's Rule 12b-1 plan, distribution agreement, administrative services agreement, transfer agency agreement and other material service agreements.
• Based on its evaluation of the information provided, the Contract Committee presented its findings and recommendations to the Independent Trustees as a group. The Independent Trustees reviewed the Contract Committee's findings and recommendations and presented their recommendations to the full Board.
In connection with the contract review process, the Contract Committee and the Board considered the factors discussed below, among others. The Board also considered that DWS and its predecessors have managed the Fund since its inception, and the Board believes that a long-term relationship with a capable, conscientious advisor is in the best interests of the Fund. The Board considered, generally, that shareholders chose to invest or remain invested in the Fund knowing that DWS managed the Fund, and that the Agreement was approved by the Fund's shareholders. DWS is part of Deutsche Bank, a major global banking institution that is engaged in a wide range of financial services. The Board believes that there are significant advantages to being part of a global asset management business that offers a wide range of investing expertise and resources, including hundreds of portfolio managers and analysts with research capabilities in many countries throughout the world.
While shareholders may focus primarily on fund performance and fees, the Fund's Board considers these and many other factors, including the quality and integrity of DWS's personnel and such other issues as back-office operations, fund valuations, and compliance policies and procedures.
Nature, Quality and Extent of Services. The Board considered the terms of the Agreement, including the scope of advisory services provided under the Agreement. The Board noted that, under the Agreement, DWS provides portfolio management services to the Fund and that, pursuant to a separate administrative services agreement, DWS provides administrative services to the Fund. The Board considered the experience and skills of senior management and investment personnel, the resources made available to such personnel, the ability of DWS to attract and retain high-quality personnel, and the organizational depth and stability of DWS. The Board reviewed the Fund's performance over short-term and long-term periods and compared those returns to various agreed-upon performance measures, including market indices and a peer universe compiled by the independent fee consultant using information supplied by Lipper Inc. ("Lipper"). The Board also noted that it has put into place a process of identifying "Focus Funds" (e.g., funds performing poorly relative to their benchmark or a peer universe compiled by Lipper), and receives more frequent reporting and information from DWS regarding such funds, along with DWS's remedial plans to address underperformance. The Board believes this process is an effective manner of identifying and addressing underperforming funds. Based on the information provided, the Board noted that for the one-, three- and five-year periods ended December 31, 2008, the Fund's performance (Class A shares) was in the 3rd quartile, 3rd quartile and 1st quartile, respectively, of the applicable Lipper universe (the 1st quartile being the best performers and the 4th quartile being the worst performers). The Board also observed that the Fund has underperformed its benchmark in each of the one-, three- and five-year periods ended December 31, 2008.
On the basis of this evaluation and the ongoing review of investment results by the Board, the Board concluded that the nature, quality and extent of services provided by DWS historically have been and continue to be satisfactory.
Fees and Expenses. The Board considered the Fund's investment management fee schedule, operating expenses, and total expense ratios, and comparative information provided by Lipper and the independent fee consultant regarding investment management fee rates paid to other investment advisors by similar funds (1st quartile being the most favorable and 4th quartile being the least favorable). With respect to management fees paid to other investment advisors by similar funds, the Board noted that the contractual fee rates paid by the Fund, which include the 0.10% fee paid to DWS under the Fund's administrative services agreement, were higher than the median (4th quartile) of the applicable Lipper peer group (based on Lipper data provided as of December 31, 2008). The Board also reviewed data comparing each share class's total (net) operating expenses to the applicable Lipper expense universe. The Board concluded that the comparative Lipper operating expense data was of limited utility, as it likely significantly understated the current expense ratios of many peer funds due to the substantial declines in net assets as a result of market losses and net redemptions that many funds experienced between mid-September 2008 and March 2009 and that were not reflected in the data. The Board also noted that the expense limitations agreed to by DWS helped to ensure that the Fund's total (net) operating expenses would remain competitive.
The information considered by the Board as part of their review of management fees included information regarding fees charged by DWS and its affiliates to similar institutional accounts and to similar funds managed by the same portfolio management teams but offered primarily to European investors ("DWS Europe funds"), in each case as applicable. The Board observed that advisory fee rates for institutional accounts generally were lower than the management fees charged by similarly managed DWS US mutual funds ("DWS Funds"), but also took note of the differences in services provided to DWS Funds as compared to institutional accounts. In the case of DWS Europe funds, the Board observed that fee rates for DWS Europe funds generally were higher than for similarly managed DWS Funds, but noted that differences in the types of services provided to DWS Funds relative to DWS Europe funds made it difficult to compare such fees.
On the basis of the information provided, the Board concluded that management fees were reasonable and appropriate in light of the nature, quality and extent of services provided by DWS.
Profitability. The Board reviewed detailed information regarding revenues received by DWS under the Agreement. The Board considered the estimated costs and pre-tax profits realized by DWS from advising the DWS Funds, as well as estimates of the pre-tax profits attributable to managing the Fund in particular. The Board also received information regarding the estimated enterprise-wide profitability of DWS and its affiliates with respect to all fund services in totality and by fund. The Board reviewed DWS's methodology in allocating its costs to the management of the Fund. Based on the information provided, the Board concluded that the pre-tax profits realized by DWS in connection with the management of the Fund were not unreasonable. The Board also reviewed information regarding the profitability of certain similar investment management firms. The Board noted that while information regarding the profitability of such firms is limited (and in some cases is not necessarily prepared on a comparable basis), DWS and its affiliates' overall profitability with respect to the DWS fund complex (after taking into account distribution and other services provided to the funds by DWS and its affiliates) was lower than the overall profitability levels of many comparable firms for which such data was available.
Economies of Scale. The Board considered whether there are economies of scale with respect to the management of the Fund and whether the Fund benefits from any economies of scale. The Board noted that the Fund's management fee schedule includes fee breakpoints. The Board concluded that the Fund's fee schedule represents an appropriate sharing between the Fund and DWS of such economies of scale as may exist in the management of the Fund at current asset levels.
Other Benefits to DWS and Its Affiliates. The Board also considered the character and amount of other incidental benefits received by DWS and its affiliates, including any fees received by DWS for administrative services provided to the Fund and any fees received by an affiliate of DWS for distribution services. The Board also considered benefits to DWS related to brokerage and soft-dollar allocations, including allocating brokerage to pay for research generated by parties other than the executing broker dealers, which pertain primarily to funds investing in equity securities, along with the incidental public relations benefits to DWS related to DWS Funds advertising and cross-selling opportunities among DWS products and services. The Board concluded that management fees were reasonable in light of these fallout benefits.
Compliance. The Board considered the significant attention and resources dedicated by DWS to documenting and enhancing its compliance processes in recent years. The Board noted in particular (i) the experience and seniority of both DWS's chief compliance officer and the Fund's chief compliance officer; (ii) the large number of DWS compliance personnel; and (iii) the substantial commitment of resources by DWS and its affiliates to compliance matters.
Based on all of the information considered and the conclusions reached, the Board unanimously (including the Independent Trustees) determined that the continuation of the Agreement is in the best interests of the Fund. In making this determination the Board did not give particular weight to any single factor identified above. The Board considered these factors over the course of numerous meetings, certain of which were in executive session with only the Independent Trustees and their counsel present. It is possible that individual Trustees may have weighed these factors differently in reaching their individual decisions to approve the continuation of the Agreement.
Summary of Management Fee Evaluation by Independent Fee Consultant
October 9, 2009, As Revised November 20, 2009
Pursuant to an Order entered into by Deutsche Investment Management Americas and affiliates (collectively, "DeAM") with the Attorney General of New York, I, Thomas H. Mack, have been appointed the Independent Fee Consultant for the DWS Funds (formerly the DWS Scudder Funds). My duties include preparing an annual written evaluation of the management fees DeAM charges the Funds, considering among other factors the management fees charged by other mutual fund companies for like services, management fees DeAM charges other clients for like services, DeAM's costs of supplying services under the management agreements and related profit margins, possible economies of scale if a Fund grows larger, and the nature and quality of DeAM's services, including fund performance. This report summarizes my evaluation for 2009, including my qualifications, the evaluation process for each of the DWS Funds, consideration of certain complex-level factors, and my conclusions. I served in substantially the same capacity in 2007 and 2008.
Qualifications
For more than 35 years I have served in various professional capacities within the investment management business. I have held investment analysis and advisory positions, including securities analyst, portfolio strategist and director of investment policy with a large investment firm. I have also performed business management functions, including business development, financial management and marketing research and analysis.
Since 1991, I have been an independent consultant within the asset management industry. I have provided services to over 125 client organizations, including investment managers, mutual fund boards, product distributors and related organizations. Over the past ten years I have completed a number of assignments for mutual fund boards, specifically including assisting boards with management contract renewal.
I hold a Master of Business Administration degree, with highest honors, from Harvard University and Master of Science and Bachelor of Science (highest honors) degrees from the University of California at Berkeley. I am an independent director and audit committee financial expert for two closed-end mutual funds and serve in various leadership and financial oversight capacities with non-profit organizations.
Evaluation of Fees for each DWS Fund
My work focused primarily on evaluating, fund-by-fund, the fees charged to each of the 124 publicly offered Fund portfolios in the DWS Fund family. For each Fund, I considered each of the key factors mentioned above, as well as any other relevant information. In doing so I worked closely with the Funds' Independent Directors in their annual contract renewal process, as well as in their approval of contracts for several new funds (documented separately).
In evaluating each Fund's fees, I reviewed comprehensive materials provided by or on behalf of DeAM, including expense information prepared by Lipper Analytical, comparative performance information, profitability data, manager histories, and other materials. I also accessed certain additional information from the Lipper, Strategic Insight, and Morningstar databases and drew on my industry knowledge and experience.
To facilitate evaluating this considerable body of information, I prepared for each Fund a document summarizing the key data elements in each area as well as additional analytics discussed below. This made it possible to consider each key data element in the context of the others.
In the course of contract renewal, DeAM agreed to implement a number of fee and expense adjustments requested by the Independent Directors which will favorably impact future fees and expenses, and my evaluation includes the effects of these changes.
Fees and Expenses Compared with Other Funds
The competitive fee and expense evaluation for each fund focused on two primary comparisons:
The Fund's contractual management fee (the advisory fee plus the administration fee where applicable) compared with those of a group of typically 12-15 funds in the same Lipper investment category (e.g. Large Capitalization Growth) having similar distribution arrangements and being of similar size.
The Fund's total expenses compared with a broader universe of funds from the same Lipper investment category and having similar distribution arrangements.
These two comparisons provide a view of not only the level of the fee compared with funds of similar scale but also the total expense the Fund bears for all the services it receives, in comparison with the investment choices available in the Fund's investment category and distribution channel. The principal figure-of-merit used in these comparisons was the subject Fund's percentile ranking against peers.
DeAM's Fees for Similar Services to Others
DeAM provided management fee schedules for all of its US domiciled fund and non-fund investment management accounts in any of the investment categories where there is a DWS Fund. These similar products included the other DWS Funds, non-fund pooled accounts, institutional accounts and sub-advisory accounts. Using this information, I calculated for each Fund the fee that would be charged to each similar product, at the subject Fund's asset level.
Evaluating information regarding non-fund products is difficult because there are varying levels of services required for different types of accounts, with mutual funds generally requiring considerably more regulatory and administrative types of service as well as having more frequent cash flows than other types of accounts. Also, while mutual fund fees for similar fund products can be expected to be similar, there will be some differences due to different pricing conditions in different distribution channels (e.g. retail funds versus those used in variable insurance products), differences in underlying investment processes and other factors.
Costs and Profit Margins
DeAM provided a detailed profitability analysis for each Fund. After making some adjustments so that the presentation would be more comparable to the available industry figures, I reviewed profit margins from investment management alone, from investment management plus other fund services (excluding distribution) provided to the Funds by DeAM (principally shareholder services), and DeAM profits from all sources, including distribution. A later section comments on overall profitability.
Economies of Scale
Economies of scale — an expected decline in management cost per dollar of fund assets as fund assets grow — are very rarely quantified and documented because of inherent difficulties in collecting and analyzing relevant data. However, in virtually every investment category that I reviewed, larger funds tend to have lower fees and lower total expenses than smaller funds. To see how each DWS Fund compares with this industry observation, I reviewed:
The trend in Fund assets over the last five years and the accompanying trend in total expenses. This shows if the Fund has grown and, if so, whether total expense (management fees as well as other expenses) have declined as a percent of assets.
Whether the Fund has break-points in its management fee schedule, the extent of the fee reduction built into the schedule and the asset levels where the breaks take effect, and in the case of a sub-advised Fund how the Fund's break-points compare with those of the sub-advisory fee schedule.
How the Fund's contractual fee schedule compares with trends in the industry data. To accomplish this, I constructed a chart showing how actual latest-fiscal-year contractual fees of the Fund and of other similar funds relate to average fund assets, with the subject Fund's contractual fee schedule superimposed.
Quality of Service — Performance
The quality-of-service evaluation focused on investment performance, which is the principal result of the investment management service. Each Fund's performance was reviewed over the past 1, 3, 5 and 10 years, as applicable, and compared with that of other funds in the same investment category and with a suitable market index.
In addition, I calculated and reviewed risk-adjusted returns relative to an index of similar mutual funds' returns and a suitable market index. The risk-adjusted returns analysis provides a way of determining the extent to which the Fund's return comparisons are mainly the product of investment value-added (or lack thereof) or alternatively taking considerably more or less risk than is typical in its investment category.
I also received and considered the history of portfolio manager changes for each Fund, as this provided an important context for evaluating the performance results.
Complex-Level Considerations
While this evaluation was conducted mainly at the individual fund level, there are some issues relating to the reasonableness of fees that can alternatively be considered across the whole fund complex:
I reviewed DeAM's profitability analysis for all DWS Funds, with a view toward determining if the allocation procedures used were reasonable and how profit levels compared with public data for other investment managers.
I considered whether DeAM and affiliates receive any significant ancillary or "fall-out" benefits that should be considered in interpreting the direct profitability results. These would be situations where serving as the investment manager of the Funds is beneficial to another part of the Deutsche Bank organization.
I considered how aggregated DWS Fund expenses had varied over the years, by asset class and in the context of trends in asset levels.
I reviewed the structure of the DeAM organization, trends in staffing levels, and information on compensation of investment management and other professionals compared with industry data.
Findings
Based on the process and analysis discussed above, which included reviewing a wide range of information from management and external data sources and considering among other factors the fees DeAM charges other clients, the fees charged by other fund managers, DeAM's costs and profits associated with managing the Funds, economies of scale, possible fall-out benefits, and the nature and quality of services provided, in my opinion the management fees charged the DWS Funds are reasonable.

Thomas H. Mack
The following table presents certain information regarding the Board Members and Officers of the Trust as of September 30, 2009. Each Board Member's year of birth is set forth in parentheses after his or her name. Unless otherwise noted, (i) each Board Member has engaged in the principal occupation(s) noted in the table for at least the most recent five years, although not necessarily in the same capacity; and (ii) the address of each Independent Board Member is c/o Dawn-Marie Driscoll, PO Box 100176, Cape Coral, FL 33904. Except as otherwise noted below, the term of office for each Board Member is until the election and qualification of a successor, or until such Board Member sooner dies, resigns, is removed or as otherwise provided in the governing documents of the fund. Because the fund does not hold an annual meeting of shareholders, each Board Member will hold office for an indeterminate period. The Board Members may also serve in similar capacities with other funds in the fund complex. The Length of Time Served represents the year in which the Board Member joined the board of one or more DWS funds now overseen by the Board.
Independent Board Members | ||
Name, Year of Birth, Position with the Fund and Length of Time Served1 | Business Experience and Directorships During the Past Five Years | Number of Funds in DWS Fund Complex Overseen |
| Paul K. Freeman (1950) Chairperson since 20092 Board Member since 1993 | Consultant, World Bank/Inter-American Development Bank; Governing Council of the Independent Directors Council (governance, executive committees); formerly, Project Leader, International Institute for Applied Systems Analysis (1998-2001); Chief Executive Officer, The Eric Group, Inc. (environmental insurance) (1986-1998) | 124 |
| John W. Ballantine (1946) Board Member since 1999 | Retired; formerly, Executive Vice President and Chief Risk Management Officer, First Chicago NBD Corporation/The First National Bank of Chicago (1996-1998); Executive Vice President and Head of International Banking (1995-1996). Directorships: Healthways, Inc. (provider of disease and care management services); Portland General Electric (utility company); Stockwell Capital Investments PLC (private equity). Former Directorships: First Oak Brook Bancshares, Inc. and Oak Brook Bank | 124 |
| Henry P. Becton, Jr. (1943) Board Member since 1990 | Vice Chair, WGBH Educational Foundation. Directorships: Association of Public Television Stations; Becton Dickinson and Company3 (medical technology company); Belo Corporation3 (media company); Boston Museum of Science; Public Radio International; PRX, The Public Radio Exchange; The PBS Foundation. Former Directorships: American Public Television; Concord Academy; New England Aquarium; Mass. Corporation for Educational Telecommunications; Committee for Economic Development; Public Broadcasting Service | 124 |
| Dawn-Marie Driscoll (1946) Board Member since 1987 | President, Driscoll Associates (consulting firm); Executive Fellow, Center for Business Ethics, Bentley University; formerly, Partner, Palmer & Dodge (1988-1990); Vice President of Corporate Affairs and General Counsel, Filene's (1978-1988). Directorships: Trustee of 20 open-end mutual funds managed by Sun Capital Advisers, Inc. (since 2007); Director of ICI Mutual Insurance Company (since 2007); Advisory Board, Center for Business Ethics, Bentley University; Trustee, Southwest Florida Community Foundation (charitable organization). Former Directorships: Investment Company Institute (audit, executive, nominating committees) and Independent Directors Council (governance, executive committees) | 124 |
| Keith R. Fox (1954) Board Member since 1996 | Managing General Partner, Exeter Capital Partners (a series of private equity funds). Directorships: Progressive Holding Corporation (kitchen goods importer and distributor); Natural History, Inc. (magazine publisher); Box Top Media Inc. (advertising); The Kennel Shop (retailer) | 124 |
| Kenneth C. Froewiss (1945) Board Member since 2001 | Adjunct Professor of Finance, NYU Stern School of Business (September 2009-present; Clinical Professor from 1997-September 2009); Member, Finance Committee, Association for Asian Studies (2002-present); Director, Mitsui Sumitomo Insurance Group (US) (2004-present); prior thereto, Managing Director, J.P. Morgan (investment banking firm) (until 1996) | 124 |
| Richard J. Herring (1946) Board Member since 1990 | Jacob Safra Professor of International Banking and Professor, Finance Department, The Wharton School, University of Pennsylvania (since July 1972); Co-Director, Wharton Financial Institutions Center (since July 2000); Director, Japan Equity Fund, Inc. (since September 2007), Thai Capital Fund, Inc. (since September 2007), Singapore Fund, Inc. (since September 2007). Formerly, Vice Dean and Director, Wharton Undergraduate Division (July 1995-June 2000); Director, Lauder Institute of International Management Studies (July 2000-June 2006) | 124 |
| William McClayton (1944) Board Member since 2004 | Managing Director, Diamond Management & Technology Consultants, Inc. (global management consulting firm) (2001-present); Directorship: Board of Managers, YMCA of Metropolitan Chicago; formerly: Senior Partner, Arthur Andersen LLP (accounting) (1966-2001); Trustee, Ravinia Festival | 124 |
| Rebecca W. Rimel (1951) Board Member since 1995 | President and Chief Executive Officer, The Pew Charitable Trusts (charitable organization) (1994 to present); Trustee, Thomas Jefferson Foundation (charitable organization) (1994 to present); Trustee, Executive Committee, Philadelphia Chamber of Commerce (2001-2007); Trustee, Pro Publica (2007-present) (charitable organization); Director, CardioNet, Inc.3 (2009-present) (health care). Formerly, Executive Vice President, The Glenmede Trust Company (investment trust and wealth management) (1983-2004); Board Member, Investor Education (charitable organization) (2004-2005); Director, Viasys Health Care3 (January 2007-June 2007) | 124 |
| William N. Searcy, Jr. (1946) Board Member since 1993 | Private investor since October 2003; Trustee of 20 open-end mutual funds managed by Sun Capital Advisers, Inc. (since October 1998). Formerly, Pension & Savings Trust Officer, Sprint Corporation3 (telecommunications) (November 1989-September 2003) | 124 |
| Jean Gleason Stromberg (1943) Board Member since 1997 | Retired. Formerly, Consultant (1997-2001); Director, US Government Accountability Office (1996-1997); Partner, Fulbright & Jaworski, L.L.P. (law firm) (1978-1996). Directorships: The William and Flora Hewlett Foundation; Business Leadership Council, Wellesley College. Former Directorships: Service Source, Inc., Mutual Fund Directors Forum (2002-2004), American Bar Retirement Association (funding vehicle for retirement plans) (1987-1990 and 1994-1996) | 124 |
| Robert H. Wadsworth (1940) Board Member since 1999 | President, Robert H. Wadsworth & Associates, Inc. (consulting firm) (1983 to present); Director, The Phoenix Boys Choir Association | 127 |
Interested Board Member | ||
Name, Year of Birth, Position with the Fund and Length of Time Served1 | Business Experience and Directorships During the Past Five Years | Number of Funds in Fund Complex Overseen |
| Axel Schwarzer4 (1958) Board Member since 2006 | Managing Director5, Deutsche Asset Management; Vice Chairman5 of Deutsche Asset Management and Member of the Management Board of DWS Investments, responsible for Global Relationship Management; formerly: Head of Deutsche Asset Management Americas (2005-2009); CEO of DWS Investments (2005-2009); board member of DWS Investments, Germany (1999-2005); Head of Sales and Product Management for the Retail and Private Banking Division of Deutsche Bank in Germany (1997-1999); various strategic and operational positions for Deutsche Bank Germany Retail and Private Banking Division in the field of investment funds, tax driven instruments and asset management for corporates (1989-1996) | 124 |
Officers6 | |
Name, Year of Birth, Position with the Fund and Length of Time Served7 | Principal Occupation(s) During Past 5 Years and Other Directorships Held |
| Michael G. Clark8 (1965) President, 2006-present | Managing Director5, Deutsche Asset Management (2006-present); President of DWS family of funds; Director, ICI Mutual Insurance Company (since October 2007); formerly, Director of Fund Board Relations (2004-2006) and Director of Product Development (2000-2004), Merrill Lynch Investment Managers; Senior Vice President Operations, Merrill Lynch Asset Management (1999-2000) |
| John Millette9 (1962) Vice President and Secretary, 1999-present | Director5, Deutsche Asset Management |
| Paul H. Schubert8 (1963) Chief Financial Officer, 2004-present Treasurer, 2005-present | Managing Director5, Deutsche Asset Management (since July 2004); formerly, Executive Director, Head of Mutual Fund Services and Treasurer for UBS Family of Funds (1998-2004); Vice President and Director of Mutual Fund Finance at UBS Global Asset Management (1994-1998) |
| Caroline Pearson9 (1962) Assistant Secretary, 1997-present | Managing Director5, Deutsche Asset Management |
| Rita Rubin10 (1970) Assistant Secretary, 2009-present | Vice President and Counsel, Deutsche Asset Management (since October 2007); formerly, Vice President, Morgan Stanley Investment Management (2004-2007); Attorney, Shearman & Sterling LLP (2004); Vice President and Associate General Counsel, UBS Global Asset Management (2001-2004) |
| Paul Antosca9 (1957) Assistant Treasurer, 2007-present | Director5, Deutsche Asset Management (since 2006); Vice President, The Manufacturers Life Insurance Company (U.S.A.) (1990-2006) |
| Jack Clark9 (1967) Assistant Treasurer, 2007-present | Director5, Deutsche Asset Management (since 2007); formerly, Vice President, State Street Corporation (2002-2007) |
| Diane Kenneally9 (1966) Assistant Treasurer, 2007-present | Director5, Deutsche Asset Management |
| Jason Vazquez10 (1972) Anti-Money Laundering Compliance Officer, 2007-present | Vice President, Deutsche Asset Management (since 2006); formerly, AML Operations Manager for Bear Stearns (2004-2006), Supervising Compliance Principal and Operations Manager for AXA Financial (1999-2004) |
| Robert Kloby10 (1962) Chief Compliance Officer, 2006-present | Managing Director5, Deutsche Asset Management |
| J. Christopher Jackson10 (1951) Chief Legal Officer, 2006-present | Director5, Deutsche Asset Management (2006-present); formerly, Director, Senior Vice President, General Counsel and Assistant Secretary, Hansberger Global Investors, Inc. (1996-2006); Director, National Society of Compliance Professionals (2002-2005) (2006-2009) |
2 Mr. Freeman assumed the Chairperson role as of January 1, 2009. Prior to that Ms. Driscoll served as Chairperson of certain DWS funds since 2004.
3 A publicly held company with securities registered pursuant to Section 12 of the Securities Exchange Act of 1934.
4 The mailing address of Axel Schwarzer is DWS Investment GmbH, Mainzer Landstr. 178-190, Floor 5C, 60327 Frankfurt am Main, Germany. Mr. Schwarzer is an interested Board Member by virtue of his positions with Deutsche Asset Management. As an interested person, Mr. Schwarzer receives no compensation from the fund.
5 Executive title, not a board directorship.
6 As a result of their respective positions held with the Advisor, these individuals are considered "interested persons" of the Advisor within the meaning of the 1940 Act. Interested persons receive no compensation from the fund.
7 The length of time served represents the year in which the officer was first elected in such capacity for one or more DWS funds.
8 Address: 345 Park Avenue, New York, New York 10154.
9 Address: One Beacon Street, Boston, MA 02108.
10 Address: 280 Park Avenue, New York, New York 10017.
The fund's Statement of Additional Information ("SAI") includes additional information about the Board Members. The SAI is available, without charge, upon request. If you would like to request a copy of the SAI, you may do so by calling the following toll-free number: (800) 621-1048.
| |
For More Information | The automated telephone system allows you to access personalized account information and obtain information on other DWS funds using either your voice or your telephone keypad. Certain account types within Classes A, B, C and S also have the ability to purchase, exchange or redeem shares using this system. For more information, contact your financial advisor. You may also access our automated telephone system or speak with a DWS Investments representative by calling the appropriate number below: For shareholders of Classes A, B and C: (800) 621-1048For shareholders of Class S: (800) 728-3337 |
Web Site | www.dws-investments.com View your account transactions and balances, trade shares, monitor your asset allocation, and change your address, 24 hours a day.Obtain prospectuses and applications, blank forms, interactive worksheets, news about DWS funds, subscription to fund updates by e-mail, retirement planning information, and more. |
Written Correspondence | DWS Investments PO Box 219151Kansas City, MO 64121-9151 |
Proxy Voting | The fund's policies and procedures for voting proxies for portfolio securities and information about how the fund voted proxies related to its portfolio securities during the 12-month period ended June 30 are available on our Web site — www.dws-investments.com (click on "proxy voting"at the bottom of the page) — or on the SEC's Web site — www.sec.gov. To obtain a written copy of the fund's policies and procedures without charge, upon request, call us toll free at (800) 621-1048. |
Principal Underwriter | If you have questions, comments or complaints, contact: DWS Investments Distributors, Inc. 222 South Riverside PlazaChicago, IL 60606-5808 (800) 621-1148 |
| Class A | Class B | Class C | Class S | InstitutionalClass |
Nasdaq Symbol | PPIAX | PPLBX | PPLCX | DBPIX | PPILX |
CUSIP Number | 23336Y 748 | 23336Y 623 | 23336Y 730 | 23336Y 755 | 23336Y 772 |
Fund Number | 418 | 618 | 718 | 822 | 1422 |

ITEM 2. | CODE OF ETHICS |
|
|
| As of the end of the period, September 30, 2009, DWS Short Duration Plus Fund has a code of ethics, as defined in Item 2 of Form N-CSR, that applies to its Principal Executive Officer and Principal Financial Officer.
There have been no amendments to, or waivers from, a provision of the code of ethics during the period covered by this report that would require disclosure under Item 2.
A copy of the code of ethics is filed as an exhibit to this Form N-CSR.
|
|
|
ITEM 3. | AUDIT COMMITTEE FINANCIAL EXPERT |
|
|
| The Funds’ audit committee is comprised solely of trustees who are “independent” (as such term has been defined by the Securities and Exchange Commission (“SEC”) in regulations implementing Section 407 of the Sarbanes-Oxley Act (the “Regulations”)). The Funds’ Board of Trustees has determined that there are several “audit committee financial experts” (as such term has been defined by the Regulations) serving on the Funds’ audit committee including Mr. William McClayton, the chair of the Funds’ audit committee. The SEC has stated that an audit committee financial expert is not an “expert” for any purpose, including for purposes of Section 11 of the Securities Act of 1933 and the designation or identification of a person as an audit committee financial expert pursuant to this Item 3 of Form N-CSR does not impose on such person any duties, obligations or liability that are greater than the duties, obligations and liability imposed on such person as a member of the audit committee and board of directors in the absence of such designation or identification. |
|
|
ITEM 4. | PRINCIPAL ACCOUNTANT FEES AND SERVICES |
|
|
DWS SHORT DURATION PLUS FUND
FORM N-CSR DISCLOSURE RE: AUDIT FEES
The following table shows the amount of fees that PricewaterhouseCoopers, LLP (“PWC”), the Fund’s independent registered public accounting firm, billed to the Fund during the Fund’s last two fiscal years. The Audit Committee approved in advance all audit services and non-audit services that PWC provided to the Fund.
Services that the Fund’s Independent Registered Public Accounting Firm Billed to the Fund
Fiscal Year | Audit Fees Billed to Fund | Audit-Related | Tax Fees Billed to Fund | All |
2009 | $61,368 | $0 | $0 | $0 |
2008 | $63,092 | $0 | $0 | $0 |
Services that the Fund’s Independent Registered Public Accounting Firm Billed to the Adviser and Affiliated Fund Service Providers
The following table shows the amount of fees billed by PWC to Deutsche Investment Management Americas, Inc. (“DeIM” or the “Adviser”), and any entity controlling, controlled by or under common control with DeIM (“Control Affiliate”) that provides ongoing services to the Fund (“Affiliated Fund Service Provider”), for engagements directly related to the Fund’s operations and financial reporting, during the Fund’s last two fiscal years.
Fiscal Year | Audit-Related | Tax Fees Billed to Adviser and Affiliated Fund Service Providers | All |
2009 | $2,000 | $0 | $0 |
2008 | $0 | $19,000 | $0 |
The “Audit-Related Fees” were billed for services in connection with the agreed-upon procedures and the above “Tax Fees” were billed in connection with tax compliance and tax planning.
Non-Audit Services
The following table shows the amount of fees that PWC billed during the Fund’s last two fiscal years for non-audit services. The Audit Committee pre-approved all non-audit services that PWC provided to the Adviser and any Affiliated Fund Service Provider that related directly to the Fund’s operations and financial reporting. The Audit Committee requested and received information from PWC about any non-audit services that PWC rendered during the Fund’s last fiscal year to the Adviser and any Affiliated Fund Service Provider. The Committee considered this information in evaluating PWC’s independence.
Fiscal Year | Total (A) | Total Non-Audit Fees billed to Adviser and Affiliated Fund Service Providers (engagements related directly to the operations and financial reporting of the Fund) (B) | Total Non-Audit Fees billed to Adviser and Affiliated Fund Service Providers (all other engagements) (C) | Total of (A), (B) |
2009 | $0 | $0 | $0 | $0 |
2008 | $0 | $19,000 | $600,000 | $619,000 |
All other engagement fees were billed for services provided by PWC for services related to consulting on an IT project.
Audit Committee Pre-Approval Policies and Procedures. Generally, each Fund’s Audit Committee must pre approve (i) all services to be performed for a Fund by a Fund’s Independent Registered Public Accounting Firm and (ii) all non-audit services to be performed by a Fund’s Independent Registered Public Accounting Firm for the DIMA Entities with respect to operations and financial reporting of the Fund, except that the Chairperson or Vice Chairperson of each Fund’s Audit Committee may grant the pre-approval for non-audit services described in items (i) and (ii) above for non-prohibited services for engagements of less than $100,000. All such delegated pre approvals shall be presented to each Fund’s Audit Committee no later than the next Audit Committee meeting.
There were no amounts that were approved by the Audit Committee pursuant to the de minimis exception under Rule 2-01 of Regulation S-X.
According to the registrant’s principal Independent Registered Public Accounting Firm, all of the principal Independent Registered Public Accounting Firm's hours spent on auditing the registrant's financial statements were attributed to work performed by full-time permanent employees of the principal Independent Registered Public Accounting Firm.
***
PwC advised the Fund's Audit Committee that PwC has identified two matters that it determined to be inconsistent with the SEC's auditor independence rules. In the first instance, an employee of PwC had power of attorney over an account which included DWS funds. The employee did not perform any audit services for the DWS Funds, but did work on a non audit project for Deutsche Bank AG. In the second instance, an employee of PwC served as a nominee shareholder (effectively equivalent to a Trustee) of various companies/trusts since 2001. Some of these companies held shares of Aberdeen, a sub advisor to certain DWS Funds, and of certain funds sponsored by subsidiaries of Deutsche Bank AG. The trustee relationship has ceased. PwC informed the Audit Committee that these matters could have constituted an investment in an affiliate of an audit client in violation of the Rule 2-01(c)(1) of Regulation S-X. PwC advised the Audit Committee that PwC believes its independence had not been impacted as it related to the audits of the Fund. In reaching this conclusion, PwC noted that during the time of its audit, the engagement team was not aware of the investment and that PwC does not believe these situations affected PwC's ability to act objectively and impartially and to issue a report on financial statements as the funds' independent auditor.
|
|
ITEM 5. | AUDIT COMMITTEE OF LISTED REGISTRANTS |
|
|
| Not Applicable |
|
|
ITEM 6. | SCHEDULE OF INVESTMENTS |
|
|
| Not Applicable |
|
|
ITEM 7. | DISCLOSURE OF PROXY VOTING POLICIES AND PROCEDURES FOR CLOSED-END MANAGEMENT INVESTMENT COMPANIES |
|
|
| Not applicable. |
|
|
ITEM 8. | PORTFOLIO MANAGERS OF CLOSED-END MANAGEMENT INVESTMENT COMPANIES |
|
|
| Not applicable. |
ITEM 9. | PURCHASES OF EQUITY SECURITIES BY CLOSED-END MANAGEMENT INVESTMENT COMPANY AND AFFILIATED PURCHASERS |
|
|
| Not Applicable. |
ITEM 10. | SUBMISSION OF MATTERS TO A VOTE OF SECURITY HOLDERS |
|
|
| The primary function of the Nominating and Governance Committee is to identify and recommend individuals for membership on the Board and oversee the administration of the Board Governance Guidelines. Shareholders may recommend candidates for Board positions by forwarding their correspondence by U.S. mail or courier service to Chairman of the Board, P.O. Box 100176, Cape Coral, FL 33910. |
|
|
ITEM 11. | CONTROLS AND PROCEDURES |
|
|
| (a) The Chief Executive and Financial Officers concluded that the Registrant’s Disclosure Controls and Procedures are effective based on the evaluation of the Disclosure Controls and Procedures as of a date within 90 days of the filing date of this report. |
|
|
| (b) There have been no changes in the registrant’s internal control over financial reporting that occurred during the second fiscal quarter of the period covered by this report that has materially affected, or is reasonably likely to materially affect, the registrant’s internal controls over financial reporting. |
|
|
ITEM 12. | EXHIBITS |
|
|
| (a)(1) Code of Ethics pursuant to Item 2 of Form N-CSR is filed and attached hereto as EX-99.CODE ETH. |
|
|
| (a)(2) Certification pursuant to Rule 30a-2(a) under the Investment Company Act of 1940 (17 CFR 270.30a-2(a)) is filed and attached hereto as Exhibit 99.CERT. |
|
|
| (b) Certification pursuant to Rule 30a-2(b) under the Investment Company Act of 1940 (17 CFR 270.30a-2(b)) is furnished and attached hereto as Exhibit 99.906CERT. |
Form N-CSR Item F
SIGNATURES
Pursuant to the requirements of the Securities Exchange Act of 1934 and the Investment Company Act of 1940, the registrant has duly caused this report to be signed on its behalf by the undersigned, thereunto duly authorized.
Registrant: | DWS Short Duration Plus Fund, a series of DWS Advisor Funds |
|
|
|
|
By: | /s/Michael G. Clark Michael G. Clark President |
|
|
Date: | November 30, 2009 |
Pursuant to the requirements of the Securities Exchange Act of 1934 and the Investment Company Act of 1940, this report has been signed below by the following persons on behalf of the registrant and in the capacities and on the dates indicated.
Registrant: | DWS Short Duration Plus Fund, a series of DWS Advisor Funds |
|
|
|
|
By: | /s/Michael G. Clark Michael G. Clark President |
|
|
Date: | November 30, 2009 |
|
|
|
|
By: | /s/Paul Schubert Paul Schubert Chief Financial Officer and Treasurer |
|
|
Date: | November 30, 2009 |